
A Study on Factors Influencing the Choice of Investors towards ...
17
Journal of Contemporary Issues in Business and Government Vol. 27, No. 5,2021 https://cibg.org.au/ P-ISSN: 2204-1990; E-ISSN: 1323-6903 DOI: 10.47750/cibg.2021.27.05.005 41 A Study on Factors Influencing the Choice of Investors towards Mutual Funds Nittan Arora 1 , Dr. Sonia Chawla 2 1 Resaerch Scholar, Department of Management Studies, IKG Punjab Technical University, Kapurthala 2 Associate Professor, Department of hum. & Management, Dr B R Ambedkar National Institute of Technology, Jalandhar Abstract: The study is based on a sample of 200 qualified respondents chosen using multistage random sampling to understand the influence of various factors on investment decision and choice of investment towards mutual funds. The article identifies association of attributes risk perception, investment pattern and risk taking ability with demographic factors. Study mainly focuses on the factors influencing the choice of investors towards mutual funds and the impact of demographic factors on risk perception, investment pattern and risk taking ability of mutual fund investors. 283 respondents contacted for getting 200 mutual funds investors. Chi-square & Henry Garret Rating techniques applied for analysis the data. Regular return on schemes has emerged to be the most important factor and less Procedure least important factor that affects the choice of the investors towards selecting mutual funds. Most of the demographic factors have no significant association with investment pattern, risk perception and risk taking ability. Keywords: Association, Demographic, Investors, Mutual funds, Risk. I. INTRODUCTION The Indian financial system is based on four basic components like financial market, financial institutions, financial service and financial instruments. After economic liberalisation, The Indian financial system had undergone a lot of changes. Guerley and Shaw (1995) suggested that role of a financial institution is to capitalize the opportunities for saving and thereby increasing investment rate in the economy. In the past, a large proportion of increased saving has gone into bank deposits and small saving schemes. At present the increase in savings have been in shares, real estate and mutual funds, In future, the increase in savings is expected to flow more into mutual funds, due to its increased return and the recent tax incentives offered by the government In today’s modern world, the mutual funds have become the vital investment vehicle and treaded as the valuable and effective investment options (Chakraborty and Digal, 2013). Mutual fund industry observed 11.4% growth in AUM (Asset under Management) during 2018-19 (SEBI
-
Upload
khangminh22 -
Category
Documents
-
view
3 -
download
0
Transcript of A Study on Factors Influencing the Choice of Investors towards ...
Journal of Contemporary Issues in Business and Government Vol. 27, No. 5,2021
https://cibg.org.au/
P-ISSN: 2204-1990; E-ISSN: 1323-6903
DOI: 10.47750/cibg.2021.27.05.005
41
A Study on Factors Influencing the Choice of Investors
towards Mutual Funds
Nittan Arora1, Dr. Sonia Chawla2 1Resaerch Scholar, Department of Management Studies, IKG Punjab Technical
University, Kapurthala 2Associate Professor, Department of hum. & Management, Dr B R Ambedkar National
Institute of Technology, Jalandhar
Abstract:
The study is based on a sample of 200 qualified respondents chosen using multistage random
sampling to understand the influence of various factors on investment decision and choice of
investment towards mutual funds. The article identifies association of attributes risk perception,
investment pattern and risk taking ability with demographic factors. Study mainly focuses on the
factors influencing the choice of investors towards mutual funds and the impact of demographic
factors on risk perception, investment pattern and risk taking ability of mutual fund investors.
283 respondents contacted for getting 200 mutual funds investors. Chi-square & Henry Garret
Rating techniques applied for analysis the data. Regular return on schemes has emerged to be the
most important factor and less Procedure least important factor that affects the choice of the
investors towards selecting mutual funds. Most of the demographic factors have no significant
association with investment pattern, risk perception and risk taking ability.
Keywords: Association, Demographic, Investors, Mutual funds, Risk.
I. INTRODUCTION
The Indian financial system is based on four basic components like financial market, financial
institutions, financial service and financial instruments. After economic liberalisation, The Indian
financial system had undergone a lot of changes. Guerley and Shaw (1995) suggested that role of
a financial institution is to capitalize the opportunities for saving and thereby increasing
investment rate in the economy. In the past, a large proportion of increased saving has gone into
bank deposits and small saving schemes. At present the increase in savings have been in shares,
real estate and mutual funds, In future, the increase in savings is expected to flow more into
mutual funds, due to its increased return and the recent tax incentives offered by the government
In today’s modern world, the mutual funds have become the vital investment vehicle and treaded
as the valuable and effective investment options (Chakraborty and Digal, 2013). Mutual fund
industry observed 11.4% growth in AUM (Asset under Management) during 2018-19 (SEBI

Journal of Contemporary Issues in Business and Government Vol. 27, No. 5,2021
https://cibg.org.au/
P-ISSN: 2204-1990; E-ISSN: 1323-6903
DOI: 10.47750/cibg.2021.27.05.005
42
Reports,2019) Mutual funds are joint investment vehicles that accumulate wealth from entities
and occasionally unacquainted investors, to purchase the utmost potential stocks/securities or
investment avenues to deliver the maximum paybacks with the minimum risk (Manda &
Polisetty, 2020)
SEBI and Asset management companies (AMCs) themselves have made several efforts to
increase the familiarity retail investors have with investment jargon. To further popularise MFs
and propel their growth, the Securities and Exchange Board of India (SEBI) has been introduced
several new reforms like stress testing of liquid and money market mutual funds, relaxation of
restrictions for managing off shore funds, more disclosures in case of various schemes,
tightening of exposure limit on investment by mutual funds and modification of the product
labelling in mutual funds from three to five categories i.e. Low, Moderate Low, Moderate,
Moderate High, High(SEBI reports).
Mutual fund Industry Started in India with the initiative of the Government of India and Reserve
Bank of India with the formation of Unit Trust of India in 1963. First Phase (1964-1987) In
1963 Unit Trust of India (UTI) was established by an act of parliament and functioned under RBI
(Reserve Bank of India). Second Phase (1987-1993, Public Sector Funds Entry) In 1987 non-
UTI, public sector mutual funds came into existence by Public sector banks. Third Phase (1993-
2003, Entry of Private Sector Funds) Kothari Pioneer (now merged with Franklin Templeton)
was the first private sector mutual fund registered in July 1993. Fourth Phase (since February
2003) In February 2003, the UTI act was repealed and bifurcated into 2 entities UTI mutual fund
and specified undertaking of the Unit Trust of India. Indian mutual fund industry has witnessed
impressive growth with their number of schemes increased from 1 in 1964 to 2042 in 2019, with
43 players i.e. mutual fund companies in the market. The total AUM had also increased from Rs.
24.67 crore in March 1965 to Rs. 23,93,486 crore in September, 2019.
II. REVIEW OF LITERATURE
Tapan and Nalini (2002) attempted to study the perception of investors, investor’s preferences,
customer satisfaction level and problems faced by agents while selling mutual funds. Convenient
sampling technique was applied to choose the sample size i.e. 225 from Orissa state. The
questionnaire was used to collect the data. 225 respondents were asked but only 80 investors and
20 agents gave full information. Qualified sample was 100 only. Spearman's rank correlation and
perceptual map were used to analyse the data. 60% of the respondent invested in private sector
mutual funds. Tax plan schemes ranked 1 and most of the investors invested in Kothari Pioneer
Mutual funds. Correlation between preferences and investment in MF companies was .9 by
Spearman’s method. Safety of87 funds (internal) & sponsor reputation (external) were most
important factors and loan facility was the least important factor while choosing a mutual fund
plan. Most of the investors averagely satisfied with the performance and want to invest in initial
issue period. Out of 7 mutual funds companies, 5 were in the same cluster of high return and
high market attractiveness. UTI was most popular mutual fund according to agents. Bad

Journal of Contemporary Issues in Business and Government Vol. 27, No. 5,2021
https://cibg.org.au/
P-ISSN: 2204-1990; E-ISSN: 1323-6903
DOI: 10.47750/cibg.2021.27.05.005
43
performance of capital market was the difficulty faced by agents for selling the mutual funds.
Most of the investors were not satisfied with the performance of mutual funds except UTI. The
study concluded that awareness campaigns should be there for catching investor's attention
towards mutual funds. Parihar et al; (2009) studied the impact of demographic variables on
investor’s attitude and rank the factors for selection of mutual funds. The questionnaire was used
to collect the data from 200 respondents of Agra region with judgmental sampling technique.
Hypothesis established that demographic factors and attitude towards mutual funds were
independent to each other. Chi-Square and weighted average technique was used to analyse the
data. Age, gender and income had the association with an attitude of investors towards mutual
funds but education & occupation had no such association. Return ranked 1st and transparency
ranked 5th as factors responsible for investment in mutual funds. 57 respondents had a positive
attitude, 95 had neutral and 48 had a negative attitude towards mutual funds. Pandey (2011)
analysed investor behaviour, investment pattern and factors affecting their periodic investment.
Convenience sampling technique was applied to get the response from 50 investors through
structured questionnaire. Hypothesis testing was done and accepted in both the cases i.e.
investors did not go for periodic investment and high saving potential did not invest much in
mutual funds. Study concluded that investors were ignorant regarding mutual funds so there was
a need to change the mindset of investors. Objectives and time constraint must be asked from
investors while making investment plan or decision by financial advisors. Priya (2011) examined
investment pattern, investor’s attitude, risk tolerance, perception, problems, grievances and
redressal mechanism of mutual fund investor. Researcher divided Kerala into 3 geographical
areas and took 1 district from each geographical area of the study. Structured questionnaire used
to collect the data from 450 respondents. Simple random and multistage random sampling
techniques were applied. Tools applied were T test, multiple regressions, discriminate analysis,
Garrett ranking, Compound growth rate, Chi-square and factor analysis. The demographic result
revealed that graduated, married, male, aged of 31-40 with an annual income up to 1 lakh
invested in mutual funds. Bank deposit and gold were preferred investment for small while
mutual fund and real estate were preferred investment for large investors. Bank deposit ranked I
and mutual fund VII according to Garrett ranking. The investment objective of the investors was
to meet contingencies and children education. Agent and brokers were the sources of
information. Most of the investors had less than 2 years of experience. There was no significant
difference between investment strategy and demographic factors. Factor analysis converted 19
variables into 7 factors. Das (2012) evaluated Investor’s perception, Influences of demographic
factors, investment objectives and problems faced by small investors. The study was descriptive
in nature and structured questionnaire used to collect the data from 250 respondent of Assam
state. Purposive sampling technique was applied to select 10 brokers from 5 districts each and
each broker gave a link of 5 investors. Percentage, cross tabulation, F test and Chi-square applied
to analyse the data. There was no significant relationship of satisfaction with age, education,
occupation, the amount of investment and income. Gender of respondents had a significant
relationship with satisfaction. Reliability, capital gain and return were the factors which

Journal of Contemporary Issues in Business and Government Vol. 27, No. 5,2021
https://cibg.org.au/
P-ISSN: 2204-1990; E-ISSN: 1323-6903
DOI: 10.47750/cibg.2021.27.05.005
44
influenced investment. Tax benefit, high return and safety were the objectives of investment.
Friends and relatives had more impact while the selection of mutual funds. Less liquidity,
security and awareness were the problems faced by investors. Chi-square gave the result that
perception of the investors was depended upon liquidity, flexibility, tax saving, service quality
and transparency independent from management fee, return on income factor. Jain and Rawal
(2012) studied the preference, pattern and factors affecting the selection of investment.
Descriptive research design was used. Convenience sampling technique was applied to collect
the data from 123 respondents of Delhi and Gurgaon with a pretested questionnaire, out of which
90 were selected for further study. Hypothesis testing was done to know the association/relation
between preference of financial Instrument, mutual fund schemes with age, gender and annual
savings respectively. It was found that men were more interested in real estate investment and
women were in mutual funds. Growth schemes in the age category of 20-30 and tax savings
schemes in above 50 age category were more preferred for investment. Chi-square showed age,
gender and saving had an association with preferences towards the financial instrument. In the
case of mutual fund schemes, age and saving had an association but gender had not. Factor
analysis extracted 4 factors from 18 variables affected the choice of schemes. Kothari (2012)
studied the behaviour and perception of investors towards the investment options by different
age group in Indore city. Hypothesis testing was done to know the significance. Descriptive
research design was used. The sample size was taken 100 and data were collected with closed
ended questionnaire with the help of convenient judgemental sampling from Indore city. Mean
and Standard Deviation tool was applied through SPSS. Cronbach alpha applied to know the
reliability of data and it was 0.829. The study revealed that combined mean was 3.523 and
variance was .259. Study concluded that there was a significant difference between the
perceptions of different age group towards the investment. Youngsters were more interested to
investing their money in mutual funds. Mehta and Shah (2012) examined preferences, factors
affecting buying behaviour and performance evaluation of the preferred schemes by the
investors. Convenience sampling technique was applied to choose the sample size of 100
educated investors of Ahmadabad and Baroda city. Judgemental sampling technique was used to
select the schemes for performance evaluation. The questionnaire was used to collect the data.
Chi-Square test and Cramer’s V tools were applied for analysing the data. Findings revealed that
mutual funds were second preferred avenue for investment and high return was the major factor
that influenced the buying behaviour of mutual funds investors. Chi-square revealed that factors
preferred while investment and age was independent to each other. Canara Robeco Equity tax
saver-growth was the best scheme out of selected scheme by Sharpe and Treynor and had the
highest return. Mishra and Kumar (2012) evaluated the impact of perceived Purchase risk (PPR)
on the behaviour of investors with respect to information search, information sources, attributes
& depth during information processing. 350 respondents were contacted in the region of Jammu
& Kashmir with convenient sampling technique but 268 were able to fulfil the requirement of the
survey i.e. invested at least in one scheme of the mutual fund within 1 month prior to the survey.
The pre-tested structured questionnaire was used to collect the response from the investors. EFA

Journal of Contemporary Issues in Business and Government Vol. 27, No. 5,2021
https://cibg.org.au/
P-ISSN: 2204-1990; E-ISSN: 1323-6903
DOI: 10.47750/cibg.2021.27.05.005
45
and Cronbach's alpha was applied to check out the reliability and validity. Hypothesis
established as perceived purchase risk had a negative impact on the number of sources of
information, financial portal, the number of attributes, the extent of information processing, used
by mutual fund investors and positive impact on MF sales agents and banks as a source of
information. Regression analysis and T test were applied to analyse the data. PPR was taken as
independent variable and investor behaviour as the dependent variable. The hypothesis was
significant in all cases except banks as a source of information. There was a difference in the
behaviour of high PPR and less PPR mutual fund investors in case of Information search and
information processed. High PPR used fewer sources of information and processed it but rely
more on formal sources like agents for their investment decision due to less confidence. T test
also explained the difference between investment behaviour of high PPR and less PPR. They
suggested that government should interfere to shifting the mutual fund industry from distribution
to investor centric with various information and education programmes. Agrawal & Jain (2013)
attempted to find out most preferred investment avenue in Matura, perception of investor’s,
factors considered before investment and overall criterion of investors. Structured questionnaire
was applied to collect the data from 300 small & big investors from Aug. 13 to Sept. 13.
Snowball sampling technique was applied and covered 6 colonies/bazaars as sampling area.
Bank, LIC were most aware investment avenues and 288 respondents were aware about mutual
fund. Least aware investment avenue was future & options. Return (46%) & Tax Planning (26%)
were the most important criteria for investment. Safety was the reason for investment in Bank,
LIC, PPF, Bonds, Gold, NSC, KVP and MIS. Return was the return for investment in Mutual
fund, Real estate, Commodity market, Equity and Liquidity only for Future and options. Real
estate was the mode of investment with surplus fund. Padmaja (2013) examined the perception,
awareness, preferences and satisfaction level of investors towards mutual funds with reference to
ICICI Prudential Mutual funds. Descriptive research design was used and data collected through
structured questionnaire with Convenience sampling technique from Vijayawada. The sample
size was 100. Percentage and ranking technique applied for analyzing the data. It was found in
the study that 76% respondent aware about the mutual funds and 54 % respondent invested in
mutual funds. The preferred reason for investment was saving and higher returns. Equity fund
was most preferred funds among all. For SIP plans SBI Magnum Tax gain scheme was most
favourite one and then ICICI Prudential tax plan. ICICI Prudential Mutual funds were mostly
preferred by service class. Preference period for the investment was 3 years. Study suggested that
more awareness programmes for the Investors should be introduced and more advertisement
campaign in rural areas. Rakesh and Srinivas (2013) studied the perception of investors
towards investment in mutual funds. Stratified random sampling applied to select 400 investors
from 3 different regions Srikakulam, Vizianagaram, Visakhapatnam. A close-ended
questionnaire was used to collect the data from institutions and investment centres. Data
collection was done from February 2013 to May 2013. Investors in the age group of less than 35
with annual income 3-6 lakhs invested more in mutual funds and highest risk taker as compare to
other groups. More preference was given to open ended schemes. The majority of the investors

Journal of Contemporary Issues in Business and Government Vol. 27, No. 5,2021
https://cibg.org.au/
P-ISSN: 2204-1990; E-ISSN: 1323-6903
DOI: 10.47750/cibg.2021.27.05.005
46
invested in bank sponsored mutual funds. Brokers/agents were the major sources of information
& mode of investment. Return & safety, tax benefits and regular income were main the features
to attract investors. The study suggested that more debt schemes need to introduce and education
of investors required. Thomas (2013) examined the behaviour of mutual fund investors with
weighted objectives: Investment purpose, preference for mutual fund product & Investment
Avenues, post-buying behaviour & satisfaction level of investors with relation to time horizon,
risk perception and demographic profile. The hypothesis was set as investment objectives of
investors do not vary with the time horizon, risk perception and demographic features do not
affect the level of preference towards mutual fund product. Descriptive research design was
applied. Primary data collection was done from 400 individual investors of Kerala through
Structured questionnaire consisting 3 parts i.e. demographic, pre-buying, post buying behaviour.
Secondary data was collected from AMFI, SEBI and RBI websites. A pilot survey was
conducted from 150 respondents for reliability and validity checking through Cronbach's alpha
and Bentler Bonett fit index respectively. Simple random sampling technique applied for
choosing the sample size from investor's population of Kerala as 100 respondents from the north,
160 from central and 140 from south zone. Various tools and methods applied by the researcher
were SPSS, Kruskal Wallis Test, Weighted score ranking & box plot, Chi-square test, Factor
Analysis-principle component method, Friedman's test and Structural equation modelling with
AMOS-17. The return was the most important objective of the investment followed by safety
and capital appreciation. Out of 10 demographic factors hypothesis was accepted for only 4
factors i.e. Locality, gender, age and saving. In the case of saving and preferred investment
avenue, gold ranked I, real estate II and mutual fund ranked III. 53.5% of respondent had a
moderate level of risk. Service Quality & fund quality were the key factors influenced the mutual
fund product. Open ended scheme was most opted scheme by investors. Redemption, additional
buying and future buying intention majorly affected the post buying of an investor. Study
concluded that investors did not select the right mutual fund scheme due to financial illiteracy.
AMC’s should draft such kind of schemes which provide safety and excellent returns to the
investors and strengthen the existing policy of training for the distributor channels. Karthikeyan
and Preetha (2014) studied the factors that guide the choice of investment, awareness level,
Perception, saving behaviour of the investors towards mutual funds. Descriptive research design
was applied and Convenience sampling technique used to collect the data from 126 respondents
with pre tested structured questionnaire. Percentage & Correlation were used to find out the
degree of relationship. Chi-Square used to find out association between variables and one way
ANOVA used to analysis the significant difference between groups and within groups. Findings
of the study state that the majority of respondents invested 11-20% of their annual Income in
mutual funds and that investment was done majorly due to Tax benefits. The study found no
association between the risk in mutual funds and future investments. There was positive and
significant relation between percentage investment in mutual funds and annual income of
respondent but level of satisfaction had no significance with future investment chances.
Khitoliya (2014) examined investor’s perception, awareness level, risk appetite and preferred

Journal of Contemporary Issues in Business and Government Vol. 27, No. 5,2021
https://cibg.org.au/
P-ISSN: 2204-1990; E-ISSN: 1323-6903
DOI: 10.47750/cibg.2021.27.05.005
47
type of mutual fund scheme. 200 respondents hold age 25-55 were contacted in the region of
Delhi. Questionnaire was used to collect the data and only 192 responded gave full information.
Chi-square, percentage and spss-17 tools were applied for analysis. Researcher found that there
was strong relation between age, education with awareness level & rationale of investment but
no relation with occupation. Half of the respondents were aware about mutual funds. Tax benefit,
flexibility was greatest benefit and internet, newspaper was source of information. Less
information was the reason not to invest and poor fund performance for withdrawal in mutual
funds. 55% male respondents preferred high risk high return type of scheme. Most of the
investors took the advice of relatives and friends while investment in mutual fund. Kumar &
Kumar (2014) studied investor’s perception regarding mutual fund as low risk investment. Data
collected from 160 respondents of Sirsa district through structured questionnaire. Hypothesis
established as no significant difference between mutual fund as low risk investment and
perception of investor’s. Mean, percentage, frequency, spss-13 and chi-square applied to analysis
the data. Majority of the respondents were belong to age category less than 30, Graduate (45%),
Serviceman (38.1%), 4-7 lac (37.5%) and male (78.1%). Age, qualification, occupation, income
and gender had no significant difference regarding opinion of low risk investment. Investors had
negative perception towards mutual funds as low risk investment. Researcher found that most of
the respondents were neutral and dissatisfied with the opinion regarding mutual fund as low risk
investment. Dodiya (2015) examined the influence of demographic variables on investor’s attitude and ranked the variables responsible for selection of mutual fund. Hypothesis was
established as demographic factors of respondents & their attitude were independent towards
mutual fund. Structured questionnaire was used to collect the data from 300 respondents of
Ahmadabad city. Tools applied for analysis were t test, factor analysis and weighted ranking
method. Cronbach alpha was .791. Return raked 1, liquidity ranked 2 as factors affected the
selection of mutual fund. 85 respondents (28.3%) had positive, 143(47.7%) neutral and 72(24%)
negative attitude towards mutual fund. Gender, Age, Income & Occupation had significant
relation and education had not any signification relation with attitude of respondents towards
mutual funds. Jatana and Barodawala (2015) attempted to identify the factors affecting the
choice of investors towards mutual funds investment. The study was based on survey method.
Data was collected through interview schedule from the sample of 1000 respondents by
convenience sampling technique from various parts of the country. The reliability and internal
consistency were tested by Cronbach Alpha Coefficient. Bartlett’s test of sphericity was used for
analysing the correlation matrix. Factor analysis converted 20 variables into 5 factors-monetary
returns, regulations, customer support, promotional measures and market risk. Monetary return
was the important factor affecting the investment decisions of the investors in relation to mutual
funds in India. Acharya (2016) studied the influence of demographic factors, like age, education,
mentality, gender on investment behaviour of the investors. Hypothesis established as
Investment and education were independent to each other. The sample size was 256 respondents
from the Gujarat state. One way ANOVA (5% level of significance) was applied for analysis the
data. The study revealed that education group with graduation & higher had highest average

Journal of Contemporary Issues in Business and Government Vol. 27, No. 5,2021
https://cibg.org.au/
P-ISSN: 2204-1990; E-ISSN: 1323-6903
DOI: 10.47750/cibg.2021.27.05.005
48
investment in the mutual funds. Youngsters had keen interest to invest in mutual funds. Sindhu
et al (2017) studied the relationship between personal attributes & investment perception,
influence of education level on knowledge regarding mutual fund, Occupational effect on
information dissemination, relation of age & Income level with safety of investment & mutual
fund return respectively. 1000 questionnaires were distributed in Hyderabad region with the help
of random sampling technique but only 522 responses were clear and used further for analysis
purpose. Tools applied for analysis were Cronbach alpha, Chi-square, Kruskal wallis H test and
SPSS-20. 5 variables Knowledge, information, safety, return & decision making were considered
for study. Perfect positive correlation was found between Knowledge & information .779 and
Weak positive correlation between Knowledge & Safe Investment avenues. Out of 5 variables, 4
were found reliable except decision making. Researcher found that no significant relation of
Education with knowledge, Occupation with information, income level with decision making
and annual income with return on investment. Only age had the significant relation with safety
regarding investment (risk taking ability).
II. OBJECTIVES OF THE STUDY
To assess the factors influencing the choice of investors for investment in mutual funds.
To study the association of demographic factors with risk perception, investment pattern
and risk taking ability.
III. RESEARCH METHODOLOGY
Descriptive research design is applied in this study. Multistage sampling technique applied to
collect the data. In the first stage, stratified random sampling technique is applied. Doaba region
divided into 4 different strata on the basis of geographical regions i.e. Districts. In the second
stage, convenience sampling technique applied to select 50 mutual fund investors from each
stratum. Total sample size for the study is 200. The sample taken from each stratum equally i.e.
50 and equally distributed among districts of Doaba region. 283 investors contacted to fill up the
structured questionnaire to be sent through emails, G form and by personal investigation for
getting 200 mutual fund investors. Tools applied for analysis the data is Chi-square, Henry
Garret Rating and Percentage.
IV. DATA ANALYSIS AND INTERPRETATION
Table 1.1 Demographic Profile of mutual fund investors
Variables Factors Freq. Percentage
Gender
Female 64 32.00
Male 136 68.00
Total 200 100
Age Below 30 87 43.50
30-40 58 29.00
40-50 23 11.50
50-60 19 9.50
Above 60 13 6.50
Total 200 100

Journal of Contemporary Issues in Business and Government Vol. 27, No. 5,2021
https://cibg.org.au/
P-ISSN: 2204-1990; E-ISSN: 1323-6903
DOI: 10.47750/cibg.2021.27.05.005
49
Education
Level
Secondary/High
School 21 10.50
Graduation 97 48.50
Post Graduation 67 33.50
Ph.D 9 4.50
Others 6 3.00
Total 200 100
Annual
Income
Below Rs. 2
lakh 24 12.00
2-5 lakh 107 53.50
5-10 lakh 57 28.50
Above 10 Lakh 12 6.00
Total 200 100
Occupation
Govt.
Employee 31 15.50
Professionals 23 11.50
Private
Employee 81 40.50
Businessman 56 28
Others 9 4.50
Total 200 100
Risk
Associated
Low 17 8.50
Moderate Low 23 11.50
Moderate 87 43.50
Moderate High 43 21.50
High 30 15.00
Total 200 100
Investment
Pattern
Monthly (SIP) 93 46.50
Quarterly 19 9.50
Once in Six
Months 22 11.00
Once in a Year 46 23.00
Very Rare 20 10.00
Total 200 100
Risk
Taking
ability
Risk Averter 51 25.50
Moderate Risk
Taker 92 46.00
Risk Taker 57 28.50
Total 200 100
Table 1.1 shows distribution of respondents according to gender variable. Out of 200
respondents, majority 68% were male and the rest 32% were female.
As shown in table, 43.5% belong to age group of less than 30 years, 29% of respondents belong
to age group of 30-40 years, 11.5% belong to age group of 40-50 years, 9% belong to age group
of 50-60 and remaining are of 60 years and above age.
Above table shows distribution of respondents by their educational level. It can be observed that
around 10.5% of respondents are secondary/high school level, 48.5% are graduates followed by
33.5 % postgraduates, 4.5% respondents are PhDs and remaining 3% are having other
educational qualification.
Above table shows that12% of respondents have income less than Rs. 2 lacs per year. About
53.5% of respondents have income between Rs.2 lacs to Rs.5lacs per year, 28.5% of the
respondents have income of Rs. 5 lacs to Rs. 10 lacs per year and very few, around 6% of
respondents have earning more than Rs. 10 lacs per year.
Journal of Contemporary Issues in Business and Government Vol. 27, No. 5,2021
https://cibg.org.au/
P-ISSN: 2204-1990; E-ISSN: 1323-6903
DOI: 10.47750/cibg.2021.27.05.005
50
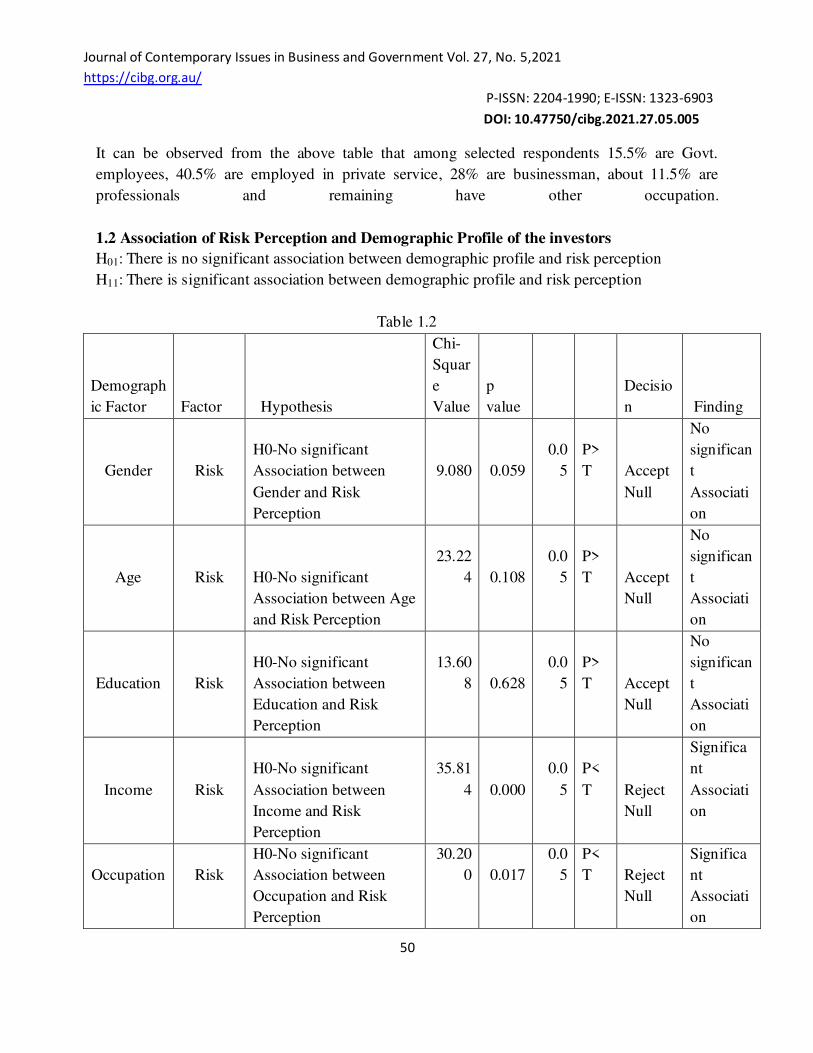
It can be observed from the above table that among selected respondents 15.5% are Govt.
employees, 40.5% are employed in private service, 28% are businessman, about 11.5% are
professionals and remaining have other occupation.
1.2 Association of Risk Perception and Demographic Profile of the investors
H01: There is no significant association between demographic profile and risk perception
H11: There is significant association between demographic profile and risk perception
Table 1.2
Demograph
ic Factor Factor Hypothesis
Chi-
Squar
e
Value
p
value
Decisio
n Finding
Gender
Risk
H0-No significant
Association between
Gender and Risk
Perception
9.080
0.059
0.0
5
P>
T
Accept
Null
No
significan
t
Associati
on
Age
Risk
H0-No significant
Association between Age
and Risk Perception
23.22
4
0.108
0.0
5
P>
T
Accept
Null
No
significan
t
Associati
on
Education
Risk
H0-No significant
Association between
Education and Risk
Perception
13.60
8
0.628
0.0
5
P>
T
Accept
Null
No
significan
t
Associati
on
Income
Risk
H0-No significant
Association between
Income and Risk
Perception
35.81
4
0.000
0.0
5
P<
T
Reject
Null
Significa
nt
Associati
on
Occupation
Risk
H0-No significant
Association between
Occupation and Risk
Perception
30.20
0
0.017
0.0
5
P<
T
Reject
Null
Significa
nt
Associati
on

Journal of Contemporary Issues in Business and Government Vol. 27, No. 5,2021
https://cibg.org.au/
P-ISSN: 2204-1990; E-ISSN: 1323-6903
DOI: 10.47750/cibg.2021.27.05.005
51
The above table 1.2 shows that there is no association between risk perception of investors and
demographic factors, viz. gender, age and education where p-value is higher than 0.05. It can be
inferred that, there is no significant association of criteria of risk perception and gender, age and
education except two criteria Income and occupation, where (P-value= 0.059>0.05, P-value =
0.108>0.05 & P-value = 0.628>0.05). So, null hypothesis is not rejected except in three cases
specified above.
From table 1.2, it can be inferred that demographic factors, viz. Income and Occupation are
significantly associated with criteria used to judge the Risk perception of mutual funds investors
for investment decision. As P values in all cases are less than significant level (p-values< 0.05),
this lead to reject the null hypothesis. This indicates that Income and occupation of respondents
have significant effect on criteria used to judge the risk perception of the investors.
1.3 Association of Investment Pattern and Demographic Profile of the investors
H02: There is no significant association between demographic profile and investment pattern
H12: There is significant association between demographic profile and investment pattern.
Table-1.3
Demograph
ic Factor Factor Hypothesis
Chi-
Square
Value
p
value
Decisio
n Findings
Gender
Investmen
t Pattern
H0-No significant
Association between
Gender and
Investment pattern 1.865 0.761 0.05
P>
T
Accept
Null
No
significan
t
Associati
on
Age
Investmen
t Pattern
H0-No significant
Association between
Age and Investment
pattern 33.162 0.007 0.05
P<
T
reject
Null
significan
t
Associati
on
Education
Investmen
t Pattern
H0-No significant
Association between
Education and
Investment pattern 25.253 0.065 0.05
P>
T
Accept
Null
No
significan
t
Associati

Journal of Contemporary Issues in Business and Government Vol. 27, No. 5,2021
https://cibg.org.au/
P-ISSN: 2204-1990; E-ISSN: 1323-6903
DOI: 10.47750/cibg.2021.27.05.005
52
on
Income
Investmen
t Pattern
H0-No significant
Association between
Income and
Investment pattern 5.632 0.933 0.05
P>
T
Accept
Null
No
significan
t
Associati
on
Occupation
Investmen
t Pattern
H0-No significant
Association between
Occupation and
Investment pattern 18.317 0.306 0.05
P>
T
Accept
Null
No
significan
t
Associati
on
The above table 1.3 shows that there is no association between the investment pattern of
investors and demographic factors, viz. gender, education, income & occupation where p-value
is higher than 0.05 in all cases except age. It can be inferred that, there is no significant
association of criteria of investment pattern and gender, education, income & occupation, where
(P-value=0.761>0.05, P-value = 0.065>0.05 P-value= 0.933>0.05 & P-value = 0.306>0.05). So,
null hypothesis is not rejected in all cases specified above except age.
From table 1.3, it can be inferred that demographic factor, viz. age is significantly associated
with criteria used to judge the investment pattern of mutual funds investors for investment
decision. As P values is less than significant level (p-values< 0.05), this led to rejection of null
hypothesis. This indicates that age of respondents have significant effect on criteria used to judge
the investment pattern of the investor.
1.4 Association of Risk Taking Ability and Demographic Profile of the investors
H03: There is no significant association between demographic profile and risk taking ability.
H13: There is significant association between demographic profile and risk taking ability.
Table-1.4
Demograph
ic Factor Factor Hypothesis
Chi-
Square
Value
p
valu
e
Decisio
n
Findings
Gender
Risk
Taking
Ability
H0-No significant
Association between
Gender and Risk
taking ability
9.276
0.01
0
0.05
P<
T
Reject
Null
significan
t
Associati
on

Journal of Contemporary Issues in Business and Government Vol. 27, No. 5,2021
https://cibg.org.au/
P-ISSN: 2204-1990; E-ISSN: 1323-6903
DOI: 10.47750/cibg.2021.27.05.005
53
Age
Risk
Taking
Ability
H0-No significant
Association between
Age and Risk taking
ability
31.052
0.00
0
0.05
P<
T
Reject
Null
significan
t
Associati
on
Education
Risk
Taking
Ability
H0-No significant
Association between
Education and
Investment pattern
5.092
0.74
8
0.05
P>
T
Accept
Null
No
significan
t
Associati
on
Income
Risk
Taking
Ability
H0-No significant
Association between
Income and
Investment pattern
12.933
0.04
4
0.05
P<
T
Reject
Null
significan
t
Associati
on
Occupation
Risk
Taking
Ability
H0-No significant
Association between
Occupation and
Investment pattern
13.879
0.08
5
0.05
P>
T
Accept
Null
No
significan
t
Associati
on
The above table 1.4 shows that there is no association between risk taking ability of investors
and demographic factors, viz. education & occupation where p-value is higher than 0.05 in both
cases. It can be inferred that, there is no significant association of risk taking ability with
education & occupation except three criteria gender, age & income, where (P-value=0.748>0.05
& P-value = 0.085>0.05 So, null hypothesis is not rejected in two cases specified above except
gender, age and income.
From table 1.4, it can be inferred that demographic factor, viz. gender, age and income is
significantly associated with criteria used to judge the risk taking ability of mutual funds
investors for investment decision. As P values is less than significant level (p-values< 0.05), this
led to rejection of null hypothesis. This indicates that gender, age and income of respondents
have significant effect on criteria used to judge the investment pattern of the investors.
1.5 Factors influencing the choice of investors for investment in mutual funds.
Table-1.5
Factors Highly
Importa
nt
Importa
nt
Some
What
Importa
nt
Not very
Importa
nt
Not at
all
Importa
nt
Tota
l
Weighte
d Total
Score
Weighte
d
Ranking
Liquidity 103 41 19 30 7 200 803 2

Journal of Contemporary Issues in Business and Government Vol. 27, No. 5,2021
https://cibg.org.au/
P-ISSN: 2204-1990; E-ISSN: 1323-6903
DOI: 10.47750/cibg.2021.27.05.005
54
Regular
Return on
Schemes 107 61 19 12 1 200 861 1
Professional
Management 78 30 39 32 21 200 712 6
More
Diversificatio
n 46 94 37 14 9 200 754 3
Prestige Value
as on
inception 34 48 63 28 27 200 634 10
Safety 62 41 25 19 53 200 640 9
Capital
Appreciation 31 53 37 46 33 200 603 11
High return as
compared to
other option 57 65 19 11 48 200 672 7
Risk
Associated 91 28 39 16 26 200 742 4
Tax Benefits 69 50 37 25 19 200 725 5
Fund
Performance
Record 42 57 29 63 9 200 660 8
Scheme
Expense Ratio 18 31 96 32 23 200 589 13
Less
Procedure 41 21 33 50 55 200 543 15
Minimum
Initial
Investment 23 27 92 28 30 200 585 14
Others 37 33 56 35 39 200 594 12
Tota
l 10117
The above table shows the factors influencing the choice of investors and ranking these factors
for investment in mutual funds. It can be inferred from table that rank 1 assigned to Regular
Return on Schemes by Garret raking whereas rank 2 assigned to Liquidity and 3 rank assigned to
More Diversification. Rank 15 assigned to Less Procedure of mutual fund, which least
importance factor while investing in mutual funds. Rank 4 assigned to Risk Associated, rank 5
assigned to Tax Benefits, rank 6 assigned to Professional Management, rank 7 assigned to High

Journal of Contemporary Issues in Business and Government Vol. 27, No. 5,2021
https://cibg.org.au/
P-ISSN: 2204-1990; E-ISSN: 1323-6903
DOI: 10.47750/cibg.2021.27.05.005
55
return as compared to other option, rank 8 assigned to Fund Performance Record. Most
important factors while investments in mutual funds are regular return on schemes, liquidity and
more diversification respectively.
V. FINDINGS
1. Majority of respondents were males, age group less than 30 category, graduate
qualification, income 2-5 lacs annually and private employees.
2. Most of respondent have a view that risk association with mutual fund is moderate.
3. Majority of investors interested in SIP as investment pattern and having moderate risk
taking ability.
4. Income and occupation significantly associated with risk perception of mutual funds
investors for investment decision whereas gender, age and education are not
associated.
5. No significant association of investment pattern with gender, education, income,
occupation except age.
6. No significant association of risk taking ability with education & occupation whereas
age, gender and income significantly associated.
7. Most important factors while investments in mutual funds are regular return on
schemes, liquidity and more diversification respectively and least important factors
are less procedure & Minimum Initial Investment respectively.
VI. CONCLUSION
The present study throws a light on the factors influencing the choice of investors towards
mutual funds. Understanding the requirements of investors by the mutual fund companies has
become necessary to accelerate the required pace of growth. A detailed analysis of risk
perceptions of the investors was made in this study. This study provides an insight into the
factors that affects the investment making decision of the investors. Regular returns on schemes
have emerged to be the most important factor that affects the choice of the investors in selecting
mutual fund. These results will help the mutual fund companies to understand the expectations of
the Investors. The above analysis indicates that risk perception, investment pattern and risk
taking ability of an individual have no significant association with demographic profiles of the
investors.
VII. REFERENCES
1. Panda, T. K., & Tripathy, N. P. (2002). An application of multidimensional scaling
model towards brand positioning of mutual funds: A case study of tax saving
scheme. Finance India, 16(3), 991.
2. Parihar, B. B. S., Sharma, R., & Parihar, D. S. (2009). Analyzing investors' attitude
towards mutual funds as an investment option. IUP Journal of Management
Research, 8(7), 56.

Journal of Contemporary Issues in Business and Government Vol. 27, No. 5,2021
https://cibg.org.au/
P-ISSN: 2204-1990; E-ISSN: 1323-6903
DOI: 10.47750/cibg.2021.27.05.005
56
3. Pandey, A. (2011). Investors' behaviour: mutual fund. SCMS Journal of Indian
Management, 8(1), 28.
4. Priya, S. (2011). Investor’s attitude and behaviour towards mutual fund investment in
Kerala.
5. Das, S. (2012). Small investor’s perceptions on mutual funds in Assam: an empirical
analysis. Journal of Research in Commerce and Management , 1(8).
6. Jain, N., & Rawal, S. (2012). Behavioural analysis of individual investors towards
selection of mutual fund schemes: An empirical study. International Journal of
Marketing & Business Communication, 1(4), 64.
7. Kothari, H. (2012). Investor’s behaviour towards investment avenues: A study with
reference to Indore city. Altius Shodh Journal of Management & Commerce.
8. Mehta, S., & Shah, C. (2012). The performance of Indian mutual funds with special
reference to evaluation of their reliability. Adarsh Journal of Management
Research, 5(2), 41-54.
9. Mishra, S. K., & Kumar, M. (2012). The impact of perceived purchase risk on investment
behaviour of mutual fund investors. The decision, 39(2), 3.
10. Agarwal, G., & Jain, M. (2013). Investor’s Preference towards Mutual Fund in
comparison to other Investment Avenues. Journal of Indian Research, 1(4), 115-131.
11. Padmaja, R. (2013). A study of consumer behaviour towards mutual funds with special
reference to ICICI Prudential mutual funds, Vijayawada. International Journal of
Management Research and Business Strategy, 2(2), 1-14.
12. Rakesh, D. K., & Srinivas, M. V. (2013). Understanding Individual Investors Investment
Behavior in Mutual Funds (A Study on Investors of North Coastal Andhra
Pradesh). International Journal of Management (IJM), 4(3), 185-198.
13. Thomas, B. J. (2013). Mutual fund investor’s behaviour in Kerala.
14. Karthikeyan, R., & Preetha, R. (2014). Mutual funds–MIDAS touch. International
Journal, 2(3).
15. Khitoliya, P. (2014). Investors awareness and perceived risk attitude towards mutual
fund: an empirical study in Delhi. Int J Commer Bus Manag, 3(3), 450-456.
16. Kumar, S., & Kumar, V. (2014). INVESTORS' PERCEPTION TOWARDS MUTUAL
FUNDS: A STUDY OF LOW RISK INVESTMENTS. International Journal of
Management Research and Reviews, 4(3), 388.
17. Dodiya, B. M. (2015). A study on the attitude of the Investors towards Investment in
Mutual Fund. Research Hub- International Multidisciplinary Research Journal, 2(5), 1-4.
18. Jatana, R., & Barodawala, M. (2015). Investment choice of Indian investors in mutual
funds: An empirical study.
19. Acharya, M. N. (2016). A statistical analysis and empirical study of investor’s behaviour
in mutual fund market.

Journal of Contemporary Issues in Business and Government Vol. 27, No. 5,2021
https://cibg.org.au/
P-ISSN: 2204-1990; E-ISSN: 1323-6903
DOI: 10.47750/cibg.2021.27.05.005
57
20. Sindhu., Krishna, Y,R., & Reddy A.S. ( 2017) Understanding the relationship between
investors' personal attributes and investment perceptions towards mutual fund
investments. Indian Journal of Finance, 11(2).
21. Gurley and Shaw, 'Financial aspects of Development', -IC Renew, v0145, 1955, pp 515-
539.
22. Chakraborty, S., & Digal, S. (2013). Analysis of Investment Pattern of Mutual Funds
Investors–An Empirical Study in Orissa. GITAM Journal of Management, April, 192-
207.
23. Manda, V. K., & Polisetty, A. COMPETITION & CONCENTRATION OF
THEINDIAN MUTUAL FUND INDUSTRY.
Websites
1. https://www.amfiindia.com/indian-mutual
2. https://www.amfiindia.com/research-information/mf-history
3. http://www.sebi.gov.in/
4. https://www.moneycontrol.com/mutual-funds
5. https://www.crisil.com/en/home/what-we-do/financial-products/historical-factsheets.html
6. https://www.valueresearchonline.com/funds/newsnapshot.asp?schemecode=1972&utm_
medium=vro.in