a study of the reasons for shrink-resistance and ... - UNSWorks
317
A STUDY OF THE REASONS FOR SHRINK-RESISTANCE AND MACHINE WASHABILITY OF SUPERLIGHT WEIGHT, WOVEN, PURE WOOL FABRICS BY CATHRYN ELIZABETH LEE SCHOOL OF MATERIALS SCIENCE AND ENGINEERING UNIVERSITY OF NEW SOUTH WALES SUPERVISORS: ASSOCIATE PROFESSOR MARK HOFFMAN, EMERITUS PROFESSOR MIKE PAILTHORPE, DR SURINDER TANDON A Thesis Submitted for Fulfillment of the Degree of Doctor of Philosophy FEBRUARY, 2006
-
Upload
khangminh22 -
Category
Documents
-
view
5 -
download
0
Transcript of a study of the reasons for shrink-resistance and ... - UNSWorks
A STUDY OF THE REASONS FOR
SHRINK-RESISTANCE AND MACHINE WASHABILITY
OF SUPERLIGHT WEIGHT, WOVEN, PURE WOOL FABRICS
BY
CATHRYN ELIZABETH LEE SCHOOL OF MATERIALS SCIENCE AND ENGINEERING
UNIVERSITY OF NEW SOUTH WALES
SUPERVISORS: ASSOCIATE PROFESSOR MARK HOFFMAN, EMERITUS PROFESSOR MIKE PAILTHORPE,
DR SURINDER TANDON
A Thesis Submitted for Fulfillment of the Degree of Doctor of Philosophy
FEBRUARY, 2006

i
“Woollens should be washed early in the morning, on a bright, breezy day for preference.
The more quickly they are dried the less they will shrink”
Common-Sense Laundry Book, p50, The NSW Cookery Teachers’ Association,
George B. Philip & Son, Sydney (circa 1920).
1
ABSTRACT
The washing of wool textiles has been an ongoing problem for the wool industry as the
conditions of washing, especially in an automatic washing machine invariably lead to
the felting shrinkage of the fabric. Much research effort has gone into the prevention of
felting shrinkage to make wool fabrics ‘machine washable’, however the processes
which have been most effective in achieving this alter the properties of the fibres. This
project has been an investigation into the reasons for the shrink-resistance of a woven,
pure wool, fabric that has not been treated with any chemical shrink-resist treatments.
The fabric was developed by Canesis Network Limited, as part of ongoing research into
weavable singles yarns.
It has been found that, for the fabrics in this project, felting shrinkage resistance is
dependent upon a unique yarn structure with high levels of twist, tight fabric
construction with high end and pick density and short float lengths, and finishing
processes which permanently set the fabric using heat and steam under lateral
compression. This combination of factors means that the individual fibres are so tightly
bound in the yarns and the fabric structure, and so well set in their close configuration
that they are unable to move in washing and cause felting. The density of the fabric was
found to be the measure that best described the reasons for the changes the felting
shrinkage of the fabric.
Due to the recognised importance of the scales and the directional frictional effect in
felting experiments were carried out to determine if there had been any change in the
frictional properties of the fibres through low stress mechanical testing. Furthermore, as
changes to wool chemistry have been used extensively in other shrink-resistance
treatments, chemical testing was carried out. It was found that changes took place in the
parameters measured in these tests; however, they were unable to explain the changes in
felting shrinkage.
2
CONTENTS STATEMENT OF ORIGINALITY..................................................................................ii
COPYRIGHT STATEMENT..........................................................................................iii
ABSTRACT...................................................................................................................... 1
CONTENTS...................................................................................................................... 2
ACKNOWLEDGEMENTS............................................................................................ 18
ABBREVIATIONS ........................................................................................................ 21
CHAPTER 1 PROJECT BACKGROUND .................................................................... 22
CHAPTER 2 HYPOTHESIS.......................................................................................... 23
CHAPTER 3 LITERATURE REVIEW, FELTING AND OTHER FORMS OF
WOOL SHRINKAGE AND FINISHING OF WOOL FABRICS ................................. 25
3.1 INTRODUCTION .......................................................................................... 25
3.2 THE FELTING PROCESS............................................................................. 25
3.3 FRICTION IN WOOL.................................................................................... 26
3.4 THEORIES ON SCALES AND FRICTION ................................................. 27
3.4.1 “The Ratchet Mechanism”...................................................................... 27
3.4.2 “The Ploughing Mechanism”.................................................................. 28
3.4.3 Other Theories ........................................................................................ 28
3.5 CONDITIONS OF FELTING ........................................................................ 29
3.5.1 Temperature ............................................................................................ 29
3.5.2 pH and The Action Of Soaps And Detergents........................................ 30
3.6 FIBRE PROPERTIES AFFECTING FELTING ............................................ 31
3.6.1 Fibre Length............................................................................................ 31
3.6.2 Fibre Diameter ........................................................................................ 32
3.6.3 Fibre Crimp............................................................................................. 33
3.6.4 Elastic Properties/Elasticity .................................................................... 34
3.7 YARN AND FABRIC PROPERTIES AFFECTING FELTING................... 35
3.8 THEORIES ON WOOL FRICTION AND FELTING................................... 36
3.9 WOOL FABRIC FINISHING PROCESSES ................................................. 38
3.9.1 Scouring .................................................................................................. 38
3.9.2 Milling..................................................................................................... 40
3.9.3 Drying ..................................................................................................... 41
3.9.4 Carbonising ............................................................................................. 42
Contents
3
3.9.5 Raising and Brushing.............................................................................. 43
3.9.6 Setting and Pressing Processes ............................................................... 43
3.9.6.1 Crabbing.............................................................................................. 43
3.9.6.2 Potting ................................................................................................. 44
3.9.6.3 Beaming .............................................................................................. 44
3.9.6.4 Decatising ........................................................................................... 45
3.9.6.5 Pressing ............................................................................................... 47
3.9.7 Singeing And Shearing ........................................................................... 48
3.9.8 London Shrinkage................................................................................... 48
3.10 CONVENTIONAL SHRINKPROOFING METHODS................................. 49
3.10.1 Degradative Processes ............................................................................ 50
3.10.1.1 Chlorination Processes........................................................................ 51
3.10.1.2 Other Degradative Processes .............................................................. 52
3.10.2 Electrical Discharge Treatments Or Plasma Treatments ........................ 53
3.10.2.1 Glow Discharge Treatments ............................................................... 53
3.10.2.2 Corona Treatments.............................................................................. 54
3.10.3 Enzyme Processes................................................................................... 54
3.10.4 Polymer Treatments ................................................................................ 55
3.10.5 Other Methods Of Preventing Shrinkage................................................ 57
3.11 OTHER FORMS OF SHRINKAGE IN WOOL FABRICS........................... 57
3.11.1 Relaxation Shrinkage .............................................................................. 57
3.11.2 Hygral Expansion.................................................................................... 57
3.12 SETTING OF WOOL FABRICS ................................................................... 59
3.13 SUMMARY.................................................................................................... 61
CHAPTER 4 MATERIALS AND METHODS ............................................................. 62
4.1 FABRIC PRODUCTION: WEAVING, FINISHING, AND SAMPLING.... 62
4.1.1 Weaving .................................................................................................. 62
4.1.2 Finishing And Sampling ......................................................................... 64
4.1.2.1 Plain Weave: Pilot Production............................................................ 65
4.1.2.1.1 Pressure Decatising Cycle................................................................... 67
4.1.2.2 Plain Weave: Bulk Production ............................................................ 67
4.1.2.3 Twill Fabric Production ...................................................................... 70
4.2 SAMPLE PREPARATION AND TEST METHODS.................................... 74

Contents
4
4.2.1 Measurement Errors................................................................................ 74
4.2.2 Sample Preparation ................................................................................. 75
4.2.2.1 Test Conditions ................................................................................... 75
4.2.3 Wash Shrinkage ...................................................................................... 76
4.2.4 Physical Test Methods ............................................................................ 79
4.2.4.1 Fabric Width ....................................................................................... 79
4.2.4.2 Mass Per Unit Area............................................................................. 80
4.2.4.3 Yarn Crimp ......................................................................................... 80
4.2.4.4 Ends and Picks .................................................................................... 81
4.2.4.5 Derived Parameters ............................................................................. 81
4.2.5 Objective Testing .................................................................................... 84
4.2.5.1 Fabric Assurance by Simple Testing (FAST) Method ....................... 84
4.2.5.2 Kawabata Evaluation System- Fabric (KES-F) Method..................... 86
4.2.6 Chemical Testing .................................................................................... 88
4.2.6.1 Initial Sample Preparation................................................................... 88
4.2.6.2 Alkali Solubility.................................................................................. 89
4.2.6.3 Urea Bisulfite Solubility ..................................................................... 90
4.2.6.4 pH of Water Extract of Wool.............................................................. 90
4.2.6.5 Amino Acid Analysis (AAA) ............................................................. 91
4.2.6.6 Spectroscopy ....................................................................................... 93
4.2.7 Yarn Testing............................................................................................ 94
4.2.8 Microscopy ............................................................................................. 96
4.2.9 Data Analysis .......................................................................................... 98
4.2.9.1 Error Calculation................................................................................. 98
4.2.9.2 Plots and Regression ........................................................................... 98
4.2.9.3 Correlation Values .............................................................................. 99
4.2.9.4 Other Methods .................................................................................... 99
CHAPTER 5 WASH TESTING, RESULTS AND DISCUSSION ............................. 101
5.1 WOOLMARK 1X7A RELAXATION SHRINKAGE................................. 101
5.2 WOOLMARK 5X5A TOTAL AREA SHRINKAGE.................................. 106
5.2.1 Pilot Production .................................................................................... 106
5.2.2 Bulk Production .................................................................................... 107
5.2.3 2/1 Twill Production (26ppcm and 33ppcm) ........................................ 109
Contents
5
5.2.4 3/3 Twill Production (26ppcm and 33ppcm) ........................................ 110
5.3 WOOLMARK 5X5A FELTING SHRINKAGE.......................................... 111
5.3.1 Pilot Production .................................................................................... 111
5.3.2 Bulk Production .................................................................................... 113
5.3.3 2/1 Twill Production (26ppcm and 33ppcm) ........................................ 114
5.3.4 3/3 Twill Production (26ppcm and 33ppcm) ........................................ 116
5.3.5 Felting Shrinkage: Comparisons Across Batches ................................. 117
5.4 CUFF EDGE FELTING ............................................................................... 118
5.4.1 Pilot Production .................................................................................... 118
5.4.2 Bulk Production .................................................................................... 118
5.4.3 Twill Productions (All Productions)..................................................... 119
5.4.4 Correlations with Felting Shrinkage ..................................................... 120
5.5 DISCUSSION............................................................................................... 120
CHAPTER 6 PHYSICAL TESTING, RESULTS AND DISCUSSION.................. 123
6.1 WIDTH ......................................................................................................... 123
6.1.1 Pilot Production .................................................................................... 123
6.1.2 Bulk Production .................................................................................... 123
6.1.3 Twill Production ................................................................................... 123
6.1.4 Calculated ............................................................................................. 124
6.1.5 Correlations with Felting Shrinkage ..................................................... 124
6.2 MASS PER UNIT AREA: MEASURED AND CALCULATED ............... 127
6.2.1 Pilot Production ............................................................................................ 127
6.2.2 Bulk Production ............................................................................................ 128
6.2.3 Twill Productions.................................................................................. 128
6.2.4 Calculated ............................................................................................. 128
6.2.5 Correlations with Felting Shrinkage ..................................................... 128
6.3 YARN CRIMP.............................................................................................. 130
6.3.1 Pilot Production .................................................................................... 130
6.3.2 Bulk Production .................................................................................... 130
6.3.3 Twill Productions.................................................................................. 130
6.3.4 Correlations with Felting Shrinkage ..................................................... 131
6.4 ENDS AND PICKS ...................................................................................... 133
6.4.1 Pilot Production .................................................................................... 133
Contents
6
6.4.2 Bulk Production .................................................................................... 133
6.4.3 Twill Productions.................................................................................. 133
6.4.4 Correlations with Felting Shrinkage ..................................................... 134
6.5 COVER FACTOR: SI AND FRACTIONAL....................................... 136
6.5.1 Pilot Production .................................................................................... 136
6.5.2 Bulk Production .................................................................................... 136
6.5.3 Twill Productions.................................................................................. 137
6.5.4 Correlations with Felting Shrinkage ..................................................... 137
6.6 COMPACTNESS RATIO ............................................................................ 138
6.6.1 Pilot Production .................................................................................... 138
6.6.2 Bulk Production .................................................................................... 139
6.6.3 Twill Productions.................................................................................. 139
6.6.4 Correlations with Felting Shrinkage ..................................................... 139
6.7 FABRIC VOLUME DENSITY.................................................................... 140
6.7.1 Pilot Production .................................................................................... 140
6.7.2 Bulk Production .................................................................................... 141
6.7.3 Twill Productions.................................................................................. 141
6.7.4 Correlations with Felting Shrinkage ..................................................... 141
6.8 DISCUSSION............................................................................................... 143
CHAPTER 7 OBJECTIVE TESTING, RESULTS AND DISCUSSION.................... 145
7.1 FAST TESTING ........................................................................................... 145
7.1.1 Relaxation Shrinkage (RS) ................................................................... 145
7.1.1.1 Pilot Production ................................................................................ 146
7.1.1.2 Bulk Production ................................................................................ 146
7.1.1.3 Twill Productions.............................................................................. 147
7.1.1.4 Correlations with Felting Shrinkage ................................................. 147
7.1.2 Hygral Expansion (HE)..................................................................... 150
7.1.2.1 Pilot Production ................................................................................ 150
7.1.2.2 Bulk Production ................................................................................ 151
7.1.2.3 Twill Productions.............................................................................. 151
7.1.2.4 Correlations with Felting Shrinkage ................................................. 152
7.1.3 Formability............................................................................................ 155
7.1.3.1 All Productions ................................................................................. 155
Contents
7
7.1.3.2 Correlations with Felting Shrinkage ................................................. 155
7.1.4 Extensibility .......................................................................................... 157
7.1.4.1 Pilot Production ................................................................................ 157
7.1.4.2 Bulk Production ................................................................................ 157
7.1.4.3 Twill Productions.............................................................................. 158
7.1.4.4 Correlations with Felting Shrinkage ................................................. 158
7.1.5 Bending Rigidity (B)............................................................................. 160
7.1.5.1 Pilot Production ................................................................................ 160
7.1.5.2 Bulk Production ................................................................................ 160
7.1.5.3 2/1 Twill Production ......................................................................... 161
7.1.5.4 3/3 Twill Production ......................................................................... 161
7.1.5.5 Correlations with Felting Shrinkage ................................................. 161
7.1.6 Shear Rigidity ....................................................................................... 163
7.1.6.1 Pilot Production ................................................................................ 163
7.1.6.2 Bulk Production ................................................................................ 163
7.1.6.3 2/1 Twill Production ......................................................................... 163
7.1.6.4 3/3 Twill Production ......................................................................... 163
7.1.6.5 Correlations with Felting Shrinkage ................................................. 164
7.1.7 Compression ......................................................................................... 165
7.1.7.1 Pilot Production ................................................................................ 165
7.1.7.2 Bulk Production ................................................................................ 166
7.1.7.3 2/1 Twill Production ......................................................................... 166
7.1.7.4 3/3 Twill Production ......................................................................... 167
7.1.7.5 Correlations with Felting Shrinkage ................................................. 167
7.2 KESF TESTING ........................................................................................... 171
7.2.1 Surface Properties MIU, MMD, and SMD........................................... 171
7.2.1.1 Pilot Production ................................................................................ 171
7.2.1.2 Bulk Production ................................................................................ 171
7.2.1.3 Twill Productions.............................................................................. 172
7.2.1.4 Correlations with Felting Shrinkage ................................................. 172
7.2.2 Bending Properties................................................................................ 176
7.2.2.1 Pilot Production ................................................................................ 176
7.2.2.2 Bulk Production ................................................................................ 176
Contents
8
7.2.2.3 2/1 Twill Production ......................................................................... 177
7.2.2.4 3/3 Twill Production ......................................................................... 177
7.2.2.5 Correlations with Felting Shrinkage ................................................. 178
7.2.3 Shear Properties .................................................................................... 181
7.2.3.1 Pilot Production .................................................................................... 181
7.2.3.2 Bulk Production .................................................................................... 181
7.2.3.3 Twill Productions.................................................................................. 181
7.2.3.4 Correlations with Felting Shrinkage ..................................................... 182
7.2.4 Tensile Properties.................................................................................. 186
7.2.4.1 Pilot Production ................................................................................ 186
7.2.4.2 Bulk Production ................................................................................ 186
7.2.4.3 Twill Productions.............................................................................. 187
7.2.4.4 Correlations with Felting Shrinkage ................................................. 188
7.2.5 Compression Properties .................................................................... 191
7.2.5.1 Pilot Production ................................................................................ 191
7.2.5.2 Bulk Production ................................................................................ 191
7.2.5.3 Twill Productions.............................................................................. 192
7.2.5.4 Correlations with Felting Shrinkage ................................................. 192
7.3 DISCUSSION............................................................................................... 195
CHAPTER 8 CHEMICAL TESTING, RESULTS AND DISCUSSION .................... 197
8.1 SOLUBILITY TESTING ............................................................................. 197
8.1.1 Alkali Solubility............................................................................................ 197
8.1.1.1 Pilot Production ................................................................................ 197
8.1.1.2 Bulk Production ................................................................................ 199
8.1.2 UREA BISULFITE SOLUBILITY ...................................................... 201
8.1.2.1 Pilot Production ................................................................................ 201
8.1.2.2 Bulk Production ................................................................................ 203
8.2 AMINO ACID ANALYSIS ......................................................................... 205
8.2.1.1 Pilot Production ................................................................................ 205
8.2.1.2 Bulk Production ................................................................................ 208
8.3 DISCUSSION............................................................................................... 210
CHAPTER 9 MICROSCOPY RESULTS AND DISCUSSION.................................. 212
9.1 FIELD EMISSION SCANNING ELECTRON MICROSCOPY................. 212
Contents
9
9.1.1 Pilot Production .................................................................................... 212
9.2 ENVIRONMENTAL SCANNING ELECTRON MICROSCOPY (ESEM)215
9.1.2 Bulk Production .................................................................................... 215
9.1.3 Twill Productions.................................................................................. 219
9.1.3.1 2/1 Twill Production: 26ppcm .......................................................... 219
9.1.3.2 2/1 Twill Production: 33ppcm .......................................................... 222
9.1.3.3 3/3 Twill Production: 26ppcm .......................................................... 224
9.1.3.4 3/3 Twill Production: 33ppcm ......................................................... 227
9.1.3.5 Washed Samples ............................................................................... 229
9.3 DISCUSSION....................................................................................... 230
CHAPTER 10 YARN TESTING, RESULTS AND DISCUSSION............................ 231
10.1 RESULTS ..................................................................................................... 231
10.2 DISCUSSION............................................................................................... 232
CHAPTER 11 CONCLUSIONS .................................................................................. 235
REFERENCES ............................................................................................................. 240
APPENDICES ....................................................................................................................
APPENDIX 1 SAMPLE NAMES AND ABBREVIATIONS ..................................... 262
APPENDIX 2 YARN SHRINKAGE TRIALS ............................................................ 266
APPENDIX 3 TEST RESULTS................................................................................... 267
APPENDIX 4 TYPICAL TENSILE AND COMPRESSION CHARTS ..................... 312
LIST OF FIGURES
Figure 3.1 Wool Fibre..................................................................................................... 27
Figure 3.2 The Ratchet Mechanism................................................................................ 28
Figure 3.3 Traditional Dolly Scour................................................................................. 39
Figure 3.4 Milling Machine ............................................................................................ 41
Figure 3.5 Yorkshire Crab .............................................................................................. 44
Figure 3.6 Pressure Decatising Unit ............................................................................... 46
Figure 3.7 Shearing......................................................................................................... 48
Figure 4.1 Finishing and Sampling of Plain Weave Pilot Production ............................ 66
Figure 4.2 Finishing and Sampling of Plain Weave Bulk Production............................ 69
Figure 4.3 Finishing and Sampling of 2/1 and 3/3 Twill Fabrics: 26 picks per cm........ 72
Figure 4.4 Finishing and Sampling of 2/1 and 3/3 Twill Fabrics:33 picks per cm......... 73
Contents
10
Figure 4.5 Marking of Wash Samples ............................................................................ 77
Figure 4.6 Yarn Felting Unit........................................................................................... 96
Figure 5.1 Area Relaxation Shrinkage (1x7A): Pilot Production ................................. 102
Figure 5.2 Area Relaxation Shrinkage (1x7A): Bulk Production................................. 103
Figure 5.3 Area Relaxation Shrinkage (1x7A): 2/1 Twill Production.......................... 104
Figure 5.4 Area Relaxation Shrinkage (1x7A): 3/3 Twill Production.......................... 105
Figure 5.5 Total Area Shrinkage (1x7A & 5x5A): Pilot Production............................ 107
Figure 5.6 Total Area Shrinkage (1x7A & 5x5A): Bulk Production............................ 108
Figure 5.7 Total Area Shrinkage (1x7A & 5x5A): 2/1Twill Production...................... 110
Figure 5.8 Total Area Shrinkage (1x7A & 5x5A): 3/3 Twill Production..................... 111
Figure 5.9 Felting Shrinkage (5x5A only): Pilot Production........................................ 112
Figure 5.10 Felting Shrinkage (5x5A only): Bulk Production ..................................... 114
Figure 5.11 Felting Shrinkage (5x5A only): 2/1 Twill Production (26ppcm only)...... 115
Figure 5.12 Felting Shrinkage (5x5A only): 3/3 Twill Production (26ppcm only)...... 116
Figure 5.13 Area Felting Shrinkage (5x5 only): Corresponding Samples.................... 117
Figure 5.14 Cuff Edge Felting Shrinkage (5x5A only): Bulk Production.................... 119
Figure 6.1 Fabric Area Felting Shrinkage (5x5A only) v Fabric Total Width
(Measured), including selvdges .................................................................................... 127
Figure 6.2 Fabric Area Felting Shrinkage (5x5A only) v gsm (Measured).................. 129
Figure 6.3 Warp Felting Shrinkage (5x5A only) v Warp Yarn Crimp......................... 132
Figure 6.4 Weft Felting Shrinkage (5x5A only) v Weft Yarn Crimp........................... 132
Figure 6.5 Weft Felting Shrinkage (5x5A only) v Picks per Centimetre ..................... 135
Figure 6.6 Warp Felting Shrinkage (5x5A only) v Ends per Centimetre ..................... 135
Figure 6.7 Fabric Area Felting Shrinkage (5x5A only) v Total Cover Factor
(Fractional).................................................................................................................... 138
Figure 6.8 Fabric Area Felting Shrinkage (5x5A only) v Compactness Ratio ............. 140
Figure 6.9 Fabric Area Felting Shrinkage (5x5A only) v Fabric Density at 2g Load .. 142
Figure 6.10 Fabric Area Felting Shrinkage (5x5A only) v Fabric Density
at 100g Load ................................................................................................................. 142
Figure 7.1 Warp Relaxation Shrinkage, FAST Method: All Productions,
Corresponding Samples ................................................................................................ 148
Figure 7.2 Weft Relaxation Shrinkage, FAST Method: All Productions,
Corresponding Samples ................................................................................................ 148
Contents
11
Figure 7.3 Warp Felting Shrinkage (5x5A only) v Warp Relaxation Shrinkage
(FAST) .......................................................................................................................... 149
Figure 7.4 Weft Felting Shrinkage (5x5A only) v Weft Relaxation Shrinkage
(FAST) .......................................................................................................................... 149
Figure 7.5 Warp Hygral Expansion in Finishing: All Batches,
Corresponding Samples ................................................................................................ 152
Figure 7.6 Weft Hygral Expansion in Finishing: All Batches,
Corresponding Samples ................................................................................................ 153
Figure 7.7 Warp Felting Shrinkage (5x5A only) v Warp Hygral Expansion (FAST).. 154
Figure 7.8 Weft Felting Shrinkage (5x5A only) v Weft Hygral Expansion (FAST) ... 154
Figure 7.9 Warp Felting Shrinkage (5x5A only) v Warp Formability (FAST)............ 156
Figure 7.10 Weft Felting Shrinkage (5x5A only) v Weft Formability (FAST)............ 156
Figure 7.11 Warp Felting Shrinkage (5x5A only) v Warp 100g Extensibility
(FAST) .......................................................................................................................... 159
Figure 7.12 Weft Felting Shrinkage (5x5A only) v Weft 100g Extensibility (FAST) . 159
Figure 7.13 Fabric Area Felting Shrinkage (5x5A only) v Bias Extensibility (FAST) 160
Figure 7.14 Warp Felting Shrinkage (5x5A only) v Warp Bending Rigidity (FAST) . 162
Figure 7.15 Weft Felting Shrinkage (5x5A only) v Weft Bending Rigidity (FAST)... 162
Figure 7.16 Fabric Area Felting Shrinkage (5x5A only) v Shear Rigidity (FAST) ..... 165
Figure 7.17 Fabric Area Felting Shrinkage (5x5A only) v 2g Unreleased Thickness
(FAST) .......................................................................................................................... 169
Figure 7.18 Fabric Area Felting Shrinkage (5x5A only) v 100g Unreleased Thickness
(FAST) .......................................................................................................................... 169
Figure 7.19 Fabric Area Felting Shrinkage (5x5A only) v Unreleased Surface
Thickness (FAST)......................................................................................................... 170
Figure 7.20 Fabric Area Felting Shrinkage (5x5A only) v Released Surface Thickness
(FAST) .......................................................................................................................... 170
Figure 7.21 Warp Felting Shrinkage (5x5A only) v Warp Coefficient of Friction
(MIU) ............................................................................................................................ 174
Figure 7.22 Weft Felting Shrinkage (5x5A only) v Weft Coefficient of Friction
(MIU) ............................................................................................................................ 174
Figure 7.23 Warp Felting Shrinkage (5x5A only) v Warp Geometric Roughness
(SMD) ........................................................................................................................... 175

Contents
12
Figure 7.24 Weft Felting Shrinkage (5x5A only) v Weft Geometric Roughness
(SMD) ........................................................................................................................... 175
Figure 7.25 Warp Felting Shrinkage (5x5A only) v Warp Bending Rigidity .............. 179
Figure 7.26 Weft Felting Shrinkage (5x5A only) v Weft Bending Rigidity ................ 179
Figure 7.27 Warp Felting Shrinkage (5x5A only) v Warp Bending Hysteresis
at 1cm-1.......................................................................................................................... 180
Figure 7.28 Weft Felting Shrinkage (5x5A only) v Weft Bending Hysteresis
at 1cm-1.......................................................................................................................... 180
Figure 7.29 Warp Felting Shrinkage (5x5A only) v Warp Shear Rigidity................... 184
Figure 7.30 Weft Felting Shrinkage (5x5A only) v Weft Shear Rigidity..................... 184
Figure 7.31 Warp Felting Shrinkage (5x5A only) v Warp Shear Hysteresis (at
0.5degrees shear angle)................................................................................................. 185
Figure 7.32 Weft Felting Shrinkage (5x5A only) v Weft Shear Hysteresis (at
0.5degrees shear angle)................................................................................................. 185
Figure 7.33 Warp Felting Shrinkage (5x5A only) v Warp Tensile Strain.................... 189
Figure 7.34 Weft Felting Shrinkage (5x5A only) v Weft Tensile Strain...................... 189
Figure 7.35 Warp Felting Shrinkage (5x5A only) v Warp Tensile Resilience............. 190
Figure 7.36 Weft Felting Shrinkage (5x5A only) v Weft Tensile Resilience .............. 190
Figure 7.37 Fabric Area Felting Shrinkage (5x5A only) v Compression..................... 193
Figure 7.38 Fabric Area Felting Shrinkage (5x5A only) v Compressional Energy ..... 193
Figure 7.39 Fabric Area Felting Shrinkage (5x5A only) v Compressional Resilience 194
Figure 8.1 Alkali Solubility in Finishing: Pilot Production.......................................... 198
Figure 8.2 Fabric Area Felting Shrinkage (5x5A only) v Alkali Solubility: Pilot
Production ..................................................................................................................... 199
Figure 8.3 Alkali Solubility in Finishing: Bulk Production.......................................... 200
Figure 8.4 Fabric Area Felting Shrinkage (5x5A only) v Alkali Solubility: Bulk
Production ..................................................................................................................... 201
Figure 8.5 Urea Bisulfite Solubility in Finishing: Pilot Production ............................. 202
Figure 8.6 Fabric Area Felting Shrinkage (5x5A only) v Urea Bisulfite Solubility:
Pilot Production ............................................................................................................ 203
Figure 8.7 Urea Bisulfite Solubility in Finishing: Bulk Production ............................. 204
Figure 8.8 Fabric Area Felting Shrinkage (5x5A only) v Urea Bisulfite Solubility:
Bulk Production ............................................................................................................ 205
Contents
13
Figure 8.9 Lanthionine in Finishing: Pilot Production ................................................. 207
Figure 8.10 Fabric Area Felting Shrinkage (5x5A only) v Lanthionine Content: Pilot
Production ..................................................................................................................... 207
Figure 8.11 Lanthionine in Finishing: Bulk Production ............................................... 209
Figure 8.12 Fabric Area Felting Shrinkage (5x5A only) v Lanthionine Content: Bulk
Production ..................................................................................................................... 210
Figure 9.1 Loom Sample, Pilot..................................................................................... 213
Figure 9.2 CrabSample, Pilot........................................................................................ 213
Figure 9.3 Stent Sample, Pilot ...................................................................................... 213
Figure 9.4 Crop Sample, Pilot ...................................................................................... 213
Figure 9.5a Decatised at 110°C for 2min, Pilot............................................................ 214
Figure 9.5b Decatised at 110°C for 4min, Pilot............................................................ 214
Figure 9.5c Decatised at 110°C for 6min, Pilot............................................................ 214
Figure 9.6a Decatised at 114°C for 2min, Pilot............................................................ 214
Figure 9.6b Decatised at 114°C for 4min, Pilot............................................................ 214
Figure 9.6c Decatised at 114°C for 6min, Pilot............................................................ 214
Figure 9.7a Decatised at 121°C for 2min, Pilot............................................................ 214
Figure 9.7b Decatised at 121°C for 4min, Pilot............................................................ 214
Figure 9.7c Decatised at 121°C for 6min, Pilot............................................................ 214
Figure 9.8a Loomstate: damaged fibres, Pilot .............................................................. 215
Figure 9.8b 121°C 6min: damaged fibres, Pilot ........................................................... 215
Figure 9.9a Loomstate Sample: Surface, Bulk.............................................................. 216
Figure 9.9b Plain Loomstate: Warp Cross Section, Bulk.............................................. 216
Figure 9.9c Plain Loomstate: Weft Cross Section, Bulk............................................... 216
Figure 9.10a Plain Scoured Sample: Surface, Bulk ...................................................... 216
Figure 9.10b Plain Scoured: Warp Cross Section, Bulk ............................................... 216
Figure 9.10c Plain Scoured: Weft Cross Section, Bulk ................................................ 216
Figure 9.11a Plain Crabbed: Sample: Surface, Bulk..................................................... 216
Figure 9.11b Plain Crabbed: Warp Cross Section, Bulk ............................................... 216
Figure 9.11c Plain Crabbed: Weft Cross Section, Bulk ................................................ 216
Figure 9.12a Plain Stentered: Sample: Surface, Bulk ................................................... 217
Figure 9.12b Plain Stentered: Warp Cross Section, Bulk ............................................. 217
Figure 9.12c Plain Stentered: Weft Cross Section, Bulk .............................................. 217
Contents
14
Figure 9.13a Plain Cropped: Sample: Surface, Bulk..................................................... 217
Figure 9.13b Plain Cropped: Warp Cross Section, Bulk............................................... 217
Figure 9.13c Plain Cropped: Weft Cross Section, Bulk................................................ 217
Figure 9.14a Plain Dec 121°C 6m: Surface, Bulk......................................................... 217
Figure 9.14b Plain Dec 121°C: Warp Cross Section, Bulk........................................... 217
Figure 9.14c Plain Dec 121°C: Weft Cross Section, Bulk ............................................ 217
Figure 9.15a Plain Dec 121°C 6m+RP: Surface, Bulk ................................................. 218
Figure 9.15b Plain Dec 121°C+RP: Warp Cross Section, Bulk.................................... 218
Figure 9.15c Plain Dec 121°C+RP: Weft Cross Section, Bulk..................................... 218
Figure 9.16a Plain Dec 121°C 6m+RP+Dec 121°C6m: Surface, Bulk ........................ 218
Figure 9.16b Plain Dec 121°C+RP+ 121°C6m: Warp Cross Section, Bulk ................. 218
Figure 9.16c Plain Dec 121°C+RP+121°C6m: Weft Cross Section, Bulk ................... 218
Figure 9.17a Plain Dec 121°C 6m+RP+Dec 121°C6m+BL2: Surface, Bulk ............... 218
Figure 9.17b Plain Dec 121°C+RP+121°C6m +BL2: Warp Cross Section, Bulk........ 218
Figure 9.17c Plain Dec 121°C+RP+121°C6m +BL2: Weft Cross Section, Bulk......... 218
Figure 9.18a 2x1 26ppcm Loomstate Sample: Surface ................................................ 219
Figure 9.18b 2x1 26ppcm Loomstate: Warp Cross Section ......................................... 219
Figure 9.18c 2x1 26ppcm Loomstate: Weft Cross Section .......................................... 219
Figure 9.19a 2x1 26ppcm Scoured Sample: Surface .................................................... 220
Figure 9.19b 2x1 26ppcm Scoured: Warp Cross Section ............................................. 220
Figure 9.19c 2x1 26ppcm Scoured: Weft Cross Section .............................................. 220
Figure 9.20a 2x1 26ppcm Crabbed Sample: Surface.................................................... 220
Figure 9.20b 2x1 26ppcm Crabbed: Warp Cross Section............................................. 220
Figure 9.20c 2x1 26ppcm Crabbed: Weft Cross Section.............................................. 220
Figure 9.21a 2x1 26ppcm Stentered Sample: Surface .................................................. 220
Figure 9.21b 2x1 26ppcm Stentered: Warp Cross Section ........................................... 220
Figure 9.21c 2x1 26ppcm Stentered: Weft Cross Section ............................................ 220
Figure 9.22a 2x1 26ppcm Cropped Sample: Surface ................................................... 221
Figure 9.22b 2x1 26ppcm Cropped: Warp Cross Section ............................................ 221
Figure 9.22c 2x1 26ppcm Cropped: Weft Cross Section ............................................. 221
Figure 9.23a 2x1 26ppcm Dec 121°C 6min: Surface ................................................... 221
Figure 9.23b 2x1 26ppcm Dec121°C 6m: Warp Cross Section ................................... 221
Figure 9.23c 2x1 26ppcm Dec121°C 6m: Weft Cross Section .................................... 221
Contents
15
Figure 9.24a 2x1 26ppcm Dec 121°C 6min+ RP: Surface ........................................... 221
Figure 9.24b 2x1 26ppcm Dec121°C 6m+RP: Warp Cross Section ............................ 221
Figure 9.24c 2x1 26ppcm Dec121°C 6m+RP: Weft Cross Section ............................. 221
Figure 9.25a 2x1 26ppcm Dec 121°C 6min+ RP+121°C 6m: Surface ........................ 222
Figure 9.25b 2x1 26ppcm Dec121°C 6m+RP+121°C 6m: Warp Cross Section.......... 222
Figure 9.25c 2x1 26ppcm Dec121°C 6m+RP+121°C 6m: Weft Cross Section........... 222
Figure 9.26a 2x1 26ppcm Dec 121°C 6min+ RP+121°C 6m+BL2: Surface ............... 222
Figure 9.26b 2x1 26ppcm Dec121°C 6m+RP+121°C 6m+ BL2: Warp Cross Section222
Figure 9.26c 2x1 26ppcm Dec121°C 6m+RP+ 121°C 6m+BL2: Weft Cross Section 222
Figure 9.27a 2x1 33ppcm Loomstate Sample: Surface ................................................ 222
Figure 9.27b 2x1 33ppcm Loomstate: Warp Cross Section ......................................... 222
Figure 9.27c 2x1 33ppcm Loomstate: Weft Cross Section .......................................... 222
Figure 9.28a 2x1 33ppcm Crabbed Sample: Surface.................................................... 223
Figure 9.28b 2x1 33ppcm Crabbed: Warp Cross Section............................................. 223
Figure 9.28c 2x1 33ppcm Crabbed: Weft Cross Section.............................................. 223
Figure 9.29a 2x1 33ppcm Stentered Sample: Surface .................................................. 223
Figure 9.29b 2x1 33ppcm Stentered: Warp Cross Section ........................................... 223
Figure 9.29c 2x1 33ppcm Stentered: Weft Cross Section ............................................ 223
Figure 9.30a 2x1 33ppcm Finished Sample: Surface ................................................... 223
Figure 9.30b 2x1 33ppcm Finished: Warp Cross Section ............................................ 223
Figure 9.30c 2x1 33ppcm Finished: Weft Cross Section ............................................. 223
Figure 9.31a 3x3 26ppcm Loomstate Sample: Surface ................................................ 224
Figure 9.31b 3x3 26ppcm Loomstate: Warp Cross Section ......................................... 224
Figure 9.31c 3x3 26ppcm Loomstate: Weft Cross Section .......................................... 224
Figure 9.32a 3x3 26ppcm Scoured Sample: Surface .................................................... 224
Figure 9.32b 3x3 26ppcm Scoured: Warp Cross Section ............................................. 224
Figure 9.32c 3x3 26ppcm Scoured: Weft Cross Section .............................................. 224
Figure 9.33a 3x3 26ppcm Crabbed Sample: Surface.................................................... 224
Figure 9.33b 3x3 26ppcm Crabbed: Warp Cross Section............................................. 224
Figure 9.33c 3x3 26ppcm Crabbed: Weft Cross Section.............................................. 224
Figure 9.34a 3x3 26ppcm Stentered Sample: Surface .................................................. 225
Figure 9.34b 3x3 26ppcm Stentered: Warp Cross Section ........................................... 225
Figure 9.34c 3x3 26ppcm Stentered: Weft Cross Section ............................................ 225
Contents
16
Figure 9.35a 3x3 26ppcm Cropped Sample: Surface ................................................... 225
Figure 9.35b 3x3 26ppcm Cropped: Warp Cross Section ............................................ 225
Figure 9.35c 3x3 26ppcm Cropped: Weft Cross Section ............................................. 225
Figure 9.36a 3x3 26ppcm Dec 121°C 6min: Surface ................................................... 225
Figure 9.36b 3x3 26ppcm Dec121°C 6m: Warp Cross Section ................................... 225
Figure 9.36c 3x3 26ppcm Dec121°C 6m: Weft Cross Section .................................... 225
Figure 9.37a 3x3 26ppcm Dec 121°C 6min+ RP: Surface ........................................... 226
Figure 9.37b 3x3 26ppcm Dec121°C 6m+RP: Warp Cross Section ............................ 226
Figure 9.37c 3x3 26ppcm Dec121°C 6m+RP: Weft Cross Section ............................. 226
Figure 9.38a 3x3 26ppcm Dec 121°C 6min+ RP+121°C 6m: Surface ........................ 226
Figure 9.38b 3x3 26ppcm Dec121°C 6m+RP+121°C 6m: Warp Cross Section.......... 226
Figure 9.38c 3x3 26ppcm Dec121°C 6m+RP+ 121°C 6m: Weft Cross Section.......... 226
Figure 9.39a 3x3 26ppcm Dec 121°C 6min+ RP+121°C 6m+BL2: Surface ............... 226
Figure 9.39b 3x3 26ppcm Dec121°C 6m+RP+121°C 6m+ BL2: Warp Cross Section226
Figure 9.39c 3x3 26ppcm Dec121°C 6m+RP+ 121°C 6m+BL2: Weft Cross Section 226
Figure 9.40a 3x3 33ppcm Loomstate Sample: Surface ................................................ 227
Figure 9.40b 3x3 33ppcm Loomstate: Warp Cross Section ......................................... 227
Figure 9.40c 3x3 33ppcm Loomstate: Weft Cross Section .......................................... 227
Figure 9.41a 3x3 33ppcm Crabbed Sample: Surface.................................................... 227
Figure 9.41b 3x3 33ppcm Crabbed: Warp Cross Section............................................. 227
Figure 9.41c 3x3 33ppcm Crabbed: Weft Cross Section.............................................. 227
Figure 9.42a 3x3 33ppcm Stentered Sample: Surface .................................................. 227
Figure 9.42b 3x3 33ppcm Stentered: Warp Cross Section ........................................... 227
Figure 9.42c 3x3 33ppcm Stentered: Weft Cross Section ............................................ 227
Figure 9.43a 3x3 33ppcm Finished Sample: Surface ................................................... 228
Figure 9.43b 3x3 33ppcm Finished: Warp Cross Section ............................................ 228
Figure 9.43c 3x3 33ppcm Finished: Weft Cross Section ............................................. 228
Figure 9.44a Plain Loomstate Bulk Washed Sample: Surface ..................................... 228
Figure 9.44b Plain Loomstate Bulk Washed: Warp Cross Section .............................. 228
Figure 9.44c Plain Loomstate Bulk Washed: Weft Cross Section ............................... 228
Figure 9.45a Plain Dec 121°C 6m+RP+Dec 121°C6m+BL2 Bulk Washed Sample:
Surface .......................................................................................................................... 228
Contents
17
Figure 9.45b Plain Dec 121°C 6m+RP+Dec 121°C6m+BL2 Bulk Washed: Warp
Cross Section ................................................................................................................ 228
Figure 9.45c Plain Dec 121°C 6m+RP+Dec 121°C6m+BL2 Bulk Washed: Weft
Cross Section ................................................................................................................ 228
Figure 10.1 Yarn Felting Shrinkage v Time of Felting ................................................ 232
Figure A4.1a Typical Tensile Curve (2/1 Twill 121/6+RP+121/6).............................. 312
Figure A4.1b Typical Tensile Curve (Plain KD instead of crab) ................................. 312
Figure A4.2a Typical Compression Curve (2/1 Twill 121/6+RP+121/6) .................... 313
Figure A4.1b Typical Compression Curve (Plain KD instead of crab) ........................ 313
LIST OF TABLES Table 4.1 Fabric Production Specifications .................................................................... 63
Table 4.2 Decatising Time and Temperature Conditions ............................................... 65
Table 4.3 Length Measurement Equipment.................................................................... 74
Table 4.4 Sample Conditioning frictional difference ..................................................... 75
Table 4.5 Mass of ECE Phosphate Reference Detergent for Each Test ......................... 76
Table 4.6 Specimen Size for Wash Samples .................................................................. 77
Table 4.7 Conditioning of Wash Samples Prior to Measurement .................................. 78
Table 4.8 Number of Repeats for gsm Calculation......................................................... 80
Table 6.1 Width and Felting Shrinkage Data................................................................ 126
Table A1.1 Pilot Plain Weave Sampling ...................................................................... 262
Table A1.2 Bulk Plain Weave Sampling ...................................................................... 262
Table A1.3 2/1 and 3/3 Twill Weave Sampling ........................................................... 262
Table A2.1 Results of Yarn Shrinkage Trial ................................................................ 266
Table A3.1 Wash Testing Results................................................................................. 268
Table A3.2 Physical Test Results ................................................................................. 273
Table A3.3 Objective Test Results, FAST Testing....................................................... 283
Table A3.4 Objective Test Results, KES-F Testing ..................................................... 293
Table A3.5 Chemical Testing ....................................................................................... 298
Table A3.6 Pilot Amino Acid Analysis ........................................................................ 303
Table A3.7 Bulk Amino Acid Analysis........................................................................ 305
Table A3.8 Yarn Testing............................................................................................... 309
18
ACKNOWLEDGEMENTS
Thank you to Australian Wool Innovation Limited for their generous financial support
that has made this project possible.
Funding for the research conducted pursuant to this thesis was provided by Australian
wool producers and the Australian Government through Australian Wool Innovation
Limited.
Thanks to Canesis Network Limited, for the technical assistance and the provision of
library facilities, laboratory facilities and pilot plant equipment that has made this
project possible.
Thanks to Associate Professor Mark Hoffman, Emeritus Professor Mike Pailthorpe, and
Dr Surinder Tandon for ongoing help and guidance.
Thanks to Dr Nigel Johnson, Dr Robert Finch, and all the staff at Canesis Network
Limited for help and support and making my trips to New Zealand so fantastic.
My thanks also go to the following people:
Juan Araya and Thanh Vo Ngoc of the School of Chemistry, UNSW for help with
chemical testing, especially for the use of laboratory facilities.
Dr Allan De Boos of Australian Wool Innvation Limited for helpful discussions on the
interpretation of results, especially KES-F results.
Dr Elizabeth Carter of the Vibrational Spectroscopy Facility, School of Chemistry,
University of Sydney for help in spectroscopy trials.
Peter Durrant of Canesis Network Limited for photographing some of the equipment
used in this project.
Acknowledgements
19
Heather Glassey of Canesis Network Limited for assistance in carrying out yarn
shrinkage test trials.
Lorraine Greer, Lynn Griffin, Waveney Potts, Ashley Fairbrass and the rest of the staff
in Canesis Network Limited, Testing for training in equipment use and assistance with
test methods.
Roger Hartshorn of Canesis Network Limited for help in the production of the yarn
felting shrinkage test apparatus and the production of test yarns that did not come from
production.
Aaron Jackson, Les Duckmanton and Lyell Bright of Canesis Network Limited for
finishing fabrics and helping in collecting samples. Also the staff of Alliance Textiles,
Limited and Lane Walker Rudkin, for their help with finishing.
Dr Serge Kokot of the School of Physical and Chemical Sciences, Queensland
University of Technology, Prof Brynn Hibbert, and Diako Ebrahimi of the School of
Chemistry, and Dr Andy Wilkins of Canesis Network Limited for their help with data
analysis.
Dr Jim Lappage of Canesis Network Limited for helpful discussions on weaveable
singles yarns and yarn felting shrinkage experiments.
John Lindsay of Canesis Network Limited for help with fabric production at all stages.
Jenny Norman, Vera Piegerova, Sigrid Fraser, and Dr Marion Kalceff-Stevens of the
Electron Microscopy Unit, UNSW for assistance with microscopy work. Also, Dr
Gerry Danilatos of ESEM Research Laboratory for a helpful discussion on ESEM work.
Dr Doug Rankin of Canesis Network Limited for helpful discussions on chemical
testing of wool and other factors which may be tested to determine contribution to
shrink-resist effect.
Acknowledgements
20
Sandy Souter of Canesis Network Limited for weaving and Richard Hill and Ian Fowler
for yarn production.
Carol Thomas of Canesis Network Limited for ongoing support with library searches
and the provision of (sometimes difficult to obtain) literature.
David Trinh and Angela Langdon, fellow students for help in understanding the concept
of ‘measurement errors’.
Peter van den Brink of Canesis Network Limited for conducting HPLC for amino acid
analysis.
Dr Richard Walls, of Canesis Network Limited for assistance and training in the use of
KES-F equipment.
Dr Jack Watt, of Canesis Network Limited for helpful discussions on fabric felting,
fabric mechanical properties, yarn felting shrinkage, and possible reasons why the
shrink-resist effect may have been achieved.
Dr Joy Woods, of Canesis Network Limited for help with microscopy work.
The library staff at CSIRO TFT Geelong for the use of their library facilities.
21
ABBREVIATIONS
AAA Amino Acid Analysis
AOX Adsorbable Organo-Halides
CNL Canesis Network Limited
EMU Electron Microscopy Unit
epcm ends per centimetre
ESEM Environmental Scanning Electron Microscopy
FS Felting Shrinkage
gsm grams per square metre
HE Hygral Expansion
ppcm picks per centimetre
RS Relaxation Shrinkage
SEM Scanning Electron Microscope
tpm Turns per metre
UNSW University of New South Wales
WRONZ Wool Research Organisation of New Zealand
αm Alpha metric, twist factor
22
CHAPTER 1
PROJECT BACKGROUND
This project developed from prior research and development by Canesis Network
Limited (CNL) (formerly the Wool Research Organisation of New Zealand, Inc. -
WRONZ) into weaveable singles yarns, and their use in light weight, woven, pure wool
fabrics. It was found through this work, that a fabric had been produced which
demonstrated a remarkably low felting propensity without the application of any
conventional shrink-resist treatments. The reason for this resistance to felting was not
completely understood, but it was clear that this property could have significant
commercial benefits. The purpose of this project was to determine the reasons for the
shrink-resist property demonstrated by this fabric.
The potential benefits of such research include manufacturing cost reductions, as a
machine washable wool fabric can be produced, without the costs associated with a
conventional shrink-resist process. There are also environmental advantages, as most
conventional shrink-resist processes are considered to be environmentally harmful,
especially those involving the use of AOX producing compounds.
The fabrics that were developed by CNL have been so successful that trials have begun
for full commercial production in several mills.
23
CHAPTER 2
HYPOTHESIS
“That shrink-resistance is imparted as a combination of physical properties
imposed by a unique yarn structure, the setting of yarn and fabric by various
finishing processes, and changes in the frictional properties of the fibres
through finishing the fabric.”
The unique yarn structure refers to fibres being better bound in the structure of the
Solospun™ yarn [1] which has a structure that is slightly different to conventional ring
spun yarn, and also has high twist.
In order to examine the reasons for the shrink-resistance of the fabric, yarn was spun
and fabric was woven and finished according to the specifications determined in the
earlier research and development work conducted at CNL. Several changes were made
to the production route as problems were identified, however these were documented
for comparison with the original work and to evaluate the potential impact on changes
to shrink-resistance. The batch referred to as “Pilot” in this project most closely
resembles the initial development samples.
In order to test the hypothesis, the following areas were explored and tested:
1. Finishing processes: Fabric samples were taken from the production process at
key stages in finishing and subjected to a range of tests, including shrinkage
from machine washing, to identify the effect of each finishing process on the
shrinkage of the fabric. Tests were also carried out to determine how changes in
other fabric properties may have influenced changes in the fabric felting
shrinkage. Test methods also included procedures which would indicate
changes in the frictional properties of fibres and/or yarns.
Chapter 2 Hypothesis
24
2. Fabric structure: Different fabric structures were woven in order to determine
the contribution of the fabric structure to the felting shrinkage of the fabric. This
involved changes to the weave type, float length, and pick density.
3. Unique yarn structure: Solospun™ yarn samples, taken from fabric production
were tested for their felting shrinkage behaviour and compared with the felting
shrinkage behaviour of a conventional, two fold, ring spun yarns, as well as
other Solospun™ yarns with different twist factors.
Note: The specifications for the fibres, and yarn production used by CNL had
been found to be successful in achieving the shrink-resist outcome. It is
possible that changes to fibre and yarn specifications may have an effect on the
felting shrinkage of the fabric. However, resource limitations meant that an
exhaustive study of all possible parameters was not possible and so these
specifications were not altered significantly from those used previously at CNL.
CHAPTER 3
LITERATURE REVIEW
FELTING AND OTHER FORMS OF WOOL SHRINKAGE AND
FINISHING OF WOOL FABRICS
3.1 INTRODUCTION
Felting of wool has been studied by many researchers for many years who have
investigated fibre friction properties, and the conditions which cause felting. Many
theories have been developed as to why wool felts, and much effort has been spent on
developing treatments to prevent felting and overcome the difficulties associated with
machine washing. However, felting is not the only form of shrinkage a fabric may
experience, and other forms of shrinkage may be introduced by some finishing
processes.
3.2 THE FELTING PROCESS
Felting is the process which occurs in wool and other animal fibres, of irreversible
“entanglement”1 [2] creating a dense mass of fibres [2, 3]. Felting can occur in loose
wool form, yarns, or fabrics, and is caused by fibre movement in relation to other fibres
in the mass, under conditions of moisture and agitation [2]. Wool fibres have
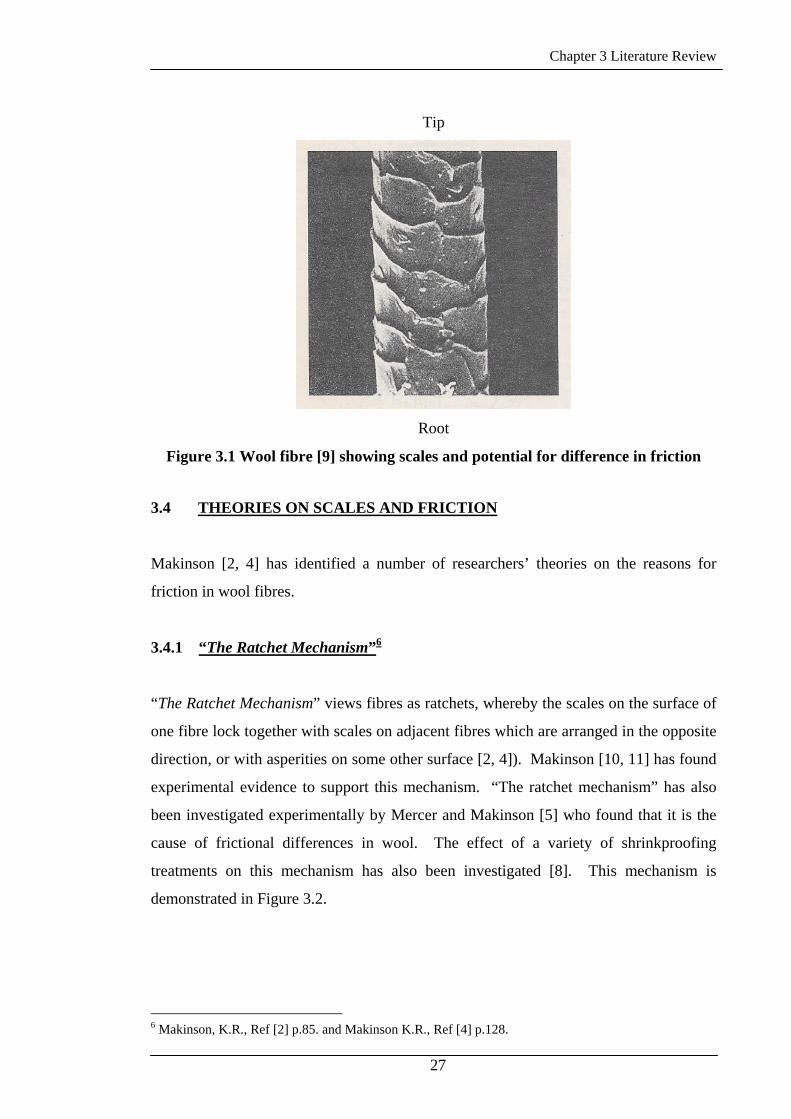
overlapping scales on their surface, as shown in Figure 3.1 which creates a frictional
difference between rubbing toward the root and the tip [2, 4]. The scales overlap such
that the steep edge of each scale faces the tip end of the fibre [2]. This frictional
difference causes fibres to move preferentially toward the root [3, 5]. For felting to
occur, it requires, amongst other things, that the fibres are moved [6].
1 Makinson, K.R., Ref [2], p.112.
25
Chapter 3 Literature Review
Felting has also been defined as “a form of tangling produced by the persistent
rootward migration of the individual fibres, which is caused by the frictional difference
of the fibres”2 [5].
Felting is a property that can be considered an advantage or disadvantage depending on
the end use of the product. The ability of wool fibres to felt is often used under the
controlled conditions of milling to produce thicker fabrics with greater pick and end
density than is possible through weaving alone. Uses for such fabrics include blankets
and heavy coating fabrics [3]. However, for most applications, the felting of wool
fabrics is a serious disadvantage, causing shrinkage, loss of elasticity, and changes to
the fabric structure and surface [7], eventually leading to a garment which is too small
to wear or an article which is no longer suitable for its intended use [3]. This has
serious consequences for the washing of wool fabrics, because washing invariably
involves moisture and agitation. There is an array of felting prevention methods
available, some of which are outlined in Section 3.10.
3.3 FRICTION IN WOOL
As stated above, there is a difference in the coefficient of friction of wool fibres
depending on the direction of rubbing. This frictional difference in wool is often
referred to as the “directional frictional effect”3 (DFE) [3]. Friction in wool has been
extensively studied by Makinson (eg [2, 4, 8]). The coefficients of friction for wool
fibres are measured for “with-scale”, “(µw)”4 rubbing and “against-scale”, “(µa,)”5
rubbing [8].
2 Mercer, E.H., and Makinson, K.R., Ref [5] p. T234. 3 For example Moncrieff, R.W., Ref [3], p.76. 4 Makinson, K.R., Ref [8] p.1084. 5 Makinson, K.R., Ref [8] p.1084.
26
Chapter 3 Literature Review
Tip
Root
Figure 3.1 Wool fibre [9] showing scales and potential for difference in friction
3.4 THEORIES ON SCALES AND FRICTION
Makinson [2, 4] has identified a number of researchers’ theories on the reasons for
friction in wool fibres.
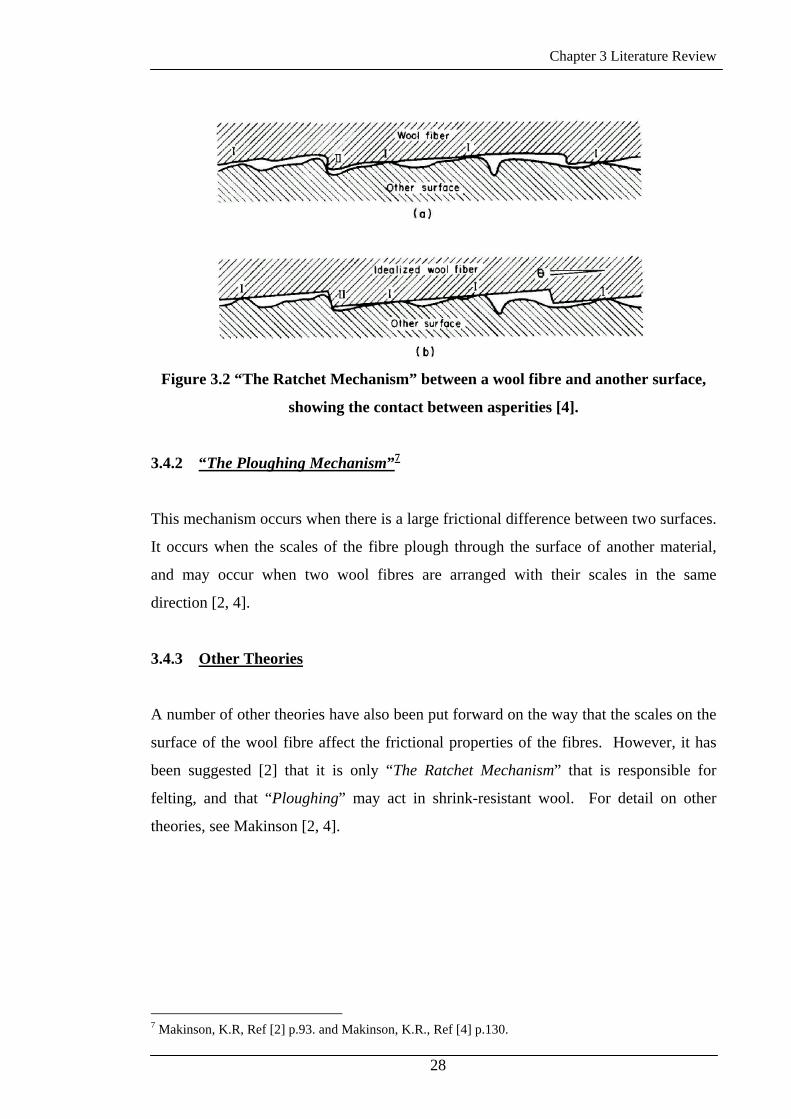
3.4.1 “The Ratchet Mechanism”6
“The Ratchet Mechanism” views fibres as ratchets, whereby the scales on the surface of
one fibre lock together with scales on adjacent fibres which are arranged in the opposite
direction, or with asperities on some other surface [2, 4]). Makinson [10, 11] has found
experimental evidence to support this mechanism. “The ratchet mechanism” has also
been investigated experimentally by Mercer and Makinson [5] who found that it is the
cause of frictional differences in wool. The effect of a variety of shrinkproofing
treatments on this mechanism has also been investigated [8]. This mechanism is
demonstrated in Figure 3.2.
6 Makinson, K.R., Ref [2] p.85. and Makinson K.R., Ref [4] p.128.
27
Chapter 3 Literature Review
Figure 3.2 “The Ratchet Mechanism” between a wool fibre and another surface,
showing the contact between asperities [4].
3.4.2 “The Ploughing Mechanism”7
This mechanism occurs when there is a large frictional difference between two surfaces.
It occurs when the scales of the fibre plough through the surface of another material,
and may occur when two wool fibres are arranged with their scales in the same
direction [2, 4].
3.4.3 Other Theories
A number of other theories have also been put forward on the way that the scales on the
surface of the wool fibre affect the frictional properties of the fibres. However, it has
been suggested [2] that it is only “The Ratchet Mechanism” that is responsible for
felting, and that “Ploughing” may act in shrink-resistant wool. For detail on other
theories, see Makinson [2, 4].
7 Makinson, K.R, Ref [2] p.93. and Makinson, K.R., Ref [4] p.130.
28
Chapter 3 Literature Review
3.5 CONDITIONS OF FELTING
The conditions of felting vary depending on the form of the fibre mass, that is, if the
fibres are in loose fibre, top, yarn, or fabric form. In general, however, felting requires
fibre agitation in an aqueous solution. Other conditions for felting are discussed in
more detail in the following sections.
3.5.1 Temperature
The effect of the temperature on felting has been researched by many workers, for many
years, but full agreement is lacking on the temperature most conducive to the felting of
wool in any form.
The rate of felting of loose wool has been shown to increase in the range 21-80°C in
0.1N HCl with a small quantity of non-ionic detergent [12]. The same study also
showed that, in acid solutions, there was a decrease in friction both with and against the
scales as temperature increased, but in water, the friction remained almost constant over
the same temperature range. Studies on single fibres [5] indicated an increase in the
difference between friction measured in the two directions along the fibre, as the
temperature was increased, which was suggested may, in part, explain the increase in
feltability with increases in temperature.
Yarn shrinkage studies [13], conducted at different pH values, also showed that felting
increased, as temperature increased, over the range 20-60°C. The effect of pH on
felting shrinkage will be discussed in Section 3.5.2.
Schofield [14], in his research on loose wool felting, found that felting increases with
water temperature, up to the boiling point. The methods used in this study have been
criticised by Speakman [15, 16]. Others [17] have concluded from their experiments,
that 45°C is the optimum milling temperature in water. This is because the extensibility
of the fibres increases as the temperature increases, but the ability to recover from
extension decreases with temperature. The importance of extension and recovery has
also been suggested by others [18] where 35°C is suggested as the temperature above
29
Chapter 3 Literature Review
which the recovery properties are reduced. Speakman, Menkart and Liu [19] found that
the critical temperature for fabric milling depended on the pH of the milling solution.
In alkali conditions the best milling was found to be in the temperature range 35-37°C,
and in acid conditions, shrinkage increased with increasing temperature, but an
optimum temperature was not found.
Recommended temperatures for milling in practical situations vary. Bearpark, Marriott,
and Park [20] suggested temperatures in the range 40-50°C, while Rouette and Kittan
[21] suggested a range of 30-35°C, but commented that the rate of felting is increased
with increased temperature.
3.5.2 pH and The Action Of Soaps And Detergents
Overall, felting has been shown to be greatest in acid or alkaline conditions, but this
will vary depending on the conditions under which felting takes place.
Research on the frictional properties of single fibres [5] showed that there was a change
in the frictional properties with changes in pH of the solution they were measured in.
Studies on fabric milling [17] showed that shrinkage is greatest at pH 10 for alkaline
milling; and shrinkage increases as pH decreases under acid conditions. Mercer [13]
found in tests on yarn shrinkage, a continuous decrease in felting from acid to alkali pH
conditions, with a small increase seen around pH 10, depending on the conditions, and
the lowest yarn felting was found at pH 9-10. Measurements of DFE under different pH
conditions suggested that the change in felting with pH was a result of changes in the
DFE of fibres, as changes in the DFE of fibres with changes in pH were comparable
with the results of felting experiments [22].
Further studies on fabric milling [23] showed that shrinkage decreased as pH increased
from acid to alkaline in buffered solutions. Measures of fibre scaliness with pH, in the
same study, showed slightly different trends to the behaviour of the fabric. The elastic
properties of the wool fibres were highlighted as the reason for the difference between
the scaliness and felting shrinkage as pH changed [23]. Later studies [18], using
30
Chapter 3 Literature Review
unbuffered solutions indicated that fabric felting shrinkage in the range pH 8-9 is
affected by adsorbed soap, and that this is responsible for a small increase in felting in
this range.
Feldtman and McPhee [24] also found that felting of untreated fabric is more rapid in
acid conditions than in alkaline conditions, and that temperature had an effect on the
rate.
3.6 FIBRE PROPERTIES AFFECTING FELTING
3.6.1 Fibre Length
The effect of fibre length on the felting of wool in different forms has been studied by a
number of researchers with varying results.
In experiments [25] using samples of loose wool which were cut to reduce the mean
fibre length, while other properties remained unchanged, a minimum fibre length for
loose wool felting was found, beyond which felt balls did not form. This was conducted
to highlight the importance of fibre bending in felting. The minimum length depends on
the type of wool, and it was assumed that the effect was a result of changes to the
bending modulus. It was later shown [26] that fibre length does not significantly effect
on the felting rate of loose wool, regardless of type, as long as the length is greater than
2cm. Other researchers [27], using the Aachen felt ball test method, found that longer
fibres showed increased felting for loose wool felting.
Research on tops [28] has shown that tops produced from longer fibres have higher
felting shrinkage than shorter fibres cut from the same wool. Research on wool tops
produced from wool grown in different countries [29], also showed a trend toward
longer fibres causing more rapid felting.
Studies on the effects of fibre length on milling shrinkage [17] of woven fabrics, using
Wensleydale fibres, which were cut manually, and used as the weft on a cotton warp,
showed that felting was greatest in fabrics with longer fibres. However, when merino
31
Chapter 3 Literature Review
fibres were studied, also as woven fabric with a cotton warp [30] short fibres were
found to felt more rapidly than longer fibres, for the same twist factors. Differences in
crimp and scaliness were suggested as possible reasons for the differences between the
two studies [30].
Hunter, Robinson, and Smuts [31] found that the felting shrinkage of plain and twill
weave fabric was highly correlated with a number of fibre properties, including fibre
length. They showed that increases in fibre length lead to decreases in felting
shrinkage. Other researchers [27] using plain and twill weave fabrics and several knit
constructions, found a trend towards reduced felting with an increase in mean fibre
length. In contrast, studies using knitted fabrics [28], and further research using both
woollen and worsted fabrics [32], have found that fabrics constructed from shorter
fibres showed less felting shrinkage.
Work conducted by van Rensburg and Barkhuysen [33] showed that although fibre
length affects the felting of wool, it is difficult to determine the degree, due to other
fibre properties also playing a part in the felting process.
3.6.2 Fibre Diameter
The results of studies relating fibre diameter to felting show better agreement between
researchers than the effect of length. This also has been investigated using a variety of
wool assemblies.
In a study of a range of the friction of different wools [34], it was found that there is a
trend toward an increase in the scaliness of fibres with decrease in fibre diameter, which
would affect milling performance.
Scheepers and Slinger [35] found that the diameter of the fibre is less important in the
felting of loose wool than the frequency of the fibre crimp. Chaudri and Whiteley [26]
also found that diameter does not have a direct effect on felting propensity of loose
wool. Others [36] showed there was no correlation between loose wool felting and
32

Chapter 3 Literature Review
diameter of weathered full length samples, but for root ends of fibres, the diameter of
the fibre was correlated with felting.
In felting tests on tops [29], the results suggested that the diameter did not contribute to
felting.
Some researchers [31] have found that felting shrinkage decreases with increases in
fibre diameter for plain and twill weave fabrics. In contrast to the studies on loose wool
and tops, studies [37] on fabrics have found that in Punte-di-Roma and Cavalry twill
fabrics, the mean fibre diameter had the greatest effect on fabric felting shrinkage of all
fibre properties studied. Hunter, Shiloh and Smuts [27] found that for woven and
Punte-di-Roma fabrics fibre diameter had the greatest effect on felting shrinkage of a
range of fibre properties examined, but for other knit structures studied, different
properties had a greater effect. However, van Rensburg and Barkhuysen [33] found that
for plain knit fabrics, increased fibre diameter was associated with increased fabric
felting shrinkage.
3.6.3 Fibre Crimp
The contribution of fibre crimp to felting has been investigated by a number of
researchers. There appears to be disagreement regarding the effect of crimp on felting
shrinkage.
In general, there is an inverse correlation for loose wool between fibre crimp and felting
[2, 36]. Veldsman and Kritzinger’s [38] study of loose wool supports this, where
overcrimped wool was found to felt less than undercrimped wool. Other investigations
[39] have shown that fibres that require less energy to remove crimp, felt more rapidly
in the early stages of felting. In addition to the inverse relationship between crimp and
loose wool felting, the form of the crimp has been found by some researchers to be
significant [26]. Others [35] found that the frequency of the crimp was more important
than its shape or form. The crimp of wool fibres has also been shown to have an effect
on loose wool felting under acid conditions [12].
33
Chapter 3 Literature Review
For wool tops and slivers [2] an increase in crimp has been associated with an increase
in felting. Other researchers have found [39] that higher crimp lead to lower felt ball
density for loose wool and lower felting shrinkage in knitted fabrics; while for slivers
and tops, higher crimp wool felted more than lower crimp.
In research on wool twill and Punte-di-Roma structures [37], it was shown that
increased in crimp was associated with reduced felting shrinkage. Also, it was shown
[27] that fibre crimp was the most influential fibre property affecting felting of rib and
single jersey knit fabrics. The influence of increased crimp on fabric felting shrinkage
was also found to be significant [31] in plain and twill weave fabrics, but not the most
significant factor.
In a study by van Rensburg and Barkhuysen [33] mixed results were found on the effect
of crimp on fabric felting shrinkage. Makinson [2] has suggested that fibre crimp has
little effect on fabric felting as it is greatly reduced during processing. Other studies
[40] indicate that crimp levels affect some yarn and fabric properties when wool is
processed on a French-spun worsted system. In a woollen system study [41] there were
changes in the fibre crimp found to result from various stages of processing. Both
studies [40, 41] showed that the degree of crimp in the loose fibre affected the amount
of crimp lost in processing.
3.6.4 Elastic Properties/Elasticity
Studies [17] on the effect of pH and temperature on felting, have shown that for wool to
felt, the fibres require conditions that allow for both the extension of the fibres and the
recovery.
Bogaty, Sookne, and Harris [42] found that for the felting of tops, chemicals which are
able to increase the resilience of wet fibres also increase the feltability of the fibres.
However, Szucht [43] found no link between elastic recovery and felting of loose wool
taken from treated tops.
34
Chapter 3 Literature Review
3.7 YARN AND FABRIC PROPERTIES AFFECTING FELTING
Twist factor and fabric construction have been shown to have a significant effect on the
felting of a wool fabric. It has been shown that increasing the yarn twist [44-47] and
fabric tightness [44-48] leads to a reduction in felting shrinkage of woven and knitted
fabrics. It has also been shown [44, 45] that plying of the yarn did not affect fabric
felting shrinkage in woven fabrics, furthermore, it has been shown [44] that woven
fabrics produced with the same direction of twist in both the warp and weft yarns felt
less than if opposite twist directions are used. Other researchers have not found the
same effect [45]. Also , Ali [49] found that for yarn shrinkage tests of plied yarns,
plying did affect felting shrinkage in hand washing, and that worsted plied yarns with
an even number of plies were more shrink-resistant than a yarn with an odd number. It
was also found that as the number of plies increased, the rate of felting decreased and
that the level of plying twist also had an effect that was not significant [49].
Some researchers [44] found that higher yarn counts lead to lower felting shrinkage,
while others [45] found that fabrics produced from finer yarns showed lower felting
shrinkage.
The construction of a fabric can have a significant influence on the propensity of that
fabric to felt. Tighter fabric constructions have greater shrink-resistance [3, 44- 48, 50].
It has also been shown [51] that on tightly woven fabrics, chemical setting treatments,
which are not shrink-resist treatments, were able to provide shrink-resistance for fabrics
which were machine washed and tumble dried. The effect of tightness of yarn and
fabric structure on felting has been explained as being due to an increase in inter-fibre
friction, preventing fibre movement [47]. Fabric weave type has also been shown to
impact on felting shrinkage, in that fabrics with longer floats felt more than plain weave
constructions [44-46].
Moncrieff [3] also points out that the structure of knitted goods means that they are
much harder to make shrink-resistant through construction.
35
Chapter 3 Literature Review
Blends with other fibres in loose wool, top, or knitted fabric, usually causes a reduction
in the feltability of the blended fibre assembly [2]. This depends on the deformability
of the fibres in the blend.
It has been concluded [33] that loose wool and fabric felting performance are not able to
be related. It has also been shown that it is difficult to relate feltability between
different types of fibre assemblies when they have been treated for shrink-resistance in
the different fibre assemblies [52]. For some fabric structures, loose fibre felting
properties have been found to be related to fabric felting shrinkage [27].
3.8 THEORIES ON WOOL FRICTION AND FELTING
There have been numerous theories produced by researchers over many years
attempting to understand why wool felts. The scale structure of wool fibres was first
recognised by Monge in 1790, [2, 3] who, through physical experiments on wool fibres,
found a directional scale structure. This scale structure was thought to affect felting by
causing the fibres in an assembly to move preferentially in one direction and lock
together [2].
The conditions which lead to felting of wool have also been recognised for many years.
Early work identified the importance of moisture, heat and pressure in order to create a
felted fabric. Moisture was considered the most important factor in causing shrinkage.
Heat and pressure were also considered important [3].
It has been recognised for many years that the scale structure of wool fibres is important
to felting, as well as the conditions the fibres are subjected to in order to cause felting.
Many other theories have been put forward which are detailed in other publications and
are outside the scope of this review (See for examples [2, [3]). Several more recent
theories are outlined below.
Shorter’s theory of felting [2, 3, 53] was based on interactions between fibres, where the
scale structure is important. The theory noted two types of interactions: tight contacts
36
Chapter 3 Literature Review
under which the fibres are unable to move, and those loose enough that fibres may
move toward the root end.
An alternative theory developed by Arnold [2, 3], was based on fibre elongations and
contractions, similar to a worm crawling. Agitation in felting causes the fibres to move
in the root direction and become extended, when they attempt to contract, the fibre root
end is held due to the scales.
Martin [2, 3, 54] developed the theory that felting occurs because fibres are locked
together under compression.
Speakman and his collaborators [17, 34], studied the physical properties of wool fibres
that have an impact on felting. In particular, it was concluded that for felting or milling
to occur the fibres must require three properties [3, 17]:
“(1) Possess a surface scale structure.
(2) Be easily stretched and deformed.
(3) Possess the power of recovery from extension.”8
The ability of fibres to curl has also been put forward as important in felting [3, 55].
Other researchers have further asserted the importance of DFE and fibre movement in
felting [22] or simply the importance of fibre movement [6, 56].
8 Speakman, J.B., Stott, E., and Chang, H., Ref [17] p.T291.
37
Chapter 3 Literature Review
3.9 WOOL FABRIC FINISHING PROCESSES
When wool fabric comes off the weaving loom it is in a state which requires a
significant amount of further processing before it can be considered finished and
suitable for its final purpose. The finishing processes the fabric undergoes vary
according to whether the fabric is knitted or woven, and if woven, whether it is a
woollen or worsted fabric. There are a wide variety of finishing processes available to
the finisher. Some of these are applicable to both woven and knitted fabrics, but in
general, the processes which will be outlined below are those related to woven fabric
finishing, and in particular to worsted fabric.
The reasons for fabric finishing include:
• cleaning to remove contaminants [9, 21, 57],
• developing the finish, such as handle, appearance, and wear performance [9, 21,
57],
• creating special characteristics [21, 57],
• additionally [57], finishing aims include: changing the moisture content or
dimensions of the fabric, or the geometry of the surface, and colouring.
3.9.1 Scouring
Scouring is often one of the first processes carried out. The scouring process involves
cleaning the fabric to remove impurities accumulated in earlier processing [9, 21, 20,
58], and is also used to relax tensions imposed during spinning and weaving [9, 21, 58].
Some fabrics require a setting process prior to scouring [59, 60].
38
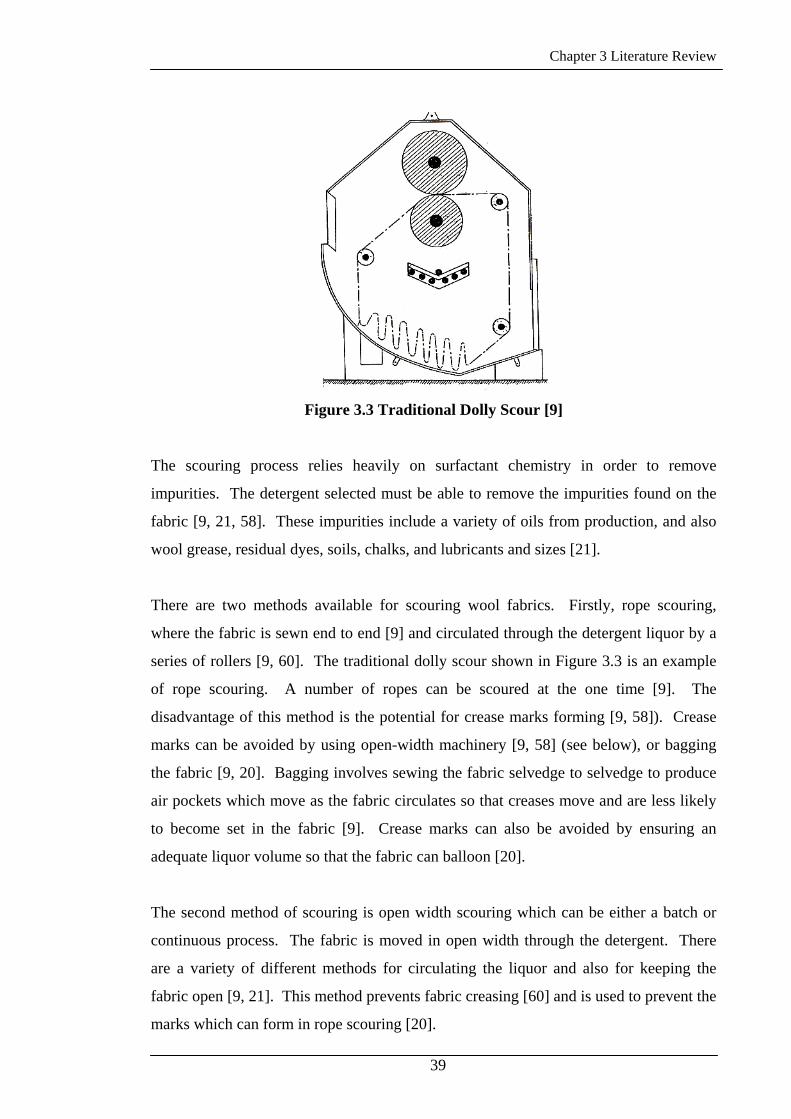
Chapter 3 Literature Review
Figure 3.3 Traditional Dolly Scour [9]
The scouring process relies heavily on surfactant chemistry in order to remove
impurities. The detergent selected must be able to remove the impurities found on the
fabric [9, 21, 58]. These impurities include a variety of oils from production, and also
wool grease, residual dyes, soils, chalks, and lubricants and sizes [21].
There are two methods available for scouring wool fabrics. Firstly, rope scouring,
where the fabric is sewn end to end [9] and circulated through the detergent liquor by a
series of rollers [9, 60]. The traditional dolly scour shown in Figure 3.3 is an example
of rope scouring. A number of ropes can be scoured at the one time [9]. The
disadvantage of this method is the potential for crease marks forming [9, 58]). Crease
marks can be avoided by using open-width machinery [9, 58] (see below), or bagging
the fabric [9, 20]. Bagging involves sewing the fabric selvedge to selvedge to produce
air pockets which move as the fabric circulates so that creases move and are less likely
to become set in the fabric [9]. Crease marks can also be avoided by ensuring an
adequate liquor volume so that the fabric can balloon [20].
The second method of scouring is open width scouring which can be either a batch or
continuous process. The fabric is moved in open width through the detergent. There
are a variety of different methods for circulating the liquor and also for keeping the
fabric open [9, 21]. This method prevents fabric creasing [60] and is used to prevent the
marks which can form in rope scouring [20].
39
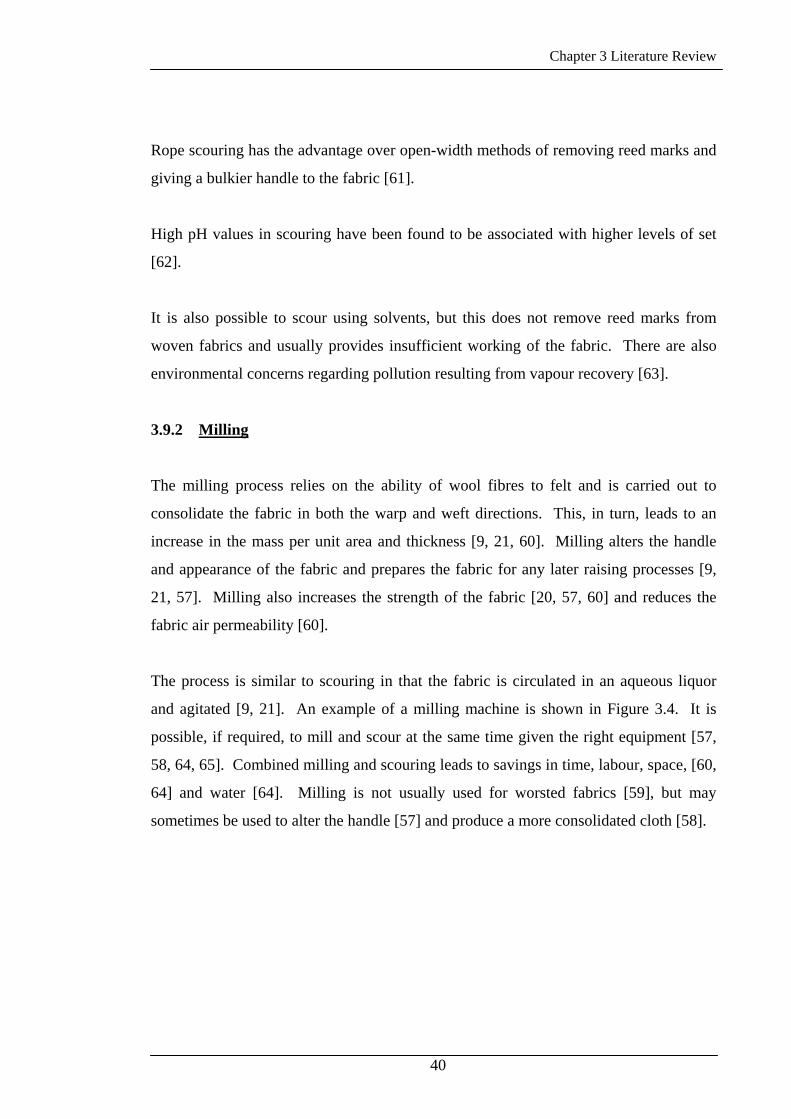
Chapter 3 Literature Review
Rope scouring has the advantage over open-width methods of removing reed marks and
giving a bulkier handle to the fabric [61].
High pH values in scouring have been found to be associated with higher levels of set
[62].
It is also possible to scour using solvents, but this does not remove reed marks from
woven fabrics and usually provides insufficient working of the fabric. There are also
environmental concerns regarding pollution resulting from vapour recovery [63].
3.9.2 Milling
The milling process relies on the ability of wool fibres to felt and is carried out to
consolidate the fabric in both the warp and weft directions. This, in turn, leads to an
increase in the mass per unit area and thickness [9, 21, 60]. Milling alters the handle
and appearance of the fabric and prepares the fabric for any later raising processes [9,
21, 57]. Milling also increases the strength of the fabric [20, 57, 60] and reduces the
fabric air permeability [60].
The process is similar to scouring in that the fabric is circulated in an aqueous liquor
and agitated [9, 21]. An example of a milling machine is shown in Figure 3.4. It is
possible, if required, to mill and scour at the same time given the right equipment [57,
58, 64, 65]. Combined milling and scouring leads to savings in time, labour, space, [60,
64] and water [64]. Milling is not usually used for worsted fabrics [59], but may
sometimes be used to alter the handle [57] and produce a more consolidated cloth [58].
40
Chapter 3 Literature Review
Figure 3.4 Milling machine [9]
Experiments on the effects of milling on fabric properties showed that the mechanical
properties of fabrics were altered as a result of changes in the fibre interactions [66].
Milling has also been found to reduce the hygral expansion in a fabric [67], and
treatment after piece dyeing reduces the hygral expansion of the fabric.
Milling should be conducted at a maximum of 40-50°C [20, 58] because above this
range, fibre damage can occur [58]. pH should be controlled, as this impacts on the rate
of milling, and liquor ratio is important as too much liquor prevents felting, and too
little causes damage to the fabric [20].
3.9.3 Drying
Discussion of drying of a wool fabric will be broken up into two parts: mechanical and
thermal. Both methods are used because thermal drying is relatively expensive, so as
much water as possible is removed mechanically before thermal drying is used [9, 21].
There are three main mechanical water removal techniques. Firstly, centrifuging or
hydro- extracting, which is able to remove the most water of all the methods. This
method is often avoided as it may create creases that are difficult to remove [9, 21], and
the removal of water may not be even throughout the piece [21, 60]. Secondly,
mangling or squeezing the fabric [9, 21, 60]. This cannot be used for delicate or pile
fabrics, where the surface may be damaged [9, 21]. It can also cause “bursting” of the
41
Chapter 3 Literature Review
fabric as a result of excessive pressure [68]. Finally, the water may be removed by
means of suction, where the fabric is passed over slots where the water is sucked out of
the fabric [9, 21, 60]. Centrifuging tends to be used for fabrics in rope form and
mangling and suction methods for fabrics in open width [65].
Thermal drying can be achieved by the use of a tenter or stenter where the fabric is
moved through the machine on chains, while hot air is blown over it. It is possible
while stentering to straighten the weft yarns in the fabric which may have become
distorted in earlier processes [9, 21]. In feeding the fabric on to the chains there must
be devices which:
• straighten any curling of the selvedges [9,21],
• ensure the chains and the selvedges meet accurately [21].
The fabric must also be overfed a certain amount in order to allow for warp shrinkage
[9, 21, 60] and in order that it is extensible [57]. Changes in the dimensions of the
fabric, caused by stentering, alter the extensibility of the fabric due to changes in yarn
crimp, which also affects the hygral expansion of the fabric [69]. Care must be taken in
the way the fabric is fed into the stenter to avoid excessive or insufficient relaxation
shrinkage [70]. The fabric is cooled on exit [9, 21, 60] and should have a regain of
around 10-12% [65].
3.9.4 Carbonising
Carbonising is a process which is rarely carried out on worsted goods. It is used to
remove vegetable matter from the fabric and for worsted fabrics, this is usually done in
the mechanical processes leading up to spinning [9, 21].
The carbonising process involves treating the wool with acid which breaks the cellulose
down into a brittle material, and on drying and heating, this can be removed
mechanically. The fabric is then neutralised [9, 20, 21, 58, 60]. It is important to use
enough acid to cause degradation of the cellulose material without damaging the wool
[58].
42
Chapter 3 Literature Review
3.9.5 Raising and Brushing
The raising process is carried out to produce a pile on the surface of the fabric using
bristles to lift fibres out of the plain of the fabric. The brushing process is used to lay
the pile in one direction [9, 21].
The raising process can cause warp stretching of the fabric, and weight losses [20, 57]
and strength losses [57].
3.9.6 Setting and Pressing Processes
These two processes have been dealt with together as they can overlap.
3.9.6.1 Crabbing
Crabbing is often the first process in worsted fabric finishing, and is carried out for
controlled relaxation of tensions from spinning and weaving. Without such a process,
the fabric can distort [20, 58, 63] and develop uneven shrinkage during later processing
[58, 59]. This initial setting may also be carried out by “wet blowing”9 [59]. Crabbing
permanently sets the fabric and can be used to remove marks from fabric [60].
For batch crabbing processes, the fabric is wound onto a roll which is in hot water and
is rotated, under pressure from a top roller [9, 21, 58-60]. The times recommended for
this rotation vary, but most suggestions are for around 10 minutes [21, 58-60]. The
fabric is rewound in the opposite direction and the process is repeated [9, 58, 60] to
avoid differences through the length of the fabric [9, 58]. Finally, the fabric is unwound
through cold water for cooling [9, 21] or has air drawn through the fabric [60]. An
example of batch crabbing using a Yorkshire crab is shown in Figure 3.5.
9 Brearley, A., and Iredale, J.A., Ref [59] p. 143.
43
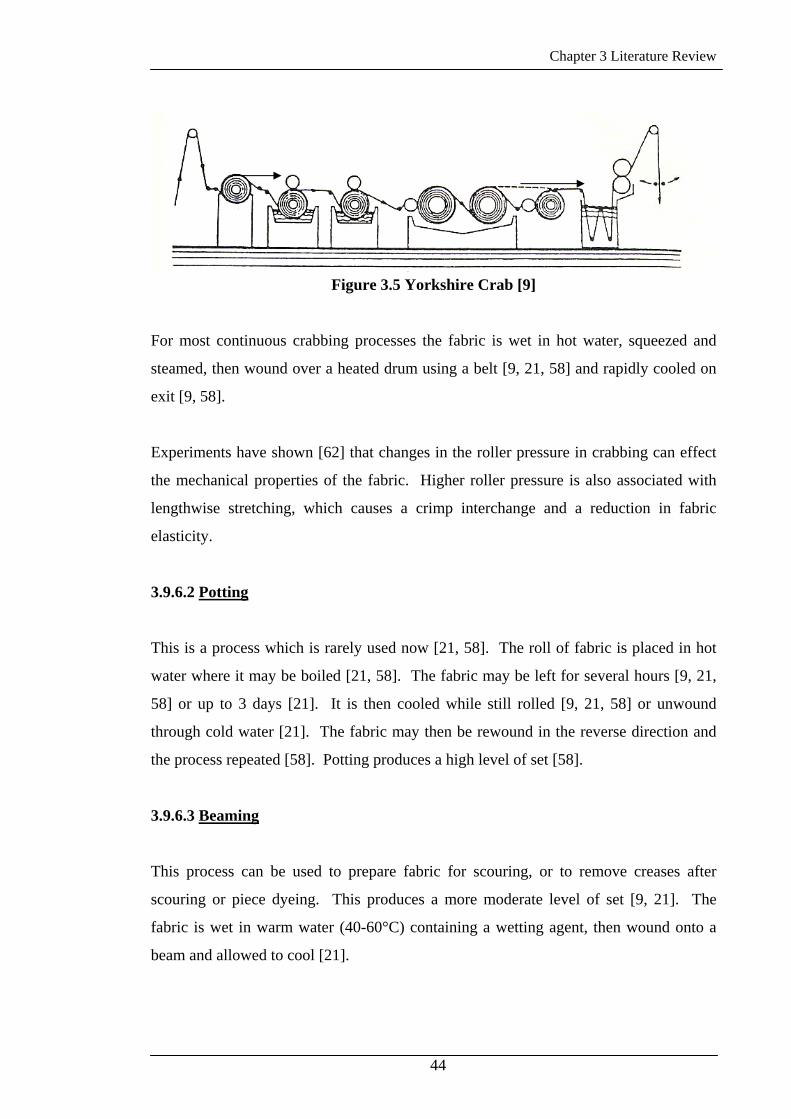
Chapter 3 Literature Review
Figure 3.5 Yorkshire Crab [9]
For most continuous crabbing processes the fabric is wet in hot water, squeezed and
steamed, then wound over a heated drum using a belt [9, 21, 58] and rapidly cooled on
exit [9, 58].
Experiments have shown [62] that changes in the roller pressure in crabbing can effect
the mechanical properties of the fabric. Higher roller pressure is also associated with
lengthwise stretching, which causes a crimp interchange and a reduction in fabric
elasticity.
3.9.6.2 Potting
This is a process which is rarely used now [21, 58]. The roll of fabric is placed in hot
water where it may be boiled [21, 58]. The fabric may be left for several hours [9, 21,
58] or up to 3 days [21]. It is then cooled while still rolled [9, 21, 58] or unwound
through cold water [21]. The fabric may then be rewound in the reverse direction and
the process repeated [58]. Potting produces a high level of set [58].
3.9.6.3 Beaming
This process can be used to prepare fabric for scouring, or to remove creases after
scouring or piece dyeing. This produces a more moderate level of set [9, 21]. The
fabric is wet in warm water (40-60°C) containing a wetting agent, then wound onto a
beam and allowed to cool [21].
44

Chapter 3 Literature Review
3.9.6.4 Decatising
When decatising is used toward the end of the finishing process, it is important in
determining the handle and tailoring properties of the fabric [71]. Decatising is used to
stabilise the finish from other processes, set the fabric, and increase the dimensional
stability. It can be performed either as a continuous or batch process [21]. Decatising
falls into three main groups.
Firstly, finish decatising is carried out to affect the lustre [21] or surface properties of
the fabric [9]. It can also be used to increase the dimensional stability [21]. Secondly,
lustre decatising is carried out to produce lustre [9, 21]. Both these processes are
carried out at atmospheric pressure. The fabric is wound onto a perforated roller with a
wrapper cloth and steam is pumped through the roll. The effect of these processes can
be varied by altering the tension in the wrapper, pumping steam from inside or outside
the roll, treatment time, steam moisture content, cooling the fabric on or off the roll, or
the tension in unwinding [21]. For finish decatising, the fabric will never reach
temperatures greater than 100°C, but for lustre decatising the fabric can reach 108°C
[9].
Thirdly, pressure decatising involves treating the fabric in an autoclave under pressure
at temperatures of up to 130°C [21]. The fabric is rolled onto a perforated cylinder [72]
with a wrapper cloth and then treated in an autoclave [9, 21, 72] for up to 5 [9, 72] or 6
minutes [21]. An example of a Pressure Decatising Unit is shown in Figure 3.7. The
effects can be varied by similar means to those outlined above [21]. The air in the
autoclave can be removed by steam or vacuum [64]. Pressure decatising produces
permanent set [58] and the amount of permanent set depends on the treatment
conditions [60, 72]. The fabric is also cohesively set [72].
45

Chapter 3 Literature Review
Figure 3.6 Pressure Decatising Unit [58]
Shows batching at 2, autoclave at 4, and unwinding at 6.
The processes outlined above are all for batch treatments, but advances have also been
made in continuous atmospheric processes. The continuous atmospheric processes
operate by passing the fabric over a perforated cylinder or series of cylinders while
under tension [21].
Continuous pressure decatising has been much harder to achieve due to the difficulty in
producing high pressure, while the fabric moves continuously and also achieving the
required tension in the fabric [21, 58]. This has now been overcome and continuous
pressure decatising is possible [21, 58, 73].
Pressure decatising can lead to yellowing [61, 65, 74], loss of brightness [74] and the
potential for variation through the roll [61]. The fabric can also lose strength and
abrasion resistance [74].
Experiments by Jeong and Phillips [75] showed that the drape coefficient of fabrics
were effected by pressure decatising. The fabrics also showed a slight increase in mass
due to a decrease in the dimensions of the fabric. This loss in dimensions has also been
found by other researchers [76, 77], one of the consequences being an increase in
extensibility [77]. The fabric also increases in lustre [74].
46
Chapter 3 Literature Review
Amino acid analysis of decatised fabrics which have been dyed or blank dyed has
shown a general increase in the cysteine and cystine content [78]. Increasing the time
of steaming has been found to produce an increase in the lanthionine content and
reduced the urea bisulfite solubility. High regain and long decatising times will also
increase hygral expansion [79]. Increases in the winding tension of the fabric caused an
increase in length and a reduction in width and thickness [79]. The wrapper has an
important effect on the temperature and regain of a fabric, which has an effect on the
finished fabric [71]. The regain of the wrapper cloth has been shown to have an effect
on the mechanical properties of the fabric [80].
Decatising, either as atmospheric or pressure decatising, may be used to stabilise fabrics
prior to other finishing processes [65].
3.9.6.5 Pressing
Paper pressing is a discontinuous process where the fabric is folded with a piece of
glazed cardboard inserted into each fold and, at regular intervals, an electrically heated
board is inserted which is used to heat the fabric. When the stack of fabric has been
completed the electrically heated boards are heated while pressure is applied [9, 21].
This is maintained for up to eight [21] to 12 hours [9] at 40-80°C [9]. The fabric is then
turned so that the areas in the folds are pressed and the process is repeated [9, 21, 60].
Semi-continuous paper pressing equipment has been developed where multiple layers of
fabric are pressed at once [9, 21, 60].
Continuous pressing methods, such as rotary pressing, involve passing the fabric
between a heated cylinder and a fixed heated bed. The bed is kept under pressure. At
the end of the process the fabric is cooled and conditioned [9, 21, 60].
An alternative pressing system has been developed called the Contipress. This process
involves steaming the fabric and then pressing it against a heated roller using a heated
belt. This gives less warp tension and higher pressure [9].
47
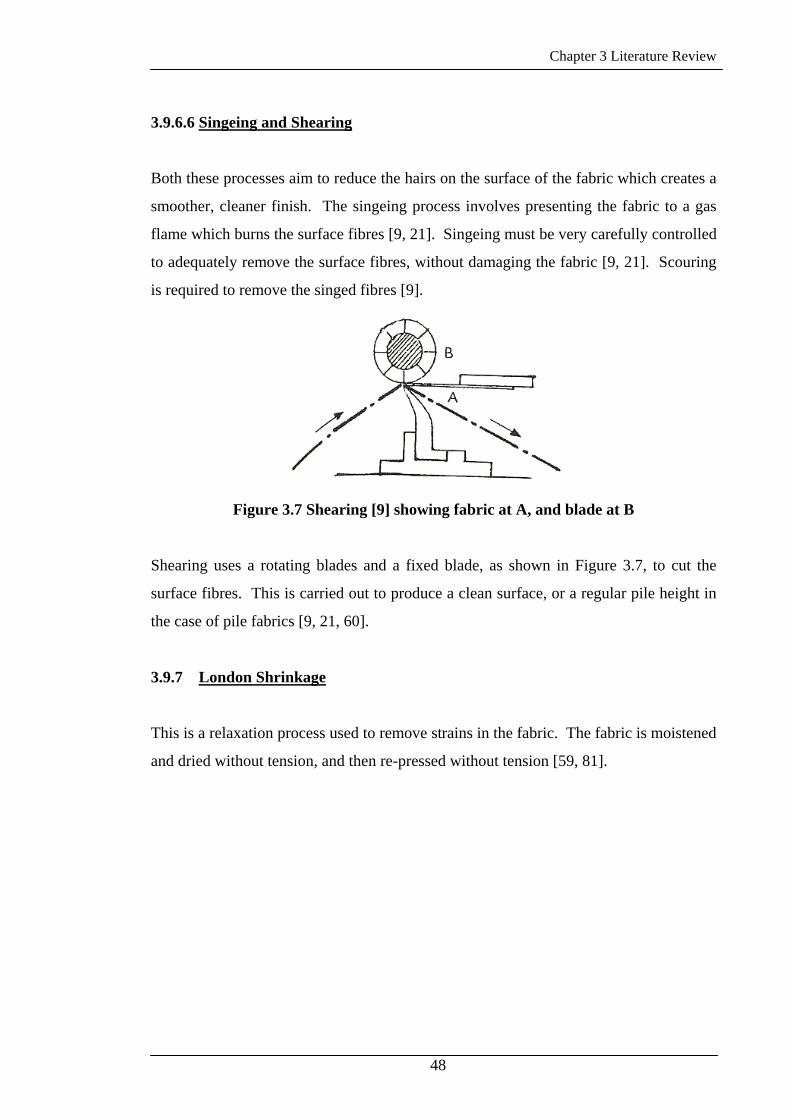
Chapter 3 Literature Review
3.9.6.6 Singeing and Shearing
Both these processes aim to reduce the hairs on the surface of the fabric which creates a
smoother, cleaner finish. The singeing process involves presenting the fabric to a gas
flame which burns the surface fibres [9, 21]. Singeing must be very carefully controlled
to adequately remove the surface fibres, without damaging the fabric [9, 21]. Scouring
is required to remove the singed fibres [9].
Figure 3.7 Shearing [9] showing fabric at A, and blade at B
Shearing uses a rotating blades and a fixed blade, as shown in Figure 3.7, to cut the
surface fibres. This is carried out to produce a clean surface, or a regular pile height in
the case of pile fabrics [9, 21, 60].
3.9.7 London Shrinkage
This is a relaxation process used to remove strains in the fabric. The fabric is moistened
and dried without tension, and then re-pressed without tension [59, 81].
48
Chapter 3 Literature Review
3.10 CONVENTIONAL SHRINKPROOFING METHODS
There have been an enormous number of methods devised for the prevention of wool
felting, but very few have become commercially successful. Not all the possibilities for
shrinkproofing wool have been dealt with here. Those that will be, are mainly those
which have been used commercially. Shrinkproofing processes that will be dealt with
here have been grouped into four main categories:
• Degradative processes,
• Plasma Treatments,
• Enzyme Treatments, and
• “Additive”10/Polymer processes.
Wool shrinkproofing can be carried out at the fibre, top, yarn, or fabric stage, however,
not all treatments are suited to application at all stages of production.
The term ‘shrinkproofing’ refers only to treatments which decrease the felting of wool.
It does not include other sources of shrinkage in fabric [2].
Many chemical shrinkproofing processes (particularly degradative treatments) work by
rupturing crosslinks and breaking other bonds, [2, 3]. However, not all agents capable
of breaking disulfide bonds [82, 83] or reducing cystine content [84] are able to reduce
felting shrinkage.
Shrinkproofing requires changes in the frictional properties of wool fibres and studies
by Makinson [8], on different treatment types, suggest that the frictional difference
should be reduced. However, McPhee [84] was not able to show a direct relationship
between frictional difference and felting behaviour.
Experiments indicate that, to be effective, chemical modification needs to be
concentrated in the cuticle [83, 85]. If the cortex is subjected to treatment, fibre
properties such as extension, bending, and swelling can be affected [85].
10 Makinson, K.R., Ref [2] p. 256.
49
Chapter 3 Literature Review
Shrinkproofing treatments have generally been found to have a negative effect on the
soil release properties of fabrics with the exception of chlorine-Hercosett applied to
wool tops [86].
3.10.1 Degradative Processes
Degradative processes are those which cause degradation of the cuticle [2].
Degradative processes are often only used for hand washing applications, as they tend
to cause too much damage to the wool when treating to the standard required for
machine washability [87].
Traditional degradative techniques effected shrinkproofing through damage to or
removal of the scales, causing a reduction in the frictional difference of the fibres [2].
However, many degradative treatments currently used, reduce felting by making the
cuticle softer when wet than when dry. This is because the disulfide bonds in the
exocuticle have been degraded. When dry, the fibre is held together by hydrogen bonds
and salt links, and so the scales are not soft. Mild treatments increase the with-scale
friction making it more difficult for the fibre to move. Severe treatments increase with-
scale friction and decrease the frictional difference, so that the fibres can move in either
direction [2].
It is also possible to reduce felting by removal of scales or scale tips, but these methods
cause excessive damage and leave the fibres vulnerable to later damage [2].
Attempts have also been made to explain the action of degradative treatments in terms
of electrical charge in the fibres causing repulsion when wet [2, 63]. Investigations into
how charged groups effect shrinkproofing have been inconclusive, but they have
indicated that charged groups do have an effect [88].
It is important to control the rate of reaction in degradative processes to avoid excessive
fibre damage and give even treatment [89]. Salts can be used to control degradation and
have been shown to be able to allow lower concentrations of chemicals to achieve a
desired level of shrink-resistance [82].
50
Chapter 3 Literature Review
3.10.1.1 Chlorination Processes
The history of chlorination processes is associated with the development of processes to
enhance the dyeing of wool, [2, 3, 81] in particular for printing [3, 81]. The early
processes were difficult to control [3].
The chlorination processes fall into three main groups:
• Wet chlorination processes [2, 3]
• Dry chlorination processes [2, 3], and
• Chlorine-Hercosett processes11.
There are a number of methods and agents which can be used for treating wool with wet
chlorination processes.
When wet chlorination processes are used involving free chlorine a severe treatment
occurs. Treatments using two to four percent chlorine on weight of wool cause a loss in
weight of about four percent [3].
Alternatively, hypochlorous acid causes very little damage to the wool. Hypochlorous
acid also maintains warmth and soft handle. Damage to the wool fibre starts with much
higher concentrations of chlorine compared with chlorine water [3].
Dichloroisocyanuric acid (DCCA) can also be used, which, it is suggested, releases
hypochlorous acid when hydrolysed to create cysteic acid in the cuticle from cystine
[2]. Temperature and pH are used to control the reaction [20, 63, 90].
Chloramines and chloramides treat wool without excessive damage. There are a
number of these chemicals which are suitable for the chlorination of wool [3].
The Negafel Process uses formic acid with aqueous hypochlorite solutions to form the
chlorinating agent [2, 3] without severe damage [3].
11 These will be dealt with in the section on polymer additives, as they require chlorination and polymer application
51
Chapter 3 Literature Review
Dry chlorination processes use gaseous chlorine to treat the fibres at a very low regain.
Dry chlorine gas will not have an effect on the shrinkage properties of wool if treated at
zero regain [3]. Dry chlorination processes do not cause any loss of weight [3]. Dry
chlorination can cause a harsh handle depending on the process used [2]. Chlorine gas
may be circulated at either atmospheric pressure [2, 3] or in an evacuated chamber [2, 3,
81].
3.10.1.2 Other Degradative Processes
There are many other degradative agents which have been tried, several of which are
outlined below.
Permanganate treatments cause damage inside the scales [91]. This causes the scales to
swell and become softer when wet [91-93] and reduces felting through changes to the
frictional properties of the fibres [92]. Makinson [92] found that there is a difference in
friction depending on how measurements are made in relation to crimp. It has also been
found that there is a difference in the scale structure depending on where the scales are
in relation to the crimp [91]. Some researchers [94] have found that permanganate
treatments cause a decrease in against-scale friction, while others [82] found an increase
in with scale friction and no change to against-scale friction for permanganate
treatments with sodium chloride. Potassium permanganate processes produce a
manganese dioxide precipitate, which requires treatment with sodium bisulfite for
removal [2]. This sodium bisulfite treatment has also been shown to increase the
shrinkproofing effect [2, 82, 95].
When added salt is used with neutral permanganate, the surface of the fibre is more
degraded as the salt concentration is increased [94]. Addition of salt has been found to
increase the rate of reaction up to a maximum concentration over which the rate
decreases again [96]. Other researchers [97] have found that only small quantities of
salt are required to give an improvement in shrink-resistance, and that larger quantities
did not have a great effect on shrinkage properties.
52
Chapter 3 Literature Review
If treated with strong acids after permanganate treatments, the shrink-resistance is
reduced [98].
Hydrogen peroxide treatments have also been found to provide shrink-resist properties
to wool fabrics [99] and can be used with or without enzyme treatments. Many other
degradative chemicals have been found to provide shrinkage resistance, but a full
discussion of each of these is outside the scope of this project. See for example [98].
3.10.2 Electrical Discharge Treatments Or Plasma Treatments
Much of the research into plasma treatments has been driven by environmental issues,
especially associated with the release of adsorbable organo-halogen (AOX) compounds
[100].
3.10.2.1 Glow Discharge Treatments
This process involves the use of electrical current under pressure [100]. These processes
treat only the surface of the fibre [100, 101].
Friction both with and against scales has been found to be increased [102] as has
interfibre friction [100]). Dyeing properties are also enhanced for loose wool [102,
103].
When tested on fabrics, plasma treatments have been found to have beneficial effects on
the dyeability of the fabric and reduced quantity of dye in effluent, increased abrasion
resistance, and reduced hygral expansion and relaxation shrinkage, as well as improved
felting resistance. Unfortunately, there is a loss of recovery and extension properties,
and an increase in stiffness of the fabric [104]. Also, to achieve machine washability,
the fabric requires additional treatment, such as the application of a polymer [100, 101]
or biopolymer [101]. However, Rakowski [100] has been able to achieve machine
washability for some hand knitting yarns. When different gases were examined for
effectiveness, oxygen was found to give the greatest reduction in felting shrinkage
[102].
53
Chapter 3 Literature Review
3.10.2.2 Corona Treatments
The corona discharge is created under atmospheric pressure, through the application of
high voltage to electrodes which are narrowly separated and produces a range of
products [105]. Some corona treatments have not been found to give good shrink-resist
results, but in general lead to increased inter-fibre friction and give improved spinning
performance, soiling resistance, and wetting properties [63]. Corona treatments have
been found to give poor felting resistance for fabrics as they do not treat more than the
surface fibres [106]. Corona treatments have been found to increase the
electronegativity of wool, however, this has not been found to be related to the shrink-
resistance of corona treated wool [107]. Corona treatments of yarns have been found to
increase yarn breaking strength, but give no change to single fibres [106]. Under some
treatment conditions, increases in with scale and against scale friction have been found
[106].
3.10.3 Enzyme Processes
These processes are based on the use of enzymes, most commonly papain, to damage
the scales [2, 3]. For enzyme processes to be effective, they require that the wool is
initially treated to start the breakage of disulfide bonds [2,3]. Enzymes are thought by
some to only attack the surface of the wool fibre as they were considered too large to
enter the fibre [3].
Many commercial enzyme processes involve a chlorination treatment at some stage [2,
108].
It should be noted that enzymes used in many domestic washing detergents have been
found to damage and degrade wool; both untreated and shrink-resist treated [109].
Enzyme treatments have also been shown to give increased whiteness, crease recovery,
drapeability, and resistance to pilling. Disadvantages include slight loss in weight and
loss of tensile strength as the concentration of enzyme is increased [110].
54
Chapter 3 Literature Review
3.10.4 Polymer Treatments
These processes are also referred to as “additive”12 treatments due to the deposition of
polymer on the surface of the fibre to produce shrinkproofing. Such polymers must be
bonded to the fibre when wet and dry, they must be able to withstand dry cleaning.
Polymer treatments can be applied either as a polymer only process, or following a
degradative pre-treatment. Polymer treatments can create shrink-resistance by several
different mechanisms [2].
It is possible to prevent felting by bonding the fibres together, in yarn or fabric form, to
prevent fibre migration. The treatments must be applied to yarn or fabric, because if
applied earlier, further processing breaks the bonds, and the wool is no longer
shrinkproofed. Such processes have been associated with poor fabric handle. The
polymer should be strong enough so that inter-fibre bonds are not broken in use, and
extendable so that the fabric is not stiff [2].
Polymer treatments may work by masking the scales, but has also been associated with
fibre bonding. Effective masking requires polymer quantities of around 5-10 per cent
on mass of fibre, and this tends to create an unsatisfactory handle [2]. This mechanism
is in place in loose wool, sliver, and top treatments [111].
The fibres can also be held apart from each other according to the “stand-off
mechanism”13, but this is often found with masking. The polymer, for this mechanism
to occur, needs to be strong and not too easily deformable, as the bridges can become
flattened [2].
Some polymers are also able to create rougher fibres, which leads to an increase in the
with-scale and against-scale friction, and some decrease in frictional difference. These
were not available commercially in 1979 [2] and no evidence has been found more
recently to support their use. There is however, evidence of polymers which are able to
change the frictional properties of wool fibres [112].
12 Makinson, K.R., Ref [2] p. 256. 13 Makinson, K.R., Ref [2] p. 268.
55
Chapter 3 Literature Review
Chlorine-Hercosett is one of the most common shrinkproofing processes for wool in top
form and can also be applied to fabrics [2]. It involves the pre-chlorination of wool
with hypochlorite, application polymer, and heat curing [58, 113]. The polymer used is
a polyamide epichlorohydrin [2, 58]. The polymer provides shrinkproofing by masking
the scales [2, 87]. The polymer swells when wet, and masks the scales [112, 114].
Chlorine-Hercosett, when applied to tops gives good handle to the finished fabric [63].
Chlorine-Hercosett treatments have also been found to increase the dye absorption rate
under some conditions [115]. These processes have been progressively updated to
produce better standards of shrinkproofing and greater efficiencies (for example [116]).
An alternative method for the application of chlorine-Hercosett treatment to tops is the
Kroy Deepim process, which uses chlorine water [87] or hypochlorous acid [58, 117].
It is claimed to use lower chemical levels, and give a more even treatment [58, 87].
Some research indicates that treatment is to a handwash standard only [87] while others
indicate that machine washability is possible [117].
There are many more polymers which can be used for the prevention of felting
shrinkage, but are too numerous to detail here. (See [2, 87, 118] for examples.)
56
Chapter 3 Literature Review
3.10.5 Other Methods Of Preventing Shrinkage
Recently, research has been conducted which indicates that felting shrinkage is
heritable and may be able to be controlled through selection and breeding [119].
3.11 OTHER FORMS OF SHRINKAGE IN WOOL FABRICS
Felting is not the only form of shrinkage in wool fabrics. There are other forms of
reversible and irreversible shrinkage which can also occur.
3.11.1 Relaxation Shrinkage
This is an irreversible form of fabric shrinkage resulting from the removal of cohesive
set [120]. It can result from highly twisted yarns, stresses from weaving or knitting, and
stretching in finishing [3]. This form of shrinkage can be alleviated by a London
shrinkage process in finishing [20].
Smith and Baird [121] have found that there are a number of factors which can affect
relaxation shrinkage in yarns, including the type of processing oils, draft, yarn twist,
fibre diameter and length, dyeing and the type of spinning system. Ali [49] has
indicated that yarn relaxation may be the cause of the bulk of fabric relaxation, along
with the stresses imposed in fabric manufacture.
Shaw [122] attributes relaxation shrinkage to the cohesive and temporary set from
finishing, while Bissett and Medley [123] found that relaxation shrinkage in a fabric can
be increased by severe setting and over processing.
3.11.2 Hygral Expansion
Hygral expansion is a reversible form of dimensional change which occurs due to
changes in the regain of fibres [124, 125]. If fibres are taken from dry, as they absorb
water, there is an increase in the fabrics dimensions as the fibres begin to expand,
followed by a slight reduction in dimensions, until an equilibrium is reached [126]. If
57
Chapter 3 Literature Review
hygral expansion is greater than five per cent [125] or five to six percent [127] problems
can arise in making up of garments.
There are several reasons put forward to explain hygral expansion in a wool fabric.
Baird [128] has suggested that hygral expansion is a result of the bilateral structure of
wool fibres. The different properties of the para- and ortho-cortex are considered to be
the reason for changes in fibre shape, when measured as loose fibres [125]. It has been
shown that fibre crimp and yarn crimp effect fabric hygral expansion [129]. Increases
in regain can also result in reduction of fabric dimensions as swelling of fibres is so
much greater than length increases [130].
The greater the degree of set in a fabric, the higher the hygral expansion experienced
and yarn crimp has the greatest effect of all fabric properties [122]. It has been shown
[130] that the degree of hygral expansion differs between warp and weft for
unsymmetrical weave patterns. Hygral expansion has been found to be linearly related
to yarn crimp in dyed fabrics, but also increases in permanent setting operations that do
not lead to crimp changes, but which increase the permanent set of the crimp [131].
This has been further confirmed by Baird [132] who showed that the relationship
between fabric hygral expansion and weave crimp depends on the degree of set, and that
there is no relationship in unset fabrics. The contribution of weave and fibre crimp has
been found by other researchers also [69, 133]. In addition to weave crimp, increases in
extensibility and reductions in shear properties were found to increase hygral
expansion, while fibre crimp increased the hygral expansion but only by a small amount
[134]. Others, [133] found hygral expansion to be slightly higher in twill weaves than
plain weaves.
Decatising, in particular, has been found to have an impact on the hygral expansion of
finished fabric. Increased steaming time and regain in decatising lead to increased
hygral expansion [79]. Dyeing also causes increases in hygral expansion [131, 135] and
milling after piece dyeing has been shown to reduce hygral expansion [67].
58
Chapter 3 Literature Review
Shaw [122, 136] has found that temperature adds a further element to fabric expansion
and defines a further mechanism, “thermal expansion”14, as being reversible changes in
fabric dimensions with changes in temperature at a constant regain. Thermal and hygral
expansion are considered to be closely related. For the same regain, expansion is
greater under autoclave conditions than atmospheric conditions indicating that both
thermal and hygral expansion occur [137]. Test methods and apparatus have been
developed to monitor changes in dimensions with regain [129, 138].
3.12 SETTING OF WOOL FABRICS
The setting process is carried out to relax stresses which have built up through spinning
and weaving [21], to give the fabric stability, to limit distortions which may occur in
later processing, to prevent or remove distortions which may have occurred from other
finishing, or to maintain appearance in garment construction and use [57]. Setting also
affects the mechanical properties of fabrics [139]. Setting takes place during many
finishing processes [57].
There are several different forms of set. Firstly, cohesive set is lost when wool is
soaked in water at room temperature [57] or in water for 30 minutes at 20°C [71,140].
This form of set is obtained when set above the glass transition temperature [140, 141],
and is stable when subsequent treatments are below this temperature [140].
Secondly, temporary set is lost in hot water or steam, but is retained in cold water
[140].
Finally, permanent set is resistant to soaking in water for 30 minutes at 70°C [57, 71,
140]. The following discussion will refer to permanent set unless otherwise stated.
Bona [71] suggests that permanent set is achieved as free thiols and disulfides move and
that setting occurs more quickly when reducing agents are used. Permanent set
generally requires that the fabric is above the glass transition temperature [141].
14 Shaw, T., Ref [122] p.34. and Shaw, T., Ref [136] p.163.
59
Chapter 3 Literature Review
It has been suggested that the conditions which release temporary set, also release
permanent set to some degree [141].
Setting takes place due to a combination of high temperature and moisture, which
causes hydrogen bonds and disulfide bonds to break and reform. This reorganisation of
bonds must be sufficient to withstand the conditions of use and the degree of set will
increase with time and temperature of treatment [74]. Some earlier researchers
considered hydrogen bonding to be the primary mechanism in permanent setting, with
or without setting agents, after an initial breakdown of cystine bonds [142].
Speakman [143] considered that in permanent setting, the bonds which reform after
breaking the disulfide bonds, are not the same as before setting. It was suggested, that
stability after setting is due to the formation of -S-NH- linkages, as well as cystine and
salt linkages. In support of this, Speakman and Whewell [144] found that treatments
which reduce the sulfur content in human hair reduce the permanent setting capabilities.
It has been found that [145] free thiol groups are essential to setting, due to the thiol-
disulfide interchange.
Regain in setting can be used to alter thickness, handle, shear properties in the finished
fabric [146]. Kopke [147] found that the rate of setting is affected by the regain of the
fabric, and that this is the most important factor in determining the rate of setting,
although temperature and pH were also found to have an effect. The regain of the fabric
in setting will also affect other fabric properties, such as breaking strength and shearing
[148]. Mechanical pressure variations have also been found to have an effect on the set
[148]. Increases in temperature cause the polymers behave more elastically [149].
Setting processes may cause stretching of the fabric which, if permanently set, will lead
to a permanent change in dimensions and a reduction in warp extensibility [57]. Cednäs
[130] has found that variations in conditions of setting as well as cloth construction,
alter the shrinkage behaviour of the finished fabric.
60
Chapter 3 Literature Review
3.13 SUMMARY
This review has considered previous research into the felting of wool fabrics and the
efforts to reduce it. However, there are many negative effects associated with the
processes which have been developed and there is a need for a treatment or process
which does not cause such problems. This project investigated the reasons for shrink-
resistance which has been achieved in fabrics developed at CNL. It is hoped that by
understanding the reasons for the shrink-resistance in this fabric, the knowledge will be
able to be applied to other wool fabric structures and types to provide machine
washability without the negative side-effects that have been associated with traditional
shrink-resist treatments.
The conventional methods of preventing felting shrinkage in wool fabrics identified
here have relied on the chemical modification of wool fibres, with some reduction being
found to be a result of the structure of the fabric. This project involved an investigation
of whether there was a chemical modification taking place in the finishing processes, or
if the structure of the fabric was such that fibre movement necessary for felting was
impossible, or if some combination of both these was taking place. Samples were taken
at finishing processes identified as likely to cause a significant chemical or physical
change in the fabric and examined to determine what, if any changes had taken place
that related to the change in the felting shrinkage properties.
61
62
CHAPTER 4
MATERIALS AND METHODS
4.1 FABRIC PRODUCTION: WEAVING, FINISHING, AND SAMPLING
Details of the fibre specifications, yarn production and much of the information relating
to finishing processes and parameter setting have been supplied by staff at CNL.
Experimental design was conducted on the basis of the literature review and in light of
the information supplied by CNL from previous productions and the details relating to
the productions for this project. Much training and guidance on the operation and
procedures involved in the test methods used was also provided by staff at CNL.
The results that were obtained in this project were effected by the natural variations in
wool fibres, the variations that occur as a result of the processes of fabric
manufacturing, and the errors resulting from testing. It was not possible to account for
the errors resulting from natural variation or from fabric manufacture. Measurement
errors were determined for some of the measurements that were made. The methods
used for this are given in Section 4.2.9.1.
In some areas of this work, the units that were used were not SI units. This was because
equipment was calibrated using these units, or because standard test methods were
written using non-SI units.
4.1.1 Weaving
Fabric production was carried out in 3 batches, and 3 different structures were woven.
All fabrics were produced from pure wool. The specifications for fibre quality, yarns,
and weaving are given in Table 4.1 below.
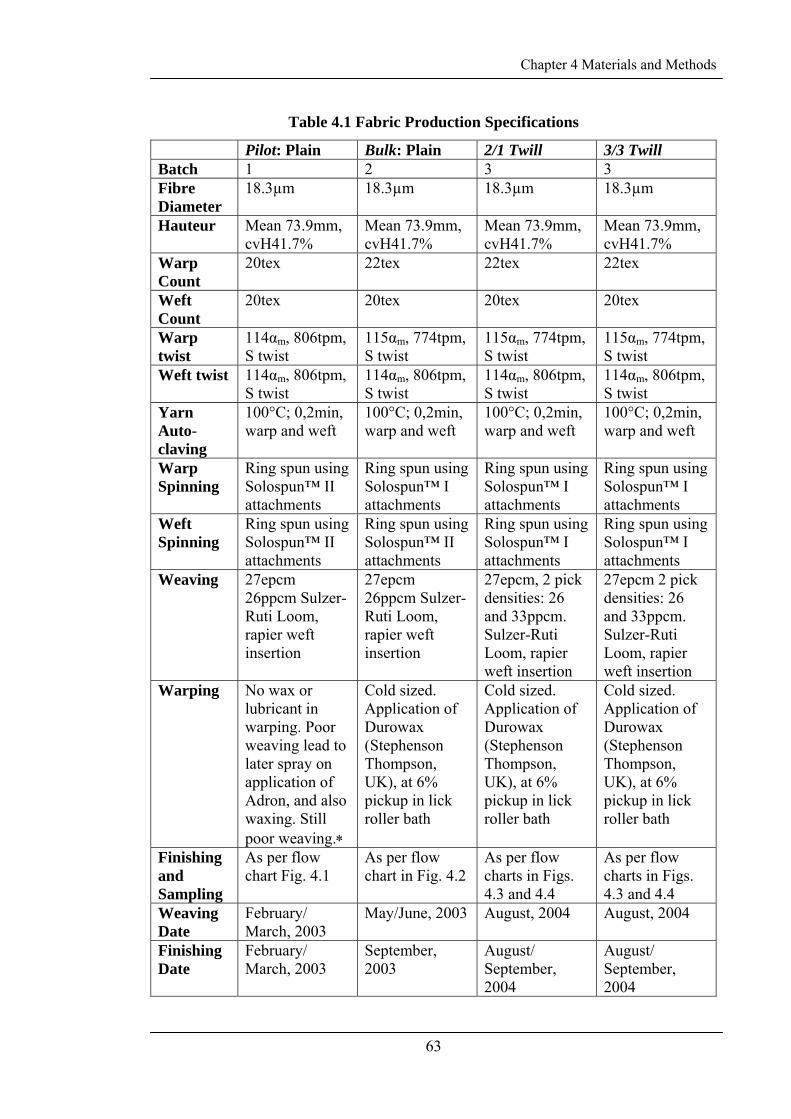
Chapter 4 Materials and Methods
63
Table 4.1 Fabric Production Specifications
Pilot: Plain Bulk: Plain 2/1 Twill 3/3 Twill Batch 1 2 3 3 Fibre Diameter
18.3µm 18.3µm 18.3µm 18.3µm
Hauteur Mean 73.9mm, cvH41.7%
Mean 73.9mm, cvH41.7%
Mean 73.9mm, cvH41.7%
Mean 73.9mm, cvH41.7%
Warp Count
20tex 22tex 22tex 22tex
Weft Count
20tex 20tex 20tex 20tex
Warp twist
114αm, 806tpm, S twist
115αm, 774tpm, S twist
115αm, 774tpm, S twist
115αm, 774tpm, S twist
Weft twist 114αm, 806tpm, S twist
114αm, 806tpm, S twist
114αm, 806tpm, S twist
114αm, 806tpm, S twist
Yarn Auto-claving
100°C; 0,2min, warp and weft
100°C; 0,2min, warp and weft
100°C; 0,2min, warp and weft
100°C; 0,2min, warp and weft
Warp Spinning
Ring spun using Solospun™ II attachments
Ring spun using Solospun™ I attachments
Ring spun using Solospun™ I attachments
Ring spun using Solospun™ I attachments
Weft Spinning
Ring spun using Solospun™ II attachments
Ring spun using Solospun™ II attachments
Ring spun using Solospun™ I attachments
Ring spun using Solospun™ I attachments
Weaving 27epcm 26ppcm Sulzer-Ruti Loom, rapier weft insertion
27epcm 26ppcm Sulzer-Ruti Loom, rapier weft insertion
27epcm, 2 pick densities: 26 and 33ppcm. Sulzer-Ruti Loom, rapier weft insertion
27epcm 2 pick densities: 26 and 33ppcm. Sulzer-Ruti Loom, rapier weft insertion
Warping No wax or lubricant in warping. Poor weaving lead to later spray on application of Adron, and also waxing. Still poor weaving.∗
Cold sized. Application of Durowax (Stephenson Thompson, UK), at 6% pickup in lick roller bath
Cold sized. Application of Durowax (Stephenson Thompson, UK), at 6% pickup in lick roller bath
Cold sized. Application of Durowax (Stephenson Thompson, UK), at 6% pickup in lick roller bath
Finishing and Sampling
As per flow chart Fig. 4.1
As per flow chart in Fig. 4.2
As per flow charts in Figs. 4.3 and 4.4
As per flow charts in Figs. 4.3 and 4.4
Weaving Date
February/ March, 2003
May/June, 2003 August, 2004 August, 2004
Finishing Date
February/ March, 2003
September, 2003
August/ September, 2004
August/ September, 2004

Chapter 4 Materials and Methods
64
*Note: The Loomstate sample for the Pilot production was taken from both the sized
and unsized warp yarn fabric. The width measurements were made across both pieces,
and the mass per unit area was measured on the sized piece. All other testing was
carried out on the unsized fabric, except microscopy, which may have been from either
piece. All other samples in the Pilot production were taken from unsized and unwaxed
warp yarn fabric.
The fibre specifications that were used were selected by CNL based on previous
research, and had been found to give good results. It is possible that changes to the
fibre specifications would have an effect on the shrink-resistance of the fabrics,
however, it was not possible to vary these parameters as part of this project due to
budget and time constraints.
4.1.2 Finishing And Sampling
Samples were taken following the finishing processes which were identified from the
previous research of others during the literature survey as likely to have an effect on
properties of the fabric which may affect the felting shrinkage. The finishing processes
and conditions, as well as the sampling locations, are shown on the flow charts in
Figures 4.1-4.4. Each sample was 50-70cm long and full width to allow for the required
test specimens to be cut.
A number of the samples taken from the Pilot production were torn from the full length
as each sample was taken. For the remainder of the productions, samples were cut from
the full length to prevent the tearing action interfering with test results. If a “torn” edge
was required for the next process in the route, a small piece was torn off to give the
“soft” edge required before the process was carried out.

Chapter 4 Materials and Methods
65
4.1.2.1 Plain Weave: Pilot Production
This production of fabric was conducted to investigate the effect of early stage finishing
processes on the felting shrinkage of the fabric and to thoroughly investigate the effect
of changes in pressure decatising time and temperature conditions. Previous
productions at CNL had identified pressure decatising as possibly affecting the shrink-
resistance [150].
During this production, a number of problems were encountered with weaving which
resulted in a short production run. This meant that the samples were approximately
50cm long, which was smaller than originally anticipated. As a result, wash samples
were smaller than specified in Woolmark TM 31 Washing of Wool Textile Products
[151], outlined in Section 4.2.2. The loomstate sample was taken in two small parts;
one from the sized warp fabric, and one from the unsized warp fabric. Other sampling
was taken from unsized and unwaxed warp.
Table 4.2 lists the pressure decatising conditions that were used for processing the
samples. Temperature and time variables were selected on the basis of calibrated
settings of the machinery, and on allowing a large enough difference in conditions so
that any changes in the fabric may be observable. Pre-vacuum and vacuum conditions
were the same for all samples tested.
Table 4.2 Decatising Time and Temperature Conditions
Temperature (°C) Time (min)
110 2, 4, 6
114 2, 4, 6
121 2, 4, 6
Finishing and sampling was carried out as per the flow chart in Figure 4.1, and the
sample names and abbreviations are given in Table A1.1 in Appendix 1.
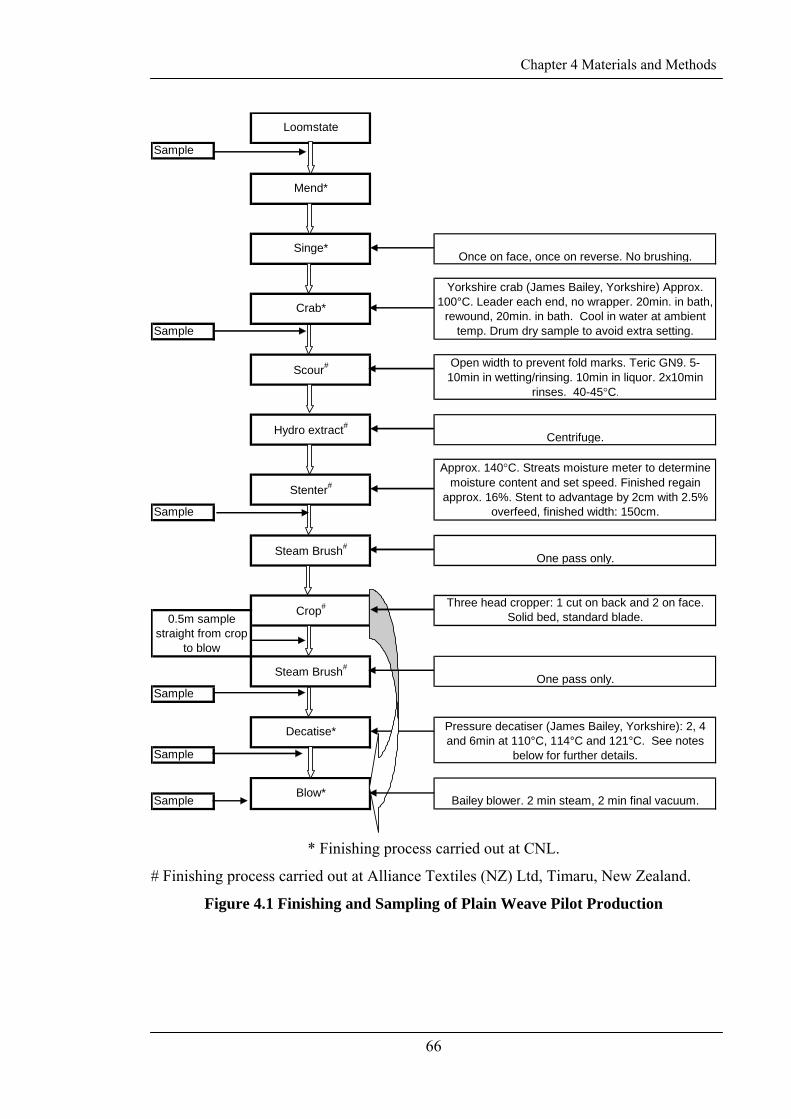
Chapter 4 Materials and Methods
66
Sample
Sample
Sample
Sample
Sample
Sample
Yorkshire crab (James Bailey, Yorkshire) Approx. 100°C. Leader each end, no wrapper. 20min. in bath,
rewound, 20min. in bath. Cool in water at ambient temp. Drum dry sample to avoid extra setting.
Open width to prevent fold marks. Teric GN9. 5-10min in wetting/rinsing. 10min in liquor. 2x10min
rinses. 40-45°C.
Centrifuge.
Approx. 140°C. Streats moisture meter to determine moisture content and set speed. Finished regain
approx. 16%. Stent to advantage by 2cm with 2.5% overfeed, finished width: 150cm.
One pass only.
Loomstate
Once on face, once on reverse. No brushing.
One pass only.
Three head cropper: 1 cut on back and 2 on face. Solid bed, standard blade.
Hydro extract#
Stenter#
Steam Brush#
Crop#
Mend*
Singe*
Crab*
Scour#
Blow*Bailey blower. 2 min steam, 2 min final vacuum.
0.5m sample straight from crop
to blow
Decatise*
Steam Brush#
Pressure decatiser (James Bailey, Yorkshire): 2, 4 and 6min at 110°C, 114°C and 121°C. See notes
below for further details.
* Finishing process carried out at CNL.
# Finishing process carried out at Alliance Textiles (NZ) Ltd, Timaru, New Zealand.
Figure 4.1 Finishing and Sampling of Plain Weave Pilot Production
Chapter 4 Materials and Methods
67
4.1.2.1.1 Pressure Decatising Cycle
The pressure decatising cycle involved a three minute pre-vacuum, and a three minute
post-steam vacuum. The nip bearing was 50psi (the pressure exerted on the roll to be
decatised by another roll) and the brake (tension used in rolling wrapper cloth) was
40psi. The pre-vacuum cycle ran to a maximum of approximately -15”Hg and 80°C,
then injected steam to raise the temperature to 102°C and just above atmospheric
pressure (this was not able to be accurately measured). The vacuum and steam injection
cycle was repeated a number of times through the pre-vacuum cycle; the number of
repeats depended on the availability of steam and the time to raise the temperature to
102°C.
The steaming cycle ran by injecting steam until it reached the maximum pressure, then
cut out, and let out the steam. It was not possible to hold the high pressure, as the
temperature would have continued to increase which would have damaged the fabric.
Steam was injected only from the outside of the roll to the inside (the opposite had been
trialed by CNL, but caused the fabric to be wet due to the limitations of the boiler).
When steam was let out it was drawn through the centre of the roll.
The final vacuum cycle ran at approximately 80°C for the full cycle. The cycle shock
cooled the fabric from the high temperature of the steaming cycle and created a vacuum
of approximately -20”Hg. There was no steaming involved in the final vacuum stage.
At the completion of the cycle, the fabric was cooled in ambient conditions.
4.1.2.2 Plain Weave: Bulk Production
A larger batch of plain weave fabric was produced to examine the full finishing route
which CNL had identified. Due to complications in weaving the Pilot batch, this Bulk
production had a higher warp yarn count and the warp yarns were sized. This meant
that some minor changes to the early stages of finishing were required. As a result, the
early stage finishing processes which had been examined in the Pilot production were
re-sampled and tested.
Chapter 4 Materials and Methods
68
The sample which was chlorinated control sample was only sampled at the final stage.
This fabric was pretreated by winch exhaustion with 3% chlorine and 3% metabisulfite
solution. Basolan MW, BASF, was then applied at 6% on weight of fibre.
Finishing conditions and sampling are shown in Figure 4.2 and sample names are given
in Appendix 1 Table A1.2.
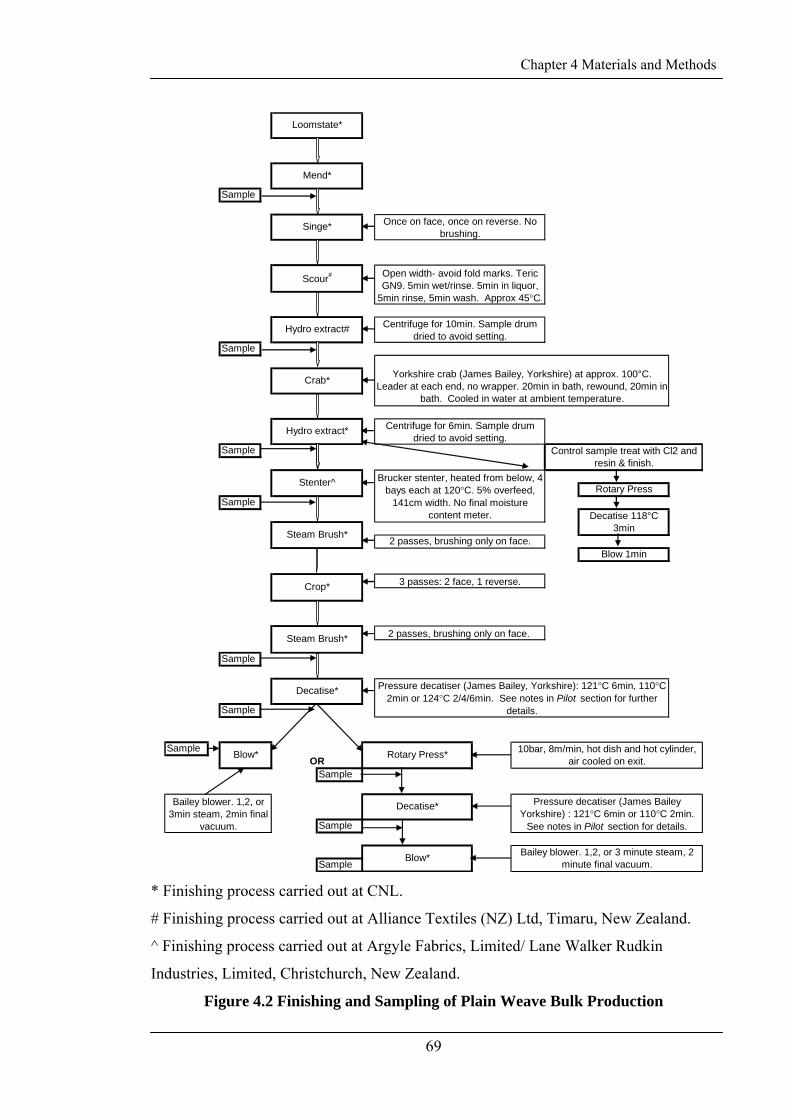
Chapter 4 Materials and Methods
69
Sample
Sample
Sample
Rotary PressSample
Blow 1min
Sample
Sample
Sample
Sample
Sample
Sample
Decatise 118°C 3min
Brucker stenter, heated from below, 4 bays each at 120°C. 5% overfeed,
141cm width. No final moisture content meter.
Yorkshire crab (James Bailey, Yorkshire) at approx. 100°C. Leader at each end, no wrapper. 20min in bath, rewound, 20min in
bath. Cooled in water at ambient temperature.
Pressure decatiser (James Bailey, Yorkshire): 121°C 6min, 110°C 2min or 124°C 2/4/6min. See notes in Pilot section for further
details.
Stenter^
Loomstate*
Open width- avoid fold marks. Teric GN9. 5min wet/rinse. 5min in liquor,
5min rinse, 5min wash. Approx 45°C.
Centrifuge for 10min. Sample drum dried to avoid setting.
Once on face, once on reverse. No brushing.
Mend*
Singe*
Scour#
Control sample treat with Cl2 and resin & finish.
Hydro extract#
Crab*
Hydro extract* Centrifuge for 6min. Sample drum dried to avoid setting.
Steam Brush*
Decatise*
OR
Decatise*
Steam Brush*
Crop*
2 passes, brushing only on face.
3 passes: 2 face, 1 reverse.
2 passes, brushing only on face.
Bailey blower. 1,2, or 3 minute steam, 2 minute final vacuum.
Blow* Rotary Press*
Blow*
Bailey blower. 1,2, or 3min steam, 2min final
vacuum.
Pressure decatiser (James Bailey Yorkshire) : 121°C 6min or 110°C 2min.
See notes in Pilot section for details.
10bar, 8m/min, hot dish and hot cylinder, air cooled on exit.
* Finishing process carried out at CNL.
# Finishing process carried out at Alliance Textiles (NZ) Ltd, Timaru, New Zealand.
^ Finishing process carried out at Argyle Fabrics, Limited/ Lane Walker Rudkin
Industries, Limited, Christchurch, New Zealand.
Figure 4.2 Finishing and Sampling of Plain Weave Bulk Production
Chapter 4 Materials and Methods
70
4.1.2.3 Twill Fabric Production
In order to examine the effect of the float length and yarn interactions on felting
shrinkage, twill weave fabrics were produced with the same yarn specifications and
finished according to the same finishing route as the plain weave productions.
Two structures were selected:
• 2/1 twill, as this is the twill structure with the smallest floats, and,
• 3/3 twill, as this allowed for longer floats in both the warp and weft without the
need for re-threading the loom.
Each structure was woven with two pick densities: 26 and 33 picks per centimetre
(ppcm) to examine the importance of yarn packing. 26ppcm had been used for the plain
weave fabrics and meant that the fabrics differed, principally, only in float length.
A single finishing routine was followed which used the conditions from the plain weave
Bulk production that gave the lowest felting shrinkage results. The finishing conditions
and sampling of the fabrics are shown in the flow charts in Figures 4.3 and 4.4 (the
sample names are given in Appendix 1 Table A1.3).
These fabrics were found to be difficult to singe and some suffered damage and
scorching in the process, especially the 3x3 twill. For most of the test specimens that
were cut, it was possible to cut around the severely damaged sections, but other
specimens had damaged areas. This proved to be a particular problem in the tensile
testing using the KES-F equipment, as some of the pieces tore in testing, and only one
sample was able to be used. The effect of this on other test results is not known.
Note that there was a change in the steps immediately following scouring, in that the
fabric was stentered at low temperature to prevent marks from centrifuging, and also
because it was not able to be immediately crabbed and therefore, would have been left
wet for some time if not stentered. Also, the Bailey blower was out of order and unable
to be used for these fabrics. For blowing treatments, the fabrics were treated in the
Chapter 4 Materials and Methods
71
autoclave for three minutes at 2-3psi and 105-108°C, followed by a five minute
vacuum.
In addition, a piece of plain weave fabric was finished with this batch and was pressure
decatised instead of crabbed to determine the importance of the crabbing process in
producing a shrink-resistant fabric. Also, as this piece had not been wet in the crabbing
process, the hydroextraction and stentering that was used for the other batches of fabric
following crabbing were omitted. That is, the fabric went from scouring to stentering to
pressure decatising at 121°C for 6min then to steam brushing and cropping, and then
followed the same finishing route as in Figures 4.3 and 4.4 above. The results of this
sample are included with the Bulk plain production.
The sample that should have been taken from the 26ppcm 2/1 Twill production at the
scouring stage was actually found to be from the 33ppcm fabric when ends and picks
were measured. Therefore, the results for this piece have not been reported, and there
are no results for a 2/1 26ppcm scoured sample.
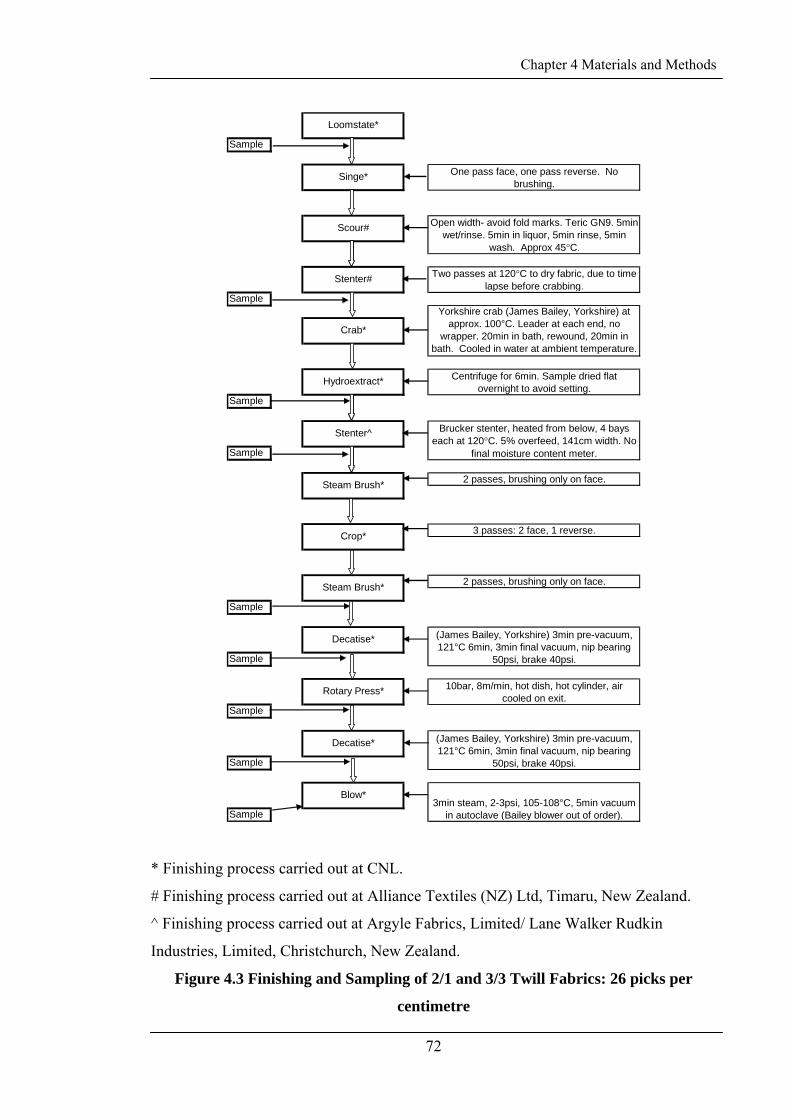
Chapter 4 Materials and Methods
72
Sample
Sample
Sample
Sample
Sample
Sample
Sample
Sample
Sample
Singe*
Scour#
Hydroextract*
Stenter#
Crab*
Loomstate*
One pass face, one pass reverse. No brushing.
Open width- avoid fold marks. Teric GN9. 5min wet/rinse. 5min in liquor, 5min rinse, 5min
wash. Approx 45°C.
Two passes at 120°C to dry fabric, due to time lapse before crabbing.
Stenter^
Steam Brush*
Crop*
Decatise*
Rotary Press*
Steam Brush*
Decatise*
Blow*
Yorkshire crab (James Bailey, Yorkshire) at approx. 100°C. Leader at each end, no
wrapper. 20min in bath, rewound, 20min in bath. Cooled in water at ambient temperature.
Centrifuge for 6min. Sample dried flat overnight to avoid setting.
Brucker stenter, heated from below, 4 bays each at 120°C. 5% overfeed, 141cm width. No
final moisture content meter.
2 passes, brushing only on face.
3min steam, 2-3psi, 105-108°C, 5min vacuum in autoclave (Bailey blower out of order).
3 passes: 2 face, 1 reverse.
2 passes, brushing only on face.
10bar, 8m/min, hot dish, hot cylinder, air cooled on exit.
(James Bailey, Yorkshire) 3min pre-vacuum, 121°C 6min, 3min final vacuum, nip bearing
50psi, brake 40psi.
(James Bailey, Yorkshire) 3min pre-vacuum, 121°C 6min, 3min final vacuum, nip bearing
50psi, brake 40psi.
* Finishing process carried out at CNL.
# Finishing process carried out at Alliance Textiles (NZ) Ltd, Timaru, New Zealand.
^ Finishing process carried out at Argyle Fabrics, Limited/ Lane Walker Rudkin
Industries, Limited, Christchurch, New Zealand.
Figure 4.3 Finishing and Sampling of 2/1 and 3/3 Twill Fabrics: 26 picks per
centimetre
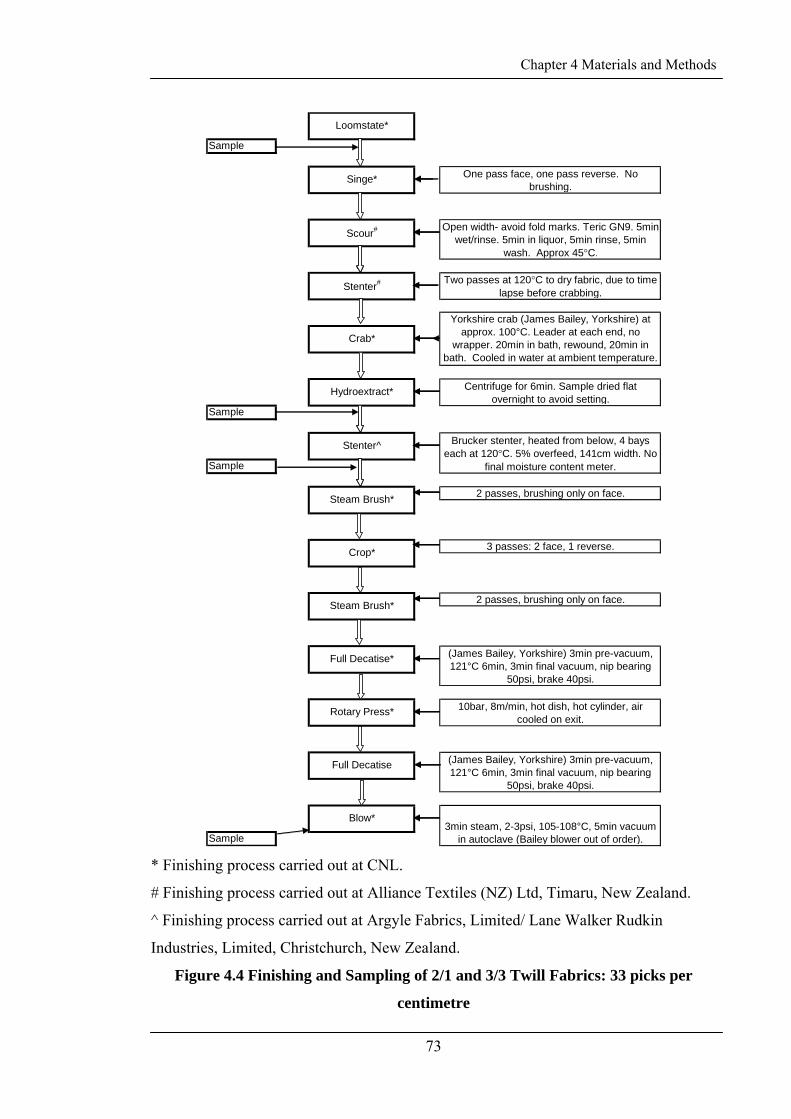
Chapter 4 Materials and Methods
73
Sample
Sample
Sample
Sample
(James Bailey, Yorkshire) 3min pre-vacuum, 121°C 6min, 3min final vacuum, nip bearing
50psi, brake 40psi.
3min steam, 2-3psi, 105-108°C, 5min vacuum in autoclave (Bailey blower out of order).
Rotary Press*
Steam Brush*
Full Decatise
Blow*
2 passes, brushing only on face.
10bar, 8m/min, hot dish, hot cylinder, air cooled on exit.
(James Bailey, Yorkshire) 3min pre-vacuum, 121°C 6min, 3min final vacuum, nip bearing
50psi, brake 40psi.
Stenter^
Steam Brush*
Crop*
Full Decatise*
Singe*
Scour#
Hydroextract*
Stenter#
Crab*
Loomstate*
One pass face, one pass reverse. No brushing.
Open width- avoid fold marks. Teric GN9. 5min wet/rinse. 5min in liquor, 5min rinse, 5min
wash. Approx 45°C.
Two passes at 120°C to dry fabric, due to time lapse before crabbing.
3 passes: 2 face, 1 reverse.
Yorkshire crab (James Bailey, Yorkshire) at approx. 100°C. Leader at each end, no
wrapper. 20min in bath, rewound, 20min in bath. Cooled in water at ambient temperature.
Centrifuge for 6min. Sample dried flat overnight to avoid setting.
Brucker stenter, heated from below, 4 bays each at 120°C. 5% overfeed, 141cm width. No
final moisture content meter.
2 passes, brushing only on face.
* Finishing process carried out at CNL.
# Finishing process carried out at Alliance Textiles (NZ) Ltd, Timaru, New Zealand.
^ Finishing process carried out at Argyle Fabrics, Limited/ Lane Walker Rudkin
Industries, Limited, Christchurch, New Zealand.
Figure 4.4 Finishing and Sampling of 2/1 and 3/3 Twill Fabrics: 33 picks per
centimetre

Chapter 4 Materials and Methods
74
4.2 SAMPLE PREPARATION AND TEST METHODS
4.2.1 Measurement Errors
Notes on the accuracy of rules used for measurements were not made for the Pilot
production, and the determination of measurement errors was therefore based on the
conservative assumption that all rules used had 1mm as the smallest divisions, ie an
accuracy of ±0.5mm. For all other sampling the accuracy of rules is given in Table 4.3.
Table 4.3 Length Measurement Equipment
Test Bulk Plain Weave Twill Weaves
Fabric Width Steel tape: 1mm divisions Steel tape: 1mm divisions
gsm 300mm steel rule: 0.5mm
divisions
Steel rule: 0.5mm divisions
Crimp 300mm steel rule: 0.5mm
divisions
300mm steel rule: 0.5mm
divisions
Ends and Picks 1mm divisions 150mm rule: 1mm
divisions or 300mm rule:
0.5mm divisions. Used
1mm divisions for error
calculation.
Wash Shrinkage 600mm rule: 1mm
divisions
1m steel rule: 0.5mm
divisions, except batch A
initial measure- 1m steel
rule: 1mm divisions
FAST RS and HE 300mm rule: 0.5mm
divisions
300mm rule: 0.5mm
divisions
4.2.2
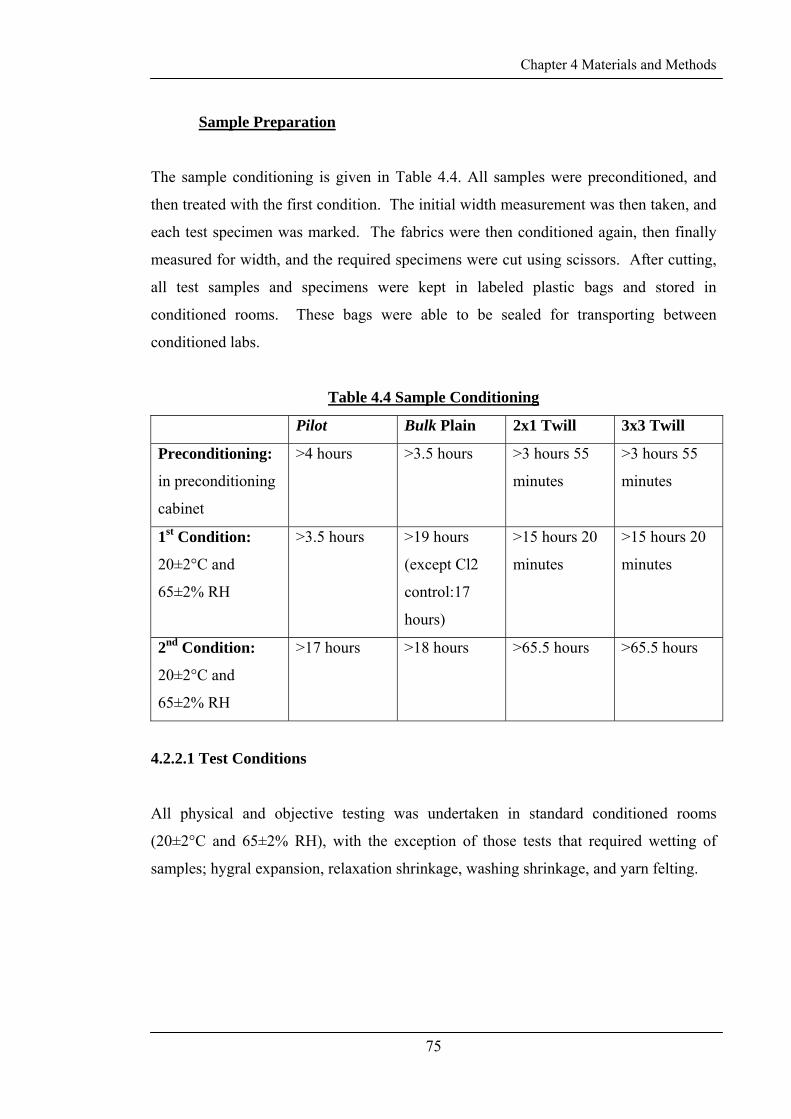
Chapter 4 Materials and Methods
75
Sample Preparation
The sample conditioning is given in Table 4.4. All samples were preconditioned, and
then treated with the first condition. The initial width measurement was then taken, and
each test specimen was marked. The fabrics were then conditioned again, then finally
measured for width, and the required specimens were cut using scissors. After cutting,
all test samples and specimens were kept in labeled plastic bags and stored in
conditioned rooms. These bags were able to be sealed for transporting between
conditioned labs.
Table 4.4 Sample Conditioning
Pilot Bulk Plain 2x1 Twill 3x3 Twill
Preconditioning:
in preconditioning
cabinet
>4 hours >3.5 hours >3 hours 55
minutes
>3 hours 55
minutes
1st Condition:
20±2°C and
65±2% RH
>3.5 hours >19 hours
(except Cl2
control:17
hours)
>15 hours 20
minutes
>15 hours 20
minutes
2nd Condition:
20±2°C and
65±2% RH
>17 hours >18 hours >65.5 hours >65.5 hours
4.2.2.1 Test Conditions
All physical and objective testing was undertaken in standard conditioned rooms
(20±2°C and 65±2% RH), with the exception of those tests that required wetting of
samples; hygral expansion, relaxation shrinkage, washing shrinkage, and yarn felting.
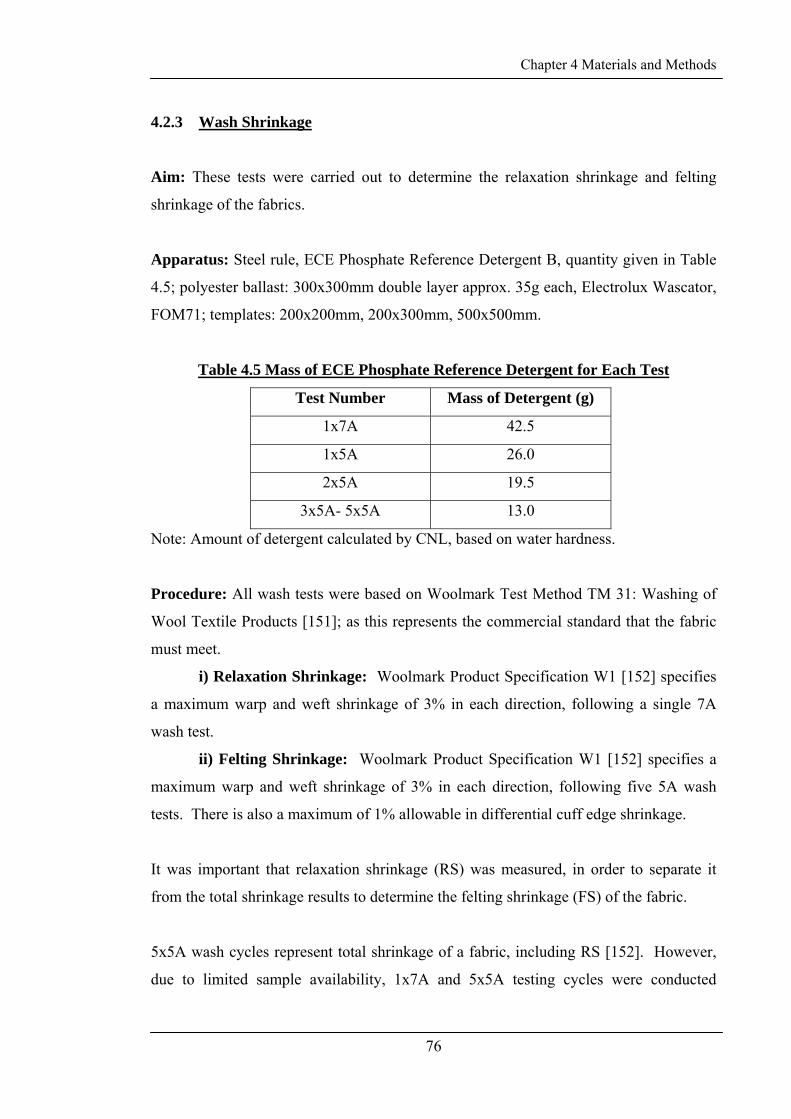
Chapter 4 Materials and Methods
76
4.2.3 Wash Shrinkage
Aim: These tests were carried out to determine the relaxation shrinkage and felting
shrinkage of the fabrics.
Apparatus: Steel rule, ECE Phosphate Reference Detergent B, quantity given in Table
4.5; polyester ballast: 300x300mm double layer approx. 35g each, Electrolux Wascator,
FOM71; templates: 200x200mm, 200x300mm, 500x500mm.
Table 4.5 Mass of ECE Phosphate Reference Detergent for Each Test
Test Number Mass of Detergent (g)
1x7A 42.5
1x5A 26.0
2x5A 19.5
3x5A- 5x5A 13.0
Note: Amount of detergent calculated by CNL, based on water hardness.
Procedure: All wash tests were based on Woolmark Test Method TM 31: Washing of
Wool Textile Products [151]; as this represents the commercial standard that the fabric
must meet.
i) Relaxation Shrinkage: Woolmark Product Specification W1 [152] specifies
a maximum warp and weft shrinkage of 3% in each direction, following a single 7A
wash test.
ii) Felting Shrinkage: Woolmark Product Specification W1 [152] specifies a
maximum warp and weft shrinkage of 3% in each direction, following five 5A wash
tests. There is also a maximum of 1% allowable in differential cuff edge shrinkage.
It was important that relaxation shrinkage (RS) was measured, in order to separate it
from the total shrinkage results to determine the felting shrinkage (FS) of the fabric.
5x5A wash cycles represent total shrinkage of a fabric, including RS [152]. However,
due to limited sample availability, 1x7A and 5x5A testing cycles were conducted
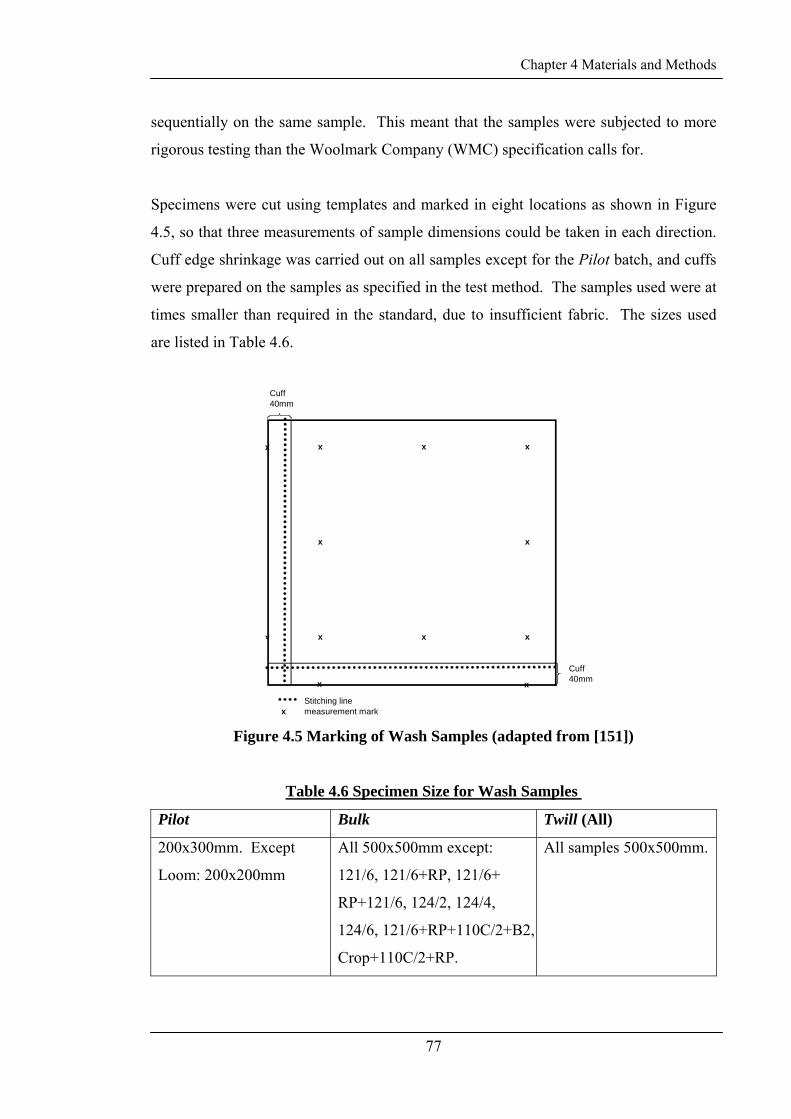
Chapter 4 Materials and Methods
77
sequentially on the same sample. This meant that the samples were subjected to more
rigorous testing than the Woolmark Company (WMC) specification calls for.
Specimens were cut using templates and marked in eight locations as shown in Figure
4.5, so that three measurements of sample dimensions could be taken in each direction.
Cuff edge shrinkage was carried out on all samples except for the Pilot batch, and cuffs
were prepared on the samples as specified in the test method. The samples used were at
times smaller than required in the standard, due to insufficient fabric. The sizes used
are listed in Table 4.6.
Cuff40mm
x x x
x x
x x x
Cuff40mm
Stitching linex measurement mark
x
x
x x
Figure 4.5 Marking of Wash Samples (adapted from [151])
Table 4.6 Specimen Size for Wash Samples
Pilot Bulk Twill (All)
200x300mm. Except
Loom: 200x200mm
All 500x500mm except:
121/6, 121/6+RP, 121/6+
RP+121/6, 124/2, 124/4,
124/6, 121/6+RP+110C/2+B2,
Crop+110C/2+RP.
All samples 500x500mm.
Chapter 4 Materials and Methods
78
The samples were washed in batches in the Wascator standard washing machine, with
enough ballast to make up a 1kg load, and the amount of detergent as specified in Table
4.5 for each cycle. The samples were dried on a washing rack, or on top of, or in the
preconditioning oven, taking care to keep the pieces as flat as possible, and conditioned
overnight prior to measurement between each cycle. Before the final measurement of
FS, the samples were conditioned at 20±2°C and 65±2% RH according to Table 4.7.
No pre-conditioning was carried out before the final conditioning and measuring.
Note: According to TM 31 [151], the total mass of samples should be not more than
0.5kg, with the balance made up of ballast. This was not adhered to, and for some of
the wash batches, the combined sample mass was greater than 0.5kg.
Table 4.7 Conditioning of Wash Samples Prior to Measurement
Pilot Bulk Twill (All)
RS: minimum of
16.5hours.
FS: minimum of 65hours.
Samples left in
conditioned lab at least
overnight before final RS
and FS measurements.
RS: 16hours 45 min.
FS: 40.5 hours.
Note: The samples were marked with dots in the layout given in Figure 4.5 and
measured between the markers to give three measurements in the warp direction, and
three in the weft direction. The means of the warp measurements and of the weft
measurements were taken and used to calculate the sample area according to:
Area = length x width (1)
However, several samples did not shrink evenly and did not remain “square”.
Therefore, the area calculation does not represent the change in the sample size as well
as the individual warp and weft measurements. In addition, this change in the shape of
the sample resulted in some unusually high error values.
Chapter 4 Materials and Methods
79
4.2.4 Physical Test Methods
4.2.4.1 Fabric Width
Aim: Total fabric width, and width between selvedges provides a simple indication of
physical change in the fabric as a result of the finishing processes. It gives an indication
of changes such as yarn crimp, relaxation, and whether there has been longitudinal
stretching or shrinkage.
Apparatus: Retractable steel tape.
Procedure: This test was based on AS2001.2.12 Determination of Width of Fabrics
[153]. This test was carried out on the full fabric sample and in three locations down
the length of each piece. The fabrics were preconditioned, and given the first
conditioning according to Table 4.4 before being measured for full fabric width (Total)
and width between selvedges (B/n Sel) using the steel tape (Initial width). The samples
were then conditioned according to the second conditioning in Table 4.4 and re-
measured (Final width).
Notes: a) The three locations used for the first and second measurements were not in the
same place down the length of the fabric. For both sets of measurements, the
width was taken at the top, middle and bottom of the sample piece.
b) Fabric length measurements were not made on the samples as this would have
required conditioning, measuring, and marking the fabric before finishing could
be carried out. This was deemed impractical. Also, changes in the lengthwise
properties of the fabrics were able to be determined from the ppcm results.
Chapter 4 Materials and Methods
80
4.2.4.2 Mass Per Unit Area
Aim: Mass per unit area was measured to indicate the changes in the fabric properties.
There were also limits on the mass for the fabric to be suitable for the intended use.
Apparatus: 150x150mm template; steel rule; electronic balance, 0.0001g accuracy.
Procedure: The method used was based on Woolmark Test Method TM 13: Mass per
Unit Area [154]. Specimens were cut using the template and trimmed to remove loose
yarns. The dimensions of each specimen were measured in three places (top, middle
and bottom) in both warp and weft directions. Each piece was then weighed using the
balance and the grams per square metre (gsm) calculated. The number of repeats in
each batch varied with sample availability, these are reported in Table 4.8.
Table 4.8 Number of Repeats for gsm Calculation
Pilot Bulk 2x1 Twill 3x3 Twill
Loom: 2, stent: 3,
all others: 4
Varied: 2-5 pieces 3-4 3-4
4.2.4.3 Yarn Crimp
Aim: Crimp was determined as an indication of physical change in the fabric. It is an
important factor in determining fabric hygral expansion [129, 131].
Apparatus: Steel rule; Shirley Crimp Tester, accuracy ±0.5mm; tweezers.
Procedure: This test method was based on Wool Research Organisation Laboratory In
House Test Method: Crimp [155], which in turn was based on ISO7211-3:1984 (E)
Textiles- Woven fabrics- Construction- Methods of analysis Part 3: Determination of
crimp of yarn in fabric [156]. The procedure involved measuring and cutting a flap of
fabric slightly more than 200mm in the direction to be measured, then fraying back to
exactly 200mm and trimming back the excess yarn. The yarns to be measured were
removed with the tweezers from the fabric, taking care not to loose twist and placed in
Chapter 4 Materials and Methods
81
the jaws of the Shirley Crimp Tester. Each yarn was measured under a load of
approximately 8g. Two sets of ten measurements were taken in two different locations
for warp (wp) crimp, and three sets of ten measurements were taken at three different
locations for weft (wf) crimp. The Pilot loomstate fabric was not measured for crimp
due to the small sample available.
4.2.4.4 Ends and Picks
Aim: This test was carried out to determine changes in the thread density to ascertain if
the shrink-resistance of the fabric is a result a tight fabric construction that prevents the
fibre movement required for felting.
Apparatus: Steel rule; 50x50mm template; velvet board.
Procedure: This test method was based on Wool Research Organisation Laboratory In
House Test Method: Ends and Picks [157], which in turn was based on ISO7211-2:1984
(E) Textiles- Woven fabrics- Methods of analysis Part 2: Determination of number of
threads per unit length [158]. The dissection method was used [158]. Specimens were
cut using the template and trimmed and frayed back to 30x30mm. The specimens were
then pulled apart and the yarns laid out on the velvet board for counting. Ends
(Ends/cm) and picks (Picks/cm) were both taken from the same specimens and results
given per centimetre. Five repeats were measured for each fabric.
4.2.4.5 Derived Parameters
A number of fabric properties were calculated using the results from direct
measurements to give “derived parameters”. These were:
Calculated width (calc width b/n sel): Determined from the total number of ends in the
loom (4486) not including selvedges divided by the measured number of ends per
centimetre.
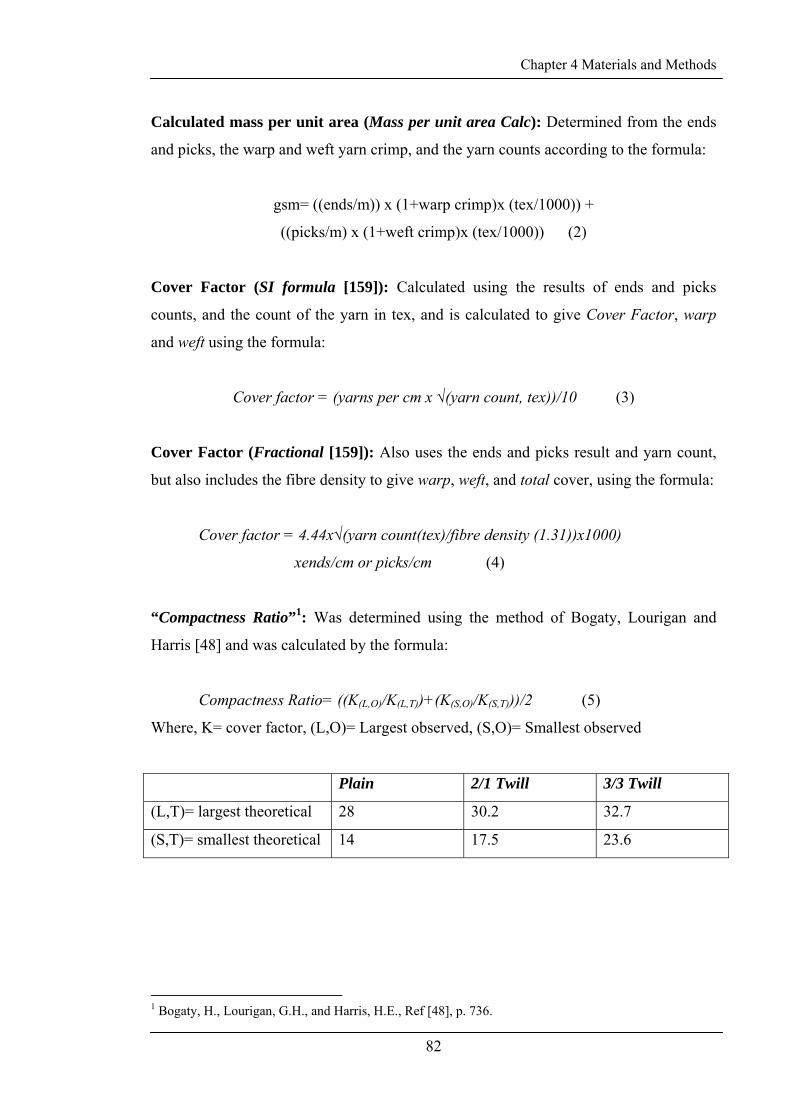
Chapter 4 Materials and Methods
82
Calculated mass per unit area (Mass per unit area Calc): Determined from the ends
and picks, the warp and weft yarn crimp, and the yarn counts according to the formula:
gsm= ((ends/m)) x (1+warp crimp)x (tex/1000)) +
((picks/m) x (1+weft crimp)x (tex/1000)) (2)
Cover Factor (SI formula [159]): Calculated using the results of ends and picks
counts, and the count of the yarn in tex, and is calculated to give Cover Factor, warp
and weft using the formula:
Cover factor = (yarns per cm x √(yarn count, tex))/10 (3)
Cover Factor (Fractional [159]): Also uses the ends and picks result and yarn count,
but also includes the fibre density to give warp, weft, and total cover, using the formula:
Cover factor = 4.44x√(yarn count(tex)/fibre density (1.31))x1000)
xends/cm or picks/cm (4)
“Compactness Ratio”1: Was determined using the method of Bogaty, Lourigan and
Harris [48] and was calculated by the formula:
Compactness Ratio= ((K(L,O)/K(L,T))+(K(S,O)/K(S,T)))/2 (5)
Where, K= cover factor, (L,O)= Largest observed, (S,O)= Smallest observed
Plain 2/1 Twill 3/3 Twill
(L,T)= largest theoretical 28 30.2 32.7
(S,T)= smallest theoretical 14 17.5 23.6
1 Bogaty, H., Lourigan, G.H., and Harris, H.E., Ref [48], p. 736.
Chapter 4 Materials and Methods
83
Theoretical compactness was taken from the charts developed by Love [160] for the
Plain weave and 2x1 Twill fabrics, and was derived from the formulae in Love’s paper
for the 3x3 Twill fabrics. Cover factors were calculated using [48]:
K= 1.073x((ends or picks/inch)/√yarn count in cotton) (6)
Fabric volume density: Density had been suggested as possibly contributing to the
shrink resistance of these fabrics [161]. Calculated from the fabric mass per unit area
(calculated) and the thickness values.
Density(ρ) = mass/volume (7)
Given: Mass per unit area (gsm) and
Thickness (mm) (taken from FAST measurements)
We know: the mass of 1 square metre
Assume: that for 1 square metre, volume = area x thickness (8)
Density simply becomes:
density(ρ), g/cm3 = (gsm/1x104)/( thickness (mm)/10) (9)
Chapter 4 Materials and Methods
84
4.2.5 Objective Testing
Note: KES-F and FAST parameters have been shown to be well correlated with each
other [162] where the same parameters are measured. However, the information that
can be obtained from each set of equipment is slightly different. KES-F gives
information on the recovery of the fabric for the parameter measured [163]. FAST is a
simple system for the gathering of mechanical data [164]. Therefore, although there is
some overlap in the results, both sets of equipment were used.
4.2.5.1 Fabric Assurance by Simple Testing (FAST) Method
Aim: FAST testing was carried out because it allowed for quick results of mechanical
testing and because it included a test method for hygral expansion [164].
Apparatus and Procedure: FAST specimen cutting template.
Fabric specimens were cut using the template and tested using each instrument,
according to the Wool Research Organisation FAST Test Method [165], which was
based on the FAST equipment manual [166] as follows.
• FAST 1: FAST Compression Tester
To prepare specimens for “released” thickness testing, the pieces were steamed
using an open Hoffman Press for 30seconds and conditioned overnight.
Released and unreleased specimens were tested under 2g and 100g loads in the
same place. This was carried out in five different locations on each specimen.
This instrument gave results of thickness under 2g load (T2) and 100g load
(T100), and surface thickness (ST). It also gave released thickness under 2g
load (TR2) and 100g load (TR100), and released surface thickness (STR).
• FAST 2: FAST Bending Tester
Specimens were measured for bending length using the Bending Tester. Three
pieces were measured in each direction, and each piece was measured face up
and face down at each end, giving a total of 12 measurements in each direction.
This instrument gave results of bending rigidity, in warp (wp) and weft (wf).
Chapter 4 Materials and Methods
85
• FAST 3: FAST Extension Tester
Specimens were measured for extensibility using the Extension Tester. Three
pieces were measured in the warp (wp) and weft (wf) direction under loads of
5gf/cm, 20gf/cm and 100gf/cm. Bias measurements were also made, under
5gf/cm load, with three measurements made in each bias direction. The results
of bias extension are used by the software, as part of the equipment, to calculate
shear rigidity (G) and the results of extension at 5gf/cm and 20gf/cm are
combined with bending rigidity to calculate formability (Form).
• FAST 4: Relaxation Shrinkage (RS)/Hygral Expansion (HE)
Apparatus: Water bath, between 25-35°C, containing 0.1% Teric GN9; rule;
ventilated oven at 105°C.
Procedure: The dimensions of the dry fabric were measured before placing in
the ventilated oven for approximately one hour. The dimensions of the dried
fabric were taken. The fabric was then placed in the water bath for
approximately 30minutes, removed, excess water removed and measured again.
Following this, the samples were placed back in the ventilated oven for
approximately one hour and then measured again. The following formulae were
used to calculate RS and HE, in the warp (wp) and weft (wf) direction:
RS(%) = ((D2-D1)/D1) x 100% (10)
HE(%) = ((W- D2)/D2) x 100% (11)
Where, D1= the dimension, warp or weft, after the first drying step
D2= the dimension, warp or weft, after the second drying step
W = the wet dimension, warp or weft, following soaking
The results of thickness measurements were also used to calculate the “Finish
Stability Ratio” (FSR), “Effective Flat Set” (EFS), “Stable Flat Set” (SFS), and
“Temporary Flat Set” 2 (TFS) according to the methods of Le, Ly, Phillips and
De Boos [167]. Permanent set was also determined from surface thickness
measurements using the method of De Boos and Brady [168].
2 Le, C., Ly, N., Phillips, D., and De Boos, A., Ref. [167] p. 3., for FSR, EFS, SFS, and TFS.
Chapter 4 Materials and Methods
86
4.2.5.2 Kawabata Evaluation System- Fabric (KES-F) Method
Aim: KES-F testing was carried out to determine the mechanical properties of the
fabrics.
Apparatus: 200x200mm cutting template; KES-F Surface Tester, Compression Tester,
Bending Tester, and Shear/Tensile Tester.
Procedure: All fabrics were tested, in duplicate for each fabric. This allowed for more
variations in finishing conditions. The same two sample pieces were used for all four
pieces of equipment for a single deformation recovery cycle, with some exceptions, see
note below. Testing was carried out, based on the methods in the equipment manuals
[169-172], with additional assistance in the use of the equipment from CNL staff, in the
following order (compression and bending were interchanged for some batches):
• Surface: Samples were tested for the coefficient of friction (MIU), the mean
deviation of friction (MMD), and the geometric roughness (SMD) in both warp
(wp) and weft (wf) directions.
• Compression: Samples were tested for compression properties: Compression
rate (EMC), compressional energy (WC), compressional resilience (RC),
linearity of compression thickness curve (LC).
• Bending: Samples were tested for bending properties in both warp (wp) and
weft (wf) directions: Bending rigidity (B), bending hysteresis at 1degree bending
(2HB 1°), and 0.5 degree bending (2HB 0.5°) with calculation for residual
bending at 1degree bending (RSB 1°) and 0.5 degree bending (RSB 0.5°).
• Shear: Samples were tested for shear properties in both warp and weft
directions: Shear rigidity (G), shear hysteresis at 0.5° shearing (2HG) and at 5°
shearing (2HG5), with calculation for residual shear (RSG).
• Tensile: Samples were tested for tensile properties in both warp (wp) and weft
(wf) directions: Tensile strain (EMT), tensile energy (WT), tensile resilience
(RT), and linearity of load extension curve (LT).
All charts were scanned, and then read using WinDIG v2.5.
Chapter 4 Materials and Methods
87
Note: Where the result of testing gave an unusual result a third specimen was examined,
if there was sufficient sample available. Where a third specimen was examined, it was
used only for the equipment piece where difficulties were encountered, and for the most
part, only the two results were used in the calculation of the final result, ie the third
specimen was not tested on all pieces of equipment. For those samples where there was
insufficient fabric remaining for a new test piece to be cut, the sample was moved, so
that as far as possible, a new area of the fabric was tested, and a repeat measurement
carried out.
In addition to the parameters that are listed above, residual bending (RSB) [173, 174]
and shear (RSG) [174] were calculated as the hysteresis measurement divided by the
rigidity measurement.
Also, it is possible to remove a component from shear results that results from the
hanging weight [173]. This amount was measured as part of the work, but was not
removed from any of the results.
Note: For the Pilot production, testing of the surface and bending properties were
conducted within weeks of fabric finishing. However, the other equipment required
repair work, and the samples were not tested for compression, shear, or tensile
properties for several months. When the samples were able to be tested, they were
conditioned in the open sample bags overnight, without pre-conditioning. For the other
productions testing of all parameters was conducted within weeks of finishing. It is
possible that there is some variability between the Pilot batch and the other batches as a
result of ageing of the Pilot samples.
Note: When all the testing for this project was completed the KES-F equipment was
moved and recalibrated. It was found in recalibration that the surface tester appeared to
have had a calibration problem which may have affected the results in this project.
Therefore, a number of samples were retested, and the differences that were found were
no greater than what had already been seen between duplicate samples. It is not known
what, if any, effect this may have had on the results.
Chapter 4 Materials and Methods
88
4.2.6 Chemical Testing
Chemical testing was carried out to determine if there were any changes in the
chemistry of the wool that could be associated with the felting shrinkage of the fabric.
In particular, to determine if the chemical changes that are usually associated with fabric
setting lead to a reduction in felting shrinkage. Such changes include the production of
lanthionine [175].
4.2.6.1 Initial Sample Preparation:
Samples for all chemical testing were initially prepared by solvent extraction as per the
solubility test methods [176-179] with the exception that all samples were cleaned in
dichloromethane, in accordance with the IWTO draft test methods [177, 179].
Apparatus: Soxhlet glassware; 200mL distilled dichloromethane per sample; cellulose
extraction thimbles; heating mantle; fumehood.
Procedure: Samples were shredded into yarn and fabric pieces of less than 1cm² then
cleaned by Soxhlet extraction in dichloromethane for 1 hour, and allowed to dry in the
fumehood. The samples were then stored in either plastic or glass specimen jars until
they were transferred to snaplock plastic bags for transportation to CNL for the
remainder of the testing.
Note: Some of the plastic specimen jars that were used for sample storage became
cracked and damaged over time. It is not known why this happened or if it had any
effect on the samples that were used in the solubility and AAA testing.
Chapter 4 Materials and Methods
89
4.2.6.2 Alkali Solubility
Aim: This test was used to determine if damage to the bonding structure of wool fibres
had occurred. In particular, to determine if disulfide bonds were broken, or peptide
chains were hydrolysed, as a result of processing [180, 181]. A reduction in solubility
would indicate an increase in cross linking [180, 181]. All plain weave fabrics were
tested for alkali solubility. Twill weave samples were not tested as the finishing route
used had already been examined in the plain weave productions and it was not expected
that a change in fabric structure would lead to a change in fibre chemistry.
Apparatus: 0.1N sodium hydroxide; acetic acid; water bath (temperature: 66±0.5°C);
stoppered flasks; sintered glass filtering crucibles; filter flask and filter pump; ventilated
oven (temperature: 105±2°C); stoppered weighing bottles; analytical balance;
desiccator; plastic sample bags.
Procedure: This test was based on a CNL Internal Test Method [176], which in turn
was based on IWTO-4-60(E) Method of Test for the Solubility of Wool in Alkali [182].
Samples were prepared according to 4.2.6.1 Initial Sample Preparation above and
weighed out into plastic sample bags, in duplicate for solubility testing and a single
specimen for dry weight determination. Solubility was determined by measuring
100mL of sodium hydroxide into each stoppered flask, which were then placed into the
water bath to warm to 66°C. The wool samples were then added and the flasks held in
the water bath for 1 hour, gently shaking each, every 15 minutes. The flasks were
removed after 1 hour and filtered through the crucibles using the filter flask. Each
sample was neutralized using the acetic acid and rinsed with distilled water, before
drying in the ventilated oven for a minimum of four hours, cooling in the desiccator and
weighing. This drying and weighing was repeated until consistent mass was achieved.
The dry weight for the sample was determined by weighing a cool, dry stoppered
weighing bottle, placing a 1g sample into the bottle and then putting the bottle into the
ventilated oven with the stoppers off for a minimum of four hours. The samples were
removed, cooled in the desiccator and weighed, with the drying and weighing repeated
until a consistent mass was achieved.
Chapter 4 Materials and Methods
90
4.2.6.3 Urea Bisulfite Solubility
Aim: Urea bisulfite solubility is an indicator of the number of disulfide bonds present in
the fibres and the presence of cross linking. Decreases in solubility indicate an increase
in the number of crosslinks in the wool [183]. All plain weave fabrics were tested for
urea bisulfite solubility. The twill weave samples were not tested as the finishing route
used had already been examined in the plain weave productions and it was not expected
that a change in fabric structure would lead to a change in fibre chemistry.
Apparatus: Urea bilsulfite solution: prepared same day as used (one litre of solution
contained 500g urea, 30g sodium metabisulfite, 20mL 5N NaOH in boiling distilled
water); urea solution (containing 25g urea per 100mL distilled water); water bath
(temperature: 66±0.5°C); stoppered flasks; sintered glass filtering crucibles; filter flask
and filter pump; ventilated oven (temperature: 105±2°C); stoppered weighing bottles;
analytical balance; desiccator; plastic sample bags.
Procedure: This test was based on a CNL internal test method [178], which was based
on IWTO 11-65(E) Method of Test for the Solubility of Wool in Urea-Bisulfite Solution
[184]. The process was the same as that used for alkali solubility, but the solvent used
was urea bisulfite solution and rinsing into the filter flask was done with urea solution
as well as distilled water. Dry weights were calculated as for alkali solubility, and there
was no need for pH of a water extract to be determined.
4.2.6.4 pH of Water Extract of Wool
Aim: Solubility testing also required the determination of the pH of a water extract of
wool. An abbreviated version of the Wool Research Organisation Laboratory In House
Method: Method of Determination of the pH Value of a Water Extract of Wool was
used [185], which was based on IWTO-2-96 Method for the Determination the pH of a
Water Extract of Wool [186].
Chapter 4 Materials and Methods
91
Apparatus: Analytical balance; stoppered flasks; boiled distilled water, pH 6.2-6.9
(boiled for five minutes then cooled); mechanical shaker; pH meter and buffer solutions.
Procedure: 2g of prepared wool was weighed into a stoppered flask, and 100mL of
boiled distilled water added. The flask was then placed in a mechanical shaker for 1
hour, then the pH measured.
Notes:
1. For both alkali and urea bisulfite solubility testing, the test methods [176, 178]
define an allowable difference of 3% between duplicates. Several results
obtained in this work had slightly greater than this difference, but were deemed
to be suitable results, as they were only slightly outside the allowable difference.
The two samples that were affected were the urea bisulfite solubility of Pilot
crabbed and Pilot 110/2.
2. There were also two samples for which only a single result was used due to
problems in conducting the experiments. These were the urea bisulfite solubility
result for the Bulk crabbed sample and the alkali solubility result for the Bulk
121/6+RP+110/2+B2 sample.
3. For several of the samples, obtaining the precision of constant weighing that was
required within each test was difficult, and many repeat weighings were carried
out without achieving a constant weigh. For these samples the filtrate was
moved in the crucible in order to attempt to achieve the constant weight
outcome. This was found to be a problem in only a small number of samples.
4.2.6.5 Amino Acid Analysis (AAA)
This test was used to determine the amino acid contents of the fibres, in particular to
determine whether lanthionine had been formed. The work was carried out by staff at
CNL using High Performance Liquid Chromatography (HPLC), according to CNL in
house test methods, on samples that were prepared according to the Initial Sample
Preparation. Lanthionine residues are thought to form as a result of the breakdown of
cystine under heat and water [181]. When exposed to boiling water lanthionine and

Chapter 4 Materials and Methods
92
lysinoalanine residues have been shown to form and these have been associated with
fabric setting as new inter-chain cross links are formed [181].
Twill weave samples were not tested as the finishing route used had already been
examined in plain weave samples and it was not expected that a change in fabric
structure would lead to a change in fibre chemistry. The samples that were examined by
AAA are listed in Table 4.8.
The Pilot and Bulk productions were treated slightly differently for the reduction and
alkylation step. This allowed for SCMC to be detected in the Bulk samples, but not in
the Pilot samples. The test method used for the Bulk samples was a variation of the
method used for the Pilot production and the results report highlighted several problems
with the Bulk samples results due to the altered method. These were an insoluble white
residue in the digested sample, changes in the amino acid contents of the control
sample, and difficulties in separating some of the amino acids from each other or from
impurities. There was also some concern regarding the levels of glycine and meso
cystine in the Cl2 control sample.
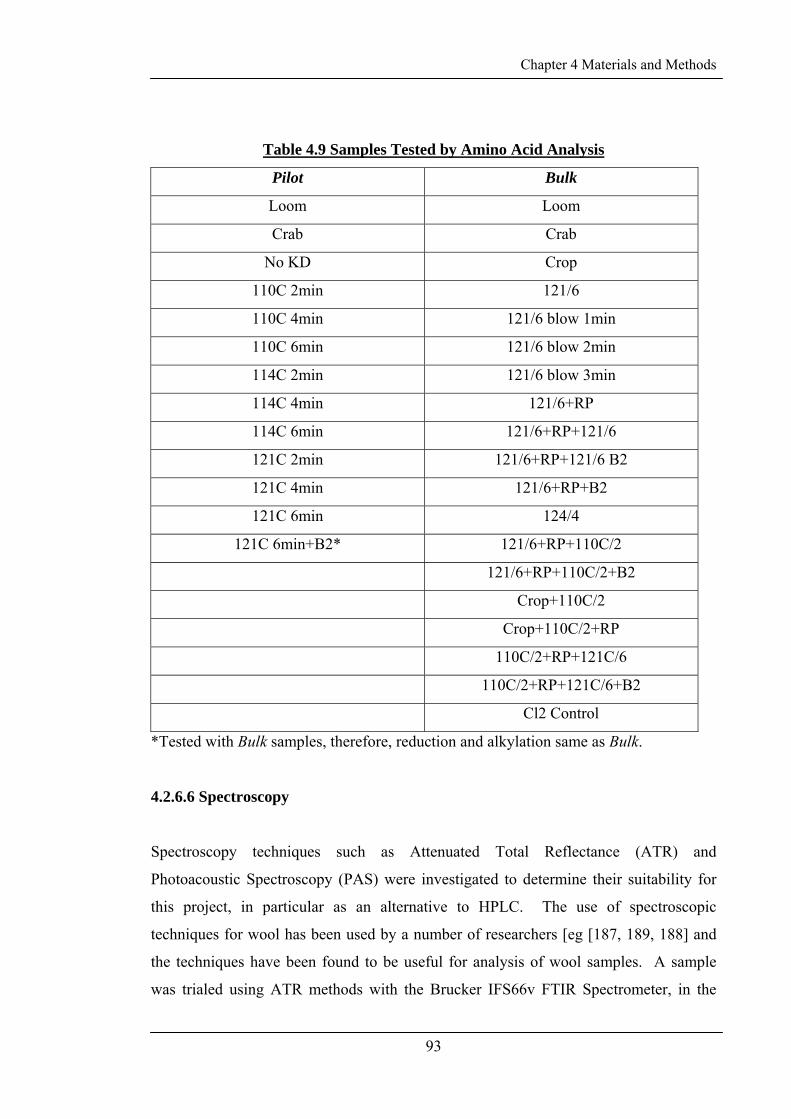
Chapter 4 Materials and Methods
93
Table 4.9 Samples Tested by Amino Acid Analysis
Pilot Bulk
Loom Loom
Crab Crab
No KD Crop
110C 2min 121/6
110C 4min 121/6 blow 1min
110C 6min 121/6 blow 2min
114C 2min 121/6 blow 3min
114C 4min 121/6+RP
114C 6min 121/6+RP+121/6
121C 2min 121/6+RP+121/6 B2
121C 4min 121/6+RP+B2
121C 6min 124/4
121C 6min+B2* 121/6+RP+110C/2
121/6+RP+110C/2+B2
Crop+110C/2
Crop+110C/2+RP
110C/2+RP+121C/6
110C/2+RP+121C/6+B2
Cl2 Control
*Tested with Bulk samples, therefore, reduction and alkylation same as Bulk.
4.2.6.6 Spectroscopy
Spectroscopy techniques such as Attenuated Total Reflectance (ATR) and
Photoacoustic Spectroscopy (PAS) were investigated to determine their suitability for
this project, in particular as an alternative to HPLC. The use of spectroscopic
techniques for wool has been used by a number of researchers [eg [187, 189, 188] and
the techniques have been found to be useful for analysis of wool samples. A sample
was trialed using ATR methods with the Brucker IFS66v FTIR Spectrometer, in the
Chapter 4 Materials and Methods
94
Vibrational Spectroscopy Facility, School of Chemistry, University of Sydney. ATR
was used because the sample could be examined in fabric form [187]. This also meant
that only the surface of the fabric could be examined [187] which had the advantage of
being able to examine changes in the surface of the fabric which may reduce felting
shrinkage.
However, the skills required to extract the results from the spectral output and to
determine the changes in the chemistry of the wool; and the time required to interpret
the results were considered to be outside the scope and time limits of this project, and
conventional chemical analysis techniques were retained.
4.2.7 Yarn Testing
Previous work on yarn felting shrinkage conducted at CNL had seen the production of a
yarn felting unit [190]. The original version of this unit had been dismantled, and a new
unit, based on the old design was built for this project. The testing procedure involved
running a wet “hank” of yarn (ie a coil) around a series of rollers which caused enough
agitation to induce felting.
Part of the course of the yarns was between a pair of contacting rollers which had a load
applied to them. Initial trials were conducted to determine the effect of varying the load
and the results suggested that this had little or no impact on the felting of the yarns.
These results are reported in Appendix 2. Variations in time were also trialed, but
samples continued to shrink until they were too short to fit over the rollers and
60minutes testing gave a good indication of the felting properties of the yarns. A 1kg
load was hung on the arm of the unit and used for all samples.
Aim: To determine if the Solospun™ yarns used in the production of the shrink-
resistant fabric are more resistant to felting than conventional two-fold ring spun yarns.
Also to determine if the twist level in Solospun™ yarns has any impact of the felting of
the yarns.
Chapter 4 Materials and Methods
95
Apparatus: CNL developed yarn felting unit (See Figure 4.6); steel rule, accuracy
±0.25mm; wetting solution (containing 4drops Teric GN9 in 3L tap water, pH6.55 (at
end of all testing)); 1metre wrap wheel; stop watch/timer; paper towel.
Samples:
1) Warp yarns used in the Twill fabric production: Solospun™ I, 22tex, 774tpm,
114αm, sample taken prior to size application.
2) Weft yarns used in the Twill fabric production: Solospun™ I, 20tex, 806tpm, 114αm.
3) 22/2tex conventional ring spun yarn. Single: 784tpm, 82αm, spin Z. Ply: 744tpm,
110αm, ply S.
4) Sample yarn: Solospun™ I, 22tex, 554tpm, 82.2αm.
5) Sample yarn: Solospun™ I, 22tex, 853tpm, 126.5αm.
Procedure: Yarn ‘hanks’ were prepared, using the wrap wheel, with 20 wraps of yarn
(ie 20m). Each hank was then measured using the steel rule by placing two pins inside
the hank and holding the hank straight, without excess tension. The length of the hank
was taken from the inside of the loop, ie at the location of the pins. The hank was then
wetted out in the Teric GN9 solution, and patted on the paper towel to remove excess
solution and the length remeasured. The hank was then placed on the felting unit and
felted for two minutes, then taken off and measured. This process of felting and
measuring was repeated for a further three minutes, then in five minute intervals, until
the total time was 60 minutes. Each sample was tested in duplicate.
The speed of the unit was 157rpm for the driving roller A. Roller B was at an offset
angle to roller A.
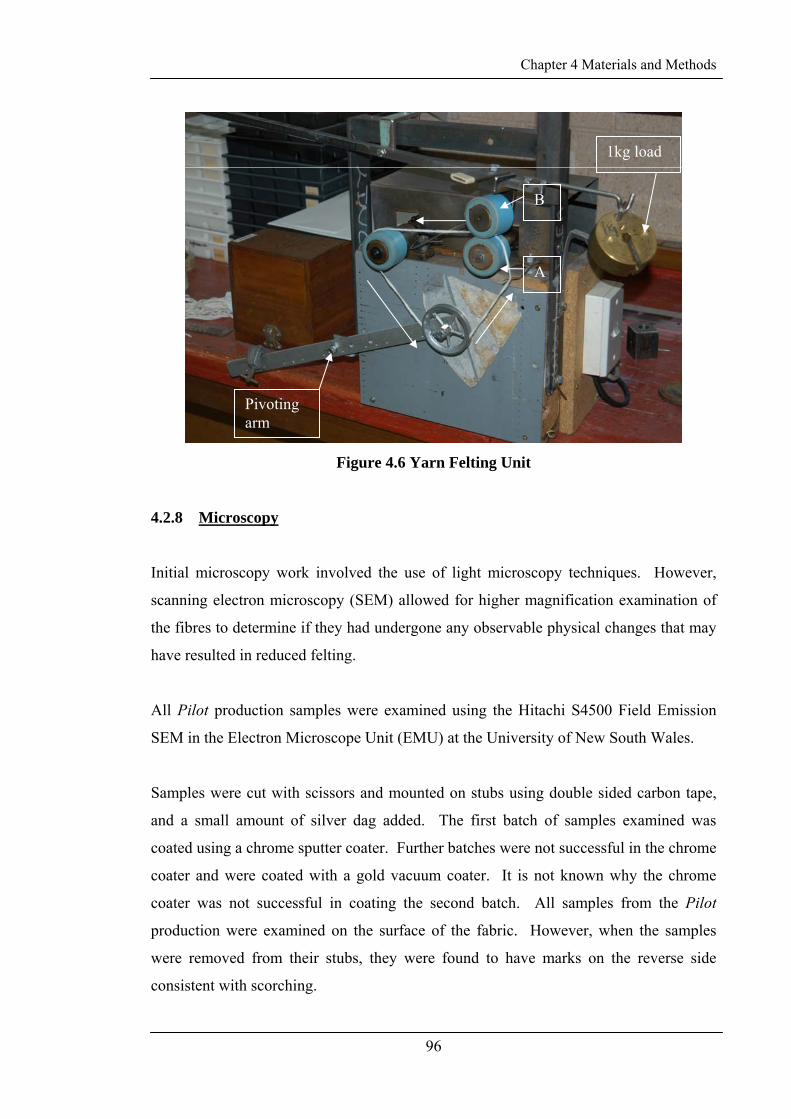
Chapter 4 Materials and Methods
96
1kg load
B
A
Pivoting arm
Figure 4.6 Yarn Felting Unit
4.2.8 Microscopy
Initial microscopy work involved the use of light microscopy techniques. However,
scanning electron microscopy (SEM) allowed for higher magnification examination of
the fibres to determine if they had undergone any observable physical changes that may
have resulted in reduced felting.
All Pilot production samples were examined using the Hitachi S4500 Field Emission
SEM in the Electron Microscope Unit (EMU) at the University of New South Wales.
Samples were cut with scissors and mounted on stubs using double sided carbon tape,
and a small amount of silver dag added. The first batch of samples examined was
coated using a chrome sputter coater. Further batches were not successful in the chrome
coater and were coated with a gold vacuum coater. It is not known why the chrome
coater was not successful in coating the second batch. All samples from the Pilot
production were examined on the surface of the fabric. However, when the samples
were removed from their stubs, they were found to have marks on the reverse side
consistent with scorching.
Chapter 4 Materials and Methods
97
Two stubs with slits cut at a 45° angle to the surface of the stub were also produced.
These allowed for samples to be mounted at a 45° angle to the surface of the stub so that
they could be manipulated to examine both the surface of the fabric and a cross section.
Very few samples were examined using this stub and the results have not been reported
here.
Following the completion of SEM examination of the Pilot production, the EMU at
UNSW commissioned an Environmental Scanning Electron Microscope (ESEM), FEI
Quanta 200. Use of this equipment was investigated to attempt to prevent any damage
to the samples as had been observed using the Hitachi S4500. This microscope was also
capable of manipulating a single sample to examine the surface and also the warp and
weft cross sections.
Trials examining samples under low vacuum at 10kV with a spot size of 3 were found
to be successful. An initial trial, using high vacuum, lead to charging in areas. The
success of this work, meant that the use of the full environmental conditions was not
necessary. Samples were prepared by placing approximately 1cm² on the sample stubs
with double sided carbon dots and gold coating using an Emitech K550 Gold Coater.
The surface, warp and weft cross sections were examined for the following samples:
Bulk production, following only the route and conditions used for the twill weave
productions; twill weave productions, all samples; Bulk loomstate washed; Bulk fully
finished washed; and Bulk Plain no KD.
Chapter 4 Materials and Methods
98
4.2.9 Data Analysis
Several data analysis techniques were used to examine the results.
4.2.9.1 Error Calculation
Measurement errors were calculated for many of the parameters measured. The full set
errors that were calculated are given in the results in Appendix 3. To calculate
measurement errors for each data set, the following method was used:
=(greatest measurement + instrument error)- (smallest measurement-
instrument error)/ (number of measurements). (12)
Or, for the ends and picks calculations:
The error for each individual measurement was made by:
=(%measurement error x gross measurement) (13)
Then for the total error:
=mean (individual errors)/3cm (14)
These were then used as absolute errors or converted to percentage errors. This method
of calculating error allowed for both the measurement error and the sample variation in
the results. Errors were not calculated for FAST and KESF instrument measurements,
or for solubility testing.
4.2.9.2 Plots and Regression
Data was plotted using Microsoft Excel and KaleidaGraph (Synergy Software, USA)
programs and Regression values calculated using Microsoft Excel. Correlation values,
calculated as described below have been quoted instead of regression values. All the
charts used throughout this thesis were produced using KaleidaGraph. Plots for the
Bulk production include the chlorinated control sample and the plain weave sample that
was decatised instead of crabbed, which was woven with the twill samples.
Chapter 4 Materials and Methods
99
4.2.9.3 Correlation Values
Correlation coefficients were determined using Microsoft Excel according to the
following formula [191]:
ρX,Y=(covX,Y)/(σX.σY) (15)
Where:
σ²x=(1/n)Σ(Xi-µx)² (16)
σ²y=(1/n)Σ(Xi-µx)² (17)
These were calculated by correlating each parameter within each individual batch as
well as across all the batches combined. The Bulk production correlation coefficients
were calculated using all samples from the Bulk production, as well as the chlorinated
control sample and the plain weave sample that was decatised instead of crabbed, which
was woven with the twill samples. The use of correlation matrices came about as a
result of an investigation of alternative data analysis techniques that were explored
during a visit to Dr Serge Kokot of the School of Physical and Chemical Sciences,
Queensland University of Technology (QUT).
4.2.9.4 Other Methods
Other data analysis techniques were examined for their usefulness in handling large
amounts of data to determine if there was a method of producing a simple formula or
test for how fabric properties affect the felting shrinkage outcome. Experts in these
areas were consulted and techniques such as Principal Component Analysis, and
Multiple Linear Regression were trialed. Some data was also trialed in Decision Lab
(Visual Decision, Inc., Canada) and Sirius (Pattern Recognition Systems AS, Norway)
during a visit to QUT, and later, in a demonstration version of Sirius. These programs
did not prove to be suitable in achieving the desired outcome of a producing a formula
for the felting shrinkage of the fabric.
Chapter 4 Materials and Methods
100
Multiple Linear Regression, was carried out in MATLAB, The MathWorks, Inc. by
Diako Ebrahimi in association with Professor Brynn Hibbert of the School of Chemistry
at UNSW. This showed some promising results, but there was insufficient time to
experiment with different combinations of this work. The work that was carried out
involved some initial data preparation in Microsoft Excel including the creation of a
correlation matrix, which was normalized and autoscaled, before transferring the data to
Matlab for Multiple Linear Regression. Further work is required in this area to
determine whether each batch should be handled independently or all the batches
together, and also what strength of correlation is sufficient. The work that was carried
out involved the full data set across all the batches. The results that were obtained have
not been reported in the thesis.
101
CHAPTER 5
WASH TESTING
RESULTS AND DISCUSSION
5.1 WOOLMARK 1X7A RELAXATION SHRINKAGE
The method used for the measurement of relaxation shrinkage (RS) is given in Chapter
4 Materials and Methods, and the full data set is given in Appendix 3, Table 3.1.
The results of RS testing by this method are given in Figures 5.1-5.4. The results show
that RS was reduced by the greatest amount for all productions by the first process in
the finishing route. In the case of the Pilot production (Figure 5.1), this was crabbing;
for the other productions (Figures 5.2-5.4), it was the combination of scouring and
crabbing depending on where the sample was taken. These processes relaxed the
stresses and strains in the fibres and yarns which built up during spinning and weaving,
and, in the case of crabbing, set the fibres in the configuration of the fabric. Following
this, changes were relatively minor. For all productions, except the Bulk, stentering
increased the RS as temporary set was imparted while the fabric was stretched. The
Bulk and 3/3 Twill productions also showed increases in the RS as a result of rotary
pressing, which was reduced again with further finishing. This was not seen in the 2x1
Twill production. The remainder of the finishing processes and conditions had mixed
effects on the RS, and, for most processes, the changes induced by the finishing process
were less than the measurement error and, therefore, of limited significance.
For the twill weave fabrics, the RS of the 2/1 Twill samples was similar for both pick
densities, however, for the 3/3 Twills, the RS is consistently lower in the 33ppcm
samples than the 26ppcm samples.
The effect of stentering on RS depends on the overfeeding of the fabric into the stenter
[70]. The use of different stenters for the two plain weave productions and the different
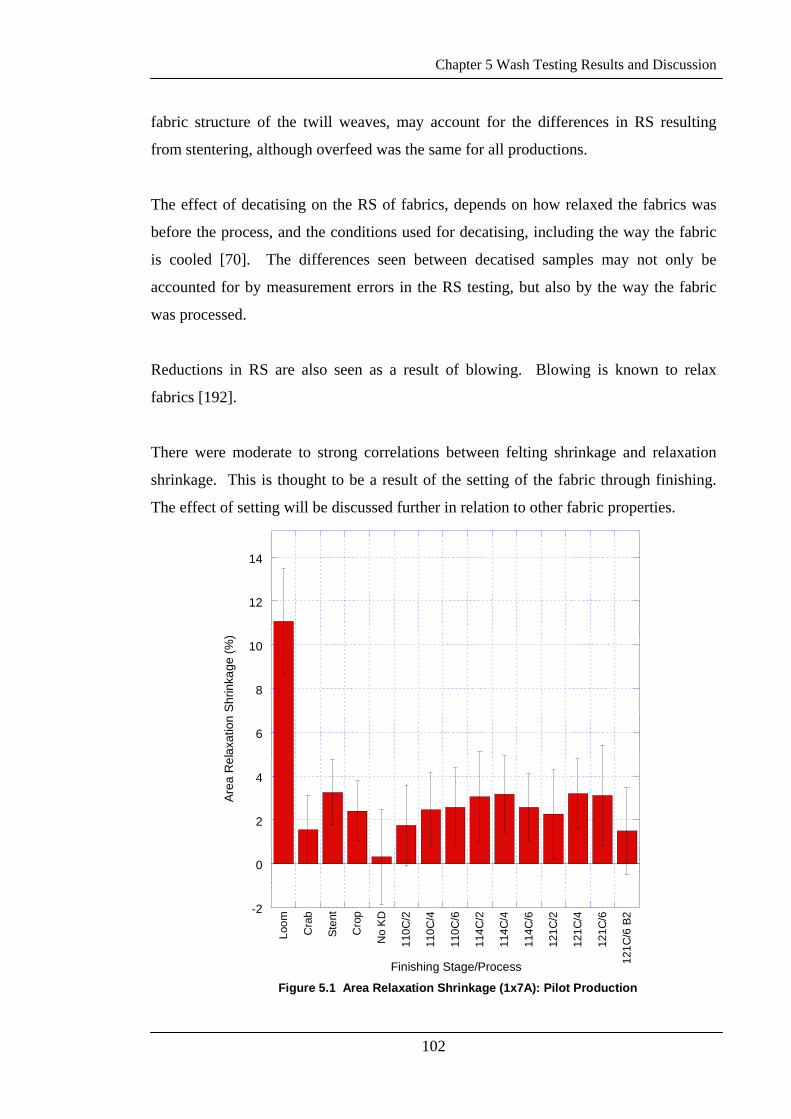
Chapter 5 Wash Testing Results and Discussion
102
fabric structure of the twill weaves, may account for the differences in RS resulting
from stentering, although overfeed was the same for all productions.
The effect of decatising on the RS of fabrics, depends on how relaxed the fabrics was
before the process, and the conditions used for decatising, including the way the fabric
is cooled [70]. The differences seen between decatised samples may not only be
accounted for by measurement errors in the RS testing, but also by the way the fabric
was processed.
Reductions in RS are also seen as a result of blowing. Blowing is known to relax
fabrics [192].
There were moderate to strong correlations between felting shrinkage and relaxation
shrinkage. This is thought to be a result of the setting of the fabric through finishing.
The effect of setting will be discussed further in relation to other fabric properties.
-2
0
2
4
6
8
10
12
14
Loom
Cra
b
Sten
t
Cro
p
No
KD
110C
/2
110C
/4
110C
/6
114C
/2
114C
/4
114C
/6
121C
/2
121C
/4
121C
/6
121C
/6 B
2
Figure 5.1 Area Relaxation Shrinkage (1x7A): Pilot Production
Are
a R
elax
atio
n S
hrin
kage
(%)
Finishing Stage/Process
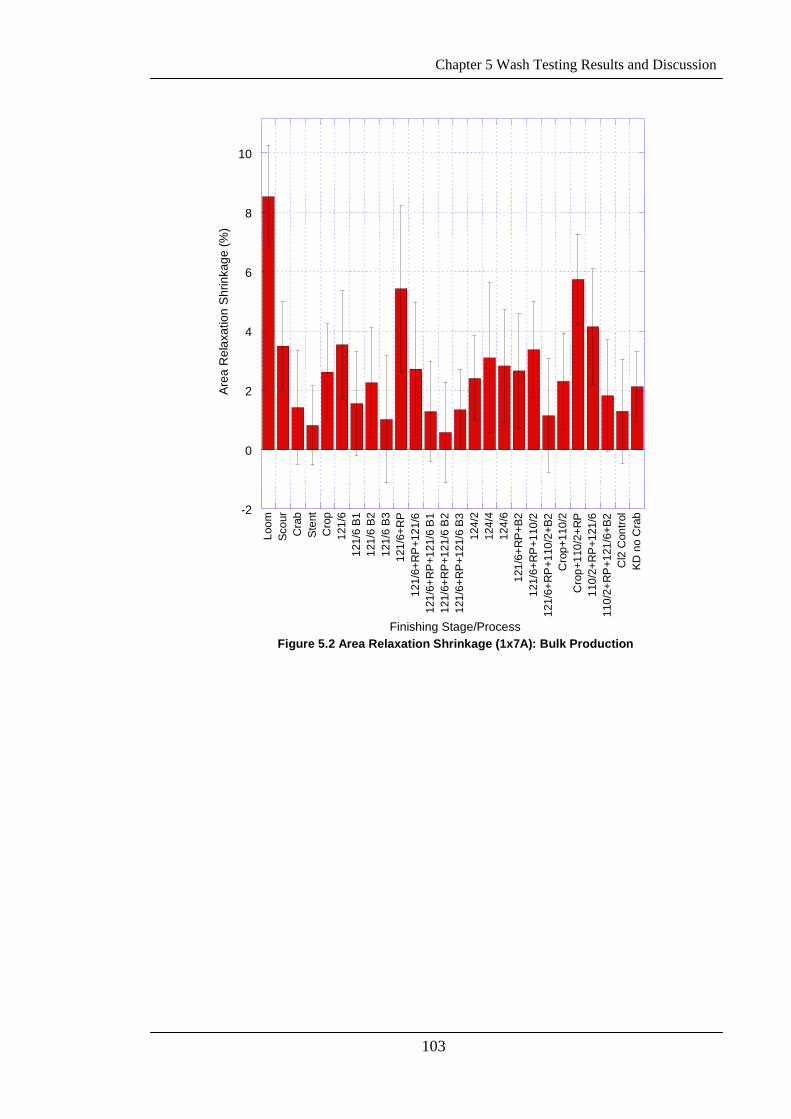
Chapter 5 Wash Testing Results and Discussion
103
-2
0
2
4
6
8
10
Loom
Scou
rC
rab
Sten
tC
rop
121/
612
1/6
B112
1/6
B212
1/6
B312
1/6+
RP
121/
6+R
P+1
21/6
121/
6+R
P+1
21/6
B1
121/
6+R
P+1
21/6
B2
121/
6+R
P+1
21/6
B3
124/
212
4/4
124/
612
1/6+
RP
+B2
121/
6+R
P+1
10/2
121/
6+R
P+1
10/2
+B2
Cro
p+11
0/2
Cro
p+11
0/2+
RP
110/
2+R
P+1
21/6
110/
2+R
P+1
21/6
+B2
Cl2
Con
trol
KD n
o C
rab
Figure 5.2 Area Relaxation Shrinkage (1x7A): Bulk Production
Are
a R
elax
atio
n S
hrin
kage
(%)
Finishing Stage/Process
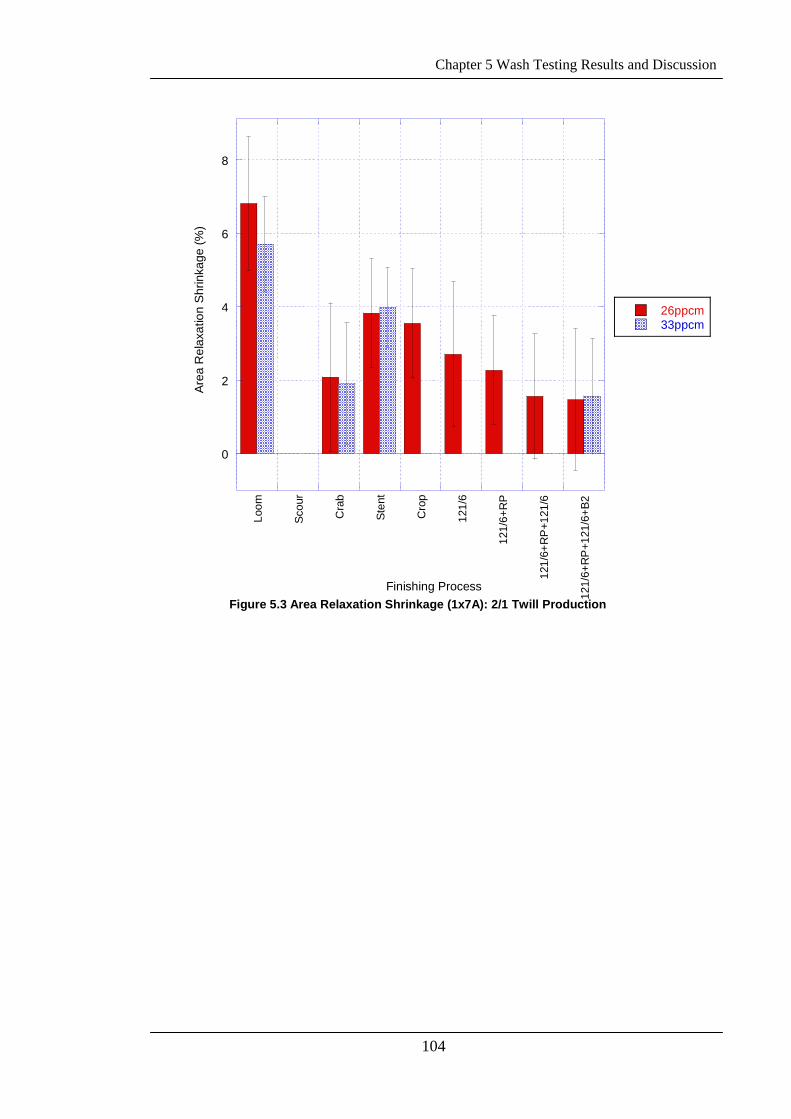
Chapter 5 Wash Testing Results and Discussion
104
0
2
4
6
8
Loom
Scou
r
Cra
b
Sten
t
Cro
p
121/
6
121/
6+R
P
121/
6+R
P+1
21/6
121/
6+R
P+1
21/6
+B2
Figure 5.3 Area Relaxation Shrinkage (1x7A): 2/1 Twill Production
26ppcm33ppcm
Area
Rel
axat
ion
Shr
inka
ge (%
)
Finishing Process

Chapter 5 Wash Testing Results and Discussion
105
0
2
4
6
8
10
12
14
Loom
Scou
r
Cra
b
Sten
t
Cro
p
121/
6
121/
6 +R
P
121/
6+R
P+1
21/6
121/
6+R
P+1
21/6
+B2
Figure 5.4 Area Relaxation Shrinkage (1x7A): 3/3 Twill Production
26ppcm33ppcm
Are
a R
elax
atio
n S
hrin
kage
(%)
Finishing Process
Chapter 5 Wash Testing Results and Discussion
106
5.2 WOOLMARK 5X5A TOTAL AREA SHRINKAGE
5.2.1 Pilot Production
The total area shrinkage, (FS and RS) results given in Figure 5.5 show that the greatest
reduction was a result of the crabbing process. The results indicate that there was an
increase in the shrinkage as a result of stentering and a decrease as a result of cropping.
However, the measurement error for the stentered sample was very high and the
significance of this result is limited. This also limits the significance of the reduction
seen in the cropped sample.
There were smaller changes in shrinkage following cropping. However, the
measurement error for each sample was greater than the difference between the
samples, so the significance of the changes is limited. The results indicate that the
severity of the conditions used for decatising did not have any significant effect on the
degree of shrinkage measured.
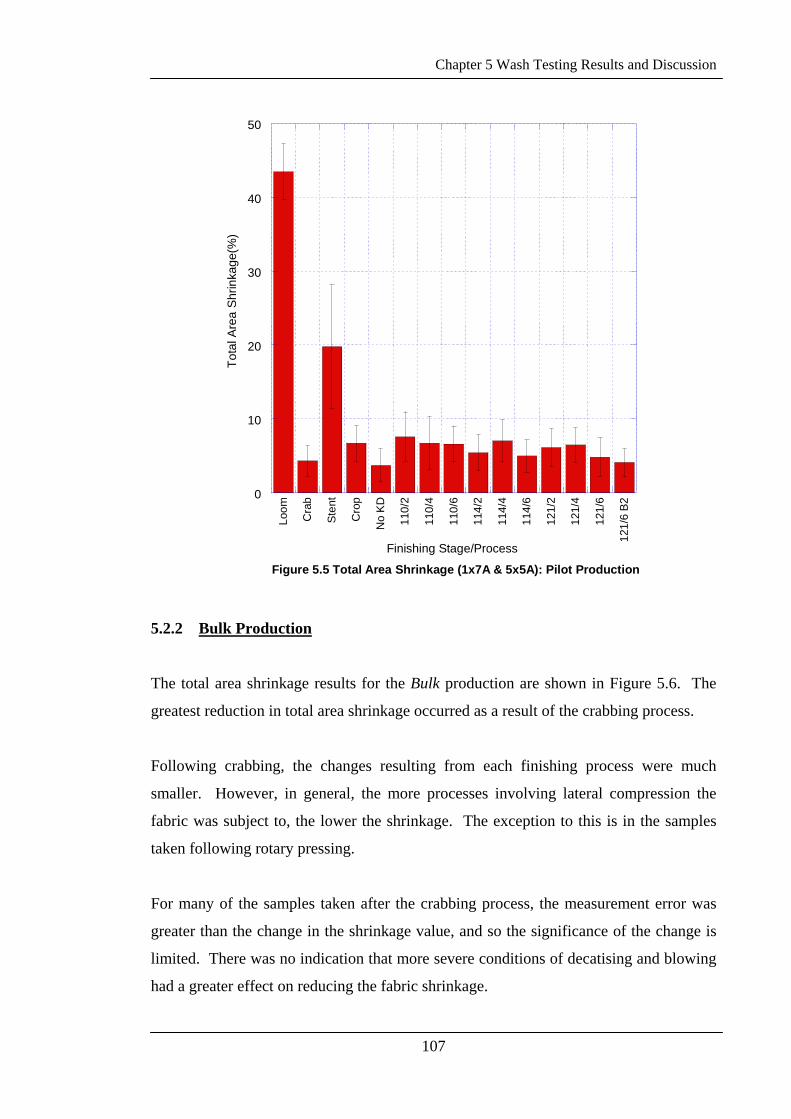
Chapter 5 Wash Testing Results and Discussion
107
0
10
20
30
40
50
Loom
Cra
b
Sten
t
Cro
p
No
KD
110/
2
110/
4
110/
6
114/
2
114/
4
114/
6
121/
2
121/
4
121/
6
121/
6 B2
Figure 5.5 Total Area Shrinkage (1x7A & 5x5A): Pilot Production
Tot
al A
rea
Shrin
kage
(%)
Finishing Stage/Process
5.2.2 Bulk Production
The total area shrinkage results for the Bulk production are shown in Figure 5.6. The
greatest reduction in total area shrinkage occurred as a result of the crabbing process.
Following crabbing, the changes resulting from each finishing process were much
smaller. However, in general, the more processes involving lateral compression the
fabric was subject to, the lower the shrinkage. The exception to this is in the samples
taken following rotary pressing.
For many of the samples taken after the crabbing process, the measurement error was
greater than the change in the shrinkage value, and so the significance of the change is
limited. There was no indication that more severe conditions of decatising and blowing
had a greater effect on reducing the fabric shrinkage.
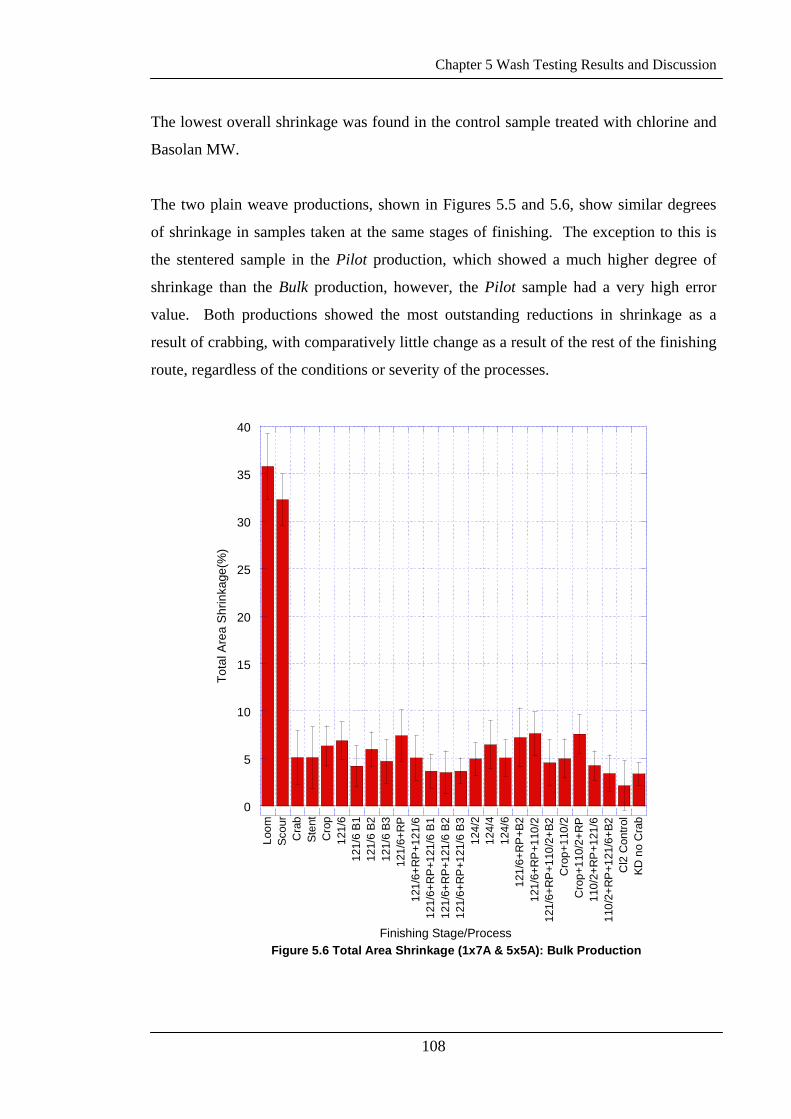
Chapter 5 Wash Testing Results and Discussion
108
The lowest overall shrinkage was found in the control sample treated with chlorine and
Basolan MW.
The two plain weave productions, shown in Figures 5.5 and 5.6, show similar degrees
of shrinkage in samples taken at the same stages of finishing. The exception to this is
the stentered sample in the Pilot production, which showed a much higher degree of
shrinkage than the Bulk production, however, the Pilot sample had a very high error
value. Both productions showed the most outstanding reductions in shrinkage as a
result of crabbing, with comparatively little change as a result of the rest of the finishing
route, regardless of the conditions or severity of the processes.
0
5
10
15
20
25
30
35
40
Loom
Scou
rC
rab
Sten
tC
rop
121/
612
1/6
B1
121/
6 B2
121/
6 B3
121/
6+R
P12
1/6+
RP
+121
/612
1/6+
RP
+121
/6 B
112
1/6+
RP
+121
/6 B
212
1/6+
RP
+121
/6 B
312
4/2
124/
412
4/6
121/
6+R
P+B
212
1/6+
RP
+110
/212
1/6+
RP
+110
/2+B
2C
rop+
110/
2C
rop+
110/
2+R
P11
0/2+
RP
+121
/611
0/2+
RP
+121
/6+B
2C
l2 C
ontro
lKD
no
Cra
b
Figure 5.6 Total Area Shrinkage (1x7A & 5x5A): Bulk Production
Tota
l Are
a S
hrin
kage
(%)
Finishing Stage/Process
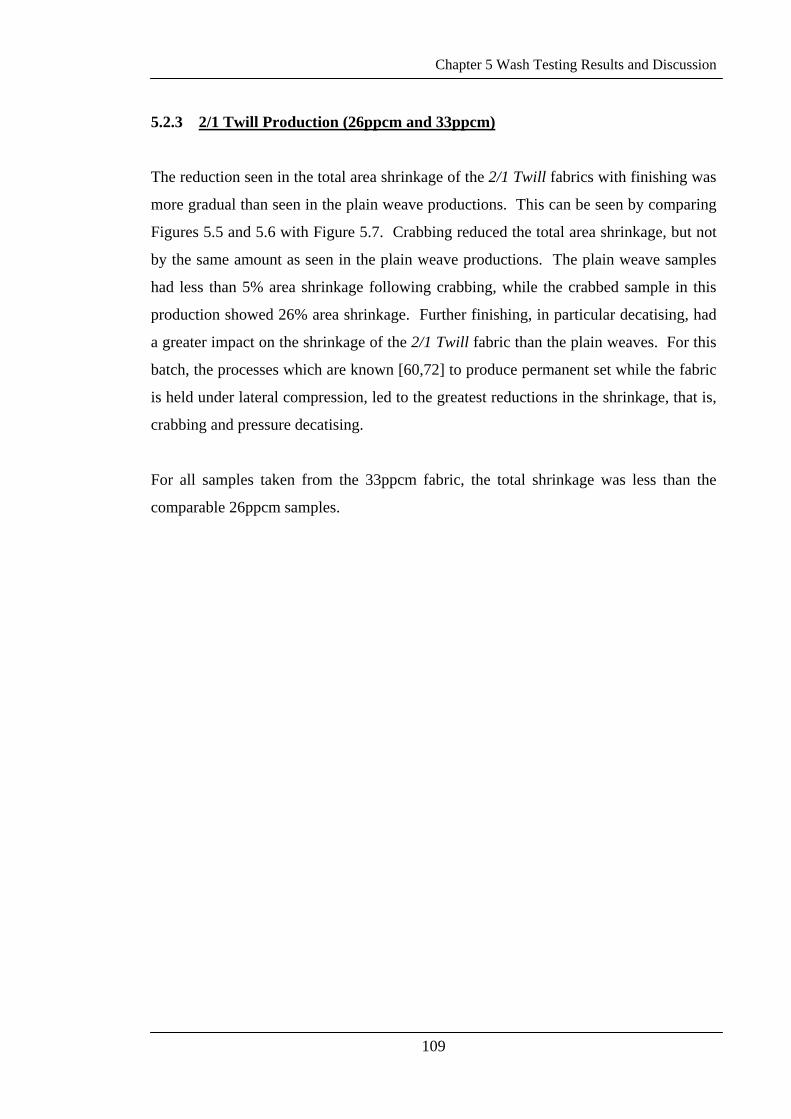
Chapter 5 Wash Testing Results and Discussion
109
5.2.3 2/1 Twill Production (26ppcm and 33ppcm)
The reduction seen in the total area shrinkage of the 2/1 Twill fabrics with finishing was
more gradual than seen in the plain weave productions. This can be seen by comparing
Figures 5.5 and 5.6 with Figure 5.7. Crabbing reduced the total area shrinkage, but not
by the same amount as seen in the plain weave productions. The plain weave samples
had less than 5% area shrinkage following crabbing, while the crabbed sample in this
production showed 26% area shrinkage. Further finishing, in particular decatising, had
a greater impact on the shrinkage of the 2/1 Twill fabric than the plain weaves. For this
batch, the processes which are known [60,72] to produce permanent set while the fabric
is held under lateral compression, led to the greatest reductions in the shrinkage, that is,
crabbing and pressure decatising.
For all samples taken from the 33ppcm fabric, the total shrinkage was less than the
comparable 26ppcm samples.
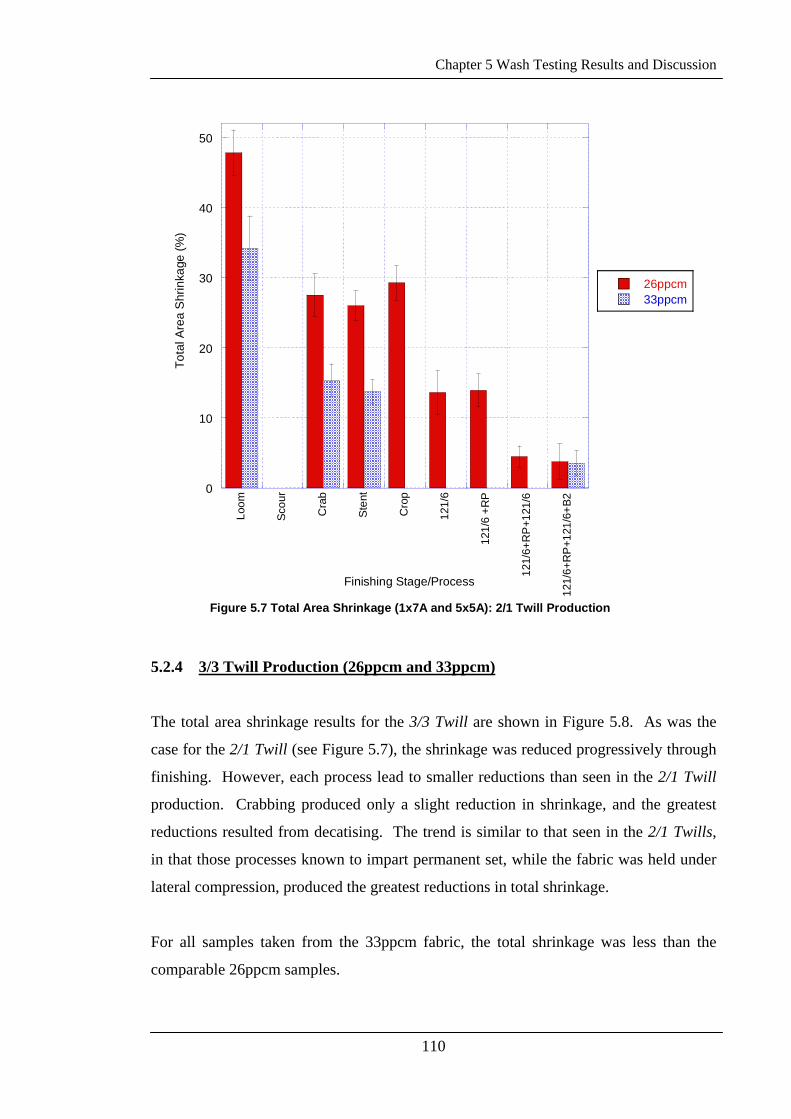
Chapter 5 Wash Testing Results and Discussion
110
0
10
20
30
40
50
Loom
Scou
r
Cra
b
Sten
t
Cro
p
121/
6
121/
6 +R
P
121/
6+R
P+1
21/6
121/
6+R
P+1
21/6
+B2
Figure 5.7 Total Area Shrinkage (1x7A and 5x5A): 2/1 Twill Production
26ppcm33ppcm
Tota
l Are
a S
hrin
kage
(%)
Finishing Stage/Process
5.2.4 3/3 Twill Production (26ppcm and 33ppcm)
The total area shrinkage results for the 3/3 Twill are shown in Figure 5.8. As was the
case for the 2/1 Twill (see Figure 5.7), the shrinkage was reduced progressively through
finishing. However, each process lead to smaller reductions than seen in the 2/1 Twill
production. Crabbing produced only a slight reduction in shrinkage, and the greatest
reductions resulted from decatising. The trend is similar to that seen in the 2/1 Twills,
in that those processes known to impart permanent set, while the fabric was held under
lateral compression, produced the greatest reductions in total shrinkage.
For all samples taken from the 33ppcm fabric, the total shrinkage was less than the
comparable 26ppcm samples.
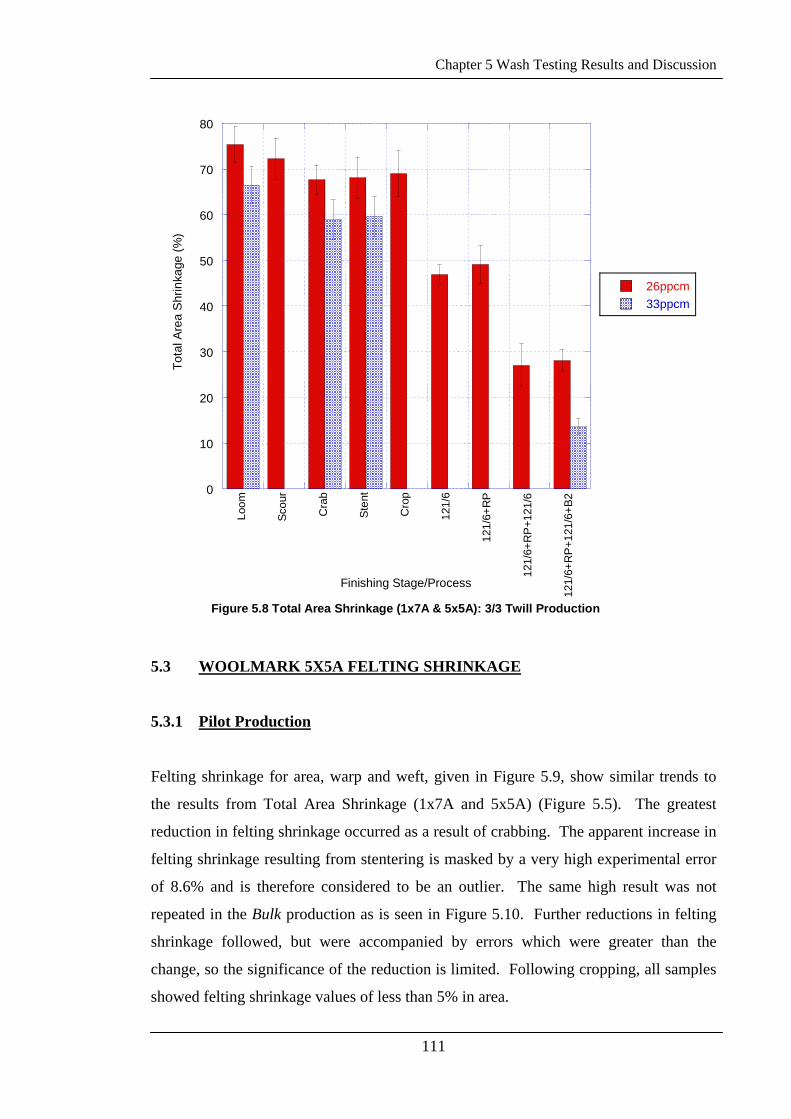
Chapter 5 Wash Testing Results and Discussion
111
0
10
20
30
40
50
60
70
80
Loom
Scou
r
Cra
b
Sten
t
Cro
p
121/
6
121/
6+R
P
121/
6+R
P+1
21/6
121/
6+R
P+1
21/6
+B2
Figure 5.8 Total Area Shrinkage (1x7A & 5x5A): 3/3 Twill Production
26ppcm33ppcm
Tota
l Are
a S
hrin
kage
(%)
Finishing Stage/Process
5.3 WOOLMARK 5X5A FELTING SHRINKAGE
5.3.1 Pilot Production
Felting shrinkage for area, warp and weft, given in Figure 5.9, show similar trends to
the results from Total Area Shrinkage (1x7A and 5x5A) (Figure 5.5). The greatest
reduction in felting shrinkage occurred as a result of crabbing. The apparent increase in
felting shrinkage resulting from stentering is masked by a very high experimental error
of 8.6% and is therefore considered to be an outlier. The same high result was not
repeated in the Bulk production as is seen in Figure 5.10. Further reductions in felting
shrinkage followed, but were accompanied by errors which were greater than the
change, so the significance of the reduction is limited. Following cropping, all samples
showed felting shrinkage values of less than 5% in area.
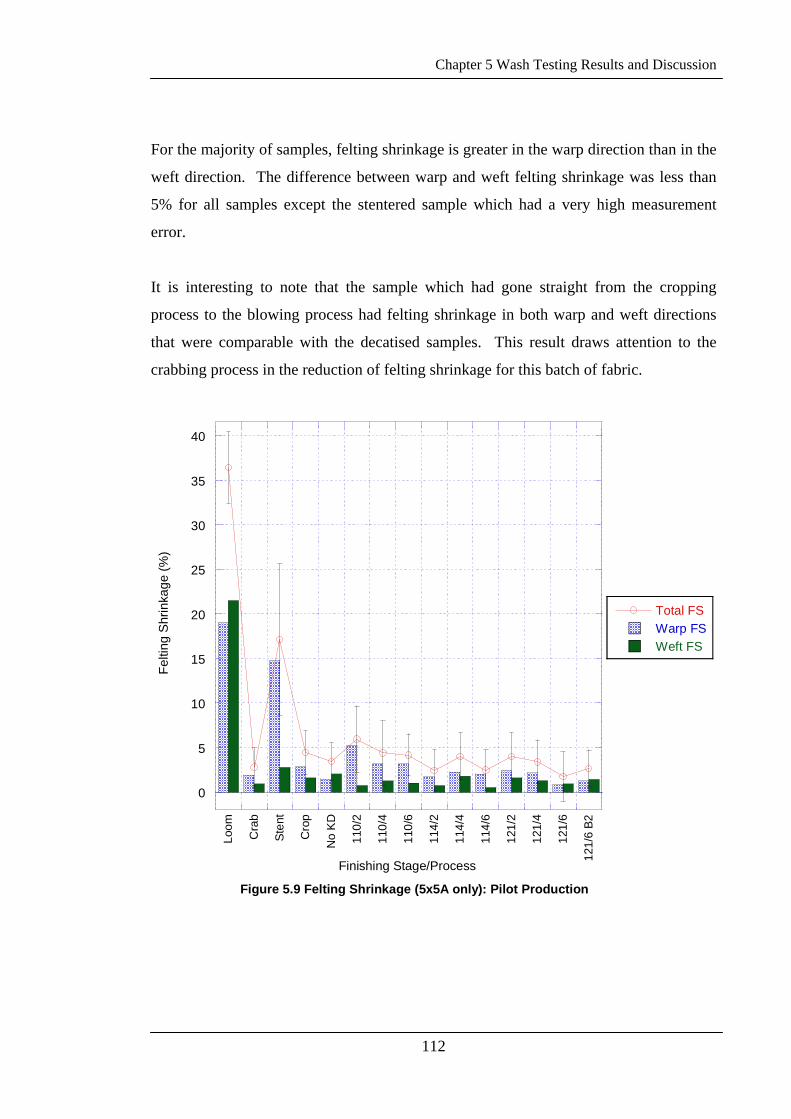
Chapter 5 Wash Testing Results and Discussion
112
For the majority of samples, felting shrinkage is greater in the warp direction than in the
weft direction. The difference between warp and weft felting shrinkage was less than
5% for all samples except the stentered sample which had a very high measurement
error.
It is interesting to note that the sample which had gone straight from the cropping
process to the blowing process had felting shrinkage in both warp and weft directions
that were comparable with the decatised samples. This result draws attention to the
crabbing process in the reduction of felting shrinkage for this batch of fabric.
0
5
10
15
20
25
30
35
40
Loom
Cra
b
Sten
t
Cro
p
No
KD
110/
2
110/
4
110/
6
114/
2
114/
4
114/
6
121/
2
121/
4
121/
6
121/
6 B2
Figure 5.9 Felting Shrinkage (5x5A only): Pilot Production
Total FSWarp FSWeft FS
Felti
ng S
hrin
kage
(%)
Finishing Stage/Process
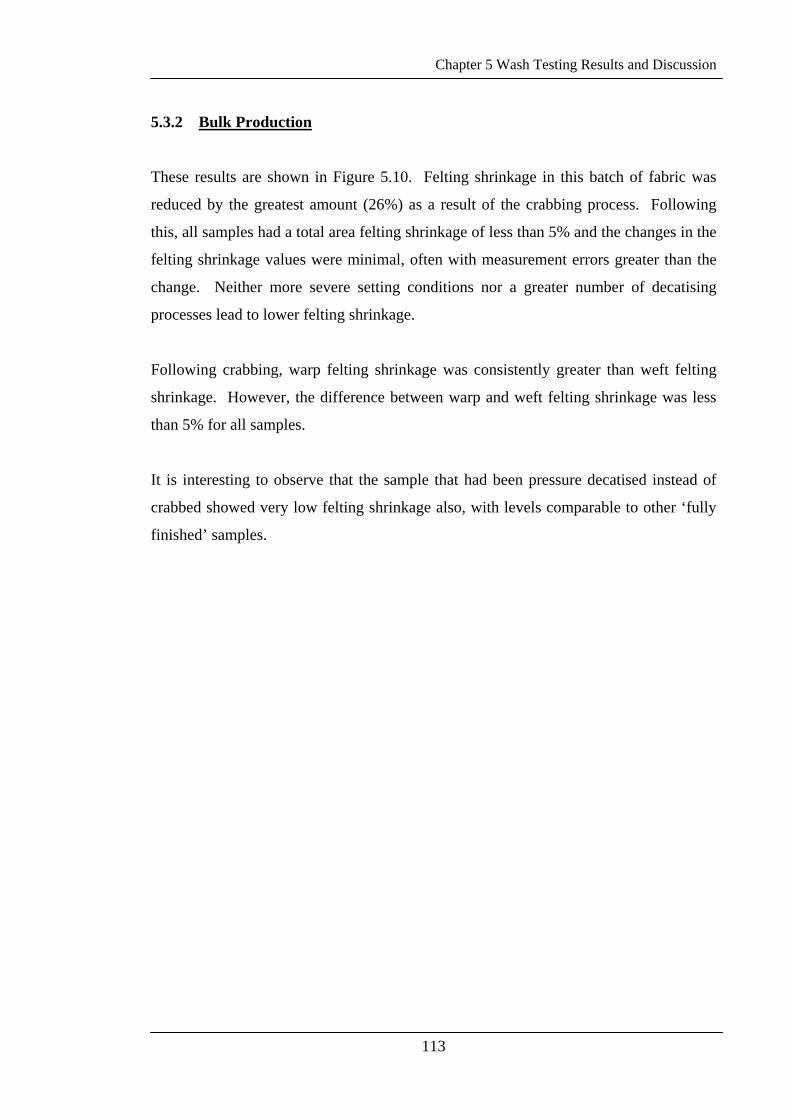
Chapter 5 Wash Testing Results and Discussion
113
5.3.2 Bulk Production
These results are shown in Figure 5.10. Felting shrinkage in this batch of fabric was
reduced by the greatest amount (26%) as a result of the crabbing process. Following
this, all samples had a total area felting shrinkage of less than 5% and the changes in the
felting shrinkage values were minimal, often with measurement errors greater than the
change. Neither more severe setting conditions nor a greater number of decatising
processes lead to lower felting shrinkage.
Following crabbing, warp felting shrinkage was consistently greater than weft felting
shrinkage. However, the difference between warp and weft felting shrinkage was less
than 5% for all samples.
It is interesting to observe that the sample that had been pressure decatised instead of
crabbed showed very low felting shrinkage also, with levels comparable to other ‘fully
finished’ samples.
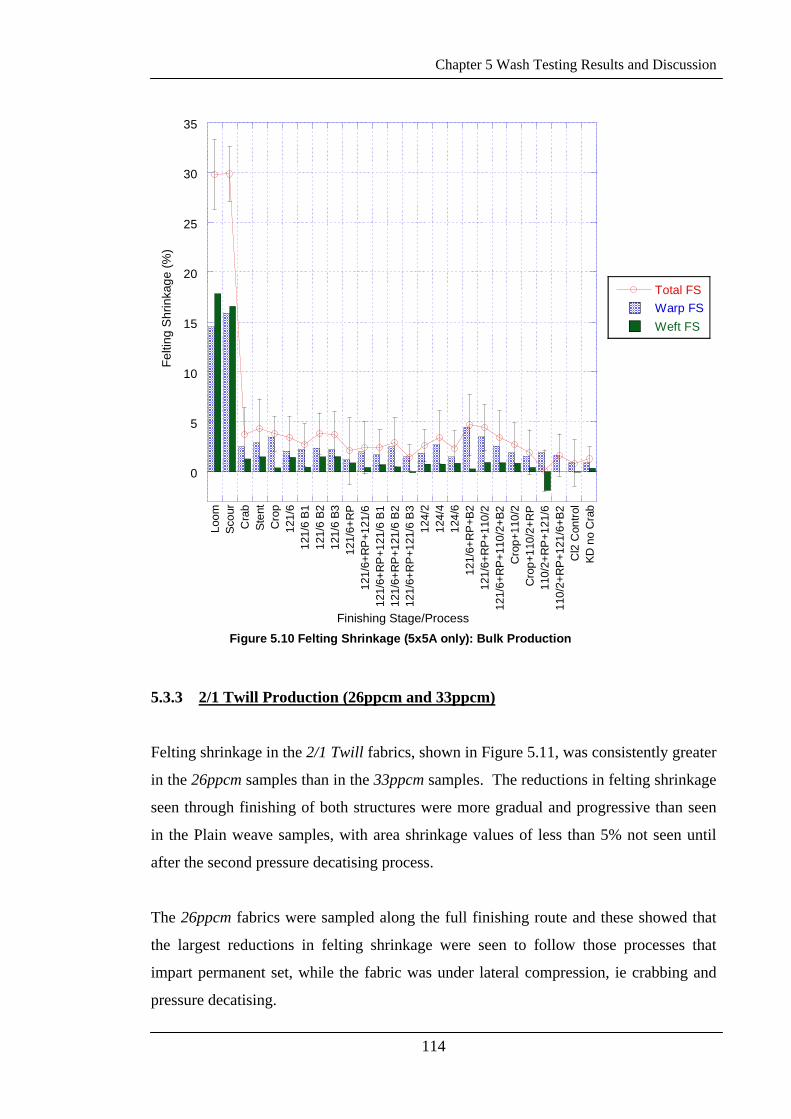
Chapter 5 Wash Testing Results and Discussion
114
0
5
10
15
20
25
30
35
Loom
Scou
rC
rab
Sten
tC
rop
121/
612
1/6
B112
1/6
B212
1/6
B312
1/6+
RP
121/
6+R
P+1
21/6
121/
6+R
P+1
21/6
B1
121/
6+R
P+1
21/6
B2
121/
6+R
P+1
21/6
B3
124/
212
4/4
124/
612
1/6+
RP
+B2
121/
6+R
P+1
10/2
121/
6+R
P+1
10/2
+B2
Cro
p+11
0/2
Cro
p+11
0/2+
RP
110/
2+R
P+1
21/6
110/
2+R
P+1
21/6
+B2
Cl2
Con
trol
KD n
o C
rab
Figure 5.10 Felting Shrinkage (5x5A only): Bulk Production
Total FSWarp FSWeft FS
Felti
ng S
hrin
kage
(%)
Finishing Stage/Process
5.3.3 2/1 Twill Production (26ppcm and 33ppcm)
Felting shrinkage in the 2/1 Twill fabrics, shown in Figure 5.11, was consistently greater
in the 26ppcm samples than in the 33ppcm samples. The reductions in felting shrinkage
seen through finishing of both structures were more gradual and progressive than seen
in the Plain weave samples, with area shrinkage values of less than 5% not seen until
after the second pressure decatising process.
The 26ppcm fabrics were sampled along the full finishing route and these showed that
the largest reductions in felting shrinkage were seen to follow those processes that
impart permanent set, while the fabric was under lateral compression, ie crabbing and
pressure decatising.
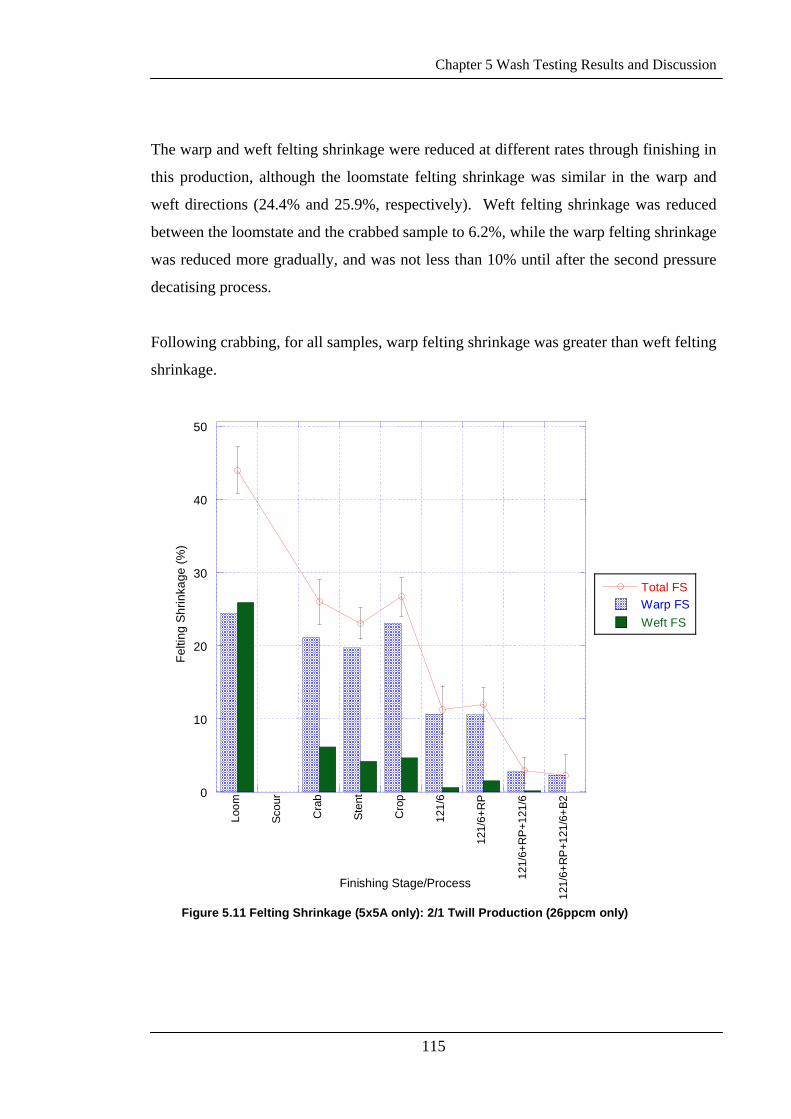
Chapter 5 Wash Testing Results and Discussion
115
The warp and weft felting shrinkage were reduced at different rates through finishing in
this production, although the loomstate felting shrinkage was similar in the warp and
weft directions (24.4% and 25.9%, respectively). Weft felting shrinkage was reduced
between the loomstate and the crabbed sample to 6.2%, while the warp felting shrinkage
was reduced more gradually, and was not less than 10% until after the second pressure
decatising process.
Following crabbing, for all samples, warp felting shrinkage was greater than weft felting
shrinkage.
0
10
20
30
40
50
Loom
Scou
r
Cra
b
Sten
t
Cro
p
121/
6
121/
6+R
P
121/
6+R
P+1
21/6
121/
6+R
P+1
21/6
+B2
Figure 5.11 Felting Shrinkage (5x5A only): 2/1 Twill Production (26ppcm only)
Total FSWarp FSWeft FS
Felti
ng S
hrin
kage
(%)
Finishing Stage/Process
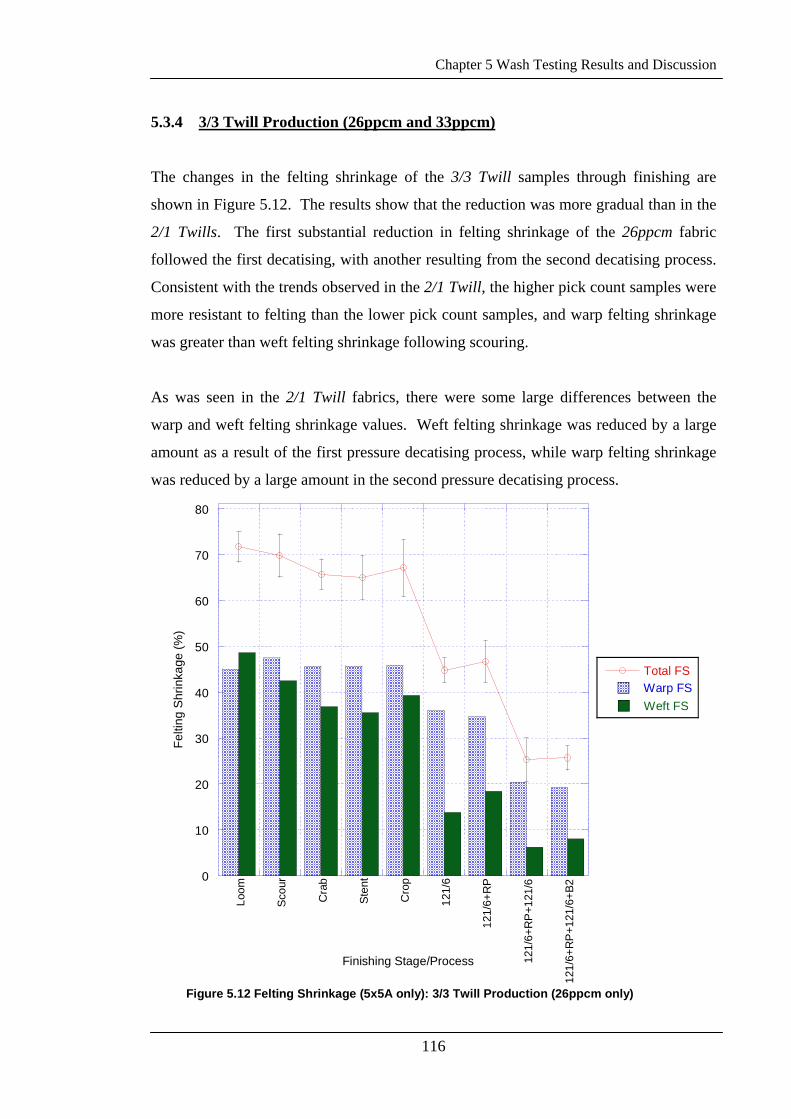
Chapter 5 Wash Testing Results and Discussion
116
5.3.4 3/3 Twill Production (26ppcm and 33ppcm)
The changes in the felting shrinkage of the 3/3 Twill samples through finishing are
shown in Figure 5.12. The results show that the reduction was more gradual than in the
2/1 Twills. The first substantial reduction in felting shrinkage of the 26ppcm fabric
followed the first decatising, with another resulting from the second decatising process.
Consistent with the trends observed in the 2/1 Twill, the higher pick count samples were
more resistant to felting than the lower pick count samples, and warp felting shrinkage
was greater than weft felting shrinkage following scouring.
As was seen in the 2/1 Twill fabrics, there were some large differences between the
warp and weft felting shrinkage values. Weft felting shrinkage was reduced by a large
amount as a result of the first pressure decatising process, while warp felting shrinkage
was reduced by a large amount in the second pressure decatising process.
0
10
20
30
40
50
60
70
80
Loom
Scou
r
Cra
b
Sten
t
Cro
p
121/
6
121/
6+R
P
121/
6+R
P+1
21/6
121/
6+R
P+1
21/6
+B2
Figure 5.12 Felting Shrinkage (5x5A only): 3/3 Twill Production (26ppcm only)
Total FSWarp FSWeft FS
Felti
ng S
hrin
kage
(%)
Finishing Stage/Process
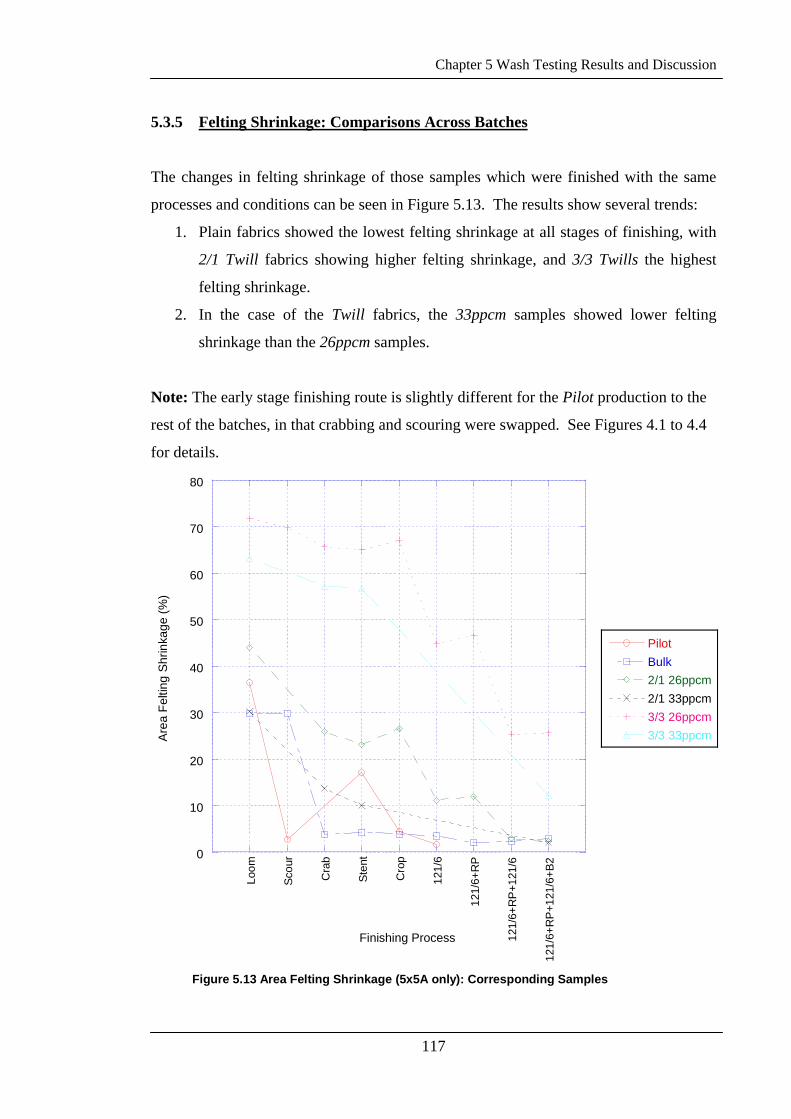
Chapter 5 Wash Testing Results and Discussion
117
5.3.5 Felting Shrinkage: Comparisons Across Batches
The changes in felting shrinkage of those samples which were finished with the same
processes and conditions can be seen in Figure 5.13. The results show several trends:
1. Plain fabrics showed the lowest felting shrinkage at all stages of finishing, with
2/1 Twill fabrics showing higher felting shrinkage, and 3/3 Twills the highest
felting shrinkage.
2. In the case of the Twill fabrics, the 33ppcm samples showed lower felting
shrinkage than the 26ppcm samples.
Note: The early stage finishing route is slightly different for the Pilot production to the
rest of the batches, in that crabbing and scouring were swapped. See Figures 4.1 to 4.4
for details.
0
10
20
30
40
50
60
70
80
Loom
Scou
r
Cra
b
Sten
t
Cro
p
121/
6
121/
6+R
P
121/
6+R
P+1
21/6
121/
6+R
P+1
21/6
+B2
Figure 5.13 Area Felting Shrinkage (5x5A only): Corresponding Samples
PilotBulk2/1 26ppcm2/1 33ppcm3/3 26ppcm3/3 33ppcmA
rea
Felti
ng S
hrin
kage
(%)
Finishing Process
Chapter 5 Wash Testing Results and Discussion
118
5.4 CUFF EDGE FELTING
Cuff edge shrinkage is a specified part of the Woolmark Test Method 13, and has been
carried out in order to determine how the fabric complies with Woolmark specifications.
There is, however, very little literature on the subject of cuff edge shrinkage, and the
reason for why cuff edge is different from fabric felting shrinkage appears to be poorly
understood.
It has been shown that cuff edge felting is related to yarn crimp in a woven fabric, in
that low yarn crimp was associated with high cuff edge felting for treated fabrics [193].
5.4.1 Pilot Production
No cuff edge shrinkage measurements were made on this production.
5.4.2 Bulk Production
Cuff edge felting shrinkage, shown in Figure 5.14, is greater in the warp direction than
the weft for all samples in this production except the loomstate. When the differential
cuff edge felting shrinkage was calculated, all the samples showed values greater than
1% in the warp direction except the 121/6+ RP sample. In the weft direction, most of
the values of differential cuff edge felting shrinkage were between -1 and +1.
The differences between warp and weft cuff edge shrinkage are consistent with the
results found for treated fabrics discussed above, in that the direction with the lowest
yarn crimp showed the highest cuff edge shrinkage. The results of yarn crimp
measurements are given in Section 6.3.
Chapter 5 Wash Testing Results and Discussion
119
0
5
10
15
Loom
Scou
rC
rab
Sten
tC
rop
121/
612
1/6
B1
121/
6 B2
121/
6 B3
121/
6+R
P12
1/6+
RP
+121
/612
1/6+
RP
+121
/6 B
112
1/6+
RP
+121
/6 B
212
1/6+
RP
+121
/6 B
312
4/2
124/
412
4/6
121/
6+R
P+B
212
1/6+
RP
+110
/212
1/6+
RP
+110
/2+B
2C
rop+
110/
2C
rop+
110/
2+R
P11
0/2+
RP
+121
/611
0/2+
RP
+121
/6+B
2C
l2 C
ontro
lKD
no
Cra
b
Figure 5.14 Cuff Edge Felting Shrinkage (5x5A only): Bulk Production
WarpWeft
Cuf
f Fel
ting
Shr
inka
ge (%
)
Finishing Stage/Process
5.4.3 Twill Productions (All Productions)
The 2/1 Twill samples also showed much higher cuff edge felting in the warp direction
than the weft for both the 26 and 33ppcm samples. The differential cuff edge felting
shrinkage was also much higher for the warp measurements than for the weft. Many of
the weft direction measurements showed that the cuff felting was less than the fabric
felting.
The 3/3 Twill samples showed similar results to the 2/1 Twill samples, however, there
were more samples with cuff edge shrinkage greater than fabric shrinkage than seen in
the 2/1 Twill production.
Chapter 5 Wash Testing Results and Discussion
120
The difference between warp and weft cuff edge felting is consistent with the results
discussed above on treated fabrics, in that the samples with the lowest yarn crimp,
showed the highest felting shrinkage. Yarn crimp results will be discussed in Section
6.3.
5.4.4 Correlations with Felting Shrinkage
For some of the fabric structures examined, there is a strong correlation between
differential cuff edge shrinkage and yarn crimp, and between cuff edge felting shrinkage
and yarn crimp. However, the strong correlations do not exist for all the fabrics and
there is no consistency across the batches in either the warp or weft direction.
There is however, a consistent trend that higher cuff edge felting is in the direction with
the lowest yarn crimp.
NOTE: A number of samples throughout this project also showed single thread
shrinkage, however, the study of this was determined to be outside the scope of the
project.
5.5 DISCUSSION
There were several consistent trends in the changes in felting shrinkage results that have
been given in this chapter.
Firstly, following the crabbing process, the warp felting shrinkage was greater than the
weft felting shrinkage for almost all samples across all the batches. This is consistent
across all the fabric structures examined, including both pick densities used in the twill
fabrics. It is difficult to account for this difference between warp and weft felting
shrinkage as it is consistent across all the batches.
It has been suggested [192] that it may be a result of differences in cover factor in
finishing, however, while the weft felting shrinkage is consistently lower than the warp,
the cover factor difference varies for the two pick densities that were measured. For the
Chapter 5 Wash Testing Results and Discussion
121
plain and twill fabrics woven at 26ppcm, the epcm is greater than the ppcm and the
warp cover is greater than the weft cover. However, for the twills woven at 33ppcm, the
ppcm is greater than the epcm and weft cover is greater than warp.
It was thought possible that the difference between warp and weft felting shrinkage is a
result of the difference between warp and weft yarn shrinkage which is demonstrated in
Chapter 10. Although the weft felting shrinkage is greater than the warp in the
loomstate and scoured samples. These samples have been subjected to the same setting
conditions as the yarns used in the yarn felting shrinkage experiments, and so it is
difficult to account for the reasons why the change between warp and weft may occur
following setting. Furthermore, the Pilot production used the same yarns for both warp
and weft and still showed the warp felting shrinkage greater than the weft felting
shrinkage. Therefore, the yarn twist can not account for the difference between warp
and weft felting shrinkage.
The possibility that the difference between the warp and weft felting shrinkage was a
result of abrasive forces in weaving increasing the hairiness of the warp yarns in
comparison with the weft yarns was also explored. If the warp yarns were more hairy
than the weft, there would be an increase in loose fibre material, which may felt more.
To test this possibility the correlation with the surface properties of the fabric were
examined and are reported in Section 7.2.1.4 using the results from KES-F testing, and
although there are some strong correlations for some of the batches, they are not
consistent. Nor are any of the surface properties consistently greater in the warp
direction than the weft.
The reasons why there is a consistent difference between warp and weft felting
shrinkage require further exploration. Other parameters which are reported in the
following chapters also show consistent differences between warp and weft, without
necessarily correlating with measures of felting shrinkage.
The second trend that was seen in the results was that the plain weave fabrics showed
the least felting shrinkage and the 3/3 Twills showed the greatest felting shrinkage, with
the 2/1 Twills falling in between. Furthermore, the fabrics that were constructed with
Chapter 5 Wash Testing Results and Discussion
122
the greatest pick density showed less felting shrinkage than the comparable lower pick
density samples. These results were as expected. It has been shown in previous work
by other researchers that woven wool fabric can have reduced felting shrinkage by
changing the construction of the fabric [44-48], however, these studies do not show
felting shrinkage to be as low as has been found in the fabrics used in the current
project. The structure of the fabric is able to lower felting shrinkage by minimising
movement of fibres [45]. Fabric construction had been suggested as a possible reason
for the shrink-resistance of these fabrics in the early stages of this project [161]. The
increased float length in the twill weave fabrics leads to a reduced number of yarn
interlacings and changes the ability of the yarn to move [192]. Conversely, the increased
pick density increases the number of yarns interlacings and also increases the
compactness of the fabric [192].
The third trend that was seen was a reduction in fabric felting shrinkage as a result of
those finishing processes which set the fabric under lateral compression, that is,
crabbing and pressure decatising. The plain weave fabrics showed large reductions in
felting shrinkage as a result of the crabbing process, as did the weft felting shrinkage in
the 2/1 Twill constructions. The sample which was pressure decatised instead of
crabbed also showed very low overall felting shrinkage, which would seem to suggest
that the set which is achieved in crabbing is not unique and that the same effect could be
achieved by replacing crabbing with decatising. The warp felting shrinkage in the 2/1
Twills and both the warp and weft in the 3/3 Twills showed more gradual reductions in
felting shrinkage occurring after the pressure decatising processes. These results
indicate that changes in the felting shrinkage of the fabric are dependent on the finishing
processes that are undertaken, and that as float lengths increase, the fabrics require more
compressive setting processes, with permanent setting to reduce the felting shrinkage.
These setting processes reduce the fabric thickness by lateral compression (shown in
Chapter 7), but also change the interyarn and interfibre friction properties as will be
discussed in Chapter 7 These processes effectively increase the density of the fabric
(shown in Chapter 6) and this leads to increased compactness of the structure. This, in
turn, adds to the inability of the fibres to move within the fabric structure.
123
CHAPTER 6
PHYSICAL TESTING
RESULTS AND DISCUSSION
6.1 WIDTH
The method used for the measurement of fabric width is given in Chapter 4 Materials
and Methods, and the full data set is given in Appendix 3 Table A3.2.
6.1.1 Pilot Production
Fabric width showed the largest reduction as a result of crabbing, as expected from the
lengthwise tension imposed in the process. There were comparatively minor reductions
through the rest of finishing. The pressure decatising or blowing of the fabric lead to a
further minor reduction in the fabric width, but there is no indication that more severe
conditions lead to a greater change in the width than milder conditions.
6.1.2 Bulk Production
The width of the samples taken from the Bulk production also showed a large reduction
as a result of crabbing. Further finishing processes lead to further reductions in width,
and, in general, the more processes the fabric was finished with, the greater the
reduction. As was the case for the Pilot production, the severity of the finishing
processes did not have an effect on the amount change seen in the fabric width.
6.1.3 Twill Production
Both twill weave structures also showed a large reduction in width as a result of the
crabbing process. There was a slight increase as a result of stentering, followed by
further reductions through the rest of finishing.
Chapter 6 Physical Testing Results and Discussion
124
6.1.4 Calculated
Fabric width was also determined from the results of the number of ends per centimetre
(epcm) measured for each sample and the number of ends in the loom. This gave a
more accurate measure of the width of the fabric for several reasons:
• More accurate equipment used for epcm than for total width,
• It was not always easy to determine the boundary between the selvedge and the
rest of the fabric for the full width measurements, and,
• The full fabric sample was not “flat” and had creases and folds which made
measurement difficult. Flattening the fabric with ironing was not suitable as this
had the potential to affect the set of the fabric, and interfere with other
measurements.
The Pilot production does not have a value for the loomstate sample, as there was
insufficient sample available for ends to be measured1.
In general, the correlation between the calculated and measured values of fabric width is
strong. The poorest correlation was seen in the Pilot production, and this was expected
as no loomstate calculation was performed.
The results for the calculated width show similar trends to the measured width, with a
large reduction resulting from crabbing, and smaller reductions following later finishing
processes.
6.1.5 Correlations with Felting Shrinkage
The relationship between the area felting shrinkage of the fabric and the fabric width is
shown in Figure 6.1. The chart indicates that a reduction in fabric width is associated
with a reduction in felting shrinkage. That is, the width was reduced in finishing, which
resulted in closer packing of warp yarns, and felting shrinkage was reduced.
1 A loomstate width calculation was not performed for the Pilot production as the small sample that was taken did not allow for ends and picks to be measured.
Chapter 6 Physical Testing Results and Discussion
125
The results show that the point at which a reduction in width had an effect on the fabric
shrinkage was different for each fabric structure. The amount of change required was
greater in the twill weave constructions than in the plain weave fabrics, reflecting the
greater ability of yarns to move due to the long floats. For instance, as shown in Tables
6.1a and 6.1b, the plain weave structures first gave less than 5% area felting shrinkage
with width reductions of 7.8% for the Pilot production and 11.2% for the Bulk
production. However, for the 2/1 Twill fabrics to show less than 5% area felting
shrinkage there were width reductions of 17.4% and 14.9% for the 26ppcm and 33ppcm
respectively. The 3/3 Twills showed width reductions of up to 20%, but felting area
felting shrinkage was not able to be reduced below 10%.
It is not proposed that the width of a fabric has a direct effect on the felting propensity
of the fabric. Rather, the change in width is an indicator of the change in the structure
of the fabric and the packing of the yarns, which may directly affect the felting
propensity. This will be explored further in the following sections, where other
measures of the fabric physical properties are discussed.
The measured fabric width, including selvedges, was reasonably well correlated with
total area felting shrinkage. The correlation coefficients ranged from 0.72-0.95 across
the six batches.
When the measured fabric width was correlated with weft felting shrinkage there were
even stronger correlations which ranged from 0.82-0.99 across the six batches. The
correlations with warp felting shrinkage were slightly weaker, ranging from 0.62 to
0.87.
The calculated fabric width, had slightly weaker correlation coefficients with total area
felting shrinkage for all productions except the 2/1 Twill 33ppcm. The Pilot production
correlations were much lower for the calculated width as a result of the missing
loomstate data point.
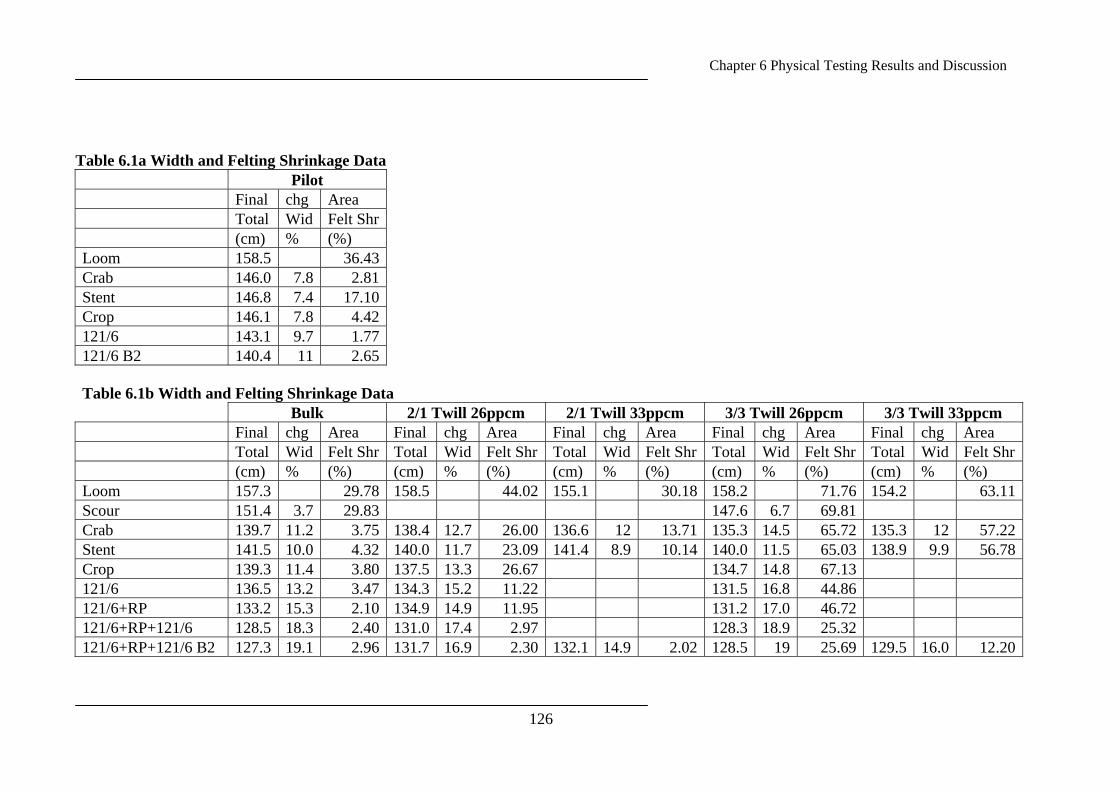
Chapter 6 Physical Testing Results and Discussion
126
Table 6.1a Width and Felting Shrinkage Data Pilot Final chg Area Total Wid Felt Shr (cm) % (%) Loom 158.5 36.43Crab 146.0 7.8 2.81Stent 146.8 7.4 17.10Crop 146.1 7.8 4.42121/6 143.1 9.7 1.77121/6 B2 140.4 11 2.65 Table 6.1b Width and Felting Shrinkage Data Bulk 2/1 Twill 26ppcm 2/1 Twill 33ppcm 3/3 Twill 26ppcm 3/3 Twill 33ppcm Final chg Area Final chg Area Final chg Area Final chg Area Final chg Area Total Wid Felt Shr Total Wid Felt Shr Total Wid Felt Shr Total Wid Felt Shr Total Wid Felt Shr (cm) % (%) (cm) % (%) (cm) % (%) (cm) % (%) (cm) % (%) Loom 157.3 29.78 158.5 44.02 155.1 30.18 158.2 71.76 154.2 63.11 Scour 151.4 3.7 29.83 147.6 6.7 69.81 Crab 139.7 11.2 3.75 138.4 12.7 26.00 136.6 12 13.71 135.3 14.5 65.72 135.3 12 57.22Stent 141.5 10.0 4.32 140.0 11.7 23.09 141.4 8.9 10.14 140.0 11.5 65.03 138.9 9.9 56.78Crop 139.3 11.4 3.80 137.5 13.3 26.67 134.7 14.8 67.13 121/6 136.5 13.2 3.47 134.3 15.2 11.22 131.5 16.8 44.86 121/6+RP 133.2 15.3 2.10 134.9 14.9 11.95 131.2 17.0 46.72 121/6+RP+121/6 128.5 18.3 2.40 131.0 17.4 2.97 128.3 18.9 25.32 121/6+RP+121/6 B2 127.3 19.1 2.96 131.7 16.9 2.30 132.1 14.9 2.02 128.5 19 25.69 129.5 16.0 12.20
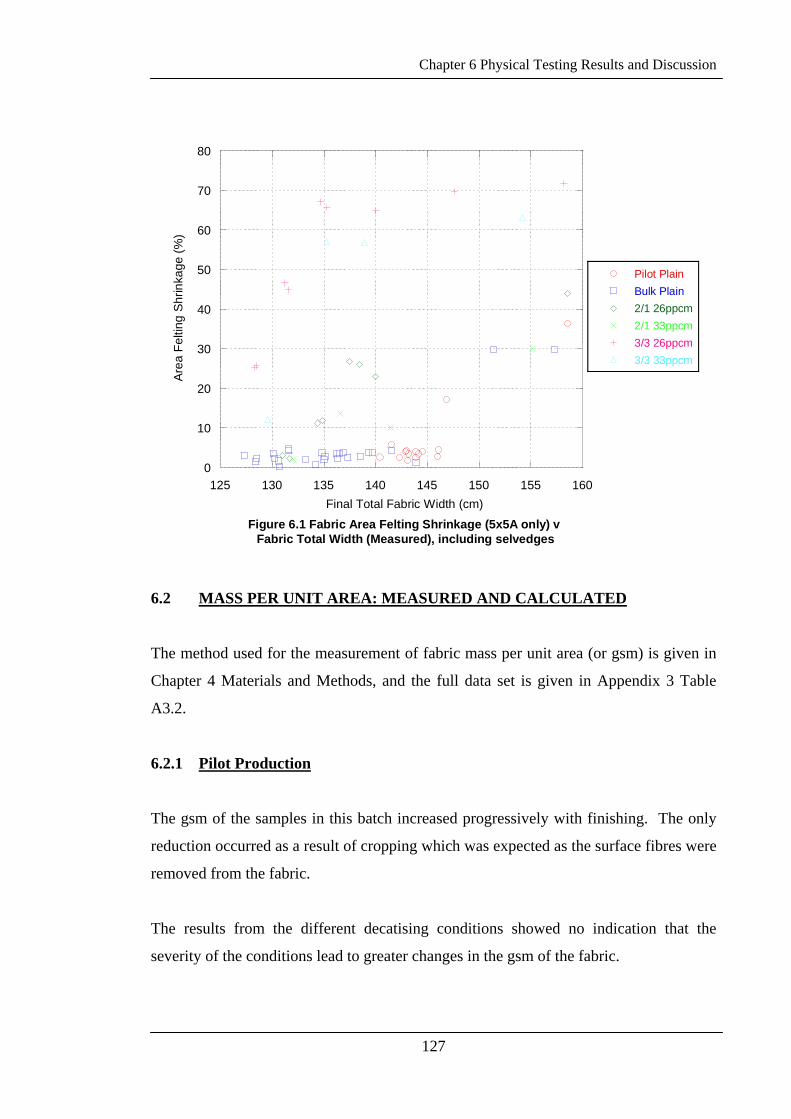
Chapter 6 Physical Testing Results and Discussion
127
0
10
20
30
40
50
60
70
80
125 130 135 140 145 150 155 160
Figure 6.1 Fabric Area Felting Shrinkage (5x5A only) v Fabric Total Width (Measured), including selvedges
Pilot PlainBulk Plain2/1 26ppcm2/1 33ppcm3/3 26ppcm3/3 33ppcm
Are
a Fe
lting
Shr
inka
ge (%
)
Final Total Fabric Width (cm)
6.2 MASS PER UNIT AREA: MEASURED AND CALCULATED
The method used for the measurement of fabric mass per unit area (or gsm) is given in
Chapter 4 Materials and Methods, and the full data set is given in Appendix 3 Table
A3.2.
6.2.1 Pilot Production
The gsm of the samples in this batch increased progressively with finishing. The only
reduction occurred as a result of cropping which was expected as the surface fibres were
removed from the fabric.
The results from the different decatising conditions showed no indication that the
severity of the conditions lead to greater changes in the gsm of the fabric.
Chapter 6 Physical Testing Results and Discussion
128
6.2.2 Bulk Production
This batch showed similar trends to the Pilot production, in that there was a general
increase through finishing, however, there was no decrease in gsm as a result of
cropping. There was a reduction as a result of rotary pressing, which would be a result
of the lengthwise stretching of the fabric in the process, which is reflected in the ends
and picks results in Section 6.4.2 Ends and Picks: Bulk Production.
In general, the more finishing processes that the fabric was subjected to, the greater the
gsm. However, there is no indication that more severe finishing conditions lead to
greater changes in the gsm.
6.2.3 Twill Productions
The gsm of the Twill fabrics also showed a general trend of increasing with finishing.
As anticipated, the 33ppcm fabrics were of greater gsm than the 26ppcm for all
comparative samples, resulting from the greater number of picks per unit area.
6.2.4 Calculated
The gsm was also determined using the results obtained from ends and picks, crimp, and
yarn count. The measured and calculated gsm for the fabrics were well correlated, with
correlation coefficients ranging from 0.84 to 0.96. The changes resulting from each
finishing process were very similar across the batches, however, the values obtained for
the measured gsm were consistently greater than the calculated values.
6.2.5 Correlations with Felting Shrinkage
The measured gsm correlates reasonably well with warp, weft and area felting
shrinkage, with values ranging from -0.70 to -0.95.
There was a slight variation in the correlation coefficients between felting shrinkage and
the calculated gsm. The correlation coefficients with area felting shrinkage ranged from
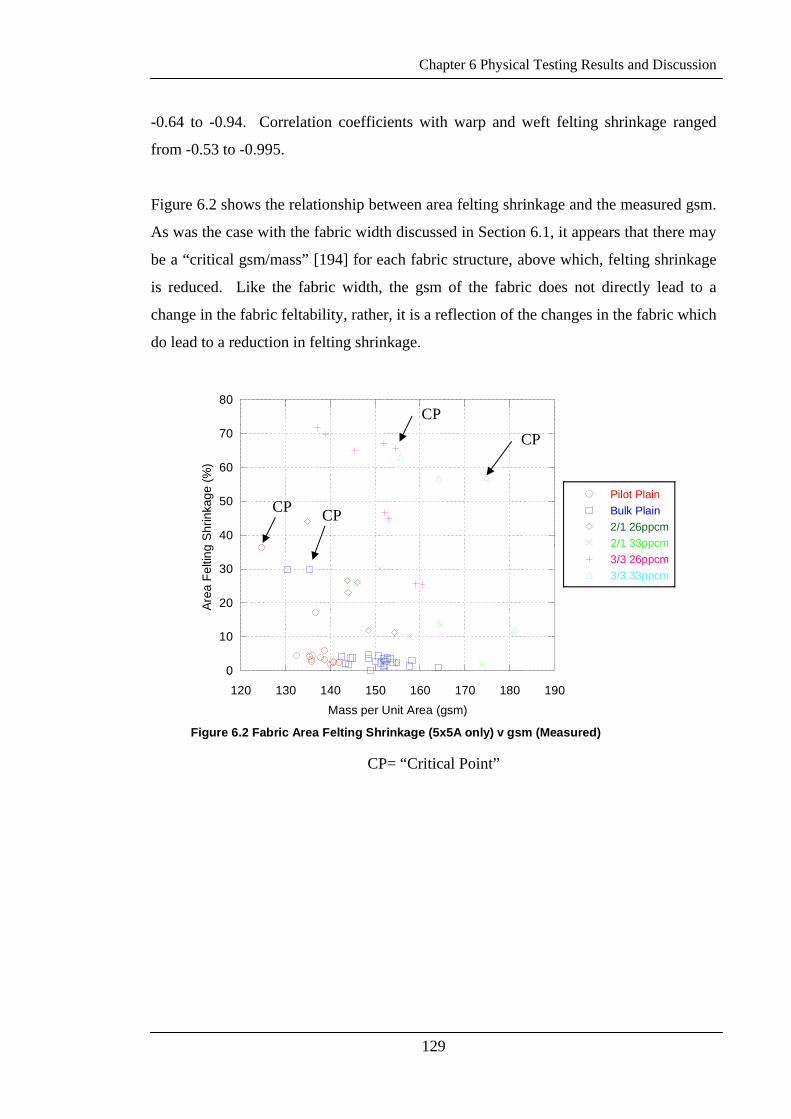
Chapter 6 Physical Testing Results and Discussion
-0.64 to -0.94. Correlation coefficients with warp and weft felting shrinkage ranged
from -0.53 to -0.995.
Figure 6.2 shows the relationship between area felting shrinkage and the measured gsm.
As was the case with the fabric width discussed in Section 6.1, it appears that there may
be a “critical gsm/mass” [194] for each fabric structure, above which, felting shrinkage
is reduced. Like the fabric width, the gsm of the fabric does not directly lead to a
change in the fabric feltability, rather, it is a reflection of the changes in the fabric which
do lead to a reduction in felting shrinkage.
0
10
20
30
40
50
60
70
80
120
Figure 6.2 Fa
Pilot PlainBulk Plain
Area
Fel
ting
Shr
inka
ge (%
)
CP CP
CP129
130 140 150 160 170 180 190
bric Area Felting Shrinkage (5x5A only) v gsm (Measured)
2/1 26ppcm2/1 33ppcm3/3 26ppcm3/3 33ppcm
Mass per Unit Area (gsm)
CP
CP= “Critical Point”
Chapter 6 Physical Testing Results and Discussion
130
6.3 YARN CRIMP
The method used for the measurement of yarn crimp is given in Chapter 4 Materials and
Methods, and the full data set is given in Appendix 3 Table A3.2.
6.3.1 Pilot Production
There is no yarn crimp data available for the loomstate sample in this batch due to a
shortage of sample.
The results of this batch showed wide variation as a result of finishing, with no overall
trend. The weft crimp was consistently greater than the warp crimp for all samples.
6.3.2 Bulk Production
Changes in warp and weft crimp were roughly inverse with each other through
finishing, that is, as one went up the other went down, but the relationship between the
two was not strong. Weft crimp was appreciably greater than warp crimp for all
samples following crabbing. Crabbing lead to a large increase in the weft crimp, while
the rest of the finishing processes also tended to increase the weft crimp, but to a lesser
extent.
6.3.3 Twill Productions
The twill weave fabrics showed similar trends in yarn crimp changes through finishing
to the Bulk production in Section 6.3.2 Yarn Crimp: Bulk Production. The 33ppcm
fabrics did not show the inverse relationship to the same extent as was seen in the Bulk
production.
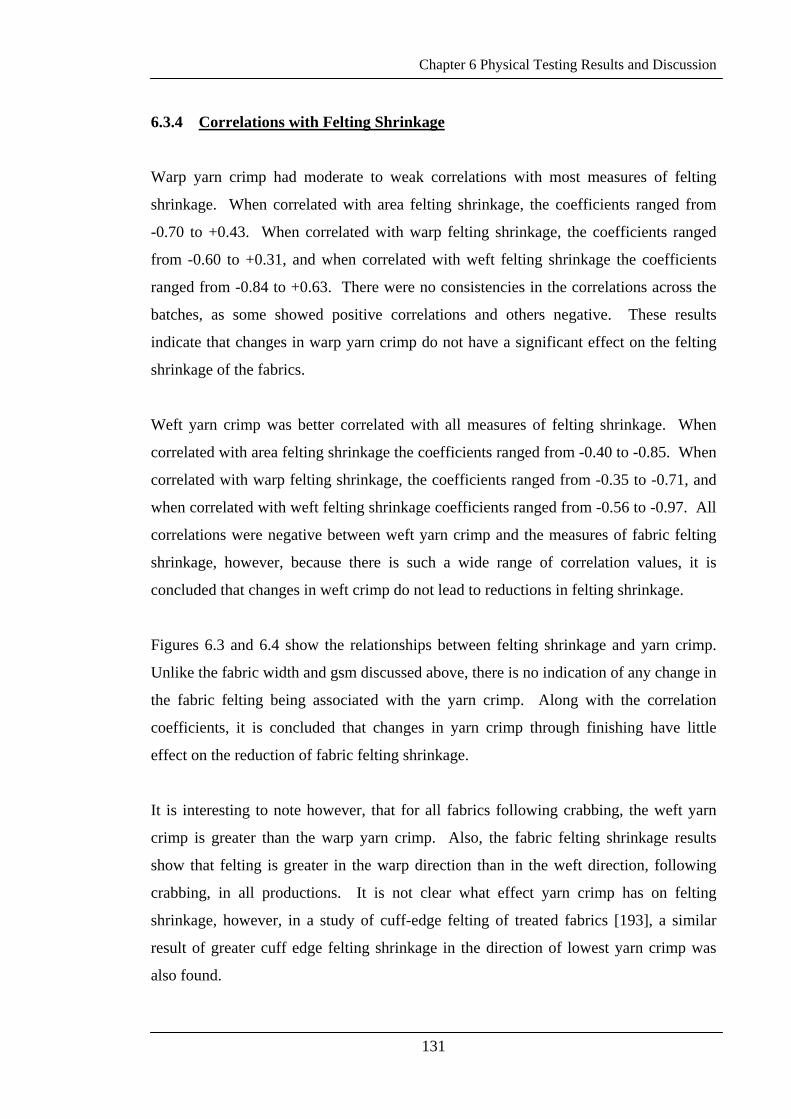
Chapter 6 Physical Testing Results and Discussion
131
6.3.4 Correlations with Felting Shrinkage
Warp yarn crimp had moderate to weak correlations with most measures of felting
shrinkage. When correlated with area felting shrinkage, the coefficients ranged from
-0.70 to +0.43. When correlated with warp felting shrinkage, the coefficients ranged
from -0.60 to +0.31, and when correlated with weft felting shrinkage the coefficients
ranged from -0.84 to +0.63. There were no consistencies in the correlations across the
batches, as some showed positive correlations and others negative. These results
indicate that changes in warp yarn crimp do not have a significant effect on the felting
shrinkage of the fabrics.
Weft yarn crimp was better correlated with all measures of felting shrinkage. When
correlated with area felting shrinkage the coefficients ranged from -0.40 to -0.85. When
correlated with warp felting shrinkage, the coefficients ranged from -0.35 to -0.71, and
when correlated with weft felting shrinkage coefficients ranged from -0.56 to -0.97. All
correlations were negative between weft yarn crimp and the measures of fabric felting
shrinkage, however, because there is such a wide range of correlation values, it is
concluded that changes in weft crimp do not lead to reductions in felting shrinkage.
Figures 6.3 and 6.4 show the relationships between felting shrinkage and yarn crimp.
Unlike the fabric width and gsm discussed above, there is no indication of any change in
the fabric felting being associated with the yarn crimp. Along with the correlation
coefficients, it is concluded that changes in yarn crimp through finishing have little
effect on the reduction of fabric felting shrinkage.
It is interesting to note however, that for all fabrics following crabbing, the weft yarn
crimp is greater than the warp yarn crimp. Also, the fabric felting shrinkage results
show that felting is greater in the warp direction than in the weft direction, following
crabbing, in all productions. It is not clear what effect yarn crimp has on felting
shrinkage, however, in a study of cuff-edge felting of treated fabrics [193], a similar
result of greater cuff edge felting shrinkage in the direction of lowest yarn crimp was
also found.
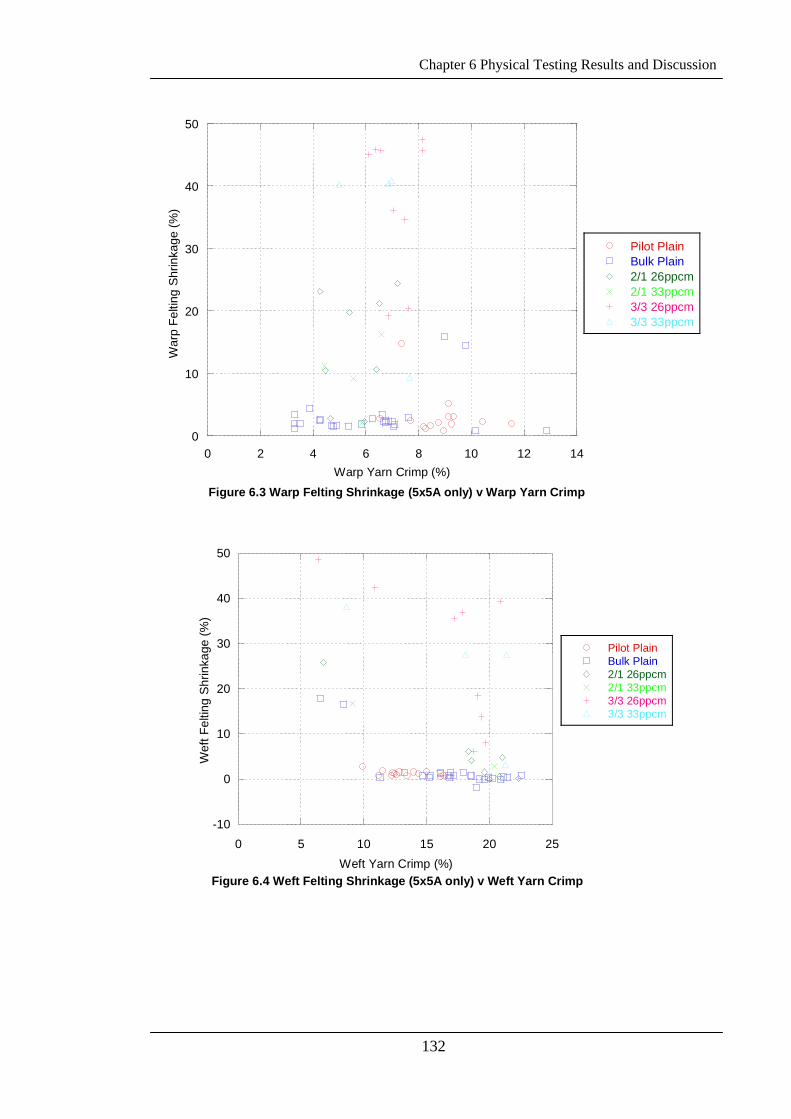
Chapter 6 Physical Testing Results and Discussion
132
0
10
20
30
40
50
0 2 4 6 8 10 12 14
Figure 6.3 Warp Felting Shrinkage (5x5A only) v Warp Yarn Crimp
Pilot PlainBulk Plain2/1 26ppcm2/1 33ppcm3/3 26ppcm3/3 33ppcm
War
p Fe
lting
Shr
inka
ge (%
)
Warp Yarn Crimp (%)
-10
0
10
20
30
40
50
0 5 10 15 20 25
Figure 6.4 Weft Felting Shrinkage (5x5A only) v Weft Yarn Crimp
Pilot PlainBulk Plain2/1 26ppcm2/1 33ppcm3/3 26ppcm3/3 33ppcm
Wef
t Fel
ting
Shr
inka
ge (%
)
Weft Yarn Crimp (%)
Chapter 6 Physical Testing Results and Discussion
133
6.4 ENDS AND PICKS
The method used for the measurement of fabric ends and picks is given in Chapter 4
Materials and Methods, and the full data set is given in Appendix 3 Table 3.2.
6.4.1 Pilot Production
Loomstate data for this batch was not collected due to a sample shortage.
The results for the remainder of the samples measured in this production show that the
number of ends and picks varied through the finishing route, but there was no consistent
pattern through finishing except that the epcm was greater than the number of ppcm.
There was no indication that the severity of the decatising conditions had any effect on
the end or pick density of these fabrics.
6.4.2 Bulk Production
This batch of fabrics showed much greater change through finishing than the Pilot
batch. The end density was greater than the pick density for all samples. There was
also a general trend of increasing epcm with finishing; ppcm was more variable. There
was no indication that more severe finishing conditions lead to greater changes in either
ends or pick density, however, the more finishing processes the fabric was put through,
the greater the epcm.
6.4.3 Twill Productions
The Twill fabrics showed similar trends to the Bulk production, with general increases in
epcm in finishing, and variable changes in the ppcm. The results also showed that the
epcm is greater than the ppcm for the 26ppcm fabrics, but the reverse is true of the
33ppcm fabrics.
Chapter 6 Physical Testing Results and Discussion
134
6.4.4 Correlations with Felting Shrinkage
The ppcm results correlate poorly with all measures of felting shrinkage and for all
fabric types except the 3/3 33ppcm Twill fabric. This fabric has correlation coefficients
of -0.75 to -0.93 across the three measures of felting shrinkage.
The other fabric structures had correlation coefficients which ranged from -0.59 to 0.16.
There was no greater correlation between ppcm and either warp or weft felting
shrinkage.
The results of felting shrinkage alone (see Figure 5.13) show that the higher pick count
twill fabrics had lower values of felting shrinkage at comparable stages of finishing than
the lower pick count fabrics. The relationship between weft felting shrinkage and ppcm
is shown in Figure 6.5. This indicates that the change in felting shrinkage of the fabric
is not related to the change in the number of ppcm through finishing.
The epcm results showed much stronger correlations with felting shrinkage for all
fabrics except the Pilot production. The Pilot production correlation coefficients with
the three measures of fabric felting shrinkage ranged from -0.09 to -0.27. For the other
fabric productions the correlation coefficients ranged from -0.54 to -0.995. Epcm data
is better correlated with weft felting shrinkage than with warp felting shrinkage.
From the chart of epcm versus warp felting shrinkage shown in Figure 6.6, it appears
that there is a “critical value” [194] for epcm which lead to the reduction in shrinkage,
below this value, felting shrinkage is appreciably greater. This is the case for all the
fabrics except the Pilot production.
Although it is evident in the fabric felting shrinkage results that the ppcm has an effect
on the felting shrinkage of samples taken at comparable stages, the results of the epcm
show that the changes in the felting shrinkage through finishing are more dependent on
the changes in the epcm that result from each finishing process.
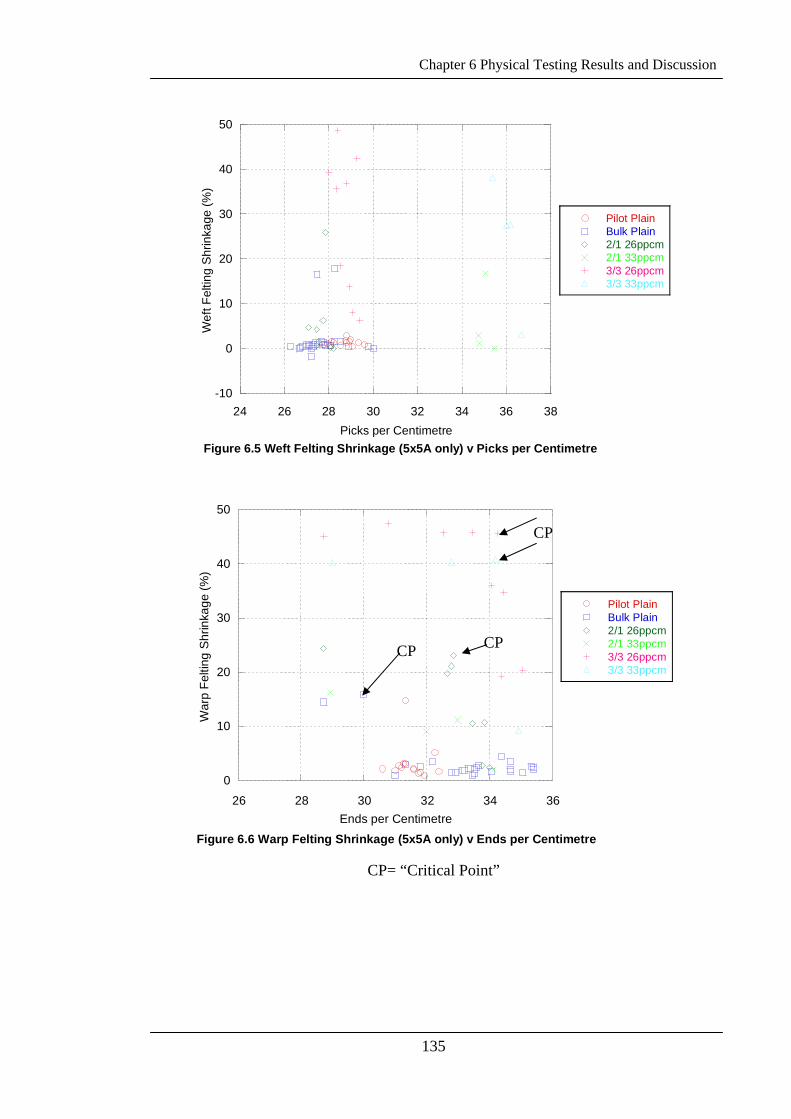
Chapter 6 Physical Testing Results and Discussion
135
-10
0
10
20
30
40
50
24 26 28 30 32 34 36 38
Figure 6.5 Weft Felting Shrinkage (5x5A only) v Picks per Centimetre
Pilot PlainBulk Plain2/1 26ppcm2/1 33ppcm3/3 26ppcm3/3 33ppcm
Wef
t Fel
ting
Shr
inka
ge (%
)
Picks per Centimetre
0
10
20
30
40
50
26 28 30 32 34 36
Figure 6.6 Warp Felting Shrinkage (5x5A only) v Ends per Centimetre
Pilot PlainBulk Plain2/1 26ppcm2/1 33ppcm3/3 26ppcm3/3 33ppcm
War
p Fe
lting
Shr
inka
ge (%
)
Ends per Centimetre
CP
CP CP
CP= “Critical Point”
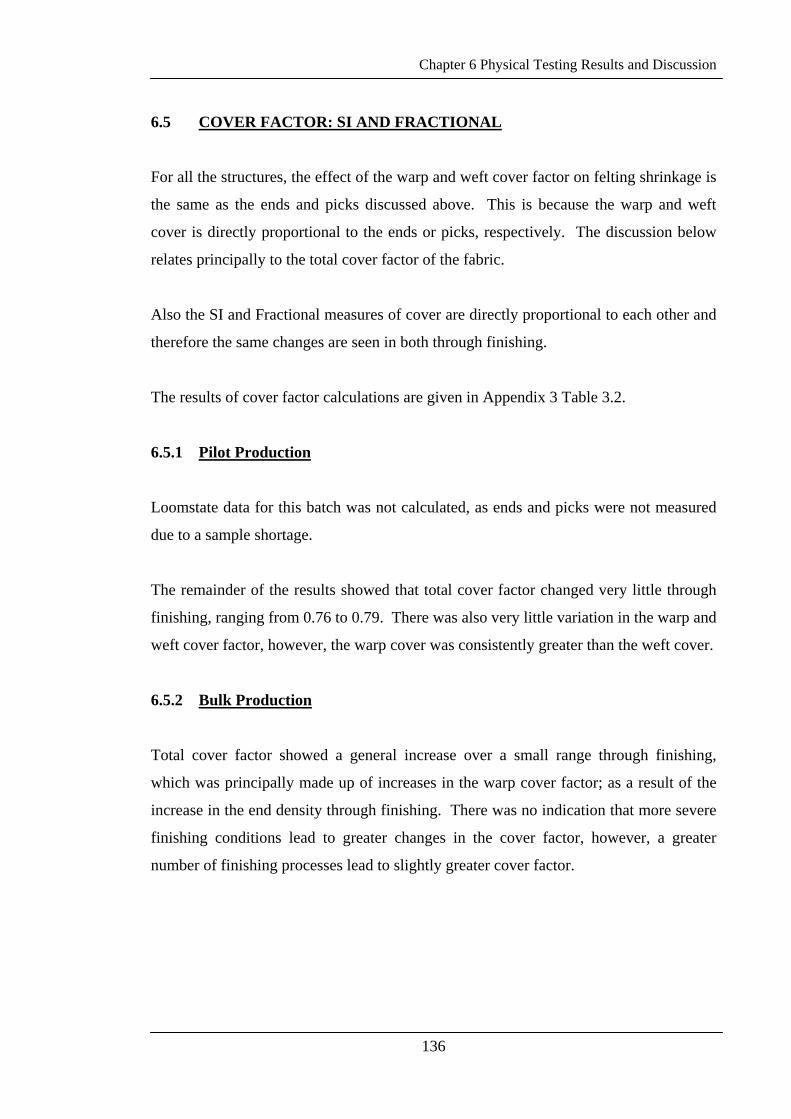
Chapter 6 Physical Testing Results and Discussion
136
6.5 COVER FACTOR: SI AND FRACTIONAL
For all the structures, the effect of the warp and weft cover factor on felting shrinkage is
the same as the ends and picks discussed above. This is because the warp and weft
cover is directly proportional to the ends or picks, respectively. The discussion below
relates principally to the total cover factor of the fabric.
Also the SI and Fractional measures of cover are directly proportional to each other and
therefore the same changes are seen in both through finishing.
The results of cover factor calculations are given in Appendix 3 Table 3.2.
6.5.1 Pilot Production
Loomstate data for this batch was not calculated, as ends and picks were not measured
due to a sample shortage.
The remainder of the results showed that total cover factor changed very little through
finishing, ranging from 0.76 to 0.79. There was also very little variation in the warp and
weft cover factor, however, the warp cover was consistently greater than the weft cover.
6.5.2 Bulk Production
Total cover factor showed a general increase over a small range through finishing,
which was principally made up of increases in the warp cover factor; as a result of the
increase in the end density through finishing. There was no indication that more severe
finishing conditions lead to greater changes in the cover factor, however, a greater
number of finishing processes lead to slightly greater cover factor.
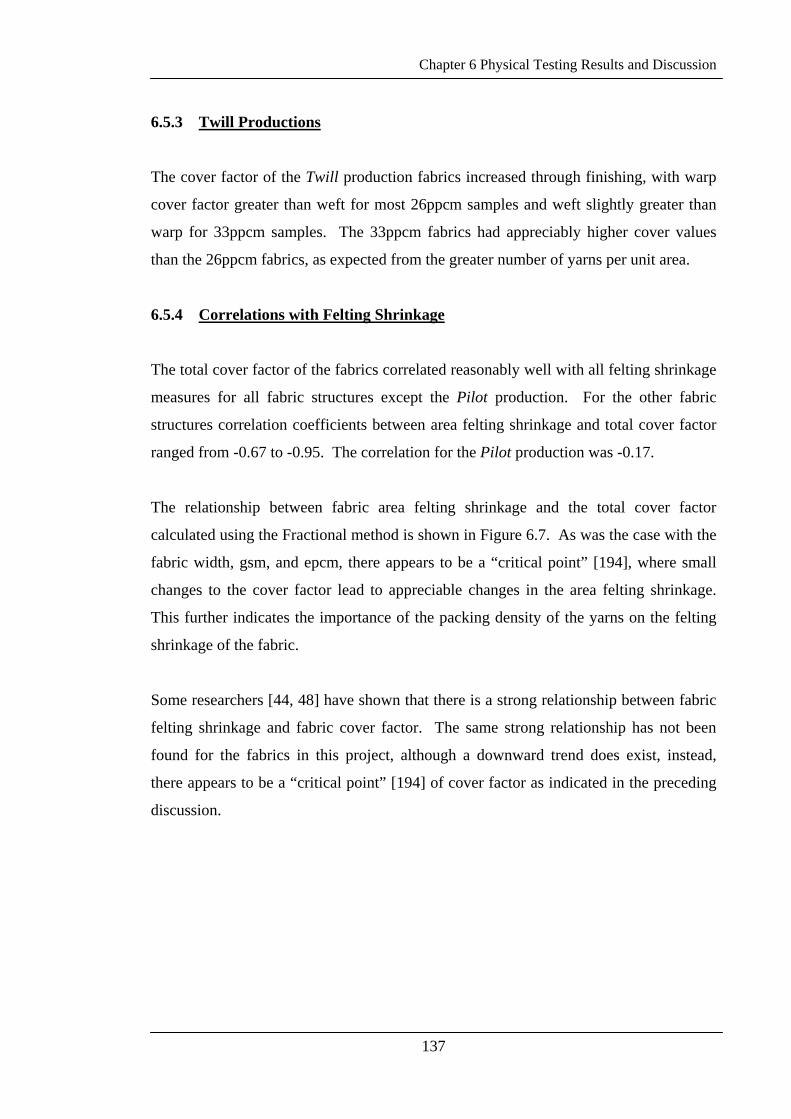
Chapter 6 Physical Testing Results and Discussion
137
6.5.3 Twill Productions
The cover factor of the Twill production fabrics increased through finishing, with warp
cover factor greater than weft for most 26ppcm samples and weft slightly greater than
warp for 33ppcm samples. The 33ppcm fabrics had appreciably higher cover values
than the 26ppcm fabrics, as expected from the greater number of yarns per unit area.
6.5.4 Correlations with Felting Shrinkage
The total cover factor of the fabrics correlated reasonably well with all felting shrinkage
measures for all fabric structures except the Pilot production. For the other fabric
structures correlation coefficients between area felting shrinkage and total cover factor
ranged from -0.67 to -0.95. The correlation for the Pilot production was -0.17.
The relationship between fabric area felting shrinkage and the total cover factor
calculated using the Fractional method is shown in Figure 6.7. As was the case with the
fabric width, gsm, and epcm, there appears to be a “critical point” [194], where small
changes to the cover factor lead to appreciable changes in the area felting shrinkage.
This further indicates the importance of the packing density of the yarns on the felting
shrinkage of the fabric.
Some researchers [44, 48] have shown that there is a strong relationship between fabric
felting shrinkage and fabric cover factor. The same strong relationship has not been
found for the fabrics in this project, although a downward trend does exist, instead,
there appears to be a “critical point” [194] of cover factor as indicated in the preceding
discussion.
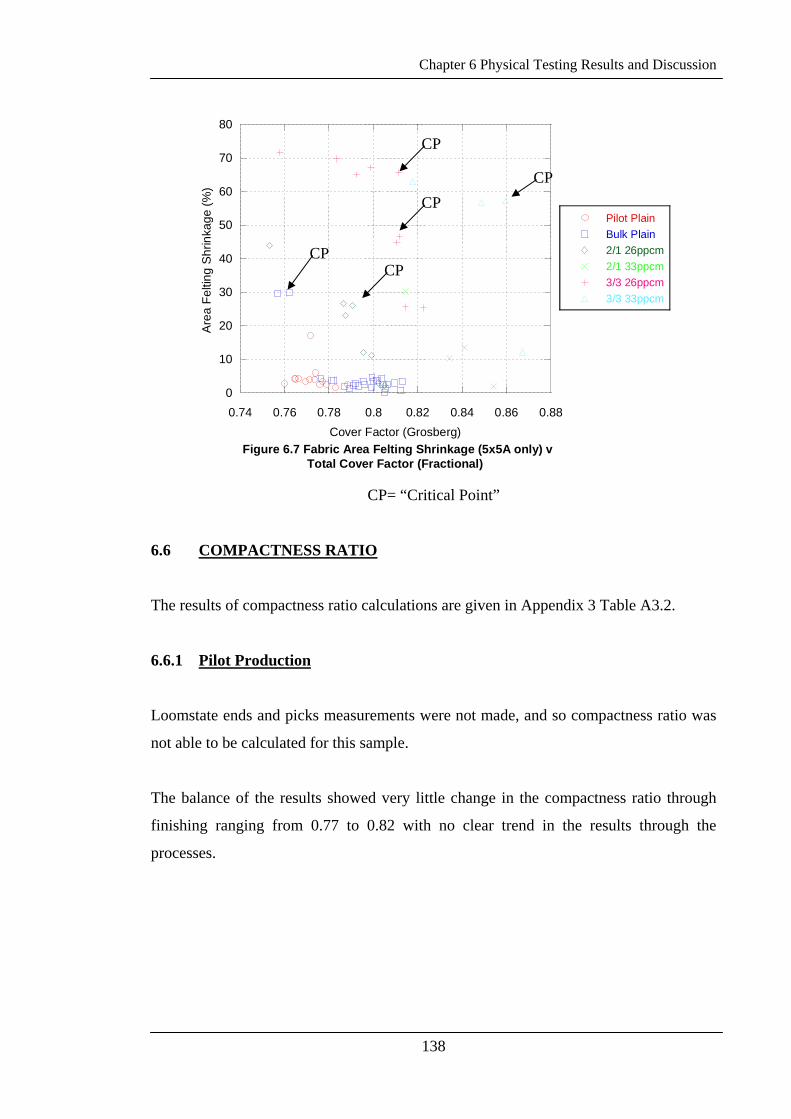
Chapter 6 Physical Testing Results and Discussion
138
0
10
20
30
40
50
60
70
80
0.74 0.76 0.78 0.8 0.82 0.84 0.86 0.88
Figure 6.7 Fabric Area Felting Shrinkage (5x5A only) vTotal Cover Factor (Fractional)
Pilot PlainBulk Plain2/1 26ppcm2/1 33ppcm3/3 26ppcm3/3 33ppcm
Are
a Fe
lting
Shr
inka
ge (%
)
Cover Factor (Grosberg)
CP
CP
CP
CPCP
CP= “Critical Point”
6.6 COMPACTNESS RATIO
The results of compactness ratio calculations are given in Appendix 3 Table A3.2.
6.6.1 Pilot Production
Loomstate ends and picks measurements were not made, and so compactness ratio was
not able to be calculated for this sample.
The balance of the results showed very little change in the compactness ratio through
finishing ranging from 0.77 to 0.82 with no clear trend in the results through the
processes.
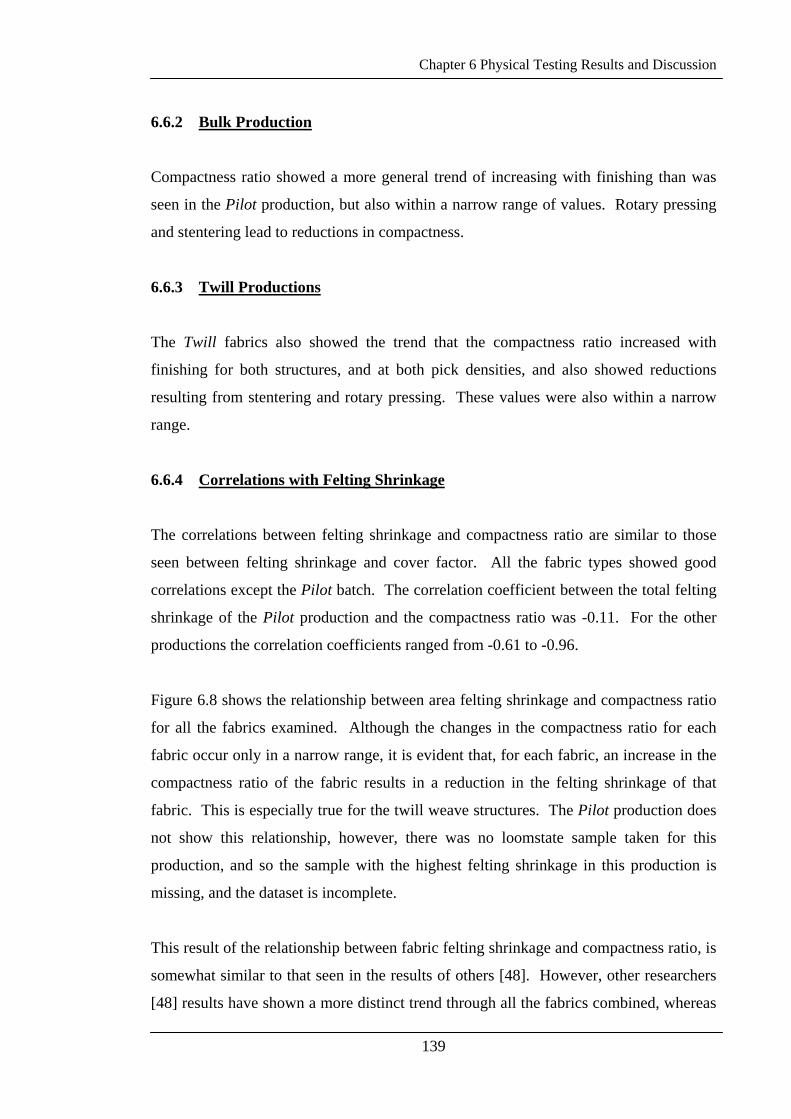
Chapter 6 Physical Testing Results and Discussion
139
6.6.2 Bulk Production
Compactness ratio showed a more general trend of increasing with finishing than was
seen in the Pilot production, but also within a narrow range of values. Rotary pressing
and stentering lead to reductions in compactness.
6.6.3 Twill Productions
The Twill fabrics also showed the trend that the compactness ratio increased with
finishing for both structures, and at both pick densities, and also showed reductions
resulting from stentering and rotary pressing. These values were also within a narrow
range.
6.6.4 Correlations with Felting Shrinkage
The correlations between felting shrinkage and compactness ratio are similar to those
seen between felting shrinkage and cover factor. All the fabric types showed good
correlations except the Pilot batch. The correlation coefficient between the total felting
shrinkage of the Pilot production and the compactness ratio was -0.11. For the other
productions the correlation coefficients ranged from -0.61 to -0.96.
Figure 6.8 shows the relationship between area felting shrinkage and compactness ratio
for all the fabrics examined. Although the changes in the compactness ratio for each
fabric occur only in a narrow range, it is evident that, for each fabric, an increase in the
compactness ratio of the fabric results in a reduction in the felting shrinkage of that
fabric. This is especially true for the twill weave structures. The Pilot production does
not show this relationship, however, there was no loomstate sample taken for this
production, and so the sample with the highest felting shrinkage in this production is
missing, and the dataset is incomplete.
This result of the relationship between fabric felting shrinkage and compactness ratio, is
somewhat similar to that seen in the results of others [48]. However, other researchers
[48] results have shown a more distinct trend through all the fabrics combined, whereas
Chapter 6 Physical Testing Results and Discussion
140
the results of this project indicate that each fabric batch is distinct from each other. This
may be a result of Figure 6.8 showing results at each stage of finishing, while the result
of other work [48] show only fully finished fabrics.
0
10
20
30
40
50
60
70
80
0.5 0.55 0.6 0.65 0.7 0.75 0.8 0.85 0.9
Figure 6.8 Fabric Area Felting Shrinkage (5x5A only) vCompactness Ratio
Pilot PlainBulk Plain2/1 26ppcm2/1 33ppcm3/3 26ppcm3/3 33ppcm
Are
a Fe
lting
Shr
inka
ge (%
)
Compactness Ratio
6.7 FABRIC VOLUME DENSITY
The results of fabric density calculations are given in Appendix 3 Table A3.2.
6.7.1 Pilot Production
Loomstate measurements of FAST thickness were not made due to sample shortage, so
density was not calculated for this sample.
The balance of the results for this production showed that density increased with
finishing, however, there is no indication that the increased severity of the decatising
process had a greater effect on the density of the fabric.
Chapter 6 Physical Testing Results and Discussion
141
6.7.2 Bulk Production
This production also showed an overall increase as a result of finishing. The processes
that had the greatest effect on the density were those that produced permanent set while
the fabric was held under lateral compression, that is, crabbing and pressure decatising.
As was the case for the Pilot batch, there was no indication that an increase in the
severity of the finishing processes lead to increased fabric density, however, the more
processes the fabric was subjected to, the greater the density.
6.7.3 Twill Productions
The Twill weave fabrics also showed that the density increased as a result of finishing,
however the changes as a result of crabbing were not as large as seen in the plain
productions for the 2/1 Twills and were substantially less in the 3/3 Twills. Large
increases in density were not observed until the first decatising process. The results for
the 33ppcm samples were slightly greater than the 26ppcm samples.
6.7.4 Correlations with Felting Shrinkage
The density of the fabric, when measured at 2g loading correlated well with all
measures of felting shrinkage for all batches, with the exception of the Pilot production.
The twill weave productions showed especially good correlations with felting
shrinkage. Correlations with area felting shrinkage for all fabrics except the Pilot
production ranged from -0.79 to -1.00, with similar values for the warp and weft felting
shrinkage.
When the fabric density was calculated using the thickness at 100g loading, the
correlations with felting shrinkage were generally slightly weaker, but followed the
same trend across the batches, of poor correlations with the Pilot production, and
especially good correlations with the Twill productions.
Figures 6.9 and 6.10 show the relationship between fabric area felting shrinkage and
fabric density. They show that, for each fabric, there is a reduction in the area felting
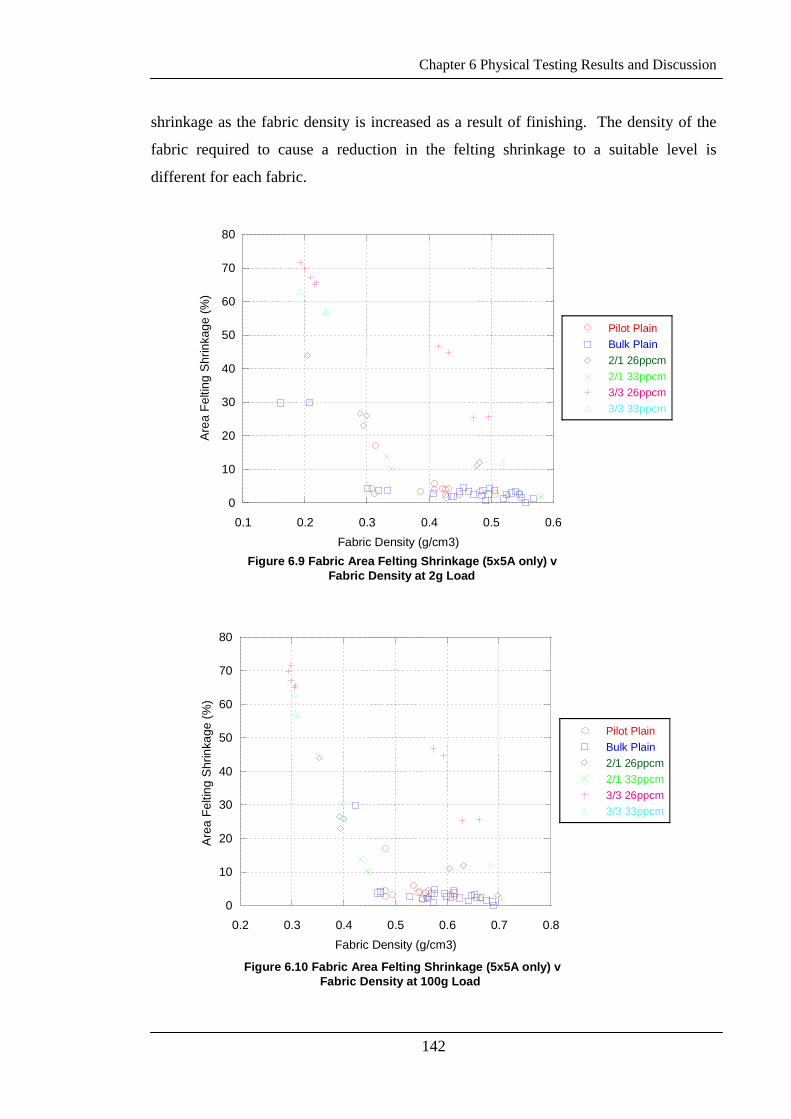
Chapter 6 Physical Testing Results and Discussion
142
shrinkage as the fabric density is increased as a result of finishing. The density of the
fabric required to cause a reduction in the felting shrinkage to a suitable level is
different for each fabric.
0
10
20
30
40
50
60
70
80
0.1 0.2 0.3 0.4 0.5 0.6
Figure 6.9 Fabric Area Felting Shrinkage (5x5A only) v Fabric Density at 2g Load
Pilot PlainBulk Plain2/1 26ppcm2/1 33ppcm3/3 26ppcm3/3 33ppcm
Are
a Fe
lting
Shr
inka
ge (%
)
Fabric Density (g/cm3)
0
10
20
30
40
50
60
70
80
0.2 0.3 0.4 0.5 0.6 0.7 0.8
Figure 6.10 Fabric Area Felting Shrinkage (5x5A only) vFabric Density at 100g Load
Pilot PlainBulk Plain2/1 26ppcm2/1 33ppcm3/3 26ppcm3/3 33ppcm
Are
a Fe
lting
Shr
inka
ge (%
)
Fabric Density (g/cm3)
Chapter 6 Physical Testing Results and Discussion
143
6.8 DISCUSSION
The majority of the parameters measured in this section show no direct relationship with
fabric felting shrinkage, with some parameters appearing to have a “critical point” [194]
at which a large change in felting shrinkage is found.
The changes that took place in the fabric width were as expected for each finishing step,
given the conditions of each. The correlation between width and felting shrinkage
suggests that felting shrinkage reductions are dependent on the structure of the fabric
and that, as finishing progresses, structural change takes place which, in some part,
leads to the reduction in felting shrinkage. The structural change that takes place with
the reduction in width is changes in the ends and picks density and the yarn crimp.
Fabric mass per unit area reflects similar physical changes taking place in the fabric, as
a result of finishing, leading to changes in the felting shrinkage. That is, there is an
increase in the compactness of the fabric as a result of finishing.
Changes in the yarn crimp through finishing also showed poor correlations with fabric
felting shrinkage. However, there is an interesting result of the fabric direction with the
greatest yarn crimp having the lowest felting shrinkage, which is consistent with results
that were found for cuff-edge felting on treated fabrics by others [193].
Changes in the pick and/or end density of a fabric have been shown by other researchers
[44-48, 48] to lead to changes in the felting shrinkage of a fabric, however, not to levels
as low as seen in the current project under the washing conditions used in the current
project. The difference between the 26ppcm and the 33ppcm fabrics has already been
discussed in Chapter 5. The poor to moderate correlations between ends and picks and
felting shrinkage were somewhat surprising, as it was expected that felting shrinkage
may change more in line with end and/or pick density. The “critical” [194] number of
ends that appears to exist suggests that there maybe a point at which the number of ends
can impact on felting shrinkage. It was thought that there may be a combined effect on
felting shrinkage of the ends and picks together, however, cover factor results lend
Chapter 6 Physical Testing Results and Discussion
144
further support to the idea that there is a “critical” [194] number of yarns per centimeter
that will reduce felting shrinkage.
Increased fabric compactness ratio has been shown by others [46-48] to lead to
reductions in fabric felting shrinkage, however, not to the same level as has been found
for the fabrics in this project following the washing conditions used in this project .
This has been shown to be the case here also for all the fabrics except the Pilot
production. The poor correlations for the Pilot production may be a result of there not
being full set of data (the small loomstate sample meant that there were no results to
calculate the compactness ratio). The relationships seen in this work are not as strong as
those seen in the work of others [48], nor is there a strong trend across all the fabric
batches. However, there is a distinct trend to increases in compactness ratio being
associated with reductions in felting shrinkage.
The relationships between fabric felting shrinkage and fabric density show some of the
strongest correlations that were found in this project. Density had been suggested in the
early stages of this project as a possible contributor to the shrink-resist effect [161]. As
was the case for the compactness ratio, the correlations for the Pilot production were
weak, most likely as a result of the missing loomstate sample. This measure differs
from the compactness ratio, in that it takes into account changes in the thickness of the
fabric, rather than just how closely packed the yarns are. It shows the importance of
changes in the thickness of the fabric in achieving the shrink-resistance. This measure
indicates that felting shrinkage is reduced in these samples through finishing as a result
of the fabric becoming more compact not only in terms of the close proximity of the
yarns to each other, but also because the fabric becomes more compressed through
finishing. For the twill weave samples that increase in density to similar levels as seen
in the plain weave fabrics, but which do not show the same levels of felting shrinkage,
the difference would seem to be a result of the float lengths and pick densities. Short
float lengths and/or higher pick densities give lower felting shrinkage at comparable
levels of fabric density.
145
CHAPTER 7
OBJECTIVE TESTING
RESULTS AND DISCUSSION
7.1 FAST TESTING
The methods used to gather FAST results are given in Chapter 4 Materials and Methods
and the full data set is given in Appendix 3 Table A3.3.
Due to a shortage of sample in the Pilot production, there were no FAST measurements
made on the loomstate sample. The remainder of the Pilot production samples were
measured.
7.1.1 Relaxation Shrinkage (RS)
Figures 7.1 Warp Relaxation Shrinkage, FAST Method: All Productions and 7.2 Weft
Relaxation Shrinkage, FAST Method: All Productions show the changes in RS through
finishing for comparable samples from each production batch, and allow for the
variations across batches to be determined. The effects of various finishing processes
on the RS of fabrics has already been discussed in Section 5.1 in relation to the
Woolmark method of measurement. Although the two methods are not highly
correlated the effects of each process are similar but to different degrees.
Chapter 7 Objective Testing Results and Discussion
146
7.1.1.1 Pilot Production
The measurement errors for these samples were high compared with the results, in many
cases higher than the measurement itself. As a result it is difficult to make conclusions
about the results.
There is no indication of trends through the finishing processes or with changes in the
severity of the decatising conditions. Nor is there any regularity in the difference
between warp and weft RS. The changes observed in these samples were as expected
based on the finishing treatments used. For instance, following stentering, the RS
measurements showed a large width (weft) shrinkage resulting from the stretching in the
stentering process, while the sample increased in length as a result of the testing
process.
7.1.1.2 Bulk Production
This production also showed large sample errors, with many errors larger than the
measurement.
This production of fabric showed a large reduction in RS through scouring and
crabbing. Following this there were many changes in the RS through finishing, with the
biggest change being a large increase in the warp RS as a result of rotary pressing.
For those samples which were finished with the same decatising and/or blowing
conditions as in the Pilot production, values of RS were similar. For the earlier stage
samples, there are greater differences between the two batches, which may be accounted
for by the change in the finishing sequence resulting from the application of warp size
to the Bulk production.
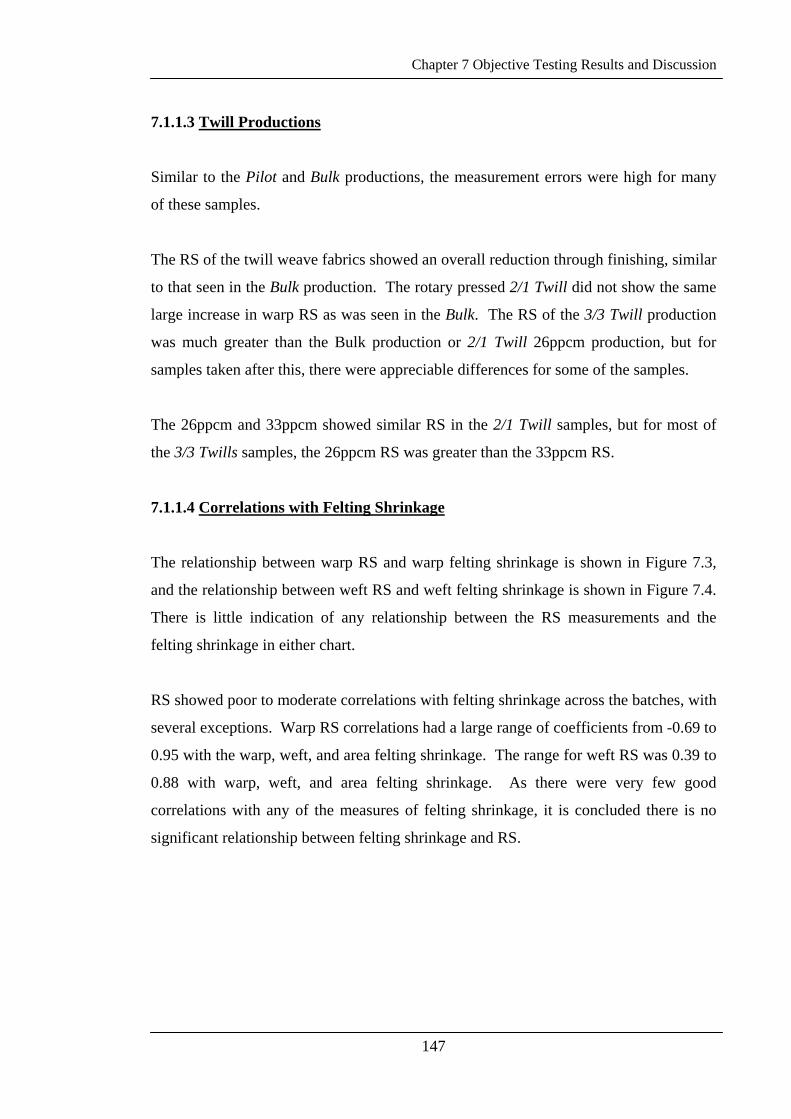
Chapter 7 Objective Testing Results and Discussion
147
7.1.1.3 Twill Productions
Similar to the Pilot and Bulk productions, the measurement errors were high for many
of these samples.
The RS of the twill weave fabrics showed an overall reduction through finishing, similar
to that seen in the Bulk production. The rotary pressed 2/1 Twill did not show the same
large increase in warp RS as was seen in the Bulk. The RS of the 3/3 Twill production
was much greater than the Bulk production or 2/1 Twill 26ppcm production, but for
samples taken after this, there were appreciable differences for some of the samples.
The 26ppcm and 33ppcm showed similar RS in the 2/1 Twill samples, but for most of
the 3/3 Twills samples, the 26ppcm RS was greater than the 33ppcm RS.
7.1.1.4 Correlations with Felting Shrinkage
The relationship between warp RS and warp felting shrinkage is shown in Figure 7.3,
and the relationship between weft RS and weft felting shrinkage is shown in Figure 7.4.
There is little indication of any relationship between the RS measurements and the
felting shrinkage in either chart.
RS showed poor to moderate correlations with felting shrinkage across the batches, with
several exceptions. Warp RS correlations had a large range of coefficients from -0.69 to
0.95 with the warp, weft, and area felting shrinkage. The range for weft RS was 0.39 to
0.88 with warp, weft, and area felting shrinkage. As there were very few good
correlations with any of the measures of felting shrinkage, it is concluded there is no
significant relationship between felting shrinkage and RS.
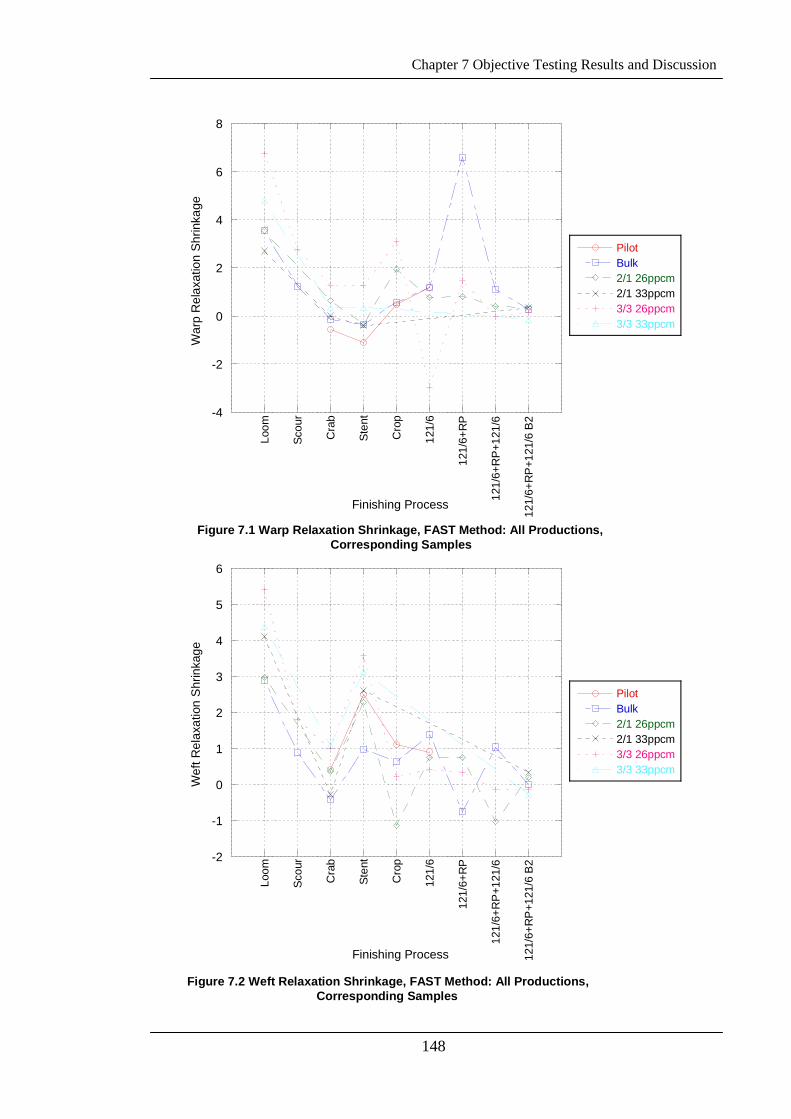
Chapter 7 Objective Testing Results and Discussion
148
-4
-2
0
2
4
6
8
Loom
Scou
r
Cra
b
Sten
t
Cro
p
121/
6
121/
6+R
P
121/
6+R
P+1
21/6
121/
6+R
P+1
21/6
B2
Figure 7.1 Warp Relaxation Shrinkage, FAST Method: All Productions, Corresponding Samples
PilotBulk2/1 26ppcm2/1 33ppcm3/3 26ppcm3/3 33ppcm
War
p R
elax
atio
n S
hrin
kage
Finishing Process
-2
-1
0
1
2
3
4
5
6
Loom
Scou
r
Cra
b
Sten
t
Cro
p
121/
6
121/
6+R
P
121/
6+R
P+1
21/6
121/
6+R
P+1
21/6
B2
Figure 7.2 Weft Relaxation Shrinkage, FAST Method: All Productions,Corresponding Samples
PilotBulk2/1 26ppcm2/1 33ppcm3/3 26ppcm3/3 33ppcm
Wef
t Rel
axat
ion
Shr
inka
ge
Finishing Process
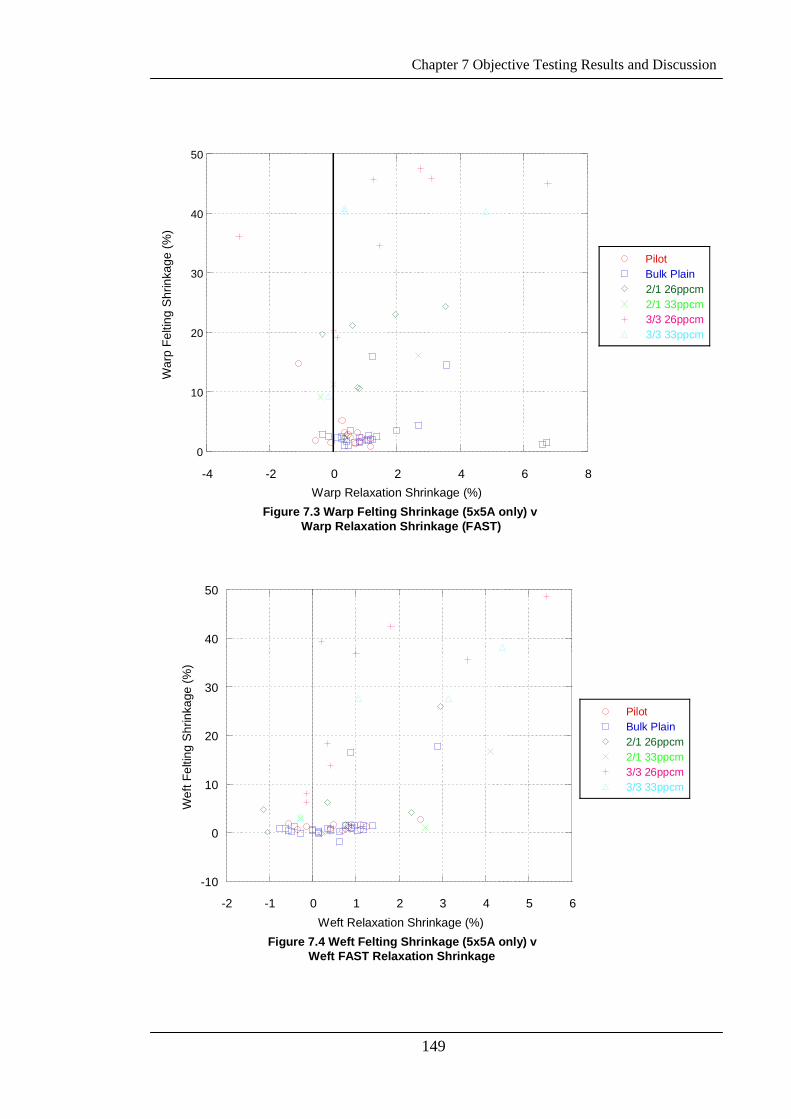
Chapter 7 Objective Testing Results and Discussion
149
0
10
20
30
40
50
-4 -2 0 2 4 6 8
Figure 7.3 Warp Felting Shrinkage (5x5A only) v Warp Relaxation Shrinkage (FAST)
PilotBulk Plain2/1 26ppcm2/1 33ppcm3/3 26ppcm3/3 33ppcm
War
p Fe
lting
Shr
inka
ge (%
)
Warp Relaxation Shrinkage (%)
-10
0
10
20
30
40
50
-2 -1 0 1 2 3 4 5 6
Figure 7.4 Weft Felting Shrinkage (5x5A only) vWeft FAST Relaxation Shrinkage
PilotBulk Plain2/1 26ppcm2/1 33ppcm3/3 26ppcm3/3 33ppcm
Wef
t Fel
ting
Shr
inka
ge (%
)
Weft Relaxation Shrinkage (%)
Chapter 7 Objective Testing Results and Discussion
150
7.1.2 Hygral Expansion (HE)
Figures 7.5 Warp Hygral Expansion in Finishing: All Batches and 7.6 Weft Hygral
Expansion in Finishing: All Batches show the changes in HE through finishing for all
the productions, and allow for comparisons to be made across all batches.
It has been reported [132] that fabric hygral expansion increases as setting treatments
become more severe. Although the setting methods are different here to those in the
work of Baird [132] there is no indication that the severity of the treatments has any
effect on the hygral expansion of the fabric. Although the results do show an increase
in HE following the initial setting process of crabbing, but reductions in HE were seen
from other setting processes. It was also reported [125, 132] that yarn crimp was related
to fabric HE. Such a strong correlation was not seen in any of the fabrics examined here
when correlated as individual batches or as all batches combined. The FAST HE
measurement method has been shown to be well correlated with other methods of
measuring HE [124]. Processes which permanently set wool fabrics while they are wet
are known to increase HE [70], therefore, it is no surprise that crabbing processes for all
batches lead to, in most cases, large increases in the HE of the fabric.
7.1.2.1 Pilot Production
Due to a shortage of sample, no HE measurements were made on the Loomstate sample.
Measurements were made on the balance of the samples.
The most consistent trend through finishing was that the weft HE was greater than the
warp HE. Weft HE changed very little in finishing, but warp HE increased slightly
following a reduction resulting from stentering, and the difference between warp and
weft was reduced slightly. There is no evidence that more severe decatising conditions
have a greater effect on the HE than milder conditions.
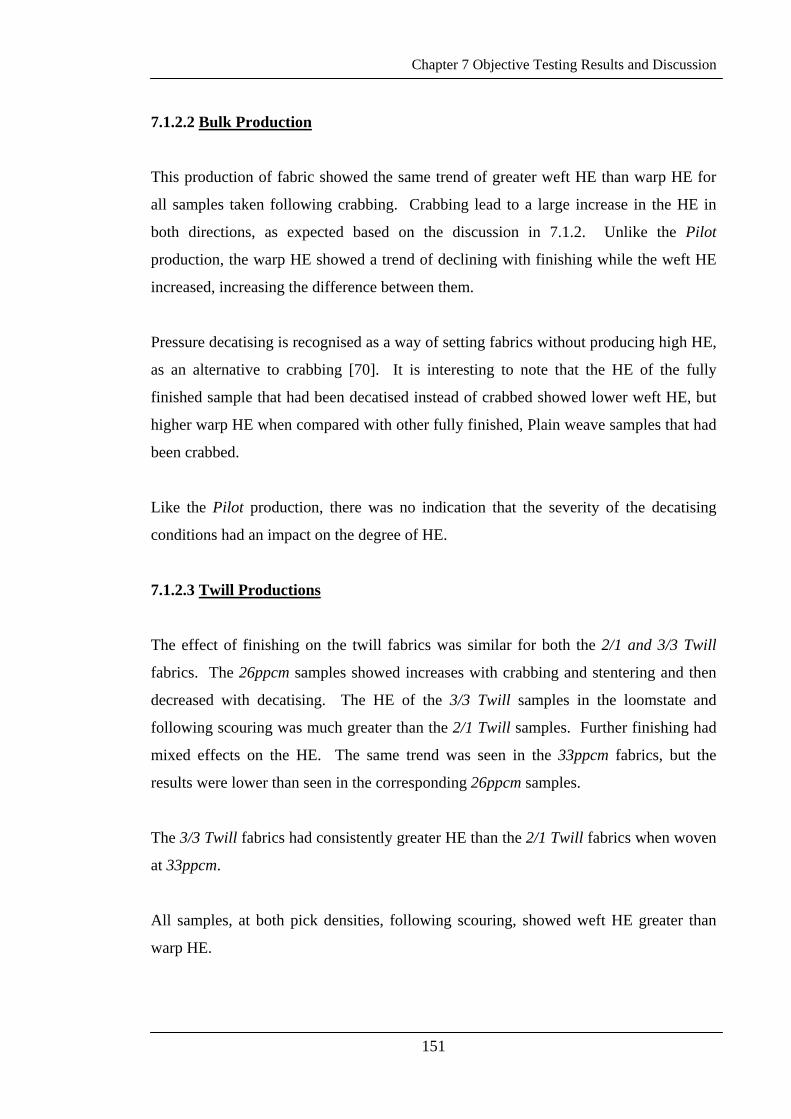
Chapter 7 Objective Testing Results and Discussion
151
7.1.2.2 Bulk Production
This production of fabric showed the same trend of greater weft HE than warp HE for
all samples taken following crabbing. Crabbing lead to a large increase in the HE in
both directions, as expected based on the discussion in 7.1.2. Unlike the Pilot
production, the warp HE showed a trend of declining with finishing while the weft HE
increased, increasing the difference between them.
Pressure decatising is recognised as a way of setting fabrics without producing high HE,
as an alternative to crabbing [70]. It is interesting to note that the HE of the fully
finished sample that had been decatised instead of crabbed showed lower weft HE, but
higher warp HE when compared with other fully finished, Plain weave samples that had
been crabbed.
Like the Pilot production, there was no indication that the severity of the decatising
conditions had an impact on the degree of HE.
7.1.2.3 Twill Productions
The effect of finishing on the twill fabrics was similar for both the 2/1 and 3/3 Twill
fabrics. The 26ppcm samples showed increases with crabbing and stentering and then
decreased with decatising. The HE of the 3/3 Twill samples in the loomstate and
following scouring was much greater than the 2/1 Twill samples. Further finishing had
mixed effects on the HE. The same trend was seen in the 33ppcm fabrics, but the
results were lower than seen in the corresponding 26ppcm samples.
The 3/3 Twill fabrics had consistently greater HE than the 2/1 Twill fabrics when woven
at 33ppcm.
All samples, at both pick densities, following scouring, showed weft HE greater than
warp HE.
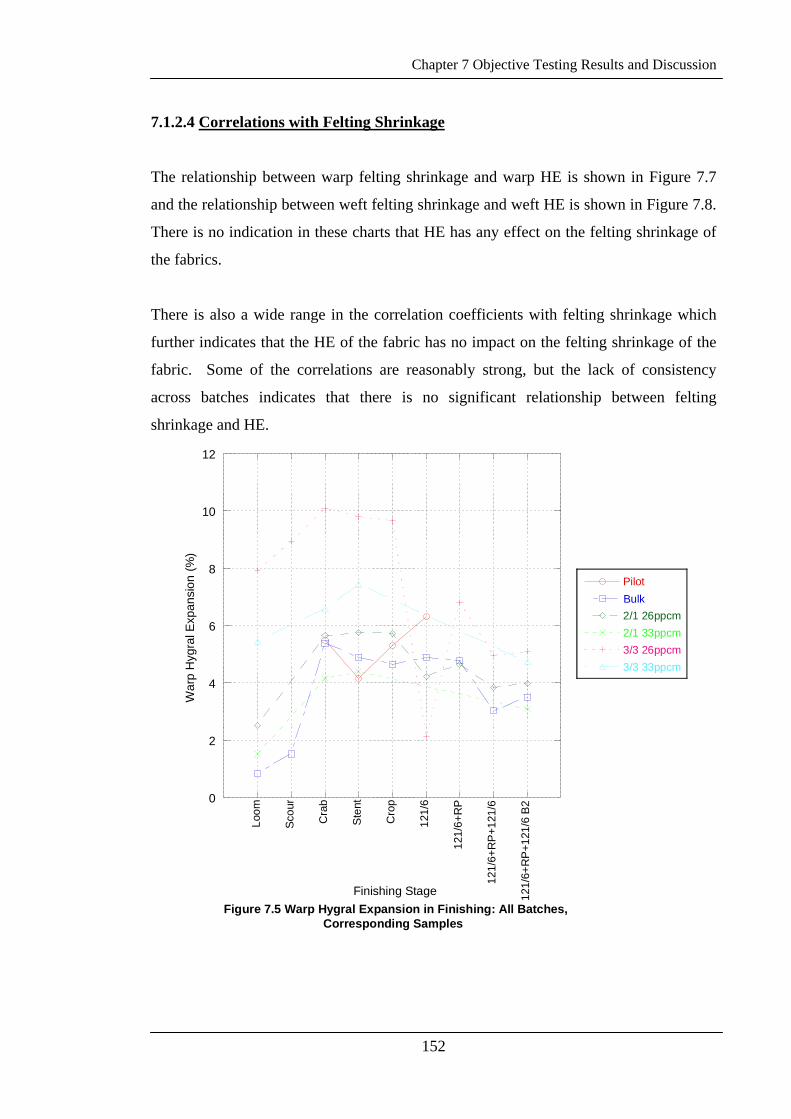
Chapter 7 Objective Testing Results and Discussion
152
7.1.2.4 Correlations with Felting Shrinkage
The relationship between warp felting shrinkage and warp HE is shown in Figure 7.7
and the relationship between weft felting shrinkage and weft HE is shown in Figure 7.8.
There is no indication in these charts that HE has any effect on the felting shrinkage of
the fabrics.
There is also a wide range in the correlation coefficients with felting shrinkage which
further indicates that the HE of the fabric has no impact on the felting shrinkage of the
fabric. Some of the correlations are reasonably strong, but the lack of consistency
across batches indicates that there is no significant relationship between felting
shrinkage and HE.
0
2
4
6
8
10
12
Loom
Scou
r
Cra
b
Ste
nt
Cro
p
121/
6
121/
6+R
P
121/
6+R
P+1
21/6
121/
6+R
P+1
21/6
B2
Figure 7.5 Warp Hygral Expansion in Finishing: All Batches,Corresponding Samples
PilotBulk2/1 26ppcm2/1 33ppcm3/3 26ppcm3/3 33ppcm
War
p H
ygra
l Exp
ansi
on (%
)
Finishing Stage
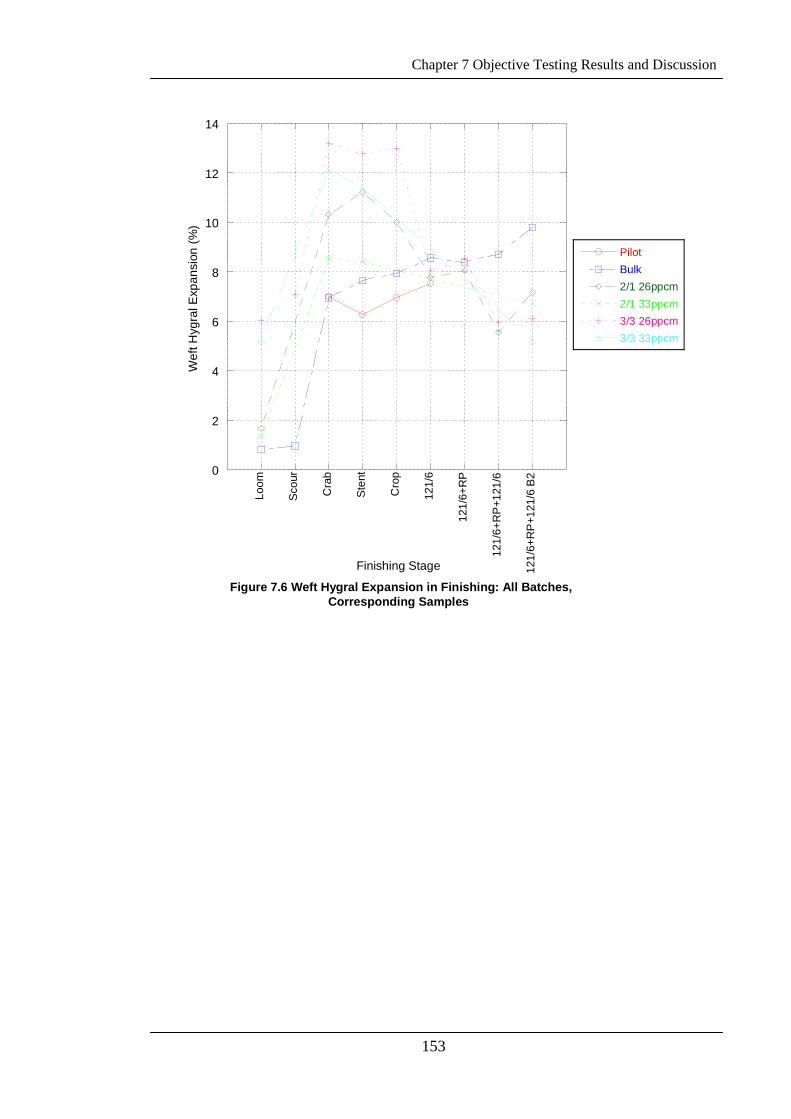
Chapter 7 Objective Testing Results and Discussion
153
0
2
4
6
8
10
12
14
Loom
Scou
r
Cra
b
Sten
t
Cro
p
121/
6
121/
6+R
P
121/
6+R
P+1
21/6
121/
6+R
P+1
21/6
B2
Figure 7.6 Weft Hygral Expansion in Finishing: All Batches,Corresponding Samples
PilotBulk2/1 26ppcm2/1 33ppcm3/3 26ppcm3/3 33ppcm
Wef
t Hyg
ral E
xpan
sion
(%)
Finishing Stage
Chapter 7 Objective Testing Results and Discussion
154
0
10
20
30
40
50
0 2 4 6 8 10 12
Figure 7.7 Warp Felting Shrinkage (5x5A only) v Warp Hygral Expansion (FAST)
PilotBulk Plain2/1 26ppcm2/1 33ppcm3/3 26ppcm3/3 33ppcm
War
p Fe
lting
Shr
inka
ge (%
)
Warp Hygral Expansion (%)
-10
0
10
20
30
40
50
0 2 4 6 8 10 12 14
Figure 7.8 Weft Felting Shrinkage (5x5A only) vWeft Hygral Expansion (FAST)
PilotBulk Plain2/1 26ppcm2/1 33ppcm3/3 26ppcm3/3 33ppcm
Wef
t Fel
ting
Shr
inka
ge (%
)
Weft Hygral Expansion (%)
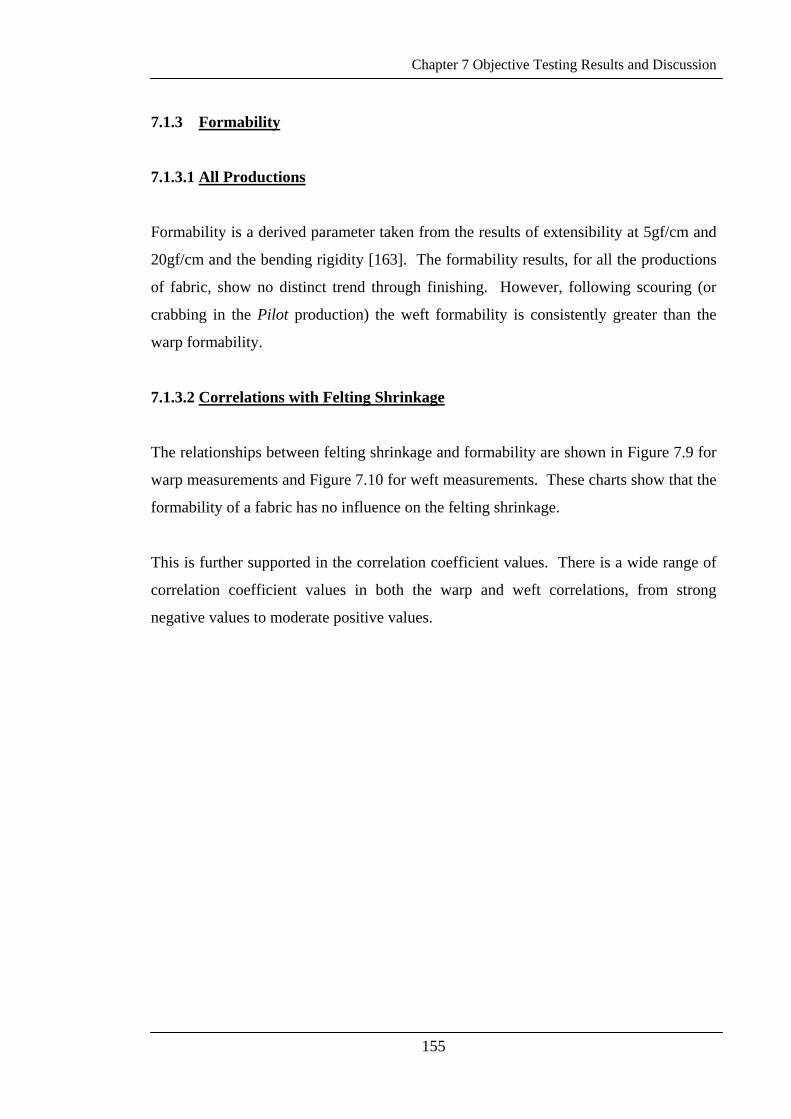
Chapter 7 Objective Testing Results and Discussion
155
7.1.3 Formability
7.1.3.1 All Productions
Formability is a derived parameter taken from the results of extensibility at 5gf/cm and
20gf/cm and the bending rigidity [163]. The formability results, for all the productions
of fabric, show no distinct trend through finishing. However, following scouring (or
crabbing in the Pilot production) the weft formability is consistently greater than the
warp formability.
7.1.3.2 Correlations with Felting Shrinkage
The relationships between felting shrinkage and formability are shown in Figure 7.9 for
warp measurements and Figure 7.10 for weft measurements. These charts show that the
formability of a fabric has no influence on the felting shrinkage.
This is further supported in the correlation coefficient values. There is a wide range of
correlation coefficient values in both the warp and weft correlations, from strong
negative values to moderate positive values.
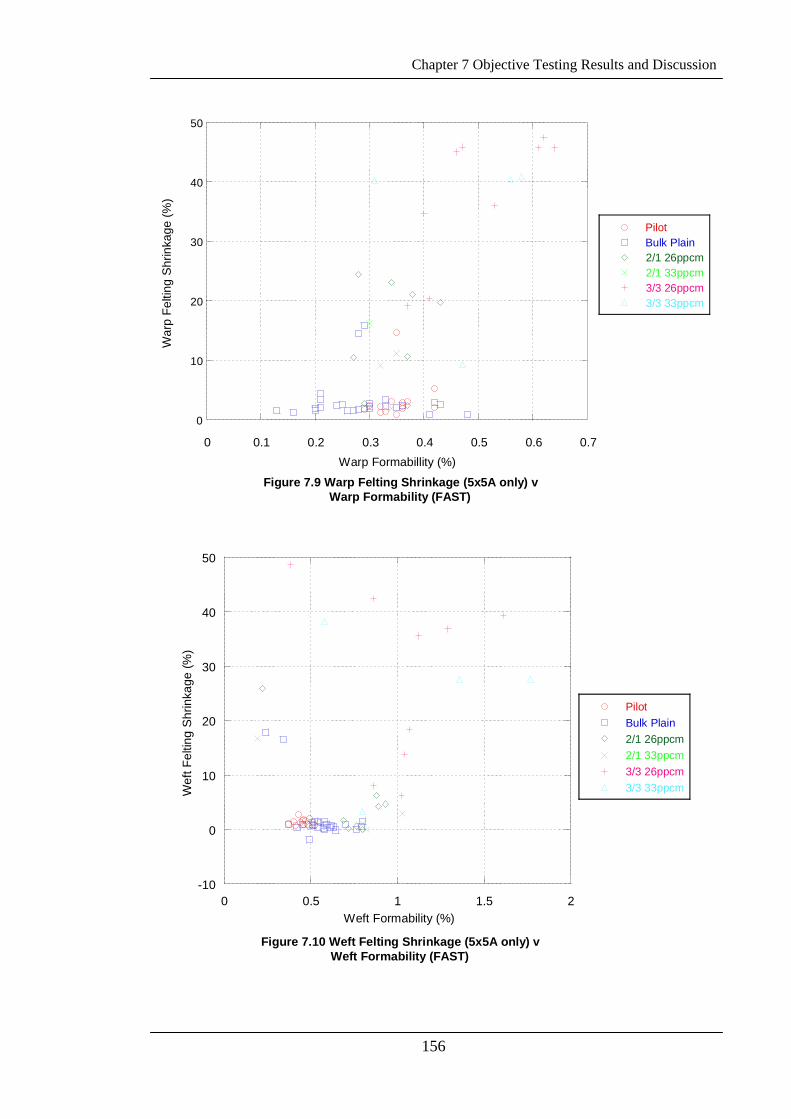
Chapter 7 Objective Testing Results and Discussion
156
0
10
20
30
40
50
0 0.1 0.2 0.3 0.4 0.5 0.6 0.7
Figure 7.9 Warp Felting Shrinkage (5x5A only) vWarp Formability (FAST)
PilotBulk Plain2/1 26ppcm2/1 33ppcm3/3 26ppcm3/3 33ppcm
War
p Fe
lting
Shr
inka
ge (%
)
Warp Formabillity (%)
-10
0
10
20
30
40
50
0 0.5 1 1.5 2
Figure 7.10 Weft Felting Shrinkage (5x5A only) vWeft Formability (FAST)
PilotBulk Plain2/1 26ppcm2/1 33ppcm3/3 26ppcm3/3 33ppcmW
eft F
eltin
g S
hrin
kage
(%)
Weft Formability (%)
Chapter 7 Objective Testing Results and Discussion
157
7.1.4 Extensibility
7.1.4.1 Pilot Production
For all the extensibility measurements made using the three loads, weft extensibility is
greater than warp extensibility. The 5g results showed only small changes as a result of
each process and no consistent trend in the changes.
The results of the 20g and 100g tests followed similar trends to each other, with the
100g results greater than the 20g results. There were greater differences between the
samples than seen in the 5g results, however, there was still no indication of a trend
resulting from finishing.
Bias extensibility showed a general decrease as a result of blowing or pressure
decatising.
There is no evidence in any of the measures of extensibility that the severity of the
decatising conditions had any effect on the measurement.
7.1.4.2 Bulk Production
Unlike the Pilot production, all three measures of extensibility followed a similar trend
in this production. All three measures showed increases, in both the warp and weft
directions, in the processes up to stentering. Following this, the extensibility did not
appear to follow any trend, and there was no indication that the severity or number of
finishing processes had any effect on the degree of change seen in extensibility.
Bias extensibility increased as a result of scouring and crabbing, and then most
processes following this reduced the bias extensibility.
Chapter 7 Objective Testing Results and Discussion
158
7.1.4.3 Twill Productions
The 5g, 20g, and 100g extensibility showed very similar trends through finishing for
both the warp and weft directions. Both the 2/1 and 3/3 Twills showed similar trends
for both pick densities. Warp extensibility changed very little through finishing. Weft
extensibility showed a large increase between the loomstate and crabbing which was
then reduced by the processes from the first decatising onwards in the 5g and 20g tests,
but changed very little in the 100g results.
As was the case for the Bulk production, bias extensibility increased as a result of early
stage finishing, and then was reduced in decatising, rotary pressing and blowing for the
2/1 Twill and was high in the Loomstate 3/3 Twill and decreased from decatising
onwards.
7.1.4.4 Correlations with Felting Shrinkage
The relationship between warp felting shrinkage and warp fabric 100g extensibility is
shown in Figure 7.11 and between weft felting shrinkage and weft 100g extensibility in
Figure 7.12. The relationship between fabric area felting shrinkage and bias
extensibility is shown in Figure 7.13.
The figures show that the extensibility of the fabric has very little effect on the felting
shrinkage of the fabric.
This is further supported by the correlation coefficients between all the measures of
fabric extensibility and felting shrinkage which were, in general, moderate to poor for
all the measures of fabric extensibility, with several strong correlations. There was a
wide range of positive and negative correlation coefficient values. There is no evidence
in the results that supports extensibility having any significant effect on the felting
shrinkage of the fabrics.
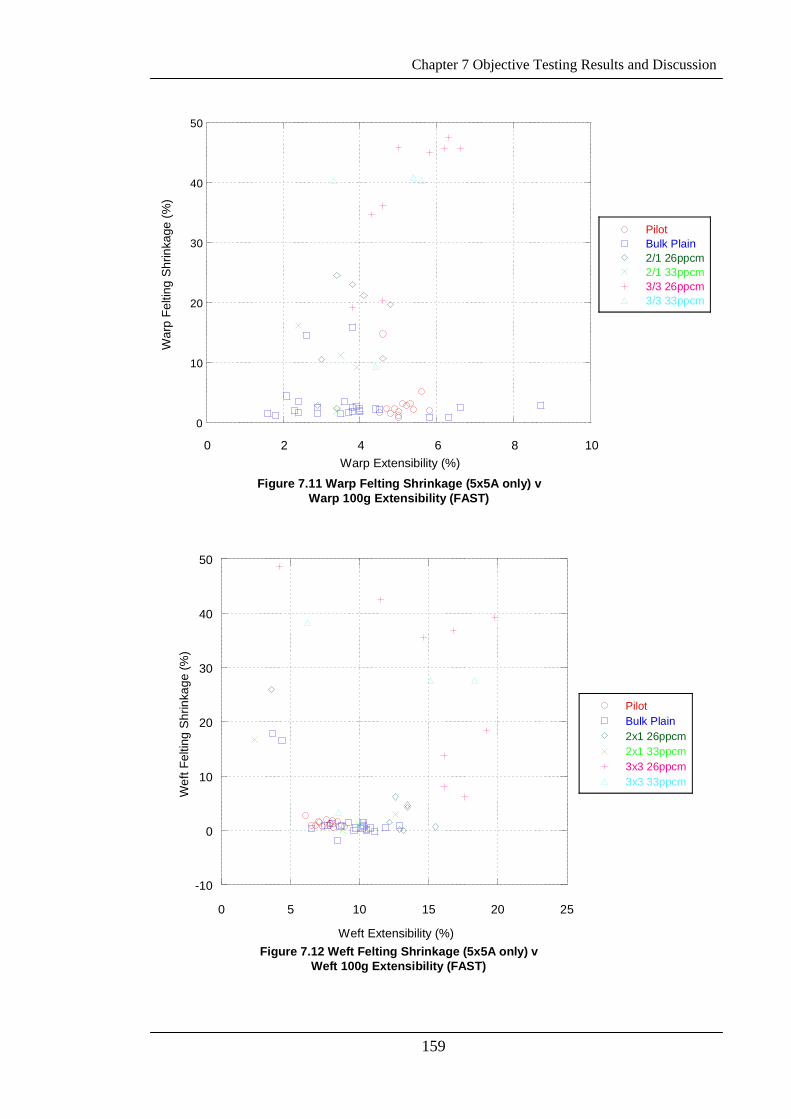
Chapter 7 Objective Testing Results and Discussion
159
0
10
20
30
40
50
0 2 4 6 8 10
Figure 7.11 Warp Felting Shrinkage (5x5A only) vWarp 100g Extensibility (FAST)
PilotBulk Plain2/1 26ppcm2/1 33ppcm3/3 26ppcm3/3 33ppcm
War
p Fe
lting
Shr
inka
ge (%
)
Warp Extensibility (%)
-10
0
10
20
30
40
50
0 5 10 15 20 25
Figure 7.12 Weft Felting Shrinkage (5x5A only) vWeft 100g Extensibility (FAST)
PilotBulk Plain2x1 26ppcm2x1 33ppcm3x3 26ppcm3x3 33ppcm
Wef
t Fel
ting
Shr
inka
ge (%
)
Weft Extensibility (%)
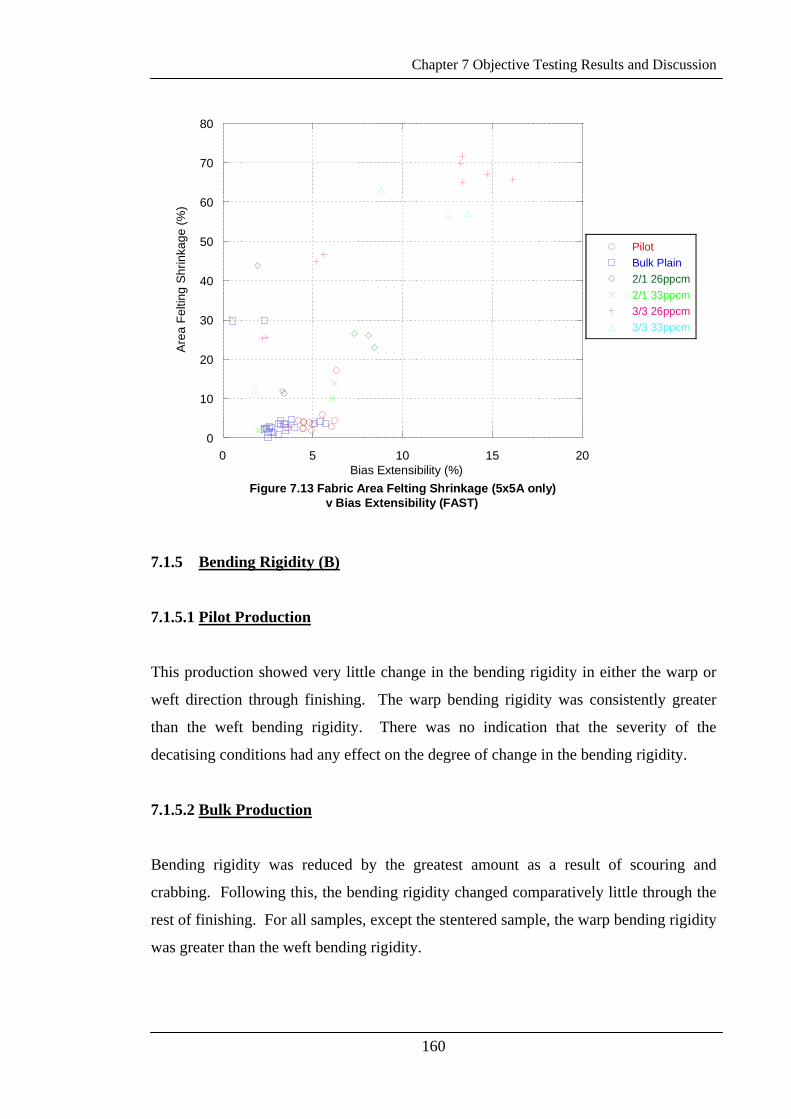
Chapter 7 Objective Testing Results and Discussion
160
0
10
20
30
40
50
60
70
80
0 5 10 15 20
Figure 7.13 Fabric Area Felting Shrinkage (5x5A only)v Bias Extensibility (FAST)
PilotBulk Plain2/1 26ppcm2/1 33ppcm3/3 26ppcm3/3 33ppcm
Are
a Fe
lting
Shr
inka
ge (%
)
Bias Extensibility (%)
7.1.5 Bending Rigidity (B)
7.1.5.1 Pilot Production
This production showed very little change in the bending rigidity in either the warp or
weft direction through finishing. The warp bending rigidity was consistently greater
than the weft bending rigidity. There was no indication that the severity of the
decatising conditions had any effect on the degree of change in the bending rigidity.
7.1.5.2 Bulk Production
Bending rigidity was reduced by the greatest amount as a result of scouring and
crabbing. Following this, the bending rigidity changed comparatively little through the
rest of finishing. For all samples, except the stentered sample, the warp bending rigidity
was greater than the weft bending rigidity.
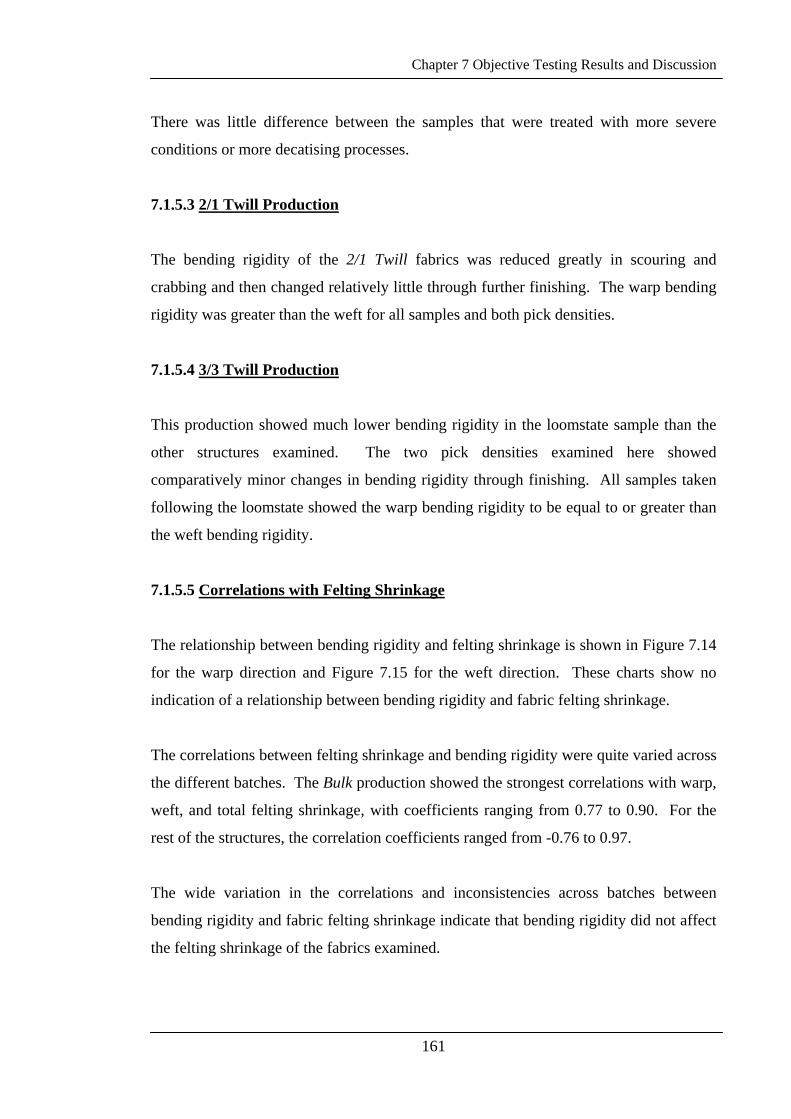
Chapter 7 Objective Testing Results and Discussion
161
There was little difference between the samples that were treated with more severe
conditions or more decatising processes.
7.1.5.3 2/1 Twill Production
The bending rigidity of the 2/1 Twill fabrics was reduced greatly in scouring and
crabbing and then changed relatively little through further finishing. The warp bending
rigidity was greater than the weft for all samples and both pick densities.
7.1.5.4 3/3 Twill Production
This production showed much lower bending rigidity in the loomstate sample than the
other structures examined. The two pick densities examined here showed
comparatively minor changes in bending rigidity through finishing. All samples taken
following the loomstate showed the warp bending rigidity to be equal to or greater than
the weft bending rigidity.
7.1.5.5 Correlations with Felting Shrinkage
The relationship between bending rigidity and felting shrinkage is shown in Figure 7.14
for the warp direction and Figure 7.15 for the weft direction. These charts show no
indication of a relationship between bending rigidity and fabric felting shrinkage.
The correlations between felting shrinkage and bending rigidity were quite varied across
the different batches. The Bulk production showed the strongest correlations with warp,
weft, and total felting shrinkage, with coefficients ranging from 0.77 to 0.90. For the
rest of the structures, the correlation coefficients ranged from -0.76 to 0.97.
The wide variation in the correlations and inconsistencies across batches between
bending rigidity and fabric felting shrinkage indicate that bending rigidity did not affect
the felting shrinkage of the fabrics examined.
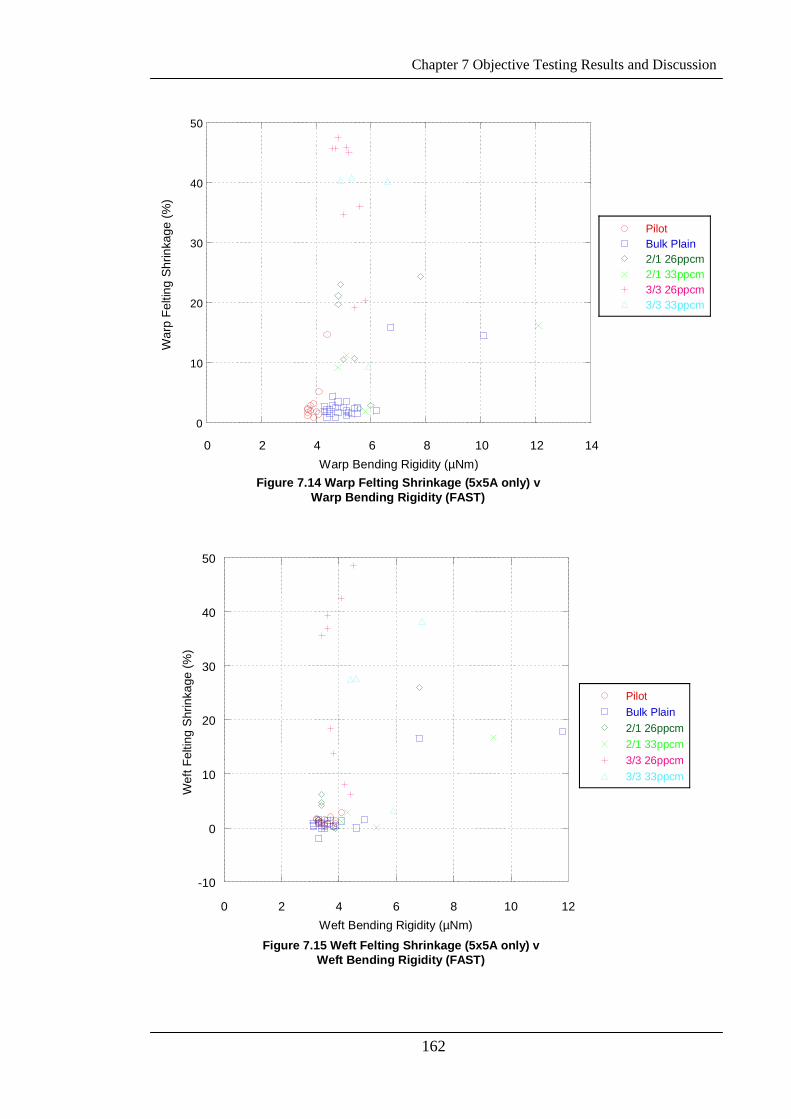
Chapter 7 Objective Testing Results and Discussion
162
0
10
20
30
40
50
0 2 4 6 8 10 12 14
Figure 7.14 Warp Felting Shrinkage (5x5A only) vWarp Bending Rigidity (FAST)
PilotBulk Plain2/1 26ppcm2/1 33ppcm3/3 26ppcm3/3 33ppcm
War
p Fe
lting
Shr
inka
ge (%
)
Warp Bending Rigidity (µNm)
-10
0
10
20
30
40
50
0 2 4 6 8 10 12
Figure 7.15 Weft Felting Shrinkage (5x5A only) vWeft Bending Rigidity (FAST)
PilotBulk Plain2/1 26ppcm2/1 33ppcm3/3 26ppcm3/3 33ppcm
Wef
t Fel
ting
Shr
inka
ge (%
)
Weft Bending Rigidity (µNm)
Chapter 7 Objective Testing Results and Discussion
163
7.1.6 Shear Rigidity
7.1.6.1 Pilot Production
This production showed that the shear rigidity of the samples changed relatively little in
the early stages of finishing but increased as a result of decatising and/or blowing. The
degree of change caused by decatising does not reflect the severity of the conditions.
7.1.6.2 Bulk Production
Scouring and crabbing lead to a large reduction in the shear rigidity in this production.
Following crabbing, the shear rigidity increased with almost all processes, especially
decatising and rotary pressing. For most samples, blowing either slightly reduced shear
rigidity, or lead to no change. As was the case for the Pilot production, there is no
indication that more severe decatising conditions lead to greater changes in shear
rigidity.
7.1.6.3 2/1 Twill Production
The changes in the 26ppcm fabric with finishing were very similar to those seen in the
Bulk production. The shear rigidity was high in the loomstate sample and reduced in
scouring and crabbing, then increased in later finishing. The shear rigidity was lower in
the 26ppcm samples than the comparable 33ppcm samples. The loomstate 33ppcm
sample had a shear rigidity value that was substantially greater than the loomstate
26ppcm sample.
7.1.6.4 3/3 Twill Production
Both pick densities had low shear rigidity in the loomstate samples, which remained low
through the finishing route up to the first decatising process. Following the first
decatising process, the shear rigidity increased with further finishing. The shear rigidity
was lower in the 26ppcm samples than the comparable 33ppcm samples.
Chapter 7 Objective Testing Results and Discussion
164
7.1.6.5 Correlations with Felting Shrinkage
Figure 7.16 shows the relationship between the fabric felting shrinkage and shear
rigidity. The 3/3 Twill structures shown on this chart suggest that the shear rigidity of
the fabric affects the felting shrinkage. However, the other fabric structures examined
do not show this same effect.
The correlation coefficients between fabric felting shrinkage and shear rigidity also
varied widely across the batches. The Pilot production showed weak negative
correlations with felting shrinkage, while the Bulk production showed moderate positive
correlations. The 2/1 Twills had a mixture of positive and negative and strong and weak
correlations. The 3/3 Twills had strong negative correlations with all measures of
felting shrinkage.
The wide variety and inconsistency of the correlation coefficients along with the
relationships shown in Figure 7.16 lead to the conclusion that there is no significant
relationship between felting fabric shrinkage and fabric shear rigidity.
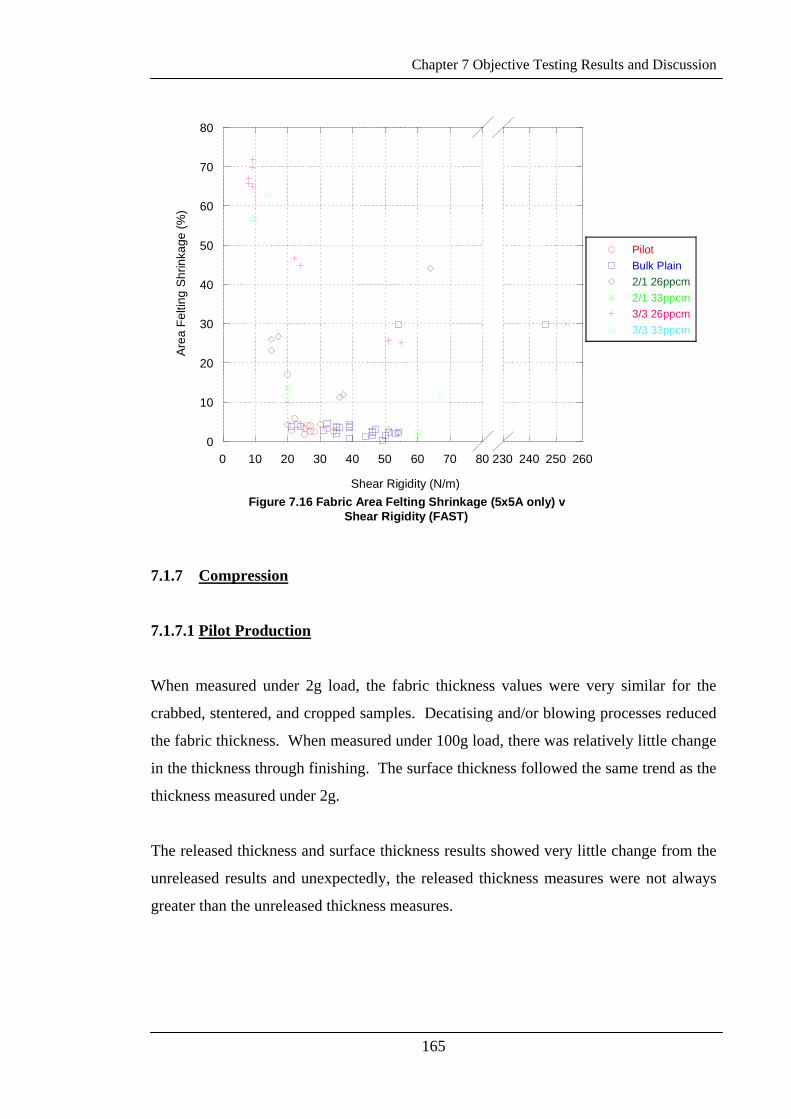
Chapter 7 Objective Testing Results and Discussion
165
0
10
20
30
40
50
60
70
80
0 10 20 30 40 50 60 70 80 230 240 250 260
Figure 7.16 Fabric Area Felting Shrinkage (5x5A only) vShear Rigidity (FAST)
PilotBulk Plain2/1 26ppcm2/1 33ppcm3/3 26ppcm3/3 33ppcm
Are
a Fe
lting
Shr
inka
ge (%
)
Shear Rigidity (N/m)
7.1.7 Compression
7.1.7.1 Pilot Production
When measured under 2g load, the fabric thickness values were very similar for the
crabbed, stentered, and cropped samples. Decatising and/or blowing processes reduced
the fabric thickness. When measured under 100g load, there was relatively little change
in the thickness through finishing. The surface thickness followed the same trend as the
thickness measured under 2g.
The released thickness and surface thickness results showed very little change from the
unreleased results and unexpectedly, the released thickness measures were not always
greater than the unreleased thickness measures.
Chapter 7 Objective Testing Results and Discussion
166
There was no indication that the changes in the severity of the decatising conditions had
any greater effect on the thickness or surface thickness of the fabric in either the
released or unreleased results.
7.1.7.2 Bulk Production
The results obtained under 2g load showed there was large reduction in fabric thickness
as a result of scouring and crabbing. Following this, there was a gradual reduction in
the fabric thickness. The more finishing processes the fabric was subjected to, the
thinner it became.
When measured under the 100g load, the reduction in the fabric thickness was much
more gradual, with the first large reduction seen following the first decatising process.
Rotary pressing had very little effect, but there were more reductions in the thickness
with further decatising and blowing.
There was a large reduction in the surface thickness of the samples as a result of
scouring and crabbing, with more gradual reductions resulting from further finishing.
The surface thickness of the loomstate and scoured samples was much greater in the
released state than the unreleased state. For all other samples the released thickness was
slightly greater than the unreleased thickness.
The released thickness and surface thickness values were consistently greater than the
unreleased thickness and surface thickness. There was one exception to this being the
sample which was decatised at 121°C for 6min, rotary pressed, then blown for 2
minutes, when measured under 100g load.
7.1.7.3 2/1 Twill Production
When measured under both the 2g load and the 100g load, the changes in the thickness
and surface thickness values followed a very similar trend to the results of the Bulk
production. The values were similar for both the 26ppcm and 33ppcm samples. The
Chapter 7 Objective Testing Results and Discussion
167
released surface thickness values were consistently greater than the unreleased surface
thickness values.
7.1.7.4 3/3 Twill Production
The released and unreleased thickness measured at both 2g and 100g load of the 3/3
twill fabric reduced more gradually with finishing than the Plain or 2/1 Twill fabrics.
There was very little change in the thickness between the loomstate and cropped
samples. Following this, decatising lead to a large reduction in thickness, and thickness
continued to reduce through the rest of the finishing route.
The changes in the surface thickness were more gradual than the changes seen in the
fabric thickness. The released thickness values were consistently greater than the
unreleased thickness values for all the samples in this batch.
7.1.7.5 Correlations with Felting Shrinkage
Figures 7.17 to 7.20 show the relationships between fabric felting shrinkage and some
of the thickness measurements. The released thickness at 2g and 100g is not shown as
the changes were very similar to the unreleased values for most samples. It is clear
from these figures that the thickness of the fabric, or the changes in the thickness of the
fabric have an effect on the felting shrinkage of the fabric. The charts indicate that a
reduction in the thickness of the fabric either causes a reduction in the felting shrinkage,
or the changes in thickness reflect some other change in the fabric which leads to the
reduction in felting shrinkage.
The thickness measures were generally well correlated with warp, weft, and area felting
shrinkage measures for all samples with the exception of the Pilot production which had
poor to moderate correlations. Values for all productions, except the Pilot, ranged from
0.50 to 1.00, with the majority of correlation coefficients greater than 0.80. The Pilot
production, however, had correlation coefficients which ranged from 0.33 to 0.51.
Chapter 7 Objective Testing Results and Discussion
168
The strong correlations seen in these results suggest that fabric thickness is an indicator
of the felting shrinkage of the fabric and that thickness, in some part, contributes to the
felting resistance. See also density discussion in Chapter 6 Physical Results.
The results of thickness measurements were also used to determine the “Finish Stability
Ratio”, “Effective Flat Set”, “Stable Flat Set”, “Temporary Flat Set”1 [167] and the
Permanent Set [168]. This was carried out in order to determine if there was any
correlation between any of the measures of set and the felting shrinkage of the fabric.
Each of these measures of the set in the fabric show a wide range of correlation
coefficient values across the batches, with most of the correlations being weak. The
lack of consistency in correlations for any of the measures of set has led to the
conclusion that none of these measures of set reflect the changes in the felting shrinkage
of the fabric, and are therefore not associated with the shrink-resist effect seen in the
fabric.
1 Le, C., Ly, N., Phillips, D., and De Boos, A., Ref. [167] p. 3., for FSR, EFS, SFS, and TFS.
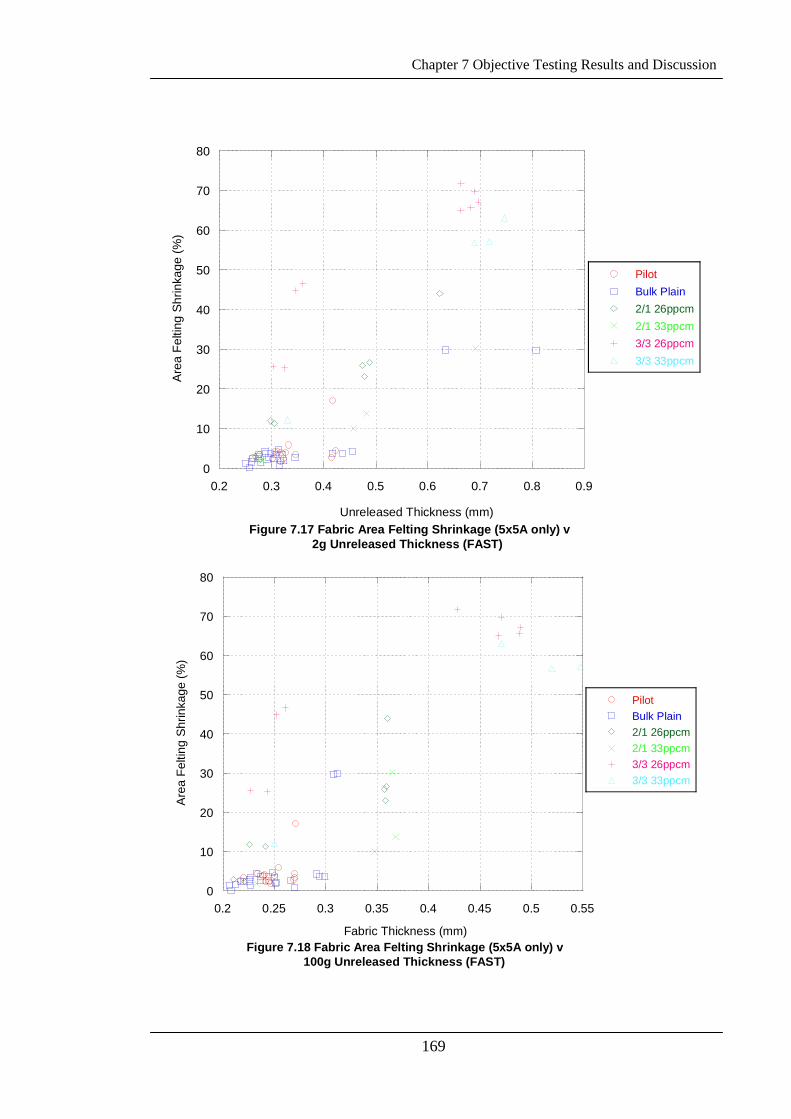
Chapter 7 Objective Testing Results and Discussion
169
0
10
20
30
40
50
60
70
80
0.2 0.3 0.4 0.5 0.6 0.7 0.8 0.9
Figure 7.17 Fabric Area Felting Shrinkage (5x5A only) v2g Unreleased Thickness (FAST)
PilotBulk Plain2/1 26ppcm2/1 33ppcm3/3 26ppcm3/3 33ppcm
Are
a Fe
lting
Shr
inka
ge (%
)
Unreleased Thickness (mm)
0
10
20
30
40
50
60
70
80
0.2 0.25 0.3 0.35 0.4 0.45 0.5 0.55
Figure 7.18 Fabric Area Felting Shrinkage (5x5A only) v100g Unreleased Thickness (FAST)
PilotBulk Plain2/1 26ppcm2/1 33ppcm3/3 26ppcm3/3 33ppcm
Are
a Fe
lting
Shr
inka
ge (%
)
Fabric Thickness (mm)
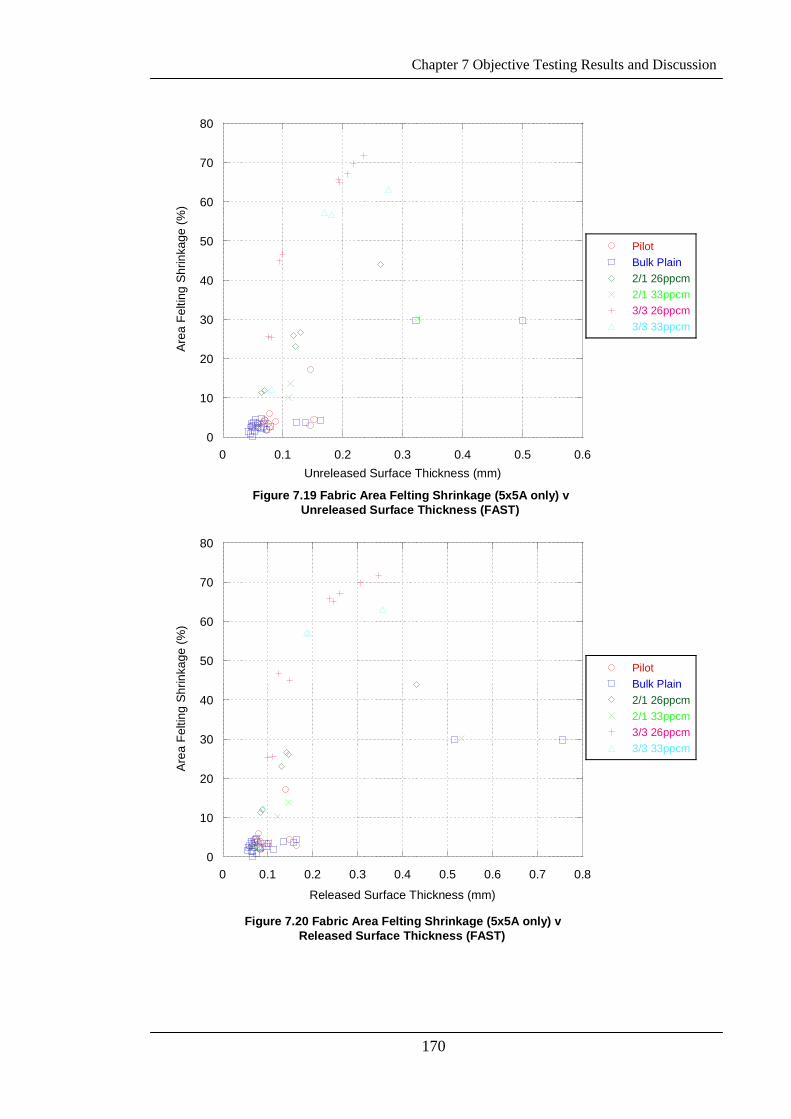
Chapter 7 Objective Testing Results and Discussion
170
0
10
20
30
40
50
60
70
80
0 0.1 0.2 0.3 0.4 0.5 0.6
Figure 7.19 Fabric Area Felting Shrinkage (5x5A only) vUnreleased Surface Thickness (FAST)
PilotBulk Plain2/1 26ppcm2/1 33ppcm3/3 26ppcm3/3 33ppcm
Are
a Fe
lting
Shr
inka
ge (%
)
Unreleased Surface Thickness (mm)
0
10
20
30
40
50
60
70
80
0 0.1 0.2 0.3 0.4 0.5 0.6 0.7 0.8
Figure 7.20 Fabric Area Felting Shrinkage (5x5A only) vReleased Surface Thickness (FAST)
PilotBulk Plain2/1 26ppcm2/1 33ppcm3/3 26ppcm3/3 33ppcm
Are
a Fe
lting
Shr
inka
ge (%
)
Released Surface Thickness (mm)
Chapter 7 Objective Testing Results and Discussion
171
7.2 KES-F TESTING
The methods used to gather KES-F results are given in Chapter 4 Materials and
Methods and the full data set is given in Appendix 3 Table A3.4.
7.2.1 Surface Properties MIU, MMD, and SMD
7.2.1.1 Pilot Production
The coefficient of friction (MIU) of this production increased in the warp direction as a
result of stentering, but apart from this, the overall trend was a reduction in surface
friction through finishing. There was very little difference in the results for the samples
which were decatised using different conditions. Furthermore, there was no indication
that the more severe conditions lead to lower surface friction.
The mean deviation of friction (MMD) was greatly reduced in crabbing, increased
slightly in stentering and then changed very little after this. The warp MMD was
greater than the weft for almost all samples.
There was no clear trend in the changes to the geometric roughness (SMD) with
finishing, however, the warp was consistently rougher than the weft for all the samples.
7.2.1.2 Bulk Production
MIU increased with each finishing process between the loomstate sample and cropping.
It was then reduced by the first decatising process while further processing had mixed
effects on the friction. There was no consistency in the results following the first
decatising process that would suggest that the number or severity of the finishing
processes lead to greater changes in the MIU.
The mean deviation of friction appears to show no trends through finishing in this
production.
Chapter 7 Objective Testing Results and Discussion
172
There was no clear trend in the measures of SMD for this fabric production. However,
the measurements showed that the warp was consistently more rough than the weft.
7.2.1.3 Twill Productions
As was the case with the plain weave fabrics, all the twill weave fabrics showed a
reduction in the MIU as finishing progressed.
The mean deviation of friction was reduced in the weft direction for the 2/1 Twills
between loomstate crabbing, but the rest of the samples show very little change. The
3/3 Twill fabrics showed an overall downward trend in the warp MMD and a large
reduction in the weft direction from crabbing and very little change following this.
The geometric roughness of the fabrics was different for the 2/1 and 3/3 Twill
productions. The 2/1 Twill, 26ppcm showed very little change in the warp geometric
roughness results, while the weft measurements showed a reduction in roughness
through finishing. The 2/1 Twill, 33ppcm showed very little change through finishing,
with the results for warp and weft almost identical.
The 3/3 Twill, 26ppcm showed an increase in the warp geometric roughness through
scouring and crabbing, and then a reduction through the rest of the finishing processes.
The weft geometric roughness was reduced through finishing. The 33ppcm fabrics
followed the same trends as the 26ppcm fabrics.
7.2.1.4 Correlations with Felting Shrinkage
Figures 7.21 to 7.24 show the relationships between felting shrinkage in the warp and
weft directions and the coefficients of friction (MIU) and the geometric roughness
(SMD). These charts show, that although there is some indication of a relationship
between felting shrinkage and the surface measurements for some of the fabric types, it
is not consistent, and therefore, unlikely that the surface properties have any effect on
the felting shrinkage of the fabrics.
Chapter 7 Objective Testing Results and Discussion
173
The results shown in the figures are further supported by the correlation coefficient
values. The different measures of the surface properties of the fabrics showed a wide
range in the values of their correlation coefficients with felting shrinkage measures.
However, there was no measure of surface properties that showed good correlations
with all the batches of fabric that were produced. In particular, there were very few
strong correlations between the surface properties and the felting shrinkage of the plain
weave productions.
As a result of the wide range of correlation coefficients and the lack of consistent
correlations across all the fabric batches, it has been concluded that there is no
significant relationship between the surface properties measured by the KES-F system
and fabric felting shrinkage properties.

Chapter 7 Objective Testing Results and Discussion
174
0
10
20
30
40
50
0.1 0.15 0.2 0.25 0.3 0.35
Figure 7.21 Warp Felting Shrinkage (5x5A only) vWarp Coefficient of Friction (MIU)
PilotBulk Plain2/1 26ppcm2/1 33ppcm3/3 26ppcm3/3 33ppcm
War
p Fe
lting
Shr
inka
ge (%
)
Warp Coefficient of Friction (MIU)
-10
0
10
20
30
40
50
0 0.05 0.1 0.15 0.2 0.25 0.3
Figure 7.22 Weft Felting Shrinkage (5x5A only) vWeft Coefficient of Friction (MIU)
PilotBulk Plain2/1 26ppcm2/1 33ppcm3/3 26ppcm3/3 33ppcm
Wef
t Fel
ting
Shr
inka
ge (%
)
Weft Coefficient of Friction (MIU)
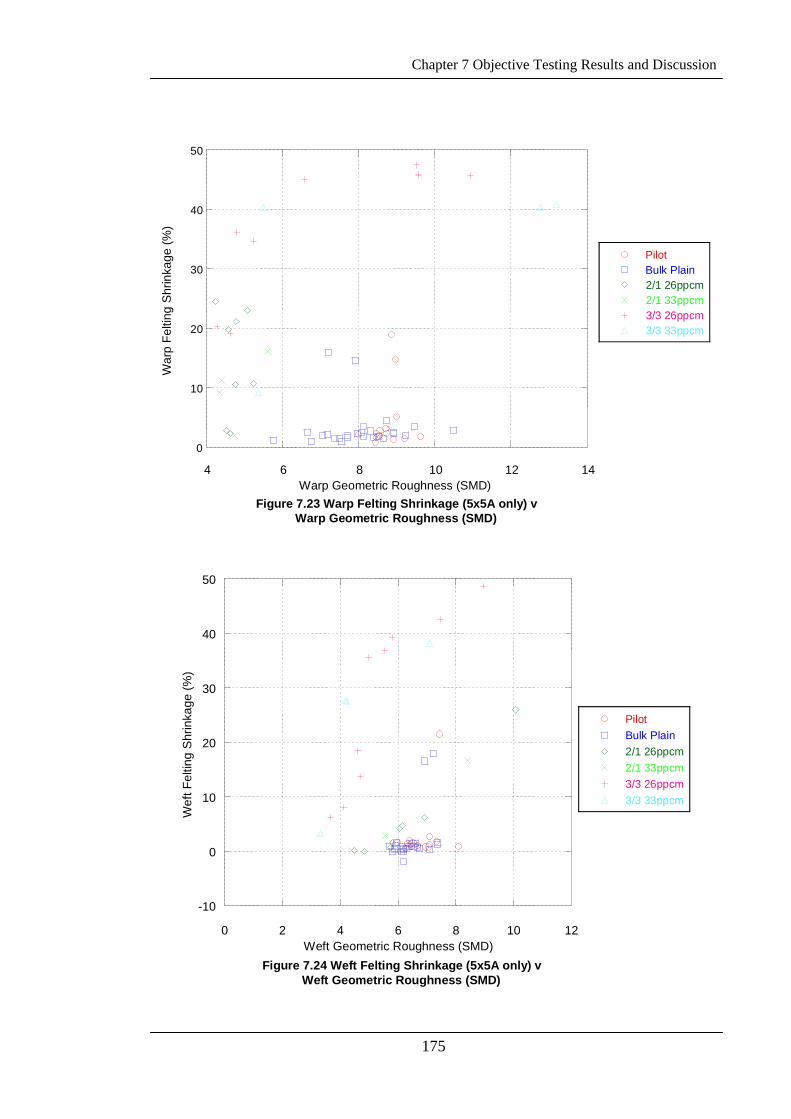
Chapter 7 Objective Testing Results and Discussion
175
0
10
20
30
40
50
4 6 8 10 12 14
Figure 7.23 Warp Felting Shrinkage (5x5A only) vWarp Geometric Roughness (SMD)
PilotBulk Plain2/1 26ppcm2/1 33ppcm3/3 26ppcm3/3 33ppcm
War
p Fe
lting
Shr
inka
ge (%
)
Warp Geometric Roughness (SMD)
-10
0
10
20
30
40
50
0 2 4 6 8 10 12
Figure 7.24 Weft Felting Shrinkage (5x5A only) vWeft Geometric Roughness (SMD)
PilotBulk Plain2/1 26ppcm2/1 33ppcm3/3 26ppcm3/3 33ppcm
Wef
t Fel
ting
Shr
inka
ge (%
)
Weft Geometric Roughness (SMD)
Chapter 7 Objective Testing Results and Discussion
176
7.2.2 Bending Properties
7.2.2.1 Pilot Production
The bending rigidity (B) of this production was considerably reduced by crabbing, and
increased slightly in stentering. Cropping lead to a small reduction in bending rigidity.
Following this, there was very little difference between the different decatising
conditions used. For all the samples taken from crabbing onwards, the warp bending
rigidity was greater than the weft.
The bending hysteresis and the residual bending at 1cm-1 and 0.5cm-1 were reduced
appreciably by crabbing and then changed comparatively little as a result of further
finishing processes, with the one exception being that the sample decatised at 114°C for
4min showed an increase in the residual bending. There was also a small increase seen
in the samples which had been blown but not pressure decatised (No KD) when
measured at 1cm-1 bending
There was no indication that the severity of the decatising conditions had any effect on
any of the bending properties of these fabrics.
7.2.2.2 Bulk Production
For this production, scouring lead to a slight increase in the warp bending rigidity (B),
and a substantial reduction in the weft bending rigidity. Crabbing reduced both the
warp and weft B, and there was very little change resulting from stentering and
cropping. From decatising onwards, the rest of the finishing route generally lead to
small increases in the bending rigidity. For the samples taken from scouring onwards,
the warp B was greater than the weft.
Bending hysteresis and residual bending rigidity at 1cm-1 and 0.5cm-1 were all reduced
substantially a result of scouring and crabbing. Following this there was comparatively
little change in the residual bending values, and very slight increases seen in the
hysteresis as the fabric was finished further.
Chapter 7 Objective Testing Results and Discussion
177
There was no indication in any of the samples that the severity of the conditions had any
effect on the bending properties.
7.2.2.3 2/1 Twill Production
The bending rigidity for samples in this production, at both pick densities was reduced
in early finishing (scouring and crabbing) and then changed very little through the rest
of finishing. For all the samples, except the loomstate 33ppcm sample, the warp
bending rigidity was greater than the weft.
The bending hysteresis and residual bending at both 1cm-1 and 0.5cm-1 showed the same
trend as the bending rigidity. There was a large reduction resulting from scouring and
crabbing, followed by very little change through the rest of finishing. Warp bending
hysteresis was greater than weft bending hysteresis for the majority of samples. Warp
and weft residual bending were very similar to each other.
7.2.2.4 3/3 Twill Production
The bending rigidity of these fabrics changed very little in finishing, with the exception
that the 3/3 Twill 26ppcm sample showed a reduction in the weft bending rigidity, and
then very little further change.
The bending hysteresis and residual bending of the 3/3 Twill fabrics at 1cm-1 and
0.5cm-1 were reduced by scouring, and then changed very little through the rest of
finishing.
Chapter 7 Objective Testing Results and Discussion
178
7.2.2.5 Correlations with Felting Shrinkage
Figures 7.25 and 7.26 show the relationship between warp and weft felting shrinkage
with warp and weft bending rigidity, respectively. There is no indication in either of the
charts that changes in the bending rigidity of the fabric have any effect on fabric felting
shrinkage. Figures 7.27 and 7.28 show the relationship between warp and weft felting
shrinkage and warp and weft bending hysteresis at 1degree bending, respectively.
There is no indication in these charts that the bending hysteresis of the fabric has any
effect on the felting shrinkage of the fabric.
There was a wide range of values of correlation coefficients between felting shrinkage
and the bending properties of the samples ranging from strong negative to strong
positive values. The correlations were stronger for almost all bending properties, across
all the fabric structures, with weft felting shrinkage than with warp. Some of bending
properties, when correlated with weft felting shrinkage showed very strong correlations,
but the isolation of this to the weft direction only indicates that the felting shrinkage of
the fabric is not related to the bending properties.
Given the wide range of values of correlation coefficients, and the lack of trends in
correlation coefficients across the batches, it is concluded that the bending properties of
the fabric are not related to the felting shrinkage properties.
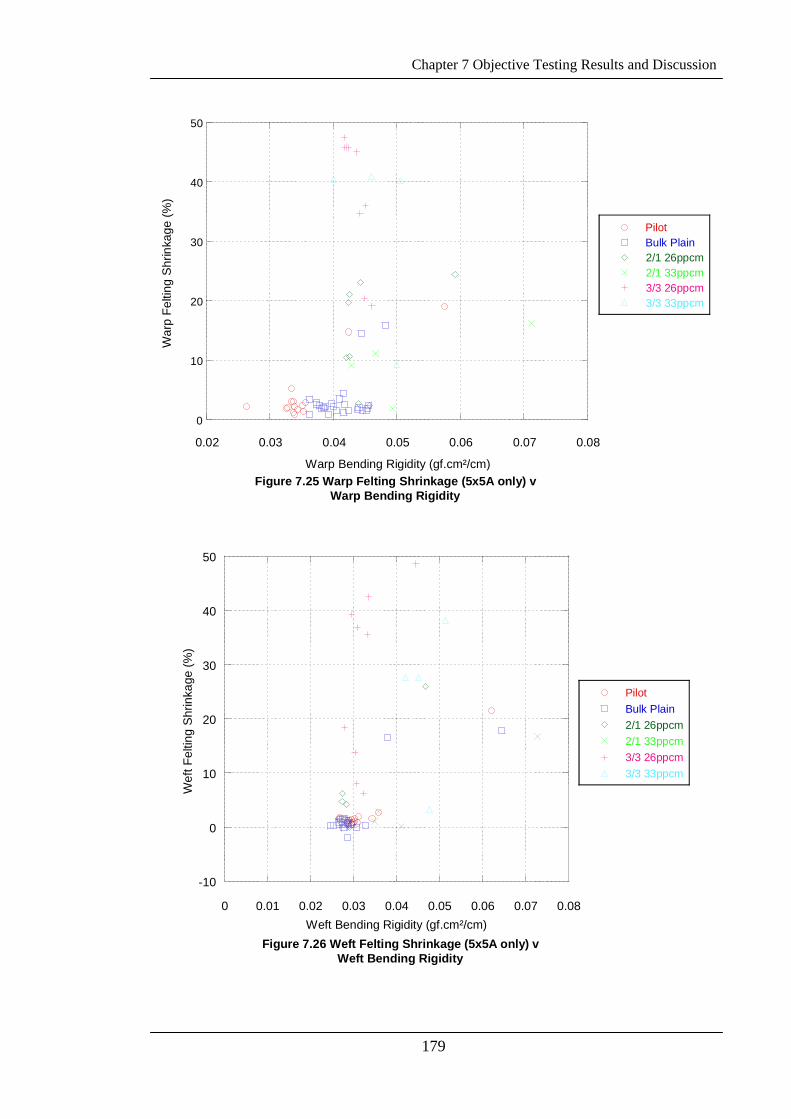
Chapter 7 Objective Testing Results and Discussion
179
0
10
20
30
40
50
0.02 0.03 0.04 0.05 0.06 0.07 0.08
Figure 7.25 Warp Felting Shrinkage (5x5A only) vWarp Bending Rigidity
PilotBulk Plain2/1 26ppcm2/1 33ppcm3/3 26ppcm3/3 33ppcm
War
p Fe
lting
Shr
inka
ge (%
)
Warp Bending Rigidity (gf.cm²/cm)
-10
0
10
20
30
40
50
0 0.01 0.02 0.03 0.04 0.05 0.06 0.07 0.08
Figure 7.26 Weft Felting Shrinkage (5x5A only) vWeft Bending Rigidity
PilotBulk Plain2/1 26ppcm2/1 33ppcm3/3 26ppcm3/3 33ppcm
Wef
t Fel
ting
Shr
inka
ge (%
)
Weft Bending Rigidity (gf.cm²/cm)
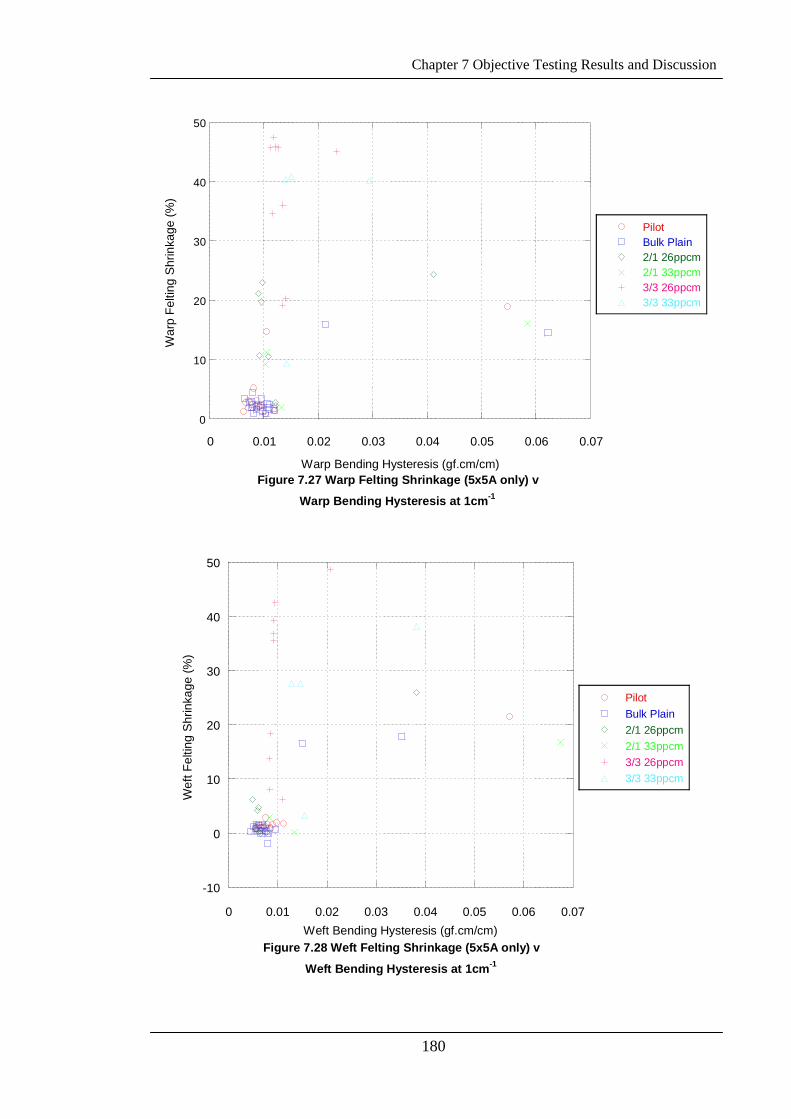
Chapter 7 Objective Testing Results and Discussion
180
0
10
20
30
40
50
0 0.01 0.02 0.03 0.04 0.05 0.06 0.07
Figure 7.27 Warp Felting Shrinkage (5x5A only) v
Warp Bending Hysteresis at 1cm-1
PilotBulk Plain2/1 26ppcm2/1 33ppcm3/3 26ppcm3/3 33ppcm
War
p Fe
lting
Shr
inka
ge (%
)
Warp Bending Hysteresis (gf.cm/cm)
-10
0
10
20
30
40
50
0 0.01 0.02 0.03 0.04 0.05 0.06 0.07
Figure 7.28 Weft Felting Shrinkage (5x5A only) v
Weft Bending Hysteresis at 1cm-1
PilotBulk Plain2/1 26ppcm2/1 33ppcm3/3 26ppcm3/3 33ppcm
Wef
t Fel
ting
Shr
inka
ge (%
)
Weft Bending Hysteresis (gf.cm/cm)
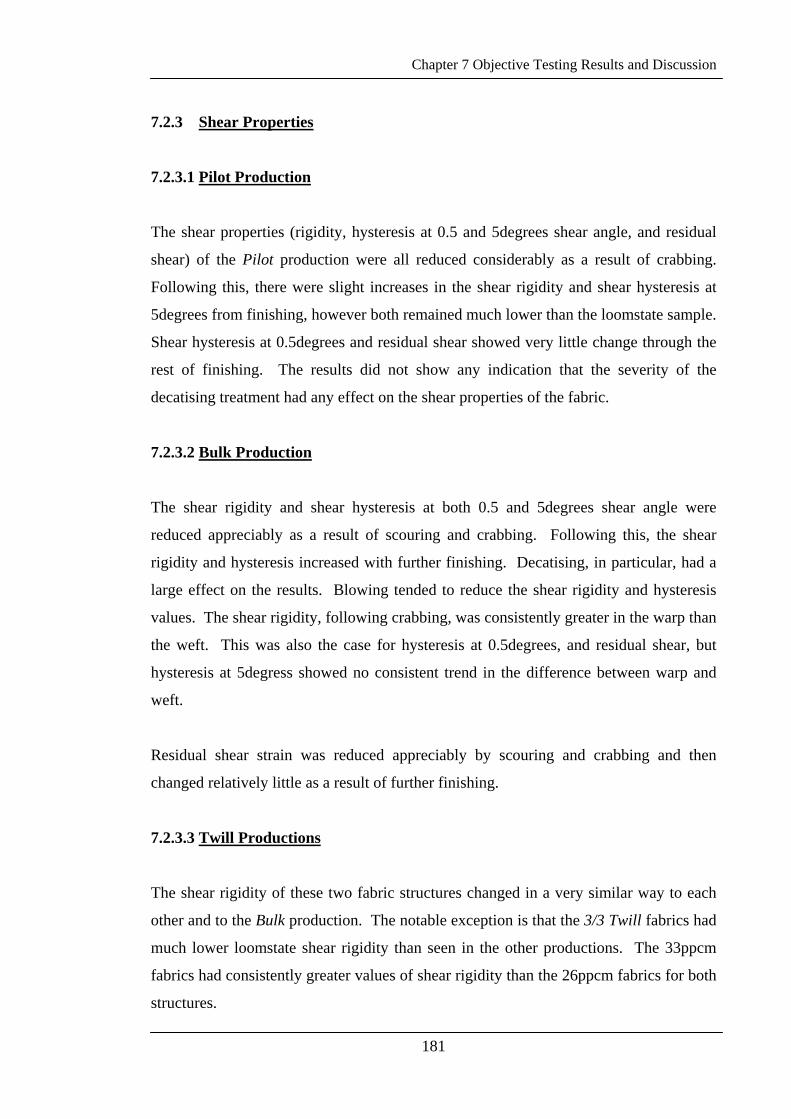
Chapter 7 Objective Testing Results and Discussion
181
7.2.3 Shear Properties
7.2.3.1 Pilot Production
The shear properties (rigidity, hysteresis at 0.5 and 5degrees shear angle, and residual
shear) of the Pilot production were all reduced considerably as a result of crabbing.
Following this, there were slight increases in the shear rigidity and shear hysteresis at
5degrees from finishing, however both remained much lower than the loomstate sample.
Shear hysteresis at 0.5degrees and residual shear showed very little change through the
rest of finishing. The results did not show any indication that the severity of the
decatising treatment had any effect on the shear properties of the fabric.
7.2.3.2 Bulk Production
The shear rigidity and shear hysteresis at both 0.5 and 5degrees shear angle were
reduced appreciably as a result of scouring and crabbing. Following this, the shear
rigidity and hysteresis increased with further finishing. Decatising, in particular, had a
large effect on the results. Blowing tended to reduce the shear rigidity and hysteresis
values. The shear rigidity, following crabbing, was consistently greater in the warp than
the weft. This was also the case for hysteresis at 0.5degrees, and residual shear, but
hysteresis at 5degress showed no consistent trend in the difference between warp and
weft.
Residual shear strain was reduced appreciably by scouring and crabbing and then
changed relatively little as a result of further finishing.
7.2.3.3 Twill Productions
The shear rigidity of these two fabric structures changed in a very similar way to each
other and to the Bulk production. The notable exception is that the 3/3 Twill fabrics had
much lower loomstate shear rigidity than seen in the other productions. The 33ppcm
fabrics had consistently greater values of shear rigidity than the 26ppcm fabrics for both
structures.
Chapter 7 Objective Testing Results and Discussion
182
For the 2/1 Twills, the shear hysteresis at both 0.5 and 5degrees shear angle was reduced
between the loomstate and crabbed samples. At 0.5degrees shear angle there were
minor increases resulting from decatising. At 5degrees shear angle, decatising lead to
larger increases in the hysteresis.
For the 3/3 Twills, the shear hysteresis at 0.5 and 5degrees shear angle was reduced in
finishing up to stentering. Cropping had very little effect on shear hysteresis. As was
seen in the Bulk and 2/1 Twill productions, decatising lead to large increases in the shear
hysteresis.
For the 2/1 Twills, the residual shear was greatly reduced between the loomstate and the
crabbed sample. Following this, there was relatively little change.
For the 3/3 Twills, the residual shear showed a progressive reduction between the
loomstate and the cropped sample. The first pressure decatising process increased it
slightly. Rotary pressing slightly increased the warp residual shear, and had little effect
on the weft. The final decatising reduced the residual shear slightly and blowing lead to
minor increases.
7.2.3.4 Correlations with Felting Shrinkage
Figures 7.29 and 7.30 show the relationship between warp and weft felting shrinkage
and warp and weft shear rigidity, respectively. These charts indicate that although some
of the fabric structures show a relationship between fabric felting shrinkage and the
shear rigidity, this is not consistent across all the fabric structures.
Figures 7.31 and 7.32 show the relationship between warp and weft felting shrinkage
and warp and weft shear hysteresis, measured at 0.5degrees shear angle. These charts
also show that there is no consistent relationship between fabric felting shrinkage and
shear hysteresis across all the fabric structures.
Chapter 7 Objective Testing Results and Discussion
183
There was a wide range of values for the correlation coefficients between fabric felting
shrinkage and the fabric shear properties. Some of the properties show positive
correlations, while others show negative, and there is no consistency across the different
batches which would suggest that changes in the shear properties contribute to the
reduction in fabric felting shrinkage.
It is therefore concluded that the shear properties of the fabrics have no influence on the
felting shrinkage properties of the fabric.
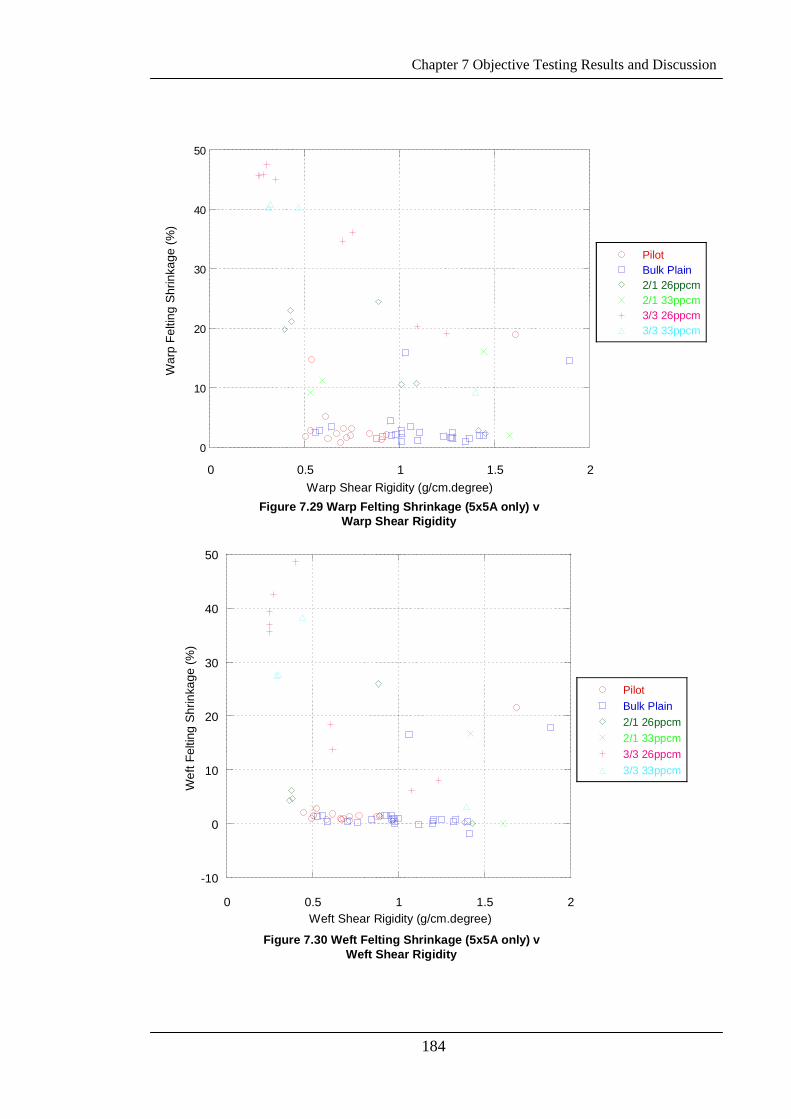
Chapter 7 Objective Testing Results and Discussion
184
0
10
20
30
40
50
0 0.5 1 1.5 2
Figure 7.29 Warp Felting Shrinkage (5x5A only) vWarp Shear Rigidity
PilotBulk Plain2/1 26ppcm2/1 33ppcm3/3 26ppcm3/3 33ppcm
War
p Fe
lting
Shr
inka
ge (%
)
Warp Shear Rigidity (g/cm.degree)
-10
0
10
20
30
40
50
0 0.5 1 1.5 2
Figure 7.30 Weft Felting Shrinkage (5x5A only) vWeft Shear Rigidity
PilotBulk Plain2/1 26ppcm2/1 33ppcm3/3 26ppcm3/3 33ppcm
Wef
t Fel
ting
Shr
inka
ge (%
)
Weft Shear Rigidity (g/cm.degree)
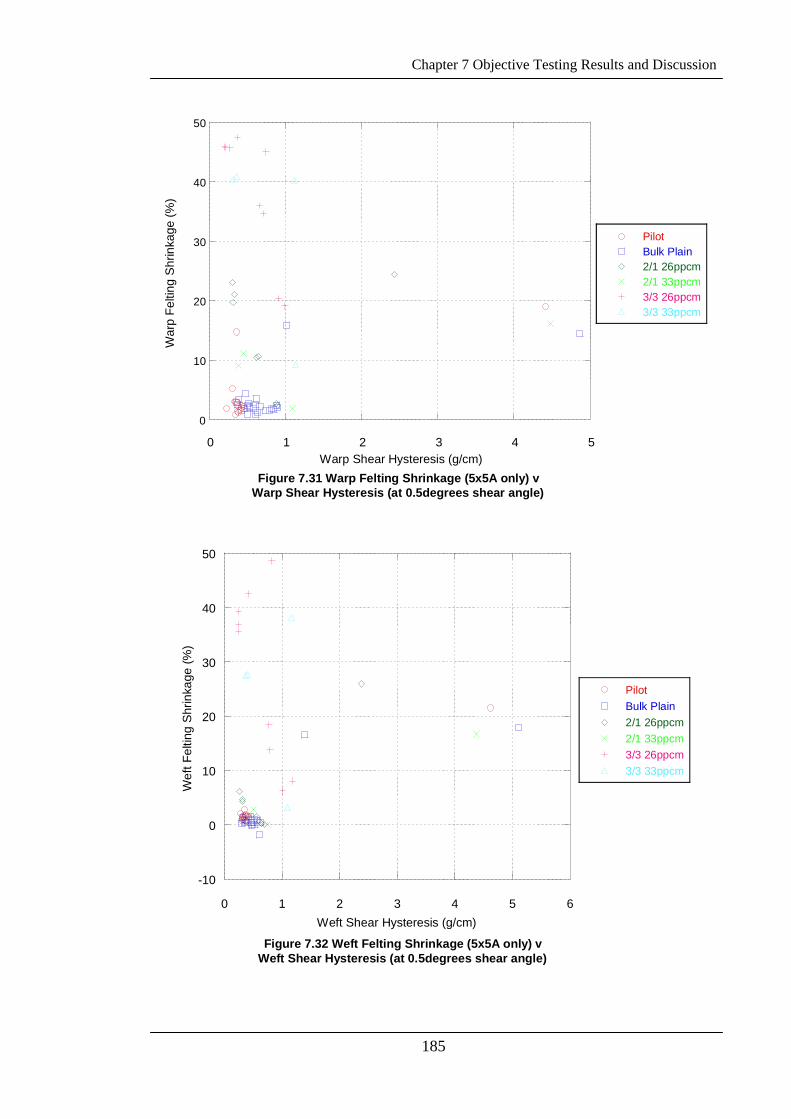
Chapter 7 Objective Testing Results and Discussion
185
0
10
20
30
40
50
0 1 2 3 4 5
Figure 7.31 Warp Felting Shrinkage (5x5A only) vWarp Shear Hysteresis (at 0.5degrees shear angle)
PilotBulk Plain2/1 26ppcm2/1 33ppcm3/3 26ppcm3/3 33ppcm
War
p Fe
lting
Shr
inka
ge (%
)
Warp Shear Hysteresis (g/cm)
-10
0
10
20
30
40
50
0 1 2 3 4 5 6
Figure 7.32 Weft Felting Shrinkage (5x5A only) vWeft Shear Hysteresis (at 0.5degrees shear angle)
PilotBulk Plain2/1 26ppcm2/1 33ppcm3/3 26ppcm3/3 33ppcm
Wef
t Fel
ting
Shr
inka
ge (%
)
Weft Shear Hysteresis (g/cm)
Chapter 7 Objective Testing Results and Discussion
186
7.2.4 Tensile Properties
Examples of typical tensile testing charts are shown in Appendix 4.
7.2.4.1 Pilot Production
The tensile strain and tensile energy followed very similar trends through finishing.
Crabbing lead to a large increase in the weft tensile strain and tensile energy. Stentering
lead to slight reductions in both directions, while cropping lead to slight increases. The
effect of decatising and/or blowing was mixed. Some samples showed increases in the
tensile strain and/or energy, while others showed a reduction.
The tensile resilience of the samples increased between the loomstate sample and the
cropped sample and was then reduced as a result of the blowing or decatising processes.
The linearity of the load extension curve was reduced as a result of crabbing and then
changed relatively little through the rest of the finishing processes.
There was no indication that the degree of change seen in any of the tensile properties
was related to the severity of the decatising conditions.
7.2.4.2 Bulk Production
The tensile strain and tensile resilience of this production followed the same trend as
each other through finishing. The weft measurements increased through finishing,
while warp measurements gave more mixed results. Following scouring, the weft
measurements were consistently greater than the warp.
The tensile resilience showed increases in the warp resilience and decreases in the weft
as a general result of finishing. For all the samples except the stentered, the warp tensile
resilience is greater than the weft and the difference between warp and weft increased as
finishing progressed.
Chapter 7 Objective Testing Results and Discussion
187
The linearity of the load extension curve was reduced in scouring and crabbing, and
then increased progressively with the rest of the finishing processes, but not to the same
level as the loomstate sample. Warp and weft values were very similar to each other.
7.2.4.3 Twill Productions
Note: Difficulties in fabric singeing meant that some of these samples were difficult to
get a test result from, especially the 3/3 twill fabrics. Consequently, some of the results
used in this section are from only one piece.
The tensile strain of the 2/1 Twill fabric fabrics increased greatly in the weft direction
between the loomstate and crabbed samples, and then changed very little as a result of
further finishing. The warp tensile strain changed very little through finishing. The
33ppcm fabrics had similar values except for a reduction in the weft direction resulting
from stentering. The 3/3 Twills showed similar trends to the 2/1 Twills, with a more
gradual increase in the weft direction.
The tensile energy followed a similar trend to the tensile strain of increases in the weft
direction resulting from finishing and very little change in the warp direction. The weft
direction increases were slightly more gradual than seen in the tensile strain results.
The tensile resilience changed very little between the loomstate and the cropped
samples. Decatising then lead to large reductions in the weft direction, but there was
almost no change in the warp direction. The warp resilience was consistently greater
than the weft for all samples, except the loomstate.
The linearity of the load extension curve was similar for all the twill weave fabrics. It
was reduced in both directions as a result of scouring and crabbing, then changed very
little until decatising. The first decatising treatment lead to a large increase in the
linearity of the load extension curve in both warp and weft direction and there was very
little change following this.

Chapter 7 Objective Testing Results and Discussion
188
7.2.4.4 Correlations with Felting Shrinkage
Figures 7.33 and 7.34 show the relationships between warp felting shrinkage and warp
tensile strain, and weft felting shrinkage and weft tensile strain, respectively. There is
no indication, from the charts, that changes in the tensile strain of the fabric have any
effect on the felting shrinkage of the fabric.
Figures 7.35 and 7.36 show the relationships between warp felting shrinkage and warp
tensile resilience, and weft felting shrinkage and weft tensile resilience, respectively.
The charts show that for some of the fabric structures, there is a relationship between
felting shrinkage and tensile resilience, however, this is not consistent across all the
fabric structures. As was the case with the tensile strain, there is no indication that a
change in the tensile resilience has any effect on the felting shrinkage of the fabric.
There is a wide range of correlation coefficients for the relationships between the fabric
tensile properties and fabric felting shrinkage. There was no consistency in the
correlations that were seen and although the felting shrinkage of some batches of fabric
showed strong correlations with tensile properties, there was no consistency across all
the fabric structures examined. This lack of consistency in the correlations leads to the
conclusion that tensile properties have no significant effect on fabric felting shrinkage.
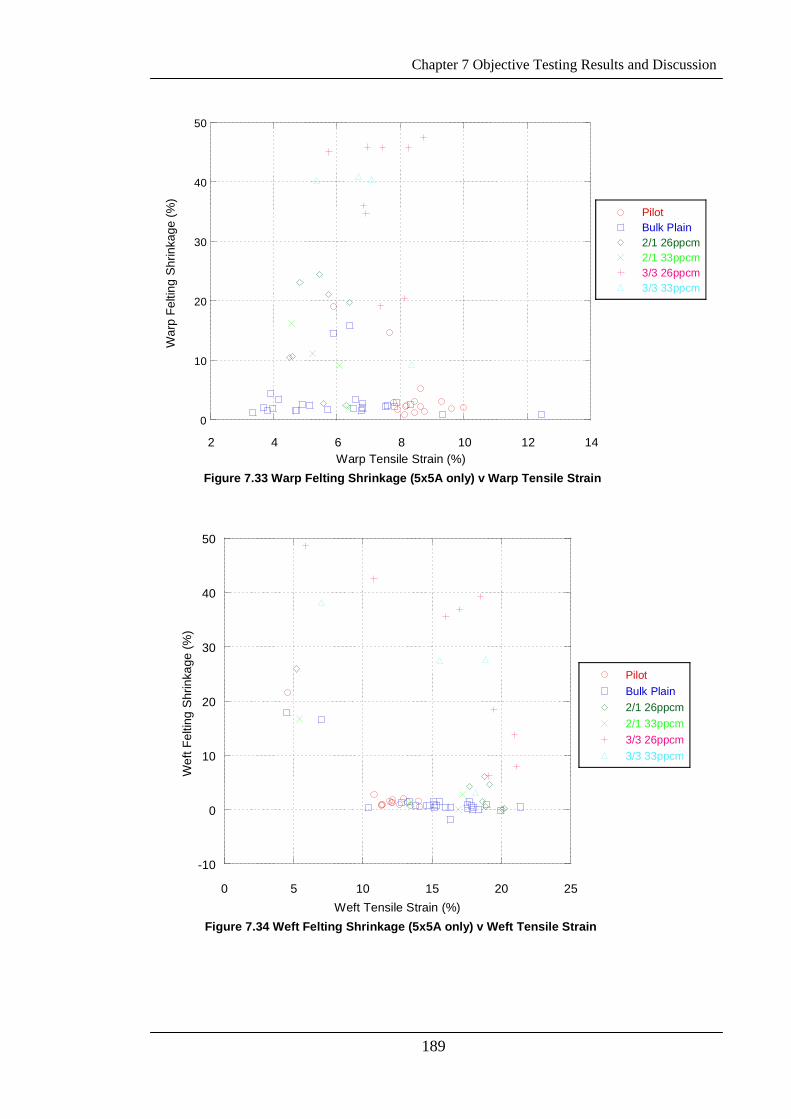
Chapter 7 Objective Testing Results and Discussion
189
0
10
20
30
40
50
2 4 6 8 10 12 14
Figure 7.33 Warp Felting Shrinkage (5x5A only) v Warp Tensile Strain
PilotBulk Plain2/1 26ppcm2/1 33ppcm3/3 26ppcm3/3 33ppcm
War
p Fe
lting
Shr
inka
ge (%
)
Warp Tensile Strain (%)
-10
0
10
20
30
40
50
0 5 10 15 20 25
Figure 7.34 Weft Felting Shrinkage (5x5A only) v Weft Tensile Strain
PilotBulk Plain2/1 26ppcm2/1 33ppcm3/3 26ppcm3/3 33ppcm
Wef
t Fel
ting
Shr
inka
ge (%
)
Weft Tensile Strain (%)
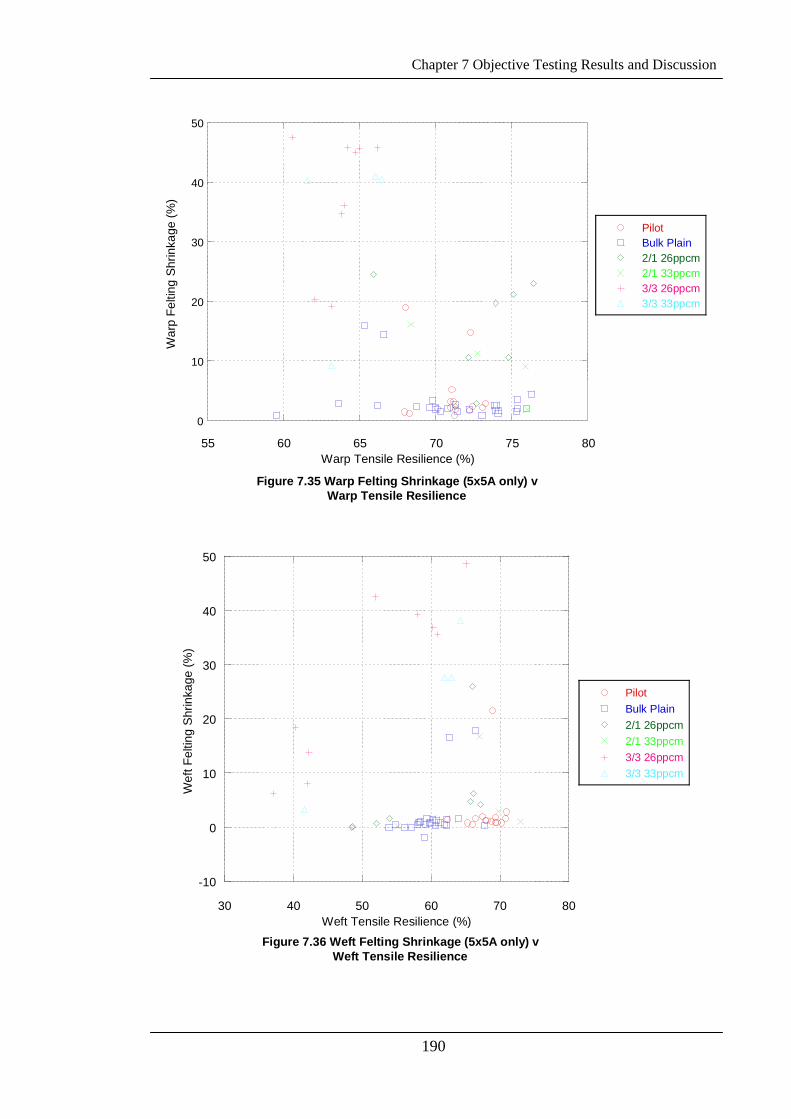
Chapter 7 Objective Testing Results and Discussion
190
0
10
20
30
40
50
55 60 65 70 75 80
Figure 7.35 Warp Felting Shrinkage (5x5A only) vWarp Tensile Resilience
PilotBulk Plain2/1 26ppcm2/1 33ppcm3/3 26ppcm3/3 33ppcm
War
p Fe
lting
Shr
inka
ge (%
)
Warp Tensile Resilience (%)
-10
0
10
20
30
40
50
30 40 50 60 70 80
Figure 7.36 Weft Felting Shrinkage (5x5A only) vWeft Tensile Resilience
PilotBulk Plain2/1 26ppcm2/1 33ppcm3/3 26ppcm3/3 33ppcm
Wef
t Fel
ting
Shr
inka
ge (%
)
Weft Tensile Resilience (%)
Chapter 7 Objective Testing Results and Discussion
191
7.2.5 Compression Properties
Examples of typical compression charts are shown in Appendix 4.
7.2.5.1 Pilot Production
The compressional rate and the compressional energy of the samples taken from this
production were progressively reduced in finishing with the largest reduction seen to
result from crabbing. There was no indication that the severity of the decatising had any
impact on the compressional rate or energy.
The results of compressional resilience did not show any consistent trends through
finishing. There was very little change in early finishing, decatising lead to a reduction,
but the amount of reduction was highly variable and did not appear to correspond to the
severity of the decatising treatment. Blowing in one instance reduced the resilience
slightly, and in the other, lead to a large increase.
The linearity of the compression curve did not show any distinct trends through
finishing.
7.2.5.2 Bulk Production
The compressional rate and compressional energy showed similar trends through
finishing. The largest reduction occurred as a result of the crabbing process, and each
combination of finishing conditions lead, overall, to reduced values of compressional
rate and energy.
As was the case with the Pilot production, the compressional resilience did not show
any trends through finishing.
The linearity of the compression curve showed little change through finishing, however
in this production decatising tended to increase the linearity value, rotary pressing
decreased it, and blowing had mixed effects.
Chapter 7 Objective Testing Results and Discussion
192
7.2.5.3 Twill Productions
The compressional rate and compressional energy for all the twill weave fabrics were
reduced through finishing. The compression rate values in the 2/1 Twill loomstate
samples were much greater than the 3/3 loomstate samples. The compressional rate and
compressional energy were greatly reduced in the 2/1 Twill by scouring/crabbing and
then further slightly reduced in decatising. The 3/3 Twill did not show large reductions
until the first pressure decatising process.
The compressional resilience and linearity of the compression thickness curve showed
no distinct trends resulting from the finishing processes.
7.2.5.4 Correlations with Felting Shrinkage
Figures 7.37, 7.38 and 7.39 show the relationships between fabric area shrinkage and
the compressional results obtained. The charts show that changes in the felting
shrinkage of the fabric may be a result of changes in the compressional properties of the
fabric.
There were some consistently strong correlations between fabric felting shrinkage and
the compressional properties across all the batches of fabric. Compressional rate and
compressional energy both show strong positive correlations. The compressional rate
had several exceptions with slightly lower values in the 3/3 Twill structures, but the
compressional energy had correlation coefficients ranging from 0.78 to 0.9875. These
strong correlations with compression properties compare well with the strong
correlations seen between fabric felting shrinkage and FAST compression results.
There was a much wider range of correlation coefficients in the compressional
resilience and the linearity of the load compression curve, ranging from strong negative
correlations to moderate positive correlations. This wide range of correlations, and the
lack of consistency across the different batches of fabrics, indicate that compressional
resilience and linearity of the load compression curve are not related to the felting
shrinkage of these fabrics.
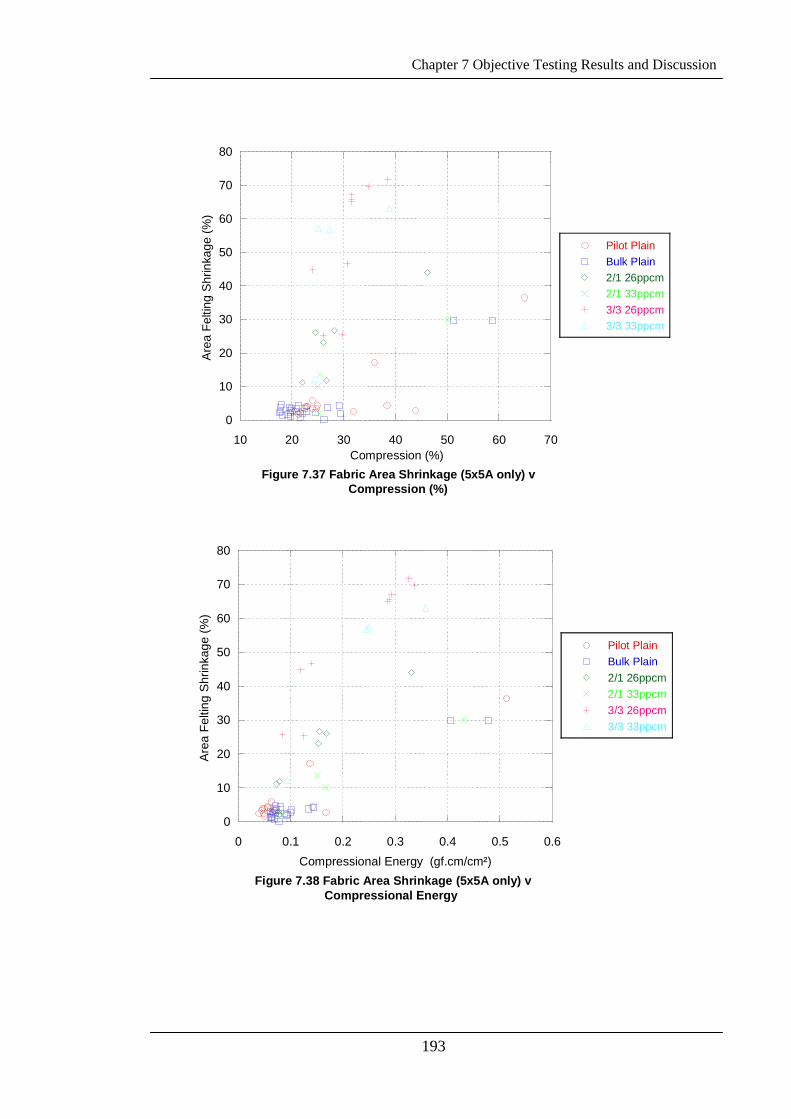
Chapter 7 Objective Testing Results and Discussion
193
0
10
20
30
40
50
60
70
80
10 20 30 40 50 60 70
Figure 7.37 Fabric Area Shrinkage (5x5A only) vCompression (%)
Pilot PlainBulk Plain2/1 26ppcm2/1 33ppcm3/3 26ppcm3/3 33ppcm
Are
a Fe
lting
Shr
inka
ge (%
)
Compression (%)
0
10
20
30
40
50
60
70
80
0 0.1 0.2 0.3 0.4 0.5 0.6
Figure 7.38 Fabric Area Shrinkage (5x5A only) vCompressional Energy
Pilot PlainBulk Plain2/1 26ppcm2/1 33ppcm3/3 26ppcm3/3 33ppcm
Are
a Fe
lting
Shr
inka
ge (%
)
Compressional Energy (gf.cm/cm²)
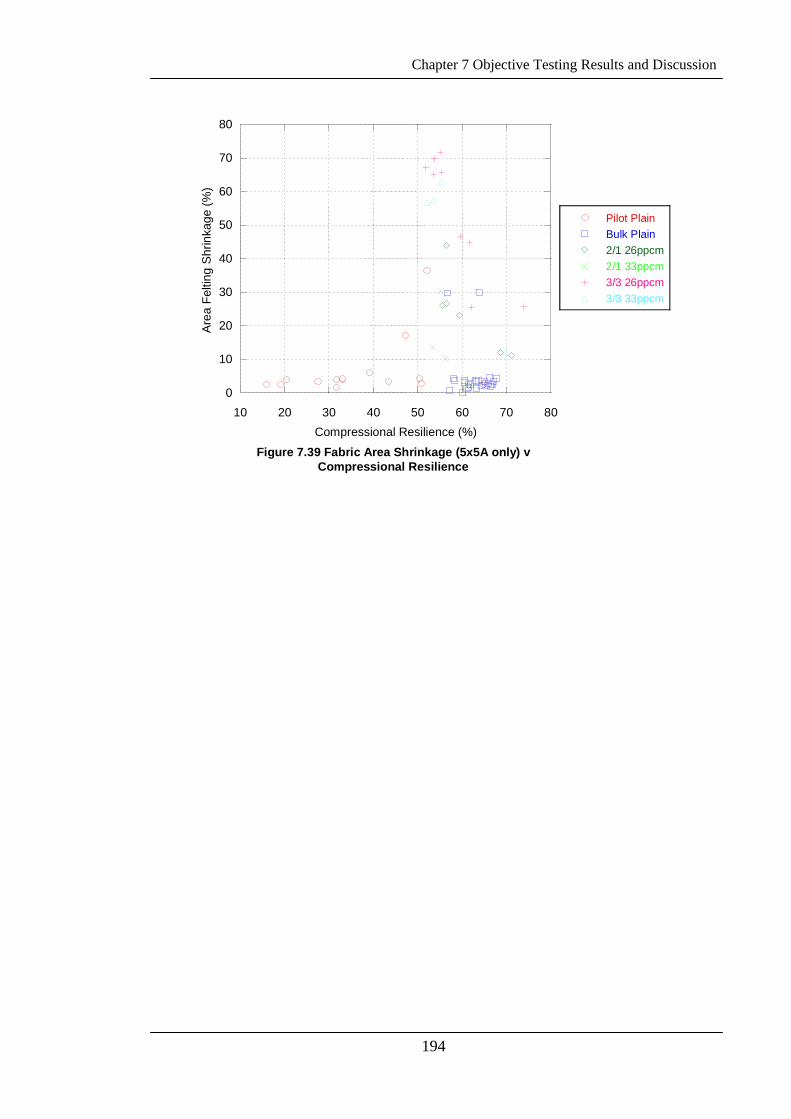
Chapter 7 Objective Testing Results and Discussion
194
0
10
20
30
40
50
60
70
80
10 20 30 40 50 60 70 80
Figure 7.39 Fabric Area Shrinkage (5x5A only) vCompressional Resilience
Pilot PlainBulk Plain2/1 26ppcm2/1 33ppcm3/3 26ppcm3/3 33ppcm
Are
a Fe
lting
Shr
inka
ge (%
)
Compressional Resilience (%)
Chapter 7 Objective Testing Results and Discussion
195
7.3 DISCUSSION
Many of the properties measured in this section have been associated with changes in
the interyarn and/or interfibre frictional properties of the fabrics as finishing takes place.
For instance, residual bending has been associated with interfibre friction in fabric and
the better the fabric is set, the more effect it will have on bending properties [139].
Other bending properties, in particular bending hysteresis have also been associated
with interfibre friction, which is also affected by the twist properties of the yarn [195].
Extension properties are also determined by interfibre friction [195]. Where both warp
and weft extensibility increase, the change has been shown to be a result of the fabric
having relaxed during processing [196]. For example, as was seen in the Bulk
production, in the processes up to stentering.
Fabric shear properties have been associated with interyarn friction [195] [197]).
Mahar, Dhingra, and Postle [174] found that warp and weft shear properties were well
correlated with each other. This was also found in the current project.
Bending and shear properties are reduced as a result of setting of wool fabrics [57], with
the first setting operation giving the largest change. This has also, been shown to be the
case in the current results.
Le, Tester, Ly and De Jong [198] also found that decatising lead to a number of changes
in the mechanical properties of the fabric when measured using FAST equipment
resulting from changes in the interactions between fibres and yarns. They also found
that the regain, temperature, and prior rotary pressing all had an effect on the final
decatised fabric. It has been shown that decatising relaxes the fabric; increased
decatising temperature increases the level of permanent set [198]. Pressure decatising,
and other setting processes have been shown in this project to change the mechanical
properties of the fabrics, however, this does not appear to have any influence over the
felting shrinkage properties of the fabric. Rather, the changes are seen to be reflected in
properties such as relaxation shrinkage and hygral expansion.
Chapter 7 Objective Testing Results and Discussion
196
As fibre friction is also a major factor in determining the felting properties of fibres as a
result of the scales on the surface and the difference in friction with direction of rubbing
[eg 2, 4], it was anticipated that measures which indicate changes in fibre friction within
the fabric may also reflect changes in the felting shrinkage of the fabric. As discussed
above, mechanical properties have been shown to reflect changes in the frictional
properties of fibres and yarns within fabrics. The low stress mechanical properties of
fabrics may have been able to demonstrate changes in the frictional properties of the
fibres and therefore, indicate changes in the felting propensity.
However, in this study, there was a lack of distinct trends in the data or in the
correlations with felting shrinkage across all the batches of fabric, which would indicate
that changes in the frictional properties of the fibres, yarns, or fabric did not have a
significant impact on the reduction of the felting shrinkage that was observed. Although
some trends were observed between felting shrinkage and mechanical properties for
some of the fabrics, there were no consistent trends across all the productions. The only
exception to this was the compression results which, for both the FAST and KES-F
results, show that the fabric felting shrinkage is related to the compression properties of
the fabrics for all the fabric structures examined. The reasons for this are discussed in
Chapter 6, as thickness contributes the fabric density calculations.
The results of the mechanical testing indicate that changes in the frictional properties of
the fibres have occurred as a result of the finishing processes that were used. However,
the lack of consistent trends through all the fabrics indicates that changes in the
frictional properties of the fibres, reflected in the mechanical properties of the fabric, are
unable to directly explain the shrink-resist effect that has been found in these fabrics.
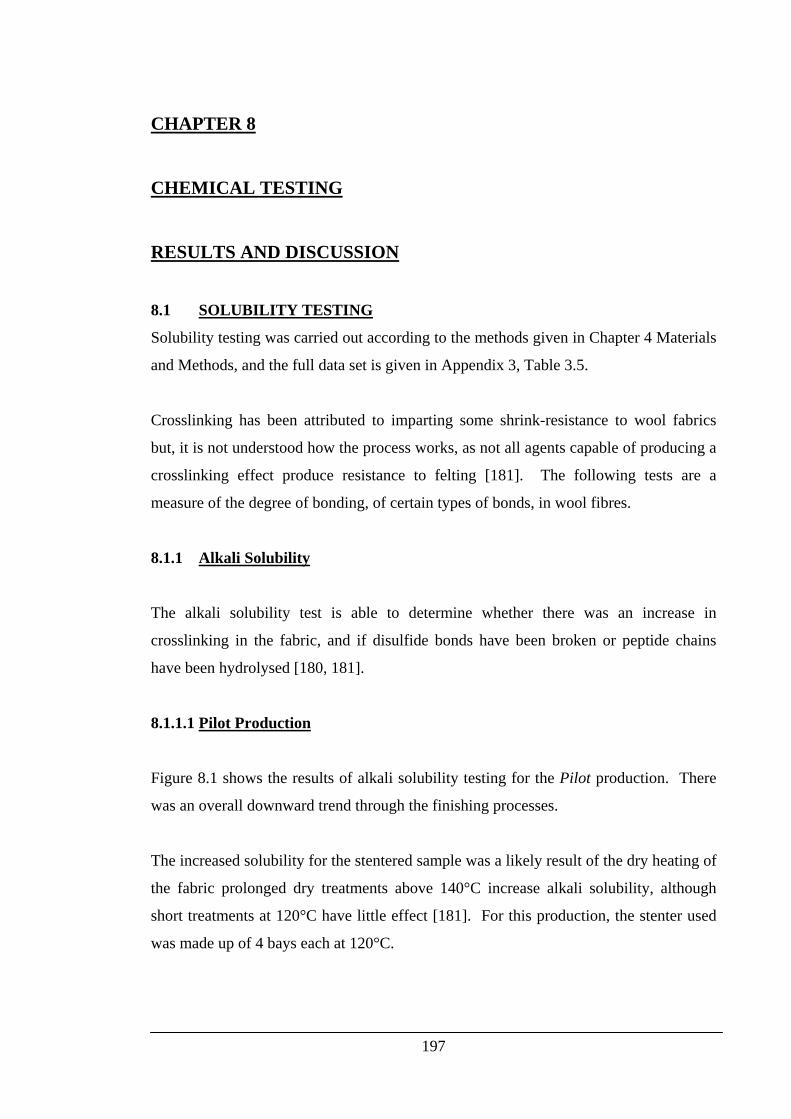
197
CHAPTER 8
CHEMICAL TESTING
RESULTS AND DISCUSSION
8.1 SOLUBILITY TESTING
Solubility testing was carried out according to the methods given in Chapter 4 Materials
and Methods, and the full data set is given in Appendix 3, Table 3.5.
Crosslinking has been attributed to imparting some shrink-resistance to wool fabrics
but, it is not understood how the process works, as not all agents capable of producing a
crosslinking effect produce resistance to felting [181]. The following tests are a
measure of the degree of bonding, of certain types of bonds, in wool fibres.
8.1.1 Alkali Solubility
The alkali solubility test is able to determine whether there was an increase in
crosslinking in the fabric, and if disulfide bonds have been broken or peptide chains
have been hydrolysed [180, 181].
8.1.1.1 Pilot Production
Figure 8.1 shows the results of alkali solubility testing for the Pilot production. There
was an overall downward trend through the finishing processes.
The increased solubility for the stentered sample was a likely result of the dry heating of
the fabric prolonged dry treatments above 140°C increase alkali solubility, although
short treatments at 120°C have little effect [181]. For this production, the stenter used
was made up of 4 bays each at 120°C.
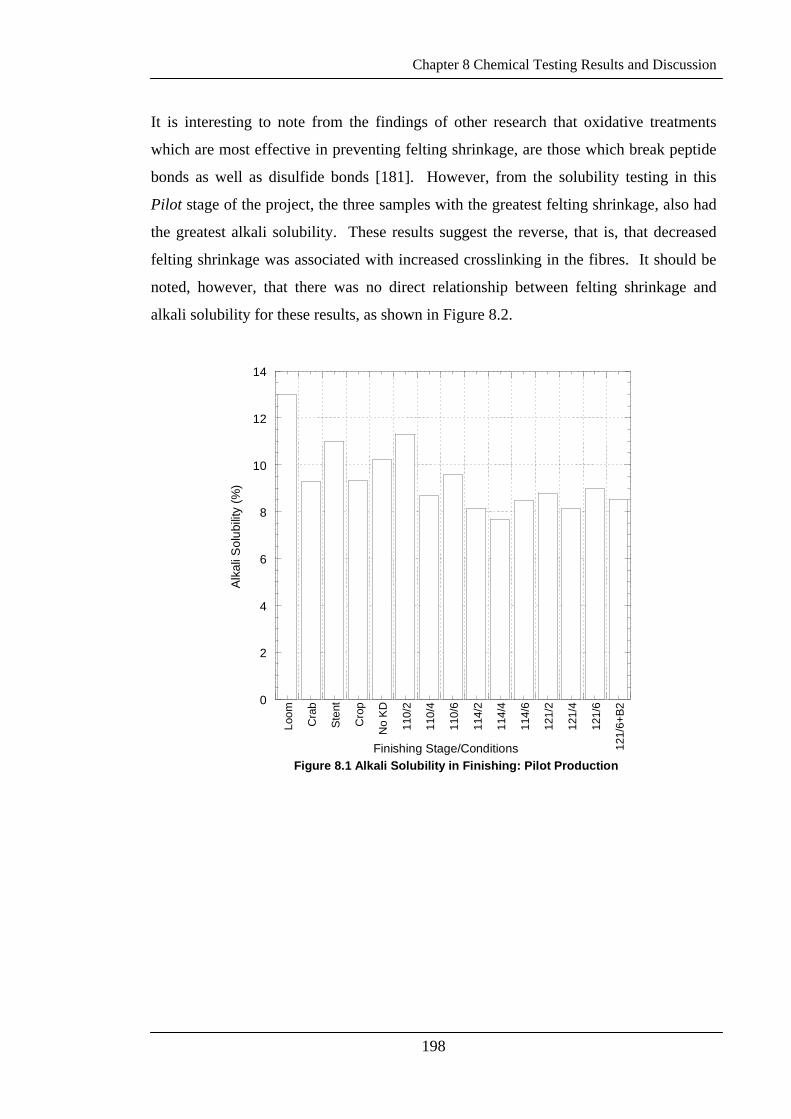
Chapter 8 Chemical Testing Results and Discussion
198
It is interesting to note from the findings of other research that oxidative treatments
which are most effective in preventing felting shrinkage, are those which break peptide
bonds as well as disulfide bonds [181]. However, from the solubility testing in this
Pilot stage of the project, the three samples with the greatest felting shrinkage, also had
the greatest alkali solubility. These results suggest the reverse, that is, that decreased
felting shrinkage was associated with increased crosslinking in the fibres. It should be
noted, however, that there was no direct relationship between felting shrinkage and
alkali solubility for these results, as shown in Figure 8.2.
0
2
4
6
8
10
12
14
Loom
Cra
b
Sten
t
Cro
p
No
KD
110/
2
110/
4
110/
6
114/
2
114/
4
114/
6
121/
2
121/
4
121/
6
121/
6+B2
Figure 8.1 Alkali Solubility in Finishing: Pilot Production
Alk
ali S
olub
ility
(%)
Finishing Stage/Conditions
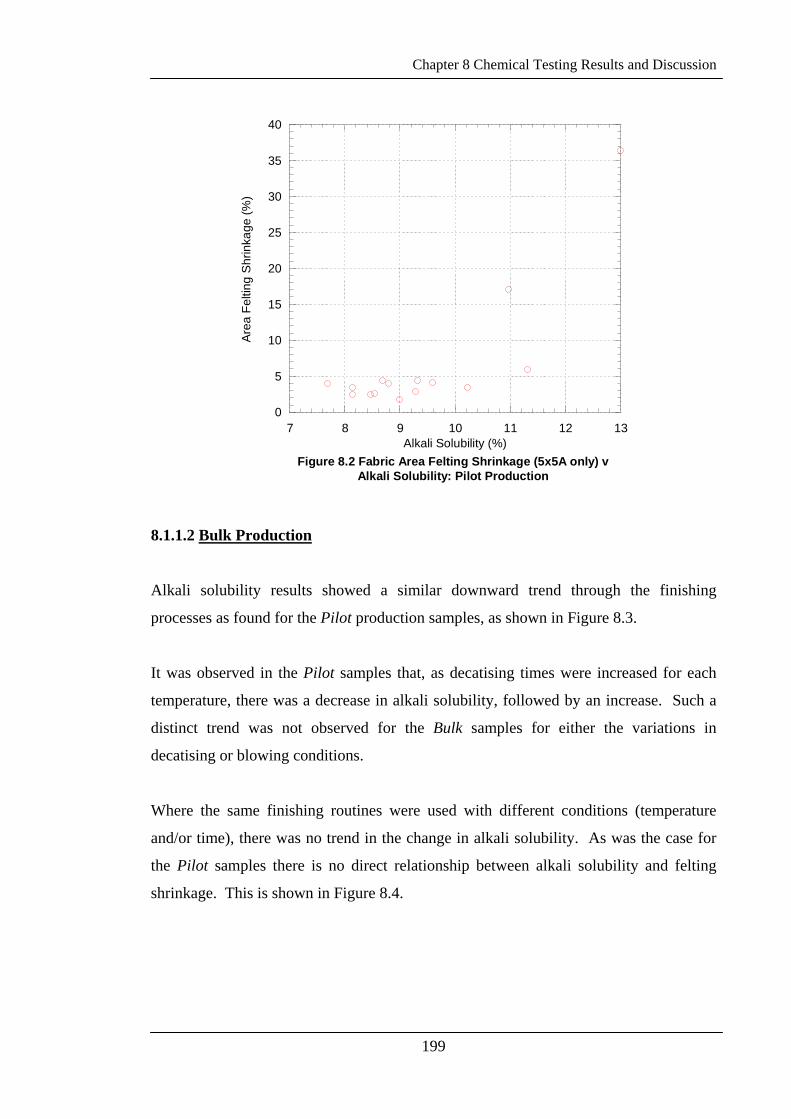
Chapter 8 Chemical Testing Results and Discussion
199
0
5
10
15
20
25
30
35
40
7 8 9 10 11 12
Figure 8.2 Fabric Area Felting Shrinkage (5x5A only) vAlkali Solubility: Pilot Production
Area
Fel
ting
Shr
inka
ge (%
)
Alkali Solubility (%)13
8.1.1.2 Bulk Production
Alkali solubility results showed a similar downward trend through the finishing
processes as found for the Pilot production samples, as shown in Figure 8.3.
It was observed in the Pilot samples that, as decatising times were increased for each
temperature, there was a decrease in alkali solubility, followed by an increase. Such a
distinct trend was not observed for the Bulk samples for either the variations in
decatising or blowing conditions.
Where the same finishing routines were used with different conditions (temperature
and/or time), there was no trend in the change in alkali solubility. As was the case for
the Pilot samples there is no direct relationship between alkali solubility and felting
shrinkage. This is shown in Figure 8.4.
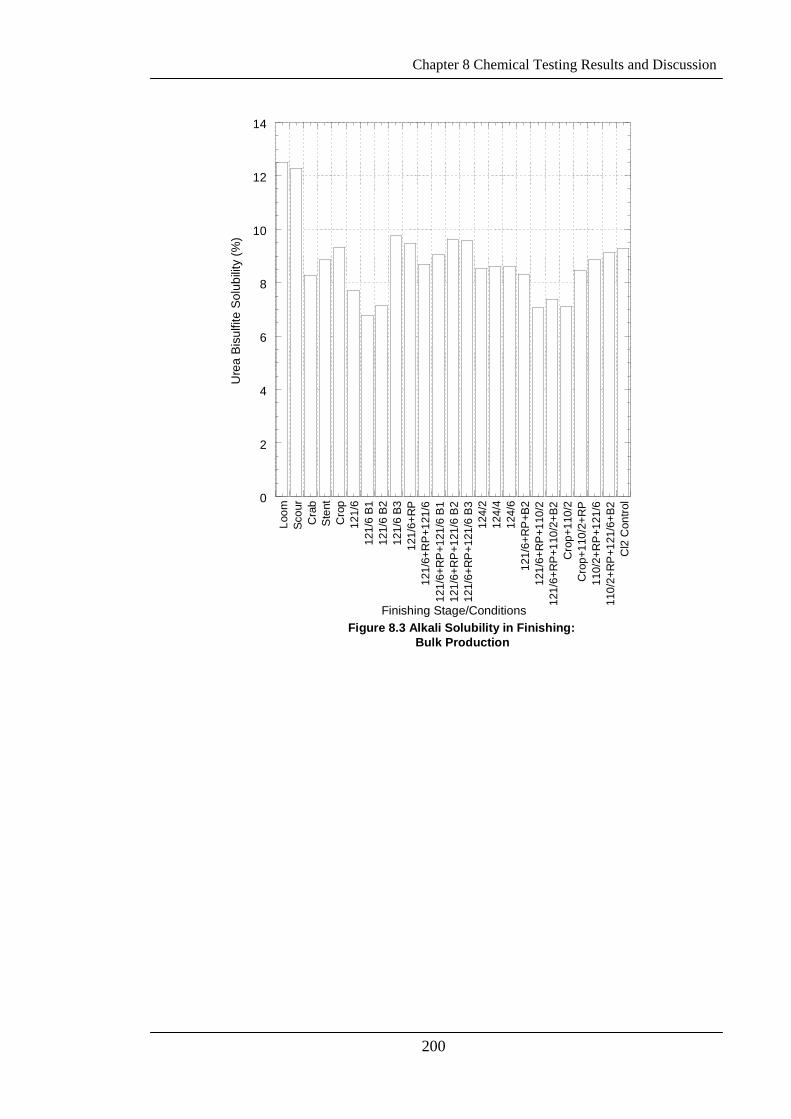
Chapter 8 Chemical Testing Results and Discussion
200
0
2
4
6
8
10
12
14
Loom
Scou
rC
rab
Sten
tC
rop
121/
612
1/6
B112
1/6
B212
1/6
B312
1/6+
RP
121/
6+R
P+1
21/6
121/
6+R
P+1
21/6
B1
121/
6+R
P+1
21/6
B2
121/
6+R
P+1
21/6
B3
124/
212
4/4
124/
612
1/6+
RP
+B2
121/
6+R
P+1
10/2
121/
6+R
P+1
10/2
+B2
Cro
p+11
0/2
Cro
p+11
0/2+
RP
110/
2+R
P+1
21/6
110/
2+R
P+1
21/6
+B2
Cl2
Con
trol
Figure 8.3 Alkali Solubility in Finishing: Bulk Production
Ure
a Bi
sulfi
te S
olub
ility
(%)
Finishing Stage/Conditions
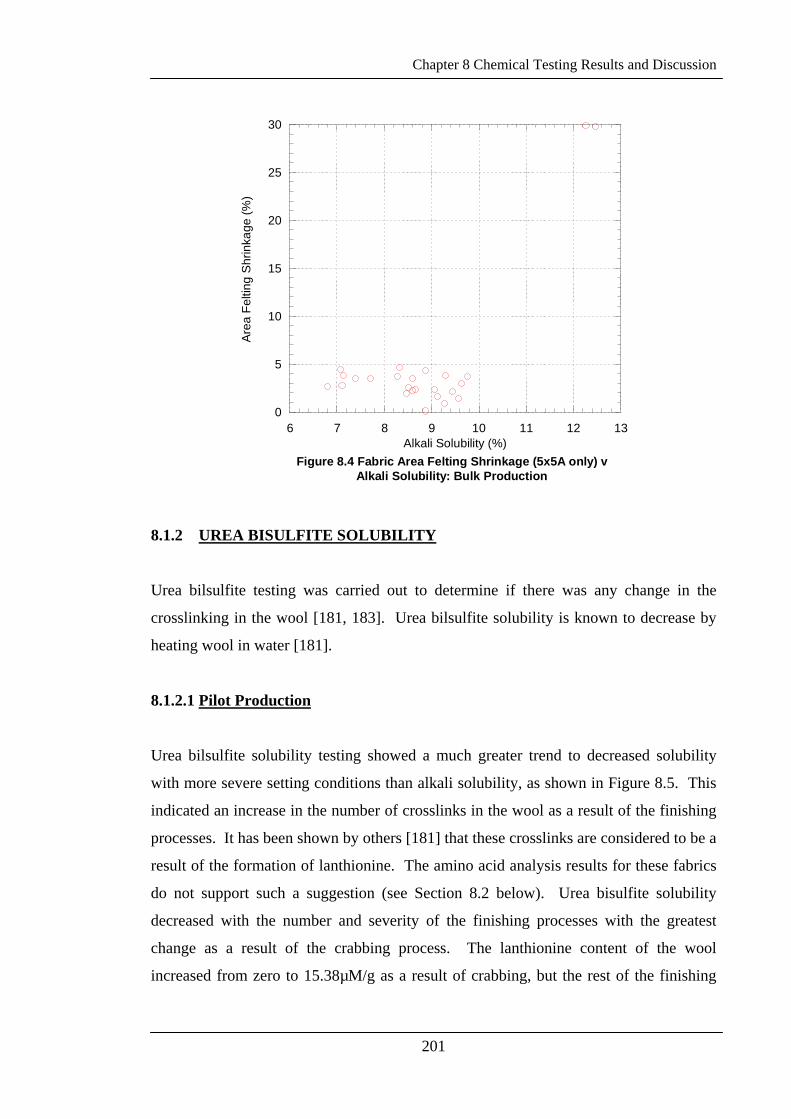
Chapter 8 Chemical Testing Results and Discussion
201
0
5
10
15
20
25
30
6 7 8 9 10 11 12
Figure 8.4 Fabric Area Felting Shrinkage (5x5A only) vAlkali Solubility: Bulk Production
Area
Fel
ting
Shr
inka
ge (%
)
Alkali Solubility (%)13
8.1.2 UREA BISULFITE SOLUBILITY
Urea bilsulfite testing was carried out to determine if there was any change in the
crosslinking in the wool [181, 183]. Urea bilsulfite solubility is known to decrease by
heating wool in water [181].
8.1.2.1 Pilot Production
Urea bilsulfite solubility testing showed a much greater trend to decreased solubility
with more severe setting conditions than alkali solubility, as shown in Figure 8.5. This
indicated an increase in the number of crosslinks in the wool as a result of the finishing
processes. It has been shown by others [181] that these crosslinks are considered to be a
result of the formation of lanthionine. The amino acid analysis results for these fabrics
do not support such a suggestion (see Section 8.2 below). Urea bisulfite solubility
decreased with the number and severity of the finishing processes with the greatest
change as a result of the crabbing process. The lanthionine content of the wool
increased from zero to 15.38µM/g as a result of crabbing, but the rest of the finishing
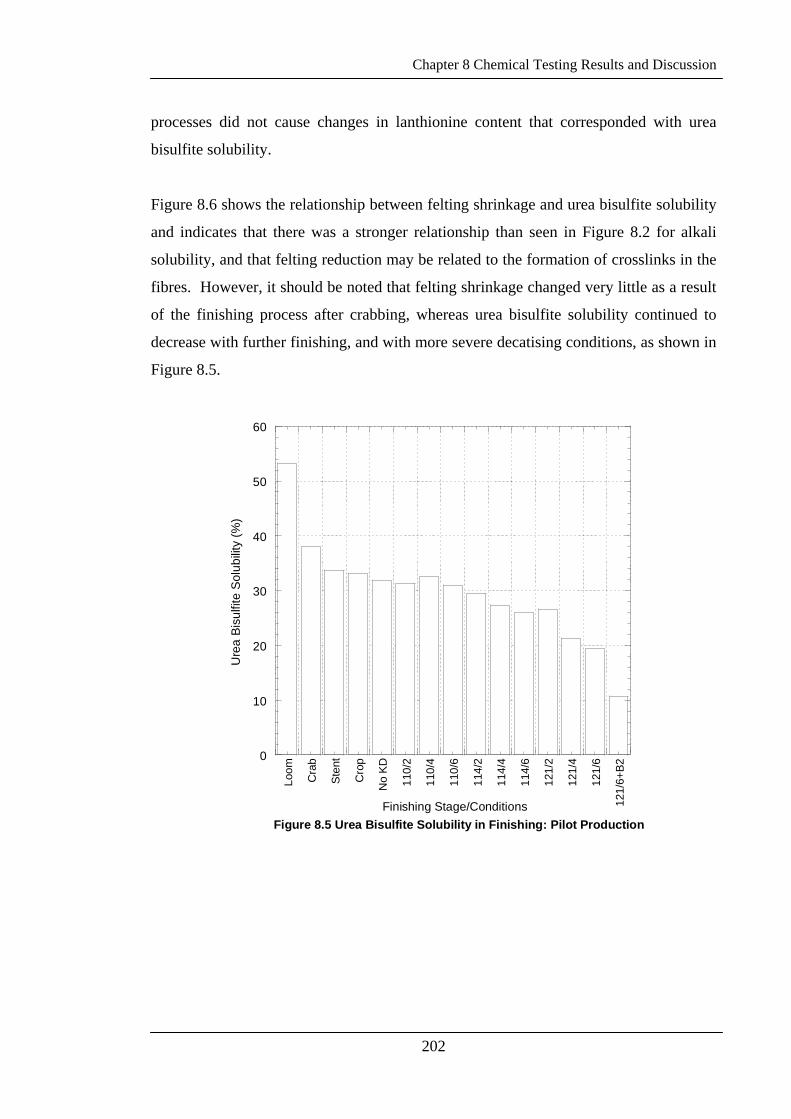
Chapter 8 Chemical Testing Results and Discussion
202
processes did not cause changes in lanthionine content that corresponded with urea
bisulfite solubility.
Figure 8.6 shows the relationship between felting shrinkage and urea bisulfite solubility
and indicates that there was a stronger relationship than seen in Figure 8.2 for alkali
solubility, and that felting reduction may be related to the formation of crosslinks in the
fibres. However, it should be noted that felting shrinkage changed very little as a result
of the finishing process after crabbing, whereas urea bisulfite solubility continued to
decrease with further finishing, and with more severe decatising conditions, as shown in
Figure 8.5.
0
10
20
30
40
50
60
Loom
Cra
b
Sten
t
Cro
p
No
KD
110/
2
110/
4
110/
6
114/
2
114/
4
114/
6
121/
2
121/
4
121/
6
121/
6+B2
Figure 8.5 Urea Bisulfite Solubility in Finishing: Pilot Production
Ure
a Bi
sulfi
te S
olub
ility
(%)
Finishing Stage/Conditions
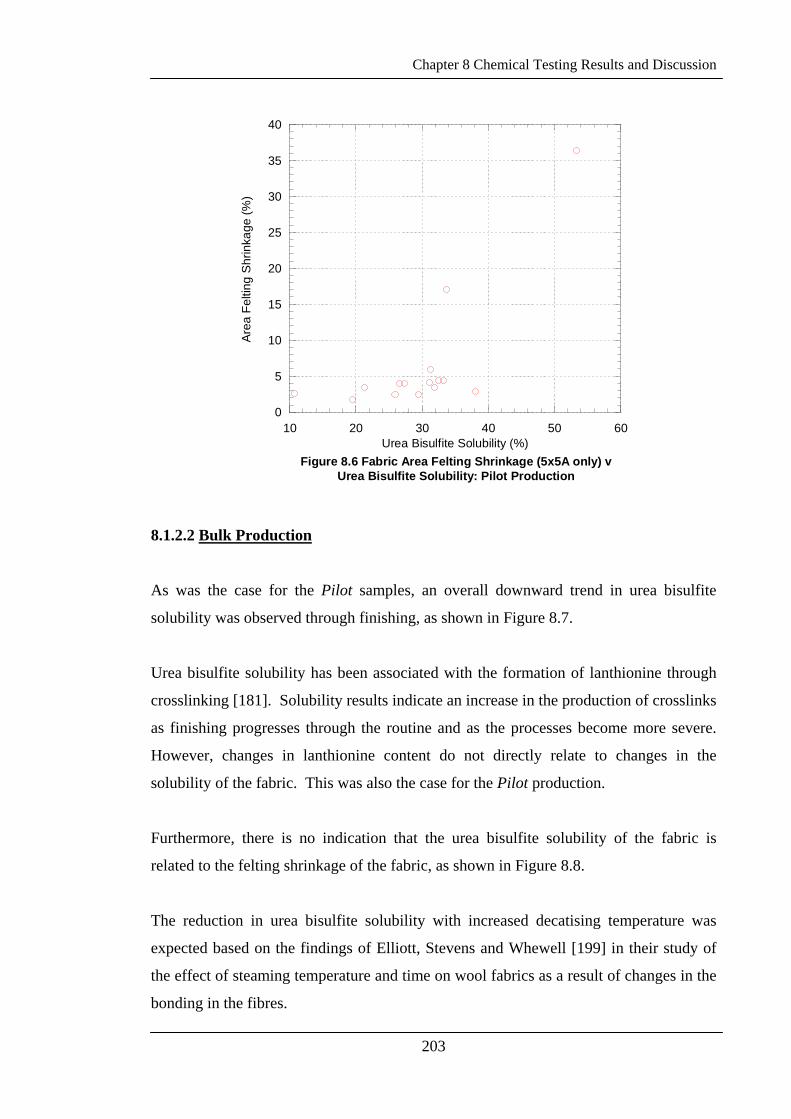
Chapter 8 Chemical Testing Results and Discussion
203
0
5
10
15
20
25
30
35
40
10 20 30 40 50 60
Figure 8.6 Fabric Area Felting Shrinkage (5x5A only) vUrea Bisulfite Solubility: Pilot Production
Area
Fel
ting
Shr
inka
ge (%
)
Urea Bisulfite Solubility (%)
8.1.2.2 Bulk Production
As was the case for the Pilot samples, an overall downward trend in urea bisulfite
solubility was observed through finishing, as shown in Figure 8.7.
Urea bisulfite solubility has been associated with the formation of lanthionine through
crosslinking [181]. Solubility results indicate an increase in the production of crosslinks
as finishing progresses through the routine and as the processes become more severe.
However, changes in lanthionine content do not directly relate to changes in the
solubility of the fabric. This was also the case for the Pilot production.
Furthermore, there is no indication that the urea bisulfite solubility of the fabric is
related to the felting shrinkage of the fabric, as shown in Figure 8.8.
The reduction in urea bisulfite solubility with increased decatising temperature was
expected based on the findings of Elliott, Stevens and Whewell [199] in their study of
the effect of steaming temperature and time on wool fabrics as a result of changes in the
bonding in the fibres.
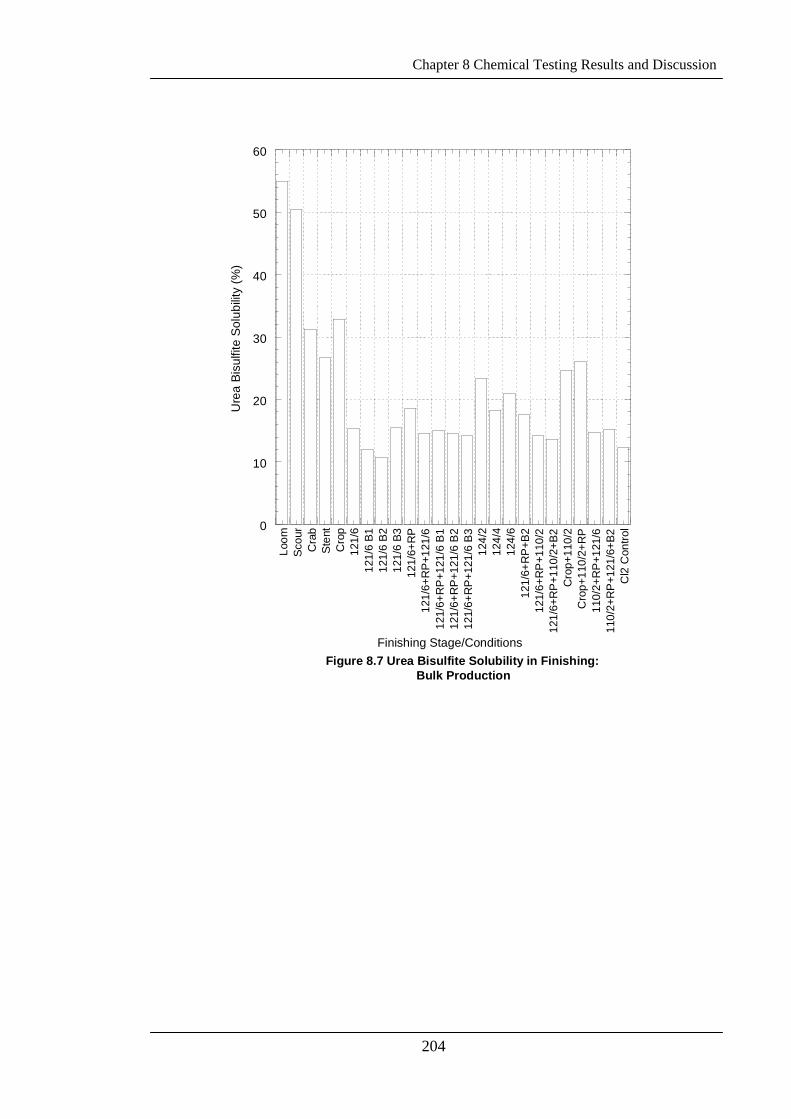
Chapter 8 Chemical Testing Results and Discussion
204
0
10
20
30
40
50
60
Loom
Scou
rC
rab
Sten
tC
rop
121/
612
1/6
B112
1/6
B212
1/6
B312
1/6+
RP
121/
6+R
P+1
21/6
121/
6+R
P+1
21/6
B1
121/
6+R
P+1
21/6
B2
121/
6+R
P+1
21/6
B3
124/
212
4/4
124/
612
1/6+
RP
+B2
121/
6+R
P+1
10/2
121/
6+R
P+1
10/2
+B2
Cro
p+11
0/2
Cro
p+11
0/2+
RP
110/
2+R
P+1
21/6
110/
2+R
P+1
21/6
+B2
Cl2
Con
trol
Figure 8.7 Urea Bisulfite Solubility in Finishing: Bulk Production
Ure
a Bi
sulfi
te S
olub
ility
(%)
Finishing Stage/Conditions
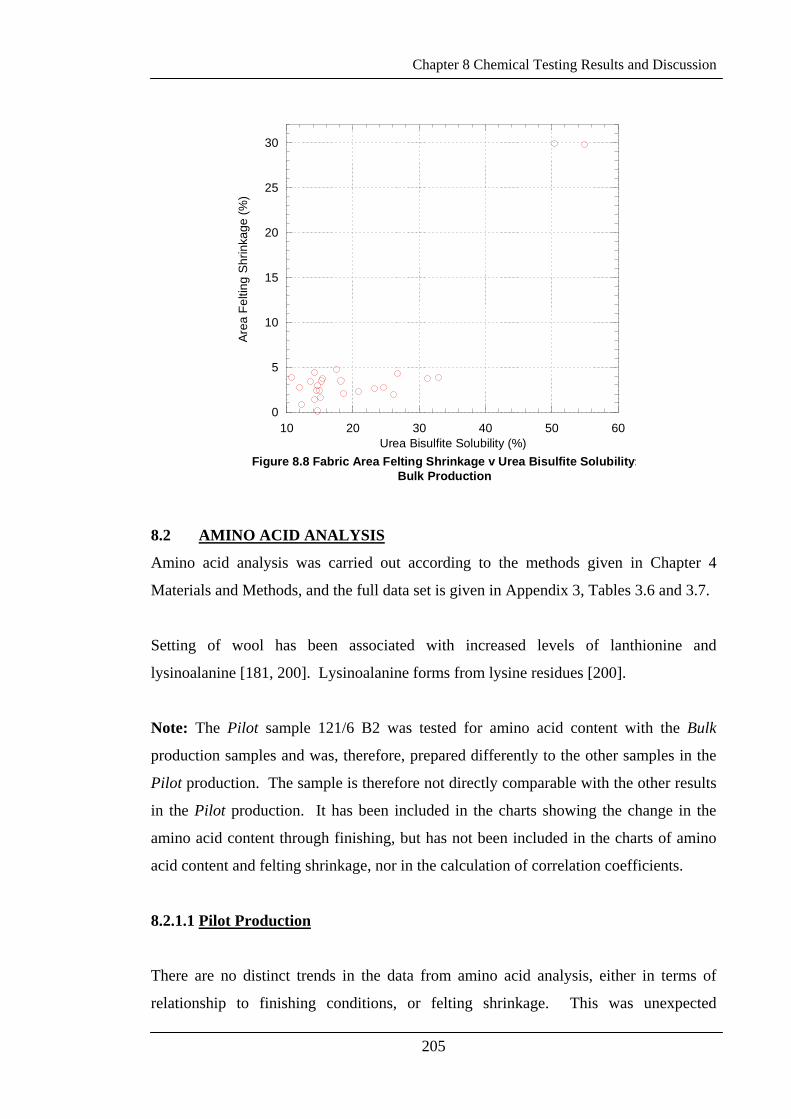
Chapter 8 Chemical Testing Results and Discussion
205
0
5
10
15
20
25
30
10 20 30 40 50 60
Figure 8.8 Fabric Area Felting Shrinkage v Urea Bisulfite Solubility:Bulk Production
Area
Fel
ting
Shrin
kage
(%)
Urea Bisulfite Solubility (%)
8.2 AMINO ACID ANALYSIS
Amino acid analysis was carried out according to the methods given in Chapter 4
Materials and Methods, and the full data set is given in Appendix 3, Tables 3.6 and 3.7.
Setting of wool has been associated with increased levels of lanthionine and
lysinoalanine [181, 200]. Lysinoalanine forms from lysine residues [200].
Note: The Pilot sample 121/6 B2 was tested for amino acid content with the Bulk
production samples and was, therefore, prepared differently to the other samples in the
Pilot production. The sample is therefore not directly comparable with the other results
in the Pilot production. It has been included in the charts showing the change in the
amino acid content through finishing, but has not been included in the charts of amino
acid content and felting shrinkage, nor in the calculation of correlation coefficients.
8.2.1.1 Pilot Production
There are no distinct trends in the data from amino acid analysis, either in terms of
relationship to finishing conditions, or felting shrinkage. This was unexpected
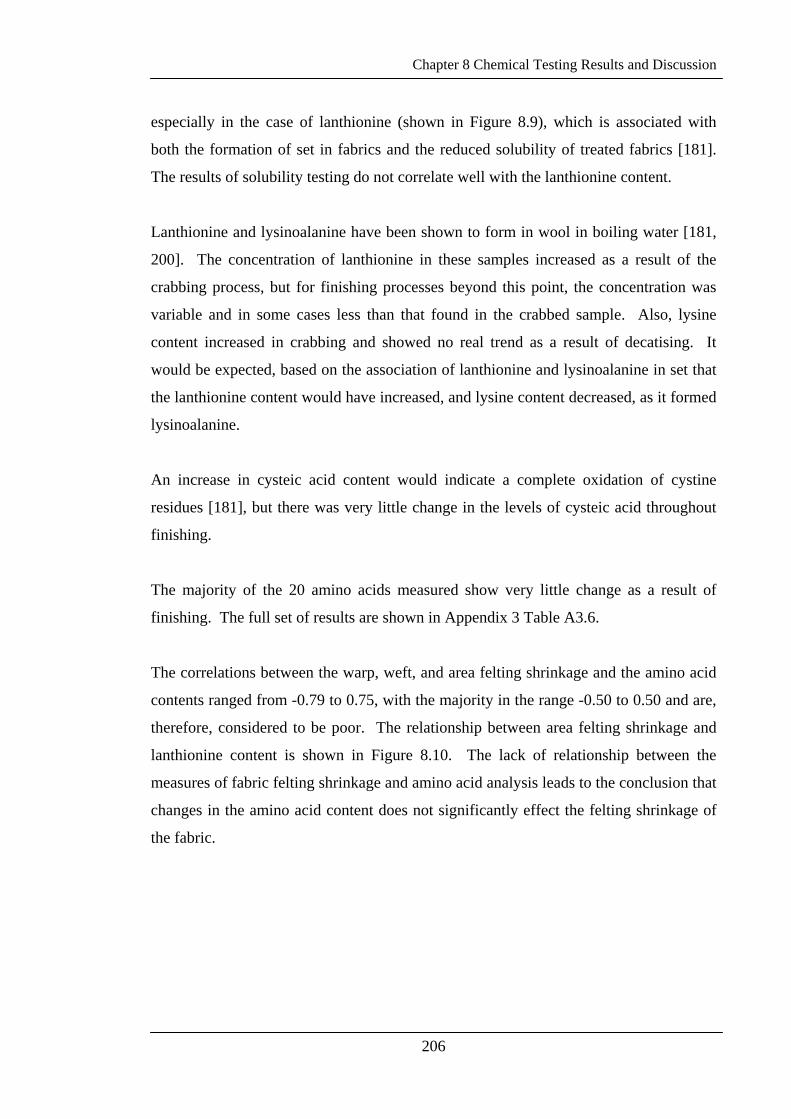
Chapter 8 Chemical Testing Results and Discussion
206
especially in the case of lanthionine (shown in Figure 8.9), which is associated with
both the formation of set in fabrics and the reduced solubility of treated fabrics [181].
The results of solubility testing do not correlate well with the lanthionine content.
Lanthionine and lysinoalanine have been shown to form in wool in boiling water [181,
200]. The concentration of lanthionine in these samples increased as a result of the
crabbing process, but for finishing processes beyond this point, the concentration was
variable and in some cases less than that found in the crabbed sample. Also, lysine
content increased in crabbing and showed no real trend as a result of decatising. It
would be expected, based on the association of lanthionine and lysinoalanine in set that
the lanthionine content would have increased, and lysine content decreased, as it formed
lysinoalanine.
An increase in cysteic acid content would indicate a complete oxidation of cystine
residues [181], but there was very little change in the levels of cysteic acid throughout
finishing.
The majority of the 20 amino acids measured show very little change as a result of
finishing. The full set of results are shown in Appendix 3 Table A3.6.
The correlations between the warp, weft, and area felting shrinkage and the amino acid
contents ranged from -0.79 to 0.75, with the majority in the range -0.50 to 0.50 and are,
therefore, considered to be poor. The relationship between area felting shrinkage and
lanthionine content is shown in Figure 8.10. The lack of relationship between the
measures of fabric felting shrinkage and amino acid analysis leads to the conclusion that
changes in the amino acid content does not significantly effect the felting shrinkage of
the fabric.
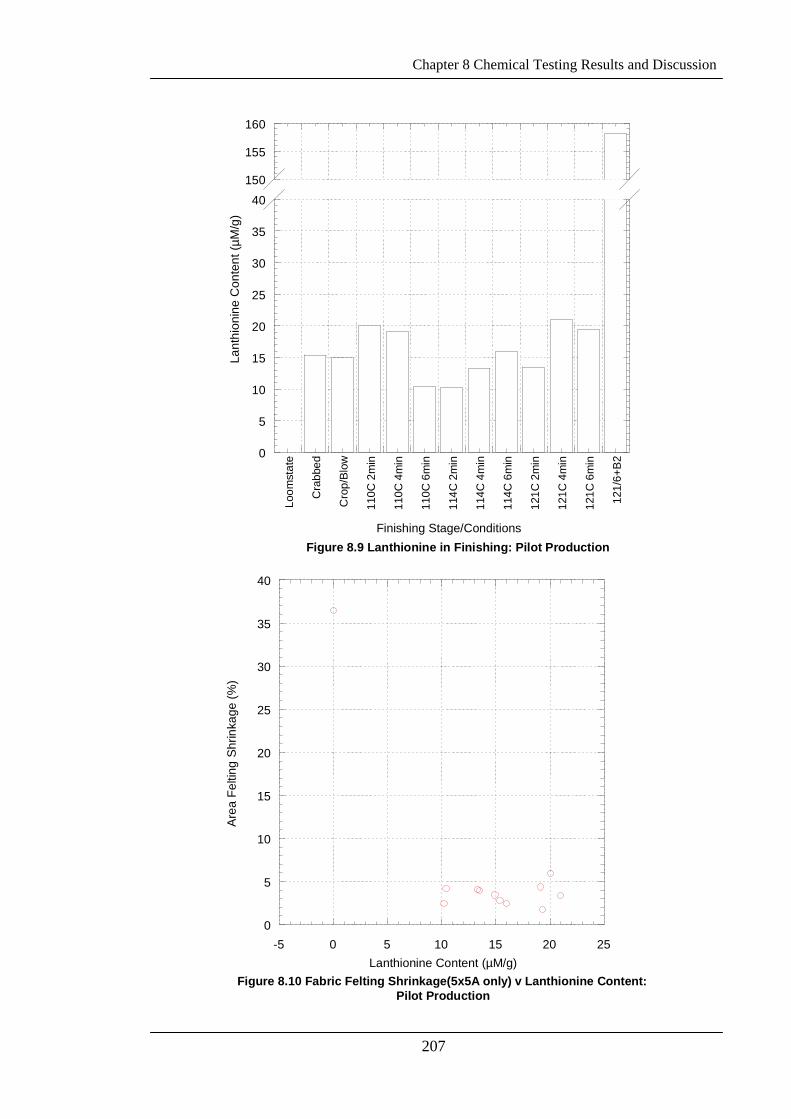
Chapter 8 Chemical Testing Results and Discussion
207
0
5
10
15
20
25
30
35
40150
155
160
Loom
stat
e
Cra
bbed
Cro
p/Bl
ow
110C
2m
in
110C
4m
in
110C
6m
in
114C
2m
in
114C
4m
in
114C
6m
in
121C
2m
in
121C
4m
in
121C
6m
in
121/
6+B2
Figure 8.9 Lanthionine in Finishing: Pilot Production
Lant
hion
ine
Con
tent
(µM
/g)
Finishing Stage/Conditions
0
5
10
15
20
25
30
35
40
-5 0 5 10 15 20 25
Figure 8.10 Fabric Felting Shrinkage(5x5A only) v Lanthionine Content: Pilot Production
Are
a Fe
lting
Shr
inka
ge (%
)
Lanthionine Content (µM/g)
Chapter 8 Chemical Testing Results and Discussion
208
8.2.1.2 Bulk Production
As was the case for the Pilot production, most of the 21 amino acids which were tested
for, did not show any distinct trends through finishing, and for some of the samples
there was very high variability between duplicates. There were also a few amino acids
which showed almost no change through the finishing routes examined, and others still
which showed almost similar changes across the three finishing routes examined.
Interestingly, although there were no distinct trends in the changes that occurred in the
lanthionine or the meso cystine, the two are well correlated with each other (correlation
coefficient 0.88) This is as expected, as cystine transforms into lanthionine under
conditions of heat and moisture [181].
As was seen in the Pilot production results there is no direct relationship between fabric
area felting shrinkage and any of the amino acids measured for. Correlation coefficients
between the amino acids and the three measures of felting shrinkage ranged from -0.54
to 0.38.
Figure 8.11 shows the changes in lanthionine levels through finishing for the Bulk
production. Figure 8.12 shows the relationship between fabric area felting shrinkage
and lanthionine content. There is no indication that the lanthionine content has any
significant effect on the felting shrinkage of the fabric. It would be expected that there
would be an increase in the lanthionine content as the fabric was set [200, 181].
Lysine content reduced slightly as a result of crabbing, as would be expected as it
converts to lysinoalanine in setting [200] but following this, there were no distinct
trends in the lysine content.
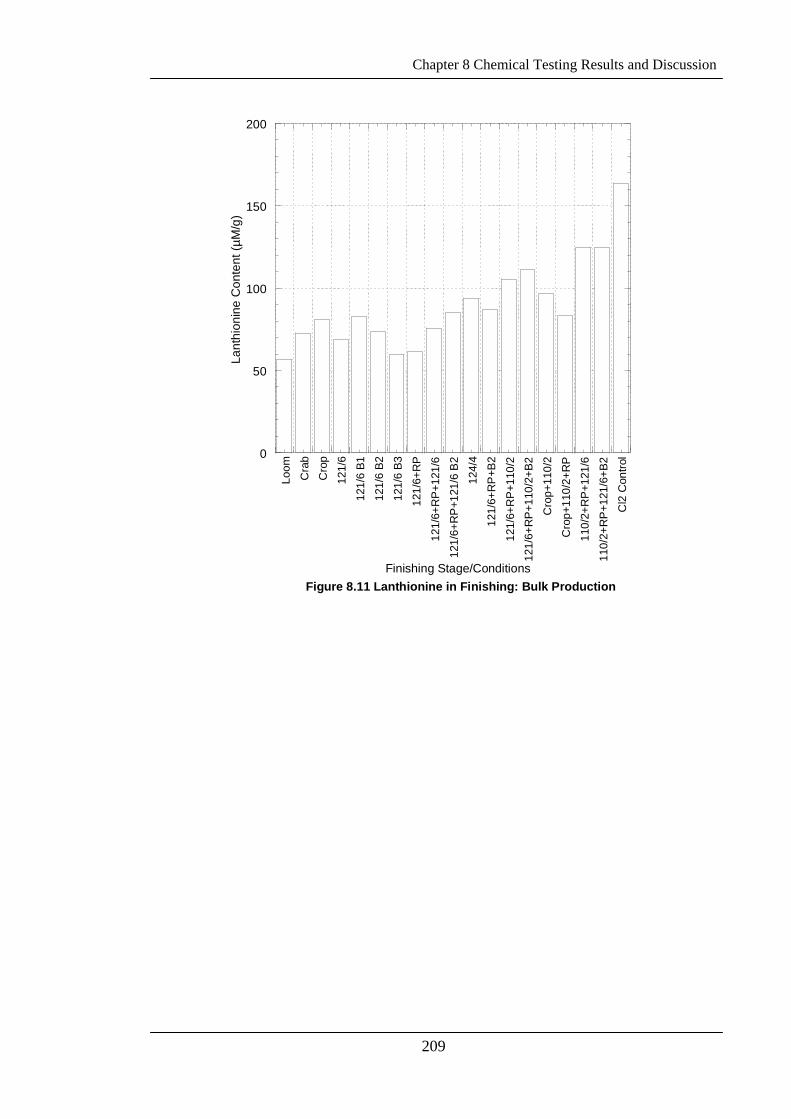
Chapter 8 Chemical Testing Results and Discussion
209
0
50
100
150
200
Loom
Cra
bC
rop
121/
6
121/
6 B1
121/
6 B2
121/
6 B3
121/
6+R
P
121/
6+R
P+1
21/6
121/
6+R
P+1
21/6
B2
124/
4
121/
6+R
P+B
2
121/
6+R
P+1
10/2
121/
6+R
P+1
10/2
+B2
Cro
p+11
0/2
Cro
p+11
0/2+
RP
110/
2+R
P+1
21/6
110/
2+R
P+1
21/6
+B2
Cl2
Con
trol
Figure 8.11 Lanthionine in Finishing: Bulk Production
Lant
hion
ine
Con
tent
(µM
/g)
Finishing Stage/Conditions
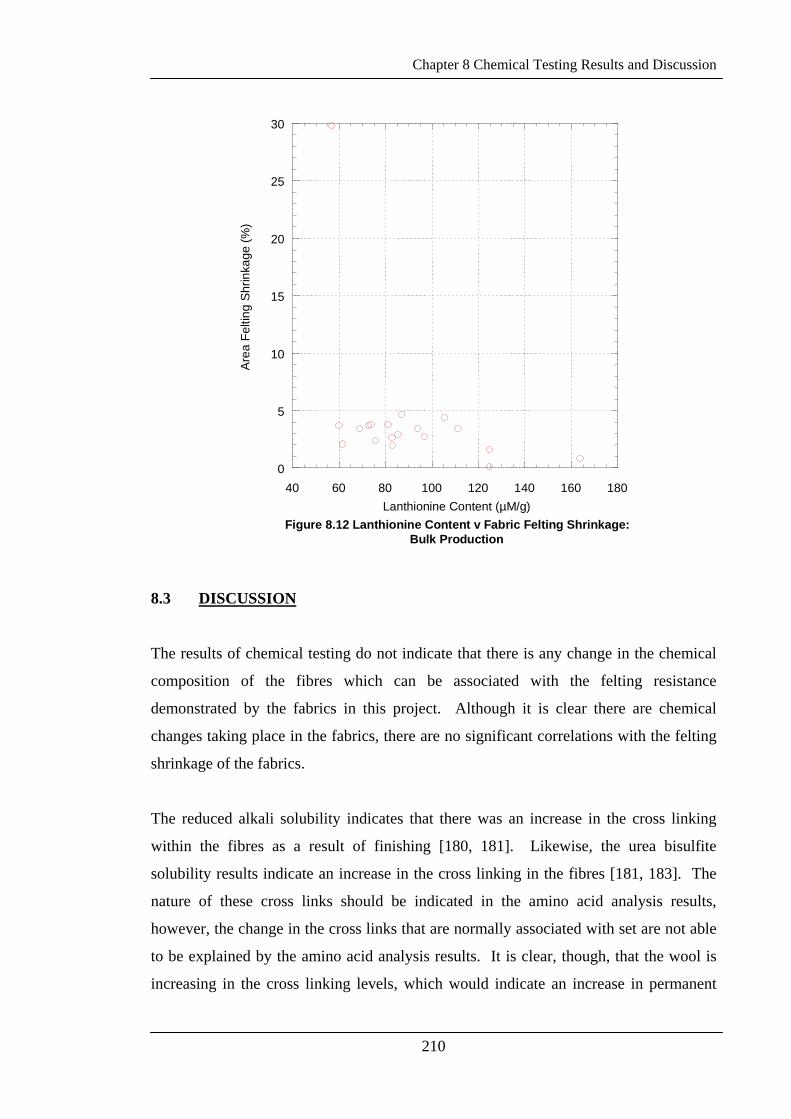
Chapter 8 Chemical Testing Results and Discussion
210
0
5
10
15
20
25
30
40 60 80 100 120 140 160 180
Figure 8.12 Lanthionine Content v Fabric Felting Shrinkage:Bulk Production
Are
a Fe
lting
Shr
inka
ge (%
)
Lanthionine Content (µM/g)
8.3 DISCUSSION
The results of chemical testing do not indicate that there is any change in the chemical
composition of the fibres which can be associated with the felting resistance
demonstrated by the fabrics in this project. Although it is clear there are chemical
changes taking place in the fabrics, there are no significant correlations with the felting
shrinkage of the fabrics.
The reduced alkali solubility indicates that there was an increase in the cross linking
within the fibres as a result of finishing [180, 181]. Likewise, the urea bisulfite
solubility results indicate an increase in the cross linking in the fibres [181, 183]. The
nature of these cross links should be indicated in the amino acid analysis results,
however, the change in the cross links that are normally associated with set are not able
to be explained by the amino acid analysis results. It is clear, though, that the wool is
increasing in the cross linking levels, which would indicate an increase in permanent
Chapter 8 Chemical Testing Results and Discussion
211
set. However, there are strong correlations between fabric felting shrinkage and
solubility, and, therefore, this measure of fabric set is unable to explain the reduction in
felting shrinkage that was observed.
It is of some concern that the results of amino acid analyses do not show the changes
that have been shown by others [181, 200] to occur as a result of setting of wool. It was
expected that increases in lanthionine would be seen [181, 200] as the fabric was set as
well as reductions in lysine content as it formed lysinoalanine which has also been
associated with set [200]. It is not clear why these changes in the amino acid content
did not take place.
The high variances between some of the duplicates, are also of concern. Some of the
amino acid analyses may require repeating as the differences between the two batches
were vastly different for some of the amino acids detected. This may be a result of the
different hydrolysis method that reduced and alkylated the cystine. Repeat testing of
these samples was not possible as part of this project as a result of funding limits.
212
CHAPTER 9
MICROSCOPY
RESULTS AND DISCUSSION
9.1 FIELD EMISSION SCANNING ELECTRON MICROSCOPY
This work was carried out to determine if there were any physical changes taking place
in the fabrics that could be observed, which may have lead to the reduction in felting
shrinkage as a result of fabric finishing. The Pilot production samples that were used
for this work were all examined using the Hitachi S4500 Field Emission SEM.
9.1.1 Pilot Production
The Pilot production SEM images Figures 9.1-9.7c, distinctly show changes in the
packing of the yarns and the distance between adjacent yarns through the finishing
processes. It is evident in the pictures that the gaps between the yarns were reduced
through finishing, especially between the loomstate sample in Figure 9.1 and the
crabbed sample in Figure 9.2.
From the surface examination of the samples, it appears as though the diameters of the
yarns are increasing. However, this is most likely a result of the yarns becoming
‘squashed’ through lateral compression in finishing and more elliptical in cross section.
This suggestion is supported in the results of cross sectional examination of the Bulk
production in Section 9.2 below.
Closer examination of individual fibres as shown in Figures 9.8a and 9.8b also showed
that the surface of the fibres had sustained some damage, and that scales had been
damaged, and in some instances removed from the surface of the fibres. However, this
was found to be consistent with the findings of others [201-203] and occurs as a result
of fibre processing. As this finding is not unique to this project, it has been concluded

Chapter 9 Microscopy Results and Discussion
213
that fibre damage does not have a significant effect on the reduction in felting shrinkage
of these fabrics.
Figure 9.1 Loom Sample, Pilot
Figure 9.2 Crab Sample, Pilot
Figure 9.3 Stent Sample, Pilot
Figure 9.4 Crop Sample, Pilot
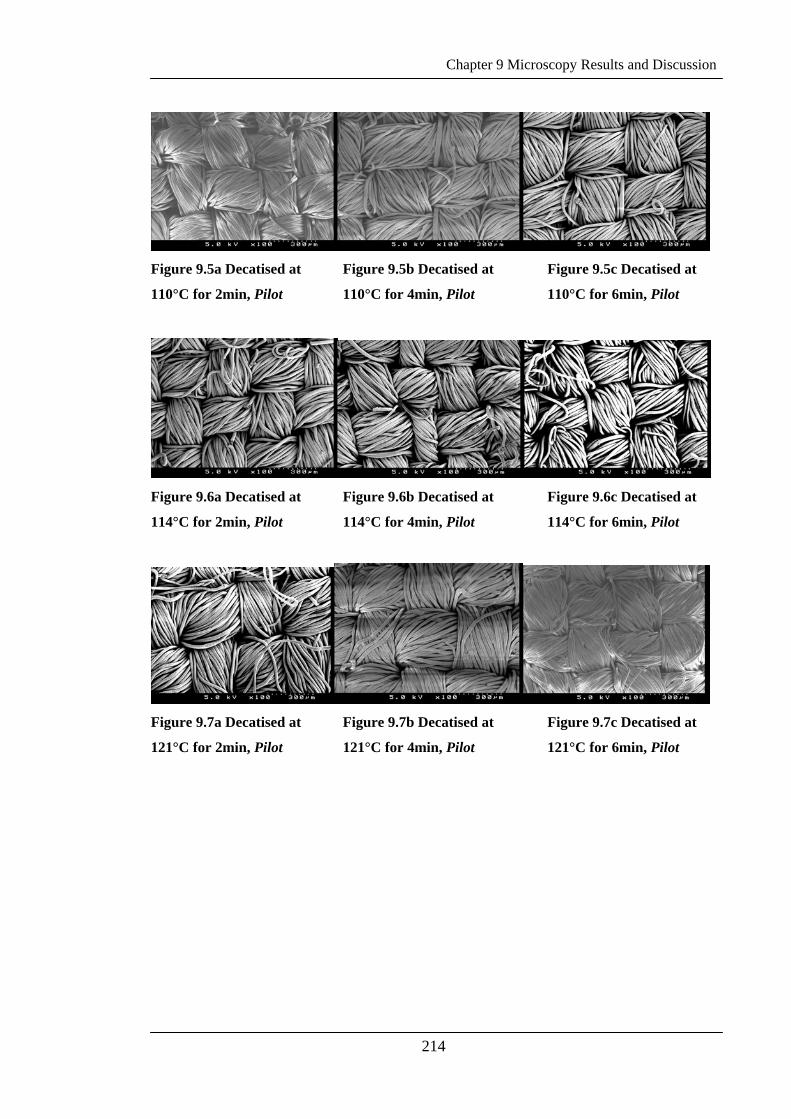
Chapter 9 Microscopy Results and Discussion
214
Figure 9.5a Decatised at
110°C for 2min, Pilot
Figure 9.5b Decatised at
110°C for 4min, Pilot
Figure 9.5c Decatised at
110°C for 6min, Pilot
Figure 9.6a Decatised at
114°C for 2min, Pilot
Figure 9.6b Decatised at
114°C for 4min, Pilot
Figure 9.6c Decatised at
114°C for 6min, Pilot
Figure 9.7a Decatised at
121°C for 2min, Pilot
Figure 9.7b Decatised at
121°C for 4min, Pilot
Figure 9.7c Decatised at
121°C for 6min, Pilot
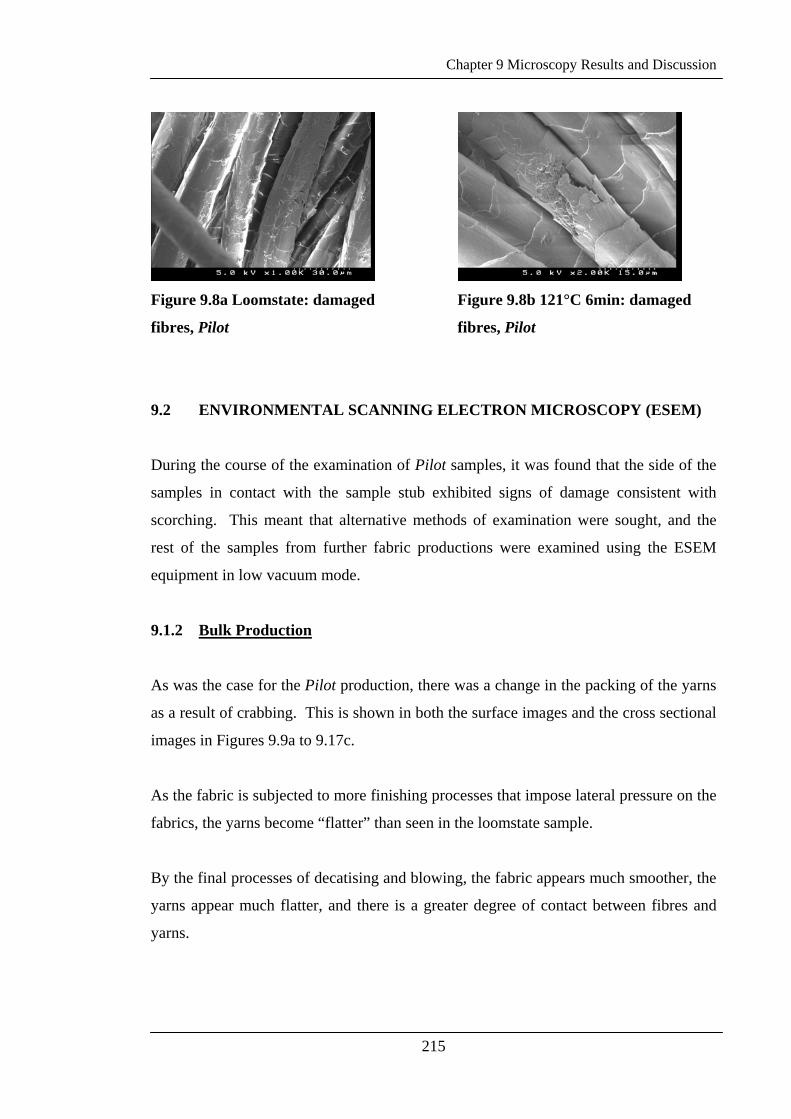
Chapter 9 Microscopy Results and Discussion
215
Figure 9.8a Loomstate: damaged
fibres, Pilot
Figure 9.8b 121°C 6min: damaged
fibres, Pilot
9.2 ENVIRONMENTAL SCANNING ELECTRON MICROSCOPY (ESEM)
During the course of the examination of Pilot samples, it was found that the side of the
samples in contact with the sample stub exhibited signs of damage consistent with
scorching. This meant that alternative methods of examination were sought, and the
rest of the samples from further fabric productions were examined using the ESEM
equipment in low vacuum mode.
9.1.2 Bulk Production
As was the case for the Pilot production, there was a change in the packing of the yarns
as a result of crabbing. This is shown in both the surface images and the cross sectional
images in Figures 9.9a to 9.17c.
As the fabric is subjected to more finishing processes that impose lateral pressure on the
fabrics, the yarns become “flatter” than seen in the loomstate sample.
By the final processes of decatising and blowing, the fabric appears much smoother, the
yarns appear much flatter, and there is a greater degree of contact between fibres and
yarns.
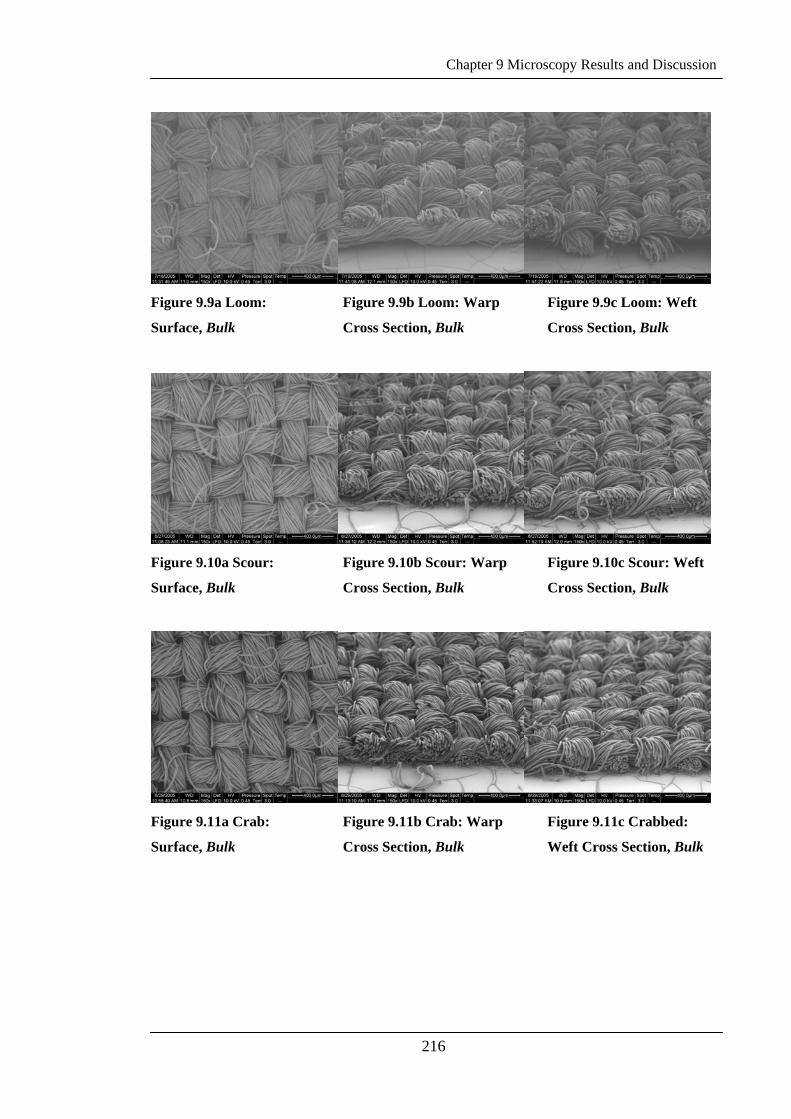
Chapter 9 Microscopy Results and Discussion
216
Figure 9.9a Loom:
Surface, Bulk
Figure 9.9b Loom: Warp
Cross Section, Bulk
Figure 9.9c Loom: Weft
Cross Section, Bulk
Figure 9.10a Scour:
Surface, Bulk
Figure 9.10b Scour: Warp
Cross Section, Bulk
Figure 9.10c Scour: Weft
Cross Section, Bulk
Figure 9.11a Crab:
Surface, Bulk
Figure 9.11b Crab: Warp
Cross Section, Bulk
Figure 9.11c Crabbed:
Weft Cross Section, Bulk
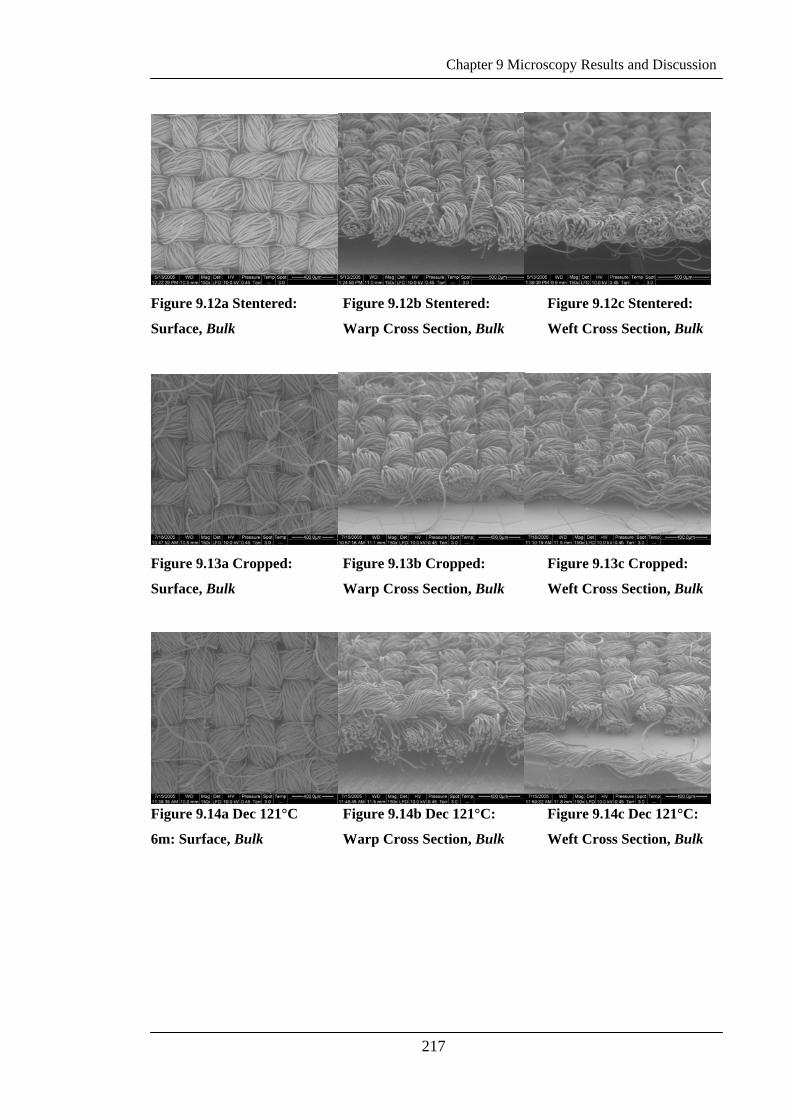
Chapter 9 Microscopy Results and Discussion
217
Figure 9.12a Stentered:
Surface, Bulk
Figure 9.12b Stentered:
Warp Cross Section, Bulk
Figure 9.12c Stentered:
Weft Cross Section, Bulk
Figure 9.13a Cropped:
Surface, Bulk
Figure 9.13b Cropped:
Warp Cross Section, Bulk
Figure 9.13c Cropped:
Weft Cross Section, Bulk
Figure 9.14a Dec 121°C
6m: Surface, Bulk
Figure 9.14b Dec 121°C:
Warp Cross Section, Bulk
Figure 9.14c Dec 121°C:
Weft Cross Section, Bulk
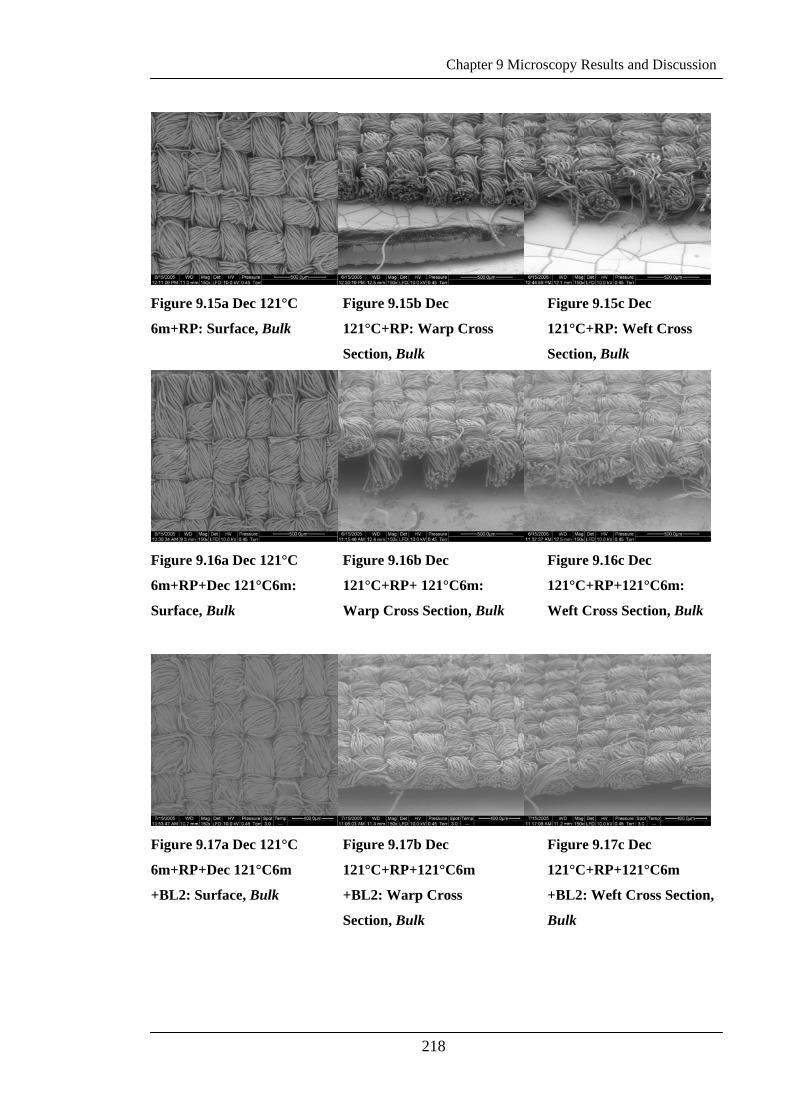
Chapter 9 Microscopy Results and Discussion
218
Figure 9.15a Dec 121°C
6m+RP: Surface, Bulk
Figure 9.15b Dec
121°C+RP: Warp Cross
Section, Bulk
Figure 9.15c Dec
121°C+RP: Weft Cross
Section, Bulk
Figure 9.16a Dec 121°C
6m+RP+Dec 121°C6m:
Surface, Bulk
Figure 9.16b Dec
121°C+RP+ 121°C6m:
Warp Cross Section, Bulk
Figure 9.16c Dec
121°C+RP+121°C6m:
Weft Cross Section, Bulk
Figure 9.17a Dec 121°C
6m+RP+Dec 121°C6m
+BL2: Surface, Bulk
Figure 9.17b Dec
121°C+RP+121°C6m
+BL2: Warp Cross
Section, Bulk
Figure 9.17c Dec
121°C+RP+121°C6m
+BL2: Weft Cross Section,
Bulk
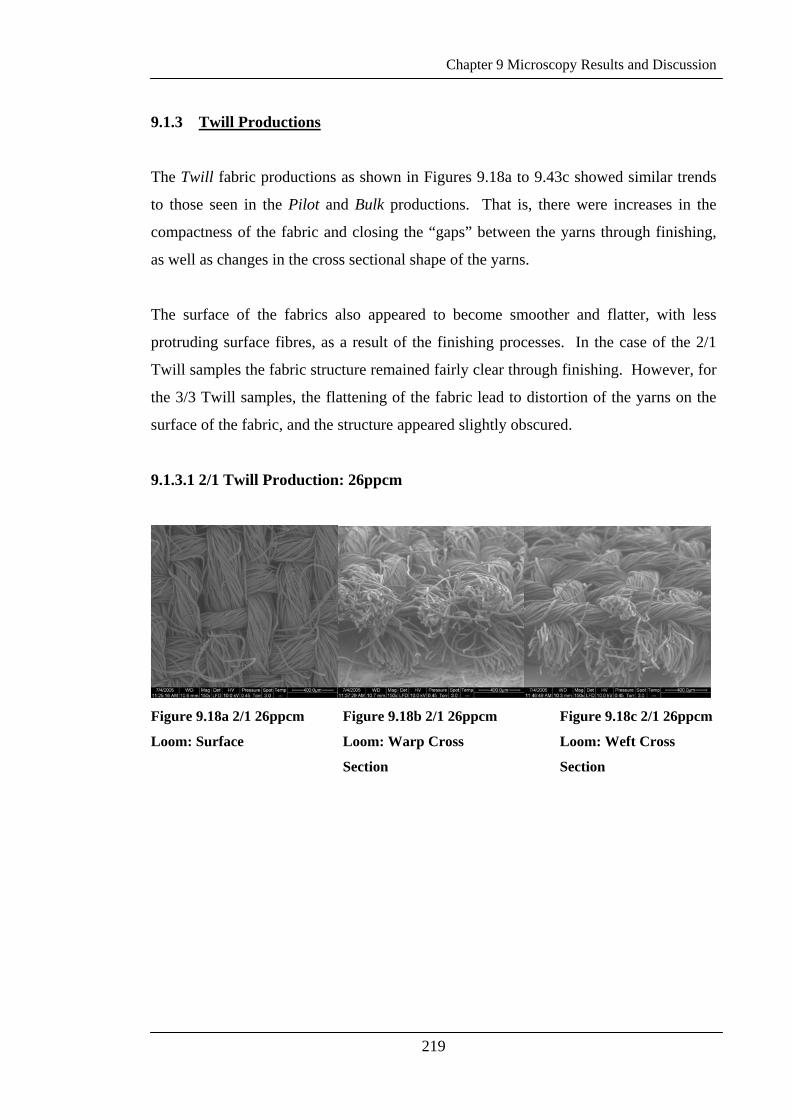
Chapter 9 Microscopy Results and Discussion
219
9.1.3 Twill Productions
The Twill fabric productions as shown in Figures 9.18a to 9.43c showed similar trends
to those seen in the Pilot and Bulk productions. That is, there were increases in the
compactness of the fabric and closing the “gaps” between the yarns through finishing,
as well as changes in the cross sectional shape of the yarns.
The surface of the fabrics also appeared to become smoother and flatter, with less
protruding surface fibres, as a result of the finishing processes. In the case of the 2/1
Twill samples the fabric structure remained fairly clear through finishing. However, for
the 3/3 Twill samples, the flattening of the fabric lead to distortion of the yarns on the
surface of the fabric, and the structure appeared slightly obscured.
9.1.3.1 2/1 Twill Production: 26ppcm
Figure 9.18a 2/1 26ppcm
Loom: Surface
Figure 9.18b 2/1 26ppcm
Loom: Warp Cross
Section
Figure 9.18c 2/1 26ppcm
Loom: Weft Cross
Section
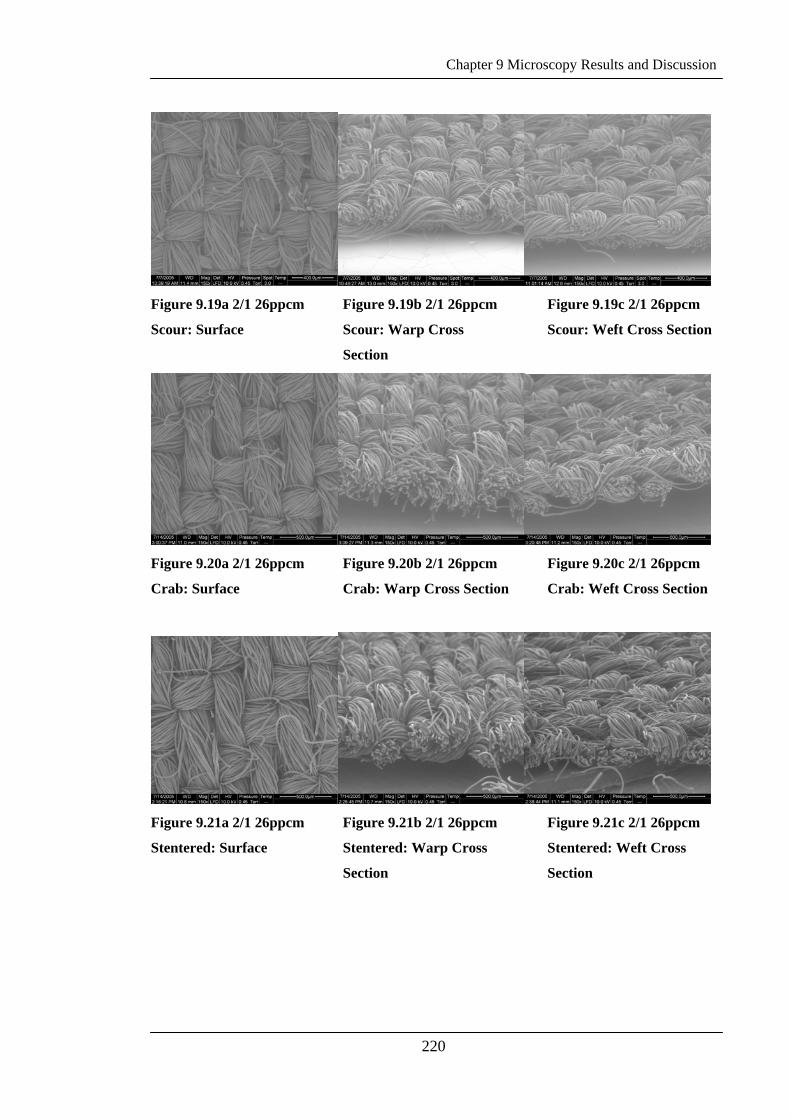
Chapter 9 Microscopy Results and Discussion
220
Figure 9.19a 2/1 26ppcm
Scour: Surface
Figure 9.19b 2/1 26ppcm
Scour: Warp Cross
Section
Figure 9.19c 2/1 26ppcm
Scour: Weft Cross Section
Figure 9.20a 2/1 26ppcm
Crab: Surface
Figure 9.20b 2/1 26ppcm
Crab: Warp Cross Section
Figure 9.20c 2/1 26ppcm
Crab: Weft Cross Section
Figure 9.21a 2/1 26ppcm
Stentered: Surface
Figure 9.21b 2/1 26ppcm
Stentered: Warp Cross
Section
Figure 9.21c 2/1 26ppcm
Stentered: Weft Cross
Section
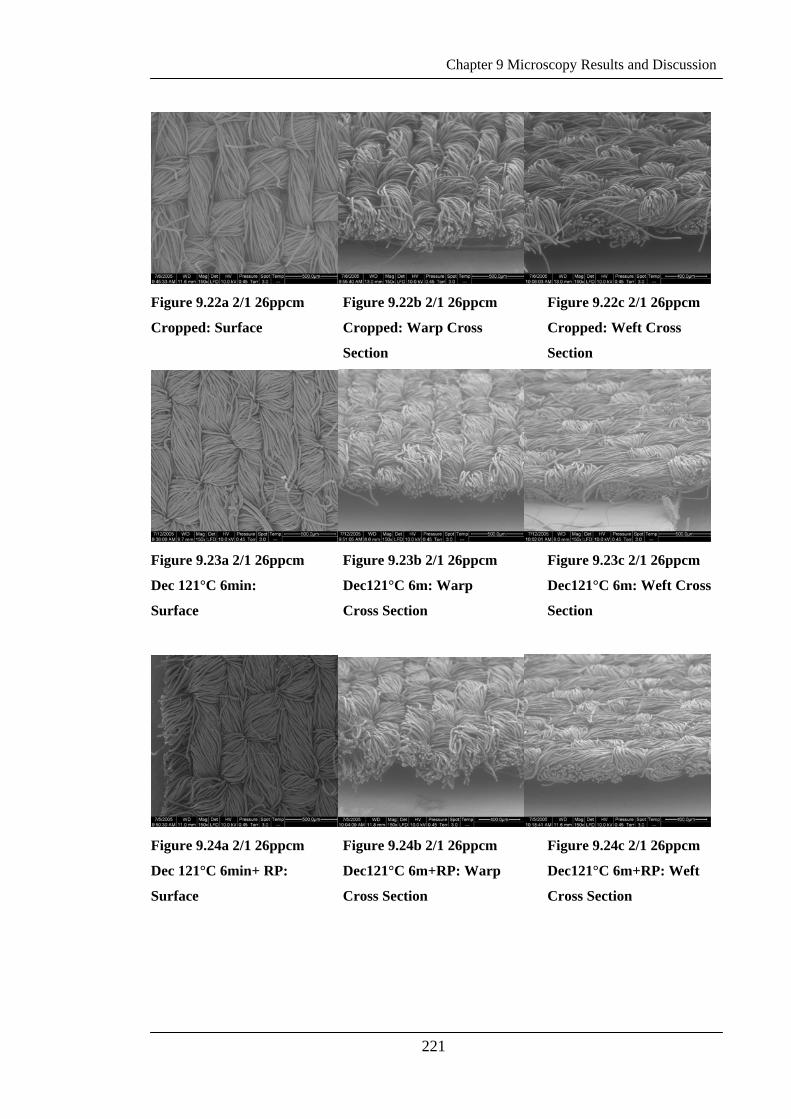
Chapter 9 Microscopy Results and Discussion
221
Figure 9.22a 2/1 26ppcm
Cropped: Surface
Figure 9.22b 2/1 26ppcm
Cropped: Warp Cross
Section
Figure 9.22c 2/1 26ppcm
Cropped: Weft Cross
Section
Figure 9.23a 2/1 26ppcm
Dec 121°C 6min:
Surface
Figure 9.23b 2/1 26ppcm
Dec121°C 6m: Warp
Cross Section
Figure 9.23c 2/1 26ppcm
Dec121°C 6m: Weft Cross
Section
Figure 9.24a 2/1 26ppcm
Dec 121°C 6min+ RP:
Surface
Figure 9.24b 2/1 26ppcm
Dec121°C 6m+RP: Warp
Cross Section
Figure 9.24c 2/1 26ppcm
Dec121°C 6m+RP: Weft
Cross Section
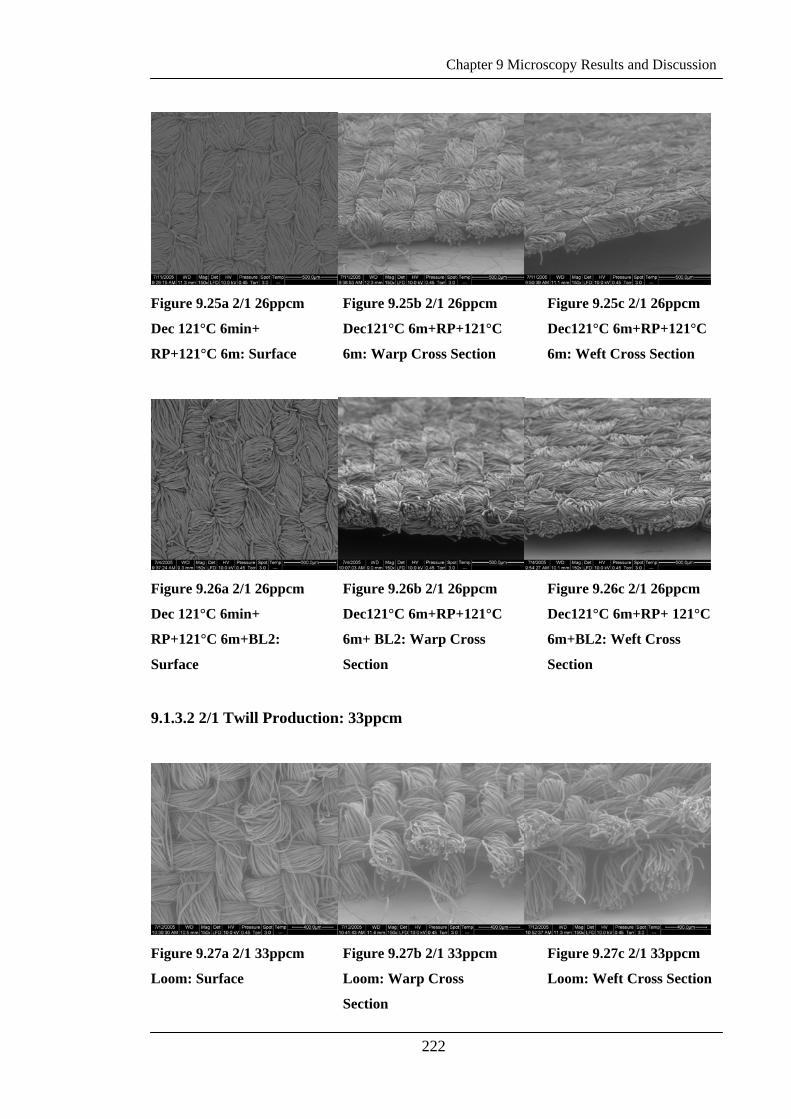
Chapter 9 Microscopy Results and Discussion
222
Figure 9.25a 2/1 26ppcm
Dec 121°C 6min+
RP+121°C 6m: Surface
Figure 9.25b 2/1 26ppcm
Dec121°C 6m+RP+121°C
6m: Warp Cross Section
Figure 9.25c 2/1 26ppcm
Dec121°C 6m+RP+121°C
6m: Weft Cross Section
Figure 9.26a 2/1 26ppcm
Dec 121°C 6min+
RP+121°C 6m+BL2:
Surface
Figure 9.26b 2/1 26ppcm
Dec121°C 6m+RP+121°C
6m+ BL2: Warp Cross
Section
Figure 9.26c 2/1 26ppcm
Dec121°C 6m+RP+ 121°C
6m+BL2: Weft Cross
Section
9.1.3.2 2/1 Twill Production: 33ppcm
Figure 9.27a 2/1 33ppcm
Loom: Surface
Figure 9.27b 2/1 33ppcm
Loom: Warp Cross
Section
Figure 9.27c 2/1 33ppcm
Loom: Weft Cross Section
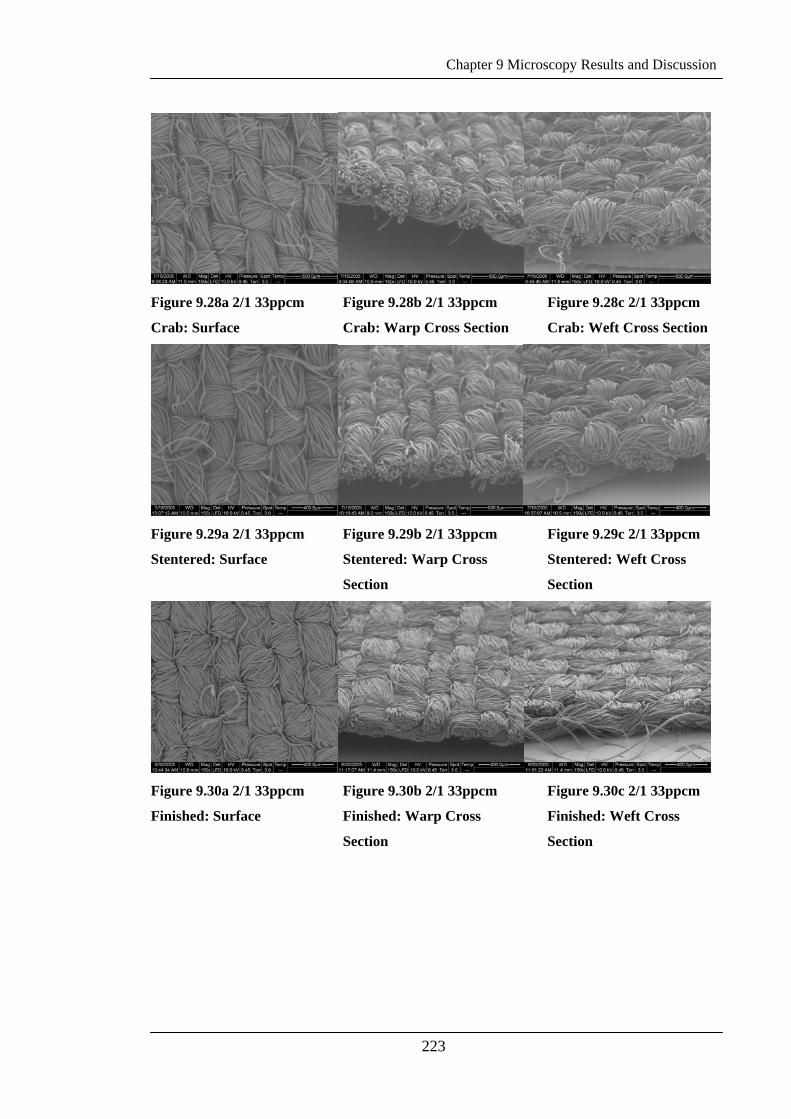
Chapter 9 Microscopy Results and Discussion
223
Figure 9.28a 2/1 33ppcm
Crab: Surface
Figure 9.28b 2/1 33ppcm
Crab: Warp Cross Section
Figure 9.28c 2/1 33ppcm
Crab: Weft Cross Section
Figure 9.29a 2/1 33ppcm
Stentered: Surface
Figure 9.29b 2/1 33ppcm
Stentered: Warp Cross
Section
Figure 9.29c 2/1 33ppcm
Stentered: Weft Cross
Section
Figure 9.30a 2/1 33ppcm
Finished: Surface
Figure 9.30b 2/1 33ppcm
Finished: Warp Cross
Section
Figure 9.30c 2/1 33ppcm
Finished: Weft Cross
Section
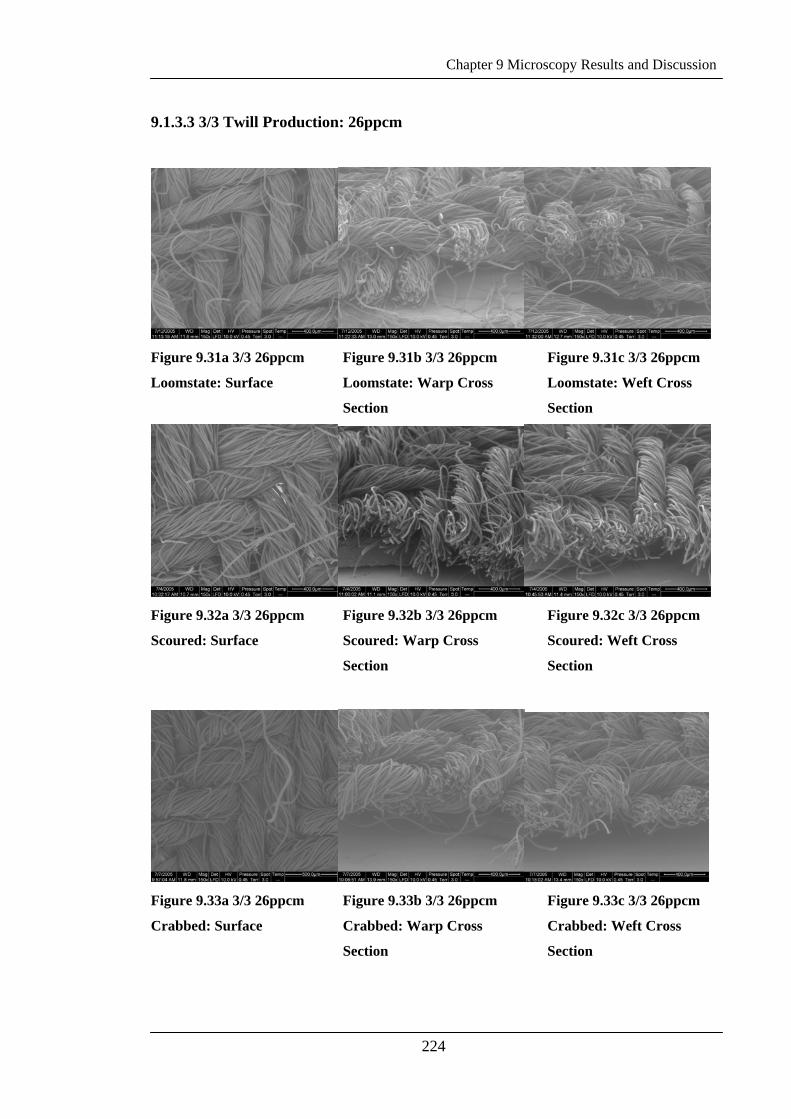
Chapter 9 Microscopy Results and Discussion
224
9.1.3.3 3/3 Twill Production: 26ppcm
Figure 9.31a 3/3 26ppcm
Loomstate: Surface
Figure 9.31b 3/3 26ppcm
Loomstate: Warp Cross
Section
Figure 9.31c 3/3 26ppcm
Loomstate: Weft Cross
Section
Figure 9.32a 3/3 26ppcm
Scoured: Surface
Figure 9.32b 3/3 26ppcm
Scoured: Warp Cross
Section
Figure 9.32c 3/3 26ppcm
Scoured: Weft Cross
Section
Figure 9.33a 3/3 26ppcm
Crabbed: Surface
Figure 9.33b 3/3 26ppcm
Crabbed: Warp Cross
Section
Figure 9.33c 3/3 26ppcm
Crabbed: Weft Cross
Section

Chapter 9 Microscopy Results and Discussion
225
Figure 9.34a 3/3 26ppcm
Stentered: Surface
Figure 9.34b 3/3 26ppcm
Stentered: Warp Cross
Section
Figure 9.34c 3/3 26ppcm
Stentered: Weft Cross
Section
Figure 9.35a 3/3 26ppcm
Cropped: Surface
Figure 9.35b 3/3 26ppcm
Cropped: Warp Cross
Section
Figure 9.35c 3/3 26ppcm
Cropped: Weft Cross
Section
Figure 9.36a 3/3 26ppcm
Dec 121°C 6min:
Surface
Figure 9.36b 3/3 26ppcm
Dec121°C 6m: Warp
Cross Section
Figure 9.36c 3/3 26ppcm
Dec121°C 6m: Weft Cross
Section
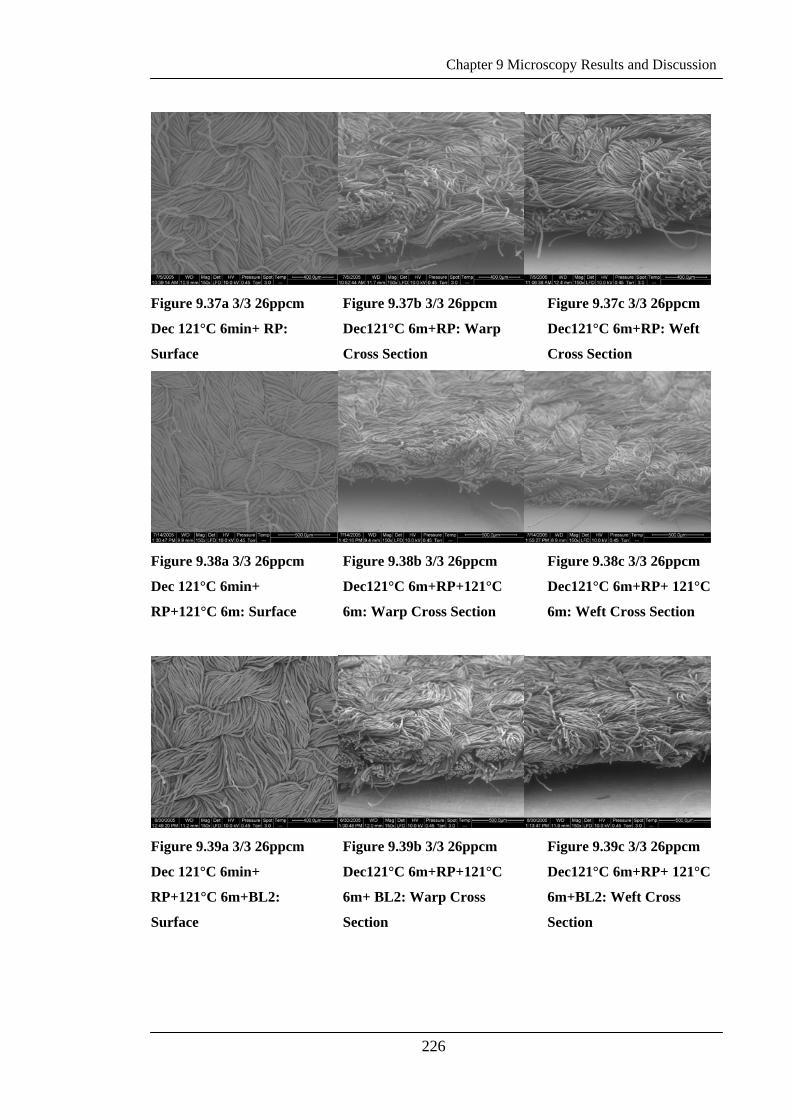
Chapter 9 Microscopy Results and Discussion
226
Figure 9.37a 3/3 26ppcm
Dec 121°C 6min+ RP:
Surface
Figure 9.37b 3/3 26ppcm
Dec121°C 6m+RP: Warp
Cross Section
Figure 9.37c 3/3 26ppcm
Dec121°C 6m+RP: Weft
Cross Section
Figure 9.38a 3/3 26ppcm
Dec 121°C 6min+
RP+121°C 6m: Surface
Figure 9.38b 3/3 26ppcm
Dec121°C 6m+RP+121°C
6m: Warp Cross Section
Figure 9.38c 3/3 26ppcm
Dec121°C 6m+RP+ 121°C
6m: Weft Cross Section
Figure 9.39a 3/3 26ppcm
Dec 121°C 6min+
RP+121°C 6m+BL2:
Surface
Figure 9.39b 3/3 26ppcm
Dec121°C 6m+RP+121°C
6m+ BL2: Warp Cross
Section
Figure 9.39c 3/3 26ppcm
Dec121°C 6m+RP+ 121°C
6m+BL2: Weft Cross
Section
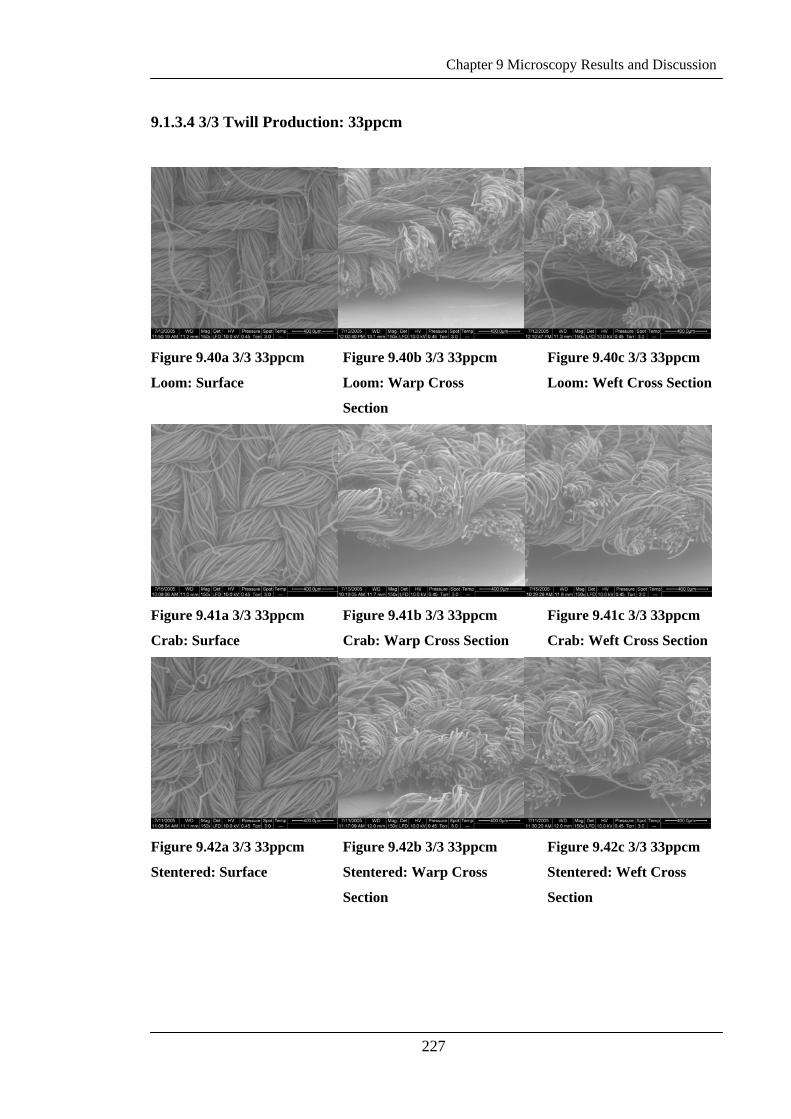
Chapter 9 Microscopy Results and Discussion
227
9.1.3.4 3/3 Twill Production: 33ppcm
Figure 9.40a 3/3 33ppcm
Loom: Surface
Figure 9.40b 3/3 33ppcm
Loom: Warp Cross
Section
Figure 9.40c 3/3 33ppcm
Loom: Weft Cross Section
Figure 9.41a 3/3 33ppcm
Crab: Surface
Figure 9.41b 3/3 33ppcm
Crab: Warp Cross Section
Figure 9.41c 3/3 33ppcm
Crab: Weft Cross Section
Figure 9.42a 3/3 33ppcm
Stentered: Surface
Figure 9.42b 3/3 33ppcm
Stentered: Warp Cross
Section
Figure 9.42c 3/3 33ppcm
Stentered: Weft Cross
Section
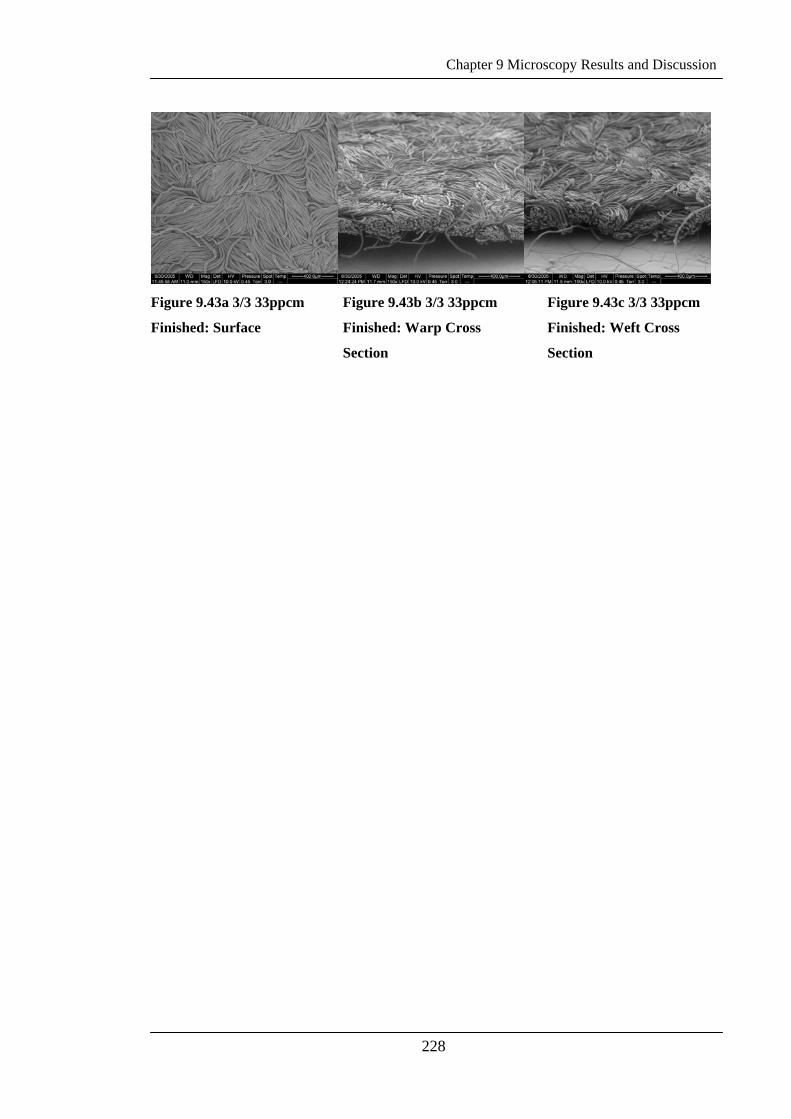
Chapter 9 Microscopy Results and Discussion
228
Figure 9.43a 3/3 33ppcm
Finished: Surface
Figure 9.43b 3/3 33ppcm
Finished: Warp Cross
Section
Figure 9.43c 3/3 33ppcm
Finished: Weft Cross
Section
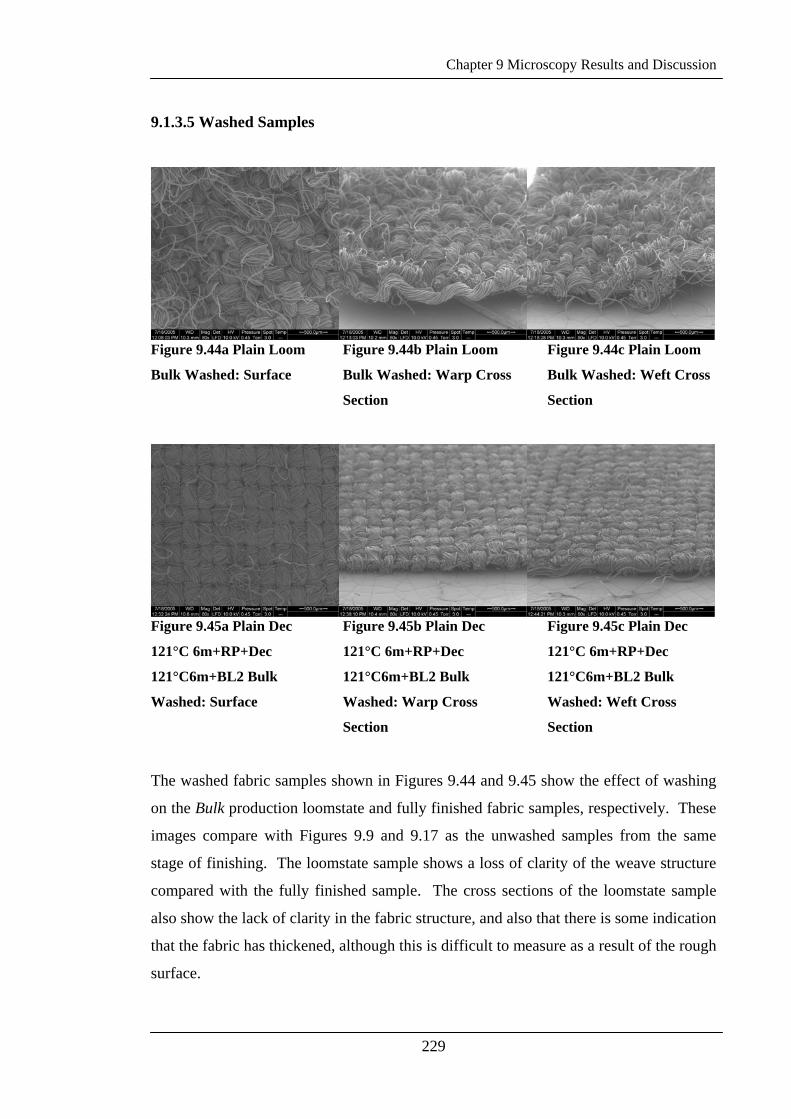
Chapter 9 Microscopy Results and Discussion
229
9.1.3.5 Washed Samples
Figure 9.44a Plain Loom
Bulk Washed: Surface
Figure 9.44b Plain Loom
Bulk Washed: Warp Cross
Section
Figure 9.44c Plain Loom
Bulk Washed: Weft Cross
Section
Figure 9.45a Plain Dec
121°C 6m+RP+Dec
121°C6m+BL2 Bulk
Washed: Surface
Figure 9.45b Plain Dec
121°C 6m+RP+Dec
121°C6m+BL2 Bulk
Washed: Warp Cross
Section
Figure 9.45c Plain Dec
121°C 6m+RP+Dec
121°C6m+BL2 Bulk
Washed: Weft Cross
Section
The washed fabric samples shown in Figures 9.44 and 9.45 show the effect of washing
on the Bulk production loomstate and fully finished fabric samples, respectively. These
images compare with Figures 9.9 and 9.17 as the unwashed samples from the same
stage of finishing. The loomstate sample shows a loss of clarity of the weave structure
compared with the fully finished sample. The cross sections of the loomstate sample
also show the lack of clarity in the fabric structure, and also that there is some indication
that the fabric has thickened, although this is difficult to measure as a result of the rough
surface.
Chapter 9 Microscopy Results and Discussion
230
The differences in the washing performance of these two samples makes it quite clear
from these images that the finishing route has a very large impact on the prevention of
felting shrinkage of the fabrics. The fully finished sample remained smooth and flat,
and with a clearly defined structure following washing, while the loomstate sample
became very badly distorted as a result of washing.
9.3 DISCUSSION
The results of the microscopy examination of the fabrics support the results in Chapter 6
Physical Testing and the Thickness Testing in Chapter 7 Objective Testing that the
fabric becomes thinner and more dense as a result of the finishing processes. There is
an observable change in the cross sectional shape of the yarns as they became flatter and
more elliptical through finishing. It can also be seen that the number of picks and ends
per unit area increased through finishing.
It is also clear that finishing has a profound effect on the behaviour of these fabrics in
washing. The fully finished fabric that had been washed according to 5x5A cycles was
similar in appearance to the unwashed sample. The loomstate sample, on the other
hand, was severely affected by the washing process and distorted badly.
Although some evidence of fibre surface damage has been found, it appears to be
consistent with levels of damage that normally occur in fibre processing [201-203] and
is not unique to these fabrics
The results which are shown here present a visual verification of the changes in
compactness and density through finishing which have been measured and which
appear to be responsible for the shrink-resistance. They do not, unfortunately allow for
any quantitative results to be obtained.
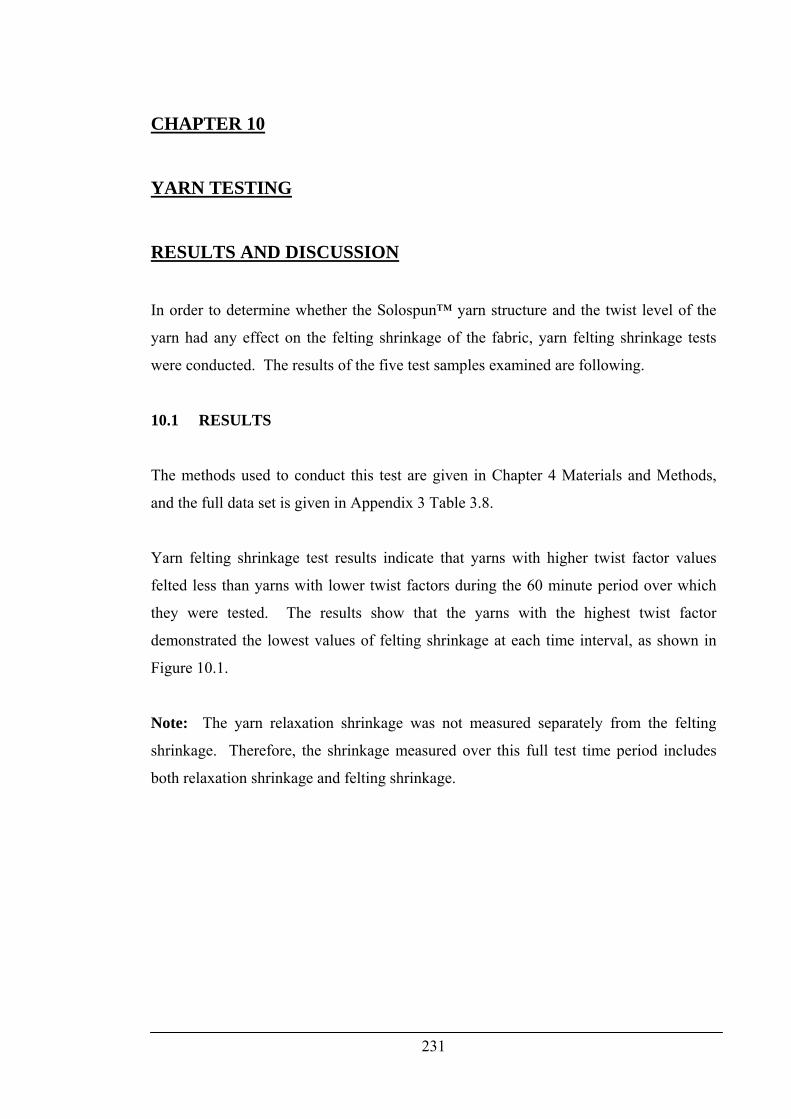
231
CHAPTER 10
YARN TESTING
RESULTS AND DISCUSSION
In order to determine whether the Solospun™ yarn structure and the twist level of the
yarn had any effect on the felting shrinkage of the fabric, yarn felting shrinkage tests
were conducted. The results of the five test samples examined are following.
10.1 RESULTS
The methods used to conduct this test are given in Chapter 4 Materials and Methods,
and the full data set is given in Appendix 3 Table 3.8.
Yarn felting shrinkage test results indicate that yarns with higher twist factor values
felted less than yarns with lower twist factors during the 60 minute period over which
they were tested. The results show that the yarns with the highest twist factor
demonstrated the lowest values of felting shrinkage at each time interval, as shown in
Figure 10.1.
Note: The yarn relaxation shrinkage was not measured separately from the felting
shrinkage. Therefore, the shrinkage measured over this full test time period includes
both relaxation shrinkage and felting shrinkage.
Chapter 10 Yarn Testing Results and Discussion
232
0
5
10
15
20
25
30
35
40
0 5 10 15 20 25 30 35 40 45 50 55 60
Figure 10.1 Yarn Felting Shrinkage v Time of Felting
Warp yarn 114αm
,
22tex, 774tpm
Weft yarn 114αm
,
20tex, 806tpm
22/2, 82αm
spin,
110αm
ply
Sample 82αm
,
22tex 554tpm
Sample 127αm
,
22tex 853tpm
Yarn
Fel
ting
(%)
Felting Time (min.)
10.2 DISCUSSION
The fabrics which have been tested in this project have been constructed using yarns
with the same αm value (114) but with a greater number of turns per meter for the weft
yarns than for the warp yarns for all fabrics except the Pilot production. The Pilot
production used the same yarn construction for both warp and weft. The yarns with the
greater number of turns per meter demonstrated the lowest values of felting shrinkage.
The conventional two-fold yarn used in this examination showed one of the highest
felting shrinkage results. Ali [49] found that, in hand washing conditions, yarn felting
shrinkage was lower in plied yarns than in singles. It is difficult to make comparisons
between the singles and two-fold yarns in this work, as the singles yarns were produced
using Solospun™ attachments, and the two-fold yarns without. Furthermore, the
method used to determine the ply twist in Ali’s work was not carried out here.
However, the results obtained in this study appear to contradict this result.
In all productions, the loomstate samples showed greater felting shrinkage in the weft
direction than the warp, which is opposite to what might be expected from the yarn
Chapter 10 Yarn Testing Results and Discussion
233
shrinkage results. The majority of the samples taken from scouring/crabbing onwards
have greater felting shrinkage in the warp direction than the weft direction.
This is slightly unusual in that it would be expected that the loomstate samples would
show felting shrinkage values to be more in line with the results obtained for yarn
shrinkage. The yarns have been subjected to minimal setting in autoclaving in order to
reduce twist liveliness (see Table 4.1 in Materials and Methods for conditions) prior to
weaving and the loomstate fabrics were not subjected to any more setting.
The reasons why the loomstate samples do not reflect the results of yarn felting
shrinkage work are not understood. It is expected, though, that it is a result of the fabric
construction, in that the thread density and the yarn intersections restrict yarn and fibre
movement which, in turn, prevents felting. Fabric structural factors also impact on the
felting shrinkage of the other fabric samples, and the degree to which the yarn felting
propensity impacts on the fabric felting shrinkage has not been assessed, although it
appears that the yarn felting properties do contribute to the fabric felting properties.
The structure of Solospun™ yarns is such that fibres are held more securely within the
yarn than in other yarn structures [1]. This may account, somewhat, for the reduction in
shrinkage, as the fibres within the yarns are less able to move and migrate in washing.
Furthermore, it has been shown [204] that the hairiness of Solospun™ yarns was related
to the twist factor of the yarns. This would suggest that the reduction in felting
shrinkage of the yarns seen in this project is not a result of a reduction in the hairiness of
the yarns.
The reduction in felting shrinkage of yarns with increases in yarn twist is consistent
with results which had previously been obtained at CNL [205].
Researchers [44, 47] have also found that for fabrics made from yarns of higher twist,
the felting shrinkage was lower than for fabrics made from yarns of lower twist.
Although only one twist factor was used for the fabrics in the current project, the results
of comparative yarn testing, combined with the results from other researchers [44, 47],
Chapter 10 Yarn Testing Results and Discussion
234
would suggest that the high twist factor yarns that were used for the fabrics in this
project contribute to the shrink-resist effect.
The effect of the yarn structure on the felting shrinkage of the fabric requires further
investigation. It is not clear, at this stage, what contribution the yarn structure makes to
the shrink-resistance of the fabric, although the yarn felting results indicate that the
structure and the twist factor have some influence on the fabric felting properties.
235
CHAPTER 11
CONCLUSIONS
The felting shrinkage of fabrics in this project has been measured at various stages of
finishing, when constructed and finished according to the specifications that were
developed by Canesis Network, Limited, during product development work. In order to
determine the reasons for the observed shrink-resistance, testing of samples finished
under varied conditions was also conducted. Furthermore, fabrics that were woven with
different constructions were also examined after finishing with a single set of finishing
conditions. This meant that the effect of the finishing processes and the effect some of
the fabric construction parameters were able to be studied.
Fabric testing included a wide range of tests. Most importantly, wash testing was
carried out according to Woolmark standards [151, 152] to examine the shrink-
resistance of the fabric samples in detail. This involved an examination of both
relaxation shrinkage and felting shrinkage. The results of felting tests were then able to
be compared with the results of other testing to determine the reasons for the shrink-
resistance. Wash testing showed that the fabrics with the lowest felting shrinkage
throughout finishing were the plain weave constructions, followed by the 2x1 twills,
while the 3x3 twills showed the highest degrees of felting shrinkage through finishing.
This result highlighted the importance of float length in achieving shrink-resistance.
Furthermore, in the twill weave samples, those constructed at 26ppcm were shown to
felt more than those constructed at 33ppcm, and this provided evidence of the
importance of the end and pick density in shrink-resistance.
From the results of the plain weave productions, it appeared that the crabbing process
was responsible for the changes that were leading to a reduction in felting shrinkage.
However, when the twill weave fabrics were investigated, they showed a more gradual
reduction in felting shrinkage, with reductions not only occurring from crabbing, but
also as a result of the pressure decatising processes. This result pointed to the
possibility that the lateral compression taking place in these processes was responsible
Chapter 11 Conclusion
236
for the reduced felting shrinkage. This theory was confirmed by the results obtained in
thickness testing, which were then used to determine fabric volume density.
Furthermore, when a plain weave sample was pressure decatised instead of crabbed, the
final ‘fully finished’ sample showed felting shrinkage results that were comparable with
those obtained for ‘fully finished’ samples that had been crabbed. All these factors
indicate that setting of the fabric under lateral compression is the essential element in
the finishing routine, and that crabbing does not lead to a unique outcome that could not
also be achieved in pressure decatising.
To attempt to understand the reasons why the shrink-resist effect occurred in the fabrics,
other testing included the physical properties of the fabrics to determine if there was
some basic physical change taking place during finishing that may have lead to the
shrink-resistance. For the most part these results showed the greatest correlations with
felting shrinkage, especially when used in conjunction with other results from
mechanical testing. Several parameters displayed a “critical point” [194] where change
in the parameter was associated with large reductions in felting shrinkage. The
parameters that showed the strongest correlations were compactness ratio and density
(calculated using data from mechanical testing). These results showed that the
construction of the fabric, and the changes in the structure that took place in finishing,
were major factors in the prevention of felting. Although reductions of felting
shrinkage through construction have been found by other researchers in previous work
[44-48], levels as low as have been found in the current project resulting from the
washing conditions used in this testing, were not observed in these previous studies.
The observation that fabrics with different float lengths can have similar densities but
very different levels of felting shrinkage gives further demonstration that the increased
float length provides extra ability for the fibres to move and therefore, felt.
The observation that felting shrinkage is reduced through the fabric construction is not
new. It has been found previously by several researchers [44-48] however, the ability to
produce a fabric with felting shrinkage levels as low as seen in this project, without
conventional shrink-resist treatments, is unusual. The levels seen here, in many of the
samples meet the standards of the Woolmark Company for machine washability [152].
It has been suggested that this is a result of the Solospun™ yarn structure allowing for

Chapter 11 Conclusion
237
more compact fabrics than had previously been achievable with conventional spinning
technology [206].
Mechanical testing, using objective test methods, was carried out to determine if there
was a change in the mechanical properties of the fabric which would reduce felting
shrinkage. In particular, a number of mechanical properties of fabrics reflect the inter-
yarn and inter-fibre friction within the fabric. In general, the correlations of these
results with measures of felting shrinkage were poor. There is no indication that the
changes in the mechanical properties can be used to explain the reduction in felting
shrinkage. From these results, it was determined that there is no indication that changes
in the frictional properties are responsible for the reduction in felting shrinkage.
Chemical testing was carried out to determine if the finishing of the fabric was causing
some chemical change that reduced felting shrinkage. Chemical methods have
traditionally been used to reduce felting shrinkage, and although there was no evidence
that chemical change through processes involving steam, water or water with teric
would reduce felting shrinkage, the traditional importance of chemical change in shrink-
resistance made this an important area of investigation. The results of this work showed
some strong trends as a result of finishing and the severity of the conditions used in the
solubility of the wool. However, overall, for both solubility testing and amino acid
analysis, there were no strong correlations with felting shrinkage. It was therefore,
concluded, that although there were chemical changes taking place in the fibres as a
result of finishing, they were not the cause of the shrink-resistance. They do, however,
indicate an increase in setting of the fabric.
Microscopy was used to determine if there had been any observable changes to the
surface of the fibres and also to observe changes in the fabric structure through
finishing. Damage to the surface of wool fibres has also been used as a method of
preventing felting shrinkage, due to the importance of the scales in the occurrence of
felting. Although there was some damage to fibres found in the samples used in this
project, in that scales were damaged and in some cases removed, this was found to be
no more severe than that which might normally be associated with the processing of
wool [201-203]. Microscopy results did show that, as finishing progressed, the fabrics

Chapter 11 Conclusion
238
became thinner and flatter, and the individual yarns become less rounded. Surface
examination of the fabrics showed that the yarns were closer together. Overall,
microscopy gave a visual demonstration of the compaction of the fabric in all directions
through finishing.
Finally yarn testing was used to determine if the unique structure of the Solospun™
yarn lead to an inherently greater degree of shrink-resistance than conventional yarns.
Yarn testing demonstrated that high levels of yarn twist in Solospun™ yarns resulted in
yarns that felted less. The results of yarn shrinkage testing suggest that Solospun™
yarns bring an inherent level of shrink-resistance to the fabric, however, a final
conclusion on this is difficult to make with only a single conventional yarn structure
examined, and without comparable fabrics produced from conventional yarn structures.
Overall, it appears that the shrink-resistance of these fabrics is the result of a number of
factors. Firstly, the high twist yarns, of unique structure appear to have inherently lower
felting shrinkage. Secondly, the construction of the fabric is an important factor,
through the pick density and the float length, in that high pick density fabrics, with
shorter float lengths show lower felting shrinkage. Thirdly, the finishing of the fabric is
important in compacting the fabric and making it more dense. In short, the fabrics have
been constructed and finished in such a way that it is not possible, under the wash
testing conditions, for the fibres to move relative to one another and result in felting
shrinkage.
Further work is required to understand the role that the yarn structure plays in the
shrink-resistance of these fabrics. The results given in Chapter 10 indicate that the yarn
felting propensity is low in the yarns used for the fabric, but the contribution that this
makes to the fabrics themselves is, at this stage, not well understood. It would also be
of benefit to determine whether a comparable conventional 2 fold ring spun yarn can be
used to achieve the same shrink-resist effect if woven and finished to the same
specifications. For commercialisation, an understanding of the performance of these
fabrics in tumble driers would also be important. It would also be useful to determine
how, or if, these findings might apply to other fabric structures. For instance, would it
be possible to produce a knitted structure that had inherent shrink-resist properties as
Chapter 11 Conclusion
239
demonstrated here? Further work on the crabbing process and its contribution to shrink-
resistance is also required. Comparable felting shrinkage results were seen in the
sample that had been pressure decatised instead of crabbed, but a full study of this route
was not conducted. The reason for the consistent difference between the warp and weft
felting shrinkage also requires further exploration.
The hypothesis “that shrink-resistance is imparted as a combination of physical
properties imposed by a unique yarn structure, the setting of yarn and fabric by various
finishing processes, and changes in the frictional properties of the fibres through
finishing the fabric” has been tested. The results that were obtained do indeed indicate
that shrink-resistance is the result of a combination of factors. Firstly, the physical
properties of the yarns have been examined and the results show that the Solospun™
structure is more resistant to felting shrinkage than conventional two-fold structures.
Furthermore, the high twist factor yarns that was used was found to be more resistant to
felting shrinkage in yarn testing than lower twist yarns. Secondly, the finishing
processes that set the fabric under lateral compression have been shown to have a large
effect on the reduction in felting shrinkage, through the increased density of the fabric,
rather than through chemical changes as may have been anticipated. Thirdly, there is no
indication from the results of mechanical testing of the fabrics that felting shrinkage has
been reduced by changes to the frictional properties of the fibres.
Furthermore, it was also found that the structure of the fabric, in terms of end and pick
density, and float length, contributes to producing the shrink-resist effect. The
‘tightness’ of the fabric prevents the fibres from moving when subjected to felting
conditions.
240
REFERENCES
[1] Prins, M., Lamb, P., and Finn, N., “Solospun™- The Long Staple Weavable Singles
Yarn”, Text. Inst. 81st World Conf., WS17B, 1-19 (2001).
[2] Makinson, K.R., Shrinkproofing of Wool. Marcel Dekker, New York, 1979.
[3] Moncrieff, R.W., Wool Shrinkage and Its Prevention. The National Trade Press Ltd,
London, 1953.
[4] Makinson, K.R., “Surface Properties of Wool Fibers” pp. 109-164 in Surface
Characteristics of Fibers and Textiles (in Two Parts), Part I. Edited by M.J. Schick.
Marcel Dekker, Inc., New York, 1975.
[5] Mercer, E.H., and Makinson, K.R., “The Frictional Properties of Wool and Other
Textile Fibres”, J. Text. Inst., 38, T227-T240 (1947).
[6] Scholfield, J., “Researches on Wool Felting- Part III”, J. Text. Inst., 33, T181-T194
(1942).
[7] Lewis, J., “Superwash Wool- Part I: A Review of The Development of Superwash
Technology”, Wool Sci. Rev., 55, 2-29 (1977).
[8] Makinson, K.R., “Mechanisms Involved In Shrinkproofing By Degradative
Treatments”, App, Polymer Symp., [18], Part II, 1083-1096 (1971).
[9] Bona, M., An Introduction to Wool Fabric Finishing. Paravia -Textilia, Biella, 1993.
[10] Makinson, K.R., “On The Cause of the Frictional Difference of the Wool Fibre”,
Trans. Faraday Soc., 44, 279-282 (1948).
[11] Makinson, K.R., “The Use of a Diffraction Grating as the Rubbing Surface in the
Study of the Frictional Properties of Wool Fibres”, Text. Res. J., 37[9] 763-771 (1967).
References
241
[12] Sherman, J.B., Balasubramaniam, E., and Whiteley, K.J., “The Effect of
Temperature on the Felting Properties of Loose Wool”, J. Text. Inst., 59[1] 1-9 (1968).
[13] Mercer, E.H., “The Felting of Wool”, J. Counc. Sci. Ind. Res., 15[4] 285-294
(1942).
[14] Schofield, J., “Researches on Wool Felting- Part I and Part II”, J. Text. Inst., 29,
T239-T252 (1938).
[15] Speakman, J.B., “Researches on Wool Felting”, J. Text. Inst., 29, T280-T282
(1938).
[16] Speakman, J.B., “Researches on Wool Felting”, J. Text. Inst., 29, T305-T306
(1938).
[17] Speakman, J.B., Stott, E., and Chang, H., “A Contribution To The Theory Of
Milling- Part 2”, J. Text. Inst., 24, T273-T292 (1933).
[18] Menkart, J., and Speakman, J.B., “The Felting of Animal Fibres”, J. Soc. Dyers
Colour., 64[1] 14-19 (1948).
[19] Menkart, J., and Speakman, J.B., “The Felting of Animal Fibres”, J. Soc. Dyers
Colour., 64[1] 14-19 (1948).
[20] Bearpark, I., Marriott, F.W., and Park, J., A Practical Introduction to the Dyeing
and Finishing of Wool Fabrics. Society of Dyers and Colourists, Bradford, 1986.
[21] Rouette, H.K., and Kittan, G., Wool Fabric Finishing. Wool Development
International Ltd, Ilkley, 1991 (English Edition).
[22] Bohm, L., “The Frictional Properties of Wool Fibres in Relation to Felting”, J. Soc.
Dyers Colour., 61[11] 278-283 (1945).
References
242
[23] Speakman, J.B., Chamberlain, N.H., and Menkart, J., “The Lepidometer- An
Instrument For Measuring The Scaliness of Animal Fibres”, J. Text. Inst., 36, T91-T106
(1945).
[24] Feldtman, H.D., and McPhee, J.R., “The Effect of Temperature on the Felting Of
Shrink-Resistant Wool”, Text. Res. J., 34[3] 199-206 (1964).
[25] Chaudri, M.A., and Whiteley, K.J., “Frictional and Felting Properties of Wool
Fibres Treated With Benzoquinone”, J. Text. Inst., 60[2] 37-45 (1969).
[26] Chaudri, M.A., and Whiteley, K.J., “The Influence of Natural Variations in Fiber
Properties on the Felting Characteristics of Loose Wool”, Text. Res. J., 40[4] 297-303
(1970).
[27] Hunter, L., Shiloh, M., and Smuts, S., “The Inter-Relationship Between Fibre
Properties, Loose Wool Felting and Fabric Felting”, SAWTRI Technical Report, No.
463, South African Wool and Textile Research Institute of the CSRI, Port Elizabeth
(February 1981).
[28] Bogaty, H., Sookne, A.M., Weiner, L.I., and Harris, M., “The Felting in
Laundering of Wool Blends”, Text. Res. J., 23[2] 114-118 (1953).
[29] Sookne, A.M., Bogaty, H., and Harris, M., “Some Felting Properties of Wools of
Different Geographical Origins”, Text. Res. J., 20[9] 637-642 (1950).
[30] Speakman, J.B., and Sun, T., “The Influence of Fibre Length on the Milling
Properties of Merino Wool”, J. Text. Inst., 27 T171-T176 (1936).
[31] Hunter. L., Robinson, G.A., and Smuts, S., “The Effect of Wool Staple Crimp,
Resistance to Compression and Other Fibre Properties on Certain Woven Fabric
Properties”, SAWTRI Technical Report, No. 439, South African Wool and Textile
Research Institute of the CSRI, Port Elizabeth (January 1979).
References
243
[32] Johnson, A., “Influence of Fiber Length on the Milling Shrinkage of Wool Cloths”,
Text. Res. J., 23[12] 937 (1953).
[33] Van Rensburg, N.J.J., and Barkhuysen, F.A., “A Study of Some Factors Which
Affect the Felting Shrinkage of Wool”, Proc. 7th Int’l. Wool Text. Res. Conf., III 138-
147 (1985).
[34] Speakman, J.B., and Stott, E., “A Contribution to the Theory of Milling- Part I: A
Method for Measuring the Scaliness of Wool Fibres”, J. Text. Inst., 22, T339-T348
(1931).
[35] Scheepers, G.E. and Slinger, R.I., “The Influence of Fibre Crimp Form on the
Felting and Compressional Properties of Wool”, SAWTRI Technical Report, No. 103,
South African Wool and Textile Research Institute of the CSRI, Port Elizabeth
(February, 1968).
[36] De Wet, P.J., “Environmental Influences on the Felting of Merino Wool” Proc. 3rd
Int’l. Wool Text. Res. Conf., III 481-488 (1965).
[37] Hunter, L., Smuts, S., and Gee,E., “The Effect of Staple Crimp, Resistance to
Compression and Other Fibre Properties on the Physical Properties of Knitted and
Woven Fabrics”, Proc. 6th Quinquennial Int’l Wool Text. Res. Conf., IV 1-15 (1980).
[38] Veldsman, D.P. and Kritzinger, C.C. “Studies on the Felting Properties of South
African Merino Wools”, J. Text Inst., 51[12 part II] T1257-T1273 (1960).
[39] Turpie, D.W.F. and Shiloh, M., “The Processing Characteristics of South Africa
Wools, Part V: Properties of Merino Wool Types Varying in Staple Crimp”, SAWTRI
Technical Report, No 189, South African Wool and Textile Research Institute of the
CSRI, Port Elizabeth, (April, 1973).
References
244
[40] Menkart, J., and Detenbeck, J.C., “The Significance of Wool Fiber Crimp- Part I:
A Study on the Worsted System”, Text. Res. J., 27[9] 665-689 (1957).
[41] Menkart, J., and Joseph, B., “The Significance of Wool Fiber Crimp- Part II: A
Study on the Woolen System”, Text. Res. J., 28[11] 940-945 (1958).
[42] Bogaty, H., Sookne, A.M., and Harris, M., “The Felting of Wool As Related to the
Elastic and Swelling Behavior of the Fiber”, Text. Res. J., 29[11] 822-826 (1951).
[43] Szucht, E., “Some Relations of Between the Resilience of Wool Fibres and Their
Felting Properties”, Proc. 3rd Int’l Wool Text. Res. Conf., III 495-502 (1965).
[44] Bogaty, H., Weiner, L.I., Sookne, A.M., and Harris, M., “Effect of Construction on
the Laundering Shrinkage of Knitted Woolens”, Text. Res. J., 21[2] 102-109 (1951).
[45] Brown, A.E., and Krasny, J.F., “The Development of Wash-and-Wear Wool
Fabrics for Modern Home Laundering”, J. Text. Inst., 51 Part II [12] T1414-T1437
(1960)
[46] Farnworth, A.J., Lipson, M., and McPhee, J.R., “Washable Non-Iron Fabrics From
Wool”, 51 Part II [12] T1504-T1516 (1960).
[47] Feldtman, H.D., and McPhee, J.R., “Machine Washing and Tumble Drying of
Wool Fabrics”, Am. Dyestuff Reporter, 53[6] 199-209 (1964).
[48] Bogaty, H., Lourigan, G.H., and Harris, H.E., “Structural Compactness Of Woven
Wool Fabrics and Their Behaviour in Modern Washing Machines”, Test. R.es. J., 28[9]
733-737 (1958).
[49] Ali, M.A., “Ply Effect on Yarn Shrinkage Due to Relaxation and Felting”, Pakistan
Journal of Scientific and Industrial Research, 13[4] 471-476 (1970).

References
245
[50] Phillips, H., “Recents Trend in The Production of Non-felting Wool”, The Dyer,
96[5] 201-203 (1946).
[51] Kärrholm, E.M., Cednäs, U.M., and Nordhammar, P.G., “An Experimental
Investigation of Relationships Between Construction, Finishing and End Properties of
Worsted Fabrics”, Proc. 3rd Int’l. Wool Text. Res. Conf., IV 449-461 (1965).
[52] Sherman, J.B., and Whiteley, K.J., “Comparison of the Felting Properties of Loose
Wool Fibres, Worsted-Spun Yarn, and Knitted Fabric”, J. Text. Inst., 60[5] 171-180
(1969).
[53] Shorter, S.A., “The Moisture Content of Wool- Its Relation to Scientific Theory
and Commercial Practice”, J. Soc. Dyers Colour., 39[9] 270-276 (1923).
[54] Martin, A.J.P., “Observations on the Theory of Felting”, J. Soc. Dyers Colour.,
60[12] 325-328 (1944).
[55] Harris, M., “Some Factors Contributing to the Felting of Wool”, Am. Dyestuff
Reporter, 34[4] P73-P76 (1945).
[56] Schofield, J., “Observations on the Theory of Felting”, J. Soc. Dyers Colour., 61[3]
77 (1945).
[57] De Boos, A.G., and Wemyss, A.M., “Objective Evaluation of Wool Fabric
Finishing”, J. Text. Inst., 84[4] 506-519 (1993).
[58] Shaw, T., and White, M.A., “The Chemical Technology of Wool Finishing”, pp.
317-442 in Handbook of Fibre Science and Technology: Vol II, Chemical Processing of
Fibers and Fabrics. Functional Finishes: Part B. Edited by Lewin, M., and Sello, S.B.
Marcel Dekker, Inc., New York, 1984.
[59] Brearley, A., and Iredale, J., The Worsted Industry, 2nd Edition, WIRA, Leeds,
1980.
References
246
[60] Brady, P.R., “An Overview of Wool Fabric Finishing”, pp. 6-43 in Finishing and
Wool Fabric Properties: A Guide to the Theory and Practice of Finishing Wool
Fabrics. Edited by Brady, P.R. CSIRO Wool Technology, Geelong, 1997.
[61] McPhee, J.R., and Shaw, T., “The Chemical Technology of Wool Processing”,
Rev. Prog. Coloration, 14, 58-68 (1984).
[62] Smuts, S., Slinger, R.I., van der Merwe, J.P., “The Effect of Certain Finishing
Variables on the Mechanical Properties of Wool Worsted Fabrics”, SAWTRI Technical
Report, No. 149, South African Wool and Textile Research Institute of the CSRI, Port
Elizabeth (August 1971).
[63] Shaw, T., and Lewis, J., “The Finishing of Wool Fabrics” Textile Progress, 4[3]
(1972).
[64] White, M.A., “Wool-Finishing: Machinery Developments and Processing Trends”,
Textile Progress 13[2] 1-38 (1983).
[65] Parker, B., “Finishing Techniques for Woollen and Worsted Fabrics”, J. Soc. Dyers
Colour., 109[12] 382-384 (1993).
[66] De Boos, A.G., “The Effect of Finishing on the Mechanical and Thermal Properties
of Wool Fabrics. Part 2-Milling and Interactions in Piece Dyeing”, J. Soc. Dyers
Colour., 104[9] 338-343 (1988).
[67] Nilon, J.P., and Wemyss, A.M., “Using Milling to Control The Hygral Expansion
of Piece-Dyed Worsted Fabrics”, J. Text. Inst., 79[3] 511-516 (1988).
[68] Pailthorpe, M., Canesis Network Limited, personal communication, 2003.
References
247
[69] Tester, D., and Slevin, P., “The Role Of Stenter Settings in Determining the
Dimensional and Mechanical Properties of Wool Fabric”, J. Text Inst., 84[4] 659-668
(1993).
[70] De Boos, A.G., “How to Obtain Desired Values of Fabric Properties in Finishing”,
pp. 72-79 in Finishing and Wool Fabric Properties: A Guide to the Theory and Practice
of Finishing Wool Fabrics. Edited by Brady, P.R. CSIRO Wool Technology, Geelong,
1997.
[71] Bona, M., “Wool Fabric Decatizing and Related Setting Treatments: The Influence
of Process Parameters and New Trends in Machinery Design”, DWI Reports 123 37-48
(2000).
[72] Tester, D.H., “Pressure Decatising” pp. 89-99 in Finishing and Wool Fabric
Properties: A Guide to the Theory and Practice of Finishing Wool Fabrics. Edited by
Brady, P.R. CSIRO Wool Technology, Geelong, 1997.
[73] Bissett, I.S., Medley., Pullin, J.S., and Wrennall, L.M., “A Novel and
Comprehensive Final Finishing Process for Worsted and Related Fabrics”, J. Soc. Dyers
Colour., 89[12] 466-473 and 522 (1973).
[74] Medley, J.A., “High Temperature Decatizing” Interim Report, WIRA Report 65,
July 1969.
[75] Jeong, Y.J., and Phillips, D.G., “Effect of Pressure Decatizing on Fabric Drape”,
Text. Res. J., 71[5] 415-419 (2001).
[76] Cook, J.R., and Fleischfresser, B.E., “Dimensional Changes Resulting From
Pressure-decatizing of Wool Fabric”, J. Text. Inst., 80[1] 120-128 (1989).
[77] De Boos, A.G., “The Effect of Finishing on the Mechanical and Thermal Properties
of Wool Fabrics. Part 1- The Properties of Piece-Dyed Fabrics”, J. Soc. Dyers Colour.,
103[10] 350-355 (1987).

References
248
[78] Garcia, J., Postle, R., and Pailthorpe, M.T., “Changes in the Chemical Composition
of Wool During Dyeing and Finishing and Their Effects On Fabric Properties”, Text.
Res. J., 65[8] 477-485 (1995).
[79] Lees, K., and Elsworth, F.F. “The Decatising Process, With Special Reference to
Its Influence on the Dimensional Stability of Woven Cloth”, Proc. 3rd Int’l. Wool Text.
Res. Conf., III 555-564 (1965).
[80] Das, U.K., “Influence of Wrapper Moisture Content on Wool Fabric Mechanical
Properties After Pressure Decatizing”, Text, Res. J., 63[1] 59-60 (1993).
[81] Hall, A.J., Textile Finishing. Heywood Press, London, 1966.
[82] McPhee, J.R., “Reaction of Wool With Oxidising Agents in Concentrated Salt
Solutions”, Text. Res. J., 30[5] 349-357 (1960).
[83] Bradbury, J.H., “Application of the Descaling Technique to the Theory of
Shrinkproofing of Wool”, J. Text. Inst., 51[12] T1226-T1236 (1960).
[84] McPhee, J.R., “Rate of Felting of Untreated and Shrink-Resistant Wool Fabrics”,
Text. Res. J., 31[9] 770-778 (1961).
[85] Bradbury, J.H., Rogers, G.E., and Filshie, B.K., “The Theory of Shrinkproofing of
Wool- Part V: Electron and Light Microscopy of Wool Fibers After Chemical
Treatments”, Text. Res. J., 33[8] 617-630 (1963).
[86] Mehta, R.D., “Shrinkproofing Treatments Have a Profound Effect on Soiling
Characteristics of Wool”, Text. Chemist Colorist, 16[5] 106-108 (1984).
[87] De Boos, A.G., “Finishing Wool Fabrics To Improve Their End-use Performance”,
Textile Progress, 20[1]1989.
References
249
[88] Meichelbeck, H., and Knittel, H., “The Influence of Charged Groups and of
Detergent Sorption on the Felting Behavior of Wool”, App. Polymer Symp., [18], Part I,
507-512 (1971).
[89] Alexander, P., “Recent Developments in Non-shrink Processes for Wool”, J. Soc.
Dyers Colour., 66[7] 349-357 (1950).
[90] Swanepoel, O.A., and Becker, J., “Aspects of the Shrinkproofing and Bleaching of
Wool”, SAWTRI Technical Report, No. 105, South African Wool and Textile Research
Institute of the CSRI, Port Elizabeth (April 1968).
[91] Makinson, K.R., “Some New Observations on the Effects of Mild Shrinkproofing
Treatments on Wool Fibres”, Text. Res. J., 38[8] 831-842 (1968).
[92] Makinson, K.R., “Effects of the KMnO4/Salt Shrinkproofing Treatment on the
Frictional Properties of Wool Fibers- Part I: Correlation Between the Static Coefficients
of Friction and Measurements on the Intrados and Extrados of the Crimp”, Text. Res. J.,
39[8] 710-721 (1969).
[93] Makinson, K.R., “Effects of the KMnO4/Salt Shrinkproofing Treatment on the
Frictional Properties of Wool Fibers- Part II: Dependence on the Nature of the Rubbing
Surface”, Text. Res. J., 39[11] 1072-1074 (1969).
[94] Andrews, M.W., Inglis, A.S., Rothery, F.E., and Williams, V.A, “Wool
Shrinkproofing Studies- Part III: Fiber Modification in Neutral Potassium
Permanganate-Salt Treatments”, Text. Res. J., 33[9] 705-711 (1963).
[95] Williams, V.A., “Wool Shrinkproofing Studies- Part II: The Felting Shrinkage of
Permanganate Treated Wool”, Text. Res. J., 33[6] 444-452 (1963).
[96] Williams, V.A., “Wool Shrinkproofing Studies- Part I: The Influence of Inorganic
Salts on the Reaction of Potassium Permanganate with Wool in Neutral Solution”, Text.
Res. J., 32[12] 977-985 (1962).
References
250
[97] Kantouch, A., Bendak, A., and Sadek, M., “Studies on the Shrink-Resist Treatment
of Wool With Potassium Permanganate”, Text. Res. J., 48[11] 619-624 (1978).
[98] Davidson, A.N., and Preston, R., “Shrink-Resisting Wool: Some Novel Features
and the Description of a New Process”, J. Text. Inst., 47[8] P685-P707 (1956).
[99] Cardamone, J.M., Yao, J., and Nun ̀ez, A., “Controlling Shrinkage in Wool Fabrics:
Effective Hydrogen Peroxide Systems”, Text. Res. J., 74[10] 887-898 (2004).
[100] Rakowski, W., “Plasma Treatment of Wool Today. Part 1- Fibre Properties,
Spinning and Shrinkproofing”, J. Soc. Dyers Colour., 113[9] 250-255 (1997).
[101] Erra, P., Molina, R., Jocic, D., Julia, M.R., Cuesta, A., and Tascon, J.M.D,
“Shrinkage Properties of Wool Treated with Low Temperature Plasma and Chitosan
Biopolymer”, Text. Res. J., 69[11] 811-815 (1999).
[102] Kan, C.W., Chan, K., and Yuen, C.W.M., “Low Temperature Plasma on Wool
Substrates: The Effect of the Nature of the Gas”, Text. Res. J., 69[6] 407-416 (1999).
[103] Kan, C.W., Chan, K., Yuen, C.W.M., and Miao, M.H., “Effect Of Low
Temperature Plasma, Chlorination, and Polymer Treatments and Their Combinations on
the Properties of Wool Fibres”, Text. Res. J., 68[11] 814-820 (1998).
[104] Ganssauge, D., and Thomas, H., “Finishing of Fabrics- Influence of a Plasma
Treatment on The Finishing Processes and the Fabric Properties”, Wool Tech. Sheep
Breed., 49[4] 302-310 (2001).
[105] Ueda, M., and Tokino, S., “Physico-Chemical Modifications of Fibres and Their
Effect on Coloration and Finishing”, Rev. Prog. Coloration, 26, 9-19, (1996).
[106] Thorsen, W.J., and Kodani, R.Y., “A Corona Discharge Method of Producing
Shrink-Resistant Wool and Mohair”, Text. Res. J., 36[7] 651-661 (1966).
References
251
[107] Landwehr, R.C., “Electrostatic Properties of Corona-Treated Wool and Mohair”,
Text. Res. J., 39[8] 792-793 (1969).
[108] Pardeshi, P.D., Paul, R., and Manjrekar, S.G., “Wool Processing: Challenges and
Prospects”, Asian Text. J., 11[4] 52-57 (2002).
[109] Nolte, H., Bishop, D.P., and Höcker, H., “Effects of Proteolytic and Lipolytic
Enzymes on Untreated and Shrink-resist-treated Wool”, J. Text. Inst., 87 Part 1[1] 212-
226 (1996).
[110] Singh, M., and Goel, A., “A Comparative Study Of Enzymatic Treatment on
Woollen Fabrics”, Asian Text. J., 11[4] 33-38 (2002).
[111] Kershaw, A., and Lewis, J., “The Role Of Polymer Treatments in The Shrink-
Proofing of Wool”, Textile Month, April 1976, 40-44.
[112] De Boos, A.G., “Effect of Shrinkresist Polymers on the Mechanical Properties of
Woven Wool Fabrics”, pp285-300 in Proceedings of the Japan-Australia Joint
Symposium on Objective Specification of Fabric Quality, Mechanical Properties and
Performance, Edited by S. Kawabata, R. Postle, and Masako Niwa, Textile Machinery
Society of Japan, Kyoto, Japan, 1982.
[113] Lewis, J., “Superwash Wool- Part II: Continuous Shinkproofing Processes”, Wool
Sci. Rev., 55, 23-42 (1978).
[114] Pailthorpe, M., Canesis Network Limited, personal communication, 2005.
[115] Cegarra, J., and Riva, A., “A Comparative Dyeing Kinetic Study of Untreated,
Chlorinated and Hercosett Wool With Acid and Reactive Dyes”, Proc. 6th Quinquennial
Int’l Wool Text. Res. Conf., V 545-558 (1980).
References
252
[116] Aulbach, M., Kettlewell, R., and Jackson, J., “Shrink-Resist Wool Process”,
International Dyer, 186[6] 23-29 (2001).
[117] Cockett, K.R.F., Jackson, J., Kettlewell, R., Lewis, J., Smart, R., Smith, P.,
“Developments in the Shrinkproofing of Wool to the Superwash Standard”, Proc. 6th
Quinquennial Int’l Wool Text. Res. Conf., V 1-17 (1980).
[118] De Boos, A.G., “Non-Cross-Linking Cationic Polymers For the Shrink Resist
Treatment of Wool”, J. Text. Inst., 75[3] 184-190 (1984).
[119] Greef, J.C., and Schlink, A.C., “The Inheritance of Felting of Merino Wool”,
Wool Tech. Sheep Breed., 50[1] 6-10 (2002).
[120] De Boos, A.G., “The Dimensional Stability of Wool Fabrics”, pp. 57-71 in
Finishing and Wool Fabric Properties: A Guide to the Theory and Practice of Finishing
Wool Fabrics. Edited by Brady, P.R. CSIRO Wool Technology, Geelong, 1997.
[121] Smith, L.J. and Baird, K., “Relaxation Shrinkage of Worsted Yarns. Part III: The
Dependence of Relaxation Shrinkage in Worsted Yarns on Processing Factors”, Text.
Res. J., 46[2] 104-112 (1976).
[122] Shaw, T., “Dimensional Stability of Woven Wool Fabrics: Part I- Its Effects on
Garment Making”, American Dyestuff Reporter, 76[6] 34-41 (1987).
[123] Bissitt, I.S., and Medley, J.A., “Optimum Conditions in Autoclave Setting” App.
Polymer Symp., [18] Part II, 955-961 (1971).
[124] Baird, K., “Hygral Expansion in Wool Fabrics”, Wool Sc. Rev., [31] 12-31 (1967).
[125] Baird, M., and Shahkarami, S., “Hygral Expansion”, Textile Month, 30-32, March
(1999).
References
253
[126] Lindberg, J., “Hygral Expansion of Wool Fabrics”, Proc. 3rd Int’l. Wool Text.
Res. Conf., III 53-63 (1965).
[127] Allen, C.F., De Boos, A.G., Ly, N.G., and Shaw, T., “Improving The Quality of
Wool Fabrics Using FAST”,Aachen Textile Conference, Schriftenreihe des Deutshen
Wollforschunginstitutes (DWI Reports) 105 287-299 (1990).
[128] Baird, K., “The Contribution Of The Bilateral Structure Of Wool To Hygral
Expansion”, J. Text. Inst., 64[9] 509-514 (1973).
[129] Dhingra, R.C., Postle, R., Mahar, T.J., “Hygral Expansion in Woven Wool
Fabrics”, J. Text. Inst., 55[1] 28-40 (1985).
[130] Cednas, M., “Dimensional Stability of Wool Fabrics”, J. Text. Inst., 52[6] T251-
T271 (1961).
[131] Garcia, J., Pailthorpe, M.T., Postle, R., “Effects of Dyeing and Finishing on
Hygral Expansion and Other Crimp-Dependent Physical Properties of Wool Fabrics”,
Text. Res. J., 64[8] 466-475 (1994).
[132] Baird, K., “Dimensional Stability of Woven Wool Fabrics: Hygral Expansion”,
Text. Res. J., 33[12] 973-984 (1963).
[133] Shiloh, M., Hunter, L., and Smuts, S., “The Effect of Fibre Properties and Weave
Crimp on The Hygral Expansion of Woven Wool Fabrics”, J. Text. Inst., 73[5] 238-245
(1982).
[134] Mahar, T.J., Dhingra, R.C., and Postle, R., “Interactions Between the Mechanical
Properties and Dimensional Stability of Wool Fabrics”, pp. 489-500 in Objective
Measurement: Applications to Product Design and Process Control. Proceedings of the
Third Australia-Japan Bilateral Science and Technology Symposium on Objective
Evaluation of Apparel Fabrics Edited by S. Kawabata, R. Postle, and Masako Niwa,
Textile Machinery Society of Japan, Kyoto, Japan, 1985.
References
254
[135] Shaw, T., “Dimensional Stability of Woven Wool Fabrics: Part II- Its Effects on
Garment Making”, American Dyestuff Reporter, 76[7] 26-32 (1987).
[136] Shaw, T., “Thermal Expansion of Woven Wool Fabrics at Constant Moisture
Regain”, Proc. 7th Int’l. Wool Text. Res. Conf., III 158-167 (1985).
[137] Baird, M., “The Hygral/Thermal Dimensional Behaviour of Worsted Fabrics
Under Autoclave Conditions. Part I”, J. Text. Inst., 83[1] 156-162 (1992).
[138] Baird, M., Laird, B., and Weedall, P., “Hygral Expansion”, Textile Horizons,
14[4] 31-32 (1994).
[139] De Boos, A.G., Harrigan, F.J., and White, M.A., “Objective Assessment of the
Effect of Setting Processes in the Properties of Wool-Containing Fabrics”, pp311-319 in
Objective Evaluation of Apparel Fabric. Proceedings of the Second Australia-Japan
Bilateral Science and Technology Symposium, Edited by R. Postle, S. Kawabata, and
Masako Niwa. Textile Machinery Society of Japan, Osaka, Japan, 1983.
[140] Rouette, H.K., “Age-Old Decatizing Chemistry Makes Surface Finish Possible”,
Int’l. Text. Bull.- Dyeing/Printing Finishing, 41[3] 5-12 (1995).
[141] Brady, P.R., “The Theory of Practical Wool Setting”, pp. 100-120 in Finishing
and Wool Fabric Properties: A Guide to the Theory and Practice of Finishing Wool
Fabrics. Edited by Brady, P.R. CSIRO Wool Technology, Geelong, 1997.
[142] Farnworth, A.J., “A Hydrogen Bonding Mechanism for the Permanent Setting of
Wool Fibers”, Text. Res. J., 27[8] 632-640 (1957).
[143] Speakman, J.B., “The Reactivity of the Sulphur Linkage in Animal Fibres- Part I:
The Chemical Mechanism of Permanent Set”, J. Soc. Dyers Colour., 52[9] 335-346
(1936).
References
255
[144] Speakman, J.B., Whewell, C.S., “The Reactivity of the Sulphur Linkage in
Animal Fibres- Part II: The Action of Baryta and Caustic Soda on Human Hair”, J. Soc.
Dyers Colour., 52[10] 380-387 (1936).
[145] Milligan, B., Caldwell, J.B., and Leach, S.J., “The Role of Thiol Groups in
Setting and Release of Set”, Proc. 3rd Int’l. Wool Text. Res. Conf., II 309-317 (1965).
[146] Tester, D., Michie, N., and de Jong, S., “The Effect of Regain Variation on Fabric
Finishing and Mechanical Properties”, Proc. 8th Int’l. Wool Text. Res. Conf., V 139-148
(1990).
[147] Kopke, V., “The Role of Water in the Setting of Wool: A Study of Setting At
Temperatures Above 100°C- Part I: Degree of Set”, J. Text Inst., 61[8] 361-387 (1970).
[148] Kopke, V., “The Role of Water in the Setting of Wool: A Study of Setting At
Temperatures Above 100°C- Part II: Fabric Properties”, J. Text Inst., 61[8] 388-407
(1970).
[149] Bona, M., “The Relaxation of Wool Cloth”, Int’l Text. Bull.- Dyeing/Printing/
Finishing, 40[1] 38-44 (1994).
[150] Pailthorpe, M., Canesis Network Limited, personal communication, 2002.
[151] The Woolmark Company, Woolmark Test Method: Washing of Wool Textile
Products, TM 31, August, 2002.
[152] The Woolmark Company, Product Specification: Flat Woven, Pile Woven and
Pressed Felt Apparel Products, W1, August, 2000.
[153] Standards Association of Australia, Methods of Test for Textiles, Part 2- Physical
Tests AS2001.2.12 Determination of Width of Fabrics, 1987.
References
256
[154] The Woolmark Company, Woolmark Test Method: Mass per Unit Area (Fabrics,
Wool Fillings or Pillows), TM 13, May, 2000.
[155] Canesis Network Limited, Wool Research Organisation Testing Laboratory,
Laboratory In House Test Method: Crimp, Version 2, Issued 26/05/1994.
[156] International Organization for Standardization, Textiles- Woven Fabrics-
Construction- Methods of analysis- Part 3: Determination of crimp of yarn in fabric,
ISO 7211/3-1984(E).
[157] Canesis Network Limited, Wool Research Organisation Testing Laboratory,
Laboratory In House Test Method: Ends and Picks, Version 2, Issued 21/06/1994.
[158] International Organization for Standardization, Textiles- Woven Fabrics-
Construction- Methods of analysis- Part 2: Determination of number of threads per unit
length, ISO 9211/2-1984(E).
[159] Booth, J.E., Textile Mathematics. Volume Three. The Textile Institute,
Manchester, 1977.
[160] Love, L., “Graphical Relationships in Cloth for Plain, Twill, and Sateen Weaves”,
Text. Res. J., 24[12] 1073-1083 (1954).
[161] Watt, J., Canesis Network Limited, personal communication, February, 2003.
[162] Ly, N.G., Tester, D.H., Buckenham, P., Roczniok, A.F., Adriaansen, A.L.,
Scaysbrook, F., and De Jong, S., “Simple Instruments for Quality Control by Finishers
and Tailors”, Text. Res. J., 61[7] 402-406 (1991).
[163] De Boos, A.G., “The Objective Measurement of Finished Fabric”, pp. 44-56 in
Finishing and Wool Fabric Properties: A Guide to the Theory and Practice of Finishing
Wool Fabrics. Edited by Brady, P.R. CSIRO Wool Technology, Geelong, 1997.
References
257
[164] De Boos, A., and Tester, D., “SiroFAST: Fabric Assurance By Simple Testing”
CSIRO Report No. WT 92.02, January 1994, (from www.tft.csiro.au February 2003).
[165] Canesis Network Limited, Wool Research Organisation Testing Laboratory,
Laboratory In House Test Method: FAST Test, Issued 17/07/1998.
[166] CSIRO Division of Wool Technology, FAST Fabric Assurance by Simple
Testing, Instruction Manual, CSIRO Division of Wool Technology, Sydney Laboratory,
Ryde, Sydney.
[167] Le, C., Ly, N., Phillips, D., De Boos, A., “Characterising the Stability of The
Surface Finish on Wool Fabrics”,10th Int’l Wool Text. Res. Conf., FI-1 1-9 (2000).
[168] De Boos, A.G., and Brady, P.R., “Objective Evaluation of Processes and
Machinery”, pp. 80-88 in Finishing and Wool Fabric Properties: A Guide to the Theory
and Practice of Finishing Wool Fabrics. Edited by Brady, P.R. CSIRO Wool
Technology, Geelong, 1997.
[169] KES Kato Tech Co., Ltd., Manual for Tensile and Shear Tester KES-FB-1.
[170] KES Kato Tech Co., Ltd., Manual for Pure Bending Tester KES-FB-2.
[171] KES Kato Tech Co., Ltd., Manual for Compression Tester KES-FB-3.
[172] KES Kato Tech Co., Ltd., Manual for Surface Tester KES-FB-4.
[173] De Boos, A.G., Australian Wool Innovation Ltd, personal communication, July,
2003.
[174] Mahar, T.J., Dhingra, R.C., and Postle, R., “Measuring and Interpreting Low-
Stress Fabric Mechanical and Surface Properties. Part I: Precision and Measurement”,
Text. Res. J., 57[6] 357-369 (1987).
References
258
[175] Pailthorpe, M., Canesis Network Limited, personal communication, 2002.
[176] Canesis Network Limited, Internal Test Method based on IWTO-4-60(E) Method
of Test for Solubility of Wool in Alkali, October, 1991.
[177] International Wool Textile Organisation, Method of Test For the Solubility of
Wool in Alkali, Draft TM-4-00.
[178] Canesis Network Limited, Internal Test Method based on IWTO-4-65(E) Method
of Test for Solubility of Wool in Urea-Bisulphite Solution, October, 1991.
[179] International Wool Textile Organisation, Method of Test For the Solubility of
Wool in Urea Bisulfite Solution, Draft TM-11-99.
[180] Lees, K., and Elsworth, F.F., “A Study of the Alkali Solubility Test for
Determining the Degree of Fibre Damage in Wool”, J. Soc. Dyers Colour., 68[6] 207-
213 (1952).
[181] Maclaren, J.A., and Milligan, B., Wool Science: The Chemical Reactivity of the
Wool Fibre. Science Press, Marrickville, 1981.
[182] International Wool Textile Organisation, Method of Test for the Solubility of
Wool in Alkali, IWTO-4-60(E).
[183] Lees, K., and Elsworth, F.F., “The Solubility of Wool in Urea Bisulphite
Solutions and its Use As A Measure of Fibre Modification”, Proc. Int’l Wool Text. Res.
Conf., C 363-373 (1955).
[184] International Wool Textile Organisation, Method of Test for the Solubility of
Wool in Urea- Bisulfite Solution, IWTO-11-65(E).

References
259
[185] Canesis Network Limited, Wool Research Organisation Testing Laboratory,
Laboratory In House Test Method, Method for the Determination of the pH Value of a
Water Extract of Wool, Version 3, 04/03/1999.
[186] International Wool Textile Organisation, Method for the Determination the pH of
a Water Extract of Wool, IWTO-2-96.
[187] Carter, E.A., Fredericks, P.M., and Church, J.S., “Fourier Transform Infrared
Photoacoustic Spectroscopy of Surface-Treated Wool”, Text. Res. J., 66[12] 787-794
(1996).
[188] Carter, E.A., Fredericks, P.M., Church, J.S, and Denning, R.J., “FT-Raman
Spectroscopy of Wool- I. Preliminary Studies”, Spectrochimica Acta. Part A: Molecular
Spectroscopy, 50A[11] 1927-1936 (1994).
[189] Hogg, L.J., Edwards, H.G.M., Farwell, D.W., and Peters, A.T., “FT Raman
Spectroscopic Studies of Wool”, J. Soc. Dyers Colour., 110[5/6] 196-199 (1994).
[190] Lappage, J., Canesis Network Limited, personal communication, 2003.
[191] Microsoft Excel 2002, Microsoft Excel Help, About Statistical Analysis Tools,
Correlation.
[192] Tandon, S., Canesis Network Limited, personal communication, January, 2006.
[193] Cookson, P.G., and DeBoos, A.G., “Effects of Synthappret BAP-Based
Treatments on the Cuff-Edge Felting and Mechanical Properties of a Lightweight
Woven Wool Fabric”, Text. Res. J., 62[10] 595-602 (1992).
[194] Pailthorpe, M., Canesis Network Limited, personal communication, August,
2005.
References
260
[195] Grosberg, P., “The Role of Friction in the Mechanical Behaviour of Fabrics”, pp.
563-575 in Surface Characteristics of Fibres and Textiles. Part II. Edited by
Schick,M.J.. Marcel Dekker, Inc., New York, 1977.
[196] Dhingra, R.C., Lui, D., and Postle, R., “Measuring and Interpreting Low-Stress
Fabric Mechanical and Surface Properties. Part II: Application to Finishing,
Drycleaning and Photodegradation of Wool Fabrics”, Text. Res. J., 59[6] 357-368
(1989).
[197] Grosberg, P., and Park, B.J., “The Mechanical Properties of Woven Fabrics. Part
V: The Initial Modulus and the Frictional Restraint in Shearing of Plain Weave
Fabrics”, Text. Res. J., 36[5] 420-431 (1966).
[198] Le, C.V., Tester, D.H., Ly, N.G., de Jong, S., “Changes in Fabric Mechanical
Properties After Pressure Decatizing as Measured by FAST”, Text. Res. J., 64[2] 61-69
(1994).
[199] Elliott, J., Stevens, C.B., and Whewell, C.S., “The Effect of Some High
Temperature Treatments on Wool”, Proc. 3rd Int’l Wool Text. Res. Conf, III 581-594
(1965).
[200] Robson, A., Williams, M.J., and Woodhouse, J.M., “The Formation of
Lysinoalanine and Lanthionine in Wool Fibres Stretched in Boiling Water, and Their
Relation to Permanent Set”, J. Text. Inst., 60[4] 140-151 (1969).
[201] Brack, N., Lamb, R.N., Pham, D., Phillips, T., and Turner, P., “Effect of Physical
Processing on the Wool Fiber Surface”, Text. Res. J., 71[10] 911-915 (2001).
[202] Gharehaghaji, A.A., and Johnson, N.A.G., “Wool-fibre Microdamage Caused by
Opening Processes. Part I: Sliver Opening”, J. Text. Inst., 84[3] 336-347 (1993).
References
261
[203] Gharehaghaji, A.A., and Johnson, N.A.G., “Wool-fibre Microdamage Caused by
Opening Processes. Part I: A Study of the Contact Between Opening Elements and
Wool Fibre in Controlled Extension”, J. Text. Inst., 86[3] 402-414 (1995).
[204] Fukuhara, S., Endo, S., and Hori, M., “Effects of Spinning Conditions and Yarn
Composition in Solospun (Weavable Single Yarn) Spinning”, 10th Int’l Wool Text. Res.
Conf., YA-7 1-9 (2000).
[205] Lappage, J., Canesis Network Limited, personal communication, August, 2004.
[206] Watt, J., Canesis Network Limited, personal communication, February, 2006.
262
APPENDIX 1
SAMPLE NAMES AND ABBREVIATIONS
Table A1.1 Pilot Plain Weave Sampling
Sample Abbreviation
Loomstate Loom
Crabbed Crab
Stentered Stent
Cropped Crop
Cropping to Blowing without decatising No KD
Cropped and decatised at 110°C for 2 min 110C/2
Cropped and decatised at 110°C for 4 min 110C/4
Cropped and decatised at 110°C for 6 min 110C/6
Cropped and decatised at 114°C for 2 min 114C/2
Cropped and decatised at 114°C for 4 min 114C/4
Cropped and decatised at 114°C for 6 min 114C/6
Cropped and decatised at 121°C for 2 min 121C/2
Cropped and decatised at 121°C for 4 min 121C/4
Cropped and decatised at 121°C for 6 min 121C/6
Cropped, decatised: 121°C for 6min and blown for 2min 121/6+B2
Table A1.2 Bulk Plain Weave Sampling
Sample Abbreviation
Loomstate Loom
Scoured Scour
Crabbed Crab
Stentered Stent
Cropped Crop
Decatised: 121°C for 6min 121/6
Decatised: 121°C for 6min then blown for 1min 121/6 B1
Appendix 1
263
Decatised: 121°C for 6min then blown for 2min 121/6 B2
Decatised: 121°C for 6min then blown for 3min 121/6 B3
Decatised: 121°C for 6min then rotary pressed 121/6+RP
Decatised: 121°C for 6min, rotary pressed then decatised:
121°C for 6min
121/6+RP+121/6
Decatised: 121°C for 6min, rotary pressed, decatised:
121°C for 6min, then blown: 1min
121/6+RP+121/6 B1
Decatised: 121°C for 6min, rotary pressed, decatised:
121°C for 6min, then blown: 2min
121/6+RP+121/6 B2
Decatised: 121°C for 6min, rotary pressed, decatised:
121°C for 6min, then blown: 3min
121/6+RP+121/6 B3
Decatised: 124°C for 2min 124/2
Decatised: 124°C for 4min 124/4
Decatised: 124°C for 6min 124/6
Decatised: 121°C for 6min, rotary pressed then blown for 2
min
121/6+RP+B2
Decatised: 121°C for 6min, rotary pressed then decatised:
110°C for 2min
121/6+RP+110/2
Decatised: 121°C for 6min, rotary pressed, decatised:
110°C for 2min then blown for 2 min
121/6+RP+110/2+B2
Cropped then decatised at 110°C for 2min Crop+110/2
Cropped, decatised: 110°C for 2min, then rotary pressed Crop+110/2+RP
Cropped, decatised: 110°C for 2min, then rotary pressed 110/2+RP+121/6
Cropped, decatised: 110°C for 2min, rotary pressed, then
blown for 2min
110/2+RP+121/6+B2
Control Sample, treated with chlorination+resin treatment
and finished
Cl2 Control
Plain weave, Pressure decatised instead of crabbed,
produced with Twills
KD no Crab
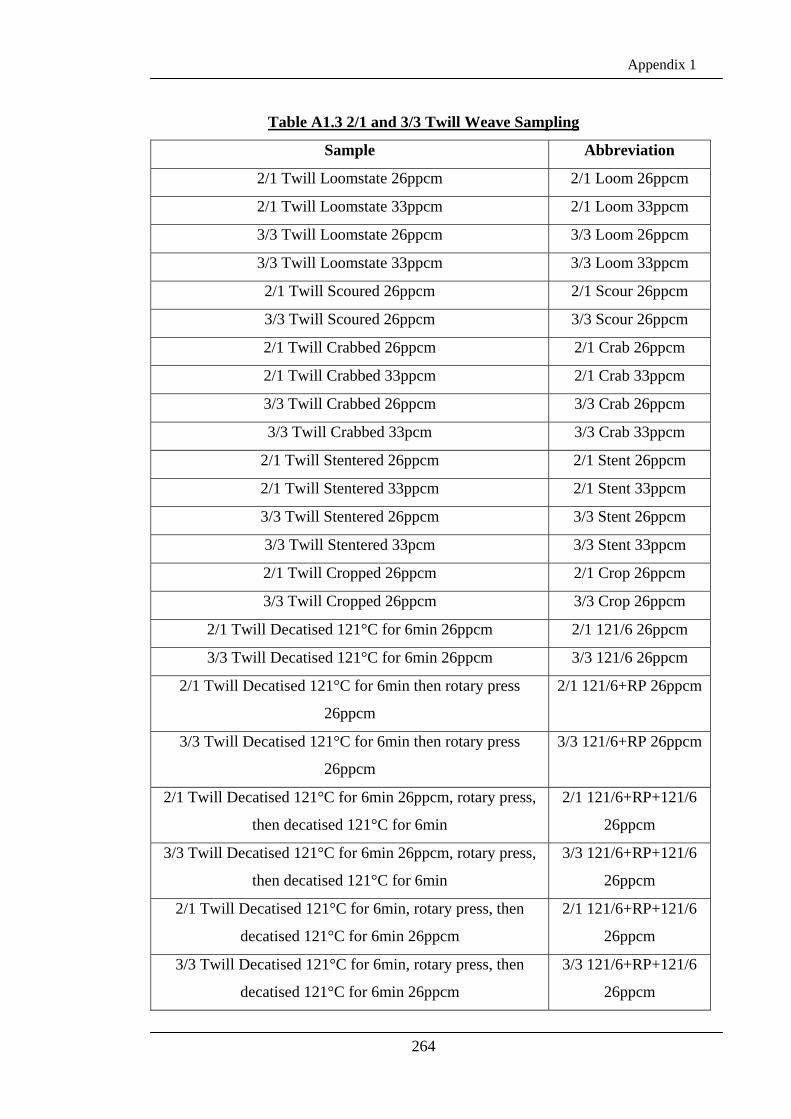
Appendix 1
264
Table A1.3 2/1 and 3/3 Twill Weave Sampling
Sample Abbreviation
2/1 Twill Loomstate 26ppcm 2/1 Loom 26ppcm
2/1 Twill Loomstate 33ppcm 2/1 Loom 33ppcm
3/3 Twill Loomstate 26ppcm 3/3 Loom 26ppcm
3/3 Twill Loomstate 33ppcm 3/3 Loom 33ppcm
2/1 Twill Scoured 26ppcm 2/1 Scour 26ppcm
3/3 Twill Scoured 26ppcm 3/3 Scour 26ppcm
2/1 Twill Crabbed 26ppcm 2/1 Crab 26ppcm
2/1 Twill Crabbed 33ppcm 2/1 Crab 33ppcm
3/3 Twill Crabbed 26ppcm 3/3 Crab 26ppcm
3/3 Twill Crabbed 33pcm 3/3 Crab 33ppcm
2/1 Twill Stentered 26ppcm 2/1 Stent 26ppcm
2/1 Twill Stentered 33ppcm 2/1 Stent 33ppcm
3/3 Twill Stentered 26ppcm 3/3 Stent 26ppcm
3/3 Twill Stentered 33pcm 3/3 Stent 33ppcm
2/1 Twill Cropped 26ppcm 2/1 Crop 26ppcm
3/3 Twill Cropped 26ppcm 3/3 Crop 26ppcm
2/1 Twill Decatised 121°C for 6min 26ppcm 2/1 121/6 26ppcm
3/3 Twill Decatised 121°C for 6min 26ppcm 3/3 121/6 26ppcm
2/1 Twill Decatised 121°C for 6min then rotary press
26ppcm
2/1 121/6+RP 26ppcm
3/3 Twill Decatised 121°C for 6min then rotary press
26ppcm
3/3 121/6+RP 26ppcm
2/1 Twill Decatised 121°C for 6min 26ppcm, rotary press,
then decatised 121°C for 6min
2/1 121/6+RP+121/6
26ppcm
3/3 Twill Decatised 121°C for 6min 26ppcm, rotary press,
then decatised 121°C for 6min
3/3 121/6+RP+121/6
26ppcm
2/1 Twill Decatised 121°C for 6min, rotary press, then
decatised 121°C for 6min 26ppcm
2/1 121/6+RP+121/6
26ppcm
3/3 Twill Decatised 121°C for 6min, rotary press, then
decatised 121°C for 6min 26ppcm
3/3 121/6+RP+121/6
26ppcm
Appendix 1
265
2/1 Twill Decatised 121°C for 6min, rotary press, decatised
121°C for 6min, then blow for 2min 26ppcm
2/1 26ppcm Finished
3/3 Twill Decatised 121°C for 6min, rotary press, decatised
121°C for 6min, then blow for 2min 26ppcm
3/3 26ppcm Finished
2/1 Twill Decatised 121°C for 6min, rotary press, decatised
121°C for 6min, then blow for 2min 33ppcm
2/1 33ppcm Finished
3/3 Twill Decatised 121°C for 6min, rotary press, decatised
121°C, for 6min, then blow for 2min 33ppcm
3/3 33ppcm Finished
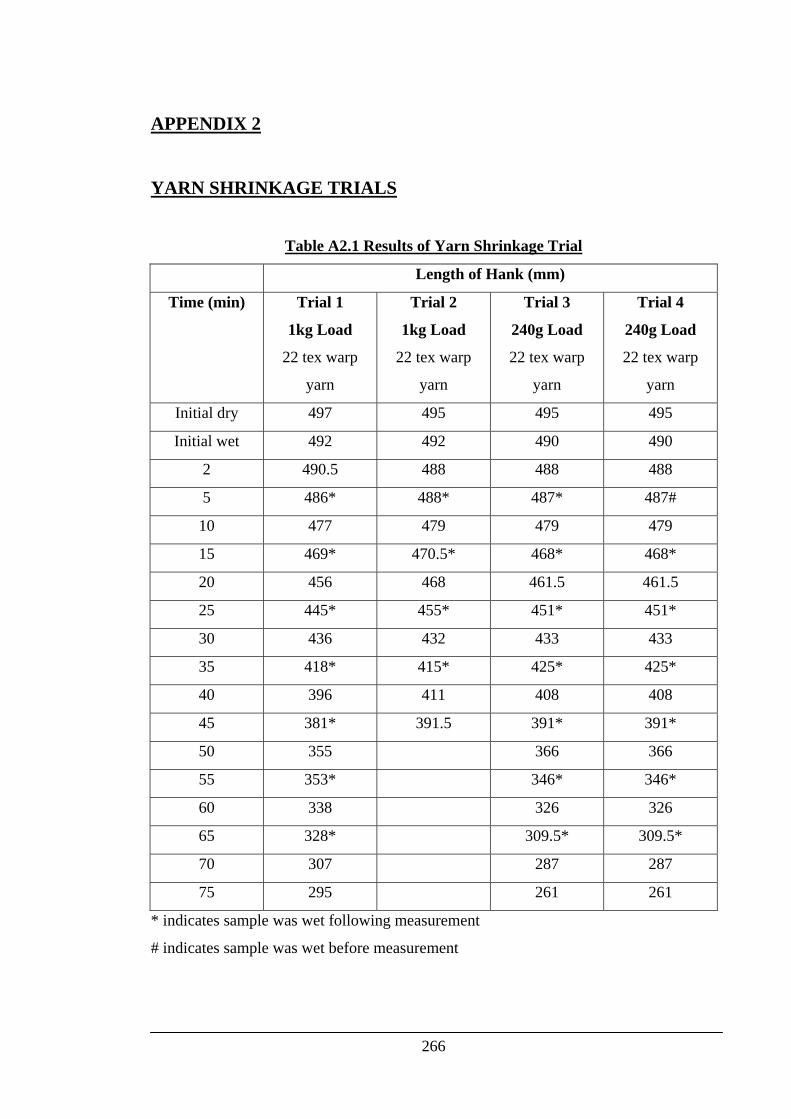
266
APPENDIX 2
YARN SHRINKAGE TRIALS
Table A2.1 Results of Yarn Shrinkage Trial
Length of Hank (mm)
Time (min) Trial 1
1kg Load
22 tex warp
yarn
Trial 2
1kg Load
22 tex warp
yarn
Trial 3
240g Load
22 tex warp
yarn
Trial 4
240g Load
22 tex warp
yarn
Initial dry 497 495 495 495
Initial wet 492 492 490 490
2 490.5 488 488 488
5 486* 488* 487* 487#
10 477 479 479 479
15 469* 470.5* 468* 468*
20 456 468 461.5 461.5
25 445* 455* 451* 451*
30 436 432 433 433
35 418* 415* 425* 425*
40 396 411 408 408
45 381* 391.5 391* 391*
50 355 366 366
55 353* 346* 346*
60 338 326 326
65 328* 309.5* 309.5*
70 307 287 287
75 295 261 261
* indicates sample was wet following measurement
# indicates sample was wet before measurement

267
APPENDIX 3
TEST RESULTS
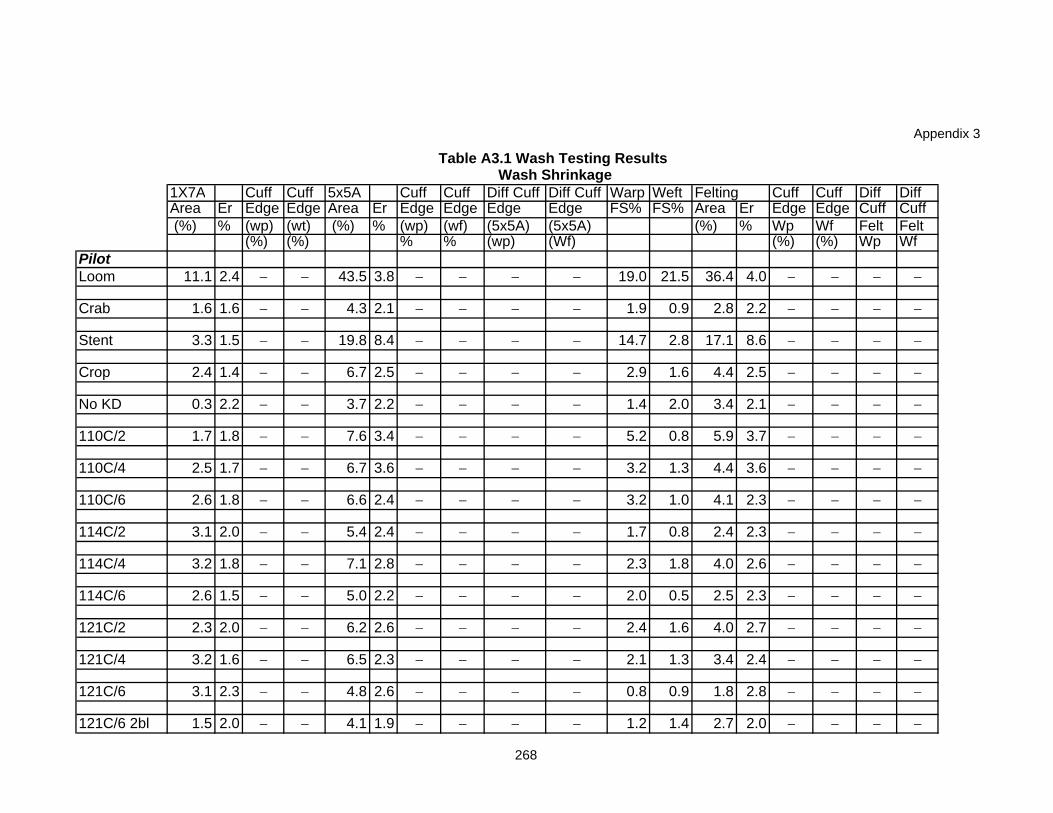
Appendix 3
1X7A Cuff Cuff 5x5A Cuff Cuff Diff Cuff Diff Cuff Warp Weft Felting Cuff Cuff Diff DiffArea Er Edge Edge Area Er Edge Edge Edge Edge FS% FS% Area Er Edge Edge Cuff Cuff (%) % (wp) (wt) (%) % (wp) (wf) (5x5A) (5x5A) (%) % Wp Wf Felt Felt
(%) (%) % % (wp) (Wf) (%) (%) Wp WfPilotLoom 11.1 2.4 − − 43.5 3.8 − − − − 19.0 21.5 36.4 4.0 − − − −
Crab 1.6 1.6 − − 4.3 2.1 − − − − 1.9 0.9 2.8 2.2 − − − −
Stent 3.3 1.5 − − 19.8 8.4 − − − − 14.7 2.8 17.1 8.6 − − − −
Crop 2.4 1.4 − − 6.7 2.5 − − − − 2.9 1.6 4.4 2.5 − − − −
No KD 0.3 2.2 − − 3.7 2.2 − − − − 1.4 2.0 3.4 2.1 − − − −
110C/2 1.7 1.8 − − 7.6 3.4 − − − − 5.2 0.8 5.9 3.7 − − − −
110C/4 2.5 1.7 − − 6.7 3.6 − − − − 3.2 1.3 4.4 3.6 − − − −
110C/6 2.6 1.8 − − 6.6 2.4 − − − − 3.2 1.0 4.1 2.3 − − − −
114C/2 3.1 2.0 − − 5.4 2.4 − − − − 1.7 0.8 2.4 2.3 − − − −
114C/4 3.2 1.8 − − 7.1 2.8 − − − − 2.3 1.8 4.0 2.6 − − − −
114C/6 2.6 1.5 − − 5.0 2.2 − − − − 2.0 0.5 2.5 2.3 − − − −
121C/2 2.3 2.0 − − 6.2 2.6 − − − − 2.4 1.6 4.0 2.7 − − − −
121C/4 3.2 1.6 − − 6.5 2.3 − − − − 2.1 1.3 3.4 2.4 − − − −
121C/6 3.1 2.3 − − 4.8 2.6 − − − − 0.8 0.9 1.8 2.8 − − − −
121C/6 2bl 1.5 2.0 − − 4.1 1.9 − − − − 1.2 1.4 2.7 2.0 − − − −
Wash ShrinkageTable A3.1 Wash Testing Results
268
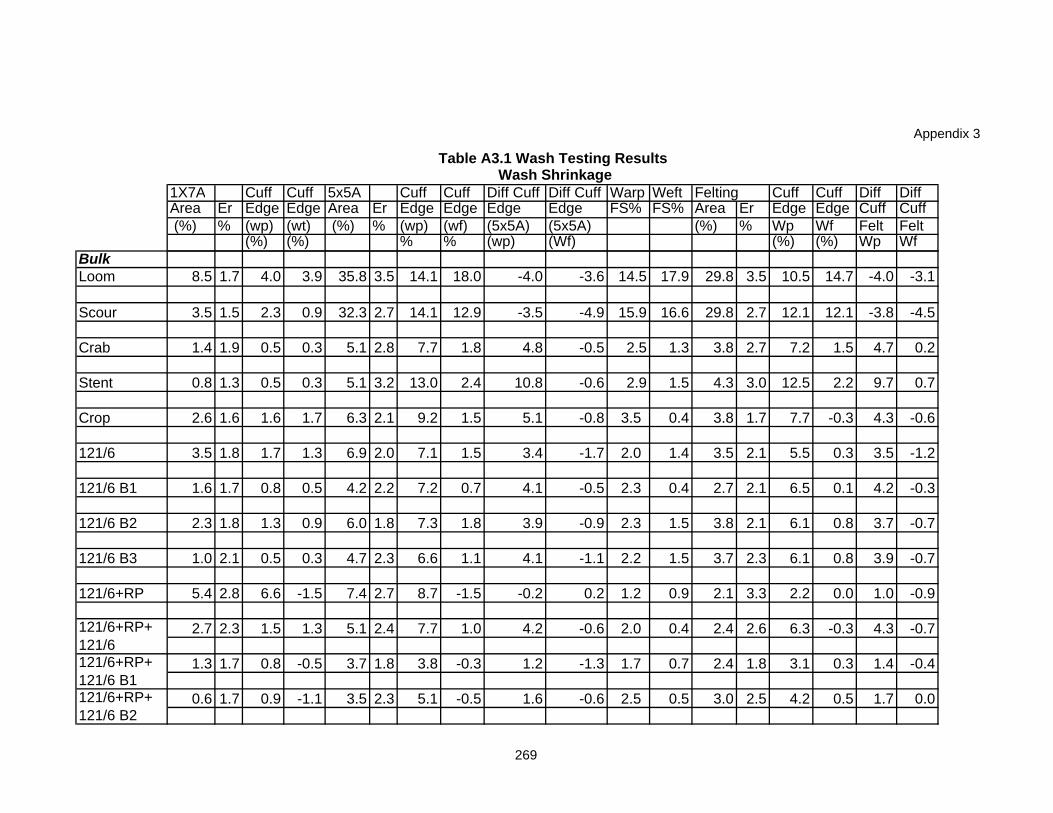
Appendix 3
1X7A Cuff Cuff 5x5A Cuff Cuff Diff Cuff Diff Cuff Warp Weft Felting Cuff Cuff Diff DiffArea Er Edge Edge Area Er Edge Edge Edge Edge FS% FS% Area Er Edge Edge Cuff Cuff (%) % (wp) (wt) (%) % (wp) (wf) (5x5A) (5x5A) (%) % Wp Wf Felt Felt
(%) (%) % % (wp) (Wf) (%) (%) Wp Wf
Wash ShrinkageTable A3.1 Wash Testing Results
BulkLoom 8.5 1.7 4.0 3.9 35.8 3.5 14.1 18.0 -4.0 -3.6 14.5 17.9 29.8 3.5 10.5 14.7 -4.0 -3.1
Scour 3.5 1.5 2.3 0.9 32.3 2.7 14.1 12.9 -3.5 -4.9 15.9 16.6 29.8 2.7 12.1 12.1 -3.8 -4.5
Crab 1.4 1.9 0.5 0.3 5.1 2.8 7.7 1.8 4.8 -0.5 2.5 1.3 3.8 2.7 7.2 1.5 4.7 0.2
Stent 0.8 1.3 0.5 0.3 5.1 3.2 13.0 2.4 10.8 -0.6 2.9 1.5 4.3 3.0 12.5 2.2 9.7 0.7
Crop 2.6 1.6 1.6 1.7 6.3 2.1 9.2 1.5 5.1 -0.8 3.5 0.4 3.8 1.7 7.7 -0.3 4.3 -0.6
121/6 3.5 1.8 1.7 1.3 6.9 2.0 7.1 1.5 3.4 -1.7 2.0 1.4 3.5 2.1 5.5 0.3 3.5 -1.2
121/6 B1 1.6 1.7 0.8 0.5 4.2 2.2 7.2 0.7 4.1 -0.5 2.3 0.4 2.7 2.1 6.5 0.1 4.2 -0.3
121/6 B2 2.3 1.8 1.3 0.9 6.0 1.8 7.3 1.8 3.9 -0.9 2.3 1.5 3.8 2.1 6.1 0.8 3.7 -0.7
121/6 B3 1.0 2.1 0.5 0.3 4.7 2.3 6.6 1.1 4.1 -1.1 2.2 1.5 3.7 2.3 6.1 0.8 3.9 -0.7
121/6+RP 5.4 2.8 6.6 -1.5 7.4 2.7 8.7 -1.5 -0.2 0.2 1.2 0.9 2.1 3.3 2.2 0.0 1.0 -0.9
2.7 2.3 1.5 1.3 5.1 2.4 7.7 1.0 4.2 -0.6 2.0 0.4 2.4 2.6 6.3 -0.3 4.3 -0.7
1.3 1.7 0.8 -0.5 3.7 1.8 3.8 -0.3 1.2 -1.3 1.7 0.7 2.4 1.8 3.1 0.3 1.4 -0.4
0.6 1.7 0.9 -1.1 3.5 2.3 5.1 -0.5 1.6 -0.6 2.5 0.5 3.0 2.5 4.2 0.5 1.7 0.0
121/6+RP+ 121/6 B1
121/6+RP+ 121/6
121/6+RP+ 121/6 B2
269

Appendix 3
1X7A Cuff Cuff 5x5A Cuff Cuff Diff Cuff Diff Cuff Warp Weft Felting Cuff Cuff Diff DiffArea Er Edge Edge Area Er Edge Edge Edge Edge FS% FS% Area Er Edge Edge Cuff Cuff (%) % (wp) (wt) (%) % (wp) (wf) (5x5A) (5x5A) (%) % Wp Wf Felt Felt
(%) (%) % % (wp) (Wf) (%) (%) Wp Wf
Wash ShrinkageTable A3.1 Wash Testing Results
1.3 1.3 2.1 0.3 3.7 1.4 5.5 0.0 2.5 -0.8 1.5 -0.1 1.4 1.3 3.4 -0.3 1.9 -0.2
124/2 2.4 1.4 1.2 0.5 5.0 1.7 5.7 1.0 2.5 -0.8 1.9 0.8 2.6 1.6 4.6 0.5 2.7 -0.3
124/4 3.1 2.5 1.4 1.0 6.4 2.6 5.7 1.5 1.8 -1.1 2.7 0.8 3.5 2.6 4.5 0.5 1.7 -0.3
124/6 2.8 1.9 1.3 1.5 5.1 1.9 4.0 1.5 1.4 -1.0 1.5 0.8 2.3 1.8 2.7 0.0 1.2 -0.8
Dec+RP+B2 2.7 1.9 4.0 -1.1 7.2 3.1 11.0 -0.5 3.4 -0.2 4.4 0.3 4.7 3.0 7.2 0.5 2.8 0.3
3.4 1.6 2.5 0.5 7.6 2.3 10.7 0.7 4.6 -1.0 3.5 0.9 4.4 2.3 8.3 0.1 4.8 -0.8
1.2 1.9 1.7 -0.5 4.6 2.4 10.2 -1.3 6.0 -1.6 2.6 0.9 3.4 2.6 8.7 -0.7 6.1 -1.7
Crop+110/2 2.3 1.6 1.9 0.5 5.0 2.0 8.3 0.4 4.8 -1.2 1.9 0.9 2.7 2.1 6.5 -0.1 4.6 -1.0
5.7 1.5 5.2 0.3 7.6 2.0 14.3 -1.0 7.3 -1.6 1.5 0.4 1.9 2.2 9.6 -1.3 8.1 -1.7
4.1 1.9 2.1 0.4 4.3 1.5 6.3 0.4 2.8 -0.4 1.9 -1.9 0.1 2.1 4.2 0.0 2.3 1.9
1.8 1.9 0.7 0.7 3.4 1.9 4.4 0.8 1.6 0.1 1.6 0.0 1.6 2.1 3.8 0.1 2.1 0.1
Cl2 Control 1.3 1.8 0.3 0.3 2.1 2.6 0.7 0.4 -0.7 -0.4 0.9 0.0 0.9 2.3 0.4 0.1 -0.5 0.2
KD No Crab 2.1 1.2 1.1 0.8 3.4 1.2 1.6 1.1 -0.5 -0.3 0.9 0.4 1.3 1.2 0.5 0.3 -0.4 -0.1
121/6+RP+ 121/6 B3
121/6+RP+ 110/2121/6+RP+110/2+B2
Crop+Mild +RP110/2+RP+ 121/6110/2+RP+ 121/6+B2
270
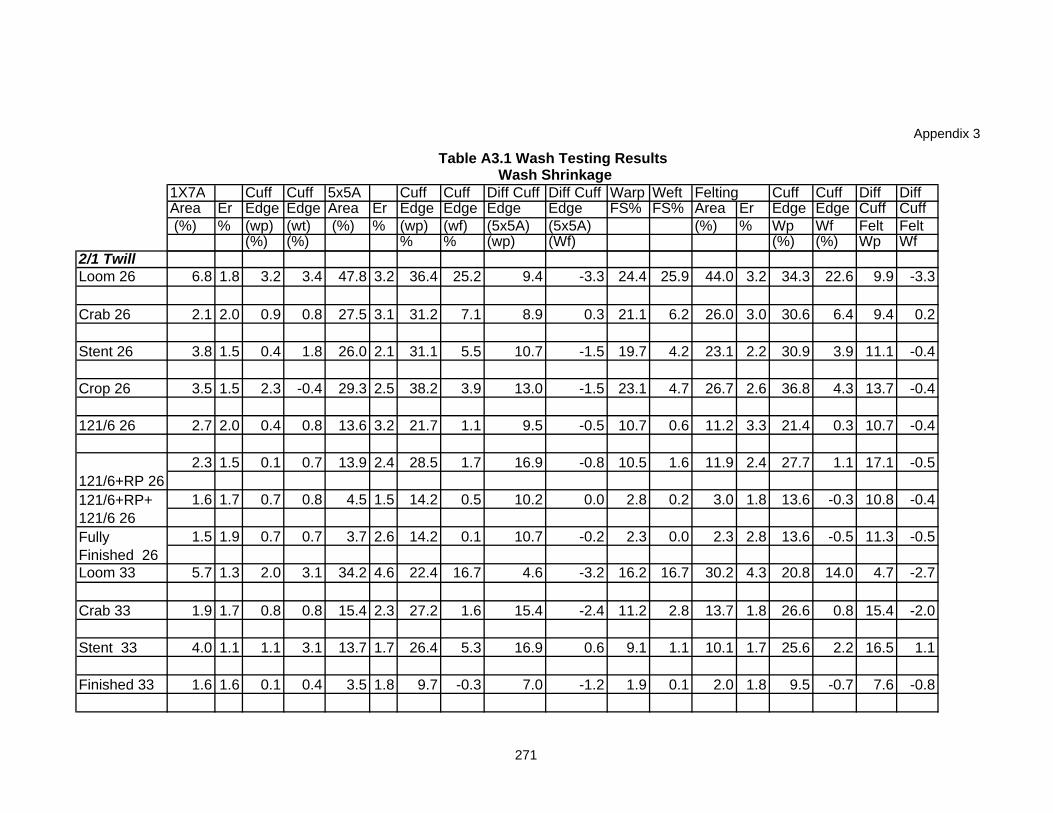
Appendix 3
1X7A Cuff Cuff 5x5A Cuff Cuff Diff Cuff Diff Cuff Warp Weft Felting Cuff Cuff Diff DiffArea Er Edge Edge Area Er Edge Edge Edge Edge FS% FS% Area Er Edge Edge Cuff Cuff (%) % (wp) (wt) (%) % (wp) (wf) (5x5A) (5x5A) (%) % Wp Wf Felt Felt
(%) (%) % % (wp) (Wf) (%) (%) Wp Wf
Wash ShrinkageTable A3.1 Wash Testing Results
2/1 TwillLoom 26 6.8 1.8 3.2 3.4 47.8 3.2 36.4 25.2 9.4 -3.3 24.4 25.9 44.0 3.2 34.3 22.6 9.9 -3.3
Crab 26 2.1 2.0 0.9 0.8 27.5 3.1 31.2 7.1 8.9 0.3 21.1 6.2 26.0 3.0 30.6 6.4 9.4 0.2
Stent 26 3.8 1.5 0.4 1.8 26.0 2.1 31.1 5.5 10.7 -1.5 19.7 4.2 23.1 2.2 30.9 3.9 11.1 -0.4
Crop 26 3.5 1.5 2.3 -0.4 29.3 2.5 38.2 3.9 13.0 -1.5 23.1 4.7 26.7 2.6 36.8 4.3 13.7 -0.4
121/6 26 2.7 2.0 0.4 0.8 13.6 3.2 21.7 1.1 9.5 -0.5 10.7 0.6 11.2 3.3 21.4 0.3 10.7 -0.4
2.3 1.5 0.1 0.7 13.9 2.4 28.5 1.7 16.9 -0.8 10.5 1.6 11.9 2.4 27.7 1.1 17.1 -0.5
1.6 1.7 0.7 0.8 4.5 1.5 14.2 0.5 10.2 0.0 2.8 0.2 3.0 1.8 13.6 -0.3 10.8 -0.4
1.5 1.9 0.7 0.7 3.7 2.6 14.2 0.1 10.7 -0.2 2.3 0.0 2.3 2.8 13.6 -0.5 11.3 -0.5
Loom 33 5.7 1.3 2.0 3.1 34.2 4.6 22.4 16.7 4.6 -3.2 16.2 16.7 30.2 4.3 20.8 14.0 4.7 -2.7
Crab 33 1.9 1.7 0.8 0.8 15.4 2.3 27.2 1.6 15.4 -2.4 11.2 2.8 13.7 1.8 26.6 0.8 15.4 -2.0
Stent 33 4.0 1.1 1.1 3.1 13.7 1.7 26.4 5.3 16.9 0.6 9.1 1.1 10.1 1.7 25.6 2.2 16.5 1.1
Finished 33 1.6 1.6 0.1 0.4 3.5 1.8 9.7 -0.3 7.0 -1.2 1.9 0.1 2.0 1.8 9.5 -0.7 7.6 -0.8
121/6+RP 26121/6+RP+ 121/6 26Fully Finished 26
271
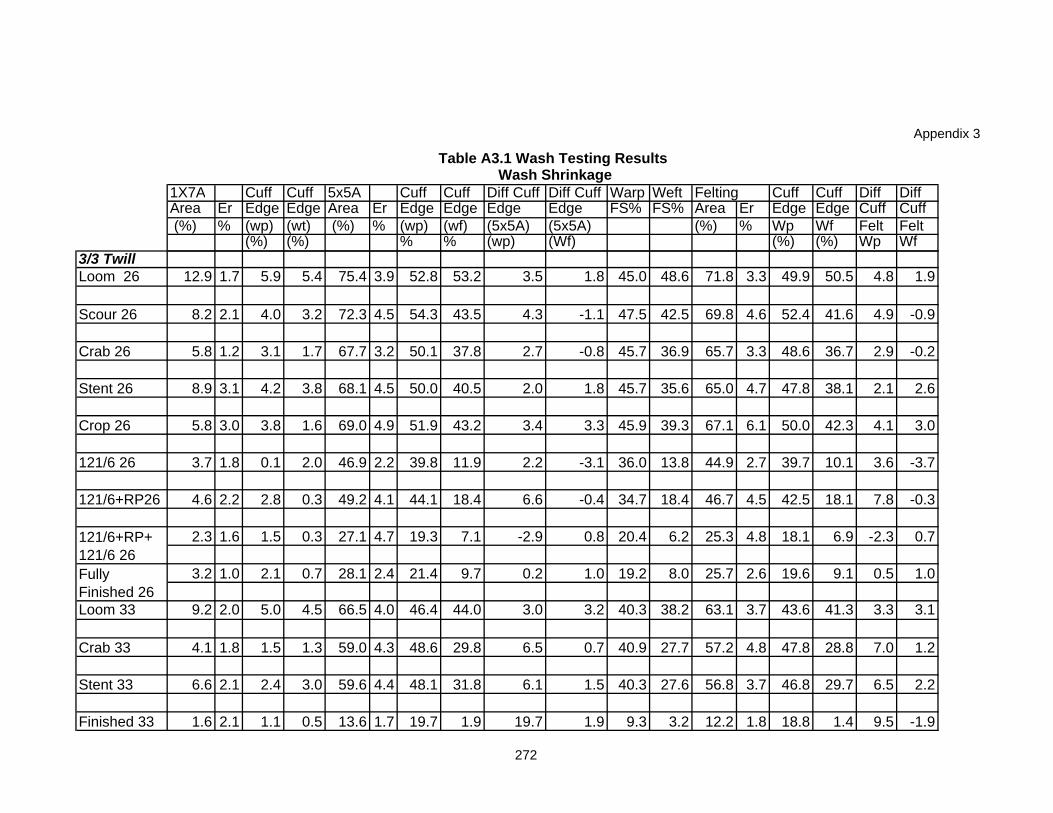
Appendix 3
1X7A Cuff Cuff 5x5A Cuff Cuff Diff Cuff Diff Cuff Warp Weft Felting Cuff Cuff Diff DiffArea Er Edge Edge Area Er Edge Edge Edge Edge FS% FS% Area Er Edge Edge Cuff Cuff (%) % (wp) (wt) (%) % (wp) (wf) (5x5A) (5x5A) (%) % Wp Wf Felt Felt
(%) (%) % % (wp) (Wf) (%) (%) Wp Wf
Wash ShrinkageTable A3.1 Wash Testing Results
3/3 TwillLoom 26 12.9 1.7 5.9 5.4 75.4 3.9 52.8 53.2 3.5 1.8 45.0 48.6 71.8 3.3 49.9 50.5 4.8 1.9
Scour 26 8.2 2.1 4.0 3.2 72.3 4.5 54.3 43.5 4.3 -1.1 47.5 42.5 69.8 4.6 52.4 41.6 4.9 -0.9
Crab 26 5.8 1.2 3.1 1.7 67.7 3.2 50.1 37.8 2.7 -0.8 45.7 36.9 65.7 3.3 48.6 36.7 2.9 -0.2
Stent 26 8.9 3.1 4.2 3.8 68.1 4.5 50.0 40.5 2.0 1.8 45.7 35.6 65.0 4.7 47.8 38.1 2.1 2.6
Crop 26 5.8 3.0 3.8 1.6 69.0 4.9 51.9 43.2 3.4 3.3 45.9 39.3 67.1 6.1 50.0 42.3 4.1 3.0
121/6 26 3.7 1.8 0.1 2.0 46.9 2.2 39.8 11.9 2.2 -3.1 36.0 13.8 44.9 2.7 39.7 10.1 3.6 -3.7
121/6+RP26 4.6 2.2 2.8 0.3 49.2 4.1 44.1 18.4 6.6 -0.4 34.7 18.4 46.7 4.5 42.5 18.1 7.8 -0.3
2.3 1.6 1.5 0.3 27.1 4.7 19.3 7.1 -2.9 0.8 20.4 6.2 25.3 4.8 18.1 6.9 -2.3 0.7
3.2 1.0 2.1 0.7 28.1 2.4 21.4 9.7 0.2 1.0 19.2 8.0 25.7 2.6 19.6 9.1 0.5 1.0
Loom 33 9.2 2.0 5.0 4.5 66.5 4.0 46.4 44.0 3.0 3.2 40.3 38.2 63.1 3.7 43.6 41.3 3.3 3.1
Crab 33 4.1 1.8 1.5 1.3 59.0 4.3 48.6 29.8 6.5 0.7 40.9 27.7 57.2 4.8 47.8 28.8 7.0 1.2
Stent 33 6.6 2.1 2.4 3.0 59.6 4.4 48.1 31.8 6.1 1.5 40.3 27.6 56.8 3.7 46.8 29.7 6.5 2.2
Finished 33 1.6 2.1 1.1 0.5 13.6 1.7 19.7 1.9 19.7 1.9 9.3 3.2 12.2 1.8 18.8 1.4 9.5 -1.9
Fully Finished 26
121/6+RP+ 121/6 26
272
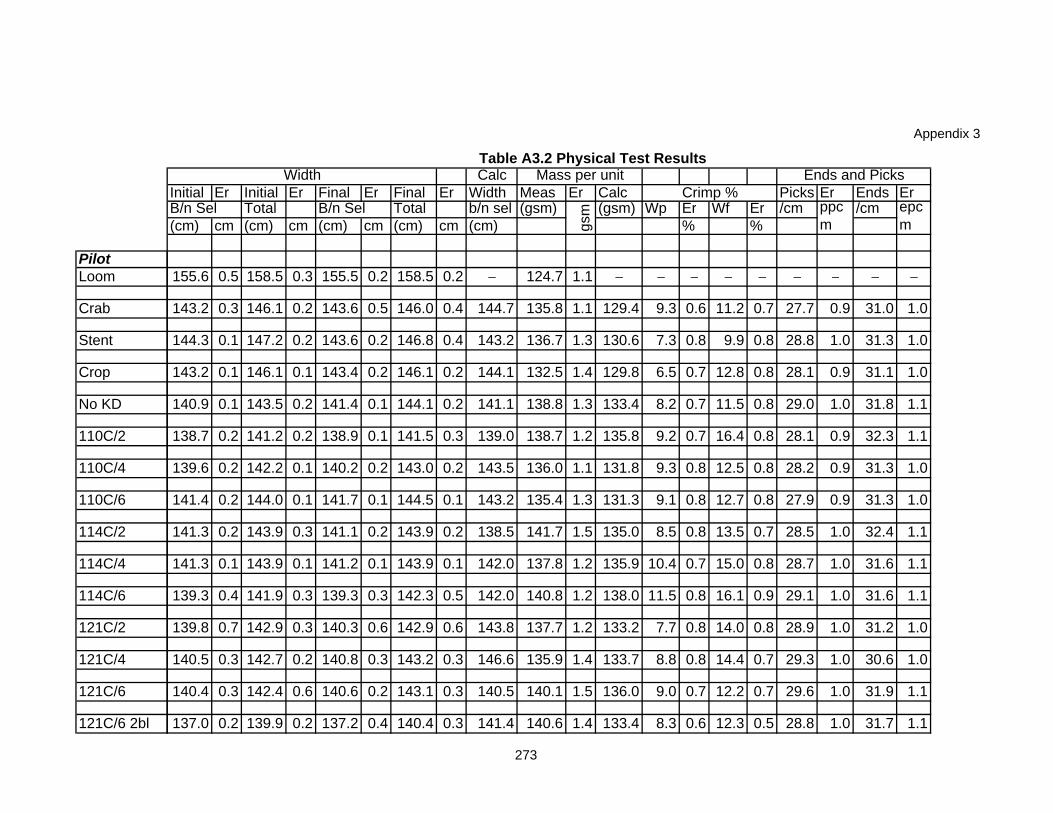
Appendix 3
PilotLoom
Crab
Stent
Crop
No KD
110C/2
110C/4
110C/6
114C/2
114C/4
114C/6
121C/2
121C/4
121C/6
121C/6 2bl
CalcInitial Er Initial Er Final Er Final Er Width Meas Er Calc Picks Er Ends ErB/n Sel Total B/n Sel Total b/n sel (gsm) (gsm) Wp Er Wf Er /cm /cm(cm) cm (cm) cm (cm) cm (cm) cm (cm) % %
155.6 0.5 158.5 0.3 155.5 0.2 158.5 0.2 − 124.7 1.1 − − − − − − − − −
143.2 0.3 146.1 0.2 143.6 0.5 146.0 0.4 144.7 135.8 1.1 129.4 9.3 0.6 11.2 0.7 27.7 0.9 31.0 1.0
144.3 0.1 147.2 0.2 143.6 0.2 146.8 0.4 143.2 136.7 1.3 130.6 7.3 0.8 9.9 0.8 28.8 1.0 31.3 1.0
143.2 0.1 146.1 0.1 143.4 0.2 146.1 0.2 144.1 132.5 1.4 129.8 6.5 0.7 12.8 0.8 28.1 0.9 31.1 1.0
140.9 0.1 143.5 0.2 141.4 0.1 144.1 0.2 141.1 138.8 1.3 133.4 8.2 0.7 11.5 0.8 29.0 1.0 31.8 1.1
138.7 0.2 141.2 0.2 138.9 0.1 141.5 0.3 139.0 138.7 1.2 135.8 9.2 0.7 16.4 0.8 28.1 0.9 32.3 1.1
139.6 0.2 142.2 0.1 140.2 0.2 143.0 0.2 143.5 136.0 1.1 131.8 9.3 0.8 12.5 0.8 28.2 0.9 31.3 1.0
141.4 0.2 144.0 0.1 141.7 0.1 144.5 0.1 143.2 135.4 1.3 131.3 9.1 0.8 12.7 0.8 27.9 0.9 31.3 1.0
141.3 0.2 143.9 0.3 141.1 0.2 143.9 0.2 138.5 141.7 1.5 135.0 8.5 0.8 13.5 0.7 28.5 1.0 32.4 1.1
141.3 0.1 143.9 0.1 141.2 0.1 143.9 0.1 142.0 137.8 1.2 135.9 10.4 0.7 15.0 0.8 28.7 1.0 31.6 1.1
139.3 0.4 141.9 0.3 139.3 0.3 142.3 0.5 142.0 140.8 1.2 138.0 11.5 0.8 16.1 0.9 29.1 1.0 31.6 1.1
139.8 0.7 142.9 0.3 140.3 0.6 142.9 0.6 143.8 137.7 1.2 133.2 7.7 0.8 14.0 0.8 28.9 1.0 31.2 1.0
140.5 0.3 142.7 0.2 140.8 0.3 143.2 0.3 146.6 135.9 1.4 133.7 8.8 0.8 14.4 0.7 29.3 1.0 30.6 1.0
140.4 0.3 142.4 0.6 140.6 0.2 143.1 0.3 140.5 140.1 1.5 136.0 9.0 0.7 12.2 0.7 29.6 1.0 31.9 1.1
137.0 0.2 139.9 0.2 137.2 0.4 140.4 0.3 141.4 140.6 1.4 133.4 8.3 0.6 12.3 0.5 28.8 1.0 31.7 1.1
epcm
Ends and Picks
gsm
Crimp %Width Mass per unit
ppcm
Table A3.2 Physical Test Results
273
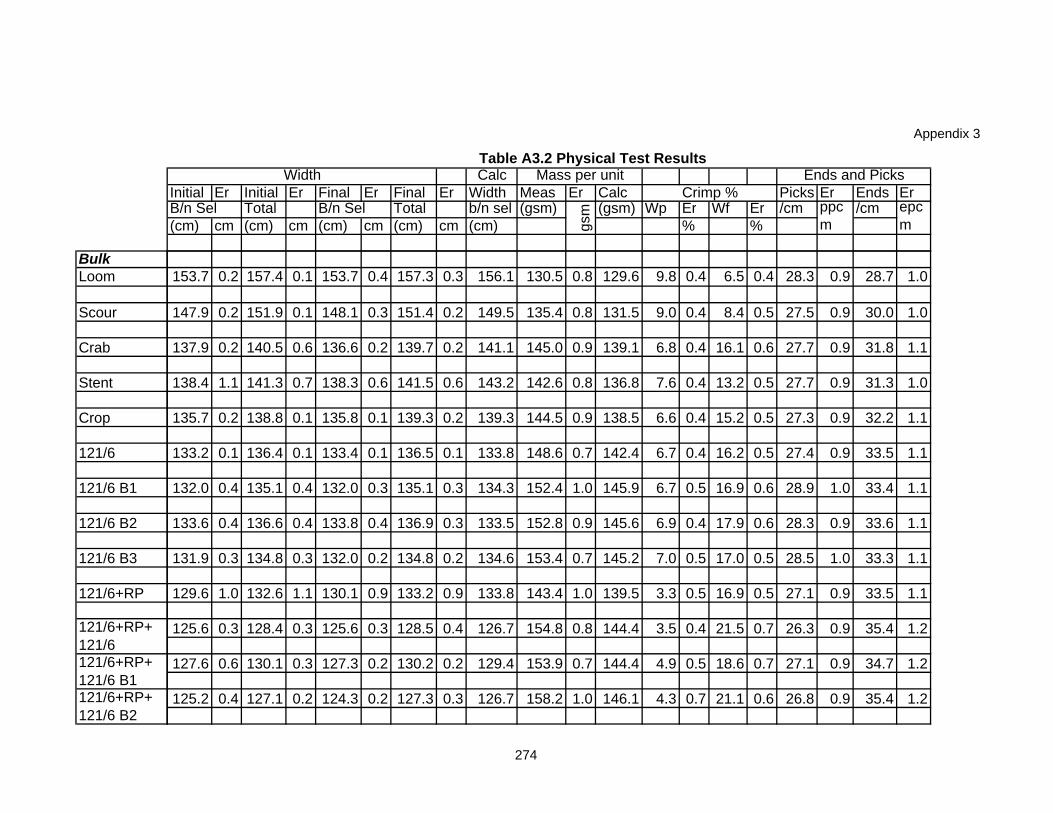
Appendix 3
BulkLoom
Scour
Crab
Stent
Crop
121/6
121/6 B1
121/6 B2
121/6 B3
121/6+RP
121/6+RP+ 121/6 B1
121/6+RP+ 121/6
121/6+RP+ 121/6 B2
CalcInitial Er Initial Er Final Er Final Er Width Meas Er Calc Picks Er Ends ErB/n Sel Total B/n Sel Total b/n sel (gsm) (gsm) Wp Er Wf Er /cm /cm(cm) cm (cm) cm (cm) cm (cm) cm (cm) % %
epcm
Ends and Picks
gsm
Crimp %Width Mass per unit
ppcm
Table A3.2 Physical Test Results
153.7 0.2 157.4 0.1 153.7 0.4 157.3 0.3 156.1 130.5 0.8 129.6 9.8 0.4 6.5 0.4 28.3 0.9 28.7 1.0
147.9 0.2 151.9 0.1 148.1 0.3 151.4 0.2 149.5 135.4 0.8 131.5 9.0 0.4 8.4 0.5 27.5 0.9 30.0 1.0
137.9 0.2 140.5 0.6 136.6 0.2 139.7 0.2 141.1 145.0 0.9 139.1 6.8 0.4 16.1 0.6 27.7 0.9 31.8 1.1
138.4 1.1 141.3 0.7 138.3 0.6 141.5 0.6 143.2 142.6 0.8 136.8 7.6 0.4 13.2 0.5 27.7 0.9 31.3 1.0
135.7 0.2 138.8 0.1 135.8 0.1 139.3 0.2 139.3 144.5 0.9 138.5 6.6 0.4 15.2 0.5 27.3 0.9 32.2 1.1
133.2 0.1 136.4 0.1 133.4 0.1 136.5 0.1 133.8 148.6 0.7 142.4 6.7 0.4 16.2 0.5 27.4 0.9 33.5 1.1
132.0 0.4 135.1 0.4 132.0 0.3 135.1 0.3 134.3 152.4 1.0 145.9 6.7 0.5 16.9 0.6 28.9 1.0 33.4 1.1
133.6 0.4 136.6 0.4 133.8 0.4 136.9 0.3 133.5 152.8 0.9 145.6 6.9 0.4 17.9 0.6 28.3 0.9 33.6 1.1
131.9 0.3 134.8 0.3 132.0 0.2 134.8 0.2 134.6 153.4 0.7 145.2 7.0 0.5 17.0 0.5 28.5 1.0 33.3 1.1
129.6 1.0 132.6 1.1 130.1 0.9 133.2 0.9 133.8 143.4 1.0 139.5 3.3 0.5 16.9 0.5 27.1 0.9 33.5 1.1
125.6 0.3 128.4 0.3 125.6 0.3 128.5 0.4 126.7 154.8 0.8 144.4 3.5 0.4 21.5 0.7 26.3 0.9 35.4 1.2
127.6 0.6 130.1 0.3 127.3 0.2 130.2 0.2 129.4 153.9 0.7 144.4 4.9 0.5 18.6 0.7 27.1 0.9 34.7 1.2
125.2 0.4 127.1 0.2 124.3 0.2 127.3 0.3 126.7 158.2 1.0 146.1 4.3 0.7 21.1 0.6 26.8 0.9 35.4 1.2
274
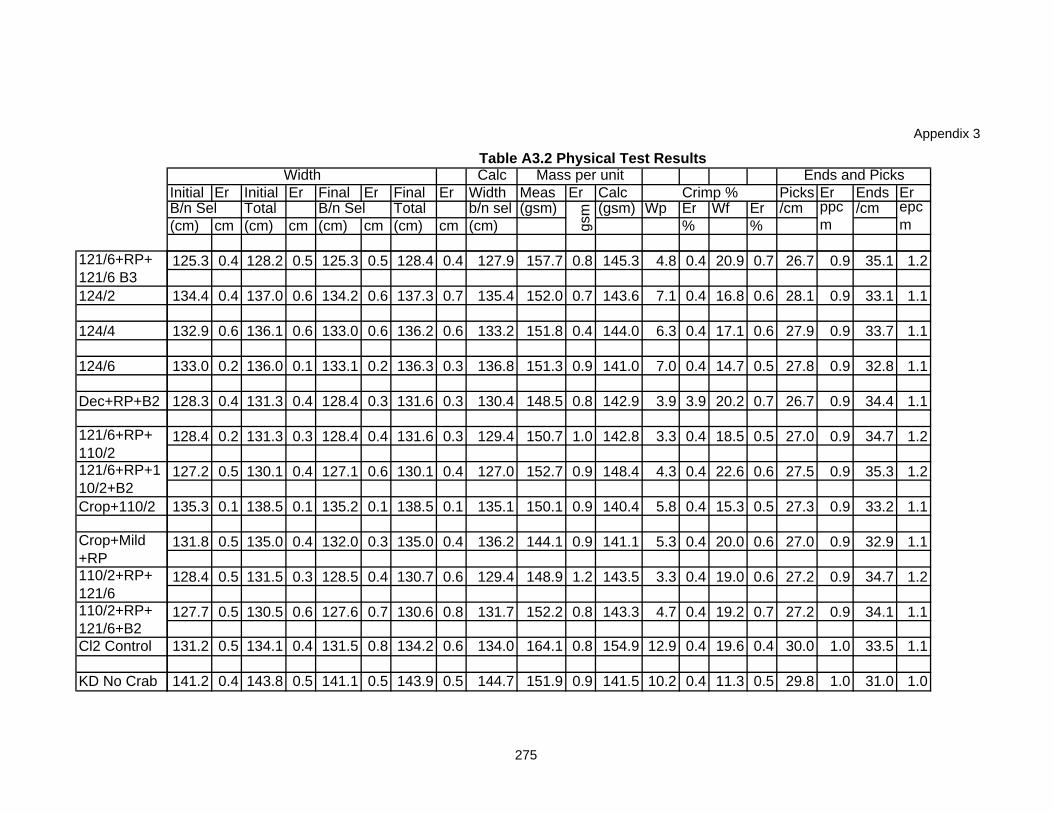
Appendix 3
124/2
124/4
124/6
Dec+RP+B2
Crop+110/2
Cl2 Control
KD No Crab
121/6+RP+ 121/6 B3
121/6+RP+ 110/2121/6+RP+110/2+B2
Crop+Mild +RP110/2+RP+ 121/6110/2+RP+ 121/6+B2
CalcInitial Er Initial Er Final Er Final Er Width Meas Er Calc Picks Er Ends ErB/n Sel Total B/n Sel Total b/n sel (gsm) (gsm) Wp Er Wf Er /cm /cm(cm) cm (cm) cm (cm) cm (cm) cm (cm) % %
epcm
Ends and Picks
gsm
Crimp %Width Mass per unit
ppcm
Table A3.2 Physical Test Results
125.3 0.4 128.2 0.5 125.3 0.5 128.4 0.4 127.9 157.7 0.8 145.3 4.8 0.4 20.9 0.7 26.7 0.9 35.1 1.2
134.4 0.4 137.0 0.6 134.2 0.6 137.3 0.7 135.4 152.0 0.7 143.6 7.1 0.4 16.8 0.6 28.1 0.9 33.1 1.1
132.9 0.6 136.1 0.6 133.0 0.6 136.2 0.6 133.2 151.8 0.4 144.0 6.3 0.4 17.1 0.6 27.9 0.9 33.7 1.1
133.0 0.2 136.0 0.1 133.1 0.2 136.3 0.3 136.8 151.3 0.9 141.0 7.0 0.4 14.7 0.5 27.8 0.9 32.8 1.1
128.3 0.4 131.3 0.4 128.4 0.3 131.6 0.3 130.4 148.5 0.8 142.9 3.9 3.9 20.2 0.7 26.7 0.9 34.4 1.1
128.4 0.2 131.3 0.3 128.4 0.4 131.6 0.3 129.4 150.7 1.0 142.8 3.3 0.4 18.5 0.5 27.0 0.9 34.7 1.2
127.2 0.5 130.1 0.4 127.1 0.6 130.1 0.4 127.0 152.7 0.9 148.4 4.3 0.4 22.6 0.6 27.5 0.9 35.3 1.2
135.3 0.1 138.5 0.1 135.2 0.1 138.5 0.1 135.1 150.1 0.9 140.4 5.8 0.4 15.3 0.5 27.3 0.9 33.2 1.1
131.8 0.5 135.0 0.4 132.0 0.3 135.0 0.4 136.2 144.1 0.9 141.1 5.3 0.4 20.0 0.6 27.0 0.9 32.9 1.1
128.4 0.5 131.5 0.3 128.5 0.4 130.7 0.6 129.4 148.9 1.2 143.5 3.3 0.4 19.0 0.6 27.2 0.9 34.7 1.2
127.7 0.5 130.5 0.6 127.6 0.7 130.6 0.8 131.7 152.2 0.8 143.3 4.7 0.4 19.2 0.7 27.2 0.9 34.1 1.1
131.2 0.5 134.1 0.4 131.5 0.8 134.2 0.6 134.0 164.1 0.8 154.9 12.9 0.4 19.6 0.4 30.0 1.0 33.5 1.1
141.2 0.4 143.8 0.5 141.1 0.5 143.9 0.5 144.7 151.9 0.9 141.5 10.2 0.4 11.3 0.5 29.8 1.0 31.0 1.0
275
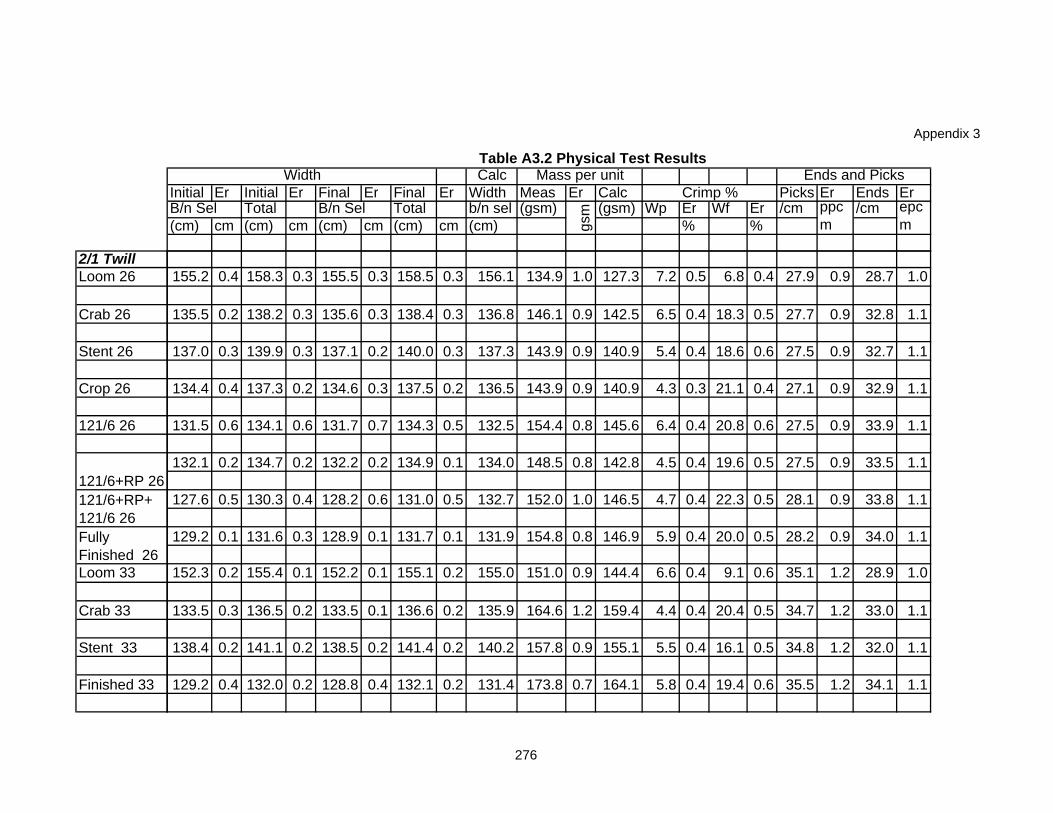
Appendix 3
2/1 TwillLoom 26
Crab 26
Stent 26
Crop 26
121/6 26
Loom 33
Crab 33
Stent 33
Finished 33
121/6+RP 26121/6+RP+ 121/6 26Fully Finished 26
CalcInitial Er Initial Er Final Er Final Er Width Meas Er Calc Picks Er Ends ErB/n Sel Total B/n Sel Total b/n sel (gsm) (gsm) Wp Er Wf Er /cm /cm(cm) cm (cm) cm (cm) cm (cm) cm (cm) % %
epcm
Ends and Picks
gsm
Crimp %Width Mass per unit
ppcm
Table A3.2 Physical Test Results
155.2 0.4 158.3 0.3 155.5 0.3 158.5 0.3 156.1 134.9 1.0 127.3 7.2 0.5 6.8 0.4 27.9 0.9 28.7 1.0
135.5 0.2 138.2 0.3 135.6 0.3 138.4 0.3 136.8 146.1 0.9 142.5 6.5 0.4 18.3 0.5 27.7 0.9 32.8 1.1
137.0 0.3 139.9 0.3 137.1 0.2 140.0 0.3 137.3 143.9 0.9 140.9 5.4 0.4 18.6 0.6 27.5 0.9 32.7 1.1
134.4 0.4 137.3 0.2 134.6 0.3 137.5 0.2 136.5 143.9 0.9 140.9 4.3 0.3 21.1 0.4 27.1 0.9 32.9 1.1
131.5 0.6 134.1 0.6 131.7 0.7 134.3 0.5 132.5 154.4 0.8 145.6 6.4 0.4 20.8 0.6 27.5 0.9 33.9 1.1
132.1 0.2 134.7 0.2 132.2 0.2 134.9 0.1 134.0 148.5 0.8 142.8 4.5 0.4 19.6 0.5 27.5 0.9 33.5 1.1
127.6 0.5 130.3 0.4 128.2 0.6 131.0 0.5 132.7 152.0 1.0 146.5 4.7 0.4 22.3 0.5 28.1 0.9 33.8 1.1
129.2 0.1 131.6 0.3 128.9 0.1 131.7 0.1 131.9 154.8 0.8 146.9 5.9 0.4 20.0 0.5 28.2 0.9 34.0 1.1
152.3 0.2 155.4 0.1 152.2 0.1 155.1 0.2 155.0 151.0 0.9 144.4 6.6 0.4 9.1 0.6 35.1 1.2 28.9 1.0
133.5 0.3 136.5 0.2 133.5 0.1 136.6 0.2 135.9 164.6 1.2 159.4 4.4 0.4 20.4 0.5 34.7 1.2 33.0 1.1
138.4 0.2 141.1 0.2 138.5 0.2 141.4 0.2 140.2 157.8 0.9 155.1 5.5 0.4 16.1 0.5 34.8 1.2 32.0 1.1
129.2 0.4 132.0 0.2 128.8 0.4 132.1 0.2 131.4 173.8 0.7 164.1 5.8 0.4 19.4 0.6 35.5 1.2 34.1 1.1
276

Appendix 3
3/3 TwillLoom 26
Scour 26
Crab 26
Stent 26
Crop 26
121/6 26
121/6+RP26
Loom 33
Crab 33
Stent 33
Finished 33
Fully Finished 26
121/6+RP+ 121/6 26
CalcInitial Er Initial Er Final Er Final Er Width Meas Er Calc Picks Er Ends ErB/n Sel Total B/n Sel Total b/n sel (gsm) (gsm) Wp Er Wf Er /cm /cm(cm) cm (cm) cm (cm) cm (cm) cm (cm) % %
epcm
Ends and Picks
gsm
Crimp %Width Mass per unit
ppcm
Table A3.2 Physical Test Results
155.1 0.4 158.2 0.2 155.1 0.1 158.2 0.1 156.1 137.1 0.9 127.5 6.1 0.4 6.4 0.4 28.4 0.9 28.7 1.0
144.2 0.2 147.2 0.3 144.7 0.3 147.6 0.4 145.6 138.9 1.1 138.2 8.1 0.4 10.9 0.5 29.3 1.0 30.8 1.0
132.4 0.5 135.1 0.6 132.4 0.4 135.3 0.5 130.9 154.5 1.2 149.4 8.2 0.4 17.9 0.5 28.8 1.0 34.3 1.1
137.1 0.2 140.2 0.1 137.1 0.1 140.0 0.2 137.9 145.5 1.2 142.7 6.6 0.4 17.3 0.5 28.3 0.9 32.5 1.1
131.5 0.3 134.5 0.3 131.8 0.2 134.7 0.2 134.0 151.9 1.0 146.0 6.4 0.4 20.9 0.4 28.0 0.9 33.5 1.1
128.7 0.2 131.3 0.2 128.7 0.3 131.5 0.2 131.7 152.9 0.9 149.3 7.0 0.4 19.4 0.5 28.9 1.0 34.1 1.1
128.4 0.3 131.2 0.2 128.4 0.3 131.2 0.3 130.2 152.2 1.0 149.5 7.5 0.4 19.1 0.5 28.5 1.0 34.5 1.1
126.1 0.4 128.4 0.3 125.7 0.4 128.3 0.3 127.9 160.6 1.0 152.9 7.6 0.4 18.8 0.5 29.4 1.0 35.1 1.2
125.6 0.2 128.3 0.1 126.0 0.2 128.5 0.2 130.4 158.9 0.9 150.4 6.9 0.4 19.7 0.4 29.1 1.0 34.4 1.1
151.1 0.2 154.0 0.2 151.2 0.3 154.2 0.2 154.7 155.6 1.0 143.9 5.0 0.4 8.6 0.4 35.4 1.2 29.0 1.0
132.7 0.5 135.5 0.5 132.6 0.4 135.3 0.4 131.2 174.8 1.2 168.4 7.0 0.4 21.4 0.5 36.2 1.2 34.2 1.1
136.3 0.4 139.0 0.3 136.1 0.2 138.9 0.2 136.8 164.2 0.9 162.1 6.9 0.4 18.1 0.6 36.0 1.2 32.8 1.1
126.6 1.0 129.3 0.9 126.8 0.8 129.5 0.7 128.4 181.0 0.8 171.7 7.6 0.4 21.3 0.6 36.7 1.2 34.9 1.2
277
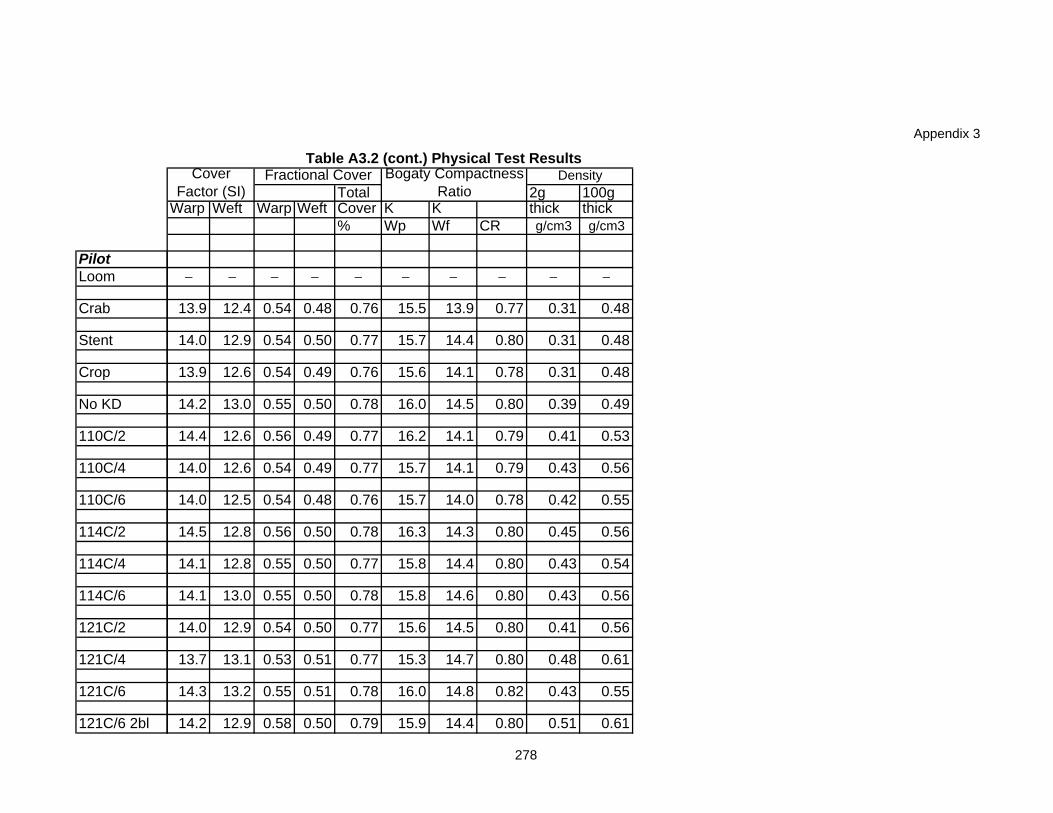
Appendix 3
PilotLoom
Crab
Stent
Crop
No KD
110C/2
110C/4
110C/6
114C/2
114C/4
114C/6
121C/2
121C/4
121C/6
121C/6 2bl
Total 2g 100gWarp Weft Warp Weft Cover K K thick thick
% Wp Wf CR g/cm3 g/cm3
− − − − − − − − − −
13.9 12.4 0.54 0.48 0.76 15.5 13.9 0.77 0.31 0.48
14.0 12.9 0.54 0.50 0.77 15.7 14.4 0.80 0.31 0.48
13.9 12.6 0.54 0.49 0.76 15.6 14.1 0.78 0.31 0.48
14.2 13.0 0.55 0.50 0.78 16.0 14.5 0.80 0.39 0.49
14.4 12.6 0.56 0.49 0.77 16.2 14.1 0.79 0.41 0.53
14.0 12.6 0.54 0.49 0.77 15.7 14.1 0.79 0.43 0.56
14.0 12.5 0.54 0.48 0.76 15.7 14.0 0.78 0.42 0.55
14.5 12.8 0.56 0.50 0.78 16.3 14.3 0.80 0.45 0.56
14.1 12.8 0.55 0.50 0.77 15.8 14.4 0.80 0.43 0.54
14.1 13.0 0.55 0.50 0.78 15.8 14.6 0.80 0.43 0.56
14.0 12.9 0.54 0.50 0.77 15.6 14.5 0.80 0.41 0.56
13.7 13.1 0.53 0.51 0.77 15.3 14.7 0.80 0.48 0.61
14.3 13.2 0.55 0.51 0.78 16.0 14.8 0.82 0.43 0.55
14.2 12.9 0.58 0.50 0.79 15.9 14.4 0.80 0.51 0.61
Fractional Cover Bogaty Compactness Ratio
DensityCover Factor (SI)
Table A3.2 (cont.) Physical Test Results
278
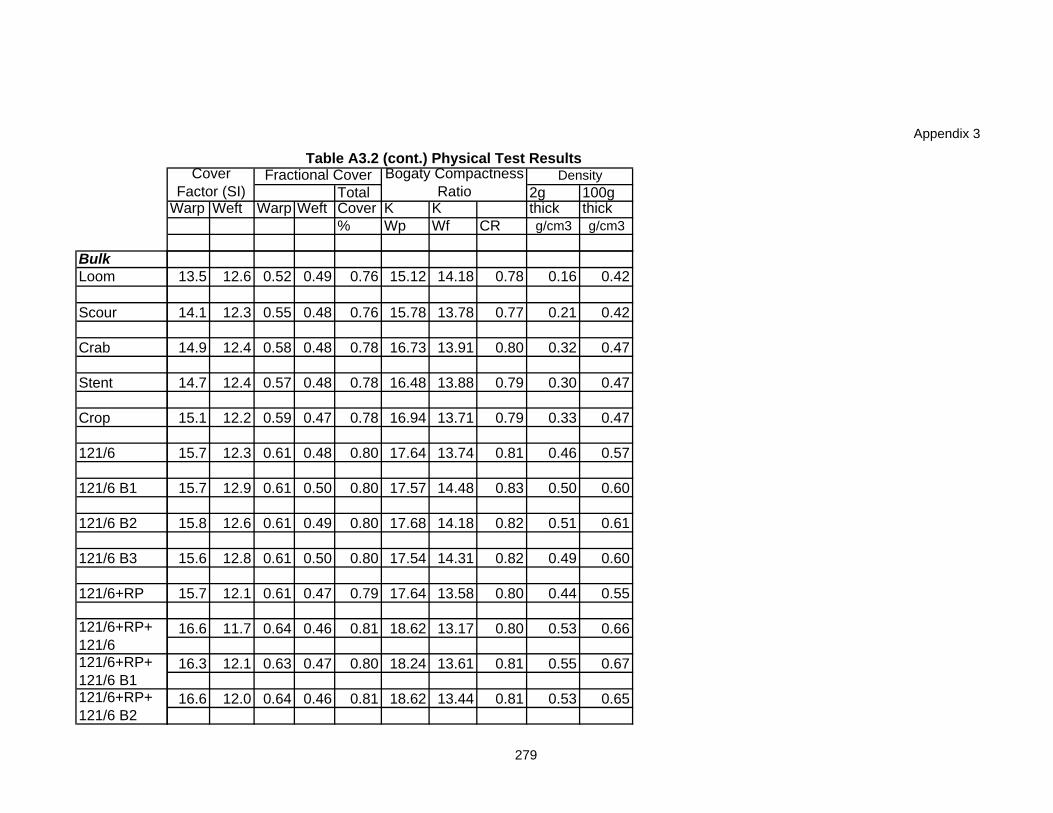
Appendix 3
BulkLoom
Scour
Crab
Stent
Crop
121/6
121/6 B1
121/6 B2
121/6 B3
121/6+RP
121/6+RP+ 121/6 B1
121/6+RP+ 121/6
121/6+RP+ 121/6 B2
Total 2g 100gWarp Weft Warp Weft Cover K K thick thick
% Wp Wf CR g/cm3 g/cm3
Fractional Cover Bogaty Compactness Ratio
DensityCover Factor (SI)
Table A3.2 (cont.) Physical Test Results
13.5 12.6 0.52 0.49 0.76 15.12 14.18 0.78 0.16 0.42
14.1 12.3 0.55 0.48 0.76 15.78 13.78 0.77 0.21 0.42
14.9 12.4 0.58 0.48 0.78 16.73 13.91 0.80 0.32 0.47
14.7 12.4 0.57 0.48 0.78 16.48 13.88 0.79 0.30 0.47
15.1 12.2 0.59 0.47 0.78 16.94 13.71 0.79 0.33 0.47
15.7 12.3 0.61 0.48 0.80 17.64 13.74 0.81 0.46 0.57
15.7 12.9 0.61 0.50 0.80 17.57 14.48 0.83 0.50 0.60
15.8 12.6 0.61 0.49 0.80 17.68 14.18 0.82 0.51 0.61
15.6 12.8 0.61 0.50 0.80 17.54 14.31 0.82 0.49 0.60
15.7 12.1 0.61 0.47 0.79 17.64 13.58 0.80 0.44 0.55
16.6 11.7 0.64 0.46 0.81 18.62 13.17 0.80 0.53 0.66
16.3 12.1 0.63 0.47 0.80 18.24 13.61 0.81 0.55 0.67
16.6 12.0 0.64 0.46 0.81 18.62 13.44 0.81 0.53 0.65
279
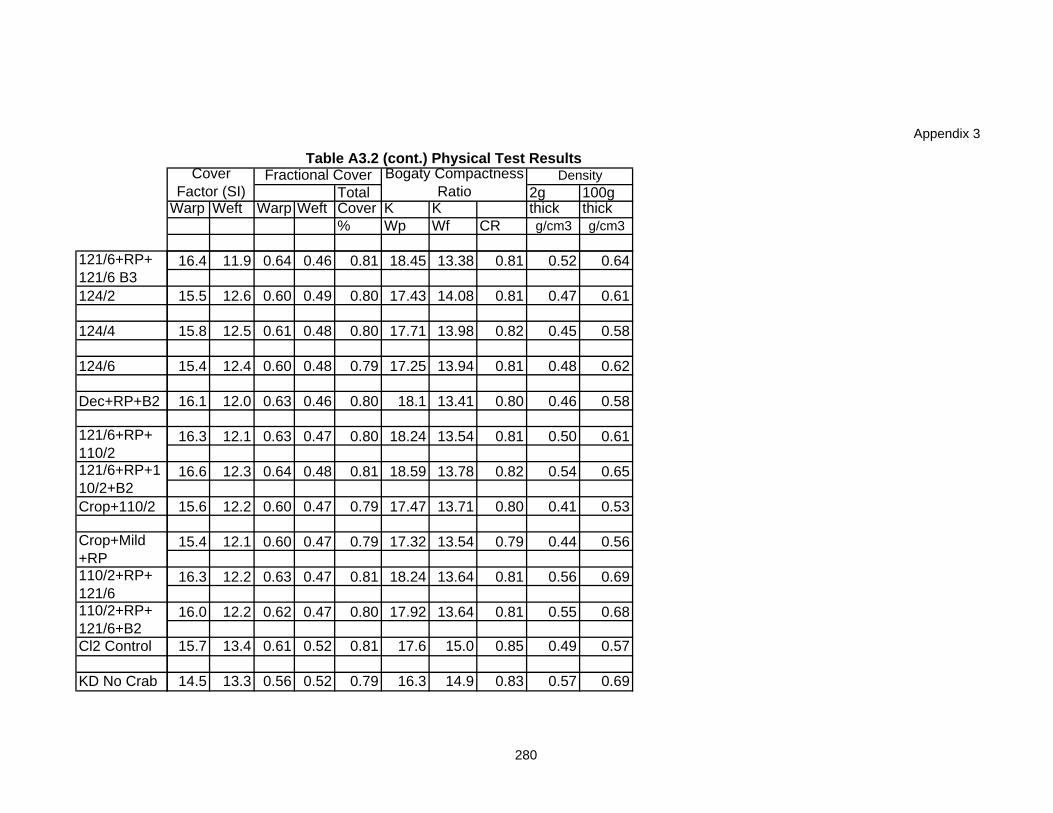
Appendix 3
124/2
124/4
124/6
Dec+RP+B2
Crop+110/2
Cl2 Control
KD No Crab
121/6+RP+ 121/6 B3
121/6+RP+ 110/2121/6+RP+110/2+B2
Crop+Mild +RP110/2+RP+ 121/6110/2+RP+ 121/6+B2
Total 2g 100gWarp Weft Warp Weft Cover K K thick thick
% Wp Wf CR g/cm3 g/cm3
Fractional Cover Bogaty Compactness Ratio
DensityCover Factor (SI)
Table A3.2 (cont.) Physical Test Results
16.4 11.9 0.64 0.46 0.81 18.45 13.38 0.81 0.52 0.64
15.5 12.6 0.60 0.49 0.80 17.43 14.08 0.81 0.47 0.61
15.8 12.5 0.61 0.48 0.80 17.71 13.98 0.82 0.45 0.58
15.4 12.4 0.60 0.48 0.79 17.25 13.94 0.81 0.48 0.62
16.1 12.0 0.63 0.46 0.80 18.1 13.41 0.80 0.46 0.58
16.3 12.1 0.63 0.47 0.80 18.24 13.54 0.81 0.50 0.61
16.6 12.3 0.64 0.48 0.81 18.59 13.78 0.82 0.54 0.65
15.6 12.2 0.60 0.47 0.79 17.47 13.71 0.80 0.41 0.53
15.4 12.1 0.60 0.47 0.79 17.32 13.54 0.79 0.44 0.56
16.3 12.2 0.63 0.47 0.81 18.24 13.64 0.81 0.56 0.69
16.0 12.2 0.62 0.47 0.80 17.92 13.64 0.81 0.55 0.68
15.7 13.4 0.61 0.52 0.81 17.6 15.0 0.85 0.49 0.57
14.5 13.3 0.56 0.52 0.79 16.3 14.9 0.83 0.57 0.69
280
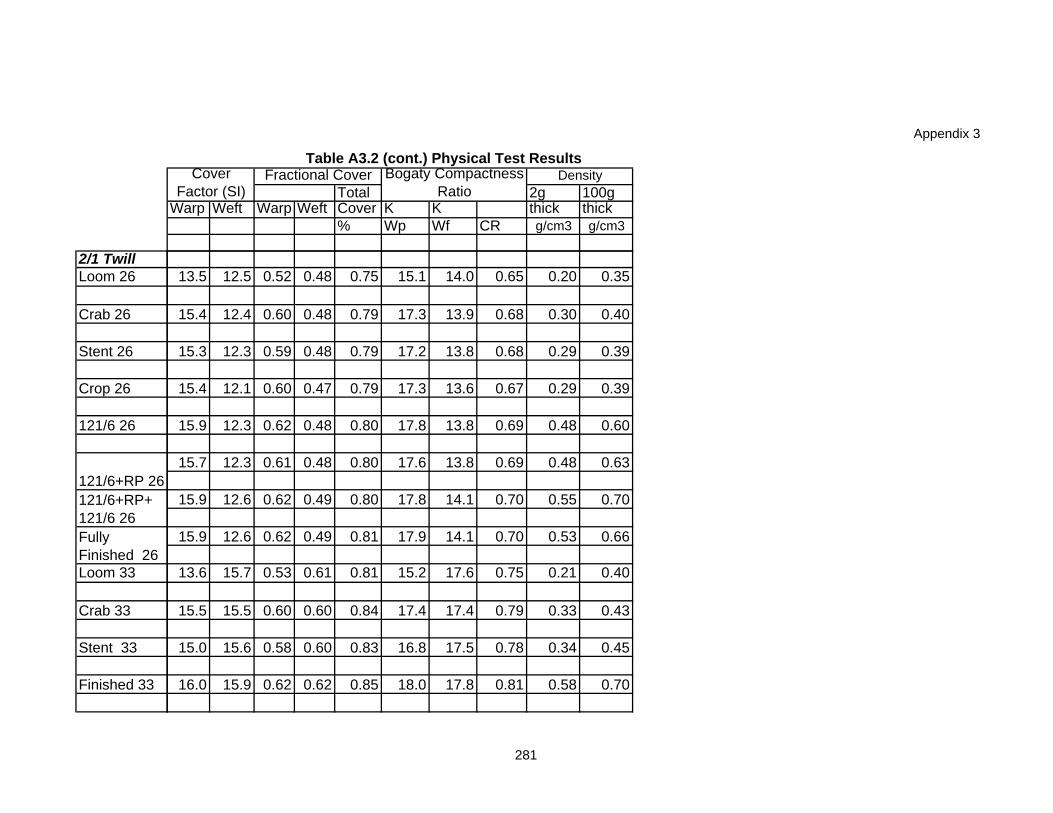
Appendix 3
2/1 TwillLoom 26
Crab 26
Stent 26
Crop 26
121/6 26
Loom 33
Crab 33
Stent 33
Finished 33
121/6+RP 26121/6+RP+ 121/6 26Fully Finished 26
Total 2g 100gWarp Weft Warp Weft Cover K K thick thick
% Wp Wf CR g/cm3 g/cm3
Fractional Cover Bogaty Compactness Ratio
DensityCover Factor (SI)
Table A3.2 (cont.) Physical Test Results
13.5 12.5 0.52 0.48 0.75 15.1 14.0 0.65 0.20 0.35
15.4 12.4 0.60 0.48 0.79 17.3 13.9 0.68 0.30 0.40
15.3 12.3 0.59 0.48 0.79 17.2 13.8 0.68 0.29 0.39
15.4 12.1 0.60 0.47 0.79 17.3 13.6 0.67 0.29 0.39
15.9 12.3 0.62 0.48 0.80 17.8 13.8 0.69 0.48 0.60
15.7 12.3 0.61 0.48 0.80 17.6 13.8 0.69 0.48 0.63
15.9 12.6 0.62 0.49 0.80 17.8 14.1 0.70 0.55 0.70
15.9 12.6 0.62 0.49 0.81 17.9 14.1 0.70 0.53 0.66
13.6 15.7 0.53 0.61 0.81 15.2 17.6 0.75 0.21 0.40
15.5 15.5 0.60 0.60 0.84 17.4 17.4 0.79 0.33 0.43
15.0 15.6 0.58 0.60 0.83 16.8 17.5 0.78 0.34 0.45
16.0 15.9 0.62 0.62 0.85 18.0 17.8 0.81 0.58 0.70
281

Appendix 3
3/3 TwillLoom 26
Scour 26
Crab 26
Stent 26
Crop 26
121/6 26
121/6+RP26
Loom 33
Crab 33
Stent 33
Finished 33
Fully Finished 26
121/6+RP+ 121/6 26
Total 2g 100gWarp Weft Warp Weft Cover K K thick thick
% Wp Wf CR g/cm3 g/cm3
Fractional Cover Bogaty Compactness Ratio
DensityCover Factor (SI)
Table A3.2 (cont.) Physical Test Results
13.5 12.7 0.52 0.49 0.76 15.1 14.2 0.53 0.19 0.30
14.4 13.1 0.56 0.51 0.78 16.2 14.7 0.56 0.20 0.29
16.1 12.9 0.62 0.50 0.81 18.0 14.4 0.58 0.22 0.31
15.3 12.7 0.59 0.49 0.79 17.1 14.2 0.56 0.22 0.30
15.7 12.5 0.61 0.49 0.80 17.6 14.0 0.57 0.21 0.30
16.0 12.9 0.62 0.50 0.81 17.9 14.5 0.58 0.43 0.59
16.2 12.8 0.63 0.50 0.81 18.1 14.3 0.58 0.415 0.573
16.4 13.1 0.64 0.51 0.82 18.4 14.7 0.59 0.472 0.629
16.1 13.0 0.63 0.50 0.81 18.1 14.6 0.59 0.497 0.663
13.6 15.8 0.53 0.61 0.82 15.3 17.8 0.61 0.193 0.306
16.0 16.2 0.62 0.63 0.86 18.0 18.2 0.66 0.235 0.307
15.4 16.1 0.60 0.62 0.85 17.3 18.1 0.65 0.234 0.314
16.4 16.4 0.64 0.64 0.87 18.4 18.4 0.67 0.519 0.684
282
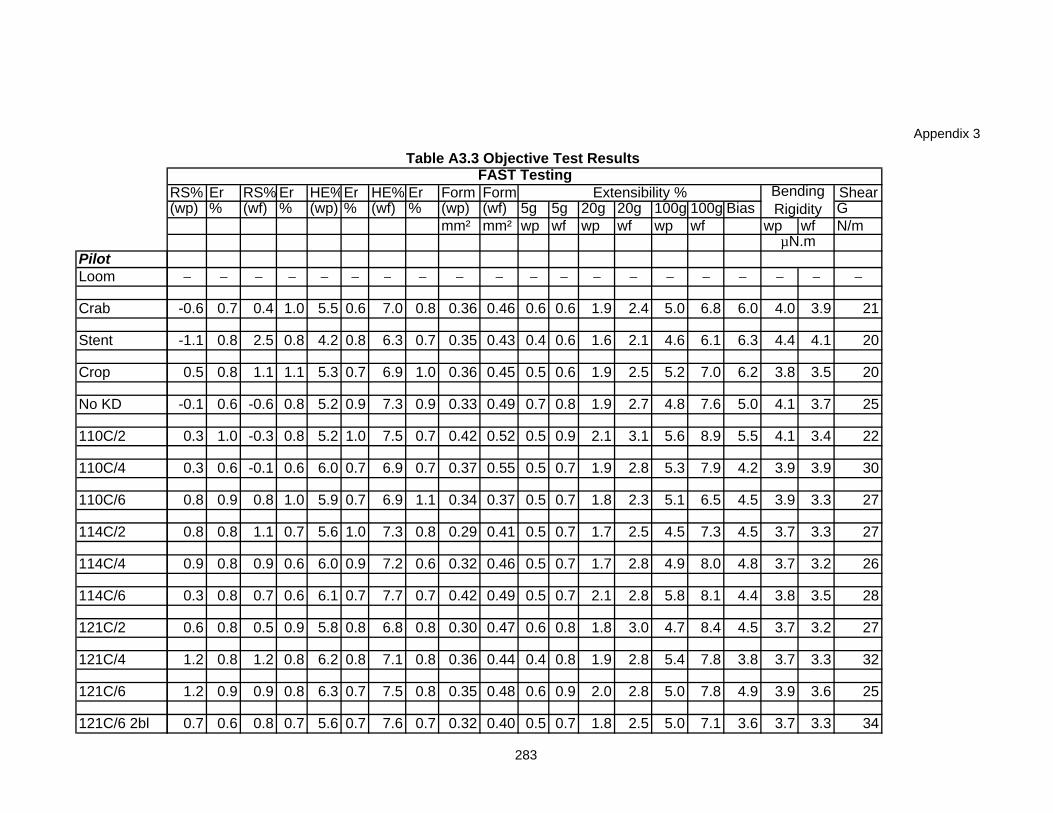
Appendix 3
PilotLoom
Crab
Stent
Crop
No KD
110C/2
110C/4
110C/6
114C/2
114C/4
114C/6
121C/2
121C/4
121C/6
121C/6 2bl
RS% Er RS% Er HE%Er HE% Er Form Form Shear(wp) % (wf) % (wp) % (wf) % (wp) (wf) 5g 5g 20g 20g 100g 100g Bias G
mm² mm² wp wf wp wf wp wf wp wf N/m
− − − − − − − − − − − − − − − − − − − −
-0.6 0.7 0.4 1.0 5.5 0.6 7.0 0.8 0.36 0.46 0.6 0.6 1.9 2.4 5.0 6.8 6.0 4.0 3.9 21
-1.1 0.8 2.5 0.8 4.2 0.8 6.3 0.7 0.35 0.43 0.4 0.6 1.6 2.1 4.6 6.1 6.3 4.4 4.1 20
0.5 0.8 1.1 1.1 5.3 0.7 6.9 1.0 0.36 0.45 0.5 0.6 1.9 2.5 5.2 7.0 6.2 3.8 3.5 20
-0.1 0.6 -0.6 0.8 5.2 0.9 7.3 0.9 0.33 0.49 0.7 0.8 1.9 2.7 4.8 7.6 5.0 4.1 3.7 25
0.3 1.0 -0.3 0.8 5.2 1.0 7.5 0.7 0.42 0.52 0.5 0.9 2.1 3.1 5.6 8.9 5.5 4.1 3.4 22
0.3 0.6 -0.1 0.6 6.0 0.7 6.9 0.7 0.37 0.55 0.5 0.7 1.9 2.8 5.3 7.9 4.2 3.9 3.9 30
0.8 0.9 0.8 1.0 5.9 0.7 6.9 1.1 0.34 0.37 0.5 0.7 1.8 2.3 5.1 6.5 4.5 3.9 3.3 27
0.8 0.8 1.1 0.7 5.6 1.0 7.3 0.8 0.29 0.41 0.5 0.7 1.7 2.5 4.5 7.3 4.5 3.7 3.3 27
0.9 0.8 0.9 0.6 6.0 0.9 7.2 0.6 0.32 0.46 0.5 0.7 1.7 2.8 4.9 8.0 4.8 3.7 3.2 26
0.3 0.8 0.7 0.6 6.1 0.7 7.7 0.7 0.42 0.49 0.5 0.7 2.1 2.8 5.8 8.1 4.4 3.8 3.5 28
0.6 0.8 0.5 0.9 5.8 0.8 6.8 0.8 0.30 0.47 0.6 0.8 1.8 3.0 4.7 8.4 4.5 3.7 3.2 27
1.2 0.8 1.2 0.8 6.2 0.8 7.1 0.8 0.36 0.44 0.4 0.8 1.9 2.8 5.4 7.8 3.8 3.7 3.3 32
1.2 0.9 0.9 0.8 6.3 0.7 7.5 0.8 0.35 0.48 0.6 0.9 2.0 2.8 5.0 7.8 4.9 3.9 3.6 25
0.7 0.6 0.8 0.7 5.6 0.7 7.6 0.7 0.32 0.40 0.5 0.7 1.8 2.5 5.0 7.1 3.6 3.7 3.3 34
FAST TestingBending Rigidity
Table A3.3 Objective Test Results
µN.m
Extensibility %
283
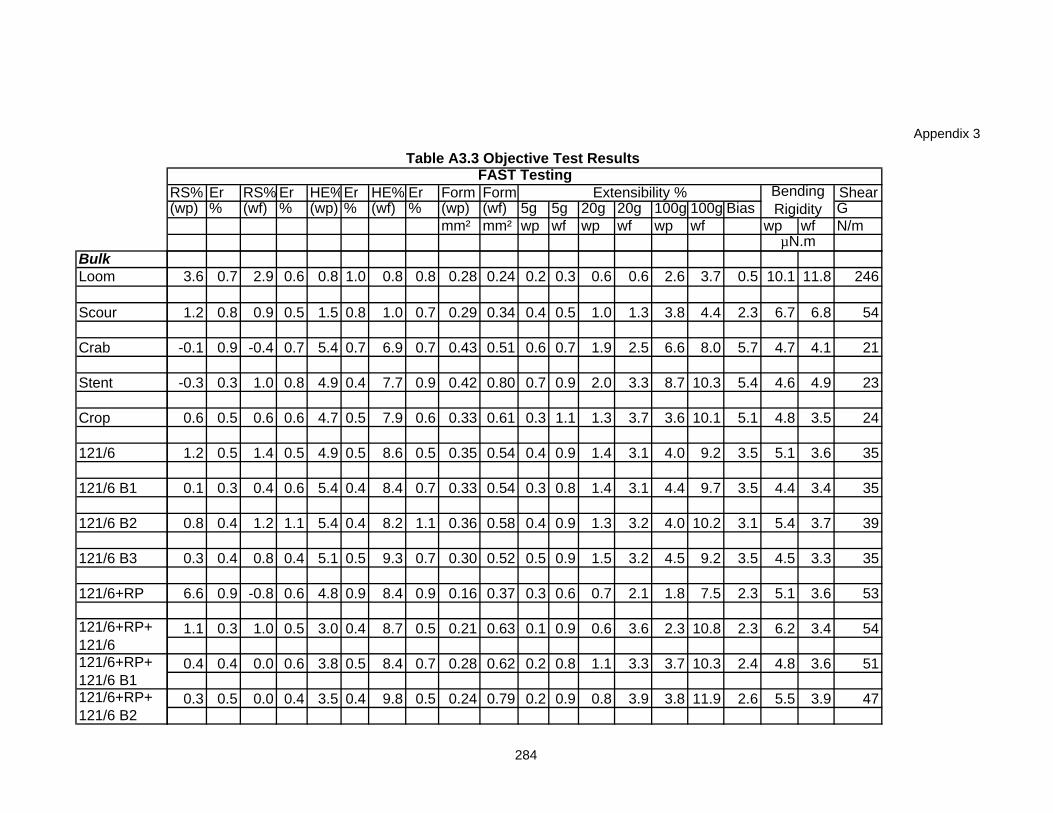
Appendix 3
BulkLoom
Scour
Crab
Stent
Crop
121/6
121/6 B1
121/6 B2
121/6 B3
121/6+RP
121/6+RP+ 121/6 B1
121/6+RP+ 121/6
121/6+RP+ 121/6 B2
RS% Er RS% Er HE%Er HE% Er Form Form Shear(wp) % (wf) % (wp) % (wf) % (wp) (wf) 5g 5g 20g 20g 100g 100g Bias G
mm² mm² wp wf wp wf wp wf wp wf N/m
FAST TestingBending Rigidity
Table A3.3 Objective Test Results
µN.m
Extensibility %
3.6 0.7 2.9 0.6 0.8 1.0 0.8 0.8 0.28 0.24 0.2 0.3 0.6 0.6 2.6 3.7 0.5 10.1 11.8 246
1.2 0.8 0.9 0.5 1.5 0.8 1.0 0.7 0.29 0.34 0.4 0.5 1.0 1.3 3.8 4.4 2.3 6.7 6.8 54
-0.1 0.9 -0.4 0.7 5.4 0.7 6.9 0.7 0.43 0.51 0.6 0.7 1.9 2.5 6.6 8.0 5.7 4.7 4.1 21
-0.3 0.3 1.0 0.8 4.9 0.4 7.7 0.9 0.42 0.80 0.7 0.9 2.0 3.3 8.7 10.3 5.4 4.6 4.9 23
0.6 0.5 0.6 0.6 4.7 0.5 7.9 0.6 0.33 0.61 0.3 1.1 1.3 3.7 3.6 10.1 5.1 4.8 3.5 24
1.2 0.5 1.4 0.5 4.9 0.5 8.6 0.5 0.35 0.54 0.4 0.9 1.4 3.1 4.0 9.2 3.5 5.1 3.6 35
0.1 0.3 0.4 0.6 5.4 0.4 8.4 0.7 0.33 0.54 0.3 0.8 1.4 3.1 4.4 9.7 3.5 4.4 3.4 35
0.8 0.4 1.2 1.1 5.4 0.4 8.2 1.1 0.36 0.58 0.4 0.9 1.3 3.2 4.0 10.2 3.1 5.4 3.7 39
0.3 0.4 0.8 0.4 5.1 0.5 9.3 0.7 0.30 0.52 0.5 0.9 1.5 3.2 4.5 9.2 3.5 4.5 3.3 35
6.6 0.9 -0.8 0.6 4.8 0.9 8.4 0.9 0.16 0.37 0.3 0.6 0.7 2.1 1.8 7.5 2.3 5.1 3.6 53
1.1 0.3 1.0 0.5 3.0 0.4 8.7 0.5 0.21 0.63 0.1 0.9 0.6 3.6 2.3 10.8 2.3 6.2 3.4 54
0.4 0.4 0.0 0.6 3.8 0.5 8.4 0.7 0.28 0.62 0.2 0.8 1.1 3.3 3.7 10.3 2.4 4.8 3.6 51
0.3 0.5 0.0 0.4 3.5 0.4 9.8 0.5 0.24 0.79 0.2 0.9 0.8 3.9 3.8 11.9 2.6 5.5 3.9 47
284
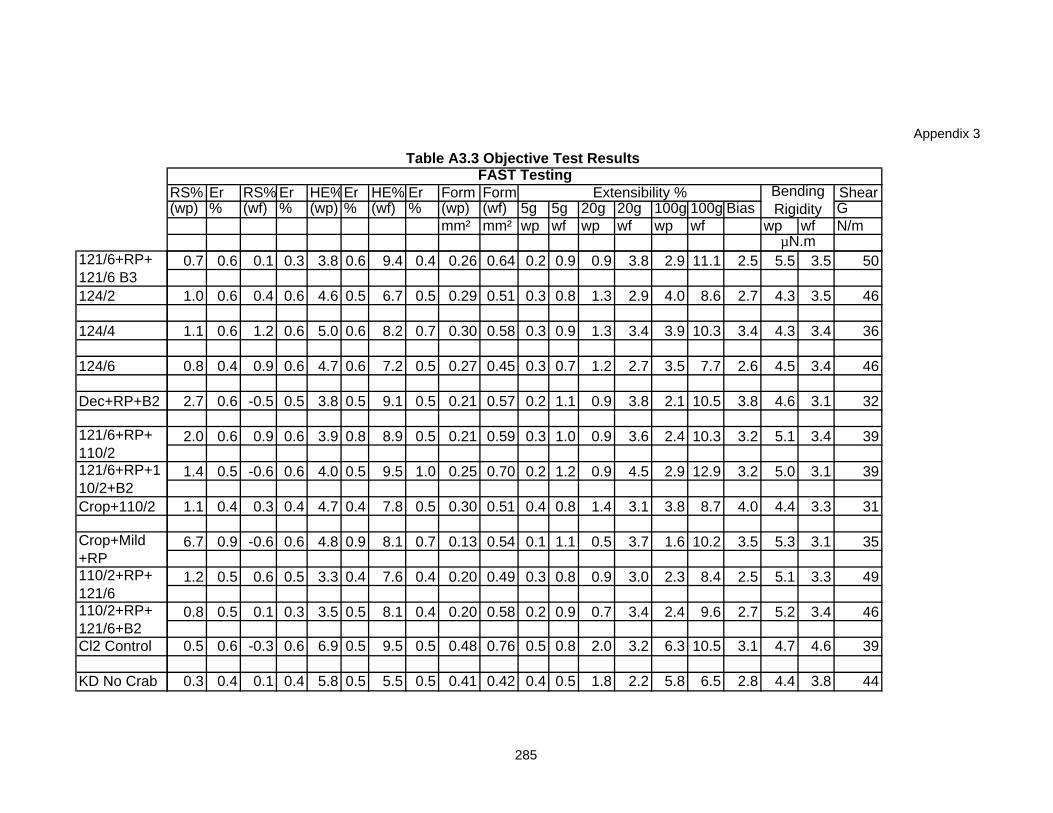
Appendix 3
124/2
124/4
124/6
Dec+RP+B2
Crop+110/2
Cl2 Control
KD No Crab
121/6+RP+ 121/6 B3
121/6+RP+ 110/2121/6+RP+110/2+B2
Crop+Mild +RP110/2+RP+ 121/6110/2+RP+ 121/6+B2
RS% Er RS% Er HE%Er HE% Er Form Form Shear(wp) % (wf) % (wp) % (wf) % (wp) (wf) 5g 5g 20g 20g 100g 100g Bias G
mm² mm² wp wf wp wf wp wf wp wf N/m
FAST TestingBending Rigidity
Table A3.3 Objective Test Results
µN.m
Extensibility %
0.7 0.6 0.1 0.3 3.8 0.6 9.4 0.4 0.26 0.64 0.2 0.9 0.9 3.8 2.9 11.1 2.5 5.5 3.5 50
1.0 0.6 0.4 0.6 4.6 0.5 6.7 0.5 0.29 0.51 0.3 0.8 1.3 2.9 4.0 8.6 2.7 4.3 3.5 46
1.1 0.6 1.2 0.6 5.0 0.6 8.2 0.7 0.30 0.58 0.3 0.9 1.3 3.4 3.9 10.3 3.4 4.3 3.4 36
0.8 0.4 0.9 0.6 4.7 0.6 7.2 0.5 0.27 0.45 0.3 0.7 1.2 2.7 3.5 7.7 2.6 4.5 3.4 46
2.7 0.6 -0.5 0.5 3.8 0.5 9.1 0.5 0.21 0.57 0.2 1.1 0.9 3.8 2.1 10.5 3.8 4.6 3.1 32
2.0 0.6 0.9 0.6 3.9 0.8 8.9 0.5 0.21 0.59 0.3 1.0 0.9 3.6 2.4 10.3 3.2 5.1 3.4 39
1.4 0.5 -0.6 0.6 4.0 0.5 9.5 1.0 0.25 0.70 0.2 1.2 0.9 4.5 2.9 12.9 3.2 5.0 3.1 39
1.1 0.4 0.3 0.4 4.7 0.4 7.8 0.5 0.30 0.51 0.4 0.8 1.4 3.1 3.8 8.7 4.0 4.4 3.3 31
6.7 0.9 -0.6 0.6 4.8 0.9 8.1 0.7 0.13 0.54 0.1 1.1 0.5 3.7 1.6 10.2 3.5 5.3 3.1 35
1.2 0.5 0.6 0.5 3.3 0.4 7.6 0.4 0.20 0.49 0.3 0.8 0.9 3.0 2.3 8.4 2.5 5.1 3.3 49
0.8 0.5 0.1 0.3 3.5 0.5 8.1 0.4 0.20 0.58 0.2 0.9 0.7 3.4 2.4 9.6 2.7 5.2 3.4 46
0.5 0.6 -0.3 0.6 6.9 0.5 9.5 0.5 0.48 0.76 0.5 0.8 2.0 3.2 6.3 10.5 3.1 4.7 4.6 39
0.3 0.4 0.1 0.4 5.8 0.5 5.5 0.5 0.41 0.42 0.4 0.5 1.8 2.2 5.8 6.5 2.8 4.4 3.8 44
285
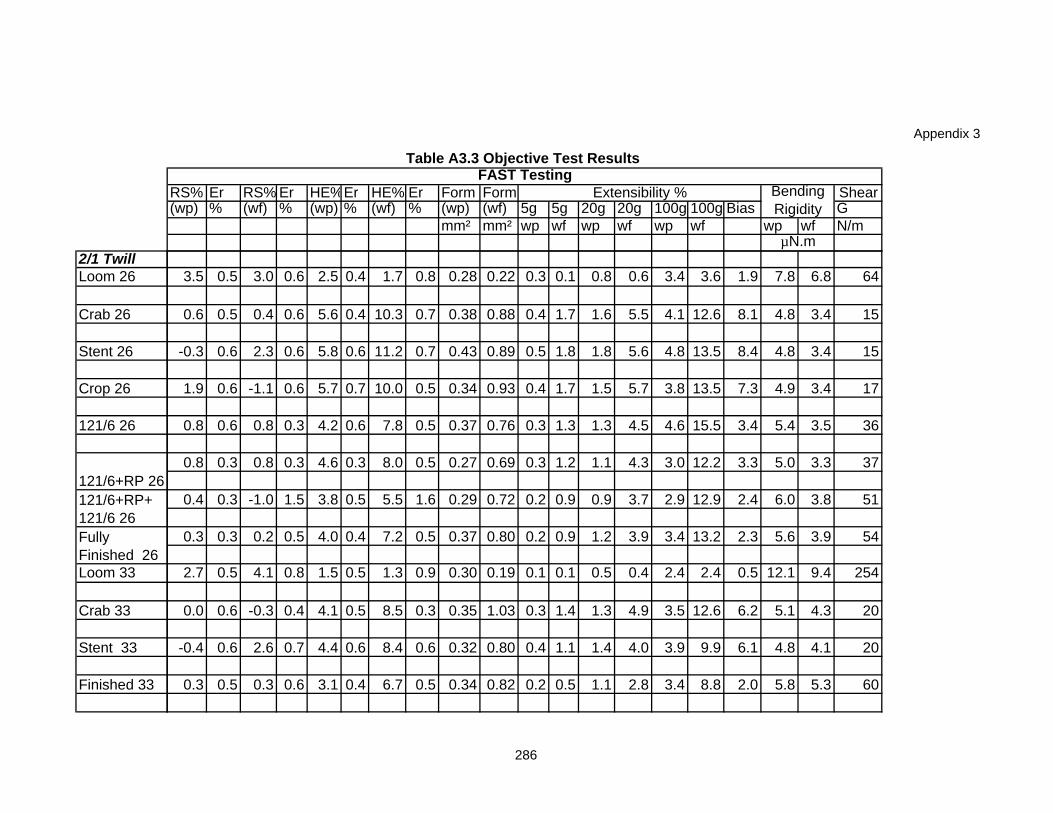
Appendix 3
2/1 TwillLoom 26
Crab 26
Stent 26
Crop 26
121/6 26
Loom 33
Crab 33
Stent 33
Finished 33
121/6+RP 26121/6+RP+ 121/6 26Fully Finished 26
RS% Er RS% Er HE%Er HE% Er Form Form Shear(wp) % (wf) % (wp) % (wf) % (wp) (wf) 5g 5g 20g 20g 100g 100g Bias G
mm² mm² wp wf wp wf wp wf wp wf N/m
FAST TestingBending Rigidity
Table A3.3 Objective Test Results
µN.m
Extensibility %
3.5 0.5 3.0 0.6 2.5 0.4 1.7 0.8 0.28 0.22 0.3 0.1 0.8 0.6 3.4 3.6 1.9 7.8 6.8 64
0.6 0.5 0.4 0.6 5.6 0.4 10.3 0.7 0.38 0.88 0.4 1.7 1.6 5.5 4.1 12.6 8.1 4.8 3.4 15
-0.3 0.6 2.3 0.6 5.8 0.6 11.2 0.7 0.43 0.89 0.5 1.8 1.8 5.6 4.8 13.5 8.4 4.8 3.4 15
1.9 0.6 -1.1 0.6 5.7 0.7 10.0 0.5 0.34 0.93 0.4 1.7 1.5 5.7 3.8 13.5 7.3 4.9 3.4 17
0.8 0.6 0.8 0.3 4.2 0.6 7.8 0.5 0.37 0.76 0.3 1.3 1.3 4.5 4.6 15.5 3.4 5.4 3.5 36
0.8 0.3 0.8 0.3 4.6 0.3 8.0 0.5 0.27 0.69 0.3 1.2 1.1 4.3 3.0 12.2 3.3 5.0 3.3 37
0.4 0.3 -1.0 1.5 3.8 0.5 5.5 1.6 0.29 0.72 0.2 0.9 0.9 3.7 2.9 12.9 2.4 6.0 3.8 51
0.3 0.3 0.2 0.5 4.0 0.4 7.2 0.5 0.37 0.80 0.2 0.9 1.2 3.9 3.4 13.2 2.3 5.6 3.9 54
2.7 0.5 4.1 0.8 1.5 0.5 1.3 0.9 0.30 0.19 0.1 0.1 0.5 0.4 2.4 2.4 0.5 12.1 9.4 254
0.0 0.6 -0.3 0.4 4.1 0.5 8.5 0.3 0.35 1.03 0.3 1.4 1.3 4.9 3.5 12.6 6.2 5.1 4.3 20
-0.4 0.6 2.6 0.7 4.4 0.6 8.4 0.6 0.32 0.80 0.4 1.1 1.4 4.0 3.9 9.9 6.1 4.8 4.1 20
0.3 0.5 0.3 0.6 3.1 0.4 6.7 0.5 0.34 0.82 0.2 0.5 1.1 2.8 3.4 8.8 2.0 5.8 5.3 60
286
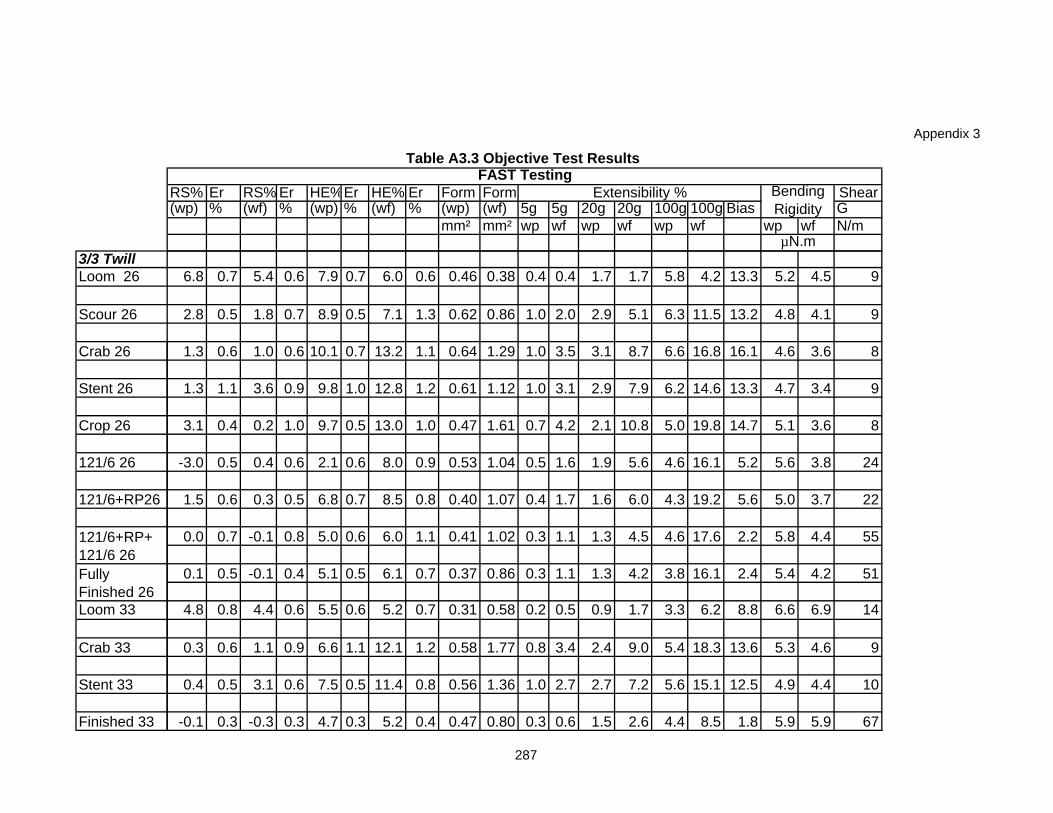
Appendix 3
3/3 TwillLoom 26
Scour 26
Crab 26
Stent 26
Crop 26
121/6 26
121/6+RP26
Loom 33
Crab 33
Stent 33
Finished 33
Fully Finished 26
121/6+RP+ 121/6 26
RS% Er RS% Er HE%Er HE% Er Form Form Shear(wp) % (wf) % (wp) % (wf) % (wp) (wf) 5g 5g 20g 20g 100g 100g Bias G
mm² mm² wp wf wp wf wp wf wp wf N/m
FAST TestingBending Rigidity
Table A3.3 Objective Test Results
µN.m
Extensibility %
6.8 0.7 5.4 0.6 7.9 0.7 6.0 0.6 0.46 0.38 0.4 0.4 1.7 1.7 5.8 4.2 13.3 5.2 4.5 9
2.8 0.5 1.8 0.7 8.9 0.5 7.1 1.3 0.62 0.86 1.0 2.0 2.9 5.1 6.3 11.5 13.2 4.8 4.1 9
1.3 0.6 1.0 0.6 10.1 0.7 13.2 1.1 0.64 1.29 1.0 3.5 3.1 8.7 6.6 16.8 16.1 4.6 3.6 8
1.3 1.1 3.6 0.9 9.8 1.0 12.8 1.2 0.61 1.12 1.0 3.1 2.9 7.9 6.2 14.6 13.3 4.7 3.4 9
3.1 0.4 0.2 1.0 9.7 0.5 13.0 1.0 0.47 1.61 0.7 4.2 2.1 10.8 5.0 19.8 14.7 5.1 3.6 8
-3.0 0.5 0.4 0.6 2.1 0.6 8.0 0.9 0.53 1.04 0.5 1.6 1.9 5.6 4.6 16.1 5.2 5.6 3.8 24
1.5 0.6 0.3 0.5 6.8 0.7 8.5 0.8 0.40 1.07 0.4 1.7 1.6 6.0 4.3 19.2 5.6 5.0 3.7 22
0.0 0.7 -0.1 0.8 5.0 0.6 6.0 1.1 0.41 1.02 0.3 1.1 1.3 4.5 4.6 17.6 2.2 5.8 4.4 55
0.1 0.5 -0.1 0.4 5.1 0.5 6.1 0.7 0.37 0.86 0.3 1.1 1.3 4.2 3.8 16.1 2.4 5.4 4.2 51
4.8 0.8 4.4 0.6 5.5 0.6 5.2 0.7 0.31 0.58 0.2 0.5 0.9 1.7 3.3 6.2 8.8 6.6 6.9 14
0.3 0.6 1.1 0.9 6.6 1.1 12.1 1.2 0.58 1.77 0.8 3.4 2.4 9.0 5.4 18.3 13.6 5.3 4.6 9
0.4 0.5 3.1 0.6 7.5 0.5 11.4 0.8 0.56 1.36 1.0 2.7 2.7 7.2 5.6 15.1 12.5 4.9 4.4 10
-0.1 0.3 -0.3 0.3 4.7 0.3 5.2 0.4 0.47 0.80 0.3 0.6 1.5 2.6 4.4 8.5 1.8 5.9 5.9 67
287
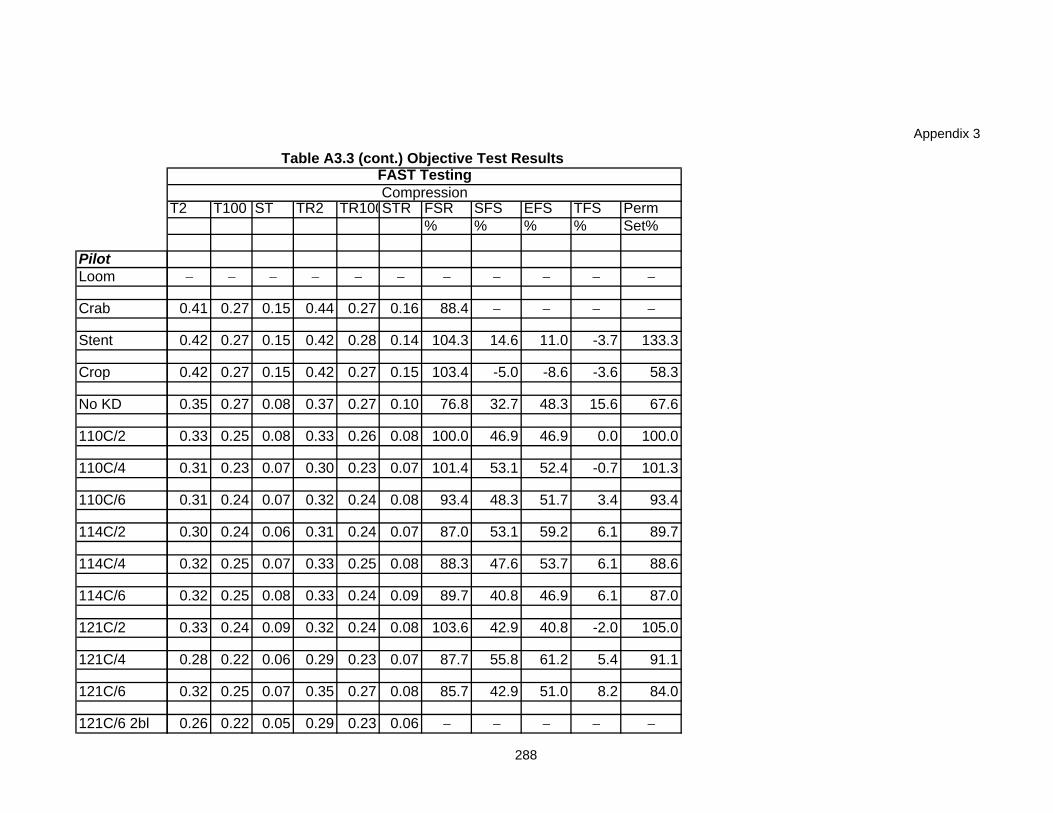
Appendix 3
PilotLoom
Crab
Stent
Crop
No KD
110C/2
110C/4
110C/6
114C/2
114C/4
114C/6
121C/2
121C/4
121C/6
121C/6 2bl
T2 T100 ST TR2 TR100STR FSR SFS EFS TFS Perm% % % % Set%
− − − − − − − − − − −
0.41 0.27 0.15 0.44 0.27 0.16 88.4 − − − −
0.42 0.27 0.15 0.42 0.28 0.14 104.3 14.6 11.0 -3.7 133.3
0.42 0.27 0.15 0.42 0.27 0.15 103.4 -5.0 -8.6 -3.6 58.3
0.35 0.27 0.08 0.37 0.27 0.10 76.8 32.7 48.3 15.6 67.6
0.33 0.25 0.08 0.33 0.26 0.08 100.0 46.9 46.9 0.0 100.0
0.31 0.23 0.07 0.30 0.23 0.07 101.4 53.1 52.4 -0.7 101.3
0.31 0.24 0.07 0.32 0.24 0.08 93.4 48.3 51.7 3.4 93.4
0.30 0.24 0.06 0.31 0.24 0.07 87.0 53.1 59.2 6.1 89.7
0.32 0.25 0.07 0.33 0.25 0.08 88.3 47.6 53.7 6.1 88.6
0.32 0.25 0.08 0.33 0.24 0.09 89.7 40.8 46.9 6.1 87.0
0.33 0.24 0.09 0.32 0.24 0.08 103.6 42.9 40.8 -2.0 105.0
0.28 0.22 0.06 0.29 0.23 0.07 87.7 55.8 61.2 5.4 91.1
0.32 0.25 0.07 0.35 0.27 0.08 85.7 42.9 51.0 8.2 84.0
0.26 0.22 0.05 0.29 0.23 0.06 − − − − −
Table A3.3 (cont.) Objective Test Results FAST TestingCompression
288
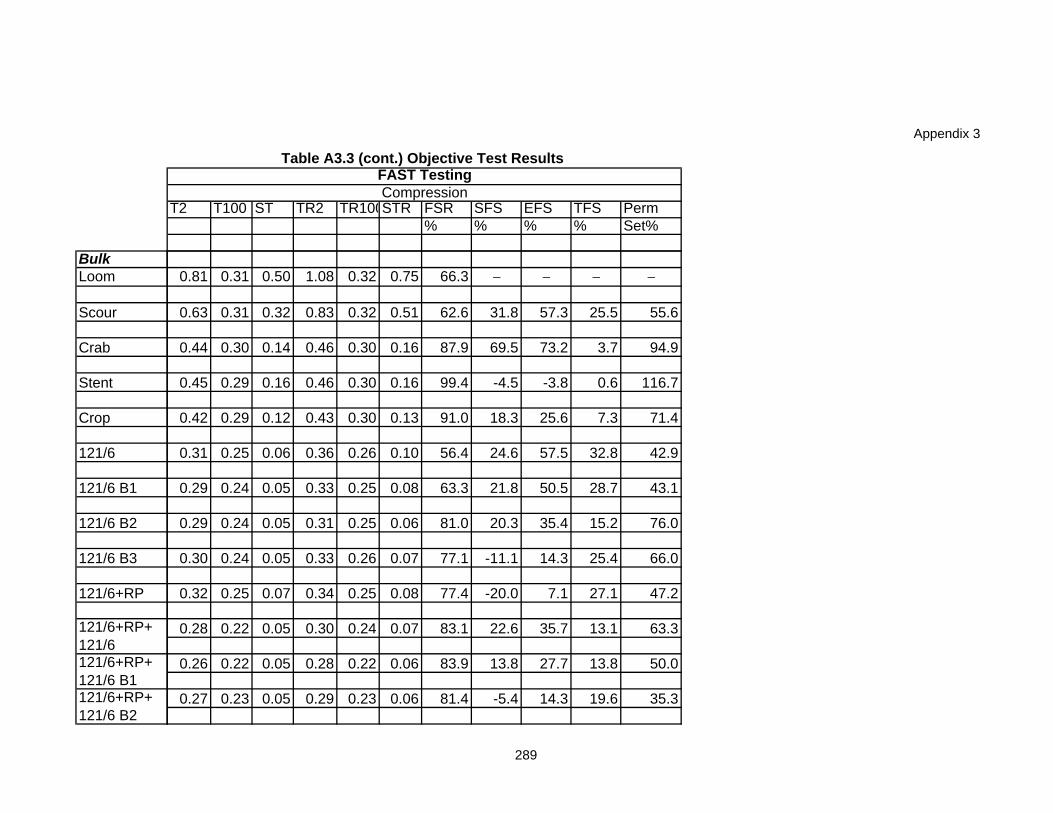
Appendix 3
BulkLoom
Scour
Crab
Stent
Crop
121/6
121/6 B1
121/6 B2
121/6 B3
121/6+RP
121/6+RP+ 121/6 B1
121/6+RP+ 121/6
121/6+RP+ 121/6 B2
T2 T100 ST TR2 TR100STR FSR SFS EFS TFS Perm% % % % Set%
Table A3.3 (cont.) Objective Test Results FAST TestingCompression
0.81 0.31 0.50 1.08 0.32 0.75 66.3 − − − −
0.63 0.31 0.32 0.83 0.32 0.51 62.6 31.8 57.3 25.5 55.6
0.44 0.30 0.14 0.46 0.30 0.16 87.9 69.5 73.2 3.7 94.9
0.45 0.29 0.16 0.46 0.30 0.16 99.4 -4.5 -3.8 0.6 116.7
0.42 0.29 0.12 0.43 0.30 0.13 91.0 18.3 25.6 7.3 71.4
0.31 0.25 0.06 0.36 0.26 0.10 56.4 24.6 57.5 32.8 42.9
0.29 0.24 0.05 0.33 0.25 0.08 63.3 21.8 50.5 28.7 43.1
0.29 0.24 0.05 0.31 0.25 0.06 81.0 20.3 35.4 15.2 76.0
0.30 0.24 0.05 0.33 0.26 0.07 77.1 -11.1 14.3 25.4 66.0
0.32 0.25 0.07 0.34 0.25 0.08 77.4 -20.0 7.1 27.1 47.2
0.28 0.22 0.05 0.30 0.24 0.07 83.1 22.6 35.7 13.1 63.3
0.26 0.22 0.05 0.28 0.22 0.06 83.9 13.8 27.7 13.8 50.0
0.27 0.23 0.05 0.29 0.23 0.06 81.4 -5.4 14.3 19.6 35.3
289
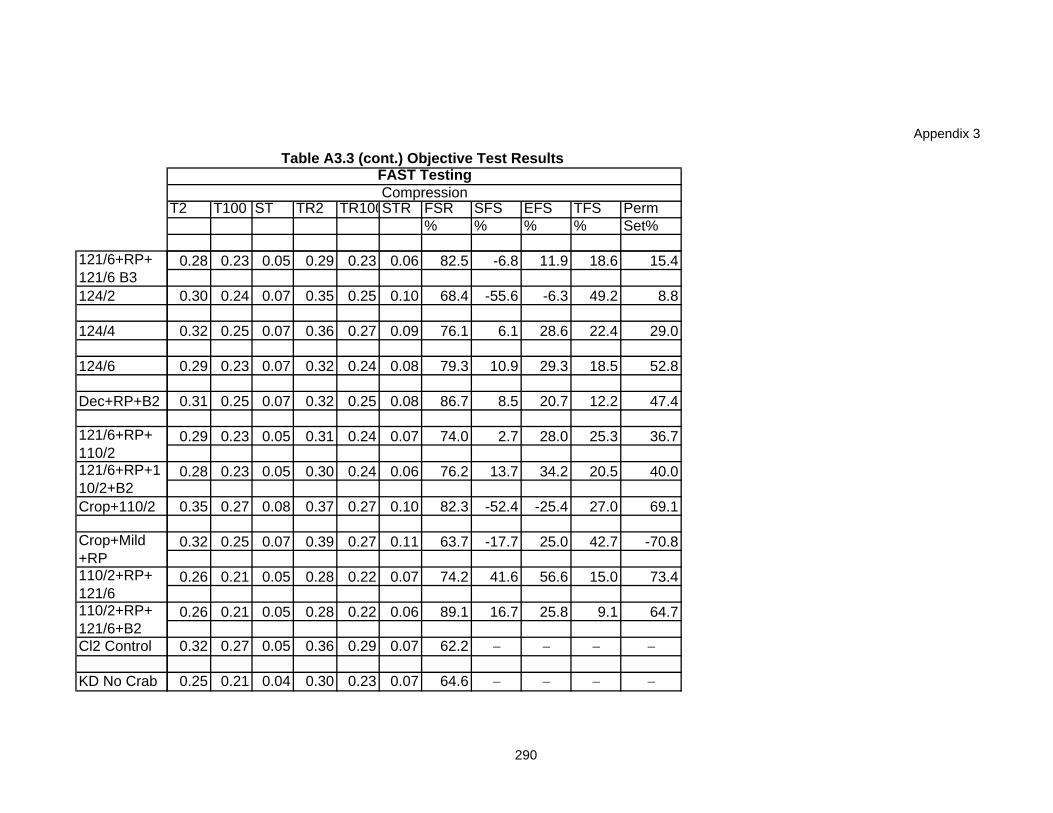
Appendix 3
124/2
124/4
124/6
Dec+RP+B2
Crop+110/2
Cl2 Control
KD No Crab
121/6+RP+ 121/6 B3
121/6+RP+ 110/2121/6+RP+110/2+B2
Crop+Mild +RP110/2+RP+ 121/6110/2+RP+ 121/6+B2
T2 T100 ST TR2 TR100STR FSR SFS EFS TFS Perm% % % % Set%
Table A3.3 (cont.) Objective Test Results FAST TestingCompression
0.28 0.23 0.05 0.29 0.23 0.06 82.5 -6.8 11.9 18.6 15.4
0.30 0.24 0.07 0.35 0.25 0.10 68.4 -55.6 -6.3 49.2 8.8
0.32 0.25 0.07 0.36 0.27 0.09 76.1 6.1 28.6 22.4 29.0
0.29 0.23 0.07 0.32 0.24 0.08 79.3 10.9 29.3 18.5 52.8
0.31 0.25 0.07 0.32 0.25 0.08 86.7 8.5 20.7 12.2 47.4
0.29 0.23 0.05 0.31 0.24 0.07 74.0 2.7 28.0 25.3 36.7
0.28 0.23 0.05 0.30 0.24 0.06 76.2 13.7 34.2 20.5 40.0
0.35 0.27 0.08 0.37 0.27 0.10 82.3 -52.4 -25.4 27.0 69.1
0.32 0.25 0.07 0.39 0.27 0.11 63.7 -17.7 25.0 42.7 -70.8
0.26 0.21 0.05 0.28 0.22 0.07 74.2 41.6 56.6 15.0 73.4
0.26 0.21 0.05 0.28 0.22 0.06 89.1 16.7 25.8 9.1 64.7
0.32 0.27 0.05 0.36 0.29 0.07 62.2 − − − −
0.25 0.21 0.04 0.30 0.23 0.07 64.6 − − − −
290
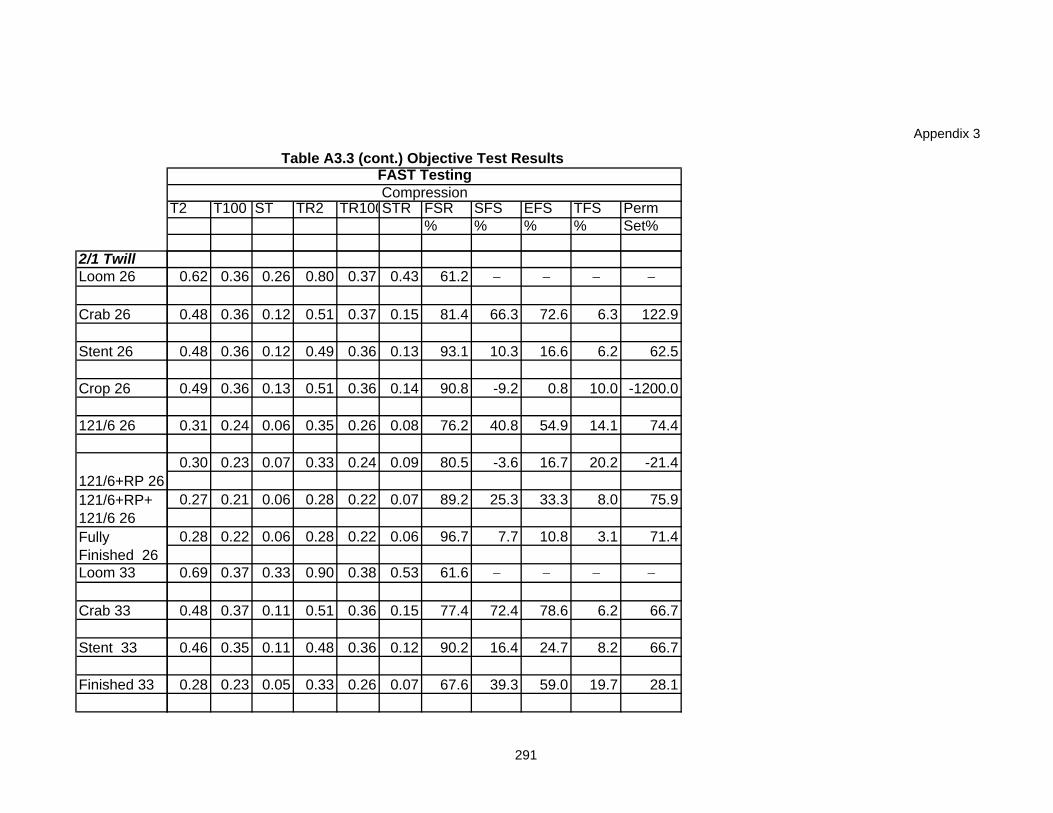
Appendix 3
2/1 TwillLoom 26
Crab 26
Stent 26
Crop 26
121/6 26
Loom 33
Crab 33
Stent 33
Finished 33
121/6+RP 26121/6+RP+ 121/6 26Fully Finished 26
T2 T100 ST TR2 TR100STR FSR SFS EFS TFS Perm% % % % Set%
Table A3.3 (cont.) Objective Test Results FAST TestingCompression
0.62 0.36 0.26 0.80 0.37 0.43 61.2 − − − −
0.48 0.36 0.12 0.51 0.37 0.15 81.4 66.3 72.6 6.3 122.9
0.48 0.36 0.12 0.49 0.36 0.13 93.1 10.3 16.6 6.2 62.5
0.49 0.36 0.13 0.51 0.36 0.14 90.8 -9.2 0.8 10.0 -1200.0
0.31 0.24 0.06 0.35 0.26 0.08 76.2 40.8 54.9 14.1 74.4
0.30 0.23 0.07 0.33 0.24 0.09 80.5 -3.6 16.7 20.2 -21.4
0.27 0.21 0.06 0.28 0.22 0.07 89.2 25.3 33.3 8.0 75.9
0.28 0.22 0.06 0.28 0.22 0.06 96.7 7.7 10.8 3.1 71.4
0.69 0.37 0.33 0.90 0.38 0.53 61.6 − − − −
0.48 0.37 0.11 0.51 0.36 0.15 77.4 72.4 78.6 6.2 66.7
0.46 0.35 0.11 0.48 0.36 0.12 90.2 16.4 24.7 8.2 66.7
0.28 0.23 0.05 0.33 0.26 0.07 67.6 39.3 59.0 19.7 28.1
291
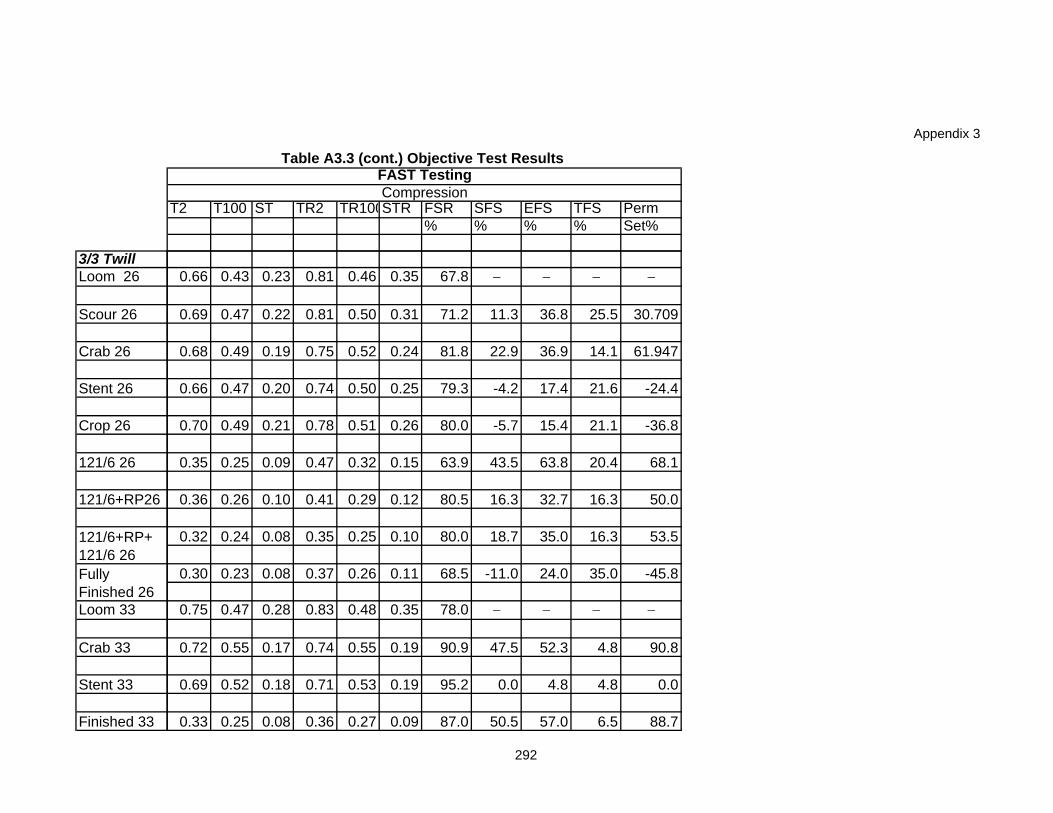
Appendix 3
3/3 TwillLoom 26
Scour 26
Crab 26
Stent 26
Crop 26
121/6 26
121/6+RP26
Loom 33
Crab 33
Stent 33
Finished 33
Fully Finished 26
121/6+RP+ 121/6 26
T2 T100 ST TR2 TR100STR FSR SFS EFS TFS Perm% % % % Set%
Table A3.3 (cont.) Objective Test Results FAST TestingCompression
0.66 0.43 0.23 0.81 0.46 0.35 67.8 − − − −
0.69 0.47 0.22 0.81 0.50 0.31 71.2 11.3 36.8 25.5 30.709
0.68 0.49 0.19 0.75 0.52 0.24 81.8 22.9 36.9 14.1 61.947
0.66 0.47 0.20 0.74 0.50 0.25 79.3 -4.2 17.4 21.6 -24.4
0.70 0.49 0.21 0.78 0.51 0.26 80.0 -5.7 15.4 21.1 -36.8
0.35 0.25 0.09 0.47 0.32 0.15 63.9 43.5 63.8 20.4 68.1
0.36 0.26 0.10 0.41 0.29 0.12 80.5 16.3 32.7 16.3 50.0
0.32 0.24 0.08 0.35 0.25 0.10 80.0 18.7 35.0 16.3 53.5
0.30 0.23 0.08 0.37 0.26 0.11 68.5 -11.0 24.0 35.0 -45.8
0.75 0.47 0.28 0.83 0.48 0.35 78.0 − − − −
0.72 0.55 0.17 0.74 0.55 0.19 90.9 47.5 52.3 4.8 90.8
0.69 0.52 0.18 0.71 0.53 0.19 95.2 0.0 4.8 4.8 0.0
0.33 0.25 0.08 0.36 0.27 0.09 87.0 50.5 57.0 6.5 88.7
292
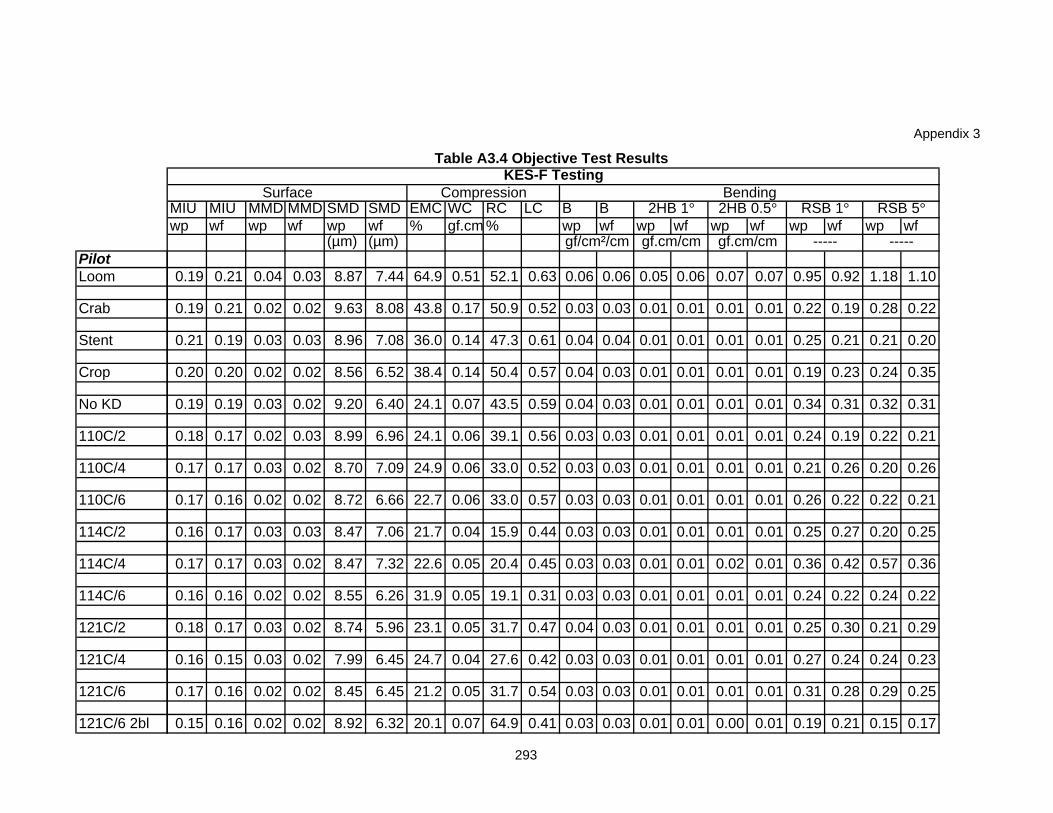
Appendix 3
PilotLoom
Crab
Stent
Crop
No KD
110C/2
110C/4
110C/6
114C/2
114C/4
114C/6
121C/2
121C/4
121C/6
121C/6 2bl
MIU MIU MMD MMD SMD SMD EMC WC RC LC B Bwp wf wp wf wp wf % gf.cm % wp wf wp wf wp wf wp wf wp wf
(µm) (µm)
0.19 0.21 0.04 0.03 8.87 7.44 64.9 0.51 52.1 0.63 0.06 0.06 0.05 0.06 0.07 0.07 0.95 0.92 1.18 1.10
0.19 0.21 0.02 0.02 9.63 8.08 43.8 0.17 50.9 0.52 0.03 0.03 0.01 0.01 0.01 0.01 0.22 0.19 0.28 0.22
0.21 0.19 0.03 0.03 8.96 7.08 36.0 0.14 47.3 0.61 0.04 0.04 0.01 0.01 0.01 0.01 0.25 0.21 0.21 0.20
0.20 0.20 0.02 0.02 8.56 6.52 38.4 0.14 50.4 0.57 0.04 0.03 0.01 0.01 0.01 0.01 0.19 0.23 0.24 0.35
0.19 0.19 0.03 0.02 9.20 6.40 24.1 0.07 43.5 0.59 0.04 0.03 0.01 0.01 0.01 0.01 0.34 0.31 0.32 0.31
0.18 0.17 0.02 0.03 8.99 6.96 24.1 0.06 39.1 0.56 0.03 0.03 0.01 0.01 0.01 0.01 0.24 0.19 0.22 0.21
0.17 0.17 0.03 0.02 8.70 7.09 24.9 0.06 33.0 0.52 0.03 0.03 0.01 0.01 0.01 0.01 0.21 0.26 0.20 0.26
0.17 0.16 0.02 0.02 8.72 6.66 22.7 0.06 33.0 0.57 0.03 0.03 0.01 0.01 0.01 0.01 0.26 0.22 0.22 0.21
0.16 0.17 0.03 0.03 8.47 7.06 21.7 0.04 15.9 0.44 0.03 0.03 0.01 0.01 0.01 0.01 0.25 0.27 0.20 0.25
0.17 0.17 0.03 0.02 8.47 7.32 22.6 0.05 20.4 0.45 0.03 0.03 0.01 0.01 0.02 0.01 0.36 0.42 0.57 0.36
0.16 0.16 0.02 0.02 8.55 6.26 31.9 0.05 19.1 0.31 0.03 0.03 0.01 0.01 0.01 0.01 0.24 0.22 0.24 0.22
0.18 0.17 0.03 0.02 8.74 5.96 23.1 0.05 31.7 0.47 0.04 0.03 0.01 0.01 0.01 0.01 0.25 0.30 0.21 0.29
0.16 0.15 0.03 0.02 7.99 6.45 24.7 0.04 27.6 0.42 0.03 0.03 0.01 0.01 0.01 0.01 0.27 0.24 0.24 0.23
0.17 0.16 0.02 0.02 8.45 6.45 21.2 0.05 31.7 0.54 0.03 0.03 0.01 0.01 0.01 0.01 0.31 0.28 0.29 0.25
0.15 0.16 0.02 0.02 8.92 6.32 20.1 0.07 64.9 0.41 0.03 0.03 0.01 0.01 0.00 0.01 0.19 0.21 0.15 0.17
gf/cm²/cm
KES-F Testing
RSB 5°
gf.cm/cm
2HB 1°Compression Bending
2HB 0.5°
gf.cm/cm ----- -----
Table A3.4 Objective Test Results
RSB 1°Surface
293
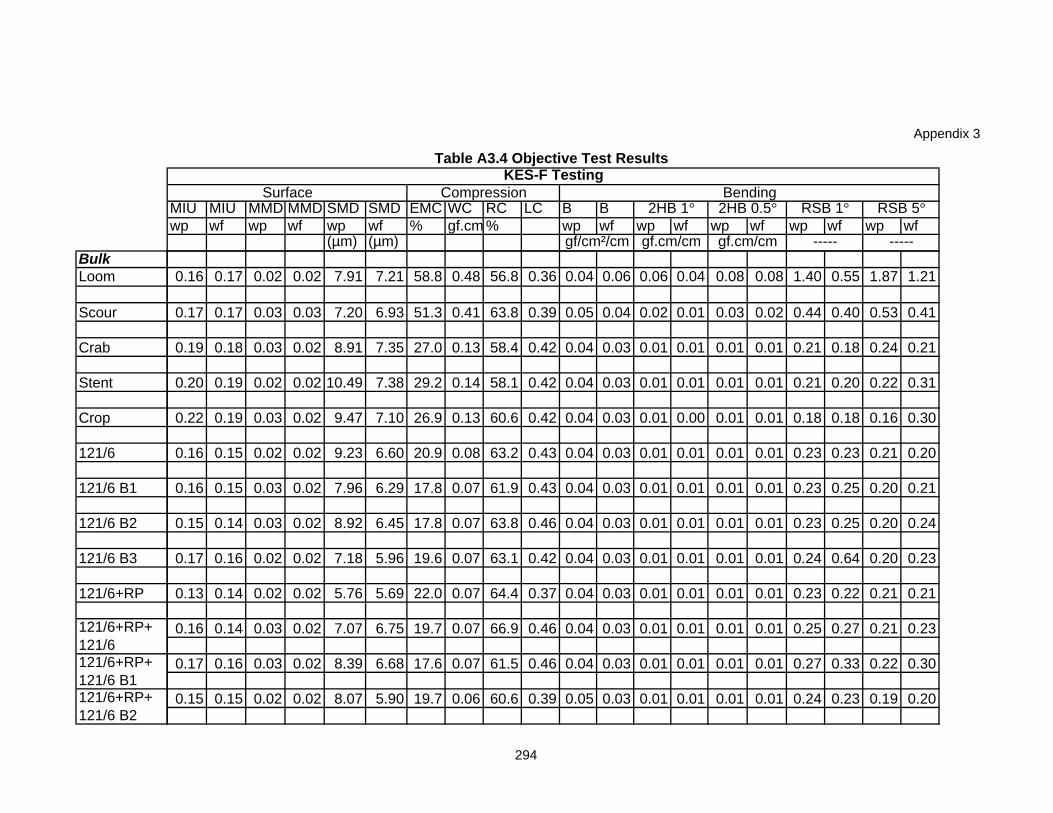
Appendix 3
BulkLoom
Scour
Crab
Stent
Crop
121/6
121/6 B1
121/6 B2
121/6 B3
121/6+RP
121/6+RP+ 121/6 B1
121/6+RP+ 121/6
121/6+RP+ 121/6 B2
MIU MIU MMD MMD SMD SMD EMC WC RC LC B Bwp wf wp wf wp wf % gf.cm % wp wf wp wf wp wf wp wf wp wf
(µm) (µm) gf/cm²/cm
KES-F Testing
RSB 5°
gf.cm/cm
2HB 1°Compression Bending
2HB 0.5°
gf.cm/cm ----- -----
Table A3.4 Objective Test Results
RSB 1°Surface
0.16 0.17 0.02 0.02 7.91 7.21 58.8 0.48 56.8 0.36 0.04 0.06 0.06 0.04 0.08 0.08 1.40 0.55 1.87 1.21
0.17 0.17 0.03 0.03 7.20 6.93 51.3 0.41 63.8 0.39 0.05 0.04 0.02 0.01 0.03 0.02 0.44 0.40 0.53 0.41
0.19 0.18 0.03 0.02 8.91 7.35 27.0 0.13 58.4 0.42 0.04 0.03 0.01 0.01 0.01 0.01 0.21 0.18 0.24 0.21
0.20 0.19 0.02 0.02 10.49 7.38 29.2 0.14 58.1 0.42 0.04 0.03 0.01 0.01 0.01 0.01 0.21 0.20 0.22 0.31
0.22 0.19 0.03 0.02 9.47 7.10 26.9 0.13 60.6 0.42 0.04 0.03 0.01 0.00 0.01 0.01 0.18 0.18 0.16 0.30
0.16 0.15 0.02 0.02 9.23 6.60 20.9 0.08 63.2 0.43 0.04 0.03 0.01 0.01 0.01 0.01 0.23 0.23 0.21 0.20
0.16 0.15 0.03 0.02 7.96 6.29 17.8 0.07 61.9 0.43 0.04 0.03 0.01 0.01 0.01 0.01 0.23 0.25 0.20 0.21
0.15 0.14 0.03 0.02 8.92 6.45 17.8 0.07 63.8 0.46 0.04 0.03 0.01 0.01 0.01 0.01 0.23 0.25 0.20 0.24
0.17 0.16 0.02 0.02 7.18 5.96 19.6 0.07 63.1 0.42 0.04 0.03 0.01 0.01 0.01 0.01 0.24 0.64 0.20 0.23
0.13 0.14 0.02 0.02 5.76 5.69 22.0 0.07 64.4 0.37 0.04 0.03 0.01 0.01 0.01 0.01 0.23 0.22 0.21 0.21
0.16 0.14 0.03 0.02 7.07 6.75 19.7 0.07 66.9 0.46 0.04 0.03 0.01 0.01 0.01 0.01 0.25 0.27 0.21 0.23
0.17 0.16 0.03 0.02 8.39 6.68 17.6 0.07 61.5 0.46 0.04 0.03 0.01 0.01 0.01 0.01 0.27 0.33 0.22 0.30
0.15 0.15 0.02 0.02 8.07 5.90 19.7 0.06 60.6 0.39 0.05 0.03 0.01 0.01 0.01 0.01 0.24 0.23 0.19 0.20
294
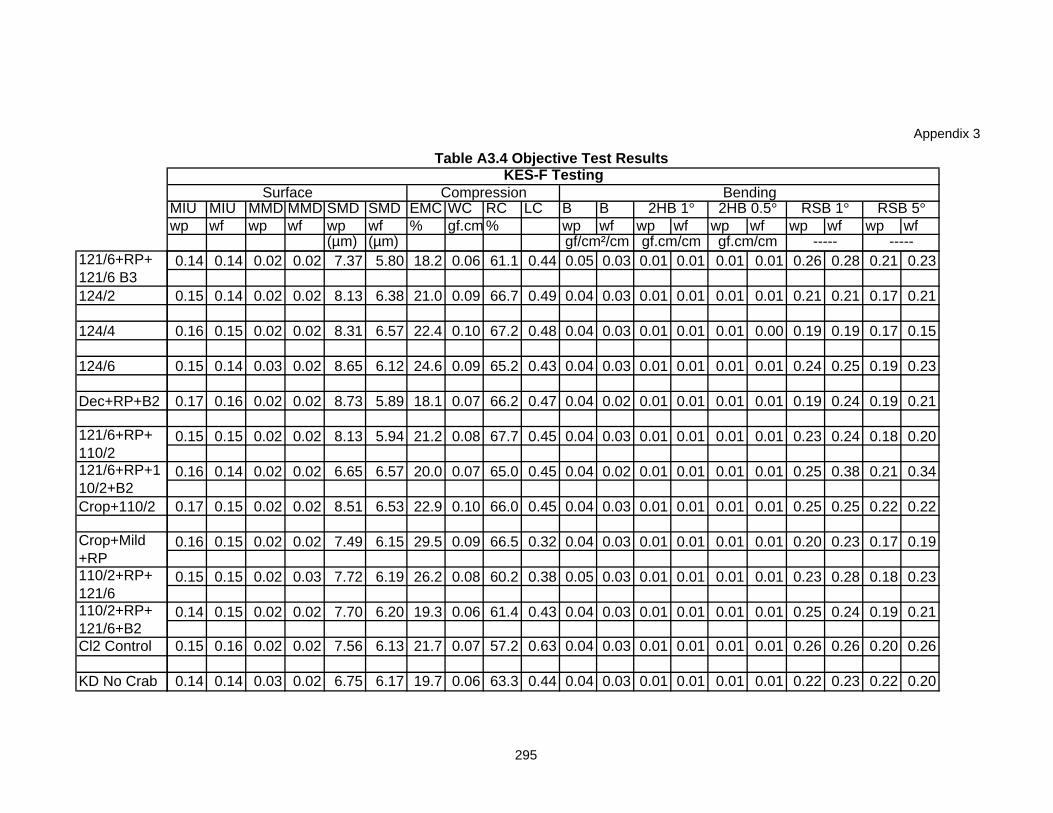
Appendix 3
124/2
124/4
124/6
Dec+RP+B2
Crop+110/2
Cl2 Control
KD No Crab
121/6+RP+ 121/6 B3
121/6+RP+ 110/2121/6+RP+110/2+B2
Crop+Mild +RP110/2+RP+ 121/6110/2+RP+ 121/6+B2
MIU MIU MMD MMD SMD SMD EMC WC RC LC B Bwp wf wp wf wp wf % gf.cm % wp wf wp wf wp wf wp wf wp wf
(µm) (µm) gf/cm²/cm
KES-F Testing
RSB 5°
gf.cm/cm
2HB 1°Compression Bending
2HB 0.5°
gf.cm/cm ----- -----
Table A3.4 Objective Test Results
RSB 1°Surface
0.14 0.14 0.02 0.02 7.37 5.80 18.2 0.06 61.1 0.44 0.05 0.03 0.01 0.01 0.01 0.01 0.26 0.28 0.21 0.23
0.15 0.14 0.02 0.02 8.13 6.38 21.0 0.09 66.7 0.49 0.04 0.03 0.01 0.01 0.01 0.01 0.21 0.21 0.17 0.21
0.16 0.15 0.02 0.02 8.31 6.57 22.4 0.10 67.2 0.48 0.04 0.03 0.01 0.01 0.01 0.00 0.19 0.19 0.17 0.15
0.15 0.14 0.03 0.02 8.65 6.12 24.6 0.09 65.2 0.43 0.04 0.03 0.01 0.01 0.01 0.01 0.24 0.25 0.19 0.23
0.17 0.16 0.02 0.02 8.73 5.89 18.1 0.07 66.2 0.47 0.04 0.02 0.01 0.01 0.01 0.01 0.19 0.24 0.19 0.21
0.15 0.15 0.02 0.02 8.13 5.94 21.2 0.08 67.7 0.45 0.04 0.03 0.01 0.01 0.01 0.01 0.23 0.24 0.18 0.20
0.16 0.14 0.02 0.02 6.65 6.57 20.0 0.07 65.0 0.45 0.04 0.02 0.01 0.01 0.01 0.01 0.25 0.38 0.21 0.34
0.17 0.15 0.02 0.02 8.51 6.53 22.9 0.10 66.0 0.45 0.04 0.03 0.01 0.01 0.01 0.01 0.25 0.25 0.22 0.22
0.16 0.15 0.02 0.02 7.49 6.15 29.5 0.09 66.5 0.32 0.04 0.03 0.01 0.01 0.01 0.01 0.20 0.23 0.17 0.19
0.15 0.15 0.02 0.03 7.72 6.19 26.2 0.08 60.2 0.38 0.05 0.03 0.01 0.01 0.01 0.01 0.23 0.28 0.18 0.23
0.14 0.15 0.02 0.02 7.70 6.20 19.3 0.06 61.4 0.43 0.04 0.03 0.01 0.01 0.01 0.01 0.25 0.24 0.19 0.21
0.15 0.16 0.02 0.02 7.56 6.13 21.7 0.07 57.2 0.63 0.04 0.03 0.01 0.01 0.01 0.01 0.26 0.26 0.20 0.26
0.14 0.14 0.03 0.02 6.75 6.17 19.7 0.06 63.3 0.44 0.04 0.03 0.01 0.01 0.01 0.01 0.22 0.23 0.22 0.20
295
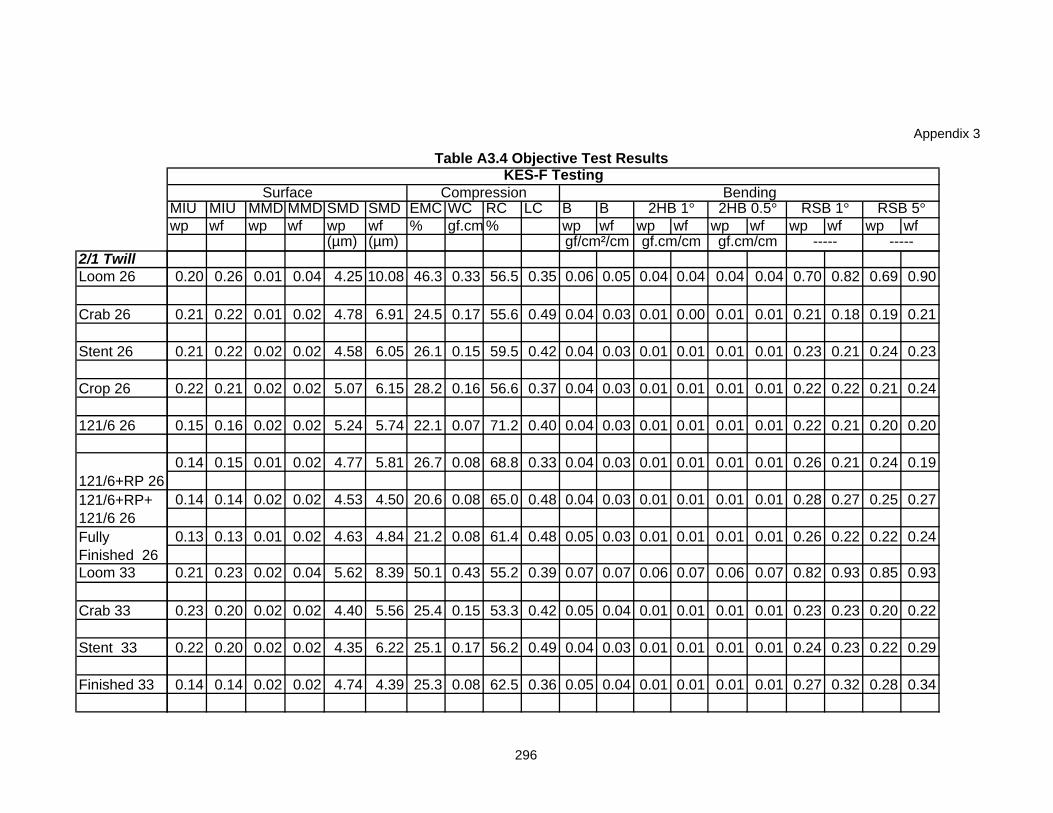
Appendix 3
2/1 TwillLoom 26
Crab 26
Stent 26
Crop 26
121/6 26
Loom 33
Crab 33
Stent 33
Finished 33
121/6+RP 26121/6+RP+ 121/6 26Fully Finished 26
MIU MIU MMD MMD SMD SMD EMC WC RC LC B Bwp wf wp wf wp wf % gf.cm % wp wf wp wf wp wf wp wf wp wf
(µm) (µm) gf/cm²/cm
KES-F Testing
RSB 5°
gf.cm/cm
2HB 1°Compression Bending
2HB 0.5°
gf.cm/cm ----- -----
Table A3.4 Objective Test Results
RSB 1°Surface
0.20 0.26 0.01 0.04 4.25 10.08 46.3 0.33 56.5 0.35 0.06 0.05 0.04 0.04 0.04 0.04 0.70 0.82 0.69 0.90
0.21 0.22 0.01 0.02 4.78 6.91 24.5 0.17 55.6 0.49 0.04 0.03 0.01 0.00 0.01 0.01 0.21 0.18 0.19 0.21
0.21 0.22 0.02 0.02 4.58 6.05 26.1 0.15 59.5 0.42 0.04 0.03 0.01 0.01 0.01 0.01 0.23 0.21 0.24 0.23
0.22 0.21 0.02 0.02 5.07 6.15 28.2 0.16 56.6 0.37 0.04 0.03 0.01 0.01 0.01 0.01 0.22 0.22 0.21 0.24
0.15 0.16 0.02 0.02 5.24 5.74 22.1 0.07 71.2 0.40 0.04 0.03 0.01 0.01 0.01 0.01 0.22 0.21 0.20 0.20
0.14 0.15 0.01 0.02 4.77 5.81 26.7 0.08 68.8 0.33 0.04 0.03 0.01 0.01 0.01 0.01 0.26 0.21 0.24 0.19
0.14 0.14 0.02 0.02 4.53 4.50 20.6 0.08 65.0 0.48 0.04 0.03 0.01 0.01 0.01 0.01 0.28 0.27 0.25 0.27
0.13 0.13 0.01 0.02 4.63 4.84 21.2 0.08 61.4 0.48 0.05 0.03 0.01 0.01 0.01 0.01 0.26 0.22 0.22 0.24
0.21 0.23 0.02 0.04 5.62 8.39 50.1 0.43 55.2 0.39 0.07 0.07 0.06 0.07 0.06 0.07 0.82 0.93 0.85 0.93
0.23 0.20 0.02 0.02 4.40 5.56 25.4 0.15 53.3 0.42 0.05 0.04 0.01 0.01 0.01 0.01 0.23 0.23 0.20 0.22
0.22 0.20 0.02 0.02 4.35 6.22 25.1 0.17 56.2 0.49 0.04 0.03 0.01 0.01 0.01 0.01 0.24 0.23 0.22 0.29
0.14 0.14 0.02 0.02 4.74 4.39 25.3 0.08 62.5 0.36 0.05 0.04 0.01 0.01 0.01 0.01 0.27 0.32 0.28 0.34
296
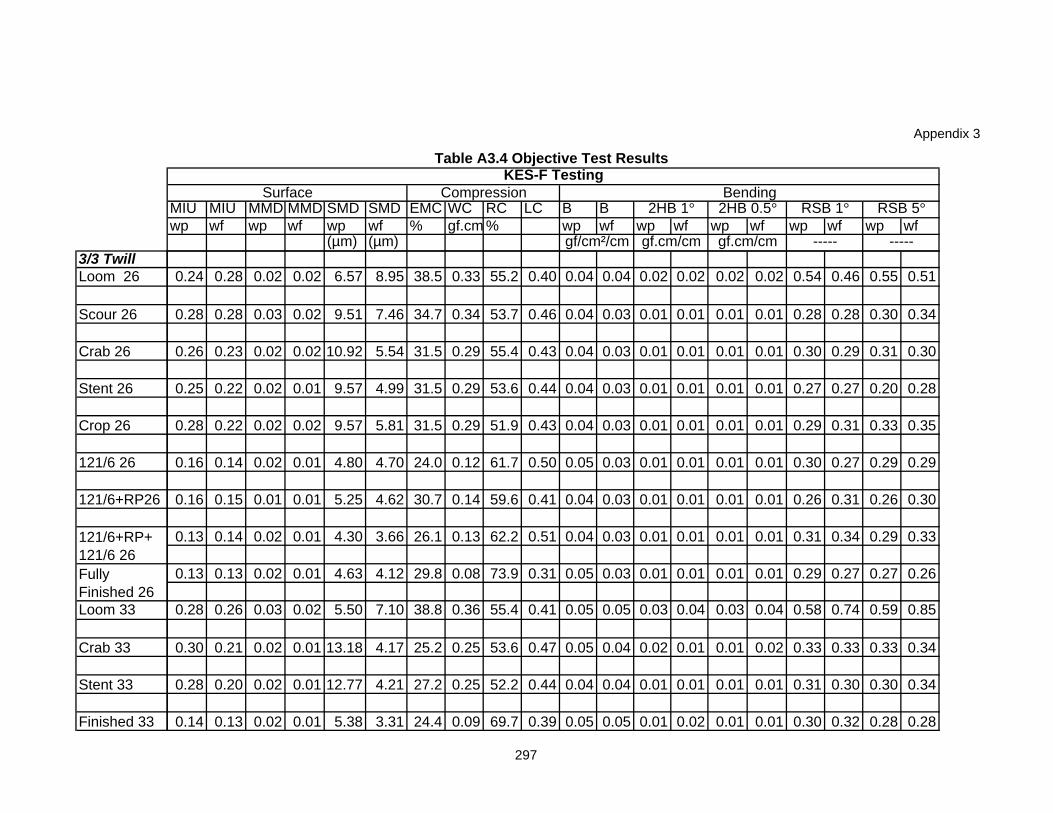
Appendix 3
3/3 TwillLoom 26
Scour 26
Crab 26
Stent 26
Crop 26
121/6 26
121/6+RP26
Loom 33
Crab 33
Stent 33
Finished 33
Fully Finished 26
121/6+RP+ 121/6 26
MIU MIU MMD MMD SMD SMD EMC WC RC LC B Bwp wf wp wf wp wf % gf.cm % wp wf wp wf wp wf wp wf wp wf
(µm) (µm) gf/cm²/cm
KES-F Testing
RSB 5°
gf.cm/cm
2HB 1°Compression Bending
2HB 0.5°
gf.cm/cm ----- -----
Table A3.4 Objective Test Results
RSB 1°Surface
0.24 0.28 0.02 0.02 6.57 8.95 38.5 0.33 55.2 0.40 0.04 0.04 0.02 0.02 0.02 0.02 0.54 0.46 0.55 0.51
0.28 0.28 0.03 0.02 9.51 7.46 34.7 0.34 53.7 0.46 0.04 0.03 0.01 0.01 0.01 0.01 0.28 0.28 0.30 0.34
0.26 0.23 0.02 0.02 10.92 5.54 31.5 0.29 55.4 0.43 0.04 0.03 0.01 0.01 0.01 0.01 0.30 0.29 0.31 0.30
0.25 0.22 0.02 0.01 9.57 4.99 31.5 0.29 53.6 0.44 0.04 0.03 0.01 0.01 0.01 0.01 0.27 0.27 0.20 0.28
0.28 0.22 0.02 0.02 9.57 5.81 31.5 0.29 51.9 0.43 0.04 0.03 0.01 0.01 0.01 0.01 0.29 0.31 0.33 0.35
0.16 0.14 0.02 0.01 4.80 4.70 24.0 0.12 61.7 0.50 0.05 0.03 0.01 0.01 0.01 0.01 0.30 0.27 0.29 0.29
0.16 0.15 0.01 0.01 5.25 4.62 30.7 0.14 59.6 0.41 0.04 0.03 0.01 0.01 0.01 0.01 0.26 0.31 0.26 0.30
0.13 0.14 0.02 0.01 4.30 3.66 26.1 0.13 62.2 0.51 0.04 0.03 0.01 0.01 0.01 0.01 0.31 0.34 0.29 0.33
0.13 0.13 0.02 0.01 4.63 4.12 29.8 0.08 73.9 0.31 0.05 0.03 0.01 0.01 0.01 0.01 0.29 0.27 0.27 0.26
0.28 0.26 0.03 0.02 5.50 7.10 38.8 0.36 55.4 0.41 0.05 0.05 0.03 0.04 0.03 0.04 0.58 0.74 0.59 0.85
0.30 0.21 0.02 0.01 13.18 4.17 25.2 0.25 53.6 0.47 0.05 0.04 0.02 0.01 0.01 0.02 0.33 0.33 0.33 0.34
0.28 0.20 0.02 0.01 12.77 4.21 27.2 0.25 52.2 0.44 0.04 0.04 0.01 0.01 0.01 0.01 0.31 0.30 0.30 0.34
0.14 0.13 0.02 0.01 5.38 3.31 24.4 0.09 69.7 0.39 0.05 0.05 0.01 0.02 0.01 0.01 0.30 0.32 0.28 0.28
297
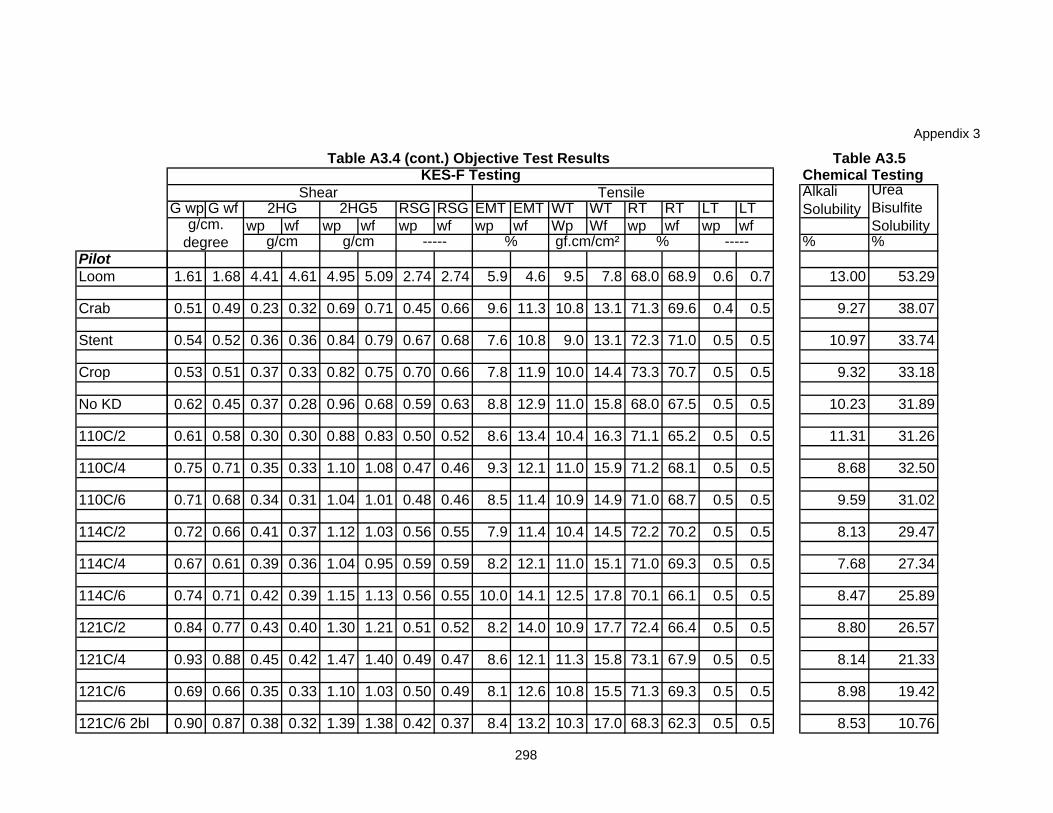
Appendix 3
PilotLoom
Crab
Stent
Crop
No KD
110C/2
110C/4
110C/6
114C/2
114C/4
114C/6
121C/2
121C/4
121C/6
121C/6 2bl
Chemical Testing
G wp G wf RSG RSG EMT EMT WT WT RT RT LT LTwp wf wp wf wp wf wp wf Wp Wf wp wf wp wf
% %
1.61 1.68 4.41 4.61 4.95 5.09 2.74 2.74 5.9 4.6 9.5 7.8 68.0 68.9 0.6 0.7 13.00 53.29
0.51 0.49 0.23 0.32 0.69 0.71 0.45 0.66 9.6 11.3 10.8 13.1 71.3 69.6 0.4 0.5 9.27 38.07
0.54 0.52 0.36 0.36 0.84 0.79 0.67 0.68 7.6 10.8 9.0 13.1 72.3 71.0 0.5 0.5 10.97 33.74
0.53 0.51 0.37 0.33 0.82 0.75 0.70 0.66 7.8 11.9 10.0 14.4 73.3 70.7 0.5 0.5 9.32 33.18
0.62 0.45 0.37 0.28 0.96 0.68 0.59 0.63 8.8 12.9 11.0 15.8 68.0 67.5 0.5 0.5 10.23 31.89
0.61 0.58 0.30 0.30 0.88 0.83 0.50 0.52 8.6 13.4 10.4 16.3 71.1 65.2 0.5 0.5 11.31 31.26
0.75 0.71 0.35 0.33 1.10 1.08 0.47 0.46 9.3 12.1 11.0 15.9 71.2 68.1 0.5 0.5 8.68 32.50
0.71 0.68 0.34 0.31 1.04 1.01 0.48 0.46 8.5 11.4 10.9 14.9 71.0 68.7 0.5 0.5 9.59 31.02
0.72 0.66 0.41 0.37 1.12 1.03 0.56 0.55 7.9 11.4 10.4 14.5 72.2 70.2 0.5 0.5 8.13 29.47
0.67 0.61 0.39 0.36 1.04 0.95 0.59 0.59 8.2 12.1 11.0 15.1 71.0 69.3 0.5 0.5 7.68 27.34
0.74 0.71 0.42 0.39 1.15 1.13 0.56 0.55 10.0 14.1 12.5 17.8 70.1 66.1 0.5 0.5 8.47 25.89
0.84 0.77 0.43 0.40 1.30 1.21 0.51 0.52 8.2 14.0 10.9 17.7 72.4 66.4 0.5 0.5 8.80 26.57
0.93 0.88 0.45 0.42 1.47 1.40 0.49 0.47 8.6 12.1 11.3 15.8 73.1 67.9 0.5 0.5 8.14 21.33
0.69 0.66 0.35 0.33 1.10 1.03 0.50 0.49 8.1 12.6 10.8 15.5 71.3 69.3 0.5 0.5 8.98 19.42
0.90 0.87 0.38 0.32 1.39 1.38 0.42 0.37 8.4 13.2 10.3 17.0 68.3 62.3 0.5 0.5 8.53 10.76
Table A3.5
Shear Tensile KES-F Testing
Urea Bisulfite Solubility
Alkali Solubility
%g/cm.
degree g/cm g/cm gf.cm/cm² -----%-----
2HG5
Table A3.4 (cont.) Objective Test Results
2HG
298
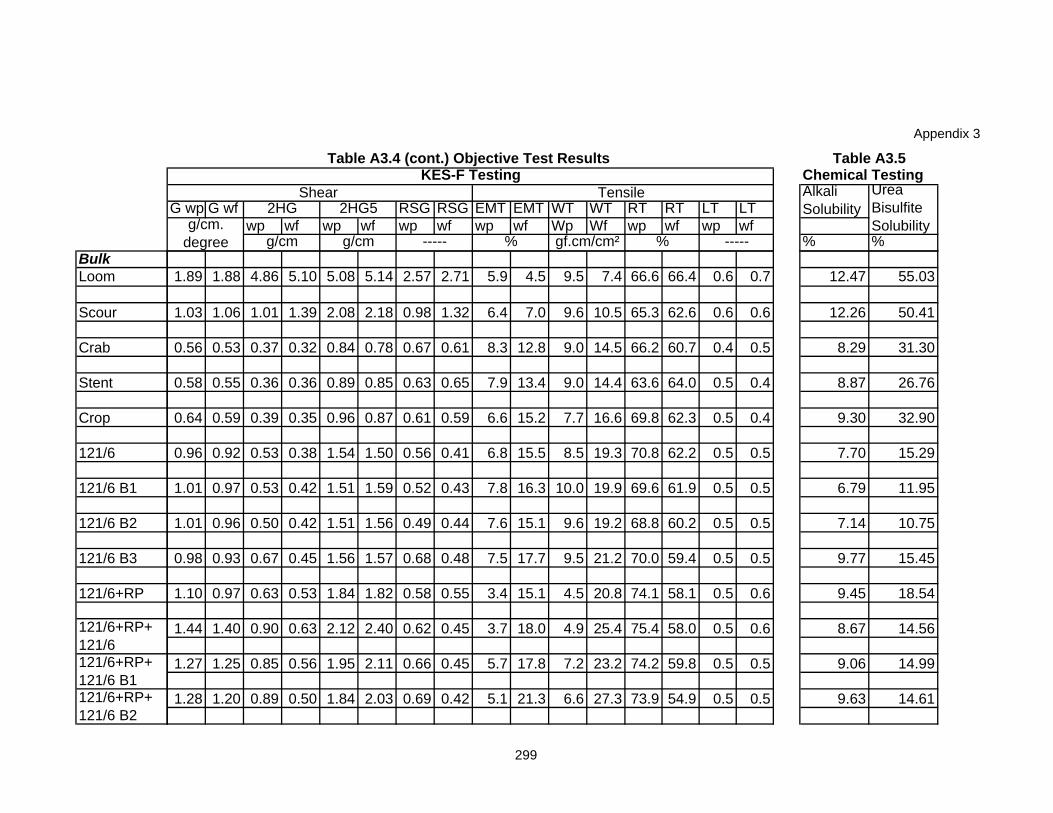
Appendix 3
BulkLoom
Scour
Crab
Stent
Crop
121/6
121/6 B1
121/6 B2
121/6 B3
121/6+RP
121/6+RP+ 121/6 B1
121/6+RP+ 121/6
121/6+RP+ 121/6 B2
Chemical Testing
G wp G wf RSG RSG EMT EMT WT WT RT RT LT LTwp wf wp wf wp wf wp wf Wp Wf wp wf wp wf
% %
Table A3.5
Shear Tensile KES-F Testing
Urea Bisulfite Solubility
Alkali Solubility
%g/cm.
degree g/cm g/cm gf.cm/cm² -----%-----
2HG5
Table A3.4 (cont.) Objective Test Results
2HG
1.89 1.88 4.86 5.10 5.08 5.14 2.57 2.71 5.9 4.5 9.5 7.4 66.6 66.4 0.6 0.7 12.47 55.03
1.03 1.06 1.01 1.39 2.08 2.18 0.98 1.32 6.4 7.0 9.6 10.5 65.3 62.6 0.6 0.6 12.26 50.41
0.56 0.53 0.37 0.32 0.84 0.78 0.67 0.61 8.3 12.8 9.0 14.5 66.2 60.7 0.4 0.5 8.29 31.30
0.58 0.55 0.36 0.36 0.89 0.85 0.63 0.65 7.9 13.4 9.0 14.4 63.6 64.0 0.5 0.4 8.87 26.76
0.64 0.59 0.39 0.35 0.96 0.87 0.61 0.59 6.6 15.2 7.7 16.6 69.8 62.3 0.5 0.4 9.30 32.90
0.96 0.92 0.53 0.38 1.54 1.50 0.56 0.41 6.8 15.5 8.5 19.3 70.8 62.2 0.5 0.5 7.70 15.29
1.01 0.97 0.53 0.42 1.51 1.59 0.52 0.43 7.8 16.3 10.0 19.9 69.6 61.9 0.5 0.5 6.79 11.95
1.01 0.96 0.50 0.42 1.51 1.56 0.49 0.44 7.6 15.1 9.6 19.2 68.8 60.2 0.5 0.5 7.14 10.75
0.98 0.93 0.67 0.45 1.56 1.57 0.68 0.48 7.5 17.7 9.5 21.2 70.0 59.4 0.5 0.5 9.77 15.45
1.10 0.97 0.63 0.53 1.84 1.82 0.58 0.55 3.4 15.1 4.5 20.8 74.1 58.1 0.5 0.6 9.45 18.54
1.44 1.40 0.90 0.63 2.12 2.40 0.62 0.45 3.7 18.0 4.9 25.4 75.4 58.0 0.5 0.6 8.67 14.56
1.27 1.25 0.85 0.56 1.95 2.11 0.66 0.45 5.7 17.8 7.2 23.2 74.2 59.8 0.5 0.5 9.06 14.99
1.28 1.20 0.89 0.50 1.84 2.03 0.69 0.42 5.1 21.3 6.6 27.3 73.9 54.9 0.5 0.5 9.63 14.61
299
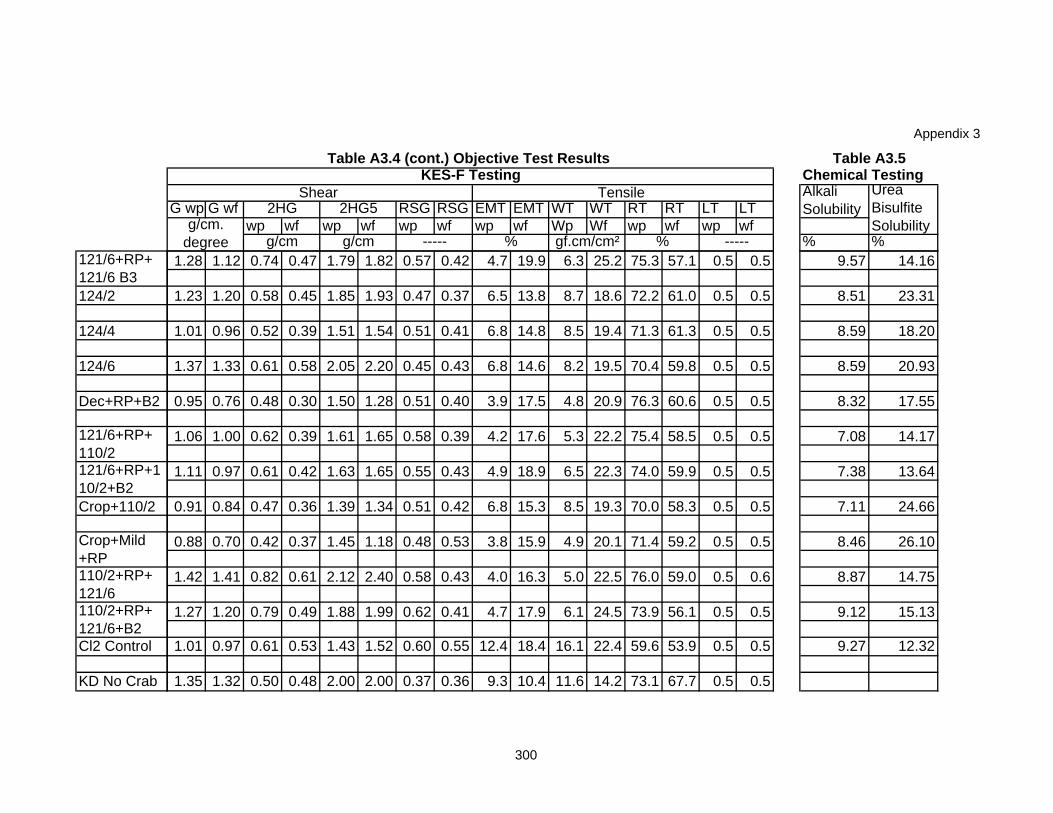
Appendix 3
124/2
124/4
124/6
Dec+RP+B2
Crop+110/2
Cl2 Control
KD No Crab
121/6+RP+ 121/6 B3
121/6+RP+ 110/2121/6+RP+110/2+B2
Crop+Mild +RP110/2+RP+ 121/6110/2+RP+ 121/6+B2
Chemical Testing
G wp G wf RSG RSG EMT EMT WT WT RT RT LT LTwp wf wp wf wp wf wp wf Wp Wf wp wf wp wf
% %
Table A3.5
Shear Tensile KES-F Testing
Urea Bisulfite Solubility
Alkali Solubility
%g/cm.
degree g/cm g/cm gf.cm/cm² -----%-----
2HG5
Table A3.4 (cont.) Objective Test Results
2HG
1.28 1.12 0.74 0.47 1.79 1.82 0.57 0.42 4.7 19.9 6.3 25.2 75.3 57.1 0.5 0.5 9.57 14.16
1.23 1.20 0.58 0.45 1.85 1.93 0.47 0.37 6.5 13.8 8.7 18.6 72.2 61.0 0.5 0.5 8.51 23.31
1.01 0.96 0.52 0.39 1.51 1.54 0.51 0.41 6.8 14.8 8.5 19.4 71.3 61.3 0.5 0.5 8.59 18.20
1.37 1.33 0.61 0.58 2.05 2.20 0.45 0.43 6.8 14.6 8.2 19.5 70.4 59.8 0.5 0.5 8.59 20.93
0.95 0.76 0.48 0.30 1.50 1.28 0.51 0.40 3.9 17.5 4.8 20.9 76.3 60.6 0.5 0.5 8.32 17.55
1.06 1.00 0.62 0.39 1.61 1.65 0.58 0.39 4.2 17.6 5.3 22.2 75.4 58.5 0.5 0.5 7.08 14.17
1.11 0.97 0.61 0.42 1.63 1.65 0.55 0.43 4.9 18.9 6.5 22.3 74.0 59.9 0.5 0.5 7.38 13.64
0.91 0.84 0.47 0.36 1.39 1.34 0.51 0.42 6.8 15.3 8.5 19.3 70.0 58.3 0.5 0.5 7.11 24.66
0.88 0.70 0.42 0.37 1.45 1.18 0.48 0.53 3.8 15.9 4.9 20.1 71.4 59.2 0.5 0.5 8.46 26.10
1.42 1.41 0.82 0.61 2.12 2.40 0.58 0.43 4.0 16.3 5.0 22.5 76.0 59.0 0.5 0.6 8.87 14.75
1.27 1.20 0.79 0.49 1.88 1.99 0.62 0.41 4.7 17.9 6.1 24.5 73.9 56.1 0.5 0.5 9.12 15.13
1.01 0.97 0.61 0.53 1.43 1.52 0.60 0.55 12.4 18.4 16.1 22.4 59.6 53.9 0.5 0.5 9.27 12.32
1.35 1.32 0.50 0.48 2.00 2.00 0.37 0.36 9.3 10.4 11.6 14.2 73.1 67.7 0.5 0.5
300
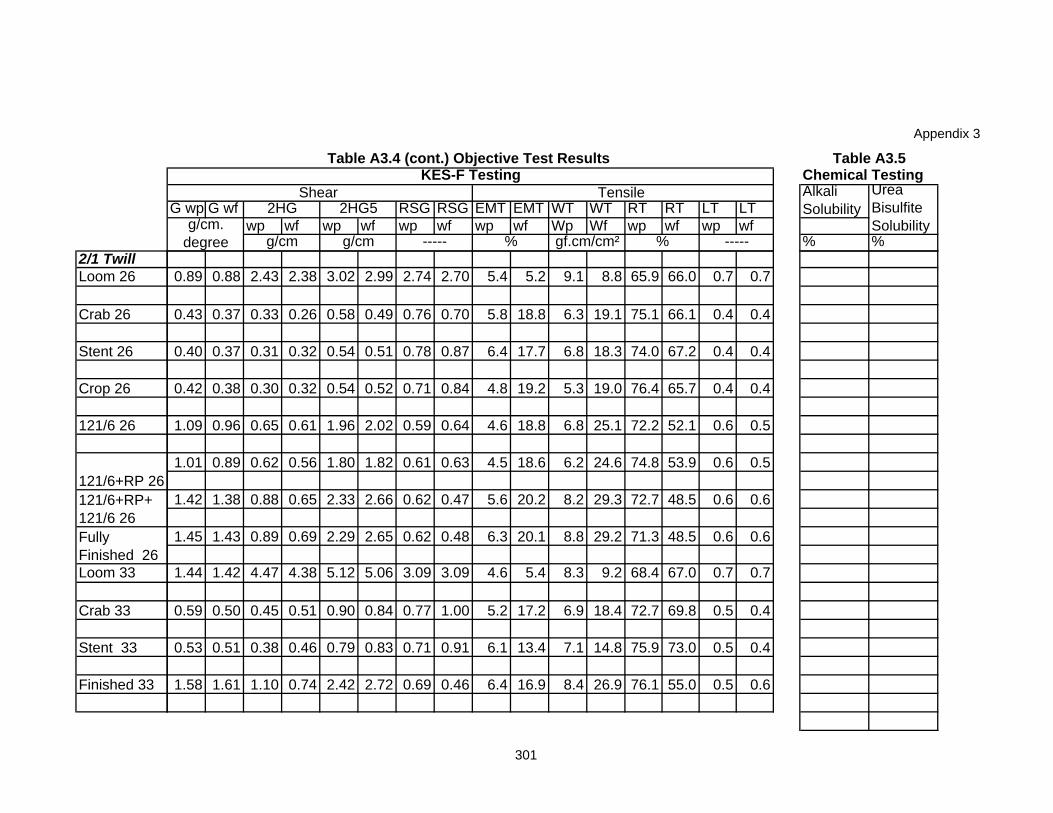
Appendix 3
2/1 TwillLoom 26
Crab 26
Stent 26
Crop 26
121/6 26
Loom 33
Crab 33
Stent 33
Finished 33
121/6+RP 26121/6+RP+ 121/6 26Fully Finished 26
Chemical Testing
G wp G wf RSG RSG EMT EMT WT WT RT RT LT LTwp wf wp wf wp wf wp wf Wp Wf wp wf wp wf
% %
Table A3.5
Shear Tensile KES-F Testing
Urea Bisulfite Solubility
Alkali Solubility
%g/cm.
degree g/cm g/cm gf.cm/cm² -----%-----
2HG5
Table A3.4 (cont.) Objective Test Results
2HG
0.89 0.88 2.43 2.38 3.02 2.99 2.74 2.70 5.4 5.2 9.1 8.8 65.9 66.0 0.7 0.7
0.43 0.37 0.33 0.26 0.58 0.49 0.76 0.70 5.8 18.8 6.3 19.1 75.1 66.1 0.4 0.4
0.40 0.37 0.31 0.32 0.54 0.51 0.78 0.87 6.4 17.7 6.8 18.3 74.0 67.2 0.4 0.4
0.42 0.38 0.30 0.32 0.54 0.52 0.71 0.84 4.8 19.2 5.3 19.0 76.4 65.7 0.4 0.4
1.09 0.96 0.65 0.61 1.96 2.02 0.59 0.64 4.6 18.8 6.8 25.1 72.2 52.1 0.6 0.5
1.01 0.89 0.62 0.56 1.80 1.82 0.61 0.63 4.5 18.6 6.2 24.6 74.8 53.9 0.6 0.5
1.42 1.38 0.88 0.65 2.33 2.66 0.62 0.47 5.6 20.2 8.2 29.3 72.7 48.5 0.6 0.6
1.45 1.43 0.89 0.69 2.29 2.65 0.62 0.48 6.3 20.1 8.8 29.2 71.3 48.5 0.6 0.6
1.44 1.42 4.47 4.38 5.12 5.06 3.09 3.09 4.6 5.4 8.3 9.2 68.4 67.0 0.7 0.7
0.59 0.50 0.45 0.51 0.90 0.84 0.77 1.00 5.2 17.2 6.9 18.4 72.7 69.8 0.5 0.4
0.53 0.51 0.38 0.46 0.79 0.83 0.71 0.91 6.1 13.4 7.1 14.8 75.9 73.0 0.5 0.4
1.58 1.61 1.10 0.74 2.42 2.72 0.69 0.46 6.4 16.9 8.4 26.9 76.1 55.0 0.5 0.6
301
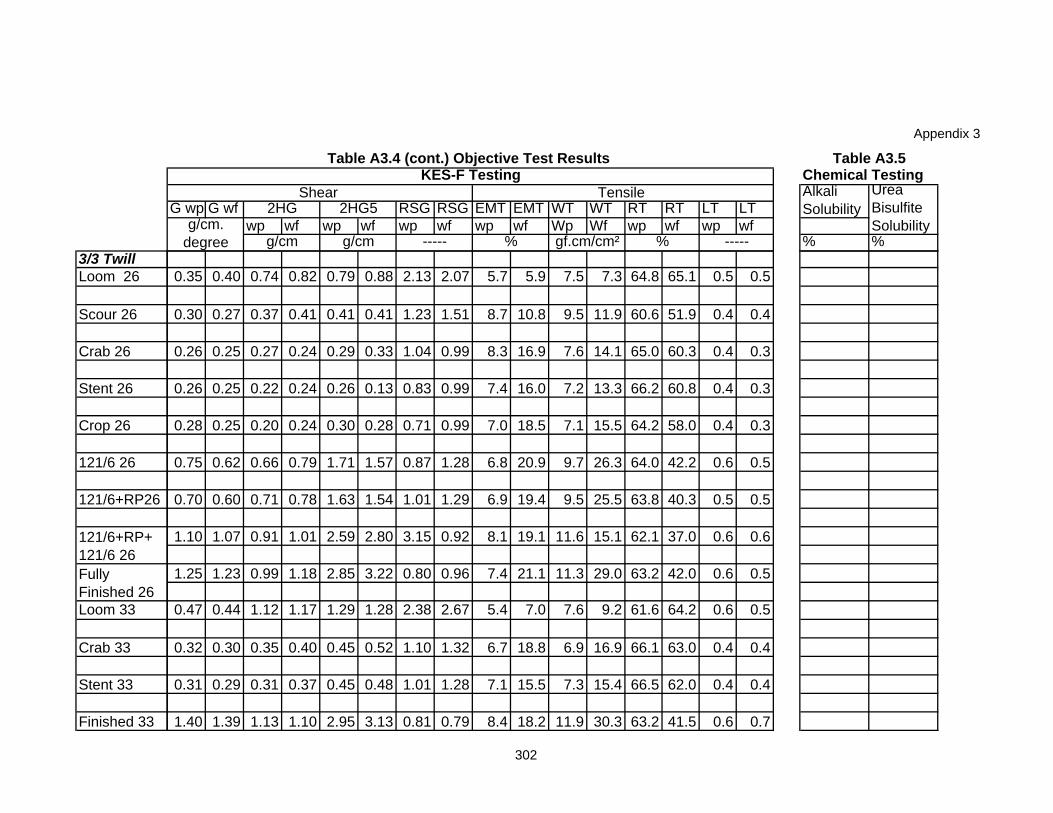
Appendix 3
3/3 TwillLoom 26
Scour 26
Crab 26
Stent 26
Crop 26
121/6 26
121/6+RP26
Loom 33
Crab 33
Stent 33
Finished 33
Fully Finished 26
121/6+RP+ 121/6 26
Chemical Testing
G wp G wf RSG RSG EMT EMT WT WT RT RT LT LTwp wf wp wf wp wf wp wf Wp Wf wp wf wp wf
% %
Table A3.5
Shear Tensile KES-F Testing
Urea Bisulfite Solubility
Alkali Solubility
%g/cm.
degree g/cm g/cm gf.cm/cm² -----%-----
2HG5
Table A3.4 (cont.) Objective Test Results
2HG
0.35 0.40 0.74 0.82 0.79 0.88 2.13 2.07 5.7 5.9 7.5 7.3 64.8 65.1 0.5 0.5
0.30 0.27 0.37 0.41 0.41 0.41 1.23 1.51 8.7 10.8 9.5 11.9 60.6 51.9 0.4 0.4
0.26 0.25 0.27 0.24 0.29 0.33 1.04 0.99 8.3 16.9 7.6 14.1 65.0 60.3 0.4 0.3
0.26 0.25 0.22 0.24 0.26 0.13 0.83 0.99 7.4 16.0 7.2 13.3 66.2 60.8 0.4 0.3
0.28 0.25 0.20 0.24 0.30 0.28 0.71 0.99 7.0 18.5 7.1 15.5 64.2 58.0 0.4 0.3
0.75 0.62 0.66 0.79 1.71 1.57 0.87 1.28 6.8 20.9 9.7 26.3 64.0 42.2 0.6 0.5
0.70 0.60 0.71 0.78 1.63 1.54 1.01 1.29 6.9 19.4 9.5 25.5 63.8 40.3 0.5 0.5
1.10 1.07 0.91 1.01 2.59 2.80 3.15 0.92 8.1 19.1 11.6 15.1 62.1 37.0 0.6 0.6
1.25 1.23 0.99 1.18 2.85 3.22 0.80 0.96 7.4 21.1 11.3 29.0 63.2 42.0 0.6 0.5
0.47 0.44 1.12 1.17 1.29 1.28 2.38 2.67 5.4 7.0 7.6 9.2 61.6 64.2 0.6 0.5
0.32 0.30 0.35 0.40 0.45 0.52 1.10 1.32 6.7 18.8 6.9 16.9 66.1 63.0 0.4 0.4
0.31 0.29 0.31 0.37 0.45 0.48 1.01 1.28 7.1 15.5 7.3 15.4 66.5 62.0 0.4 0.4
1.40 1.39 1.13 1.10 2.95 3.13 0.81 0.79 8.4 18.2 11.9 30.3 63.2 41.5 0.6 0.7
302
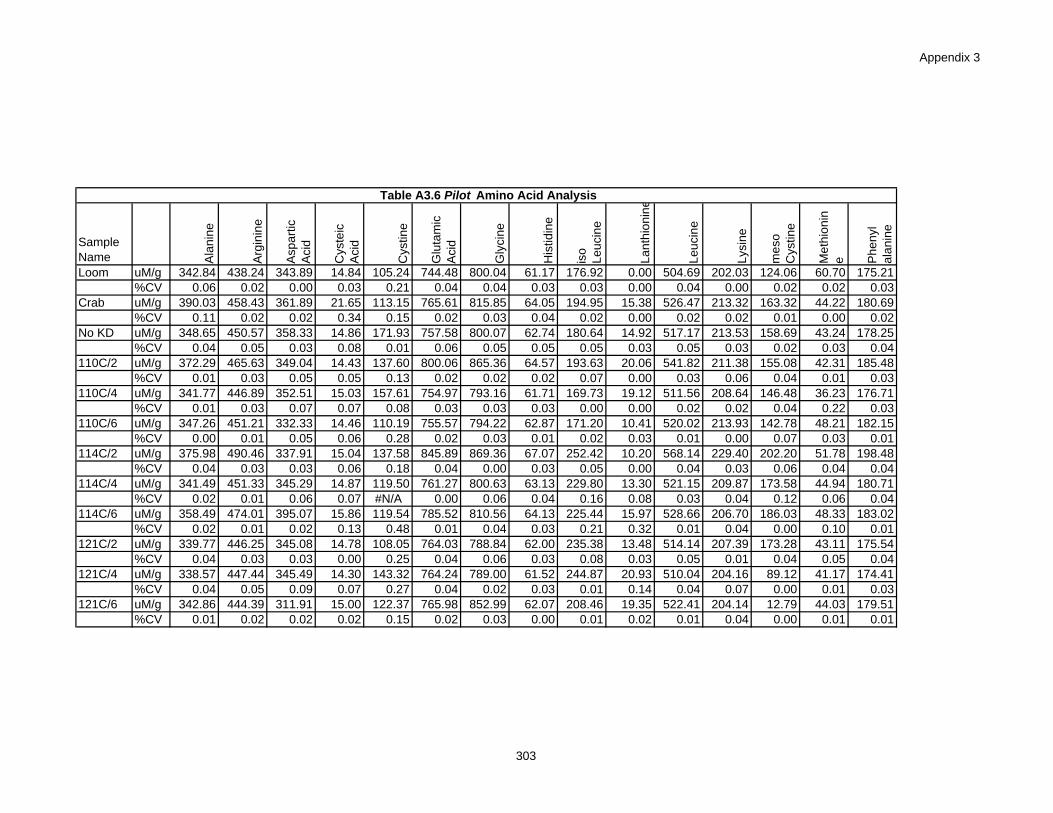
Appendix 3
Sample Name Al
anin
e
Argi
nine
Aspa
rtic
Aci
d
Cys
teic
A
cid
Cys
tine
Glu
tam
ic
Aci
d
Gly
cine
His
tidin
e
iso
Leuc
ine
Lant
hion
ine
Leuc
ine
Lysi
ne
mes
o C
ystin
e
Met
hion
ine Ph
enyl
al
anin
e
Loom uM/g 342.84 438.24 343.89 14.84 105.24 744.48 800.04 61.17 176.92 0.00 504.69 202.03 124.06 60.70 175.21%CV 0.06 0.02 0.00 0.03 0.21 0.04 0.04 0.03 0.03 0.00 0.04 0.00 0.02 0.02 0.03
Crab uM/g 390.03 458.43 361.89 21.65 113.15 765.61 815.85 64.05 194.95 15.38 526.47 213.32 163.32 44.22 180.69%CV 0.11 0.02 0.02 0.34 0.15 0.02 0.03 0.04 0.02 0.00 0.02 0.02 0.01 0.00 0.02
No KD uM/g 348.65 450.57 358.33 14.86 171.93 757.58 800.07 62.74 180.64 14.92 517.17 213.53 158.69 43.24 178.25%CV 0.04 0.05 0.03 0.08 0.01 0.06 0.05 0.05 0.05 0.03 0.05 0.03 0.02 0.03 0.04
110C/2 uM/g 372.29 465.63 349.04 14.43 137.60 800.06 865.36 64.57 193.63 20.06 541.82 211.38 155.08 42.31 185.48%CV 0.01 0.03 0.05 0.05 0.13 0.02 0.02 0.02 0.07 0.00 0.03 0.06 0.04 0.01 0.03
110C/4 uM/g 341.77 446.89 352.51 15.03 157.61 754.97 793.16 61.71 169.73 19.12 511.56 208.64 146.48 36.23 176.71%CV 0.01 0.03 0.07 0.07 0.08 0.03 0.03 0.03 0.00 0.00 0.02 0.02 0.04 0.22 0.03
110C/6 uM/g 347.26 451.21 332.33 14.46 110.19 755.57 794.22 62.87 171.20 10.41 520.02 213.93 142.78 48.21 182.15%CV 0.00 0.01 0.05 0.06 0.28 0.02 0.03 0.01 0.02 0.03 0.01 0.00 0.07 0.03 0.01
114C/2 uM/g 375.98 490.46 337.91 15.04 137.58 845.89 869.36 67.07 252.42 10.20 568.14 229.40 202.20 51.78 198.48%CV 0.04 0.03 0.03 0.06 0.18 0.04 0.00 0.03 0.05 0.00 0.04 0.03 0.06 0.04 0.04
114C/4 uM/g 341.49 451.33 345.29 14.87 119.50 761.27 800.63 63.13 229.80 13.30 521.15 209.87 173.58 44.94 180.71%CV 0.02 0.01 0.06 0.07 #N/A 0.00 0.06 0.04 0.16 0.08 0.03 0.04 0.12 0.06 0.04
114C/6 uM/g 358.49 474.01 395.07 15.86 119.54 785.52 810.56 64.13 225.44 15.97 528.66 206.70 186.03 48.33 183.02%CV 0.02 0.01 0.02 0.13 0.48 0.01 0.04 0.03 0.21 0.32 0.01 0.04 0.00 0.10 0.01
121C/2 uM/g 339.77 446.25 345.08 14.78 108.05 764.03 788.84 62.00 235.38 13.48 514.14 207.39 173.28 43.11 175.54%CV 0.04 0.03 0.03 0.00 0.25 0.04 0.06 0.03 0.08 0.03 0.05 0.01 0.04 0.05 0.04
121C/4 uM/g 338.57 447.44 345.49 14.30 143.32 764.24 789.00 61.52 244.87 20.93 510.04 204.16 89.12 41.17 174.41%CV 0.04 0.05 0.09 0.07 0.27 0.04 0.02 0.03 0.01 0.14 0.04 0.07 0.00 0.01 0.03
121C/6 uM/g 342.86 444.39 311.91 15.00 122.37 765.98 852.99 62.07 208.46 19.35 522.41 204.14 12.79 44.03 179.51%CV 0.01 0.02 0.02 0.02 0.15 0.02 0.03 0.00 0.01 0.02 0.01 0.04 0.00 0.01 0.01
Table A3.6 Pilot Amino Acid Analysis
303
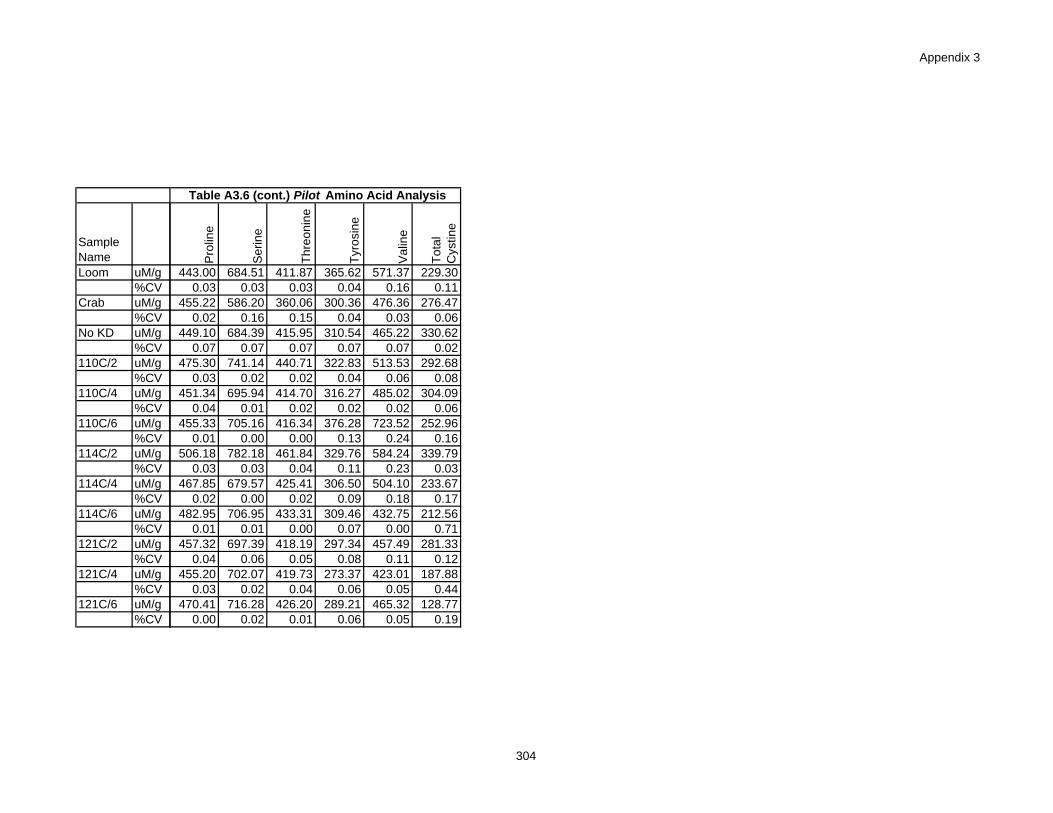
Appendix 3
Sample NameLoom uM/g
%CVCrab uM/g
%CVNo KD uM/g
%CV110C/2 uM/g
%CV110C/4 uM/g
%CV110C/6 uM/g
%CV114C/2 uM/g
%CV114C/4 uM/g
%CV114C/6 uM/g
%CV121C/2 uM/g
%CV121C/4 uM/g
%CV121C/6 uM/g
%CV
Pro
line
Ser
ine
Thre
onin
e
Tyro
sine
Val
ine
Tota
l C
ystin
e
443.00 684.51 411.87 365.62 571.37 229.300.03 0.03 0.03 0.04 0.16 0.11
455.22 586.20 360.06 300.36 476.36 276.470.02 0.16 0.15 0.04 0.03 0.06
449.10 684.39 415.95 310.54 465.22 330.620.07 0.07 0.07 0.07 0.07 0.02
475.30 741.14 440.71 322.83 513.53 292.680.03 0.02 0.02 0.04 0.06 0.08
451.34 695.94 414.70 316.27 485.02 304.090.04 0.01 0.02 0.02 0.02 0.06
455.33 705.16 416.34 376.28 723.52 252.960.01 0.00 0.00 0.13 0.24 0.16
506.18 782.18 461.84 329.76 584.24 339.790.03 0.03 0.04 0.11 0.23 0.03
467.85 679.57 425.41 306.50 504.10 233.670.02 0.00 0.02 0.09 0.18 0.17
482.95 706.95 433.31 309.46 432.75 212.560.01 0.01 0.00 0.07 0.00 0.71
457.32 697.39 418.19 297.34 457.49 281.330.04 0.06 0.05 0.08 0.11 0.12
455.20 702.07 419.73 273.37 423.01 187.880.03 0.02 0.04 0.06 0.05 0.44
470.41 716.28 426.20 289.21 465.32 128.770.00 0.02 0.01 0.06 0.05 0.19
Table A3.6 (cont.) Pilot Amino Acid Analysis
304
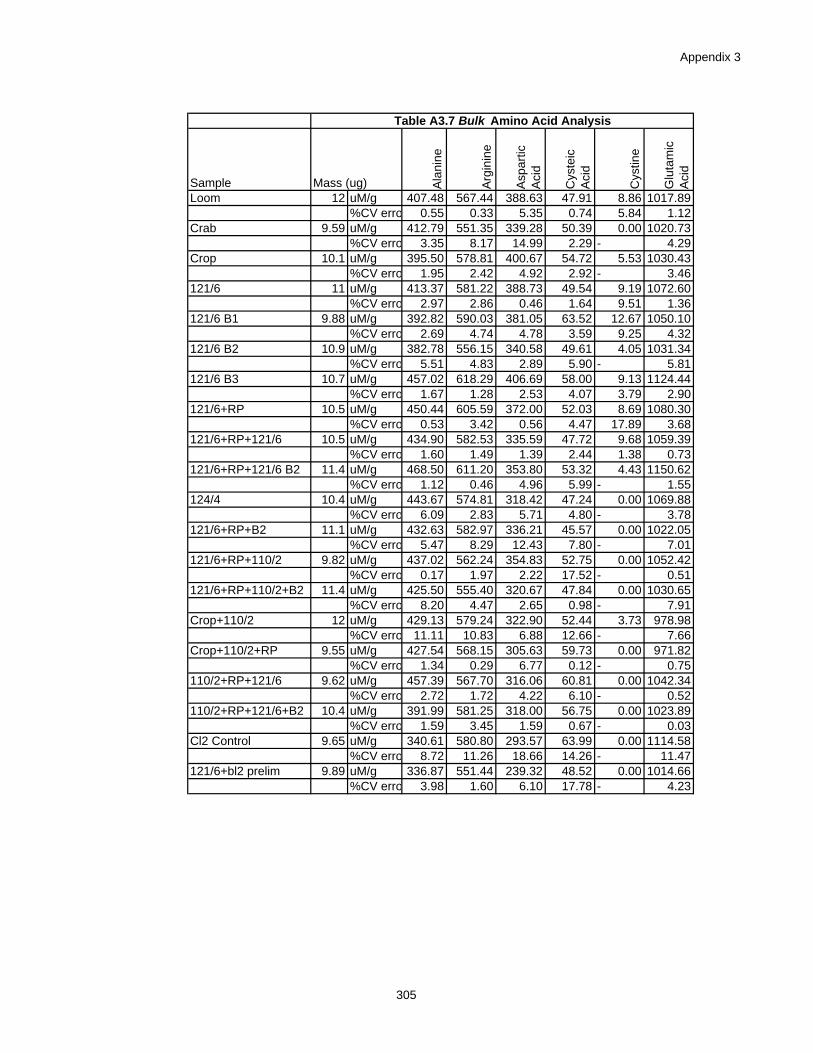
Appendix 3
Sample Mass (ug) Alan
ine
Argi
nine
Aspa
rtic
Aci
d
Cys
teic
A
cid
Cys
tine
Glu
tam
ic
Aci
d
Loom 12 uM/g 407.48 567.44 388.63 47.91 8.86 1017.89%CV erro 0.55 0.33 5.35 0.74 5.84 1.12
Crab 9.59 uM/g 412.79 551.35 339.28 50.39 0.00 1020.73%CV erro 3.35 8.17 14.99 2.29 - 4.29
Crop 10.1 uM/g 395.50 578.81 400.67 54.72 5.53 1030.43%CV erro 1.95 2.42 4.92 2.92 - 3.46
121/6 11 uM/g 413.37 581.22 388.73 49.54 9.19 1072.60%CV erro 2.97 2.86 0.46 1.64 9.51 1.36
121/6 B1 9.88 uM/g 392.82 590.03 381.05 63.52 12.67 1050.10%CV erro 2.69 4.74 4.78 3.59 9.25 4.32
121/6 B2 10.9 uM/g 382.78 556.15 340.58 49.61 4.05 1031.34%CV erro 5.51 4.83 2.89 5.90 - 5.81
121/6 B3 10.7 uM/g 457.02 618.29 406.69 58.00 9.13 1124.44%CV erro 1.67 1.28 2.53 4.07 3.79 2.90
121/6+RP 10.5 uM/g 450.44 605.59 372.00 52.03 8.69 1080.30%CV erro 0.53 3.42 0.56 4.47 17.89 3.68
121/6+RP+121/6 10.5 uM/g 434.90 582.53 335.59 47.72 9.68 1059.39%CV erro 1.60 1.49 1.39 2.44 1.38 0.73
121/6+RP+121/6 B2 11.4 uM/g 468.50 611.20 353.80 53.32 4.43 1150.62%CV erro 1.12 0.46 4.96 5.99 - 1.55
124/4 10.4 uM/g 443.67 574.81 318.42 47.24 0.00 1069.88%CV erro 6.09 2.83 5.71 4.80 - 3.78
121/6+RP+B2 11.1 uM/g 432.63 582.97 336.21 45.57 0.00 1022.05%CV erro 5.47 8.29 12.43 7.80 - 7.01
121/6+RP+110/2 9.82 uM/g 437.02 562.24 354.83 52.75 0.00 1052.42%CV erro 0.17 1.97 2.22 17.52 - 0.51
121/6+RP+110/2+B2 11.4 uM/g 425.50 555.40 320.67 47.84 0.00 1030.65%CV erro 8.20 4.47 2.65 0.98 - 7.91
Crop+110/2 12 uM/g 429.13 579.24 322.90 52.44 3.73 978.98%CV erro 11.11 10.83 6.88 12.66 - 7.66
Crop+110/2+RP 9.55 uM/g 427.54 568.15 305.63 59.73 0.00 971.82%CV erro 1.34 0.29 6.77 0.12 - 0.75
110/2+RP+121/6 9.62 uM/g 457.39 567.70 316.06 60.81 0.00 1042.34%CV erro 2.72 1.72 4.22 6.10 - 0.52
110/2+RP+121/6+B2 10.4 uM/g 391.99 581.25 318.00 56.75 0.00 1023.89%CV erro 1.59 3.45 1.59 0.67 - 0.03
Cl2 Control 9.65 uM/g 340.61 580.80 293.57 63.99 0.00 1114.58%CV erro 8.72 11.26 18.66 14.26 - 11.47
121/6+bl2 prelim 9.89 uM/g 336.87 551.44 239.32 48.52 0.00 1014.66%CV erro 3.98 1.60 6.10 17.78 - 4.23
Table A3.7 Bulk Amino Acid Analysis
305
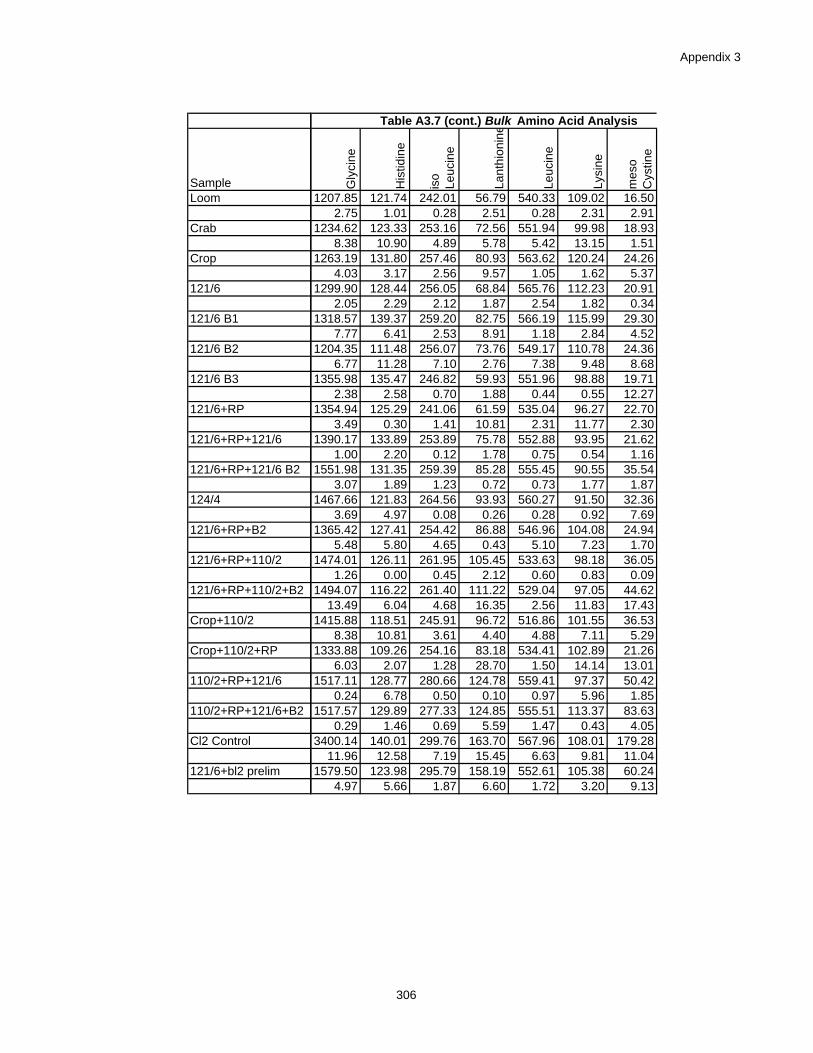
Appendix 3
SampleLoom
Crab
Crop
121/6
121/6 B1
121/6 B2
121/6 B3
121/6+RP
121/6+RP+121/6
121/6+RP+121/6 B2
124/4
121/6+RP+B2
121/6+RP+110/2
121/6+RP+110/2+B2
Crop+110/2
Crop+110/2+RP
110/2+RP+121/6
110/2+RP+121/6+B2
Cl2 Control
121/6+bl2 prelim
Gly
cine
His
tidin
e
iso
Leuc
ine
Lant
hion
ine
Leuc
ine
Lysi
ne
mes
o C
ystin
e
1207.85 121.74 242.01 56.79 540.33 109.02 16.502.75 1.01 0.28 2.51 0.28 2.31 2.91
1234.62 123.33 253.16 72.56 551.94 99.98 18.938.38 10.90 4.89 5.78 5.42 13.15 1.51
1263.19 131.80 257.46 80.93 563.62 120.24 24.264.03 3.17 2.56 9.57 1.05 1.62 5.37
1299.90 128.44 256.05 68.84 565.76 112.23 20.912.05 2.29 2.12 1.87 2.54 1.82 0.34
1318.57 139.37 259.20 82.75 566.19 115.99 29.307.77 6.41 2.53 8.91 1.18 2.84 4.52
1204.35 111.48 256.07 73.76 549.17 110.78 24.366.77 11.28 7.10 2.76 7.38 9.48 8.68
1355.98 135.47 246.82 59.93 551.96 98.88 19.712.38 2.58 0.70 1.88 0.44 0.55 12.27
1354.94 125.29 241.06 61.59 535.04 96.27 22.703.49 0.30 1.41 10.81 2.31 11.77 2.30
1390.17 133.89 253.89 75.78 552.88 93.95 21.621.00 2.20 0.12 1.78 0.75 0.54 1.16
1551.98 131.35 259.39 85.28 555.45 90.55 35.543.07 1.89 1.23 0.72 0.73 1.77 1.87
1467.66 121.83 264.56 93.93 560.27 91.50 32.363.69 4.97 0.08 0.26 0.28 0.92 7.69
1365.42 127.41 254.42 86.88 546.96 104.08 24.945.48 5.80 4.65 0.43 5.10 7.23 1.70
1474.01 126.11 261.95 105.45 533.63 98.18 36.051.26 0.00 0.45 2.12 0.60 0.83 0.09
1494.07 116.22 261.40 111.22 529.04 97.05 44.6213.49 6.04 4.68 16.35 2.56 11.83 17.43
1415.88 118.51 245.91 96.72 516.86 101.55 36.538.38 10.81 3.61 4.40 4.88 7.11 5.29
1333.88 109.26 254.16 83.18 534.41 102.89 21.266.03 2.07 1.28 28.70 1.50 14.14 13.01
1517.11 128.77 280.66 124.78 559.41 97.37 50.420.24 6.78 0.50 0.10 0.97 5.96 1.85
1517.57 129.89 277.33 124.85 555.51 113.37 83.630.29 1.46 0.69 5.59 1.47 0.43 4.05
3400.14 140.01 299.76 163.70 567.96 108.01 179.2811.96 12.58 7.19 15.45 6.63 9.81 11.04
1579.50 123.98 295.79 158.19 552.61 105.38 60.244.97 5.66 1.87 6.60 1.72 3.20 9.13
Table A3.7 (cont.) Bulk Amino Acid Analysis
306
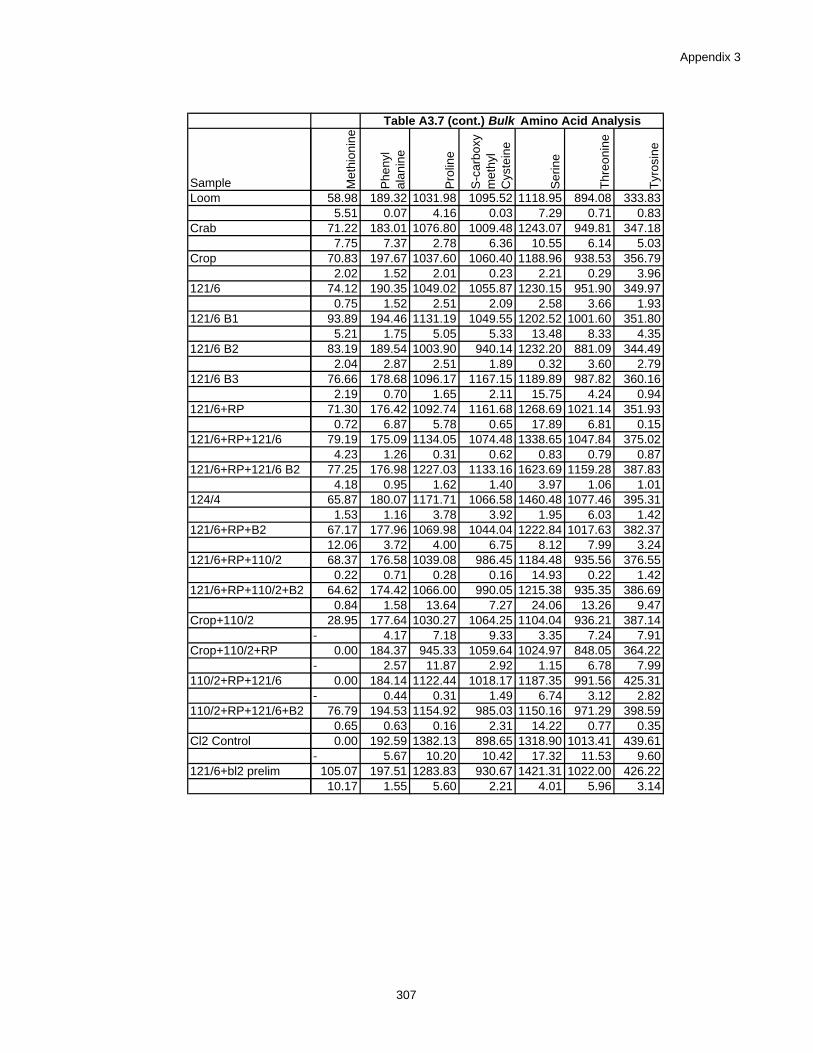
Appendix 3
SampleLoom
Crab
Crop
121/6
121/6 B1
121/6 B2
121/6 B3
121/6+RP
121/6+RP+121/6
121/6+RP+121/6 B2
124/4
121/6+RP+B2
121/6+RP+110/2
121/6+RP+110/2+B2
Crop+110/2
Crop+110/2+RP
110/2+RP+121/6
110/2+RP+121/6+B2
Cl2 Control
121/6+bl2 prelim
Met
hion
ine
Phen
yl
alan
ine
Pro
line
S-c
arbo
xy
met
hyl
Cys
tein
e
Ser
ine
Thre
onin
e
Tyro
sine
58.98 189.32 1031.98 1095.52 1118.95 894.08 333.835.51 0.07 4.16 0.03 7.29 0.71 0.83
71.22 183.01 1076.80 1009.48 1243.07 949.81 347.187.75 7.37 2.78 6.36 10.55 6.14 5.03
70.83 197.67 1037.60 1060.40 1188.96 938.53 356.792.02 1.52 2.01 0.23 2.21 0.29 3.96
74.12 190.35 1049.02 1055.87 1230.15 951.90 349.970.75 1.52 2.51 2.09 2.58 3.66 1.93
93.89 194.46 1131.19 1049.55 1202.52 1001.60 351.805.21 1.75 5.05 5.33 13.48 8.33 4.35
83.19 189.54 1003.90 940.14 1232.20 881.09 344.492.04 2.87 2.51 1.89 0.32 3.60 2.79
76.66 178.68 1096.17 1167.15 1189.89 987.82 360.162.19 0.70 1.65 2.11 15.75 4.24 0.94
71.30 176.42 1092.74 1161.68 1268.69 1021.14 351.930.72 6.87 5.78 0.65 17.89 6.81 0.15
79.19 175.09 1134.05 1074.48 1338.65 1047.84 375.024.23 1.26 0.31 0.62 0.83 0.79 0.87
77.25 176.98 1227.03 1133.16 1623.69 1159.28 387.834.18 0.95 1.62 1.40 3.97 1.06 1.01
65.87 180.07 1171.71 1066.58 1460.48 1077.46 395.311.53 1.16 3.78 3.92 1.95 6.03 1.42
67.17 177.96 1069.98 1044.04 1222.84 1017.63 382.3712.06 3.72 4.00 6.75 8.12 7.99 3.2468.37 176.58 1039.08 986.45 1184.48 935.56 376.55
0.22 0.71 0.28 0.16 14.93 0.22 1.4264.62 174.42 1066.00 990.05 1215.38 935.35 386.69
0.84 1.58 13.64 7.27 24.06 13.26 9.4728.95 177.64 1030.27 1064.25 1104.04 936.21 387.14
- 4.17 7.18 9.33 3.35 7.24 7.910.00 184.37 945.33 1059.64 1024.97 848.05 364.22
- 2.57 11.87 2.92 1.15 6.78 7.990.00 184.14 1122.44 1018.17 1187.35 991.56 425.31
- 0.44 0.31 1.49 6.74 3.12 2.8276.79 194.53 1154.92 985.03 1150.16 971.29 398.59
0.65 0.63 0.16 2.31 14.22 0.77 0.350.00 192.59 1382.13 898.65 1318.90 1013.41 439.61
- 5.67 10.20 10.42 17.32 11.53 9.60105.07 197.51 1283.83 930.67 1421.31 1022.00 426.22
10.17 1.55 5.60 2.21 4.01 5.96 3.14
Table A3.7 (cont.) Bulk Amino Acid Analysis
307
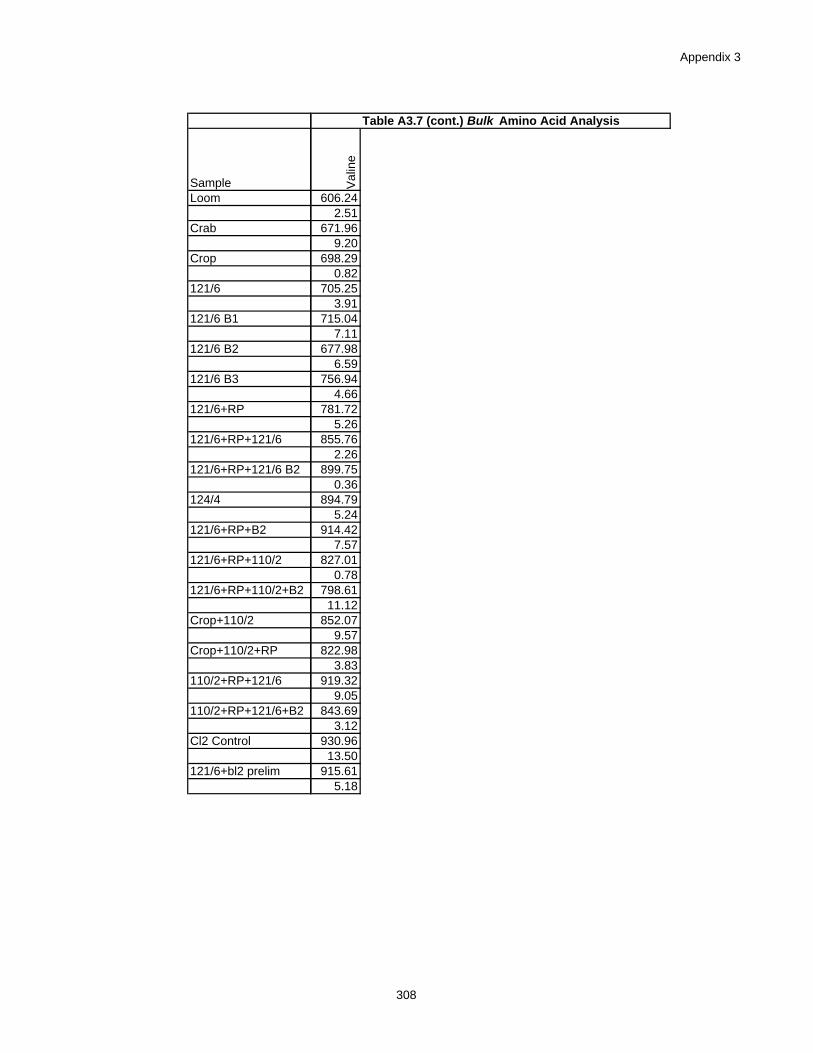
Appendix 3
SampleLoom
Crab
Crop
121/6
121/6 B1
121/6 B2
121/6 B3
121/6+RP
121/6+RP+121/6
121/6+RP+121/6 B2
124/4
121/6+RP+B2
121/6+RP+110/2
121/6+RP+110/2+B2
Crop+110/2
Crop+110/2+RP
110/2+RP+121/6
110/2+RP+121/6+B2
Cl2 Control
121/6+bl2 prelim
Val
ine
606.242.51
671.969.20
698.290.82
705.253.91
715.047.11
677.986.59
756.944.66
781.725.26
855.762.26
899.750.36
894.795.24
914.427.57
827.010.78
798.6111.12
852.079.57
822.983.83
919.329.05
843.693.12
930.9613.50
915.615.18
Table A3.7 (cont.) Bulk Amino Acid Analysis
308
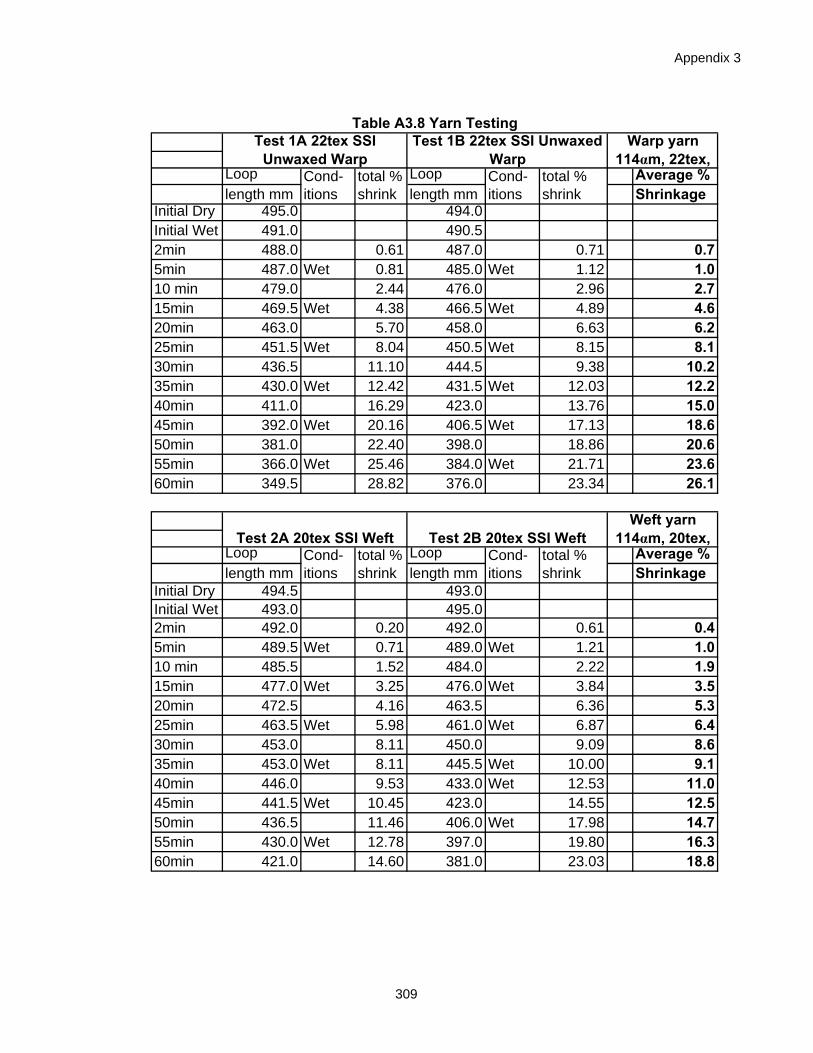
Appendix 3
Loop Loop Average %length mm length mm Shrinkage
Initial Dry 495.0 494.0Initial Wet 491.0 490.52min 488.0 0.61 487.0 0.71 0.75min 487.0 Wet 0.81 485.0 Wet 1.12 1.010 min 479.0 2.44 476.0 2.96 2.715min 469.5 Wet 4.38 466.5 Wet 4.89 4.620min 463.0 5.70 458.0 6.63 6.225min 451.5 Wet 8.04 450.5 Wet 8.15 8.130min 436.5 11.10 444.5 9.38 10.235min 430.0 Wet 12.42 431.5 Wet 12.03 12.240min 411.0 16.29 423.0 13.76 15.045min 392.0 Wet 20.16 406.5 Wet 17.13 18.650min 381.0 22.40 398.0 18.86 20.655min 366.0 Wet 25.46 384.0 Wet 21.71 23.660min 349.5 28.82 376.0 23.34 26.1
Loop Loop Average %length mm length mm Shrinkage
Initial Dry 494.5 493.0Initial Wet 493.0 495.02min 492.0 0.20 492.0 0.61 0.45min 489.5 Wet 0.71 489.0 Wet 1.21 1.010 min 485.5 1.52 484.0 2.22 1.915min 477.0 Wet 3.25 476.0 Wet 3.84 3.520min 472.5 4.16 463.5 6.36 5.325min 463.5 Wet 5.98 461.0 Wet 6.87 6.430min 453.0 8.11 450.0 9.09 8.635min 453.0 Wet 8.11 445.5 Wet 10.00 9.140min 446.0 9.53 433.0 Wet 12.53 11.045min 441.5 Wet 10.45 423.0 14.55 12.550min 436.5 11.46 406.0 Wet 17.98 14.755min 430.0 Wet 12.78 397.0 19.80 16.360min 421.0 14.60 381.0 23.03 18.8
Table A3.8 Yarn Testing
Test 2B 20tex SSI Weft
Warp yarn 114αm, 22tex,
Weft yarn 114αm, 20tex,
Test 1A 22tex SSI Unwaxed Warp
Test 1B 22tex SSI Unwaxed Warp
Test 2A 20tex SSI Weft
Cond-itions
Cond-itions
Cond-itions
Cond-itions
total % shrink
total % shrink
total % shrink
total % shrink
309
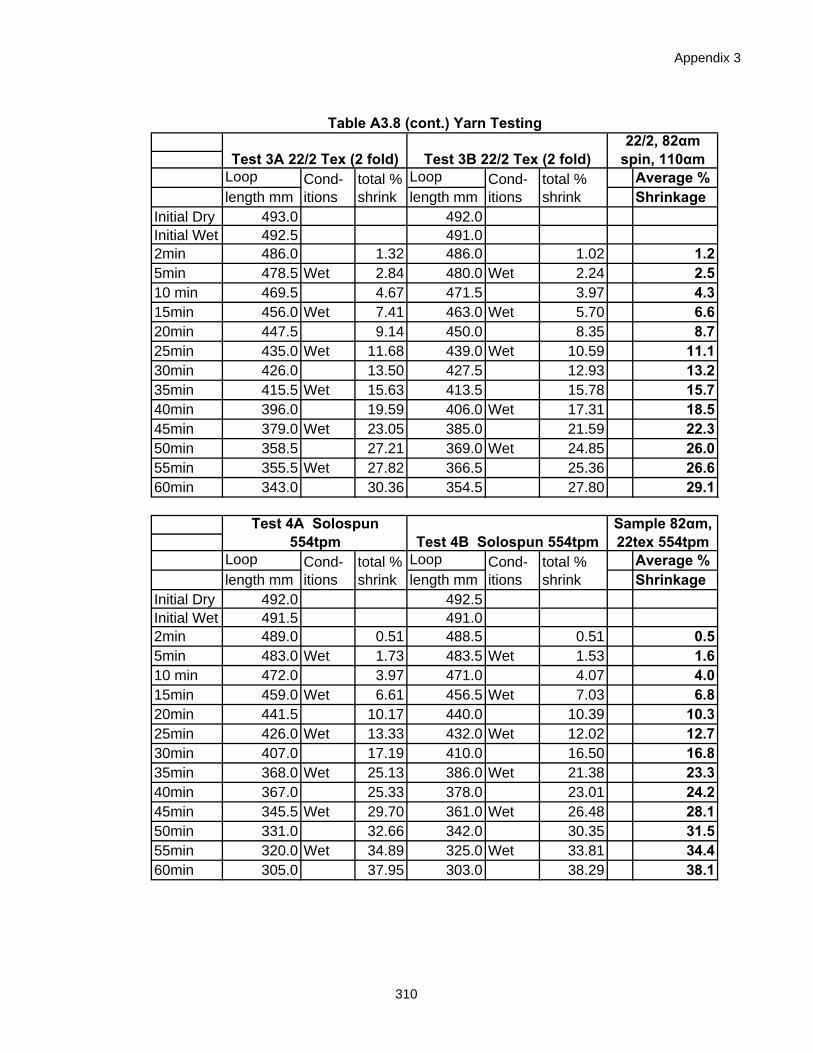
Appendix 3
Loop Loop Average %length mm length mm Shrinkage
Initial Dry 493.0 492.0Initial Wet 492.5 491.02min 486.0 1.32 486.0 1.02 1.25min 478.5 Wet 2.84 480.0 Wet 2.24 2.510 min 469.5 4.67 471.5 3.97 4.315min 456.0 Wet 7.41 463.0 Wet 5.70 6.620min 447.5 9.14 450.0 8.35 8.725min 435.0 Wet 11.68 439.0 Wet 10.59 11.130min 426.0 13.50 427.5 12.93 13.235min 415.5 Wet 15.63 413.5 15.78 15.740min 396.0 19.59 406.0 Wet 17.31 18.545min 379.0 Wet 23.05 385.0 21.59 22.350min 358.5 27.21 369.0 Wet 24.85 26.055min 355.5 Wet 27.82 366.5 25.36 26.660min 343.0 30.36 354.5 27.80 29.1
Loop Loop Average %length mm length mm Shrinkage
Initial Dry 492.0 492.5Initial Wet 491.5 491.02min 489.0 0.51 488.5 0.51 0.55min 483.0 Wet 1.73 483.5 Wet 1.53 1.610 min 472.0 3.97 471.0 4.07 4.015min 459.0 Wet 6.61 456.5 Wet 7.03 6.820min 441.5 10.17 440.0 10.39 10.325min 426.0 Wet 13.33 432.0 Wet 12.02 12.730min 407.0 17.19 410.0 16.50 16.835min 368.0 Wet 25.13 386.0 Wet 21.38 23.340min 367.0 25.33 378.0 23.01 24.245min 345.5 Wet 29.70 361.0 Wet 26.48 28.150min 331.0 32.66 342.0 30.35 31.555min 320.0 Wet 34.89 325.0 Wet 33.81 34.460min 305.0 37.95 303.0 38.29 38.1
Table A3.8 (cont.) Yarn Testing22/2, 82αm
spin, 110αm Test 3A 22/2 Tex (2 fold) Test 3B 22/2 Tex (2 fold)
Sample 82αm, 22tex 554tpm
Cond-itions
Cond-itions
Test 4A Solospun 554tpm Test 4B Solospun 554tpm
Cond-itions
Cond-itions
total % shrink
total % shrink
total % shrink
total % shrink
310
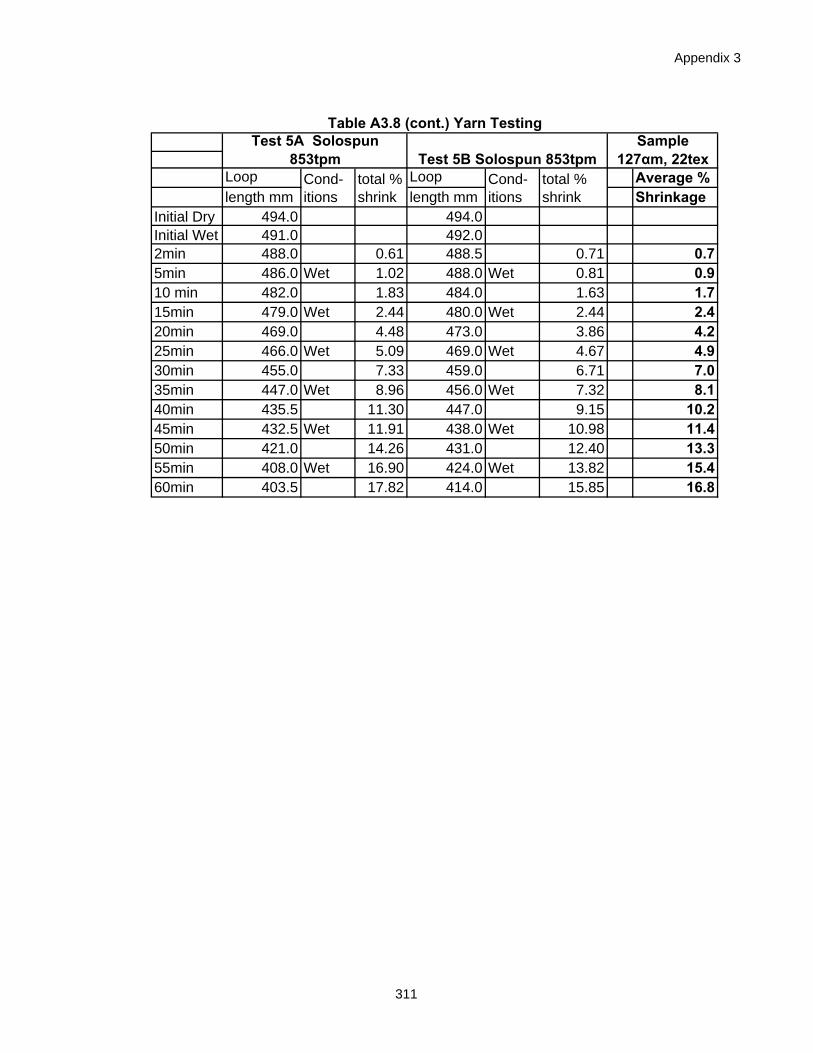
Appendix 3
Loop Loop Average %length mm length mm Shrinkage
Initial Dry 494.0 494.0Initial Wet 491.0 492.02min 488.0 0.61 488.5 0.71 0.75min 486.0 Wet 1.02 488.0 Wet 0.81 0.910 min 482.0 1.83 484.0 1.63 1.715min 479.0 Wet 2.44 480.0 Wet 2.44 2.420min 469.0 4.48 473.0 3.86 4.225min 466.0 Wet 5.09 469.0 Wet 4.67 4.930min 455.0 7.33 459.0 6.71 7.035min 447.0 Wet 8.96 456.0 Wet 7.32 8.140min 435.5 11.30 447.0 9.15 10.245min 432.5 Wet 11.91 438.0 Wet 10.98 11.450min 421.0 14.26 431.0 12.40 13.355min 408.0 Wet 16.90 424.0 Wet 13.82 15.460min 403.5 17.82 414.0 15.85 16.8
Table A3.8 (cont.) Yarn TestingTest 5A Solospun
853tpm Test 5B Solospun 853tpmSample
127αm, 22tex total % shrink
total % shrink
Cond-itions
Cond-itions
311
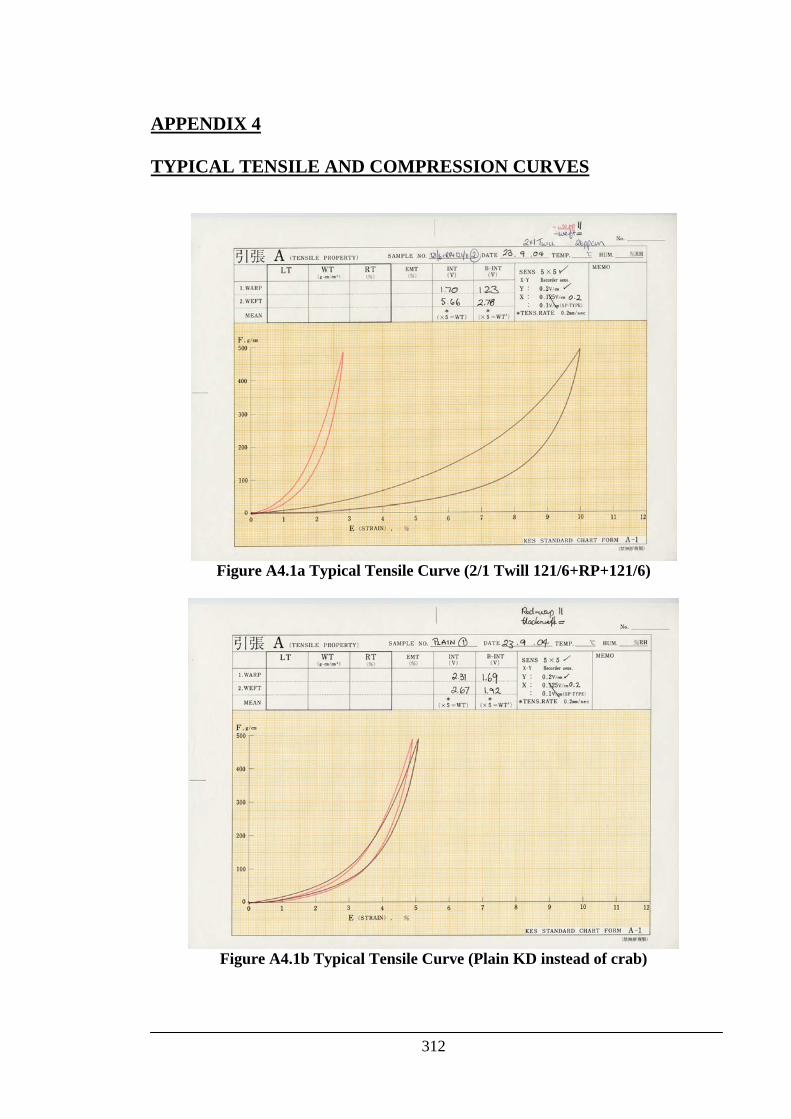
APPENDIX 4 TYPICAL TENSILE AND COMPRESSION CURVES
Figure A4.1a Typical Tensile Curve (2/1 Twill 121/6+RP+121/6)
Figure A4.1b Typical Tensile Curve (Plain KD instead of crab)
312
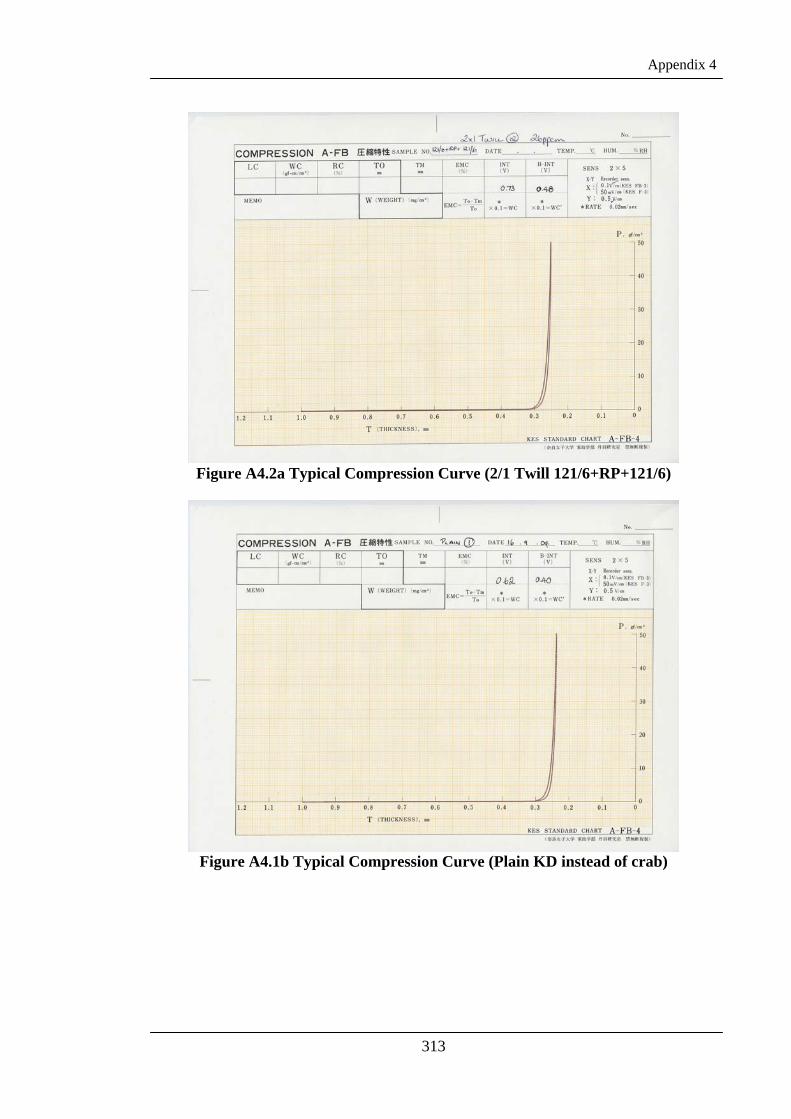
Appendix 4
313
Figure A4.2a Typical Compression Curve (2/1 Twill 121/6+RP+121/6)
Figure A4.1b Typical Compression Curve (Plain KD instead of crab)