A Study Of The P2X7 Purinoceptor And Vascular ATP ...
259
A Study Of The P2X7 Purinoceptor And Vascular ATP Metabolic Pathways In Chronic Kidney Disease-Associated Arterial Calcification Richard Stephen Fish 2014 A thesis submitted to University College London in fulfilment of the requirement for the degree of Doctor of Philosophy This work is kindly supported by a clinical research training fellowship awarded by Kidney Research UK
-
Upload
khangminh22 -
Category
Documents
-
view
1 -
download
0
Transcript of A Study Of The P2X7 Purinoceptor And Vascular ATP ...

A Study Of The P2X7 Purinoceptor And Vascular
ATP Metabolic Pathways In Chronic Kidney
Disease-Associated Arterial Calcification
Richard Stephen Fish
2014
A thesis submitted to University College London in fulfilment of the
requirement for the degree of Doctor of Philosophy
This work is kindly supported by a clinical research training fellowship awarded by
Kidney Research UK

i
DECLARATION
I, Richard Stephen Fish, confirm that the work presented in this thesis is my
own. Where information has been derived from other sources, I confirm that
this has been indicated in the thesis.
Date: November 2014
Richard Stephen Fish
ii
ABSTRACT
The risk of cardiovascular-related death is several-fold higher in patients with
chronic kidney disease (CKD) compared with the general population. Arterial
calcification (AC) is extremely common in patients with CKD and strongly
associates with cardiovascular-related mortality, however, there are currently no
specific treatments to prevent its development and/or progression. Abundant
evidence now suggests that AC is cell-mediated and actively-regulated, involving
mechanisms linked to bone homeostasis, production of calcification inhibitors and
vascular smooth muscle cell (VSMC) function.
The P2X7 receptor (P2X7R) is an ATP-sensitive cation channel which has been
implicated in several biological processes, in non-vascular contexts, thought to be
important in the aetiology of AC. In addition, disruption to the normal function of
some enzymes involved in ATP metabolism has been shown to contribute to AC,
although little is known about their role in CKD-related arterial calcium deposition.
The work in this thesis tested the primary hypothesis that P2X7R contributes to the
pathogenesis of CKD-associated AC. Preliminary work was also conducted to
examine the expression of components of the ATP-metabolising system in this
clinical setting.
P2X7R expression was confirmed in human and rodent vascular smooth muscle but
was un-affected by calcification. In vitro, the P2X7R-specific antagonist, A438079,
did not influence calcium deposition occurring in the presence of human VSMCs or
segments of rat aorta exposed to ‘calcification-promoting’ medium. Calcification of
cultured rat aorta was also not influenced by a second P2X7R-specific antagonist,
A839977, or by BzATP (a receptor agonist). Aortic rings from mice deficient in
P2X7R calcified to a similar extent to wild-type controls in vitro.
A novel, adenine-based mouse model was developed to evaluate the effect of P2X7R
gene deficiency on CKD-associated AC in vivo. However, the number of mice
exhibiting AC in the final experiment was too low to draw any firm conclusion.
Therefore, rats were fed an adenine-containing, high phosphate diet for 4 weeks (to
iii
induce CKD and AC) and administered a selective P2X7R antagonist, twice daily,
throughout this period. Pharmacological blockade of P2X7R did not influence the
magnitude of aortic calcification in this model.
Quantification of mRNA performed on tissue obtained from the in vivo rat
experiment suggested that VSMC-specific markers are down-regulated in calcified
arteries, although VSMC osteogenic transformation, which is widely reported in the
literature to occur in the context of AC, was not detected. Expression of the
apoptosis marker, caspase-3, was increased in calcified arteries in vivo. P2X7R
blockade did not influence any of these changes in mRNA expression.
Expression of mRNA for ENPP-1, an ATP-metabolising enzyme responsible for the
generation of the calcification inhibitor, pyrophosphate (PPi), was significantly
increased in calcified arteries from CKD rats. Functional activity of ENPP-1 was
also increased in these vessels. The expression of mRNA for other components of
the ATP-metabolising system was also in keeping with an attempt by VSMCs to
generate more PPi, possibly as an adaptive, defensive response to uraemic,
calcification-promoting factors. Furthermore, an increase in ENPP-1 mRNA
expression was detected in calcified inferior epigastric arteries from patients with
end-stage renal disease (extracted at the time of kidney transplantation).
In summary, P2X7R does not appear to contribute to the pathogenesis of CKD-
associated AC, although this should be confirmed in experimental models which
more closely simulate human disease. Arterial expression of enzymes involved in the
metabolism of ATP does seem to change in AC. Future work should therefore focus
on gauging the clinical relevance of this in order to better understand the
mechanisms underlying the disease and potentially develop new therapeutic
interventions.

iv
ACKNOWLEDGEMENTS
I am grateful to Kidney Research UK for awarding my Clinical Research Training
Fellowship which made this work possible.
I would also like to thank my supervisors, Dr Jill Norman, Dr Frederick Tam,
Professor David Wheeler and Professor Robert Unwin, for their guidance and help.
The P2X7R antagonist, AZ11657312, employed during the rat in vivo experiment,
was kindly provided by AstraZeneca (coordinated by Dr Peter Gilmour) as part of a
grant, jointly funded with the Medical Research Council, awarded to my supervisors.
Many thanks to Dr Richard Weaver for performing the in vivo P2X7R antagonist
pharmacokinetic studies, Dr Tertius Hough for the routine biochemical analysis of
serum and urine and Ms Mahrokh Nohadani for Pircosirius red staining of kidney
sections. Obtaining ethical approval for the collection of human tissues was
coordinated by Dr Rukshana Shroff and the transplant surgery and collection of
arteries from patients was performed by Mr Ben Lindsey, Mr Bimbi Fernando, Mr
Neal Banga and Mr Colin Forman.
I am also thankful to the following individuals for their invaluable help and teaching
which enabled me learn and perform the techniques employed during this work: Mr
Mark Neal, Ms Alison O’Hara, Mr Duncan Moore, Mrs Michelle Murphy, Dr
Joanne (in vivo procedures), Dr Annette Schumacher (animal diets), Professor Tim
Arnett and Dr Isabel Orriss (micro-CT scanning and purinergic system expertise), Dr
John Booth (P2X7 and qPCR expertise), Professor Alan Salama (experimental
advice), Dr Ben Caplin (human tissue work and statistics), Dr Siobhan Moyes and
Dr Johanna Donovan (in vitro work, Western blotting, immunofluorescence and
imaging), Dr Patricia DeWinter (qPCR) and Dr Nathan Davies (PPi assay).
Finally, throughout this project, my wife, Ruth, has provided me with an unwavering
and tireless source of support and encouragement. I am, as always, grateful for her
understanding, perspective, companionship and love.

v
TABLE OF CONTENTS
DECLARATION .......................................................................................................... i
ABSTRACT ................................................................................................................. ii
ACKNOWLEDGEMENTS ........................................................................................ iv
LIST OF FIGURES.................................................................................................... xv
LIST OF TABLES ................................................................................................. xviii
ABBREVIATIONS.................................................................................................... xx
CHAPTER 1 – INTRODUCTION ........................................................................... 1
PART 1 - Chronic Kidney Disease-Associated Arterial Calcification .................. 1
1.1 Chronic Kidney Disease Is Associated With Increased Cardiovascular Risk ....... 1
1.2 Arterial Calcification In Patients With Chronic Kidney Disease........................... 1
1.3 The Aetiology Of Arterial Calcification ................................................................ 2
1.3.1 AC is not simply the result of passive mineral deposition. ............................. 2
1.4 Methods Used To Study Arterial Calcification ...................................................... 3
1.4.1 Cell and tissue culture models. ........................................................................ 3
1.4.2 Rat models. ...................................................................................................... 4
1.4.2.i Non-CKD rat models. ................................................................................ 4
1.4.2.ii The 5/6th
nephrectomy model. .................................................................. 4
1.4.2.iii The Cy/+ rat. ............................................................................................ 5
1.4.2.iv The adenine nephropathy model. ............................................................. 5
1.4.3.i Non-CKD models. ..................................................................................... 6
1.4.3.ii CKD model. .............................................................................................. 6
1.5 The Pathogenesis Of Arterial Calcification ........................................................... 7
1.5.1 The role of the VSMC. .................................................................................... 7
1.5.1.i Links with bone formation......................................................................... 7
vi
1.5.1.ii VSMC apoptosis and release of MVs. ................................................... 10
1.5.2 AC is related to bone health. ......................................................................... 11
1.5.3 Inhibitors of calcification. ............................................................................. 12
1.5.3.i Fetuin A. .................................................................................................. 12
1.5.3.ii MGP........................................................................................................ 12
1.5.4 Degradation and remodelling of the ECM. ................................................... 13
1.6 Current Treatment Options For Arterial Calcification ......................................... 14
PART 2 - Adenosine Tri-Phosphate And Arterial Calcification ......................... 16
1.7 An Overview Of The Purinergic System ............................................................. 16
1.7.1 Potential sources of extracellular ATP. ......................................................... 18
1.8 Purinergic Receptor-Mediated Calcification........................................................ 18
1.8.1 P2Y receptors. ............................................................................................... 18
1.8.2 Other purinergic receptors. ............................................................................ 19
1.9 The P2X7 Receptor .............................................................................................. 20
1.9.1 Structural properties. ..................................................................................... 20
1.9.2 Tissue distribution. ........................................................................................ 21
1.9.3 Agonists and antagonists. .............................................................................. 21
1.9.3.i Receptor agonists. .................................................................................... 21
1.9.3.ii Receptor antagonists. .............................................................................. 22
1.9.4 Receptor functions and potential links to CKD-associated AC. ................... 22
1.9.4.i P2X7R and bone. ..................................................................................... 23
1.9.4.ii P2X7R and apoptosis.............................................................................. 24
1.9.4.iii P2X7R and ECM degradation. .............................................................. 25
1.9.4.iv P2X7R and renal disease. ...................................................................... 25
1.10 The ATP-Metabolising System And Calcification ............................................ 26
1.10.1 ATP metabolism and PPi generation: the roles of ENPP-1 and ANK. ....... 26

vii
1.10.1.i Clinical manifestations of genetic mutations in ENPP-1 - generalised
AC of infancy and autosomal recessive hypophosphataemic rickets type 2. ..... 27
1.10.1.ii Murine models of ENPP-1 deficiency - correlation with human disease.
............................................................................................................................ 27
1.10.1.iii ENPP-1 regulation at the cellular level. .............................................. 28
1.10.1.iv The role of ANK. ................................................................................. 29
1.10.2 Roles played by other ecto-nucleotidases.................................................... 29
1.10.2.i TNAP. .................................................................................................... 29
1.10.2.ii Mutations in NT5E in patients with calcification of arteries and joints.
............................................................................................................................ 30
1.10.2.iii The potential involvement of CD39 in AC. ........................................ 31
PART 3 - Hypotheses, Rationales, Aims and Objectives ...................................... 31
1.11 Primary Hypothesis ............................................................................................ 31
1.11.1 Rationale. ..................................................................................................... 31
1.11.2 Experimental aims and objectives. .............................................................. 33
1.12 Supplementary Hypothesis................................................................................. 34
1.12.1 Rationale. ..................................................................................................... 34
1.12.2 Experimental aims and objectives. .............................................................. 35
CHAPTER 2 - MATERIALS AND METHODS................................................... 36
2.1 Reagents And Materials ....................................................................................... 36
2.2 Studies With Human Tissue ................................................................................. 36
2.2.1 Ethical considerations. ................................................................................... 36
2.2.2 Tissue collection, processing and storage. .................................................... 36
2.3 Animal Husbandry ............................................................................................... 37
2.4 Experiments To Develop A Murine Model Of Chronic Kidney Disease-
Associated Arterial Calcification ............................................................................... 37
2.4.1 Administration of folic acid to mice. ............................................................. 37
viii
2.4.1.i Reagents and diets. .................................................................................. 37
2.4.1.ii Study protocol......................................................................................... 39
2.4.2 Pilot studies to examine the effect of feeding adenine-containing diets to
mice. ....................................................................................................................... 39
2.4.2.i Diets. ........................................................................................................ 39
2.4.2.ii Study animals. ........................................................................................ 39
2.4.2.iii Administration of diets. ......................................................................... 40
2.5 Backcrossing Of P2X7-/-
Mice Onto The DBA/2 Background ............................ 40
2.5.1 Background: original generation of P2X7-/-
mice. ........................................ 40
2.5.2 Backcrossing procedure................................................................................. 40
2.5.3 Genotyping of mice. ...................................................................................... 41
2.5.3.i Solutions. ................................................................................................. 41
2.5.3.ii Genotyping procedure. ........................................................................... 41
2.6 Experiment To Determine The Effect Of P2X7R Gene Deletion On Arterial
Calcification ............................................................................................................... 43
2.6.1 Study animals. ............................................................................................... 43
2.6.2 Study protocol. .............................................................................................. 43
2.7 Experiment To Assess The Influence Of A Selective P2X7R Antagonist On
Arterial Calcification In Rats ..................................................................................... 43
2.7.1 Pilot studies examining the effects of administering adenine-containing diets
to rats. ..................................................................................................................... 43
2.7.2 Group and dietary assignments for final experiment. ................................... 43
2.7.3 Preparation and administration of the selective P2X7R antagonist. ............. 44
2.7.3.i Compound administration by oral gavage. .............................................. 44
2.7.4 Determination of serum levels of AZ11657312. ........................................... 45
2.7.5 Collection of biological samples. .................................................................. 45
2.8 Blood Sampling From Rodents ............................................................................ 45
2.9 Harvesting And Storage Of Rodent Tissue .......................................................... 46

ix
2.10 Biochemical Analysis Of Serum And Urine ...................................................... 47
2.10.1 Routine biochemistry................................................................................... 47
2.10.1.i Calculation of corrected calcium. .......................................................... 47
2.10.2 PTH Enzyme-Linked Immunosorbent Assay (ELISA). .............................. 48
2.10.2.i General principle. .................................................................................. 48
2.10.2.ii Method. ................................................................................................. 48
2.10.3 PPi assay. ..................................................................................................... 48
2.11 Assessment Of ENPP-1 Activity In Arterial Tissue .......................................... 49
2.12 Micro-Computerised Tomography (CT) Analysis Of Bone .............................. 50
2.12.1 General principles. ....................................................................................... 50
2.12.2 Micro-CT scanning. ..................................................................................... 50
2.12.3 Data analysis. ............................................................................................... 50
2.13 Tissue Culture .................................................................................................... 51
2.13.1 Specific reagents. ......................................................................................... 51
2.13.2 In vitro culture of human VSMCs. .............................................................. 53
2.13.3 Generation of rodent VSMCs. ..................................................................... 53
2.13.4 Culture of rodent aortic rings. ..................................................................... 54
2.14 Viability Testing Of Cultured Aortas ................................................................. 55
2.15 O-Cresolphthalein Complexone Method To Quantify The Calcium Content Of
A Solution .................................................................................................................. 55
2.15.1 General principle. ........................................................................................ 55
2.15.2 Sample preparation. ..................................................................................... 56
2.15.3 Reagents. ..................................................................................................... 56
2.15.4 Quantification of calcium. ........................................................................... 56
2.16 Quantitative Polymerase Chain Reaction (qPCR) ............................................. 57
2.16.1 General principles. ....................................................................................... 58
2.16.2 RNA extraction from aortas. ....................................................................... 59
x
2.16.3 Measurement of RNA concentration and purity. ........................................ 60
2.16.4 Assessment of RNA integrity. ..................................................................... 60
2.16.5 Synthesis of complementary DNA (cDNA). ............................................... 61
2.16.6 Primer design and optimisation. .................................................................. 62
2.16.7 Preparation of cDNA standards. .................................................................. 66
2.16.8 Quantitative PCR. ........................................................................................ 68
2.16.9 Calculation of gene copy number. ............................................................... 68
2.17 Western Blotting ................................................................................................ 69
2.17.1 General principles. ....................................................................................... 70
2.17.2 Solutions. ..................................................................................................... 70
2.17.3 Protein extraction from aortic tissue............................................................ 71
2.17.4 Measurement of sample protein content...................................................... 71
2.17.5 Electrophoresis. ........................................................................................... 72
2.17.6 Transfer........................................................................................................ 72
2.17.7 Protein labelling and visualisation............................................................... 72
2.18 Immunofluorescence .......................................................................................... 73
2.19 Histological Analysis ......................................................................................... 75
2.19.1 Sample preparation and deparaffinisation of sections. ................................ 75
2.19.2 Silver nitrate stain according to von Kossa. ................................................ 75
2.19.3.i Semi-quantitative scoring of calcium deposition. ................................. 76
2.19.3 Alizarin red staining. ................................................................................... 76
2.19.4 Quantification of renal fibrosis on Picrosirius red stained kidney sections. 76
2.20 Statistical Analysis ............................................................................................. 77
CHAPTER 3 – OPTIMISATION OF A TISSUE CULTURE MODEL TO
ASSESS THE ROLE OF P2X7R IN ARTERIAL CALCIFICATION .............. 78
3.1 Introduction .......................................................................................................... 78

xi
3.2 Results .................................................................................................................. 78
3.2.1 P2X7R is expressed in primary hVSMCs in vitro. ....................................... 78
3.2.2 Experiments culturing VSMCs in high calcium and phosphate-containing
medium yield inconsistent results. ......................................................................... 79
3.2.2.i Generation of, and calcification experiments using, rat VSMCs. ........... 81
3.2.3 Characterisation and optimisation of an ex vivo aortic ring calcification
model. ..................................................................................................................... 83
3.2.3.i Calcification of rat aortic rings can be induced by culturing in a medium
containing phosphate concentrations above 2.5mM. .......................................... 83
3.2.3.ii Viability of rings is maintained following culture in 3mM phosphate for
10 days. ............................................................................................................... 85
3.2.3.iii Time-course of cultured aortic ring calcification. ................................. 86
3.2.3.iv Attempts to improve the consistency of aortic ring calcification. ......... 87
3.2.4 The role of P2X7R in AC using an ex vivo model. ....................................... 89
3.2.4.i The effect of pharmacological manipulation of P2X7R on rat aortic ring
calcification. ........................................................................................................ 89
3.2.4.ii Cultured aortic rings from WT and P2X7-/-
mice exhibit a similar degree
of calcification. ................................................................................................... 91
3.2.5 Expression of mRNA for P2X7R, markers of VSMC phenotype and caspase-
3. ............................................................................................................................. 92
3.3 Discussion ............................................................................................................ 96
3.4 Summary ............................................................................................................ 102
CHAPTER 4 – DEVELOPMENT OF A NOVEL MOUSE MODEL TO
STUDY THE EFFECT OF P2X7R DEFICIENCY ON CHRONIC KIDNEY
DISEASE-ASSOCIATED ARTERIAL CALCIFICATION ............................. 103
4.1 Introduction ........................................................................................................ 103
4.2 Results ................................................................................................................ 105
4.2.1 Administration of folic acid to WT DBA/2 mice. ....................................... 105
4.2.2 Optimisation of an adenine-based regime. .................................................. 110
xii
4.2.2.i A diet containing high phosphate, low protein and adenine induces CKD
and AC in male DBA/2 mice. ........................................................................... 110
4.2.2.ii A modified adenine-containing diet is poorly tolerated by C57Bl/6 mice.
.......................................................................................................................... 115
4.2.2.iii Male offspring of 5th
generation backcrossed mice exhibit AC on a
modified adenine-diet. ...................................................................................... 115
4.2.2.iv Diets containing a higher adenine content or flavour enhancers are
poorly tolerated. ................................................................................................ 116
4.2.3 The effect of P2X7R gene deletion on CKD-associated AC. ..................... 116
4.2.3.i Selection of dietary regime. ................................................................... 116
4.2.3.ii Survival and qualitative outcomes. ....................................................... 117
4.2.3.iv Analysis of aortic calcification ............................................................ 117
4.2.3.v Analysis of biochemistry. ..................................................................... 117
4.2.3.vi Relationship of aortic calcification to biological parameters. ............. 118
4.3 Discussion .......................................................................................................... 121
4.4 Summary ............................................................................................................ 125
CHAPTER 5 – EXPERIMENT TO ASSESS THE INFLUENCE OF A
SELECTIVE P2X7R ANTAGONIST ON CHRONIC KIDNEY DISEASE-
ASSOCIATED ARTERIAL CALCIFICATION IN RATS ............................... 126
5.1 Introduction ........................................................................................................ 126
5.2 Results ................................................................................................................ 126
5.2.1 Optimisation of the rat adenine model. ....................................................... 126
5.2.1.i The addition of 0.75% adenine to a high phosphate diet leads to AC and
marked renal impairment in rats by 4 weeks. ................................................... 126
5.2.1.ii Reduction of the dietary adenine content to 0.25% does not increase the
consistency of AC when administered for 6 weeks. ......................................... 130
5.2.2 Experiment to assess the influence of a selective P2X7R antagonist on AC.
.............................................................................................................................. 130
5.2.2.i Selection of diets.................................................................................... 130
xiii
5.2.2.ii Survival and tolerability of oral gavage. .............................................. 131
5.2.2.iii Serum levels of P2X7R antagonist. ..................................................... 132
5.2.2.iv P2X7R expression in normal and calcified aorta. ............................... 132
5.2.2.v P2X7R antagonism does not influence the development of AC in
adenine-fed rats. ................................................................................................ 133
5.2.2.vi Analysis of mRNA expression of molecules implicated in AC
pathways. .......................................................................................................... 135
5.2.2.vii P2X7R antagonism does not impact on the degree of renal impairment
observed in the adenine nephropathy model..................................................... 138
5.2.2.viii P2X7R antagonism does not influence changes in bone induced by
adenine feeding. ................................................................................................ 145
5.3 Discussion .......................................................................................................... 150
5.4 Summary ............................................................................................................ 157
CHAPTER 6 – ATP METABOLIC PATHWAYS IN ARTERIES FROM
RODENTS AND HUMANS WITH CHRONIC KIDNEY DISEASE .............. 158
6.1 Introduction ........................................................................................................ 158
6.2 Results ................................................................................................................ 159
6.2.1 Studies in rodent arteries. ............................................................................ 160
6.2.1.i ENPP-1 mRNA expression and enzyme activity are increased in calcified
rodent arteries. .................................................................................................. 160
6.2.1.ii Serum PPi measurements in rodents with and without CKD. .............. 162
6.2.1.iii Analysis of mRNA expression for other ATP metabolism-related
molecules. ......................................................................................................... 163
6.2.1.iv Analysis of ATP metabolism-related molecules over time using an ex
vivo model of AC. ............................................................................................ 165
6.2.2 Studies in human arteries............................................................................. 167
6.2.2.i Clinical characteristics. .......................................................................... 168
6.2.2.ii Calcification in arteries from patients with ESRD. .............................. 168
6.2.2.iii Analysis of arterial mRNA expression for ENPP-1 and ANK............ 171

xiv
6.3 Discussion .......................................................................................................... 173
6.4 Summary ............................................................................................................ 177
CHAPTER 7 – GENERAL DISCUSSION .......................................................... 178
7.1 Summary Of Key Findings ................................................................................ 178
7.2 P2X7R And Arterial Calcification ..................................................................... 180
7.3 Vascular ATP Metabolic Pathways And Arterial Calcification ........................ 185
7.4 Conclusion.......................................................................................................... 189
PUBLICATIONS AND PRESENTATIONS .......................................................... 190
REFERENCES ......................................................................................................... 191

xv
LIST OF FIGURES
Figure 1.1. Pathogenic Mechanisms of CKD-Associated AC. .................................... 8
Figure 1.2. The Purinergic System and its Regulation of AC in VSMCs. ................. 17
Figure 1.3. Pathogenic Pathways of AC Potentially Modifiable by P2X7R Blockade
.................................................................................................................................... 52
Figure 2.1. Genotyping of Mice. ................................................................................ 52
Figure 2.2. Micro-CT Analysis of Bone. ................................................................... 52
Figure 2.3. Representative Standard Curve for Quantifying Calcium Concentration.
.................................................................................................................................... 57
Figure 2.4. Assessment of RNA Purity.. .................................................................... 62
Figure 2.5. Assessment of RNA Integrity. ................................................................. 62
Figure 2.6. Optimisation of qPCR Assay for Runx-2. ............................................... 63
Figure 2.7. Assessing Specificity of Primers. ............................................................ 66
Figure 2.8. An Optimised qPCR Assay. .................................................................... 69
Figure 2.9. Quantification of Picrosirius Red Staining of Kidney Sections. ............. 77
Figure 3.1. Immunofluorescent Staining of P2X7R in hVSMCs. ............................. 79
Figure 3.2. Western Blot of P2X7R Protein from Cultured hVSMCs ....................... 79
Figure 3.3. The Effect of the Specific P2X7R Antagonist A438079 on hVSMC-
Associated Calcification (Donor 1). ........................................................................... 81
Figure 3.4. The Effect of the Specific P2X7R Antagonist A438079 on hVSMC-
Associated Calcification (Donor 2). ........................................................................... 81
Figure 3.5. Characterisation and Culture of rVSMCs. ............................................... 82
Figure 3.6. Calcification of Rat Aortic Rings in vitro with Increasing Phosphate
Concentrations............................................................................................................ 84
Figure 3.7. Digitally Magnified Images of Calcified Rat Aorta. ............................... 84
Figure 3.8. H & E Stain of Normal and Calcified Aortic Rings. ............................... 85
Figure 3.9. Measurement of ATP in Culture Medium to Assess Tissue Viability. ... 86
Figure 3.10. Calcification of Rat Aortic Rings Over Time. ....................................... 86
xvi
Figure 3.11. The Effect of Elastase on Cultured Aortic Rings. ................................. 88
Figure 3.12. The Effect of the Specific P2X7R Antagonist A438079 and Agonist
BzATP on Aortic Ring Calcification. ........................................................................ 90
Figure 3.13. The Effect of the Specific P2X7R Antagonist A839977 on Aortic Ring
Calcification. .............................................................................................................. 91
Figure 3.14. The Influence of P2X7R Gene Deletion on Aortic Ring Calcification. 92
Figure 3.15. Expression of P2X7R in Control and Calcified Rat Aortic Rings......... 95
Figure 3.16. mRNA Copy Numbers for SM-22 and Caspase-3 in Cultured Rat Aortic
Rings Over Time. ....................................................................................................... 95
Figure 4.1. Weight Loss in Mice Treated with Folic Acid. ..................................... 105
Figure 4.2. Serum Biochemistry in Mice Treated with Folic Acid. ......................... 106
Figure 4.3. Absence of Kidney and Aortic Disease in Mice Treated with 240µg/g
Folic Acid. ................................................................................................................ 107
Figure 4.4. Acute Tubular Injury in Mice Treated with 480µg/g Folic Acid. ......... 108
Figure 4.5. Kidney and Aortic Disease in One Mouse Treated with 480µg/g Folic
Acid. ......................................................................................................................... 109
Figure 4.6. Weight Loss in Adenine-Fed Mice. ....................................................... 111
Figure 4.7. Kidney and Aortic Disease in Adenine-Fed Mice. ................................ 112
Figure 4.8. Changes in Serum Biochemistry in Adenine-Fed Mice. ....................... 113
Figure 4.9. Weight Loss in WT and KO Mice. ........................................................ 117
Figure 4.10. Serum Biochemistry in WT and KO Mice .......................................... 120
Figure 5.1. Aortic Calcium Deposition in Rats. ....................................................... 128
Figure 5.2. Macro- and Microscopic Appearance of Kidneys from Rats. ............... 129
Figure 5.3. P2X7R Protein Expression in Control and Calcified Rat Aorta. ........... 133
Figure 5.4. Quantification of Aortic Calcium Deposition........................................ 134
Figure 5.5. Calcium Deposition in Adenine-Fed Rat Aortas. .................................. 134
Figure 5.6. Correlation of Aortic Calcium Content and Number of Missed Gavages.
.................................................................................................................................. 135
Figure 5.7. Expression of Molecules Implicated in AC. .......................................... 138

xvii
Figure 5.8. Picrosirius Red Staining of Rat Kidney Tissue. .................................... 139
Figure 5.9. Kidney:Body Weight Ratio and Fluid Balance. .................................... 140
Figure 5.10. Serum Biochemistry Measured at 2 Weeks in V and HD groups. ...... 143
Figure 5.11. End-Point Serum Biochemistry. .......................................................... 144
Figure 5.12. End-Point Creatinine Clearance and Urine Biochemistry. .................. 145
Figure 5.13. Micro-CT Imaging of Cortical and Trabecular Bone. ......................... 147
Figure 5.14. Micro-CT Analysis of Bone. ............................................................... 148
Figure 5.15. Comparison of Bone Volume Between Control and CKD Rats.......... 149
Figure 6.1. ENPP-1 mRNA Expression in Rat Aorta. ............................................. 161
Figure 6.2. ENPP-1 Activity in Rat Aorta. .............................................................. 162
Figure 6.3. PPi Content of Rat Serum. ..................................................................... 162
Figure 6.4. Expression of ATP-Metabolism Related Molecules in Rat Aorta......... 164
Figure 6.5. mRNA Copy Numbers for ATP Metabolism-Related Molecules in
Cultured Rat Aortic Rings Over Time. .................................................................... 167
Figure 6.6. Calcium Deposition in Arteries from Patients with ESRD. .................. 170
Figure 6.7. Expression of ENPP-1 and ANK mRNA in Arteries from Patients with
ESRD........................................................................................................................ 172

xviii
LIST OF TABLES
Table 2.1. Animal Diets. ............................................................................................ 38
Table 2.2. Primers used for P2X7 Genotyping of Mice. ............................................ 42
Table 2.3. qPCR of Human RNA............................................................................... 64
Table 2.4. qPCR of Rat RNA. .................................................................................... 65
Table 2.5. Antibodies used for Western Blots. .......................................................... 74
Table 2.6. Antibodies used for Immunofluorescence. ............................................... 74
Table 3.1. mRNA Copy Numbers for P2X7R, SM-22 and Caspase-3 in Cultured Rat
Aortic Rings Over Time. ............................................................................................ 94
Table 4.1. Changes in Serum Biochemistry in Adenine-Fed Mice.......................... 114
Table 4.2. Serum Biochemistry Changes in WT and KO Mice. .............................. 119
Table 5.1. Serum Biochemistry from Rats in First Pilot Experiment. ..................... 129
Table 5.2. Kidney Parameters and Serum Biochemistry from Rats (n=4) in Second
Pilot Experiment....................................................................................................... 130
Table 5.3. Weight Changes. ..................................................................................... 131
Table 5.4. Corrected Absolute mRNA Copy Numbers for P2X7R. ........................ 132
Table 5.5. Aortic Calcification. ................................................................................ 134
Table 5.6. Corrected Absolute mRNA Copy Numbers............................................ 137
Table 5.7. Kidney:Body Weight Ratio and Fluid Balance....................................... 140
Table 5.8. Serum Biochemistry Measured at 2 Weeks in V and HD Groups. ......... 142
Table 5.9. End-Point Serum Biochemistry. ............................................................. 142
Table 5.10. End-Point Creatinine Clearance and Urine Biochemistry. ................... 145
Table 5.11. Micro-CT Analysis of Bone. ................................................................. 149
Table 6.1. mRNA Copy Numbers for ATP-Metabolism Related Molecules in Rat
Aorta. ........................................................................................................................ 160
Table 6.2. mRNA Copy Numbers for ATP Metabolism-Related Molecules in
Cultured Rat Aortic Rings Over Time. .................................................................... 166

xix
Table 6.3. Summary of Patient Characteristics ........................................................ 169

xx
ABBREVIATIONS
28S 28S Ribosomal RNA
2D 2-Dimensional
3D 3-Dimensional
α-SMA Alpha-Smooth Muscle Actin
ABCC-6 ATP Binding Cassette-6
AC Arterial Calcification
ADHR Autosomal Dominant Hypophosphataemic Rickets
ADP Adenosine Di-Phosphate
ADPKD Autosomal Dominant Polycystic Kidney Disease
ALP Alkaline Phosphatase
ALT Alanine Transaminase
AMP Adenosine Mono-Phosphate
ANCA Anti-Neutrophil Cytoplasmic Antibody
ANK Ankylosis Protein
ANOVA Analysis Of Variance
ApoE Apolipoprotein E
APRT Adenine Phosphoribosyltransferase
APS Ammonium Persulfate
ARHR2 Autosomal Recessive Hypophosphataemic Rickets Type 2
ATP Adenosine Tri-Phosphate
BCA Bicinchoninic Acid
BMD Bone Mineral Density
BMP Bone Morphogenetic Protein
bp Base Pair
BSA Bovine Serum Albumin
xxi
BzATP 2,3-(Benzoyl-4-Benzoyl)-ATP
cAMP Cyclic AMP
CD39 synonymous with Ecto-Nucleoside Triphosphate
Diphosphohydrolase-1 (NTPDase-1)
CD73 synonymous with Ecto-5'-Nucleotidase
cDNA Complementary DNA
CKD Chronic Kidney Disease
CKD-MBD Chronic Kidney Disease-Mineral Bone Disorder
CT Computerised Tomography
DAPI 4',6-Diamidino-2-Phenylindole
DMEM Dulbecco’s Modified Eagle Medium
DMSO Dimethyl Sulfoxide
DNA Deoxyribonucleic Acid
dNTP Deoxynucleotide
DTT Dithiothreitol
ECM Extraellular Matrix
EDTA Ethylenediaminetetraacetic Acid
ELISA Enzyme-Linked Immunosorbent Assay
ENPP Ecto-Nucleotide Pyrophosphatase/Phosphodiesterase
ERK Extracellular-Signal-Regulated Kinase
ESRD End-Stage Renal Disease
FGF-23 Fibroblast Growth Factor-23
GACI Generalised Arterial Calcification Of Infancy
GAPDH Glyceraldehyde 3-Phosphate Dehydrogenase
GFR Glomerular Filtration Rate
GSK Glaxo
H & E Haematoxylin & Eosin
xxii
HmD Haemodialysis
HEPES 4-(2-Hydroxyethyl)-1-Piperazineethanesulfonic Acid
HPMC Hydroxypropyl Methylcellulose/0.1% Tween80
HPRT Hypoxanthine-Guanine Phosphoribosyltransferase
HRP Horseradish Peroxidase
hVSMC Human Vascular Smooth Muscle Cell
IEL Internal Elastic Lamina
IHD Ischaemic Heart Disease
IL Interleukin
ip Intraperitoneal
KDIGO Kidney Disease Improving Global Outcomes
KO Knockout
KW Kruskal Wallis
LDLR Low-Density Lipoprotein Receptor
LPS Lipopolysaccharide
MeATP Methylene ATP
MGP Matrix Gla Protein
M-MLV Moloney-Murine Leukemia Virus
MMP Matrix Metalloproteinase
MMW Mean Molecular Weight
mRNA Messenger RNA
MRS Magnetic Resonance Spectroscopy
MV Matrix Vesicle
MWU Mann-Whitney U
NBF Neutral Buffered Formalin
NLRP3 Nacht Domain-,Leucine-Rich Repeat-,and PYD-Containing
Protein-3
xxiii
NS Nephrotic Syndrome
NT5E 5'-nucleotidase, Ecto (gene encoding ecto-5'-nucleotidase
(CD73))
NTPDase Ecto-Nucleoside Triphosphate Diphosphohydrolase (CD39)
P2X7R P2X7 Receptor
PAGE Polyacrylamide Gel Electrophoresis
PBS Phosphate-Buffered Saline
PCR Polymerase Chain Reaction
PD Peritoneal Dialysis
PFA Para-Formaldehyde
pNP-TMP Thymidine 5’-Monophosphate p-Nitrophenyl Ester Sodium
Salt
PPADS Pyridoxalphosphate-6-Azopheny-2’,4’-Disulfonate
PPi Inorganic Pyrophosphate
PTH Parathyroid Hormone
PWV Pulse Wave Velocity
qPCR Quantitative Polymerase Chain Reaction
RIN RNA Integrity Number
RIPA Radioimmunoprecipitation Assay
RNA Ribonucleic Acid
RPL13a Ribosomal Protein L13a
RRT Renal Replacement Therapy
RT Reverse Transcription
Runx-2 Runt-Related Transcription Factor-2
rVSMC Rat Vascular Smooth Muscle Cell
SD Standard Deviation
SDHA Succinate Dehydrogenase Complex, Subunit A
SDS Sodium Docecyl Sulphate
xxiv
SM-22 Smooth Muscle-22
SMMHC Smooth Muscle Myosin Heavy Chain
SNP Single Nucleotide Polymorphism
TAE Tris-Acetate-EDTA
TBS Tris-Buffered Saline
TBS/T Tris-Buffered Saline/Tween
TEM Transmission Electron Microscopy
TEMED Tetramethylethylenediamine
TNAP Tissue Non-Specific Alkaline Phosphatase
TNF-α Tumour Necrosis Factor Alpha
TP Transplant
Tris Tris(hydroxymethyl)aminomethane
tRNA Transfer RNA
UDP Uridine-5'-Di-phosphate
Up4A Uridine Adenosine Tetraphosphate
UTP Uridine-5'-Tri-phosphate
UUO Unilateral Ureteric Obstruction
UV Ultraviolet
VSMC Vascular Smooth Muscle Cell
WT Wild-type
YWHAZ Tyrosine 3-Monooxygenase/Tryptophan 5-Monooxygenase
Activation Protein Zeta

1
CHAPTER 1 – INTRODUCTION
PART 1 - Chronic Kidney Disease-Associated Arterial Calcification
1.1 Chronic Kidney Disease Is Associated With Increased Cardiovascular Risk
Chronic Kidney Disease (CKD) is a global health problem with an estimated
prevalence of 12% in developed countries (Levey et al 2011, Levey & Coresh 2012).
Cardiovascular events are the leading cause of death in patients with CKD
(Angelantonio et al 2010) and those on renal replacement therapy (RRT) (Pruthi et
al 2014). Moreover, renal impairment is associated with a marked increase in
cardiovascular risk compared with the general population (Tonelli et al 2006) and
this risk continues to increase as glomerular filtration rate (GFR) declines (Go et al
2004). Scoring systems which use traditional ‘Framingham’ risk factors (Dawber et
al 1957, Dawber et al 1959) to predict the likelihood of a cardiovascular event
consistently produce underestimates in patients with CKD (Weiner et al 2007) and
accordingly the concept of ‘renal specific’ risk factors has emerged. A number of
these non-traditional risk factors have been proposed (Baigent et al 2000) and
include chronic inflammation, volume overload, elevated parathyroid hormone
(PTH), anaemia, ‘uraemic toxins’, hyperhomocysteinaemia, hyperphosphataemia
and, perhaps most importantly, arterial calcification (AC).
1.2 Arterial Calcification In Patients With Chronic Kidney Disease
AC is highly prevalent in patients with CKD and can occur in the intimal or medial
layers of the vessel wall (Amann 2008). Intimal calcification occurs in the context of
atherosclerotic disease in a fashion identical to that seen in the general population
and is associated with the numerous, well-established risk factors known to promote
this process (Dawber et al 1957, Dawber et al 1959). Calcification of the arterial
media is much more specific, although not unique, to patients with CKD (Amann
2008).
AC is linked to adverse health outcomes and numerous studies have shown that the
severity of AC predicts survival, with higher calcification scores associated with
increased mortality in both dialysis (London et al 2003) and pre-dialysis patients
(Chiu et al 2010). In the case of intimal calcification this observation is hardly
surprising given that it is directly related to atherosclerotic disease. However, medial
2
AC leads to decreased arterial compliance, an increase in pulse-wave velocity
(PWV) and an associated increase in cardiac afterload (London et al 2003, Sigrist et
al 2007, Sutliff et al 2011), which may also contribute to this increase in
cardiovascular risk.
AC also contributes to profound morbidity in patients with end-stage renal disease
(ESRD). AC of the iliac vessels frequently precludes successful kidney
transplantation because of the difficulty posed in forming donor-recipient arterial
anastomoses and, similarly, creation of arterio-venous fistulae can be complicated in
patients requiring haemodialysis (HmD). In addition, AC contributes to the
devastating and often fatal condition calciphylaxis (calcific uraemic arteriolopathy)
(Adrogue et al 1981).
1.3 The Aetiology Of Arterial Calcification
Calcification of the arterial intima, as discussed above, is associated with
atherosclerosis. The pathogenesis of this form of vascular disease is relatively well
established and known to involve lipid accumulation, inflammatory cell infiltration
and plaque formation (Weber & Noels 2011). In contrast, the mechanisms
contributing to arterial medial calcification are much less well understood but seem
to be different to those involved in atheroma because lipid and inflammation are
consistently absent in these lesions and calcification can occur independently at this
site (Shanahan et al 1999, Shroff et al 2008). This form of disease is the focus of this
thesis and all subsequent reference to AC relates to calcium deposition within the
medial layer of the vessel wall.
1.3.1 AC is not simply the result of passive mineral deposition.
The traditionally held view was that AC occurred in patients with CKD when the
circulating concentrations of calcium and phosphate were elevated to such a degree
so as to ‘supersaturate’ serum, with the consequent passive deposition of both in the
walls of blood vessels. However, AC is frequently seen in patients with ‘normal’
circulating levels of these ions such as in the setting of diabetes (Shanahan et al
1999) and/or aging (Allison et al 2004), and not all patients with
hyperphosphataemia develop AC (Parfitt 1969, Amann 2008). Therefore intuitively

3
the pathogenesis must be more complex than the explanation offered by this simple
‘passive-deposition’ model.
The ‘passive-deposition’ theory also falls down when one considers the normal
process of bone formation. In this tissue, on-going mineralisation manifesting as
hydroxyapatite deposition (which is also the most common form of mineral detected
in AC (Schliper et al 2010)), occurs in an organised fashion without the requirement
of elevated serum calcium and phosphate concentrations. This suggests that
conditions and/or adaptations in the local environment, rather than the absolute
concentration of the relevant circulating ions, determine whether calcification
develops. In addition, there are now several described genetic disorders that result in
abnormal calcification of the vasculature without disturbances in serum calcium and
phosphate balance (Rutsch et al 2003, St Hilaire et al 2011, Nitschke et al 2012,
Eytan et al 2013).
The implication from these observations is that ‘non-passive’ factors must contribute
to the pathogenesis of AC. As will now be reviewed, this concept has led to a recent
explosion of research into the possible factors governing the development and
progression of ectopic arterial calcium deposition.
1.4 Methods Used To Study Arterial Calcification
Before discussing the current theories pertaining to the pathogenesis of AC it is
important to outline the various experimental systems employed to study the disease.
In vitro and in vivo models have been developed, each with distinct advantages and
drawbacks.
1.4.1 Cell and tissue culture models.
As expanded upon below, the vascular smooth muscle cell (VSMC) has emerged as
a ‘key player’ in the development of AC and in vitro models used frequently involve
the culture of this cell type. In culture, VSMCs are described to form nodules which
spontaneously calcify over a number of weeks (Proudfoot et al 1998). When the
concentration of phosphate and/or calcium of the culture medium is increased,
calcification is reported to occur more rapidly and in association with matrix vesicles
(MVs) released from the cell (Reynolds et al 2004).

4
Although VSMCs in culture can secrete matrix (Underwood & Whitelock 1998,
Reynolds et al 2004), they lack their normal extracellular architecture. In particular,
the elastic lamina is absent in vitro, which in vivo is the initial site of medial AC
(Lanzer et al 2014). Ex vivo arterial ring culture models offer an alternative approach
to overcome this issue (Lomashvili et al 2004, Shroff et al 2010). Here, segments of
artery are removed from either animals or humans and cultured in a similar fashion
to VSMCs. Owing to the fact that tissue is intact in this system, it is thought to better
simulate ‘real life’ conditions. Furthermore, when VSMCs are placed in culture they
lose their contractile properties usually present in vivo and simultaneously change
expression profiles of some genes (Nakano-Kurimoto et al 2009). Ring culture
models are thought to also minimise this effect (Lomashvili et al 2004).
1.4.2 Rat models.
In rats, AC can be induced by CKD-independent or -dependent mechanisms. For
investigating CKD-associated AC there are 3 main rat models in common use – the
5/6th
nephrectomy model, the Cy/+ rat and the adenine nephropathy model. A brief
account of the non-CKD models will first be given before expanding upon these
CKD-dependent systems.
1.4.2.i Non-CKD rat models.
In the absence of renal injury AC has successfully been induced by the
administration of warfarin (Price et al 1998), owing to its antagonism of vitamin K,
which is required to activate the calcification inhibitor matrix gla-protein (MGP)
(Hao et al 1995) (see section 1.5.3.ii). High-dose vitamin D can also be injected into
rats with the effect of causing widespread AC (Fleisch et al 1965). A more invasive
method of producing AC was described by Basalyga et al (2004) whereby the aorta
was surgically exposed and calcium chloride directly applied for 15 minutes using a
pre-soaked gauze.
1.4.2.ii The 5/6th
nephrectomy model.
The 5/6th
nephrectomy model usually involves a two-stage surgical procedure
whereby a partial nephrectomy of one kidney is performed, followed by a
contralateral total nephrectomy some days later (Chauntin & Ferris 1932). This
reduction in functional renal mass is enough to induce the serum biochemical
5
changes of CKD such as elevations in creatinine, urea and phosphate, but rarely
leads to arterial calcium deposition (Shobeiri et al 2010). AC can be induced in this
model by the addition of a high phosphate diet. The normal dietary phosphate
content for rats is around 0.5% (Haut et al 1980). If this is increased to at least 0.9%,
some rats, but not all, will develop AC over 3-6 months (Neven & D’Haese 2011).
Additional daily administration of vitamin D to animals on this regime has been
reported to bring calcification rates closer to 100% (Haffner et al 2005).
1.4.2.iii The Cy/+ rat.
The heterozygous Cy/+ rat develops autosomal dominant polycystic kidney disease
(ADPKD) and by around 9 months of age displays all the biochemical features of
advanced CKD (Kaspareit-Rittinghausen et al 1990). AC was induced in this model
by Moe et al (2008). These investigators fed a 0.7% phosphate-containing diet to
male Cy/+ rats and observed high-turnover bone disease and AC in 60% of these
animals at 38 weeks. Interestingly, no calcification was observed at 34 weeks.
1.4.2.iv The adenine nephropathy model.
The third rat model involves the dietary administration of adenine. This model
closely resembles the human disease, adenine phosphoribosyltransferase (APRT)
deficiency - a rare, autosomal recessive disorder which can result in ESRD if
untreated (Bollee et al 2010). Adenine is usually metabolised by the enzyme APRT
to generate adenosine mono-phosphate (AMP) (Hori & Henderson 1966). As a
consequence of this reaction the concentration of circulating adenine is usually
maintained at a very low level. However, if present in sufficiently high amounts, (a
diet containing 0.75% adenine is commonly administered), the excess load will
cause the enzyme to become saturated. Under these circumstances adenine is
metabolised by xanthine oxidase to yield the product 2,8-dihydroxyadenine which is
relatively insoluble at urinary pH and therefore precipitates out in the tubular lumen
causing obstruction, fibrosis and ultimately advanced renal impairment (Yokozawa
et al 1986, Okada et al 1999). High-turnover bone disease is also a feature of this
model (Katsumata et al 2003).
If used in combination with a high phosphate diet, some rats fed this regime will
develop AC over 4 weeks (Shobeiri et al 2010, Neven & D’Haese 2011). However,
6
many of the early studies that employed this model reported high variability with
some animals developing extensive AC but calcium deposition undetectable in
others. In this regard a major advance was made by Price et al (2006) who combined
the 0.75% adenine/high phosphate regime with a low (2.5%) dietary protein content.
This had the unexpected effect of inducing extensive aortic calcification in all
animals. The mechanism underlying this observation is unclear but may involve a
higher bioavailability of phosphate due to less of the ion being bound to protein
(Neven & D’Haese 2011).
1.4.3 Mouse models.
1.4.3.i Non-CKD models.
A number of murine models of AC are described in mice with targeted genetic
deletions. Examples include animals with a specific knockout (KO) of genes
encoding apolipoprotein E (apoE) (Jawein et al 2004), low-density lipoprotein
receptor (LDLR) (Ishibashi et al 1994), MGP (Luo et al 1997), ecto-nucleotide
pyrophosphatase/phosphodiesterase-1 (ENPP-1) (Sali et al 1999) and fetuin A
(Schafer et al 2003). The apoE and LDLR KO animals actually develop
atherosclerotic calcification and are therefore less useful for studying medial disease.
The others have deletions in genes encoding calcification inhibitors (see section
1.5.3).
1.4.3.ii CKD model.
To investigate AC due to CKD, only one mouse model has been described to date
(El-Abbadi et al 2009). This involves a two-stage surgical reduction of renal mass
(5/6th
nephrectomy) in adult, female, DBA/2 mice, followed by an extended period
of high phosphate feeding. In the original report by El-Abbadi et al (2009) the
majority of mice exhibited extensive medial aortic calcification with typical
biochemical features of advanced renal disease after 3 months. Interestingly, these
authors reported that female mice developed aortic calcification much more readily
than males, hence the exclusive use of this gender. These investigators have also
shown that high-turnover bone disease occurs in this model (Lau et al 2012a).
The DBA/2 strain of mouse used in this model appears to be critical as it is prone to
cardiovascular calcification whereas other commonly employed strains such as the

7
C57Bl/6 are reported to be resistant (Eaton et al 1978). The mechanism underlying
this strain difference has been partially elucidated. Using quantitative trait locus
analysis, a number of relevant loci have been mapped with the major contributor
(Dyscalc1) located on chromosome 7 (Ivandic et al 2001). The causative gene was
subsequently found to be Abcc6 (which encodes the ATP-binding cassette
transporter ABCC-6). Mice prone to calcification display reduced levels of this
protein (Meng et al 2007).
1.5 The Pathogenesis Of Arterial Calcification
There is now overwhelming evidence to indicate that AC involves the non-passive
deposition of mineral and that it is a cell-mediated and regulated process. A number
of mechanisms have been implicated in the pathogenesis and those which have been
consistently advanced in the literature are now discussed. It should be noted however
that for the majority of these pathways much controversy and divided opinion still
exists within the scientific community regarding their relevance and role in
mediating AC. A summary of these mechanisms is shown in Figure 1.1.
1.5.1 The role of the VSMC.
1.5.1.i Links with bone formation.
Although a number of cell types have been shown to contribute to AC (Shanahan et
al 2011), the VSMC is now considered to be fundamentally important. VSMCs are
of mesenchymal origin and display a continuum of plasticity in their phenotype,
ranging from a contractile state at one end to a synthetic entity at the other. This
latter state is characterised by the ability of the cell to proliferate and secrete growth
factors and extracellular matrix (ECM) (Rensen et al 2007).

8
9
Techniques such as transmission electron microscopy (TEM) (Schlieper et al 2010)
and magnetic resonance spectroscopy (MRS) (Duer et al 2008) have revealed that in
man, arterial mineral deposits frequently take the form of hydroxyapatite in a
structure that very closely resembles the architecture of bone. In keeping with these
observations, a number of in vitro studies (reviewed in Shanahan et al 2011) have
reported that, when cultured in calcification-promoting (high phosphate) conditions,
VSMC phenotype switches from the contractile state to take on characteristics more
typically associated with bone-forming, (i.e. synthetic and secretory), osteoblast-like
cells. This so called ‘osteogenic transformation’ is usually inferred by detecting a
decrease in messenger ribonucleic acid (mRNA) and/or protein for VSMC-specific
markers such as alpha-smooth muscle actin (α-SMA) and smooth muscle-22 (SM-
22) (Proudfoot & Shanahan 2012) in association with an increase in osteogenic
transcription factors such as runt-related transcription factor-2 (runx-2) (Komori et al
1997, Ducy et al 1997) and osterix (Nakashima et al 2002) and/or other bone-related
proteins including bone morphogenetic protein (BMP) -2 (Celil et al 2005).
Similar findings have also been reported by some groups using in vivo models. For
example, using immunohistochemistry to assess aortas taken from 5/6th
nephrectomised mice, Pai et al (2011) reported decreased and increased staining in
calcified vessels for SM-22 and runx-2, respectively. In humans, increased staining
for runx-2 and other bone-related proteins has been reported in calcified vessels
taken from patients with ESRD (Moe et al 2002, Shroff et al 2008).
It is thought that phosphate plays a key role in mediating VSMC osteogenic
transformation. In vitro studies have suggested that VSMCs up-regulate runx-2 when
cultured in high phosphate conditions and that this occurs in a dose-dependent
manner (Jono et al 2000). Intracellular uptake of phosphate through the sodium-
dependent co-transporters PiT-1 and PiT-2 is thought to be vital to this pathway
because cell and animal studies in which these proteins were knocked-down showed
suppression of both runx-2 expression and calcium deposition (Li et al 2006,
Crouthamel et al 2013).
How phosphate brings about these cellular changes is unknown. One group have
implicated activation of extracellular-signal-regulated kinase (ERK) 1/2 as a possible
mechanistic pathway because up-regulation of runx-2 occurred in parallel with
10
increased phosphorylation of this protein in murine VSMCs exposed to high
phosphate in vitro. Inhibition of ERK1/2 phosphorylation prevented this effect
(Speer et al 2009). Other potential phosphate-induced mechanisms include
increasing SM-22 methylation (Montes de Oca et al 2010) and an elevation in
reactive oxygen species (Zhao et al 2011).
1.5.1.ii VSMC apoptosis and release of MVs.
Some studies have implicated apoptosis as an important mechanism in driving the
development of AC. Cultured VSMCs undergo apoptosis in calcification-promoting
conditions and apoptotic bodies are thought to act as nucleation sites for mineral
attachment and crystal expansion (Proudfoot et al 2000). Increased apoptosis has
been demonstrated in calcified arteries taken from patients with CKD (Shroff et al
2008) and apoptosis inhibitors have been shown to reduce AC in an ex vivo model
(Shroff et al 2010).
Elevated extracellular calcium is thought to be an important driver of apoptosis in
this context. VSMCs undergo enhanced apoptosis when cultured in an elevated
concentration of calcium and the apoptotic bodies formed calcify to a greater extent
when the environment is rich in this ion (Proudfoot et al 2000). In this study by
Proudfoot et al, phosphate appeared to exert a synergistic effect in mediating
apoptosis. This may be due to phosphate-induced suppression of the anti-apoptotic
factor, growth arrest-specific protein 6 (Son et al 2006).
Another early event in the development of AC is thought to be the release of MVs by
VSMCs. MVs are membrane-bound sacs containing pre-formed hydroxyapatite
which, in a similar fashion to apoptotic bodies, can serve as nucleation sites for
hydroxyapatite growth (Reynolds et al 2004). In non-calcified states VSMCs still
seem to contain MVs but here the vesicles are loaded with calcification inhibitors
such as fetuin A (Reynolds et al 2005). The combination of suppressed inhibitor
levels (see section 1.5.3) and elevated extracellular calcium appear to confer the
property of ‘calcification-competence’ on these MVs.
11
1.5.2 AC is related to bone health.
Over recent years a number of studies have consistently reported an inverse
relationship between bone health and AC. In both the general population and in those
with osteoporosis, bone mineral density (BMD) has been shown to negatively
correlate with extra-osseous mineralisation (see Persy & D’Haese 2009). A
connection with rarer bone disorders such as Paget’s disease has also been suggested
(Laroche & Delmotte 2005). A similar association seems to exist in CKD, although
as detailed below, the spectrum of bone disease is more complex in this clinical
setting, encompassing more than isolated alterations in BMD.
In recognition of the fact that in a number of observational studies investigating
patients with renal impairment, disturbances in mineral homeostasis were closely
linked not only to bone health, but also to arterial disease in the form of ectopic
calcification, in 2006 the Kidney Disease Improving Global Outcomes (KDIGO)
group coined the term ‘Chronic Kidney Disease-Mineral Bone Disorder’ (CKD-
MBD) (Moe et al 2006). This is defined as the presence, in a patient with CKD, of at
least one of the following:
1. Abnormalities in serum phosphate, calcium, PTH or vitamin D.
2. Abnormalities of bone turnover, mineralisation, volume, linear growth or
strength.
3. Vascular or other soft tissue calcification.
Although the paradigm of CKD-MBD has now been adopted by the renal
community it must be borne in mind that a definitive link between bone and AC has
yet to be proven (Persy & D’Haese 2009).
As implied by the second component of the CKD-MBD definition above, several
elements of normal bone homeostasis can be disturbed in patients with renal
dysfunction. Which of these processes is most closely related to AC is unknown.
Low bone turnover has been found to associate with AC by some groups (London et
al 2004, Tomiyama et al 2010) whilst others have found a link with both high- and
low-turnover states (Barreto et al 2008, Asci et al 2011). Experimentally, correction
of the low-turnover state in CKD mice, achieved by administration of BMP-7,
12
resulted in an attenuation of AC (Davies et al 2005). The study by Tomiyama et al
(2010) also reported an inverse relationship between AC and bone density and
volume. Other groups have also found AC to negatively correlate with bone volume
(Barreto et al 2008, Adragao et al 2009).
1.5.3 Inhibitors of calcification.
A number of calcification inhibitors are produced in vivo to protect against unwanted
ectopic mineral deposition in sites such as the cardiovascular system. Possibly the
one that has received most attention is inorganic pyrophosphate (PPi) which is
discussed in depth in Part 2 of this chapter. Other inhibitors that have been studied in
some detail include fetuin A and MGP.
1.5.3.i Fetuin A.
Fetuin A is a protein synthesised in the liver and is present in extracellular tissue as
well as in high concentrations in plasma. The molecule strongly binds calcium and
phosphate and is thought to act as a scavenger of these ions to prevent calcification
(Jahnen-Dechent et al 2011). In keeping with this theory, fetuin A KO mice display
widespread extra-skeletal mineral deposits (Schafer et al 2003, Jahnen-Dechent et al
2011).
Serum fetuin A appears to be suppressed in patients with ESRD (Ketteler et al 2003)
but not early stages of CKD (Ix et al 2006). In a cross-sectional study of dialysis
patients Ketteler et al (2003), found an association between lower circulating fetuin
A and cardiovascular mortality. Whether this finding is related to inhibition of
calcification is not clear, however some studies have found an inverse correlation
between plasma fetuin A levels and AC in patients with CKD (Moe et al 2005, Koos
et al 2009).
1.5.3.ii MGP.
MGP is a vitamin K-dependent protein present in bone and the vasculature (Hao et al
1995). As noted above, rodents treated with the vitamin K antagonist, warfarin,
develop AC (Price et al 1998) and MGP KO mice exhibit widespread ectopic
mineral deposition (Luo et al 1997). In humans, a mutated form of MGP occurs in
Keutal’s syndrome (Munroe et al 1999), a rare autosomal recessive disorder in
13
which AC is a feature, albeit relatively mild (Meier et al 2001). MGP is reported to
be up-regulated in calcified arteries taken from uraemic rats, possibly as a protective
response, although the exact mechanism through which it inhibits AC remains
uncertain (Lomashvili et al 2011). Patients with CKD are vitamin K-deficient
(Holden et al 2010) and treatment with vitamin K reduces AC in uraemic rats
(McCabe et al 2013). Together these findings suggest that CKD is, in effect, a state
of functional MGP deficiency.
1.5.4 Degradation and remodelling of the ECM.
Microscopic evaluation of the early stages of AC has indicated that mineral
deposition initially occurs on elastin fibres in the ECM (Lanzer et al 2014, O’Neill &
Adams 2014). Elastin has a propensity to bind calcium and phosphate (Urry 1971)
and increasing evidence suggests that integral and structural disruption of this
molecule within the ECM contributes to AC (Pai & Giachelli 2010).
Matrix metalloproteinases (MMPs) -2 and -9 and cathepsin S are enzymes capable of
degrading elastin (Chow et al 2007). In vivo studies have indicated that genetic
deficiency of any of these proteins can protect against arterial calcium deposition
(Basalyga et al 2004, Aikawa et al 2009). Using the Cy/+ rat model, Chen et al
(2011) showed an increase in activity of both MMP-2 and MMP-9 in CKD and that
blocking enzyme activity pharmacologically reduced calcification in an ex vivo
model. Up-regulation of MMP-2 was also detected in arteries taken from patients
with CKD compared with controls (Ada et al 2009) and this correlated with both the
degree of elastin fibre disorganisation and detectable calcification. In the murine
model of CKD-associated AC, fragmentation and disruption of elastin were seen to
occur prior to the onset of calcification (Pai et al 2011).
Interestingly some authors have also shown that elastin fragments can induce VSMC
osteogenic transformation in vitro even in the absence of increased phosphate
(Simionescu et al 2005). When high phosphate conditions are present, calcification
is accelerated in the presence of elastin degradation products (Hosaka et al 2009).

14
1.6 Current Treatment Options For Arterial Calcification
At present there are no treatments available to specifically prevent or attenuate the
progression of AC. Cholesterol-lowering agents are of proven efficacy for reducing
atherosclerosis-related mortality in those at risk in the general population (Baigent et
al 2005) and this benefit seems to be maintained in patients with CKD (Baigent et al
2011) although probably not in those on dialysis (Wanner et al 2005, Fellstrom et al
2009). The utility of these agents in kidney transplant (TP) recipients is currently
uncertain (Palmer et al 2014). Beta-blockers and agents that inhibit the renin-
angiotensin-aldosterone system may also confer some cardiovascular protection in
selected patients with CKD although large, randomised, prospective studies using
patient-centred outcomes are lacking (Kidney Disease: Improving Global Outcomes
(KDIGO) CKD Work Group 2013).
Although AC is not simply a function of circulating concentrations of phosphate and
calcium, as demonstrated experimentally in the studies discussed previously (section
1.5), these ions are clearly able to contribute to ectopic mineralisation. These
observations, coupled with the apparent link between bone health and AC, have led
many to investigate whether correcting phosphate and calcium biochemistry in
patients with CKD will influence the development and/or progression of arterial
calcium deposition.
Phosphate-binding agents are commonly prescribed to patients with ESRD in an
attempt to limit intestinal absorption of this ion and a number of studies have
evaluated the influence of these compounds on AC. Phosphate-binders can be either
calcium-containing or non-calcium-containing and a major issue that has recently
come to light is the excess calcium burden caused by administration of the former
class of compound. Many studies have indicated that calcium-containing binders
lead to a more rapid progression of AC compared with non-calcium-containing
agents (Chertow et al 2002, Block et al 2005, Russo et al 2007) and moreover, a
recent meta-analysis demonstrated that calcium-containing compounds were also
associated with a higher mortality rate (Jamal et al 2013).
In fact, whether phosphate-binders are beneficial at all is uncertain. No prospective
trial has ever been performed to determine whether these agents confer a survival
15
benefit compared with placebo. A prospective trial which evaluated both calcium-
based and non-calcium-based phosphate binders in patients not yet on RRT
suggested that whilst these agents do lower serum phosphate, they may actually lead
to increased AC (Block et al 2012). It should be noted that progression of AC was
not the primary outcome in this study and patient numbers were relatively small. In
addition, the greatest risk for AC seemed to be in the group taking calcium-based
drugs. However, the findings highlight the urgent need for trials addressing patient-
level outcomes. At present most clinicians would still advocate the use of phosphate-
binders for patients with hyperphosphataemia although it is likely that prescriptions
of calcium-based agents will now fall.
Calcimimetic drugs such as cinacalcet, effectively reduce serum PTH and also
suppress calcium and phosphate levels (Quarles et al 2003, Block et al 2004). These
agents have been shown to reduce AC in rats with CKD (Kawata et al 2008, Henley
et al 2009). The ADVANCE trial (Raggi et al 2011) compared the effect of cinacalet
plus low dose vitamin D with vitamin D therapy alone, on the progression of AC in
patients on HmD. The primary outcome measure in this trial was progression in
density of AC and this did not reach statistical significance. However, when AC was
measured volumetrically, cinacalcet retarded progression. In the EVOLVE trial
(Chertow et al 2012), cinacalcet led to a non-significant reduction in the primary
composite end-point of cardiovascular events and death compared with placebo. The
effect reached statistical significance after correcting for baseline characteristics.
A number of other interventions which aim to minimise phosphate and/or calcium
loading are currently recommended by KDIGO (Kidney Disease: Improving Global
Outcomes (KDIGO) CKD–MBD Work Group 2009). Logically they would all seem
to be beneficial, although none have been evaluated in long-term, randomised,
controlled trials. Suggested measures include restricting dietary intake of phosphate,
optimising dialytic phosphate removal, minimising dialysate calcium concentrations
and avoiding excessive vitamin D therapy.
Despite theoretical advantages of these interventions they remain non-specific to AC
and whilst some may possibly slow progression of the disease, there is currently no
way of inhibiting the process altogether. Based on what is known about the
pathogenesis of AC a number of potential therapeutic agents are currently in the
16
early stages of investigation. Examples of these include vitamin K (Krueger et al
2013) and sodium thiosulphate (Adirekkiat et al 2010). As will now be discussed,
there are a number of reasons to consider evaluating various components of the
purinergic system as potential targets for therapy.
PART 2 - Adenosine Tri-Phosphate And Arterial Calcification
1.7 An Overview Of The Purinergic System
The ability of adenosine tri-phosphate (ATP) to exert physiological effects in the
mammalian heart, in addition to its role as the main cellular energy source, was first
recognised almost a century ago in the seminal work of Drury and Szent-Gyorgi
(1929). The extracellular ATP receptor system, known collectively as the purinergic
system, was first predicted by Burnstock in the 1970s and is now well-characterised
(Burnstock 2006, Burnstock 2012). It has been implicated in a number of biological
processes and disease states, well illustrated by the therapeutic role of the P2Y12
antagonist, clopidogrel, in the treatment of myocardial infarction (Sabatine et al
2005).
Two broad categories of purinergic receptors have been identified on a wide range of
cells (see Burnstock 2012 for an in-depth review and historical perspective). P1
receptors are G protein-coupled and respond primarily to adenosine. Four subtypes
have been described to date, A1, A2A, A2B and A3. P2 receptors are principally
activated by tri- and di-nucleotides and are classified as either P2X or P2Y. P2X
receptors are ion-gated channels consisting of 3 subunits, 7 subtypes are currently
recognised (P2X1-7). P2Y receptors are G protein-coupled with 8 subtypes currently
known (P2Y1, 2, 4, 6, 11-14). Receptors are numbered according to the order in
which they were discovered. The dis-continuous P2Y numbering system is because
some receptors were initially assigned to this group but subsequently identified as
either species homologues or as belonging to an alternative receptor family.
The availability of extracellular nucleotides for activation of these receptors is tightly
regulated by a number of enzymes, the ecto-nucleotidases, which catalyse the
metabolism of ATP and related molecules (Figure 1.2) (Zimmermann et al 2012).
There are 4 broad categories of enzymes in this class. Ecto-nucleoside triphosphate
diphosphohydrolases (NTPDases), of which there are 8, including CD39 (NTPDase-
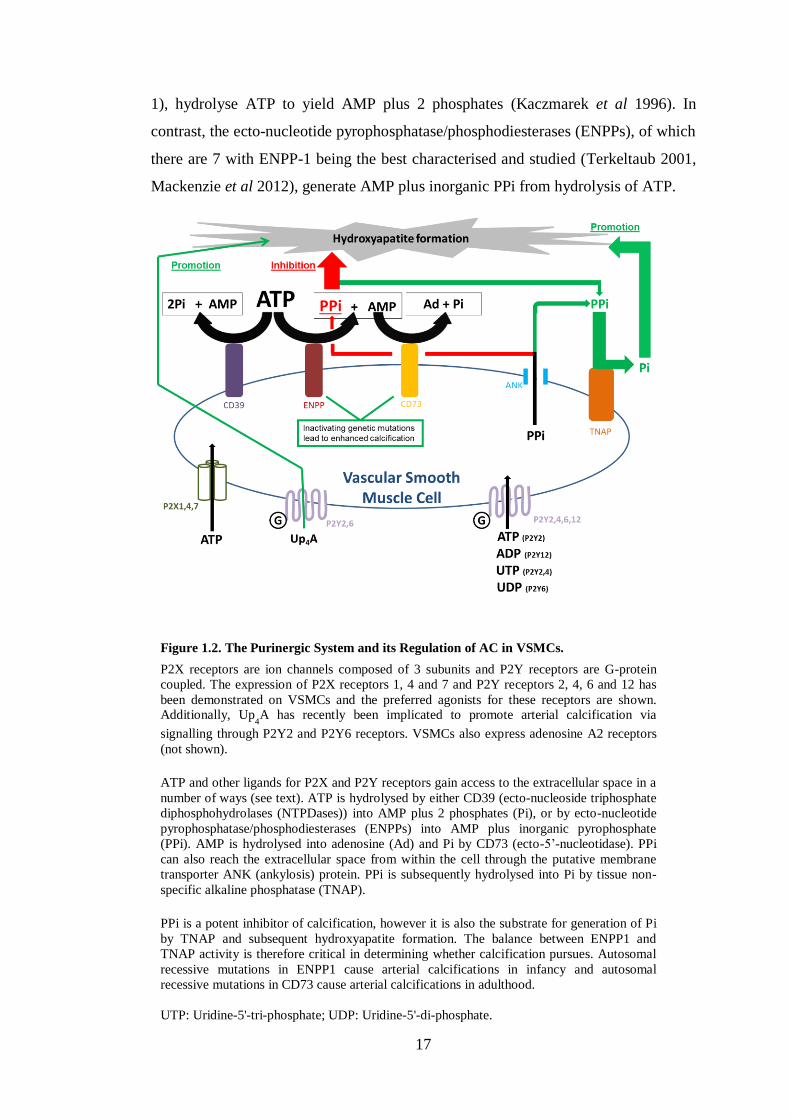
17
1), hydrolyse ATP to yield AMP plus 2 phosphates (Kaczmarek et al 1996). In
contrast, the ecto-nucleotide pyrophosphatase/phosphodiesterases (ENPPs), of which
there are 7 with ENPP-1 being the best characterised and studied (Terkeltaub 2001,
Mackenzie et al 2012), generate AMP plus inorganic PPi from hydrolysis of ATP.
Figure 1.2. The Purinergic System and its Regulation of AC in VSMCs.
P2X receptors are ion channels composed of 3 subunits and P2Y receptors are G-protein
coupled. The expression of P2X receptors 1, 4 and 7 and P2Y receptors 2, 4, 6 and 12 has
been demonstrated on VSMCs and the preferred agonists for these receptors are shown. Additionally, Up
4A has recently been implicated to promote arterial calcification via
signalling through P2Y2 and P2Y6 receptors. VSMCs also express adenosine A2 receptors
(not shown).
ATP and other ligands for P2X and P2Y receptors gain access to the extracellular space in a
number of ways (see text). ATP is hydrolysed by either CD39 (ecto-nucleoside triphosphate
diphosphohydrolases (NTPDases)) into AMP plus 2 phosphates (Pi), or by ecto-nucleotide
pyrophosphatase/phosphodiesterases (ENPPs) into AMP plus inorganic pyrophosphate
(PPi). AMP is hydrolysed into adenosine (Ad) and Pi by CD73 (ecto-5’-nucleotidase). PPi
can also reach the extracellular space from within the cell through the putative membrane
transporter ANK (ankylosis) protein. PPi is subsequently hydrolysed into Pi by tissue non-
specific alkaline phosphatase (TNAP).
PPi is a potent inhibitor of calcification, however it is also the substrate for generation of Pi
by TNAP and subsequent hydroxyapatite formation. The balance between ENPP1 and
TNAP activity is therefore critical in determining whether calcification pursues. Autosomal
recessive mutations in ENPP1 cause arterial calcifications in infancy and autosomal
recessive mutations in CD73 cause arterial calcifications in adulthood.
UTP: Uridine-5'-tri-phosphate; UDP: Uridine-5'-di-phosphate.
18
This family of enzymes can alternatively hydrolyse ATP to generate adenosine di-
phosphate (ADP) and subsequent AMP with phosphate side-products, although this
reaction occurs much less readily than that of PPi generation. PPi is a potent
inhibitor of hydroxyapatite formation (Fleisch et al 1965), and thus tissue
calcification, but can be converted to phosphate by the action of the enzyme tissue
non-specific alkaline phosphatase (TNAP) (Murshed et al 2005), thereby promoting
mineralisation. Intracellular PPi may also be secreted via the ankylosis protein
(ANK) (Terkeltaub 2001). AMP is converted to adenosine by the action of ecto-5’-
nucleotidase (CD73), which also generates one phosphate molecule (Arch &
Newsholme 1978).
1.7.1 Potential sources of extracellular ATP.
ATP release from erythrocytes (Bergfeld & Forrester 1992) and perivascular nerves
(Lew & White 1987) has been described. With respect to the cardiovascular system
specifically, studies have shown that endothelial cells (Bodin & Burnstock 1996) and
VSMCs (Katsuragi et al 1991) are able to contribute directly to extracellular ATP
levels. Proposed mechanisms of release from these cells include vesicular
exocytosis, ATP-binding cassettes, and connexin and pannexin hemi-channels. In
addition, direct cell surface synthesis of ATP by F1/F0-ATP synthase has been
proposed (Lohman et al 2012).
1.8 Purinergic Receptor-Mediated Calcification
The expression of P2 receptors in VSMCs has been investigated and the presence of
P2X1, P2X4 and P2X7 has been demonstrated, along with P2Y2, P2Y4, P2Y6 and
P2Y12. Of the P1 sub-family, A2 receptors are the main receptors present in the
arterial media (Wang et al 2002, Wang et al 2003, Erlinge & Burnstock 2008,
Burnstock 2009, Schuchardt et al 2011) (Figure 1.2).
1.8.1 P2Y receptors.
P2Y receptors have been directly implicated in the process of AC. Schuchardt and
colleagues (2012) were able to show enhanced calcification of both cultured rat
VSMCs and the medial layer of rodent aortic rings on exposure to calcification
medium (culture medium supplemented with 10mM β-glycerolphosphate) with the
addition of uridine adenosine tetraphosphate (Up4A). This molecule, released from

19
endothelial cells under conditions such as hypoxia or exposure to shear stress is able
to activate a number of P2X and P2Y receptors (Matsumoto et al 2011). The authors
went on to identify P2Y2 and P2Y6 as potential mediators of AC in experiments
using VSMCs exposed to specific receptor antagonists and also aortic rings from
P2Y2 KO mice. Furthermore, this study found that Up4A is elevated in patients with
CKD.
Of interest, Erlinge and colleagues (1998) have linked P2Y2 receptors to a switch in
VSMC phenotype from contractile to synthetic in experiments showing that the
expression of mRNA for this receptor is upregulated in rodent VSMCs in long-term
culture (representing cells in the synthetic state) compared with rodent aortic medial
cells (VSMCs in the contractile state). P2Y2 receptor agonists have also been shown
to increase TNAP activity in human heart valve interstitial cells (Osman et al 2006),
which was interpreted by the authors to indicate a pro-mineralising function.
However, the situation is clearly complex, since in contrast to these findings,
experiments by Cote and colleagues (2012a) provoked cultured human aortic valve
interstitial cells to calcify using medium containing 2-5 mM phosphate and exposed
them to either suramin (a general purinergic receptor antagonist), iso-
pyridoxalphosphate-6-azopheny-2’,4’-disulfonate (iso-PPADS) (P2X receptor
antagonist) or CGS15943 (adenosine receptor antagonist). They found that only
suramin increased mineralisation, whereas the other agents had no effect. They
concluded that this was consistent with an inhibitory effect of P2Y on valve
calcification. They went on to show that treatment of cells with 2-thioUTP, a P2Y2
agonist, reduced mineralisation, and that P2Y2 knockdown increased mineral
deposition. With further experiments, the authors implicated inhibition of apoptosis
by P2Y2 as the underlying mechanism that seemed to protect against calcification.
1.8.2 Other purinergic receptors.
Although controversial, adenosine has been linked to AC through in vitro
experiments attempting to explain the mechanism whereby genetic deficiency of the
enzyme CD73 leads to calcium deposition in peripheral arteries (St Hilaire et al
2011) (see section 1.10.2.ii). To date, there are no reports of studies investigating the
role of P2X receptors in this context. However, as will now be discussed, one
20
member of this sub-family – the P2X7 receptor (P2X7R), has several links to
processes implicated in the biology of arterial calcium deposition, making it worthy
of exploration as a potential player in the pathogenesis and as a possible therapeutic
target.
1.9 The P2X7 Receptor
1.9.1 Structural properties.
The basic structure of P2X7R is the same as the other 6 P2X receptors, i.e. an
oligomer, composed of 3 subunits, each possessing intracellular N- and C- termini
and two membrane-spanning domains separated by an extracellular loop (Burnstock
2006). However, P2X7R has several important unique properties which distinguish it
from other members of the P2X sub-family. These include a markedly higher ATP
requirement for activation, a substantially (200 amino acids) longer intracellular C-
terminus and the ability to generate a large ‘pore-like’ structure within the cell
membrane (Suprenant et al 1996).
Mathematical modelling has been used to predict the possible ‘cascade of events’
involved in the production of this transmembrane pore (Yan et al 2010, Pelegrin
2011), which is thought to be key in mediating many biological actions of P2X7R
(Wiley et al 2011). Following binding of one ATP molecule, P2X7R undergoes a
conformational change and the affinity for ATP is reduced. Attachment of a second
ATP molecule induces further architectural disruption and the opening of a low-
conductance channel, permitting the transmembrane movement of small cations.
ATP affinity is further reduced. Addition of a third ATP molecule to this complex
causes a conformational shift back to a symmetrical shape. This is associated with
formation of the high-conductance pore which is permeable to molecules up to
900kDa in size.
P2X7R in the cell membrane is usually anchored to non-muscle myosin and
disassociation from this protein is thought to be important in the final step of pore
formation. The C-terminus may well regulate this process as disruption to the normal
structure of this region of the protein does not affect the ion-channel function of
P2X7R but does impact on large molecule transmembrane flux (i.e. pore formation)
(Adinolfi et al 2010).
21
1.9.2 Tissue distribution.
Originally P2X7R was thought to be exclusively expressed on haemopoietic cells.
However, it has now been shown to have a fairly ubiquitous distribution in the
human body although levels of expression differ widely between tissues (Burnstock
& Knight 2004). In keeping with the known pro-inflammatory role of P2X7R
(discussed in section 1.9.4), the receptor is most abundant in macrophages and other
mononuclear peripheral blood cells. Interestingly neutrophils only show intracellular
expression (Gu et al 2000, Wiley et al 2011).
In the vascular system, the expression of P2X7R has not been very well
characterised. However, presence of the receptor has been demonstrated in human
umbilical cord artery and vein (Piscopiello et al 2013), as well as on human
endothelial cells (Wilson et al 2007), smooth muscle in veins (Cario-Toumaninatz et
al 1998) and arterial adventitia in rats (Lewis & Evans 2001). P2X7R protein
expression in arterial VSMCs has not previously been reported although the presence
of mRNA has been detected (Wang et al 2002, Schuchardt et al 2011). With
relevance to the possible link between AC and bone, the presence of P2X7R has
been demonstrated in both osteoblasts (Gartland et al 2001) and osteoclasts
(Jorgensen et al 2002).
1.9.3 Agonists and antagonists.
1.9.3.i Receptor agonists.
Compared with other P2X receptors, P2X7R requires much higher concentrations of
ATP for activation (EC50 > 80–100µM at P2X7R) (Suprenant et al 1996). The most
potent receptor agonist is the ATP analogue 2,3-(benzoyl-4-benzoyl)-ATP (BzATP)
for which EC50 = 7µM (Suprenant et al 1996). It should be noted however that
BzATP is not a specific P2X7R agonist as it is able to activate many other P2X and
some P2Y receptors (Bianchi et al 1999, Michel et al 2001). BzATP is followed, in
order of decreasing affinity, by ATP, 2-methylthio-ATP, adenosine-(γ-thio)-
triphosphate and ADP (North 2002).
22
1.9.3.ii Receptor antagonists.
A number of molecules capable of inhibiting P2X receptors have been used in
research for many years. Examples of these general P2X antagonists include
suramin, oxidised ATP and PPADS (Wiley et al 2011). KN-62 is a relatively
specific antagonist of P2X7R in humans and mice but does not inhibit the receptor in
rats (Donnelly-Roberts et al 2007).
Specific antagonists to P2X7R have only become commercially-available over the
last few years and have greatly facilitated research into the characteristics and
functions of the receptor. One of the most commonly used agents is A438079 – a
tetrazole-based compound originally developed by the Abbott Laboratory (Nelson et
al 2006). This has an IC50 value of 0.1 and 0.3µM for BzATP-induced Ca2+
influx
through human and rat P2X7Rs respectively (Donnelly-Roberts et al 2007).
A438079 has been widely used for in vitro studies and has also successfully been
employed in rodent studies to modulate nociception (McGaraughty et al 2007) and
ameliorate experimental glomerulonephritis (Taylor et al 2009a). Other
commercially-available specific P2X7R antagonists include A740003, AZ11645373
and A839977. Early phase human clinical trials in conditions such as rheumatoid
arthritis have indicated that pharmacological blockade of P2X7R is well tolerated
and safe (Keystone et al 2012, Stock et al 2012).
1.9.4 Receptor functions and potential links to CKD-associated AC.
The best characterised function of P2X7R is its role in mediating assembly of the
Nacht Domain-, Leucine-Rich Repeat-, and PYD-Containing Protein-3 (NLRP3)
inflammasome (Di Virgilio 2007). In macrophages primed by stimulants such as
bacterial-derived lipopolysaccharide (LPS) or inflammatory cytokines such as
tumour necrosis factor-alpha (TNF-α), P2X7R orchestrates the release of interleukin
(IL) 1-beta and IL-18 along with caspase-1 activation by inducing inflammasome
assembly. These events seem to be dependent upon a fall in intracellular potassium
brought about by ion transit through the P2X7R-associated pore (Booth et al 2012).
P2X7R therefore appears to function as a ‘damage sensor’ in these circumstances,
acting to induce a local inflammatory response (Di Virgilio 2007).
23
As reviewed in Part 1 of this introduction (section 1.3), despite a clear role in
atherosclerosis, inflammatory cells are consistently reported to be absent in medial
AC lesions (Shanahan et al 1999, Shroff et al 2008). Some authors have shown that
inflammatory cytokines such as TNF-α can exacerbate VSMC-associated
calcification in vitro (Tinut et al 2000) and one recent report has linked the NLRP3
inflammasome itself to calcium deposition (Wen et al 2013). However, a definitive
contribution of these and associated inflammatory processes in the pathogenesis of
AC requires confirmation.
Whilst the role of inflammatory-related mechanisms in AC awaits verification there
are a number of other known functions of P2X7R which would seem to have a more
relevant and direct association with what is currently known about the pathogenesis
of AC. These potential links are outlined below and form the basis upon which the
primary hypothesis of this thesis is made.
1.9.4.i P2X7R and bone.
Early work examining the bone phenotype of mice with a genetic deficiency of
P2X7R (P2X7-/-
mice) indicated a functional role for the receptor in this tissue but
yielded contrasting results. Studies by Ke et al (2002) suggested that P2X7-/-
animals
had a marked decrease in bone mineral content and bone formation and increased
bone resorption compared with controls. However, work by Gartland et al (2003a)
found no difference in BMD and an increase in cortical bone. Importantly, 2 lines of
P2X7-/-
mice have been developed. The Pfizer KO (Solle et al 2001) was produced
by the insertion of a neomycin cassette into exon 13 resulting in disruption of the C-
terminus. This animal was used by Ke et al (2002). The Gartland group (2003a), in
contrast, studied the Glaxo (GSK) KO. This mouse was originally generated by the
insertion of a lacZ transgene into exon 1 (procedure described by Chessell et al
2005). Subsequent studies have indicated that a functional splice variant, P2X7-k,
which is expressed in some tissues in the GSK model, escapes inactivation and
therefore may explain the differences seen between the 2 lines (Nicke et al 2009).
An alternative splice variant has been described in the Pfizer model but this is non-
functional (Taylor et al 2009b). The implication from these observations is that
findings in the GSK mouse should be interpreted with caution.

24
Data obtained from in vitro studies have been equally inconclusive. Experiments
have been conducted examining the role of P2X7R in both osteoblasts and
osteoclasts but the functional effect of the receptor in both cell types remains
uncertain. Panupinthu et al (2008) reported a stimulatory effect of P2X7R on bone
formation which was suggested to occur through osteoblast receptor-mediated
production of lysophosphatidic acid, a promoter of osteogenesis (Sims et al 2013). In
contrast, using an armoury of antagonists and agonists, Orriss et al (2012) found that
P2X7R exerted an inhibitory influence on osteoblast function resulting in suppressed
bone formation. These authors highlighted a number of methodological differences
between these two studies to potentially explain the disparate findings.
In osteoclasts, P2X7R may have an inhibitory effect (prevention of bone resorption),
as deficiency of the receptor has been shown to suppress apoptosis of mouse
osteoclasts (Gartland et al 2003b). However, paradoxically, inhibition of the receptor
using antagonists and a monoclonal antibody has been shown to limit the generation
of multi-nucleated osteoclasts from precursor cells which would also theoretically
lead to a net decrease in bone resorption (Agrawal et al 2010). Interestingly, one
group have reported that P2X7R is required to actually release ATP, which is in turn
metabolised to adenosine, which signals through P1 receptors to drive giant
osteoclast formation (Pellegatti et al 2011). Deficiency of P2X7R prevented this
process and inhibited resorption of bone.
The exact role of P2X7R in the skeletal system remains elusive, however, there is
irrefutable evidence to indicate that in some way, the receptor is involved in bone
homeostasis. Worthy of particular note are the observations that in man, loss-of-
function P2X7R single nucleotide polymorphisms (SNPs) have been associated with
an increased risk of developing osteoporosis (Gartland et al 2012) and fracture
(Ohrlendorff et al 2007).
1.9.4.ii P2X7R and apoptosis.
Exposure to ATP can result in cell death by P2X7R-mediated mechanisms
(Franceschi et al 1996). This may be a function of the P2X7R ion-channel as
relatively a brief exposure to ATP (insufficient to permit pore formation) triggers
apoptotic death in mast cells (Bulanova et al 2005). However, the pore-forming
25
capacity of P2X7R also seems to be important in causing cell death as it appears to
lead to osmotic shifts and consequent cytolysis (Suprenant et al 1996).
P2X7R-mediated apoptosis has been shown in a number of cell types including skin
epithelia (Gröschel-Stewart et al 1999), astrocytes (Zheng et al 1991), dendritic cells
(Coutinho-Silva et al 1999), macrophages (Suprenant et al 1996) and, with respect to
the vascular system, porcine aortic endothelial cells (von Albertini et al 1998). This
functional role for the receptor appears to be clinically relevant. In experimental
glomerulonephritis in mice, P2X7R co-localised with glomerular cells positive for
the apoptotic marker, caspase-3 (Turner et al 2007) and genetic deficiency of P2X7R
ameliorated renal injury in this model (Taylor et al 2009a).
With relevance to the possible pathogenesis of AC, P2X7R is thought to enhance
apoptosis of human osteoblasts (Gartland et al 2001). As discussed above, P2X7R-
mediated apoptosis of osteoclasts has also been reported (Gartland et al 2003b),
however other groups have suggested a suppressed apoptotic effect (Grol et al 2009).
Whether P2X7R is also involved in apoptosis of VSMCs is currently unknown.
1.9.4.iii P2X7R and ECM degradation.
Release of ECM-degrading enzymes from mononuclear cells represents a further
mechanism potentially linking P2X7R and AC. Work studying this cell type in
culture demonstrated P2X7R-dependent release of MMP-9 following exposure to
ATP. This effect was lost when cells were also treated with P2X7R antagonists (Gu
& Wiley 2006). In addition, another group were able to show P2X7R-dependent
release of cathepsins from macrophages in concentrations sufficient to degrade a
collagen matrix (Lopez-Castejon et al 2010).
1.9.4.iv P2X7R and renal disease.
All causes of kidney injury, if unresolved for a prolonged period of time, have the
potential to result in fibrosis of the renal interstitium. The extent of this fibrosis is
known to correlate well with declining renal function (i.e. progression of CKD)
(Bohle et al 1991, Nangaku 2004). P2X7R has been implicated in the aetiology of a
number of specific renal pathologies including glomerulonephritis (Taylor et al
2009a), polycystic kidney disease (Chang et al 2011) and diabetic nephropathy
26
(Vonend et al 2004). However, more relevant to the development of AC is a reported
link between the receptor and tubulointerstitial fibrosis.
Using the unilateral ureteric obstruction (UUO) model, Goncalves et al (2006)
demonstrated after 14 days, that kidneys from P2X7-/-
mice showed less collagen
deposition and macrophage infiltration. In addition, significantly fewer
myofibroblasts were detected in the medulla. Furthermore, in vitro studies have
revealed a possible P2X7R-mediated cross-talk between renal epithelial cells and
fibroblasts (Ponnusamy et al 2011) and receptor inhibition has also been shown to
ameliorate fibrosis in non-renal models (Riteau et al 2010).
1.10 The ATP-Metabolising System And Calcification
1.10.1 ATP metabolism and PPi generation: the roles of ENPP-1 and ANK.
Data implicating direct signalling by purine receptors in the process of AC is just
beginning to emerge, however more is known about the roles played by the enzymes
involved in the hydrolysis of ATP (Figure 1.2) and the associated metabolites, in
particular PPi. The ability of PPi to inhibit ectopic calcification was demonstrated
almost half a century ago using subcutaneous injections in rats exposed to high doses
of vitamin D (Fleisch et al 1965). The mechanism whereby this is achieved seems to
be the chemisorption of PPi onto the surface of hydroxyapatite, preventing
attachment of further calcium and phosphate, and thus inhibiting crystal growth
(Francis 1969). More recent work has provided further experimental evidence of the
importance of PPi in preventing AC. For example, cultured rodent aortic rings
exposed to an elevated phosphate concentration will calcify following PPi removal
using alkaline phosphatase (Lomashvili et al 2004). Treatment with intraperitoneal
(ip) PPi also reduces AC induced in uraemic rats (O’Neill et al 2011) and also in
ApoE KO mice (Riser et al 2011). In the setting of CKD in man, PPi levels inversely
correlate with the degree of AC (O’Neill et al 2010), and reduced levels are seen in
dialysis patients irrespective of dialysis modality, inflammation or nutritional status,
when compared with control subjects (Lomashvili et al 2005).
27
1.10.1.i Clinical manifestations of genetic mutations in ENPP-1 - generalised AC of
infancy and autosomal recessive hypophosphataemic rickets type 2.
As previously discussed (section 1.7), ENPP-1 generates PPi (and AMP) following
the hydrolysis of ATP and alterations in this reaction are clinically relevant. One of
the earliest and most significant discoveries in this respect was that autosomal
recessive mutations leading to inactivation of ENPP-1 result in the condition of
generalised AC of infancy (GACI) (Rutsch et al 2003). This disorder is characterised
by increased hydroxyapatite deposition within the elastic laminae of arteries, with
associated stenosis and mortality. The ectopic calcification seen in this disease is
presumably due to reduced PPi production and availability. Indeed treatment with
bisphosphonates, which are analogues of PPi, have been shown to improve the
prognosis of the condition (Rutsch et al 2008). Subsequent genetic studies have
demonstrated that inactivating mutations of the ENPP-1 gene can also cause
autosomal recessive hypophosphataemic rickets type 2 (ARHR2) (Levy-Litan et al
2010, Lorenz-Depiereux et al 2010). Moreover, the ENPP-1 inactivating K121Q
(rs1044498) polymorphism is associated with increased AC scores in dialysis
patients (Eller et al 2008).
1.10.1.ii Murine models of ENPP-1 deficiency - correlation with human disease.
The potential importance of ENPP-1 in disorders of calcification was initially
discovered from work studying the ‘tiptoe walking’ (ttw/ttw) mouse. This mouse,
originally developed in Japan in 1978 (Hosoda et al 1981), is characterised by
ectopic calcification most marked in peripheral and intervertebral joints (Sakamoto
et al 1994), leading to progressive ankylosis. The phenotype was shown to result
from a nonsense mutation in the ENPP-1 gene (Okawa et al 1998). Subsequently an
ENPP-1 KO mouse was developed (Sali et al 1999), the phenotype of which has
been investigated in detail.
These animals show spontaneous calcification of the coronary arteries and aorta
(Mackenzie et al 2012) and markers of bone formation are demonstrable in the aortic
media (Zhu et al 2011). Decreased serum calcium and phosphate concentrations are
present compared with wild-type (WT) mice (Mackenzie et al 2012). Of interest,
these mice also show increased levels of the phosphaturic hormone fibroblast growth
factor 23 (FGF-23) (Mackenzie et al 2012), as has also been reported in ARHR2

28
(Levy-Litan et al 2010, Lorenz-Depiereux et al 2010): FGF23 has been linked to AC
in patients with CKD (Desjardin et al 2012) and FGF23 mutations that resist
degradation are the cause of autosomal dominant hypophosphataemic rickets
(ADHR) (White et al 2000).
The bones of ENPP-1 KO mice show abnormal mineralisation and architecture,
probably due to decreased PPi availability for conversion to inorganic phosphate by
TNAP (Anderson et al 2005). It is interesting to note that while the ENPP-1 KO
mouse biochemical and bone phenotype is similar to that of patients with ARHR2,
these patients do not seem to develop AC. Conversely patients with GACI, while
exhibiting the same vascular changes as ENPP-1 KO mice, do not tend to show the
same skeletal and biochemical abnormalities.
1.10.1.iii ENPP-1 regulation at the cellular level.
Limited information is available on the regulation of ENPP-1 expression and
function in VSMCs. Using early passage rat VSMCs, Prosdocimo and colleagues
(2010) showed a decrease in ENPP-1 mRNA expression under calcification
conditions in vitro, growing cells in 5mM phosphate and 1µM forskolin (used to
activate adenylate cyclase and thus elevate cyclic AMP (cAMP)) for 10 days. Of
note, the authors were not able to demonstrate a significant decrease in mRNA
expression when cells were grown in 5mM phosphate alone, implicating an
important role for cAMP in the calcification pathway. These authors also assessed
ENPP-1 protein expression and functional activity, and suggested that while both
5mM phosphate and 1µM forskolin could independently reduce protein expression
after 10 days, functional activity was the same as at baseline, as shown by no change
in methylene ATP (MeATP) metabolism, a specific substrate.
In contrast to this study, Huang and colleagues (2008), using later passage murine
aortic VSMCs, showed an increase in ENPP-1 expression following exposure to
25µM forskolin and 5mM β-glycerolphosphate for 7 days in culture. In addition,
Mathieu’s group, using human valve cells, found an increase in ENPP-1 expression
with increasing concentrations of phosphate in the culture medium (Cote et al
2012a). Furthermore, this group generated data suggesting that non-specific
29
inhibition of ecto-nucleotidases could attenuate AC in rats treated with warfarin
(Cote et al 2012b).
It should be noted that this group used a different strain of rodent than Prosdocimo et
al (2010) and the subtypes of ecto-nucleotidases detected in aortas were markedly
different between the two laboratories. The regulation of ENPP-1 expression and
activity is clearly complex and negative feedback mechanisms involving TNAP-
regulated ENPP-1 expression and activity, described in experiments using bone cells
(Johnson et al 2000) is an added complication. The regulation of ENPP-1 in the
setting of CKD is currently unknown but worthy of investigation.
1.10.1.iv The role of ANK.
Another important player implicated in the generation of extracellular PPi is ANK, a
transmembrane protein that may mediate intracellular PPi efflux from cells (Ho et al
2000, Terkeltaub 2001). Autosomal dominant inherited mutations in the gene
encoding ANK have been demonstrated to cause two different calcification
disorders: craniometaphyseal dysplasia (Nurnberg et al 2001) and autosomal
dominant familial calcium PPi dihydrate deposition (Williams et al 2002).
Furthermore, aortas taken from Ank KO mice calcify more readily than those from
WT mice when exposed to an elevated phosphate concentration in vitro (Villa-
Bellosta et al 2011a) and Ank KO mice fed a high phosphate diet develop AC
(Murshed et al 2005). Intriguingly, Villa-Bellosta et al (2011a) have suggested that
ANK might be able to transport ATP from the intra- to the extracellular
compartment.
1.10.2 Roles played by other ecto-nucleotidases.
1.10.2.i TNAP.
The availability of PPi is not only dependent on its generation, but also on its
metabolism which is controlled by the enzyme TNAP. This protein is present on
most cell types, including VSMCs, and catalyses the conversion of PPi to inorganic
phosphate, thereby promoting mineralisation (Murshed et al 2005). The human
condition, hypophosphatasia, is caused by missense loss-of-function mutations in the
TNAP gene. This inherited trait is considered to be an autosomal dominant negative,
although recessive inheritance patterns have also been described (Mornet 2007).

30
TNAP serum levels are reduced in these patients, PPi concentrations increased, and
bone mineralisation impaired (Russell et al 1971). TNAP KO mice die before
weaning and exhibit a similar phenotype to the human disease (Fedde et al 1999).
TNAP has been linked to AC. Elegant experiments from O’Neill’s group
(Lomashvili et al 2008) used two rodent CKD models to demonstrate that both the
expression and activity of TNAP are increased in uraemic conditions, suggesting this
as a potential mechanism for the increased prevalence of AC in patients with CKD.
While the exact pathway mediating the observed increase in TNAP was not
elucidated, mRNA expression was not increased, but when aortic rings were isolated
and incubated with uraemic serum, an increase in TNAP activity was detected,
indicating that an as yet unidentified circulating factor may be responsible for up-
regulating enzyme activity. The authors suggest that this factor is probably not
phosphate or PTH, because of the low concentrations likely to have been present in
vitro.
1.10.2.ii Mutations in NT5E in patients with calcification of arteries and joints.
Another significant finding arose recently from genetic studies of 3 families
exhibiting extensive calcification of lower limb vessels in adulthood (St Hilaire et al
2011). These patients showed autosomal recessive homozygous or compound
heterozygous mutations in the 5’-nucleotidase, ecto (NT5E) gene, which encodes the
CD73 protein, an enzyme responsible for the conversion of AMP to adenosine (Arch
& Newsholme 1978) (Figure 1.2).
To investigate the potential mechanism behind these findings the investigators
examined skin fibroblasts from affected individuals and demonstrated a marked
increase in TNAP activity and calcification when cells were incubated with β-
glycerolphosphate compared with fibroblasts from healthy controls. These effects in
vitro could be reversed by administration of either adenosine or rescue by
transfection with a CD73-encoding vector.
The authors hypothesise that the calcification seen in individuals with CD73
mutations is due to decreased inhibition of TNAP secondary to reduced levels of
adenosine. However, as pointed out by some commentators (Robson et al 2011), the
expression profile of ecto-nucleotidases on fibroblasts is different to that on VSMCs;
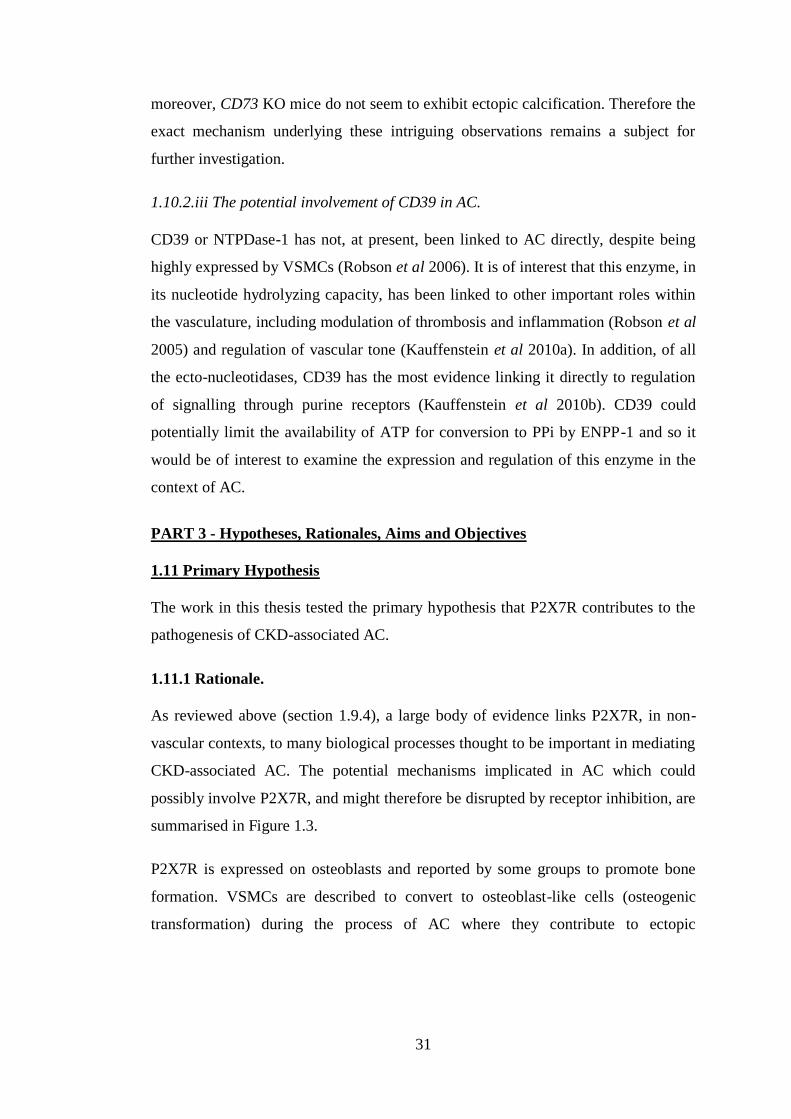
31
moreover, CD73 KO mice do not seem to exhibit ectopic calcification. Therefore the
exact mechanism underlying these intriguing observations remains a subject for
further investigation.
1.10.2.iii The potential involvement of CD39 in AC.
CD39 or NTPDase-1 has not, at present, been linked to AC directly, despite being
highly expressed by VSMCs (Robson et al 2006). It is of interest that this enzyme, in
its nucleotide hydrolyzing capacity, has been linked to other important roles within
the vasculature, including modulation of thrombosis and inflammation (Robson et al
2005) and regulation of vascular tone (Kauffenstein et al 2010a). In addition, of all
the ecto-nucleotidases, CD39 has the most evidence linking it directly to regulation
of signalling through purine receptors (Kauffenstein et al 2010b). CD39 could
potentially limit the availability of ATP for conversion to PPi by ENPP-1 and so it
would be of interest to examine the expression and regulation of this enzyme in the
context of AC.
PART 3 - Hypotheses, Rationales, Aims and Objectives
1.11 Primary Hypothesis
The work in this thesis tested the primary hypothesis that P2X7R contributes to the
pathogenesis of CKD-associated AC.
1.11.1 Rationale.
As reviewed above (section 1.9.4), a large body of evidence links P2X7R, in non-
vascular contexts, to many biological processes thought to be important in mediating
CKD-associated AC. The potential mechanisms implicated in AC which could
possibly involve P2X7R, and might therefore be disrupted by receptor inhibition, are
summarised in Figure 1.3.
P2X7R is expressed on osteoblasts and reported by some groups to promote bone
formation. VSMCs are described to convert to osteoblast-like cells (osteogenic
transformation) during the process of AC where they contribute to ectopic
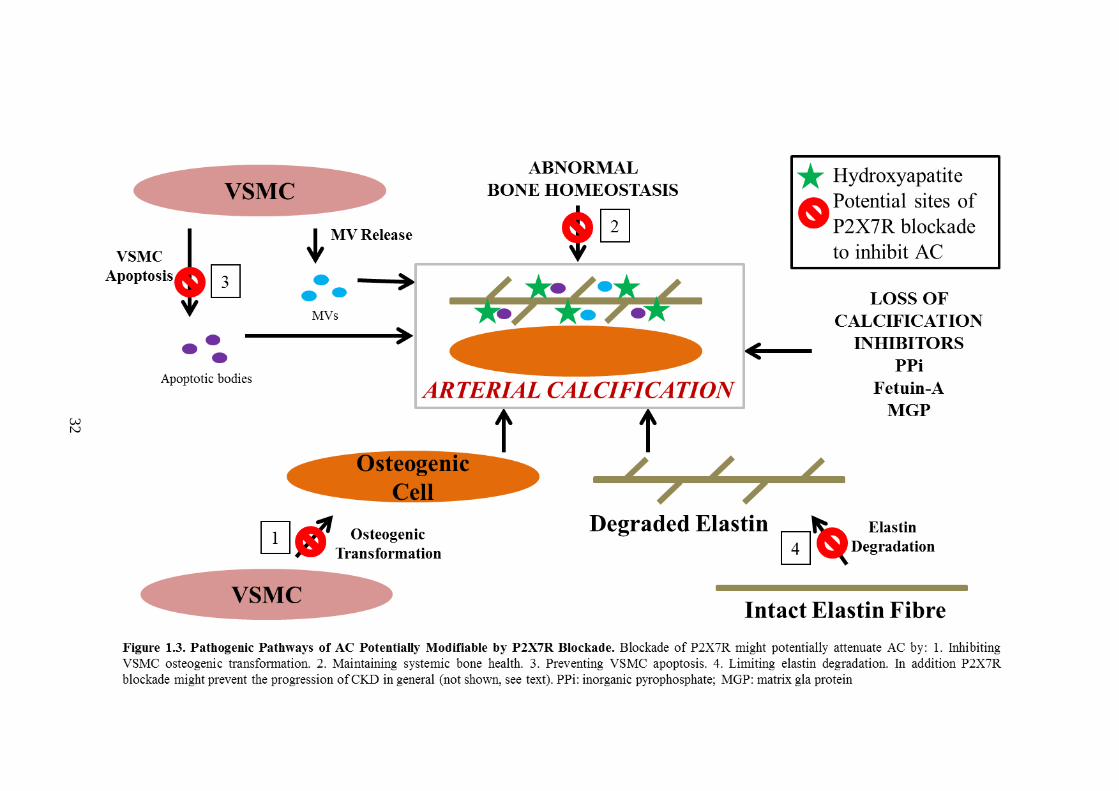
32
33
mineralisation in a fashion resembling bone formation. Blockade of P2X7R might
therefore inhibit this process. Alternatively, other studies have suggested that P2X7R
may suppress bone formation. Disruption of normal bone homeostasis is associated
with AC and therefore, conversely, inhibiting P2X7R might ameliorate arterial
calcium deposition through maintaining systemic bone health.
In contexts unrelated to bone, AC is closely linked to VSMC apoptosis. Apoptosis is
mediated by P2X7R in a number of non-vascular cell types and might potentially
play a similar role in VSMCs. P2X7R is also known to contribute to release of
enzymes capable of degrading ECM such as MMPs. ECM degradation is thought to
be an important step in the development of AC and P2X7R blockade might limit this
process. Finally, there is some evidence to suggest that P2X7R may contribute to the
progression of CKD in general by promoting renal fibrosis.
To date, no previous studies have examined whether P2X7R plays a role in the
development and/or the progression of AC. In addition, despite the adverse impacts
on health conferred by AC, no specific treatments are currently available. The main
goal of this project was therefore to determine if P2X7R is implicated in the
aetiology of AC and whether the receptor might potentially be a future therapeutic
target.
1.11.2 Experimental aims and objectives.
1. To assess the role of P2X7R in AC in vitro using an optimised model.
Specific objectives:
a) Confirm the expression of P2X7R in VSMCs.
b) Optimise an in vitro model of AC.
c) Examine the effects of P2X7R-specific antagonists and agonists on AC in
vitro.
d) Study the effect of P2X7R deficiency on AC in vitro using genetically
manipulated cells and/or tissue.

34
2. To examine the impact of P2X7R gene deletion on AC in vivo.
Specific objectives:
a) Develop and optimise a non-surgical mouse model of CKD-associated AC.
b) Determine the effect of P2X7R gene deletion on AC using this model.
3. To evaluate the effect of pharmacological P2X7R blockade on AC in vivo.
Specific objectives:
a) Optimise a rat model of CKD-associated AC.
b) Determine the expression of P2X7R in normal and calcified rodent arteries.
c) Investigate the effect of pharmacological P2X7R antagonism on AC in rats.
d) Assess the influence of pharmacological P2X7R antagonism on AC-related
cellular pathways in vivo.
e) Examine the impact of pharmacological P2X7R antagonism on architectural
changes in rodent bone caused by CKD.
1.12 Supplementary Hypothesis
This project also sought to test the hypothesis that the expression profiles of arterial
ATP-metabolising enzymes are altered in CKD-associated AC.
1.12.1 Rationale.
As reviewed in Part 2 of this introduction, several components of the ATP-
metabolising system have links with calcification. However, with the exception of
TNAP, these ecto-nucleotidases have not been specifically assessed in the setting of
CKD-associated AC. Uraemia has been shown to alter the activity of TNAP. Similar
induced functional changes in companion ATP-related proteins could potentially
impact on the production of molecules known to influence AC, in particular PPi.
Knowledge of any such regulation would firstly increase the understanding of the
pathogenesis of AC and secondly, potentially provide novel targets for therapeutic
interventions.
35
Therefore whilst not the primary goal of this thesis, and not intended to be an
exhaustive investigation, the work performed in relation to this supplementary
hypothesis (Chapter 6) strived to generate preliminary data pertaining to the
expression profiles of the constituents of the arterial ATP-metabolising system.
Attention centred on ENPP-1 given its capacity to generate PPi.
1.12.2 Experimental aims and objectives.
1. To examine the expression of ENPP-1 and associated enzymes responsible for
ATP metabolism in normal and calcified arteries.
Specific objectives:
a) Compare the expression of ENPP-1, CD39, CD73, TNAP and ANK in
arteries of CKD rats with those from control animals.
b) Analyse the functional activity of ENPP-1 in arteries taken from CKD rats
and control animals.
c) Assess the expression of ENPP-1 in calcified and un-calcified arteries
taken from humans with ESRD.

36
CHAPTER 2 - MATERIALS AND METHODS
2.1 Reagents And Materials
Unless stated otherwise, all reagents were purchased from Sigma (Poole, UK).
Tissue culture plasticware was manufactured by Corning (New York, USA).
Microcentrifuge tubes were manufactured by Eppendorf (Hamburg, Germany).
Dissection equipment was purchased from Thermo Fisher Scientific (Loughborough,
UK) with the exception of scalpels which were obtained from Scientific Laboratory
Supplies (SLS) (Nottingham, UK). All experimental diets were produced by SSNIFF
(Soest, Germany). Suppliers of specific reagents and equipment are detailed in the
relevant sections below. All water (H2O) used for making reagents and for wash
steps was molecular biology grade (resistivity 18.2MΩ).
2.2 Studies With Human Tissue
2.2.1 Ethical considerations.
The collection of, and all subsequent research undertaken with human arteries
described in this thesis were approved by a Committee from the National Research
Ethics Service. All patients provided prior written consent permitting the removal,
(at the time of kidney transplantation), and subsequent use for research of, a short
segment of one inferior epigastric artery.
2.2.2 Tissue collection, processing and storage.
Patients admitted to the Royal Free London NHS Foundation Trust in order to
receive a kidney TP (from a live or a deceased donor), were eligible for inclusion.
During the TP operation, following the routine surgical division of the inferior
epigastric artery, a short segment of this vessel (typically 1-2cm in length) was
removed and immediately placed into a vial containing Medium-199 supplemented
with 0.1mg/ml streptomycin and 100U/ml penicillin. The sample was then stored at
4ºC for a maximum of 24 hours before processing.
A short segment from the end of the vessel was fixed in 10% Neutral-Buffered
Formalin (NBF) for 24 hours, washed 3 times in Phosphate-Buffered Saline (PBS)
and embedded in paraffin. The remaining vessel had as much adventitia removed as
possible following which a transverse cut was made to divide it into 2 equal
37
segments. One half was snap-frozen in liquid nitrogen and stored at -80ºC. The other
half was put into RNAlater (Qiagen, Manchester, UK) and stored at -20ºC until
required.
2.3 Animal Husbandry
All in vivo work was approved by the Home Office Science Unit and performed
under personal license 70/24024 and project license 70/7344 (Dr Jill Norman).
Animals were housed and experimental work performed in the Comparative Biology
Unit, UCL Medical School, Royal Free Campus. Rats and mice were maintained on
a 12 hour light-dark cycle and given free access to food and water at all times.
Animals were fed a standard maintenance diet (Special Diets Services, Essex, UK)
until such time as dietary manipulation was commenced (see relevant experiments
for details). Maximum cage occupancy for experiments was 4 for rats and 5 for mice.
All rats used were adult, male Wistars, aged approximately 10-12 weeks and
weighing approximately 400g (Charles River, Margate, UK). Genders, strains and
ages of mice are described in the relevant sections. All animals fed experimental
diets were weighed weekly with daily visual monitoring of clinical wellbeing.
2.4 Experiments To Develop A Murine Model Of Chronic Kidney Disease-
Associated Arterial Calcification
2.4.1 Administration of folic acid to mice.
2.4.1.i Reagents and diets.
Folic acid powder was dissolved in 0.3M NaHCO3 solution (vehicle) to obtain the
required concentration, filtered through a 0.2µM filter and protected from light. The
concentration of folic acid solution was such that the administered volume was
consistently between 240-360µl irrespective of the dose received. Solutions were
always made up fresh and administered within one hour of being prepared.
The experimental diet used in this study contained 1% (high) phosphate. All other
constituents were present at normal levels (diet A, Table 2.1).
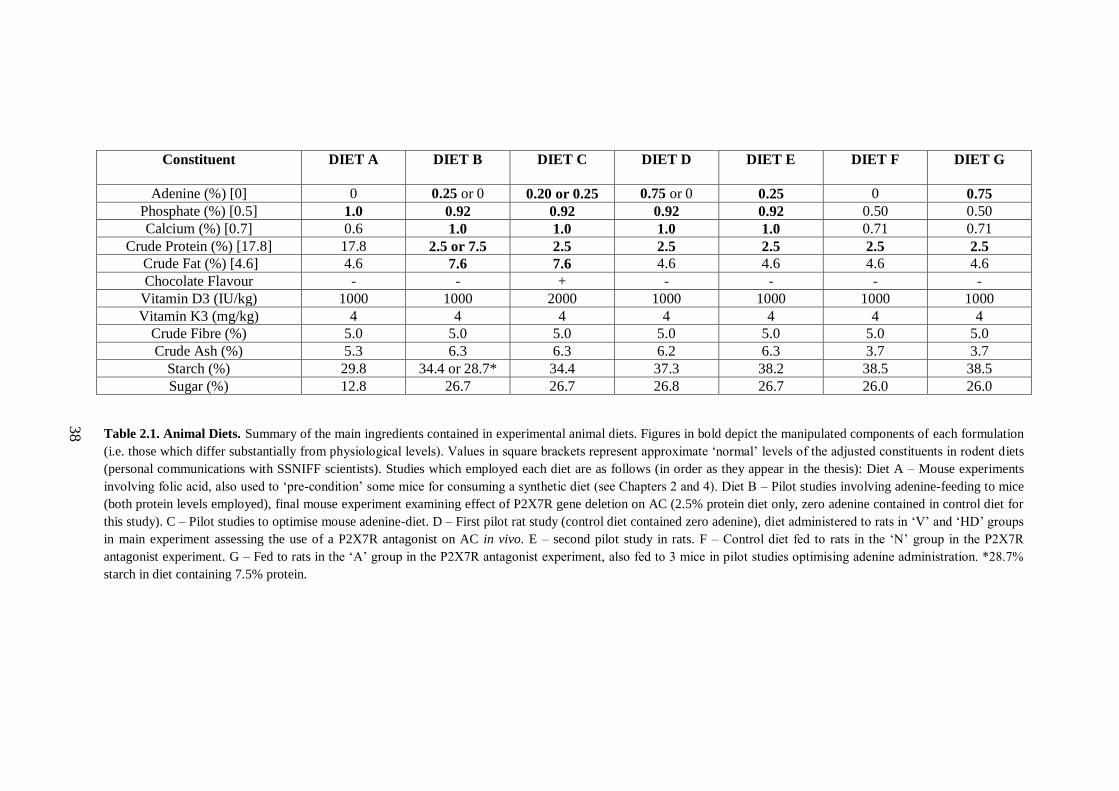
38
Constituent
DIET A
DIET B
DIET C DIET D DIET E DIET F DIET G
Adenine (%) [0] 0 0.25 or 0 0.20 or 0.25 0.75 or 0 0.25 0 0.75
Phosphate (%) [0.5] 1.0 0.92 0.92 0.92 0.92 0.50 0.50
Calcium (%) [0.7] 0.6 1.0 1.0 1.0 1.0 0.71 0.71
Crude Protein (%) [17.8] 17.8 2.5 or 7.5 2.5 2.5 2.5 2.5 2.5
Crude Fat (%) [4.6] 4.6 7.6 7.6 4.6 4.6 4.6 4.6
Chocolate Flavour - - + - - - -
Vitamin D3 (IU/kg) 1000 1000 2000 1000 1000 1000 1000
Vitamin K3 (mg/kg) 4 4 4 4 4 4 4
Crude Fibre (%) 5.0 5.0 5.0 5.0 5.0 5.0 5.0
Crude Ash (%) 5.3 6.3 6.3 6.2 6.3 3.7 3.7
Starch (%) 29.8 34.4 or 28.7* 34.4 37.3 38.2 38.5 38.5
Sugar (%) 12.8 26.7 26.7 26.8 26.7 26.0 26.0
Table 2.1. Animal Diets. Summary of the main ingredients contained in experimental animal diets. Figures in bold depict the manipulated components of each formulation
(i.e. those which differ substantially from physiological levels). Values in square brackets represent approximate ‘normal’ levels of the adjusted constituents in rodent diets
(personal communications with SSNIFF scientists). Studies which employed each diet are as follows (in order as they appear in the thesis): Diet A – Mouse experiments
involving folic acid, also used to ‘pre-condition’ some mice for consuming a synthetic diet (see Chapters 2 and 4). Diet B – Pilot studies involving adenine-feeding to mice
(both protein levels employed), final mouse experiment examining effect of P2X7R gene deletion on AC (2.5% protein diet only, zero adenine contained in control diet for
this study). C – Pilot studies to optimise mouse adenine-diet. D – First pilot rat study (control diet contained zero adenine), diet administered to rats in ‘V’ and ‘HD’ groups
in main experiment assessing the use of a P2X7R antagonist on AC in vivo. E – second pilot study in rats. F – Control diet fed to rats in the ‘N’ group in the P2X7R
antagonist experiment. G – Fed to rats in the ‘A’ group in the P2X7R antagonist experiment, also fed to 3 mice in pilot studies optimising adenine administration. *28.7%
starch in diet containing 7.5% protein.

39
2.4.1.ii Study protocol.
DBA/2 mice were obtained from Harlan (Bicester, UK) and an in-house breeding
colony was established. Females exclusively were used for this study. Mice of
approximately 20 weeks of age received an ip injection of either folic acid or vehicle
whilst under mild reversible isofluorane anaesthesia. The following day the high
phosphate diet was started and continued for 20 weeks at which time mice were
sacrificed. Blood was sampled at baseline, (before folic acid administration), and at
subsequent time-points (detailed in Chapter 4).
2.4.2 Pilot studies to examine the effect of feeding adenine-containing diets to
mice.
2.4.2.i Diets.
Diets B and C (Table 2.1) were principally used for these experiments. These diets
contained 0.9% (high) phosphate, 1% (high) calcium and 7.6% fat. The fat content
was elevated slightly from the standard 4.6% in order to try and make the pellets
softer and more palatable for the mice. Diet C had chocolate flavouring added and a
slightly elevated (but still physiological) vitamin D3 level (2000 IU/kg). The adenine
and protein contents of these diets were adjusted as described in Chapter 4. Diet A
(high phosphate only, Table 2.1) was fed to some mice for a week before the
adenine-containing feed was started in order to ‘pre-condition’ the animals for eating
a synthetic diet (see Chapter 4). The effect of 0.75% adenine was examined in 3
mice (see Chapter 4).
2.4.2.ii Study animals.
Mice used in these experiments were aged 10-12 weeks. A number of pilot studies
using adenine-containing feed were performed (see Chapter 4). The first pilot study
involved male and female WT DBA/2 mice taken from the in-house breeding
colony. Subsequent studies assessed C57Bl/6 males (obtained from Charles River,
Margate, UK) and backcrossed WT male mice of the 5th
generation (described in
section 2.5).
40
2.4.2.iii Administration of diets.
Test diets were fed to mice for 6 weeks unless they were poorly tolerated and had to
be withdrawn early. For the early experiments, diets were administered in the form
of both pellets and powder, however powder tended to be scuffed out into bedding
and that remaining in feeding bowels found wet. As such, pellets only were used for
the later studies.
2.5 Backcrossing Of P2X7-/-
Mice Onto The DBA/2 Background
2.5.1 Background: original generation of P2X7-/-
mice.
Pfizer P2X7-/-
mice were originally generated by inserting a neomycin cassette into
exon 13 and deletion of nucleotides 1527-1607 (Solle et al 2001) and ultimately
maintained on the Bl/6 background. All P2X7-/-
mice used in this thesis are the Pfizer
model.
2.5.2 Backcrossing procedure.
The aim of backcrossing was to transfer the P2X7-/-
(on the C57Bl/6, calcification
resistant background) onto the DBA/2 (calcification prone) background (Eaton et al
1978). To obtain at least 97% of the DBA/2 background it was calculated that a
minimum of 5 backcrossings would be required. Initially 3 adult male P2X7-/-
mice
(Pfizer, New York, New York, USA) were kindly donated by Dr Frederick Tam
(Imperial College, London, UK) and bred with 3 WT female DBA/2 mice (Harlan,
Bicester, UK). Male offspring identified by genotyping as heterozygous were
backcrossed with WT DBA/2 females to produce the subsequent generation.
Initially, male offspring were bred with the original 3 WT female mice, however,
after generation 3 it was necessary to obtain new, younger females to continue with
backcrossing. Backcrossing was stopped when the 5th
generation had been reached,
and 5th
generation heterozygous mice were then bred to produce WTs and P2X7-/-
.
Mice used in the final experiment to assess the effect P2X7R gene deletion on AC
(see section 2.6 and Chapter 4) were either offspring from these breeding pairs or
offspring of subsequent WT and KO pairs that were set up. However, as no further
backcrossing occurred after the 5th
generation, all mice were of the same
background. All mice were genotyped before entry into an experiment.

41
2.5.3 Genotyping of mice.
Ear punches were obtained under mild, reversible isofluorane anaesthesia. Tissue
samples were digested and deoxyribonucleic acid (DNA) liberated using an adapted
‘HotShot’ protocol (Truett et al 2000). This method works on the principle that
NaOH will denature double-stranded DNA by causing hydrogen bonds between
nitrogenous bases to loosen. Tris(hydroxymethyl)aminomethane (Tris)-Cl is
included to maintain pH.
2.5.3.i Solutions.
Stock solutions (50x) were made up:
Solution 1 contained 1.25M NaOH, 10mM ethylenediaminetetraacetic acid (EDTA),
pH≈12, made by dissolving 50g NaOH and 2.9g EDTA into ≈900ml H2O which was
then made up to 1L.
Solution 2 contained 2M Tris-Cl, pH≈5, made by dissolving 315.2g Tris-Cl in
≈900ml H2O which was then made up to 1L.
2.5.3.ii Genotyping procedure.
Fresh 1x aliquots of solutions 1 and 2 were made by adding 1470µl polymerase
chain reaction (PCR) -grade water to 30ul of each 50x solution. 75µl of solution 1
was put into each 0.2ml PCR tube and earclips were then added (one per tube).
Samples were incubated on a GeneAmp PCR System (Applied Biosystems) at 95°C
for 30 minutes followed by a 4°C hold. Samples were then removed and 75µl of
solution 2 was added to each. Samples were mixed and then, if not analysed
immediately, stored at -20°C.
To run the genotyping reaction, 2µl DNA was added to 23µl of a ‘mastermix ‘of
reagents, the contents and relative proportions of which were the following:
12.5µl REDTaq ReadyMix.
1µl of each primer (4 primers were required – see Table 2.2).
PCR grade water to make up to 23µl.
The PCR steps and conditions for genotyping were as follows:

42
1. 3 min at 94°C
2. 30 seconds at 94°C
3. 1min at 60°C
4. 1min at 72°C.
Steps 2-4 were repeated for 35 cycles.
5. 2 min at 72°C
6. Hold at 10°C
The PCR run was performed using the same machine as that used for DNA
extraction. PCR products, along with a 100 base-pair (bp) marker ladder (Thermo
Fisher Scientific), were then electrophoresed on a 2% agarose gel made with 1x TAE
(Tris-Acetate-EDTA) containing 0.04ul/ml ethidium bromide at 80V for 40min. 1x
TAE was made by diluting a 50x TAE solution (containing 2M Tris acetate and
0.05M EDTA at pH 8.2) in H2O.
Bands were observed under ultraviolet (UV) light in a UV lightbox (Biorad, Hemel
Hempstead, UK). A single band at 363bp indicated WT; a single band at 280bp
indicated P2X7-/-
; double bands indicated heterzygous mice (Figure 2.1).
Wild Type Forward TGG ACT TCT CCG ACC TGT CT
Wild Type Reverse TGG CAT AGC ACC TGT AAG CA
Mutant Forward CTT GGG TGG AGA GGC TAT TC
Mutant Reverse AGG TGA GAT GAC AGG AGA TC
Table 2.2. Primers used for P2X7 Genotyping of Mice.
Figure 2.1. Genotyping of Mice. PCR products were run on a 2% agarose gel and visualised under
UV light. A single band at 363bp indicated WT; a single band at 280bp indicated P2X7-/-
; double
bands indicate heterzygous mice. A 100 bp reference ladder is shown in the left-hand land.
← 363bp ← 280bp
100 bp ladder

43
2.6 Experiment To Determine The Effect Of P2X7R Gene Deletion On Arterial
Calcification
2.6.1 Study animals.
Male WT and P2X7-/-
mice aged 10-14 weeks were entered into the study. The
generation and background of these mice is described in section 2.5. Where possible,
mice were caged in pairs, although by necessity a few triplet and singleton cages
were set up. These were comparable in number for WTs and KOs. Baseline blood
was taken in the week prior to dietary manipulation.
2.6.2 Study protocol.
Mice were divided into 4 groups: WT and P2X7-/-
controls (WTC, n=8, and KOC,
n=8) and WT-adenine and P2X7-/-
-adenine groups (WTA, n=11, and KOA, n=10).
Mice were fed a diet containing 0.9% phosphate, 1% calcium, 7.6% fat and 2.5%
protein with the addition of adenine (0.25%) as appropriate (Diet B, Table 2.1).
Animals were fed test diets for 6 weeks before sacrifice.
2.7 Experiment To Assess The Influence Of A Selective P2X7R Antagonist On
Arterial Calcification In Rats
2.7.1 Pilot studies examining the effects of administering adenine-containing
diets to rats.
Small pilot studies were first undertaken to optimise the in vivo model for use in the
final experiment. In the first of these, rats were divided into 2 groups (n=4 per
group). All were fed a diet containing 0.92% phosphorus, 1% calcium and 2.5%
protein for 4 weeks. 0.75% adenine was added for 4 animals (Diet D, Table 2.1).
A second pilot study was performed whereby a further 4 rats were fed a similar diet
but with an adenine content of 0.25% (Diet E, Table 2.1) for 6 weeks. This regime
was not as successful for inducing AC as Diet D hence 0.75% adenine was employed
in the final experiment (see below and Chapter 5 for details).
2.7.2 Group and dietary assignments for final experiment.
Rats were divided into 5 groups and fed test diets for 4 weeks. The ‘control’ group
(N, n=10), received a diet containing a normal amount of phosphate (0.5%) and
calcium (0.7%) and a low (2.5%) protein content (Diet F, Table 2.1). The ‘adenine

44
alone’ group (A, n=6), received a similar diet but with the addition of 0.75% adenine
(Diet G, Table 2.1). The ‘vehicle-treated’ (V, n=9), ‘low-dose P2X7R antagonist-
treated’ (LD, n=7) and ‘high-dose P2X7R antagonist-treated’ (HD, n=8) groups were
fed a similar diet to the A group, but with elevated levels of phosphate and calcium
(0.92% and 1% respectively), i.e. the diet from the pilot experiments which resulted
in the most consistent AC (Diet D, Table 2.1).
2.7.3 Preparation and administration of the selective P2X7R antagonist.
For the duration of the 4 weeks, animals in the V, LD and HD groups received twice
daily oral gavage of either the P2X7R antagonist AZ11657312 (AstraZeneca,
Cheshire, UK) (LD and HD groups) or vehicle alone (0.5% hydroxypropyl
methylcellulose/0.1% Tween80) (HPMC) (AstraZeneca) (V group). LD rats received
20mg/kg per dose, the HD group received 60mg/kg. These doses were selected based
upon previous data (held by AstraZeneca), showing biological effects of the higher
dose in other, (non-vascular related), in vivo experimental rat models. Owing to
practical and logistical restrictions, the N and A groups were not gavaged and were
run either side, (A group before, and N group after), of the period during which
gavaging of the other 3 groups took place.
AZ11657312 was provided as a powder and the manufacturer advised that the
compound would be soluble in HPMC for up to 2 weeks at ambient temperature, in
the dark at pH 6.5. In general, fresh batches were made up on a weekly basis. The
required mass of powder was weighed out and placed into a sterile receptacle
marked with accurate volume indicators. Approximately 75% of the required vehicle
volume was then added before briefly vortexing to wet the compound. The pH was
then brought up to 6.5 with the drop-wise addition of 0.1M NaOH and vehicle added
to make up to the final required volume. Aliquots of 10ml were made and stored at
room temperature in the dark (wrapped in aluminium foil). All stocks of the vehicle
were also brought up to pH 6.5 by the drop-wise addition of 0.1M NaOH and stored
similarly.
2.7.3.i Compound administration by oral gavage.
Oral gavaging was performed at 8am and 4pm daily throughout the study period.
Animals were scruffed, and a metal gavage cannula, connected to a 5ml syringe
45
containing the appropriate volume of study agent, was passed down the oesophagus
into the stomach prior to administration. Animals were immediately returned to their
cage and observed for signs of distress. On occasion, usually due to severe resistance
in passing the gavage cannula, dosing was not attempted (detailed in Chapter 5).
2.7.4 Determination of serum levels of AZ11657312.
To assess whether adequate serum concentrations of antagonist were maintained for
a sufficient length of time, blood samples were taken from rats in the HD group. 4
rats had blood withdrawn from the tail vein on the first day of study at 2 hours post
first dose (peak), and immediately before the second dose (trough). Further blood
samples were taken on day 14 (trough level) and at sacrifice (trough). In addition,
day 14 peak samples were taken from the other 4 HD rats. Serum drug
concentrations were measured post hoc by liquid chromatography-tandem mass
spectrometry (Xenogesis, Nottingham, UK).
2.7.5 Collection of biological samples.
On day 14 of study, rats had 500µl blood withdrawn from a tail vein for assessment
of renal and liver function. On the penultimate day of study, immediately following
the morning gavage, rats were put into individual metabolic cages for 24 hours
where they were provided with free access to study diet and water. The following
morning they were weighed and returned to their home cage. The urine volume was
measured before snap freezing 5 x 1ml aliquots, and the water intake determined.
Rats were then sacrificed and tissue collected.
2.8 Blood Sampling From Rodents
Blood samples from live mice were obtained from either the tail or saphenous veins.
Blood from deceased mice was obtained via cardiac puncture using a 25G needle.
Mouse blood was collected in 250µl lithium-heparin containing microvettes
(Sarstedt, Leicester, UK). Following collection, blood was centrifuged at 400xg for
20 minutes at room temperature. Serum was then removed, aliquotted out, and stored
at -80ºC.
Blood samples from live rats were taken from the tail vein using a ‘butterfly’ needle,
collected into the same type of receptacle, and processed in the same way, as mouse

46
samples. The exception to this was for samples taken for measurement of drug levels
which were collected into EDTA-containing vials (Sarstedt). Blood samples from
deceased rats were taken via cardiac puncture using a 23G needle, and collected into
6ml, lithium-heparin containing vials (Sarstedt). Following collection, blood was
centrifuged at 400xg for 20 minutes. Serum was then collected, aliquotted, and
stored at -80ºC.
2.9 Harvesting And Storage Of Rodent Tissue
Mice and rats were individually sacrificed by exposure to an elevated CO2
concentration. Death was confirmed by cervical dislocation. The ventral surface was
then sprayed with 70% ethanol and a midline incision made, starting over the lower
abdomen and working up until the diaphragm was punctured. This was then divided,
the rib cage reflected, and blood drawn from the right ventricle.
Liver, spleen, bowel and lungs were removed, following which both kidneys were
dissected out and weighed. For rats, a transverse incision was made to divide the left
kidney into upper and lower halves. A transverse slice was taken from the cut
surface of the upper half and fixed in 4% paraformaldehyde (PFA) (TAAB,
Aldermaston, UK) for 24 hours before washing 3 times in PBS. Specimens were
kept at 4ºC in PBS until processing for histological assessment. The remaining left
upper pole was cut in half longitudinally. One half was snap-frozen in liquid nitrogen
and stored at -80ºC, the other half was stored at -20 ºC in RNAlater (Qiagen,
Manchester, UK). For mice, the top half of the left kidney was fixed in 4% PFA
(TAAB) and subsequently processed as described above. The lower half was snap-
frozen.
Following harvesting of kidney tissue, a cut was made through the right iliac artery
and the aorta flushed through with ice-cold PBS. Aortas were then dissected out and
cleaned of excess connective tissue. Rat aortas were divided into 3 sections – arch,
thoracic and abdominal. The first 2cm of thoracic and abdominal aorta, and the
aortic arch from the root to the brachiocephalic branch, were all placed into PBS for
subsequent quantitative analysis of calcium content. The next 2mm from each
segment was fixed in 4% PFA (TAAB) for histological assessment (subsequent
handling was as described for kidney tissue above). The remaining arch and thoracic
47
aorta were snap-frozen in liquid nitrogen and stored at -80ºC. A small segment of
abdominal aorta was snap-frozen and stored in a similar way, however the majority
of remaining abdominal aorta was stored in RNA later (Qiagen) at -20ºC. For mouse
aortas, a thin slice was taken from the proximal arch and fixed for histological
processing and the rest of the arch (until just distal to the third branch) was put into
PBS for subsequent assessment of calcium content. The remaining aorta was all
placed into RNAlater (Qiagen) except for a thin slice taken at the level of the
diaphragm for histological processing as above.
Finally, the right femur (rats) was dissected out, quickly cleaned and fixed in 10%
NBF for 48 hours, before being moved into 70% ethanol at room temperature for
medium-term storage.
2.10 Biochemical Analysis Of Serum And Urine
2.10.1 Routine biochemistry.
All routine serum and urine biochemical analysis was performed at MRC Harwell,
Oxfordshire, UK. The majority of analytical techniques involved colourimetric
quantification of analytes following a reaction with specific reagents (all detailed in
Hough et al 2002). Creatinine was analysed using the enzymatic method and urea
using the urease/glutamate dehydrogenase method. Calcium and phosphate were
analysed using arsenazo III and molybdate respectively. Alkaline phosphatase (ALP)
was measured using 4-nitrophenylphosphate and albumin using bromocresol green.
Cholesterol analysis employed cholesterol oxidase and peroxidase and alanine
transaminase (ALT) measurement utilised a modified technique without pyridoxyl
phosphate. Urinary protein was determined photometrically.
2.10.1.i Calculation of corrected calcium.
Corrected calcium was determined by the following formula:
Corrected calcium = measured total calcium - ((measured albumin - 30) x 0.017)
This is based on the assumption that there is 0.017 mmol/l calcium per g/l albumin
and that average albumin = 30g/l (Stechman et al 2010).

48
2.10.2 PTH Enzyme-Linked Immunosorbent Assay (ELISA).
2.10.2.i General principle.
The PTH concentration in rat serum was measured using the Rat Intact PTH ELISA
Kit (Immutopics Inc, San Clemente, California, USA). This kit utilises the
‘sandwich’ ELISA principle whereby samples are incubated in a streptavidin-coated
well together with 2 PTH antibodies (a biotinylated capture antibody and a
horseradish peroxidase (HRP) -conjugated antibody respectively) to form a complex.
Following the incubation period and a series of wash steps, a substrate solution is
applied to the residual complex bound to the well and incubated. The colour intensity
produced by the resultant reaction is directly proportional to the amount of PTH
present and this can be measured spectrophotometrically.
2.10.2.ii Method.
Serum samples were slowly thawed on ice and then centrifuged at 400xg at 4ºC for 1
minute in order to pellet off any fibrin strands or cellular debris. Samples, positive
controls and standards (all 25µl) were pipetted out in duplicate into test wells
(positive controls and standards were provided in the kit). A solution (100µl)
containing both antibodies was then applied to all wells which were incubated at
room temperature for 3 hours in the dark with gentle rocking. An additional volume
of one sample was run without antibody added as a negative control.
Following this incubation step wells were washed 5 times with 350µl wash solution
before applying 150µl ELISA HRP substrate for 30 minutes (incubation carried out
at room temperature in the dark with gentle rocking). Absorbance was then read at
620nm. ELISA Stop Solution (100µl) was then immediately added to each well and
mixed for 1 minute. The absorbance was then read at 450nm on a microplate reader
(EZ Read 400; Biochrom Ltd, Cambridge, UK). Final PTH concentrations were
calculated using the standard curve. The standards provided in the kit were such that
the working range for the assay was 0 – 3160 pg/ml.
2.10.3 PPi assay.
To assess relative differences in PPi content between serum samples, the
‘Pyrophosphate Assay Kit II’ was used (Abcam, Cambridge, UK). This kit uses a
49
proprietary fluorogenic PPi sensor which has a fluorescence intensity proportional to
the concentration of PPi present.
Initially, 20µl of each serum sample was added to 80µl PBS and the absorbance
profile read in order to assess for scatter and any potential absorbance within the
range of emission wavelengths relevant for the measurement of PPi fluorescence. No
major absorbance peaks were detected around 470nm for any sample, and in general
the degree of scatter was similar for all.
For PPi measurement, 50µl serum was incubated with 50µl PPi sensor at room
temperature in the dark for 10 minutes before reading the fluorescence at Ex/Em =
370/470nm using a FLUOstar Omega plate reader (BMG Labtech, Ortenberg,
Germany). Test samples were run in duplicate, and in addition, a further 50µl
volume of each was analysed without the presence of PPi sensor in order to control
for background autofluorescence. The final results were calculated as the mean of
duplicate samples and expressed in arbitrary fluorescence units.
2.11 Assessment Of ENPP-1 Activity In Arterial Tissue
ENPP-1 activity was assessed by colourimetrically measuring the hydrolysis of the
synthetic substrate thymidine 5’-monophosphate p-nitrophenyl ester sodium salt
(pNP-TMP) (Nam et al 2011, Lomashvili et al 2011). This reaction liberates p-
nitrophenylate which causes the reaction solution to turn yellow, the optical density
of which can be measured at 405nm. It should be noted that this assay is not specific
for ENPP-1 as pNP-TMP is also a substrate for other ENPPs. However, as ENPP-1
has been shown to be the dominant ENPP in both cultured VSMCs and in-tact
arterial tissue (Villa-Bellosta et al 2011a) this system represents a reasonable method
for evaluating its activity.
Arterial tissue was taken from storage at -80ºC and slowly thawed on ice in isotonic
buffer (PBS containing 1mM CaCl2). Volumes of reaction solution (200µl),
consisting of 180µl buffer and 20µl pNP-TMP (5mM final concentration), were
pipetted into a 96 well-plate and baseline optical density readings were taken.
Arterial segments had any residual blot clot removed and were divided in 2 in order
to run samples in duplicate. These were then placed into the reaction solution-
containing wells and incubated at room temperature in the dark for 1 hour. Wells
50
containing only reaction solution and/or isotonic buffer (without tissue) were run as
negative controls. Rings were removed from their wells, dried overnight and
weighed. The final optical density of each individual reaction was recorded and the
mean taken of replicate samples. Results were expressed as change in optical density
(arbitrary units) per mg tissue.
2.12 Micro-Computerised Tomography (CT) Analysis Of Bone
All work involving micro-CT technology was performed in collaboration with
Professor Tim Arnett (UCL, London).
2.12.1 General principles.
Examination of an object by micro-CT enables information to be obtained about its
3-dimensional (3D) structure in a convenient and relatively quick manner. Test
objects are held in place on a high-precision stage and rotated. Two-dimensional X-
ray shadows are obtained from a number of angular viewpoints and these are used to
reconstruct cross-sectional images of the object using a well-defined cone-beam
algorithm originally described by Feldkamp et al (1984). Ultimately this information
generates a 3D representation of the internal micro-structure of the object under
examination.
2.12.2 Micro-CT scanning.
Femurs were taken from storage (in 70% ethanol), wrapped in cling-film (to prevent
drying out and movement artefact during scanning), and mounted on the stage of the
scanner (SKYSCAN 1172, Brucker, Kontich, Belgium). Scanning conditions
consisted of a 0.5mm aluminium filter, an X-ray voltage of 40kV, an X-ray current
of 250µA and a camera resolution of 2000x1048. The rotation step was set a 0.4º.
Scans typically lasted an hour in length. Upon completion of the scan, cross-
sectional images were reconstructed as outlined above.
2.12.3 Data analysis.
In order to analyze trabecular and cortical bone parameters it was first necessary to
define a ‘reference point’ on each femur to ensure measurements were standardised
across samples. This point was determined using the reconstructed images and
moving up slice by slice, starting at the growth plate, until the first ‘broken bridge’
51
of primary spongiosa was seen (Figure 2.2A). For each femur, the trabecular bone
was examined in a 1mm long segment starting 3mm above the reference point, and
cortical bone was examined in a 1mm long segment starting 6.5mm above the
reference point.
The areas containing trabecular and cortical bone to be analyzed were defined in the
respective 1mm segments on each femur by digitally drawing round the ‘region of
interest’ every 10 slices (Figures 2.2B and C). Slices in between were automatically
interpolated by the computer programme. Regions of interest were then converted
into binary images and processed by SKYSCAN software to generate measurements
of bone parameters.
2.13 Tissue Culture
2.13.1 Specific reagents.
The P2X7R antagonists A438079 and A839977 were both purchased from Tocris
(Bristol, UK). BzATP and A438079 were made up in sterile H2O. A839977 was
made up in dimethyl sulfoxide (DMSO). Corresponding volumes of these vehicular
agents were added to control medium for experiments.
For experiments using elastase, porcine pancreatic elastase was bought as lyophilised
powder and reconstituted with sterile H2O. This was then aliquotted and stored at -
20ºC. For experiments, the required volume of thawed elastase solution was added
directly to culture medium.
For experiments using alkaline phosphatase, calf intestinal alkaline phosphatase
(Invitrogen, Paisley, UK) was purchased as a solution and stored at -20ºC until

52
B C
Figure 2.2. Micro-CT Analysis of Bone. A: Identification of Reference Point. The
‘reference point’ on each femur was determined by moving up slice by slice, starting at
the growth plate, until the first ‘broken bridge’ of primary spongiosa was seen (arrow).
For each femur, the trabecular bone was examined in a 1mm long segment starting 3mm
above the reference point, and cortical bone was examined in a 1mm long segment
starting 6.5mm above the reference point. B: Cortical Bone Region of Interest. A line
was digitally drawn around the whole cross-sectional image followed by a second line
within the central portion of the image in order to exclude any trabecular bone. The area
selected for analysis was then highlighted red. C: Trabecular Bone Region of Interest. A
single line was digitally drawn in the centre of the image in order to separate the cortical
and trabecular bone. The area selected for analysis was then highlighted red.
A

53
required. It was then added directly to culture medium to obtain the required
concentration.
To increase the pH of tissue culture medium, drops of sterile 10M NaOH were added
to basal medium. Following mixing, the pH of a 3ml aliquot was taken immediately
using a pH probe.
2.13.2 In vitro culture of human VSMCs.
Primary human VSMCs (hVSMCs) (TCS Cell Works, Buckingham, UK) were
grown at 37°C and 5% CO2 in cell culture flasks containing medium M199 (Lonza,
Slough, UK) supplemented with growth factors (smooth muscle cell growth
supplement, (TCS Cell Works)), 5% fetal calf serum (as part of the growth
supplement), 4mM L-glutamine (Invitrogen), 25ug/ml gentamicin and 50ng/ml
amphotericin. At approximately 80% confluence cells were trypsinised and passaged
at no greater than 1:3 split using warmed 1X 0.05% trypsin-EDTA (Invitrogen). For
experiments, cells were used at passage 6-10 and plated at an approximate density of
1x10⁴ cells per ml. Cells were counted using a haemocytometer and non-viable cells
were stained with trypan blue.
At 50-60% confluency cells were serum-starved overnight and then exposed to
experimental medium. ‘Calcification-promoting medium’ was made by
supplementing basal medium with small volumes of either 3M CaCl and/or 3M
NaH2PO4 to obtain the required concentration of calcium and phosphate
respectively. In all experimental medium (control or calcification-promoting) serum
was supplemented to 4% unless otherwise indicated and contained gentamcin,
amphotericin and L-glutamine at the same concentrations as detailed above.
Experiments ran for the time courses indicated (see Chapter 3). Medium was
changed every 2-3 days.
2.13.3 Generation of rodent VSMCs.
To reduce the number of animals used, aortas of Sprague-Dawley rats taken from
control arms of experiments were kindly donated from others in our group. Aortas
were cleaned of blood, fat and connective tissue under a dissecting microscope and
cut into rings approximately 1mm in depth. Rings were then cultured in identical
conditions as those described for hVSMCs. It was usual to observe outgrowths of

54
cells after 2 weeks. When significant outgrowths were visible, rings were then taken
out and placed in fresh culture dishes. Cells were trypsinised and placed in fresh
culture dishes as described above. Cells were characterised as VSMCs by positive
immunofluorescent staining for α-SMA and smooth muscle myosin heavy chain
(SMMHC), and also by light microscopic evaluation of their growth pattern, with
‘hill-and-valley’ morphology considered typical of VSMCs (Proudfoot & Shanahan
2012) (shown in Chapter 3).
2.13.4 Culture of rodent aortic rings.
Unless otherwise stated, all aortic ring culture experiments were performed using
medium M199 containing Earle's buffered salt solution, 4mM L-glutamine, 6 g/L 4-
(2-hydroxyethyl)-1-piperazineethanesulfonic acid (HEPES) and 2.2 g/L NaHCO3
(Lonza), supplemented with 25ug/ml gentamicin and 50ng/ml amphotericin.
Wistar rats (of similar characteristics as those described for in vivo work above) were
sacrificed by exposure to an elevated carbon dioxide concentration. Aortas were
immediately dissected out using standard sterile procedures and placed into culture
medium on ice. Fine dissection of the aorta was then performed using a dissecting
microscope in a Class II lamina flow cabinet. Blood, fat and connective tissue was
removed but a small covering of adventitia was left in situ to minimise injury to the
medial layer. Injury to the arterial media at time of harvest has been shown to
contribute to calcification (Lomashvili et al 2004). Aortas were then divided into
segments of approximately 3-4mm in length, taken from the thoracic to the distal
abdominal section, measured using a ruler under the microscopic. Segments were
placed into individual wells of a 24-well plate containing culture medium which had
been left to equilibrate in an incubator at 37°C and 5% CO2 for a number of hours
beforehand. A typical aorta yielded around 20 segments of this size.
The following day rings were exposed to experimental medium. Rings from adjacent
segments of aorta would be exposed to different study conditions. To make
experimental medium, individual volumes (one per condition) of basal medium were
placed in an incubator for at least 1 hour to equilibrate to 37°C and 5% CO2.
Individual volumes were then quickly taken out of the incubator, an appropriate
volume of NaH2PO4 added to bring the phosphate concentration up to the required
55
level, and then placed back in the incubator for at least another hour. This was
necessary to avoid major increases in medium pH (due to loss of CO2 buffering)
which might result in precipitation of the supplemented ions (Lomashvili et al 2004).
Following this, the necessary volume of reagent (e.g. P2X7R antagonist) was added
to generate the final experimental medium. Rings were then cultured in their
respective medium for 10 days. Medium was changed every 2-3 days following this
protocol.
2.14 Viability Testing Of Cultured Aortas
Viability of cultured aortas was assessed as a function of the ATP-metabolising
capacity of the vessel. Rings were cultured as described above except that the
medium did not contain phenol-red (Invitrogen). At desired time-points medium was
removed from rings and immediately snap-frozen in liquid nitrogen and stored at -
20ºC until required. Rings were immediately placed into fresh medium.
The ATP content of culture medium was determined using the Adenosine 5’-
triphosphate (ATP) Bioluminescent Assay Kit (FLAA). A master mix of reaction
reagents was made up in the following proportions: 300µl ATP Assay Mix
(containing luciferase, luciferin, MgSO4, dithiothreitol (DTT), EDTA, bovine serum
albumin (BSA) and tricine buffer salts) made up initially in H2O, 600µl Dilution
Buffer (containing MgSO4, DTT, EDTA, BSA and tricine buffer salts) made up
initially in H2O and 600µl H2O.
Culture medium (50µl) was added to 100µl master mix. A standard curve was also
prepared. Samples were then analysed using an Anthos Lucy 1 Luminometer
(Anthos Labtech Instruments, Salzburg, Austria).
2.15 O-Cresolphthalein Complexone Method To Quantify The Calcium Content
Of A Solution
2.15.1 General principle.
This method utilises the principle that in an alkaline medium, calcium ions form a
violet-coloured complex with o-cresolphthalein. 8-hydroxyquinoline is included in
the reaction to minimise any interference from magnesium ions (Sarkar & Chauhan

56
1967). The absorbance of the resultant complex can be measured
spectophotometrically and compared to a standard curve.
2.15.2 Sample preparation.
Medium was removed and cells and aortic rings were washed twice in PBS (free of
calcium and magnesium), and in the case of rings, as much as possible of the
adventitia was removed under a dissecting microscope (usually all although this was
not possible in the case of rings from mice). Rings were then placed in 150ul 0.6M
HCl overnight to liberate the deposited calcium. For cells, 0.6M HCl was applied
directly into the wells and plates were then left overnight. For in vivo samples, aortic
segments were cleaned of adherent blood clot and fat, washed twice in PBS, and
placed overnight in 0.6M HCl (500µl for rat aortas and 150µl for mouse tissue).
Calcium content of the HCl was subsequently quantified using the o-cresolphthalein
complexone method.
2.15.3 Reagents.
Colour reagent: 25mg o-cresolphthalein complexone powder was dissolved in a
solution containing 15ml 11.6M HCl and 25ml H2O. Following this 250mg 8
hydroxy-quinoline was added and the volume made up to 250ml with H2O before
dissolving completely.
Alkaline buffer: 37.8 ml of 2-amino-2-methyl-1-propanol with 150ml H2O. The pH
was adjusted to 10.7 with 11.6M HCl and the volume made up to 250ml with H2O.
Both the colour reagent and alkaline buffer were shielded from light prior to use.
For each analysis appropriate calcium standards were prepared from a 50mg/dl stock
standard which was made by dissolving 625 mg of dried and desiccated calcium
carbonate with 3.5ml 11.6M HCl in a total volume of 500ml H2O.
2.15.4 Quantification of calcium.
Test samples and appropriately diluted standards (all 100µl) were pipetted into
sterile 5ml tubes. Colour reagent (2ml) was added to each, followed by 2ml of
alkaline-buffer. Samples were then incubated at room temperature in the dark for 15
minutes in order for the colour to stabilize. Duplicate 100µl volumes were then

57
pipetted into a flat bottomed, transparent 96-well plate and read at 562nm on a
microplate reader (EZ Read 400; Biochrom Ltd). A standard curve was constructed
against which test sample readings were compared (Figure 2.3).
The calcium concentration was then ‘corrected’ for tissue dry weight, (for aortic
samples), or protein content for cells. Aortic rings/segments were dried at 50ºC
overnight and weighed on a semi-micro balance capable of measuring down to 10µg
(ME235S, Sartorius, Epsom, UK). For cells, 2 washes in PBS were performed before
lysis in 0.1% sodium docecyl sulphate (SDS) and 0.1M NaOH. The lysate protein
concentrations were then measured using the bicinchoninic acid (BCA) assay
(Pierce) (method described under ‘Western blotting’).
Figure 2.3. Representative Standard Curve for Quantifying Calcium
Concentration. Optical density is plotted linearly against calcium concentration
with an R2
value of 0.996 in this example.
0 10 20 30 40 50
0.70
0.56
0.42
0.28
0.14
0
Op
tica
l Den
sity
(au
)
Calcium Concentration (mg/dl)
58
2.16 Quantitative Polymerase Chain Reaction (qPCR)
2.16.1 General principles.
The purpose of PCR is to amplify, (by making several million copies of), a gene
sequence from a small starting quantity of DNA in order to permit its detection. A
DNA template is entered into a reaction alongside oligonucleotide primers specific
for the gene of interest, deoxynucleotides (dNTPs) and a DNA-polymerase enzyme.
Following an initial exposure to 95ºC to activate the polymerase, reactants pass
through 3 steps, each at optimised temperatures, to permit DNA denaturing, primer
annealing and product extension respectively. These steps are repeated for a number
of cycles. After each cycle the amount of product doubles, meaning that an
exponential increase occurs as the reaction proceeds, and this continues until one or
more of the reagents has been exhausted.
Quantitative PCR is an adaptation of this basic technique, and has been designed in
order to measure the magnitude of gene expression in the starting material. Analysis
is made during the exponential phase of the reaction so that reagents are not limited,
and before the products are so abundant that they may hybridize and interfere with
primer binding. All qPCR formats rely on the detection of a fluorescent signal which
increases with rising product. The fluorescent dye SYBR green was used for all
qPCR assays in this thesis.
SYBR green binds strongly to double-stranded DNA, and in the bound state the level
of fluorescence increases 100-fold. It can therefore be included in a qPCR assay,
where the increase in fluorescence will be directly proportional to the accumulating
product (Schneeberger et al 1995). Fluorescence intensity at a defined threshold can
be compared to that of known standards in order to determine the starting quantity of
mRNA, following normalisation to a number of ‘housekeeping’ genes.
Due to the extreme sensitivity of qPCR, and the almost ubiquitous presence of
RNAse enzymes in the environment, it is of paramount importance to adhere to strict
handling and operating procedures when carrying out work with RNA. Ideally,
specific work surfaces should be reserved for PCR work, and gloves and laboratory
coats should be worn at all times. All reagents should be ‘PCR-grade’ and all
equipment verified as being ‘RNAse free’. It is also vital to apply a high level of
59
quality control to the RNA samples used for downstream applications, and this
should include an assessment of purity and integrity.
2.16.2 RNA extraction from aortas.
RNA extraction was performed using the RNeasy Fibrous Tissue Mini Kit (Qiagen)
according to the provided protocol. This is a column-based system whereby tissue is
exposed to a number of agents, proprietary buffers and centrifugation wash steps,
ultimately resulting in RNA binding to a silica membrane from which it can be
eluted.
Arterial tissue was placed in RNAlater (Qiagen) following harvest, and stored at -
20ºC prior to RNA extraction. Segments were taken from storage, cleaned of
residual blood clot and as much adventitia as possible, then placed in individual,
round bottomed, 2ml tubes, each containing 2 x 5mm stainless steel beads (all
Qiagen). ‘Buffer RLT’ (300µl), supplemented with 10µl/ml of β-mercaptoethanol,
was then added to each sample and these were then immediately shaken for 5-10
minutes at 50Hz using a TissueLyzer LT (Qiagen) to achieve full lysis and
homogenisation. ‘Buffer RLT’ contains guanidine thiocyanate, a chaotropic agent,
which aids both lysis of tissue and binding of RNA to the silica membrane. The
addition of β-mercaptoethanol serves to inactivate RNAses.
Lysates were transferred to fresh tubes, and 590µl of RNAse-free H2O followed by
10µl of proteinase K added, before heating at 55ºC for 10 minutes. Proteinase K
serves to remove contractile proteins and connective tissue, usually high in
abundance within fibrous tissue such as aorta, in order to aid RNA purification.
Tubes were then centrifuged for 3 minutes at 10000xg, the supernatant transferred
into a fresh tube and 450µl 100% ethanol mixed with the lysate to provide
favourable binding conditions to the membrane. Each sample was added to a spin
column and centrifuged at 8000xg for 15 seconds, following which the membrane
was washed by centrifuging through 350µl ‘buffer RW1’.
To remove any potential contamination from DNA, an on-column DNAse digestion
step was performed. Prior to use, 1500 Kunitz units of lyophilised DNase were
reconstituted in 550µl of RNase-free water and aliquotted. Following reconstitution,

60
10µl was added to 70µl of ‘buffer RDD’, gently mixed, and applied directly to the
membrane for 15 minutes.
The membrane was then washed as before with ‘buffer RW1’, following which
500µl ‘buffer RPE’ containing 4 volumes of 100% ethanol was added to remove
trace salts. The column was then centrifuged for 15 seconds at 8000xg. In order to
dry the membrane and avoid carryover of ethanol, this step was repeated but with
centrifugation for 2 minutes.
Finally, to elute the RNA, 30µl was added to the membrane and the column
centrifuged at 8000xg for 1 minute. To maximise the RNA yield, the elutant was
then re-applied onto the membrane and the column was again centrifuged. RNA was
aliquotted for analysis of concentration, purity and integrity, and for use in
downstream applications. Samples were stored at -80ºC until required.
2.16.3 Measurement of RNA concentration and purity.
The concentration and purity of all RNA samples used for qPCR were measured,
using a Nanodrop 2000 (Thermo Fisher Scientific). This instrument is a scanning
spectrophotometer which uses fibre-optic technology. Nucleic acid has a peak
absorption wavelength of 260nm and this property can be used to determine the
concentration of RNA or DNA within a sample. Potential contaminants have
different absorbance wavelengths, for example protein absorbs at 280nm, and the
ratio of 260/280 can be measured. 260/280 ratios of over 1.7 are generally
considered to indicate an acceptable level of RNA purity (Fleige & Pfaffl 2006).
RNA (1µl) was loaded onto the instrument pedestal for readings to be taken (Figure
2.4).
2.16.4 Assessment of RNA integrity.
RNA integrity was assessed using a Bioanalyzer 2100 (Agilent, Wokingham, UK).
This technology involves a ‘chip’ containing micro-channels, into which a sieving
polymer and a fluorescent dye (combined beforehand in the form of a ‘gel-matrix’)
are loaded. Samples are electrophoresed through the gel-matrix, and due to the
presence of a constant mass-to-charge ratio RNAs are separated according to size.
Each RNA molecule takes up the dye, and RNA-dye complexes are detected using a
laser. The information obtained is converted into an electropherogram (Figure 2.5)
61
and used to generate an RNA integrity number (RIN). Values exceeding 5 are
suggested to be imply sufficient integrity for qPCR assays with values above 8 said
to represent highly preserved RNA integrity (Fleige & Pfaffl 2006). In some
instances, usually due to a low yield of RNA following extraction from tissue,
integrity was not measured. This was mainly an issue for tissue culture work and
samples from human vessels. All aortas from in vivo animal experiments had an
assessment of RNA integrity performed.
2.16.5 Synthesis of complementary DNA (cDNA).
For PCR to proceed, a starting DNA template is required. It was therefore first
necessary to generate cDNA templates by subjecting each RNA sample to a reverse
transcription (RT) reaction. The SuperScript VILO cDNA Synthesis kit (Invitrogen)
was used for this purpose and reactions were performed using a G-Storm Thermal
Cycler (G-Storm, Somerton, UK).
A mastermix containing 10X SuperScript Enzyme Mix (2µl per sample), and 5X
Reaction Mix (4µl per sample,) was made first. The Enzyme Mix contains an
engineered Moloney-Murine Leukemia Virus (M-MLV) reverse transcriptase,
RNase H activity, recombinant ribonuclease inhibitor and a proprietary helper
protein. The Reaction Mix contains random primers, MgCl2 and dNTPs in an
optimised buffer. Mastermix (6µl) was then added to the appropriate volume of RNA
and the reaction volume made up to 20µl. ‘Non-RT’ control reactions were also set
up for samples in an identical fashion, except RNAse-free water replaced the 10X
Enzyme Mix. For samples taken from rat in vivo experiments, 1µg of aortic RNA
was reverse transcribed. Due to less available tissue and lower RNA yields, 200ng of
RNA was reverse transcribed from cultured rings, and 100ng from human arteries.
Samples were incubated at 25ºC for 10 minutes to permit primer annealing, followed
by 42ºC for an hour in order for cDNA synthesis to occur. The reaction was then
terminated by heating to 85ºC for 5 minutes. After cooling, products were diluted
down 1.10 (in vivo samples) in yeast transfer RNA (tRNA) (10µg/ml) (which acts as
a carrier molecule). Aliquots were made and stored at -80ºC. Tissue culture samples
were diluted 1.5 and human samples were used undiluted.
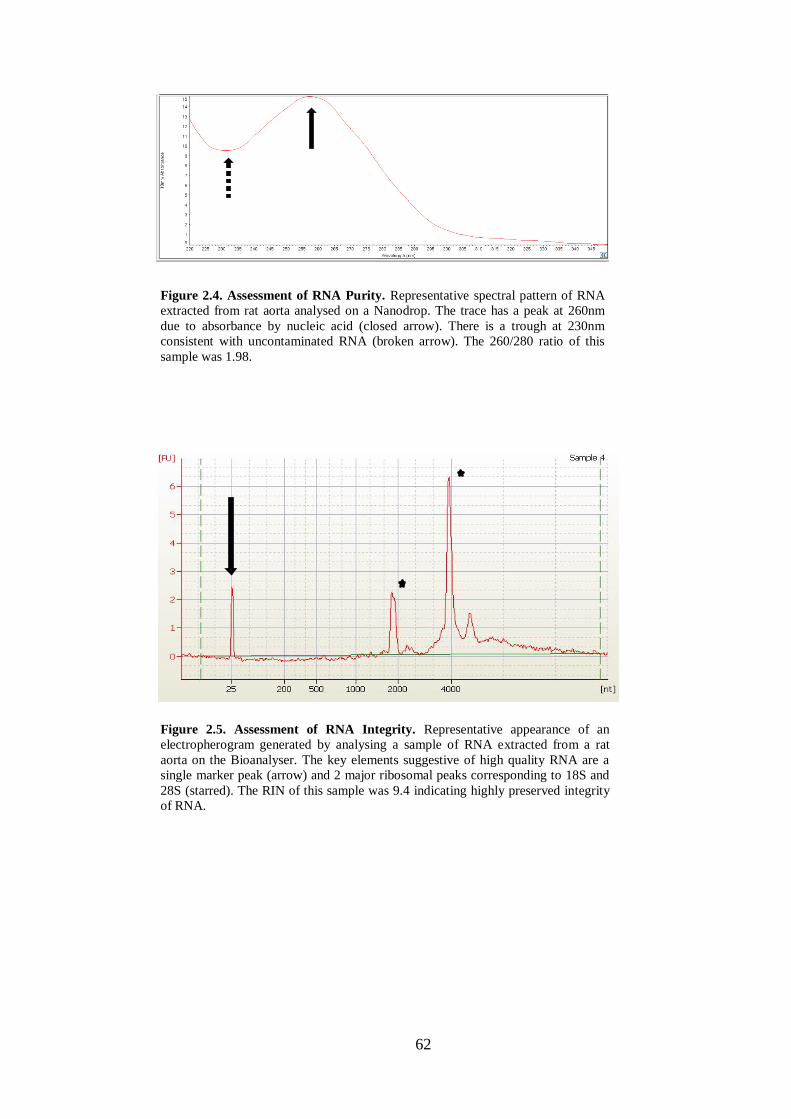
62
Figure 2.4. Assessment of RNA Purity. Representative spectral pattern of RNA
extracted from rat aorta analysed on a Nanodrop. The trace has a peak at 260nm
due to absorbance by nucleic acid (closed arrow). There is a trough at 230nm
consistent with uncontaminated RNA (broken arrow). The 260/280 ratio of this
sample was 1.98.
Figure 2.5. Assessment of RNA Integrity. Representative appearance of an
electropherogram generated by analysing a sample of RNA extracted from a rat
aorta on the Bioanalyser. The key elements suggestive of high quality RNA are a
single marker peak (arrow) and 2 major ribosomal peaks corresponding to 18S and
28S (starred). The RIN of this sample was 9.4 indicating highly preserved integrity
of RNA.
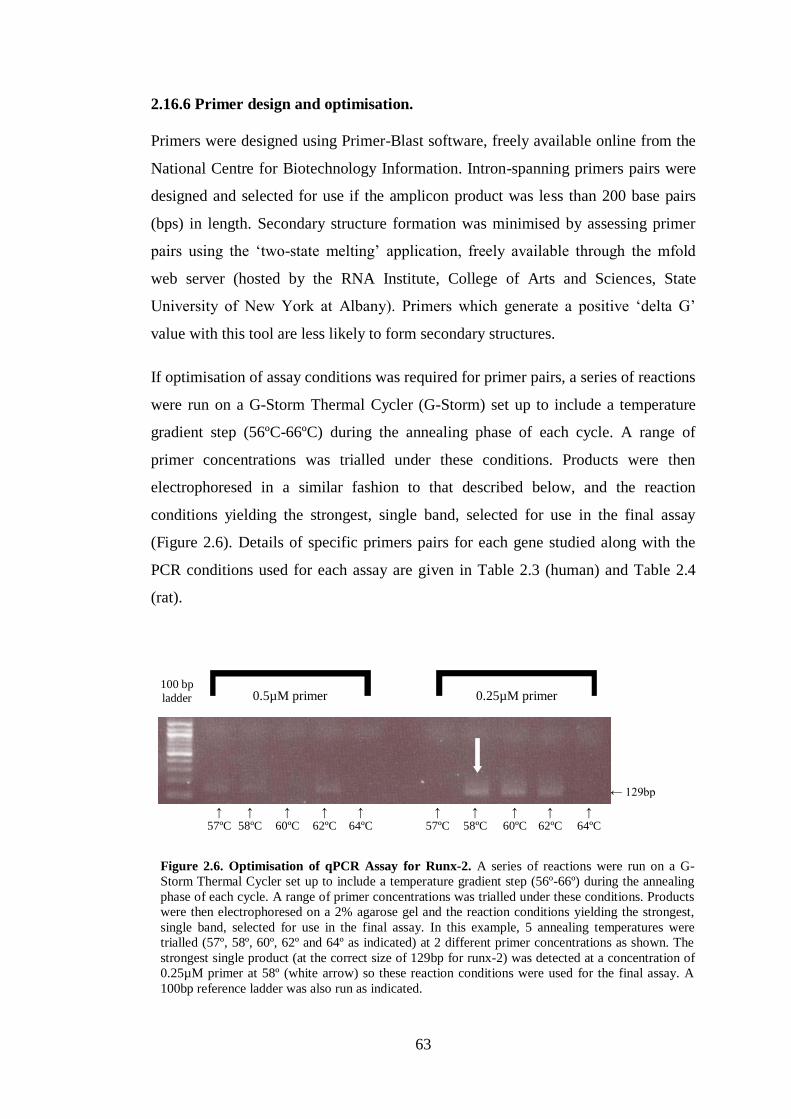
63
2.16.6 Primer design and optimisation.
Primers were designed using Primer-Blast software, freely available online from the
National Centre for Biotechnology Information. Intron-spanning primers pairs were
designed and selected for use if the amplicon product was less than 200 base pairs
(bps) in length. Secondary structure formation was minimised by assessing primer
pairs using the ‘two-state melting’ application, freely available through the mfold
web server (hosted by the RNA Institute, College of Arts and Sciences, State
University of New York at Albany). Primers which generate a positive ‘delta G’
value with this tool are less likely to form secondary structures.
If optimisation of assay conditions was required for primer pairs, a series of reactions
were run on a G-Storm Thermal Cycler (G-Storm) set up to include a temperature
gradient step (56ºC-66ºC) during the annealing phase of each cycle. A range of
primer concentrations was trialled under these conditions. Products were then
electrophoresed in a similar fashion to that described below, and the reaction
conditions yielding the strongest, single band, selected for use in the final assay
(Figure 2.6). Details of specific primers pairs for each gene studied along with the
PCR conditions used for each assay are given in Table 2.3 (human) and Table 2.4
(rat).
Figure 2.6. Optimisation of qPCR Assay for Runx-2. A series of reactions were run on a G-
Storm Thermal Cycler set up to include a temperature gradient step (56º-66º) during the annealing
phase of each cycle. A range of primer concentrations was trialled under these conditions. Products
were then electrophoresed on a 2% agarose gel and the reaction conditions yielding the strongest,
single band, selected for use in the final assay. In this example, 5 annealing temperatures were
trialled (57º, 58º, 60º, 62º and 64º as indicated) at 2 different primer concentrations as shown. The
strongest single product (at the correct size of 129bp for runx-2) was detected at a concentration of
0.25µM primer at 58º (white arrow) so these reaction conditions were used for the final assay. A
100bp reference ladder was also run as indicated.
0.5µM primer 0.25µM primer 100 bp ladder
← 129bp
↑ 57ºC
↑ 58ºC
↑ 60ºC
↑ 62ºC
↑ 64ºC
↑ 64ºC
↑ 62ºC
↑ 60ºC
↑ 58ºC
↑ 57ºC

64
Gene Forward Primer Reverse Primer Primer Concentration
(µM)
No. of
cycles
Annealing Temp.
(deg. C)
RPL13a CCTGGAGGAGAAGAGGAAAGAGA TTGAGGACCTCTGTGTATTTGTCAA 0.50 40 58
SDHA AGAAGCCCTTTGAGGAGCA CGATCACGGGTCTATATTCCAGA 0.50 40 58
HPRT TGACACTGGCAAAACAATGCA GGTCCTTTTCACCAGCAAGCT 0.50 40 58
ENPP-1 AAAGTACTCTCGCTGGTATTGTC TCACAGCGACAGTTCCCAAA 0.50 40 60
ANK GCAGCCCACATCAAGAAGTT TCCAAAACATCACGAAACAGA 0.50 40 60
Table 2.3. qPCR of Human RNA. Primers used for qPCR analysis of RNA extracted from human arterial tissue and details of cycle number and annealing temperature for
each assay. RPL13a: ribosomal protein L13a; SDHA: succinate dehydrogenase complex, subunit A; HPRT: hypoxanthine-guanine phosphoribosyltransferase.
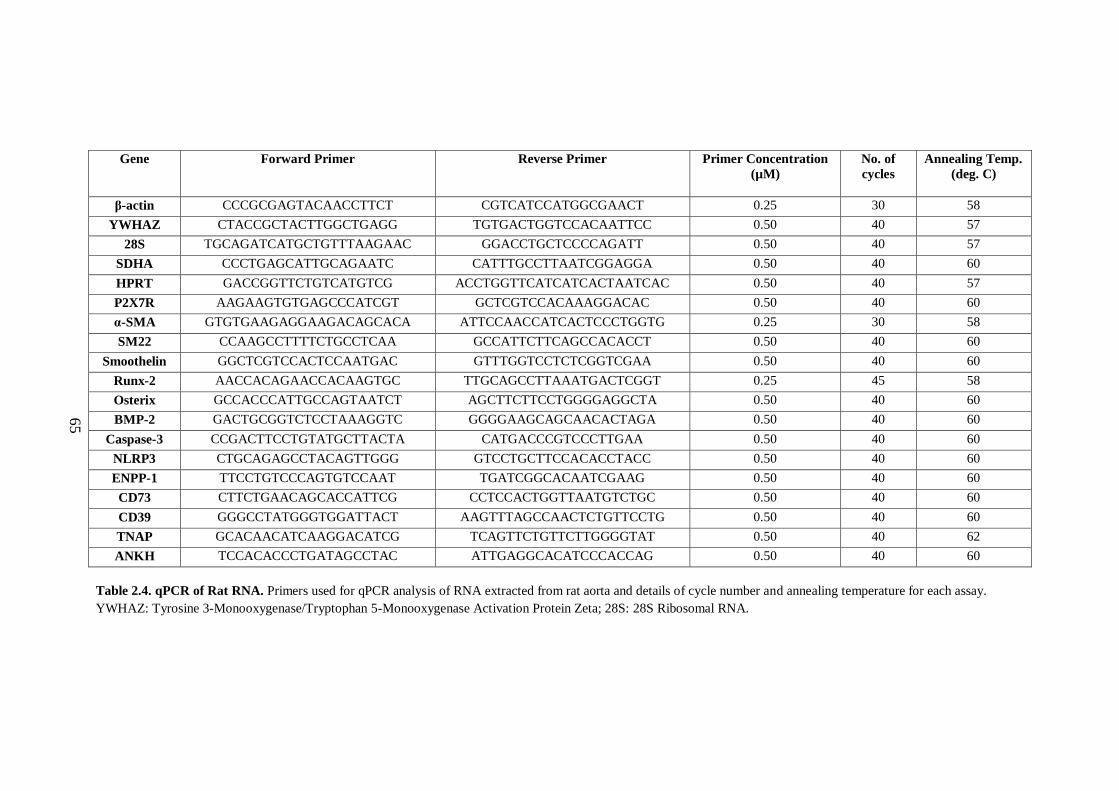
65
Gene Forward Primer Reverse Primer Primer Concentration
(µM)
No. of
cycles
Annealing Temp.
(deg. C)
β-actin CCCGCGAGTACAACCTTCT CGTCATCCATGGCGAACT 0.25 30 58
YWHAZ CTACCGCTACTTGGCTGAGG TGTGACTGGTCCACAATTCC 0.50 40 57
28S TGCAGATCATGCTGTTTAAGAAC GGACCTGCTCCCCAGATT 0.50 40 57
SDHA CCCTGAGCATTGCAGAATC CATTTGCCTTAATCGGAGGA 0.50 40 60
HPRT GACCGGTTCTGTCATGTCG ACCTGGTTCATCATCACTAATCAC 0.50 40 57
P2X7R AAGAAGTGTGAGCCCATCGT GCTCGTCCACAAAGGACAC 0.50 40 60
α-SMA GTGTGAAGAGGAAGACAGCACA ATTCCAACCATCACTCCCTGGTG 0.25 30 58
SM22 CCAAGCCTTTTCTGCCTCAA GCCATTCTTCAGCCACACCT 0.50 40 60
Smoothelin GGCTCGTCCACTCCAATGAC GTTTGGTCCTCTCGGTCGAA 0.50 40 60
Runx-2 AACCACAGAACCACAAGTGC TTGCAGCCTTAAATGACTCGGT 0.25 45 58
Osterix GCCACCCATTGCCAGTAATCT AGCTTCTTCCTGGGGAGGCTA 0.50 40 60
BMP-2 GACTGCGGTCTCCTAAAGGTC GGGGAAGCAGCAACACTAGA 0.50 40 60
Caspase-3 CCGACTTCCTGTATGCTTACTA CATGACCCGTCCCTTGAA 0.50 40 60
NLRP3 CTGCAGAGCCTACAGTTGGG GTCCTGCTTCCACACCTACC 0.50 40 60
ENPP-1 TTCCTGTCCCAGTGTCCAAT TGATCGGCACAATCGAAG 0.50 40 60
CD73 CTTCTGAACAGCACCATTCG CCTCCACTGGTTAATGTCTGC 0.50 40 60
CD39 GGGCCTATGGGTGGATTACT AAGTTTAGCCAACTCTGTTCCTG 0.50 40 60
TNAP GCACAACATCAAGGACATCG TCAGTTCTGTTCTTGGGGTAT 0.50 40 62
ANKH TCCACACCCTGATAGCCTAC ATTGAGGCACATCCCACCAG 0.50 40 60
Table 2.4. qPCR of Rat RNA. Primers used for qPCR analysis of RNA extracted from rat aorta and details of cycle number and annealing temperature for each assay.
YWHAZ: Tyrosine 3-Monooxygenase/Tryptophan 5-Monooxygenase Activation Protein Zeta; 28S: 28S Ribosomal RNA.
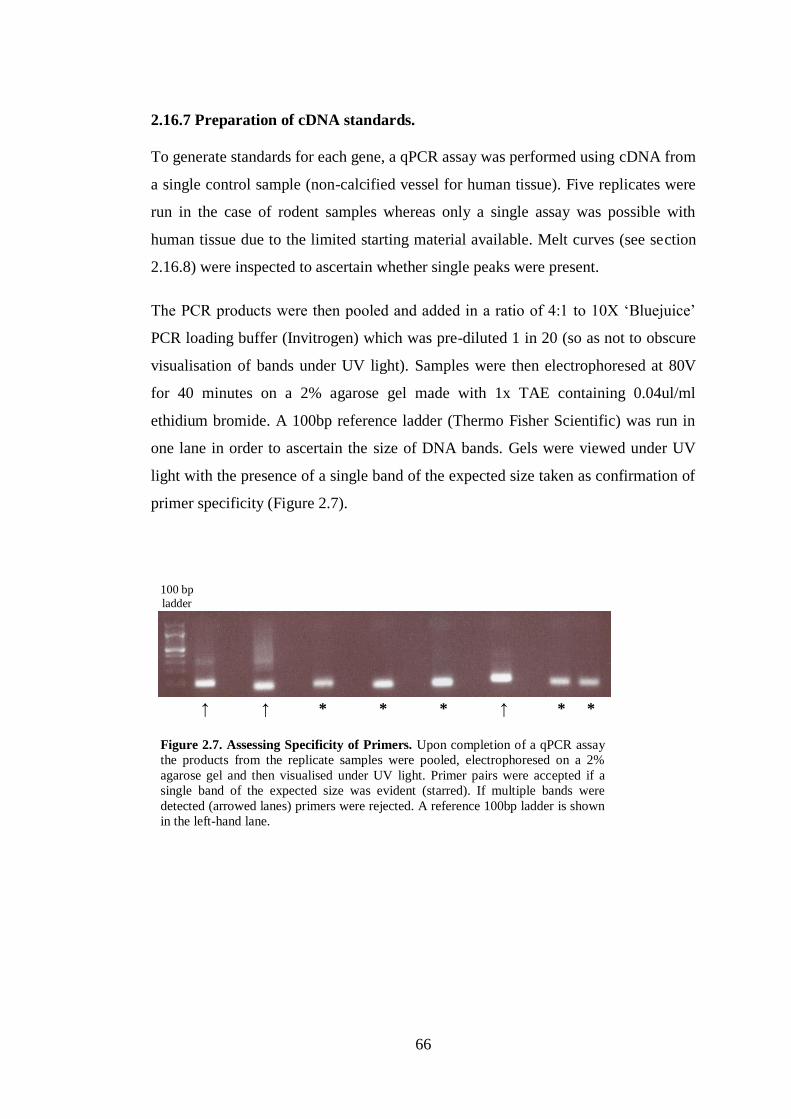
66
2.16.7 Preparation of cDNA standards.
To generate standards for each gene, a qPCR assay was performed using cDNA from
a single control sample (non-calcified vessel for human tissue). Five replicates were
run in the case of rodent samples whereas only a single assay was possible with
human tissue due to the limited starting material available. Melt curves (see section
2.16.8) were inspected to ascertain whether single peaks were present.
The PCR products were then pooled and added in a ratio of 4:1 to 10X ‘Bluejuice’
PCR loading buffer (Invitrogen) which was pre-diluted 1 in 20 (so as not to obscure
visualisation of bands under UV light). Samples were then electrophoresed at 80V
for 40 minutes on a 2% agarose gel made with 1x TAE containing 0.04ul/ml
ethidium bromide. A 100bp reference ladder (Thermo Fisher Scientific) was run in
one lane in order to ascertain the size of DNA bands. Gels were viewed under UV
light with the presence of a single band of the expected size taken as confirmation of
primer specificity (Figure 2.7).
Figure 2.7. Assessing Specificity of Primers. Upon completion of a qPCR assay
the products from the replicate samples were pooled, electrophoresed on a 2%
agarose gel and then visualised under UV light. Primer pairs were accepted if a
single band of the expected size was evident (starred). If multiple bands were
detected (arrowed lanes) primers were rejected. A reference 100bp ladder is shown
in the left-hand lane.
* * * * * ↑ ↑ ↑
100 bp ladder
67
The Geneclean Spin Kit (MPBiomedicals, Solon, USA) was then used to extract and
purify cDNA from gels. This kit employs the principle that DNA will bind to silica
in an environment high in chaotropic salt, and will elute when the salt concentration
is lowered. DNA bands were excised from agarose gels under UV light, placed into a
spin column containing 400µl ‘Geneclean Spin Glassmilk’ and melted at 55ºC. The
Glassmilk contains a suspension of proprietary silica matrix and chaotropic binding
salt thereby providing the necessary conditions for DNA binding.
Following a centrifugation step with ‘Geneclean Spin New Wash’, a solution
containing NaCl, Tris, EDTA and ethanol (added prior to use) which acts to remove
any remaining salt and agarose whilst ensuring DNA remains bound, the column was
centrifuged for 2 minutes at 14000xg to dry the pellet. ‘Geneclean Spin Elution
Solution’ (15µl), (PCR-grade water provided with the kit), was added to the column
and the pellet suspended within it. DNA was eluted and collected by centrifugation
at 14000xg for 30 seconds.
The concentration of extracted cDNA was measured using a Nanodrop (Thermo
Fisher Scientific) thereby enabling subsequent calculation of the number of DNA
copies present in 1µl by applying the following equations:
1. MMW of amplicon = amplicon length (in bp) x 660
[MMW: mean molecular weight; 660 = MMW of 1bp]
2. Amplicon copy number in 1ng = (6.02 x 10²³
/ MW amplicon) x 10-9
[6.02x1023
= Avogadro’s constant]
3. Number of copies in 1µl = cDNA/µl x copies of amplicon/ng
By diluting the concentrated cDNA it was possible to prepare standards from 107
-
102 per 2µl (the volume used in qPCR assays). These were made up in tRNA and
stored at -80ºC.

68
2.16.8 Quantitative PCR.
For every gene, each test sample was run in duplicate, and 6 standards (102 – 10
7),
were run in triplicate. RT-negative and tRNA (diluent alone) samples were also run
as negative controls on each occasion.
Reactions volumes of 10µl were prepared using a CAS-1200 robotic pipetting device
(Qiagen). cDNA (2µl) was added to a mastermix containing 5µl SensiMix
SYBR Hi-ROX (Bioline, London, UK) and an equal volume and concentration of
forward and reverse primers (see Tables 2.3 and 2.4 for details), made up to 8µl with
RNase-free water. The SensiMix reagent contains SYBR Green I dye, dNTPs,
stabilisers and enhancers.
Reactions were run on a RotorGene 6000 (Qiagen). Reactions commenced with a 10
minute hold at 95ºC for polymerase activation, followed by repeated cycles of
denaturation, annealing and extension steps, all 10 seconds in length. The number of
cycles and annealing temperature varied according to the primer pairs, details of
which are given in Tables 2.3 (human) and 2.4 (rat). After the final cycle, a melt
curve was constructed by increasing the temperature from 72ºC to 95ºC by 1ºC every
5 seconds.
Upon completion of the run, an assessment was made of the standard curve linearity
(r2 value) and reaction efficiency (Figure 2.8A). Accepted values were >0.99 and
0.85-1.10 respectively. Melt curves were also inspected to verify that single peaks
had been obtained (Figure 2.8B). Gene copy numbers from each sample were then
determined by comparing the cycle number (Ct value) at which the fluorescence
threshold (automatically determined by the RotorGene system) was reached, to the
standard curve (Figure 2.8C). Final copy numbers were calculated from the
geometric means of duplicate samples.
2.16.9 Calculation of gene copy number.
In order to compare copy numbers of a gene of interest between samples from
different treatment groups, it is necessary to normalise the results to one or more
stable ‘housekeeping’ genes, the expression of which should not change regardless
of experimental conditions. By using a panel of stable housekeeping genes in

69
combination for this normalisation process, a greater level of accuracy can be
achieved.
GeNorm software was used to facilitate the choosing of the most stable
housekeeping genes to use for normalisation. The mathematical principles
underlying this programme were originally described by Vandesompele et al (2002).
GeNorm calculates the average pairwise variation for a gene with all other tested
reference genes, to derive a stability factor ‘M’. It is then possible to choose the most
stable combination of housekeeping genes. From this selection, the geometric mean
is calculated in order to derive a ‘normalisation factor’ for each test sample, by
which all raw copy numbers are divided in order to obtain the final corrected copy
number for each gene of interest.
Figure 2.8. An Optimised qPCR Assay. Representative results obtained from an optimised qPCR
assay analysing rat aortic RNA. A: Standard curve generated from the results in Figure C. In this
example R2
was 0.999 and the efficiency was 0.95. B: Typical melt-curve showing a single peak for
all samples and standards suggestive of a single reaction product. C: Typical results of a qPCR
assay. Fluorescence is plotted against cycle number with the red horizontal line representing the
automatically derived threshold at which Ct readings are taken. Standards (each in triplicate) are
seen as the pink, orange, green, yellow, blue and red lines (107
- 102
respectively) (arrows). Samples
are indicated by purple lines. Turquoise and brown lines represent reverse transcription-negative
and tRNA samples respectively and all fall below the threshold line indicating absence of RNA
content.
A
C
B
70
2.17 Western Blotting
2.17.1 General principles.
The purpose of a Western blot is to detect the presence of a protein within a
biological sample. The starting material (cells or tissue) is homogenised in a lysis
buffer, containing protease and phosphatase inhibitors to minimise degradation, in
order to liberate proteins. The denatured lysate is then electrophoresed through a
SDS polyacrylamide gel, resulting in the separation of proteins according to their
molecular weight. The protein bands are then transferred onto a membrane, usually
nitrocellulose, by applying a voltage across the gel. Once transferred onto the
membrane, an antibody specific to the protein of interest (primary antibody) can be
applied, followed by a secondary antibody, commonly an HRP-conjugated.
Numerous secondary antibodies can bind to one primary antibody, and by cleaving
the chemiluminescent agent that is subsequently applied to the membrane, the signal
generated is amplified. The final signal is detected by exposing the membrane to a
photosensitive film which is then developed.
2.17.2 Solutions.
Radioimmunoprecipitation assay (RIPA) buffer: 1% Triton X100; 0.1% SDS;
150mM NaCl; 10mM Tris pH 7.2; 0.5% NP40; Protease and phosphatase inhibitor
cocktail, 1 tablet in 10ml (Thermo Fisher Scientific).
Stacking gel: 3.4ml water; 630ul 1M Tris pH 6.8; 750ul 30% Protogel acrylamide
(National Diagnostics, Hessle, UK); 50ul 10% SDS; 75ul 10% ammonium persulfate
(APS); 10ul tetramethylethylenediamine (TEMED) (BioRad).
10% resolving gel: 4ml water; 2.5ml 1.5M Tris pH 8.8; 3.34ml 30% Protogel
acrylamide (National Diagnostics); 100ul 10% SDS; 80ul 10% APS; 10ul TEMED
(BioRad).
10x SDS Polyacrylamide Gel Electrophoresis (PAGE) Running buffer: 30.3g Tris
base; 144.1g glycine; 10ml 10% SDS; made up to 1L with distilled water.
Transfer buffer (Bjerrum and Schafer-Nielson): 5.82g Tris; 2.93g glycine; 3.75ml
10% SDS; 200ml methanol; made up to 1L with distilled water.
71
10x Tris-Buffered Saline (TBS): 900 ml distilled ater; 24g Tris base; 88g NaCl; pH
then adjusted to 7.6 with 12M HCl and solution made up to 1L with distilled water.
Blocking solution: Required % protein (non-fat milk powder or BSA as indicated)
added to 1L 1xTBS/T (TBS/Tween) (made by adding 1ml Tween to 999ml of 1x
TBS i.e. 0.1% Tween).
2.17.3 Protein extraction from aortic tissue.
Aortic rings were snap-frozen in liquid nitrogen immediately following harvest and
subsequently stored at -80ºC. For protein extraction, the frozen tissue was transferred
into a 2ml round-bottomed collection tube containing 2x5mm steel balls (all Qiagen)
which had all been kept on dry ice for 30 minutes beforehand. RIPA buffer (150µl)
was then added and the tube immediately rapidly shaken at 50Hz for approximately
4x5 minute bursts using a TissueLyzer LT (Qiagen) in order to homogenise the
tissue. The resultant lysate was then transferred into a fresh tube on ice and
centrifuged at 8000xg for 5 minutes. The supernatant was removed and aliquots
made for long-term storage at -20ºC. A 5µl aliquot was used to determine the protein
concentration as described below.
2.17.4 Measurement of sample protein content.
The protein concentration of tissue lysates was determined using the BCA protein
assay (Pierce). This technique utilises the fact that in the presence of an alkaline
medium, protein will reduce Cu2+
to Cu1+
. The resulting Cu1+
will chelate with BCA
to form a purple, water soluble compound, the absorbance of which increases
linearly with increasing protein concentration over a wide range of values, and can
be measured spectophotometrically at 562nm. Using this method, a standard curve
can be constructed using known concentrations of BSA, against which experimental
samples can be compared in order to measure total protein content.
To generate protein standards, appropriate dilutions of BSA stock solution (2mg/ml)
were made using H2O to form volumes of 20µl. To each 20µl standard, 5µl of RIPA
buffer was added. For test samples, 5µl of lysate was added to 20µl H2O. A mixture
was then made, in a 50:1 ratio, of ‘reagent A’ (containing sodium carbonate, sodium
bicarbonate, BCA and sodium tartrate in 0.1M sodium hydroxide), and ‘reagent B’
(containing 4% cupric sulphate). The working reagent (200µl) was then added to
72
each standard and test sample before incubating at 37ºC for 30 minutes. After
cooling to room temperature, the absorbance of duplicate 100µl aliquots, placed in a
96 well, transparent, flat-bottomed plate was read on a microplate reader (EZ Read
400; Biochrom Ltd). A standard curve was generated and test sample protein
concentrations calculated.
2.17.5 Electrophoresis.
Electrophoresis was performed using a BioRad Mini-Protean II System (BioRad). To
prepare samples for electrophoresis, appropriate volumes of lysis (RIPA) buffer were
added to each to equalise volumes, following which a 1X loading buffer (Biorad)
was added in a ratio of 1:1. Samples were heated at 95°C for 10 minutes to denature
and then centrifuged at 10000xg for 30 seconds. Samples were loaded onto the gel
immersed in 1x running buffer. A Spectra Multi-colour Broad Range Protein Ladder
(Thermo Fisher Scientific) (10µl) was loaded into one of the lanes in order to
ascertain the molecular weight of subsequently detected protein bands. Gels were
initially run at 10mA. When samples had stacked at the stacking gel/resolving gel
interface, the current was increased to 20mA and the gel run until the loading dye
reached the bottom of the gel.
2.17.6 Transfer.
For semi-dry transfer, gels were removed from the cassette and gently rocked in
transfer buffer for 30 minutes. Following this the gel was placed on top of 0.2µm
nitrocellulose membrane (GE Healthcare Life Science, Amersham, UK) which was
placed onto 4-5 layers of filter paper on the transfer plate (Semi-dry Transblot,
BioRad). Air bubbles were removed and the gel covered in further filter paper. All
filter paper and nitrocellulose had also been pre-soaked in transfer buffer. Transfer
was performed at 12V for 45 minutes. Successful transfer was assessed by staining
the nitrocellulose membrane with Ponceau S. This stain was removed by washing
several times in water. The membrane was then blocked by gently agitating in
blocking solution for at least 2 hours at room temperature.
2.17.7 Protein labelling and visualisation.
Primary antibodies were made up in blocking solution and applied at the appropriate
concentration for the indicated time period (Table 2.5). Membranes were washed for

73
5 minutes 4 times in TBS/T following which the secondary antibody, made up in
blocking solution was applied for the required time (Table 2.5). Membranes were
washed for 5 minutes 3 times in TBS/T, followed by a final 5 minute wash in PBS.
The chemiluminescent substrate Lumiglo (New England Biolabs, Hitchin, UK) was
then applied for 1 minute. Excess substrate was dabbed off, the membrane wrapped
in parafilm and placed in a developing cassette (Kodak, Rochester, New York,
USA). In a darkroom, photo-sensitive film was applied to the wrapped membrane
and held within the cassette for the required length of time (typically a number of
seconds). Blots were then developed using a Compact X4 automatic processor
(Xograph, Stonehouse, UK). Image J software was used to compare bands by
densitometry.
2.18 Immunofluorescence
Cells were grown in 8 well chamber slides (BD Falcon, Oxford, UK) until 80%
confluent. Culture medium was then gently tipped off, cells were washed once in
PBS supplemented with 0.9mM calcium and 0.49mM magnesium and 200ul 4%
PFA was then applied for 5 minutes followed by 3 washes in PBS. If
permeabilisation was required, 200ul ice-cold methanol was applied to wells for 5
minutes followed by 3 PBS washes. Cells were then blocked for 30 minutes with
200µl serum from the species in which the secondary antibody was derived. The
primary antibody (Table 2.6), made up in PBS, was then applied for the indicated
length of time. IgG from the primary species was applied at equivalent
concentrations as a control for non-specific binding. Slides were washed 3 times in
PBS and the appropriate secondary antibody (Table 2.6), made up in PBS, was
applied for 1 hour. Cells were then washed 3 times in PBS and finally in H2O before
being mounted with hard-set mounting medium (Vector Labs, Peterborough, UK)
which included 4',6-diamidino-2-phenylindole (DAPI) for nuclear visualisation.
Once set, slides were examined using an epifluorescence microscope (Zeiss,
Cambridge, UK).

74
Target Protein Primary
Antibody
Primary Dilution
(Time and
incubation
temperature)
Secondary
Antibody
Secondary
Dilution
(Time and
incubation
temperature)
Human P2X7R ab109246
(Abcam)
Rabbit
monoclonal
1:1000
(overnight at 4ºC)
HRP-conjugated
Goat anti-Rabbit
polyclonal
(Thermo Fisher)
1:3000
(1 hour at room
temperature)
Rat P2X7R ab109246
(Abcam)
Rabbit
monoclonal
1:1000
(overnight at 4ºC)
HRP-conjugated
Goat anti-rabbit
polyclonal
(Thermo Fisher)
1:3000
(1 hour at room
temperature)
Rat α-actin A2228
(Sigma)
Mouse
monoclonal
1:10,000
(1 hour at room
temperature)
HRP-conjugated
Rabbit anti-mouse
polyclonal
(Abcam)
1:3000
(1 hour at room
temperature)
Human
GAPDH
ab8245
(Abcam)
Mouse
monoclonal
1:10,000
(1 hour at room
temperature)
HRP-conjugated
Rabbit anti-mouse
polyclonal
(Abcam)
1:3000
(1 hour at room
temperature)
Rat GAPDH ab8245
(Abcam)
Mouse
monoclonal
1:10,000
(1 hour at room
temperature)
HRP-conjugated
Rabbit anti-mouse
polyclonal
(Abcam)
1:3000
(1 hour at room
temperature)
Table 2.5. Antibodies used for Western Blots. GAPDH: Glyceraldehyde 3-Phosphate Dehydrogenase.
Target Protein Primary
Antibody
Primary Dilution
(Time and
incubation
temperature)
Secondary
Antibody
Secondary
Dilution
(Time and
incubation
temperature)
Human P2X7R ab109246
(Abcam)
Rabbit
monoclonal
1:250
(overnight at 4ºC)
Dylight 488-
conjugated goat
anti-rabbit
(Vector Labs)
1:100
(1hour at room
temperature)
Rat α-SMA M0851
(DAKO)
1:50
(overnight at 4ºC)
Dylight 488-
conjugated horse
anti-mouse
(Vector Labs)
1:100
(1hour at room
temperature)
Rat SMMHC sc6956
(Santa Cruz)
1:500
(overnight at 4ºC)
Dylight 488-
conjugated horse
anti-mouse
(Vector Labs)
1:100
(1hour at room
temperature)
Table 2.6. Antibodies used for Immunofluorescence.

75
2.19 Histological Analysis
2.19.1 Sample preparation and deparaffinisation of sections.
Tissue samples were fixed in either 4% PFA or 10% NBF as indicated. Initial
processing, embedding into paraffin and cutting of sections, along with staining for
haematoxylin and eosin (H & E) and Picrosirius red was performed by Ms Mahrokh
Nohadani.
Slides were deparaffinised and rehydrated by performing the following washes:
1. Xylene: 2 x 3 minutes
2. 100% ethanol: 2 x 3 minutes
3. 95% ethanol: 3 minutes
4. 70 % ethanol: 3 minutes
5. 50 % ethanol: 3 minutes
6. H2O
2.19.2 Silver nitrate stain according to von Kossa.
The von Kossa technique for staining tissue mineralisation was first described in
1901 (von Kossa 1901). Under a strong light source, calcium ions within salt
compounds, (usually calcium-phosphate), become reduced and replaced with silver.
This is visualised as a deep metallic silver colour on microscopy.
All reagents were purchased from Merck Millipore (Watford, UK). Following
deparaffinisation and hydration to water, slides were rinsed in several changes of
distilled water and incubated with 1% silver nitrate solution under ultraviolet light
for 25 minutes. Slides were rinsed in H2O. 5% sodium thiosulfate was applied for 5
minutes to remove unreacted silver before rinsing again in H2O. Nuclear fast red
counterstain was applied for 5 minutes. Slides were rinsed in H2O, dehydrated
through graded alcohol and cleared in xylene. Coverslips were applied using
permanent mounting medium (Vector Labs).
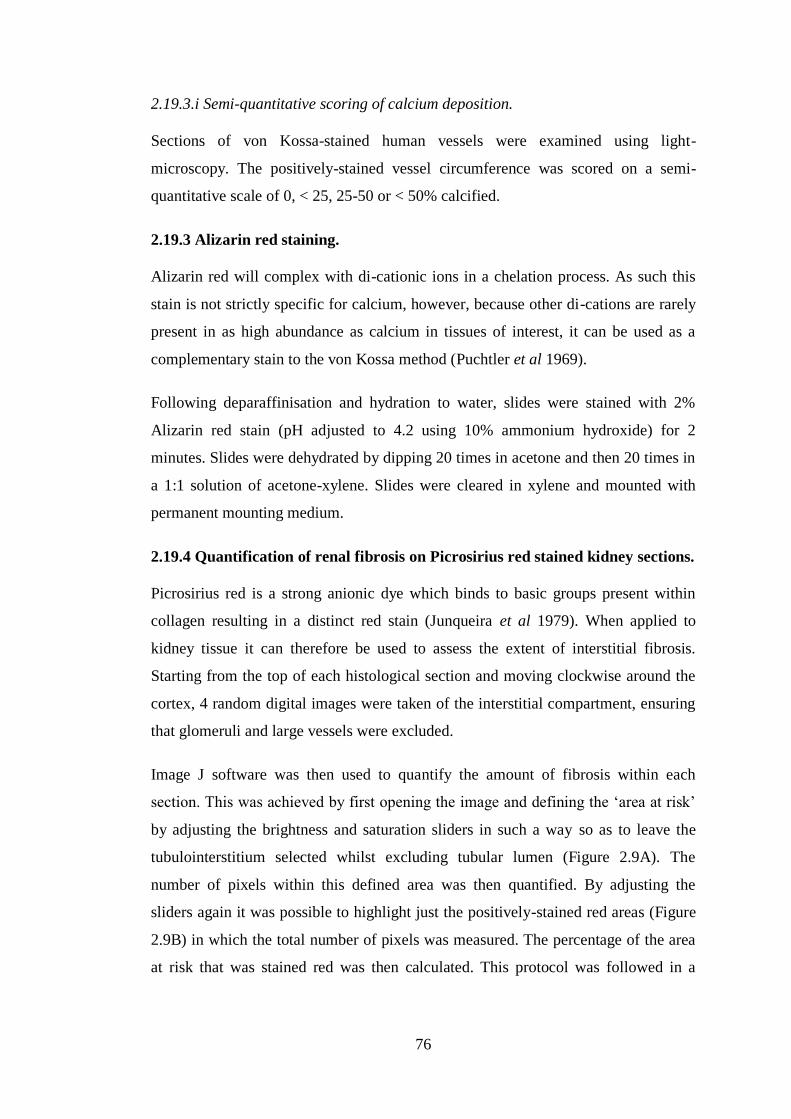
76
2.19.3.i Semi-quantitative scoring of calcium deposition.
Sections of von Kossa-stained human vessels were examined using light-
microscopy. The positively-stained vessel circumference was scored on a semi-
quantitative scale of 0, < 25, 25-50 or < 50% calcified.
2.19.3 Alizarin red staining.
Alizarin red will complex with di-cationic ions in a chelation process. As such this
stain is not strictly specific for calcium, however, because other di-cations are rarely
present in as high abundance as calcium in tissues of interest, it can be used as a
complementary stain to the von Kossa method (Puchtler et al 1969).
Following deparaffinisation and hydration to water, slides were stained with 2%
Alizarin red stain (pH adjusted to 4.2 using 10% ammonium hydroxide) for 2
minutes. Slides were dehydrated by dipping 20 times in acetone and then 20 times in
a 1:1 solution of acetone-xylene. Slides were cleared in xylene and mounted with
permanent mounting medium.
2.19.4 Quantification of renal fibrosis on Picrosirius red stained kidney sections.
Picrosirius red is a strong anionic dye which binds to basic groups present within
collagen resulting in a distinct red stain (Junqueira et al 1979). When applied to
kidney tissue it can therefore be used to assess the extent of interstitial fibrosis.
Starting from the top of each histological section and moving clockwise around the
cortex, 4 random digital images were taken of the interstitial compartment, ensuring
that glomeruli and large vessels were excluded.
Image J software was then used to quantify the amount of fibrosis within each
section. This was achieved by first opening the image and defining the ‘area at risk’
by adjusting the brightness and saturation sliders in such a way so as to leave the
tubulointerstitium selected whilst excluding tubular lumen (Figure 2.9A). The
number of pixels within this defined area was then quantified. By adjusting the
sliders again it was possible to highlight just the positively-stained red areas (Figure
2.9B) in which the total number of pixels was measured. The percentage of the area
at risk that was stained red was then calculated. This protocol was followed in a
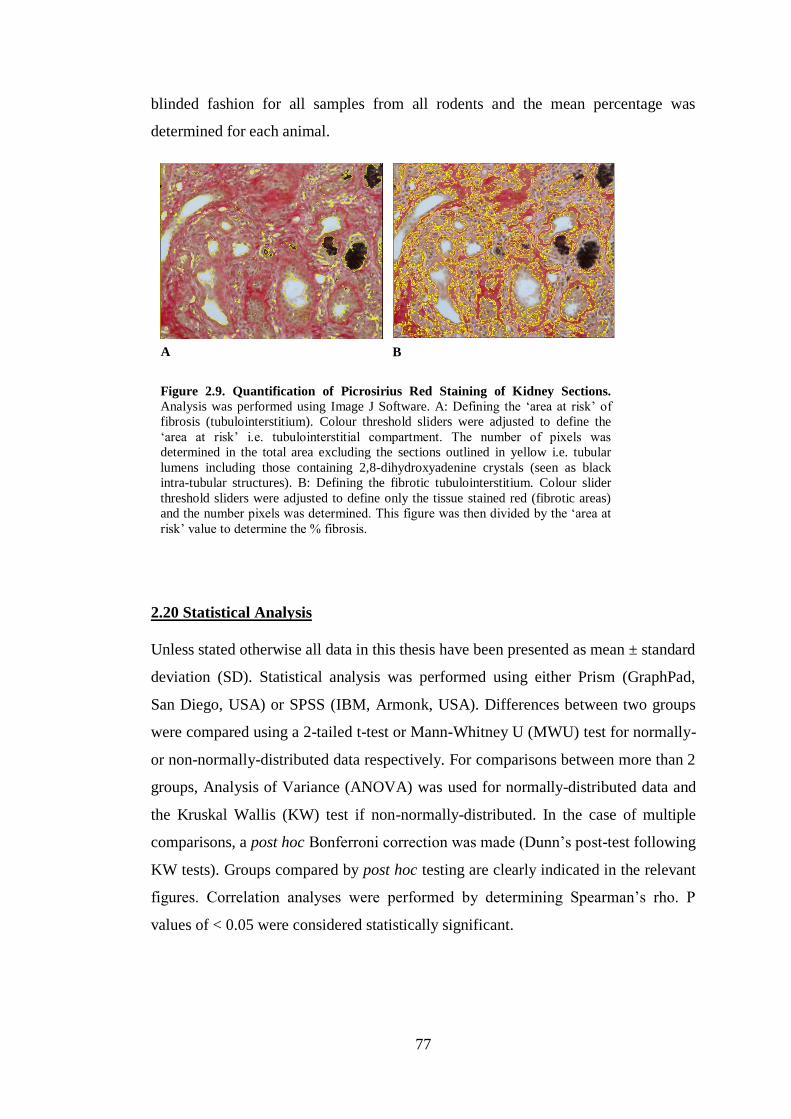
77
blinded fashion for all samples from all rodents and the mean percentage was
determined for each animal.
2.20 Statistical Analysis
Unless stated otherwise all data in this thesis have been presented as mean ± standard
deviation (SD). Statistical analysis was performed using either Prism (GraphPad,
San Diego, USA) or SPSS (IBM, Armonk, USA). Differences between two groups
were compared using a 2-tailed t-test or Mann-Whitney U (MWU) test for normally-
or non-normally-distributed data respectively. For comparisons between more than 2
groups, Analysis of Variance (ANOVA) was used for normally-distributed data and
the Kruskal Wallis (KW) test if non-normally-distributed. In the case of multiple
comparisons, a post hoc Bonferroni correction was made (Dunn’s post-test following
KW tests). Groups compared by post hoc testing are clearly indicated in the relevant
figures. Correlation analyses were performed by determining Spearman’s rho. P
values of < 0.05 were considered statistically significant.
Figure 2.9. Quantification of Picrosirius Red Staining of Kidney Sections.
Analysis was performed using Image J Software. A: Defining the ‘area at risk’ of
fibrosis (tubulointerstitium). Colour threshold sliders were adjusted to define the
‘area at risk’ i.e. tubulointerstitial compartment. The number of pixels was
determined in the total area excluding the sections outlined in yellow i.e. tubular
lumens including those containing 2,8-dihydroxyadenine crystals (seen as black
intra-tubular structures). B: Defining the fibrotic tubulointerstitium. Colour slider
threshold sliders were adjusted to define only the tissue stained red (fibrotic areas)
and the number pixels was determined. This figure was then divided by the ‘area at
risk’ value to determine the % fibrosis.
A B
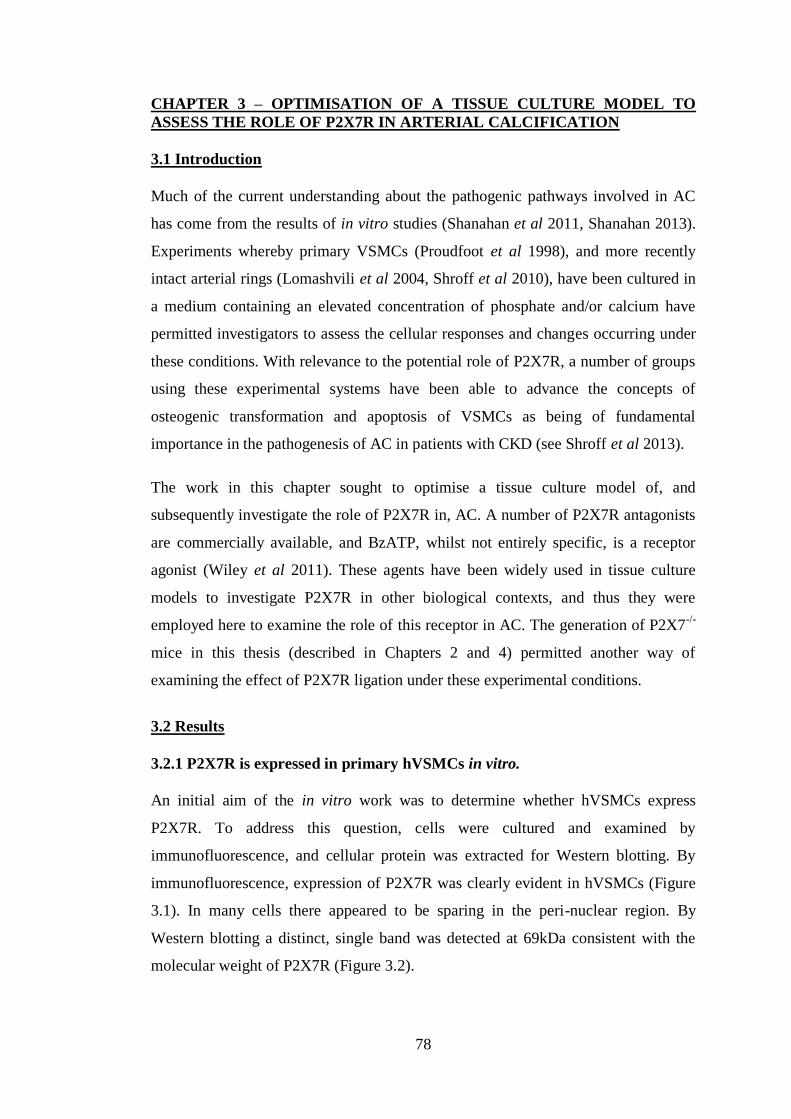
78
CHAPTER 3 – OPTIMISATION OF A TISSUE CULTURE MODEL TO
ASSESS THE ROLE OF P2X7R IN ARTERIAL CALCIFICATION
3.1 Introduction
Much of the current understanding about the pathogenic pathways involved in AC
has come from the results of in vitro studies (Shanahan et al 2011, Shanahan 2013).
Experiments whereby primary VSMCs (Proudfoot et al 1998), and more recently
intact arterial rings (Lomashvili et al 2004, Shroff et al 2010), have been cultured in
a medium containing an elevated concentration of phosphate and/or calcium have
permitted investigators to assess the cellular responses and changes occurring under
these conditions. With relevance to the potential role of P2X7R, a number of groups
using these experimental systems have been able to advance the concepts of
osteogenic transformation and apoptosis of VSMCs as being of fundamental
importance in the pathogenesis of AC in patients with CKD (see Shroff et al 2013).
The work in this chapter sought to optimise a tissue culture model of, and
subsequently investigate the role of P2X7R in, AC. A number of P2X7R antagonists
are commercially available, and BzATP, whilst not entirely specific, is a receptor
agonist (Wiley et al 2011). These agents have been widely used in tissue culture
models to investigate P2X7R in other biological contexts, and thus they were
employed here to examine the role of this receptor in AC. The generation of P2X7-/-
mice in this thesis (described in Chapters 2 and 4) permitted another way of
examining the effect of P2X7R ligation under these experimental conditions.
3.2 Results
3.2.1 P2X7R is expressed in primary hVSMCs in vitro.
An initial aim of the in vitro work was to determine whether hVSMCs express
P2X7R. To address this question, cells were cultured and examined by
immunofluorescence, and cellular protein was extracted for Western blotting. By
immunofluorescence, expression of P2X7R was clearly evident in hVSMCs (Figure
3.1). In many cells there appeared to be sparing in the peri-nuclear region. By
Western blotting a distinct, single band was detected at 69kDa consistent with the
molecular weight of P2X7R (Figure 3.2).
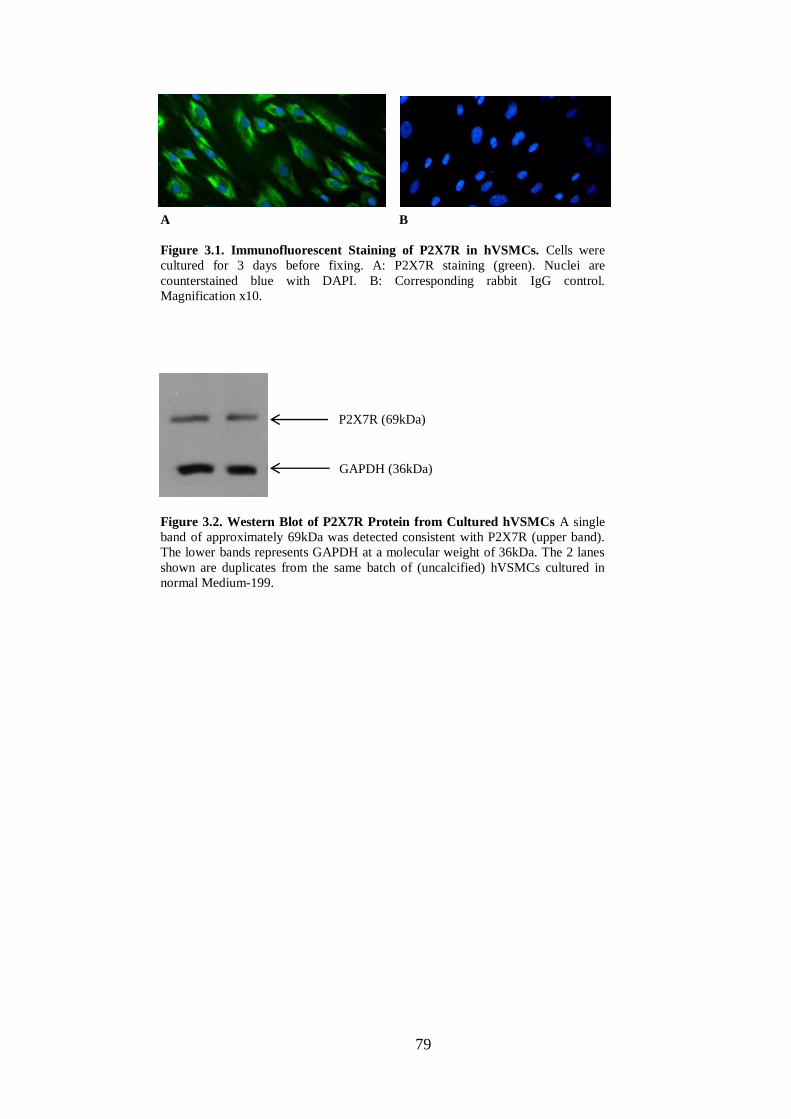
79
Figure 3.1. Immunofluorescent Staining of P2X7R in hVSMCs. Cells were
cultured for 3 days before fixing. A: P2X7R staining (green). Nuclei are
counterstained blue with DAPI. B: Corresponding rabbit IgG control.
Magnification x10.
A B
Figure 3.2. Western Blot of P2X7R Protein from Cultured hVSMCs A single
band of approximately 69kDa was detected consistent with P2X7R (upper band).
The lower bands represents GAPDH at a molecular weight of 36kDa. The 2 lanes
shown are duplicates from the same batch of (uncalcified) hVSMCs cultured in
normal Medium-199.
P2X7R (69kDa)
GAPDH (36kDa)

80
3.2.2 Experiments culturing VSMCs in high calcium and phosphate-containing
medium yield inconsistent results.
With P2X7R expression confirmed in VSMCs, its role in VSMC-associated
calcification in vitro was assessed. A commonly used model of AC is the in vitro
culture of VSMCs in a medium containing an elevated concentration of phosphate
and/or calcium (see Chapter 1, section 1.4.1). This in vitro system was therefore
initially employed to assess the influence of the selective P2X7R antagonist,
A438079, on hVSMC-associated calcium deposition. Several experiments were
performed, using commercially-available hVSMCs from two different donors.
In hVSMCs from donor 1, the addition of 10µM A438079 to the calcification
medium resulted in a trend towards decreased calcium deposition after 6 days (6.4 ±
3.4 vs 2.8 ± 1.6µg/µg without and with A438079, respectively; p = 0.200) (Figure
3.3). However, a second, repeat experiment using cells from this donor yielded
minimal calcification in all groups, including the control cells cultured in
calcification medium alone (data not shown).
The supply of cells from this first donor was limited, so a second donor’s cells were
obtained for use. In contrast to the results for donor 1, in hVSMCs from donor 2 a
trend was seen towards enhanced calcium deposition in the presence of increasing
concentrations of A438079 at day 6 (0.61 ± 0.11 vs 0.78 ± 0.06 vs 0.86 ± 0.16µg/µg
for control, 5µM and 10µM A438079, respectively; p = 0.067). A similar but less
marked trend was seen at day 4 (p = 0.177) (Figure 3.4). However, a repeat
experiment with these cells yielded equivocal calcium deposition at days 4 and 6
across all groups (p = 0.112 and 0.733 respectively) (Figure 3.4), and two subsequent
experiments with cells from this donor failed to result in calcification in any culture
well (data not shown).
A striking feature of this model which became apparent after a number of
experiments had been performed was the inconsistency of calcification. It was not
uncommon to observe calcium deposition in association with cells in one
experiment, only for it to be absent when culturing cells from the same donor under
identical conditions a second or third time. In addition to the ‘inter-experiment’
calcification variability, in experiments where calcium deposition was observed, the
cell donor appeared to be exerting a major influence on the outcome i.e. the effect of

81
A438079 on mineralisation. Given this latter observation, it was decided to try and
standardise the genetic background of cells in an attempt to gain more reproducible
results by eliminating the potential effects of human variation.
Figure 3.3. The Effect of the Specific P2X7R Antagonist A438079 on hVSMC-
Associated Calcification (Donor 1). Cells from the first donor were cultured for 6
days in either normal control Medium-199 (N Med) or in ‘calcification’ Medium-199
(Cal Med) containing calcium and phosphate concentrations of 2.7mM and 2mM
respectively. The specific P2X7R antagonist A438079 was added where indicated to
a final concentration of 10µM. N=3 per group. Error bars represent mean ± SD.
Figure 3.4. The Effect of the Specific P2X7R Antagonist A438079 on hVSMC-
Associated Calcification (Donor 2). Cells from the second donor were cultured for
either 4 or 6 days in normal control Medium-199 (N Med) or ‘calcification’ Medium-
199 (Cal Med) containing calcium and phosphate concentrations of 2.7mM and 2mM
respectively. The specific P2X7R antagonist A438079 was added where indicated to
a final concentration of either 5 (+5) or 10 (+10) µM. N=3 per group. Error bars
represent mean ± SD.
1st
experiment 2nd
experiment
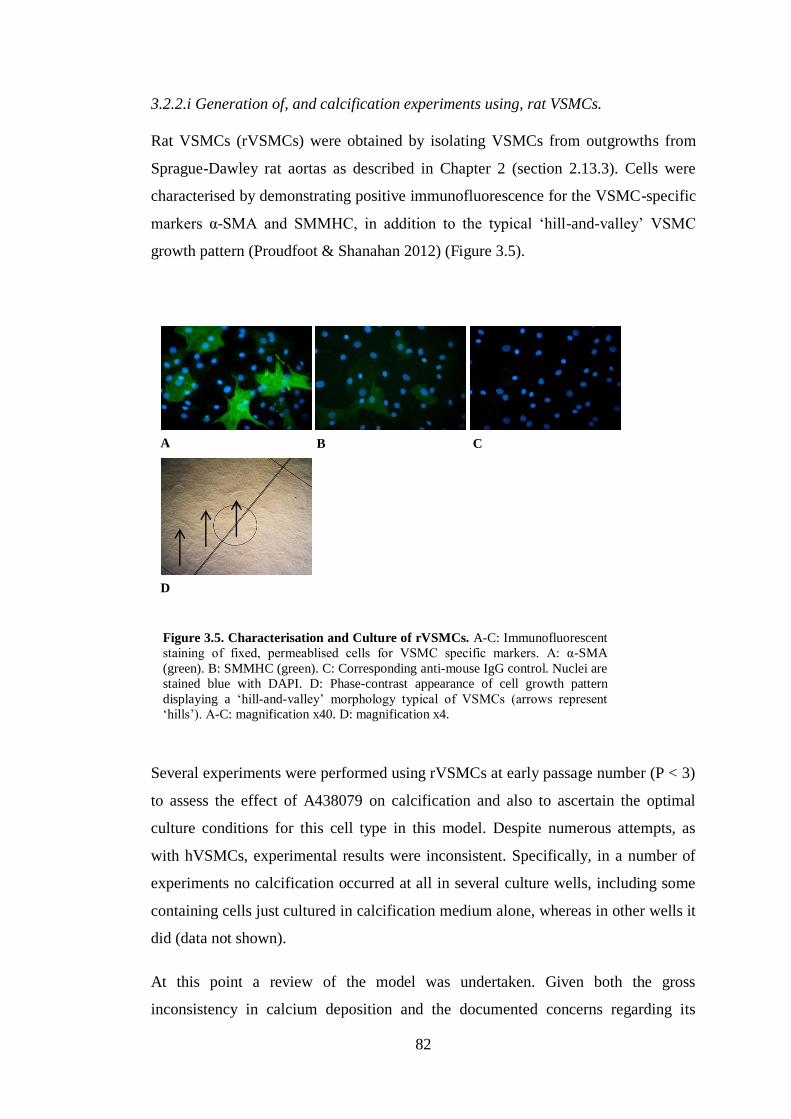
82
3.2.2.i Generation of, and calcification experiments using, rat VSMCs.
Rat VSMCs (rVSMCs) were obtained by isolating VSMCs from outgrowths from
Sprague-Dawley rat aortas as described in Chapter 2 (section 2.13.3). Cells were
characterised by demonstrating positive immunofluorescence for the VSMC-specific
markers α-SMA and SMMHC, in addition to the typical ‘hill-and-valley’ VSMC
growth pattern (Proudfoot & Shanahan 2012) (Figure 3.5).
Several experiments were performed using rVSMCs at early passage number (P < 3)
to assess the effect of A438079 on calcification and also to ascertain the optimal
culture conditions for this cell type in this model. Despite numerous attempts, as
with hVSMCs, experimental results were inconsistent. Specifically, in a number of
experiments no calcification occurred at all in several culture wells, including some
containing cells just cultured in calcification medium alone, whereas in other wells it
did (data not shown).
At this point a review of the model was undertaken. Given both the gross
inconsistency in calcium deposition and the documented concerns regarding its
A B C
D
Figure 3.5. Characterisation and Culture of rVSMCs. A-C: Immunofluorescent
staining of fixed, permeablised cells for VSMC specific markers. A: α-SMA
(green). B: SMMHC (green). C: Corresponding anti-mouse IgG control. Nuclei are
stained blue with DAPI. D: Phase-contrast appearance of cell growth pattern
displaying a ‘hill-and-valley’ morphology typical of VSMCs (arrows represent
‘hills’). A-C: magnification x40. D: magnification x4.

83
biological relevance, both of which are discussed below, this in vitro system was
abandoned as an experimental tool for work in this thesis in favour of the aortic ring
ex vivo culture model.
3.2.3 Characterisation and optimisation of an ex vivo aortic ring calcification
model.
3.2.3.i Calcification of rat aortic rings can be induced by culturing in a medium
containing phosphate concentrations above 2.5mM.
Previous reports had suggested that normal vessels, from both humans (Shroff et al
2010) and rats (Lomashvili et al 2004), would maintain viability but not calcify if
cultured in a high phosphate-containing medium alone. To test these observations,
rings of rat aorta were cultured in media containing a range of increasing phosphate
concentrations (1 - 3.8mM) for 10 days.
Calcification was evident in rings cultured in phosphate concentrations of ≥ 2.5mM
as assessed by von Kossa staining (Figure 3.6). Mineralisation was seen as linear
deposits, tracking along the elastic laminae between VSMCs (Figure 3.7). VSMCs in
these vessels appeared morphologically normal on H & E staining (Figure 3.8). In
rings containing heavier calcium deposition, more notable in those cultured in
phosphate concentrations > 3mM, marked, circumferential mineralisation was
evident, completely disrupting the normal vessel architecture, presumably as a
consequence of the more brittle sections ‘fracturing’ during sectioning (Figure 3.6).
Calcification was also frequently observed in the adventitia (Figure 3.7), highlighting
the importance of removing this layer prior to calcification quantification in order to
accurately ascertain the degree of medial calcium deposition.
Rings cultured in 3mM phosphate had marked calcium deposition without overt
disruption of the vessel wall on histological assessment. It was therefore decided to
set 3mM as the phosphate concentration for subsequent work with this model.
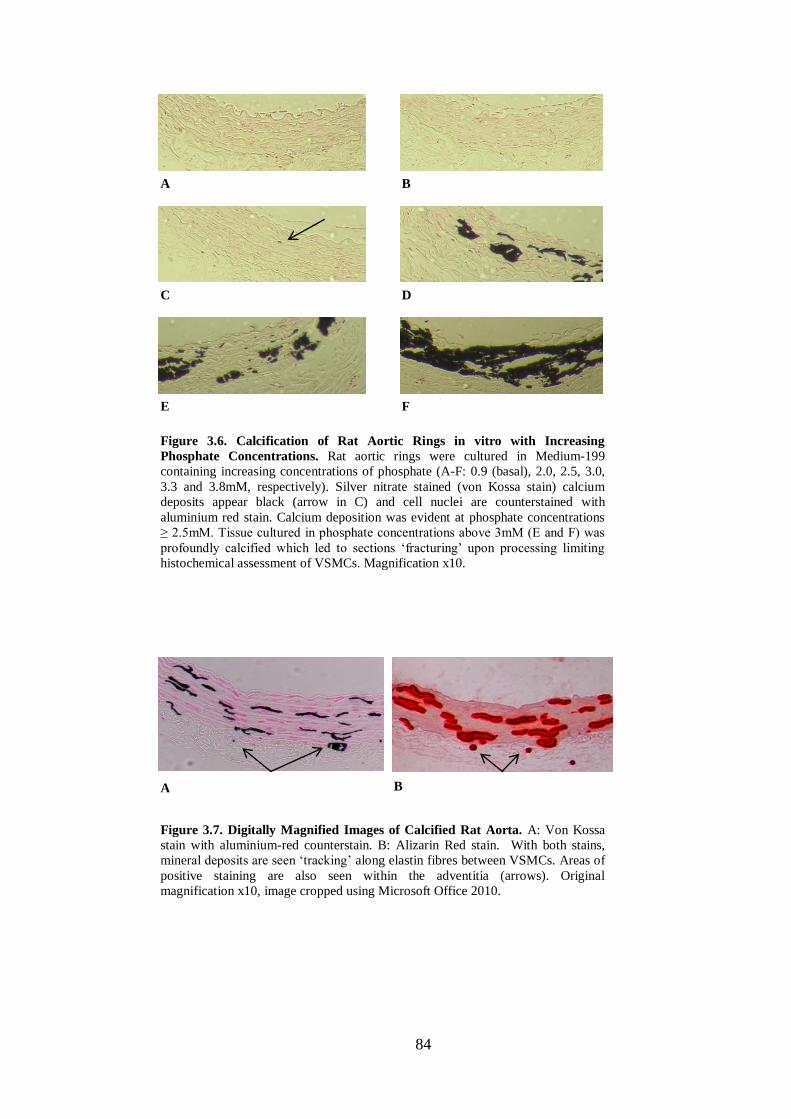
84
A B
C D
F E
Figure 3.6. Calcification of Rat Aortic Rings in vitro with Increasing
Phosphate Concentrations. Rat aortic rings were cultured in Medium-199
containing increasing concentrations of phosphate (A-F: 0.9 (basal), 2.0, 2.5, 3.0,
3.3 and 3.8mM, respectively). Silver nitrate stained (von Kossa stain) calcium
deposits appear black (arrow in C) and cell nuclei are counterstained with
aluminium red stain. Calcium deposition was evident at phosphate concentrations
≥ 2.5mM. Tissue cultured in phosphate concentrations above 3mM (E and F) was
profoundly calcified which led to sections ‘fracturing’ upon processing limiting
histochemical assessment of VSMCs. Magnification x10.
Figure 3.7. Digitally Magnified Images of Calcified Rat Aorta. A: Von Kossa
stain with aluminium-red counterstain. B: Alizarin Red stain. With both stains,
mineral deposits are seen ‘tracking’ along elastin fibres between VSMCs. Areas of
positive staining are also seen within the adventitia (arrows). Original
magnification x10, image cropped using Microsoft Office 2010.
A B
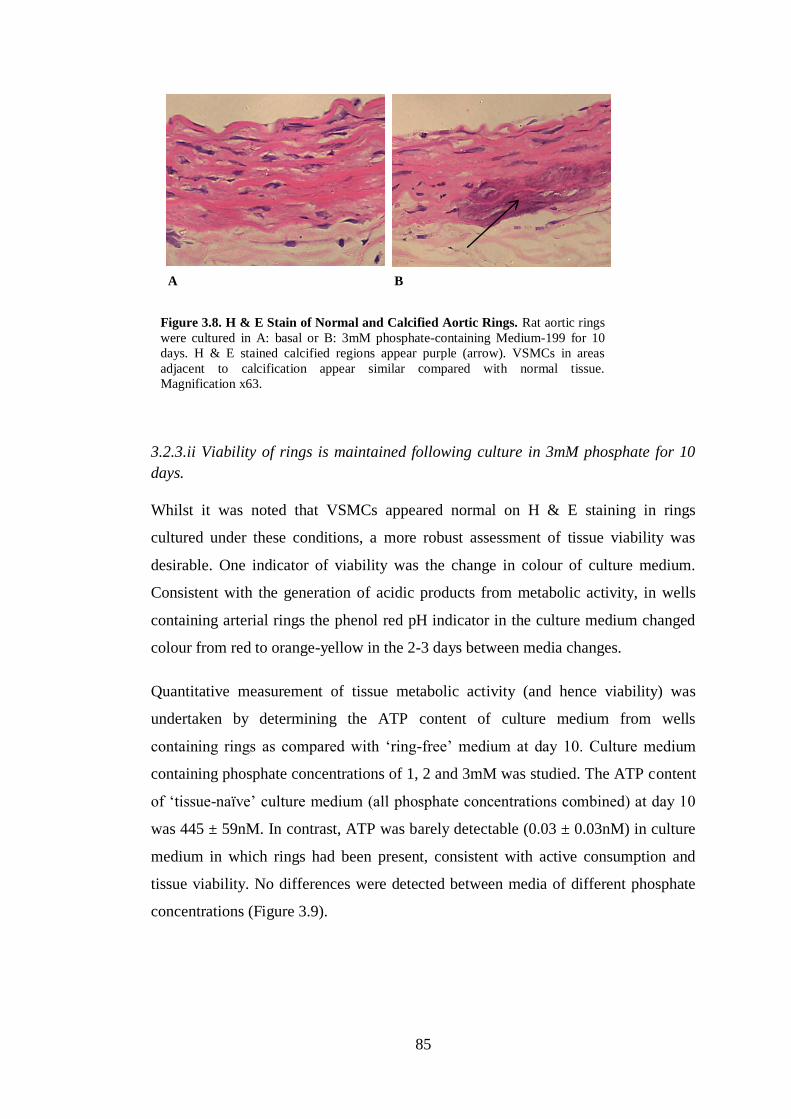
85
3.2.3.ii Viability of rings is maintained following culture in 3mM phosphate for 10
days.
Whilst it was noted that VSMCs appeared normal on H & E staining in rings
cultured under these conditions, a more robust assessment of tissue viability was
desirable. One indicator of viability was the change in colour of culture medium.
Consistent with the generation of acidic products from metabolic activity, in wells
containing arterial rings the phenol red pH indicator in the culture medium changed
colour from red to orange-yellow in the 2-3 days between media changes.
Quantitative measurement of tissue metabolic activity (and hence viability) was
undertaken by determining the ATP content of culture medium from wells
containing rings as compared with ‘ring-free’ medium at day 10. Culture medium
containing phosphate concentrations of 1, 2 and 3mM was studied. The ATP content
of ‘tissue-naïve’ culture medium (all phosphate concentrations combined) at day 10
was 445 ± 59nM. In contrast, ATP was barely detectable (0.03 ± 0.03nM) in culture
medium in which rings had been present, consistent with active consumption and
tissue viability. No differences were detected between media of different phosphate
concentrations (Figure 3.9).
Figure 3.8. H & E Stain of Normal and Calcified Aortic Rings. Rat aortic rings
were cultured in A: basal or B: 3mM phosphate-containing Medium-199 for 10
days. H & E stained calcified regions appear purple (arrow). VSMCs in areas
adjacent to calcification appear similar compared with normal tissue.
Magnification x63.
A B
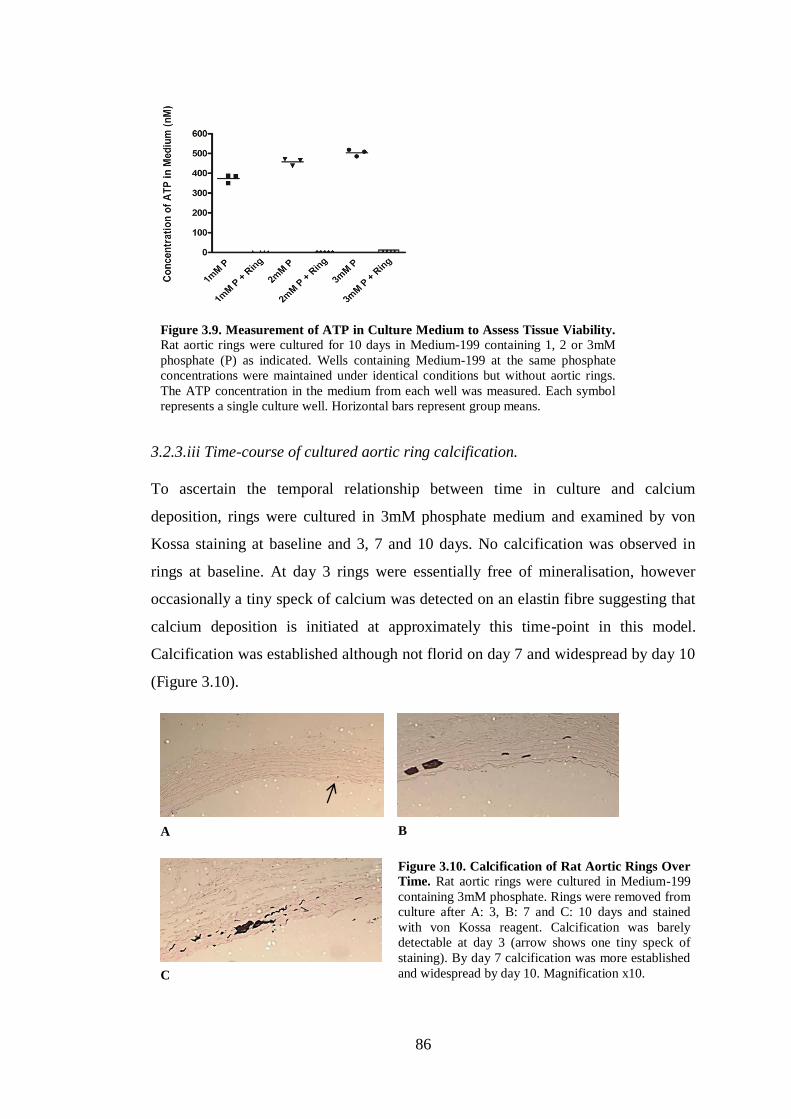
86
3.2.3.iii Time-course of cultured aortic ring calcification.
To ascertain the temporal relationship between time in culture and calcium
deposition, rings were cultured in 3mM phosphate medium and examined by von
Kossa staining at baseline and 3, 7 and 10 days. No calcification was observed in
rings at baseline. At day 3 rings were essentially free of mineralisation, however
occasionally a tiny speck of calcium was detected on an elastin fibre suggesting that
calcium deposition is initiated at approximately this time-point in this model.
Calcification was established although not florid on day 7 and widespread by day 10
(Figure 3.10).
Figure 3.9. Measurement of ATP in Culture Medium to Assess Tissue Viability.
Rat aortic rings were cultured for 10 days in Medium-199 containing 1, 2 or 3mM
phosphate (P) as indicated. Wells containing Medium-199 at the same phosphate
concentrations were maintained under identical conditions but without aortic rings.
The ATP concentration in the medium from each well was measured. Each symbol
represents a single culture well. Horizontal bars represent group means.
A
C
B
Figure 3.10. Calcification of Rat Aortic Rings Over
Time. Rat aortic rings were cultured in Medium-199
containing 3mM phosphate. Rings were removed from
culture after A: 3, B: 7 and C: 10 days and stained
with von Kossa reagent. Calcification was barely
detectable at day 3 (arrow shows one tiny speck of
staining). By day 7 calcification was more established
and widespread by day 10. Magnification x10.
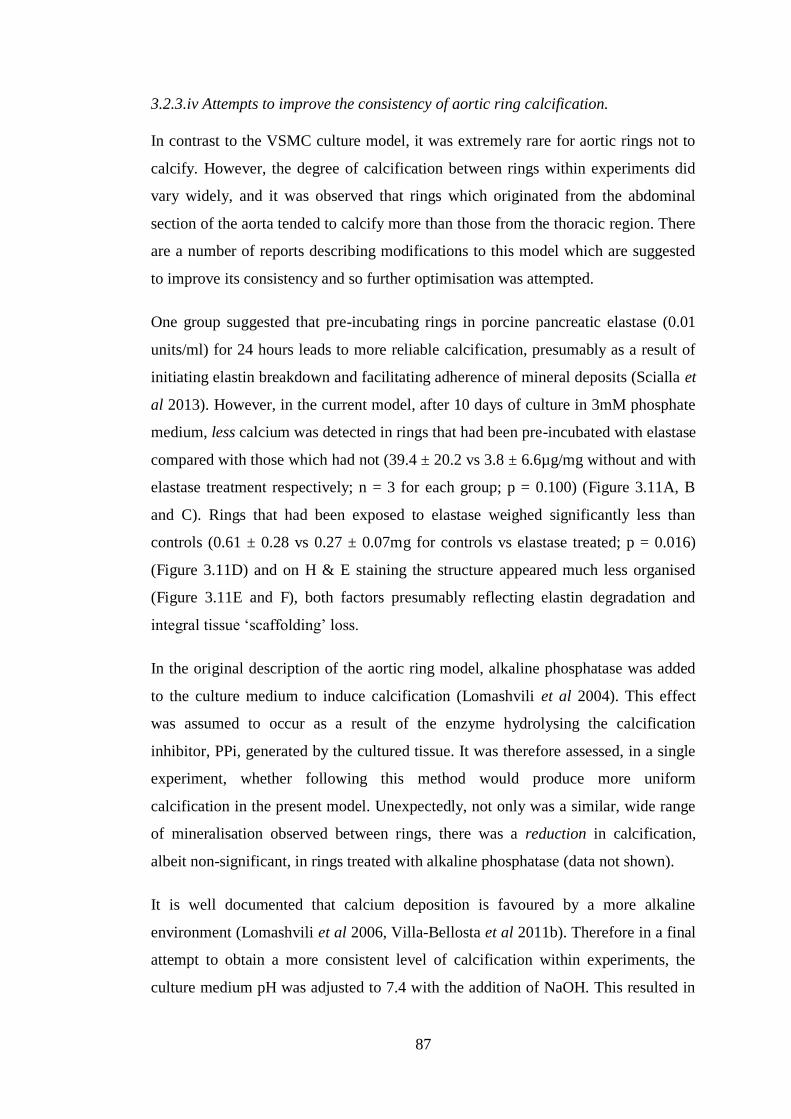
87
3.2.3.iv Attempts to improve the consistency of aortic ring calcification.
In contrast to the VSMC culture model, it was extremely rare for aortic rings not to
calcify. However, the degree of calcification between rings within experiments did
vary widely, and it was observed that rings which originated from the abdominal
section of the aorta tended to calcify more than those from the thoracic region. There
are a number of reports describing modifications to this model which are suggested
to improve its consistency and so further optimisation was attempted.
One group suggested that pre-incubating rings in porcine pancreatic elastase (0.01
units/ml) for 24 hours leads to more reliable calcification, presumably as a result of
initiating elastin breakdown and facilitating adherence of mineral deposits (Scialla et
al 2013). However, in the current model, after 10 days of culture in 3mM phosphate
medium, less calcium was detected in rings that had been pre-incubated with elastase
compared with those which had not (39.4 ± 20.2 vs 3.8 ± 6.6µg/mg without and with
elastase treatment respectively; n = 3 for each group; p = 0.100) (Figure 3.11A, B
and C). Rings that had been exposed to elastase weighed significantly less than
controls (0.61 ± 0.28 vs 0.27 ± 0.07mg for controls vs elastase treated; p = 0.016)
(Figure 3.11D) and on H & E staining the structure appeared much less organised
(Figure 3.11E and F), both factors presumably reflecting elastin degradation and
integral tissue ‘scaffolding’ loss.
In the original description of the aortic ring model, alkaline phosphatase was added
to the culture medium to induce calcification (Lomashvili et al 2004). This effect
was assumed to occur as a result of the enzyme hydrolysing the calcification
inhibitor, PPi, generated by the cultured tissue. It was therefore assessed, in a single
experiment, whether following this method would produce more uniform
calcification in the present model. Unexpectedly, not only was a similar, wide range
of mineralisation observed between rings, there was a reduction in calcification,
albeit non-significant, in rings treated with alkaline phosphatase (data not shown).
It is well documented that calcium deposition is favoured by a more alkaline
environment (Lomashvili et al 2006, Villa-Bellosta et al 2011b). Therefore in a final
attempt to obtain a more consistent level of calcification within experiments, the
culture medium pH was adjusted to 7.4 with the addition of NaOH. This resulted in
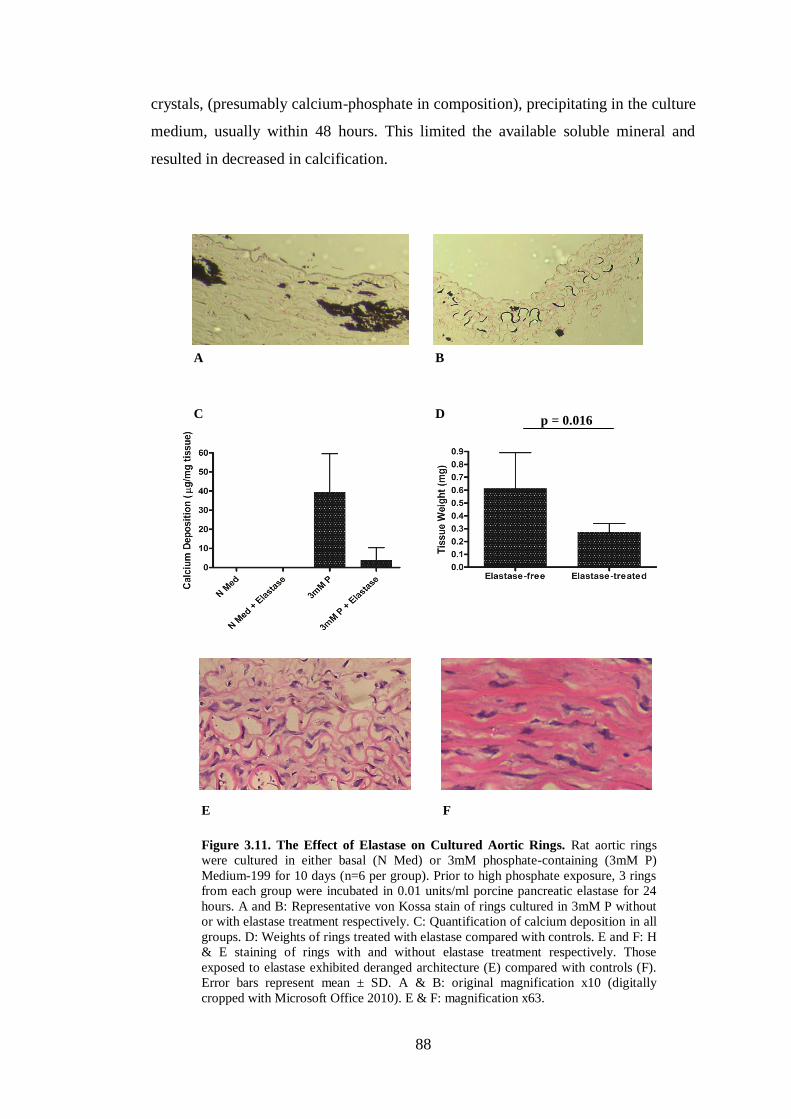
88
crystals, (presumably calcium-phosphate in composition), precipitating in the culture
medium, usually within 48 hours. This limited the available soluble mineral and
resulted in decreased in calcification.
Figure 3.11. The Effect of Elastase on Cultured Aortic Rings. Rat aortic rings
were cultured in either basal (N Med) or 3mM phosphate-containing (3mM P)
Medium-199 for 10 days (n=6 per group). Prior to high phosphate exposure, 3 rings
from each group were incubated in 0.01 units/ml porcine pancreatic elastase for 24
hours. A and B: Representative von Kossa stain of rings cultured in 3mM P without
or with elastase treatment respectively. C: Quantification of calcium deposition in all
groups. D: Weights of rings treated with elastase compared with controls. E and F: H
& E staining of rings with and without elastase treatment respectively. Those
exposed to elastase exhibited deranged architecture (E) compared with controls (F).
Error bars represent mean ± SD. A & B: original magnification x10 (digitally
cropped with Microsoft Office 2010). E & F: magnification x63.
A B
E
C
F
D p = 0.016
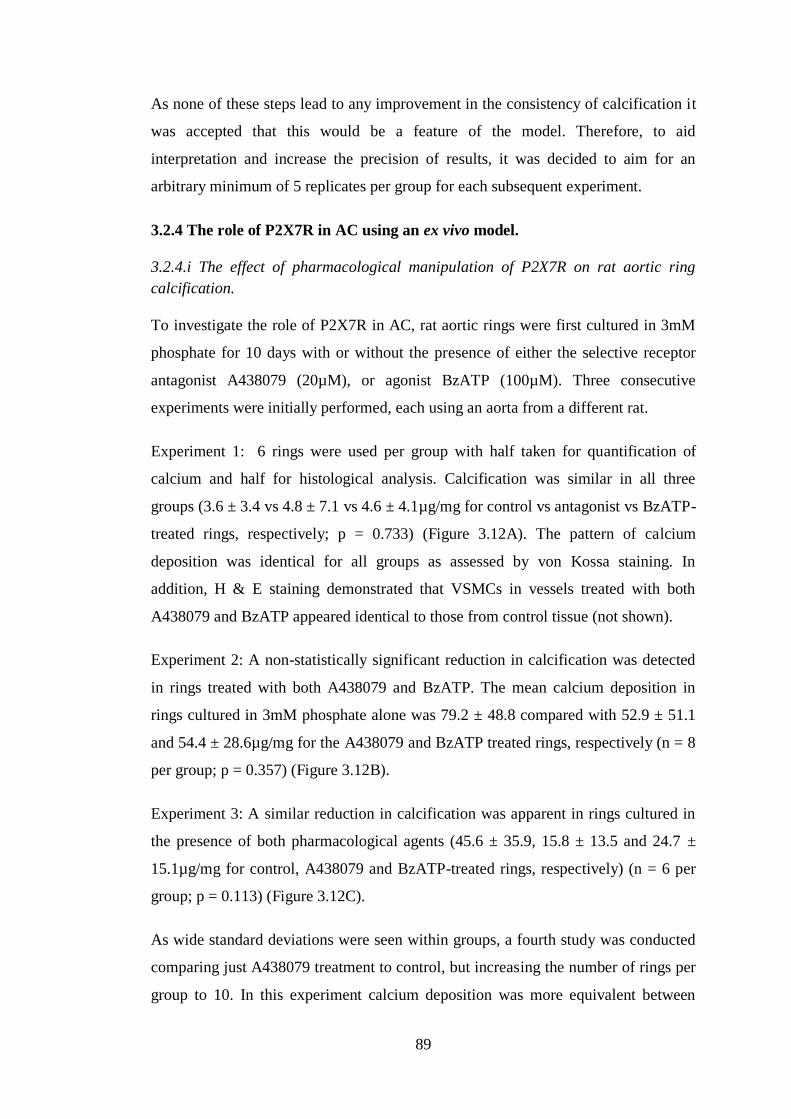
89
As none of these steps lead to any improvement in the consistency of calcification it
was accepted that this would be a feature of the model. Therefore, to aid
interpretation and increase the precision of results, it was decided to aim for an
arbitrary minimum of 5 replicates per group for each subsequent experiment.
3.2.4 The role of P2X7R in AC using an ex vivo model.
3.2.4.i The effect of pharmacological manipulation of P2X7R on rat aortic ring
calcification.
To investigate the role of P2X7R in AC, rat aortic rings were first cultured in 3mM
phosphate for 10 days with or without the presence of either the selective receptor
antagonist A438079 (20µM), or agonist BzATP (100µM). Three consecutive
experiments were initially performed, each using an aorta from a different rat.
Experiment 1: 6 rings were used per group with half taken for quantification of
calcium and half for histological analysis. Calcification was similar in all three
groups (3.6 ± 3.4 vs 4.8 ± 7.1 vs 4.6 ± 4.1µg/mg for control vs antagonist vs BzATP-
treated rings, respectively; p = 0.733) (Figure 3.12A). The pattern of calcium
deposition was identical for all groups as assessed by von Kossa staining. In
addition, H & E staining demonstrated that VSMCs in vessels treated with both
A438079 and BzATP appeared identical to those from control tissue (not shown).
Experiment 2: A non-statistically significant reduction in calcification was detected
in rings treated with both A438079 and BzATP. The mean calcium deposition in
rings cultured in 3mM phosphate alone was 79.2 ± 48.8 compared with 52.9 ± 51.1
and 54.4 ± 28.6µg/mg for the A438079 and BzATP treated rings, respectively (n = 8
per group; p = 0.357) (Figure 3.12B).
Experiment 3: A similar reduction in calcification was apparent in rings cultured in
the presence of both pharmacological agents (45.6 ± 35.9, 15.8 ± 13.5 and 24.7 ±
15.1µg/mg for control, A438079 and BzATP-treated rings, respectively) (n = 6 per
group; p = 0.113) (Figure 3.12C).
As wide standard deviations were seen within groups, a fourth study was conducted
comparing just A438079 treatment to control, but increasing the number of rings per
group to 10. In this experiment calcium deposition was more equivalent between
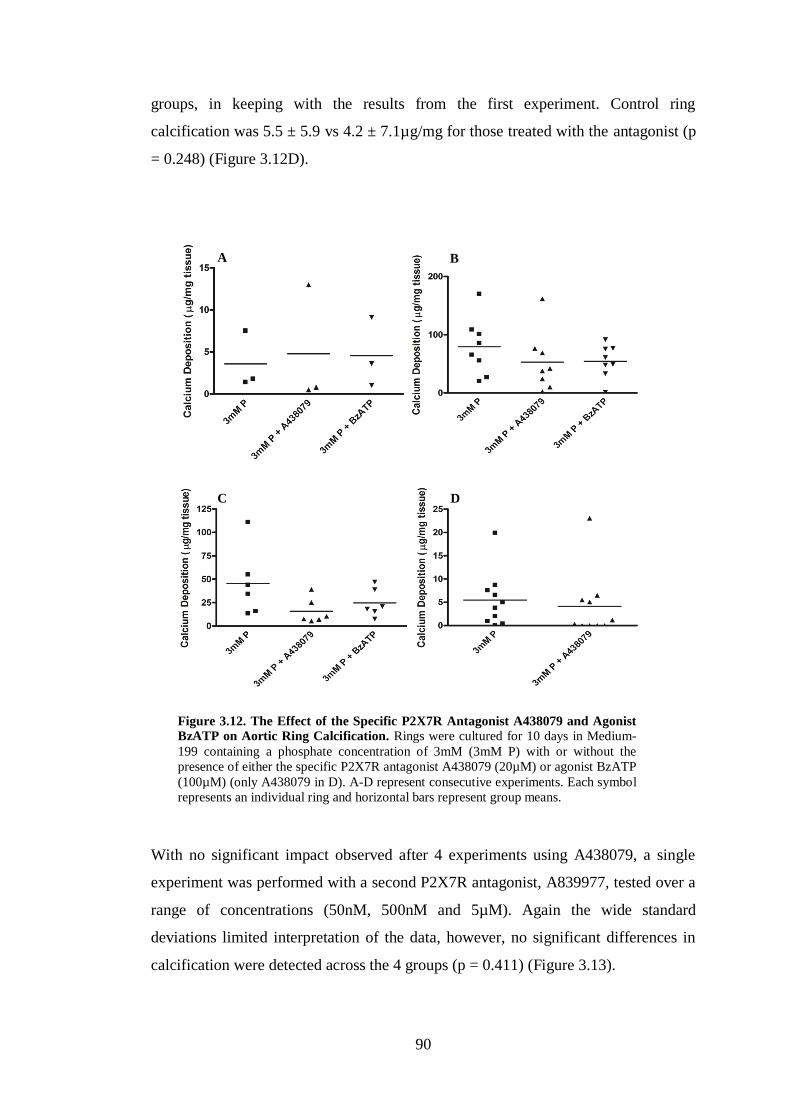
90
groups, in keeping with the results from the first experiment. Control ring
calcification was 5.5 ± 5.9 vs 4.2 ± 7.1µg/mg for those treated with the antagonist (p
= 0.248) (Figure 3.12D).
With no significant impact observed after 4 experiments using A438079, a single
experiment was performed with a second P2X7R antagonist, A839977, tested over a
range of concentrations (50nM, 500nM and 5µM). Again the wide standard
deviations limited interpretation of the data, however, no significant differences in
calcification were detected across the 4 groups (p = 0.411) (Figure 3.13).
Figure 3.12. The Effect of the Specific P2X7R Antagonist A438079 and Agonist
BzATP on Aortic Ring Calcification. Rings were cultured for 10 days in Medium-
199 containing a phosphate concentration of 3mM (3mM P) with or without the
presence of either the specific P2X7R antagonist A438079 (20µM) or agonist BzATP
(100µM) (only A438079 in D). A-D represent consecutive experiments. Each symbol
represents an individual ring and horizontal bars represent group means.
A B
C D
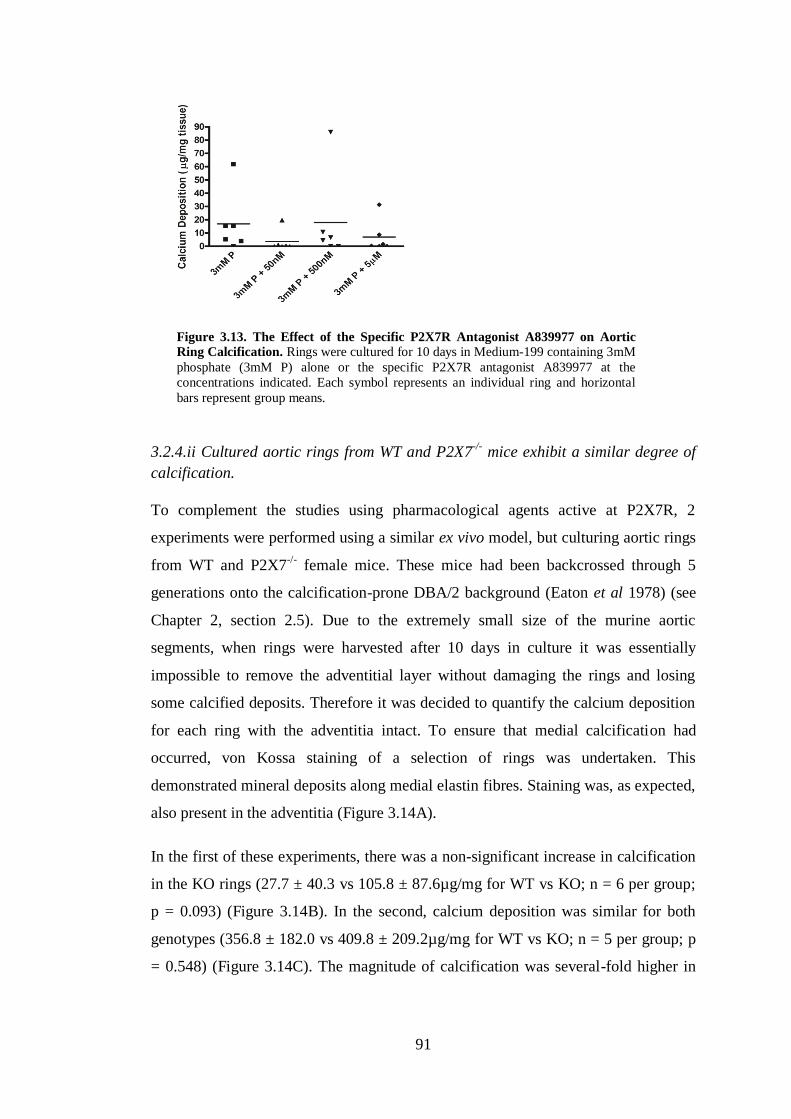
91
3.2.4.ii Cultured aortic rings from WT and P2X7-/-
mice exhibit a similar degree of
calcification.
To complement the studies using pharmacological agents active at P2X7R, 2
experiments were performed using a similar ex vivo model, but culturing aortic rings
from WT and P2X7-/-
female mice. These mice had been backcrossed through 5
generations onto the calcification-prone DBA/2 background (Eaton et al 1978) (see
Chapter 2, section 2.5). Due to the extremely small size of the murine aortic
segments, when rings were harvested after 10 days in culture it was essentially
impossible to remove the adventitial layer without damaging the rings and losing
some calcified deposits. Therefore it was decided to quantify the calcium deposition
for each ring with the adventitia intact. To ensure that medial calcification had
occurred, von Kossa staining of a selection of rings was undertaken. This
demonstrated mineral deposits along medial elastin fibres. Staining was, as expected,
also present in the adventitia (Figure 3.14A).
In the first of these experiments, there was a non-significant increase in calcification
in the KO rings (27.7 ± 40.3 vs 105.8 ± 87.6µg/mg for WT vs KO; n = 6 per group;
p = 0.093) (Figure 3.14B). In the second, calcium deposition was similar for both
genotypes (356.8 ± 182.0 vs 409.8 ± 209.2µg/mg for WT vs KO; n = 5 per group; p
= 0.548) (Figure 3.14C). The magnitude of calcification was several-fold higher in
Figure 3.13. The Effect of the Specific P2X7R Antagonist A839977 on Aortic
Ring Calcification. Rings were cultured for 10 days in Medium-199 containing 3mM
phosphate (3mM P) alone or the specific P2X7R antagonist A839977 at the
concentrations indicated. Each symbol represents an individual ring and horizontal
bars represent group means.
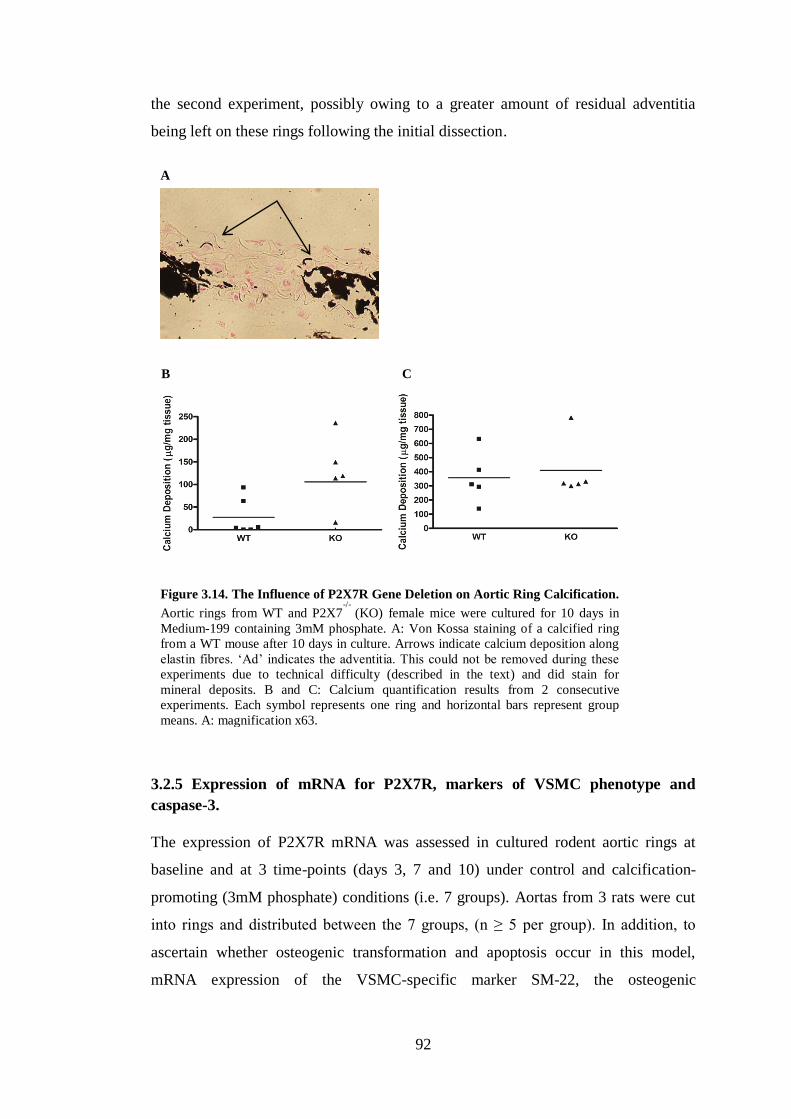
92
the second experiment, possibly owing to a greater amount of residual adventitia
being left on these rings following the initial dissection.
3.2.5 Expression of mRNA for P2X7R, markers of VSMC phenotype and
caspase-3.
The expression of P2X7R mRNA was assessed in cultured rodent aortic rings at
baseline and at 3 time-points (days 3, 7 and 10) under control and calcification-
promoting (3mM phosphate) conditions (i.e. 7 groups). Aortas from 3 rats were cut
into rings and distributed between the 7 groups, (n ≥ 5 per group). In addition, to
ascertain whether osteogenic transformation and apoptosis occur in this model,
mRNA expression of the VSMC-specific marker SM-22, the osteogenic
Ad
A
C B
Figure 3.14. The Influence of P2X7R Gene Deletion on Aortic Ring Calcification.
Aortic rings from WT and P2X7-/-
(KO) female mice were cultured for 10 days in
Medium-199 containing 3mM phosphate. A: Von Kossa staining of a calcified ring
from a WT mouse after 10 days in culture. Arrows indicate calcium deposition along
elastin fibres. ‘Ad’ indicates the adventitia. This could not be removed during these
experiments due to technical difficulty (described in the text) and did stain for
mineral deposits. B and C: Calcium quantification results from 2 consecutive
experiments. Each symbol represents one ring and horizontal bars represent group
means. A: magnification x63.
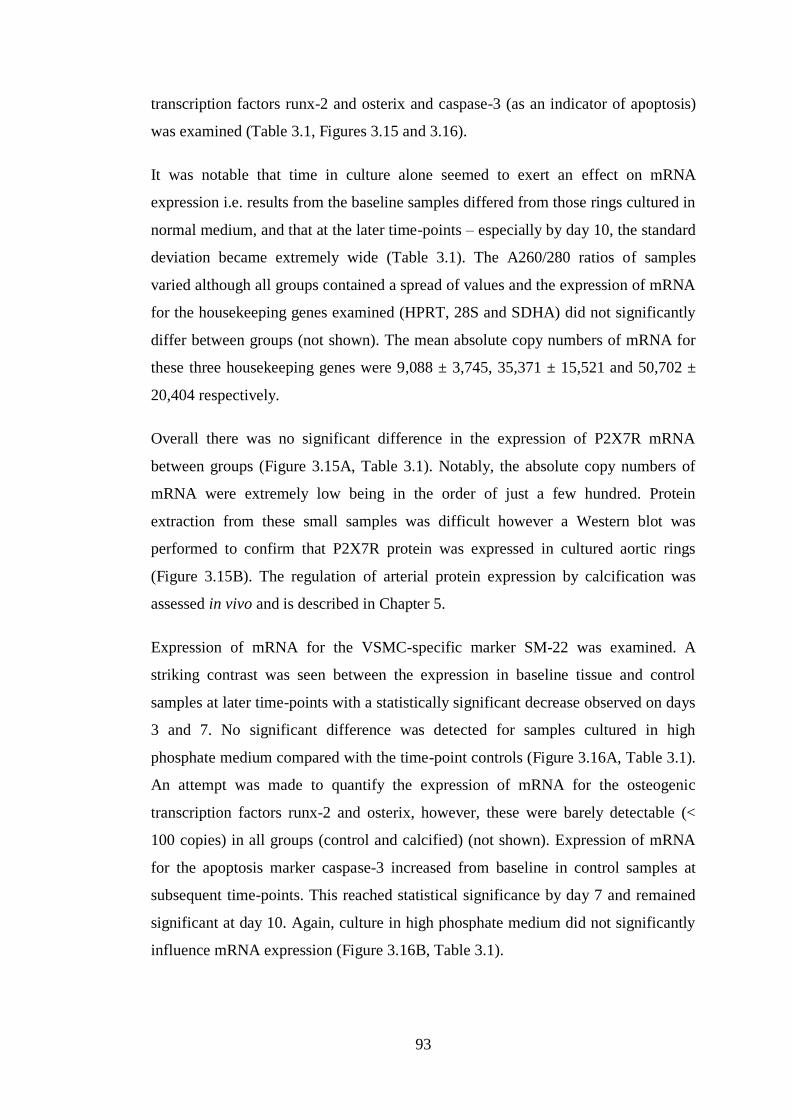
93
transcription factors runx-2 and osterix and caspase-3 (as an indicator of apoptosis)
was examined (Table 3.1, Figures 3.15 and 3.16).
It was notable that time in culture alone seemed to exert an effect on mRNA
expression i.e. results from the baseline samples differed from those rings cultured in
normal medium, and that at the later time-points – especially by day 10, the standard
deviation became extremely wide (Table 3.1). The A260/280 ratios of samples
varied although all groups contained a spread of values and the expression of mRNA
for the housekeeping genes examined (HPRT, 28S and SDHA) did not significantly
differ between groups (not shown). The mean absolute copy numbers of mRNA for
these three housekeeping genes were 9,088 ± 3,745, 35,371 ± 15,521 and 50,702 ±
20,404 respectively.
Overall there was no significant difference in the expression of P2X7R mRNA
between groups (Figure 3.15A, Table 3.1). Notably, the absolute copy numbers of
mRNA were extremely low being in the order of just a few hundred. Protein
extraction from these small samples was difficult however a Western blot was
performed to confirm that P2X7R protein was expressed in cultured aortic rings
(Figure 3.15B). The regulation of arterial protein expression by calcification was
assessed in vivo and is described in Chapter 5.
Expression of mRNA for the VSMC-specific marker SM-22 was examined. A
striking contrast was seen between the expression in baseline tissue and control
samples at later time-points with a statistically significant decrease observed on days
3 and 7. No significant difference was detected for samples cultured in high
phosphate medium compared with the time-point controls (Figure 3.16A, Table 3.1).
An attempt was made to quantify the expression of mRNA for the osteogenic
transcription factors runx-2 and osterix, however, these were barely detectable (<
100 copies) in all groups (control and calcified) (not shown). Expression of mRNA
for the apoptosis marker caspase-3 increased from baseline in control samples at
subsequent time-points. This reached statistical significance by day 7 and remained
significant at day 10. Again, culture in high phosphate medium did not significantly
influence mRNA expression (Figure 3.16B, Table 3.1).
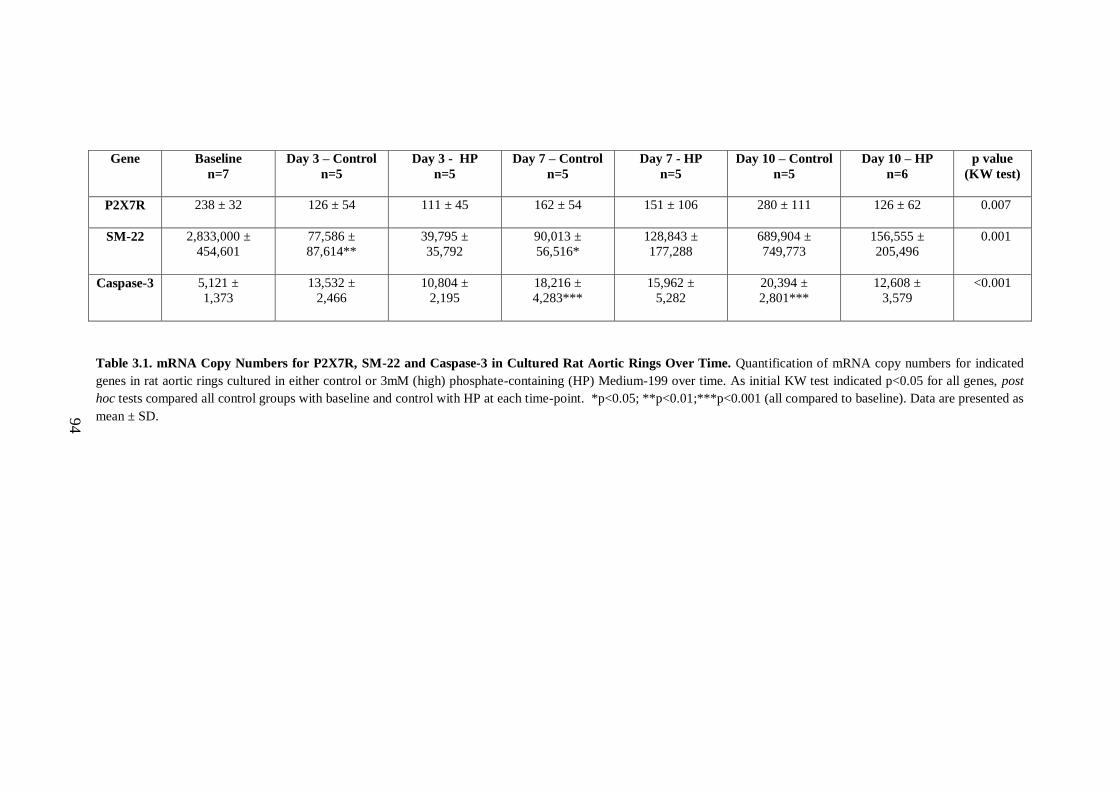
94
Gene
Baseline
n=7
Day 3 – Control
n=5
Day 3 - HP
n=5
Day 7 – Control
n=5
Day 7 - HP
n=5
Day 10 – Control
n=5
Day 10 – HP
n=6
p value
(KW test)
P2X7R
238 ± 32 126 ± 54 111 ± 45 162 ± 54 151 ± 106 280 ± 111 126 ± 62 0.007
SM-22
2,833,000 ±
454,601
77,586 ±
87,614**
39,795 ±
35,792
90,013 ±
56,516*
128,843 ±
177,288
689,904 ±
749,773
156,555 ±
205,496
0.001
Caspase-3
5,121 ±
1,373
13,532 ±
2,466
10,804 ±
2,195
18,216 ±
4,283***
15,962 ±
5,282
20,394 ±
2,801***
12,608 ±
3,579
<0.001
Table 3.1. mRNA Copy Numbers for P2X7R, SM-22 and Caspase-3 in Cultured Rat Aortic Rings Over Time. Quantification of mRNA copy numbers for indicated
genes in rat aortic rings cultured in either control or 3mM (high) phosphate-containing (HP) Medium-199 over time. As initial KW test indicated p<0.05 for all genes, post
hoc tests compared all control groups with baseline and control with HP at each time-point. *p<0.05; **p<0.01;***p<0.001 (all compared to baseline). Data are presented as
mean ± SD.
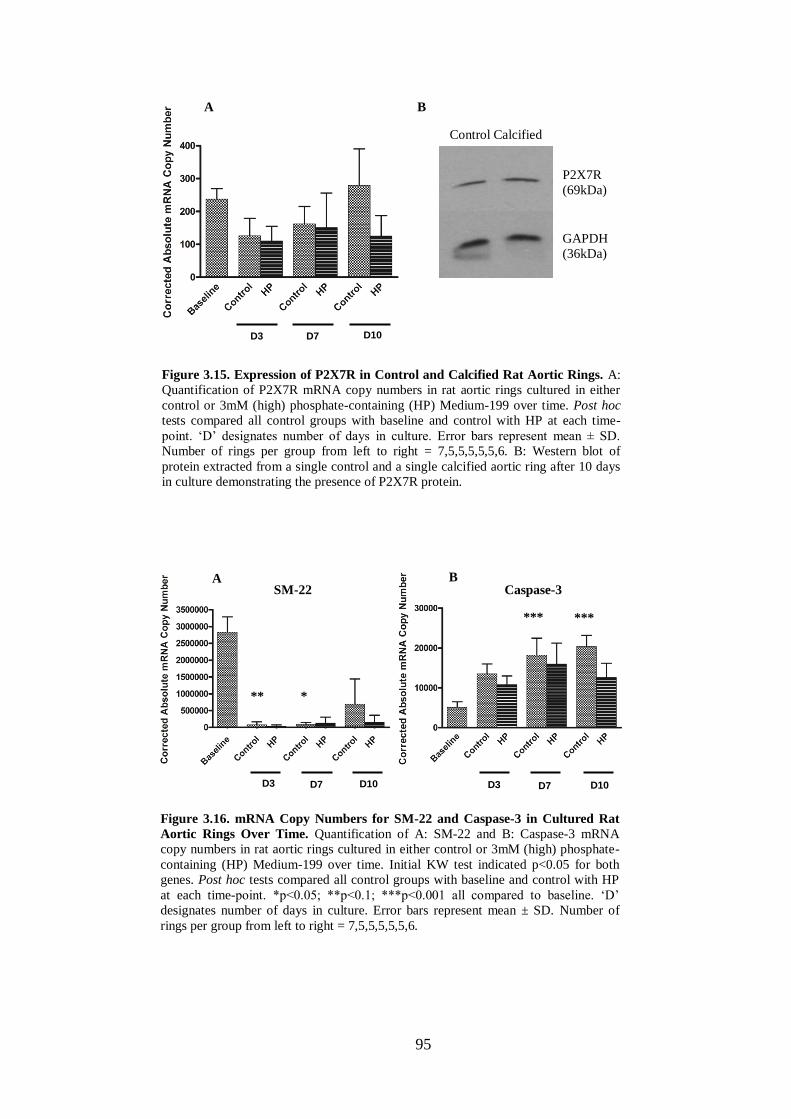
95
Figure 3.15. Expression of P2X7R in Control and Calcified Rat Aortic Rings. A:
Quantification of P2X7R mRNA copy numbers in rat aortic rings cultured in either
control or 3mM (high) phosphate-containing (HP) Medium-199 over time. Post hoc
tests compared all control groups with baseline and control with HP at each time-
point. ‘D’ designates number of days in culture. Error bars represent mean ± SD.
Number of rings per group from left to right = 7,5,5,5,5,5,6. B: Western blot of
protein extracted from a single control and a single calcified aortic ring after 10 days
in culture demonstrating the presence of P2X7R protein.
Control Calcified
P2X7R (69kDa)
GAPDH (36kDa)
A B SM-22 Caspase-3
*
*** ***
**
Figure 3.16. mRNA Copy Numbers for SM-22 and Caspase-3 in Cultured Rat
Aortic Rings Over Time. Quantification of A: SM-22 and B: Caspase-3 mRNA
copy numbers in rat aortic rings cultured in either control or 3mM (high) phosphate-
containing (HP) Medium-199 over time. Initial KW test indicated p<0.05 for both
genes. Post hoc tests compared all control groups with baseline and control with HP
at each time-point. *p<0.05; **p<0.1; ***p<0.001 all compared to baseline. ‘D’
designates number of days in culture. Error bars represent mean ± SD. Number of
rings per group from left to right = 7,5,5,5,5,5,6.
A B
D3 D7 D10
D3 D7 D10 D3 D7 D10
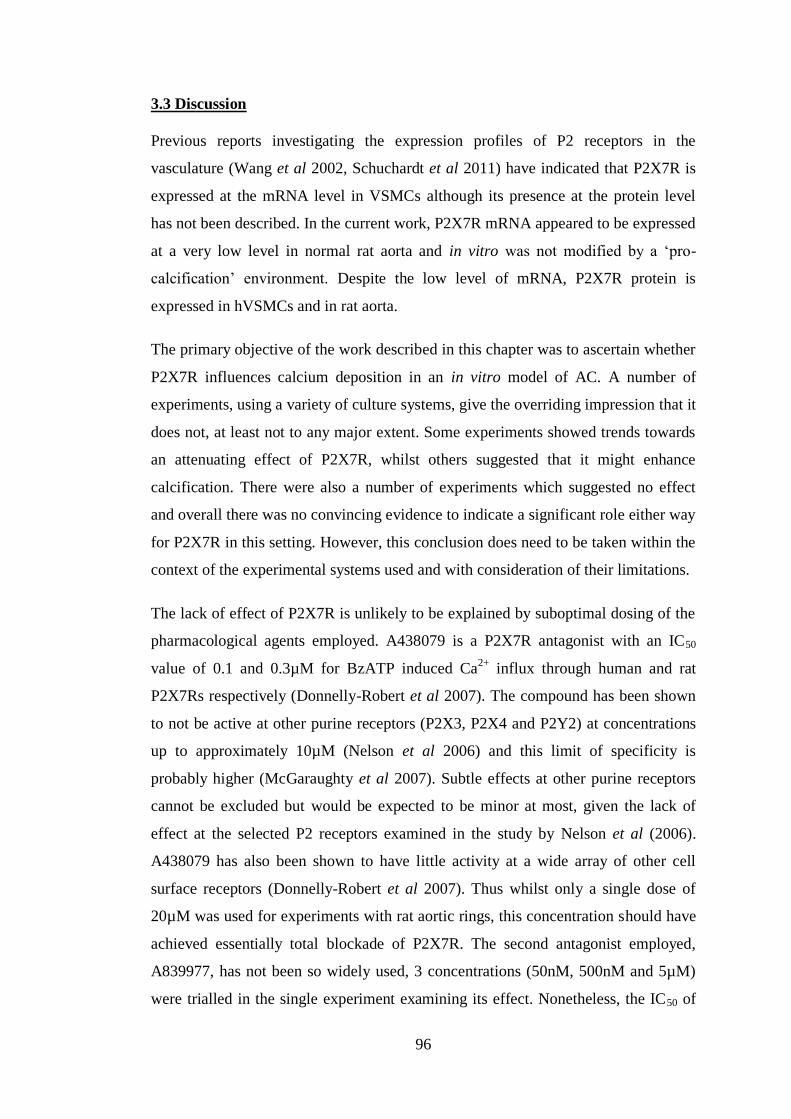
96
3.3 Discussion
Previous reports investigating the expression profiles of P2 receptors in the
vasculature (Wang et al 2002, Schuchardt et al 2011) have indicated that P2X7R is
expressed at the mRNA level in VSMCs although its presence at the protein level
has not been described. In the current work, P2X7R mRNA appeared to be expressed
at a very low level in normal rat aorta and in vitro was not modified by a ‘pro-
calcification’ environment. Despite the low level of mRNA, P2X7R protein is
expressed in hVSMCs and in rat aorta.
The primary objective of the work described in this chapter was to ascertain whether
P2X7R influences calcium deposition in an in vitro model of AC. A number of
experiments, using a variety of culture systems, give the overriding impression that it
does not, at least not to any major extent. Some experiments showed trends towards
an attenuating effect of P2X7R, whilst others suggested that it might enhance
calcification. There were also a number of experiments which suggested no effect
and overall there was no convincing evidence to indicate a significant role either way
for P2X7R in this setting. However, this conclusion does need to be taken within the
context of the experimental systems used and with consideration of their limitations.
The lack of effect of P2X7R is unlikely to be explained by suboptimal dosing of the
pharmacological agents employed. A438079 is a P2X7R antagonist with an IC50
value of 0.1 and 0.3µM for BzATP induced Ca2+
influx through human and rat
P2X7Rs respectively (Donnelly-Robert et al 2007). The compound has been shown
to not be active at other purine receptors (P2X3, P2X4 and P2Y2) at concentrations
up to approximately 10µM (Nelson et al 2006) and this limit of specificity is
probably higher (McGaraughty et al 2007). Subtle effects at other purine receptors
cannot be excluded but would be expected to be minor at most, given the lack of
effect at the selected P2 receptors examined in the study by Nelson et al (2006).
A438079 has also been shown to have little activity at a wide array of other cell
surface receptors (Donnelly-Robert et al 2007). Thus whilst only a single dose of
20µM was used for experiments with rat aortic rings, this concentration should have
achieved essentially total blockade of P2X7R. The second antagonist employed,
A839977, has not been so widely used, 3 concentrations (50nM, 500nM and 5µM)
were trialled in the single experiment examining its effect. Nonetheless, the IC50 of

97
this agent at rat P2X7R is 42nM (Honore et al 2009) and hence adequate antagonism
should have been achieved. BzATP, whilst frequently cited as such, is not a specific
agonist at P2X7R having partial activity a number of other P2 receptors (Bianchi et
al 1999, Michel et al 2001). However, 100µM (the concentration used in this
chapter), is generally considered to be appropriate to obtain relatively specific
activation of P2X7R (Orriss et al 2012), and in practical terms provides the best
means of achieving this. Taken together these data suggest that the pharmacological
manipulation of P2X7R in this chapter should have been successful.
Of the number of theoretical ways in which P2X7R might influence AC (outlined in
Chapter 1, summarised in Figure 1.3), only some are relevant and potentially able to
be evaluated in these in vitro models. In essence, the systems described in this
chapter are modelling ‘phosphate-induced calcification’. This is clearly very
different from calcification induced by a uraemic milieu where phosphate is only one
of several factors likely to be involved. It therefore follows that only the influence of
P2X7R on phosphate-driven VSMC osteogenic transformation and/or apoptosis can
be assessed in these models, whereas its effect on a pathway such as uraemia-
induced disruption of normal bone physiology and related vascular effects cannot be.
That osteogenic transformation is necessary to induce calcification is a frequently
stated conclusion from experiments using cultured VSMCs (Shanahan et al 2011,
Shanahan 2013, Shroff et al 2013). However, this has been refuted by some groups.
For example, a study which exposed both formalin-fixed and viable control VSMCs
to high phosphate medium in vitro found greater calcium deposition associated with
the fixed cells (Villa-Bellosta et al 2011b). The authors therefore concluded that
VSMC-associated calcification was actively inhibited by viable cells rather than
induced following an active switch in phenotype. Another report, from a different
group, demonstrated that a change in phenotype of VSMCs towards an osteoblast-
like cell only occurred after mineralisation was present, thereby suggesting that it
was the calcium-phosphate crystals themselves causing the switch, not vice-versa
(Sage et al 2011). Reports of osteogenic transformation occurring in the ring culture
model are also variable. Some authors have shown positive immunohistochemical
staining for osteogenic markers in calcified cultured arteries (Shroff et al 2010).
However, other groups that have published widely using this system have suggested
98
that the switch in cell phenotype does not occur (Lomshvili et al 2008, Lomshvili et
al 2011). The same can be said for apoptosis (Lomashvili et al 2004).
The aim of the work in this chapter was not specifically to confirm or refute these
previous findings, however the analysis of mRNA expression for the genes of
interest described here raises some points of note. No significant differences were
found at any time-point for control versus calcified aortas in any marker of VSMC
phenotype or the apoptosis marker caspase-3. No markers of osteogenic
transformation were detected. These findings would seem to support the view that
VSMC osteogenic transformation and apoptosis are not involved in the calcification
process in this experimental system and therefore raise questions about their
involvement in the process of AC in general. If in fact these 2 mechanisms do not
occur in this context, then it is unsurprising that P2X7R did not exert any significant
impact on calcium deposition in the experiments described in this chapter.
The results from experiments using cultured VSMCs are difficult to interpret due to
the profound experimental variability. In a number of experiments, some cells, and
on occasion all cells, cultured in ‘calcification’ medium alone, i.e. those intended to
serve as control calcified cells, failed to exhibit any calcium deposition. This was not
an infrequent finding, essentially meaning that any differences in calcium deposition
occurring in groups treated with A438079 could not, with any confidence, be
assigned to the effect of treatment.
The reliability and consistency of this model have been challenged previously, with a
number of authors commenting that the range of phosphate added to the culture
medium in order to observe calcification varies tremendously between laboratories
(Villa-Bellosta et al 2011b). Indeed, some groups have reported calcification with as
little as 2mM P in the culture medium (Villa-Bellosta et al 2011b), whereas others
have not been able to induce any calcium deposition with concentrations below 5mM
(Ciceri et al 2012a). Furthermore, groups have reported that in some circumstances
they were unable to induce any calcification in certain batches of cells which were
therefore not used for experiments (Shalhoub et al 2010). There are also instances of
groups having to alter the length of time cells were left in culture to yield
calcification when experiments were performed on different occasions (Ciceri et al
2012a, Ciceri et al 2012b). Personal communications to a number of researchers in

99
the field have also added weight to the conclusion that this model suffers from
marked variability and inconsistency.
Whilst these inconsistencies make results difficult to interpret, potentially a more
fundamental limitation of this model might be its lack of biological relevance. This
was ultimately the reason for abandoning it as an experimental tool for work in this
thesis. VSMCs in culture lack their normal ECM. In particular, the elastic lamina is
absent, which is the initial site of calcification within the arterial wall as shown by
work in this thesis (Figure 3.6 and also see Chapters 5 & 6) and other investigators
(Lanzer et al 2014). In addition, the use of serum and associated growth factors,
along with variations in cell passage number, can grossly influence VSMC
phenotype and may promote proliferation (Zeidan et al 2000, Lomashvili et al 2004,
Nakano-Kurimoto et al 2009). Therefore this system simulates a very different
environment from that seen in vivo. Furthermore, exactly what is ‘calcifying’ in this
setting is not altogether clear. Cultured VSMCs are reported to secrete matrix-
vesicles upon which calcium is deposited (Reynolds et al 2004). However, there are
reports demonstrating that much of the ‘calcification’ that is seen results from
passive deposition of calcium-phosphate crystals onto the culture plate (Sage et al
2011). Additionally, calcium deposition has been shown to occur in this context with
other, non-vascular cells, such as those from the renal proximal tubule (Villa-
Bellosta et al 2011b, Sage et al 2011).
Some, but by no means all, of these issues are overcome with the aortic ring ex vivo
model. Here, tissue is essentially ‘intact’ and, as demonstrated, calcification occurs
along elastin fibres thereby bearing a closer resemblance to findings in patients with
CKD (see Chapter 6). Aortic rings cultured in 3mM phosphate consistently calcified
without the need for any additional supplements to the medium or pre-treatment.
This is in contrast to previous reports using this model. Rat rings cultured in 3.8mM
phosphate were shown to be free of calcification after 10 days in culture unless
alkaline phosphatase was added to the culture medium (Lomashvili et al 2004), and
human vessels from healthy control patients did not calcify in a medium containing
2mM phosphate plus 2.7mM calcium whereas those from patients on dialysis did
(Shroff et al 2010). The latter of these reports can conceivably be explained by the
differences in species and/or the concentrations of phosphate and calcium used
100
(although the calcium x phosphate product is identical to that used in the current
work, the individual ion concentrations differ). It is more difficult to reconcile the
lack of calcification described in the former study with the observations made in this
chapter, especially as a lower phosphate concentration was used here. Indeed, when
rings were cultured in 3.8mM phosphate in the present work, calcification of almost
the entire vessel was seen. In addition, when rings were cultured with alkaline
phosphatase, less calcification was observed. Apart from the basic culture medium
and strain of rat (Dulbecco’s Modified Eagle Medium (DMEM) and Sprague-
Dawley, respectively, in the original report by Lomashvili et al (2004)), an identical
protocol to that described was used so it is unclear why the opposite effect occurred.
It is possible that there were subtle differences in the composition of reagents and/or
culture environment not specified in the initial paper. As the primary goal of using
alkaline phosphatase in the current work was to improve the consistency of
calcification, and after one attempt a reduction in calcium deposition was seen, this
approach was not pursued further. It is therefore possible that the findings in this
single experiment were spurious, however, the use of 3mM phosphate to induce
calcification without additional reagents was consistent throughout the work
described in this chapter and is clearly in contrast to this original report.
Another advantage of the ring culture system is that serum and growth factor
supplementation are unnecessary to maintain cell viability, thereby minimising the
effect these additives can have on cell activity and phenotype. However, the analysis
of mRNA for SM-22 suggests that expression of this VSMC marker, and therefore
possibly VSMC phenotype, are modified by simply maintaining rings in normal
culture medium. In addition, the results for caspase-3 indicate that even these
‘control’ conditions may induce some degree of apoptosis. That changes in gene
expression profiles can be induced by culture conditions alone was shown in a
previous report which described a change from baseline in runx-2 mRNA expression
in control rings cultured for 3 days without the addition of any ‘extra’ reagent
(Lomashvili et al 2011). Although the ring culture model has a number of
advantages over primary cell culture, maintenance of cell phenotype and absence of
apoptosis, previously cited to be additional benefits (Lomashvili et al 2004, Shroff et
al 2010) were not observed in the studies presented herein.

101
The magnitude of calcification differed between experiments performed in this
chapter and wide standard deviations in calcification were frequently seen within
groups of cultured rings. Attempts to improve the consistency of calcification were
unsuccessful. Unexpectedly, the ‘pre-treatment’ of rings with elastase for 24 hours
led to a reduction in calcification. The report originally detailing this method
suggested that in vitro, elastase initiates elastin breakdown, mimicking the in vivo
histological findings from calcified mouse aortas described by the same group,
leading to more consistent calcification (Scialla et al 2013). As this group cultured
mouse aortic rings, (in contrast to the rat vessels used in the present work), it is
possible that species differences account for the disparate findings. The fact that in
the current study elastase-treated rings weighed much less than the corresponding
controls suggests that the enzyme was in effect causing overt elastin dissolution
rather than just initiating its breakdown. This might also explain the reduced
calcification.
A number of potential reasons exist to account for the variability in calcification
between rings within individual experiments. The importance of removing the
adventitia from vessels prior to quantifying medial calcium deposition was
demonstrated histologically, with deposits frequently seen within the adventitial
layer. However, in removing the adventitia there is the potential to damage the vessel
and dislodge adherent calcium. This may occur to different, random extents between
rings. Removing the adventitia prior to commencing the experiment is not a solution
to this problem as this can damage the medial layer resulting in more calcification
and thus cause greater variability overall (Lomashvili et al 2004). It is also possible
that rings from different sections of the aorta calcify differently. A notable feature of
the rat in vivo work in this thesis (Chapter 5) is that the abdominal aorta seems to
calcify before the thoracic segment and the aortic arch, as has been described
previously in animal experiments (Shobeiri et al 2013). Whatever the explanation(s),
none of these factors should have biased the outcome in either direction since all
rings were handled in the same way. Additionally, adjacent rings were exposed to
different treatments thereby eliminating the potential effects conferred by where on
the aorta the ring originated from.

102
3.4 Summary
The results from this chapter suggest that P2X7R does not influence AC in the tissue
culture models employed. How relevant these experimental systems are to ‘real life’
biology remains unclear. In particular, it is uncertain whether some mechanisms
widely reported to be important in the pathogenesis of AC occur in these settings.
The role(s) of P2X7R in AC pathways which are dependent upon a uraemic milieu
cannot easily be tested under these conditions. In vivo studies are necessary to
investigate these processes and were the focus of the work described in Chapters 4
and 5.

103
CHAPTER 4 – DEVELOPMENT OF A NOVEL MOUSE MODEL TO
STUDY THE EFFECT OF P2X7R DEFICIENCY ON CHRONIC KIDNEY
DISEASE-ASSOCIATED ARTERIAL CALCIFICATION
4.1 Introduction
VSMC or ring culture models can be used to study calcium deposition and cellular
changes that occur in response to agents thought to be important in the process of
CKD-associated AC. However, as alluded to in Chapter 3 it is extremely difficult to
simulate a ‘uraemic milieu’ per se in vitro, and these models have a number of other
limitations. In vivo systems provide a complementary approach to in vitro studies
and permit investigation under more biologically and physiologically relevant
conditions.
A number of pathways thought to contribute to the pathogenesis CKD-associated AC
have been described which are dependent upon systemic changes induced by renal
impairment, and therefore can only really be assessed in vivo. Two examples of these
are disturbances in bone homeostasis (Persy & D’Haese 2009) and arterial ECM
degradation (Pai & Giachelli 2010). P2X7R is potentially relevant to both, having
been linked to these processes in other contexts (Grol et al 2009, Gu & Wiley 2006).
In addition, P2X7R has been shown to attenuate progression of CKD itself in some
animal models (Goncalves et al 2006) and therefore in so doing might concurrently
retard progression of AC. Finally, the work in Chapter 3 cast some doubt as to
whether osteogenic transformation and apoptosis of VSMCs, pathways that
hypothetically might be influenced by P2X7R, are involved in the development of
AC. Assessing these pathways in vivo and specifically in the setting of CKD along
with any impact of P2X7R is therefore relevant and desirable.
The aim of the work described in this chapter was to assess whether P2X7R
deficiency influences the development and progression of CKD-associated AC in
vivo by comparing P2X7-/-
mice with WT controls in an appropriate disease model.
As reviewed in Chapter 1 (section 1.4.3), just one murine model of CKD-associated
AC is described in the literature (El Abadi et al 2009). The original report detailing
the development of this model indicated that CKD alone was not sufficient for AC to
develop and that it had to be combined with a high phosphate diet. The model itself
involves extensive surgical manipulation (5/6th
nephrectomy) thereby limiting its
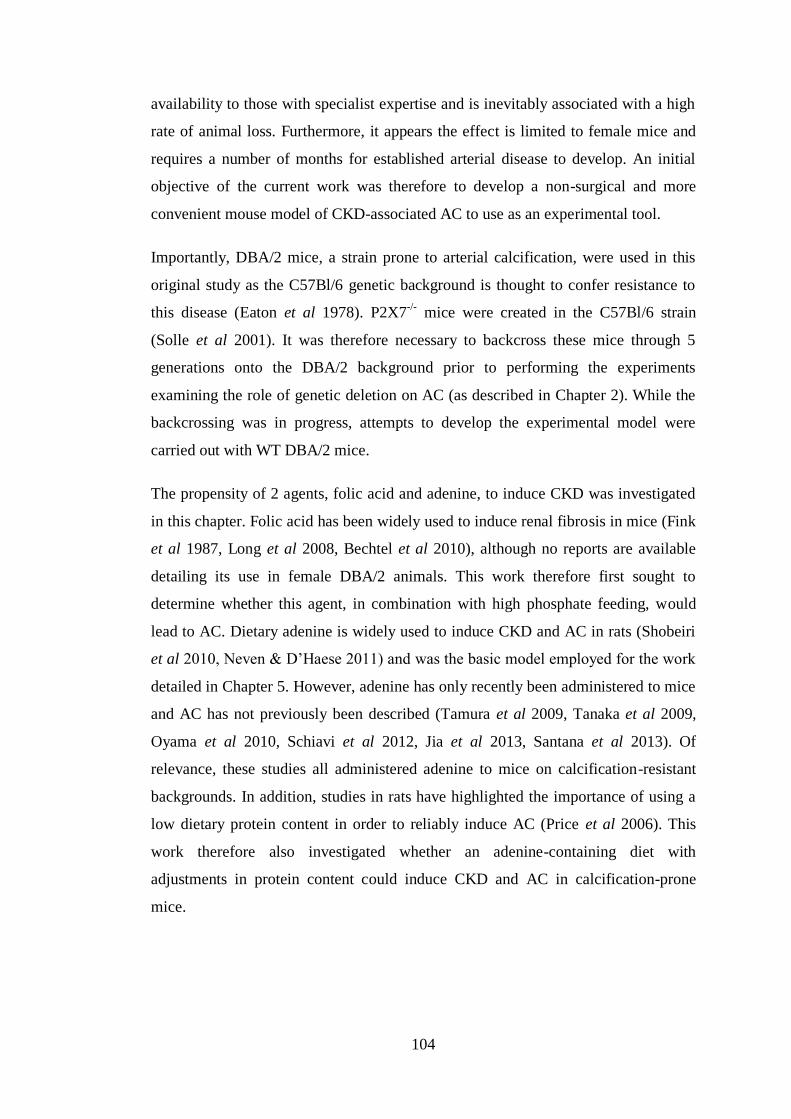
104
availability to those with specialist expertise and is inevitably associated with a high
rate of animal loss. Furthermore, it appears the effect is limited to female mice and
requires a number of months for established arterial disease to develop. An initial
objective of the current work was therefore to develop a non-surgical and more
convenient mouse model of CKD-associated AC to use as an experimental tool.
Importantly, DBA/2 mice, a strain prone to arterial calcification, were used in this
original study as the C57Bl/6 genetic background is thought to confer resistance to
this disease (Eaton et al 1978). P2X7-/-
mice were created in the C57Bl/6 strain
(Solle et al 2001). It was therefore necessary to backcross these mice through 5
generations onto the DBA/2 background prior to performing the experiments
examining the role of genetic deletion on AC (as described in Chapter 2). While the
backcrossing was in progress, attempts to develop the experimental model were
carried out with WT DBA/2 mice.
The propensity of 2 agents, folic acid and adenine, to induce CKD was investigated
in this chapter. Folic acid has been widely used to induce renal fibrosis in mice (Fink
et al 1987, Long et al 2008, Bechtel et al 2010), although no reports are available
detailing its use in female DBA/2 animals. This work therefore first sought to
determine whether this agent, in combination with high phosphate feeding, would
lead to AC. Dietary adenine is widely used to induce CKD and AC in rats (Shobeiri
et al 2010, Neven & D’Haese 2011) and was the basic model employed for the work
detailed in Chapter 5. However, adenine has only recently been administered to mice
and AC has not previously been described (Tamura et al 2009, Tanaka et al 2009,
Oyama et al 2010, Schiavi et al 2012, Jia et al 2013, Santana et al 2013). Of
relevance, these studies all administered adenine to mice on calcification-resistant
backgrounds. In addition, studies in rats have highlighted the importance of using a
low dietary protein content in order to reliably induce AC (Price et al 2006). This
work therefore also investigated whether an adenine-containing diet with
adjustments in protein content could induce CKD and AC in calcification-prone
mice.

105
4.2 Results
4.2.1 Administration of folic acid to WT DBA/2 mice.
Folic acid has successfully been used to induce CKD in other (non-DBA/2) strains of
mice, with an ip dose of generally 240µg/g or less reported to result in renal fibrosis
(Long et al 2008). This concentration was therefore initially administered to 6 WT
female DBA/2 mice with a further 4 receiving vehicle control. High phosphate
feeding (Diet A, Table 2.1) commenced the day after the ip injection for all animals
and continued for 20 weeks.
The appearance, movement and social interaction of all 6 mice injected with 240µg/g
folic acid was indistinguishable from the 4 controls at all times following treatment.
Mean weight change after 7 days in controls was +2.5 ± 7.6% compared with -1.0 ±
5.7% in folic acid-treated animals (p = 0.430). The corresponding values at 20 weeks
were +0.1 ± 3.4 vs +2.4 ± 5.8% (p = 0.493) (Figure 4.1).
Serum concentrations of urea, creatinine, phosphate, calcium (uncorrected due to
insufficient serum for additional measurement of albumin) and alkaline phosphatase
were measured at baseline, 2, 5, 9, 15 and 20 weeks. In addition, serum was
collected from 2 mice after 3 days in order to assess for acute kidney injury. With the
exception of phosphate, which showed an approximate 2-fold increase at 20 weeks
compared to baseline in both groups, all biochemical parameters remained relatively
Figure 4.1. Weight Loss in Mice Treated with Folic Acid. Percent weight loss at
selected time-points compared with baseline in control mice (n=4, filled squares) and
those treated with 240 (n=6, unfilled squares) and 300µg/g folic acid (n=3, unfilled
triangles). Data are presented as mean ± SD.

106
stable throughout the study period. There were no significant differences between
groups in the absolute change of any analyte at week 20 compared to baseline
(Figure 4.2).
Histologically, kidneys taken from animals in both groups were indistinguishable,
exhibiting essentially a normal appearance (Figure 4.3). No calcification was
Creatinine
ALP
Calcium Phosphate
Urea
Figure 4.2. Serum Biochemistry in Mice Treated with Folic Acid. Concentrations
of indicated serum parameters over time in control mice (n=4, filled squares) and
those treated with 240 (n=6, unfilled squares) and 300µg/g folic acid (n=3, unfilled
triangles). Data are presented as mean ± SD.
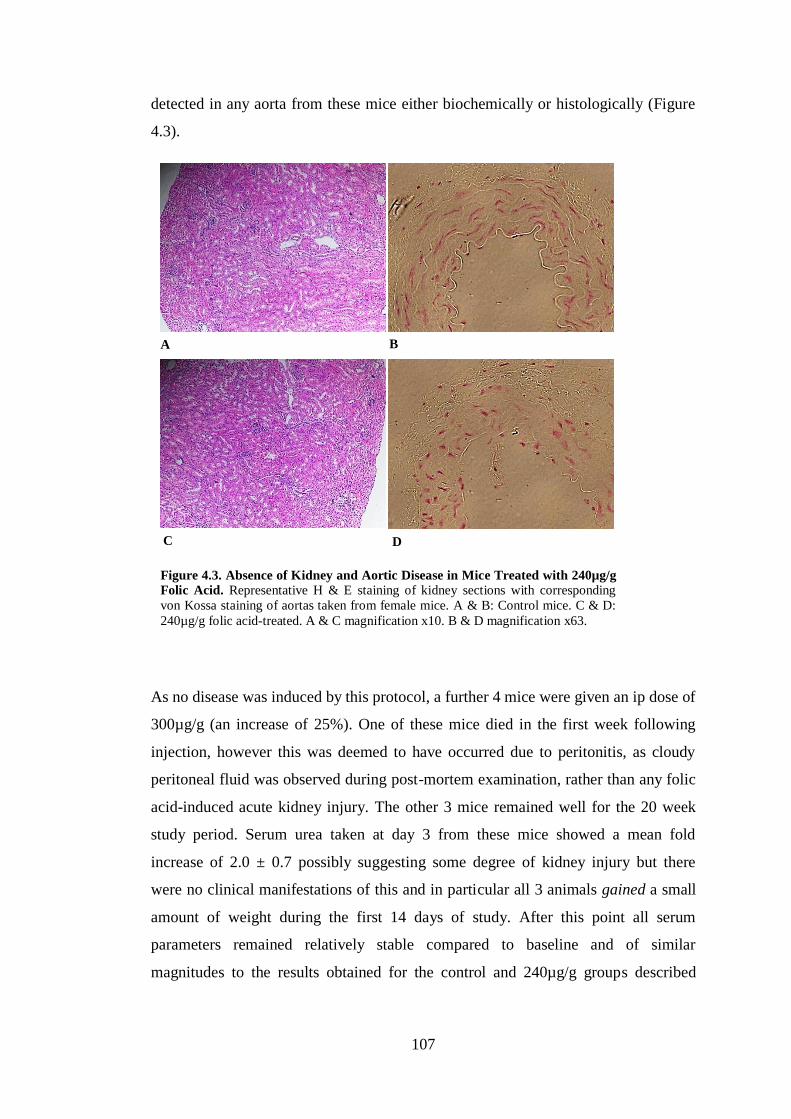
107
detected in any aorta from these mice either biochemically or histologically (Figure
4.3).
As no disease was induced by this protocol, a further 4 mice were given an ip dose of
300µg/g (an increase of 25%). One of these mice died in the first week following
injection, however this was deemed to have occurred due to peritonitis, as cloudy
peritoneal fluid was observed during post-mortem examination, rather than any folic
acid-induced acute kidney injury. The other 3 mice remained well for the 20 week
study period. Serum urea taken at day 3 from these mice showed a mean fold
increase of 2.0 ± 0.7 possibly suggesting some degree of kidney injury but there
were no clinical manifestations of this and in particular all 3 animals gained a small
amount of weight during the first 14 days of study. After this point all serum
parameters remained relatively stable compared to baseline and of similar
magnitudes to the results obtained for the control and 240µg/g groups described
A
D C
B
Figure 4.3. Absence of Kidney and Aortic Disease in Mice Treated with 240µg/g
Folic Acid. Representative H & E staining of kidney sections with corresponding
von Kossa staining of aortas taken from female mice. A & B: Control mice. C & D:
240µg/g folic acid-treated. A & C magnification x10. B & D magnification x63.
108
above (Figure 4.2). There was no aortic calcification and no histological abnormality
in aortas or kidneys after 20 weeks.
Given that the concentrations of folic acid administered to this point had no effect, it
seemed likely that much higher doses would be required to induce renal injury. It
was therefore decided to double the original starting dose to 480µg/g and examine
the effect in a further 6 female DBA/2 mice. All but one of these animals died in the
first week. Histological examination of kidneys from deceased mice revealed dilated
tubules with flattened epithelium, a number containing casts and other debris - all
findings consistent with a folic acid-induced acute kidney injury (Figure 4.4).
Of particular note, the one mouse that did not die in the first week initially lost
weight without appearing overtly unwell and had a serum urea rise from 4.4mmol/l
at baseline to 71.0mmol/l at day 3. However, it gained weight over subsequent days
to survive the 20 week study period. Following sacrifice, the histological appearance
of the kidney from this mouse was not noticeably different from the control kidneys
previously examined (Figure 4.5A). However, von Kossa staining demonstrated
calcium deposits within the aorta which were clearly seen to be associated with
elastin fibres in the medial layer of the vessel (Figure 4.5B and C).
C
C
Figure 4.4. Acute Tubular Injury in Mice Treated with 480µg/g Folic Acid.
H & E stained kidney sections from a mouse which died within 3 days following
treatment with 480µg/g folic acid. Features of acute tubular injury are present
including epithelial flattening and intra-luminal debris (arrows) and tubular casts
(‘C’). Magnification x20.

109
Although AC was evident in this one animal, the mortality rate of 83% associated
with this higher dose of folic acid was clearly unacceptably high. A further dose
adjustment was therefore made and 360µg/g was administered to 2 mice. Both
animals died during the first week following injection of folic acid with similar
histological renal findings to those described for 480µg/g (not shown). Following
these attempts it became clear that the use of folic acid was unlikely to prove
successful for inducing the required clinical characteristics. An alternative chemical
agent for induction of renal disease with AC was therefore sought.
A
C
B
Figure 4.5. Kidney and Aortic Disease in One Mouse Treated with 480µg/g Folic
Acid. A: H & E stain of kidney tissue demonstrating essentially normal features. B:
von Kossa stain of aorta. Calcium deposits are stained black (arrows and inside box).
Counterstained with aluminium red. C: Close up of boxed section in ‘B’
demonstrating calcium deposition along elastic fibres. A & B magnification x10; C
magnification x63.
110
4.2.2 Optimisation of an adenine-based regime.
4.2.2.i A diet containing high phosphate, low protein and adenine induces CKD and
AC in male DBA/2 mice.
Initially 16 WT DBA/2 mice, (8 male and 8 female), were assigned to receive a high
phosphate diet containing 0.25% adenine and either 7.5% or 2.5% protein (split
evenly between genders) for 6 weeks (Diet B, Table 2.1). Of the 4 male mice on the
7.5% protein diet, 2 had to be caged individually as they did not have any littermates.
One of these mice was noted to display atypical behaviour from the outset of the
experiment and died during the first week. Post-mortem examination revealed a
massively distended bladder probably caused by 2,8-dihydroxyadenine crystals
causing obstructive nephropathy (Santana et al 2013). The other mouse died at day
13 and of note, von Kossa staining of the abdominal aorta revealed calcium
deposition within the arterial media. It became clear that mice fed this diet could not
be caged individually. Therefore to assess whether aortic calcification would occur
consistently with the 7.5% protein diet it was decided to administer it to a further 8
males and 4 females (not needing to be caged individually). One further male
receiving this diet died but all other mice (including those in other arms of this pilot
study) survived through to 6 weeks.
Changes in weight varied significantly between groups (Figure 4.6). The male mice
on 2.5% protein had the greatest weight loss, exceeding that of the females on 2.5%
protein although not reaching statistical significance. Male mice on 7.5% protein
also lost weight but significantly less than males on 2.5% protein. Females on 7.5%
protein gained a little weight overall. Although the weight loss was quite extensive
in some cases, no surviving mice displayed any manifestations of distress and
exhibited normal behaviour throughout the experiment.
Calcium was detected in the aortic arch and abdominal aorta from 3 of the 4 male
mice fed 2.5% protein and 2 of the 9 surviving males fed 7.5% protein. Aortic
calcification was only detectable in one female mouse fed 2.5% protein and was
absent in all 8 females fed 7.5% protein (Figure 4.7). Histologically, kidneys from
animals with demonstrable aortic calcification exhibited increased tubulointerstitial
changes (tubular dilatation and epithelial flattening) and fibrosis when compared
with those from animals without arterial mineral deposition. Green-brown crystals
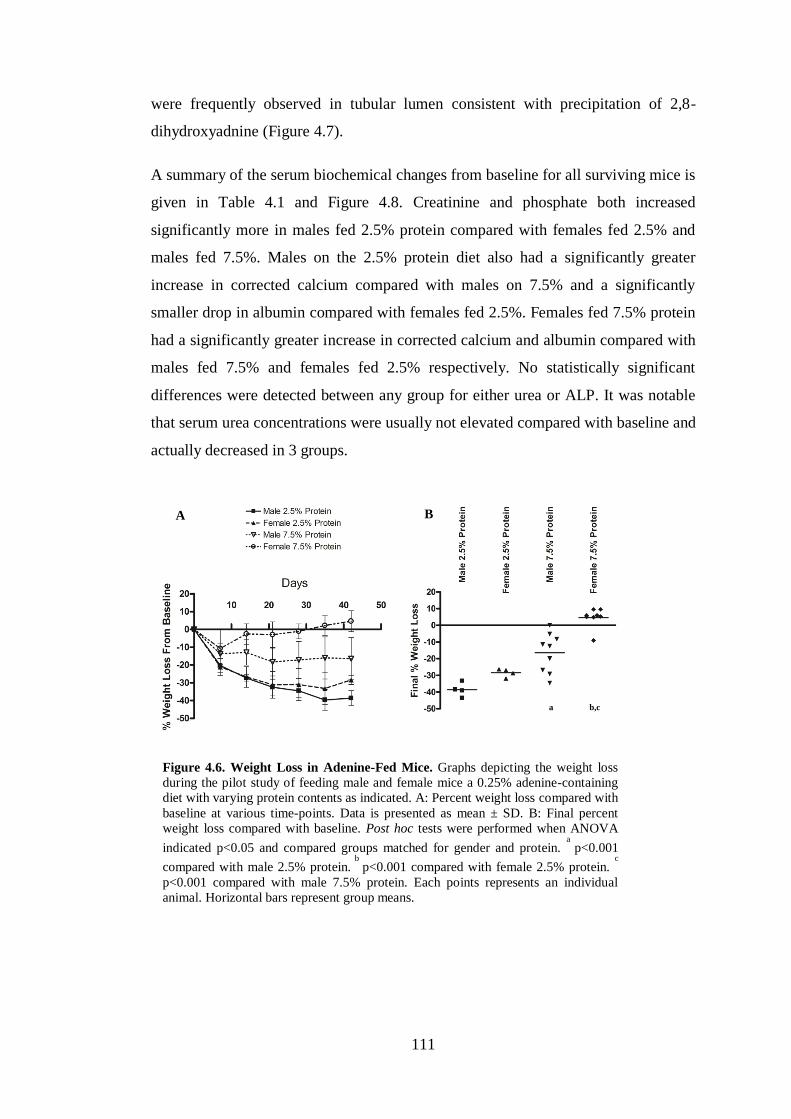
111
were frequently observed in tubular lumen consistent with precipitation of 2,8-
dihydroxyadnine (Figure 4.7).
A summary of the serum biochemical changes from baseline for all surviving mice is
given in Table 4.1 and Figure 4.8. Creatinine and phosphate both increased
significantly more in males fed 2.5% protein compared with females fed 2.5% and
males fed 7.5%. Males on the 2.5% protein diet also had a significantly greater
increase in corrected calcium compared with males on 7.5% and a significantly
smaller drop in albumin compared with females fed 2.5%. Females fed 7.5% protein
had a significantly greater increase in corrected calcium and albumin compared with
males fed 7.5% and females fed 2.5% respectively. No statistically significant
differences were detected between any group for either urea or ALP. It was notable
that serum urea concentrations were usually not elevated compared with baseline and
actually decreased in 3 groups.
A B
Figure 4.6. Weight Loss in Adenine-Fed Mice. Graphs depicting the weight loss
during the pilot study of feeding male and female mice a 0.25% adenine-containing
diet with varying protein contents as indicated. A: Percent weight loss compared with
baseline at various time-points. Data is presented as mean ± SD. B: Final percent
weight loss compared with baseline. Post hoc tests were performed when ANOVA
indicated p<0.05 and compared groups matched for gender and protein. a
p<0.001
compared with male 2.5% protein. b
p<0.001 compared with female 2.5% protein. c
p<0.001 compared with male 7.5% protein. Each points represents an individual
animal. Horizontal bars represent group means.
a
b,c

112
A B
D C
G H
F E
I
Figure 4.7. Kidney and Aortic Disease
in Adenine-Fed Mice. Representative H
& E stained kidney sections with
corresponding von Kossa-stained aortic
sections from mice fed 0.25% adenine
diets of varying protein content. Calcium
deposits stain black. A & B: Male mouse
fed 2.5% protein. C & D: Female mouse
fed 2.5% protein. E & F: Male mouse fed
7.5% protein. G & H: Female mouse fed
7.5% protein. I: High-magnification view
showing an intra-luminal 2,8-dihydroxyadenine crystal (arrow). A, C, E and G
magnification x10. B, D, F, H and I magnification x40.
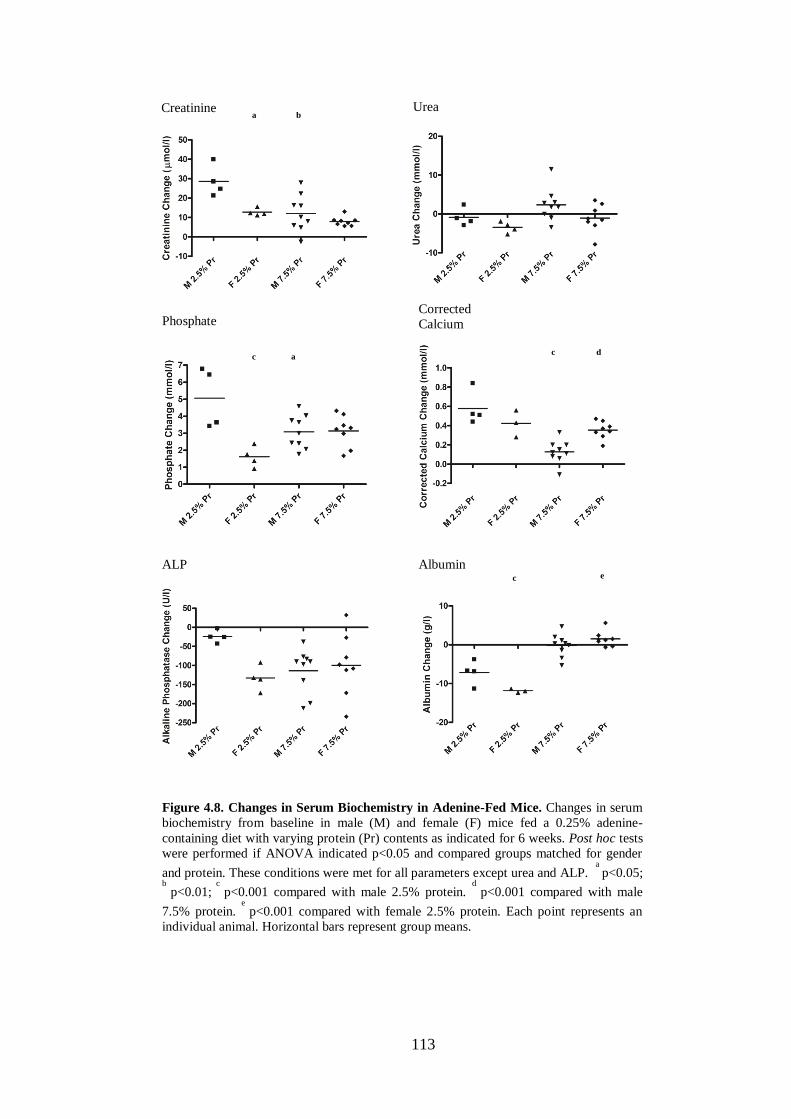
113
Creatinine
Phosphate
Urea
Corrected Calcium
ALP Albumin
Figure 4.8. Changes in Serum Biochemistry in Adenine-Fed Mice. Changes in serum
biochemistry from baseline in male (M) and female (F) mice fed a 0.25% adenine-
containing diet with varying protein (Pr) contents as indicated for 6 weeks. Post hoc tests
were performed if ANOVA indicated p<0.05 and compared groups matched for gender
and protein. These conditions were met for all parameters except urea and ALP. a
p<0.05; b
p<0.01; c
p<0.001 compared with male 2.5% protein. d
p<0.001 compared with male
7.5% protein. e
p<0.001 compared with female 2.5% protein. Each point represents an
individual animal. Horizontal bars represent group means.
a
b
a
c
d
c
c
e
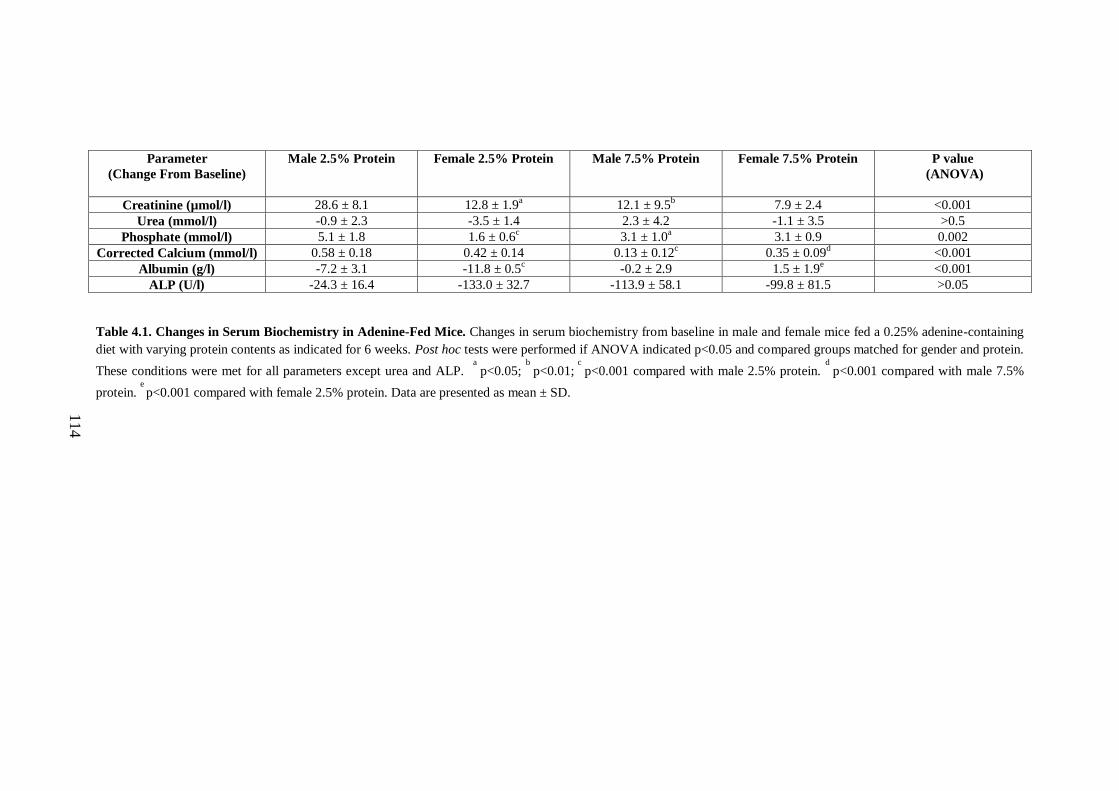
114
Parameter
(Change From Baseline)
Male 2.5% Protein Female 2.5% Protein Male 7.5% Protein Female 7.5% Protein P value
(ANOVA)
Creatinine (µmol/l) 28.6 ± 8.1 12.8 ± 1.9a 12.1 ± 9.5
b 7.9 ± 2.4 <0.001
Urea (mmol/l) -0.9 ± 2.3 -3.5 ± 1.4 2.3 ± 4.2 -1.1 ± 3.5 >0.5
Phosphate (mmol/l) 5.1 ± 1.8 1.6 ± 0.6c 3.1 ± 1.0
a 3.1 ± 0.9 0.002
Corrected Calcium (mmol/l) 0.58 ± 0.18 0.42 ± 0.14 0.13 ± 0.12c 0.35 ± 0.09
d <0.001
Albumin (g/l) -7.2 ± 3.1 -11.8 ± 0.5c -0.2 ± 2.9 1.5 ± 1.9
e <0.001
ALP (U/l) -24.3 ± 16.4 -133.0 ± 32.7 -113.9 ± 58.1 -99.8 ± 81.5 >0.05
Table 4.1. Changes in Serum Biochemistry in Adenine-Fed Mice. Changes in serum biochemistry from baseline in male and female mice fed a 0.25% adenine-containing
diet with varying protein contents as indicated for 6 weeks. Post hoc tests were performed if ANOVA indicated p<0.05 and compared groups matched for gender and protein.
These conditions were met for all parameters except urea and ALP. a
p<0.05; b
p<0.01; c
p<0.001 compared with male 2.5% protein. d
p<0.001 compared with male 7.5%
protein. e
p<0.001 compared with female 2.5% protein. Data are presented as mean ± SD.
115
4.2.2.ii A modified adenine-containing diet is poorly tolerated by C57Bl/6 mice.
Previous reports had suggested that mice on the C57Bl/6 background are resistant to
AC (Eaton et al 1978, El Abbadi et al 2009). To confirm whether this was also the
case using an adenine-containing diet to induce disease, the most efficacious regime
from the previous experiment (Diet B with 2.5% protein, Table 2.1) was fed to 5
male C57Bl/6 mice. This proved to be tolerated extremely poorly. One mouse had to
be sacrificed after 3 weeks and the other 4 by the end of the 4th
week. By this time-
point all mice had lost 40-50% body weight and exhibited a range of signs indicating
poor health. A post-mortem examination was performed on all 5 animals and of note
the mouse removed in the 3rd
week did have evidence of aortic calcification,
however no arterial disease was observed in the other 4 mice. Baseline biochemistry
was not measured in these animals, however the final serum creatinine and
phosphate concentrations were 93.8 ± 14.1µmol/l and 6.7 ± 0.8mmol/l respectively,
indicating advanced renal impairment.
4.2.2.iii Male offspring of 5th
generation backcrossed mice exhibit AC on a modified
adenine-diet.
The unsuccessful use of the adenine-containing diet in C57Bl/6 mice confirmed the
necessity of moving the P2X7R gene deletion onto the DBA/2 background.
Therefore when offspring were produced from mice backcrossed through 5
generations, 4 WT males were fed Diet B (2.5% protein) (Table 2.1) to assess
whether disease could be induced. These 4 mice were first fed a high phosphate diet
(Diet A, Table 2.1) for one week in an attempt to aid acclimatisation to the adenine-
diet (being of similar consistency and texture). Diet A (Table 2.1) had previously
been shown (having been used as the control diet in the experiments using folic acid
described above) to have minimal effects on biochemistry or weight change and was
again well tolerated here by these 4 mice. The trajectory of weight loss over the next
6 weeks was similar to that seen with the original 4 WT DBA/2 males fed this diet
(not shown). One mouse died one day before the 6 week time-point and post-mortem
examination revealed calcification within the aortic arch. At the end of 6 weeks the
other 3 mice were switched back to the high phosphate ‘acclimatisation’ diet (Diet
A, Table 2.1) in order to see whether they would gain weight whilst potentially
permitting any AC to continually develop in the context of established CKD.

116
Unexpectedly this intervention was not tolerated and all 3 animals died during the
subsequent 7 days. However, post-mortem examination and subsequent analysis
demonstrated calcium deposition in the aortic arches of all 3 animals confirming the
propensity of this new strain (5th
generation back-crossed mice) to develop AC when
fed Diet B (containing 2.5% protein, Table 2.1).
4.2.2.iv Diets containing a higher adenine content or flavour enhancers are poorly
tolerated.
A number of further dietary modifications were evaluated in an attempt to produce a
regime that was more palatable, in the hope of inducing CKD and AC that was not
associated with such a degree of weight loss. To assess whether a 0.75% adenine-
containing diet could be given for a brief (3 day) period with subsequent high
phosphate feeding alone, 3 male 5th
generation mice were fed this regime. All
animals became extremely sick within 3 days, 2 died and the other was returned to a
high phosphate diet alone. After 6 weeks this mouse showed no evidence of disease.
Chocolate-flavoured diets are commercially available which mice are reported to
find very palatable (personal communications with scientists at SSNIFF). To
investigate whether this would improve the intake of adenine-containing diets, 2
chocolate-flavoured formulations were trialled, one containing 0.25% and the other
0.20% adenine. Both contained 2.5% protein (Diet C, Table 2.1). Each diet was fed
to 4 male 5th
generation mice and overall they were tolerated extremely poorly. All
mice had to be sacrificed by 4 weeks. No AC was detected in these animals.
4.2.3 The effect of P2X7R gene deletion on CKD-associated AC.
4.2.3.i Selection of dietary regime.
Given the results from all of the pilot studies detailed above it was clear that the
optimal experimental conditions were met when male mice (5th
generation
backcross) were fed a high phosphate, 0.25% adenine, 2.5% protein-containing diet
(Diet B, Table 2.1) for 6 weeks without any initial ‘acclimatisation’ feeding. This
regime was therefore administered to 11 WT (WTA) and 10 P2X7-/-
(KOA) mice. A
control (C) diet (Diet B without adenine, Table 2.1) was fed to 8 mice of each
genotype (WTC and KOC respectively).
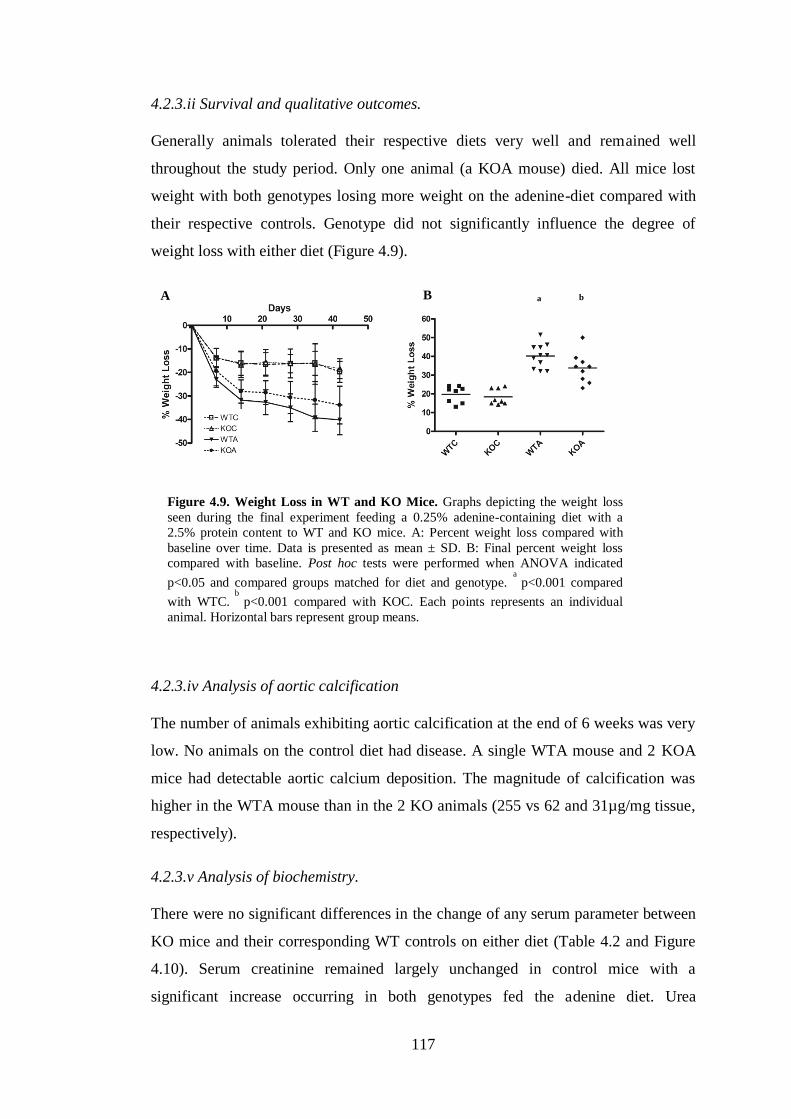
117
4.2.3.ii Survival and qualitative outcomes.
Generally animals tolerated their respective diets very well and remained well
throughout the study period. Only one animal (a KOA mouse) died. All mice lost
weight with both genotypes losing more weight on the adenine-diet compared with
their respective controls. Genotype did not significantly influence the degree of
weight loss with either diet (Figure 4.9).
4.2.3.iv Analysis of aortic calcification
The number of animals exhibiting aortic calcification at the end of 6 weeks was very
low. No animals on the control diet had disease. A single WTA mouse and 2 KOA
mice had detectable aortic calcium deposition. The magnitude of calcification was
higher in the WTA mouse than in the 2 KO animals (255 vs 62 and 31µg/mg tissue,
respectively).
4.2.3.v Analysis of biochemistry.
There were no significant differences in the change of any serum parameter between
KO mice and their corresponding WT controls on either diet (Table 4.2 and Figure
4.10). Serum creatinine remained largely unchanged in control mice with a
significant increase occurring in both genotypes fed the adenine diet. Urea
A B a
b
Figure 4.9. Weight Loss in WT and KO Mice. Graphs depicting the weight loss
seen during the final experiment feeding a 0.25% adenine-containing diet with a
2.5% protein content to WT and KO mice. A: Percent weight loss compared with
baseline over time. Data is presented as mean ± SD. B: Final percent weight loss
compared with baseline. Post hoc tests were performed when ANOVA indicated
p<0.05 and compared groups matched for diet and genotype. a
p<0.001 compared
with WTC. b
p<0.001 compared with KOC. Each points represents an individual
animal. Horizontal bars represent group means.
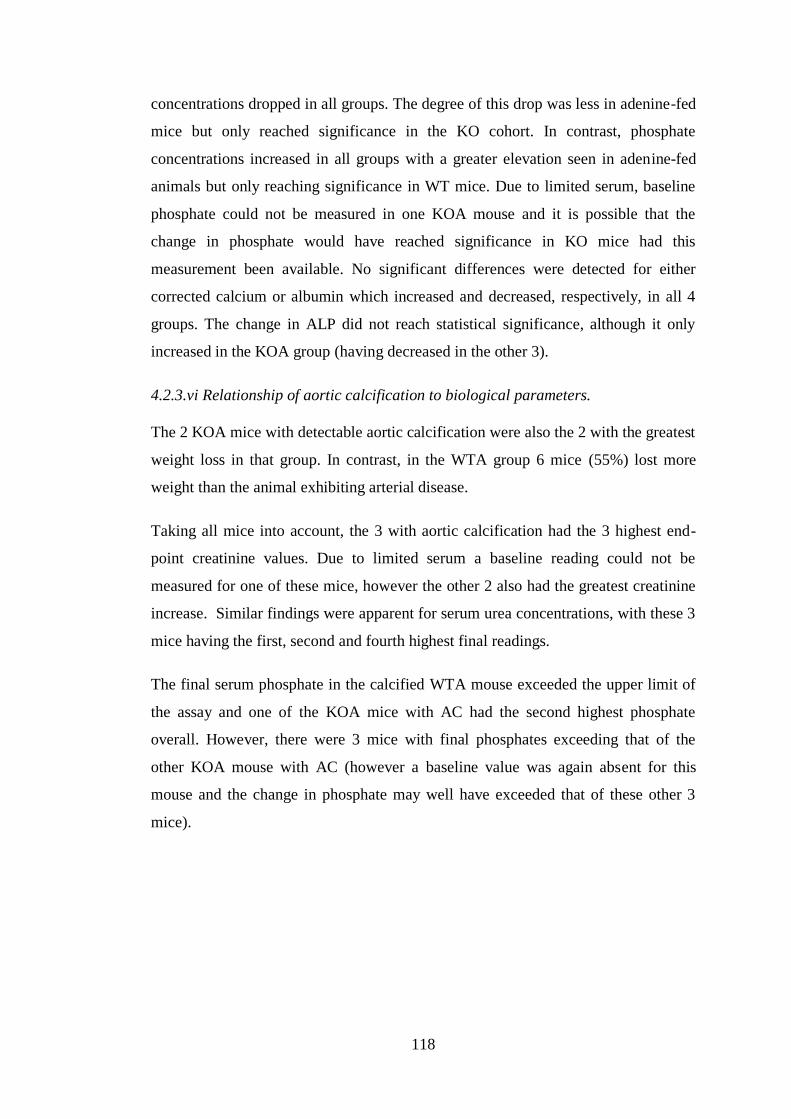
118
concentrations dropped in all groups. The degree of this drop was less in adenine-fed
mice but only reached significance in the KO cohort. In contrast, phosphate
concentrations increased in all groups with a greater elevation seen in adenine-fed
animals but only reaching significance in WT mice. Due to limited serum, baseline
phosphate could not be measured in one KOA mouse and it is possible that the
change in phosphate would have reached significance in KO mice had this
measurement been available. No significant differences were detected for either
corrected calcium or albumin which increased and decreased, respectively, in all 4
groups. The change in ALP did not reach statistical significance, although it only
increased in the KOA group (having decreased in the other 3).
4.2.3.vi Relationship of aortic calcification to biological parameters.
The 2 KOA mice with detectable aortic calcification were also the 2 with the greatest
weight loss in that group. In contrast, in the WTA group 6 mice (55%) lost more
weight than the animal exhibiting arterial disease.
Taking all mice into account, the 3 with aortic calcification had the 3 highest end-
point creatinine values. Due to limited serum a baseline reading could not be
measured for one of these mice, however the other 2 also had the greatest creatinine
increase. Similar findings were apparent for serum urea concentrations, with these 3
mice having the first, second and fourth highest final readings.
The final serum phosphate in the calcified WTA mouse exceeded the upper limit of
the assay and one of the KOA mice with AC had the second highest phosphate
overall. However, there were 3 mice with final phosphates exceeding that of the
other KOA mouse with AC (however a baseline value was again absent for this
mouse and the change in phosphate may well have exceeded that of these other 3
mice).
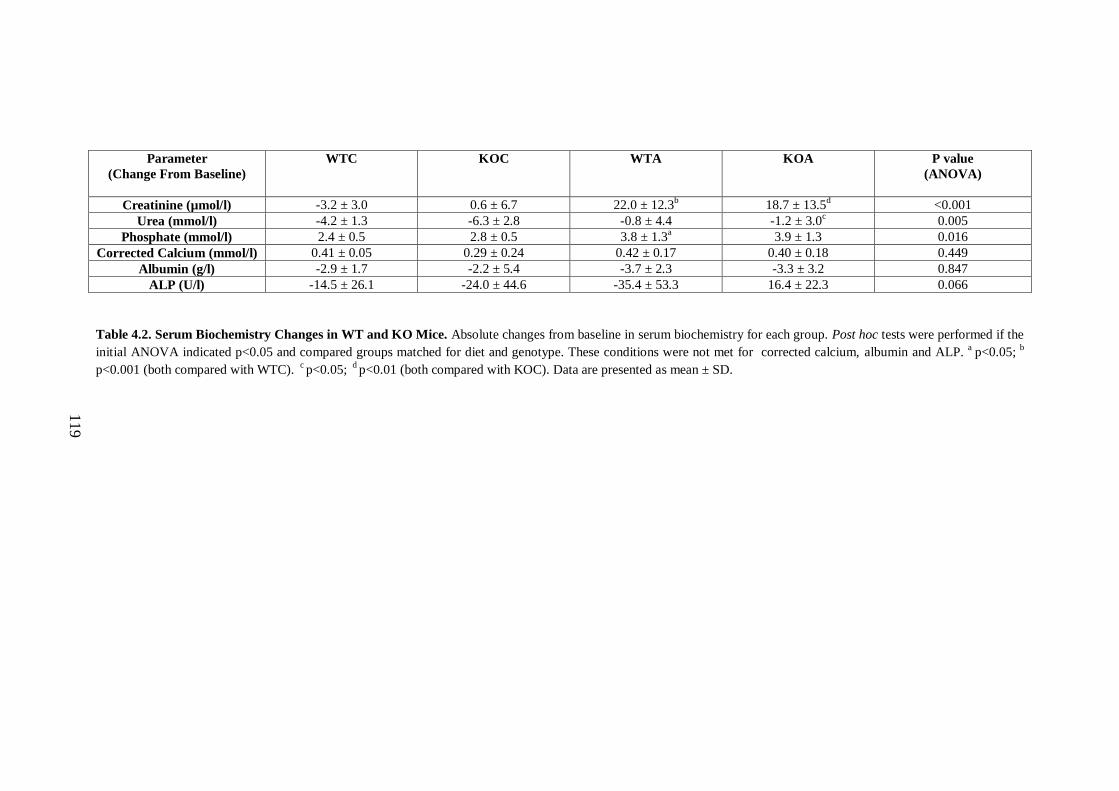
119
Parameter
(Change From Baseline)
WTC KOC WTA KOA P value
(ANOVA)
Creatinine (µmol/l) -3.2 ± 3.0 0.6 ± 6.7 22.0 ± 12.3b
18.7 ± 13.5d
<0.001
Urea (mmol/l) -4.2 ± 1.3 -6.3 ± 2.8 -0.8 ± 4.4 -1.2 ± 3.0c 0.005
Phosphate (mmol/l) 2.4 ± 0.5 2.8 ± 0.5 3.8 ± 1.3a 3.9 ± 1.3 0.016
Corrected Calcium (mmol/l) 0.41 ± 0.05 0.29 ± 0.24 0.42 ± 0.17 0.40 ± 0.18 0.449
Albumin (g/l) -2.9 ± 1.7 -2.2 ± 5.4 -3.7 ± 2.3 -3.3 ± 3.2 0.847
ALP (U/l) -14.5 ± 26.1 -24.0 ± 44.6 -35.4 ± 53.3 16.4 ± 22.3 0.066
Table 4.2. Serum Biochemistry Changes in WT and KO Mice. Absolute changes from baseline in serum biochemistry for each group. Post hoc tests were performed if the
initial ANOVA indicated p<0.05 and compared groups matched for diet and genotype. These conditions were not met for corrected calcium, albumin and ALP. a
p<0.05; b
p<0.001 (both compared with WTC). c
p<0.05; d
p<0.01 (both compared with KOC). Data are presented as mean ± SD.
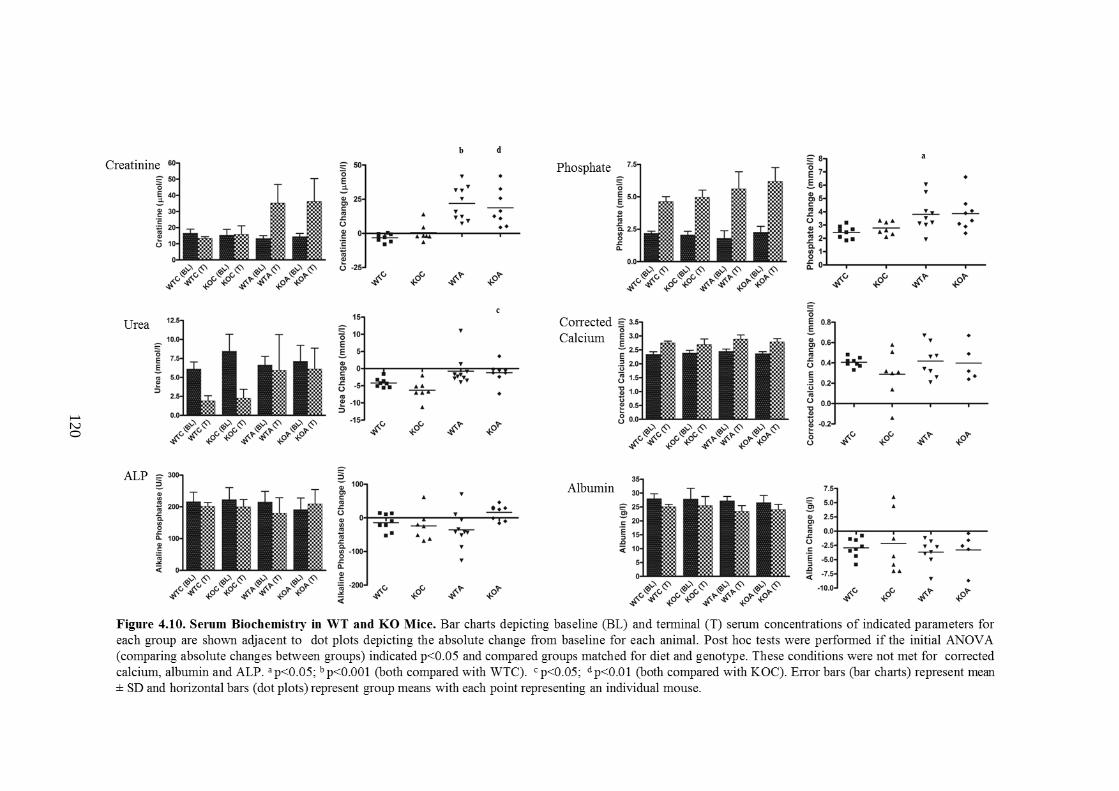
120
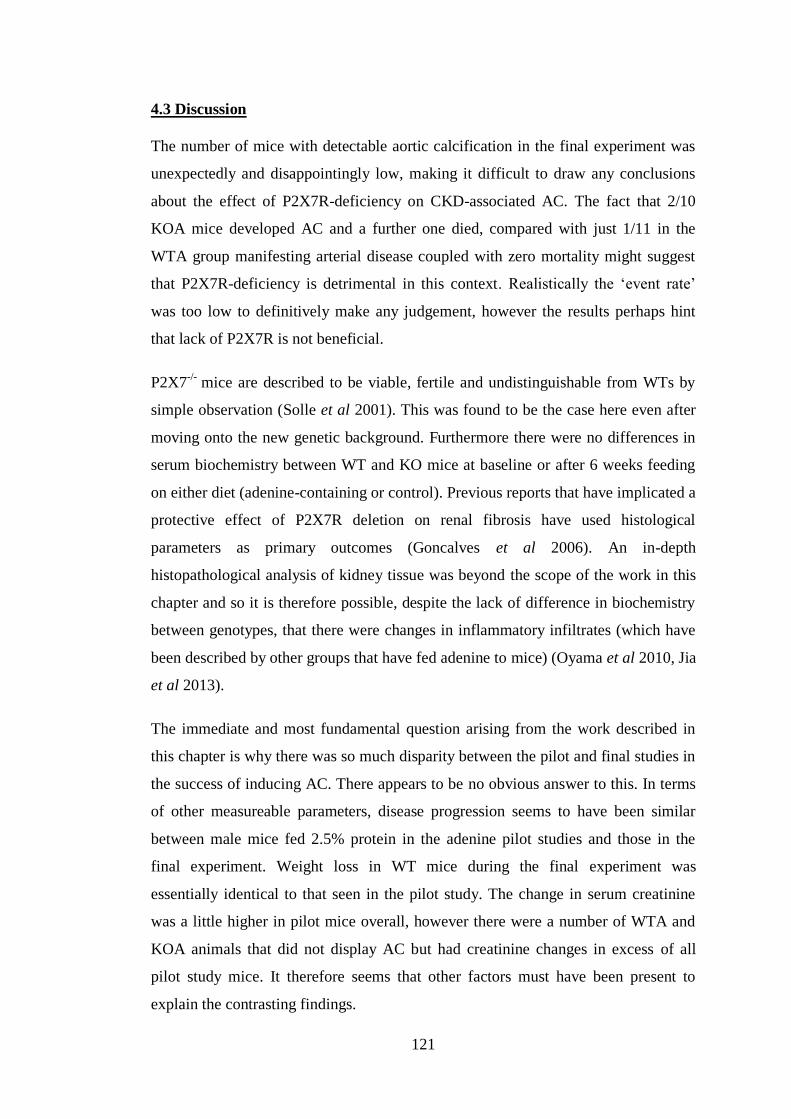
121
4.3 Discussion
The number of mice with detectable aortic calcification in the final experiment was
unexpectedly and disappointingly low, making it difficult to draw any conclusions
about the effect of P2X7R-deficiency on CKD-associated AC. The fact that 2/10
KOA mice developed AC and a further one died, compared with just 1/11 in the
WTA group manifesting arterial disease coupled with zero mortality might suggest
that P2X7R-deficiency is detrimental in this context. Realistically the ‘event rate’
was too low to definitively make any judgement, however the results perhaps hint
that lack of P2X7R is not beneficial.
P2X7-/-
mice are described to be viable, fertile and undistinguishable from WTs by
simple observation (Solle et al 2001). This was found to be the case here even after
moving onto the new genetic background. Furthermore there were no differences in
serum biochemistry between WT and KO mice at baseline or after 6 weeks feeding
on either diet (adenine-containing or control). Previous reports that have implicated a
protective effect of P2X7R deletion on renal fibrosis have used histological
parameters as primary outcomes (Goncalves et al 2006). An in-depth
histopathological analysis of kidney tissue was beyond the scope of the work in this
chapter and so it is therefore possible, despite the lack of difference in biochemistry
between genotypes, that there were changes in inflammatory infiltrates (which have
been described by other groups that have fed adenine to mice) (Oyama et al 2010, Jia
et al 2013).
The immediate and most fundamental question arising from the work described in
this chapter is why there was so much disparity between the pilot and final studies in
the success of inducing AC. There appears to be no obvious answer to this. In terms
of other measureable parameters, disease progression seems to have been similar
between male mice fed 2.5% protein in the adenine pilot studies and those in the
final experiment. Weight loss in WT mice during the final experiment was
essentially identical to that seen in the pilot study. The change in serum creatinine
was a little higher in pilot mice overall, however there were a number of WTA and
KOA animals that did not display AC but had creatinine changes in excess of all
pilot study mice. It therefore seems that other factors must have been present to
explain the contrasting findings.

122
One possibility is that there were subtle genetic differences between the 5th
generation mice used in the pilot study, all of which developed AC, and those in the
main experiment. However, the 3 mice with aortic disease in the final study were all
of different parentage and housed with littermates which did not display AC thus
arguing against a genetic-related factor.
Another potential explanation is the one week ‘acclimatisation’ period employed in
the pilot study during which mice were fed a high phosphate diet (Diet A, Table 2.1).
This was not done in the main experiment as in the pilot study it had not obviously
influenced subsequent dietary intake of the adenine-containing feed, or weight loss,
and one animal had died before 6 weeks on the adenine diet. Diet A (Table 2.1) did
not influence any biochemical parameter during the first 2 weeks of feeding as
shown by the studies with folic acid during which it was fed to all mice. Therefore
whilst not impossible, it is difficult to see how an initial one week period on this diet
would greatly enhance rates of aortic calcification. Mice in the pilot study were
converted back to Diet A (Table 2.1) after 6 weeks of adenine feeding but all died
within a few days of the switch. This brief period of time after the dietary change
seems too short for extensive disease to develop and AC was almost certainly
present before this point. A further possible reason for the contrasting findings could
relate to subtle differences in the make-up of the diets however this also seems
unlikely given that although different batches, they were made by the same
manufacturer to the same formulation and specification and stored in identical
fashion.
All in vivo models of AC are reported to result in variable rates of calcification
which may ultimately have been the reason for the present findings. Only one murine
model of CKD-associated AC has previously been described (El-Abbadi et al 2009)
and in this original report all mice (n=7) exhibited some degree of aortic calcification
but a wide range of values was seen. Of note however, all control animals were
found to have mild degrees of aortic calcification and some CKD mice only had AC
to a similar degree as this ’healthy’ cohort. A number of subsequent studies (all by
the Giachelli laboratory) have employed this model (Pai et al 2011, Lau et al 2012a,
Lau et al 2012b, Scialla et al 2013) and confirm variability in calcification. The
study by Scialla et al (2013) reported only a 50% success of AC induction. No
123
definitive explanation for this variability has been put forward by any group - it is
almost certainly multi-factorial and likely that many of these unidentified
determinants were at play in the current work.
When considering the potential utility of the model developed in this chapter as a
future experimental tool, it is worth making comparisons (in respect of factors other
than calcification consistency) with that established by Giachelli’s group (El-Abbadi
et al 2009). Advantages of adenine feeding include the no requirement for surgery,
and hence no peri-operative mortality, a relatively short length of time necessary for
AC to develop (mice are usually followed for at least 3 months with the surgical
model) and the no gender dependence (male mice are not used in the surgical model
due to an increased resistance to AC). In terms of biochemistry, only selected
parameters have been reported in the surgical model. Urea rather than creatinine has
been used as a marker of renal impairment and shows an approximate 3-fold
elevation compared with controls. This is in contrast to the present work in which
serum urea was, if anything, slightly decreased - almost certainly a reflection of both
decreased body weight and protein intake. This is definitely a limitation of the
adenine-based model. Weight loss also occurs in the surgical model but has not been
reported in terms of ‘percentage loss’ so it is difficult to make an accurate
comparison with the results here. Creatinine appears to be a better marker of renal
function in the adenine-model as it consistently increased. Elevations in serum
phosphate are comparable between the two models, however an increase in ALP is
seen in the Giachelli model (in contrast to a general decrease with adenine) along
with an elevated PTH (which was not measured in the present work due to the
limited volume of serum). In keeping with these serum results, high-turnover bone
disease has been demonstrated with the surgical model (Lau et al 2012a). Analysis of
bone was not performed in the current work so it is unclear whether the two systems
are equivalent in this respect.
The work by Giachelli’s group and the results from the adenine experiments here do
indicate that for AC to occur, an advanced state of renal impairment needs to be
reached. Folic acid was essentially unsuccessful for inducing renal disease in the
present work. In retrospect, successful studies that have employed folic acid to
induce CKD report obtaining less than 30% fibrosis after 20 weeks associated with
124
serum creatinine values of around half those detected in adenine-fed mice with AC
in this work (Bechtel et al 2010). Folic acid is therefore unlikely to achieve the
necessary degree of renal impairment required for AC to develop.
When considering the conditions necessary for AC to develop in vivo, the fates of 3
mice involved in the pilot studies, all of which displayed calcified aortas, are
particularly intriguing. The animals in question are the one female DBA/2
administered 480µg/g folic acid, the one male C57Bl/6 (which died in week 3) and
the male DBA/2 (which died at day 13). These mice are biologically diverse
differing in gender, strain and method used to induce disease. Furthermore, disease
in the latter 2 animals developed relatively rapidly (in less than 3 weeks). The
uniting factor seems to be that all 3 had pronounced weight loss over a few days and
whilst one remained fairly well and recovered, the other 2 quickly declined. A
number of systemic changes are likely to be present in this clinical setting. Renal
impairment is inevitable with a consequential elevation in serum phosphate.
Additionally, these animals were almost certainly profoundly volume-contracted.
The fact that AC appears to be able to develop very quickly (within days) under
these circumstances raises the possibility that in this context ectopic calcification
occurs due to mechanisms other than those requiring ‘active’ and ‘cell-mediated’
changes. C57Bl/6 mice are resistant to AC and this is thought to be due in part to a
greater expression of the Abcc6 gene (Meng et al 2007). The fact that one of these
mice developed AC demonstrates that this resistance can be overcome in certain
situations. One possibility is that under these conditions of advanced dehydration
and mineral imbalance the systemic environment simply favours passive
precipitation of mineral.
Male mice were more prone to disease with adenine feeding whereas only females
are reported to develop AC with the surgical model (El-Abbadi et al 2009). In many
mouse models of renal disease males appear to be affected to a greater degree than
females (Si et al 2009). This disparity has often been attributed to hormonal
influences and may well be the explanation here. Clearly with surgical induction
disease will be induced irrespective of hormonal effects, although why males should
be resistant to AC in this context is unknown. The greater success of AC induction
with lower dietary protein is consistent with the findings in rats and is thought to

125
possibly result due to a higher bioavailability of phosphate (Neven & D’Haese
2011).
4.4 Summary
A novel mouse model of CKD-associated AC has been developed based on a
modified adenine-containing diet. Unfortunately at present this model suffers from a
high level of inconsistency and proved to be unhelpful in addressing the primary
question of whether P2X7R deficiency attenuates disease. To try and provide an
answer to this an alternative in vivo system was sought and is the focus of the work
described in Chapter 5.

126
CHAPTER 5 – EXPERIMENT TO ASSESS THE INFLUENCE OF A
SELECTIVE P2X7R ANTAGONIST ON CHRONIC KIDNEY DISEASE-
ASSOCIATED ARTERIAL CALCIFICATION IN RATS
5.1 Introduction
The experiments described in Chapter 4 were ultimately unhelpful for assessing the
effect of P2X7R deficiency on AC due to the low number of mice exhibiting arterial
calcium deposition. It was therefore necessary to find an alternative method of
examining the influence of in vivo receptor ligation on disease progression.
Although adenine diet-based models are infrequently used in mice, they have
successfully been employed to induce the combination of CKD and aortic
calcification in rats for several years (Katsumata et al 2003). The P2X7R antagonist,
AZ11657312, has previously been administered to rats in other disease models
(AstraZeneca unpublished data) and was available for use in this work. Thus, this
agent along with the rat adenine model provided the necessary experimental tools to
test the hypothesis that P2X7R blockade could ameliorate CKD-associated AC in
vivo.
5.2 Results
5.2.1 Optimisation of the rat adenine model.
It was first necessary to confirm that feeding an adenine-containing diet to rats
would lead to AC and CKD, as is described in the literature (Shobeiri et al 2010,
Neven & D’Haese 2011). In addition, it was important to ascertain what degree of
consistency of AC would be achieved using this model and whether it would
therefore be a suitable model with which to assess the impact of a pharmacological
agent.
5.2.1.i The addition of 0.75% adenine to a high phosphate diet leads to AC and
marked renal impairment in rats by 4 weeks.
A high phosphate diet (Diet D, Table 2.1) was administered to 8 male Wistar rats for
4 weeks. In the case of 4 of these 8 rats, the diet was supplemented with 0.75%
adenine. Rats fed the high phosphate control diet gained 1.2 ± 4.5% body weight,
whereas those on the adenine diet lost 25.9 ± 3.4% by the end of 4 weeks. Despite

127
the weight loss, those in the adenine group continued to display normal activity and
social interaction. No animals died during this experiment.
Quantitative and qualitative assessment (von Kossa staining) of aortas from control
rats revealed complete absence of calcification (Figure 5.1A). In contrast, all aortas
from rats fed the adenine-containing diet had at least some calcium deposition. The
degree of calcification within vessels was extremely variable, ranging from
circumferential calcium deposition of the entire vessel, essentially dividing the
medial layer in half (Figure 5.1B), to smaller, scattered, linear deposits along
sections of elastin within the media (Figure 5.1C-E). No staining was detected along
the internal elastic lamina (IEL). Calcification was detected in the abdominal aortas
from all adenine-fed rats with a mean of 13.6 ± 11.0µg/mg. However, calcium was
only detected in the thoracic aorta and aortic arch in one (the same) animal.
Kidneys from control rats looked normal both macroscopically and histologically
(Figure 5.2A and B). In contrast, kidneys from adenine-fed rats appeared grossly
enlarged and ‘sandy’ coloured (Figure 5.2A). The mean kidney weight from control
rats was 2.77 ± 0.21g compared with 9.57 ± 1.40g in the adenine fed cohort (p <
0.001). The respective kidney to body weight ratios were 0.006 ± 0.000 vs 0.030 ±
0.004 (p < 0.001). H & E staining of kidneys from adenine-fed rats showed
morphologically normal glomeruli but marked abnormalities in the tubulointerstitial
compartment (Figure 5.2C). Many tubules appeared dilated with epithelial flattening,
and many contained green-brown crystals, consistent with 2,8-dihydroxyadenine
deposition (Monico & Milliner 2012). Interstitial fibrosis was apparent as evidenced
by expansion of the tubulointerstitium and ECM accumulation (Norman & Fine
1999).
Serum biochemical results were in keeping with these histological findings, with the
adenine-fed rats having significantly higher levels of urea, creatinine and phosphate
compared with controls (Table 5.1).
128
Figure 5.1. Aortic Calcium Deposition in Rats. Aortic sections were stained with
silver nitrate (von Kossa stain) for calcification (stained black). A: Negative
calcium staining in an aorta from a control rat. B-D: Positive staining in aortas
from 3 different adenine-fed rats showing varying extents of mineral deposition. E:
Higher magnification (x63) image showing calcification along elastin fibres
running between intact VSMCs. All sections counterstained with aluminium red.
A-D magnification x10.
A B
C D
E
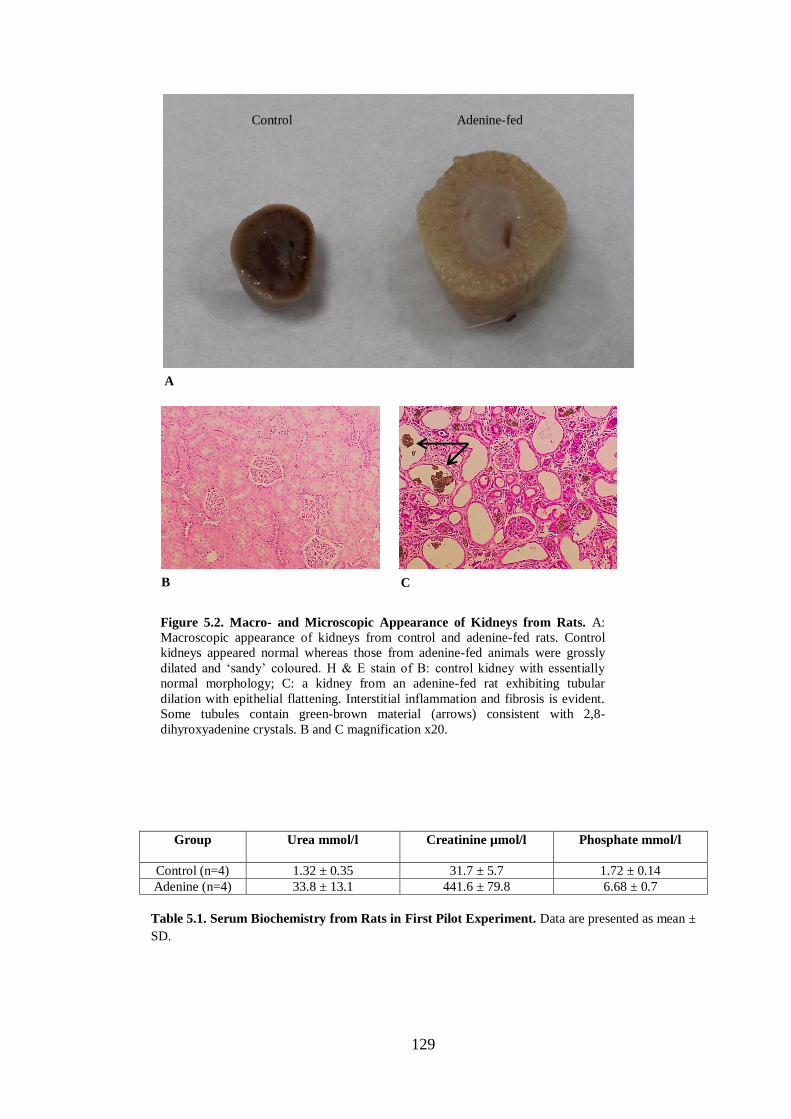
129
Group
Urea mmol/l Creatinine µmol/l Phosphate mmol/l
Control (n=4) 1.32 ± 0.35 31.7 ± 5.7 1.72 ± 0.14
Adenine (n=4) 33.8 ± 13.1 441.6 ± 79.8 6.68 ± 0.7
Table 5.1. Serum Biochemistry from Rats in First Pilot Experiment. Data are presented as mean ±
SD.
Control Adenine-fed
Figure 5.2. Macro- and Microscopic Appearance of Kidneys from Rats. A:
Macroscopic appearance of kidneys from control and adenine-fed rats. Control
kidneys appeared normal whereas those from adenine-fed animals were grossly
dilated and ‘sandy’ coloured. H & E stain of B: control kidney with essentially
normal morphology; C: a kidney from an adenine-fed rat exhibiting tubular
dilation with epithelial flattening. Interstitial inflammation and fibrosis is evident.
Some tubules contain green-brown material (arrows) consistent with 2,8-
dihyroxyadenine crystals. B and C magnification x20.
A
B C
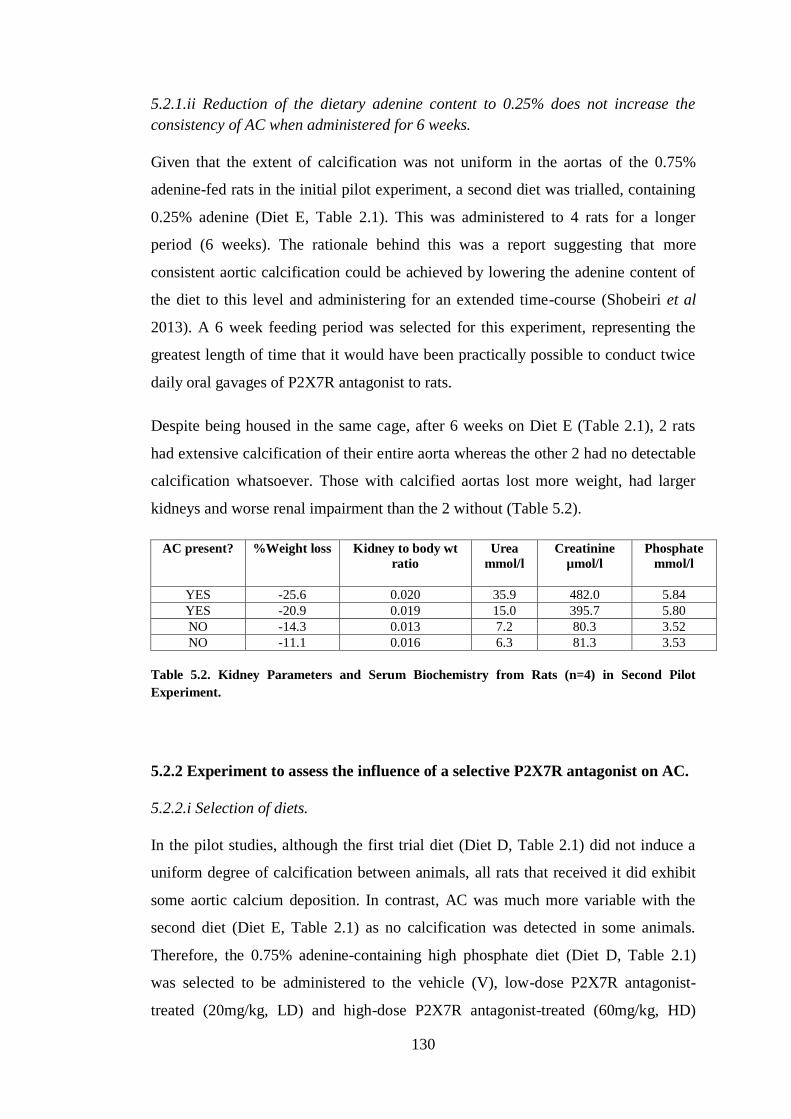
130
5.2.1.ii Reduction of the dietary adenine content to 0.25% does not increase the
consistency of AC when administered for 6 weeks.
Given that the extent of calcification was not uniform in the aortas of the 0.75%
adenine-fed rats in the initial pilot experiment, a second diet was trialled, containing
0.25% adenine (Diet E, Table 2.1). This was administered to 4 rats for a longer
period (6 weeks). The rationale behind this was a report suggesting that more
consistent aortic calcification could be achieved by lowering the adenine content of
the diet to this level and administering for an extended time-course (Shobeiri et al
2013). A 6 week feeding period was selected for this experiment, representing the
greatest length of time that it would have been practically possible to conduct twice
daily oral gavages of P2X7R antagonist to rats.
Despite being housed in the same cage, after 6 weeks on Diet E (Table 2.1), 2 rats
had extensive calcification of their entire aorta whereas the other 2 had no detectable
calcification whatsoever. Those with calcified aortas lost more weight, had larger
kidneys and worse renal impairment than the 2 without (Table 5.2).
AC present? %Weight loss Kidney to body wt
ratio
Urea
mmol/l
Creatinine
µmol/l
Phosphate
mmol/l
YES -25.6 0.020 35.9 482.0 5.84
YES -20.9 0.019 15.0 395.7 5.80
NO -14.3 0.013 7.2 80.3 3.52
NO -11.1 0.016 6.3 81.3 3.53
Table 5.2. Kidney Parameters and Serum Biochemistry from Rats (n=4) in Second Pilot
Experiment.
5.2.2 Experiment to assess the influence of a selective P2X7R antagonist on AC.
5.2.2.i Selection of diets.
In the pilot studies, although the first trial diet (Diet D, Table 2.1) did not induce a
uniform degree of calcification between animals, all rats that received it did exhibit
some aortic calcium deposition. In contrast, AC was much more variable with the
second diet (Diet E, Table 2.1) as no calcification was detected in some animals.
Therefore, the 0.75% adenine-containing high phosphate diet (Diet D, Table 2.1)
was selected to be administered to the vehicle (V), low-dose P2X7R antagonist-
treated (20mg/kg, LD) and high-dose P2X7R antagonist-treated (60mg/kg, HD)

131
groups. Control groups ‘N’ and ‘A’ were fed a diet containing normal phosphate
without or with 0.75% adenine (Diets F and G, respectively, Table 2.1) (see Chapter
2, section 2.7).
5.2.2.ii Survival and tolerability of oral gavage.
There was no mortality in the N, A or V groups. In contrast, 4/7 rats in the LD and
2/8 in the HD groups died. Three of these deaths were due to immediate
complications of the gavage procedure itself. The other 3 rats had a more insidious
onset of morbidity. One lost an excessive amount of weight, one exhibited a sub-
acute onset of respiratory distress, and the other displayed an unacceptably high
degree of agitation.
The extent to which each individual animal tolerated the oral gavage procedure was
variable, with some remaining calm and un-fazed, and others showing varying
degrees of agitation. Whilst difficult to objectively measure, it was noted throughout
the experiment that rats receiving vehicle alone seemed to be more tolerant of the
procedure than those receiving the study drug. On isolated occasions, due to either
encountering severe resistance at the level of the proximal oesophagus when
attempting to pass the gavage cannula, or the rat displaying severe agitation, the dose
could not be administered. Of the surviving animals, the V group received 89.5% of
scheduled doses, the LD group received 79.2% and the HD group 88.4% (p = 0.39
for V vs HD). Only 4 rats (all in the V group) received all of the scheduled doses.
The rats in the N group all gained weight, whereas all those in the other 4 groups lost
weight to a similar degree (Table 5.3).
Group
% Weight change
N (n = 10) +11.2 ± 5.9
A (n = 6) -29.2 ± 2.8
V (n = 9) -28.5 ± 2.6
LD (n = 3) -33.4 ± 3.8
HD (n = 6) -28.9 ± 2.8
Table 5.3. Weight Changes. Percent weight changes from baseline after 4 weeks. Data are presented
as mean ± SD.

132
Due to the low final numbers of LD rats, this group was excluded from subsequent
statistical analysis of biological parameters.
5.2.2.iii Serum levels of P2X7R antagonist.
The mean serum concentration of AZ11657312, taken 2 hours after the first dose
(peak level) in 4 HD rats was 4039 ± 2486 ng/ml. The corresponding concentration
immediately before the second dose (trough level) was 1926 ± 1297 ng/ml. After 2
weeks of study, another trough level was taken which was 1785 ± 662 ng/ml. Only
2/4 of these rats survived to the end of the study. A final serum sample was taken at
sacrifice with drug levels of 29 and 200 ng/ml detected in these 2 animals. The other
4 rats in the HD group had a peak drug level taken at 2 weeks to confirm absorption
of the compound. This was measured at 3005 ± 1432 ng/ml.
5.2.2.iv P2X7R expression in normal and calcified aorta.
The absolute mRNA copy numbers for P2X7R for each group are given in Table 5.4
(p = 0.046). The mean copy number in the 3 adenine-treated groups was higher than
controls without reaching statistical significance following post hoc testing. There
was no significant difference between the A, V and HD groups.
N
(n=10)
A
(n = 6)
V
(n = 9)
HD
(n = 6)
607 ± 379 1,114 ± 308 989 ± 292 1,191 ± 747
Table 5.4. Corrected Absolute mRNA Copy Numbers for P2X7R. Post hoc testing compared all
groups to N and V as initial KW test indicated p<0.05. Following this, no significant differences were
detected. Data are presented as mean ± SD.
P2X7R protein expression in normal and calcified aorta was assessed by Western
blotting. Protein lysates from the A group were excessively haemorrhagic, so to
avoid potential contamination from blood proteins, the N group was compared to the
V and HD groups only. A blot was run using the 3 samples in each group with
calcification closest to the respective group mean (Figure 5.3). By densitometry the
mean band intensity between the 3 groups was very similar suggesting equivalent
protein expression (p = 0.19).

133
5.2.2.v P2X7R antagonism does not influence the development of AC in adenine-fed
rats.
The differences in arterial calcium deposition between the V and HD groups, and the
V and A groups were not statistically significant (Table 5.5 and Figures 5.4 and 5.5).
As expected, no calcification was detected in the aortas from control rats. In the
other 4 groups, calcium was present in all but 2 aortas (both from HD rats) when
analysed colourimetrically. Of note, these 2 rats missed the most doses of those in
the HD group (8 and 13 doses missed). In addition, the rat with the lowest aortic
calcium content in the V group was the one with the greatest number of missed doses
(24 doses missed). For the V and HD groups together, there was a strong negative
correlation between doses missed and aortic calcification (Spearman rho = -0.62; p =
0.013) (Figure 5.6).
N V HD
P2X7R 69kDa
α-tubulin 55kDa
Figure 5.3. P2X7R Protein Expression in Control and Calcified Rat Aorta.
Western blot of protein lysates from aorta taken from 3 rats in each of the N, V and
HD groups shown with the corresponding band densitometry below. Error bars
represent mean ± SD.
N V HD
Me
an
Den
sit
om
etr
y (
arb
itra
ry u
nit
s)
0
1
2

134
Group
Aortic calcium content (µg/mg tissue)
N (n = 10) 0 ± 0
A (n = 6) 46.2 ± 31.0**
V (n = 9) 35.7 ± 34.2 **
LD (n = 3) 41.8 ± 30.4
HD (n = 6) 35.0 ± 28.5 *
Table 5.5. Aortic Calcification. Quantification of total aortic calcium content in each group. Post
hoc testing compared all groups (except LD) to N and V as initial KW test indicated p<0.05. *p<0.05;
**p<0.01 all compared to N. Data are presented as mean ± SD.
Figure 5.4. Quantification of Aortic Calcium Deposition. Quantification of total
aortic calcium content in each rat in the indicated groups. Post hoc testing
compared all groups (except LD) to N and V as initial KW test indicated p<0.05.
*p<0.05; **p<0.01 all compared to N. Each symbol represents one animal.
Horizontal bars represent group means.
A B
Figure 5.5. Calcium Deposition in Adenine-Fed Rat Aortas. Representative
images of von Kossa stained rat aortas. Extensive, heavy calcification (stained
black) is seen throughout the arterial media in both vessels shown. A: Vehicle-
treated. B: High-dose P2X7R antagonist-treated. Counterstained with aluminium
red. Magnification x10.
** ** *
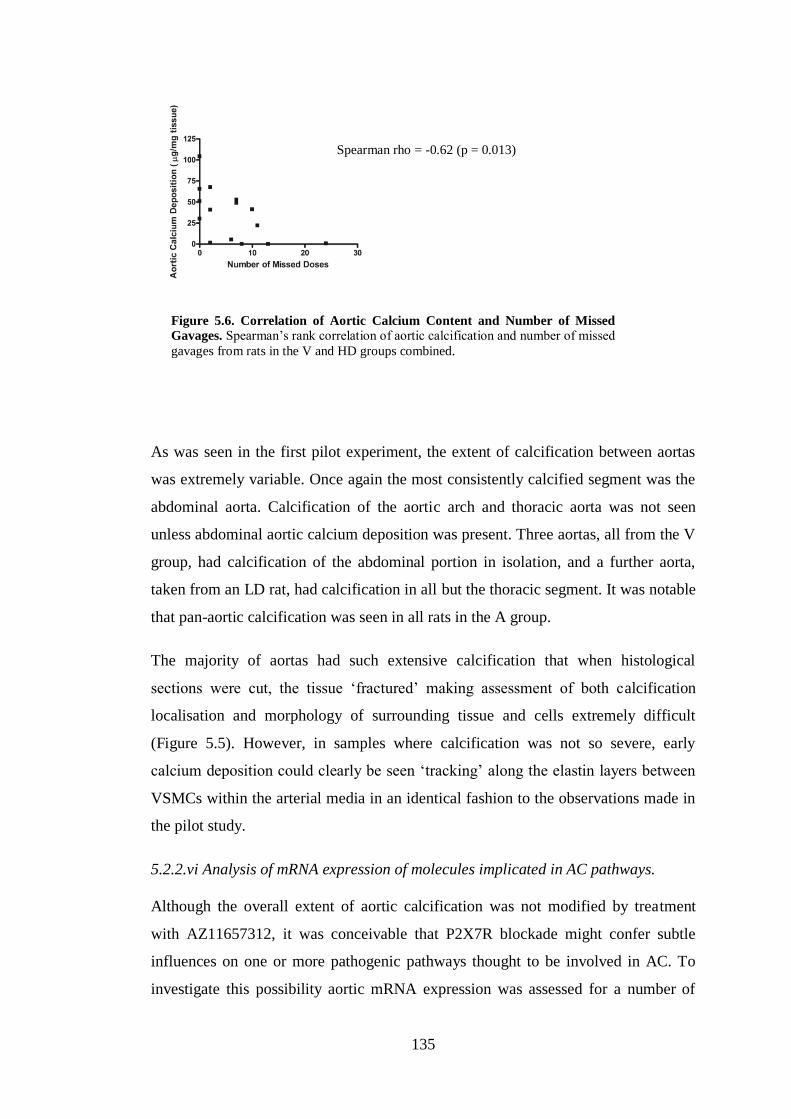
135
As was seen in the first pilot experiment, the extent of calcification between aortas
was extremely variable. Once again the most consistently calcified segment was the
abdominal aorta. Calcification of the aortic arch and thoracic aorta was not seen
unless abdominal aortic calcium deposition was present. Three aortas, all from the V
group, had calcification of the abdominal portion in isolation, and a further aorta,
taken from an LD rat, had calcification in all but the thoracic segment. It was notable
that pan-aortic calcification was seen in all rats in the A group.
The majority of aortas had such extensive calcification that when histological
sections were cut, the tissue ‘fractured’ making assessment of both calcification
localisation and morphology of surrounding tissue and cells extremely difficult
(Figure 5.5). However, in samples where calcification was not so severe, early
calcium deposition could clearly be seen ‘tracking’ along the elastin layers between
VSMCs within the arterial media in an identical fashion to the observations made in
the pilot study.
5.2.2.vi Analysis of mRNA expression of molecules implicated in AC pathways.
Although the overall extent of aortic calcification was not modified by treatment
with AZ11657312, it was conceivable that P2X7R blockade might confer subtle
influences on one or more pathogenic pathways thought to be involved in AC. To
investigate this possibility aortic mRNA expression was assessed for a number of
Figure 5.6. Correlation of Aortic Calcium Content and Number of Missed
Gavages. Spearman’s rank correlation of aortic calcification and number of missed
gavages from rats in the V and HD groups combined.
Spearman rho = -0.62 (p = 0.013)
136
molecules implicated in disease progression (Table 5.6 and Figure 5.7). The
A260/280 ratios of all RNA samples were above 1.7 and all RIN values exceeded 8,
indicating high levels of purity and integrity, respectively.
The stability of five housekeeping genes was assessed (β-actin, HPRT, 28S, SDHA
and YWHAZ) with β-actin found to be the least stable. Final absolute mRNA copy
numbers were calculated by correcting for the combination of HPRT, 28S, SDHA
and YWHAZ, as determined by the GeNorm programme (see Chapter 2, section
2.16.9). These 4 housekeeping genes had mean absolute copy numbers of 16,040 ±
3,678, 43,565 ± 14,847, 31,914 ± 22,249 and 188,593 ± 151,961, respectively.
A significant reduction in mRNA expression of the VSMC-specific markers α-SMA,
SM-22 and smoothelin (Proudfoot & Shanahan 2012) was seen in the A, V and HD
groups compared with controls. However, no difference was seen in expression
between these 3 groups. The absolute mRNA copy numbers for these 3 genes were
in the order of several tens of thousands, and several million in the case of α-SMA,
indicating abundant expression relative to the housekeeping genes (Figure 5.7A-C,
Table 5.6).
To assess for osteogenic transformation of VSMCs, mRNA expression of the
osteogenic transcription factors runx-2 (Komori et al 1997, Ducy et al 1997) and
osterix (Nakashima et al 2002), along with a key regulator of their induction, BMP-2
(Celil et al 2005, Hruska et al 2005), was measured (Figure 5.7D-F). A significant
increase was seen in runx-2 expression in the A, V and HD groups compared with
the controls, but there was no difference between these 3 groups. No differences
were detected between any groups for osterix or BMP-2 mRNA expression.
Absolute copy numbers for BMP-2 were of the order of a few thousand in all groups,
however, the copy numbers for runx-2, even in the calcified groups, were very low,
and in the case of osterix, mRNA expression was barely detectable (Table 5.6).
Copy numbers of mRNA for the apoptotic marker caspase-3, and the NLRP3
inflammasome, both showed a significant up-regulation in calcified vessels
compared with controls but no difference in the HD group compared with V.
Absolute copy numbers for both were in the order of several thousand (Figure 5.7G
and H, Table 5.6).
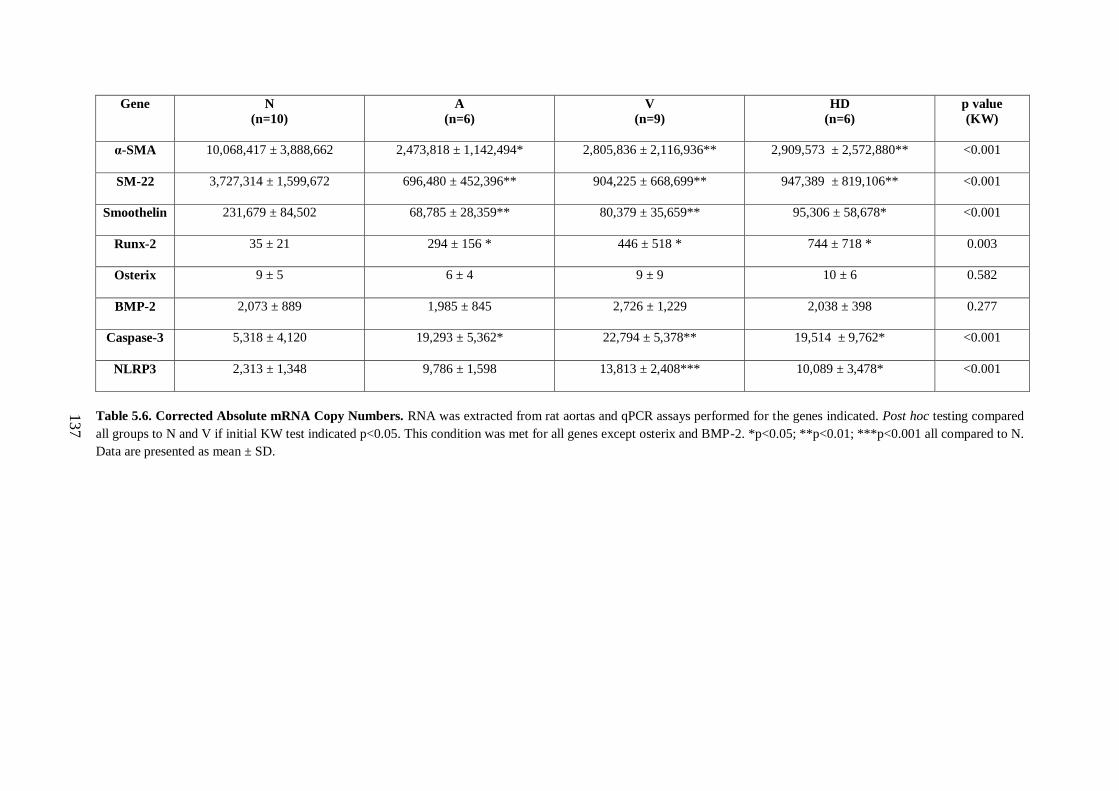
137
Gene N
(n=10)
A
(n=6)
V
(n=9)
HD
(n=6)
p value
(KW)
α-SMA
10,068,417 ± 3,888,662 2,473,818 ± 1,142,494* 2,805,836 ± 2,116,936** 2,909,573 ± 2,572,880** <0.001
SM-22
3,727,314 ± 1,599,672 696,480 ± 452,396** 904,225 ± 668,699** 947,389 ± 819,106** <0.001
Smoothelin
231,679 ± 84,502 68,785 ± 28,359** 80,379 ± 35,659** 95,306 ± 58,678* <0.001
Runx-2 35 ± 21
294 ± 156 * 446 ± 518 * 744 ± 718 * 0.003
Osterix 9 ± 5
6 ± 4 9 ± 9 10 ± 6 0.582
BMP-2
2,073 ± 889 1,985 ± 845 2,726 ± 1,229 2,038 ± 398 0.277
Caspase-3
5,318 ± 4,120 19,293 ± 5,362* 22,794 ± 5,378** 19,514 ± 9,762* <0.001
NLRP3
2,313 ± 1,348 9,786 ± 1,598 13,813 ± 2,408*** 10,089 ± 3,478* <0.001
Table 5.6. Corrected Absolute mRNA Copy Numbers. RNA was extracted from rat aortas and qPCR assays performed for the genes indicated. Post hoc testing compared
all groups to N and V if initial KW test indicated p<0.05. This condition was met for all genes except osterix and BMP-2. *p<0.05; **p<0.01; ***p<0.001 all compared to N.
Data are presented as mean ± SD.

138
Figure 5.7. Expression of Molecules Implicated in AC. RNA was extracted from rat
aortas and qPCR assays performed for the genes indicated. Post hoc testing compared
all groups to N and V if initial KW test indicated p<0.05. This condition was met for
all genes except osterix and BMP-2. *p<0.05; **p<0.01; ***p<0.001 all compared to
N. Each symbol represents one animal. Horizontal bars represent group means.
A B
C D
E
G
F
H
α-SMA SM-22
Smoothelin Runx-2
Osterix BMP-2
Caspase-3 NLRP3
* ** ** ** ** **
* ** ** * * *
* * ** * ***

139
5.2.2.vii P2X7R antagonism does not impact on the degree of renal impairment
observed in the adenine nephropathy model.
Histologically, kidneys from adenine-fed rats were grossly different from controls,
with similar changes seen to those observed in the pilot experiments. The amount of
interstitial fibrosis in V and HD kidney sections was assessed using Picrosirius red
staining (Figure 5.8). The mean fibrosis score in kidneys from V rats was 21.6 ±
6.7% compared with 21.8 ± 8.1% in HD rats (p = 0.936).
A
C
B
Figure 5.8. Picrosirius Red Staining of Rat Kidney Tissue. Representative
Picrosirius red stained kidney sections. A: Vehicle-treated (V) group. B: High-dose
antagonist-treated (HD) group. C: Control (N) group. 2,8-dihydroxyadenine crystals
stain as black (arrow in A). Quantitative analysis of collagen staining (see text)
showed no significant difference between the V and HD groups. Magnification x40.
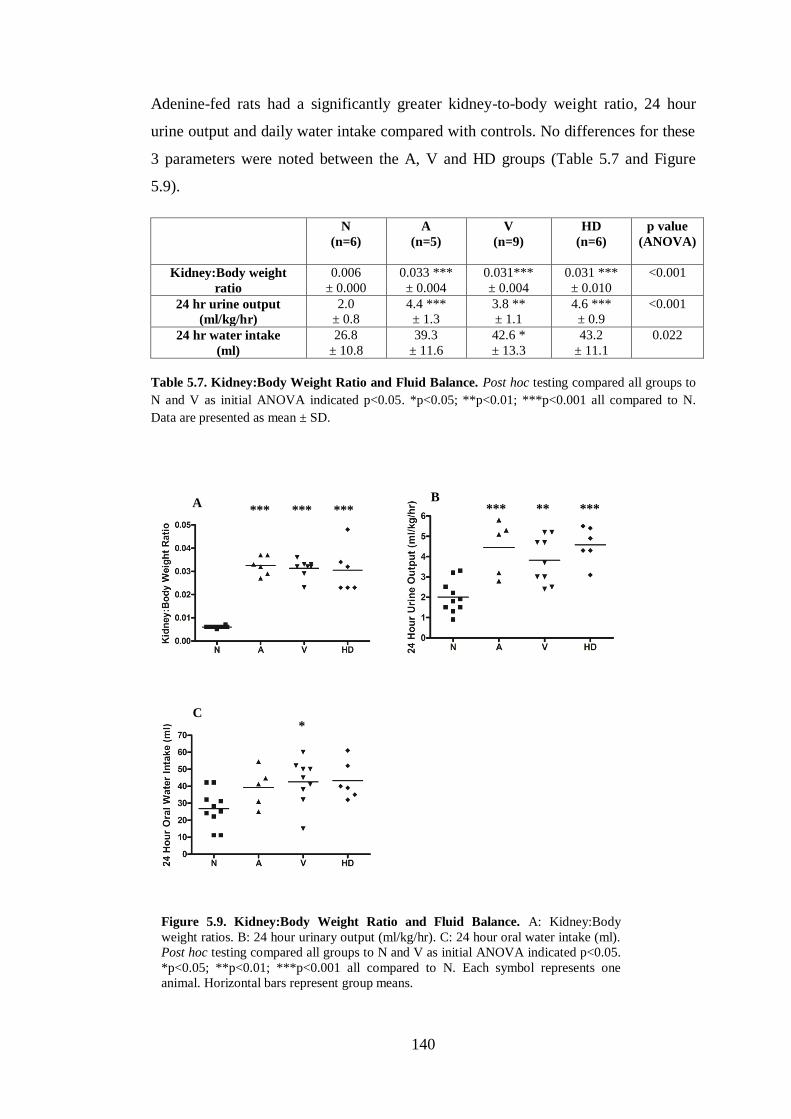
140
Adenine-fed rats had a significantly greater kidney-to-body weight ratio, 24 hour
urine output and daily water intake compared with controls. No differences for these
3 parameters were noted between the A, V and HD groups (Table 5.7 and Figure
5.9).
N
(n=6)
A
(n=5)
V
(n=9)
HD
(n=6)
p value
(ANOVA)
Kidney:Body weight
ratio
0.006
± 0.000
0.033 ***
± 0.004
0.031***
± 0.004
0.031 ***
± 0.010
<0.001
24 hr urine output
(ml/kg/hr)
2.0
± 0.8
4.4 ***
± 1.3
3.8 **
± 1.1
4.6 ***
± 0.9
<0.001
24 hr water intake
(ml)
26.8
± 10.8
39.3
± 11.6
42.6 *
± 13.3
43.2
± 11.1
0.022
Table 5.7. Kidney:Body Weight Ratio and Fluid Balance. Post hoc testing compared all groups to
N and V as initial ANOVA indicated p<0.05. *p<0.05; **p<0.01; ***p<0.001 all compared to N.
Data are presented as mean ± SD.
A
C
B
Figure 5.9. Kidney:Body Weight Ratio and Fluid Balance. A: Kidney:Body
weight ratios. B: 24 hour urinary output (ml/kg/hr). C: 24 hour oral water intake (ml).
Post hoc testing compared all groups to N and V as initial ANOVA indicated p<0.05.
*p<0.05; **p<0.01; ***p<0.001 all compared to N. Each symbol represents one
animal. Horizontal bars represent group means.
*** *** *** *** ** ***
*
141
Serum biochemistry was assessed at 2 weeks in V and HD rats (Table 5.8 and Figure
5.10) and in all animals following sacrifice (Tables 5.9 and Figures 5.11).
Additionally, Table 5.10 and Figure 5.12 summarise the results from analysis of
urine (samples collected during the 24 hours prior to tissue harvest).
At 2 weeks there was no significant difference in any serum analyte between the V
and HD groups except for ALP which was increased in V rats (Table 5.8, Figure
5.10). However, the ALP concentration measured at the end of the experiment did
not differ. There was no significant difference in any other serum parameter
measured at the end of the experiment between these 2 groups (Table 5.9, Figure
5.11), although HD rats had a significantly higher 24 hour protein excretion (Table
5.10, Figure 5.12).
Compared with N rats, those in groups A, V and HD had increased serum
concentrations of creatinine, urea, phosphate and PTH and decreased levels of
corrected calcium, albumin, ALP and ALT. All differences were statistically
significant except those for urea, corrected calcium and PTH for HD animals (Table
5.9, Figure 5.11).
A, V and HD rats had significantly lower creatinine clearances and significantly
higher 24 hour urinary protein excretion compared with the N group. The 24 hour
urinary phosphate excretion was also lower in these 3 groups compared with N rats
and this was statistically significant except for in HD animals. No differences were
seen in urinary calcium excretion across all 4 groups (Table 5.10, Figure 5.12).
Comparisons between the V and A groups were also non-significant in most cases.
Of note, the serum concentrations of both creatinine and urea were significantly
greater in the A group Table 5.9, Figure 5.11), however the creatinine clearance was
similar in both cohorts (Table 5.10, Figure 5.12). Urinary protein excretion was
significantly increased in the A group (Table 5.10, Figure 5.12).

142
V
(n=9)
HD
(n=8)
P value
(t-test)
Creatinine (µmol/l) 126.6 ± 29.3 119.1 ± 22.5 0.566
Urea (mmol/l) 7.9 ± 2.8 8.0 ± 2.2 0.914
Phosphate (mmol/l) 3.4 ± 0.5 3.0 ± 0.6 0.139
Corrected Calcium (mmol/l) 2.6 ± 0.1 2.6 ± 0.2 0.920
Albumin (g/l) 29.2 ± 1.6 30.0 ± 1.7 0.302
Alkaline Phosphatase (U/l) 174.6 ± 25.3 138.6 ± 29.7 0.017
ALT (U/l) 58.3 ± 37.7 43.3 ± 15.3 0.308
Table 5.8. Serum Biochemistry Measured at 2 Weeks in V and HD Groups. Measurement of indicated serum parameters at 2 weeks from V and HD rats. Data are
presented as mean ± SD.
N
(n=10)
A
(n=6)
V
(n=9)
HD
(n=6)
P value
(ANOVA)
Creatinine (µmol/l) 32.7 ± 4.3 633.9 ± 153.8c,e
404.8 ± 103.6c 318.4 ± 106.8
c <0.001
Urea (mmol/l) 1.7 ± 0.8 54.4 ± 24.1c,d
28.2 ± 12.5c 18.8 ± 8.4 <0.001
Phosphate (mmol/l) 4.4 ± 0.6 8.0 ± 0.9c 7.0 ± 0.9
c 6.8 ± 1.5
c <0.001
Corrected Calcium (mmol/l) 3.3 ± 0.1 3.0 ± 0.2b 3.1 ± 0.2
a 3.2 ± 0.2 0.005
PTH (pg/ml) 1013 ± 379 2203 ± 1047b 2003 ± 362
b 1736 ± 493 0.001
Albumin (g/l) 33.2 ± 1.8 28.7 ± 2.2c 28.9 ± 1.5
c 28.1 ± 1.1
c <0.001
Alkaline Phosphatase (U/l) 288.2 ± 81.8 108.5 ± 31.7c 147.4 ± 47.0
c 166.7 ± 33.5
c <0.001
ALT (U/l) 56.3 ± 25.4 30.0 ± 7.9a 30.0 ± 8.7
b 28.3 ± 9.5
a 0.003
Table 5.9. End-Point Serum Biochemistry. Measurements of indicated serum parameters at the time of sacrifice. Post hoc testing compared all groups to N and V as initial
ANOVA indicated p<0.05. a p<0.05;
b p<0.01;
c p<0.001 (all compared to N).
d p<0.05,
e p<0.01 (all compared to V).
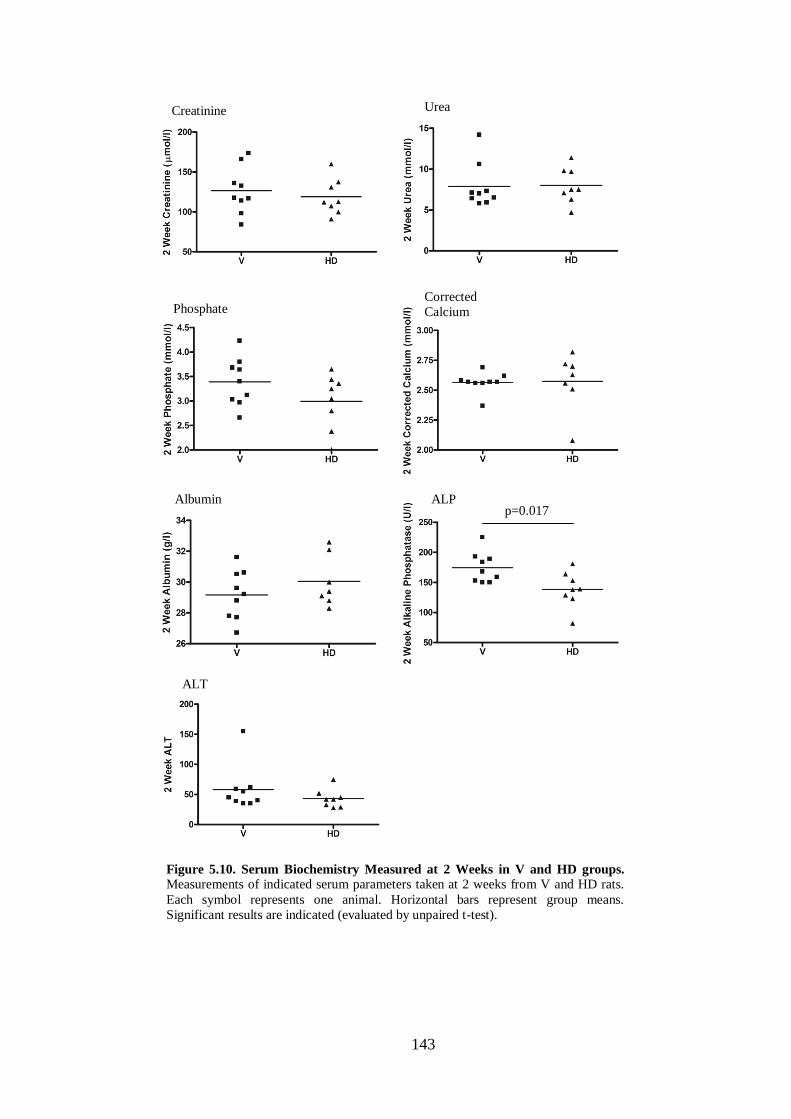
143
Figure 5.10. Serum Biochemistry Measured at 2 Weeks in V and HD groups.
Measurements of indicated serum parameters taken at 2 weeks from V and HD rats.
Each symbol represents one animal. Horizontal bars represent group means.
Significant results are indicated (evaluated by unpaired t-test).
ALT
ALP Albumin
Corrected
Calcium Phosphate
Urea Creatinine
p=0.017

144
Figure 5.11. End-Point Serum Biochemistry. Measurements of indicated serum
parameters taken at the time of sacrifice. Post hoc testing compared all groups to N
and V as initial ANOVA indicated p<0.05. a
p<0.05; b
p<0.01; c
p<0.001 (all
compared to N). d
p<0.05, e
p<0.01 (all compared to V). Each symbol represents
one animal. Horizontal bars represent group means.
c,e
c
c
c
c,d
c
c
c
a
b
c
c
c
c
c
c
a
b
a
Creatinine Urea
Phosphate Corrected
Calcium
Albumin ALP
ALT
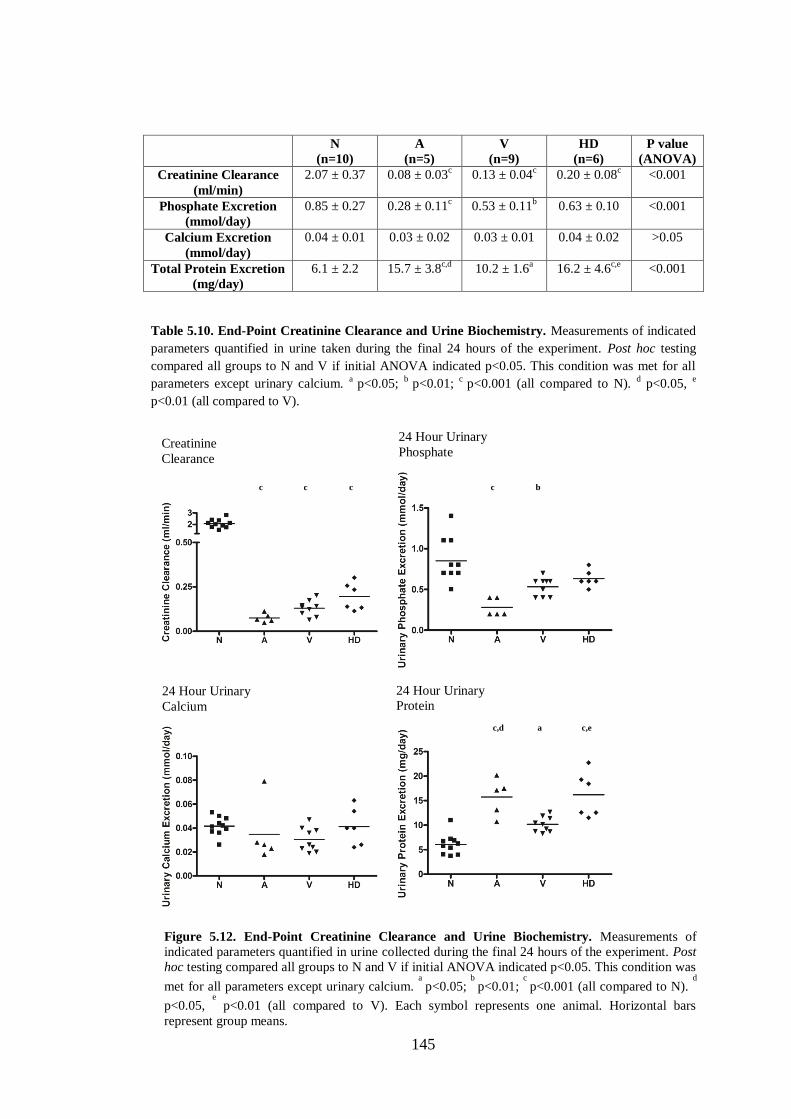
145
N
(n=10)
A
(n=5)
V
(n=9)
HD
(n=6)
P value
(ANOVA)
Creatinine Clearance
(ml/min)
2.07 ± 0.37 0.08 ± 0.03c
0.13 ± 0.04c 0.20 ± 0.08
c <0.001
Phosphate Excretion
(mmol/day)
0.85 ± 0.27 0.28 ± 0.11c 0.53 ± 0.11
b 0.63 ± 0.10 <0.001
Calcium Excretion
(mmol/day)
0.04 ± 0.01 0.03 ± 0.02 0.03 ± 0.01 0.04 ± 0.02 >0.05
Total Protein Excretion
(mg/day)
6.1 ± 2.2 15.7 ± 3.8c,d
10.2 ± 1.6a
16.2 ± 4.6c,e
<0.001
Table 5.10. End-Point Creatinine Clearance and Urine Biochemistry. Measurements of indicated
parameters quantified in urine taken during the final 24 hours of the experiment. Post hoc testing
compared all groups to N and V if initial ANOVA indicated p<0.05. This condition was met for all
parameters except urinary calcium. a
p<0.05; b
p<0.01; c
p<0.001 (all compared to N). d p<0.05,
e
p<0.01 (all compared to V).
Figure 5.12. End-Point Creatinine Clearance and Urine Biochemistry. Measurements of
indicated parameters quantified in urine collected during the final 24 hours of the experiment. Post
hoc testing compared all groups to N and V if initial ANOVA indicated p<0.05. This condition was
met for all parameters except urinary calcium. a
p<0.05; b
p<0.01; c
p<0.001 (all compared to N). d
p<0.05, e
p<0.01 (all compared to V). Each symbol represents one animal. Horizontal bars
represent group means.
Creatinine
Clearance
24 Hour Urinary
Phosphate
24 Hour Urinary
Calcium 24 Hour Urinary
Protein
c
c
c
c
b
c,d
c,e
a
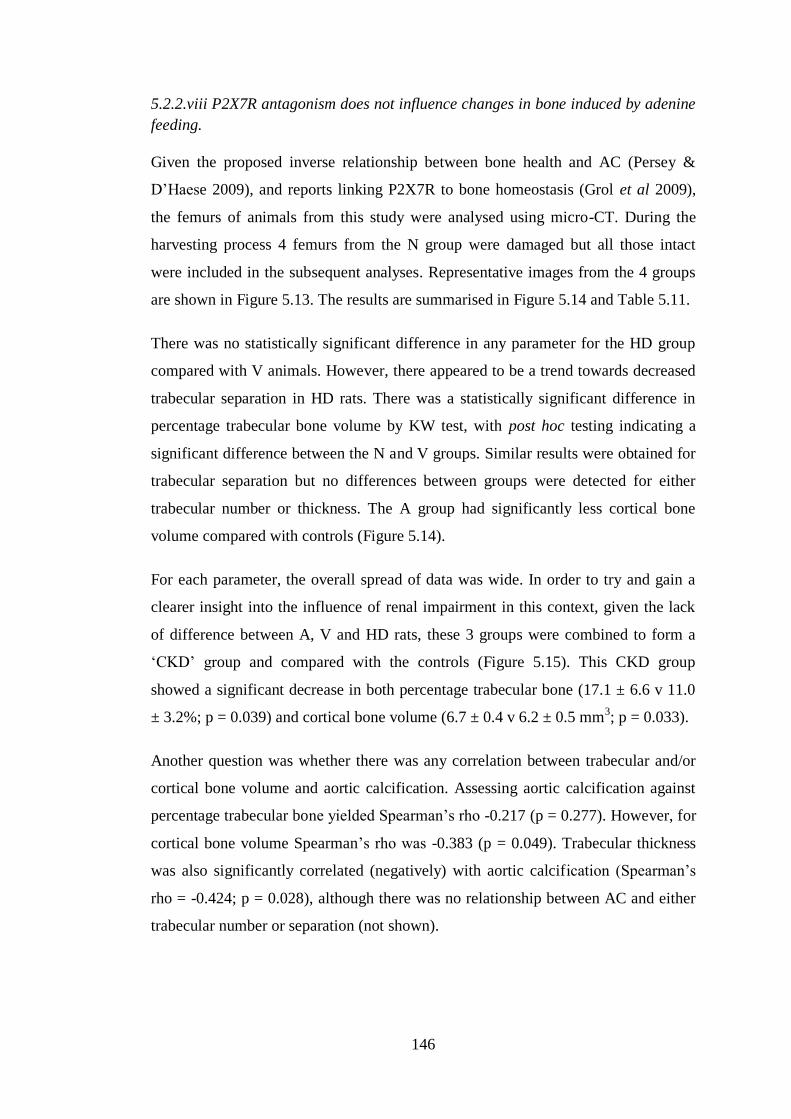
146
5.2.2.viii P2X7R antagonism does not influence changes in bone induced by adenine
feeding.
Given the proposed inverse relationship between bone health and AC (Persey &
D’Haese 2009), and reports linking P2X7R to bone homeostasis (Grol et al 2009),
the femurs of animals from this study were analysed using micro-CT. During the
harvesting process 4 femurs from the N group were damaged but all those intact
were included in the subsequent analyses. Representative images from the 4 groups
are shown in Figure 5.13. The results are summarised in Figure 5.14 and Table 5.11.
There was no statistically significant difference in any parameter for the HD group
compared with V animals. However, there appeared to be a trend towards decreased
trabecular separation in HD rats. There was a statistically significant difference in
percentage trabecular bone volume by KW test, with post hoc testing indicating a
significant difference between the N and V groups. Similar results were obtained for
trabecular separation but no differences between groups were detected for either
trabecular number or thickness. The A group had significantly less cortical bone
volume compared with controls (Figure 5.14).
For each parameter, the overall spread of data was wide. In order to try and gain a
clearer insight into the influence of renal impairment in this context, given the lack
of difference between A, V and HD rats, these 3 groups were combined to form a
‘CKD’ group and compared with the controls (Figure 5.15). This CKD group
showed a significant decrease in both percentage trabecular bone (17.1 ± 6.6 v 11.0
± 3.2%; p = 0.039) and cortical bone volume (6.7 ± 0.4 v 6.2 ± 0.5 mm3; p = 0.033).
Another question was whether there was any correlation between trabecular and/or
cortical bone volume and aortic calcification. Assessing aortic calcification against
percentage trabecular bone yielded Spearman’s rho -0.217 (p = 0.277). However, for
cortical bone volume Spearman’s rho was -0.383 (p = 0.049). Trabecular thickness
was also significantly correlated (negatively) with aortic calcification (Spearman’s
rho = -0.424; p = 0.028), although there was no relationship between AC and either
trabecular number or separation (not shown).
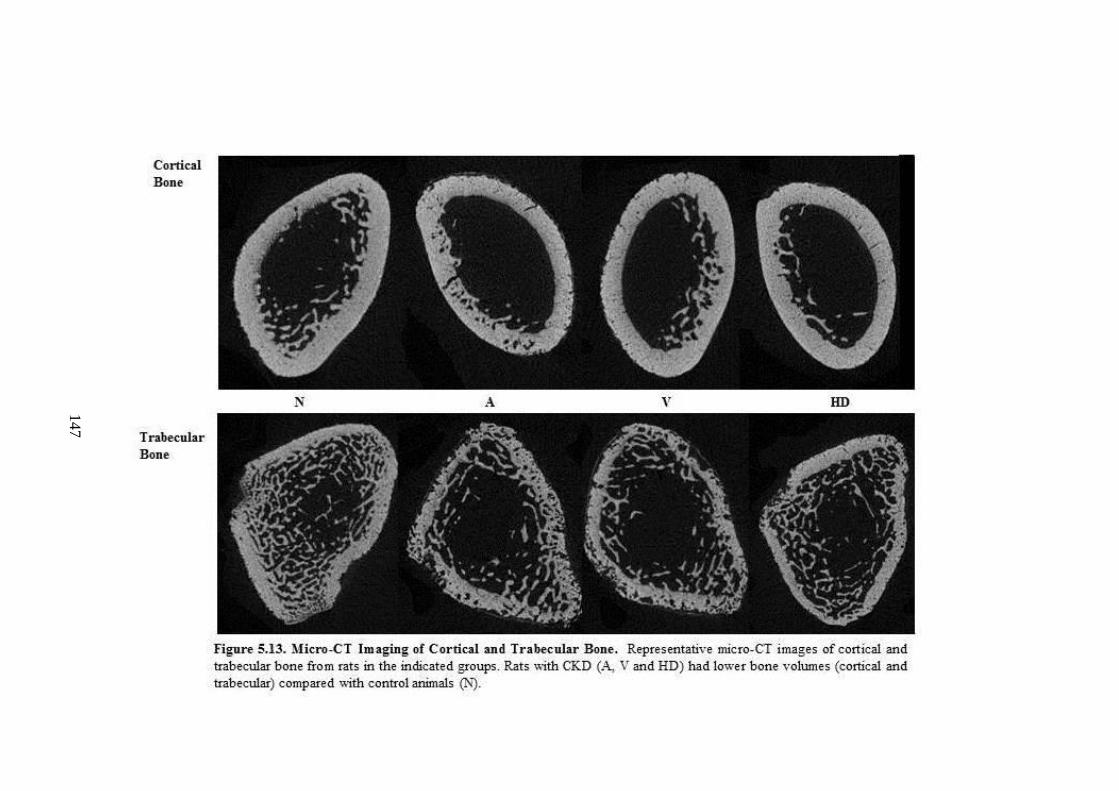
147
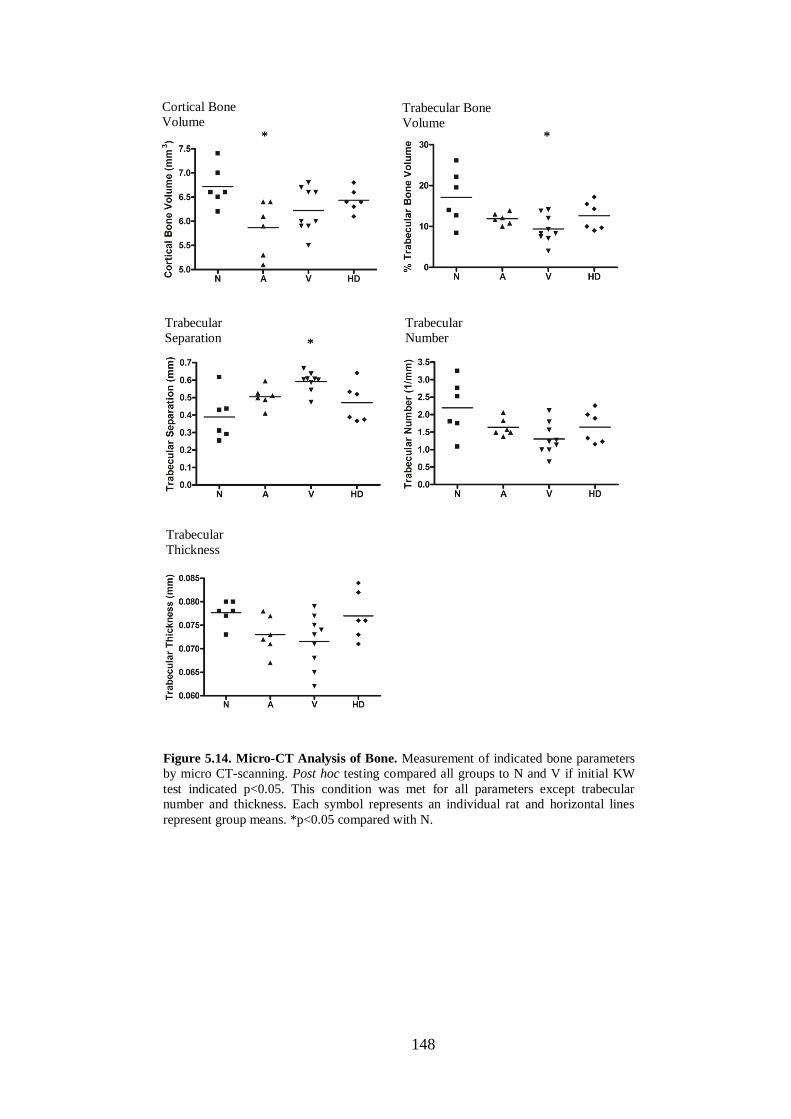
148
Cortical Bone
Volume Trabecular Bone
Volume
Trabecular
Separation Trabecular Number
Trabecular Thickness
Figure 5.14. Micro-CT Analysis of Bone. Measurement of indicated bone parameters
by micro CT-scanning. Post hoc testing compared all groups to N and V if initial KW
test indicated p<0.05. This condition was met for all parameters except trabecular
number and thickness. Each symbol represents an individual rat and horizontal lines
represent group means. *p<0.05 compared with N.
* *
*
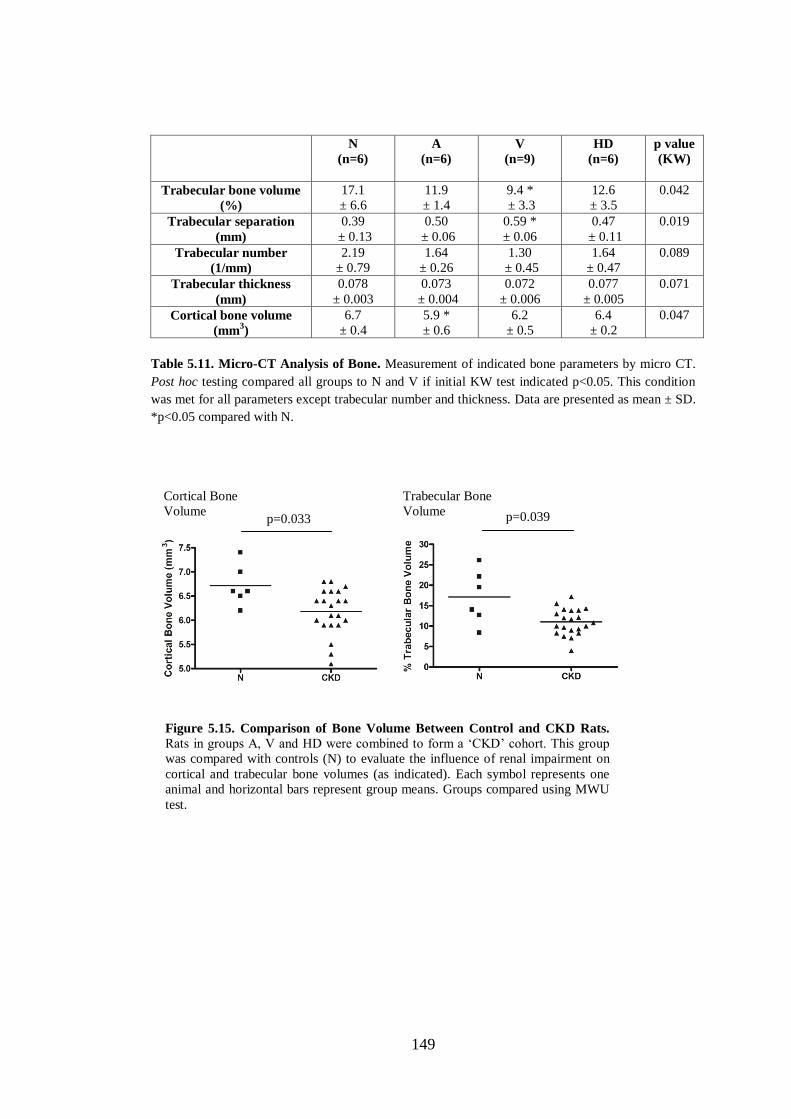
149
N
(n=6)
A
(n=6)
V
(n=9)
HD
(n=6)
p value
(KW)
Trabecular bone volume
(%)
17.1
± 6.6
11.9
± 1.4
9.4 *
± 3.3
12.6
± 3.5
0.042
Trabecular separation
(mm)
0.39
± 0.13
0.50
± 0.06
0.59 *
± 0.06
0.47
± 0.11
0.019
Trabecular number
(1/mm)
2.19
± 0.79
1.64
± 0.26
1.30
± 0.45
1.64
± 0.47
0.089
Trabecular thickness
(mm)
0.078
± 0.003
0.073
± 0.004
0.072
± 0.006
0.077
± 0.005
0.071
Cortical bone volume
(mm3)
6.7
± 0.4
5.9 *
± 0.6
6.2
± 0.5
6.4
± 0.2
0.047
Table 5.11. Micro-CT Analysis of Bone. Measurement of indicated bone parameters by micro CT.
Post hoc testing compared all groups to N and V if initial KW test indicated p<0.05. This condition
was met for all parameters except trabecular number and thickness. Data are presented as mean ± SD.
*p<0.05 compared with N.
Cortical Bone Volume
Trabecular Bone Volume
p=0.033 p=0.039
Figure 5.15. Comparison of Bone Volume Between Control and CKD Rats.
Rats in groups A, V and HD were combined to form a ‘CKD’ cohort. This group
was compared with controls (N) to evaluate the influence of renal impairment on
cortical and trabecular bone volumes (as indicated). Each symbol represents one
animal and horizontal bars represent group means. Groups compared using MWU
test.

150
5.3 Discussion
Pharmacological blockade of P2X7R had no effect on the degree of AC seen in this
experiment. The high dose of 60mg/kg antagonist employed here was selected based
on unpublished data (held by AstraZeneca) showing it to be effective in rat models
including the streptococcal cell wall model of rheumatoid arthritis in which it
significantly reduced ankle swelling. Pharmacokinetic studies (AstraZeneca,
unpublished observations) had demonstrated that this dose, administered twice daily,
maintains serum levels above 10 x pA2 (reported to be 225 ng/ml). The pA2 value is
the concentration of antagonist required to necessitate a doubling of the agonist
concentration to elicit the original response (Schild 1947) and ten times this value
are frequently targeted in pre-clinical studies. Serum levels measured in HD rats
demonstrated that adequate trough concentrations were obtained during this study
and although on average animals received approximately 90% of the originally
intended doses it can be reasoned that sufficient receptor antagonism was achieved
for the majority of the experimental period and that sub-therapeutic dosing is
therefore unlikely to account for the lack of effect on AC. However, tissue levels of
antagonist were not quantified and therefore inadequate cellular uptake of drug
cannot be excluded although there is no obvious reason to suggest that this should
have occurred.
The qPCR experiments described in this chapter were primarily performed because
although overall calcification was not affected by P2X7R blockade, it was possible
that cellular pathways thought to be involved in AC, such as VSMC osteogenic
transformation and/or apoptosis (Shanahan et al 2011, Shanahan 2013, Shroff et al
2013), were still being influenced. The qPCR experiments described in Chapter 3
suggested that in the ring culture model of AC these mechanisms may not even
occur, thereby going some way to explain the lack of effect of P2X7R ligation on
arterial calcium deposition in vitro. It was therefore also clearly relevant to assess
whether they could be demonstrated at all in vivo and specifically under uraemic
conditions.
Expression of mRNA for all 3 VSMC-specific markers studied, α-SMA, SM-22 and
smoothelin, significantly decreased in calcified tissue, suggesting that in
calcification-promoting conditions in vivo, VSMCs do undergo a change of

151
phenotype. These changes were not, however, influenced by P2X7R blockade. Most
reports in the literature assign this change in phenotype to cells taking on
characteristics of ‘bone-like’ cells and show a concurrent up-regulation in osteogenic
markers (Shroff et al 2010). In the current work, mRNA for the osteogenic
transcription factor osterix (Nakashima et al 2002) was essentially absent in all
samples. Furthermore, expression of mRNA for BMP-2, a key regulator of osterix
(Celil et al 2005, Hruska et al 2005) was unchanged in calcified vessels compared to
controls. Although the osteogenic transcription factor runx-2 (Komori et al 1997,
Ducy et al 1997) was up-regulated in calcified vessels, the mRNA copy numbers
were extremely low, even in the arteries containing mineral deposition. Its functional
significance is therefore doubtful. These findings, like those in Chapter 3, challenge
the relevance of osteogenic transformation in the development of CKD-associated
AC and are in agreement with some previous work.
Of particular note is a recent study which employed a well-controlled
immunohistochemistry protocol to stain normal and calcified arteries of varying
sizes from humans with and without CKD (O’Neill & Adams 2014). Staining for
both osterix and osteocalcin (bone gla protein) was absent. A number of reports
using the rat adenine model have also failed to detect any significant increase in
mRNA for osteogenic markers in calcified tissue (O’Neill et al 2008, Lomashvili et
al 2011). One group have suggested that VSMCs undergo chondrocytic rather than
osteogenic transformation in the adenine model (Neven et al 2010) associated with
an up-regulation of sox9. There is minimal evidence linking P2X7R with cartilage
formation and hence this possibility was not examined in this thesis.
In contrast to the in vitro findings in Chapter 3, an increase in mRNA expression of
the apoptosis marker, caspase-3, was seen in calcified vessels compared with
controls. This suggests that a factor present in the uraemic environment is required to
induce VSMC apoptosis in this model. In keeping with this theory, increased
apoptosis has been demonstrated in arterial tissue from dialysis patients as compared
with healthy controls (Shroff et al 2008). It is unclear from the current work whether
apoptosis is a causative phenomenon, occurring prior to the onset of calcification as
suggested by some groups (Shroff et al 2010), or a late, consequence of tissue
damage as suggested by others (O’Neill & Adams 2014). It is also possible that the

152
increased apoptosis is unrelated to calcification and is the effect of another toxin. In
this regard, and as discussed below, it is unknown whether adenine exerts any direct
effects on vascular cells. P2X7R inhibition did not influence the expression of
caspase-3 mRNA suggesting that the receptor does not mediate apoptosis in this
context.
The ability of P2X7R to activate the NLRP3 inflammasome is well described (Di
Virgilio 2007) and one recent report suggested that NLRP3 is involved in AC (Wen
et al 2013). In keeping with this study, calcified aorta had significantly greater levels
of inflammasome mRNA in the present work, however this was not altered by
P2X7R blockade. One possible explanation for these apparently paradoxical findings
is that inflammasome activation in calcified arteries might be P2X7R-independent,
as has been described in adipose tissue (Sun et al 2012).
The expression of P2X7R at both the mRNA and protein level was unchanged in
calcified vessels compared with controls. This is consistent with the results from
Chapter 3 and the data taken together indicate that expression of P2X7R in rat aorta
is not affected by the presence of calcium deposition either alone or in the presence
of a uraemic environment. At present it is unclear what functional role the receptor
plays in arterial tissue.
As emphasised in the KDIGO guidelines for CKD-MBD (Kidney Disease:
Improving Global Outcomes (KDIGO) CKD–MBD Work Group 2009) (see Chapter
1, section 1.5.2), a spectrum of bone disturbances can occur in CKD. These include
abnormalities in turnover, mineralisation and volume. Compared with traditional 2-
dimensional (2D) histomorphometric-based procedures and with relevance to CKD-
MBD, because micro-CT gives a 3D view, it is superior for measuring bone volume
(Bouxsein et al 2010). Indeed, micro-CT is now considered the ‘gold-standard’
method of assessing small rodent bone morphology and microstructure under
experimental conditions and the results generated by this technique have been shown
to correlate very well with those obtained from histomorphometry (Bouxsein et al
2010).
As outlined in Chapter 1 (section 1.9.4.i), the exact role of P2X7R in bone biology is
a point of controversy with 2 strains of P2X7-/-
mice reported to show opposing
153
changes in bone volume compared with WT controls (Ke et al 2002, Gartland et al
2003a) and different groups using cultured bone cells reporting either positive
(Panupinthu et al 2008) or negative effects (Orriss et al 2012) of the receptor on
bone formation. This study is the first to examine the effect of pharmacological
P2X7R blockade on CKD-related bone disease and overall, receptor antagonism
failed to exert a significant impact on any parameter measured by micro-CT.
Assuming that adequate uptake of antagonist into bone was achieved, the implication
is that any effect of P2X7R blockade on bone remodelling was outweighed by the
influences of other factors, which probably include increased PTH (which was
shown to occur in the present study), and suppressed vitamin D, which is also known
to occur in this model (Neven et al 2010).
Investigators that have used histomorphometry to assess bone from adenine-fed rats
have consistently demonstrated features consistent with a high-turnover state such as
increased osteoid and osteoblast parameters (Henley et al 2009, De Schutter et al
2011, O’Neill et al 2011). Micro-CT cannot be used to directly assess bone turnover,
as histological assessment of cell-types is required. However, previous studies have
demonstrated that on micro-CT imaging, high-turnover disease associates with loss
of trabecular bone volume and increased trabecular separation (De Schutter et al
2011, Hopper et al 2007). These findings are consistent with those presented here. A
decrease in cortical bone volume was also seen in adenine-fed animals in the present
study which is consistent with a previous report (De Schutter et al 2011).
No correlation was found between final trabecular bone volume and AC in this work,
although a negative correlation was found with final cortical bone volume and
trabecular thickness. One previous study (De Schutter et al 2011), correlated changes
in cortical bone volume, as measured on micro-CT, with the magnitude of aortic
calcification. For practical reasons scanning could only be performed post-mortem in
this study. Change in bone volume is likely to better represent uraemia-induced bone
disease compared with just a final reading, however, the findings in the present work
are in keeping with this study by De Schutter et al (2011) and suggest that cortical
bone volume is related to AC.
Serum biochemistry cannot definitively predict the degree of bone turnover (Kidney
Disease: Improving Global Outcomes (KDIGO) CKD–MBD Work Group 2009),

154
however, elevated PTH, ALP and phosphate are usually observed in high-turnover
disease whilst PTH and ALP are often normal or decreased in low-turnover states.
The serum biochemistry from the adenine-fed rats in the current work is mainly
consistent with high bone turnover with the exception of ALP, which was,
surprisingly, suppressed compared with controls. Most studies that have employed
the rat adenine model have not specifically measured serum ALP. A recent study
(Sun et al 2013) found no difference in ALP in adenine-fed rats compared with
controls and an older report (Okada et al 1999) compared results after 2 and 6 weeks
of adenine feeding, (there was no control group) and again found no difference. Of
note an increase in ALP with this model has not been reported. Serum albumin levels
were found to decline in adenine-fed animals in this work and this is often reported
(Yokozawa et al 1986, Price et al 2006). It is therefore possible that synthetic liver
function is suppressed with this model and the ALP is a reflection of this, rather than
indicating bone disturbances. In keeping with this is the fact that ALT was also
decreased in the adenine groups in the current study.
In both the initial pilot experiment and the main study, the abdominal aortic segment
was the most consistently calcified region. Most other studies examining AC in vivo
have not specifically looked at each aortic segment individually however this
observation is in keeping with one previous report (Shobeiri et al 2013). It is also
consistent with the in vitro work described in Chapter 3 in which abdominal aortic
segments calcified to a greater extent than those from more proximal regions.
Differences in AC between vascular beds has rarely been studied in man, although
one report found a greater incidence of AC in the abdominal aorta compared to the
thoracic region in obese patients (Jensky et al 2011). Although not widely studied,
potential reasons to account for the regional differences include maladaptive
responses to haemodynamic changes in the abdominal aorta compared with the
thoracic region (Ameer et al 2014) and differences in embryological origin of cells
from each anatomical site which has been shown to influence the propensity to
calcify (Leroux-Berger et al 2011).
The magnitude of renal impairment, AC and other associated clinical features seen
with the adenine model is unquestionably related to dietary intake and therefore any
factor that suppresses the ability or willingness of an animal to eat will potentially

155
attenuate development and progression of disease. This issue is perhaps the greatest
limitation of this experiment. Although not statistically significant, for some
outcome measures, particularly biochemical markers of renal function, there were
arguably trends towards a more favourable outcome for the HD group compared
with the V controls. Despite these results, the overall subjective impression
throughout the experiment was that HD rats, whilst not sick, were not faring as well.
These apparent paradoxical observations are probably best explained by considering
the negative correlation between the number of missed gavages and aortic
calcification. Rats did not receive a dose of antagonist on a particular occasion if
either the gavage cannula could not be passed due to resistance at the level of the
oesophagus, or there were other concerns over an animal’s condition. Thus the
number of missed doses is in effect a surrogate marker of poorer animal health and
likely to reflect a suppressed dietary intake of adenine. The implication of this is that
the likelihood of any one animal developing AC is intimately linked to how well it
tolerates the oral gavage procedure, with those less tolerant more likely to sustain
oesophageal trauma during dosing with the knock-on effect of decreasing oral intake,
thereby confounding any real pharmacological effect of the substance being
administered. Rats in the HD group (and in fact the LD group too) subjectively
seemed to tolerate the gavage procedure less well than V controls and a subtle
influence conferred by the smell or taste of the antagonist cannot be excluded as a
contributing factor to this. The fact that these two groups were less tolerant of the
procedure probably also explains, to a large extent, why they both suffered from a
higher mortality rate compared with the V group as the procedure itself was made
more difficult in these situations.
The adenine rat model is commonly used for investigating AC in vivo. The rates of
calcification reported with this model vary widely and can be enhanced by reducing
the protein content of the diet to 2.5% (Price et al 2006). The protein content of all
diets administered in this chapter was set to this level and of those rats fed 0.75%
adenine, aortic calcification occurred in all but 2. It was notable that calcification
occurred in all rats fed the diet containing 0.75% adenine and normal phosphate
(Diet G, Table 2.1). The original rationale for including this group was to try and
obtain a control cohort that had uraemia without AC. The adenine diet is almost
always used in combination with high (usually 0.9%) phosphate (Shobeiri et al 2010,

156
Neven et al 2011), however one previous study (Lomashvili et al 2008) had
employed a 0.75% adenine diet combined with normal (0.4%) phosphate to
successfully induce renal impairment alone. This report was the basis for employing
Diet G (Table 2.1) in the current work. In retrospect, the disparity in calcification
described in the study by Lomashvili et al (2008) and this chapter is almost certainly
down to the protein content of the respective diets. This was not specifically stated in
the work by Lomashvili et al and it is likely that normal dietary protein was given
rather than the 2.5% utilised here.
The fact that calcification occurred in all rats in the A group meant it was not
possible to determine whether any particular biological effect observed in adenine-
fed rats, (when compared with controls), was specifically due to calcification, or
secondary to uraemia per se. There are also other factors, unrelated to the degree of
CKD, which could have contributed to the differences observed between control rats
and those fed adenine. It is unknown whether the AC seen in adenine-fed animals is
only attributable to the uraemic state invoked, or whether adenine itself is a direct
vascular toxin. A large proportion of adenine within the intestinal lumen has been
shown to be taken up into the circulation un-metabolised (Salati et al 1984) and the
free base has been shown to be directly toxic to some cell types including human
lymphoblasts (Snyder et al 1978). Work performed over 50 years ago, when the
effects of adenine-feeding to rodents were just beginning to be described, suggested
that the clinical manifestations are purely attributable to renal impairment (Philips et
al 1951), however, until proven otherwise a direct effect on the vasculature cannot
be excluded particularly considering the increased expression of the apoptosis
marker caspase-3 in calcified vessels seen here.
Adenine-fed animals also lost a considerable amount of weight compared with
controls (in which there was mild weight gain) and this is another potentially
confounding factor. The weight loss of approximately 30% seen in this study is in
keeping with most other reports using this model (Price et al 2006) and is likely due
to both the adenine diet being less palatable and also the increased catabolism known
to occur in advanced renal disease (Slee 2012). Some groups have tried to control for
the weight loss by adopting a paired-feeding strategy (Lomashvili et al 2009)
however a lot of wastage of dietary pellets was seen in this study, which makes

157
accurate monitoring of oral intake very difficult. In addition, because much of the
weight loss seen is almost certainly a consequence of uraemia, rather than
suppressed intake (although this unquestionably does occur), it can be argued that
limiting the availability of diet for non-CKD animals in effect adds another variable
into the experiment rather than acting as a control procedure.
Given the number of limitations with this experiment it is worthwhile considering
whether either an alternative experimental model and/or method of drug delivery
could have been employed. As discussed in Chapter 1, there are 2 other rat models of
CKD-associated AC described – the 5/6th
nephrectomy model (Chauntin & Ferris
1932) and the Cy/+ rat model (Kaspareit-Rittinghausen et al 1990). AC in the 5/6th
model is much less consistent than with adenine, often reported to be less than 50%
(Shobeiri et al 2010, Neven & D’Haese 2011). In addition, both of these alternative
models require a number of months for AC to develop which make them impractical
from the point of view of drug delivery by oral gavage. The potential options for
administration of the antagonist were extensively discussed prior to commencing the
experiment. More convenient methods such as integration of the compound into feed
or drinking water, or the use of an implantable drug delivery system were not viable
due to issues surrounding drug stability (AstraZeneca personal communications).
Twice daily ip administration has been used by some, including others in our group
(Booth et al unpublished observations), however not without adverse effects. In
addition, the strongest pharmacokinetic data was obtained using oral dosing
(AstraZeneca personal communications). It was therefore felt that overall, this model
and method of dosing were the best available options.
5.4 Summary
Pharmacological P2X7R blockade failed to influence the extent of CKD-associated
AC in the rat adenine model and did not appear to modulate any of the biological
pathways to which it might be linked that are thought to mediate this disease. The
work in this chapter further challenges the relevance of osteogenic transformation to
the aetiology of AC but suggests that apoptosis may occur, although the timing of
this is unclear. This work has also demonstrated that both trabecular and cortical
bone loss occur in this in vivo model although again, this was not influenced by
ligation of P2X7R.
158
CHAPTER 6 – ATP METABOLIC PATHWAYS IN ARTERIES FROM
RODENTS AND HUMANS WITH CHRONIC KIDNEY DISEASE
6.1 Introduction
The results of the work described in Chapters 3-5 did not provide any significant
indication that P2X7R is implicated in the pathogenesis of CKD-associated AC.
Therefore for the latter part of this thesis the focus switched from investigating
P2X7R in isolation to considering more broadly the potential involvement of ATP in
the calcification process.
As discussed in detail in Chapter 1 (section 1.10), there is increasing interest in the
importance of ATP metabolism in the evolution of AC. In particular, the role of ATP
as a substrate for the enzyme ENPP-1, which catalyses the conversion of ATP to
AMP and (more relevantly) the calcification inhibitor, PPi, (Figure 1.2, re-printed as
an aide memoire on the following page), has received attention (Persy & McKee
2011, O’Neill et al 2011, Villa-Bellosta & Sorribas 2013, Lomashvili et al 2014).
PPi can directly inhibit hydroxyapatite formation (Fleisch et al 1965), however
conversely, it can be metabolised by TNAP to generate phosphate, thereby
promoting calcification (Murshed et al 2005). Genetic deficiency of ENPP-1 causes
extensive AC in both mice (Sakamoto et al 1994) and humans (Rutsch et al 2003)
leading to premature death. Increased arterial TNAP expression and activity have
been demonstrated in uraemic rats (Lomashvili et al 2008) and in patients with CKD
(Shroff et al 2008), possibly contributing to AC, however it is unknown whether
there are also changes in ENPP-1 in this clinical setting. Other components of the
ATP-metabolising system present in the vasculature might also play a role in the
calcification process but have not been studied in the context of renal impairment.
These include the enzymes CD39 and CD73 and the putative PPi transporter, ANK
(Figure 1.2).
The primary objective of the work described in this chapter was to determine, with
an emphasis on ENPP-1, whether the expression of enzymes involved in ATP
metabolism is altered in calcified arteries from subjects with CKD. The rodent tissue
collected during the work performed in previous chapters provided the necessary
resources to address this question in an in vivo model. In addition, segments of
inferior epigastric artery from patients undergoing renal transplantation were
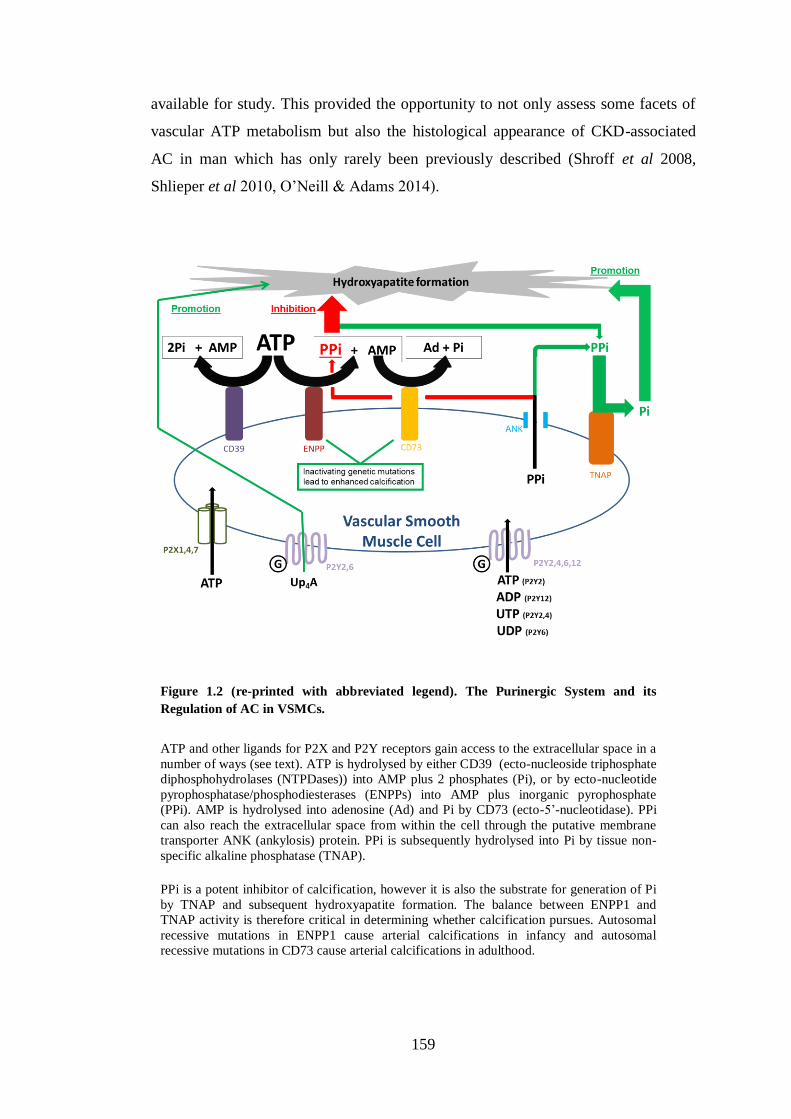
159
available for study. This provided the opportunity to not only assess some facets of
vascular ATP metabolism but also the histological appearance of CKD-associated
AC in man which has only rarely been previously described (Shroff et al 2008,
Shlieper et al 2010, O’Neill & Adams 2014).
Figure 1.2 (re-printed with abbreviated legend). The Purinergic System and its
Regulation of AC in VSMCs.
ATP and other ligands for P2X and P2Y receptors gain access to the extracellular space in a
number of ways (see text). ATP is hydrolysed by either CD39 (ecto-nucleoside triphosphate
diphosphohydrolases (NTPDases)) into AMP plus 2 phosphates (Pi), or by ecto-nucleotide
pyrophosphatase/phosphodiesterases (ENPPs) into AMP plus inorganic pyrophosphate
(PPi). AMP is hydrolysed into adenosine (Ad) and Pi by CD73 (ecto-5’-nucleotidase). PPi
can also reach the extracellular space from within the cell through the putative membrane
transporter ANK (ankylosis) protein. PPi is subsequently hydrolysed into Pi by tissue non-
specific alkaline phosphatase (TNAP).
PPi is a potent inhibitor of calcification, however it is also the substrate for generation of Pi
by TNAP and subsequent hydroxyapatite formation. The balance between ENPP1 and
TNAP activity is therefore critical in determining whether calcification pursues. Autosomal
recessive mutations in ENPP1 cause arterial calcifications in infancy and autosomal
recessive mutations in CD73 cause arterial calcifications in adulthood.
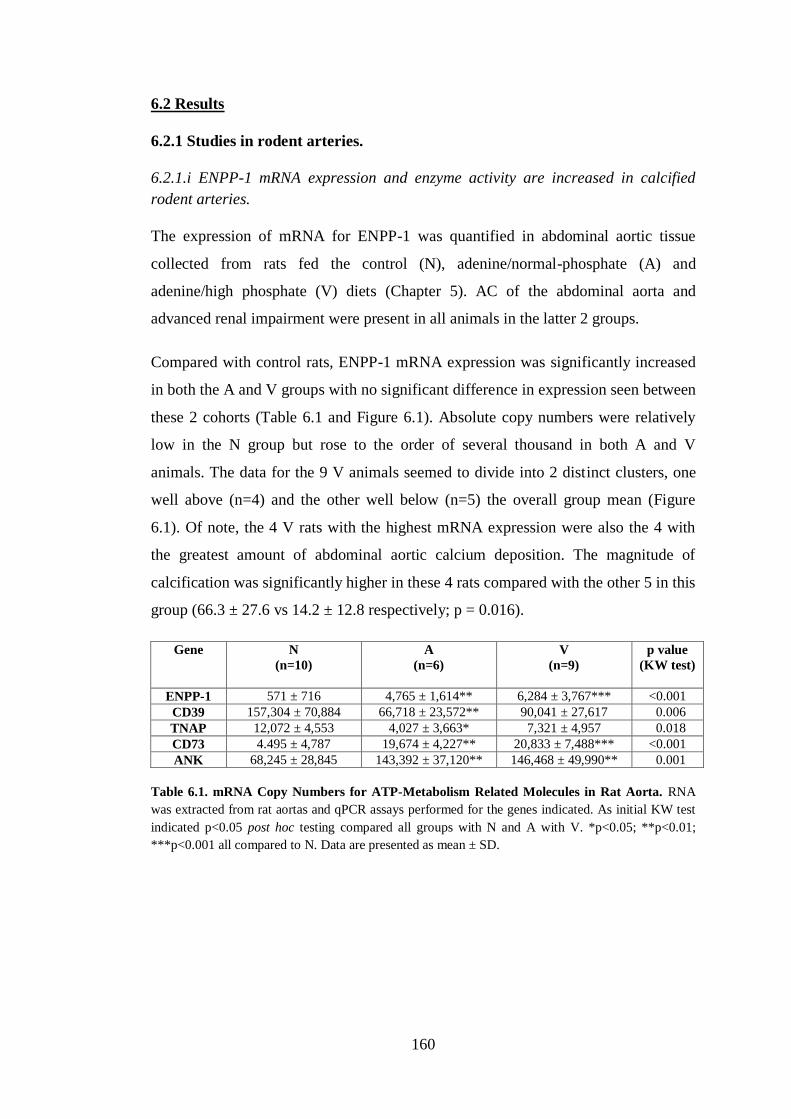
160
6.2 Results
6.2.1 Studies in rodent arteries.
6.2.1.i ENPP-1 mRNA expression and enzyme activity are increased in calcified
rodent arteries.
The expression of mRNA for ENPP-1 was quantified in abdominal aortic tissue
collected from rats fed the control (N), adenine/normal-phosphate (A) and
adenine/high phosphate (V) diets (Chapter 5). AC of the abdominal aorta and
advanced renal impairment were present in all animals in the latter 2 groups.
Compared with control rats, ENPP-1 mRNA expression was significantly increased
in both the A and V groups with no significant difference in expression seen between
these 2 cohorts (Table 6.1 and Figure 6.1). Absolute copy numbers were relatively
low in the N group but rose to the order of several thousand in both A and V
animals. The data for the 9 V animals seemed to divide into 2 distinct clusters, one
well above (n=4) and the other well below (n=5) the overall group mean (Figure
6.1). Of note, the 4 V rats with the highest mRNA expression were also the 4 with
the greatest amount of abdominal aortic calcium deposition. The magnitude of
calcification was significantly higher in these 4 rats compared with the other 5 in this
group (66.3 ± 27.6 vs 14.2 ± 12.8 respectively; p = 0.016).
Gene
N
(n=10)
A
(n=6)
V
(n=9)
p value
(KW test)
ENPP-1 571 ± 716 4,765 ± 1,614** 6,284 ± 3,767*** <0.001
CD39 157,304 ± 70,884 66,718 ± 23,572** 90,041 ± 27,617 0.006
TNAP 12,072 ± 4,553 4,027 ± 3,663* 7,321 ± 4,957 0.018
CD73 4.495 ± 4,787 19,674 ± 4,227** 20,833 ± 7,488*** <0.001
ANK 68,245 ± 28,845 143,392 ± 37,120** 146,468 ± 49,990** 0.001
Table 6.1. mRNA Copy Numbers for ATP-Metabolism Related Molecules in Rat Aorta. RNA
was extracted from rat aortas and qPCR assays performed for the genes indicated. As initial KW test
indicated p<0.05 post hoc testing compared all groups with N and A with V. *p<0.05; **p<0.01;
***p<0.001 all compared to N. Data are presented as mean ± SD.

161
To assess whether ENPP-1 was also increased at the protein level in arteries from A
and V rats several efforts were made to perform Western blots of aortic protein
lysates. Unfortunately despite trialling several commercially-available primary
antibodies these attempts proved unsuccessful with no bands of appropriate
molecular weights ever being detected.
Although ENPP-1 protein expression could not be evaluated, it was possible to
quantify actual enzyme activity by measuring the metabolism of the synthetic
substrate pNP-TMP (Nam et al 2011, Lomashvili et al 2011). Using this method,
ENPP-1 activity was assessed in segments of aortic arch obtained from 7, 6 and 7
rats in the N, A and V groups, respectively. In keeping with the mRNA results, a
significant increase in activity was detected in arteries from A and V rats compared
with controls, with both groups exhibiting an approximate doubling in enzyme
function (Figure 6.2A). Three aortic arch segments from the V group had no
detectable calcification when analysed colourimetrically. Therefore in order to
ascertain the effect of uraemia alone, the enzyme activity in these 3 samples was
compared with the N group. A significant increase was detected in these non-
calcified, uraemic vessels which had a mean change in optical density (enzyme
activity) of 0.74 ± 0.16 arbitrary units/mg tissue compared with 0.47 ± 0.10 in
controls (p = 0.012) (Figure 6.2B).
Figure 6.1. ENPP-1 mRNA Expression in Rat Aorta. RNA was extracted from
rat aortas (abdominal aorta) and a qPCR assay performed for ENPP-1. Post hoc
testing compared all groups with N and compared A with V. **p<0.01;
***p<0.001 all compared to N. Each symbol represents one animal. Horizontal
bars represent group means.
** ***
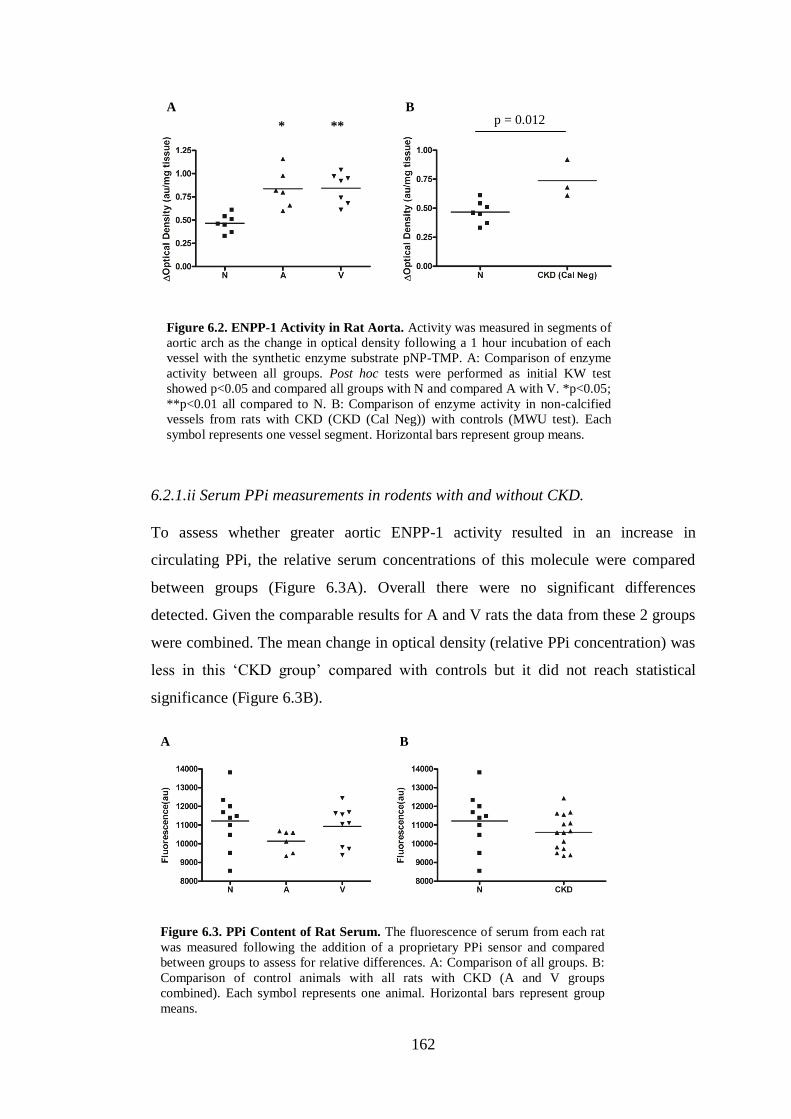
162
6.2.1.ii Serum PPi measurements in rodents with and without CKD.
To assess whether greater aortic ENPP-1 activity resulted in an increase in
circulating PPi, the relative serum concentrations of this molecule were compared
between groups (Figure 6.3A). Overall there were no significant differences
detected. Given the comparable results for A and V rats the data from these 2 groups
were combined. The mean change in optical density (relative PPi concentration) was
less in this ‘CKD group’ compared with controls but it did not reach statistical
significance (Figure 6.3B).
A B
* ** p = 0.012
Figure 6.2. ENPP-1 Activity in Rat Aorta. Activity was measured in segments of
aortic arch as the change in optical density following a 1 hour incubation of each
vessel with the synthetic enzyme substrate pNP-TMP. A: Comparison of enzyme
activity between all groups. Post hoc tests were performed as initial KW test
showed p<0.05 and compared all groups with N and compared A with V. *p<0.05;
**p<0.01 all compared to N. B: Comparison of enzyme activity in non-calcified
vessels from rats with CKD (CKD (Cal Neg)) with controls (MWU test). Each
symbol represents one vessel segment. Horizontal bars represent group means.
A B
Figure 6.3. PPi Content of Rat Serum. The fluorescence of serum from each rat
was measured following the addition of a proprietary PPi sensor and compared
between groups to assess for relative differences. A: Comparison of all groups. B:
Comparison of control animals with all rats with CKD (A and V groups
combined). Each symbol represents one animal. Horizontal bars represent group
means.

163
6.2.1.iii Analysis of mRNA expression for other ATP metabolism-related molecules.
Following the findings for ENPP-1 expression and activity, other components of the
ATP-metabolising system were assessed in rodent vessels. Quantification of mRNA
expression for the enzymes CD39, TNAP and CD73, along with the ANK protein,
was performed (Table 6.1 and Figure 6.4).
In the case of CD39, mRNA expression was reduced in calcified arteries compared
with controls. This only reached statistical significance for the A group following
post hoc testing although there was also a marked decrease in the V group. It was
notable that the magnitude of CD39 mRNA expression was in the order of several
tens of thousands.
A decrease in mRNA expression for TNAP was also seen in calcified vessels,
although once again only reaching statistical significance in the A group after post
hoc analysis. The level of TNAP mRNA expression was much lower than CD39
being present in the order of only a few thousand copies.
In contrast to the findings for these 2 enzymes, a statistically significant increase in
mRNA expression for both CD73 and ANK were seen in both the A and V groups
compared with controls. Orders of magnitude of expression were several thousands
and tens of thousands respectively.

164
Figure 6.4. Expression of ATP-Metabolism Related Molecules in Rat Aorta. RNA
was extracted from rat aortas and qPCR assays performed for the genes indicated. Post
hoc testing compared all groups with N and A with V as initial KW test indicated
p<0.05. *p<0.05; **p<0.01; ***p<0.001 all compared to N. Each symbol represents
one animal. Horizontal bars represent group means.
CD39
CD73
TNAP
ANK
** *
** *** ** **
165
6.2.1.iv Analysis of ATP metabolism-related molecules over time using an ex vivo
model of AC.
To try and begin to understand the factors governing these altered expression
profiles, the ex vivo ring culture model (described in Chapter 3) was used to
investigate the changes over time in vessels exposed to an elevated phosphate
concentration. Analysis was conducted using the samples obtained from the time-
course experiment detailed in Chapter 3, section 3.2.5 – ‘Expression of mRNA for
P2X7R, markers of VSMC phenotype and caspase-3’, in which cultured rings,
obtained from 3 rats, were distributed evenly between control and high phosphate
groups for each time-point (baseline and 3, 7 and 10 days). The results are
summarised in Table 6.2 and Figure 6.5.
For ENPP-1 there was a general trend towards an increase in mRNA expression in
the control samples compared with baseline with increasing time in culture - this was
statistically significant at days 7 and 10. At each time-point there was no significant
difference between ENPP-1 expression in control rings and those exposed to high
phosphate. In the case of CD39, mRNA expression was suppressed in control rings
compared with baseline and this was statistically significant at days 3 and 7. Again
no differences were detected between control and corresponding high phosphate
samples at any time-point. TNAP mRNA expression was markedly suppressed in all
control ring groups compared with baseline, reaching statistical significance at day 3
and day 10 (a clear trend was also evident at day 7). No differences were detected in
phosphate-treated rings compared with their time-point controls. Expression of
mRNA for CD73 was elevated in all control rings compared with baseline vessels
with statistically significant differences detected at all time-points. High phosphate
conditions again did not exert any significant impact. Results for ANK mRNA
expression were much more equivalent between groups and although the initial KW
test indicated significant differences overall, none were detected with post hoc tests
comparing control samples to baseline and groups matched for time-point (control vs
high phosphate).
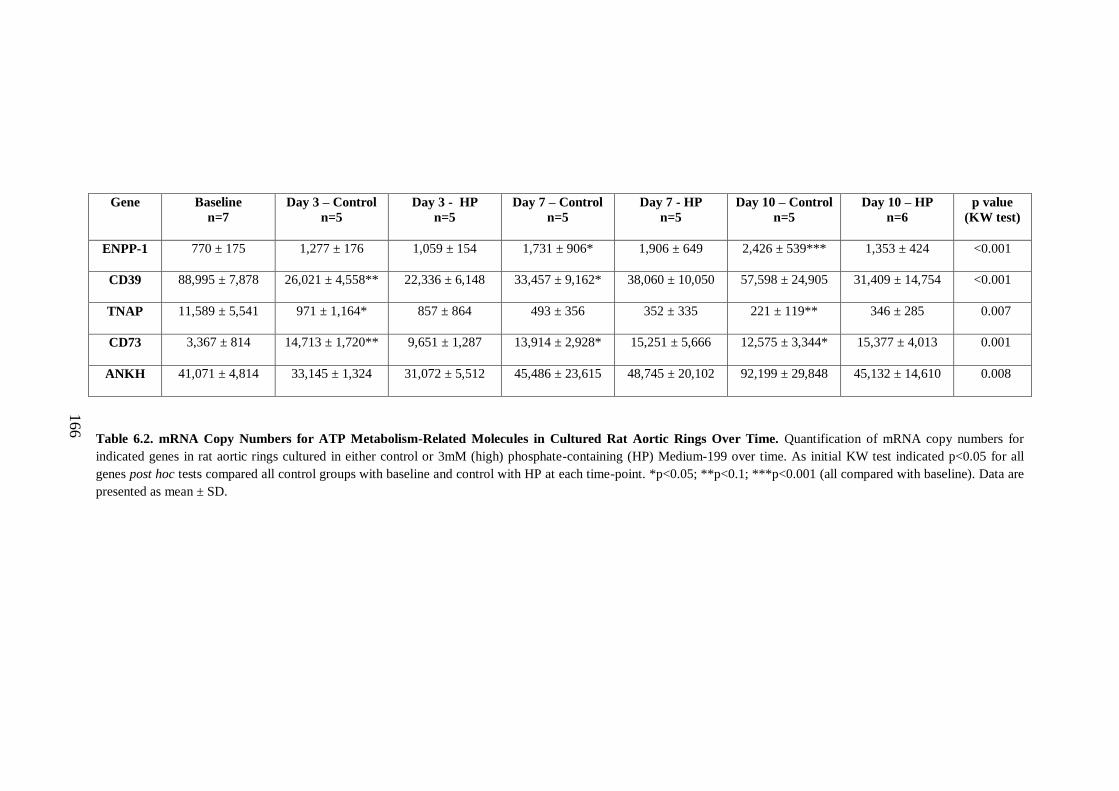
166
Gene
Baseline
n=7
Day 3 – Control
n=5
Day 3 - HP
n=5
Day 7 – Control
n=5
Day 7 - HP
n=5
Day 10 – Control
n=5
Day 10 – HP
n=6
p value
(KW test)
ENPP-1 770 ± 175
1,277 ± 176 1,059 ± 154 1,731 ± 906* 1,906 ± 649 2,426 ± 539*** 1,353 ± 424 <0.001
CD39 88,995 ± 7,878
26,021 ± 4,558** 22,336 ± 6,148 33,457 ± 9,162* 38,060 ± 10,050 57,598 ± 24,905 31,409 ± 14,754 <0.001
TNAP 11,589 ± 5,541
971 ± 1,164* 857 ± 864 493 ± 356 352 ± 335 221 ± 119** 346 ± 285 0.007
CD73 3,367 ± 814
14,713 ± 1,720** 9,651 ± 1,287 13,914 ± 2,928* 15,251 ± 5,666 12,575 ± 3,344* 15,377 ± 4,013 0.001
ANKH 41,071 ± 4,814
33,145 ± 1,324 31,072 ± 5,512 45,486 ± 23,615 48,745 ± 20,102 92,199 ± 29,848 45,132 ± 14,610 0.008
Table 6.2. mRNA Copy Numbers for ATP Metabolism-Related Molecules in Cultured Rat Aortic Rings Over Time. Quantification of mRNA copy numbers for
indicated genes in rat aortic rings cultured in either control or 3mM (high) phosphate-containing (HP) Medium-199 over time. As initial KW test indicated p<0.05 for all
genes post hoc tests compared all control groups with baseline and control with HP at each time-point. *p<0.05; **p<0.1; ***p<0.001 (all compared with baseline). Data are
presented as mean ± SD.

167
ENPP-1
Figure 6.5. mRNA Copy Numbers for ATP Metabolism-Related Molecules in
Cultured Rat Aortic Rings Over Time. Quantification of mRNA copy numbers for
indicated genes of interest in rat aortic rings cultured in either control or 3mM (high)
phosphate-containing (HP) Medium-199 over time. Initial KW test indicated p<0.05
for all genes. Post hoc tests compared all control groups with baseline and control
with HP at each time-point. *p<0.05; **p<0.1; ***p<0.001 all compared with
baseline. ‘D’ designates number of days in culture. Error bars represent mean ± SD.
Number of rings per group from left to right = 7,5,5,5,5,5,6.
* ***
CD39
** *
CD73 TNAP
ANK
* ** ** * *
D3 D7 D10
D3 D7 D10 D3 D7 D10
D3 D7 D10 D3 D7 D10

168
6.2.2 Studies in human arteries.
6.2.2.i Clinical characteristics.
A total of 15 inferior epigastric artery segments were available for study. Table 6.3
summarises the clinical characteristics for these 15 patients. The average patient age
was 47 ± 15 years (range 19-71) and the cohort contained 8 males. All except one
patient (patient 2) received a live-donor TP. No patients were diabetic and 3 had a
known history of ischaemic heart disease (IHD). In terms of renal replacement
therapy, 4 patients were transplanted pre-emptively (including one with a failing
graft which had originally been placed before the requirement for dialysis). One
further patient was transplanted with their first, failing graft in situ having originally
received peritoneal dialysis (PD) for a year. Four patients were on HmD and 6 were
receiving PD. At the time of transplantation 6 patients were taking phosphate
binders, 2 of which were calcium-based compounds. No patients were taking
warfarin.
6.2.2.ii Calcification in arteries from patients with ESRD.
Calcium deposition was detectable with von Kossa staining in 12 out of the 15
samples (80%). Calcification, when present, was most frequently seen as speckled
deposits, scattered throughout the medial layer of the vessel wall. Calcification
predominantly localised to the outer region of the media with relative sparing of the
medial tissue proximal to the arterial lumen. The specks of calcification were
associated with ECM fibres rather than with cells (Figure 6.6). In the 12 vessels with
positive von Kossa staining, calcification was detectable in at least 50% of the
section circumference in 4 samples, 5 arteries had 25-50% of the circumference
affected, with the other 3 exhibiting small clusters of speckled calcification in a few
discrete areas (Figure 6.6 and Table 6.3). Calcification of the IEL was mainly seen in
vessels exhibiting the greatest degree (>50% circumference effected) of medial
deposition (Figure 6.6). One sample (patient 8) was an exception to this with only
IEL staining detectable. Of note, the cause of ESRD in this patient was enteric
hyperoxaluria and nephrocalcinosis necessitating the use of calcium carbonate as
treatment.
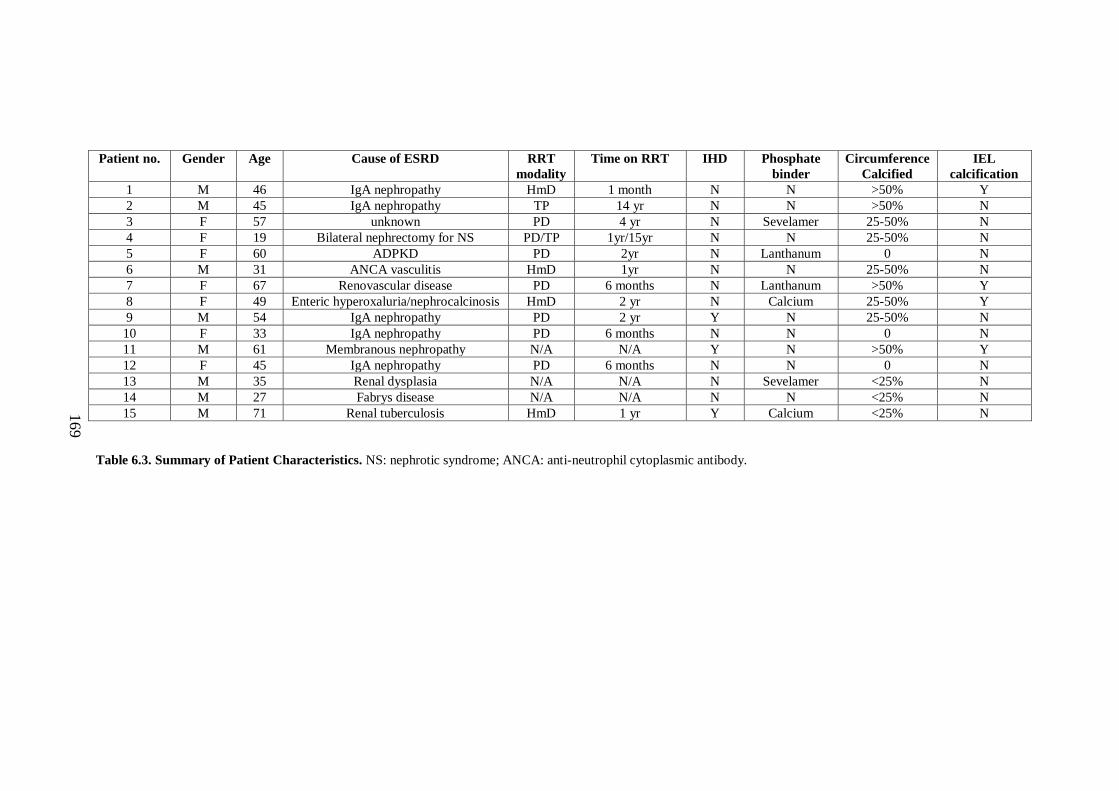
169
Patient no.
Gender Age Cause of ESRD RRT
modality
Time on RRT IHD Phosphate
binder
Circumference
Calcified
IEL
calcification
1 M 46 IgA nephropathy HmD 1 month N N >50% Y
2 M 45 IgA nephropathy TP 14 yr N N >50% N
3 F 57 unknown PD 4 yr N Sevelamer 25-50% N
4 F 19 Bilateral nephrectomy for NS PD/TP 1yr/15yr N N 25-50% N
5 F 60 ADPKD PD 2yr N Lanthanum 0 N
6 M 31 ANCA vasculitis HmD 1yr N N 25-50% N
7 F 67 Renovascular disease PD 6 months N Lanthanum >50% Y
8 F 49 Enteric hyperoxaluria/nephrocalcinosis HmD 2 yr N Calcium 25-50% Y
9 M 54 IgA nephropathy PD 2 yr Y N 25-50% N
10 F 33 IgA nephropathy PD 6 months N N 0 N
11 M 61 Membranous nephropathy N/A N/A Y N >50% Y
12 F 45 IgA nephropathy PD 6 months N N 0 N
13 M 35 Renal dysplasia N/A N/A N Sevelamer <25% N
14 M 27 Fabrys disease N/A N/A N N <25% N
15 M 71 Renal tuberculosis HmD 1 yr Y Calcium <25% N
Table 6.3. Summary of Patient Characteristics. NS: nephrotic syndrome; ANCA: anti-neutrophil cytoplasmic antibody.
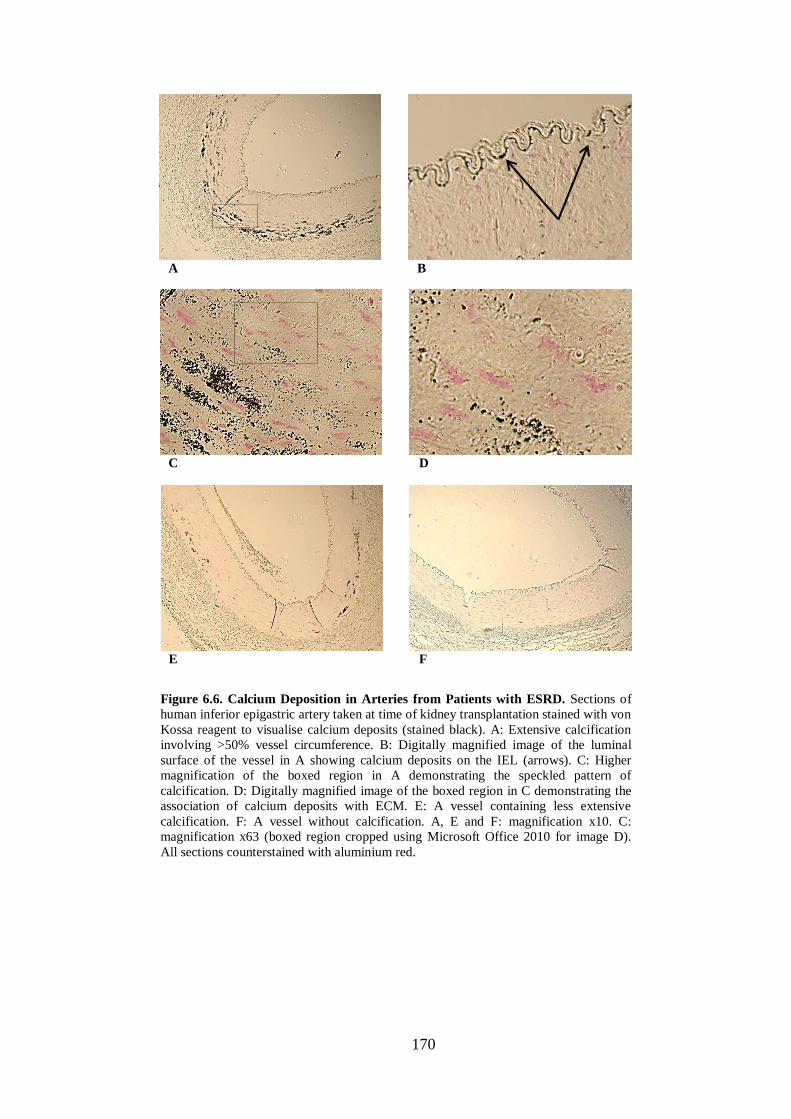
170
A B
E F
D C
Figure 6.6. Calcium Deposition in Arteries from Patients with ESRD. Sections of
human inferior epigastric artery taken at time of kidney transplantation stained with von
Kossa reagent to visualise calcium deposits (stained black). A: Extensive calcification
involving >50% vessel circumference. B: Digitally magnified image of the luminal
surface of the vessel in A showing calcium deposits on the IEL (arrows). C: Higher
magnification of the boxed region in A demonstrating the speckled pattern of
calcification. D: Digitally magnified image of the boxed region in C demonstrating the
association of calcium deposits with ECM. E: A vessel containing less extensive
calcification. F: A vessel without calcification. A, E and F: magnification x10. C:
magnification x63 (boxed region cropped using Microsoft Office 2010 for image D).
All sections counterstained with aluminium red.

171
The patients without AC were all female. Neither renal replacement therapy vintage
or patient age were related to AC in this small cohort - all 4 patients receiving pre-
emptive TPs had detectable AC whereas the 3 patients without any vascular calcium
deposition had all been on dialysis for at least 6 months. The mean age of the
patients without AC was almost identical to those with disease (46 ± 14 vs 47 ± 16
years respectively; p = 0.936). The 3 patients with known IHD all had detectable
calcification.
6.2.2.iii Analysis of arterial mRNA expression for ENPP-1 and ANK.
Owing to limited tissue availability, the yield of RNA extracted from human arteries
was low. It was therefore only possible to reverse transcribe 100ng for each sample
and to evaluate ENPP-1 and ANK mRNA expression. The expression of three
housekeeping genes, SDHA, HPRT and RPL13a was quantified and mean copy
numbers were 22,280 ± 8161, 18,143 ± 9346 and 871,779 ± 463,771 respectively.
RPL13a was the least stable and was therefore not used to generate final corrected
copy numbers. In the case of HPRT, 3 technical replicates displayed a standard
deviation exceeding 2 cycles, raising concern about the validity of using it as a
calibrator gene for this work. It was therefore decided to correct the copy numbers
for all genes of interest in 2 ways: using the combination of SDHA/HPRT and
SDHA in isolation. One sample (a calcified vessel) showed copy numbers very much
lower than the overall mean for all 3 housekeeping genes (e.g. a factor of 10 lower
for HPRT) and was excluded from the analyses. Comparisons were made between
the 3 un-calcified vessels and all those with calcium deposition.
For quantification of ENPP-1 mRNA expression, one sample from a calcified vessel
failed to amplify leaving n=10 in this group. Using the HPRT/SDHA combination to
correct copy numbers, mRNA expression in calcified vessels showed a non-
significant increase compared with un-calcified tissue (1579 ± 401 vs 3306 ± 3013
for un-calcified vs calcified respectively; p = 0.077). When corrected for SDHA
alone, the increase in expression in the calcified samples became statistically
significant (1594 ± 513 vs 3526 ± 3025 for un-calcified vs calcified respectively; p =
0.049) (Figure 6.7). There appeared to be 2 outliers in the calcified group – one well
above and one well below the group mean (Figure 6.7). Both results were included in

172
the analysis described above however their exclusion only strengthened the
significance of the result (p = 0.012 following removal of these 2 data points).
In contrast to the findings for ENPP-1, expression for ANK mRNA was similar
between groups (Figure 6.7). When corrected for HPRT/SDHA mean copy numbers
were 86,832 ± 43,301 vs 77,323 ± 19,437 for un-calcified compared with calcified
vessels respectively (p = 0.350). Using SDHA alone as the calibrator gene, the
corresponding corrected copy numbers were 85,548 ± 41,233 vs 83,000 ± 21,693 (p
= 0.436).
Figure 6.7. Expression of ENPP-1 and ANK mRNA in Arteries from Patients
with ESRD. RNA was extracted from segments of inferior epigastric artery
obtained at the time of kidney transplantation from patients with ESRD. qPCR
assays were performed for the genes indicated Copy numbers of mRNA for each
gene were corrected for both the combination of HPRT/SDHA and SDHA alone
(see text). Groups compared with MWU test. Each symbol represents one vessel.
Horizontal bars represent group means.
ENPP-1 (HPRT/SDHA corrected) ENPP-1 (SDHA corrected)
ANK (HPRT/SDHA corrected) ANK (SDHA corrected)
p = 0.077 p = 0.049

173
6.3 Discussion
The most notable findings from the rat in vivo work described in this chapter were
that ENPP-1 mRNA expression increased in calcified arteries taken from rodents
with CKD and that functional enzyme activity was also elevated in aortas from these
animals. As discussed in Chapter 5, because all adenine-fed animals developed
calcification of the abdominal aorta, (the section harvested for qPCR experiments), it
was impossible to determine whether this increase in mRNA expression was related
to the presence of uraemia or the calcium deposition itself. However, the fact that the
aortic arch did not calcify in all rats made it possible to evaluate the effect of uraemia
in isolation. The results suggest that arterial ENPP-1 activity increases in the setting
of CKD even in the absence (or presumably prior to the onset of) calcification.
No up-regulation of ENPP-1 mRNA was seen in calcified rings in vitro indicating
that under these conditions calcification per se does not induce expression and
neither does the presence of an elevated phosphate concentration. However, ENPP-1
mRNA expression did increase in calcified human vessels which were all taken from
patients with ESRD suggesting that in the presence of uraemia, calcification is
associated with an increase in ENPP-1. A link between ENPP-1 mRNA expression
and arterial calcium deposition in the setting of CKD was also suggested by the rat in
vivo data which implied that the magnitudes of each were directly related. The
results from the human tissue analysis are consistent with the rat in vivo findings and
therefore confirm that the results from the animal experiment are related to
calcification rather than a ‘model-specific’ factor such as adenine.
As ENPP-1 is heavily expressed in bone cells (Johnson et al 2000) the increase in
expression and activity seen in calcified vessels could be a reflection of VSMC
osteogenic transformation. However, given the findings in Chapters 3 and 5, which
suggested that this process may not occur to any major extent during the
development of AC, it seems an unlikely explanation for the increased ENPP-1
expression. Based on current understanding (Mackenzie et al 2012), the main role of
ENPP-1 appears to be the generation of PPi and it therefore seems likely that the
changes in expression seen in the current work are related to this biological function.
174
Serum PPi concentrations were not elevated in rodents with AC despite the increase
in arterial ENPP-1 activity. In fact, although not statistically significant, if anything a
reduction was apparent in CKD animals. This is consistent with the suppressed
serum PPi that has been detected in patients with renal impairment (Lomashvili et al
2005, O’Neill et al 2010). At present the tissue source of systemic PPi is unclear but
some authors have suggested that bone is likely to be the major contributor
(Lomashvili et al 2014). The vasculature undoubtedly produces PPi as shown by its
presence in medium following aortic ring culture (Lomashvili et al 2004). However,
whether in vivo it is released to a sufficient degree to contribute to systemic levels or
only utilised locally is unknown. The results from the current study would suggest
that arterial production does not influence serum levels. Whilst impossible to
measure, presumably the increase in arterial ENPP-1 activity did result in a greater
amount of local PPi production and a fundamental question is therefore what was the
fate of this PPi? Potentially it may have been metabolised by TNAP, which would
favour the development of calcification, or alternatively perhaps it was generated in
an attempt to directly inhibit hydroxyapatite growth, as part of a protective response
by the vasculature against ensuing AC.
Which of these 2 apparently opposing hypotheses is more likely has been
unwittingly evaluated, albeit under non-uraemic conditions, in a recent report
(Lomashvili et al 2014). In this study, aortas from WT (calcification-resistant) mice
were transplanted into ENPP-1 KO recipients, (which have minimal circulating PPi
and therefore develop spontaneous AC) thereby modelling increased arterial ENPP-1
expression in a ‘pro-calcification’ systemic environment. Whilst the grafted (WT)
aortic segments did calcify, the surrounding vessel (ENPP-1-deficient aorta)
calcified to a much greater extent. TNAP activity was equal in both genotypes so
could not explain these findings. The data imply that an increase in arterial ENPP-1
(PPi generation) will attenuate local calcium deposition rather than promote it and
therefore suggest that the greater enzyme activity detected in calcified vessels in the
current study arises as part of a protective response by the vasculature against the
calcification-inducing factors present in the uraemic circulation.
CD39 activity results in the formation of 2 phosphate ions (along with AMP) (Figure
1.2) and therefore seemingly provides conditions to favour calcification. Expression
175
was significantly decreased in adenine-fed rats theoretically limiting the availability
of phosphate whilst increasing PPi, both of which also seem to be in keeping with an
‘anti-calcification’ response. Clearly this increased PPi could be hydrolysed by
TNAP and therefore enhance calcification, however if this does represent a
pathogenic mechanism it would appear to be a rather redundant and complex way of
generating, in effect, the same end-product i.e. phosphate from PPi.
Mutations of the NT5E gene, which encodes the CD73 enzyme, have been shown to
be associated with calcification of distal arteries in humans (St Hilaire et al 2011)
although, as discussed in Chapter 1 (section 1.10.2.ii), the mechanism underlying
this finding is not completely understood. CD73 catalyses the conversion of AMP
into phosphate and adenosine (Figure 1.2) and it is most plausible that the latter
product is the key regulator of calcification in this context (St Hilaire et al 2011).
Vascular CD73 expression in the setting of CKD-associated AC has not been
previously described. However, the increase in CD73 mRNA seen in the current
work coupled with the known deleterious effect of genetic deficiency would also be
consistent with an adaptive, protective response by arterial cells.
Previous studies have demonstrated an increase in TNAP activity in arteries from
both rats (Lomashvili et al 2008) and patients (Shroff et al 2008) with CKD and so it
seems surprising that expression of TNAP mRNA was decreased in calcified rodent
vessels in the present work. The study by Lomashvili et al (2008) used 2 rodent
models of CKD (adenine and 5/6th
nephrectomy) and notably AC was not present in
any animal. TNAP protein expression and activity were increased in aortas from
these rats however mRNA levels were no different from controls indicating that
regulation of TNAP is probably mainly post-transcriptional. In the study by Shroff et
al (2008) examining human tissue, only TNAP activity (not mRNA expression) was
measured and notably, in patients with CKD not yet on dialysis, no increase in
arterial TNAP activity was apparent despite the presence of early calcium deposition.
Activity was increased in patients that were on dialysis. The findings from these 2
studies seem to differ somewhat and the exact role for this protein in the
pathogenesis of AC therefore remains to be fully elucidated. Limited tissue
availability meant that TNAP activity could not be measured in the present work and
because mRNA expression may not reflect functional enzyme activity it is difficult
176
to interpret the data obtained here. If in fact arterial TNAP activity does reduce in
this setting it should result in an elevated local PPi concentration (Figure 1.2) and
protect against calcification.
The expression of mRNA for ANK was increased in calcified rodent, but not human
vessels. Differences in species and/or the small number of non-calcified human
samples are 2 immediately obvious potential reasons for this. However, the changes
in expression of the other proteins examined in calcified arteries all seem to favour
an elevation in extracellular PPi and so an increase in ANK expression would be
consistent with this. Just one previous study (Zhao et al 2012) has assessed ANK
specifically in the setting of CKD and the authors of this paper concluded that
expression of the protein was decreased in rodents and patients with renal
impairment. However, it is unclear in this report how many human samples were
assessed and the rodent model differed significantly from that used in the current
study, involving extensive surgical manipulation of the aorta in order to deliberately
induce inflammation.
The results from the ring culture experiment, like those described in Chapter 3,
indicated that time in culture alone can significantly influence the mRNA expression
profiles for a number of genes in arterial tissue. Again wide standard deviations were
seen in most groups, especially for the samples cultured for 10 days, further limiting
interpretation. However, it was notable that the presence of an elevated phosphate
concentration did not influence the expression of any molecule either before (day 3)
or after (days 7 and 10) the appearance of overt calcification. This implies that the
alterations in expression seen in calcified vessels in vivo are mediated by ‘uraemic-
specific’ factors.
The histological appearance of AC in humans with CKD has only been examined in
a small number of previous reports (Shroff et al 2008, Shlieper et al 2010, O’Neill &
Adams 2014). These studies, in keeping with the findings in this chapter, have all
reported a speckled, punctate pattern of calcium deposition within the arterial media.
Calcification has consistently been shown to be associated with ECM, as was
observed in the current work, with variable involvement of the IEL. A notable
difference in the present work however was the apparent relative sparing of the inner
media from mineral deposition. There is no immediately obvious explanation for this
177
and in fact some previous studies have specifically commented that, in complete
contrast to the findings here, the sub-intimal region of the media was predominantly
effected (O’Neill & Adams 2014). This is the first study to analyse inferior epigastric
artery specimens in patients with CKD with previous work examining vessels of
larger or smaller calibre. It is possible, as suggested by some authors (Schliper
2014), that the mechanisms contributing to AC along with how the disease manifests
differ depending on the anatomical site of the vascular bed.
There are a number of limitations to the work reported in this chapter. Owing to
limited tissue, with the exception of ENPP-1, protein expression and/or enzyme
activity could not be assessed for any of the other molecules examined. In the case of
CD39, mRNA expression has been shown to correlate well with enzyme activity in
other contexts (Liao et al 2010), although whether this holds true for CD73 and
ANK is less clear. As discussed above, this does not seem to be the case for TNAP.
The number of human samples available for study was low, making it difficult to
draw comparisons between calcified and non-calcified vessels. Furthermore, the
calcification ‘status’ of each patient was assessed in a single histological section and
it is possible that the staining pattern seen was not representative of the whole vessel.
The lack of a non-CKD control group is a further limitation. The low yield of RNA
from human tissue made qPCR experiments technically challenging. In particular it
was not possible to obtain an RNA integrity number (RIN) for many samples.
6.4 Summary
The work in this chapter has shown for the first time that ENPP-1 expression and
activity are increased in calcified arteries from rodents and humans with CKD. This
increase appears to begin prior to the onset of calcification but seems to continue as
disease progresses and may well be part of a vascular defence mechanism against, as
yet unidentified, uraemic-specific factors which induce mineral deposition. Other
vascular proteins involved in ATP metabolism also appear to be regulated in this
context, possibly in order to protect against increasing calcification. Manipulating
certain components of this pathway may potentially offer therapeutic benefit. This
concept is expanded upon as part of the general discussion in Chapter 7.
178
CHAPTER 7 – GENERAL DISCUSSION
7.1 Summary Of Key Findings
The main aim of the work described in this thesis was to answer a fundamental
research question: ‘Is P2X7R involved in the pathogenesis of CKD-associated AC?’.
With respect to addressing this aim the following key findings have emerged:
1. P2X7R is expressed in human and rodent vascular smooth muscle with
expression remaining unaltered in the presence of calcification (Chapters 3 &
5).
2. Neither pharmacological blockade nor genetic deletion of P2X7R influence
AC in vitro (Chapter 3).
3. Pharmacological blockade of P2X7R does not influence AC in vivo using the
adenine nephropathy model (Chapter 5).
The hypothesis that P2X7R might participate in the pathogenesis of AC was based
upon studies linking it, in non-vascular-related contexts, to mechanisms thought to
be important in the aetiology of disease (Figure 1.3, re-printed on the following page
as an aide memoire). Whilst not a primary aim of this thesis, the work conducted
here has made some intriguing observations in regard to some of these previously
described ‘disease-mediating’ pathways:
1. The VSMC-specific markers α-SMA, SM-22 and smoothelin are down-
regulated at the mRNA level in calcified arteries in vivo (Chapter 5).
2. Arterial expression of mRNA for some classic markers of osteogenic
transformation is absent in both in vitro and in vivo models of AC (Chapters
3 & 5).
3. Expression of mRNA for the apoptosis marker caspase-3 is up-regulated in
calcified arteries in vivo but not in vitro (Chapters 3 & 5).
4. None of these changes in mRNA expression are influenced by P2X7R
blockade in vivo.

179
180
Studies in the latter parts of this thesis (Chapter 6) moved away from P2X7R directly
to focus on arterial ATP-metabolic pathways. Time constraints permitted some
preliminary studies to be conducted to assess whether there are changes in
expression profiles of components of this system associated with AC. The following
novel findings emerged:
1. ENPP-1 mRNA expression and activity are increased in vivo in calcified
rodent arteries.
2. ENPP-1 mRNA expression is increased in calcified arteries from patients
with ESRD.
3. Calcified rodent arteries in vivo have increased expression of CD73 and ANK
mRNA while expression of mRNA for CD39 and TNAP decreases.
4. Phosphate and/or the presence of calcification per se do not appear to
mediate the changes in gene expression profiles observed in vitro.
7.2 P2X7R And Arterial Calcification
The overarching impression from the work conducted in this thesis is that P2X7R is
not involved in the pathogenesis of AC. A number of diverse experimental systems
were used to evaluate the receptor in this context but none of the data obtained
suggested that it participates in mediating disease. However, to our knowledge, this
work represents the first set of experiments specifically designed to assess the role of
P2X7R in AC and therefore before concluding that the receptor is not involved in the
evolution of disease, whether or not the original hypothesis has been adequately
tested needs to be considered.
The potential relationship between P2X7R and AC was investigated robustly in
vitro. Ex vivo studies in which rodent vessels were treated with high-dose, receptor-
specific pharmacological agents (antagonists and agonists) in the presence/absence
of calcification-promoting medium, culture of arteries from receptor-deficient mice
and in vitro studies with primary VSMCs were performed, representing a
comprehensive array of experimental strategies. Cellular deficiency of P2X7R could
also have been assessed using interfering RNA methodology but as discussed in
detail in Chapter 3, experiments using primary VSMCs in culture were abandoned
181
early on in favour of the ring culture model and the studies on cultured tissue from
P2X7-/-
mice should have achieved the same objective.
Although the majority of available in vitro methods were used in this thesis to try
and address the primary research question, whether these models are actually
suitable for examining the pathogenesis of CKD-associated AC is debatable. Failing
to mimic a uraemic milieu and, as demonstrated here with the ex vivo model and
previously with cultured VSMCs (Nakano-Kurimoto et al 2009), the induction of
changes in gene expression with or without the addition of ‘calcification-enhancing’
reagents, are major disadvantages common to both primary cell- and arterial ring-
based systems. The absence of intact elastin fibres, the initial sites of calcium
deposition (Lanzer et al 2014, O’Neill & Adams 2014), is another major limitation
of studies using cultured VSMCs. How translatable any findings from experiments
using these models are to human disease therefore remains uncertain.
From these perspectives it might be seen that in vivo experiments are preferable. As
discussed in Chapter 5, to investigate AC in vivo, especially when assessing a
potential therapeutic intervention, the adenine nephropathy model is superior to the
alternative options of using either the Cy/+ rat or 5/6th
nephrectomy as calcification
is much more consistent and develops over weeks rather than months (Shobeiri et al
2010, Neven & D’Haese 2011). However, the question remains, how closely does
this adenine-based system really resemble the human disease it is trying to mimic?
In general, the main benefits of animal work in this context are that calcified arteries
will have been exposed to circulating ‘uraemic toxins’ and vessels are surrounded by
their usual biological environment. Other relevant biochemical disturbances such as
elevated PTH and FGF-23 and decreased vitamin D will also be present (Neven et al
2010). In terms of the renal lesion, adenine overload in rats results in a similar
histological appearance to that seen in patients with APRT deficiency, the enzyme
responsible for adenine metabolism (Hori & Henderson 1966). This rare condition is
associated with renal calculi, interstitial fibrosis and progression to ESRD if
untreated (Bollee et al 2010, Monico et al 2012). However, whether mineral-bone
disorder is particularly severe in these patients is unknown.
182
One notable feature of the rat experiment described in Chapter 5 was the extremely
high serum concentration of phosphate in most animals. The normal serum
concentration of phosphate in Wistar rats is reported to be around 2mmol/l (Baxter et
al 2000, Tripathi et al 2013). In rats treated with adenine in this thesis, serum
phosphate concentrations were often in the order of 7-8mmol/l and occasionally as
high as 9mmol/l i.e. over 4 times the normal value. Serum phosphate levels of this
relative order are never seen in man. In clinical practice the highest serum
phosphates generally occur in acute settings, typically within the contexts of tumour
lysis syndrome (McBride & Westervelt 2012) or rhabdomyolysis (Efstratiadis et al
2007). For illustrative purposes, possibly the highest serum phosphate on record was
documented by Bywaters & Beall (1941) when describing the clinical progression of
traumatic crush injuries during the Blitz. The serum phosphate at the time of death in
one patient is recorded at just over 4mmol/l (about 3 times the upper limit of
normal).
As continually referred to throughout this work, the current conceptualisation of AC
(and indeed the fundamental principle on which this thesis is centred), is that it does
not occur simply due to the passive deposition of mineral in the arterial wall. In
further support of this theory, calcium and phosphate, when added simultaneously to
human plasma even at the upper limit of concentrations seen in acute disease states,
do not precipitate out (O’Neill 2007). This study by O’Neill suggested that a calcium
x phosphate product of above 16mmol/l2 would be required for mineral to become
insoluble in human serum - this is still around double the level of what might
possibly be seen in patients with profoundly disturbed calcium and phosphate
homeostasis i.e. this situation is unlikely to ever occur in man and therefore other
mechanisms must be in play for AC to develop. Whether the findings in this study
are translatable back to rodents is uncertain, however it seems plausible that
elevations in calcium and in particular phosphate, to the extent seen in rat models of
CKD, could result in extensive ‘passive’ arterial mineral deposition. Clearly ‘non-
passive’ mechanisms (e.g. changes in VSMC gene expression profiles and levels of
calcification inhibitors) will be present concurrently, as shown by the current work
and numerous previous studies (Price et al 2006, Lomashvili et al 2009, Neven et al
2010), thereby still permitting inferences to be made about mechanistic pathways
involved in the development of disease. However, a substantial calcification burden
183
resulting from passive mineral precipitation could well overwhelm and mask the
effect of any intervention targeting ‘cell-mediated’ pathological pathways.
When considering how well the role of P2X7R was assessed in this work, it also
needs to be evaluated how well receptor ligation was achieved in the studies
performed. No firm conclusions could be drawn from the experiments with P2X7-/-
mice due to a surprisingly low number of animals developing AC. This meant that
the only available way to practically examine the effect of suppressed receptor
activity in vivo was to pharmacologically block it, in the rat adenine model.
Although the result of this study strongly suggested that P2X7R blockade does not
impact on the pathogenesis of AC there were, as discussed extensively in Chapter 5,
a number of limitations to the experiment. It could therefore be argued that there
remains an element of uncertainty relating to the involvement of the receptor in this
disease process and it is worth considering how the negative findings relating to
P2X7R and AC described in this thesis might be confirmed.
P2X7R KO rats are not currently available but would be a useful tool in the future
should they be developed. In the meantime, if using a rat model, receptor ligation
would need to be achieved by pharmacological blockade. Probably the most obvious
refinement to the experiment conducted in this thesis (Chapter 5) would be to
administer the drug by a different route e.g. an implantable delivery system. This
method of dosing would also open up the option of employing the 2 alternative (5/6th
nephrectomy and Cy/+) rat CKD-AC models, as long term administration of the drug
would be possible (AC takes months to develop in these two models (Neven et al
2011)). However, as alluded to in Chapter 5, this would require extensive
optimisation of the drug for it to become feasible.
The mouse 5/6th
nephrectomy model (El-Abbadi et al 2009) could be employed to
examine WT and KO mice but is likely to need an extended operator training period
and result in a high loss of animals. An alternative would be to attempt further
refinement of the adenine mouse model developed in this thesis (Chapter 4) in order
to obtain more consistent disease and less animal morbidity. Potential modifications
might include titration of the adenine, protein, phosphate and calcium contents of the
diet and/or changing the mode of adenine administration – both ip injection and
delivery in an oral suspension have been described in rat studies (Forbes 1971, Terai
184
et al 2009). In addition, this thesis focussed mainly on DBA/2 mice as this strain was
employed by the Giachelli lab in their description of the 5/6th
nephrectomy model
(El-Abbadi et al 2009). However, the C3H strain is also described to be prone to
ectopic calcification (Eaton et al 1978) and it would be interesting to assess the
effect of these interventions in animals on this background. Finally, the work in this
thesis examined the propensity of 2 agents, folic acid and adenine, to induce CKD
and AC but there are numerous other ‘chemical’ agents available which can cause
marked renal fibrosis in mice. Examples include cyclosporine (Bing et al 2006) and
aristolochic acid (Huang et al 2013) and it would therefore be informative to
combine these agents with high phosphate feeding to assess whether AC develops.
Given the limitations of the animal models, it might be preferable to directly assess
P2X7R within the context of human CKD-associated AC. Unfortunately the number
of human vessels available for study in this thesis was low (n=15), thereby limiting
the number of experiments that could be undertaken with them. With a larger sample
size and tissue yield it would become possible to perform a range of complementary
laboratory techniques, to examine receptor expression in calcified and non-calcified
vessels. It would clearly also be advantageous to obtain control tissue from healthy
donors for comparison. However, whilst studies of this nature can be useful, they
cannot provide information concerning causality of a particular disease or the
chronology of contributing biological processes.
One method of investigating a potential link between P2X7R and AC in humans
with CKD might be to assess whether SNPs that alter receptor function associate
with disease severity. Whilst possible, major barriers would need to be overcome
before performing such an analysis. Firstly, whilst a number of P2X7R SNPs are
described, many have minor allele frequencies of less than 5% (Wiley et al 2011,
Gartland et al 2012). Therefore a large patient cohort would be required to detect any
association with disease. Secondly, one would need to consider how to detect arterial
calcium deposition within the vessel media in these subjects. In practical terms this
would probably need to be achieved using radiological methods, however plain X-
rays and CT scanning cannot reliably discriminate between intimal and medial
calcification (Sigrist et al 2007, Marinelli et al 2013). Newer generation ultrasound
machines can distinguish between the two locations in superficial vessels such as

185
femoral, carotid and brachial arteries (Coll et al 2011) but evaluating calcification in
more central sites such as the abdominal aorta or coronary arteries may be less
straightforward. Finally, coronary artery calcification is now usually measured in
terms of an Agatston score (Agatston et al 1990). This is a well-validated clinical
tool permitting a quantifiable assessment of disease progression. However at present,
and as commented on by some authors (Vezzoli et al 2014), no such method exists
for gauging the extent of ultrasonically detected calcification in peripheral arteries.
Defining ‘progression of AC’ in this setting therefore becomes problematic.
In summary, the results in this thesis do not support a role for P2X7R in the
pathogenesis of CKD-associated AC. The role of the receptor in mediating disease
has been evaluated rigorously within the limitations of the available experimental
models. Optimisation and/or development of superior experimental systems to study
this disease process will be required in order to definitively confirm redundancy of
P2X7R in this clinical context. Studies in man are feasible but may first require
resolution of some logistical, practical and technical issues.
7.3 Vascular ATP Metabolic Pathways And Arterial Calcification
Whilst the work described in Chapters 3-5 was aimed at testing a central hypothesis
(i.e. that P2X7R mediates AC), the work in Chapter 6 was more ‘hypothesis
generating’, as it was conducted as a preliminary exercise to assess the expression of
enzymes involved in ATP-metabolism in normal and uraemic, calcified arteries. The
findings from these experiments are both novel and intriguing, possibly in keeping
with an adaptive, defensive response by the vasculature against persistent uraemia
and subsequent calcium deposition. It should therefore now be considered what steps
are required to prove or refute this hypothesis and, in addition, what the future
implications may be.
The most relevant function of the ATP-metabolising system in relation to AC is the
regulation of extracellular PPi. All components of this pathway can seemingly
influence the level of this molecule either directly or indirectly – ENPP-1 and TNAP
by direct generation and hydrolysis respectively (Terkeltaub 2001, Murshed et al
2005), ANK by transmembrane transport (Terkeltaub 2001) and CD39 by regulating
the amount of ATP available for ENPP-1 (Kaczmarek et al 1996) (Figure 1.2). The
186
relationship between ENPP-1, TNAP and ANK in determining local PPi
concentration has been shown to be critically important in relation to skeletal bone
formation (Harmey et al 2004) and a similar situation may well occur in the
vasculature regarding AC. Given these observations, a key piece of information
required is how the function of each of these proteins changes in CKD and
moreover, how these changes relate to each other in terms of time and function. In
the current work, the activity of only one enzyme, ENPP-1, was examined. Therefore
the effect of both uraemia alone and subsequent calcification needs to be confirmed
for all components of this pathway in a larger sample size. To this end it might be
preferable to employ the 5/6th
nephrectomy model of disease as it is likely to result in
a greater number of animals with renal impairment that do not develop AC as
compared with the adenine model (Neven & D’Haese 2011) thereby permitting a
better evaluation of the effect of uraemia in isolation. This would also serve to
exclude any change in these enzymes specifically induced by adenine. Studies on
human vessels will also be valuable in terms of establishing the net changes in
expression but in practical terms are unlikely to be helpful in assessing the time-
course of events. When this information is obtained, future research aiming to
examine any individual component of this system in the context of CKD will need to
ensure that appropriate expression profiles of all other proteins in this pathway are
present in order to draw translatable conclusions.
ENPP-1 deficiency is unquestionably associated with arterial calcium deposition.
Rare human conditions such as GACI (Rutsch et al 2003), Pseudoxanthoma
elasticum (Nitschke et al 2012) and Cole disease (Eytan et al 2013), all of which
have ectopic calcification as part of the disease phenotype, can arise due to mutations
in the ENPP-1 gene. It might therefore intuitively seem that an increase in enzyme
activity, as observed in this work in uraemic subjects, would be protective. However,
mutations in this gene can also cause ARHR (Levy-Litan et al 2010), a disease of
deficient skeletal mineralisation, so the situation is far from straightforward. Very
few studies have examined the expression of ENPP-1 in relation to AC, but those
that have been published differ somewhat in their findings. Nitschke et al (2011)
found decreased expression in human carotid artery calcified atherosclerotic plaques,
whereas Cote et al (2012a) reported an increased expression in human calcified
aortic valves. These studies examined pathologies slightly removed from medial AC
187
and were performed in non-uraemic patients. However, taken together all these
observations illustrate the complexity of ENPP-1 in this clinical context and
emphasise the need for further work to better understand its exact role, especially in
relation to CKD.
How might the functional effect of increased ENPP-1 activity be investigated
experimentally? One approach might be to compare arterial ENPP-1 overexpression
with WT tissue in uraemic, pro-calcifying conditions. ENPP-1 has been successfully
overexpressed in a number of sites in mice including liver, muscle, brain and adipose
tissue (Maddux et al 2006, Pan et al 2011). Arterial expression was not commented
on in these reports. The obvious barrier to overcome in employing this methodology
in vivo is finding a suitable CKD-AC model, the potential options for which have
been discussed above. As an alternative, it would be interesting to assess whether in
the ex vivo model, the addition of uraemic serum to the culture medium might better
simulate in vivo conditions compared with just the addition of supplementary
phosphate as used in this thesis. Supplementing culture medium with uraemic serum
has been previously employed to examine other factors thought to influence AC in
the context of uraemia (Lomashvili et al 2008, Kramann et al 2011).
There are currently limited alternative options for directly examining the effect of
increased ENPP-1 activity. In man, SNPs of the ENPP-1 gene are generally ‘loss-of
function’ and although putative ‘gain-of-function’ mutations are described these are
thought not to interfere with the catalytic site of the protein (Terkeltaub 2006).
Pharmacological activators of the enzyme are not yet available as the molecular
structure has only recently been determined (Kato et al 2012). Primary cells could be
directly genetically manipulated to overexpress the protein but subsequent
experiments will be limited and their translational relevance questionable, as alluded
to throughout this thesis. As an indirect strategy, the response of increasing the
substrate (i.e. ATP) for the enzyme could be examined, although it would need to be
confirmed that subsequent metabolism of the nucleotide was occurring via ENPP-1
and not via alternative pathways (such as CD39). Possibly the easiest way to ensure
these criteria are met would be to conduct experiments using CD39-deficient vessels,
in parallel with suitable control tissue.

188
If ENPP-1 is up-regulated as a protective response against uraemic toxins and
ensuing arterial calcium deposition it might point towards CKD being a state of
‘relative PPi deficiency’. This concept is supported by in vivo studies which have
prevented the development of AC in uraemic animals by direct administration of PPi
(O’Neill et al 2011, Riser et al 2011). However, there is a question as to whether this
relative deficiency is because PPi is all hydrolysed by TNAP or because it is all
incorporated into the expanding hydroxyapatite. Alternatively, do uraemic conditions
perhaps render ENPP-1 less efficient at producing PPi or even cause PPi to be less
efficient at preventing calcification? It is also unclear what exactly is regulating the
altered expression and activity of ENPP-1 (and other enzymes). Answering these
questions may provide insight into the regulation of the calcification process overall
and indicate some potential therapeutic targets.
If the aim of future therapy does prove to be attenuating a relative deficiency of PPi,
it is worth speculating on the potential options. Bisphosphonates, which are
analogues of PPi, prevent AC in uraemic rodents (Price et al 2006) and improve the
prognosis in GACI (Rutsch et al 2008). However, these agents are likely to result in
disrupted bone homeostasis in the setting of CKD (Lomashvili et al 2009) and are
also directly nephrotoxic (Perazella & Markowitz 2008) thus limiting their use in
this setting. PPi itself reduces AC in rodents, but has a very short half-life if given
orally (Schibler et al 1968) and this would seem to restrict its use clinically.
However, it is unknown how much PPi is deposited within the vessel wall (the actual
target site) and, in addition, the bioavailability of PPi can be increased by ip
administration (O’Neill et al 2011). Further research into the pharmacology of this
agent is therefore needed but there is reason to be optimistic about its potential
therapeutic use in the future. Some work has been conducted in vitro to determine
whether TNAP inhibitors might be a useful treatment strategy by minimising PPi
breakdown (Narisawa et al 2007). These drugs were effective at attenuating
calcification in these models but in vivo analysis is clearly required as there may well
be undesired side-effects of these agents, particularly relating to bone homeostasis.
Might increasing PPi production be an option? An inhibitor of CD39 would
theoretically increase the available ATP for ENPP-1 production of PPi. Of interest,
the ecto-ATPase inhibitor ARL67156, which has been shown to suppress the activity

189
of both CD39 and ENPP-1 (Levisque et al 2007), attenuated aortic calcification in
warfarin-treated rats (Cote et al 2012b). However, this study by Cote et al is
intriguing in that it failed to detect expression of CD39 mRNA in the vasculature (in
complete contrast to the present study and others (Behdad et al 2009, Villa-Bellosta
et al 2011a) where this enzyme was found to be extremely abundant). These findings
therefore clearly need to be confirmed with a detailed assessment of the mechanisms
involved. Finally, as a speculative and theoretical concept, enzyme replacement
therapy is used in conditions such as Fabry’s disease to correct deficiencies of
proteins vital to maintain normal physiology (Rozenfeld & Neumann 2011). Perhaps
in the future, if supported by research, it might be possible to develop and administer
recombinant ENPP-1 in the hope of preventing, or slowing the progression of, AC in
patients with CKD.
7.4 Conclusion
Arterial calcium deposition occurring in the setting of CKD is a complex, likely
multifactorial process. Current experimental models to study the pathophysiology of
this condition have a number of limitations and may not closely simulate human
disease, making it difficult to draw consistent conclusions. P2X7R does not appear
to be a mediator of CKD-associated AC however improved models are required to
confirm this. The arterial expression of enzymes involved in the metabolism of ATP
does seem to change in AC and future work should focus on gauging the clinical
relevance of this in order to better understand the mechanisms underlying the disease
and potentially develop new therapeutic interventions.

190
PUBLICATIONS AND PRESENTATIONS
Peer reviewed publications:
1. Fish, R.S., Klootwijk, E., Tam, F.W., Kleta, R., Wheeler, D.C., Unwin, R.J.
and Norman, J. (2013). ATP and Arterial Calcification. European Journal of
Clinical Investigation, 43(4), pp.405-412.
Presentations:
1. Richard S. Fish, Peter Gilmour, Frederick W.K. Tam, David C. Wheeler, Jill
T. Norman, Robert J. Unwin. Pharmacological blockade of the ATP-sensitive
P2X7 receptor does not influence the progression of experimental arterial
calcification.
Poster presentation at 2014 UK Renal Association Conference, Glasgow.
Awarded ‘Best Poster In Group’.
2. Richard S. Fish. Development and Evaluation of Novel Mouse Models of
Chronic Kidney Disease Associated Arterial Calcification.
Oral presentation at 2013 Royal Society of Medicine President’s Prize
Meeting (Nephrology Section).
3. Richard S. Fish, Frederick W.K. Tam, David C. Wheeler, Jill T. Norman,
Robert J. Unwin. Female DBA/2 mice have relative resistance to folic acid
induced acute kidney injury.
Poster presentation at 2013 UK Renal Association Conference, Bournmouth.

191
REFERENCES
Adinolfi, E., Cirillo, M., Woltersdorf, R., Falzoni, S., Chiozzi, P., Pellegatti, P.,
Callegari, M.G., Sandona, D., Markwardt, F., Schmalzing, G. and Di Virgilio, F.
(2010). Trophic activity of a naturally occurring truncated isoform of the P2X7
receptor. The FASEB Journal, 24(9), pp.3393-3404.
Adirekkiat, S., Sumethkul, V., Ingsathit, A., Domrongkitchaiporn, S.,
Phakdeekitcharoen, B., Kantachuvesiri, S., Kitiyakara, C., Klyprayong, P. and
Disthabanchong, S. (2010). Sodium thiosulfate delays the progression of coronary
artery calcification in haemodialysis patients. Nephrology Dialysis
Transplantation, 25(6), pp.1923-1929.
Adragao, T., Herberth, J., Monier-Faugere, M.C., Branscum, A., Ferreira, A.,
Frazao, J.M., Dias Curto, J. and Malluche, H.H. (2009). Low bone volume-a risk
factor for coronary calcifications in hemodialysis patients. Clinical Journal of the
American Society of Nephrology, 4(2), pp.450-455.
Adrogue, H.J., Frazier, M.R., Zeluff, B. and Suki, W.N. (1981). Systemic
calciphylaxis revisited. American Journal of Nephrology, 1(3-4), pp.177-183.
Agatston, A.S., Janowitz, W.R., Hildner, F.J., Zusmer, N.R., Viamonte, M.Jr. and
Detrano, R. (1990). Quantification of coronary artery calcium using ultrafast
computed tomography. Journal of the American College of Cardiology, 15(4),
pp.827-832.
Agrawal, A., Buckley, K.A., Bowers, K., Furber, M., Gallagher, J.A. and Gartland,
A. (2010). The effects of P2X7 receptor antagonists on the formation and function
of human osteoclasts in vitro. Purinergic Signalling, 6(3), pp.307-315.
Aikawa, E., Aikawa, M., Libby, P., Figueiredo, J.L., Rusanescu, G., Iwamoto, Y.,
Fukuda, D., Kohler, R., Shi, G.P., Jaffer, F.A. and Weissleder, R. (2009). Arterial
and aortic valve calcification abolished by elastolytic cathepsin S deficiency in
chronic renal disease. Circulation, 119(13), pp.1785-1794.
Allison, M.A., Criqui, M.H. and Wright, C.M. (2004). Patterns and risk factors for

192
systemic calcified atherosclerosis. Arteriosclerosis, Thrombosis, and Vascular
Biology, 24(2), pp.331-336.
Amann, K. (2008). Media calcification and intima calcification are distinct entities in
chronic kidney disease. Clinical Journal of the American Society of Nephrology,
3(6), pp.1599-1605.
Ameer, O.Z., Salman, I.M., Avolio, A.P., Phillips, J.K. and Butlin, M. (2014).
Opposing changes in thoracic and abdominal aortic biomechanical properties in
rodent models of vascular calcification and hypertension. American Journal of
Physiology-Heart and Circulatory Physiology, 307(2), pp.H143-151.
Anderson, H.C., Harmey, D., Camacho, N.P., Garimella, R., Sipe, J.B., Tague, S.,
Bi, X., Johnson, K., Terkeltaub, R. and Millan, J.L. (2005). Sustained
osteomalacia of long bones despite major improvement in other
hypophosphatasia-related mineral deficits in tissue nonspecific alkaline
phosphatase/nucleotide pyrophosphatase phosphodiesterase 1 double-deficient
mice. The American Journal of Pathology, 166(6), pp.1711-1720.
Arch, J.R. and Newsholme, E.A. (1978). Activities and some properties of 5'-
nucleotidase, adenosine kinase and adenosine deaminase in tissues from
vertebrates and invertebrates in relation to the control of the concentration and the
physiological role of adenosine. The Biochemical Journal, 174(3), pp.965-977.
Asci, G., Ok, E., Savas, R., Ozkahya, M., Duman, S., Toz, H., Kayikcioglu, M.,
Branscum, A.J., Monier-Faugere, M.C., Herberth, J. and Malluche, H.H. (2011).
The link between bone and coronary calcifications in CKD-5 patients on
haemodialysis. Nephrology Dialysis Transplantation, 26(3), pp.1010-1015.
Baigent, C., Burbury, K. and Wheeler, D. (2000). Premature cardiovascular disease
in chronic renal failure. The Lancet, 356(9224), pp.147-152.
Baigent, C., Landray, M.J., Reith, C., Emberson, J., Wheeler, D.C., Tomson, C.,
Wanner, C., Krane, V., Cass, A., Craig, J., Neal, B., Jiang, L., Hooi, L.S.,
Agodoa, L., Gaziano, M., Kasiske, B.b Walker, R., Massy, Z.A., Feldt-
Rasmussen, B., Krairittichai, U., Ophascharoensuk, V., Fellstrom, B., Holdaas,
193
H., Tesar, V., Wiecek, A., Grobbee, D., de Zeeuw, D., Gronhagen-Riska, C.,
Dasqupta, T., Lewis, D., Herrington, W., Mafham, M., Majoni, W., Wallendszus,
K., Grimm, R., Pedersen, T., Tobert, J., Armitage, J., Baxter, A., Bray, C., Chen,
Y., Chen, Z., Hill, M., Knott, C., Parish, S., Simpson, D., Sleight, P., Young, A.
and Collins, R. (2011). The effects of lowering LDL cholesterol with simvastatin
plus ezetimibe in patients with chronic kidney disease (Study of Heart and Renal
Protection): a randomised placebo-controlled trial. The Lancet, 377(9784),
pp.2181-2192.
Baigent, C., Keech, A., Kearney, P.M., Blackwell, L., Buck, G., Pollicino, C., Kirby,
A., Sourjina, T., Peto, R., Collins, R. and Simes, R. (2005). Efficacy and safety of
cholesterol-lowering treatment: prospective meta-analysis of data from 90 056
participants in 14 randomised trials of statins. The Lancet, 366, pp.1267-78.
Barreto, D.V., Barreto, F.de C., Carvalho, A.B., Cuppari, L., Draibe, S.A., Dalboni,
M.A., Moyses, R.M., Neves, K.R., Jorgetti, V., Miname, M., Santos, R.D. and
Canziani, M.E. (2008). Association of changes in bone remodeling and coronary
calcification in hemodialysis patients: a prospective study. American Journal of
Kidney Diseases, 52(6), pp.1139-1150.
Basalyga, D.M., Simionescu, D.T., Xiong, W., Baxter, B.T., Starcher, B.C. and
Vyavahare, N.R. (2004). Elastin Degradation and Calcification in an Abdominal
Aorta Injury Model Role of Matrix Metalloproteinases. Circulation, 110(22),
pp.3480-3487.
Baxter, J., Shimizu, F., Takiguchi, Y., Wada, M. and Yamaguchi, T. (2000). Effect
of iron (III) chitosan intake on the reduction of serum phosphorus in rats. Journal
of Pharmacy and Pharmacology, 52(7), pp.863-874.
Bechtel, W., McGoohan, S., Zeisberg, E.M., Muller, G.A., Kalbacher, H., Salant,
D.J., Muller, C.A., Kalluri, R. and Zeisberg, M. (2010). Methylation determines
fibroblast activation and fibrogenesis in the kidney. Nature Medicine, 16(5),
pp.544-550.
Behdad, A., Sun, X., Khalpey, Z., Enjyoji, K., Wink, M., Wu, Y., Usheva, A. and
Robson, S.C. (2009). Vascular smooth muscle cell expression of ectonucleotidase

194
CD39 (ENTPD1) is required for neointimal formation in mice. Purinergic
Signalling, 5(3), pp.335-342.
Bergfeld, G.R. and Forrester, T. (1992). Release of ATP from human erythrocytes in
response to a brief period of hypoxia and hypercapnia. Cardiovascular Research,
26(1), pp.40-47.
Bianchi, B.R., Lynch, K.J., Touma, E., Niforatos, W., Burgard, E.C., Alexander,
K.M., Park, H.S., Yu, H., Metzger, R., Kowaluk, E., Jarvis, M.F. and van Biesen,
T. (1999). Pharmacological characterisation of recombinant human and rat P2X
receptor subtypes. European Journal of Pharmacology, 376(1-2), pp.127-138.
Bing, P., Maode, L., Li, F. and Sheng, H. (2006). Expression of renal transforming
growth factor-beta and its receptors in a rat model of chronic cyclosporine-
induced nephropathy. Transplantation Proceedings, 38(7), pp.2176-2179.
Block, G.A., Martin, K.J., de Francisco, A.L., Turner, S.A., Avram, M.M., Suranyi,
M.G., Hercz, G., Cunningham, J., Abu-Alfa, A.K., Messa, P., Coyne, D.W.,
Locatelli, F., Cohen, R.M., Evenepoel, P., Moe, S.M., Fournier, A., Braun, J.,
McCary, L.C., Zani, V.J., Olson, K.A., Drueke, T.B. and Goodman, W.G. (2004).
Cinacalcet for secondary hyperparathyroidism in patients receiving hemodialysis.
New England Journal of Medicine, 350(15), pp.1516-1525.
Block, G.A., Spiegel, D.M., Ehrlich, J., Mehta, R., Lindbergh, J., Dreisbach, A. and
Raggi, P. (2005). Effects of sevelamer and calcium on coronary artery
calcification in patients new to hemodialysis. Kidney International, 68(4),
pp.1815-1824.
Block, G.A., Wheeler, D.C., Persky, M.S., Kestenbaum, B., Ketteler, M., Spiegel,
D.M., Allison, M.A., Asplin, J., Smits, G., Hoofnagle, A.N., Kooienga, L.,
Thadhani, R., Mannstadt, M., Wolf, M. and Chertow, G.M. (2012). Effects of
phosphate binders in moderate CKD. Journal of the American Society of
Nephrology, 23(8), pp.1407-1415.
Bodin, P. and Burnstock, G. (1996). ATP-stimulated release of ATP by human
endothelial cells. Journal of Cardiovascular Pharmacology, 27(6), pp.872-875.
195
Bohle, A., Wehrmann, M., Bogenschutz, O., Batz, C., Muller, C.A. and Muller, G.A.
(1991). The pathogenesis of chronic renal failure in diabetic nephropathy:
investigation of 488 cases of diabetic glomerulosclerosis. Pathology, Research
and Practice, 187(2-3), pp.251-259.
Bollee, G., Dollinger, C., Boutaud, L., Guillemot, D., Bensman, A., Harambat, J.,
Deteix, P., Daudon, M., Knebelmann, B. and Ceballos-Picot, I. (2010). Phenotype
and genotype characterisation of adenine phosphoribosyltransferase deficiency.
Journal of the American Society of Nephrology, 21(4), pp.679-688.
Booth, J.W., Tam, F.W. and Unwin, R.J. (2012). P2 purinoceptors: Renal
pathophysiology and therapeutic potential. Clinical Nephrology, 78(2), pp.154-
163.
Bouxsein, M.L., Boyd, S.K., Christiansen, B.A., Guldberg, R.E., Jepsen, K.J. and
Muller, R. (2010). Guidelines for assessment of bone microstructure in rodents
using micro-computed tomography. Journal of Bone and Mineral Research,
25(7), pp.1468-1486.
Bulanova, E., Budagian, V., Orinska, Z., Hein, M., Petersen, F., Thon, L., Adam, D.
and Bulfone-Paus, S. (2005). Extracellular ATP induces cytokine expression and
apoptosis through P2X7 receptor in murine mast cells. The Journal of
Immunology, 174(7), pp.3880-3890.
Burnstock, G. (2002). Purinergic signaling and vascular cell proliferation and death.
Arteriosclerosis, Thrombosis, and Vascular Biology, 22(3), pp.364-373.
Burnstock, G. (2006). Purinergic Signalling. British Journal of Pharmacology,
147(S1), pp.172-181.
Burnstock, G. (2009). Purinergic regulation of vascular tone and remodelling.
Autonomic and Autacoid Pharmacology, 29(3), pp.63-72.
Burnstock, G. (2012). Purinergic Signalling: its unpopular beginning, its acceptance
and its exciting future. Bioessays, 34(3), pp.218-225.
Burnstock, G. and Knight, G.E. (2004). Cellular distribution and functions of P2

196
receptor subtypes in different systems. International Review of Cytology, 240,
pp.31-304.
Bywaters, E.G. and Beall, D. (1941). Crush injuries with impairment of renal
function. British Medical Journal, 1(4185), pp.427-432.
Cario-Toumaniantz, C., Loirand, G., Ladoux, A. and Pacaud, P. (1998). P2X7
receptor activation-induced contraction and lysis in human saphenous vein
smooth muscle. Circulation Research, 83(2), pp.196-203.
Celil, A.B. and Campbell, P.G. (2005). BMP-2 and insulin-like growth factor-I
mediate Osterix (Osx) expression in human mesenchymal stem cells via the
MAPK and protein kinase D signaling pathways. Journal of Biological
Chemistry, 280(36), pp.31353-31359.
Chang, M.Y., Lu, J.K., Tian, Y.C., Chen, Y.C., Hung, C.C., Huang, Y.H., Chen,
Y.H., Wu, M.S., Yang, C.W. and Cheng, Y.C. (2011). Inhibition of the P2X7
receptor reduces cystogenesis in PKD. Journal of the American Society of
Nephrology, 22(9), pp.1696-1706.
Chanutin, A. and Ferris, E.B. Jr. (1932). Experimental renal insufficiency produced
by partial nephrectomy: I. Control diet. Archives of Internal Medicine, 49(5),
pp.767-787.
Chen, N.X., O'Neill, K.D., Chen, X., Kiattisunthorn, K., Gattone, V.H. and Moe,
S.M. (2011). Activation of arterial matrix metalloproteinases leads to vascular
calcification in chronic kidney disease. American Journal of Nephrology, 34(3),
pp.211-219.
Chertow, G.M., Block, G.A., Correa-Rotter, R., Drueke, T.B., Floege, J., Goodman,
W.G., Herzog, C.A., Kubo, Y., London, G.M., Mahaffey, K.W., Mix, T.C., Moe,
S.M., Trotman, M.L., Wheeler, D.C. and Parfrey, P.S. (2012). Effect of cinacalcet
on cardiovascular disease in patients undergoing dialysis. The New England
Journal of Medicine, 367(26), pp.2482-2494.
Chertow, G.M., Burke, S.K. and Raggi, P. (2002). Sevelamer attenuates the
progression of coronary and aortic calcification in hemodialysis patients. Kidney
197
International, 62(1), pp.245-252.
Chessell, I.P., Hatcher, J.P., Bountra, C., Michel, A.D., Hughes, J.P., Green, P.,
Egerton, J., Murfin, M., Richardson, J., Peck, W.L., Grahames, C.B., Casula,
M.A., Yiangou, Y., Birch, R., Anand, P. and Buell, G.N. (2005). Disruption of the
P2X7 purinoceptor gene abolishes chronic inflammatory and neuropathic pain.
Pain, 114(3), pp.386-396.
Chiu, Y.W., Adler, S.G., Budoff, M.J., Takasu, J., Ashai, J. and Mehrotra, R. (2010).
Coronary artery calcification and mortality in diabetic patients with proteinuria.
Kidney International, 77(12), pp.1107-1114.
Chow, A.K., Cena, J. and Schulz, R. (2007). Acute actions and novel targets of
matrix metalloproteinases in the heart and vasculature. British Journal of
Pharmacology, 152(2), pp.189-205.
Chung, A.W., Yang, H.H., Sigrist, M.K., Brin, G., Chum, E., Gourlay, W.A. and
Levin, A. (2009). Matrix metalloproteinase-2 and -9 exacerbate arterial stiffening
and angiogenesis in diabetes and chronic kidney disease. Cardiovascular
Research, 84(3), pp.494-504.
Ciceri, P., Volpi, E., Brenna, I., Arnaboldi, L., Neri, L., Brancaccio, D. and
Cozzolino, M. (2012a). Combined effects of ascorbic acid and phosphate on rat
VSMC osteoblastic differentiation. Nephrology Dialysis Transplantation, 27(1),
pp.122-127.
Ciceri, P., Volpi, E., Brenna, I., Elli, F., Borghi, E., Brancaccio, D. and Cozzolino,
M. (2012b). The combination of lanthanum chloride and the calcimimetic
calindol delays the progression of vascular smooth muscle cells calcification.
Biochemical and Biophysical Research Communications, 418(4), pp.770-773.
Coll, B., Betriu, A., Mart'inez-Alonso, M., Amoedo, M.L., Arcidiacono, M.V.,
Borras, M., Valdivielso, J.M. and Fernandez, E. (2011). Large artery calcification
on dialysis patients is located in the intima and related to atherosclerosis. Clinical
Journal of the American Society of Nephrology, 6(2), pp.303-310.
Costa-Junior, H.M., Sarmento Vieira, F. and Coutinho-Silva, R. (2011). C terminus
198
of the P2X7 receptor: treasure hunting. Purinergic Signalling, 7(1), pp.7-19.
Cote, N., El Husseini, D., Pepin, A., Guauque-Olarte, S., Ducharme, V., Bouchard-
Cannon, P., Audet, A., Fournier, D., Gaudreault, N., Derbali, H., McKee, M.D.,
Simard, C., Despres, J.P., Pibarot, P., Bosse, Y. and Mathieu, P. (2012a). ATP
acts as a survival signal and prevents the mineralisation of aortic valve. Journal of
Molecular and Cellular Cardiology, 52(5), pp.1191-1202.
Cote, N., El Husseini, D., Pepin, A., Bouvet, C., Gilbert, L.A., Audet, A., Fournier,
D., Pibarot, P., Moreau, P. and Mathieu, P. (2012b). Inhibition of
ectonucleotidase with ARL67156 prevents the development of calcific aortic
valve disease in warfarin-treated rats. European Journal of Pharmacology, 689(1-
3), pp.139-146.
Coutinho-Silva, R., Persechini, P.M., Bisaggio, R.D., Perfettini, J.L., Neto, A.C.,
Kanellopoulos, J.M., Motta-Ly, I., Dautry-Varsat, A. and Ojcius, D.M. (1999).
P2Z/P2X7 receptor-dependent apoptosis of dendritic cells. American Journal of
Physiology, 276(5 Pt 1):C1139-47.
Crouthamel, M.H., Lau, W.L., Leaf, E.M., Chavkin, N.W., Wallingford, M.C.,
Peterson, D.F., Li, X., Liu, Y., Chin, M.T., Levi, M. and Giachelli, C.M. (2013).
Sodium-Dependent Phosphate Cotransporters and Phosphate-Induced
Calcification of Vascular Smooth Muscle Cells: Redundant Roles for PiT-1 and
PiT-2. Arteriosclerosis, Thrombosis, and Vascular Biology, 33(11), pp.2625-
2632.
Davies, M.R., Lund, R.J., Mathew, S. and Hruska, K.A. (2005). Low turnover
osteodystrophy and vascular calcification are amenable to skeletal anabolism in
an animal model of chronic kidney disease and the metabolic syndrome. Journal
of the American Society of Nephrology, 16(4), pp.917-928.
Dawber, T.R., Kannel, W.B., Revotskie, N., Stokes III, J., Kagan, A. and Gordon, T.
(1959). Some Factors Associated with the Development of Coronary Heart
Disease—Six Years' Follow-Up Experience in the Framingham Study. American
Journal of Public Health and the Nations Health, 49(10), pp.1349-1356.
199
Dawber, T.R., Moore, F.E. and Mann, G.V. (1957). Coronary heart disease in the
Framingham study. American Journal of Public Health and the Nations Health,
47(4 Pt 2), pp.4-24.
De Schutter, T.M., Neven, E., Persy, V.P., Behets, G.J., Postnov, A.A., De Clerck,
N.M. and D’Haese, P.C. (2011). Vascular calcification is associated with cortical
bone loss in chronic renal failure rats with and without ovariectomy: the
calcification paradox. American Journal of Nephrology, 34(4), pp.356-366.
Desjardins, L., Liabeuf, S., Renard, C., Lenglet, A., Lemke, H.D., Choukroun, G.,
Drueke, T.B. and Massy, Z.A. (2012). FGF23 is independently associated with
vascular calcification but not bone mineral density in patients at various CKD
stages. Osteoporosis International, 23(7), pp.2017-2025.
Di Angelantonio, E., Chowdhury, R., Sarwar, N., Aspelund, T., Danesh, J. and
Gudnason, V. (2010). Chronic kidney disease and risk of major cardiovascular
disease and non-vascular mortality: prospective population based cohort study.
British Medical Journal, 341, c4986.
Di Virgilio, F. (2007). Liaisons dangereuses: P2X7 and the inflammasome. Trends in
Pharmacological Sciences, 28(9), pp.465-472.
Donnelly-Roberts, D.L. and Jarvis, M.F. (2007). Discovery of P2X7 receptor-
selective antagonists offers new insights into P2X7 receptor function and
indicates a role in chronic pain states. British Journal of Pharmacology, 151(5),
pp.571-579.
Donnelly-Roberts, D.L., Namovic, M.T., Han, P. and Jarvis, M.F. (2009).
Mammalian P2X7 receptor Pharmacology: comparison of recombinant mouse, rat
and human P2X7 receptors. British Journal of Pharmacology, 157(7), pp.1203-
1214.
Drury, A.N. and Szent-Gyorgyi, A. (1929). The physiological activity of adenine
compounds with especial reference to their action upon the mammalian heart. The
Journal of Physiology, 68(3), pp.213-237.
Ducy, P., Zhang, R., Geoffroy, V., Ridall, A.L. and Karsenty, G. (1997).

200
Osf2/Cbfa1: a transcriptional activator of osteoblast differentiation. Cell, 89(5),
pp.747-754.
Duer, M.J., Friscic, T., Proudfoot, D., Reid, D.G., Schoppet, M., Shanahan, C.M,
Skepper, J.N. and Wise, E.R. (2008). Mineral surface in calcified plaque is like
that of bone further evidence for regulated mineralisation. Arteriosclerosis,
Thrombosis, and Vascular Biology, 28(11), pp.2030-2034.
Eaton, G.J., Custer, R.P., Johnson, F.N. and Stabenow, K.T. (1978). Dystrophic
cardiac calcinosis in mice: genetic, hormonal, and dietary influences. The
American Journal of Pathology, 90(1), pp.173-186.
Efstratiadis, G., Voulgaridou, A., Nikiforou, D., Kyventidis, A., Kourkouni, E. and
Vergoulas, G. (2007). Rhabdomyolysis updated. Hippokratia, 11(3), pp.129-137.
El-Abbadi, M.M., Pai, A.S., Leaf, E.M., Yang, H.Y., Bartley, B.A., Quan, K.K.,
Ingalls, C.M., Liao, H.W. and Giachelli, C.M. (2009). Phosphate feeding induces
arterial medial calcification in uremic mice: role of serum phosphorus, fibroblast
growth factor-23, and osteopontin. Kidney International, 75(12), pp.1297-1307.
Eller, P., Hochegger, K., Feuchtner, G.M., Zitt, E., Tancevski, I., Ritsch, A.,
Kronenberg, F., Rosenkranz, A.R., Patsch, J.R. and Mayer, G. (2008). Impact of
ENPP1 genotype on arterial calcification in patients with end-stage renal failure.
Nephrology Dialysis Transplantation, 23(1), pp.321-327.
Erlinge, D. and Burnstock, G. (2008). P2 receptors in cardiovascular regulation and
disease. Purinergic Signalling, 4(1), pp.1-20.
Erlinge, D., Hou, M., Webb, T.E., Barnard, E.A. and Moller, S. (1998). Phenotype
changes of the vascular smooth muscle cell regulate P2 receptor expression as
measured by quantitative RT-PCR. Biochemical and Biophysical Research
Communications, 248(3), pp.864-870.
Eytan, O., Morice-Picard, F., Sarig, O., Ezzedine, K., Isakov, O., Li, Q., Ishida-
Yamamoto, A., Shomron, N., Goldsmith, T., Fuchs-Telem, D., Adir, N., Uitto, J.,
orlow, S.J., Taieb, A. and Sprecher, E. (2013). Cole Disease Results from
Mutations in ENPP1. The American Journal of Human Genetics, 93(4), pp.752-
201
757.
Fedde, K.N., Blair, L., Silverstein, J., Coburn, S.P., Ryan, L.M., Weinstein, R.S.,
Waymire, K., Narisawa, S., Millan, J.L., Macgregor, G.R. and Whyte, M.P.
(1999). Alkaline phosphatase knock-out mice recapitulate the metabolic and
skeletal defects of infantile hypophosphatasia. Journal of Bone and Mineral
Research, 14(12), pp.2015-2026.
Feldkamp, L.A., Davis, L.C. and Kress, J.W. (1984). Practical cone-beam algorithm.
Journal of the Optical Society of America, 1(6), pp.612-619.
Fellstrom, B.C., Jardine, A.G., Schmieder, R.E., Holdaas, H., Bannister, K., Beutler,
J., Chae, D.W., Chevaile, A., Cobbe, S.M., Gronhagen-Riska, C., De Lima, J.J.,
Lins, R., Mayer, G., McMahon, A.W., Parving, H.H., Remuzzi, G., Sameulsson,
O., Sonkodi, S., Sci, D., Suleymanlar, G., Tsakiris, D., Tesar, V., Todorov, V.,
Wiecek, A., Wuthrich, R.P., Gottlow, M., Johnsson, E. and Zannad, F. (2009).
Rosuvastatin and cardiovascular events in patients undergoing hemodialysis. New
England Journal of Medicine, 360(14), pp.1395-1407.
Fink, M., Henry, M. and Tange, J.D. (1987). Experimental folic acid nephropathy.
Pathology, 19(2), pp.143-149.
Fleige, S. and Pfaffl, M.W. (2006). RNA integrity and the effect on the real-time
qRT-PCR performance. Molecular Aspects of Medicine, 27(2-3), pp.126-139.
Fleisch, H., Schibler, D., Maerki, J. and Frossard, I. (1965). Inhibition of aortic
calcification by means of pyrophosphate and polyphosphates. Nature, 207(5003),
pp.1300-1301.
Forbes, R.M. (1971). Attempts to Alter Kidney Calcification in the Magnesium-
Deficient Rat. The Journal of Nutrition, 101(1), pp.35-44.
Franceschi, C., Abbracchio, M.P., Barbieri, D., Ceruti, S., Ferrari, D., Iliou, J.P.,
Rounds, S., Schubert, P., Schulze-Lohoff, E., Rassendren, F.A., Staub, M.,
Volonte, C., Wakade, A.R. and Burnstock, G. (1996). Purines and cell death.
Drug Development Research, 39(3-4), pp.442-449.

202
Francis, M.D. (1969). The inhibition of calcium hydroxyapatite crystal growth by
polyphosphonates and polyphosphates. Calcified Tissue Research, 3(1), pp.151-
162.
Gartland, A., Buckley, K.A., Hipskind, R.A., Bowler, W.B. and Gallagher, J.A.
(2003a). P2 Receptors in Bone-Modulation of Osteoclast Formation and Activity
via P2X7 Activation. Critical Reviews in Eukaryotic Gene Expression, 13(2-4),
pp.237-242.
Gartland, A., Buckley, K.A., Hipskind, R.A., Perry, M.J., Tobias, J.H., Buell, G.,
Chessell, I., Bowler, W.B. and Gallagher, J.A. (2003b). Multinucleated Osteoclast
Formation In Vivo and In Vitro by P2X7 Receptor-Deficient Mice. Critical
Reviews in Eukaryotic Gene Expression, 13(2-4), pp.243-253.
Gartland, A., Hipskind, R.A., Gallagher, J.A. and Bowler, W.B, (2001). Expression
of a P2X7 receptor by a subpopulation of human osteoblasts. Journal of Bone and
Mineral Research, 16(5), pp.846-856.
Gartland, A., Skarratt, K.K., Hocking, L.J., Parsons, C., Stokes, L., Jorgensen, N.R.,
Fraser, W.D., Reid, D.M., Gallagher, J.A. and Wiley, J.S. (2012). Polymorphisms
in the P2X7 receptor gene are associated with low lumbar spine bone mineral
density and accelerated bone loss in post-menopausal women. European Journal
of Human Genetics, 20(5), pp.559-564.
Go, A.S., Chertow, G.M., Fan, D., McCulloch, C.E. and Hsu, C.Y. (2004). Chronic
kidney disease and the risks of death, cardiovascular events, and hospitalisation.
New England Journal of Medicine, 351(13), pp.1296-1305.
Goncalves, R.G., Gabrich, L., Rosario, A. Jr., Takiya, C.M., Ferreira, M.L., Chiarini,
L.B., Persechini, P.M., Coutinho-Silva, R. and Leite, M. Jr. (2006). The role of
purinergic P2X7 receptors in the inflammation and fibrosis of unilateral ureteral
obstruction in mice. Kidney International, 70(9), pp.1599-1606.
Grol, M.W., Panupinthu, N., Korcok, J., Sims, S.M. and Dixon, S.J. (2009).
Expression, signaling, and function of P2X7 receptors in bone. Purinergic
Signalling, 5(2), pp.205-221.
203
Groschel-Stewart, U., Bardini, M., Robson, T. and Burnstock, G. (1999).
Localisation of P2X5 and P2X7 receptors by immunohistochemistry in rat
stratified squamous epithelia. Cell and Tissue Research, 296(3), pp.599-605.
Gu, B.J. and Wiley, J.S. (2006). Rapid ATP-induced release of matrix
metalloproteinase 9 is mediated by the P2X7 receptor. Blood, 107(12), pp.4946-
4953.
Gu, B.J., Zhang, W.Y., Bendall, L.J., Chessell, I.P., Buell, G.N. and Wiley, J.S.
(2000). Expression of P2X7 purinoceptors on human lymphocytes and
monocytes: evidence for nonfunctional P2X7 receptors. American Journal of
Physiology-Cell Physiology, 279(4), C1189-1197.
Haffner, D., Hocher, B., Muller, D., Simon, K., K"onig, K., Richter, C.M., Eggert,
B., Schwarz, J., Godes, M., Nissel, R. and Querfeld, U. (2005). Systemic
cardiovascular disease in uremic rats induced by 1,25(OH)2D3. Journal of
Hypertension, 23(5), pp.1067-1075.
Hao, H., Hirota, S., Tsukamoto, Y., Imakita, M., Ishibashi-Ueda, H. and Yutani, C.
(1995). Alterations of bone matrix protein mRNA expression in rat aorta in vitro.
Arteriosclerosis, Thrombosis, and Vascular Biology, 15(9), pp.1474-1480.
Harmey, D., Hessle, L., Narisawa, S., Johnson, K.A., Terkeltaub, R. and Millan, J.L.
(2004). Concerted Regulation of Inorganic Pyrophosphate and Osteopontin by
akp2, enpp1, and ank: An Integrated Model of the Pathogenesis of Mineralisation
Disorders. The American Journal of Pathology, 164(4), pp.1199-1209.
Haut, L.L., Alfrey, A.C., Guggenheim, S., Buddington, B. and Schrier, N. (1980).
Renal toxicity of phosphate in rats. Kidney International, 17(6), pp.722-731.
Henley, C., Davis, J., Miller, G., Shatzen, E., Cattley, R., Li, X., Martin, D., Yao,
W., Lane, N. and Shalhoub, V. (2009). The calcimimetic AMG 641 abrogates
parathyroid hyperplasia, bone and vascular calcification abnormalities in uremic
rats. European Journal of Pharmacology, 616(1-3), pp.306-313.
Ho, A.M., Johnson, M.D. and Kingsley, D.M. (2000). Role of the mouse ank gene in
control of tissue calcification and arthritis. Science, 289(5477), pp.265-270.
204
Holden, R.M., Morton, A.R., Garland, J.S., Pavlov, A., Day, A.G. and Booth, S.L.
(2010). Vitamins K and D status in stages 3-5 chronic kidney disease. Clinical
Journal of the American Society of Nephrology, 5(4), pp.590-597.
Honore, P., Donnelly-Roberts, D., Namovic, M., Zhong, C., Wade, C., Chandran, P.,
Zhu, C., Carroll, W., Perez-Medrano, A., Iwakura, Y. and Jarvis, M.F. (2009).
The antihyperalgesic activity of a selective P2X7 receptor antagonist, A-839977,
is lost in IL-1alphabeta knockout mice. Behavioural Brain Research, 204(1),
pp.77-81.
Hopper, T.A., Wehrli, F.W., Saha, P.K., Andre, J.B., Wright, A.C., Sanchez, C.P.
and Leonard, M.B. (2007). Quantitative microcomputed tomography assessment
of intratrabecular, intertrabecular, and cortical bone architecture in a rat model of
severe renal osteodystrophy. Journal of Computer Assisted Tomography, 31(2),
pp.320-328.
Hori, M. and Henderson, J.F. (1966). Kinetic studies of adenine
phosphoribosyltransferase. Journal of Biological Chemistry, 241(14), pp.3404-
3408.
Hosaka, N., Mizobuchi, M., Ogata, H., Kumata, C., Kondo, F., Koiwa, F., Kinugasa,
E. and Akizawa, T. (2009). Elastin degradation accelerates phosphate-induced
mineralisation of vascular smooth muscle cells. Calcified Tissue International,
85(6), pp.523-529.
Hosoda, Y., Yoshimura, Y. and Hiqaki, S. (1981). A new breed of mouse showing
multiple osteochondral lesions – twy mouse. Ryumachi, 21 Suppl, pp.157-164.
Hough, T.A., Nolan, P.M., Tsipouri, V., Toye, A.A., Gray, I.C., Goldsworthy, M.,
Moir, L., Cox, R.D., Clements, S., Glenister, P.H., Wood, J., Selley, R.L.,
Strivens, M.A., Vizor, L., McCormack, S.L., Peters, J., Fisher, E.M., Spurr, N,.
Rastan, S., Martin, J.E., Brown, S.D. and Hunter, A.J. (2002). Novel phenotypes
identified by plasma biochemical screening in the mouse. Mammalian Genome,
13(10), pp.595-602.
Hruska, K.A., Mathew, S. and Saab, G. (2005). Bone morphogenetic proteins in
205
vascular calcification. Circulation Research, 97(2), pp.105-114.
Huang, L., Scarpellini, A., Funck, M., Verderio, E.A. and Johnson, T.S. (2013).
Development of a chronic kidney disease model in C57BL/6 mice with relevance
to human pathology. Nephron Extra, 3(1), pp.12-29.
Huang, M.S., Sage, A.P., Lu, J., Demer, L.L. and Tintut, Y. (2008). Phosphate and
pyrophosphate mediate PKA-induced vascular cell calcification. Biochemical and
Biophysical Research Communications, 374(3), pp.553-558.
Ishibashi, S., Goldstein, J.L., Brown, M.S., Herz, J. and Burns, D.K. (1994). Massive
xanthomatosis and atherosclerosis in cholesterol-fed low density lipoprotein
receptor-negative mice. Journal of Clinical Investigation, 93(5), pp.1885-1893.
Ivandic, B.T., Utz, H.F., Kaczmarek, P.M., Aherrahrou, Z., Axtner, S.B., Klepsch,
C., Lusis, A.J. and Katus, H.A. (2001). New Dyscalc loci for myocardial cell
necrosis and calcification (dystrophic cardiac calcinosis) in mice. Physiological
Genomics, 6(3), pp.137-144.
Ix, J.H., Shlipak, M.G., Brandenburg, V.M., Ali, S., Ketteler, M. and Whooley, M.A.
(2006). Association between human fetuin-A and the metabolic syndrome data
from the heart and soul study. Circulation, 113(14), pp.1760-1767.
Jahnen-Dechent, W., Heiss, A., Schafer, C. and Ketteler, M. (2011). Fetuin-A
regulation of calcified matrix metabolism. Circulation Research, 108(12),
pp.1494-1509.
Jamal, S.A., Vandermeer, B., Raggi, P., Mendelssohn, D.C., Chatterley, T., Dorgan,
M., Lok, C.E., Fitchett, D. and Tsuyuki, R.T. (2013). Effect of calcium-based
versus non-calcium-based phosphate binders on mortality in patients with chronic
kidney disease: an updated systematic review and meta-analysis. The Lancet,
382(9900), pp.1268-1277.
Jawien, J., Nastalek, P. and Korbut, R. (2004). Mouse models of experimental
atherosclerosis. Journal of Physiology and Pharmacology, 55(3), pp.503-517.
Jensky, N.E., Criqui, M.H., Wright, C.M., Wassel, C.L., Alcaraz, J.E. and Allison,
206
M.A. (2011). The association between abdominal body composition and vascular
calcification. Obesity (Silver Spring), 19(12), pp.2418-2424.
Jia, T., Olauson, H., Lindberg, K., Amin, R., Edvardsson, K., Lindholm, B.,
Andersson, G., Wernerson, A., Sabbagh, Y., Schiavi, S. and Larsson, T.E. (2013).
A novel model of adenine-induced tubulointerstitial nephropathy in mice. BMC
Nephrology, 14(1), pp.116.
Johnson, K.A., Hessle, L., Vaingankar, S., Wennberg, C., Mauro, S., Narisawa, S.,
Goding, J.W., Sano, K., Millan, J.L. and Terkeltaub, R. (2000). Osteoblast tissue-
nonspecific alkaline phosphatase antagonizes and regulates PC-1. American
Journal of Physiology-Regulatory, Integrative and Comparative Physiology,
279(4), R1365-1377.
Jono, S., McKee, M.D., Murry, C.E., Shioi, A., Nishizawa, Y., Mori, K., Morii, H.
and Giachelli, C.M. (2000). Phosphate regulation of vascular smooth muscle cell
calcification. Circulation Research, 87(7), E10-17.
Jorgensen, N.R., Henriksen, Z., Sorensen, O.H., Eriksen, E.F., Civitelli, R. and
Steinberg, T.H. (2002). Intercellular calcium signaling occurs between human
osteoblasts and osteoclasts and requires activation of osteoclast P2X7 receptors.
Journal of Biological Chemistry, 277(9), pp.7574-7580.
Junqueira, L.C., Bignolas, G. and Brentani, R.R. (1979). Picrosirius staining plus
polarisation microscopy, a specific method for collagen detection in tissue
sections. The Histochemical Journal, 11(4), pp.447-455.
Kaczmarek, E., Koziak, K., Sevigny, J., Siegel, J.B., Anrather, J., Beaudoin, A.R.,
Bach, F.H. and Robson, S.C. (1996). Identification and characterisation of
CD39/vascular ATP diphosphohydrolase. Journal of Biological Chemistry,
271(51), pp.33116-33122.
Kapustin, A.N., Davies, J.D., Reynolds, J.L., McNair, R., Jones, G.T., Sidibe, A.,
Schurgers, L.J., Skepper, J.N., Proudfoot, D., Mayr, M. and Shanahan, C.M.
(2011). Calcium regulates key components of vascular smooth muscle cell-
derived matrix vesicles to enhance mineralisation. Circulation Research, 109(1),
207
e1-12.
Kaspareit-Rittinghausen, J., Deerberg, F., Rapp, K.G. and Wcislo, A. (1990). A new
rat model for polycystic kidney disease of humans. Transplantation Proceedings,
22(6), pp.2582–2583.
Kato, K., Nishimasu, H., Okudaira, S., Mihara, E., Ishitani, R., Takagi, J., Aoki, J.
and Nureki, O. (2012). Crystal structure of Enpp1, an extracellular glycoprotein
involved in bone mineralisation and insulin signaling. Proceedings of the
National Academy of Sciences of the United States of America, 109(42),
pp.16876-16881.
Katsumata, K., Kusano, K., Hirata, M., Tsunemi, K., Nagano, N., Burke, S.K. and
Fukushima, N. (2003). Sevelamer hydrochloride prevents ectopic calcification
and renal osteodystrophy in chronic renal failure rats. Kidney International, 64(2),
pp.441-450.
Katsuragi, T., Tokunaga, T., Ogawa, S., Soejima, O., Sato, C. and Furukawa, T.
(1991). Existence of ATP-evoked ATP release system in smooth muscles.
Journal of Pharmacology and Experimental Therapeutics, 259(2), pp.513-518.
Kauffenstein, G., Drouin, A., Thorin-Trescases, N., Bachelard, H., Robaye, B.,
D'Orleans-Juste, P., Marceau, F., Thorin, E. and Sevigny, J. (2010a). NTPDase1
(CD39) controls nucleotide-dependent vasoconstriction in mouse. Cardiovascular
Research, 85(1), pp.204-213.
Kauffenstein, G., Furstenau, C.R., D'Orleans-Juste, P. and Sevigny, J. (2010b). The
ecto-nucleotidase NTPDase1 differentially regulates P2Y1 and P2Y2 receptor-
dependent vasorelaxation. British Journal of Pharmacology, 159(3), pp.576-585.
Kawata, T., Nagano, N., Obi, M., Miyata, S., Koyama, C., Kobayashi, N., Wakita, S.
and Wada, M. (2008). Cinacalcet suppresses calcification of the aorta and heart in
uremic rats. Kidney International, 74(10), pp.1270-1277.
Ke, H.Z., Qi, H., Weidema, A.F., Zhang, Q., Panupinthu, N., Crawford, D.T.,
Grasser, W.A., Paralkar, V.M., Li, M., Audoly, L.P., Gabel, C.A., Lee, W.S.,
Dixon, S.J., Sims, S.M. and Thompson, D.D. (2003). Deletion of the P2X7

208
nucleotide receptor reveals its regulatory roles in bone formation and resorption.
Molecular Endocrinology, 17(7), pp.1356-1367.
Ketteler, M., Bongartz, P., Westenfeld, R., Wildberger, J.E., Mahnken, A.H., Bohm,
R., Metzger, T., Wanner, C., Jahnen-Dechent, W. and Floege, J. (2003).
Association of low fetuin-A (AHSG) concentrations in serum with cardiovascular
mortality in patients on dialysis: a cross-sectional study. The Lancet, 361(9360),
pp.827-833.
Keystone, E.C., Wang, M.M., Layton, M., Hollis, S. and McInnes, I.B. (2011).
Clinical evaluation of the efficacy of the P2X7 purinergic receptor antagonist
AZD9056 on the signs and symptoms of rheumatoid arthritis in patients with
active disease despite treatment with methotrexate or sulphasalazine. Annals of
the Rheumatic Diseases, 71(10), pp.1630-1635.
Kidney Disease: Improving Global Outcomes (KDIGO) CKD Work Group. (2013).
KDIGO 2012 clinical practice guideline for the evaluation and management of
chronic kidney disease. Kidney International Supplements, 3(1), pp.1-150.
Kidney Disease: Improving Global Outcomes (KDIGO) CKD–MBD Work Group.
(2009). KDIGO clinical practice guideline for the diagnosis, evaluation,
prevention, and treatment of Chronic Kidney Disease-Mineral and Bone Disorder
(CKD-MBD). Kidney International Supplement, 76 (Suppl 113), S1-S130.
Komori, T., Yagi, H., Nomura, S., Yamaguchi, A., Sasaki, K., Deguchi, K., Shimizu,
Y., Bronson, R.T., Gao, Y.H., Inada, M., Sato, M., Okamoto, R., Kitamura, Y.,
Yoshiki, S. and Kishimoto, T. (1997). Targeted Disruption of Cbfa1 Results in a
Complete Lack of Bone Formation owing to Maturational Arrest of Osteoblasts.
Cell, 89(5), pp.755-764.
Koos, R., Brandenburg, V., Mahnken, A.H., Muhlenbruch, G., Stanzel, S., Gunther,
R.W., Floege, J., Jahnen-Dechent, W., Kelm, M. and Kuhl, H.P. (2009).
Association of fetuin-A levels with the progression of aortic valve calcification in
non-dialyzed patients. European Heart Journal, 30(16), pp.2054-2061.
Kramann, R., Couson, S.K., Neuss, S., Kunter, U., Bovi, M., Bornemann, J.,
209
Knuchel, R., Jahnen-Dechent, W., Floege, J. and Schneider, R.K. (2011).
Exposure to uremic serum induces a procalcific phenotype in human
mesenchymal stem cells. Arteriosclerosis, Thrombosis, and Vascular Biology,
31(9), e45-54.
Krueger, T., Schlieper, G., Schurgers, L., Cornelis, T., Cozzolino, M., Jacobi, J.,
Jadoul, M., Ketteler, M., Rump, L.C., Stenvinkel, P., Westenfeld, R., Wiecek, A.,
Reinartz, S., Hilgers, R.D. and Floege, J. (2013). Vitamin K1 to slow vascular
calcification in haemodialysis patients (VitaVasK trial): a rationale and study
protocol. Nephrology Dialysis Transplantation, [Epub ahead of print].
Lanzer, P., Boehm, M., Sorribas, V., Thiriet, M., Janzen, J., Zeller, T., St Hilaire, C.
and Shanahan, C. (2014). Medial vascular calcification revisited: review and
perspectives. European Heart Journal, 35(23), pp.1515-1525.
Laroche, M. and Delmotte, A. (2005). Increased arterial calcification in Paget’s
disease of bone. Calcified Tissue International, 77(3), pp.129-133.
Lau, W.L., Leaf, E.M., Hu, M.C., Takeno, M.M., Kuro-o, M., Moe, O.W. and
Giachelli, C.M. (2012b). Vitamin D receptor agonists increase klotho and
osteopontin while decreasing aortic calcification in mice with chronic kidney
disease fed a high phosphate diet. Kidney International, 82(12), pp.1261-1270.
Lau, W.L., Linnes, M., Chu, E.Y., Foster, B.L., Bartley, B.A., Somerman, M.J. and
Giachelli, C.M. (2012a). High phosphate feeding promotes mineral and bone
abnormalities in mice with chronic kidney disease. Nephrology Dialysis
Transplantation, 28(1), pp.62-69.
Leroux-Berger, M., Queguiner, I., Maciel, T.T., Ho, A., Relaix, F. and Kempf, H.
(2011). Pathologic calcification of adult vascular smooth muscle cells differs on
their crest or mesodermal embryonic origin. Journal of Bone and Mineral
Research, 26(7), pp.1543-1553.
Levesque, S.A., Lavoie, E.G., Lecka, J., Bigonnesse, F. and Sevigny, J. (2007).
Specificity of the ecto-ATPase inhibitor ARL 67156 on human and mouse
ectonucleotidases. British Journal of Pharmacology, 152(1), pp.141-150.
210
Levey, A.S. and Coresh, J. (2012). Chronic kidney disease. The Lancet, 379(9811),
pp.165-180.
Levey, A.S., de Jong, P.E., Coresh, J., El Nahas, M., Astor, B.C., Matsushita, K.,
Gansevoort, R.T., Kasiske, B.L. and Eckardt, K.U. (2010). The definition,
classification, and prognosis of chronic kidney disease: a KDIGO Controversies
Conference report. Kidney International, 80(1), pp.17-28.
Levy-Litan, V., Hershkovitz, E., Avizov, L., Leventhal, N., Bercovich, D., Chalifa-
Caspi, V., Manor, E., Buriakovsky, S., Hadad, Y., Goding, J. and Parvari, R.
(2010). Autosomal-Recessive Hypophosphatemic Rickets Is Associated with an
Inactivation Mutation in the ENPP1 Gene. The American Journal of Human
Genetics, 86(2), pp.273-278.
Lew, M.J. and White, T.D. (1987). Release of endogenous ATP during sympathetic
nerve stimulation. British Journal of Pharmacology, 92(2), pp.349-355.
Lewis, C.J. and Evans, R.J. (2001). P2X receptor immunoreactivity in different
arteries from the femoral, pulmonary, cerebral, coronary and renal circulations.
Journal of Vascular Research, 38(4), pp.332-340.
Li, X., Yang, H.Y. and Giachelli, C.M. (2006). Role of the sodium-dependent
phosphate cotransporter, Pit-1, in vascular smooth muscle cell calcification.
Circulation Research, 98(7), pp.905-912.
Liao, H., Hyman, M.C., Baek, A.E., Fukase, K. and Pinsky, D.J. (2010).
cAMP/CREB-mediated transcriptional regulation of ectonucleoside triphosphate
diphosphohydrolase 1 (CD39) expression. Journal of Biological Chemistry,
285(19), pp.14791-14805.
Lohman, A.W., Billaud, M. and Isakson, B.E. (2012). Mechanisms of ATP release
and signalling in the blood vessel wall. Cardiovascular Research, 95(3), pp.269-
280.
Lomashvili, K., Garg, P. and O'Neill, W.C. (2006). Chemical and hormonal
determinants of vascular calcification in vitro. Kidney International, 69(8),
pp.1464-1470.
211
Lomashvili, K.A., Cobbs, S., Hennigar, R.A., Hardcastle, K.I. and O’Neill, W.C.
(2004). Phosphate-induced vascular calcification: role of pyrophosphate and
osteopontin. Journal of the American Society of Nephrology, 15(6), pp.1392-
1401.
Lomashvili, K.A., Garg, P., Narisawa, S., Millan, J.L. and O'Neill, W.C. (2008).
Upregulation of alkaline phosphatase and pyrophosphate hydrolysis: potential
mechanism for uremic vascular calcification. Kidney International, 73(9),
pp.1024-1030.
Lomashvili, K.A., Khawandi, W. and O’Neill, W.C. (2005). Reduced plasma
pyrophosphate levels in hemodialysis patients. Journal of the American Society of
Nephrology, 16(8), pp.2495-2500.
Lomashvili, K.A., Monier-Faugere, M.C., Wang, X., Malluche, H.H. and O'Neill,
W.C. (2009). Effect of bisphosphonates on vascular calcification and bone
metabolism in experimental renal failure. Kidney International, 75(6), pp.617-
625.
Lomashvili, K.A., Narisawa, S., Millan, J.L. and O'Neill, W.C. (2014). Vascular
calcification is dependent on plasma levels of pyrophosphate. Kidney
International, 85(6), pp.1351-1356.
Lomashvili, K.A., Wang, X., Wallin, R. and O'Neill, W.C. (2011). Matrix Gla
protein metabolism in vascular smooth muscle and role in uremic vascular
calcification. Journal of Biological Chemistry, 286(33), pp.28715-28722.
London, G.M., Guerin, A.P., Marchais, S.J, Metivier, F., Pannier, B. and Adda, H.
(2003). Arterial media calcification in end-stage renal disease: impact on all-cause
and cardiovascular mortality. Nephrology Dialysis Transplantation, 18(9),
pp.1731-1740.
London, G.M., Marty, C., Marchais, S.J., Guerin, A.P., Metivier, F. and de
Vernejoul, M.C. (2004). Arterial calcifications and bone histomorphometry in
end-stage renal disease. Journal of the American Society of Nephrology, 15(7),
pp.1943-1951.
212
Long, D.A., Price, K.L., Ioffe, E., Gannon, C.M., Gnudi, L., White, K.E.,
Yancopoulos, G.D., Rudge, J.S. and Woolf, A.S. (2008). Angiopoietin-1 therapy
enhances fibrosis and inflammation following folic acid-induced acute renal
injury. Kidney International, 74(3), pp.300-309.
Lopez-Castejon, G., Theaker, J., Pelegrin, P., Clifton, A.D., Braddock, M. and
Surprenant, A. (2010). P2X7 receptor-mediated release of cathepsins from
macrophages is a cytokine-independent mechanism potentially involved in joint
diseases. The Journal of Immunology, 185(4), pp.2611-2619.
Lorenz-Depiereux, B., Schnabel, D., Tiosano, D., Hausler, G. and Strom, T.M.
(2010). Loss-of-Function ENPP1 Mutations Cause Both Generalized Arterial
Calcification of Infancy and Autosomal-Recessive Hypophosphatemic Rickets.
The American Journal of Human Genetics, 86(2), pp.267-272.
Luo, G., Ducy, P., McKee, M.D., Pinero, G.J., Loyer, E., Behringer, R.R. and
Karsenty, G. (1997). Spontaneous calcification of arteries and cartilage in mice
lacking matrix GLA protein. Nature, 386(6620), pp.78-81.
Mackenzie, N.C., Huesa, C., Rutsch, F. and MacRae, V.E. (2012). New insights into
NPP1 function: lessons from clinical and animal studies. Bone, 51(5), pp.961-968.
Mackenzie, N.C., Zhu, D., Milne, E.M., van't Hof, R., Martin, A., Darryl Quarles, L.,
Millan, J.L., Farquharson, C. and MacRae, V.E. (2012). Altered bone
development and an increase in FGF-23 expression in Enpp1(-/-) mice. PloS One,
7(2), e32177.
Maddux, B.A., Chang, Y.N., Accili, D., McGuinness, O.P., Youngren, J.F. and
Goldfine, I.D. (2006). Overexpression of the insulin receptor inhibitor PC-
1/ENPP1 induces insulin resistance and hyperglycemia. American Journal of
Physiology-Endocrinology and Metabolism, 290(4), E746-749.
Maeda, N., Doi, K. and Mitsuoka, T. (1986). Development of heart and aortic lesions
in DBA/2NCrj mice. Laboratory Animals, 20(1), pp.5-8.
Marinelli, A., Pistolesi, V., Pasquale, L., Di Lullo, L., Ferrazzano, M., Baudena, G.,
Della Grotta, F. and Di Napolie, A. (2013). Diagnosis of Arterial Media
213
Calcification in Chronic Kidney Disease. Cardiorenal Medicine, 3(2), pp.89-95.
Massy, Z.A., Ivanovski, O., Nguyen-Khoa, T., Angulo, J., Szumilak, D., Mothu, N.,
Phan, O., Daudon, M., Lacour, B., Drueke, T.B. and Muntzel, M.S. (2005).
Uremia accelerates both atherosclerosis and arterial calcification in apolipoprotein
E knockout mice. Journal of the American Society of Nephrology, 16(1), pp.109-
116.
Matsumoto, T., Tostes, R.C. and Webb, R.C. (2011). The role of uridine adenosine
tetraphosphate in the vascular system. Advances in Pharmacological Sciences,
2011, pp.435132.
McBride, A. and Westervelt, P. (2012). Recognizing and managing the expanded
risk of tumor lysis syndrome in hematologic and solid malignancies. Journal of
Hematology & Oncology, 5, pp.75.
McCabe, K.M., Booth, S.L., Fu, X., Shobeiri, N., Pang, J.J., Adams, M.A. and
Holden, R.M. (2013). Dietary vitamin K and therapeutic warfarin alter the
susceptibility to vascular calcification in experimental chronic kidney disease.
Kidney International, 83(5), pp.835-844.
McGaraughty, S., Chu, K.L., Namovic, M.T., Donnelly-Roberts, D.L., Harris, R.R.,
Zhang, X.F., Shieh, C.C., Wismer, C.T., Zhu, C.Z., Gauvin, D.M., Fabiyi, A.C.,
Honore, P., Gregg, R.J., Kort, M.E., Nelson, D.W., Carroll, W.A., Marsh, K.,
Faltynek, C.R. and Jarvis, M.F. (2007). P2X7-related modulation of pathological
nociception in rats. Neuroscience, 146(4), pp.1817-1828.
Meier, M., Weng, L.P., Alexandrakis, E., Ruschoff, J. and Goeckenjan, G. (2001).
Tracheobronchial stenosis in Keutel syndrome. European Respiratory Journal,
17(3), pp.566-569.
Meng, H., Vera, I., Che, N., Wang, X., Wang, S.S., Ingram-Drake, L., Schadt, E.E.,
Drake, T.A. and Lusis, A.J. (2007). Identification of Abcc6 as the major causal
gene for dystrophic cardiac calcification in mice through integrative genomics.
Proceedings of the National Academy of Sciences of the United States of America,
104(11), pp.4530-4535.

214
Michel, A.D., Xing, M. and Humphrey, P.P. (2001). Serum constituents can affect
2'-& 3'-O-(4-benzoylbenzoyl)-ATP potency at P2X(7) receptors. British Journal
of Pharmacology, 132(7), pp.1501-1508.
Moe, S., Drueke, T., Cunningham, J., Goodman, W., Martin, K., Olgaard, K., Ott, S.,
Sprague, S., Lameire, N. and Eknoyan, G. (2006). Definition, evaluation, and
classification of renal osteodystrophy: a position statement from Kidney Disease:
Improving Global Outcomes (KDIGO). Kidney International, 69(11), pp.1945-
1953.
Moe, S.M., O'Neill, K.D., Duan, D., Ahmed, S., Chen, N.X., Leapman, S.B.,
Fineberg, N. and Kopecky, K. (2002). Medial artery calcification in ESRD
patients is associated with deposition of bone matrix proteins. Kidney
International, 61(2), pp.638-647.
Moe, S.M., Reslerova, M., Ketteler, M., O'Neill, K., Duan, D., Koczman, J.,
Westenfeld, R., Jahnen-Dechent, W. and Chen, N.X. (2005). Role of calcification
inhibitors in the pathogenesis of vascular calcification in chronic kidney disease
(CKD). Kidney International, 67(6), pp.2295-2304.
Moe, S.M., Seifert, M.F., Chen, N.X., Sinders, R.M., Chen, X., Duan, D., Henley,
C., Martin, D. and Gattone, V.H. 2nd
. (2009). R-568 reduces ectopic calcification
in a rat model of chronic kidney disease-mineral bone disorder (CKD-MBD).
Nephrology Dialysis Transplantation, 24(8), pp.2371-2377.
Monico, C.G. and Milliner, D.S. (2011). Genetic determinants of urolithiasis. Nature
Reviews Nephrology, 8(3), pp.151-162.
Montes de Oca, A., Madueno, J.A., Martinez-Moreno, J.M., Guerrero, F., Munoz-
Castaneda, J., Rodriguez-Ortiz, M.E., Mendoza, F.J., Almaden, Y., Lopez, I.,
Rodriguez, M. and Aquilera-Tejero, E. (2010). High phosphate-induced
calcification is related to SM22-alpha promoter methylation in vascular smooth
muscle cells. Journal of Bone and Mineral Research, 25(9), pp.1996-2005.
Mornet, E. (2007). Hypophosphatasia. Orphanet Journal of Rare Diseases, 2, pp.40.
Munroe, P.B., Olgunturk, R.O., Fryns, J.P., Van Maldergem, L., Ziereisen, F.,
215
Yuksel, B., Gardiner, R.M. and Chung, E. (1999). Mutations in the gene encoding
the human matrix Gla protein cause Keutel syndrome. Nature Genetics, 21(1),
pp.142-144.
Murshed, M., Harmey, D., Millan, J.L., McKee, M.D. and Karsenty, G. (2005).
Unique coexpression in osteoblasts of broadly expressed genes accounts for the
spatial restriction of ECM mineralisation to bone. Genes & Development, 19(9),
pp.1093-1104.
Nakano-Kurimoto, R., Ikeda, K., Uraoka, M., Nakagawa, Y., Yutaka, K., Koide, M.,
Takahashi, T., Matoba, S., Yamada, H., Okigaki, M. and Matsubara, H. (2009).
Replicative senescence of vascular smooth muscle cells enhances the calcification
through initiating the osteoblastic transition. American Journal of Physiology-
Heart and Circulatory Physiology, 297(5), H1673-1684.
Nakashima, K., Zhou, X., Kunkel, G., Zhang, Z., Deng, J.M., Behringer, R.R. and de
Crombrugghe, B. (2002). The novel zinc finger-containing transcription factor
osterix is required for osteoblast differentiation and bone formation. Cell, 108(1),
pp.17-29.
Nam, H.K., Liu, J., Li, Y., Kragor, A. and Hatch, N.E. (2011). Ectonucleotide
pyrophosphatase/phosphodiesterase-1 (ENPP1) protein regulates osteoblast
differentiation. Journal of Biological Chemistry, 286(45), pp.39059-39071.
Nangaku, M. (2004). Mechanisms of Tubulointerstitial Injury in the Kidney: Final
Common Pathways to End-stage Renal Failure. Internal Medicine, 43(1), pp.9-17.
Narisawa, S., Harmey, D., Yadav, M.C., O'Neill, W.C., Hoylaerts, M.F. and Millan,
J.L. (2007). Novel inhibitors of alkaline phosphatase suppress vascular smooth
muscle cell calcification. Journal of Bone and Mineral Research, 22(11),
pp.1700-1710.
Nelson, D.W., Gregg, R.J., Kort, M.E., Perez-Medrano, A., Voight, E.A., Wang, Y.,
Grayson, G., Namovic, M.T., Donnelly-Roberts, D.L., Niforatos, W., Honore, P.,
Jarvis, M.F., Faltynek, C.R. and Carroll, W.A. (2006). Structure-activity
relationship studies on a series of novel, substituted 1-benzyl-5-phenyltetrazole
216
P2X7 antagonists. Journal of Medicinal Chemistry, 49(12), pp.3659-3666.
Neven, E. and D'Haese, P.C. (2011). Vascular Calcification in Chronic Renal Failure
What Have We Learned From Animal Studies? Circulation Research, 108(2),
pp.249-264.
Neven, E., Dams, G., Postnov, A., Chen, B., De Clerck, N., De Broe, M.E.,
D’Haese, P.C. and Persy, V. (2009). Adequate phosphate binding with lanthanum
carbonate attenuates arterial calcification in chronic renal failure rats. Nephrology
Dialysis Transplantation, 24(6), pp.1790-1799.
Neven, E., Persy, V., Dauwe, S., De Schutter, T., De Broe, M.E. and D'Haese, P.C.
(2010). Chondrocyte rather than osteoblast conversion of vascular cells underlies
medial calcification in uremic rats. Arteriosclerosis, Thrombosis, and Vascular
Biology, 30(9), pp.1741-1750.
Nicke, A., Kuan, Y.H., Masin, M., Rettinger, J., Marquez-Klaka, B., Bender, O.,
Gorecki, D.C., Murrell-Lagnado, R.D. and Soto, F. (2009). A functional P2X7
splice variant with an alternative transmembrane domain 1 escapes gene
inactivation in P2X7 knock-out mice. Journal of Biological Chemistry, 284(38),
pp.25813-25822.
Nitschke, Y., Baujat, G., Botschen, U., Wittkampf, T., du Moulin, M., Stella, J., Le
Merrer, M., Guest, G., Lambot, K., Tazarourte-Pinturier, M.F., Chassaing, N.,
Roche, O., Feenstra, I., Loechner, K., Deshpande, C., Garber, S.J., Chikarmane,
R., Steinmann, B., Shahinvan, T., Martorell, L., Davies, J., Smith, W.E., Kahler,
S.G., McCulloch, M., Wraige, E., Loidi, L., Hohne, W., Martin, L., Hadj-Rabia,
S., Terkeltaub, R. and Rutsch, F. (2012). Generalized Arterial Calcification of
Infancy and Pseudoxanthoma Elasticum Can Be Caused by Mutations in Either
ENPP1 or ABCC6. The American Journal of Human Genetics, 90(1), pp.25-39.
Nitschke, Y., Hartmann, S., Torsello, G., Horstmann, R., Seifarth, H., Weissen-
Plenz, G. and Rutsch, F. (2011). Expression of NPP1 is regulated during
atheromatous plaque calcification. Journal of Cellular and Molecular Medicine,
15(2), pp.220-231.

217
Norman, J.T. and Fine, L.G. (1999). Progressive renal disease: fibroblasts,
extracellular matrix, and integrins. Experimental Nephrology, 7(2), pp.167-177.
North, R.A. (2002). Molecular physiology of P2X receptors. Physiological Reviews,
82(4), pp.1013-1067.
Nurnberg, P., Thiele, H., Chandler, D., Hohne, W., Cunningham, M.L., Ritter, H.,
Leschik, G., Uhlmann, K., Mischung, C., Harrop, K., Goldblatt, J., Borochowitz,
Z.U., Kotzot, D., Westermann, F., Mundlos, S., Braun, H.S., Laing, N. and
Tinschert, S. (2001). Heterozygous mutations in ANKH, the human ortholog of
the mouse progressive ankylosis gene, result in craniometaphyseal dysplasia.
Nature Genetics, 28(1), pp.37-41.
Ohlendorff, S.D., Tofteng, C.L., Jensen, J.E., Petersen, S., Civitelli, R., Fenger, M.,
Abrahamsen, B., Hermann, A.P., Eiken, P. and Jorgensen, N.R. (2007). Single
nucleotide polymorphisms in the P2X7 gene are associated to fracture risk and to
effect of estrogen treatment. Pharmacogenetics and Genomics, 17(7), pp.555-567.
Okada, H., Kaneko, Y., Yawata, T., Uyama, H., Ozono, S., Motomiya, Y. and Hirao,
Y. (1999). Reversibility of adenine-induced renal failure in rats. Clinical and
Experimental Nephrology, 3(2), pp.82-88.
Okawa, A., Nakamura, I., Goto, S., Moriya, H., Nakamura, Y. and Ikegawa, S.
(1998). Mutation in Npps in a mouse model of ossification of the posterior
longitudinal ligament of the spine. Nature Genetics, 19(3), pp.271-273.
O'Neill, W.C. (2007). The fallacy of the calcium-phosphorus product. Kidney
International, 72(7), pp.792-796.
O'Neill, W.C. and Adams, A.L. (2014). Breast arterial calcification in chronic kidney
disease: absence of smooth muscle apoptosis and osteogenic transdifferentiation.
Kidney International, 85(3), pp.668-676.
O'Neill, W.C., Lomashvili, K.A., Malluche, H.H., Faugere, M.C. and Riser, B.L.
(2011). Treatment with pyrophosphate inhibits uremic vascular calcification.
Kidney International, 79(5), pp.512-517.

218
O’Neill, W.C., Sigrist, M.K. and McIntyre, C.W. (2010). Plasma pyrophosphate and
vascular calcification in chronic kidney disease. Nephrology Dialysis
Transplantation, 25(1), pp.187-191.
Orriss, I.R., Burnstock, G. and Arnett, T.R. (2010). Purinergic signalling and bone
remodelling. Current Opinion in Pharmacology, 10(3), pp.322-330.
Orriss, I.R., Key, M.L., Brandao-Burch, A., Patel, J.J., Burnstock, G. and Arnett,
T.R. (2012). The regulation of osteoblast function and bone mineralisation by
extracellular nucleotides: The role of p2x receptors. Bone, 51(3), pp.389-400.
Orriss, I.R., Utting, J.C., Brandao-Burch, A., Colston, K., Grubb, B.R., Burnstock,
G. and Arnett, T.R. (2007). Extracellular nucleotides block bone mineralisation in
vitro: evidence for dual inhibitory mechanisms involving both P2Y2 receptors
and pyrophosphate. Endocrinology, 148(9), pp.4208-4216.
Osman, L., Chester, A.H., Amrani, M., Yacoub, M.H. and Smolenski, R.T. (2006).
A novel role of extracellular nucleotides in valve calcification a potential target
for atorvastatin. Circulation, 114(1 Suppl), I566-572.
Oyama, Y., Hashiguchi, T., Taniguchi, N., Tancharoen, S., Uchimura, T., Biswas,
K.K., Kawahara, K., Nitanda, T., Umekita, Y., Lotz, M. and Maruyama, I. (2010).
High-mobility group box-1 protein promotes granulomatous nephritis in adenine-
induced nephropathy. Laboratory Investigation, 90(6), pp.853-866.
Pai, A., Leaf, E.M., El-Abbadi, M. and Giachelli, C.M. (2011). Elastin degradation
and vascular smooth muscle cell phenotype change precede cell loss and arterial
medial calcification in a uremic mouse model of chronic kidney disease. The
American Journal of Pathology, 178(2), pp.764-773.
Pai, A.S. and Giachelli, C.M. (2010). Matrix remodeling in vascular calcification
associated with chronic kidney disease. Journal of the American Society of
Nephrology, 21(10), pp.1637-1640.
Palmer, S.C., Navaneethan, S.D., Craig, J.C., Perkovic, V., Johnson, D.W.,
Nigwekar, S.U., Hegbrant, J. and Strippoli, G.F. (2014). HMG CoA reductase
inhibitors (statins) for kidney transplant recipients. Cochrane Database
219
Systematic Reviews, 1, CD005019.
Pan, W., Ciociola, E., Saraf, M., Tumurbaatar, B., Tuvdendorj, D., Prasad, S.,
Chandalia, M. and Abate, N. (2011). Metabolic consequences of ENPP1
overexpression in adipose tissue. American Journal of Physiology-Endocrinology
and Metabolism, 301(5), E901-911.
Panupinthu, N., Rogers, J.T., Zhao, L., Solano-Flores, L.P., Possmayer, F., Sims,
S.M. and Dixon, S.J. (2008). P2X7 receptors on osteoblasts couple to production
of lysophosphatidic acid: a signaling axis promoting osteogenesis. The Journal of
Cell Biology, 181(5), pp.859-871.
Parfitt, A.M. (1969). Soft-tissue calcification in uremia. Archives of Internal
Medicine, 124(5), pp.544-556.
Pelegrin, P. (2011). Many ways to dilate the P2X7 receptor pore. British Journal of
Pharmacology, 163(5), pp.908-911.
Pellegatti, P., Falzoni, S., Donvito, G., Lemaire, I. and Di Virgilio, F. (2011). P2X7
receptor drives osteoclast fusion by increasing the extracellular adenosine
concentration. The FASEB Journal, 25(4), pp.1264-1274.
Perazella, M.A. and Markowitz, G.S. (2008). Bisphosphonate nephrotoxicity. Kidney
International, 74(11), pp.1385-1393.
Persy, V. and D’Haese, P. (2009). Vascular calcification and bone disease: the
calcification paradox. Trends in Molecular Medicine, 15(9), pp.405-416.
Persy, V.P. and McKee, M.D. (2011). Prevention of vascular calcification: is
pyrophosphate therapy a solution? Kidney International, 79(5), pp.490-493.
Philips, F.S., Thiersch, J.B. and Bendich, A. (1952). Adenine intoxication in relation
to in vivo formation and deposition of 2, 8-dioxyadenine in renal tubules. Journal
of Pharmacology and Experimental Therapeutics, 104(1), pp.20-30.
Piscopiello, M., Sessa, M., Anzalone, N., Castellano, R., Maisano, F., Ferrero, E.,
Chiesa, R., Alfieri, O., Comi, G., Ferrero, M.E. and Foglieni, C. (2013). P2X7
receptor is expressed in human vessels and might play a role in atherosclerosis.
220
International Journal of Cardiology, 168(3), pp.2863-2866.
Ponnusamy, M., Liu, N., Gong, R., Yan, H. and Zhuang, S. (2011). ERK pathway
mediates P2X7 expression and cell death in renal interstitial fibroblasts exposed
to necrotic renal epithelial cells. American Journal of Physiology-Renal
Physiology, 301(3), F650-659.
Price, P.A., Faus, S.A. and Williamson, M.K. (1998). Warfarin causes rapid
calcification of the elastic lamellae in rat arteries and heart valves.
Arteriosclerosis, Thrombosis, and Vascular Biology, 18(9), pp.1400-1407.
Price, P.A., Roublick, A.M. and Williamson, M.K. (2006). Artery calcification in
uremic rats is increased by a low protein diet and prevented by treatment with
ibandronate. Kidney International, 70(9), pp.1577-1583.
Prosdocimo, D.A., Wyler, S.C., Romani, A.M., O'Neill, W.C. and Dubyak, G.R.
(2010). Regulation of vascular smooth muscle cell calcification by extracellular
pyrophosphate homeostasis: synergistic modulation by cyclic AMP and
hyperphosphatemia. American Journal of Physiology-Cell Physiology, 298(3),
C702-713.
Proudfoot, D. and Shanahan, C. (2012). Human vascular smooth muscle cell culture.
Methods in Molecular Biology, 806, pp.251-263.
Proudfoot, D., Skepper, J.N., Hegyi, L., Bennett, M.R., Shanahan, C.M. and
Weissberg, P.L. (2000). Apoptosis regulates human vascular calcification in vitro
evidence for initiation of vascular calcification by apoptotic bodies. Circulation
Research, 87(11), pp.1055-1062.
Proudfoot, D., Skepper, J.N., Shanahan, C.M. and Weissberg, P.L. (1998).
Calcification of human vascular cells in vitro is correlated with high levels of
matrix Gla protein and low levels of osteopontin expression. Arteriosclerosis,
Thrombosis, and Vascular Biology, 18(3), pp.379-388.
Pruthi, R., Steenkamp, R. and Feest, T. (2014). UK Renal Registry 16th Annual
Report: Chapter 8 Survival and cause of death of UK adult patients on renal
replacement therapy in 2012: national and centre-specific analyses. Nephron

221
Clinical Practice, 125(1-4), pp.139-169.
Puchtler, H., Meloan, S.N. and Terry, M.S. (1969). On the history and mechanism of
alizarin and alizarin red S stains for calcium. Journal of Histochemistry &
Cytochemistry, 17(2), pp.110-124.
Quarles, L.D., Sherrard, D.J., Adler, S., Rosansky, S.J., McCary, L.C., Liu, W.,
Turner, S.A. and Bushinsky, D.A. (2003). The calcimimetic AMG 073 as a
potential treatment for secondary hyperparathyroidism of end-stage renal disease.
Journal of the American Society of Nephrology, 14(3), pp.575-583.
Raggi, P., Chertow, G.M., Torres, P.U., Csiky, B., Naso, A., Nossuli, K., Moustafa,
M., Goodman, W.G., Lopez, N., Downey, G., Dehmel, B. and Floege, J. (2011).
The ADVANCE study: a randomized study to evaluate the effects of cinacalcet
plus low-dose vitamin D on vascular calcification in patients on hemodialysis.
Nephrology Dialysis Transplantation, 26(4), pp.1327-1339.
Rensen, S.S., Doevendans, P.A. and van Eys, G.J. (2007). Regulation and
characteristics of vascular smooth muscle cell phenotypic diversity. Netherlands
Heart Journal, 15(3), pp.100-108.
Reynolds, J.L., Joannides, A.J., Skepper, J.N., McNair, R., Schurgers, L.J.,
Proudfoot, D., Jahnen-Dechent, W., Weissberg, P.L. and Shanahan, C.M. (2004).
Human vascular smooth muscle cells undergo vesicle-mediated calcification in
response to changes in extracellular calcium and phosphate concentrations: a
potential mechanism for accelerated vascular calcification in ESRD. Journal of
the American Society of Nephrology, 15(11), pp.2857-2867.
Reynolds, J.L., Skepper, J.N., McNair, R., Kasama, T., Gupta, K., Weissberg, P.L.,
Jahnen-Dechent, W. and Shanahan, C.M. (2005). Multifunctional roles for serum
protein fetuin-a in inhibition of human vascular smooth muscle cell calcification.
Journal of the American Society of Nephrology, 16(10), pp.2920-2930.
Riser, B.L., Barreto, F.C., Rezg, R., Valaitis, P.W., Cook, C.S., White, J.A., Gass,
J.H., Maizel, J., Louvet, L., Drueke, T.B., Holmes, C.J. and Massy, Z.A. (2011).
Daily peritoneal administration of sodium pyrophosphate in a dialysis solution

222
prevents the development of vascular calcification in a mouse model of uraemia.
Nephrology Dialysis Transplantation, 26(10), pp.3349-3357.
Riteau, N., Gasse, P., Fauconnier, L., Gombault, A., Couegnat, M., Fick, L.,
Kanellopoulos, J., Quesniaux, V.F., Marchand-Adam, S., Crestani, B., Ryffel, B.
and Couillin, I. (2010). Extracellular ATP is a danger signal activating P2X7
receptor in lung inflammation and fibrosis. American Journal of Respiratory and
Critical Care Medicine, 182(6), pp.774-783.
Robson, S.C. (2012). Role of CD73 and extracellular adenosine in disease: Presented
by Maria P. Abbracchio. Purinergic Signalling, 7(4), pp.367-372.
Robson, S.C., Sevigny, J. and Zimmermann, H. (2006). The E-NTPDase family of
ectonucleotidases: structure function relationships and pathophysiological
significance. Purinergic Signalling, 2(2), pp.409-430.
Robson, S.C., Wu, Y., Sun, X., Knosalla, C., Dwyer, K. and Enjyoji, K. (2005).
Ectonucleotidases of CD39 family modulate vascular inflammation and
thrombosis in transplantation. Seminars in Thrombosis and Hemostasis, 31(2),
pp.217-233.
Rozenfeld, P. and M Neumann, P.M. (2011). Treatment of Fabry disease: current
and emerging strategies. Current Pharmaceutical Biotechnology, 12(6), pp.916-
922.
Russell, R.G., Bisaz, S., Donath, A., Morgan, D.B. and Fleisch, H. (1971). Inorganic
pyrophosphate in plasma in normal persons and in patients with
hypophosphatasia, osteogenesis imperfecta, and other disorders of bone. Journal
of Clinical Investigation, 50(5), pp.961-969.
Russo, D., Miranda, I., Ruocco, C., Battaglia, Y., Buonanno, E., Manzi, S., Russo,
L., Scafarto, A. and Andreucci, V.E. (2007). The progression of coronary artery
calcification in predialysis patients on calcium carbonate or sevelamer. Kidney
International, 72(10), pp.1255-1261.
Rutsch, F., Boyer, P., Nitschke, Y., Ruf, N., Lorenz-Depierieux, B., Wittkampf, T.,
Weissen-Plenz, G., Fischer, R.J., Mughal, Z., Gregory, J.W., Davies, J.H., Loirat,
223
C., Strom, T.M., Schnabel, D., Nurnberg, P. and Terkeltaub, R. (2008).
Hypophosphatemia, hyperphosphaturia, and bisphosphonate treatment are
associated with survival beyond infancy in generalized arterial calcification of
infancy. Circulation Cardiovascular Genetics, 1(2), pp.133-140.
Rutsch, F., Ruf, N., Vaingankar, S., Toliat, M.R., Suk, A., Hohne, W., Schauer, G.,
Lehmann, M., Roscioli, T., Schnabel, D., Epplen, J.T., Knisely, A., Superti-Furga,
A., McGill, J., Filippone, M., Sinaiko, A.R., Vallance, H., Hinrichs, B., Smith,
W., Ferre, M., Terkeltaub, R. and Nurnberg, P. (2003). Mutations in ENPP1 are
associated with 'idiopathic’ infantile arterial calcification. Nature Genetics, 34(4),
pp.379-381.
Sabatine, M.S., Cannon, C.P., Gibson, C.M., Lopez-Sendon, J.L., Montalescot, G.,
Theroux, P., Claeys, M.J., Cools, F., Hill, K.A., Skene, A.M., McCabe, C.H. and
Braunwald, E. (2005). Addition of clopidogrel to aspirin and fibrinolytic therapy
for myocardial infarction with ST-segment elevation. New England Journal of
Medicine, 352(12), pp.1179-1189.
Sage, A.P., Lu, J., Tintut, Y. and Demer, L.L. (2010). Hyperphosphatemia-induced
nanocrystals upregulate the expression of bone morphogenetic protein-2 and
osteopontin genes in mouse smooth muscle cells in vitro. Kidney International,
79(4), pp.414-422.
Sakamoto, M., Hosoda, Y., Kojimahara, K., Yamazaki, T. and Yoshimura, Y.
(1994). Arthritis and ankylosis in twy mice with hereditary multiple
osteochondral lesions: with special reference to calcium deposition. Pathology
International, 44(6), pp.420-427.
Salati, L.M., Gross, C.J., Henderson, L.M. and Savaiano, D.A. (1984). Absorption
and metabolism of adenine, adenosine-5'-monophosphate, adenosine and
hypoxanthine by the isolated vascularly perfused rat small intestine. The Journal
of Nutrition, 114(4), pp.753-760.
Sali A, Favaloro J, Terkeltaub R, Goding J. (1999). Germline deletion of the
nucleoside triphosphate pyrophosphohydrolase (NTPPPH) plasma cellmembrane
glycoprotein-1 (PC-1) produces abnormal calcification of periarticular tissues. In:
224
Vanduffel L, Lemmems R, editors. Ecto-ATPases and Related Ectoenzymes.
Shaker Publishing, pp.267-282.
Santana, A.C., Degaspari, S., Catanozi, S., Delle, H., de Sa Lima, L., Silva, C.,
Blanco, P., Solez, K., Scavone, C. and Noronha, I.L. (2013). Thalidomide
suppresses inflammation in adenine-induced CKD with uraemia in mice.
Nephrology Dialysis Transplantation, 28(5), pp.1140-1149.
Sarkar, B.C. and Chauhan, U.P. (1967). A new method for determining micro
quantities of calcium in biological materials. Analytical Biochemistry, 20(1),
pp.155-166.
Schafer, C., Heiss, A., Schwarz, A., Westenfeld, R., Ketteler, M., Floege, J., Muller-
Esterl, W., Schinke, T. and Jahnen-Dechent, W. (2003). The serum protein alpha
2-Heremans-Schmid glycoprotein/fetuin-A is a systemically acting inhibitor of
ectopic calcification. The Journal of Clinical Investigation, 112(3), pp.357-366.
Schiavi, S.C., Tang, W., Bracken, C., O’Brien, S.P., Song, W., Boulanger, J., Ryan,
S., Phillips, L., Liu, S., Arbeeny, C., Ledbetter, S. and Sabbaqh, Y. (2012). Npt2b
deletion attenuates hyperphosphatemia associated with CKD. Journal of the
American Society of Nephrology, 23(10), pp.1691-1700.
Schibler, D., Russell, R.G. and Fleisch, H. (1968). Inhibition by pyrophosphate and
polyphosphate of aortic calcification induced by vitamin D3 in rats. Clinical
Science, 35(2), pp.363-372.
Schild, H.O. (1947). pA, a new scale for the measurement of drug antagonism.
British Journal of Pharmacology and Chemotherapy, 2(3), pp.189-206.
Schlieper, G. (2014). Vascular calcification in chronic kidney disease: not all arteries
are created equal. Kidney International, 85(3), pp.501-503.
Schlieper, G., Aretz, A., Verberckmoes, S.C., Kruger, T., Behets, G.J., Ghadimi, R.,
Weirich, T.E., Rohrmann, D., Langer, S., Tordoir, J.H., Amann, K., Westenfeld,
R., Brandenburg, V.M., D’Haese, P.C., Mayer, J., Ketteler, M., McKee, M.D. and
Floege, J. (2010). Ultrastructural analysis of vascular calcifications in uremia.
Journal of the American Society of Nephrology, 21(4), pp.689-696.
225
Schneeberger, C., Speiser, P., Kury, F. and Zeillinger, R. (1995). Quantitative
detection of reverse transcriptase-PCR products by means of a novel and sensitive
DNA stain. PCR Methods and Applications, 4(4), pp.234-238.
Schuchardt, M., Prufer, J., Prufer, N., Wiedon, A., Huang, T., Chebli, M.,
Jankowski, V., Jankowski, J., Schafer-Korting, M., Zidek, W., van der Giet, M.
and Tolle, M. (2011). The endothelium-derived contracting factor uridine
adenosine tetraphosphate induces P2Y2-mediated pro-inflammatory signaling by
monocyte chemoattractant protein-1 formation. Journal of Molecular Medicine
(Berlin, Germany), 89(8), pp.799-810.
Schuchardt, M., Tolle, M., Prufer, J., Prufer, N., Huang, T., Jankowski, V.,
Jankowski, J., Zidek, W. and van der Giet, M. (2012). Uridine adenosine
tetraphosphate activation of the purinergic receptor P2Y enhances in vitro
vascular calcification. Kidney International, 81(3), pp.256-265.
Scialla, J.J., Lau, W.L., Reilly, M.P., Isakova, T., Yang, H.Y., Crouthamel, M.H.,
Chavkin, N.W., Rahman, M., Wahl, P., Amaral, A.P., Hamano, T., Master, S.R.,
Nessel, L., Chai, B., Xie, D., Kallem, R.R., Chen, J., Lash, J.P., Kusek, J.W.,
Budoff, M.J., Giachelli, C.M. and Wolf, M. (2013). Fibroblast growth factor 23 is
not associated with and does not induce arterial calcification. Kidney
International, 83(6), pp.1159-1168.
Shalhoub, V., Shatzen, E.M., Ward, S.C., Young, J.I., Boedigheimer, M., Twehues,
L., McNinch, J., Scully, S., Twomey, B., Baker, D., Kiaei, P., Damore, M.A.,
Pan, Z., Haas, K. and Martin, D. (2010). Chondro/osteoblastic and cardiovascular
gene modulation in human artery smooth muscle cells that calcify in the presence
of phosphate and calcitriol or paricalcitol. Journal of Cellular Biochemistry,
111(4), pp.911-921.
Shanahan, C.M. (2013). Mechanisms of vascular calcification in CKD-evidence for
premature ageing?. Nature Reviews Nephrology, 9(11), pp.661-670.
Shanahan, C.M., Cary, N.R., Salisbury, J.R., Proudfoot, D., Weissberg, P.L. and
Edmonds, M.E. (1999). Medial Localisation of Mineralisation-Regulating
Proteins in Association With Monckeberg’s Sclerosis Evidence for Smooth
226
Muscle Cell-Mediated Vascular Calcification. Circulation, 100(21), pp.2168-
2176.
Shanahan, C.M., Crouthamel, M.H., Kapustin, A. and Giachelli, C.M. (2011).
Arterial calcification in chronic kidney disease: key roles for calcium and
phosphate. Circulation Research, 109(6), pp.697-711.
Shobeiri, N., Adams, M.A. and Holden, R.M. (2010). Vascular Calcification in
Animal Models of CKD: A Review. American Journal of Nephrology, 31(6),
pp.471-481.
Shobeiri, N., Pang, J., Adams, M.A. and Holden, R.M. (2013). Cardiovascular
disease in an adenine-induced model of chronic kidney disease: the temporal link
between vascular calcification and haemodynamic consequences. Journal of
Hypertension, 31(1), pp.160-168.
Shroff, R., Long, D.A. and Shanahan, C. (2013). Mechanistic insights into vascular
calcification in CKD. Journal of the American Society of Nephrology, 24(2),
pp.179-189.
Shroff, R.C., McNair, R., Figg, N., Skepper, J.N., Schurgers, L., Gupta, A., Hiorns,
M., Donald, A.E., Deanfield, J., Rees, L. and Shanahan, C.M. (2008). Dialysis
accelerates medial vascular calcification in part by triggering smooth muscle cell
apoptosis. Circulation, 118(17), pp.1748-1757.
Shroff, R.C., McNair, R., Skepper, J.N., Figg, N., Schurgers, L.J., Deanfield, J.,
Rees, L. and Shanahan, C.M. (2010). Chronic mineral dysregulation promotes
vascular smooth muscle cell adaptation and extracellular matrix calcification.
Journal of the American Society of Nephrology, 21(1), pp.103-112.
Si, H., Banga, R.S., Kapitsinou, P., Ramaiah, M., Lawrence, J., Kambhampati, G.,
Gruenwald, A., Bottinger, E., Glicklich, D., Tellis, V., Greenstein, S., Thomas,
D.B., Pullman, J., Fazzari, M. and Susztak, K. (2009). Human and murine kidneys
show gender-and species-specific gene expression differences in response to
injury. PLoS One, 4(3), e4802.
Sigrist, M.K., Taal, M.W., Bungay, P. and McIntyre, C.W. (2007). Progressive
227
vascular calcification over 2 years is associated with arterial stiffening and
increased mortality in patients with stages 4 and 5 chronic kidney disease.
Clinical Journal of the American Society of Nephrology, 2(6), pp.1241-1248.
Sim, J.A., Young, M.T., Sung, H.Y., North, R.A. and Surprenant, A. (2004).
Reanalysis of P2X7 receptor expression in rodent brain. The Journal of
Neuroscience, 24(28), pp.6307-6314.
Simionescu, A., Philips, K. and Vyavahare, N. (2005). Elastin-derived peptides and
TGF-beta1 induce osteogenic responses in smooth muscle cells. Biochemical and
Biophysical Research Communications, 334(2), pp.524-532.
Sims, S.M., Panupinthu, N., Lapierre, D.M., Pereverzev, A. and Dixon, S.J. (2013).
Lysophosphatidic acid: A potential mediator of osteoblast-osteoclast signaling in
bone. Biochimica et Biophysica Acta, 1831(1), pp.109-116.
Slee, A.D. (2012). Exploring metabolic dysfunction in chronic kidney disease.
Nutrition and Metabolism (London), 9(1), p.36.
Snyder, F.F., Hershfield, M.S. and Seegmiller, J.E. (1978). Cytotoxic and metabolic
effects of adenosine and adenine on human lymphoblasts. Cancer Research,
38(8), pp.2357-2362.
Solle, M., Labasi, J., Perregaux, D.G., Stam, E., Petrushova, N., Koller, B.H.,
Griffiths, R.J. and Gabel, C.A. (2001). Altered Cytokine Production in Mice
Lacking P2X7Receptors. Journal of Biological Chemistry, 276(1), pp.125-132.
Son, B.K., Kozaki, K., Iijima, K., Eto, M., Kojima, T., Ota, H., Senda, Y., Maemura,
K., Nakano, T., Akishita, M. and Ouchi, Y. (2006). Statins protect human aortic
smooth muscle cells from inorganic phosphate-induced calcification by restoring
Gas6-Axl survival pathway. Circulation Research, 98(8), pp.1024-1031.
Speer, M.Y., Yang, H.Y., Brabb, T., Leaf, E., Look, A., Lin, W.L, Frutkin, A.,
Dichek, D. and Giachelli, C.M. (2009). Smooth muscle cells give rise to
osteochondrogenic precursors and chondrocytes in calcifying arteries. Circulation
Research, 104(6), pp.733-741.

228
St Hilaire, C, Ziegler, S.G., Markello, T.C., Brusco, A., Groden, C., Gill, F.,
Carlson-Donohoe, H., Lederman, R.J., Chen, M.Y., Yang, D., Siegenthaler, M.P.,
Arduino, C., Mancini, C., Freudenthal, B., Stanescu, H.C., Zdebik, A.A.,
Chaganti, R.K., Nussbaum, R.L., Kleta, R., Gahl, W.A. and Boehm, M. (2011).
NT5E mutations and arterial calcifications. New England Journal of Medicine,
364(5), pp.432-442.
Stechman, M.J., Ahmad, B.N., Loh, N.Y., Reed, A.A., Stewart, M., Wells, S.,
Hough, T., Bentley, L., Cox, R.D., Brown, S.D. and Thakker, R.V. (2010).
Establishing normal plasma and 24-hour urinary biochemistry ranges in C3H,
BALB/c and C57BL/6J mice following acclimatisation in metabolic cages.
Laboratory Animals, 44(3), pp.218-225.
Stenvinkel, P., Carrero, J.J., Axelsson, J., Lindholm, B., Heimburger, O. and Massy,
Z. (2008). Emerging biomarkers for evaluating cardiovascular risk in the chronic
kidney disease patient: how do new pieces fit into the uremic puzzle? Clinical
Journal of the American Society of Nephrology, 3(2), pp.505-521.
Stock, T.C., Bloom, B.J., Wei, N., Ishaq, S., Park, W., Wang, X., Gupta, P. and
Mebus, C.A. (2012). Efficacy and safety of CE-224,535, an antagonist of P2X7
receptor, in treatment of patients with rheumatoid arthritis inadequately controlled
by methotrexate. The Journal of Rheumatology, 39(4), pp.720-727.
Sun, C.C., Vaja, V., Chen, S., Theurl, I., Stepanek, A., Brown, D.E., Cappellini,
M.D., Weiss, G., Hong, C.C., Lin, H.Y. and Babitt, J.L. (2013). A hepcidin
lowering agent mobilizes iron for incorporation into red blood cells in an adenine-
induced kidney disease model of anemia in rats. Nephrology Dialysis
Transplantation, 28(7), pp.1733-1743.
Sun, S., Xia, S., Ji, Y., Kersten, S. and Qi, L. (2012). The ATP-P2X7 signaling axis
is dispensable for obesity-associated inflammasome activation in adipose tissue.
Diabetes, 61(6), pp.1471-1478.
Surprenant, A., Rassendren, F., Kawashima, E., North, R.A. and Buell, G. (1996).
The cytolytic P2Z receptor for extracellular ATP identified as a P2X receptor
(P2X7). Science, 272(5262), pp.735-738.
229
Sutliff, R.L., Walp, E.R., El-Ali, A.M., Elkhatib, S., Lomashvili, K.A. and O'Neill,
W.C. (2011). Effect of medial calcification on vascular function in uremia.
American Journal of Physiology-Renal Physiology, 301(1), F78-83.
Tamagaki, K., Yuan, Q., Ohkawa, H., Imazeki, I., Moriguchi, Y., Imai, N., Sasaki,
S., Takeda, K. and Fukagawa, M. (2006). Severe hyperparathyroidism with bone
abnormalities and metastatic calcification in rats with adenine-induced uraemia.
Nephrology Dialysis Transplantation, 21(3), pp.651-659.
Tamura, M., Aizawa, R., Hori, M. and Ozaki, H. (2009). Progressive renal
dysfunction and macrophage infiltration in interstitial fibrosis in an adenine-
induced tubulointerstitial nephritis mouse model. Histochemistry and Cell
Biology, 131(4), pp.483-490.
Tanaka, T., Doi, K., Maeda-Mamiya, R., Negishi, K., Portilla, D., Sugaya, T., Fujita,
T. and Noiri, E. (2009). Urinary L-type fatty acid-binding protein can reflect renal
tubulointerstitial injury. The American Journal of Pathology, 174(4), pp.1203-
1211.
Taylor, S.R., Turner, C.M., Elliott, J.I., McDaid, J., Hewitt, R., Smith, J., Pickering,
M.C., Whitehouse, D.L., Cook, H.T., Burnstock, G., Pusey, C.D, Unwin, R.J. and
Tam, F.W. (2009a). P2X7 deficiency attenuates renal injury in experimental
glomerulonephritis. Journal of the American Society of Nephrology, 20(6),
pp.1275-1281.
Taylor, S.R., Gonzalez-Begne, M., Sojka, D.K., Richardson, J.C., Sheardown, S.A.,
Harrison, S.M., Pusey, C.D., Tam, F.W. and Elliott, J.I. (2009b). Lymphocytes
from P2X7-deficient mice exhibit enhanced P2X7 responses. Journal of
Leukocyte Biology, 85(6), pp.978-986.
Terai, K., Nara, H., Takakura, K., Mizukami, K., Sanagi, M., Fukushima, S.,
Fujimori, A., Itoh, H. and Okada, M. (2009). Vascular calcification and secondary
hyperparathyroidism of severe chronic kidney disease and its relation to serum
phosphate and calcium levels. British Journal of Pharmacology, 156(8), pp.1267-
1278.
230
Terkeltaub, R. (2006). Physiologic and pathologic functions of the NPP nucleotide
pyrophosphatase/phosphodiesterase family focusing on NPP1 in calcification.
Purinergic Signalling, 2(2), pp.371-377.
Terkeltaub, R.A. (2001). Inorganic pyrophosphate generation and disposition in
pathophysiology. American Journal of Physiology-Cell Physiology, 281(1), C1-
11.
Tintut, Y., Patel, J., Parhami, F. and Demer, L.L. (2000). Tumor necrosis factor-
alpha promotes in vitro calcification of vascular cells via the cAMP pathway.
Circulation, 102(21), pp.2636-2642.
Tomiyama, C., Carvalho, A.B., Higa, A., Jorgetti, V., Draibe, S.A. and Canziani,
M.E. (2010). Coronary calcification is associated with lower bone formation rate
in CKD patients not yet in dialysis treatment. Journal of Bone and Mineral
Research, 25(3), pp.499-504.
Tonelli, M., Wiebe, N., Culleton, B., House, A., Rabbat, C., Fok, M., McAlister, F.
and Garg, A.X. (2006). Chronic kidney disease and mortality risk: a systematic
review. Journal of the American Society of Nephrology, 17(7), pp.2034-2047.
Tripathi, S., Suzuki, N. and Srivastav, A.K. (2013). Response of serum minerals
(calcium, phosphate, and magnesium) and endocrine glands (calcitonin cells and
parathyroid gland) of wistar rat after chlorpyrifos administration. Microscopy
Research and Technique, 76(7), pp.673-678.
Truett, G.E., Heeger, P., Mynatt, R.L., Truett, A.A., Walker, J.A. and Warman, M.L.
(2000). Preparation of PCR-quality mouse genomic DNA with hot sodium
hydroxide and tris (HotSHOT). Biotechniques, 29(1), pp.52-54.
Turner, C.M., Tam, F.W., Lai, P.C., Tarzi, R.M., Burnstock, G., Pusey, C.D., Cook,
H.T. and Unwin, R.J. (2007). Increased expression of the pro-apoptotic ATP-
sensitive P2X7 receptor in experimental and human glomerulonephritis.
Nephrology Dialysis Transplantation, 22(2), pp.386-395.
Underwood, P.A., Bean, P.A. and Whitelock, J.M. (1998). Inhibition of endothelial
cell adhesion and proliferation by extracellular matrix from vascular smooth
231
muscle cells: role of type V collagen. Atherosclerosis, 141(1), pp.141-152.
Urry, D.W. (1971). Neutral sites for calcium ion binding to elastin and collagen: a
charge neutralisation theory for calcification and its relationship to
atherosclerosis. Proceedings of the National Academy of Sciences of the United
States of America, 68(4), pp.810-814.
Vandesompele, J., De Preter, K., Pattyn, F., Poppe, B., Van Roy, N., De Paepe, A.
and Speleman, F. (2002). Accurate normalisation of real-time quantitative RT-
PCR data by geometric averaging of multiple internal control genes. Genome
Biology, 3(7), RESEARCH0034.
Vezzoli, G., Rubinacci, A., Lazzaroni, M. and Soldati, L. (2014). It’s time for a
practical method quantifying vascular calcification. Journal of Translational
Medicine, 12(1), pp.172.
Villa-Bellosta, R. and Sorribas, V. (2013). Prevention of vascular calcification by
polyphosphates and nucleotides-role of ATP. Circulation Journal, 77(8),
pp.2145-2151.
Villa-Bellosta, R., Wang, X., Millan, J.L., Dubyak, G.R. and O'Neill, W.C. (2011a).
Extracellular pyrophosphate metabolism and calcification in vascular smooth
muscle. American Journal of Physiology-Heart and Circulatory Physiology,
301(1), H61-68.
Villa-Bellosta, R., Millan, A. and Sorribas, V. (2011b). Role of calcium-phosphate
deposition in vascular smooth muscle cell calcification. American Journal of
Physiology-Cell Physiology, 300(1), C210-220.
von Albertini, M., Palmetshofer, A., Kaczmarek, E., Koziak, K., Stroka, D., Grey,
S., Stuhlmeier, K.M. and Robson, S.C. (1998). Extracellular ATP and ADP
activate transcription factor NF-kappaB and induce endothelial cell apoptosis.
Biochemical and Biophysical Research Communications, 248(3), pp.822-829.
von Kossa, J. (1901). Ueber die im Organismus kunstlich erzeugbaren
Verkalkungen. Ziegler's Beitr path Anat, 29, pp.163-202.
232
Vonend, O., Turner, C.M., Chan, C.M., Loesch, A., Dell'Anna, G.C., Srai, K.S.,
Burnstock, G. and Unwin, R.J. (2004). Glomerular expression of the ATP-
sensitive P2X7 receptor in diabetic and hypertensive rat models. Kidney
International, 66(1), pp.157-166.
Wang, L., Andersson, M., Karlsson, L., Watson, M.A., Cousens, D.J., Jern, S. and
Erlinge, D. (2003). Increased mitogenic and decreased contractile P2 receptors in
smooth muscle cells by shear stress in human vessels with intact endothelium.
Arteriosclerosis, Thrombosis, and Vascular Biology, 23(8), pp.1370-1376.
Wang, L., Karlsson, L., Moses, S., Hultgaardh-Nilsson, A., Andersson, M., Borna,
C., Gudbjartsson, T., Jern, S. and Erlinge, D. (2002). P2 receptor expression
profiles in human vascular smooth muscle and endothelial cells. Journal of
Cardiovascular Pharmacology, 40(6), pp.841-853.
Wanner, C., Krane, V., Marz, W., Olschewski, M., Mann, J.F., Ruf, G. and Ritz, E.
(2005). Atorvastatin in patients with type 2 diabetes mellitus undergoing
hemodialysis. New England Journal of Medicine, 353(3), pp.238-248.
Weber, C. and Noels, H. (2011). Atherosclerosis: current pathogenesis and
therapeutic options. Nature Medicine, 17(11), pp.1410-1422.
Weiner, D.E., Tighiouart, H., Elsayed, E.F., Griffith, J.L., Salem, D.N., Levey, A.S.
and Sarnak, M.J. (2007). The Framingham predictive instrument in chronic
kidney disease. Journal of the American College of Cardiology, 50(3), pp.217-
224.
Wen, C., Yang, X., Yan, Z., Zhao, M., Yue, X., Cheng, X., Zheng, Z., Guan, K.,
Dou, J., Xu, T., Zhang, Y., Song, T., Wei, C. and Zhong, H. (2013). Nalp3
inflammasome is activated and required for vascular smooth muscle cell
calcification. International Journal of cardiology, 168(3), pp.2242-2247.
White, K.E., Evans, W.E., O'Riordan, J.L.H., Speer, M.C., Econs, M.J., Lorenz-
Depiereux, B., Grabowski, M., Meitinger, T. and Strom, T.M. (2000). Autosomal
dominant hypophosphataemic rickets is associated with mutations in FGF23.
Nature Genetics, 26(3), pp.345-348.

233
Wiley, J.S., Sluyter, R., Gu, B.J., Stokes, L. and Fuller, S.J. (2011). The human
P2X7 receptor and its role in innate immunity. Tissue Antigens, 78(5), pp.321-
332.
Williams, C.J., Zhang, Y., Timms, A., Bonavita, G., Caeiro, F., Broxholme, J.,
Cuthbertson, J., Jones, Y., Marchegiani, R., Reginato, A., Russell, R.G.,
Wordsworth, B.P., Carr, A.J. and Brown, M.A. (2002). Autosomal dominant
familial calcium pyrophosphate dihydrate deposition disease is caused by
mutation in the transmembrane protein ANKH. The American Journal of Human
Genetics, 71(4), pp.985-991.
Wilson, H.L., Varcoe, R.W., Stokes, L., Holland, K.L., Francis, S.E., Dower, S.K.,
Surprenant, A. and Crossman, D.C. (2007). P2X receptor characterisation and IL-
1/IL-1Ra release from human endothelial cells. British Journal of Pharmacology,
151(1), pp.115-127..
Yan, Z., Khadra, A., Li, S., Tomi'c, M., Sherman, A. and Stojilkovic, S.S. (2010).
Experimental characterisation and mathematical modeling of P2X7 receptor
channel gating. The Journal of Neuroscience, 30(42), pp.14213-14224.
Yokozawa, T., Zheng, P.D., Oura, H. and Koizumi, F. (1986). Animal model of
adenine-induced chronic renal failure in rats. Nephron, 44(3), pp.230-234.
Zeidan, A., Nordstrom, I., Dreja, K., Malmqvist, U. and Hellstrand, P. (2000).
Stretch-dependent modulation of contractility and growth in smooth muscle of rat
portal vein. Circulation Research, 87(3), pp.228-234.
Zhao, G., Xu, M.J., Zhao, M.M., Dai, X.Y., Kong, W., Wilson, G.M., Guan, Y.,
Wang, C.Y. and Wang, X. (2012). Activation of nuclear factor-kappa B
accelerates vascular calcification by inhibiting ankylosis protein homolog
expression. Kidney International, 82(1), pp.34-44.
Zhao, M.M., Xu, M.J., Cai, Y., Zhao, G., Guan, Y., Kong, W., Tang, C. and Wang,
X. (2011). Mitochondrial reactive oxygen species promote p65 nuclear
translocation mediating high phosphate-induced vascular calcification in vitro and
in vivo. Kidney International, 79(10), pp.1071-1079.
234
Zheng, L.M., Zychlinsky, A., Liu, C.C., Ojcius, D.M. and Young, J.D. (1991).
Extracellular ATP as a trigger for apoptosis or programmed cell death. The
Journal of Cell Biology, 112(2), pp.279-288.
Zhu, D., Mackenzie, N.C., Millan, J.L., Farquharson, C. and MacRae, V.E. (2011).
The appearance and modulation of osteocyte marker expression during
calcification of vascular smooth muscle cells. PLoS One, 6(5), e19595.
Zimmermann, H., Zebisch, M. and Strater, N. (2012). Cellular function and
molecular structure of ecto-nucleotidases. Purinergic Signalling, 8(3), pp.437-
502.