Thermodynamic Evaluation of the Interactions between ... - MDPI
Upload
khangminh22Category
view
0download
0
A STUDY OF
THE INTERACTIONS BETWEEN PHENYTOIN
AND PHARMACEUTICAL ANTACIDS,
EXCIPIENTS AND ADSORBENTS
A thesis presented for the degree of
MASTER OF SCIENCE
at Rhodes University
by
PETER JOHN GILBERT
January 1981

ACKNOWLEDGMENTS
Sincere thanks are extended to
Professor E. Ramstad
and
Professor T.J. McCarthy
My wife, Jennifer
The Port Elizabeth Technikon
Professor Neil Buchanan
The Foundation for Pharmaceutical Education
Professors Renn Kutt and C.E. Pippenger
My colleagues at the Port Elizabeth Technikon
ii
for supervising this project and for their advice and encouragement
for her constant support and for typing this thesis
for use of facilities
for his encouragement and ready supply of numerous journal articles
for financial support
for information
who have assisted in many ways
INTRODUCTION
CHAPTER
1.1
1.2
1. 3
1.4
1 .4. 1
1.4.2
1 .4.3
1.4.4
1.5
1 .5 . 1
1.6
1 .6. 1
1 .6.2
CHAPTER 2
2.1
2 . 2
2.3
2.4
CONTENTS
LITERATURE SURVEY
Phenytoin
Physicochemical properites of phenytoin
Absorption of phenytoin
Interactions of phenytoin
Interaction of phenytoin with antacids
Interaction of phenytoin with excipients
Interaction of phenytoin with metal ions
Interaction between phenytoin and adsorbents
Analytical methods for phenytoin
Spectrophotometric determination of phenytoin
Methods for assessing drug interactions
In vitro adsorption studies
In vitro drug diffusion studies through membranes
MATERIALS
Antacids, adsorbents and starches
Phenytoin
Solutions for adsorption studies
Apparatus for in vitro diffusion studies
iii
PAGE
3
3
3
4
5
5
9
12
13
14
15
19
20
25
31
31
32
34
35
2.4. 1
2.4.2
2.4.3
CHAPTER 3
3.1
3. 1 . 1
3. 1 .2
3.1.3
3.2
3.2.1
3.2 . 2
3.2.3
3.3
3.3.1
3.3.2
3.3.3
3.3.4
CHAPTER 4
4. 1
4.1.1
4. 1. 2
4.2
Construction of apparatus
Selection of animal
Physiological solutions
METHODS
Analytical procedure for phenytoin
Benzophenone-extraction procedure : Method 1
Benzophenone-extraction procedure Method 2
Calculation of results
In vitro adsorption studies
General method
Methods for specific tests
Calculation of results
In vitro diffusion studies
General method
Precautions
Specific test methods
Calculation and presentation of results
RESULTS
Adsorption studies
Adsorption of phenytoin onto particulate matter suspended in simulated gastric and intestinal solutions
Adsorption of phenytoin onto particulate matter suspended in distilled water
Studies on the diffusion of phenytoin across the isolated guinea-pig ileum
'v
PAGE
35
40
40
43
43
49
54
58
60
62
63
64
65
65
67
68
68
76
76
76
78
78

CHAPTER 5
5. I
5.2
5.2. I
5.2 . 2
5.2.3
5.2.4
SUMMARY
REFERENCES
DISCUSSION
Adsorption studies
Diffusion of phenytoin across the isolated guinea-pig ileum
Use of the circulation technique and methods adopted for assessment of the trans-ileal diffusion of phenytoin
Effect of pH on the trans-ileal diffusion of phenytoin
Effect of calcium component of the physiological solution on the transileal diffusion of phenytoin
Effect of calcium, magnesium and aluminium containing compounds on the trans-ileal diffusion of phenytoin
v
PAGE
91
91
92
92
96
99
99
108
110

Fig.
Fig. 2
Fig. 3
Fig. 4
Fig. 5
Fig. 6
Fig. 7
Fig. 8
Fig. 9
Fig. 10
Fig. 11
Fig. 12
GRAPHS AND ILLUSTRATIONS
Circulation chamber and modified distribution head for Sartorius Absorption Simulator
Diagram of modifications to Sartorius Absorption Simulator
Tube connections for Modified Sartorius Absorption Simulator
Absorption spectrum for benzophenone in n-heptane
Calibration curve for the determination of benzophenone in n-heptane
Absorption spectrum for phenytoin oxidation product in n-heptane
Calibration curve for the determination of phenytoin by benzophenone-extration procedure : Method 1
Calibration curve for the determination of phenytoin by benzophenone-extraction procedure : Method 2
Effect of calcium component of the physiological solution on the diffusion of phenytoin across the isolated guinea-pig ileum at pH 7,2
Effect of pH on the diffusion of phenytoin across the isolated guinea-pig ileum
Comparison of the effect of calcium chloride and calcium carbonate on the diffusion of phenytoin across the isolated guinea-pig ileum at pH 6,5
Comparison of the effect of magnesium chloride and light magnesium carbonate on the diffusion of phenytoin across the isolated guinea-pig ileum at pH 7,5
V1
P~E
37
38
39
45
46
47
53
59
85
86
87
88

Fig. 13
Fig. 14
Fig. 15
Effect of magnesium trisilicate on the diffusion of phenytoin across the isolated guinea-pig ileum at pH 7,5
Effect of aluminium hydroxide and light kaolin on the diffusion of phenytoin across the isolated guinea-pig ileum at pH 7,5
Schematic representation of the trans-ileal diffusion of phenytoin
V11
P~E
89
90
95
Table
Table 2
Table 3
Table 4
Table 5
Table 6
Table 7
Table 8
Table 9
Table 10
Table II
TABLES
Composition of artificial gastric and intestinal juice for in vitro adsorption studies
Composition of physiological solution according to Aguiar and Fifelski (1966)
Analysis of results for benzophenoneextraction procedure : Method I
Analysis of resul ts for benzophenoneextraction procedure : Method 2
Specific test methods for assessment of diffusion of phenytoin across the isolated guinea-pig ileum
Circulation technique : method for calculating the corrected amounts of phenytoin in samples
BASIC programme for calculation of corrected amounts of phenytoin in samples
Percentage phenytoin remaining in solution and measured pH after incubation with particulate matter suspended in simulated gastric solution
Percentage phenytoin rema1n1ng in solution and measured pH after incubation with particulate matter suspended in simulated intestinal solution
Percentage phenytoin rema1n1ng in solution and measured pH after incubation with particulate matter suspended in water
Results of diffusion of phenytoin across the isolated guinea-pig ileum
viii
P~E
34
42
51
57
71
74
75
79
80
82
83
ABBREVIATIONS
AUC Area under blood level curve
B.P. British Pharmacopoeia
B.P.C. British Pharmaceutical Codex
1. P. A. International Pharmaceutical Abstracts
S.D. Standard deviation
U.S.P. Uni ted States Pharmacopoeia
1X
A STUDY OF THE INTERACTIONS BETWEEN
PHENYTOIN AND PHARMACEUTICAL ANTACIDS)
EXCIPIENTS AND ADSORBENTS
INTRODllCTION:
Phenytoi n IS n drug wh i ch is widely used in the treatment of
epilepsy. Therapeutically, it is important that the correc t
conce ntration of phenytoin is maintained in the plasma because
low plasma levels may result in the inadequate control of
seizures, while elevated plasma levels may result in the
appearance of symptoms of toxicity. Martindale's Extra
Pharmacopoeia (1977) suggests that the dose of the drug be
adjusted to the needs of the individual patient to achieve the
adequate control of seizures.
Phenytoin sodium is a strongly alkaline compound which may cause
gastric irritation unless each dose is taken with water after
meals, a practi ce which may reduce the therapeutic effect. The
a lkalinity may lead patients to erroneously take antacids while
being treated with phenytoin 1n an attempt to reduce the gastro
intestinal irritation caused by the drug.
A review of the literature has revealed that the administration
of antacid preparations and medicinals which contain adsorbent
powders such as kaolin and activated charcoal may alter the gastro-
intestinal absorpti on of orally administered drugs. In addition,
the excipients used in the preparation of pharmaceutical dosage
forms can influence the absorption of drugs. Phenytoin interactions
have heen observed by Decker ct a1. (1968), who reported on
the adsorption of phenytoin from solution onto activated
charcoal; by Tyrer et al. (1970), who attributed cases of
phenytoin toxicity to phenytoin/excipient interactions, and by
Pippenger (1975), who observed an interaction between orally
administered phenytoin and antacids. It appears that further
investigations into the phenomena studied by both Tyrer and
Pippenger might prove useful because of the sparcity of
information concerning these interactions available in current
literature.
Two separate areas of study were therefore proposed:
( 1) An assessment of the in vitro removal of phenytoin from
s()lution hy insoluhle particulate matter;
(2) In vitro studies to determine the effect of selected
ant acids and adsorbents on the passage of phenytoin
through a biological membrane at various pH values.
2

CHAPTER 1 LITERATURE SURVEY
1.1 PHENYTOIN
According to Delgado and Isaacson (1970), phenytoin was
first prepared by Biltz in 1908. The drug was evaluated
by Merritt and Putnam in 1938 and found to be effective
in protecting cats against convulsive seizures induced by
electrical stimulation. Since its introduction as a
medicinal agent, phenytoin has become a prime drug for
use in the treatment of epilepsy.
Martindale's Extra Pharmacopoeia (1977) states that
phenytoin has little hypnotic action and is believed to
stabilise rather than to elevate the seizure threshold and
to limit the spread of seizure activity. It is of value
1n the control of grand mal and psychomotor epilepsy but
is of little value in petit mal attacks. It can also be
used in the treatment of status epilepticus, in the control
of seizures in neurosurgery and in the treatment of cardiac
arrhythmias.
Orally, phenytoin may be administered as the free acid or
as the sodium salt. The suggested initial dose for
adults is 100 mg of phenytoin sodium three times daily,
progressively increasing the dose at intervals of a few
days to a maximum of 600 mg daily .
1.2 PHYSICOCHEMICAL PROPERTIES OF PHENYTOIN
The physicochemical properties of phenytoin have been
reviewed by Feldman et al. (1975) and Schwartz et al.
(1977).
of 8,3.
Phenytoin is a weak organic acid with a pK a
The solubility of the drug in water is
dependent on pH; it is poorly soluble in water but
readily dissolves 1n alkali. Phenytoin is a sufficiently
3
weak acid to exist mainly in the unionised form at pH values
less than eight.
Dill et al. (1956) and Schwartz et al. (1977) both give
ranges for the solubility of phenytoin. For example, 3 Schwartz quotes solubilities of 56,8 ~g/cm at pH 8,3
falling to 18 , 4 ~g/cm3 at pH 4,9 at 25 DC.
Schwartz warns that it is necessary for investigators to
have a clear understanding of the physicochemical
characteristics of phenytoin. "Because of its limited
solubility , hydro-alcoholic solutions have been used in
the past to broaden the experimental range of concentrations.
Alcohol would affect in vitro binding experiments; studies
intended to be of clinical relevance should be conducted
at physiologic temperature, pH, ionic strength in aqueous
buffer."
1.3 ABSORPTION OF PHENYTOIN
Glazko (1972 a) states that the absorption of phenytoin after
oral administration is slow, somewhat variable and
occassionally incomplete and that significant differences
in the bio-availability of phenytoin from oral pharmaceutical
preparations have been reported. The absorption of
phenytoin has been reviewed by Woodbury and Swinyard (1972),
who state that phenytoin is mainly absorbed through the
intestinal mucosa by passive diffusion, a phenomenon which
is governed by the pK and lipid solubility of the compound a
and the pH of the medium in which the substance is dissolved.
In the stomach, phenytoin (pK 8,3) will be predominantly a
in the non-ionised form but absorption will be limited by
the low solubility of the drug in the gastric juice
(pH about 2,0) . In the duodenum (pH 7,0 to 7,5) the
proportion of phenytoin which is ionised increases and the
drug becomes more soluble in the intestinal fluids. This
4

increased solubility (which is enhanced by the presence
of bile salts) and the large surface area of the small
intestine both contribute to the rapid absorption of the
drug from this region of the gastro-intestinal tract.
However , even at the higher pH of the intestinal fluid,
phenytoin is relatively insoluble, (100 ~g/cm3 at pH 7,8).
The rate of absorption depends mainly on the rate at which
phenytoin can enter
phenytoin in plasma
the blood stream.
is only 75 ~g/cm3 The solubility of
at 37 °C . Thus
absorption can occur only at the rate at which the
phenytoin is removed from the blood by storage in fat,
binding to tissue and plasma constituents, metabolism by
the liver, and excretion into bile and urine.
1.4 INTERACTIONS OF PHENYTOIN
Phenytoin is known to interact with a number of other drugs.
These interactions are summarised in the Extra Pharmacopoeia
(1977) and have been well documented by Martin et al. (1971),
Hartshorn (1972),
and Kutt (1975).
Kutt (1972), Buchanan and Sholiton (1972)
Kutt (1975) states that a variety of
interactions may take place between anti-epileptic drugs
or between anti-epileptic drugs and other therapeutic or
chemical agents. These interac tions will result in
alterations in the solubility, absorption, metabolism,
elimination and tissue distribution of the drug in question.
No attempt will be made to discuss the numerous interactions
of phenytoin with other drugs , but the specific interactions
of phenytoin with antacids, excipients, adsorbents and
metal ~ons will be dealt with individually.
1.4.1 Interaction of phenytoin with antacids
The field of drug-antacid interactions has been reviewed
by Hurwitz (1977), who states that antacids are commonly
used drugs which are often considered by many patients and
5

physicians to be inert and free from pharmacological
effect. The Extra Pharmacopoeia (1977) cautions against
the administration of other medication to patients on
antacid therapy because, "Castro-intestinal absorption
can be reduced by adsorption on insoluble antacids or
changes in gastric emptying time and the effects of a
drug may be diminished or enhanced by alterations in the
intestinal pH or by the formation of complexes".
The interaction between antacids and phenytoin was
observed by Pippenger (personal communication 1978).
"In 1973 we did observe clinically that patients receiving
antacid therapy showed a marked reduction in the serum
concentrations of phenytoin which were achieved on
standard dosage regimens. .•• Further investigation
into this matter clearly demonstrated that the low serum
concentration was directly due to a blockage of phenytoin
absorption by the antacid, Mylanta." (A dried aluminium
hydroxide gel - magnesium hydroxide, dimethicone combina
tion. )
In further studies Pippenger (personal communication 1978)
reports that three different antacid preparations "when
given simultaneously with the total daily dosage of
phenytoin, caused a marked reduction in serum phenytoin
concentrations". In conclusion, Pippenger states,
"There is no question on the basis of these studies, that
there is indeed a clear-cut interaction between antacids
and the absorption of phenytoin. Further clinical studies
on patients receiving these two drugs in combination
indicated that the effect of antacid on the absorption of
phenytoin could be blocked simply by administering the
antacid four hours away from the time the phenytoin was
administered. II
Pippenger attributes the observed phenytoin-antacid
6

interactions to a combination of factors, including
(I) incomplete breakdown of the phenytoin capsule;
(2) the possible chelation of the phenytoin by the
magnesium and calcium salts present in the antacids;
and
(3) a blocking of the absorptive sites of the phenytoin
within the intestinal mucosa.
Three further studies pertaining to the interaction of
phenytoin and antacids were published by O'Brien et al.
(1978), Kulshrestha et al. (1978) and Garnett et al.
(1979) .
O'Brien et al. studied the effects of antacids on the
pharmacokinetics of phehytoin and observed that neither 3 10 cm of Aluminium Hydroxide Gel B.P. nor a magnesium
hydroxide mixture altered significantly either the rate or
the extent of the absorption of a single oral dose of
phenytoin . The authors attribute their failure to show
an effect of antacids on the kineti cs of phenytoin to t he
design of the study and to the fact th a t changes in the
steady state concentrations of phenytoin in the plasma
may be a more sens i ti ve index than changes in the single
dose kinetics studied.
In a more meaningful study, Kulshrestha et al. (1978)
administered two antacid preparations (one containing
calcium carbonate and the other a mixture of aluminium
Ilydroxide and magnesium trisilicate - Gelusil R) to
groups of epileptic patients who were s tabilised on
phenytoin therapy . The concentration of phenytoin in
the serum was monitored. Analysis of the results revealed
that there was no change in the mean concentration of
phenytoin in the serum within the group treated with
7
calcium carbonate . The group treated with Gelusil R
experienced a slight but statistically significant fall
in the concentration of phenytoin in the serum (from 40,4
to 35,4 ~m/dm3 .
The following factors are mentioned as the possible causeS
for the fall in concentration of phenytoin in the serum :
(1) the antacids may release metal ions which chelate
with phenytoin and result in reduced absorption;
(2) aluminium hydroxide and magnesium trisilicate may
form gels in the gastro-intestinal tract. These
gels could possibly adsorb the phenytoin, thus
reducing the absorption of the latter;
(3) the antacids may increase the pH of the upper region
of the gastro-intestinal tract, thus increasing
the ionisation of the phenytoin and hence reducing
its absorption. However, the brief duration of
the pH change would perhaps be insufficient to
reduce the absorption of the relatively slowly
absorbed drug;
(4) the presence of aluminium salts may reduce the
gastro-intestinal motility, a condition which could
delay absorption if not reduce the amount of drug
absorbed .
Garnett et al. (1979) investigated the bio-availability
of phenytoin given concomitantly with antacids. The
antacids used were a combination of aluminium hydroxide
and magnesium hydroxide gel, calcium carbonate and a
combinat i on of aluminium hydroxide and magnesium tri-
silicate . Eight subjects were used and served as their
own controls. On analysis all the antacids decreased
the mean AUC for phenytoin . These authors state that
their data support the reports of an interaction between
8

phenytoin and antacids .
From these sources, two areas of study emerged:
(1) an investigation of the adsorption of phenytoin
onto the particulate matter, this phenomenon could
delay the absorption of the drug;
(2) an assessment of the possible interactions between
phenytoin and the antacids with respect to their
influence on the permeation of the phenytoin through
a membrane.
1.4.2 Interaction of phenytoin with excipients
Phenytoin is frequently administered as the sodium salt
in capsule form. The Pharmaceutical Codex (1979) states
that it is customary to issue capsules almost completely
filled, an inert diluent being necessary when the dose of
the medicament is less than 100 mg and if the capsules
are machine filled. The Codex lists the following
diluents as being suitable: lactose, magnesium carbonate,
magnesium oxide, calcium carbonate, starch, mannitol and
kaolin. This list includes three antacids and kaolin,
which is acknowledged by the Codex to have adsorbent
properties. In addition, pharmaceutical grade starches
may interact with medicinals.
The interaction of antacids and starches, used as excipients,
with dicoumarol was demonstrated by Akers et al . (1973).
In studies conducted in dogs, significantly higher plasma
levels were observed when dicoumarol was administered with
magnesium oxide or hydroxide . The use of talc, aluminium
hydroxide and starch resulted in significantly lower
plasma levels of the drug. The interaction of starch with
pharmaceuticals has been reported by Zografi and Mattocks
(1963), who report on the adsorption of anionic dyes by
9

starch. Goudah and Guth (1965) found that potato starch
and arrowroot starch form complexes with benzoic acid and
p-hydroxybenzoic acid esters. Salicylic acid was found
to form an insoluble complex with both starches.
Caffeine, however, did not interact with the starches
tested. Mansour and Guth (1968) further found that
preservatives such as benzoic acid, p-hydroxybenzoic acid
and sorbic acid form complexes with potato starch, arrow
root starch, corn starch, rice starch and a number of
commercial starches rich in amylose and that the starches
show different affinit i es for the same compound according
to their content of amylose.
Since starches act as adsorbents and form complexes with
medicinals, it appeared that an investigation of the
interactions of phenytoin with starch could prove of
value.
A specific interaction between phenytoin and an excipient
has been widely reported as a result of an outbreak of
phenytoin intoxication in Australia in 1968. Tyrer
et al. (1970) studied the outbreak in Brisbane and
repor t that, in all, 51 persons were affected.
Investigations l ed to the conclusion that a change in the
excipient in the phenytoin sodium capsules was the cause
of the observed intoxication. The exc ipient had been
changed from calcium sulphate dihydrate to lactose prior
to the reported outbreak.
Further direct evidence was obtained from a series of
determinations of the concentration of phenytoin in the
blood of a single patient who was changed from phenytoin
with lactose to phenytoin with calcium sulphate as
excipient and then back to phenytoin with lactose as
excipie nt. The concentration of phenytoin in the patient's
10

blood fell rapidly to a quarter of its former value when
the pheyntoin with calcium sulphate was used instead of
phenytoin with lactose. The concentration of phenytoin
in the blood rose again when phenytoin with lactose as
excipient was re-introduced. Similar tests carried out
on a further three patients produced the same type of
result.
Tyrer et al. (1970) draw the following conclusions from
their study :
(1) the evidence presented showed that a change in the
excipient in the phenytoin sodium capsules was
associated with the alterations in concentration
of phenytoin in the blood and with the clinical
anticonvulsant intoxication observed;
(2) the mechanism through which the changed excipient
exerted its effects seemed to be the same among
epileptics;
(3) the excipients used in pharmaceutical preparations
may not always be biologically inert. Excipients
present in one preparation may theoretically alter
the metabolism of another drug administered
simultaneously.
A survey of the literature, however, has failed to reveal
further i nformation as to the nature of the calcium
sulphate/phenytoin interaction, but it seems possible
that the following explanations can be considered :
(1) an alteration in the dissolution rate of the capsules
containing calcium sulphate dihydrate;
(2) since calci um sulphate dihydrate is moderately
soluble in both water and dilute mineral acids, the
11

calcium ions released in the gastro-intestinal tract
may possibly chelate with the phenytoin in solution
within the gastro-intestinal tract and so reduce the
absorption of the anticonvulsant.
1.4.3 Interaction of phenytoin with metal ions
Antacids and other compounds containing polyvalent cations
such as aluminium, calciu!n and magnesium may release these
ions in the gastro-intestinal tract. Certain materials
may form chelate. or complexes with these cations. This
phenomenon may result in the reduction in the amount of
drug absorbed from the gastro-intestinal tract.
Neuvonen (1976) discusses the interactions influencing the
absorption of tetracylines and states that the absorption
of all tetracycline derivatives may be seriously affected
by the simultaneous ingestion of antacids containing
polyvalent cations such as AI(III), Mg(II) and Ca(II).
The effect of this interaction was demonstrated in vitro
by Juul Christensen et al. (196 7). Their studies show
that the diffusion of tetracycline hydrochloride through
a membrane is diminished by magnesium oxide, aluminium
hydroxide and calcium carbonate.
The elevated plasma levels of dicoumarol in dogs resulting
from the co-administration of magnesium oxide or hydroxide
reported by Akers et al . (1973) are attributed to chelate
formation. The magnesium chelate of dicoumarol produces
higher plasma levels than the drug administered alone.
Like many of the barbiturates, phenytoin forms a
characteristic copper complex when treated with copper
sulphate in pyridine s olution . This reaction forms the
basis for the B. P . C. i dentification test for phenytoin.
12
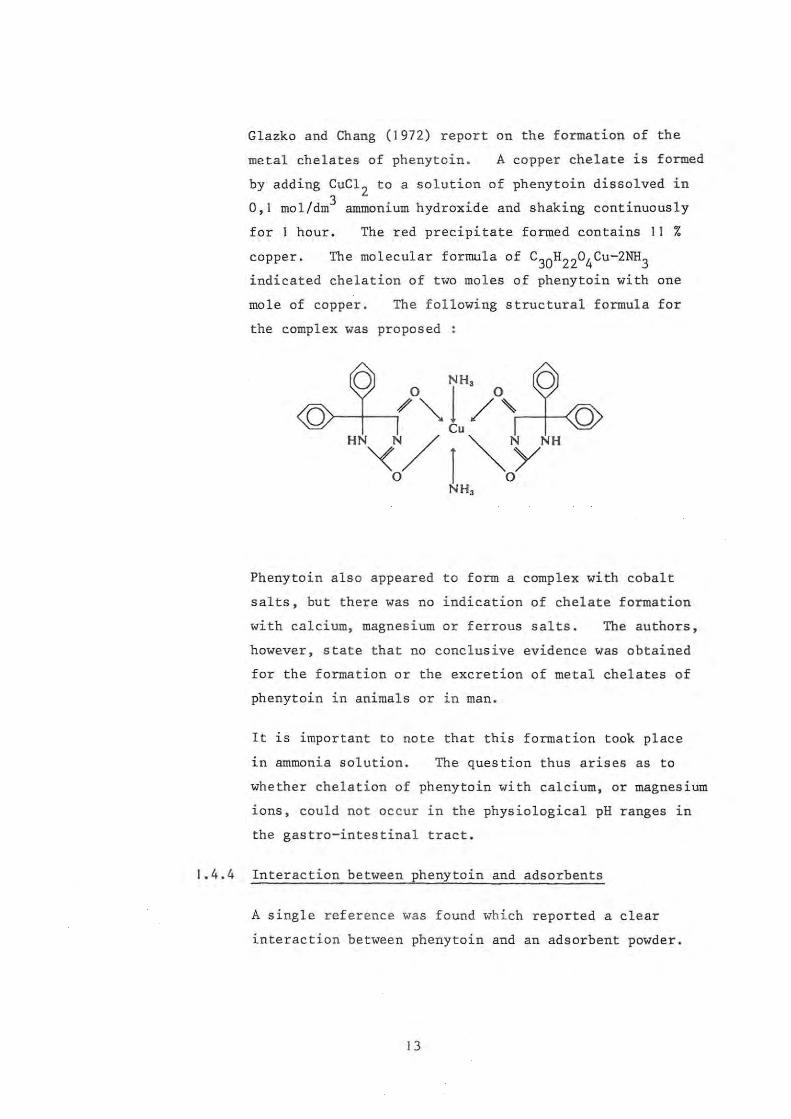
Glazko and Chang (1972) report on the formation of the
metal chelates of phenytoin . A copper chelate is formed
by adding CuCl 2 to a solution of phenytoin dissolved in
0,1 mol/dm3 ammonium hydroxide and shaking continuously
for 1 hour. The red precipitate formed contains 11 %
copper.
indicated chelation of two moles of phenytoin with one
mole of copper. The following structural formula for
the complex was proposed :
Phenytoin als o appeared to form a complex with cobalt
salts, but there was no indication of chelate formation
with calcium, magnesium or ferrous salts. The authors,
however, state that no conclusive evidence was obtained
for the formation or the excretion of metal chelates of
phenytoin in animals or in man .
It is important to note that this formation took place
in ammonia solution. The question thus arises as to
whether chelation of phenytoin with calcium, or magnesium
ions, could not occur in the phys i ological pH ranges in
the gastro-intestinal tract.
1.4.4 Interaction between phenytoin and adsorbents
A single reference was found which reported a clear
interaction between phenytoin and an adsorbent powder.
13

This study is reported by Decker et al. (1968) and was
carried out to assess the effectiveness of activated
charcoal as an adsorbent in cases of poisoning by drugs
and other toxic compounds.
One hundred cm3 of artificial gastric juice was placed
in a flask and incubated at 37 °c in a metabolic shaker.
For the medicinals, capsules or tablets were used and
these were emptied or crushed before dispersion in a
small volume of water and addition to the flask. A slurry 3 of 5 g of charcoal in 50 em of water was transferred to
the flask and incubation (with shaking) was continued.
After 20 min, the charcoal was separated from the contents
of the flask by rapid filtration or centrifugation and
the amount of drug remaining in solution was determined
by the appropriate analytical method. The results of
Decker et al . show that more than 80 % of the phenytoin
is removed from solution in tests conducted with I, 7
and 20 phenytoin tablets of an unspecified strength.
1.5 ANALYTICAL METHODS FOR PHENYTOIN
The var'ous analytical methods ava ilable for the determina
tion of phenytoin in both pharmaceutical dosage forms and
In bio-availabil i ty studi es are reviewed by Clazko (1972 b).
In addition to the methods listed by Clazko, a number of more
recent procedures such as radio-immunoassay, enzyme
immunoassay, spectrofluorimetry and high pressure liquid
chromatography are available. In view of the many methods
available, the following criteria were set for the choice
of the most suitable procedure :
(I) The solubil ity of phenytoin is limited at
physiolog ical pH values, therefore the method had to
be sufficiently accurate to measure concentrations up 3
to 100 ~g/cm of the drug;
14

(2) The method should be rapid and simple enough for
a large number of determinations to be performed
daily by a single worker;
(3) The availability and cost of the apparatus and
reagents.
On assessment, the spec trophotometric methods and in
particular the benzophencCle-extraction procedure seemed
most suitable and therefore a detailed investigation of
these were carried out.
1.5.1 Spectrophotometric determination of phenytoin
Glazko (1972 b) states that the first maj or bre akthrough
in these methods was reported in 1956 with the develop
ment of a spectrophotometric method by Plaa and Hine and
the colorimetric procedure by Dill et al. The method
of Dill et al. (1956) has been widely used but according
to Glazko, it is time consuming. The practicalities
were therefore not investigated but the method was borne
in mind as a useful a l ternative.
According to Clarke (1969), phenytoin in methanol
exhibits an absorption maximum at 258 nm. This
property has been used by a number of workers for the
measurement of phenytoin and the barbiturates in both
pharmaceutical dosage forms and the blood. Examples of
such work include the determination of phenytoin and
phenobarbitone in serum by Westerink and Glerum (1964),
and Huisman and Dek (1964). The spectrophotometric
determination of phenytoin and barbiturates in
pharmaceutical dosage forms has been reported by
Diliberto (1969) and Amer et al . (1976) among others. These
workers used various solvents at different pH's in order
that the mixture of compounds could be determined.
The benzophenone-extra c t ion procedure was reviewed by
15

Glazko (1972 b). This method was originally introduced
by Wallace et al. (1965) and is based upon the formation
of benzophenone from phenytoin by heating with alkali
and further treatment with bromine. The reaction
product is separated by steam distillation, followed by
extraction of the benzoph2none from the distillate with
an organic solvent and measurement of the ultraviolet
absorbance. Glazko (1972 b) states that the advantage
of this method is that phenobarbitone, and most other
drugs, do not interfere with the assay, and normal
plasma blanks are low. However, the original procedure
required large volumes of blood and a great many
modifications were made in order to provide a technique
suitable for clinical applications.
Wallace (1966, 1968 and 1969) published further
modifications which incorporate the use of potassium
permanganate for the oxidation step, and the elimination
of the distillation procedure by refluxing with no-heptane
during the oxidation of the sample. The procedure was
scaled down by Lee and Bass (1970), who achieved a
sensitivity of 1 ~g/cm3 with 2 cm3 samples of plasma.
Morselli (1970) used a scaled-down procedure and refluxing
to achieve an assay rate of 40 samples per 4 hours.
Further investigations and modifications of the method
were published by Bock and Sherwin (1971), Meulenhoff and
Kutsch Lojenga (1972), Glazko (1972 b), Saitoh et al.
(1973), Wallace et al . (1974), and Wallace and Hamilton
(1974).
Saitoh et al . (1973) describe a modification to the method
proposed by Wallace (1968) . Improvements were made
possible by the introduction of changes in the reaction
conditions and by the determination of the benzophenone
concentration by the use of the expanded scale of a
16
recording spectrophotometer. The conversion of phenytoin
to benzophenone was found to be quantitative and the
blank value negligible . The method allows the use of 3 plasma or whole blood samples as small as 0,1 em. In
addition, the method has proved useful for in vitro
investigations and was successfully applied to a study
of the dissolution behaviour of phenytoin from a ground
mixture with microcrystalline cellulose by Yamamoto et al .
(1976) . It was therefore decided to carry out an in
depth study of this methoQ.
Saitoh et al. describe the method of Wallace (1968) as
follows :
" 20 ml of 1 % KMnO 4 in 7N NaOH and 5 ml of n-heptane
are added to diphenylhydantoin extracted from biological
specimens, and the mixture is then refluxed for 30 min
with constant magnetic stirring. After cooling, the
n-heptane layer is separated from the aqueous permanganate
layer and its absorbance is determined at 247 nm against
pure n-heptane." Blank values from 10 cm3 of oxalated
whole blood containing no phenytoin were determined.
Saitoh et al. experienced problems with the blank readings
and investigated this aspect . Higher blank readings
were obtained when the n- heptane was added to the
oxidation mixture prior to refluxing. A procedure was
devised in which the phenytoin was converted to
benzophenone and extracted in the n-heptane after cooling.
This method yielded blank readings of an acceptably low
absorbance.
The effect of reaction conditions on the yield of
benzopllenone was investigated hy Saitoh et a1. because
the Wallace method of refluxing is time consuming if a
number of samples are to be analysed . The results of
17

the study show that the oxidation of phenytoin with
alkaline permanganate should be performed at temperatures
lower than 80 °C. Furthermore, refluxing for 30 min
with constant stirring as proposed by Wallace (1968)
is unnecessary and that the benzophenone which forms
quantitatively by the permanganate oxidation at 80 °c for 5 min is completely extracted by the n-heptane after
shaking for 10 min.
The method devised by Saitoh et al. is as follows :
The phenytoin is extracted from the blood or plasma as
described and to 0,5 cm3 of the phenytoin extract is
added 10 cm3 of 1 % KMn04 in 7 mol/dm3 NaOH. The
tube is immersed in a water bath at 80 °c for 5 min. 3 After cooling, 2 cm of n-heptane is added to the
solution and the mixture is shaken for 10 min and
centrifuged for 5 min. The n-heptane layer is then
transferred into a microcell .and the absorbance recorded
on a ten-fold scale of a recording spectrophotometer over
the range of 220 to 270 nm against pure n-heptane.
The peak reading at 247 nm is read on the recording
paper.
Using this method, Saitoh et al. conclude that there
is a linear relationship between the absorbance readings
and the phenytoin concentrations up to 30 ~g/cm3. The average percentage phenytoin recovered from all
samples with this method was found to be 100,1 with a
standard deviation of 1,0.
The method devised by Saitoh et al. (1973) was reviewed
by Wallace and Hamilton (1974), who state that, according
to their investigations, the nonreflux technique does
not provide the sensitivity obtained through reflux.
However, the method does offer the advantages of not
18
requiring the more expenSive reflux apparatus and
of achieving its optimum sensitivity in less time .
" Thus, for laboratories having a limited budget and
not possessing reflux apparatus, the nonreflux technique
may be the most appropriate method."
In addition, the publication of Wallace and Hamilton
gives the following practicalities :
(I) The amount of potassium permanganate (0,1 to 0,4 g
per 10 cm3) and the concentration of the sodium
hydroxide (5 - II mol/dm3) are not critical for
the quantitative oxidation of phenytoin;
(2) Centrifugation of the n-heptane/permanganate
oxidising mixture is unnecessary for the recovery
of the n-heptane . Separation is achieved by the
addition of water to float the n-heptane to the
neck of the oxidation flask or tube, from whence
it is transferred to the spectrophotometer cell.
Bearing the above discussion in mind, it was decided to
proceed with an investigation of the oxidation method as
devised by Saitoh et al. This involved an investiga-
tion into the sensitivity of the method, the production
of absorbance curves to assess the wavelength at which
the peak absorbance occurred, and the preparation of
standard curves for benzophenone in n-heptane and for
the oxidation procedure for phenytoin.
1.6 METHODS FOR ASSESSING DRUG INTERATIONS
It has previously been shown that possible phenytoin
antacid and phenytoin-excipient interactions have been
observed clinically but information is lacking as to
the nature of these interactions. A brief survey of
the feasibility of in vivo studies on human subjects
19

or in animals was made but practical difficulties
relating to cost, availability of apparatus and the
inconclusive clinical results obtained by O'Brien et al.
(1978) mitigated against such studies. The various
in vitro methods available were therefore investigated.
These methods were classified into two separate
categories, namely, the adsorption of drugs from
solution onto particulate matter and the assessment of
drug diffusion through various membranes of both natural
and synthetic materials.
1.6 . 1 "In Vitro" adsorption studies
A number of successful in vitro -studies have been
performed to demonstrate the adsorption of drugs in
solution onto dispersed insoluble powders. furthermore,
it has been possible to correlate these results to
clinical studies on human subjects in some instances.
In a series of studies conducted between 1961 and 1968,
Sorby and co-workers attempted to elucidate the effects
of various adsorbents on the absorption of a number of
phenothiazine derivatives. Preliminary studies by
Sorby and Plein (1961) indicate that considerable
adsorption of the phenothiazines onto kaolin, talc and
activated charcoal takes place. The in vitro studies
were extended by Sorby (1965) and by Sorby and Liu (1966)
in an attempt to establish a more complete understanding
of the relationship which exists between the adsorption
of drugs onto powders and their bioavailability. The
possibility of using in vitro data to predict in vivo
effects was investigated.
Promazine and admixtures of either activated attapulgite,
or activated charcoal were used in 1965. The rate and
the extent of the absorption of the drug in humans was
studied using urinary excretion data. It was found that
20

the initial rate of the appearance of the drug in the
ur1ne is slowed but there is little decrease in the
total availability of promazine when it is administered
in mixtures containing activated attapulgite. Activated
charcoal is reported to decrease both the rate and the
extent of the absorption of promazine. In the test,
50 mg of promazine hydrochloride was equilibrated with
the adsorbent prior to administration.
In the 1966 study, the adsorbent and the drug were not
equilibrated prior to administration. This change in
procedure served the purpose of ensuring that the
results would have maximum applicability to the clinical
situation. In vivo tests were conducted on a single
male subject using 50 mg of promazine hydrochloride and
an antidiarrhoeal preparation containing attapulgite and
citrus pectin. It was found that the presence of the
antidiarrhoeal mixture within the gastro-intestinal
tract is sufficient to retard the absorption of the
promazine. Adsorption isotherms were determined before
in vivo tests were conducted. Sorby et al. (1966)
further demonstrated the effects of pH and electrolyte
concentration on the adsorption of phenothazine onto
kaolin, talc and activated charcoal.
However, in a later study, Sorby (1968) found that
promazine absorption from the human gastro-intestinal
tract is unaffected by small amounts of activated
attapulgite and activated charcoal if the drug and the
adsorbent are not equilibrated before administration of
a test dose.
Blaug and Gross (1965) reviewed the adsorption of a number
of drugs onto antacids. Their discussion of reports
dating from 1938 to 1965 deals with the loss of atropine,
belladonna alkaloids and anticholinergics from solution
21

onto various insoluble antacids . Blaug and Gross
measured the adsorption of nine anticholinergic drugs
in aqueous solution onto six different insoluble antacids.
The results obtained were plotted and interpreted
according to the Langmuir isotherm. It was found that
the adsorptive power of the antacids varies with the
anticholinergic drugs investigated; atropine sulphate,
methantheline bromide, propantheline bromide and
oxyphenonium bromide are adsorbed to the greatest extent,
and that magnesium trisilicate shows the highest
adsorptive capacity of the antacids studied. Blaug and
Gross caution against the administration of strong
adsorbents and anticholinergic drugs in combination.
El-Nakeeb and Yousef (1968) investigated the effect of
twenty-two compounds used as adsorbing, suspending and
solubilising agents on the activity of eight antibiotics.
Kaolin was found to reduce the antibacterial activity
of neomycin, streptomycin and tetracycline hydrochloride.
The reduction in activity is attributed to adsorption
of the antibiotics onto kaolin. Khalil et al. (1976),
however, report that out of a group of powders tested with
seven antibiotics, kaolin has the least adsorptive power
and that the tetracyclines are more highly adsorbed than
other antibiotics.
The adsorption of digoxin onto an aluminium hydroxide
magnesium hydroxide combination and onto a kaolin-pectin
combination was demonstrated by Binnion and McDermott
(1972) who observed that both medications interfere with
the absorption of digoxin in humans.
Khalil and Moustafa (1973) studied the in vitro adsorption
of some tranquilisers, sedatives and anticholinergic
compounds by antacids. The results indicate that in
most cases magnesium trisilicate and magnesium oxide have
22
relatively higher adsorptive capacities for the compounds
used. Calcium carbonate and aluminium hydroxide have
an intermediate capacity, while bismuth oxycarbonate has
the least adsorptive power. It was found that pheno
barbitone and meprobamate are not adsorbed to any
significant extent. The authors conclude by stating
that careful in vitro and in vivo testing of drug
availability is advisable prior to the administration of
combinations of drugs and antacids. However, in vitro
experiments are usually simpler, easier to interpret and
should, with careful consideration of results, help to
predict possible interactions that might take place in
a dosage form or in the gastro-intestinal tract following
the simultaneous administration of drug-antacid
combinations.
The adsorption of atropine and hyoscine onto magnesium
trisilicate was studied by El-Masry and Khalil (1974).
They report that at relatively low initial concentrations
of the drug, the adsorption data is shown to fit a
Langmuir plot while at higher concentrations the extent
of adsorption increases due to multilayer formation.
Further in vitro adsorption studies of hyoscyamine onto
magnesium trisilicate in Magnesium Trisilicate and
Belladonna Mixture B.P.C. were performed. It was
found that about 93 % of the hyoscyamine content of the
belladonna tincture is adsorbed onto the magnesium
trisilicate and that adsorption is complete within 30 min.
The uptake of digoxin and digitoxin by antacids was
assessed by Khalil (1974). Among the antacids tested,
magn es ium trisilicate exhibits the highest adsorptive
effect. The relatively weak adsorptive capacity of
calcium carbonate, magnesium oxide, magnesium carbonate
and aluminium hydroxide gel appear of little significance
since these antacids dissolve in the gastric juice in vivo.
23

Magnesium trisilicate reacts in acid media and forms
hydrated silica gel, which has adsorbing properties.
The adsorption of the two glycosides was found to be
dependent on the level of hydrochloric acid in the medium.
Adsorption was noted even when 94 % of the antacid was
converted to the gel.
Khalil et al. (1976) investigated the 1n vitro
adsorption of various antibiotics onto antacids. They
report that magnesium trisilicate and magnesium oxide
show the highest adsorptive capacity; calcium carbonate
and aluminium hydroxide have intermediate power, while
bismuth oxycarbonate has the least adsorptive power.
Tetracyclines were found to be more highly adsorbed than
other antibiotics while triacetyloleandomycin and
chloramphenicol have intermediate values. It was found
that ampicillin is only adsorbed to a slight extent, while
cloxacillin is not adsorbed.
Naggar et al. (1976) investigated the in vitro adsorp
tion of some antirheumatics onto antacids and kaolin.
These workers show that magnesium oxide, followed by
aluminium hydroxide and bismuth oxycarbonate have a
"fairly high" adsorptive capacity for compounds such as
the salicylates, mefenamic acid and flufenamic acid.
Magnesium trisilicate was found to have a tendency to
adsorb phenazone, aminophenazone, indomethacin and
methiazinic acid. Indomethacin, methiazinic acid,
mefenamic acid and flufenamic acid are significantly
adsorbed by kaolin.
Yu et al. (1976) observed that patients suffering from
chronic diarrhoea and who were stabilised with codeine
phosphate suffe red relapses when the codeine phosphate
was added to a kaolin mixture prior to administration.
In vitro adsorption studi es conducted with synthetic
24

gastric or intestinal fluids revealed that codeine phosphate
is adsorbed onto kaolin and that the amount of drug
adsorbed depends on the time of contact with the kaolin.
Numerous other studies of the adsorption phenomena have
been reported. For example, Ridout (1968 (a) and (b))
investigated the adsorption isotherms for atropine sulphate
onto kaolin. Further investigations to elucidate the
nature of the kaolin surface and the adsorption phenomenon
were carried out by Armstrong and Clarke (1971, 1973 and
1976) .
It has previously been reported that Decker et al. (1968)
studied the adsorption of phenytoin and other toxic
substances onto activated charcoal. A number of other
workers have performed tests to assess the effectiveness
of activated charcoal as an adsorbent for drugs. These
include Sintek et al. (1978), Sellers et al. (1977) and
Sanvordeker and Dajani (1975) who studied theophylline;
various analgesics, sedatives , tranquilizers, antidepress
ants and diphenoxylate hydrochloride with respect to their
adsorption onto activated charcoal in vitro.
1.6.2 "In vitro" drug diffusion studies through membranes
Bates and Gibaldi (1970) state that a variety of
experimental methods are available for studying the
absorption of drugs. In vitro techniques are often
relatively simple and may provide valuable information on
the gastro-intestinal absorption of drugs.
The techniques available for the study of drug diffusion
in vitro may be broadly classified into those methods
which make use of synthetic lipid membranes and those
me t hods which make use of biological membranes. Both
classifications are based on the creation of suitable
conditions of pH on either side of the membrane and the
25

measurement of the diffusion of a substance across the
membrane under the conditions created.
Schanker (1961) states that gastro-intestinal membranes
and many other biological membranes act as lipid barriers
to most drugs. Levy and Mroszczak (1968) report that
physicochemical systems consisting of two aqueous phases
of different pH separated by a lipid phase are employed
as models for in vitro studies of drug absorption by
passive diffusion. These 'n vitro models may be
classified into two groups
(I) Models in which the aqueous phases are separated
by a lipid membrane. Such systems were used by
Inui et al . (1977), Yano et al. (1974), Falk and
Fuerst (1974) and Nakano (1971) among others. The
Sartorius Membranefilter Company has developed a
commercially available apparatus devised by Stricke-r.
Stricker (1971 (a) and (b) and 1973) published
reviews on works using this particular apparatus,
while Iinuma et al. (1976), used the Sartorius
apparatus to demonstrate the correlation between the
permeation rate constants through the artificial
membrane and the in situ absorption rate constant
for a series of sulphonamides and barbiturates in the
rat;
(2) Models employing a water-immiscible organic liquid
as a barrier. These are discussed in the publica
tions of Doluisio and Swintosky (1964), Lamy (1964),
Perrin (1967), and Khalil and Martin (1967).
Levy and Mroszczak (1968) state that the former type
appears more suitable for determining the effect of complex
formation on drug permeation because of the relatively high
aquC'otls-1.ipid phase volume ratio inherent in a system where
26

the lipid phase is located in a membrane. Systems in
which the lipid phase is represented by a water-immiscible
organic liquid interposed between two aqueous phases have
the disadvantage of a low and biologically unrealistic
aqueous-lipid phase volume ratio, with the organic phase
acting as a very effective trap for the more lipid
soluble components of a drug complex and thereby making
it difficult to maintain an adequate concentration of that
component in one or both of the aqueous phases.
The use of the Sartorius Absorption Simulator was con
sidered but the apparatus was not suitable for use in these
studies because it is not designed for use with suspensions
which tend to cause sediment formation within the diffusion
chamber. For this reason, methods which make use of
biological membranes and which were suitable for use with
suspensions were investigated. Bates and Gibaldi (1970)
classify the methods which employ biological membranes
as follows
(I) Everted small intestinal sac technique
This method was devi sed by Wilson and Wiseman (1954)
and involves isolating a small segment of the
intestine of a laboratory animal, everting the segment,
and filling the sac with a small volume of drug-free
physiological buffer. Both ends of the segment are
tied off and the sac is immersed in a flask contain
ing a relatively larger volume of buffer solution
that contains the drug. The flask and its contents
are then oxygenated and agitated continuously at 37 °c for a specified period of time. After incubation,
the ~nner or serosal fluid is assayed for drug
content . Bates and Gibaldi (1970) state that the
integrity of the preparation is usually maintained
for periods of up to 1 hour . Eversion provides a
27

means of prolonging the viability of the epithelial
cells which have a very high oxygen requirement .
However, Tidball et al. (1967) found that the oxygen
utilisation of normally orientated segments of the
small intestine of the rat does not differ significantly
from that of the everted segments. In addition,
Mayersohn and Gibaldi (1969) showed that the passive
transfer of salicylate across the everted rat intestine
is virtually identical when the mucosal solution is
gassed with either oxygen or nitrogen.
The major disadvantage of the sac method is the
difficulty in obtaining more than one serosal sample
per intestinal segment. This problem was overcome
by Crane and Wilson (1958) who tied the intestinal
segment to a cannula so that a series of serosal
samples could be obtained. The everted gut
technique has been used successfully by a number of
workers including Aguiar and Fifelski (1966),
Feldman et al. (1970), Kaplan and Cotler (1972)
and Chowhan and Amaro (1977) .
The ma~n problem associated with the use of the
everted gut in the present study was the anticipated
difficulty in maintaining the uniformity of a
suspens~on during the test. From an examination of
the apparatus normally used, it did not appear
practical to attempt to add a stirring mechanism
which would not interfere with the intestinal segment.
In addition, the apparatus is normally constructed
from
~n a
a large test-tube which
water-bath at 37 °C.
is partially immersed
The lack of a suitable
stirring unit for such a system necessitated the
investigation of other techniques employing
hiological membranes .
28

(2) Circulation techniques
Bates and Gibaldi (1970) state that circulation
techniques have been used infrequently for drug
absorption studies. These methods involve the
isolation of the entire small intestine of a laboratory
animal or a segment thereof and establishing a closed
circulation of oxygenated buffer through the lumen.
The outer solution on the serosal side of the
intestinal membrane is also circulated and oxygenated.
Absorption rates from the lumen to the outer solution
are followed by sampling both the fluid circulating
through the lumen and the solution on the serosal
side of the intestine . Both serosal and mucosal
volumes are relatively large and comparable. The
duration of the experiment is usually 1 hour .
Bates and Gibaldi state that the method is applicable
to kinetic studies of the factors affecting drug
absorption. The major advantages claimed for the
method are that both surfaces of the i ntestine are
oxygenated and that eversion of the membrane is not
necessary . The method is described by Fi sher and
Parsons (1949), Wiseman (1953) and Darlington and
Quastel (1953).
The method of Fisher and Parsons (1949) may be out
lined as follows :
A rat is anaesthetised with ether and the abdomen
is opened by a midline incision . Both ends of a
segment of the small intestine are cannulated and a
closed circulation of an oxygen-saturated, CO2 -
bicarbonate buffered fluid i s established through the
lumen before the circulation of blood to the intestinal
wall is interrupted . The segment is suspended in a
29

bath of oxygenated Ringer solution, and the absorption
processes followed by sampling the fluid circulating
through the lumen and the fluid bathing the exterior
of the intestine . Fisher and Parsons attribute the
success of the technique to the fact that there is
no time at which the mucosal cells are deprived of
an adequate supply of oxygen.
Fisher and Parsons place great emphasis on the oxygen
requirements of the isolated intestine. However,
the results of Tidball et a1. (1967) and Mayersohn
and Gibaldi (1969) quoted earlier indicate that the
oxygen requirements of the isolated intestine may not
be as critical as was first thought by investigators .
Wiseman (1953) used a similar method to that devised
by Fisher and Parsons for his study. The apparatus
used by Darlington and Quastel (1953) is similar to
that used by Wiseman but these investigators did not
anaesthetise the animal prior to removal of the
intestine. A male guinea-pig is killed by decapitation
and allowed to bleed. The abdomen is opened in the
midline and all of the intestine is removed except
that portion adjacent to the stomach which adheres
firmly to the surrounding tissue. The intestine is
placed 1D a small beaker of the solution to be used
i n the experiment, all the solutions having previously
been brought to 38 °c and gassed with 93 % 02 + 7 % CO 2 .
In order to obtain a standardised procedure, the
intestine in the beaker is removed and that part of
the intestine which is 30 to 40 cm from the stomach
in the intact animal is cut out, and the inside washed
with the solution to be used . Care is taken to
maintain the orientation of the intestine so that
perfusion is carried out through the segment in the
normal direction of flow.

CHAPTER 2 MATERIALS
2.1 ANTACIDS, ADSORBENTS AND STARCHES
Antacids used in the study were selected on the basis of
their frequent administration as medicinals and on their
being representative of the common cations and anions used
in therapeutics. In addition, the literature shows that
they have the ability to adsorb various drugs in vitro_ and
that the cations released from these compounds by the
action of hydrochloric acid may form complexes with drugs
(such as the tetracyclines).
The following antacids were selected
Dried Aluminium Hydroxide Gel (B.P.)
Calcium Carbonate (B . P . )
Magnesium Carbonate, Heavy and Light (B.P.)
Magnesium Oxide, Light (B.P.)
Magnesium Trisilicate (B.P.)
Light Kaolin (B.P . ) and Activated Charcoal (Norit OL)
were chosen as the adsorbents . Both substances are known
to adsorb drugs from solution in vitro and are acknowledged
by the Pharmaceutical Codex (1979) as possessing adsorbent
properties. Activated charcoal is known to adsorb phenytoin
and was used in the in vitro adsorption studies for
comparative purposes.
Of the compounds listed above , the Codex states that all
except magnesium trisilicate and activated charcoal are
suitable diluents for capsules . In addition, starch is
also included by the Codex and was therefore used in this
study. The literature has shown that the affinity of
starches for drugs may differ according to the amylose
content of the starch. Because the source of Starch B.P.
can be maize, rice, wheat or potato, it was decided to
investigate these starches individually.
31
The preparation, composition and properties of the
compounds selected are well known and will not be reproduced
here. For this study use was made of pharmaceutical or
laboratory grade materials which were readily available
from local sources of supply. Identification and particle
size analyses were not performed but all the powders were
screened through a 125 ~m sieve prior to use . This
ensured that all the powders complied with the B.P.
requirements for "Very Fine Powder". No further
reprocessing or activation procedures were carried out on
these agents prior to their use.
2. 2 PRENYTO IN
Phenytoin B.P.C. is 5,5 - diphenylhydantoin (or
5,5 - diphenyl-2-4-imidazolidinedione). It has a
molecular mass of 252,3 and possesses the following
structural formula :
Phenytoin is a white or almost white, odourless or
almost odourless, tasteless crystalline powder. It is
very slightly soluble in water but is soluble in solutions
of alkali hydroxides and in 70 parts of alcohol, 500 parts
of chloroform and in 600 parts of ether.
soluble in hot alcohol.
It is more
According to the Merck Index the melting point is
between 295 DC and 298 °C. Martindale and the U.S.P.
(XIX) give the melting point at about 295 °c with
decomposition .
32
Atherden (1969) states that Phenytoin Sodium B. P. is the
sodium derivative of the tautomeric (lactim) form of
phenytoin and has a molecular mass of 274,3. It is a
white, odourless, somewhat hygroscopic powder which on
exposure to air absorbs carbon dioxide with the liberation
of phenytoin . It is soluble in water and in alcohol but
is insoluble in chloroform and ether . Solution in water
is often incomplete unless the pH is raised to above 11,7.
The phenytoin used for this study was supplied by Parke
Davis (Batch No. 76049) . Lennon Limited supplied the
sample of Phenytoin Sodium (Batch No . 62782), and a B.P .
Commission Authentic Specimen of Phenytoin (Batch No. 556)
which was used as a primary reference standard .
The primary method of identification adopted for the
phenytoin was by means of the infra-red absorption spectra.
The spectrum of the Authentic Specimen was compared to that
of the samples . Clarke (1969) gives the principle
absorption peaks measured in potassium bromide. Potassium
bromide discs were produced on a Jasco press according to
the manufacturer's instructions and the spectra were recorded
between 2000 and 600 em- I with potassium bromide as
reference on a Beckman IRIO Spectrophotometer.
The phenytoin sodium provided by Lennon Limited was received
with a certificate of analysis showing the sample to be
99,3 % pure . Since this sample complied with the identifica-
tion test, no further analytical procedures were performed
on it.
The sample of phenytoin obtained from Parke Davis was
subjected to a melting point determination and assay by
means of non-aqueous titration to determine its purity. The
method for the melting point was that of Class la compounds
of the U.S.P . (XVIII) using a commercial Gallenkamp melting
33

point apparatus . Ncn-aq:J.eOtl2 ti ::ration was performed
according to the metho:.1 of the UG S~Pq (XIX ) . It was
found that the Par ke D&vis 3 ~cple complied wi th the identifica
tion test, the melt ing poi,ot c:cit~rion and the purity
specified in the Pha rm1copoei a .
2 .3 SOLUTIONS FOR ADSORPT:;ON STUDIES
A number of saInt jon'; ,,-; c.<t' ~ c~n ,;d. tl:,·. ~ed for use in this
study. These incl Lidc:.u ;;Lilulated gas tric or intestinal
juice U.S . P . and various citrate and phos ph ate buffer
formulat i ons. Ibe buf fe i' s ystem selected was simi l ar
to that used by Sorby et a1. (I 966) . These i nvestigators
used buffers of pH 2,5 and 6,5 containing 0,03 mol/dm3
of total phosphate . Since initial investigations
indicated that the S~r t.ori.us Solub i.li ty Simulator
Mode l 16751 could be of value in es timating the effects of
powders on the absorpt i on of phenytoin (Stricker, personal
verbal connnunicati on 1978) it "as decided to use the
solut ions recoTImlended in th8: operating instructions to
this apparatus . Ta bl.e 1 r'"fle ets the composition of the
solutions used and the (o·'-.tJ. phospha t e concentrations .
which compar e favoura bly vi th tllOs e used by Sorby .
TABLE 1
COMPOSITION OF ARTIFICIAG GASTRIC AND INTESTINAL JUICE FOR tl"fli(VITlZO" ADSORPTION ' STUDIES
,---.-------... ------------------~ i Artific i a l Artificial I Gast ric Intestinal ___ J,_ . ..:uice _._. ___ J_u_i_c_e __ -l
pH (! 0 ,2 ) 6,5
Mass Na3P04-12H
20 'rr ---~
9 50 added (g) > 12,50
Phos1?hate conc3n - 0 025 trat~on mol/dm '
3 cm
0 , 033
0,06 mol/dm3
HCI .- "-b' to 1000
.--------------~
31,

2.4 APPARATUS FOR "IN VITRO" DIFFUSION STUDIES
An examination of the Sartorius Absorption Simulator
led to the belief that it would be possible to modify
the apparatus in such a manner that the diffusion chamber
could be replaced with a length of ileum of a small
laboratory animal according to the method of Fisher and
Parsons (1949) . The fol l owing features of the Absorption
Simulator can be used advantageously for the construction
of the apparatus for the circulation technique . Namely,
(a) thermostatically controlled chambers surrounded by
heated jackets and equipped with separate
thermometers;
(b) magnetic stirrers for each chamber to ensure
homogeniety of the solutions in the chambers;
(c) a dual peristaltic pump which enables two solutions
to be circulated simultaneously.
2.4.1 Construction of apparatus
In order to perform the circulation studies it was necessary
to construct a modif i ed distribution head to replace the
standard units supplied with the Absorption Simulator .
The modified distribution head required the following
materials :
(a) a tapered rubber bung approximately 28 mm thick and
having an upper diameter of 48 mm and a lower
diameter of 41 mm ;
(b) two glass eye droppers 70 mm long and having an
external diameter of 7 mm . The lower end of the
dropper is shaped to form a nipple and the upper
end is grooved ;
(c) approximately 140 mm of 0,325 rnm diameter stainless

steel wire;
(d) a Luer Lock blunt-ended syringe needae Ij5 x 7,0 mm.
Two holes 7 rom in diameter and two holes 12 rom in diameter
were bored through the bung and positioned in such a manner
that holes of the same diameter were radially opposite each
other. The glass droppers were fitted into the smaller
holes so that the tips of the droppers protruded through
the bung to a distance of approximately 30 rom. One end
of the stainless steel wire was formed into a ring 8 rom
in diameter. The free end was positioned in one of the
larger holes in the bung and held in position by a plastic
tube 13 rom in diameter and approximately 20 rom long forced
into the hole so trapping the wire between the wall of the
bung and the plastic tube itself. The wire was positioned
in such a manner that the loop protruded approximately
95 rom below the lower surface of the bung into the
chamber. The plastic tube retaining the wire support
had an internal diameter of 11 rom and served as an outlet
for the gas and as an access so that samples could be
withdrawn from the chamber and fresh buffer added. The
other larger hole was used as a socket for the thermometer
supplied with the Absorption Simulator.
A fifth hole of 2 rom in diameter was bored through the
bung adjacent to the thermometer socket and the 115 mm
needle was inserted so that the Luer fitting rested on
the upper surface of the bung .
The detailed layout of the circulation chamber and the
distribution head is shown in Figure 1.
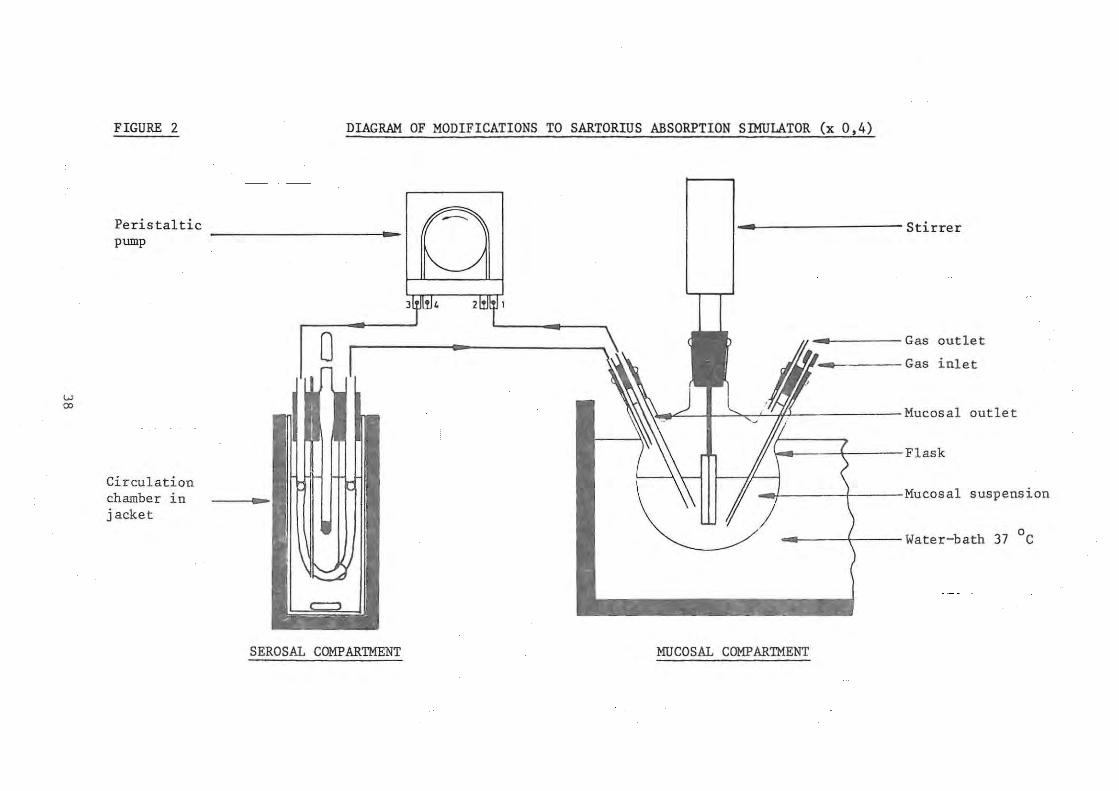
A diagramatic representation of the apparatus is shown in
Figure 2 and the detailed tube connections to the
peristaltic pump of the Abso r ption Simulator in Figure 3.
36

FIGURE 1 CIRCULATION CHAMBER AND MODIFIED DISTRIBUTION
HEAD FOR THE SARTORIUS ABSORPTION SIMULATOR (x 0,7)
- Sartorius thermomete r
lIr~~-1--~T---------------- Inlet tube 4 __ ----------- Outlet tube
_ ------------ Rub be r bung
4 ___ --------- Chamber
t-..It--------Length of ileum
I~---~~-+r---------Gas inlet
~==~~,-W---------Wire support
_~H-------- .Serosal solution
~==~;;;;~~~~---------Magnetic follower
37
W 0:>
FIGURE 2
Peris tal tic pump
Circulation chamber in jacket
DIAGRAM OF MODIFICATIONS TO SARTORIUS ABSORPTION SIMULATOR (x 0,4)
~----------------- Stirrer
o _ Gas outlet
'11_ Gas inlet
.\~/ I >. '" ., If.' Mucosal outlet
\_ ~ Flask
_ / Mucosal suspension
o .. ~ Water-bath 37 C
SEROSAL COMPARTMENT MUCOSAL COMPARTMENT

w
'"
FIGURE 3
Peristaltic pump
Modified distribution .. I head
TUBE CONNECTIONS FOR MODIFIED SARTORIUS ABSORPTION SIMULATOR
Test 1
3
Test 2
Test 1 ·Test 2
SEROSAL COMPARTMENTS MUCOSAL CCMPARTMENTS

By making use of this configuration it was possible to
conduct two tests simultaneously employing adjacent
segments of ileum from the same animal.
Figure 3 shows that both chambers of the Absorption
Simulator were fitted with the modified distribution heads. ~
The drug suspensions were held in 500 cm~ three-necked
flasks positioned in a water-bath maintained at 37 °c immediately alongside the Absorption Simulator. The central
neck of each flask was fitted with an Electrothermal
Mini-Stirrer. One neck of each flask was fitted with a
rubber bung into which a 115 x 2,0 mm syringe needle had
been fitted to serve as a gas inlet. An additional hole
was bored in this bung to serve as a gas outlet. The
third neck of the flask was fitted with a bung through which
two plastic tubes were passed to serve as the inlet and
outlet for the suspension .
2.4.2 Selection of animal
For work of this type, it is common practice to use animals
of one strain and preferably of the same sex and approximately
the same age and mass throughout. At the time of con-
ducting the experimental work, suitable laboratory rats
were not available in sufficient number or at reasonable
cost. Darlington and Quastel (1953) used guinea-pigs for
their study. These animals were readily obtainable from the
local branch of the South African Institute for Medical
Research and were used for this study. The gut of the
guinea-pig proved to be of a suitable size for the
apparatus. Although not of standard masS and of both sexes,
the results of the work indicate that they were suitable for
use in this type of study.
2.4.3 Physiological solutions
A number of formulae for various physiological solutions
40
are reported suitable for use with isolated mammalian
organs when performing the everted intestinal sac technique
or the circulation technique. An examination of the
formulae for these solutions reveals that most of them
contain glucose. The benzophenone-extraction procedure
for determination of phenytoin cannot be performed in
the presence of reducing sug ars . It was therefore
necessary to use a solution which was glucose free . A
search of the literature showed that Aguiar and Fifelski
(1966) had used a suitable buffer in their study of the
effect of pH on the in vitro absorption of flufenamic
acid. The advantages of this solution are that it contains
no glucose and that the pH can be adjusted over a wide
range. Aguiar and Fifelski used a mixture of 95 % oxygen
and 5 % carbon dioxide to. gas the solution.
The composition of the solution used in this work and
prepared in accordance with the formula of Aguiar and
Fifelski ~s shown in Table 2. This formula yields a
solution of pH 7,2 . Solutions of a lower pH were pre
pared by the addition of 20 mmoles of aspartic acid to the
original solution, the pH was then adjusted to the
desired value by the addition of sodium hydroxide or
hydrochloric acid solution .
For this work the physiological solution was freshly
prepared daily from sterile concentrated stock solutions
which were suitably diluted in a volumetric flask. The
volume of the calcium chloride solution used was determined
by the Mohr titration according to Vogel (1966) . In
addition, all stock solutions were inspected regularly to
ensure that they were free from microbial growth.
41

.pI'->
TABLE 2
Components
Sodium Chloride
Potassium Chloride
Calcium Chloride
Sodium Phosphate (Dibasic)
Sodium Phosphate (Monobasic)
Distilled Water
Aspartic Acid
COMPOSITION OF PHYSIOLOGICAL SOLUTION ACCORDING TO
AGUIAR AND FIFELSKI (1966).
Relative Conc. Requ~red g/dm3 Molecular Formula Molecular Mass mmoles/dm
NaCl 58,44 145,0 8,473
KCl 74,56 4,56 0,340
CaC12 ,2H2O 147,00 1.25 0,184
Na2HP04 ,I2H2O 358,14 1,33 0,476
NaH2
P04 ,2H2O 156,01 0,33 0,051
to I dm3
NH2·CH(COOH).CH2·COOH 133 , II 20,0 2.662
--_. -

CHAPTER 3 METHODS
3 . 1 ANALYTICAL PROCEDURE FOR PHENYTOIN
The analytical method was based on the benzophenone
extraction procedure developed by Saitoh et al. (1973).
The following parameters listed by Saitoh were used as
· a basis for the methods which were developed:
(a) There is a linear relationship between the
absorbance readings and phenytoin concentrations 3 up to 30 ~g/cm ;
(b) The molar absorptivity of benzophenone is 4
1 , 895 x 10 ;
(c) If quantitat ively converted, 3
corresponds to 5 cm of 3,97
benzophenone .
5 ~g of phenytoin
x 10-6 mol/dm3
In order that a workable assay method be established,
it was necessary to assess the shape of the absorbance
curve of benzophenone in n- heptane, the wavelength at
which the maximum absor bance occurred and whether
benzophenone was the only product resulting from the
oxidation process .
1. Determination of the shape of the absorbance curve
of benzophenone in n-heptane
By means of the molar absorptivity value for
benzophenone it was calculated that an optimum
absorbance of 0,4 would be given by a solution
containing 3,846 ~g /cm3 of benzophenone in
n-heptane. To establish the shape of the absorbance
curve, a 5 ~g/cm3 dilution of benzophenone in
43

n-heptane was prepared and the absorbance spectrum
was recorded for a 1 em path length against n-heptane
between 220 and 300 nm on a Beckman DB Spectro-
photometer. The absorption spectrum shown in
Figure 4 has a well defined maximum at 247 nm. The
absorbance spectrum for I em of pure n-heptane against
water is also shown . The percentage transmission of
the pure n-heptane recorded at 245 nm was 97 %
(Manufacturer's specification 98 % at 245 nm).
2. Preparation of calibration line for the determination
of benzophenone in n-heptane
Solutions containing between 3 and 6 ~g/cm of
benzophenone in n- heptane were prepared by dilution.
The absorbance of each solution was measured at 247 nm
against n-heptane as reference and the procedure was
repeated in triplicate. Figure 5 shows the
calibration curve obtained from the procedure. From
these results it was concluded that there is a linear
relationship between the absorbance
benzophenone concentrations up to 6
readings 3
~g/cm .
and the
3. Verification of absorbance spectrum of phenytoin
oxidation product
A solution containing 40 ~g/cm3 3 0,1 mol/dm NaOH was prepared.
of phenytoin in 3
Alcm
solution was oxidised by heating with 10
sample 3 em of
of this
%
7 mol/dm3 NaOH for 5 min at 80 °C. The
solution was cooled to room temperature and ~he
oxidation product was extracted in 5 cm3 of n-heptane.
Figure 6 shows a well defined spectrum for the oxidation
product with a maximum at 247 nm and a shape which is
identical to that recorded for benzophenone in n-heptane.
The blank showed 99 % transmission at 247 nrn. It was
44

FIGURE 4
" 0 .... <I) <I) .... i3 <I)
" '" H E-<
<II 0()
'" '-'
" <II U H <II
P<
ABSORPTION SPECTRUM FOR BENZOPHENONE IN
n-HEPTANE
0
20
/ '" "" A
40
60
80
B
220 250
Wavelength nm
A Absorption spec t rum for benzophenone 1n n-heptane.
B Absorption spectrum for n-heptane against referenc e water.
45
300

FIGURE 5
0,6
0,5
OJ 0,4
" ..... '" N
'-'
'" 0,3 OJ
" @ .0 .. 0
"' ~ 0,2
0, 1
CALIBRATION CURVE FOR THE DETERMINATION OF
BENZOPHENONE IN n-HEPTANE
o Test
o Test 2
8 Test 3
2 3 4
Benzophenone Concentration ~g/cm3
46
5

FIGURE 6
" 0 .... '" '" 'g '" " '" ...
f-<
<lI 00
'" " " <lI <J ... OJ
P<
ABSORPTION SPECTRUM FOR PHENYTOIN OXIDATION
PRODUCT IN n-HEPTANE
o /247 nrn
A
20
40
60
80
220 250 300
Wave leng th nrn
A Absorption spectrum for phenytoin oxidation product in n-hept ane .
B Absorption spect r um for blank.
47

3.1.1 Benzophenone-extraction procedure : Method 1
This assay method was developed for the measurement of
phenytoin concentrations up to 40 ~g/cm3 . Concentrations
exceeding this value could be determined by accurately
diluting the phenytoin solution prior to the assay procedure
being carried out . This method was suitable for use i I,
the in vitro adsorption studies and in situations where
higher phenytoin concentrations were encountered .
(a) 3 The 1 cm sample to be assayed
of 1 % KMn04 i n 7 mol/dm3 NaOH
3 was added to 10 cm
in a 50 cm3 pear -
shaped flask f i tted wi th a ground-glass stopper;
(b) The flask was inverted ten times to ensure mixing and
then heated at 80 °c for 5 min in a water-bath;
(c) The flask was cooled to room temperature in running 3 water and 5 cm of n-heptane was added and the flask
shaken on a mechanical shaker for 10 min;
(d) The n-heptane was floated free of the oxidising
solution with distilled water and raised to the neck
of the flask;
(e) The n-heptane was removed with a Pasteur pipette
and transferred to a spectrophotometer cell. The
absorbance was measured at 247 nm against pure
n-heptane;
(f) The blank value was determined by repeating the
procedure omitting the phenytoin.
A calibration curve was prepared to assess the effectiveness
of the procedure and for use in the determination of t he
phenytoin concentrations of unknown samples .
Approximately 50
and dissolved in
mg of phenytoin was weighed 3 and made up to 50 cm with
49
out accurately 3 0,1 mol/dm NaOH .

This solution was used to prepare phenytoin dilutions
of the following strengths in 0,1 3 mol/dm NaOR
10 \.Ig/cm 3 ( 1 to 100) 20 \.Ig/cm 3 ( 1 to 50)
30 \.Ig/cm 3 (3 to 100) 40 \.Ig/cm 3 (2 to 50)
cm3 aliquots of the dilutions were treated as previously
outlined. Sixfold repeats were performed for each
dilution and the procedure was repeated in triplicate. A
blank determination was carried out in sixfold with the
phenytoin omitted from the procedure.
Table 3 shows the results from the oxidation procedure. -3 The mean blank absorbance obtained was - 0,001 (S.D. 1,7 x 10 ) .
This value was so low that its influence on the calibration
curve appeared insignificant and, therefore, no correction
was made to the results obtained. The results shown in
columns 1 to 5 reflect the mean values obtained from the
six repeats in each case. Results were calculated
individually and then averaged, the following method being
us ed to obtain the figures reflected in the Table :
Column 1: Benzophenone concentrations were obtained
by means of a polynomial regression programme and the use
of the co-ordinates for the benzophenone calibration curve.
Column 2: The equivalent phenytoin concentration was
calculated from the following formula :
Molecular Mass Phenytoin x Benzophenone Concentration x 5
Molecular Mass Benzophenone
252,26 i.e.
182,21
6,922 x
x Benzophenone Concentration x 5
Benzophenone Concentration 3 \.Ig/cm
The factor of 5 is introduced because the benzophenone derived
from the phenytoin solution was extracted into 5 cm3 of n-heptane.
50

This solution was used to prepare phenytoin dilutions
of the following strengths in 0,1 3 mol/dm NaOH
10 Ilg/ cm 3 ( 1 to 100) 20 Ilg/cm
3 (1 to 50)
30 Ilg/ cm 3 (3 to 100) 40 Ilg/cm
3 (2 to 50)
cm3
aliquots of the dilutions were treated as previously
outlined. Sixfold repeats were performed for each
dilution and the procedure was repeated in triplicate. A
blank determination was carried out in sixfold with the
phenytoin omitted from the procedure.
Table 3 shows the results from the oxidation procedure. -3 The mean blank absorbance obtained was - 0,001 (S.D. 1,7 x 10 ) .
This value was so low that its influence on the calibration
curve appeared insignificant and, therefore, no correction
was made to the results obtained. The results shown in
columns 1 to 5 reflect the mean values obtained from the
six repeats in each case. Results were calculated
individually and then averaged, the following method being
used to obtain the figures reflected in the Table :
Column 1: Benzophenone concentrations were obtained
by means of a polynomial regression programme and the use
of the co-ordinates for the benzophenone calibration curve.
Column 2: The equivalent phenytoin concentration was
calculated from the following formula :
Molecular Mass Phenytoin x Benzophenone Concentration x 5
Molecular Mass Benzophenone
252,26 i. e.
182,21
6,922 x
x Benzophenone Concentration x 5
Benzophenone Concentration 3 Ilg/cm
The factor of 5 is introduced because the benzophenone derived
from the phenytoin solution was extracted into 5 cm3 of n-heptane .
50

TABLE 3
Test Mass Phenytoin Number
mg
en
1 50,1
2 51,4
3 51 ,3
ANALYSIS OF RESULTS FOR BENZOPHENONE-EXTRACTION PROCEDURE
METHOD 1
Calculation of Results
Benzophenone Calibration Curve Molar Absorptivity
Phenytoin Mean Benzophenone Phenytoin % Phenytoin Phenytoin % Phenytoin Cone Absorbance Cone Cone Cone p.gIcm3 at 247 nm p.gIem3 p.gIcm3 Recovered p.gIcm3 Recovered
10,02 0 ,140 (0,003) 1,287 8,907 88,9 (1,9) 9,285 92,7 (1,9) 20,04 0 ,278 (0,004) 2,610 18,063 90 ,1 (1,3) 18,525 92,4 (1,3) 30,06 0 ,417 10,006j 3,933 27,230 90 ,6 (1,3j 27,777 92,4 ~1, 3j 40,08 0,558 0,003 5,272 36,493 91,1 (0 ,5 37,128 92,7 0,5
10,28 0,143 (0,001) 1,322 9,147 89,0 (0,8) 9,525 92,7 (0,8) 20,56 0,290 (0,005) 2,724 18,855 91,7 (1,5) 19,325 94,0 (1,5) 30 ,84 0 ,432 (0,005j 4,073 28,195 91,4 11, lj 28,753 93,2 ~l,lj 41,12 0,576 (0,003 5,447 37,707 91,7 0,5 38,347 93,3 0,5
10,26 0,139 (0,002) 1,282 8,875 86,5 (1,4) 9,247 90,2 (1,5~ 20,52 0,285 (0 ,005) 2,670 18,478 90,1 (1,7) 18,948 92,3 (1,7 30,78 0,421 10 , 002j 3,964 27,437 89,1 10 , 5j 27,988 90 , 9 10,5 ~ 41,04 0,570 0 ,007 5,387 37,285 9:) ,9 1 , 2 37,930 92 , 4 1,2 j
1 2 :3 4 5 - - - --- - - - -- -- - -- - --- - - ----- -- - -- -- - --- --
!
!

Column 3: Percentage phenytoin recovered
Calculated Concentration x 100
Actual Concentration
Columns 4 and 5: By use of the molar absorptivity for
benzophenone it was calculated that the absorptivity value
for benzophenone is 104,00 and that the equivalent
benzophenone concentrat i on may be determined from the
measured absorbance. The equivalent phenytoin concentrat i o:<'
may be calculated by applying the conversion factor of
6,922 as above and the percentage recovery of phenytoin
is calculated as per Column 3.
The calibration curve prepared from the triplicate results
is shown in Figure 7. Analysis of the co-ordinates of
these points revealed a correlation coefficient of 0,999.
The gradient obtained was 0,014 and the y intercept - 0,00'2.
The plot obtained was a straight l i ne and was
so close to the origin that it was concluded that the
product of the oxidation procedure obeyed Beer's Law for 3 phenytoin concentrations up to 40 ~g/cm. The percentage
recovery differed slightly, depending on the method of
assessment. By use of the benzophenone calibration plot,
a mean percentage recovery for the 72 determinations of
90,09 (S.D. 1,89) was achieved and by use of the molar
absorptivity value for benzophenone, the percentage
recovery was 92,44 (S.D. 1,57).
A comparison of the above results with those of Saitoh et al .
(1973) and Wallace and Hamilton (1974) proved useful in
assessing the method. It must be borne in mind that both
groups extracted the phenytoin from biological fluids
prior to assay, whereas no prior extraction was necessary
for the method devised for this study. Saitoh achieved a
percentage recovery of between 99,6 to 100,9 % in the range
52
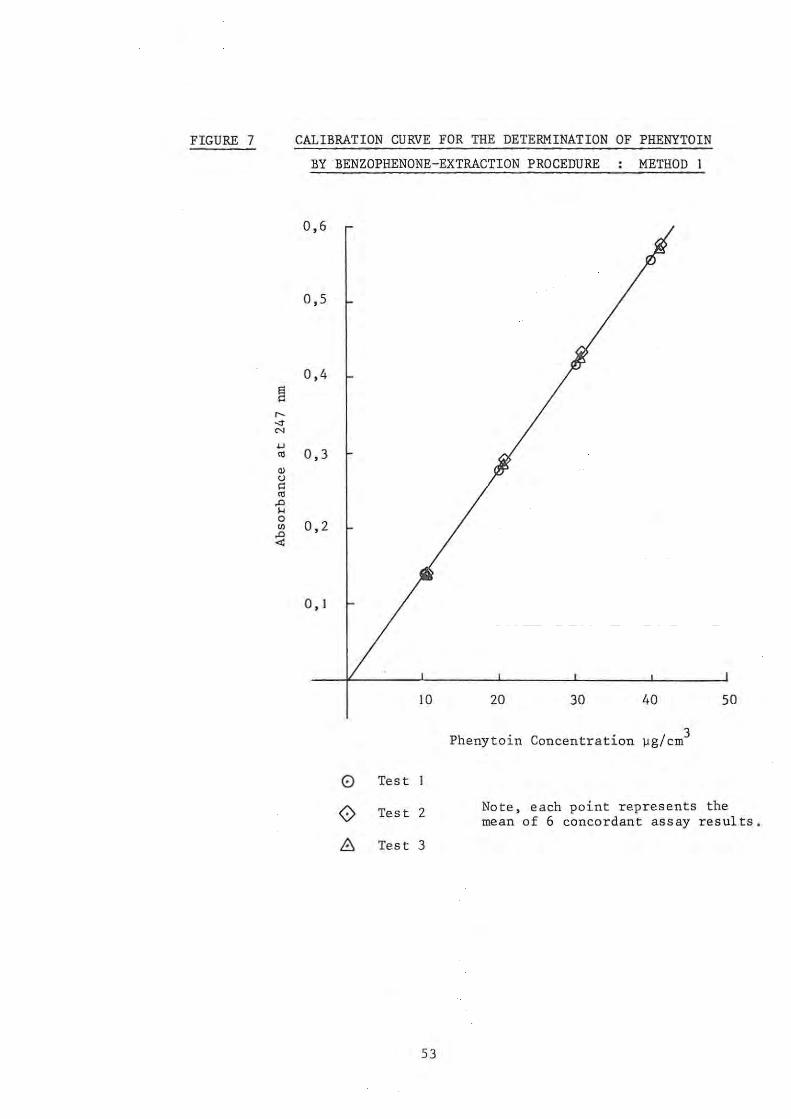
FIGURE 7 CALIBRATION CURVE FOR THE DETERMINATION OF PHENYTOIN
BY BENZOPHENONE-EXTRACTION PROCEDURE METHOD 1
0,6
0,5
0,4
~ r-
'" N
'-'
'" 0,3
'" cJ
" '" A ... a
0,2 VI A ...:
0, 1
10 20 30 40 50
Phenytoin Concentration )Jg/ em 3
0 Test
0 Test 2 Note, each point represents the mean of 6 concordant assay res ults.
8:. Test 3
53

5 to 30 ~g/cm3 of phenytoin , whereas Wallace and Hamilton's
semi-micro procedure yielded a percentage phenytoin
recovery of between 103,5 and 91,4 with a mean of 94,1 %
over the range 5 to 80 j.lg/cm 3 Wallace and Hamil ton
achieved a sensitivity of 70 % when assessing the work of
Sai toh et al . It was concluded tha·t, although the phenytoin
yield obtained was less than that obtained by Saitoh et al.,
it compared favourably wi th the recovery by the method of
Wallace and Hamilton. It also appears that the Saitoh
method is more accurate and sensitive than the assessment
of Wallace and Hamilton indicates.
It was further concluded that the use of the calibration
curve for the oxidation method (Figure 7) would give
results of adequate accuracy and sensitivity when applied
to the in vitro studies contemplated.
3.1 . 2 Benzophenone-extraction procedure : Method 2
Because of the low rate of diffusion of phenytoin through
biological membranes it was necessary to develop the
assay procedure further in order that lower concentrations
of phenytoin could be measu red more accurately during the
diffusion studies . It appeared possibl e to measure the
concentrations of these dilute solutions by increasing the 3 3
sample size of the phenytoin solution from 1 cm to 5 cm 3 3
and by reducing the volume of n-heptane from 5 cm to 2 em •
Because of the small volume of n-heptane it was necessary
to obtain and use semi-micro quartz spectrophotometer cells
having a capacity of approximately 1,5 cm3 and a path
length of 1 cm.
The assay method origin:1lly developed made use of 3 cm 3 phenytoin solut ions which were oxidised by use of 10 em
3 volumes of 1 % KI-ln04
i n 7 mol/dm NaOH . The use of a
5 cm3 phenytoin solution resulted in the dilution of the

3 oxidising solution to 15 em . In order to preserve the
oxidising capacity of the solution it was necessary to
increase the concentration of the KMn04
to 1,5 % and the
strength of the alkali to 10 mol/dm3 This dilution of
the concentrated oxidising solution resulted in
concentrations of KMn04
and NaOH which fell within the
limits set by Wallace and Hamilton (1974).
A further factor to be borne in mind was that the diffusion
studies were carried out in physiological solution,
the formula of which is given in Table 2. It was
therefore necessary to assess the effectiveness of the
assay procedure in the presence of the constituents of
this solution.
Because of the altered conditions for the oxidation
procedure a second calibration curve for the determination
of phenytoin was prepared as follows
1. Approximately 25 mg of phenytoin was
weighed and dissolved in and made up
with 0,1 mol/dm3 NaOH;
accurately 3
to25=
2. 1 cm3 of this solution was diluted to 100 cm3 with
3.
4.
physiological solution of pH 7,2 and the pH of the
solution was readjusted by the dropwise addition
of Hel;
I, 2, 3,4
diluted to
and 5 cm3 volumes of solution (2) were 3 25 em with physiological buffer to
provide solutions containing 2, 4, 6, 8 and 10 ~g/ 3
5 em of phenytoin respectively;
3 5 em aliquots of the diluted solutions were
3 assayed for phenytoin content by use of 10 em
of 1,5 % KMn04
in 10 mol/dm3 NaOH. The oxidation
procedure was performed as previously described and
the benzophenone extracted in 2 cm3 n-hep tane;
55

5. The absorbance of the benzophenone solutions was
read at 247 rum against pure n-heptane;
6. Blank values were determined by repeating the
procedure with the phenytoin o~itted;
7 . Each dilution was assayed in triplicate and the
procedure was repeated in triplicate.
Table 4 shows the analysis of r esults of the second method.
The mean blank absorbance obtai ned with the physiological - 3 buffers was 0,006 (S . D. 4 , 5 x 10 ) . The mean bl ank
was used to correct the measured absorbances. The
results shown in Columns I to 5 r eflect the mean values
obtained from the triplicate repeats, the results being
calculated individually and then averaged . The figures
ref lec ted in Table 4 were obtained as follows :
Column I: Benzophenone concentr~tions were obtained by
means of a polynomial regression programme and the use
of the co-ordinate s for the benzophenone calibration
curve (Figure 5);
Column 2: The equivalent phenytoin concentration was
calculated by making use of the rel ative molecular
masses as shown under Section 3.1 .1. A factor of 2 was,
however, used because the benzophenone derived from the
phenytoin solution was extracted into 2 cm3 of n-heptane;
Column 3: The method used to calcula te the percentage
phenytoin recovered has been shown under Section 3.1.1;
Columns 4 and 5: The concentration of phenytoin was
calculated from the measured absorbance at 247 rum and the
molar absorptivity of
was converted to ~g/5
benzophenone. The concentration 3 em The percentage recovery was
calculated as previously outlined .
An examination of Table 4 revealed that there was a marked
56

\.n '-J
TABLE 4
Test Number
1
2
3
Mass Phenytoin
rug
25,4
26,1
26,8
ANALYSIS OF RESULTS FOR BENZOPHENONE-EXTRACTION PROCEDURE
METHOD 2
Calculation of Results
Benzophenone Calibration Curve Molar Absorptivity
Phenytoin Mean Benzophenone Phenytoin % Phenytoin Phenytoin % Phenytoin Cone 3 Absorbance Cone Cone Cone
pg/em3 pg/5 em3 Recovered pg/5 em3 Recovered pg/5 em at 247 run
2,032 0,059 0,520 1,440 70,86 1,571 77,30 4,064 0,116 1,063 2,943 72,42 3,088 75,99 6,096 0,184 1,711 4,736 77,69 4,899 80,36 8,128 0,231 2,158 5,977 73,53 6,150 75,66
10,160 0,254 2,378 6,583 64 , 79 6,762 66,56
2,088 0,074 0,663 1,835 87,88 1,970 94,35 4,176 0,136 1,253 3,469 83,08 3,621 86,70 6,264 0,198 1,844 5,106 81,52 5,271 84,15 8,352 0,243 2,273 6,293 75,35 6,469 77 ,46
10,440 0,276 2,587 7,164 68,62 7,348 70,38
2,144 0,067 0,596 1,651 76,98 1,783 83,20 4,288 0,133 1,225 3,391 79,09 3,541 82,58 6,432 0,194 1,806 5,001 77,75 5,165 80,30 8,576 0,245 2,292 6,346 74,00 6,523 76,06
10,720 0,271 2,540 7,03 2 65,60 7,215 67,30
1 2 3 4 5

reduction in the efficiency of the assay method when 3 concentrations of 10 ~g/5 em were tested . This reduction
in sensitivity was attributed to less efficient extraction
of the benzophenone in the reduced volume of n-heptane.
It has previously been shown that Beer's Law is obeyed
for benzophenone in n-heptane up to 6 ~g/cm3 and for
phenytoin concentrations up to 40 ~g/cm3 for Method 1.
Preliminary investigations with
that concentrations exceeding 8
the diffusion studies showed 3
~g/5 em were unlikely to be
encountered and therefore
phenytoin solutions of 10
the absorbance readings for the 3
~g/5 em were not taken into account
in constructing the calibration curve. The calibration
curve was prepared from 32 readings and is shown in Figure 8.
Analysis of the co-ordinates of these points revealed a
correlation coefficient of 0,994 with a gradient of 0,028
and the y intercept 0,011.
The mean percentage recovery of phenytoin was 77,5
(S.D. 4,9) when calculated from the benzophenone calibration
curve and 81,2 (S.D. 5,5) when calculated from the molar
absorptivity value for benzophenone with phenytoin 3
concentrations up to and including the values for 8 ~g/5 em
Although the sensitivity of Method 2 is less than that of
Method 1, it was nevertheless an improvement on the 70 %
sensitivity achieved by Wallace and Hamilton (1974) when
reviewing the method of Saitoh et al. (1973). It was
concluded that Method 2 would be satisfactory for solutions
of phenytoin in physiological solution not exceeding
8 ~g/5 cm3 in concentration.
3.1.3 Calculation of results
The analyses of the points of the calibration curve of
the benzophenone in n-heptane and of the benzophenone
extraction procedures Methods 1 and 2 were performed by
use of a polynomial regression programme on a Hewlett-
58
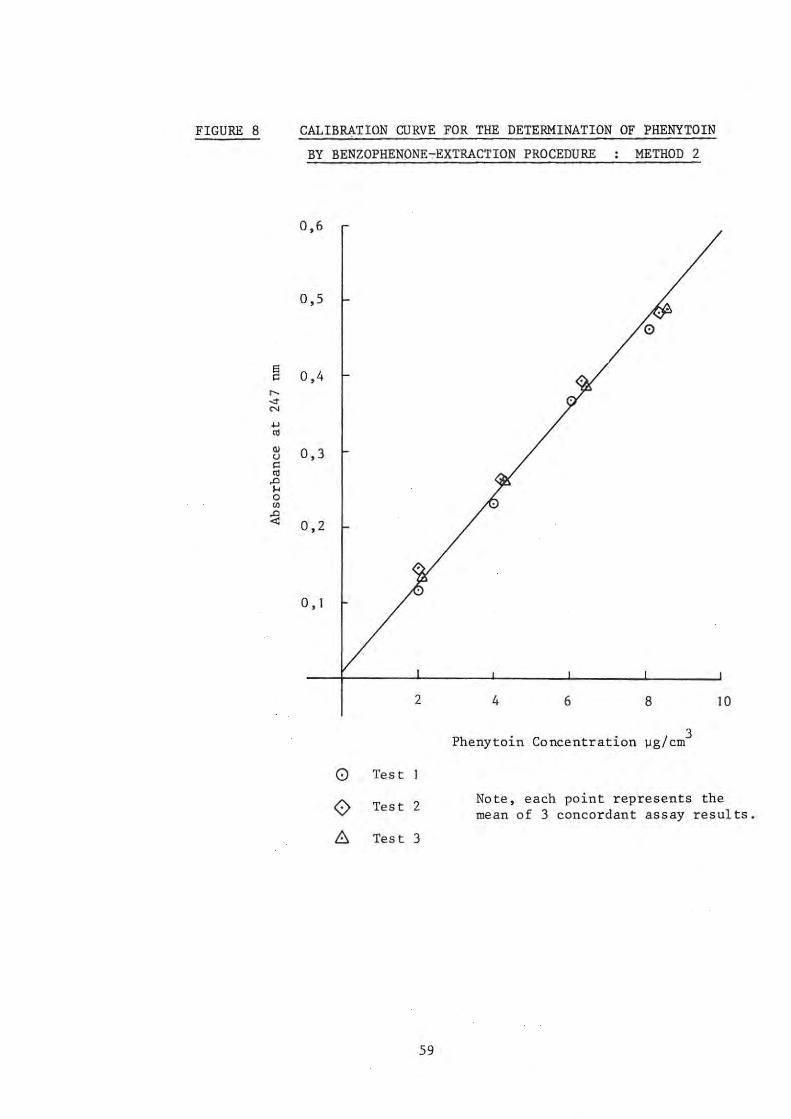
FIGURE 8 CALIBRATION CURVE FOR THE DETERMINATION OF PHENYTOIN
BY BENZOPHENONE~EXTRACTION PROCEDURE METHOD 2
0,6
0,5
0
e 0,4 " r--
'" '" ..., '" '" 0,3 0
" '" ..0 .... 0
'" ~ 0,2
0, 1
2 4 6 8 10
Phenytoin Concentration ~g/cm 3
0 Test
0 Test 2 Note, each point represents the mean of 3 concordant assay results.
6 Test 3
59

Packard 9830 A calculator. A triangular factorisation
of the X'X metric is used to calculate the coefficients
and the statistics according to Graybill (1961). With
the use of this programme it was possible to obtain the
correlation coefficient for the points, the best line to
fit the points, the y intercept and the gradient. By
means of the co-ordinates of the points of the calibration
curves and the use of the polynomial regression programme
it was possible to obtain the concentration of phenytoin
in unknown solutions directly from the absorbance values.
Visual reading of data from the calibration curves was,
therefore, unnecessary _
3. 2 "IN V ITRO" ADSORPTION STUDIES
Most workers in this field have based their in vitro
adsorption studies on the work of Batuyios and Brecht
(1957) . The following factors were considered in the
selection of a standardised technique
(1) Solute concentration: The concentrati.on of
phenytoin selected was determined by the solubility
of the drug in the gastro-intestinal fluids and was
based upon the
Concentrations
values given by Schwartz et al. (1977). 3 of 25 ~g/cm were used for most studies
as this was within th e solubility of phenytoin at the
pH's of the tests;
(2) Ratio of insoluble powder to drug solution: The
literature shows that the ratio chosen by different
workers varies. For example, Blaug and Gross 3 (1965) used 1 g of antacid per 50 em of drug solution.
EI-Masry and Khalil (1974) used 100 cm3 of aqueous
alkaloidal solution
present study 100 mg
solution was used.
60
to 1 g of adsorbent. 3 of powder per 10 em
For the
of drug
This was the same ratio as that

used by EI-Masry and Khalil (I to 100) and in
addition made it possible for the study to be 3 conveniently carried out in 10 cm test tubes fitted
with ground-glass stoppers .
(3) Nature of solvent and pH: The effect of pH is of
significance in the design of in vitro adsorption
studies for phenytoin because of the low solubility
of the drug in simulated gastro-intestinal fluids.
The problem is further compounded by the fact that the
antacid powders react with the hydrochloric acid used
in simulated gastric juicea Because of the solution
of the antacids in artificial gastric juice, Blaug
and Gross (1965) performed their studies using water
as solvent. Naggar et al. (1976), Khalil (1977),
El-Masry and Khalil (1974) and Khalil and Moustafa (1973)
adopted a similar approach to this problem. However,
Khalil (1974) demonstrated the adsorbing power of
hydrated silica gel formed by the interaction of
magnesium trisilicate and 0,2 mol/dm3 HCl. The
problem may thus not simply be circumvented by the use
of water as solvent since the by-products of the acid
neutralisation may themselves have adsorbing properties .
The presence of ions such as phosphate or citrate in
the solution was shown to suppress the adsorption of
atropine and hyoscine onto magnesium trisilicate by
EI-Masry and Khalil (1974). It was therefore
necessary to design the tests in such a manner that any
reduction in adsorption by the phosphate component
of the simulated gastro-intestinal solutions could b8
detected.
(4) Temperature and duration of incubation: All
adsorption studies were carried out at 37 °c + 0,5 °C.
The time of incubation has been varied greatly by
61

investigators. Batuyios and Brecht (1957) state
that I h of mixing was adequate but the experimental
time used was 3 h. Blaug and Gross (1965) allowed
equilibration to proceed for 24 h . Decker et al .
(1968) used 20 min in an attempt to simulate the
length of time taken between the administration of a
dose of activated charcoal and gastric lavage.
EI-Masry and Khalil (1974) show that the adsorption
of atropine and hyoscine on to magnesium trisilicate
takes place within 10 min and adopted 30 min for their
experiments. Preliminary studies of 30 min, I h,
2 hand 3 h suggested that if adsorption did occur,
30 min of incubation was adequate and this duration
was adopted for most studies.
3.2 . 1 General method
1. 100 mg quantities of the powders were placed in the
10 cm3 test tubes;
2. The phenytoin solution was prepared by dilution and
10 cm3 aliquots were pipetted into the test tubes;
3. The test tubes were stoppered and shaken in a
horizontal position on a mechanical shaker for 10 min
and then transferred to a water-bath at 37 °c (: 0,5 °C) and allowed to incubate for the specified time;
4. Because of the lack of a shaker water-bath it was
necessary to remove the test tubes at 5 min intervals
and to shake them briefly but vigorously to maintain
the suspension;
5. After incubation , the test tubes were centr i.fuged
at 3000 rpm for 30 min;
6. The supernatant was removed by use of a glass/mGtal
syringe and filtered through a syringe filter-holder
fitted with a prefilter and a 0,8 ~m membrane
62
filter into a clean dry test tube;
7 3 I' f h f ' l d ' • 1 em a 1qUOtS 0 tel trate were assaye 1n
duplicate by means of the benzophenone-extraction
procedure Method I;
8. The remaining filtrate and suspension was remixed
and the pH was measured with a Metrohm E520 pH meter;
9. A blank was performed by repeating the procedure
with the solvent and the powders but omitting the
phenytoin;
10. A control was performed by use of the phenytoin
solution which was treated in the same manner as the
tests but lacked the powder .
3 . 2.2 Methods for specific tests
I . Studies on the adsorption of phenytoin onto the
particulate matter from Simul ated gastric and
intestinal solutions
The phenytoin solution was prepared by dissolving
approximately 25 mg of the accurately weighed drug
with 0,1 mol/dm3 NaOH. in and making
I cm3
aliqots
100 cm3
with
solution and
up to 10 cm3
of this solution were diluted to
ei ther 3
10 cm
simulated gastric or intestinal
samples of these solutions were
used for the studies with 100 mg of the appropriate
powder .
The test method adopted was performed in accordance
with the general method as outlined under Section 3.2. I .
2. Studies on the adsorption of phenytoin onto particulate
matter from aqueous solution
3 Phenytoin concentrations of 25, 40 and 60 ~g/cm were
used. The so l utions were prepared by dissolving the
appropriate mass of phenytoin in 50 3 3
cm of 0,1 mol/dm
63
NaoH. A 5 3 cm sample of the phenytoin solution was
the n diluted to 500 cm3 with distilled water. Ten cm3
aliquots of the diluted phenytoin solution were used
for the tests, which were conducted in accordance with
the method previously outlined. For the assay of
those solutions containing 40 and 60 Vg/cm3 of phenytoin,
3 cm3 of the filtrate from the tests was diluted with 3 an equal volume of 0,1 mol/dm NaOH. This ensured
that the concentration of phenytoin assayed fell well
within the limits of accuracy of the benzophenone
extraction procedure Method I .
Dur i ng this set of tests, it was decided to measure
the possible loss of phenytoin onto the filter system.
Samples of the controls which comprised the phenytoin
solution without the powder were assayed before and
after filtration and the results compared . It was
found that no loss of phenytoin took place onto the
filter system.
3.2.3 Calculation of results
The absorbance at 247 nm of the tests and the controls was
corrected by taking into consideration the blank readings :
1.e. Corrected absorbance = Measured absorbance blank.
By use of the benzophenone-extraction procedure Method I,
the phenytoin concentrations were obtained from the
calibration curve by means of the polynomial regression
programme.
In each instance, the concentrati on of phenytoin remaining
1n the supernatant was compared to the phenytoin concentra-
tion of the controls. The percentage phenytoin remaining
in solution was calculated as follows :
64
% phenytoin remaining in supernatant =
Phenytoin in supernatant ~g/cm 3 cone .
3 x 100
Phenytoin conc. of control ~g/cm
The results were then tabulated and compared.
3.3 "IN VITRO" DIFFUSION STUDIES
3.3. I General method
I. Preparation of physiological solution and drug
suspension
I. The physiological solution was prepared in
accordance with Table 2 and was adjusted to
pH 7,2;
2. 3 125 cm of physiological solution of pH 7,2
was pipetted into compartments of the simulator
to serve as the serosal solutions;
3. 250 cm3 of physiological solution was pipetted
into the 500 cm3 flasks which served as
reservoirs for the mucosal solution. 30 mg of
phenytoin sodium was then added to each flask
followed by the substance under test. The pH
of the mucosal flasks was then adjusted to the
desired value;
4. The temperature of both the serosal and mucosal
compartments was maintained at 37 °c ~ 0,5 °C;
5. Sufficient oxygenated physiological solution
was maintained at 37 °c for the preparation of
the intestinal segments.
2. Preparation of the intestinal segments
I. An adult guinea-pig was isolated for 24 h prior
to use. Food was withheld but the animal was
65
allowed water ad libitum;
2. The animal was stunned by a sharp blow to the
base of the head and sacrificed by decapitation;
3. The intestine was removed via a midline incision
in the abdomen and was transferred to a beaker
which contained oxygenated physiological solution
at 37 °C;
4. Both the inside and the outside of the intestine
were gently rinsed with the solution using a
syr10ge to remove any intestinal contents and
blood;
5. The ileum was identified and two adjacent segments
17 cm + 0,5 cm long were measured and cut to
length. A pai r of blunt forceps were used to
open the cut end of the ileum sufficiently to
allow the inlet tube of the distribution head to
be inserted into the lumen . The ileum was
securely fixed over the formed end of the glass tube
with waxed dental floss. The free end of the
ileum was then threaded through the WIre loop and
attached to the outlet tube in a similar manner.
Care was taken to ensure that the proximal and
distal ends of the ileum were in accordance with
the direction of flow . The procedure was repeated
with the second distribution head;
6. The intestinal loops attached to the distribution
heads were suspended In the physiological
solution in the serosal compartments and a mixture
of 95 % oA~gen and 5 % carbon dioxide was passed
through the contents of both the serosal and
mucosal compartments .
66

3. Experimental procedure
I. The tubing was connected according to Figure 3,
the stirrers and peristaltic pump were started
and the drug suspensions were circulated through
the intestinal segments;
2. 3 Two 5 cm samples were withdrawn by pipette from
each serosal compar tment at 15 min intervals
for 90 min. The volumes of solution in the
compartments were maintained by replacing the
solution withdrawn with 10 cm3 of fresh
physiological solution at 37 °C. The samples
withdrawn were run into the pear-shaped flasks
ready for assay;
3. The pH of the contents of the mucosal flasks was
monitored and adjusted when necessary to maintain
a constant pH in the mucosal compartment through
out the test;
4.
5.
3 At the end of the experiment 10 cm of the
suspens10n was withdrawn from the mucosal flasks
and clarified by filtration through a prefilter/
0,8 ~m membrane filter system fitted to a glass/
metal syringe;
3 The 5 cm samples from the serosal compartments
were assayed for the content of phenytoin by
means of the benzophenone-extraction procedure
Method 2;
6. The concentration of phenytoin present in the
filtrate of the mucosal suspensions was determined
by the assay of I cm3 aliquots by means of the
benzophenone -extraction procedure Method I.
3.3 . 2 Precautions
The following precautions were necessary when the
67

c~rculation technique was used :
I.. The physiological solution was prepared and used
on the day of the experiment; , 2. Care was taken to ensure that the guinea-pig was
not excited prior to being killed;
3. Care was taken ~n the correct identification of the
ileum and that the correct orientation of the intestine
was maintained;
4. Care was taken to ensure that the contents remaining
in the intestine were gently flushed from the lumen.
This procedure prevented blockage of the apparatus
during the experiment;
5. All fat and mesentary adhering to the intestine were
gently removed but care was taken to avoid tearing
of the membrane;
6. Care was taken that the segments of ileum did not
become twisted during attachment to the distribution
head;
7. All air was removed from the segments and the tubing
of the apparatus;
8. The time taken for the preparation of the intestinal
segments did not exceed 10 min.
3.3.3 Specific test methods
The methods adopted for the various tests and the tests
conducted using the modified Sartorius Absorption Simulator
are given in Table 5.
3.3.4 Calculation and presentation of results
Sticker (1973) reminds us that the passive diffusion of
a drug through a membrane with time can be divided into
68

three periods :
I. In the first period, diffusion of the drug occurs
mainly from the mucosal solution to the serosal
solution;
2. During the second period there is a simultaneous
back-diffusion to a greater or lesser extent from
the serosal solution to the mucosal solution;
3. During the third period of diffusion, the rates are
the same in both directions, so that there is no
further change in the conditions.
Stricker states that the rate of diffusion of a substance
from the mucosal to the serosal side can, therefore, best
be determined during the first period for which there is
a linear relationship between drug diffusion and time.
From the data obtained with the circulation technique it was,
therefore, possible to determine the diffusion rates from
the slope of the lines obtained when the amount of phenytoin
which diffused through the membrane was plotted against
time. From these plots, an in vitro permeability profile
for phenytoin under the various experimental conditions
could be determined in terms of -
(a) diffusion rate;
(b) lag time;
(c) the amount of phenytoin transferred 1n 90 min.
In order to calculate the amount of phenytoin which diffused
through the membrane it was necessary to take into con
sideration the amount of drug removed 1n each sample of the
serosal fluid. This was based upon the fact that at the
end of each 15 min interval, two 5 cm3 samples were removed 3
from the 125 cm volume of the serosal compartment and that
10 cm3
of fresh solution was added to replace the volume
69
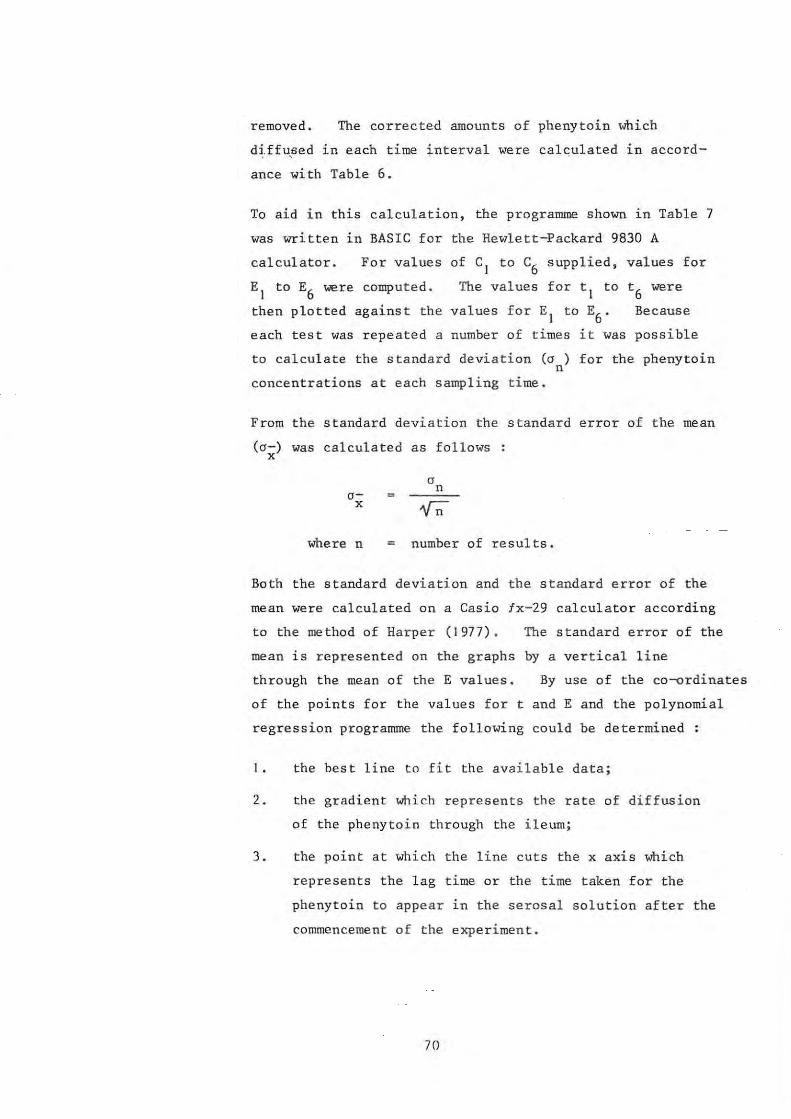
removed. The corrected amounts of phenytoin which
diffu,sed in ,each time interval were calculated in accord
ance with Table 6.
To aid in this calculation, the programme shown in Table 7
was written in BASIC for the Hewlett-Packard 9830 A
calculator. For values of C1
to C6
s uppl ied, values for
EI to E6 ""re computed.
then plotted against the
The values for tl to
values for EI to E6
•
t6 were
Bec.ause
each test was repeated a number of times it was possible
to calculate the standard deviation (0 ) for the phenytoin n
concentrations at each sampling time.
From the standard deviation the standard error of the mean
(0-) was calculated as follows x
ox
= a n
where n = number of results.
Both the standard deviation and the standard error of the
mean were calculated on a Casio fx-29 calculator according
to the method of Harper (1977) . The standard error of the
mean is represented on the graphs by a vertical line
through the mean of the E values. By use of the co-ordinates
of the points for the values for t and E and the polynomial
regression programme the following could be determined :
I. the best line to fit the available data;
2. the gradient which represents the rate of diffusion
of the phenytoin through the ileum;
3. the point at which the line cuts the x axis which
represents the lag time or the time taken for the
phenytoin to appear in the serosal solution after the
commenc.ement of the experiment.
70

TABLE 5 SPECIFIC TEST METHODS FOR ASSESSMENT OF DIFFUSION OF PHENYTOIN
ACROSS THE ISOLATED GUINEA-PIG ILEUM
Nature of test Mucosal Solution Remarks
I. S·tudies on the Physiological solution Three tests were performed with the standard effec t of the calcium pH 7,2 physiologica1
3solution which contained
component of physio- 125 mmoles/dm of calcium chloride and three logical solution on tests with physiological solution which diffus ion of lacked the calcium chloride component.
" phenytoin.
2. Studies on the Physiological solution The pH's of these tests were determined ' by effect of pH on the adjusted to pH 7,5; the pH's at which the tests with the antacids diffusion of pH 6,5; pH 5,2 and were conducted. They served as a demon-phenytoin. pH 3,0 stration of the effect of pH on the
diffusion of phenytoin and also as controls against which the tests conducted with the antacids and other compounds could be com-pared. For solutions of pH 7,5 and ~,5 adjustments were made with 0,1 mol/dm NaOH and HCl. Solutions of pH 5,2 and 3,0 contained aspartic acid to aid in the adjust-ment of pH. No results were recorded at pH 3,0 because at this low pH the ileum degraded rapidly and became unusable.
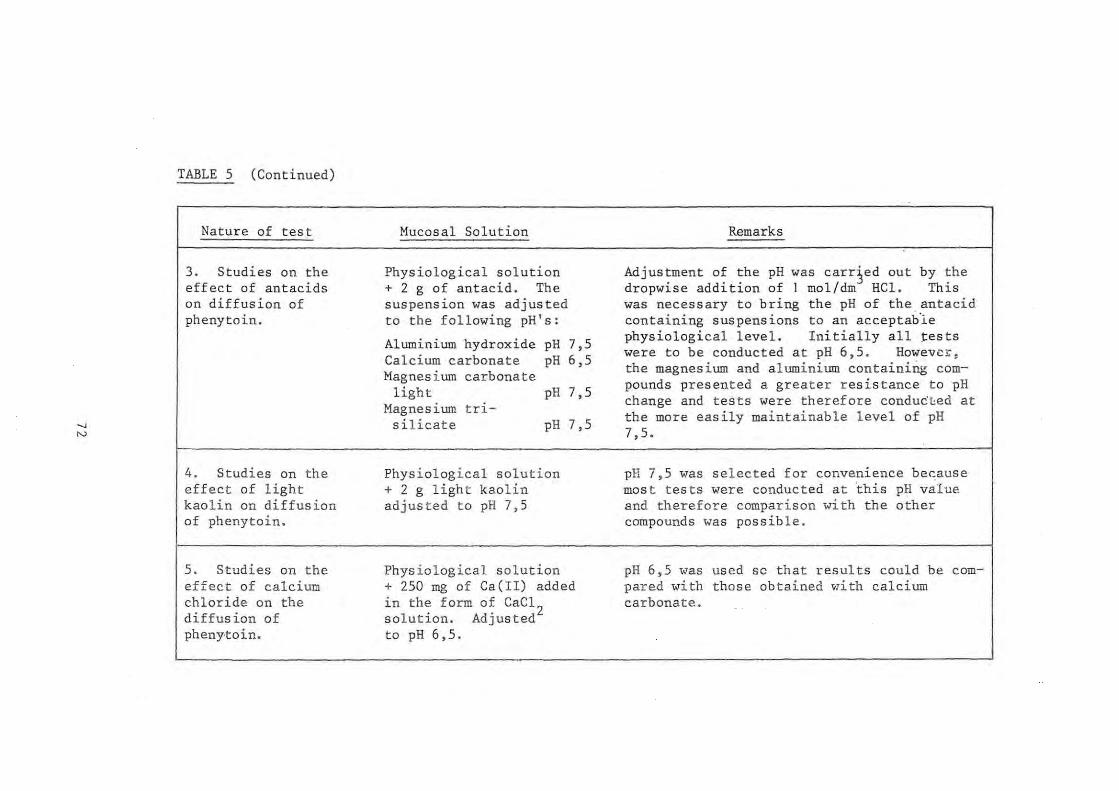
...., N
TABLE 5 (Continued)
Nature of test
3. Studies on the effect of antacids on diffusion of phenytoin.
4. Studies on the effect of light kao l in on diffusion of phenytoin.
5. Studies on the effect of calcium chloride on the diffus ion of pheny'toin.
Mucosal Solution Remarks
Physiological solution Adjustment of the pH was carr~ed out by the + Z g of antacid. The dropwise addition of 1 mol/dm HCl. This suspension was adjusted was necessary to bring the pH of the , antacid to the following pH 's: containing suspens ions to an acceptab-le
Aluminium hydroxide pH 7,5 physiological level. Initially all tests were to be conducted at pH 6,5 . Howevc"
Calcium carbonate pH 6,5 the magnesium and aluminium containing com-Magnesium carbonate pounds presented a greater resistance to pH light pH 7,5
Magnesium tri-change and tests were therefore conducted at
silicate pH 7,5 the more easily maintainable level of pH 7,5.
Physiological solution pH 7,5 was selected for convenience be~ause + Z g light kaolin mos t tes ts were conduc ted at 'this pH value adjusted to pH 7,5 and therefore comparison with the other
compounds was possible.
Physiological solution pH 6,5 was used so that results could be com-+ 250 mg of Ca(II) added pared with those obtained ~lith calcium in the form of CaCl
Z carbonate.
solution . Adjusted to pH 6,5.

-.J W
TABLE 5 (Continued)
Nature of test
6. Studies on the effect of magnesium chloride on the diffusion of phenytoin.
NOTE: 1.
Mucosal Solution
Physiological solution + 250 mg of Mg(II) added in the form of MgCI
2.
Adjusted to pH 7,5
Remarks
pH 7,5 was used so that results could be compared with those obtained with the magnesium containing compounds .
SEROSAL SOLUTION. All tests were conducted with 125 cm3 physiological solution of pH 7,2 prepared according to Aguiar and Fifelski (1966) .
2. MUCOSAL SOLUTION . All tests were conducted with 250 cm3 physiological solution to which was added 30 mg phenytoin sodium prior to pH adjustment.
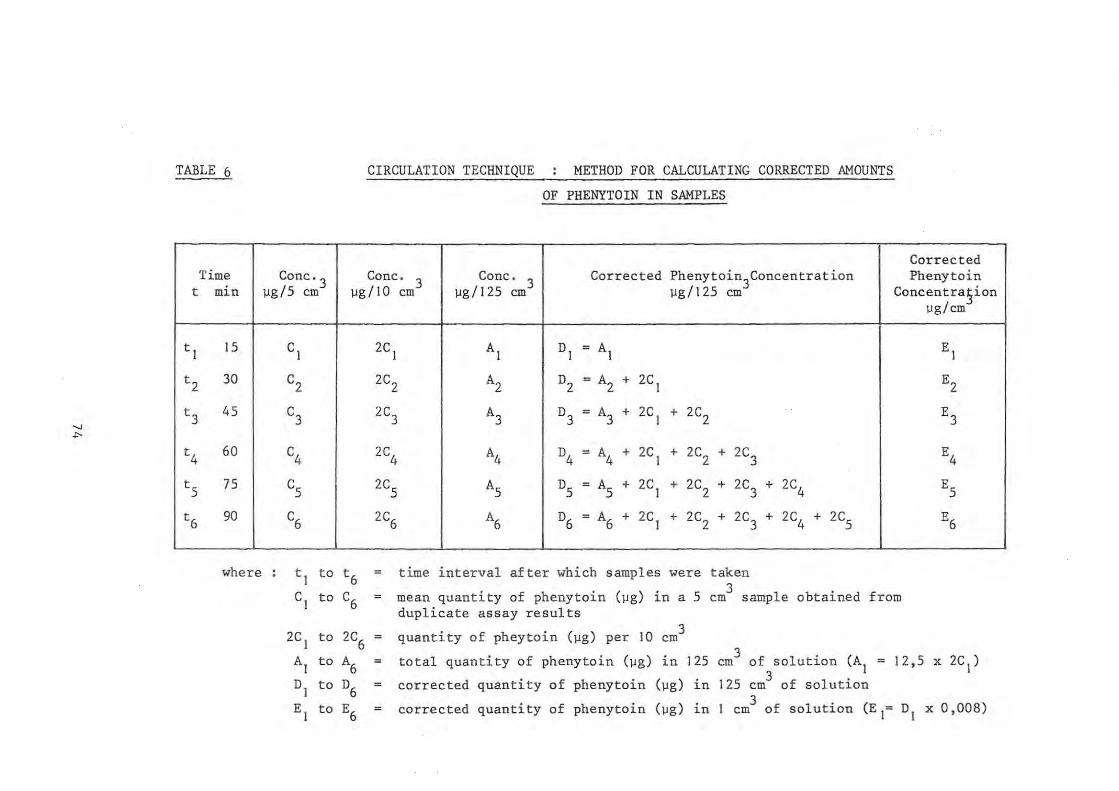
" .,.
TABLE 6
Time t min
t J JS
t2 30
t3 4S
t4 60
ts 7S
t6 90
where
CIRCULATION TECHNIQUE METHOD FOR CALCULATING CORRECTED AMOUNTS
OF PHENYTOIN IN SAMPLES
Corrected Conc· 3 Cone.
3 Cone. 3 Corrected Phenytoin3Concentration Phenytoin
\lg/S em Ilg/JO em Ilg/J2S em Ilg/J2S em Concentra,§ion Ilg/ cm
CJ 2C J AJ DJ = AJ EJ
C2 2C2 A2 D2 = A2 + 2C J E2
C3
2C3 A3 D3 = A3 + 2C J + 2C2 E3
C4
2C4 A4 D4 = A4 + 2C J + 2C2 + 2C3 E4
Cs
2CS AS DS = AS + 2C J + 2C 2 + 2C3 + 2C4 E5
C6 2C6 A6 D6 = A6 + 2C J + 2C2 + 2C3 + 2C4 + 2C5 E6
t J to t6 = time interval after which samples were taken . 5 3 CJ to C6 mean quantity of phenytoin (Ilg) l.n a em sample obtained from
duplicate assay results
2C J to 2C6
quantity of pheytoin (\lg) per JO em 3
AJ to A6 = total quantity of phenytoin (Ilg) in J25 cm3 of solution (AJ = J2,5 x 2C J)
DJ to D6 = corrected quantity of phenytoin (Ilg) in J25 cm3 of solution
EJ to E6 corrected quantity of phenytoin (Ilg) in J 3 of solution (E J= DJ x 0,008) em
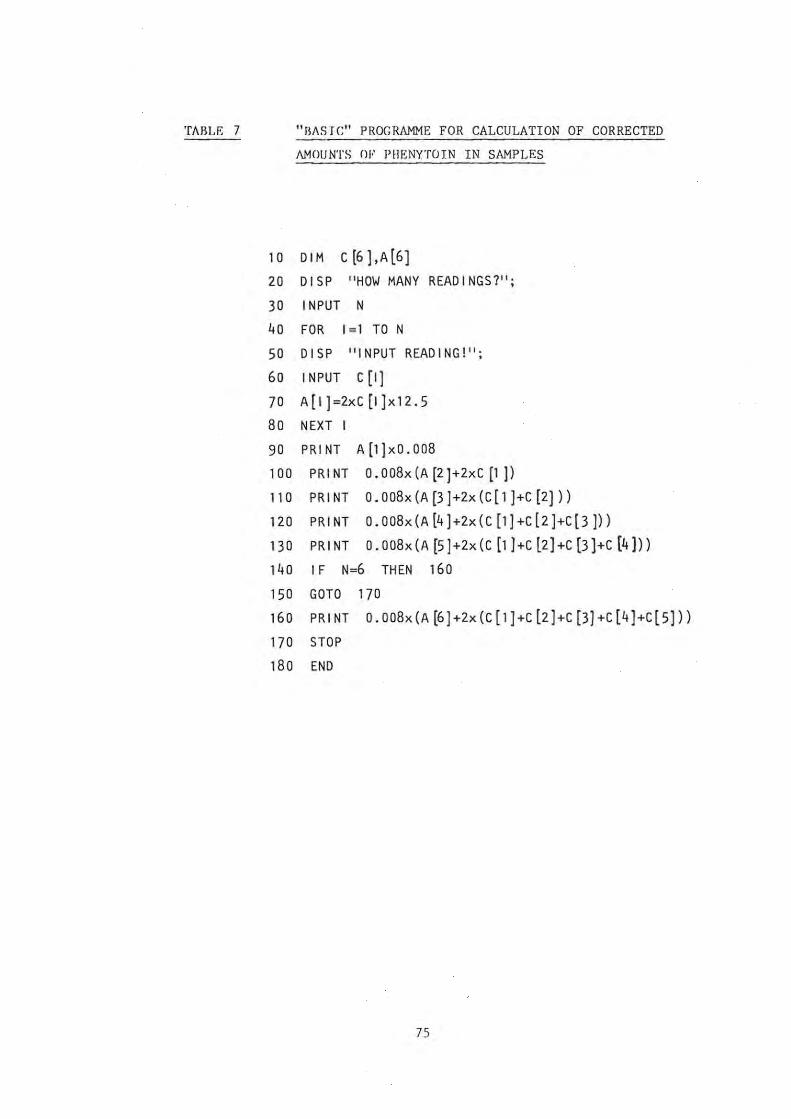
TAllLE 7 "FIIISJC" PROG RAMME FOR CALCULATION OF CORRECTED
AMOUNTS OF PIIJ,NYTOIN IN SAMPLES
10 DIM C (6 J,A[6]
20 DIS P "HOW MANY READ I NGS 7" ;
30 INPUT N
40 FOR 1=1 TO N
50 DISP "INPUT READING!";
60 INPUT C [I]
70 A[I)=2xC [1]x12.5
80 NEXT I
90 PRINT A(1)xO.008
100 PRI NT O. 008x (A (2)+2xC [1 )l 110 PRINT 0 . 008x(A(3)+2x(C[l)+C (2)))
120 PRINT 0.008x(A (4)+2x( C [l]+C(2)+c(3]))
130 PRINT 0 . 008x (A [5]+2x(C [l)+C l2]+C [3]+C (4]))
140 IF N=6 THEN 160
150 GOTO 170
160 PRINT 0.008x(A~)+2x(C[1]+cl2)+C[3)+C[4]+C[5]))
170 STOP
180 END
75

CHAPTER 4 RESULTS
4.1 ADSORPTION STUDIES
4.1 . I Adsorption of phenytoin onto particulate matter suspended
in simulated gastric and intestinal solutions
The amounts of phenytoin, expressed as a percentage of the
control, remaining in solution after incubation with the
various agents are presented in Tables 8 and 9. For each
time period, Column A represents the percentage phenytoin
remaining in the supernatant and column B the pH of the
suspension. The columns labelled "blank" reflect the pH of
the suspensions of the particulate matter in the sim
ulated gastric or intestinal solutions prepared without
the phenytoin. The columns labelled "control" reflect the
pH of the simulated gastric and intestinal solutions
containing phenytoin used for the tests and lacking the
powders. The concentration of phenytoin in the solutions
used for the tests are also shown in ~g/cm3 and were
calculated from :
(a) the mass of phenytoin used in preparing the dilutions
(Column C);
(b) the assay results of the control solutions (Column D).
It is to be noted that for each agent tested, a
of phenytoin in 0, I mol/dm3
NaOH was prepared.
aliquots were then diluted to 100 cm3 with the
dilution 3
I em
simulated
gastric and intestinal solutions. This accounts for the
fact that both Tables 8 and 9 reflect the same phenytoin
concentrations according to mass. The concentration of
phenytoin according to the assay represents the mean of
duplicate concordant results. Columns C and D show a
good correlation between the phenytoin concentration as
76

determined by mass and by assay of the solution incubated
at 37 °c for 180 min. It is to be noted that the solutions
used for these assays were the same as those used for the
tests and were centrifuged and filtered ln an identical
manner to the tests . According to the assay results
99,2 % (S . D. ~ 2,8) of the phenytoin was recovered from
the simulated gastric solutions of measured pH 3,0
(S.D. ~ 2,7), and 97,8 % (S . D. ~ 2,7) from the simulated
intestinal solution of measured pH 6,6 (S . D. ~ 0,1).
From these results it appears that no degradation of the
phenytoin in solution takes place over the 180 min test
period in either simulated gastric or intest inal solution .
In addition precipitation of the phenytoin from solution
at the pH of the gastric solutions did not take place.
If precipitation had occurred, the concentrations shown
ln column D would have been detectably lower than those
shown in column C. Therefore any loss of phenytoin from
solution onto the particulate matter can be attributed to
adsorption.
In the tests presented the antacid powders react with the
acid content of the simulated gastric and intestinal
solutions to establish their own pH environment. It was
calculated that there is insufficient HCl present in 10 cm3
of the simulated gastric or intestinal solution to
inactivate 100 mg quantities of the antacid, therefore
particulate matter remained in suspension In all the tubes
at the completion of the experiment.
Preliminary studies were carried out with aluminium hydroxide,
activated charcoal and magnesium trisilicate with
incubation periods of 3D, 60, 120 and 180 min. The
remaining tests i n this seri es were carried out with
incubation periods of 30 and 180 mln. Since these studies
showed little difference between the results at the varlOUS
time intervals, all subsequent tests were carried out with
77

an incubation period of 30 m1n.
4.1.2 Adsorption of phenytoin onto particulate matter suspended
in distilled water
The conditions of the study and the results are shown in
Table 10. Light magnesium oxide was included in this
series of tests. Because the preliminary studies on the
starches showed similar results, it was decided to confine
this series of tests to maize starch.
4.2 STUDIES ON THE DIFFUSION OF PHENYTOIN ACROSS THE ISOLATED
GUINEA-PIG ILEUM
The results of these studies are represented graphically
in Figures 9 to 14 and are tabulated in Table 11. These
results are presented in accordance with the discussion
of Section 3.3.4.
78

" '"
: :cllLE 8 PERCENTAGE PHENYTOIN REMAINING IN SOLUTION ANU MEASURED pH AFTER INCUBATION WITH
PARTICULATE MATTER SUSPENDED IN SIMULATED GASTRIC SOLUTION
Phenytoi~ Cone ~g/cm
Test Blank Control Hass Assay
Length of Incubation Min 30 60 120 180 180 180 - 180
Particulate Matter A B A B A B A B pH pH C D
Aluminium Hydroxide 97 6,2 99 6,2 100 6,2 99 6,2 6,0 3,0 25,9 26 ,9
Calcium Carbonate 98 6,6 - - - - 98 7,0 6,7 3,0 25,2 25,0
Charcoal, Activated 0 5,0 0 5,0 0 5,0 0 5,0 3,7 3,2 24,9 24,2
Magnesium Carbonate, 102 7,9 - - - - 100 7,8 7,7 3,0 25,2 25,0 Heav:.~
Magnesium Carbonate, 102 7,4 - - - - 101 8,3 8,2 3,0 24,8 25,6 Light
Magnesium Trisilicate 97 7,0 99 7,2 98 7,4 102 7,3 7,3 3,2 24,3 23,5
Kaolin Light 99 3,0 - - - - 101 3,0 2,8 3,0 25,9 25,0
Starch, Maize 88 2,9 - - - - 90 2,9 2,8 3,0 24,8 25,6
Starch, Potato 93 3,0 - - - - 94 3,0 3,0 2,9 24,7 23,8
Starch, Rice 94 3,0 - - - - 92 3,0 2,9 2,9 25,6 25,5
Starch, Wheat 93 3, 1 - - - - 95 3,0 2,8 2,9 24,7 23,8 _ .
N . ~ . See note on page 81
I
I
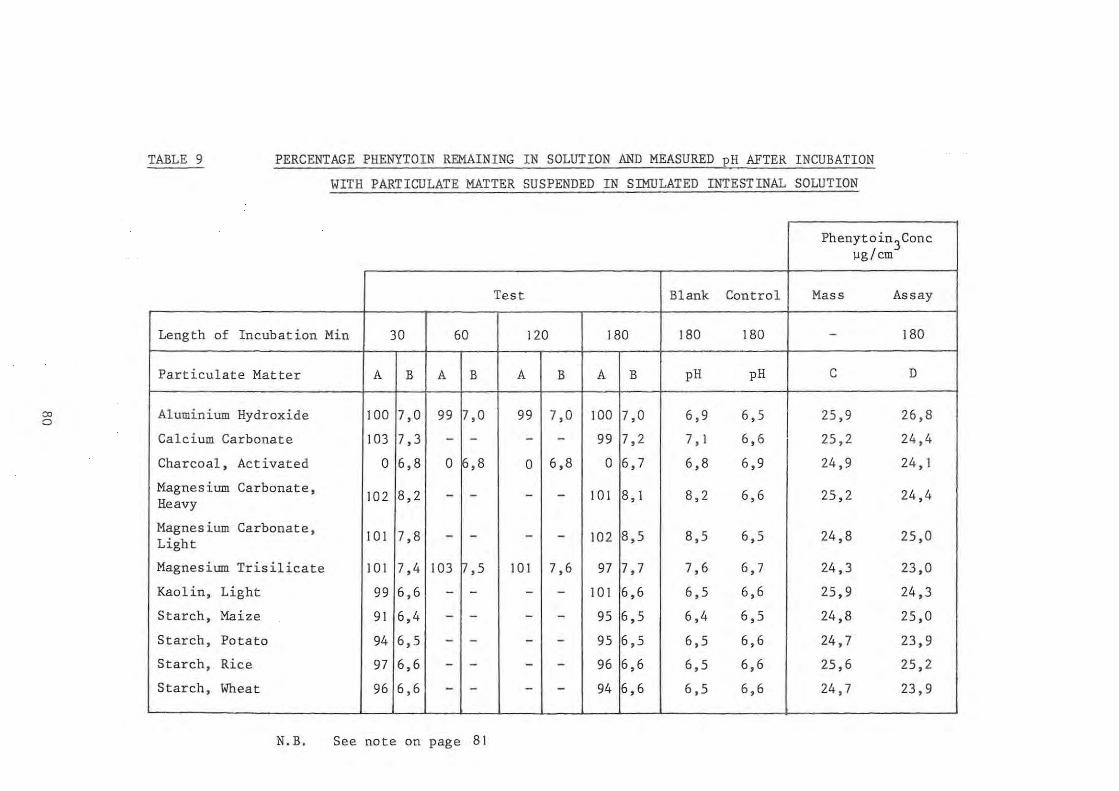
'" o
TABLE 9 PERCENTAGE PHENYTOIN REMAINING IN SOLUTION AND MEASURED pH AFTER INCUBATION
WITH PARTICULATE MATTER SUSPENDED IN SIMULATED INTESTINAL SOLUTION
Phenytoin3Conc ]lg/ cm
Test Blank Control Mass Assay
Length of Incubation Min 30 60 120 180 180 180 - 180
Particulate Matter A B A B A B A B pH pH C D
Aluminium Hydroxide 100 7,0 99 7,0 99 7,0 100 7,0 6,9 6,5 25,9 26,8
Calcium Carbonate 103 7,3 - - - - 99 7,2 7, I 6,6 25,2 24,4
Charcoal, Activated 0 6,8 0 ~,8 0 6,8 0 6,7 6,8 6,9 24,9 24, I
Magnesium Carbonate, 102 8,2 - - - - 101 8, I 8,2 6,6 25,2 24,4 Heavy
Magnesium Carbonate, 101 7,8 - - - - 102 8,5 8,5 6,5 24,8 25,0 Light
Magnesium Trisilicate 101 7,4 103 ~,5 101 7,6 97 7,7 7,6 6,7 24,3 23,0
Kaolin, Light 99 6,6 - - - - 101 6,6 6,5 6,6 25,9 24,3
Starch, Maize 91 6,4 - - - - 95 6,5 6,4 6,5 24,8 25,0
Starch, Potato 94 6,5 - - - - 95 6,5 6,5 6,6 24,7 23,9
Starch, Rice 97 6,6 - - - - 96 6,6 6,5 6,6 25,6 25,2
Starch, Wheat 96 6,6 - - - - 94 6,6 6,5 6,6 24,7 23,9 - - --- -
N. B. See note on page 81
I I
__ I

co
NOTES RELEVANT TO TABLES 8 AND 9
Column A
Column B
Blank ---
Control
Column C
Column D
represents the percentage phenytoin remaining in the supernatant.
represents the pH of the suspension with the phenytoin.
this column represents the pH of the suspensions after 180 min in the absence of phenytoin.
this column represents the pH of the phenytoin solution in the absence of the particulate matter.
initial concentration of phenytoin in test solution calculated from the mass used.
concentration of phentyoin in test solut i on after 180 min according to assay.

TABLE 10
PERCENTAGE PHENYTOIN REMAINING IN SOLUTION AND
MEASURED pH AFTER INCUBATION WITH PARTICULATE
MATTER SUSPENDED IN WATER
Phenytoin3Conc ~g/cm
25 40
Particulate Matter A B A B A
Aluminium Hydroxide 100 8,2 99 8,2 98
Calcium Carbonate 99 10, 2 99 10,2 98
Charcoal, Activated 0 7,7 0 7,6 0
Magnesium Carbonate, 100 10,2 98 10,2 99 Light
Magnesium Oxide, 95 10,5 98 10 .5 96 Light
Magnesium Trisilicate 100 10, 1 99 10, 1 99
Kaolin, Light 100 9,6 99 9,6 100
Starch, Maize 101 10,0 99 10,3 98
NOTE:
60
1. Duplicate concordant results were obtained for each concentration of phenytoin used.
2. Length of incubation 30 min.
B
8,1
10,2
7,8
10,3
10,4
10,1
9,5
10,0
3. Column A represents the percentage phenytoin remaining in the supernatant after 30 min.
4. Column B represents the pH of the suspension after 30 min.
82

co w
TABLE II
Test
Calcium-free Buffer pH 7,2
Standard Physio-logical Buffer pH 7,2
pH 7,5
pH 6,5
pH 5,2
pH 3,0
Aluminium Hydroxide Gel pH 7,5
Calcium Carbonate pH 6,5
Light Magnesium Carbonate pH 7,5
Magnesium Trisilicate pH 7,5
RESULTS OF DIFFUSION OF PHENYTOIN ACROSS THE ISOLATED GUINEA-PIG ILEUM
Number Corre la tion Mean diffusion Mean lag Corrected phenytoin Phenytoin cone. in of coefficient rase time (min) cone. in serosal s03n mucosal solution 3
tests (\lg/ em /min) after 90 min (\lg/em ) after 90 min (\lg/cm )
3 0,893 0,016 (0,002) 18,8 (10,6) 1,14 (0,15) 32,8 ( -)
(single r esult obtained)
31,9 (I,9) 3 0,967 0,015 (0,003) 18,3 (4,7) I ,06 (0, 14) (mean of duplicate tests)
14 0,910 0,017 (0,003) 16,2 (4,9) 1,29 (0,29) 33,4 (3,9)
6 0,912 0,014 (0,002) 20,6 (4 ,6) 0,93 (0,20) 23,8 (2,5 )
3 0,969 0,010 (0,001) 25,6 (4,6) 0,63 (0,08) 22,3 (1,2)
2 No results obtained because of denaturation of proteins of the membrane during the course of the experiments
3 0,981 0,025 (0,002) 15,5 ( I ,3) 1,89(0,1 4) 46, I (3,0) I
3 0,941 0,010 (0,001) 30,0 (5,8) 0,53 (0,10) 26,5 ( I ,0)
3 0,931 0,012 (0,002) 30, I (4,7) 0.73 (0.15) 27,6 (2,4)
2 0,993 0,016 (3,5xI64) 15,9 (I , I ) I ,16 (0,04 ) 42,4 (I , I)
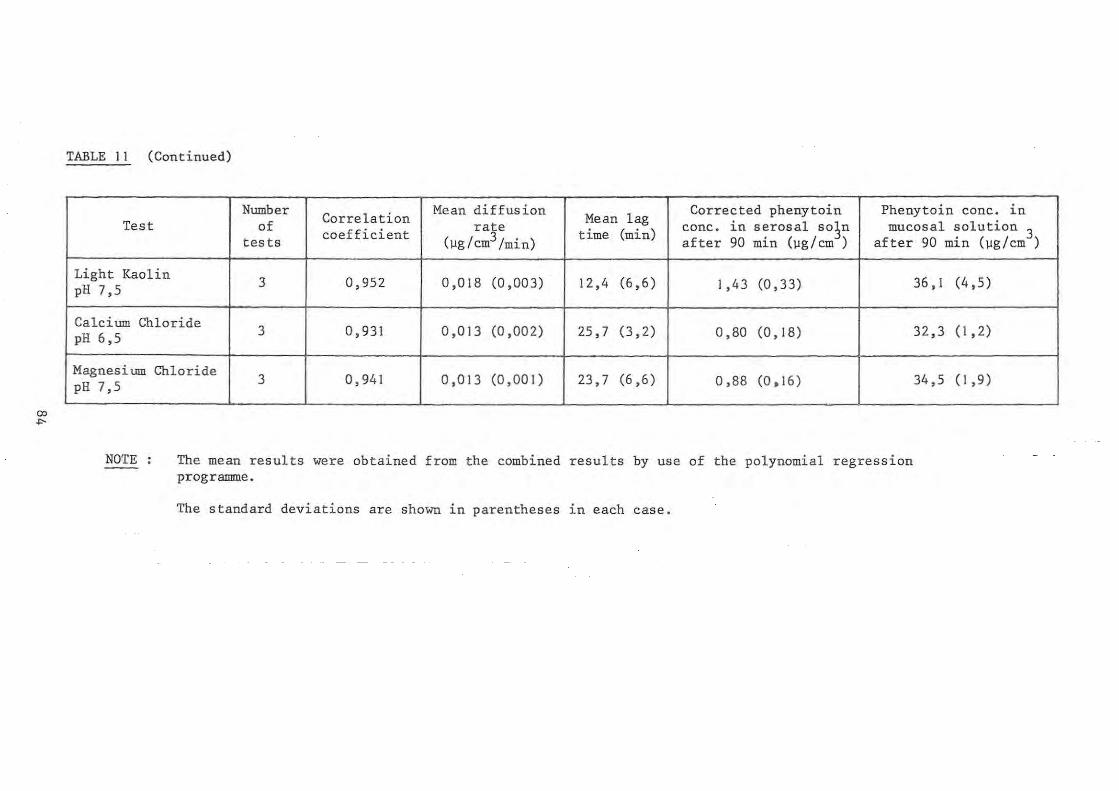
"" ..,.
TABLE II (Continued)
Number Correlation Mean diffusion Mean lag
Corrected phenytoin Phenytoin conc. in Test of coefficient rate time (min) conc. in serosal so~n mucosal solution 3
tests (Ilg / cm3/min) after 90 min (~g/cm ) after 90 min (~g/cm )
Light Kaolin 3 0,952 0,018 (0,003) 12,4 (6,6 ) 1,43 (0,33) 36, I (4,5) pH 7,5
Calcium Chloride 3 0,931 0,013 (0,002) 25,7 (3,2) 0,80 (0,18) 32,3 (1,2) pH 6,5
Magnesium Chloride 3 0,941 0,013 (0,001) 23,7 (6,6) 0,88 (0,16) 34,5 (1,9) pH 7,5
~ -
NOTE The mean results were obtained from the combined results by use of the polynomial regression programme.
The standard deviat ions are shown in parentheses in each case.
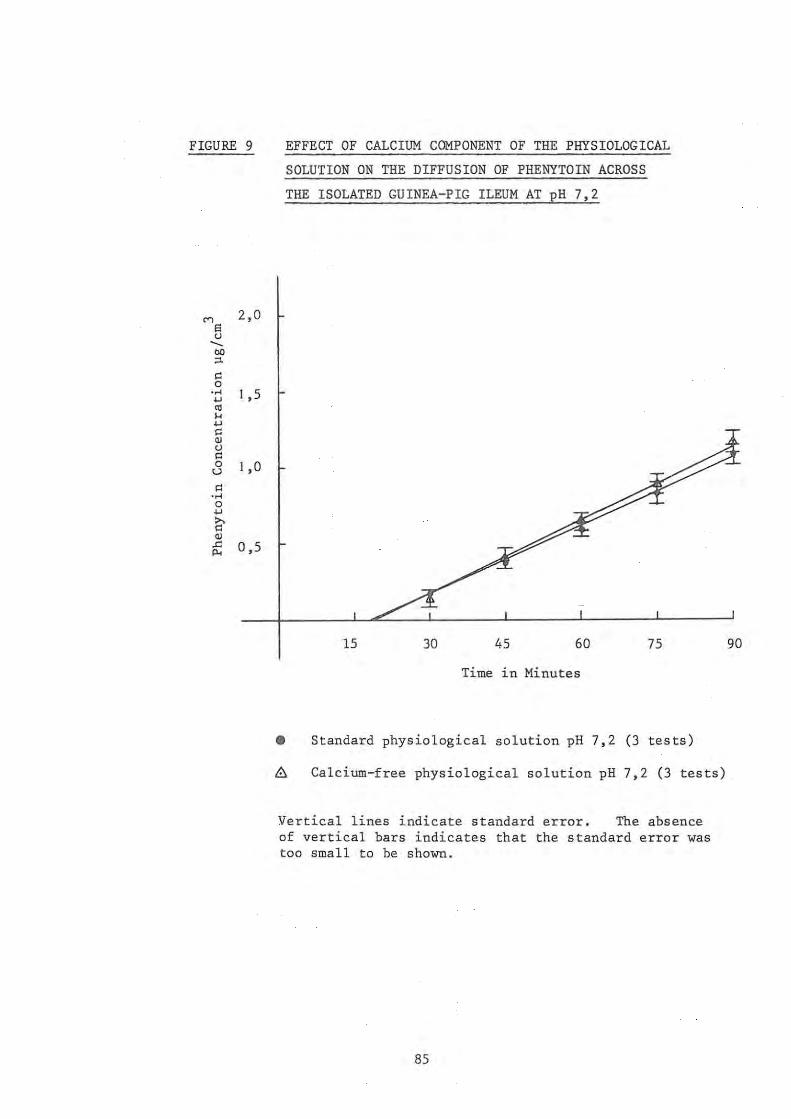
FIGURE 9
'" 2,0
a <1 -.. co ;:l.
0: 0 ..... I ,5 ~
'" ... ~
0: QJ <1 0: 0 I ,0 u 0: ..... 0 ~
>, 0: QJ
..c: 0,5 Po<
EFFECT OF CALCIUM COMPONENT OF THE PHYSIOLOGICAL
SOLUTION 'ON THE DIFFUSION OF PHENYTOIN ACROSS
THE ISOLATED GUINEA-PIG ILEUM AT pH 7,2
15 30 45 60 75
Time in Minutes
• Standard physiological solution pH 7,2 (3 tests)
~ Calcium-free physiological solution pH 7,2 (3 tests)
Vertical lines indicate standard error. The absence of vertical bars indicates that the standard error was too small to be shown.
85
90
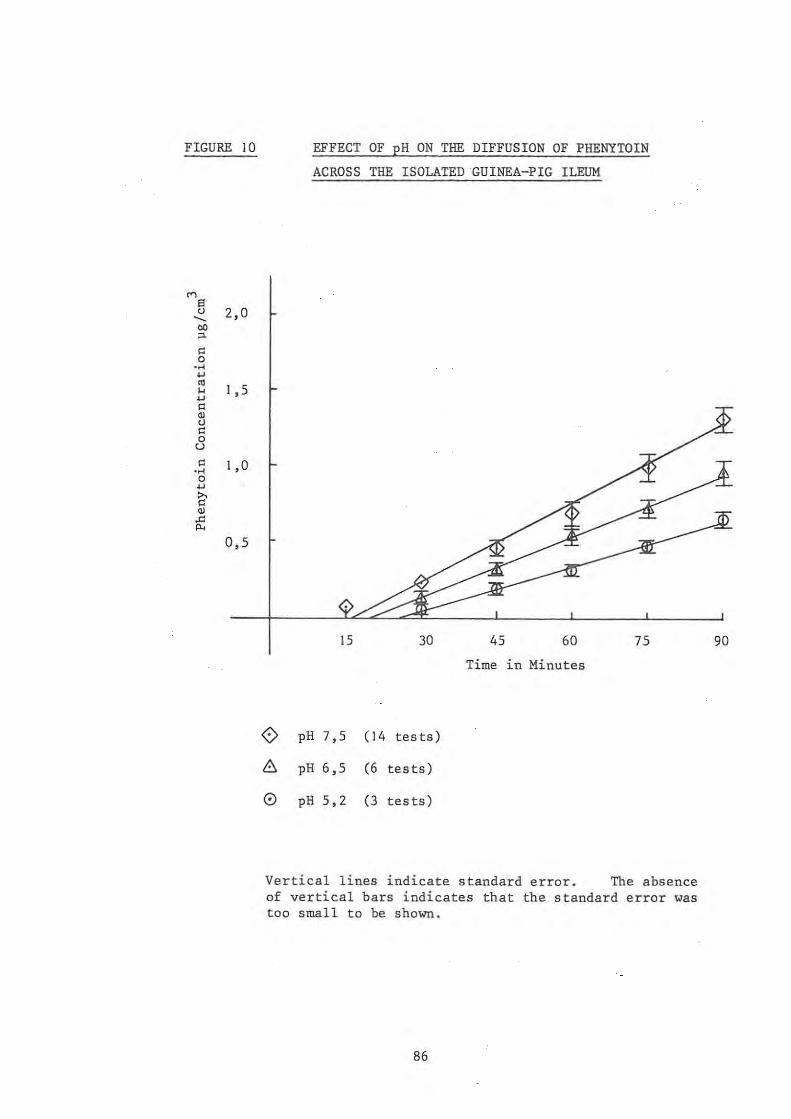
FIGURE 10
'" S tJ 2,0
---00 "-
" 0 ·H ... '" 1 , 5 ... ... " '" tJ
" 0 u
" 1,0 ·H 0 ... ~ '" .c
'" 0,5
EFFECT OF pH ON THE DIFFUSION OF PHENYTOIN
ACROSS THE ISOLATED GUINEA-PIG ILEUM
15 30
o pH 7,5 (14 tests)
8 pH 6,5 (6 tests)
o pH 5,2 (3 tes ts)
45 60 75
Time in Minutes
Vertical lines indicate standard error. The absence of vertical bars indicates that the standard error was too small to be shown.
86
90

FIGURE 11
M S <.J 2,0 ---OIl "'-~ 0
• ..<
'"' '" 1 ,5 ... '"' ~ OJ <.J ~ 0 u
" 1 ,0 • ..< 0
'"' & OJ .c p.,
0,5
COMPARISON OF THE EFFECT OF CALCIUM CHLORIDE
AND CALCIUM CARBONATE ON THE DIFFUSION OF
PHENYTOIN ACROSS THE ISOLATED GUINEA-PIG ILEUM
AT pH 6,5
15 30 45 60 75
Time in Minutes
~ Diffusion at pH 6,5 (6 tests)
~ Calcium chloride pH 6,5 (3 tests)
<? Calcium carbonate pH 6,5 (3 tests)
Vertical lines indicate standard error . The absence of vertical bars indicates that the standard error was too small to be shown.
87
90

FIGURE 12
'" 2,0 s <J --OIl
'" " a .....
1 ,5 ., '" " ., " '" <J
" a 1 ,0 u
" ..... a ., ~ '" '" 0,5 '"
COMPARISON OF THE EFFECT OF MAGNESIUM CHLORIDE
AND LIGHT MAGNESIUM CARBONATE ON THE DIFFUSION
OF PHENYTOIN ACROSS THE ISOLATED GUINEA-PIG
ILEUM AT pH 7 ,5
15 30 45 60 75
Time in Minutes
<> Diffusion at pH 7,5 (14 tests)
o Magnesium chloride (3 tests)
~ Light magnesium carbonate (3 tests)
Vertical lines indicate standard error . The absence of vertical bars indicates that the standard error was too small to be shown.
88
90

FIGURE 13
2,0 <')
S u --"" ;J.
'" 1 , 5 0 ..... ... '" H ... '" ., u
'" 1 , 0 0 u
'" ..... 0 ... ~ 0,5 ., .c '"
A
EFFECT OF MAGNESIUM TRISILICATE ON THE DIFFUSION
OF PHENYTOIN ACROSS THE ISOLATED GUINEA-PIG ILEUM
AT pH 7,5
15
Represents 14 tests. points and
30 45 60 75
Time in Minutes
the diffusion at pH 7,5. Mean of For clarity the position of the
the standard errors have been omitted.
G) Magnesium trisilicate (2 tests)
Vertical lines indicate standard ' error . The absence of vertical bars indicates that the standard error was too sma 11 to be shown.
89
t
90
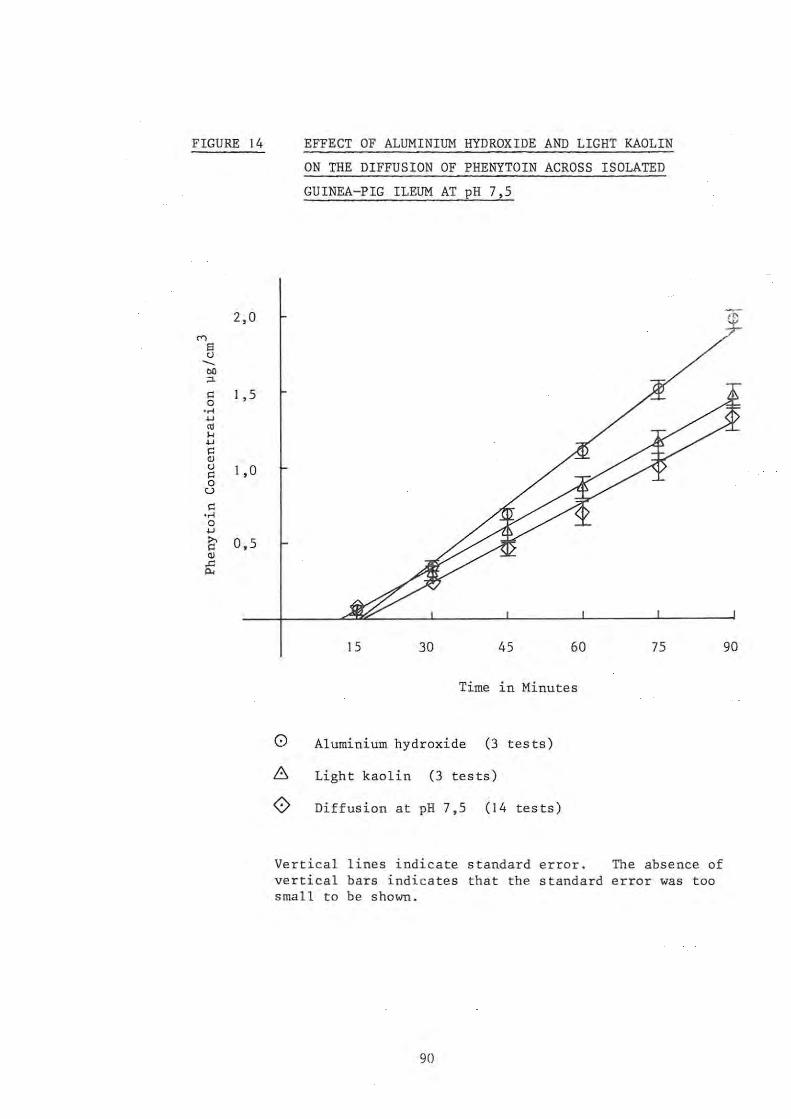
FIGURE 14
2,0
'" 8 <J --eo ;J.
" I ,5 0 ..... w <11 H w
" OJ <J I ,0 " 0 u
" .... 0 w i;' 0,5 OJ .c Po<
EFFECT OF ALUMINIUM HYDROXIDE AND LIGHT KAOLIN
ON THE DIFFUSION OF PHENYTOIN ACROSS ISOLATED
GUINEA-PIG ILEUM AT pH 7,5
15 30 45 60
Time in Minutes
o Aluminium hydroxide (3 tests)
~ Light kaolin (3 tests)
<? Diffusion at pH 7,5 (14 tests)
75
Vertical lines indicate standard error. The absence of vertical bars indicates that the standard error was too small to be shown.
90
If>
90

CHAPTERS DISCUSSION
5.1 ADSORPTION STUDIES
An examination of the results shown in Tables 8, 9 and 10
reveals that activated charcoal only is capable of adsorbing
phenytoin to a significant extent in vitro . This finding
confirms the results of Decker et al. (1968) who show that
activated charcoal has a considerable adsorbing capacity
for phenytoin.
Generally, there was no loss of phenytoin from solution
onto the antacid substances (aluminium hydroxide gel,
calcium carbonate, heavy and light magnesium carbonate and
magnesium trisilicate). The results indicate that a
small loss of phenytoin from solution occurs in the presence
of the starches.
adsorption.
This small decrease can be attributed to
From Table 10 it may be seen that no significant adsorption
takes place onto the particulate matter from aqueous
solution at the pH's indicated in the table. Once again,
some of the compounds tend to establish their own pH
environment. This makes it impossible to compare the
results at one and the same pH value. A small decrease
in phenytoin concentration (5 %) was observed with the
light magnesium oxide but this is unlikely to be of
significance.
It is to be noted that at pH 2,9 the maize starch adsorbed
phenytoin to the extent of 12 % but it failed to remove
the phenytoin from aqueous solutions of pH 10 at the three
concentrations tested. This may be due to the fact that,
at pH 10, phenytoin is 98 % ionised, but at pH 6,5 it is
only 1,6 % ionised and at pH 3,0 the drug is almost totally
91

unionised. Sanvordeker and Dajani (1975) demonstrated
that the non-ionised species of diphenoxylate hydrochloride
is preferentially adsorbed onto activated charcoal compared
to its ionised species in solution and Tsuchiya and Levy
(1972) demonstrated that the unionised forms of aspirin,
salicylamide and phenylpropanonalime are more extensively
adsorbed in vitro. The loss of phenytoin onto the starches
may therefore be attributed to the prefential adsorption
of the unionised form at pH 6,5 and pH 3,0 .
An examination of a commercial sample of phenytoin sodium
100 mg capsules revealed that the product contains
approximately 150 mg of diluent, which represents a
significant proportion of the total capsule mass . Clinically
the small loss of phenytoin from solution onto the pharma
ceutical grade starches at pH 6,5 and pH 3,0 would not
appear to be significant. The use of 150 mg of starch
as diluent with 100 mg of phenytoin sodium is unlikely to
result in any significant loss of phenytoin onto the starch
at pH's below 6,5. In addition, the starches are
digested during their passage through the gastro-intestinal
tract and would therefore release any drug bound to their
surface.
From the results of this study, it seems unlikely that the
adsorption phenomenon is the cause of the reduced blood
levels of phenytoin noted by Pippenger (personal communication
1978), Kulshrestha et al. (1978) and Garnett et al. (1979).
5.2 DIFFUSION OF PHENYTOIN ACROSS THE ISOLATED GUINEA-PIG ILEUM
5.2.1 Use of the circulation technique and methods adopted for
assessment of the trans-ileal diffusion of phenytoin
During the development of the circulation technique it was
necessary to introduce a number of modifications to obtain
92

meaningful
containing
results. 3 25 ~g/cm
For i nitial investigations a solut ion
of phenytoin in physiological solution
was used as the mucosal solution. However, this proved
unsatisfac t ory as there was insufficient phenytoin present
in the mucosal compar t ment to both saturate the membrane and
diffuse into the serosal compartment in a measurable
concentration. On consideration of this problem two
solutions seemed possible :
I . The use of an increased volume of phenytoin s olution
in the mucosal compartment;
2. The use of phenytoin sodium in excess of i ts solubi lity
in the mucosal compartment.
The first method is recommended by Stricker (1973) for use
with the Sartorius Absorption Simulator in testing very
lipid soluble compounds. With this system, an increased
amount of drug is dissolved in a large volume of mucosal
solution (e.g. 1 dm3) . Sufficient drug is therefore
present in solution to both saturate and penetrate the lipid
membrane in sufficient quantities for measurable concentra-
tions to be reached in the serosal solution . Whilst this
system is suitable for some diffusion studies, i t was felt
that it would not be possible for a meaningful comparison
to be made between the in vitro results and published in
vivo studies using this method.
By use of the second system it was possible to create a
situation in vitro which closely resembled the in vivo
conditions pertaining to the absorption of phenytoin as
outlined by Woodbury and Swinyard (1 972), i .e . phenytoin
does not dissolve completely within the intestine. The
undissolved phenytoin will go into solution only at the
rate at which the drug can be absorbed .
The following points are of note concerning t he method
93

adopted :
1. Phenytoin sodium is used largely in capsule form in
medication in a dosage of 30 to 100 mg (B.P.C. 1973);
2. Schwartz et al. (1977)
at pH 7,4 and at 37 °c give the solubility of phenytoin
3 as 31 ~g/cm. It was calculated 3 that with the use of 250 cm of physiological solution
of pH 7,5 this volume would be saturated by 7,75 mg of
phenytoin;
3. A mass of 30 mg of phenytoin sodium was used in the
mucosal solution . Phenytoin sodium dissolves more
rapidly than phenytoin and this ensured that saturation
of the mucosal solution occurred at a rapid rate.
(Yamamoto et al. (1976));
4. Phenytoin is reputed to have a high fat solubility and
is protein bound . Sufficient phenytoin was thus
present to saturate the isolated ileum before diffusion
could occur;
5. In addition to saturating the membrane a "pool" of
undissolved phenytoin would remain in the mucosal
compartment. This "pool" resulted in a constant
concentration of drug available for trans-ileal diffusion .
The process which takes p+ace in the system adopted is
represented diagramatically in Figure 15. An examination
of the figure shows that two factors influence the diffusion
of phenytoin, namely, the dissolution rate of the drug, and
its degree of ionisation in the pH environment of the mucosal
compartment.
With the use of the circulation technique it was possible
to monitor the pH and by suitable adjustment to control, the
degree of ionisation of the compound. Therefore it was
possible to assess the influence of the antacids and other
compounds on the dissolution and the eventual trans-ileal
94

FIGURE 15 SCHEMATIC REPRESENTATION OF THE TRANS-ILEAL
DIFFUSION OF PHENYTOIN
Phenytoin Sodium Particle (in excess of solubili ty)
o
Phenytoin Sodium : .. ~======~.~ Phenytoin e + Na ~ (Degree of dissociation governed by pH of medium)
Phenytoin H
Trans-ileal Diffusion + membrane
Phenytoin H ;;; .. ~~ .. ~ Phenytoin e ( trans-ileal)
• According to Yamamoto et al. (1976) dissolution is =--"-"-rate determining step.
95
+ H ~
the

diffusion of phenytoin.
An examination of Table I I shows that the trans-ileal
diffusion of phenytoin takes place according to the first
diffusion period as def i ned by Stricker (1973) in that
correlation . coefficients of between 0,893 and 0,993 were
obtained for the points of the lines. These were regarded
as being acceptable in terms of the system and demonstra t e
the validity of the circulation technique for the in vi tr~
investigation of drug absorption .
5.2.2 Effect of pH on the trans-ileal diffusion of phenytoin
The studies on the influence of pH on the diffusion of
phenytoin were conducted for two reasons :
I. To establish a pattern for the trans-ileal diffusion
of phenytoin at specific pH values. These results
serve as controls against which the tests performed
In the presence of the substances can be compared;
2. To establish the validity of the circulation procedure
for the assessment of drug absorption in vitro .
pH influences the diffusion of substances across a membrane
1n two ways
I. by affecting the solubility of the compound;
2 . by determining the degree of ionisation of the
subs tance.
This statement is corroborated by Aguiar and Fifelski (1966)
who state that the rate of absorption of a drug is
dependent on two independent processes, namely, the rate
of dissolution of the drug in the medium, and its rate of
permeation through the gastric wall or intestinal lumen.
"For a relatively insoluble drug (less than 0,01 mg/ml) the
rate of solution becomes a fundamental factor affecting the
96
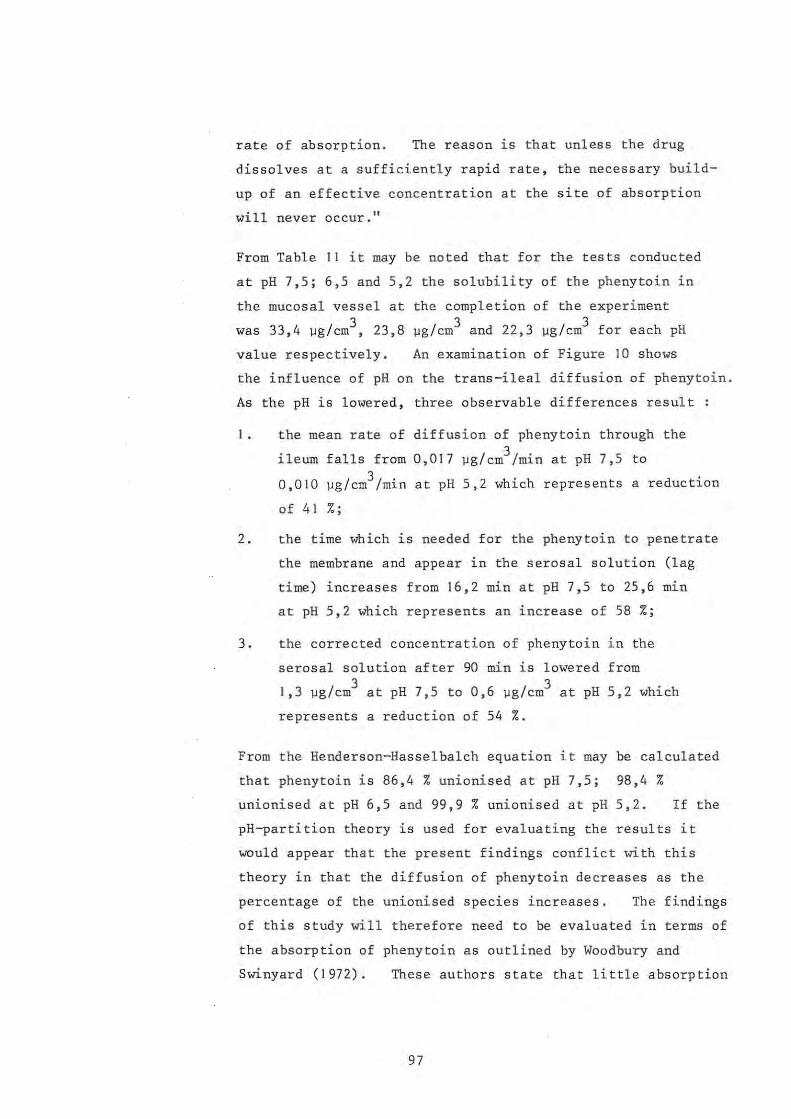
rate of absorption. The reason is that unless the drug
dissolves at a sufficiently rapid rate, the necessary build
up of an effective concentration at the site of absorption
will never occur,"
From Table 11 it may be noted that for the tests conducted
at pH 7,5; 6,5 and 5,2 the solubility of the phenytoin in
the mucosal vessel at 3 was 33,4 ~g/cm , 23,8
value respectively.
the completion of the experiment 3 3
~g/cm and 22 , 3 ~g/cm for each pH
An examination of Figure 10 shows
the influence of pH on the trans-ileal diffusion of phenytoin.
As the pH is lowered, three observable differences result
1 • the mean rate of
ileum falls from
0,010 ~g/cm3/min of 41 %;
diffusion of phenytoin through the '3 0,017 ~g/cm /min at pH 7,5 to
at pH 5,2 which represents a reduction
2. the time Which is needed for the phenytoin to penetrate
the membrane and appear in the serosal solution (lag
time) increases from 16,2 min at pH 7,5 to 25,6 min
at pH 5,2 Which represents an increase of 58 %;
3. the corrected concentration of phenytoin in the
serosal solution 3 1,3 ~g/cm at pH
after 90 min is lowered from 3 7,5 to 0,6 ~g/cm at pH 5,2 which
represents a reduction of 54 %.
From the Henderson-Hasselbalch equation it may be calculated
that phenytoin is 86,4 % unionised at pH 7,5; 98,4 %
unionised at pH 6,5 and 99,9 % unionised at pH 5,2. If the
pH-partition theory is used for evaluating the results it
would appear that the present findings conflict with this
theory in that the diffusion of phenytoin decreases as the
percentage of the unionised species increases. The findings
of this study will therefore need to be evaluated in terms of
the absorption of phenytoin as outlined by Woodbury and
Swinyard (1972). These authors state that little absorption
97

of phenytoin occurs in the stomach because of the low
solubility of the drug in the gastric juice. Thus,
despite the fact that phenytoin exists predominantly ~n
the unionised form and should be absorbed readily by
passive diffusion, it attains only a very low concentration
in the gastric juice and consequently is poorly and slowly
absorbed. In the duodenum where the pH is approximately
7 to 7,5, more drug exists in the ionised form, and hence
~ s considerably more soluble in the intestinal fluid.
It is at this site where the maximum absorption of phenytoin
occurs.
From the results of this study it appears that the
solubility of the phenytoin in the intestinal fluids is
critical to the absorption of the drug. Although the
solubility of the phenytoin exceeds the limit set by
Aguiar and Fifelski (1966), the results demonstrate the
validity of the observations of Woodbury and Swinyard (1972)
regarding the factors influencing the absorption of orally
administered phenytoin.
The absorption of phenytoin is acknowledged by Yamamoto
et al. (1976) to be dissolution rate -limi ted. A further
point to be borne in mind in the interpretation of these
resul ts is the dissolution rate of the phenytoin in the
mucosal compartment. The dissolution rate of the phenytoin
was not measured during these experiments. A lower
dissolution rate at the lower pH values can be postulated
as a contributing factor to the lowering of the trans-
ileal diffusion of phenytoin with lowered pH. This factor
would account for the differences in diffusion monitored
at pH 6,5 and pH 5,2 which cannot wholly be explained by the
solubility differences of the phenytoin measured at the
conclusion of the experiment.
98

5.2.3 Effect of calcium component of the physiological solution
on the trans-ileal di ffus i on of phenytoin
The results of this study are shown in Figure 9 and Table 11.
This work was carried out in the form of a preliminary
investigation using the physiological solution of Agui ar
and Fifelski (1966) prepared with and without the 1, 25 x 10- 3
moles/dm3 of calcium chloride. From these tests it was
apparent that the calcium component of the physiological
solution did not influence the diffusion of phenytoin
significantly . These tests were necessitated because of
the observation of Tyrer et al. (1970) that the excipient
calcium sulphate adversely affects the blood levels of
phenytoin. It was felt that the calcium component of the
physiological solution could adversely affect the diffusio.n
of the drug .
During these preliminary studies, the decision was made to
monitor the concentration of phenytoin rema i ning in solution
on the mucosal side of the membrane at the conclusion of
each experiment . A single result (from a dupl i cate assay
procedure) was obtained for the calcium-free physiological
solution and two results for the standard physiological
solution . The final concentrations reached are shown
in Table 11 . In all other tests, the concentration of
phenytoin in the mucosal solution was determined at the
completion of the experiment .
From the results recorded it was apparent that the inclusion
of calcium chloride in the physiological solution would not
adversely influence future work and therefore t he standard
physiological solut i on was used for all subsequent tests.
5.2 . 4 Effect of calcium , magnesium and aluminium containing
compounds on the trans-ileal diffusion of phenytoin
The result of these studies are shown in Figures 11 to 14.
99

The methods adopted for these tests are summarised in
Table 5 and the results in Table 11. The reader is
reminded of the difficulty which arose during the studies
conducted with the antacid substances . In all these
tests 2 g of the antacid was added to 250 cm3 of physiological
buffer which contained 30 mg of phenytoin sodium . The
initial pH of the suspension was monitored and the pH was
adjusted with HCl to an acceptable physiological value.
Initially all these tests were to be conducted at pH 6,5.
This method worked successfully for calcium carbonate.
However, subsequent tests showed that the other antacids
exhibited a greater resistance to this pH change and were
more easily stabilised to pH 7,5. Both these pH values
are acceptable in terms of the intestinal absorption of
drugs. Bates and Gibaldi (1970) give the pH of the small
intestine as approximately 6,5 and Woodbury and Swinyard
(1972) as approximately 7 to 7,5. From the results presented
it is therefore not possible to compare the effects of
calcium and magnesium compounds as the tests were conducted
at different pH values .
A further factor to be borne 1n mind is that the antacid
compounds themselves act as buffers . Because of the presence
of the biological membrane it was not practical to neutralise
these compounds completely since the pH of the tests had to
be maintained at physiologically acceptable levels . There-
fore the system was adopted whereby surveylance was made
of the mucosal pH and adjustments made when necessary during
the duration of the tests.
The influence of these substances will be discussed on an
individual basis . Comparis ons will be made where possible
using the parameters of lag time, diffusion rate, final
concentration attained in the serosal solution and the
final concentration of the phenytoin in solution in the
mucosal compartment on completion of the experiment .
100

I. Calcium Carbonate
The presence of calcium carbonate produces a significant
lowering in the trans-ileal diffusion of phenytoin as
compared to the tests performed in the absence of the
antacid at pH 6,5 .
by noted:
From Table II three differences may
I. The mean diffusion rate of 0,010 ~g/cm3/min of
phenytoin is 28 , 6 % lower than the tests at pH 6 , 5;
2. The lag time increases from 20,6 min to 30,0 min;
3. In the presence of calcium carbonate there is an
increase in the solubility of the phenytoin from
23,8 to 26,5 ~g/cm3/min in the mucosal compartment
at pH 6,5 .
The initial pH of the mucosal suspension which contained
2 g of calcium carbonate with the phenytoin sodium was
8,0 . This was adjusted to pH 6,5 with HCl. As a
resul t of the pH adjustment soluble calcium was released
into the mucosal compartment. Additional calcium would
also be released from the calcium carbonate as a result
of the formation of calcium bicarbonate by the action of
the CO 2 content of the gassing mixture. It was fel t
that the release of soluble calcium would influence the
trans-ileal diffusion of phenytoin; therefore a similar
series of tests were performed with calcium chloride
so that the influence of calcium ions could be assessed
independently.
2. Magnesium Carbonate
An examination of the results reveals that the presence
of light magnesium carbonate has an ef fect similar to
that of calcium carbonate on the diffusion of the
phenytoin, although the tests were conducted at different
101
pH values. The rate of diffusion was reduced from
0,017 to 0,012 ~g/cm3/min which represents a fall of 29 %.
However, it is to be noted that there was a fall in the
solubility of the phenytoin in the mucosal solution at 3 pH 7,5 to 27,6 ~g/cm. The initial impression was that the
lowered diffusion rate of the phenytoin was caused by
the reduced concentration of the drug in the mucosal
solution but this fact does not explain the observation
completely.
The rate of diffusion of the phenytoin measured in the
presence of the magnesium carbonate was lower than in
tests conducted without the antacids at pH 6 , 5 . The
diffusion rate for the tests in the absence of antacids
at pH 6,5 was 0,014 ~g/cm3/min which is 14,3 % higher
than the diffusion rate of phenytoin in the presence of
magnesium carbonate at pH 7,5. Furthermore, the solubil-
ity of phenytoin in 3 23,8 ~g/cm as opposed
the mucosal solution at pH 6,5 was
to 27, 6 ~g/ em3 in the presence of
magnesium carbonate at pH 7,5 . From these results it
appears that the differences in concentration of phenytoin
in the mucosal compartment could not alone explain the .
difference in diffusion rates observed in the experiments.
It was felt, however, that the presence of magnesium ions
released from the magnesium carbonate by the action of
the acid could be the factor influencing the diffusion
and the solubility of the phenytoin. Therefore a
series of tests with magnesium chloride in the mucosal
compartment were conducted in an attempt to clarify this
observation.
3. Magnesium Trisilicate
The results of two tests are shown in Figure 13. A
comparison of the two lines shows a slight reduction in
the diffusion of phenytoin in the presence of magnesium
102

trisilicate at pH 7,5 . Magnesium trisilicate is a
slow acting antacid . During the tests with this
compound, difficulty was experienced in maintaining the
pH at a constant level. Difficulty was also experienced
with the membranes which tended to contract sufficiently
to interrupt the flow of mucosal fluid at times .
Although there was very little difference between the
diffusion rates in the presence and in the absence of
magnesium trisilicate, the solubility of the phenytoin
was found to increase to 42,4 ~g/cm3 at the controlled
pH 7,5. While the results from the duplicate tests
are insufficient to prove conclusively an effect of
magnesium trisilicate on the diffusion of phenytoin, a
greater diffusion than that recorded is expected in view
of the increased solubility of the phenytoin i n the
presence of the antacid .
4 . Aluminium Hydroxide Gel
Figure 14 illustrates how the presence of aluminium
hydroxide gel increases markedly the diffusion of
phenytoin at pH 7,5 . The diffusion rate rose to
0,025 ~g/cm3/min which represents an increase of 47 %
over the tests conducted at pH 7 , 5 in the absence of
the antacid . The increase in diffusion can be attributed
to the increased solubility of the phenytoin in the
presence of aluminium hydroxide gel. It therefore
appears that even though AI(III) would be released into
the mucosal compartment by the action of the acid, it
does not adversely influence the diffusion of phenytoin
under the test conditions.
5. Light Kaolin
Although kaol i n contains aluminium in the form of hydrated
aluminium silicate, unlike aluminium hydroxide gel, the
substance does not di ssolve in dilute mineral acids with
103

the formation of soluble aluminium (AI III) . The
trans -ileal diffusion of phenytoin in the presence of
light kaolin is shown in Figure 14. The results
obtained in the presence of both aluminium hydroxide gel
and light kaolin are similar . The solubility of the
phenytoin in the mucosal compartment increases ~n the
presence of the light kaolin. Although this increase
is lower than in the presence of aluminium hydroxide
gel, it nevertheless was accompanied by an increase in
the diffusion of the phenytoin at pH 7,5 .
6. Calcium (Ca (II»
It has previ ously been shown that the presence of
1,25 x 10⁻³ moles/dm3 of calcium chlor ide in the mucosal
solution did not produce a detectable change in the rate
of phenytoin diffusion . However, when the calcium 3 ion concentrat ion was i ncreased to 0,025 moles/dm ,
the solubility 3 32,3 )1g/cm a t
of t he phenytoin was found t o increase to
pH 6,5. This higher concentration did
not result in an increase in the diffusion rate of
phenytoin. The diffusion rate fell by 7,1 % from
0,014 to 0 , 013 )1g/cm3 /min at pH 6,5 and the lag time
increased by 5,1 min .
From these results it appeared that the presence of free
calcium ions in the mucosal compartment resulted in an
alteration in the amount of phenytoin which appeared
in solution at the conclusion of the experiments and
adversely influenced the trans-ileal di ffusion of
phenytoin.
7. Magnesium (Mg (II»
The addi don of
chloride to the
250 mg of Mg (II) in the form of magnesium 3 mucosal compartment (0,041 mol/dm Mg (II»
resulted in a very slight increase in the solubility of
104

of the phenytoin in the mucosal compartment a t the 3 conclusion of the tests . (33,4 to 34,5 jlg/cm ) . However,
the diffusion rate fell from 0,017 to 0,013 jlg/cm3 /min
which represents a reduction of 23,5 %. The lag time
increased from 16,2 to 23,7 min, and the concentration
in the serosal compartment at the completion of the 3 tests was found t o be 0,88 jlg/cm as opposed to
3 1,25 jlg/cm fo r t he tests at pH 7,5 conducted in the
presence of phenytoin alone.
From these results it appears that the presence of
magnesium ions in the mucosal compartment results in
an inhibition of the trans-ileal diffusion of phenytoin.
The findings of the effects of the antacids, kaolin, calcium
chloride and magnesium chloride on the trans-ileal diffusion
of phenyto i n may be summarised as follows :
I. Magnesium and calcium ions cause a lowering of the trans
ileal diffusion of phenytoin as does the presence of
calcium carbonate and magnesium carbonate . Calcium
and magnesium i ons released from the antacid may therefore
account for the lowering of the diffusion rates by an
unknown mechanism ;
2. The effects of calcium and magnesium are not, however,
directly comparable as the molar concentrations of these
ions are different in the tests and the tests were
conducted at different pH values;
3. The dissolution of the phenytoin sodium varied in the
presence of the powders . This occurred in spite of the
fact that the duration of the tests, the rate of
agitation and the temperature were standardised;
4. When increased dissolution of the phenytoin sodium
occurred in the absence of magnesium and calcium ions,
it was accompanied by an increase in the trans-ileal
diffusion ;
105

5. In most instances, an increase in the dissolution of
the phenytoin sodium in the presence of Ca(II) and
Mg(II) resulted in a decrease in the trans-ileal diffusion.
These results may be compared with the findings of Juul
Christensen et al. (1967) who demonstrated the influence
of gastri c antacids on the release in vitro of tetracycline
hydrochloride . They showed that the diffusion of
tetracycline hydrochloride through a membrane is diminished
by magnesium oxide, aluminium hydroxide and calcium carbon-
ate. This inhibition is attributed to the release of
polyvalent metal ions into the system by the action of the
acid in the simulated gastric juice. These ions are known
to form non-diffusable complexes with tetracycline.
Although the formation of phenytoin-calcium and phenytoin
magnesium complexes have not been demonstrated, the forma
tion of such complexes might account for the differences
in phenytoin diffusion observed in the present study . In
the light of the lack of evidence in this area it would seem
unwise to speculate further concerning the formation of such
complexes .
From the present study it has been possible to demonstrate
qualitatively the differences 1n the trans-ileal diffusion
of phenytoin in the presence and in the absence of some
calcium and magnesium containing compounds . These observed
differences may account for the lowering of phenytoin
plasma levels observed by Pippenger (personal communication
1978), Kulshrestha et al . (1978), and Garnett et al. ( 1979) .
when antacids containing aluminium hydroxide gel, magnesium
hydroxide, magnesium trisi licate and calcium carbonate were
administered with phenytoin. It is to be noted t ha t
aluminium hydroxide gel was often used in combination with
magnesium containing compounds . It may be postulated that
the magnesium containing component contributed to the
106

decreased blood levels of phenytoin reported .
In the light of the present findings it would appear unwise
for patients to take magnesium or calcium containing
compounds concurrently with oral phenytoin preparations.
Furthermore, the inclusion of the diluents calcium carbonate,
magnesium carbonate or magnesium oxide in capsules containing
phenytoin sodium should be viewed with circumspection . The
Pharmaceutical Codex (1979) cautions against the use of
calcium sulphate as a diluent for phenytoin sodium capsules
but recommends the abovementioned antacids as suitable
diluents for capsules provided that the medicament and the
diluent are compatible. It would seem appropriate if this
precautionary note were extended to cover all calcium and
magnesium containing diluents in phenytoin sodium capsules.
107
SUMMARY
Phenytoin has been r eviewed with respect to its phys ico
chemical properties, absorption after oral administration
and interactions with other medicinal compounds . A
detailed discussion of the recorded interactions of phenytoin
with antacids, excipients, metal ions and pharmaceutical
adsorbents is presented . The analytical methods available
for phenytoin are assessed. The in vitro methodology for
the assessment of drug-adsorbent, drug-antacid and drug
excipient interactions is reviewed.
Two methods for the determination of phenytoin by use of
the benzophenone-extraction procedure according to Saitoh
et al. (1973) have been developed. These are presented ~n 3 order that concentrations of up to 40 ~g/cm and up to
8 ~g/cm3 of phenytoin in aqueous solution may be determined.
The Sartorius Absorption Simulator has been modified to
accommodate a length of isolated guinea-pig ileum after the
circulation technique of Fisher and Parsons (1949). The
construction of the apparatus and the experimental procedure
is detailed.
The loss of phenytoin from solution onto some common
pharmaceutical antacids, excipients and adsorbents has been
as sessed . Of the compounds tested, activated charcoal only
is capable of removing significant amounts of phenytoin from
solution .
The modified Sartorius Absorption Simulator has been used
to demonstrate the effect of pH on the trans-ileal diffusion
of phenytoin according to the theory governing the absorption
of orally administered phenytoin as proposed by Woodbury and
Swinyard (1972).
The influence of calcium and magnesium containing antacids
108

and the presence of calcium and magnesium 10ns in solution
on the trans-ileal diffusion of phenytoin is demonstrated.
Conclusions are drawn as to the usefulness of the circula
tion technique for the demonstration of drug interactions
in vitro. The concurrent administration of calcium
and magnesium containing antacids with phenytoin is assessed
in terms of the present findings and published clinical
data. The use of calcium and magnesium containing com
pounds as excipients for phenytoin sodium capsules is
questioned.
Jog
REFERENCES
Aguiar, A.J. and Fifelski, R. J. (1966) J . Pharm. Sci. 55: 1387-1391
Akers, M.J., Lach, J.L. and Fischer, L.J. (1973) ibid . 62 : 391-395
Amer, M.M., Ahmad, A.K.S . and Hassan, S.M. (1977) J . Pharm. Pharmacol. 29 : 355-357
Armstrong, N.A. and Clarke, C.D. (1971) ibid. 23: 95S-100S
Armstrong, N.A. and Clarke, C. D. (1973) J. Pharm. Sci . 62 : 379-383
Armstrong, N.A. and Clarke, C.D . (1976) ibid . 65 : 373-375
Atherden, L.M. (1969) in: Bentley and Driver's Textbook of Pharmaceutical Chemistry. 8th edition, Oxford University Press, London, p 198
Bates, T.R. and Gibaldi, M. (1970) in : Swarbrick, J . (ed) Current Concepts in Pharmaceutical Sciences , Biopharmaceutics. Lea & Febiger, Philadelphia, pp 57-99
, Batuyios, N.H . and Brecht, E.A. (1957) J . Am. Pharm. Ass . Sci.
Edn . 46: 524-531
Binnion, P.F. and McDermott, M. (1972) Lancet 2: 592, from : I.P.A. 10 0878
Blaug, S.M. and Gross, M.R. (1965) J. Pharm . Sci. 54: 289-294
Bock, G.W . and Sherwin, A.L. (1971) Clin. Chern. Acta 34: 97 - 103 from: Chemical Abstracts 105930e
British Pharmaceutical Codex (1973), The Pharmaceutical Press, London
British Pharmacopoeia (1973), The Pharmaceutical Pr ess, London
Buchanan, R.A. and Sholiton, L.J. (1972) in: Woodbury, D.M., Penry, J.K. and Schmidt, R. P. (eds) Antiepileptic Drugs. Raven Press, New York, pp 181-191
Chowhan, Z.T . and Amaro A.A. (1977) J. Pharm. Sci 66 : 1249-1253
110

Clarke, E.G.D. (1969) in: Isolation and Identification of Drugs.
Crane,
The Pharmaceutical Press, London
R.K. and Wilson, T.H. (1958) J. Appl . Physiol. 12 : 145 from:Bates, T.R. and Gibaldi, M. (1970) in: Current Concepts in Pharmaceutical Sciences, Biopharmaceutics. Lea & Febiger, Philadelphia, pp 82-86
Darlington, W.A . and Quastel, J.H . (1953) Ar ch . Biochem. , 43 : 194-207
Decker, W.J., Combs, H.F. and Corby, D.G. (1968) Toxicol. Appl . Pharmacol. 13: 454-460
Delgado, J.N. and Isaacson, E. I. (1970) in : Burger, A. (ed) Medicinal Chemistry. Wiley-Interscience , PP 1386-1401
Diliberto, J . J . (1969) J. Pharm. Sci. ~: 747-749
Dill, W.A. ,Kazenko, A. , Wolf, L.M. and Glazko, A.J. (1956) J. Pharmacol. Exp. Ther. ~: 270-279
Doluisio, J.T. and Swintosky, J.V. (1964) J. Pharm. Sci . 53: 597-601
El-Masry, S. and Khalil, S.A.H. (1974) J . Pharm. Pharmacol. 26: 243-248
El-Nakeeb, M.A. and Yousef, R.T. (1968) Acta Pharm. Suec. 5: I~
Falk, M. and Fuerst, W. ( 1974) Pharmazie 29 : 590-593 from: Chemical Abstracts 34991g
Feldman, S., Salvino, M. and Gibaldi, M. (1970) J. Pharm. Sci. 59 : 705-707
Feldman, S., Kostenbauder, H. B. and Riegelman, S. (1975) J. Am. Pharm. Assoc. NSI5 : 647-650
Fisher, R.B. and Parsons, D. S. (1949) J. Physiol. 110 : 36-46
Garnett, W.R. , Carter, B. L. and Pellock, J.M . (1979) Therapeutic Drug Monitoring ~: 435-436
Glazko, A. J . (1972 a) Pharmacology 8: 163-177 from : Woodbury, D.M. and Fingl, E. (1975) In: The Pharmacological Basis of Therapeuti cs . Macmillan, New York, p 205
I I I

Glazko, A.J. (1972 b) in: Woodbury, D.M., Penry , J.K. and Schmidt, R.P. (eds) Antiepileptic Drugs. Raven Press, New York, pp 103-112
Glazko, A.J. and Chang, T. (1972) in: ibid . pp 127-136
Goudah, M.W. and Guth, E.P. (1965) J. Pharm. Sci. 54: 298-301
Graybill, F.A. (1961) in: An Introduction to Linear Statistic Models. McGraw-Hill, New York, from: Hewlett-Packard Calculator 9830A Math Pac, 1: 57
Harper, W.M . (1977) in: Statistics. 3rd Edition Macdonald and Evans, Plymouth, p 159
Hartshorn, E.A. (1972) Drug Intel. Clin. Pharm. 6 : 130-137
Huisman, J.W. and Dek, M.C. (1964) Pharm. Weekbl. 99: 1121-1124
Hurwitz, A. (1977) Clin. Pharrnacokinet. 2: 269-280
Iinuma, M., Nishina, Y. and Akashi, S. (1976) Yakuzaigaku~: 65-72 from: loP.A. 14 0581
Inui, K., Tabara,K., Hori, R., Kaneda, A. , Muranishi, S. and Sezaki, H. (1977) J. Pharrn. Pharmacol. 29: 22-26
Juul Christensen, E.K., Kerckhoffs, H.P.M. and Huizinga, T. (1967) Pharrn . Weekbl. 102: 463-473
Kaplan, S.A. and Cotler, S. (1972) J. Pharm. Sci. ~: 1361-1365
Khalil, S.A.H. (1974) J. Pharm. Pharmacol. 26: 961-967
Khalil, S.A .H. (1977) J. Pharm. Sci. 66: 289-290
Khalil, S.A. and Martin, A.N. (1967) ibid . 56: 1225-1233
Khalil, S.A . and Moustafa, M.A. (1973) Pharrnazie~: 116-118
Khalil, S.A . , Daabis, N.A., Naggar, V.F. and Motawi, M.M. (1976) ibid. 31: 105-109
Kulshrestha, V. K. , Thomas, M., Wadsworth , J. and Richens, A. (1978) Br. J. Clin. Pharmac. 6 : 177-179
Kutt, H. (1972) in: Woodbury, D.M., Penry, J .K. and Schmidt, R.P. (eds) Antiepileptic Drugs. Raven Press, New York, pp 169-180
112
Kutt, H. (1975) Epilepsia 16: 393-402
Lamy, P.P. (1964) Dissertation Abstr. ~: 2247 from : l.P.A. 1365c
Lee, 5.1. and Bass, N.H. (1970) Neurology 20: 115-124 from: Chemical Abstracts 98744e
Levy, G. and Mroszczak, E.J. (1968) J. Pharm. Sci. 57: 235-239
Mansour, Z. and Guth, E.P. (1968) ibid. 57: 404-411 from: l.P.A. 894e
Martin, E.W., Alexander, S.F., Farage, D.J. and Hassan, W.E . (1971) in: Hazards of Medication, J.B. Lippincott Company, Philadelphia
Martindale, The Extra Pharmacopoeia (1977), 27th Edition, The Pharmaceutical Press, London
Mayersohn, M. and Gibaldi, M. (1969) Paper presented to Acadamy of Pharmaceutical Sciences, 116th Annual Meeting of APhA, from: Bates, T.R. and Gibaldi, M. (1970) in : Current Concepts in Pharmaceutical Sciences, Biopharmaceutics. Lea & Febiger, Philadelphia pp 81-82
Merck Index (1968), 8th Edition, Merck & Co., Rahway, N.J.
Meulenhoff, J.S. and Kutsch Lojenga, J.C. (1972) Pharm. Weekbl. 107: 737-744
Morselli, P.L. (1970) Clin . Chim. Acta 28: 37-40 from: Glazko, A.J. (1972) in: Antiepileptic Drugs-.-Raven Press, New York, p 105
Naggar, V.F., Khalil, S.A. and Daabis, N.A. (1976) Pharmazie 31: 461-465
Nakano, M. (1971) J. Pharm. Sci. 60: 571-575
Neuvonen, P.J. (1976) Drugs II: 45-54
O'Brien, L.S . , Orme, M. L'E. and Beckenridge, A.M. (1978) Br. J. Clin. Pharmacol. 6: 176-177
Perrin, J. (1967) J. Pharm. Pharmacol. 19: 25-31
Pharmaceutical Codex (1979), 11th Edition, The Pharmaceutical Press, London
113
Pippenger, C.E. (1975) in: Epilepsia~: 393-402
Ridout, C.W. (1968 a) Pharm. Acta Helv. 43: 42-49 from I.P.A. 6 0768
Ridout, C.W. (1968 b) ibid. 43: 177-181 from loP.A. 6 0940
Saitoh, Y., Nishihara, K., Nakagawa, F. and Suzuki, T. (1973) J. Pharm. Sci. 62: 206-210
Sanvordeker, D.R. and Dajani, E.Z. (1975) ibid. 64: 1877-1879
Schanker, L.S . (1961) Ann.Rev. Pharmacol. 1: 29 from: Levy, G. and Mroszczak, E.J. (1968) J. Pharm. Sci. 57 : 235-239
Schwartz, P.A., Rhodes, C. T. and Cooper, J.W. (1977) J. Pharm. Sci. 66: 994-997
Sellers, E.M., Khouw, V. and Dolman, L. (1977) ibid . ~: 1640-1641
Sintek, C., Hendeles, L. and Weinberger, M. (1978) Drug. lntell. Clin. Pharm. 12: 158-159
Sorby, D. L. (1965) J. Pharm. Sci. 54: 677-{;83
Sorby, D.L. (1968) ibid. 57: 1604-1607
Sorby, D.L. and Liu, G. (1966) ibid. 55: 504-510 -
Sorby, D.L. and Plein, E.M. (1961) ibid . 50: 355
Sorby, D.L., Plein, E.M. and Benmaman, J.D. (1966) ibid. 55: 785 -7 94
Stricker, H. (1971 a) Drugs Made . in Ger. 14: 93-97
Stricker, H. (1971 b) ibid. 14: 126-140
Stricker, H. (1973) ibid. 16: 80-88
Tidball, S.C., Liebross, T. R., Thomas, S. and Cassidy, M.M. (1967) Physiologist 10: 325 from: Bates, T.R. and Gibaldi, M. (1970) in: Current Concepts in Pharmaceutical Sciences, Biopharmaceutics. Lea & Febiger, Philadelphia, p 81
Tsuchiya, T. and Levy, G. (1972) J. Pharm. Sci. 61: 586-589
Tyrer, J . H., Eadie, M.J., Sutherland, J.M. and Hooper, W.D. (1970) Brit. Med. J . 4: 271-273
114

United States Pharmacopoeia (1970), 18th Revision. The United States Pharmacopeial Convention, Inc .
United States Pharmacopoeia (1975), 19th Revision. The United States Pharmacopeial Convention, Inc.
Vogel, A.I. (1966) in: A Text-book of Qualitative .Inorganic Analysis. 3rd Edition. Longmans, London, p 259
Wallace, J.E. (1966) J. Forensic Sci . 11 : 552-559 from: Chemical Abstracts 17823f
Wallace, J.E. (1968) Anal. Chem. 40: 978-980 from: Saitoh, Y., Nishihara, K., Nakagawa, F. and Suzuki, T. (1973) J. Pharm. Sci. 62: 206-210
Wallace, J.E. (1969) Clin Chern. 15: 323-330 from Chemical Abstracts 1807w
Wallace, J.E . and Hamilton, H.E. (1974) J. Pharm. Sci. 63: 1795-1798
Wallace, J.E., Biggs, J. and Dahl, E.V. (1965) Anal. Chern. 37: 410-413 from: loP.A. 1374c
Wallace, J.E., Farquhar, J.K., Hamilton, H.E . and Everhart, B.A. (1974) Clin. Chem. 20: 515-516 from: Chemical Abstracts 99133c
Westerink, D. and Glerum, J.H. (1964) Pharm. Weekbl. 99 : 657-664 from loP.A. 1561e
Wilson, T.H. and Wiseman, G. (1954) J. Physiol. 123 : 116 from : Bates, T.R. and Gibaldi, M. (1970) in: Current Concepts in Pharmaceutical Sciences, Biopharmaceutics . Lea & Febiger, Philadelphia, pp 81-82
Wiseman, G. (1953) J. Physiol. 120: 63-72
Woodbury, D.M . and Swinyard, E.A. (1972) in: Woodbury, D.M., Penry, J.K. and Schmidt, R.P. (eds) Antiepileptic Drugs. Raven Press, New York, pp 113-123
Yamamoto, K., Nakano, M., Arita, T., Takayama, Y. and Nakai, Y. (1976) J. Pharm. Sci. 65: 1484-1488
Yano, N., Nozawa, Y. and Higashide, F. (1974) Yakuzaigaku~: 59-64 from I.P.A. 12 2439
115

Yu, S.K.S., Oppenheim, R. C. and Stewart, N.F . (1976) Aust. J. Pharm. 57: 468
Zografi, G. and Mattocks, A.M. (1963) J. Pharm. Sci. 52: 1103 from: Martin, A.N., Swarbrick, J. and Cammarata, A. (1970) Physical Pharmacy 2nd Edition. Lea & Febiger, Philadelphia
p 436
11 6
Copyright © 2022 FDOKUMEN