A statistical method for source apportionment of riverine nitrogen loads
14
A statistical method for source apportionment of riverine nitrogen loads B. Grizzetti a, * , F. Bouraoui a , G. de Marsily b , G. Bidoglio a a Joint Research Centre of the European Commission, Soil and Waste Unit, Institute for Environment and Sustainability, TP 460, I-21020 Ispra (VA), Italy b Laboratory of Applied Geology, UMR CNRS ‘Sisyphe’, University Paris VI, France Received 30 November 2003; revised 1 May 2004; accepted 1 July 2004 Abstract This study describes a source apportionment methodology for riverine nitrogen transport. A statistical model was developed relating stream nitrogen load to spatially referenced nitrogen sources and basin characteristics. It is able to estimate the nitrogen load on the basis of only three parameters. It considers applied fertiliser, atmospheric deposition and point discharges as sources and rainfall, topography and water flow as basin characteristics. The model was calibrated on three European watersheds, the Wash (UK), the Zelivka (Czech Republic) and the Vilaine (France) river basins in order to represent a range of different climatic characteristics and nitrogen input pressures. Based on model predictions, the spatial and temporal variations of diffuse nitrogen emission were described, identifying critical areas more prone to nitrogen loss. The model makes it possible to estimate the contribution of each nitrogen sources (point and diffuse) to the total river load. Finally, scenarios of different nitrogen input pressure were analysed. The model was shown to be a suitable tool for understanding the fate of the actual nitrogen input pressure and evaluating the impact of alternative management strategies with a limited data requirement. q 2004 Elsevier B.V. All rights reserved. Keywords: Nitrogen; Modelling; Management; Load estimation 1. Introduction The Water Framework Directive (Commission of the European Communities, 2000) introduces new criteria and measures for managing Europe’s waters under an integrating ecosystem-based approach (Kallis and Butler, 2001). The Directive aims at good ecological and chemical quality status for all waters (surface, underground and coastal) by means of pollution-control measures that have to be planned at the hydrologic river basin level. The implemen- tation of the Water Framework Directive poses a variety of challenges, including a demanding time- table, the practical implementation of the new measures, and the financial costs to the Member States (Murray et al., 2002). With regard to point and diffuse sources of pollution, the Water Framework Directive requires Member States to identify Journal of Hydrology 304 (2005) 302–315 www.elsevier.com/locate/jhydrol 0022-1694/$ - see front matter q 2004 Elsevier B.V. All rights reserved. doi:10.1016/j.jhydrol.2004.07.036 * Corresponding author. Tel.: C39 332 789 079; fax: C39 332 785 601. E-mail address: [email protected] (B. Grizzetti).
-
Upload
independent -
Category
Documents
-
view
2 -
download
0
Transcript of A statistical method for source apportionment of riverine nitrogen loads

A statistical method for source apportionment of riverine
nitrogen loads
B. Grizzettia,*, F. Bouraouia, G. de Marsilyb, G. Bidoglioa
aJoint Research Centre of the European Commission, Soil and Waste Unit, Institute for Environment and Sustainability,
TP 460, I-21020 Ispra (VA), ItalybLaboratory of Applied Geology, UMR CNRS ‘Sisyphe’, University Paris VI, France
Received 30 November 2003; revised 1 May 2004; accepted 1 July 2004
Abstract
This study describes a source apportionment methodology for riverine nitrogen transport. A statistical model was developed
relating stream nitrogen load to spatially referenced nitrogen sources and basin characteristics. It is able to estimate the nitrogen
load on the basis of only three parameters. It considers applied fertiliser, atmospheric deposition and point discharges as sources
and rainfall, topography and water flow as basin characteristics. The model was calibrated on three European watersheds, the
Wash (UK), the Zelivka (Czech Republic) and the Vilaine (France) river basins in order to represent a range of different
climatic characteristics and nitrogen input pressures. Based on model predictions, the spatial and temporal variations of diffuse
nitrogen emission were described, identifying critical areas more prone to nitrogen loss. The model makes it possible to
estimate the contribution of each nitrogen sources (point and diffuse) to the total river load. Finally, scenarios of different
nitrogen input pressure were analysed. The model was shown to be a suitable tool for understanding the fate of the actual
nitrogen input pressure and evaluating the impact of alternative management strategies with a limited data requirement.
q 2004 Elsevier B.V. All rights reserved.
Keywords: Nitrogen; Modelling; Management; Load estimation
1. Introduction
The Water Framework Directive (Commission of
the European Communities, 2000) introduces new
criteria and measures for managing Europe’s waters
under an integrating ecosystem-based approach
(Kallis and Butler, 2001). The Directive aims at good
0022-1694/$ - see front matter q 2004 Elsevier B.V. All rights reserved.
doi:10.1016/j.jhydrol.2004.07.036
* Corresponding author. Tel.: C39 332 789 079; fax: C39 332
785 601.
E-mail address: [email protected] (B. Grizzetti).
ecological and chemical quality status for all waters
(surface, underground and coastal) by means of
pollution-control measures that have to be planned
at the hydrologic river basin level. The implemen-
tation of the Water Framework Directive poses a
variety of challenges, including a demanding time-
table, the practical implementation of the new
measures, and the financial costs to the Member
States (Murray et al., 2002). With regard to point and
diffuse sources of pollution, the Water Framework
Directive requires Member States to identify
Journal of Hydrology 304 (2005) 302–315
www.elsevier.com/locate/jhydrol
B. Grizzetti et al. / Journal of Hydrology 304 (2005) 302–315 303
significant human pressures and evaluate their
impacts on water quality. The pollution of surface
and sub-surface water by nitrate is controlled
specifically by the Nitrate Directive (Council of the
European Communities, 1991). Although the Nitrate
Directive came into force more than a decade ago, the
large amount of nitrate in the water is still a major
concern for European countries, since the designation
of vulnerable areas and the enforcement of standards
have been a very slow process (Kallis and Butler,
2001). The characterisation of water status, the
description of pollution sources impact, the establish-
ment of monitoring programs and the implementation
of river basin management plans require an analysis
of the current basin status and estimates of the
relative significance of the different sources of
pollution. Considering the necessity for integrated
management and the scale of planned application
(national or transboundary), models are indispensable
tools. Models enhance the planning process providing
a forecast of the impact on water quality, contributing
to the understanding the processes responsible for
pollution and detecting areas of concern (Novotny
and Olem, 1994).
A variety of methods have been used to model the
transfer of nitrogen in river basins. Conceptual and
physically based models (Conan et al., 2003; Billen
and Garnier, 2000; Arheimer and Brandt, 1998;
Arnold et al., 1998; Whitehead et al., 1998; Wittgren
and Arheimer, 1996) describe the processes respon-
sible for nitrogen wash-off into surface water and
leaching to groundwater in large heterogeneous
basins. They allow forecasting and a better under-
standing of processes; however, calibration and data
requirements are important in large-scale applications
aimed at policy support. Other simplified models
addressing the problem of water quality are proposed
in the literature and based on the export-coefficient
approach (Hetling et al., 1999; Johnes, 1996; Grimvall
and Stalnacke, 1996), mass balance GIS-based
method (Pieterse et al., 2003; Skop and Srensen,
1998; Adamus and Bergman, 1995) and statistical
regression (Seitzinger et al., 2002; De Wit, 2000,
2001; Behrendt and Optiz, 2000; Smith et al., 1997).
Besides the objectives required by a comprehen-
sive basin analysis of nitrogen fate, two fundamental
aspects have to be considered in model selection: the
spatial and temporal scales of the study and the data
availability at that scale. The use of physically based
models at the regional scale poses a variety of
problems as they rely on a fine resolution parameter-
isation (Beven, 2001). The choice of model complex-
ity depends on the information available, on the
natural variability and a fine resolution is useless
when data required by the model to describe this
variability are not available (Bloschl and Grayson,
2002). Thus, the choice of an appropriate model for a
particular application results in a trade-off between
model complexity and uncertainty of input par-
ameters. In general, the appropriate level of model
complexity decreases with the size of the area to be
modelled (Addiscott and Mirza, 1998). Statistical
models have often been used to study nitrogen fate at
large scales (Caracao and Cole, 1999; Howarth et al.,
1996; Seitzinger and Kroeze, 1998; Beusen et al.,
1995), but models with more detailed descriptions of
nitrogen sources and attenuation processes represent
more accurately the predictions of stream export
(Alexander et al., 2002a).
The objective of this study is to present the
development of a model to assess the fate of the actual
nitrogen input pressures and evaluate the impact of
management strategies on water quality at medium and
large basin scales. In particular, the model endeavours
to quantify the relative importance of different nitrogen
sources (point and diffuse) in the total export and to
identify the areas subjected to higher pollution
pressures where priority actions should be undertaken.
Several important aspects were considered in the
model development: the parsimony of the model
parameters and the data requirement, the availability
of data and the spatial variation of watershed proper-
ties. The model presented in this study employs a
statistical approach to estimate the nitrogen river loads,
considering spatially referenced physical and climatic
basin characteristics.
2. Methodology
2.1. The model
The model is inspired by the spatially referenced
regressions on watershed attributes (SPARROW)
methodology (Smith et al., 1997), where the river
nitrogen load is modelled by a non-linear regression

B. Grizzetti et al. / Journal of Hydrology 304 (2005) 302–315304
equation on nitrogen sources and basin attributes. The
SPARROW methodology was applied in large areas
of the United States (Alexander et al., 2000; Preston
and Brakebill, 1999; Smith et al., 1997), and in New
Zealand (Alexander et al., 2002b).
The modelling approach proposed in this study
employs a simplified conceptual model, which
distinguishes between two different pathways in
nitrogen transfer from sources to the river outlet:
nitrogen passing through land before reaching the
stream, and nitrogen delivered directly to the water
body. The first pathway concerns the diffuse sources
while the latter is typical of point sources. The model
considers applied fertiliser (artificial and manure),
atmospheric deposition, scattered dwellings as diffuse
nitrogen sources, and discharges from sewers, waste
water treatment plants and industries as point sources.
It was decided to use nitrogen application instead of
nitrogen surplus as input to avoid the introduction of
new uncertainty with estimates of crop uptake and to
allow scenario analysis without considering the
impact of changes in the fertiliser application rate
on the crop uptake, which is difficult to evaluate.
The region of study is subdivided into a number of
sub-basins according to data availability. In each sub-
basin, the river nitrogen load is related to the sum of
the different nitrogen sources reduced by the retention
processes occurring in soils and water. The model
considers a routing structure for the nitrogen load
along the watershed, according to the river network.
The nitrogen load estimated at the outlet of a sub-
basin is entered as an additional point source to the
downstream sub-basin. The load at the outlet of sub-
basin i is expressed as
log10 Li Z log10ðxDS;iBiRi CxPS;iRiÞCEi (1)
Li is the annual nitrogen load (t N/year); Bi, basin
reducing factor (dimensionless); Ri, river reducing
factor (dimensionless); xDS,i, sum of diffuse sources
(t N/year); xPS,i, sum of point sources (t N/year) and Ei
is the error term.
The nitrogen removal occurring in soils and in the
river is represented by the basin and the river reducing
factors, respectively. A variety of factors can
influence the rate of nitrogen export from catchments,
including natural basin characteristics, hydrological
and meteorological conditions, land use and
management practices (Lepisto, 1995; Howarth et
al., 1996). The relationship between nitrogen export
and different basin characteristics (annual rainfall, wet
season rainfall, temperature, slope, topography wet-
ness index (TWI), river length, drainage density,
annual flow, low flow) were examined. The rainfall
during the rainy season, the TWI (Beven and Kirkby,
1979) and the low flow were retained as they better
described the nitrogen export from catchments,
according to a preliminary analysis based on Pearson
correlation coefficient and a principal component
analysis.
Rainfall enhances the nitrogen loss by leaching or
surface and sub-surface runoff. These processes
increase when soils are saturated. We found that
rainfall occurring during the rainy season, when the
soils are almost saturated, was more significant for
describing the nitrogen export than the annual rainfall.
The TWI measures the degree of accumulation of
water at a site. High values of this index are typical of
saturated areas, where the conditions are more
suitable for denitrification. The retention of nitrogen
in surface waters is determined by the residence time
and area of contact at the sediment–water interface
(Haag and Kaupenjohann, 2001). The residence time
increases in low flow conditions, enhancing the
denitrification process (Kronvang et al., 1999).
Nitrogen removal decreases in deeper channels as
the contact surface between sediment and stream
water is reduced (Alexander et al., 2000), and the
stream depth generally decreases in low flow
conditions. Therefore, the in-stream retention pro-
cesses were related to the low water flow in the model.
In the model, the basin reducing factor is assumed
to be a function of the rainfall amount in the rainy
season and of the TWI. This factor includes all
nitrogen losses due to soil denitrification, volatilis-
ation, plants consumption and soil storage. The river
reducing factor is related to water low flow and it
accounts for in-stream denitrification, volatilisation,
aquatic plant consumption and net sedimentation. The
diffuse sources are reduced by both factors, while
point sources are affected only by the river reduction
factor, as they reach the stream directly. Both basin
and river reducing factors are parameterised as
exponential decreasing functions, as follows
Bi Z expðKðaPxP;i CaBxB;iÞÞ (2)

Fig. 1. Location of the three watersheds.
B. Grizzetti et al. / Journal of Hydrology 304 (2005) 302–315 305
Ri Z expðKðaQxQ;iÞÞ (3)
xP,i is the normalised rainfall of rainy season
(dimensionless); xB,i, normalised topography wetness
index (dimensionless); xQ,i, normalised water dis-
charge of low flow period (dimensionless); aP,
rainfall coefficient (dimensionless); aB topography
coefficient (dimensionless); aQ water flow coefficient
(dimensionless); i is the sub-basin number.
Since the variables representing the basin charac-
teristics, i.e. the rainfall, the TWI and the low flow, are
expressed by different measurement scales, their
values were scaled before being entered in the
model in order to compare the different parameters
and the model coefficients. The rainfall and water low
flow variables, unlike the TWI, have a positive
influence on nitrogen losses, thus they were taken in
the reciprocal form before scaling. In this way all a
coefficients, in Eqs. 2 and 3, are expected to be
positive. The variables were reduced to the same scale
by maximum scaling (Frank and Todeschini, 1994), as
expressed by the following equation
xj;i Z x0j;i=Uj ðj Z P; j Z B; j Z QÞ
Uj Z max ðx0j;iÞ for i Z 1;.; n
((4)
In this study, the maximum scaling method was
used because it avoids negative values. The error
term, in Eq. 1, is assumed to be multiplicative, and the
estimation algorithm is applied when both sides of the
regression equation have been converted into logar-
ithmic form. Thus discrepancies between observed
and predicted nitrogen loads can be minimised
independently of differences in magnitude.
2.2. The studied areas
The model was first developed in a large area
draining into The Wash in the United Kingdom, and
then calibrated on two other European basins Zelivka
(Czech Republic) and Vilaine (France), in order to
represent different climate characteristics and nitro-
gen input pressures (Fig. 1). Selected characteristics
of the three watersheds are given in Table 1.
The region of study draining towards The Wash in
the UK has a surface area of about 8900 km2 and
partially covers the river basins of Great Ouse, Nene,
Welland and Witham, in East Anglia. The average air
temperature is 4 8C in winter and 17 8C in summer,
with rainfall spatially ranging between 528 and
695 mm/year and increasing with altitude. The rivers
have low natural base flow except in the south-eastern
part where the Chalk aquifer crops out and the rivers
are fed mainly by base flow. The average flow of the
Great Ouse at the Offord gauging station is 15 m3/s,
with flow peaks during the winter season. The area is
generally low-lying, with elevations not exceeding
250 m a.s.l. The coastal plain, called the Fenland, was
not included in the study as no data were available.
The western and central parts are characterised by rich
clay soils, while sandy soils dominate in the eastern
part. Livestock and cereals are farmed intensively
throughout the region, creating potential diffuse
sources of both ground and surface-water pollution.
Grassland is dominant in the western part, where the
density of cattle and sheep is high. In the studied area,
the average nitrogen input by fertiliser is about
147 kg N/ha year, but the western part tends to have
higher nutrient inputs, reflecting the higher livestock
density. The population density is about 230 inhabi-
tants per km2, and more than 95% of the population is
connected to the sewerage system.
The Zelivka catchment (1186 km2) is situated
south–east of Prague in the Czech Republic and
belongs to the Elbe basin. The downstream part of
the river is dammed and constitutes the Zelivka
drinking water reservoir. The mean annual

Table 1
Characteristics of the three watersheds
Watershed Area (km2) Rainfalla (mm) Average water flow
(m3/s)
Arable land (%) Fertiliser appli-
cation (kg N/
ha year)
Wash 8913 528–695 15 74 147
Zelivka 1186 640–720 6 52 42
Vilaine 10,530 630–1000 70 74 125
a The rainfall values refer to the highest and lowest average annual precipitation among the available rainfall gauging stations.
B. Grizzetti et al. / Journal of Hydrology 304 (2005) 302–315306
precipitation is around 670 mm and the typical range
of annual temperature is 5–8 8C. The mean annual
discharge at the basin outlet is 6.3 m3/s, with peaks in
March and April due to snowmelt. The region is
characterised by silty loam soils, especially Dystric
Cambisol, but near the riverbeds Eutric Gleysols and
Gleyic Fluvisols prevail. Arable lands cover 52% of
the watershed, permanent grass lands 13% and forest
30%. Nowadays the livestock and agricultural
productions are of medium intensity. Nevertheless
the reduction in fertiliser application on arable land,
which started in 1989 as a result of the change in the
state economy, has not yet been followed by a
decrease of the in-stream nitrate concentration (Holas
et al., 1999). The number of inhabitants is about
53,000. Half of them live in towns and villages,
where waste water is connected to water treatment
plants, while the rural population disposes sewage in
septic tanks.
The Vilaine catchment is situated in the Brittany
region, in the north-western of France. It covers
10,530 km2 and discharges into the Atlantic Ocean.
The climate of the region is oceanic, with an average
annual temperature of 12 8C. The average annual
precipitation is 773 mm, but it reaches 1000 mm in
the western part of the basin. The average discharge at
the downstream gauging station is 70 m3/s, with
higher values during the winter season. The entire
region is characterised by clay and silty soils.
Agricultural lands occupy about 70% of the catch-
ment area and cereal production and husbandry are
intensive throughout. Half of the French pig farms are
concentrated in the Brittany region. The population
density is about 80 inhabitants/km2 and more than
60% of the population is connected to sewage and
waste water treatment plants.
2.3. Model parameterisation
During the model parameterisation, each region of
study was subdivided into a number of sub-basins
according to data availability, so that each sub-basin
drains towards a water quality gauging station. During
the selection of the stations, careful attention was
given to the homogeneity of sub-basin size. When the
sub-basins map was lacking, the digital elevation
model (DEM) was processed to delineate the areas
draining to the gauging stations. For the Vilaine
catchment, annual values of nitrate load were
available only for four gauging stations, including
the basin outlet. Nevertheless the watershed was
subdivided into a larger number of catchments, to
increase the spatial resolution, although calibration
was done on the four available points. For each
watershed, the period of calibration was established
according to the available data time-series. The
watershed subdivision and the calibration period are
summarised in Table 2. Once the watershed discre-
tisation was established, the nitrogen input from
different sources was computed for each sub-basin.
The data source varies according to the watershed, but
for fertiliser application, point discharges, and number
of people not connected to the sewer system, the
information was provided on an administrative basis.
Data on atmospheric nitrogen deposition were derived
from the EMEP data (EMEP, 2003) or direct
measurements. A rainfall gauge was assigned to
each sub-basin by the Thiessen polygon technique and
the average value of the TWI was computed based on
the DEM. Finally, the average value of low flow was
calculated at the outlet of each sub-basin. In the case
of the Vilaine, ten stations were available for water
discharge records, and the low flow values for

Table 2
Characteristics of model parameterisation in the three watersheds
Calibration period Number of sub-
basins
Mean sub-basin area
(km2)
Number of water
quality stations
Total number of
observations
Wash 1995–1999 50 178 50 248
Zelivka 1996–2000 13 91 13 65
Vilaine 1992–1997 112 94 4 24
B. Grizzetti et al. / Journal of Hydrology 304 (2005) 302–315 307
the ungauged sub-basins were obtained by regression
between low flow and drained river length (r2 Z0.99).
3. Results and discussion
3.1. Model calibration and validation
The calibration objective is to estimate the optimal
values for the model parameters aP, aB and aQ, which
are unique for each watershed under study. Then,
based on these optimal parameters and the watershed
attributes, different values of basin and river reducing
factor (Eqs. (2) and (3)) are determined for each sub-
basin of the watershed. The parameter calibration was
performed separately in the three basins under study,
by means of the optimisation model UCODE (Poeter
and Hill, 1998), which minimises the sum of squared
residuals by the modified Gauss–Newton method. The
agreement between the measures and the model
predictions was evaluated by the Nash–Sutcliffe
coefficient, which takes values between 1 and KN,
with 1 indicating a perfect agreement. The Nash–
Sutcliffe coefficient E (Nash and Sutcliffe, 1970) is
expressed as
E Z 1 K
PniZ1ðOi KPiÞ
2PniZ1ðOi KmOÞ
2(5)
where Oi and Pi correspond, respectively, to the
measured and predicted nitrogen loads for the sub-
basin i, and mO is the average measured nitrogen load.
In all cases the model predictions are in reasonable
agreement with the measured values, as indicated by
the Nash–Sutcliffe coefficients of 0.88, 0.96 and 0.90
for the Wash, Zelivka and Vilaine basins, respectively.
According to Willmott (1984) the root mean
squared error (RMSE) can be divided into a
systematic and an unsystematic portion. The first
indicates a systematic tendency of the model to over-
or under-estimate, while the latter expresses the model
inaccuracy due essentially to measurement errors.
Thus a low portion of systematic root mean squared
error (RMSEs) can indicate the model robustness. In
the present study, the systematic part of RMSE is
below 10% for all basins. Discrepancies between
predicted and measured values occur in some cases
but the mean absolute error obtained in all calibrations
is always lower than 30% of the average measured
load. This uncertainty is connected to measurement
and model input uncertainty, besides model structure.
The calibration results for the Wash, the Zelivka and
the Vilaine basins are shown in Fig. 2.
The model was validated with observations that
had not been used for calibration, in the Wash (from
1990 to 1994) and in the Zelivka basins (for the year
2000), with an efficiency of 0.96 in both cases, which
confirm the model robustness (Fig. 3). No validation
was done for the Vilaine as all the data were used for
calibrating the model. The satisfactory results of
model calibration and validation show the flexibility
of the model and its applicability to basins character-
ised by different activities and climates.
3.2. Nitrogen emission pattern
Once calibrated and validated, the model was used
to quantify the amount of nitrogen discharged into the
stream (diffuse emission) and to locate the critical
areas with the largest contribution to the total nitrogen
load. The maps of diffuse emissions of nitrogen in the
studied watersheds are shown in Fig. 4.
In the Wash basin, diffuse emissions are higher in
the western part, where cattle farming is intense. In
this area, the nitrogen retention processes are reduced,
as precipitations are higher than in the sub-basins
situated in the south. Moreover, the southern sub-
basins lie partially over the Chalk aquifer outcrop,
where water can infiltrate and nitrate can be
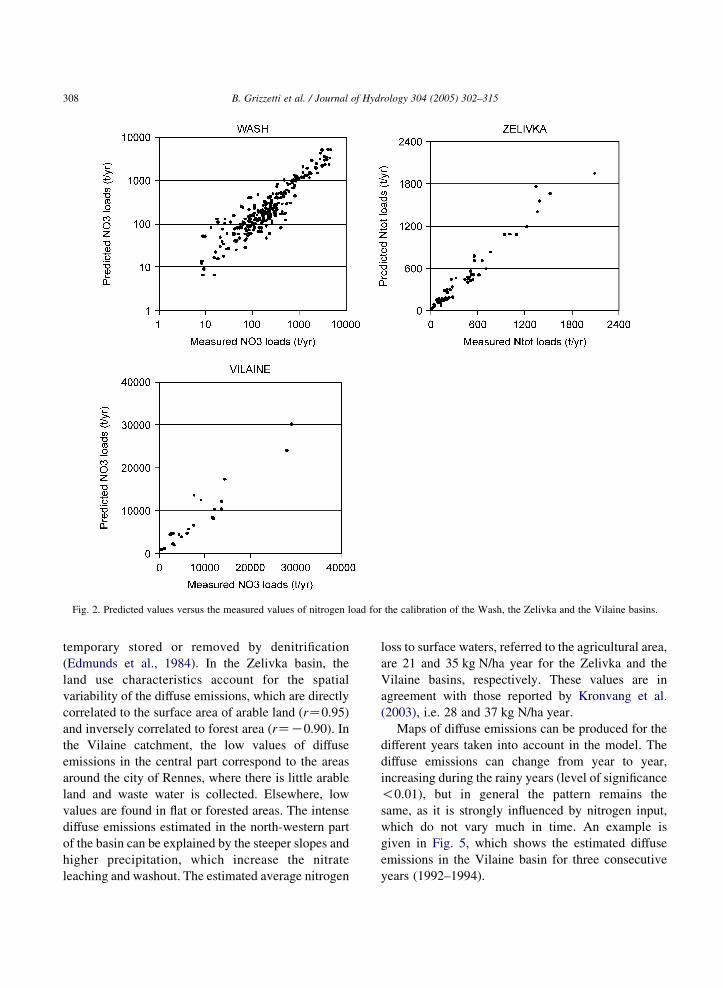
Fig. 2. Predicted values versus the measured values of nitrogen load for the calibration of the Wash, the Zelivka and the Vilaine basins.
B. Grizzetti et al. / Journal of Hydrology 304 (2005) 302–315308
temporary stored or removed by denitrification
(Edmunds et al., 1984). In the Zelivka basin, the
land use characteristics account for the spatial
variability of the diffuse emissions, which are directly
correlated to the surface area of arable land (rZ0.95)
and inversely correlated to forest area (rZK0.90). In
the Vilaine catchment, the low values of diffuse
emissions in the central part correspond to the areas
around the city of Rennes, where there is little arable
land and waste water is collected. Elsewhere, low
values are found in flat or forested areas. The intense
diffuse emissions estimated in the north-western part
of the basin can be explained by the steeper slopes and
higher precipitation, which increase the nitrate
leaching and washout. The estimated average nitrogen
loss to surface waters, referred to the agricultural area,
are 21 and 35 kg N/ha year for the Zelivka and the
Vilaine basins, respectively. These values are in
agreement with those reported by Kronvang et al.
(2003), i.e. 28 and 37 kg N/ha year.
Maps of diffuse emissions can be produced for the
different years taken into account in the model. The
diffuse emissions can change from year to year,
increasing during the rainy years (level of significance
!0.01), but in general the pattern remains the
same, as it is strongly influenced by nitrogen input,
which do not vary much in time. An example is
given in Fig. 5, which shows the estimated diffuse
emissions in the Vilaine basin for three consecutive
years (1992–1994).

Fig. 3. Predicted values versus the measured values for the validation of the Wash and the Zelivka basins.
B. Grizzetti et al. / Journal of Hydrology 304 (2005) 302–315 309
3.3. Source apportionment
Once calibrated, the model can estimate the relative
contribution to the river export by each nitrogen
source by considering the different pathways of
nitrogen transfer. The comparison between the nitro-
gen source apportionment of the basin input and of the
river load, according to model predictions, can give an
insight into basin behaviour and help to identify the
sources that most affect the water quality. It is essential
to understand which factors have an impact on the
water quality in order to provide effective programs to
remedy pollution (Puckett, 1995). The source appor-
tionment estimate for the principal water gauging
stations in the three basins is shown in Fig. 6 and
Table 3. In all three watersheds, the input of nitrogen is
dominated by agricultural sources except the Czech
basin, where forests cover 30% of the area and
fertiliser applications have decreased in the last
decade. The nitrogen load in the Vilaine River
depends mainly on agricultural inputs due to the
intensive cropping and breeding. Furthermore, the
contribution of point sources is small, as more than
60% of the population is connected to waste water
treatment plants. For the English basin, point sources
contribute 32% to the total load (Table 3). The values
refer to the upstream part of the Great Ouse catchment,
also characterised by a great diffuse emission rate.
The contribution of the different sources to the
river total load depends on the inputs and on
the ability of basin to remove nitrogen during its
transport from land to water. The model can estimate
the average nitrogen removal in the studied basins
(Table 4). The total removal values (Table 4) are
rather high as they include the crop uptake, besides the
losses by volatilisation and denitrification. However,
an estimate of the basin nitrogen retention by
denitrification, volatilisation and soil storage, can
easily be computed as the difference between the total
basin retention estimated by the model and the
nitrogen removed by crops. In Central and Northern
Europe, up to 80% of the nitrogen input is retained in
watersheds (Caracao and Cole, 1999). In southern
Sweden, it was estimated that 48% of the nitrogen
losses from arable land is removed during the
transport to surface waters (Arheimer and Brandt,
2000). Hetling et al. (1999) observed that the loss of
nitrogen in fertilisers, once they had been spread on
the field, by storage, denitrification and volatilisation
could be about 10–30% of the agricultural input. In
the Zelivka basin, the lower value of nitrogen removal
during the transport through the soil may indicate the
saturation of the nitrogen retention capacity of soils.
In fact in this region, the nitrate concentration in the
rivers has not decreased even after the reduction of
fertiliser input (Holas et al., 1999), which means that
soils are releasing the previously stored nitrogen.
The nitrogen retention by the rivers increases with
the water residence time, which occurs where the area
is mostly flat, as in the Vilaine basin, or partly

Fig. 4. Diffuse nitrogen emission (kg N/ha year) estimated for the Wash, the Zelivka and the Vilaine basins, during the studied periods.
B. Grizzetti et al. / Journal of Hydrology 304 (2005) 302–315310
occupied by a lake, as in the Zelivka basin. In Europe,
the river retention is estimated around 10–20% (Haag
and Kaupenjohann, 2001; Howarth et al., 1996), but
higher values of water retention are observed in lakes
(Howarth et al., 1996). In general the calibrated
retention rates found in this study fall within the range
given in the literature.
3.4. Scenario analysis
Once the areas of high nitrogen pressure have been
identified, and the contribution of each nitrogen
source to the water pollution has been estimated, the
model can be used to test the impact of alternative
management strategies. In the Vilaine watershed, the
effect of changing nitrogen input was investigated in
the two basins draining into the Oust (O041) and the
Vilaine (V042) gauging stations, respectively (Fig. 7).
These basins are characterised by similar source
contributions but differ in the diffuse emissions and in
the source apportionment of the river load (Fig. 7).
The average diffuse emission rate in the O041 basin is
37 kg N/ha year compared to the 20 kg N/ha year
estimated for the V042 basin. This is partly due to
the nitrogen application, around 140 kg N/ha year in
the O041 and 130 kg N/ha year in the V042, but also
to the physical and climate characteristics. In fact, in
the O041 basin, the precipitation and the slope are

Fig. 5. Nitrogen diffuse emission (kg N/ha year) estimated for the Vilaine basin for the years 1992, 1993 and 1994, with annual precipitations of
702, 795 and 1000 mm, respectively.
Fig. 6. Pie charts of the nitrogen source apportionment of input (on
the left) and of the river transport (on the right) for the three studied
watersheds.
B. Grizzetti et al. / Journal of Hydrology 304 (2005) 302–315 311
higher than in the V042, contributing to stronger
nitrate leaching and wash out. The greater extent of
the urban area in the V042 may explain the major
contribution by point sources to the river load in this
basin. The impact of a decrease in the diffuse and
point sources was tested in the two basins. The
variation of the predicted nitrate load at the two
outlets when the fertiliser and point discharges were
reduced by 5, 10 and 20% was investigated. The
results of the different scenarios are shown in Fig. 7.
The reduction of fertiliser application of 10%
produces a decrease of more than 5% in the in-stream
nitrate load. The model can predict the overall annual
variation, but differences in seasonal values may be
expected.
In the O041 basin, the model was also used to
evaluate the potential impact of installing new pig
farms for a total increase of 10,000 pigs. Three

Table 3
Nitrogen source apportionment of the river transport for the three
studied watersheds
Fertiliser
input (%)
Atmospheric
deposition
(%)
Point sources
(%)
Washa 64 4 32
Zelivka 70 16 14
Vilaine 91 3 6
a Estimated on the upstream basin of the Great Ouse river.
B. Grizzetti et al. / Journal of Hydrology 304 (2005) 302–315312
scenarios were tested corresponding to different
locations of the farms (Fig. 8): in scenarios 1 and 2,
the new source is placed in the upstream part of the
basin, while in scenario 3 the farms are set close to the
basin outlet. The hypothetic farms produce about
140 t N/year, which are added as manure to the sub-
basin where the farms are placed. The same change in
the basin input leads to different variations on in-
stream nitrate load predicted at the basin outlet in the
three scenarios (Fig. 8). The increments of
the nitrogen load differ according to the location of
the sub-basin concerned by the new farms, and
especially by its typical retention rate and its distance
from the outlet. In fact the higher impact occurs in
scenario 1, where the farms are placed in a sub-basin
with a low retention capacity (71%), while the lower
variation takes place in scenario 2, where the farms
are situated in a sub-basin with a higher retention
capacity (83%). A comparison of the impact gener-
ated by scenarios 2 and 3, which involve sub-basins of
similar retention, 83 and 81%, seems to show that the
longer the path (scenario 2), the more nitrogen is
removed during the transport.
These applications show that the model is suitable
for a general evaluation of management strategies.
Nevertheless, the scenario analysis results should be
Table 4
Nitrogen total removal with respect to the gross load
Total removal
(%)
Land removal
(%)
River removal
(%)
Washa 91 93 2
Zelivka 73 74 6
Vilaine 83 81 17
Land and river retention percentages refer to their input.a Estimated on the upstream basin of the Great Ouse river.
interpreted with some caution, as the model does not
consider in detail the physical processes involved in
nitrogen transport and transformation, e.g. the release
of nitrogen previously stored in the soils. Moreover,
the basin response to variation in nitrogen input does
not necessarily occur immediately but can involve a
lag time (Stalnacke et al., 2003). A long transfer time
of water through the soil and the aquifer, the soil
capacity to store excessive amount of nitrogen or, on
the contrary, the mineralisation of previously accu-
mulated organic nitrogen can retard the variation of
in-stream nitrogen concentration due to changes in the
nitrogen input. Stalnacke et al. (2003) observed that in
Latvia the strong decrease in agricultural intensity
during the 1990 s has caused a only small change in
river nitrogen concentration. The same was found in
the Zelivka catchment by Holas et al. (1999).
Considering this peculiar condition, an analysis was
made in this study of the Zelivka watershed to
investigate the reduction in the river nitrogen load that
would be expected as a result of the decrease of the
nitrogen fertiliser application of the 1990s, if no
release of nitrogen previously stored in the basin
occurred. The nitrogen input and the weather
characteristics of the period 1996–2000 form the
present scenario. Then the model was calibrated while
the fertiliser application was increased by 35%, which
corresponds to the typical amount of the 1980s, thus, a
new set of model coefficient aP, aT and aQ, was
obtained for precipitation, topography and water flow,
respectively, using the present measured water quality
series but with the underlying assumption that the
nitrogen concentrations measured during 1996–2000
are still conditioned by past fertiliser application.
Finally, the new coefficients were entered in the
model considering the nitrogen input and the weather
conditions of the present scenarios in order to predict
the nitrogen loads that would have been expected over
the period 1996–2000 if there had been no reduction
in agricultural intensity. The comparison between the
nitrogen load predictions obtained with the coeffi-
cients calibrated in the two different conditions shows
that a reduction of 29% in the nitrogen load may be
expected at the basin outlet as a result of the input
changes, once the surplus of nitrogen already
accumulated in the soil or stored in the groundwater
has been depleted.

Fig. 7. Scenarios analysis of decreasing nitrogen input in the basins drained by the stations Oust 04199200 and Vilaine 04213000. (a) Nitrogen
source apportionment of input and of the river transport. (b) Nitrate load variation according to the different scenarios.
B. Grizzetti et al. / Journal of Hydrology 304 (2005) 302–315 313
4. Conclusion
In this study, a statistical model was developed
relating in-stream nitrogen load to spatially refer-
enced nitrogen sources and basin characteristics.
Fig. 8. Scenarios analysis of placing new pig farms in the basin drained b
scenarios 1, 2 and 3. The location of the farm in the three scenarios is ind
The model was successfully calibrated and validated
in three European basins, representing different
climate characteristics and land uses. The model
was shown to be able to describe the spatial
and temporal variability of the nitrogen pressure on
y the stations Oust 04199200. Variation of nitrate load according to
icated by the map.
B. Grizzetti et al. / Journal of Hydrology 304 (2005) 302–315314
the river system, identifying the areas subject to
higher nitrogen losses. Moreover, the model made it
possible to estimate the relative contribution by each
nitrogen source to the river export and understand the
basin behaviour and the role of each source. The
model is rather flexible and can be applied to basins
characterised by different activities and climate.
Since the model structure considers the spatial
distribution of the data and includes physical and
climatic parameters for the basin description, the model
can also be used in a predictive mode and for the
evaluation of different management strategies. In
particular, the impact of variations in nitrogen input
was studied as well as the contribution by nitrogen
stored in soils. Nevertheless, the scenario results should
be considered with caution as the model does not
consider the physical processes involved in nitrogen
transport and transformation. All these model appli-
cations are achieved with parsimony of parameters
(only three parameters) and data requirement.
The model was shown to be suitable for screening
studies of medium and large basins. Model applica-
bility at a finer scale has to be investigated in more
detail. In fact, the analysis of the nitrogen pressure,
and in general of the model results, was made using
the sub-basins as unit of evaluation; the size of sub-
basins depends on the detail of the spatially referenced
data of basin characteristics and nitrogen sources, as
well as on weather and water gauging stations density,
DEM resolution, river network information, and
naturally the sources description. It is important to
note that these data are usually available at the scale
we used in this study for the whole Europe. The
applicability of the model to larger European basins is
under investigation.
Acknowledgements
This work was carried out partially using the data
collected in the frame of EUROHARP, a research
project founded by the European Commission under
the Fifth Framework Program (contract no EVK1-CT-
2001-00096). The authors would like to thank the
Hydrobiological Institute (HBI-AS CR) for providing
the data of the Zelivka catchment, and the Institut
Francais de l’Environment (IFEN) for providing the
data of the Vilaine catchment.
References
Adamus, C.L., Bergman, M.J., 1995. Estimating non-point sources
pollution loads with a GIS screening model. Water Research
Bulletin 31, 647–655.
Addiscott, T.M., Mirza, N.A., 1998. Modelling contaminant
transport at catchment or regional scale. Agriculture, Ecosys-
tems and Environment 67, 211–221.
Alexander, R.B., Smith, R.A., Schwarz, G.E., 2000. Effect of stream
channel size on the delivery of nitrogen to the Gulf of Mexico.
Nature 403, 758–761.
Alexander, R.B., Johnes, P.J., Boyer, E.W., Smith, R.A., 2002a. A
comparison ofmodels for estimating the riverineexportofnitrogen
from large watersheds. Biogeochemistry 57/58, 295–339.
Alexander, R.B., Elliott, A.H., Shankar, U., McBride, G.B., 2002b.
Estimating the sources and transport of nutrients in the Waikato
River, Basin, New Zealand. Water Resources Research 38,
1268–1290.
Arheimer, B., Brandt, M., 1998. Modelling nitrogen transport and
retention in the catchments of southern Sweden. Ambio 27,
471–480.
Arheimer, B., Brandt, M., 2000. Watershed modelling of nonpoint
nitrogen losses from arable land to Swedish coast in 1985 and
1994. Ecological Engineering 14, 389–404.
Arnold, J.G., Srinivasan, R., Muttiah, R.S., Williams, J.R., 1998.
Large area hydrologic modeling and assessment. Part I. Model
development. Journal of the American Water Resources
Association 34, 73–89.
Behrendt, H., Opitz, D., 2000. Retention of nutrients in river
systems: dependence on specific runoff and hydraulic load.
Hydrobiologia 410, 111–122.
Beusen, A.H.W., Klepper, O., Meinardi, C.R., 1995. Modelling the
flow of nitrogen and phosphorus in Europe: from loads to
coastal seas. Water Science and Technology 31, 141–145.
Beven, K.J., 2001. How far we can go in distributed hydrological
modelling?. Hydrology and Earth System Sciences 5 (1), 1–12.
Beven, K.J., Kirkby, M.J., 1979. A physically based, variable
contributing area model of basin hydrology. Hydrological
Sciences Bulletin 24 (1), 43–69.
Billen, G., Garnier, J., 2000. Nitrogen transfers through the Seine
drainage network: a budget based on the application of the
‘Riverstrahler’ model. Hydrobiologia 410, 139–150.
Bloschl, G., Grayson, R., 2002. Advances in distributed hydro-
logical modelling—towards a new paradigm, Third Inter-
national Conference on Water Resources and Environmental
Research, Dresden 2002.
Caracao, N.F., Cole, J.J., 1999. Human impact on nitrate export: an
analysis using major world rivers. Ambio 28 (2), 67–70.
Commission of the European Communities, 2000. Directive
2000/60/EC of the European Parliament and the council
establishing a framework for community action in the field of
water policy. Official Journal of the European Communities 22-
12-2000, 72.
Conan, C., Bouraoui, F., Turpin, N., de Marsily, G., Bidglio, G.,
2003. Modelling flow and nitrate fate at catchment scale in
Britany (France). Journal of Environmental Quality 32 (6),
2026–2032.

B. Grizzetti et al. / Journal of Hydrology 304 (2005) 302–315 315
Council of the European Communities, 1991. Directive
91/676/EEC concerning the protection of waters against
pollution caused by nitrates from agricultural source. Official
Journal L 1991;, 375.
De Wit, M., 2000. Modelling nutrient fluxes from source to river
load: a macroscopic analysis applied to the Rhine and Elbe
basins. Hydrobiologia, The Hague 410, 123–130.
De Wit, M.J.M., 2001. Nutrient fluxes at the river basin scale. I. The
PolFlow model. Hydrological Processes 15, 743–759.
Edmunds, W.M., Miles, D.L., Cook, J.M., 1984. A comparative
study of sequential redox processes in three British aquifers, in:
Eriksson, E. (Ed.), Hydrochemical Balances of Freshwater
Systems Proceedings of the Uppsala Symposium. IAHS-AISH
Publisher, Wallingford, OX, p. 150 pp. 55–70.
EMEP, 2003. Co-operative Programme for Monitoring and
Evaluation of the Long-Range Transmission of Air Pollutants
in Europe.
Frank, I.E., Todeschini, R., 1994. The Data Analysis Handbook.
Elsevier, Amsterdam.
Grimvall, A., Stalnacke, P., 1996. Statistical methods for source
apportionment of riverine loads of pollutants. Environmetrics 7,
201–213.
Haag, D., Kaupenjohann, M., 2001. Landscape fate of nitrate fluxes
and emissions in Central Europe. A critical review of concepts,
data, and models for transport and retention. Agriculture
Ecosystem and Environment 86, 1–21.
Hetling, L.J., Jaworski, N.A., Garretson, D.J., 1999. Comparison of
nutrient input loading and riverine export fluxes in large
watersheds. Water Science and Technology 39, 189–196.
Holas, J., Holas, M., Chour, V., 1999. Pollution by phosphorus and
nitrogen in water streams feeding the Zelivka drinking water
reservoir. Water Science and Technology 39 (12), 207–214.
Howarth, R.W., Billen, G., Swaney, D., Townsend, A., Jaworski, N.,
Lajtha, K., Downing, J.A., Elmgren, R., Caraco, N., Jordan, T.,
Berendse, F., Freney, J., Kudeyarov, V., Murdoch, P., Zhao-
Liang, Z., 1996. Regional nitrogen budgets and riverine N & P
fluxes for the drainages to the North Atlantic Ocean: natural and
human influences. Biogeochemistry 35, 75–139.
Johnes, P.J., 1996. Evaluation and management of the impact of
land use change on the nitrogen and phosphorus load delivered
to surface waters: the export coefficient modelling approach.
Journal of Hydrology 183, 323–349.
Kallis, G., Butler, D., 2001. The EU water framework directive:
measures and implications. Water Policy 3, 125–142.
Kronvang, B., Hoffmann, C.C., Svendsen, L.M., Windolf, J.,
Jensen, J.P., Dørge, J., 1999. Retention of nutrients in river
basins. Aquatic Ecology 33, 29–40.
Kronvang, B., Larsen, S.E., Andersen, H.E., 2003. Source
apportionment of nutrient loads in 17 European catchments,
Proceedings of the Seventh International Specialised Con-
ference on Diffuse pollution and Basin Management, Dublin
2003.
Lepisto, A., 1995. Influence of catchment characteristics, forestry
activities and deposition on nitrogen export from small forested
catchments. Water, Air and Soil Pollution 84, 81–102.
Murray, C.N., Bidoglio, G., Zaldivar, J., Bouraoui, F., 2002. The
water framework directive: the challenges of implementation
for river basin-costal zone research. Fresenius Environmental
Bulletin 11 (9a), 530–541.
Nash, J.E., Sutcliffe, J.V., 1970. River flow forecasting through
conceptual models. Journal of Hydrology 10, 282–290.
Novotny, V., Olem, H., 1994. Water Quality: Prevention,
Identification, and Management of Diffuse Pollution. Van
Nostrand Reinhold, New York. Chap. 9, pp. 507–572.
Pieterse, N.M., Bleuten, W., Jørgensen, S.E., 2003. Contribution of
point sources and diffuse sources to nitrogen and phosphorus
loads in lowland river tributaries. Journal of Hydrology 271,
213–225.
Poeter, E.P., Hill, M.C., 1998. Documentation of Ucode, A
Computer Code for Universal Inverse Modeling. 98-4080,
U.S. Geological Survey, Denver, Colorado 1998.
Preston, S.D., Brakebill, J.W., 1999. Application of spatially
referenced regression modeling for the evaluation of total
nitrogen loading in the Chesapeake Bay Watershed, U.S.
Geological Survey Water Resources Investigations Report 99-
4054, Baltimore, Maryland 1999.
Puckett, J.L., 1995. Identifying the major sources of nutrient water
pollution: a national watershed-based analysis connects non-
point- and point-sources of nitrogen and phosphorus with
regional land use and other factors. Environmental Science
Technology 29, 408–414.
Seitzinger, S.P., Kroeze, C., 1998. Global distribution of nitrous
oxide production and N inputs in freshwater and coastal marine
ecosystems. Global Biochemistry Cycles 12, 93–113.
Seitzinger, S.P., Styles, R.V., Boyer, E.W., Alexander, R.B.,
Billen, G., Howarth, R.W., Mayer, B., Van Breemen, N.,
2002. Nitrogen retention in rivers: model development and
application to watersheds in the northeastern U.S.A. Biogeo-
chemistry 57/58, 199–237.
Skop, E., Srensen, P.B., 1998. GIS-based modelling of solute fluxes
at the catchment scale: a case study of the agricultural
contribution to riverine nitrogen loading in the Vejle Fjord
catchment, Denmark. Ecological Modelling 106, 291–310.
Smith, R.A., Schwarz, G.E., Alexander, R.A., 1997. Regional
interpretation of water-quality monitoring data. Water
Resources Research 33, 2781–2798.
Stalnacke, P., Grimvall, A., Libiseller, C., Laznik, M., Kokorite, I.,
2003. Trends in nutrient concentrations in Latvian rivers and
response to the dramatic change in agriculture. Journal of
Hydrology 283, 184–205.
Whitehead, P.G., Wilson, E.J., Butterfield, D., 1998. A semi-distributed
Integrated Nitrogen model for multiple source assessment in
Catchment (INCA). Part I. Model structure and process equations.
Science of the Total Environment 210/211, 547–558.
Willmott, C.J., 1984. On the evaluation of model performance in
physical geography, in: Gaile, L., Willmott, C.J. (Eds.), Spatial
Statistics and Models. D. Reidel, Dordrect, Holland, pp. 443–460.
Wittgren, H.B., Arheimer, B., 1996. Source apportionment of
riverine nitrogen transport based on catchment modelling.
Water Science and Technology 33 (4–5), 109–115.