Source apportionment of particulate matter at urban mixed site in Indonesia using PMF
Upload
independentCategory
view
0download
0
Receptor modeling application framework forparticle source apportionment
John G. Watson a,*, Tan Zhu b, Judith C. Chow a, Johann Engelbrecht a,Eric M. Fujita a, William E. Wilson c
a Desert Research Institute, Division of Atmospheric Sciences, 2215 Raggio Parkway, Reno, NV 89512, USAb Nankai University, Environmental Science and Engineering Institute, Tianjin 300071, People�s Republic of China
c US Environmental Protection Agency, Research Triangle Park, NC 27711, USA
Received 30 August 2000; accepted 24 January 2002
Abstract
Receptor models infer contributions from particulate matter (PM) source types using multivariate measurements of
particle chemical and physical properties. Receptor models complement source models that estimate concentrations
from emissions inventories and transport meteorology. Enrichment factor, chemical mass balance, multiple linear re-
gression, eigenvector, edge detection, neural network, aerosol evolution, and aerosol equilibrium models have all been
used to solve particulate air quality problems, and more than 500 citations of their theory and application document
these uses. While elements, ions, and carbons were often used to apportion TSP, PM10, and PM2:5 among many source
types, many of these components have been reduced in source emissions such that more complex measurements of
carbon fractions, specific organic compounds, single particle characteristics, and isotopic abundances now need to be
measured in source and receptor samples. Compliance monitoring networks are not usually designed to obtain data for
the observables, locations, and time periods that allow receptor models to be applied. Measurements from existing
networks can be used to form conceptual models that allow the needed monitoring network to be optimized. The
framework for using receptor models to solve air quality problems consists of: (1) formulating a conceptual model; (2)
identifying potential sources; (3) characterizing source emissions; (4) obtaining and analyzing ambient PM samples for
major components and source markers; (5) confirming source types with multivariate receptor models; (6) quantifying
source contributions with the chemical mass balance; (7) estimating profile changes and the limiting precursor gases for
secondary aerosols; and (8) reconciling receptor modeling results with source models, emissions inventories, and re-
ceptor data analyses.
Published by Elsevier Science Ltd.
Keywords: Receptor model; PM10; PM2:5; Chemical mass balance; Enrichment factor; Principal component analysis; Factor analysis
Contents
1. Introduction . . . . . . . . . . . . . . . . . . . . . . . . . . . . . . . . . . . . . . . . . . . . . . . . . . . . . . . . . . 1094
2. Receptor modeling procedure . . . . . . . . . . . . . . . . . . . . . . . . . . . . . . . . . . . . . . . . . . . . . . 1098
Chemosphere 49 (2002) 1093–1136
www.elsevier.com/locate/chemosphere
*Corresponding author. Tel.: +1-775-674-7050; fax: +1-775-674-7009.
E-mail address: [email protected] (J.G. Watson).
0045-6535/02/$ - see front matter Published by Elsevier Science Ltd.
PII: S0045-6535 (02 )00243-6
2.1. Step 1: Form a conceptual model . . . . . . . . . . . . . . . . . . . . . . . . . . . . . . . . . . . . . . . . 1099
2.2. Step 2: Compile emissions . . . . . . . . . . . . . . . . . . . . . . . . . . . . . . . . . . . . . . . . . . . . . 1100
2.3. Step 3: Characterize sources . . . . . . . . . . . . . . . . . . . . . . . . . . . . . . . . . . . . . . . . . . . . 1102
2.4. Step 4: Analyze samples for material balance . . . . . . . . . . . . . . . . . . . . . . . . . . . . . . . . 1105
2.5. Step 5: Multivariate analysis. . . . . . . . . . . . . . . . . . . . . . . . . . . . . . . . . . . . . . . . . . . . 1109
2.6. Step 6: Calculate source contributions . . . . . . . . . . . . . . . . . . . . . . . . . . . . . . . . . . . . . 1109
2.7. Step 7: Evaluate limiting precursors of secondary aerosol . . . . . . . . . . . . . . . . . . . . . . . 1110
2.8. Step 8: Reconcile source contributions. . . . . . . . . . . . . . . . . . . . . . . . . . . . . . . . . . . . . 1111
3. Summary and conclusions . . . . . . . . . . . . . . . . . . . . . . . . . . . . . . . . . . . . . . . . . . . . . . . . 1112
Disclaimer . . . . . . . . . . . . . . . . . . . . . . . . . . . . . . . . . . . . . . . . . . . . . . . . . . . . . . . . . . . . . . 1113
References . . . . . . . . . . . . . . . . . . . . . . . . . . . . . . . . . . . . . . . . . . . . . . . . . . . . . . . . . . . . . . 1113
1. Introduction
Receptor models infer contributions from different
source types using multivariate measurements taken at
one or more receptor locations. These receptors can be
fixed indoor or outdoor monitors or mobile samplers
that follow the activities of an individual or group of
people. Source models estimate receptor concentrations
from source emissions and meteorological measure-
ments. Receptor models use ambient concentrations and
the abundances of chemical components in source
emissions to quantify source contributions. Source and
receptor models are complementary rather than com-
petitive. Each has strengths and weaknesses that com-
pensate for the other. Both types of models can and
should be used in an air quality source assessment of
outdoor and indoor air.
Chemical and physical analysis methods are often
termed receptor models. A chemical ‘‘tracer’’ is often
sought for certain sources. Microscopic analysis, gas
chromatograms, X-ray spectra, carbon-14 (14C) and
other isotopic abundances, and many other analytical
outputs provide patterns that might allow a source
contribution to be identified and quantified. Without the
receptor model mathematics and applications frame-
work, however, these analytical methods do not quan-
tify source contributions.
True receptor models are not statistical black boxes.
They are based on the same scientific principles as
source models, but they are explanatory rather than
predictive of source contributions. Receptor models in-
clude the enrichment factors (EFs), chemical mass bal-
ance (CMB), eigenvector analysis (also termed principal
component analysis (PCA), factor analysis (FA), and
empirical orthogonal functions (EOF)), multiple lin-
ear regression, neural networks, edge detection, cluster
analysis, Fourier Transform time series, and a number
of other multivariate data analysis methods. Chemical
models that are usually embedded in source-oriented
models can also be used as receptor models to estimate
how emissions characteristics might change between
source and receptor and to determine limiting precursors
for secondary aerosols that form during transport.
Several books (Hopke, 1985, 1991), specialty con-
ference proceedings (Macias and Hopke, 1981; Hopke
and Dattner, 1982; Pace, 1986; Watson, 1989; Watson
et al., 1989; Chow et al., 1993c), and review articles
(Cooper and Watson, 1980; Gordon, 1980, 1988; Wat-
son, 1984; Javitz et al., 1988a; Watson et al., 2001a;
Chow and Watson, 2002; Watson and Chow, 2002b)
examine different types and variations of receptor mod-
els. Table 1 describes several receptor model types and
classifies published references by theory and application.
Examples are drawn from many countries throughout
the world. Some of the receptor model applications
apply to indoor air and personal exposure, but most
determine contributions to particles in outdoor air. Neu-
ral networks, edge detection, and chemical evolution
receptor models are still under development and are of
greater interest to researchers than to those attempting
to solve air pollution problems. EFs and the CMB are
well established and have been widely used to develop
pollution control strategies. The multivariate PCA, FA,
and EOF models have been used to confirm and some-
times identify unrecognized source types; their use for
estimating source profiles for input to the CMB is still
under study.
The particle size fractions normally monitored
throughout the world are total suspended particulate
(TSP, mass of particles with aerodynamic diameters
K 30 lm), PM10 (aerodynamic diameters <10 lm), andPM2:5 (aerodynamic diameters <2.5 lm). PM2:5 is be-coming more commonly measured because this fraction
can penetrate deep into the human lung and more effi-
ciently penetrates between outdoor and indoor envi-
ronments. PM2:5 contains most of the carbon, sulfate,
nitrate, and heavy metal components, while the larger
particles are dominated by suspended dust, with some
contributions from sea salt, pollen and plant detritus.
This article provides a framework for using receptor
models to determine those sources requiring emissions
reductions to improve air quality in populated areas
1094 J.G. Watson et al. / Chemosphere 49 (2002) 1093–1136

Table 1
Summary of receptor model types with references to their theory and use
Explanation Theory and evaluation Application
Enrichment factors
The ratios of atmospheric concentra-
tions of elements to a reference
element are compared to the same
ratios in geological or marine material.
Differences are explained in terms of
anthropogenic sources. Heavy metal
enrichments are usually attributed to
industrial emitters. Sulfur enrichment
is attributed to secondary sulfate.
Potassium enrichment is attributed to
burning and cooking. Local soil and
road dust compositions often differ
from global crystal compositions
Vinogradov (1959), Turekian and Wed-
epohl (1961), Taylor (1964), Mason (1966),
Gordon et al. (1973), Zoller et al. (1974),
Rahn (1976), Lawson and Winchester
(1979a), Reimann and de Caritat (2000)
Dams et al. (1971), Hoffman and Duce (1972), Hoffman et al. (1972), Moyers and Duce (1972),
Tsunogai et al. (1972), Wilkniss and Bressan (1972), Bogen (1973), Bressan et al. (1973), Zoller et al.
(1973, 1974), Heindryckx and Dams (1974), Mroz and Zoller (1975), Struempler (1975), King
et al. (1976), Neustadter et al. (1976), Meinert and Winchester (1977), Moyers et al. (1977), Rahn
et al. (1977), Buat-M�eenard and Arnold (1978), Lawson and Winchester (1978, 1979b), Husain and
Samson (1979), Fogg and Rahn (1984), Husain et al. (1984), Pacyna (1986), Lowenthal and Rahn
(1987b), Sturges (1989), Carter and Borys (1993), Rashid and Griffiths (1993), Benner et al. (1995),
Aunela-Tapola et al. (1998), Gatz et al. (1998), Deboudt et al. (1999), Reimann and de Caritat (2000),
Chen et al. (2001), Choi et al. (2001), Paciga et al. (1975, 1976), Winchester et al. (1974, 1979)
Chemical mass balance
Ambient chemical concentrations are
expressed as the sum of products of
species abundances and source
contributions. These equations are
solved for the source contributions
when ambient concentrations and
source profiles are supplied as input.
Several different solution methods
have been applied, but the effective
variance least squares estimation
method is most commonly used
because it incorporates precision
estimates for all of the input data into
the solution and propagates these
errors to the model outputs
Britt and Luecke (1973), Friedlander
(1973a, 1981), Watson (1979), Belsley et al.
(1980), Cooper and Watson (1980), Gordon
et al. (1981), Core et al. (1982), deCesar and
Cooper (1982), Gerlach et al. (1982), An-
derson et al. (1984), Dzubay et al. (1984),
Stevens and Pace (1984), Daisey (1985),
Gordon and Olmez (1986), Holzman et al.
(1986), US EPA (1987), Vong et al. (1988),
Larson and Vong (1989), Wang and Hopke
(1989), Matamala and Nininger (1990),
Kim et al. (1992a), Song and Hopke
(1996a,b), Gleser (1997), Hopke and Song
(1997), Gordon (1980, 1988), Watson et al.
(1981, 1984, 1990b, 1991, 1997b, 1998c),
Henry (1982, 1992, 1997a), Currie et al.
(1984, 1994), deCesar et al. (1985, 1986),
Cheng and Hopke (1986, 1989), Lowenthal
et al. (1987, 1988, 1992, 1994), Javitz et al.
(1988a,b), Lowenthal and Rahn (1988a,b,
1989), Kim and Henry (1989, 1999)
Hidy and Friedlander (1971), Winchester and Nifong (1971), Miller et al. (1972), Kneip et al. (1973),
Friedlander (1973a,b), Gartrell and Friedlander (1975), Hammerle and Pierson (1975), Kowalczyk
et al. (1978, 1982), Mizohata and Mamuro (1979), Watson (1979), Alpert and Hopke (1980, 1981),
Cooper (1980), Dzubay (1980, 1989), Rheingrover and Gordon (1980, 1988), Heisler et al. (1980),
Gatz et al. (1981), Stelson and Seinfeld (1981), Houck et al. (1982, 1992), Johnson and McIntyre
(1982), Liljestrand (1982), Stolzenburg et al. (1982), Cass and McRae (1983), Feeley and Liljestrand
(1983), Rahn and Lowenthal (1984, 1985), Scheff et al. (1984), Stevens et al. (1990), Chow (1985),
Lowenthal and Rahn (1985), Mangelson et al. (1985), Sexton et al. (1985), Chow and Spengler (1986),
Lewis et al. (1986, 1988), Rau (1986), Eatough et al. (1987, 1992, 1996, 1997a, 1997b, 2000), Iyer et al.
(1987), Batterman et al. (1988), Chow et al. (1988b, 1990a,b, 1991a,b, 1992a,b, 1995, 1996b, 1999,
2000), Cooper et al. (1988, 1989), Dresser and Baird (1988), Dzubay et al. (1988), Gray et al. (1988),
Hlavinka and Bullin (1988), Magliano (1988), Vong et al. (1988), Casuccio et al. (1989), Dzubay and
Mamane (1989), Eatough (1989), Ge et al. (1989), Miller et al. (1989), Rau and Khalil (1989), Stafford
and Liljestrand (1989), Vossler et al. (1989), Egami et al. (1990), Kasahara et al. (1990), Kim and
Hopke (1990), Pistikopoulos et al. (1990), van Borm et al. (1990), Conner and Stevens (1991), Glover
et al. (1991), Toriyama et al. (1991), White and Macias (1991), Yoshizumi (1991), Hawthorne et al.
(1992), Heaton et al. (1992), Kim et al. (1992b), M€uuller (1992), Skidmore and Chow (1992), Vermette
et al. (1992), Zelenka et al. (1992, 1993), Annegarn and Pzybylowicz (1993), Wadden et al. (1993),
Bighouse and Houck (1994), Sharma and Patil (1994), Sheffield et al. (1994), Venkataraman and
Friedlander (1994), Watson et al. (1994b, 1996, 1997a, 1998b, 1999b), Adachi et al. (1995), Kao and
Friedlander (1995), Zhu et al. (1995a,b, 1996, 1998, 1999), Lowenthal et al. (1996, 1997a,b), Miguel
et al. (1995), Harrison et al. (1996), Hidy and Venkataraman (1996), Schauer et al. (1996), South Coast
Air Quality Management District (1996), Chen et al. (1997, 2001), Fujita et al. (1997, 1998), Malm and
Gebhart (1997), Vega et al. (1997), Willis et al. (1997), Adgate et al. (1998), Artaxo et al. (1998a,b,
1990), Biegalski et al. (1998), Coe and Chinkin (1998), Liu et al. (1998), Magliano et al. (1998, 1999),
Pinto et al. (1998), R.J. Lee Group (1998), Zhang et al. (1998a), Hosiokangas et al. (1999), Pitchford
et al. (1999), Brook et al. (2000), Green and Tombach (2000), Engelbrecht et al. (2000, 2001, 2002)
Schauer and Cass (2000), Mazzera et al. (2001), Park et al. (2001a,b), Shu et al. (2001), Temesi et al.
(2001), Chow and Watson (2002)
J.G.Watso
net
al./Chem
osphere
49(2002)1093–1136
1095

Table 1 (continued)
Explanation Theory and evaluation Application
Linear regression
Mass, sulfate concentrations or light
extinction are expressed as a linear
sum of unknown regression coeffi-
cients times source marker concentra-
tions measured at a receptor. The
markers must originate only in the
source type being apportioned, which
is a stringent assumption rarely met in
practice. The regression coefficients
represent the inverse of the chemical
abundance of the marker species in the
source emissions. The product of the
regression coefficient and the marker
concentration for a specific sample is
the tracer solution to the CMB that
yields the source contribution
Ito et al. (1986), White (1986, 1989), White
and Macias (1987), Milionis and Davies
(1994a,b), Lowenthal et al. (1995), Ayers
(2001)
Kleinman et al. (1980), Ouimette et al. (1981), Ouimette and Flagan (1982), Kneip et al. (1983),
Morandi et al. (1987, 1991), Trijonis et al. (1987), Lowenthal and Rahn (1989), Malm et al. (1990b),
Okamoto et al. (1990), Malm and Gebhart (1997), Chan et al. (1999), Green and Tombach (2000)
Temporal and spatial correlation eigenvectors (PCA, FA, EOF)
Temporal correlations are calculated
from a time series of chemical con-
centrations at one or more locations.
Eigenvectors of this correlation matrix
are determined and a subset is rotated
to maximize and minimize correlations
of each factor with each measured
species. The factors are interpreted as
source profiles by comparison of fac-
tor loadings with source measure-
ments. Several different normalization
and rotation schemes have been used,
but their physical significance has not
been established
Spatial correlations are calculated
from chemical measurements taken on
simultaneous samples at a large num-
ber of locations. Eigenvectors of this
correlation matrix represent a spatial
distribution of source influence over
the area, providing that the samplers
have been located to represent the
gradients in source contributions. As
with temporal correlation models,
several normalization and rotation
schemes have been applied
Armstrong (1967), Blifford and Meeker
(1967), Prinz and Stratmann (1968), Craw-
ford (1975), Duewer et al. (1976), Gether
and Seip (1979), Hopke (1981, 1988),
Richman (1981, 1986), Hopke et al. (1982,
1983, 1995), Karl et al. (1982), Bergametti
et al. (1983), Cooper (1983), Henry (1984,
1986, 1987, 1991, 1997b), Hwang et al.
(1984), Chow and Spengler (1986), Ito et al.
(1986), Derde et al. (1987), Heidam (1987),
Lowenthal and Rahn (1987a), Cheng and
Lioy (1989), Henry and Kim (1989, 1990),
Zeng and Hopke (1989, 1992a), Henry et al.
(1991, 1999), Glover and Hopke (1992,
1994), Green et al. (1992a), Kuik et al.
(1993a), Paatero and Tapper (1993, 1994),
Richman and Vermette (1993), Nitta et al.
(1994), Poissant (1994), Brunet and
Vautard (1996), Centner et al. (1996),
Moro et al. (1997), Paatero (1997, 1998,
2000) Brumelis et al. (2000)
Blifford and Meeker (1967), Prinz and Stratmann (1968), Vavilova et al. (1969), Peterson (1970),
Padmanabhamarty (1975), Hopke (1976, 1981, 1982), Hopke et al. (1976, 1980, 1982, 1988, 1993),
Gaarenstroom et al. (1977), Barone et al. (1978), Gatz (1978), Hardy and Walton (1978), Gether and
Seip (1979), Henry and Hidy (1979, 1981, 1982), Alpert and Hopke (1980, 1981), Boutron and Martin
(1980), Throgmorton (1980), Cox and Clark (1981), Rohbock et al. (1981), Chang et al. (1982), Houck
et al. (1982), Lioy et al. (1982), Liu et al. (1982, 1995), Overland and Preisendorfer (1982), Rahn et al.
(1982), Roscoe et al. (1982, 1984), Bergametti et al. (1983), Cheng et al. (1993a,b), Hoogerbrugge et al.
(1983), Severin et al. (1983), Ashbaugh et al. (1984), Malm et al. (1985, 1987, 1990a), Smeyers-Verbeke
et al. (1984), Pitchford and Pitchford (1985), Thurston and Spengler (1985a,b), Wolff and Korsog
(1985), Wolff et al. (1985a,b), Chow and Spengler (1986), Crawley and Sievering (1986), Daisey et al.
(1986), Thomas (1986), Johnson and Malm (1987), Keiding et al. (1987), Kim et al. (1987), Koutrakis
and Spengler (1987), Kim and Hopke (1988), Lowenthal and Rahn (1987a), Lowenthal et al. (1992),
Pratsinis et al. (1988), Valaoras et al. (1988), Henry and Kim (1989), Koutrakis et al. (1989), Pio et al.
(1989), Artaxo et al. (1990), Artaxo et al. (1998a, 1990), Bomboi et al. (1990), Gebhart et al. (1990),
Okamoto et al. (1990), Henry et al. (1991), Morandi et al. (1991), Bridgman (1992), Buhr et al. (1992,
1995, 1996), Green et al. (1992a,b, 1993), Rouhani et al. (1992), Sharma and Patil (1992), Sharma and
Singh (1992), Zeng and Hopke (1992b), Gao et al. (1993a,b), Kuik et al. (1993a,b), Michaud et al.
(1993, 1996), Richman and Vermette (1993), Anttila et al. (1994), Berg et al. (1994), Brown and Lund
(1994), Nitta et al. (1994), Xie et al. (1994a,b, 1999a,b), Plumb and Zheng (1996), Sj€oogren et al. (1996),
Swietlicki et al. (1996), Veltkamp et al. (1996), Deininger and Saxena (1997), Gebhart and Malm
(1997), Henry (1997b,c,d), Yoo and Kim (1997), Echalar et al. (1998), Norris et al. (1998),
Statheropoulos et al. (1998), Polissar et al. (1998, 1999, 2001a,b), Currie et al. (1999), Huang et al.
(1999, 2001), Lee et al. (1999), Li and Deng (1999), Paterson et al. (1999), Rocha et al. (1999),
Yakovleva et al. (1999), Ames et al. (2000), Chan et al. (2000), Chueinta et al. (2000), Kim and Henry
(2000), Kusmierczyk-Michulec and Marks (2000), Ogawa et al. (2000), Pryor and Barthelmie (2000),
Ramadan et al. (2000), Tsai et al. (2000), Hien et al. (2001), Jeon et al. (2001), Kavouras et al. (2001),
Park et al. (2001a), Poirot et al. (2001), Roberts et al. (2001), Song et al. (2001)
1096
J.G.Watso
net
al./Chem
osphere
49(2002)1093–1136
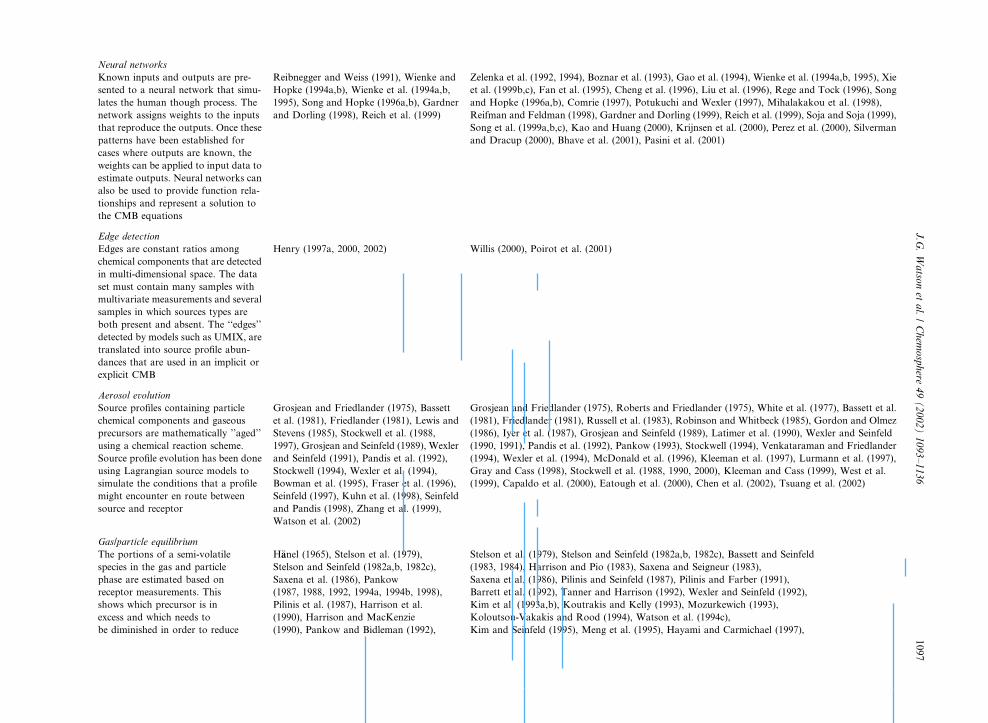
Neural networks
Known inputs and outputs are pre-
sented to a neural network that simu-
lates the human though process. The
network assigns weights to the inputs
that reproduce the outputs. Once these
patterns have been established for
cases where outputs are known, the
weights can be applied to input data to
estimate outputs. Neural networks can
also be used to provide function rela-
tionships and represent a solution to
the CMB equations
Reibnegger and Weiss (1991), Wienke and
Hopke (1994a,b), Wienke et al. (1994a,b,
1995), Song and Hopke (1996a,b), Gardner
and Dorling (1998), Reich et al. (1999)
Zelenka et al. (1992, 1994), Boznar et al. (1993), Gao et al. (1994), Wienke et al. (1994a,b, 1995), Xie
et al. (1999b,c), Fan et al. (1995), Cheng et al. (1996), Liu et al. (1996), Rege and Tock (1996), Song
and Hopke (1996a,b), Comrie (1997), Potukuchi and Wexler (1997), Mihalakakou et al. (1998),
Reifman and Feldman (1998), Gardner and Dorling (1999), Reich et al. (1999), Soja and Soja (1999),
Song et al. (1999a,b,c), Kao and Huang (2000), Krijnsen et al. (2000), Perez et al. (2000), Silverman
and Dracup (2000), Bhave et al. (2001), Pasini et al. (2001)
Edge detection
Edges are constant ratios among
chemical components that are detected
in multi-dimensional space. The data
set must contain many samples with
multivariate measurements and several
samples in which sources types are
both present and absent. The ‘‘edges’’
detected by models such as UMIX, are
translated into source profile abun-
dances that are used in an implicit or
explicit CMB
Henry (1997a, 2000, 2002) Willis (2000), Poirot et al. (2001)
Aerosol evolution
Source profiles containing particle
chemical components and gaseous
precursors are mathematically ’’aged’’
using a chemical reaction scheme.
Source profile evolution has been done
using Lagrangian source models to
simulate the conditions that a profile
might encounter en route between
source and receptor
Grosjean and Friedlander (1975), Bassett
et al. (1981), Friedlander (1981), Lewis and
Stevens (1985), Stockwell et al. (1988,
1997), Grosjean and Seinfeld (1989), Wexler
and Seinfeld (1991), Pandis et al. (1992),
Stockwell (1994), Wexler et al. (1994),
Bowman et al. (1995), Fraser et al. (1996),
Seinfeld (1997), Kuhn et al. (1998), Seinfeld
and Pandis (1998), Zhang et al. (1999),
Watson et al. (2002)
Grosjean and Friedlander (1975), Roberts and Friedlander (1975), White et al. (1977), Bassett et al.
(1981), Friedlander (1981), Russell et al. (1983), Robinson and Whitbeck (1985), Gordon and Olmez
(1986), Iyer et al. (1987), Grosjean and Seinfeld (1989), Latimer et al. (1990), Wexler and Seinfeld
(1990, 1991), Pandis et al. (1992), Pankow (1993), Stockwell (1994), Venkataraman and Friedlander
(1994), Wexler et al. (1994), McDonald et al. (1996), Kleeman et al. (1997), Lurmann et al. (1997),
Gray and Cass (1998), Stockwell et al. (1988, 1990, 2000), Kleeman and Cass (1999), West et al.
(1999), Capaldo et al. (2000), Eatough et al. (2000), Chen et al. (2002), Tsuang et al. (2002)
Gas/particle equilibrium
The portions of a semi-volatile
species in the gas and particle
phase are estimated based on
receptor measurements. This
shows which precursor is in
excess and which needs to
be diminished in order to reduce
H€aanel (1965), Stelson et al. (1979),
Stelson and Seinfeld (1982a,b, 1982c),
Saxena et al. (1986), Pankow
(1987, 1988, 1992, 1994a, 1994b, 1998),
Pilinis et al. (1987), Harrison et al.
(1990), Harrison and MacKenzie
(1990), Pankow and Bidleman (1992),
Stelson et al. (1979), Stelson and Seinfeld (1982a,b, 1982c), Bassett and Seinfeld
(1983, 1984), Harrison and Pio (1983), Saxena and Seigneur (1983),
Saxena et al. (1986), Pilinis and Seinfeld (1987), Pilinis and Farber (1991),
Barrett et al. (1992), Tanner and Harrison (1992), Wexler and Seinfeld (1992),
Kim et al. (1993a,b), Koutrakis and Kelly (1993), Mozurkewich (1993),
Koloutsou-Vakakis and Rood (1994), Watson et al. (1994c),
Kim and Seinfeld (1995), Meng et al. (1995), Hayami and Carmichael (1997),
J.G.Watso
net
al./Chem
osphere
49(2002)1093–1136
1097

with a variety of industrial, area, and mobile emissions.
An eight-step receptor source apportionment procedure
is outlined and illustrated with examples from winter-
time Denver, CO (Watson et al., 1998b). These examples
are complemented by information extracted from sev-
eral of the references in Table 1.
2. Receptor modeling procedure
Semi-quantitative source apportionment can be ap-
plied to existing samples from air quality compliance
networks (Chow et al., 2002b), but these networks are
seldom designed for source apportionment. Compliance
monitoring sites do not usually provide the contrast
needed between different times of the day and proximity
to or distance from suspected contributors. Filter sub-
strates used for compliance are not usually compatible
with all of the needed measurements. Chow and Watson
(1994a) and Chow et al. (1996a) describe a ‘‘Level 1’’
(i.e., preliminary or first-level) particulate matter (PM)
assessment that can be completed with existing filters as
a pilot study to form a conceptual model. The inaccu-
racy of the Level 1 assessment usually precludes justifi-
cation for advanced emissions reduction strategies. The
following eight steps should be performed when con-
ducting a source apportionment study.
(1) Formulate conceptual model: The conceptual
model provides a plausible, though not necessarily ac-
curate, explanation of the sources, their zones of influ-
ence, transport from distant areas, timing of emissions
throughout the day, and meteorology that affects rela-
tive emissions rates, transport, dispersion, transforma-
tion, and receptor concentration. The conceptual model
guides the location of monitoring sites, sampling peri-
ods, sampling frequencies, sample durations, the selec-
tion of samples for laboratory analysis, and the species
that are quantified in those samples. A conceptual model
can be postulated from studies in similar areas, from
smaller pilot studies (e.g., analysis of archived filters),
and analysis of existing air quality and meteorological
data.
(2) Compile emissions inventory: Receptor models
need to be supplied with sources that are potential
contributors. A receptor model inventory requires only
source categories, not the locations and emission rates of
specific sources. While ducted point source emissions
can be reasonably estimated through source tests and
operating records, area and mobile source emissions are
inexact. The most common cause of differences between
relative source contributions from source and receptor
models is inaccurate emissions estimates (Core et al.,
1981; Ryan et al., 1988; Watson and Chow, 2000;
Watson et al., 2000). Receptor model results focus re-
sources on those source emissions that are the most
important contributors to excessive PM concentrations.Table1(continued)
Explanation
Theoryandevaluation
Application
concentrationsintheparticlephase.
Thetheoryismosthighlydeveloped
forammoniumnitrateandhasbeen
usedtodeterminetheextentto
whichammoniaoroxidesof
nitrogenreductionsareneededto
reduceambientammoniumnitrate
levels
Kimetal.(1993a,b),Pankowetal.
(1993),HarrisonandMsibi(1994),Kim
andSeinfeld(1995),Mengetal.(1995,
1997),MatsumotoandTanaka(1996),
MengandSeinfeld(1996),Jangand
Kamens(1998),AnsariandPandis
(1999a,b),Lazaridis(1999),Blanchard
etal.(2000),Zhangetal.(2000)
Audiffrenetal.(1998),AnsariandPandis(1999a,b),Diazetal.(1999),Jacobson(1999),
Blanchardetal.(2000),Zhangetal.(2000),Cleggetal.(2001),Moyaetal.(2001)
1098 J.G. Watson et al. / Chemosphere 49 (2002) 1093–1136
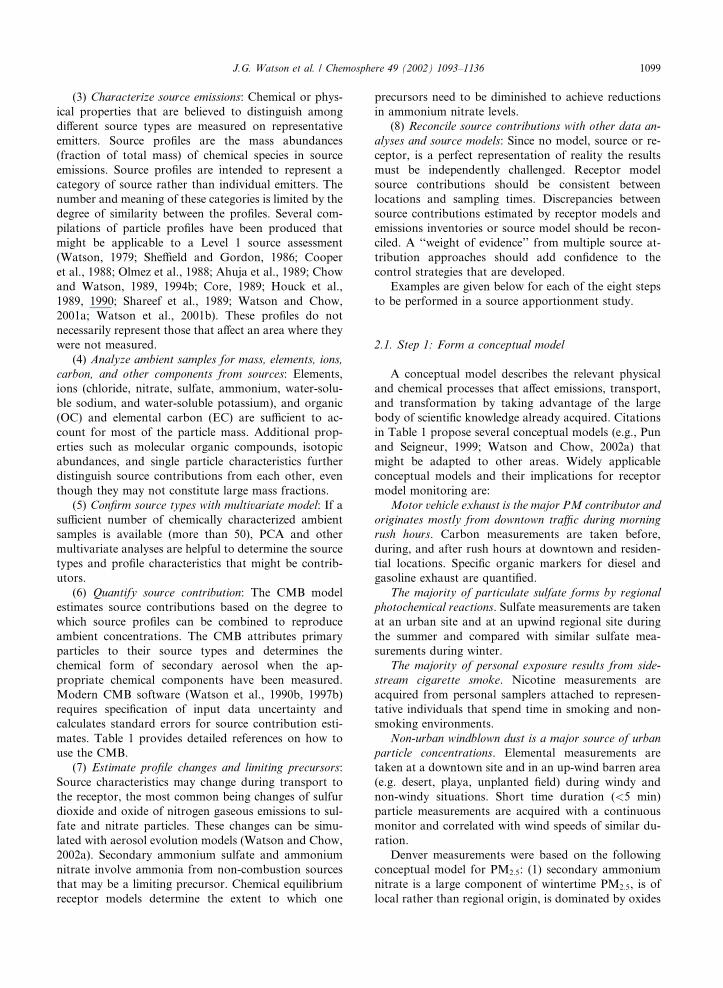
(3) Characterize source emissions: Chemical or phys-
ical properties that are believed to distinguish among
different source types are measured on representative
emitters. Source profiles are the mass abundances
(fraction of total mass) of chemical species in source
emissions. Source profiles are intended to represent a
category of source rather than individual emitters. The
number and meaning of these categories is limited by the
degree of similarity between the profiles. Several com-
pilations of particle profiles have been produced that
might be applicable to a Level 1 source assessment
(Watson, 1979; Sheffield and Gordon, 1986; Cooper
et al., 1988; Olmez et al., 1988; Ahuja et al., 1989; Chow
and Watson, 1989, 1994b; Core, 1989; Houck et al.,
1989, 1990; Shareef et al., 1989; Watson and Chow,
2001a; Watson et al., 2001b). These profiles do not
necessarily represent those that affect an area where they
were not measured.
(4) Analyze ambient samples for mass, elements, ions,
carbon, and other components from sources: Elements,
ions (chloride, nitrate, sulfate, ammonium, water-solu-
ble sodium, and water-soluble potassium), and organic
(OC) and elemental carbon (EC) are sufficient to ac-
count for most of the particle mass. Additional prop-
erties such as molecular organic compounds, isotopic
abundances, and single particle characteristics further
distinguish source contributions from each other, even
though they may not constitute large mass fractions.
(5) Confirm source types with multivariate model: If a
sufficient number of chemically characterized ambient
samples is available (more than 50), PCA and other
multivariate analyses are helpful to determine the source
types and profile characteristics that might be contrib-
utors.
(6) Quantify source contribution: The CMB model
estimates source contributions based on the degree to
which source profiles can be combined to reproduce
ambient concentrations. The CMB attributes primary
particles to their source types and determines the
chemical form of secondary aerosol when the ap-
propriate chemical components have been measured.
Modern CMB software (Watson et al., 1990b, 1997b)
requires specification of input data uncertainty and
calculates standard errors for source contribution esti-
mates. Table 1 provides detailed references on how to
use the CMB.
(7) Estimate profile changes and limiting precursors:
Source characteristics may change during transport to
the receptor, the most common being changes of sulfur
dioxide and oxide of nitrogen gaseous emissions to sul-
fate and nitrate particles. These changes can be simu-
lated with aerosol evolution models (Watson and Chow,
2002a). Secondary ammonium sulfate and ammonium
nitrate involve ammonia from non-combustion sources
that may be a limiting precursor. Chemical equilibrium
receptor models determine the extent to which one
precursors need to be diminished to achieve reductions
in ammonium nitrate levels.
(8) Reconcile source contributions with other data an-
alyses and source models: Since no model, source or re-
ceptor, is a perfect representation of reality the results
must be independently challenged. Receptor model
source contributions should be consistent between
locations and sampling times. Discrepancies between
source contributions estimated by receptor models and
emissions inventories or source model should be recon-
ciled. A ‘‘weight of evidence’’ from multiple source at-
tribution approaches should add confidence to the
control strategies that are developed.
Examples are given below for each of the eight steps
to be performed in a source apportionment study.
2.1. Step 1: Form a conceptual model
A conceptual model describes the relevant physical
and chemical processes that affect emissions, transport,
and transformation by taking advantage of the large
body of scientific knowledge already acquired. Citations
in Table 1 propose several conceptual models (e.g., Pun
and Seigneur, 1999; Watson and Chow, 2002a) that
might be adapted to other areas. Widely applicable
conceptual models and their implications for receptor
model monitoring are:
Motor vehicle exhaust is the major PM contributor and
originates mostly from downtown traffic during morning
rush hours. Carbon measurements are taken before,
during, and after rush hours at downtown and residen-
tial locations. Specific organic markers for diesel and
gasoline exhaust are quantified.
The majority of particulate sulfate forms by regional
photochemical reactions. Sulfate measurements are taken
at an urban site and at an upwind regional site during
the summer and compared with similar sulfate mea-
surements during winter.
The majority of personal exposure results from side-
stream cigarette smoke. Nicotine measurements are
acquired from personal samplers attached to represen-
tative individuals that spend time in smoking and non-
smoking environments.
Non-urban windblown dust is a major source of urban
particle concentrations. Elemental measurements are
taken at a downtown site and in an up-wind barren area
(e.g. desert, playa, unplanted field) during windy and
non-windy situations. Short time duration (<5 min)particle measurements are acquired with a continuous
monitor and correlated with wind speeds of similar du-
ration.
Denver measurements were based on the following
conceptual model for PM2:5: (1) secondary ammonium
nitrate is a large component of wintertime PM2:5, is of
local rather than regional origin, is dominated by oxides
J.G. Watson et al. / Chemosphere 49 (2002) 1093–1136 1099

of nitrogen emissions from mobile emissions rather than
elevated power station emissions, and is limited by nitric
acid production rather than by available ammonia; (2)
PM carbon is dominated by diesel exhaust and wood
smoke, with less important contributions from gasoline
exhaust and cooking; and (3) fugitive dust contributions
are minimal, except when roads are sanded after snow,
and is from manmade deposits rather than natural wind
erosion during winter. To evaluate these concepts, nitric
acid and ammonia gas measurements were needed with
particulate ammonium nitrate and ammonium sulfate
measurements at urban and non-urban sites. Specific
organic compounds were needed to separate the different
carbon source contributions. Elemental concentrations
were needed to differentiate coal fly ash from suspended
dust. Urban and non-urban monitors were needed with
nighttime and morning samples that would bracket
morning traffic and nighttime heating emissions. Testing
this conceptual model also required extensive meteoro-
logical measurements at the surface and aloft to deter-
mine how surface and elevated emissions would mix
throughout the day.
2.2. Step 2: Compile emissions
Emission models (Dickson and Oliver, 1991) estimate
temporal and spatial emission rates based on activity
level, emission rate per unit of activity, and meteorology.
Emissions models apply emission factors measured for a
range of activity levels from representative sources to
values for those activities estimated for a study area.
Commonly used activity surrogates are: (1) fuel con-
sumed, product produce, or material inputs for in-
dustrial sources; (2) vehicle miles traveled, fuel sales,
miles of roadway, or vehicle registrations for mobile
source emissions; and (3) population density, number of
households or businesses, amount of residential wood or
coal sold for area source emissions. Activity data are
often unavailable for the spatial scales desired of source
models, and emissions are estimated for a larger area
(e.g., a county, state, or province) and spatially allocated
to a smaller scale based on population census tracts,
land-use maps, and roadway networks. An accurate
inventory for source modeling often requires greater
effort and expense than field monitoring for air quality
concentrations and meteorology.
US EPA (1999) publishes AP-42 emission factors
used to formulate national inventories, but these are
often inappropriate for specific airsheds, especially those
outside of the US. This is recognized in the AP-42 in-
troduction that recommends locally derived emission
factors, where possible, and reiterates the limitations of
factors derived from a few tests at other times and pla-
ces.
Emissions inventory models are often used to de-
velop control strategies by linear rollback modeling
(Barth, 1970; deNevers and Morris, 1975; Cass, 1981;
Cass and McRae, 1981, 1983). The linear rollback model
assumes that atmospheric concentrations in excess of
background are proportional to aggregate emission
rates. Reducing excessive concentrations of a pollutant
to levels below a pre-set standard requires emissions
reductions that are proportionally equal to the relative
amount by which the standard is exceeded. Receptor
models are often used in conjunction with linear roll-
back to determine the contribution of source categories
to excessive concentrations. The linear rollback is then
performed on a category-specific basis, starting with the
largest contributors. This is a more accurate method of
justifying emissions reductions than a rollback of un-
speciated PM because the relative emissions from indi-
vidual sources within a category are believed to be more
accurate than the absolute emissions within the category
or the relative emissions between source categories (e.g.,
Cass and McRae, 1981, 1983).
While source models need spatial and temporal res-
olution and very accurate emissions rates, receptor
models need only a seasonal or annual average, area-
wide inventory to identify potential source categories.
Individual emitters must be grouped into more gen-
eralized categories with similar source profiles. For
example, an outdoor inventory will often contain sepa-
rate entries for power generation, industrial, and in-
stitutional coal combustion. Since these combustion
processes, and often the coal, are similar in a given
airshed, it is unlikely that their contributions can be
distinguished by the CMB and they must be combined
into a ‘‘coal-burning category’’. Source categories that
are often combined for particulate receptor modeling
are:
Vegetative burning and cooking: Fireplaces, wood
stoves, prescribed burns, wildfires, char-broiling, and
meat cooking. Some of these sub-categories may be
separated when appropriate organic compounds are
measured.
Diesel exhaust: Heavy and light duty cars and trucks,
off-road equipment, stationary engines for pumps and
generators, and locomotives.
Gasoline exhaust: Heavy and light duty cars and
trucks, and small engines. Emissions inventories do not
usually contain breakdowns by cold-starts and poorly
maintained vehicles, although these might be discrimi-
nated by certain organic compounds in a profile. Since
leaded fuels are no longer used in the US, there is no
need to separately apportion use of this fuel, but leaded
gasoline is still in use in many other countries.
Fugitive dust: Paved roads, unpaved roads, agricul-
tural tilling, construction, wind erosion, and industrial
aggregate. These can sometimes be divided into sub-
categories based on single particle shape and elemental
content or the measurement of specific mineral compo-
sition.
1100 J.G. Watson et al. / Chemosphere 49 (2002) 1093–1136
Metals: Copper smelters, lead smelters, steel mills,
and aluminum mills. These often have similar metal
emissions but in different abundances depending on the
process.
Aggregate handling: Cement, quarrying, and mining.
Ores, in particular, are often enriched in the materials
being extracted and sub-categories may be defined for
these cases. When low level measurements of trace ele-
ments such as copper, zinc, and lead are made, metal
processing operations that use these materials can be
classified into separate categories.
Indoor inventories might include the following par-
ticulate source types (Sexton et al., 1986; Sexton and
Hayward, 1987; Koutrakis et al., 1992): (1) outdoor air
that infiltrates through doors, windows, and poor insu-
lation; (2) house dust from track-in and resuspension
from vacuuming and personal movement; (3) cooking,
both from the fuel combustion and the food, especially
during frying; (4) sidestream smoke when the building
contains smokers; (5) animal dander and fur in the pres-
ence of pets and other animals; (6) molds, spores, and
fungi, especially those that form and are entrained from
ventilation ducts; (7) vehicle exhaust in commuter trans-
port compartments; and (8) a large variety of occupa-
tional emissions, depending on the type of work involved.
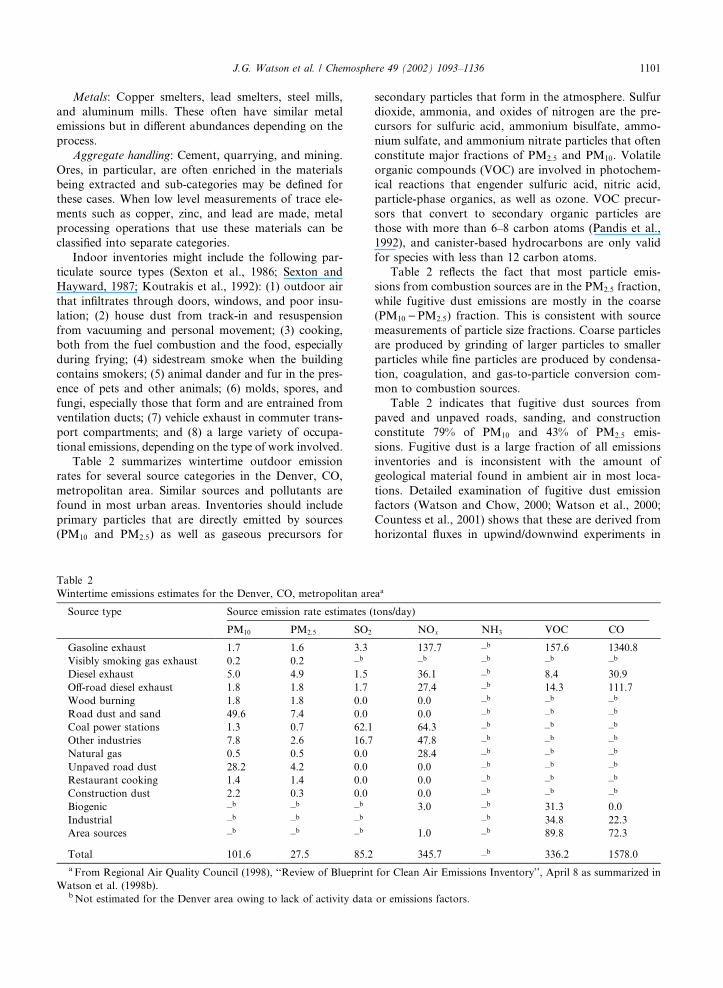
Table 2 summarizes wintertime outdoor emission
rates for several source categories in the Denver, CO,
metropolitan area. Similar sources and pollutants are
found in most urban areas. Inventories should include
primary particles that are directly emitted by sources
(PM10 and PM2:5) as well as gaseous precursors for
secondary particles that form in the atmosphere. Sulfur
dioxide, ammonia, and oxides of nitrogen are the pre-
cursors for sulfuric acid, ammonium bisulfate, ammo-
nium sulfate, and ammonium nitrate particles that often
constitute major fractions of PM2:5 and PM10. Volatile
organic compounds (VOC) are involved in photochem-
ical reactions that engender sulfuric acid, nitric acid,
particle-phase organics, as well as ozone. VOC precur-
sors that convert to secondary organic particles are
those with more than 6–8 carbon atoms (Pandis et al.,
1992), and canister-based hydrocarbons are only valid
for species with less than 12 carbon atoms.
Table 2 reflects the fact that most particle emis-
sions from combustion sources are in the PM2:5 fraction,
while fugitive dust emissions are mostly in the coarse
(PM10 )PM2:5) fraction. This is consistent with sourcemeasurements of particle size fractions. Coarse particles
are produced by grinding of larger particles to smaller
particles while fine particles are produced by condensa-
tion, coagulation, and gas-to-particle conversion com-
mon to combustion sources.
Table 2 indicates that fugitive dust sources from
paved and unpaved roads, sanding, and construction
constitute 79% of PM10 and 43% of PM2:5 emis-
sions. Fugitive dust is a large fraction of all emissions
inventories and is inconsistent with the amount of
geological material found in ambient air in most loca-
tions. Detailed examination of fugitive dust emission
factors (Watson and Chow, 2000; Watson et al., 2000;
Countess et al., 2001) shows that these are derived from
horizontal fluxes in upwind/downwind experiments in
Table 2
Wintertime emissions estimates for the Denver, CO, metropolitan areaa
Source type Source emission rate estimates (tons/day)
PM10 PM2:5 SO2 NOx NH3 VOC CO
Gasoline exhaust 1.7 1.6 3.3 137.7 –b 157.6 1340.8
Visibly smoking gas exhaust 0.2 0.2 –b –b –b –b –b
Diesel exhaust 5.0 4.9 1.5 36.1 –b 8.4 30.9
Off-road diesel exhaust 1.8 1.8 1.7 27.4 –b 14.3 111.7
Wood burning 1.8 1.8 0.0 0.0 –b –b –b
Road dust and sand 49.6 7.4 0.0 0.0 –b –b –b
Coal power stations 1.3 0.7 62.1 64.3 –b –b –b
Other industries 7.8 2.6 16.7 47.8 –b –b –b
Natural gas 0.5 0.5 0.0 28.4 –b –b –b
Unpaved road dust 28.2 4.2 0.0 0.0 –b –b –b
Restaurant cooking 1.4 1.4 0.0 0.0 –b –b –b
Construction dust 2.2 0.3 0.0 0.0 –b –b –b
Biogenic –b –b –b 3.0 –b 31.3 0.0
Industrial –b –b –b –b 34.8 22.3
Area sources –b –b –b 1.0 –b 89.8 72.3
Total 101.6 27.5 85.2 345.7 –b 336.2 1578.0
a From Regional Air Quality Council (1998), ‘‘Review of Blueprint for Clean Air Emissions Inventory’’, April 8 as summarized in
Watson et al. (1998b).bNot estimated for the Denver area owing to lack of activity data or emissions factors.
J.G. Watson et al. / Chemosphere 49 (2002) 1093–1136 1101

which 60–90% of the emissions are within the lowest
two meters above ground level. Since these low level
emissions are likely to deposit within a few hundred
meters of the emissions point, they should not be part of
emission factors used to represent urban-scale invento-
ries.
Mobile source combustion emissions from diesel and
gasoline engines operating on- and off-road are impor-
tant contributions in nearly all urban areas. Fujita et al.
(1997) identified two-stroke engines, common on small
motorbikes, as an important mobile source category in
Bangkock, Thailand. For the Denver area, Table 2
shows that motor vehicle exhaust (the sum of gasoline,
diesel, and off-road emissions) constitutes 31% of PM2:5emissions, with diesel (including off-road) representing
more than 79% of vehicle exhaust. Poorly maintained
gasoline vehicles, identified by visible exhaust, constitute
11% of gasoline-fueled vehicle emissions and only 2% of
total vehicle emissions.
Vehicle emission testing is expensive, and it is difficult
to recruit commercially used trucks for testing; as a re-
sult, the California emissions inventory is based on tests
of 6000 light-duty gasoline vehicles, as compared to only
70 heavy-duty diesel trucks (Lloyd and Cackette,
2001a,b). Recent tests have shown large discrepancies
between motor vehicle emission factors and on-road
tests for a variety of pollutants. Hansen and Rosen
(1990) report measurements from Berkeley, CA, of
carbon emissions from individual vehicles in on-road
operation. They measured the ratio of light-absorbing
carbon to CO2 as vehicles drove past the Lawrence
Berkeley Laboratory, and found a factor of 250 between
the highest and lowest ratio for 60 gasoline-fueled ve-
hicles. They did not categorize vehicles by weight and
age, but the range of ratios shows the potential for large
uncertainties in these factors. Further evidence of these
discrepancies was found by using remote sensing of in-
dividual tailpipe emissions for carbon monoxide, hy-
drocarbons, and oxides of nitrogen (Bishop et al., 1989,
1996, 1997; Ashbaugh et al., 1992; Stedman et al., 1993;
Zhang et al., 1993; Cadle and Stephens, 1994; Stephens
et al., 1996; Johnson et al., 1998; Singer et al., 1998).
Remote sensing shows that approximately 20% of the
on-road vehicles emit nearly 80% of the pollutants. Ex-
cess emissions are due to off-cycle operating conditions
and poor-maintenance that are not well represented by
laboratory dynamometer studies. Remote sensors for
suspended particles are still being developed, although
excessive gaseous emissions detected by current tech-
nology probably indicate poor combustion properties
that also increase particle emissions over those currently
estimated by emissions models.
Table 2 shows that residential wood combustion
(RWC) constitutes �7% of PM2:5 emissions for winter-time Denver. This estimate includes the effectiveness of
control measures such as new technology stoves and no-
burn days that were implemented after a 1988 receptor
modeling study found wood-burning contributing 25%
of wintertime PM2:5 in Denver (Watson et al., 1988).
Special tests of wood-burning emissions (McDonald
et al., 2000) using contemporary wood-burning methods
were made for the Denver area.
The impact of cooking on indoor air has been well
documented (Truesdale, 1982; Davidson et al., 1986;
Reid et al., 1986; Ahuja et al., 1987; Raiyani et al., 1993;
Smith, 1995; Ballard-Tremeer and Jawurek, 1996; Fan
and Zhang, 1998; Albalak et al., 1999; Lee et al., 2001),
and its effects on outdoor PM2:5 concentrations have
been identified (Hildemann et al., 1991; Rogge et al.,
1991; McDonald et al., 1998; Kleeman et al., 1999;
Nolte et al., 1999; Schauer et al., 1999; Mugica et al.,
2001). Table 2 indicates that �5% of PM2:5 is emitted bythis source. For Table 2 emissions, refineries, cement
production, grain handling, and aggregate handling op-
erations were quantified with 12% of PM2:5 emissions;
coal-fired power stations emitted 2.5% of PM2:5 while
other combustion, mostly with natural gas, is estimated
to contribute �2% of the total.Table 2 shows nearly 60% of the oxides of nitrogen
deriving from mobile sources, with coal-fired power
generation emitting 19% of the total. Coal is the
major sulfur dioxide emitter in areas where it is used,
and this is evident for Denver. Motor vehicle fuels also
include sulfur that may be more influential for the
formation of wintertime sulfate if it is emitted into
ground-level fogs under stagnant conditions where con-
version can be very rapid. A significant quantity (8%)
of sulfur dioxide derives from mobile sources, with half
of that deriving from on-road and off-road diesel ex-
haust.
Fig. 1 shows how inventory PM2:5 emissions are
combined into source categories that can be distin-
guished at receptors by their chemical components. This
figure assumes that measured organic compounds used
in CMB calculations can distinguish among different
carbon sub-types such as cooking/burning and gasoline/
diesel exhaust. These sub-types usually cannot be dis-
tinguished by commonly applied elemental/ion/carbon
analyses. All of the fugitive dust sources are combined
because distinguishing species have not yet been devel-
oped that conclusively separate paved road, unpaved
road, and construction sources. Salt used as a de-icing
material can be detected, but it does not have a constant
abundance relative to other geological materials because
it is applied intermittently and is soon washed away by
melting snow.
2.3. Step 3: Characterize sources
Analogous to the measurement of emission factors,
source profiles are created by sampling emissions from
a variety of single emitters or small groups of emit-
1102 J.G. Watson et al. / Chemosphere 49 (2002) 1093–1136

ters. These samples are then submitted to a variety of
chemical and physical analyses to determine those
properties that will allow contributions from the sources
they represent to be distinguished at receptors. The mass
for each of these properties is normalized to a common
property in the emissions from all sources, typically the
PM10 or PM2:5 mass emissions rate. This mass fraction is
termed the species abundance.
Individual profiles are formed from single samples,
and the precisions of the numerator and denominator of
the species abundances are propagated (Watson et al.,
2001c) to obtain the individual profile uncertainties.
These individual profiles are further composited to ob-
tain the source profiles used for CMB source appor-
tionment. The simplest composite consists of the average
and standard deviation of species abundances for all
individual profiles within a group. For example, if ten
tests of diesel vehicle exhaust are taken, the composite
species abundance is an average of the ten individual
profile abundances and the uncertainty is the standard
deviation of that average. Outlier tests are applied to
reject individual profiles that unduly bias the average
and standard deviation of the composite profile. There
are always some outliers in any series of source tests,
usually for reasons that can never be determined. It is
important to obtain ten or more samples that run the
range of operating conditions and fuels in an area to
develop source profiles.
The ideal source sampling method would allow for
chemical and physical transformations of source emis-
sions to occur prior to sample collection. Lacking this
ideal, the sampling would at least quantify the precur-
sors of the receptor profile so that a theoretically or
empirically derived transformation could be applied.
The following methods (Gordon et al., 1984; Chow
et al., 1988a; Watson and Chow, 2001a; Watson et al.,
2001b) are commonly used for different source types to
obtain samples from which profiles may be determined:
Hot exhaust sampling: Effluent is extracted from a
duct or stack at emissions temperatures and drawn
though filters. The EPA ‘‘Method 201’’ stack test method
is most commonly applied in the US to determine com-
pliance with PM10 emissions standards. Hot exhaust does
not permit the condensation of vapors into particles prior
to sampling, and it sometimes interferes with the sam-
pling substrate or container. In coal-fired station emis-
sions, the selenium does not condense on other particles
until temperatures approach ambient. Hot exhaust sam-
ples are not often taken on substrates or in containers
amenable to extensive chemical analysis. Even though it
is widely used for compliance, hot exhaust sampling is
not appropriate for receptor modeling studies.
Diluted exhaust sampling: Effluent extracted from a
duct is mixed with clean ambient air so that gases can
condense on particles (Heinsohn et al., 1980; Hildemann
et al., 1989; Zielinska et al., 1998; England et al., 2000).
The near-ambient temperature effluent is then drawn
through substrates that are analyzed for the desired
properties. Diluted exhaust samplers are used for labo-
ratory simulations of emissions from individual sources.
Dynamometer simulations use diluted exhaust sampling
to estimate emissions for different vehicle types, fuels,
Fig. 1. PM2:5 emissions from Table 2 are combined into categories that might be resolved by receptor models. Paved road dust,
unpaved road dust, and construction emissions are summed, as are on-road and off-road diesel emissions.
J.G. Watson et al. / Chemosphere 49 (2002) 1093–1136 1103
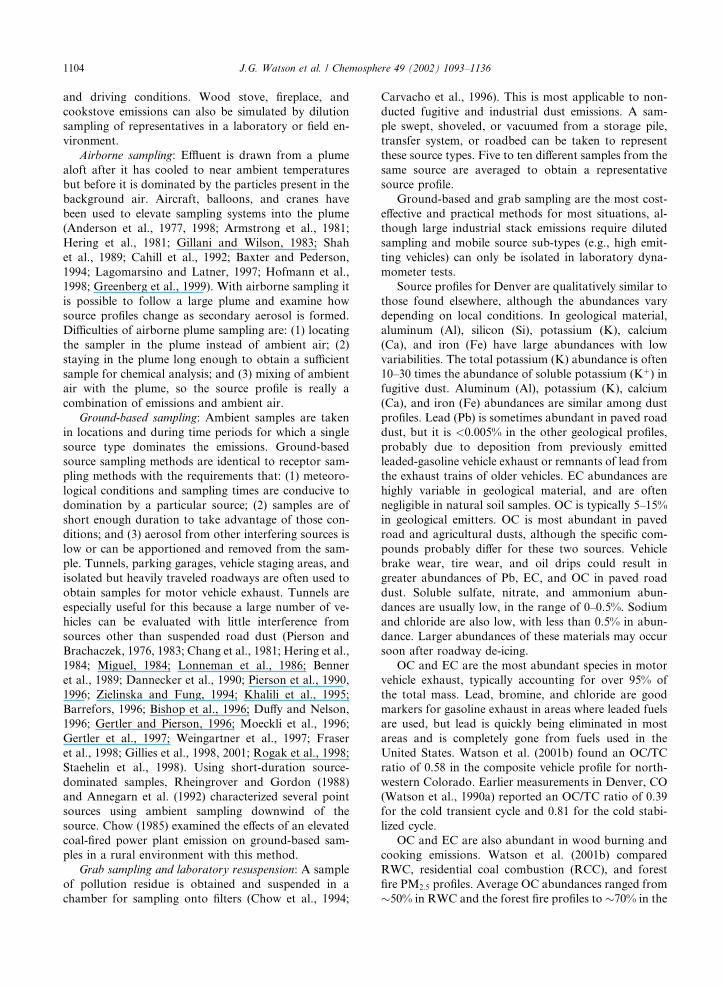
and driving conditions. Wood stove, fireplace, and
cookstove emissions can also be simulated by dilution
sampling of representatives in a laboratory or field en-
vironment.
Airborne sampling: Effluent is drawn from a plume
aloft after it has cooled to near ambient temperatures
but before it is dominated by the particles present in the
background air. Aircraft, balloons, and cranes have
been used to elevate sampling systems into the plume
(Anderson et al., 1977, 1998; Armstrong et al., 1981;
Hering et al., 1981; Gillani and Wilson, 1983; Shah
et al., 1989; Cahill et al., 1992; Baxter and Pederson,
1994; Lagomarsino and Latner, 1997; Hofmann et al.,
1998; Greenberg et al., 1999). With airborne sampling it
is possible to follow a large plume and examine how
source profiles change as secondary aerosol is formed.
Difficulties of airborne plume sampling are: (1) locating
the sampler in the plume instead of ambient air; (2)
staying in the plume long enough to obtain a sufficient
sample for chemical analysis; and (3) mixing of ambient
air with the plume, so the source profile is really a
combination of emissions and ambient air.
Ground-based sampling: Ambient samples are taken
in locations and during time periods for which a single
source type dominates the emissions. Ground-based
source sampling methods are identical to receptor sam-
pling methods with the requirements that: (1) meteoro-
logical conditions and sampling times are conducive to
domination by a particular source; (2) samples are of
short enough duration to take advantage of those con-
ditions; and (3) aerosol from other interfering sources is
low or can be apportioned and removed from the sam-
ple. Tunnels, parking garages, vehicle staging areas, and
isolated but heavily traveled roadways are often used to
obtain samples for motor vehicle exhaust. Tunnels are
especially useful for this because a large number of ve-
hicles can be evaluated with little interference from
sources other than suspended road dust (Pierson and
Brachaczek, 1976, 1983; Chang et al., 1981; Hering et al.,
1984; Miguel, 1984; Lonneman et al., 1986; Benner
et al., 1989; Dannecker et al., 1990; Pierson et al., 1990,
1996; Zielinska and Fung, 1994; Khalili et al., 1995;
Barrefors, 1996; Bishop et al., 1996; Duffy and Nelson,
1996; Gertler and Pierson, 1996; Moeckli et al., 1996;
Gertler et al., 1997; Weingartner et al., 1997; Fraser
et al., 1998; Gillies et al., 1998, 2001; Rogak et al., 1998;
Staehelin et al., 1998). Using short-duration source-
dominated samples, Rheingrover and Gordon (1988)
and Annegarn et al. (1992) characterized several point
sources using ambient sampling downwind of the
source. Chow (1985) examined the effects of an elevated
coal-fired power plant emission on ground-based sam-
ples in a rural environment with this method.
Grab sampling and laboratory resuspension: A sample
of pollution residue is obtained and suspended in a
chamber for sampling onto filters (Chow et al., 1994;
Carvacho et al., 1996). This is most applicable to non-
ducted fugitive and industrial dust emissions. A sam-
ple swept, shoveled, or vacuumed from a storage pile,
transfer system, or roadbed can be taken to represent
these source types. Five to ten different samples from the
same source are averaged to obtain a representative
source profile.
Ground-based and grab sampling are the most cost-
effective and practical methods for most situations, al-
though large industrial stack emissions require diluted
sampling and mobile source sub-types (e.g., high emit-
ting vehicles) can only be isolated in laboratory dyna-
mometer tests.
Source profiles for Denver are qualitatively similar to
those found elsewhere, although the abundances vary
depending on local conditions. In geological material,
aluminum (Al), silicon (Si), potassium (K), calcium
(Ca), and iron (Fe) have large abundances with low
variabilities. The total potassium (K) abundance is often
10–30 times the abundance of soluble potassium (Kþ) in
fugitive dust. Aluminum (Al), potassium (K), calcium
(Ca), and iron (Fe) abundances are similar among dust
profiles. Lead (Pb) is sometimes abundant in paved road
dust, but it is <0.005% in the other geological profiles,probably due to deposition from previously emitted
leaded-gasoline vehicle exhaust or remnants of lead from
the exhaust trains of older vehicles. EC abundances are
highly variable in geological material, and are often
negligible in natural soil samples. OC is typically 5–15%
in geological emitters. OC is most abundant in paved
road and agricultural dusts, although the specific com-
pounds probably differ for these two sources. Vehicle
brake wear, tire wear, and oil drips could result in
greater abundances of Pb, EC, and OC in paved road
dust. Soluble sulfate, nitrate, and ammonium abun-
dances are usually low, in the range of 0–0.5%. Sodium
and chloride are also low, with less than 0.5% in abun-
dance. Larger abundances of these materials may occur
soon after roadway de-icing.
OC and EC are the most abundant species in motor
vehicle exhaust, typically accounting for over 95% of
the total mass. Lead, bromine, and chloride are good
markers for gasoline exhaust in areas where leaded fuels
are used, but lead is quickly being eliminated in most
areas and is completely gone from fuels used in the
United States. Watson et al. (2001b) found an OC/TC
ratio of 0.58 in the composite vehicle profile for north-
western Colorado. Earlier measurements in Denver, CO
(Watson et al., 1990a) reported an OC/TC ratio of 0.39
for the cold transient cycle and 0.81 for the cold stabi-
lized cycle.
OC and EC are also abundant in wood burning and
cooking emissions. Watson et al. (2001b) compared
RWC, residential coal combustion (RCC), and forest
fire PM2:5 profiles. Average OC abundances ranged from
�50% in RWC and the forest fire profiles to �70% in the
1104 J.G. Watson et al. / Chemosphere 49 (2002) 1093–1136

RCC profile. EC averaged 3% in forest fire, 12% in
RWC, and 26% in RCC. The OC/TC ratio was highest
in the forest fire profile (0.94) and similar for the two
residential combustion profiles, with 0.73 in RCC and
0.81 in RWC. Watson and Chow (2001a) measured
profiles for asparagus field burning in California�s Im-perial Valley with OC/TC ratios of 0.93, similar to the
0.94 ratio for forest fire emissions. A similar observation
was made for charbroil cooking emissions, with 60–70%
OC abundances and high (>0.95) OC/TC ratios. TheKþ/K ratios of 0.80–0.90 in burning profiles (Calloway
et al., 1989) are in large contrast to the low soluble to
total potassium ratios found in geological material.
Coal-fired power generation profiles differ substan-
tially from residential coal burning, even though the
fuels are similar, owing to the different combustion
conditions and different emissions. Sulfate is one of the
most abundant constituents in the particle phase and
sulfur dioxide can be hundreds to thousands of time
higher than the particle mass. Sulfur dioxide is a good
indicator of contributions from nearby coal-fired power
stations when it has not reacted or deposited signifi-
cantly during transport to a receptor. Crystal elements
such as Si, Ca, and Fe are often present at 30–50% of the
corresponding levels in geological material, while Al
abundances are similar to or enriched over those found
in surface soils. Other elements such as phosphorus (P),
potassium (K), titanium (Ti), chromium (Cr), manga-
nese (Mn), strontium (Sr), zirconium (Zr), and barium
(Ba) are often detectable at less than 1% levels.
All of the elemental abundances are highly dependent
on the ash composition of the parent coal, as well as the
specific combustion process and pollution control de-
vices. Watson et al. (2001b) detected selenium (Se) at the
level of 0.2–0.4% in coal-fired power station emissions
with no scrubbers or wet scrubbers, but not in emissions
from a unit with a dry limestone scrubber. Se is usually
in the gaseous phase within hot stack emissions, and it
condenses on particles when air is cooled in the dilution
chamber. Abundances of Ca (15%), Cl (1%), and nitrate
(1%) in the limestone-scrubbed unit were a few times
higher than in the other units. These differences may
have resulted from the dry lime scrubber, which added
some calcium and absorbed the selenium in the vapor
phase.
These examples show that although there are simi-
larities in chemical compositions for different sources,
using source profiles from one airshed or time period
may not provide a valid CMB apportionment for am-
bient samples in another airshed or in another time pe-
riod. Source emissions of precursor gases and primary
particles are highly variable due to differences in fuel use,
operating conditions, and sampling methods. Source
and ambient measurements must be paired in time to
establish reasonable estimates of source/receptor rela-
tionships. Trace metals acquired from elemental analysis
of Teflon-membrane filters are only abundant in the
geological and some industrial profiles. Elemental mea-
surements by themselves are necessary, but insufficient,
for a receptor modeling study. Chemical speciation must
also include ammonium, sulfate, nitrate, OC, and EC.
Separating carbon fractions with the use of different
combustion temperatures and atmospheres can also be a
useful tool in source apportionment studies (Chow et al.,
1993b). Watson et al. (1994a), using the thermal evolu-
tion method in the IMPROVE protocol (Chow et al.,
1993b, 2001), showed that gasoline- and diesel-powered
vehicle emissions exhibit different abundances of differ-
ent fractions of OC and EC. Engelbrecht et al. (2002)
used seven carbon fractions in their CMB analysis to
distinguish source contributions between regular and
low-smoke RCC. Simultaneous gas measurements as
well as other characteristics of suspended particles will
be needed as more refined control strategies are devel-
oped using receptor models.
The Denver example measured organic compounds
such as those listed in Table 3 in both source and re-
ceptor samples to apportion source sub-types such as
meat cooking, wood burning, and exhaust from different
vehicle operating modes. Sampling and analysis meth-
ods for organic compounds are still being perfected.
Organic analyses are more difficult or costly to apply
than currently available elemental, ion, and carbon
measurements.
2.4. Step 4: Analyze samples for material balance
A material balance is a preliminary source appor-
tionment that allocates TSP, PM10, or PM2:5 to geo-
logical material, OC, EC, sulfate, nitrate, ammonium,
and possibly salt (from marine aerosol, de-icing, or
windblown dry lake beds). Several summaries of particle
sampling and analysis methods (Watson and Chow,
1993, 1994, 2001b; Chow and Watson, 1994a, 1998;
Chow, 1995) describe ambient sampling and chemical
analysis options. The material balance requires elemen-
tal, ionic, and carbon analyses. Although not a source
apportionment, the material balance provides guidance
on which components are the major cause of excessive
mass concentrations. This knowledge can focus efforts
to improve the emissions inventory for source modeling
and allows a speciated linear rollback model to be ap-
plied for initial control strategy development. The fol-
lowing sample analysis hierarchy (updated from Chow
et al., 1996a) demonstrates how elemental, ionic, and
carbon concentrations can be measured for different
levels of resources:
Analyze archived filter samples: High-volume quartz-
fiber filter samples used to determine mass for compli-
ance with air quality standards are sub-optimal for
chemical analysis, but they are commonly available
throughout the world. These filters have already been
J.G. Watson et al. / Chemosphere 49 (2002) 1093–1136 1105

weighed to determine mass concentration. They can be
analyzed for elements by X-ray fluorescence (Watson
et al., 1999a) with appropriate corrections for filter ab-
sorption and blank subtraction; for ions by ion chro-
matography (Chow and Watson, 1999) and atomic
absorption spectrophotometry (Chow et al., 2002b), and
for carbon by thermal combustion carbon analysis
(Chow et al., 1993b, 2001). Aluminum and silicon can-
not be quantified on these samples because they are part
of the filter matrix. Other trace elements may also be
present in the filter matrix as impurities, and large
fractions of volatile species such as ammonium nitrate
may have evaporated during storage (Witz et al., 1990).
For PM2:5 standard attainment, US EPA requires sam-
pling with low-volume federal reference method (FRM)
samplers equipped with Teflon-membrane filters. These
samples can be analyzed for elements by X-ray fluores-
cence. Sulfate can be estimated from the sulfur concen-
Table 3
Organic compounds from different OC emission and in ambient air
Species Predominant sources Particle–gas phase distribution
PAH
Naphthalene Motor vehicles, wood smoke Gas phase
Methylnaphthalenes Motor vehicles, wood smoke Gas phase
Dimethynaphthalenes Motor vehicles, wood smoke Gas phase
Biphenyl Motor vehicles, wood smoke Gas phase
Acenaphthylene Motor vehicles, wood smoke Gas phase
Acenaphthene Motor vehicles, wood smoke Gas phase
Fluorene Motor vehicles, wood smoke Gas phase
Phenanthrene Motor vehicles, wood smoke Particle–gas phase
Anthracene Motor vehicles, wood smoke Particle–gas phase
Fluoranthene Motor vehicles, wood smoke Particle–gas phase
Pyrene Motor vehicles, wood smoke Particle–gas phase
Retene Motor vehicles, wood smoke Particle–gas phase
Benzo[b]naphtho[2,1]thiophene Motor vehicles Particle phase
Benz[a]anthracene Motor vehicles, wood smoke Particle phase
Chrysene Motor vehicles, wood smoke Particle phase
Benzo[bþ jþ k]fluoranthene Motor vehicles, wood smoke Particle phase
Benzo[a]pyrene Motor vehicles, wood smoke Particle phase
Indene[123-cd]pyrene Motor vehicles, wood smoke Particle phase
Dibenzo[ahþ ac]anthracene Motor vehicles, wood smoke Particle phase
Benzo[ghi]perylene Motor vehicles, wood smoke Particle phase
Coronene Motor vehicles, wood smoke Particle phase
Hopanes and Steranes
Cholestanes Motor vehicles Particle phase
Trisnorhopanes Motor vehicles Particle phase
Norhopanes Motor vehicles Particle phase
Hopanes Motor vehicles Particle phase
Guaiacols
4-Methylguaiacol Wood smoke Gas phase
4-Allylguaiacol Wood smoke Particle–gas phase
Isouegenol Wood smoke Particle–gas phase
Acetovanillone Wood smoke Particle phase
Syringols
Syringol Wood smoke, mostly hardwood Particle–gas phase
4-Methylsyringol Wood smoke, mostly hardwood Particle–gas phase
Syringaldehyde Wood smoke, mostly hardwood Particle phase
Lactones
Caprolactone Meat cooking Gas phase
Decanolactone Meat cooking Particle–gas phase
Undecanoic-c-lactone Meat cooking Particle–gas phase
Sterols
Cholesterol Meat cooking Particle phase
Sitosterol Meat cooking, wood smoke Particle phase
1106 J.G. Watson et al. / Chemosphere 49 (2002) 1093–1136

tration. Nitrate and sulfate ions can be subsequently
measured by ion chromatography, except that heating
and vacuum stages during X-ray fluorescence analysis
enhances nitrate volatilization and results in a low esti-
mate of nitrate concentration.
Planned compliance sampling: If it is known that
chemical analyses will be applied to some or all of the
high-volume PM10 or low-volume PM2:5 samples, sev-
eral precautions should be taken. When procuring fil-
ters, minimally acceptable blank concentrations should
be stated for each chemical to be quantified. Filter
holders that mate to the high-volume PM10 sampler or
PM2:5 FRM sampler should be obtained, and filters
should be loaded and unloaded using gloved hands in
a laboratory setting to minimize contamination. The
passive period in the sampler before and after air is
drawn through the filter should be minimized, and filters
should be stored in clean containers under refrigeration
after weighing.
Collocated filter sampling: An additional sampler
with a Teflon-membrane filter appropriate for complete
elemental analysis can be collocated with the high-vol-
ume PM10 compliance sampler. This filter should also be
pre- and post-weighed and submitted to the same ac-
ceptance testing and storage conditions described for
planned compliance sampling. For the PM2:5 FRM,
collocated quartz-fiber filters appropriate for ion and
carbon analysis are needed. Chow (1995) identifies sev-
eral sampling systems that can be collocated. A Minivol
sampler with a 5 lmin�1 flow rate (Baldauf et al., 2001;
Chow et al., 2002a) is a cost-effective method of adding
additional filter media to a sampling site.
Collocated continuous monitor sampling: Watson et al.
(1998a) and McMurry (2000) describe several continu-
ous particle detectors that can obtain mass, mass-sur-
rogates, and chemical- or size-specific concentrations
over averaging periods of 1–60 min duration. These
monitors can identify diurnal patterns, associate high
concentrations with wind directions from sources, and
provide indicators of concentrations between infrequent
filter samples (which are often every sixth day). Nephe-
lometers with ‘‘smart’’ heaters are the most cost-effective
continuous monitors. These measure light scattering
rather than particle mass, but good relationships be-
tween the two variables can often be established (Chow
et al., 2002c). Since light scattering increases rapidly as
soluble particles take on water at humidities exceeding
70%, a smart heater in the sample line provides a tem-
perature increase sufficient to maintain sampler humid-
ities below this threshold. Constant heating at high
temperatures (typically >30 �C) causes volatile particlesto evaporate, thereby negatively biasing the mass esti-
mate.
Sequential filter sampling: Daily samples, or samples
taken during different parts of the day, are often needed
to evaluate pollution buildups or to relate concentra-
tions to human exposure or observed health end-points.
Sequential filter samplers using several filter media in
parallel have been used to acquire these types of filters
for subsequent analysis (e.g., Chow et al., 1993a; Chow,
1995). Sequential sampling systems have been applied in
PM2:5 FRM networks across the US. Several filters are
loaded and a timing mechanism switches the flow
through different sets of filters at pre-set intervals.
Saturation sampling: An area can be saturated with
small, battery-powered samplers to evaluate the zone of
representation for long-term monitors and the zone of
influence for source emissions. This strategy is useful for
spatial correlation receptor models and when chemical
profiles of specific emitters are too similar to differenti-
ate them from each other. Samplers are located within
and around the suspected emitters (Tropp et al., 1998;
Blanchard et al., 1999; Chow et al., 1999, 2002a; Gillies
et al., 1999).
Denuder and absorbant sampling: Volatile substances
such as ammonium nitrate and organic compounds re-
quire denuders and gas-absorbing backup filters (Kitto
and Colbeck, 1999). Precursor gases for chemical re-
ceptor models can also be obtained from these sampling
strategies.
Fig. 2 illustrates a material balance for a single high
volume TSP sample from a sample in Xian, China. This
sample had a relatively high TSP mass loading (336
lgm�3) and was measured on a day with stagnant me-
teorology in a residential area. The commonly held
conceptual model in Xian is that most of the high TSP
concentrations result from dust storms in the region
Fig. 2. Material balance for a 24-h 336 lgm�3 TSP quartz filter
sample from an eastern urban site in Xian, China for October
27, 1997. Aluminum and silicon cannot be quantified on these
samples because they are in the filter matrix and much of the
nitrate may have volatilized before analysis. Fugitive dust
emissions are estimated as 20 times the iron concentration and
OC is multiplied by 1.2 to account for unmeasured hydrogen
and oxygen associated with urban organic compounds.
J.G. Watson et al. / Chemosphere 49 (2002) 1093–1136 1107

(Zhang et al., 1996, 1997, 1998b). The simple material
balance in Fig. 2 demonstrates that only half of the TSP
is due to dust. Given the low wind speeds during the
sampling period, most of this is probably from nearby
roads and vacant land rather than windblown loess in
the desert. This could be further verified by comparison
with simultaneous samples taken at other sites closer to
cleaner or dirtier roadways. OC and EC account for 34%
of TSP mass, indicating that combustion sources are a
major portion of TSP. Secondary sulfate constitutes a
relatively low fraction. Although the nitrate concentra-
tion is a minor portion of TSP, it is probable that much
of the original nitrate sampled was lost from the filter
prior to chemical analysis. Additional archived samples
for different time periods and locations would need to be
analyzed and compared to form a conceptual model.
Some of these should include periods of high winds
when desert dust might be a large contributor. This
simple analysis on archived filters helps to focus emis-
sions characterization efforts and future network design
by establishing the most abundant components of the
suspended particle mass. It suggests that primary emis-
sions reductions for local dust and combustion sources
(both mobile and area) should be pursued to reduce
ambient concentrations.
The other extreme for the material balance is illus-
trated in Fig. 3 for two PM2:5 pollution episodes near
Denver, CO. Samples were taken during the morning,
afternoon, and overnight on consecutive days. The days
selected for detailed chemical analysis were determined
after examining mass concentrations measured on each
sample, thereby reducing the study cost by minimizing
analyses on low concentration samples. Three pollution
episodes can be detected in these data, each with dif-
Fig. 3. Material balance for PM2:5 concentrations measured at Welby, CO, located on the northern edge of Denver, resulting from
gravimetric, elemental, ion, and carbon analysis (Watson et al., 1998b). Three samples per day were acquired from 0600 to 1200, 1200
to 1800, and 1800 to 0600 MST with the first sample centered over the date in 1996. Organic material is 1.4 times the OC measurement
to compensate for unmeasured hydrogen and oxygen (Turpin and Lim, 2001). Geological is defined as 1:89Alþ 2:14Siþ 1:4Caþ1:43Fe to account for unmeasured oxides in minerals. Soot is operationally defined as EC reported by the IMPROVE thermal/optical
reflectance method (Chow et al., 1993b, 2001). The unidentified fraction is the difference between measured mass and the sum of other
components. This is negative when the sum exceeds the measured mass. The unidentified amount is typically within measurement
uncertainties when elements, ions, and carbon are measured.
1108 J.G. Watson et al. / Chemosphere 49 (2002) 1093–1136

ferent compositions. The first two that peak on the
mornings of January 14, 1996 and January 17, 1996 have
secondary ammonium nitrate and OC and EC as their
most abundant components. The episode peaking on the
morning of January 20, 1996 is dominated by OC and
EC. Examining wind directions in conjunction with the
evolution of these episodes shows PM2:5 levels are
highest when secondary sulfate and nitrate are trans-
ported back into the city where they mix with fresh
emissions.
The morning sample on January 14, 1996 experi-
enced an invalid sample for the quartz filter, so carbon
and ion analyses were not performed. This sample il-
lustrates the need for ions and carbon to obtain a ma-
terial balance. The elements account for less than 10% of
the measured PM2:5 mass, even when the geological
marker elements are weighted for unmeasured oxides.
2.5. Step 5: Multivariate analysis
Several multivariate data analysis methods should be
applied to the data to confirm potential source contri-
butions. These should make use of whatever air quality
and meteorological measurements are available within
the study area. Several useful analyses are described
below.
Time series plots: Mass concentrations are plotted for
each sampling period, similar to that illustrated in Fig.
3, and compared among different monitoring locations.
Similar temporal patterns and concentrations indicate
urban or regional scale source contributions, while a
large divergence at one site indicates a middle-scale or
neighborhood-scale source influence. This is extremely
useful in short duration, continuous measurements.
Using a successive moving average subtraction method,
Watson and Chow (2001a) demonstrated that short-
duration pulses in 5-min black carbon concentrations
caused by nearby sources can be used in urban areas to
estimate spatial zones of influence. Seasons and days of
the week on which highest concentrations occur can be
detected. Examination of these plots and comparisons
among different sampling sites assists the selection of a
sample subset for chemical analysis.
Diurnal plots: When continuous particle monitoring
data are available, average concentrations can be cal-
culated for each hour over a subset of days to identify
patterns. These patterns can be associated with meteo-
rological conditions and emissions for different sites.
These plots often reveal increases in concentrations
during morning and evening rush hours on weekdays at
downtown locations that are not seen on weekends or at
residential sites. This indicates that local traffic emis-
sions are large contributors. The evening traffic peak
may not appear during summer when mixed layers are
deep later into the evening, but it will be very evident
during winter when sunset corresponds to evening traf-
fic. Residential heating with wood or coal often appears
as an elevated nighttime concentration that does not
decay until very early the following morning.
Pollution roses: Averages of hourly or shorter time
duration data can be calculated for wind direction sec-
tors. Watson and Chow (2002a) showed that large
concentrations associated with a given wind direction
indicate a major source from that direction. Frequent
wind direction shifts over a 24-h period usually preclude
this type of analysis for day-long samples.
Time series correlation: Correlation coefficients can
be calculated for chemical concentrations to determine
which ones vary together and which ones do not. High
correlation coefficients usually indicate origin from a
common source or effects of common meteorology on all
sources.
Spatial correlation: High spatial correlations among
chemical components indicate urban or regional source
influences, while low correlations indicate that the
chemical component is mostly from nearby origin.
Eigenvector analysis: As explained in Table 1, time
series or spatial eigenvector analysis in the form of PCA,
FA, or EOF defines a smaller sample space for the
measured chemical concentrations that can sometimes
be related to source contributions. Source profiles from
direct measurements are needed to interpret these ei-
genvectors.
All of these methods except the spatial eigenvec-
tor analysis were applied by Watson et al. (1998b) for
the Denver study prior to estimating source contri-
butions. These analyses provided the conceptual bases
for selecting the source profiles applied to each indi-
vidual sample on which chemical components were
measured.
2.6. Step 6: Calculate source contributions
All of the multivariate models include, implicitly or
explicitly, a CMB that quantifies source contributions.
The CMB expresses each aerosol property concentration
measured at a receptor as the sum of a source contri-
bution multiplied by the abundance of the correspond-
ing aerosol property in the source emissions. When these
equations are not collinear (i.e., source profiles sub-
stantially differ among different emitters) and the chem-
ical abundances in the source profile are reasonably
constant (i.e., standard deviations less than half the
average abundance for representative source tests), these
equations can be solved for the source contributions.
Species abundances and the receptor concentrations,
with appropriate uncertainty estimates, serve as input
data to the CMB model. The output consists of the
amount contributed by each source type represented by
a profile to the total mass and each chemical species.
The CMB modeling procedure requires: (1) identifi-
cation of the contributing sources types; (2) selection of
J.G. Watson et al. / Chemosphere 49 (2002) 1093–1136 1109

chemical species or other properties to be included in the
calculation; (3) estimation of the fraction of each of the
chemical species which is contained in each source type
(source profiles); (4) estimation of the uncertainty in
both ambient concentrations and source profiles; and
(5) solution of the CMB equations. Several solutions
methods have been proposed for the CMB equations
that are documented in Table 1 citations. Of these, the
effective variance weighted solution (Watson et al., 1984)
is almost universally applied because it: (1) theoretically
yields the most likely solutions to the CMB equations,
providing model assumptions are met; (2) uses all
available chemical measurements, not just so-called
‘‘tracer’’ species; (3) analytically estimates the uncer-
tainty of the source contributions based on precisions of
both the ambient concentrations and source profiles;
and (4) gives greater influence to chemical species with
higher precisions in both the source and receptor mea-
surements than to species with lower precisions.
CMB model assumptions are: (1) compositions of
source emissions are constant over the period of ambient
and source sampling; (2) chemical species do not react
with each other (i.e., they add linearly); (3) all sources
with a potential for contributing to the receptor have
been identified and have had their emissions character-
ized; (4) the number of sources or source categories is
less than or equal to the number of species; (5) the
source profiles are linearly independent of each other;
and (6) measurement uncertainties are random, uncor-
related, and normally distributed.
The degree to which these assumptions are met in
applications depends to a large extent on the particle
and gas properties measured at source and receptor.
CMB model performance is examined generically, by
applying analytical and randomized testing methods,
and specifically for each application by following an
applications and validation protocol. The six assump-
tions are fairly restrictive and they will never be totally
complied with in actual practice. Fortunately, the CMB
model can tolerate reasonable deviations from these
assumptions, as documented in the theory and testing
references of Table 1. Deviations from assumptions may
increase the stated uncertainties of the source contribu-
tion estimates.
The formalized protocol for CMB model application
and validation (Pace and Watson, 1987; Watson et al.,
1991, 1998c) is applicable to the apportionment of gas-
eous organic compounds and particles. This seven-step
protocol: (1) determines model applicability; (2) selects a
variety of profiles to represent identified contributors;
(3) evaluates model outputs and performance measures;
(4) identifies and evaluates deviations from model as-
sumptions; (5) identifies and corrects of model input
deficiencies; (6) verifies consistency and stability of
source contribution estimates; and (7) evaluates CMB
results with respect to other data analysis and source
assessment methods. Chow and Watson (2002) found
that this protocol was seldom followed in more than 20
recent CMB applications.
Fig. 4 shows average source contributions for the
Denver samples obtained by following this protocol.
Using organic compounds measured at source and re-
ceptor, it was demonstrated that meat cooking could be
distinguished from wood burning. The three classes of
gasoline vehicle exhaust (hot stabilized, cold start, and
high emitters) could be distinguished by CMB from their
source profiles. These sub-groups needed to be com-
bined for receptor sites where only the elements, ions,
and carbon were measured.
2.7. Step 7: Evaluate limiting precursors of secondary
aerosol
Most applications use source profiles measured at the
source, with at most dilution to ambient temperatures
and <1 min of aging prior to collection to allow forcondensation and rapid transformation. Profiles have
been ‘‘aged’’ with aerosol evolution models (Watson
et al., 2002), prior to submission to the CMB. These
models simulate changes between source and receptor;
they are often overly simplified and require additional
assumptions regarding chemical mechanisms, relative
transformation and deposition rates, mixing volumes,
and transport times.
Changes in ammonia or nitric acid precursor con-
centrations do not proportionally result in reductions in
ammonium nitrate concentrations. Ammonia concen-
trations might increase with emissions (e.g., larger fer-
tilizer applications, a larger number of farm animals) or
from reductions in sulfur dioxide emissions that would
Fig. 4. Average 1997 wintertime source contribution estimates to
PM2:5 determined by the CMB receptor model for samples taken
at Welby, CO, located on the northern edge of Denver, CO.
1110 J.G. Watson et al. / Chemosphere 49 (2002) 1093–1136
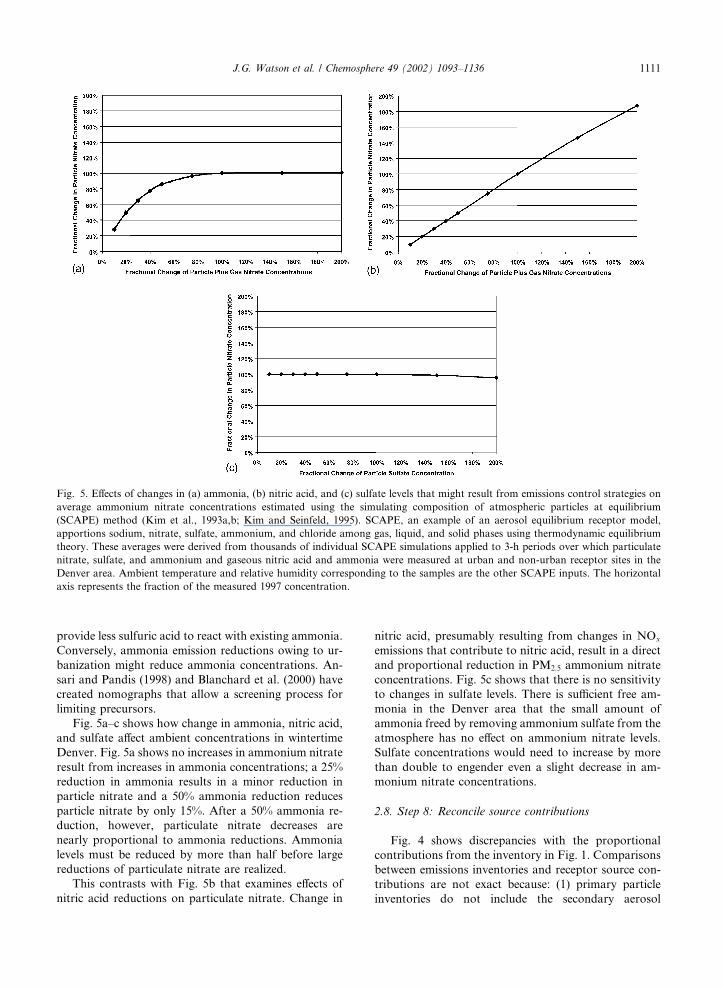
provide less sulfuric acid to react with existing ammonia.
Conversely, ammonia emission reductions owing to ur-
banization might reduce ammonia concentrations. An-
sari and Pandis (1998) and Blanchard et al. (2000) have
created nomographs that allow a screening process for
limiting precursors.
Fig. 5a–c shows how change in ammonia, nitric acid,
and sulfate affect ambient concentrations in wintertime
Denver. Fig. 5a shows no increases in ammonium nitrate
result from increases in ammonia concentrations; a 25%
reduction in ammonia results in a minor reduction in
particle nitrate and a 50% ammonia reduction reduces
particle nitrate by only 15%. After a 50% ammonia re-
duction, however, particulate nitrate decreases are
nearly proportional to ammonia reductions. Ammonia
levels must be reduced by more than half before large
reductions of particulate nitrate are realized.
This contrasts with Fig. 5b that examines effects of
nitric acid reductions on particulate nitrate. Change in
nitric acid, presumably resulting from changes in NOx
emissions that contribute to nitric acid, result in a direct
and proportional reduction in PM2:5 ammonium nitrate
concentrations. Fig. 5c shows that there is no sensitivity
to changes in sulfate levels. There is sufficient free am-
monia in the Denver area that the small amount of
ammonia freed by removing ammonium sulfate from the
atmosphere has no effect on ammonium nitrate levels.
Sulfate concentrations would need to increase by more
than double to engender even a slight decrease in am-
monium nitrate concentrations.
2.8. Step 8: Reconcile source contributions
Fig. 4 shows discrepancies with the proportional
contributions from the inventory in Fig. 1. Comparisons
between emissions inventories and receptor source con-
tributions are not exact because: (1) primary particle
inventories do not include the secondary aerosol
Fig. 5. Effects of changes in (a) ammonia, (b) nitric acid, and (c) sulfate levels that might result from emissions control strategies on
average ammonium nitrate concentrations estimated using the simulating composition of atmospheric particles at equilibrium
(SCAPE) method (Kim et al., 1993a,b; Kim and Seinfeld, 1995). SCAPE, an example of an aerosol equilibrium receptor model,
apportions sodium, nitrate, sulfate, ammonium, and chloride among gas, liquid, and solid phases using thermodynamic equilibrium
theory. These averages were derived from thousands of individual SCAPE simulations applied to 3-h periods over which particulate
nitrate, sulfate, and ammonium and gaseous nitric acid and ammonia were measured at urban and non-urban receptor sites in the
Denver area. Ambient temperature and relative humidity corresponding to the samples are the other SCAPE inputs. The horizontal
axis represents the fraction of the measured 1997 concentration.
J.G. Watson et al. / Chemosphere 49 (2002) 1093–1136 1111

determined by receptor models; and (2) inventories are
usually averaged over large areas and time periods while
receptor model source contributions apply to the zone of
representation of the receptor and to the time period
over which samples were taken.
Major discrepancies were found between emissions
estimates and receptor source apportionment of ambient
samples for wintertime Denver, CO. Secondary ammo-
nium sulfate and ammonium nitrate accounted for 35%
of PM2:5 in the receptor samples. Although sulfur dioxide
and oxides of nitrogen emissions are often included in
urban inventories, the fraction that converts to sulfate
and nitrate can only be determined by source or receptor
modeling. Ammonia emissions that engender the am-
monium portion of these secondary contributions are
seldom estimated. The emissions inventory estimated that
45% of emissions resulted from fugitive dust sources,
while the receptormodel source apportionment found the
dust contribution to be 16%. The inventory showed that
diesel exhaust constituted 80% of mobile source emis-
sions, while receptor analysis with organic compounds
showed that diesel exhaust constituted only �25% of themobile source contributions. This finding has resulted
in focusing efforts on better representing the emis-
sions from gasoline vehicles in the inventory used for
control strategy development and source modeling. This
was a substantial deviation from the conceptual model
stated earlier, and it is justification for refining that
model.
Fig. 6 shows how source contributions vary among
the seven measurement locations in the Denver area.
There were similar PM2:5 mass concentrations at both
urban (Welby, CAMP, Fort Collins) and non-urban
(Brighton, Evans, and Masters) sites, but the composi-
tion was quite different. The non-urban sites were
dominated by secondary sulfate and nitrate. Analyzing
sequential and diurnal samples along with wind flow
patterns shows that oxides of nitrogen generated in the
urban area mix in low lying fogs with ammonia from the
rural areas results in higher secondary sulfate and nitrate
levels that add mass to the primary particles generated
within the city. This is another refinement to the original
conceptual model.
3. Summary and conclusions
Receptor models complement source models for
evaluating the contributions from different sources to
measured concentrations. They use chemical charac-
teristics measured at both source and receptor to ac-
complish this apportionment. Elemental analysis is
necessary, but not sufficient for receptor models. Ele-
ments, ions, and carbon must be measured at a mini-
mum. Additional chemical components such as organic
compounds, carbon fractions, isotopic abundances, and
single particle characteristics are methods that are being
developed to further distinguish among source types.
Fig. 6. Average source contributions to PM2:5 at seven receptor locations around Denver, CO, during the winter of 1995–1996.
1112 J.G. Watson et al. / Chemosphere 49 (2002) 1093–1136

Substantial information can be obtained from relatively
inexpensive chemical analyses of archived filters, al-
though these are not optimal for quantitative receptor
source apportionment. The cost of a receptor modeling
study needs to be balanced against the value of the in-
formation obtained from the study. Examples from a
modern receptor study in wintertime Denver showed
that emission estimates from gasoline vehicles were
substantially underestimated and fugitive dust emissions
were overestimated. The planned emissions reduction
strategies to focus on diesel emissions reductions would
not yield the expected benefits. Gasoline vehicle exhaust
from cold starts and high emitting (poorly maintained)
vehicles were identified as large contributors that were
not adequately represented by the inventory. The in-
tended control strategy of reducing oxides of nitrogen
emissions to improve ammonium nitrate levels was
confirmed by demonstrating that there is sufficient am-
monia to neutralize available nitric acid. The costs of
implementing emissions reduction strategies that did not
result in the desired effects on air quality would be
hundreds of times the cost of the receptor modeling
study and would prolong human exposure in the area to
excessive particle concentrations until the effective con-
trol strategies were identified.
Disclaimer
This paper was supported in part by EPA. However,
it has not undergone technical review by EPA. There-
fore, the views are those of the authors and do not
represent EPA policy. Mention of trade names or
commercial products does not constitute EPA endorse-
ment or recommendation.
References
Adachi, A., Okiayu, M., Nishikawa, A., Kobayashi, T., 1995.
Evaluation of source apportionment to suspended particu-
late matter in air samples collected from Kobe area by
chemical mass balance method. J. Hyg. Chem. 41 (2), 167–
171.
Adgate, J.L., Willis, R.D., Buckley, T.J., Chow, J.C., Watson,
J.G., Rhoads, G.G., Lioy, P.J., 1998. Chemical mass
balance source apportionment of lead in house dust.
Environ. Sci. Technol. 32 (1), 108–114.
Ahuja, D.R., Joshi, V., Smith, K.R., Venkataraman, C., 1987.
Thermal performance and emission characteristics of un-
vented biomass-burning cookstoves: A proposed standard
method for evaluation. Biomass 12, 247–270.
Ahuja, M.S., Paskind, J.J., Houck, J.E., Chow, J.C., 1989.
Design of a study for the chemical and size characterization
of particulate matter emissions from selected sources in
California. In: Watson, J.G. (Ed.), Transactions, Receptor
Models in Air Resources Management. Air and Waste
Management Association, Pittsburgh, PA, pp. 145–158.
Albalak, R., Keeler, G.J., Frisancho, A.R., Haber, M., 1999.
Assessment of PM10 concentrations from domestic biomass
fuel combustion in two rural Bolivian highland villages.
Environ. Sci. Technol. 33 (15), 2505–2509.
Alpert, D.J., Hopke, P.K., 1980. A quantitative determination
of sources in the Boston urban aerosol. Atmos. Environ. 14,
1137–1146.
Alpert, D.J., Hopke, P.K., 1981. A determination of the sources
of airborne particles collected during the regional air
pollution study. Atmos. Environ. 15 (5), 675–687.
Ames, M.R., Gullu, G., Beal, J., Olmez, I., 2000. Receptor
modeling for elemental source contributions to fine aerosols
in New York state. J. Air Waste Mgmt. Assoc. 50 (5), 881–
887.
Anderson, J.A., Blumenthal, D.L., Sem, G.J., 1977. Charac-
terization of Denver�s urban plume using an instrumentedaircraft. In: Russel, P.A. (Ed.), Denver Air Pollution Study-
1973. US Environmental Protection Agency, Research
Triangle Park, NC.
Anderson, B.E., Cofer, W.R., Bagwell, D.R., Barrick, J.W.,
Hudgins, C.H., Brunke, K.E., 1998. Airborne observations
of aircraft aerosol emissions––1. Total nonvolatile particle
emission indices. Geophys. Res. Lett. 25 (10), 1689–1692.
Anderson, M.K., Brookman, E.T., Londergan, R.J., Yocom,
J.E., Watson, J.G., Lioy, P.J., 1984. Source apportionment
techniques and considerations in combining their use. In:
Receptor Model Technical Series, vol. V. Report No. EPA-
450/4-84-020. US Environmental Protection Agency, Office
of Air Quality Planning and Standards, Research Triangle
Park, NC.
Annegarn, H.J., Braga Marcazzan, G.M., Cereda, E., March-
inonni, M., Zucchiatti, A., 1992. Source profiles by unique
ratios (SPUR) analysis: Determination of source profiles
from receptor-site streaker samples. Atmos. Environ. A 26
(2), 333–343.
Annegarn, H.J., Pzybylowicz, W.J., 1993. Total CMB analysis
of streaker aerosol samples by PIXE, PIGE, beta- and
optical-absorption analyses. Nucl. Instrum. Meth. Phys.
Res. Sec. B––Beam Interact. Mater. Atoms B 75 (1–4), 582–
587.
Ansari, A.S., Pandis, S.N., 1998. Response of inorganic PM to
precursor concentrations. Environ. Sci. Technol. 32 (18),
2706–2714.
Ansari, A.S., Pandis, S.N., 1999a. An analysis of four models
predicting the partitioning of semivolatile inorganic aerosol
components. Aerosol Sci. Technol. 31 (2–3), 129–153.
Ansari, A.S., Pandis, S.N., 1999b. The effect of metastable
equilibrium states on the partitioning of nitrate between the
gas and aerosol phases. Atmos. Environ. 34 (1), 157–168.
Anttila, P., Paatero, P., Tapper, U., J€aarvinen, O., 1994.Application of positive matrix factorization to source
apportionment: Results of a study of bulk deposition
chemistry in Finland. Atmos. Environ. 29, 1705–1718.
Armstrong, J.S., 1967. Derivation of theory by means of factor
analysis or Tom Swift and his electric factor analysis
machine. Am. Stat. 12, 17–21.
Armstrong, J.A., Russell, P.A., Sparks, L.E., Drehmel, D.C.,
1981. Tethered balloon sampling systems for monitoring air
pollution. J. Air Pollut. Control Assoc. 31, 735–743.
J.G. Watson et al. / Chemosphere 49 (2002) 1093–1136 1113
Artaxo, P., Andrade, F., Maenhaut, W., 1990. Trace ele-
ments and receptor modelling of aerosols in the Antarctic
peninsula. Nucl. Instrum. Meth. Phys. Res. B 49, 383–
387.
Artaxo, P., Fernandes, E.T., Martins, J.V., Yamasoe, M.A.,
Hobbs, P.V., Maenhaut, W., Longo, K.M., Castanho, A.,
1998a. Large-scale aerosol source apportionment in Amazo-
nia. J. Geophys. Res. 103 (D24), 31837–31847.
Artaxo, P., Fernandes, E.T., Martins, J.V., Yamasoe, M.A.,
Hobbs, P.V., Maenhaut, W., Longo, K.M., Castanho, A.,
1998b. Large-scale aerosol source apportionment in Amazo-
nia. J. Geophys. Res. 103 (D24), 31837–31847.
Ashbaugh, L.L., Myrup, L.O., Flocchini, R.G., 1984. A
principal component analysis of sulphur concentrations in
the western United States. Atmos. Environ. 18 (4), 783–
791.
Ashbaugh, L.L., Lawson, D.R., Johnson, B.J., Huang, S.,
Bishop, G.A., Guenther, P.L., Stedman, D.H., Stephens,
R., Groblicki, P.J., Parikh, J., 1992. On-road remote sensing
of carbon monoxide and hydrocarbons emissions during
several vehicle operating conditions. In: Chow, J.C., Ono,
D.M. (Eds.), Transactions, PM10 Standards and Nontradi-
tional Source Controls. Air and Waste Management Asso-
ciation, Pittsburgh, PA, pp. 885–898.
Audiffren, N., Renard, M., Buisson, E., Chaumerliac, N., 1998.
Deviations from the Henry�s law of equilibrium duringcloud events: A numerical approach of the mass transfer
between phases and its specific numerical effects. Atmos.
Res. 49 (2), 139–162.
Aunela-Tapola, L., Hatanpaa, E., Hoffren, H., Laitinen, T.,
Larjava, K., Rasila, P., Tolvanen, M., 1998. A study of
trace element behavior in two modern coal-fired power
plants––II. Trace element balances in two plants equipped
with semi-dry flue gas desulphurisation facilities. Fuel
Processing Technology 55 (1), 13–34.
Ayers, G.P., 2001. Comment of regression analysis of air
quality data. Atmos. Environ. 35 (13), 2423–2425.
Baldauf, R.W., Lane, B.D., Marotz, G.A., Wiener, R.W., 2001.
Performance evaluation of the portable MiniVol particulate
matter sampler. Atmos. Environ. 35, 6087–6091.
Ballard-Tremeer, G., Jawurek, H.H., 1996. Comparison of five
rural wood-burning cooking devices: Efficiencies and emis-
sions. Biomass Bioenergy 11, 419–430.
Barrefors, G., 1996. Air pollutants in road tunnels. Sci. Total
Environ. 189–190, 431–436.
Barrett, J.C., Clement, C.F., Ford, I.J., 1992. The effect of
redistribution on aerosol removal rates. J. Aerosol Sci. 23
(6), 639–656.
Barth, D., 1970. Federal motor vehicle emissions goals for CO,
HC, and NOx based on desired air quality levels. J. Air
Pollut. Control Assoc. 20 (8), 519–527.
Barone, J.B., Cahill, T.A., Eldred, R.A., Flocchini, R.G.,
Shadoan, D.J., Dietz, T.M., 1978. A multivariate statistical
analysis of visibility degradation at four California cities.
Atmos. Environ. 12, 2213–2221.
Bassett, M.E., Gelbard, F.G., Seinfeld, J.H., 1981. Mathemat-
ical model for multicomponent aerosol formation and
growth in plumes. Atmos. Environ. 15, 2395–2406.
Bassett, M.E., Seinfeld, J.H., 1983. Atmospheric equilibrium
model of sulfate and nitrate aerosols. Atmos. Environ. 17
(11), 2237–2252.
Bassett, M.E., Seinfeld, J.H., 1984. Atmospheric equilibrium
model of sulfate and nitrate aerosols. II. Particle size
analysis. Atmos. Environ. 18 (6), 1163–1170.
Batterman, S.A., Dzubay, T.G., Baumgardner, R.E., 1988.
Development of crustal profiles for receptor modeling.
Atmos. Environ. 22 (9), 1821–1828.
Baxter, R.A., Pederson, J.R., 1994. A measurement method for
sampling pollutants aloft in complex terrain. In: Solomon,
P.A. (Ed.), Planning and Managing Regional Air Quality,
Modeling and Measurement Studies. CRC Press, Boca
Raton, FL, pp. 699–710.
Belsley, D.A., Kuh, E.D., Welsch, R.E., 1980. Regression
Diagnostics: Identifying Influential Data and Sources of
Collinearity. John Wiley, New York, NY.
Benner, B.A., Gordon, G.E., Wise, S.A., 1989. Mobile sources
of atmospheric PAH: A roadway tunnel study. Environ. Sci.
Technol. 23, 1269–1278.
Benner, B.A., Wise, S.A., Currie, L.A., Klouda, G.A., Kline-
dinst, D.B., Zweidinger, R.B., Stevens, R.K., Lewis, C.W.,
1995. Distinguishing the contributions of residential wood
combustion and mobile source emissions using relative
concentrations of dimethylphenanthrene isomers. Environ.
Sci. Technol. 29 (9), 2382–2389.
Berg, T., Røyset, O., Steinnes, E., 1994. Component analysis of
data for trace elements and main components in precipita-
tion falling on Norway. Environ. Monit. Assess. 31 (3), 259–
274.
Bergametti, G., Dutot, A.L., Quisefit, J.P., Vie Le Sage, R.,
1983. Correspondence analysis applied to volcanic aerosols.
J. Volcanol. Geotherm. Res. 15, 355–367.
Bhave, P.V., Fergenson, D.P., Prather, K.A., Cass, G.R., 2001.
Source apportionment of fine particulate matter by cluster-
ing single-particle data: Tests of receptor model accuracy.
Environ. Sci. Technol. 35 (10), 2060–2072.
Biegalski, S.R., Landsberger, S., Hoff, R.M., 1998. Source–
receptor modeling using trace metals in aerosols collected at
three rural Canadian Great Lakes sampling stations. J. Air
Waste Mgmt. Assoc. 48 (3), 227–237.
Bighouse, R.D., Houck, J.E., 1994. Chemical mass balance
source profile data for Weirton, West Virginia. In: Devel-
opment of a PM10 SIP for the City of Weirton, West
Virginia, vol. 3, Report No. EPA No. 68-D3-0030; AGI No.
30,401.001. Prepared for Science Applications Intl. Corp.,
Falls Church, VA, by AGI Technologies, Portland, OR.
Bishop, G.A., Starkey, J.R., Ihlenfeldt, A., Williams, W.J.,
Stedman, D.H., 1989. IR long-path photometry: A remote
sensing tool for automobile emissions. Anal. Chem. 61 (10),
671A–677A.
Bishop, G.A., McLaren, S.E., Stedman, D.H., Pierson, W.R.,
Zweidinger, R.B., Ray, W., 1996. Method comparisons of
vehicle emissions measurements in the Fort McHenry and
Tuscarora mountain tunnels. Atmos. Environ. 30 (12),
2307–2316.
Bishop, G.A., Stedman, D.H., Castro, J., D�aavalos, F.J., 1997.
On-road remote sensing of vehicle emissions in Mexico.
Environ. Sci. Technol. 31 (12), 3505–3510.
Blanchard, C.L., Carr, E.L., Collins, J.F., Smith, T.B., Lehr-
man, D.E., Michaels, H.M., 1999. Spatial representativeness
and scales of transport during the 1995 Integrated Moni-
toring Study in California�s San Joaquin Valley. Atmos.Environ. 33 (29), 4775–4786.
1114 J.G. Watson et al. / Chemosphere 49 (2002) 1093–1136

Blanchard, C.L., Roth, P.M., Tanenbaum, S.J., Ziman, S.D.,
Seinfeld, J.H., 2000. The use of ambient measurements to
identify which precursor species limit aerosol nitrate for-
mation. J. Air Waste Mgmt. Assoc. 50 (12), 2073–2084.
Blifford, I.H., Meeker, G.O., 1967. A factor analysis model of
large scale pollution. Atmos. Environ. 1, 147–157.
Bogen, J., 1973. Trace elements concentrations in atmospheric
aerosol in the Heidelberg area measured by instrumental
neutron activation analysis. Atmos. Environ. 7, 1117–1125.
Bomboi, M.T., Hernandez, A., Mari~nno, F., Hontoria, E., 1990.
Application of multivariate analysis for characterization of
organic compounds from urban runoff. Sci. Total Environ.
93, 523–536.
Boutron, C., Martin, S., 1980. Source of 12 trace metals in
Antarctic snows determined by principal component ana-
lysis. J. Geophys. Res. 85 (C10), 5631–5638.
Bowman, F.M., Pilinis, C., Seinfeld, J.H., 1995. Ozone and
aerosol productivity of reactive organics. Atmos. Environ.
29 (5), 579–590.
Boznar, M., Lesjak, M., Mlakar, P., 1993. A neural network-
based method for short-term predictions of ambient SO2concentrations in highly polluted industrial areas of com-
plex terrain. Atmos. Environ. B 27 (2), 221.
Bressan, D.J., Carr, R.A., Wilkniss, P.E., 1973. Geochemical
aspects of inorganic aerosols near the ocean–atmosphere
interface. In: Kothny, E.L. (Ed.), Trace Elements in the
Environment. American Chemical Society, Washington,
DC, pp. 55–63.
Bridgman, H.A., 1992. Evaluating rainwater contamination
and sources in southeast Australia using factor analysis.
Atmos. Environ. A 26 (13), 2401–2412.
Britt, H.I., Luecke, R.H., 1973. The estimation of parameters in
nonlinear, implicit models. Technometrics 15 (2), 233–247.
Brook, J.R., Woodhouse, S.A., Blanchard, P., Dann, T.,
Dabek-Zlotorzynska, E., Goldthorp, S., Wiebe, A., Li,
S.M., Guise-Bagley, L., Hoff, R., Mamedov, A., Hanson-
Smith, L., Nejedly, Z., Campbell, J.L., Chow, J.C., 2000.
Chemical mass balance analyses of Toronto area PM2:5.
Environment Canada, Toronto, ON, Canada, Report No.
AES/AQRB-PERD-04.
Brown, A.D., Lund, L.J., 1994. Factors controlling throughfall
characteristics at a high elevation Sierra Nevada site,
California. Environ. Qual. 23 (4), 844–850.
Brumelis, G., Lapina, L., Nikodemus, O., Tabors, G., 2000.
Use of an artificial model of monitoring data to aid
interpretation of principal component analysis. Environ.
Modell. Software 15 (8), 755–763.
Brunet, G., Vautard, R., 1996. Empirical normal modes ver-
sus empirical orthogonal functions for statistical prediction.
J. Atmos. Sci. 53 (23), 3468–3489.
Buat-M�eenard, P., Arnold, M., 1978. The heavy metal chemistry
of atmospheric particulate matter emitted by Mount Etna
volcano. Geophys. Res. Lett. 5, 245–248.
Buhr, M.P., Trainer, M., Parrish, D.D., Sievers, R.E., Fehsen-
feld, F.C., 1992. Assessment of pollutant emission invento-
ries by principal component analysis of ambient air
measurements. Geophys. Res. Lett. 19 (10), 1009–1012.
Buhr, M.P., Parrish, D.D., Elliot, J., Holloway, J., Carpenter,
J., Goldan, P., Kuster, W., Trainer, M., Montzka, S.,
McKeen, S., Fehsenfeld, F.C., 1995. Evaluation of ozone
precursor source types using principal component analysis
of ambient air measurements in rural Alabama. J. Geophys.
Res. 100 (D11), 22853–22860.
Buhr, M.P., Hsu, K.J., Liu, C.M., Liu, R., Wei, L., Liu, Y.C.,
Kuo, Y.S., 1996. Trace gas measurements and air mass
classification from a ground station in Taiwan during the
PEM-West A experiment, 1991. J. Geophys. Res. 101 (D1),
2025–2035.
Cadle, S.H., Stephens, R., 1994. Remote sensing of vehicle
exhaust emissions. Environ. Sci. Technol. 28 (6), 258A–
264A.
Cahill, T.A., Wilkinson, K., Schnell, R.C., 1992. Composition
analyses of size-resolved aerosol samples taken from aircraft
downwind of Kuwait, spring 1991. J. Geophys. Res. 97
(D13), 14513–14520.
Calloway, C.P., Li, S.M., Buchanan, J.W., Stevens, R.K., 1989.
A refinement of the potassium tracer method for residential
wood smoke. Atmos. Environ. 23 (1), 67–69.
Capaldo, K.P., Pilinis, C., Pandis, S.N., 2000. A computation-
ally efficient hybrid approach for dynamic gas/aerosol
transfer in air quality models. Atmos. Environ. 34 (21),
3617–3627.
Carter, E.J., Borys, R.D., 1993. Aerosol-cloud chemical frac-
tionation: Enrichment factor analysis of cloud water.
J. Atmos. Chem. 17 (3), 277–292.
Carvacho, O.F., Ashbaugh, L.L., Matsumura, R.T., Southard,
R.J., Flocchini, R.G., 1996. Measurement of PM10 potential
from agricultural soils using a dust resuspension test
chamber. In: Proceedings, International Conference on Air
Pollution from Agricultural Operations. Midwest Plan
Service, Kansas City, MO.
Cass, G.R., 1981. Sulfate air quality control strategy design.
Atmos. Environ. 15 (7), 1227–1249.
Cass, G.R., McRae, G.J., 1981. Minimizing the cost of air
pollution control. Environ. Sci. Technol. 15 (7), 748–757.
Cass, G.R., McRae, G.J., 1983. Source–receptor reconciliation
of routine air monitoring data for trace metals: An emission
inventory assisted approach. Environ. Sci. Technol. 17 (3),
129–139.
Casuccio, G.S., Schwoeble, A.J., Henderson, B.C., Lee, R.J.,
Hopke, P.K., Sverdrup, G.M., 1989. The use of CCSEM
and microimaging to study source/receptor relationships.
In: Watson, J.G. (Ed.), Transactions, Receptor Models in
Air Resources Management. Air and Waste Management
Association, Pittsburgh, PA, pp. 39–58.
Centner, V., Massart, D.L., deNoord, O.E., deJong, S.,
Vandeginste, B.M., Sterna, C., 1996. Elimination of unin-
formative variables for multivariate calibration. Anal.
Chem. 68 (21), 3851–3858.
Chan, Y.C., Simpson, R.W., McTainsh, G.H., Vowles, P.D.,
Cohen, D.D., Bailey, G.M., 1999. Source apportionment
of visibility degradation problems in Brisbane (Australia)
using the multiple linear regression techniques. Atmos.
Environ. 33 (19), 3237–3250.
Chan, Y.C., Vowles, P.D., McTainsh, G.H., Simpson, R.W.,
Cohen, D.D., Bailey, G.M., Mcorist, G.D., 2000. Charac-
terisation and source identification of PM10 aerosol samples
collected with a high volume cascade impactor in Brisbane
(Australia). Sci. Total Environ. 262 (1–2), 5–19.
Chang, S., Hopke, P.K., Rheingrover, S.W., Gordon, G.E.,
1982. Target transformation factor analysis of wind-trajec-
tory selected samples. In: Proceedings of the 75th Annual
J.G. Watson et al. / Chemosphere 49 (2002) 1093–1136 1115
Meeting, June 20, 1982, New Orleans, LA. Air Pollution
Control Association, Pittsburgh, PA.
Chang, T.Y., Modzelewski, S.W., Norbeck, J.M., Pierson,
W.R., 1981. Tunnel air quality and vehicle emissions.
Atmos. Environ. 15 (6), 1011–1016.
Chen, C.L., Tsuang, B.J., Pan, R.C., Tu, C.Y., Liu, J.H.,
Huang, P.L., Bai, H., Cheng, M.T., 2002. Quantification
on source/receptor relationship of primary pollutants and
secondary aerosols from ground sources––Part II. Model
description and case study. Atmos. Environ. 36 (3), 421–
434.
Chen, K.S., Lin, C.F., Chou, Y.M., 2001. Determination of
source contributions to ambient PM2:5 in Kaohsiung,
Taiwan, using a receptor model. J. Air Waste Mgmt. Assoc.
51 (4), 489–498.
Chen, W.C., Wang, C.S., Wei, C.C., 1997. An assessment of
source contributions to ambient aerosols in central Taiwan.
J. Air Waste Mgmt. Assoc. 47 (4), 501–509.
Cheng, M.D., Hopke, P.K., 1986. Linear programming proce-
dure and regression diagnostics for least-squares solution
using CMB receptor model. In: Pace, T.G. (Ed.), Transac-
tions, Receptor Methods for Source Apportionment: Real
World Issues and Applications. Air Pollution Control
Association, Pittsburgh, PA, pp. 94–104.
Cheng, M.D., Hopke, P.K., 1989. Identification of markers for
chemical mass balance receptor model. Atmos. Environ. 23
(6), 1373–1384.
Cheng, M.D., Lioy, P.J., 1989. Simulation study of target
transformation factor analysis: Determination of the num-
ber of sources using eigenvalues. In: Watson, J.G. (Ed.),
Transactions, Receptor Models in Air Resources Manage-
ment. Air and Waste Management Association, Pittsburgh,
PA, pp. 196–213.
Cheng, M.D., Hopke, P.K., Barrie, L.A., Rippe, A., Olson,
M.P., Landsberger, S., 1993a. Qualitative determination of
source regions of aerosol in Canadian High Arctic. Environ.
Sci. Technol. 27 (10), 2063–2071.
Cheng, M.D., Hopke, P.K., Zeng, Y., 1993b. A receptor-
oriented methodology for determining source regions of
particulate sulfate observed at Dorset, Ontario. J. Geophys.
Res. 98 (D9), 16839–16850.
Cheng, M.D., Gao, N., Hopke, P.K., 1996. Source apportion-
ment study of nitrogen species measured in Southern
California in 1987. J. Environ. Eng. 122 (March), 183–190.
Choi, J.C., Lee, M., Chun, Y., Kim, J., Oh, S., 2001. Chemical
composition and source signature of spring aerosol in Seoul,
Korea. J. Geophys. Res. 106 (D16), 18067–18074.
Chow, J.C., 1985. A composite modeling approach to assess air
pollution source/receptor relationships. Sc.D. Dissertation,
Harvard University, Cambridge, MA.
Chow, J.C., 1995. Critical review: Measurement methods to
determine compliance with ambient air quality standards
for suspended particles. J. Air Waste Mgmt. Assoc. 45 (5),
320–382.
Chow, J.C., Spengler, J.D., 1986. A method of combining
dispersion models and trajectory models with principal
component analysis and chemical mass balance receptor
models. In: Pace, T.G. (Ed.), Transactions, Receptor
Methods for Source Apportionment: Real World Issues
and Applications. Air Pollution Control Association, Pitts-
burgh, PA, pp. 194–211.
Chow, J.C., Frazier, C.A., Watson, J.G., 1988a. A survey of
existing fugitive/area source characterization methods for
receptor modeling. In: Hoffnagle, G.F., Lebowitz, M.
(Eds.), Proceedings, Particulate Matter/Fugitive Dusts:
Measurements and Control in Western Arid Regions. Air
Pollution Control Association, Pittsburgh, PA, pp. 176–189.
Chow, J.C., Watson, J.G., Frazier, C.A., Egami, R.T., Good-
rich, A., Ralph, C., 1988b. Spatial and temporal source
contributions to PM10 and PM2:5 in Reno, NV. In: Mathai,
C.V., Stonefield, D.H. (Eds.), Transactions, PM10: Imple-
mentation of Standards. Air Pollution Control Association,
Pittsburgh, PA, pp. 438–457.
Chow, J.C., Watson, J.G., 1989. Summary of particulate data
bases for receptor modeling in the United States. In:
Watson, J.G. (Ed.), Transactions, Receptor Models in Air
Resources Management. Air and Waste Management As-
sociation, Pittsburgh, PA, pp. 108–133.
Chow, J.C., Egami, R.T., Watson, J.G., DeLong, T., 1990a.
Applying the air quality source apportionments to geother-
mal power plant emissions. Geotherm. Resour. Council
Bull. 19 (8), 208–213.
Chow, J.C., Watson, J.G., Egami, R.T., Frazier, C.A., Lu, Z.,
Goodrich, A., Bird, A., 1990b. Evaluation of regenerative-
air vacuum street sweeping on geological contributions to
PM10. J. Air Waste Mgmt. Assoc. 40 (8), 1134–1142.
Chow, J.C., Watson, J.G., Richards, L.W., Haase, D.L.,
McDade, C., Dietrich, D.L., Moon, D., Sloane, C.S.,
1991a. The 1989–1990 Phoenix PM10 Study, vol. II, Source
apportionment, Report No. DRI 8931.6F2. Prepared for
Arizona Department of Environmental Quality, Phoenix,
AZ, by Desert Research Institute, Reno, NV.
Chow, J.C., Watson, J.G., Richards, L.W., Haase, D.L.,
McDade, C., Dietrich, D.L., Moon, D., Sloane, C.S.,
1991b. The 1989–1990 Pilot Tucson PM10 Study, vol. II,
Source apportionment, Report No. DRI 8931.8F2. Pre-
pared for Arizona Department of Environmental Quality,
Phoenix, AZ, by Desert Research Institute, Reno, NV.
Chow, J.C., Liu, C.S., Cassmassi, J.C., Watson, J.G., Lu, Z.,
Pritchett, L.C., 1992a. A neighborhood-scale study of PM10source contributions in Rubidoux, California. Atmos.
Environ. A 26 (4), 693–706.
Chow, J.C., Watson, J.G., Lowenthal, D.H., Solomon, P.A.,
Magliano, K.L., Ziman, S.D., Richards, L.W., 1992b. PM10source apportionment in California�s San Joaquin Valley.Atmos. Environ. A 26 (18), 3335–3354.
Chow, J.C., Watson, J.G., Bowen, J.L., Frazier, C.A., Gertler,
A.W., Fung, K.K., Landis, D., Ashbaugh, L.L., 1993a. A
sampling system for reactive species in the western United
States. In: Winegar, E.D., Keith, L.H. (Eds.), Sampling and
Analysis of Airborne Pollutants. Lewis Publishers, Ann
Arbor, MI, pp. 209–228.
Chow, J.C., Watson, J.G., Ono, D.M., Mathai, C.V., 1993b.
PM10 standards and nontraditional particulate source con-
trols: A summary of the A&WMA/EPA International
Specialty Conference. J. Air Waste Mgmt. Assoc. 43 (1),
74–84.
Chow, J.C., Watson, J.G., Pritchett, L.C., Pierson, W.R.,
Frazier, C.A., Purcell, R.G., 1993c. The DRI thermal/
optical reflectance carbon analysis system: Description,
evaluation and applications in US air quality studies.
Atmos. Environ. A 27 (8), 1185–1201.
1116 J.G. Watson et al. / Chemosphere 49 (2002) 1093–1136

Chow, J.C., Watson, J.G., 1994a. Guidelines for PM10 sampling
and analysis applicable to receptor modeling. Report No.
EPA-452/R-94-009. Prepared for US EPA, Office of Air
Quality Planning and Standards, Research Triangle Park,
NC, by Desert Research Institute, Reno, NV.
Chow, J.C., Watson, J.G., 1994b. Contemporary source profiles
for geological material and motor vehicle emissions. Report
No. DRI 2625.2F. Prepared for US EPA, Office of Air
Quality Planning and Standards, Research Triangle Park,
NC, by Desert Research Institute, Reno, NV.
Chow, J.C., Watson, J.G., 1998. Guideline on speciated
particulate monitoring. Prepared for US EPA, Research
Triangle Park, NC, by Desert Research Institute, Reno,
NV.
Chow, J.C., Watson, J.G., 1999. Ion chromatography in
elemental analysis of airborne particles. In: Landsberger,
S., Creatchman, M. (Eds.), Elemental Analysis of Airborne
Particles, vol. 1. Gordon and Breach Science, Amsterdam,
pp. 97–137.
Chow, J.C., Watson, J.G., Houck, J.E., Pritchett, L.C., Rogers,
C.F., Frazier, C.A., Egami, R.T., Ball, B.M., 1994. A
laboratory resuspension chamber to measure fugitive dust
size distributions and chemical compositions. Atmos. Envi-
ron. 28 (21), 3463–3481.
Chow, J.C., Fairley, D., Watson, J.G., de Mandel, R., Fujita,
E.M., Lowenthal, D.H., Lu, Z., Frazier, C.A., Long, G.,
Cordova, J., 1995. Source apportionment of wintertime
PM10 at San Jose, CA. J. Environ. Eng. 21, 378–387.
Chow, J.C., Watson, J.G., Divita Jr., F., 1996a. Particulate
matter with aerodynamic diameters smaller than 10 lm––Measurement methods and sampling strategies. In: Keith,
L.H. (Ed.), Principles of Environmental Sampling, second
ed. American Chemical Society, Washington, DC, pp. 539–
573.
Chow, J.C., Watson, J.G., Lowenthal, D.H., Countess,
R.J., 1996b. Sources and chemistry of PM10 aerosol in
Santa Barbara County, CA. Atmos. Environ. 30 (9), 1489–
1499.
Chow, J.C., Watson, J.G., Green, M.C., Lowenthal, D.H.,
DuBois, D.W., Kohl, S.D., Egami, R.T., Gillies, J.A.,
Rogers, C.F., Frazier, C.A., Cates, W., 1999. Middle- and
neighborhood-scale variations of PM10 source contributions
in Las Vegas, Nevada. J. Air Waste Mgmt. Assoc. 49 (6),
641–654.
Chow, J.C., Watson, J.G., Green, M.C., Lowenthal, D.H.,
Bates, B.A., Oslund, W., Torres, G., 2000. Cross-border
transport and spatial variability of suspended particles in
Mexicali and California�s Imperial Valley. Atmos. Environ.34 (11), 1833–1843.
Chow, J.C., Watson, J.G., Crow, D., Lowenthal, D.H.,
Merrifield, T., 2001. Comparison of IMPROVE and
NIOSH carbon measurements. Aerosol Sci. Technol. 34
(1), 23–34.
Chow, J.C., Watson, J.G., 2002. Review of PM2:5 and PM10apportionment for fossil fuel combustion and other sources
by the chemical mass balance receptor model. Energy Fuels
16 (2), 222–260.
Chow, J.C., Watson, J.G., Edgerton, S.A., Vega, E., Ortiz, E.,
2002a. Spatial differences in outdoor PM10 mass and aerosol
composition in Mexico City. J. Air Waste Mgmt. Assoc. 52
(4), 423–434.
Chow, J.C., Watson, J.G., Hackett, E.I., Stone, R.H., Hins-
vark, B.A., 2002b. Method No. 822: General atomic
absorption procedure for trace metals in airborne material
collected on filters. In: Lodge, J.P. (Ed.), Methods of Air
Sampling and Analysis, fourth ed. Air and Waste Manage-
ment Association, Pittsburgh, PA, in press.
Chow, J.C., Watson, J.G., Lowenthal, D.H., Richards, L.W.,
2002c. Comparability between PM2:5 and light scattering
measurements. Environ. Monit. Assess., in press.
Chueinta, W., Hopke, P.K., Paatero, P., 2000. Investigation of
sources of atmospheric aerosol at urban and suburban
residential areas in Thailand by positive matrix factoriza-
tion. Atmos. Environ. 34 (20), 3319–3329.
Clegg, S.L., Seinfeld, J.H., Brimblecombe, P., 2001. Thermo-
dynamic modelling of aqueous aerosols containing electro-
lytes and dissolved organic compounds. J. Aerosol Sci. 32
(6), 713–738.
Coe, D.L., Chinkin, L.R., 1998. The use of a day-specific source
activity database to augment CMB source apportionment
modeling. In: Chow, J.C., Koutrakis, P. (Eds.), Proceedings,
PM2:5: A Fine Particle Standard. Air Waste Management
Association, Pittsburgh, PA, pp. 463–474.
Comrie, A.C., 1997. Comparing neural networks and regression
models for ozone forecasting. J. Air Waste Mgmt. Assoc. 47
(6), 653–663.
Conner, T.L., Stevens, R.K., 1991. Receptor modeling of fine
particles in the Tacoma tideflats airshed. In: Proceedings of
the 84th Annual Meeting, Vancouver, BC, Canada. Air and
Waste Management Association, Pittsburgh, PA.
Cooper, J.A., 1980. Environmental impact of residential wood
combustion emissions and its implications. J. Air Pollut.
Control Assoc. 30 (8), 855–861.
Cooper, J.C., 1983. Factor analysis: An overview. Am. Stat. 37,
141–147.
Cooper, J.A., Watson, J.G., 1980. Receptor oriented methods
of air particulate source apportionment. J. Air Pollut.
Control Assoc. 30 (10), 1116–1125.
Cooper, J.A., Sherman, J.R., Miller, E., Redline, D., Valdo-
novinos, L., Pollard, W.L., 1988. CMB source apportion-
ment of PM10 downwind of an oil-fired power plant in
Chula Vista, California. In: Mathai, C.V., Stonefield, D.H.
(Eds.), Transactions, PM10: Implementation of Standards.
Air and Waste Management Association, Pittsburgh, PA,
pp. 495–507.
Cooper, J.A., Miller, E.A., Redline, D.C., Spidell, R.L.,
Caldwell, L.M., Sarver, R.H., Tansyy, B.L., 1989. PM10source apportionment of Utah Valley winter episodes
before, during, and after closure of the West Orem steel
plant. Prepared for Kimball, Parr, Crockett and Waddops,
Salt Lake City, UT, by NEA, Inc., Beaverton, OR.
Core, J.E., 1989. Source profile development for PM10 receptor
modeling. In: Watson, J.G. (Ed.), Transactions, Receptor
Models in Air Resources Management. Air and Waste
Management Association, Pittsburgh, PA, pp. 134–144.
Core, J.E., Hanrahan, P.L., Cooper, J.A., 1981. Air particulate
control strategy development. In: Macias, E.S., Hopke, P.K.
(Eds.), Atmospheric Aerosol: Source/Air Quality Relation-
ships. American Chemical Society, Washington, DC,
pp. 107–123.
Core, J.E., Cooper, J.A., Hanrahan, P.L., Cox, W.M., 1982.
Particulate dispersion model evaluation: A new approach
J.G. Watson et al. / Chemosphere 49 (2002) 1093–1136 1117

using receptor models. J. Air Pollut. Control Assoc. 32 (11),
1142–1147.
Countess, R.J., Barnard, W.R., Claiborn, C.S., Gillette, D.A.,
Latimer, D.A., Pace, T.G., Watson, J.G., 2001. Methodo-
logy for estimating fugitive windblown and mechanically
resuspended road dust emissions applicable for regional
scale air quality modeling. Report No. 30203-9. Western
Regional Air Partnership, Denver, CO.
Cox, W.M., Clark, J., 1981. Ambient ozone concentration
patterns among eastern US urban areas using factor
analysis. J. Air Pollut. Control Assoc. 31 (7), 762–766.
Crawford, C.B., 1975. Determining the number of interpretable
factors. Psychol. Bull. 82 (2), 226–237.
Crawley, J., Sievering, H., 1986. Factor analysis of the MAP3S/
RAINE precipitation chemistry network: 1976–1980. Atmos.
Environ. 29 (5), 1001–1013.
Currie, L.A., Gerlach, R.W., Lewis, C.W., Balfour, W.D.,
Cooper, J.A., Dattner, S.L., deCesar, R.T., Gordon, G.E.,
Heisler, S.L., Hopke, P.K., Shah, J.J., Thurston, G.D.,
Williamson, H.J., 1984. Interlaboratory comparison of
source apportionment procedures: Results for simulated
data sets. Atmos. Environ. 18 (8), 1517–1537.
Currie, L.A., Sheffield, A.E., Riederer, G., Gordon, G.E., 1994.
Improved atmospheric understanding through exploratory
data analysis and complementary modeling: The urban K–
Pb–C system. Atmos. Environ. 28 (8), 1359–1369.
Currie, L.A., Klouda, G.A., Benner Jr., B.A., Garrity, K.,
Eglinton, T.I., 1999. Isotopic and molecular fractionation in
combustion: Three routes to molecular marker validation,
including direct molecular �dating� (GC/AMS). Atmos.Environ. 33 (17), 2789–2806.
Daisey, J.M., 1985. A new approach to the identification of
sources of airborne mutagens and carcinogens: Receptor
source apportionment modeling. Environ. Int. 11, 285–291.
Daisey, J.M., Kebbekus, B.B., Bozzelli, J.W., Lioy, P.J., 1986.
Exploratory application of factor analysis to volatile
organic compound concentration data from urban sites in
New Jersey. In: Pace, T.G. (Ed.), Transactions, Receptor
Methods for Source Apportionment: Real World Issues and
Applications. Air Pollution Control Association, Pitts-
burgh, PA, pp. 149–160.
Dams, R., Robbins, J.A., Rahn, K.A., Winchester, J.W., 1971.
Quantitative relationships among trace elements over in-
dustrialized N.W. Indiana. In: Nuclear Techniques in
Environmental Pollution. International Atomic Energy
Agency, Vienna, Austria, pp. 139–145.
Dannecker, W., Schr€ooder, B., Stechmann, H., 1990. Organic
and inorganic substances in highway tunnel exhaust air.
Sci. Total Environ. 93, 293–300.
Davidson, C., Borrazzo, J.E., Hendrickson, C.T., 1986. Pollu-
tant emission factors for gas stoves: A literature survey.
Report No. CR-812543-01-0. US EPA, Research Triangle
Park, NC.
Deboudt, K., Flament, P., Weis, D., Mennessier, J.P., Maqu-
inghen, P., 1999. Assessment of pollution aerosols sources
above the Straits of Dover using lead isotope geochemistry.
Sci. Total Environ. 236, 57–74.
deCesar, R.T., Cooper, J.A., 1982. Evaluation of multivariate
and chemical mass balance approaches to aerosol source
apportionments using synthetic data and an expanded
PACS data set. In: Hopke, P.K., Dattner, S.L. (Eds.),
Receptor Models Applied to Contemporary Pollution
Problems. Air Pollution Control Association, Pittsburgh,
PA, pp. 127–140.
deCesar, R.T., Edgerton, S.A., Khalil, M.A.K., Rasmussen,
R.A., 1985. Sensitivity analysis of mass balance receptor
modeling: methyl chloride as an indicator of wood smoke.
Chemosphere 14 (10), 1495–1501.
deCesar, R.T., Edgerton, S.A., Khalil, M.A.K., Rasmussen,
R.A., 1986. A tool for designing receptor model studies to
apportion source impacts with specified precisions. In: Pace,
T.G. (Ed.), Transactions, Receptor Methods for Source
Apportionment: Real World Issues and Applications. Air
Pollution Control Association, Pittsburgh, PA, pp. 56–67.
Deininger, C.K., Saxena, V.K., 1997. A validation of back
trajectories of air masses by principal component analysis of
ion concentrations in cloud water. Atmos. Environ. 31 (2),
295–300.
deNevers, N., Morris, J.R., 1975. Rollback modeling: Basic and
modified. J. Air Pollut. Control Assoc. 25 (9), 943–947.
Derde, M.P., Buydens, L., Guns, C., Massart, D.L., Hopke,
P.K., 1987. Comparison of rule-building expert systems
with pattern recognition for the classification of analytical
data. Anal. Chem. 59, 1868–1871.
Diaz, J.M.F., Bra~nna, M.A.R., Garcia, B.A., Mu~nniz, C.G.P.,
Nieto, P.J.G., 1999. Difficulties inherent to the use of
analytic solution of the condensation–evaporation equation
for multicomponent aerosols. Atmos. Environ. 33 (8), 1245–
1260.
Dickson, R.J., Oliver, W.R., 1991. Emissions models for
regional air quality studies. Environ. Sci. Technol. 25 (9),
1533–1535.
Dresser, A.L., Baird, B.K., 1988. A dispersion and receptor
model analysis of the wintertime PM10 problem in Telluride,
Colorado. In: Mathai, C.V., Stonefield, D.H. (Eds.),
Transactions, PM10: Implementation of Standards. Air
Pollution Control Association, Pittsburgh, PA, pp. 458–471.
Duewer, D.L., Kowalski, B.R., Fasching, J.L., 1976. Improving
the reliability of factor analysis of chemical data by utilizing
the measured analytical uncertainty. Anal. Chem. 48 (13),
2002–2010.
Duffy, B.L., Nelson, P.F., 1996. Non-methane exhaust compo-
sition in the Sydney Harbour Tunnel: A focus on benzene
and 1,3-butadiene. Atmos. Environ. 30 (15), 2759–2768.
Dzubay, T.G., 1980. Chemical element balance method applied
to dichotomous sampler data. Ann. N.Y. Acad. Sci. 338,
126–144.
Dzubay, T.G., 1989. Evaluation of composite receptor meth-
ods. In: Watson, J.G. (Ed.), Transactions, Receptor Models
in Air Resources Management. Air and Waste Management
Association, Pittsburgh, PA, pp. 367–378.
Dzubay, T.G., Mamane, Y., 1989. Use of electron microscopy
data in receptor models for PM10. Atmos. Environ. 23, 467–
476.
Dzubay, T.G., Stevens, R.K., Balfour, W.D., Williamson, H.J.,
Cooper, J.A., Core, J.E., deCesar, R.T., Crutcher, E.R.,
Dattner, S.L., Davis, B.L., Heisler, S.L., Shah, J.J., Hopke,
P.K., Johnson, D.L., 1984. Interlaboratory comparison of
receptor model results for Houston aerosol. Atmos. Envi-
ron. 18 (8), 1555–1566.
Dzubay, T.G., Stevens, R.K., Gordon, G.E., Olmez, I.,
Sheffield, A.E., Courtney, W.J., 1988. A composite receptor
1118 J.G. Watson et al. / Chemosphere 49 (2002) 1093–1136
method applied to Philadelphia aerosol. Environ. Sci.
Technol. 22 (1), 46–52.
Eatough, D.J., 1989. The chemical composition of ETS III:
Identification of conservative tracers of ETS. Environ. Int.
15, 19–28.
Eatough, D.J., Bennett, J.R., Lytle, N., Brutsch, M., Luke,
T.T., Houtrouw, S., Mangelson, N.F., Hill, M.W., Lewis,
E.A., Hansen, L.D., Eatough, N.L., Farber, R.J., 1987.
Identification of the presence of coal-fired power plant
emissions using spherical particles and total fluoride as
tracers. In: Bhardwaja, P.S. (Ed.), Transactions, Visibility
Protection: Research and Policy Aspects. Air Pollution
Control Association, Pittsburgh, PA, pp. 720–735.
Eatough, D.J., Eatough, M., Hansen, L., Lewis, E.A., 1992.
Apportionment of sulfur oxides and sulfate at Canyonlands
during the winter of 1990. In: Chow, J.C., Ono, D.M.
(Eds.), Transactions, PM10 Standards and Nontraditional
Particulate Source Controls. Air and Waste Management
Association, Pittsburgh, PA, pp. 293–308.
Eatough, D.J., Eatough, M., Lewis, L.J., Lewis, E.A., Toml-
inson, E.M., Gordon, J.L., Eatough, N.L., 1996. Appor-
tionment of sulfur oxides at Canyonlands during the winter
of 1990. II. Fingerprints of emissions from point and
regional sources impacting Canyonlands. Atmos. Environ.
30 (2), 283–294.
Eatough, D.J., Du, A., Joseph, J.M., Caka, F.M., Sun, B.,
Lewis, L., Mangelson, N.F., Eatough, M., Rees, L.B.,
Eatough, N.L., Farber, R.J., Watson, J.G., 1997a. Regional
source profiles of sources of SOX at the Grand Canyon
during Project MOHAVE. J. Air Waste Mgmt. Assoc. 47
(2), 101–118.
Eatough, D.J., Farber, R.J., Watson, J.G., 1997b. Second
generation chemical mass balance source apportionment of
sulfur oxides and sulfate at the Grand Canyon during the
Project Mohave 1992 summer intensive. In: Tombach, I.H.
(Ed.), Proceedings, Visual Air Quality: Aerosols and Global
Radiation Balance. Air and Waste Management Associa-
tion, Pittsburgh, PA, pp. 1153–1160.
Eatough, D.J., Farber, R.J., Watson, J.G., 2000. Second-
generation chemical mass balance source apportionment of
sulfur oxides and sulfate at the Grand Canyon during the
Project MOHAVE summer intensive. J. Air Waste Mgmt.
Assoc. 50 (5), 759–774.
Echalar, F., Artaxo, P., Martins, J.V., Yamasoe, M., Gerab, F.,
Maenhaut, W., Holben, B., 1998. Long-term monitoring of
atmospheric aerosols in the Amazon Basin: Source identi-
fication and apportionment. J. Geophys. Res. 103 (D24),
31849–31864.
Egami, R.T., Chow, J.C., Watson, J.G., de Long, T., 1990.
PM10 source apportionment study in Pleasant Valley,
Nevada. In: Transactions, 1990 International Symposium
on Geothermal Energy. Geothermal Resources Council,
Davis, CA, pp. 1115–1120.
Engelbrecht, J.P., Swanepoel, L., Zunckel, M., Chow, J.C.,
Watson, J.G., Egami, R.T., 2000. Modelling PM10 aerosol
data from the Qalabotjha low-smoke fuels macro-scale
experiment in South Africa. Ecol. Modell. 127, 235–244.
Engelbrecht, J.P., Swanepoel, L., Chow, J.C., Watson, J.G.,
Egami, R.T., 2001. PM2:5 and PM10 concentrations from the
Qalabotjha low-smoke fuels macro-scale experiment in
South Africa. Environ. Monit. Assess. 69 (1), 1–15.
Engelbrecht, J.P., Swanepoel, L., Chow, J.C., Watson, J.G.,
Egami, R.T., 2002. A comparison of source contributions
from residential coal and low-smoke fuels, using CMB
modeling, in South Africa. Environ. Sci. Policy 5 (2), 157–
167.
Fan, A., Hopke, P.K., Raunemaa, T., Oblad, M., Pacyna, J.M.,
1995. A study on the potential sources of air pollutants
observed at Tj€oorn, Sweden. Environ. Sci. Pollut. Res. 2 (2),
107–115.
Fan, C.W., Zhang, J., 1998. Particulate matter and other air
pollutants from several portable household combustion
devices: Particle size distributions, emission rates, emission
factors, and potential exposures. In: Chow, J.C., Koutrakis,
P. (Eds.), Proceedings, PM2:5: A Fine Particle Standard.
Air and Waste Management Association, Pittsburgh, PA,
pp. 876–888.
Feeley, J.A., Liljestrand, H.M., 1983. Source contributions to
acid precipitation in Texas. Atmos. Environ. 17 (4), 807–
814.
Fogg, T.R., Rahn, K.A., 1984. Boron as a tracer of aerosol
from combustion of coal. Geophys. Res. Lett. 1 (9), 854–
857.
Fraser, M.P., Grosjean, D., Grosjean, E., Rasmussen, R.A.,
Cass, G.R., 1996. Air quality model evaluation data for
organics: 1. Bulk chemical and gas/particle distribution
factors. Environ. Sci. Technol. 30 (5), 1731–1743.
Fraser, M.P., Cass, G.R., Simoneit, B.R.T., 1998. Gas-phase
and particle-phase organic compounds emitted from motor
vehicle traffic in a Los Angeles roadway tunnel. Environ.
Sci. Technol. 32 (14), 2051–2060.
Friedlander, S.K., 1973a. Chemical element balances and
identification of air pollution sources. Environ. Sci. Tech-
nol. 7 (3), 235–240.
Friedlander, S.K., 1973b. Relating particulate pollution to
sources: Case of the Los Angeles aerosol. In: Third
International Clean Air Congress, Dusseldorf, Federal
Republic of Germany.
Friedlander, S.K., 1981. New developments in receptor mod-
eling theory. In: Macias, E.S., Hopke, P.K. (Eds.), Atmo-
spheric Aerosol: Source/Air Quality Relationships.
American Chemical Society, Washington, DC, pp. 1–19.
Fujita, E.M., Lu, Z., Frazier, C.A., Watson, J.G., 1997.
Application of the chemical mass balance receptor model
to apportionment of suspended particulate matter in the
Bangkok metropolitan region. Prepared for Radian Inter-
national Corporation, Austin, TX, by Desert Research
Institute, Reno, NV.
Fujita, E.M., Watson, J.G., Chow, J.C., Robinson, N.F.,
Richards, L.W., Kumar, N., 1998. Northern Front Range
Air Quality Study. vol. C: Source apportionment and
simulation methods and evaluation. Prepared for Colorado
State University, Cooperative Institute for Research in the
Atmosphere, Ft. Collins, CO, by Desert Research Institute,
Reno, NV.
Gaarenstroom, P.D., Perone, S.P., Moyers, J.L., 1977. Appli-
cation of pattern recognition and factor analysis for
characterization of atmospheric particulate composition in
southwest desert atmosphere. Environ. Sci. Technol. 11 (8),
795–800.
Gao, N., Cheng, M.D., Hopke, P.K., 1993a. Potential source
contribution function analysis and source apportionment
J.G. Watson et al. / Chemosphere 49 (2002) 1093–1136 1119
of sulfur species measured at Rubidoux, CA during the
Southern California Air Quality Study, 1987. Anal. Chim.
Acta 277 (2), 369–380.
Gao, N., Cheng, M.D., Hopke, P.K., 1993b. PSCF analysis and
source apportionment of sulfur species measured at Rubi-
doux, CA during SCAQS, 1987. Anal. Chim. Acta 277, 369–
380.
Gao, N., Cheng, M.D., Hopke, P.K., 1994. Receptor modeling
of airborne ionic species collected in SCAQS, 1987. Atmos.
Environ. 28 (8), 1447–1470.
Gardner, M.W., Dorling, S.R., 1998. Artificial neural networks
(the multilayer perceptron)––A review of applications in the
atmospheric sciences. Atmos. Environ. 32 (14–15), 2627–
2636.
Gardner, M.W., Dorling, S.R., 1999. Neural network mod-
elling and prediction of hourly NOX and NO2 concen-
trations in urban air in London. Atmos. Environ. 33 (5),
709–720.
Gartrell Jr., G., Friedlander, S.K., 1975. Relating particulate
pollution to sources: The 1972 California Aerosol Charac-
terization Study. Atmos. Environ. 9, 279–299.
Gatz, D.F., 1978. Identification of aerosol sources in the St.
Louis area using factor analysis. J. Appl. Meteorol. 17, 600–
608.
Gatz, D.F., Stensland, G.J., Miller, M.V., Leslie, A.C.D., 1981.
Sources of airborne calcium in rural central Illinois. In:
Macias, E.S., Hopke, P.K. (Eds.), Atmospheric Aerosol:
Source/Air Quality Relationships. American Chemical So-
ciety, pp. 303–325.
Gatz, D.F., Stensland, G.J., Miller, M.V., 1998. Element
enrichment in some soil dust PM2:5 source compositions.
In: Chow, J.C., Koutrakis, P. (Eds.), Proceedings, PM2:5: A
Fine Particle Standard. Air and Waste Management Asso-
ciation, Pittsburgh, PA, pp. 699–712.
Ge, S., Khalil, M.A.K., Rau, J.A., 1989. The application of a
chemical mass balance model in China. In: Watson, J.G.
(Ed.), Transactions, Receptor Models in Air Resources
Management. Air and Waste Management Association,
Pittsburgh, PA, pp. 12–19.
Gebhart, K.A., Latimer, D.A., Sisler, J.F., 1990. Empirical
orthogonal function analysis of the particulate sulfate
concentrations measured during WHITEX. In: Mathai,
C.V. (Ed.), Transactions, Visibility, and Fine Particles.
Air and Waste Management Association, Pittsburgh, PA,
pp. 860–871.
Gebhart, K.A., Malm, W.C., 1997. Spatial and temporal
patterns in particle data measured during the MOHAVE
study. J. Air Waste Mgmt. Assoc. 47 (2), 119–135.
Gether, J., Seip, H.M., 1979. Analysis of air pollution data by
the combined use of interactive graphic presentation and a
clustering technique. Atmos. Environ. 13, 87–96.
Gerlach, R.W., Currie, L.A., Lewis, C.W., 1982. Review of the
Quail Roost II receptor model simulation exercise. In:
Hopke, P.K., Dattner, S.L. (Eds.), Proceedings, Receptor
Models Applied to Contemporary Pollution Problems. Air
Pollution Control Association, Pittsburgh, PA, pp. 96–109.
Gertler, A.W., Pierson, W.R., 1996. Recent measurements of
mobile source emission factors in North American tunnels.
Sci. Total Environ. 189–190, 107–113.
Gertler, A.W., Wittorff, D.N., McLaren, R., Belzer, W., Dann,
T., 1997. Characterization of vehicle emissions in Vancou-
ver, BC during the 1993 Lower Fraser Valley Oxidants
Study. Atmos. Environ. 31 (14), 2107–2112.
Gillani, N.V., Wilson, W.E., 1983. Gas-to-particle conversion
of sulfur in power plant plumes––II. Observations of liquid-
phase conversion. Atmos. Environ. 17, 1739.
Gillies, J.A., Gertler, A.W., Sagebiel, J.C., Dippel, W.A., 1998.
On-road PM2:5 and PM10 emissions in the Sepulveda
Tunnel, Los Angeles, California. In: Chow, J.C., Koutrakis,
P. (Eds.), Proceedings, PM2:5: A Fine Particle Standard. Air
and Waste Management Association, Pittsburgh, PA,
pp. 677–698.
Gillies, J.A., Watson, J.G., Rogers, C.F., DuBois, D.W., Chow,
J.C., Langston, R., Sweet, J., 1999. Long term efficiencies of
dust suppressants to reduce PM10 emissions from unpaved
roads. J. Air Waste Mgmt. Assoc. 49 (1), 3–16.
Gillies, J.A., Gertler, A.W., Sagebiel, J.C., Dippel, W.A., 2001.
On-road particulate matter (PM2:5 and PM10 emissions in
the Sepulveda Tunnel, Los Angeles, California). Environ.
Sci. Technol. 35 (6), 1054–1063.
Gleser, L.J., 1997. Some thoughts on chemical mass balance
models. Chemom. Intell. Lab. Sys. 37 (1), 15–22.
Glover, D.M., Hopke, P.K., 1992. Exploration of multivariate
chemical data by projection pursuit. Chemom. Intell. Lab.
Sys. 16, 45–59.
Glover, D.M., Hopke, P.K., 1994. Exploration of multivariate
atmospheric particulate compositional data by projection
pursuit. Atmos. Environ. 28 (8), 1411–1424.
Glover, D.M., Hopke, P.K., Vermette, S.J., Landsberger, S.,
D�Auben, D.R., 1991. Source apportionment with sitespecific source profiles. J. Air Waste Mgmt. Assoc. 41 (3),
294–305.
Gordon, G.E., Zoller, W.H., Gladney, E.S., 1973. Abnormally
enriched trace elements in the atmosphere. In: Trace
Substances in Environmental Health. University of Mis-
souri Environmental Trace Substances Center, Columbia,
MO, pp. 167–177.
Gordon, G.E., 1980. Receptor models. Environ. Sci. Technol.
14, 792–800.
Gordon, G.E., Olmez, I., 1986. Hybrid receptor modeling with
multiple sources and vertical mixing. In: Pace, T.G. (Ed.),
Transactions, Receptor Methods for Source Apportion-
ment: Real World Issues and Applications. Air Pollution
Control Association, Pittsburgh, PA, pp. 229–238.
Gordon, G.E., 1988. Receptor models. Environ. Sci. Technol.
22 (10), 1132–1142.
Gordon, G.E., Zoller, W.H., Kowalczyk, G.S., Rheingrover,
S.W., 1981. Composition of source components needed for
aerosol receptor models. In: Macias, E.S., Hopke, P.K.
(Eds.), Atmospheric Aerosol: Source Air/Quality Rela-
tionships. American Chemical Society, Washington, DC,
pp. 51–74.
Gordon, G.E., Pierson, W.R., Daisey, J.M., Lioy, P.J., Cooper,
J.A., Watson, J.G., Cass, G.R., 1984. Considerations
for design of source apportionment studies. Atmos. Envi-
ron. 18 (8), 1567–1582.
Gray, H.A., Cass, G.R., 1998. Source contributions to atmo-
spheric fine carbon particle concentrations. Atmos. Environ.
32 (22), 3805–3825.
Gray, H.A., Landry, B., Liu, C.S., Henry, R.C., Cooper, J.A.,
Sherman, J.R., 1988. Receptor modeling for PM10 source
apportionment in the South Coast Air Basin of California.
1120 J.G. Watson et al. / Chemosphere 49 (2002) 1093–1136

In: Mathai, C.V., Stonefield, D.H. (Eds.), Transactions,
PM10: Implementation of Standards. Air Pollution Control
Association, Philadelphia, PA, pp. 399–418.
Green, M.C., Flocchini, R.G., Myrup, L.O., 1992a. The
relationship of the extinction coefficient distribution to
wind field patterns in Southern California. Atmos. Environ.
A 26 (5), 827–840.
Green, M.C., Myrup, L.O., Flocchini, R.G., 1992b. A method
for classification of wind field patterns and its application
to Southern California. Int. J. Climatol. 12, 111–135.
Green, M.C., Flocchini, R.G., Myrup, L.O., 1993. Use of
temporal principal components analysis to determine sea-
sonal periods. Appl. Meteorol. 32 (5), 986–995.
Green, M.C., Tombach, I.H., 2000. Use of Project MOHAVE
perfluorocarbon tracer data to evaluate source and receptor
models. J. Air Waste Mgmt. Assoc. 50 (5), 717–723.
Greenberg, J.P., Guenther, A., Zimmerman, P., Baugh, W.,
Geron, C., Davis, K., Helmig, D., Klinger, L.F., 1999.
Tethered balloon measurements of biogenic VOCs in the
atmospheric boundary layer. Atmos. Environ. 33 (6), 855–
867.
Grosjean, D., Friedlander, S.K., 1975. Gas–particle distribu-
tion factors for organic and other pollutants in the Los
Angeles atmosphere. J. Air Pollut. Control Assoc. 25 (10),
1038–1044.
Grosjean, D., Seinfeld, J.H., 1989. Parameterization of the
formation potential of secondary organic aerosols. Atmos.
Environ. 23 (8), 1733–1747.
Hammerle, R.H., Pierson, W.R., 1975. Sources and elemental
composition of aerosol in Pasadena, California, by energy-
dispersive X-ray fluorescence. Environ. Sci. Technol. 9 (12),
1058–1068.
Hansen, A.D.A., Rosen, H., 1990. Individual measurements
of the emission factor of aerosol black carbon in auto-
mobile plumes. J. Air Waste Mgmt. Assoc. 40 (12), 1654–
1657.
Hardy, D.M., Walton, J.J., 1978. Principal components ana-
lysis of vector wind measurements. J. Appl. Meteorol. 17,
1153–1162.
Harrison, R.M., MacKenzie, A.R., 1990. A numerical simula-
tion of kinetic constraints upon achievement of the ammo-
nium nitrate dissociation equilibrium in the troposphere.
Atmos. Environ. A 24 (1), 91–102.
Harrison, R.M., Msibi, I.M., 1994. Validation of techniques for
fast response measurement of HNO3 and NH3 and deter-
mination of the [NH3] [HNO3] concentration product.
Atmos. Environ. 28 (2), 247–256.
Harrison, R.M., Pio, C.A., 1983. An investigation of the
atmospheric HNO3, NH3, NH4NO3 equilibrium relation-
ship in a cool, humid climate. Tellus 35B, 155–159.
Harrison, R.M., Sturges, W.T., Kitto, A.M.N., Li, Y., 1990.
Kinetics of evaporation of ammonium chloride and ammo-
nium nitrate aerosols. Atmos. Environ. A 24 (7), 1883–1888.
Harrison, R.M., Smith, D.J.T., Luhana, L., 1996. Source
apportionment of atmospheric polycyclic aromatic hydro-
carbons collected from an urban location in Birmingham,
UK. Environ. Sci. Technol. 30 (3), 825–832.
Hawthorne, S.B., Miller, D.J., Langenfeld, J.J., Krieger, M.S.,
1992. PM10 high-volume collection and quantitation of
semi- and nonvolatile phenols, methoxylated phenols,
alkanes, and polycyclic aromatic hydrocarbons from winter
urban air and their relationship to wood smoke. Environ.
Sci. Technol. 26 (11), 2251–2262.
Hayami, H., Carmichael, G.R., 1997. Analysis of aerosol
composition at Cheju Island, Korea, using a two-bin gas–
aerosol equilibrium model. Atmos. Environ. 31 (20), 3429–
3440.
H€aanel, G., 1965. The properties of atmospheric aerosolparticles as functions of the relative humidity at thermody-
namic equilibrium with the surrounding moist air. Adv.
Geophys. 19, 73.
Heaton, R.W., Rahn, K.A., Lowenthal, D.H., 1992. Regional
apportionment of sulfate and tracer elements in Rhode
Island precipitation. Atmos. Environ. A 26 (8), 1529–1544.
Heidam, N.Z., 1987. Bootstrap estimates of factor model
variability. Atmos. Environ. 21, 1203–1217.
Heindryckx, R., Dams, R., 1974. Continental, marine and
anthropogenic contributions to the inorganic composition
of the aerosol of an industrial zone. J. Radioanal. Chem. 19,
339–349.
Heinsohn, R.J., Davis, J.W., Knapp, K.T., 1980. Dilution
source sampling systems. Environ. Sci. Technol. 14, 1205.
Heisler, S.L., Henry, R.C., Watson, J.G., Hidy, G.M., Ander-
son, J., Hall, J.S., van Valin, C.C., Waggoner, A.P., 1980.
The nature and origins of the Denver winter haze––Findings
of the 1978 experiment, vol. I. Report No. ERT no. P-5417
D. Prepared for Motor Vehicle Manufacturers Assoc. of the
US Environmental Research and Technology, Inc., West-
lake Village, CA.
Henry, R.C., Hidy, G.M., 1979. Multivariate analysis of
particulate sulfate and other air quality variables by
principal components––Part I. Annual data from Los
Angeles and New York. Atmos. Environ. 13, 1581–1596.
Henry, R.C., Hidy, G.M., 1981. Authors� reply to discussions:Multivariate analysis of particulate sulfate and other air
quality variables by principal components––Part I. Annual
data from Los Angeles and New York. Atmos. Environ. 15,
425–426.
Henry, R.C., Hidy, G.M., 1982. Multivariate analysis of
particulate sulfate and other air quality variables by
principal components––Part II. Salt Lake City, Utah and
St. Louis, Missouri. Atmos. Environ. 16, 929–943.
Henry, R.C., 1982. Stability analysis of receptor models that
use least squares fitting. In: Hopke, P.K., Dattner, S.L.
(Eds.), Proceedings, Receptor Models Applied to Contem-
porary Air Pollution Problems. Air Pollution Control
Association, Pittsburgh, PA, pp. 141–162.
Henry, R.C., 1984. Fundamental limitations of factor analysis
receptor models. In: Liu, B.Y.H., Pui, D.Y.H., Fissan, H.J.
(Eds.), Aerosols: Science, Technology and Industrial Ap-
plications of Airborne Particles. Elsevier Press, New York,
pp. 359–362.
Henry, R.C., 1986. Fundamental limitations of receptor models
using factor analysis. In: Pace, T.G. (Ed.), Transactions,
Receptor Methods for Source Apportionment: Real World
Issues and Applications. Air Pollution Control Association,
Pittsburgh, PA, pp. 68–77.
Henry, R.C., 1987. Current factor analysis receptor models are
ill-posed. Atmos. Environ. 21 (8), 1815–1820.
Henry, R.C., 1991. Multivariate receptor models. In: Hopke,
P.K. (Ed.), Receptor Modeling for Air Quality Manage-
ment. Elsevier, Amsterdam, The Netherlands, pp. 117–147.
J.G. Watson et al. / Chemosphere 49 (2002) 1093–1136 1121

Henry, R.C., 1992. Dealing with near collinearity in chemical
mass balance receptor models. Atmos. Environ. A 26 (5),
933–938.
Henry, R.C., 1997a. History and fundamentals of multivariate
air quality receptor models. Chemom. Intell. Lab. Sys. 37,
37–42.
Henry, R.C., 1997b. Receptor model applied to patterns in
space (RMAPS) Part I––Model description. J. Air Waste
Mgmt. Assoc. 47 (2), 216–219.
Henry, R.C., 1997c. Receptor model applied to patterns in
space (RMAPS) Part II––Apportionment of airborne par-
ticulate sulfur from Project MOHAVE. J. Air Waste Mgmt.
Assoc. 47 (2), 220–225.
Henry, R.C., 1997d. Receptor modeling applied to patterns in
space (RMAPS) Part III––Apportionment of airborne
particulate sulfur in western Washington state. J. Air Waste
Mgmt. Assoc. 47 (2), 226–230.
Henry, R.C., Kim, B.M., 1989. A factor analysis receptor
model with explicit physical constraints. In: Watson, J.G.
(Ed.), Transactions, Receptor Models in Air Resources
Management. Air and Waste Management Association,
Pittsburgh, PA, pp. 214–225.
Henry, R.C., Kim, B.M., 1990. Extension of self-modeling
curve resolution to mixtures of more than three components
Part 1. Finding the basic feasible region. Chemom. Intell.
Lab. Sys. 8, 205–216.
Henry, R.C., Wang, Y.J., Gebhart, K.A., 1991. The relation-
ship between empirical orthogonal functions and sources of
air pollution. Atmos. Environ. A 25 (2), 503–509.
Henry, R.C., Park, E.S., Spiegelman, C.H., 1999. Comparing
a new algorithm with the classic methods for estimating
the number of factors. Chemom. Intell. Lab. Sys. 48, 91–
97.
Henry, R.C., 2000. UNMIX Version 2 Manual. Ronald C.
Henry, Ph.D., West Hills, CA.
Henry, R.C., 2002. Multivariate receptor modeling by n-dimensional edge detection. Chemom. Intell. Lab. Sys.,
accepted.
Hering, S.V., Bowen, J.L., Wengert, J.G., Richards, L.W.,
1981. Characterization of the regional haze in the south-
western United States. Atmos. Environ. 15 (10/11), 1999–
2009.
Hering, S.V., Miguel, A.H., Dod, R.L., 1984. Tunnel measure-
ments of the PAH, carbon thermogram and elemental
source signature for vehicular exhaust. Sci. Total Environ.
36, 39–45.
Hidy, G.M., Friedlander, S.K., 1971. The nature of the Los
Angeles aerosol. In: Englund, H.M., Beery, W.T. (Eds.),
Proceedings of the Second International Clean Air Con-
gress. Academic Press, New York, pp. 391–404.
Hidy, G.M., Venkataraman, C., 1996. The chemical mass
balance method for estimating atmospheric particle sources
in southern California. Chem. Eng. Commun. 151, 187–209.
Hien, P.D., Binh, N.T., Truong, Y., Ngo, N.T., Sieu, L.N.,
2001. Comparative receptor modelling study of TSP, PM2and PM2–10 in Ho Chi Minh City. Atmos. Environ. 35 (15),
2669–2678.
Hildemann, L.M., Cass, G.R., Markowski, G.R., 1989. A
dilution stack sampler for collection of organic aerosol
emissions: Design, characterization and field tests. Aerosol
Sci. Technol. 10 (10–11), 193–204.
Hildemann, L.M., Markowski, G.R., Jones, M.C., Cass, G.R.,
1991. Submicrometer aerosol mass distributions of emis-
sions from boilers, fireplaces, automobiles, diesel trucks,
and meat-cooking operations. Aerosol Sci. Technol. 14 (1),
138–152.
Hlavinka, M.W., Bullin, J.A., 1988. Validation of mobile
source emission estimates using mass balance techniques.
J. Air Pollut. Control Assoc. 38 (8), 1035–1039.
Hoffman, G.L., Duce, R.A., Hoffman, E.J., 1972. Trace metals
in the Hawaiian marine atmosphere. J. Geophys. Res. 77,
5322–5329.
Hoffman, G.L., Duce, R.A., 1972. Consideration of the
chemical fractionation of alkali and alkaline earth metals
in the Hawaiian marine atmosphere. J. Geophys. Res. 77,
5161–5169.
Hofmann, D.J., Stone, R.S., Wood, M.E., Deshler, T., Harris,
J.M., 1998. An analysis of 25 years of balloon-borne aerosol
data in search of a signature of the subsonic commercial
aircraft fleet. Geophys. Res. Lett. 25, 2433–2436.
Holzman, M.I., Scheff, P.A., Yusoff, M.R., 1986. Application
and evaluation of four regression techniques for a chemical
mass balance receptor model. In: Proceedings of the 79th
Annual Meeting, 22 June, 1986, Minneapolis, MN. Air
Pollution Control Association, Pittsburgh, PA.
Hoogerbrugge, R., Willig, S.J., Kistemaker, P.G., 1983.
Discriminant analysis by double stage principal component
analysis. Anal. Chem. 55, 1710–1712.
Hopke, P.K., 1976. The application of multivariate analysis for
interpretation of the chemical and physical analysis of lake
sediments. J. Environ. Sci. Health A 11 (6), 367–383.
Hopke, P.K., 1981. The application of factor analysis to urban
aerosol source resolution. In: Macias, E.S., Hopke, P.K.
(Eds.), Atmospheric Aerosol: Source/Air Quality Relation-
ships. American Chemical Society, Washington DC, pp. 21–
49.
Hopke, P.K., 1982. Discussion: �Trace element concentrationsin summer aerosols at rural sites in New York state and
their possible sources� and �Seasonal variation in thecomposition of ambient sulfate-containing aerosols in the
New York area�. Environ. Sci. Technol. 16, 1279–1281.Hopke, P.K., 1985. Receptor Modeling in Environmental
Chemistry. John Wiley, New York.
Hopke, P.K., 1988. Target transformation factor analysis as an
aerosol mass apportionment method: A review and sensi-
tivity study. Atmos. Environ. 22 (9), 1777–1792.
Hopke, P.K., Gladney, E.S., Gorden, G.E., Zoller, W.H.,
Jones, A.G., 1976. The use of multivariate analysis to
identify sources of selected elements in Boston urban
aerosol. Atmos. Environ. 10, 1015–1025.
Hopke, P.K., Lamb, R.E., Natusch, D.F.S., 1980. Multiele-
mental characterization of urban roadway dust. Environ.
Sci. Technol. 14, 164–172.
Hopke, P.K., Dattner, S.L., 1982. Receptor Models Applied to
Contemporary Pollution Problems. Air and Waste Man-
agement Association, Pittsburgh, PA.
Hopke, P.K., Severin, K.G., Chang, S.N., 1982. Application
and verification studies of target transformation factor
analysis as an aerosol receptor model. In: Hopke, P.K.,
Dattner, S.L. (Eds.), Proceedings, Receptor Models Applied
to Contemporary Pollution Problems. Air Pollution Control
Association, Pittsburgh, PA, pp. 110–126.
1122 J.G. Watson et al. / Chemosphere 49 (2002) 1093–1136

Hopke, P.K., Alpert, D.J., Roscoe, B.A., 1983. FANTASIA––
A program for target transformation factor analysis to
apportion sources in environmental samples. Comput.
Chem. 7 (3), 149–155.
Hopke, P.K., Wlaschin, W., Landsberger, S., Sweet, C.W.,
Vermette, S.J., 1988. The source apportionment of PM10 in
South Chicago. In: Mathai, C.V., Stonefield, D.H. (Eds.),
Transactions, PM10: Implementation of Standards. Air
Pollution Control Association, Pittsburgh, PA, pp. 484–
494.
Hopke, P.K., 1991. In: Hopke, P.K. (Ed.), Receptor Modeling
for Air Quality Management. Elsevier, Amsterdam, The
Netherlands.
Hopke, P.K., Gao, N., Cheng, M.D., 1993. Combining
chemical and meteorological data to infer source areas of
airborne pollutants. Chemom. Intell. Lab. Sys. 19 (2), 187–
199.
Hopke, P.K., Li, C.L., Ciszek, W., Landsberger, S., 1995. The
use of bootstrapping to estimate conditional probability
fields for source locations of airborne pollutants. Chemom.
Intell. Lab. Sys. 30 (1), 69–79.
Hopke, P.K., Song, X.H., 1997. The chemical mass balance as a
multivariate calibration problem. Chemom. Intell. Lab. Sys.
37, 5–14.
Hosiokangas, J., Ruuskanen, J., Pekkanen, J., 1999. Effects of
soil dust episodes and mixed fuel sources on source
apportionment of PM10 particles in Kuopio, Finland.
Atmos. Environ. 33 (21), 3821–3829.
Houck, J.E., Cooper, J.A., Frazier, C.A., deCesar, R.T.,
Mohan, J.F., Maughan, D., Roberts, J., 1982. Receptor
model source apportionment of lead in an airshed with lead
smelters. In: Hopke, P.K., Dattner, S.L. (Eds.), Receptor
Models Applied to Contemporary Pollution Problems. Air
Pollution Control Association, Pittsburgh, PA, pp. 34–
45.
Houck, J.E., Chow, J.C., Ahuja, M.S., 1989. The chemical and
size characterization of particulate material originating
from geological sources in California. In: Watson, J.G.
(Ed.), Transactions, Receptor Models in Air Resources
Management. Air and Waste Management Association,
Pittsburgh, PA, pp. 322–333.
Houck, J.E., Goulet, J.M., Chow, J.C., Watson, J.G., Pritchett,
L.C., 1990. Chemical characterization of emission sources
contributing to light extinction. In: Mathai, C.V. (Ed.),
Transactions, Visibility and Fine Particles. Air and Waste
Management Association, Pittsburgh, PA, pp. 437–446.
Houck, J.E., Rau, J.A., Body, S., Chow, J.C., 1992. Source
apportionment––Pocatello, Idaho PM10 nonattainment
area. In: Chow, J.C., Ono, D.M. (Eds.), Transactions,
PM10 Standards and Nontraditional Particulate Source
Controls. Air and Waste Management Association, Pitts-
burgh, PA, pp. 219–230.
Huang, S., Rahn, K.A., Arimoto, R., 1999. Testing and
optimizing two factor-analysis techniques on aerosol at
Narragansett, Rhode Island. Atmos. Environ. 33 (14),
2169–2185.
Huang, S., Arimoto, R., Rahn, K.A., 2001. Sources and source
variations for aerosol at Mace Head, Ireland. Atmos.
Environ. 35 (8), 1421–1437.
Husain, L., Samson, P.J., 1979. Long-range transport of trace
elements. J. Geophys. Res. 84 (C3), 1237–1240.
Husain, L., Webber, J.S., Canelli, E., Dutkiewicz, V.A.,
Halstead, J.A., 1984. Mn/V ratio as a tracer of aerosol
sulfate transport. Atmos. Environ. 18 (6), 1059–1071.
Hwang, C.S., Severin, K.G., Hopke, P.K., 1984. A comparison
of R- and Q-modes in target transformation factor analysis
for resolving environmental data. Atmos. Environ. 18 (2),
345–352.
Ito, K., Kneip, T.J., Lioy, P.J., 1986. The effects of number of
samples and random error on the factor analysis/multiple
linear regression (FA/MLR) receptor modeling technique.
Atmos. Environ. 20, 1433.
Iyer, H.K., Malm, W.C., Ahlbrandt, R.A., 1987. A mass
balance method for estimating the fractional contributions
of pollutants from various sources to a receptor site. In:
Bhardwaja, P.S. (Ed.), Transactions, Visibility Protection:
Research and Policy Aspects. Air Pollution Control Asso-
ciation, Pittsburgh, PA, pp. 861–871.
Jacobson, M.Z., 1999. Studying the effects of calcium and
magnesium on size-distributed nitrate and ammonium with
EQUISOLV II. Atmos. Environ. 33 (22), 3635–3650.
Jang, M., Kamens, R.M., 1998. A thermodynamic approach
for modeling partitioning of semivolatile organic com-
pounds on atmospheric particulate matter: Humidity effects.
Environ. Sci. Technol. 32 (9), 1237–1243.
Javitz, H.S., Watson, J.G., Guertin, J.P., Mueller, P.K., 1988a.
Results of a receptor modeling feasibility study. J. Air
Pollut. Control Assoc. 38 (5), 661–667.
Javitz, H.S., Watson, J.G., Robinson, N.F., 1988b. Perfor-
mance of the chemical mass balance model with simulated
local-scale aerosols. Atmos. Environ. 22 (10), 2309–2322.
Jeon, S.J., Meuzelaar, H.L.C., Sheya, S.A.N., Lighty, J.S.,
Jarman, W.M., Kasteler, C., Sarofim, A.F., Simoneit,
B.R.T., 2001. Exploratory studies of PM10 receptor and
source profiling by GC/MS and principal component
analysis of temporally and spatially resolved ambient
samples. J. Air Waste Mgmt. Assoc. 51 (5), 766–784.
Johnson, B.J., Huang, S.C., Pitchford, M.L., Ayoub, H.C.,
Naylor, M.H., 1998. Preliminary on-road measurement of
the effect of oxygenated fuel on CO emissions near Las
Vegas, Nevada. J. Air Waste Mgmt. Assoc. 48 (1), 59–64.
Johnson, C.E., Malm, W.C., 1987. Identifying visibility-reduc-
ing pollution sources using principal component analysis.
In: Bhardwaja, P.S. (Ed.), Transactions, Visibility Protec-
tion: Research and Policy Aspects. Air Pollution Control
Association, Pittsburgh, PA, pp. 823–836.
Johnson, D.L., McIntyre, B.L., 1982. A particle class balance
receptor model for aerosol apportionment in Syracuse, NY.
In: Dattner, S.L., Hopke, P.K. (Eds.), Proceedings, Recep-
tor Models Applied to Contemporary Problems. Air Pollu-
tion Control Assoication, Pittsburgh, PA, pp. 238–247.
Kao, A.S., Friedlander, S.K., 1995. Frequency distributions of
PM10 chemical components and their sources. Environ. Sci.
Technol. 29 (1), 19–28.
Kao, J.J., Huang, S.S., 2000. Forecasting using neural network
versus Box–Jenkins methodology for ambient air quality
monitoring data. J. Air Waste Mgmt. Assoc. 50 (2), 219–
226.
Karl, T.R., Koscielny, A.J., Diaz, H.F., 1982. Potential errors
in the application of principal component (eigenvector)
analysis to geophysical data. J. Appl. Meteorol. 21, 1183–
1186.
J.G. Watson et al. / Chemosphere 49 (2002) 1093–1136 1123

Kasahara, M., Choi, K.C., Takahashi, K., 1990. Source
contribution of atmospheric aerosols in Japan by chemical
mass balance method. Atmos. Environ. A 24 (3), 457–466.
Kavouras, I.G., Koutrakis, P., Cereceda-Balic, F., Oyola, P.,
2001. Source apportionment of PM10 and PM2:5 in five
Chilean cities using factor analysis. J. Air Waste Mgmt.
Assoc. 51 (3), 451–464.
Keiding, K., Sorensen, M.S., Pind, N., 1987. A receptor model
for urban aerosols based on oblique factor-analysis. Anal.
Chim. Acta 193, 295–307.
Khalili, N.R., Scheff, P.A., Holsen, T.M., 1995. PAH source
fingerprints for coke ovens, diesel and gasoline engines,
highway tunnels, and wood combustion emissions. Atmos.
Environ. 29 (4), 533–542.
Kim, B.M., Henry, R.C., 1989. Analysis of multicollinearity
indicators and influential species for chemical mass balance
receptor model. In: Watson, J.G. (Ed.), Transactions,
Receptor Models in Air Resources Management. Air and
Waste Management Association, Pittsburgh, PA, pp. 379–
390.
Kim, B.M., Henry, R.C., 1999. Diagnostics for determining
influential species in the chemical mass balance receptor
model. J. Air Waste Mgmt. Assoc. 49 (12), 1449–1455.
Kim, B.M., Henry, R.C., 2000. Application of SAFER model
to the Los Angeles PM10 data. Atmos. Environ. 34 (11),
1747–1759.
Kim, B.M., Lewis, R., Hogo, H., 1992a. Source apportionment
by chemical mass balance: A comparison between measured
source profiles and SAFER model estimated source profiles.
In: Chow, J.C., Ono, D.M. (Eds.), Transactions, PM10Standards and Nontraditional Particulate Source Controls.
Air and Waste Management Association, Pittsburgh, PA,
pp. 146–162.
Kim, B.M., Zeldin, M.D., Liu, C., 1992b. Source apportion-
ment study for state implementation plan development in
the Coachella Valley. In: Chow, J.C., Ono, D.M. (Eds.),
Transactions, PM10 Standards and Nontraditional Particu-
late Source Controls. Air and Waste Management Associ-
ation, Pittsburgh, PA, pp. 979–991.
Kim, D.S., Hopke, P.K., Massart, D.L., Kaufman, L., Casuc-
cio, G.S., 1987. Multivariate analysis of CCSEM auto
emission data. Sci. Total Environ. 59, 141–155.
Kim, D.S., Hopke, P.K., 1988. The classification of individual
particles based on computer-controlled scanning electron
microscopy data. Aerosol Sci. Technol. 9, 133–151.
Kim, D.S., Hopke, P.K., 1990. Particle class balance for
apportioning aerosol mass with size segregation scheme.
J. Korea Soc. Environ. Eng. 12 (3), 9–19.
Kim, Y.P., Seinfeld, J.H., 1995. Atmospheric gas–aerosol
equilibrium––III. Thermodynamics of crustal elements
Ca2þ, Kþ, and Mg2þ. Aerosol Sci. Technol. 22 (1), 93–110.
Kim, Y.P., Seinfeld, J.H., Saxena, P., 1993a. Atmospheric gas–
aerosol equilibrium––I. Thermodynamic model. Aerosol
Sci. Technol. 19 (2), 157–181.
Kim, Y.P., Seinfeld, J.H., Saxena, P., 1993b. Atmospheric gas–
aerosol equilibrium––II. Analysis of common approxima-
tions and activity coefficient calculation methods. Aerosol
Sci. Technol. 19 (2), 182–198.
King, R.B., Fordyce, J.S., Antoine, A.C., Leibecki, H.F.,
Neustadter, H.E., Sidik, S.M., 1976. Elemental composition
of airborne particulates and source indentification: An
extensive one year survey. J. Air Pollut. Control Assoc. 26,
1073–1078.
Kitto, A.M., Colbeck, I., 1999. Filtration and denuder sam-
pling techniques. In: Spurny, K.R. (Ed.), Analytical Chem-
istry of Aerosols. CRC Press LLC, Boca Raton, FL,
pp. 103–132.
Kleeman, M.J., Cass, G.R., Eldering, A., 1997. Modeling the
airborne particle complex as a source-oriented external
mixture. J. Geophys. Res. 102 (D17), 21355–21372.
Kleeman, M.J., Cass, G.R., 1999. Effect of emissions control
strategies on the size and composition distribution of urban
particulate air pollution. Environ. Sci. Technol. 33 (1), 177–
189.
Kleeman, M.J., Schauer, J.J., Cass, G.R., 1999. Size and
composition distribution of fine particulate matter emitted
from wood burning, meat charbroiling, and cigarettes.
Environ. Sci. Technol. 33 (20), 3516–3523.
Kleinman, M.T., Pasternack, B.S., Eisenbud, M., Kneip, T.J.,
1980. Identifying and estimating the relative importance of
sources of airborne particulates. Environ. Sci. Technol. 14
(1), 62–65.
Kneip, T.J., Kleinman, M.T., Eisenbud, M., 1973. Relative
contribution of emission sources to the total airborne
particulates in New York City. In: Third International
Clean Air Congress, Dusseldorf.
Kneip, T.J., Mallon, R.P., Kleinman, M.T., 1983. The impact
of changing air quality on multiple regression models for
coarse and fine particle fractions. Atmos. Environ. 17 (2),
299–304.
Koloutsou-Vakakis, S., Rood, M.J., 1994. The (NH4)2SO4–
Na2SO4–H2O system: Comparison of deliquescence humid-
ities measured in the field and estimated from laboratory
measurements and thermodynamic modeling. Tellus B 46
(1), 1–15.
Koutrakis, P., Kelly, B.P., 1993. Equilibrium size of atmo-
spheric aerosol sulfates as a function of particle acidity and
ambient relative humidity. J. Geophys. Res. 98 (D4), 7141–
7147.
Koutrakis, P., Spengler, J.D., 1987. Source apportionment of
ambient particles in Steubenville, OH using specific rotation
factor analysis. Atmos. Environ. 21 (7), 1511–1519.
Koutrakis, P., Keeler, G.J., Spengler, J.D., Lowenthal, D.H.,
1989. Analysis of simulated data using specific rotation
factor analysis. In: Watson, J.G. (Ed.), Transactions,
Receptor Models in Air Resources Management. Air and
Waste Management Association, Pittsburgh, PA, pp. 190–
195.
Koutrakis, P., Briggs, S.L.K., Leaderer, B.P., 1992. Source
apportionment of indoor aerosols in Suffolk and Onodaga
Counties, New York. Environ. Sci. Technol. 26 (3), 521–
527.
Kowalczyk, G.S., Choquette, C.E., Gordon, G.E., 1978.
Chemical element balances and identification of air pollu-
tion sources in Washington, DC. Atmos. Environ. 12, 1143–
1153.
Kowalczyk, G.S., Gordon, G.E., Rheingrover, S.W., 1982.
Identification of atmospheric particulate sources in Wash-
ington, DC using chemical element balances.. Environ. Sci.
Technol. 16, 79–90.
Krijnsen, H.C., van Kooten, W.E.J., Calis, H.P.A., Verbeek,
R.P., van den Bleek, C.M., 2000. Evaluation of an artificial
1124 J.G. Watson et al. / Chemosphere 49 (2002) 1093–1136
neural network for NOx emission prediction from a
transient diesel engine as a base for NO sub(x) control.
Can. J. Chem. Eng. 78 (2), 408–417.
Kuhn, M., Builtjes, P.J.H., Poppe, D., Simpson, D., Stockwell,
W.R., Andersson-Sk€oold, Y., Baart, A., Das, M., Fiedler, F.,
Hov, Ø, Kirchner, F., Makar, P.A., Milford, J.B., Roemer,
M.G.M., Ruhnke, R., et al., 1998. Intercomparison of the
gas-phase chemistry in several chemistry and transport
models. Atmos. Environ. 32 (4), 693–709.
Kuik, P., Blaauw, M., Sloof, J.E., Wolterbeck, H.T., 1993a.
The use of Monte Carlo methods in factor analysis. Atmos.
Environ. A 27 (13), 1967–1974.
Kuik, P., Sloof, J.E., Wolterbeck, H.T., 1993b. Application of
Monte Carlo-assisted factor analysis to large sets of
environmental pollution data. Atmos. Environ. A 27 (13),
1975–1984.
Kusmierczyk-Michulec, J., Marks, R., 2000. The influence of
sea-salt aerosols on the atmospheric extinction over the
Baltic and the North Seas. J. Aerosol Sci. 31 (11), 1299–
1316.
Lagomarsino, R.J., Latner, N., 1997. A tethered balloon air
sampling system for determining the vertical distribution of
atmospheric tracers. J. Air Waste Mgmt. Assoc. 47 (9), 990–
994.
Larson, T.V., Vong, R.J., 1989. Partial least squares regression
methodology: Application to source receptor modeling. In:
Watson, J.G. (Ed.), Transactions, Receptor Models in Air
Resources Management. Air and Waste Management As-
sociation, Pittsburgh, PA, pp. 391–403.
Latimer, D.A., Iyer, H.K., Malm, W.C., 1990. Application of a
differential mass balance model to attribute sulfate haze in
the Southwest. In: Mathai, C.V. (Ed.), Transactions,
Visibility and Fine Particles. Air and Waste Management
Association, Pittsburgh, PA, pp. 819–830.
Lawson, D.R., Winchester, J.W., 1978. Sulfur and trace
element concentration relationships in aerosols from the
South American continent. Geophys. Res. Lett. 5, 195–198.
Lawson, D.R., Winchester, J.W., 1979a. A standard crustal
aerosol as a reference for elemental enrichment factors.
Atmos. Environ. 13, 925–930.
Lawson, D.R., Winchester, J.W., 1979b. Sulfur, potassium, and
phosphorus associations in aerosols from South American
tropical rain forests. J. Geophys. Res. 84, 3723–3727.
Lazaridis, M., 1999. Gas–particle partitioning of organic
compounds in the atmosphere. J. Aerosol Sci. 30 (9),
1165–1170.
Lee, E., Chan, C.K., Paatero, P., 1999. Application of positive
matrix factorization in source apportionment of particulate
pollutants in Hong Kong. Atmos. Environ. 33 (19), 3201–
3212.
Lee, S.C., Li, W.M., Yin Chan, L., 2001. Indoor air quality at
restaurants with different styles of cooking in metropolitan
Hong Kong. Sci. Total Environ. 279 (1–3), 181–193.
Lewis, C.W., Stevens, R.K., 1985. Hybrid receptor model for
secondary sulfate from an SO2 point source. Atmos.
Environ. 19 (6), 917–924.
Lewis, C.W., Baumgardner, R.E., Stevens, R.K., 1986. Recep-
tor modeling study of Denver winter haze. Environ. Sci.
Technol. 20, 1126–1136.
Lewis, C.W., Baumgardner, R.E., Stevens, R.K., Claxton,
L.D., Lewtas, J., 1988. Contribution of woodsmoke and
motor vehicle emissions to ambient aerosol mutagenicity.
Environ. Sci. Technol. 22 (8), 968–971.
Li, Z.Y., Deng, X.M., 1999. Optimization of environmental
monitoring sites by principal component subset selection
based on comprehensive relative importance of pollutants.
China Environ. Sci. 19 (5), 458–460.
Liljestrand, H.M., 1982. Acidic precipitation source identifica-
tion by chemical mass balance methods employing frac-
tionation factors. In: Dattner, S.L., Hopke, P.K. (Eds.),
Proceedings, Receptor Models Applied to Contemporary
Pollution Problems. Air Pollution Control Association,
Pittsburgh, PA, pp. 212–223.
Lioy, P.J., Mallon, R.P., Lippmann, M., Kneip, T.J., Samson,
P.J., 1982. Factors affecting the variability of summertime
sulfate in a rural area using principal component analysis.
J. Air Pollut. Control Assoc. 32 (10), 1043–1047.
Liu, C.K., Roscoe, B.A., Severin, K.G., Hopke, P.K., 1982.
The application of factor analysis to source apportionment
of aerosol mass. J. Am. Ind. Hyg. Assoc. 43, 314–318.
Liu, X.D., Hopke, P.K., Cohen, D., Bailey, G.M., 1995.
Sources of fine particle lead, bromine, and elemental carbon
in southeastern Australia. Sci. Total Environ. 175 (1), 65–
79.
Liu, X., Gao, N., Hopke, P.K., Cohen, D., Bailey, G., Crisp, P.,
1996. Evaluation of spatial patterns of fine particle sulfur
and lead concentrations in New South Wales, Australia.
Atmos. Environ. 30 (1), 9–24.
Liu, X., Feng, Y., Jia, H., Zhang, Y., Ma, Q., Shao, Y., 1998.
Source apportionment of Qingdao atmospheric aerosol with
chemical mass balance method. Res. Environ. Sci. 11 (5),
51–54.
Lloyd, A.C., Cackette, T.A., 2001a. 2001 Critical review––
Diesel engines: Environmental impact and control. J. Air
Waste Mgmt. Assoc. 51 (6), 809–847.
Lloyd, A.C., Cackette, T.A., 2001b. Diesel engines: Environ-
mental impact and control. EM 8 (6), 34–41.
Lonneman, W.A., Sella, R.L., Meeks, S.A., 1986. Non-methane
organic composition in the Lincoln Tunnel. Environ. Sci.
Technol. 20, 790–796.
Lowenthal, D.H., Rahn, K.A., 1985. Regional sources of
pollution aerosol at Barrow, Alaska during winter 1979–
1980 as deduced from elemental tracers. Atmos. Environ.
19, 2011–2024.
Lowenthal, D.H., Rahn, K.A., 1987a. Application of the
factor-analysis receptor model to simulated urban- and
regional-scale data sets. Atmos. Environ. 21 (9), 2005–2013.
Lowenthal, D.H., Rahn, K.A., 1987b. The Mn/V ratio in
retrospect. J. Air Pollut. Control Assoc. 37 (7), 829–830.
Lowenthal, D.H., Rahn, K.A., 1988a. Tests of regional
elemental tracers of pollution aerosols. 2. Sensitivity of
signatures and apportionments to variations in operating
parameters. Atmos. Environ. 22, 420–426.
Lowenthal, D.H., Rahn, K.A., 1988b. Reproducibility of
regional apportionments of pollution aerosol in the north-
eastern United States. Atmos. Environ. 22 (9), 1829–1833.
Lowenthal, D.H., Rahn, K.A., 1989. The relationship between
secondary sulfate and primary regional signatures in north-
eastern aerosol and precipitation. Atmos. Environ. 23 (7),
1511–1515.
Lowenthal, D.H., Hanumara, R.C., Rahn, K.A., Currie, L.A.,
1987. Effects of systematic error, estimates and uncertainties
J.G. Watson et al. / Chemosphere 49 (2002) 1093–1136 1125
in chemical mass balance apportionments: Quail Roost II
revisited. Atmos. Environ. 21 (3), 501–510.
Lowenthal, D.H., Wunschel, K.R., Rahn, K.A., 1988. Tests of
regional elemental tracers of pollution aerosols. 1. Distinct-
ness of regional signatures, stability during transport,
and empirical validation. Environ. Sci. Technol. 22, 413–
420.
Lowenthal, D.H., Chow, J.C., Watson, J.G., Neuroth, G.R.,
Robbins, R.B., Shafritz, B.P., Countess, R.J., 1992. The
effects of collinearity on the ability to determine aerosol
contributions from diesel- and gasoline-powered vehicles
using the chemical mass balance model. Atmos. Environ. A
26 (13), 2341–2351.
Lowenthal, D.H., Zielinska, B., Chow, J.C., Watson, J.G.,
Gautam, M., Ferguson, D.H., Neuroth, G.R., Stevens,
K.D., 1994. Characterization of heavy-duty diesel vehicle
emissions. Atmos. Environ. 28 (4), 731–743.
Lowenthal, D.H., Rogers, C.F., Saxena, P., Watson, J.G.,
Chow, J.C., 1995. Sensitivity of estimated light extinction
coefficients to model assumptions and measurement errors.
Atmos. Environ. 29 (7), 751–766.
Lowenthal, D.H., Chow, J.C., Watson, J.G., Dipple, W.A.,
Mazzera, D.M., 1996. PM10 source apportionment at
McMurdo Station, Antarctica. EM 2, 28–30.
Lowenthal, D.H., Chow, J.C., Mazzera, D.M., 1997a. PM10source apportionment at McMurdo Station, Antarctica.
Antarctic J. 32, 165–167.
Lowenthal, D.H., Wittorff, D.N., Gertler, A.W., Sakiyama,
S.K., 1997b. CMB source apportionment during REVEAL.
J. Environ. Eng. 123 (1), 80–87.
Lurmann, F.W., Wexler, A.S., Pandis, S.N., Musarra, S.,
Kumar, N., Seinfeld, J.H., 1997. Modelling urban and
regional aerosols––II. Application to California�s SouthCoast Air Basin. Atmos. Environ. 31 (17), 2695–2716.
Macias, E.S., Hopke, P.K., 1981. Atmospheric Aerosol: Source/
Air Quality Relationships. American Chemical Society,
Washington, DC.
Magliano, K.L., 1988. Level 1 PM10 assessment in a California
air basin. In: Mathai, C.V., Stonefield, D.H. (Eds.), Trans-
actions, PM10: Implementation of Standards. Air Pollution
Control Association, Pittsburgh, PA, pp. 508–517.
Magliano, K.L., Ranzieri, A.J., Solomon, P.A., 1998. Chemical
mass balance modeling of the 1995 integrated monitoring
study database. In: Chow, J.C., Koutrakis, P. (Eds.),
Proceedings, PM2:5: A Fine Particle Standard. Air and
Waste Management Association, Pittsburgh, PA, pp. 824–
838.
Magliano, K.L., Hughes, V.M., Chinkin, L.R., Coe, D.L.,
Haste, T.L., Kumar, N., Lurmann, F.W., 1999. Spatial and
temporal variations in PM10 and PM2:5 source contributions
and comparison to emissions during the 1995 integrated
monitoring study. Atmos. Environ. 33 (29), 4757–4773.
Malm, W.C., Johnson, C.E., Bresch, J.F., 1985. Application of
principal component analysis for purposes of identifying
source–receptor relationships. In: Pace, T.G. (Ed.), Trans-
actions, Receptor Methods for Source Apportionment: Real
World Issues and Applications. Air Pollution Control
Association, Pittsburgh, PA, pp. 127–148.
Malm, W.C., Johnson, C.E., Bresch, J.F., Cahill, T.A., 1987.
An eigenvector analysis of particulate data in the western
United States. In: Bhardwaja, P.S. (Ed.), Transactions,
Visibility Protection: Research and Policy Aspects. Air
Pollution Control Association, Pittsburgh, PA, pp. 837–860.
Malm, W.C., Gebhart, K.A., 1997. Source apportionment of
sulfur and light extinction using receptor modeling tech-
niques. J. Air Waste Mgmt. Assoc. 47 (3), 250–268.
Malm, W.C., Gebhart, K.A., Henry, R.C., 1990a. An investi-
gation of the dominant source regions of fine sulfur in the
Western United States and their areas of influence. Atmos.
Environ. A 24, 3047–3060.
Malm, W.C., Iyer, H.K., Gebhart, K.A., 1990b. Application of
tracer mass balance regression to WHITEX data. In:
Mathai, C.V. (Ed.), Transactions, Visibility and Fine
Particles. Air and Waste Management Association, Pitts-
burgh, PA, pp. 806–818.
Mangelson, N.F., deCesar, R.T., Fields, S.M., Cooper, J.A.,
1985. Effects of sampling duration on aerosol source
apportionment by the chemical mass balance method. In:
Pace, T.G. (Ed.), Williamsburg Specialty Conference. Air
Pollution Control Association, Pittsburgh, PA.
Mason, B., 1966. Principles of Geochemistry, third ed. John
Wiley, New York, NY.
Matamala, L.V., Nininger, R.C., 1990. A Monte-Carlo simu-
lation to assess the sensitivity of structured regression
coefficients to measurement precision. In: Mathai, C.V.
(Ed.), Transactions, Visibility and Fine Particles. Air and
Waste Management Association, Pittsburgh, PA, pp. 700–
707.
Matsumoto, K., Tanaka, H., 1996. Formation and dissociation
of atmospheric particulate nitrate and chloride; an approach
based on phase equilibrium. Atmos. Environ. 30 (4), 639–
648.
Mazzera, D.M., Lowenthal, D.H., Chow, J.C., Watson, J.G.,
2001. Sources of PM10 and sulfate aerosol at McMurdo
Station, Antarctica. Chemosphere 45 (3), 347–356.
McDonald, J.D., Zielinska, B., Fujita, E.M., Chow, J.C.,
Watson, J.G., Sagebiel, J.C., 1998. The development of
chemical emission profiles for residential wood combustion
and meat cooking for use in the apportionment of atmo-
spheric carbonaceous aerosol. In: Chow, J.C., Koutrakis, P.
(Eds.), Proceedings, PM2:5: A Fine Particle Standard. Air
and Waste Management Association, Pittsburgh, PA,
pp. 645–660.
McDonald, J.D., Zielinska, B., Fujita, E.M., Sagebiel, J.C.,
Chow, J.C., Watson, J.G., 2000. Fine particle and gaseous
emission rates from residential wood combustion. Environ.
Sci. Technol. 34 (11), 2080–2091.
McDonald, K.M., Cheng, L., Olson, M.P., Angle, R.P., 1996.
A comparison of box and plume model calculations for
sulphur deposition and flux in Alberta, Canada. Atmos.
Environ. 30 (17), 2969–2980.
McMurry, P.H., 2000. A review of atmospheric aerosol
measurements. Atmos. Environ. 34 (12–14), 1959–1999.
Meinert, D.L., Winchester, J.W., 1977. Chemical relationships
in the North Atlantic marine aerosol. J. Geophys. Res. 82,
1778–1782.
Meng, Z., Seinfeld, J.H., 1996. Time scales to achieve
atmospheric gas–aerosol equilibrium for volatile species.
Atmos. Environ. 30 (16), 2889–2900.
Meng, Z., Seinfeld, J.H., Saxena, P., Kim, Y.P., 1995. Atmo-
spheric gas–aerosol equilibrium IV. Thermodynamics of
carbonates. Aerosol Sci. Technol. 23 (2), 131–154.
1126 J.G. Watson et al. / Chemosphere 49 (2002) 1093–1136
Meng, Z., Seinfeld, J.H., Saxena, P., Kim, Y.P., 1997. Gas/
aerosol distribution of formic and acetic acids. Aerosol Sci.
Technol. 23, 561–578.
Michaud, D., Baril, M., Perrault, G., 1993. Characterization of
airborne dust from cast iron foundries by physico-chemical
methods and multivariate statistical analyses. J. Air Waste
Mgmt. Assoc. 43 (5), 729–735.
Michaud, D., Baril, M., Dion, C., Perrault, G., 1996. Charac-
terization of airborne dust from two nonferrous foundries
by physico-chemical methods and multivariate statistical
analyses. J. Air Waste Mgmt. Assoc. 46 (5), 450–457.
Miguel, A.H., 1984. ‘‘Atmospheric’’ reactivity of particulate
polycyclic aromatic hydrocarbons collected in an urban
tunnel. Sci. Total Environ. 36, 305–311.
Miguel, A.H., Dos Reis Pedreira Filho, W., Allen, A.G., 1995.
Chemical mass balance source apportionment of indoor
PM15 in Brazilian corporate offices and restaurants. Indoor
Environ. 4 (6), 355–361.
Mihalakakou, G., Santamouris, M., Asimakopoulos, D.N.,
1998. Modeling ambient air temperature time series using
neural networks. J. Geophys. Res. 103 (D16), 19509–19518.
Miller, E.A., Cooper, J.A., Guimaraes, F., Alonso, C.D., Filho,
B., 1989. Cubatao aerosol source apportionment study. In:
Watson, J.G. (Ed.), Transactions, Receptor Models in Air
Resources Management. Air Pollution Control Assoc.,
Pittsburgh, PA, pp. 23–36.
Miller, M.S., Friedlander, S.K., Hidy, G.M., 1972. A chemical
element balance for the Pasadena aerosol. J. Colloid
Interface Sci. 39 (1), 165–176.
Milionis, A.E., Davies, T.D., 1994a. Regression and stochastic
models for air pollution––I. Review, comments and sugges-
tions. Atmos. Environ. 28 (17), 2801–2810.
Milionis, A.E., Davies, T.D., 1994b. Regression and stochastic
models for air pollution––II. Application of stochastic
models to examine the links between ground-level smoke
concentrations and temperature inversions. Atmos. Envi-
ron. 28 (17), 2811–2823.
Mizohata, A., Mamuro, T., 1979. Chemical element balances in
aerosol over Sakai, Osaka. Ann. Rep. Radiat. Center Osaka
Prefecture 20, 55–69.
Morandi, M.T., Daisey, J.M., Lioy, P.J., 1987. Development of
a modified factor analysis/multiple regression model to
apportion suspended particulate matter in a complex urban
airshed. Atmos. Environ. 21 (8), 1821–1831.
Morandi, M.T., Lioy, P.J., Daisey, J.M., 1991. Comparison of
two multivariate modeling approaches for the source
apportionment of inhalable particulate matter in Newark,
NJ. Atmos. Environ. A 25 (5–6), 927–937.
Moro, G., Lasagni, M., Rigamonti, N., Cosentino, U., Pitea,
D., 1997. Critical review of the receptor model based on
target transformation factor analysis. Chemosphere 35 (8),
1847–1865.
Moya, M., Ansari, A.S., Pandis, S.N., 2001. Partitioning of
nitrate and ammonium between the gas and particulate
phases during the 1997 IMADA-AVER study in Mexico
City. Atmos. Environ. 35 (10), 1791–1804.
Moyers, J.L., Duce, R.A., 1972. Gaseous and particulate iodine
in the marine atmosphere. J. Geophys. Res. 77, 5229–5238.
Moyers, J.L., Ranweiler, L.E., Hopf, S.B., Karte, N.E., 1977.
Evaluation of particulate trace species in southwest desert
atmosphere. Environ. Sci. Technol. 11 (8), 789–795.
Mozurkewich, M., 1993. The dissociation constant of ammo-
nium nitrate and its dependance on temperature, relative
humidity and particle size. Atmos. Environ. A 27 (2), 261–
270.
Mroz, E.J., Zoller, W.H., 1975. Composition of atmospheric
particulate matter from the eruption of Heimaey, Iceland.
Science 190, 461–464.
Mugica, V., Vega, E., Chow, J.C., Reyes, E., Sanchez, G.,
Arriaga, J.L., Egami, R.T., Watson, J.G., 2001. Speci-
ated non-methane organic compounds emissions from
food cooking in Mexico. Atmos. Environ. 35 (10), 1729–
1734.
M€uuller, C., 1992. Source apportionment study of atmospheric
particulates in the Vaal Triangle. M.Sc. Thesis, University
of Witwatersrand, Johannesburg, South Africa.
Neustadter, H.E., Fordyce, J.S., King, R.B., 1976. Elemental
composition of airborne particulates and source identifica-
tion: Data analysis techniques. J. Air Pollut. Control Assoc.
26 (11), 1079–1084.
Nitta, H., Ichikawa, M., Sato, M., Konishi, S., Ono, M., 1994.
A new approach based on a covariance structure model to
source apportionment of indoor fine particles in Tokyo.
Atmos. Environ. 28 (4), 631–636.
Norris, G., Larson, T.V., Koenig, J., Sullivan, W., Claiborn,
C.S., Finn, D., Edgar, R., 1998. Sources of fine particulate
composition variability in Spokane, Washington. In: Chow,
J.C., Koutrakis, P. (Eds.), Proceedings, PM2:5: A Fine
Particle Standard. Air and Waste Management Association,
Pittsburgh, PA, pp. 28–37.
Nolte, C.G., Schauer, J.J., Cass, G.R., Simoneit, B.R.T., 1999.
Highly polar organic compounds present in meat smoke.
Environ. Sci. Technol. 33 (19), 3313–3316.
Ogawa, N., Kikuchi, R., Okamura, T., Inotsume, J., Adzuhata,
T., Ozeki, T., Kajikawa, M., 2000. Evaluation of ionic
pollutants in cloud droplets at a mountain ridge in northern
Japan using constrained oblique rotational factor analysis.
Atmos. Res. 54, 279–283.
Okamoto, S., Hayashi, M., Nakajima, M., Kainuma, Y.,
Shiozawa, K., 1990. A factor analysis-multiple regression
model for source apportionment of suspended particulate
matter. Atmos. Environ. A 24 (8), 2089–2097.
Olmez, I., Sheffield, A.E., Gordon, G.E., Houck, J.E., Pritchett,
L.C., Cooper, J.A., Dzubay, T.G., Bennett, R.L., 1988.
Compositions of particles from selected sources in Phila-
delphia for receptor model applications. J. Air Pollut.
Control Assoc. 38 (11), 1392–1402.
Ouimette, J.R., Flagan, R.C., Kelso, A.R., 1981. Chemical
species contributions to light scattering by aerosols at a
remote arid site: Comparison of statistical and theoretical
results. In: Macias, E.S., Hopke, P.K. (Eds.), Atmospheric
Aerosol, Source/Air Quality Relationships. American
Chemical Society, Washington, DC, pp. 125–156.
Ouimette, J.R., Flagan, R.C., 1982. The extinction coefficient of
multicomponent aerosols. Atmos. Environ. 16 (10), 2405–
2419.
Overland, J.E., Preisendorfer, R.W., 1982. A significance test
for principal components applied to a cyclone climatology.
Mon. Weather Rev. 110 (1), 1–4.
Paatero, P., 1997. Least squares formulation of robust non-
negative factor analysis. Chemom. Intell. Lab. Sys. 37, 23–
35.
J.G. Watson et al. / Chemosphere 49 (2002) 1093–1136 1127

Paatero, P., 1998. User�s guide for positive matrix factorizationprograms PMF2 and PMF3 Part 1: Tutorial. University of
Helsinki, Helsinki, Finland.
Paatero, P., 2000. User�s guide for positive matrix factorizationprograms PMF2 and PMF3 Part 2: Reference. University of
Helsinki, Helsinki, Finland.
Paatero, P., Tapper, U., 1993. Analysis of different modes of
factor analysis as least squares fit problems. Chemom.
Intell. Lab. Sys. 18, 183–194.
Paatero, P., Tapper, U., 1994. Positive matrix factorization: A
non-negative factor model with optimal utilization of error
estimates of data values. Environmetrics 5, 111–126.
Pace, T.G., 1986. In: Pace, T.G. (Ed.), Transactions, Receptor
Methods for Source Apportionment: Real World Issues and
Applications. Air Pollution Control Association, Pitts-
burgh, PA.
Pace, T.G., Watson, J.G., 1987. Protocol for applying and
validating the CMB model. Report No. EPA 450/4-87-010.
US Environmental Protection Agency, Research Triangle
Park, NC.
Paciga, J.J., Roberts, T.M., Jervis, R.E., 1975. Particle size
distributions of lead, bromine, and chlorine in urban-
industrial aerosols. Environ. Sci. Technol. 9, 1141–1144.
Paciga, J.J., John, J., Jervis, R.E., 1976. Multielement size
characterization of urban aerosols. Environ. Sci. Technol.
10, 1124–1128.
Pacyna, J.M., 1986. Atmospheric trace elements from natural
and anthropogenic sources. In: Nriagu, J.O., Davidson, C.I.
(Eds.), Toxic Metals in the Atmosphere. John Wiley, New
York, pp. 33–52.
Padmanabhamarty, U.K., 1975. Eigenvectors of sulfur dioxide
in metropolitan Toronto and their association with mete-
orological parameters. Atmos. Environ. 9, 365–366.
Pandis, S.N., Harley, R.A., Cass, G.R., Seinfeld, J.H., 1992.
Secondary organic aerosol formation and transport. Atmos.
Environ. A 26 (13), 2269–2282.
Pankow, J.F., 1987. Review and comparative analysis of the
theories on partitioning between the gas and aerosol
particulate phases in the atmosphere. Atmos. Environ. 21
(11), 2275–2283.
Pankow, J.F., 1988. The calculated effects of non-exchangeable
material on the gas–particle distributions of organic com-
pounds. Atmos. Environ. 22 (7), 1405–1409.
Pankow, J.F., 1992. Application of common y-intercept
regression parameters for logKp vs 1=T for predicting gas–particle partitioning in the urban environment. Atmos.
Environ. A 26 (14), 2489–2498.
Pankow, J.F., 1993. A simple box model for the annual cycle of
partitioning of semi-volatile organic compounds between
the atmosphere and the Earth�s surface. Atmos. Environ. A27 (7), 1139–1152.
Pankow, J.F., 1994a. An absorption model of gas/particle
partitioning of organic compounds in the atmosphere.
Atmos. Environ. 28 (2), 185–188.
Pankow, J.F., 1994b. An absorption model of the gas/aerosol
partitioning involved in the formation of secondary organic
aerosol. Atmos. Environ. 28 (2), 189–194.
Pankow, J.F., 1998. Further discussion of the octanol/air
partition coefficient K0a as a correlating parameter for gas/particle partitioning coefficient. Atmos. Environ. 32 (9),
1493–1498.
Pankow, J.F., Bidleman, T.F., 1992. Interdependence of the
slopes and intercepts from log–log correlations of measured
gas–particle partitioning and vapor pressure: I. Theory and
analysis of available data. Atmos. Environ. A 26 (6), 1071–
1080.
Pankow, J.F., Storey, J.M.E., Yamasaki, H., 1993. Effects of
relative humidity on gas/particle partitioning of semivolatile
organic compounds to urban particulate matter. Environ.
Sci. Technol. 27 (10), 2220–2226.
Park, S.S., Bae, M.S., Kim, Y.J., 2001a. Chemical composition
and source apportionment of PM2:5 particles in the Sihwa
area, Korea. J. Air Waste Mgmt. Assoc. 51 (3), 393–405.
Park, S.S., Kim, Y.J., Fung, K., 2001b. Characteristics of PM2:5carbonaceous aerosol in the Sihwa industrial area, Korea.
Atmos. Environ. 35 (4), 657–665.
Pasini, A., Pelino, V., Potesta, S., 2001. A neural network
model for visibility nowcasting from surface observations:
Results and sensitivity to physical input variables. J.
Geophys. Res. 106 (D14), 14951–14959.
Paterson, K.G., Sagady, J.L., Hooper, D.L., 1999. Analysis of
air quality data using positive matrix factorization. Environ.
Sci. Technol. 33 (4), 635–641.
Perez, P., Trier, A., Reyes, J., 2000. Prediction of PM2:5concentrations several hours in advance using neural
networks in Santiago, Chile. Atmos. Environ. 34 (8),
1189–1196.
Peterson, J.T., 1970. Distribution of sulfur dioxide over
metropolitan St. Louis as described by empirical orthogonal
functions, and its relation to meteorological parameters.
Atmos. Environ. 4, 501–518.
Pierson, W.R., Brachaczek, W.W., 1976. Particulate matter
associated with vehicles on the road. Trans. Soc. Automot.
Eng. 85, 209–227.
Pierson, W.R., Brachaczek, W.W., 1983. Particulate matter
associated with vehicles on the road II. Aerosol Sci.
Technol. 2, 1–40.
Pierson, W.R., Gertler, A.W., Bradow, R.L., 1990. Comparison
of the SCAQS tunnel study with other on-road vehicle
emission data. J. Air Waste Mgmt. Assoc. 40 (11), 1495–
1504.
Pierson, W.R., Gertler, A.W., Robinson, N.F., Sagebiel, J.C.,
Zielinska, B., Bishop, G.A., Stedman, D.H., Zweidinger,
R.B., Ray, W.D., 1996. Real-world automotive emissions––
Summary of studies in the Fort McHenry and Tuscarora
Mountain tunnels. Atmos. Environ. 30 (12), 2233–2256.
Pilinis, C., Farber, R.J., 1991. Evaluation of the effects of
emission reductions on secondary particulate matter in the
South Coast Air Basin of California. J. Air Waste Mgmt.
Assoc. 41 (5), 702–709.
Pilinis, C., Seinfeld, J.H., 1987. Continued development of a
general equilibrium model for inorganic multicomponent
atmospheric aerosols. Atmos. Environ. 21 (11), 2453–2466.
Pilinis, C., Seinfeld, J.H., Seigneur, C., 1987. Mathematical
modeling of the dynamics of multicomponent atmospheric
aerosols. Atmos. Environ. 21 (4), 943–955.
Pinto, J.P., Stevens, R.K., Willis, R.D., Kellogg, R.B., Ma-
mane, Y., Novak, J., Santroch, J., Benes, I., Lenicek, J.,
Bures, V., 1998. Czech air quality monitoring and receptor
modeling study. Environ. Sci. Technol. 32 (7), 843–854.
Pio, C.A., Nunes, T.V., Borrego, C.S., Martins, J.G., 1989.
Assessment of air pollution sources in an industrial atmo-
1128 J.G. Watson et al. / Chemosphere 49 (2002) 1093–1136
sphere using principal component and multilinear regression
analysis. Sci. Total Environ. 66, 65–72.
Pistikopoulos, P., Masclet, P., Mouvier, G., 1990. A receptor
model adapted to reactive species: Polycyclic aromatic
hydrocarbons––Evaluation of source contributions in an
open urban site I. Particle compounds. Atmos. Environ. A
24 (5), 1189–1197.
Pitchford, M.L., Pitchford, A., 1985. Analysis of regional
visibility in the southwest using principal component and
back trajectory techniques. Atmos. Environ. 19 (8), 1301–
1316.
Pitchford, M.L., Green, M.C., Kuhns, H.D., Tombach, I.H.,
Malm, W.C., Scruggs, M., Farber, R.J., Mirabella, V.A.,
White, W.H., McDade, C., Watson, J.G., Koracin, D.,
Hoffer, T.E., Lowenthal, D.H., Vimont, J.C., et al., 1999.
Project MOHAVE Final Report. US Environmental Pro-
tection Agency, Region IV, San Francisco, CA.
Plumb, R.A., Zheng, X., 1996. Source determination from trace
gas observations: An orthogonal function approach and
results for long-lived gases with surface sources. J. Geophys.
Res. 101 (D13), 18569–18586.
Poirot, R.L., Wishinski, P.R., Hopke, P.K., Polissar, A.V.,
2001. Comparative application of multiple receptor meth-
ods to identify aerosol sources in northern Vermont.
Environ. Sci. Technol. 35 (23), 4622–4636.
Poissant, L., 1994. A practical demonstration of the absolute
PCA�s bias. Atmos. Environ. 28 (12), 2129–2135.Polissar, A.V., Hopke, P.K., Paatero, P., Malm, W.C., Sisler,
J.F., 1998. Atmospheric aerosol over Alaska 2. Elemental
composition and sources. J. Geophys. Res. 103 (D15),
19045–19057.
Polissar, A.V., Hopke, P.K., Paatero, P., Kaufmann, Y.J., Hall,
D.K., Bodhaine, B.A., Dutton, E.G., Harris, J.M., 1999.
The aerosol at Barrow, Alaska: Long-term trends and
source locations. Atmos. Environ. 33 (16), 2441–2458.
Polissar, A.V., Hopke, P.K., Harris, J.M., 2001a. Source
regions for atmospheric aerosol measured at Barrow,
Alaska. Environ. Sci. Technol. 35 (21), 4214–4226.
Polissar, A.V., Hopke, P.K., Poirot, R.L., 2001b. Atmospheric
aerosol over Vermont: Chemical composition and sources.
Environ. Sci. Technol. 35 (23), 4604–4621.
Potukuchi, S., Wexler, A.S., 1997. Predicting vapor pressures
using neural networks. Atmos. Environ. 31 (5), 741–754.
Pratsinis, S.E., Zeldin, M.D., Ellis, E.C., 1988. Source resolu-
tion of the fine carbonaceous aerosol by principal compo-
nent-stepwise regression analysis. Environ. Sci. Technol. 22
(2), 212–216.
Prinz, B., Stratmann, H., 1968. The possible use of factor
analysis in investigating air quality. Staub-Reinhaltl. Luft
28 (1), 33–39.
Pryor, S.C., Barthelmie, R.J., 2000. REVEAL II: Seasonality
and spatial variability of particle and visibility conditions in
the Fraser Valley. Sci. Total Environ. 257 (2-3), 95–110.
Pun, B.K., Seigneur, C., 1999. Understanding particulate
matter formation in the California San Joaquin Valley:
Conceptual model and data needs. Atmos. Environ. 33 (29),
4865–4875.
Rahn, K.A., 1976. Silicon and aluminum in atmospheric aero-
sols: Crust-air fractionation. Atmos. Environ. 10, 597–601.
Rahn, K.A., Borys, R.D., Shaw, G.E., 1977. The Asian source
of Arctic haze bands. Nature 268, 712–714.
Rahn, K.A., Lewis, N.F., Lowenthal, D.H., 1982. Elemental
tracers of Canadian smelter aerosol transported into the
Northeastern United States. In: Hopke, P.K., Dattner, S.L.
(Eds.), Proceedings, Receptor Modeling Applied to Con-
temporary Pollution Problems. Air Pollution Control
Association, Pittsburgh, PA, pp. 163–174.
Rahn, K.A., Lowenthal, D.H., 1984. Northeastern and mid-
western contributions to pollution aerosol in the northwest-
ern United States. Science 223, 132.
Rahn, K.A., Lowenthal, D.H., 1985. Pollution aerosol in the
northeast: Northeastern–midwestern contributions. Science
228, 275–284.
Raiyani, C.V., Shah, S.H., Desai, N.M., Kenkaiah, K., Patel,
J.S., Parikh, D.J., Kashyap, S.K., 1993. Characterization
and problems of indoor pollution due to cooking stove
smoke. Atmos. Environ. A 27, 1643–1655.
Ramadan, Z., Song, X.H., Hopke, P.K., 2000. Identification of
sources of Phoenix aerosol by positive matrix factorization.
J. Air Waste Mgmt. Assoc. 50 (8), 1308–1320.
Rashid, M., Griffiths, R.F., 1993. Ambient K, S, and Si in fine
and coarse aerosols of Kuala Lumpur, Malaysia. J. Aerosol
Sci. 24 (1), S5–S6.
Rau, J.A., 1986. Residential wood combustion aerosol charac-
terization as a function of size and source apportionment
using chemical mass balance modeling. Ph.D. Dissertation,
Oregon Graduate Center, Beaverton, OR.
Rau, J.A., Khalil, M.A.K., 1989. Tracers of pollution from
wood burning and receptor modeling. In: Watson, J.G.
(Ed.), Transactions, Receptor Models in Air Resources
Management. Air and Waste Management Association,
Pittsburgh, PA, pp. 353–364.
Rege, M.A., Tock, R.W., 1996. A simple neural network for
estimating emission rates of hydrogen sulfide and ammonia
from single point sources. J. Air Waste Mgmt. Assoc. 46
(10), 953–962.
Regional Air Quality Council, 1998. Review of blueprint for
clean air emissions inventories. Regional Air Quality
Council, Denver, CO.
Reibnegger, G., Weiss, G., 1991. Neural networks as a tool
for utilizing laboratory information: Comparison with
linear discriminant analysis and with classification and
regression trees. Proc. Natl. Acad. Sci. USA 88 (24), 11426–
11430.
Reich, S.L., Gomez, D.R., Dawidowski, L.E., 1999. Artificial
neural network for the identification of unknown air
pollution sources. Atmos. Environ. 33 (18), 3045–3052.
Reid, H.F., Smith, K.R., Sherchand, B., 1986. Indoor smoke
exposures from traditional and improved cookstoves:
Comparisons among rural Nepali women. Mountain Res.
Develop. 6, 293–304.
Reifman, J., Feldman, E.E., 1998. Identification and control of
NOX emissions using neural networds. J. Air Waste Mgmt.
Assoc. 48 (5), 408–417.
Reimann, C., de Caritat, P., 2000. Intrinsic flaws of element
enrichment factors (EFs) in environmental geochemistry.
Environ. Sci. Technol. 34 (24), 5084–5091.
Rheingrover, S.W., Gordon, G.E., 1980. Identifying locations
of dominant point sources of elements in urban atmospheres
from large multi-element data sets. In: 4th International
Conference on Nuclear Methods in Environmental and
Energy Research, 14 April, 1980, Columbia, MO.
J.G. Watson et al. / Chemosphere 49 (2002) 1093–1136 1129
Rheingrover, S.W., Gordon, G.E., 1988. Wind-trajectory
method for determining compositions of particles from
major air pollution sources. Aerosol Sci. Technol. 8, 29–61.
Richman, M.B., 1981. Obliquely rotated principal compo-
nents: An improved meteorological map typing technique?
J. Appl. Meteorol. 20, 1145–1159.
Richman, M.B., 1986. Rotation of principal components.
J. Clim. 6 (3), 293–335.
Richman, M.B., Vermette, S.J., 1993. The use of Procrustes
Target Analysis to discriminate dominant source regions of
fine sulfur in the western USA. Atmos. Environ. A 27 (4),
475–481.
RJ Lee Group, 1998. Weirton Steel Receptor Model Project:
Source apportionment of particulate matter collected during
PM10 exceedance days in Weirton, West Virginia using
CCSEM data and the CMB7 receptor model. Prepared for
Weirton Steel Corporation, Weirton, WV, by RJ Lee
Group, Monroeville, PA.
Roberts, P.T., Friedlander, S.K., 1975. Conversion of SO2 to
sulfur particulate in the Los Angeles atmosphere. Environ.
Health Perspect. 10, 103–108.
Roberts, G.C., Andreae, M.O., Maenhaut, W., Fernandez-
Jimenez, M.T., 2001. Composition and sources of aerosol
in a central African rain forest during the dry season.
J. Geophys. Res. 106 (D13), 14423–14434.
Robinson, N.F., Whitbeck, M.R., 1985. A flexible nonempirical
model for cloud chamber studies. J. Air Pollut. Control
Assoc. 35 (7), 746–748.
Rocha, T.A.P., Horvath, H., Oliveira, J.A.B.P., Duarte, A.C.,
1999. Trends in alkanes and PAHs in airborne particulate
matter from Oporto and Vienna: Identification and com-
parison. Sci. Total Environ. 236, 231–236.
Rogak, S.N., Green, S.I., Pott, U., 1998. Use of tracer gas for
direct calibration of emission-factor measurements in a
traffic tunnel. J. Air Waste Mgmt. Assoc. 48 (6), 545–552.
Rogge, W.F., Hildemann, L.M., Mazurek, M.A., Cass, G.R.,
Simoneit, B.R.T., 1991. Sources of fine organic aerosol 1.
Charbroilers and meat cooking operations. Environ. Sci.
Technol. 25 (6), 1112–1125.
Rohbock, E., Georgii, H.W., M€uuller, J., 1981. Discussion: Mul-
tivariate analysis of particulate sulfate and other air quality
variables by principal components––Part I. Annual data from
Los Angeles and New York. Atmos. Environ. 15, 424.
Roscoe, B.A., Hopke, P.K., Dattner, S.L., Jenks, J.M., 1982.
The use of principal component factor analysis to interpret
particulate compositional data sets. J. Air Pollut. Control
Assoc. 32 (6), 637–642.
Roscoe, B.A., Chen, C.Y., Hopke, P.K., 1984. Comparison of
the target transformation factor analysis of coal composi-
tion data with X-ray diffraction analysis. Anal. Chim. Acta
160, 121–134.
Rouhani, S., Ebrahimpour, M.R., Yaqub, I., Gianella, E.,
1992. Multivariate geostatistical trend detection and net-
work evaluation of space–time acid deposition data––II.
Application to NADP/NTN data. Atmos. Environ. A 26
(14), 2615–2626.
Russell, A.G., McRae, G.J., Cass, G.R., 1983. Mathematical
modeling of the formation and transport of ammonium
nitrate aerosol. Atmos. Environ. 17 (5), 949–964.
Ryan, W.M., West, C.R., Holtz, D.R., Peters, T.A., Cooper,
J.A., Ono, D.M., 1988. Reconciliation of receptor and
dispersion modeling impacts of PM10 in Hayden, Arizona.
In: Mathai, C.V., Stonefield, D.H. (Eds.), Transactions,
PM10: Implementation of Standards. Air Pollution Control
Association, Pittsburgh, PA, pp. 419–429.
Saxena, P., Seigneur, C., 1983. Modeling of multiphase
atmospheric aerosols. Atmos. Environ. 17 (7), 1315–1329.
Saxena, P., Hudischewskyj, A.B., Seigneur, C., Seinfeld, J.H.,
1986. A comparative study of equilibrium approaches to the
chemical characterization of secondary aerosols. Atmos.
Environ. 20 (7), 1471–1483.
Schauer, J.J., Cass, G.R., 2000. Source apportionment of
wintertime gas-phase and particle-phase air pollutants using
organic compounds as tracers. Environ. Sci. Technol. 34 (9),
1821–1832.
Schauer, J.J., Rogge, W.F., Mazurek, M.A., Hildemann, L.M.,
Cass, G.R., Simoneit, B.R.T., 1996. Source apportionment
of airborne particulate matter using organic compounds as
tracers. Atmos. Environ. 30 (22), 3837–3855.
Schauer, J.J., Kleeman, M.J., Cass, G.R., Simoneit, B.R.T.,
1999. Measurement of emissions from air pollution sources.
C1 through C29 organic compounds from meat charbroiling.
Environ. Sci. Technol. 33 (10), 1566–1577.
Scheff, P.A., Wadden, R.A., Allen, R.J., 1984. Development
and validation of a chemical element mass balance for
Chicago. Environ. Sci. Technol. 18 (12), 923–931.
Seinfeld, J.H., 1997. Dynamics of urban and regional atmo-
spheric aerosols. J. Aerosol Sci. 28 (Suppl. 1), S417.
Seinfeld, J.H., Pandis, S.N., 1998. Atmospheric Chemistry and
Physics: From Air Pollution to Climate Change. John
Wiley, New York, NY.
Severin, K.G., Roscoe, B.A., Hopke, P.K., 1983. The use
of factor analysis in source determination of particu-
late emissions. In: Particulate Science and Technology.
Hemisphere Publishing Corporation, New York, pp. 183–
192.
Sexton, K., Hayward, S.B., 1987. Source apportionment of
indoor air pollution. Atmos. Environ. 21 (2), 407–418.
Sexton, K., Liu, K.S., Hayward, S.B., Spengler, J.D., 1985.
Characterization and source apportionment of wintertime
aerosol in a wood-burning community. Atmos. Environ. 19
(8), 1225–1236.
Sexton, K., Liu, K.S., Treitman, R.D., Spengler, J.D., Turner,
W.A., 1986. Characterization of indoor air quality in wood-
burning residences. Environ. Int. 12, 265–278.
Shah, J.J., Johnson, R.L., Houck, J.E., 1989. Source charac-
terization using tethered balloons and lightweight samplers.
In: Watson, J.G. (Ed.), Transactions, Receptor Models in
Air Resources Management. Air and Waste Management
Association, Pittsburgh, PA, pp. 334–345.
Shareef, G.S., Bravo, L.A., Stelling, J.H.E., Kuykendal, W.B.,
Mobley, J.D., 1989. Air emissions species data base. In:
Watson, J.G. (Ed.), Transactions, Receptor Models in Air
Resources Management. Air and Waste Management As-
sociation, Pittsburgh, PA, pp. 73–83.
Sharma, V.K., Patil, R.S., 1992. Size distribution of atmo-
spheric aerosols and their source identification using factor
analysis in Bombay, India. Atmos. Environ. B 26 (1), 135–
140.
Sharma, V.K., Patil, R.S., 1994. Chemical mass balance model
for source apportionment of aerosols in Bombay. Environ.
Monit. Assess. 29 (1), 75–88.
1130 J.G. Watson et al. / Chemosphere 49 (2002) 1093–1136

Sharma, P.K., Singh, G., 1992. Distribution of suspended
particulate matter with trace element composition and
apportionment of possible sources in the Raniganj Coal-
field, India. Environ. Monit. Assess. 22 (2), 237–244.
Sheffield, A.E., Gordon, G.E., 1986. Variability of particle
composition from ubiquitous sources: Results from a new
source-composition library. In: Pace, T.G. (Ed.), Transac-
tions, Receptor Methods for Source Apportionment: Real
World Issues and Applications. Air Pollution Control
Association, Pittsburgh, PA, pp. 9–22.
Sheffield, A.E., Gordon, G.E., Currie, L.A., Reiderer, G.E.,
1994. Organic elemental and isotopic tracers of air pollution
sources in Albuquerque, NM. Atmos. Environ. 28 (8),
1371–1384.
Shu, J., Dearing, J.A., Morse, A.P., Yu, L., Yuan, N., 2001.
Determining the sources of atmospheric particles in Shang-
hai, China, from magnetic and geochemical properties.
Atmos. Environ. 35 (15), 2615–2625.
Silverman, D., Dracup, J.A., 2000. Artificial neural net-
works and long-range precipitation prediction in California.
J. Appl. Meteorol. 39, 57–66.
Singer, B.C., Harley, R.A., Littlejohn, D., Ho, J., Vo, T., 1998.
Scaling of infrared remote sensor hydrocarbon measure-
ments for motor vehicle emission inventory calculations.
Environ. Sci. Technol. 32 (21), 3241–3248.
Sj€oogren, M., Li, H., Rannug, U., Westerholm, R., 1996.Multivariate analysis of exhaust emissions from heavy-duty
diesel fuels. Environ. Sci. Technol. 30 (1), 38–49.
Skidmore, L., Chow, J.C., 1992. PM10 air quality assessment
for the Jefferson County, Ohio air quality control region. In:
Chow, J.C., Ono, D.M. (Eds.), Transactions, PM10 Stan-
dards and Nontraditional Particulate Source Controls, pp.
1016–1031.
Smeyers-Verbeke, J., Den Hartog, J.C., Dekker, W.H., Coo-
mans, D., Buydens, L., Massart, D.L., 1984. The use of
principal components analysis for the investigation of an
organic air pollutants data set. Atmos. Environ. 18 (11),
2471–2478.
Smith, K.R., 1995. Health, energy, and greenhouse-gas impacts
of biomass combustion. Energy for Sustainable Develop. 1
(4), 23–29.
Soja, G., Soja, A.M., 1999. Ozone indices based on simple
meteorological parameters: Potentials and limitations of
regression and neural network models. Atmos. Environ. 33
(26), 4299–4308.
Song, X.H., Hopke, P.K., 1996a. Analysis of source contribu-
tions to the ambient aerosol sample by simulated annealing.
Chemom. Intell. Lab. Sys. 34, 275–281.
Song, X.H., Hopke, P.K., 1996b. Solving the chemical mass
balance problem using an artificial neural network. Environ.
Sci. Technol. 30 (2), 531–535.
Song, X.H., Hadjiiski, L., Hopke, P.K., Ashbaugh, L.L.,
Carvacho, O., Casuccio, G.S., Schlaegle, S., 1999a. Source
apportionment of soil samples by the combination of two
neural networks based on computer-controlled scanning
electron microscopy. J. Air Waste Mgmt. Assoc. 49 (7),
773–783.
Song, X.H., Hopke, P.K., Bruns, M.A., Graham, K., Scow, K.,
1999b. Pattern recognition of soil samples based on the
microbial fatty acid contents. Environ. Sci. Technol. 33 (20),
3524–3530.
Song, X.H., Hopke, P.K., Fergenson, D.P., Prather, K.A.,
1999c. Classification of single particles analyzed by ATO-
FMS using an artificial neural network ART-2a. Anal.
Chem. 71 (4), 860–865.
Song, X.H., Polissar, A.V., Hopke, P.K., 2001. Sources of fine
particle composition in the northeastern US. Atmos. Envi-
ron. 35 (31), 5277–5286.
South Coast Air Quality Management District, 1996. 1997 air
quality maintenance plan: Appendix V, Modeling and
attainment demonstrations. South Coast Air Quality Man-
agement District, Diamond Bar, CA.
Staehelin, J., Keller, C., Stahel, W., Schl€aapfer, K., Wunderli, S.,
1998. Emission exhaust factors from road traffic from a
tunnel study (Gubrist tunnel, Switzerland)––Part III: Re-
sults of organic compounds, SO2 and speciation of organic
emission. Atmos. Environ. 32 (6), 999–1010.
Stafford, M.A., Liljestrand, H.M., 1989. The use of fraction-
ated coarse and fine fingerprints for the source apportion-
ment of PM10. In: Watson, J.G. (Ed.), Transactions,
Receptor Models in Air Resources Management. Air and
Waste Management Association, Pittsburgh, PA, pp. 159–
171.
Statheropoulos, M., Vassiliadis, N., Pappa, A., 1998. Principal
component and canonical correlation analysis for examin-
ing air pollution and meteorological data. Atmos. Environ.
32 (6), 1087–1096.
Stedman, D.H., Zhang, Y., Bishop, G.A., Guenther, S.P.,
Beaton, S.P., 1993. On-road hydrocarbon remote sensing.
In: Proceedings of the 86th Annual Meeting, 13 June, 1993,
Denver, CO. Air and Waste Management Association,
Pittsburgh, PA.
Stelson, A.W., Friedlander, S.K., Seinfeld, J.H., 1979. A note
on the equilibrium relationship between ammonia and nitric
acid and particulate ammonium nitrate. Atmos. Environ.
13, 369–371.
Stelson, A.W., Seinfeld, J.H., 1981. Chemical mass accounting
of urban aerosol. Environ. Sci. Technol. 15 (6), 671–679.
Stelson, A.W., Seinfeld, J.H., 1982a. Relative humidity and
temperature dependence of the ammonium nitrate dissoci-
ation constant. Atmos. Environ. 16 (5), 983–992.
Stelson, A.W., Seinfeld, J.H., 1982b. Relative humidity and pH
dependence of the vapor pressure of ammonium nitrate–
nitric acid solutions at 25 �C. Atmos. Environ. 16 (5), 993–1000.
Stelson, A.W., Seinfeld, J.H., 1982c. Thermodynamic predic-
tion of the water activity, NH4NO3 dissociation constant,
density and refractive index for the NH4NO3–(NH4)2SO4–
H2O system at 25 �C. Atmos. Environ. 16 (10), 2507–2514.Stephens, R.D., Mulawa, P.A., Giles, M.T., Kennedy, K.G.,
Groblicki, P.J., Cadle, S.H., Knapp, K.T., 1996. An exper-
imental evaluation of remote sensing-based hydrocarbon
measurements: A comparison to FID measurements. J. Air
Waste Mgmt. Assoc. 46 (2), 148–158.
Stevens, R.K., Pace, T.G., 1984. Review of the mathematical
and empirical receptor models workshop (Quail Roost II).
Atmos. Environ. 18, 1499–1506.
Stevens, R.K., Lewis, C.W., Dzubay, T.G., Cupitt, L.T.,
Lewtas, J., 1990. Sources of mutagenic activity in urban
fine particles. Toxicol. Ind. Health 6 (5), 81–93.
Stockwell, W.R., Milford, J.B., McRae, G.J., Middleton, P.,
Chang, J.S., 1988. Nonlinear coupling in the NOx–SOx
J.G. Watson et al. / Chemosphere 49 (2002) 1093–1136 1131

reactive organic system. Atmos. Environ. 22 (11), 2481–
2490.
Stockwell, W.R., Middleton, P., Chang, J.S., Tang, X., 1990.
The second generation regional acid deposition model
chemical mechanism for regional air quality modeling.
J. Geophys. Res. 95, 16343–16367.
Stockwell, W.R., 1994. The effect of gas-phase chemistry on
aqueous-phase sulfur dioxide oxidation rates. J. Atmos.
Chem. 19 (3), 317–329.
Stockwell, W.R., Kirchner, F., Kuhn, M., Seefeld, S., 1997. A
new mechanism for regional atmospheric chemistry model-
ing. J. Geophys. Res. 102, 25847–25879.
Stockwell, W.R., Watson, J.G., Robinson, N.F., Steiner, W.E.,
Sylte, W.W., 2000. The ammonium nitrate particle equiv-
alent of NOx emissions for continental wintertime condi-
tions. Atmos. Environ. 34 (27), 4711–4717.
Stolzenburg, T.R., Andren, A.W., Stolenburg, M.R., 1982.
Source reconciliation of atmospheric aerosols. Water Air
Soil Pollut. 17, 75–85.
Struempler, A.W., 1975. Trace element composition in atmo-
spheric particulates during 1973 and the summer of 1974
at Chadron, Nebraska. Environ. Sci. Technol. 9, 1164–
1168.
Sturges, W.T., 1989. Identification of pollution sources of
anomalously enriched elements. Atmos. Environ. 23 (9),
2067–2072.
Swietlicki, E., Puri, S., Hansson, H.C., Edner, H., 1996. Urban
air pollution source apportionment using a combination of
aerosol and gas monitoring techniques. Atmos. Environ. 30
(15), 2795–2809.
Tanner, R.L., Harrison, R.M., 1992. Acid–base equilibria of
aerosols and gases in the atmosphere. In: Buffle, J., Van
Leeuwen, H.P. (Eds.), Environmental Particles. Lewis
Publishers, Ann Arbor, MI, pp. 75–106.
Taylor, S.R., 1964. Abundance of chemical elements in the
continental crust: A new table. Geochim. Cosmochim. Acta
28, 1273.
Temesi, D., Molnar, A., Meszaros, E., Feczko, T., Gelencser,
A., Kiss, G., Krivacsy, Z., 2001. Size resolved chemical mass
balance of aerosol particles over rural Hungary. Atmos.
Environ. 35 (25), 4347–4355.
Thomas, W.W., 1986. Principal component analysis of trace
substance concentration in rainwater samples. Atmos.
Environ. 20 (5), 995–1000.
Throgmorton, J.A., 1980. Identification of major sources of
particulate matter in the ambient air through the use of
factor analysis. In: Proceedings of the 73th Annual Meeting,
22 June, 1980, Montreal, PQ, Canada. Air Pollution
Control Association, Pittsburgh, PA.
Thurston, G.D., Spengler, J.D., 1985a. A multivariate assess-
ment of meteorological influences on inhalable particle
source impacts. J. Climatol. Appl. Meterol. 24, 1245–1256.
Thurston, G.D., Spengler, J.D., 1985b. A quantitative assess-
ment of source contributions to inhalable particulate matter
pollution in metropolitan Boston. Atmos. Environ. 19 (1),
9–25.
Toriyama, S., Shimada, H., Arakawa, H., Takata, T., Saka-
mori, S., 1991. An estimate of source contribution of
atmospheric aerosols in Toyama prefecture by chemical
mass balance method. Nippon Kagaku Kaishi May (5),
454–464.
Trijonis, J.C., Pitchford, M.L., McGown, M., Blumenthal,
D.L., Dodson, T., Flocchini, R.G., Kelso, R., Knuth, W.R.,
Macias, E.S., Gara, J.E., Pitchford, A., Smith, T.B.,
Waggoner, A.P., Watson, J.G., Weiss, R.E., White, W.H.,
1987. Preliminary extinction budget results from the RE-
SOLVE program. In: Bhardwaja, P.S. (Ed.), Transactions,
Visibility Protection: Research and Policy Aspects. Air
Pollution Control Association, Pittsburgh, PA, pp. 872–883.
Tropp, R.J., Jones, K., Kuhn, G., Berg Jr., N.J., 1998.
Comparison of PM2:5 saturation samplers with prototype
PM2:5 federal reference method samplers. In: Chow, J.C.,
Koutrakis, P. (Eds.), Proceedings, PM2:5: A Fine Particle
Standard. Air and Waste Management Association, Pitts-
burgh, PA, pp. 215–225.
Truesdale, R.S., 1982. Residential stove emissions from coal
and other alternative fuels combustion. In: Frederick, E.R.
(Ed.), Residential Wood and Coal Combustion. Air Pollu-
tion Control Association, Pittsburgh, PA.
Tsai, F.C., Apte, M.G., Daisey, J.M., 2000. An exploratory
analysis of the relationship between mortality and the
chemical composition of airborne particulate matter. Inhal.
Toxicol. 12 (suppl. 2), 121–135.
Tsuang, B.J., Chen, C.L., Pan, R.C., Liu, J.H., 2002. Quanti-
fication on source/receptor relationship of primary pollu-
tants and secondary aerosols from ground sources––Part 1.
Theory. Atmos. Environ. 36 (3), 411–419.
Tsunogai, S., Saito, K., Nakaya, S., 1972. Chemical composi-
tion of oceanic aerosol. J. Geophys. Res. 77, 5283–5292.
Turekian, K.K., Wedepohl, K.H., 1961. Distribution of the
elements in some major units of the Earth�s crust. Geol. Soc.Am. Bull. 72, 175–191.
Turpin, B.J., Lim, H.J., 2001. Species contributions to PM2:5mass concentrations: Revisiting common assumptions for
estimating organic mass. Aerosol Sci. Technol. 35 (1), 602–
610.
US EPA, 1987. Receptor model technical series, Volume III
(Revised). CMB user�s manual (Version 6.0). Report No.EPA-450/4-83-014R. US Environmental Protection Agency,
Research Triangle Park, NC.
US EPA, 1999. Compilation of air pollutant emission factors,
vol. I, Stationary point and area sources. Report No. AP-
42, fifth ed. US Environmental Protection Agency, Research
Triangle Park, NC.
Valaoras, G., Huntzicker, J.J., White, W.H., 1988. On the
contribution of motor vehicles to the Athenian ‘‘Nephos’’:
An application of factor signatures. Atmos. Environ. 22 (5),
965–971.
van Borm, W.A., Adams, F.C., Maenhaut, W., 1990. Receptor
modeling of the Antwerp aerosol. Atmos. Environ. 24B,
419–435.
Vavilova, N.G., Genikhovich, Y.L., Son�kin, L.R., 1969.Statistical analysis of data on air pollution in cities by
means of natural functions. In: Glavnaia Geofizicheskaia
Observatoriia im A.I. Voeikova. Hydrometeorological Pub-
lishers, Leningrad, Soviet Union, pp. 27–32.
Vega, E., Garc�ııa, I., Apam, D., Ru�ıız, M.E., Barbiaux, M.,
1997. Application of a chemical mass balance receptor
model to respirable particulate matter in Mexico City. J. Air
Waste Mgmt. Assoc. 47 (4), 524–529.
Veltkamp, P.R., Hansen, K.J., Barkley, R.M., Sievers, R.E.,
1996. Principal component analysis of summertime organic
1132 J.G. Watson et al. / Chemosphere 49 (2002) 1093–1136
aerosols at Niwot Ridge, Colorado. J. Geophys. Res. 101
(D14), 19495–19504.
Venkataraman, C., Friedlander, S.K., 1994. Source resolution
of fine particulate polycyclic aromatic hydrocarbons using a
receptor model modified for reactivity. J. Air Waste Mgmt.
Assoc. 44 (9), 1103–1108.
Vermette, S.J., Williams, A.L., Landsberger, S., 1992. PM10source apportionment using local surface dust profiles:
Examples from Chicago. In: Chow, J.C., Ono, D.M. (Eds.),
Transactions, PM10 Standards and Nontraditional Particu-
late Source Controls. Air and Waste Management Associ-
ation, Pittsburgh, PA, pp. 262–271.
Vinogradov, A.P., 1959. The Geochemistry of Rare and
Dispersed Chemical Elements in Soils, second ed. Consul-
tants Bureau, Inc., New York, NY.
Vong, R.J., Geladi, P., Wold, S., Esbensen, K., 1988. Source
contributions to ambient aerosol calculated by discriminant
partial least squares regression (PLS). J. Chemom. 2, 281–
296.
Vossler, T.L., Lewis, C.W., Stevens, R.K., Dzubay, T.G.,
Gordon, G.E., Tuncel, S.G., Russwurm, G.M., Keeler,
G.J., 1989. Compositions and origin of summertime air
pollutants at Deep Creek Lake, Maryland. Atmos. Environ.
23 (7), 1535–1547.
Wadden, R.A., Lee, H.S., Scheff, P.A., Lin, J., 1993. Sulfur and
nitrogen balances for the Chicago area by receptor model-
ing. In: Proceedings of the 86th Annual Meeting, 13 June,
1993, Denver, CO. Air and Waste Management Associa-
tion, Pittsburgh, PA.
Wang, D., Hopke, P.K., 1989. The use of constrained least-
squares to solve the chemical mass balance problem. Atmos.
Environ. 23 (10), 2143–2150.
Watson, J.G., 1979. Chemical element balance receptor
model methodology for assessing the sources of fine and
total suspended particulate matter in Portland, Oregon.
Ph.D. Dissertation, Oregon Graduate Center, Beaverton,
OR.
Watson, J.G., 1984. Overview of receptor model principles.
J. Air Pollut. Control Assoc. 34 (6), 619–623.
Watson, J.G., 1989. Transactions, Receptor Models in Air
Resources Management. Air and Waste Management As-
sociation, Pittsburgh, PA.
Watson, J.G., Henry, R.C., Cooper, J.A., Macias, E.S., 1981.
The state of the art of receptor models relating ambient
suspended particulate matter to sources. In: Macias, E.S.,
Hopke, P.K. (Eds.), Atmospheric Aerosol, Source/Air
Quality Relationships. American Chemical Society, Wash-
ington, DC, pp. 89–106.
Watson, J.G., Cooper, J.A., Huntzicker, J.J., 1984. The
effective variance weighting for least squares calculations
applied to the mass balance receptor model. Atmos.
Environ. 18 (7), 1347–1355.
Watson, J.G., Chow, J.C., Richards, L.W., Andersen, S.R.,
Houck, J.E., Dietrich, D.L., 1988. The 1987–1988 Metro
Denver Brown Cloud Air Pollution Study, Volume III:
Data interpretation. Report No. DRI 8810.1. Prepared for
1987–88 Metro Denver Brown Cloud Study, Inc., Greater
Denver Chamber of Commerce, Denver, CO, by Desert
Research Institute, Reno, NV.
Watson, J.G., Chow, J.C., Mathai, C.V., 1989. Receptor
models in air resources management: A summary of the
APCA International Specialty Conference. J. Air Pollut.
Control Assoc. 39 (4), 419–426.
Watson, J.G., Chow, J.C., Pritchett, L.C., Houck, J.E.,
Ragazzi, R.A., 1990a. Chemical source profiles for partic-
ulate motor vehicle exhaust under cold and high altitude
operating conditions. Sci. Total Environ. 93, 183–190.
Watson, J.G., Robinson, N.F., Chow, J.C., Henry, R.C., Kim,
B.M., Pace, T.G., Meyer, E.L., Nguyen, Q., 1990b. The US
EPA/DRI chemical mass balance receptor model, CMB 7.0.
Environ. Software 5 (1), 38–49.
Watson, J.G., Chow, J.C., 1993. Ambient air sampling. In:
Willeke, K., Baron, P.A. (Eds.), Aerosol Measurement:
Principles, Techniques and Applications. Van Nostrand,
Reinhold, New York, NY, pp. 622–639.
Watson, J.G., Chow, J.C., 1994. Particle and gas measurements
on filters. In: Markert, B. (Ed.), Environmental Sampling
for Trace Analysis. VCH, New York, pp. 125–161.
Watson, J.G., Chow, J.C., 2000. Reconciling urban fugitive
dust emissions inventory and ambient source contribution
estimates: Summary of current knowledge and needed
research. Report No. 6110.4D2. Prepared for US Environ-
mental Protection Agency, Research Triangle Park, NC, by
Desert Research Institute, Reno, NV.
Watson, J.G., Chow, J.C., Pace, T.G., 2000. Fugitive dust
emissions. In: Davis, W.T. (Ed.), Air Pollution Engineering
Manual, second ed. John Wiley, New York, pp. 117–135.
Watson, J.G., Chow, J.C., 2001a. Source characterization of
major emission sources in the Imperial and Mexicali valleys
along the US/Mexico border. Sci. Total Environ. 276 (1–3),
33–47.
Watson, J.G., Chow, J.C., 2001b. Ambient air sampling.
In: Baron, P., Willeke, K. (Eds.), Aerosol Measurement:
Principles, Techniques, and Applications, second ed. John
Wiley, New York, NY, pp. 821–844.
Watson, J.G., Chow, J.C., Pace, T.G., 1991. Chemical mass
balance. In: Hopke, P.K. (Ed.), Receptor Modeling for Air
Quality Management. Elsevier, New York, NY, pp. 83–116.
Watson, J.G., Chow, J.C., Lowenthal, D.H., Pritchett, L.C.,
Frazier, C.A., Neuroth, G.R., Robbins, R., 1994a. Differ-
ences in the carbon composition of source profiles for diesel-
and gasoline-powered vehicles. Atmos. Environ. 28 (15),
2493–2505.
Watson, J.G., Chow, J.C., Lu, Z., Fujita, E.M., Lowenthal,
D.H., Lawson, D.R., 1994b. Chemical mass balance source
apportionment of PM10 during the Southern California air
quality study. Aerosol Sci. Technol. 21 (1), 1–36.
Watson, J.G., Chow, J.C., Lurmann, F.W., Musarra, S., 1994c.
Ammonium nitrate, nitric acid, and ammonia equilibrium
in wintertime Phoenix, Arizona. J. Air Waste Mgmt. Assoc.
44 (4), 405–412.
Watson, J.G., Blumenthal, D.L., Chow, J.C., Cahill, C.F.,
Richards, L.W., Dietrich, D., Morris, R., Houck, J.E.,
Dickson, R.J., Andersen, S.R., 1996. Mt. Zirkel Wilderness
Area reasonable attribution study of visibility impairment,
vol. II: Results of data analysis and modeling. Prepared for
Colorado Department of Public Health and Environment,
Denver, CO, by Desert Research Institute, Reno, NV.
Watson, J.G., Chow, J.C., Rogers, C.F., Green, M.C., Kohl,
S.D., Frazier, C.A., Robinson, N.F., DuBois, D.W., 1997a.
Annual report for the Robbins Particulate Study––October
1995–September 1996. Report No. 7100.3F2. Prepared for
J.G. Watson et al. / Chemosphere 49 (2002) 1093–1136 1133

VERSAR Inc., Lombard, IL, by Desert Research Institute,
Reno, NV.
Watson, J.G., Robinson, N.F., Lewis, C.W., Coulter, C.T.,
Chow, J.C., Fujita, E.M., Lowenthal, D.H., Conner, T.L.,
Henry, R.C., Willis, R.D., 1997b. Chemical mass balance
receptor model version 8 (CMB) user�s manual. Preparedfor US Environmental Protection Agency, Research Trian-
gle Park, NC, by Desert Research Institute, Reno, NV.
Watson, J.G., Chow, J.C., Moosm€uuller, H., Green, M.C.,
Frank, N.H., Pitchford, M.L., 1998a. Guidance for using
continuous monitors in PM2:5 monitoring networks. Report
No. EPA-454/R-98-012. Prepared for US EPA, Office of Air
Quality Planning and Standards, Research Triangle Park,
NC, by Desert Research Institute, Reno, NV.
Watson, J.G., Fujita, E.M., Chow, J.C., Zielinska, B., Rich-
ards, L.W., Neff, W.D., Dietrich, D., 1998b. Northern
Front Range Air Quality Study. Final report. Prepared for
Colorado State University, Fort Collins, CO, by Desert
Research Institute, Reno, NV.
Watson, J.G., Robinson, N.F., Lewis, C.W., Coulter, C.T.,
Chow, J.C., Fujita, E.M., Conner, T.L., Pace, T.G., 1998c.
CMB8 applications and validation protocol for PM2:5 and
VOCs. Report No. 1808.2D1. Prepared for US Environ-
mental Protection Agency, Research Triangle Park, NC, by
Desert Research Institute, Reno, NV.
Watson, J.G., Chow, J.C., Frazier, C.A., 1999a. X-ray fluores-
cence analysis of ambient air samples. In: Landsberger, S.,
Creatchman, M. (Eds.), Elemental Analysis of Airborne
Particles, vol. 1. Gordon and Breach Science, Amsterdam,
pp. 67–96.
Watson, J.G., Chow, J.C., Kohl, S.D., Kuhns, H.D., Robinson,
N.F., Frazier, C.A., Etyemezian, V., 1999b. Annual report
for the Robbins Particulate Study: October 1996 through
September 1997. Report No. 7100.4F3. Prepared for VER-
SAR, Inc., Lombard, IL, by Desert Research Institute,
Reno, NV.
Watson, J.G., Chow, J.C., Fujita, E.M., 2001a. Review of
volatile organic compound source apportionment by chem-
ical mass balance. Atmos. Environ. 35 (9), 1567–1584.
Watson, J.G., Chow, J.C., Houck, J.E., 2001b. PM2:5 chemical
source profiles for vehicle exhaust, vegetative burning,
geological material, and coal burning in northwestern
Colorado during 1995. Chemosphere 43 (8), 1141–1151.
Watson, J.G., Turpin, B.J., Chow, J.C., 2001c. The measure-
ment process: Precision, accuracy, and validity. In: Cohen,
B.S., McCammon, C.S.J. (Eds.), Air Sampling Instruments
for Evaluation of Atmospheric Contaminants, ninth ed.
American Conference of Governmental Industrial Hygien-
ists, Cincinnati, OH, pp. 201–216.
Watson, J.G., Chow, J.C., 2002a. A wintertime PM2:5 episode
at the Fresno, CA, supersite. Atmos. Environ. 36 (3), 465–
475.
Watson, J.G., Chow, J.C., 2002b. Particulate pattern recogni-
tion. In: Murphy, B.L., Morrison, R. (Eds.), Introduction to
Environmental Forensics. Academic Press, New York, NY,
pp. 429–460.
Watson, J.G., Chow, J.C., Lowenthal, D.H., Robinson, N.F.,
Cahill, C.F., 2002. Simulating changes in source profiles
from coal-fired power stations: Use in chemical mass
balance of PM2:5 in the Mt. Zirkel Wilderness. Energy
Fuels 16 (2), 311–324.
Weingartner, E., Keller, C., Stahel, W.A., Burtscher, H.,
Baltensperger, U., 1997. Aerosol emission in a road tunnel.
Atmos. Environ. 31 (3), 451–462.
West, J.J., Ansari, A.S., Pandis, S.N., 1999. Marginal PM2:5:
Nonlinear aerosol mass response to sulfate reductions in the
eastern United States. J. Air Waste Mgmt. Assoc. 49 (12),
1415–1424.
Wexler, A.S., Seinfeld, J.H., 1990. The distribution of ammo-
nium salts among a size and composition dispersed aerosol.
Atmos. Environ. A 24 (5), 1231–1246.
Wexler, A.S., Seinfeld, J.H., 1991. Second-generation inorganic
aerosol model. Atmos. Environ. A 25 (12), 2731–2748.
Wexler, A.S., Seinfeld, J.H., 1992. Analysis of aerosol ammo-
nium nitrate: Departures from equilibrium during SCAQS.
Atmos. Environ. A 26 (4), 579–591.
Wexler, A.S., Lurmann, F.W., Seinfeld, J.H., 1994. Modeling
urban and regional aerosols––I. Model development. At-
mos. Environ. 28 (3), 531–546.
White, W.H., 1986. On the theoretical and empirical basis for
apportioning extinction by aerosols: A critical review.
Atmos. Environ. 20 (9), 1659–1672.
White, W.H., 1989. MLRCLS: A basic routine for multiple
regression by corrected least squares. In: Watson, J.G.
(Ed.), Transactions, Receptor Models in Air Resources
Management. Air and Waste Management Association,
Pittsburgh, PA, pp. 269–275.
White, W.H., Husar, R.B., Friedlander, S.K., 1977. A Study of
Los Angeles Smog Aerosol Dynamics by Air Trajectory
Analysis. In: Proceedings of the 66th Annual Meeting,
Chicago, IL. Air Pollution Control Association, Pittsburgh,
PA.
White, W.H., Macias, E.S., 1987. On measurement error and
the empirical relationship of atmospheric extinction to
aerosol composition in the non-urban west. In: Bhardwaja,
P.S. (Ed.), Transactions, Visibility Protection: Research and
Policy Aspects. Air Pollution Control Association, Pitts-
burgh, PA, pp. 783–794.
White, W.H., Macias, E.S., 1991. Chemical mass balanc-
ing with ill defined sources: Regional apportionment in
the California desert. Atmos. Environ. A 25 (8), 1547–
1557.
Wienke, D., Gao, N., Hopke, P.K., 1994a. Multiple site
receptor modeling with a minimal spanning tree combined
with a neural network. Environ. Sci. Technol. 28 (6), 1023–
1030.
Wienke, D., Hopke, P.K., 1994a. Projection of Prim�s minimalspanning tree into Kohonen�s neural network for identifi-cation of airborne particle sources by their multielement
trace patterns. Anal. Chim. Acta 291, 1–18.
Wienke, D., Hopke, P.K., 1994b. Visual neural mapping
technique for locating fine airborne particles sources.
Environ. Sci. Technol. 28 (6), 1015–1022.
Wienke, D., Xie, Y., Hopke, P.K., 1994b. An adaptive
resonance theory based artificial neural network (ART-2a)
for rapid identification of airborne particle shapes from
their scanning electron microscopy images. Chemom. Intell.
Lab. Sys. 25, 367–387.
Wienke, D., Xie, Y., Hopke, P.K., 1995. Classification of
airborne particles by analytical scanning electron micro-
scopy imaging and a modified Kohonen neural network
(3MAP). Anal. Chim. Acta 310 (1), 1–14.
1134 J.G. Watson et al. / Chemosphere 49 (2002) 1093–1136
Wilkniss, P.E., Bressan, D.J., 1972. Fractionation of the
elements F, Cl, Na and K at the sea–air interface. J.
Geophys. Res. 77, 5307–5315.
Willis, R.D., Ellenson, W.D., Pinto, J.P., Hartlage, T.A.,
Novak, J., Dosdalek, H., Cernikovsky, L., Bures, V., 1997.
Ostrava ambient monitoring and source receptor modeling
study. Report No. EPA/600/R-97/030. US EPA.
Willis, R.D., 2000. Workshop on UNMIX and PMF as applied
to PM2:5. Report No. EPA/600/A-00/048. U.S. Environ-
mental Protection Agency, Research Triangle Park, NC.
Winchester, J.W., Nifong, G.D., 1971. Water pollution in Lake
Michigan by trace elements from aerosol fallout. Water Air
Soil Pollut. 1, 50–64.
Winchester, J.W.,Meinert, D.L., Nelson, J.W., Johansson, T.B.,
VanGrieken, R.E., Orsini, C., Kaufmann, H.C., Akselsson,
R., 1974. Trace metals in the St. Louis aerosol. In:
Proceedings, Second International Conference on Nuclear
Methods in Environmental Research. University of Mis-
souri, Rolla, MO.
Winchester, J.W., Ferek, R.J., Lawson, D.R., Pilotte, J.O.,
Thiemens, M.H., Wangen, L.E., 1979. Comparison of
aerosol sulfur and crustal element concentrations in particle
size fractions from continental US locations. Water Air Soil
Pollut. 12, 431–440.
Witz, S., Eden, R.W., Wadley, M.W., Dunwoody, C., Papa,
R.P., Torre, K.J., 1990. Rapid loss of particulate nitrate,
chloride and ammonium on quartz fiber filters during
storage. J. Air Waste Mgmt. Assoc. 40 (1), 53–61.
Wolff, G.T., Korsog, P.E., 1985. Estimates of the contribution
of sources to inhalable particulate concentrations in Detroit.
Atmos. Environ. 19 (9), 1399–1409.
Wolff, G.T., Korsog, P.E., Kelly, N.A., Ferman, M.A., 1985a.
Relationships between fine particulate species, gaseous
pollutants and meteorological parameters in Detroit. At-
mos. Environ. 19 (8), 1341–1349.
Wolff, G.T., Korsog, P.E., Stroup, D.P., Ruthkosky, M.S.,
Morrissey, M.L., 1985b. The influence of local and regional
sources on the concentration of inhalable particulate matter
in southeastern Michigan. Atmos. Environ. 19 (2), 305–313.
Xie, Y.L., Hopke, P.K., Casuccio, G.S., Henderson, B.C.,
1994a. Use of multiple fractal dimensions to quantify
airborne particle shape. Aerosol Sci. Technol. 20, 161–168.
Xie, Y.L., Hopke, P.K., Wienke, D., 1994b. Airborne particle
classification with a combination of chemical composition
and shape index utilizing an adaptive resonance artificial
neural network. Environ. Sci. Technol. 28 (11), 1921–1928.
Xie, Y.L., Hopke, P.K., Paatero, P., Barrie, L.A., Li, S.M.,
1999a. Identification of source nature and seasonal varia-
tions of Arctic aerosol by positive matrix factorization.
Atmos. Sci. 56 (2), 249–260.
Xie, Y.L., Hopke, P.K., Paatero, P., Barrie, L.A., Li, S., 1999b.
Identification of source nature and seasonal variations of
Arctic aerosol by the multilinear engine. Atmos. Environ. 33
(16), 2549–2562.
Xie, Y.L., Hopke, P.K., Paatero, P., Barrie, L.A., Li, S., 1999c.
Locations and preferred pathways of possible sources of
Arctic aerosol. Atmos. Environ. 33 (14), 2229–2239.
Yakovleva, E., Hopke, P.K., Wallace, L., 1999. Receptor
modeling assessment of particle total exposure assessment
methodology data. Environ. Sci. Technol. 33 (20), 3645–
3652.
Yoo, S.J., Kim, D.S., 1997. Classification of ambient particu-
late samples using cluster analysis and disjoint principal
component analysis. J. Korea Air Poll. Res. 13 (1), 51–63.
Yoshizumi, K., 1991. Source apportionment of aerosols in the
Tokyo metropolitan area by chemical element balance.
Energy Buildings 16 (1–2), 711–717.
Zelenka, M.P., Lioy, P.J., Qing-Ci, H., Wilson, W.E., 1992.
Development of a new methodology for characterizing air
pollution sources in China. In: Chow, J.C., Ono, D.M.
(Eds.), Transactions, PM10 Standards and Nontraditional
Particulate Source Controls. Air and Waste Management
Association, Pittsburgh, PA, pp. 163–182.
Zelenka, M.P., Wilson, W.E., Lioy, P.J., 1993. Source appor-
tionment of air pollution in China: Extending the usefulness
of receptor modeling by combining multivariate and chem-
ical mass balance models. In: Proceedings of the 86th
Annual Meeting, 13 June, 1993, Denver, CO. Air and Waste
Management Association, Pittsburgh, PA.
Zelenka, M.P., Wilson, W.E., Chow, J.C., Lioy, P.J., 1994. A
combined TTFA/CMB receptor modeling approach and
its application to air pollution sources in China. Atmos.
Environ. 28 (8), 1425–1435.
Zeng, Y., Hopke, P.K., 1989. Three-mode factor analysis: A
new multivariate method for analyzing spatial and temporal
composition variation. In: Watson, J.G. (Ed.), Transac-
tions, Receptor Models in Air Resources Management. Air
and Waste Management Association, Pittsburgh, PA,
pp. 173–189.
Zeng, Y., Hopke, P.K., 1992a. A new receptor model: A direct
trilinear decomposition followed by a matrix reconstruction.
Chemometrics 6 (2), 65–83.
Zeng, Y., Hopke, P.K., 1992b. The application of three-mode
factor analysis (TMFA) to receptor modeling of SCENES
particle data. Atmos. Environ. A 26 (9), 1701–1711.
Zhang, J., Chen, Z., Wang, W., 1998a. Source apportionment
on fine particulates in atmosphere in Beijing. Acta Scientiae
Circumstantiae 18 (1), 62–67.
Zhang, X.Y., Arimoto, R., An, Z.S., Chen, T., Zhang, G., Zhu,
G., Wang, X., 1993. Atmospheric trace elements over source
regions for Chinese dust: Concentrations, sources, and
atmospheric deposition on the Loess Plateau. Atmos.
Environ. A 27 (13), 2051–2067.
Zhang, X.Y., Zhang, G.Y., Zhu, G.H., Zhang, D.E., An, Z.S.,
Chen, T., Huang, X.P., 1996. Elemental tracers for Chinese
source dust. Sci. China, Ser. D 39 (5), 512–521.
Zhang, X.Y., Arimoto, R., An, Z.S., 1997. Dust emission from
Chinese desert sources linked to variations in atmospheric
circulation. J. Geophys. Res. 102 (D23), 28041–28047.
Zhang, X.Y., Arimoto, R., Zhu, G.H., Chen, T., Zhang, G.Y.,
1998b. Concentration, size-distribution and deposition of
mineral aerosol over Chinese desert regions. Tellus B 50 (4),
317–330.
Zhang, Y., Seigneur, C., Seinfeld, J.H., Jacobson, M.Z.,
Binkowski, F.S., 1999. Simulation of aerosol dynamics: A
comparative review of algorithms used in air quality models.
Aerosol Sci. Technol. 31 (6), 487–514.
Zhang, Y., Seigneur, C., Seinfeld, J.H., Jacobson, M., Clegg,
S.L., Binkowski, F.S., 2000. A comparative review of
inorganic aerosol thermodynamic equilibrium modules:
similarities, differences, and their likely causes. Atmos.
Environ. 34 (1), 117–137.
J.G. Watson et al. / Chemosphere 49 (2002) 1093–1136 1135
Zhu, T., Bai, Z., Chen, W., 1995a. Source analysis of air par-
ticulate in Qinhuangdao city. Res. Environ. Sci. 8 (5), 49–55.
Zhu, T., Zhou, J., Bai, Z., 1995b. Source apportionment for air
particulate matter in Dagang oil field. Pure Appl. Chem. 67,
1477–1481.
Zhu, T., Bai, Z., Chen, W., Xie, X., 1996. Application of
receptor model chemical mass balance source apportion-
ment for air particulate matters in TEDA. Urban Environ.
Urban Ecol. 9 (1), 9–14.
Zhu, T., Sun, R., Zhang, L., Jiang, L., 1998. Study on
identifying the distribution and pollution sources of PAHs
in airborne particulate in Dagang Area, Tianjin. China
Environ. Sci. 18 (4), 289–292.
Zhu, T., Zhu, X., Liu, W., Lu, Y., Wang, Y., 1999. Application
and prospect of chemical mass balance for the source
apportionment of air pollutants. In: Proceedings, 7th
National Conference on Aerosol, Xi�an, China.
Zielinska, B., Fung, K.K., 1994. The composition and concen-
tration of hydrocarbons in the range of C2 to C18 emitted
from motor vehicles. Sci. Total Environ. 146–147, 281–
288.
Zielinska, B., McDonald, J.D., Hayes, T., Chow, J.C., Fujita,
E.M., Watson, J.G., 1998. Northern Front Range Air
Quality Study. vol. B: Source measurements. Prepared for
Colorado State University, Fort Collins, CO, by Desert
Research Institute, Reno, NV.
Zoller, W.H., Gordon, G.E., Gladney, E.S., Jones, A.G., 1973.
The sources and distribution of vanadium in the atmo-
sphere. In: Kothny, E.L. (Ed.), Trace Elements in the
Environment. American Chemical Society, Washington,
DC, pp. 123–132.
Zoller, W.H., Gladney, E.S., Duce, R.A., 1974. Atmospheric
concentrations and sources of trace metals at the South
Pole. Science 183, 198–200.
1136 J.G. Watson et al. / Chemosphere 49 (2002) 1093–1136
Copyright © 2022 FDOKUMEN