A Statewide Consortium's Adoption of a Unified Nursing Curriculum: Evaluation of the First Two Years
32
Running head: EVALUATION OF A STATEWIDE CONSORTIUM CURRICULUM 1 2 A State-Wide Consortium’s Adoption of a Unified Nursing Curriculum: 3 Evaluation of the First Two Years 4 5 Alice M. Tse, Victoria Niederhauser, John J. Steffen, Lois Magnussen, 6 Nova Morrisette, Rachael Polokoff, and Johnelle Chock 7 8 9 10 Author Note 11 Alice Tse, Lois Magnussen (retired), and Johnelle Chock, Department of Nursing; John 12 J. Steffen (retired), Department of Social Sciences; Nova Morrisette, and Rachael Polokoff, 13 Department of Psychology, University of Hawaii at Manoa; Victoria Niederhauser, College of 14 Nursing, University of Tennessee Knoxville. 15 This research was supported by a grant from the Robert Wood Johnson Foundation, 16 Evaluating Innovations in Nursing Education Program, Grant #68173. 17 Correspondence concerning this article should be addressed to Alice Tse, Department of Nursing, 18 University of Hawaii at Manoa, 2528 McCarthy Mall, Honolulu, HI 96822. [email protected] 19 20 21
-
Upload
manoa-hawaii -
Category
Documents
-
view
6 -
download
0
Transcript of A Statewide Consortium's Adoption of a Unified Nursing Curriculum: Evaluation of the First Two Years
Running head: EVALUATION OF A STATEWIDE CONSORTIUM CURRICULUM
1
2
A State-Wide Consortium’s Adoption of a Unified Nursing Curriculum: 3
Evaluation of the First Two Years 4
5
Alice M. Tse, Victoria Niederhauser, John J. Steffen, Lois Magnussen, 6
Nova Morrisette, Rachael Polokoff, and Johnelle Chock 7
8
9
10
Author Note 11
Alice Tse, Lois Magnussen (retired), and Johnelle Chock, Department of Nursing; John 12
J. Steffen (retired), Department of Social Sciences; Nova Morrisette, and Rachael Polokoff, 13
Department of Psychology, University of Hawaii at Manoa; Victoria Niederhauser, College of 14
Nursing, University of Tennessee Knoxville. 15
This research was supported by a grant from the Robert Wood Johnson Foundation, 16
Evaluating Innovations in Nursing Education Program, Grant #68173. 17
Correspondence concerning this article should be addressed to Alice Tse, Department of Nursing, 18
University of Hawaii at Manoa, 2528 McCarthy Mall, Honolulu, HI 96822. [email protected] 19
20
21
Running head: EVALUATION OF A STATEWIDE CONSORTIUM CURRICULUM
22
23
24
A State-Wide Consortium’s Adoption of a Unified Nursing Curriculum: 25
Evaluation of the First Two Years 26
27
28
. 29
30
EVALUATION OF A STATEWIDE CONSORTIUM CURRICULUM 1
Abstract 31
AIM This article provides an evaluation of the first two years of implementation of a 32
Statewide Nursing Consortium (SNC) curriculum, on nursing faculty work life, teaching 33
productivity and quality of education. 34
BACKGROUND In response to the national call for nursing education reform, the SNC 35
incorporated new approaches to competency-based, student-centered learning and the design of 36
clinical education. 37
METHODS Faculty and two cohorts of students were measured at three points over the 38
first two years of the curriculum implementation. 39
RESULTS The expected positive impact of the SNC was documented at the start of the 40
first year but was not sustained. Students reported having more confidence in their clinical skills 41
at the start of the first year, yet demonstrated significantly less confidence in their ability after 42
two years. 43
CONCLUSIONS Faculty indicated greater opportunity for collaboration, but the SNC 44
experience did not alter their classroom performance or satisfaction beyond the first year. 45
46
47
48
49
50
Keywords: Pedagogy, Nursing Education, Evaluation, Teaching, OCNE 51
EVALUATION OF A STATEWIDE CONSORTIUM CURRICULUM 2
52
A State-Wide Consortium’s Adoption of a Unified Nursing Curriculum: 53
Evaluation of the First Two Years 54
55
Several landmark calls to action led a large flagship public University system to 56
transform the educational model for nursing in the State. A single baccalaureate nursing 57
curriculum was implemented for university and community college students throughout the state 58
to bolster faculty teaching productivity, improve faculty work life, increase student enrollment 59
through a intervention to address workforce shortages, create increased access to Baccalaureate 60
nursing education in the state, and enhance clinical learning. This Statewide Nursing 61
Consortium (SNC) sought to transform the educational environment based on an understanding 62
of learning. Based on the approach taken by the Oregon Consortium for Nursing Education 63
(OCNE) (Herinckx, Munkvold, & Tanner, 2014; Munkvold, Tanner, & Herinckx, 2012; Tanner, 64
Gubrud-Howe, & Shores, 2008). The SNC consisted of a common curriculum taught on all 65
campuses (community College and Flagship campus) for the first two years of a three-year 66
baccalaureate degree and provided mechanisms for the seamless transfer of students to the 67
university for the final year of the baccalaureate curriculum. 68
The SNC curriculum offers an innovative, integrated learning opportunity for nursing 69
students throughout the state, regardless of their island of residence. The curriculum incorporates 70
a new competency- based pedagogy organized around foci of care, including concept-based and 71
student-centered learning, spiraling curriculum, and case-based clinical educational redesign. 72
The development of the SNC is detailed by Author et al. (2012, 2013). 73
Background 74
“A better use and preparation of nurses, including a mandate that 80% of all nurses 75
EVALUATION OF A STATEWIDE CONSORTIUM CURRICULUM 3
should have baccalaureate preparation by 2020” was put forth by the Institute of Medicine’s 76
Report, “The Future of Nursing: Leading Change, Advancing Health” (IOM, 2010). The 77
Carnegie Foundation for the Advancement of Teaching (Benner, Sutphen, Leonard, & Day, 78
2010) also indicated that schools of nursing were lagging behind in responding to changes in the 79
practice setting fostered by science and technology. Over a decade ago, a set of core 80
competencies were proposed to be included in all health professional’s education in the 21st 81
century by the 2003 Institute of Medicine in its Summit Report, “Health Professions Education: 82
A Bridge to Quality”. In addition, health professionals were urged to take a critical look at what 83
constituted a competent health care professional by the Pew Commission’s “21 Competencies for 84
Health Education in the 21st Century” (O'Neil & Pew Health Professions Commission, 1998). 85
Purpose, Conceptual Framework and Evaluation Questions 86
The purpose of this evaluation was to examine the overarching evaluation question: How 87
does the SNC intervention enhance faculty work life (thus sustaining recruitment, retention, and 88
productivity), quality of education and promote productivity? The theoretical rationale for 89
productivity-job satisfaction relationship was grounded in expectancy-based and self-90
determination theories of motivation (Judge, Bono, Thoresen, & Patton, 2001). 91
In response to the demands on nursing education reform, this article specifically explores: 92
(1) the impact of implementation of the SNC curriculum on faculty work-life, teaching 93
productivity, and quality of education among faculty members; (2) the impact of implementation 94
of the SNC curriculum on confidence in performing nursing functions among students; (3) the 95
differential impact of implementation of the SNC program on faculty work-life, teaching 96
productivity, and quality of education between faculty members in programs that have adopted 97
this curriculum (Intervention) versus those in programs that have not adopted it (Comparison); 98
(4) the differential impact of implementation of the SNC curriculum on confidence in performing 99
EVALUATION OF A STATEWIDE CONSORTIUM CURRICULUM 4
nursing functions between students in Intervention versus those in Comparison programs; and (5) 100
differences in how faculty members in Intervention programs versus those in Comparison 101
programs spend time in their work related professional activities. 102
Design and Method 103
Design 104
A quasi-experimental design involving both quantitative and qualitative methodologies 105
(mixed methods) was used to evaluate the impact of the SNC intervention. The quantitative 106
analysis used a nonequivalent comparison group design with a baseline, end of Year 1, and one-107
year later post-test (end of Year 2). A qualitative evaluation involved key informant interviews 108
with purposefully selected faculty participants at the Intervention and Comparison schools was 109
done to enrich interpretation of the outcome data. 110
Data Source and Sample 111
This evaluation is an analysis of faculty and student responses from two community 112
colleges and one 4-year university which admitted students into the SNC curriculum 113
(Intervention). These responses were compared with two other community colleges and one 114
other 4-year university which maintained their traditional curricular approaches (Comparison). 115
Informed consent was obtained from all participants and codes were assigned to sites and 116
participants. Inclusion criteria for the Intervention group were that each participant at the time 117
the project started was teaching a course within the SNC curriculum (faculty) or were enrolled in 118
the SNC curriculum courses (student). The inclusion criteria for faculty and students of the 119
comparison schools were that they agreed to participate. 120
Surveys. Each Fall beginning in 2010-2011 (Cohort 1) through the 2011-2012 (Cohort 121
2) academic year, all first-year students enrolled at the Intervention and Comparison schools 122
were recruited on a rolling basis to participate in the Student Surveys. A total of 422 student 123
EVALUATION OF A STATEWIDE CONSORTIUM CURRICULUM 5
surveys (Intervention N=296; Comparison N=126) were obtained over the two years. The 124
students participated at baseline, end of year one, and one year later post-test. 125
Faculty at the Intervention and Comparison schools were invited to participate in the 126
Faculty Surveys. A total of 44 Intervention and 26 Comparison faculty completed surveys 127
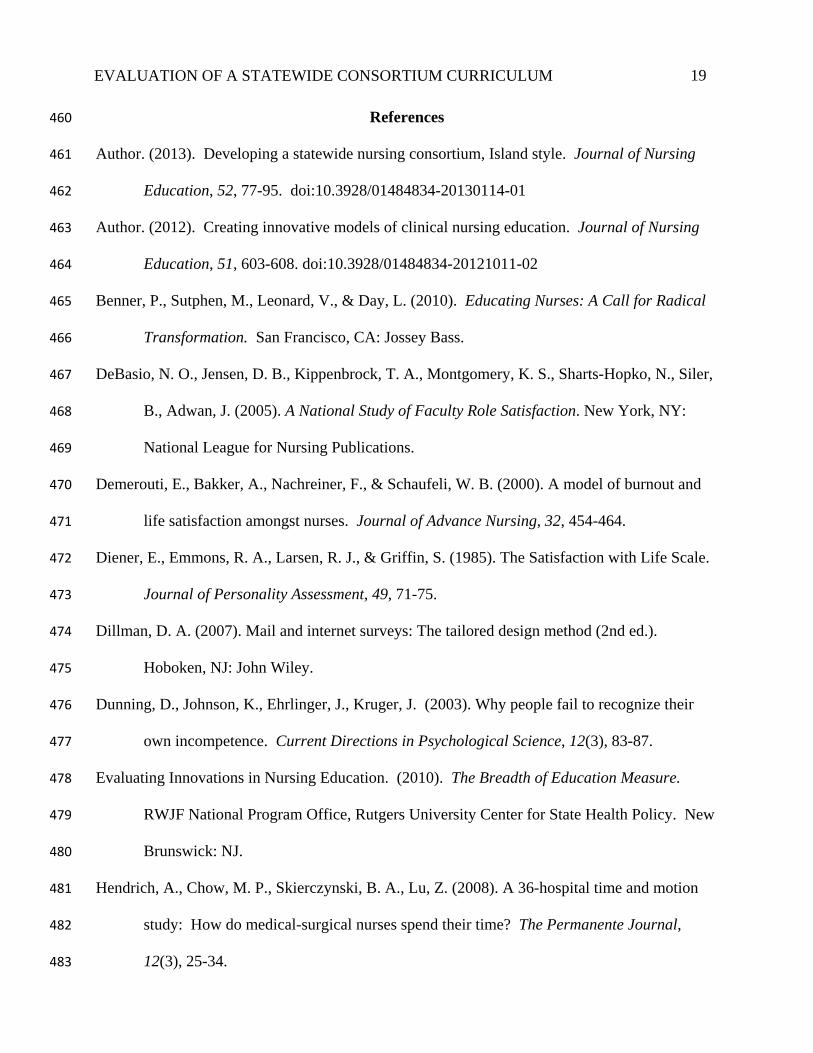
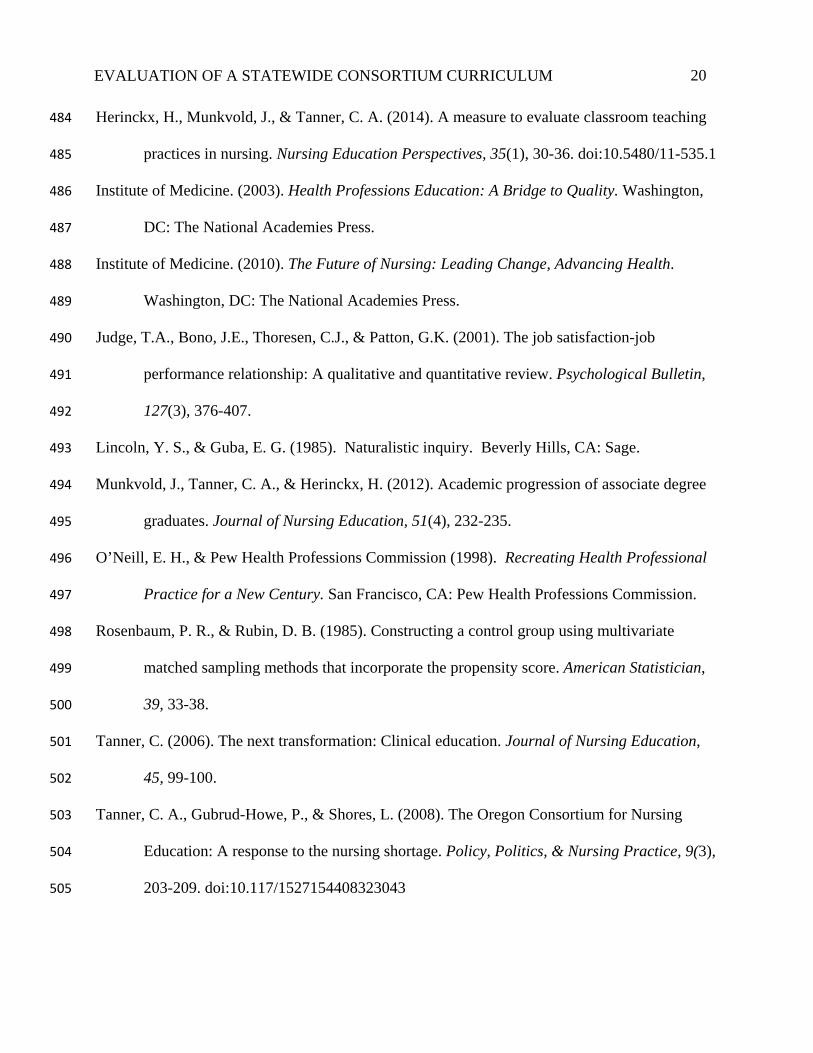
during the same three data collection times. Table 1 shows the survey response rates over the two 128
years for the faculty and student groups. 129
INSERT TABLE 1 HERE 130
According to Table 1, the average student response rate ranged between 8% to 69%. The 131
faculty response rate ranged between 48% to 56%. 132
The data were collected by administering hard copy surveys to students in a classroom or 133
faculty at a meeting. Participants were given a survey packet (baseline). Subsequent data 134
collection was done with the same methodology at two intervals (end of Year 1 and end of Year 135
2). A customized electronic survey link provided reminders for nonrespondents/those who were 136
not present. At least three reminders were emailed to nonrespondents to improve response rates 137
(Dillman, 2007). Faculty members who consented to participate received a $50 gift card; 138
students who consented received a $10 gift card. 139
All but one of the faculty (N = 43) and 77% of the students (N = 324) were female. 140
Faculty averaged 52 years of age (SD = 9.5) with a range from 28 to 67 years and students 141
averaged 29 years of age (SD = 8.6) with a range from 19 to 65 years. Asians, overall, were the 142
largest racial group, constituting 16% of the faculty and 42% of the students, with Caucasians 143
(71% faculty, 24% students), two or more races (3% faculty, 16% students), and Native 144
Hawaiian and Pacific Islanders (6% faculty, 13% students) as the next largest groups. Fifty-145
seven percent of the student respondents were enrolled in the community colleges and 43% were 146
enrolled at the 4-year universities. 147
EVALUATION OF A STATEWIDE CONSORTIUM CURRICULUM 6
Key informant interviews. Interviews were implemented with two randomly selected 148
faculty sub-samples from the Intervention (N=7) and Comparison (N=5) groups. The selected 149
Intervention and five Comparison faculty were engaged in individual interviews at baseline and 150
one year follow-up. Data collection consisted of digitally recorded telephone or Skype open-151
ended and semi structured interviews, addressing faculty work life, teaching productivity and 152
quality of education, lasting 30 to 90 minutes. 153
Time analysis. Using state of the art technologies that have been tested in a landmark 154
nursing time and motion study (Hendrich, Chow, Skierczynski, & Lu, 2008) this evaluation 155
assessed a sub-sample of Intervention (N=15) and Comparison (N=14) faculty’s activities 156
during their working day. Three periods over one semester were sampled: at the start of the 157
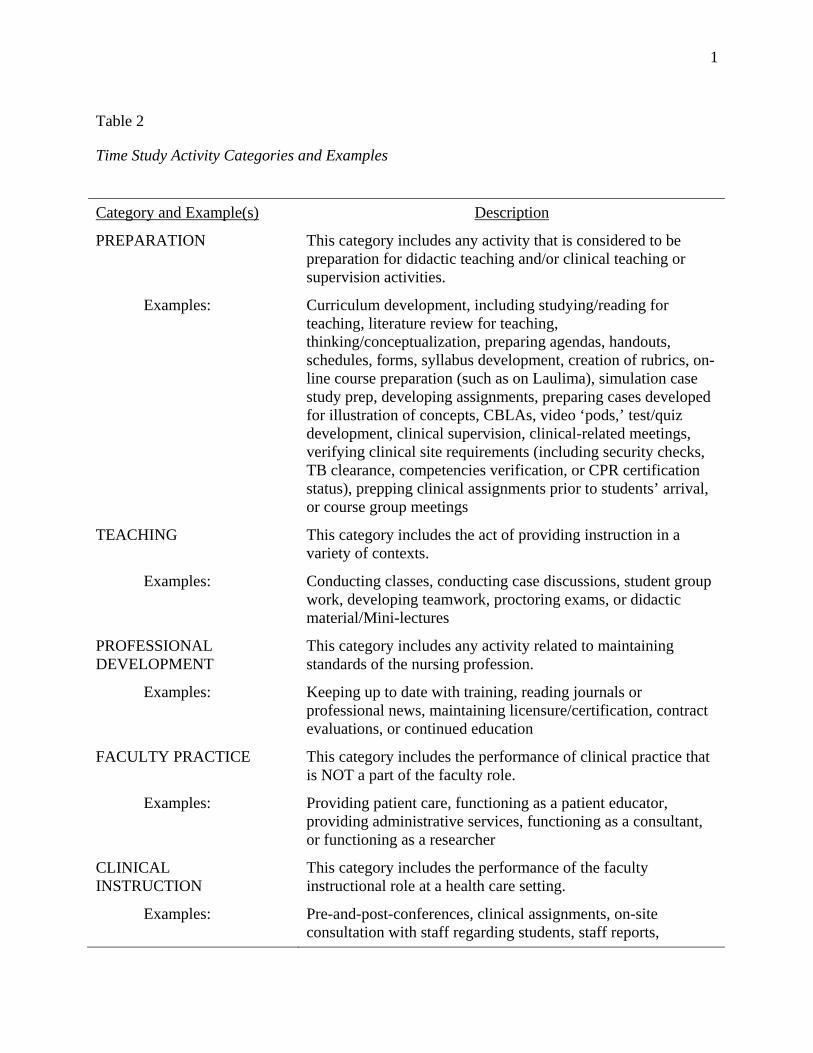
semester, mid-semester and end of semester. Activities and their superordinate categories were 158
determined through interviews and focus groups with participating faculty. The activity 159
categories are shown in Table 2. 160
INSERT TABLE 2 HERE 161
Using the activity categories, faculty participants were provided with an iPod-Touch to 162
record their activities at 24 randomly determined points in time during their waking day. When 163
the alarm sounded, participants used a form developed with FilemakerPro 11 to report their 164
activity, location, and the expected duration of the activity. Participants received an additional 165
$100 gift card or were given the iPod touch they used for data collection upon completion. 166
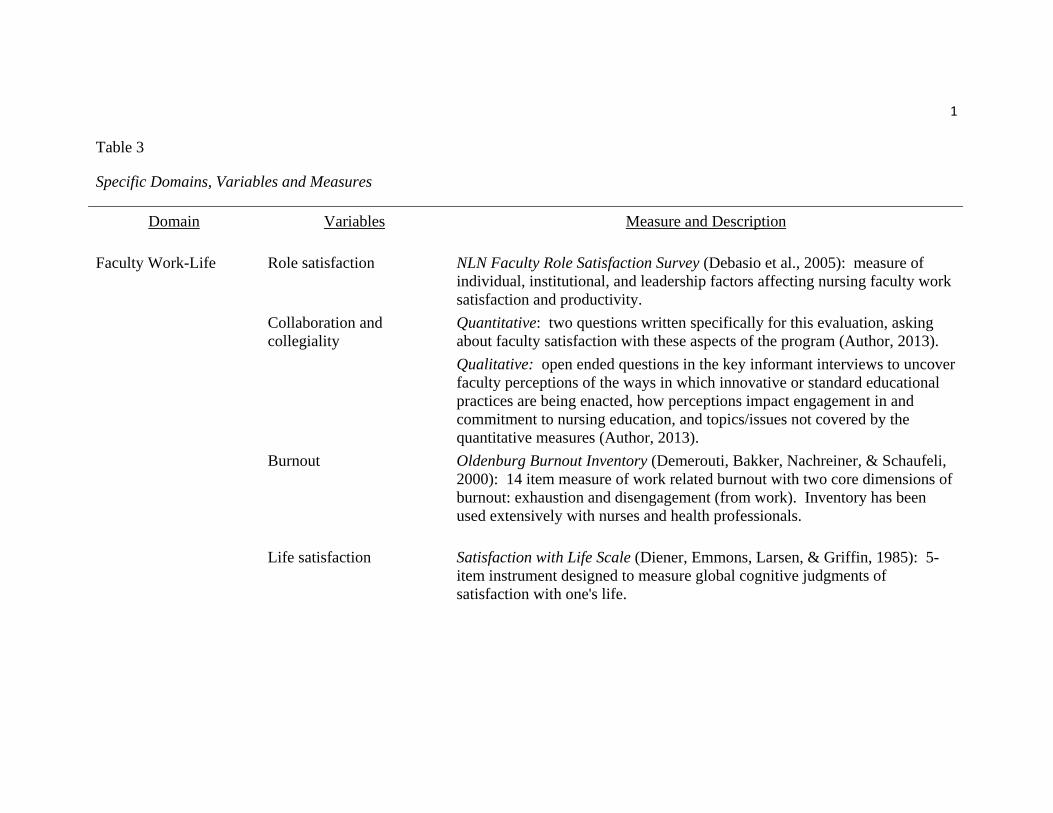
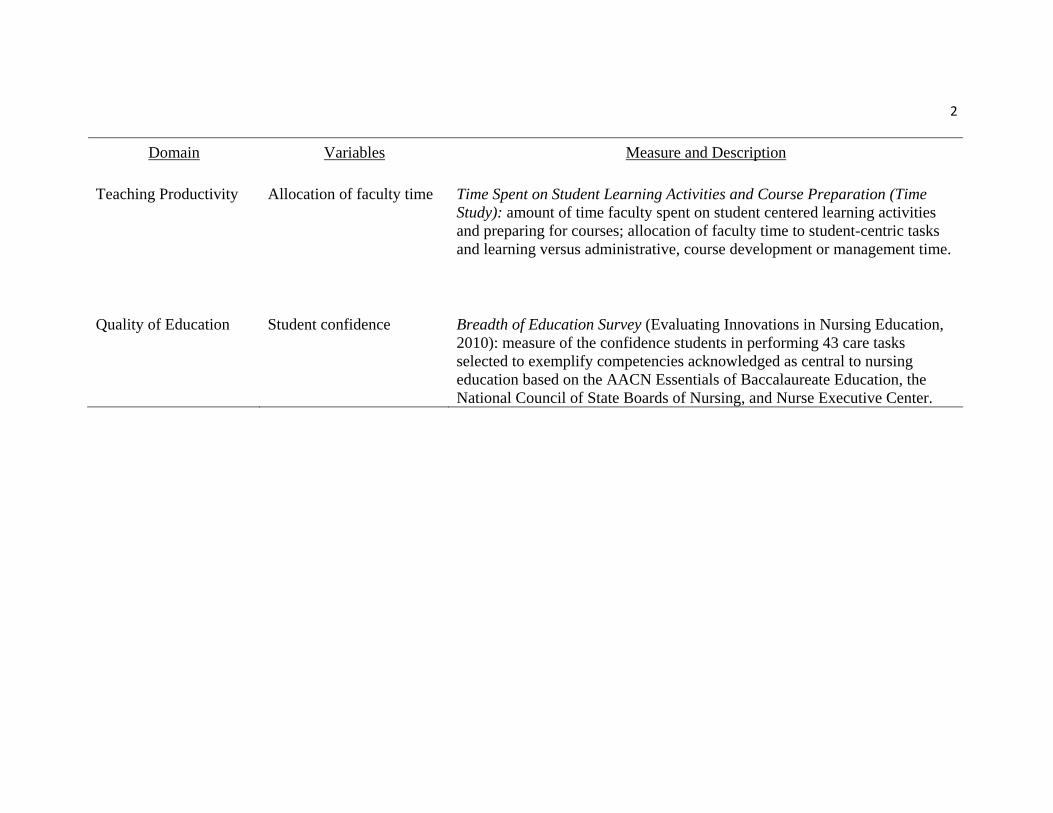
Variables and Measures 167
The measures were designed to collect information regarding the impact the SNC 168
curriculum on expanding teaching capacity of nursing faculty. Three domains were addressed: 169
perceptions of faculty work life, teaching productivity of faculty, and quality of education. Table 170
3 provides a depiction of the three domains, the variables and associated measures. 171
EVALUATION OF A STATEWIDE CONSORTIUM CURRICULUM 7
INSERT TABLE 3 HERE 172
Faculty Work-Life. A key factor in conserving faculty time is the development of 173
instructional materials that are shared among consortium faculty and students, e.g., student-ready 174
case studies, simulation scenarios, group discussion guides, reference lists with study guides, and 175
clinical learning activities. Increased access to the availability of shared campus resources across 176
campuses allow faculty to spend time on significant learning activities. The following variables 177
were used to evaluate faculty work-life: 178
• Role Satisfaction – NLN Faculty Role Satisfaction Survey (Debasio et al., 2005) 179
• Collaboration and Collegiality – Quantitative and qualitative depictions (Author, 180
2013) 181
• Burnout – Oldenburg Burnout Inventory (Demerouti, Bakker, Nachreiner, & 182
Schaufeli, 2000) 183
• Life Satisfaction – Satisfaction with Life Scale (Diener, Emmons, Larsen, & Griffin, 184
1985) 185
Teaching Productivity. The SNC is engaging in a change that is transformative in 186
nature and represents a high degree of collaboration among nursing faculty from Associate 187
Degree and Baccalaureate Nursing Programs overcoming barriers related to geographic isolation 188
and limited learning tools on smaller or rural campuses. The curricular changes may ensure 189
increased teaching productivity and a better work life for faculty. Expertise and innovative 190
teaching tools and methods shared across campuses allow faculty to spend more time on student-191
centered learning activities rather than course development activities. Teaching productivity 192
was measured by the following variable: 193
• Allocation of faculty time – Amount of time faculty spent on student centered 194
learning activities and preparing for courses, student-centric tasks and learning 195
EVALUATION OF A STATEWIDE CONSORTIUM CURRICULUM 8
versus administrative, course development or management time 196
Quality of Education. As nursing faculty adopt a learner/outcome-centered education 197
model to replace the outdated teaching/content-centered model, it is important to assess whether 198
the teaching and learning activities resulting from collaborative nursing faculty efforts improve 199
student outcomes. Quality of education was measured by the following variable: 200
• Student confidence – Breadth of Education Survey (Evaluating Innovations in 201
Nursing Education, 2010) 202
Data Analysis 203
At the time of this analysis, the data were available for the first 2 years of the curriculum 204
implementation. 205
Surveys. SPSS v. 19 statistical package was employed. Propensity score matching was 206
used to approach equivalence between intervention and comparison groups (Rosenbaum and 207
Rubin, 1985). Propensity scores were computed using demographic and work related (for 208
faculty participants) characteristics. These included, for example, age, sex, race, faculty 209
member’s degree, years of teaching, and years in nursing. When practical, propensity scores 210
were used to create five hierarchically ordered participant groups, or strata, of equal size. These 211
propensity score derived groups were then matched between the Intervention and Comparison 212
groups discarding outliers if no cross-group matches were obtained. 213
Responses of faculty in the Intervention group were compared using repeated measures 214
analyses of variance, with baseline and one year follow-up administrations as the repeated 215
measures. This allowed for inspection of changes occurring over the year following the new 216
curriculum implementation. In the following analyses, eta squared (η2) was used to estimate 217
effect sizes for multivariate and univariate analyses of variance, interpreting values of .01 as 218
small, .059 as medium, and .138 as large. Missing values were replaced with the mean of the 219
EVALUATION OF A STATEWIDE CONSORTIUM CURRICULUM 9
remaining items when four or fewer missing were present. Responses of students in the 220
Intervention group were similarly analyzed. 221
In cases where several items were individually analyzed with repeated measures analysis. 222
When this occurred, a Bonferroni correction for experiment-wise error was used to reduce the 223
conventional level of significance (p < .05). 224
The differential impact of implementation of the SNC program between faculty members 225
in programs that have adopted this curriculum (Intervention) versus those in programs that have 226
not adopted it (Comparison) was analyzed using a one-way repeated measures multivariate 227
analysis of covariance (MANCOVA). Group assignment (Intervention and Comparison) was the 228
main factor tested with time of survey administration (baseline and follow-up) as the repeated 229
measure. Propensity scores, used as a covariate, were obtained through logistic regression using 230
demographic and work-related characteristics of faculty members as predictors and group 231
assignment (dummy coded with 0 for Comparison and 1 for Intervention group membership) as 232
the dependent variable. Predictors with insufficient variability, redundancy with other predictors, 233
and inability to predict group membership at p < .50 were eliminated from the final model 234
solutions. 235
The analytic model for determining any differential impact of the SNC curriculum on 236
confidence in performing nursing functions between students in Intervention versus those in 237
Comparison programs was analyzed using a two way repeated measures analysis of variance 238
(ANOVA) was used as the these analyses. Group assignment (Intervention and Comparison) and 239
propensity score strata were the main factors tested with time of survey administration (baseline 240
and follow-up) as the repeated measure. This allowed for inspection of any differential changes 241
that occurred for the Intervention and Comparison students over the year following 242
implementation of the new curriculum. 243
EVALUATION OF A STATEWIDE CONSORTIUM CURRICULUM 10
Key informant interviews. Interviews were transcribed verbatim. Qualitative data 244
analysis software NVivo 9 assisted with data management. The interview guide addressed 245
faculty work life, teaching productivity and quality of education. Saturation was reached after 246
the completion of the 12 interviews. The process of inductive content analysis was used. 247
Constant comparative analysis with no a priori codes was used. Text analysis was conducted 248
with an independent coder providing secondary verification of saturation. The interviews were 249
recoded into descriptive themes. A final summary of themes was sent to all participants to verify 250
their experiences in order to confirm or challenge the accuracy of the work (Lincoln & 251
Guba,1985). 252
Time analysis. SPSS v. 19 was used to compare activity categories during the working 253
day between the Intervention and Comparison faculty sub-sample. Chi-square effect sizes were 254
estimated post hoc using phi (φ) and interpreting values of .10 as small, .39 as medium, and .50 255
as large. 256
Results 257
Analysis of the Evaluation Questions 258
Impact of implementation of the SNC over time among faculty in programs that 259
have adopted the curriculum. For the Intervention faculty (N=44), repeated measures analyses 260
demonstrated that Burnout, Life Satisfaction, Collaboration and Collegiality showed a significant 261
change from baseline to follow-up. More burnout was reported on the Oldenburg Burnout 262
Inventory (F(1,35) = 13.76, p < .001, η2 = .282) and less collaboration and collegiality both 263
within their programs (collaboration: F(1,35) = 6.75, p < .05, η2 = .162; collegiality: F(1,35) = 264
12.1, p < .001, η2 = .257) and across other entities in their colleges or universities (collaboration: 265
F(1,35) = 4.21, p < .05, η2 = .107; collegiality: F(1,35) = 4.12, p < .05, η2 = .105) . Satisfaction 266
with Life did not show any differences over time. On the NLN Survey, only one of the 55 items 267
EVALUATION OF A STATEWIDE CONSORTIUM CURRICULUM 11
achieved an adjusted significance level. Intervention faculty reported that they felt less 268
confidence in the direction in which the profession of nursing was headed from baseline to the 269
first year follow-up (F(1,36) = 13.01, p < .0001, η2 = .266). 270
Impact of implementation of the SNC curriculum on confidence in performing 271
nursing functions among students in programs that have adopted this curriculum. 272
Responses of Intervention students (N = 440; follow-up data were only available for 162 273
participants) to the Breadth of Education Survey (BOE) were analyzed using repeated measures 274
analyses of variance. The BOE revealed a sharp increase in students’ confidence in performing 275
nursing tasks from baseline to the first year follow-up (F(1,161) = 3785.01, p < .0001, η2 = .959). 276
A repeated measures multivariate analysis of variance (without replacement of missing values) 277
was then performed on all 43 Breadth of Education Survey items to determine which individual 278
items showed the most change. The change from baseline to follow-up was significant (F(43,97) 279
= 6.1, p < .0001, η2 = .730). Subsequent univariate analyses showed that all 43 items showed a 280
significant increase in students’ confidence at the p < .001 level or better. 281
Differential impact of implementation of the SNC program on faculty work-life, 282
teaching productivity, and quality of education between faculty members in programs that 283
have adopted this curriculum (Intervention) versus those in programs that have not 284
adopted it (Comparison). Eleven demographic and work related characteristics were entered 285
using backward regression. Using the propensity score as the predicted probability of 286
membership in the Intervention group for each individual, predictors with insufficient variability, 287
redundancy with other predictors, and inability to predict group membership at p < .50 were 288
eliminated from the final model solution. The five final predictors that met the above stated 289
criteria were older age, fewer years as a nursing faculty member, not having a doctoral degree, 290
having an APN certification, and not having a plan for achieving academic career goals. It was 291
EVALUATION OF A STATEWIDE CONSORTIUM CURRICULUM 12
impractical due to a small Comparison group to create five strata using propensity scores; thus, 292
propensity scores were used as covariates in these analyses. 293
The Oldenburg Burnout and Satisfaction with Life scales and the collaboration and 294
collegiality measures, separately, were analyzed using multivariate, repeated measure, analyses 295
of covariance. None of these measures reached multivariate or univariate statistical significance 296
for their main effects or interactions. There were no differences between Intervention and 297
Comparison faculty, over administrations, on these measures. 298
Thirteen MANCOVAs were performed on the 55 NLN Survey items. NLN items were 299
grouped for MANCOVAs based on their conceptual similarity. No main effects for group or 300
time reached significance. One analysis reached significance for a group by time interaction 301
(F(3,45) = 3.48, p < .05, η2 = .188). The analysis for, “I have confidence in the current direction 302
in which the following are headed …” had three items concerning respondents’ confidence in the 303
“Profession of nursing”, “My college or university”, and “My department or school of nursing 304
within my college or university”. Univariate analyses on each item showed a significant group 305
by time interaction for “My college or university” (F(1,47) = 5.07, p < .05, η2 = .097) with 306
Comparison faculty showing a sharp decline in confidence while Intervention faculty showed no 307
substantive change from baseline to follow-up. 308
Key Informant Interviews. Overall, the Intervention faculty participants felt productive 309
in their teaching, were pleased with the quality of the educational product delivered, and satisfied 310
with their work lives. They felt that the planned approaches to team teaching and other activities 311
created the perfect environment for increased collaboration and collegiality. A hallmark of the 312
program was collaboration and collegiality, not just bounded by a department or college, but 313
across the university system. Given the longer period of time in which they were able to 314
implement the new curriculum and teaching modules, they were more comfortable with the 315
EVALUATION OF A STATEWIDE CONSORTIUM CURRICULUM 13
program at the follow-up interview. Concern over an increased workload was not a major finding 316
as it was at the baseline interviews. At both interview periods, all of the intervention 317
interviewees were satisfied with the demonstrable increase in active and critical student learning. 318
Some expressed delight at the level of their own learning as well. 319
The faculty of the Comparison group also felt productive in their teaching, were pleased 320
with the quality of the educational product they were delivering, and satisfied with their work 321
lives. They perceived their colleagues to be collegial and provided examples of their 322
collaborative projects, including some instances of team teaching. All of the comparison group 323
faculty participants were satisfied with their current work situations. Naturally, given their 324
independent statuses, their collaboration and collegiality resonated within their department or 325
college. While some collaboration and collegiality was noted with peers across the University 326
system, most examples were department or college specific. 327
Differential impact of implementation of the SNC curriculum on confidence in 328
performing nursing functions between students in Intervention versus those in Comparison 329
program. Responses of student participants in the SNC curriculum adoption group 330
(Intervention; n = 440) and those in the Comparison group (n = 249) to the BOE were analyzed 331
using repeated measures analyses of variance with baseline and one year follow-up 332
administrations (follow-up data were only available for 162 Intervention participants and 89 333
Comparison participants) as the repeated measures. Propensity scores were obtained through 334
logistic regression as previously described. Sixteen demographic and work related 335
characteristics were entered using backward regression. The 12 final predictors that met the 336
above stated criteria were younger age, being female, not intending to continue toward the BSN 337
degree, and a mixture of eight different races or ethnicities (being black or white; not being 338
native Hawaiian, Hispanic, American Indian, Japanese, Korean, or Vietnamese). 339
EVALUATION OF A STATEWIDE CONSORTIUM CURRICULUM 14
Five strata, from lowest to highest propensity scores were created. The BOE revealed a 340
sharp increase in students’ confidence in performing nursing tasks for both groups and across all 341
strata from baseline to the first year follow-up (F(1,236) = 338.99, p < .0001, η2 = .590). There 342
were no significant main effects for group (F(1,236) = .053, ns) or strata (F(4,236) = .091, ns) 343
nor their interaction (F(4,236) = .824, ns). There were significant effects for the group by time 344
(F(1,236) = 16.97, p < .0001, η2 = .067) and strata by time (F(4,236) = 2.51, p < .05, η2 = .041) 345
interactions but their effect sizes were quite small. The group by strata by time interaction was 346
not significant (F(4,236) = .332, ns). Figure 1 shows the time by group interaction and shows 347
that the increase for the Comparison group was sharper than that for the Intervention group. 348
Figure 2, representing the change over time for the five propensity score strata, shows that the 349
lower strata (first and second) showed the sharpest increase while the highest stratum (fifth) had 350
the smallest increase. 351
INSERT FIGURES 1 AND 2 HERE 352
Subsequent univariate analyses showed that Comparison students had a significantly 353
sharper increase in confidence over time than the Intervention students for all 43 items. 354
Generally, the first and second strata showed sharper increases than the fifth stratum for those 19 355
of 43 items that reached significance. 356
Differences in how faculty members in Intervention programs versus those in 357
Comparison programs spend time in their work related professional activities. For Wave 1 358
(semester start) the two groups differed significantly in activities (χ2 (10) = 68.6, p < .0001, 359
φ = .306). Intervention Group participants were more likely to report engaging in college and 360
university service, faculty clinical practice, teaching, and other educational activities than did the 361
Comparison group. Conversely, the Comparison group reported more engagement in clinical 362
instruction, paperwork, personal, teaching preparation, and research and professional 363
EVALUATION OF A STATEWIDE CONSORTIUM CURRICULUM 15
development activities than their counterparts. The groups also differed with regard to the 364
locations for their activities (χ2 (2) = 32.8, p < .0001, φ = .213) with Intervention participants 365
more likely to be in school or some other place and Comparison participants more likely to be at 366
home at the time of the event. 367
For Wave 2 (mid semester), the two groups differed significantly in activities (χ2 (10) = 368
56.1, p < .0001, φ = .286). Intervention Group participants were more likely to report engaging in 369
paperwork, teaching preparation, and teaching than did those in the Comparison Group. 370
Conversely, those in the Comparison Group reported more engagement in clinical instruction, 371
personal, research and professional development, and other educational activities than their 372
counterparts. The groups also differed with regard to the locations for their activities (χ2 (2) = 373
32.9, p < .0001, φ = .222) with Intervention participants more likely to be in school or some other 374
place and Comparison participants more likely to be at home at the time of the event. 375
For Wave 3 (semester end), the two groups differed significantly in activities (χ2 (10) = 376
39.9, p < .0001, φ = .235). Intervention Group participants were more likely to report engaging in 377
paperwork, student support, and other educational activities than did those in the Comparison 378
Group. Conversely, those in the Comparison Group reported more engagement in preparation 379
and research and professional development activities than their counterparts. The groups did not 380
differ with regard to the locations for their activities (χ2 (2) = 4.3, ns). 381
Discussion 382
Intervention faculty reported increased burnout and decreased collaboration and 383
collegiality at the one-year follow-up assessment. They also expressed less confidence in the 384
direction in which the profession of nursing was headed. While these statistically significant 385
results had small to medium effect sizes, they should not be minimized. As previously noted, 386
systemic change brings with it a period of disturbance and these findings may well be an 387
EVALUATION OF A STATEWIDE CONSORTIUM CURRICULUM 16
expression of that disturbance. Additionally, there were no differences between the Intervention 388
and Comparison faculty groups at each time period in burnout, collegiality and collaboration, 389
suggesting that the implementation of the SNC curriculum did not significantly impact burnout, 390
collegiality and collaboration the Intervention faculty members. 391
An increase in confidence for the Comparison group students was sharper than that for 392
the Intervention group over the first 2 years. Comparison students had more experience with 393
specific nursing tasks. These findings are suggestive of the Dunning–Kruger effect (Dunning, 394
Johnson, Ehrlinger & Kruger, 2003) which is a cognitive bias wherein inexperienced individuals 395
experience an illusory superiority, mistakenly rating their ability higher because of inability of 396
the inexperienced to recognize their mistakes. Implications relate to addressing student’s self-397
confidence as a component of effective nursing education. Effect sizes for these analyses were 398
remarkably strong. As expected, beginning students gain confidence when performing tasks. 399
No substantive differences were found from baseline to first-year follow-up between the 400
Intervention and Comparison groups in analyses of the major study survey measures. The only 401
statistically significant group by time effect was that the Comparison group had a sharper decline 402
in their confidence in the direction their nursing program was taking than the Intervention group. 403
The effect size for this analysis was quite small. These findings do suggest that there is no 404
immediate positive impact of the curriculum change. Other nursing education programs 405
contemplating such changes might be warned by these findings not to promise that there will be 406
an immediate noticeable positive impact for faculty upon adoption of curricular revisions. In the 407
interviews, Intervention faculty admitted to some initial start-up dissatisfaction, but then 408
proclaimed increasing comfort with the new curriculum and the enhancement of collaboration 409
among their colleagues. Comparison faculty, in contrast, reported great satisfaction with their 410
work lives as well as rewarding colleague collaborations. One explanation for this discrepancy 411
EVALUATION OF A STATEWIDE CONSORTIUM CURRICULUM 17
may well be that the follow-up interviews were conducted toward the end of the second year of 412
the evaluation while the surveys for the first cohort (the largest of all four) were administered 413
closer to the start of the second year. Perhaps these interviews, at least for the Intervention 414
faculty, reflect a settling-in with the curriculum revisions. 415
Analyses showed that both groups of students showed increased confidence in 416
performing nursing tasks from baseline to first-year follow-up but that the increase for the 417
Comparison group was stronger than that for the Intervention group. The effect sizes for the 418
Intervention versus Comparison differences, however, are small. This finding is consistent with 419
the differences between the SNC and traditional curricula. The SNC curriculum emphasizes 420
problem solving and meta-skill building while the more traditional curriculum focuses upon the 421
development of specific, demonstrable skills. It would be expected that Comparison students 422
would outpace Intervention students with regard to this measure at the initial stages of training as 423
they likely have had more direct, hands-on experiences. 424
Limitations 425
First, as noted above, the data presented here are incomplete. There are data from two 426
cohorts that have not yet been fully integrated into the evaluation data set. While the addition of 427
data may change some of the conclusions drawn here it is unlikely to do so because somewhat 428
over 75% of the potentially available data for the follow-ups have already been collected. 429
Second, the intervention under study, implementation of a revised curriculum and didactic plan, 430
is extraordinarily complex and required a radical shift by most participating faculty from the 431
usual ways of educating nursing students. Any such systemic change brings with it a period of 432
uncertainty, confusion, dissatisfaction, and adaptation. It is likely that some of the short-term 433
findings are colored by this. A truer picture of the impact of the SNC curriculum will likely be 434
obtained in later follow-up assessments. Third, the management of the faculty and student 435
EVALUATION OF A STATEWIDE CONSORTIUM CURRICULUM 18
participants and in-person administration of the self-report instruments was far more complex 436
and costly than had been anticipated because the study sample was dispersed over four islands 437
comprising the SNC. Forth, aside from basing the selection of the measures on the reported 438
reliability and validity values reported in the literature, no psychometric analysis was performed. 439
Independent evaluation of content validity by members of the project and evaluation teams was 440
used as a part of the measures selection processes. Lastly, the effect sizes were not calculated. 441
Conclusions 442
Collectively, the findings from this evaluation reveal a complex picture of change 443
promoted by the implementation of the SNC curriculum. SNC faculty reported an increase in 444
burnout and decrease in collaboration and collegiality from baseline to follow-up in their survey 445
responses but key informant interviews with a small sample of these faculty members indicated 446
the opposite effect. Analyses comparing Intervention and Comparison faculty showed no 447
meaningful differential change in the study measures over time, including burnout, collegiality 448
and collaboration. While both groups of students increased their confidence over time (BOE), 449
increases in Comparison students’ confidence were stronger than those for Intervention students. 450
The implementation validation study findings were equally complex showing that differences 451
between Intervention and Comparison faculty in their activities were not consistent over the 452
course of the semester. The expected impact of the SNC implementation in increasing 453
Intervention faculty involvement in students’ educational and training activities was found at the 454
start of the semester but not at later points in time. One limiting factor to drawing conclusions 455
from these findings is that complete study data were only available for the first year follow-up. 456
Continued follow-up of both faculty and student participants through the 5th year is important to 457
determine the ultimate trajectory of this innovation and document its sustainability. 458
459
EVALUATION OF A STATEWIDE CONSORTIUM CURRICULUM 19
References 460
Author. (2013). Developing a statewide nursing consortium, Island style. Journal of Nursing 461
Education, 52, 77-95. doi:10.3928/01484834-20130114-01 462
Author. (2012). Creating innovative models of clinical nursing education. Journal of Nursing 463
Education, 51, 603-608. doi:10.3928/01484834-20121011-02 464
Benner, P., Sutphen, M., Leonard, V., & Day, L. (2010). Educating Nurses: A Call for Radical 465
Transformation. San Francisco, CA: Jossey Bass. 466
DeBasio, N. O., Jensen, D. B., Kippenbrock, T. A., Montgomery, K. S., Sharts-Hopko, N., Siler, 467
B., Adwan, J. (2005). A National Study of Faculty Role Satisfaction. New York, NY: 468
National League for Nursing Publications. 469
Demerouti, E., Bakker, A., Nachreiner, F., & Schaufeli, W. B. (2000). A model of burnout and 470
life satisfaction amongst nurses. Journal of Advance Nursing, 32, 454-464. 471
Diener, E., Emmons, R. A., Larsen, R. J., & Griffin, S. (1985). The Satisfaction with Life Scale. 472
Journal of Personality Assessment, 49, 71-75. 473
Dillman, D. A. (2007). Mail and internet surveys: The tailored design method (2nd ed.). 474
Hoboken, NJ: John Wiley. 475
Dunning, D., Johnson, K., Ehrlinger, J., Kruger, J. (2003). Why people fail to recognize their 476
own incompetence. Current Directions in Psychological Science, 12(3), 83-87. 477
Evaluating Innovations in Nursing Education. (2010). The Breadth of Education Measure. 478
RWJF National Program Office, Rutgers University Center for State Health Policy. New 479
Brunswick: NJ. 480
Hendrich, A., Chow, M. P., Skierczynski, B. A., Lu, Z. (2008). A 36-hospital time and motion 481
study: How do medical-surgical nurses spend their time? The Permanente Journal, 482
12(3), 25-34. 483
EVALUATION OF A STATEWIDE CONSORTIUM CURRICULUM 20
Herinckx, H., Munkvold, J., & Tanner, C. A. (2014). A measure to evaluate classroom teaching 484
practices in nursing. Nursing Education Perspectives, 35(1), 30-36. doi:10.5480/11-535.1 485
Institute of Medicine. (2003). Health Professions Education: A Bridge to Quality. Washington, 486
DC: The National Academies Press. 487
Institute of Medicine. (2010). The Future of Nursing: Leading Change, Advancing Health. 488
Washington, DC: The National Academies Press. 489
Judge, T.A., Bono, J.E., Thoresen, C.J., & Patton, G.K. (2001). The job satisfaction-job 490
performance relationship: A qualitative and quantitative review. Psychological Bulletin, 491
127(3), 376-407. 492
Lincoln, Y. S., & Guba, E. G. (1985). Naturalistic inquiry. Beverly Hills, CA: Sage. 493
Munkvold, J., Tanner, C. A., & Herinckx, H. (2012). Academic progression of associate degree 494
graduates. Journal of Nursing Education, 51(4), 232-235. 495
O’Neill, E. H., & Pew Health Professions Commission (1998). Recreating Health Professional 496
Practice for a New Century. San Francisco, CA: Pew Health Professions Commission. 497
Rosenbaum, P. R., & Rubin, D. B. (1985). Constructing a control group using multivariate 498
matched sampling methods that incorporate the propensity score. American Statistician, 499
39, 33-38. 500
Tanner, C. (2006). The next transformation: Clinical education. Journal of Nursing Education, 501
45, 99-100. 502
Tanner, C. A., Gubrud-Howe, P., & Shores, L. (2008). The Oregon Consortium for Nursing 503
Education: A response to the nursing shortage. Policy, Politics, & Nursing Practice, 9(3), 504
203-209. doi:10.117/1527154408323043 505
Table 1
Participants and Survey Response Rates
Baseline (N)
Baseline Cohort 2 (N)
End Year 1 (N)
End Year 1 Cohort 2 (N)
End Year 2 (N)
End Year 2 Cohort 2 (N)
Total Observations (N)
Intervention Group* Faculty University A 11 11 11 Comm. College B 12 12 12 Comm. College C 3 3 3 Total 26 26 26 78 Completed Surveys 15 13 16 44 Response Rate (%) 58% 50% 62% 56% Comparison Group* Faculty University B 8 8 8 Comm. College D 6 6 6 Comm. College E 4 4 4 Total 18 18 18 54 Completed Surveys 13 9 4 26 Response Rate (%) 72% 50% 22% 48% Intervention Group* Students University A Cohort 1 66 66 66 198 Completed Surveys 41 40 39 120 Response Rate (%) 62% 61% 59% 61% Cohort 2** 66 66 66 198 Completed Surveys 45 40 13 98 Response Rate (%) 68% 61% 20% 49% Community College B
Baseline (N)
Baseline Cohort 2 (N)
End Year 1 (N)
End Year 1 Cohort 2 (N)
End Year 2 (N)
End Year 2 Cohort 2 (N)
Total Observations (N)
Cohort 1 40 40 40 120 Completed Surveys 15 9 4 28 Response Rate (%) 38% 23% 10% 23% Cohort 2** 37 37 37 111 Completed Surveys 20 7 3 30 Response Rate (%) 54% 19% 8% 27% Community College C Cohort 1 25 25 25 75 Completed Surveys 9 7 4 20 Response Rate (%) 36% 28% 16% 27% Cohort 2^ -- -- -- -- Completed Surveys -- -- -- -- Response Rate (%) -- -- -- -- Comparison Group* Students University B Cohort 1 24 24 24 72 Completed Surveys 24 19 7 50 Response Rate (%) 100% 79% 29% 69% Cohort 2^ -- -- -- -- Completed Surveys -- -- -- -- Response Rate (%) -- -- -- -- Community College D Cohort 1 39 39 39 117 Completed Surveys 20 13 7 40 Response Rate (%) 51% 33% 18% 34% Cohort 2*^^ 27 27 -- 54 Completed Surveys 18 10 -- 28 Response Rate (%) 67% 37% -- 52% Community College E
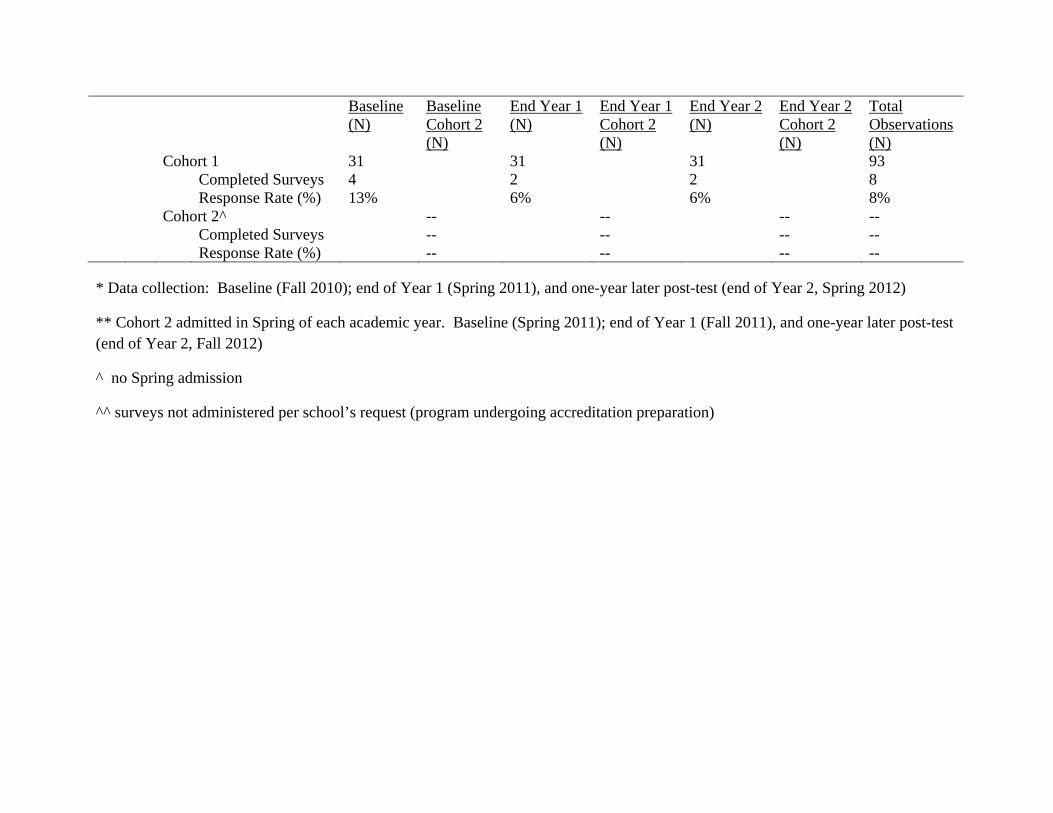
Baseline (N)
Baseline Cohort 2 (N)
End Year 1 (N)
End Year 1 Cohort 2 (N)
End Year 2 (N)
End Year 2 Cohort 2 (N)
Total Observations (N)
Cohort 1 31 31 31 93 Completed Surveys 4 2 2 8 Response Rate (%) 13% 6% 6% 8% Cohort 2^ -- -- -- -- Completed Surveys -- -- -- -- Response Rate (%) -- -- -- --
* Data collection: Baseline (Fall 2010); end of Year 1 (Spring 2011), and one-year later post-test (end of Year 2, Spring 2012)
** Cohort 2 admitted in Spring of each academic year. Baseline (Spring 2011); end of Year 1 (Fall 2011), and one-year later post-test (end of Year 2, Fall 2012)
^ no Spring admission
^^ surveys not administered per school’s request (program undergoing accreditation preparation)
1
Table 2
Time Study Activity Categories and Examples
Category and Example(s) Description
PREPARATION
This category includes any activity that is considered to be preparation for didactic teaching and/or clinical teaching or supervision activities.
Examples: Curriculum development, including studying/reading for teaching, literature review for teaching, thinking/conceptualization, preparing agendas, handouts, schedules, forms, syllabus development, creation of rubrics, on-line course preparation (such as on Laulima), simulation case study prep, developing assignments, preparing cases developed for illustration of concepts, CBLAs, video ‘pods,’ test/quiz development, clinical supervision, clinical-related meetings, verifying clinical site requirements (including security checks, TB clearance, competencies verification, or CPR certification status), prepping clinical assignments prior to students’ arrival, or course group meetings
TEACHING This category includes the act of providing instruction in a variety of contexts.
Examples: Conducting classes, conducting case discussions, student group work, developing teamwork, proctoring exams, or didactic material/Mini-lectures
PROFESSIONAL DEVELOPMENT
This category includes any activity related to maintaining standards of the nursing profession.
Examples: Keeping up to date with training, reading journals or professional news, maintaining licensure/certification, contract evaluations, or continued education
FACULTY PRACTICE This category includes the performance of clinical practice that is NOT a part of the faculty role.
Examples: Providing patient care, functioning as a patient educator, providing administrative services, functioning as a consultant, or functioning as a researcher
CLINICAL INSTRUCTION
This category includes the performance of the faculty instructional role at a health care setting.
Examples: Pre-and-post-conferences, clinical assignments, on-site consultation with staff regarding students, staff reports,
2
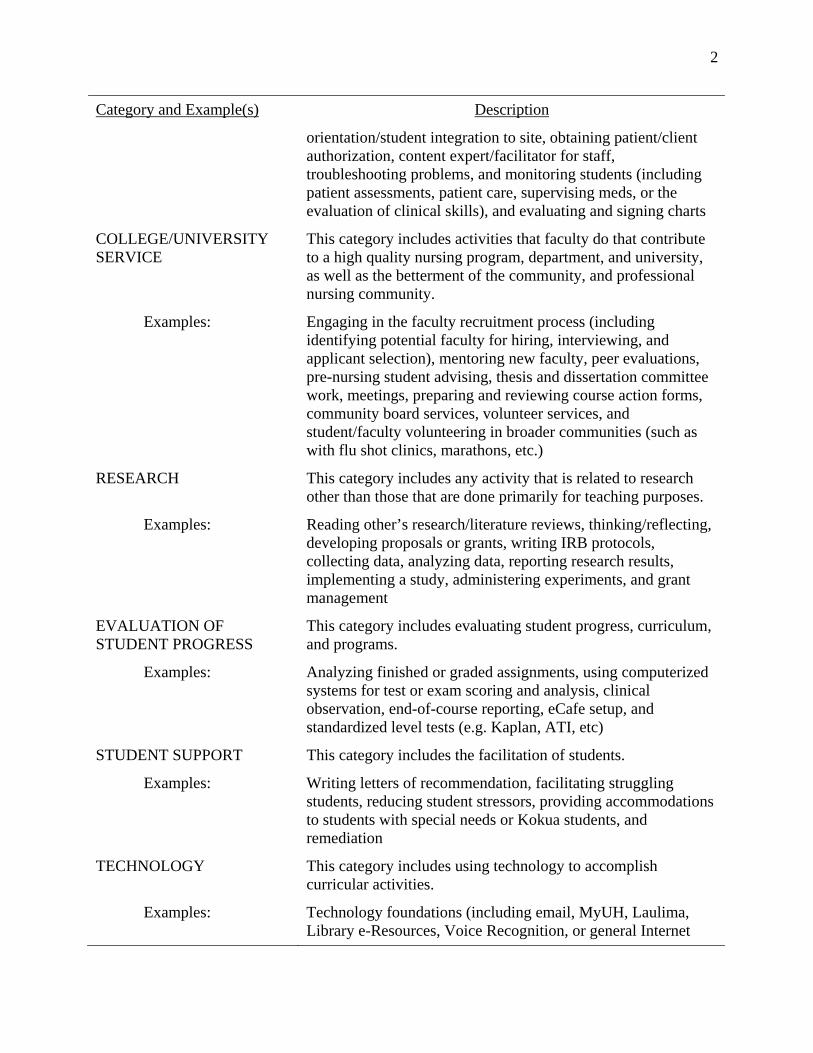
Category and Example(s) Description
orientation/student integration to site, obtaining patient/client authorization, content expert/facilitator for staff, troubleshooting problems, and monitoring students (including patient assessments, patient care, supervising meds, or the evaluation of clinical skills), and evaluating and signing charts
COLLEGE/UNIVERSITY SERVICE
This category includes activities that faculty do that contribute to a high quality nursing program, department, and university, as well as the betterment of the community, and professional nursing community.
Examples: Engaging in the faculty recruitment process (including identifying potential faculty for hiring, interviewing, and applicant selection), mentoring new faculty, peer evaluations, pre-nursing student advising, thesis and dissertation committee work, meetings, preparing and reviewing course action forms, community board services, volunteer services, and student/faculty volunteering in broader communities (such as with flu shot clinics, marathons, etc.)
RESEARCH This category includes any activity that is related to research other than those that are done primarily for teaching purposes.
Examples: Reading other’s research/literature reviews, thinking/reflecting, developing proposals or grants, writing IRB protocols, collecting data, analyzing data, reporting research results, implementing a study, administering experiments, and grant management
EVALUATION OF STUDENT PROGRESS
This category includes evaluating student progress, curriculum, and programs.
Examples: Analyzing finished or graded assignments, using computerized systems for test or exam scoring and analysis, clinical observation, end-of-course reporting, eCafe setup, and standardized level tests (e.g. Kaplan, ATI, etc)
STUDENT SUPPORT This category includes the facilitation of students.
Examples: Writing letters of recommendation, facilitating struggling students, reducing student stressors, providing accommodations to students with special needs or Kokua students, and remediation
TECHNOLOGY This category includes using technology to accomplish curricular activities.
Examples: Technology foundations (including email, MyUH, Laulima, Library e-Resources, Voice Recognition, or general Internet
3
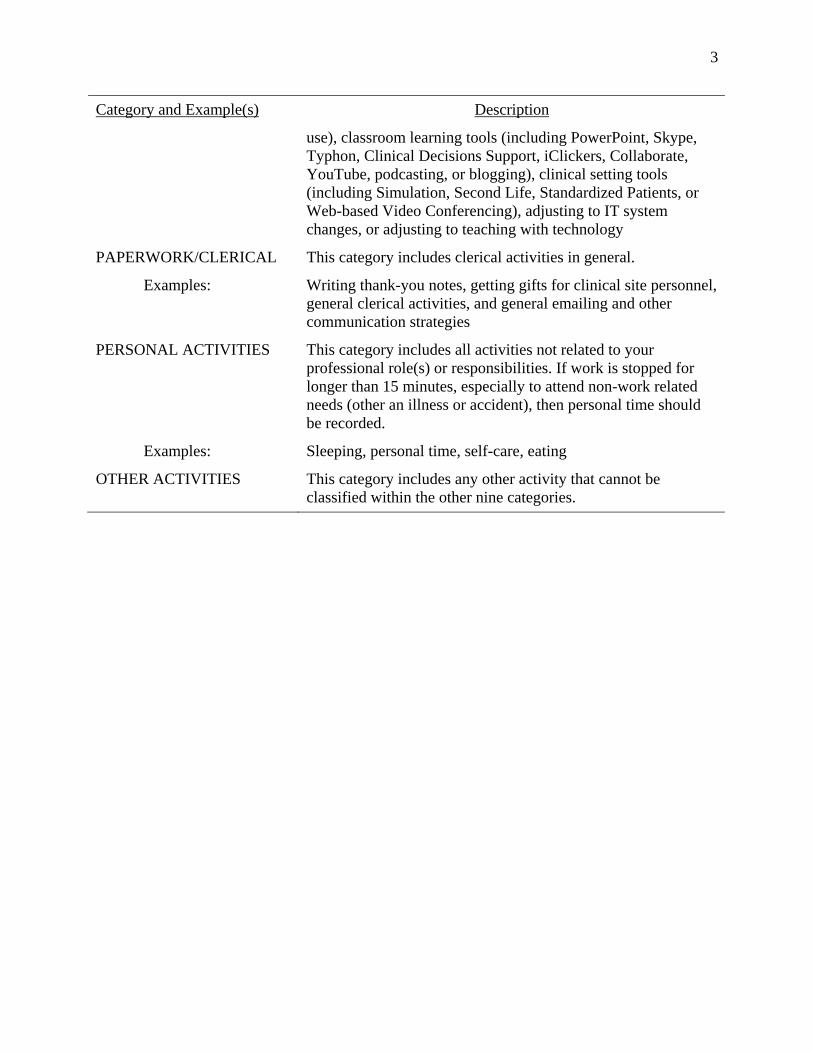
Category and Example(s) Description
use), classroom learning tools (including PowerPoint, Skype, Typhon, Clinical Decisions Support, iClickers, Collaborate, YouTube, podcasting, or blogging), clinical setting tools (including Simulation, Second Life, Standardized Patients, or Web-based Video Conferencing), adjusting to IT system changes, or adjusting to teaching with technology
PAPERWORK/CLERICAL This category includes clerical activities in general.
Examples: Writing thank-you notes, getting gifts for clinical site personnel, general clerical activities, and general emailing and other communication strategies
PERSONAL ACTIVITIES This category includes all activities not related to your professional role(s) or responsibilities. If work is stopped for longer than 15 minutes, especially to attend non-work related needs (other an illness or accident), then personal time should be recorded.
Examples: Sleeping, personal time, self-care, eating
OTHER ACTIVITIES This category includes any other activity that cannot be classified within the other nine categories.
1 Table 3
Specific Domains, Variables and Measures
Domain
Variables Measure and Description
Faculty Work-Life
Role satisfaction NLN Faculty Role Satisfaction Survey (Debasio et al., 2005): measure of individual, institutional, and leadership factors affecting nursing faculty work satisfaction and productivity.
Collaboration and collegiality
Quantitative: two questions written specifically for this evaluation, asking about faculty satisfaction with these aspects of the program (Author, 2013). Qualitative: open ended questions in the key informant interviews to uncover faculty perceptions of the ways in which innovative or standard educational practices are being enacted, how perceptions impact engagement in and commitment to nursing education, and topics/issues not covered by the quantitative measures (Author, 2013).
Burnout Oldenburg Burnout Inventory (Demerouti, Bakker, Nachreiner, & Schaufeli, 2000): 14 item measure of work related burnout with two core dimensions of burnout: exhaustion and disengagement (from work). Inventory has been used extensively with nurses and health professionals.
Life satisfaction Satisfaction with Life Scale (Diener, Emmons, Larsen, & Griffin, 1985): 5-item instrument designed to measure global cognitive judgments of satisfaction with one's life.
2
Domain
Variables Measure and Description
Teaching Productivity Allocation of faculty time Time Spent on Student Learning Activities and Course Preparation (Time Study): amount of time faculty spent on student centered learning activities and preparing for courses; allocation of faculty time to student-centric tasks and learning versus administrative, course development or management time.
Quality of Education Student confidence
Breadth of Education Survey (Evaluating Innovations in Nursing Education, 2010): measure of the confidence students in performing 43 care tasks selected to exemplify competencies acknowledged as central to nursing education based on the AACN Essentials of Baccalaureate Education, the National Council of State Boards of Nursing, and Nurse Executive Center.
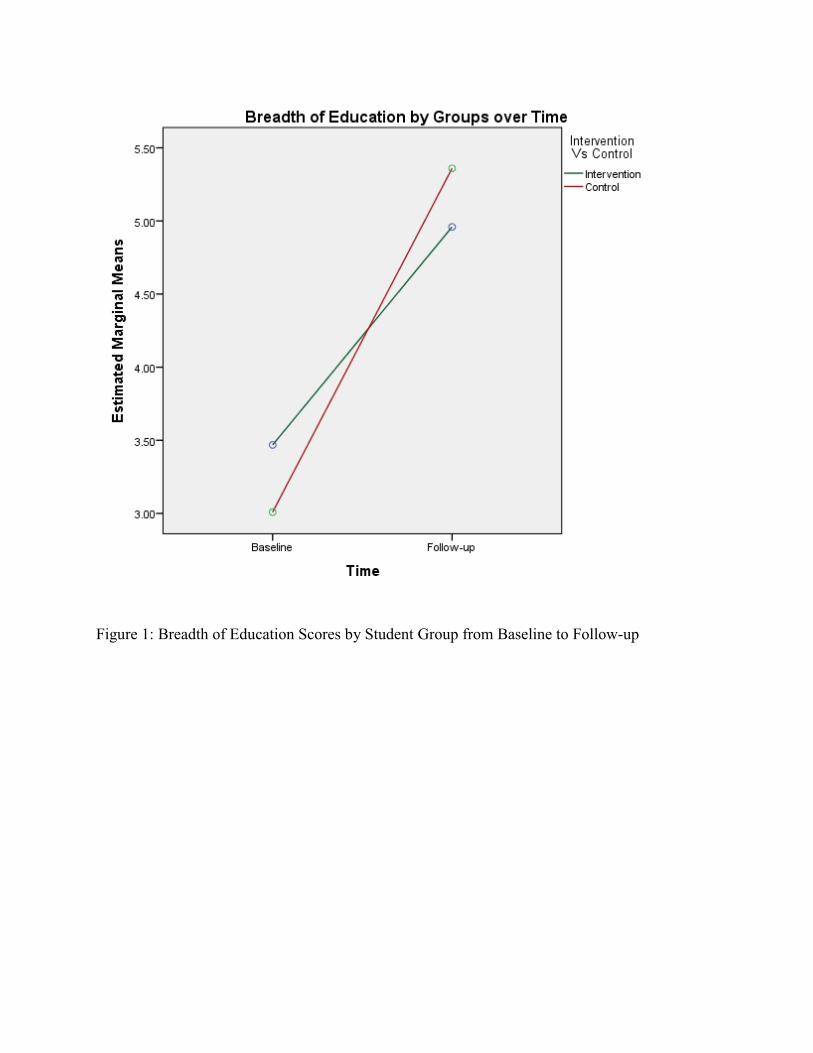
Figure 1: Breadth of Education Scores by Student Group from Baseline to Follow-up
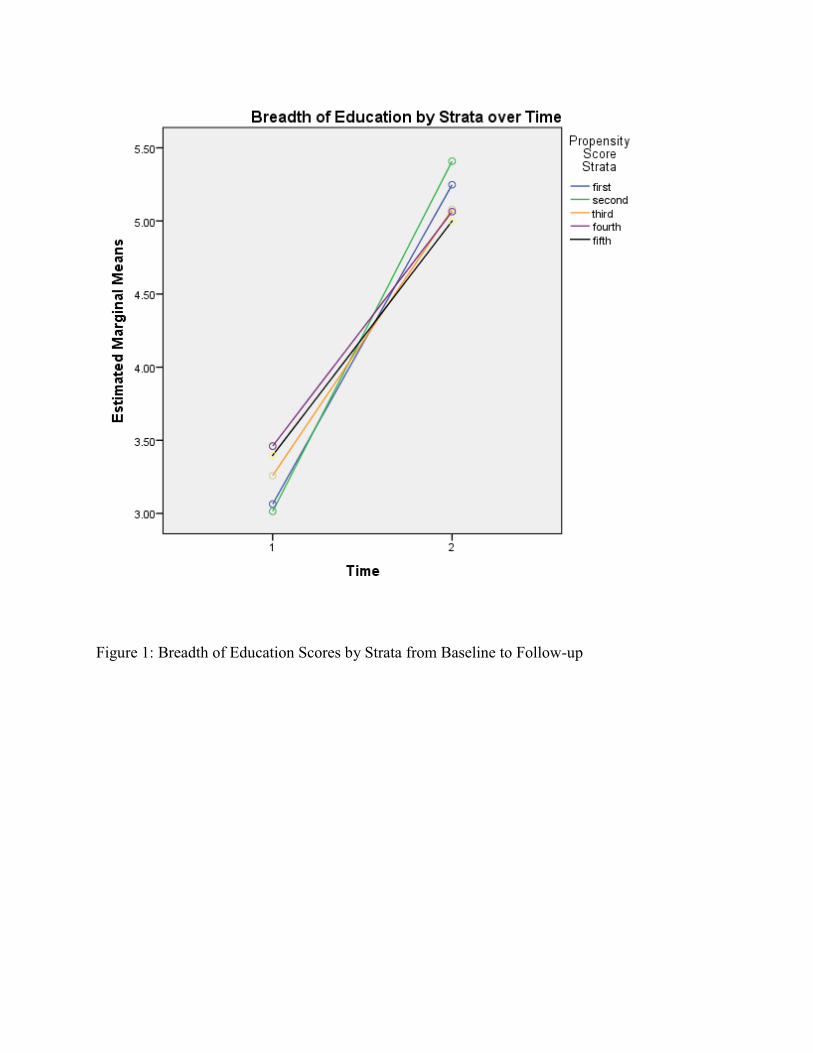
Figure 1: Breadth of Education Scores by Strata from Baseline to Follow-up