Statewide Federal-Aid Highways 2035 Transportation Plan
487
Statewide Federal-Aid Highways 2035 Transportation Plan July 2014 Prepared for: State of Hawaii Department of Transportation Highways Division
-
Upload
khangminh22 -
Category
Documents
-
view
1 -
download
0
Transcript of Statewide Federal-Aid Highways 2035 Transportation Plan
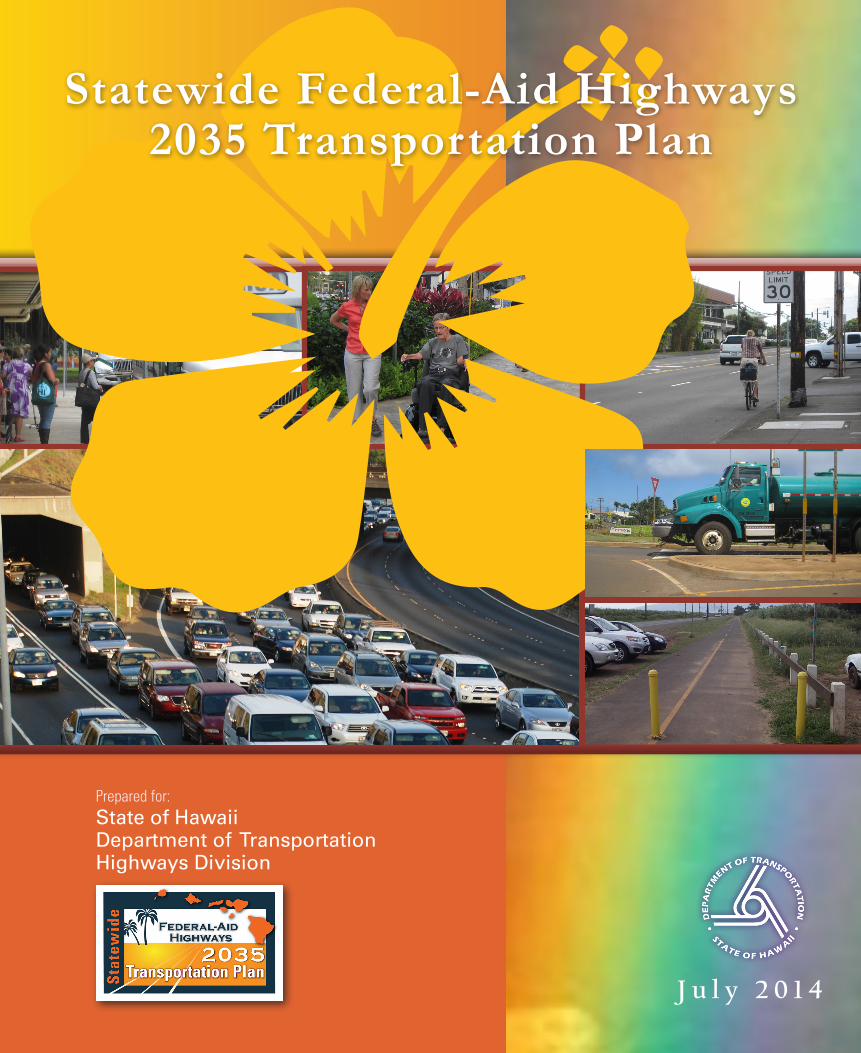
Statewide Federal-Aid Highways 2035 Transportation Plan
J u l y 2 0 1 4
Prepared for: State of Hawaii Department of Transportation Highways Division


Federal-Aid Highways 2035 Transportation Plan
Prepared for State of Hawaii
Department of Transportation Highways Division
July 2014
Prepared by

The State of Hawaii is committed to modernizing our highway systems to meet the future needs of our people. Our state Department of Transportation has completed the Statewide Federal-Aid Highways 2035 Transportation Plan, providing a solid foundation for making informed land transportation planning decisions through the year 2035. It marks the first time in our islands that a transportation plan of this magnitude has been completed on a statewide scale. The benefits of this present-day work will be critical to Hawaii’s future goals of modernizing our transportation systems, improving safety on our highways, and meeting our ambitious, yet obtainable, sustainability goals.
To accomplish this task, regional 2035 transportation plans for the counties of Honolulu, Maui, Hawaii, and Kauai have been updated and integrated into a single, comprehensive statewide plan. Public involvement and community input were key components in the planning effort, which embraced the unique social, cultural, and historical values of the people of Hawaii. Our sincerest thanks go to all of our citizens and stakeholders who participated in the process and provided their valuable insight. The Plan develops not only goals and objectives for transportation improvements, but also sets performance standards by which success will be measured. This performance gauge will allow for an objective and unbiased assessment of proposed improvements before they are implemented, streamlining and reducing waste throughout the process. This statewide plan, unprecedented in scope for the Aloha State, is an important step forward towards ensuring that transportation improvements can be implemented long-term in fiscally responsible and timely fashions. We will continue our collaborative efforts in our communities statewide to meet our future needs.
Sincerely,
Neil Abercrombie Governor State of Hawaii

The federal-aid highways system is the central transportation network that allows for the efficient movement of people, goods, and services on each of our islands. If the system cannot keep up with demand, we feel the effects in our schedules, our pocketbooks, and throughout our daily lives. The Statewide Federal-Aid Highways 2035 Transportation Plan is a vital addition to our Highways Division planning toolkit and will provide guidance for our long-term improvements to ensure that our highways can continue to meet future demands. The Plan will focus on increasing highway safety for freight, motorists, transit, cyclists, and pedestrians, and on supporting our local economy
and environment. It will also promote systemwide efficiency, accessibility, and mobility for all users. Setting these fundamental priorities in advance of specific planning efforts will ensure that improving our quality of life will be a central motivator in all of our projects. Development of this Plan has been driven by community members and stakeholders who participated in the planning process. We would like to extend a special mahalo to each of these individuals who took the time to contribute their experiences and input.
Sincerely, Ford Fuchigami Interim Director Hawaii Department of Transportation


Table of Contents Chapter Page Acronyms and Abbreviations .......................................................................................................................... xi
I. Introduction and Overview .................................................................................................................. 1-1 Purpose ................................................................................................................................................... 1-1 Challenges and Opportunities ................................................................................................................ 1-2
Challenges .................................................................................................................................... 1-2 Opportunities ............................................................................................................................... 1-3
Federal-Aid Highways ........................................................................................................................... 1-3 Statewide Transportation Planning Process ........................................................................................... 1-4 Plan Development Process ..................................................................................................................... 1-6 Stakeholder Involvement........................................................................................................................ 1-7
II. Goals and Objectives ............................................................................................................................ 2-1 Consistency with Plans, Policies, and Programs .................................................................................... 2-1 Planning Factors ..................................................................................................................................... 2-4 Stakeholder Involvement........................................................................................................................ 2-5 Goals and Objectives .............................................................................................................................. 2-6 Goals and District Plans ....................................................................................................................... 2-17
III. Statewide Transportation Context and Needs.................................................................................... 3-1 Introduction ............................................................................................................................................ 3-1 Plans, Policies, and Programs ................................................................................................................ 3-1 Land Use ................................................................................................................................................ 3-2 Socioeconomic Conditions ..................................................................................................................... 3-9
Population and Households ......................................................................................................... 3-9 Employment ............................................................................................................................... 3-14 Visitor Industry .......................................................................................................................... 3-19
Roadway System .................................................................................................................................. 3-20 Travel Demand ..................................................................................................................................... 3-22
Vehicular Volume ...................................................................................................................... 3-22 Freight System ........................................................................................................................... 3-33 Public Transit System ................................................................................................................ 3-37 Bikeway System ........................................................................................................................ 3-38 Pedestrian System ...................................................................................................................... 3-40 Emergency Response System .................................................................................................... 3-41
Land Transportation Needs .................................................................................................................. 3-42 Stakeholder Input ....................................................................................................................... 3-42 Alignment with Goals/Objectives .............................................................................................. 3-43
IV. Implementation ..................................................................................................................................... 4-1 Potential Solutions ................................................................................................................................. 4-1 Implementation Programs ...................................................................................................................... 4-3
System Preservation ..................................................................................................................... 4-4 Capacity ....................................................................................................................................... 4-5 Congestion ................................................................................................................................... 4-5 Safety ........................................................................................................................................... 4-5 Other ............................................................................................................................................ 4-6
Contents Page vii
TBG0
6271
4093
019H
NL
Nonmotorized .............................................................................................................................. 4-6 Transit ......................................................................................................................................... 4-6
Connecting this Plan and the Statewide Transportation Improvement Program ................................... 4-7 Mid-Range Plan ........................................................................................................................... 4-7 STIP ............................................................................................................................................. 4-7
Funding .................................................................................................................................................. 4-8 Federal Funds .............................................................................................................................. 4-8 MAP-21 ....................................................................................................................................... 4-9 State Funds .................................................................................................................................. 4-9 Inflation ..................................................................................................................................... 4-10 Future Funding .......................................................................................................................... 4-10 Supplemental Funding and Non-Funding Strategies ................................................................. 4-12
Reducing Transportation Infrastructure Funding Needs ...................................................................... 4-13 Land Use Planning .................................................................................................................... 4-13 Transportation Demand Management Strategies ...................................................................... 4-13
Performance Measures ......................................................................................................................... 4-14 Additional Strategies ........................................................................................................................... 4-15
V. References ............................................................................................................................................. 5-1
Exhibits 1-1 Federal Functional Classification ........................................................................................................ 1-3 1-2 Channelization of Trips ....................................................................................................................... 1-4 1-3 Statewide Integrated Transportation Planning .................................................................................... 1-5 1-4 Plan Development Process .................................................................................................................. 1-6 1-5 Stakeholder Groups ............................................................................................................................. 1-7 1-6 STAC and Sub-STAC Agencies ......................................................................................................... 1-8 1-7 SAC Member Categories .................................................................................................................... 1-8 2-1 Key Federal, State, and Local Plans Reviewed ................................................................................... 2-2 2-2 Planning Factors .................................................................................................................................. 2-4 2-3 Planning Factors and MAP-21 Performance Goals ............................................................................ 2-5 2-4 OahuMPO Stakeholder Structure ........................................................................................................ 2-6 2-5 Statewide Land Transportation Goals and Objectives ........................................................................ 2-7 2-6 ORTP 2035 Vision, Goals, and Objectives ....................................................................................... 2-18 2-7 Goal Priority Weights ....................................................................................................................... 2-20 3-1 LUC Land Use Districts ...................................................................................................................... 3-3 3-2a Oahu Land Use District Designations ................................................................................................. 3-4 3-2b Maui Land Use District Designations ................................................................................................. 3-5 3-2c Molokai Land Use District Designations ............................................................................................ 3-6 3-2d Lanai Land Use District Designations ................................................................................................ 3-6 3-2e Hawaii Land Use District Designations .............................................................................................. 3-7 3-2f Kauai Land Use District Designations ................................................................................................ 3-8 3-3 Forecast Population ........................................................................................................................... 3-10 3-4 Forecast Households ......................................................................................................................... 3-10 3-5a Oahu Population Change (2007 to 2035) .......................................................................................... 3-10 3-5b Maui Households, 2007 .................................................................................................................... 3-11 3-5c Maui Households, 2035 .................................................................................................................... 3-11 3-5d Hawaii Households, 2007 ................................................................................................................. 3-12 3-5e Hawaii Households, 2035 ................................................................................................................. 3-12 3-5f Kauai Households, 2007 ................................................................................................................... 3-13 3-6 Forecast Employment........................................................................................................................ 3-14
Page viii Contents
3-7a Oahu Employment Change (2007 to 2035) ....................................................................................... 3-15 3-7b Maui Employment, 2007 ................................................................................................................... 3-16 3-7c Maui Employment, 2035 ................................................................................................................... 3-16 3-7d Hawaii Employment, 2007 ................................................................................................................ 3-17 3-7e Hawaii Employment, 2035 ................................................................................................................ 3-17 3-7f Kauai Employment, 2007 .................................................................................................................. 3-18 3-7g Kauai Employment, 2035 .................................................................................................................. 3-18 3-8 Forecast Arterial and Collector Lane Miles ....................................................................................... 3-21 3-9 Roadway Performance ....................................................................................................................... 3-23 3-10a Oahu 2007 a.m. Level of Service ...................................................................................................... 3-24 3-10b Oahu 2035 a.m. Level of Service ...................................................................................................... 3-25 3-10c Maui 2007 Volume-to-Capacity Ratio and Level of Service ............................................................ 3-26 3-10d Maui 2035 Volume-to-Capacity Ratio and Level of Service (No Build) .......................................... 3-27 3-10e Molokai and Lanai 2007 and 2035 (No Build) Volume-to-Capacity Ratio and Level of Service .... 3-28 3-10f Hawaii 2007 Volume-to-Capacity Ratio and Level of Service ......................................................... 3-29 3-10g Hawaii 2035 Volume-to-Capacity Ratio and Level of Service (No Build) ....................................... 3-30 3-10h Kauai 2007 Volume-to-Capacity Ratio and Level of Service ........................................................... 3-31 3-10i Kauai 2035 Volume-to-Capacity Ratio and Level of Service (No Build) ......................................... 3-32 3-11 Forecast Airport and Harbor Cargo ................................................................................................... 3-33 3-12a Maui 2035 Freight Distribution ......................................................................................................... 3-34 3-12b Hawaii 2035 Freight Distribution ...................................................................................................... 3-35 3-12c Kauai 2035 Freight Distribution ........................................................................................................ 3-36 3-13 Existing Transit Service by Region ................................................................................................... 3-37 3-14 Bike Facility Types ............................................................................................................................ 3-38 4-1 Statewide Needs and Solutions ............................................................................................................ 4-4 4-2 Implementation from Long-Range Plan to STIP ................................................................................. 4-8 4-3 Historical Federal Contribution ........................................................................................................... 4-9 4-4 Statewide Need and Revenue ............................................................................................................ 4-11 4-5 Estimated Cost of HDOT Program Needs ......................................................................................... 4-11 4-6 Future Funding Distribution by HDOT Program .............................................................................. 4-11
Contents Page ix


Acronyms and Abbreviations CAC Citizen Advisory Committee
DBEDT Department of Business, Economic Development, and Tourism
FHWA Federal Highway Administration
FY fiscal year
HDOT State of Hawaii Department of Transportation
HSHSP Hawaii Strategic Highway Safety Plan
HSTP Hawaii Statewide Transportation Plan
ITS Intelligent Transportation System
LOS Level of Service
MAP-21 Moving Ahead for Progress in the 21st Century
NHS National Highway System
OahuMPO Oahu Metropolitan Planning Organization
ORTP Oahu Regional Transportation Plan
SAC Stakeholder Advisory Committee
SAFETEA-LU Safe, Accountable, Flexible, Efficient Transportation Equity Act: A Legacy for Users
STAC Statewide Transportation Advisory Committee
STIP Statewide Transportation Improvement Program
Sub-STAC Sub-Statewide Transportation Advisory Committee
TAC Technical Advisory Committee
TAZ traffic analysis zone
TEU twenty-foot equivalent unit
USC United States Code
V/C volume-to-capacity
Acronyms and Abbreviations Page xi


Chapter IIntroduction and Over view

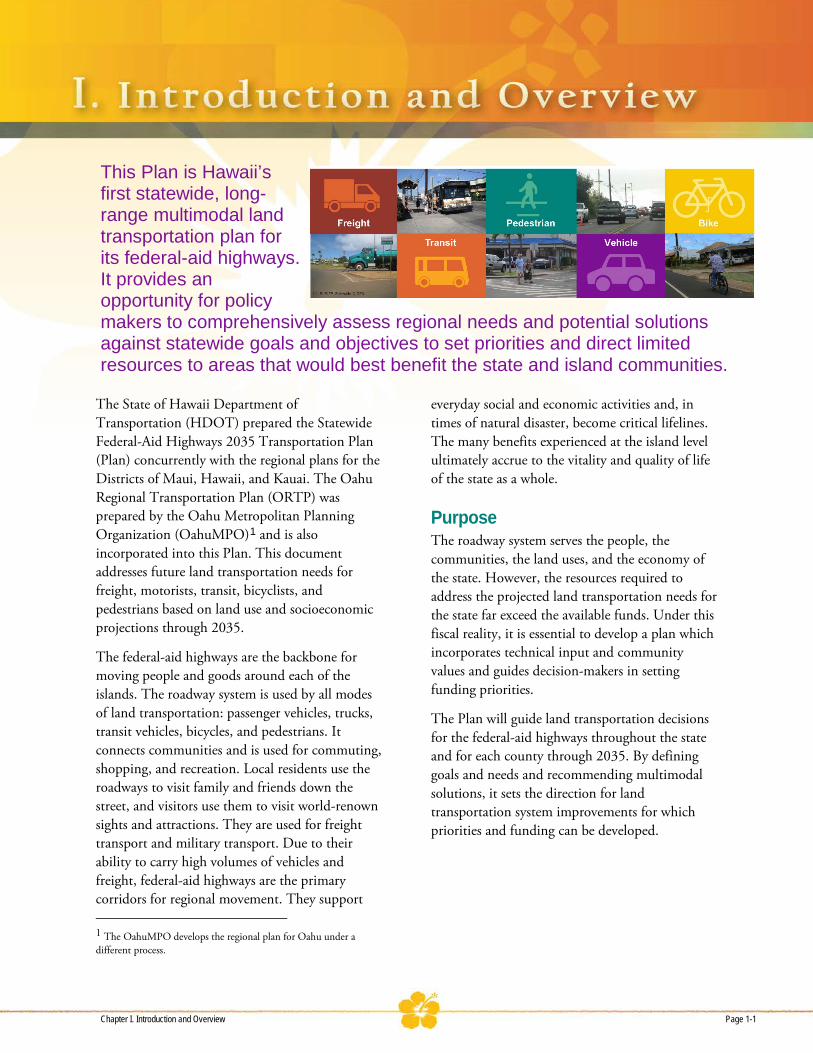
This Plan is Hawaii’s first statewide, long-range multimodal land transportation plan for its federal-aid highways. It provides an opportunity for policy makers to comprehensively assess regional needs and potential solutions against statewide goals and objectives to set priorities and direct limited resources to areas that would best benefit the state and island communities.
The State of Hawaii Department of Transportation (HDOT) prepared the Statewide Federal-Aid Highways 2035 Transportation Plan (Plan) concurrently with the regional plans for the Districts of Maui, Hawaii, and Kauai. The Oahu Regional Transportation Plan (ORTP) was prepared by the Oahu Metropolitan Planning Organization (OahuMPO)1 and is also incorporated into this Plan. This document addresses future land transportation needs for freight, motorists, transit, bicyclists, and pedestrians based on land use and socioeconomic projections through 2035.
The federal-aid highways are the backbone for moving people and goods around each of the islands. The roadway system is used by all modes of land transportation: passenger vehicles, trucks, transit vehicles, bicycles, and pedestrians. It connects communities and is used for commuting, shopping, and recreation. Local residents use the roadways to visit family and friends down the street, and visitors use them to visit world-renown sights and attractions. They are used for freight transport and military transport. Due to their ability to carry high volumes of vehicles and freight, federal-aid highways are the primary corridors for regional movement. They support
1 The OahuMPO develops the regional plan for Oahu under a different process.
everyday social and economic activities and, in times of natural disaster, become critical lifelines. The many benefits experienced at the island level ultimately accrue to the vitality and quality of life of the state as a whole.
Purpose The roadway system serves the people, the communities, the land uses, and the economy of the state. However, the resources required to address the projected land transportation needs for the state far exceed the available funds. Under this fiscal reality, it is essential to develop a plan which incorporates technical input and community values and guides decision-makers in setting funding priorities.
The Plan will guide land transportation decisions for the federal-aid highways throughout the state and for each county through 2035. By defining goals and needs and recommending multimodal solutions, it sets the direction for land transportation system improvements for which priorities and funding can be developed.
Chapter I. Introduction and Overview Page 1-1
By establishing priorities for the next twenty years, this statewide Plan supports and helps implement the HDOT Highways Division’s mission:
To provide a safe, and efficient and accessible highway system through utilization of available resources in the maintenance, enhancement and
support of land transportation facilities
A statewide transportation plan is required by federal statute (23 USC 135) and the current federal transportation legislation: Moving Ahead for Progress in the 21st Century (MAP-21), passed in 2012 and previously by legislation, the Safe, Accountable, Flexible, Efficient Transportation Equity Act: A Legacy For Users (SAFETEA-LU), passed in 2005. Each state must develop a long-range transportation plan for all areas of the state with a minimum 20-year forecast period. This Plan fulfills the statewide planning requirement, and provides the guidance for metropolitan planning also required by federal statutes.
Federal planning regulations (23 Code of Federal Regulations 450) implement these statutes, and require periodic evaluations and updates as appropriate. These regulations require states to conduct a statewide planning process that considers all modes of transportation, is coordinated with transportation planning activities carried out in metropolitan areas, and involves consultation with nonmetropolitan areas.
Additionally, Hawaii Revised Statutes Section 279A requires the state to develop a balanced, multimodal statewide transportation system that serves clearly identified social, economic, and environmental objectives. This Plan, along with the transportation plans for the City and County of Honolulu and the Districts of Maui, Hawaii, and Kauai that support it, fulfills Hawaii’s statewide transportation planning requirement.
Challenges and Opportunities During the research, analysis and consultation with stakeholders that occurred over the course of developing the Plan, challenges for land
transportation planning were identified as were opportunities for addressing them.
Challenges Island Transportation Systems – One of the challenges is systematically and fairly addressing the land transportation needs of a state made up of several interdependent islands whose economies and communities are interconnected, but whose local values and particular needs may vary.
Limited Funds – The gap between funding needs and available funds has been widening over the years. It has become increasingly difficult to generate revenues from existing and new sources. The challenge is to find sustainable solutions that allow Hawaii’s economy and communities to achieve their goals.
Projected Growth – Statewide projections of population, household, and employment, as well as county land use plans, all indicate significant growth to year 2035. This growth places an increasing strain on the land transportation system resulting in more congestion and greater wear and tear on roadways.
System Preservation – Roadway surfaces, bridges, and other facilities should be maintained in a state of good repair, but years of deferred maintenance and low funding levels have made this a challenging objective. More resources should be applied to preserve existing assets.
Safety – Unsafe driver behavior and unsafe roads were identified by Oahu’s resident in the public outreach conducted for the Oahu Regional Transportation Plan (ORTP) 2035. Statewide and neighbor island stakeholders also identified improved safety as an important goal.
Security/Disaster Response – For islands where communities are connected by a single belt road, a well-functioning land transportation system is a critical component of emergency services and civil protection.
Multimodal Trips – There is an increasing awareness of the benefits of multimodal transportation and increasing numbers of people
Page 1-2 Chapter I. Introduction and Overview

are using the roadways for public transit, bicycling, and walking. However, this creates potential conflicts in a limited right-of-way also used by motorists and trucks. The challenge is to safely and economically accommodate all modes where appropriate.
Energy Conservation – About 20 percent of the state’s energy is used by trucks, buses, and cars. The Hawaii Clean Energy Initiative has set goals to reduce Hawaii’s dependence on imported fossil fuel. Land transportation and land use plans should promote sustainable energy conservation practices.
Environmental Resources/Sea-level Rise – The environmental and cultural resources that support the state’s quality of life and key sectors of the economy, such as tourism, should not be adversely affected by transportation facilities. At the same time, transportation facilities should be protected from or adapt to the damaging effects of sea-level rise.
Opportunities County Land Use Plans – The land transportation plan is based on county land use plans. Projected traffic congestion could be alleviated with implementation of sustainable land use plans that reduce vehicle trips.
Statewide Long-range Planning – This statewide Plan is an opportunity for policy makers to assess long-range transportation needs and funding requirements on a comprehensive, statewide basis in time to take appropriate policy and funding actions before issues become critical.
State Safety Plan – The HDOT’s Hawaii Strategic Highway Safety Plan (HSHSP) addresses issues related to improving traffic safety data collection, increasing traffic safety awareness, and other crucial traffic safety issues. The vision of the HSHSP is to have Hawaii’s road users arrive safely at their destinations. The goal of that plan is to reduce the number of traffic-related fatalities. The land transportation plans extend HSHSP initiatives by including goals and objectives for a safe, multimodal system.
Sustainable Transportation Solutions –Technological innovations and growing public awareness provide opportunities to create an efficient transportation system that minimizes energy consumption and emissions and promotes healthy lifestyles. The use of Complete Streets principles and design guidelines to promote safe use of the roadways by multiple modes (pedestrians, bicyclists, transit, motorists, and freight) is a sustainable solution and a component of the land transportation plans.
Funding Sources – The critical nature of the widening gap between transportation needs and funding levels could broaden the discussion of enhancing existing revenue sources or formulating new ones. Chapter IV of this Plan identifies potential revenue sources.
Federal-Aid Highways For the federal-aid highways, federal policy directs state Departments of Transportation (DOTs) to establish a classification of roads, based on function, so that roadways can be improved appropriately as funding opportunities arise. This functional classification groups streets and highways into classes, or systems, according to the character of service they are intended to provide, as shown on Exhibit 1-1.
Exhibit 1-1. Federal Functional Classification
Principal Arterials:
Interstate Other Freeways and Expressways Other Principal Arterials
Other types of roadways:
Minor Arterial Major Collector Minor Collector Local
Functional classification uses a common nomenclature to provide a consistently defined roadway network across the country.
Chapter I. Introduction and Overview Page 1-3
All highways in the United States are functionally classified by state DOTs (in conjunction with local agencies) based on criteria established by the Federal Highway Administration (FHWA). The functional classification is used for planning, design, budgeting, programming, and fiscal management. For example, functional classification is used to determine federal, state, regional, and local priorities for roadway resurfacing or reconstruction. It also determines the eligibility for some FHWA funding categories.
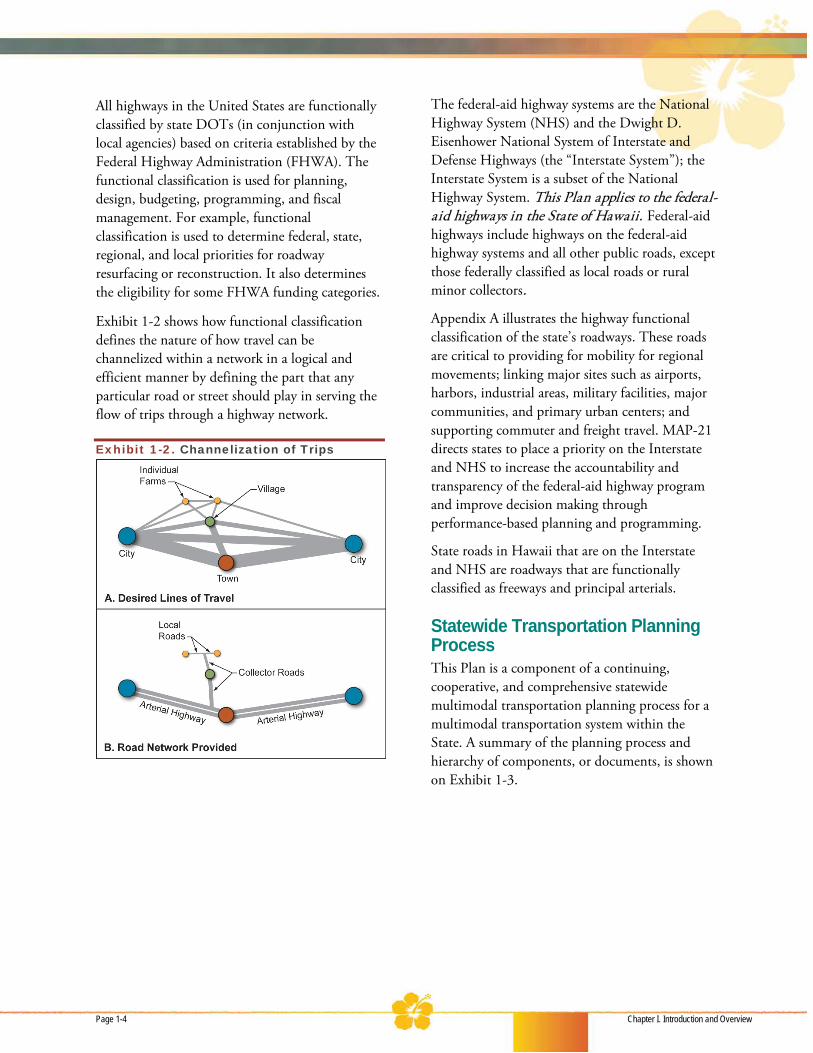
Exhibit 1-2 shows how functional classification defines the nature of how travel can be channelized within a network in a logical and efficient manner by defining the part that any particular road or street should play in serving the flow of trips through a highway network.
Exhibit 1-2. Channelization of Trips
The federal-aid highway systems are the National Highway System (NHS) and the Dwight D. Eisenhower National System of Interstate and Defense Highways (the “Interstate System”); the Interstate System is a subset of the National Highway System. This Plan applies to the federal-aid highways in the State of Hawaii. Federal-aid highways include highways on the federal-aid highway systems and all other public roads, except those federally classified as local roads or rural minor collectors.
Appendix A illustrates the highway functional classification of the state’s roadways. These roads are critical to providing for mobility for regional movements; linking major sites such as airports, harbors, industrial areas, military facilities, major communities, and primary urban centers; and supporting commuter and freight travel. MAP-21 directs states to place a priority on the Interstate and NHS to increase the accountability and transparency of the federal-aid highway program and improve decision making through performance-based planning and programming.
State roads in Hawaii that are on the Interstate and NHS are roadways that are functionally classified as freeways and principal arterials.
Statewide Transportation Planning Process This Plan is a component of a continuing, cooperative, and comprehensive statewide multimodal transportation planning process for a multimodal transportation system within the State. A summary of the planning process and hierarchy of components, or documents, is shown on Exhibit 1-3.
Page 1-4 Chapter I. Introduction and Overview
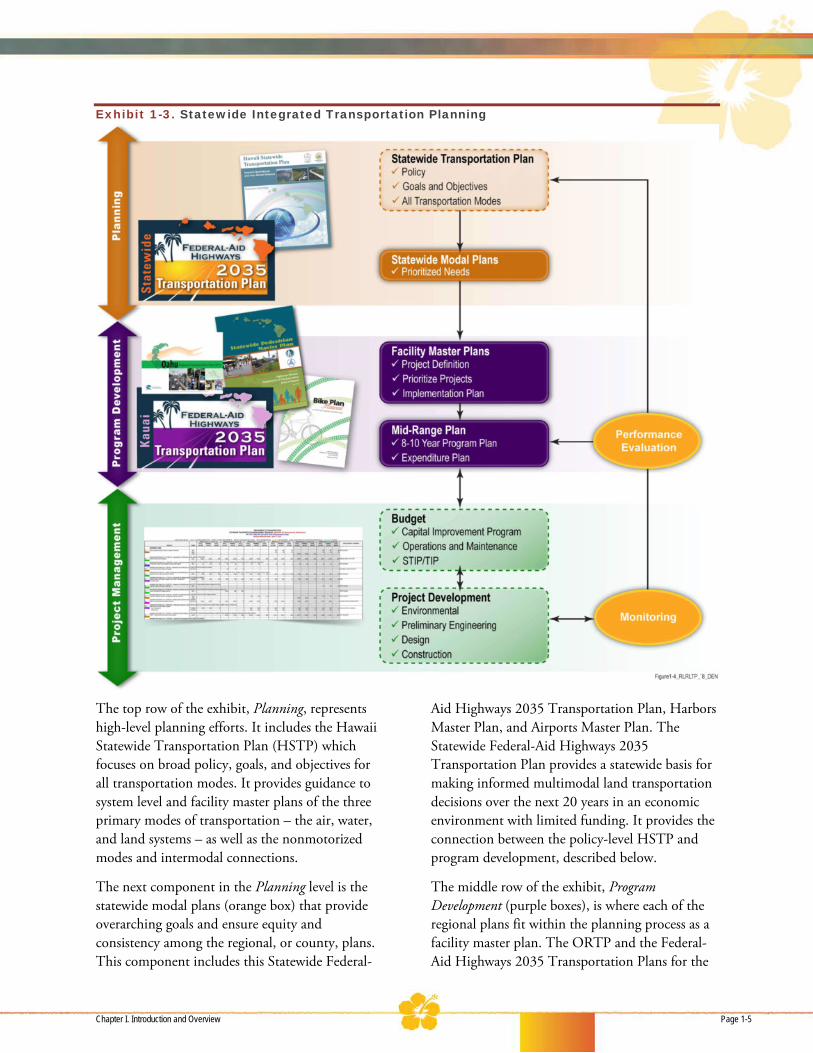
Exhibit 1-3. Statewide Integrated Transportation Planning
The top row of the exhibit, Planning, represents high-level planning efforts. It includes the Hawaii Statewide Transportation Plan (HSTP) which focuses on broad policy, goals, and objectives for all transportation modes. It provides guidance to system level and facility master plans of the three primary modes of transportation – the air, water, and land systems – as well as the nonmotorized modes and intermodal connections.
The next component in the Planning level is the statewide modal plans (orange box) that provide overarching goals and ensure equity and consistency among the regional, or county, plans. This component includes this Statewide Federal-
Aid Highways 2035 Transportation Plan, Harbors Master Plan, and Airports Master Plan. The Statewide Federal-Aid Highways 2035 Transportation Plan provides a statewide basis for making informed multimodal land transportation decisions over the next 20 years in an economic environment with limited funding. It provides the connection between the policy-level HSTP and program development, described below.
The middle row of the exhibit, Program Development (purple boxes), is where each of the regional plans fit within the planning process as a facility master plan. The ORTP and the Federal-Aid Highways 2035 Transportation Plans for the
Chapter I. Introduction and Overview Page 1-5

Districts of Maui, Hawaii, and Kauai integrate with the overarching Statewide Federal-Aid Highways 2035 Transportation Plan for the federal-aid highway system, providing mid-range and long-range components that support and help implement the state plan.
Other plans within the Program Development level include Bike Plan Hawaii and the Statewide Pedestrian Master Plan. These plans were used in developing the statewide and district land transportation plans.
The bottom row of the exhibit is Project Management (green boxes). This includes budgeting (that is, the Statewide Transportation Improvement Program [STIP] process) and Project Development. It is at this last step of the overall process where individual projects are funded, permitted, designed, and constructed.
Plan Development Process The statewide Plan and regional plans were concurrently formulated through a series of
milestones in an open and comprehensive process that developed goals, objectives, and strategies before identifying potential solutions. The major plan milestones for the statewide Plan are shown on Exhibit 1-4. Milestones for the regional plans are also shown to illustrate the concurrent process.
The process allowed the project team to objectively evaluate alternative solutions and assess how well they met the goals and objectives defined by stakeholders. The Plan is based on input from stakeholders from around the state as well as each county’s land use and transportation plans, policies, and programs to ensure it is consistent with the vision of Hawaii’s communities.
Decision-makers, advisory committees, and the general public were included throughout the process, as indicated on Exhibit 1-4, to ensure quality decisions. Clearly identifying plan milestones allowed stakeholders to visualize the entire process and identify points at which to provide input.
Exhibit 1-4. Plan Development Process
Page 1-6 Chapter I. Introduction and Overview
Establish Goals and Objectives – This milestone focused on reviewing existing regulatory and policy requirements related to land transportation, and developing goals and objectives for the long-range land transportation system.
Gather Data and Develop Model – This milestone included gathering data and information related to the land transportation system and current HDOT programs. A major portion of the task included developing/updating the regional travel demand models, which were the bases for consistently forecasting and assessing future traffic conditions.
Define Future Conditions – Based on the forecasting results and endorsed program definitions, this milestone focused on identifying future system deficiencies and developing priorities and evaluation criteria for the plans.
Identify Solutions – This milestone focused on developing potential solutions to address overall plan policies, goals and objectives, and identified transportation needs and deficiencies. Funding sources, allocations, and financing strategies were also identified.
Develop and Evaluate Solutions and Create Implementation Plan – This milestone focused on evaluating the potential solutions against requirements and plan goals and objectives and creating implementation recommendations.
Draft and Refine Plans – This milestone documented the plan’s development process, analyses, and recommendations. The document was refined and finalized based on stakeholder comments and input.
Stakeholder Involvement Stakeholder involvement was vital to the development of the plans. Stakeholder groups provided diverse viewpoints at specific milestones in the plan development process and helped shape the direction of the plans.
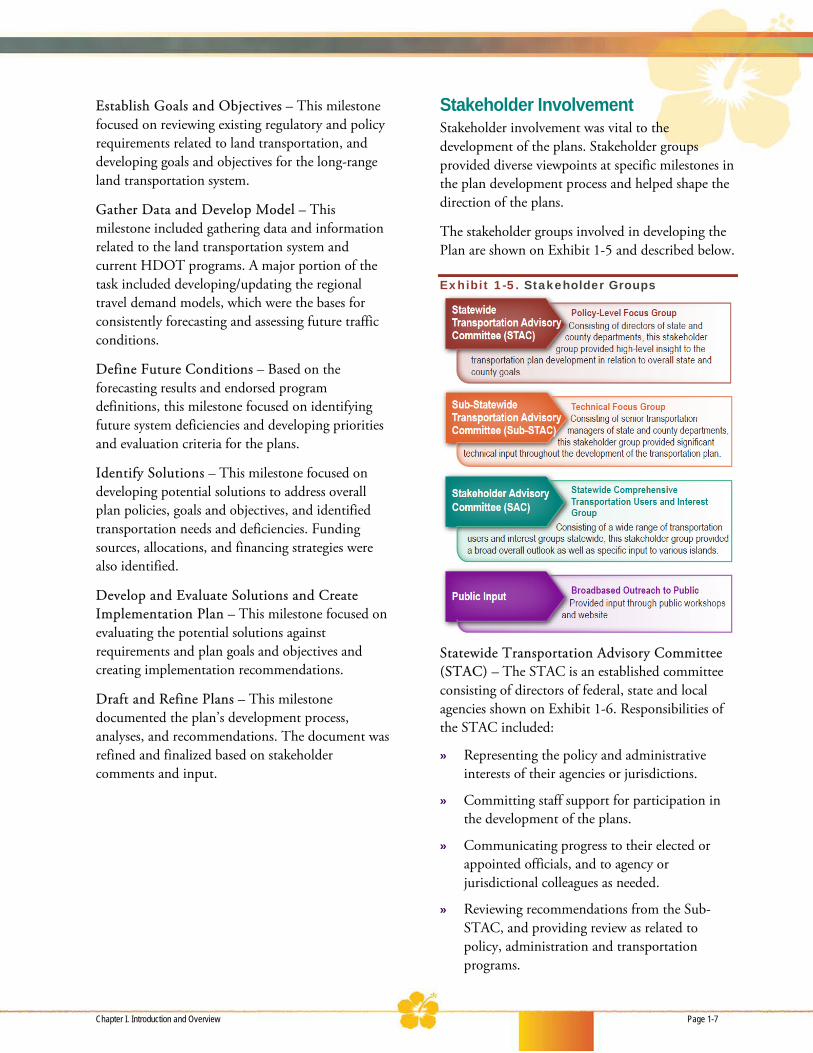
The stakeholder groups involved in developing the Plan are shown on Exhibit 1-5 and described below.
Exhibit 1-5. Stakeholder Groups
Statewide Transportation Advisory Committee (STAC) – The STAC is an established committee consisting of directors of federal, state and local agencies shown on Exhibit 1-6. Responsibilities of the STAC included:
» Representing the policy and administrative interests of their agencies or jurisdictions.
» Committing staff support for participation in the development of the plans.
» Communicating progress to their elected or appointed officials, and to agency or jurisdictional colleagues as needed.
» Reviewing recommendations from the Sub-STAC, and providing review as related to policy, administration and transportation programs.
Chapter I. Introduction and Overview Page 1-7

Exhibit 1-6. STAC and Sub-STAC Agencies Agency/
Jurisdiction Department
State of Hawaii Department of Transportation State of Hawaii Department of Business,
Economic Development & Tourism
State of Hawaii Department of Health State of Hawaii Civil Defense City and County of Honolulu
Department of Transportation Services
City and County of Honolulu
Department of Planning and Permitting
Hawaii County Planning Department Hawaii County Department of Public Works Hawaii County Mass Transit Agency Kauai County Planning Department Kauai County Department of Public Works Kauai County Transportation Agency Maui County Planning Department Maui County Department of Public Works Maui County Department of Transportation Ex-Officio members Oahu Metropolitan Planning Organization Federal Highway Administration Federal Transit Administration Federal Aviation Administration Sub-Statewide Transportation Advisory Committee (Sub-STAC) - The Sub-STAC consisted of senior transportation managers from the agencies shown on Exhibit 1-6. Responsibilities of the Sub-STAC included:
» Representing the interests of their agencies or jurisdictions.
» Providing technical support, information, insight and reviews.
» Communicating progress to their directors, elected or appointed officials, and to agency or jurisdictional colleagues as needed.
» Reviewing recommendations from the public and planning team, reviewing background materials and make informed, comprehensive recommendations at the milestones of the project. The decisions made by the Sub-STAC would become the recommended plan to the policy level stakeholders and HDOT Director.
Stakeholder Advisory Committee (SAC) - The SAC provided a balanced representation of public interests for the Plan. The members represented a broad range of transportation system users, communities, geographic areas, ages, and diverse populations as shown on Exhibit 1-7. They served as a communication link with those interests and communities and provided insight into public sentiment regarding the planning process. The SAC included representatives of minority and disadvantaged (low-income) groups consistent with the HDOT’s commitment to Title VI of the Civil Rights Act. All meetings were open to the public, but the focus of the meetings was on facilitation of discussions by SAC members.
Exhibit 1-7. SAC Member Categories Category
Transit Health Freight Utilities
Car Environment Visitor Industry Sustainability
Business Community Energy Residential Community Cultural Developer Community Disabled Persons
Pedestrian Military Bicyclist Elderly School Safety
Higher Education
The SAC members were volunteers selected by the HDOT. Members were solicited through an application process to ensure that a comprehensive group of interests and demographics were represented. Responsibilities of the SAC members included:
» Representing their constituents’ perspectives during group deliberations.
» Communicating progress with their constituents.
» Providing feedback at key milestones of plan development. Providing input prior to distribution of key materials at public workshops.
» Acting as ambassadors for the planning process.
» Providing recommendations to the HDOT.
Page 1-8 Chapter I. Introduction and Overview

The SAC also functioned as a Citizen Advisory Committee (CAC) for the Hawaii and Maui plans because a sufficient number of volunteers from diverse backgrounds could not be obtained for these two districts.
SAC Meeting
Public Input – The planning team used a variety of public involvement and outreach methods to communicate with the public. These techniques were intended to reach a comprehensive cross-section of the community and transportation system users and allow them to provide meaningful and broad-based input. The public involvement process was tailored to fit each island through island-specific public involvement specialists.
Public Meetings – In addition to the comprehensive committee structure, the general public provided input to shape the statewide and regional plans through public workshops to identify needs and opportunities in the transportation system and to review the draft Plan.
Kauai Public Meeting
Hilo Public Meeting
Chapter I. Introduction and Overview Page 1-9
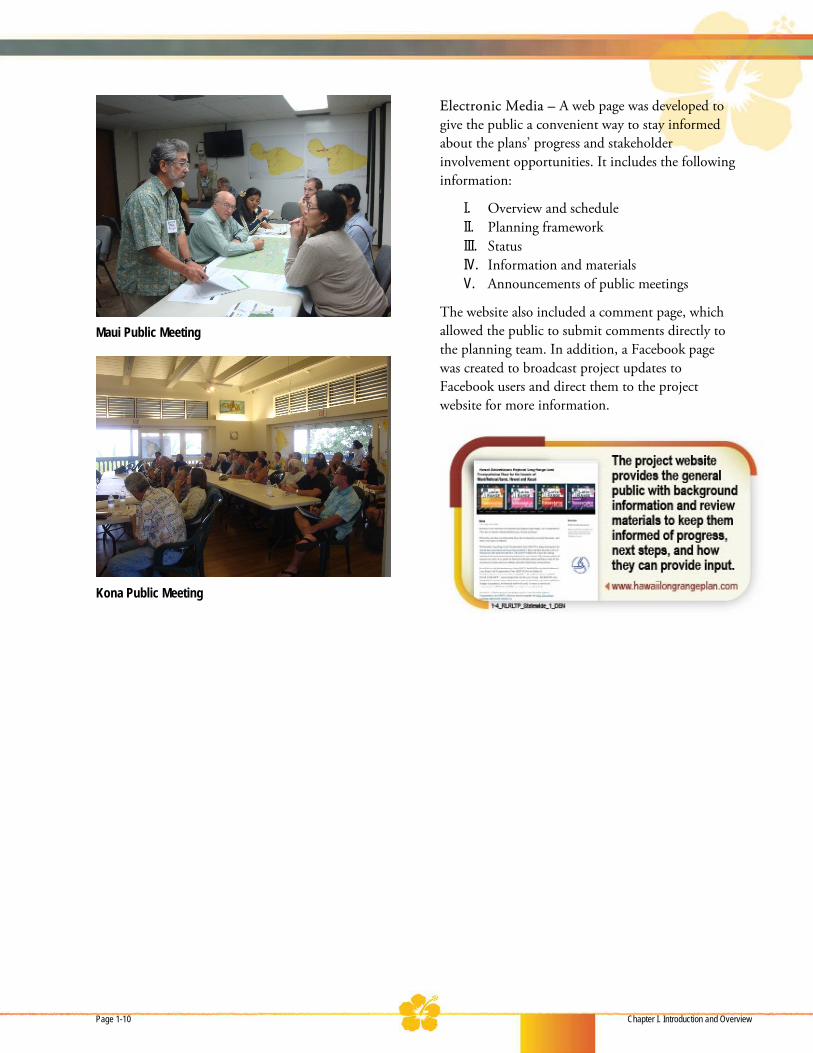
Maui Public Meeting
Kona Public Meeting
Electronic Media – A web page was developed to give the public a convenient way to stay informed about the plans’ progress and stakeholder involvement opportunities. It includes the following information:
I. Overview and schedule II. Planning framework III. Status IV. Information and materials V. Announcements of public meetings
The website also included a comment page, which allowed the public to submit comments directly to the planning team. In addition, a Facebook page was created to broadcast project updates to Facebook users and direct them to the project website for more information.
Page 1-10 Chapter I. Introduction and Overview
Chapter IIGoals and Objectives

Goals and objectives are important to ensure that the planning process and long-range land transportation plans at the statewide and district levels reflect the state’s vision for transportation to guide future transportation investment decisions. Goals provide general overarching guidance and objectives provide ways to achieve goals.
The goals and objectives of this Plan were developed in alignment with existing federal, state and local regulatory and policy requirements as well as the mission of the HDOT Highways Division. They were developed from the same planning framework as the HSTP, whose goals and objectives are at a higher policy level to address the state’s air, water, and land transportation systems. Therefore, the goals and objectives of this Statewide Federal-Aid Highways 2035 Transportation Plan are consistent with the HSTP to best achieve the mission of the overall transportation system and the HDOT Highways Division.
The key steps to developing this Plan’s goals and objectives were:
» Federal, state, and county plans, policies, and programs were reviewed to ensure the Plan’s compliance and alignment with adopted plans and requirements.
» The federal planning factors were used as a framework to ensure a comprehensive plan that addressed federal requirements.
» The HDOT worked with stakeholder committees to develop and refine the goal statements through an iterative process.
Each step in the process is further described in this section.
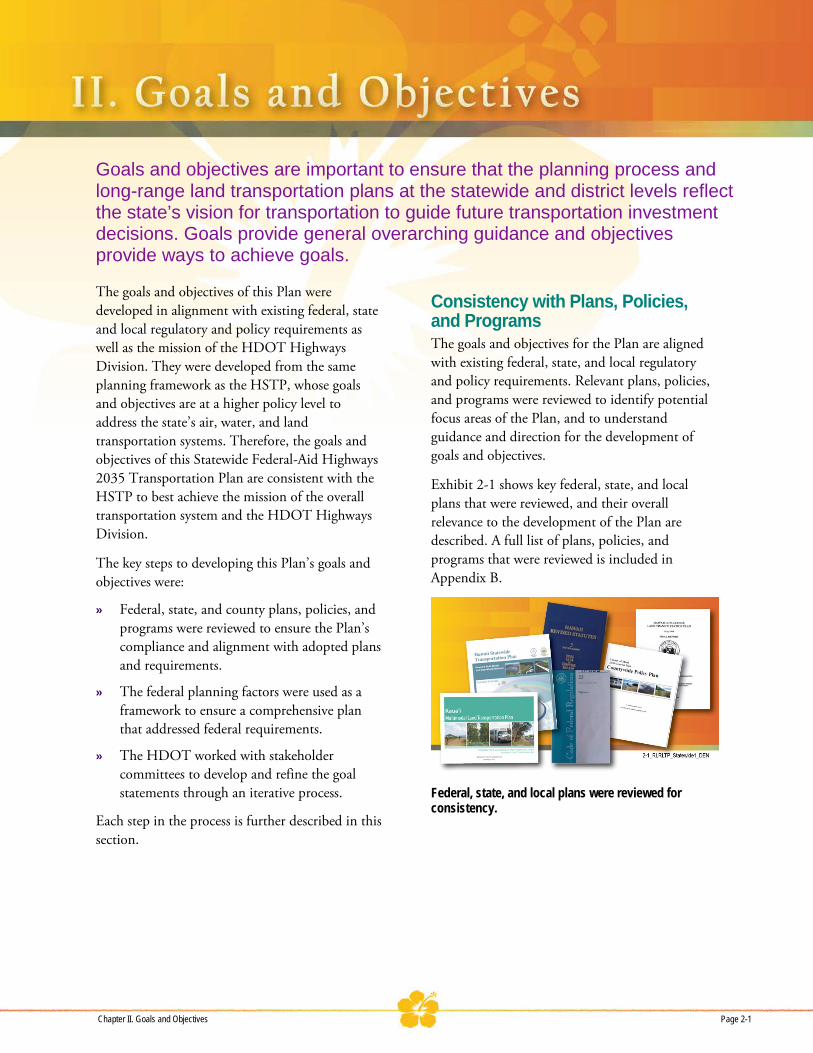
Consistency with Plans, Policies, and Programs The goals and objectives for the Plan are aligned with existing federal, state, and local regulatory and policy requirements. Relevant plans, policies, and programs were reviewed to identify potential focus areas of the Plan, and to understand guidance and direction for the development of goals and objectives.
Exhibit 2-1 shows key federal, state, and local plans that were reviewed, and their overall relevance to the development of the Plan are described. A full list of plans, policies, and programs that were reviewed is included in Appendix B.
Federal, state, and local plans were reviewed for consistency.
Chapter II. Goals and Objectives Page 2-1
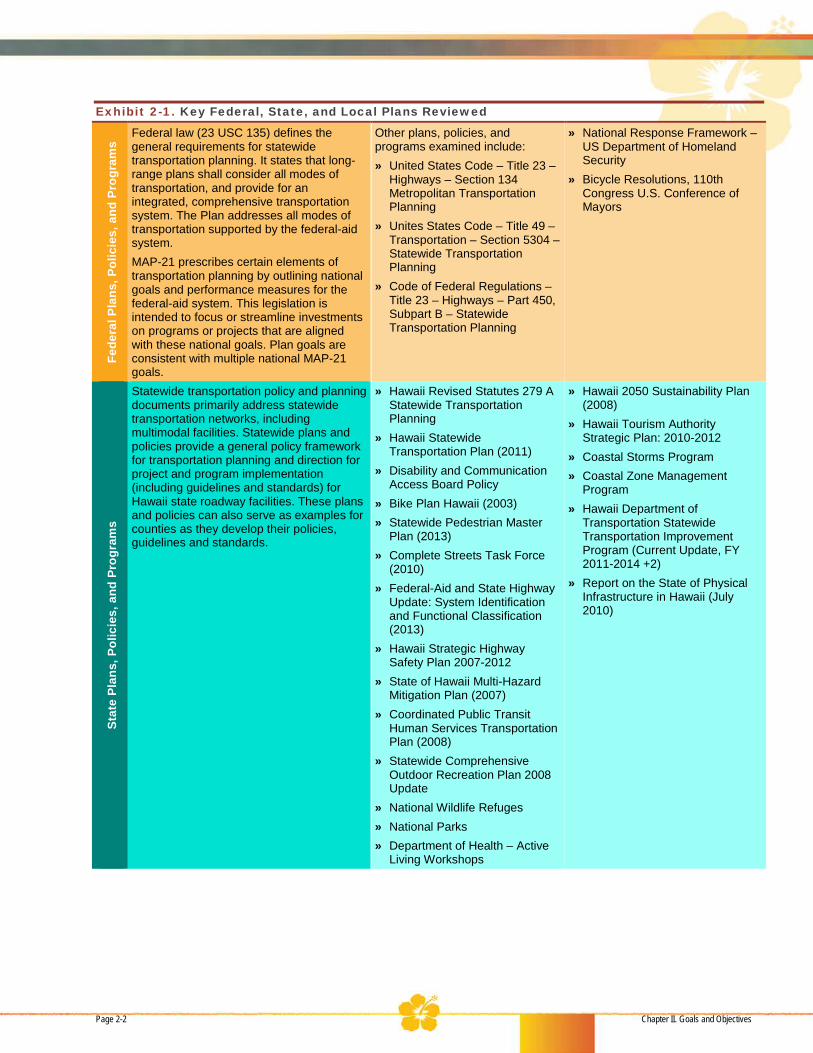
Exhibit 2-1. Key Federal, State, and Local Plans Reviewed Fe
dera
l Pla
ns, P
olic
ies,
and
Pro
gram
s
Federal law (23 USC 135) defines the general requirements for statewide transportation planning. It states that long-range plans shall consider all modes of transportation, and provide for an integrated, comprehensive transportation system. The Plan addresses all modes of transportation supported by the federal-aid system. MAP-21 prescribes certain elements of transportation planning by outlining national goals and performance measures for the federal-aid system. This legislation is intended to focus or streamline investments on programs or projects that are aligned with these national goals. Plan goals are consistent with multiple national MAP-21 goals.
Other plans, policies, and programs examined include: » United States Code – Title 23 –
Highways – Section 134 Metropolitan Transportation Planning
» Unites States Code – Title 49 – Transportation – Section 5304 – Statewide Transportation Planning
» Code of Federal Regulations – Title 23 – Highways – Part 450, Subpart B – Statewide Transportation Planning
» National Response Framework – US Department of Homeland Security
» Bicycle Resolutions, 110th Congress U.S. Conference of Mayors
Stat
e Pl
ans,
Pol
icie
s, a
nd P
rogr
ams
Statewide transportation policy and planning documents primarily address statewide transportation networks, including multimodal facilities. Statewide plans and policies provide a general policy framework for transportation planning and direction for project and program implementation (including guidelines and standards) for Hawaii state roadway facilities. These plans and policies can also serve as examples for counties as they develop their policies, guidelines and standards.
» Hawaii Revised Statutes 279 A Statewide Transportation Planning
» Hawaii Statewide Transportation Plan (2011)
» Disability and Communication Access Board Policy
» Bike Plan Hawaii (2003) » Statewide Pedestrian Master
Plan (2013) » Complete Streets Task Force
(2010) » Federal-Aid and State Highway
Update: System Identification and Functional Classification (2013)
» Hawaii Strategic Highway Safety Plan 2007-2012
» State of Hawaii Multi-Hazard Mitigation Plan (2007)
» Coordinated Public Transit Human Services Transportation Plan (2008)
» Statewide Comprehensive Outdoor Recreation Plan 2008 Update
» National Wildlife Refuges » National Parks » Department of Health – Active
Living Workshops
» Hawaii 2050 Sustainability Plan (2008)
» Hawaii Tourism Authority Strategic Plan: 2010-2012
» Coastal Storms Program » Coastal Zone Management
Program » Hawaii Department of
Transportation Statewide Transportation Improvement Program (Current Update, FY 2011-2014 +2)
» Report on the State of Physical Infrastructure in Hawaii (July 2010)
Page 2-2 Chapter II. Goals and Objectives

Exhibit 2-1. Key Federal, State, and Local Plans Reviewed
Local plans and policies are consistent with statewide policy. However, they are more specific than federal or state plans and policies and reflect unique regional priorities. The Plan is consistent with the general direction of local plans and policies in that it strives to provide a safe, multimodal transportation system for all users.
» Kauai County General Plan (2000)
» Kauai Long-Range Land Transportation Plan (1997)
» Kauai County Multi Hazard Mitigation Strategy (2003)
» Kauai Multimodal Land Transportation Plan (2013)
» Kauai Energy Sustainability Plan (2010)
» Resolution No. 2010-48 Complete Streets Policy (2010)
» Kauai Commercial Harbors 2025 Master Plan (2001)
» Lihue Airport Master Plan Update (1989)
» Port Allen Airport, Master Plan Update (2001)
» County of Kauai Capital Budget
Loca
l Pla
ns, P
olic
ies,
and
Pro
gram
s
» Hawaii County General Plan (2005)
» Island of Hawaii Community Development Plans (2008)
» Hilo Bayfront Trails Master Plan (2009)
» Hawaii County Long-Range Land Transportation Plan (1998)
» Hawaii Multi-Hazard Mitigation Plan (2005)
» Hawaii Commercial Harbors 2020 Master Plan (1998)
» Kona International Airport at Keahole Airport Master Plan (2010)
» Hilo International Airport Master Plan (2002)
» Waimea-Kohala Airport Master Plan (1999)
» Upolu Airport Master Plan (1999) » Hakalau Forest National Wildlife
Refuge Comprehensive Conservation Plan and Environmental Assessment (Ongoing)
» Ala Kahakai National Historic Trail (2009)
» County of Hawaii Transportation/Capital Improvement Plan Capital Budget and Six-Year Capital Improvements Program FY 2010-2011
» County of Maui General Plan – Countywide Policy Plan 2030 (2010)
» Maui Community Plans (Hana, Kahoolawe, Lanai, Molokai, Kihei-Makena, Makawao-Pukalani-Kula, Paia-Haiku, Wailuku-Kahului and West Maui)
» Maui Long-Range Land Transportation Plan (1997)
» Joint State/County Maui Interim Transportation Plan (2002)
» County of Maui Short-Range Transit Plan (2005)
» County of Maui Multi-Hazard Mitigation Plan (2010 draft)
» Molokai Long-Range Land Transportation Plan (1997)
» Kahului Commercial Harbor 2030 Master Plan and Draft Environmental Impact Statement (2007)
» Maui Island Plan General Plan 2030 (2012)
» Kahului Airport Master Plan (1993)
» Kapalua Airport (no master plan available)
» Hana Airport Master Plan (1998) » Lanai Airport Master Plan Update
(1999) » Molokai Airport Master Plan
(1999) » Kalaupapa Airport Master Plan
(1990) » Maui National Wildlife Refuge
Complex Comprehensive Conservation Plan and Environmental Assessment (ongoing)
» County of Maui Budget Proposal, Fiscal Year 2011 Capital Improvement Plan
Chapter II. Goals and Objectives Page 2-3

Exhibit 2-1. Key Federal, State, and Local Plans Reviewed
» Oahu Regional Transportation Plan 2035 (April 2011)
» Oahu Bike Plan (August 2012) » Human Services Transportation
Coordination Plan (2009) » Oahu Commercial Harbors
2020 Master Plan (1997) » Honolulu International Airport
Master Plan (1994) (currently being updated)
» Kalaeloa Airport Master Plan (1998)
» Dillingham Airfield Master Plan and Noise Compatibility Program (1993)
» James Campbell and Pearl Harbor National Wildlife Refuge Comprehensive Conservation Plan and Environmental Assessment (Ongoing)
» Resolution No. 08-125, CD1 (2008)
» City and County of Honolulu Executive Capital Budget and Program for Fiscal Year 2011
Planning Factors The Plan is developed around a set of eight federal planning factors that are intended to address transportation comprehensively. The goals and objectives are aligned with each of the factors and reflect the desired outcome of the Plan. Planning factors and general criteria are shown on Exhibit 2-2.
The HDOT began the long-range planning process when SAFETEA-LU (Safe, Accountable, Flexible, Efficient Transportation Equity Act: A Legacy for Users) was the current federal legislation. Since formulation of the plan goals, MAP-21 (Moving Ahead for Progress in the 21st Century) replaced and supplemented parts of SAFETEA-LU in July 2012. The HDOT checked consistency of the goals and objectives with MAP-21 to ensure the Plan aligned with MAP-21 performance goals as codified in 23 USC 135. See Exhibit 2-3.
Exhibit 2-2. Planning Factors
Page 2-4 Chapter II. Goals and Objectives
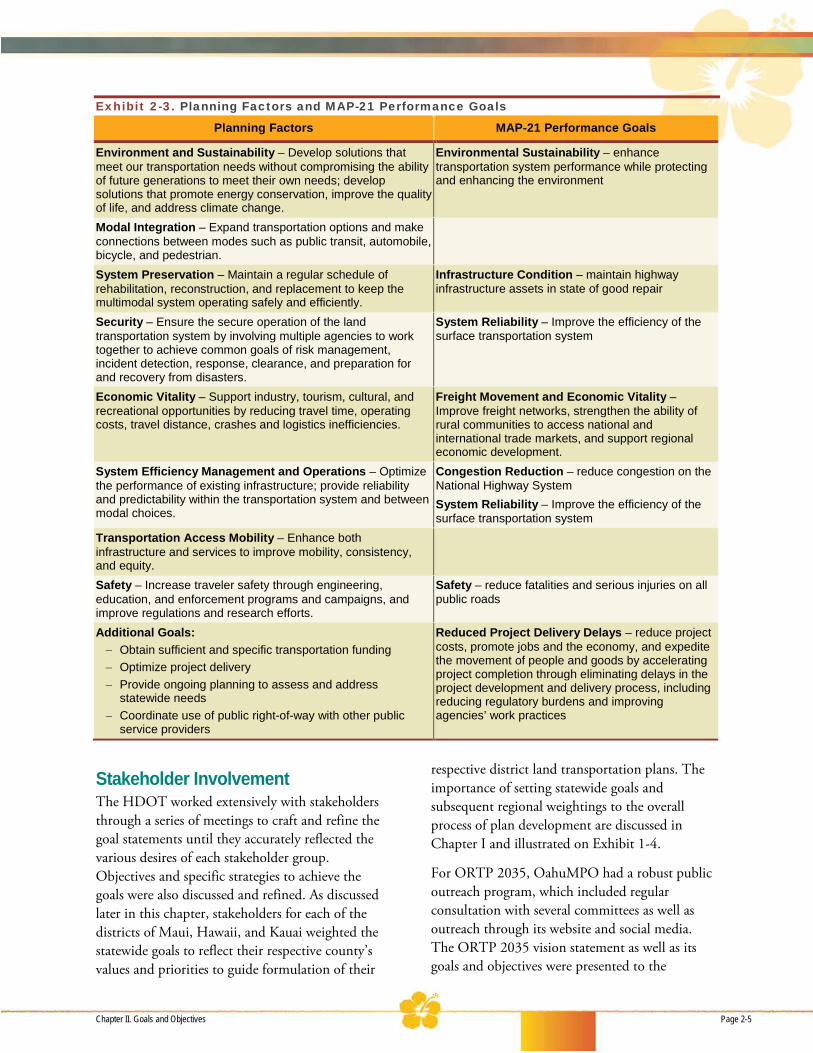
Exhibit 2-3. Planning Factors and MAP-21 Performance Goals
Planning Factors MAP-21 Performance Goals
Environment and Sustainability – Develop solutions that meet our transportation needs without compromising the ability of future generations to meet their own needs; develop solutions that promote energy conservation, improve the quality of life, and address climate change.
Environmental Sustainability – enhance transportation system performance while protecting and enhancing the environment
Modal Integration – Expand transportation options and make connections between modes such as public transit, automobile, bicycle, and pedestrian.
System Preservation – Maintain a regular schedule of rehabilitation, reconstruction, and replacement to keep the multimodal system operating safely and efficiently.
Infrastructure Condition – maintain highway infrastructure assets in state of good repair
Security – Ensure the secure operation of the land transportation system by involving multiple agencies to work together to achieve common goals of risk management, incident detection, response, clearance, and preparation for and recovery from disasters.
System Reliability – Improve the efficiency of the surface transportation system
Economic Vitality – Support industry, tourism, cultural, and recreational opportunities by reducing travel time, operating costs, travel distance, crashes and logistics inefficiencies.
Freight Movement and Economic Vitality – Improve freight networks, strengthen the ability of rural communities to access national and international trade markets, and support regional economic development.
System Efficiency Management and Operations – Optimize the performance of existing infrastructure; provide reliability and predictability within the transportation system and between modal choices.
Congestion Reduction – reduce congestion on the National Highway System System Reliability – Improve the efficiency of the surface transportation system
Transportation Access Mobility – Enhance both infrastructure and services to improve mobility, consistency, and equity.
Safety – Increase traveler safety through engineering, education, and enforcement programs and campaigns, and improve regulations and research efforts.
Safety – reduce fatalities and serious injuries on all public roads
Additional Goals: − Obtain sufficient and specific transportation funding − Optimize project delivery − Provide ongoing planning to assess and address
statewide needs − Coordinate use of public right-of-way with other public
service providers
Reduced Project Delivery Delays – reduce project costs, promote jobs and the economy, and expedite the movement of people and goods by accelerating project completion through eliminating delays in the project development and delivery process, including reducing regulatory burdens and improving agencies’ work practices
Stakeholder Involvement The HDOT worked extensively with stakeholders through a series of meetings to craft and refine the goal statements until they accurately reflected the various desires of each stakeholder group. Objectives and specific strategies to achieve the goals were also discussed and refined. As discussed later in this chapter, stakeholders for each of the districts of Maui, Hawaii, and Kauai weighted the statewide goals to reflect their respective county’s values and priorities to guide formulation of their
respective district land transportation plans. The importance of setting statewide goals and subsequent regional weightings to the overall process of plan development are discussed in Chapter I and illustrated on Exhibit 1-4.
For ORTP 2035, OahuMPO had a robust public outreach program, which included regular consultation with several committees as well as outreach through its website and social media. The ORTP 2035 vision statement as well as its goals and objectives were presented to the
Chapter II. Goals and Objectives Page 2-5
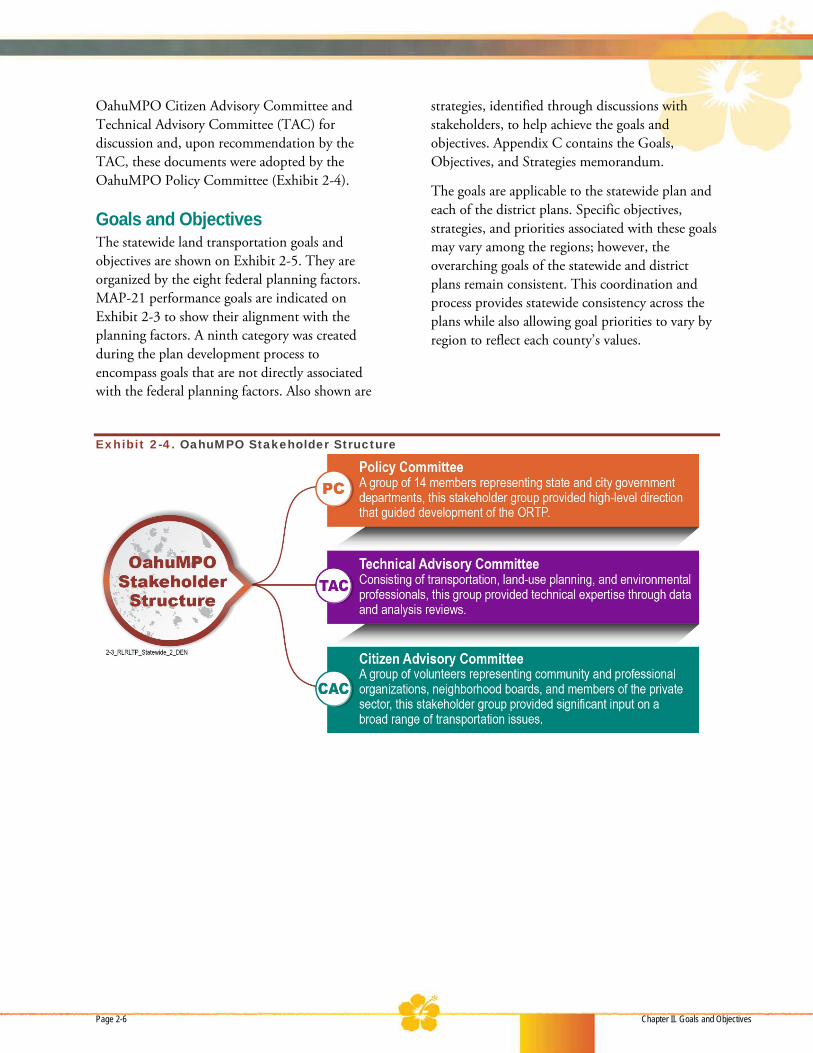
OahuMPO Citizen Advisory Committee and Technical Advisory Committee (TAC) for discussion and, upon recommendation by the TAC, these documents were adopted by the OahuMPO Policy Committee (Exhibit 2-4).
Goals and Objectives The statewide land transportation goals and objectives are shown on Exhibit 2-5. They are organized by the eight federal planning factors. MAP-21 performance goals are indicated on Exhibit 2-3 to show their alignment with the planning factors. A ninth category was created during the plan development process to encompass goals that are not directly associated with the federal planning factors. Also shown are
strategies, identified through discussions with stakeholders, to help achieve the goals and objectives. Appendix C contains the Goals, Objectives, and Strategies memorandum.
The goals are applicable to the statewide plan and each of the district plans. Specific objectives, strategies, and priorities associated with these goals may vary among the regions; however, the overarching goals of the statewide and district plans remain consistent. This coordination and process provides statewide consistency across the plans while also allowing goal priorities to vary by region to reflect each county’s values.
Exhibit 2-4. OahuMPO Stakeholder Structure
Page 2-6 Chapter II. Goals and Objectives

Exhibit 2-5. Statewide Land Transportation Goals and Objectives Federal Planning Factor: Environment and Sustainability
Aligns to MAP-21 Performance Goal: Environmental Sustainability – enhance transportation system performance while protecting and enhancing the environment Goals Objectives Strategies
1.1 Preserve and enhance the natural environment, including biological and aesthetic resources.
» Avoid, minimize, and provide reasonable measures to mitigate degradation of the natural environment caused by transportation facilities and operations.
» Construct and maintain a transportation system that complements scenic corridors and protected views.
» Provide transportation facilities that complement the natural environment and enhance quality of life.
» Review environmental assessments to identify potential degradation of the natural environment caused by transportation facilities and operations.
» Create categories of environmental mitigation to protect habitat and ecologically sensitive areas from potential impacts of transportation facilities and operations.
» Develop and maintain landscape plans that preserve the scenic environment.
» Improve the aesthetic quality of gateway roads. » Provide educational interpretive sites regarding preserving and
enhancing the natural environment for public viewing at scenic pull-offs, and Park & Rides.
1.2 Preserve and enhance Hawaii’s cultural resources environment, including archaeological and historical sites.
» Avoid, minimize, and provide reasonable measures to mitigate degradation of Hawaii’s cultural resources environment caused by transportation facilities and operations
» Review environmental assessments to identify potential degradation of cultural resources caused by transportation facilities and operations.
» Create categories of environmental mitigation to protect culturally sensitive areas from potential impacts of transportation facilities and operations.
» Develop a formal consultation process with Native Hawaiian Organizations.
» Develop consistent and comprehensive processes for addressing cultural, natural, and historic resources.
» Coordinate transportation corridor and public safety needs with the preservation of historical and cultural features.
1.3 Meet the relevant environmental regulations and standards set by Federal, State, and County/City agencies. Maintain collaborative working relationships with agencies and comply with goals of their relevant plans and policies.
» Develop transportation solutions that support federal, state, and regional natural resource agency programs.
» Create transportation system solutions that meet all aesthetic, noise, air, and water quality standards.
» Periodically evaluate environmental regulation compliance, evaluate compliance goals, and prioritize improvements needed.
» Consult and collaborate with regulatory agencies to implement solutions.
Chapter II. Goals and Objectives Page 2-7
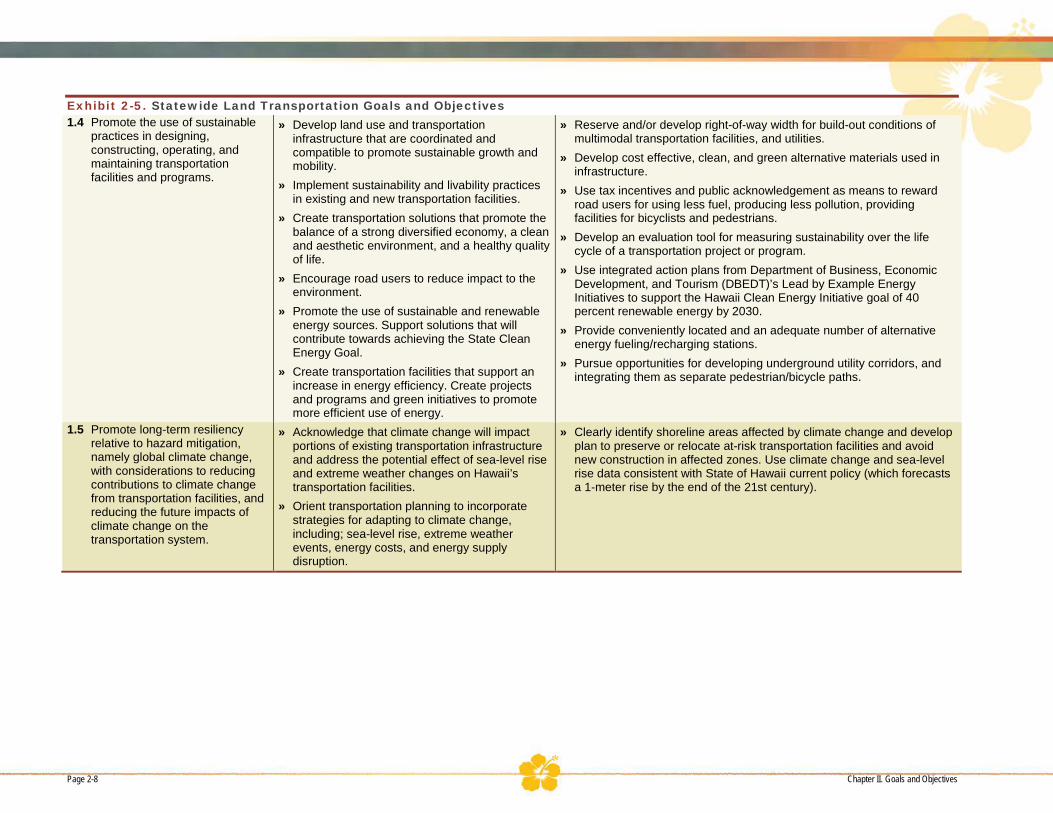
Exhibit 2-5. Statewide Land Transportation Goals and Objectives 1.4 Promote the use of sustainable
practices in designing, constructing, operating, and maintaining transportation facilities and programs.
» Develop land use and transportation infrastructure that are coordinated and compatible to promote sustainable growth and mobility.
» Implement sustainability and livability practices in existing and new transportation facilities.
» Create transportation solutions that promote the balance of a strong diversified economy, a clean and aesthetic environment, and a healthy quality of life.
» Encourage road users to reduce impact to the environment.
» Promote the use of sustainable and renewable energy sources. Support solutions that will contribute towards achieving the State Clean Energy Goal.
» Create transportation facilities that support an increase in energy efficiency. Create projects and programs and green initiatives to promote more efficient use of energy.
» Reserve and/or develop right-of-way width for build-out conditions of multimodal transportation facilities, and utilities.
» Develop cost effective, clean, and green alternative materials used in infrastructure.
» Use tax incentives and public acknowledgement as means to reward road users for using less fuel, producing less pollution, providing facilities for bicyclists and pedestrians.
» Develop an evaluation tool for measuring sustainability over the life cycle of a transportation project or program.
» Use integrated action plans from Department of Business, Economic Development, and Tourism (DBEDT)’s Lead by Example Energy Initiatives to support the Hawaii Clean Energy Initiative goal of 40 percent renewable energy by 2030.
» Provide conveniently located and an adequate number of alternative energy fueling/recharging stations.
» Pursue opportunities for developing underground utility corridors, and integrating them as separate pedestrian/bicycle paths.
1.5 Promote long-term resiliency relative to hazard mitigation, namely global climate change, with considerations to reducing contributions to climate change from transportation facilities, and reducing the future impacts of climate change on the transportation system.
» Acknowledge that climate change will impact portions of existing transportation infrastructure and address the potential effect of sea-level rise and extreme weather changes on Hawaii’s transportation facilities.
» Orient transportation planning to incorporate strategies for adapting to climate change, including; sea-level rise, extreme weather events, energy costs, and energy supply disruption.
» Clearly identify shoreline areas affected by climate change and develop plan to preserve or relocate at-risk transportation facilities and avoid new construction in affected zones. Use climate change and sea-level rise data consistent with State of Hawaii current policy (which forecasts a 1-meter rise by the end of the 21st century).
Page 2-8 Chapter II. Goals and Objectives
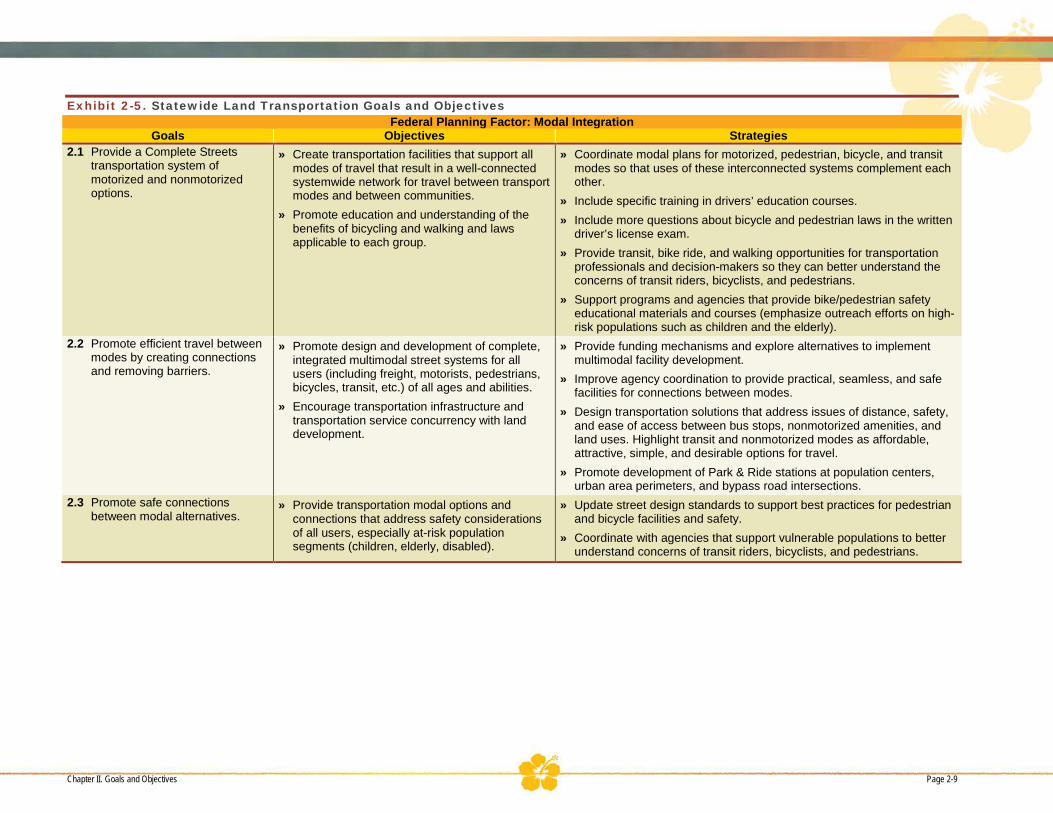
Exhibit 2-5. Statewide Land Transportation Goals and Objectives Federal Planning Factor: Modal Integration
Goals Objectives Strategies 2.1 Provide a Complete Streets
transportation system of motorized and nonmotorized options.
» Create transportation facilities that support all modes of travel that result in a well-connected systemwide network for travel between transport modes and between communities.
» Promote education and understanding of the benefits of bicycling and walking and laws applicable to each group.
» Coordinate modal plans for motorized, pedestrian, bicycle, and transit modes so that uses of these interconnected systems complement each other.
» Include specific training in drivers’ education courses. » Include more questions about bicycle and pedestrian laws in the written
driver’s license exam. » Provide transit, bike ride, and walking opportunities for transportation
professionals and decision-makers so they can better understand the concerns of transit riders, bicyclists, and pedestrians.
» Support programs and agencies that provide bike/pedestrian safety educational materials and courses (emphasize outreach efforts on high-risk populations such as children and the elderly).
2.2 Promote efficient travel between modes by creating connections and removing barriers.
» Promote design and development of complete, integrated multimodal street systems for all users (including freight, motorists, pedestrians, bicycles, transit, etc.) of all ages and abilities.
» Encourage transportation infrastructure and transportation service concurrency with land development.
» Provide funding mechanisms and explore alternatives to implement multimodal facility development.
» Improve agency coordination to provide practical, seamless, and safe facilities for connections between modes.
» Design transportation solutions that address issues of distance, safety, and ease of access between bus stops, nonmotorized amenities, and land uses. Highlight transit and nonmotorized modes as affordable, attractive, simple, and desirable options for travel.
» Promote development of Park & Ride stations at population centers, urban area perimeters, and bypass road intersections.
2.3 Promote safe connections between modal alternatives.
» Provide transportation modal options and connections that address safety considerations of all users, especially at-risk population segments (children, elderly, disabled).
» Update street design standards to support best practices for pedestrian and bicycle facilities and safety.
» Coordinate with agencies that support vulnerable populations to better understand concerns of transit riders, bicyclists, and pedestrians.
Chapter II. Goals and Objectives Page 2-9

Exhibit 2-5. Statewide Land Transportation Goals and Objectives Federal Planning Factor: System Preservation
Aligns to MAP-21 Performance Goal: Infrastructure Condition – maintain highway infrastructure assets in state of good repair Goals Objectives Strategies
3.1 Manage transportation assets and optimize investments.
» Plan and implement maintenance, resurfacing, rehabilitation, and reconstruction to optimize existing transportation system improvements and spending.
» Maintain inventory of all transportation assets. Include information on current condition of assets. Maintain systems to monitor and evaluate infrastructure changes so they match regular planning investment cycles.
» Identify variations in cost for periodic maintenance versus total replacement of facilities to help prioritize projects. Consider total life cycle costs.
» Improve use of technology to protect and preserve existing infrastructure.
» Support a strong policy of size and weight enforcement, including innovative technologies to protect and preserve the existing infrastructure.
3.2. Maintain safe, efficient, complete transportation system for the long term.
» Plan and implement existing system improvements to effectively sustain the overall transportation system’s safe, efficient, and complete operations.
» Maintain a schedule for maintenance, replacement, and reconstruction using asset inventory information.
» Maintain and/or upgrade critical routes (i.e., routes serving as single access to communities with inadequate size/load capacity) and as key emergency evacuation and/or services corridors.
» Maintain an aggressive Preventative Maintenance Program to extend the useful life of current infrastructure.
» Improve coordination of system preservation needs with other infrastructure projects and programs.
» Include impacts related to all hazards mitigation, including global climate change, in assessment of system preservation plans.
Page 2-10 Chapter II. Goals and Objectives
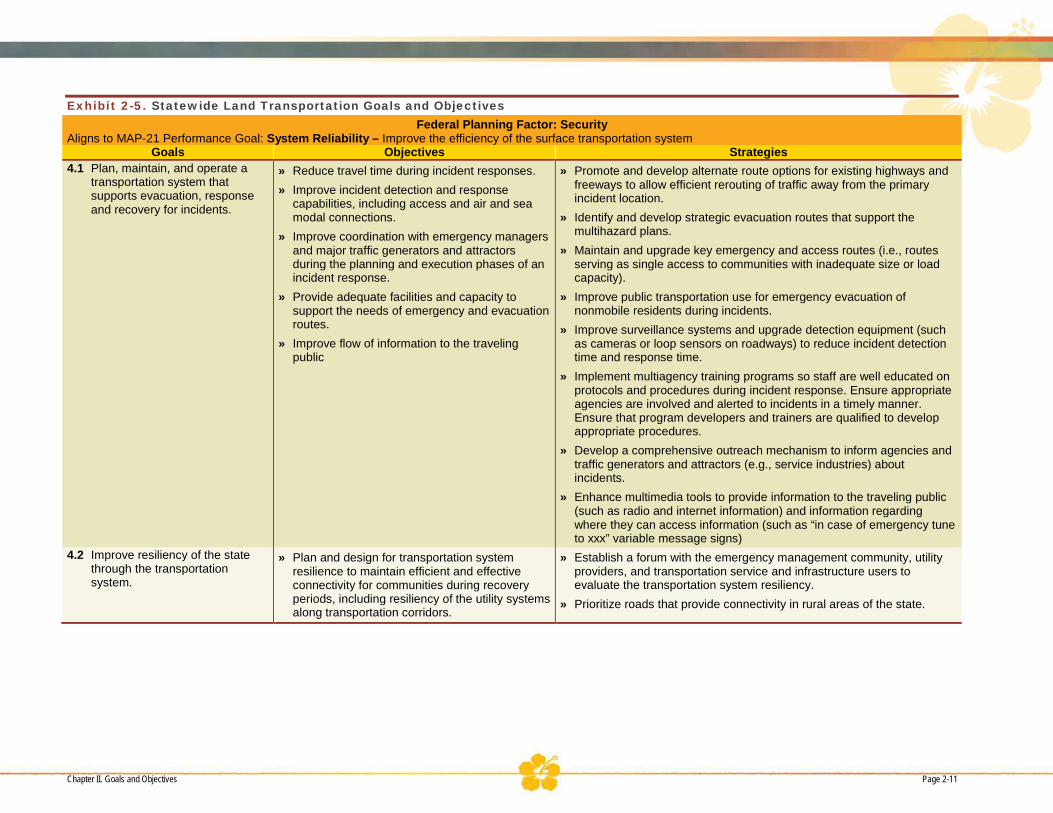
Exhibit 2-5. Statewide Land Transportation Goals and Objectives Federal Planning Factor: Security
Aligns to MAP-21 Performance Goal: System Reliability – Improve the efficiency of the surface transportation system Goals Objectives Strategies
4.1 Plan, maintain, and operate a transportation system that supports evacuation, response and recovery for incidents.
» Reduce travel time during incident responses. » Improve incident detection and response
capabilities, including access and air and sea modal connections.
» Improve coordination with emergency managers and major traffic generators and attractors during the planning and execution phases of an incident response.
» Provide adequate facilities and capacity to support the needs of emergency and evacuation routes.
» Improve flow of information to the traveling public
» Promote and develop alternate route options for existing highways and freeways to allow efficient rerouting of traffic away from the primary incident location.
» Identify and develop strategic evacuation routes that support the multihazard plans.
» Maintain and upgrade key emergency and access routes (i.e., routes serving as single access to communities with inadequate size or load capacity).
» Improve public transportation use for emergency evacuation of nonmobile residents during incidents.
» Improve surveillance systems and upgrade detection equipment (such as cameras or loop sensors on roadways) to reduce incident detection time and response time.
» Implement multiagency training programs so staff are well educated on protocols and procedures during incident response. Ensure appropriate agencies are involved and alerted to incidents in a timely manner. Ensure that program developers and trainers are qualified to develop appropriate procedures.
» Develop a comprehensive outreach mechanism to inform agencies and traffic generators and attractors (e.g., service industries) about incidents.
» Enhance multimedia tools to provide information to the traveling public (such as radio and internet information) and information regarding where they can access information (such as “in case of emergency tune to xxx” variable message signs)
4.2 Improve resiliency of the state through the transportation system.
» Plan and design for transportation system resilience to maintain efficient and effective connectivity for communities during recovery periods, including resiliency of the utility systems along transportation corridors.
» Establish a forum with the emergency management community, utility providers, and transportation service and infrastructure users to evaluate the transportation system resiliency.
» Prioritize roads that provide connectivity in rural areas of the state.
Chapter II. Goals and Objectives Page 2-11
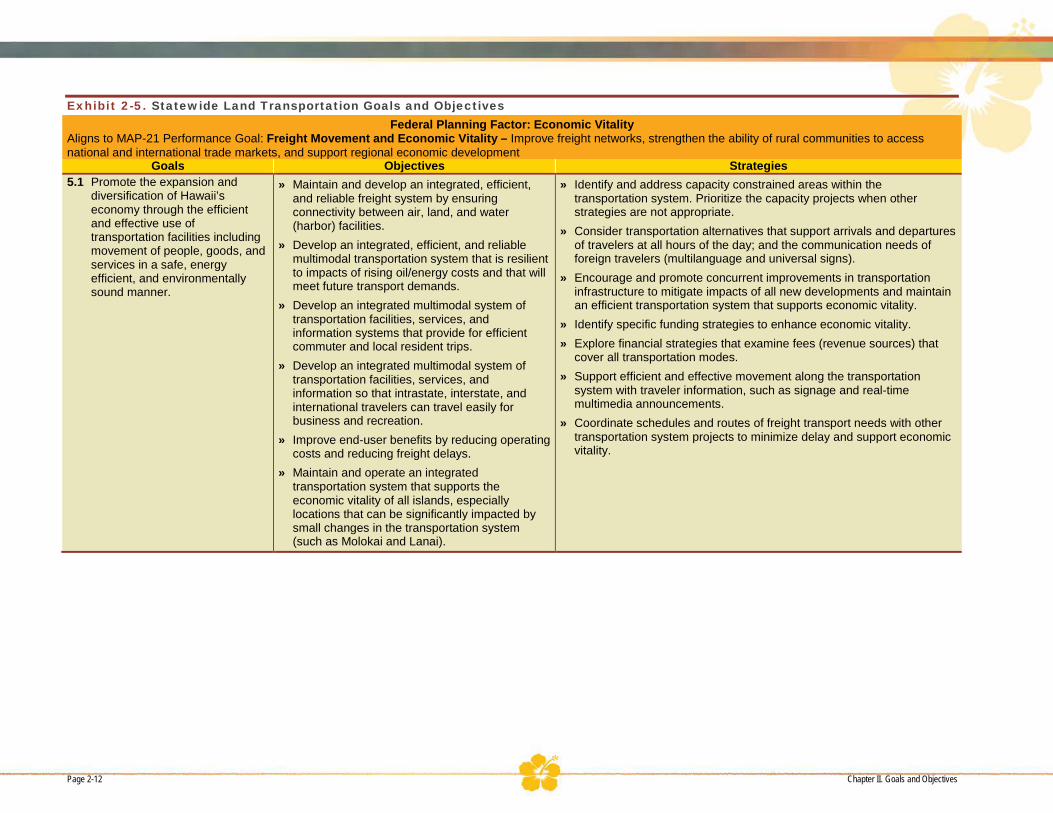
Exhibit 2-5. Statewide Land Transportation Goals and Objectives Federal Planning Factor: Economic Vitality
Aligns to MAP-21 Performance Goal: Freight Movement and Economic Vitality – Improve freight networks, strengthen the ability of rural communities to access national and international trade markets, and support regional economic development
Goals Objectives Strategies 5.1 Promote the expansion and
diversification of Hawaii’s economy through the efficient and effective use of transportation facilities including movement of people, goods, and services in a safe, energy efficient, and environmentally sound manner.
» Maintain and develop an integrated, efficient, and reliable freight system by ensuring connectivity between air, land, and water (harbor) facilities.
» Develop an integrated, efficient, and reliable multimodal transportation system that is resilient to impacts of rising oil/energy costs and that will meet future transport demands.
» Develop an integrated multimodal system of transportation facilities, services, and information systems that provide for efficient commuter and local resident trips.
» Develop an integrated multimodal system of transportation facilities, services, and information so that intrastate, interstate, and international travelers can travel easily for business and recreation.
» Improve end-user benefits by reducing operating costs and reducing freight delays.
» Maintain and operate an integrated transportation system that supports the economic vitality of all islands, especially locations that can be significantly impacted by small changes in the transportation system (such as Molokai and Lanai).
» Identify and address capacity constrained areas within the transportation system. Prioritize the capacity projects when other strategies are not appropriate.
» Consider transportation alternatives that support arrivals and departures of travelers at all hours of the day; and the communication needs of foreign travelers (multilanguage and universal signs).
» Encourage and promote concurrent improvements in transportation infrastructure to mitigate impacts of all new developments and maintain an efficient transportation system that supports economic vitality.
» Identify specific funding strategies to enhance economic vitality. » Explore financial strategies that examine fees (revenue sources) that
cover all transportation modes. » Support efficient and effective movement along the transportation
system with traveler information, such as signage and real-time multimedia announcements.
» Coordinate schedules and routes of freight transport needs with other transportation system projects to minimize delay and support economic vitality.
Page 2-12 Chapter II. Goals and Objectives

Exhibit 2-5. Statewide Land Transportation Goals and Objectives Federal Planning Factor: System Efficiency Management and Operations
Aligns to MAP-21 Performance Goal: Congestion Reduction – reduce congestion on the National Highway System Aligns to MAP-21 Performance Goal: System Reliability – Improve the efficiency of the surface transportation system
Goals Objectives Strategies 6.1 Improve capacity and efficiency,
and reduce congestion within the existing transportation system for long-term benefit.
» Improve consistency and predictability of travel time along existing corridors.
» Preserve the functional classification system hierarchical operating characteristics.
» Promote transportation demand management and operations techniques, such as carpooling/vanpooling and staggered work hours.
» Promote high-occupancy facilities to improve mobility within the existing infrastructure.
» Promote Intelligent Transportation Systems (ITS) strategies and implement advanced traveler information devices to monitor traffic operations. Inform users of conditions, and identify locations where avoiding bottlenecks or geometric constraints can improve traffic flow, reduce delay, and improve reliability of the system.
» Preserve the function of transportation facilities by implementing appropriate access management requirements based on the roadway’s functional characteristics.
» Develop connectivity between subdivisions and interior roadways to maintain mobility and function of arterials and major collectors.
Chapter II. Goals and Objectives Page 2-13

Exhibit 2-5. Statewide Land Transportation Goals and Objectives Federal Planning Factor: Transportation Access Mobility
Goals Objectives Strategies 7.1 Provide appropriate and reliable
transportation access options statewide to all users.
» Provide services and infrastructure to support modal alternatives for all demographics.
» Coordinate between public and private transit and bus service providers to integrate programs, align investments, and provide affordable, streamlined services.
» Coordinate multimodal infrastructure and transit service improvements with human service agencies to determine needs of underserved populations, such as disabled, elderly, and environmental justice (EJ) populations.
7.2 Ensure transportation investments in programs and prioritization processes are balanced (across modes and demographics, i.e., serves EJ populations).
» Prioritize projects equitably to serve all modes and demographics, with attention to underserved communities.
» Provide constant and continuous information broadly to the public about expenditures on transportation infrastructure and services, and operations performance.
» Create a monitoring system to evaluate transportation projects and programs against the goals and standards that they were originally developed to achieve. Develop strategies and tools to support corrective actions.
» Promote transparent decision processes with broader citizen engagement and oversight. This can be accomplished by establishing sub-area groups, advisory boards, or committees comprised of a broad spectrum of representatives for residents, including underserved populations (such as disabled, elderly, and EJ populations).
» Support paratransit programs that meet the needs of the disabled and elderly population.
» Identify changes in demographics, transportation modes, and needs of users on a regular basis.
Page 2-14 Chapter II. Goals and Objectives
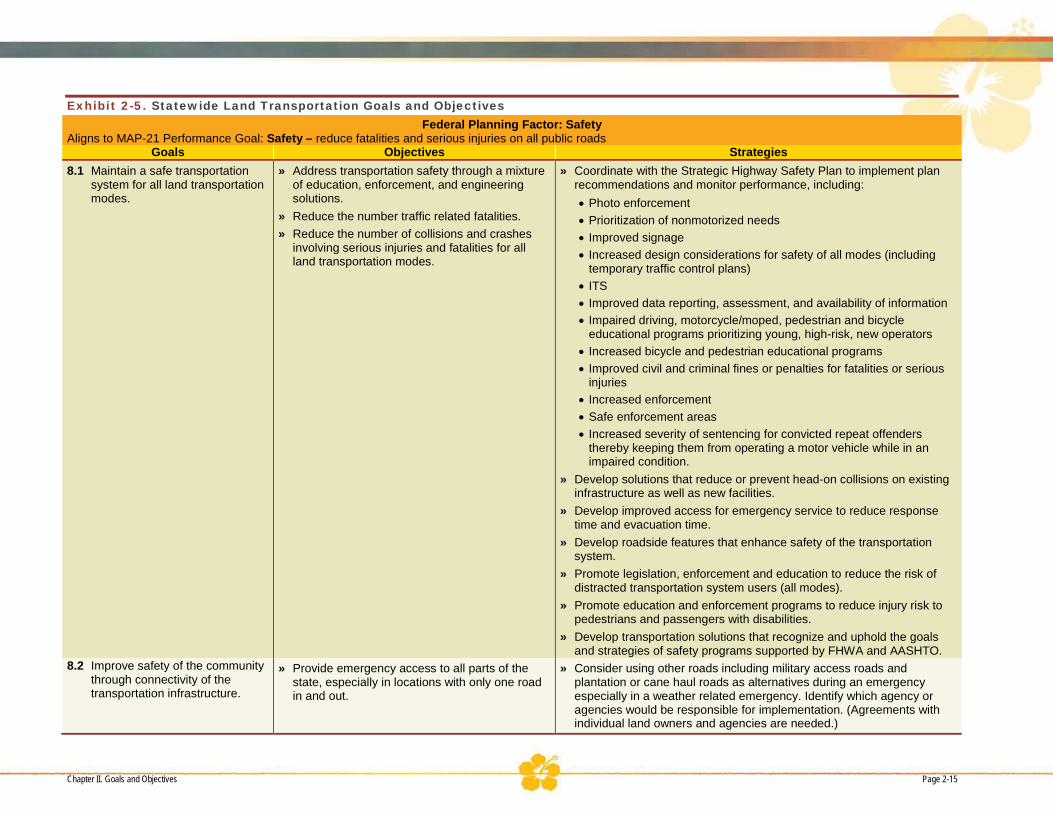
Exhibit 2-5. Statewide Land Transportation Goals and Objectives Federal Planning Factor: Safety
Aligns to MAP-21 Performance Goal: Safety – reduce fatalities and serious injuries on all public roads Goals Objectives Strategies
8.1 Maintain a safe transportation system for all land transportation modes.
» Address transportation safety through a mixture of education, enforcement, and engineering solutions.
» Reduce the number traffic related fatalities. » Reduce the number of collisions and crashes
involving serious injuries and fatalities for all land transportation modes.
» Coordinate with the Strategic Highway Safety Plan to implement plan recommendations and monitor performance, including: • Photo enforcement • Prioritization of nonmotorized needs • Improved signage • Increased design considerations for safety of all modes (including
temporary traffic control plans) • ITS • Improved data reporting, assessment, and availability of information • Impaired driving, motorcycle/moped, pedestrian and bicycle
educational programs prioritizing young, high-risk, new operators • Increased bicycle and pedestrian educational programs • Improved civil and criminal fines or penalties for fatalities or serious
injuries • Increased enforcement • Safe enforcement areas • Increased severity of sentencing for convicted repeat offenders
thereby keeping them from operating a motor vehicle while in an impaired condition.
» Develop solutions that reduce or prevent head-on collisions on existing infrastructure as well as new facilities.
» Develop improved access for emergency service to reduce response time and evacuation time.
» Develop roadside features that enhance safety of the transportation system.
» Promote legislation, enforcement and education to reduce the risk of distracted transportation system users (all modes).
» Promote education and enforcement programs to reduce injury risk to pedestrians and passengers with disabilities.
» Develop transportation solutions that recognize and uphold the goals and strategies of safety programs supported by FHWA and AASHTO.
8.2 Improve safety of the community through connectivity of the transportation infrastructure.
» Provide emergency access to all parts of the state, especially in locations with only one road in and out.
» Consider using other roads including military access roads and plantation or cane haul roads as alternatives during an emergency especially in a weather related emergency. Identify which agency or agencies would be responsible for implementation. (Agreements with individual land owners and agencies are needed.)
Chapter II. Goals and Objectives Page 2-15

Exhibit 2-5. Statewide Land Transportation Goals and Objectives Additional Goals, Objectives and Strategies
Goals Objectives Strategies 9.1 Obtain sufficient and specific
transportation funding » Create and implement a funding
mechanism that would cover the costs of providing a safe, efficient, sustainable transportation system into the future.
» Obtain diverse funding and ensure that funding set aside for transportation is used only for transportation.
» Coordinate and communicate with the Counties on future transit corridors
» Supplement current transportation funding by identifying and securing diverse funding sources to support the multimodal transportation system (e.g., public and private partnerships).
» Identify and implement user fees that equitably spreads the cost burden over all modes of transportation without impacting EJ populations.
» Reduce the deficit in state transportation facilities with increased taxes specifically earmarked for Capital Improvements or Maintenance.
» Support policy that requires new development/growth to fund their impacts on transportation facilities (impact fees).
9.2 Optimize project delivery. » Improve coordination of plans and resources.
» Improve efficiency of planning and delivery of projects.
» Plan, develop, and maintain transportation infrastructure within programmed budget amounts.
» From planning through operations, improve coordination and communication between multiple departments, public citizen groups, and agencies to address needs and resources efficiently.
» Provide communications between multiple departments, public citizen groups, and agencies related to status of projects.
» In areas where multiple state and/or federal agencies have authority, create a lead agency to manage overall project reducing delays, redundancies and inefficiencies. Develop procedures and protocol to monitor compliance, cooperation, communication and efficiency.
» Utilize transportation funds efficiently, and maximize revenues. 9.3 Provide ongoing planning to
assess and address statewide needs.
» Monitor, evaluate and develop solutions, and adjust program goals on a continuing periodic coordinated basis.
» Continue to implement the 3-C planning process (comprehensive, cooperative and continuing).
9.4 Coordinate use of public right-of-way with other public service providers.
» Continue the safe accommodation and installation of utility facilities within the right-of-way or easement along state highways and federal-aid county highways.
» Coordinate with utility service providers to work together in establishing location, design, and methods for the possible accommodation and installation of utility facilities along state highways and federal aid county highways. Considerations should include, but not be limited to safety, future widening and site specific issues.
» Coordinate and communicate transportation and utility planning efforts to enable development of a coordinated transportation and utility system.
Page 2-16 Chapter II. Goals and Objectives
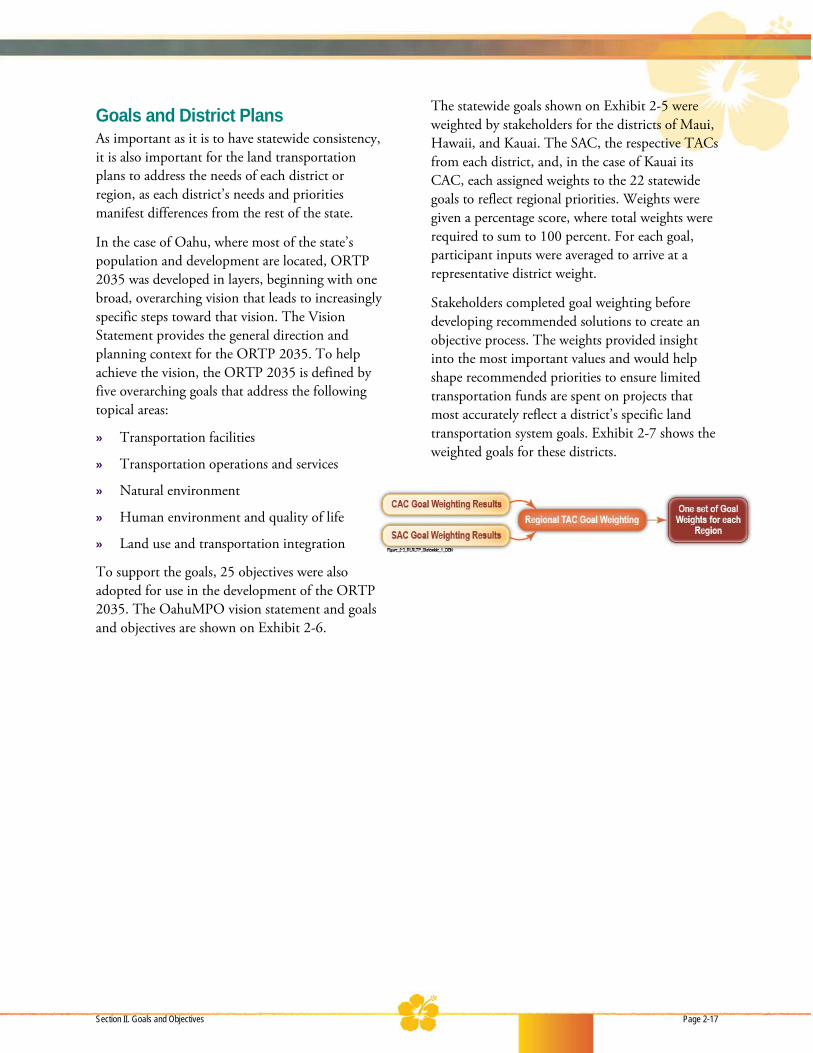
Goals and District Plans As important as it is to have statewide consistency, it is also important for the land transportation plans to address the needs of each district or region, as each district’s needs and priorities manifest differences from the rest of the state.
In the case of Oahu, where most of the state’s population and development are located, ORTP 2035 was developed in layers, beginning with one broad, overarching vision that leads to increasingly specific steps toward that vision. The Vision Statement provides the general direction and planning context for the ORTP 2035. To help achieve the vision, the ORTP 2035 is defined by five overarching goals that address the following topical areas:
» Transportation facilities
» Transportation operations and services
» Natural environment
» Human environment and quality of life
» Land use and transportation integration
To support the goals, 25 objectives were also adopted for use in the development of the ORTP 2035. The OahuMPO vision statement and goals and objectives are shown on Exhibit 2-6.
The statewide goals shown on Exhibit 2-5 were weighted by stakeholders for the districts of Maui, Hawaii, and Kauai. The SAC, the respective TACs from each district, and, in the case of Kauai its CAC, each assigned weights to the 22 statewide goals to reflect regional priorities. Weights were given a percentage score, where total weights were required to sum to 100 percent. For each goal, participant inputs were averaged to arrive at a representative district weight.
Stakeholders completed goal weighting before developing recommended solutions to create an objective process. The weights provided insight into the most important values and would help shape recommended priorities to ensure limited transportation funds are spent on projects that most accurately reflect a district’s specific land transportation system goals. Exhibit 2-7 shows the weighted goals for these districts.
Section II. Goals and Objectives Page 2-17

Exhibit 2-6. ORTP 2035 Vision, Goals, and Objectives
ORTP 2035 Vision, Goals, and Objectives
VISION: In 2035, Oahu will be a place where we will have efficient, well-maintained, safe, secure, convenient, appropriate, and economical choices in getting from place to place. Our transportation system will move us and the goods we use in a manner that supports the island’s high quality of life, natural beauty, economic vitality, and land use policies by supporting appropriate density development and avoiding urban sprawl. This system will promote energy conservation and economic sustainability as well as the protection of our ports of entry, preparation for emergency situations, and changes in global climate patterns.
Element Goals Objectives I. Transportation
Facilities Provide an inclusive, multimodal transport system whose connectedness provides efficient means for users desiring to move about this island by bicycle, freight carrier, pedestrian facility, road, transit service, and intermodal connectors.
1. Develop, operate, and maintain alternative transportation facilities, including bikeways, walkways, and other accessible pedestrian, bicycle, and environmentally-friendly elements.
2. Enhance the integration and connectivity of the regional transportation system.
3. Provide efficient, convenient, and cost-effective transit service to Oahu’s citizens.
4. Promote the intermodal efficiency of harbor terminal facilities, airport terminal facilities, and land transportation systems.
5. Provide rehabilitation, renewal, and modernization of facilities in sufficient magnitude to ensure system preservation and continued, effective operation.
II. Transportation Operations & Services
Develop, operate, and maintain Oahu’s island-wide transportation system to ensure the efficient, dependable, safe, secure, convenient, and economical movement of people and goods.
1. Promote planning, design, operation, maintenance, and construction of transportation facilities and systems to support economic development and vitality.
2. Optimize transportation resources through Transportation Demand Management strategies, including telecommuting solutions, to encouraging transit ridership and ridesharing, while reducing single-occupancy vehicle travel and auto dependency.
3. Encourage public-private partnerships in providing transportation services.
4. Monitor and enhance the performance and efficiency of Oahu’s transportation system through the use of operation management strategies, such as ITS, Transportation System Management, Transportation Demand Management, and the OahuMPO Congestion Management Process.
5. Ensure that Oahu’s transportation system is planned, designed, constructed, maintained, and operated in an integrated and cost-effective manner.
6. Ensure user and community safety, and practical systems for the disabled by incorporating the priorities, programs, physical design and operation of transportation facilities, and other improvements, consistent with the Hawaii Strategic Highway Safety Plan and Americans with Disabilities Act Standards.
7. Increase the peak-period, person-carrying capacities of Oahu’s transportation network.
8. Reduce security risks associated with terrorism and other criminal acts, natural and man-made disasters, and other emergencies that would impact the transportation system.
Page 2-18 Chapter II. Goals and Objectives
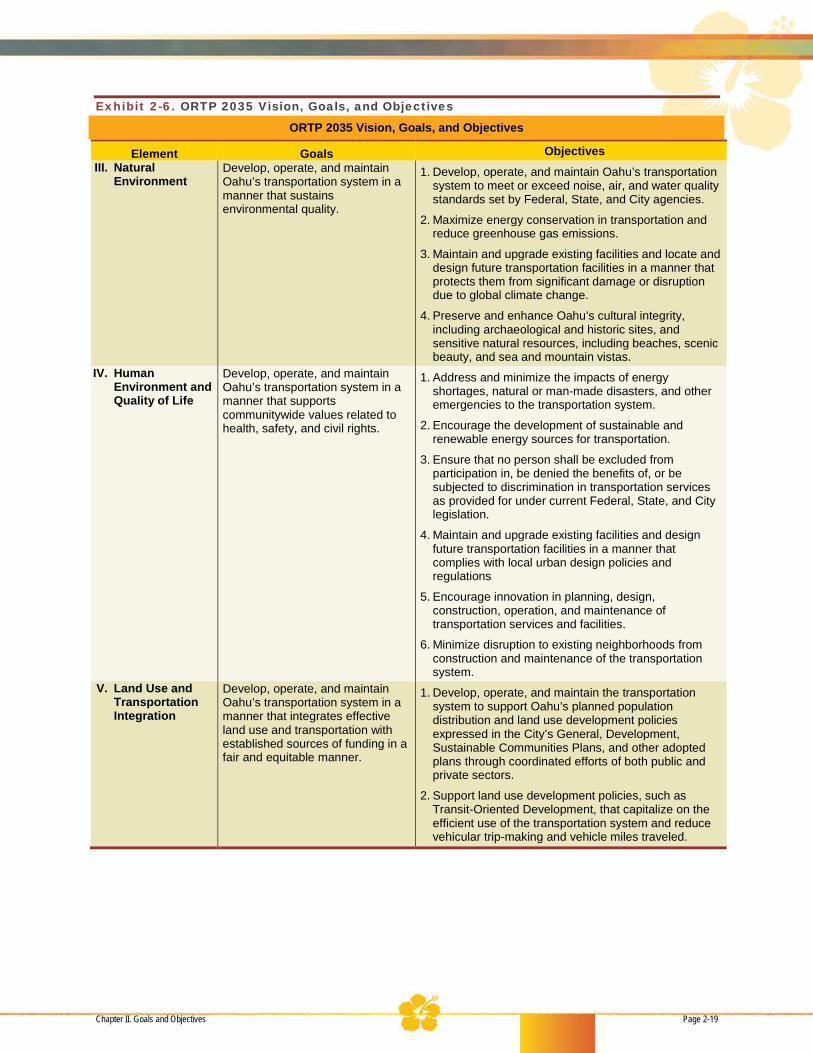
Exhibit 2-6. ORTP 2035 Vision, Goals, and Objectives
ORTP 2035 Vision, Goals, and Objectives
Element Goals Objectives III. Natural
Environment Develop, operate, and maintain Oahu’s transportation system in a manner that sustains environmental quality.
1. Develop, operate, and maintain Oahu’s transportation system to meet or exceed noise, air, and water quality standards set by Federal, State, and City agencies.
2. Maximize energy conservation in transportation and reduce greenhouse gas emissions.
3. Maintain and upgrade existing facilities and locate and design future transportation facilities in a manner that protects them from significant damage or disruption due to global climate change.
4. Preserve and enhance Oahu’s cultural integrity, including archaeological and historic sites, and sensitive natural resources, including beaches, scenic beauty, and sea and mountain vistas.
IV. Human Environment and Quality of Life
Develop, operate, and maintain Oahu’s transportation system in a manner that supports communitywide values related to health, safety, and civil rights.
1. Address and minimize the impacts of energy shortages, natural or man-made disasters, and other emergencies to the transportation system.
2. Encourage the development of sustainable and renewable energy sources for transportation.
3. Ensure that no person shall be excluded from participation in, be denied the benefits of, or be subjected to discrimination in transportation services as provided for under current Federal, State, and City legislation.
4. Maintain and upgrade existing facilities and design future transportation facilities in a manner that complies with local urban design policies and regulations
5. Encourage innovation in planning, design, construction, operation, and maintenance of transportation services and facilities.
6. Minimize disruption to existing neighborhoods from construction and maintenance of the transportation system.
V. Land Use and Transportation Integration
Develop, operate, and maintain Oahu’s transportation system in a manner that integrates effective land use and transportation with established sources of funding in a fair and equitable manner.
1. Develop, operate, and maintain the transportation system to support Oahu’s planned population distribution and land use development policies expressed in the City’s General, Development, Sustainable Communities Plans, and other adopted plans through coordinated efforts of both public and private sectors.
2. Support land use development policies, such as Transit-Oriented Development, that capitalize on the efficient use of the transportation system and reduce vehicular trip-making and vehicle miles traveled.
Chapter II. Goals and Objectives Page 2-19

Exhibit 2-7. Goal Priority Weights
Planning Factor Long-Range Land Transportation Plan Goal
Kauai Goal
Priority Weight
Maui Goal Priority Weight
Hawaii Goal
Priority Weight
1. Environment and Sustainability
1.1 Preserve and enhance the natural environment, including biological and aesthetic resources.
4% 4% 3%
1.2 Preserve and enhance Hawaii’s cultural resources environment, including archaeological and historical sites.
3% 4% 3%
1.3 Meet the relevant environmental regulations and standards set by Federal, State, and County/City agencies. Maintain collaborative working relationships with agencies and comply with goals of their relevant plans and policies.
4% 4% 1%
1.4 Promote the use of sustainable practices in designing, constructing, operating, and maintaining transportation facilities and programs.
3% 4% 3%
1.5 Promote long-term resiliency relative to all hazards mitigation, namely global climate change, with considerations to reducing contributions to climate change from transportation facilities, and reducing the future impacts of climate change on the transportation system.
6% 5% 5%
2 Modal Integration
2.1 Provide a Complete Streets transportation system of motorized and nonmotorized options.
7% 8% 7%
2.2 Promote efficient travel between modes by creating connections and removing barriers.
3% 6% 4%
2.3 Promote safe connections between modal alternatives.
3% 5% 3%
3 System Preservation
3.1 Manage transportation assets and optimize investments.
3% 4% 4%
3.2 Maintain a safe, efficient, complete transportation system for the long term.
8% 6% 7%
4 Security 4.1 Plan, maintain, and operate a transportation system that supports evacuation, response, and recovery for incidents.
6% 5% 6%
4.2 Improve resiliency of the state through the transportation system.
4% 3% 3%
5 Economic Vitality
5.1 Promote the expansion and diversification of Hawaii’s economy through the efficient and effective use of transportation facilities including movement of people, goods, and services in a safe, energy efficient, and environmentally sound manner.
4% 5% 8%
6 System Efficiency Management and Operations
6.1 Improve capacity and efficiency, and reduce congestion within the existing transportation system for long-term benefit.
7% 5% 10%
7 Transportation Access Mobility
7.1 Provide appropriate and reliable transportation access options statewide to all users.
4% 4% 4%
7.2 Ensure transportation investments in programs and prioritization processes are balanced across modes and demographics (i.e., serves EJ populations).
3% 4% 4%
Page 2-20 Chapter II. Goals and Objectives

Exhibit 2-7. Goal Priority Weights
Planning Factor Long-Range Land Transportation Plan Goal
Kauai Goal
Priority Weight
Maui Goal Priority Weight
Hawaii Goal
Priority Weight
8 Safety 8.1 Maintain a safe transportation system for all land transportation modes.
8% 7% 9%
8.2 Improve safety of the community through connectivity of the transportation infrastructure.
4% 4% 5%
9 Additional Goals
9.1 Obtain sufficient and specific transportation funding
7% 4% 5%
9.2 Optimize project delivery. 3% 3% 2% 9.3 Provide ongoing planning to assess and address
statewide needs. 3% 3% 3%
9.4 Coordinate use of public right-of-way with other public service providers.
3% 3% 1%
100% 100% 100%
Chapter II. Goals and Objectives Page 2-21

Chapter IIIStatewide Transportation Context and Needs


The existing land transportation system within the state consists of roadways, paths, and transportation services that provide for the needs of multimodal users; cars, freight, transit, pedestrians, and bicyclists all use the roadway system. The transportation system includes both state and county facilities and is the means by which the HDOT Highways Division mission is upheld. Introduction The roadway network plays a large part in ensuring Hawaii’s people and economies function efficiently. It is used by residents and visitors alike, and supports nearly every industry within the state. Hawaii’s roadway network is crucial to the transport of goods, since unlike other states, rail transport is not an option for moving freight within regions. It is also a critical link for emergency services and relief efforts during disasters.
As the state’s economy evolves and the population grows, the needs of the transportation system will change. Preparing for this change involves looking at the transportation system as a whole; considering all potential users of all modes that use the roadways. Needs and deficiencies in the system should be identified so that appropriate solutions or strategies can be developed to serve Hawaii’s people.
This section describes the process taken to identify needs of the statewide transportation system. Major components of the process include:
» A review of existing plans, policies, and programs and land use to gain an understanding of the direction of transportation planning and to build upon needs already identified in previous efforts
» An assessment of existing and future socioeconomic characteristics to show the expected changes over time
» A summary of the forecasted travel demand and anticipated performance of the future roadway network
» Facilitated stakeholder group meetings to gain input from a comprehensive range of roadway users
Plans, Policies, and Programs Plans, policies, and programs that provide guidance to the statewide Plan were reviewed. This step was necessary to understand federal, state, and local transportation planning directions and to build effectively upon adopted work. This review allowed this Plan to remain consistent with planning efforts at the federal and state levels, while also taking into consideration local issues.
Relevant federal laws include the United States Code, Title 23, Section 135, which governs statewide transportation planning, and MAP-21 legislation which establishes parameters for transportation planning through a set of national goals and measures specifically aimed at the preservation and improved performance of the federal-aid system.
Important statewide documents providing guidance for the Plan include the Hawaii Statewide Transportation Plan, the Statewide Pedestrian Master Plan, and Bike Plan Hawaii. The two modal plans provide an assessment of current conditions and identify areas where improvements could be made to enhance the nonmotorized transportation network. The Hawaii Statewide Transportation Plan is a policy document that provides the context for transportation improvements at all levels of planning for all modes. This document does not identify specific needs statewide, but rather aligns other planning efforts with a set of goals intended to help achieve an optimum land transportation system.
Chapter III. Statewide Transportation Context and Needs Page 3-1

In addition to federal and statewide plans, county general plans and regional transportation plans for Maui, Hawaii, Kauai, and Oahu were reviewed. These plans offer a focused look at regional issues, and identify needs and deficiencies unique to each area. As referred to in Chapter II, see Appendix B for a complete summary of the plans, policies, and programs consulted.
Land Use The roadway system is often driven by land use decisions. Land use districts outline allowable development and constraints that affect transportation demands, infrastructure and services.
The State Land Use Commission (LUC) establishes land use district boundaries statewide including Urban, Rural, Agricultural, and Conservation districts, as described below.
» Urban Districts generally include lands characterized by “city-like” concentrations of people, structures, and services. This District also includes vacant areas for future development. Generally, lot sizes and uses permitted in the district area are established by the respective counties through ordinances or rules.
Downtown Honolulu is an example of an urban district.
» Rural Districts are composed primarily of small farms intermixed with low-density residential lots with a minimum size of one-half acre. Jurisdiction over Rural Districts is shared by the Commission and county
governments. Permitted uses include those relating or compatible to agricultural use and low-density residential lots. Variances can be obtained through the special use permitting process.
» Agricultural Districts include lands for the cultivation of crops, aquaculture, raising livestock, wind energy facility, timber cultivation, agriculture-support activities (that is,, mills, employee quarters, etc.), and land with significant potential for agriculture uses. Golf courses and golf-related activities may also be included in this district, provided the land is not in the highest productivity categories of the Land Study Bureau’s detailed classification system. Uses permitted in the highest productivity agricultural categories are governed by statute. Uses in the lower-productivity categories are established by the Commission.
Ninety five percent of Hawaii’s land mass is classified in the Agricultural and Conservation Districts.
» Conservation lands are comprised primarily of lands in existing forest and water reserve zones and include areas necessary for protecting watersheds and water sources, scenic and historic areas, parks, wilderness, open space, recreational areas, habitats of endemic plants, fish and wildlife, and all submerged lands seaward of the shoreline. The Conservation District also includes lands subject to flooding and soil erosion. Conservation Districts are administered by the State Board of Land and
Page 3-2 Chapter III. Statewide Transportation Context and Needs

Natural Resources and uses are governed by rules promulgated by the State Department of Land and Natural Resources.
Roughly 95 percent of the state’s land mass is classified in the Agricultural and Conservation Districts, in nearly equal percentages. Approximately 5 percent of statewide land is designated for urban use, while less than 1 percent is designated rural.
The distribution of land use districts statewide varies by region. Oahu, the most developed and populous region, has the highest percentage in the Urban District. More than a quarter of the island,
the most of any region, is categorized as urban. Lands in the Urban District are concentrated along the south side of the island (downtown Honolulu, Pearl Harbor, Kapolei), central Oahu, and along the southeast coast and are directly served by the state’s interstate freeway network. There are no lands in the Rural District on Oahu.
Maui (including Molokai and Lanai), Hawaii, and Kauai are far less urban than Oahu. Nearly 95 percent of land areas in each of these regions are categorized as agricultural or conservation, while less than 5 percent of the total land mass is classified as urban (Exhibit 3-1).
Exhibit 3-1. LUC Land Use Districts
Region Total Area
(Acres) Classification by State Land Use Commission
Urban Rural Agricultural Conservation Oahu 386,190 100,765 0 128,810 156,615
Percent of Region 100% 26% 0% 33% 41% Maui 722,100 28,620 8,325 402,355 282,800
Percent of Region 100% 4% 1% 56% 39% Hawaii 2,573,395 53,720 1,290 1,214,040 1,304,345
Percent of Region 100% 2% <1% 47% 51% Kauai 353,905 14,560 1,255 139,320 198,770
Percent of Region 100% 4% <1% 39% 56% Statewide Total 4,035,590 197,665 10,870 1,884,525 1,942,530
Percent of Total 100% 5% <1% 47% 48% Source: State of Hawaii Department of Business, Economic Development and Tourism, 2010.
Land use district designations and their function have a very direct impact on transportation, as each has its own transportation demands. Urban areas are likely to require more connectivity, wider roadways, and more demand for mobility or circulation between key destinations. The rural, agricultural, and conservation areas, while still requiring transportation facilities have more of a focus on moving vehicles, often with an emphasis on longer-distance travel instead of the local trip that could be served by bicycling or walking.
Appropriate transportation infrastructure within each of the land use districts should be planned to accommodate the specific type of growth allowed by that land use classification. More intense land uses will need a complete and robust system, while agricultural districts and conservation lands
generally will require less. This infrastructure should also complement the statewide land use planning processes by supporting focused areas of growth. Future transportation needs based on expected land use developments are considered in this Plan.
See Exhibits 3-2a through 3-2f for statewide land use district boundaries.
Chapter III. Statewide Transportation Context and Needs Page 3-3

Exhibit 3-2a. Oahu Land Use District Designations
Page 3-4 Chapter III. Statewide Transportation Context and Needs
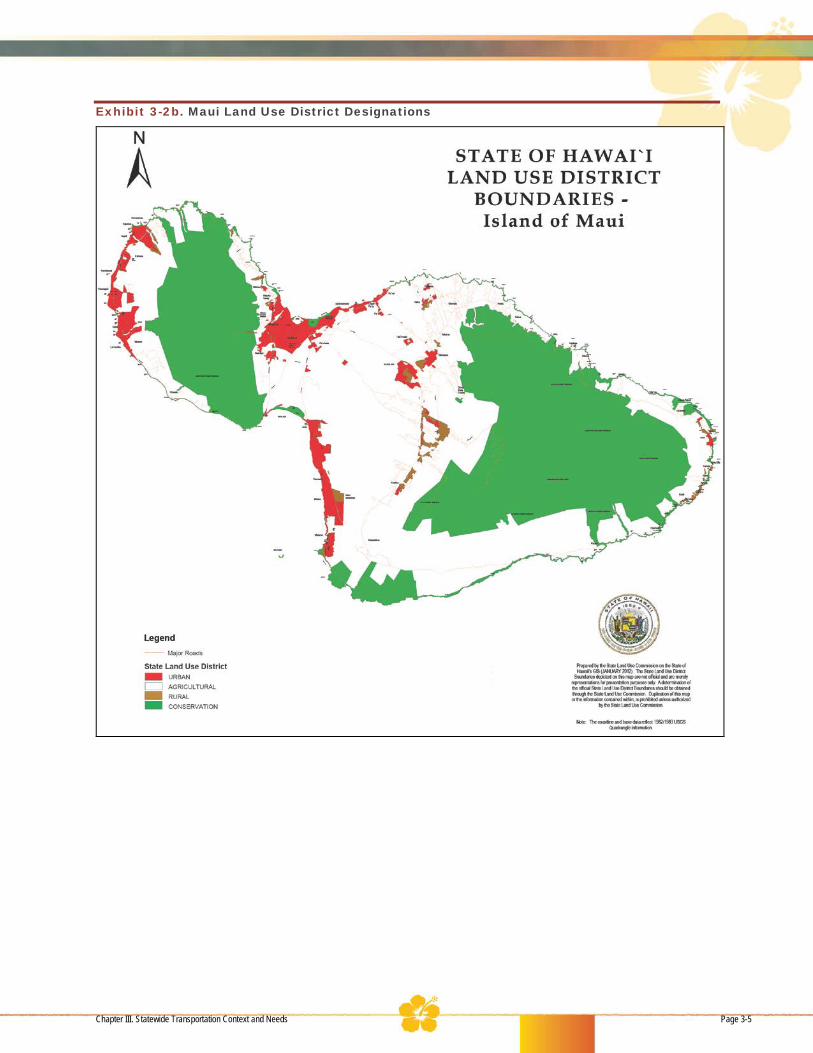
Exhibit 3-2b. Maui Land Use District Designations
Chapter III. Statewide Transportation Context and Needs Page 3-5

Exhibit 3-2c. Molokai Land Use District Designations
Exhibit 3-2d. Lanai Land Use District Designations
Page 3-6 Chapter III. Statewide Transportation Context and Needs
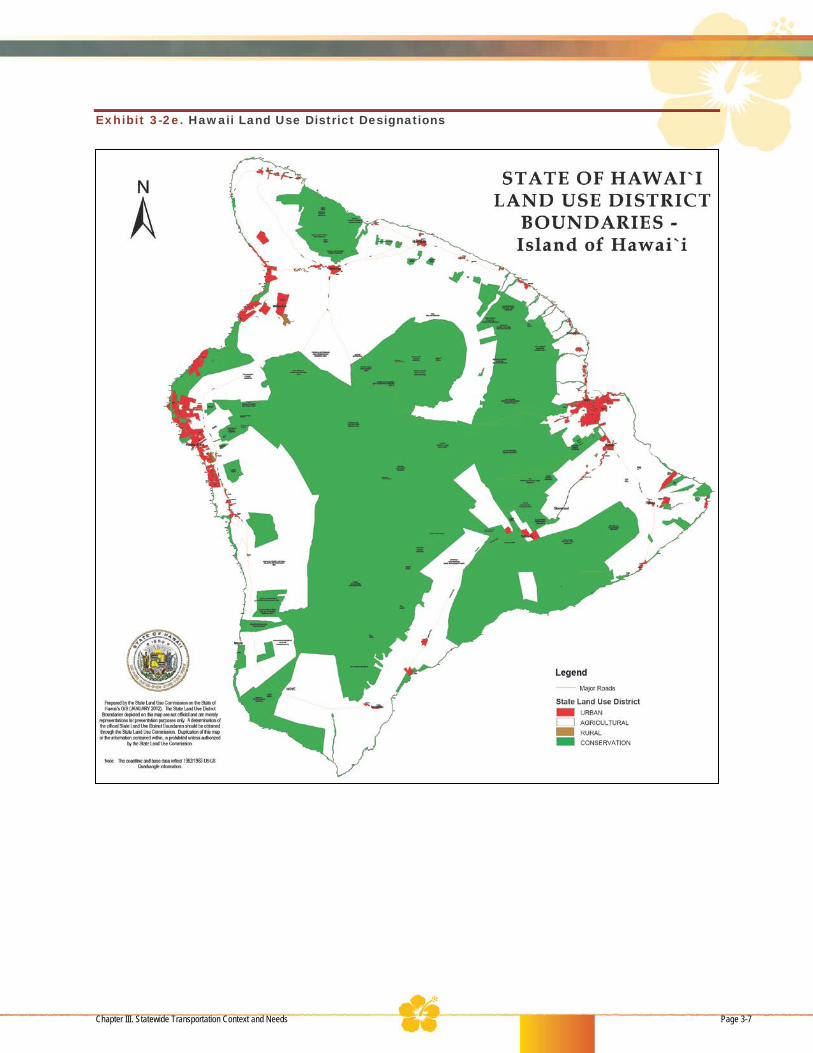
Exhibit 3-2e. Hawaii Land Use District Designations
Chapter III. Statewide Transportation Context and Needs Page 3-7

Exhibit 3-2f. Kauai Land Use District Designations
Page 3-8 Chapter III. Statewide Transportation Context and Needs
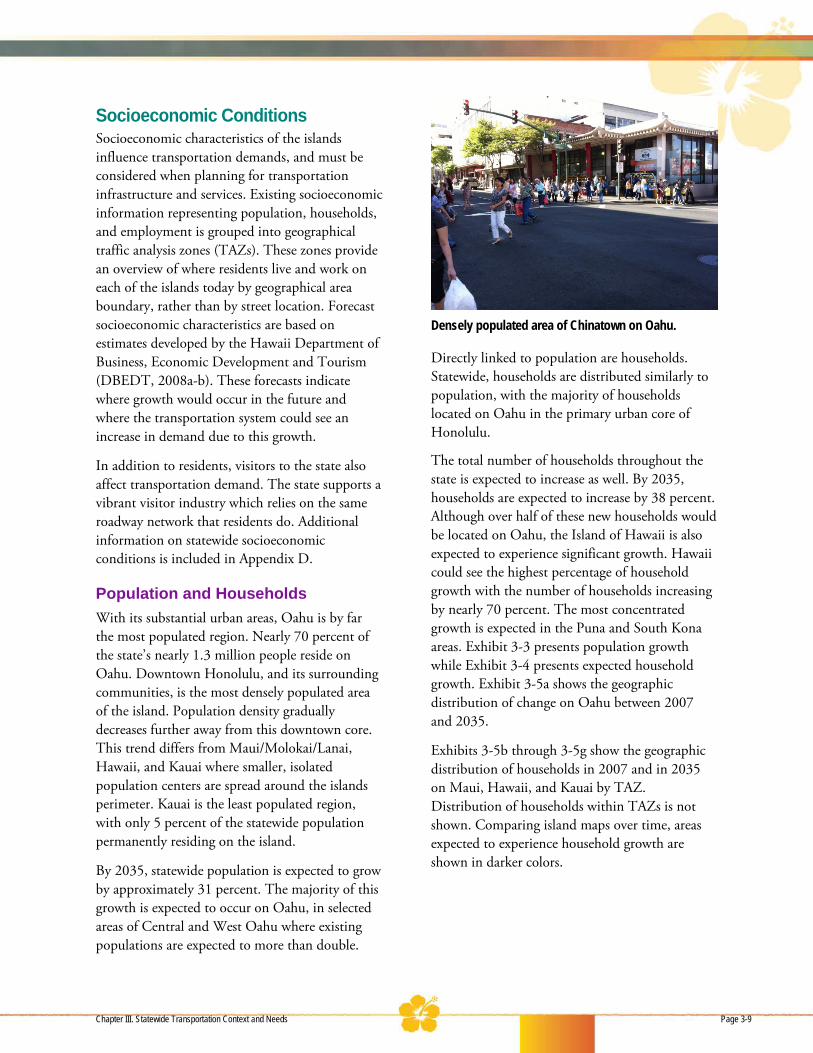
Socioeconomic Conditions Socioeconomic characteristics of the islands influence transportation demands, and must be considered when planning for transportation infrastructure and services. Existing socioeconomic information representing population, households, and employment is grouped into geographical traffic analysis zones (TAZs). These zones provide an overview of where residents live and work on each of the islands today by geographical area boundary, rather than by street location. Forecast socioeconomic characteristics are based on estimates developed by the Hawaii Department of Business, Economic Development and Tourism (DBEDT, 2008a-b). These forecasts indicate where growth would occur in the future and where the transportation system could see an increase in demand due to this growth.
In addition to residents, visitors to the state also affect transportation demand. The state supports a vibrant visitor industry which relies on the same roadway network that residents do. Additional information on statewide socioeconomic conditions is included in Appendix D.
Population and Households With its substantial urban areas, Oahu is by far the most populated region. Nearly 70 percent of the state’s nearly 1.3 million people reside on Oahu. Downtown Honolulu, and its surrounding communities, is the most densely populated area of the island. Population density gradually decreases further away from this downtown core. This trend differs from Maui/Molokai/Lanai, Hawaii, and Kauai where smaller, isolated population centers are spread around the islands perimeter. Kauai is the least populated region, with only 5 percent of the statewide population permanently residing on the island.
By 2035, statewide population is expected to grow by approximately 31 percent. The majority of this growth is expected to occur on Oahu, in selected areas of Central and West Oahu where existing populations are expected to more than double.
Densely populated area of Chinatown on Oahu.
Directly linked to population are households. Statewide, households are distributed similarly to population, with the majority of households located on Oahu in the primary urban core of Honolulu.
The total number of households throughout the state is expected to increase as well. By 2035, households are expected to increase by 38 percent. Although over half of these new households would be located on Oahu, the Island of Hawaii is also expected to experience significant growth. Hawaii could see the highest percentage of household growth with the number of households increasing by nearly 70 percent. The most concentrated growth is expected in the Puna and South Kona areas. Exhibit 3-3 presents population growth while Exhibit 3-4 presents expected household growth. Exhibit 3-5a shows the geographic distribution of change on Oahu between 2007 and 2035.
Exhibits 3-5b through 3-5g show the geographic distribution of households in 2007 and in 2035 on Maui, Hawaii, and Kauai by TAZ. Distribution of households within TAZs is not shown. Comparing island maps over time, areas expected to experience household growth are shown in darker colors.
Chapter III. Statewide Transportation Context and Needs Page 3-9

Exhibit 3-3. Forecast Population
Region Population by Year Population Growth
2007 2035 Difference Percent Growth Oahu(a) 905,500 1,113,600 208,100 23% Maui(b) 145,700 207,900 62,200 43% Hawaii(b) 173,000 280,100 107,100 62% Kauai(b) 64,300 85,200 20,900 33% Statewide Total 1,288,500 1,686,800 398,300 31% (a) Source: Oahu Regional Transportation Plan 2035, 2011. (b) Source: State of Hawaii Department of Business, Economic Development and Tourism, 2010.
Exhibit 3-4. Forecast Households
Region Households by Year Household Growth
2007 2035 Difference Percent Growth Oahu(a) 311,000 405,900 94,900 31% Maui(b) 51,000 77,800 26,800 53% Hawaii(b) 62,900 106,300 43,400 69% Kauai(b) 22,900 29,800 6,900 30% Statewide Total 447,800 619,800 172,000 38% (a) Source: Oahu Regional Transportation Plan 2035, 2011. (b) Source: State of Hawaii Department of Business, Economic Development and Tourism, 2010.
Exhibit 3-5a. Oahu Population Change (2007 to 2035)
Page 3-10 Chapter III. Statewide Transportation Context and Needs

Exhibit 3-5b. Maui Households, 2007
Exhibit 3-5c. Maui Households, 2035
Chapter III. Statewide Transportation Context and Needs Page 3-11

Exhibit 3-5d. Hawaii Households, 2007
Exhibit 3-5e. Hawaii Households, 2035
Page 3-12 Chapter III. Statewide Transportation Context and Needs

Exhibit 3-5f. Kauai Households, 2007
Exhibit 3-5g. Kauai Households, 2035
Chapter III. Statewide Transportation Context and Needs Page 3-13
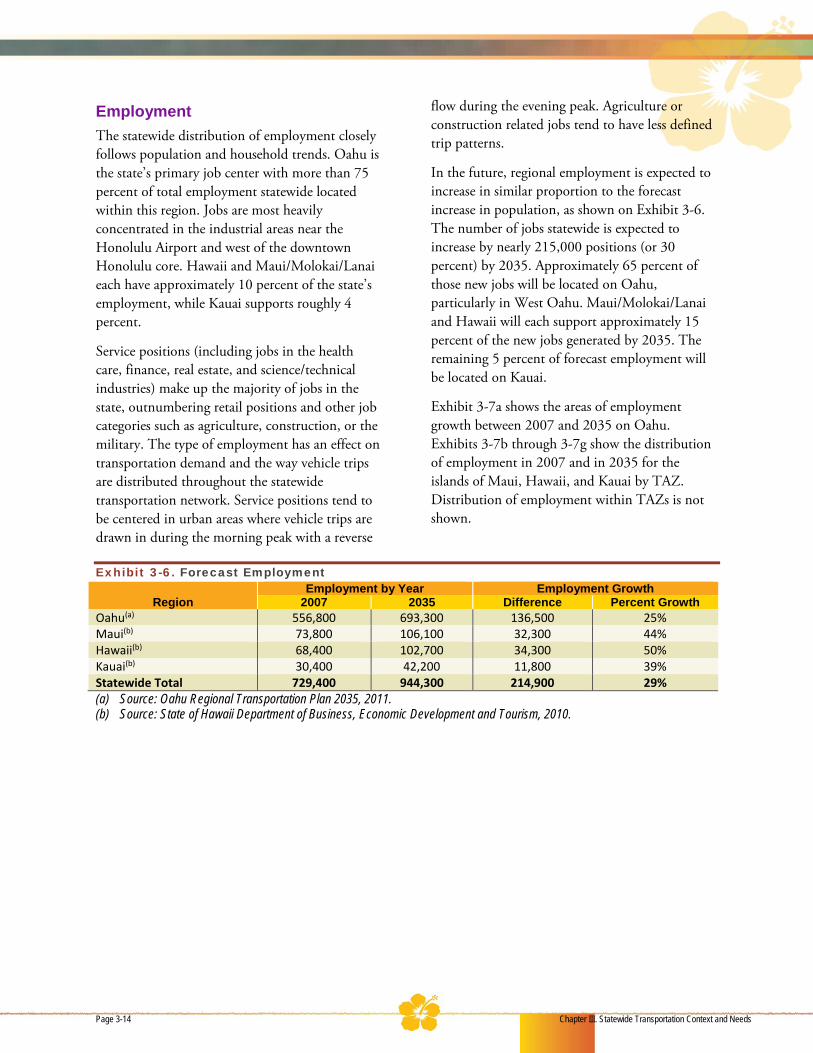
Employment The statewide distribution of employment closely follows population and household trends. Oahu is the state’s primary job center with more than 75 percent of total employment statewide located within this region. Jobs are most heavily concentrated in the industrial areas near the Honolulu Airport and west of the downtown Honolulu core. Hawaii and Maui/Molokai/Lanai each have approximately 10 percent of the state’s employment, while Kauai supports roughly 4 percent.
Service positions (including jobs in the health care, finance, real estate, and science/technical industries) make up the majority of jobs in the state, outnumbering retail positions and other job categories such as agriculture, construction, or the military. The type of employment has an effect on transportation demand and the way vehicle trips are distributed throughout the statewide transportation network. Service positions tend to be centered in urban areas where vehicle trips are drawn in during the morning peak with a reverse
flow during the evening peak. Agriculture or construction related jobs tend to have less defined trip patterns.
In the future, regional employment is expected to increase in similar proportion to the forecast increase in population, as shown on Exhibit 3-6. The number of jobs statewide is expected to increase by nearly 215,000 positions (or 30 percent) by 2035. Approximately 65 percent of those new jobs will be located on Oahu, particularly in West Oahu. Maui/Molokai/Lanai and Hawaii will each support approximately 15 percent of the new jobs generated by 2035. The remaining 5 percent of forecast employment will be located on Kauai.
Exhibit 3-7a shows the areas of employment growth between 2007 and 2035 on Oahu. Exhibits 3-7b through 3-7g show the distribution of employment in 2007 and in 2035 for the islands of Maui, Hawaii, and Kauai by TAZ. Distribution of employment within TAZs is not shown.
Exhibit 3-6. Forecast Employment
Region Employment by Year Employment Growth
2007 2035 Difference Percent Growth Oahu(a) 556,800 693,300 136,500 25% Maui(b) 73,800 106,100 32,300 44% Hawaii(b) 68,400 102,700 34,300 50% Kauai(b) 30,400 42,200 11,800 39% Statewide Total 729,400 944,300 214,900 29% (a) Source: Oahu Regional Transportation Plan 2035, 2011. (b) Source: State of Hawaii Department of Business, Economic Development and Tourism, 2010.
Page 3-14 Chapter III. Statewide Transportation Context and Needs

Exhibit 3-7a. Oahu Employment Change (2007 to 2035)
Chapter III. Statewide Transportation Context and Needs Page 3-15
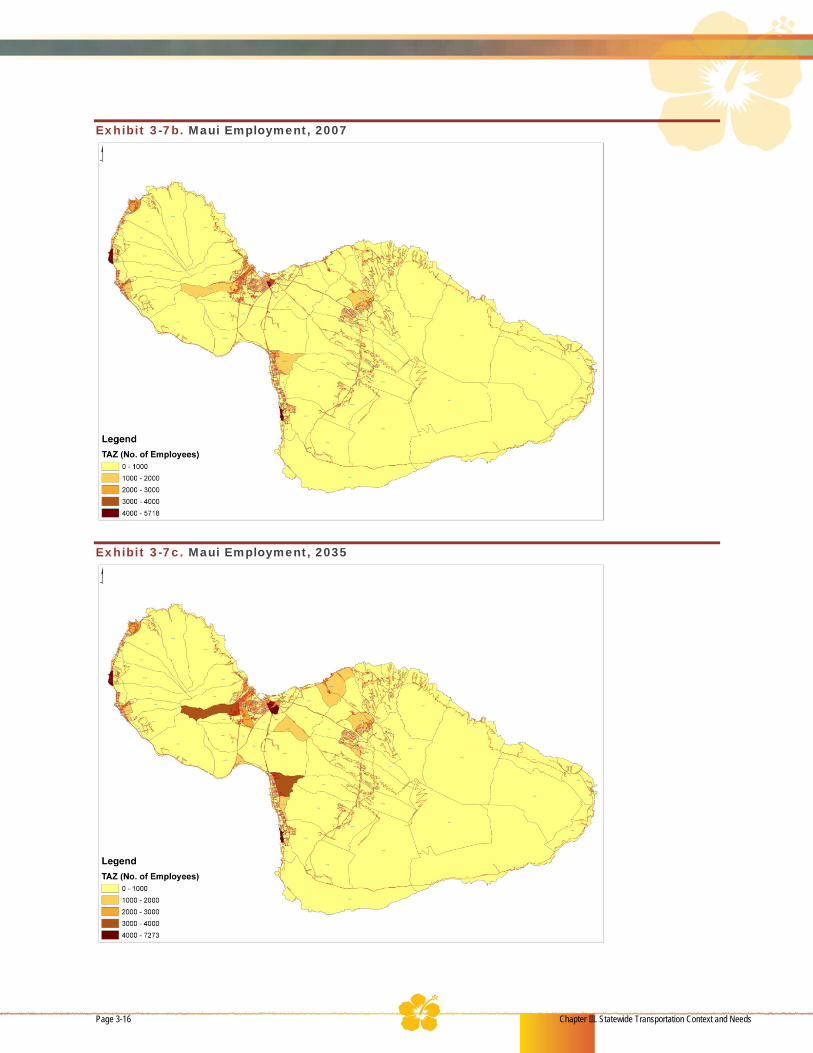
Exhibit 3-7b. Maui Employment, 2007
Exhibit 3-7c. Maui Employment, 2035
Page 3-16 Chapter III. Statewide Transportation Context and Needs
Exhibit 3-7d. Hawaii Employment, 2007
Exhibit 3-7e. Hawaii Employment, 2035
Chapter III. Statewide Transportation Context and Needs Page 3-17

Exhibit 3-7f. Kauai Employment, 2007
Exhibit 3-7g. Kauai Employment, 2035
Page 3-18 Chapter III. Statewide Transportation Context and Needs
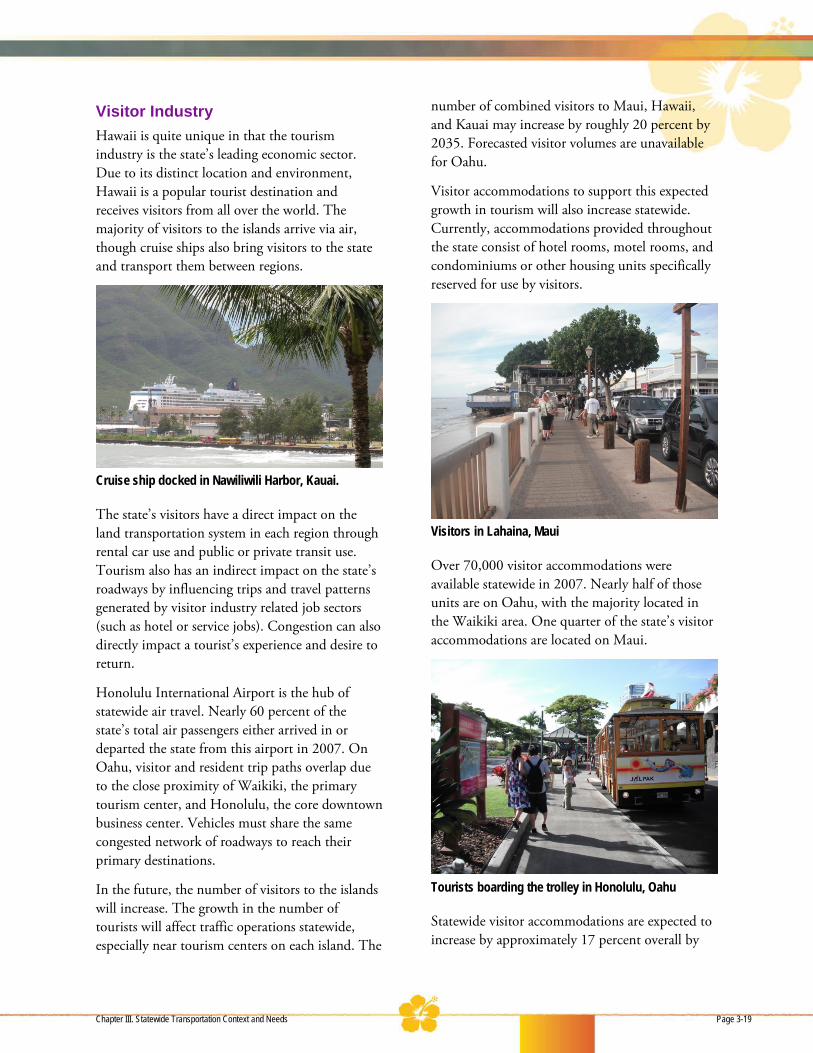
Visitor Industry Hawaii is quite unique in that the tourism industry is the state’s leading economic sector. Due to its distinct location and environment, Hawaii is a popular tourist destination and receives visitors from all over the world. The majority of visitors to the islands arrive via air, though cruise ships also bring visitors to the state and transport them between regions.
Cruise ship docked in Nawiliwili Harbor, Kauai.
The state’s visitors have a direct impact on the land transportation system in each region through rental car use and public or private transit use. Tourism also has an indirect impact on the state’s roadways by influencing trips and travel patterns generated by visitor industry related job sectors (such as hotel or service jobs). Congestion can also directly impact a tourist’s experience and desire to return.
Honolulu International Airport is the hub of statewide air travel. Nearly 60 percent of the state’s total air passengers either arrived in or departed the state from this airport in 2007. On Oahu, visitor and resident trip paths overlap due to the close proximity of Waikiki, the primary tourism center, and Honolulu, the core downtown business center. Vehicles must share the same congested network of roadways to reach their primary destinations.
In the future, the number of visitors to the islands will increase. The growth in the number of tourists will affect traffic operations statewide, especially near tourism centers on each island. The
number of combined visitors to Maui, Hawaii, and Kauai may increase by roughly 20 percent by 2035. Forecasted visitor volumes are unavailable for Oahu.
Visitor accommodations to support this expected growth in tourism will also increase statewide. Currently, accommodations provided throughout the state consist of hotel rooms, motel rooms, and condominiums or other housing units specifically reserved for use by visitors.
Visitors in Lahaina, Maui
Over 70,000 visitor accommodations were available statewide in 2007. Nearly half of those units are on Oahu, with the majority located in the Waikiki area. One quarter of the state’s visitor accommodations are located on Maui.
Tourists boarding the trolley in Honolulu, Oahu
Statewide visitor accommodations are expected to increase by approximately 17 percent overall by
Chapter III. Statewide Transportation Context and Needs Page 3-19
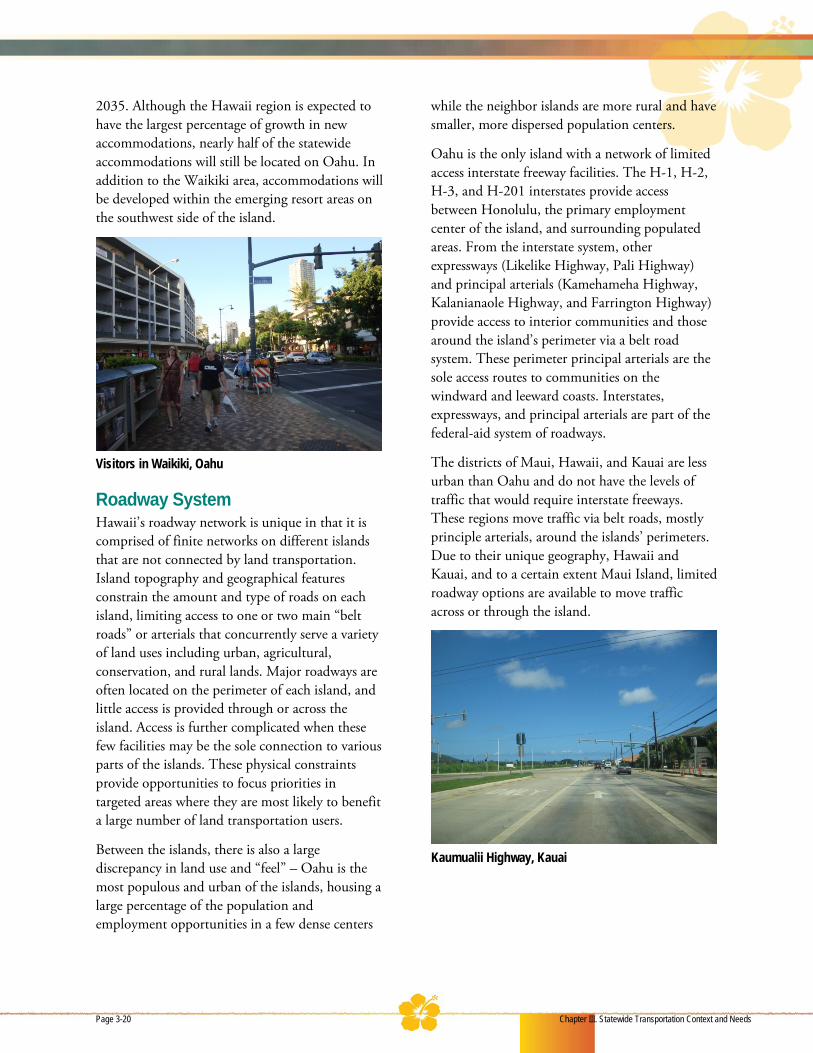
2035. Although the Hawaii region is expected to have the largest percentage of growth in new accommodations, nearly half of the statewide accommodations will still be located on Oahu. In addition to the Waikiki area, accommodations will be developed within the emerging resort areas on the southwest side of the island.
Visitors in Waikiki, Oahu
Roadway System Hawaii’s roadway network is unique in that it is comprised of finite networks on different islands that are not connected by land transportation. Island topography and geographical features constrain the amount and type of roads on each island, limiting access to one or two main “belt roads” or arterials that concurrently serve a variety of land uses including urban, agricultural, conservation, and rural lands. Major roadways are often located on the perimeter of each island, and little access is provided through or across the island. Access is further complicated when these few facilities may be the sole connection to various parts of the islands. These physical constraints provide opportunities to focus priorities in targeted areas where they are most likely to benefit a large number of land transportation users.
Between the islands, there is also a large discrepancy in land use and “feel” – Oahu is the most populous and urban of the islands, housing a large percentage of the population and employment opportunities in a few dense centers
while the neighbor islands are more rural and have smaller, more dispersed population centers.
Oahu is the only island with a network of limited access interstate freeway facilities. The H-1, H-2, H-3, and H-201 interstates provide access between Honolulu, the primary employment center of the island, and surrounding populated areas. From the interstate system, other expressways (Likelike Highway, Pali Highway) and principal arterials (Kamehameha Highway, Kalanianaole Highway, and Farrington Highway) provide access to interior communities and those around the island’s perimeter via a belt road system. These perimeter principal arterials are the sole access routes to communities on the windward and leeward coasts. Interstates, expressways, and principal arterials are part of the federal-aid system of roadways.
The districts of Maui, Hawaii, and Kauai are less urban than Oahu and do not have the levels of traffic that would require interstate freeways. These regions move traffic via belt roads, mostly principle arterials, around the islands’ perimeters. Due to their unique geography, Hawaii and Kauai, and to a certain extent Maui Island, limited roadway options are available to move traffic across or through the island.
Kaumualii Highway, Kauai
Page 3-20 Chapter III. Statewide Transportation Context and Needs

From central Maui Island, Hana Highway is the primary regional access to the east and Honoapiilani Highway provides the sole access to the western side of the island. Molokai and Lanai do not have principal or minor arterials; traffic is carried via a system of collector roadways.
Honoapiilani Highway, Maui
On Hawaii, the Hawaii Belt Road (also known as Mamalahoa Highway) and Queen Kaahumanu Highway are the principal arterials that provide access to communities around the island’s perimeter. On Kauai, Kaumualii Highway is the sole arterial to and from the western side of the island while Kuhio Highway, which follows the east and north shore, is the only arterial access route for communities along these coasts.
The state’s federal-aid roadway system consists of approximately 2,400 lane miles each of arterials and collectors. Arterials include interstates,
expressways, and principal/major arterials and minor arterials. Over half of arterial facilities are located on Oahu, as they serve the more urban environment and heavier volumes of traffic compared to the other regions. Collector roadways are more evenly split between the regions. Hawaii District has the most collector roadway lane miles, which reflects the relatively low volumes that typically travel longer distances due to the sheer size of the island. Appendix A contains maps that show the functional classification of roads in the federal-aid network.
Interstate H-1 Freeway, Oahu
By 2035, over 100 lane miles of arterial are planned statewide. A portion of these arterial lane miles will be the result of new facilities, while some will be former collector roadways that are upgraded or improved to a higher functional class. Exhibit 3-8 presents the lane miles of roadway by region.
Exhibit 3-8. Forecast Arterial and Collector Lane Miles
Region Arterial Lane Miles Collector Lane Miles
2007 2035(c) 2007 2035(c) Oahu(a) 1,342 1,362 622 648 Maui(b) (d) 261 271 555 558 Hawaii(b) 656 768 972 892 Kauai(b) 159 163 233 233 Statewide Total 2,418 2,564 2,382 2,331 (a) Source: Oahu Regional Transportation Plan 2035 Technical Report, 2011. (b) Source: CH2M HILL, 2012. (c) This refers to the 2035 baseline condition, which includes projects that have been completed since 2007 and those that
have committed construction funding as defined by the STIP (Revision #3, FFY 2011 thru 2014) (d) The lane miles numbers reflect the arterials and collectors that are on the Island of Maui only.
Chapter III. Statewide Transportation Context and Needs Page 3-21

Travel Demand Demand for space on the state’s roadways will increase because of projected statewide growth in population and employment, and anticipated changes in land use (through development and densification). The federal-aid highway system supports all modes of travel; therefore, the impact of this increased demand is likely to affect general traffic, freight vehicles, transit, bicyclists, and pedestrians.
Peak hour traffic through Middle Street merge, Interstate H-1 Freeway, Oahu
The following discussion compares existing and future demand and describes the changing conditions of each travel mode. Competing needs of the various modes as they share the same roadway are also identified.
Vehicular Volume Traffic operations can be described by volume to capacity (V/C) ratios and level of service (LOS).
The V/C measurement quantifies the relative vehicle demand versus the capacity of a facility.
The capacity of a facility depends on a variety of factors including the number of lanes, the operating speed and even the number of driveways or intersections on a roadway. A V/C ratio of 1.0 indicates the vehicle demand is equal to the capacity of the facility, and generally correlates to LOS F.
The LOS generally describes operating conditions in terms of driver perception by 6 letter-grade categories. LOS A typically represents conditions with little or no delay, while LOS F indicates poor operations with long wait times or extreme congestion.
Congested conditions, Kauai
Due to its primarily urban land use, roadway performance on Oahu is reported for the two-hour a.m. peak period of a typical work day morning commute. Of the roadways with a functional classification of arterial or higher, roughly 8 percent are currently congested during the a.m. peak. Most of this congestion occurs on freeways and their associated ramps. These roadways serve a disproportionately higher percentage of morning commute trips than roadways that have the lower classification of arterial.
In the other regions, congestion is reported in terms of daily volumes because peaking characteristics are less pronounced during the typical morning or afternoon commute periods. At least 20 percent of the arterial lane miles on Maui are currently congested and operate at LOS F at some point during the day. Arterials on
Page 3-22 Chapter III. Statewide Transportation Context and Needs

Hawaii and Kauai operate slightly better with approximately 10 percent and 15 percent, respectively, performing at LOS F. There are no freeways or expressways on Maui, Hawaii, or Kauai which means these congested arterials are mainly principal arterial state highways which serve more than typical commute trips. Freight trucks, transit, agricultural vehicles, as well as cross-region tourist vehicles must all compete for space on these arterial highways.
Traffic operations are expected to worsen on arterials statewide by 2035 compared with existing
conditions. Exhibit 3-9 shows the percentage of arterials that are expected to operate at LOS D or better (some light congestion is possible), LOS E (traffic is approaching capacity), and LOS F (congested). Vehicular volumes in all regions are anticipated to grow as land uses are developed and population and employment opportunities increase. Increases in traffic would result in greater demand on the state’s roadway infrastructure and higher levels of congestion, which result in poorer operating conditions.
Exhibit 3-9. Roadway Performance
Region
Percentage of Roadway Lane Miles 2007 2035
LOS A-D LOS E LOS F LOS A-D LOS E LOS F Oahu(a) 86% 6% 8% 85% 6% 9% Maui(b) 72% 6% 22% 40% 6% 54% Hawaii(b) 84% 6% 10% 69% 7% 24% Kauai(b) 79% 7% 14% 69% 6% 25% (a) Source: Oahu Regional Transportation Plan 2035, 2011. Results are reported for a.m. peak operations. (b) Source: CH2M HILL, 2012. Results are reported for daily operations. Even with future planned and programmed improvement projects constructed in anticipation of growth, congestion is still expected. On Oahu, nearly 10 percent of arterials would operate at LOS F during the morning peak. In other regions, the percentage of arterial lane miles at LOS F would more than double compared to 2007 conditions. On Maui, more than half of the arterial lane miles would be expected to operate at LOS F in 2035 compared to just over 20 percent in 2007. On the Island of Hawaii, nearly one quarter of arterial lane miles would be expected to operate at LOS F under future conditions, compared to just 10 percent under existing conditions. Kauai’s arterials would continue to be congested in 2035; approximately 25 percent of its arterials are expected to operate at LOS F compared to less than 15 percent today.
Lower functionally classified collector roadways operate well statewide, with over 95 percent of all collector roadways currently operating at LOS C or better conditions in all regions. In the future,
these roadways are expected to see an increase in traffic, but would likely continue to provide reliable service. Statewide, over 90 percent of all collectors roadways would operate at LOS C or better. See Exhibits 3-10a through 3-10i for roadway performance maps for each region in both 2007 and 2035.
Farrington Highway, Ewa, Oahu
Chapter III. Statewide Transportation Context and Needs Page 3-23
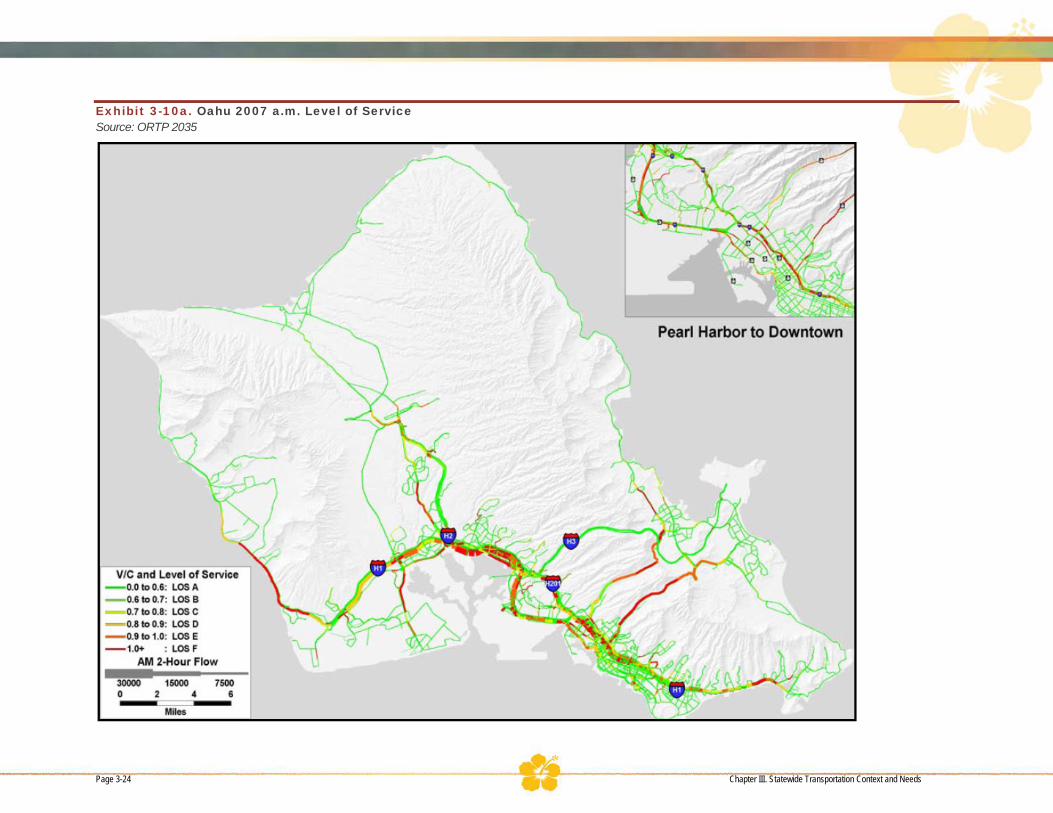
DRAFT
Exhibit 3-10a. Oahu 2007 a.m. Level of Service Source: ORTP 2035
Page 3-24 Chapter III. Statewide Transportation Context and Needs

DRAFT
Exhibit 3-10b. Oahu 2035 a.m. Level of Service Source: ORTP 2035
Chapter III. Statewide Transportation Context and Needs Page 3-25

DRAFT
Exhibit 3-10c. Maui 2007 Volume-to-Capacity Ratio and Level of Service
Page 3-26 Chapter III. Statewide Transportation Context and Needs

DRAFT
Exhibit 3-10d. Maui 2035 Volume-to-Capacity Ratio and Level of Service (No Build)
Chapter III. Statewide Transportation Context and Needs Page 3-27

DRAFT
Exhibit 3-10e. Molokai and Lanai 2007 and 2035 (No Build) Volume-to-Capacity Ratio and Level of Service
Page 3-28 Chapter III. Statewide Transportation Context and Needs

DRAFT
Exhibit 3-10f. Hawaii 2007 Volume-to-Capacity Ratio and Level of Service
Chapter III. Statewide Transportation Context and Needs Page 3-29
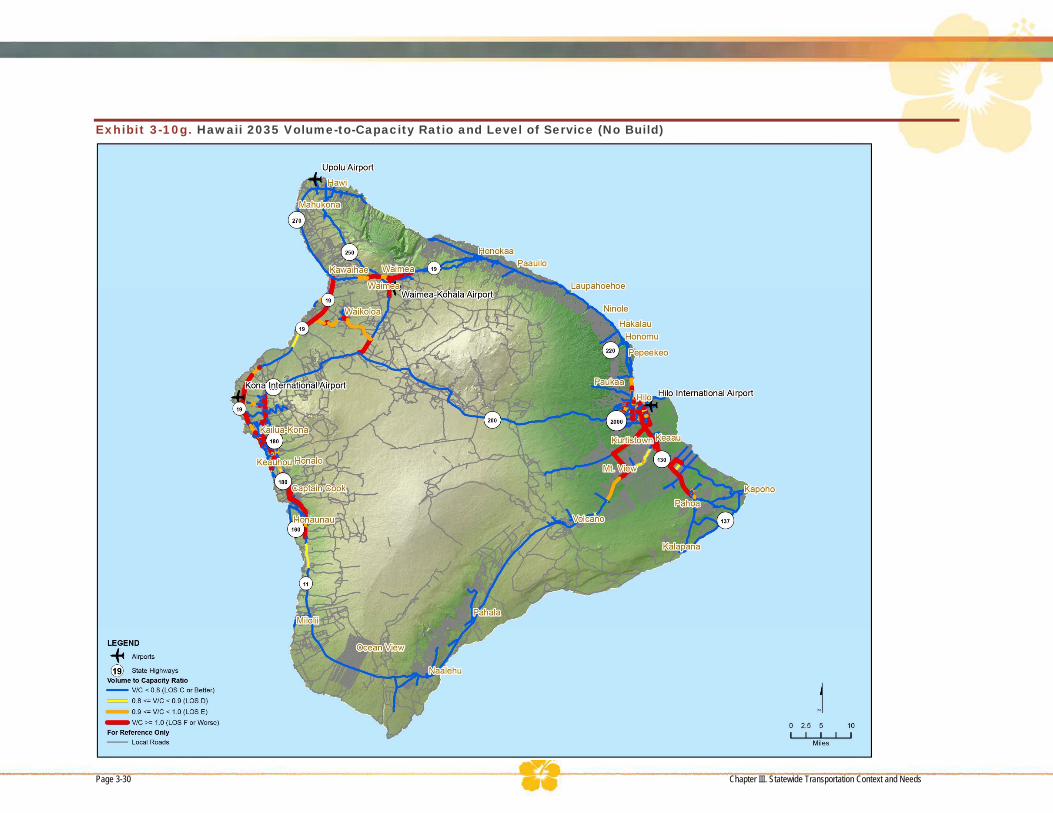
DRAFT
Exhibit 3-10g. Hawaii 2035 Volume-to-Capacity Ratio and Level of Service (No Build)
Page 3-30 Chapter III. Statewide Transportation Context and Needs
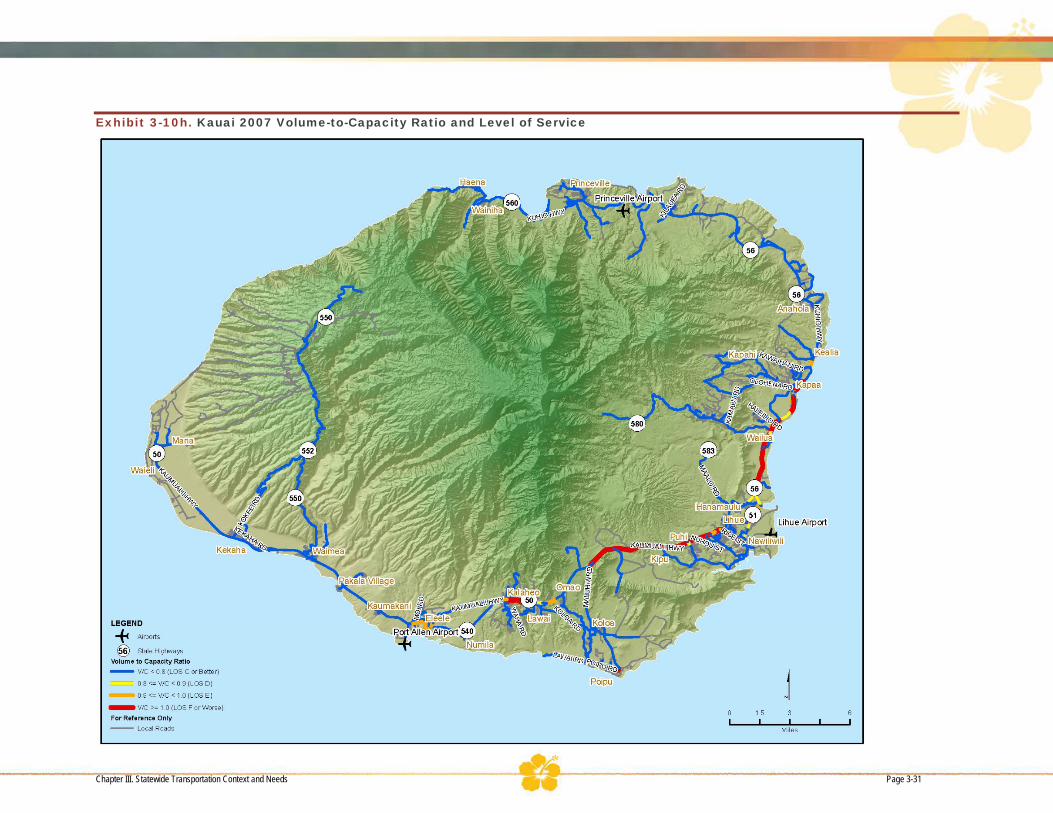
DRAFT
Exhibit 3-10h. Kauai 2007 Volume-to-Capacity Ratio and Level of Service
Chapter III. Statewide Transportation Context and Needs Page 3-31
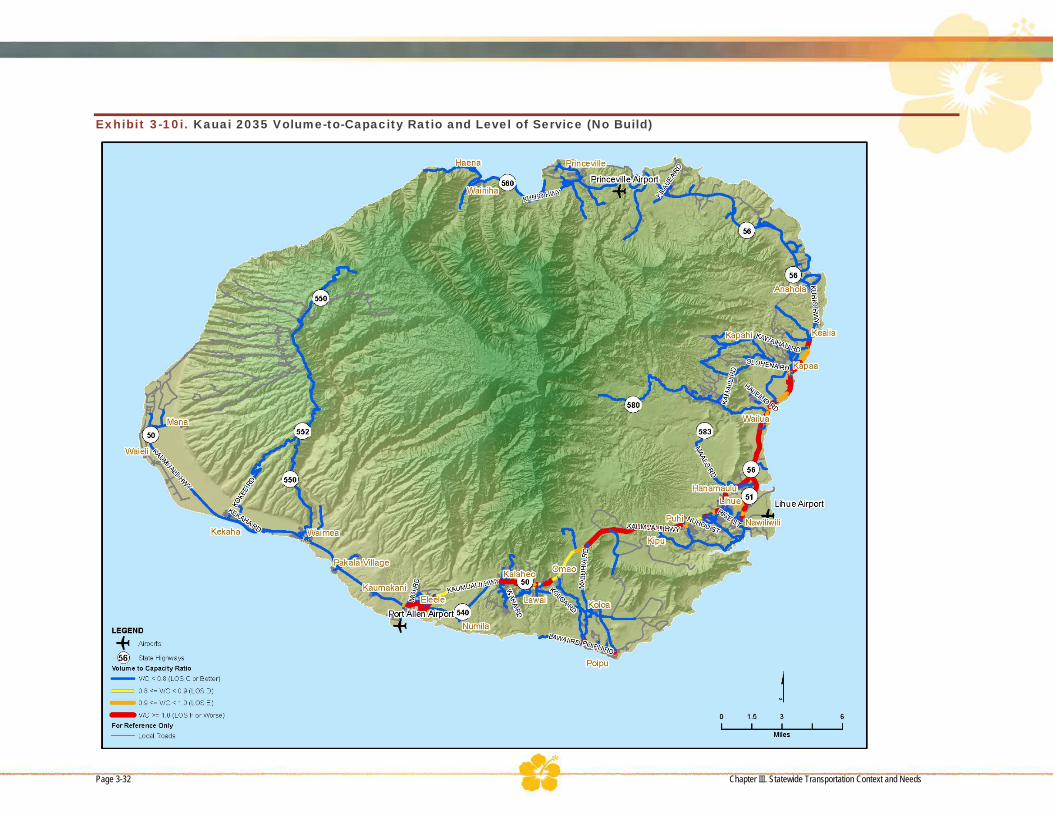
DRAFT
Exhibit 3-10i. Kauai 2035 Volume-to-Capacity Ratio and Level of Service (No Build)
Page 3-32 Chapter III. Statewide Transportation Context and Needs
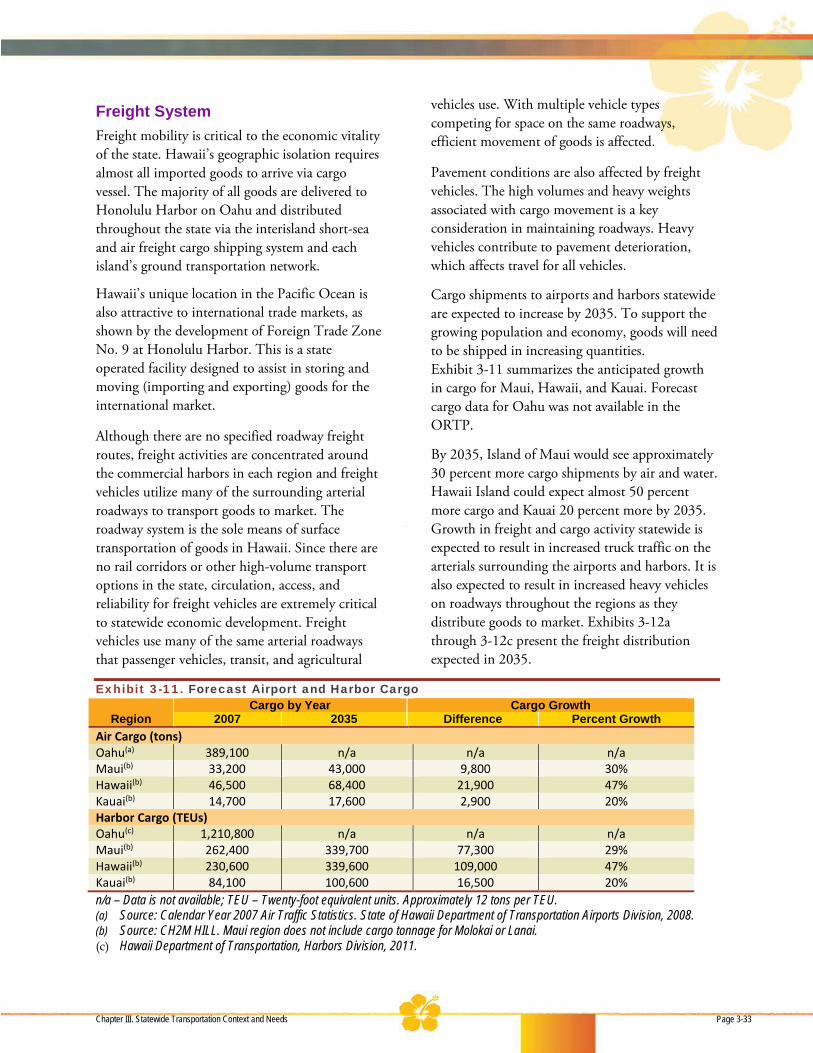
DRAFT
Freight System Freight mobility is critical to the economic vitality of the state. Hawaii’s geographic isolation requires almost all imported goods to arrive via cargo vessel. The majority of all goods are delivered to Honolulu Harbor on Oahu and distributed throughout the state via the interisland short-sea and air freight cargo shipping system and each island’s ground transportation network.
Hawaii’s unique location in the Pacific Ocean is also attractive to international trade markets, as shown by the development of Foreign Trade Zone No. 9 at Honolulu Harbor. This is a state operated facility designed to assist in storing and moving (importing and exporting) goods for the international market.
Although there are no specified roadway freight routes, freight activities are concentrated around the commercial harbors in each region and freight vehicles utilize many of the surrounding arterial roadways to transport goods to market. The roadway system is the sole means of surface transportation of goods in Hawaii. Since there are no rail corridors or other high-volume transport options in the state, circulation, access, and reliability for freight vehicles are extremely critical to statewide economic development. Freight vehicles use many of the same arterial roadways that passenger vehicles, transit, and agricultural
vehicles use. With multiple vehicle types competing for space on the same roadways, efficient movement of goods is affected.
Pavement conditions are also affected by freight vehicles. The high volumes and heavy weights associated with cargo movement is a key consideration in maintaining roadways. Heavy vehicles contribute to pavement deterioration, which affects travel for all vehicles.
Cargo shipments to airports and harbors statewide are expected to increase by 2035. To support the growing population and economy, goods will need to be shipped in increasing quantities. Exhibit 3-11 summarizes the anticipated growth in cargo for Maui, Hawaii, and Kauai. Forecast cargo data for Oahu was not available in the ORTP.
By 2035, Island of Maui would see approximately 30 percent more cargo shipments by air and water. Hawaii Island could expect almost 50 percent more cargo and Kauai 20 percent more by 2035. Growth in freight and cargo activity statewide is expected to result in increased truck traffic on the arterials surrounding the airports and harbors. It is also expected to result in increased heavy vehicles on roadways throughout the regions as they distribute goods to market. Exhibits 3-12a through 3-12c present the freight distribution expected in 2035.
Exhibit 3-11. Forecast Airport and Harbor Cargo
Region Cargo by Year Cargo Growth
2007 2035 Difference Percent Growth Air Cargo (tons) Oahu(a) 389,100 n/a n/a n/a Maui(b) 33,200 43,000 9,800 30% Hawaii(b) 46,500 68,400 21,900 47% Kauai(b) 14,700 17,600 2,900 20% Harbor Cargo (TEUs) Oahu(c) 1,210,800 n/a n/a n/a Maui(b) 262,400 339,700 77,300 29% Hawaii(b) 230,600 339,600 109,000 47% Kauai(b) 84,100 100,600 16,500 20% n/a – Data is not available; TEU – Twenty-foot equivalent units. Approximately 12 tons per TEU. (a) Source: Calendar Year 2007 Air Traffic Statistics. State of Hawaii Department of Transportation Airports Division, 2008. (b) Source: CH2M HILL. Maui region does not include cargo tonnage for Molokai or Lanai. (c) Hawaii Department of Transportation, Harbors Division, 2011.
Chapter III. Statewide Transportation Context and Needs Page 3-33
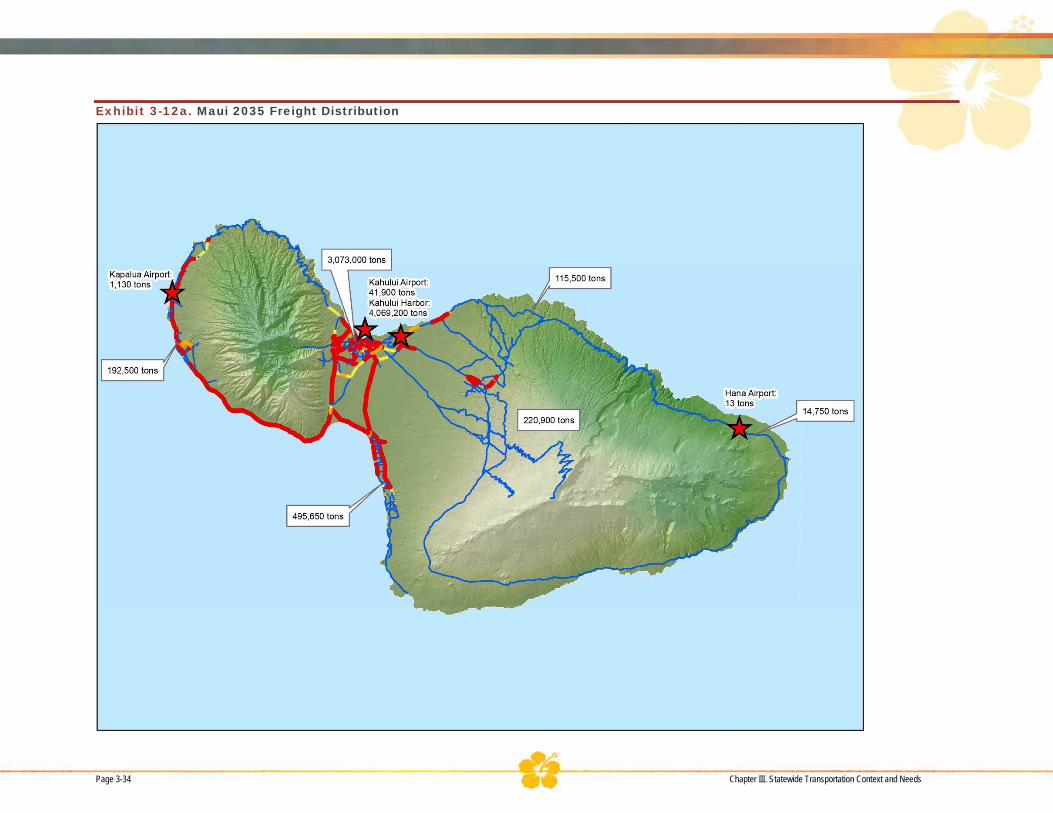
DRAFT DRAFT
Exhibit 3-12a. Maui 2035 Freight Distribution
Page 3-34 Chapter III. Statewide Transportation Context and Needs

Exhibit 3-12b. Hawaii 2035 Freight Distribution
Chapter III. Statewide Transportation Context and Needs Page 3-35

DRAFT DRAFT
Exhibit 3-12c. Kauai 2035 Freight Distribution
Page 3-36 Chapter III. Statewide Transportation Context and Needs

Public Transit System Public transit provides a personal mobility option and opportunity for all, regardless of age, income, social status or physical ability by offering a modal alternative for those who are unable to or choose not to drive. Additionally, public transit benefits overall quality of life through reduced traffic congestion and improved air quality. Each region has adopted policies supporting transit implementation. Although each region operates its own transit system, they all provide fixed-route service, commuter service, paratransit service, and
park-and-ride lots or transit centers for users. Exhibit 3-13 provides a summary of transit service currently provided by each of the regions. Public transit service is not provided on Molokai or Lanai.
Hele-on Bus on the Island of Hawaii.
Exhibit 3-13. Existing Transit Service by Region
Type of Service Oahu(a) Maui(b) Hawaii(c) Kauai(d)
Fixed-Route Service 99 total routes
12 routes 10 routes 6 routes
Commuter Service Routes 4 routes 5 routes 1 route
Paratransit Service Yes Yes Yes Yes
Park-and-Ride Lots 5 locations 2 locations 2 locations 6 locations
Transit Centers Yes Yes No No
(a) Source: Oahu Regional Transportation Plan 2035, Oahu Metropolitan Planning Organization, 2011. (b) Source: http://www.co.maui.hi.us/bus/, County of Maui Department of Transportation, 2012. (c) Source: http://heleonbus.org/, Hawaii County Mass Transit Agency, 2012. (d) Source: http://www.kauai.gov/default.aspx?tabid=208, County of Kauai Transportation Agency, 2012. Transit use is expected to become increasingly important to travelers in the future. As the state’s roadways become congested, users may look to transit as an option for their trip purposes. Ridership is expected to increase as the population grows, and, as a result, the number of buses necessary to carry passengers would likely need to increase.
In addition to the number of buses, the size of transit vehicles could also increase. In each of the regions, transit routes rely on the highway system to operate service and maintain schedules. High-occupancy vehicle lanes are available on selected roadways on Oahu, but are not an option for transit vehicles in the other regions. On Maui, Hawaii, and Kauai, buses, passenger vehicles, and freight all must share the same road. The increased congestion or delay on the highways would have a
negative impact on transit service in terms of reliability. Improved traffic operations on these shared roadways is necessary in order to provide efficient transit service if future demand is to be accommodated.
The ORTP 2035 assumes that the Honolulu Rail Transit Project will be operating between East Kapolei and Ala Moana Center by the year 2035 and that TheBus transit route system will be restructured to integrate with rail. Providing non-automobile transportation alternatives between Kapolei and Ewa to Downtown Honolulu and the Ala Moana Shopping Center promotes accessibility, reduces congestion and air pollution, and supports the economy.
Chapter III. Statewide Transportation Context and Needs Page 3-37

DRAFT DRAFT
Model of the Honolulu Authority for Rapid Transportation (HART) train
Bikeway System Existing bicycle facilities within the state consist primarily of three types: paths, bike lanes, and shared roadways. These facilities are illustrated on Exhibit 3-14.
Exhibit 3-14. Bike Facility Types Source: Bike Plan Hawaii, Hawaii Department of Transportation (2003)
Paths or Shared Use Paths – a facility either within the highway right-of-way or within an independent right-of-way that is physically separated from a roadway. Shared use paths may
also be used by pedestrians, skaters, wheelchair users, joggers and other nonmotorized users.
Bike Lanes – a portion of a roadway which has been designated by striping, signing, and pavement markings for the preferential or exclusive use of bicyclists.
Shared Roadways – a roadway open to both bicycle and motor vehicle travel. This may be an existing roadway, street with wide curb lanes, or road with paved shoulders. A Signed Shared Roadway is a shared roadway which has been designated by signing as a preferred route for bicycle use.
Bike Plan Hawaii2 summarizes the multifaceted benefits of bicycling, not only as a means of transportation, but also related to health, economics, community, and the environment. Nearly 70 percent of all documented bicycle facilities in the state are shared use facilities, where bicycles must share space with pedestrians, nonmotorized users, or motorized vehicles. Close to half of all bicycle facilities (98 of 209 total miles) within the state are located on Oahu. These facilities are fairly evenly split between shared use paths, bicycle lanes, and signed shared roadways. Major facilities providing regional connectivity include the Pearl Harbor Bike Path and shared use paths and bike lanes on Nimitz Highway, Kalanianaole Highway, and Ala Moana Boulevard/Kalakaua Avenue. Several facilities are also provided within the Honolulu urban core.
2 Bike Plan Hawaii a State of Hawaii Master Plan Abridged Version. Highways Division Department of Transportation State of Hawaii, September 2003.
Bike Path
Bike Lane
Signed Shared Roadway
Page 3-38 Chapter III. Statewide Transportation Context and Needs

DRAFT
Bicyclist in Hilo, Hawaii
Regional bicycle facilities on Maui include nearly 25 miles of signed shared roadway on Honoapiilani Highway between Maalaea and Kapalua in west Maui, as well as approximately 7 miles of signed shared roadway on Piilani Highway in Kihei. On Kauai, bicycles are currently accommodated via 9 miles of signed shared roadway on Kaumualii Highway west of
Lihue to Koloa, and 5 miles of signed shared roadway on Kapule Highway and Kuhio Highway between Lihue and Wailua.
On Hawaii, bicycle facilities primarily exist in populated areas and provide mainly local access only. For example, signed shared roadways are provided within Hilo along Hawaii Belt Road (Highway 11) and between Kona town and the Keahole Airport along Queen Kaahumanu Highway, but regional bicycle connectivity between communities on the belt road system is not available.
Future needs for bicycle facilities have been identified in Bike Plan Hawaii. To plan for increased bicycle use, shared use roads, dedicated bicycle lanes, and shared use paths are proposed in every region of the state. These facilities are often on federal-aid roadways and are intended to accommodate bicycles alongside motorized vehicles on the same road.
Bicycling can provide more than just transportation benefits
Chapter III. Statewide Transportation Context and Needs Page 3-39
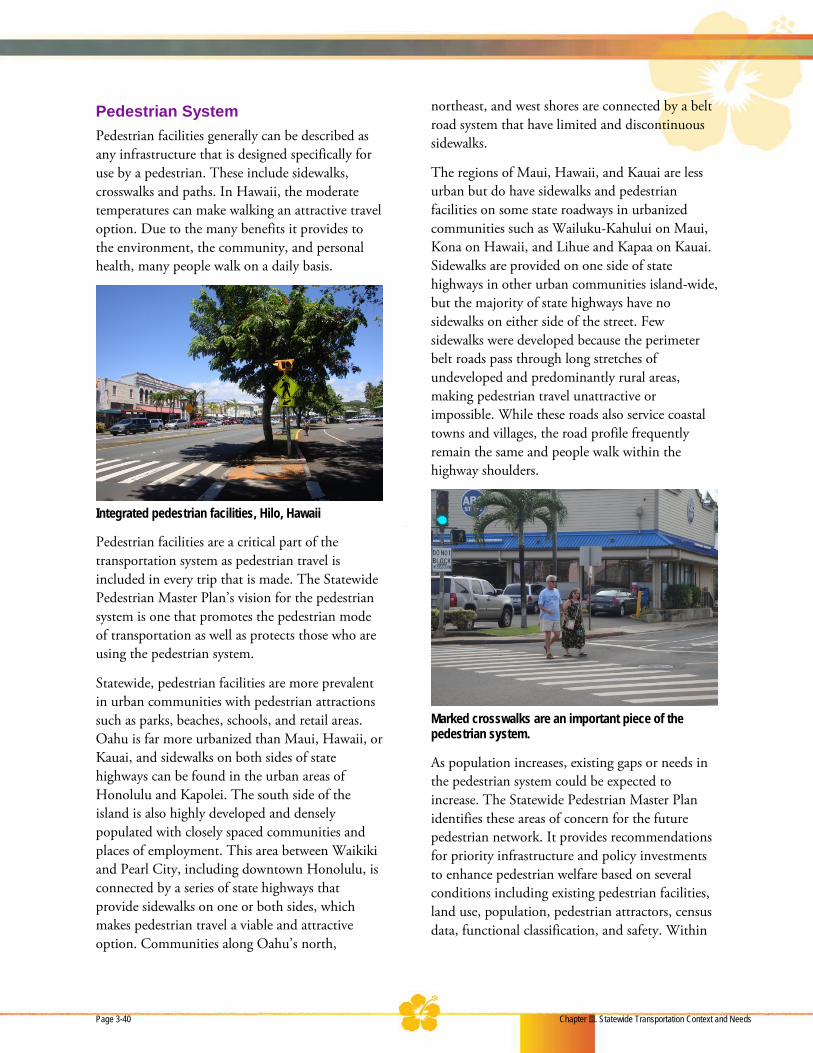
DRAFT
Pedestrian System Pedestrian facilities generally can be described as any infrastructure that is designed specifically for use by a pedestrian. These include sidewalks, crosswalks and paths. In Hawaii, the moderate temperatures can make walking an attractive travel option. Due to the many benefits it provides to the environment, the community, and personal health, many people walk on a daily basis.
Integrated pedestrian facilities, Hilo, Hawaii
Pedestrian facilities are a critical part of the transportation system as pedestrian travel is included in every trip that is made. The Statewide Pedestrian Master Plan’s vision for the pedestrian system is one that promotes the pedestrian mode of transportation as well as protects those who are using the pedestrian system.
Statewide, pedestrian facilities are more prevalent in urban communities with pedestrian attractions such as parks, beaches, schools, and retail areas. Oahu is far more urbanized than Maui, Hawaii, or Kauai, and sidewalks on both sides of state highways can be found in the urban areas of Honolulu and Kapolei. The south side of the island is also highly developed and densely populated with closely spaced communities and places of employment. This area between Waikiki and Pearl City, including downtown Honolulu, is connected by a series of state highways that provide sidewalks on one or both sides, which makes pedestrian travel a viable and attractive option. Communities along Oahu’s north,
northeast, and west shores are connected by a belt road system that have limited and discontinuous sidewalks.
The regions of Maui, Hawaii, and Kauai are less urban but do have sidewalks and pedestrian facilities on some state roadways in urbanized communities such as Wailuku-Kahului on Maui, Kona on Hawaii, and Lihue and Kapaa on Kauai. Sidewalks are provided on one side of state highways in other urban communities island-wide, but the majority of state highways have no sidewalks on either side of the street. Few sidewalks were developed because the perimeter belt roads pass through long stretches of undeveloped and predominantly rural areas, making pedestrian travel unattractive or impossible. While these roads also service coastal towns and villages, the road profile frequently remain the same and people walk within the highway shoulders.
Marked crosswalks are an important piece of the pedestrian system.
As population increases, existing gaps or needs in the pedestrian system could be expected to increase. The Statewide Pedestrian Master Plan identifies these areas of concern for the future pedestrian network. It provides recommendations for priority infrastructure and policy investments to enhance pedestrian welfare based on several conditions including existing pedestrian facilities, land use, population, pedestrian attractors, census data, functional classification, and safety. Within
Page 3-40 Chapter III. Statewide Transportation Context and Needs
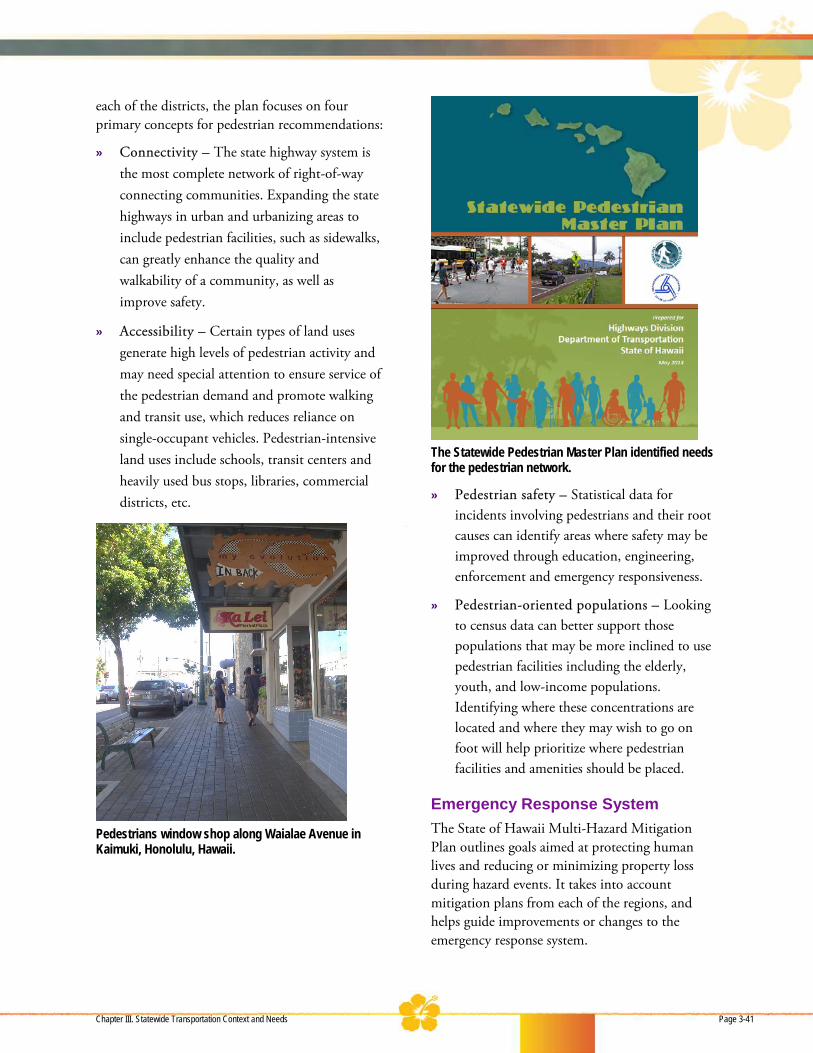
DRAFT
each of the districts, the plan focuses on four primary concepts for pedestrian recommendations:
» Connectivity – The state highway system is the most complete network of right-of-way connecting communities. Expanding the state highways in urban and urbanizing areas to include pedestrian facilities, such as sidewalks, can greatly enhance the quality and walkability of a community, as well as improve safety.
» Accessibility – Certain types of land uses generate high levels of pedestrian activity and may need special attention to ensure service of the pedestrian demand and promote walking and transit use, which reduces reliance on single-occupant vehicles. Pedestrian-intensive land uses include schools, transit centers and heavily used bus stops, libraries, commercial districts, etc.
Pedestrians window shop along Waialae Avenue in Kaimuki, Honolulu, Hawaii.
The Statewide Pedestrian Master Plan identified needs for the pedestrian network.
» Pedestrian safety – Statistical data for incidents involving pedestrians and their root causes can identify areas where safety may be improved through education, engineering, enforcement and emergency responsiveness.
» Pedestrian-oriented populations – Looking to census data can better support those populations that may be more inclined to use pedestrian facilities including the elderly, youth, and low-income populations. Identifying where these concentrations are located and where they may wish to go on foot will help prioritize where pedestrian facilities and amenities should be placed.
Emergency Response System The State of Hawaii Multi-Hazard Mitigation Plan outlines goals aimed at protecting human lives and reducing or minimizing property loss during hazard events. It takes into account mitigation plans from each of the regions, and helps guide improvements or changes to the emergency response system.
Chapter III. Statewide Transportation Context and Needs Page 3-41

DRAFT
The land transportation system is critical for emergency operations during any type of disaster, whether it is natural or a threat to security. The road system is a lifeline and provides a means for delivery of relief as well as aids in evacuation or relocation. When roads are impassable or unsafe, relief efforts are delayed. Failure to support emergency response could be a great impediment to dealing with the overall impacts of a hazard event.
Congested roadways, limited access or circulation options, and poor road conditions are all potential obstacles that could make evacuation or response difficult. Many communities statewide are connected by a sole belt roadway, and when this roadway is congested, there are few, or sometimes no other, options for emergency response vehicles to bypass the affected area. Roads or bridges that become unsafe or impassable during weather events also present a hurdle for emergency response and evacuation. Response times would be delayed and residents would be impacted.
Kamehameha Highway, Nanahu Bridge (Hoolapa Stream), Oahu
Improvements in future highway operations across the state are needed to provide viable access routes and options during emergencies and hazard events. The pavement and structural condition of roadways and bridges also need to be preserved and maintained in order to support efficient response with short notice.
Land Transportation Needs Needs and deficiencies of the state land transportation system were identified through various methods. Relevant plans, policies, and programs were reviewed to gain focus on previously identified deficiencies and the recommended actions to address them. Future projected land use and socioeconomic conditions were evaluated, and the resulting forecast demand was assessed against the transportation infrastructure to identify where poor operations could occur.
In addition to reviews and analysis, an equally important contributor to the identification of transportation needs and deficiencies were discussions with the stakeholder groups. Stakeholder groups represented a wide range of users and interests statewide, and helped to identify programmatic transportation system needs as they aligned with the eight planning factors and the final goals and objectives of the Plan. A summary of the public stakeholder involvement process is included in Appendix E.
Stakeholder Input Agency and user perspectives of comprehensive land transportation needs were captured through facilitated discussions with stakeholder groups. During these discussions, stakeholders were given maps of the state’s transportation network. These maps included the roadway network, future traffic conditions in terms of congested locations, and potential locations of project-level solutions that were previously identified through relevant plans and policies. These potential solutions were included on the maps to indicate where needs may have already been examined on each of the islands.
Page 3-42 Chapter III. Statewide Transportation Context and Needs
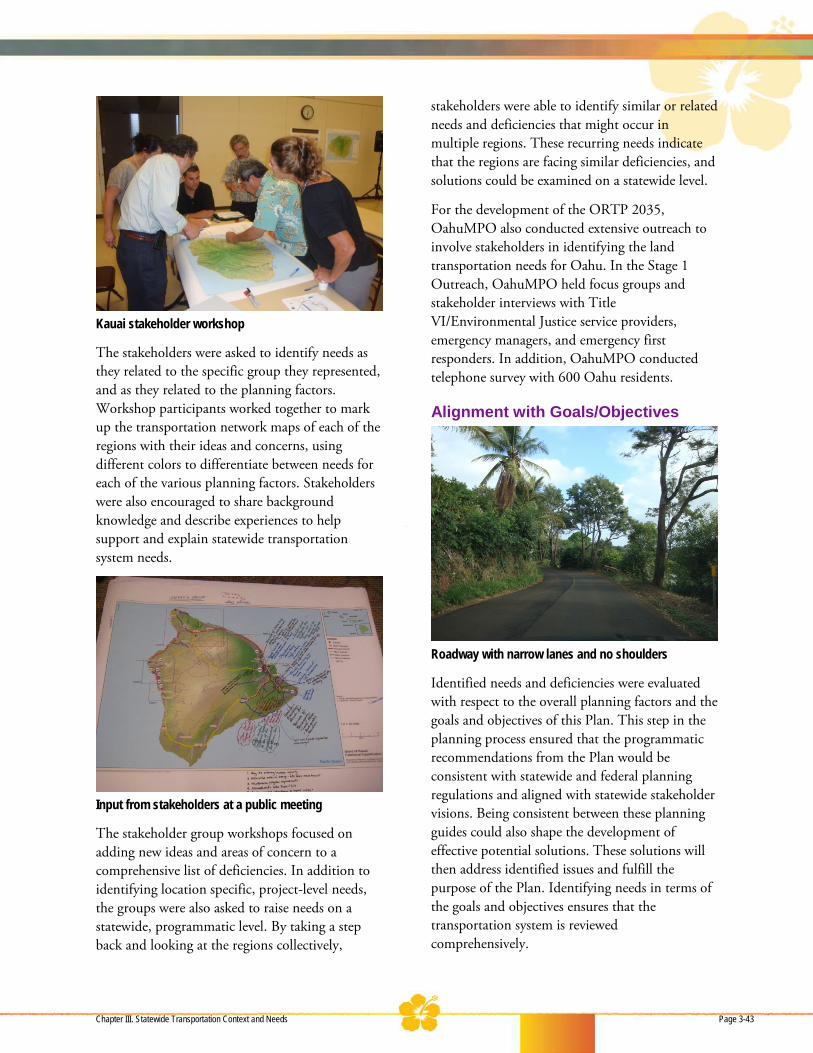
DRAFT
Kauai stakeholder workshop
The stakeholders were asked to identify needs as they related to the specific group they represented, and as they related to the planning factors. Workshop participants worked together to mark up the transportation network maps of each of the regions with their ideas and concerns, using different colors to differentiate between needs for each of the various planning factors. Stakeholders were also encouraged to share background knowledge and describe experiences to help support and explain statewide transportation system needs.
Input from stakeholders at a public meeting
The stakeholder group workshops focused on adding new ideas and areas of concern to a comprehensive list of deficiencies. In addition to identifying location specific, project-level needs, the groups were also asked to raise needs on a statewide, programmatic level. By taking a step back and looking at the regions collectively,
stakeholders were able to identify similar or related needs and deficiencies that might occur in multiple regions. These recurring needs indicate that the regions are facing similar deficiencies, and solutions could be examined on a statewide level.
For the development of the ORTP 2035, OahuMPO also conducted extensive outreach to involve stakeholders in identifying the land transportation needs for Oahu. In the Stage 1 Outreach, OahuMPO held focus groups and stakeholder interviews with Title VI/Environmental Justice service providers, emergency managers, and emergency first responders. In addition, OahuMPO conducted telephone survey with 600 Oahu residents.
Alignment with Goals/Objectives
Roadway with narrow lanes and no shoulders
Identified needs and deficiencies were evaluated with respect to the overall planning factors and the goals and objectives of this Plan. This step in the planning process ensured that the programmatic recommendations from the Plan would be consistent with statewide and federal planning regulations and aligned with statewide stakeholder visions. Being consistent between these planning guides could also shape the development of effective potential solutions. These solutions will then address identified issues and fulfill the purpose of the Plan. Identifying needs in terms of the goals and objectives ensures that the transportation system is reviewed comprehensively.
Chapter III. Statewide Transportation Context and Needs Page 3-43
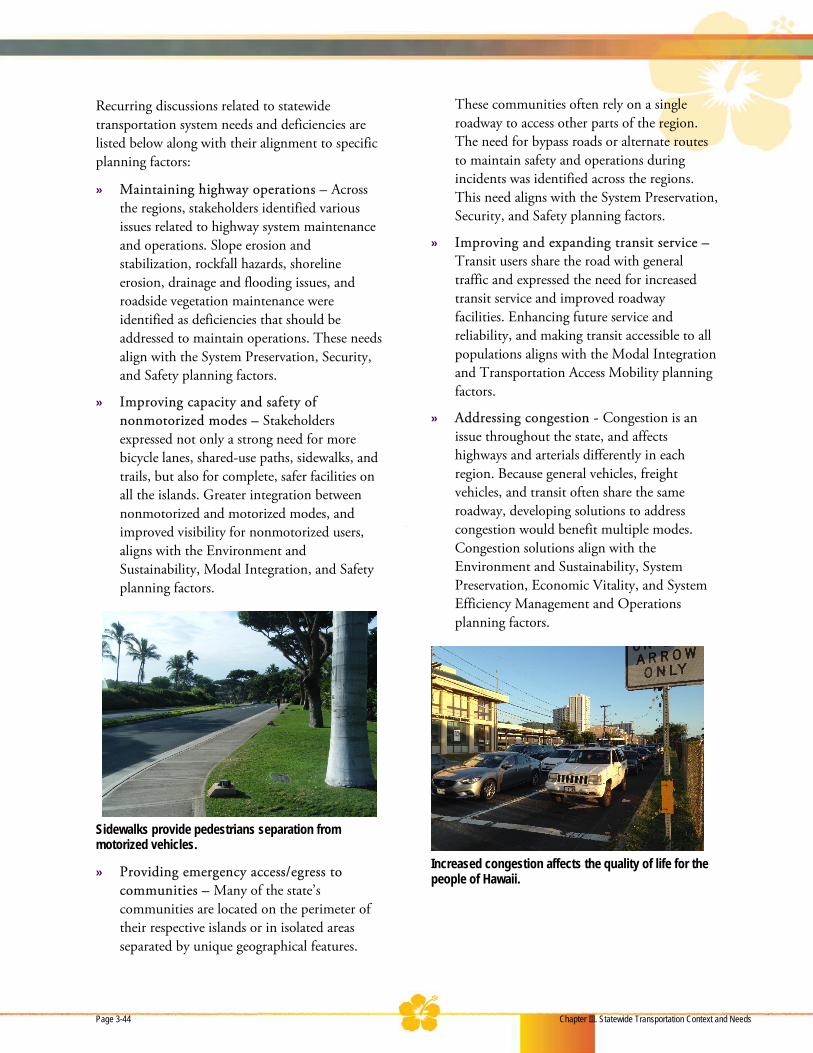
DRAFT
Recurring discussions related to statewide transportation system needs and deficiencies are listed below along with their alignment to specific planning factors:
» Maintaining highway operations – Across the regions, stakeholders identified various issues related to highway system maintenance and operations. Slope erosion and stabilization, rockfall hazards, shoreline erosion, drainage and flooding issues, and roadside vegetation maintenance were identified as deficiencies that should be addressed to maintain operations. These needs align with the System Preservation, Security, and Safety planning factors.
» Improving capacity and safety of nonmotorized modes – Stakeholders expressed not only a strong need for more bicycle lanes, shared-use paths, sidewalks, and trails, but also for complete, safer facilities on all the islands. Greater integration between nonmotorized and motorized modes, and improved visibility for nonmotorized users, aligns with the Environment and Sustainability, Modal Integration, and Safety planning factors.
Sidewalks provide pedestrians separation from motorized vehicles.
» Providing emergency access/egress to communities – Many of the state’s communities are located on the perimeter of their respective islands or in isolated areas separated by unique geographical features.
These communities often rely on a single roadway to access other parts of the region. The need for bypass roads or alternate routes to maintain safety and operations during incidents was identified across the regions. This need aligns with the System Preservation, Security, and Safety planning factors.
» Improving and expanding transit service – Transit users share the road with general traffic and expressed the need for increased transit service and improved roadway facilities. Enhancing future service and reliability, and making transit accessible to all populations aligns with the Modal Integration and Transportation Access Mobility planning factors.
» Addressing congestion - Congestion is an issue throughout the state, and affects highways and arterials differently in each region. Because general vehicles, freight vehicles, and transit often share the same roadway, developing solutions to address congestion would benefit multiple modes. Congestion solutions align with the Environment and Sustainability, System Preservation, Economic Vitality, and System Efficiency Management and Operations planning factors.
Increased congestion affects the quality of life for the people of Hawaii.
Page 3-44 Chapter III. Statewide Transportation Context and Needs
Chapter IV Implementation


This statewide Plan is the vision of what the land transportation system would be in 2035, without financial constraints. How do we implement the Plan and what can we do to move forward from here?
Potential Solutions Based on the identified statewide needs, stakeholders and the planning team developed potential programmatic solutions to address the recognized needs and issues for the Oahu, Maui, Hawaii, and Kauai regions. Identifying solutions is the first step in moving towards the vision of the Plan.
For the Districts of Maui, Hawaii, and Kauai, this process involved reviews of relevant plans and policies to examine previously suggested solutions, as well as the future forecasted conditions of the state’s roadways to see where needs and deficiencies, such as increased congestion or gaps in facilities, would be likely to occur. Recurring needs across the regions were considered as a starting point to develop statewide potential solutions.
For Oahu, recommended solutions were developed and prioritized through a separate OahuMPO planning process, resulting in ORTP 2035 (April 2011).
Programmatic solutions involve changes or improvements to address overarching system needs. These solutions would affect more than just a specific roadway facility or location; programmatic solutions have an impact statewide and systemwide. Solutions were developed to meet the highlighted statewide needs identified in Chapter III, and to align with the Plan’s guiding goals and objectives. Appendix F provides additional detail on the statewide solution development and evaluation process.
Examples of potential statewide solutions that were voiced across the state are described in the following paragraphs.
Preserve and maintain continuous highway system operations – Potential solutions to provide continuous highway operations include regular maintenance and upkeep of existing facilities, such as resurfacing or reconstruction of roadways on a planned cycle and repairing sidewalks and bicycle facilities before they become unusable. These solutions would protect transportation investments and preserve the system for the long term. Additional solutions to maintain operations include removing vegetation from alongside state highways and identifying and implementing drainage improvements to prevent flooding and runoff. Installing infrastructure to prevent erosion and landslides, as well as cleaning and maintaining bridge piers and roadway pavement would be solutions to prevent travel way deterioration.
Maintaining the infrastructure and assets is important because the roadway network is the lifeline of the islands. Keeping roadways and bridges in optimal form is a key factor in helping Hawaii to build its economy and progress towards its transportation goals.
Landslide protection, Kuhio Highway, Lumahai, Kauai.
Preserving the transportation system also supports fiscal responsibility. The transportation network is an asset, and limited resources have been spent
Chapter IV. Implementation Page 4-1
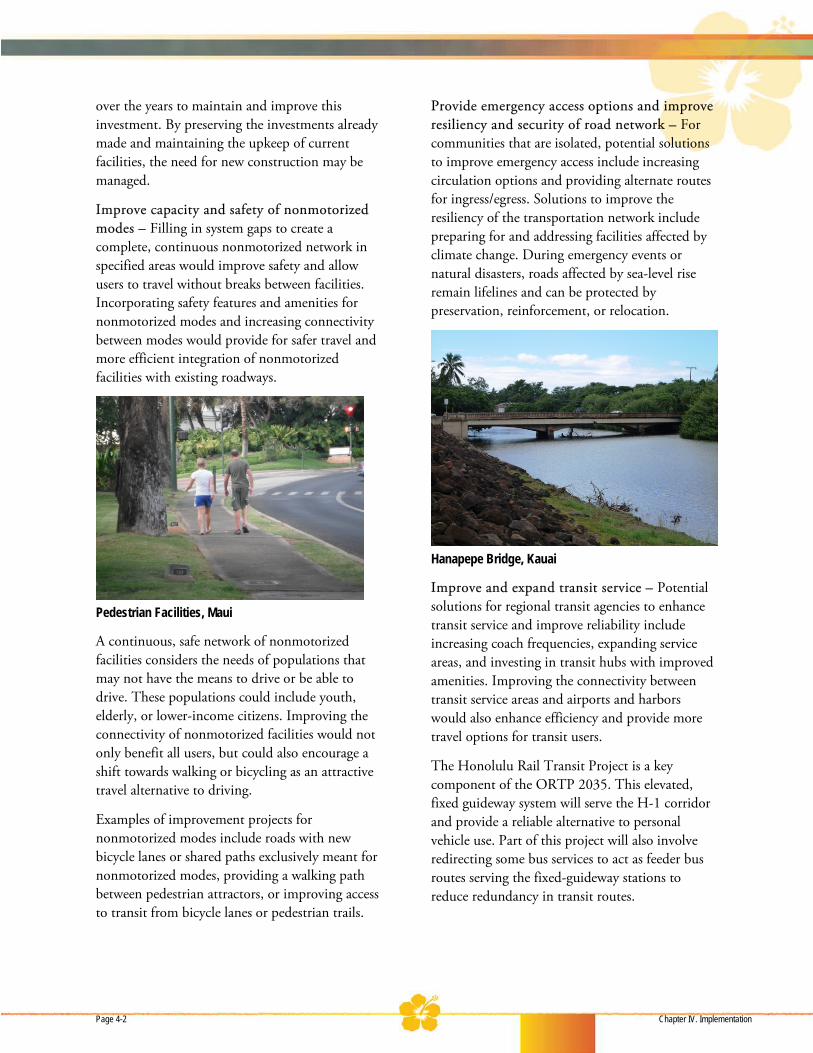
over the years to maintain and improve this investment. By preserving the investments already made and maintaining the upkeep of current facilities, the need for new construction may be managed.
Improve capacity and safety of nonmotorized modes – Filling in system gaps to create a complete, continuous nonmotorized network in specified areas would improve safety and allow users to travel without breaks between facilities. Incorporating safety features and amenities for nonmotorized modes and increasing connectivity between modes would provide for safer travel and more efficient integration of nonmotorized facilities with existing roadways.
Pedestrian Facilities, Maui
A continuous, safe network of nonmotorized facilities considers the needs of populations that may not have the means to drive or be able to drive. These populations could include youth, elderly, or lower-income citizens. Improving the connectivity of nonmotorized facilities would not only benefit all users, but could also encourage a shift towards walking or bicycling as an attractive travel alternative to driving.
Examples of improvement projects for nonmotorized modes include roads with new bicycle lanes or shared paths exclusively meant for nonmotorized modes, providing a walking path between pedestrian attractors, or improving access to transit from bicycle lanes or pedestrian trails.
Provide emergency access options and improve resiliency and security of road network – For communities that are isolated, potential solutions to improve emergency access include increasing circulation options and providing alternate routes for ingress/egress. Solutions to improve the resiliency of the transportation network include preparing for and addressing facilities affected by climate change. During emergency events or natural disasters, roads affected by sea-level rise remain lifelines and can be protected by preservation, reinforcement, or relocation.
Hanapepe Bridge, Kauai
Improve and expand transit service – Potential solutions for regional transit agencies to enhance transit service and improve reliability include increasing coach frequencies, expanding service areas, and investing in transit hubs with improved amenities. Improving the connectivity between transit service areas and airports and harbors would also enhance efficiency and provide more travel options for transit users.
The Honolulu Rail Transit Project is a key component of the ORTP 2035. This elevated, fixed guideway system will serve the H-1 corridor and provide a reliable alternative to personal vehicle use. Part of this project will also involve redirecting some bus services to act as feeder bus routes serving the fixed-guideway stations to reduce redundancy in transit routes.
Page 4-2 Chapter IV. Implementation
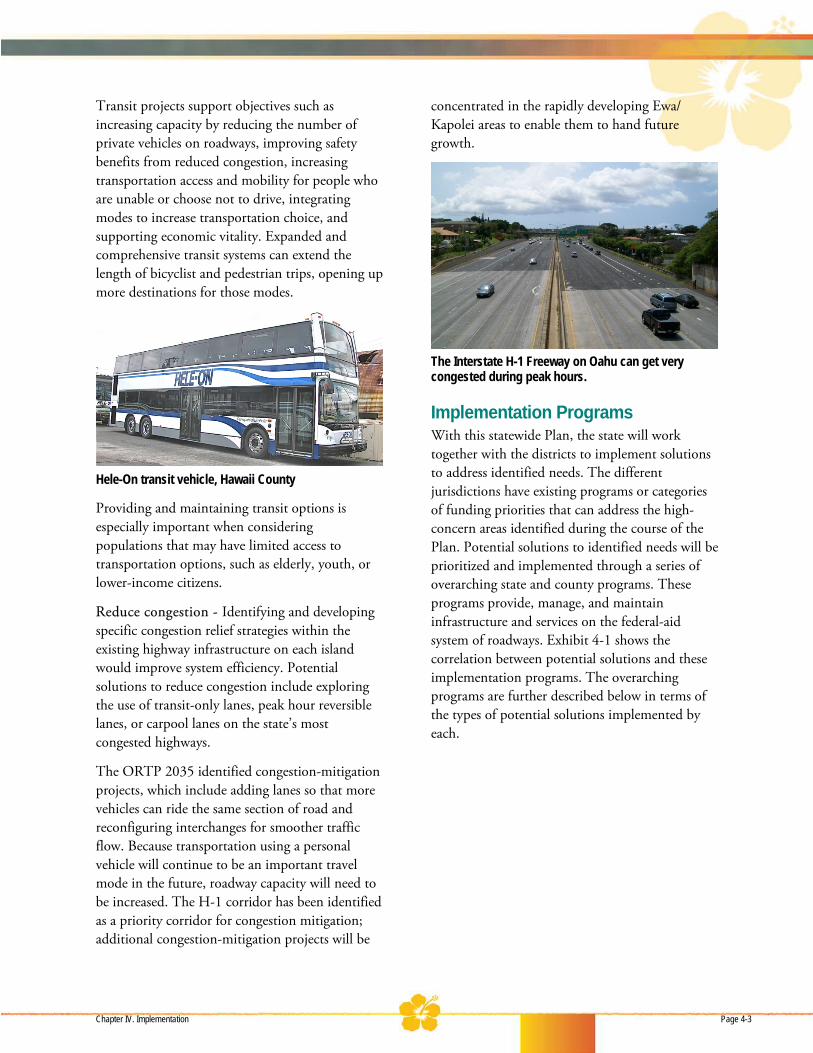
Transit projects support objectives such as increasing capacity by reducing the number of private vehicles on roadways, improving safety benefits from reduced congestion, increasing transportation access and mobility for people who are unable or choose not to drive, integrating modes to increase transportation choice, and supporting economic vitality. Expanded and comprehensive transit systems can extend the length of bicyclist and pedestrian trips, opening up more destinations for those modes.
Hele-On transit vehicle, Hawaii County
Providing and maintaining transit options is especially important when considering populations that may have limited access to transportation options, such as elderly, youth, or lower-income citizens.
Reduce congestion - Identifying and developing specific congestion relief strategies within the existing highway infrastructure on each island would improve system efficiency. Potential solutions to reduce congestion include exploring the use of transit-only lanes, peak hour reversible lanes, or carpool lanes on the state’s most congested highways.
The ORTP 2035 identified congestion-mitigation projects, which include adding lanes so that more vehicles can ride the same section of road and reconfiguring interchanges for smoother traffic flow. Because transportation using a personal vehicle will continue to be an important travel mode in the future, roadway capacity will need to be increased. The H-1 corridor has been identified as a priority corridor for congestion mitigation; additional congestion-mitigation projects will be
concentrated in the rapidly developing Ewa/ Kapolei areas to enable them to hand future growth.
The Interstate H-1 Freeway on Oahu can get very congested during peak hours.
Implementation Programs With this statewide Plan, the state will work together with the districts to implement solutions to address identified needs. The different jurisdictions have existing programs or categories of funding priorities that can address the high-concern areas identified during the course of the Plan. Potential solutions to identified needs will be prioritized and implemented through a series of overarching state and county programs. These programs provide, manage, and maintain infrastructure and services on the federal-aid system of roadways. Exhibit 4-1 shows the correlation between potential solutions and these implementation programs. The overarching programs are further described below in terms of the types of potential solutions implemented by each.
Chapter IV. Implementation Page 4-3

Exhibit 4-1. Statewide Needs and Solutions
Statewide Need Potential Programmatic Solutions
Implemented through HDOT
Program
Aligned with Plan Goals and Objectives
Preserve and maintain highway operations
• Perform regular maintenance on roads and bridges.
• Remove roadside vegetation.
• Install erosion control and slope stabilization.
• Improve drainage facilities.
• Replace highway lighting.
• Repair bicycle lanes and sidewalks.
System Preservation
System Preservation, System Efficiency Management and Operations, Security
Improve nonmotorized capacity and safety
• Encourage Complete Streets.
• Construct new bicycle lanes and sidewalks.
• Provide lights, pavements markers, signage.
Capacity, Safety Safety, Environment and Sustainability, Modal Integration
Provide emergency access and improve resiliency
• Construct alternate routes or bypass roads.
• Reinforce critical lifeline facilities.
• Relocate roads away from shoreline.
Capacity Security, Safety
Improve and expand transit service
• Increase frequency of routes.
• Introduce service to new areas.
• Create transit connections to airports and harbors.
• Enhance transit amenities.
Regional transit authorities
Modal Integration, Transportation Access Mobility
Address and reduce congestion
• Consider transit-only lanes or high-occupancy vehicle lanes.
• Explore peak-hour, directional traffic control.
• Implement ITS technologies.
Congestion Economic Vitality, System Efficiency Management and Operations
System Preservation The System Preservation Program provides regular maintenance of transportation facilities to maintain the overall operations of the transportation system. Typical types of activities carried out by the System Preservation Program include:
» Pavement resurfacing and rehabilitation
» Bridge replacement and rehabilitation
» Drainage improvements
» Erosion control and runoff protection
» Sidewalk and bicycle facility repair
Highway maintenance is crucial statewide, especially on the islands belt roads which are often community lifelines. Maintaining the state’s
highways aligns with the System Preservation and System Efficiency Management and Operations goals of the Plan.
Erosion and drainage issues, Anahola, Kauai
Page 4-4 Chapter IV. Implementation

Capacity The Capacity Program supports capacity needs for all modes of land transportation. Through coordination between the HDOT and county, the types of projects that are implemented by the Capacity Program include:
» Roadway widening
» New roadway connections (bypasses, circulation improvements)
» New bridges
» New or improved pedestrian and bicycle facilities
Capacity improvements to the nonmotorized network would be carried out through pedestrian and bicycle subprograms within the Capacity Program. To accommodate future increases in population, new or improved nonmotorized infrastructure would be necessary. Planning for this increase aligns with the Plan’s Environment and Sustainability, Modal Integration and System Efficiency Management and Operations goals.
Congestion The Congestion Program manages and optimizes the performance of current transportation facilities. The focus of this program is to improve mobility, reliability and predictability of travel within the existing transportation network infrastructure. Typical projects that this program is responsible for include:
» Traffic signal upgrades
» Traffic signal optimization
» ITS
» Intersection improvements (including geometry and infrastructure)
Signalized intersection, Eleele, Kauai
Potential statewide solutions or strategies to reduce congestion are often coordinated with projects from the System Preservation Program and Safety Program. Congestion relief improvements align with the Economic Vitality and System Efficiency Management and Operations goals of the Plan because they support providing and maintaining an efficient transportation system.
Safety The Safety Program provides funding for safety related education and public outreach programs. It is also responsible for roadway and infrastructure improvements aimed at reducing the severity and number of crashes in areas characterized by high-accident occurrences. This program typically implements safety projects involving:
» Guardrail and shoulder improvements
» Rockfall and slope stabilization
» Shoreline erosion protection
» Retaining walls
» Upgraded pedestrian and bicycle facilities
» Highway lighting
Chapter IV. Implementation Page 4-5

Pedestrian crosswalk at Molokai High School, Molokai
Safety improvements would be aligned with the Plan’s Environment and Sustainability and Safety goals. Non-motorized safety improvements would be carried out through pedestrian and bicycle subprograms under the Safety Program, and would be accomplished through new facilities that provide greater separation from motorized modes or enhanced facilities that provide increased visibility between modes. Other potential solutions that could be implemented statewide include public awareness or educational campaigns.
Other Other potential solutions include additional studies to explore issues in depth, including circulation studies and access studies at specific locations.
The HDOT Highways Division includes an Other Program category to capture improvements to other highway facilities, right-of-way work, planning and research studies, and staff labor.
Solutions related to the environment and sustainability, and maintaining the unique natural environment surrounding many of the state’s roadways, would fall under the Other Program.
Nonmotorized Although there is not a separate program for nonmotorized modes, the Safety, System Preservation, and Capacity Programs each include
subprograms specifically focused on nonmotorized improvements including new facilities and repair and maintenance of existing facilities.
The pedestrian subprograms are responsible for implementing and addressing needs and deficiencies identified in the Statewide Pedestrian Master Plan. Similarly, the bicycle subprogram elements address the state’s prioritized needs identified in Bike Plan Hawaii.
Coordination between programs and overarching master plans ensures consistency in the long-term vision of the State of Hawaii’s land transportation system.
Shared path provides access for pedestrians and bicycles along Hana Highway in Paia, Maui.
Transit Transit service is operated independently by each of the counties. The programs do not directly implement transit improvements or maintain transit facilities, but coordination occurs between the HDOT and the transit agencies on each county so that resources, land uses, and inventory are complementary. Coordination between transit agencies and the HDOT occurs during planning, implementation, and operation of services to ensure the HDOT facilities adequately support transit vehicles and amenities.
The HDOT also provides support to county transit through distribution of federal transit funds from the Federal Transit Administration.
Page 4-6 Chapter IV. Implementation
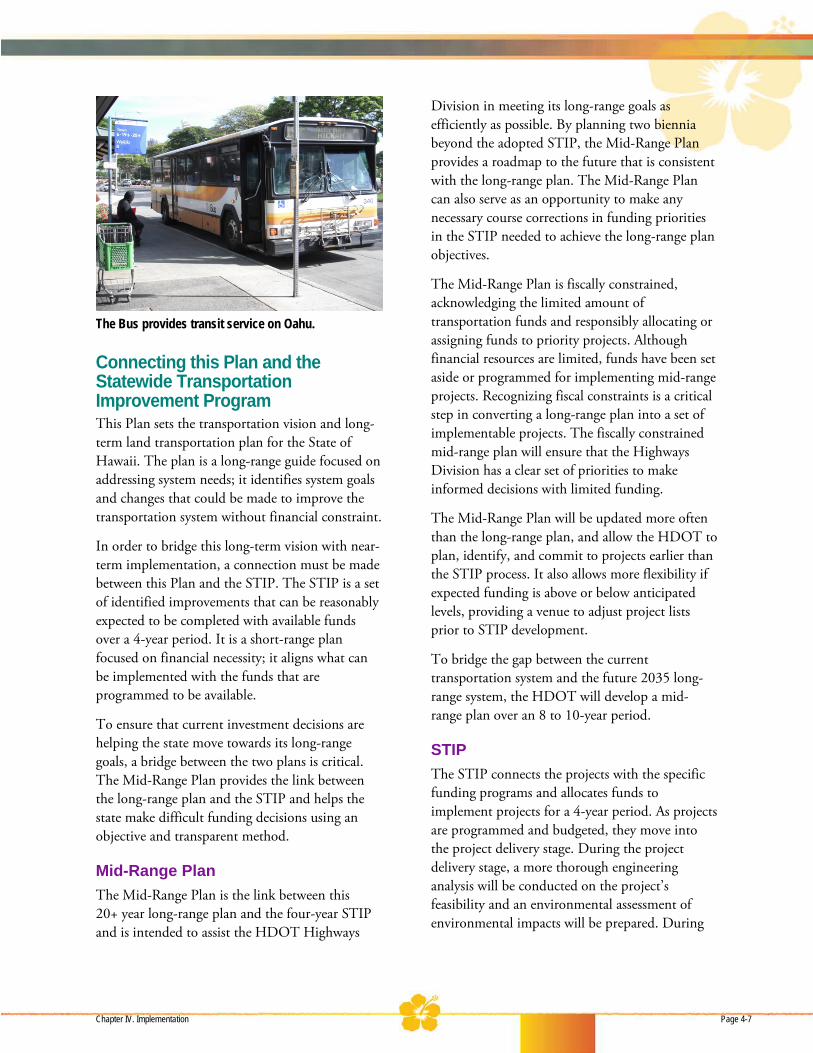
The Bus provides transit service on Oahu.
Connecting this Plan and the Statewide Transportation Improvement Program This Plan sets the transportation vision and long-term land transportation plan for the State of Hawaii. The plan is a long-range guide focused on addressing system needs; it identifies system goals and changes that could be made to improve the transportation system without financial constraint.
In order to bridge this long-term vision with near-term implementation, a connection must be made between this Plan and the STIP. The STIP is a set of identified improvements that can be reasonably expected to be completed with available funds over a 4-year period. It is a short-range plan focused on financial necessity; it aligns what can be implemented with the funds that are programmed to be available.
To ensure that current investment decisions are helping the state move towards its long-range goals, a bridge between the two plans is critical. The Mid-Range Plan provides the link between the long-range plan and the STIP and helps the state make difficult funding decisions using an objective and transparent method.
Mid-Range Plan The Mid-Range Plan is the link between this 20+ year long-range plan and the four-year STIP and is intended to assist the HDOT Highways
Division in meeting its long-range goals as efficiently as possible. By planning two biennia beyond the adopted STIP, the Mid-Range Plan provides a roadmap to the future that is consistent with the long-range plan. The Mid-Range Plan can also serve as an opportunity to make any necessary course corrections in funding priorities in the STIP needed to achieve the long-range plan objectives.
The Mid-Range Plan is fiscally constrained, acknowledging the limited amount of transportation funds and responsibly allocating or assigning funds to priority projects. Although financial resources are limited, funds have been set aside or programmed for implementing mid-range projects. Recognizing fiscal constraints is a critical step in converting a long-range plan into a set of implementable projects. The fiscally constrained mid-range plan will ensure that the Highways Division has a clear set of priorities to make informed decisions with limited funding.
The Mid-Range Plan will be updated more often than the long-range plan, and allow the HDOT to plan, identify, and commit to projects earlier than the STIP process. It also allows more flexibility if expected funding is above or below anticipated levels, providing a venue to adjust project lists prior to STIP development.
To bridge the gap between the current transportation system and the future 2035 long-range system, the HDOT will develop a mid-range plan over an 8 to 10-year period.
STIP The STIP connects the projects with the specific funding programs and allocates funds to implement projects for a 4-year period. As projects are programmed and budgeted, they move into the project delivery stage. During the project delivery stage, a more thorough engineering analysis will be conducted on the project’s feasibility and an environmental assessment of environmental impacts will be prepared. During
Chapter IV. Implementation Page 4-7
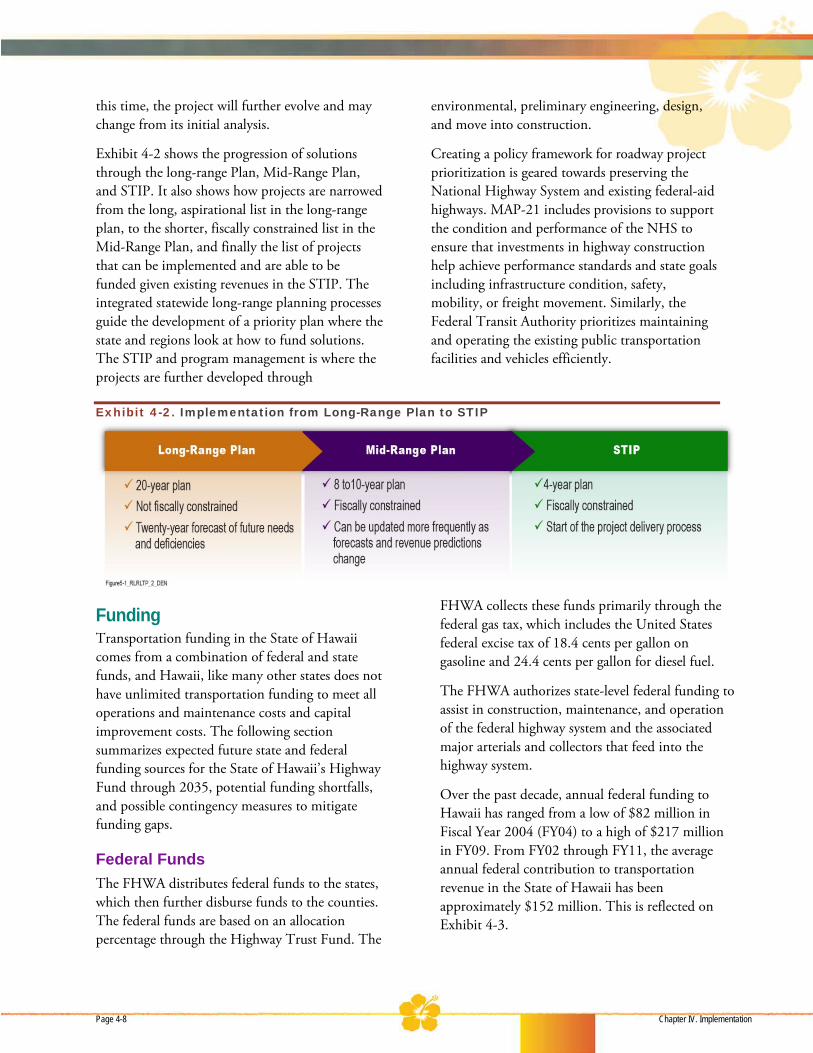
this time, the project will further evolve and may change from its initial analysis.
Exhibit 4-2 shows the progression of solutions through the long-range Plan, Mid-Range Plan, and STIP. It also shows how projects are narrowed from the long, aspirational list in the long-range plan, to the shorter, fiscally constrained list in the Mid-Range Plan, and finally the list of projects that can be implemented and are able to be funded given existing revenues in the STIP. The integrated statewide long-range planning processes guide the development of a priority plan where the state and regions look at how to fund solutions. The STIP and program management is where the projects are further developed through
environmental, preliminary engineering, design, and move into construction.
Creating a policy framework for roadway project prioritization is geared towards preserving the National Highway System and existing federal-aid highways. MAP-21 includes provisions to support the condition and performance of the NHS to ensure that investments in highway construction help achieve performance standards and state goals including infrastructure condition, safety, mobility, or freight movement. Similarly, the Federal Transit Authority prioritizes maintaining and operating the existing public transportation facilities and vehicles efficiently.
Exhibit 4-2. Implementation from Long-Range Plan to STIP
Funding Transportation funding in the State of Hawaii comes from a combination of federal and state funds, and Hawaii, like many other states does not have unlimited transportation funding to meet all operations and maintenance costs and capital improvement costs. The following section summarizes expected future state and federal funding sources for the State of Hawaii’s Highway Fund through 2035, potential funding shortfalls, and possible contingency measures to mitigate funding gaps.
Federal Funds The FHWA distributes federal funds to the states, which then further disburse funds to the counties. The federal funds are based on an allocation percentage through the Highway Trust Fund. The
FHWA collects these funds primarily through the federal gas tax, which includes the United States federal excise tax of 18.4 cents per gallon on gasoline and 24.4 cents per gallon for diesel fuel.
The FHWA authorizes state-level federal funding to assist in construction, maintenance, and operation of the federal highway system and the associated major arterials and collectors that feed into the highway system.
Over the past decade, annual federal funding to Hawaii has ranged from a low of $82 million in Fiscal Year 2004 (FY04) to a high of $217 million in FY09. From FY02 through FY11, the average annual federal contribution to transportation revenue in the State of Hawaii has been approximately $152 million. This is reflected on Exhibit 4-3.
Page 4-8 Chapter IV. Implementation

The purchasing power of the federal gas tax has been and will continue to decrease in the future with more fuel-efficient vehicles and inflation. The federal gas tax has not been raised since 1993, and has not kept pace with rising inflation. Compounding the issue is an existing gap between current federal gas tax revenues and the nationwide funding needs. There are a few congressional bills to increase the federal gas tax and recommendations for shifting to an alternate taxing structure, but none are likely to be implemented in the near future.
Exhibit 4-3. Historical Federal Contribution
$ Million
$50 Million
$100 Million
$150 Million
$200 Million
$250 Million
2002 2003 2004 2005 2006 2007 2008 2009 2010 2011
MAP-21 In July 2012, the adoption of Moving Ahead for Progress in the 21st Century (MAP-21) allowed for change in the way federal funding is distributed to individual states. Previously, core federal highway programs were able to distribute funds to states using individual formulas. Now, funds are distributed in a lump sum to states based on 2012 proportions (by state) received under SAFETEA-LU. The individual states are then able to allocate and distribute funds internally to their core programs with some limited flexibility to transfer funds between programs.
Since the enactment of MAP-21, funding methods and amounts through FY14 are not likely to be aligned with the historic trend of the last decade. Beyond FY14, the amount of future federal dollars that Hawaii will receive for the highway system is unknown. In order to conservatively forecast the amount of available federal funds through the long-range planning period, the Plan assumes a constant
average amount of approximately $152 million annually between FY12 and FY35.
The Highway Trust Fund, dependent upon the gas tax, has been decreasing for all states over the past few years as the vehicle fleet becomes more fuel efficient and per capita vehicle miles traveled continues to decrease nationwide. The Congressional Budget Office estimates that the Highway Trust Fund will not be able to sustain current levels of expenditure before the end of fiscal year 2014 without additional funds.
State Funds The state raises funds from six primary sources: fuel taxes, rental/tour vehicle surcharges, weight taxes, vehicle registration fees, miscellaneous fees, and interest from invested highway funds.
Highway Fuel License Tax – The highway fuel tax is $0.17 per gallon of gasoline and diesel oil for highway use and $0.02 per gallon of gasoline, diesel oil, and liquid petroleum gas for non-highway use. Fuel taxes are collected by the Department of Taxation and transferred to the State Highway Fund. In FY11, the highway fuel tax contributed approximately $89.0 million to the State Highway Fund.
Vehicle Registration Fees – The state vehicle registration fee is $45 per vehicle. In FY11, the registration fees contributed approximately $20.8 million to the State Highway Fund.
Weight Taxes – All vehicles in the state are assessed an annual state vehicle weight tax. This tax is $0.0175 per pound, or a maximum charge of $300 per vehicle. In FY 2011, weight taxes contributed approximately $33.4 million in revenues to the State Highway Fund.
Rental/Tour Vehicle Surcharge – The rental/tour vehicle surcharge imposes a daily tax on the rental of all motor vehicles and tour vehicles. In FY11, the rental and tour vehicle surcharge contributed approximately $43.9 million to the State Highway Fund.
Interest – This is income derived from the investment of Highway Special fund money held by
Chapter IV. Implementation Page 4-9

the State. In FY11, interest income was approximately $4.0 million.
Miscellaneous – Miscellaneous revenues include permit fees, driver license fees, inspection fees, rental fees, and other miscellaneous revenues.
The highway fuel license tax and the rental/tour vehicle surcharges make up over 60 percent of all state highway fund revenue and are expected to be major contributors to future funds. While federal funding is assumed to remain constant, state funding revenues could be expected to grow on an annual basis of approximately 1 percent per year. This growth rate is consistent with growth rates presented in the 2011 Highway Revenue Bonds Official Statement. See Appendix G for more detail on funding and revenue sources.
Based on estimated federal funding and state revenues, the total combined transportation funding for the State of Hawaii could be expected to increase to nearly $495 million annually by 2035 (FY11 total is approximately $400 million). This results in cumulative total estimated revenue of $11.10 billion from 2011 through 2035. These values are not adjusted for inflation.
Inflation The state accounts for inflation when developing financial plans that include distribution of future federal dollars. The HDOT uses a constant inflation rate of 4 percent for all financial planning. This plan assumes future transportation funding dollars, with state revenue sources expected to increase at approximately 1 percent per year, and federal sources to remain at a constant level. This means that the buying power of the transportation revenue sources will decrease in real terms between now and 2035. When adjusted for inflation, the estimated federal and state revenues available for transportation projects between FY11-FY35 would total approximately $7.01 billion.
Decreasing funding and inflation concerns require the state to look at other funding sources to fund priority transportation projects and programs.
Future Funding As discussed above, there is a large gap between the cost of statewide land transportation needs and available forecasted funds. Based on preliminary cost estimates of the regional transportation needs and the unknown costs of addressing statewide programmatic needs, expenses will outweigh revenues.
Between 2014 and 2035, available funds are projected to be approximately $7.01 billion while the combined statewide needs would cost over $30 billion. This results in a statewide funding gap of over $23 billion. See Exhibit 4-4 for the expected dollars needed to implement statewide needs versus the projected revenue.
This shortfall between anticipated funding levels and funding needs is not unique to Hawaii; a consortium of states is studying alternatives to the gas tax to fund highways, and there are a number of pilot projects throughout the states looking into road usage charges, where drivers pay based on the miles they drive. In 2015, the state of Oregon will start a pilot program of 5,000 drivers to test a number of data collection methods and fee structures.
Exhibit 4-4 indicates that each of the regions have different transportation deficiencies and therefore different funding needs. These individual regional needs and deficiencies are addressed through the plans for the districts of Maui, Hawaii, and Kauai. As shown, estimated statewide transportation needs are not likely to be met with expected revenues. This situation, while not unique, will require the state to prioritize solutions in order to ensure effective use of available funding resources, and equitably distribute limited funds.
Page 4-10 Chapter IV. Implementation

Exhibit 4-4. Statewide Need and Revenue
Region Estimated Need ($B)
Expected Revenue
($B)
Funding Gap ($B)
Oahu $16.7 $3.6 ($13.1)
Maui $3.7 $1.6 ($2.1)
Hawaii $7.4 $1.2 ($6.2)
Kauai $3.1 $0.6 ($2.5)
Total $30.2 $7.0 ($23.9)
Each region would likely experience a funding shortage by 2035, which would result in each program also finding a significant gap in available funds. Exhibit 4-5 presents the estimated cost of needs by program where information is available.
Exhibit 4-5. Estimated Cost of HDOT Program Needs
Program Oahu Maui Hawaii Kauai
System Preservation
$406 M $1.1 B $315 M
Safety $680 M $960 M $595 M
Capacity $2.5 B $4.1 B $2.1 B
Congestion $60 M $405 M $57 M
Other $60 M $795 M $10 M
Total $16.7 B $3.7 B $7.4 B $3.1 B
The current funding outlook indicates a significant statewide gap, and based on historical trends this gap is not expected to close over this Plan’s planning horizon. While funding gaps may narrow slightly, shortfalls in available dollars will continue to be a key factor in planning and prioritizing future transportation investments.
This Plan acknowledges the need to make hard investment decisions and provides a sound prioritization process as one tool to help decision-makers work through difficult choices. With technical advice and guidance from federal and state policies and plans, and contextual perspectives from state and county staff and the community, the Plan was developed through many layers of input. The Plan uses a comprehensive process to evaluate and
prioritize projects while incorporating core goals and values developed at the outset of the process. It provides a strategy for moving forward with implementation, which will effectively use the funds available for addressing the needs of the transportation system.
This Plan provides key decision-makers with insight into continuing the community’s values through program priorities. Community priorities are included in the weighted goals and reflected in the planned future funding distribution to the HDOT Highways Division Programs shown on Exhibit 4-6. This funding allocation emphasizes statewide needs by program, rather than by district.
Exhibit 4-6. Future Funding Distribution by HDOT Program
Programs Percentages
System Preservation 45% Safety 18% Capacity 25% Congestion 10% Other 2% TOTAL 100%
This breakdown of estimated program funding is consistent with the Plan’s goals mentioned in Chapter II:
» Preserving the existing system
» Enhancing safety
» Realizing efficiency and expanded roadway capacity
» Realizing multimodal integration and Complete Streets
» Increasing resiliency and ability to respond to emergency events
» Increasing funding levels
Future distribution of funds is consistent with MAP-21. While investing in the transportation system could involve new facilities, MAP-21 guidance is largely focused on improving or enhancing current assets, and preserving and maintaining the condition of existing infrastructure.
Chapter IV. Implementation Page 4-11
The majority of MAP-21 federal highway funds are dedicated to strengthening the National Highway System, which includes key principal arterials and through preservation and improvement of priority roadways in the existing federal-aid network. Additional information regarding MAP-21’s performance goals are shared later in this section.
Supplemental Funding and Non-Funding Strategies Based on the above analysis, the state is not expected to have enough funding to address all identified needs. Funding shortages will likely mean deferral of needed projects and may delay critical improvements to safety, congestion relief, and infrastructure preservation. Delays to improvements in the transportation system lead to frustration among the taxpaying citizens who expect the highway infrastructure to keep up with the growing demand. Unpredictability in funding sources for transportation projects also makes it difficult to plan for future facilities.
While this Plan provides critical guidance for decision-makers, especially during times when needs exceed available funding, the state may consider alternative revenue sources to continue to fund the needs of the transportation system. Appendix H summarizes potential future funding strategies and other revenue sources that could be considered by the Legislature and other governing bodies, including:
» Mileage-based user fees – Drivers pay a fee based on the number of miles traveled on public roadways. Private roadways would be excluded. Mileage could be tracked through various methods.
» Tolls – Drivers pay a fee each time a specific public roadway is used or a certain bridge is crossed. Toll fees may change based on the time of day. Tolling in Hawaii would require the Legislature to change the current laws that prohibit toll charges.
» Special general excise tax on automotive parts and services – Taxes would be collected through the performance of specific services
(such as vehicle inspections or repairs) and the sale of equipment related to motorized vehicles.
» General excise tax increase – A portion of revenue from an increase in the general sales tax could be allocated to transportation improvements and projects.
» Public/private partnerships – An agreement between a private entity and a public agency to deliver transportation projects, typically with greater involvement and risk taken by the private entity.
» Impact fees on new development – Private developers pay a pre-determined fee per development unit. This fee is based on the number of vehicle trips expected to be generated by the potential development.
» Bicycle registration – A bicycle licensing system could be developed, and user fees could be collected based on the type of bicycle registered. Fees could support maintenance and upkeep of bicycle lanes and shared roadways.
» Carbon tax/cap – A fee or tax could be imposed on producers of large amounts of carbon. These producers would pay a fee to offset their carbon production.
» Increase current funding sources – Because new sources of funding are difficult to identify, increasing the existing mechanisms – such as raising the rental/tour vehicle surcharge or vehicle weight tax – could generate additional revenue.
» Revise or restructure current funding systems – Updating and revising regulations for fee systems that may be outdated, such as the Vehicle Size and Weight Program or the Heavy Vehicle Use Tax, could increase the amount of revenue collected.
» Grant anticipation borrowing – This strategy allows public agencies to borrow against anticipated future federal and/or state revenues to fund capital projects that require large upfront expenditures. Existing programs include Grant Anticipation Revenue Vehicle
Page 4-12 Chapter IV. Implementation
(GARVEE) bonds for highways and Grant Anticipation Note (GAN) bonds for transit.
» State infrastructure banks and other revolving loan funds – These are lending organizations initially funded with federal grants and/or state funds and operated at the state level. These funds leverage federal and state resources by lending rather than granting federal-aid funds, and can attract nonfederal public and private investment.
» Bonds – Bonds are issued by the state or other agency to finance assets with long useful lives (such as transportation projects). The administering entity issues bonds with a set return on investment, and investors purchase the bonds to help fund transportation projects. Bonds help smooth the impact of large expensive projects by providing upfront capital, and allowing the state or county to repay over a set amount of time.
» Land swaps and donated lands – This strategy is not a funding source per se, however, right-of-way costs can be a large portion of total transportation project costs. Working with land owners to either swap land for right-of-way or to donate land for a project could be a way to reduce project costs. Donated land could also be used as a local match to leverage federal funds.
Reducing Transportation Infrastructure Funding Needs In addition to identifying and implementing transportation projects to address identified needs, there are a number of other strategies to reduce the demand on the transportation system and to meet future needs without investing directly into the vehicle transportation network. The two main strategies are described below.
Land Use Planning Transportation and land use are closely linked. Transportation demand is derived from surrounding land uses, where certain types of land uses and more intensive development are known to generate greater travel demand. The demand for
auto-based travel—and the concomitant need for roadway investment—can be influenced through land use decisions and urban design. For example, the development of denser, mixed-use areas or “20-Minute Neighborhoods” often leads to greater travel options for community members. Private auto use declines when the environment is attractive to pedestrians, bicyclists, and transit users. But achieving land use changes requires zoning codes and regulations that allow for mixed uses and flexible design.
Transportation Demand Management Strategies Another way to reduce the need for transportation infrastructure funding is to reduce the vehicle demand on roadways. There are a number of strategies that states and counties can implement to help manage travel demand. Most strategies aim to change the mode of travel, the time of travel, or to replace the trip with other options, as described below:
» Make bicycling attractive – require bicycle-friendly facilities, such as easily accessed and secure bike parking and storage, showers at destination locations (including employers), and other amenities.
» Make walking attractive - Require sidewalks and pedestrian infrastructure such as mid-block crossings, pedestrian activated signals, and shaded routes. Change land use patterns or zoning codes to create more walkable districts and improve connectivity among pedestrian destinations.
» Make transit attractive – Increase the number of transit routes, expand service hours, and shorten headways to improve the overall transit network. Create a transit pass programs with large employers, subsidize passes for employees or residents, and create transit priority corridors to ensure transit is an attractive option to the single-occupancy vehicle.
» Make ridesharing attractive – implement education and ride-matching programs to increase the number of people per vehicle, and reduce single-occupancy vehicles on the
Chapter IV. Implementation Page 4-13
roadway. Work with employers and high-volume destinations to implement ridesharing programs through incentives such as preferential parking. Explore social media and mobile apps to facilitate connections between program participants.
» Make parking more expensive – implement parking pricing in high-demand areas to increase the cost of driving alone.
» Change travel times – work with employers to implement flexible work schedules to reduce congestion during peak travel times.
» Reduce potential trips – work with employers to implement teleworking to reduce the amount of trips employees take to work.
Performance Measures Federal statutes now require performance measures to ensure that transportation projects and investments meet federal goals. The MAP-21 legislation requires performance measures for six of the federally-required planning factors to support a performance and outcome-based state highway program, and provides a set of broad national transportation performance goals intended to help states invest their limited funds efficiently. MAP-21 performance goals include:
» Safety – significantly reduce traffic fatalities and serious injuries on all public roads
» Infrastructure Condition – maintain highway infrastructure assets in state of good repair
» Congestion Reduction – significantly reduce congestion on the National Highway System
» System Reliability – improve the efficiency of the surface transportation system
» Freight Movement and Economic Vitality – improve freight networks, strengthen the ability of rural communities to access national and international trade markets, and support regional economic development
» Environmental Sustainability – enhance transportation system performance while protecting and enhancing the natural environment
» Reduce Project Delivery Delays – reduce project costs, promote jobs and the economy, and expedite the movement of people and goods by accelerating project completion through eliminating delays in the project development and delivery process, including reducing regulatory burdens and improving agencies’ work practices.
The MAP-21 performance goals align with the Statewide and regional plan planning factors, as shown in Exhibit 2-3 in Chapter II. The planning factors are the framework of the Plan, and have guided the creation of the goals and objectives, identification of needs, and the development of prioritized potential solutions.
Using these measures to assess roadway system performance after projects are implemented is an important part of the overall long-range planning process. Once implemented, projects or system improvements should maintain or enhance operations by addressing identified needs and deficiencies. To evaluate how well a particular project is performing, the transportation system should be monitored and results should be measured against a set of predetermined performance goals or targets.
Meeting these targets could mean that the implemented project was the appropriate one, and that there is value being gained from the dollars invested; in theory, the transportation system is better because the project was constructed. If targets are not met, changes to the projects or priorities could be made to continue striving towards the goal. Ongoing tracking of system performance would provide valuable information to guide future planning for evolving needs.
The HDOT programs currently collect data for use in maintenance cycles and priority setting. Each program will set up performance measures that are consistent with its goals and objectives and with MAP-21.
Given limited funding for all state highway programs, it is critical that investments provide value and work towards achieving desired outcomes. Since the potential solutions have been shaped
Page 4-14 Chapter IV. Implementation
around the planning factors, the investments made to implement these solutions are aligned with the MAP-21 national performance goals.
Additional Strategies This Plan provides the framework to prepare Hawaii’s land transportation system to meet the needs of its residents and visitors by 2035. In addition to prioritization processes and funding mechanisms, this Plan includes additional strategies that could provide further benefit to the state’s land transportation system. These strategies include:
» Improve coordination between jurisdictions and align efforts earlier in planning processes. By sharing information on future infrastructure or facilities well in advance, state and county funds may be identified or set aside earlier to ensure they are there for the highest priority needs.
» Incorporate statewide policies through legislation to require planning of balanced, integrated land transportation systems throughout the state’s communities.
» Help counties promote transit options and increase visibility of available transit infrastructure and service. Strive to effectively link customers and transportation services.
» Incorporate policies to designate freight routes or truck routes on roadways adjacent to airports and harbors. Provide optimum travel paths for freight vehicles to distribute cargo efficiently on each island.
» Emphasize the functional classification of roadways and ensure that transportation facilities are appropriately sized and located. Ensure a land transportation system which allows local trips to be conducted primarily on the local roadway system in urbanized areas.
» Accelerate delivery of transportation projects and gain benefit from time and cost savings through design-build or construction-contractor partnerships. This is consistent with the FHWA’s Every Day Counts Initiative and MAP-21’s performance goal of reduced project delivery delays.
Chapter IV. Implementation Page 4-15

Chapter V References

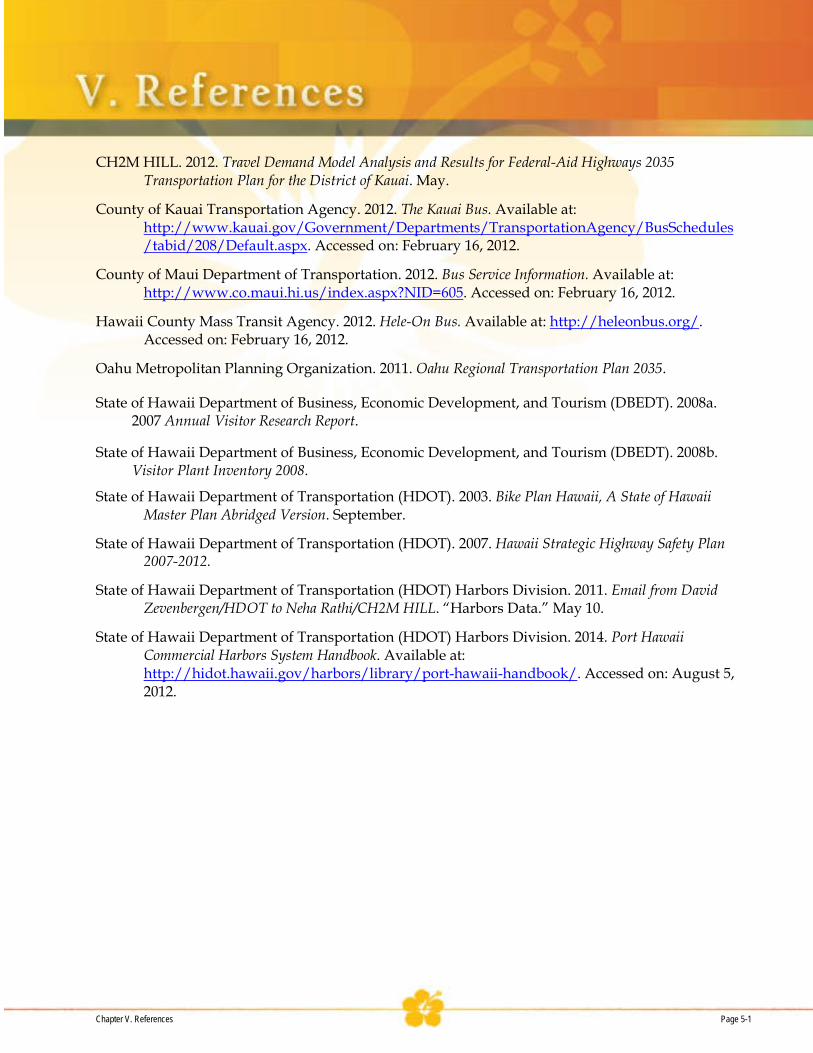
CH2M HILL. 2012. Travel Demand Model Analysis and Results for Federal-Aid Highways 2035 Transportation Plan for the District of Kauai. May.
County of Kauai Transportation Agency. 2012. The Kauai Bus. Available at: http://www.kauai.gov/Government/Departments/TransportationAgency/BusSchedules/tabid/208/Default.aspx. Accessed on: February 16, 2012.
County of Maui Department of Transportation. 2012. Bus Service Information. Available at: http://www.co.maui.hi.us/index.aspx?NID=605. Accessed on: February 16, 2012.
Hawaii County Mass Transit Agency. 2012. Hele-On Bus. Available at: http://heleonbus.org/. Accessed on: February 16, 2012.
Oahu Metropolitan Planning Organization. 2011. Oahu Regional Transportation Plan 2035.
State of Hawaii Department of Business, Economic Development, and Tourism (DBEDT). 2008a. 2007 Annual Visitor Research Report.
State of Hawaii Department of Business, Economic Development, and Tourism (DBEDT). 2008b. Visitor Plant Inventory 2008.
State of Hawaii Department of Transportation (HDOT). 2003. Bike Plan Hawaii, A State of Hawaii Master Plan Abridged Version. September.
State of Hawaii Department of Transportation (HDOT). 2007. Hawaii Strategic Highway Safety Plan 2007-2012.
State of Hawaii Department of Transportation (HDOT) Harbors Division. 2011. Email from David Zevenbergen/HDOT to Neha Rathi/CH2M HILL. “Harbors Data.” May 10.
State of Hawaii Department of Transportation (HDOT) Harbors Division. 2014. Port Hawaii Commercial Harbors System Handbook. Available at: http://hidot.hawaii.gov/harbors/library/port-hawaii-handbook/. Accessed on: August 5, 2012.
Chapter V. References Page 5-1
http://www.kauai.gov/Government/Departments/TransportationAgency/BusSchedules/tabid/208/Default.aspx


Appendix AHighway Functional Classification Maps


KEY TO SHEETS
0 30000 FEET1000010000 20000
N
DATE REVISIONS
XXXXXXXX
XXXXXXXX
XXXXXXXX
XXXXXXXX
XXXXXXXX
XXXXXXXX
XXXXXXXX
XXXXXXXX
XXXXXXXX
XXXXXXXX
XXXXXXXX
XXXXXXXX
XXXXXXXX X
X
X
X
X
X
X
X
X
X
X
X
X
HIGHWAY FUNCTIONAL CLASSIFICATION MAP
PREPARED BY THE
STATE OF HAWAII
DEPARTMENT OF TRANSPORTATIONHIGHWAYS DIVISION
HIGHWAY PLANNING BRANCHIN COOPERATION WITH THE
U.S. DEPARTMENT OF TRANSPORTATION
FEDERAL HIGHWAY ADMINISTRATION
ISLAND OF OAHU
2013
0 1 2 3 4 mi
SCALE 1" = 10,000'
Ineligible
Legend
Rural Principal Arterial - Other
Rural Minor Arterial
Rural Major Collector
Rural Minor Collector
Urban Areas
Urban Principal Arterial - Interstate
Urban Principal Arterial - Freeways/Expressways
Urban Principal Arterial - Other
Urban Minor Arterial
Urban Major Collector
Urban Minor Collector
Committed / Under Construction
PAGE 5
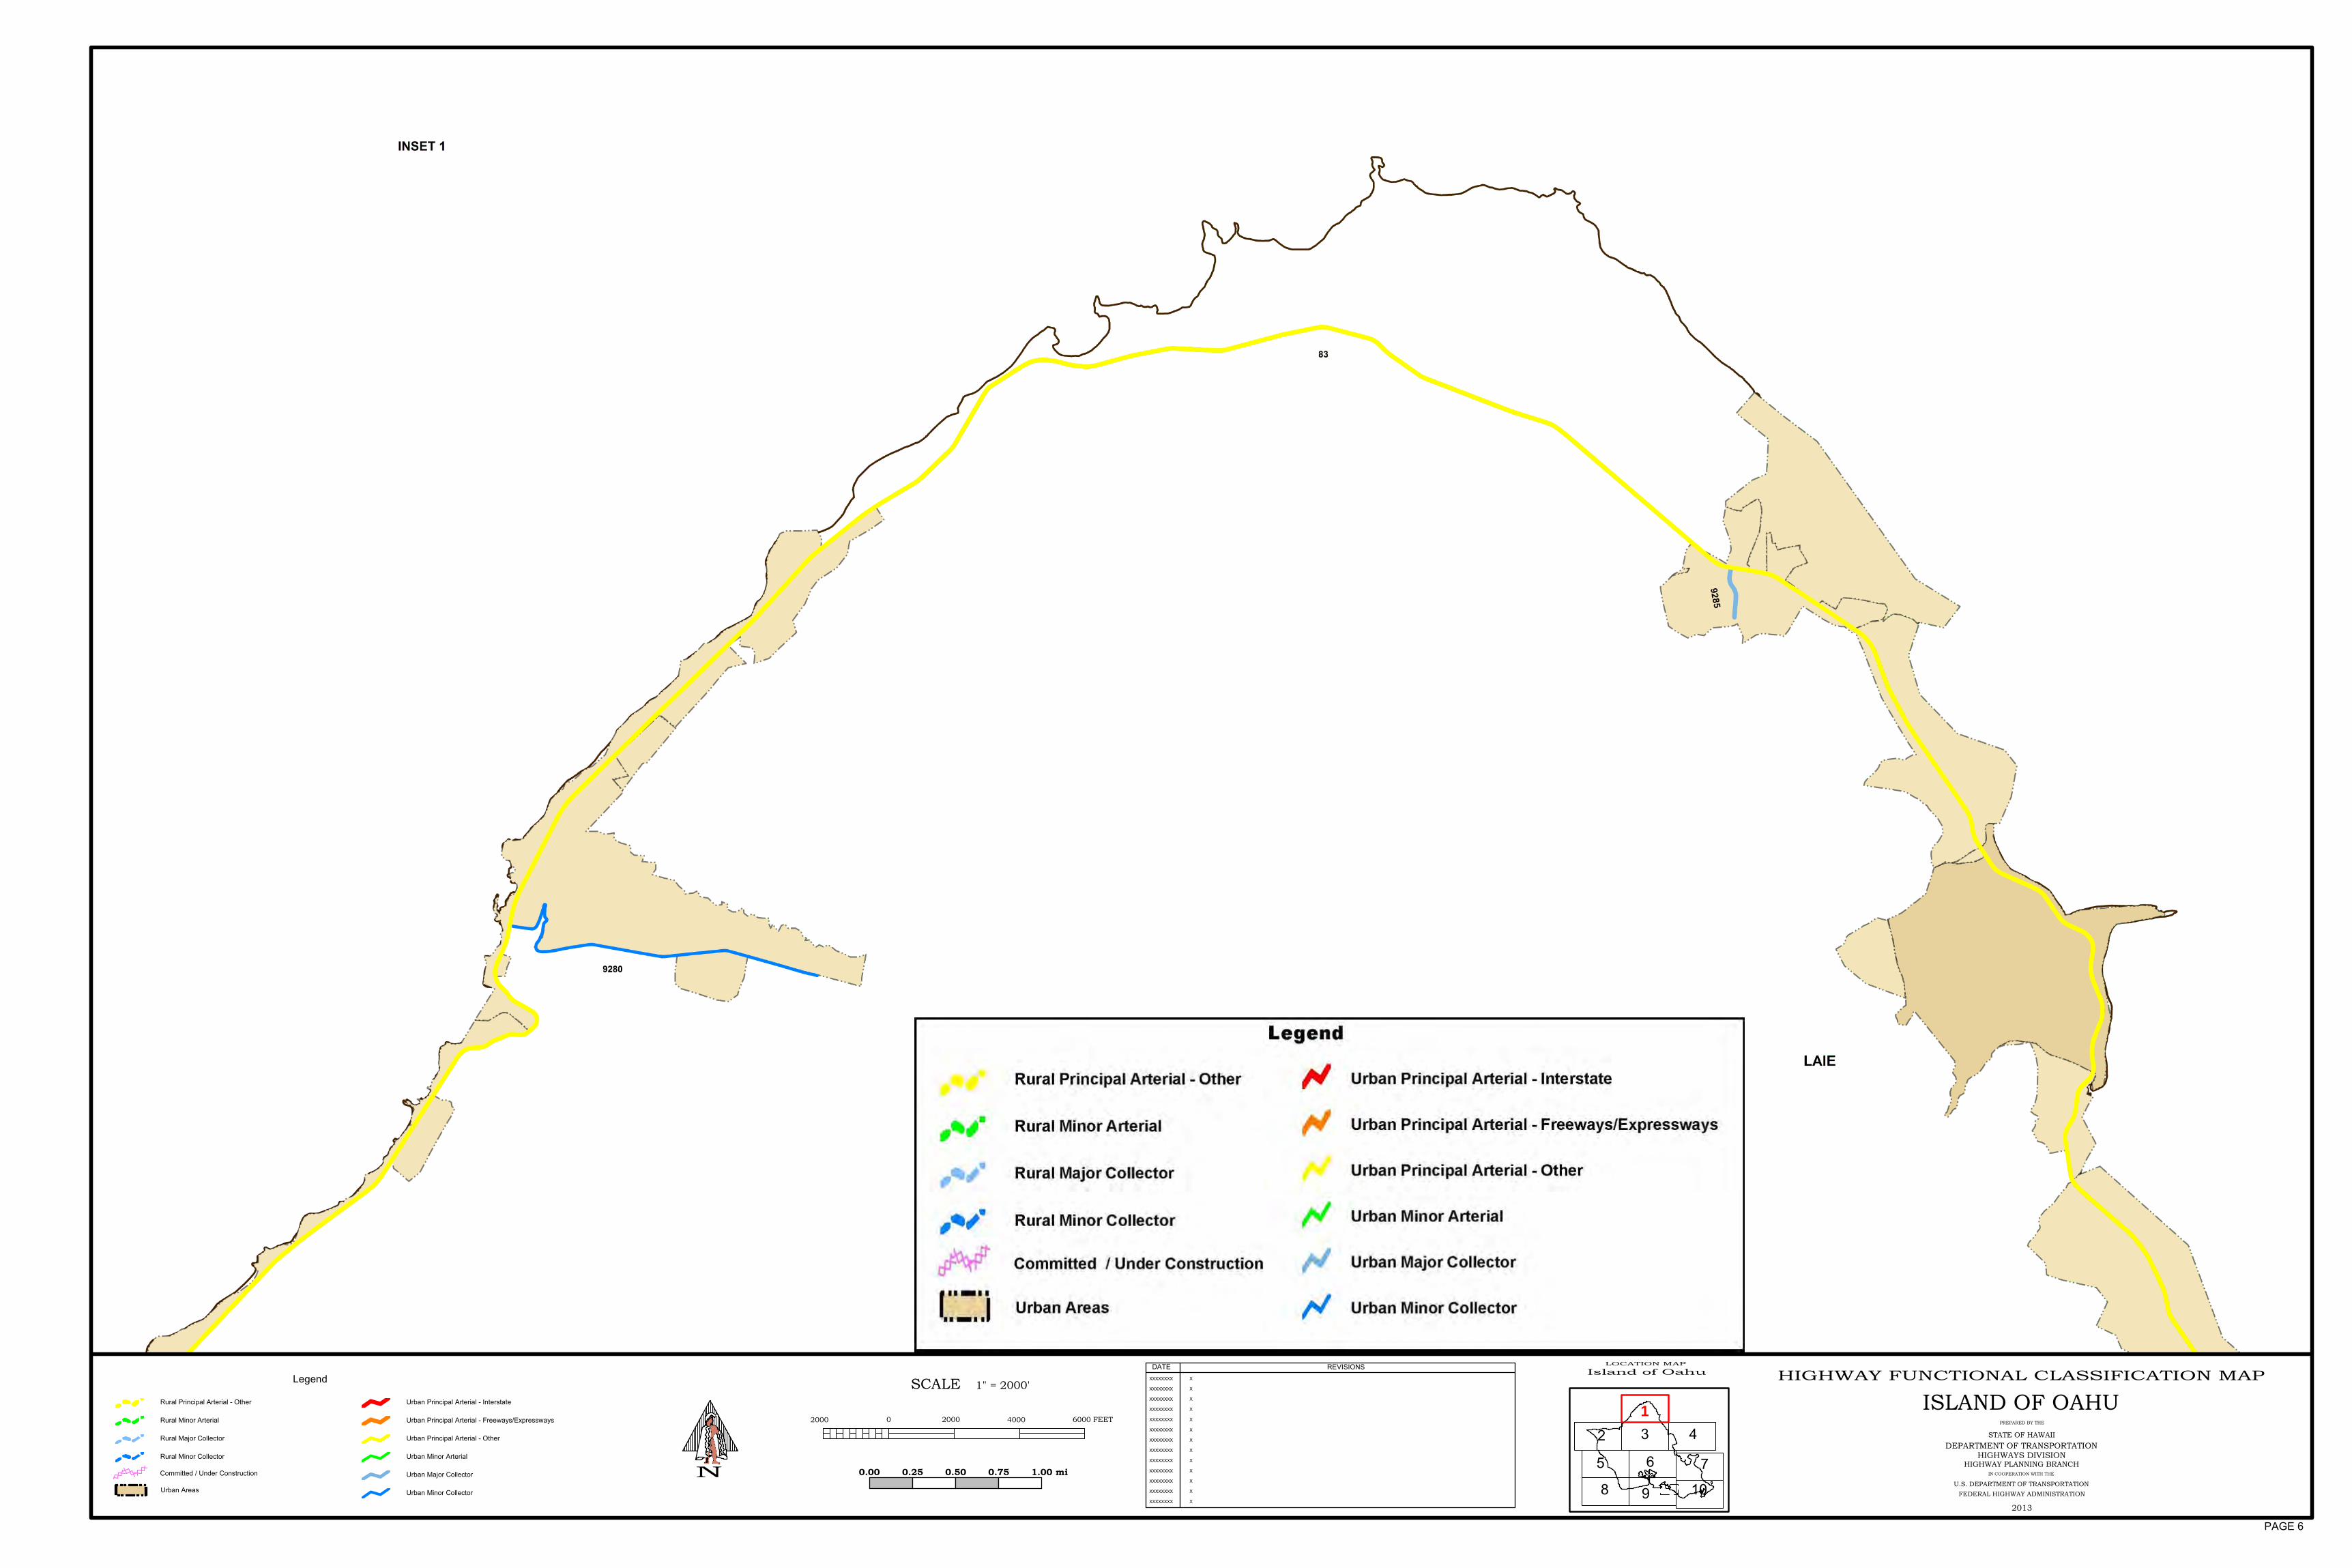
N
SCALE 1" = 2000'
02000 2000 4000 6000 FEET
LOCATION MAP
Island of Oahu
1
2 3 4
6 7
1098
DATE REVISIONS
XXXXXXXX
XXXXXXXX
XXXXXXXX
XXXXXXXX
XXXXXXXX
XXXXXXXX
XXXXXXXX
XXXXXXXX
XXXXXXXX
XXXXXXXX
XXXXXXXX
XXXXXXXX
XXXXXXXX X
X
X
X
X
X
X
X
X
X
X
X
X
HIGHWAY FUNCTIONAL CLASSIFICATION MAP
PREPARED BY THE
STATE OF HAWAII
DEPARTMENT OF TRANSPORTATIONHIGHWAYS DIVISION
HIGHWAY PLANNING BRANCHIN COOPERATION WITH THE
U.S. DEPARTMENT OF TRANSPORTATION
FEDERAL HIGHWAY ADMINISTRATION
ISLAND OF OAHU
2013
0.00 0.25 0.50 0.75 1.00 mi5
Legend
Rural Principal Arterial - Other
Rural Minor Arterial
Rural Major Collector
Rural Minor Collector
Urban Areas
Urban Principal Arterial - Interstate
Urban Principal Arterial - Freeways/Expressways
Urban Principal Arterial - Other
Urban Minor Arterial
Urban Major Collector
Urban Minor Collector
Committed / Under Construction
PAGE 6

Island of Oahu
1
2 3 4
6 7
1098
DATE REVISIONS
XXXXXXXX
XXXXXXXX
XXXXXXXX
XXXXXXXX
XXXXXXXX
XXXXXXXX
XXXXXXXX
XXXXXXXX
XXXXXXXX
XXXXXXXX
XXXXXXXX
XXXXXXXX
XXXXXXXX X
X
X
X
X
X
X
X
X
X
X
X
X
HIGHWAY FUNCTIONAL CLASSIFICATION MAP
PREPARED BY THE
STATE OF HAWAII
DEPARTMENT OF TRANSPORTATIONHIGHWAYS DIVISION
HIGHWAY PLANNING BRANCHIN COOPERATION WITH THE
U.S. DEPARTMENT OF TRANSPORTATION
FEDERAL HIGHWAY ADMINISTRATION
ISLAND OF OAHU
2013
LOCATION MAP
N
SCALE 1" = 2000'
02000 2000 4000 6000 FEET
0.00 0.25 0.50 0.75 1.00 mi5
Legend
Rural Principal Arterial - Other
Rural Minor Arterial
Rural Major Collector
Rural Minor Collector
Urban Areas
Urban Principal Arterial - Interstate
Urban Principal Arterial - Freeways/Expressways
Urban Principal Arterial - Other
Urban Minor Arterial
Urban Major Collector
Urban Minor Collector
Committed / Under Construction
PAGE 7

Island of Oahu
1
2 3 4
6 7
1098
DATE REVISIONS
XXXXXXXX
XXXXXXXX
XXXXXXXX
XXXXXXXX
XXXXXXXX
XXXXXXXX
XXXXXXXX
XXXXXXXX
XXXXXXXX
XXXXXXXX
XXXXXXXX
XXXXXXXX
XXXXXXXX X
X
X
X
X
X
X
X
X
X
X
X
X
HIGHWAY FUNCTIONAL CLASSIFICATION MAP
PREPARED BY THE
STATE OF HAWAII
DEPARTMENT OF TRANSPORTATIONHIGHWAYS DIVISION
HIGHWAY PLANNING BRANCHIN COOPERATION WITH THE
U.S. DEPARTMENT OF TRANSPORTATION
FEDERAL HIGHWAY ADMINISTRATION
ISLAND OF OAHU
2013
LOCATION MAP
N
SCALE 1" = 2000'
02000 2000 4000 6000 FEET
0.00 0.25 0.50 0.75 1.00 mi5
Legend
Rural Principal Arterial - Other
Rural Minor Arterial
Rural Major Collector
Rural Minor Collector
Urban Areas
Urban Principal Arterial - Interstate
Urban Principal Arterial - Freeways/Expressways
Urban Principal Arterial - Other
Urban Minor Arterial
Urban Major Collector
Urban Minor Collector
Committed / Under Construction
PAGE 8
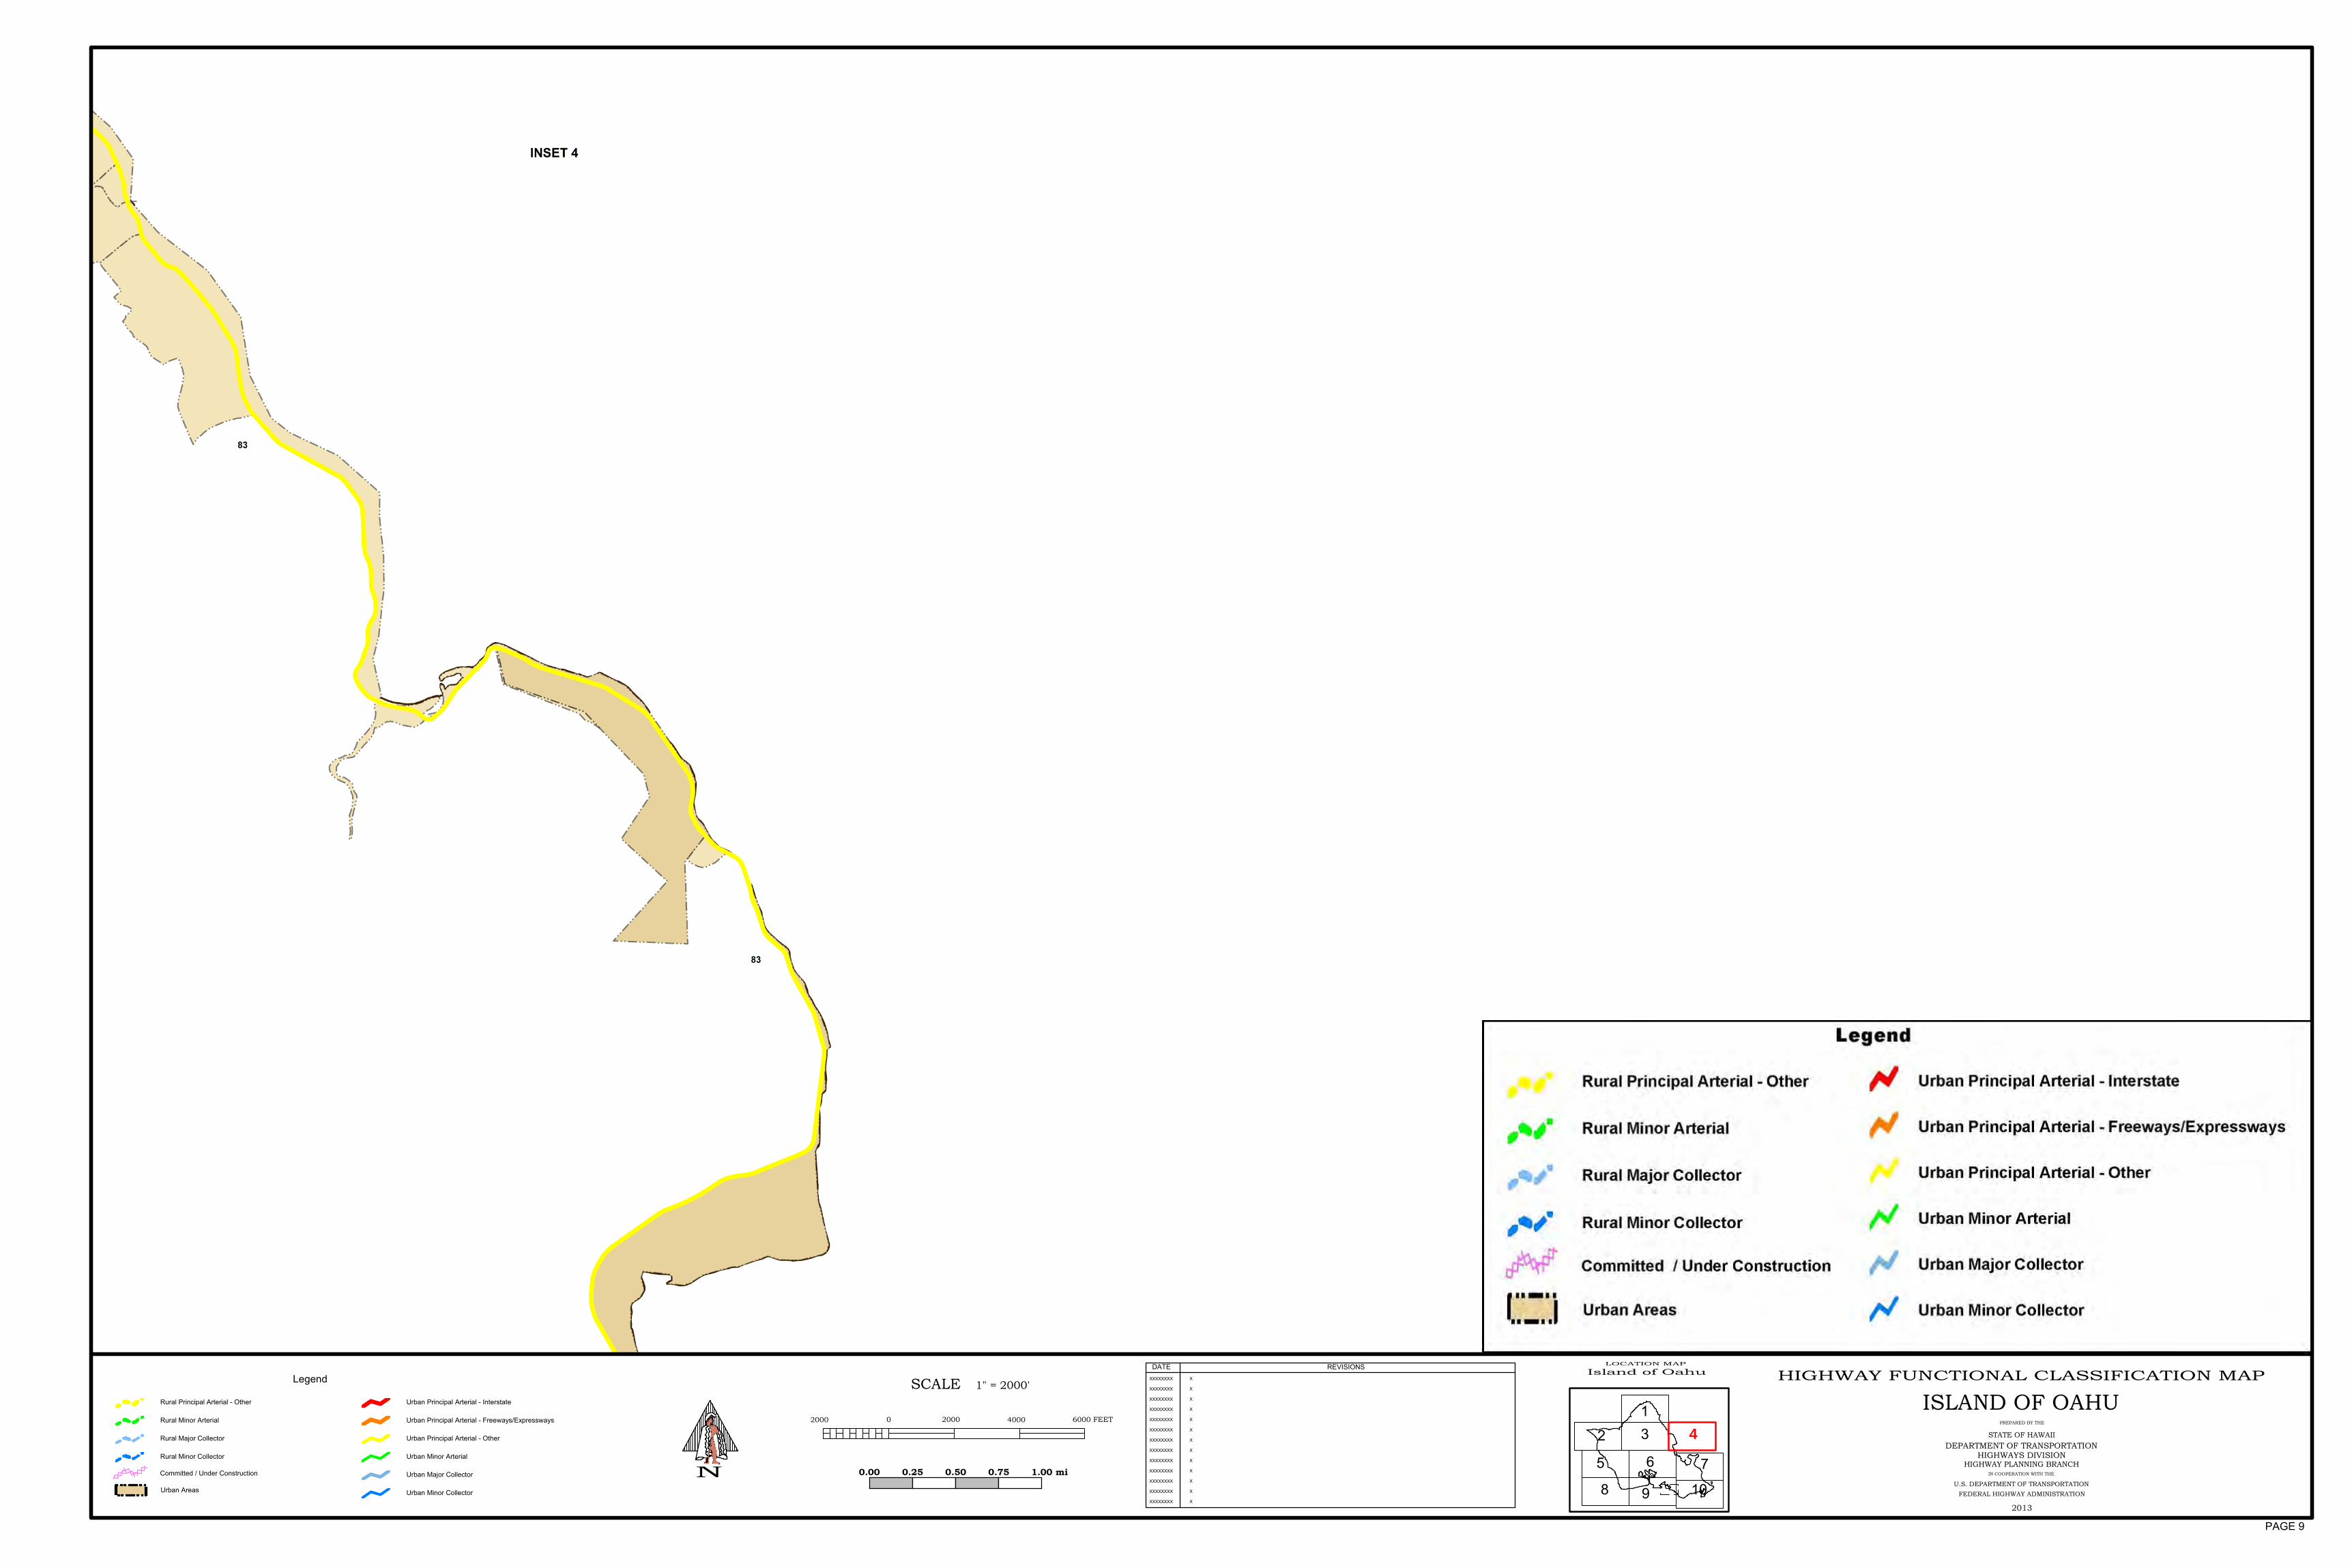
Island of Oahu
1
2 3 4
6 7
1098
DATE REVISIONS
XXXXXXXX
XXXXXXXX
XXXXXXXX
XXXXXXXX
XXXXXXXX
XXXXXXXX
XXXXXXXX
XXXXXXXX
XXXXXXXX
XXXXXXXX
XXXXXXXX
XXXXXXXX
XXXXXXXX X
X
X
X
X
X
X
X
X
X
X
X
X
HIGHWAY FUNCTIONAL CLASSIFICATION MAP
PREPARED BY THE
STATE OF HAWAII
DEPARTMENT OF TRANSPORTATIONHIGHWAYS DIVISION
HIGHWAY PLANNING BRANCHIN COOPERATION WITH THE
U.S. DEPARTMENT OF TRANSPORTATION
FEDERAL HIGHWAY ADMINISTRATION
ISLAND OF OAHU
2013
LOCATION MAP
N
SCALE 1" = 2000'
02000 2000 4000 6000 FEET
0.00 0.25 0.50 0.75 1.00 mi5
Legend
Rural Principal Arterial - Other
Rural Minor Arterial
Rural Major Collector
Rural Minor Collector
Urban Areas
Urban Principal Arterial - Interstate
Urban Principal Arterial - Freeways/Expressways
Urban Principal Arterial - Other
Urban Minor Arterial
Urban Major Collector
Urban Minor Collector
Committed / Under Construction
PAGE 9

Island of Oahu
1
2 3 4
5 6 7
1098
DATE REVISIONS
XXXXXXXX
XXXXXXXX
XXXXXXXX
XXXXXXXX
XXXXXXXX
XXXXXXXX
XXXXXXXX
XXXXXXXX
XXXXXXXX
XXXXXXXX
XXXXXXXX
XXXXXXXX
XXXXXXXX X
X
X
X
X
X
X
X
X
X
X
X
X
HIGHWAY FUNCTIONAL CLASSIFICATION MAP
PREPARED BY THE
STATE OF HAWAII
DEPARTMENT OF TRANSPORTATIONHIGHWAYS DIVISION
HIGHWAY PLANNING BRANCHIN COOPERATION WITH THE
U.S. DEPARTMENT OF TRANSPORTATION
FEDERAL HIGHWAY ADMINISTRATION
ISLAND OF OAHU
2013
LOCATION MAP
N
SCALE 1" = 2000'
02000 2000 4000 6000 FEET
0.00 0.25 0.50 0.75 1.00 mi
Legend
Rural Principal Arterial - Other
Rural Minor Arterial
Rural Major Collector
Rural Minor Collector
Urban Areas
Urban Principal Arterial - Interstate
Urban Principal Arterial - Freeways/Expressways
Urban Principal Arterial - Other
Urban Minor Arterial
Urban Major Collector
Urban Minor Collector
Committed / Under Construction
PAGE 10
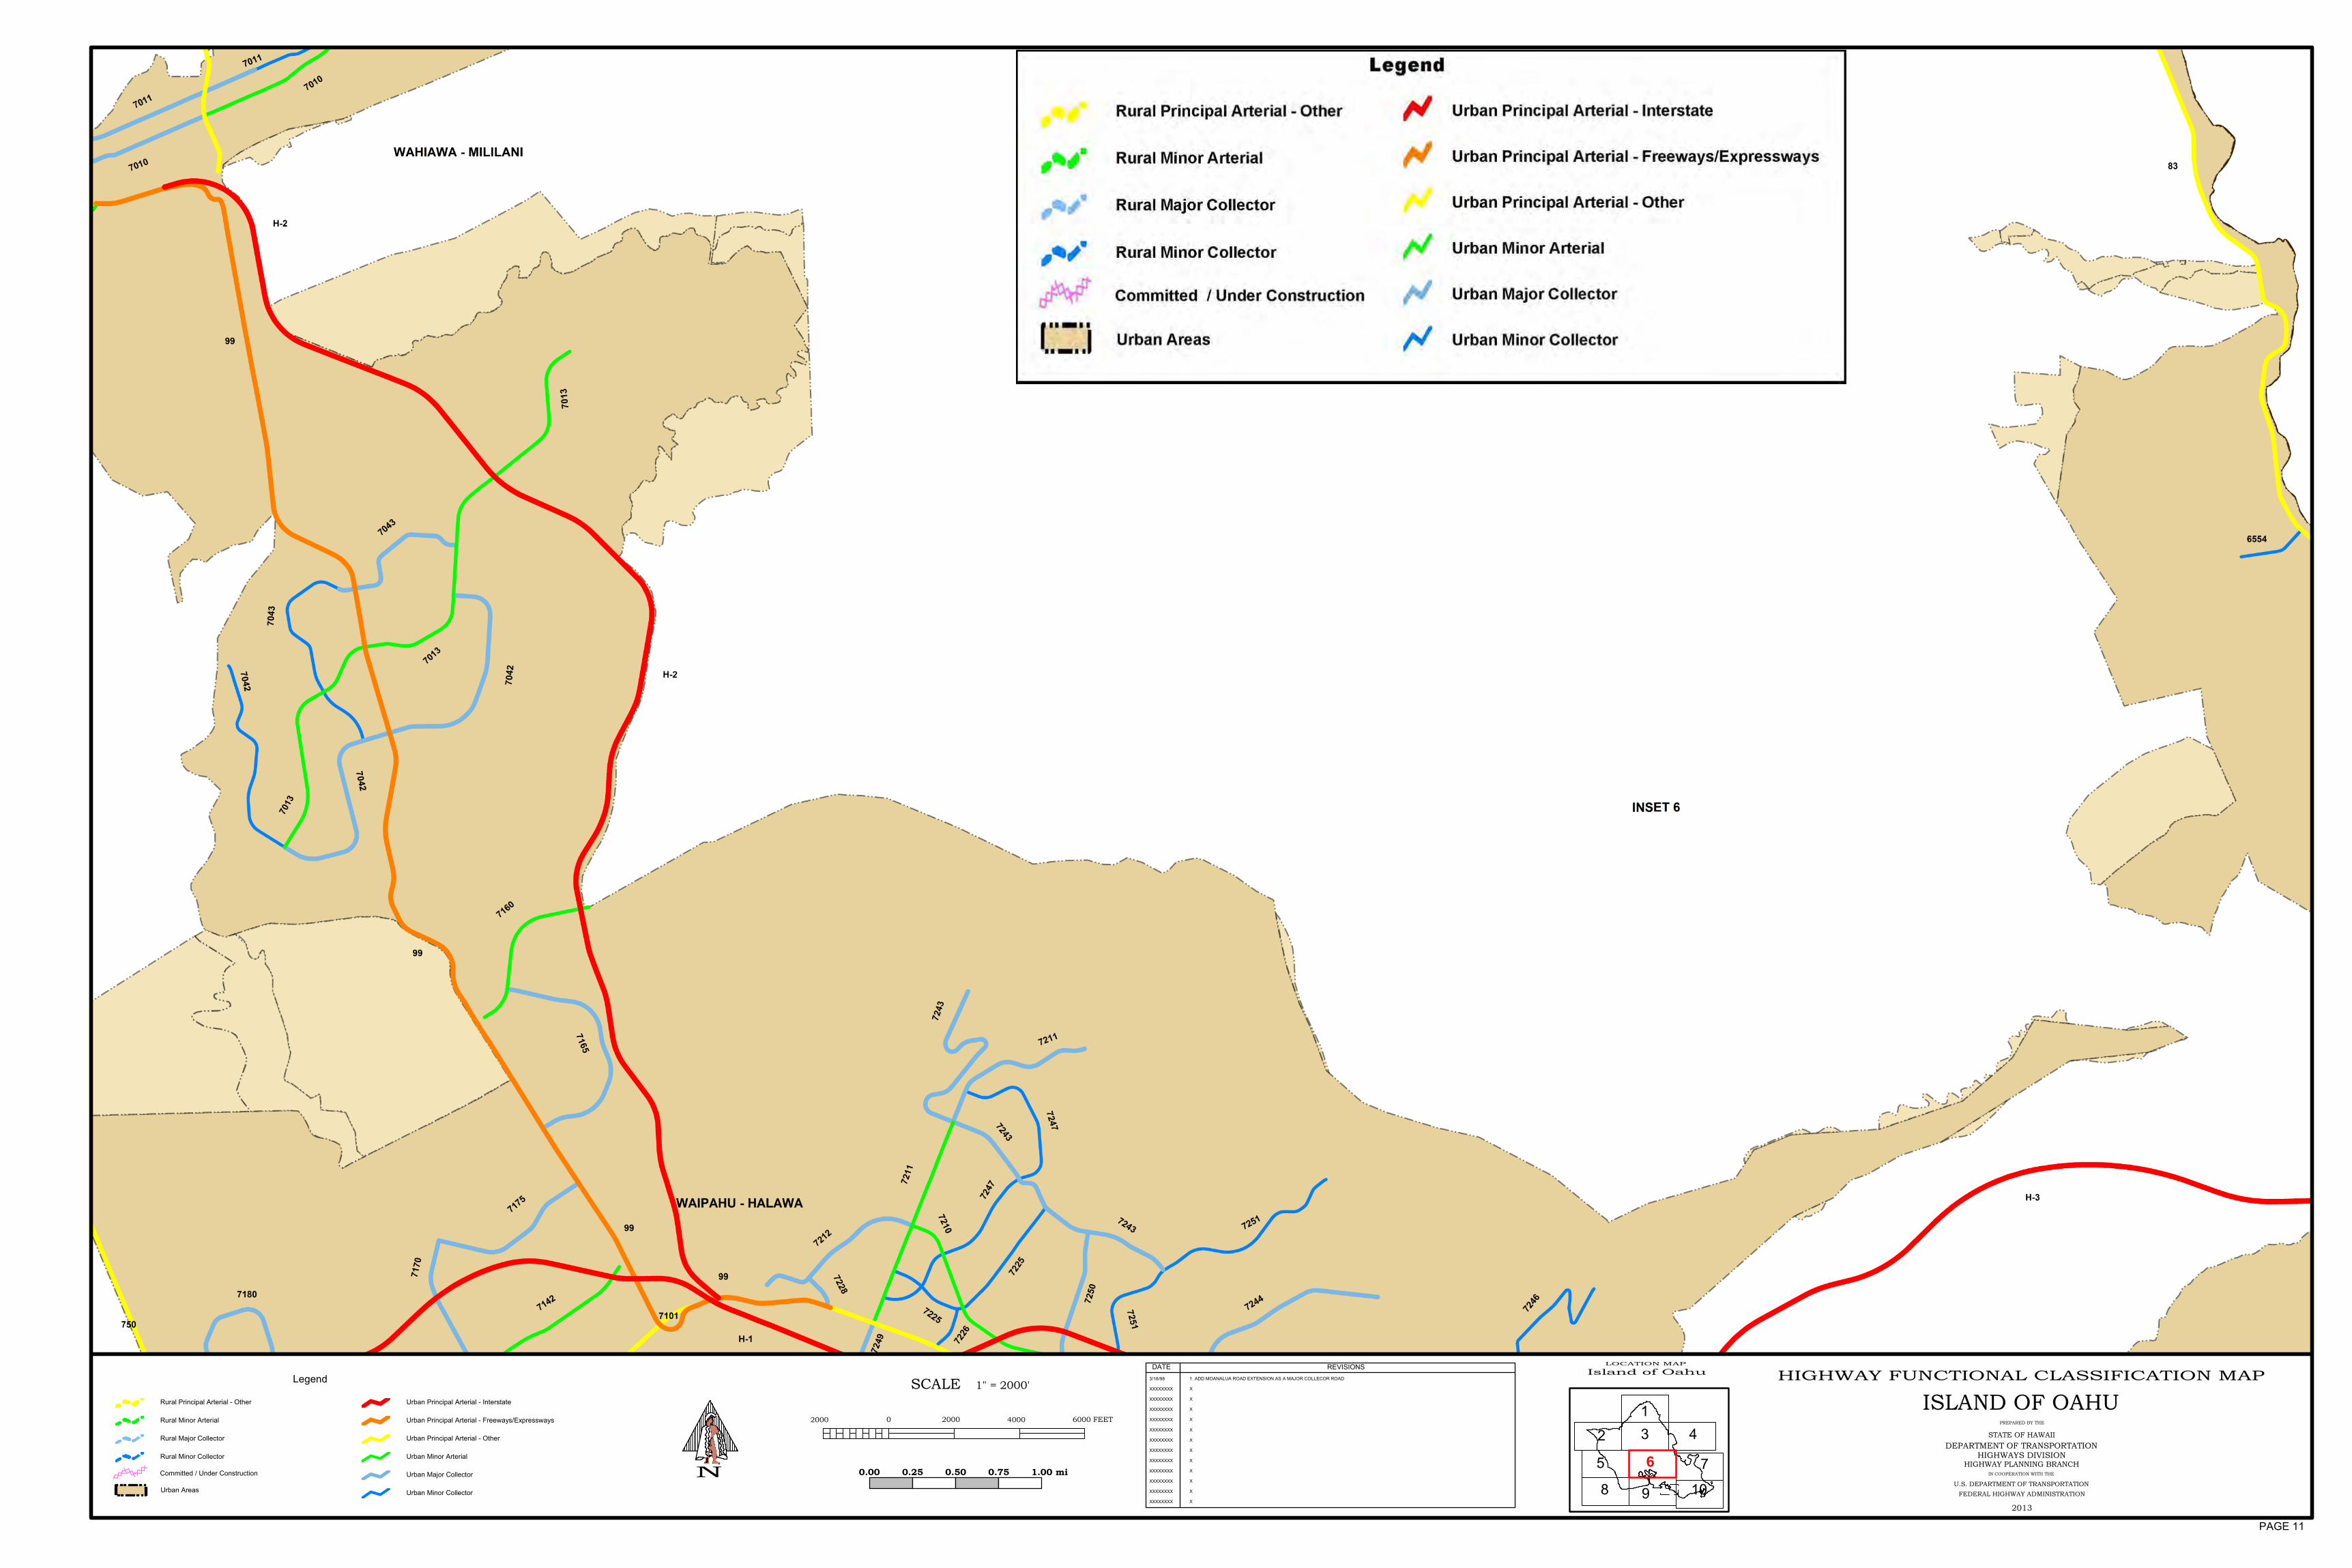
Island of Oahu
1
2 3 4
6 7
1098
DATE REVISIONS
XXXXXXXX
XXXXXXXX
XXXXXXXX
XXXXXXXX
XXXXXXXX
XXXXXXXX
XXXXXXXX
XXXXXXXX
XXXXXXXX
XXXXXXXX
XXXXXXXX
XXXXXXXX
3/18/98 1. ADD MOANALUA ROAD EXTENSION AS A MAJOR COLLECOR ROAD
X
X
X
X
X
X
X
X
X
X
X
X
HIGHWAY FUNCTIONAL CLASSIFICATION MAP
PREPARED BY THE
STATE OF HAWAII
DEPARTMENT OF TRANSPORTATIONHIGHWAYS DIVISION
HIGHWAY PLANNING BRANCHIN COOPERATION WITH THE
U.S. DEPARTMENT OF TRANSPORTATION
FEDERAL HIGHWAY ADMINISTRATION
ISLAND OF OAHU
2013
LOCATION MAP
N
SCALE 1" = 2000'
02000 2000 4000 6000 FEET
0.00 0.25 0.50 0.75 1.00 mi5
Legend
Rural Principal Arterial - Other
Rural Minor Arterial
Rural Major Collector
Rural Minor Collector
Urban Areas
Urban Principal Arterial - Interstate
Urban Principal Arterial - Freeways/Expressways
Urban Principal Arterial - Other
Urban Minor Arterial
Urban Major Collector
Urban Minor Collector
Committed / Under Construction
PAGE 11

HIGHWAY FUNCTIONAL CLASSIFICATION MAPIsland of Oahu
1
2 3 4
6 7
1098
DATE REVISIONS
XXXXXXXX
XXXXXXXX
XXXXXXXX
XXXXXXXX
XXXXXXXX
XXXXXXXX
XXXXXXXX
XXXXXXXX
XXXXXXXX
XXXXXXXX
XXXXXXXX
XXXXXXXX
XXXXXXXX X
X
X
X
X
X
X
X
X
X
X
X
X
PREPARED BY THE
STATE OF HAWAII
DEPARTMENT OF TRANSPORTATIONHIGHWAYS DIVISION
HIGHWAY PLANNING BRANCHIN COOPERATION WITH THE
U.S. DEPARTMENT OF TRANSPORTATION
FEDERAL HIGHWAY ADMINISTRATION
ISLAND OF OAHU
2013
LOCATION MAP
N
SCALE 1" = 2000'
02000 2000 4000 6000 FEET
0.00 0.25 0.50 0.75 1.00 mi5
Legend
Rural Principal Arterial - Other
Rural Minor Arterial
Rural Major Collector
Rural Minor Collector
Urban Areas
Urban Principal Arterial - Interstate
Urban Principal Arterial - Freeways/Expressways
Urban Principal Arterial - Other
Urban Minor Arterial
Urban Major Collector
Urban Minor Collector
Committed / Under Construction
PAGE 12
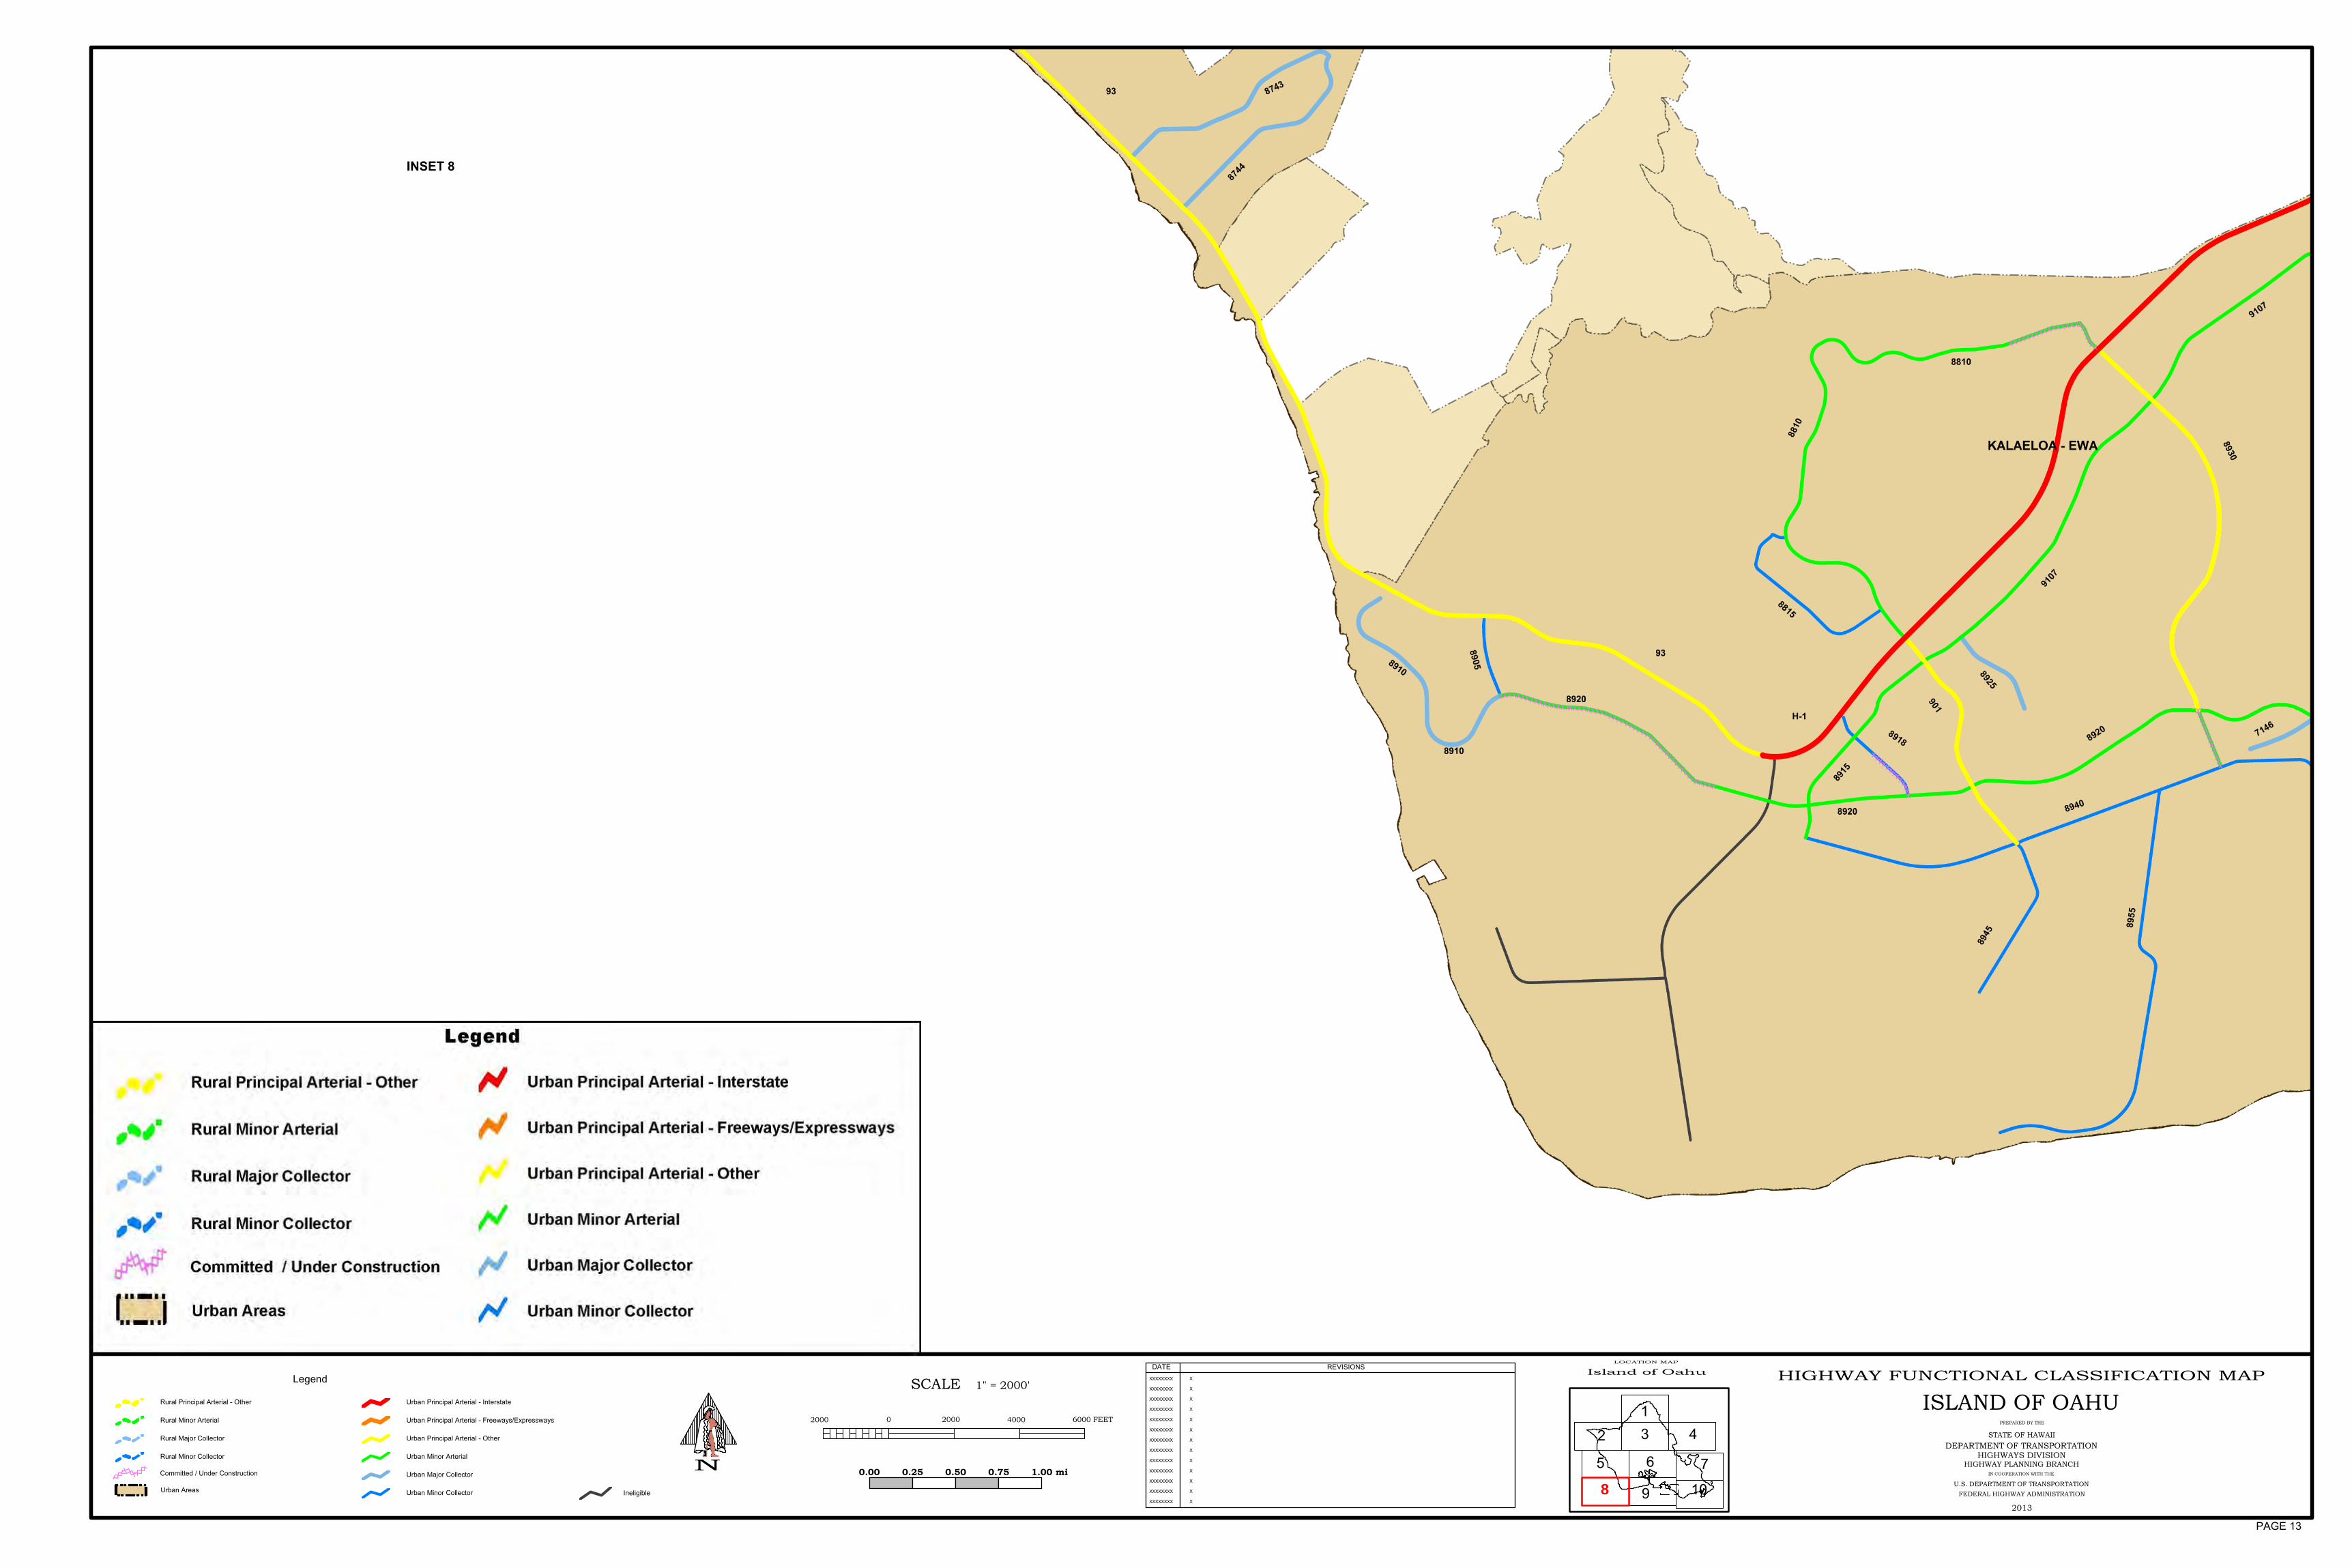
LOCATION MAP
Island of Oahu
1
2 3 4
6 7
1098
HIGHWAY FUNCTIONAL CLASSIFICATION MAP
PREPARED BY THE
STATE OF HAWAII
DEPARTMENT OF TRANSPORTATIONHIGHWAYS DIVISION
HIGHWAY PLANNING BRANCHIN COOPERATION WITH THE
U.S. DEPARTMENT OF TRANSPORTATION
FEDERAL HIGHWAY ADMINISTRATION
ISLAND OF OAHU
2013
DATE REVISIONS
XXXXXXXX
XXXXXXXX
XXXXXXXX
XXXXXXXX
XXXXXXXX
XXXXXXXX
XXXXXXXX
XXXXXXXX
XXXXXXXX
XXXXXXXX
XXXXXXXX
XXXXXXXX
XXXXXXXX X
X
X
X
X
X
X
X
X
X
X
X
X
N 5
SCALE 1" = 2000'
02000 2000 4000 6000 FEET
0.00 0.25 0.50 0.75 1.00 mi
Ineligible
Legend
Rural Principal Arterial - Other
Rural Minor Arterial
Rural Major Collector
Rural Minor Collector
Urban Areas
Urban Principal Arterial - Interstate
Urban Principal Arterial - Freeways/Expressways
Urban Principal Arterial - Other
Urban Minor Arterial
Urban Major Collector
Urban Minor Collector
Committed / Under Construction
PAGE 13
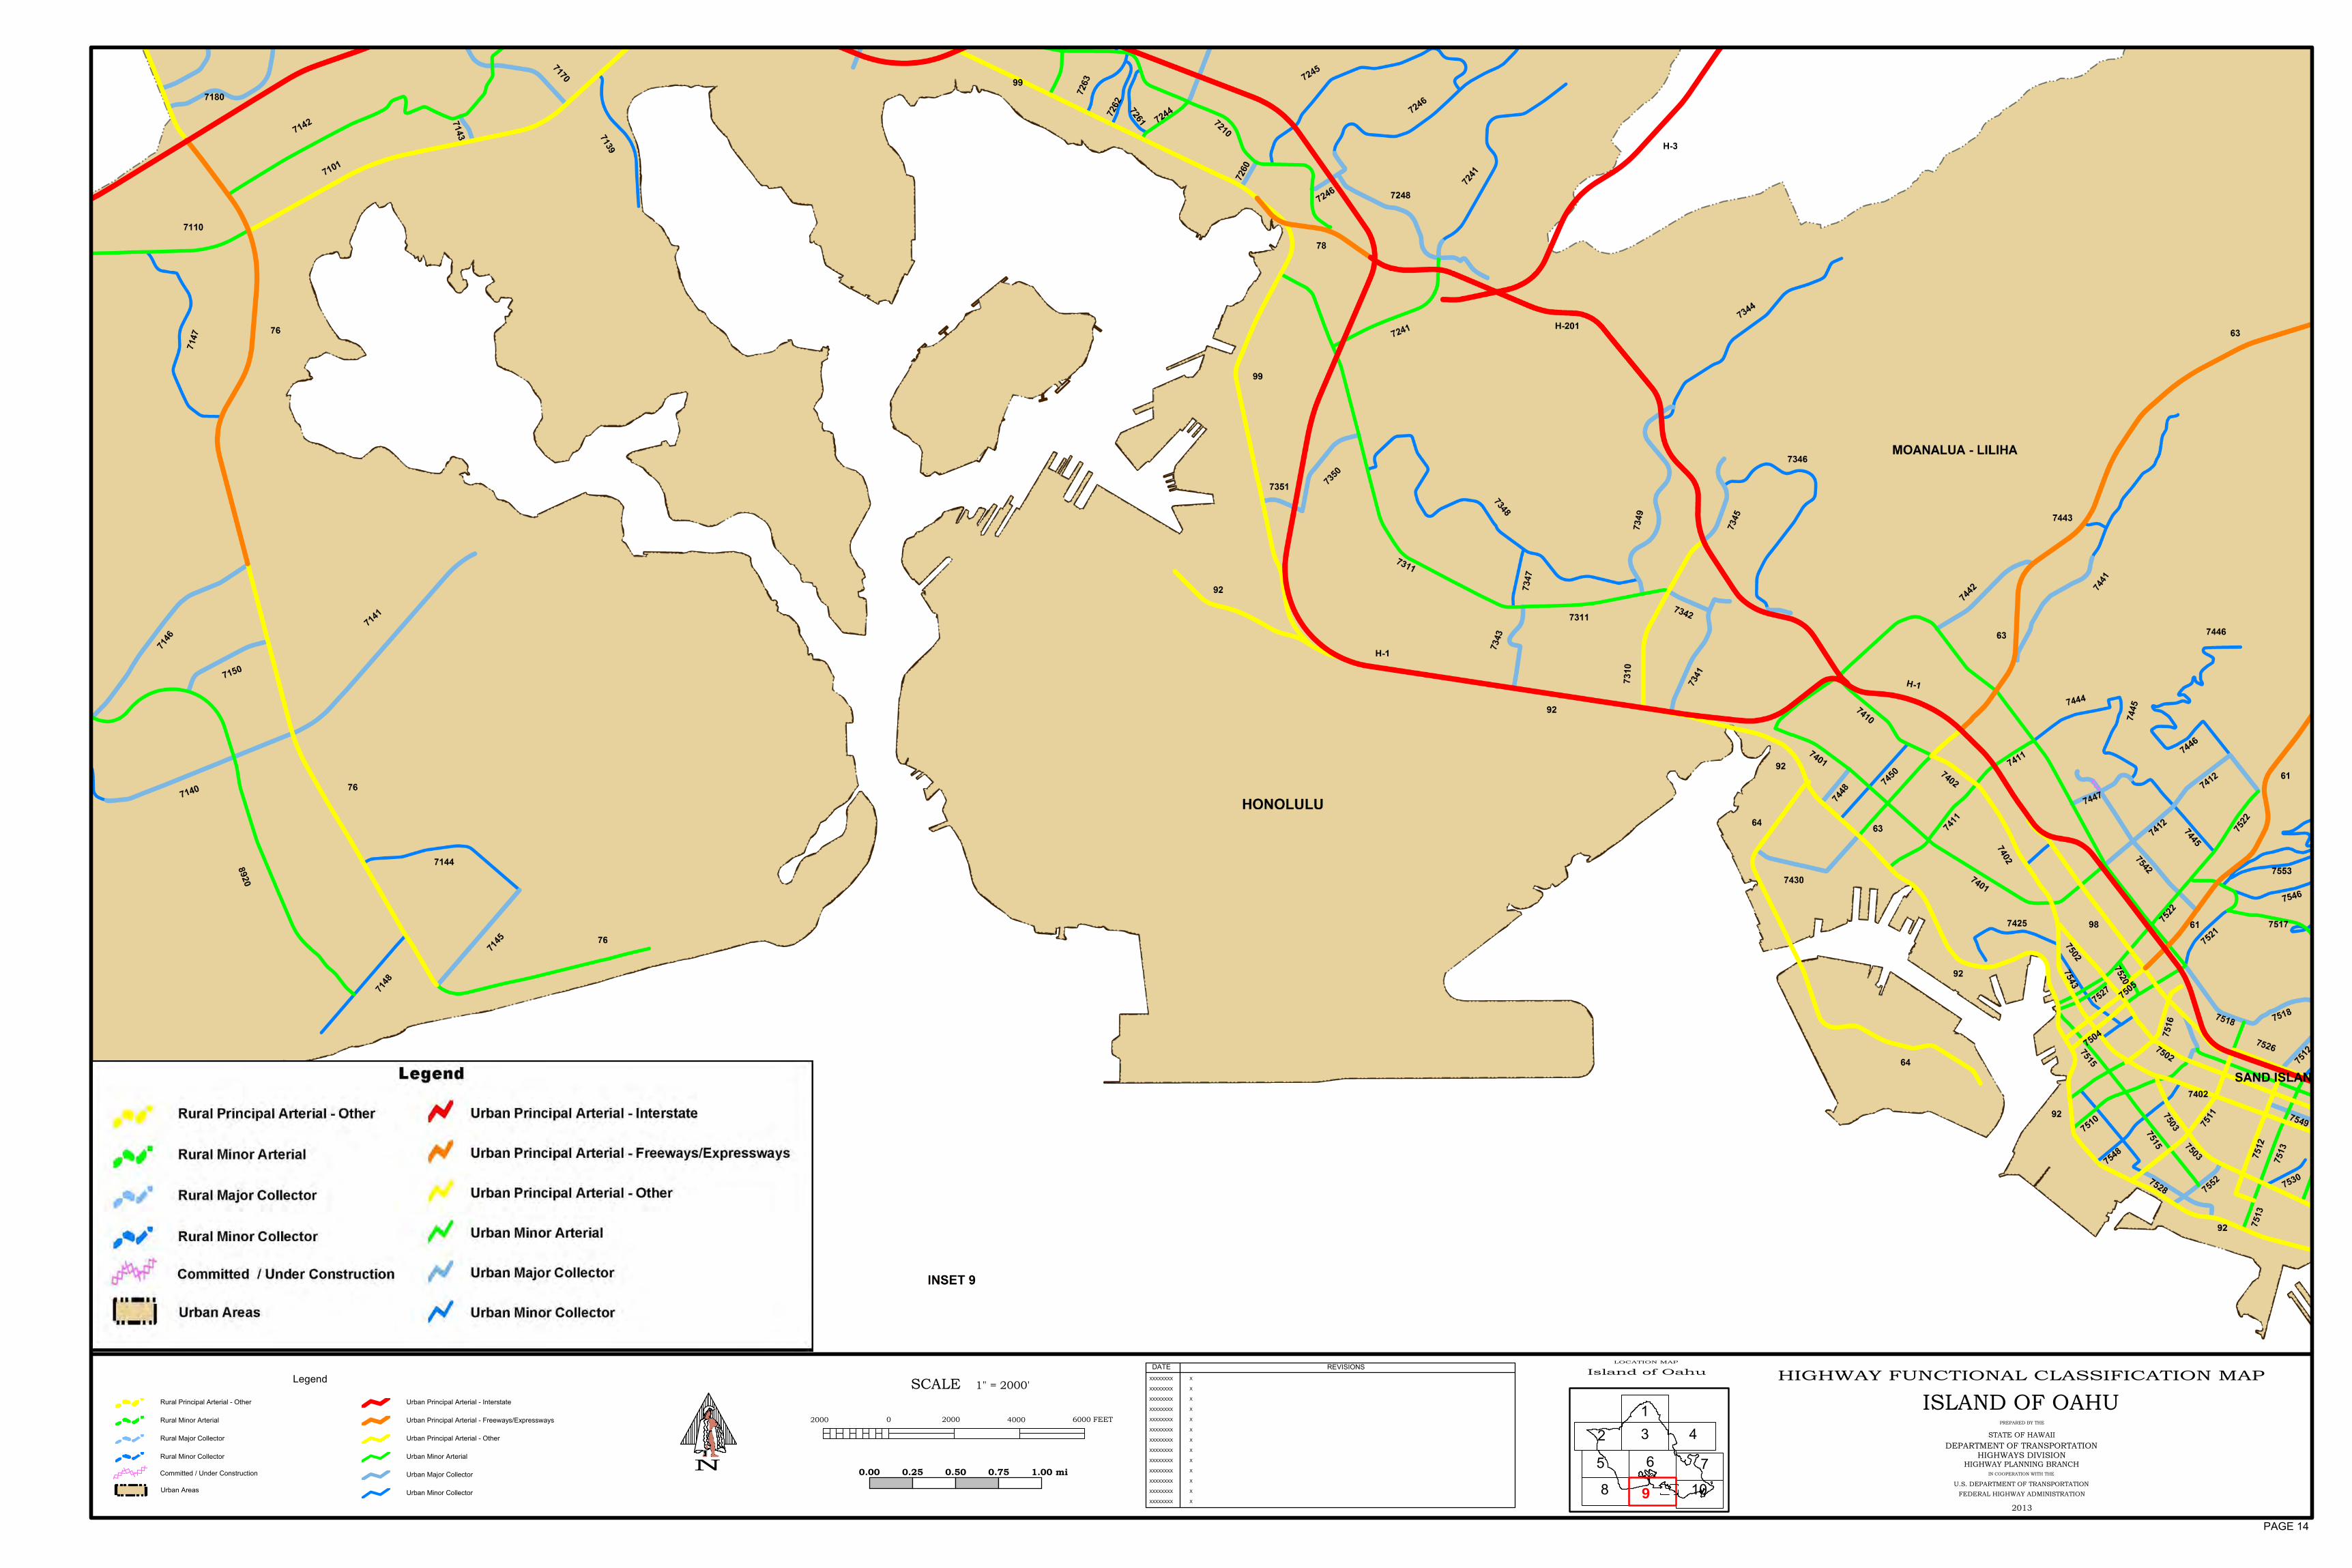
LOCATION MAP
Island of Oahu
1
2 3 4
6 7
1098
HIGHWAY FUNCTIONAL CLASSIFICATION MAP
PREPARED BY THE
STATE OF HAWAII
DEPARTMENT OF TRANSPORTATIONHIGHWAYS DIVISION
HIGHWAY PLANNING BRANCHIN COOPERATION WITH THE
U.S. DEPARTMENT OF TRANSPORTATION
FEDERAL HIGHWAY ADMINISTRATION
ISLAND OF OAHU
2013
DATE REVISIONS
XXXXXXXX
XXXXXXXX
XXXXXXXX
XXXXXXXX
XXXXXXXX
XXXXXXXX
XXXXXXXX
XXXXXXXX
XXXXXXXX
XXXXXXXX
XXXXXXXX
XXXXXXXX
XXXXXXXX X
X
X
X
X
X
X
X
X
X
X
X
X
N 5
SCALE 1" = 2000'
02000 2000 4000 6000 FEET
0.00 0.25 0.50 0.75 1.00 mi
Legend
Rural Principal Arterial - Other
Rural Minor Arterial
Rural Major Collector
Rural Minor Collector
Urban Areas
Urban Principal Arterial - Interstate
Urban Principal Arterial - Freeways/Expressways
Urban Principal Arterial - Other
Urban Minor Arterial
Urban Major Collector
Urban Minor Collector
Committed / Under Construction
PAGE 14
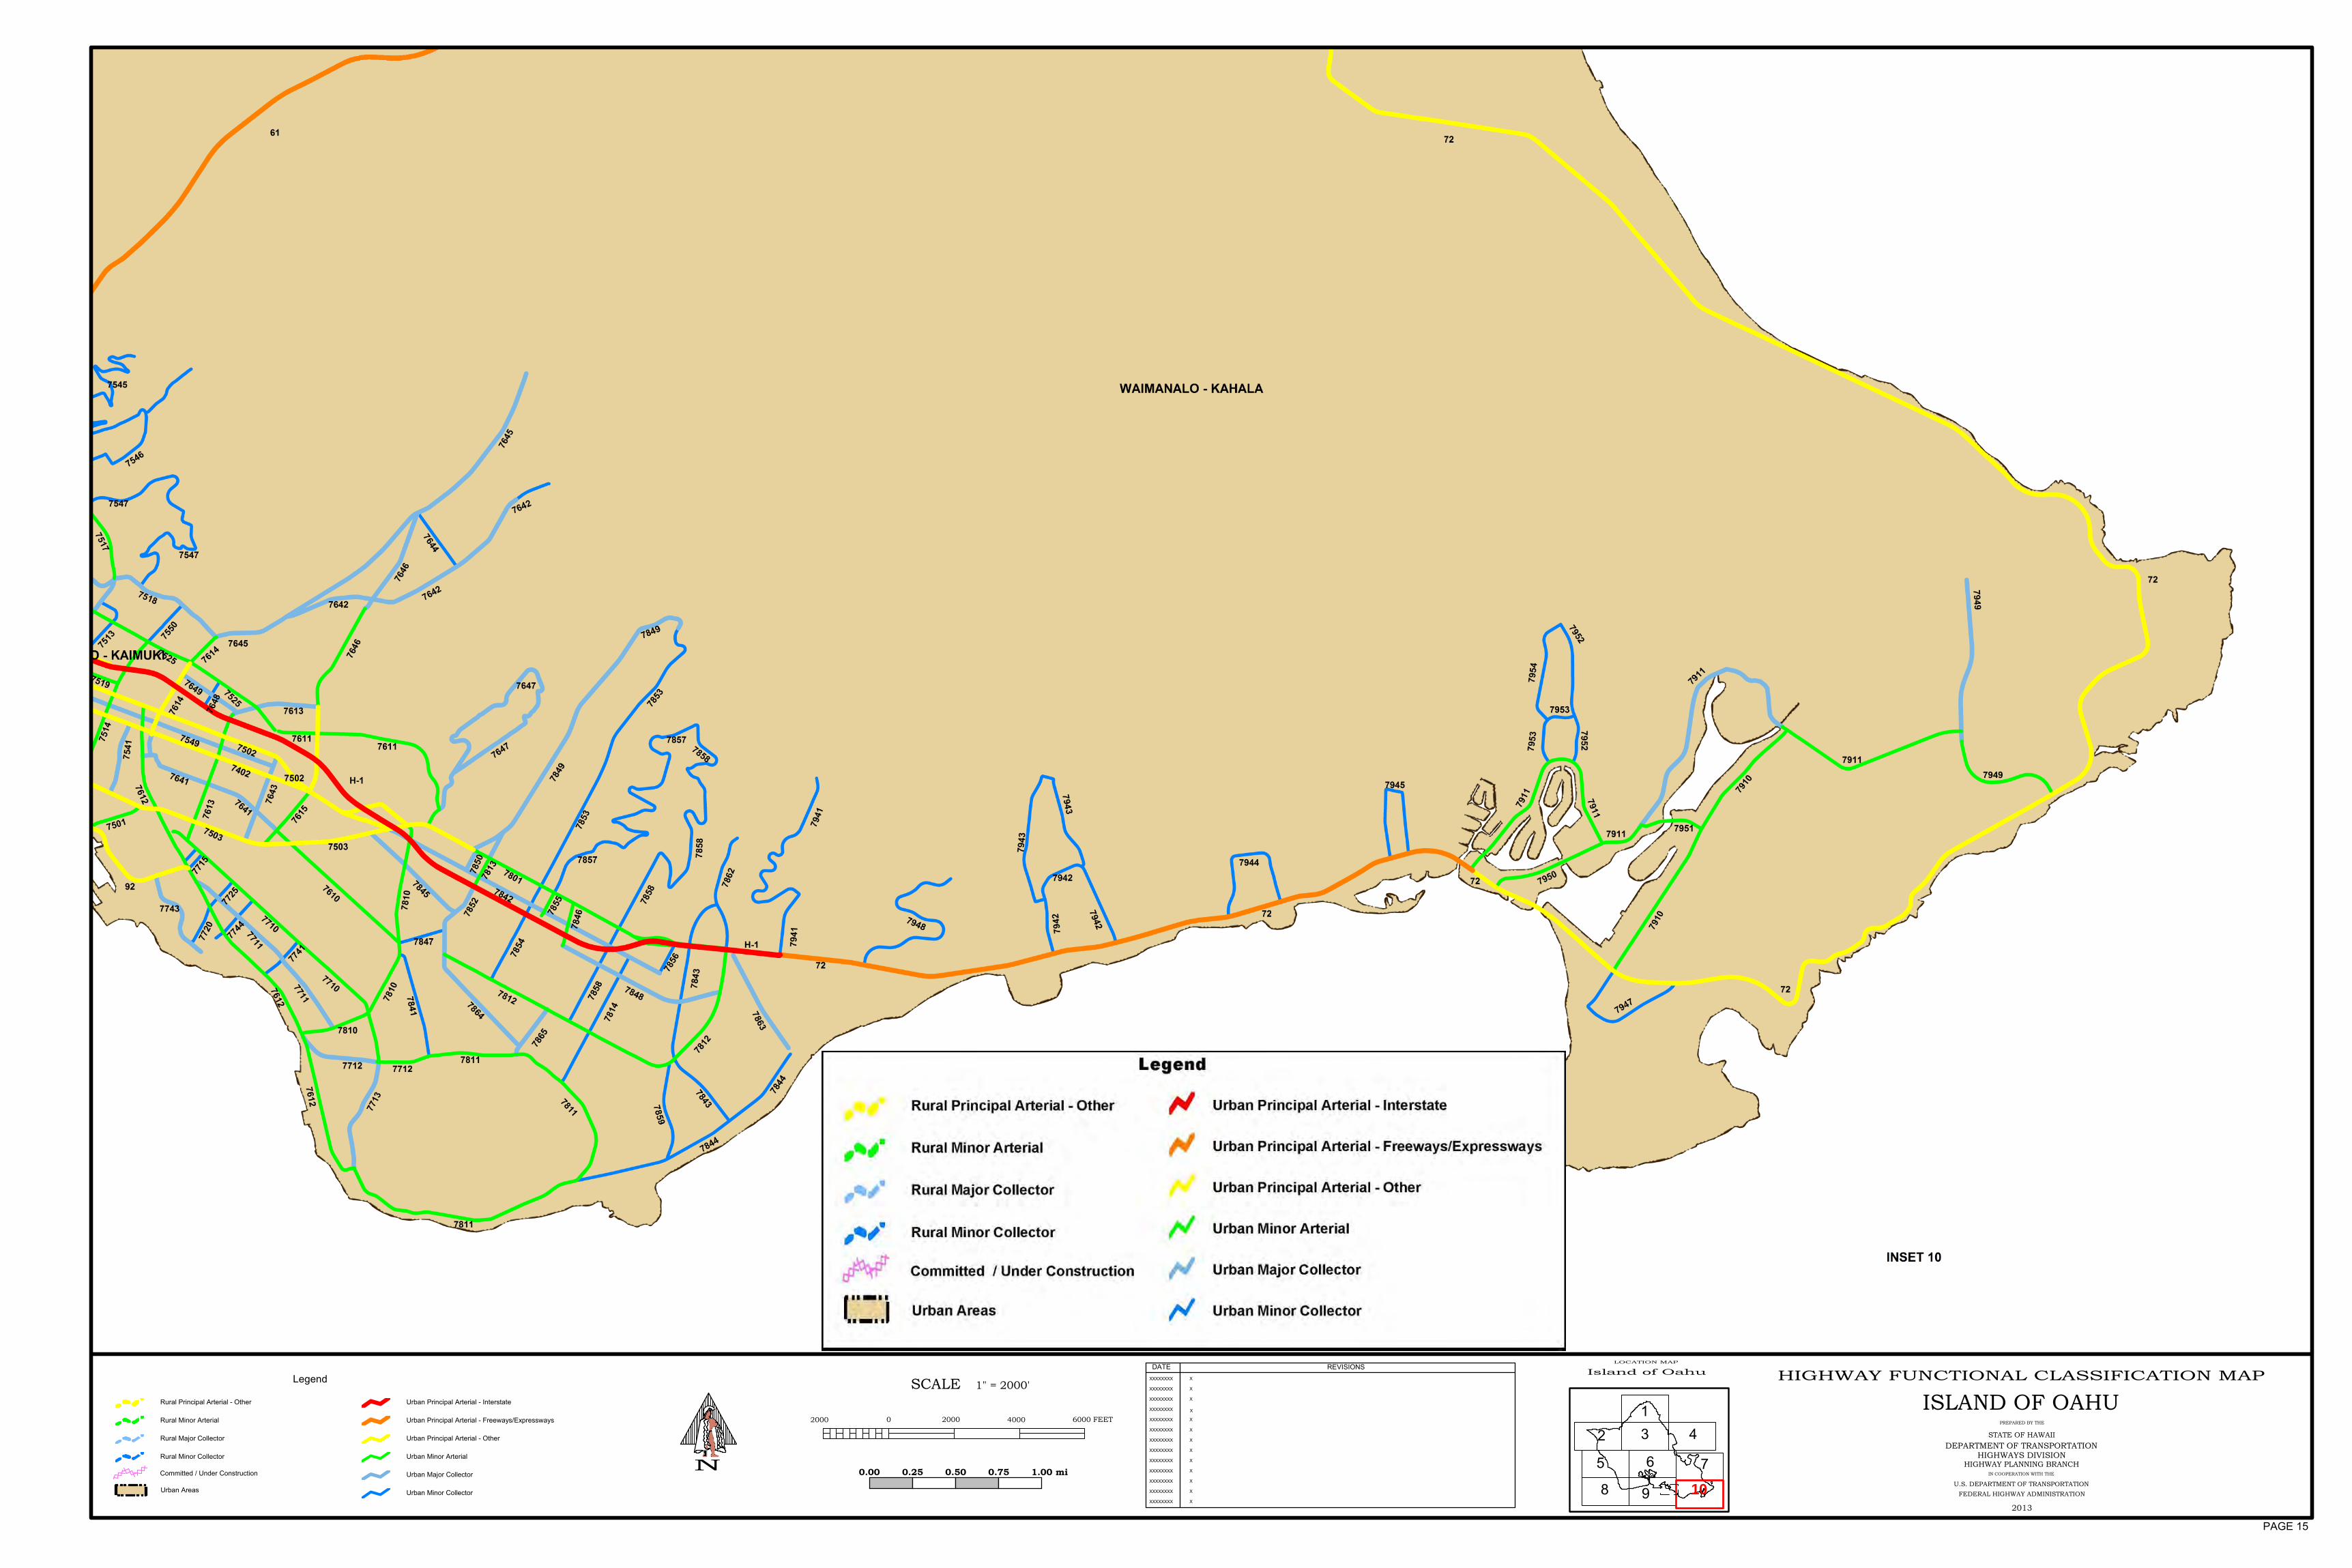
LOCATION MAP
Island of Oahu
1
2 3 4
6 7
1098
HIGHWAY FUNCTIONAL CLASSIFICATION MAP
PREPARED BY THE
STATE OF HAWAII
DEPARTMENT OF TRANSPORTATIONHIGHWAYS DIVISION
HIGHWAY PLANNING BRANCHIN COOPERATION WITH THE
U.S. DEPARTMENT OF TRANSPORTATION
FEDERAL HIGHWAY ADMINISTRATION
ISLAND OF OAHU
2013
DATE REVISIONS
XXXXXXXX
XXXXXXXX
XXXXXXXX
XXXXXXXX
XXXXXXXX
XXXXXXXX
XXXXXXXX
XXXXXXXX
XXXXXXXX
XXXXXXXX
XXXXXXXX
XXXXXXXX
XXXXXXXX X
X
X
X
X
X
X
X
X
X
X
X
N 5
SCALE 1" = 2000'
02000 2000 4000 6000 FEET
0.00 0.25 0.50 0.75 1.00 mi
X
Legend
Rural Principal Arterial - Other
Rural Minor Arterial
Rural Major Collector
Rural Minor Collector
Urban Areas
Urban Principal Arterial - Interstate
Urban Principal Arterial - Freeways/Expressways
Urban Principal Arterial - Other
Urban Minor Arterial
Urban Major Collector
Urban Minor Collector
Committed / Under Construction
PAGE 15
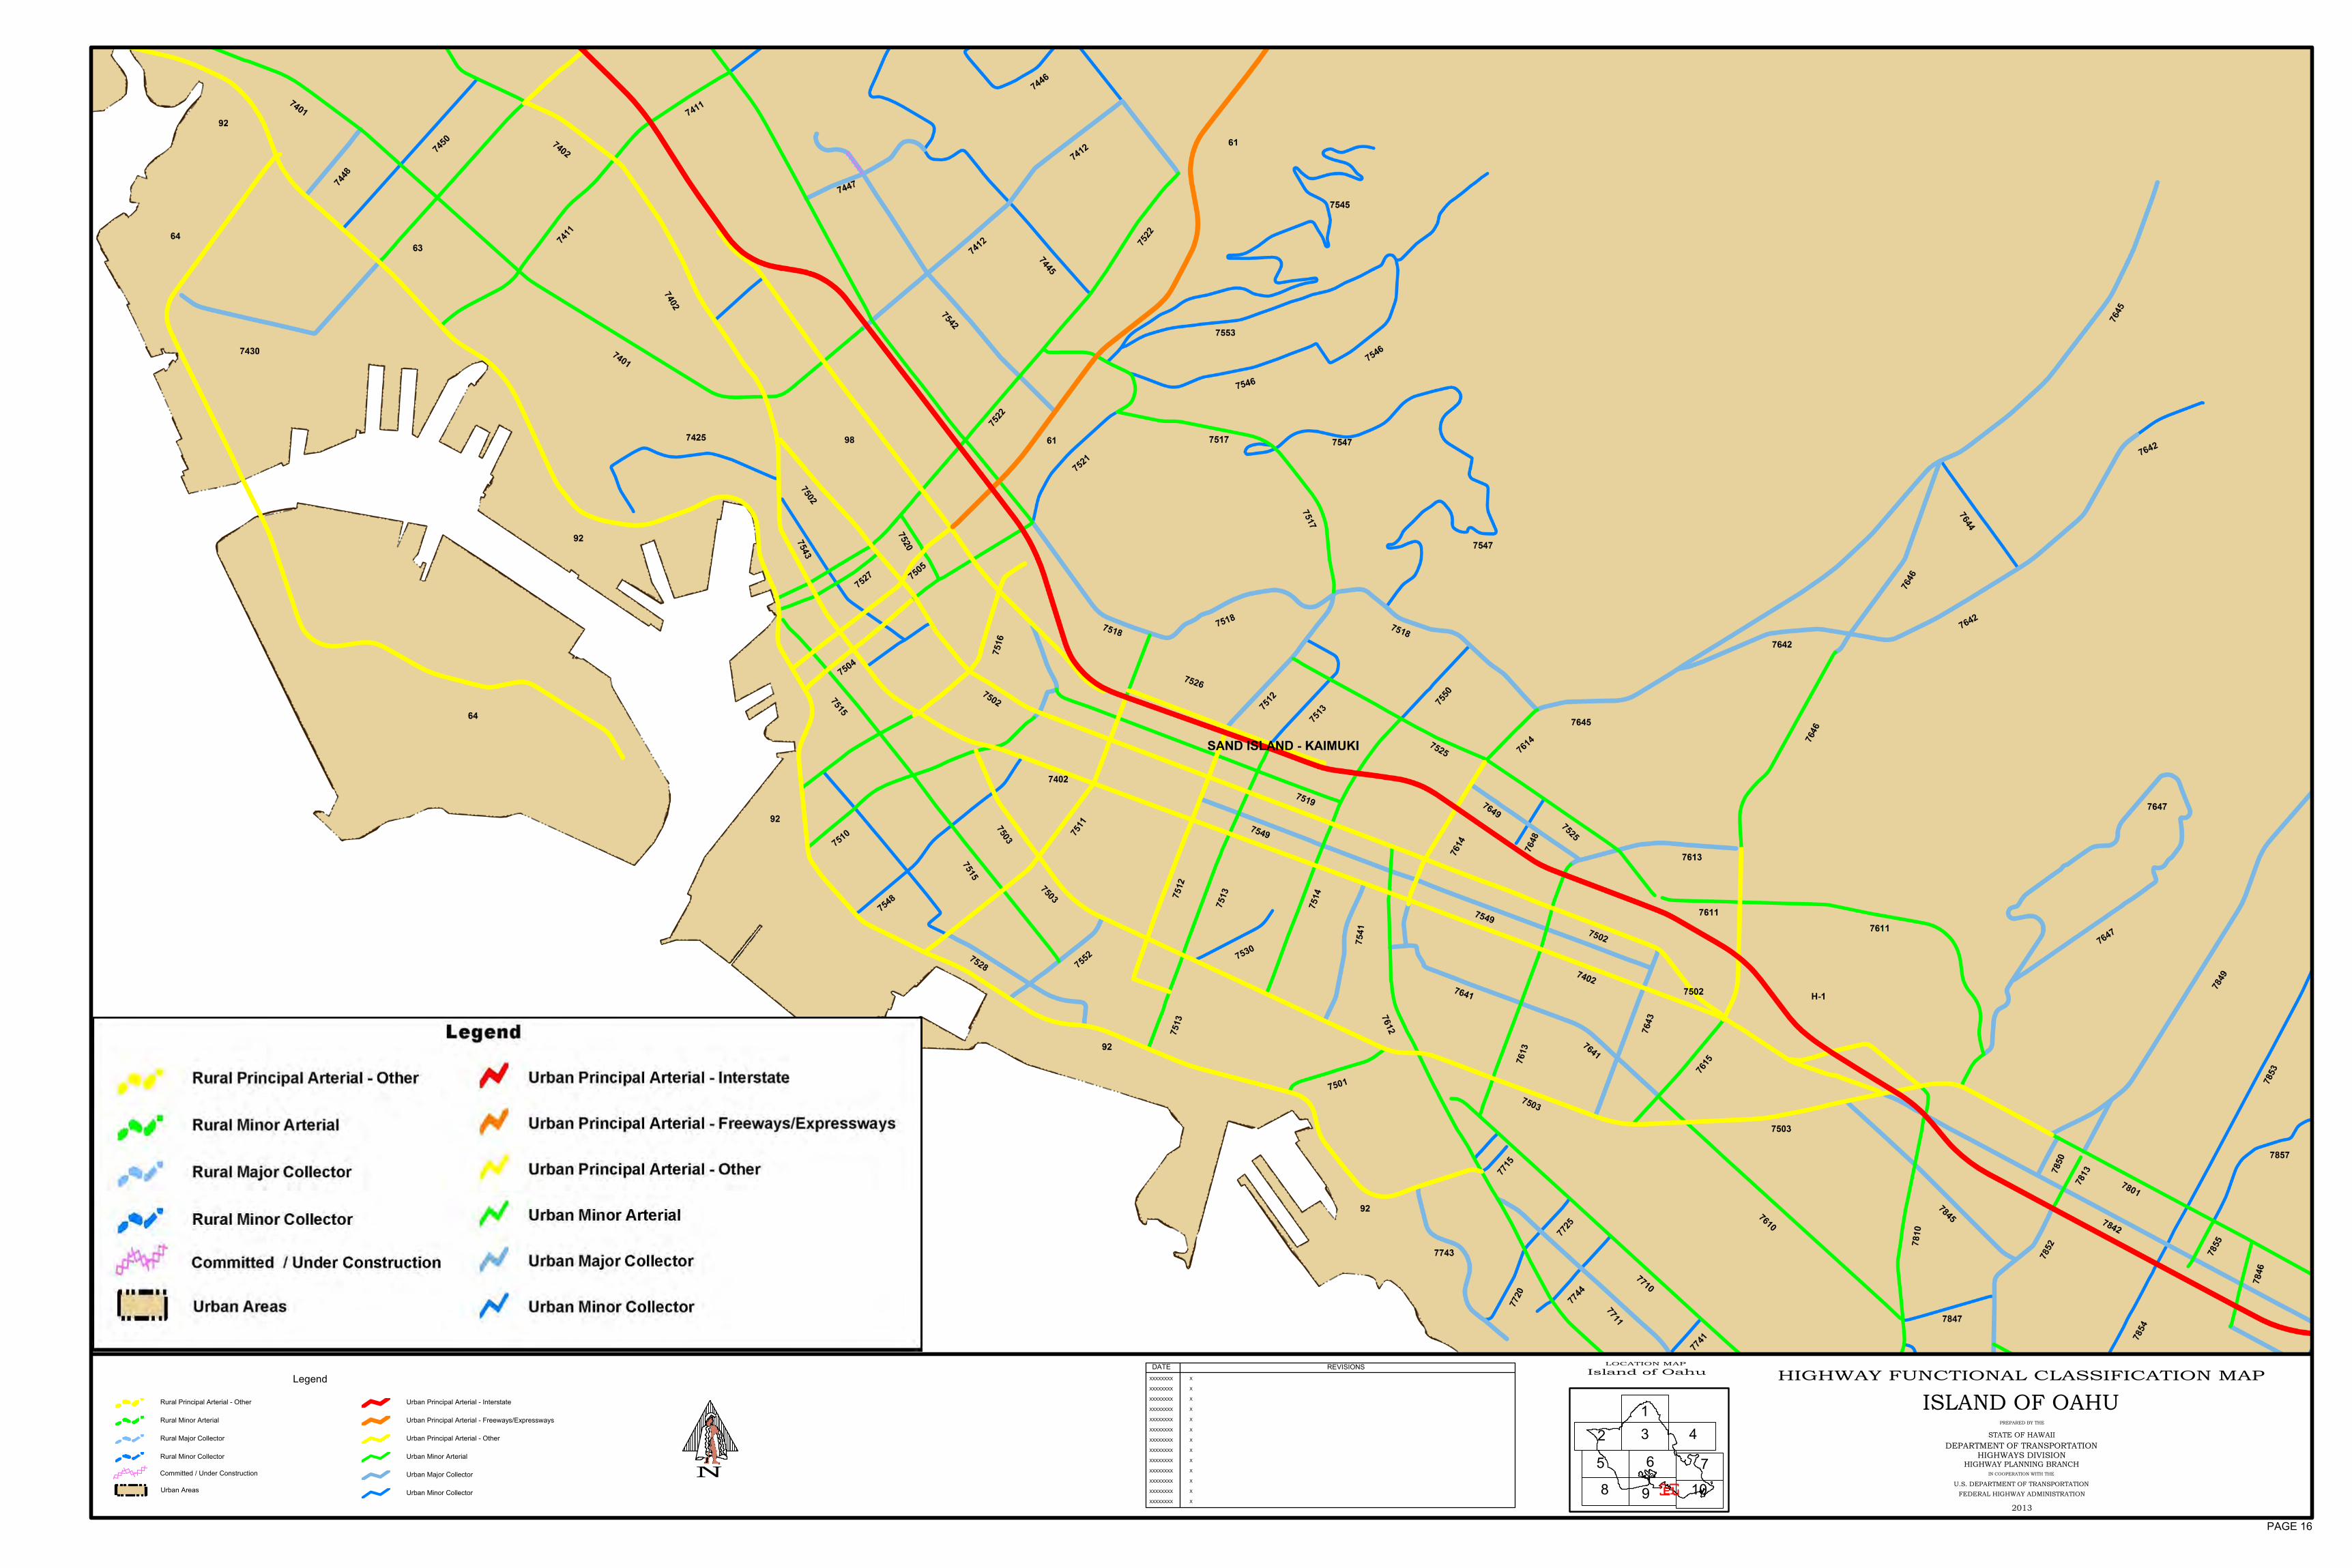
HIGHWAY FUNCTIONAL CLASSIFICATION MAPIsland of Oahu
1
2 3 4
6 7
1098
DATE REVISIONS
XXXXXXXX
XXXXXXXX
XXXXXXXX
XXXXXXXX
XXXXXXXX
XXXXXXXX
XXXXXXXX
XXXXXXXX
XXXXXXXX
XXXXXXXX
XXXXXXXX
XXXXXXXX
XXXXXXXX X
X
X
X
X
X
X
X
X
X
X
X
X
PREPARED BY THE
STATE OF HAWAII
DEPARTMENT OF TRANSPORTATIONHIGHWAYS DIVISION
HIGHWAY PLANNING BRANCHIN COOPERATION WITH THE
U.S. DEPARTMENT OF TRANSPORTATION
FEDERAL HIGHWAY ADMINISTRATION
ISLAND OF OAHU
2013
LOCATION MAP
NE1
5
Legend
Rural Principal Arterial - Other
Rural Minor Arterial
Rural Major Collector
Rural Minor Collector
Urban Areas
Urban Principal Arterial - Interstate
Urban Principal Arterial - Freeways/Expressways
Urban Principal Arterial - Other
Urban Minor Arterial
Urban Major Collector
Urban Minor Collector
Committed / Under Construction
PAGE 16

KEY TO SHEETS
DATE REVISIONS
XXXXXXXX
XXXXXXXX
XXXXXXXX
XXXXXXXX
XXXXXXXX
XXXXXXXX
XXXXXXXX
XXXXXXXX
XXXXXXXX
XXXXXXXX
XXXXXXXX
XXXXXXXX
XXXXXXXX X
X
X
X
X
X
X
X
X
X
X
X
X
HIGHWAY FUNCTIONAL CLASSIFICATION MAP
PREPARED BY THE
STATE OF HAWAII
DEPARTMENT OF TRANSPORTATIONHIGHWAYS DIVISION
HIGHWAY PLANNING BRANCHIN COOPERATION WITH THE
U.S. DEPARTMENT OF TRANSPORTATION
FEDERAL HIGHWAY ADMINISTRATION
2013
N
SCALE 1" = 10,000'
010000 10000 20000 30000 FEETISLAND OF MAUI
0 1 2 3 4 5 mi
Legend
Rural Principal Arterial - Other
Rural Minor Arterial
Rural Major Collector
Rural Minor Collector
Urban Areas
Urban Principal Arterial - Interstate
Urban Principal Arterial - Freeways/Expressways
Urban Principal Arterial - Other
Urban Minor Arterial
Urban Major Collector
Urban Minor Collector
Committed / Under Construction
PAGE 17

DATE REVISIONS
XXXXXXXX
XXXXXXXX
XXXXXXXX
XXXXXXXX
XXXXXXXX
XXXXXXXX
XXXXXXXX
XXXXXXXX
XXXXXXXX
XXXXXXXX
XXXXXXXX
XXXXXXXX
XXXXXXXX X
X
X
X
X
X
X
X
X
X
X
X
X
HIGHWAY FUNCTIONAL CLASSIFICATION MAP
PREPARED BY THE
STATE OF HAWAII
DEPARTMENT OF TRANSPORTATIONHIGHWAYS DIVISION
HIGHWAY PLANNING BRANCHIN COOPERATION WITH THE
U.S. DEPARTMENT OF TRANSPORTATION
FEDERAL HIGHWAY ADMINISTRATION
2013
SCALE 1" = 2,000'
02000 2000 4000 6000 FEET
LAHAINA
N
LOCATION MAP
Island of Maui
0.00 0.25 0.50 0.75 1.00 mi
INSET MAP 1
Legend
Rural Principal Arterial - Other
Rural Minor Arterial
Rural Major Collector
Rural Minor Collector
Urban Areas
Urban Principal Arterial - Interstate
Urban Principal Arterial - Freeways/Expressways
Urban Principal Arterial - Other
Urban Minor Arterial
Urban Major Collector
Urban Minor Collector
Committed / Under Construction
PAGE 18

DATE REVISIONS
XXXXXXXX
XXXXXXXX
XXXXXXXX
XXXXXXXX
XXXXXXXX
XXXXXXXX
XXXXXXXX
XXXXXXXX
XXXXXXXX
XXXXXXXX
XXXXXXXX
XXXXXXXX
XXXXXXXX X
X
X
X
X
X
X
X
X
X
X
X
X
N
SCALE 1" = 2,000'
02000 2000 4000 6000 FEET
HIGHWAY FUNCTIONAL CLASSIFICATION MAP
PREPARED BY THE
STATE OF HAWAII
DEPARTMENT OF TRANSPORTATIONHIGHWAYS DIVISION
HIGHWAY PLANNING BRANCHIN COOPERATION WITH THE
U.S. DEPARTMENT OF TRANSPORTATION
FEDERAL HIGHWAY ADMINISTRATION
2013
WAILUKU AND KAHULUI
LOCATION MAP
Island of Maui
0.00 0.25 0.50 0.75 1.00 mi
INSET MAP 2
Legend
Rural Principal Arterial - Other
Rural Minor Arterial
Rural Major Collector
Rural Minor Collector
Urban Areas
Urban Principal Arterial - Interstate
Urban Principal Arterial - Freeways/Expressways
Urban Principal Arterial - Other
Urban Minor Arterial
Urban Major Collector
Urban Minor Collector
Committed / Under Construction
PAGE 19
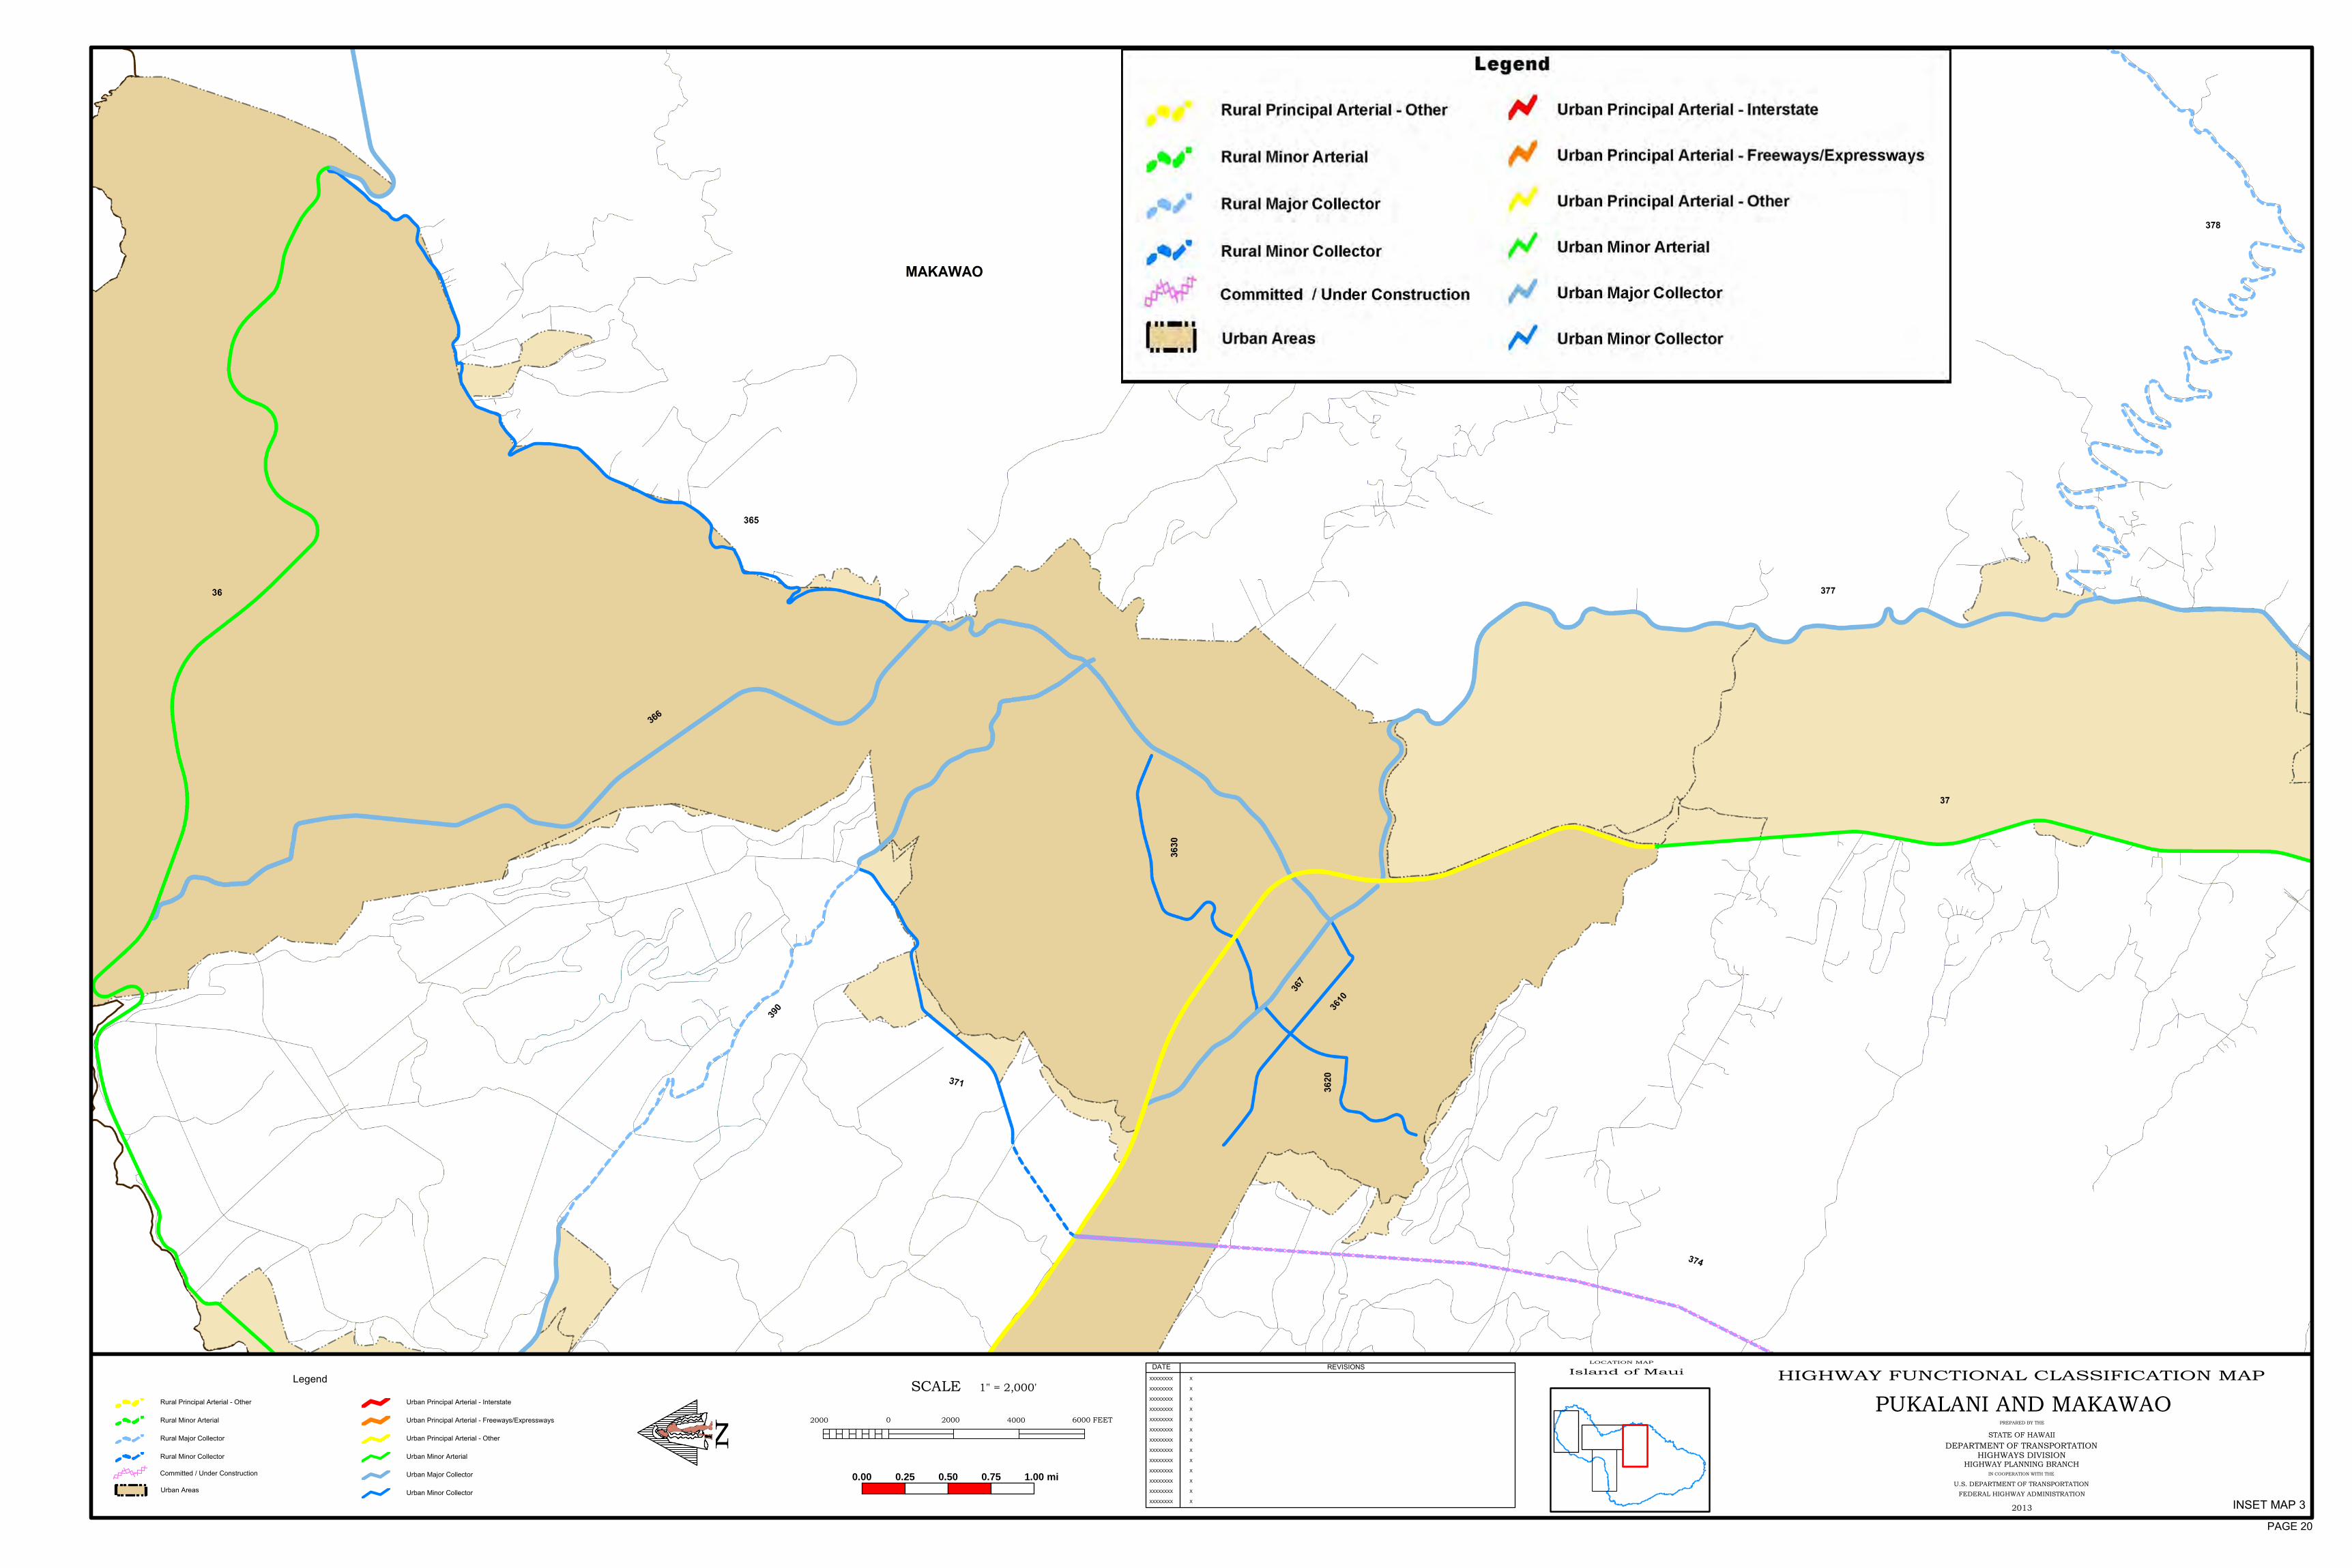
DATE REVISIONS
XXXXXXXX
XXXXXXXX
XXXXXXXX
XXXXXXXX
XXXXXXXX
XXXXXXXX
XXXXXXXX
XXXXXXXX
XXXXXXXX
XXXXXXXX
XXXXXXXX
XXXXXXXX
XXXXXXXX X
X
X
X
X
X
X
X
X
X
X
X
X
HIGHWAY FUNCTIONAL CLASSIFICATION MAP
PREPARED BY THE
STATE OF HAWAII
DEPARTMENT OF TRANSPORTATIONHIGHWAYS DIVISION
HIGHWAY PLANNING BRANCHIN COOPERATION WITH THE
U.S. DEPARTMENT OF TRANSPORTATION
FEDERAL HIGHWAY ADMINISTRATION
2013
SCALE 1" = 2,000'
02000 2000 4000 6000 FEET
PUKALANI AND MAKAWAO
N
LOCATION MAP
Island of Maui
0.00 0.25 0.50 0.75 1.00 mi
INSET MAP 3
Legend
Rural Principal Arterial - Other
Rural Minor Arterial
Rural Major Collector
Rural Minor Collector
Urban Areas
Urban Principal Arterial - Interstate
Urban Principal Arterial - Freeways/Expressways
Urban Principal Arterial - Other
Urban Minor Arterial
Urban Major Collector
Urban Minor Collector
Committed / Under Construction
PAGE 20

DATE REVISIONS
XXXXXXXX
XXXXXXXX
XXXXXXXX
XXXXXXXX
XXXXXXXX
XXXXXXXX
XXXXXXXX
XXXXXXXX
XXXXXXXX
XXXXXXXX
XXXXXXXX
XXXXXXXX
XXXXXXXX X
X
X
X
X
X
X
X
X
X
X
X
X
SCALE 1" = 2,000'
02000 2000 4000 6000 FEET
KIHEI
HIGHWAY FUNCTIONAL CLASSIFICATION MAP
PREPARED BY THE
STATE OF HAWAII
DEPARTMENT OF TRANSPORTATIONHIGHWAYS DIVISION
HIGHWAY PLANNING BRANCHIN COOPERATION WITH THE
U.S. DEPARTMENT OF TRANSPORTATION
FEDERAL HIGHWAY ADMINISTRATION
2013
N
LOCATION MAP
Island of Maui
0.00 0.25 0.50 0.75 1.00 mi
INSET MAP 4
Legend
Rural Principal Arterial - Other
Rural Minor Arterial
Rural Major Collector
Rural Minor Collector
Urban Areas
Urban Principal Arterial - Interstate
Urban Principal Arterial - Freeways/Expressways
Urban Principal Arterial - Other
Urban Minor Arterial
Urban Major Collector
Urban Minor Collector
Committed / Under Construction
PAGE 21

PREPARED BY THE
STATE OF HAWAII
DEPARTMENT OF TRANSPORTATIONHIGHWAYS DIVISION
HIGHWAY PLANNING BRANCHIN COOPERATION WITH THE
U.S. DEPARTMENT OF TRANSPORTATION
FEDERAL HIGHWAY ADMINISTRATIONN
HIGHWAY FUNCTIONAL CLASSIFICATION MAP
0
SCALE 1" = 6,500'
ISLAND OF MOLOKAI6500 6500 13000 19500 FEET
2013
DATE REVISIONS
XXXXXXXX
XXXXXXXX
XXXXXXXX
XXXXXXXX
XXXXXXXX
XXXXXXXX
XXXXXXXX
XXXXXXXX
XXXXXXXX
XXXXXXXX
XXXXXXXX
XXXXXXXX
XXXXXXXX X
X
X
X
X
X
X
X
X
X
X
X
X
0 1 2 3 4 5 mi
Legend
Rural Principal Arterial - Other
Rural Minor Arterial
Rural Major Collector
Rural Minor Collector
Committed / Under Construction Urban
Areas
Urban Principal Arterial - Interstate
Urban Principal Arterial - Freeways/Expressways
Urban Principal Arterial - Other
Urban Minor Arterial
Urban Major Collector
Urban Minor Collector
PAGE 22

N
SCALE 1" = 5,000'
05000 5000 10000 15000 FEET
HIGHWAY FUNCTIONAL CLASSIFICATION MAP
PREPARED BY THE
STATE OF HAWAII
DEPARTMENT OF TRANSPORTATIONHIGHWAYS DIVISION
HIGHWAY PLANNING BRANCHIN COOPERATION WITH THE
U.S. DEPARTMENT OF TRANSPORTATION
FEDERAL HIGHWAY ADMINISTRATION
ISLAND OF LANAI
2013
DATE REVISIONS
XXXXXXXX
XXXXXXXX
XXXXXXXX
XXXXXXXX
XXXXXXXX
XXXXXXXX
XXXXXXXX
XXXXXXXX
XXXXXXXX
XXXXXXXX
XXXXXXXX
XXXXXXXX
XXXXXXXX X
X
X
X
X
X
X
X
X
X
X
X
X
0.0 0.5 1.0 1.5 2.0 2.5 mi
Legend
Rural Principal Arterial - Other
Rural Minor Arterial
Rural Major Collector
Rural Minor Collector
Urban Areas
Urban Principal Arterial - Interstate
Urban Principal Arterial - Freeways/Expressways
Urban Principal Arterial - Other
Urban Minor Arterial
Urban Major Collector
Urban Minor Collector
Committed / Under Construction
PAGE 23
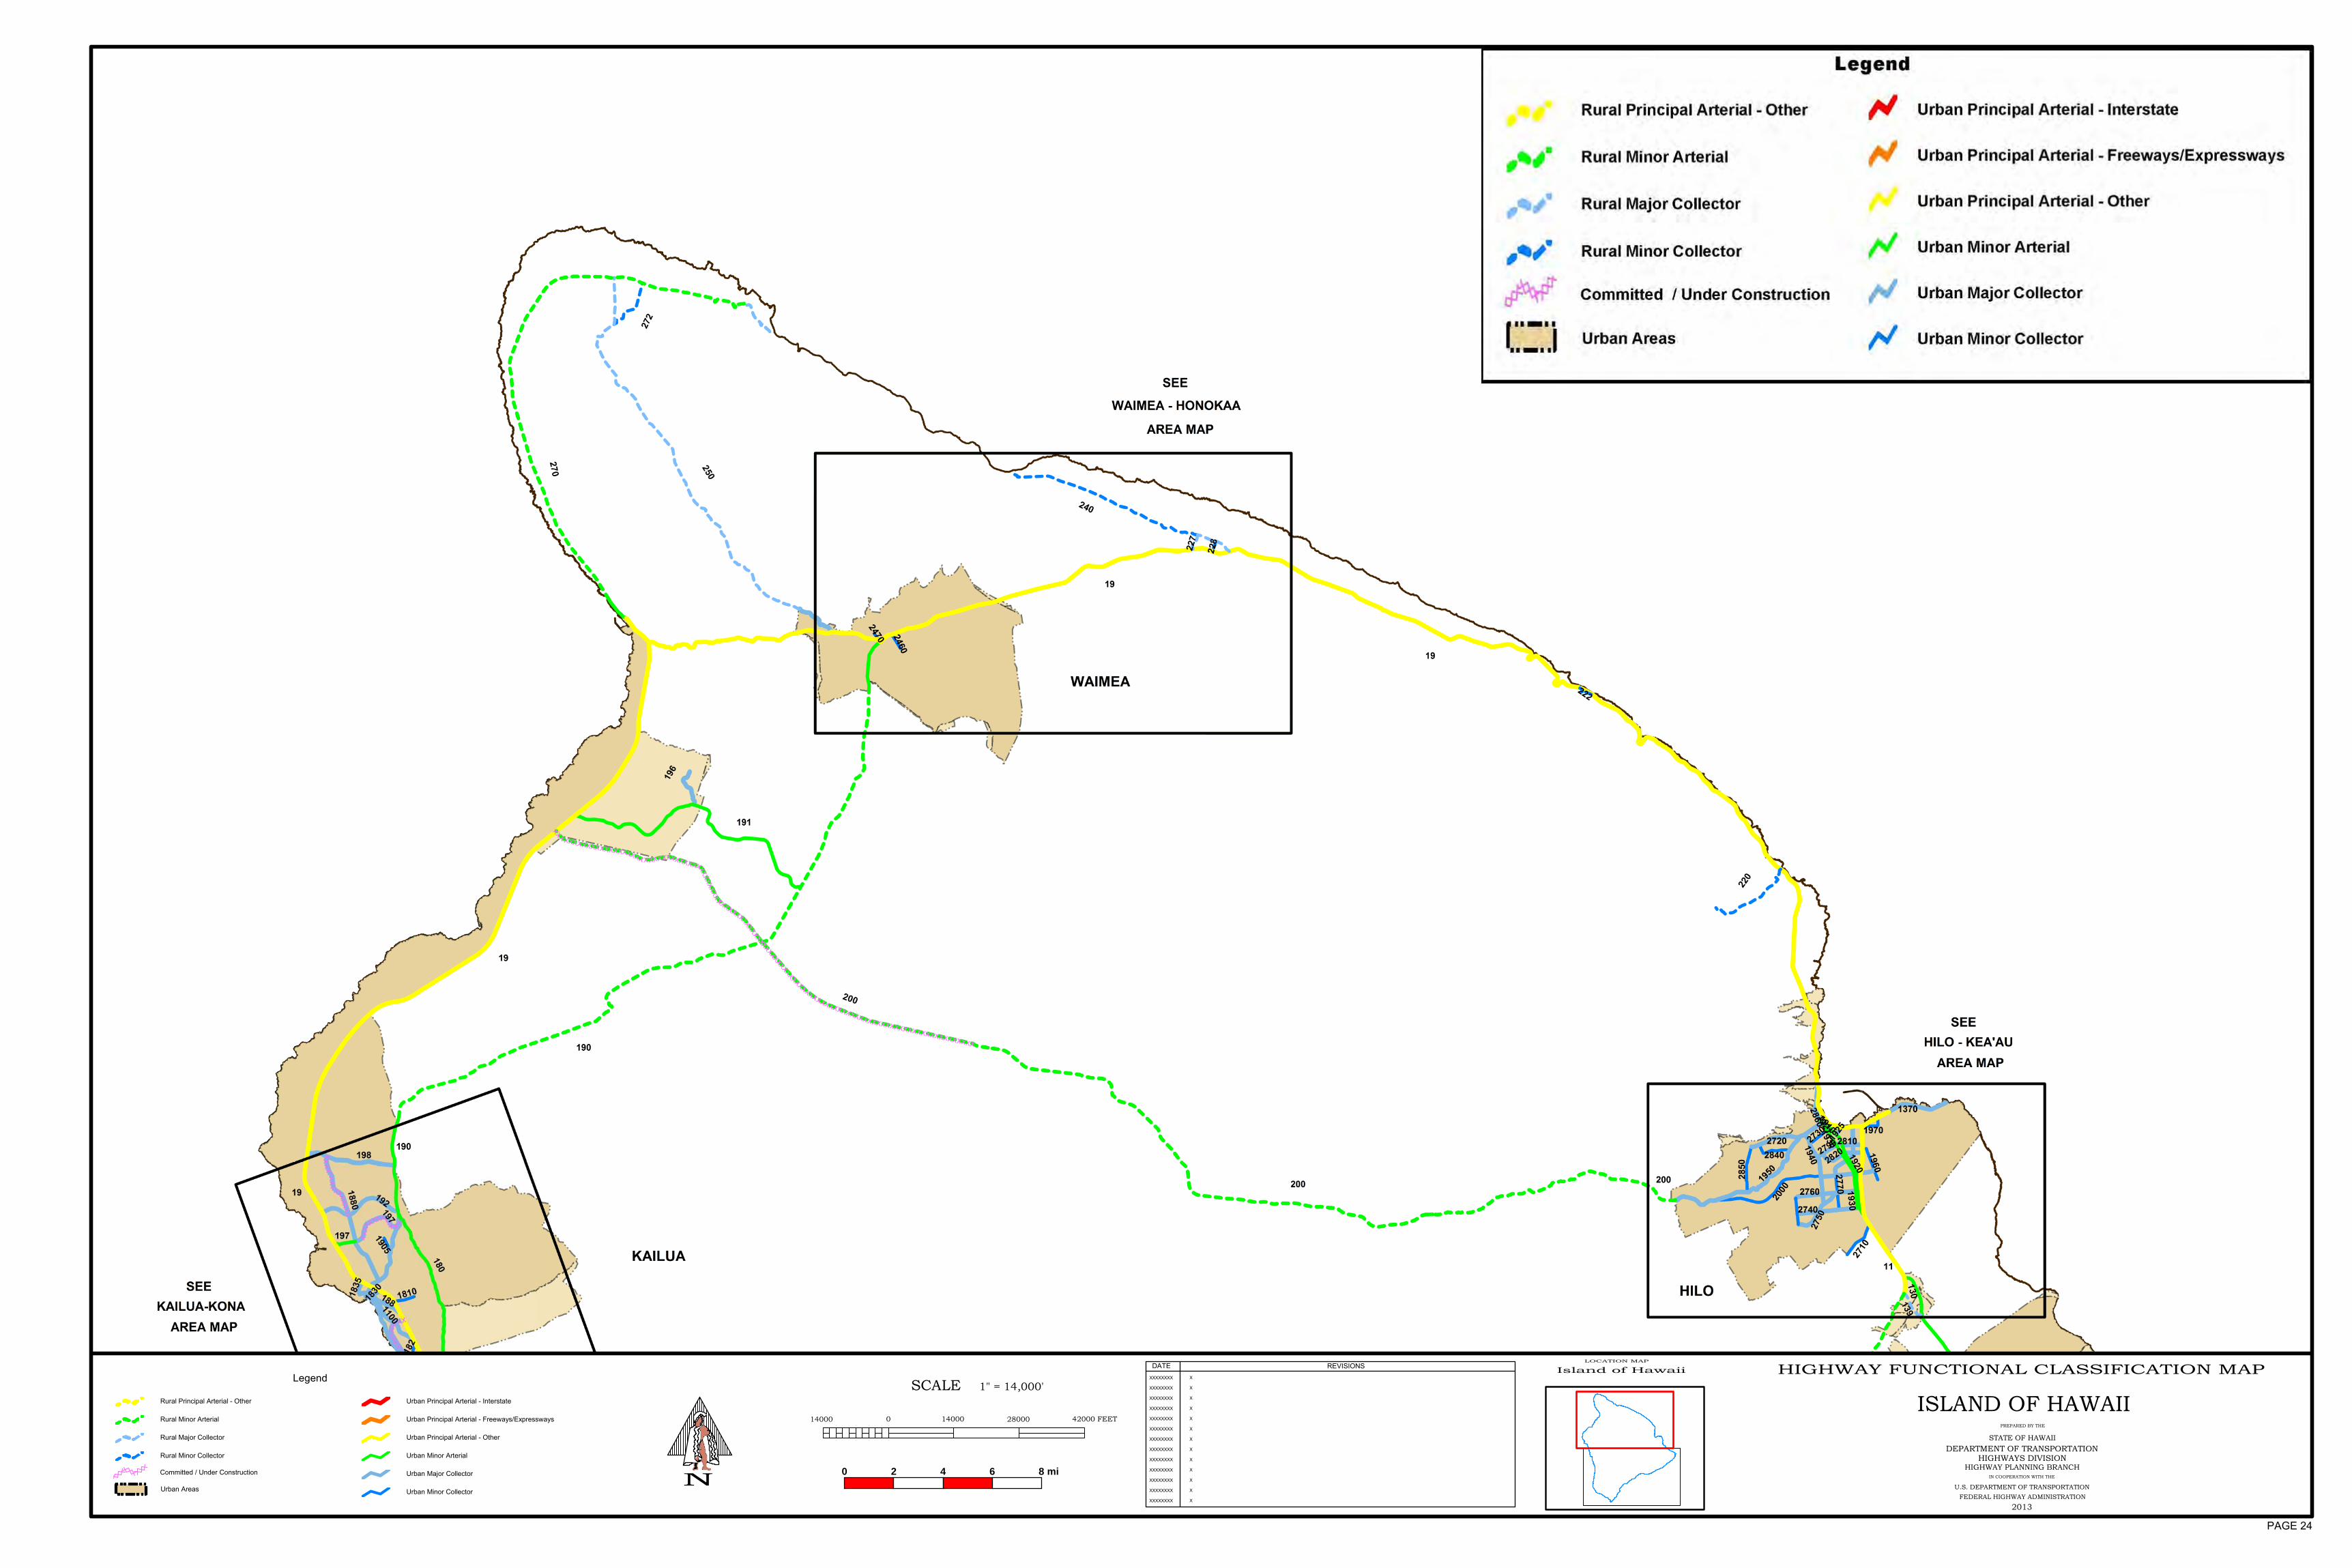
DATE REVISIONS
XXXXXXXX
XXXXXXXX
XXXXXXXX
XXXXXXXX
XXXXXXXX
XXXXXXXX
XXXXXXXX
XXXXXXXX
XXXXXXXX
XXXXXXXX
XXXXXXXX
XXXXXXXX
XXXXXXXX X
X
X
X
X
X
X
X
X
X
X
X
X
HIGHWAY FUNCTIONAL CLASSIFICATION MAP
PREPARED BY THE
STATE OF HAWAII
DEPARTMENT OF TRANSPORTATIONHIGHWAYS DIVISION
HIGHWAY PLANNING BRANCHIN COOPERATION WITH THE
U.S. DEPARTMENT OF TRANSPORTATION
FEDERAL HIGHWAY ADMINISTRATION
2013
SCALE 1" = 14,000'
014000 14000 28000 42000 FEET
ISLAND OF HAWAII
LOCATION MAP
Island of Hawaii
0 2 4 6 8 miN
Legend
Rural Principal Arterial - Other
Rural Minor Arterial
Rural Major Collector
Rural Minor Collector
Urban Areas
Urban Principal Arterial - Interstate
Urban Principal Arterial - Freeways/Expressways
Urban Principal Arterial - Other
Urban Minor Arterial
Urban Major Collector
Urban Minor Collector
Committed / Under Construction
PAGE 24
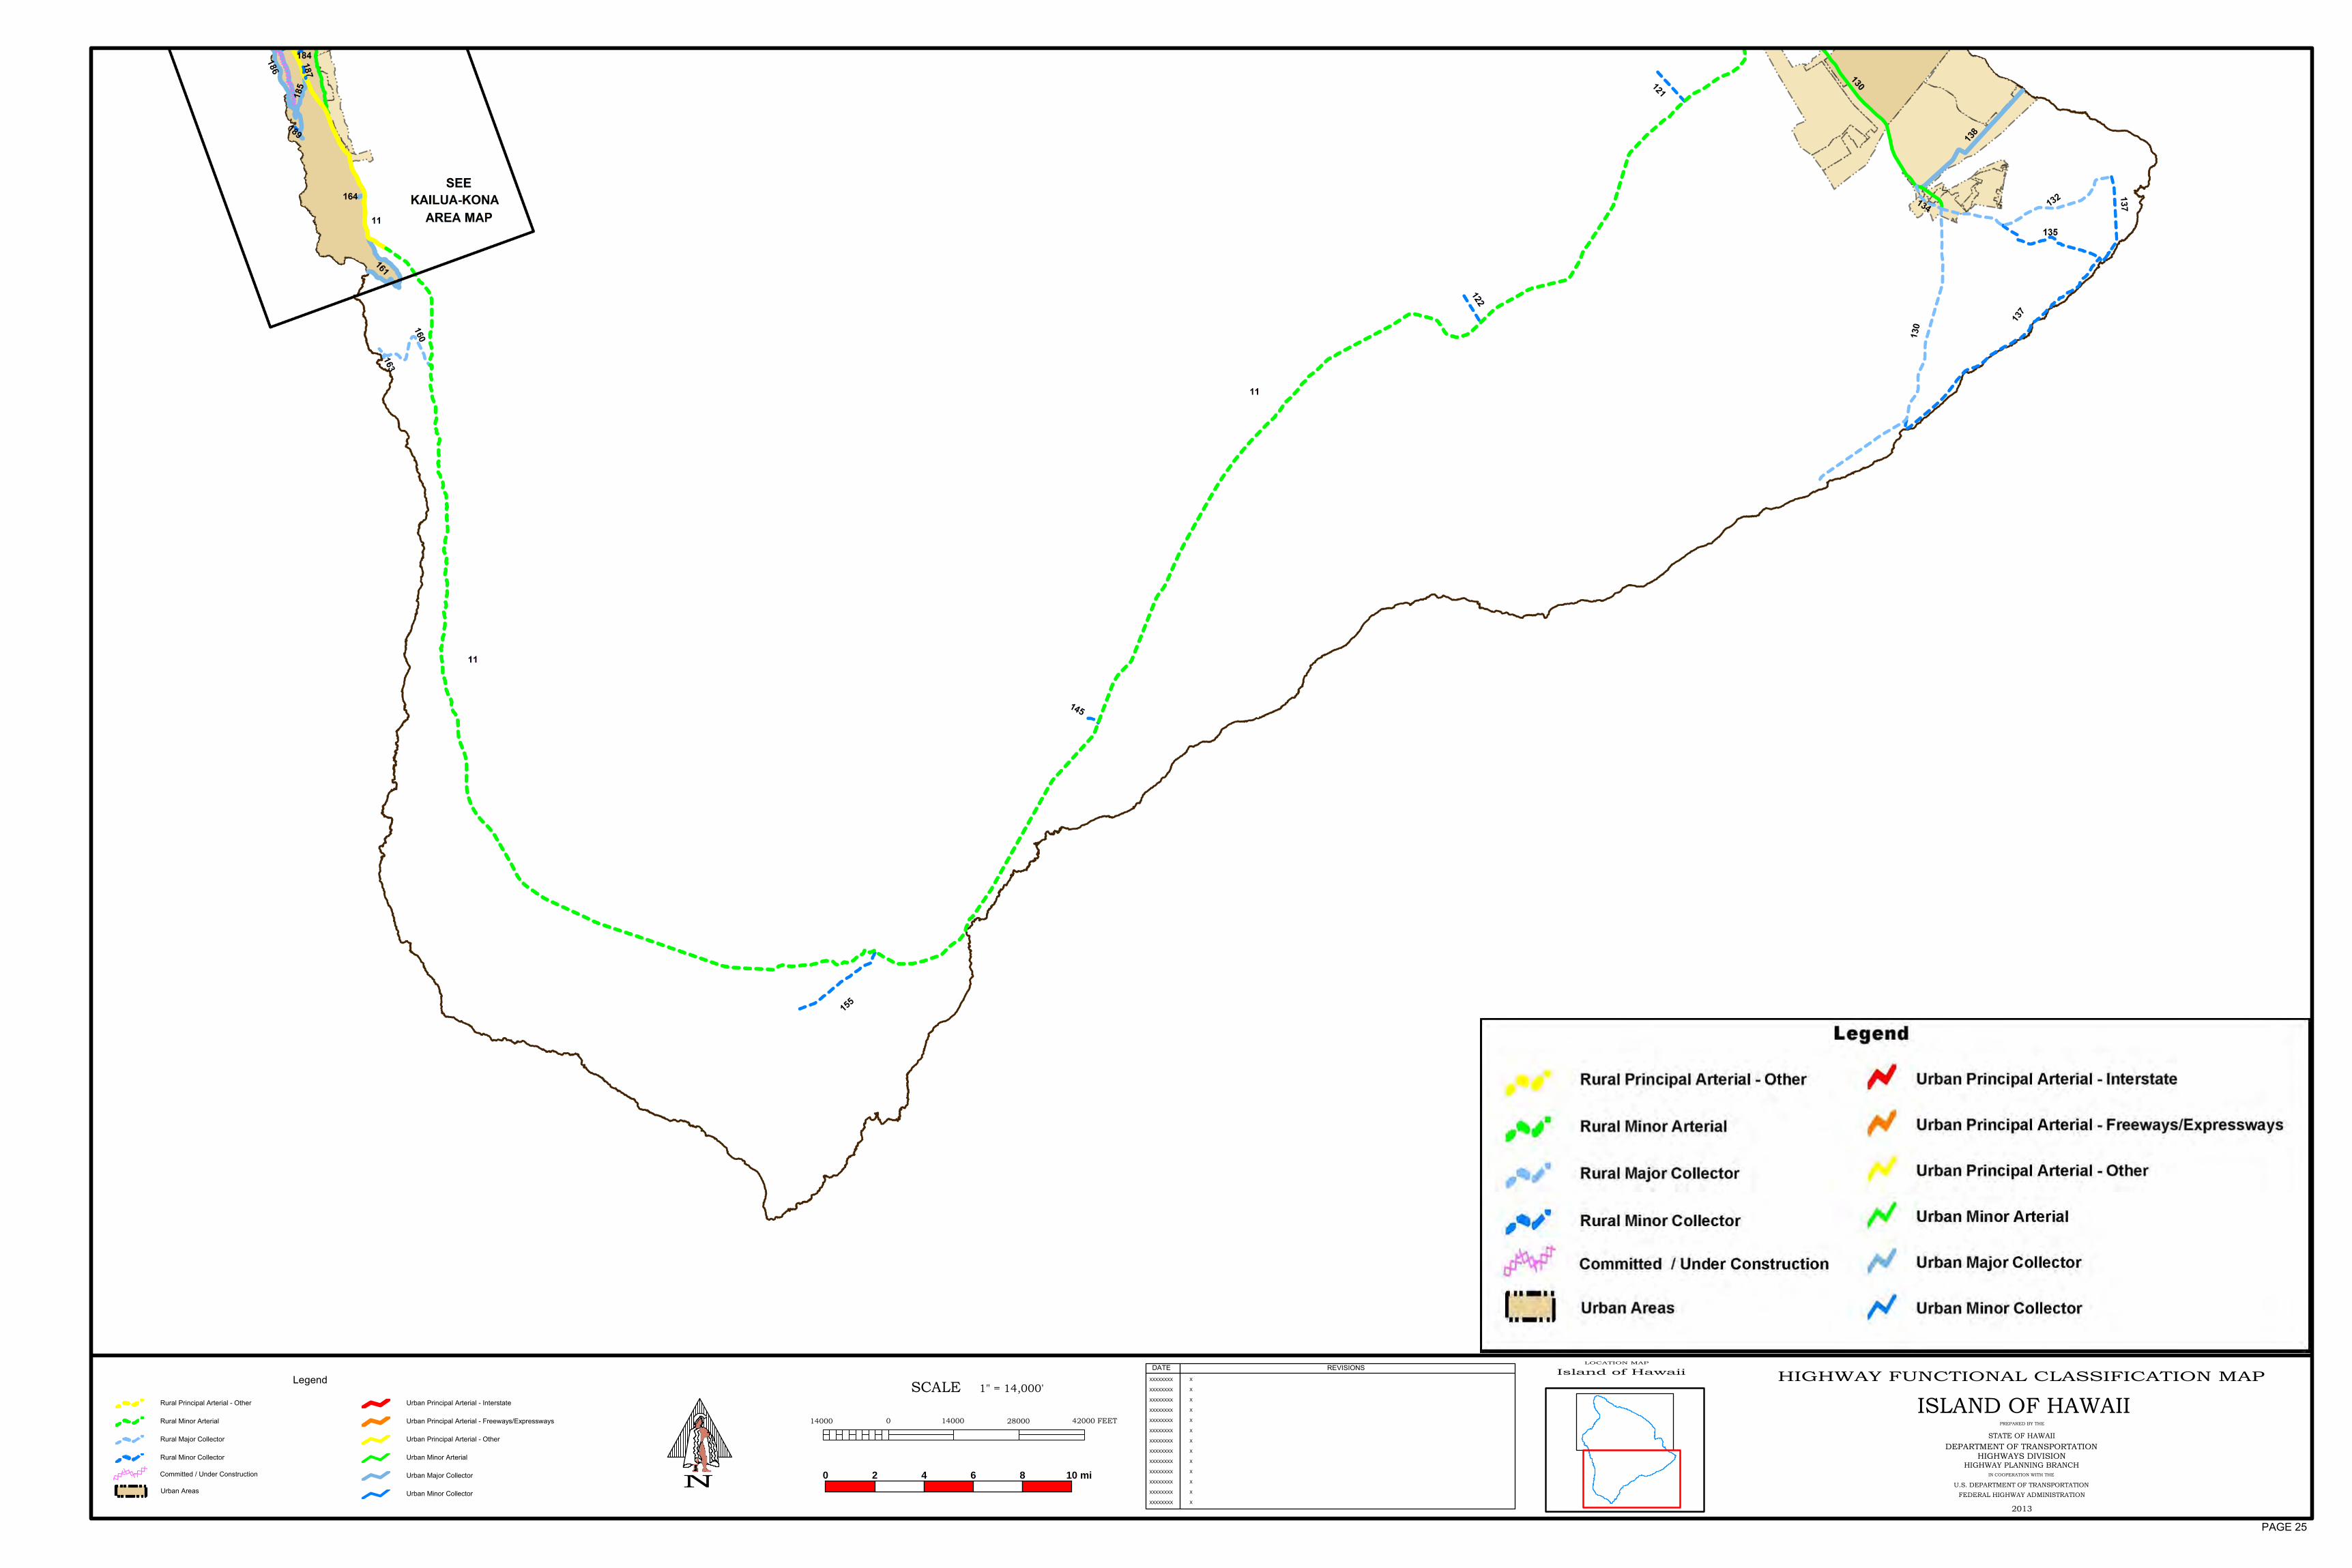
DATE REVISIONS
XXXXXXXX
XXXXXXXX
XXXXXXXX
XXXXXXXX
XXXXXXXX
XXXXXXXX
XXXXXXXX
XXXXXXXX
XXXXXXXX
XXXXXXXX
XXXXXXXX
XXXXXXXX
XXXXXXXX X
X
X
X
X
X
X
X
X
X
X
X
X
HIGHWAY FUNCTIONAL CLASSIFICATION MAP
PREPARED BY THE
STATE OF HAWAII
DEPARTMENT OF TRANSPORTATIONHIGHWAYS DIVISION
HIGHWAY PLANNING BRANCHIN COOPERATION WITH THE
U.S. DEPARTMENT OF TRANSPORTATION
FEDERAL HIGHWAY ADMINISTRATION
2013
LOCATION MAP
Island of Hawaii
ISLAND OF HAWAII
N
SCALE 1" = 14,000'
014000 14000 28000 42000 FEET
0 2 4 6 8 10 mi
Legend
Rural Principal Arterial - Other
Rural Minor Arterial
Rural Major Collector
Rural Minor Collector
Urban Areas
Urban Principal Arterial - Interstate
Urban Principal Arterial - Freeways/Expressways
Urban Principal Arterial - Other
Urban Minor Arterial
Urban Major Collector
Urban Minor Collector
Committed / Under Construction
PAGE 25

DATE REVISIONS
XXXXXXXX
XXXXXXXX
XXXXXXXX
XXXXXXXX
XXXXXXXX
XXXXXXXX
XXXXXXXX
XXXXXXXX
XXXXXXXX
XXXXXXXX
XXXXXXXX
XXXXXXXX
XXXXXXXX X
X
X
X
X
X
X
X
X
X
X
X
X
HIGHWAY FUNCTIONAL CLASSIFICATION MAP
PREPARED BY THE
STATE OF HAWAII
DEPARTMENT OF TRANSPORTATIONHIGHWAYS DIVISION
HIGHWAY PLANNING BRANCHIN COOPERATION WITH THE
U.S. DEPARTMENT OF TRANSPORTATION
FEDERAL HIGHWAY ADMINISTRATION
2013
SCALE 1" = 3,000'
03000 3000 6000 9000 FEET
KAILUA-KONA
LOCATION MAP
Island of Hawaii
N
N 0.0 0.5 1.0 1.5 2.0 mi
Legend
Rural Principal Arterial - Other
Rural Minor Arterial
Rural Major Collector
Rural Minor Collector
Urban Areas
Urban Principal Arterial - Interstate
Urban Principal Arterial - Freeways/Expressways
Urban Principal Arterial - Other
Urban Minor Arterial
Urban Major Collector
Urban Minor Collector
Committed / Under Construction
PAGE 26

DATE REVISIONS
XXXXXXXX
XXXXXXXX
XXXXXXXX
XXXXXXXX
XXXXXXXX
XXXXXXXX
XXXXXXXX
XXXXXXXX
XXXXXXXX
XXXXXXXX
XXXXXXXX
XXXXXXXX
XXXXXXXX X
X
X
X
X
X
X
X
X
X
X
X
X
HIGHWAY FUNCTIONAL CLASSIFICATION MAP
PREPARED BY THE
STATE OF HAWAII
DEPARTMENT OF TRANSPORTATIONHIGHWAYS DIVISION
HIGHWAY PLANNING BRANCHIN COOPERATION WITH THE
U.S. DEPARTMENT OF TRANSPORTATION
FEDERAL HIGHWAY ADMINISTRATION
2013
WAIMEA - HONOKAA
LOCATION MAP
Island of Hawaii
N
SCALE 1" = 3,000'
03000 3000 6000 9000 FEET
0.0 0.5 1.0 1.5 2.0 miN
Legend
Rural Principal Arterial - Other
Rural Minor Arterial
Rural Major Collector
Rural Minor Collector
Urban Areas
Urban Principal Arterial - Interstate
Urban Principal Arterial - Freeways/Expressways
Urban Principal Arterial - Other
Urban Minor Arterial
Urban Major Collector
Urban Minor Collector
Committed / Under Construction
PAGE 27
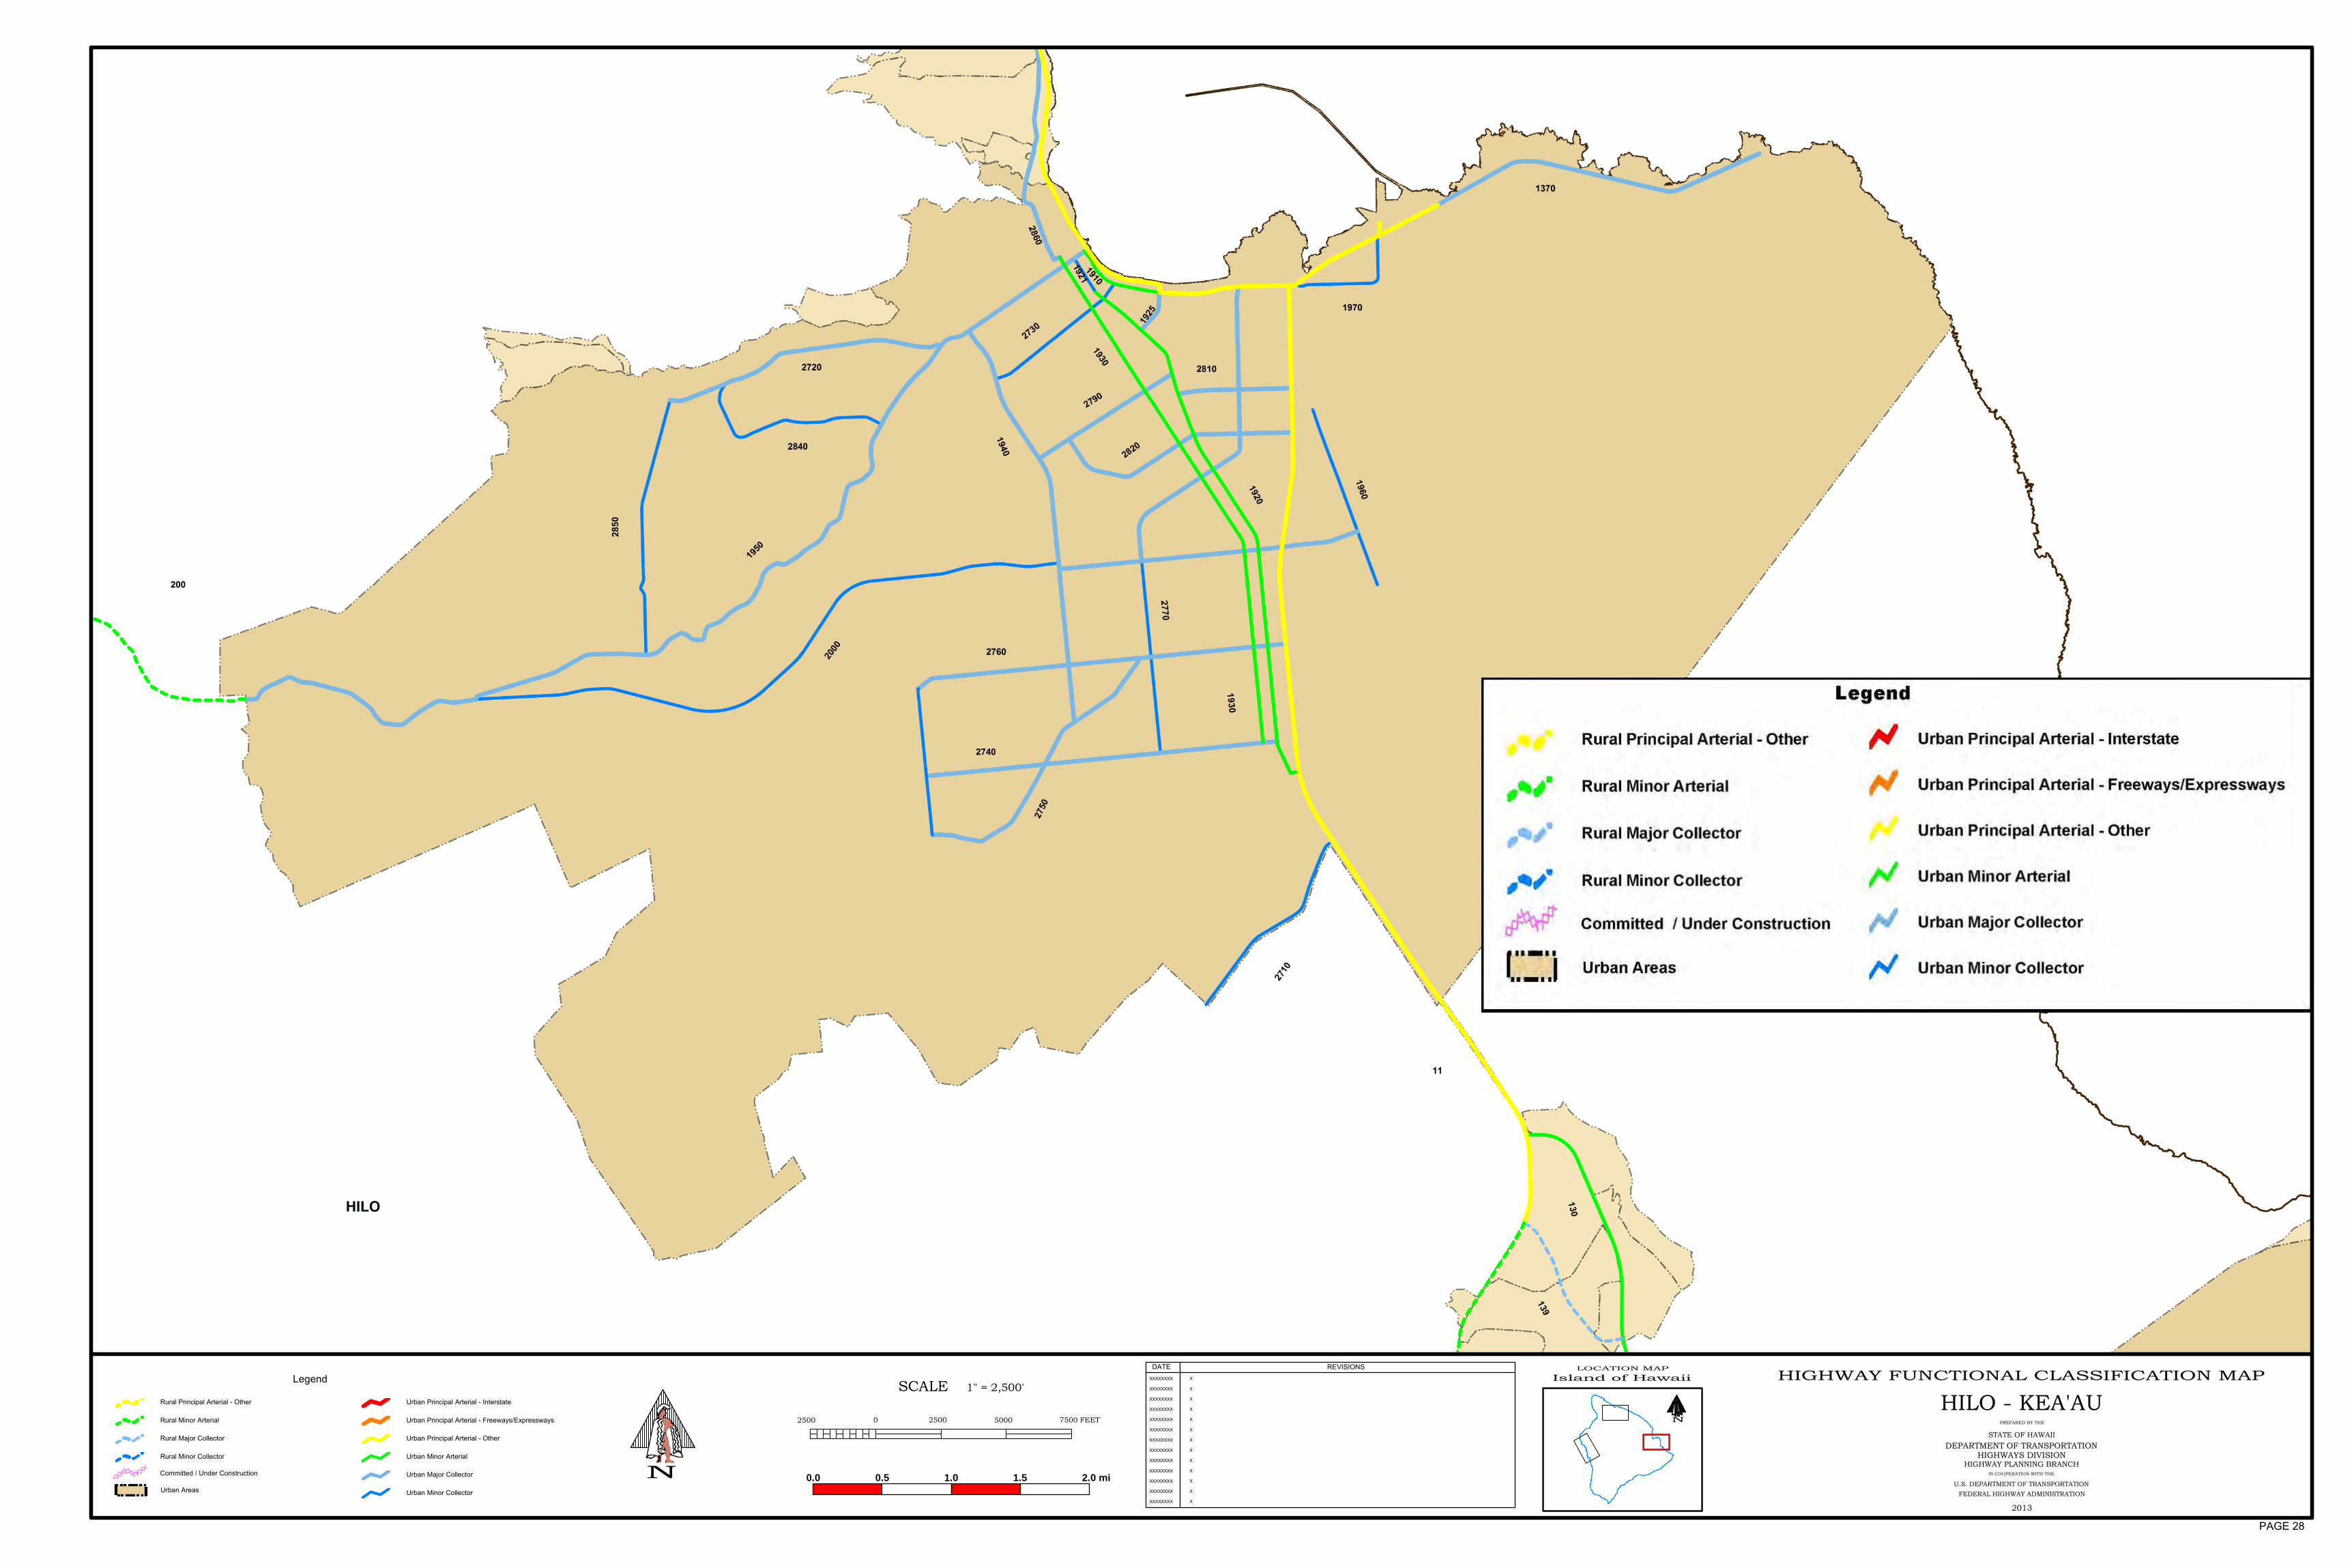
DATE REVISIONS
XXXXXXXX
XXXXXXXX
XXXXXXXX
XXXXXXXX
XXXXXXXX
XXXXXXXX
XXXXXXXX
XXXXXXXX
XXXXXXXX
XXXXXXXX
XXXXXXXX
XXXXXXXX
XXXXXXXX X
X
X
X
X
X
X
X
X
X
X
X
X
HIGHWAY FUNCTIONAL CLASSIFICATION MAP
PREPARED BY THE
STATE OF HAWAII
DEPARTMENT OF TRANSPORTATIONHIGHWAYS DIVISION
HIGHWAY PLANNING BRANCHIN COOPERATION WITH THE
U.S. DEPARTMENT OF TRANSPORTATION
FEDERAL HIGHWAY ADMINISTRATION
2013
SCALE 1" = 2,500'
02500 2500 5000 7500 FEET
HILO - KEA'AU
LOCATION MAP
Island of Hawaii
N
N 0.0 0.5 1.0 1.5 2.0 mi
Legend
Rural Principal Arterial - Other
Rural Minor Arterial
Rural Major Collector
Rural Minor Collector
Urban Areas
Urban Principal Arterial - Interstate
Urban Principal Arterial - Freeways/Expressways
Urban Principal Arterial - Other
Urban Minor Arterial
Urban Major Collector
Urban Minor Collector
Committed / Under Construction
PAGE 28

KEY TO SHEETS
HIGHWAY FUNCTIONAL CLASSIFICATION MAP
PREPARED BY THE
STATE OF HAWAII
DEPARTMENT OF TRANSPORTATIONHIGHWAYS DIVISION
HIGHWAY PLANNING BRANCHIN COOPERATION WITH THE
U.S. DEPARTMENT OF TRANSPORTATION
FEDERAL HIGHWAY ADMINISTRATION
2013
N
SCALE 1" = 7,000'
07000 7000 14000 21000 FEETISLAND OF KAUAI
DATE REVISIONS
XXXXXXXX
XXXXXXXX
XXXXXXXX
XXXXXXXX
XXXXXXXX
XXXXXXXX
XXXXXXXX
XXXXXXXX
XXXXXXXX
XXXXXXXX
XXXXXXXX
XXXXXXXX
XXXXXXXX X
X
X
X
X
X
X
X
X
X
X
X
X
0 1 2 3 4 5 mi
0.00 0.25 0.50 0.75 1.00 mi
0.00 0.25 0.50 0.75 1.00 mi
0.00 0.25 0.50 0.75 1.00 mi
0.00 0.25 0.50 0.75 1.00 mi
INSET 1
INSET 2
INSET 4
INSET 3
Legend
Rural Principal Arterial - Other
Rural Minor Arterial
Rural Major Collector
Rural Minor Collector
Urban Areas
Urban Principal Arterial - Interstate
Urban Principal Arterial - Freeways/Expressways
Urban Principal Arterial - Other
Urban Minor Arterial
Urban Major Collector
Urban Minor Collector
Committed / Under Construction
PAGE 2
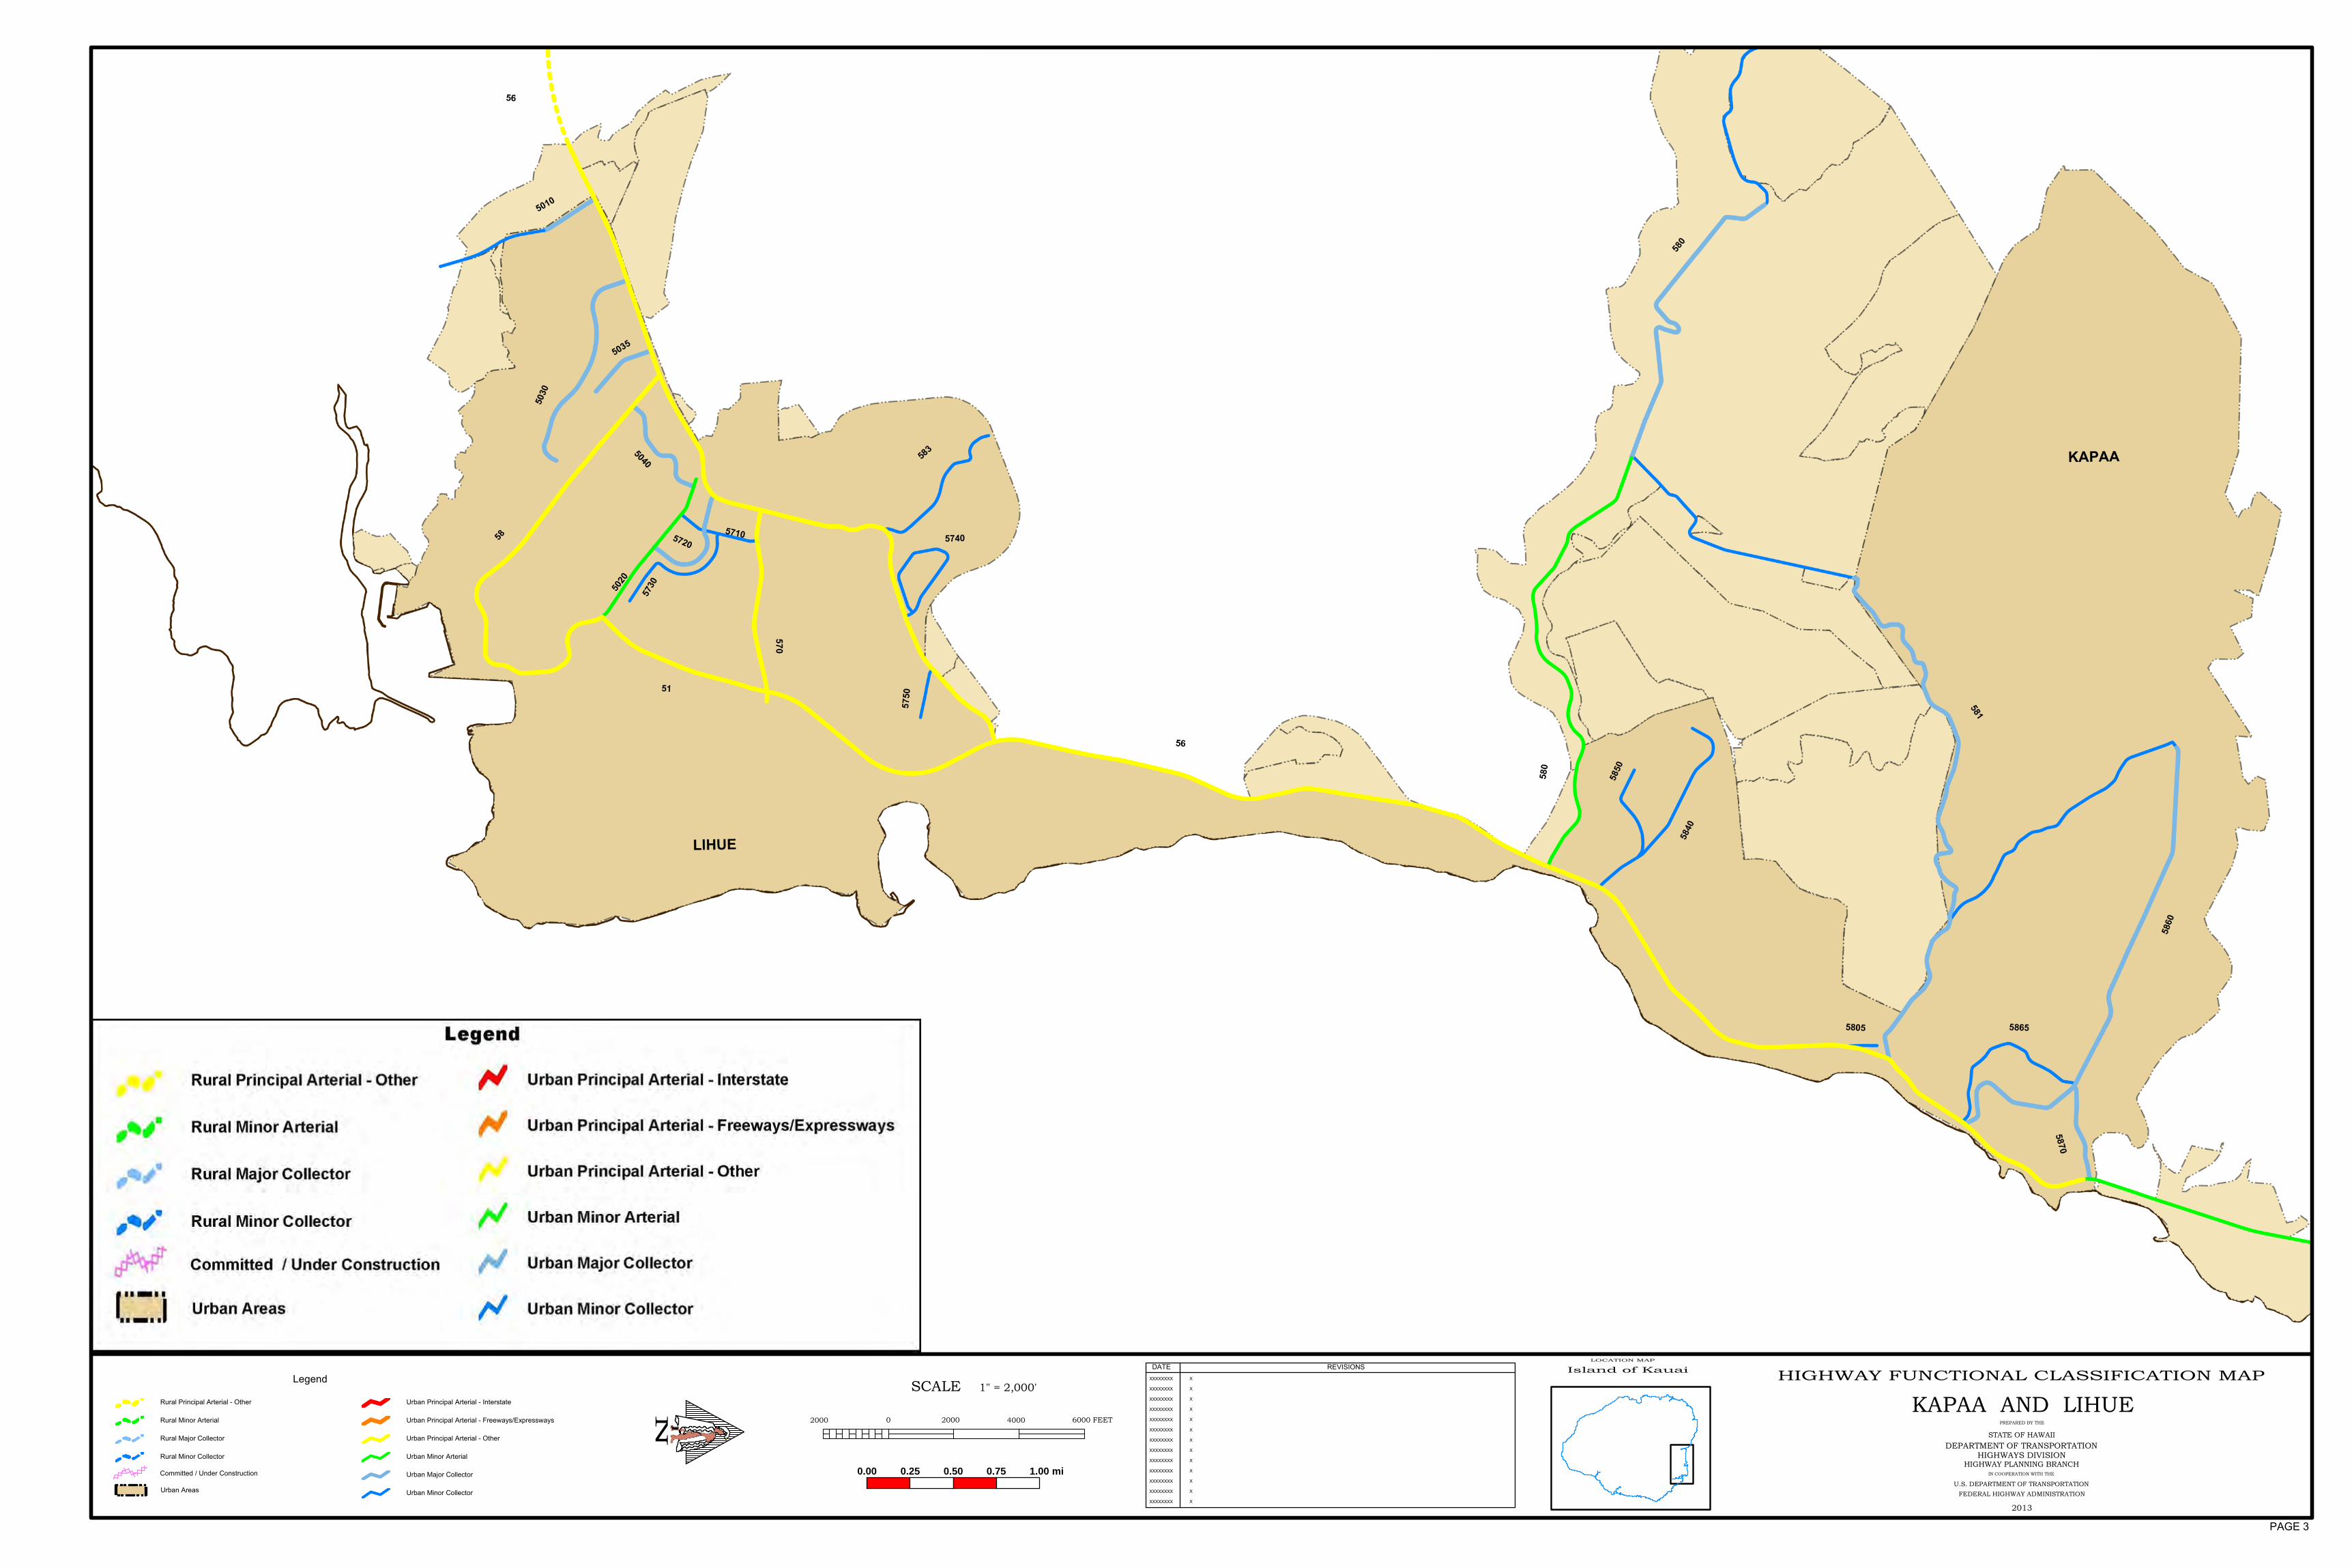
DATE REVISIONS
XXXXXXXX
XXXXXXXX
XXXXXXXX
XXXXXXXX
XXXXXXXX
XXXXXXXX
XXXXXXXX
XXXXXXXX
XXXXXXXX
XXXXXXXX
XXXXXXXX
XXXXXXXX
XXXXXXXX X
X
X
X
X
X
X
X
X
X
X
X
X
HIGHWAY FUNCTIONAL CLASSIFICATION MAP
PREPARED BY THE
STATE OF HAWAII
DEPARTMENT OF TRANSPORTATIONHIGHWAYS DIVISION
HIGHWAY PLANNING BRANCHIN COOPERATION WITH THE
U.S. DEPARTMENT OF TRANSPORTATION
FEDERAL HIGHWAY ADMINISTRATION
2013
SCALE 1" = 2,000'
02000 2000 4000 6000 FEET
KAPAA AND LIHUE
Island of Kauai
LOCATION MAP
N
0.00 0.25 0.50 0.75 1.00 mi
Legend
Rural Principal Arterial - Other
Rural Minor Arterial
Rural Major Collector
Rural Minor Collector
Urban Areas
Urban Principal Arterial - Interstate
Urban Principal Arterial - Freeways/Expressways
Urban Principal Arterial - Other
Urban Minor Arterial
Urban Major Collector
Urban Minor Collector
Committed / Under Construction
PAGE 3

DATE REVISIONS
XXXXXXXX
XXXXXXXX
XXXXXXXX
XXXXXXXX
XXXXXXXX
XXXXXXXX
XXXXXXXX
XXXXXXXX
XXXXXXXX
XXXXXXXX
XXXXXXXX
XXXXXXXX
XXXXXXXX X
X
X
X
X
X
X
X
X
X
X
X
X
HIGHWAY FUNCTIONAL CLASSIFICATION MAP
PREPARED BY THE
STATE OF HAWAII
DEPARTMENT OF TRANSPORTATIONHIGHWAYS DIVISION
HIGHWAY PLANNING BRANCHIN COOPERATION WITH THE
U.S. DEPARTMENT OF TRANSPORTATION
FEDERAL HIGHWAY ADMINISTRATION
2013
SCALE 1" = 2,000'
02000 2000 4000 6000 FEET
HANAPEPE AND KOLOA
N
Island of Kauai
LOCATION MAP
0.00 0.25 0.50 0.75 1.00 mi
Legend
Rural Principal Arterial - Other
Rural Minor Arterial
Rural Major Collector
Rural Minor Collector
Urban Areas
Urban Principal Arterial - Interstate
Urban Principal Arterial - Freeways/Expressways
Urban Principal Arterial - Other
Urban Minor Arterial
Urban Major Collector
Urban Minor Collector
Committed / Under Construction
PAGE 4

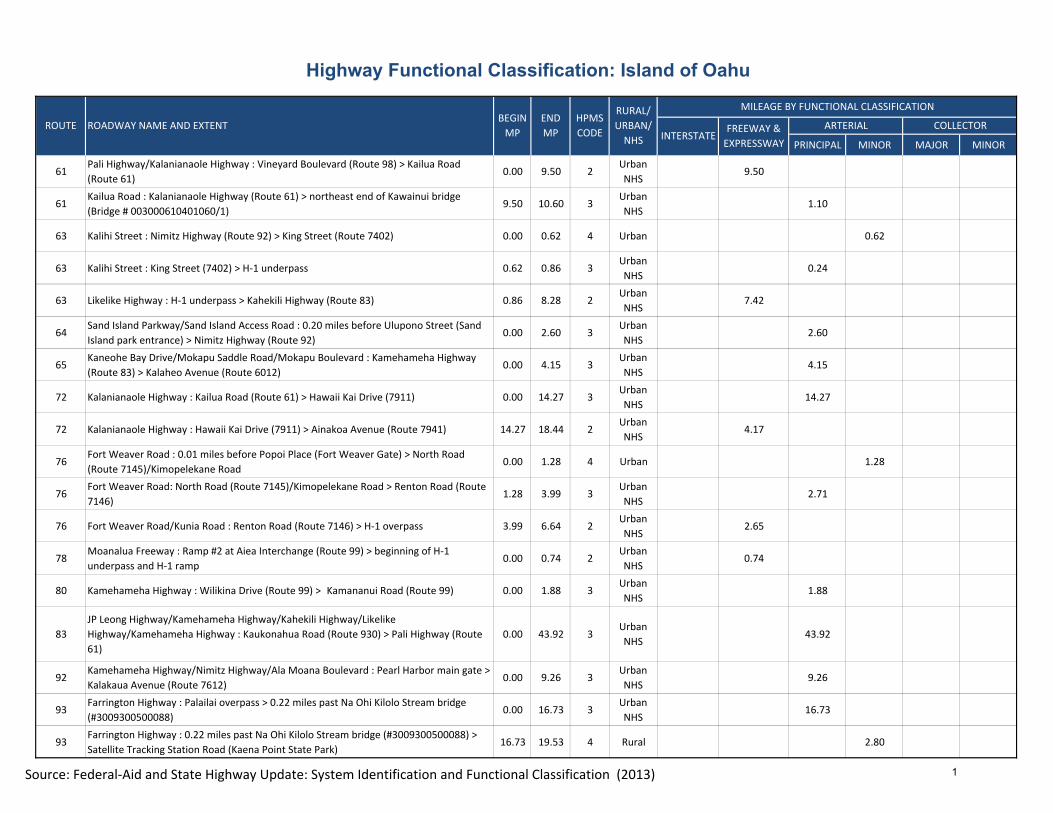
Highway Functional Classification: Island of Oahu
PRINCIPAL MINOR MAJOR MINOR
61Pali Highway/Kalanianaole Highway : Vineyard Boulevard (Route 98) > Kailua Road
(Route 61)0.00 9.50 2
Urban
NHS9.50
61Kailua Road : Kalanianaole Highway (Route 61) > northeast end of Kawainui bridge
(Bridge # 003000610401060/1)9.50 10.60 3
Urban
NHS1.10
63 Kalihi Street : Nimitz Highway (Route 92) > King Street (Route 7402) 0.00 0.62 4 Urban 0.62
63 Kalihi Street : King Street (7402) > H‐1 underpass 0.62 0.86 3Urban
NHS0.24
63 Likelike Highway : H‐1 underpass > Kahekili Highway (Route 83) 0.86 8.28 2Urban
NHS7.42
64Sand Island Parkway/Sand Island Access Road : 0.20 miles before Ulupono Street (Sand
Island park entrance) > Nimitz Highway (Route 92)0.00 2.60 3
Urban
NHS2.60
65Kaneohe Bay Drive/Mokapu Saddle Road/Mokapu Boulevard : Kamehameha Highway
(Route 83) > Kalaheo Avenue (Route 6012)0.00 4.15 3
Urban
NHS4.15
72 Kalanianaole Highway : Kailua Road (Route 61) > Hawaii Kai Drive (7911) 0.00 14.27 3Urban
NHS14.27
72 Kalanianaole Highway : Hawaii Kai Drive (7911) > Ainakoa Avenue (Route 7941) 14.27 18.44 2Urban
NHS4.17
76Fort Weaver Road : 0.01 miles before Popoi Place (Fort Weaver Gate) > North Road
(Route 7145)/Kimopelekane Road0.00 1.28 4 Urban 1.28
76Fort Weaver Road: North Road (Route 7145)/Kimopelekane Road > Renton Road (Route
7146) 1.28 3.99 3
Urban
NHS2.71
76 Fort Weaver Road/Kunia Road : Renton Road (Route 7146) > H‐1 overpass 3.99 6.64 2Urban
NHS2.65
78Moanalua Freeway : Ramp #2 at Aiea Interchange (Route 99) > beginning of H‐1
underpass and H‐1 ramp0.00 0.74 2
Urban
NHS0.74
80 Kamehameha Highway : Wilikina Drive (Route 99) > Kamananui Road (Route 99) 0.00 1.88 3Urban
NHS1.88
83
JP Leong Highway/Kamehameha Highway/Kahekili Highway/Likelike
Highway/Kamehameha Highway : Kaukonahua Road (Route 930) > Pali Highway (Route
61)
0.00 43.92 3Urban
NHS43.92
92Kamehameha Highway/Nimitz Highway/Ala Moana Boulevard : Pearl Harbor main gate >
Kalakaua Avenue (Route 7612)0.00 9.26 3
Urban
NHS9.26
93Farrington Highway : Palailai overpass > 0.22 miles past Na Ohi Kilolo Stream bridge
(#3009300500088)0.00 16.73 3
Urban
NHS16.73
93Farrington Highway : 0.22 miles past Na Ohi Kilolo Stream bridge (#3009300500088) >
Satellite Tracking Station Road (Kaena Point State Park)16.73 19.53 4 Rural 2.80
ROUTE ROADWAY NAME AND EXTENTBEGIN
MP
END
MP
HPMS
CODE
RURAL/
URBAN/
NHS
MILEAGE BY FUNCTIONAL CLASSIFICATION
ARTERIAL COLLECTORFREEWAY &
EXPRESSWAYINTERSTATE
Source: Federal-Aid and State Highway Update: System Identification and Functional Classification (2013) 1

Highway Functional Classification: Island of Oahu
PRINCIPAL MINOR MAJOR MINOR
ROUTE ROADWAY NAME AND EXTENTBEGIN
MP
END
MP
HPMS
CODE
RURAL/
URBAN/
NHS
MILEAGE BY FUNCTIONAL CLASSIFICATION
ARTERIAL COLLECTORFREEWAY &
EXPRESSWAYINTERSTATE
98 Olomea Street/Halona Street/Vineyard Boulevard : ramp from H‐1 > on‐ramp to H‐1 0.00 1.76 3Urban
NHS1.76
99Kamehameha Highway/Kamananui Road/Wilikina Drive : JP Leong Highway (Route 83) >
Kunia Road (Route 750)0.00 9.08 3
Urban
NHS9.08
99Wilikina Drive/Kamehameha Highway/Farrington Highway : Kunia Road (Route 750) >
Acacia Road (Route 7228)9.08 18.25 2
Urban
NHS9.17
99Kamehameha Highway : Acacia Road (Route 7228) > end of route (Pearl Harbor
interchange)18.25 23.83 3
Urban
NHS5.58
750 Kunia Road : H‐1 interchange > 1.06 miles past Anonui Street 0.00 2.00 3Urban
NHS2.00
750 Kunia Road : 1.06 miles past Anonui Street > 0.15 miles before divided highway 2.00 7.04 4 Rural 5.04
750 Kunia Road : 0.15 miles before divided highway > Wilikina Drive (Route 99) 7.04 8.05 4Urban
NHS1.01
801 Kaukonahua Road : Kamehameha Highway (Route 80) > Kamananui Road (Route 99) 0.00 0.20 4 Urban 0.20
801 Kaukonahua Road : Kamananui Road (Route 99) > Wilikina Drive (Route 803) 0.20 2.20 4 Rural 2.00
803Wilikina Drive/Kaukonahua Road : Kamananui Road (Route 99) > beginning of urban
boundary0.00 5.04 4 Rural 5.04
803 Kaukonahua Road : beginning of urban boundary > Farrington Highway (Route 930) 5.04 5.84 4 Urban 0.80
901 Fort Barrette Road : Naval Reservation gate > Makakilo overpass 0.00 1.38 3Urban
NHS1.38
930Farrington Highway : 0.09 miles west of Dillingham Airfield Access Road (Kaena Point
State Park bounday) > Dillingham Air Field Entrance0.00 2.15 4 Rural 2.15
930Farrington Highway/Kaukonahua Road/Farrington Highway : Dillingham Air Field
Entrance > Joseph P Leong Highway (Route 83)2.15 7.92 4 Urban 5.77
6001Kailua Road : Kawainui Stream bridge (#003000610401060)> Oneawa Street (Route
6016)0.00 0.20 3
Urban
NHS0.20
6010 Hamakua Drive : Keolu Drive (Route 6013) > Kailua Road (Route 61) 0.00 0.85 4 Urban 0.85
6011 Kailua Road : Oneawa Street (Route 6016) > Kalaheo Avenue (Route 6012) 0.00 1.06 5 Urban 1.06
6012 Kalaheo Avenue: Kailua Road (Route 6011) > Mokapu Boulevard (Route 65) 0.00 2.10 5 Urban 2.10
Source: Federal-Aid and State Highway Update: System Identification and Functional Classification (2013) 2

Highway Functional Classification: Island of Oahu
PRINCIPAL MINOR MAJOR MINOR
ROUTE ROADWAY NAME AND EXTENTBEGIN
MP
END
MP
HPMS
CODE
RURAL/
URBAN/
NHS
MILEAGE BY FUNCTIONAL CLASSIFICATION
ARTERIAL COLLECTORFREEWAY &
EXPRESSWAYINTERSTATE
6013 Keolu Drive : Kalanianaole highway (Route 72) > Keolu Drive 0.00 3.17 5 Urban 3.17
6014 Kuulei Road : Kailua Road (Route 6011) > Kalaheo Avenue (Route 6012) 0.00 0.60 4 Urban 0.60
6015 Mokapu Road : North Kalaheo Avenue (Route 6012) > Kaneohe Marine Corps Air Station 0.00 0.60 5 Urban 0.60
6016 Oneawa Street : Kailua Road (Route 6011) > Mokapu Boulevard (Route 65) 0.00 1.30 4 Urban 1.30
6017 Wanaao Road : Kailua Road (Route 6011) > Keolu Drive (Route 6013) 0.00 0.85 6 Urban 0.85
6020 Nanialii Street : Keolu Drive (Route 6013) > Kina Street (Route 6048) 0.00 0.27 6 Urban 0.27
6025 Kanapuu Drive : Kalanianaole Highway (Route 72) > Keolu Drive (Route 6013) 0.00 0.73 6 Urban 0.73
6041 Kainalu Drive : Kainui Drive (Route 6042) > Kailua Road (6011) 0.00 1.76 6 Urban 1.76
6042 Kainui Drive : Oneawa Street (Route 6016) > Kalaheo Avenue (Route 6012) 0.00 0.70 6 Urban 0.70
6043 Kihapai Street/Punaa Street : Oneawa Street (Route 6016) > Oneawa Street (Route 6016) 0.00 1.03 6 Urban 1.03
6044 Kalama Street : Oneawa Street (Route 6016) > Kainalu Drive (Route 6041) 0.00 0.38 6 Urban 0.38
6045South Kalaheo Avenue/Lihiwai Road/Kawailoa Road : Kailua Road (Route 6011) > Alala
Road 0.00 0.53 4 Urban 0.53
6045 Alala Road : Kawailoa Road > Mokulua Drive 0.53 0.60 5 Urban 0.07
6046Awakea Road/Ka Awakea Road : Wanaao Road (Route 6017) > Papalani Street (Route
6047)0.00 0.33 6 Urban 0.33
6047 Papalani Street : Wanaao Road (Route 6017) > Keolu Drive (Route 6013) 0.00 0.43 6 Urban 0.43
6048 Hele Street/Kina Street : Keolu Drive (Route 6013) > Hele Street (Route 6048) 0.00 1.65 6 Urban 1.65
6049 Akamai Street/Akumu Street : Keolu Drive (Route 6013) > Keolu Drive (Route 6013) 0.00 1.20 6 Urban 1.20
6050Ulumanu Drive/Ulupii Street/Uluhala Street : Kailua Road (Route 61) > Kalanianaole
Highway (Route 61)0.00 1.09 6 Urban 1.09
Source: Federal-Aid and State Highway Update: System Identification and Functional Classification (2013) 3

Highway Functional Classification: Island of Oahu
PRINCIPAL MINOR MAJOR MINOR
ROUTE ROADWAY NAME AND EXTENTBEGIN
MP
END
MP
HPMS
CODE
RURAL/
URBAN/
NHS
MILEAGE BY FUNCTIONAL CLASSIFICATION
ARTERIAL COLLECTORFREEWAY &
EXPRESSWAYINTERSTATE
6051 Auloa Road/Maunawili Road : Kalanianaole Highway (Route 61) > Aloha Oe Drive 0.00 1.26 6 Urban 1.26
6510 Kamehameha Highway : Kaneohe Bay Drive (Route 65) > Haiku Road (Route 6542) 0.00 1.42 4 Urban 1.42
6510 Kamehameha Highway : Haiku Road (Route 6542) > Kahekili Highway (Route 83) 1.42 5.57 5 Urban 4.15
6511 Kaneohe Bay Drive : Mokapu Saddle Road (Route 65) > Mokapu Boulevard (Route 65) 0.00 2.62 5 Urban 2.62
6542 Haiku Road : Kamehameha Highway (Route 6510) > Kahekili Highway (Route 83) 0.00 0.70 4 Urban 0.70
6542 Haiku Road : Kahekili Highway (Route 83) > Kahuhipa Street (Route 6544) 0.70 1.20 6 Urban 0.50
6543 Keaahala Road : Kamehameha Highway (Route 6510) > Pookela Street 0.00 0.75 5 Urban 0.75
6544 Kahuhipa Street : Kamehameha Highway (Route 6510) > Kahekili Highway (Route 83) 0.00 0.63 5 Urban 0.63
6544 Kahuhipa Street : Kahekili Highway (Route 83) > Haiku Road (Route 6542) 0.63 1.19 6 Urban 0.56
6545Lilipuna Road/Wailele Road/William Henry Road: Kamehameha Highway (Route 6510) >
Kamehameha Highway (Route 6510)0.00 1.37 6 Urban 1.37
6546 Waikalua Road : Kamehameha Highway (Route 6510) > Kaneohe Beach Park 0.00 1.03 5 Urban 1.03
6547Anoi Road/Luluku Road : Kapunahala Elementary entrance > Kamehameha Highway
(Route 83)0.00 1.07 6 Urban 1.07
6548Koa Kahiko Street/Kenela Street/Namoku Street : Kamehameha Highway (Route 83) >
Mokulele Drive (Route 6549)0.00 0.80 6 Urban 0.80
6549 Mokulele Drive : Kamehameha Highway (Route 83) > Kaneohe Bay Drive (Route 65) 0.00 1.16 5 Urban 1.16
6551 Aumoku Street : Kaneohe Bay Drive (Route 65) > Koa Kahiko Street (Route 6548) 0.00 0.18 6 Urban 0.18
6553Hui Iwa Street/Hui Ulili Street/Ahuimanu Place : Kahekili Highway (S junction) > Kahekili
Highway (N junction) (Route 83)0.00 1.39 6 Urban 1.39
6554 Waihee Road : Kamehameha Highway (Route 83)> Ahilama Road 0.00 0.43 6 Urban 0.43
7010 California Avenue : Kilani Avenue (Route 7011) > Kamehameha Highway (Route 80) 0.00 0.90 5 Urban 0.90
Source: Federal-Aid and State Highway Update: System Identification and Functional Classification (2013) 4

Highway Functional Classification: Island of Oahu
PRINCIPAL MINOR MAJOR MINOR
ROUTE ROADWAY NAME AND EXTENTBEGIN
MP
END
MP
HPMS
CODE
RURAL/
URBAN/
NHS
MILEAGE BY FUNCTIONAL CLASSIFICATION
ARTERIAL COLLECTORFREEWAY &
EXPRESSWAYINTERSTATE
7010 California Avenue : Kamehameha Highway (Route 80) > Uuku Street (Route 7041) 0.90 2.10 4 Urban 1.20
7010 California Avenue : Uuku Street (Route 7041) > 0.20 miles northeast of Hill Drive 2.10 3.26 6 Urban 1.16
7011 Kilani Avenue : California Avenue (Route 7010) > Cane Street 0.00 1.11 5 Urban 1.11
7011 Kilani Avenue : Cane Street > Glen Avenue (Route 7041) 1.11 1.37 6 Urban 0.26
7012 Whitmore Avenue : Kamehameha Highway (Route 80) > entrance to Naval Reservation 0.00 1.87 6 Urban 1.87
7013 Meheula Parkway : Kaapeha Street > Lanikuhana Avenue (Route 7042) 0.00 3.78 4 Urban 3.78
7041Glen Avenue/Royal Palm Drive/Uuku Street : Kilani Avenue (Route 7011) > California
Avenue (Route 7010)0.00 0.82 6 Urban 0.82
7042 Lanikuhana Avenue : Ahiku Street > Meheula Parkway (Route 7013) 0.00 1.23 6 Urban 1.23
7042 Lanikuhana Avenue : Meheula Parkway (Route 7013) > Meheula Parkway (Route 7013) 1.23 3.88 5 Urban 2.65
7043 Kuahelani Avenue : Meheula Parkway (Route 7013) > Kamehameha Highway (Route 99) 0.00 0.90 5 Urban 0.90
7043Kuahelani Avenue : Kamehameha Highway (Route 99) > Lanikuhana Avenue (Route
7042)0.90 2.20 6 Urban 1.30
7101 Farrington Highway : Kunia Road (Route 76) > Kamehameha Highway (Route 99) 0.00 3.00 3Urban
NHS3.00
7110Farrington Highway : Fort Weaver Road (Route 76) > west access to Old Fort Weaver
Road 0.00 0.60 4 Urban 0.60
7139Waipio Point Access Road : Farrington Highway (Route 7101) > Waipio Soccer Complex
gate0.00 0.84 6 Urban 0.84
7140 Geiger Road : Franklin D Roosevelt Avenue (Route 8940) > Fort Weaver Road (Route 76) 0.00 1.18 5 Urban 1.18
7141 Iroquois Road : Fort Weaver Road (Route 76) > military reservation (West Loch) 0.00 1.51 5 Urban 1.51
7142 Waipahu Street : Kunia Road (Route 76)> Kamehameha Highway (Route 99) 0.00 3.03 4 Urban 3.03
7143 Waipahu Depot Road : Waipahu Street (Route 7142) > Farrington Highway (Route 7101) 0.00 0.20 5 Urban 0.20
Source: Federal-Aid and State Highway Update: System Identification and Functional Classification (2013) 5

Highway Functional Classification: Island of Oahu
PRINCIPAL MINOR MAJOR MINOR
ROUTE ROADWAY NAME AND EXTENTBEGIN
MP
END
MP
HPMS
CODE
RURAL/
URBAN/
NHS
MILEAGE BY FUNCTIONAL CLASSIFICATION
ARTERIAL COLLECTORFREEWAY &
EXPRESSWAYINTERSTATE
7144 Hanakahi Street : Fort Weaver Road (Route 76) > North Road (Route 7145) 0.00 1.00 6 Urban 1.00
7145 North Road : Fort Weaver Road (Route 76) > Hanakahi Street (Route 7144) 0.00 0.73 5 Urban 0.73
7146 Renton Road : Fort Weaver Road (Route 76) > 0.01 miles West of Kihi Street 0.00 1.70 5 Urban 1.70
7147 Old Fort Weaver Road: Farrington Highway (Route 7110) > Fort Weaver Road (Route 76) 0.00 1.27 6 Urban 1.27
7148 Papipi Road : Fort Weaver Road (Route 76) > Pohakupuna Road 0.00 0.80 6 Urban 0.80
7150 Kolowaka Drive : Fort Weaver Road (Route 76) > Kapolei Parkway (Route 8920) 0.00 0.56 5 Urban 0.56
7160 Ka Uka Boulevard : H‐2 > Kamehameha Highway (Route 99) 0.00 1.00 4 Urban 1.00
7165 Waipio Uka Street : Ka Uka Boulevard (Route 7160) > Kamehameha Highway (Route 99) 0.00 1.43 5 Urban 1.43
7170 Paiwa Street : Farrington Highway (Route 7101) > Lumiaina Street (Route 7175) 0.00 1.42 5 Urban 1.42
7175 Lumiaina Street : Paiwa Street (Route 7170) > Kamehameha Highway (Route 99) 0.00 0.98 5 Urban 0.98
7180Kupuna Loop : south junction with Kunia Road (Route 750) > north junction with Kunia
Road (Route 750)0.00 1.93 5 Urban 1.93
7210 Moanalua Road : Waimano Home Road (Route 7211) > Kaimakani Street 0.00 3.47 4 Urban 3.47
7211Waimano Home Road : Kamehameha Highway (Route 99) > Komo Mai Drive (Route
7243)0.00 1.25 4 Urban 1.25
7211 Waimano Home Road : Komo Mai Drive (Route 7243) > entrance to Waimano Hospital 1.25 2.23 5 Urban 0.98
7212 Kuala Street : Waimano Home Road (Route 7211) > Kamehameha Highway 0.00 1.02 5 Urban 1.02
7225 Hoomalu Street : Waimano Home Road (Route 7211) > Komo Mai Drive (Route 7243) 0.00 1.23 6 Urban 1.23
7226 Puu Poni Street : Kamehameha Highway (Route 99) > Hoomalu Street (Route 7225) 0.00 0.25 6 Urban 0.25
7228 Acacia Road : Kuala Street (Route 7212) > Kamehameha Highway (Route 99) 0.00 0.20 5 Urban 0.20
Source: Federal-Aid and State Highway Update: System Identification and Functional Classification (2013) 6
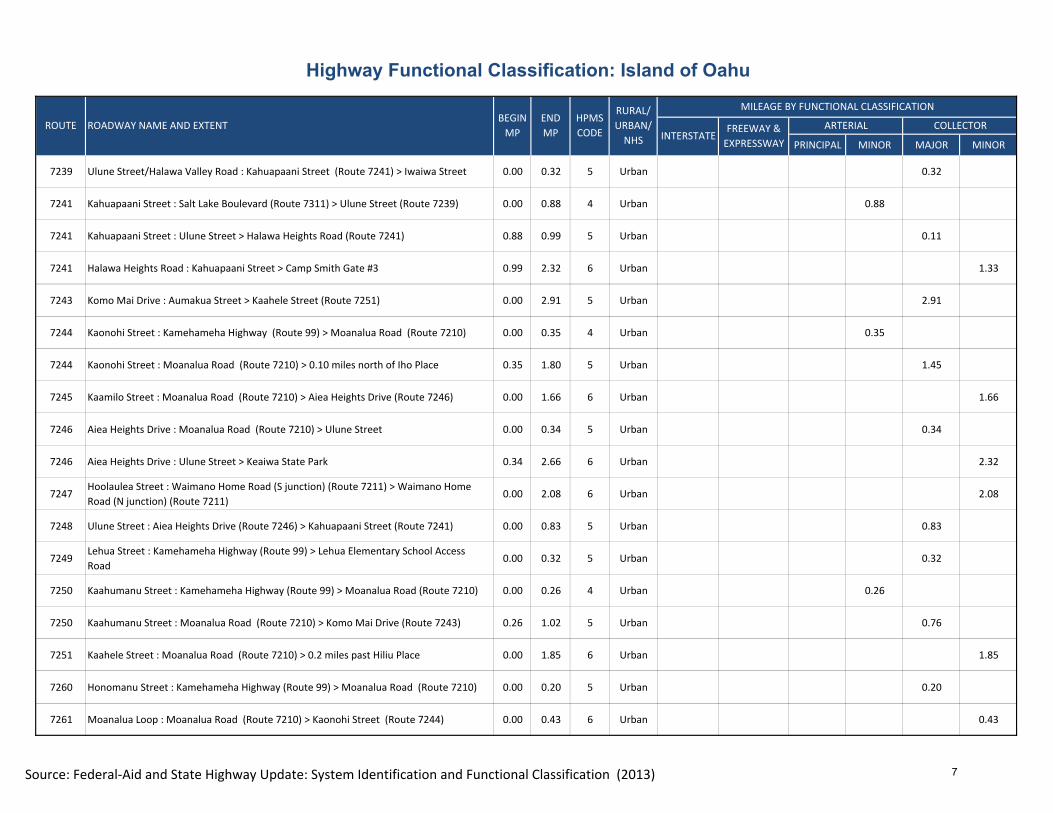
Highway Functional Classification: Island of Oahu
PRINCIPAL MINOR MAJOR MINOR
ROUTE ROADWAY NAME AND EXTENTBEGIN
MP
END
MP
HPMS
CODE
RURAL/
URBAN/
NHS
MILEAGE BY FUNCTIONAL CLASSIFICATION
ARTERIAL COLLECTORFREEWAY &
EXPRESSWAYINTERSTATE
7239 Ulune Street/Halawa Valley Road : Kahuapaani Street (Route 7241) > Iwaiwa Street 0.00 0.32 5 Urban 0.32
7241 Kahuapaani Street : Salt Lake Boulevard (Route 7311) > Ulune Street (Route 7239) 0.00 0.88 4 Urban 0.88
7241 Kahuapaani Street : Ulune Street > Halawa Heights Road (Route 7241) 0.88 0.99 5 Urban 0.11
7241 Halawa Heights Road : Kahuapaani Street > Camp Smith Gate #3 0.99 2.32 6 Urban 1.33
7243 Komo Mai Drive : Aumakua Street > Kaahele Street (Route 7251) 0.00 2.91 5 Urban 2.91
7244 Kaonohi Street : Kamehameha Highway (Route 99) > Moanalua Road (Route 7210) 0.00 0.35 4 Urban 0.35
7244 Kaonohi Street : Moanalua Road (Route 7210) > 0.10 miles north of Iho Place 0.35 1.80 5 Urban 1.45
7245 Kaamilo Street : Moanalua Road (Route 7210) > Aiea Heights Drive (Route 7246) 0.00 1.66 6 Urban 1.66
7246 Aiea Heights Drive : Moanalua Road (Route 7210) > Ulune Street 0.00 0.34 5 Urban 0.34
7246 Aiea Heights Drive : Ulune Street > Keaiwa State Park 0.34 2.66 6 Urban 2.32
7247Hoolaulea Street : Waimano Home Road (S junction) (Route 7211) > Waimano Home
Road (N junction) (Route 7211)0.00 2.08 6 Urban 2.08
7248 Ulune Street : Aiea Heights Drive (Route 7246) > Kahuapaani Street (Route 7241) 0.00 0.83 5 Urban 0.83
7249Lehua Street : Kamehameha Highway (Route 99) > Lehua Elementary School Access
Road0.00 0.32 5 Urban 0.32
7250 Kaahumanu Street : Kamehameha Highway (Route 99) > Moanalua Road (Route 7210) 0.00 0.26 4 Urban 0.26
7250 Kaahumanu Street : Moanalua Road (Route 7210) > Komo Mai Drive (Route 7243) 0.26 1.02 5 Urban 0.76
7251 Kaahele Street : Moanalua Road (Route 7210) > 0.2 miles past Hiliu Place 0.00 1.85 6 Urban 1.85
7260 Honomanu Street : Kamehameha Highway (Route 99) > Moanalua Road (Route 7210) 0.00 0.20 5 Urban 0.20
7261 Moanalua Loop : Moanalua Road (Route 7210) > Kaonohi Street (Route 7244) 0.00 0.43 6 Urban 0.43
Source: Federal-Aid and State Highway Update: System Identification and Functional Classification (2013) 7

Highway Functional Classification: Island of Oahu
PRINCIPAL MINOR MAJOR MINOR
ROUTE ROADWAY NAME AND EXTENTBEGIN
MP
END
MP
HPMS
CODE
RURAL/
URBAN/
NHS
MILEAGE BY FUNCTIONAL CLASSIFICATION
ARTERIAL COLLECTORFREEWAY &
EXPRESSWAYINTERSTATE
7262 Kanuku Street : Hekaha Street (Route 7263) > Kamehameha Highway (Route 99) 0.00 0.40 6 Urban 0.40
7263 Hekaha Street : Kamehameha Highway (Route 99) > Moanalua Road (Route 7210) 0.00 0.44 6 Urban 0.44
7310Puuloa Road : Kamehameha Highway/Nimitz Highway (Route 92) > southwest end of
Puuloa overpass0.00 1.03 3
Urban
NHS1.03
7311 Salt Lake Boulevard : Puuloa Road (Route 7310) > Kamehameha Highway (Route 99) 0.00 3.43 4 Urban 3.43
7341Kikowaena Street/Ahua Street : Moanalua Freeway (Route 201) > Nimitz Highway (Route
92)0.00 0.79 5 Urban 0.79
7342 Pukoloa Street : Puuloa Road (Route 7310) > Ahua Street (Route 7341) 0.00 0.26 5 Urban 0.26
7343Arizona Road/Camp Catlin Road : Salt Lake Boulevard (Route 7311) > Nimitz Highway
(Route 92)0.00 0.53 5 Urban 0.53
7344 Ala Aolani Street : Moanalua Freeway (Route 210) > Ala Noe Place 0.00 1.46 6 Urban 1.46
7345Jarret White Road : Moanalua Freeway (southwest Puuloa Road overpass) (Route 210) >
Tripler Hospital gate0.00 0.55 5
Urban
NHS0.55
7346 Ala Mahamoe Street : Jarret White Road (Route 7345) > Kaua Street 0.00 1.50 6 Urban 1.50
7346 Kaua Street : Ala Mahamoe Street > Middle Street (Route 7414) 1.50 2.11 5 Urban 0.61
7347 Ala Lilikoi Street : Salt Lake Boulevard (Route 7311) > Likini Street (Route 7348) 0.00 0.34 6 Urban 0.34
7348Pakini Street/Likini Street : Salt Lake Boulevard (Route 7311) > Ala Napunani Street
(Route 7349)0.00 2.36 6 Urban 2.36
7349 Ala Napunani Street : Salt Lake Boulevard (Route 7311) > Ala Aolani Street (Route 7344) 0.00 1.32 5 Urban 1.32
7350 Bougainville Drive : Radford Drive (Route 7351) > Salt Lake Boulevard (Route 7311) 0.00 0.59 5 Urban 0.59
7351 Radford Drive : Kamehameha Highway (Route 99) > Bougainville Drive (Route 7350) 0.00 0.23 5 Urban 0.23
7401Kamehameha Highway/Dillingham Boulevard : Middle Street (Route 7415) > King Street
(Route 7402)0.00 1.95 4 Urban 1.95
7402 King Street : Kalihi Street (Route 63) > Harding Avenue (Route 7842) 0.00 5.20 3Urban
NHS5.20
Source: Federal-Aid and State Highway Update: System Identification and Functional Classification (2013) 8

Highway Functional Classification: Island of Oahu
PRINCIPAL MINOR MAJOR MINOR
ROUTE ROADWAY NAME AND EXTENTBEGIN
MP
END
MP
HPMS
CODE
RURAL/
URBAN/
NHS
MILEAGE BY FUNCTIONAL CLASSIFICATION
ARTERIAL COLLECTORFREEWAY &
EXPRESSWAYINTERSTATE
7410 King Street : Middle Street (Route 7415) > Kalihi Street (Route 63) 0.00 0.72 4 Urban 0.72
7411Houghtailing Street/Waiakamilo Road : School Street (Route 7414) > Nimitz Highway
(Route 92)0.00 1.13 4 Urban 1.13
7412 Liliha Street : Wyllie Street (Route 7446) > H‐1 overpass 0.00 0.98 5 Urban 0.98
7413 Liliha Street : King Street (Route 7402) > H‐1 overpass 0.00 0.35 4 Urban 0.35
7414 School Street : Lusitana Street (Route 7521) > Notley Street (Route 74140) 0.00 2.69 4 Urban 2.69
7414 Middle Street : Notley Street (Route 74140) > Kaua Street (Route 7346) 2.69 3.10 4Urban
NHS0.41
7415 Middle Street : Kaua Street (Route 7346) > Kamehameha Highway (Route 7401) 0.00 0.51 4 Urban 0.51
7420 Palama Street : King Street (Route 7402) > Vineyard Boulevard (Route 98) 0.00 0.20 6 Urban 0.20
7425 Iwilei Road/Pacific Street : King Street (Route 7402) > Nimitz Highway (Route 92) 0.00 0.66 6 Urban 0.66
7430Kalihi Street/Auiki Street : Nimitz Highway (Route 92) > Sand Island Access Road (Route
64)0.00 0.66 5 Urban 0.66
7441 Kalihi Street : Likelike Highway (Route 63) > Wailele Street 0.00 0.76 5 Urban 0.76
7441 Kalihi Street : Wailele Street > Kalaepaa Drive 0.76 1.74 6 Urban 0.98
7442 Kamehameha IV Road : School Street (Route 7414) > Likelike Highway (Route 63) 0.00 0.70 5 Urban 0.70
7443 Nalanieha Street : Likelike Highway (Route 63) > Kalihi Street (Route 7441) 0.00 0.15 6 Urban 0.15
7444Kealia Drive/Hillcrest Street/Houghtailing Street : Makanani Drive (Route 7445) > School
Street (Route 7414)0.00 0.60 6 Urban 0.60
7445Judd Street/Iholena Street/Lolena Street/Makanani Drive : Nuuanu Avenue (Route 7522)
> Kealia Drive (Route 7444)0.00 1.34 6 Urban 1.34
7446 Wyllie Street/Alewa Drive : Liliha Street (Route 7412)> Hoomaikai Street 0.00 2.04 6 Urban 2.04
7447 Lanakila Avenue/Judd Street : School Street (Route 7414) > Iholena Street (Route 7445) 0.00 0.40 5 Urban 0.40
Source: Federal-Aid and State Highway Update: System Identification and Functional Classification (2013) 9

Highway Functional Classification: Island of Oahu
PRINCIPAL MINOR MAJOR MINOR
ROUTE ROADWAY NAME AND EXTENTBEGIN
MP
END
MP
HPMS
CODE
RURAL/
URBAN/
NHS
MILEAGE BY FUNCTIONAL CLASSIFICATION
ARTERIAL COLLECTORFREEWAY &
EXPRESSWAYINTERSTATE
7448 Puuhale Road : Nimitz Highway (Route 92) > Dillingham Boulevard (Route 7401) 0.00 0.25 5 Urban 0.25
7450 Mokauea Street : Nimitz Highway (Route 92) > King Street (Route 7410) 0.00 0.58 6 Urban 0.58
7501 Atkinson Drive : Ala Moana Boulevard (Route 92) > Kapiolani Boulevard (Route 7503) 0.00 0.30 4 Urban 0.30
7502 Beretania Street : University Avenue (Route 7615) > King Street (Route 7402) 0.00 3.31 3Urban
NHS3.31
7503 Kapiolani Boulevard : South Street (Route 7510) >Waialae Avenue (Route 7801) 0.00 3.12 3Urban
NHS3.12
7504 Alakea Street : Nimitz Highway (Route 92) > Beretania Street (Route 7502) 0.00 0.40 3Urban
NHS0.40
7504Queen Emma Street/Kukui Street : Beretania Street (Route 7502) > Pali Highway (Route
7505)0.40 0.60 4 Urban 0.20
7505 Pali Highway/Bishop Street : Vineyard Boulevard (Route 98) > Nimitz Highway (Route 92) 0.00 0.62 3Urban
NHS0.62
7510South Street/Alapai Street : Ala Moana Boulevard (Route 92) > Beretania Street (Route
7502) 0.00 0.78 4 Urban 0.78
7510Alapai Street/Lusitana Street : Beretania Street (Route 7502) > Vineyard Boulevard
(Route 98)0.78 1.08 5 Urban 0.30
7511 Ward Avenue : Ala Moana Boulevard (Route 92) > H‐1 0.00 0.96 3Urban
NHS0.96
7511 Ward Avenue : H‐1 > Prospect Street (Route 7518) 0.96 1.15 4 Urban 0.19
7512 Pensacola Street : Nehoa Street (Route 7518) > Luanalilo Street (Route 7526) 0.00 0.50 5 Urban 0.50
7512Pensacola Street/Waimanu Street : Lunalilo Street (Route 7526) > Piikoi Street (Route
7513)0.50 1.40 3
Urban
NHS0.90
7513 Piikoi Street : Ala Moana Boulevard (Route 92) > Lunalilo Street (Route 7526) 0.00 0.94 4 Urban 0.94
7513 Piikoi Street : Lunalilo Street (Route 7526) > Pensacola Street (Route 7512) 0.94 1.37 6 Urban 0.43
7514 Keeaumoku Street : Kapiolani Boulevard (Route 7503) > Wilder Avenue (Route 7525) 0.00 0.90 4 Urban 0.90
7515 Queen Street : Kamakee Street (Route 7552) > Nimitz Highway (Route 92) 0.00 1.27 4 Urban 1.27
Source: Federal-Aid and State Highway Update: System Identification and Functional Classification (2013) 10

Highway Functional Classification: Island of Oahu
PRINCIPAL MINOR MAJOR MINOR
ROUTE ROADWAY NAME AND EXTENTBEGIN
MP
END
MP
HPMS
CODE
RURAL/
URBAN/
NHS
MILEAGE BY FUNCTIONAL CLASSIFICATION
ARTERIAL COLLECTORFREEWAY &
EXPRESSWAYINTERSTATE
7516 Punchbowl Street : H‐1 > King Street (Route 7402) 0.00 0.57 3Urban
NHS0.57
7516 Punchbowl Street : King Street (Route 7402) > Ala Moana Boulevard (Route 92) 0.57 0.96 4 Urban 0.39
7517 Auwaiolimu Street : Lusitana Street (Route 7521) > Nehoa Street (Route 7518) 0.00 0.94 4 Urban 0.94
7518Iolani Avenue/Prospect Street/Nehoa Street : Lusitana Street (Route 7521) > Punahou
Street (Route 7614) 0.00 1.81 5 Urban 1.81
7519 Kinau Street : Alapai Street (Route 7510) > Keeaumoku Street (Route 7514) 0.00 0.90 4 Urban 0.90
7520 Kukui Street : Nuuanu Avenue (Route 7522) > Pali Highway (Route 7505) 0.00 0.12 4 Urban 0.12
7521 Lusitana Street : School Street (Route 7414) > Auwaiolimu Street (Route 7517) 0.00 0.42 6 Urban 0.42
7521Lusitana Street/Pauoa Road : Auwaiolimu Street (Route 7517) > Nuuanu Avenue (Route
7522)0.42 0.83 4 Urban 0.41
7522 Nuuanu Avenue : Wyllie Street (Route 7524) > Nimitz Highway (Route 92) 0.00 1.70 4 Urban 1.70
7523 Queen Emma Street : Kukui Street (Route 7504) > School Street (Route 7414) 0.00 0.32 4 Urban 0.32
7524 Wyllie Street : Liliha Street (Route 7412)> Nuuanu Avenue (Route 7522) 0.00 0.27 5 Urban 0.27
7525 Wilder Avenue : Dole Street (Route 7611) > Pensacola Street (Route 7512) 0.00 1.27 4 Urban 1.27
7526 Lunalilo Street : H‐1 off ramp > Ward Avenue (Route 7511) 0.00 0.62 3Urban
NHS0.62
7527 Bethel Street : Nimitz Highway (Route 92) > Beretania Street (Route 7502) 0.00 0.32 4 Urban 0.32
7528 Pohukaina Street/Kamani Street : Punchbowl Street (Route 7516) > Auahi Street 0.00 0.60 6 Urban 0.60
7528 Auahi Street/Queen Street : Kamani Street > Ala Moana Boulevard (Route 92) 0.60 1.20 5 Urban 0.60
7530 Sheridan Street : Rycroft Street > Kapiolani Boulevard (Route 7503) 0.00 0.27 6 Urban 0.27
7541 Kaheka Street : Kapiolani Boulevard (Route 7503) > King Street (Route 7402) 0.00 0.42 5 Urban 0.42
Source: Federal-Aid and State Highway Update: System Identification and Functional Classification (2013) 11

Highway Functional Classification: Island of Oahu
PRINCIPAL MINOR MAJOR MINOR
ROUTE ROADWAY NAME AND EXTENTBEGIN
MP
END
MP
HPMS
CODE
RURAL/
URBAN/
NHS
MILEAGE BY FUNCTIONAL CLASSIFICATION
ARTERIAL COLLECTORFREEWAY &
EXPRESSWAYINTERSTATE
7542 Keola Street/Kuakini Street : Hala Drive > Pali Highway (Route 61) 0.00 1.04 5 Urban 1.04
7543 Hotel Street : Richards Street (Route 7544) > King Street (Route 7402) [bus only] 0.00 0.57 6 Urban 0.57
7544 Richards Street : Beretania Street (Route 7502) > King Street (Route 7042) 0.00 0.23 6 Urban 0.23
7545 Pacific Heights Road : Pauoa Road (Route 7521) > end of route 0.00 2.20 6 Urban 2.20
7546Booth Road/Kekuanoni Street/Kapulei Street/Pauoa Road : Pacific Heights Road (Route
7545) > Lusitana Street (Route 7521)0.00 1.90 6 Urban 1.90
7547Hookui Street/Puowaina Drive/Tantalus Drive/Makiki Heights Drive/Mott Smith Drive :
Auwaiolimu Street (Route 7517) > Nehoa Street (Route 7518) 0.00 2.06 6 Urban 2.06
7548 Cooke Street : Ala Moana Boulevard (Route 92) > King Street (Route 7402) 0.00 0.66 6 Urban 0.66
7549 Young Street : Pensacola Street (Route 7512) > Isenberg Street (Route 7643) 0.00 1.40 5 Urban 1.40
7550 Keeaumoku Street : Wilder Avenue (Route 7525) > Nehoa Street (Route 7518) 0.00 0.30 6 Urban 0.30
7552 Kamakee Street : Ala Moana Boulevard (Route 92) > Kapiolani Boulevard (Route 7503) 0.00 0.34 5 Urban 0.34
7553 Booth Road : Kekuanoni Street (Route 7546) > 2000 feet past Kekuanoni Street 0.00 0.38 6 Urban 0.38
7601Old Waialae Road/King Street : Kapiolani Boulevard (Route 7503) > end of divided
roadway 0.00 0.41 3
Urban
NHS0.41
7610 Date Street : University Avenue (Route 7615) > Kapahulu Avenue (Route 7810) 0.00 0.96 4 Urban 0.96
7611 St Louis Drive/Dole Street : Waialae Avenue (Route 7801) > Wilder Avenue (Route 7525) 0.00 1.34 4 Urban 1.34
7612 Kalakaua Avenue : Beretania Street (Route 7502) > Paki Avenue (Route 7713) 0.00 3.08 4 Urban 3.08
7613 McCully Street : Kalakaua Avenue (Route 7612) > Metcalf Street (Route 7613) 0.00 0.88 4 Urban 0.88
7613 Metcalf Street : McCully Street > University Avenue (Route 7646) 0.88 1.37 5 Urban 0.49
7614 Philip Street/Punahou Street : Kalakaua Avenue (Route 7612) > King Street (Route 7402) 0.00 0.17 5 Urban 0.17
Source: Federal-Aid and State Highway Update: System Identification and Functional Classification (2013) 12

Highway Functional Classification: Island of Oahu
PRINCIPAL MINOR MAJOR MINOR
ROUTE ROADWAY NAME AND EXTENTBEGIN
MP
END
MP
HPMS
CODE
RURAL/
URBAN/
NHS
MILEAGE BY FUNCTIONAL CLASSIFICATION
ARTERIAL COLLECTORFREEWAY &
EXPRESSWAYINTERSTATE
7614 Punahou Street : King Street (Route 7402) > Wilder Avenue (Route 7525) 0.17 0.64 3Urban
NHS0.47
7614 Punahou Street : Wilder Avenue (Route 7525) > Nehoa Street (Route 7518) 0.64 0.86 4 Urban 0.22
7615 University Avenue : Kapiolani Boulevard (Route 7503) > King Street (Route 7402) 0.00 0.40 4 Urban 0.40
7615 University Avenue : King Street (Route 7402) > Metcalf Street (Route 7613) 0.40 0.90 3Urban
NHS0.50
7641Date Street/Citron Street/Kuikahi Street/Philip Street : University Avenue (Route 7615) >
Punahou Street (Route 7614)0.00 0.91 5 Urban 0.91
7642 East Manoa Road : Manoa Road (Route 7645) > Alani Drive (Route 7642) 0.00 1.81 5 Urban 1.81
7642 Alani Drive : East Manoa Road (Route 7642) > Woodlawn Drive (N Junction) 1.81 2.06 6 Urban 0.25
7643 Isenberg Street : Kapiolani Boulevard (Route 7503) > Beretania Street (Route 7502) 0.00 0.52 5 Urban 0.52
7644 Lowrey Avenue : Manoa Road (Route 7645) > East Manoa Road (Route 7642) 0.00 0.39 6 Urban 0.39
7645 Manoa Road : Nehoa Street (Route 7518) > Waakaua Street 0.00 2.45 5 Urban 2.45
7646 University Avenue : Metcalf Street (Route 7613) > Oahu Avenue 0.00 0.65 4 Urban 0.65
7646 Oahu Avenue : University Avenue (Route 7646) > Manoa Road (route 7645) 0.65 1.29 5 Urban 0.64
7647St Louis Drive/Bertram Street/St Louis Drive/Bertram Street/St Louis Drive/Noah
Street/St Louis Drive/Alencastre Street : Dole Street (Route 7611) > St Louis Drive0.00 2.11 5 Urban 2.11
7648 Alexander Street : Wilder Avenue (Route 7525) > H‐1 0.00 0.16 6 Urban 0.16
7649 Dole Street : Punahou Street (Route 7614) > Metcalf Street (Route 7613) 0.00 0.38 5 Urban 0.38
7710 Ala Wai Boulevard : Kapahulu Avenue (Route 7810) > Kalakaua Avenue (Route 7612) 0.00 1.57 4 Urban 1.57
7711 Kuhio Avenue : Kalakaua Avenue (Route 7612) > Kapahulu Avenue (Route 7810) 0.00 1.17 5 Urban 1.17
7712 Monsarrat Avenue : Kalakaua Avenue (Route 7612) > Paki Avenue (Route 7713) 0.00 0.47 5 Urban 0.47
Source: Federal-Aid and State Highway Update: System Identification and Functional Classification (2013) 13

Highway Functional Classification: Island of Oahu
PRINCIPAL MINOR MAJOR MINOR
ROUTE ROADWAY NAME AND EXTENTBEGIN
MP
END
MP
HPMS
CODE
RURAL/
URBAN/
NHS
MILEAGE BY FUNCTIONAL CLASSIFICATION
ARTERIAL COLLECTORFREEWAY &
EXPRESSWAYINTERSTATE
7712 Monsarrat Avenue : Paki Avenue (Route 7713) > Trousseau Street 0.47 0.99 4 Urban 0.52
7713 Paki Avenue : Diamond Head Road (Route 7811) > Monsarrat Avenue (Route 7712) 0.00 0.66 5 Urban 0.66
7713 Paki Avenue : Monsarrat Avenue (Route 7712) > Kapahulu Avenue (Route 7610) 0.66 0.95 4 Urban 0.29
7714 Niu Street : Ala Wai Boulevard (Route 7710) > Kalakaua Avenue (Route 7612) 0.00 0.10 6 Urban 0.10
7715 Pau Street : Kalakaua Avenue (Route 7612) > Ala Wai Boulevard (Route 7710) 0.00 0.11 6 Urban 0.11
7720 Saratoga Road : Kalia Road (Route 7743) > Kalakaua Avenue (Route 7612) 0.00 0.24 6 Urban 0.24
7725 Kalaimoku Street : Kalakaua Avenue (Route 7612) > Ala Wai Boulevard (Route 7710) 0.00 0.20 6 Urban 0.20
7741Kaiulani Street/Kanekapolei Street : Kalakaua Avenue (Route 7612) > Ala Wai Boulevard
(Route 7710)0.00 0.37 6 Urban 0.37
7743 Kalia Road : Ala Moana Boulevard (Route 92) > Lewers Street (Route 7744) 0.00 0.56 5 Urban 0.56
7744 Lewers Street : Kalia Road (Route 7743) > Ala Wai Boulevard (Route 7710) 0.00 0.42 6 Urban 0.42
7801 Waialae Avenue : Kapahulu Avenue (Route 7810) > Palolo Avenue (Route 7849) 0.00 0.42 3Urban
NHS0.42
7801 Waialae Avenue : Palolo Avenue (Route 7849) > Kilauea Avenue (Route 7812) 0.42 2.02 4 Urban 1.60
7810 Kapahulu Avenue : Kalakaua Avenue (Route 7612) > Waialae Avenue (Route 7801) 0.00 1.56 4 Urban 1.56
7811 Diamond Head Road : Trousseau Street > Paki Avenue (7713) 0.00 2.73 4 Urban 2.73
7812 Kilauea Avenue : Waialae Avenue (Route 7801) > 6th Avenue (Route 7852) 0.00 2.24 4 Urban 2.24
7813 6th Avenue : H‐1 > Waialae Avenue (Route 7801) 0.00 0.18 4 Urban 0.18
7814 18th Avenue : Harding Avenue (Route 7842) > Diamond Head Road (Route 7811) 0.00 0.82 6 Urban 0.82
7841 Campbell Avenue : Monsarrat Avenue (Route 7712) > Kapahulu Avenue (Route 7810) 0.00 0.62 6 Urban 0.62
Source: Federal-Aid and State Highway Update: System Identification and Functional Classification (2013) 14

Highway Functional Classification: Island of Oahu
PRINCIPAL MINOR MAJOR MINOR
ROUTE ROADWAY NAME AND EXTENTBEGIN
MP
END
MP
HPMS
CODE
RURAL/
URBAN/
NHS
MILEAGE BY FUNCTIONAL CLASSIFICATION
ARTERIAL COLLECTORFREEWAY &
EXPRESSWAYINTERSTATE
7842 Harding Avenue : 21st Avenue (Route 7856) > Kapiolani Boulevard (Route 7503) 0.00 1.78 5 Urban 1.78
7843 Hunakai Street : Kilauea Avenue (Route 7862) > Kahala Avenue (Route 7844) 0.00 1.50 6 Urban 1.50
7844 Kahala Avenue : Diamond Head Road (Route 7811) > Kealaolu Avenue (Route 7863) 0.00 1.50 6 Urban 1.50
7845 Kaimuki Avenue : Kapiolani Boulevard (Route 7503) > 6th Avenue (Route 7852) 0.00 0.68 5 Urban 0.68
7846 Koko Head Avenue : Waialae Avenue (Route 7801) > Pahoa Avenue (Route 7848) 0.00 0.26 4 Urban 0.26
7847 Mooheau Avenue : Kapahulu Avenue (Route 7810) > 6th Avenue (Route 7852) 0.00 0.27 6 Urban 0.27
7848 Pahoa Road : Koko Head Avenue (Route 7846) > Kilauea Avenue (Route 7812) 0.00 1.00 5 Urban 1.00
7849 Palolo Avenue : 10th Avenue (Route 7853) > Waialae Avenue (Route 7801) 0.00 1.86 5 Urban 1.86
7850 5th Avenue : Waialae Avenue (Route 7801) > Harding Avenue (Route 7842) 0.00 0.20 5 Urban 0.20
7851 6th Avenue : Waialae Avenue (Route 7801) > Palolo Avenue (Route 7849) 0.00 0.17 5 Urban 0.17
7852 6th Avenue : H‐1 > Alohea Avenue (Route 7864) 0.00 0.50 5 Urban 0.50
7853 10th Avenue : Palolo Avenue (Route 7848) > Waialae Avenue (Route 7801) 0.00 1.85 6 Urban 1.85
7854 10th Avenue : Kilauea Avenue (Route 7812) > Waialae Avenue (Route 7801) 0.00 0.62 6 Urban 0.62
7855 11th Avenue : Waialae Avenue (Route 7801) > H‐1 0.00 0.18 4 Urban 0.18
7856 21st Avenue : Harding Avenue (Route 7842) > Waialae Avenue (Route 7801) 0.00 0.20 6 Urban 0.20
7857 Sierra Drive : Waialae Avenue (Route 7801) > Maunalani Circle 0.00 2.30 6 Urban 2.30
7858Lurline Drive/Monterey Drive/Paula Drive/Koko Drive/16th Avenue : Maunalani Circle >
Kilauea Avenue (Route 7812)0.00 2.82 6 Urban 2.82
7859 Elepaio Street : Kilauea Avenue (Route 7812) > Kahala Avenue (Route 7844) 0.00 0.57 6 Urban 0.57
Source: Federal-Aid and State Highway Update: System Identification and Functional Classification (2013) 15
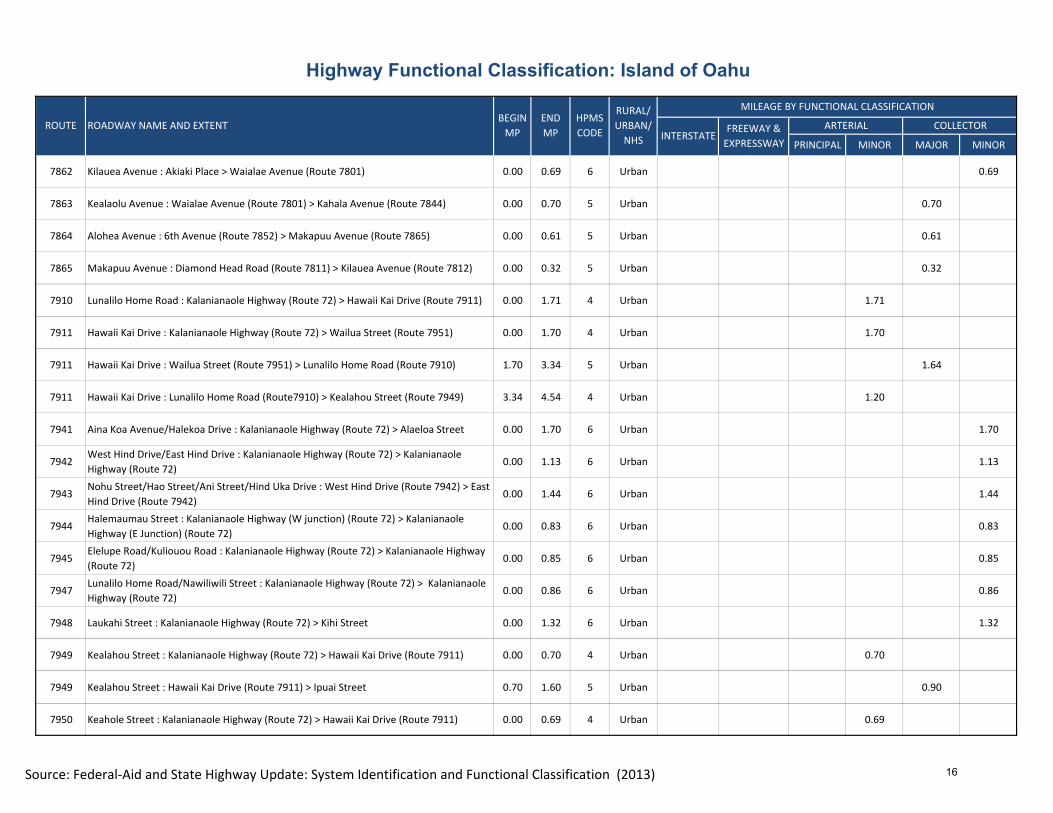
Highway Functional Classification: Island of Oahu
PRINCIPAL MINOR MAJOR MINOR
ROUTE ROADWAY NAME AND EXTENTBEGIN
MP
END
MP
HPMS
CODE
RURAL/
URBAN/
NHS
MILEAGE BY FUNCTIONAL CLASSIFICATION
ARTERIAL COLLECTORFREEWAY &
EXPRESSWAYINTERSTATE
7862 Kilauea Avenue : Akiaki Place > Waialae Avenue (Route 7801) 0.00 0.69 6 Urban 0.69
7863 Kealaolu Avenue : Waialae Avenue (Route 7801) > Kahala Avenue (Route 7844) 0.00 0.70 5 Urban 0.70
7864 Alohea Avenue : 6th Avenue (Route 7852) > Makapuu Avenue (Route 7865) 0.00 0.61 5 Urban 0.61
7865 Makapuu Avenue : Diamond Head Road (Route 7811) > Kilauea Avenue (Route 7812) 0.00 0.32 5 Urban 0.32
7910 Lunalilo Home Road : Kalanianaole Highway (Route 72) > Hawaii Kai Drive (Route 7911) 0.00 1.71 4 Urban 1.71
7911 Hawaii Kai Drive : Kalanianaole Highway (Route 72) > Wailua Street (Route 7951) 0.00 1.70 4 Urban 1.70
7911 Hawaii Kai Drive : Wailua Street (Route 7951) > Lunalilo Home Road (Route 7910) 1.70 3.34 5 Urban 1.64
7911 Hawaii Kai Drive : Lunalilo Home Road (Route7910) > Kealahou Street (Route 7949) 3.34 4.54 4 Urban 1.20
7941 Aina Koa Avenue/Halekoa Drive : Kalanianaole Highway (Route 72) > Alaeloa Street 0.00 1.70 6 Urban 1.70
7942West Hind Drive/East Hind Drive : Kalanianaole Highway (Route 72) > Kalanianaole
Highway (Route 72)0.00 1.13 6 Urban 1.13
7943Nohu Street/Hao Street/Ani Street/Hind Uka Drive : West Hind Drive (Route 7942) > East
Hind Drive (Route 7942)0.00 1.44 6 Urban 1.44
7944Halemaumau Street : Kalanianaole Highway (W junction) (Route 72) > Kalanianaole
Highway (E Junction) (Route 72)0.00 0.83 6 Urban 0.83
7945Elelupe Road/Kuliouou Road : Kalanianaole Highway (Route 72) > Kalanianaole Highway
(Route 72)0.00 0.85 6 Urban 0.85
7947Lunalilo Home Road/Nawiliwili Street : Kalanianaole Highway (Route 72) > Kalanianaole
Highway (Route 72)0.00 0.86 6 Urban 0.86
7948 Laukahi Street : Kalanianaole Highway (Route 72) > Kihi Street 0.00 1.32 6 Urban 1.32
7949 Kealahou Street : Kalanianaole Highway (Route 72) > Hawaii Kai Drive (Route 7911) 0.00 0.70 4 Urban 0.70
7949 Kealahou Street : Hawaii Kai Drive (Route 7911) > Ipuai Street 0.70 1.60 5 Urban 0.90
7950 Keahole Street : Kalanianaole Highway (Route 72) > Hawaii Kai Drive (Route 7911) 0.00 0.69 4 Urban 0.69
Source: Federal-Aid and State Highway Update: System Identification and Functional Classification (2013) 16

Highway Functional Classification: Island of Oahu
PRINCIPAL MINOR MAJOR MINOR
ROUTE ROADWAY NAME AND EXTENTBEGIN
MP
END
MP
HPMS
CODE
RURAL/
URBAN/
NHS
MILEAGE BY FUNCTIONAL CLASSIFICATION
ARTERIAL COLLECTORFREEWAY &
EXPRESSWAYINTERSTATE
7951 Wailua Street : Hawaii Kai Drive (Route 7911) > Lunalilo Home Road (Route 7910) 0.00 0.37 4 Urban 0.37
7952 Hahaione Street : Hawaii Kai Drive (Route 7911) > Ainapo Street (Route 7954) 0.00 0.83 6 Urban 0.83
7953 Pepeekeo Street : Hawaii Kai Drive (Route 7911) > Hahaione Street (Route 7952) 0.00 0.42 6 Urban 0.42
7954 Ainapo Street : Pepeekeo Street (Route 7953) > Hahaione Street (Route 7952) 0.00 0.63 6 Urban 0.63
8300 Kamehameha Highway : Weed Junction > JP Leong Highway (Route 83) 0.00 2.00 4 Urban 2.00
8541Old Goverment Road/Plantation Road : Farrington Highway (Route 93) > Waianae Valley
Road (Route 8542)0.00 0.70 5 Urban 0.70
8542 Waianae Valley Road : Farrington Highway (Route 93) > Haleahi Road 0.00 2.52 5 Urban 2.52
8543 Lualualei Homestead Road : Farrington Highway (Route 93) > Halona Road 0.00 1.10 5 Urban 1.10
8741 Hakimo Road : Farrington Highway (Route 93) > Paakea Road (Route 8755) 0.00 1.47 5 Urban 1.47
8743 Haleakala Avenue : Farrington Highway (Route 93) > Nanakuli Avenue (Route 8744) 0.00 1.38 5 Urban 1.38
8744 Nanakuli Avenue : Farrington Highway (Route 93) > Haleakala Avenue (Route 8743) 0.00 1.34 5 Urban 1.34
8750 Kaukama Road : Farrington Highway (Route 93) > Pakeke Street 0.00 0.82 6 Urban 0.82
8755 Mailiilii Road/Paakea Road : Farrington Highway (Route 93) > Hakimo Road (Route 8741) 0.00 2.70 6 Urban 2.70
8760 Makaha Valley Road : Farrington Highway (Route 93) > Lahaina Street 0.00 0.10 5 Urban 0.10
8810 Makakilo Drive : H‐1 (Makakilo Interchange) > H‐1 (Kualakai Parkway interchange) 0.00 3.37 4 Urban 3.37
8815Palailai Street/Nohohale Street : Makakilo Drive (SE junction) > Makakilo Dr (NW
junction) (Route 8810)0.00 1.21 6 Urban 1.21
8905 Koio Drive : Aliinui Drive (Route 8910) > Farrington Highway (Route 93) 0.00 0.49 6 Urban 0.49
8910 Aliinui Drive : Farrington Highway (Route 93) > Koio Drive (Route 8905) 0.00 1.69 5 Urban 1.69
Source: Federal-Aid and State Highway Update: System Identification and Functional Classification (2013) 17

Highway Functional Classification: Island of Oahu
PRINCIPAL MINOR MAJOR MINOR
ROUTE ROADWAY NAME AND EXTENTBEGIN
MP
END
MP
HPMS
CODE
RURAL/
URBAN/
NHS
MILEAGE BY FUNCTIONAL CLASSIFICATION
ARTERIAL COLLECTORFREEWAY &
EXPRESSWAYINTERSTATE
8915 Kamokila Boulevard : Farrington Highway (Route 9107) > Roosevelt Avenue (Route 8940) 0.00 0.95 4 Urban 0.95
8918 Wakea Street : Kapolei Parkway (Route 8920) > H‐1 0.00 0.60 6 Urban 0.60
8920 Kapolei Parkway : Aliinui Drive (Route 8910) > Papipi Road (Route 7148) 0.00 7.77 4 Urban 7.77
8925 Kealanani Avenue : Farrington Highway (Route 9107) > Kamaaha Loop 0.00 0.58 5 Urban 0.58
8930 Kualakai Parkway : H‐1 > Kapolei Parkway (Route 8920) 0.00 2.47 3Urban
NHS2.47
8930 Kualakai Parkway : Kapolei Parkway (Route 8920) > Roosevelt Avenue (Route 8940) 2.47 2.87 4 Urban 0.40
8940Franklin D Roosevelt Avenue : Geiger Road (Route 7140) > Kamokila Boulevard (Route
8915)0.00 3.30 6 Urban 3.30
8945 Enterprise Avenue : Franklin D Roosevelt Avenue (Route 8940) > Midway Avenue 0.00 0.98 6 Urban 0.98
8955Coral Sea Road : Franklin D Roosevelt Avenue (Route 8940) > Barbers Point Air Station
Gate0.00 2.69 6 Urban 2.69
9107Farrington Highway : west access to Old Fort Weaver Road > Kamokila Boulevard (Route
8915)0.00 4.07 4 Urban 4.07
9262 Waialua Beach Road : Weed Junction > Crozier Loop 0.00 2.53 5 Urban 2.53
9263 Haleiwa Road : Kamehameha Highway (Route 8300) > Waialua Beach Road (Route 9262) 0.00 1.60 5 Urban 1.60
9265 Goodale Avenue : Waialua Beach Road (Route 9262) > Farrington Highway (Route 930) 0.00 0.86 5 Urban 0.86
9270 Puuiki Street : Farrington Highway (Route 930) > Kealohanui Street 0.00 0.50 6 Urban 0.50
9274 Paalaa Road : Kamehameha Highway (Route 8300) > Haleiwa Road (Route 9263) 0.00 0.77 6 Urban 0.77
9275 Kuoha Street : Waialua Beach Road (Route 9262) > Kukea Circle 0.00 0.29 6 Urban 0.29
9276 Komo Street : Waialua Beach Road (Route 9262) > Kaui Street 0.00 0.19 6 Urban 0.19
9280 Pupukea Road : Kamehameha Highway (Route 83) > Kanalani Place 0.00 2.30 6 Urban 2.30
Source: Federal-Aid and State Highway Update: System Identification and Functional Classification (2013) 18
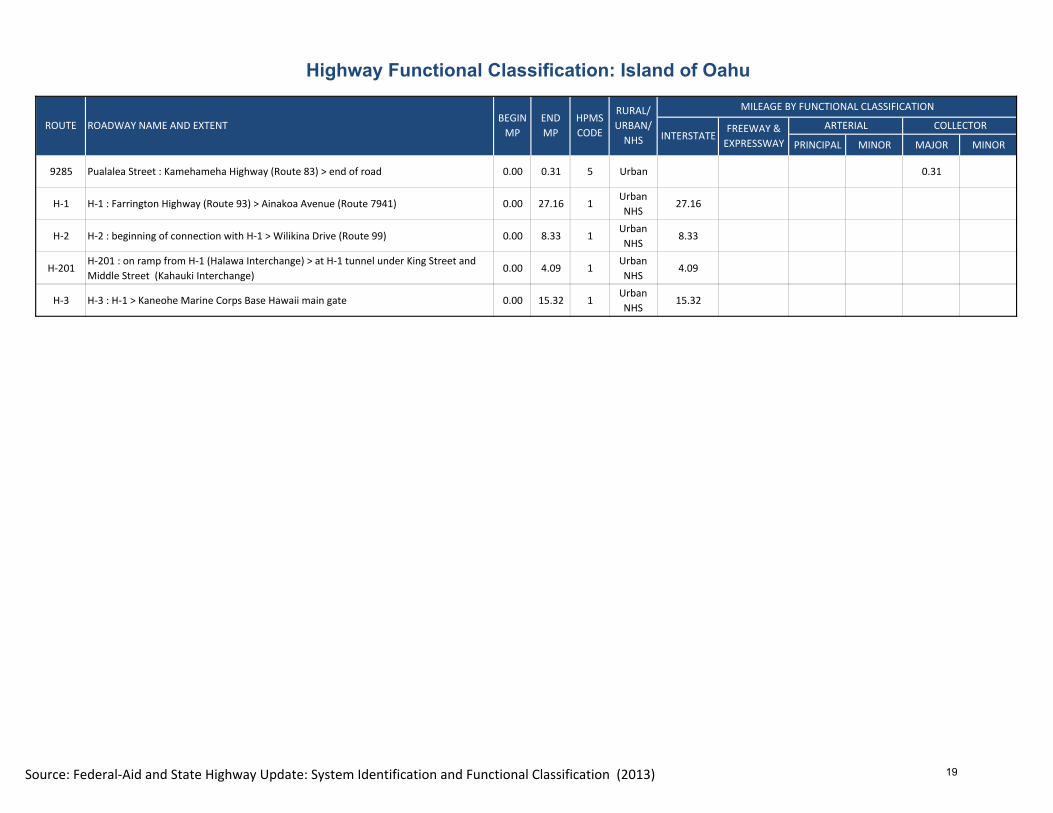
Highway Functional Classification: Island of Oahu
PRINCIPAL MINOR MAJOR MINOR
ROUTE ROADWAY NAME AND EXTENTBEGIN
MP
END
MP
HPMS
CODE
RURAL/
URBAN/
NHS
MILEAGE BY FUNCTIONAL CLASSIFICATION
ARTERIAL COLLECTORFREEWAY &
EXPRESSWAYINTERSTATE
9285 Pualalea Street : Kamehameha Highway (Route 83) > end of road 0.00 0.31 5 Urban 0.31
H‐1 H‐1 : Farrington Highway (Route 93) > Ainakoa Avenue (Route 7941) 0.00 27.16 1Urban
NHS27.16
H‐2 H‐2 : beginning of connection with H‐1 > Wilikina Drive (Route 99) 0.00 8.33 1Urban
NHS8.33
H‐201H‐201 : on ramp from H‐1 (Halawa Interchange) > at H‐1 tunnel under King Street and
Middle Street (Kahauki Interchange)0.00 4.09 1
Urban
NHS4.09
H‐3 H‐3 : H‐1 > Kaneohe Marine Corps Base Hawaii main gate 0.00 15.32 1Urban
NHS15.32
Source: Federal-Aid and State Highway Update: System Identification and Functional Classification (2013) 19

Highway Functional Classification: Islands of Maui, Molokai, and Lanai
PRINCIPAL MINOR MAJOR MINOR
30 High Street/Honoapiilani Highway: Main Street (Route 32) > Kuihelani Highway (Route 380) 0.00 4.88 3Urban
NHS4.88
30Honoapiilani Highway : Kuihelani Highway (Route 380) > proposed Lahaina Bypass (Route
3000)4.88 17.65 3
Rural
NHS12.77
30 Honoapiilani Highway : proposed Lahaina Bypass (Route 3000) > Front Street (Route 3010) 17.65 19.69 3Urban
NHS2.04
30 Honoapiilani Highway : Front Street (Route 3010) > Napilihau Street (Route 3090) 19.69 29.03 4 Urban 9.34
30 Honoapiilani Highway : Napilihau Street (Route 3090) > Plantation Estates Drive 29.03 31.14 5 Urban 2.11
30Honoapiilani Highway/ Kahekili Highway : Plantation Estates Drive > end of state route (0.35
mi east of Papanahoa Stream Bridge (bridge #009000300304184)31.14 41.67 5 Rural 10.53
31 Piilani Highway : Mokulele Highway (Route 311) > Approx. 0.6 miles south of Wailea Ike Drive 0.00 7.75 3Urban
NHS7.75
32 West Main Street/Kaahumanu Avenue : High Street (Route 30) > Hobron Avenue (Route 32A) 0.00 2.85 3Urban
NHS2.85
36 Hana Highway : Kaahumanu Avenue (Route 32)> Haleakala Highway (Route 37) 0.00 2.92 3Urban
NHS2.92
36 Hana Highway : Haleakala Highway (Route 37) > Kaupakalua Road (Route 365) 2.92 16.23 4 Urban 13.31
37Haleakala Highway/Kula Highway: Hana Highway (Route 36) > Kalialinui Bridge
(#009000370301383)0.00 9.40 3
Urban
NHS9.40
37 Kula Highway : Kalialinui Bridge (#009000370301383) > Kekaulike Avenue (Route 377) 9.40 14.25 4 Urban 4.85
37 Kula Highway : Kekaulike Avenue (Route 377) > Old Makena Road 14.25 21.39 5 Rural 7.14
303 Puukolii Road : Honoapiilani Highway (Route 30) > Lahaina Bypass (Route 3000) 0.00 0.80 5 Urban 0.80
310 North Kihei Road : Honoapiilani Highway (Route 30) > Mokulele Highway (Route 311) 0.00 3.60 4 Urban 3.60
311Puunene Avenue/Mokulele Highway : Kuihelani Highway (Route 380) > Piilani Highway (Route
31)0.00 6.41 3
Urban
NHS6.41
340 Kahekili Highway : Waiehu Beach Road (Route 3400)> Waihee Bridge (#009003400500233) 0.00 2.31 5 Urban 2.31
340 Kahekili Highway : Waihee Bridge (#009003400500233) > Camp Maluhia entrance 2.31 4.29 5 Rural 1.98
340Kahekili Highway : Camp Maluhia entrance > 0.35 miles east of Papanahoa Bridge
(#009000300304184)4.29 13.77 6 Rural 9.48
360 Hana Highway : Kaupakalua Road (Route 365) > Honokala Road 0.00 2.63 5 Urban 2.63
360 Hana Highway/Keawa Place: Honokala Road > wharf at Hana Bay 2.63 34.93 5 Rural 32.30
365 Makawao Avenue : Old Haleakala Highway (Route 367) > Kokomo Road (Route 366) 0.00 3.20 5 Urban 3.20
365 Kaupakalua Road : Kokomo Road (Route 366) > Hana Highway (Route 36) 3.20 8.56 6 Urban 5.36
RURAL/
URBAN/NHS
MILEAGE BY FUNCTIONAL CLASSIFICATION
ARTERIAL COLLECTORINTERSTATE
FREEWAY &
EXPRESSWAY
ROUTE ROADWAY NAME AND EXTENTBEGIN
MP
END
MP
HPMS
Code
Source: Federal-Aid and State Highway Update: System Identification and Functional Classification (2013) 1

Highway Functional Classification: Islands of Maui, Molokai, and Lanai
PRINCIPAL MINOR MAJOR MINOR
RURAL/
URBAN/NHS
MILEAGE BY FUNCTIONAL CLASSIFICATION
ARTERIAL COLLECTORINTERSTATE
FREEWAY &
EXPRESSWAY
ROUTE ROADWAY NAME AND EXTENTBEGIN
MP
END
MP
HPMS
Code
366 Haiku Road / Kokomo Road: Hana Highway (Route 36) > Makawao Avenue (Route 365) 0.00 5.56 5 Urban 5.56
367 Old Haleakala Highway : Haleakala Highway (Route 37) > Kula Highway (Route 37) 0.00 1.86 5 Urban 1.86
371 Haliimaile Road : Haleakala Highway (Route 37) > Kailua Road 0.00 0.70 6 Rural 0.70
371 Haliimaile Road : Kailua Road > Baldwin Avenue (Route 390) 0.70 2.62 6 Urban 1.92
374 Kihei‐Upcounty Maui Highway : Piilani Highway (Route 31) > Kihei Urban Boundary 0.00 2.60 4 Urban 2.60
374Kihei‐Upcounty Maui Highway : Kihei Urban Boundary > Haleakala Highway (Route
37)/Haliimaile Road (Route 371)2.60 9.80 4 Rural 7.20
377 Haleakala Highway/Kekaulike Avenue : Kula Highway (Route 37) > Kula Highway (Route 37) 0.00 9.17 5 Urban 9.17
378Haleakala Crater Road : Hakeakala Highway (Route 377) > Haleakala National Park boundary
(at the cattle guard near the "End State Hwy Sign")0.00 10.15 5 Rural 10.15
380 Dairy Road : Haleakala Highway (Route 36A) > Puunene Avenue (Route 3500) 0.00 0.96 5 Urban 0.96
380 Kuihelani Highway : Puunene Avenue (Route 3500) > Honoapiilani Highway (Route 30) 0.96 6.18 3Urban
NHS5.22
390 Baldwin Avenue : Hana Highway (Route 36) > end of urban boundary 0.00 2.00 5 Urban 2.00
390 Baldwin Avenue : end of urban boundary > Haliimaile Road (Route 371) 2.00 5.00 5 Rural 3.00
390 Baldwin Avenue : Haliimaile Road (Route 371) > Makawao Avenue (Route 365) 5.00 6.94 5 Urban 1.94
3000Lahaina Bypass : Honoapiilani Highway S junction (Route 30) > Kahomo Stream [urban/rural
boundary] 0.00 4.19 3
Urban
NHS4.19
3000Lahaina Bypass : Kahomo Stream [urban/rural boundary] > Honoapiilani Highway N junction
(Route 30) 4.19 8.95 3
Rural
NHS4.76
3010 Front Street : Honoapiilani Highway N Junction (Route 30) > Shaw Street (Route 3050) 0.00 1.97 5 Urban 1.97
3010 Front Street : Shaw Street (Route 3050) > Honoapiilani Highway S Junction (Route 30) 1.97 2.67 6 Urban 0.70
3015 Wainee Street : Kenui Street (Route 3070) > Lahainaluna Road (Route 3040) 0.00 0.46 6 Urban 0.46
3020 Papalaua Street : Front Street (Route 3010) > Honoapiilani Highway (Route 30) 0.00 0.23 5 Urban 0.23
3025Kaniau Road/Ainakea Street : Honoapiilani Highway (Route 30) > Kapunakea Street (Route
3060)0.00 0.92 6 Urban 0.92
3030 Dickenson Street : Front Street (Route 3010) > Honoapiilani Highway (Route 30) 0.00 0.27 6 Urban 0.27
3040 Lahainaluna Road : Front Street (Route 3010) > Lahainaluna School entry 0.00 1.63 5 Urban 1.63
3050 Shaw Street : Front Street (Route 3010) > Honoapiilani Highway (Route 30) 0.00 0.20 6 Urban 0.20
Source: Federal-Aid and State Highway Update: System Identification and Functional Classification (2013) 2
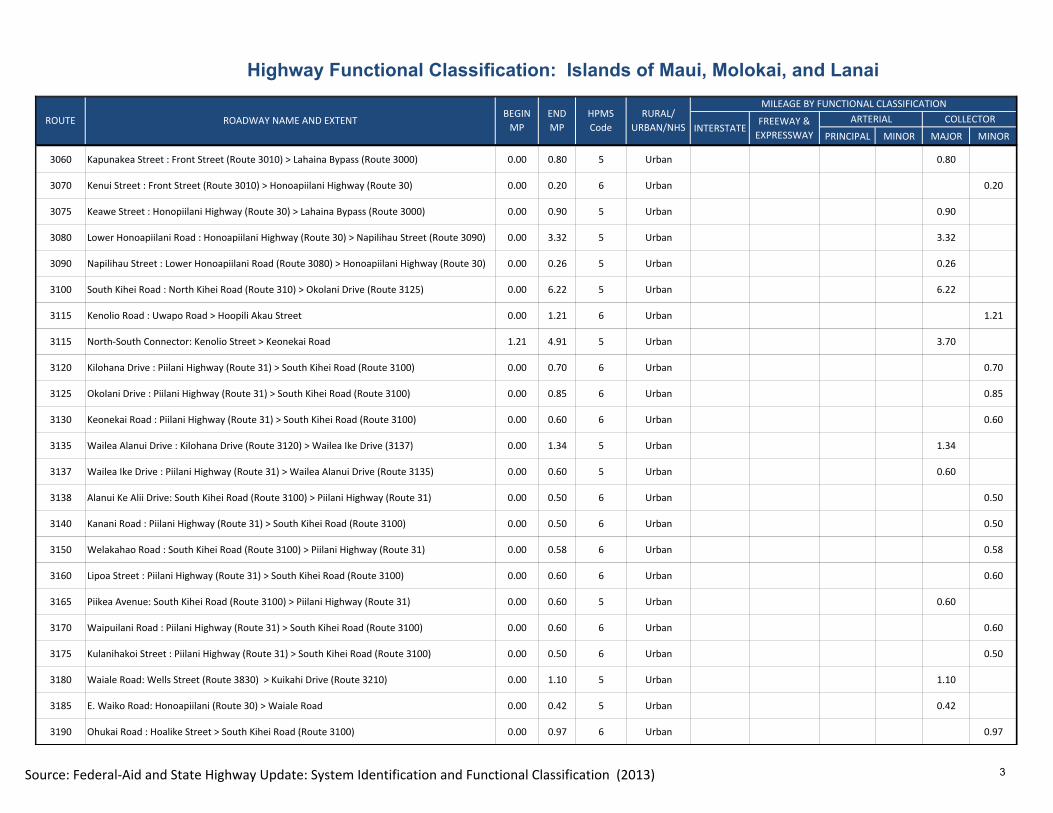
Highway Functional Classification: Islands of Maui, Molokai, and Lanai
PRINCIPAL MINOR MAJOR MINOR
RURAL/
URBAN/NHS
MILEAGE BY FUNCTIONAL CLASSIFICATION
ARTERIAL COLLECTORINTERSTATE
FREEWAY &
EXPRESSWAY
ROUTE ROADWAY NAME AND EXTENTBEGIN
MP
END
MP
HPMS
Code
3060 Kapunakea Street : Front Street (Route 3010) > Lahaina Bypass (Route 3000) 0.00 0.80 5 Urban 0.80
3070 Kenui Street : Front Street (Route 3010) > Honoapiilani Highway (Route 30) 0.00 0.20 6 Urban 0.20
3075 Keawe Street : Honopiilani Highway (Route 30) > Lahaina Bypass (Route 3000) 0.00 0.90 5 Urban 0.90
3080 Lower Honoapiilani Road : Honoapiilani Highway (Route 30) > Napilihau Street (Route 3090) 0.00 3.32 5 Urban 3.32
3090 Napilihau Street : Lower Honoapiilani Road (Route 3080) > Honoapiilani Highway (Route 30) 0.00 0.26 5 Urban 0.26
3100 South Kihei Road : North Kihei Road (Route 310) > Okolani Drive (Route 3125) 0.00 6.22 5 Urban 6.22
3115 Kenolio Road : Uwapo Road > Hoopili Akau Street 0.00 1.21 6 Urban 1.21
3115 North‐South Connector: Kenolio Street > Keonekai Road 1.21 4.91 5 Urban 3.70
3120 Kilohana Drive : Piilani Highway (Route 31) > South Kihei Road (Route 3100) 0.00 0.70 6 Urban 0.70
3125 Okolani Drive : Piilani Highway (Route 31) > South Kihei Road (Route 3100) 0.00 0.85 6 Urban 0.85
3130 Keonekai Road : Piilani Highway (Route 31) > South Kihei Road (Route 3100) 0.00 0.60 6 Urban 0.60
3135 Wailea Alanui Drive : Kilohana Drive (Route 3120) > Wailea Ike Drive (3137) 0.00 1.34 5 Urban 1.34
3137 Wailea Ike Drive : Piilani Highway (Route 31) > Wailea Alanui Drive (Route 3135) 0.00 0.60 5 Urban 0.60
3138 Alanui Ke Alii Drive: South Kihei Road (Route 3100) > Piilani Highway (Route 31) 0.00 0.50 6 Urban 0.50
3140 Kanani Road : Piilani Highway (Route 31) > South Kihei Road (Route 3100) 0.00 0.50 6 Urban 0.50
3150 Welakahao Road : South Kihei Road (Route 3100) > Piilani Highway (Route 31) 0.00 0.58 6 Urban 0.58
3160 Lipoa Street : Piilani Highway (Route 31) > South Kihei Road (Route 3100) 0.00 0.60 6 Urban 0.60
3165 Piikea Avenue: South Kihei Road (Route 3100) > Piilani Highway (Route 31) 0.00 0.60 5 Urban 0.60
3170 Waipuilani Road : Piilani Highway (Route 31) > South Kihei Road (Route 3100) 0.00 0.60 6 Urban 0.60
3175 Kulanihakoi Street : Piilani Highway (Route 31) > South Kihei Road (Route 3100) 0.00 0.50 6 Urban 0.50
3180 Waiale Road: Wells Street (Route 3830) > Kuikahi Drive (Route 3210) 0.00 1.10 5 Urban 1.10
3185 E. Waiko Road: Honoapiilani (Route 30) > Waiale Road 0.00 0.42 5 Urban 0.42
3190 Ohukai Road : Hoalike Street > South Kihei Road (Route 3100) 0.00 0.97 6 Urban 0.97
Source: Federal-Aid and State Highway Update: System Identification and Functional Classification (2013) 3

Highway Functional Classification: Islands of Maui, Molokai, and Lanai
PRINCIPAL MINOR MAJOR MINOR
RURAL/
URBAN/NHS
MILEAGE BY FUNCTIONAL CLASSIFICATION
ARTERIAL COLLECTORINTERSTATE
FREEWAY &
EXPRESSWAY
ROUTE ROADWAY NAME AND EXTENTBEGIN
MP
END
MP
HPMS
Code
3200 West Main Street/Iao Valley Road : High Street (Route 30) > Iao Valley State Park 0.00 2.70 6 Urban 2.70
3210 Kuikahi Drive : South Alu Road > Waiale Road (Route 3180) 0.00 1.16 6 Urban 1.16
3231 Mahalani Street/Waiinu Road : Kaahumanu Avenue (Route 32) > Waiale Road (Route 3180) 0.00 1.18 5 Urban 1.18
3400Kahului Beach Road/Waiehu Beach Road : Kaahumanu Avenue (Route 32) > Kahekili Highway
(Route 3405)0.00 2.62 4 Urban 2.62
3405 South Market Street/North Market Street : Wells Street (Route 3830) > Piihana Road 0.00 0.54 5 Urban 0.54
3405 Kahekili Highway : Piihana Road > Waiehu Beach Road (Route 3400) 0.54 2.26 6 Urban 1.72
3410 Wahinepio Avenue : Kahului Beach Road (Route 3400) > Papa Avenue (Route 3910) 0.00 0.52 6 Urban 0.52
3420 Kanaloa Avenue : Kaahumanu Avenue (Route 32) > Kahului Beach Road (Route 3400) 0.00 0.90 5 Urban 0.90
3500 Puunene Avenue : Kaahumanu Avenue (Route 32) > Kuihelani Highway (Route 380) 0.00 1.11 3Urban
NHS1.11
3600 Hansen Road: Mokulele Highway (Route 311) > Hana Highway (Route 36) 0.00 2.00 6 Urban 2.00
3610 Loha Street/Iolani Street : Old Haleakala Highway (Route 367) > End of Iolani Street 0.00 1.61 6 Urban 1.61
3620 Pukalani Street/Liholani Street : Old Haleakala Highway (Route 367) > Aina Lani Drive 0.00 1.40 6 Urban 1.40
3630 Makani Road : Old Haleakala Highway (Route 367) > Makawao Avenue (Route 365) 0.00 2.00 6 Urban 2.00
3700 Piilani Highway : Kula Highway (Route 37) > Haleakala National Park boundary 0.00 28.80 6 Rural 28.80
3700 Hana Highway : Haleakala National Park boundary > Keawa Place (Route 360) 28.80 38.59 5 Rural 9.79
3800 Kahului Airport Access Road : Henaloa Street > Puunene Avenue (Route 3500) 0.00 1.67 3Urban
NHS1.67
3830 Wells Street : South High Street (Route 30) > Waiale Road (Route 3830) 0.00 0.44 6 Urban 0.44
3830 Waiale Road/East Main Street : Wells Street (Route 3830) > Waiehu Beach Road (Route 3400) 0.44 1.97 5 Urban 1.53
3840 Mill Street : North Market Street (Route 3405) > East Main Street (Route 3830) 0.00 0.65 6 Urban 0.65
3910 Papa Avenue : Kaahumanu Avenue (Route 32) > Puunene Avenue (Route 3500) 0.00 2.56 5 Urban 2.56
3920 Wakea Avenue : Kaahumanu Avenue (Route 32) > Hana Highway (Route 36) 0.00 1.65 5 Urban 1.65
3930 Hina Avenue : Wakea Avenue (Route 3920) > Papa Avenue (Route 3910) 0.00 0.80 6 Urban 0.80
Source: Federal-Aid and State Highway Update: System Identification and Functional Classification (2013) 4

Highway Functional Classification: Islands of Maui, Molokai, and Lanai
PRINCIPAL MINOR MAJOR MINOR
RURAL/
URBAN/NHS
MILEAGE BY FUNCTIONAL CLASSIFICATION
ARTERIAL COLLECTORINTERSTATE
FREEWAY &
EXPRESSWAY
ROUTE ROADWAY NAME AND EXTENTBEGIN
MP
END
MP
HPMS
Code
3940 Kamehameha Avenue : Hana Highway (Route 36) > Papa Avenue (Route 3910) 0.00 1.75 6 Urban 1.75
3945 Alamaha Street : Kamehameha Avenue (Route 3940) > Dairy Road (Route 380) 0.00 0.70 6 Urban 0.70
3950 Lono Avenue : Kaahumanu Avenue (Route 32) > Papa Avenue (Route 3910) 0.00 1.30 6 Urban 1.30
3960 Onehee Avenue : Wakea Avenue > Papa Avenue (Route 3910) 0.00 0.66 6 Urban 0.66
3970 Kea Street : Wakea Avenue (Route 3920) > Papa Avenue (Route 3910) 0.00 0.60 6 Urban 0.60
32A Hobron Avenue : Hana Highway (Route 36) > Kahului Harbor gate 0.00 0.41 3Urban
NHS0.41
32B Wharf Street : Kaahumanu Avenue (Route 32) > Harbors Division lot Pier 2 0.00 0.17 3Urban
NHS0.17
36A Haleakala Highway /Keolani Place : Hana Highway (Route 36) > Kahului Airport 0.00 0.51 4 Urban 0.51
MAUI
MOLOKAI
450 Kamehameha V Highway : Ala Malama Avenue > end of pavement 0.00 27.51 5 Rural 27.51
460 Kaunakai Place / Maunaloa Highway : beginning of state route > end of state route 0.00 16.56 5 Rural 16.56
465 Airport Loop : Maunaloa Highway (east junction) > Maunaloa Highway (west junction) 0.00 2.13 5 Rural 2.13
470 Kalae Highway : Maunaloa Highway (Route 460) > Kalaupapa lookout parking lot 0.00 5.79 5 Rural 5.79
475 Lihi Pali Avenue/Puukapele Avenue : Farrington Highway (Route 480) > end of county route 0.00 4.06 6 Rural 4.06
480 Farrington Avenue/Puupeelua Avenue : Kalae Highway > Maunaloa Highway (Route 460) 0.00 3.66 5 Rural 3.66
LANAI
430 Fraser Avenue : Kaumalapau Highway (Route 440) > Caldwell Avenue 0.00 0.90 5 Rural 0.90
435 Lanai Avenue : Kaumalapau Highway > end of county route 0.00 1.00 5 Rural 1.00
440 Kaumalapau Highway/Manele Road : Kaumalapau Harbor > Hulopooe Beach Park 0.00 13.18 5 Rural 13.18
440c Airport Road : airport terminal > Kaumalapau Highway (Route 440) 0.00 0.47 5 Rural 0.47
442 Kaumalapau Highway : Manele Road (Route 440) > Lanai Avenue (Route 435) 0.00 0.20 5 Rural 0.20
Source: Federal-Aid and State Highway Update: System Identification and Functional Classification (2013) 5

Highway Functional Classfication: Island of Hawaii
PRINCIPAL MINOR MAJOR MINOR
11Kanoelehua Avenue/Volcano Road : Kamehameha Avenue (Route 19) > Old Keaau‐Pahoa Road (Route
139)0.00 7.30 3
Urban
NHS7.30
11Volcano Road/Mamalahoa Highway : Old Keaau‐Pahoa Road (Route 139) > 0.01 miles past Capt. Cook
Village Road7.30 109.22 4 Rural 101.92
11Mamalahoa Highway/Kuakini Highway/Queen Kaahumanu Highway : 0.01 miles past Capt. Cook Village
Road (end of state highway) > Palani Road (Route 190)109.22 122.08 3
Urban
NHS12.86
19Kuhio Street/Kalanianaole Street/Kamehameha Avenue/Pauahi Street/Bay Front Highway/Hawaii Belt
Road : entrance to Kuhio Wharf > 00.13 miles before Hau Street0.00 3.09 3
Urban
NHS3.09
19 Hawaii Belt Road : 0.13 miles before Hau Street > Mud Lane (Route 19) 3.09 51.82 3Rural
NHS48.73
19Hawaii Belt Road/Mamalahoa Highway/Lindsey Road/Kawaihae Road/Queen Kaahumanu Highway :
Mud Lane (Route 19) > Palani Road (Route 190)51.82 99.59 3
Urban
NHS47.77
121 North Kulani Road : Volcano Road (Route 11) > Huina Road 0.00 1.60 6 Rural 1.60
122 Wright Road : Kilinoe Road > Volcano Road (Route 11) 0.00 1.22 6 Rural 1.22
130 Keaau‐Pahoa Road : Volcano Road (Route 11) > Pahoa‐Kapoho Road (Route 132) 0.00 12.14 4 Urban 12.14
130Pahoa‐Kalapana Road/Kaimu‐Chain of Craters Road : Pahoa‐Kapoho Road (Route 132) > end of route
(0.83 miles past Royal Palm Drive)12.14 25.32 5 Rural 13.18
132 Pahoa‐Kapoho Road : Pahoa‐Keeau Road (Route 130) > Kaimu‐Kapoho Road 0.00 7.73 5 Rural 7.73
134Pahoa Village Road : Keaau‐Pahoa Road (Route 130) > Pahoa Kalapana‐Road [through Pahoa town]
(Route 130)0.00 1.49 5 Rural 1.49
135 Pohoiki Road : Pahoa‐Kapoho Road (Route 132) > Kalapana Road‐Kapoho Road (Route 137) 0.00 4.56 6 Rural 4.56
137 Kapoho Kalapana Road : Pahoa‐Kapoho Road (Route 132) > Pahoa‐Kalapana Road (Route 130) 0.00 15.06 6 Rural 15.06
138 Kahakai Boulevard : Keeau‐Pahoa Road (Route 130) > Papio Street 0.00 5.90 5 Urban 5.90
139 Old Keaau‐Pahoa Road : Volcano Road (Route 11) > Keaau‐Pahoa Road (Route 130) 0.00 1.19 5 Rural 1.19
145 Kamani Street : Pikake Street > Mamalahoa Highway (Route 11) 0.00 0.50 6 Rural 0.50
155 Kamaoa Road : South Point Access Road (Route 150) > Mamalahoa Highway (Route 11) 0.00 3.98 6 Rural 3.98
160 Ke Ala O Keawe Road : Mamalahoa Highway (Route 11) > end of route 0.00 3.82 5 Rural 3.82
161 Napoopoo Road : Puuhonua Road > Mamalahoa Highway (Route 11) 0.00 4.40 5 Urban 4.40
163 Ke Ala O Keawe Road (City of Refuge spur) : Ke Ala O Keawe Road > parking lot entrance 0.00 0.13 5 Rural 0.13
164 Halekii Street : Mamao Street > Mamalahoa Highway (Route 11) 0.00 0.26 5 Urban 0.26
ROUTE ROADWAY NAME AND EXTENTBEGIN
MP
END
MP
HPMS
Code
RURAL/
URBAN/
NHSINTERSTATE
FREEWAY &
EXPRESSWAY
ARTERIAL COLLECTOR
MILEAGE BY FUNCTIONAL CLASSIFICATION
Source: Federal-Aid and State Highway Update: System Identification and Functional Classification (2013) 1
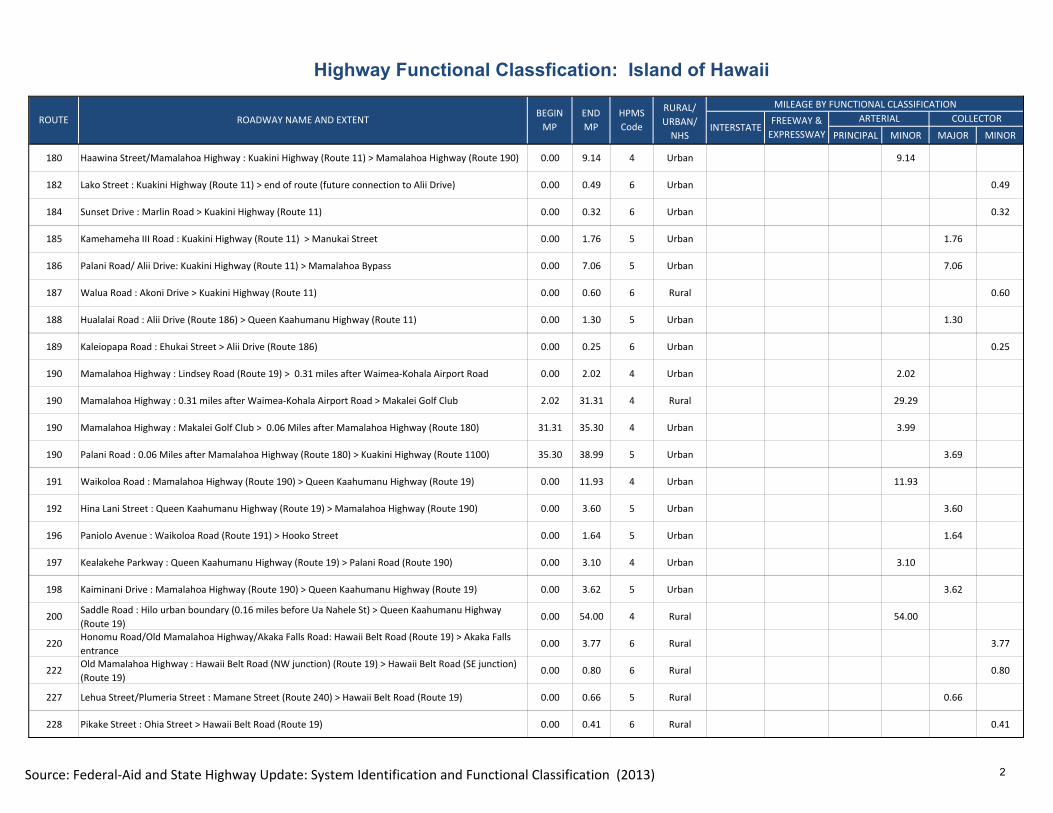
PRINCIPAL MINOR MAJOR MINOR
ROUTE ROADWAY NAME AND EXTENTBEGIN
MP
END
MP
HPMS
Code
Highway Functional Classfication: Island of Hawaii
RURAL/URBAN/
NHSINTERSTATE
FREEWAY &
EXPRESSWAY
ARTERIAL COLLECTOR
MILEAGE BY FUNCTIONAL CLASSIFICATION
180 Haawina Street/Mamalahoa Highway : Kuakini Highway (Route 11) > Mamalahoa Highway (Route 190) 0.00 9.14 4 Urban 9.14
182 Lako Street : Kuakini Highway (Route 11) > end of route (future connection to Alii Drive) 0.00 0.49 6 Urban 0.49
184 Sunset Drive : Marlin Road > Kuakini Highway (Route 11) 0.00 0.32 6 Urban 0.32
185 Kamehameha III Road : Kuakini Highway (Route 11) > Manukai Street 0.00 1.76 5 Urban 1.76
186 Palani Road/ Alii Drive: Kuakini Highway (Route 11) > Mamalahoa Bypass 0.00 7.06 5 Urban 7.06
187 Walua Road : Akoni Drive > Kuakini Highway (Route 11) 0.00 0.60 6 Rural 0.60
188 Hualalai Road : Alii Drive (Route 186) > Queen Kaahumanu Highway (Route 11) 0.00 1.30 5 Urban 1.30
189 Kaleiopapa Road : Ehukai Street > Alii Drive (Route 186) 0.00 0.25 6 Urban 0.25
190 Mamalahoa Highway : Lindsey Road (Route 19) > 0.31 miles after Waimea‐Kohala Airport Road 0.00 2.02 4 Urban 2.02
190 Mamalahoa Highway : 0.31 miles after Waimea‐Kohala Airport Road > Makalei Golf Club 2.02 31.31 4 Rural 29.29
190 Mamalahoa Highway : Makalei Golf Club > 0.06 Miles after Mamalahoa Highway (Route 180) 31.31 35.30 4 Urban 3.99
190 Palani Road : 0.06 Miles after Mamalahoa Highway (Route 180) > Kuakini Highway (Route 1100) 35.30 38.99 5 Urban 3.69
191 Waikoloa Road : Mamalahoa Highway (Route 190) > Queen Kaahumanu Highway (Route 19) 0.00 11.93 4 Urban 11.93
192 Hina Lani Street : Queen Kaahumanu Highway (Route 19) > Mamalahoa Highway (Route 190) 0.00 3.60 5 Urban 3.60
196 Paniolo Avenue : Waikoloa Road (Route 191) > Hooko Street 0.00 1.64 5 Urban 1.64
197 Kealakehe Parkway : Queen Kaahumanu Highway (Route 19) > Palani Road (Route 190) 0.00 3.10 4 Urban 3.10
198 Kaiminani Drive : Mamalahoa Highway (Route 190) > Queen Kaahumanu Highway (Route 19) 0.00 3.62 5 Urban 3.62
200Saddle Road : Hilo urban boundary (0.16 miles before Ua Nahele St) > Queen Kaahumanu Highway
(Route 19)0.00 54.00 4 Rural 54.00
220Honomu Road/Old Mamalahoa Highway/Akaka Falls Road: Hawaii Belt Road (Route 19) > Akaka Falls
entrance0.00 3.77 6 Rural 3.77
222Old Mamalahoa Highway : Hawaii Belt Road (NW junction) (Route 19) > Hawaii Belt Road (SE junction)
(Route 19)0.00 0.80 6 Rural 0.80
227 Lehua Street/Plumeria Street : Mamane Street (Route 240) > Hawaii Belt Road (Route 19) 0.00 0.66 5 Rural 0.66
228 Pikake Street : Ohia Street > Hawaii Belt Road (Route 19) 0.00 0.41 6 Rural 0.41
Source: Federal-Aid and State Highway Update: System Identification and Functional Classification (2013) 2

Highway Functional Classfication: Island of Hawaii
PRINCIPAL MINOR MAJOR MINOR
ROUTE ROADWAY NAME AND EXTENTBEGIN
MP
END
MP
HPMS
Code
RURAL/
URBAN/
NHSINTERSTATE
FREEWAY &
EXPRESSWAY
ARTERIAL COLLECTOR
MILEAGE BY FUNCTIONAL CLASSIFICATION
240Honokaa‐Waipio Road/Mamane Street : Hawaii Belt Road (Route 19) > Lehua Street/Plumeria Street
(Route 227) 0.00 1.50 5 Rural 1.50
240 Honokaa‐Waipio Road : Lehua Street/Plumeria Street (Route 227) > Waipio Valley lookout 1.50 9.62 6 Rural 8.12
250 Kohala Mountain Road : Kawaihae Road (Route 19) > beginning of rural boundary 0.00 1.77 5 Urban 1.77
250 Kohala Mountain Road/Hawi Road : beginning of rural boundary > Akoni Pule Highway (Route 270) 1.77 19.28 5 Rural 17.51
270 Kawaihae Road : Queen Kaahumanu Highway (Route 19) > Kawaihae Bridge (#001000270300326 ) 0.00 1.36 3Urban
NHS1.36
270 Kawaihae Road/Akoni Pule Highway : Kawaihae Bridge (#001000270300326 ) > Maluokalani Street 1.36 2.44 4Urban
NHS1.08
270 Akoni Pule Highway : Maluokalani Street > Niulii Bridge (#001002700502390) 2.44 25.39 4 Rural 22.95
270 Akoni Pule Highway : Niulii Bridge (#001002700502390) > Pololu Valley entrance 25.39 27.02 5 Rural 1.63
272 Kynnersley Road : Kohala Mountain Road (Route 250) > Akoni Pule Highway (Route 270) 0.00 2.32 6 Rural 2.32
1100 Kuakini Highway : Kaiwi Street (Route 1835) > Queen Kaahumanu Highway (Route 11) 0.00 3.08 5 Urban 3.08
1110 Alii Highway/Parkway : Alii Drive (Route 186) > Queen Kaahumanu Highway (Route 11) 0.00 4.44 5 Urban 4.44
1370 Kalanianaole Avenue : Kuhio Street > Pua Avenue 0.00 0.48 3Urban
NHS0.48
1370 Kalanianaole Avenue : Pua Avenue > Leleiwi Street 0.48 2.98 5 Urban 2.50
1810 Nani Kailua Drive : Hienaloli Road > Queen Kaahumanu Highway (Route 11) 0.00 0.83 6 Urban 0.83
1830 Henry Street : Kuakini Highway (Route 1100) > Queen Kaahumanu Highway (Route 11) 0.00 0.35 5 Urban 0.35
1835 Kaiwi Street : Queen Kaahumanu Highway (Route 19) > Kuakini Highway (Route 1100) 0.00 0.52 5 Urban 0.52
1880 Ane Keohokalole Highway : Palani Road (Route 190) > Kaiminani Drive (Route 198) 0.00 5.65 5 Urban 5.65
1905 Kealakaa Street : Uluaoa Street > Palani Road (Route 190) 0.00 0.54 6 Urban 0.54
1910 Kamehameha Avenue : Waianuenue Avenue (Route 1950) > Pauahi Street (Route 19) 0.00 0.66 4 Urban 0.66
1920 Kilauea Avenue : Ponahawai Street (Route 2730)> Kanoelehua Avenue (Route 11) 0.00 4.08 4 Urban 4.08
1921 Kilauea Avenue : Ponahawai Street (Route 2730) > Keawe Street 0.00 0.07 4 Urban 0.07
1921 Keawe Street : Kilauea Avenue (Route 1921) > Waianuenue Avenue (Route1950) 0.07 0.35 6 Urban 0.28
Source: Federal-Aid and State Highway Update: System Identification and Functional Classification (2013) 3

PRINCIPAL MINOR MAJOR MINOR
ROUTE ROADWAY NAME AND EXTENTBEGIN
MP
END
MP
HPMS
Code
Highway Functional Classfication: Island of Hawaii RURAL/
RURAL/URBAN/
NHSINTERSTATE
FREEWAY &
EXPRESSWAY
ARTERIAL COLLECTOR
MILEAGE BY FUNCTIONAL CLASSIFICATION
1925 Pauahi Street : Kamehameha Avenue (Route 19) > Kilauea Avenue (Route 1920) 0.00 0.30 5 Urban 0.30
1930 Kinoole Street : Wailuku Drive (Route 2860) > Haihai Street (Route 2740) 0.00 3.91 4 Urban 3.91
1940 Komohana Street : Waianuenue Avenue (Route 1950) > Ainaola Drive (Route 2750) 0.00 3.00 5 Urban 3.00
1950Waianuenue Avenue/Kaumana Drive/Saddle Road : Kamehameha Avenue (Route 1910) > Hilo urban
boundary (0.16 miles before Ua Nahele St)0.00 7.84 5 Urban 7.84
1960 Railroad Avenue : Leilani Street > Kahaopea Street 0.00 1.35 6 Urban 1.35
1970 Kamehameha Avenue/Silva Street : Railroad Avenue > Kalanianaole Street (Route 19) 0.00 0.93 6 Urban 0.93
2000 Puainako Street : Railroad Avenue (Route 1960) > Komohana Street (Route 1940) 0.00 2.18 5 Urban 2.18
2000Komohana Street/Puainako Street Extension: Puainako Street (Route 2000) > Kaumana Drive (Route
1950)2.18 6.87 6 Urban 4.69
2460 Kamamalu Street : Mamalahoa Highway (Route 19) > Hiiaka Street 0.00 0.68 6 Urban 0.68
2470 Lindsey Road : Hokuula Road > Kawaihae Road (Route 19) 0.00 0.29 6 Urban 0.29
2710 Stainback Highway : Hilo south urban boundary > Volcano Road (Route 11) 0.00 1.49 6 Urban 1.49
2720 Waianuenue Avenue : Kaumana Drive (Route 1950) > Akolea Road (Route 2850) 0.00 2.11 5 Urban 2.11
2730 Ponahawai Street : Komohana Street (Route 1940) > Kamehameha Avenue (Route 1910) 0.00 1.11 6 Urban 1.11
2740 Haihai Street : Kilauea Avenue (Route 1920) > Kupulau Road 0.00 2.55 5 Urban 2.55
2750 Ainaola Drive : Kawailani Street (Route 2760)> Kupulau Road 0.00 2.15 5 Urban 2.15
2760 Kawailani Street/Kupulau Place : Kanoelehua Avenue (Route 11) > Kupulau Road 0.00 2.70 5 Urban 2.70
2760 Kupulau Road: Kupulau Place (Route 2760) > Ainaola Drive (Route 2750) 2.70 3.90 6 Urban 1.20
2770 Iwalani Street : Haihai Street (Route 2740)> Puainako Street (Route 2000) 0.00 1.40 6 Urban 1.40
2770 Kawili Street/Manono Street : Puinako Street (Route 2000) > Kamehameha Avenue (Route 19) 1.40 3.75 5 Urban 2.35
2790 Mohouli Street : Kilauea Avenue (Route 1920) > Komohana Street (Route 1940) 0.00 1.14 5 Urban 1.14
2810 Kekuanaoa Street : Kanoelehua Avenue (Route 11) > Kilauea Avenue (Route 1920) 0.00 0.81 5 Urban 0.81
2820 Lanikaula Street/Kumukoa Street : Kanoelehua Avenue (Route 11) > Mohouli Street (Route 2790) 0.00 1.81 5 Urban 1.81
Source: Federal-Aid and State Highway Update: System Identification and Functional Classification (2013) 4

Highway Functional Classfication: Island of Hawaii
PRINCIPAL MINOR MAJOR MINOR
ROUTE ROADWAY NAME AND EXTENTBEGIN
MP
END
MP
HPMS
Code
RURAL/
URBAN/
NHSINTERSTATE
FREEWAY &
EXPRESSWAY
ARTERIAL COLLECTOR
MILEAGE BY FUNCTIONAL CLASSIFICATION
2840 Ainako Avenue/Lahi Street : Kaumana Drive (Route 1950) > Waianuenue Avenue (Route 2720) 0.00 1.50 6 Urban 1.50
2850 Akolea Road : Wainuenue Avenue (Route 2720) > Kaumana Drive (Route 1950) 0.00 1.88 6 Urban 1.88
2860 Wainaku Avenue/Wailuku Drive : Mamalahoa Highway (Route 19) > Kinoole Street (Route 1930) 0.00 1.80 5 Urban 1.80
Source: Federal-Aid and State Highway Update: System Identification and Functional Classification (2013) 5

Highway Functional Classification: Island of Kauai
PRINCIPAL MINOR MAJOR MINOR
50 Kaumualii Highway : Rice Street (Route 5020)> Cane Haul Road (dirt road) 0.00 2.10 3Urban
NHS2.10
50 Kaumualii Highway : Cane Haul Road (dirt road) > Maluhia Road (Route 520) 2.10 6.69 3Rural
NHS4.59
50Kaumualii Highway : Maluhia Road (Route 520) > Omao bridge
(#007000500302465)6.69 8.27 4 Rural 1.58
50 Kaumualii Highway : Omao bridge (#007000500302465) > Lele Road 8.27 17.02 4 Urban 8.75
50 Kaumualii Highway : Lele Road > Waimea River Bridge (#007000500301039) 17.02 22.47 4 Rural 5.45
50Kaumualii Highway : Waimea River bridge (#007000500301039) > Bridge #4
(#007000500300570)22.47 27.21 4 Urban 4.74
50Kaumualii Highway/Lio Road/Kao Road : Bridge #4 (#007000500300570) > North
entrance gate of the Pacific Missile Range Facility27.21 32.93 4 Rural 5.72
51Waapa Road/Rice Street/Kapule Highway : Nawiliwili Road (Route 58) > Kuhio
Highway (Route 56) 0.00 3.44 3
Urban
NHS3.44
56Kuhio Highway : Rice Street/Kaumualii Hwy (Route 50) > 0.11 miles past Mailihuna
Road (Route 5870) 0.00 9.95 3
Urban
NHS9.95
56Kuhio Highway : 0.11 miles past Mailihuna Road (Route 5870) > Aliomanu Road
(North connection)9.95 15.11 4 Urban 5.16
56Kuhio Highway : Aliomanu Road > Route markers 56 and 560 (same as begin Route
560, Kuhio Hwy)15.11 28.11 4 Rural 13.00
58 Nawiliwili Road : Waapa Road (Route 51) > Kaumualii Highway (Route 50) 0.00 2.06 3Urban
NHS2.06
520 Maluhia Road : Kaumualii Highway (Route 50) > Wailaau Road 0.00 2.77 4 Rural 2.77
520 Maluhia Road/Koloa Road : Wailaau Road > Poipu Road (Route 520) 2.77 3.35 4 Urban 0.58
520 Poipu Road : Koloa Road (Route 530) > Ala Kinoiki Way (Route 522) and Pee Road 3.35 6.35 5 Urban 3.00
521 Omao Road : Kaumualii Highway (Route 50) > Koloa Road (Route 530) 0.00 2.12 6 Urban 2.12
522 Ala Kinoiki Way : Poipu Road (Route 520) > Koloa Road (Route 530) 0.00 3.32 5 Urban 3.32
523 Lawai Road : Poipu Road (Route 520) > Sprouting Horn Beach Park parking lot exit 0.00 1.90 5 Urban 1.90
523 Lawai Road : Sprouting Horn Beach Park parking lot exit > Gate at the end of route 1.90 2.35 5 Rural 0.45
525 Weliweli Road : Koloa Road (Route 526) > Ala Kinoiki Way (Route 522) 0.00 0.66 6 Urban 0.66
526 Koloa Road/Waikomo Road : Maluhia Road (Route 520) > Poipu Road (Route 520) 0.00 0.76 5 Urban 0.76
COLLECTOR
MILEAGE BY FUNCTIONAL CLASSIFICATION
INTERSTATEFREEWAY &
EXPRESSWAY
ROUTE ROADWAY NAME AND EXTENTBEGIN
MP
END
MP
HPMS
CODE
RURAL/
URBAN/
NHS
ARTERIAL
Source: Federal-Aid and State Highway Update: System Identification and Functional Classification (2013) 1

Highway Functional Classification: Island of Kauai
PRINCIPAL MINOR MAJOR MINOR
COLLECTOR
MILEAGE BY FUNCTIONAL CLASSIFICATION
INTERSTATEFREEWAY &
EXPRESSWAY
ROUTE ROADWAY NAME AND EXTENTBEGIN
MP
END
MP
HPMS
CODE
RURAL/
URBAN/
NHS
ARTERIAL
530 Koloa Road : Kaumualii Highway (Route 50) > Poipu Road (Route 520) 0.00 3.43 5 Urban 3.43
531 Papalina Road : Kaumualii Highway (Route 50) > Waha Road (Route 532) 0.00 1.21 5 Urban 1.21
532 Waha Road/Lauoho Road : Niho Road > Koloa Road (Route 530) 0.00 2.41 6 Urban 2.41
534 Puuwai Road : Kaumualii Highway (Route 50) > Kikala Road 0.00 1.45 6 Urban 1.45
536 Piko Road : Kaumualii Highway (Route 50) > Koloa Road (Route 530) 0.00 0.40 6 Urban 0.40
540Halewili Road : Kaumualii Highway (east junction)(Route 50) > Kaumualii Highway
(west junction) (Route 50)0.00 3.87 5 Rural 3.87
541Waialo Road : Kaumualii Highway (Route 50) > "End of State Highway"' sign at Port
Allen0.00 0.37 5 Urban 0.37
543 Moi Road : Kaumualii Highway (Route 50) > Gate at the end of road 0.00 1.41 6 Urban 1.41
545Hanapepe Road : Kaumualii Highway (west junction) (Route 50) > Kaumualii
Highway (east junction) (Route 50)0.00 0.98 6 Urban 0.98
550 Waimea Canyon Drive : Kaumualii Highway (Route 50) > Nele Road 0.00 0.43 5 Urban 0.43
550 Waimea Canyon Drive/Kokee Road : Nele Road > Kokee State Park 0.43 14.10 5 Rural 13.67
551Kekaha Road/Akialoa Road : Kaumualii Highway (east junction) (Route 50) >
Kaumualii Highway (west junction) (Route 50) 0.00 2.52 6 Urban 2.52
552Alae Road/Kokee Road : Kaumualii Highway (Route 50)> Waimea Canyon Drive
(Route 550)0.00 7.55 5 Rural 7.55
553 Menehune Road : Kaumualii Highway (Route 50) > Gay Road 0.00 1.10 6 Urban 1.10
554 Waimea Road : Kaumualii Highway (Route 50) > Ala Wai Road 0.00 0.20 6 Urban 0.20
560 Kuhio Highway : end of Route 56 > Aku Road (Route 563) 0.00 2.65 4 Rural 2.65
560 Kuhio Highway : Aku Road (Route 563) > Haena State Park parking lot 2.65 10.01 5 Rural 7.36
562 Kolo Road/Kilauea Road : Kuhio Highway (Route 56) > Mihi Road 0.00 1.16 5 Rural 1.16
562 Kilauea Road : Mihi Road > Kilauea National Wildlife Refuge 1.16 1.71 6 Rural 0.55
563 Aku Road : Kuhio Highway (Route 560) > Weke Road (Route 565) 0.00 0.25 5 Rural 0.25
565 Weke Road : Anae Road > Hanalei Beach Park 0.00 1.09 6 Rural 1.09
566Anahola Road/Manai Road/Kukuihale Road : Kuhio Hwy (N junction) (Route 56) >
Kuhio Hwy (S junction) (Route 56)0.00 1.68 5 Urban 1.68
570Ahukini Road : Kuhio Highway (Route 56) > 0.06 miles east of Kapule Highway
(Route 51)0.00 1.12 3
Urban
NHS1.12
Source: Federal-Aid and State Highway Update: System Identification and Functional Classification (2013) 2

Highway Functional Classification: Island of Kauai
PRINCIPAL MINOR MAJOR MINOR
COLLECTOR
MILEAGE BY FUNCTIONAL CLASSIFICATION
INTERSTATEFREEWAY &
EXPRESSWAY
ROUTE ROADWAY NAME AND EXTENTBEGIN
MP
END
MP
HPMS
CODE
RURAL/
URBAN/
NHS
ARTERIAL
580 Kuamoo Road : Kuhio Highway (Route 56) > Kamalu Road (Route 581) 0.00 2.77 4 Urban 2.77
580 Kuamoo Road : Kamalu Road (Route 581) > UH AGR. Station 2.77 4.81 5 Urban 2.04
580 Kuamoo Road : UH AGR. Station > Forest Reserve Sign (end of urban boundary) 4.81 6.46 6 Urban 1.65
580Kuamoo Road : Forest Reserve Sign (end of urban boundary) > Beginning of the
ford crossing (end of 2 lane section) 6.46 6.68 6 Rural 0.22
581 Kukui Street/Olohena Road : Kuhio Highway (Route 56) > Kamalu Road (Route 581) 0.00 3.42 5 Urban 3.42
581 Kamalu Road : Olohena Road (Route 581)> Kuamoo Road (Route 580) 3.42 5.06 6 Urban 1.64
583Maalo Road : Kuhio Highway (Route 56) > Cane Haul Road/Quarry Road (end of
urban boundary)0.00 0.92 6 Urban 0.92
5010 Puhi Road : Kaumualii Highway (Route 50) > Kaneka Street 0.00 0.36 5 Urban 0.36
5010 Puhi Road : Kaneka Street > Hulemalu Street 0.36 1.00 6 Urban 0.64
5020 Rice Street : Kapule Highway (Route 51) > Kaumualii Highway (Route 50) 0.00 1.00 4 Urban 1.00
5030 Nuhou Street : Kaumualii Highway (Route 50) > Halehaka Road 0.00 1.30 5 Urban 1.30
5035 Kalepa Street : Kaumualii Highway (Route 50) > Pikake Street 0.00 0.43 5 Urban 0.43
5040 Haleko Road : Rice Street (Route 5020) > Nawiliwili Road (Route 58) 0.00 0.68 5 Urban 0.68
5710 Umi Street : Rice Street (Route 5020) > Ahukini Road (Route 570) 0.00 0.50 6 Urban 0.50
5720 Hardy Street : Kuhio Highway (Route 56) > Rice Street (Route 5020) 0.00 0.70 5 Urban 0.70
5730 Puaole Street : Umi Street (Route 5710) > Hoolako Street 0.00 0.80 6 Urban 0.80
5740 Laukona Street : Kuhio Highway (Route 56) > Laukona Street [loop] 0.00 1.05 6 Urban 1.05
5750 Hanamalu Road : Kuhio Highway (Route 56) > Hehi Road 0.00 0.30 6 Urban 0.30
5805 Ulu Street : Kuhio Highway (Route 56) > Kukui Street (Route 581) 0.00 0.20 6 Urban 0.20
5840 Haleilio Road : Kuhio Highway (Route 56) > Kaulana Road 0.00 1.25 6 Urban 1.25
5850 Nonou Road : Haleilio Road (Route 5840) > Lanakila Road 0.00 0.57 6 Urban 0.57
5860 Kawaihau Road : Kuhio Highway (Route 56) > Kapahi Road 0.00 3.00 5 Urban 3.00
5860 Kawaihau Road/Kaapuni Road : Kapahi Road > Olohena Road (Route 581) 3.00 4.78 6 Urban 1.78
5865 Hauaala Road : Kuhio Highway (Route 56) > Kawaihau Road (Route 5860) 0.00 1.06 6 Urban 1.06
5870 Mailihuna Road : Kuhio Highway (Route 56) > Kawaihau Road (Route 5860) 0.00 0.57 5 Urban 0.57
Source: Federal-Aid and State Highway Update: System Identification and Functional Classification (2013) 3
Appendix BPlan and Policy Review


TBG062714093019HNL 1
M E M O R A N D U M Statewide Federal-Aid Highways 2035 Transportation Plan and Regional Federal-Aid Highways 2035 Transportation Plans for the Districts of Maui, Hawaii, and Kauai
Plan, Policy, and Program Review (Federal and Statewide) TO: State of Hawaii Department of Transportation (HDOT) FROM: CH2M HILL DATE: February 11, 2013
Introduction The planning team reviewed federal and state policies, plans, and programs relevant to development of the Statewide Federal-Aid Highways 2035 Transportation Plan (Plan). These reviews captured major components related to and aligned with the federal planning factors defined in the United States Code (USC) and ensured the Plan addressed modes and users comprehensively.
In addition to federal and state guidance, regional and local plans and policies were also reviewed for the districts of Maui, Hawaii, and Kauai as part of the development of the Regional Federal-Aid Highways 2035 Transportation Plans for the Districts of Maui, Hawaii, and Kauai. Along with plan and policy reviews for the District of Oahu, these regional reviews were intended to ensure the statewide Plan considered regional policies. This comprehensive approach emphasized addressing community needs and values.
The following summary of federal and state plans, policies, and programs was an important first step to ensure that the Statewide Federal-Aid Highways 2035 Transportation Plan:
• Built effectively on previously adopted plans, policies, and programs • Complied with federal and state requirements, and considered local policies • Had guidance and structure for the development of potential solutions
The plan, policy, and program summaries helped to shape the Plan goals and the definition of potential solutions.
Federal Plans, Policies, and Programs Federal transportation policy and planning programs generally provide direction and funding mechanisms for statewide or regional plans or programs. Federal transportation planning policies are intentionally broad to allow states and regions the flexibility to tailor policy implementation that works for their geography and population.
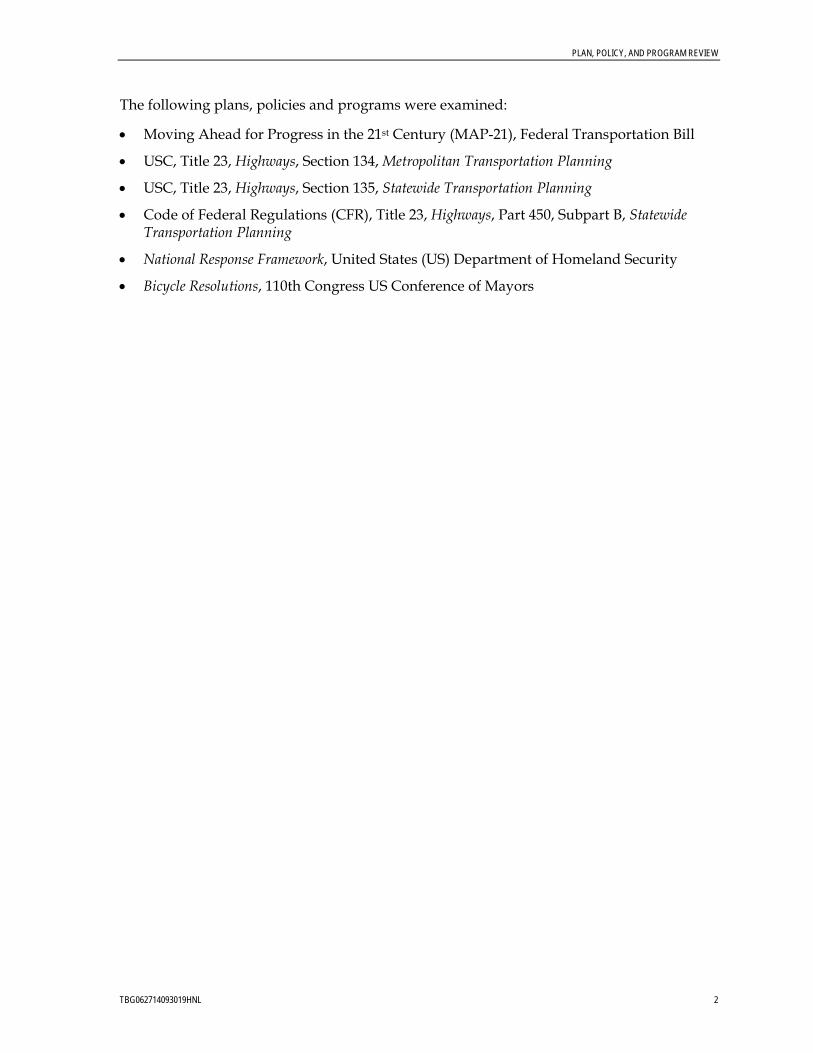
PLAN, POLICY, AND PROGRAM REVIEW
TBG062714093019HNL 2
The following plans, policies and programs were examined:
• Moving Ahead for Progress in the 21st Century (MAP-21), Federal Transportation Bill
• USC, Title 23, Highways, Section 134, Metropolitan Transportation Planning
• USC, Title 23, Highways, Section 135, Statewide Transportation Planning
• Code of Federal Regulations (CFR), Title 23, Highways, Part 450, Subpart B, Statewide Transportation Planning
• National Response Framework, United States (US) Department of Homeland Security
• Bicycle Resolutions, 110th Congress US Conference of Mayors

PLAN, POLICY, AND PROGRAM REVIEW
TBG062714093019HNL 3
Moving Ahead for Progress in the 21st Century Purpose and Content MAP-21 is the current federal transportation legislation, adopted in July 2012. It is a long-term highway authorization act and guides transportation policy at the federal level. The act includes funding for fiscal years 2013 and 2014, and outlines national goals and transportation performance targets. MAP-21 also condenses and streamlines transportation funding programs from the previous 90 into roughly 30. The act builds on and refines many of the highway, transit, bike, and pedestrian programs and policies established in 1991.
MAP-21 represents a transition to a performance and outcome-based state highway program. Performance measures in MAP-21 provide guidance for states to most efficiently invest federal funds. These measures refocus investments to align with national transportation goals, increasing the accountability and transparency of the federal-aid highway program and improving project decision-making.
States shall establish performance targets in coordination with metropolitan planning organizations (MPOs) and public transit operators (in areas not represented by MPOs). States may also develop targets specific to urbanized areas or rural areas.
State and metropolitan plans, including long-range plans, must describe these performance measures and targets used to assess system performance. Plans must also include how program and project selection will help achieve targets, once they are set (expected in fall 2014) by the United States Department of Transportation. MAP-21 includes the following national performance goals for system management:
• Safety – significantly reduce traffic fatalities and serious injuries on all public roads
• Infrastructure Condition – maintain highway infrastructure assets in state of good repair
• Congestion Reduction – significantly reduce congestion on the National Highway System
• System Reliability – improve the efficiency of the surface transportation system
• Freight Movement and Economic Vitality – improve freight networks, strengthen the ability of rural communities to access national and international trade markets, and support regional economic development
• Environmental Sustainability – enhance transportation system performance while protecting and enhancing the natural environment
• Reduce Project Delivery Delays – reduce project costs, promote jobs and the economy, and expedite the movement of people and goods by accelerating project completion through eliminating delays in the project development and delivery process, including reducing regulatory burdens and improving agencies’ work practices.
MAP-21 changes the way program funding is distributed to individual states. Previously, core highway programs were able to distribute funds to states using different individual formulas. With new legislation, formulas have been eliminated and a lump sum has been authorized to fund the core programs including the National Highway Performance

PLAN, POLICY, AND PROGRAM REVIEW
TBG062714093019HNL 4
Program, the Surface Transportation Program, the Highway Safety Improvement Program including Rail-Highway Crossings, Congestion Mitigation and Air Quality Improvement Program, and Metropolitan Planning.
A lump sum is then distributed to states proportionally (based on 2012 distributions received under the Safe, Accountable, Flexible, Efficient Transportation Equity Act: A Legacy for Users). States are able to distribute funds internally (using MAP-21 guidance on the percentage distribution) to core programs. States also have the flexibility to transfer up to 50 percent of funds from one program to another (exceptions include no transfers of Metropolitan Planning funds or funds allocated to areas based on population) to make progress towards achieving performance target goals.
Findings Related to the Plan MAP-21 makes modifications to the statewide long range planning process. Related to the shift to performance and outcome-based planning:
• The statewide planning process will establish and use a performance-based approach to transportation decision making to support the national goals.
• Each state will establish performance targets that address the performance measures, where applicable, to use in tracking progress toward attainment of critical outcomes for the State.
• The state will select performance targets in coordination with the relevant MPOs to ensure consistency, to the maximum extent practicable.
• In urbanized areas not represented by an MPO, the state will select performance targets in coordination with the providers of public transportation, to the maximum extent practicable.
• States will integrate into the statewide transportation planning process other performance-based plans and processes.
• The Secretary of Transportation shall establish criteria for the evaluation of the new performance-based planning processes.
Related to statewide long-range plans:
• The long-range plan should include a description of the performance measures and targets used in assessing system performance.
• The long-range plan should include a system performance report and subsequent updates evaluating the condition and performance of the transportation system in relation to the performance targets.
The Statewide Federal-Aid Highways 2035 Transportation Plan will support and be aligned with the new performance-based guidance outlined in MAP-21.
The Statewide Federal-Aid Highways 2035 Transportation Plan is framed around eight federal planning factors: Environment and Sustainability, Modal Integration, System Preservation, Security, Economic Vitality, System Efficiency Management and Operations, Transportation Access Mobility, and Safety. These planning factors are related to and can be aligned with the new national performance goals established by MAP-21.

PLAN, POLICY, AND PROGRAM REVIEW
TBG062714093019HNL 5
Alignment with the Planning Factors MAP-21 is in alignment with the federal planning factors as shown in the table below. Certain national goals (such as Environmental Sustainability and Safety) can be aligned directly with existing planning factors, while the goal of System Reliability can be aligned with multiple planning factors.
The national goal of System Reliability aims to improve the general efficiency of the surface transportation system. Elements of the System Preservation, System Efficiency Management and Operations, and even Security planning factors would contribute to achievement of this national goal.
Federal Planning Factors MAP-21 Performance Goals
Environment and Sustainability - Develop solutions that meet transportation needs without compromising the ability of future generations to meet their own needs; develop solutions that promote energy conservation, improve the quality of life, and address climate change.
Environmental Sustainability – enhance transportation system performance while protecting and enhancing the environment
Modal Integration - Expand transportation options and make connections between modes such as public transit, automobile, bicycle, and pedestrian.
System Preservation - Maintain a regular schedule of rehabilitation, reconstruction, and replacement to keep the multimodal system operating safely and efficiently.
Infrastructure Condition – maintain highway infrastructure assets in state of good repair
System Reliability – Improve the efficiency of the surface transportation system
Security - Ensure the secure operation of the land transportation system by involving multiple agencies to work together to achieve common goals of risk management, incident detection, response, clearance, and preparation for and recovery from disasters.
System Reliability – Improve the efficiency of the surface transportation system
Economic Vitality - Support industry, tourism, cultural, and recreational opportunities by reducing travel time, operating costs, travel distance, crashes and logistics inefficiencies.
Freight Movement and Economic Vitality – Improve freight networks, strengthen the ability of rural communities to access national and international trade markets, and support regional economic development.
System Efficiency Management and Operations - Optimize the performance of existing infrastructure; provide reliability and predictability within the transportation system and between modal choices.
Congestion Reduction – reduce congestion on the National Highway System
System Reliability – Improve the efficiency of the surface transportation system
Transportation Access Mobility - Enhance both infrastructure and services to improve mobility, consistency, and equity.
Safety - Increase traveler safety through engineering, education, and enforcement programs and campaigns, and improve regulations and research efforts.
Safety – reduce fatalities and serious injuries on all public roads
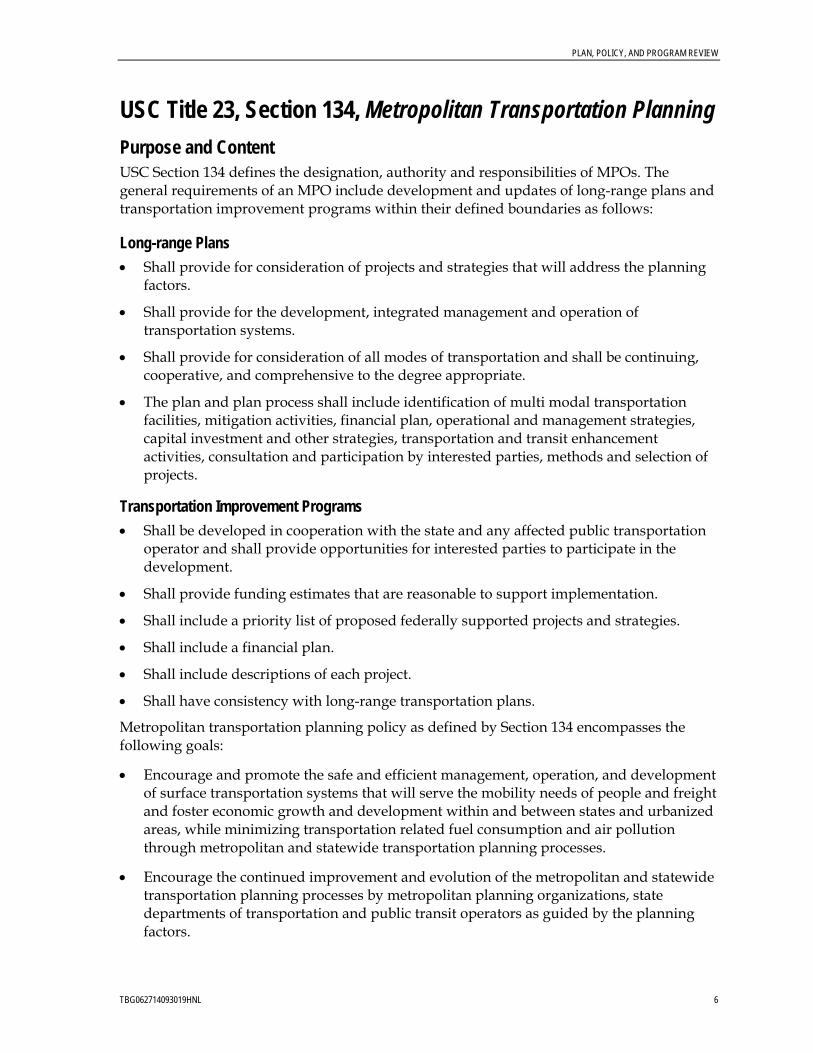
PLAN, POLICY, AND PROGRAM REVIEW
TBG062714093019HNL 6
USC Title 23, Section 134, Metropolitan Transportation Planning Purpose and Content USC Section 134 defines the designation, authority and responsibilities of MPOs. The general requirements of an MPO include development and updates of long-range plans and transportation improvement programs within their defined boundaries as follows:
Long-range Plans • Shall provide for consideration of projects and strategies that will address the planning
factors.
• Shall provide for the development, integrated management and operation of transportation systems.
• Shall provide for consideration of all modes of transportation and shall be continuing, cooperative, and comprehensive to the degree appropriate.
• The plan and plan process shall include identification of multi modal transportation facilities, mitigation activities, financial plan, operational and management strategies, capital investment and other strategies, transportation and transit enhancement activities, consultation and participation by interested parties, methods and selection of projects.
Transportation Improvement Programs • Shall be developed in cooperation with the state and any affected public transportation
operator and shall provide opportunities for interested parties to participate in the development.
• Shall provide funding estimates that are reasonable to support implementation.
• Shall include a priority list of proposed federally supported projects and strategies.
• Shall include a financial plan.
• Shall include descriptions of each project.
• Shall have consistency with long-range transportation plans.
Metropolitan transportation planning policy as defined by Section 134 encompasses the following goals:
• Encourage and promote the safe and efficient management, operation, and development of surface transportation systems that will serve the mobility needs of people and freight and foster economic growth and development within and between states and urbanized areas, while minimizing transportation related fuel consumption and air pollution through metropolitan and statewide transportation planning processes.
• Encourage the continued improvement and evolution of the metropolitan and statewide transportation planning processes by metropolitan planning organizations, state departments of transportation and public transit operators as guided by the planning factors.
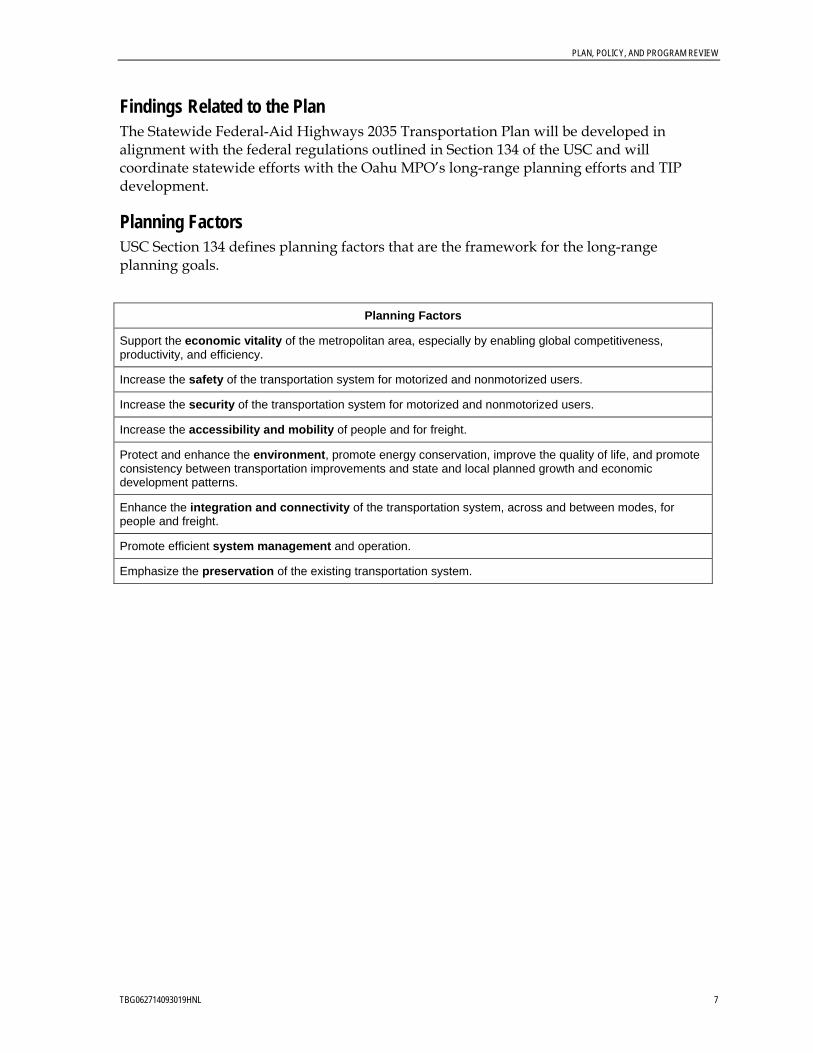
PLAN, POLICY, AND PROGRAM REVIEW
TBG062714093019HNL 7
Findings Related to the Plan The Statewide Federal-Aid Highways 2035 Transportation Plan will be developed in alignment with the federal regulations outlined in Section 134 of the USC and will coordinate statewide efforts with the Oahu MPO’s long-range planning efforts and TIP development.
Planning Factors USC Section 134 defines planning factors that are the framework for the long-range planning goals.
Planning Factors
Support the economic vitality of the metropolitan area, especially by enabling global competitiveness, productivity, and efficiency.
Increase the safety of the transportation system for motorized and nonmotorized users.
Increase the security of the transportation system for motorized and nonmotorized users.
Increase the accessibility and mobility of people and for freight.
Protect and enhance the environment, promote energy conservation, improve the quality of life, and promote consistency between transportation improvements and state and local planned growth and economic development patterns.
Enhance the integration and connectivity of the transportation system, across and between modes, for people and freight.
Promote efficient system management and operation.
Emphasize the preservation of the existing transportation system.
PLAN, POLICY, AND PROGRAM REVIEW
TBG062714093019HNL 8
USC Title 23, Section 135, Statewide Transportation Planning Purpose and Content USC Section 135 defines the responsibilities of the state and their requirements for statewide transportation planning. The general requirements of the state include development of a statewide transportation plan and statewide transportation improvement program for areas subject to USC Section 135 and nonmetropolitan areas within the state.
Statewide Long-range Plans • Shall provide for the development, integrated management and operation of
transportation systems.
• Shall consider all modes of transportation and shall be continuing, cooperative, and comprehensive to the degree appropriate.
• Shall be coordinated with plans and transportation improvement programs of MPOs as well as stakeholders and agencies with jurisdictions in nonmetropolitan areas.
• Shall provide for consideration of projects, strategies and services that will address the planning factors.
• The plan and plan process shall include a minimum 20-year forecast period, mitigation activities, financial plan, operational and management strategies, capital investment and other strategies, transportation enhancement activities, consultation, and participation by interested parties and methods.
• The statewide transportation plan should include capital, operations and management strategies, investments, procedures and other measures to ensure the preservation and most efficient use of the existing transportation system.
Statewide Transportation Improvement Programs • Shall be developed in cooperation with the MPOs as well as stakeholders and agencies
with jurisdictions in non-metropolitan areas and shall provide opportunities for interested parties to participate in the development.
• Shall include federally supported surface transportation expenditures.
• Shall include regionally significant and other projects.
• Shall have consistency with the statewide and MPO long-range transportation plans.
• Shall include projects only if full funding can reasonably be anticipated.
• Shall include a financial plan.
Findings Related to the Plan The Plan will be developed in alignment with the federal regulations outlined in USC Section 135 and will coordinate statewide efforts with the Oahu MPO’s long-range planning efforts and the counties.
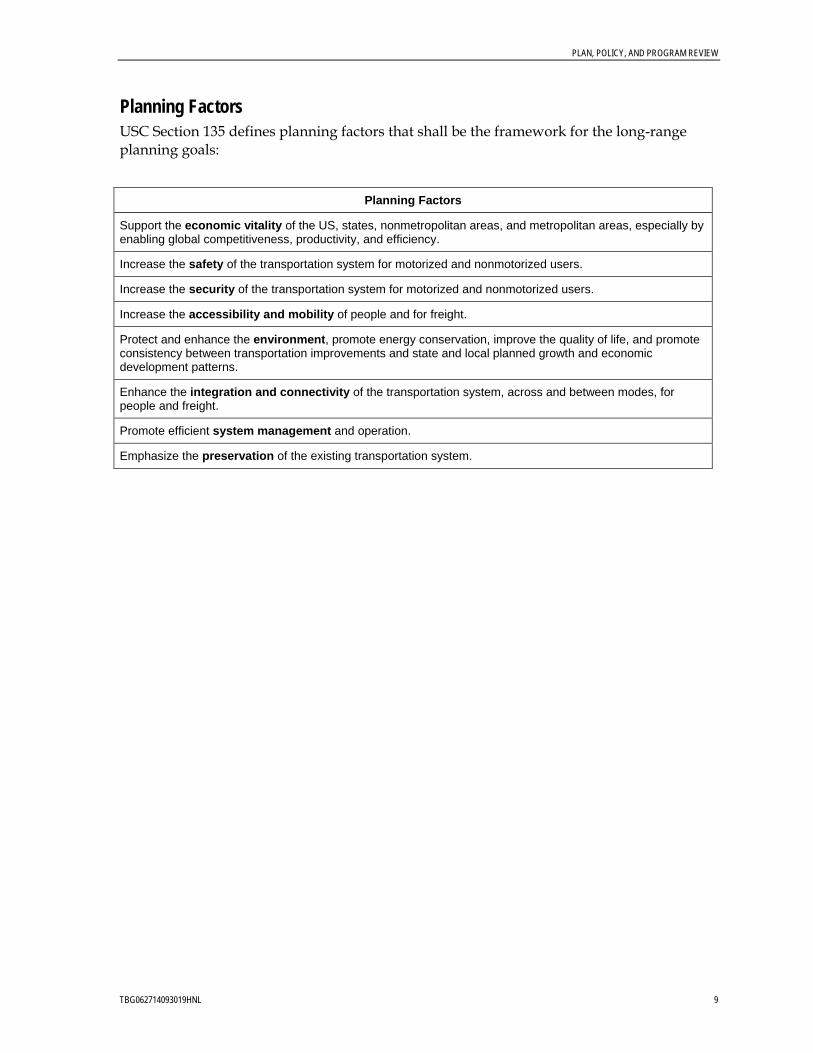
PLAN, POLICY, AND PROGRAM REVIEW
TBG062714093019HNL 9
Planning Factors USC Section 135 defines planning factors that shall be the framework for the long-range planning goals:
Planning Factors
Support the economic vitality of the US, states, nonmetropolitan areas, and metropolitan areas, especially by enabling global competitiveness, productivity, and efficiency.
Increase the safety of the transportation system for motorized and nonmotorized users.
Increase the security of the transportation system for motorized and nonmotorized users.
Increase the accessibility and mobility of people and for freight.
Protect and enhance the environment, promote energy conservation, improve the quality of life, and promote consistency between transportation improvements and state and local planned growth and economic development patterns.
Enhance the integration and connectivity of the transportation system, across and between modes, for people and freight.
Promote efficient system management and operation.
Emphasize the preservation of the existing transportation system.
PLAN, POLICY, AND PROGRAM REVIEW
TBG062714093019HNL 10
23 CFR 450, Planning Assistance and Standards Purpose and Content The purpose of 23 CFR 450 is to define the implementation of USC 134 and 135.
Subpart B relates to the statewide transportation planning process:
• Shall, at a minimum, explicitly address noted factors, including transportation management system efficiencies and needs, energy use goals, water pollution/coastal zone requirements, intermodal transportation facilities, sub-area connectivity, recreation travel needs, congestion management, socioeconomic consistency and effects, transportation system preservation, financing mechanisms, lifecycle costs and investment strategies.
• Shall be done in cooperation with participating organizations (agencies and transportation operators), including coordination of: data and analyses, programs and priorities, multi-jurisdictional intermodal connections and land use/transportation planning and public involvement.
• Public involvement shall be explicit, proactive, and provide for early and continuous involvement. Periodic review of the effectiveness of the public involvement process shall be performed and necessary revisions made.
• The Statewide Transportation Plan shall be intermodal, cover at least a 20-year period, reference applicable planning studies/policies and be coordinated with MPOs, transportation agencies, operators, stakeholders and the public.
• The Statewide Transportation Improvement Program (STIP) shall include a list of priority projects for 3 years (MPO transportation improvement program priorities remain intact), projects beyond the 3 years will be considered informational only. The STIP shall be consistent with the statewide transportation plan. The STIP must be financially constrained by year and must be approved every 2 years.
Findings Related to the Plan The content of and process of developing the Statewide Federal-Aid Highways 2035 Transportation Plan will be implemented consistently with the federal regulations outlined in 23 CFR 450. A comprehensive approach and outreach effort will be performed to ensure alignment with these regulations.
Alignment with the Planning Factors 23 CFR 450 defines the implementation of the statewide and metropolitan planning processes which considers and addresses all of the planning factors.

PLAN, POLICY, AND PROGRAM REVIEW
TBG062714093019HNL 11
National Response Framework, US Department of Homeland Security, January 2008 Purpose and Content The National Response Framework (NRF) is a guide that details how the nation conducts all-hazards response at various scales of incidents. This document establishes a comprehensive, national, all-hazards approach to domestic incident response. The Framework identifies the key response principles, as well as the roles and structures that organize national response. It describes how communities, and various government and nongovernmental partners apply these principles for a coordinated, effective national response. In addition, it describes special circumstances where the federal government exercises a larger role, including incidents where federal interests are involved and catastrophic incidents where a state would require significant support. It lays the groundwork for first responders, decision-makers, and supporting entities to provide a unified national response.
Findings Related to the Plan To strengthen response actions, the NRF describes three key phases: prepare, respond, and recover. Transportation is a vital component for all phases. Considerations include planning for transportation needs of incidents, especially interdependencies between key locations (that is, operational headquarters, emergency evacuation shelters, hospitals), and the ability to mobilize, activate and demobilize resources.
Alignment with the Planning Factors The Security planning factor is in alignment with the overall framework of the NRF. Specifically, the alignment occurs with the establishment of processes, roles and responsibilities between multiple agencies working together to achieve transportation security, through preparation, response and recovery.

PLAN, POLICY, AND PROGRAM REVIEW
TBG062714093019HNL 12
Bicycle Resolutions, 110th Congress, US Conference of Mayors, June 2008 Purpose and Content The Congressional Resolution 305 and the US Conference of Mayors Resolutions in 2008 recognize that increased and safe bicycle use for transportation and recreation is in the national interest. They also support policies and programs that promote and protect bicycle use, and encourage the Department of Transportation and the Mayor’s offices to provide leadership and coordination to make communities bicycle-friendly.
Findings Related to the Plan The Congressional Resolution 305 support policies that:
• Establish national target levels for increased bicycle use, reduce the number of motor vehicle-miles traveled, improve bicycle safety to be achieved within a specific timeframe, and collect data needed to monitor progress.
• Increase intermodal travel between public transportation and bicycles.
• Provide incentives for state and local governments to adopt and implement complete street policies designed to accommodate all users, including motorists, pedestrians, bicyclists, transit riders, and people of all ages and abilities.
• Encourage bicycle use in communities where significant segments of the population do not drive and where short trips are most common.
• Expand funding for core federal transportation programs that support nonmotorized infrastructure, education, and encouragement programs by:
- Safeguarding existing funding sources for nonmotorized transportation from inequitable treatment in the federal transportation funds rescission process;
- Supporting funding for core federal transportation programs that support nonmotorized travel, including transportation enhancements, safe routes to school, and recreational trails; and
- Ensuring that highway safety improvement program funds are spent in proportion to the percentage of bicyclist and pedestrian fatalities in each state.
• Facilitate the development of a coordinated system of US bicycle routes across the country that cross state borders and connect metropolitan regions.
• Create bicycle-friendly federal land protection legislation, such as national recreation areas, to encourage regulations and management practices for mountain biking as an environmentally friendly nonmotorized use of natural surface trails.
• Provide flexibility in federal transportation law that would speed up the delivery of nonmotorized infrastructure without sacrificing necessary environmental protections.
• Provide federal tax or funding incentives to:
PLAN, POLICY, AND PROGRAM REVIEW
TBG062714093019HNL 13
- States that adopt motor vehicle laws that protect the rights of bicyclists to share the road.
- Businesses that expand bicycle-friendly programs for their employees.
- The health care industry to develop more member discount programs that target increased physical activity such as bicycling and walking.
- Provide bicycle commuters the transportation fringe benefits currently provided to people who commute by car or mass transit.
• Build upon the Green the Capitol Initiative as a model, create and provide an environmentally sustainable and healthy working environment for employees that includes the promotion of bicycling as a transportation alternative.
In addition to the policies supported by the Congress, the US Conference of Mayors also encourages the following actions to be taken:
• Even absent federal incentives, governors and state-level leadership should embrace Complete Streets policies that acknowledge the contributions of bicycles as a means to reduce vehicle miles by integrating bicycle use into standard street design;
• Calls on all mayors that sign onto the Climate Protection Agreement to develop and implement action plans to incorporate bicycling programs and policies as a key component in reducing greenhouse gas emissions 80 percent by 2050.
• Every mayor strives to make their city a bicycle-friendly community.
Alignment with the Planning Factors The resolutions align with the Environment planning factor through encouraging bicycle use, which promotes energy conservation and improves the quality of life. They also align with the Modal Integration planning factor by supporting increasing intermodal travel between public transportation and bicycles. In addition, the resolutions align with the Safety planning factor by improving safety conditions for bicyclists and monitoring the progress through data collection.

PLAN, POLICY, AND PROGRAM REVIEW
TBG062714093019HNL 14
Statewide Plans and Policies Statewide transportation policy and planning documents primarily address statewide transportation networks, and some cover all modes. Statewide plans and policies provide a general policy framework for transportation planning and direction for project and program implementation (including guidelines and standards) for Hawaii state roadway facilities. These plans and policies can also serve as examples for counties to develop their own policies, guidelines and standards.
The following plans and policies were examined:
• HRS 279A Statewide Transportation Planning
• Hawaii Statewide Transportation Plan (2011)
• Disability and Communication Access Board Policy
• Bike Plan Hawaii (2003)
• Statewide Pedestrian Master Plan (2013)
• Complete Streets Task Force (2010)
• Federal-Aid and State Highway Update: System Identification and Functional Classification (2013)
• Hawaii Strategic Highway Safety Plan 2007-2012
• State of Hawaii Multi-Hazard Mitigation Plan (2007)
• Coordinated Public Transit Human Services Transportation Plan (2008)
• State Comprehensive Outdoor Recreation Plan 2008 Update
• National Wildlife Refuges
• National Parks
• Department of Health, Active Living Workshops
• Hawaii 2050 Sustainability Plan (2008)
• Hawaii Tourism Authority Strategic Plan: 2010-2012
• Coastal Storms Program
• Coastal Zone Management Program
• Hawaii Department of Transportation Statewide Transportation Improvement Program (Current Update, Fiscal Year 2011-2014 +2)
• Report on the State of Physical Infrastructure in Hawaii (July 2010)
PLAN, POLICY, AND PROGRAM REVIEW
TBG062714093019HNL 15
HRS 279A, Statewide Transportation Planning Purpose and Content HRS 279A provides a means of coordinating the state’s existing responsibilities for inter-island and major highway transportation planning/development with counties’ responsibilities for intra-island surface transportation system planning/development, in order to facilitate the ultimate production of a statewide transportation plan which optimizes intra-island and inter-island system integration.
The statute establishes a comprehensive, multimodal statewide transportation planning process that involves all levels of government in a cooperative process to develop coordinated transportation plans.
The statute also establishes a Statewide Transportation Council and defines its roles and responsibilities.
Findings Related to the Plan The statute requires the statewide transportation plan to develop a balanced, multimodal statewide transportation system that serves clearly identified social, economic and environmental objectives. The plan shall include, but not be limited to national system of interstate and defense highways and highways within the state highway system, airports, harbors, mass transit systems and county roads, with particular attention made to the interfacing of the various modes of transportation. It also requires that a financial plan be included, identifying both state and county system elements, noting the level of state financial assistance for the county elements.
Briefings will be given to the Statewide Transportation Council at defined points within the project development process.
Alignment with the Planning Factors The HRS 279A requirements support enhancing the Integration and Connectivity of the transportation system between various travel modes for people and freight.
It also stresses a balanced system, in corresponding to support of the Environment and Economic Vitality planning factors.
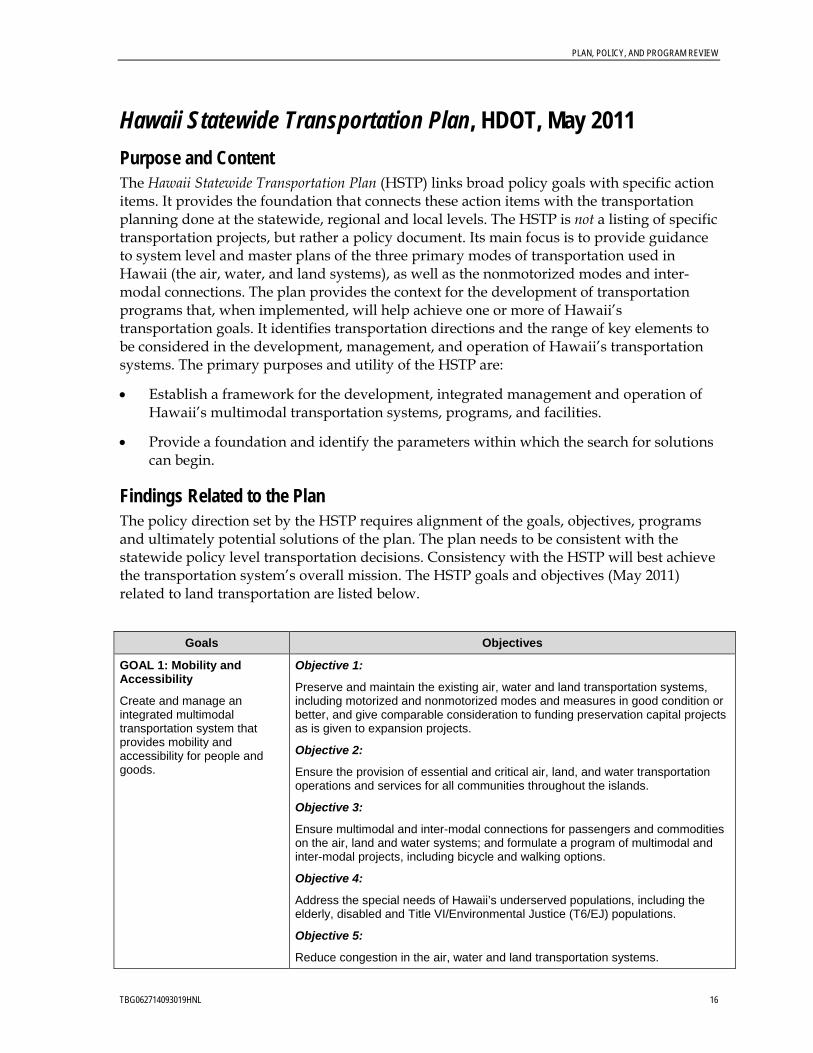
PLAN, POLICY, AND PROGRAM REVIEW
TBG062714093019HNL 16
Hawaii Statewide Transportation Plan, HDOT, May 2011 Purpose and Content The Hawaii Statewide Transportation Plan (HSTP) links broad policy goals with specific action items. It provides the foundation that connects these action items with the transportation planning done at the statewide, regional and local levels. The HSTP is not a listing of specific transportation projects, but rather a policy document. Its main focus is to provide guidance to system level and master plans of the three primary modes of transportation used in Hawaii (the air, water, and land systems), as well as the nonmotorized modes and inter-modal connections. The plan provides the context for the development of transportation programs that, when implemented, will help achieve one or more of Hawaii’s transportation goals. It identifies transportation directions and the range of key elements to be considered in the development, management, and operation of Hawaii’s transportation systems. The primary purposes and utility of the HSTP are:
• Establish a framework for the development, integrated management and operation of Hawaii’s multimodal transportation systems, programs, and facilities.
• Provide a foundation and identify the parameters within which the search for solutions can begin.
Findings Related to the Plan The policy direction set by the HSTP requires alignment of the goals, objectives, programs and ultimately potential solutions of the plan. The plan needs to be consistent with the statewide policy level transportation decisions. Consistency with the HSTP will best achieve the transportation system’s overall mission. The HSTP goals and objectives (May 2011) related to land transportation are listed below.
Goals Objectives
GOAL 1: Mobility and Accessibility
Create and manage an integrated multimodal transportation system that provides mobility and accessibility for people and goods.
Objective 1:
Preserve and maintain the existing air, water and land transportation systems, including motorized and nonmotorized modes and measures in good condition or better, and give comparable consideration to funding preservation capital projects as is given to expansion projects.
Objective 2:
Ensure the provision of essential and critical air, land, and water transportation operations and services for all communities throughout the islands.
Objective 3:
Ensure multimodal and inter-modal connections for passengers and commodities on the air, land and water systems; and formulate a program of multimodal and inter-modal projects, including bicycle and walking options.
Objective 4:
Address the special needs of Hawaii’s underserved populations, including the elderly, disabled and Title VI/Environmental Justice (T6/EJ) populations.
Objective 5:
Reduce congestion in the air, water and land transportation systems.
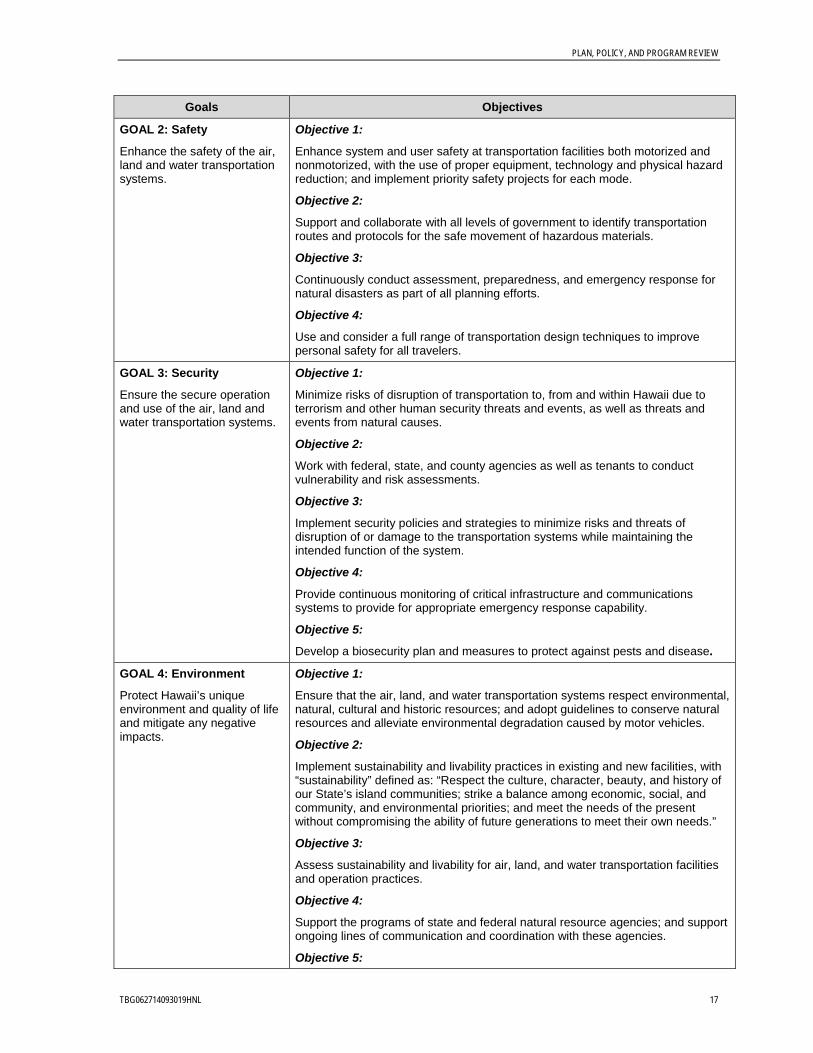
PLAN, POLICY, AND PROGRAM REVIEW
TBG062714093019HNL 17
Goals Objectives
GOAL 2: Safety
Enhance the safety of the air, land and water transportation systems.
Objective 1:
Enhance system and user safety at transportation facilities both motorized and nonmotorized, with the use of proper equipment, technology and physical hazard reduction; and implement priority safety projects for each mode.
Objective 2:
Support and collaborate with all levels of government to identify transportation routes and protocols for the safe movement of hazardous materials.
Objective 3:
Continuously conduct assessment, preparedness, and emergency response for natural disasters as part of all planning efforts.
Objective 4:
Use and consider a full range of transportation design techniques to improve personal safety for all travelers.
GOAL 3: Security
Ensure the secure operation and use of the air, land and water transportation systems.
Objective 1:
Minimize risks of disruption of transportation to, from and within Hawaii due to terrorism and other human security threats and events, as well as threats and events from natural causes.
Objective 2:
Work with federal, state, and county agencies as well as tenants to conduct vulnerability and risk assessments.
Objective 3:
Implement security policies and strategies to minimize risks and threats of disruption of or damage to the transportation systems while maintaining the intended function of the system.
Objective 4:
Provide continuous monitoring of critical infrastructure and communications systems to provide for appropriate emergency response capability.
Objective 5:
Develop a biosecurity plan and measures to protect against pests and disease.
GOAL 4: Environment
Protect Hawaii’s unique environment and quality of life and mitigate any negative impacts.
Objective 1:
Ensure that the air, land, and water transportation systems respect environmental, natural, cultural and historic resources; and adopt guidelines to conserve natural resources and alleviate environmental degradation caused by motor vehicles.
Objective 2:
Implement sustainability and livability practices in existing and new facilities, with “sustainability” defined as: “Respect the culture, character, beauty, and history of our State’s island communities; strike a balance among economic, social, and community, and environmental priorities; and meet the needs of the present without compromising the ability of future generations to meet their own needs.”
Objective 3:
Assess sustainability and livability for air, land, and water transportation facilities and operation practices.
Objective 4:
Support the programs of state and federal natural resource agencies; and support ongoing lines of communication and coordination with these agencies.
Objective 5:

PLAN, POLICY, AND PROGRAM REVIEW
TBG062714093019HNL 18
Goals Objectives
Encourage transportation systems that improve the quality of life, public health, and welfare of Hawaii’s people, and that are consistent with land use plans.
Objective 6:
Assist with streamlining environmental process by identifying categories of environmental mitigation that include but are not limited to critical habitat, environmentally sensitive areas, noise, and pollution avoidance.
Objective 7:
Adapt to the effects of global climate change and build resilience in the transportation system. Address the effects of a one meter sea level rise and extreme weather events anticipated to occur during and by the end of the 21st century on Hawaii’s air, land and water transportation facilities and provide responses to this threat in modal facility plans.
Objective 8:
Prevent and minimize the transport of invasive species (pests and diseases).
GOAL 5: Economy
Ensure that the air, land and water transportation facility systems support Hawaii’s economy and future growth objectives.
Objective 1:
Support the multimodal transportation needs in the military, tourism, agriculture, health, education, energy, and technology sectors of Hawaii’s economy; and identify sector needs, current and projected, as they relate to movement of people and goods.
Objective 2:
Create a commodity flow and freight handling system that is dependable, efficient, economical, secure and rapid for connecting the ports, land transportation facilities, and industrial/commercial land use and storage areas.
Objective 3:
Provide reliability, dependability and redundancy for commerce in the import and export goods movement system including inspection facilities at ports; address actions for security of commerce.
Objective 4:
Create modern air, land and water transportation systems that are part of a positive visitor experience.
GOAL 6: Energy
Support the state energy goal of 70% clean energy, which includes 40% produced by renewable energy and 30% from increased energy efficiency, enhancing the reliability and security of energy sources.
Objective 1:
Support the national goal to reduce transportation-related greenhouse gas emissions and reliance on foreign oil.
Objective 2:
Actively pursue actions in transportation which help to achieve the State Clean Energy Goal of 40% renewable energy by 2030; and use integrated action plans from the Department of Business, Economic Development & Tourism’s Lead by Example Energy Initiatives with priority transportation actions that would support the Hawaii Clean Energy Initiative.
Objective 3:
Identify ways to increase energy efficiency by 30% at transportation facilities; and identify projects and programs for increased efficiency of energy in support of the Hawaii Clean Energy Initiative; Leadership in Energy and Environmental Design; and other green initiatives for more efficient use of energy.
Objective 4:
Expand the use of alternative fuel and electric vehicles; provide electric recharging at transportation facilities.
Objective 5:
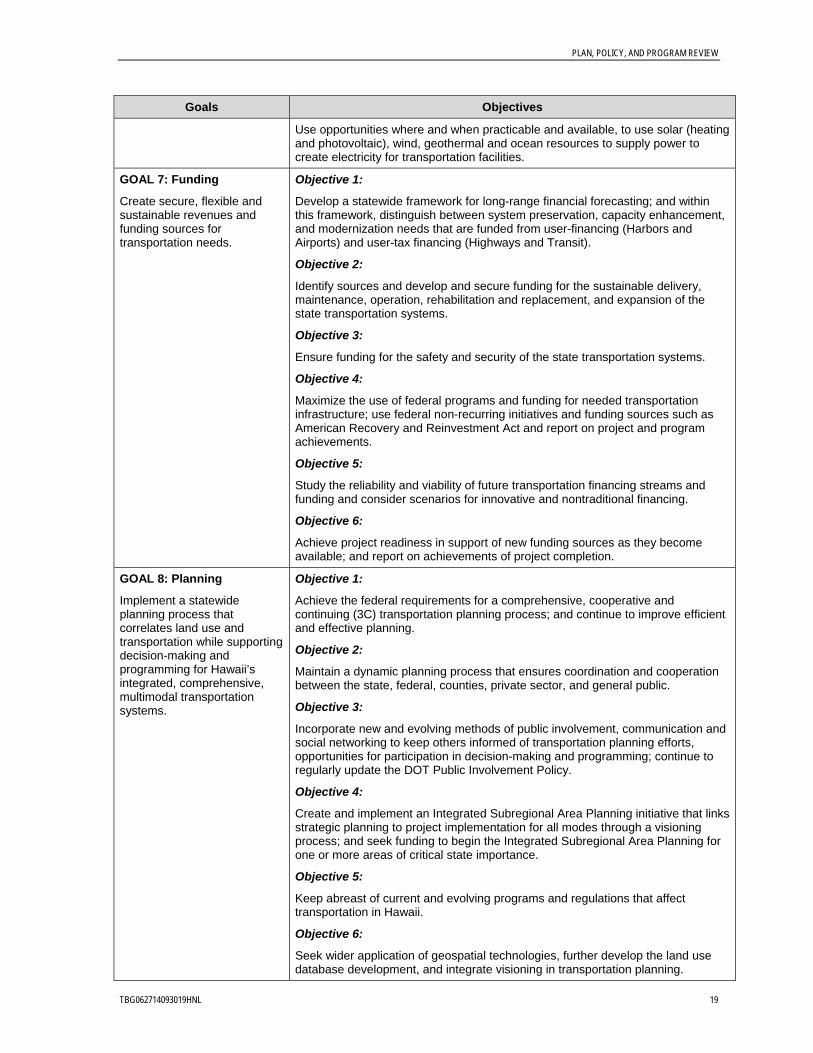
PLAN, POLICY, AND PROGRAM REVIEW
TBG062714093019HNL 19
Goals Objectives
Use opportunities where and when practicable and available, to use solar (heating and photovoltaic), wind, geothermal and ocean resources to supply power to create electricity for transportation facilities.
GOAL 7: Funding
Create secure, flexible and sustainable revenues and funding sources for transportation needs.
Objective 1:
Develop a statewide framework for long-range financial forecasting; and within this framework, distinguish between system preservation, capacity enhancement, and modernization needs that are funded from user-financing (Harbors and Airports) and user-tax financing (Highways and Transit).
Objective 2:
Identify sources and develop and secure funding for the sustainable delivery, maintenance, operation, rehabilitation and replacement, and expansion of the state transportation systems.
Objective 3:
Ensure funding for the safety and security of the state transportation systems.
Objective 4:
Maximize the use of federal programs and funding for needed transportation infrastructure; use federal non-recurring initiatives and funding sources such as American Recovery and Reinvestment Act and report on project and program achievements.
Objective 5:
Study the reliability and viability of future transportation financing streams and funding and consider scenarios for innovative and nontraditional financing.
Objective 6:
Achieve project readiness in support of new funding sources as they become available; and report on achievements of project completion.
GOAL 8: Planning
Implement a statewide planning process that correlates land use and transportation while supporting decision-making and programming for Hawaii’s integrated, comprehensive, multimodal transportation systems.
Objective 1:
Achieve the federal requirements for a comprehensive, cooperative and continuing (3C) transportation planning process; and continue to improve efficient and effective planning.
Objective 2:
Maintain a dynamic planning process that ensures coordination and cooperation between the state, federal, counties, private sector, and general public.
Objective 3:
Incorporate new and evolving methods of public involvement, communication and social networking to keep others informed of transportation planning efforts, opportunities for participation in decision-making and programming; continue to regularly update the DOT Public Involvement Policy.
Objective 4:
Create and implement an Integrated Subregional Area Planning initiative that links strategic planning to project implementation for all modes through a visioning process; and seek funding to begin the Integrated Subregional Area Planning for one or more areas of critical state importance.
Objective 5:
Keep abreast of current and evolving programs and regulations that affect transportation in Hawaii.
Objective 6:
Seek wider application of geospatial technologies, further develop the land use database development, and integrate visioning in transportation planning.
PLAN, POLICY, AND PROGRAM REVIEW
TBG062714093019HNL 20
Goals Objectives
Objective 7:
Develop performance measures to manage strategic goals and assets and to assist with better decision-making, communication, transparency, and accountability to stakeholders.
Alignment with Planning Factors The HSTP was developed within the same planning framework as the Statewide Federal-Aid Highways 2035 Transportation Plan. The focus of the goals and objectives for the HSTP is at a higher/policy level considering the air/water/land transportation modes. The land transportation plans will be in alignment with the HSTP transportation policy goals and will focus specifically on land transportation issues and needs.

PLAN, POLICY, AND PROGRAM REVIEW
TBG062714093019HNL 21
Disability and Communication Access Board, State of Hawaii Department of Health Purpose and Content The Disability and Communication Access Board (DCAB) is established under the State Department of Health. They perform the following duties and functions:
• Establish guidelines for the design of buildings and facilities by or on behalf of the state and counties.
• Provide review and recommendations on all state and county plans for buildings and facilities.
• Establish guidelines for the use of communication access services provided for persons who are deaf, hard-of-hearing, or deaf-blind in state programs and activities.
• Administer the statewide program for parking for disabled persons.
• Serve as public advocate of persons with disabilities by providing advice and recommendations on matters relating to access for persons with disabilities, with emphasis on legislative matters, administrative rules, policies, and procedures of the state and county governments.
• Review and assess the problems and needs relating to access for persons with disabilities in the state to provide recommendations in the improvement of laws and services.
• Serve as the designated state agency to coordinate the efforts of the state to comply with the requirements of the Americans with Disabilities Act for access to services, employment, telecommunications, and facility and site design.
• Provide technical assistance and guidance to, but not limited to, state and county entities in order to meet the requirements of state, federal, and county laws providing for access for persons with disabilities through public education programs and other voluntary compliance efforts.
• Administer funds allocated for its work, including disbursement and allocation of funds that may be available from public and private sources.
Findings Related to the Plan Coordination with DCAB will occur throughout the development of the plan to address transportation needs and requirements of the disabled, compliance with Americans with Disabilities Act and address policy that prohibits discrimination on the basis of disability.
Alignment with the Planning Factors The function of DCAB aligns with the Accessibility and Mobility planning factor, by supporting the enhancement of both infrastructure and services to improve mobility and equity.

PLAN, POLICY, AND PROGRAM REVIEW
TBG062714093019HNL 22
Bike Plan Hawaii, HDOT, 2003 Purpose and Content: Bike Plan Hawaii is a tool to integrate bicycling into the state’s transportation system. The plan outlines how the state intends to accommodate and promote bicycling. It draws on a combination of existing and future bicycle facilities, policies, and programs to ensure a successful bicycle network. The purpose of the bike plan is to establish a long-term strategy for bicycle facility improvements, enable better coordination between transportation and land-use planning, increase the ability to leverage funds for bicycle facilities, and provide a mechanism to achieve community consensus.
Findings Related to the Plan Development of the Statewide Federal-Aid Highways 2035 Transportation Plan will take into account the objectives and goals of Bike Plan Hawaii, which include promoting bicycling as a convenient means of transportation by providing a safe, shared roadway system for all modes of travel.
Alignment with the Planning Factors Bike Plan Hawaii aligns with the Environment and Sustainability and Safety planning factors through promotion of sustainable transportation mode choices by requiring safe and efficient bike routes. It also aligns with the Modal Integration planning factor by encouraging appropriately designed, safe, shared roadways for motor vehicles and bicycles.
The bike plan also aligns with the Economic Vitality planning factor because it recommends bicycle tourism and the idea that safe bike paths on scenic byways should be promoted to visitors to Hawaii through the tourism authority.
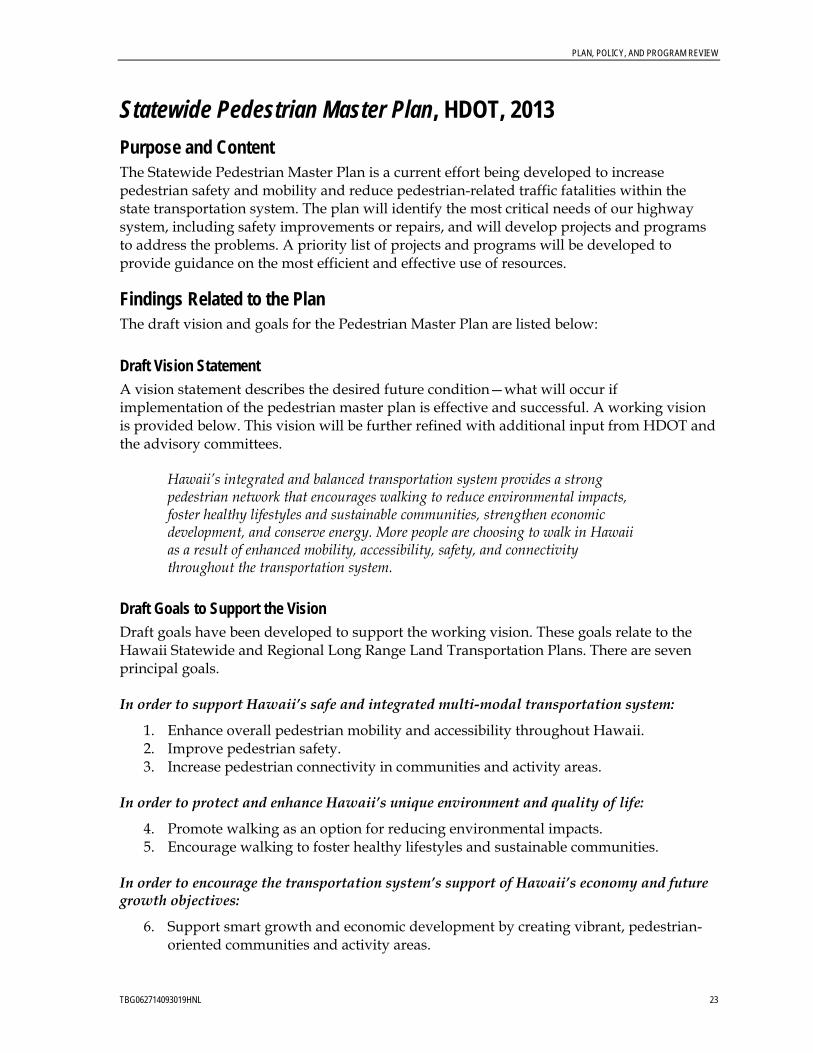
PLAN, POLICY, AND PROGRAM REVIEW
TBG062714093019HNL 23
Statewide Pedestrian Master Plan, HDOT, 2013 Purpose and Content The Statewide Pedestrian Master Plan is a current effort being developed to increase pedestrian safety and mobility and reduce pedestrian-related traffic fatalities within the state transportation system. The plan will identify the most critical needs of our highway system, including safety improvements or repairs, and will develop projects and programs to address the problems. A priority list of projects and programs will be developed to provide guidance on the most efficient and effective use of resources.
Findings Related to the Plan The draft vision and goals for the Pedestrian Master Plan are listed below: Draft Vision Statement A vision statement describes the desired future condition—what will occur if implementation of the pedestrian master plan is effective and successful. A working vision is provided below. This vision will be further refined with additional input from HDOT and the advisory committees.
Hawaii’s integrated and balanced transportation system provides a strong pedestrian network that encourages walking to reduce environmental impacts, foster healthy lifestyles and sustainable communities, strengthen economic development, and conserve energy. More people are choosing to walk in Hawaii as a result of enhanced mobility, accessibility, safety, and connectivity throughout the transportation system.
Draft Goals to Support the Vision Draft goals have been developed to support the working vision. These goals relate to the Hawaii Statewide and Regional Long Range Land Transportation Plans. There are seven principal goals. In order to support Hawaii’s safe and integrated multi-modal transportation system:
1. Enhance overall pedestrian mobility and accessibility throughout Hawaii. 2. Improve pedestrian safety. 3. Increase pedestrian connectivity in communities and activity areas.
In order to protect and enhance Hawaii’s unique environment and quality of life:
4. Promote walking as an option for reducing environmental impacts. 5. Encourage walking to foster healthy lifestyles and sustainable communities.
In order to encourage the transportation system’s support of Hawaii’s economy and future growth objectives:
6. Support smart growth and economic development by creating vibrant, pedestrian-oriented communities and activity areas.

PLAN, POLICY, AND PROGRAM REVIEW
TBG062714093019HNL 24
In order to support the state’s energy efficiency goals:
7. Promote and support walking as a viable transportation mode and enhance access to transit to reduce overall energy use.
Alignment with the Planning Factors The Statewide Pedestrian Master Plan aligns with a number of the planning factors, including:
• Increasing Safety for nonmotorized users by enhancing overall pedestrian mobility and accessibility throughout Hawaii, improving pedestrian safety and increasing pedestrian connectivity in communities and activity areas.
• Increasing Accessibility and Mobility by enhancing overall pedestrian mobility and accessibility throughout Hawaii and increasing pedestrian access options in communities and activity areas.
• Enhancing the Environment by promoting walking as an option for reducing environmental impacts and encouraging walking to foster healthy lifestyles and sustainable communities.
• Enhancing Integration and Connectivity by enhancing overall pedestrian mobility and accessibility throughout Hawaii and increasing pedestrian connectivity in communities and activity areas.
• Supporting the Economic Vitality of the metropolitan area, especially by enabling global competitiveness, productivity, and efficiency by supporting smart growth and economic development by creating vibrant, pedestrian-oriented communities and activity areas.
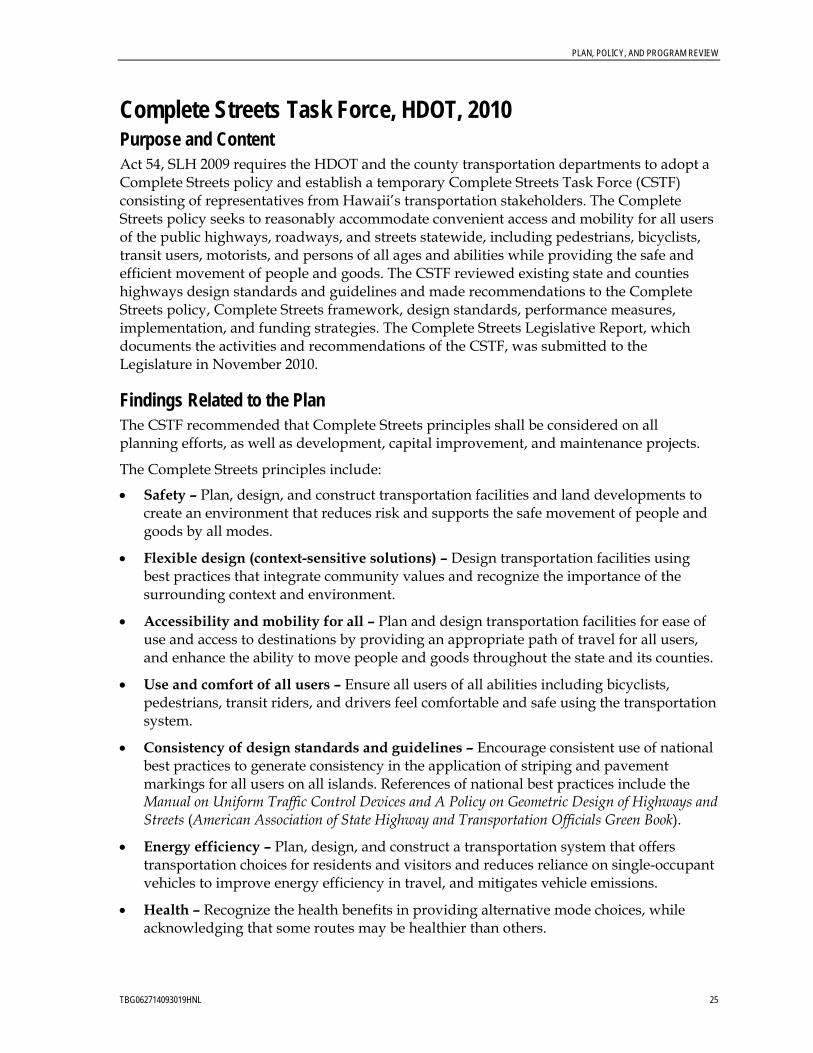
PLAN, POLICY, AND PROGRAM REVIEW
TBG062714093019HNL 25
Complete Streets Task Force, HDOT, 2010 Purpose and Content Act 54, SLH 2009 requires the HDOT and the county transportation departments to adopt a Complete Streets policy and establish a temporary Complete Streets Task Force (CSTF) consisting of representatives from Hawaii’s transportation stakeholders. The Complete Streets policy seeks to reasonably accommodate convenient access and mobility for all users of the public highways, roadways, and streets statewide, including pedestrians, bicyclists, transit users, motorists, and persons of all ages and abilities while providing the safe and efficient movement of people and goods. The CSTF reviewed existing state and counties highways design standards and guidelines and made recommendations to the Complete Streets policy, Complete Streets framework, design standards, performance measures, implementation, and funding strategies. The Complete Streets Legislative Report, which documents the activities and recommendations of the CSTF, was submitted to the Legislature in November 2010.
Findings Related to the Plan The CSTF recommended that Complete Streets principles shall be considered on all planning efforts, as well as development, capital improvement, and maintenance projects.
The Complete Streets principles include:
• Safety – Plan, design, and construct transportation facilities and land developments to create an environment that reduces risk and supports the safe movement of people and goods by all modes.
• Flexible design (context-sensitive solutions) – Design transportation facilities using best practices that integrate community values and recognize the importance of the surrounding context and environment.
• Accessibility and mobility for all – Plan and design transportation facilities for ease of use and access to destinations by providing an appropriate path of travel for all users, and enhance the ability to move people and goods throughout the state and its counties.
• Use and comfort of all users – Ensure all users of all abilities including bicyclists, pedestrians, transit riders, and drivers feel comfortable and safe using the transportation system.
• Consistency of design standards and guidelines – Encourage consistent use of national best practices to generate consistency in the application of striping and pavement markings for all users on all islands. References of national best practices include the Manual on Uniform Traffic Control Devices and A Policy on Geometric Design of Highways and Streets (American Association of State Highway and Transportation Officials Green Book).
• Energy efficiency – Plan, design, and construct a transportation system that offers transportation choices for residents and visitors and reduces reliance on single-occupant vehicles to improve energy efficiency in travel, and mitigates vehicle emissions.
• Health – Recognize the health benefits in providing alternative mode choices, while acknowledging that some routes may be healthier than others.

PLAN, POLICY, AND PROGRAM REVIEW
TBG062714093019HNL 26
• Appropriate funding – Support a jurisdiction’s ability to secure funding for multimodal facilities and provide a framework to consider and pursue funding sources and opportunities.
• Building partnerships with organizations statewide – Build partnerships among the HDOT, the counties, other governmental agencies, and stakeholders to implement complete streets throughout the state.
• Green Infrastructure/Streets – Use trees and landscaping as integral components of a Complete Street to provide both human and ecosystem benefits, such as shade, to reduce the urban heat island effect, vegetation for carbon sequestration, reducing/filtering non-point-source pollution and sediments, retaining stormwater, increasing groundwater recharge, and providing wildlife habitat.
Alignment with the Planning Factors The Complete Streets policy will help to support the Economic Vitality, protect and enhance the Environment, as well as improve roadway Safety and increase Accessibility and Mobility for travelers.

PLAN, POLICY, AND PROGRAM REVIEW
TBG062714093019HNL 27
Federal-Aid and State Highway Update: System Identification and Functional Classification, HDOT, 2013 Purpose and Content The state highway system is an integrated network of federal-aid highways serving the land transportation needs of the State of Hawaii. The current functionally classified public roads was developed by HDOT and the counties (and concurred with) in 1993 by the Federal Highways Administration. Since then, each county has experienced substantial changes in population, density, land use boundary amendments, subdivisions, and resorts/commercial/industrial developments. Due to these changes, reevaluation and classifying of the entire state’s public roads will be conducted.
Existing conditions and facilities will be analyzed and will include a review of current system maps, policies, regulations, and requirements and an identification of system gaps. Analysis will include an identification of current urban boundaries and recommended adjustment to the boundaries given the development and density changes since the last plan update.
Findings Related to the Plan Needs and recommendations for revisions to the urban boundaries, federal aid system map and statewide highway system map will be developed and coordinated with plan development.
Alignment with the Planning Factors Proper classification of areas and roadways based on the character of intended service or function addresses the planning factors at all levels of projects (planning, design, and operations and maintenance).
PLAN, POLICY, AND PROGRAM REVIEW
TBG062714093019HNL 28
Hawaii Strategic Highway Safety Plan 2007-2012, HDOT Purpose and Content The Hawaii Strategic Highway Safety Plan 2007-2012 addresses issues related to improving traffic safety data collection, increasing traffic safety awareness, and other crucial traffic safety issues. The vision of the plan is to have Hawaii’s road users to arrive safely at their destinations. The goal of the plan is to reduce the number traffic-related fatalities from an average of 135 a year (from 2001 to 2005) to 100 or fewer by 2012. The safety plan identifies seven emphasis areas that are particularly pertinent and pressing in Hawaii, including: aggressive driving, impaired driving, occupant protection, pedestrians and bicyclists, motorcycle and moped safety, facility design (roadway and intersection operations), and data and safety management.
Findings Related to the Plan The Safety Plan provides a background of these seven issues and suggests key policy strategies that address these issues through legislation and funding, enforcement, data needs, transportation and land use planning, education and community action, and engineering strategies. Strategies related to the Statewide Federal-Aid Highways 2035 Transportation Plan are summarized below:
Curbing Aggressive Driving • Enact legislation that enables photo enforcement and earmarks traffic citation funding. • Apply Intelligent Transportation Systems to improve traffic flow, evaluate speed limits,
and conduct road safety audits. • Use crash data to identify high-risk areas/areas to focus resources.
Combating Impaired Driving • Enact legislation that obtains and reinvests dollars to support impaired driving
programs.
• Develop a standardized accident report form, coordinated data collection and accessible crash database.
Protecting Vehicle Occupants • Enact legislation that obtains and reinvests dollars to support impaired driving
programs.
Safeguarding Pedestrians and Bicyclists • Provide funding to address enforcement shortfall and increase enforcement. • Improve and standardize data related to use and accidents. • Update zoning codes, design standards. • Prioritize nonmotorized needs. • Provide infrastructure and coordination program support at the county level.

PLAN, POLICY, AND PROGRAM REVIEW
TBG062714093019HNL 29
Ensuring Motorcycle and Moped Safety • Increase funding for motorcycle/moped safety programs.
• Improve motorcycle crash data and use to identify high-risk areas/areas to focus resources.
Building Safer Roads by Design • Implement striping and signing management systems.
• Install more visible signs (letter size) and delineators, improve slopes/ditches and obstacles, create medians and add guardrails where needed.
• Develop streamlined process for delivery of local road projects.
• Implement road features/designs that reduce conflicts.
• Coordinate with Police to incorporate safe enforcement areas.
• Pursue projects on a priority basis where safety issues are known.
• Adopt rights of way and management policies that maintain clear zones as designed.
• Develop a coordinated transportation master plan that emphasizes safety and accommodates users.
Improving Data and Safety Management Systems • Establish leadership towards long-term commitment to improve data and management
systems.
• Assess existing data, needs, and linking/integration of data.
• Obtain funding needed to improve data, information flow, and create and maintain an effective safety management system.
Alignment with Planning Factors The Hawaii Strategic Highway Safety Plan supports the Safety planning factor through setting policy and developing strategies to increase the safety of the transportation system for both motorized and nonmotorized users.

PLAN, POLICY, AND PROGRAM REVIEW
TBG062714093019HNL 30
State of Hawaii Multi-Hazard Mitigation Plan, Hawaii State Civil Defense Agency, 2007 Purpose and Content The purpose of the State of Hawaii Multi-Hazard Mitigation Plan is to protect human lives and reduce or minimize property loss during a natural hazard. Planning for hazard mitigation can also minimize economic disruption (by reducing the immediate costs of response and recovery) and ecosystem degradation caused by a natural disaster.
This update to the 2004 multihazard mitigation plan is generally based on the four county mitigation plans, and includes input from several agencies on gaps realized and lessons learned from recent natural disaster events. The plan focuses on assessing risk of certain types of natural hazards in the state, and identifying potential mitigation strategies to address these risks. Mitigation strategies should be integrated with other community needs and goals, and could include physical measures (such as improving warning systems and building structures that withstand hurricane forces) as well as regulatory measures (such as creating land planning guidelines to restrict development in high-risk hazard areas).
Findings Related to the Plan Goals and objectives of the Multi-Hazard Mitigation Plan were developed by the state in order to provide a framework or foundation for developing mitigation strategies:
• Goal 1 - Protect life and ensure safety of people in Hawaii.
• Goal 2 - Develop and implement the Statewide Hazard Mitigation Plan based on a comprehensive multihazard risk and vulnerability assessment.
• Goal 3 - Ensure the protection of the state’s natural, built, historical, and cultural assets.
• Goal 4 – Ensure the long-term viability of the state’s economy and the livelihood of the local population.
• Goal 5 - Ensure public awareness of risks, vulnerability, and multihazard mitigation actions through public education.
Objectives of the plan include:
• Improve lifelines, infrastructure, ports of entry and critical facilities, and reduce vulnerability to hazards.
• Work with the counties to assist in improvements of building codes and building inventories and assessments.
• Encourage appropriate coastal-dependent development that reduces risks from coastal hazards at all stages of development.
• Encourage and support the adoption, enforcement, training in, and updating of building codes and standards that minimize the threat to life, health, and property damage caused by natural hazards.
• Encourage and support the adoption, implementation, and updating of plans (including land use, resource management, and other state and county plans) that incorporate
PLAN, POLICY, AND PROGRAM REVIEW
TBG062714093019HNL 31
natural hazard elements (including risk and vulnerability, hazard maps, hazard mitigation best practices and standards).
• Ensure adequacy of building codes and standards, land use regulations, and zoning standards.
• Develop reconstruction and rehabilitation plans to ensure rapid recovery from disasters.
Mitigation actions include ensuring that all lifeline infrastructures are able to withstand hazard events or have contingency plans to quickly recover after a disaster, and that all emergency response critical facilities and communication systems remain operational during hazard events. The long-range plan will be developed with consideration given to the above strategies.
Alignment with the Planning Factors The multihazard mitigation plan supports the planning factors by promoting Safety, and enhancing Transportation Access and Mobility and Security during a natural hazard event.
PLAN, POLICY, AND PROGRAM REVIEW
TBG062714093019HNL 32
Coordinated Public Transit Human Services Transportation Plan, Transportation for Elderly Persons and Persons with Disabilities, Jobs Access and Reverse Commute, New Freedom; HDOT; July 3, 2008 Purpose and Content The Coordinated Service Plan (CSP) investigated coordination of transportation services for persons with special needs (elderly, disabled, low-income). The plan assessed various government, private and nonprofit programs that provide transportation services and sets the foundation for coordination and integration of services to address gaps and minimize overlaps of service.
The mission of the plan is “to provide for the safe, economic, efficient and convenient movement of people and goods.”
Findings Related to the Plan The Federal Transit Authority 5310, 5316, and 5317 programs (Transportation for Elderly Persons and Persons with Disabilities, Job Access and Reverse Commute, and New Freedom) authorize formula assistance to states that address the needs of the elderly, those with disabilities, and welfare/low income individuals.
Goals and strategies developed in the CSP present potential actions for implementation:
• Goal 1: Achieve an integrated multimodal transportation system that provides mobility and accessibility for people and goods. Proposed public and coordinated human service transport strategies to meet this goal:
− Acquiring more vehicles − Centralized operations and facilities − Expansion of fixed and paratransit services and routes − Acquiring additional accessible taxis − Expansion of services − Mobility center − Scheduler
• Goal 2: Ensure the safety and security of the air, land, and water transportation systems. Proposed public and coordinated human service transport strategies to meet this goal:
− Centralized operations and facilities − Training − Education and marketing − Tracking system
• Goal 3: Protect and enhance Hawaii’s unique environment and improve the quality of life. Proposed public and coordinated human service transport strategies to meet this goal:
− Sustainable programmatic practices − Sustainable equipment and facilities
PLAN, POLICY, AND PROGRAM REVIEW
TBG062714093019HNL 33
• Goal 4: Support Hawaii’s economic vitality. Proposed public and coordinated human service transport strategies to meet this goal:
− Acquiring more vehicles − Centralized operations and facilities − Expansion of fixed and paratransit services and routes − More efficient funds collection − Expansion of services
• Goal 5: Implement a statewide planning process that is comprehensive, cooperative, and continuing. Proposed public and coordinated human service transport strategies to meet this goal:
− Continued communication − Creation of a work group
Alignment with Planning Factors The CSP aligns and is consistent with Hawaii Statewide Transportation Plan’s primary goals, objectives, and strategies.
Goals 1 through 4 align directly with the Accessibility and Mobility, Safety, Security, and Environment planning factors.

PLAN, POLICY, AND PROGRAM REVIEW
TBG062714093019HNL 34
State Comprehensive Outdoor Recreation Plan 2008 Update, State of Hawaii, Department of Land and Natural Resources, April 2009 Purpose and Content The State Comprehensive Outdoor Recreation Plan (SCORP) is required to be eligible for Land and Water Conservation Funds assistance with the acquisition and development of public lands for outdoor recreation. Hawaii’s SCORP serves as a tool for statewide outdoor recreation planning and action. It is intended to guide federal, state, county, and private agencies in Hawaii in the planning, development, and management of Hawaii’s outdoor recreation resources. The SCORP directs Land and Water Conservation Funds grant funding into facilities that best meet the public’s outdoor recreation needs, based on the priorities set during the plan development.
The plan outlines statewide trends, provides an inventory, and identifies jurisdictions that contribute to recreational facilities as well as contributing funding sources.
The SCORP’s identified priorities include:
• Protect natural and cultural resources. • Manage recreation resources and facilities. • Meet the needs of recreation users. • Provide access to recreation resources. • Seek funding.
Findings Related to the Plan The HDOT Highways Division is responsible for administering federal funds from the former SAFETEA-LU, which authorizes reimbursements to agencies for transportation related projects, including trails, bikeways and other facilities with recreation potential.
HDOT provides recreational opportunities by developing bikeways on state highways, beautifying major highways and providing scenic roadside lookouts.
Approximately 0.3 percent of the State Fuel Tax (up to $250,000) is deposited to the Special Land and Development Fund of the Department of Land and Natural Resources for the purposes of management, maintenance and development of Na Ala Hele trails and trail accesses.
The SCORP’s strategic plan proposes actions to address priority issues. Recommendations related to HDOT and the long-range plans include the following:
• Increase the number and range of resources and facilities to support expanded participation in walking, jogging, and bicycling as healthy activities and transportation by developing a comprehensive network of safe and well-maintained linear paths and lanes.
Actions:
- Support implementation of Bike Plan Hawaii and regional plans.

PLAN, POLICY, AND PROGRAM REVIEW
TBG062714093019HNL 35
- Develop networks of nonvehicular linear paths within urban and residential areas, linking communities.
- Improve sidewalks within neighborhoods by planting shade trees and installing lighting.
• Minimize conflicts between multiple activities and user groups competing for the same recreation resources, including conflicts between visitors and residents, between youth and adult leagues, or between various trail and ocean users.
Actions:
- Provide signage and other sources of information about user rights-of-way on multiuse trails.
• Improve access to shorelines and public forest areas by protecting existing accesses, creating new accesses, and reestablishing access to areas that are currently blocked or restricted by private landownership and/or development.
Actions:
- Provide directional and entry signage to public recreation areas.
• Provide an equitable distribution of recreation resources throughout the state.
Action:
- Develop trail networks that offer easy access from urban and suburban areas to rural areas.
• Explore nonrevenue sources for supporting acquisition, recreation programs, and maintenance of recreation resources.
Action:
- Request funds for bikeway development by aggressively seeking available funding for bikeway and greenway projects.
Alignment with Planning Factors The SCORP addresses a number of the planning factors, with a focus on nonmotorized modes. These include Connectivity of communities, increasing Safety, and enhancing the Environment and quality of life.

PLAN, POLICY, AND PROGRAM REVIEW
TBG062714093019HNL 36
National Wildlife Refuges, US Fish and Wildlife Service Purpose and Content The mission of the US Fish and Wildlife Service is “working to conserve, protect, and enhance fish, wildlife, and plants and their habitats for the continuing benefit of the American people.” There are nine refuges in the State of Hawaii:
• The Big Island (Hakalau) National Wildlife Refuge Complex consists of the Hakalau Forest Unit on the windward slope of Mauna Kea and the Kona Forest Unit on the western slope of Mauna Loa.
• The Kauai Complex includes Kilauea Point National Wildlife Refuge on the north side of the island, Hanalei National Wildlife Refuge in the Hanalei River Valley, and Huleia National Wildlife Refuge on the southeast side of Kauai.
• The Oahu Complex includes the James Campbell National Wildlife Refuge on the northeast shore of Oahu, the Oahu Forest National Wildlife Refuge on the upper slopes of the Koolau Mountains, and the Pearl Harbor National Wildlife Refuge in Pearl Harbor.
• The Kakahaia National Wildlife Refuge is on the south coast of Molokai.
• The Kealia Pond National Wildlife Refuge is along the south central coast of Maui.
Findings Related to the Plan • Each of the wildlife refuges conducts a multiyear planning process to develop a 15-year
Comprehensive Conservation Plan (CCP) and environmental assessment (EA) that will guide the management of fish, wildlife, plants, habitats and public uses. The goals and objectives, and ultimately projects stemming from the plan should be consistent with these initiatives.
• Hakalau has a Draft CCP and EA (August 2010). Discussion of the draft plan is in the Plan and Policy Review (Island of Hawaii).
• The Kauai Complex of national wildlife refuges has just begun their CCP/EA processes.
• The James Campbell and Pearl Harbor National Wildlife Refuges are approximately 2 years into the planning process. Discussion of the draft plans is in the Plan and Policy Review (Island of Oahu).
• The Kakahaia and Kealia Pond National Wildlife Refuges started their planning process in 2009. Discussion of the draft plans is in the Plan and Policy Review (islands of Maui/Molokai/Lanai).
Alignment with Planning Factors Consistency with the National Wildlife Refuge long-term plans supports the Environment and Sustainability of Hawaii’s natural habitats.
PLAN, POLICY, AND PROGRAM REVIEW
TBG062714093019HNL 37
National Parks, National Park Service Purpose and Content Since 1916, the American people have entrusted the National Park Service (NPS) with the care of their national parks. With the help of volunteers and park partners, the NPS safeguards nearly 400 places with more than 275 million visitors every year.
The NPS works with tribes, local governments, nonprofit organizations, businesses, and individual citizens in revitalizing their communities, preserving local history, celebrating local heritage, and creating close to home opportunities for kids and families to get outside, be active, and have fun.
Hawaii is home to eight national parks. The parks are famous for volcanoes, beautiful landscapes and complex ecosystems that offer unusual hiking and camping opportunities. Additionally, Hawaii national parks were established to preserve native activities, history and culture both ancient and modern.
• Hawaii: Ala Kahakai National Historic Trail, Hawaii Volcanoes National Park, Kaloko-Honokohau National Historical Park, Puuhonua O Honaunau National Historic Park, and the Puukohola Heiau National Historic Site
• Maui: Haleakala National Park
• Molokai: Kalaupapa National Historic Park
• Oahu: World War II Valor in the Pacific National Monument
Findings Related to the Plan The NPS is developing General Management Plans for Hawaii Volcanoes National Park, Kalaupapa National Historic Park and Haleakala National Park. The management plans will develop visions for the future of these national parks, and guide the management of the parks for the next 15 to 20 years. The goals and objectives, and ultimately projects stemming from the plan should be consistent with these initiatives.
The Ala Kahakai National Historic Trail has a completed Comprehensive Management Plan. Discussion of the plan is in the Plan and Policy Review (Island of Hawaii).
Alignment with Planning Factors Consistency with NPS long-term plans supports the Environment and Sustainability of Hawaii’s natural habitats, as well as the Economic Vitality of the State, through attraction and accommodation of visitors.

PLAN, POLICY, AND PROGRAM REVIEW
TBG062714093019HNL 38
Active Living Workshops, State of Hawaii, Department of Health Purpose and Content The Department of Health Healthy Hawaii Initiative conducted workshops around the state to promote active living. Active living communities are designed to provide opportunities for people of all abilities to engage in routine daily physical activity and have access to healthy and affordable foods. Active living is promoted by having bicycle- and pedestrian-friendly designs, mixed-use developments, recreational facilities and schools located in walkable neighborhoods.
The initiative partnered with the Safe Routes to School program to provide an integrated approach for safety, health and transportation efficiency.
Findings Related to the Plan The initiative is focused on getting more people physically active in safe environments and creating healthy environments and neighborhoods.
Alignment with Planning Factors The initiative focuses on increasing Safety for nonmotorized modes.

PLAN, POLICY, AND PROGRAM REVIEW
TBG062714093019HNL 39
Hawaii 2050 Sustainability Plan, State of Hawaii, 2008 Purpose and Content The Hawaii 2050 Sustainability Plan provides guidance to assure that the preferred future of Hawaii is met. Recognizing a growing number of pressing issues and the threat to the quality of life for the future generations, the development of a sustainability plan to address the vital needs of Hawaii is needed. The development of the plan was initiated by the Legislature and incorporated recommendations from a 25-member task force group. The plan identified five major goals to achieve the preferred future by 2050, outlined strategic actions to achieve the goals, and specified indicators to measure the performance.
Findings Related to the Plan Five major goals to achieve the preferred future of Hawaii by 2050 provide a framework for developing strategic actions. The five major goals are:
• Goal 1: A Way of Life – Living sustainably is part of daily practice in Hawaii.
• Goal 2: The Economy – Hawaii’s diversified and globally competitive economy enables citizens to meaningfully live, work, and play in Hawaii.
• Goal 3: Environment and Natural Resources – Natural resources are responsibly and respectfully used, replenished, and preserved for future generations.
• Goal 4: Community and Social Well Being – The Hawaiian community is strong, healthy, vibrant, and nurturing, striving to provide safety nets for those in need.
• Goal 5: Kanaka Maoli and Island Values – Kanaka Maoli and island cultures and values are thriving and perpetuated.
Alignment with Planning Factors The plan supports Economic Vitality and promotes protecting and enhancing the Environment in various ways. The plan also suggests increasing Accessibility and Mobility through increasing access to public transportation, encouraging telecommuting and increasing and improving bicycle and pedestrian facilities.

PLAN, POLICY, AND PROGRAM REVIEW
TBG062714093019HNL 40
Hawaii Tourism Authority Strategic Plan: 2010-2012, Hawaii Tourism Authority
Purpose and Content The Hawaii Tourism Authority Strategic Plan: 2005-2015 identifies a shared vision for Hawaii tourism in the year 2015 by Hawaii’s tourism stakeholders. It is intended to guide stakeholders in working together to attain the state’s vision that Hawaii is the best place to live, work, and visit. The plan stresses that a successful tourism industry depends on all government agencies, community organizations and industry groups.
A Strategic Plan: 2010-2012 was developed after the completion of the Strategic Plan: 2005-2015 in response to the economic crisis. Objectives and goals were identified for the short-term (2010) and long-term (2011-2012) implementation.
Findings Related to the Plan The plan recognized the importance of maintaining and improving transportation access, infrastructure and services, and identified strategic directions to support the air, land and sea transportation systems. Strategic directions to improve the land transportation system include:
• Updating and implementing highway master plans.
• Studying the impacts of increased cruise and ferry usage on traffic and roadway infrastructure.
• Monitoring resident sentiments and visitor satisfaction data.
• Conducting periodic traffic impact assessments, and ongoing and coordinated planning to make appropriate improvements.
• Encouraging collaboration between transportation providers and accommodations and attractions providers.
• Providing better informational and directional signage.
• Prioritizing and funding targeted road improvements and creatively exploring funding sources.
• Exploring alternatives means of ground transportation.
• Exploring federally funded programs.
The plan also encourages coordination, collaboration and improved ground transportation services including improving public transportation service between airports and hotels.
Alignment with Planning Factors The plan aligns with the Economic Vitality planning factor as the overall plan strategizes to support the tourism industry. The plan also supports improving Accessibility and Mobility and enhancing the Integration and Connectivity of the transportation systems, as well as promoting Safety for both visitors and residents, and protecting and enhancing the Environment.
PLAN, POLICY, AND PROGRAM REVIEW
TBG062714093019HNL 41
Coastal Storms Program, National Oceanic and Atmospheric Administration Purpose and Content The frequency and intensity of coastal storms are intended to increase, according to current predictions. With each storm, increasing water levels will allow storm surge to reach farther inland, leading to greater impacts and damage.
The Coastal Storms Program (CSP) is a networked program with partnerships between National Oceanic and Atmospheric Administration and other federal, state, and local organizations designed to increase the resiliency of coastal communities from coastal storm impacts. The CSP is intended to develop community risk and vulnerability assessments, improved weather forecasting, observations, increased integration of outreach and existing tools.
The Pacific Islands portion of the program is currently programmed for Fiscal Year 2010 funding. Specifically, the goals and objectives include promoting improved weather observations/predictions and communication to remote communities.
Findings Related to the Plan This section is not applicable because specific areas and products have not been completed.
Alignment with Planning Factors The initiative focuses on increasing Security and Safety for communities by preparing for the hazards associated with coastal storms, earthquakes and sea level rise impacts.

PLAN, POLICY, AND PROGRAM REVIEW
TBG062714093019HNL 42
Hawaii Coastal Zone Management Program, National Oceanic and Atmospheric Administration and Office of State Planning, 1990 Purpose and Content Coastal Zone Management (CZM) is about looking at coastal areas as an ecosystem that is an interrelated whole rather than at the individual species, resources, or uses. CZM is about balancing the needs of economic development and conservation of resources in a sustainable manner. The Hawaii CZM area encompasses the entire state. What occurs on land, even on the mountains, will impact and influence the quality of the coastal waters and marine resources.
Since approval of Hawaii’s program in 1977 (Chapter 205A, Hawaii Revised Statutes), this unique federal-state partnership has proven to be a strong basis for protecting, restoring and responsibly developing the state’s important and diverse coastal communities and resources.
Hawaii’s CZM Program was enacted to provide a common focus for state and county actions dealing with land and water uses. As the state’s resource management policy umbrella, it is the guiding perspective for the design and implementation of land and water uses and activities throughout the state. Within the scopes of their authorities, agencies must assure their statutes, ordinances, rules, and actions comply with the CZM objectives and policies.
Within a framework of cooperation among federal, state, and local levels, the Hawaii CZM Program employs a wide variety of regulatory and non-regulatory techniques to address coastal issues and uphold environmental law. Among them are stewardship, planning, permitting, education and outreach, technical assistance to local governments and permit applicants, policy development and implementation, and identification of emerging issues and exploration of solutions.
Findings Related to the Plan The CZM outlines requirements and responsibilities of various agencies to support interrelated objectives and policies including:
• Recreational and Historic Resources • Scenic and Open Space Resources • Coastal and Stream Ecosystems/Water Quality Management • Economic Uses • Coastal Hazards • Managing Development
Alignment with Planning Factors The CZM objectives and policies address enhancement of the Environment through resource, land, and water quality management. The CZM encourages Modal Integration and Economic Vitality by managing and protecting coastal resources and uses supporting community, tourism, and freight.
PLAN, POLICY, AND PROGRAM REVIEW
TBG062714093019HNL 43
Accessibility and Mobility are upheld for all modes of transportation through permitting and development review/management. Integration and Connectivity of modes are also stressed as the interrelation of all activities is the focus of the CZM.
PLAN, POLICY, AND PROGRAM REVIEW
TBG062714093019HNL 44
Hawaii Statewide Transportation Improvement Program, HDOT, Current Update, Fiscal Year 2011 to 2014 (+2) Purpose and Content The Hawaii Statewide Transportation Improvement Program (STIP) is a multimodal transportation program that provides a multiyear listing of state and county projects identified for federal or special funding. The STIP is developed based on existing transportation plans and policies, and current highway, transit and transportation planning processes. It is prepared by HDOT in cooperation with the Oahu Metropolitan Planning Organization, DOT Services, City and County of Honolulu, County of Hawaii, County of Maui, and County of Kauai. To qualify for funding, STIP projects must be consistent with each county’s long-range plan and/or the Statewide Transportation Plan. In addition, STIP projects can only be located on roadways functionally classified greater than collector roads, and local neighborhood roads are not eligible for STIP funding.
Currently, HDOT is in the process of updating the STIP for the next 4-year cycle. Priorities and needs, project readiness and eligibility, and public opinion of highway and transit projects statewide have been reviewed for inclusion in the next Federal Fiscal Year 2011-2014 (+2) STIP.
Findings Related to the Plan Review of the STIP will be important to understand existing planned improvements on state facilities, which will be considered as the future baseline transportation network.
Alignment with Planning Factors The STIP projects will allow for identification of spending allocations related to the planning factors based on planned project’s alignment with HDOT programs and funding categories.
PLAN, POLICY, AND PROGRAM REVIEW
TBG062714093019HNL 45
Report on the State of Physical Infrastructure in Hawaii, Hawaii Institute for Public Affairs, July 2010 Purpose and Content The purpose of this report is to provide substantive research, data and information on Hawaii’s statewide physical infrastructure needs. The report includes a consolidated statewide summary of state and county infrastructure projects planned over a 6-year period (2010-2015) and a summary of funding requirements to maintain and/or improve them. Based on available information, findings of the report focus primarily on capital improvements projects (CIP). The report also examines Hawaii’s infrastructure resiliency in the face of natural hazards.
This report is the first of two phases. Phase II will examine issues such as land use and funding policies that impact infrastructure development.
Findings Related to the Plan The report recognizes the importance and needs of the state transportation infrastructure. Review of the needs and planned efforts in the short-term will be important to help understand existing planned improvements and validate baseline transportation network. The potential impacts from natural hazards should also be considered.
Alignment with Planning Factors The report emphasizes the importance of the state transportation infrastructure and recognizes that the transportation system is vital to the state’s Economy. The report also raises awareness on increasing Security and Safety for communities by preparing for the natural hazards.

TBG062714093019HNL 1
M E M O R A N D U M Statewide Federal-Aid Highways 2035 Transportation Plan and Regional Federal-Aid Highways 2035 Transportation Plans for the Districts of Maui, Hawaii, and Kauai
Plan and Policy Review (District of Oahu) TO: State of Hawaii Department of Transportation (HDOT) FROM: CH2M HILL DATE: May 4, 2012
Introduction The planning team reviewed regional policies and plans relevant to development of the Statewide Federal-Aid Highways 2035 Transportation Plan and the Regional Federal-Aid Highways 2035 Transportation Plans for the Districts of Maui, Hawaii, and Kauai.
This summary of regional plans and policies was an important first step to ensure that the statewide and regional federal-aid plans were:
• Built effectively on previously adopted plans, policies, and programs. • Complied with federal, state, and regional requirements; • Had guidance and structure for the development of potential solutions.
The plan and policy summaries help to shape the statewide and regional goals and the definition of potential solutions.
Regional Plans and Policies Regional plans and policies are more specific than federal or statewide plans and policies in that they address a smaller geography and define specific projects for specific island contexts.
The regional plans and policies are generally consistent with statewide policy direction. These regional plans were used to inform the development of the Statewide Federal-Aid Highways 2035 Transportation Plan (Plan).
The following plans and policies were examined for the District of Oahu:
• Oahu Regional Transportation Plan 2035 (April 2011)
• Oahu Bike Plan (August 2012)
• Human Services Transportation Coordination Plan (2009)
• Oahu Commercial Harbors 2020 Master Plan (1997)
• Honolulu International Airport Master Plan (1994) (currently being updated)
PLAN AND POLICY REVIEW (DISTRICT OF OAHU)
TBG062714093019HNL 2
• Kalaeloa Airport Master Plan (1998)
• Dillingham Airfield Master Plan and Noise Compatibility Program (1993)
• James Campbell and Pearl Harbor National Wildlife Refuge Comprehensive Conservation Plan and Environmental Assessment (Ongoing)
• Resolution No. 08-125, CD1 (2008)
• City and County of Honolulu Executive Capital Budget and Program for Fiscal Year 2011

PLAN AND POLICY REVIEW (DISTRICT OF OAHU)
TBG062714093019HNL 3
Oahu Regional Transportation Plan 2035, Oahu Metropolitan Planning Organization, April 2011 Purpose and Content The objective of the Oahu Regional Transportation Plan (ORTP) 2035 is to serve as a guide to the various long-range mobility issues and transportation needs of the broader Oahu community. The ORTP 2035 is based on forecasts provided by the State Department of Business, Economic Development, and Tourism and the City’s Department of Planning and Permitting and extends 25 years into the future. The ORTP is reviewed, at a minimum, every 5 years to adjust the assumed growth and development for the island resulting from such long-range forecasts. Each revision is based on current information and takes community priorities into consideration.
The ORTP 2035 projects the travel needs resulting from assumed land use and socioeconomic conditions anticipated by the year 2035. The intent is for decision-makers to use the ORTP 2035 as a resource to understand the available transportation system improvement options, to understand how those options fulfill the Plan’s goals and objectives, and to ensure the projects’ consistency with the ORTP to be eligible for federal transportation funds.
The ORTP contains transportation projects and programs that meet local, state, and federal policies and objectives; are fiscally constrained per federal mandates; and address transportation challenges identified by Oahu Metropolitan Planning Organization (OahuMPO) policy officials and staff.
The ORTP 2035 vision statement currently adopted reads as follows:
In 2035, Oahu will be a place where we will have efficient, well-maintained, safe, secure, convenient, appropriate, and economical choices in getting from place to place. Our transportation system will move us and the goods we use in a manner that supports the island’s high quality of life, natural beauty, economic vitality, and land use policies by supporting appropriate density development and avoiding urban sprawl. This system will promote energy conservation and economic sustainability as well as the protection of our ports of entry, preparation for emergency situations and changes in global climate patterns.
Findings Related to the Plan To help achieve the vision, the ORTP 2035 is defined by five overarching goals and 25 objectives, discussed below.
Transportation Facilities
Goal Provide an inclusive, multimodal transport system whose connectedness provides efficient means for users desiring to move about this island by bicycle, freight carrier, pedestrian facility, road, transit service, and intermodal connectors.

PLAN AND POLICY REVIEW (DISTRICT OF OAHU)
TBG062714093019HNL 4
Objectives • Develop, operate, and maintain alternative transportation facilities, including bikeways,
walkways, and other accessible pedestrian, bicycle, and environmentally friendly elements.
• Enhance the integration and connectivity of the regional transportation system.
• Provide efficient, convenient, and cost-effective transit service to Oahu’s citizens.
• Promote the intermodal efficiency of harbor terminal facilities, airport terminal facilities, and land transportation systems.
• Provide rehabilitation, renewal, and modernization of facilities in sufficient magnitude to ensure system preservation and continued, effective operation.
Transportation Operations and Services
Goal Develop, operate, and maintain Oahu’s island-wide transportation system to ensure the efficient, dependable, safe, secure, convenient, and economical movement of people and goods.
Objectives • Promote planning, design, operation, maintenance, and construction of transportation
facilities and systems to support economic development and vitality.
• Optimize transportation resources through Transportation Demand Management strategies, including telecommuting solutions, to encouraging transit ridership and ridesharing, while reducing single-occupancy vehicle travel and auto dependency.
• Encourage public/private partnerships in providing transportation services.
• Monitor and enhance the performance and efficiency of Oahu’s transportation system through the use of operation management strategies, such as Intelligent Transportation Systems, Transportation System Management, Transportation Demand Management, and the OahuMPO Congestion Management Process.
• Ensure that Oahu’s transportation system is planned, designed, constructed, maintained, and operated in an integrated and cost-effective manner.
• Ensure user and community safety, and practical systems for the disabled by incorporating the priorities, programs, physical design, and operation of transportation facilities, and other improvements, consistent with the Hawaii Strategic Highway Safety Plan and Americans with Disabilities Act Accessibility Guidelines.
• Increase the peak-period, person-carrying capacities of Oahu’s transportation network.
• Reduce security risks associated with terrorism and other criminal acts, natural and man-made disasters, and other emergencies that would impact the transportation system.
PLAN AND POLICY REVIEW (DISTRICT OF OAHU)
TBG062714093019HNL 5
Natural Environment
Goal Develop, operate, and maintain Oahu’s transportation system in a manner that sustains environmental quality.
Objectives • Develop, operate, and maintain Oahu’s transportation system to meet or exceed noise,
air, and water quality standards set by Federal, State, and City agencies.
• Maximize energy conservation in transportation and reduce greenhouse gas emissions.
• Maintain and upgrade existing facilities and locate and design future transportation facilities in a manner that protects them from significant damage or disruption due to global climate change.
• Preserve and enhance Oahu’s cultural integrity, including archaeological and historic sites, and sensitive natural resources, including beaches, scenic beauty, and sea and mountain vistas.
Human Environment and Quality of Life
Goal Develop, operate, and maintain Oahu’s transportation system in a manner that supports community-wide values related to health, safety, and civil rights.
Objectives • Address and minimize the impacts of energy shortages, natural or constructed disasters,
and other emergencies to the transportation system.
• Encourage the development of sustainable and renewable energy sources for transportation.
• Ensure that no person shall be excluded from participation in, be denied the benefits of, or be subjected to discrimination in transportation services as provided for under current federal, state, and city legislation.
• Maintain and upgrade existing facilities and design future transportation facilities in a manner that complies with local urban design policies and regulations.
• Encourage innovation in planning, design, construction, operation, and maintenance of transportation services and facilities.
• Minimize disruption to existing neighborhoods from construction and maintenance of the transportation system.
Land Use and Transportation Integration
Goal Develop, operate, and maintain Oahu’s transportation system in a manner that integrates effective land use and transportation with established sources of funding in a fair and equitable manner.

PLAN AND POLICY REVIEW (DISTRICT OF OAHU)
TBG062714093019HNL 6
Objectives • Develop, operate, and maintain the transportation system to support Oahu’s planned
population distribution and land use development policies expressed in the City’s General, Development, Sustainable Communities Plan, and other adopted plans through coordinated efforts of both public and private sectors.
• Support land use development policies, such as transit-oriented development, that capitalize on the efficient use of the transportation system and reduce vehicular trip-making and vehicle miles traveled.
The ORTP identifies projects that serve to accomplish the list of goals and objectives and presents an implementation program for mid- and long-range use of the available transportation funds across Oahu. The plan includes recommendations for future highway improvements, and includes ongoing operations, maintenance, and preservation work of regional significance in the discussion. The recommended project list and implementation plan is summarized in the tables below.
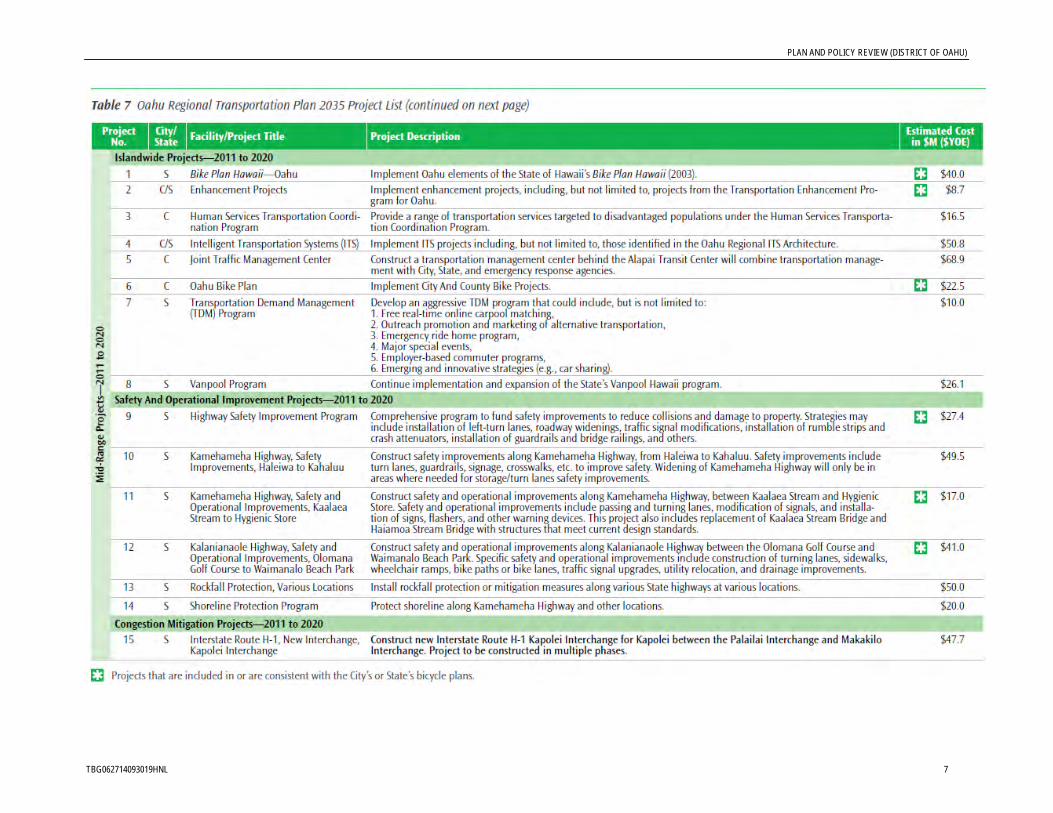
PLAN AND POLICY REVIEW (DISTRICT OF OAHU)
TBG062714093019HNL 7

PLAN AND POLICY REVIEW (DISTRICT OF OAHU)
TBG062714093019HNL 8

PLAN AND POLICY REVIEW (DISTRICT OF OAHU)
TBG062714093019HNL 9
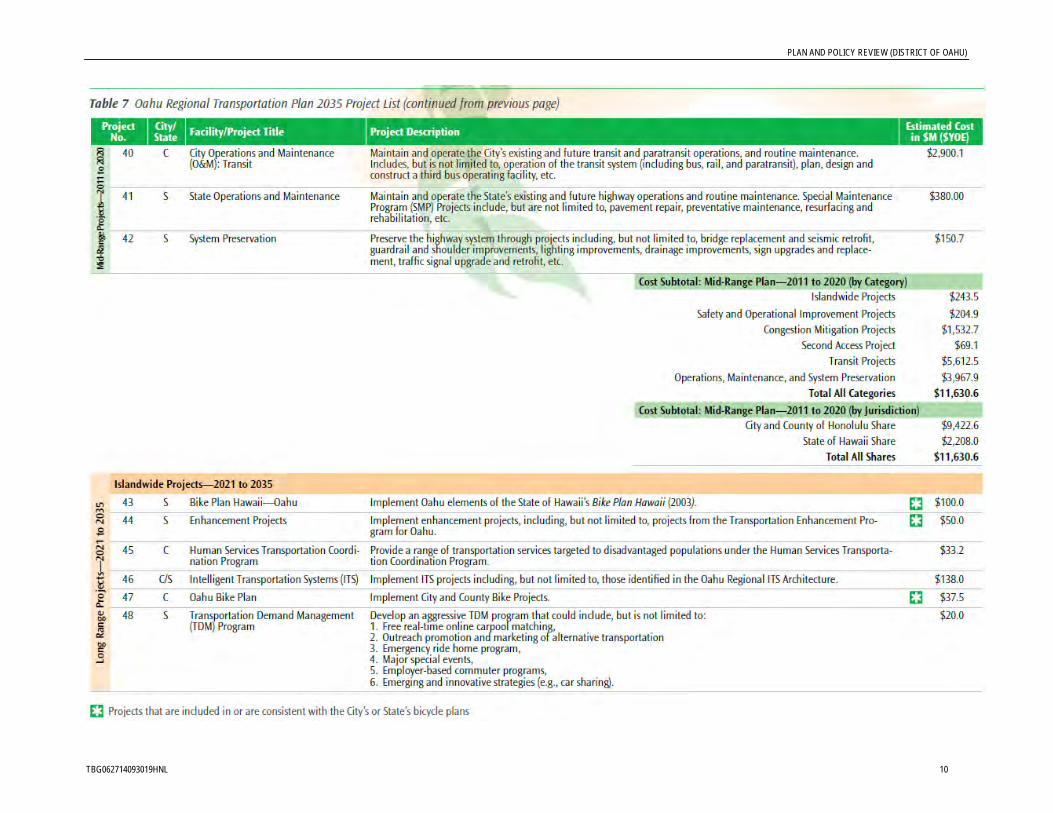
PLAN AND POLICY REVIEW (DISTRICT OF OAHU)
TBG062714093019HNL 10

PLAN AND POLICY REVIEW (DISTRICT OF OAHU)
TBG062714093019HNL 11
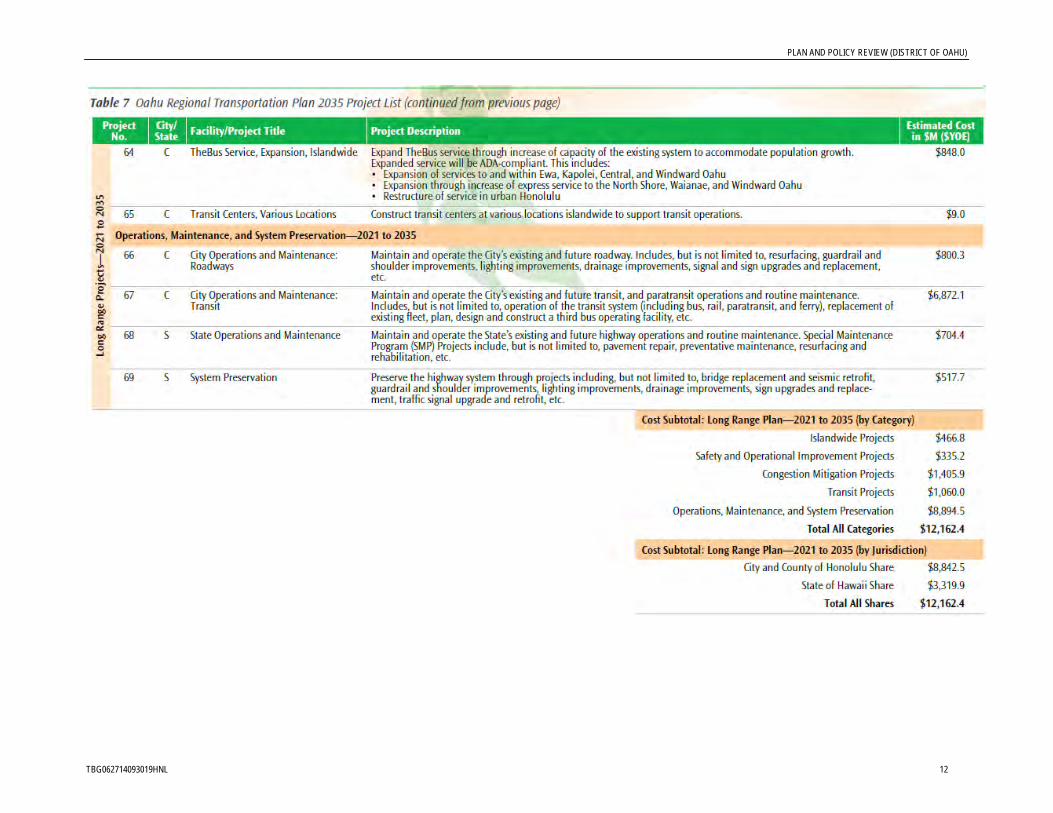
PLAN AND POLICY REVIEW (DISTRICT OF OAHU)
TBG062714093019HNL 12
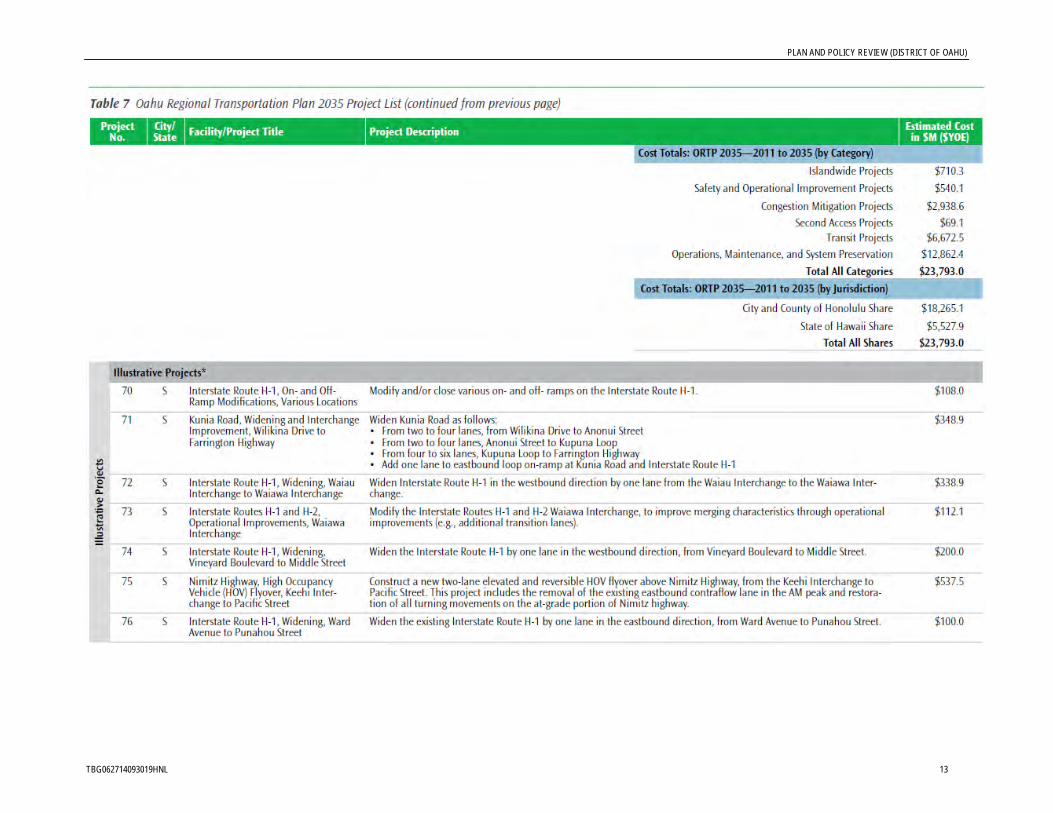
PLAN AND POLICY REVIEW (DISTRICT OF OAHU)
TBG062714093019HNL 13

PLAN AND POLICY REVIEW (DISTRICT OF OAHU)
TBG062714093019HNL 14

PLAN AND POLICY REVIEW (DISTRICT OF OAHU)
TBG062714093019HNL 15
Alignment with the Planning Factors The ORTP 2035 was developed and is updated every 5 years within the OahuMPO transportation planning requirements, similar to the statewide transportation planning requirements. The plan comprehensively addresses all of the planning factors, allowing for roll-up into the Statewide Federal-Aid Highways 2035 Transportation Plan.
PLAN AND POLICY REVIEW (DISTRICT OF OAHU)
TBG062714093019HNL 16
Oahu Bike Plan, City and County of Honolulu, August 2012 Purpose and Content The Oahu Bike Plan provides a strategy for better integrating bicycling into the City and County of Honolulu’s transportation system. It provides policy and program recommendations as well as identifying an integrated network of bicycle lanes and routes.
The Oahu Bike Plan updates and geographically expands the extent of the Honolulu Bicycle Master Plan created in 1999.
The 20-year vision for the bike plan is that “Oahu is a bicycle-friendly community where bicycling is a safe, viable, and popular travel choice for residents and visitors of all ages.”
Findings Related to the Plan Goals and objectives related to the plan include:
• Goal #1: Increase the mode share of bicycle trips.
− Objective #1: Increase the number of people who ride bikes. − Objective #2: Increase the number of bicycle trips. − Objective #3: Provide and maintain a continuous bicycle network. − Objective #4: Provide and maintain bicycle support facilities.
• Goal #2: Enhance cooperation between roadway users.
− Objective #5: Increase the awareness of bicyclists, motorists, and pedestrians of their rights and responsibilities.
− Objective #6: Enforce the traffic code.
• Goal #3: Encourage and promote bicycling as a safe, convenient, and pleasurable means of travel.
− Objective #7: Provide a variety of bikeways. − Objective #8: Reduce the number of traffic crashes involving bicycles. − Objective #9: Reduce the number of bicycle thefts.
Objective #10: Increase the number of visitors who ride bicycles. − Objective #11: Ensure integration of bicycles with transit. − Objective #12: Maintain existing bikeways in safe, rideable condition.
• Goal #4: Be recognized by the League of American Bicyclists as a Bicycle-Friendly Community.
− Objective #13: Implement the Oahu Bike Plan. − Objective #14: Provide funding to achieve the goals of the plan.
The Oahu Bike Plan proposes new bicycle network of 357 facilities covering 559 miles. These are a mix of lanes, paths, routes, and shoulder bikeways.
PLAN AND POLICY REVIEW (DISTRICT OF OAHU)
TBG062714093019HNL 17
The proposed additions to Oahu’s bikeway system are estimated to cost a total of approximately $68 million for the City. Costs for the state, federal, private, and shared jurisdiction projects are not given.
The Statewide Federal-Aid Highways 2035 Transportation Plan shall take into consideration recommendations made by the Oahu Bike Plan. Some project recommendations may be able to be programmed with other roadway projects.
Alignment with the Planning Factors The Oahu Bike Plan focuses on enhancing the Integration and Connectivity of the transportation system for and between motorized and nonmotorized modes, as well as increase Safety for bicycle users.

PLAN AND POLICY REVIEW (DISTRICT OF OAHU)
TBG062714093019HNL 18
Human Services Transportation Coordination Plan, City and County of Honolulu, July 2009 Purpose and Content The Human Services Transportation Coordination Plan provides a strategy to improve transportation options for older adults, individuals with disabilities, and persons with low incomes. The plan identifies transportation issues and challenges related to service and infrastructure, and outlines steps to address these issues through improved coordination of all publicly funded transportation on Oahu.
Findings Related to the Plan Prioritized goals for the Human Services Transportation Coordination Plan were developed through comprehensive outreach efforts with participants of the target populations and include:
• Get Coordinated – reduce duplication and inefficiencies in the transportation system.
• Get Connected – increase access to transit and other mobility options in rural and urban fringe areas.
• Get Compliant – improve timeliness and trip lengths of handi-vans.
• Get the Word Out – increase awareness of transportation options.
• Get Support – provide extra assistance to older adults and individuals with disabilities.
• Get a Cab – improve accessible transportation provided by private companies.
• Get Safe – improve safety and security while waiting for and riding the bus.
The Statewide Federal-Aid Highways 2035 Transportation Plan shall take into consideration the goals and strategies that encourage creative solutions to enhance the availability of transportation services to older adults, individuals with disabilities, and low-income individuals.
Alignment with the Planning Factors The Transportation Coordination Plan focuses on enhancing the Modal Integration and Safety of the transportation system for a target population of transit users.

PLAN AND POLICY REVIEW (DISTRICT OF OAHU)
TBG062714093019HNL 19
Oahu Commercial Harbors 2020 Master Plan, HDOT Harbors Division, May 1997 Purpose and Content The Oahu Commercial Harbors 2020 Master Plan provides a general long-range guide for ensuring efficient, safe commercial harbor development on the Island of Oahu. The plan addresses Honolulu Harbor, Kewalo Basin, and Barbers Point development, recognizing that operations at these three facilities are closely intertwined.
Honolulu Harbor is the main harbor for the State’s commercial operations. Almost all overseas cargo shipments into and out of the state are handled here. It is often over capacity due to the high volume of vessel traffic, low number of ship berths, and insufficient operational space. Barbers Point Harbor was conceived to alleviate demand on Honolulu Harbor, and serve the growing population in central and west Oahu. As the second busiest harbor in the state, plans for growth include development as a container and general cargo destination and a bulk cargo port. Kewalo Basin is smaller than the other two harbors on Oahu, and is mainly used by commercial fishing vessels and passenger cruise ships. Both types of operation exceed the existing facilities at Kewalo Basin, and have expanded to using the already busy Honolulu Harbor.
Findings Related to the Plan Primary objectives of the harbors master plan include:
• Plan port and harbor facilities properly to provide efficient facilitation of maritime shipments for the entire island.
• Promote the state’s economy by focusing on facilities for cargo, tourism, and commercial fishing operations in a manner that best serves the commerce of the state.
• Optimize commercial use of land and water resources at and adjacent to harbor facilities to create safe, efficient, productive, and ’user friendly’ environments.
• Actively pursue solutions to commercial harbor issues through investigation of and development of additional harbor facilities on the island.
Recommended roadway projects to support long-term growth and development of the harbors include widening supporting roadways at all harbors and adding dedicated turning or queuing lanes at harbor accesses. At Honolulu Harbor, a ’perimeter’ roadway around the harbor was recommended to alleviate traffic on Nimitz Highway (requires coordination with HDOT Highways Division proposed Nimitz Highway viaduct project). A new tunnel or high bridge structures were also recommended to replace the at-grade bridge over Kalihi Channel (State Highway 64). These roadway modifications would provide a second waterway access into and out of Honolulu Harbor. At Kewalo Basin, realignment of existing roadways is recommended, and at Barbers Point a new access road is recommended.
The statewide and regional federal-aid transportation plans will take into account the roadway needs for the three main harbors on Oahu to support maritime growth.

PLAN AND POLICY REVIEW (DISTRICT OF OAHU)
TBG062714093019HNL 20
Alignment with the Planning Factors The roadway recommendations outlined in the harbor plan support the Modal Integration planning factor by enhancing facilities that provide access between maritime and land transportation modes. The harbor plan also aligns with the Economic Vitality planning factor as it accommodates potential increases in the tourism industry.

PLAN AND POLICY REVIEW (DISTRICT OF OAHU)
TBG062714093019HNL 21
Honolulu International Airport (HIA) Master Plan, HDOT Airports Division, August 1994 Purpose and Content The purpose of Master Plan 2010 is to incorporate facility planning that has been done since the 1988 Master Plan Update into a comprehensive and integrated plan for development of HIA to the year 2010, including the planned international terminal building complex and the automated people mover system.
Three major and eight other planning issues were identified as those that must be dealt with by Master Plan 2010. The three major planning issues include land availability, airfield capacity, and ground access. The eight other planning issues include aircraft parking positions, air cargo facilities, ground transportation facilities (including connection to the proposed Honolulu rapid transit system), base maintenance facilities, ground support equipment facilities, bulk fuel storage facilities, utility systems, and south ramp redevelopment. This master plan was adopted in 1994 with a planning horizon of 2010.
An update to this master plan is currently in progress.
Findings Related to the Plan Annual passengers and cargo demand at the HIA is shown below.
1992 Actual 2020 Forecast
Passengers 21,290,144 39,216,000
Cargo 419,440 802,000
Aircraft Operations 403,628 504,500
Based Aircraft 238 302
To accommodate these projected demands, recommended improvements through the year 2010 are grouped into three phases. Estimated project costs are shown in 1993 dollars.
Phase I contains all approved facility improvements for which a budget has been established. Phase I projects are to be initiated by 1997. The emphasis of the improvements is placed on Airport and Airlines support facilities and land acquisition. ($220.4 million) These improvements include renovation of the International Arrivals building to provide additional processing capacity, extending the Ewa Concourse, constructing an air cargo facility for overseas cargo, extending the Interisland Terminal Makai Pier, improving the airport roadway system and constructing an employee parking facility on the North Ramp. The land acquisition is focused on acquiring land for airport use from Hickam Air Force Base.
Phase II emphasizes improvements in the airfield and ground transportation systems, and the provision of more aircraft parking positions. Phase II projects are to be initiated by 2002. ($258.8 million) Phase II improvements include constructing a terminal building on the

PLAN AND POLICY REVIEW (DISTRICT OF OAHU)
TBG062714093019HNL 22
South Ramp for air taxi and commuter airlines, constructing perimeter roadways to connect the North and South Ramps, extending the Diamond Head Concourse, begin developing the Ground Transportation Center within the terminal roadway loop, and improvements to taxiways and aprons. Outside of the airport, improvements would be implemented, including Lagoon Drive traffic mitigation, constructing new employee parking in the Kalewa Street area and relocating the Base Maintenance Facility from Aolele Street to Lagoon Drive.
Phase III provides for airfield improvements and expansion of terminal facilities. Phase III projects are to be initiated by 2010. ($1.6 billion) Phase III improvements include constructing an Airport Hotel, constructing a new International Terminal Building and providing internal circulation (automated people movers) within the airport. Ground access improvements to the airport and Base Maintenance Facility would occur within the Keehi Lagoon Triangle area, and the Interisland Terminal Mauka Pier Extension would provide more widebody aircraft capacity. Work would also continue on the Ground Transportation Center.
Alignment with the Planning Factors The Honolulu International Airport Master Plan addresses the integration of air transportation and land transportation modes. Improvements related to ground transportation access and ground transportation facilities acknowledge the Accessibility and Mobility and Economic Vitality planning factors.
Additionally these improvements are intended to create efficient and seamless transfer between modes, addressing the Integration and Connectivity of air travel with various land transportation modal choices.

PLAN AND POLICY REVIEW (DISTRICT OF OAHU)
TBG062714093019HNL 23
Kalaeloa Airport Master Plan, HDOT Airports Division, November 1998 Purpose and Content Naval Air Station, Barbers Point is scheduled to close in 1999. The use of the base after closure is being determined and implemented by the State of Hawaii and City and County of Honolulu. HDOT is recommending transfer of a portion of the base to the state for use as a reliever airport (Kalaeloa Airport).
The purpose of the Kalaeloa Airport Master Plan is to determine and document the type and extent of aviation facilities needed at Kalaeloa Airport through the year 2020 and to prepare a master plan that satisfies the projected demand. This master plan was adopted in 1998 with a planning horizon of 2020.
The objectives of the Kalaeloa Airport Master Plan are to provide the following for agency, user, and public consideration:
• A graphic representation of future airport developments within the context of current and anticipated land uses in the airport vicinity.
• The technical rationale and documentation of procedures used to formulate the proposed master plan.
• A prioritized capital improvement program and schedule for developments proposed in the master plan.
• Documentation of the master planning process for the airport, including input from airport users; federal, state, and local agencies; and the community.
Findings Related to the Plan Annual demand at the Kalaeloa Airport is shown below.
1993 Actual
(Navy Operations 2000 Forecast 2020 Forecast
Aircraft Operations 68,390 134,800 181,700
Based Aircraft 112 195
To accommodate these projected demands, recommended improvements through the year 2020 are grouped into three phases. The master plan recommends a phased development plan and capital improvement program with Phase I improvements considered to be the highest priority. Phase II and Phase III improvements are to be undertaken as the actual needs are demonstrated by demand for airport facilities and services and financial arrangements are made.
Estimated project costs are shown in 1998 dollars.
PLAN AND POLICY REVIEW (DISTRICT OF OAHU)
TBG062714093019HNL 24
Phase I projects are to be initiated by 2000. The emphasis of the improvements is placed on navigational aids and minimal airfield improvements ($1.2 million). Phase I improvements do not include recommendations that would affect the land transportation system.
Phase II projects are to be initiated by 2010. The improvements include additional navigational aids, terminal area and access improvements as well as airport support and utility improvements. The land transportation system would be improved with a perimeter road, service roads and parking ($3.9 million).
Phase III projects are to be initiated by 2020. The improvements include airfield construction, navigational aids, terminal area and access improvements as well as airport support and utility improvements. The land transportation system would be improved with additional service roads and parking ($3.3 million).
Alignment with the Planning Factors Kalaeloa Airport, as a reliever facility, reduces congestion at the Honolulu International Airport improving the Economic Vitality of the state, and overall Safety. The facility is also maintained for the United States Coast Guard and Hawaii National Guard/Civil Defense aviation needs that further support Safety and Security planning and response efforts.
Improvements related to ground transportation access and ground transportation facilities acknowledge the Accessibility and Mobility and planning factors and are mainly focused on vehicular access.

PLAN AND POLICY REVIEW (DISTRICT OF OAHU)
TBG062714093019HNL 25
Dillingham Airfield Master Plan and Noise Compatibility Program, HDOT Airports Division, August 1993 Purpose and Content The purpose of the Dillingham Airfield Master Plan and Noise Compatibility Program is to provide a comprehensive plan for the orderly development of the Airfield through the year 2010 and to satisfy the needs of general aviation on the island of Oahu in concert with HIA and any other general aviation facility that might become available during that period.
A major objective of the study is to produce a plan for development that is flexible enough to accommodate substantial changes in aviation demand, as well as the nature of aviation services required, without the over-commitment of funds or other resources. Another major objective is to maintain the essential character of Dillingham Airfield with respect to its surrounding natural beauty, accommodate a wide range of general aviation activities, and maintain the friendly and informal atmosphere that prevails there at the present time.
There are four key issues of development that are addressed in the master plan: provision for more airfield capacity, provision for more aviation service facilities, provision for more airport infrastructure, and improvement of airport safety. This master plan was adopted in 1993 with a planning horizon of 2010.
Findings related to the Plan Annual demand at the Dillingham Airfield is shown below.
1989 Actual 2010 Forecast
Aircraft Operations 117,136 226,000
Based Aircraft 44 90
To accommodate these projected demands, recommended improvements through the year 2010 are grouped into three phases. Estimated project costs are shown in 1991 dollars.
Phase I projects are to be initiated by 1997. Phase I contains improvements to be made for operational and safety reasons. These improvements include a rerouted and improved internal roadway facility to support airfield operations ($12.2 million).
Phase II projects are to be initiated by 2002. The Phase II improvements focus on additional apron space and ground transportation vehicle parking, as well as an air traffic control tower ($6.4 million).
Phase III projects are to be initiated by 2010. The Phase III supports a parallel runway with supporting taxiways and navigational aids, as well as additional apron space and ground transportation vehicle parking ($13.5 million).
Alignment with the Planning Factors The Dillingham Airfield Master Plan addresses airfield capacity, facility, and infrastructure needs. Improvements related to ground transportation are focused on internal circulation
PLAN AND POLICY REVIEW (DISTRICT OF OAHU)
TBG062714093019HNL 26
and parking demands for vehicular access. Access to the surrounding transportation system and various land transportation modes are not considered due to the location of the facility (end of Farrington Highway).
PLAN AND POLICY REVIEW (DISTRICT OF OAHU)
TBG062714093019HNL 27
James Campbell and Pearl Harbor National Wildlife Refuge Comprehensive Conservation Plan and Environmental Assessment, US Fish and Wildlife Service, Ongoing Purpose and Content The James Campbell National Wildlife Refuge is located on the northeast shore of Oahu and the Pearl Harbor National Wildlife Refuge is located in the Middle and West Lochs of Pearl Harbor.
A multiyear planning process to develop a 15-year comprehensive conservation plan and environmental assessment that will guide the management of fish, wildlife, plants, habitats, and public uses is currently being performed.
Findings Related to the Plan The plan has developed goals related to wildlife, habitat, research, educational opportunities, and cultural resources.
The preferred alternative for the Pearl Harbor National Wildlife Refuge would manage resources to emphasize and increase native habitat restoration of the coralline plain at Kalealoa Unit and wetland management at the Honouliuli and Waiawa units.
The preferred alternative for the James Campbell National Wildlife Refuge would restore wetlands and coastal dunes. A Visitor Services Plan would be developed that would identify infrastructure needs such as roads, parking, trails, and overlook areas.
The preferred alternatives identify objectives related to habitat, access, and cultural resources opportunities. The objectives may be coordinated to support appropriate levels and modes of access to the wildlife refuges from the land transportation system.
Alignment with Planning Factors Consistency with the National Wildlife Refuge long-term plans supports the Environment and Sustainability of Hawaii’s natural habitats.

PLAN AND POLICY REVIEW (DISTRICT OF OAHU)
TBG062714093019HNL 28
Resolution 08-125, CD1: Resolution Supporting Efforts by the State, City, and Other Stakeholders to Improve Bicycle Safety in the City and County of Honolulu, City and County of Honolulu Council, Adopted June 4, 2008 Purpose and Content The purpose of this resolution is to support efforts by the state, city, and other stakeholders to improve bicycle safety in the City and County of Honolulu. It also urges the state, city, and OahuMPO to continue all efforts to improve conditions for safe bicycling.
Findings Related to the Plan Efforts to improve conditions for safe bicycling include:
• Developing new bike paths, bikeways, and bike routes within and connecting Oahu communities.
• Maintaining and improving existing bike paths, bikeways, and bike routes on Oahu, including re-striping roadways, improving signage placement, regularly trimming trees and bushes, and ensuring barrier-free and clean riding areas.
• Implementing construction procedures that consider the needs of bicyclists, including seeking input from the bicycling community on major roadway projects; placing construction signs, equipment, and opala bins outside of bicycling areas; providing detour bike lanes as necessary; and ensuring that traffic loop sensors can be triggered by bicyclists and are maintained when repaving roadways.
• Enforcing existing traffic and parking laws.
• Installing bicycle racks in all state and county parks.
• Enhancing motorist education by emphasizing bicycle safety knowledge as part of the application process to successfully obtain and renew a vehicle driver’s license.
• Continuing support for and funding of the Hawaii Bicycling League’s Bike Ed Program, which has been teaching Oahu fourth-graders to safely ride bicycles on roadways since 1988.
• Assisting nonprofit organizations and others in implementing Bike and Walk “School Buses” under the federal Safe Routes to School program, whereby a group of students and accompanying adults walk, bike, or use other means such as skateboards to go to and from school along designated safe routes.
• Enhancing bicyclist education by emphasizing bicycle safety knowledge at the point of sale as part of the process of obtaining a bicycle license.

PLAN AND POLICY REVIEW (DISTRICT OF OAHU)
TBG062714093019HNL 29
Alignment with Planning Factors Resolution 08-125, CD1 is in alignment with the Safety planning factor. It also aligns with the Environment planning factor by promoting bicycling as an activity with many benefits accruing to individuals and the community.
PLAN AND POLICY REVIEW (DISTRICT OF OAHU)
TBG062714093019HNL 30
City and County of Honolulu, Executive Capital Budget and Program for Fiscal Year 2011 Purpose and Content The capital budget and program provides a listing of projects and services for the City and County of Honolulu for the fiscal year 2011. It includes estimated costs and identified sources of funds.
Findings Related to the Plan Review of the capital budget and program will be important to understand existing planned transportation improvements on state facilities, which could be considered as the future baseline transportation network.
Alignment with Planning Factors The capital program projects will somewhat allow for identification of spending allocations related to the planning factors based on planned project’s alignment with HDOT programs and funding categories.
TBG062714093019HNL 1
M E M O R A N D U M Statewide Federal-Aid Highways 2035 Transportation Plan and Regional Federal-Aid Highways 2035 Transportation Plans for the Districts of Maui, Hawaii, and Kauai
Plan and Policy Review (District of Maui) TO: State of Hawaii Department of Transportation (HDOT) FROM: CH2M HILL DATE: April 23, 2012
Introduction The planning team reviewed regional policies and plans relevant to development of the Statewide Federal-Aid Highways 2035 Transportation Plan and the Regional Federal-Aid Highways 2035 Transportation Plans for the Districts of Maui, Hawaii, and Kauai.
This summary of regional plans and policies was an important first step to ensure that the statewide and regional federal-aid plans:
• Reflect consistency through alignment of goals and objectives. • Build effectively on previously adopted plans and policies. • Comply with regional requirements. • Have guidance and structure for development of potential solutions.
The plan and policy summaries help to shape the goals for the statewide and regional transportation plans and the definition of potential solutions.
Regional Plans and Policies Regional plans and policies are more specific than federal or statewide plans and policies in that they address a smaller geography and define specific projects for specific island contexts.
The regional plans and policies are generally consistent with statewide policy; however, they will vary based on regional priorities. These regional plans and policies will be used to inform the development of the Statewide Federal-Aid Highways 2035 Transportation Plan and the Regional Federal-Aid Highways 2035 Transportation Plan for the District of Maui (Plan).
The following plans and policies were examined for the District of Maui:
• Maui County General Plan – Countywide Policy Plan 2030 (2010)
• Maui Island Plan General Plan 2030 (2012)

PLAN AND POLICY REVIEW (DISTRICT OF MAUI)
TBG062714093019HNL 2
• Maui community plans (Hana, Kahoolawe, Lanai, Molokai, Kihei-Makena, Makawao-Pukalani-Kula, Paia-Haiku, Wailuku-Kahului and West Maui)
• Maui Long-Range Land Transportation Plan (1997)
• Joint State/County Maui Interim Transportation Plan (2002)
• Maui County Short-Range Transit Plan (2005)
• Maui County Multi-Hazard Mitigation Plan (2010 draft)
• Molokai Long-Range Land Transportation Plan (1997)
• Kahului Commercial Harbor 2030 Master Plan and Draft Environmental Impact Statement (2007)
• Kahului Airport Master Plan (1993)
• Kapalua Airport (no master plan available)
• Hana Airport Master Plan (1998)
• Lanai Airport Master Plan Update (1999)
• Molokai Airport Master Plan (1999)
• Kalaupapa Airport Master Plan (1990)
• Proposed Roadway Development Program (2007)
• Resolution No. 12-34, Complete Streets Policy (2012)
• Final Environmental Impact Statement [FEIS] Honoapiilani Highway (FAP Route 30) Puamana to Honokowai (1990)
• Kihei Traffic Master Plan (1996)
• Update of Regional Transportation Forecasting Model for the Island of Maui: Model Methodology and Calibration Report (2008)
• Land Use Forecast, Island of Lanai, Maui County General Plan (2012)
• Maui National Wildlife Refuge Complex Comprehensive Conservation Plan and Environmental Assessment (ongoing)
• County of Maui Budget, Fiscal Years 2011, 2012, and 2013, Capital Improvement Plan
PLAN AND POLICY REVIEW (DISTRICT OF MAUI)
TBG062714093019HNL 3
Maui County General Plan 2030 – Countywide Policy Plan, County of Maui, 2010 Purpose and Content The Maui Countywide Policy Plan provides a policy framework for the goals and policies that reflect the identified values of Maui County and future growth. The Countywide Policy Plan also serves as an overarching umbrella framework for the Maui Island Plan and Maui’s nine community development plans (that is, Hana, Kahoolawe, Lanai, Molokai, Kihei-Makena, Makawao-Pukalani-Kula, Paia-Haiku, Wailuku-Kahului, and West Maui).
In terms of transportation, the Countywide Policy Plan acknowledges that diversification of the county’s transportation network is essential to building capacity within the existing overtaxed transportation systems. The plan encourages coordination among the county, state, and federal governments to provide vehicular and nonmotorized options, including bikeways and pedestrian corridors, to move safely around the islands.
Findings Related to the Plan The County General Plan has a broad range of goals and themes intended to describe conditions in the year 2030. A specific goal related to the long-range plan is to diversify transportation options within Maui County and to provide efficient, economical, and environmentally sensitive means of moving people and goods. Objectives of this plan are listed below, along with policies and actions that can help the county achieve this goal.
Objective Provide an effective, affordable, and convenient ground transportation system that is environmentally sustainable.
Policies • Execute planning strategies to reduce traffic congestion.
• Support the use of alternative roadway designs, such as traffic-calming techniques and modern roundabouts.
• Increase route and mode options in the ground transportation network.
• Ensure that roadway systems are safe, efficient, and maintained in good condition.
• Preserve roadway corridors that have historic, scenic, or unique physical attributes that enhance the character and scenic resources of communities.
• Promote a variety of affordable and convenient transportation services that meet countywide and community needs and expand ridership on transit systems.
• Provide and encourage the development of specialized transportation options for the young, the elderly, and persons with disabilities.
• Evaluate alternatives to preserve quality of life before widening roads.

PLAN AND POLICY REVIEW (DISTRICT OF MAUI)
TBG062714093019HNL 4
Actions • Establish efficient public-transit routes between employment centers and primary
workforce residential areas.
• Create attractive, island-appropriate, conveniently located park-and-ride and ride-share facilities.
Objective Reduce the reliance on the automobile and fossil fuels by encouraging walking, bicycling, and other energy-efficient and safe alternative modes of transportation.
Policies • Make walking and bicycling transportation safe and easy between and within
communities.
• Design new and retrofit existing rights-of-way with adequate sidewalks, bicycle lanes, or separated multi-use transit corridors.
Actions • Design, build, and modify existing bikeways to improve safety and separation from
automobiles.
• Increase enforcement to reduce abuse of bicycle and pedestrian lanes by motorized vehicles.
• Identify nonmotorized transportation options as a priority for new sources of funding.
Objective Improve and expand the planning and management of transportation systems.
Policies • Require new developments to contribute their pro rata share of local and regional
infrastructure costs.
• Support the revision of roadway design criteria and standards so that roads are compatible with surrounding neighborhoods and the character of rural areas.
• Plan for multimodal transportation and utility corridors on each island.
• Use transportation demand management as an integral part of transportation planning.
The County General Plan focuses on an environmentally sustainable, multimodal ground-transportation system. Actions include enhancing transit operations, non-motorized facilities, and developing planning/design criteria and standards appropriate to the various Maui area contexts. This focus is a shift from the Maui Long-Range Land Transportation Plan, prepared in 1997, which had a major focus increasing vehicle capacity of the transportation system. The update of the plan will incorporate the desire for roadways that support transit, multimodal options, and island context.

PLAN AND POLICY REVIEW (DISTRICT OF MAUI)
TBG062714093019HNL 5
Alignment with the Planning Factors Key strategies of the Countywide Policy Plan align with multiple planning factors. The plan is closely aligned with the Environment and Sustainability and Transportation Access Mobility planning factors. It supports protecting the natural environment while also striving to diversify the county’s transportation options to accommodate future growth. The policy also aligns with the Economic Vitality and Safety planning factors, as it recognizes that the tourism/visitor industry provides an important economic base for the county, and encourages providing safe and efficient means of travel for tourists and residents to move about the island.

PLAN AND POLICY REVIEW (DISTRICT OF MAUI)
TBG062714093019HNL 6
Maui Island Plan General Plan 2030, County of Maui, 2012 Purpose and Content The Maui Island Plan (MIP) establishes a directed growth strategy for the Island of Maui through the identification of nine community development plans that the county has identified as areas appropriate for future urbanization and revitalization. The Maui Island Plan is intended to serve as the central layer of framework that supports the Maui County General Plan. The Maui Island Plan developed a series of goals, objectives, policies, and action plan items for each element of the plan.
Findings Related to the Plan The Island Plan includes recommendations for specific proposed highway improvements, and stresses preservation and improvement of the existing roadway system so that interconnected, efficient, multi-modal transportation options will be provided in the future. The plan also suggests integrating transportation and land use programs so that future development is complemented by safe, transit-friendly corridors. A transit-specific goal adopted by the general plan includes the development of an island-wide transit system that addresses the mobility needs of residents and tourists alike.
The MIP and the Maui County General Plan 2030 have aligned goals that capture the values of the people throughout Maui. The Regional Federal-Aid Highways 2035 Transportation Plan for the District of Maui will incorporate the desire for roadways that support transit, multimodal options, and island context.
Goals, objectives, and policies of the MIP are listed below:
Goal An interconnected, efficient, and well-maintained, multimodal transportation system.
Objective
Provide for a more integrated island-wide transportation and land use planning program that reduces congestion and promotes more efficient (transit friendly) land use patterns.
Policies • Plan for an integrated multimodal transportation system comprised of public transit,
bicycle, pedestrian, automobile, and other transportation modes.
• Refocus transportation investment from the construction of additional roadways of for the automobile to the expansion of a multimodal transportation system.
• Encourage the use of Complete Streets design methods.
• Encourage employers to implement Transportation Demand Management strategies.
Objective
Safe and interconnected transit, roadway, bicycle, equestrian, and pedestrian networks.

PLAN AND POLICY REVIEW (DISTRICT OF MAUI)
TBG062714093019HNL 7
Policies • Ensure transit, roadway, and pedestrian facilities design and level-of-service standards
respect the unique character of our communities.
• Prioritize transportation improvements list to cost-effectively meet existing and future needs consistent with the MIP.
• Require new development, where appropriate, to integrate sidewalks, pathways, bikeways, and transit infrastructure into new commercial and residential projects while enhancing community character.
• Identify and improve hazardous and substandard sections of roadways, drainage infrastructure, and bridges, provided that the historical integrity of the roads and bridges are protected.
• Consider identification, acquisition where appropriate, and use of abandoned right-of-ways for bikeways, pedestrian pathways, and open-space networks.
• Support the implementation of the Central Maui Pedestrian and Bicycle Master Plan (March 2012), when consistent with the MIP.
Objective
An island-wide multimodal transportation system that respects and enhances the natural environment, scenic views, and each community’s character.
Policies • Ensure that roadway and transit alignments respect the natural environment and scenic
views.
• Ensure that roadways and transit systems in rural areas and small towns enhance community character.
• Design all transit systems to respect visual corridors and Maui’s character.
Goal An island-wide transit system that addresses the needs of residents and visitors and contributes to sustainable and livable communities.
Objective
An integrated transit system that better serves the mobility needs of Maui’s residents and visitors.
Policies • Maximize access to public transit in town centers, commercial districts, and employment
centers.
• Expand regional/interregional transit services, where appropriate, in heavily traveled corridors and within communities
• Increase the frequency of current service, add additional bus routes as demand requires, and transition to nonpolluting transit vehicles, as funding permits.

PLAN AND POLICY REVIEW (DISTRICT OF MAUI)
TBG062714093019HNL 8
• Provide adequate transit infrastructure (for example, bus pullouts, waiting benches and shelters, and signs) along current and future transit rights-of-way.
• Require new development where appropriate, to provide rights-of-way to accommodate transit circulation and support facilities.
• Identify, protect, and preserve, or acquire corridors for future inter-community transit use, including but not limited to, rail and also multimodal use corridors.
• Established transit corridors by planning for and secure appropriate right-of-way when appropriate for alternative modes of transportation (such as rail and water ferry service).
• Pursue improvements and upgrades to the existing transit system consistent with updated Maui DOT planning studies/transit plans (within the framework of comprehensive island-wide multimodal transportation plans)
• Increase interagency coordination between the Department of Planning, HDOT, County Department of Public Works, and other applicable agencies.
Objective
Plan for a more diversified and stable funding base to support transportation goals.
Policies • Support alternative methods and sources of funding transportation improvements
(including impact fees, higher taxes, fare adjustments, dedicated sources of funding, and assessments).
• Collaborate with public/private entities or nonprofit organizations to reduce public transit operational expenses.
• Coordinate with appropriate federal, state, and county agencies to fund transportation projects in areas where growth is anticipated.
Alignment with the Planning Factors The MIP aligns with the Modal Integration planning factor. It promotes and encourages an island-wide transit/multimodal/intermodal system. It also aligns with the Environment and Sustainability factor through recognition that transportation planning is critical to maintaining the unique small-town character of the island while efficiently accommodating long-term growth.
PLAN AND POLICY REVIEW (DISTRICT OF MAUI)
TBG062714093019HNL 9
Maui Community Plans: Hana (1994), Kahoolawe (1995), Lanai (1998), Molokai (2001), Kihei-Makena (1998), Makawao-Pukalani-Kula (1996), Paia-Haiku (1995), Wailuku-Kahului (2002), West Maui (1996), County of Maui Purpose and Content There are nine community plans in Maui County: Hana, Kahoolawe, Lanai, Molokai, Kihei-Makena, Makawao-Pukalani-Kula, Paia-Haiku, Wailuku-Kahului, and West Maui. Each of the plans reflects current and anticipated conditions, and advances planning goals, objectives, policies, and implementation considerations for the designated community.
The community plans provide specific recommendations to address the goals, objectives, and policies contained in the General Plan, while recognizing the values and unique context of the individual community.
Findings Related to the Plan The structure of each of the community plans was similar. Each plan included goals, objectives, policies, and implementing actions.
Goals, objectives, and policies of the various community plans relevant to the Regional Federal-Aid Highways 2035 Transportation Plan for the District of Maui are listed in the table below.
Alignment with the Planning Factors The community plans vary in their emphasis based on the context and priorities of the various communities. Similar to the General Plan and MIP, the community plans support Modal Integration with emphasis on pedestrian and bicycle transport. Certain communities also encourage inter-modal connectivity to airports and harbors, as well as transit service. The plans also align with the Environment and Sustainability planning factor through recognition that transportation combined with land use planning is critical to maintaining the unique character and cultural significance of the specific communities while efficiently accommodating long-term growth.

PLAN AND POLICY REVIEW (DISTRICT OF MAUI)
TBG062714093019HNL 10
Community Urban/Town Design Physical/Social Infrastructure Land Use Environment Cultural Resources
Hana (County of Maui, 1994)
Goal: Harmony between the natural and constructed environments through building, infrastructure, and landscaping design which ensures that the natural beauty and character of the Hana region is preserved.
Objectives and Policies:
• Encourage roadway, drainage, landscaping, and other public improvement standards that are in harmony with an informal rural or natural environment.
• Maintain the informal rural streetscape that provides character identification for Hana Town.
• Preserve significant view corridors.
Goal: Timely and environmentally sensitive development and maintenance of infrastructure systems which protect and preserve the safety and health of the Hana region’s residents and visitors, including the provision of domestic water, utility and waste disposal services, and effective transportation systems that meet the needs of residents and visitors while protecting the region’s rural character.
Objectives and Policies:
• Ensure community participation, including resident Hawaiians, in long-term infrastructure planning.
• Improve road conditions through more frequent resurfacing and repair.
• Encourage a program of roadway safety improvements, including shoulder widening, pull-over spots, and installation of new signage and guardrails that do not detract from the region’s scenic and rural character.
• Balance traffic flow and safety requirements with the preservation of the Hana region’s historic bridges.
• Encourage the development of a quasi-public shuttle service to meet the intraregional and/or interregional transportation needs of the resident of the Hana Community Plan region.
• Ensure that any master plan for the Hana Airport is consistent with the objectives and policies set forth in the Hana Community Plan.
Goal: Identification, preservation, protection and, where appropriate, restoration of significant cultural resources and practices, that provide a sense of history and identify for the Hana region.
Objectives and Policies:
• Encourage and protect traditional mauka and makai accesses for traditional cultural uses and practices.
Kahoolawe
Lanai (County of Maui, 1998)
Goal: Preserve and enhance the unique urban design character of Lanai through consideration of planning, land use, and design standards that respect the island’s rural plantation history.
Objectives and Policies:
• Establish design standards in the commercial/civic center area of Lanai City to provide special treatment in the maintenance and/or enhancement of the unique visual and physical identity of the town.
• Provide additional landscaping in Lanai City to enhance the environment, using native and noninvasive climate adapted plants appropriate for the region.
• Promote the development of a county urban design review process for proposed projects falling within the State Urban District.
• Maintain existing road rights-of-way within Lanai City.
• Encourage the development and use of subdivision and roadway design criteria and standards that are compatible with the rural character of Lanai.
• Promote the appropriate use of street lighting to ensure public safety and to preserve the rural ambiance of Lanai.
Goal: Provide adequate reliable and well-designed public infrastructure systems in a timely fashion to meet the social, economic, and public safety and welfare needs of the Lanai community.
Objectives and Policies:
• Support and construct a paved by-pass road along the northern and western perimeter of Lanai City, connecting Kaumalapau Highway and Keomoku Road.
• Establish a comprehensive transportation planning and management philosophy in keeping with the social, economic, and public safety needs of the island’s residents.
• Support roadway management policies that recognize the need to establish designated bus and truck traffic routes.
• Encourage and support a pedestrian orientation for the Lanai City core.
• Establish safe pathways connecting schools, recreation facilities, and commercial and residential areas for use by walkers, joggers and bicyclists.
• Promote traffic safety through provision of roadway safety, maintenance and signage improvements, and through strict enforcement of traffic operating rules and regulations.
• Ensure that planning, design, operation of, and access to airports and harbor facilities address the needs of the island’s residents.
• Maintain public access along agricultural roads and historic trails for hunting and access to coastal resources, hiking, and other outdoor activities.
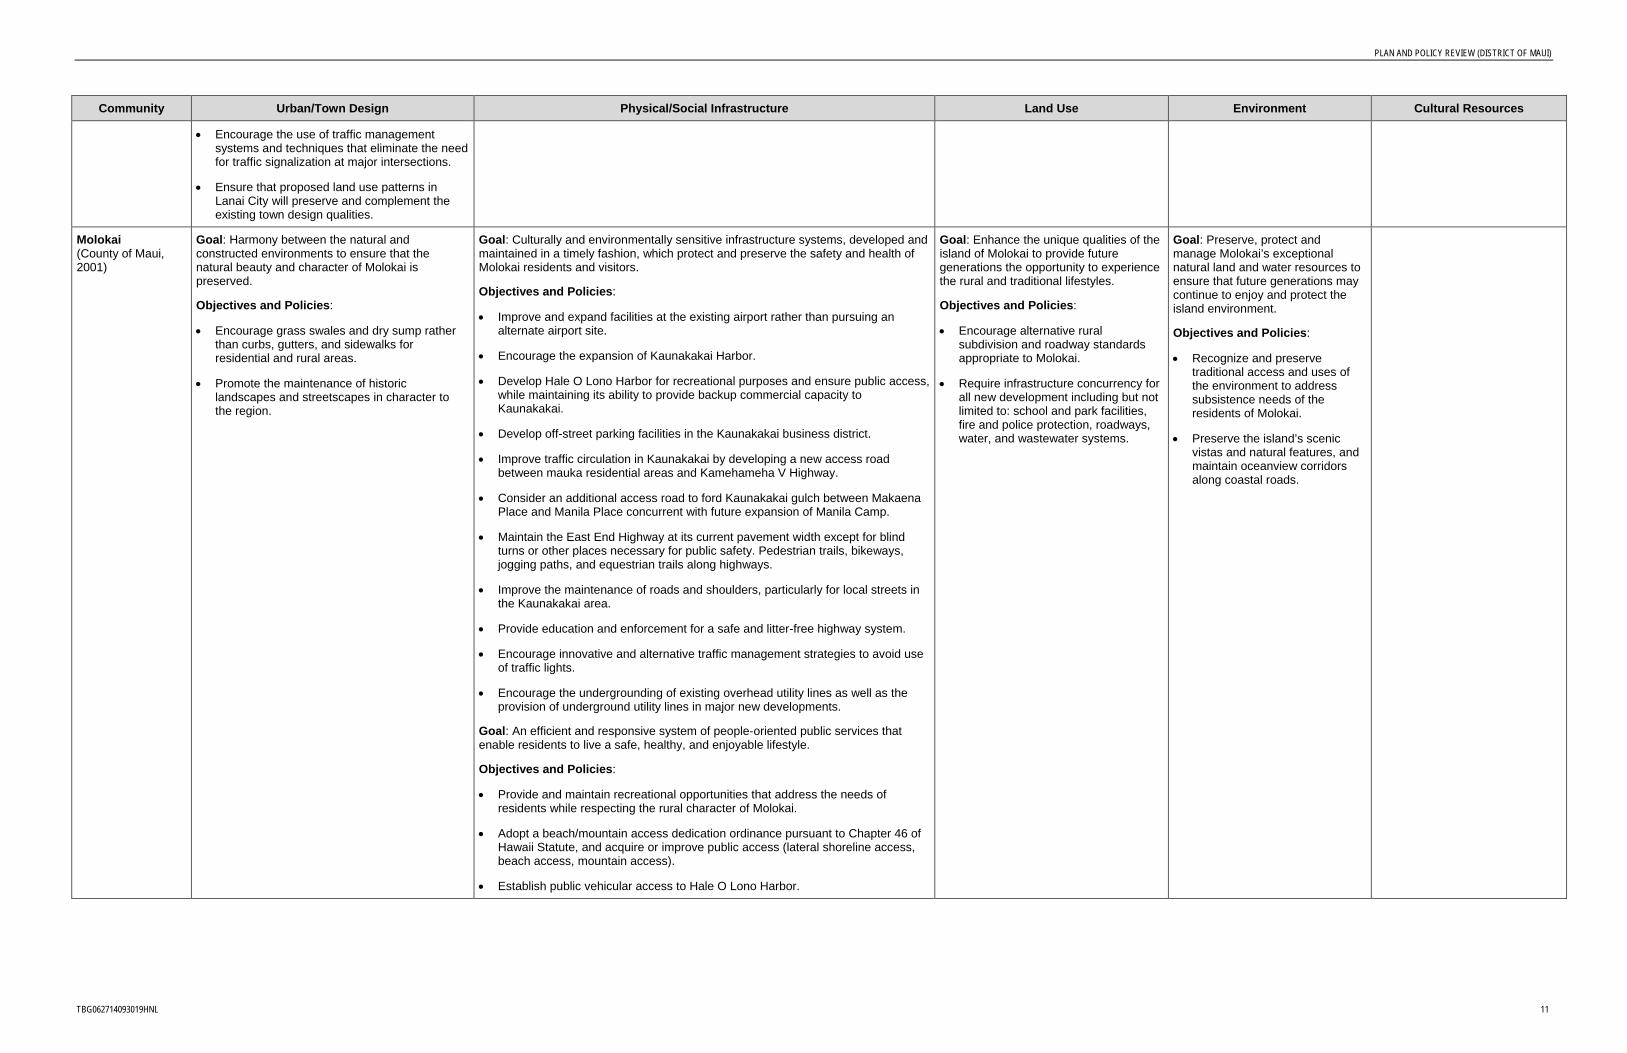
PLAN AND POLICY REVIEW (DISTRICT OF MAUI)
TBG062714093019HNL 11
Community Urban/Town Design Physical/Social Infrastructure Land Use Environment Cultural Resources
• Encourage the use of traffic management systems and techniques that eliminate the need for traffic signalization at major intersections.
• Ensure that proposed land use patterns in Lanai City will preserve and complement the existing town design qualities.
Molokai (County of Maui, 2001)
Goal: Harmony between the natural and constructed environments to ensure that the natural beauty and character of Molokai is preserved.
Objectives and Policies:
• Encourage grass swales and dry sump rather than curbs, gutters, and sidewalks for residential and rural areas.
• Promote the maintenance of historic landscapes and streetscapes in character to the region.
Goal: Culturally and environmentally sensitive infrastructure systems, developed and maintained in a timely fashion, which protect and preserve the safety and health of Molokai residents and visitors.
Objectives and Policies:
• Improve and expand facilities at the existing airport rather than pursuing an alternate airport site.
• Encourage the expansion of Kaunakakai Harbor.
• Develop Hale O Lono Harbor for recreational purposes and ensure public access, while maintaining its ability to provide backup commercial capacity to Kaunakakai.
• Develop off-street parking facilities in the Kaunakakai business district.
• Improve traffic circulation in Kaunakakai by developing a new access road between mauka residential areas and Kamehameha V Highway.
• Consider an additional access road to ford Kaunakakai gulch between Makaena Place and Manila Place concurrent with future expansion of Manila Camp.
• Maintain the East End Highway at its current pavement width except for blind turns or other places necessary for public safety. Pedestrian trails, bikeways, jogging paths, and equestrian trails along highways.
• Improve the maintenance of roads and shoulders, particularly for local streets in the Kaunakakai area.
• Provide education and enforcement for a safe and litter-free highway system.
• Encourage innovative and alternative traffic management strategies to avoid use of traffic lights.
• Encourage the undergrounding of existing overhead utility lines as well as the provision of underground utility lines in major new developments.
Goal: An efficient and responsive system of people-oriented public services that enable residents to live a safe, healthy, and enjoyable lifestyle.
Objectives and Policies:
• Provide and maintain recreational opportunities that address the needs of residents while respecting the rural character of Molokai.
• Adopt a beach/mountain access dedication ordinance pursuant to Chapter 46 of Hawaii Statute, and acquire or improve public access (lateral shoreline access, beach access, mountain access).
• Establish public vehicular access to Hale O Lono Harbor.
Goal: Enhance the unique qualities of the island of Molokai to provide future generations the opportunity to experience the rural and traditional lifestyles.
Objectives and Policies:
• Encourage alternative rural subdivision and roadway standards appropriate to Molokai.
• Require infrastructure concurrency for all new development including but not limited to: school and park facilities, fire and police protection, roadways, water, and wastewater systems.
Goal: Preserve, protect and manage Molokai’s exceptional natural land and water resources to ensure that future generations may continue to enjoy and protect the island environment.
Objectives and Policies:
• Recognize and preserve traditional access and uses of the environment to address subsistence needs of the residents of Molokai.
• Preserve the island’s scenic vistas and natural features, and maintain oceanview corridors along coastal roads.
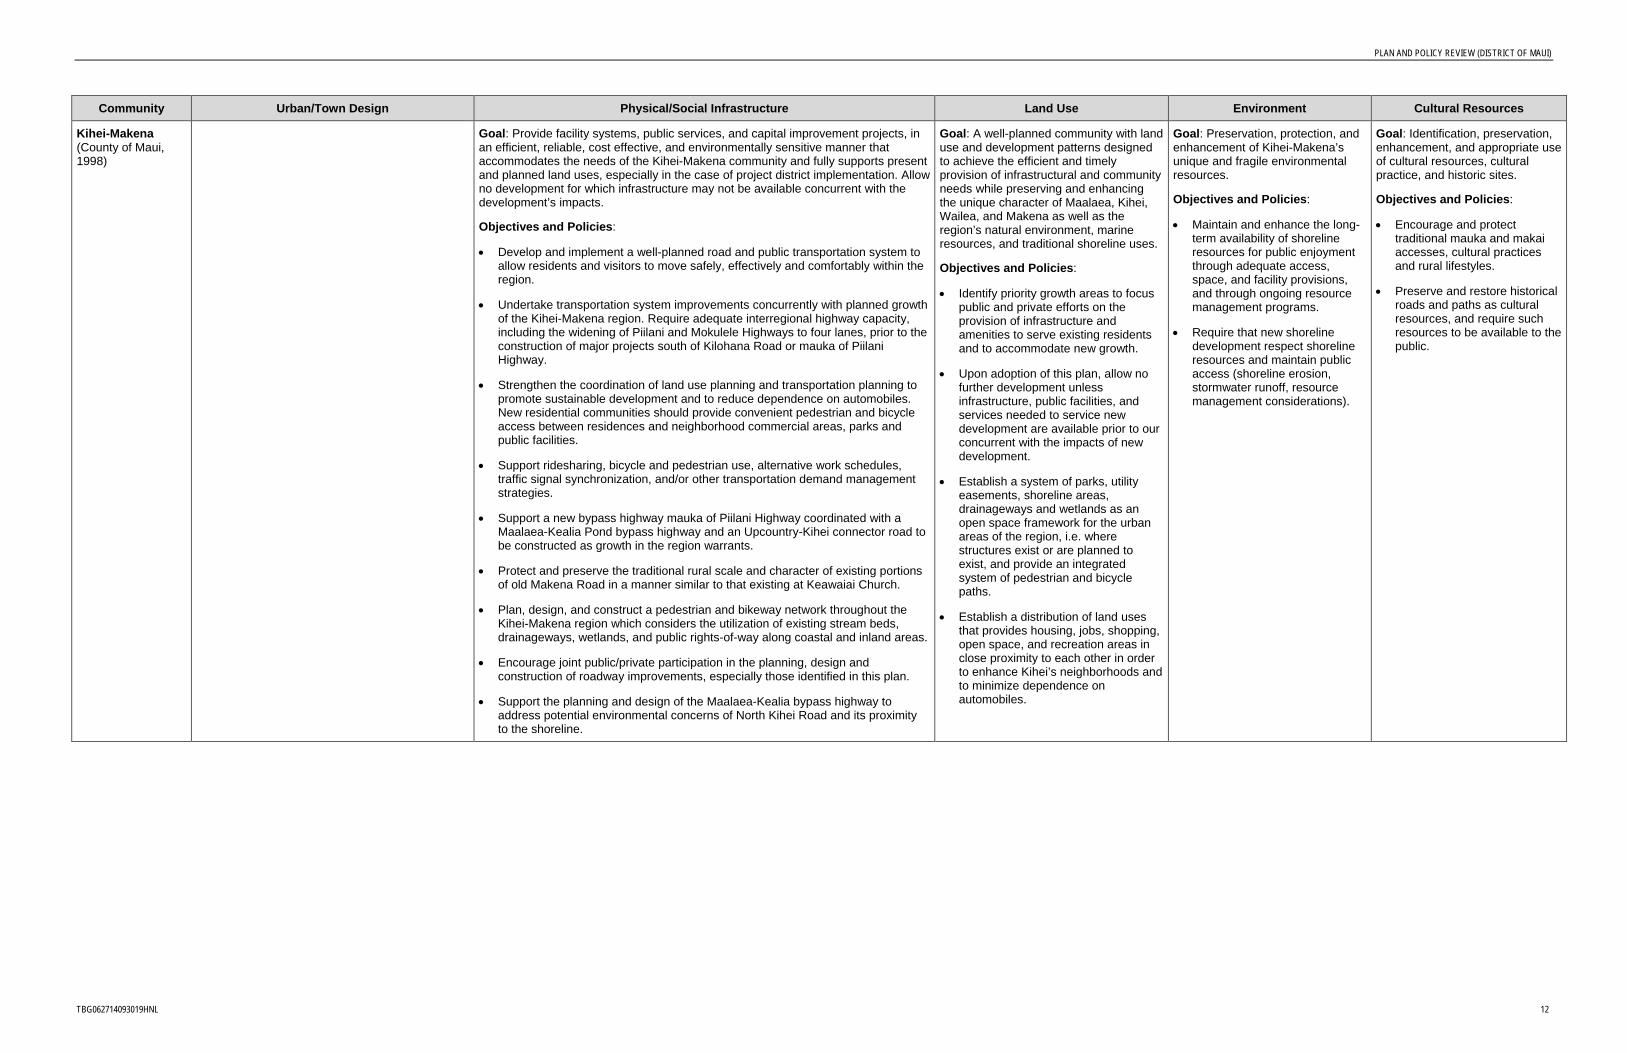
PLAN AND POLICY REVIEW (DISTRICT OF MAUI)
TBG062714093019HNL 12
Community Urban/Town Design Physical/Social Infrastructure Land Use Environment Cultural Resources
Kihei-Makena (County of Maui, 1998)
Goal: Provide facility systems, public services, and capital improvement projects, in an efficient, reliable, cost effective, and environmentally sensitive manner that accommodates the needs of the Kihei-Makena community and fully supports present and planned land uses, especially in the case of project district implementation. Allow no development for which infrastructure may not be available concurrent with the development’s impacts.
Objectives and Policies:
• Develop and implement a well-planned road and public transportation system to allow residents and visitors to move safely, effectively and comfortably within the region.
• Undertake transportation system improvements concurrently with planned growth of the Kihei-Makena region. Require adequate interregional highway capacity, including the widening of Piilani and Mokulele Highways to four lanes, prior to the construction of major projects south of Kilohana Road or mauka of Piilani Highway.
• Strengthen the coordination of land use planning and transportation planning to promote sustainable development and to reduce dependence on automobiles. New residential communities should provide convenient pedestrian and bicycle access between residences and neighborhood commercial areas, parks and public facilities.
• Support ridesharing, bicycle and pedestrian use, alternative work schedules, traffic signal synchronization, and/or other transportation demand management strategies.
• Support a new bypass highway mauka of Piilani Highway coordinated with a Maalaea-Kealia Pond bypass highway and an Upcountry-Kihei connector road to be constructed as growth in the region warrants.
• Protect and preserve the traditional rural scale and character of existing portions of old Makena Road in a manner similar to that existing at Keawaiai Church.
• Plan, design, and construct a pedestrian and bikeway network throughout the Kihei-Makena region which considers the utilization of existing stream beds, drainageways, wetlands, and public rights-of-way along coastal and inland areas.
• Encourage joint public/private participation in the planning, design and construction of roadway improvements, especially those identified in this plan.
• Support the planning and design of the Maalaea-Kealia bypass highway to address potential environmental concerns of North Kihei Road and its proximity to the shoreline.
Goal: A well-planned community with land use and development patterns designed to achieve the efficient and timely provision of infrastructural and community needs while preserving and enhancing the unique character of Maalaea, Kihei, Wailea, and Makena as well as the region’s natural environment, marine resources, and traditional shoreline uses.
Objectives and Policies:
• Identify priority growth areas to focus public and private efforts on the provision of infrastructure and amenities to serve existing residents and to accommodate new growth.
• Upon adoption of this plan, allow no further development unless infrastructure, public facilities, and services needed to service new development are available prior to our concurrent with the impacts of new development.
• Establish a system of parks, utility easements, shoreline areas, drainageways and wetlands as an open space framework for the urban areas of the region, i.e. where structures exist or are planned to exist, and provide an integrated system of pedestrian and bicycle paths.
• Establish a distribution of land uses that provides housing, jobs, shopping, open space, and recreation areas in close proximity to each other in order to enhance Kihei’s neighborhoods and to minimize dependence on automobiles.
Goal: Preservation, protection, and enhancement of Kihei-Makena’s unique and fragile environmental resources.
Objectives and Policies:
• Maintain and enhance the long-term availability of shoreline resources for public enjoyment through adequate access, space, and facility provisions, and through ongoing resource management programs.
• Require that new shoreline development respect shoreline resources and maintain public access (shoreline erosion, stormwater runoff, resource management considerations).
Goal: Identification, preservation, enhancement, and appropriate use of cultural resources, cultural practice, and historic sites.
Objectives and Policies:
• Encourage and protect traditional mauka and makai accesses, cultural practices and rural lifestyles.
• Preserve and restore historical roads and paths as cultural resources, and require such resources to be available to the public.

PLAN AND POLICY REVIEW (DISTRICT OF MAUI)
TBG062714093019HNL 13
Community Urban/Town Design Physical/Social Infrastructure Land Use Environment Cultural Resources
Makawao- Pukalani-Kula (County of Maui, 1996)
Goal: Recognition and preservation of the unique design characteristics of the Makawao, Pukalani, and Kula communities in order to enhance Upcountry’s constructed environment.
Objectives and Policies:
• Encourage urban design concepts that promote and produce pedestrian orientation, town centers, mixed land uses and energy conservation principles to enhance the identity and livability of new and existing communities.
• Support the revision of subdivision and roadway design criteria and standards to be more compatible with the rural character of the Upcountry region.
• Support the development of pedestrian, equestrian and bikeway connections that provide safe and convenient linkages within and between Upcountry communities.
• Encourage the use of appropriate landscaping, with greenways where possible, along major roadways, parking areas and land use transition areas to establish and maintain landscape themes which are consistent with the character of each Upcountry community.
Goal: The timely and environmentally sensitive development and maintenance of infrastructure systems which protect and enhance safety and health of Upcountry’s residents and visitors, including the provision of domestic water, utility and waste disposal services, and effective transportation systems that meet the needs of residents and visitors while maintaining the region’s rural character.
Objectives and Policies:
• Ensure the safe and convenient movement of people and goods by providing maintained roadways having adequate carrying capacities.
• Give priority to the “no-build” alternative of the proposed Upcountry-Kihei connector highway.
• Support the planning of new roadways provided that there would be minimal impact to the Upcountry lifestyle and character.
• Improve the road through Haliimaile.
• Encourage and support alternative transportation programs that could include various methods of land use planning and urban design, which reduce reliance on the automobile as the primary mode of travel.
• Support the establishment of a limited service public transportation system to key destinations within the Upcountry area to meet the needs of youth, after school needs of students, seniors and physically disabled.
• Establish safe pathways connecting schools, recreation facilities, and commercial and residential centers for use by walkers, joggers, equestrians, and bicyclists.
• Provide transportation improvements in accordance with the Americans with Disabilities Act, including sidewalks, bikeways, and other traffic safety improvements at existing and proposed school areas to ensure student safety.
• Promote traffic safety through provision of roadway safety and maintenance improvements, and traffic control improvements throughout the region.
• Recognize the need to establish designated truck routes.
• Encourage urban design concepts which promote pedestrian orientation and mixed land uses to reduce automobile travel and promote energy conservation.
• Achieve the energy-efficient movement of people and goods through improvements to the transportation systems serving the planning area.
Goal: The maintenance and enhancement of Upcountry’s unique and diverse rural land use character with sensitivity to existing land use patterns, natural resource values, and economic and social needs of the region’s residents.
Objectives & Policies:
• Encourage land use patterns which will support long-term viability of agriculture, discourage urban sprawl, discourage heavy industrial activities, discourage large-scale hotels, preserve and respect the Haleakala National Park, maintain a separation of character between the Upcountry and the Kihei-Makena regions.
• Recognize the four semi-urban centers of Makawao Town, Pukalani, Haliimaile, and Waiakoa Village.
Support the centralization of business activities and avoid the expansion of strip commercial development.
Support land use spatial patterns that enhance the functional viability of pedestrian-oriented town and village centers.
Goal: Protection of Upcountry’s natural resources and environment as a means of preserving and enhancing the region’s unique beauty, serenity, ecology and productivity, in order that future generations may enjoy and appreciate an environment of equal or higher quality.
Objectives and Policies:
• Encourage federal, state, and county cooperation in the preparation of a comprehensive Haleakala summit master plan to promote orderly and sensitive development that is compatible with the natural and native Hawaiian cultural environment.
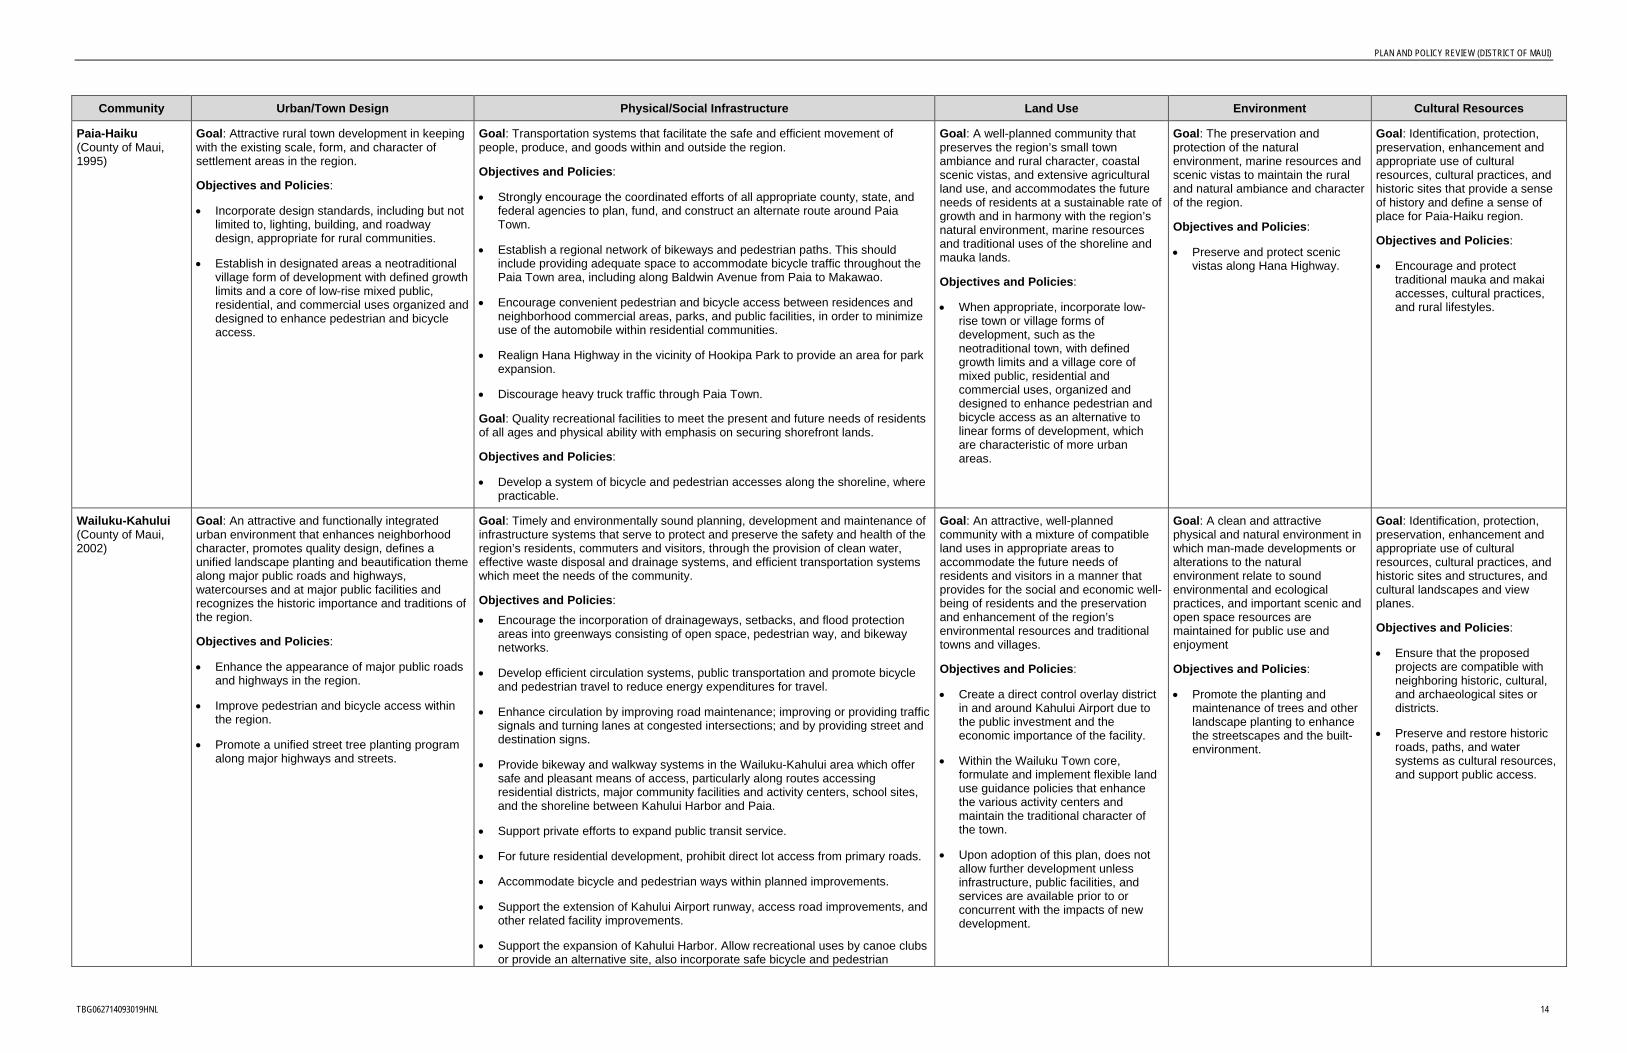
PLAN AND POLICY REVIEW (DISTRICT OF MAUI)
TBG062714093019HNL 14
Community Urban/Town Design Physical/Social Infrastructure Land Use Environment Cultural Resources
Paia-Haiku (County of Maui, 1995)
Goal: Attractive rural town development in keeping with the existing scale, form, and character of settlement areas in the region.
Objectives and Policies:
• Incorporate design standards, including but not limited to, lighting, building, and roadway design, appropriate for rural communities.
• Establish in designated areas a neotraditional village form of development with defined growth limits and a core of low-rise mixed public, residential, and commercial uses organized and designed to enhance pedestrian and bicycle access.
Goal: Transportation systems that facilitate the safe and efficient movement of people, produce, and goods within and outside the region.
Objectives and Policies:
• Strongly encourage the coordinated efforts of all appropriate county, state, and federal agencies to plan, fund, and construct an alternate route around Paia Town.
• Establish a regional network of bikeways and pedestrian paths. This should include providing adequate space to accommodate bicycle traffic throughout the Paia Town area, including along Baldwin Avenue from Paia to Makawao.
• Encourage convenient pedestrian and bicycle access between residences and neighborhood commercial areas, parks, and public facilities, in order to minimize use of the automobile within residential communities.
• Realign Hana Highway in the vicinity of Hookipa Park to provide an area for park expansion.
• Discourage heavy truck traffic through Paia Town.
Goal: Quality recreational facilities to meet the present and future needs of residents of all ages and physical ability with emphasis on securing shorefront lands.
Objectives and Policies:
• Develop a system of bicycle and pedestrian accesses along the shoreline, where practicable.
Goal: A well-planned community that preserves the region’s small town ambiance and rural character, coastal scenic vistas, and extensive agricultural land use, and accommodates the future needs of residents at a sustainable rate of growth and in harmony with the region’s natural environment, marine resources and traditional uses of the shoreline and mauka lands.
Objectives and Policies:
• When appropriate, incorporate low-rise town or village forms of development, such as the neotraditional town, with defined growth limits and a village core of mixed public, residential and commercial uses, organized and designed to enhance pedestrian and bicycle access as an alternative to linear forms of development, which are characteristic of more urban areas.
Goal: The preservation and protection of the natural environment, marine resources and scenic vistas to maintain the rural and natural ambiance and character of the region.
Objectives and Policies:
• Preserve and protect scenic vistas along Hana Highway.
Goal: Identification, protection, preservation, enhancement and appropriate use of cultural resources, cultural practices, and historic sites that provide a sense of history and define a sense of place for Paia-Haiku region.
Objectives and Policies:
• Encourage and protect traditional mauka and makai accesses, cultural practices, and rural lifestyles.
Wailuku-Kahului (County of Maui, 2002)
Goal: An attractive and functionally integrated urban environment that enhances neighborhood character, promotes quality design, defines a unified landscape planting and beautification theme along major public roads and highways, watercourses and at major public facilities and recognizes the historic importance and traditions of the region.
Objectives and Policies:
• Enhance the appearance of major public roads and highways in the region.
• Improve pedestrian and bicycle access within the region.
• Promote a unified street tree planting program along major highways and streets.
Goal: Timely and environmentally sound planning, development and maintenance of infrastructure systems that serve to protect and preserve the safety and health of the region’s residents, commuters and visitors, through the provision of clean water, effective waste disposal and drainage systems, and efficient transportation systems which meet the needs of the community.
Objectives and Policies:
• Encourage the incorporation of drainageways, setbacks, and flood protection areas into greenways consisting of open space, pedestrian way, and bikeway networks.
• Develop efficient circulation systems, public transportation and promote bicycle and pedestrian travel to reduce energy expenditures for travel.
• Enhance circulation by improving road maintenance; improving or providing traffic signals and turning lanes at congested intersections; and by providing street and destination signs.
• Provide bikeway and walkway systems in the Wailuku-Kahului area which offer safe and pleasant means of access, particularly along routes accessing residential districts, major community facilities and activity centers, school sites, and the shoreline between Kahului Harbor and Paia.
• Support private efforts to expand public transit service.
• For future residential development, prohibit direct lot access from primary roads.
• Accommodate bicycle and pedestrian ways within planned improvements.
• Support the extension of Kahului Airport runway, access road improvements, and other related facility improvements.
• Support the expansion of Kahului Harbor. Allow recreational uses by canoe clubs or provide an alternative site, also incorporate safe bicycle and pedestrian
Goal: An attractive, well-planned community with a mixture of compatible land uses in appropriate areas to accommodate the future needs of residents and visitors in a manner that provides for the social and economic well-being of residents and the preservation and enhancement of the region’s environmental resources and traditional towns and villages.
Objectives and Policies:
• Create a direct control overlay district in and around Kahului Airport due to the public investment and the economic importance of the facility.
• Within the Wailuku Town core, formulate and implement flexible land use guidance policies that enhance the various activity centers and maintain the traditional character of the town.
• Upon adoption of this plan, does not allow further development unless infrastructure, public facilities, and services are available prior to or concurrent with the impacts of new development.
Goal: A clean and attractive physical and natural environment in which man-made developments or alterations to the natural environment relate to sound environmental and ecological practices, and important scenic and open space resources are maintained for public use and enjoyment
Objectives and Policies:
• Promote the planting and maintenance of trees and other landscape planting to enhance the streetscapes and the built-environment.
Goal: Identification, protection, preservation, enhancement and appropriate use of cultural resources, cultural practices, and historic sites and structures, and cultural landscapes and view planes.
Objectives and Policies:
• Ensure that the proposed projects are compatible with neighboring historic, cultural, and archaeological sites or districts.
• Preserve and restore historic roads, paths, and water systems as cultural resources, and support public access.

PLAN AND POLICY REVIEW (DISTRICT OF MAUI)
TBG062714093019HNL 15
Community Urban/Town Design Physical/Social Infrastructure Land Use Environment Cultural Resources access. Support the investigation of alternative sites for a second commercial harbor facility.
• Support extension of Waiale Drive to a new intersection with Honoapiilani Highway.
• Preserve Waiale Bridge
• Preserve the character of Honoapiilani Highway between Waikap and Wailuku by maintaining two travel lanes and the existing trees.
West Maui (County of Maui, 1996)
Goal: An attractive and functionally integrated urban environment that enhances neighborhood character, promotes quality design at the resort destinations of Kaanapali and Kapalua, defines a unified landscape planting and beautification theme along major public roads and highways, watercourses and at major public facilities and recognizes the historic importance and traditions of the region.
Objectives and Policies:
• Enhance the appearance of major public roads and highways in the region.
• Maintain a high level of design quality for West Maui resort destination areas.
• Improve pedestrian and bicycle access within the region.
• Promote a unified street tree planting program along major highways and streets.
Goal: Timely and environmentally sound planning, development and maintenance of infrastructure systems that serve to protect and preserve the safety and health of the region’s residents, commuters and visitors, through the provision of clean water, effective waste disposal and drainage systems, and efficient transportation systems which meet the needs of the community.
Objectives and Policies:
• Support construction of the planned Lahaina Bypass Road in such a way as to promote safe, efficient travel across the region without encouraging further urbanization or impeding agricultural operations.
• Support the provision of an alternative route between West Maui and Central Maui
• Support improvements for the safe and convenient movement of people and goods, pedestrians and bicyclists in the Lahaina region.
• Support ridesharing, programs to promote safe bicycle and pedestrian travel, alternative work schedules, traffic signal synchronization, and other transportation demand management strategies.
• Promote residential communities that provide convenient pedestrian and bicycle access between residences and neighborhood commercial areas, parks and public facilities, in order to minimize use of the automobile.
• Provide landscaping along major local streets in Lahaina town to enhance the street level walking and driving experience, to aid in orientation, and to emphasize mauka-makai views.
• Establish Front Street and Wainee Street as local roads within Lahaina Town with an emphasis on enhancing pedestrian and bicycle amenities.
• Eliminate bus traffic on Front Street north of Dickenson Street.
• Provide adequate facilities for marine related light industrial activities.
• Maintain a community airstrip in the Mahinahina area and limit the current size, scale and level of services at the airstrip through conditional zoning.
• Create a direct control overlay district in and around the Kapalua/West Maui Airport.
Goal: Develop and maintain an efficient and responsive system of public services which promotes a safe, healthy, and enjoyable lifestyle, and offers opportunities for self-improvement and community well-being.
Objectives and Policies:
• Ensure adequate public access to suitable mauka recreational areas.
• Ensure adequate public access to shoreline areas.
Goal: An attractive, well-planned community with a mixture of compatible land uses in appropriate areas to accommodate the future needs of residents and visitors in a manner that provides for stable social and economic well-being of residents and the preservation and enhancement of the region’s open space areas and natural environment.
Objectives and Policies:
• Where possible, relocate the Honoapiilani Highway south of Puamana in order to reduce potential inundation and disruption of service due to storm-generated wave action.
Goal: A clean and attractive physical, natural and marine environment are based on sound environmental and ecological practices, and important scenic and open space resources are preserved and protected for public use and enjoyment
Objectives and Policies:
• Promote the planting of trees and other landscape planting to enhance the streetscapes and the built-environment.
• Protect the shoreline and beaches by preserving waterfront land as open space wherever possible. (shoreline retreat & hazard buffer zone)
Goal: To preserve, protect and restore those cultural resources and sites that best represent and exemplify the Lahaina region’s pre-contact, Hawaiian monarchy, missionary, and plantation history.
Objectives and Policies:
• Encourage and protect traditional shoreline and mountain access, cultural practices and rural/agricultural lifestyles. Ensure adequate access to our public shoreline areas for public recreation, including lateral continuity.

PLAN AND POLICY REVIEW (DISTRICT OF MAUI)
TBG062714093019HNL 16
Maui Long-Range Land Transportation Plan, HDOT, April 1997 Purpose and Content The Maui Long-Range Land Transportation Plan was developed in cooperation with the County of Maui. It serves as a guide to major surface transportation facilities and programs to year 2020. The plan is intended to identify long-range strategies and actions, as well as short-range improvements that will lead to the development of an integrated inter-modal transportation system that facilitates the efficient movement of people and goods.
The plan contains a financial element that identifies both current and potential future sources of revenue that may be available for implementation of the plan. Overall, $1.8 billion in the plan period was estimated.
The long-range land transportation plan was developed in accordance with requirements of the 1991 Intermodal Surface Transportation Efficiency Act. The plan was developed under the auspices of the Countywide Transportation Planning Process-Maui to involve the appropriate parties and secure their commitment and support of the recommendations.
Findings Related to the Plan The recommended implementation plan is summarized in the tables below, which are excerpted directly from the plan.
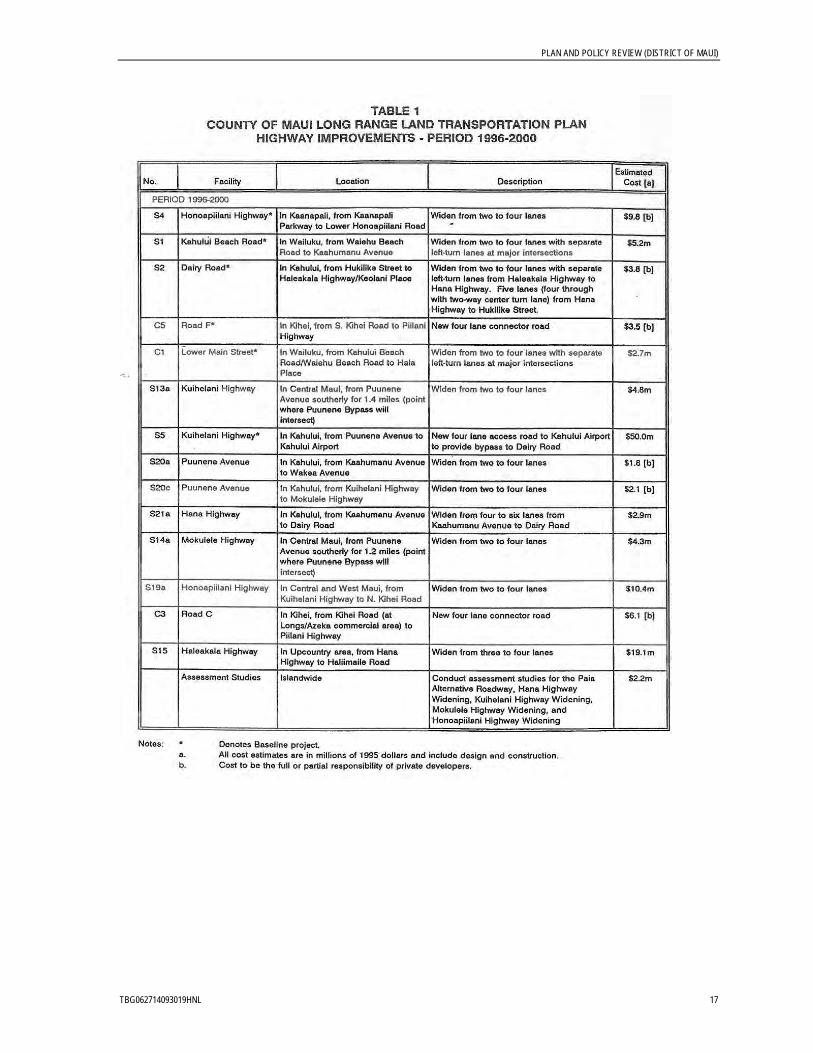
PLAN AND POLICY REVIEW (DISTRICT OF MAUI)
TBG062714093019HNL 17
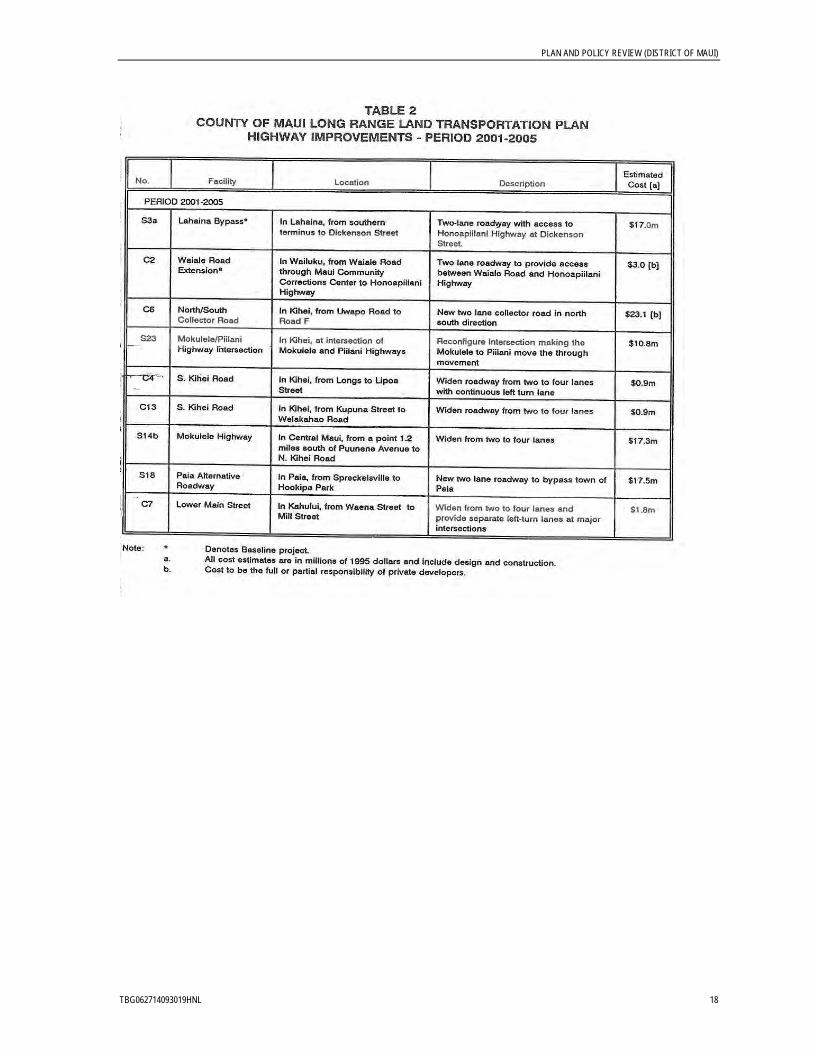
PLAN AND POLICY REVIEW (DISTRICT OF MAUI)
TBG062714093019HNL 18

PLAN AND POLICY REVIEW (DISTRICT OF MAUI)
TBG062714093019HNL 19

PLAN AND POLICY REVIEW (DISTRICT OF MAUI)
TBG062714093019HNL 20
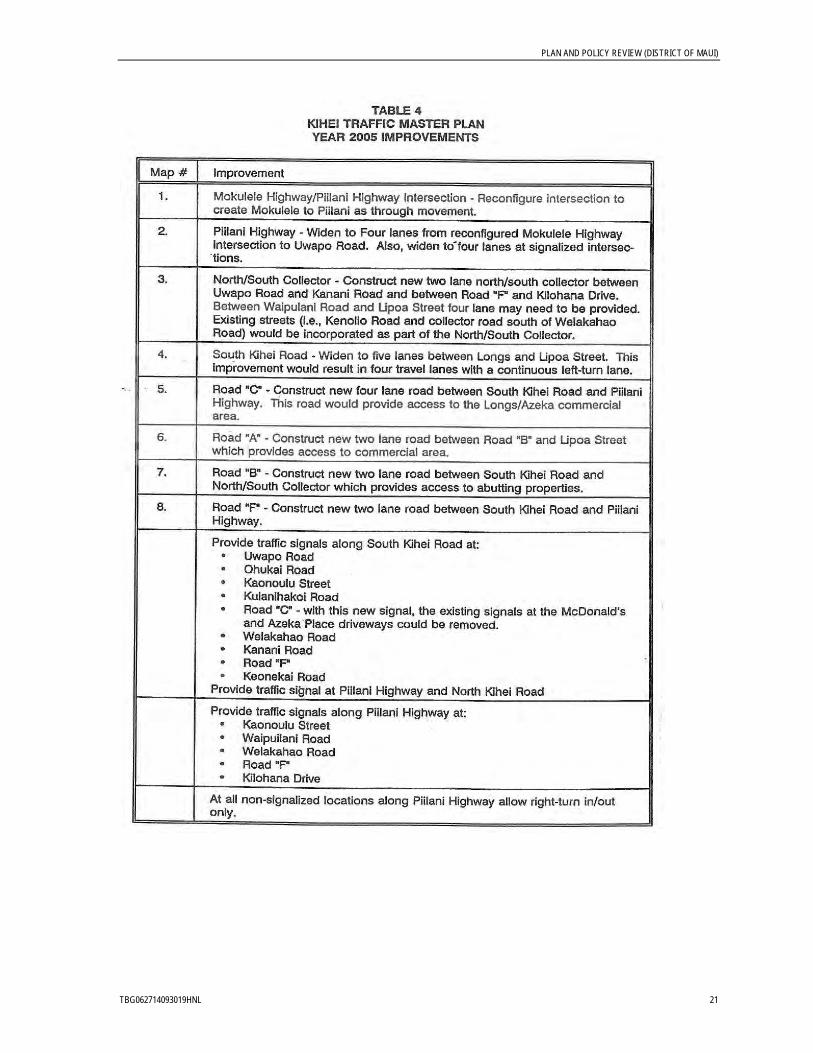
PLAN AND POLICY REVIEW (DISTRICT OF MAUI)
TBG062714093019HNL 21

PLAN AND POLICY REVIEW (DISTRICT OF MAUI)
TBG062714093019HNL 22
The Regional Federal-Aid Highways 2035 Transportation Plan for the District of Maui shall take into consideration project recommendations. These recommendations, however, were developed over 10 years ago and will be vetted against current conditions and long-range priorities. The travel demand model, land use, and stakeholder input will address appropriateness of the remaining recommendations.
Alignment with the Planning Factors The plan recommendations focused on Economic Vitality and Mobility by providing for the efficient movement of people and goods.
PLAN AND POLICY REVIEW (DISTRICT OF MAUI)
TBG062714093019HNL 23
Joint State/County Maui Interim Transportation Plan, HDOT, January 2002 Purpose and Content The Maui Interim Transportation Plan (Maui ITP) is a joint effort between the County of Maui and HDOT in consultation with an Ad Hoc Citizens Advisory Committee. The purpose of the plan is to develop interim solutions to relieve traffic congestion on the island of Maui until long-term solutions can be implemented. The plan also attempts to consolidate multiple efforts, including those of the West Maui Traffic Action Committee and the Mayor’s Transportation Action Committee, to develop alternative solutions to mitigate traffic congestion.
The Maui ITP was developed under the auspices of the Countywide Transportation Planning Process-Maui to involve the appropriate parties and secure their commitment and support of the recommendations.
Findings Related to the Plan The focus of the Maui ITP was to address congestion on specific corridors. Recommendations included:
East Maui/Upcountry • Expedite the Paia Bypass.
• Perform a Paia Town study.
• Phase the Haleakala Highway four-lane divided highway project, with the first phase encompassing the Hana Highway/Haleakala Highway intersection.
West Maui • Investigate use of Cane Haul Road as an interim roadway (in conjunction with Keawe
Street).
• Construct first phase of the Lahaina Bypass between Kapunakea Street and Lahainaluna Road and the connector road from Honoapiilani Highway to Lahaina Bypass.
• Initiate a project to widen Honoapiilani Highway to a four-lane facility between Dickenson Street to approximately 1,000 feet south of Front Street.
The Regional Federal-Aid Highways 2035 Transportation Plan for the District of Maui shall take into consideration recommendations made by the Maui ITP. These recommendations, however, will be taken into consideration as intended, as interim solutions to supplement the long-range priorities. The travel demand model, land use, and stakeholder input will address appropriateness of the recommendations.
Alignment with the Planning Factors The project recommendations focused on interim solutions to address congestion within major corridors on Maui. The focus is most closely aligned to the Mobility planning factor.
PLAN AND POLICY REVIEW (DISTRICT OF MAUI)
TBG062714093019HNL 24
Maui County Short-Range Transit Plan, County of Maui DOT, January 2005 Purpose and Content The Maui County Short-Range Transit Plan provides details on how to implement public transit, and what steps might be taken to do so. It includes guidelines on developing a marketing program to ‘brand’ Maui transit and lays out a potential short-term (5-year) implementation plan for transit and paratransit services. It also includes a financial plan that identifies funding sources for and capital costs of operating a transit program. The purpose of this plan is to provide additional, specific information on operating public transit in Maui to complement the Public Transportation Plan for the Island of Maui (2003).
Findings Related to the Plan Goals of the Short-Range Transit Plan include:
• Provide a transit system that effectively meets community needs and improves the quality of life.
• Operate and manage the transit system efficiently.
• Provide accessible transit services (multimodal linkages).
The Regional Federal-Aid Highways 2035 Transportation Plan for the District of Maui will be developed in alignment with the transit goals outlined in the Maui County Short-Range Transit Plan, and will be consistent with the overall vision of the Maui DOT for public transit.
Alignment with the Planning Factors The plan focuses on providing Modal Integration while enhancing the Economic Vitality of the island and Mobility for residents and visitors.
PLAN AND POLICY REVIEW (DISTRICT OF MAUI)
TBG062714093019HNL 25
Maui County Multi-Hazard Mitigation Plan, County of Maui, Civil Defense Agency, January 2010 Purpose and Content The purpose of the Maui County Hazard Mitigation Plan is to reduce or minimize human and property loss, economic disruption, ecosystem degradation and cultural or historical destruction from a natural disaster. The plan also provides a basis for coordination of state and county hazard mitigation programs, and encourages coordination between agencies responsible for implementing hazard mitigation through building standards and local land use development decisions and practices.
This multi-hazard mitigation plan focuses on assessing risk of certain types of natural hazards in the county, and identifying potential mitigation strategies to address these risks. Mitigation strategies should be integrated with other community needs and goals, and could include physical measures (such as improving warning systems and building structures that withstand hurricane forces) as well as regulatory measures (such as creating land planning guidelines to restrict development in high-risk hazard areas).
Findings Related to the Plan Goals of the Maui County Hazard Mitigation Plan that are applicable to the long-range transportation plan include the following:
• Reduce property damages caused by natural disasters. • Reduce economic losses and minimize disruption to local businesses. • Protect the ongoing operations of critical facilities.
Mitigation strategies include ensuring that all lifeline infrastructures are able to withstand hazard events or have contingency plans to quickly recover after a disaster, and that all emergency response critical facilities and communication systems remain operational during hazard events. The Regional Federal-Aid Highways 2035 Transportation Plan for the District of Maui will be developed with consideration given to the above strategies.
Alignment with the Planning Factors The multi-hazard mitigation plan supports the planning factors by promoting Safety, and enhancing Transportation Access and Mobility and Security during a natural hazard event.

PLAN AND POLICY REVIEW (DISTRICT OF MAUI)
TBG062714093019HNL 26
Molokai Long-Range Land Transportation Plan, HDOT, February 1997 Purpose and Content The purpose of the Molokai Long-Range Land Transportation Plan is to provide a transportation improvement plan through the Year 2020. The plan identifies issues and needs for land transportation facilities on the island, based upon socio-economic and land use forecasts for Molokai.
Moderate growth is expected on Molokai. The plan enforces a growth strategy for the island by designating areas appropriate for future urbanization and revitalization through highway facility development. The plan also summarizes existing and future forecasted transportation conditions, identifies deficiencies on highway facilities, and documents conclusions and recommendations for improvement projects or actions to address growth. Environmental, political, social, and economic issues which may need to be addressed as part of project or program implementation are identified. These projects will be incorporated into the overall planning and budgeting process for the HDOT and the County of Maui Department of Public Works.
The Molokai Long-Range Land Transportation Plan was developed under the guidance of three committees: the Policy Committee, the Technical Advisory Committee, and the Citizens Advisory Committee. The general public also was invited to attend and participate in scheduled Ad Hoc Citizens Advisory Committee meetings.
Findings Related to the Plan The goal of the Molokai Long-Range Land Transportation Plan is to implement a land transportation system that will not only provide safe and efficient movement of people, goods, and services through the Year 2020 but take into account public sentiment and the unique character of Molokai.
In the Year 2020, highway deficiencies are expected due to existing substandard roadway cross-sections and drainage issues. Major intersection movements are also expected to incur high delay times. The plan includes recommendations for specific future highway improvements, and stresses maintenance and improvement of the existing roadway system using community policies and guidelines. These recommendations, in priority order, are:
• Improve the existing drainage crossing Maunaloa Highway at Kaunakakai Stream, west of Kaunakakai Town, to an all-weather highway crossing by upgrading the drainage culverts under the highway or by constructing a bridge over the stream.
• Improve Kamehameha V Highway in East Molokai to a minimum 10 foot-wide lanes.
• Construct a modern roundabout at the intersection of Maunaloa Highway/Kamehameha V Highway and Ala Malama Avenue/Kaunakakai Place.
• Construct an all-weather highway crossing at the existing ford on Kamehameha V Highway at Kamalo 10.8 miles east of Kaunakakai Town.

PLAN AND POLICY REVIEW (DISTRICT OF MAUI)
TBG062714093019HNL 27
• Construct an all-weather highway crossing at the existing ford on Kamehameha V Highway at Ualapue 13.2 miles east of Kaunakakai Town.
• Construct an all-weather highway crossing at the existing ford on Kamehameha V Highway at Pukoo 16.0 miles east of Kaunakakai Town.
• Widen Maunaloa Highway at Kalae Highway to provide an exclusive left turn lane and a median left turn merge lane to facilitate the left turn movements to and from Kalae Highway.
• Widen Maunaloa Highway, between Kalae Highway and Ala Malama Avenue to include 12 foot-wide lanes in both directions and 6 foot-wide paved shoulders on both sides of the highway.
Alignment with the Planning Factors The focus on highway facility improvement in the Molokai Long-Range Land Transportation Plan aligns with several of the planning factors: System Preservation, System Efficiency Management and Operations, Economic Vitality, and Safety. The emphasis on community values supports the Environment and Sustainability, and Transportation Access Mobility planning factors.
PLAN AND POLICY REVIEW (DISTRICT OF MAUI)
TBG062714093019HNL 28
Kahului Commercial Harbor 2030 Master Plan and Draft Environmental Impact Statement, HDOT Harbors Division, December 2007 Purpose and Content This master plan is an update to the Kahului Commercial Harbor 2025 Master Plan. The 2025 Master Plan was a long-range guide to developing, maintaining, and enhancing Kahului Harbor on the Island of Maui. It provided recommendations on harbor improvements through 2025 that were mainly focused on accommodating overall long-term growth in cargo and commercial operations.
The Kahului Commercial Harbor 2030 Master Plan includes short- and long-term improvements through 2030. It specifically focuses on improvements to cargo (prioritizing cargo operations over other commercial operations) and recommendations that produce near-term results (in addition to long-term benefits). The 2030 Master Plan includes an EIS that evaluates the recommended improvements in terms of potential impact to areas such as air quality, traffic, public services, and infrastructure, and cultural, historic, visual, aesthetic, and recreational resources.
Findings Related to the Plan Primary objectives of the commercial harbor master plan include:
• Provide space and facilities to meet current and anticipated future demand associated with movement of cargo to and from Maui, while encouraging efficient, space-saving operations.
• Implement in the near future steps to decrease congestion within the harbor.
• Make space for operations of an inter-island ferry and cruise ships within the harbor. Cruise ships would be limited to no more than one dedicated berth at Kahului Commercial Harbor, but use of other berths for cruise ships would be possible, based on availability.
• Continue to respect recreational uses in the Kahului Commercial Harbor area.
Secondary objectives of the master plan include:
• Where possible, separate cargo and passenger operations for reasons of safety, efficiency, and visitor satisfaction with Maui.
• Develop facilities that can accommodate multiple uses in the event that vessels and demand change in the years to come.
Recommended improvements, additions, or modifications to the harbor are documented in the master plan, and are based on the knowledge and experience of harbor users and their anticipated future needs. Two development alternatives and one no-action alternative are described.

PLAN AND POLICY REVIEW (DISTRICT OF MAUI)
TBG062714093019HNL 29
Alternative A includes development of cruise and inter-island ferry facilities at the West Breakwater Harbor Development. It also recommends expansion of Piers 1 and 2 for cargo operations and a new fuel facility at Pier 3 or 4.
Alternative B includes development of cruise and inter-island ferry facilities at Pier 2 and expanded cargo facilities at Piers 1 and 3 and at the West Breakwater Harbor Development.
No Action Alternative assumes no expansion of existing facilities, except for projects already planned and approved under the 2025 Master Plan Final Environmental Assessment.
Although the 2030 Master Plan does not recommend improvements at specific roadway locations or intersections, local community plans such as the Wailuku-Kahului Community Plan do offer guidance on specific future roadway improvements, and were considered when developing the alternatives for the EIS. Operations on the connection or interface roads between harbor facilities and the highway network should also be maintained.
Coordination with the Statewide Transportation Planning Office, the Highways Division, and the Harbors Division will occur when developing planned improvements. The statewide and regional long-range transportation plans will take into account the roadway needs for Kahului Harbor to support maritime growth.
Alignment with the Planning Factors The master harbor plan supports Economic Vitality by prioritizing the efficient transport of cargo and goods. The master plan also supports System Preservation by addressing potential impacts due to long term harbor growth and future congestion through comprehensive planning of proposed harbor improvements.
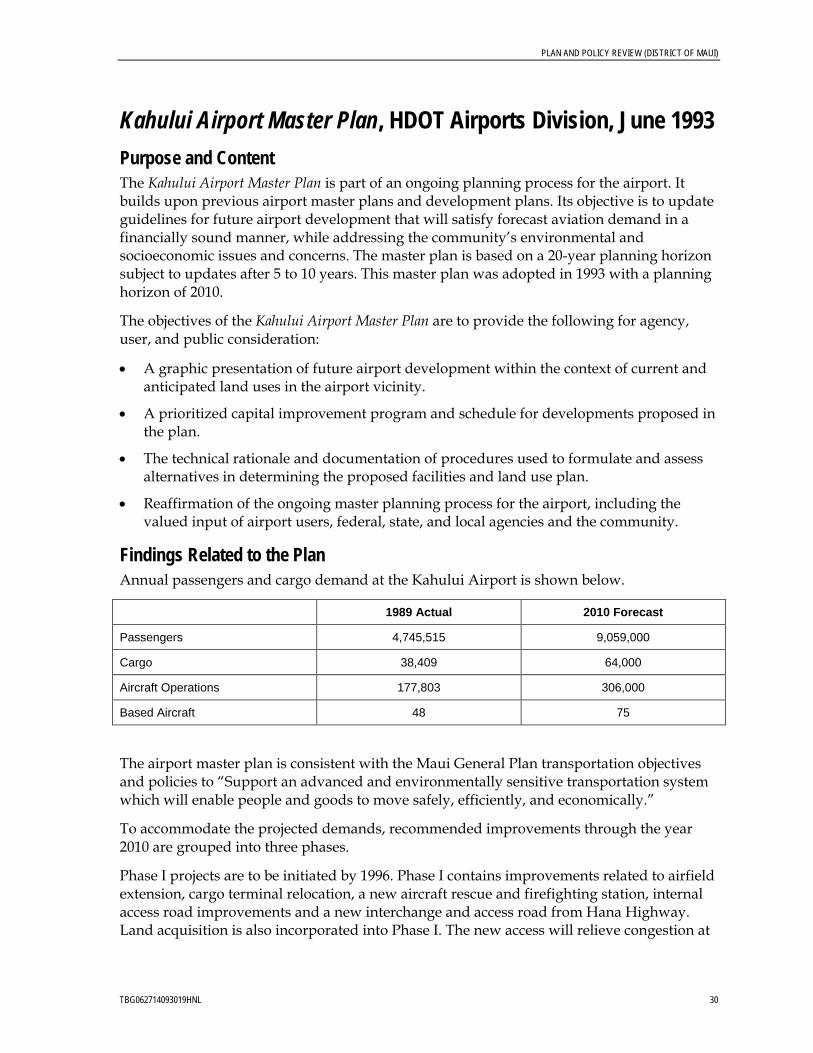
PLAN AND POLICY REVIEW (DISTRICT OF MAUI)
TBG062714093019HNL 30
Kahului Airport Master Plan, HDOT Airports Division, June 1993 Purpose and Content The Kahului Airport Master Plan is part of an ongoing planning process for the airport. It builds upon previous airport master plans and development plans. Its objective is to update guidelines for future airport development that will satisfy forecast aviation demand in a financially sound manner, while addressing the community’s environmental and socioeconomic issues and concerns. The master plan is based on a 20-year planning horizon subject to updates after 5 to 10 years. This master plan was adopted in 1993 with a planning horizon of 2010.
The objectives of the Kahului Airport Master Plan are to provide the following for agency, user, and public consideration:
• A graphic presentation of future airport development within the context of current and anticipated land uses in the airport vicinity.
• A prioritized capital improvement program and schedule for developments proposed in the plan.
• The technical rationale and documentation of procedures used to formulate and assess alternatives in determining the proposed facilities and land use plan.
• Reaffirmation of the ongoing master planning process for the airport, including the valued input of airport users, federal, state, and local agencies and the community.
Findings Related to the Plan Annual passengers and cargo demand at the Kahului Airport is shown below.
1989 Actual 2010 Forecast
Passengers 4,745,515 9,059,000
Cargo 38,409 64,000
Aircraft Operations 177,803 306,000
Based Aircraft 48 75
The airport master plan is consistent with the Maui General Plan transportation objectives and policies to “Support an advanced and environmentally sensitive transportation system which will enable people and goods to move safely, efficiently, and economically.”
To accommodate the projected demands, recommended improvements through the year 2010 are grouped into three phases.
Phase I projects are to be initiated by 1996. Phase I contains improvements related to airfield extension, cargo terminal relocation, a new aircraft rescue and firefighting station, internal access road improvements and a new interchange and access road from Hana Highway. Land acquisition is also incorporated into Phase I. The new access will relieve congestion at
PLAN AND POLICY REVIEW (DISTRICT OF MAUI)
TBG062714093019HNL 31
the Dairy Road intersection, by connecting directly to the terminal loop road. ($133.67 million)
Phase II projects are to be initiated by 2002. The Phase II improvements focus on commercial/cargo facilities, and improvements to fuel storage. Ground transportation facilities in the runway protection zone will be expanded during Phase II. Additional land acquisition would occur for a parallel runway and realignment of Hana Highway. An emergency route will be constructed linking Alahao Street with Old Stable Road. The route will support bicycle and pedestrian traffic, facilitating development of a shoreline trail and will only be open to vehicles during an emergency. The Kanaha Beach Park will also be expanded during this phase of work, increasing regional recreational activity space. ($39.76 million)
Phase III projects are to be initiated by 2010. Phase III improvements include construction of a parallel runway, apron parking, internal access road improvements, and access improvements to/realignment of Hana Highway ($149.17 million).
Alignment with the Planning Factors Kahului Airport improvements in general address the Economic Vitality of the state, by expanding the facility to accommodate additional passengers, cargo, and overseas flights.
Improvements related to ground transportation access and ground transportation facilities acknowledge the Accessibility and Mobility and planning factors, and are mainly focused on vehicular access. Mobility, for pedestrians and bicyclists, as well as overall Safety and Security, are also addressed by the construction of the emergency roadway between Alahao Street and Old Stable Road. System Preservation is addressed by providing relief to the current congested Dairy Road access to the airport facilities.
PLAN AND POLICY REVIEW (DISTRICT OF MAUI)
TBG062714093019HNL 32
Kapalua Airport, HDOT Airports Division Purpose and Content No master plan is currently available.
The Kapalua Airport is in West Maui and is served by commercial propeller air carriers and commuter/air taxi aircraft only. This facility started as a private facility until its acquisition by the State of Hawaii in 1993.
The facility consists of a single runway, terminal facilities, and support facilities. There are no air cargo facilities at this airport. Access to this airport is provided from a two-lane road off of Honoapiilani Highway. Improvements to this airport are limited to certain upgrades only. The runway, apron, and other facilities cannot be expanded without changes to the existing agreement with the County of Maui. Operations are limited to daytime hours only.
The airport is managed by the Maui Airport District, headquartered at Kahului Airport.
Findings Related to the Plan Not applicable.
Alignment with Planning Factors Not applicable.

PLAN AND POLICY REVIEW (DISTRICT OF MAUI)
TBG062714093019HNL 33
Hana Airport Master Plan, HDOT Airports Division, October 1998 Purpose and Content The purpose of the Hana Airport Master Plan is to establish a direction for future growth and development through realization of an extensive series of goals organized around five major issue areas. These issue areas and their goals are summarized below:
Overall Airport Role and Development • Determine a long-range vision for airport development.
• Choose the best uses for airport property.
• Develop, maintain, and operate the airport to maximize safety and convenience to the traveling public.
• Provide for airport-related development to balance community needs with acceptable economic returns.
• Define general aviation and commercial activity and develop consistent with projected demand.
• Develop and maintain community support for airport development.
• Maintain and design Hana Airport as a general aviation and commercial service airport, and develop and market the airport as a charming gateway, with the goal of fully realizing the community’s cultural significance.
Airfield and Airspace • Develop and operate the airport to safely and efficiently meet forecast aviation demand.
• Minimize aircraft delay.
• Maximize airfield and airspace capacity.
• Develop regional cooperation between Federal Aviation Administration and regional airports for safe productive use of the airspace resource.
Terminal Area Development • Provide passenger terminal facilities that are flexible, expandable, adaptable, efficient,
and balanced.
• Maximize public convenience and minimize passenger congestion.
• Maximize the passenger processing capability of the terminal facilities.
Economic Development • Achieve a balance between economic benefits and environmental protection. • Develop and operate the airport to be consistent with the Hana Community Plan.

PLAN AND POLICY REVIEW (DISTRICT OF MAUI)
TBG062714093019HNL 34
Environmental Protection • Protect and enhance the environment on and around the airport consistent with airport
operation.
• Minimize noise impacts.
• Protect the airport by retaining and enhancing land use compatibility of land around it.
• Design, construct, operate, and maintain airport facilities to minimize impacts on the natural environment.
This master plan was adopted in 1998 with a planning horizon of 2017.
Findings Related to the Plan The master plan recommends a phased development plan and capital improvement program with Phase I improvements (2002) being focused on improved accessibility by aircraft and improved terminal area facilities. Phase II (2007) is focused on maintaining existing airside and landside paved areas and Phase III (2017) is focused on reconstruction and maintenance of paved airside and landside surfaces. The cost of the 20-year development plan is estimated to be $10,875,000 (in 1998 dollars).
Alignment with the Planning Factors Hana Airport improvements in general are proposed to accommodate future demands and maintain existing air and landside facilities.
Improvements related to ground transportation access and ground transportation facilities acknowledge the Accessibility and Mobility planning factors, and are mainly focused on vehicular facility Preservation and additional parking demands.
PLAN AND POLICY REVIEW (DISTRICT OF MAUI)
TBG062714093019HNL 35
Lanai Airport Master Plan Update, HDOT Airports Division, June 1999 Purpose and Content The objectives of the Lanai Airport Master Plan Update are to reevaluate, monitor key conditions, and adjust the 1990 Master Plan recommendations if required by changed circumstances. The Master Plan Update will also assist in providing guidelines for future airport development make recommendations which will ensure viability of the airport in a financially sound manner, and address the Lanai Community’s environmental and socioeconomic issues and concerns through the year 2020. This master plan was adopted in 1999 with a planning horizon of 2020.
The objectives of the Lanai Airport Master Plan Update are to provide the following for agency, user, and public consideration:
• A graphic presentation of future airport development within the context of current and anticipated land uses in the airport vicinity.
• A prioritized capital improvement program and schedule for developments proposed in the plan.
• The technical rationale and documentation of procedures used to formulate and assess alternatives in determining the proposed facilities and land use plan.
• Reaffirmation of the ongoing master planning process for the airport, including the valued input of airport users, federal, state, and local agencies and the community.
Findings Related to the Plan The master plan recommends a phased development plan and capital improvement program with Phase I improvements (2010) focused on improving the airfield; new and overlay runways, taxiways, apron space and navigational aids. Associated utility infrastructure improvements and an internal perimeter road are also programmed for Phase I. Total Phase I costs are $19.987 million. Phase II (2020) is focused on completing the Phase I airfield and navigational improvements as well as expanding the terminal building and parking areas. Total Phase II costs are $3.367 million. Phase III (>2020) denotes areas to reserve for airport support, fuel storage, helicopters, general aviation needs and ground transportation. No costs were provided for Phase III.
Alignment with the Planning Factors Lanai Airport improvements in general are proposed to accommodate future demands and maintain existing air and landside facilities.
Improvements related to ground transportation access and ground transportation facilities acknowledge the Accessibility and Mobility and planning factors and are mainly focused on vehicular access.

PLAN AND POLICY REVIEW (DISTRICT OF MAUI)
TBG062714093019HNL 36
Molokai Airport Master Plan, HDOT Airports Division, May 1999 Purpose and Content: The purpose of the Molokai Airport Master Plan is to determine and document the type and extent of aviation facilities needed at Molokai Airport through the year 2020 and to prepare a master plan that satisfies the projected demand. Major elements of the master plan study include an inventory of existing conditions at the Airport and its environs; forecasts of future aviation activity; a determination of future aviation and nonaviation facility requirements; development of a master plan for airport improvements; and development of an implementation plan. This master plan was adopted in 1999 with a planning horizon of 2020.
Findings Related to the Plan Annual passengers and cargo demand at the Molokai Airport is shown below.
1992 Actual 2020 Forecast
Passengers 314,489 497,00
Cargo 1,159 4,600
Aircraft Operations 35,662 39,800
Based Aircraft 3 5
To accommodate the projected demands, recommended improvements through the year 2020 are separated into two phases. Estimated project costs are shown in 1998 dollars.
Phase I projects are to be initiated by 2005. Phase I focuses on preparation for runway extension including land acquisition, grading, drainage improvements. The intersection of Keonelele and Mokulele Avenues is proposed to be depressed (lowered) as part of this phase. ($7.18 million).
Phase II projects are to be initiated by 2020. The Phase II improvements include extending and improving the airfield runway and taxiway. A new terminal building, parking and terminal roadways would be constructed on-site. Off-site transportation improvements include upgrading portions of Hauakea Avenue and Pine Avenue, adding left-turn lanes and constructing Maunaloa Highway tunnel. ($59.47 million)
Alignment with the Planning Factors Molokai Airport improvements in general address the Economic Vitality of the state by upgrading and expanding the facility to accommodate additional passengers and cargo.
Improvements related to ground transportation access and ground transportation facilities acknowledge the Accessibility and Mobility planning factors and are mainly focused on vehicular access. The master plan provides recommended improvements for both on-site circulation/access as well as offsite improvements to the highway system.

PLAN AND POLICY REVIEW (DISTRICT OF MAUI)
TBG062714093019HNL 37
Kalaupapa Airport Master Plan, HDOT Airports Division, May 1990 Purpose and Content The purpose of the Kalaupapa Airport Master Plan is to provide a comprehensive plan for the development of Kalaupapa Airport for 20 years to the year 2008. The development program is constrained by the location of the airport in a Historical Park and Landmark, the dependence on barge transportation for importation of equipment and materials, and the complex land ownership situation involving Hawaiian Home Lands and state, federal, and private land ownership. The master plan addresses eight key issues of development within a complex framework of constraints. These eight issues include the Runway, Apron and Taxiway, Emergency Medical Evacuation at Night, Security of the Aircraft Operating Area, Passenger Terminal Facilities, Airport Support Facilities, Airport Access Road, and Land for Airport Use. This master plan was adopted in 1990 with a planning horizon of 2008.
Findings Related to the Plan Within the Kalaupapa Airport Master Plan, the Priority Action Program states that “the only improvements planned for Kalaupapa within the twenty year horizon of this Master Plan will be made in the 1991 – 1992 time frame.” Improvements include runway, taxiway, and apron improvements, access road improvements, and airfield lighting.
Alignment with the Planning Factors The Kalaupapa Master Plan focuses mainly on bringing the airport facilities into compliance with Safety and other Federal Aviation Administration requirements. Safety is also improved with provision of runway lighting that allows nighttime medical emergency and air rescue operations to occur. Additionally, with these improvements, Economic Vitality of the community can be increased by allowing more aircraft access (visitors) to the town.
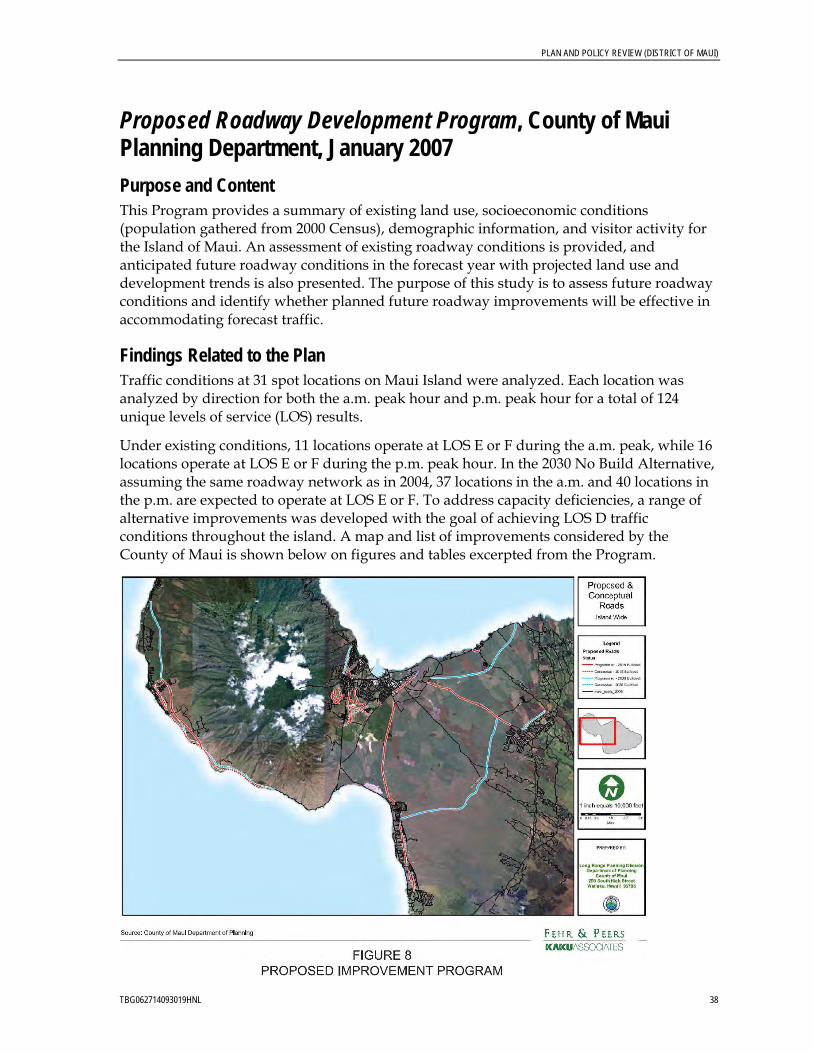
PLAN AND POLICY REVIEW (DISTRICT OF MAUI)
TBG062714093019HNL 38
Proposed Roadway Development Program, County of Maui Planning Department, January 2007 Purpose and Content This Program provides a summary of existing land use, socioeconomic conditions (population gathered from 2000 Census), demographic information, and visitor activity for the Island of Maui. An assessment of existing roadway conditions is provided, and anticipated future roadway conditions in the forecast year with projected land use and development trends is also presented. The purpose of this study is to assess future roadway conditions and identify whether planned future roadway improvements will be effective in accommodating forecast traffic.
Findings Related to the Plan Traffic conditions at 31 spot locations on Maui Island were analyzed. Each location was analyzed by direction for both the a.m. peak hour and p.m. peak hour for a total of 124 unique levels of service (LOS) results.
Under existing conditions, 11 locations operate at LOS E or F during the a.m. peak, while 16 locations operate at LOS E or F during the p.m. peak hour. In the 2030 No Build Alternative, assuming the same roadway network as in 2004, 37 locations in the a.m. and 40 locations in the p.m. are expected to operate at LOS E or F. To address capacity deficiencies, a range of alternative improvements was developed with the goal of achieving LOS D traffic conditions throughout the island. A map and list of improvements considered by the County of Maui is shown below on figures and tables excerpted from the Program.
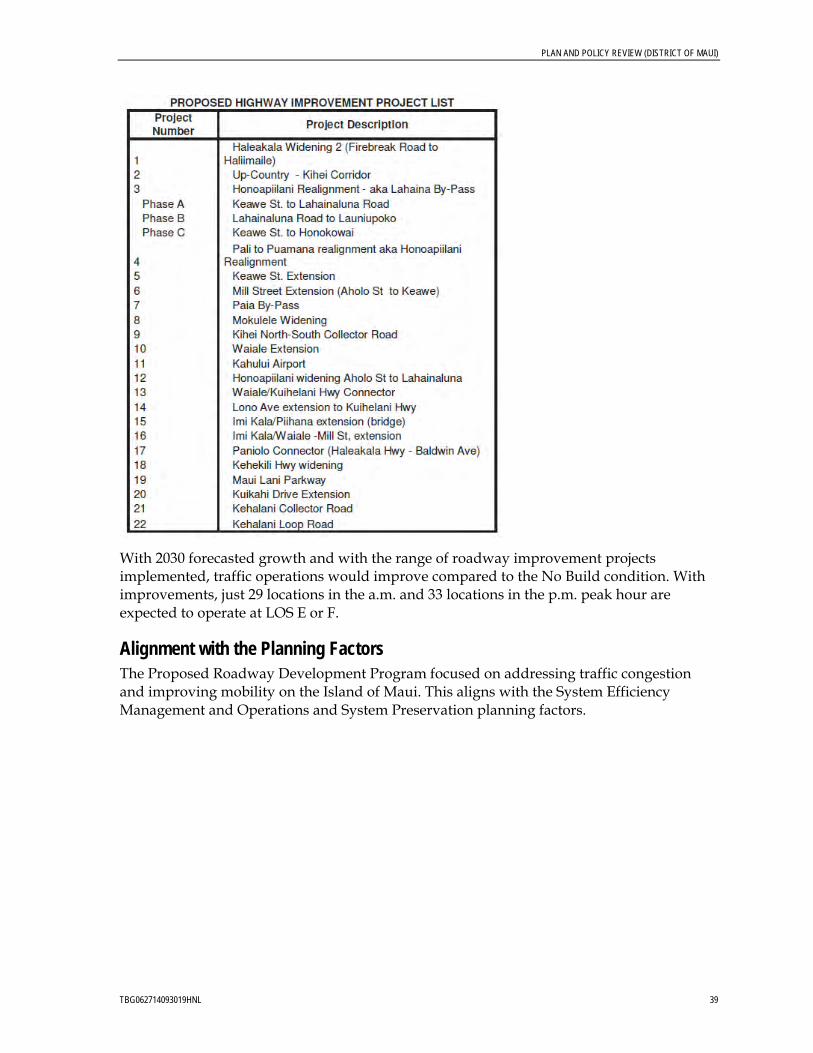
PLAN AND POLICY REVIEW (DISTRICT OF MAUI)
TBG062714093019HNL 39
With 2030 forecasted growth and with the range of roadway improvement projects implemented, traffic operations would improve compared to the No Build condition. With improvements, just 29 locations in the a.m. and 33 locations in the p.m. peak hour are expected to operate at LOS E or F.
Alignment with the Planning Factors The Proposed Roadway Development Program focused on addressing traffic congestion and improving mobility on the Island of Maui. This aligns with the System Efficiency Management and Operations and System Preservation planning factors.

PLAN AND POLICY REVIEW (DISTRICT OF MAUI)
TBG062714093019HNL 40
Resolution No. 12-34: A Resolution Establishing a Complete Streets Policy for the County of Maui, Council of the County of Maui, Adopted April 10, 2012 Purpose and Content The Council of the County of Maui adopted a Complete Street Policy to:
• Promote safe access for pedestrians, bicyclists, motorists, and public transportation users of all ages and abilities.
• Support and encourage multiple travel modes and include safe and ample space for pedestrians, bicyclists, and public transportation.
• Integrate all travel modes in the design of streets and highways, especially in and around town cores.
• Promote public transit and non-motorized travel as alternatives to single-passenger automobile travel.
• Encourage healthy lifestyles.
• Develop a connected and complete transportation network that reduces hazards and improves safety for pedestrians and cyclists, especially vulnerable populations who may be unable to operate a motor vehicle.
The resolution was developed in response to ACT 54, a 2009 Legislative Act that required counties to adopt a Complete Streets policy. The resolution was also developed to align with national engineering, planning and health organizations, numerous transportation agencies throughout the United States and the Countywide Policy Plan.
Findings Related to the Plan The resolution states that all roadway projects be balanced and equitable in accommodating all modes of travel including non-motorized users of all ages and abilities in accordance with Complete Streets principles.
The resolution is consistent with the direction of the Countywide Policy Plan which prioritizes safe, complete connections for pedestrians and bicyclists between and within communities, and requires developments to be designed with pedestrians in mind.
Alignment with the Planning Factors The Complete Streets policy addresses many of the planning factors including increasing Safety, Accessibility, and Mobility for all modes of travel with proper planning and design for all modes. The Environment and Sustainability of the county will also be enhanced because various modes of travel are encouraged.
PLAN AND POLICY REVIEW (DISTRICT OF MAUI)
TBG062714093019HNL 41
Final Environmental Impact Statement Honoapiilani Highway (FAP Route 30) Puamana to Honokowai, Maui County, 1990 Purpose and Content This FEIS was completed in 1990, and assessed existing (1987) and future (2007) forecasted traffic conditions through the Lahaina area between Puamana and Honokowai along Honoapiilani Highway. The study concluded that traffic demand would exceed the capacity of the highway in 2007; therefore, various corridor alternatives to improve congestion and address anticipated future traffic deficiencies were developed and evaluated.
Findings Related to the Plan The preferred alternative included a new roadway, mauka of the existing Honoapiilani Highway, in land that was designated for agricultural use. (Land use boundary changes would be necessary to implement the preferred alternative.) This new road would consist of two-lane and four-lane sections, and would connect Puamana to Honokowai by allowing trips to bypass Lahaina.
The Regional Federal-Aid Highways 2035 Transportation Plan for the District of Maui shall take into consideration the preferred alternative, and will compare it against current traffic conditions and current long-range priorities.
Alignment with the Planning Factors The FEIS focused mainly on addressing traffic congestion and improving mobility in the Lahaina area. This aligns with the System Efficiency Management and Operations, System Preservation, and Economic Vitality planning factors.

PLAN AND POLICY REVIEW (DISTRICT OF MAUI)
TBG062714093019HNL 42
Kihei Traffic Master Plan, County of Maui Department of Public Works and County of Maui Planning Department, October 1996 Purpose and Content The purpose of the Kihei Traffic Master Plan was to build upon the work conducted for the Maui Long-Range Land Transportation Plan (1997) and focus on localized traffic issues within the Kihei area. By focusing on local and collector streets rather than the regional and the sub-regional highways, specific short-range traffic improvements could be developed with the intention of implementation in the short term (within 10 years).
The Kihei Traffic Master Plan included an assessment of existing (1994) traffic conditions and future (2005) forecasted traffic conditions at 19 intersections along South Kihei Road and along Piilani Highway. Both the morning and the evening peak hours were analyzed.
By 2005, all but one of the study intersections was expected to operate at LOS F in the morning or evening or both peak hours.
Findings Related to the Plan Long-range improvements identified through work on the Maui Long-Range Land Transportation Plan included roadway widening and the construction of new connector roadways within Kihei.
• Reconfigure the intersection of Mokulele Highway/Piilani Highway to make the through movement between Mokulele Highway and Piilani Highway the major movement.
• Widen Piilani Highway to four lanes between Mokulele Highway and Uwapo Road and at signalized intersections for up to 300 feet on each side.
• Construct new two-lane north/south collector between Uwapo Road and Kanani Road and between Road F and Kilohana Drive.
• Widen S. Kihei Road to five lanes between Longs Drugstore and Lipoa Street.
• Construct new four-lane road, Road C, between S. Kihei Road and Piilani Highway, located north of Lipoa Street.
• Construct new two-lane road, Road A, from Road B and Lipoa Street between S. Kihei Road and the new north/south collector.
• Construct new two-lane road, Road B, between S. Kihei Road and the new north/south collector.
• Construct new two-lane road, Road F, between S. Kihei Road and Piilani Highway.
Short-range improvements included signalization of stop-controlled intersections and additional capacity at specific intersections.
• Signalize the following intersections on S. Kihei Road:
− Uwapo Road
PLAN AND POLICY REVIEW (DISTRICT OF MAUI)
TBG062714093019HNL 43
− Ohukai Road − Kaonoulu Street − Kulanihakoi Road − Road C (remove signal at McDonalds and Azeka Place driveways) − Welakahao Road − Kanani Road − Road F − Keonekai Road − Piilani Highway
• Signalize the following intersections on Piilani Highway:
− Kaonoulu Street − Waipulani Road − Welakahao Road − Road F − Kilohana Drive
• Control access to/from Piilani Highway. Only allow right-turns in and right-turns out at the following stop-controlled intersections:
− Kulanihakoi Street − Kanani Road − Keonekai Road
The Regional Federal-Aid Highways 2035 Transportation Plan for the District of Maui shall take into consideration the identified improvements, and will compare it against current traffic conditions and current long-range priorities.
Alignment with the Planning Factors The Kihei Traffic Master Plan focused mainly on addressing traffic congestion and improving mobility in the Kihei area. This aligns with the System Efficiency Management and Operations and System Preservation planning factors.

PLAN AND POLICY REVIEW (DISTRICT OF MAUI)
TBG062714093019HNL 44
Update of Regional Transportation Modeling for the Island of Maui: Model Methodology and Calibration Report, 2008 Purpose and Content The report summarizes the socio-economic data, land use data, assumptions, model structure, forecasting methodology, and forecasting processes used to develop the 2001 version of the TransCAD travel demand forecasting model for the island of Maui. The report also describes the validation process to ensure the base model reasonably represented traffic conditions for the year 2001. Forecasted traffic conditions were provided for the year 2030. The Maui travel demand model was used as a tool for long-range transportation planning.
Findings Related to the Plan The 2001 version of the forecasting model for the island of Maui was updated and refined to reflect 2007 existing traffic conditions for the Regional Federal-Aid Highways 2035 Transportation Plan for the District of Maui.
A summary of the changes made to the 2001 Maui model include:
• Additional traffic analysis zones on the Island of Maui to increase zone detail in some areas.
• Model structure changes to the scripts within TransCAD to simplify the programming and separate model process steps.
• County assessor data used as the primary data source for households and visitor accommodations.
• Base year 2007 socioeconomic and roadway network data.
• Network look-up tables expanded to include terrain and adjusted link capacities.
• PM peak-hour model was developed for the 2007 models and used instead of the link peaking factor process used in the 2001 Maui model.
• Geographic interface developed to support standard output reports and maps developed within TransCAD.
The refined model was used for planning-level analyses at the collector roadway and higher level, which showed how travel is distributed around the island based on where the socioeconomic and network modifications (such as new or improved roadways) occur. The model assigned trips generated by the model based on what could be expected to occur, given the various model inputs. The travel demand model was developed as a tool to assist in understanding the relationship between the socioeconomic patterns and the roadway network. The model assists in understanding where capacity issues could occur given the network and socioeconomic assumptions. The travel demand model is not able to perform detailed operational analysis, such as adding turn lanes at an intersection.

PLAN AND POLICY REVIEW (DISTRICT OF MAUI)
TBG062714093019HNL 45
Alignment with the Planning Factors Not applicable.

PLAN AND POLICY REVIEW (DISTRICT OF MAUI)
TBG062714093019HNL 46
Land Use Forecast, Island of Lanai, Maui County, December 2012 Purpose and Content The Land Use Forecast for Lanai is a study to support the development of the Lanai Community Plan. It includes a summary of existing urban land uses and an assessment of future urban land use supply and demand. Only urban land uses (residential, resort, commercial, and industrial categories) are analyzed; agricultural and conservation lands are not analyzed in this study.
Findings Related to the Plan Based on the socioeconomic and land use forecasts, the amount of land available in 2035 would likely to meet the projected demand for resort uses (visitor units), industrial uses, and nonresident housing. The demand for resident housing though would likely exceed the anticipated supply, and new affordable housing or redevelopment in residential areas would be needed to meet demand in 2035. Projected demand for commercial land would also likely exceed the amount of commercial space anticipated in 2035.
Demographics on Maui, Molokai, and Lanai are summarized below for 2010, 2020, and 2035. The Regional Federal-Aid Highways 2035 Transportation Plan for the District of Maui shall take into consideration the findings from the Land Use Forecast.
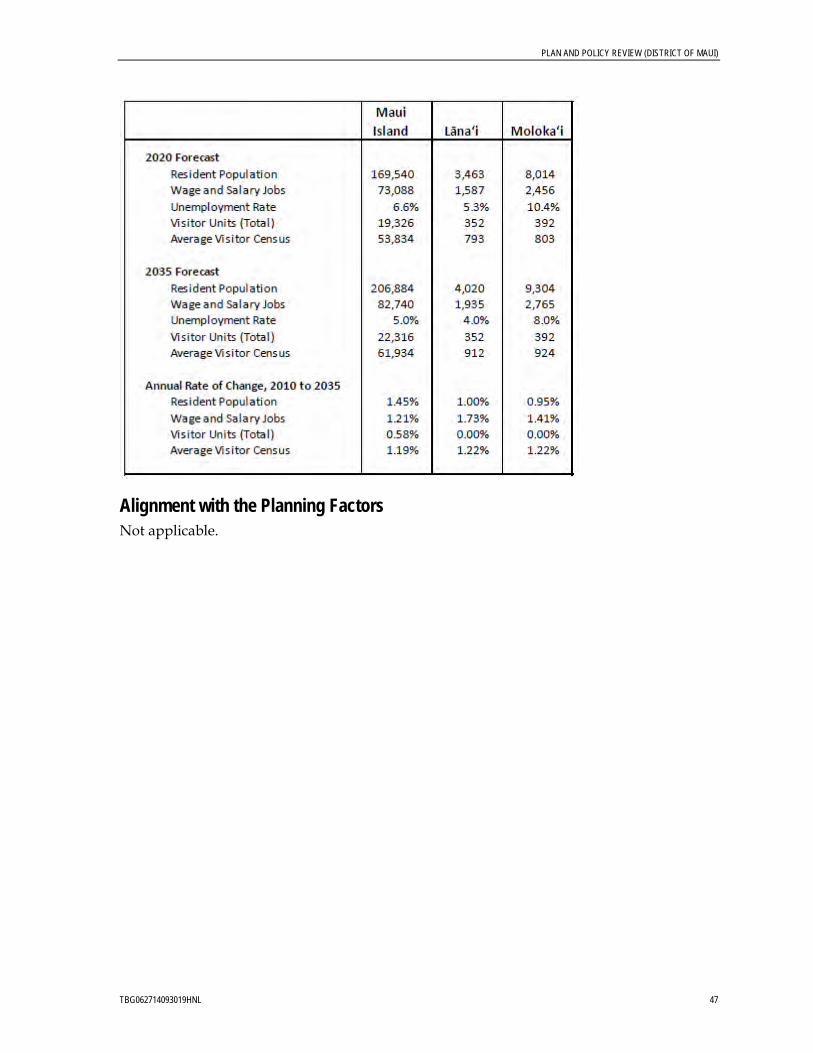
PLAN AND POLICY REVIEW (DISTRICT OF MAUI)
TBG062714093019HNL 47
Alignment with the Planning Factors Not applicable.
PLAN AND POLICY REVIEW (DISTRICT OF MAUI)
TBG062714093019HNL 48
Maui Forest National Wildlife Refuge Complex Comprehensive Conservation Plan and Environmental Assessment, United States Fish and Wildlife Service, Ongoing Purpose and Content The Maui National Wildlife Refuge Complex consists of the Kakahaia National Wildlife Refuge on the south coast of Molokai and the Kealia Pond National Wildlife Refuge on south central coast of Maui. A multiyear planning process to develop a 15-year comprehensive conservation plan and environmental assessment that will guide the management of fish, wildlife, plants, habitats, and public uses is currently being performed.
Findings Related to the Plan • The plan has received comments from the initial round of public outreach.
• Kakahaia Refuge – habitat management, partners and community, staff and visitor services, and climate change.
• Kalia Pond Refuge – Environmental nuisances, research, facility management, land acquisition, and visitor services and outreach.
• All comments will be considered as the plans are developed.
Alignment with Planning Factors Consistency with the National Wildlife Refuge long-term plans supports the Environment and Sustainability of our state’s natural habitats.
PLAN AND POLICY REVIEW (DISTRICT OF MAUI)
TBG062714093019HNL 49
County of Maui Budget Fiscal Years 2011, 2012, and 2013; Capital Improvement Program; County of Maui, Fiscal Years 2011, 2012, and 2013 Purpose and Content The capital budget provides a listing of projects and services for the County of Maui for the fiscal years 2011, 2012, and 2013. It includes estimated costs and identified sources of funds.
Findings Related to the Plan Review of the capital budget and programs will be important to understand existing planned transportation improvements on state facilities, which could be considered as the future baseline transportation network.
Alignment with Planning Factors The capital program projects will somewhat allow for identification of spending allocations related to the planning factors based on planned project’s alignment with HDOT programs and funding categories.

TBG062714093019HNL 1
M E M O R A N D U M Statewide Federal-Aid Highways 2035 Transportation Plan and Regional Federal-Aid Highways 2035 Transportation Plans for the Districts of Maui, Hawaii, and Kauai
Plan and Policy Review (District of Hawaii) TO: State of Hawaii Department of Transportation (HDOT) FROM: CH2M HILL DATE: November 2, 2010
Introduction The planning team reviewed regional policies and plans relevant to development of the Statewide Federal-Aid Highways 2035 Transportation Plan and the Regional Federal-Aid Highways 2035 Transportation Plans for the Districts of Maui, Hawaii, and Kauai.
This summary of regional plans and policies was an important first step to ensure that the statewide and regional federal-aid plans:
• Reflected consistency through alignment of goals and objectives. • Built effectively on previously adopted plans and policies. • Complied with regional requirements. • Had guidance and structure for development of potential solutions.
The plan and policy summaries help to shape the goals for the statewide and regional transportation plans and the definition of potential solutions.
Regional Plans and Policies Regional plans and policies are more specific than federal or statewide plans and policies in that they address a smaller geography and define specific projects for specific island contexts.
The regional plans and policies are generally consistent with statewide policy direction. These regional plan reviews will be used to inform the development of the Statewide Federal-Aid Highways 2035 Transportation Plan and the Regional Federal-Aid Highways 2035 Transportation Plan for the District of Hawaii (plans).
The following plans and policies were examined for the District of Hawaii:
• Hawaii County General Plan (2005)
• Island of Hawaii Community Development Plans (2008)
• Hilo Bayfront Trails Master Plan (2009)
PLAN AND POLICY REVIEW (DISTRICT OF HAWAII)
TBG062714093019HNL 2
• Hawaii County Long Range Land Transportation Plan (1998)
• Hawaii Multi Hazard Mitigation Plan (2005)
• Hawaii Commercial Harbors 2020 Master Plan (1998)
• Kona International Airport at Keahole Airport Master Plan (2010)
• Hilo International Airport Master Plan (2002)
• Waimea-Kohala Airport Master Plan (1999)
• Upolu Airport Master Plan (1999)
• Hakalau Forest National Wildlife Refuge Comprehensive Conservation Plan [CCP] and Environmental Assessment [EA] (Ongoing)
• Ala Kahakai National Historic Trail (2009)
• County of Hawaii Transportation/Capital Improvement Plan (TIP/CIP) Capital Budget and Six-Year Capital Improvements Program FY2010-2011

PLAN AND POLICY REVIEW (DISTRICT OF HAWAII)
TBG062714093019HNL 3
Hawaii County General Plan, County of Hawaii, 2005 Purpose and Content The Hawaii County General Plan (General Plan) specifies goals and policies for various elements considered community assets, such as natural resources, historic resources, public facilities and utilities, recreational resources, economic resources, housing, transportation, and land use. The General Plan includes the countywide CIP list and breaks down analysis of existing conditions and identified deficiencies by general district areas in Hawaii County: Puna, South Hilo, North Hilo, Hamakua, North Kohala, South Kohala, South Kona, North Kona, and Kau. The General Plan encourages but does not mandate the creation of Community Development Plans for each county district area. The General Plan calls for submitting an annual report to the County Council with the purpose for the annual report being to reconcile capital and operating budgets, and prioritize and assess competing community needs from a countywide perspective.
Findings Related to the Plan Recommended courses of action to improve transportation facilities and provide safer, faster, more pleasant travel were documented by district. Actions related to roadways that could influence the Regional Federal-Aid Highways 2035 Transportation Plan for the District of Hawaii include:
Puna • Explore developing a mid-level roadway makai of Highway 130, beginning at the
Hawaiian Beaches Subdivision and extending through Hawaiian Paradise Park Subdivision with a connection to Railroad Avenue in South Hilo. Consider a bikeway along the same alignment.
• Encourage widening Highway 130 to four lanes with a median and channelized intersections or modern roundabouts.
South Hilo • Improve Old Mamalahoa Highway to provide a secondary north-south route along the
Hamakua coast.
• Widen and improve major east-west collector roads between the old Mamalahoa Highway and the Belt Highway.
• Construct the proposed improvements and extension of Highway 200 (Saddle Road) from Kaumana Drive to the Queen Kaahumanu Highway in South Kohala.
• Coordinate with the state on closure of the Bayfront Highway and relocation of the existing Highway 19/Pauahi Street intersection.
• Improve Akolea Road between Piihonua and Kaumana Drive and construct its extension to the upper reaches of Ainaola Drive to provide a cross-city connection between Upper Wailuku and Waiakea-Uka.
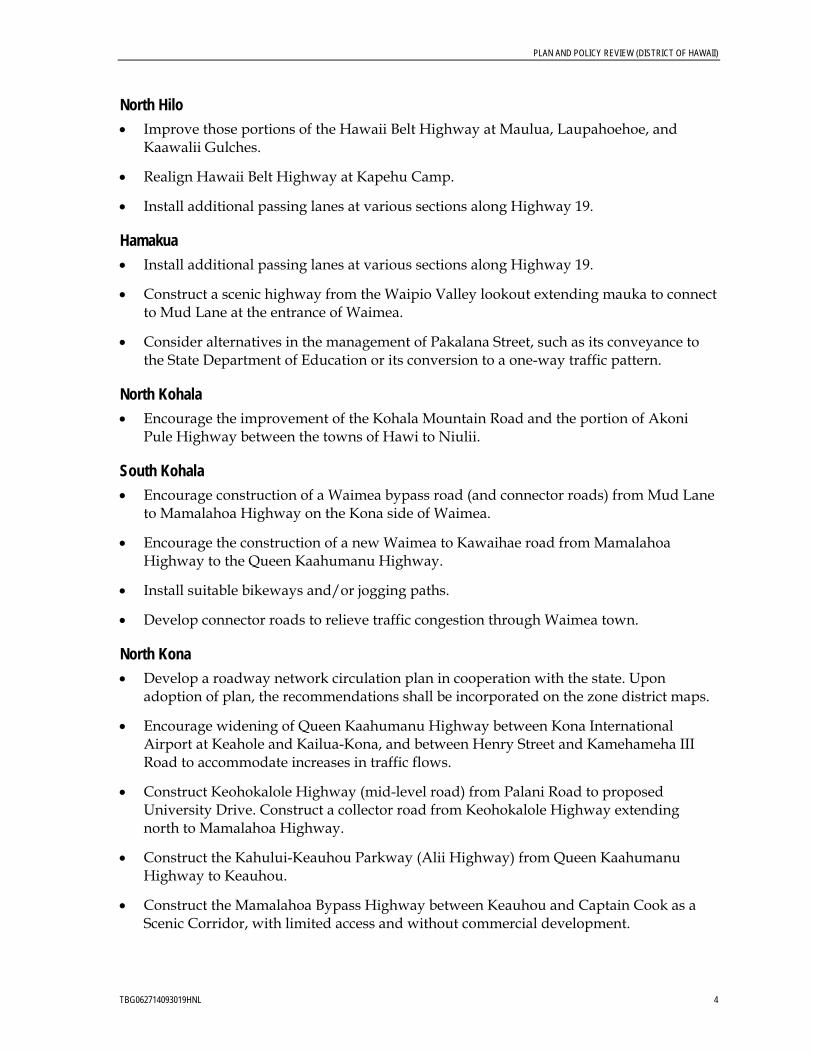
PLAN AND POLICY REVIEW (DISTRICT OF HAWAII)
TBG062714093019HNL 4
North Hilo • Improve those portions of the Hawaii Belt Highway at Maulua, Laupahoehoe, and
Kaawalii Gulches.
• Realign Hawaii Belt Highway at Kapehu Camp.
• Install additional passing lanes at various sections along Highway 19.
Hamakua • Install additional passing lanes at various sections along Highway 19.
• Construct a scenic highway from the Waipio Valley lookout extending mauka to connect to Mud Lane at the entrance of Waimea.
• Consider alternatives in the management of Pakalana Street, such as its conveyance to the State Department of Education or its conversion to a one-way traffic pattern.
North Kohala • Encourage the improvement of the Kohala Mountain Road and the portion of Akoni
Pule Highway between the towns of Hawi to Niulii.
South Kohala • Encourage construction of a Waimea bypass road (and connector roads) from Mud Lane
to Mamalahoa Highway on the Kona side of Waimea.
• Encourage the construction of a new Waimea to Kawaihae road from Mamalahoa Highway to the Queen Kaahumanu Highway.
• Install suitable bikeways and/or jogging paths.
• Develop connector roads to relieve traffic congestion through Waimea town.
North Kona • Develop a roadway network circulation plan in cooperation with the state. Upon
adoption of plan, the recommendations shall be incorporated on the zone district maps.
• Encourage widening of Queen Kaahumanu Highway between Kona International Airport at Keahole and Kailua-Kona, and between Henry Street and Kamehameha III Road to accommodate increases in traffic flows.
• Construct Keohokalole Highway (mid-level road) from Palani Road to proposed University Drive. Construct a collector road from Keohokalole Highway extending north to Mamalahoa Highway.
• Construct the Kahului-Keauhou Parkway (Alii Highway) from Queen Kaahumanu Highway to Keauhou.
• Construct the Mamalahoa Bypass Highway between Keauhou and Captain Cook as a Scenic Corridor, with limited access and without commercial development.
PLAN AND POLICY REVIEW (DISTRICT OF HAWAII)
TBG062714093019HNL 5
• Provide vertical connectors from Alii Drive to Kuakini Highway.
• Install suitable bikeways and/or jogging paths.
• Extend Lako Street to connect to Alii Drive.
• Establish the old railroad right-of-way as a pedestrian and bicycle right-of-way.
South Kona • Extend Halekii Street to connect to the proposed Mamalahoa Bypass Highway.
• Develop a roadway network circulation plan in cooperation with the state. Upon adoption of plan; recommendations shall be incorporated on the zone district maps.
• Construct the Mamalahoa Bypass Highway between Keauhou and Captain Cook as a Scenic Corridor, with limited access and without commercial development.
• Install suitable bikeways and/or jogging paths.
Kau • Improve Mamalahoa Highway, realigning where necessary.
• Explore alternatives and means to establish an evacuation route through Hawaiian Ocean View Estates Subdivision to Highway 11, in cooperation with the residents of Ocean View.
These recommendations will be considered when developing the Regional Federal-Aid Highways 2035 Transportation Plan for the District of Hawaii to identify long-range solutions and the future transportation baseline network.
Alignment with the Planning Factors The General Plan focuses on improvements to existing infrastructure that will increase mobility which supports the Transportation Access Mobility, Economic Vitality, and System Preservation planning factors. The plan also promotes expanding mobility within the existing roadway system and increases mobility for various transportation modes, which promotes System Efficiency Management and Operations planning factors.
PLAN AND POLICY REVIEW (DISTRICT OF HAWAII)
TBG062714093019HNL 6
Island of Hawaii Community Development Plans Kona (2008), North Kohala (2008), South Kohala (2008), Puna (2008), Kau (ongoing), Hamakua (ongoing), Hilo Purpose and Content The current Hawaii County General Plan, approved in 2005 by the County Council is the broad planning document for the Island of Hawaii. The General Plan encourages districts within the County to plan for the future through the implementation of Community Development Plans.
Community Development Plans translate the broad General Plan goals and policies into implementation actions specific to respective districts.
There are seven Community Development Plan areas in the County of Hawaii: Kona, North Kohala, South Kohala, Puna, Kau, Hamakua, and Hilo. The Kau and Hamakua Community Development Plans are in draft only, while the Hilo area does not have a draft plan available for review.
The community plans provide specific recommendations to address the goals, objectives, and policies contained in the General Plan, while recognizing the values and unique context of the individual community.
Findings Related to the Plan The structure of each of the community plans varied, but essentially provided goals, objectives, policies and implementing actions for each of their respective communities.
Goals, objectives, and policies of the various Community Development Plans relevant to the Regional Federal-Aid Highways 2035 Transportation Plan for the District of Hawaii are summarized in the attached table.
Alignment with the Planning Factors The Community Plans vary in their emphasis based on the context and priorities of the various communities. A major focus of the Community Development Plans align with the Environment and Sustainability factor through recognition that land use planning, directed growth and associated transportation infrastructure is critical to maintaining the unique character and cultural significance of the specific communities while efficiently accommodating long term growth. Additionally, the community plans support Modal Integration with emphasis on transit, pedestrian, bicycle, and equestrian transport. Another emphasis area included Safety and Security improvements by planning and providing for emergency and evacuation needs of remote communities as well as improved connectivity between neighborhoods/communities.

PLAN AND POLICY REVIEW (DISTRICT OF HAWAII)
TBG062714093019HNL 7
Community Urban/Town Design Physical/Social Infrastructure Land Use Environment
Kona Objective: Develop a multimodal transportation system to encourage walking, biking, transit, and other nonvehicular modes of travel.
Policy:
• Revise current street design standards to improve design of facilities that accommodate the disabled and pedestrians or bicycles.
• Develop primary and secondary transit routes to improve connectivity, and serve transit-oriented land use developments. For example, Develop Keohokalole Highway as a transit route between Kailua Village and the airport. Establish secondary transit route connecting Kailua Village with Keauhou and areas mauka of Queen Kaahumanu and Kuakini highways.
• Add nonmotorized facilities to existing streets when routine maintenance or repair work occurs.
Objective:
Develop a system of interconnected roads that provide alternative routes for automobiles while maintaining mobility on higher functioning roadways.
Policies:
• Ensure that new developments meet connectivity standards for connections to adjacent properties, maximum block sizes, and future development.
• Encourage access management on existing arterials and major collectors by minimizing new driveways or intersections. New development should access higher functioning roads from local streets.
Objective: Develop land uses that allow efficient access to transit and support minimal reliance on automobiles.
Policies:
• Develop compact, mixed-use land uses along transit routes.
• Provide transit options and walking routes in Kona.
• Encourage village-style developments.
Objective:
Minimize human impacts on natural resources by planning developments with respect to the environment. Policy:
• Implement a landscaping maintenance program. Use reclaimed wastewater where available.
North Kohala Goal: Maintain rural infrastructure.
Strategy:
• Develop and implement rural infrastructure standards.
Goal:
Provide for adequate drivable (mauka-makai) public access to coastal and mountain areas.
Strategies:
• Revise and improve Chapter 34 of the Hawaii County Code dealing with public access
• Encourage increased cooperation and coordination among agencies, land owners and the community.
• Implement a long-range plan for achieving adequate public access as part of the Community Development Plan.
Include a continuous coastal path from Pololu to Kawaihae Harbor, Mauka-makai easements between the coastal path and Akoni Pule Highway, Mauka-makai easements between Akoni Pule Highway and the Kohala mountains, and a lateral mountain road (Wylie Boulevard) from Pololu to Taga Pond.
Goal:
Revamp, repair, and/or replace aging or damaged infrastructure; improve emergency preparedness; and prioritize and implement future improvements to public facilities and services.
Strategies:
• Improve emergency preparedness and response. • Improve existing roadway systems and create emergency bypass
roads.
Goal:
Direct growth to areas within and near existing town centers to preserve the district’s open space, cultural resources, and promote agriculture. Strategy:
• Establish a view plane protection program along Kohala Mountain Road and Akoni-Pule Highway corridors.
South Kohala General Policy:
Provide for the transportation and circulation needs of the South Kohala Community and for commuters.
Subpolicies:
• For new major roads, incorporate Complete Street standards.
• Establish bicycle, pedestrian, and equestrian travel ways to link up the communities within the Hawaii District, and establish alternate travel ways within the individual communities.
General Policy: Preserve the culture and sense of place of South Kohala communities.
Sub Policies:
• Develop a concurrency management system for infrastructure concurrency
General Policy:
Develop guidelines and programs that promote environmental stewardship and the concept of sustainability.
Subpolicies:
• Preserve visually and environmentally important open space grasslands, ocean views, views of the puu, and South Kohala’s unique “Five Mountain Views.”

PLAN AND POLICY REVIEW (DISTRICT OF HAWAII)
TBG062714093019HNL 8
Community Urban/Town Design Physical/Social Infrastructure Land Use Environment
• Build safe roads.
• Identify and establish transit corridors for future mass transit service within the Highways District.
General Policy:
• Develop programs and standards that will protect the South Kohala Community from natural hazards, including major storms, flooding, tsunami, lava flows and wildfires.
Subpolicies
• Develop plans and programs for emergency routes so that people can safely move away from life-threatening natural hazards.
• Update Lighting code and enforcement of the code.
• Incorporate the concept of sustainability as defined in the State of Hawaii 2050 Sustainability Plan in future planning and projects.
Puna Goal:
Increase mass transit options and complement the development of the villages with transit service.
Objectives:
• Convert bus routes to hub and spoke service.
• Coordinate transit service with paratransit and school transportation.
• Provide park-and-ride lots.
• Ensure that pedestrians can access bus stops safely.
Goal:
Provide adequate emergency and evacuation routes.
Objectives:
• Create alternative/redundant routes for Highways 11,130, and 132 using existing routes wherever possible, develop the Puna Makai Alternative Route with the least environmental and socio-economic impacts.
• Develop local traffic connectivity network
Goal:
Provide pedestrian and bicycle-friendly roads.
Objective:
• Improve appropriate “roads in limbo” that are used widely for public access.
Goal:
Provide highways with design features that improve safety, particularly at intersections. Provide highways that are aesthetically pleasing and compatible with Puna character, and allow for increased county and community influence over highway planning and design decisions.
Objectives:
• Make safer intersection access a higher priority over highway traffic speed.
• Consider roundabouts.
• Use native landscaping.
• Incorporate traffic-calming features into highway design in preference to signage and signalization where possible.
Goal: Manage growth by encouraging a more efficient, environmentally sustainable land use pattern, i.e. “village centers”. Villages would be planned for three levels of characteristics – regional village, community village and neighborhood village – each providing varying degrees of services and amenities, with all addressing the stop of sprawl development. This will provide better accessibility for businesses and services.
Objectives:
• Develop criteria for village location, scale, uses and design.
• Enhance villages by allowing expanded infrastructure to support compact development and multimodal travel.
Goal:
Reduce the reliance of fossil fuels for transportation.
Objectives:
• Promote ride-sharing, vanpools, carpools, and telecommuting opportunities.
• Provide more services and employment within the villages to reduce commute trips
Goal:
Provide a contiguous network of scenic trails between and within subdivisions for walking, bicycling, and horseback riding. Designate and improve routes as “Scenic Byways.”
Objectives:
• Develop and preserve historic trails for nonmotorized travel.
• Identify and develop scenic byways.
Goal:
Reduce the percentage of single-occupant vehicles during peak commute periods and the percentage of residents who commute to employment and services outside of Puna.
Objectives:
• Promote ride-sharing, vanpools, carpools, and telecommuting opportunities.
• Provide more services and employment within the villages to reduce commute trips.
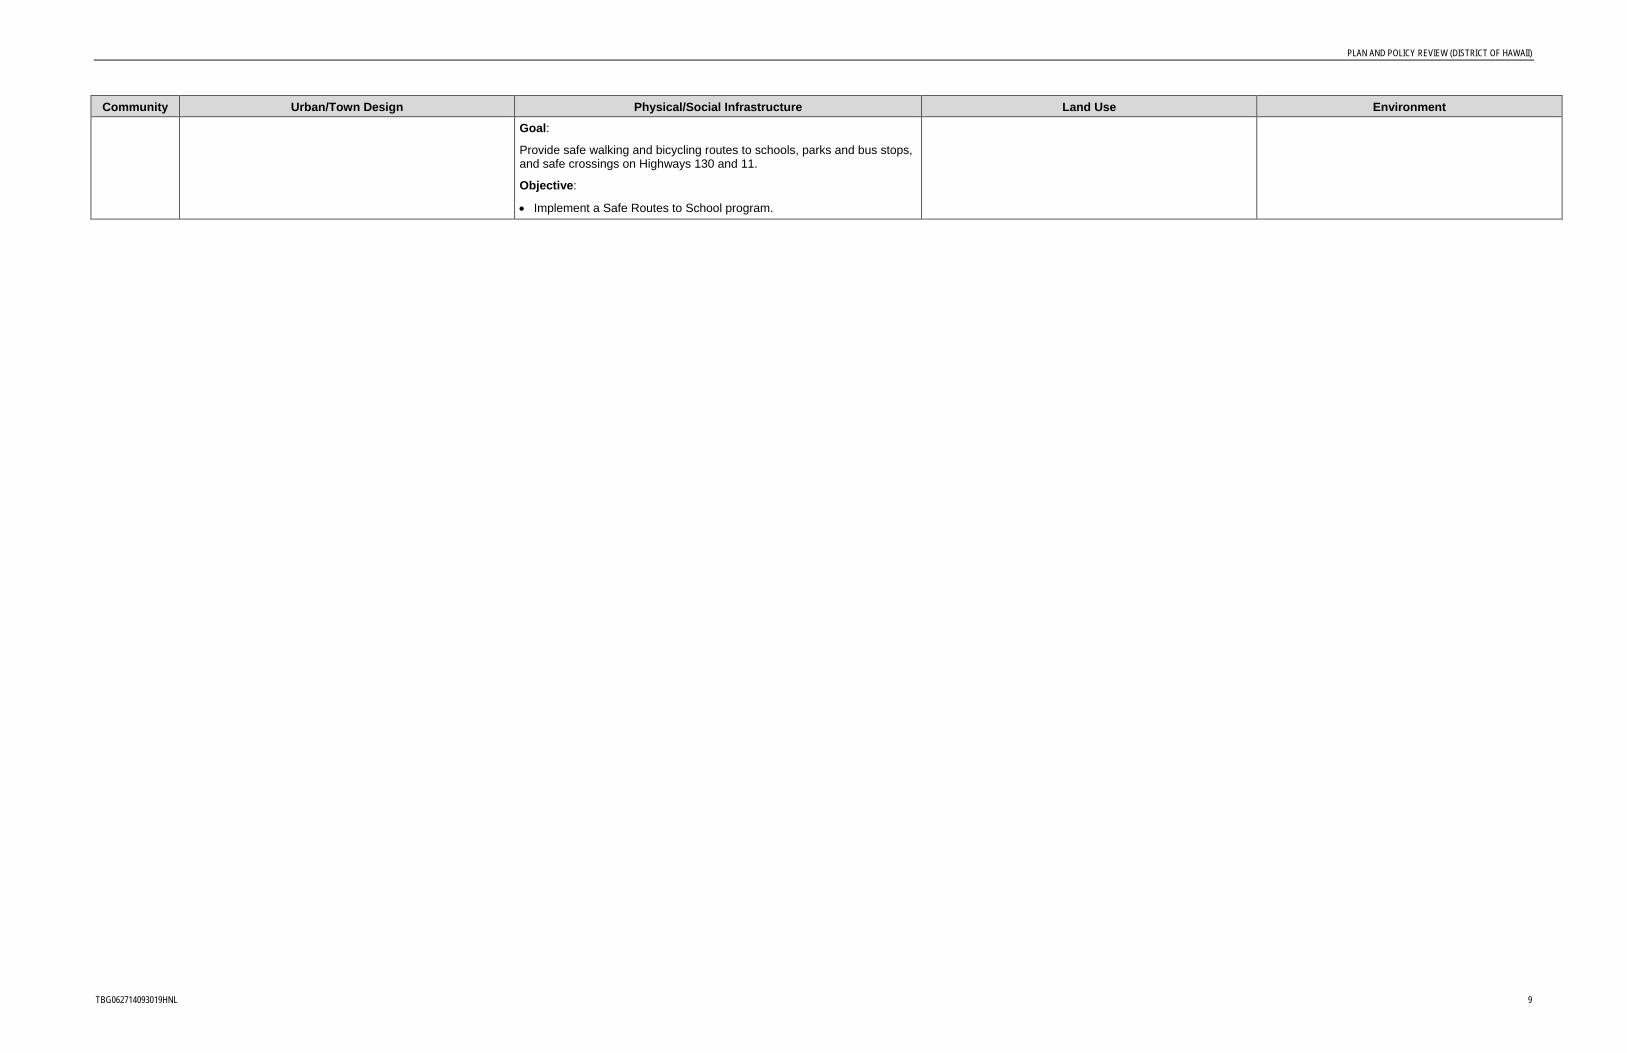
PLAN AND POLICY REVIEW (DISTRICT OF HAWAII)
TBG062714093019HNL 9
Community Urban/Town Design Physical/Social Infrastructure Land Use Environment
Goal:
Provide safe walking and bicycling routes to schools, parks and bus stops, and safe crossings on Highways 130 and 11.
Objective:
• Implement a Safe Routes to School program.
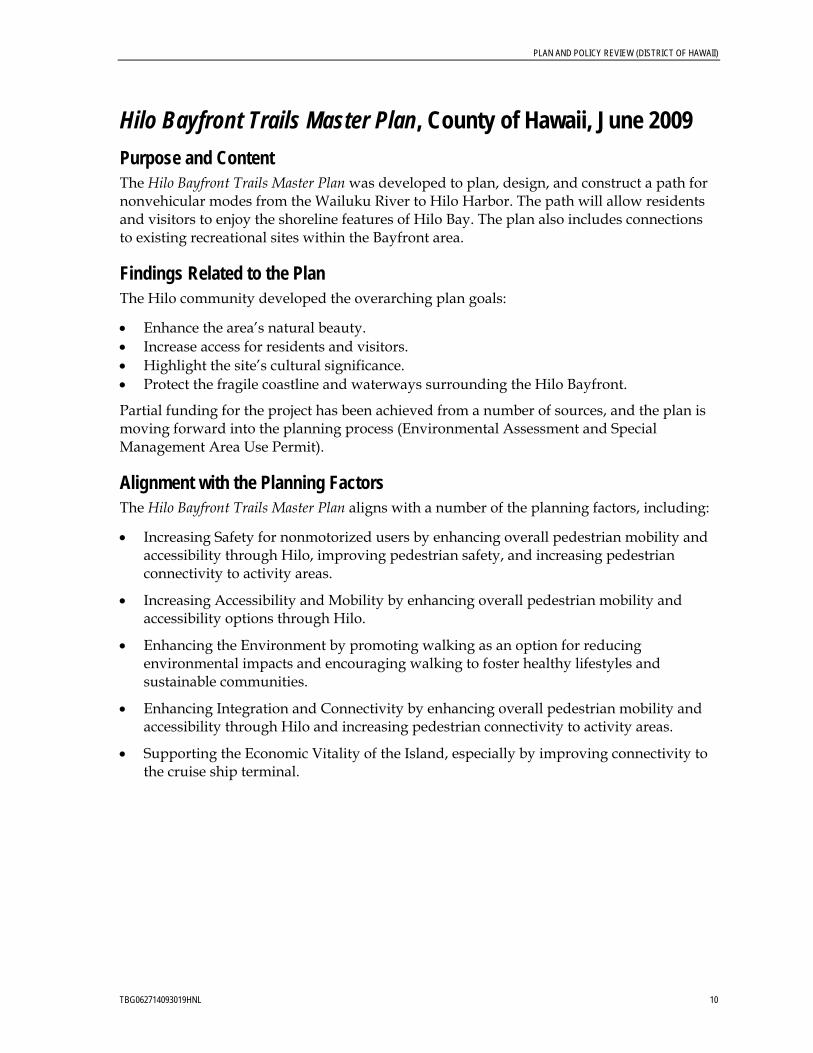
PLAN AND POLICY REVIEW (DISTRICT OF HAWAII)
TBG062714093019HNL 10
Hilo Bayfront Trails Master Plan, County of Hawaii, June 2009 Purpose and Content The Hilo Bayfront Trails Master Plan was developed to plan, design, and construct a path for nonvehicular modes from the Wailuku River to Hilo Harbor. The path will allow residents and visitors to enjoy the shoreline features of Hilo Bay. The plan also includes connections to existing recreational sites within the Bayfront area.
Findings Related to the Plan The Hilo community developed the overarching plan goals:
• Enhance the area’s natural beauty. • Increase access for residents and visitors. • Highlight the site’s cultural significance. • Protect the fragile coastline and waterways surrounding the Hilo Bayfront.
Partial funding for the project has been achieved from a number of sources, and the plan is moving forward into the planning process (Environmental Assessment and Special Management Area Use Permit).
Alignment with the Planning Factors The Hilo Bayfront Trails Master Plan aligns with a number of the planning factors, including:
• Increasing Safety for nonmotorized users by enhancing overall pedestrian mobility and accessibility through Hilo, improving pedestrian safety, and increasing pedestrian connectivity to activity areas.
• Increasing Accessibility and Mobility by enhancing overall pedestrian mobility and accessibility options through Hilo.
• Enhancing the Environment by promoting walking as an option for reducing environmental impacts and encouraging walking to foster healthy lifestyles and sustainable communities.
• Enhancing Integration and Connectivity by enhancing overall pedestrian mobility and accessibility through Hilo and increasing pedestrian connectivity to activity areas.
• Supporting the Economic Vitality of the Island, especially by improving connectivity to the cruise ship terminal.
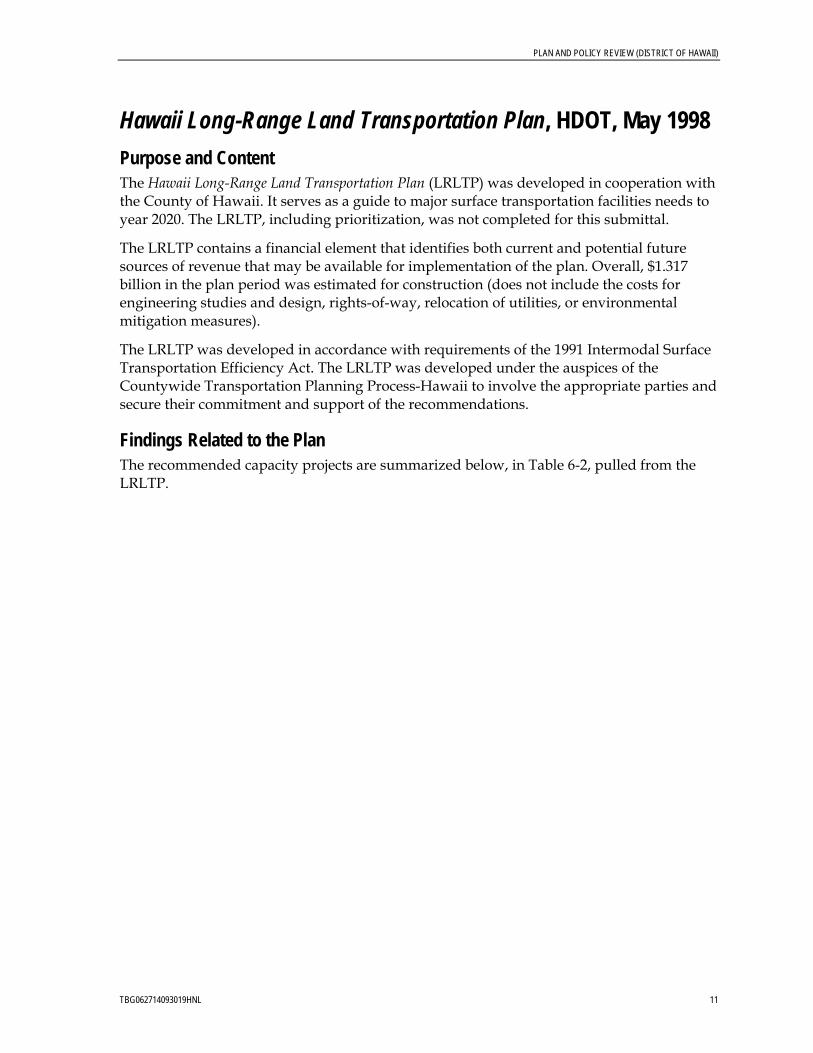
PLAN AND POLICY REVIEW (DISTRICT OF HAWAII)
TBG062714093019HNL 11
Hawaii Long-Range Land Transportation Plan, HDOT, May 1998 Purpose and Content The Hawaii Long-Range Land Transportation Plan (LRLTP) was developed in cooperation with the County of Hawaii. It serves as a guide to major surface transportation facilities needs to year 2020. The LRLTP, including prioritization, was not completed for this submittal.
The LRLTP contains a financial element that identifies both current and potential future sources of revenue that may be available for implementation of the plan. Overall, $1.317 billion in the plan period was estimated for construction (does not include the costs for engineering studies and design, rights-of-way, relocation of utilities, or environmental mitigation measures).
The LRLTP was developed in accordance with requirements of the 1991 Intermodal Surface Transportation Efficiency Act. The LRLTP was developed under the auspices of the Countywide Transportation Planning Process-Hawaii to involve the appropriate parties and secure their commitment and support of the recommendations.
Findings Related to the Plan The recommended capacity projects are summarized below, in Table 6-2, pulled from the LRLTP.

PLAN AND POLICY REVIEW (DISTRICT OF HAWAII)
TBG062714093019HNL 12
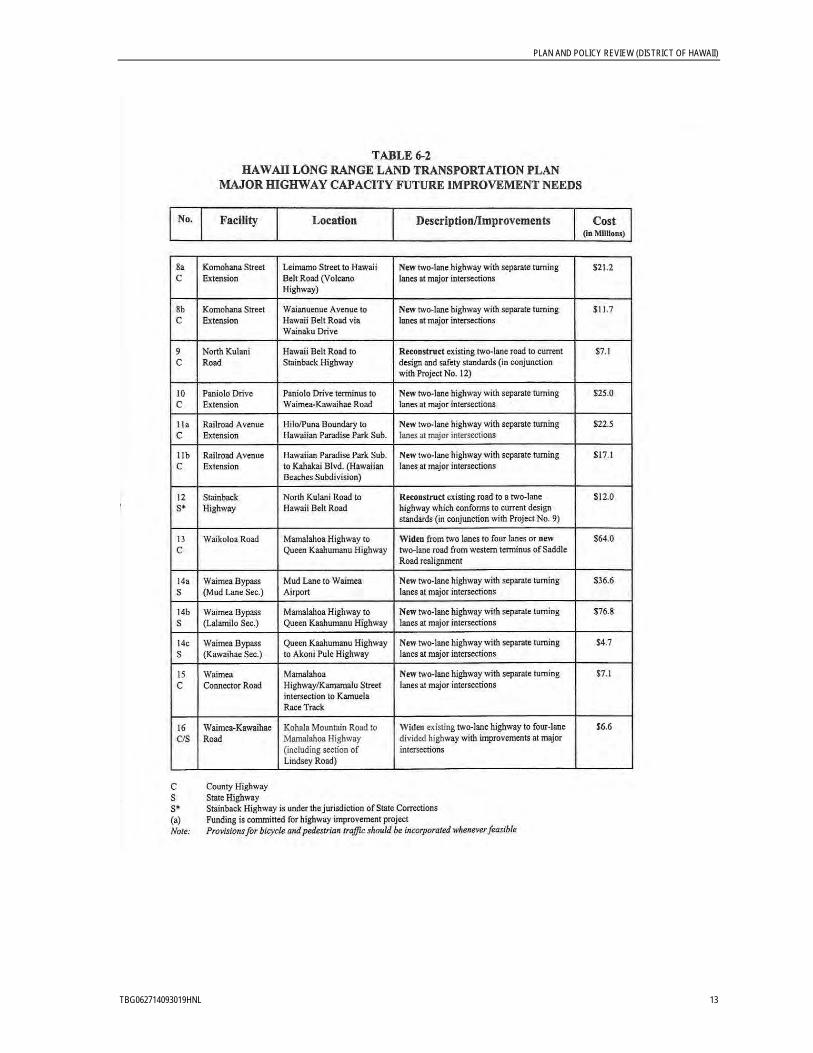
PLAN AND POLICY REVIEW (DISTRICT OF HAWAII)
TBG062714093019HNL 13

PLAN AND POLICY REVIEW (DISTRICT OF HAWAII)
TBG062714093019HNL 14

PLAN AND POLICY REVIEW (DISTRICT OF HAWAII)
TBG062714093019HNL 15

PLAN AND POLICY REVIEW (DISTRICT OF HAWAII)
TBG062714093019HNL 16
Transit improvements are referenced for further study in the Countywide Transit Plan.
Bicycle improvements are referenced to the 1994 Bike Plan Hawaii recommendations. Additionally, conceptual “nonmotorized roadways” identified for Hilo, Kailua-Kona, Waimea, and Puna are also referenced for further studies.
The Regional Federal-Aid Highways 2035 Transportation Plan for the District of Hawaii shall consider project recommendations. These recommendations, however, were developed over 10 years ago and will be vetted against current conditions and long-range priorities. The travel demand model, land use and stakeholder input will address appropriateness of the remaining recommendations.
Alignment with the Planning Factors The plan recommendations focused on Economic Vitality, and Mobility by planning to provide for the efficient movement of people and goods.
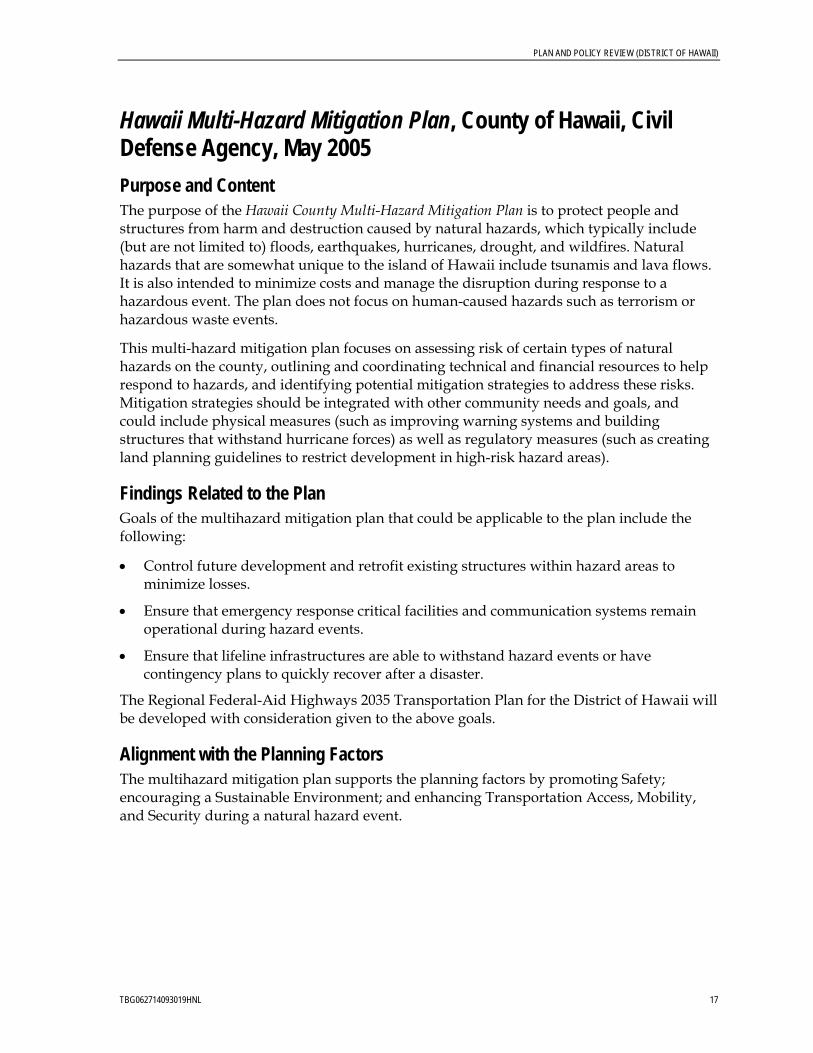
PLAN AND POLICY REVIEW (DISTRICT OF HAWAII)
TBG062714093019HNL 17
Hawaii Multi-Hazard Mitigation Plan, County of Hawaii, Civil Defense Agency, May 2005 Purpose and Content The purpose of the Hawaii County Multi-Hazard Mitigation Plan is to protect people and structures from harm and destruction caused by natural hazards, which typically include (but are not limited to) floods, earthquakes, hurricanes, drought, and wildfires. Natural hazards that are somewhat unique to the island of Hawaii include tsunamis and lava flows. It is also intended to minimize costs and manage the disruption during response to a hazardous event. The plan does not focus on human-caused hazards such as terrorism or hazardous waste events.
This multi-hazard mitigation plan focuses on assessing risk of certain types of natural hazards on the county, outlining and coordinating technical and financial resources to help respond to hazards, and identifying potential mitigation strategies to address these risks. Mitigation strategies should be integrated with other community needs and goals, and could include physical measures (such as improving warning systems and building structures that withstand hurricane forces) as well as regulatory measures (such as creating land planning guidelines to restrict development in high-risk hazard areas).
Findings Related to the Plan Goals of the multihazard mitigation plan that could be applicable to the plan include the following:
• Control future development and retrofit existing structures within hazard areas to minimize losses.
• Ensure that emergency response critical facilities and communication systems remain operational during hazard events.
• Ensure that lifeline infrastructures are able to withstand hazard events or have contingency plans to quickly recover after a disaster.
The Regional Federal-Aid Highways 2035 Transportation Plan for the District of Hawaii will be developed with consideration given to the above goals.
Alignment with the Planning Factors The multihazard mitigation plan supports the planning factors by promoting Safety; encouraging a Sustainable Environment; and enhancing Transportation Access, Mobility, and Security during a natural hazard event.
PLAN AND POLICY REVIEW (DISTRICT OF HAWAII)
TBG062714093019HNL 18
Hawaii Commercial Harbors 2020 Master Plan, HDOT Harbors Division, August 1998 Purpose and Content The Hawaii Commercial Harbors 2020 Master Plan provides long-range guidance for ensuring efficient, accessible, economical, and safe operations of the commercial harbor system on the Island of Hawaii. The plan also serves a guide to developing, maintaining, and enhancing the harbor system, which includes two facilities: Hilo Harbor and Kawaihae Harbor. Hilo Harbor is on the east side of the island and is the older of the two harbors. Kawaihae Harbor is on the west side of the island was created to alleviate demand on Hilo Harbor. Both facilities support multiple functions, including: handling of containerized, dry, and liquid cargo goods, passenger vessels, cruise and excursion ships, and charter fishing boats, as well as ship building, repair, and maintenance operations.
Findings Related to the Plans Primary objectives of the harbors master plan include:
• Plan both harbors properly to provide efficient facilitation of maritime shipments for the entire island.
• Optimize the use of land and water resources committed to marine cargo, passenger and fishing operations in an economical manner.
• Provide terminals and other harbor resources and accesses within Hilo Bay and Kawaihae Bay, as well as other locations, in a manner that best serves Hawaii’s port system.
• Minimize impact on environmental quality and recreational opportunities contiguous with Hawaii’s port facilities.
Development of the harbors could accommodate potential increases in ocean cruise vessels and in ocean-related recreation for the tourism/visitor industry. Recommended roadway projects to support long-term growth and development of the harbors include increasing the number of access roads to Hilo Harbor and improving its surrounding roadways and intersections including Kalanianaole Street, Kanoelehua Street, Silva Street, and the Kawaihae Bypass Road. At Kawaihae Harbor, a new bypass connecting Queen Kaahumanu Highway to Akoni Pule Highway (bypassing the Kawaihae Harbor area) was recommended in the Final Environmental Impact Statement for the Hawaii Commercial Harbors Master Plan. This bypass would likely help maintain adequate access and traffic operations at Kawaihae Harbor. Lower-priority recommendations documented in the Final Environmental Impact Statement near Kawaihae Harbor also include widening of Queen Kaahumanu Highway south of Kawaihae Road and a new bypass road connecting Waimea to Kawaihae.
The statewide and regional long-range transportation plans will take into account the roadway needs for Hilo Harbor and Kawaihae Harbor to support maritime growth.

PLAN AND POLICY REVIEW (DISTRICT OF HAWAII)
TBG062714093019HNL 19
Alignment with the Planning Factors The roadway improvements and recommendations outlined in the harbor plan support the Modal Integration planning factor by encouraging efficient transition between maritime and land transportation modes. It also aligns with the System Preservation and Economic Vitality planning factors because it promotes comprehensive planning of both harbors to maintain efficient use of existing highways and to improve the movement of goods and people from one side of the island to the other.

PLAN AND POLICY REVIEW (DISTRICT OF HAWAII)
TBG062714093019HNL 20
Kona International Airport at Keahole Master Plan Update, HDOT Airports Division, October 2010 Purpose and Content This master plan update study provides an evaluation of the airport’s capabilities and aviation demand and develops a plan for the timely development of new or expanded facilities to meet the projected demands. The goal of the master plan is to provide guidance for improvements at the Kona International Airport at Keahole for the next 20 years.
Findings Related to the Plan The primary objective of the master plan update is to provide the community and public officials with proper guidance for future development that will address aviation demands and be wholly compatible with the environment.
Annual passengers and cargo demand at the Kona International Airport is shown below.
2006 Actual 2030 Forecast
Passengers 3,033,212 4,721,000
Cargo 32,390 62,000
Aircraft Operations 143,218 287,900
Based Aircraft 61 160
The master plan includes improvements to the airfield, terminal, cargo, and general aviation facilities to meet the long-term forecasts for the airport.
The short term or highest priority projects focus on Phase I of the terminal modernization, as well as serving the general aviation demand. Costs for the short-term project are estimated at $140.7 million.
Phase I of the terminal modernization will include baggage claim, flight information, and passenger amenities improvements. The general aviation improvements will include third-party developments to address underserved demand, and removing commuter services from the general aviation terminal area. Heliport take-off and terminal facilities will also be improved as part of the short-term improvements. A new Aircraft Rescue and Fire Fighting station will be build and a utilities master plan will be developed. The Road M project and additional vehicle parking are key components of the short-term improvements. Road M will provide direct access to the general aviation activities and other airport operational areas from Queen Kaahumanu Highway.
The intermediate-term projects primarily address growth in demand. These projects include the establishing the parallel general aviation runway, new cargo facilities, and additional growth in the general aviation area. The intermediate-term projects are projected to cost $267.8 million.
PLAN AND POLICY REVIEW (DISTRICT OF HAWAII)
TBG062714093019HNL 21
To create and use the 5,500 feet parallel runway, the perimeter fence, service road, and taxiways will also need to be modified or created. Phase II of the terminal modernization will complete the expansion and the modernization program. Projects would include the consolidation of ticketing, baggage screening, inspection, and security. A second-level departure area for overseas flights would also be developed in this phase.
To support the terminal improvements, the terminal loop would be realigned and extended to Paoo Street, allowing the parking lot to be expanded by 400 stalls. Phase I of air cargo improvements include airside, cargo building and vehicle parking improvements to support demand through the intermediate planning horizon. The general aviation area will continue to develop through this phase. Paoo Street will no longer provide two-way access to Keahole Street. Halalau Street is planned to be extended north to the new cargo area to provide this access. The extension will also serve other airport uses including ground transportation expansion, aviation support areas, and airport industrial uses.
Long-term improvements are related to extended growth in airport activities, these projects should be considered if demand continues to increase. Long-term planning projects are estimated at $371.6 million.
Long-term airfield improvements will improve efficiency, circulation, and capacity, and would include extension of the parallel runway. The long-range terminal provides additional capacity for baggage and international operations. Also as demands warrant, additional expansion to the general aviation, heliport and cargo areas would occur. The long-term improvements include development of Road P, a new primary terminal access road. This improvement would ultimately be an interchange with Queen Kaahumanu Highway. The timing of creation of this grade-separated interchange would depend on the Highways Division and developments mauka of Queen Kaahumanu.
Alignment with the Planning Factors Kona International Airport improvements address the Economic Vitality of the state by expanding the facility to accommodate additional passengers, cargo, and overseas flights.
Improvements related to ground transportation access and ground transportation facilities acknowledge the Accessibility and Mobility planning factors and are mainly focused on vehicular access.

PLAN AND POLICY REVIEW (DISTRICT OF HAWAII)
TBG062714093019HNL 22
Hilo International Airport Master Plan, HDOT Airports Division, July 2002 Purpose and Content The Hilo International Airport Master Plan is part of an ongoing planning process that builds upon previously prepared airport master plans and development plans. Its objective is to update guidelines for future airport development, which will satisfy forecasted aviation demand in a financially feasible manner, while addressing the community’s environmental and socioeconomic issues and concerns. The master plan is based on a 20-year planning horizon subject to updates after 5 to 10 years. This master plan was adopted in 2002 with a planning horizon of 2020.
The objectives of the Airport Master Plan are to provide the following for agency, user, and public consideration:
• Plan for future development in a manner which satisfies forecast aviation demand, is financially feasible, and addresses community and environmental concerns.
• Prepare prioritized capital improvement program for airport development and funding.
• Inform and seek community, user, and agency involvement in the master planning process.
Findings Related to the Plan Annual passengers and cargo demand at the Hilo International Airport is shown below.
1992 Actual 1998 Actual 2020 Forecast
Passengers 1,573,814 1,559,494 2,196,000
Cargo 28,175 28,825 43,000
Aircraft Operations 91,055 112,479 166,900
Based Aircraft Data Not Provided 39 54
To accommodate these projected demands, recommended improvements integrate long-term terminal area requirements with forecast aviation demand and Airport access and parking needs. It provides a guide for airport development through the year 2020 and indicates possible developments beyond the planning horizon for which land should be reserved. The functional areas of the plan focus on airport property, airfield, air traffic control, passenger terminal, commuter/helicopter, air cargo, general aviation, military/civil patrol, access and parking, utilities and administration. Estimated project costs are shown in 1999 dollars.
Phase I projects are to be initiated by 2005. Phase I includes land acquisition, a new helicopter and cargo facility and associated airfield, apron, ground circulation connections and parking. Intersection improvements are planned at the Kanoelehua/Kekuanaoa Street exit. Improvements will provide an emergency access road onto Leilani Avenue. ($56.57 million)

PLAN AND POLICY REVIEW (DISTRICT OF HAWAII)
TBG062714093019HNL 23
Phase II projects are to be initiated by 2010. Facilities proposed for Phase II of the master plan are hangar and apron improvements in the northwest portion of the airport. The parking lot fronting the passenger terminal will also be expanded. Phase II improvements also incorporate internal access road improvements for circulation and safety. ($19.77 million)
Phase III projects are to be initiated in 2010 and beyond. Facilities proposed for Phase III of the master plan include runway relocation/extension and associated taxiway and apron connections and navigational aid modifications. A ground transportation baseyard, service roads, further expansion of the passenger terminal parking lot and intersection improvements at the Kekuanaoa Street and Kanoelehua Avenue intersection would also occur during this phase ($24.08 million)
Alignment with the Planning Factors The Hilo International Airport improvements in general address the Economic Vitality of the state by expanding the facility to accommodate additional passengers and cargo.
Improvements related to ground transportation access and ground transportation facilities acknowledge the Accessibility and Mobility planning factors and are mainly focused on vehicular access to/from and within the airport facilities.

PLAN AND POLICY REVIEW (DISTRICT OF HAWAII)
TBG062714093019HNL 24
Waimea-Kohala Airport Master Plan, HDOT Airports Division, February 1999 Purpose and Content The purpose of the Waimea-Kohala Airport Master Plan is to provide a comprehensive plan for the orderly development of the airport and to meet existing and forecast aviation demand through the year 2020. This master plan was adopted in 1999 with a planning horizon of 2020. The overall objectives of the Master Plan will be to
• Recommend proposed improvements that are flexible and allow the airport to meet the existing and forecast aviation demands.
• Recommend proposed improvements that consider local environment and community needs.
• Provide technical information upon which the proposed improvements can be based.
Findings Related to the Plan Annual passengers and cargo demand at the Waimea-Kohala Airport is shown below.
1997 Estimated 2020 Forecast
Passengers 10,400 26,600
Cargo 243 351
Aircraft Operations 10,500 20,100
Based Aircraft 10 19
To accommodate the forecast aviation demands and facility requirements, recommended improvements through the year 2020 have been outlined in three phases. Estimated project costs are shown in 1998 dollars.
Phase I projects are to be initiated by 2004. Phase I includes land acquisition, helicopter facility improvements, fencing improvements, taxiway lighting, and utility work. ($3.8 million)
Phase II projects are to be initiated by 2009. Phase II of the master plan includes land and easement acquisition, terminal improvements, new access roadway construction, perimeter roadway construction, parking, and utility work. ($1.385 million)
Phase III projects are to be initiated by 2020. Facilities proposed for Phase III of the master plan include construction of the remainder of the parallel taxiway, overhead utility relocation along Mamalahoa Highway, runway, and navigation improvements. Improvements also include land acquisition and construction of a new roadway to the proposed Waimea Bypass Road ($2.880 million).

PLAN AND POLICY REVIEW (DISTRICT OF HAWAII)
TBG062714093019HNL 25
Alignment with the Planning Factors The Waimea-Kohala Airport improvements in general address the Economic Vitality of the state by expanding the facility to accommodate additional passengers, aircraft operations, and air cargo.
Improvements related to ground transportation access and ground transportation facilities acknowledge the Accessibility and Mobility planning factors and are mainly focused on vehicular access to and within the airport facilities.
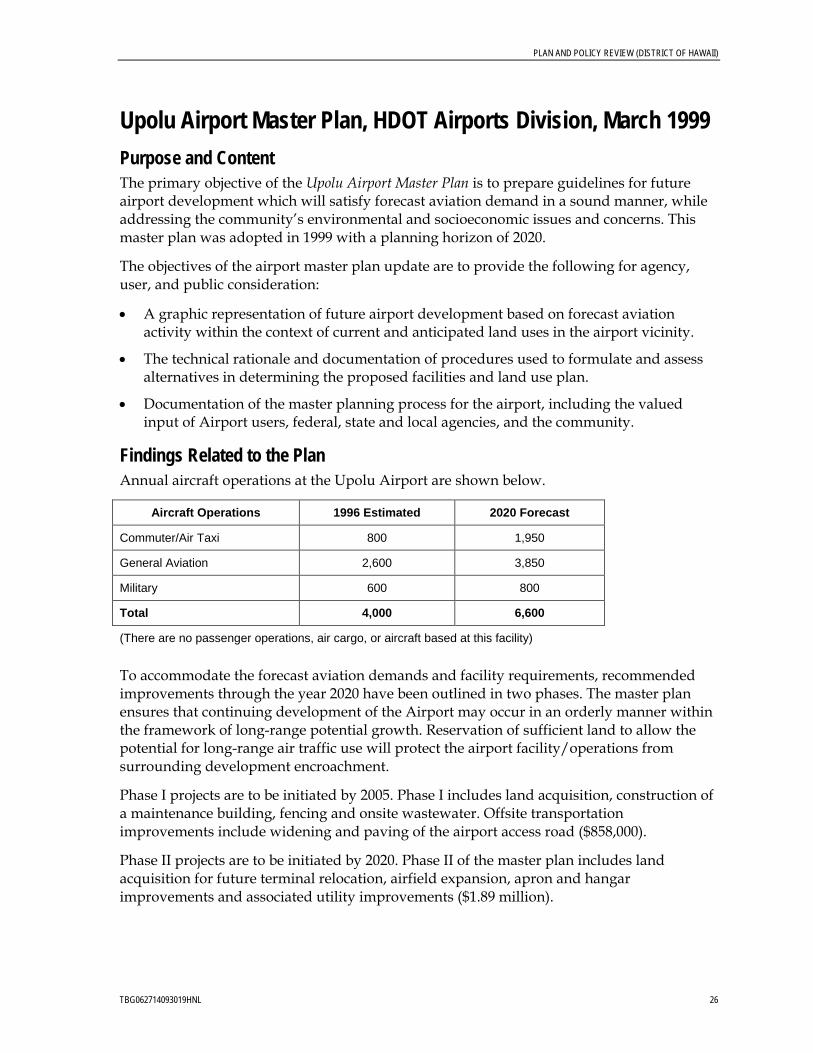
PLAN AND POLICY REVIEW (DISTRICT OF HAWAII)
TBG062714093019HNL 26
Upolu Airport Master Plan, HDOT Airports Division, March 1999 Purpose and Content The primary objective of the Upolu Airport Master Plan is to prepare guidelines for future airport development which will satisfy forecast aviation demand in a sound manner, while addressing the community’s environmental and socioeconomic issues and concerns. This master plan was adopted in 1999 with a planning horizon of 2020.
The objectives of the airport master plan update are to provide the following for agency, user, and public consideration:
• A graphic representation of future airport development based on forecast aviation activity within the context of current and anticipated land uses in the airport vicinity.
• The technical rationale and documentation of procedures used to formulate and assess alternatives in determining the proposed facilities and land use plan.
• Documentation of the master planning process for the airport, including the valued input of Airport users, federal, state and local agencies, and the community.
Findings Related to the Plan Annual aircraft operations at the Upolu Airport are shown below.
Aircraft Operations 1996 Estimated 2020 Forecast
Commuter/Air Taxi 800 1,950
General Aviation 2,600 3,850
Military 600 800
Total 4,000 6,600
(There are no passenger operations, air cargo, or aircraft based at this facility)
To accommodate the forecast aviation demands and facility requirements, recommended improvements through the year 2020 have been outlined in two phases. The master plan ensures that continuing development of the Airport may occur in an orderly manner within the framework of long-range potential growth. Reservation of sufficient land to allow the potential for long-range air traffic use will protect the airport facility/operations from surrounding development encroachment.
Phase I projects are to be initiated by 2005. Phase I includes land acquisition, construction of a maintenance building, fencing and onsite wastewater. Offsite transportation improvements include widening and paving of the airport access road ($858,000).
Phase II projects are to be initiated by 2020. Phase II of the master plan includes land acquisition for future terminal relocation, airfield expansion, apron and hangar improvements and associated utility improvements ($1.89 million).
PLAN AND POLICY REVIEW (DISTRICT OF HAWAII)
TBG062714093019HNL 27
Alignment with the Planning Factors The Upolu Airport improvements in general address the Economic Vitality of the state by expanding the facility to accommodate additional aircraft operations and the potential for use of the facility for passenger travel.
Improvements related to ground transportation access and ground transportation facilities acknowledge the Accessibility and Mobility planning factors and are mainly focused on vehicular access to/from the airport facility.

PLAN AND POLICY REVIEW (DISTRICT OF HAWAII)
TBG062714093019HNL 28
Hakalau Forest National Wildlife Refuge Comprehensive Conservation Plan and Environmental Assessment, United States Fish and Wildlife Service, Ongoing Purpose and Content The Hakalau National Wildlife Refuge consists of the Hakalau Forest Unit on the windward slope of Mauna Kea and the Kona Forest Unit on the western slope of Mauna Loa. A multiyear planning process to develop a 15-year CCP and EA that will guide the management of fish, wildlife, plants, habitats, and public uses is currently being performed.
Findings Related to the Plan The plan has developed goals related to wildlife, habitat, public use, and cultural resources.
The preferred alternative increases reforestation, restoration and ungulate (hoofed animal) removal efforts. It also increases the control of threatened and endangered plant and outplantings, invasive species and predator control. Public hunting would be closed, and staff would provide additional opportunities for outreach and environmental education and interpretation. Opportunities for land acquisition/boundary expansion would be explored, with a focus on protection of bird habitats in response to effects of climate change.
The preferred alternative identifies specific objectives related to visitor, volunteer, education, and cultural resources opportunities. The objectives may be coordinated to support appropriate levels and modes of access to the wildlife refuge from the land transportation system.
Alignment with Planning Factors Consistency with the National Wildlife Refuge long-term plans supports the Environment and Sustainability of Hawaii’s natural habitats.

PLAN AND POLICY REVIEW (DISTRICT OF HAWAII)
TBG062714093019HNL 29
Ala Kahakai National Historic Trail, Comprehensive Management Plan, National Parks Service, 2009 Purpose and Content The Ala Kahakai Nation Historic Trail [NHT] Comprehensive Management Plan consists of surviving ancient trails, historic trails developed on/parallel to traditional routes and recent paths/roads that create links between segments. The trail corridor is 175 miles long, along the west coast of the island of Hawaii.
The comprehensive management plan establishes guidelines needed to fulfill the preservation and public use goals for the NHT over the next 15 years. The plan is based on the trail’s purpose and historical significance. It offers strategies for resource protection, trail use, and facility development. It serves as the framework under which individual implementation plans will be developed.
Findings Related to the Plan The National Parks Service will provide overall administration and coordination of the NHT and will consider management of state-owned trail segments. It will also coordinate with the HDOT regarding locations affected by the trail’s right-of-way.
In addition to the trail, the development of facilities to administer the plan include visitor use facilities, establishment of an auto route (signs, viewpoints, exhibits), access roads, parking areas, and access to trail heads.
Alignment with Planning Factors Consistency with the NHT long-term plans supports the Environment and Sustainability of Hawaii’s natural habitats. It will support Economic Vitality, attracting visitors to this unique corridor. It will also support Modal Integration and connection to nonmotorized trails.

PLAN AND POLICY REVIEW (DISTRICT OF HAWAII)
TBG062714093019HNL 30
County of Hawaii Capital Budget and 6-year Capital Improvements Program, Fiscal Year 2010-2011 Purpose and Content The capital budget provides a listing of projects and services for the County of Hawaii for the fiscal year 2011. It includes estimated costs and identified sources of funds.
Findings Related to the Plan Review of the capital budget and programs will be important to understand existing planned transportation improvements on state facilities, which could be considered as the future baseline transportation network.
Alignment with Planning Factors The capital program projects will allow for identification of spending allocations related to the planning factors based on planned project’s alignment with HDOT programs and funding categories.

TBG062714093019HNL 1
M E M O R A N D U M Statewide Federal-Aid Highways 2035 Transportation Plan and Regional Federal-Aid Highways 2035 Transportation Plans for the Districts of Maui, Hawaii, and Kauai
Plan and Policy Review (District of Kauai) TO: State of Hawaii Department of Transportation (HDOT) FROM: CH2M HILL DATE: January 14, 2011
Introduction The planning team reviewed regional policies and plans relevant to development of the Statewide Federal-Aid Highways 2035 Transportation Plan and the Regional Federal-Aid Highways 2035 Transportation plans for the Districts of Maui, Hawaii, and Kauai.
This summary of regional plans and policies was an important first step to ensure that the statewide and regional federal-aid plans:
• Reflect consistency through alignment of goals and objectives • Build effectively on previously adopted plans and policies. • Comply with regional requirements. • Have guidance and structure for development of potential solutions.
The plan and policy summaries help to shape the goals for the statewide and regional transportation plans and the definition of potential solutions.
Regional Plans and Policies Regional plans and policies are more specific than federal or statewide plans and policies in that they address a smaller geography and define specific projects for specific island contexts.
The regional plans and policies are consistent with statewide policy; however, they do vary based on regional priorities. These regional plans will be used to help in the development of the Statewide Federal-Aid Highways 2035 Transportation Plan and the Regional Federal-Aid Highways 2035 Transportation Plan for the District of Kauai (Plan).
The following plans and policies were examined for the District of Kauai:
• Kauai County General Plan (2000) • Kauai Long-Range Land Transportation Plan (1997) • Kauai County Multi Hazard Mitigation Strategy (2003) • Kauai Multimodal Land Transportation Plan (2013)
PLAN AND POLICY REVIEW (DISTRICT OF KAUAI)
TBG062714093019HNL 2
• Kauai Energy Sustainability Plan (2010) • Lihue Town Core Urban Design Plan (2009) • Resolution No. 2010-48 Complete Streets Policy (2010) • Kauai Commercial Harbors 2025 Master Plan (2001) • Lihue Airport Master Plan Update (1989) • Port Allen Airport Master Plan Update (2001) • County of Kauai Capital Budget FY 2011

PLAN AND POLICY REVIEW (DISTRICT OF KAUAI)
TBG062714093019HNL 3
Kauai General Plan, County of Kauai, November 2000 Purpose and Content The Kauai General Plan (General Plan) provides guidance for land use regulations, the location and character of new developments and facilities and planning for county and state facilities and services. The General Plan sets the direction for the 20-year vision for the County of Kauai and sets policies to achieve the vision.
The vision for Kauai in 2020 is:
A “garden island” of unsurpassed natural beauty;
A rural environment of towns separated by broad open spaces;
A vital modern society formed by the people and traditions of many cultures;
An island of distinctly individual towns and communities, each with its own unique history and character;
A community which values its historic places and where people practice and draw strength from ancient languages and cultural traditions.
A rural place whose population size and economy have been shaped to sustain Kauai’s natural beauty, rural environment and lifestyle.
A community which cares for its land and waters, leading the way with best management practices in the development of roads and other public facilities and in its land development and environmental regulations.
An agricultural center, producing a wide range of crops, food, and forest products for local consumption and export.
A resort destination where visitors are welcomed, supported with adequate facilities, and provided with a variety of cultural and recreational opportunities.
A resort destination whose government and industry leaders respect the island’s residents and their need to have a community life where visitors are not always present and who find effective ways to protect residents’ customary use of special places for religious and cultural observances, fishing, gathering, hunting and recreation.
An island whose government supports the labor force and small business owners, firmly holding to essential policies and regulations while eliminating unnecessary red tape.
Findings Related to the Plan Policy related to the Kauai highway system includes:
• Use General Plan policies concerning rural character, preservation of historic and scenic resources, and scenic roadway corridors as part of the criteria for long-range highway planning and design. The goal of efficient movement of through traffic should be
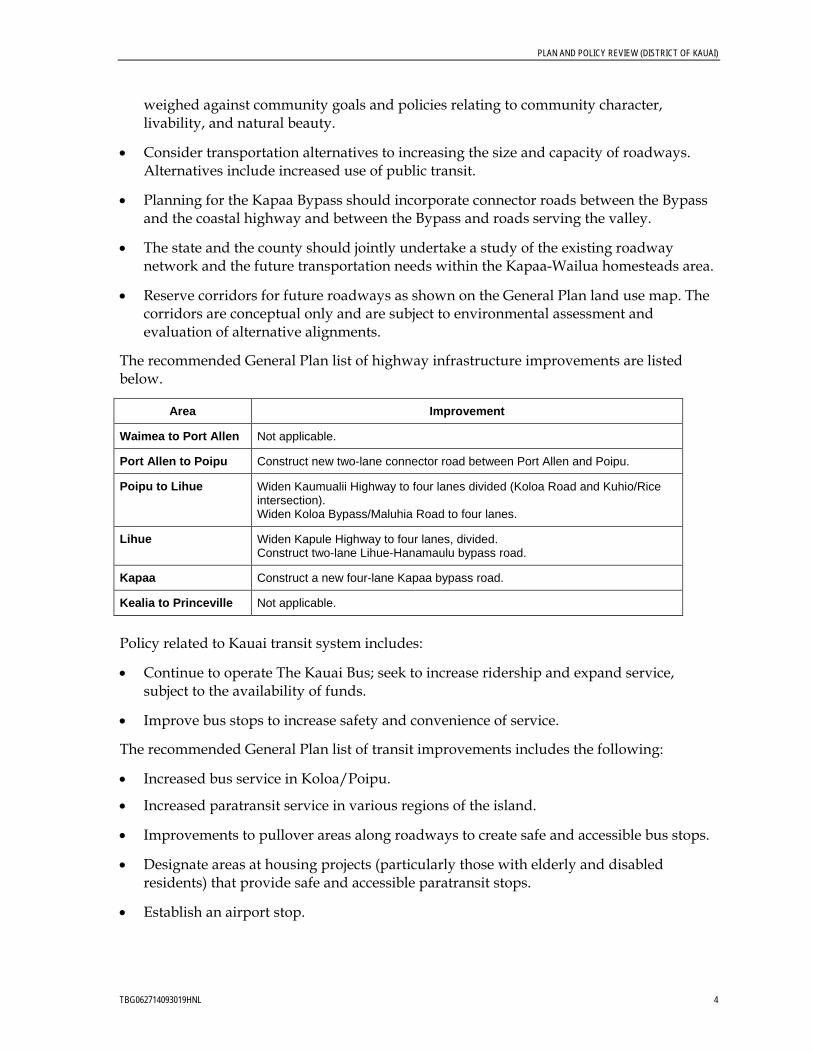
PLAN AND POLICY REVIEW (DISTRICT OF KAUAI)
TBG062714093019HNL 4
weighed against community goals and policies relating to community character, livability, and natural beauty.
• Consider transportation alternatives to increasing the size and capacity of roadways. Alternatives include increased use of public transit.
• Planning for the Kapaa Bypass should incorporate connector roads between the Bypass and the coastal highway and between the Bypass and roads serving the valley.
• The state and the county should jointly undertake a study of the existing roadway network and the future transportation needs within the Kapaa-Wailua homesteads area.
• Reserve corridors for future roadways as shown on the General Plan land use map. The corridors are conceptual only and are subject to environmental assessment and evaluation of alternative alignments.
The recommended General Plan list of highway infrastructure improvements are listed below.
Area Improvement
Waimea to Port Allen Not applicable.
Port Allen to Poipu Construct new two-lane connector road between Port Allen and Poipu.
Poipu to Lihue Widen Kaumualii Highway to four lanes divided (Koloa Road and Kuhio/Rice intersection). Widen Koloa Bypass/Maluhia Road to four lanes.
Lihue Widen Kapule Highway to four lanes, divided. Construct two-lane Lihue-Hanamaulu bypass road.
Kapaa Construct a new four-lane Kapaa bypass road.
Kealia to Princeville Not applicable.
Policy related to Kauai transit system includes:
• Continue to operate The Kauai Bus; seek to increase ridership and expand service, subject to the availability of funds.
• Improve bus stops to increase safety and convenience of service.
The recommended General Plan list of transit improvements includes the following:
• Increased bus service in Koloa/Poipu.
• Increased paratransit service in various regions of the island.
• Improvements to pullover areas along roadways to create safe and accessible bus stops.
• Designate areas at housing projects (particularly those with elderly and disabled residents) that provide safe and accessible paratransit stops.
• Establish an airport stop.

PLAN AND POLICY REVIEW (DISTRICT OF KAUAI)
TBG062714093019HNL 5
Policy related to Kauai bicycle system includes supporting funding to develop Kauai’s bikeway system to provide for alternative means of transportation, recreation, and visitor activities (economic development).
The General Plan references the improvements recommended in Bike Plan Hawaii 1994. The Master Plan proposes the development of 173 new bikeway miles. Of the 173 proposed bikeway miles, there are 136.4 miles of bicycle routes, 8.2 miles of bicycle lanes, and 28.4 miles of bicycle paths. The proposed additions to Kauai’s bikeway system are estimated to cost a total of approximately $39.3 million. About 103.3 miles would be under the jurisdiction of the state at a cost of $22.5 million, and 63.1 miles would be under the jurisdiction of the County of Kauai at a cost of $15.2 million. Approximately 6.6 proposed bikeway miles could fall under either jurisdiction and would cost $1.6 million.
The Regional Federal-Aid Highways 2035 Transportation Plan for the District of Kauai shall take into consideration recommendations made by the General Plan. The travel demand model, land use, and stakeholder input will address appropriateness of the recommendations.
The County General Plan focuses on maintaining a balance between natural/ historic/ cultural contexts with business/tourism. The plan lays out policy to consider transportation solutions rather than increasing roadway facility size. This focus is a shift from the Kauai Long-Range Land Transportation Plan prepared in 1997, which had a major focus increasing vehicle capacity of the transportation system. The update of long-range land transportation plan will incorporate the desire for alternative transportation solutions such as support of transit operations.
Alignment with the Planning Factors The General Plan policies set the framework for a balanced transportation system. The goal of efficient movement of people and goods is to be weighed against context including preservation of culture, environment, and community. These policies address the trade-offs between Economic Vitality and Mobility versus the Environment. Integration and Connectivity through transit and bicycle (nonmotorized) improvements are also addressed in the General Plan policies.

PLAN AND POLICY REVIEW (DISTRICT OF KAUAI)
TBG062714093019HNL 6
Kauai Long-Range Land Transportation Plan, HDOT, May 1997 Purpose and Content The Kauai Long-Range Land Transportation Plan was developed in cooperation with the County of Kauai. It serves as a guide to major surface transportation facilities and programs to year 2020. The plan is intended to identify long-range strategies and actions, as well as short-range improvements that will lead to the development of a transportation system that facilitates the efficient movement of people and goods.
The plan contains a financial element that identifies both current and potential future sources of revenue that may be available for implementation of the plan. Overall, $408.7 million in the plan period was estimated for construction (does not include the costs for engineering studies and design, rights-of-way, relocation of utilities, or environmental mitigation measures).
The long-range land transportation plan was developed in accordance with requirements of the 1991 Inter-modal Surface Transportation Efficiency Act. The plan was developed under the auspices of the Countywide Transportation Planning Process, Kauai, to involve the appropriate parties and secure their commitment and support of the recommendations.
Findings Related to the Plan The recommended implementation plan is summarized below.
Area 1996-2000 2001-2005 2006-2020 2020+
Waimea to Port Allen
- - Widen Kaumualii Highway to four lanes Waimea – Eleele.
-
Port Allen to Poipu
- Widen Kaumualii Highway to four lanes Kalaheo and Koloa Road.
Construct new road between Port Allen and Poipu.
Conduct Port Allen/Kalaheo/ Poipu Circulation Study.
Widen Kaumualii to four lanes Port Allen – Kalaheo.
Poipu to Lihue
Widen Kaumualii Highway to four lanes Koloa Road and Kuhio/Rice intersection.
Construct Phase 1 of the Poipu/Nawiliwili connector road.
Construct Phase 2 of the Poipu/Nawiliwili connector road.
Widen east Koloa/Poipu bypass road to four lanes.
Widen Poipu Road to four lanes Lawai Road and east Koloa/Poipu bypass road.
-

PLAN AND POLICY REVIEW (DISTRICT OF KAUAI)
TBG062714093019HNL 7
Area 1996-2000 2001-2005 2006-2020 2020+
Lihue - Realign Ahukini Rd to four lanes Kuhio Highway/Kapule Highway.
Widen Kuhio Highway to four lanes Ehiku Street and Eha Street.
Widen Kapule Highway to four lanes Rice Street/Kuhio Highway.
Widen Haleko Road to four lanes Rice Street/Nawiliwili Road.
Construct Lihue/Hanamaulu mauka bypass and connector roads to Ehiku Street, Nawiliwili Road, and Nuhou Road.
Conduct Lihue Circulation/Access Study.
Conduct Lihue Airport and Nawiliwili Harbor Access studies.
Kapaa Widen Kuhio Highway to four lanes at Kapule Highway/ Mailihuna Road.
Construct two-lane Wailua/Kapaa bypass road.
Widen Kuamoo Road and Olohena Road to four lanes at Kuhio Highway/Kamalu Road.
Widen Kawaihau Road to four lanes at Kuhio Highway/Mailihuna Road.
Widen Wailua/Kapaa bypass road to four lanes.
Widen Kamalu Road to four lanes at Kuamoo Road/Olohena Rd
Widen Kuhio Highway to six lanes at Lihue/Hanamaulu bypass road and south terminus of Wailua/Kapaa bypass road.
Conduct Kapaa Circulation/Access Study.
Consider new road at Maalo Road and Kuamoo Road.
Kealia to Princeville
- - - Provide passing lanes, where feasible on Kuhio Highway, Kealia, and Princeville.
The Regional Federal-Aid Highways 2035 Transportation Plan for the District of Kauai shall take into consideration project recommendations. These recommendations, however, were developed over 10 years ago and will be vetted against current conditions and long-range priorities. The travel demand model, land use, and stakeholder input will address appropriateness of the remaining recommendations.
Alignment with the Planning Factors The project recommendations focused on Economic Vitality and Mobility by providing for the efficient movement of people and goods. The recommendations also provide for Connectivity between communities and provide alternative routes between major regional areas during road closures caused by natural disasters or accidents.

PLAN AND POLICY REVIEW (DISTRICT OF KAUAI)
TBG062714093019HNL 8
Kauai Multi-Hazard Mitigation Strategy, Kauai County Civil Defense Agency and County of Kauai, 2003 Purpose and Content The purpose of the Kauai County Multi-Hazard Mitigation Strategy is to identify potential natural hazards, assess the vulnerabilities of the island, and develop mitigation measures to reduce the risks of these hazards. The mitigation plan can also be used as an educational tool to inform the public of hazards, and to help public agencies identify and improve resource sharing (such as mapping).
Based on current data, the strategy identifies risks and hazards that could potentially cost the community in terms of funds, productivity, and personal hardship. Hurricanes and high winds have been identified as the greatest risks for the island of Kauai, with landslides, erosion, and stream flooding also posing serious hazards. Potential mitigation strategies to address these risks are consistent with hazard mitigation guidance in the Kauai County General Plan and include improving land use development policies in high-risk areas, improving coastal management, reviewing building codes and infrastructure development standards, and increasing public awareness of risks and recovery resources. Identified mitigation measures also focus on critical facilities and infrastructure that could result in the protection of life, property, and resources.
Findings Related to the Plan Critical facilities and infrastructure projects that are identified by the multihazard mitigation plan that could be applicable to the long-range transportation plan include the following:
• Wailua Bridge Bypass Road – Improve a section of road to allow traffic to flow one-way at a time to bypass Wailua Bridge. Improve sight distance. Route emergency traffic on unimproved by-pass roadway.
• Alternate routes around major highway bridges (Hanalei, Waimea, Hanapepe, etc.) – Acquire land to create alternative routes or by-pass roads around these bridges to assist in evacuation or aid emergency vehicles.
• Relocate Kapaa Fire Station – Relocate building out of the tsunami evacuation zone.
These facility projects should be considered during development of the Regional Federal-Aid Highways 2035 Transportation Plan for the District of Kauai.
Alignment with the Planning Factors The multihazard mitigation plan supports the planning factors by promoting Safety, encouraging a Sustainable Environment, and enhancing Transportation Access and Mobility, and Security during a natural hazard event.

PLAN AND POLICY REVIEW (DISTRICT OF KAUAI)
TBG062714093019HNL 9
Kauai Multimodal Land Transportation Plan, County of Kauai Planning Department, September 2012 Purpose and Content The Kauai Multimodal Land Transportation Plan is guided by the 2000 County General Plan and outlines steps the County will need to take to achieve a balanced multimodal transportation system by the year 2035. The multimodal plan provides an evaluation and assessment of existing operations, determination of current and future needs, and descriptions of potential solutions and recommendations to address identified needs.
The plan compares two future potential scenarios: a baseline scenario that shows where Kauai’s multimodal system would be in 2035, given current growth trends, and a preferred scenario that assumes growth in vehicular traffic has been prevented or controlled to remain at 2010 levels by 2035. The preferred scenario achieves objectives outlined in the 2000 County General Plan.
The multimodal plan includes six programs (transit, bicycle, pedestrian, county roads, agriculture transportation, and land use) by which the multimodal plan will be implemented.
Findings Related to the Plan Goals of the Kauai Multimodal Land Transportation Plan that relate to development of the Plan include:
• Goal 1: A balanced, multimodal transportation system that provides choice, flexibility and resiliency in personal access and circulation for all.
• Goal 2: A freight transport system that supports the island’s economic sectors, including food and agriculture, health and wellness, sports and recreation, arts and culture, science and technology, and sustainable technologies and practices.
• Goal 3: A transportation system that supports economic vitality and provides affordable access to jobs and economic opportunity.
• Goal 4: A transportation system that supports and enhances public health.
• Goal 5: A transportation system that will be planned and designed to protect and enhance the island’s natural landscapes and environmental quality.
• Goal 6: A transportation system that makes efficient use of energy and is less dependent on imported petroleum.
• Goal 7: A transportation system that is maintained in a state of good repair.
• Goal 8: A transportation system that protects and enhances the cultural values of Kauai, the rural character of the island, and a high quality of life.
Needs and recommendations in the Kauai Multimodal Land Transportation Plan will be reviewed and coordinated with the Regional Federal-Aid Highways 2035 Transportation Plan for the District of Kauai.

PLAN AND POLICY REVIEW (DISTRICT OF KAUAI)
TBG062714093019HNL 10
Alignment with the Planning Factors The development of the Kauai Multimodal Land Transportation Plan follows the same planning framework as the Regional Federal-Aid Highways 2035 Transportation Plan for the District of Kauai, and specifically aligns with the Environment and Sustainability, Modal Integration, Economic Vitality, Transportation Access Mobility, and Safety planning factors.

PLAN AND POLICY REVIEW (DISTRICT OF KAUAI)
TBG062714093019HNL 11
Kauai Energy Sustainability Plan, County of Kauai, 2010 Purpose and Content The purpose of the Kauai Energy Sustainability Plan is to ensure maximum energy efficiency and conservation while facilitating Kauai’s production and use of local, sustainable energy resources in place of imported oil by the year 2030. Based on inputs from the stakeholder group and the community, the plan established vision, goals and objectives, and outlined recommendations for different sectors. Considerations of other alternative energy were also discussed.
Findings Related to the Plan Recommendations for the land transportation sector include:
• Reduce consumption of fossil fuels through:
− Passing 2 percent fossil fuel tax − Improving Kauai Bus System − Offering hybrid electric vehicle incentives − Supporting “As Needed” visitor vehicle rentals
• Increase renewable fuel production/use through:
− Purchasing five vegetable-oil presses to allow small farmers to produce straight vegetable oil
− Offering incentives to convert gasoline vehicles to gasoline/ethanol flex fuel vehicles
• Increase renewable energy use for ground transportation through:
− Offering Plug-in Hybrid Electric Vehicle incentives and support night-time charging infrastructure
Alignment with the Planning Factors The Kauai Energy Sustainability Plan supports a Sustainable Environment as it encourages production and use of renewable energy in opposition to the consumption of fossil fuels.

PLAN AND POLICY REVIEW (DISTRICT OF KAUAI)
TBG062714093019HNL 12
Lihue Town Core Urban Design Plan, County of Kauai, June 2009 Purpose and Content The purpose of the Lihue Town Core Urban Design Plan is to:
• Implement the intent and purpose of elements within the Kauai General Plan Update 2000 regarding the Lihue Town Core area and the Lihue Town Core Urban Design Plan of 2009.
• Provide more up-to-date design standards from those enumerated in the Lihue Development Plan 1976 in recognition of more detailed planning goals and objectives for the Lihue Town Core Area.
• Establish Special Planning Areas, land uses, development standards, and design guidelines to guide and regulate future development.
• Protect certain physical characteristics found to be of particular public value, as provided in Kauai County Code Section 8-9.6, Special Planning Areas.
• Provide for regulations of land use and development practices within the Lihue Town Core area.
Findings Related to the Plan Goals and objectives of the Lihue Town Core Urban Design Plan that relate to development of the plan include:
• Aesthetic improvements and beautification:
− Beautify Lihue streets, walkways, and parks.
− Build upon landscape improvements along Ahukini Road and Kapule Highway.
− Develop beautification projects for each Lihue neighborhood including unique designs for crosswalks and landscaping.
• Historic preservation:
− Maintain and enhance historic resources.
− Explore connections between Lihue and the Harbor through old railroad alignment (bike path, pedestrian path, train).
• Business and community revitalization:
− Allow true mixed-use housing where people live above commercial uses.
• Transportation networks:
− Develop transportation networks that support multimodal choices.
− Create a safe, pedestrian-friendly environment that encourages walking.
− Provide convenient bicycle network and facilities.
PLAN AND POLICY REVIEW (DISTRICT OF KAUAI)
TBG062714093019HNL 13
− Address congestion; provide uncongested yet appropriate traffic flow and circulation based on context-sensitive design.
− Provide appropriate development of parking facilities that encourages the use of multimodal transportation options.
− Develop alternatives for through-traffic such as the Lihue Bypass and dedicated community transportation routes.
− Include enhanced links and connections to periphery areas such as Nawiliwili Harbor, Kukui Grove Shopping Center, and Lihue Airport.
− Consider pedestrian bridges across Nawiliwili Stream to connect central Lihue to the residential communities on Nawiliwili Road, as well as adding a pedestrian path on Kaumualii Highway to connect central Lihue to Kukui Grove.
• Environment and natural resources:
− Protect and enhance natural resources by reducing or mitigating pollution that enters streams.
− Develop catchment systems for irrigation water.
Alignment with the Planning Factors The Lihue Town Core Urban Design Plan supports a Sustainable Environment and encourages Economic Vitality, Modal Integration, and Connectivity through development of context-sensitive transportation facilities.

PLAN AND POLICY REVIEW (DISTRICT OF KAUAI)
TBG062714093019HNL 14
Resolution No. 2010-48, Draft 1: A Resolution Establishing a Complete Streets Policy for the County of Kauai, County of Kauai Council, Adopted September 15, 2010 Purpose and Content The Kauai County Council adopted a Complete Street Policy to:
• Promote safe access.
• Encourage multiple travel modes.
• Integrate travel modes.
• Encourage healthy lifestyles.
• Provide a complete and connected network for pedestrians, bicyclists, motorists, and public transportation.
The resolution was developed in response to ACT 54, a 2009 Legislative Act requiring counties to adopt a Complete Streets policy. The resolution was also developed to align with national engineering, planning and health organizations, numerous transportation agencies throughout the United States and the County General Plan.
Findings Related to the Plan The resolution states that all roadway projects be balanced and equitable in accommodating all modes of travel including nonmotorized users of all ages and abilities in accordance with Complete Streets principles. Priority shall also be given to pedestrian travel in town centers and other densely populated areas for any new county transportation improvement projects.
The resolution also identifies exemptions from application of Complete Streets principles which include ordinary maintenance activities, disproportionate costs, safety risks, significant impacts to resources, and locations that prohibit nonmotorized use.
Alignment with the Planning Factors The Complete Streets policy addresses many of the planning factors including increasing Safety, Accessibility, and Mobility for all modes of travel with proper planning and design for all modes. The Environment and Sustainability of the county will also be enhanced, as various modes of travel are encouraged.
PLAN AND POLICY REVIEW (DISTRICT OF KAUAI)
TBG062714093019HNL 15
Kauai Commercial Harbors 2025 Master Plan, HDOT Harbors Division, September 2001 Purpose and Content The Kauai Commercial Harbors 2025 Master Plan provides a general guide to help develop, maintain, and enhance the island’s commercial harbor system, as well as map out potential infrastructure that may be required by carriers of essential commodities. It is also meant to ensure that commercial harbor operations are efficient, accessible, economical, and safe. On the island of Kauai, Nawiliwili Harbor and Port Allen Harbor handle the majority of marine cargo and passenger operations.
Nawiliwili Harbor mainly serves the cruise industry. Plans for future growth include new piers and berthing facilities to handle additional industry growth and to accommodate the island’s growing economy. The additional piers are also expected to accommodate potential cargo activities. Port Allen Harbor is smaller than Nawiliwili Harbor and is proposed to have new piers and berthing facilities to accommodate future cargo, passenger, and military vessels. This increase in capacity is expected to permit growth of the ports maritime industries.
Findings Related to the Plan Primary objectives of the harbors master plan include:
• Plan both harbors properly to provide efficient facilitation of maritime shipments for the entire island.
• Optimize the use of land and water resources committed to marine cargo, passenger, and fishing operations in an economical manner.
• Provide terminals and other harbor resources and accesses within Nawiliwili Harbor and Port Allen Harbor in a manner that best serves Kauai’s port system.
• Minimize impact on environmental quality and recreational opportunities contiguous with Kauai’s port facilities.
Development of the harbors is intended to accommodate potential increases in ocean cruise vessels, as well as support anticipated growth on the island.
Recommended roadway projects to support growth and improvements at Nawiliwili Harbor include a series of new connector roadways. A new two-lane connector roadway between Poipu and Nawiliwili was referenced in the Kauai Long-Range Land Transportation Plan. Two phases of this new connector are planned, with completion by 2020. A new roadway between Nawiliwili and Nuhou Road is also recommended by the harbor master plan to provide a western connection to harbor property.
The Statewide Federal-Aid Highways 2035 Transportation Plan will take into account the roadway needs for the harbors on Kauai so that convenient access for people and vehicles is provided, and a safe, efficient roadway network is maintained for distribution of goods from the cargo ships to the people.
PLAN AND POLICY REVIEW (DISTRICT OF KAUAI)
TBG062714093019HNL 16
Alignment with the Planning Factors The Kauai Commercial Harbors 2025 Master Plan is aligned with many long-range planning factors. The roadway improvements and recommendations outlined in the harbor plan support the Modal Integration planning factor by encouraging efficient transition between maritime and land transportation modes. It also aligns with the Economic Vitality planning factor as it embraces the potential increase in tourism through the cruise industry.

PLAN AND POLICY REVIEW (DISTRICT OF KAUAI)
TBG062714093019HNL 17
Lihue Airport Master Plan Update, HDOT Airports Division, October 1989 Purpose and Content The Lihue Airport Master Plan is part of an ongoing planning process for the airport that builds upon previously prepared airport master plans and development plans. Its purpose is to update guidelines for future airport development which will satisfy forecast aviation demand in a financially feasible manner, while addressing the community’s environmental and socioeconomic issues and concerns. The master plan is based on a 20-year planning horizon subject to updates after 5 to 10 years. This master plan was adopted in 1989 with a planning horizon of 2005.
The objectives of the master plan are to provide the following for public consideration:
• A graphic presentation of future airport development within the context of current and anticipated land uses in the airport vicinity.
• A prioritized capital improvement program and financially feasible schedule for developments proposed in the plan.
• The technical rationale and documentation of procedures used to formulate and assess alternatives in determining the proposed facilities and land use plan.
• Reaffirmation of the ongoing master planning process for the airport, including the valued input of airport users, federal, state and local agencies, and the community.
Findings Related to the Plan Annual passengers and cargo demand at Lihue is shown below.
1986 Actual 2005 Forecast
Passengers 2,541,089 4,430,000
Cargo 12,354 20,400
Aircraft Operations 143,905 193,000
Based Aircraft 35 57
To accommodate these projected demands, recommended improvements integrate long-term airfield and terminal area requirements with current and forecast aviation needs and airport access and parking needs. It provides a guide for airport development through the year 2005 and indicates possible developments beyond the planning horizon for which land should be reserved. Estimated project costs are shown in 1988 dollars.
Phase I projects are to be initiated by 1991. Phase I contains improvements related to airfield, terminal, general utilities/infrastructure, ground access and navigational needs. Land acquisition is also incorporated into Phase I. To support operations and access to/from the airport, Phase I includes parking for commuter and cargo facilities.

PLAN AND POLICY REVIEW (DISTRICT OF KAUAI)
TBG062714093019HNL 18
Improvements to internal airport access roads and the secondary airport access near the post office are also part of this phase. ($24.3 million)
Phase II projects are to be initiated by 1996. The Phase II improvements focus on additional apron, terminal and utilities/infrastructure needs. Improvements to the Ahukini Road access would occur during Phase II including realignment and illumination. ($16.7 million)
Phase III projects are to be initiated by 2005. Phase III improvements focus on additional apron, terminal and utilities/infrastructure needs. A new air-traffic control tower and aircraft rescue and firefighting building would also be included to service the improved airport facilities. To support ground access, improvements to internal access roads would occur as well as construction of a new access road to the new control tower and fire rescue facilities. ($15.7 million)
Alignment with the Planning Factors Lihue Airport improvements in general address the Economic Vitality of the state by expanding the facility to accommodate additional passengers, cargo, and overseas flights.
Improvements related to ground transportation access and ground transportation facilities acknowledge the Accessibility and Mobility planning factors and are mainly focused on vehicular access.

PLAN AND POLICY REVIEW (DISTRICT OF KAUAI)
TBG062714093019HNL 19
Port Allen Airport, Master Plan Update, HDOT Airports Division, August 2001 Purpose and Content The purpose of the Port Allen Airport Master Plan Update is to provide a plan for proposed airport improvements and to consolidate the appropriate elements of previous planning efforts. The proposed improvements are intended to provide more efficient and safer aircraft operations and allow helicopter operations and maintenance at the airport; create an aviation environment to accommodate existing and forecast aviation demand; and provide airport infrastructure to accommodate and encourage aviation in West Kauai. The proposed improvements will also provide the capability to allow emergency aviation activities to be conducted at night and enhance safety during low-visibility daylight conditions. The Master Plan Update is also intended to satisfy the requirements of Section 261-13.6, Hawaii Revised Statutes for a Helicopter Master Plan. This master plan was adopted in 2001 with a planning horizon of 2020.
Findings Related to the Plan Annual demand at the Port Allen Airport is shown below.
1998 Actual 1999 Actual 2020 Forecast
Aircraft Operations 6,324 5,892 8,900
Based Aircraft 5 5 9
To accommodate these projected demands, recommended improvements through the year 2020 include improvements for helicopter and plane parking, runway lighting, and parking/access road improvements. Associated infrastructure and utility improvements to support these projects would also be provided. Estimated project costs are $568,000.
Alignment with the Planning Factors Port Allen Airport improvements in general address the Safety of air operations in the region by providing helicopter and small plane parking, pads, and hangars. Safety is also improved with provision of runway lighting that allow nighttime air rescue operations to occur.
Improvements related to ground transportation access and ground transportation facilities acknowledge the Accessibility and Mobility planning factors, and are mainly focused on vehicular and adjacent shoreline access.
PLAN AND POLICY REVIEW (DISTRICT OF KAUAI)
TBG062714093019HNL 20
Capital Budget, County of Kauai, Fiscal Year July 1, 2010 to June 30, 2011 Purpose and Content The capital budget provides a listing of projects and services for the County of Kauai for the Fiscal Year 2011. It includes estimated costs and identified sources of funds.
Findings Related to the Plan Review of the capital budget and programs will be important to understand existing planned transportation improvements on state facilities, which could be considered as the future baseline transportation network.
Alignment with Planning Factors The capital program projects will allow for identification of spending allocations related to the planning factors based on planned project’s alignment with HDOT programs and funding categories.

Appendix CGoals, Objectives, and Strategies


M E M O R A N D U M Statewide Federal-Aid Highways 2035 Transportation Plan and Regional Federal-Aid Highways 2035 Transportation Plans for the Districts of Maui, Hawaii, and Kauai
Final Goals, Objectives, and Strategies PREPARED FOR: State of Hawaii Department of Transportation (HDOT) PREPARED BY: CH2M HILL DATE: November 29, 2012 This memorandum presents goals, objectives, and strategies for the Statewide Federal-Aid Highways 2035 Transportation Plan and the Regional Federal-Aid Highways 2035 Transportation Plans for the Districts of Maui, Hawaii, and Kauai. Goals, objectives, and strategies are organized by eight federal planning factors (plus an additional category for the purposes of the statewide and regional federal-aid plans), which include:
1. Environment and Sustainability 2. Modal Integration 3. System Preservation 4. Security 5. Economic Vitality 6. System Efficiency Management and Operations 7. Transportation Access Mobility 8. Safety 9. Additional Goals, Objectives, and Strategies
The planning factors and associated goals, objectives, and strategies are not listed in priority order. Priorities will be developed in a subsequent task in the development of the statewide and regional federal-aid transportation plans.
Goals, objectives, and strategies of the plans are aligned with existing federal, state and local regulatory and policy requirements and the mission of HDOT. The goals, objectives, and strategies were developed and refined with input from appropriate stakeholders to develop these final statements applicable to the statewide plan and each of the regional plans. Specific objectives, strategies and priorities associated with these goals may vary between regions; however, the overarching goals of the statewide and regional plans will be consistent.
Goals, objectives, and strategies aligned with each of the federal planning factors are outlined below.
HDOT Highways Mission: To provide a safe, and efficient and accessible highway system through utilization of available resources in the maintenance, enhancement and support of land
transportation facilities.
TBG062714093019HNL 1

FINAL GOALS AND OBJECTIVES
1. Environment and Sustainability By developing transportation solutions that are sustainable and environmentally friendly, not only can the needs of the current users be met, but future generations will also have the ability to meet their own needs. Solutions can generally be focused on promoting energy conservation, slowing the pace of climate change, and improving quality of life.
Environment and Sustainability Goals Objectives Strategies
1.1. Preserve and enhance the natural environment, including biological and aesthetic resources.
• Avoid, minimize, and provide reasonable measures to mitigate degradation of the natural environment caused by transportation facilities and operations.
• Construct and maintain a transportation system that complements scenic corridors and protected views.
• Provide transportation facilities that complement the natural environment and enhance quality of life.
• Review environmental assessments to identify potential degradation of the natural environment caused by transportation facilities and operations.
• Create categories of environmental mitigation to protect habitat and ecologically sensitive areas from potential impacts of transportation facilities and operations.
• Develop and maintain landscape plans that preserve the scenic environment.
• Improve the aesthetic quality of gateway roads.
• Provide educational interpretive sites regarding preserving and enhancing the natural environment for public viewing at scenic pull-offs, and park and rides.
1.2. Preserve and enhance Hawaii’s cultural resources environment, including archaeological and historical sites.
• Avoid, minimize, and provide reasonable measures to mitigate degradation of Hawaii’s cultural resources environment caused by transportation facilities and operations.
• Review environmental assessments to identify potential degradation of cultural resources caused by transportation facilities and operations.
• Create categories of environmental mitigation to protect culturally sensitive areas from potential impacts of transportation facilities and operations.
• Develop a formal consultation process with Native Hawaiian Organizations.
• Develop consistent and comprehensive processes for addressing cultural, natural, and historic resources.
• Coordinate transportation corridor and public safety needs with the preservation of historical and cultural features.
TBG062714093019HNL 2
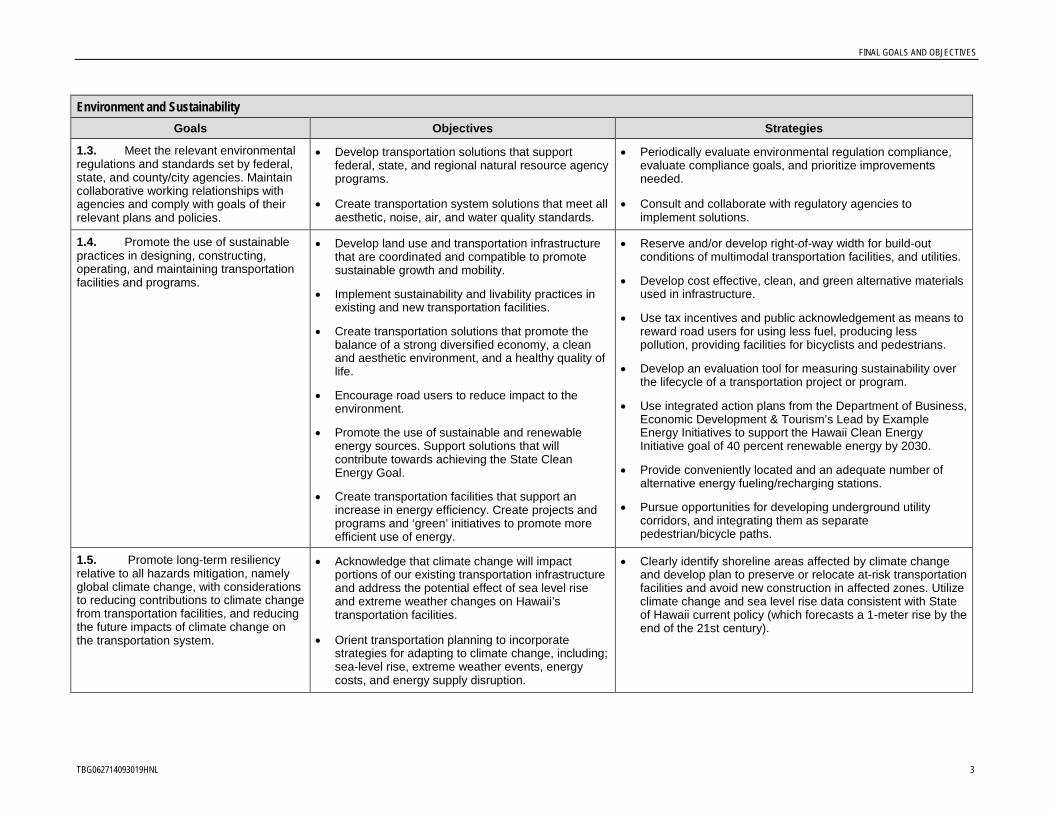
FINAL GOALS AND OBJECTIVES
Environment and Sustainability Goals Objectives Strategies
1.3. Meet the relevant environmental regulations and standards set by federal, state, and county/city agencies. Maintain collaborative working relationships with agencies and comply with goals of their relevant plans and policies.
• Develop transportation solutions that support federal, state, and regional natural resource agency programs.
• Create transportation system solutions that meet all aesthetic, noise, air, and water quality standards.
• Periodically evaluate environmental regulation compliance, evaluate compliance goals, and prioritize improvements needed.
• Consult and collaborate with regulatory agencies to implement solutions.
1.4. Promote the use of sustainable practices in designing, constructing, operating, and maintaining transportation facilities and programs.
• Develop land use and transportation infrastructure that are coordinated and compatible to promote sustainable growth and mobility.
• Implement sustainability and livability practices in existing and new transportation facilities.
• Create transportation solutions that promote the balance of a strong diversified economy, a clean and aesthetic environment, and a healthy quality of life.
• Encourage road users to reduce impact to the environment.
• Promote the use of sustainable and renewable energy sources. Support solutions that will contribute towards achieving the State Clean Energy Goal.
• Create transportation facilities that support an increase in energy efficiency. Create projects and programs and ‘green’ initiatives to promote more efficient use of energy.
• Reserve and/or develop right-of-way width for build-out conditions of multimodal transportation facilities, and utilities.
• Develop cost effective, clean, and green alternative materials used in infrastructure.
• Use tax incentives and public acknowledgement as means to reward road users for using less fuel, producing less pollution, providing facilities for bicyclists and pedestrians.
• Develop an evaluation tool for measuring sustainability over the lifecycle of a transportation project or program.
• Use integrated action plans from the Department of Business, Economic Development & Tourism’s Lead by Example Energy Initiatives to support the Hawaii Clean Energy Initiative goal of 40 percent renewable energy by 2030.
• Provide conveniently located and an adequate number of alternative energy fueling/recharging stations.
• Pursue opportunities for developing underground utility corridors, and integrating them as separate pedestrian/bicycle paths.
1.5. Promote long-term resiliency relative to all hazards mitigation, namely global climate change, with considerations to reducing contributions to climate change from transportation facilities, and reducing the future impacts of climate change on the transportation system.
• Acknowledge that climate change will impact portions of our existing transportation infrastructure and address the potential effect of sea level rise and extreme weather changes on Hawaii’s transportation facilities.
• Orient transportation planning to incorporate strategies for adapting to climate change, including; sea-level rise, extreme weather events, energy costs, and energy supply disruption.
• Clearly identify shoreline areas affected by climate change and develop plan to preserve or relocate at-risk transportation facilities and avoid new construction in affected zones. Utilize climate change and sea level rise data consistent with State of Hawaii current policy (which forecasts a 1-meter rise by the end of the 21st century).
TBG062714093019HNL 3

FINAL GOALS AND OBJECTIVES
2. Modal Integration Increasing the availability of various transportation mode choices and providing efficient and attractive connections between modes expands transportation choices within the overall system. Access to and between air/sea transport modes, motorized modes (such as public transit and automobile traffic) and non-motorized modes (bicycle and pedestrian) should be integrated to provide seamless modal connections. Applying Complete Streets principles achieves modal integration.
Modal Integration Goals Objectives Strategies
2.1. Provide a Complete Streets transportation system of motorized and non-motorized options.
• Create transportation facilities that support all modes of travel that result in a well-connected systemwide network for travel between transport modes and between communities.
• Promote education and understanding of the benefits of bicycling and walking and laws applicable to each group.
• Coordinate modal plans for motorized, pedestrian, bicycle, and transit modes so that uses of these interconnected systems complement each other.
• Include specific training in drivers’ education courses.
• Include more questions about bicycle and pedestrian laws in the written driver’s license exam.
• Provide transit, bike ride, and walking opportunities for transportation professionals and decision-makers so they can better understand the concerns of transit riders, bicyclists, and pedestrians.
• Support programs and agencies that provide bike/pedestrian safety educational materials and courses (emphasize outreach efforts on high-risk populations such as children and the elderly).
2.2. Promote efficient travel between modes by creating connections and removing barriers.
• Promote design and development of complete, integrated multimodal street systems for all users (including freight, motorists, pedestrians, bicycles, transit, etc.) of all ages and abilities.
• Encourage transportation infrastructure and transportation service concurrency with land development.
• Provide funding mechanisms and explore alternatives to implement multimodal facility development.
• Improve agency coordination to provide practical, seamless, and safe facilities for connections between modes.
• Design transportation solutions that address issues of distance, safety, and ease of access between bus stops, non-motorized amenities, and land uses. Highlight transit and non-motorized modes as affordable, attractive, simple, and desirable options for travel.
• Promote development of park and ride stations at population centers, urban area perimeters, and bypass road intersections.
TBG062714093019HNL 4

FINAL GOALS AND OBJECTIVES
Modal Integration Goals Objectives Strategies
2.3. Promote safe connections between modal alternatives.
• Provide transportation modal options and connections that address safety considerations of all users, especially at-risk population segments (children, elderly, disabled).
• Update street design standards to support best practices for pedestrian and bicycle facilities and safety.
• Coordinate with agencies that support vulnerable populations to better understand concerns of transit riders, bicyclists, and pedestrians.
3. System Preservation A programmed schedule for regular maintenance, rehabilitation, reconstruction, and replacement of transportation facilities is integral to keep the overall transportation system operating safely and efficiently. Planned assessments, maintenance, and rehabilitation should include surveys of multimodal options.
System Preservation Goals Objectives Strategies
3.1. Manage transportation assets and optimize investments.
• Plan and implement maintenance, resurfacing, rehabilitation, and reconstruction to optimize existing transportation system improvements and spending.
• Maintain inventory of all transportation assets. Include information on current condition of assets. Maintain systems to monitor and evaluate infrastructure changes so they match regular planning investment cycles.
• Identify variations in cost for periodic maintenance versus total replacement of facilities to help prioritize projects. Consider total lifecycle costs.
• Improve use of technology to protect and preserve existing infrastructure.
• Support a strong policy of size and weight enforcement, including innovative technologies to protect and preserve the existing infrastructure.
TBG062714093019HNL 5
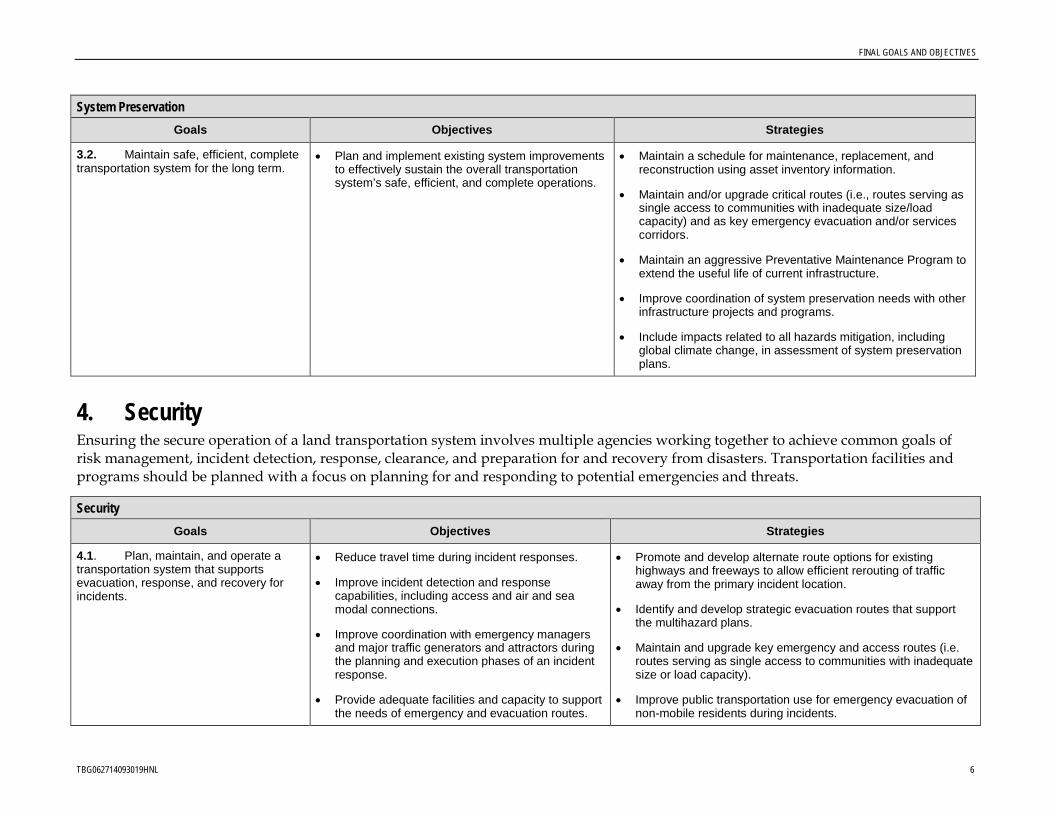
FINAL GOALS AND OBJECTIVES
System Preservation Goals Objectives Strategies
3.2. Maintain safe, efficient, complete transportation system for the long term.
• Plan and implement existing system improvements to effectively sustain the overall transportation system’s safe, efficient, and complete operations.
• Maintain a schedule for maintenance, replacement, and reconstruction using asset inventory information.
• Maintain and/or upgrade critical routes (i.e., routes serving as single access to communities with inadequate size/load capacity) and as key emergency evacuation and/or services corridors.
• Maintain an aggressive Preventative Maintenance Program to extend the useful life of current infrastructure.
• Improve coordination of system preservation needs with other infrastructure projects and programs.
• Include impacts related to all hazards mitigation, including global climate change, in assessment of system preservation plans.
4. Security Ensuring the secure operation of a land transportation system involves multiple agencies working together to achieve common goals of risk management, incident detection, response, clearance, and preparation for and recovery from disasters. Transportation facilities and programs should be planned with a focus on planning for and responding to potential emergencies and threats.
Security Goals Objectives Strategies
4.1. Plan, maintain, and operate a transportation system that supports evacuation, response, and recovery for incidents.
• Reduce travel time during incident responses.
• Improve incident detection and response capabilities, including access and air and sea modal connections.
• Improve coordination with emergency managers and major traffic generators and attractors during the planning and execution phases of an incident response.
• Provide adequate facilities and capacity to support the needs of emergency and evacuation routes.
• Promote and develop alternate route options for existing highways and freeways to allow efficient rerouting of traffic away from the primary incident location.
• Identify and develop strategic evacuation routes that support the multihazard plans.
• Maintain and upgrade key emergency and access routes (i.e. routes serving as single access to communities with inadequate size or load capacity).
• Improve public transportation use for emergency evacuation of non-mobile residents during incidents.
TBG062714093019HNL 6
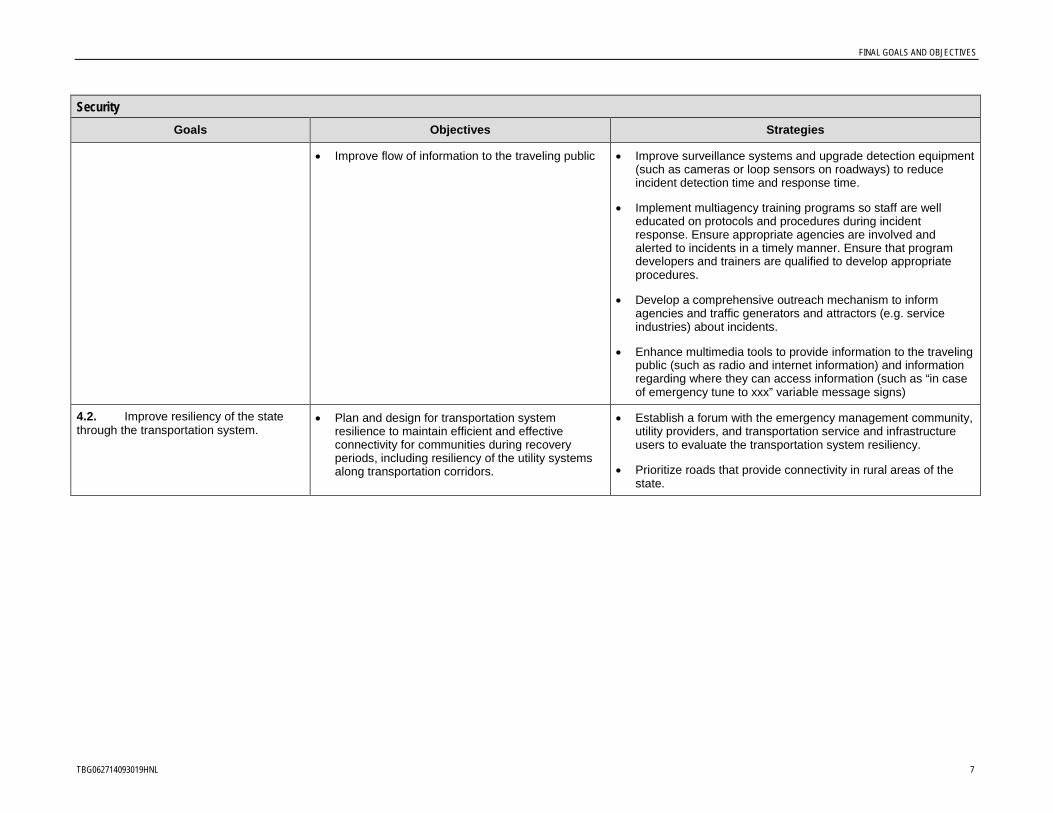
FINAL GOALS AND OBJECTIVES
Security Goals Objectives Strategies
• Improve flow of information to the traveling public • Improve surveillance systems and upgrade detection equipment (such as cameras or loop sensors on roadways) to reduce incident detection time and response time.
• Implement multiagency training programs so staff are well educated on protocols and procedures during incident response. Ensure appropriate agencies are involved and alerted to incidents in a timely manner. Ensure that program developers and trainers are qualified to develop appropriate procedures.
• Develop a comprehensive outreach mechanism to inform agencies and traffic generators and attractors (e.g. service industries) about incidents.
• Enhance multimedia tools to provide information to the traveling public (such as radio and internet information) and information regarding where they can access information (such as “in case of emergency tune to xxx” variable message signs)
4.2. Improve resiliency of the state through the transportation system.
• Plan and design for transportation system resilience to maintain efficient and effective connectivity for communities during recovery periods, including resiliency of the utility systems along transportation corridors.
• Establish a forum with the emergency management community, utility providers, and transportation service and infrastructure users to evaluate the transportation system resiliency.
• Prioritize roads that provide connectivity in rural areas of the state.
TBG062714093019HNL 7

FINAL GOALS AND OBJECTIVES
5. Economic Vitality Transportation options and multimodal facilities need to support planned, sustainable growth in residential, industry, tourism, and cultural and recreational opportunities by reducing travel time, operating costs, travel distance, crashes and logistics inefficiencies.
Economic Vitality Goals Objectives Strategies
5.1. Promote the expansion and diversification of Hawaii’s economy through the efficient and effective use of transportation facilities including movement of people, goods, and services in a safe, energy efficient, and environmentally sound manner.
• Maintain and develop an integrated, efficient, and reliable freight system by ensuring connectivity between air, land, and water (harbor) facilities.
• Develop an integrated, efficient, and reliable multimodal transportation system that is resilient to impacts of rising oil/energy costs and that will meet future transport demands.
• Develop an integrated multimodal system of transportation facilities, services, and information systems that provide for efficient commuter and local resident trips.
• Develop an integrated multimodal system of transportation facilities, services, and information so that intrastate, interstate, and international travelers can travel easily for business and recreation.
• Improve end-user benefits by reducing operating costs and reducing freight delays.
• Maintain and operate an integrated transportation system that supports the economic vitality of all islands, especially locations that can be significantly impacted by small changes in the transportation system (such as Molokai and Lanai).
• Identify and address capacity constrained areas within the transportation system. Prioritize the capacity projects when other strategies are not appropriate.
• Consider transportation alternatives that support arrivals and departures of travelers at all hours of the day; and the communication needs of foreign travelers (multilanguage and universal signs).
• Encourage and promote concurrent improvements in transportation infrastructure to mitigate impacts of all new developments and maintain an efficient transportation system that supports economic vitality.
• Identify specific funding strategies to enhance economic vitality.
• Explore financial strategies that examine fees (revenue sources) that cover all transportation modes.
• Support efficient and effective movement along the transportation system with traveler information, such as signage and real-time multimedia announcements.
• Coordinate schedules and routes of freight transport needs with other transportation system projects to minimize delay and support economic vitality.
TBG062714093019HNL 8
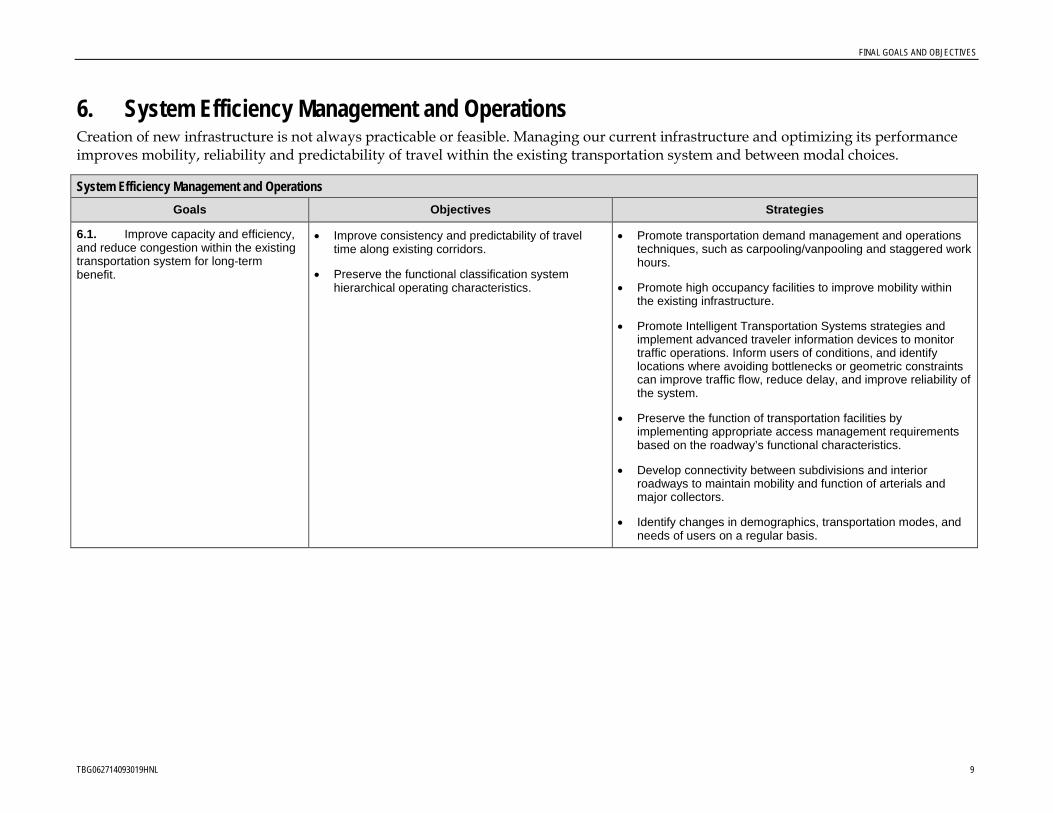
FINAL GOALS AND OBJECTIVES
6. System Efficiency Management and Operations Creation of new infrastructure is not always practicable or feasible. Managing our current infrastructure and optimizing its performance improves mobility, reliability and predictability of travel within the existing transportation system and between modal choices.
System Efficiency Management and Operations Goals Objectives Strategies
6.1. Improve capacity and efficiency, and reduce congestion within the existing transportation system for long-term benefit.
• Improve consistency and predictability of travel time along existing corridors.
• Preserve the functional classification system hierarchical operating characteristics.
• Promote transportation demand management and operations techniques, such as carpooling/vanpooling and staggered work hours.
• Promote high occupancy facilities to improve mobility within the existing infrastructure.
• Promote Intelligent Transportation Systems strategies and implement advanced traveler information devices to monitor traffic operations. Inform users of conditions, and identify locations where avoiding bottlenecks or geometric constraints can improve traffic flow, reduce delay, and improve reliability of the system.
• Preserve the function of transportation facilities by implementing appropriate access management requirements based on the roadway’s functional characteristics.
• Develop connectivity between subdivisions and interior roadways to maintain mobility and function of arterials and major collectors.
• Identify changes in demographics, transportation modes, and needs of users on a regular basis.
TBG062714093019HNL 9
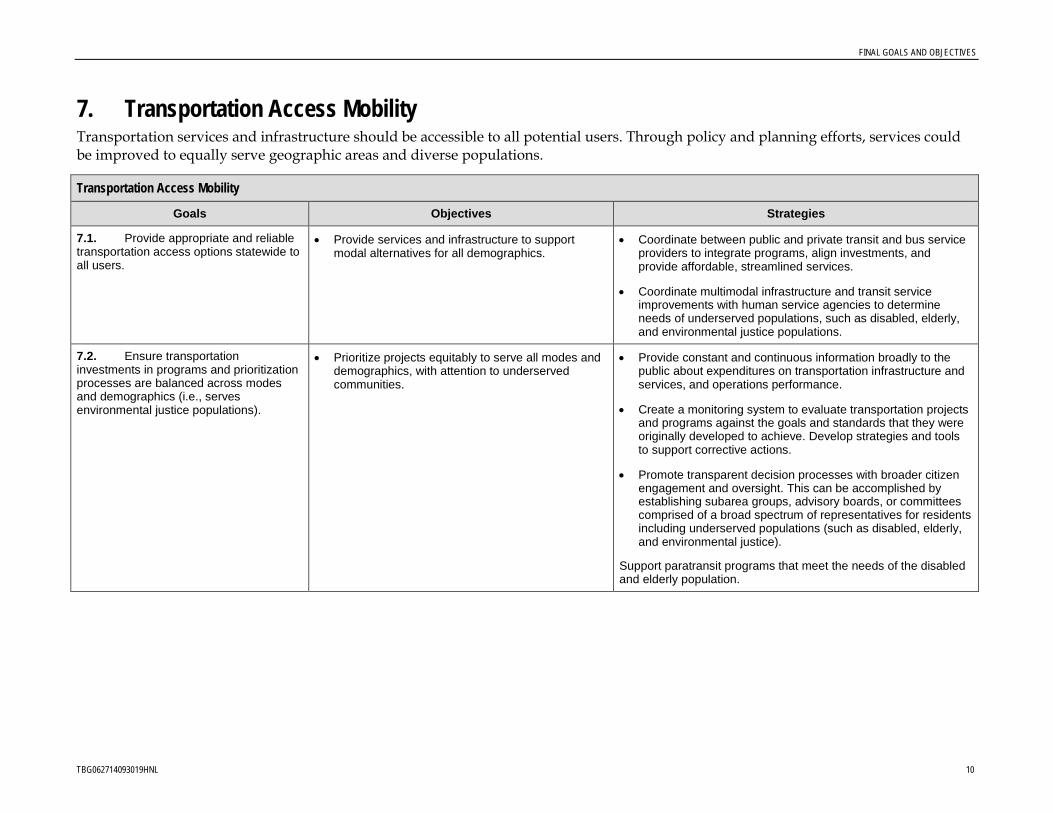
FINAL GOALS AND OBJECTIVES
7. Transportation Access Mobility Transportation services and infrastructure should be accessible to all potential users. Through policy and planning efforts, services could be improved to equally serve geographic areas and diverse populations.
Transportation Access Mobility
Goals Objectives Strategies
7.1. Provide appropriate and reliable transportation access options statewide to all users.
• Provide services and infrastructure to support modal alternatives for all demographics.
• Coordinate between public and private transit and bus service providers to integrate programs, align investments, and provide affordable, streamlined services.
• Coordinate multimodal infrastructure and transit service improvements with human service agencies to determine needs of underserved populations, such as disabled, elderly, and environmental justice populations.
7.2. Ensure transportation investments in programs and prioritization processes are balanced across modes and demographics (i.e., serves environmental justice populations).
• Prioritize projects equitably to serve all modes and demographics, with attention to underserved communities.
• Provide constant and continuous information broadly to the public about expenditures on transportation infrastructure and services, and operations performance.
• Create a monitoring system to evaluate transportation projects and programs against the goals and standards that they were originally developed to achieve. Develop strategies and tools to support corrective actions.
• Promote transparent decision processes with broader citizen engagement and oversight. This can be accomplished by establishing subarea groups, advisory boards, or committees comprised of a broad spectrum of representatives for residents including underserved populations (such as disabled, elderly, and environmental justice).
Support paratransit programs that meet the needs of the disabled and elderly population.
TBG062714093019HNL 10

FINAL GOALS AND OBJECTIVES
8. Safety Safety for users of all modes can be improved through engineering (for example, evaluation of areas that have highest rates of crashes and by designing roadways with adequate sight distance for appropriate speeds), education (media campaigns), and enforcement (red-light cameras, fines).
Safety Goals Objectives Strategies
8.1. Maintain a safe transportation system for all land transportation modes.
• Address transportation safety through a mixture of education, enforcement and engineering solutions.
• Reduce the number traffic related fatalities.
• Reduce the number of collisions and crashes involving serious injuries and fatalities for all land transportation modes.
• Coordinate with the Strategic Highway Safety Plan to implement plan recommendations and monitor performance, including:
– Photo enforcement
– Prioritization of nonmotorized needs
– Improved signage
– Increased design considerations for safety of all modes (including temporary traffic control plans)
– Intelligent Transportation Systems
– Improved data reporting, assessment, and availability of information
– Impaired driving, motorcycle/moped, pedestrian and bicycle educational programs prioritizing young high risk new operators
– Increased bicycle and pedestrian educational programs
– Improved civil and criminal fines or penalties for fatalities or serious injuries
– Increased enforcement
– Safe enforcement areas
– Increased severity of sentencing for convicted repeat offenders thereby keeping them from operating a motor vehicle while in an impaired condition
• Develop solutions that reduce or prevent head-on collisions on existing infrastructure as well as new facilities.
TBG062714093019HNL 11

FINAL GOALS AND OBJECTIVES
Safety Goals Objectives Strategies
• Develop improved access for emergency service to reduce response time and evacuation time.
• Develop roadside features that enhance safety of the transportation system.
• Promote legislation, enforcement and education to reduce the risk of distracted transportation system users (all modes).
• Promote education and enforcement programs to reduce injury risk to pedestrians and passengers with disabilities.
• Develop transportation solutions that recognize and uphold the goals and strategies of safety programs supported by FHWA and AASHTO.
8.2. Improve safety of the community through connectivity of the transportation infrastructure.
• Provide emergency access to all parts of the state, especially in locations with only one road in and out.
• Consider using other roads including military access roads and plantation or cane haul roads as alternatives during an emergency especially in a weather related emergency. Identify which agency or agencies would be responsible for implementation. (Agreements with individual land owners and agencies are needed.)
TBG062714093019HNL 12
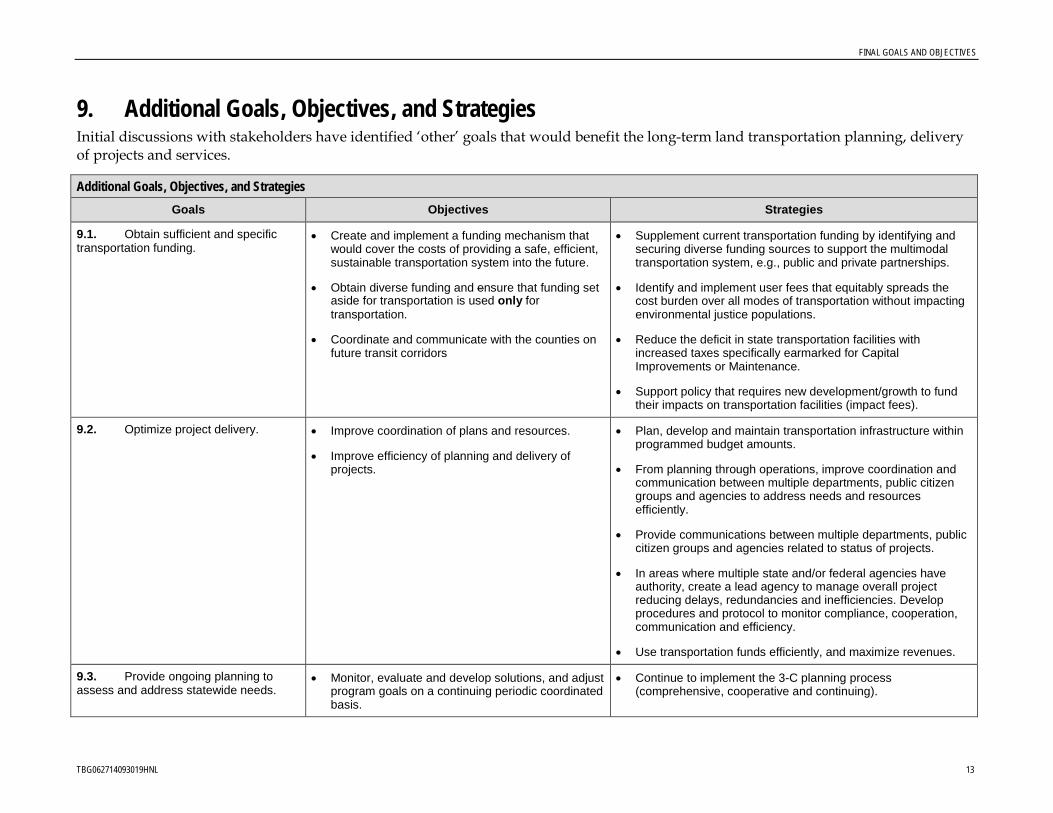
FINAL GOALS AND OBJECTIVES
9. Additional Goals, Objectives, and Strategies Initial discussions with stakeholders have identified ‘other’ goals that would benefit the long-term land transportation planning, delivery of projects and services.
Additional Goals, Objectives, and Strategies Goals Objectives Strategies
9.1. Obtain sufficient and specific transportation funding.
• Create and implement a funding mechanism that would cover the costs of providing a safe, efficient, sustainable transportation system into the future.
• Obtain diverse funding and ensure that funding set aside for transportation is used only for transportation.
• Coordinate and communicate with the counties on future transit corridors
• Supplement current transportation funding by identifying and securing diverse funding sources to support the multimodal transportation system, e.g., public and private partnerships.
• Identify and implement user fees that equitably spreads the cost burden over all modes of transportation without impacting environmental justice populations.
• Reduce the deficit in state transportation facilities with increased taxes specifically earmarked for Capital Improvements or Maintenance.
• Support policy that requires new development/growth to fund their impacts on transportation facilities (impact fees).
9.2. Optimize project delivery. • Improve coordination of plans and resources.
• Improve efficiency of planning and delivery of projects.
• Plan, develop and maintain transportation infrastructure within programmed budget amounts.
• From planning through operations, improve coordination and communication between multiple departments, public citizen groups and agencies to address needs and resources efficiently.
• Provide communications between multiple departments, public citizen groups and agencies related to status of projects.
• In areas where multiple state and/or federal agencies have authority, create a lead agency to manage overall project reducing delays, redundancies and inefficiencies. Develop procedures and protocol to monitor compliance, cooperation, communication and efficiency.
• Use transportation funds efficiently, and maximize revenues.
9.3. Provide ongoing planning to assess and address statewide needs.
• Monitor, evaluate and develop solutions, and adjust program goals on a continuing periodic coordinated basis.
• Continue to implement the 3-C planning process (comprehensive, cooperative and continuing).
TBG062714093019HNL 13

FINAL GOALS AND OBJECTIVES
Additional Goals, Objectives, and Strategies Goals Objectives Strategies
9.4. Coordinate use of public right-of-way with other public service providers.
• Continue the safe accommodation and installation of utility facilities within the right-of-way or easement along state highways and federal-aid county highways.
• Coordinate with utility service providers to work together in establishing location, design, and methods for the possible accommodation and installation of utility facilities along state highways and federal aid county highways. Considerations should include, but not be limited to safety, future widening and site specific issues.
• Coordinate and communicate transportation and utility planning efforts to enable development of a coordinated transportation and utility system.
TBG062714093019HNL 14
Appendix D
Existing and Future Baseline Assumptions and Conditions

TBG062714093019HNL 1
T E C H N I C A L M E M O R A N D U M Statewide and Regional Federal-Aid Highways 2035 Transportation Plans for the Districts of Maui, Hawaii, and Kauai
Statewide: Existing and Future Baseline Assumptions and Conditions PREPARED FOR: State of Hawaii Department of Transportation Statewide Long-
Range Land Transportation Plan, Technical Advisory Committee, and Stakeholder Advisory Committee
PREPARED BY: Cheryl Yoshida/CH2M HILL Terry Yuen/CH2M HILL Kevin Murphy/CH2M HILL Neha Rathi/CH2M HILL
DATE: Revised March 2014
Introduction The purpose of this memorandum is to present an overview of existing and future baseline land transportation system conditions within the State of Hawaii. The memorandum focuses on the federal-aid transportation system characteristics within each of the Hawaii Department of Transportation (HDOT) districts: Maui (including Molokai and Lanai Islands), Hawaii, Kauai, and Oahu. Greater detail on the regional transportation systems is provided separately in the Existing and Future Baseline Assumptions and Conditions (CH2M HILL, 2014a-c) memorandums for each district, with the exception of Oahu. The existing transportation facilities and conditions for Oahu are described in detail in the Oahu Regional Transportation Plan 2035 (Oahu Metropolitan Planning Organization, 2011).
Existing Conditions Existing Transportation System The existing transportation system within the state consists of roadways, paths and transportation services that provide for the needs of multimodal users; cars, freight, transit, pedestrians, and bicyclists. The transportation system includes both state and county facilities and is the means by which the HDOT Highways Division mission is upheld.
Existing Roadway System The roadway system is the backbone for moving both people and goods within the state. All modes of land transportation use the roadway system. It is an essential network that is used by
The Mission of the HDOT Highways Division is to provide a safe, and efficient and accessible highway system through utilization of available resources in the maintenance, enhancement and support of land transportation facilities.

STATEWIDE: EXISTING AND FUTURE BASELINE ASSUMPTIONS AND CONDITIONS
TBG062714093019HNL 2
residents and visitors alike, and supports nearly every industry within the State of Hawaii. Hawaii’s roadway network is crucial to the transport of goods, since unlike other states, rail transport is not an option for moving freight within regions. The roadway network is relied on solely to ensure Hawaii’s people and economies function efficiently.
The existing roadway system within the state consists of arterial, collector, and local roadways.
• Arterial – roadways of regional importance that are intended to serve high volumes oftraffic traveling relatively long distances. An arterial is intended to primarily serve throughtraffic and have a degree of access control.
• Collector – roadways that provide for traffic movements between arterials and local streetsand carry moderate traffic volumes over moderate distances. Collectors may also providedirect access to abutting properties.
• Local – roadways that are intended to provide access to abutting properties. They tend toaccommodate lower traffic volumes, serve short trips, and provide connections to collectorstreets.
FIGURE 1 Existing Roadway System Classifications Transportation Research Board, 2003
The Transportation Research Board (2003) shows the relationship between movement and access for the three roadway types in Figure 1. Arterials are characterized with greater emphasis on movement of traffic, while local roadways have higher emphasis on property access.
The Statewide and Regional Long-Range Land Transportation Plans will encompass solutions that are on the federal-aid roadway system. The federal-aid system includes roadways under both state and county jurisdiction classified as principal or minor arterials and collectors. Appendix A includes maps that depict the federal-aid system on each island, categorized by type of roadway facility. Table 1 summarizes the number of centerline miles of each type of facility within the state. Centerline miles represent the length of the roadway as measured along

STATEWIDE: EXISTING AND FUTURE BASELINE ASSUMPTIONS AND CONDITIONS
TBG062714093019HNL 3
the center of the road. Centerline miles do not take into account direction of travel, pavement width, or the number of travel lanes at any particular location.
TABLE 1 Miles of Functionally Classified Roadways – (Centerline Miles)
Classification
Maui/ Molokai/
Lanai Hawaii Kauai Oahu Total Percent
Principal/Major Arterials 68 129 22 232 451 23%
Minor Arterials 25 177 52 106 360 18%
Collectors 347 482 116 202 1147 59%
Total 440 788 190 540 1958 100%
HDOT, 2009
Table 2 summarizes the number of lane miles of each type of facility within the state. Lane miles are measured by direction and include the length of any travel lane along a roadway segment.
TABLE 2 Miles of Functionally Classified Roadways – (Lane Miles)
Classification
Maui/ Molokai/
Lanai Hawaii Kauai Oahu Total Percent
Principal/Major Arterials 211 292 50 979 1532 32%
Minor Arterials 50 364 109 318 841 18%
Collectors 706 972 233 456 2367 50%
Total 967 1628 392 1753 4740 100%
HDOT, 2009
Oahu is the only region in the state with a network of limited access interstate freeway facilities. The H-1, H-2, H-3, and H-201 “interstates” are categorized as principal arterials and provide access between Honolulu, the primary employment center of the island, and surrounding populated areas. From the interstate system, other principal arterials such as Kamehameha Highway, Kalanianaole Highway, and Farrington Highway provide access to interior communities and those around the island’s perimeter via a belt road system. These belt principal arterials are the sole access routes to communities on the windward and leeward coasts.
The Maui, Hawaii, and Kauai regions are less urban than Oahu and therefore do not require interstate freeways. Similar to the Oahu region, these regions move traffic via a belt road system of arterials around the islands’ perimeters. Due to their unique geography, roadway access on Hawaii and Kauai, and to a certain extent Maui Island, is mainly provided along the perimeter of the island, with limited ability to move traffic across the island.
From central Maui Island, Hana Highway is the primary regional access to the east and Honoapiilani Highway provides the sole access to the western side of the island. Molokai and
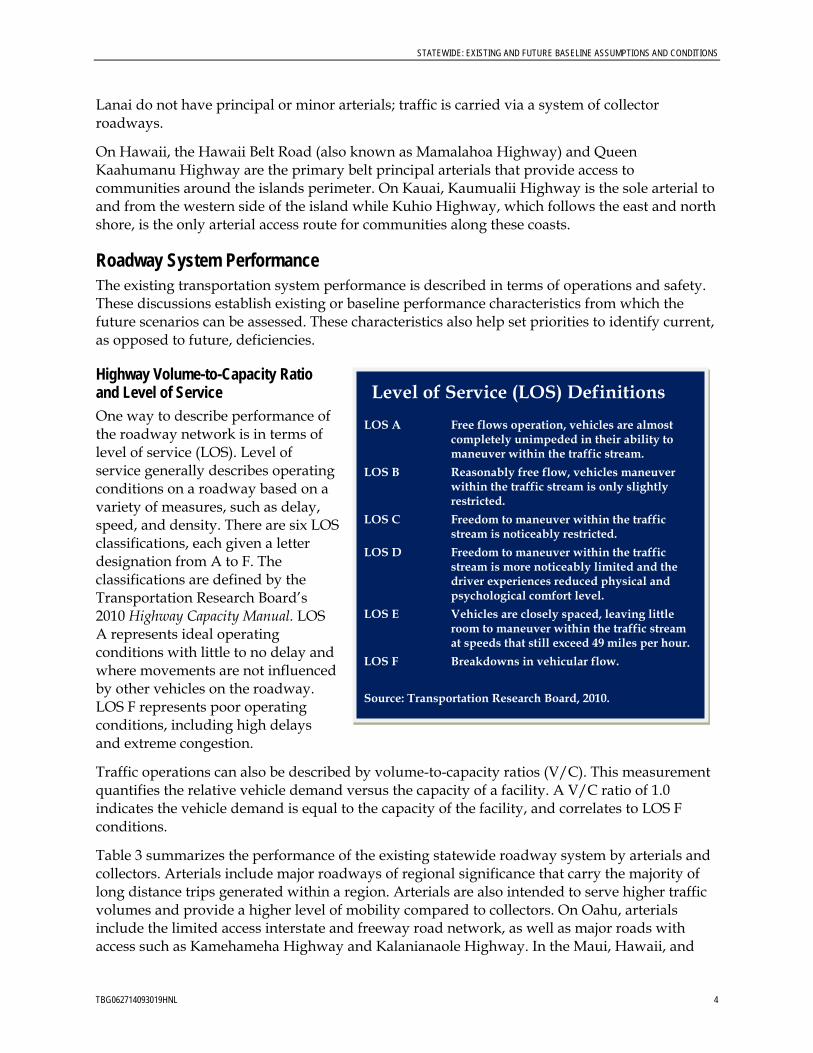
STATEWIDE: EXISTING AND FUTURE BASELINE ASSUMPTIONS AND CONDITIONS
TBG062714093019HNL 4
Lanai do not have principal or minor arterials; traffic is carried via a system of collector roadways.
On Hawaii, the Hawaii Belt Road (also known as Mamalahoa Highway) and Queen Kaahumanu Highway are the primary belt principal arterials that provide access to communities around the islands perimeter. On Kauai, Kaumualii Highway is the sole arterial to and from the western side of the island while Kuhio Highway, which follows the east and north shore, is the only arterial access route for communities along these coasts.
Roadway System Performance The existing transportation system performance is described in terms of operations and safety. These discussions establish existing or baseline performance characteristics from which the future scenarios can be assessed. These characteristics also help set priorities to identify current, as opposed to future, deficiencies.
Highway Volume-to-Capacity Ratio and Level of Service One way to describe performance of the roadway network is in terms of level of service (LOS). Level of service generally describes operating conditions on a roadway based on a variety of measures, such as delay, speed, and density. There are six LOS classifications, each given a letter designation from A to F. The classifications are defined by the Transportation Research Board’s 2010 Highway Capacity Manual. LOS A represents ideal operating conditions with little to no delay and where movements are not influenced by other vehicles on the roadway. LOS F represents poor operating conditions, including high delays and extreme congestion.
Traffic operations can also be described by volume-to-capacity ratios (V/C). This measurement quantifies the relative vehicle demand versus the capacity of a facility. A V/C ratio of 1.0 indicates the vehicle demand is equal to the capacity of the facility, and correlates to LOS F conditions.
Table 3 summarizes the performance of the existing statewide roadway system by arterials and collectors. Arterials include major roadways of regional significance that carry the majority of long distance trips generated within a region. Arterials are also intended to serve higher traffic volumes and provide a higher level of mobility compared to collectors. On Oahu, arterials include the limited access interstate and freeway road network, as well as major roads with access such as Kamehameha Highway and Kalanianaole Highway. In the Maui, Hawaii, and
Level of Service (LOS) Definitions
LOS A Free flows operation, vehicles are almost completely unimpeded in their ability to maneuver within the traffic stream.
LOS B Reasonably free flow, vehicles maneuver within the traffic stream is only slightly restricted.
LOS C Freedom to maneuver within the traffic stream is noticeably restricted.
LOS D Freedom to maneuver within the traffic stream is more noticeably limited and the driver experiences reduced physical and psychological comfort level.
LOS E Vehicles are closely spaced, leaving little room to maneuver within the traffic stream at speeds that still exceed 49 miles per hour.
LOS F Breakdowns in vehicular flow. Source: Transportation Research Board, 2010.

STATEWIDE: EXISTING AND FUTURE BASELINE ASSUMPTIONS AND CONDITIONS
TBG062714093019HNL 5
Kauai regions, the arterial system mainly consists of belt state highways that are intended to provide both mobility and access.
Because transportation network characteristics differ between Oahu and the remaining regions, statewide roadway performance is discussed in terms of regional characteristics. For the purposes of this discussion, the results summarized in Table 3 for the Island of Oahu represent 2-hour a.m. peak period operations in 2007. This a.m. analysis is representative of the distinctive peak of traffic associated with a typical work day morning commute. Daily congestion statistics are reported for arterials and collectors on the islands of Maui, Hawaii, and Kauai to represent high-level, average traffic conditions throughout the day as opposed to specific peak conditions. The islands of Molokai and Lanai are not analyzed in a travel demand model due to the low number of facilities on the federal-aid system.
On Oahu, roughly 8 percent of arterials are congested during the a.m. peak. Most of this congestion occurs on freeways, expressways, and their associated ramps. These roadways serve a higher percentage of the morning commute trips compared to lower classified arterial roadways. In the other regions, at least 10 percent of the islands’ arterial lane miles are congested and operate at LOS F. There are no freeways or expressways on Maui, Hawaii, or Kauai which means these congested arterials are mainly principal arterial state highways. Approximately 80 percent of arterials statewide operate at LOS C or better (generally uncongested conditions) during their analysis periods. Maui’s arterials operate slightly worse with just over 60 percent performing at LOS C or better, and over 20 percent at LOS F. Currently, statewide collector roadways operate well, with over 95 percent of collector roadways operating at LOS C or better conditions in all regions.
TABLE 3 2007 Roadway Performance by Region
Roadway Classification by Region
Percentage of Lane Miles
V/C < 0.8 (LOS C or better)
0.8 < V/C < 0.9 (LOS D)
0.9 < V/C < 1.0 (LOS E)
V/C > 1.0 (LOS F)
Lane Miles
Arterials (includes interstates, freeways, expressways, major and minor arterials)
Mauia,c 63% 9% 6% 22% 261
Hawaiia 79% 5% 6% 10% 656
Kauaia 76% 3% 7% 14% 159
Oahub 81% 5% 6% 8% 1342
Collectors
Mauia,c 97% 1% 0% 2% 555
Hawaiia 98% 1% 1% 0% 972
Kauaia 100% 0% 0% 0% 233
Oahub 96% 1% 1% 2% 622 a CH2M HILL, 2012. Results are reported for daily operations. b Oahu Metropolitan Planning Organization, 2011. Results are reported for a.m. peak operations. c The lane miles numbers reflect the arterials and collectors that are on the Island of Maui only.
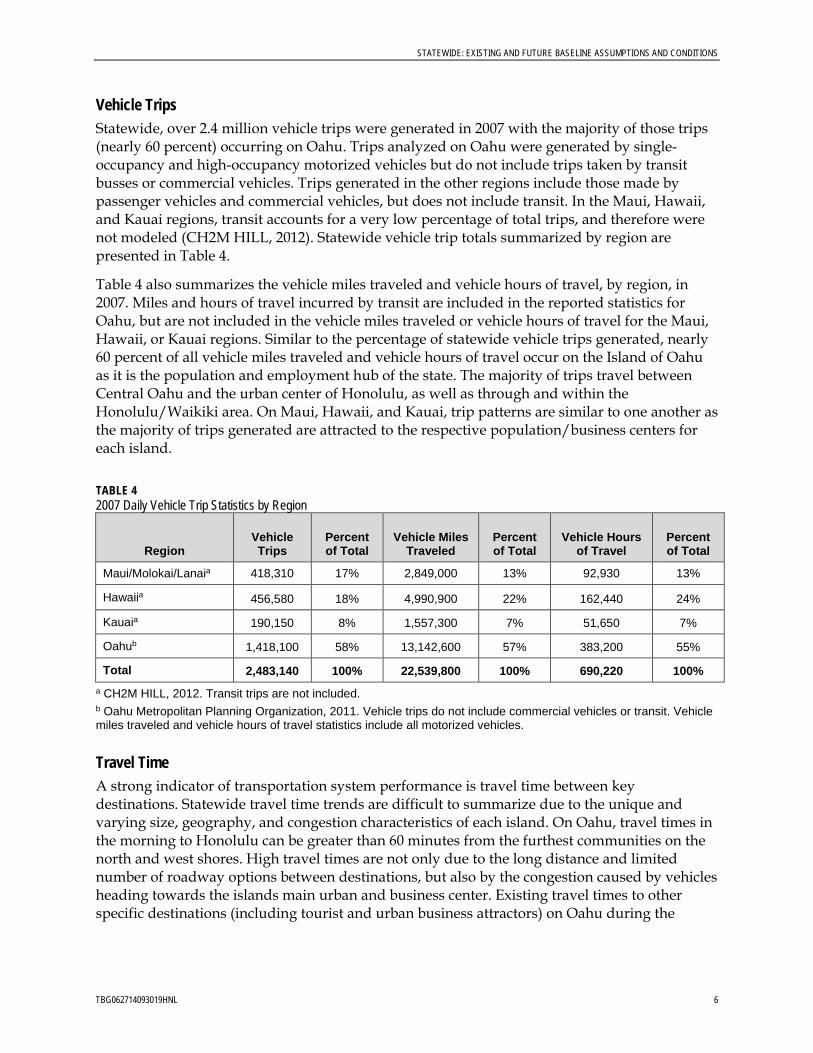
STATEWIDE: EXISTING AND FUTURE BASELINE ASSUMPTIONS AND CONDITIONS
TBG062714093019HNL 6
Vehicle Trips Statewide, over 2.4 million vehicle trips were generated in 2007 with the majority of those trips (nearly 60 percent) occurring on Oahu. Trips analyzed on Oahu were generated by single-occupancy and high-occupancy motorized vehicles but do not include trips taken by transit busses or commercial vehicles. Trips generated in the other regions include those made by passenger vehicles and commercial vehicles, but does not include transit. In the Maui, Hawaii, and Kauai regions, transit accounts for a very low percentage of total trips, and therefore were not modeled (CH2M HILL, 2012). Statewide vehicle trip totals summarized by region are presented in Table 4.
Table 4 also summarizes the vehicle miles traveled and vehicle hours of travel, by region, in 2007. Miles and hours of travel incurred by transit are included in the reported statistics for Oahu, but are not included in the vehicle miles traveled or vehicle hours of travel for the Maui, Hawaii, or Kauai regions. Similar to the percentage of statewide vehicle trips generated, nearly 60 percent of all vehicle miles traveled and vehicle hours of travel occur on the Island of Oahu as it is the population and employment hub of the state. The majority of trips travel between Central Oahu and the urban center of Honolulu, as well as through and within the Honolulu/Waikiki area. On Maui, Hawaii, and Kauai, trip patterns are similar to one another as the majority of trips generated are attracted to the respective population/business centers for each island.
TABLE 4 2007 Daily Vehicle Trip Statistics by Region
Region Vehicle Trips
Percent of Total
Vehicle Miles Traveled
Percent of Total
Vehicle Hours of Travel
Percent of Total
Maui/Molokai/Lanaia 418,310 17% 2,849,000 13% 92,930 13%
Hawaiia 456,580 18% 4,990,900 22% 162,440 24%
Kauaia 190,150 8% 1,557,300 7% 51,650 7%
Oahub 1,418,100 58% 13,142,600 57% 383,200 55%
Total 2,483,140 100% 22,539,800 100% 690,220 100% a CH2M HILL, 2012. Transit trips are not included. b Oahu Metropolitan Planning Organization, 2011. Vehicle trips do not include commercial vehicles or transit. Vehicle miles traveled and vehicle hours of travel statistics include all motorized vehicles.
Travel Time A strong indicator of transportation system performance is travel time between key destinations. Statewide travel time trends are difficult to summarize due to the unique and varying size, geography, and congestion characteristics of each island. On Oahu, travel times in the morning to Honolulu can be greater than 60 minutes from the furthest communities on the north and west shores. High travel times are not only due to the long distance and limited number of roadway options between destinations, but also by the congestion caused by vehicles heading towards the islands main urban and business center. Existing travel times to other specific destinations (including tourist and urban business attractors) on Oahu during the

STATEWIDE: EXISTING AND FUTURE BASELINE ASSUMPTIONS AND CONDITIONS
TBG062714093019HNL 7
morning commute peak are included in the appendixes of the Oahu Regional Transportation Plan 2035 (Oahu Metropolitan Planning Organization, 2011).
On Maui, Hawaii, and Kauai travel times during the afternoon commute peak from key employment hubs or highly urban areas on each island are summarized in its specific Existing and Future Baseline Assumptions and Conditions (CH2M HILL, 2014a-c) memo. On Maui, afternoon travel times between Lahaina and Hana on the east coast are typically greater than 120 minutes, primarily due to the limited number of routes between the two cities and the size of the island. Travel times from Lahaina to closer destinations, such as Wailuku, would be between 60 and 75 minutes due to congestion on the belt highway system and congestion through the town of Kahului.
Afternoon travel times on Hawaii are influenced by the large island geography and limited route choices. From Kona, trips to Waimea or to south or Honaunau would take up to 75 minutes due congestion on Queen Kaahumanu Highway and Hawaii Belt Road. From Hilo, trips to Puna and Kalapana could take over 2 hours due to congestion on Keeau-Pahoa Road (Highway 130). On Kauai, existing afternoon travel times between destinations are generally shorter than on Maui or Hawaii due to the smaller island size. Trips from Lihue to any part of the island would take less than 75 minutes, even with congestion on portions of Kaumualii Highway and Kuhio Highway.
Crash and Safety Information The Highway Safety Improvement Program compiles crash data for state and county roadways and intersections. Statewide statistics and crash rates for occurrences on state highways during the 2006 to 2008 timeframe are provided in the Existing and Future Baseline Assumptions and Conditions memos (CH2M HILL, 2014a-c) for the regions of Maui, Hawaii, and Kauai. The Oahu Regional Transportation Plan 2035 (Oahu Metropolitan Planning Organization, 2011) includes discussions on high-accident locations on Oahu.
In the State of Hawaii, traffic fatalities accounted for the majority of injury-related deaths between 2000 and 2006 (HDOT, 2007). The statewide fatality rate associated with vehicle crashes is comparable to the national average rate (approximately 1.46 fatalities per 100 million vehicle miles traveled), and efforts to improve safety on Hawaii’s highways are being developed through the Hawaii Strategic Highway Safety Plan 2007-2012 (HDOT, 2007).
While the safety of motor vehicles and their passengers is a statewide concern, a high percentage of fatalities also involve pedestrians, bicyclists, and motorcycle/moped riders who often share the state’s highways. Hawaii has one of the highest traffic-related pedestrian fatality rates compared to other states nationwide. Senior citizens are most commonly involved in these incidents.
The HDOT has provided crash information under the protection of 23 United States Code 402(k) and 409. This information may not be used in any federal or state court proceeding in any action for damages arising from any occurrence at a location mentioned or addressed in the information provided.
Existing Freight System Freight mobility is critical to the economic vitality of the state. Hawaii’s geographic isolation requires almost all imported goods to arrive via cargo vessel. The majority of all goods are

STATEWIDE: EXISTING AND FUTURE BASELINE ASSUMPTIONS AND CONDITIONS
TBG062714093019HNL 8
delivered to Honolulu Harbor on Oahu and distributed throughout the regions via the inter-island cargo system and land transportation network.
Hawaii’s unique location in the Pacific Ocean is also attractive to international trade markets, as shown by the development of Foreign Trade Zone No. 9 at Honolulu Harbor. This is a state operated facility designed to assist in storing and moving (importing and exporting) goods for the international market.
Although there are no specified roadway freight routes, freight activities are concentrated around the commercial harbors in each region and freight vehicles utilize many of the surrounding arterial roadways to transport goods to market. The roadway system is the sole means for transporting goods in Hawaii. Since there are no rail corridors or other high-volume transport options in the state, circulation, access, and reliability for freight vehicles are extremely critical to statewide economic development. Table 5 summarizes the existing facilities and operations at commercial harbors in each region.
TABLE 5 Existing Commercial Harbors and Activity by Region Region/Island Port Description
Maui Kahului Harbor 3 piers – overseas and inter-island cargo, cruise ships
Molokai Kaunakakai Harbor 1 pier – inter-island cargo, ferry terminal
Lanai Kaumalapau Harbor 1 pier – inter-island cargo
Hawaii Hilo Harbor 3 piers – overseas and inter-island cargo, cruise ships
Hawaii Kawaihae Harbor 2 piers – overseas and inter-island cargo, barges
Kauai Nawiliwili Harbor 3 piers – overseas and inter-island cargo, cruise ships
Kauai Port Allen Harbor 1 pier – bulk cargo, military mooring, excursion/charter boats
Oahu Honolulu Harbor 38 piers – overseas and inter-island cargo, Foreign Trade Zone No. 9, cruise ships, passenger vessels, commercial fishing vessels, retail, tourist attractions
Oahu Kalaeloa Barbers Point Harbor 7 piers – bulk cargo, ferry terminal
Oahu Kewalo Basin Cargo and fueling dock, boatyard
HDOT Harbors Division, 2014
Existing Bikeway System Bicycles are increasingly being recognized not only as a recreational activity, but a viable transportation mode. The Bike Plan Hawaii (HDOT, 2003) summarizes the multifaceted benefits of bicycling, not only as a means of transportation, but also related to health, economics, community, and the environment.
Bicycle facilities generally can be described as any improvement or provision made by public agencies to accommodate bicycling. The existing bicycle facilities within the state consist primarily of three types; paths, bike lanes and shared roadways. The American Association of State Highway and Transportation Officials define these facilities as:
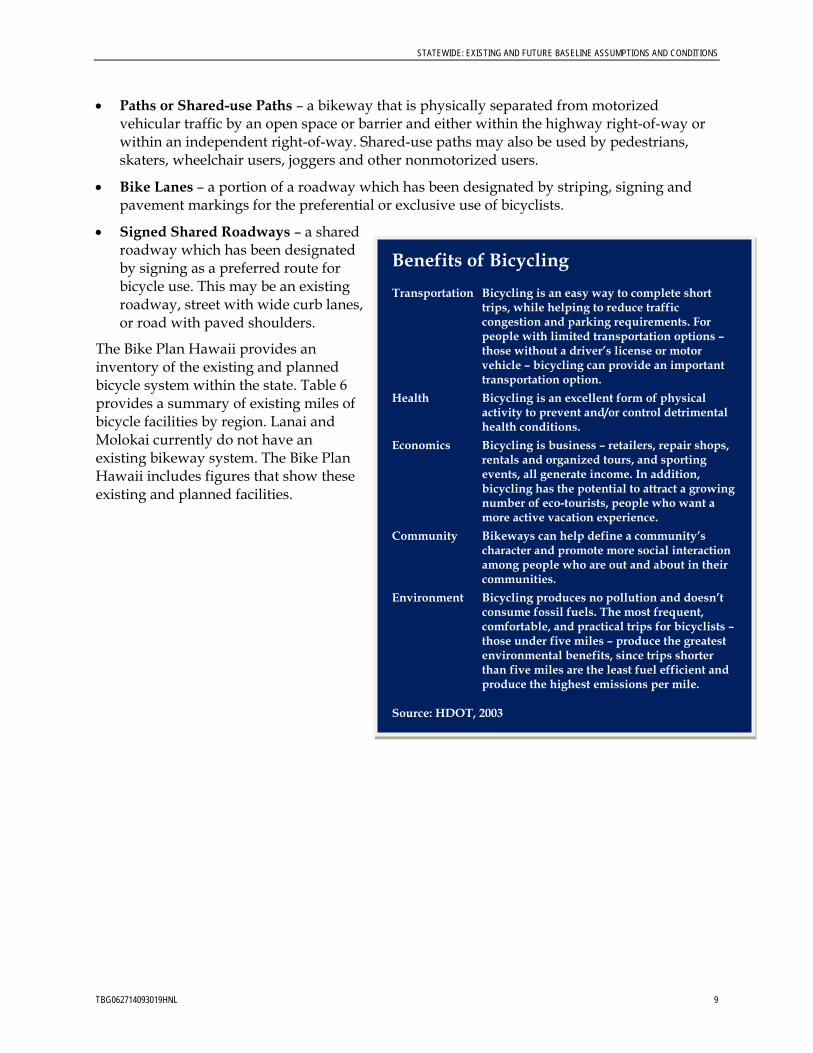
STATEWIDE: EXISTING AND FUTURE BASELINE ASSUMPTIONS AND CONDITIONS
TBG062714093019HNL 9
• Paths or Shared-use Paths – a bikeway that is physically separated from motorized vehicular traffic by an open space or barrier and either within the highway right-of-way or within an independent right-of-way. Shared-use paths may also be used by pedestrians, skaters, wheelchair users, joggers and other nonmotorized users.
• Bike Lanes – a portion of a roadway which has been designated by striping, signing and pavement markings for the preferential or exclusive use of bicyclists.
• Signed Shared Roadways – a shared roadway which has been designated by signing as a preferred route for bicycle use. This may be an existing roadway, street with wide curb lanes, or road with paved shoulders.
The Bike Plan Hawaii provides an inventory of the existing and planned bicycle system within the state. Table 6 provides a summary of existing miles of bicycle facilities by region. Lanai and Molokai currently do not have an existing bikeway system. The Bike Plan Hawaii includes figures that show these existing and planned facilities.
Benefits of Bicycling Transportation Bicycling is an easy way to complete short
trips, while helping to reduce traffic congestion and parking requirements. For people with limited transportation options – those without a driver’s license or motor vehicle – bicycling can provide an important transportation option.
Health Bicycling is an excellent form of physical activity to prevent and/or control detrimental health conditions.
Economics Bicycling is business – retailers, repair shops, rentals and organized tours, and sporting events, all generate income. In addition, bicycling has the potential to attract a growing number of eco-tourists, people who want a more active vacation experience.
Community Bikeways can help define a community’s character and promote more social interaction among people who are out and about in their communities.
Environment Bicycling produces no pollution and doesn’t consume fossil fuels. The most frequent, comfortable, and practical trips for bicyclists – those under five miles – produce the greatest environmental benefits, since trips shorter than five miles are the least fuel efficient and produce the highest emissions per mile.
Source: HDOT, 2003

STATEWIDE: EXISTING AND FUTURE BASELINE ASSUMPTIONS AND CONDITIONS
TBG062714093019HNL 10
TABLE 6 Existing Bicycle Facilities by Region (Miles)
Type of Facility Maui Hawaii Kauai Oahu Total Percent
Paths/Shared Use Paths 1a 6 7 34 48 23%
Bicycle Lanes 22 3 1 34 60 29%
Signed Shared Roadways 38 18 15b 30 101 48%
Total 61 27 23 98 209 100% a Does not include 6 miles of shared-use path recently completed along Mokulele Highway on Maui. b Does not include 2 miles of signed shared roadway recently completed along Nawiliwili Road on Kauai. HDOT, 2003
Over 70 percent of designated bicycle facilities in the state are shared-use facilities, where bicycles must share space with pedestrians, nonmotorized users or motorized vehicles. Close to half of all bicycle facilities (98 of 209 total miles) within the state are located on Oahu, the most populous region. These facilities are fairly evenly split between shared-use paths, bicycle lanes, and signed shared roadways. Major facilities providing regional connectivity include the Pearl Harbor Bike Path and shared-use paths and bike lanes on Nimitz Highway, Kalanianaole Highway, and Ala Moana Boulevard/Kalakaua Avenue. Several facilities are also provided within the Honolulu urban core.
Regional bicycle facilities on Maui include nearly 25 miles of signed shared roadway on Honoapiilani Highway between Maalaea and Kapalua in west Maui, as well as approximately 7 miles of signed shared roadway on Piilani Highway in Kihei. On Kauai, bicycles are currently accommodated via 9 miles of signed shared roadway on Kaumualii Highway west of Lihue to Koloa, and 5 miles of signed shared roadway on Kapule Highway and Kuhio Highway between Lihue and Wailua.
On Hawaii, bicycle facilities primarily exist in populated areas and provide mainly local access only. For example, signed shared roadways are provided within Hilo along Hawaii Belt Road (Highway 11) and between Kona town and the Keahole Airport along Queen Kaahumanu Highway, but regional bicycle connectivity between communities on the belt road system is not available.
Existing Pedestrian System Pedestrian facilities are a critical part of the transportation system. For every trip that is made, part of it includes pedestrian travel. The benefits of walking are similar to those noted for bicycling; transportation, health, economics, community, and the environment. The Statewide Pedestrian Master Plan (HDOT, 2013) developed a stakeholder-driven vision for the pedestrian system that promotes the pedestrian mode of
HDOT, 2013

STATEWIDE: EXISTING AND FUTURE BASELINE ASSUMPTIONS AND CONDITIONS
TBG062714093019HNL 11
transportation as well as protects those that are using the pedestrian system.
Pedestrian facilities generally can be described as any infrastructure that is designed specifically for use by a pedestrian. These include sidewalks, crosswalks, and paths.
The Statewide Pedestrian Master Plan provides an inventory of existing pedestrian infrastructure on the state highway system and includes maps that show the existing pedestrian system. Table 7 summarizes current pedestrian facilities, rounded to the nearest 0.5 mile by region.
TABLE 7 Existing Pedestrian Facilities on State Highways by Region (Miles) Pedestrian Facilities on
State Highways Maui/Molokai/
Lanai Hawaii Kauai Oahu Total Percent
Sidewalk on Both Sides 5.0 0.5 3.5 44.5 53.5 2%
Sidewalk on One Side 6.5 14.0 6.0 77.5 104.0 4%
No Sidewalk 753.0 1208.0 266.5 567.0 2794.5 94%
Total 764.5 1222.5 276.0 689.0 2952.0 100%
HDOT, 2013
Within all of the regions, facilities for pedestrians are more prevalent in urban communities with pedestrian attractions such as parks, beaches, schools and retail areas. Sidewalks on both sides of state highways can be found in the urban communities such as Wailuku-Kahului on Maui, Kona on Hawaii, Lihue and Kapaa on Kauai, and within the urban areas of Honolulu, Pearl Harbor, Mililani, and Kapolei on Oahu. Sidewalks are provided on one side of state highways in other urban communities island-wide, but as shown in Table 7, the majority of state highways have no sidewalk on either side of the street.
On Maui, Hawaii, and Kauai, few sidewalks exist on state highways because of the islands’ unique geography. Communities in these regions are mainly located along the perimeter of the island, and the state highway runs along this perimeter as a belt road. The highways pass through large, predominantly rural areas that separate communities, often by long distances that make pedestrian travel unattractive or impossible.
Oahu differs from the Maui, Hawaii, and Kauai regions because it is far more urbanized. Although communities along Oahu’s north, northeast, and west shores are connected by a belt road system with little to no sidewalks, the south side of the island is highly developed and densely populated with closely spaced communities and places of employment. The area between Waikiki and Pearl City, including downtown Honolulu, is connected by a series of state highways that provide sidewalks on one or both sides, which makes pedestrian travel a viable and attractive option.
The Statewide Pedestrian Master Plan provides recommendations for priority infrastructure and policy investments to enhance pedestrian welfare based on several conditions including existing pedestrian facilities, land use, population, pedestrian attractors, census data, functional classification and safety. Within each of the regions, the plan focuses on three primary concepts for pedestrian recommendations:

STATEWIDE: EXISTING AND FUTURE BASELINE ASSUMPTIONS AND CONDITIONS
TBG062714093019HNL 12
• Pedestrian facilities within the state highway system – The state highway system is the most complete network of right of way connecting communities. Expanding the state highways in urban and urbanizing areas to include pedestrian facilities, such as sidewalks, can greatly enhance the quality and walkability of a community, as well as improve safety.
• Pedestrian safety – Statistical data for incidents involving pedestrians and their root causes can identify areas where safety may be improved through education, engineering, enforcement, and emergency responsiveness.
• Pedestrian-oriented populations – Looking to census data can better support those populations that may be more inclined to use pedestrian facilities including the elderly, youth, and low-income populations. Identifying where these concentrations are located and where they may wish to go on foot will help prioritize where pedestrian facilities and amenities should be placed.
Existing Travel Demand Management/Transportation Systems Management Travel Demand Management (TDM) is a term used to describe strategies that reduce travel demands or redistribute travel demands to lessen impacts of peak periods. TDM strategies may include measures to encourage people to switch to higher occupancy modes, such as public transit, vanpools and carpools. TDM approaches may also encourage people to utilize non-motorized modes of travel, such as walking and bicycling.
Transportation System Management (TSM) strategies enhance the capacity of the existing transportation system through operational improvements. TSM may include contraflow or reversible lanes, high-occupancy vehicle lanes and Intelligent Transportation Systems. There are currently no statewide TDM or TSM strategies or programs in place, although each of the regions employs some level of TSM through coordinated signal timing along corridors. System management strategies (including contraflow lanes and high-occupancy vehicle lanes) are being used on select roadways in the Oahu region, as it is the most urban and congested of all regions. Oahu also employs an advanced Traffic Management Center to oversee its reversible lanes and Intelligent Transportation Systems strategies in real-time.
Existing Public Transit System Public transit provides a personal mobility option and opportunity for all, regardless of age, income, social or physical status by offering a modal alternative for those who are unable to or choose not to drive. Additionally public transit benefits overall quality of life through reduced traffic congestion and improved air quality.
Each of the regions has adopted policies supporting transit implementation. Although each region operates transit individually, they each provide fixed route service, commuter service, paratransit service, and park and ride lots or transit centers for users. Table 8 provides a summary of transit service currently provided by each of the regions. Public transit service is not provided on Molokai or Lanai.

STATEWIDE: EXISTING AND FUTURE BASELINE ASSUMPTIONS AND CONDITIONS
TBG062714093019HNL 13
TABLE 8 Existing Transit Service by Region
Type of Service Mauia Hawaiib Kauaic Oahud
Fixed Route Service 12 routes 10 routes 6 routes 99 total routes
Commuter Service Routes 4 routes 5 routes 1 route
Paratransit Service Yes Yes Yes Yes
Park and Ride Lots 2 locations 2 locations 6 locations 5 locations
Transit Centers Yes No No Yes a County of Maui DOT, 2012 b Hawaii County Mass Transit Agency, 2012 c County of Kauai Transportation Agency, 2012 d Oahu Metropolitan Planning Organization, 2011
Existing State Land Use Districts The State Land Use Commission (LUC) was developed to be responsible for preserving and protecting Hawaii’s lands. The LUC establishes the district boundaries statewide. The districts are comprised of Urban, Rural, Agricultural, and Conservation. These district characteristics are described below, as defined by the State of Hawaii LUC.
The Urban District generally includes lands characterized by “city-like” concentrations of people, structures and services. This district also includes vacant areas for future development. Jurisdiction of this district lies primarily with the respective counties. Generally, lot sizes and uses permitted in the district area are established by the respective county through ordinances or rules.
Rural Districts are composed primarily of small farms intermixed with low-density residential lots with a minimum size of 0.5 acre. Jurisdiction over Rural Districts is shared by the Commission and county governments. Permitted uses include those relating or compatible to agricultural use and low-density residential lots. Variances can be obtained through the special use permitting process.
The Agricultural District includes lands for the cultivation of crops, aquaculture, raising livestock, wind energy facility, timber cultivation, agriculture-support activities (i.e., mills, employee quarters, etc.) and land with significant potential for agriculture uses. Golf courses and golf-related activities may also be included in this district, provided the land is not in the highest productivity categories of the Land Study Bureau’s detailed classification system. Uses permitted in the highest productivity agricultural categories are governed by statute. Uses in the lower-productivity categories are established by the Commission.
Conservation Districts are comprised primarily of lands in existing forest and water reserve zones and include areas necessary for protecting watersheds and water sources, scenic and historic areas, parks, wilderness, open space, recreational areas, habitat of endemic plants, fish and wildlife, and all submerged lands seaward of the shoreline. Conservation Districts also include lands subject to flooding and soil erosion. Conservation Districts are administered by the State Board of Land and Natural Resources and uses are governed by rules promulgated by the State Department of Land and Natural Resources. Table 9 summarizes the land

STATEWIDE: EXISTING AND FUTURE BASELINE ASSUMPTIONS AND CONDITIONS
TBG062714093019HNL 14
classification by acreage for each region. Attachment 1 includes maps that show the distribution of the four different types of state land use districts on each island.
TABLE 9 LUC Land Use Districts – Total Acreage
Island Total Area (Acres)a
Classification by State Land Use Commissionb
Urban Conservation Agricultural Rural
Maui 465,800 22,823 194,836 244,088 4,053
Percent of Island Total 100% 5% 42% 52% 1%
Molokai 165,800 2,539 49,768 111,627 1,866
Percent of Island Total 100% 2% 30% 67% 1%
Lanai 90,500 3,257 38,197 46,639 2,407
Percent of Island Total 100% 4% 42% 51% 3%
Hawaiic 2,573,400 53,722 1,304,347 1,214,040 1,291
Percent of Island Total 100% 2% 51% 47% < 1%
Kauai 353,900 14,558 198,769 139,320 1,253
Percent of Island Total 100% 4% 56% 39% < 1%
Oahu 386,188 100,764 156,614 128,810 0
Percent of Island Total 100% 26% 41% 33% 0%
Statewide Total 4,035,588 197,663 1,942,531 1,884,524 10,870
Percent of Total 100% 5% 48% 47% < 1% a These totals differ somewhat from the official figures based on measurements by the Geography Division of the U.S. Bureau of the Census. b For definitions, see Hawaii Revised Statutes, Section 205-2. c May be revised, pending updates of county records. State of Hawaii Department of Business, Economic Development, and Tourism, 2011
The land use districts outline allowable development and constraints that affect transportation demands, infrastructure and services. Appropriate transportation infrastructure within each of the districts needs to be planned to accommodate the specific type of growth allowed by the land use designation. This infrastructure should also complement the statewide and regional land use planning processes by supporting focused areas of growth.
The distribution of land use districts statewide varies by region, but in general the majority of the state’s land mass is dedicated to agriculture and conservation districts in nearly equal percentages. Approximately 5 percent of statewide land is dedicated to urban use, while less than 1 percent is designated rural. Over 90 percent of each of the Maui, Hawaii, and Kauai regions is designated as agriculture and conservation districts. Maui region (including Molokai and Lanai) has slightly more agriculture district, while the Hawaii and Kauai regions have slightly more conservation land. Oahu differs from the other regions in that less than 75 percent of the island is designated as agriculture and conservation districts, and more than a quarter of the island, the most for any region, is categorized as urban. On Oahu, the most developed and populous region, urban districts are concentrated along the south side of the island (downtown Honolulu, Pearl Harbor, Kapolei), central Oahu, and along the west coast and southeast coast.

STATEWIDE: EXISTING AND FUTURE BASELINE ASSUMPTIONS AND CONDITIONS
TBG062714093019HNL 15
These urban areas are directly served by the states interstate freeway network. There are no rural districts on Oahu.
Existing Socioeconomic Conditions Socioeconomic characteristics of the islands influence transportation demands, and must be considered in the provision of transportation infrastructure and services. The socioeconomic data provides information on trip productions and attractions. Trips are typically produced from households. Trip attractions are related to activities such as employment, schools, shopping and recreation. Statistics for population, households, employment, schools, visitor accommodations, visitor attractions, airports, and harbors were used in the travel demand modeling and traffic forecasting efforts. These socioeconomic conditions are described below.
Population Table 10 summarizes the statewide population by region.
TABLE 10 Existing Population
Region Population Percent of Total Population
Maui/Molokai/Lanaia,b 145,700 11%
Hawaiia 173,000 14%
Kauaia 64,300 5%
Oahuc 905,500 70%
Total 1,288,500 100% a County Assessor Data, 2011 b Molokai and Lanai. Department of Business and Economic Development, 2011 c Oahu Metropolitan Planning Organization, 2011
With its substantial urban areas, Oahu is by far the most populated region. Nearly 70 percent of the state’s total population resides on Oahu. Downtown Honolulu, and its surrounding communities, is the most densely populated area of the island. Population density gradually decreases further away from this downtown core. This trend differs from the Maui, Hawaii, and Kauai regions where smaller, isolated population centers are spread around the islands perimeter. Kauai is the least populated region, with only 5 percent of the statewide population permanently residing on the island.
Households Table 11 summarizes the number of households within the state by region. Statewide, households are distributed similarly to population, with the majority of households located on the Island of Oahu in the central urban core of downtown Honolulu.

STATEWIDE: EXISTING AND FUTURE BASELINE ASSUMPTIONS AND CONDITIONS
TBG062714093019HNL 16
TABLE 11 Existing Households
Region Households Percent of Total Households
Maui/Molokai/Lanaia,b 51,000 11%
Hawaiia 62,900 14%
Kauaia 22,900 5%
Oahuc 311,000 70%
Total 447,800 100% a County Assessor Data, 2011 b Molokai and Lanai. Department of Business and Economic Development, 2011 c Oahu Metropolitan Planning Organization, 2011
Employment The statewide distribution of employment positions is summarized in Table 12, which closely follows the population and household trends.
TABLE 12 Existing Employment
Region Employment Percent of Total Employment
Maui/Molokai/Lanaia,b 73,800 10%
Hawaiia 68,400 10%
Kauaia 30,400 4%
Oahuc 556,800 76%
Total 729,400 100% a Hawaii Department of Labor and Industrial Relations, 2007 b Hawaii Workforce Infonet, 2007 c Oahu Metropolitan Planning Organization, 2011
Oahu is the state’s primary job center with more than 75 percent of the total employment positions statewide located within this region. Jobs are most heavily concentrated in the industrial areas near the Honolulu Airport and west of the downtown Honolulu core.
Service positions (including jobs in the health care, finance, real estate, and science/technical industries) make up the majority of jobs in the state, outnumbering retail positions and other job categories such as agriculture, construction, or military positions. The type of employment has an effect on trip generation and the way trips are distributed throughout the statewide transportation network. For example, agriculture based jobs may attract trips differently than service industry jobs or military jobs, resulting in varying trip lengths or trip distribution.
Visitor Industry The tourism industry is the state’s leading economic sector. Due to its unique location and environment, Hawaii is a popular tourist destination and receives visitors from all over the world. The majority of visitors to the islands arrive via airline carriers, but cruise ships also

STATEWIDE: EXISTING AND FUTURE BASELINE ASSUMPTIONS AND CONDITIONS
TBG062714093019HNL 17
bring visitors to the state. These visitors have a direct impact on the statewide land transportation system through rental car use and public or private transit use. Tourism also has an indirect impact on the states roadways by influencing trips and travel patterns generated by visitor industry related job sectors (such as hotel or service jobs). Table 13 summarizes visitor statistics statewide.
Honolulu International Airport, the sole passenger airport on Oahu, accommodated over 21 million air passengers in 2007. This airport is generally considered the hub of statewide air travel, as it conveyed nearly 60 percent of the state’s total air passengers. The Maui region supported approximately 20 percent of all air passengers in 2007 through its six passenger airports on Maui Island, Molokai, and Lanai.
Each region includes harbors that service the visitor industry through cruise ship accommodations. The Hawaii Department of Transportation Harbors Division estimated that nearly 2 million cruise ship passengers were accommodated at the states cruise ship terminals in 2007. Many of these passengers visited multiple ports within the regions.
Visitor accommodations are provided throughout the state and consist of hotel rooms, motel rooms, and condominiums or other housing units specifically reserved for use by visitors. Approximately 72,800 units were available in 2007, with nearly half of those visitor accommodations located on Oahu. The majority of units were located in the Waikiki area. Similar to the distribution of visitor accommodations, visitor attractions were primarily located on the Island of Oahu. Attractions include museums, cultural and historic sites, and state parks. Of the 22.5 million visitor attraction trips generated in 2007 statewide, almost 45 percent of those trips took place on Oahu. The USS Arizona Memorial in Pearl Harbor was the most visited attraction in 2007 with over 1.5 million visitors followed by the Polynesian Cultural Center and the Honolulu Zoo.
TABLE 13 Existing Visitors and Accommodations by Region
Region Air Passengersa
Cruise Passengersb
Visitor Accommodationsc
Visitor Attraction Tripsd
Maui/Molokai/Lanai 6.6 million 497,000 19,200 units 4.5 million
Hawaii 4.9 million 499,000 11,100 units 4.3 million
Kauai 3.0 million 456,000 8,700 units 3.8 million
Oahu 21.5 million 512,000 33,800 units 9.9 million
Total 36.0 million 1,964,000 72,800 units 22.5 million a HDOT, 2008. b Department of Business, Economic Development, and Tourism (DBEDT) 2008a c DBEDT, 2008b d DBEDT, 2009
Airport and Harbor Cargo Air and harbor cargo impact socioeconomic and travel demand characteristics throughout the state. Movement of goods is essential for economic development, and truck volume and weight for freight and goods movement is a key consideration in maintaining roadways. As noted
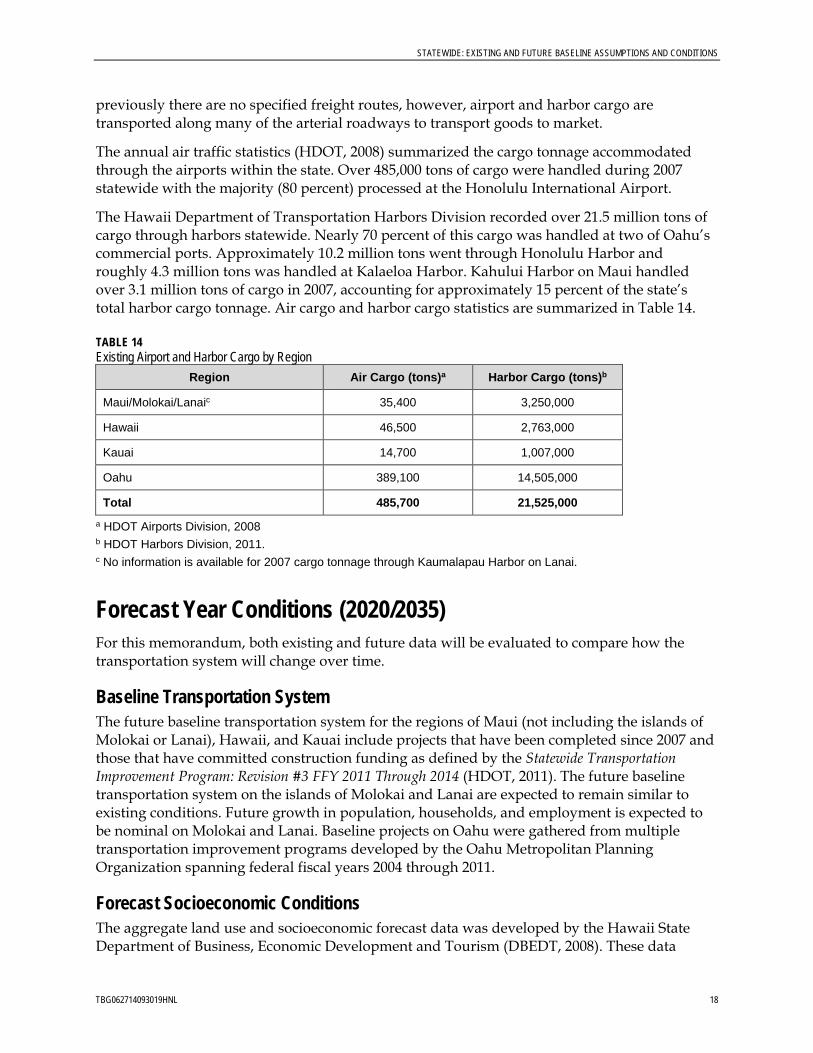
STATEWIDE: EXISTING AND FUTURE BASELINE ASSUMPTIONS AND CONDITIONS
TBG062714093019HNL 18
previously there are no specified freight routes, however, airport and harbor cargo are transported along many of the arterial roadways to transport goods to market.
The annual air traffic statistics (HDOT, 2008) summarized the cargo tonnage accommodated through the airports within the state. Over 485,000 tons of cargo were handled during 2007 statewide with the majority (80 percent) processed at the Honolulu International Airport.
The Hawaii Department of Transportation Harbors Division recorded over 21.5 million tons of cargo through harbors statewide. Nearly 70 percent of this cargo was handled at two of Oahu’s commercial ports. Approximately 10.2 million tons went through Honolulu Harbor and roughly 4.3 million tons was handled at Kalaeloa Harbor. Kahului Harbor on Maui handled over 3.1 million tons of cargo in 2007, accounting for approximately 15 percent of the state’s total harbor cargo tonnage. Air cargo and harbor cargo statistics are summarized in Table 14.
TABLE 14 Existing Airport and Harbor Cargo by Region
Region Air Cargo (tons)a Harbor Cargo (tons)b
Maui/Molokai/Lanaic 35,400 3,250,000
Hawaii 46,500 2,763,000
Kauai 14,700 1,007,000
Oahu 389,100 14,505,000
Total 485,700 21,525,000 a HDOT Airports Division, 2008 b HDOT Harbors Division, 2011. c No information is available for 2007 cargo tonnage through Kaumalapau Harbor on Lanai.
Forecast Year Conditions (2020/2035) For this memorandum, both existing and future data will be evaluated to compare how the transportation system will change over time.
Baseline Transportation System The future baseline transportation system for the regions of Maui (not including the islands of Molokai or Lanai), Hawaii, and Kauai include projects that have been completed since 2007 and those that have committed construction funding as defined by the Statewide Transportation Improvement Program: Revision #3 FFY 2011 Through 2014 (HDOT, 2011). The future baseline transportation system on the islands of Molokai and Lanai are expected to remain similar to existing conditions. Future growth in population, households, and employment is expected to be nominal on Molokai and Lanai. Baseline projects on Oahu were gathered from multiple transportation improvement programs developed by the Oahu Metropolitan Planning Organization spanning federal fiscal years 2004 through 2011.
Forecast Socioeconomic Conditions The aggregate land use and socioeconomic forecast data was developed by the Hawaii State Department of Business, Economic Development and Tourism (DBEDT, 2008). These data
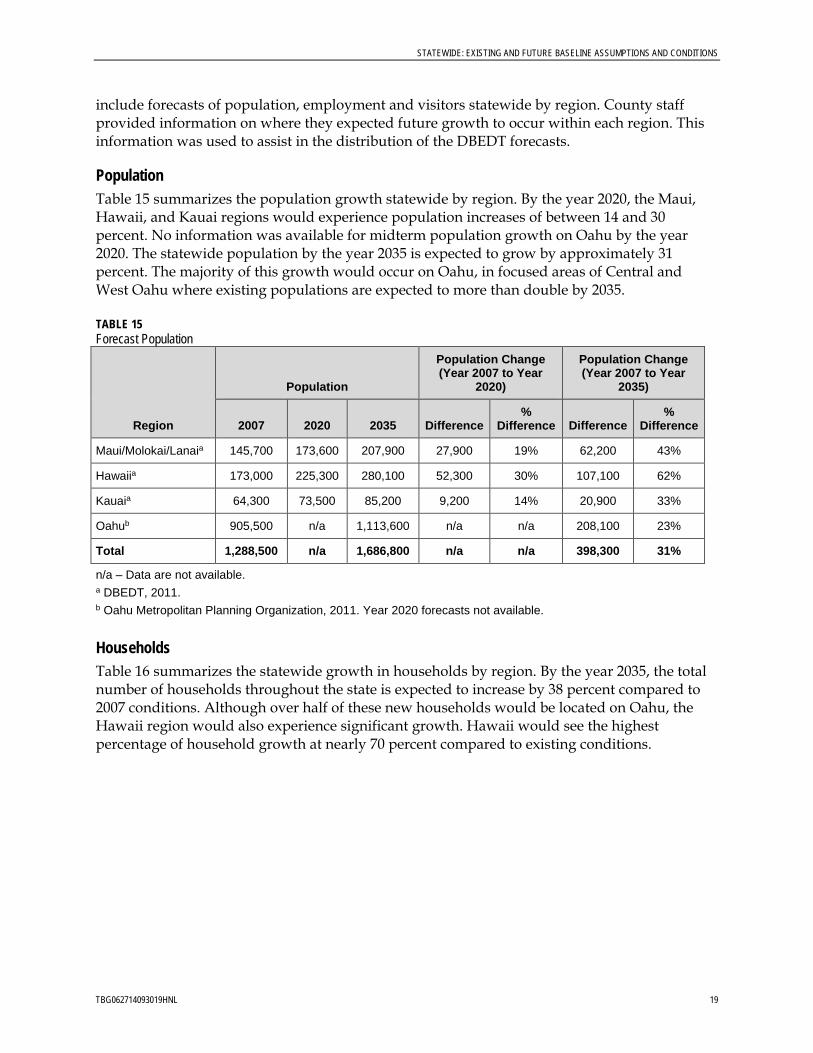
STATEWIDE: EXISTING AND FUTURE BASELINE ASSUMPTIONS AND CONDITIONS
TBG062714093019HNL 19
include forecasts of population, employment and visitors statewide by region. County staff provided information on where they expected future growth to occur within each region. This information was used to assist in the distribution of the DBEDT forecasts.
Population Table 15 summarizes the population growth statewide by region. By the year 2020, the Maui, Hawaii, and Kauai regions would experience population increases of between 14 and 30 percent. No information was available for midterm population growth on Oahu by the year 2020. The statewide population by the year 2035 is expected to grow by approximately 31 percent. The majority of this growth would occur on Oahu, in focused areas of Central and West Oahu where existing populations are expected to more than double by 2035.
TABLE 15 Forecast Population
Region
Population
Population Change (Year 2007 to Year
2020)
Population Change (Year 2007 to Year
2035)
2007 2020 2035 Difference %
Difference Difference %
Difference
Maui/Molokai/Lanaia 145,700 173,600 207,900 27,900 19% 62,200 43%
Hawaiia 173,000 225,300 280,100 52,300 30% 107,100 62%
Kauaia 64,300 73,500 85,200 9,200 14% 20,900 33%
Oahub 905,500 n/a 1,113,600 n/a n/a 208,100 23%
Total 1,288,500 n/a 1,686,800 n/a n/a 398,300 31%
n/a – Data are not available. a DBEDT, 2011. b Oahu Metropolitan Planning Organization, 2011. Year 2020 forecasts not available.
Households Table 16 summarizes the statewide growth in households by region. By the year 2035, the total number of households throughout the state is expected to increase by 38 percent compared to 2007 conditions. Although over half of these new households would be located on Oahu, the Hawaii region would also experience significant growth. Hawaii would see the highest percentage of household growth at nearly 70 percent compared to existing conditions.

STATEWIDE: EXISTING AND FUTURE BASELINE ASSUMPTIONS AND CONDITIONS
TBG062714093019HNL 20
TABLE 16 Forecast Households
Region
Households Households Change
(Year 2007 to Year 2020) Households Change
(Year 2007 to Year 2035)
2007 2020 2035 Difference %
Difference Difference %
Difference
Maui/Molokai/Lanaia 51,000 62,400 77,800 11,400 22% 26,800 53%
Hawaiia 62,900 83,200 106,300 20,300 32% 43,400 69%
Kauaia 22,900 25,600 29,800 2,700 12% 6,900 30%
Oahub 311,000 n/a 405,900 n/a n/a 94,900 31%
Total 447,680 n/a 619,830 n/a n/a 172,000 38%
n/a – Data are not available. a DBEDT, 2011. b Oahu Metropolitan Planning Organization, 2011. Year 2020 forecasts not available.
Employment Table 17 summarizes the growth in employment positions statewide between 2007 and 2035. Similar to the forecast increase in population, the number of jobs statewide is expected to increase by approximately 30 percent by the year 2035. Over 60 percent of those jobs would be located on Oahu, specifically in focused areas of West Oahu. Employment growth in the regions of Maui, Hawaii, and Kauai would be modest compared to Oahu with between 5 and 15 percent growth expected between 2020 and 2035 in each region.
TABLE 17 Forecast Employment
Region
Employment Employment Change
(Year 2007 to Year 2020) Employment Change
(Year 2007 to Year 2035)
2007 2020 2035 Difference %
Difference Difference %
Difference
Maui/Molokai/Lanaia 73,800 91,300 106,100 17,600 24% 32,300 44%
Hawaiia 68,400 85,300 102,700 17,000 25% 34,300 50%
Kauaia 30,400 36,500 42,200 6,100 20% 11,800 39%
Oahub 556,800 n/a 693,300 n/a n/a 136,500 25%
Total 729,400 n/a 944,300 n/a n/a 214,900 29%
n/a – Data are not available. a DBEDT, 2011. b Oahu Metropolitan Planning Organization, 2011. Year 2020 forecasts not available.
Visitor Industry Future forecasts for air and cruise passengers are summarized by region in Table 18. Modest growth in air and cruise passenger volume (less than 8 percent compared to existing) is expected by the year 2020 in the Maui, Hawaii, and Kauai regions. Approximately 20 percent

STATEWIDE: EXISTING AND FUTURE BASELINE ASSUMPTIONS AND CONDITIONS
TBG062714093019HNL 21
growth is expected in these regions by 2035. Forecast visitor passenger data for the Island of Oahu are not available for year 2020 or 2035.
Visitor accommodations statewide are expected to increase by approximately 17 percent overall by the year 2035 compared to existing conditions. Although the Hawaii region is expected to have the largest percentage growth in new visitor accommodations, nearly half of the statewide growth in accommodations would be located on Oahu within the emerging resort areas on the southwest side of the island.
TABLE 18 Forecast Visitors and Accommodations by Region
Region
(Year 2007 to Year 2020) (Year 2007 to Year 2035)
2007 2020 2035 Difference %
Difference Difference %
Difference
Air Passengers (millions)
Mauia 6.6 6.9 7.8 0.3 5% 1.2 18%
Hawaiia 4.9 5.3 6.1 0.4 8% 1.2 24%
Kauaia 3.0 3.1 3.6 0.1 3% 0.6 20%
Oahub 21.5 n/a n/a n/a n/a n/a n/a
Total 36.0 n/a n/a n/a n/a n/a n/a
Cruise Passengers
Mauia 497,000 516,000 581,000 19,000 4% 84,000 17%
Hawaiia 499,000 540,000 619,000 41,000 8% 120,000 24%
Kauaia 456,000 484,000 550,000 28,000 6% 94,000 21%
Oahuc 512,000 n/a n/a n/a n/a n/a n/a
Total 1,964,000 n/a n/a n/a n/a n/a n/a
Visitor Accommodations (units)
Mauia 19,200 19,500 21,800 300 2% 2,600 14%
Hawaiia 11,100 12,900 14,900 1,800 16% 3,800 34%
Kauaia 8,700 9,100 9,200 400 5% 500 6%
Oahud 33,800 n/a 39,600 n/a n/a 5,800 17%
Total 72,800 n/a 85,500 n/a n/a 12,700 17%
n/a – Data are not available. a CH2M HILL, 2012 b HDOT Airports Division, 2008 c DBEDT, 2008b d Oahu Metropolitan Planning Organization, 2011
Airport and Harbor Cargo Table 19 summarizes the forecast cargo tonnage expected at the airports and harbors statewide by 2020 and by 2035. Forecast cargo data for Oahu are not available for either future analysis

STATEWIDE: EXISTING AND FUTURE BASELINE ASSUMPTIONS AND CONDITIONS
TBG062714093019HNL 22
year. Cargo shipments to airports and harbors on Hawaii are expected to increase by nearly 50 percent by 2035 compared to existing conditions. Growth in freight and cargo activity statewide is expected to result in increased truck traffic on the arterials surrounding the regional airports and harbors, which may affect the ability to transport goods to market.
TABLE 19 Forecast Airport and Harbor Cargo by Region
Region
(Year 2007 to Year 2020) (Year 2007 to Year 2035)
2007 2020 2035 Difference %
Difference Difference %
Difference
Air Cargo (tons)
Mauia 33,200 35,900 43,000 2,700 8% 9,800 30%
Hawaiia 46,500 55,000 68,400 8,500 18% 21,900 47%
Kauaia 14,700 15,200 17,600 500 3% 2,900 20%
Oahub 389,100 n/a n/a n/a n/a n/a n/a
Total 485,700 n/a n/a n/a n/a n/a n/a
Harbor Cargo (million tons)
Mauia 3.1 3.4 4.1 0.3 10% 1.0 32%
Hawaiia 2.8 3.3 4.1 0.5 18% 1.3 46%
Kauaia 1.0 1.0 1.2 0.0 < 1% 0.2 20%
Oahuc 14.5 n/a n/a n/a n/a n/a n/a
Total 21.4 n/a n/a n/a n/a n/a n/a
n/a – Data are not available. a CH2M HILL, 2012. Maui region does not include cargo tonnage for Molokai or Lanai. b HDOT Airports Division, 2008. c HDOT Harbors Division, 2011.
Forecast System Performance The forecast transportation system performance is based on the baseline transportation system and the socioeconomic forecasts described in the previous sections. The travel demand model estimates of the future land transportation system operations are described and compared to the existing performance characteristics.
Highway Volume-to-Capacity Ratio and Level of Service Table 20 summarizes the performance of the future modeled roadway system in 2035 compared to existing conditions. Year 2020 data are not available for the region of Oahu, and therefore is not summarized in terms of statewide performance in Table 20.
Forecast roadway performance on Oahu represents operations during the 2-hour a.m. peak period of a typical work day morning commute. Daily congestion statistics are reported for arterials and collectors on the islands of Maui, Hawaii, and Kauai. Future forecast roadway conditions are not analyzed for the islands of Lanai and Molokai.

STATEWIDE: EXISTING AND FUTURE BASELINE ASSUMPTIONS AND CONDITIONS
TBG062714093019HNL 23
TABLE 20 2035 Roadway Performance by Region
Roadway Classification by Region
Percentage of Lane Miles
V/C < 0.8 (LOS C or better)
0.8 < V/C < 0.9 (LOS D)
0.9 < V/C < 1.0 (LOS E)
V/C > 1.0 (LOS F)
Lane Miles
Arterials includes interstates, freeways, expressways, major and minor arterials)
Mauia,c 31% 9% 6% 54% 271
Hawaiia 63% 6% 7% 24% 768
Kauaia 62% 7% 6% 25% 163
Oahub 79% 6% 6% 9% 1362
Collectors
Mauia,c 90% 3% 2% 5% 558
Hawaiia 89% 2% 2% 7% 892
Kauaia 100% 0% 0% 0% 233
Oahub 94% 2% 2% 2% 648 a CH2M HILL, 2012. Results are reported for daily operations. b Oahu Metropolitan Planning Organization, 2011. Results are reported for a.m. peak operations. c The lane-miles numbers reflect the arterials and collectors that are on the Island of Maui only.
Traffic operations are expected to worsen statewide by 2035 compared with existing conditions. Vehicular volumes in all regions are anticipated to grow as land uses are developed and population and employment opportunities increase. Increases in traffic would result in greater demand on the states roadway infrastructure and higher levels of congestion, which result in poorer operating conditions. Operations are expected to worsen, even with future planned and programmed improvement projects constructed in anticipation of growth.
Table 20 shows that a higher percentage of arterial and collector lane miles are expected to operate at LOS F in 2035 than in 2007. While collector roadway operations statewide would worsen slightly by 2035, the arterial roadway network in certain regions would see significant changes to LOS distribution. On the islands of Maui and Hawaii, the percentage of arterial lane miles expected to operate at LOS F in 2035 more than double compared to 2007 conditions. On Maui, 54 percent of arterial lane miles would be expected to operate at LOS F in 2035 compared to just over 20 percent in 2007. On the Island of Hawaii, over 100 miles of planned new arterial lane improvements are expected by 2035. Even with this significant increase in capacity, nearly one quarter of arterial lane miles would be expected to operate at LOS F under future conditions, compared to just 10 percent under existing conditions. On Kauai, congested arterials are expected to increase from less than 15 percent in 2007 to 25 percent in 2035.
Vehicle Trips Statewide vehicle trip totals summarized by region are presented in Table 21 for the forecast year 2035. Year 2020 data are not available for the region of Oahu, and therefore is not summarized in terms of statewide performance. Vehicle trips on Oahu include those made by motorized passenger vehicles but not trips made by transit or commercial vehicles. Trips

STATEWIDE: EXISTING AND FUTURE BASELINE ASSUMPTIONS AND CONDITIONS
TBG062714093019HNL 24
estimated for the regions of Maui, Hawaii, and Kauai include passenger and commercial vehicle trips, but do not include those made by transit. In those regions, transit accounts for a very low percentage of total trips, and therefore were not modeled (CH2M HILL, 2012).
TABLE 21 2035 Daily Vehicle Trip Statistics by Region
Region Vehicle Trips
Percent of Total
Vehicle Miles Traveled
Percent of Total
Vehicle Hours of Travel
Percent of Total
Maui/Molokai/Lanaia 636,430 19% 4,289,000 14% 191,240 8%
Hawaiia 753,180 22% 8,585,900 28% 1,556,600 66%
Kauaia 246,380 7% 1,939,800 6% 128,140 5%
Oahub 1,755,300 52% 15,610,300 50% 484,300 20%
Total 3,391,290 100% 30,425,000 100% 2,360,280 100% a CH2M HILL, 2012. Transit trips are not included. b Oahu Metropolitan Planning Organization, 2011. Vehicle trips do not include commercial vehicles or transit. Vehicle miles traveled and vehicle hours of travel statistics include all motorized vehicles.
Nearly 3.4 million daily vehicle trips are forecast in 2035. This represents an increase of more than 35 percent over the number of statewide trips generated in 2007. More than half of these trips would be generated on Oahu.
Although Oahu accounts for the majority of statewide trips, it is forecast to experience the lowest individual regional trip growth at approximately 24 percent between 2007 and 2035. Regional vehicle trips on Hawaii are expected to grow by approximately 65 percent over existing conditions. This is a result of significant increases in population and employment in the region, specifically in the Puna and South Hilo areas. Due to this high growth vehicle hours of travel increase dramatically due to congestion and delay on arterials in the area), and are expected to account for more than 65 percent of the statewide total hours traveled in 2035.
Travel Time Travel times statewide are forecast to increase by 2035 compared to existing conditions. As discussed previously, increases in population and employment on all islands would result in increased travel demand. Although some planned improvements would add capacity to certain roadways, the increase in demand is expected to worsen congestion on many of the states arterials. This is most significant on the Island of Hawaii, where belt arterials are often the sole access into and out of communities. Travel times from the Hilo area to Puna and the south coast are expected to increase by over an hour compared to existing conditions.

STATEWIDE: EXISTING AND FUTURE BASELINE ASSUMPTIONS AND CONDITIONS
TBG062714093019HNL 25
References American Association of State Highway and Transportation Officials. 1999. Guide for the
Development of Bicycle Facilities.
CH2M HILL. 2012. Travel Demand Model Analysis and Results for Federal-Aid Highways 2035 Transportation Plan for the District of Kauai. May.
CH2M HILL. 2014a. District of Maui: Existing and Future Baseline Assumptions and Conditions. March.
CH2M HILL. 2014b. District of Hawaii: Existing and Future Baseline Assumptions and Conditions. March.
CH2M HILL. 2014c. District of Kauai: Existing and Future Baseline Assumptions and Conditions. March.
County of Hawaii Department of Planning. 2008. Hawaii County Community Development Plans..
County of Kauai Transportation Agency. 2012. The Kauai Bus. Available at: http://www.kauai.gov/Government/Departments/TransportationAgency/BusSchedules/tabid/208/Default.aspx. Accessed on: February 16, 2012.
County of Maui Department of Transportation. 2012. Bus Service Information. Available at: http://www.co.maui.hi.us/index.aspx?NID=605. Accessed on: February 16, 2012.
Hawaii County Mass Transit Agency. 2012. Hele-On Bus. Available at: http://heleonbus.org/. Accessed on: February 16, 2012.
Hawaii Workforce Infonet. 2007. Labor Force Information – Labor Market Facts. Available at: https://www.hiwi.org/vosnet/analyzer/results.aspx?session=labforce. Accessed on: March, 7, 2012.
Oahu Metropolitan Planning Organization. 2011. Oahu Regional Transportation Plan 2035.
State of Hawaii County Assessor. 2011. Hawaii County Assessor Data. March/April 2011.
State of Hawaii Department of Business, Economic Development, and Tourism (DBEDT). 2008a. 2007 Annual Visitor Research Report.
State of Hawaii Department of Business, Economic Development, and Tourism (DBEDT). 2008b. Visitor Plant Inventory 2008.
State of Hawaii Department of Business, Economic Development, and Tourism (DBEDT). 2009. State of Hawaii Data Book 2008. August.
State of Hawaii Department of Business, Economic Development, and Tourism (DBEDT). 2011. State of Hawaii Data Book 2010. August.
State of Hawaii Department of Labor and Industrial Relations. 2007. Second Quarter 2007.
State of Hawaii Department of Transportation (HDOT). 2003. Bike Plan Hawaii, A State of Hawaii Master Plan Abridged Version. September.
http://www.kauai.gov/Government/Departments/TransportationAgency/BusSchedules/tabid/208/Default.aspx

STATEWIDE: EXISTING AND FUTURE BASELINE ASSUMPTIONS AND CONDITIONS
TBG062714093019HNL 26
State of Hawaii Department of Transportation (HDOT). 2007. Hawaii Strategic Highway Safety Plan 2007-2012.
State of Hawaii Department of Transportation, Airports Division (HDOT). 2008. Calendar Year 2007 Air Traffic Statistics. June.
State of Hawaii Department of Transportation (HDOT). 2009. HPMS Database 2009.
State of Hawaii Department of Transportation (HDOT). 2013. Statewide Pedestrian Master Plan. May.
State of Hawaii Department of Transportation (HDOT) Harbors Division. 2011. Email from David Zevenbergen/HDOT to Neha Rathi/CH2M HILL. “Harbors Data.” May 10.
State of Hawaii Department of Transportation (HDOT) Harbors Division. 2014. Port Hawaii Commercial Harbors System Handbook. Available at: http://hidot.hawaii.gov/harbors/library/port-hawaii-handbook/. Accessed on: August 15, 2012.
Transportation Research Board. 2003. Access Management Manual.
Transportation Research Board. 2010. Highway Capacity Manual.

Attachment 1 Land Use District Maps


FARRINGTON HWY.
FAR
RIN
GTO
N H
WY.
FARRINGTON HWY.
WAIANAE KAIFOREST RESERVE
KAMEHAM
EHA HW
Y.
Kaukonahua Road
Puaena Point
Hickam AirForce Base
KAMEHAMEHA HWY.
H-1KALANIANAOLE HWY.
KALANIANAOLEHW
Y.
PALI HW Y.
KAWAILOA FOREST RESERVE
EWA FOREST RESERVE
WAIALUA
HONOLULU
KAILUA
HALEIWA
WAIANAE
Hauula
Aliamanu Salt Lake
Kapahulu
Moiliili
Waikiki
Kaimuki Waialae
ManoaMakiki
Nuuanu
Kalihi
Lanikai
MAKAHA
Mokuleia
Sunset Beach
Waimea
Kahuku
Laie
Punaluu
Kaaawa
WAIKANE
Royal Kunia
Village Park
FOR
TW
EAVE
RR
OA
D
MAKAKILO
EWA
FARRINGTON HWY.
EWABEACH
Kane`ohe Bay Driv e
Ehukai BeachPark
Waimea Bay
Kawailoa Beach
Waialua Bay
Mokuleia Beach
Laie Bay
Makahoa Point
Laie Point
Kahuku Point
Kawela Bay
Kalaipaloa Point
Keehi Lagoon
Honolulu InternationalAirport
Kahana Bay
Kualoa PointMokolii Island
Kaoio Point
Molii Pond
Kaaawa Point
Makalii Point
Mahie Point
Kaneohe Bay
Ala Moana Beach
Waikiki Beach
Honolulu Harbor
Aloha TowerSand Island
Diamond Head
Wailea Point
Camp KaenaCamp Erdman
Kaiaka Bay
KAENA POINT
Kahe PointBeach Park
OneulaBeachPark
DillinghamAir Field
Punchbowl
University ofHawaii
Bellows AirForce Base
Makulua Islands
Popoia Island
Mokolea Rock
Moku Manu
Mokapu PointPukaulua Point
Kapoho Point
Kailua Beach
Kaelepulu Pond
Nuupia Pond
Moku o LoeIsland
KahaluuPond
KANEOHE
KAHALUU
KaneoheMarine CorpsAir Station
KawainuiSwamp
H - 3
KAMEHAM
EHAH
IGH
WAY
H - 3
LIKELIKE HWY.
H - 3
PALI HIGHWAY
Kaneohe Bay
Kokokahi
Kealohi Point
HeeiaPond
HEEIASTATEPARK
KA
NE
OHEFO
REST
RESERVE
Ho`omaluhiaBotanicalGarden
PaliGolfCourse
HawaiianMemorialParkCemetary
EwaBeachPark
KeahiPoint
WestLoch
IroquoisPoint
WaipioPoint
HonouliuliWastewaterTreatmentPlant
H-1 FREEWAY
H-1 FREEWAY
Ford IslandKaloi Gulch
Kaloi Gulch
Barbers PointBeach Park
Nimitz Beach
KALAELOA formerlyBarbers Point Naval Air Station
CAMPBELLINDUSTRIALPARK
AinaHaina
NiuValley
KawaihoaPoint
HawaiiKai
Hanauma Bay
PaleaPoint
HalonaPoint
SandyBeachPark
KokoHead
MakapuuHead
MakapuuPoint
KaohikaipuIsland
MananaIslandWaimanalo
Beach
Waimanalo
MaunaluaBay
Kahala
Kuliouou
WheelerArmy Air Base
LakeWilson
MILILANI TOWN
MILILANI MAUKA
WhitmoreVillage
SCHOFIELDBARRACKS
WAHIAWA
WAIKELEPEARLCITY
East Loch
MiddleLoch
H-2 FREEWAY
H-2 FREEWAY
KA
ME
HA
ME H
AH
WY.
KUN
IA RO
AD
KUN
IA RO
AD
H-1 FREEWAY
FARRINGTON HWY.WAIPAHU KAMEHAMEHA HIGHWAY
KAMEHAM
EHA HIGHW
AY
Waipio
Kalaeloa B
lvd.
Maili Point
Maili
MakahaBeachPark
PokaiBay
KaneilioPoint
HonokaiHale
NanakaiGardens
Ko Olina
Barbers PointDeep DraftHarbor
Nanakuli
KAPOLEI
MAKUA KEAAUFOREST
RESERVE
PUPUKEA-PAUMALU FOREST
RESERVE
DIAMONDHEAD STATEMONUMENT
HONOLULUWATERSHED
FOREST RESERVE
HONOLULUWATERSHED
FOREST RESERVE
HONOULIULI
HONOLULUWATERSHED
FOREST RESERVE
EWA FORESTRESERVE
(WAIMANO SEC.)
WAIAHOLEFOREST RESERVE(WAIAHOLE SEC)
OAHU FORESTNATIONAL
WILDLIFE REFUGEWAIANAE
KAI FORESTRESERVE
KAALA NATURALAREA RESERVE
KAENAPOINT
STATE PARK
EWA FORESTRESERVE
(POAMOHO SEC.)
MOKULEIAFOREST
RESERVE
PAHOLENATURAL AREA
RESERVE
MOKULEIAFOREST RESERVE
AHUPUAAO KAHANA
STATE PARK
KUAOKALA GAMEMANAGEMENT
AREA
KAIPAPAUFOREST
RESERVE
SACREDFALLS
STATE PARK
HAUULAFOREST
RESERVE
NANAKULIFOREST
RESERVE
KAHUKUMOTOCROSS
HONOLULUWATERSHED
FOREST RESERVE
LegendSpecial Permits
Oahu Tax Map Key - 2012
Contour Lines (100-ft.)
STATE LAND USE DISTRICTURBAN
AGRICULTURAL
CONSERVATION
STATE OF HAWAI`ILAND USE DISTRICT
BOUNDARIES - Island of O`ahu
c:/sluc_2012/2012slud_maps/oahu_slud2012_0113.mxd
1:80,000
Prepared by the State Land Use Commission on the State ofHawaii's GIS (JANUARY 2012). The State Land Use District
Boundaries depicted on this map are not official and are merelyrepresentations for presentation purposes only. A determination of
the official State Land Use District Boundaries shall be obtainedthrough the State Land Use Commission.
Note: The coastline and base data reflect 1982/1983 USGSQuadrangle information.
State Land Use District.
URBAN.
AGRICULTURAL.
RURAL.
CONSERVATION
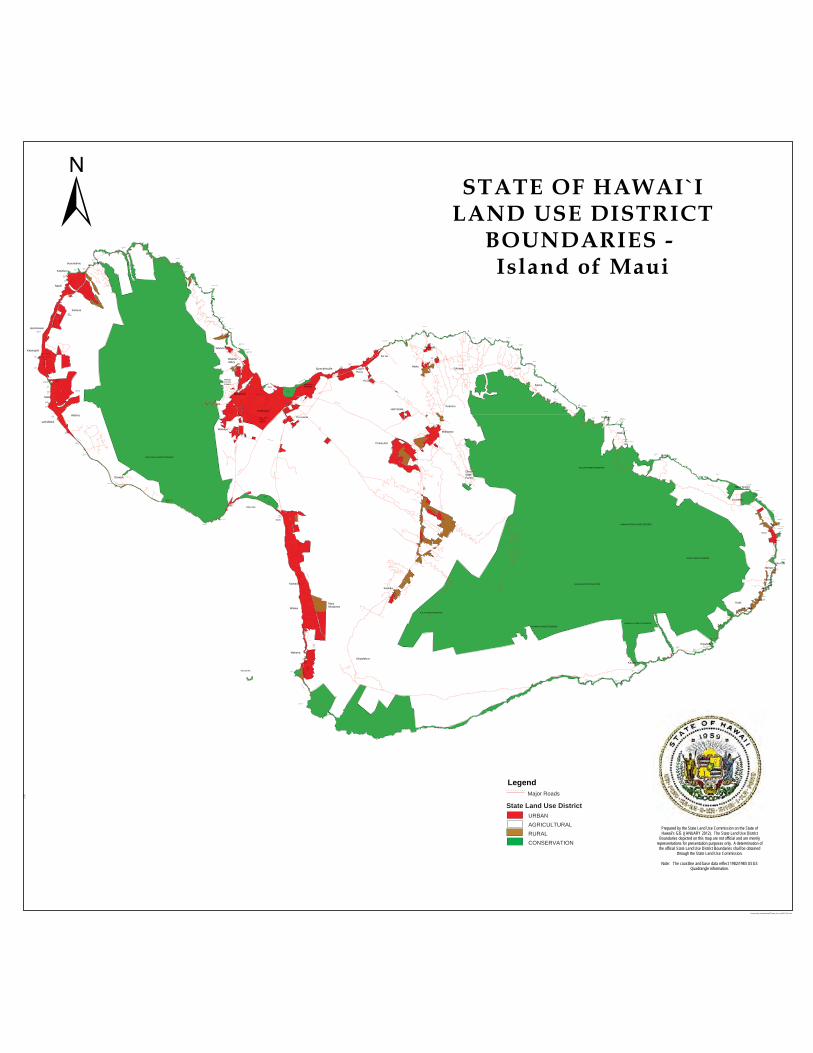
KAHEKIL I HWY.
KAHEKILI HWY.
K AHE KILI HWY.
Hale
aka
laH
wy.
Kula Hw
y.
Ke
k aulike
Hw
y.
Ha leaka la C
rate
r Roa
d
Hana Hwy.
Ha` ik
u
R d.
Hana H w y.
HANA
MakenaTennisClub
MauiPrinceResort
Ma kena
AlanuiDr.
Honokohau Bay
Mokolea Pt.
Kahakuloa Bay
Mokeehia Island
Hakuhee Pt.
Hulu Island
Waihe`e Pt.
Waihe`e BeachPark
Hookipa Park
Pauwela Pt.
Uaoa Bay Pilale Bay
Hoolawa Bay
Waipio Bay
Honopou Pt.
Honokala Pt.
Huelo Pt.
Hoalua Bay
Makaiw
a Bay
KaumahinaState Wayside
Hono
man
u Ba
y
Nuaailua Bay
Keanae Pt.
Waialohe Pond
Pauwalu
Pt.
Waiokilo Falls
Wailuanui Bay
Moku ManaManahoa Rock
Natural Arch
Wailuaiki Bay
Papiha Pt.
Waiohue Bay
Honolulunui Bay
Kalahu Pt.
Keakulikuli Pt.
Pukualua Pt.
Waianapanapa State Park
Pailoa Bay
Kuaiwa Pt.
Umalei Pt.
Kainalimu Bay
Nanualele Pt.
H A N A B A Y(Kapueokahi Harbor)
Twin RocksBoatRamp Puukii Island
Kaihalulu Bay
Waipauma Pt.
Lehoula Beach
Alau Island
Mokae LandingMokae Cove
Opau Bay
Makaalae Pt.
Pohakuloa Harbor
Oahu Pt.
Popokanaloa Pt.Keawa Bay
Mu1olea Pt.
Kauakio Bay
Wailua CoveKauakiu Pt.
Pailoa Pt.
Waiaama Bay
Ohai Pt.Pepeiaolepo Bay
Kuloa Pt.
Makaaikuloa Pt.Kukui Bay
Puhilele Pt.
Awapaewaa BayPapaloa Bay
Maulili Bay
Kakanoni Pt.
Kaapahu Bay
Kalepa Pt.
Mokuia Pt.
Kepio Pt.Waiuha Bay
Makaakini Pt.
Kamanawa Pt.Kamanawa Bay
Kailio pt.
Mamalu Bay
Lapehu Pt.
Waiu bay
Apole Pt.
Nuu BayHuakini Bay
Nakaohu Pt.
Kiakeana Pt.Wekea Pt.
La Perouse Bay
Ukumehame BeachState Park
Olowalu Wharf
Hekili Pt.
Maliko Bay
Kanaha Pond
MauiCountryClub
BaldwinPark
A H I H I B A Y
Kanahena Pt.
PUKALANI
LahainaHarbor
PaumanaPark
Launiu PokoState Park
LauniupokoPoint
LahainalunaHigh School
Wailea
Kamaole
Keokea
Puawela
Ulumalu
OlindaStateFacility
Keanae
Wailua
Nahiku
Kaupo
Hana Airport
Huelo
Kailua
`Ula`ino
Ka`eleku
Hoku`ula
Hamao
Kakio
Pu`uiki
Ha`o`u
Mu`olea
Koali
Kipahulu
Olowalu
Pa`ia
Waihee
KAHULUIHARBOR
Lower
Main
Str e
et
MO
KU
LE
LE
HW
Y
K IHE I RD.
Piil a
n i Hw
y .
So
ut hK
i hei R
d.
Sou
t hK
ihei Rd
.
PIILA
NI H
WY.
MauiMeadows
Wa
ilea
Ala n
uiDr.
MakenaNorthGolfCourse
Makena
Make na-K
e on e oi oR
oad
MakenaSouthGolfCourse
Puu Olai
Ulupalakua
Waikapu
WAILUKU
Kahe
kili
Hw
y.
Spreckelsville
WaiehuValley
KUIHELA
NI HW
Y
HO
NO
AP
IILA
NI H
WY
.
Maipoina oe Iau Beach Park
KIHEI
HALEAKALA HWY.
Hana
Hwy.
MO
KU
LELE
HW
Y.
Kanaha Beach Park
KAHULUIAIRPORT
Baldwin Ave.
Baldwin Ave.
Hali`imaile
Haiku
Ku`au
Kokomo
Makawao
Pu`unene
Kaahumanu Ave.
Waiko Raod
East Waiko Road
Waiehu BeachPark
Waiehu Pt.
KUIHELA
NI HW
Y.
KAHULUI
Maui LaniProjectDistrict 1
Low
er H
onoa
piila
niR
o adNapili
Bay
Honokahau BayOneloa
BayKapalua
Honokahau
Napili
Honokowai
Hon
oapi
ilani
Hw
y.
HonokawaiPoint
Kaanapali
KekaaPoint
KaanapaliRoyal
CourseGolf
HanakaooPoint
Wahikuli StateWayside Park
Mala
LAHAINA
Honoapiilani Hwy.
Wainee
Fire Station
WahikuPark
WahikuTerracePark
LahainaCivic andRecreationCenter
MalaWharf
PuunoaPoint
KahanaWESTMAUIAIRPORT
FlemingBeach
Honolua Bay
Low
e rH
o noa
pii la
ni H
wy.
WailukuCountryEstates
LowerPa`ia
MAALAEAMaalaeaSmall BoatHarbor
McGregor Pt.
Papawai Pt.
KEALIAPOND
AE OKEALAIKAHIKI
AHUPU
HONOKANAIA
KAMOHIO
HAKIOAWA
PU`UMOA`ULANUI
PU`UMOA`ULAIKI
PU`UMOIWI
MOLOKINI
Waikahalu lu B ay
Kamohio B ay
Kanapou B ay
KANAPOU
KOOLAU FOREST RESERVE
HALEAKALA NATIONAL PARK
HANA FOREST RESERVE
WEST MAUI FOREST RESERVE
HANAWI NATURAL AREA RESERVE
KULA FOREST RESERVE
KAHIKINUI FOREST RESERVE
KIPAHULU FOREST RESERVE
LegendSpecial Permit
Maui Tax Map Key - 2012
Major Roads
Contour Lines (100-ft.)
State Land Use DistrictURBAN
AGRICULTURAL
RURAL
CCONSERVATION
STATE OF HAWAI`ILAND USE DISTRICT
BOUNDARIES - Island of Maui& Kaho`olawe
c:/conservation_subzone/january2012/maui_consv_subz2012_0111.mxd
1:90,000
Prepared by the State Land Use Commission on the State ofHawaii's GIS (JANUARY 2012). The State Land Use District
Boundaries depicted on this map are not official and are merelyrepresentations for presentation purposes only. A determination of
the official State Land Use District Boundaries shall be obtainedthrough the State Land Use Commission.
Note: The coastline and base data reflect 1982/1983 USGSQuadrangle information.
Major Roads
State Land Use District.
URBAN.
AGRICULTURAL.
RURAL.
CONSERVATION

KALAE HWY.
Maunaloa
Kaluako`iResort
Kawakiu Road
Kaluako`i Road
`IlioPoint
HaleO LonoHarbor
Halena
MaunaloaHighway
Moloka`iAirport
HoolehuaPalaauHomesteads
Moloka`iHighSchool
Kualapu`u
Kala`e
Kalaupapa
MOLOKAIFORESTRESERVE
KaunakakaiKamiloloaHeights
Kamehameha V Highway
Kawela Kamehameha VHighway
Kamalo
Waialua
Wailua
Mokapu Island
Puko`o
Ualapu`e
Pauwalu
Pu`u OHokuRanch
Halawa
La`auPoint
MokuHo`oniki Island
A82-542 KaluaKoi Corp.
SP89-371 ChristianBroadcasting Assoc.(1st Amendment)
SP78-296 ChristianBroadcasting Assoc.(1st Amendment)
SP73-150 HC&D, Ltd.
SP77-275 IslanderU-Drive, Inc.
SP73-141 AvisRent-A-CarSystem, Inc.
SP78-324 AmericanInternational Rent-A-Car
SP77-281 AvisRent-A-CarSystem, Inc.
SP80-350 MolokaiElectric Co., Ltd.
A82-532 MolokaiElectric Co.
SP79-342 MolokaiChildren's Day Care
SP71-106 D.A.G.S.Molokai
SP74-169 D.P.W.Maui County
SP(T)64-4Murphy
SP(T)62-11Tanigawa
A80-479 FrancesH. Lindsey
87/DBA-9 LeeA. Ohigashi
SP70-75 Ahping
A84-568 MaudVan CortlandtHill SchrollTrust
SP67-41Snygg
A83-545StanleyG. Friel
SP75-213SolomonA. Kong Sr.
A84-569DPED
SP78-326 T.T.Meyer, Inc.(1st to 3rdAmendment)
SP73-148 T.T.Meyer, Inc.
A75-400 HenryR. Meyer
A80-499 CliffordSoares, et al.
SP76-240 Dept. ofHawaiian Home Lands
SP76-244 Edwin T.Okubo for Countyof Maui
SP74-192Gladys Kaai
A81-520 CookeLand Co., Inc.
9SP93-383 DPWCounty of Maui
SP71-113Unitours,Inc.
A80-493 Mr. & Mrs.William Aki & Mr. &Mrs. John Wilkerson
SP71-113Unitours,Inc.
95/DBA-003MOLOKAIRANCH,LIMITED
STATE OF HAWAI`ILAND USE DISTRICT
BOUNDARIES - Island of Moloka`i
LegendSpecial Permits
Molokai Tax Map Key
Major Roads
Minor Roads
Contour Lines (100-ft.)
LAND USE DISTRICTSURBAN
AGRICULTURAL
RURAL
CONSERVATION
1:77,000
c:\sluc_2012\2012slud_maps\molokai_slud_2012_0113.mxd
Prepared by the State Land Use Commission on the State ofHawaii's GIS (JANUARY 2012). The State Land Use District
Boundaries depicted on this map are not official and are merelyrepresentations for presentation purposes only. A determination ofthe official State Land Use District Boundaries should be obtained
through the State Land Use Commission.
Note: The coastline and base data reflect 1982/1983 USGSQuadrangle information.
Major Roads
State Land Use District.
URBAN.
AGRICULTURAL.
RURAL.
CONSERVATION

STATE OF HAWAI`ILAND USE DISTRICT
BOUNDARIES - Island of Lana`i
LegendSPECIAL PERMIT
Lanai Tax Map Key 2012
maui_maj_rd_names
Contour Lines
State Land Use DistrictsURBAN
AGRICULTURAL
RURAL
CONSERVATION
c:\sluc_2012\2012slud_maps\lanai_slud2012_0111.mxd
Prepared by the State Land Use Commission on the State ofHawaii's GIS (JANUARY 2012). The State Land Use District
Boundaries depicted on this map are not official and are merelyrepresentations for presentation purposes only. A determination ofthe official State Land Use District Boundaries should be obtained
through the State Land Use Commission.
Note: The coastline and base data reflect 1982/1983 USGS Quadrangle information.
1:33,000
Major Roads
State Land Use District.
URBAN.
AGRICULTURAL.
RURAL.
CONSERVATION
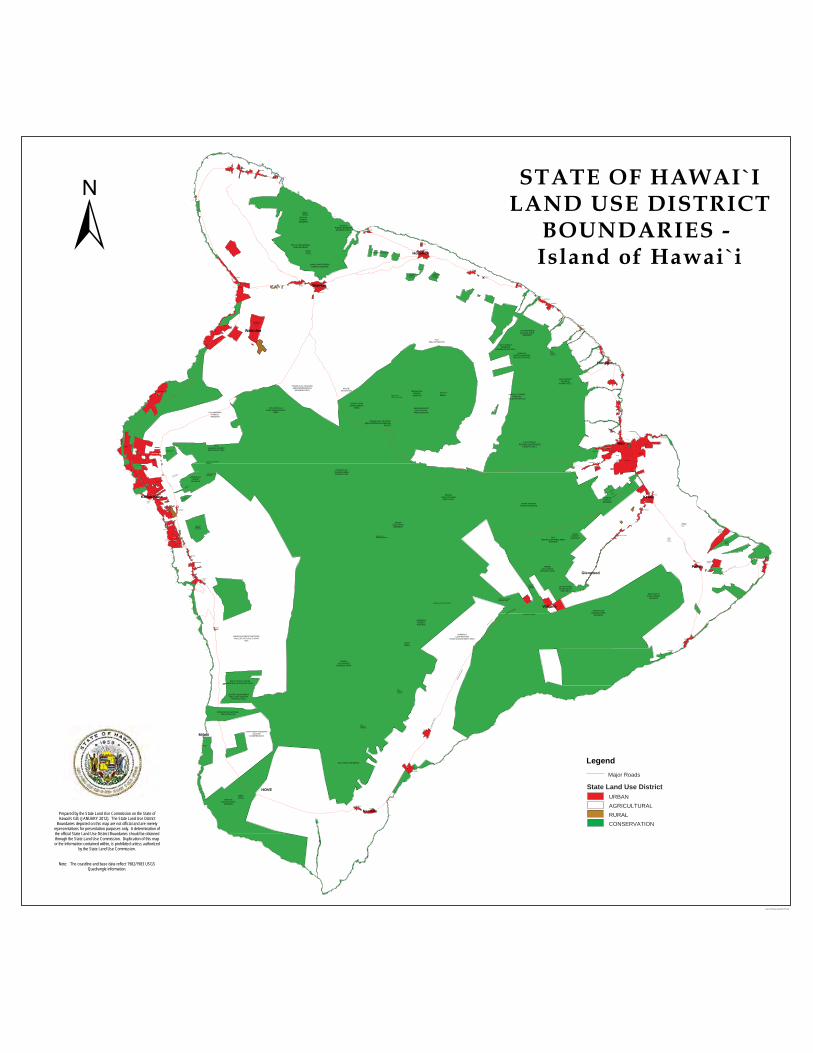
QUE
EN K
AAHU
MAN
U HW
Y.
HAWI
Kaum
ana D
rive
HONOKAA
Ch a in Cra te rs R oa d
NAALEHU
Ka Lae
MahanaBay
KaalualuBay
KaioleBay
HakumaPt.
Kupapau Pt.
KapohoCrater
Ke au ka h aM ilita r yRe se va t ion
HIL O IN TERN AT IO N AL AIR PO R T
SAD DL E RO AD
KIL
AU
EA
AV
EN
UE
HAWAII BE
LT RO
AD
M AM AL AH O A H WY.
KAL APAN A RO AD
QU EEN K AAH UM A NU H WY.
M AM AL AH O A H WY.
M AM AL AH O A H WY.
M AM AL AH O A H WY.
KAN
OE
LEH
UA AV
E.
Un ive r sit y o f Ha w ai iHilo C a m pu s
HiloHig hSch o ol
St.Jo se p hHig hSch o ol
Wa ia ke aHig hSch o ol
Ha wa iiCo m m u ni tyCo lle ge
HiloM un ic ipa lGo lf Co u r se
KAL AN IAN AO L E AVEN U E
STAIN
BACK H
IGH
WAY
VO
L CA
NO
RO
AD
KEAAU - PA
HOA RO
AD
HONUAULA FORESTRESERVE
KAUPULEHU FORESTRESERVE
MAUNA KEAFOREST RESERVE
HAMAKUAFORESTRESERVE
HAMAKUAFORESTRESERVE
KOHALAFORESTRESERVE
MAUNA LOAFOREST RESERVE
HAMAKUA FOREST RESERVEKOHALAFORESTRESERVE
MAUNA KEAFORESTRESERVE
KAUFORESTRESERVE
MANUKAFORESTRESERVE
HAWAII VOLCANOESNATIONAL PARK
KILAUEAFORESTRESERVE
KAUFORESTRESERVE
HAW
AII B
E LT
ROAD
HAWAII BELT ROAD
HAW
AII B
ELT
ROAD
PETER LEE R
OAD
KAPAPALAFORESTRESERVE
KAPAPALA FOREST RESERVE
KILAUEA CRATER
Kawaihae Bay
Waiakail io Bay
Kuhio Bay
Alealea Point
Kaoma Pt.
Makaohule Pt.
Kauil ii Pt.
Haena Pt.
Hianaula Pt.
Puakea Pt.
Limukoko Pt.
Mahukona Harbor
Kapaa BeachPark
HolanaBay
Umiwai Bay
Kawil i Pt.
Kahoiawa Pt.
KahoiawaBay
Kua Bay
Papiha Pt.
Kukio Bay
OpaeulaPond
Awakee Bay
Puialoa Pt.
Kakapa Bay
Kawikohale Pt.
MahaiulaBay
OhikiBay
Kaiwi Point
KeawaikiBay
Wel iwel i Pt.
AnaehoomaluBay
Anaehoomalu Pt.
KahapapaFishpond
Kuual iiFishpond
Upolu Pt.Kepuhi Pt.
Alanahihi Pt.
KeawaeliBay
Kauhola Pt.
HapuuBay
KeokeaBay
WaiakeaPond
KauhakoBay
KealakekuaBay
Kamakamaka Pt.
Honokaa Landing
PaauhauLanding
Mahiki Pt.
WaimanuBay
Kalalae Pt.
Akoakoa Ptt.
PaokalaniIsland
Hala Pt.
Kapoho Pt.
Cape Kumukahi
Kipu Pt.
Makaukiu Pt.
NanawaleBay
Keananuionaha Pt.
Puoa Pt.
Kauluoa Pt.
KeawanuiBay
Malae Pt.
KiholoBay
Kahuwai Bay
Mano Pt.
Waip io Bay
Papaaloa Pt.
Nahiwa Pt.
Keauhou Pt.
Apua Pt.
Kahue Pt.
Kaena Pt.
Kauna Pt.
Manuka Bay
Kamaohe Bay
Honomalino Bay
Mi lol ii Bay
Papa Bay
Al ika Bay
Kimo Pt.
Honuapo Bay
KuhuaBay
Papalehau Point
Nali ikakani Pt.
Palima pt.
MahukaBay
HonoluluLanding
Waipuku Pt.
Kalepa Pt.
HakalauBay
Awili Pt.
Humuhumu Pt.
PohueBay
Lokoa kaPo nd
Ki ona kapah uPo nd
Keokea Point
Pa wai Bay
Ke ahu olu Poi nt
Ka ilu aBa y
Pu apu aa Poin t
Ke aho le Poin t
Ma kako Bay
Unua loha P t .
Pu ukal a P t .
Ma kolea P t .
Hono kaopeBa y
Waiu lua Bay
Hope aiaFish pond
Waip uhiFish pond
Waia leaBa y
Pu ako Bay
Hapu naBa yKawaihae Bay
QUEE
N
KA`
AHU
MAN
U HI
GHW
AY
WAK OL O A R O AD
MauluaBay
Peleu li Pt.
Waiehu Pt.
Haiku P t .
HILOFORESTRESERVE
Ka iaa keaPo int
Ku kuPo int
Laup ahoe hoePo int
Haw ai`i Belt Road
Hawai`i Be lt Road
Kawaihae
Waikui
Honomakau
Kapauu
HalawaMakapala
Halaula
Kealia
Haina
Kapaahu
Kalapana
Kaimu
Kaupulehu
Kukuihaele
Kealakekua
Kainaliu
Ookala
Kukaiau
Paauilo
Milolii
Mountain View
Waiohinu
Punaluu
Kurtistown
Pahala
Hakalua
Papa`aloa
Laupahoehoe
Ninole
MAMALAHOA HWY.
Kaimi nani D rive
QU
EE
NK
AA
HU
MA
NU
HW
Y.
KEAHOLEAIRPORT
KealakeheSchool
Ku kail im okuPo int
KEALAKEHE
MAUKA TRACT
NORTH KONA
FOREST RESERVE
AND WATERSHED
HONUAULA
TRACT 3
MAKAULA-OOMAMAUKA TRACT
Waiaka
Keaau
HILO
Hilo Bay
Keaukaha
Waiakea
Kawailani
Piihonua
Waiakea
Forest
Reserve
Kaumana
Wa iko lo a St re a mK ea n u` i` om an o S tre
a m
WAIKOLOAVILLAGE
KOH
ALAM
OUN
TA INRO A D
K OH AL A M O UN TAIN
ROA D
KAWA IH AE R O AD
SAD
DLER
OA D
MA
MA
LA
HO
AH
IGH
WA
Y
H AWA II B E LTR O
AD
KuhioVillage
WAIMEA
PalemanoPoint
Ke awe ka hekaBa y
Nenu ePo int
Ke ik iw ahaPo int
PaaoaoPoint
Lein okanoPo int
KuamooPoint
Ku ala nuiPo int
Ka ukal aela e Poin t
Ka m oaPo int
Holu aloaBa y
CaptainCook
MokuakaeBay
Ke om oPo int
Moinu iPoint
Honaunau Bay
Pu uho nuaPo int
Alahaka Bay
LoaPoint
Pa lia nihiPo int
Pa pakol eaPo int
Ke awe ka heka Point
WA IKO L O A RO AD
KaunaoaBeach
KaahaPoint
Ka nekan akaPo int
Ka lokoFish pond
Ai m akapaFish pond
Wawa hiwa aPo int
Ka lokoPo int
Hono kohauBa y
NoioPo int
PALANI RO
AD
HIN A LA NI ST.
HawaiianParadisePark
HawaiiBeachesEstates
OrchidLandEstates Nanawale
ForestReserve
KE
AA
U- P
AH
OA
RO
AD
P A H O A - K A P O H O R O A D
PAHOAKaniahikuVillages
KAHALUUFORESTRESERVE
Holualoa
Ke auh ouBa y
KAILUA-KONA
Keauhou
K U A K IN I H
WY.
Ka
meh
amehaIIIR
oa
d
Ali i Count ryClub GolfCourse
Ali i Count ryClub GolfCourse
HoluaSlide
Kona Count ryClub GolfCourse
Kahalu`u
MA
MA
LAH
OA
HW
Y.
Ku ak in i High w
ay
Kua k
in i Hig
h wa
y
Alii D
r ive
KAOHEMITIGATION
PUUMALI MITIGATION
WAO KELE OPUNA FOREST
RESERVE
OLAA FORESTRESERVE (MT.
VIEW SEC.)
HAWAIIVOLCANOES
NATIONAL PARK
PUUMAKAALA NATURAL AREA
RESERVE
OLAAFOREST
RESERVE
WAIAKEAFOREST
RESERVE
HONUAULAFOREST
RESERVE
UPPER WAIAKEAFOREST RESERVE
KIPUKAAINAHOU NENE
SANCTUARY
MAUNALOA FOREST
RESERVE
PUUWAAWAA FORESTBIRD SANCTUARY
HILO FORESTRESERVE (WATERSHED
RESERVE SEC.)
POHAKULOATRAINING AREARESERVATION
MAUNA KEA ICEAGE NATURAL
AREA RESERVE
KAOHE GAMEMANAGEMENT
AREA
HILO FORESTRESERVE
(KAIWIKI SEC.)
HAKALAU FORESTNATIONAL
WILDLIFE REFUGE
PUU ANAHULUGAME MANAGEMENT
AREA
MAUNA KEAFOREST
RESERVE
HAKALAUFOREST NATIONALWILDLIFE REFUGE
LAUPAHOEHOENATURAL AREA
RESERVE
HILO FORESTRESERVE
(LAUPAHOEHOE SEC.)
POHAKULOA TRAININGAREA RESERVATION/MAUNA
KEA FR
KOHALA WATERSHEDFOREST RESERVE
KOHALAFOREST RESERVE(WAIMANU SEC.)
PUU O UMI NATURALAREA RESERVE
KOHALAFOREST
RESERVE
MANUKANATURAL AREA
RESERVE
KONA HEMA PRESERVE(NATURE
CONSERVANCY)
KIPAHOEHOE NATURALAREA RESERVE
SOUTH KONA FORESTRESERVE (KUKUIOPAE SEC.)
KAU FOREST RESERVE
KAPAPALAFOREST
RESERVE
HAWAIIVOLCANOES
NATIONAL PARK
SOUTH KONA FORESTRES. (OLELOMOANA
OPIHIHALI SEC.)
HAKALAU FOREST NATIONALWILDLIFE REFUGE S.KONA
SEC
KAPAPALACOOPERATIVE
GAME MANAGEMENT AREA
KAHAUALEANATURAL AREA
RESERVE
POHAKULOA TRAININGAREA RESERVATION
(KEAMUKU SEC)
PUU WAAWAAFOREST
RESERVE
Milolii
Honomu
Hilo
Pahoa
Keaau
Glenwood
Volcano
Naalehu
HOVE
Honokaa
Waikoloa
Waimea
Kailua-Kona
Prepared by the State Land Use Commission on the State ofHawaii's GIS (JANUARY 2012). The State Land Use District
Boundaries depicted on this map are not official and are merelyrepresentations for presentation purposes only. A determination ofthe official State Land Use District Boundaries should be obtainedthrough the State Land Use Commission. Duplication of this mapor the information contained within, is prohibited unless authorized
by the State Land Use Commission.
Note: The coastline and base data reflect 1982/1983 USGSQuadrangle information.
LegendSpecial Permit
Hawaii Tax Map Key - 2012
Major Roads
Contour Lines (100-ft.)
State Land Use DistrictURBAN
AGRICULTURAL
RURAL
CONSERVATION
STATE OF HAWAI`ILAND USE DISTRICT
BOUNDARIES - Island of Hawai`i
c:/sluc_2012/hawaii_slud_2012_0113.mxd
1:180,000
Major Roads
State Land Use District.
URBAN.
AGRICULTURAL.
RURAL.
CONSERVATION
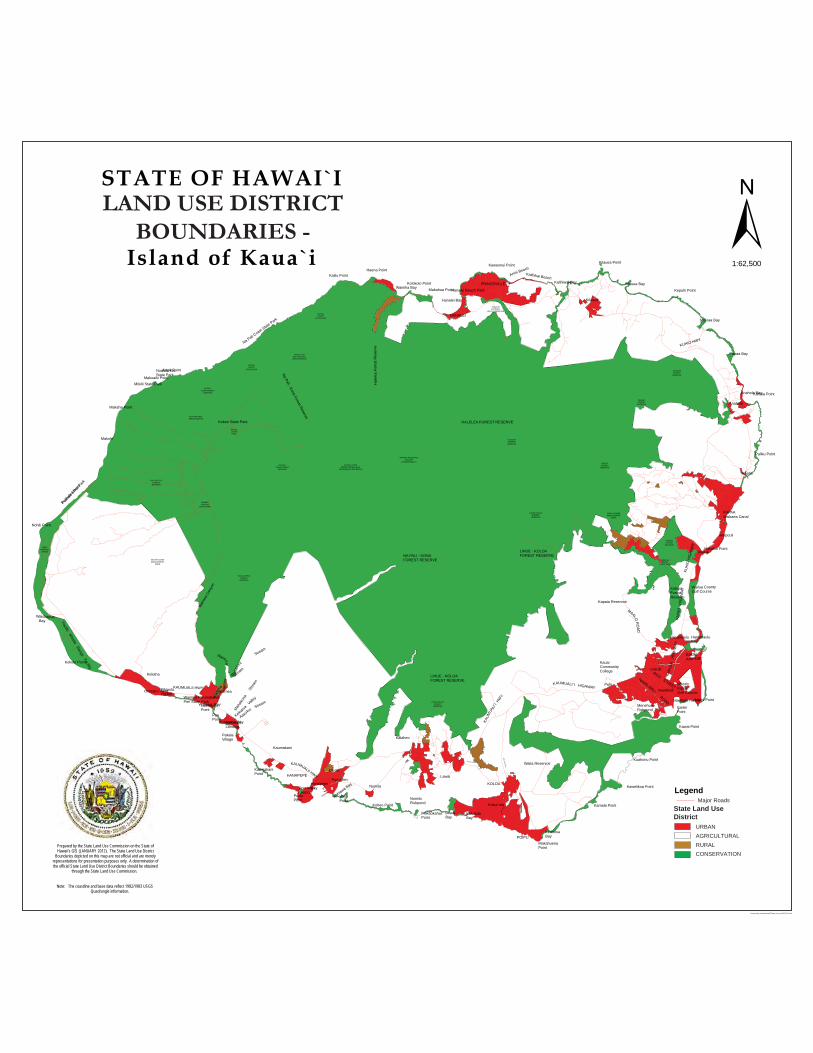
Hal
elea
For
est R
eser
ve
NA PALI - KONAFOREST RESERVE
LIHUE - KOLOAFOREST RESERVE
HALELEA FOREST RESERVE
KAPAA
PRINCEVILLE
HANALEI
LIHUE
Numila
Port Allen
Eleele
Kealia
Waipouli
Wailua
Anahola
Kilauea
Wai
mea
Can
yon
Kokee State Park
Waita Reservoir
Nawiliwili
Hanamaulu
Puhi
KAUAIAIRPORT
Kapaia Reservoir
KalepaForestReserve
Wailua CountyGolf Course
WestinKauaiGolf Course
KauaiCommunityCollege
Lawai
KAUMUALII HWY.
KUHIO HWY.
KUH
IO H
IGH
WAY
KAP
ULE
HIG
HW
AYRICE STREET
KUH
IO
HIG
HW
AY
MAALOR
OAD
NAWILIWILIROAD
KAUMUALI`I HIGHWAY
LIHUE - KOLOAFOREST RESERVE
Kalaheo
Port Allen Airport
KAUMUALII HWY.
Kaumakani
HANAPEPE
PakalaVillage
Waimea
Kekaha
Pacific Missile Range Facility
Nohili Point
Makole
Makaha Point
Milolii State ParkMakuaiki Point
Nualolo KaiState Park
Alapii Point
Puana
lea P
oint
Poliha
le Stat
e Park
Kailiu PointHaena Point
Koheo Point
Hanalei Bay
Kolokolo Point
Makahoa PointHanalei Beach Park
Kaweonui Point
Anini BeachKalihikai Beach
Kalihiwai Bay
Kawai Point
Ninini Point
Alakukui Point
Waikaea Canal
Paliku Point
Anahola BayKahala Point
Papaa Bay
Moloaa Bay
Kepuhi Point
Kilauea Bay
Kilauea Point
Wainiha Bay
HanamauluBay
CarterPoint
Nawiliwili HarborMenehuneFishpond
NomiloFishpond
WeliPoint
Wahiawa BayHanapepeBay
PuoloPoint
KaumakaniPoint
KikiaolaHarbor
Oomano Point
Kokole Point
Waiokapua Bay
Mah
aikon
a
Stre
am
Makaw
eli
Stream
Wai
mea
Stream
WaimeaS
tream
Aakukui Stream
Kekup
ua V
alley
MakaweliLanding
Hoanuanu Bay
PooPoint
LaauokalaPoint
Waimea Bay
Waimea RecreationalPier State Park
Na Pali Coast S
tate Park
Na Pali - Kona Forest Reserve
KukuiulaBay
KeoniloaBay
MakaokahaiPoint
KOLOA
KOLOA ROAD
POIP
UROAD
MALU
HIA R
OAD
POIPU
KAUM
UALI`
I HWY.
MakahuenaPoint
Kukui`ula Kamala Point
Kuahonu Point
Kawelikoa Point
LawaiBay
MOLOAAFOREST
RESERVE
KEALIAFOREST
RESERVE
KEALIAFOREST
RESERVE
LIHUE-KOLOAFOREST
RESERVE
LIHUE-KOLOAFOREST
RESERVE
WAILUARIVER
STATE PARK
PMRFBARKINGSANDS
NONOUFOREST
RESERVE
KEKAHA GAMEMANAGEMENT
AREA
WAILUA GAMEMANAGEMENT
AREA
PUU KA PELEFOREST
RESERVE
WAIMEACANYON
STATE PARK
KUIA NATURALAREA RESERVE
PUU KA PELEFOREST
RESERVE
NA PALI-KONAFOREST RES/ALAKAI
WILDERNESS PRESERVE
KOKEESTATEPARK
NA PALI-KONA FOREST
RESERVE
NA PALI-KONA FOREST
RESERVE
WAINIHA PRESERVE(NATURE
CONSERVANCY)
NA PALICOAST
STATE PARK
HALELEAFOREST
RESERVE
HONO O NAPALI NATURAL
AREA RESERVE
NA PALICOAST
STATE PARK
HANALEINATIONAL
WILDLIFE REFUGE
LegendSpecial Permit
Kauai Tax Map Key - 2012
Major Roads
Contour Lines (100-ft.)
STATE LAND USE DISTRICT
URBAN
AGRICULTURAL
RURAL
CONSERVATION
STATE OF HAWAI`ICONSERVATION DISTRICT
SUBZONE - Island of Kaua`i
c:/conservation_subzone/january2012/kauai_consv_subz2012_0111.mxd
1:62,500
Prepared by the State Land Use Commission on the State ofHawaii's GIS (JANUARY 2012). The State Land Use District
Boundaries depicted on this map are not official and are merelyrepresentations for presentation purposes only. A determination ofthe official State Land Use District Boundaries should be obtained
through the State Land Use Commission.
Note: The coastline and base data reflect 1982/1983 USGS Quadrangle information.
LAND USE DISTRICT BOUNDARIES -
Major RoadsState Land UseDistrict.
URBAN.
AGRICULTURAL.
RURAL.
CONSERVATION

Appendix EPublic Involvement Summary

TBG062714093019HNL 1
APPENDIX E
Public Involvement Summary for the Statewide Federal-Aid Highways 2035 Transportation Plan
Introduction Public involvement was a key component in the development of the Statewide Federal-Aid Highways 2035 Transportation Plan (Plan). A public involvement plan was formulated at the beginning of the Plan development process to ensure that public and stakeholder participation would be integrated into Plan development and help shape the Plan. This appendix provides a summary of the public and stakeholder involvement and describes the decision-making structure and process.
HDOT’s Public Involvement Policy The State of Hawaii Department of Transportation (HDOT) is committed to a comprehensive and fair public involvement process. As stated in the HDOT’s Public Involvement Policy, dated May 2009, the HDOT “…recognizes the value of public involvement as a programmatic measure that strengthens and solidifies its transportation programs… The HDOT Public Involvement Policy supports and encourages broad-based public involvement in the conception, development, and enhancement of transportation plans, programs, and projects.”
Goals of the Public Involvement Plan The HDOT was committed to an approach that:
• Increased public awareness and understanding of the transportation planning process in Hawaii.
• Provided an open and transparent decision-making process that was conducted through equitable and constructive two-way communication between the project team and the public.
• Provided early and ongoing opportunities for stakeholders to raise issues and concerns for consideration by the project team.
• Met applicable state and federal laws, regulations, policies, and procedures.
• Proactively informed and encouraged the participation of all stakeholders regardless of race, ethnicity, age, disability, income, or primary language — in accordance with the Federal Highway Administration (FHWA) Title VI and Environmental Justice (EJ) guidance. Encouraged broad citizen participation, including citizens who have traditionally been underserved and underrepresented, such as minority and low-income populations.
• Stimulated a broad-based interest in the HDOT’s planning activities, and builds widespread community understanding of findings and decisions.

APPENDIX E PUBLIC INVOLVEMENT SUMMARY FOR THE STATEWIDE FEDERAL-AID HIGHWAYS 2035 TRANSPORTATION PLAN
TBG062714093019HNL 2
Plan Development Process and Stakeholder Involvement A key element of the approach to developing the Plan was a structured and transparent planning process that clearly identified major tasks and decision points. Thorough and thoughtful consideration of issues during major tasks by all of the project stakeholder groups helped to ensure quality decisions that would not have to be revisited later in the project because something of significance had been omitted or improperly addressed. Public and stakeholder involvement activities, such as meetings and workshops, were integrated into the work plan so that the stakeholder input could shape the decisions made during major tasks in the planning process.
The primary avenues for stakeholder input and discussion were through a Statewide Transportation Advisory Committee (STAC), a Sub-Statewide Transportation Advisory Committee (Sub-STAC), and a Stakeholder Advisory Committee (SAC). Because the Plan was developed concurrently with the Regional Federal-Aid Highways 2035 Transportation Plans for the Districts of Maui, Hawaii, and Kauai, feedback received at the regional level were factored into the formulation of the Plan. The Plan also incorporated the Oahu Regional Transportation Plan 2035, which was developed by the Oahu Metropolitan Planning Organization (OahuMPO) in spring 2011. Extensive public outreach was conducted on Oahu by the OahuMPO.
Additional outreach avenues included flyers, public notices, HDOT press releases, a Facebook page, and a project website. Public comments were also received through mail, email, and phone. More information on the major tasks and the role of public and stakeholder input in shaping the outcome of the task, as well as concerns expressed by the stakeholders, is provided in subsequent sections below.
Plan Development Process The Statewide Federal-Aid Highways 2035 Transportation Plan and the Regional Federal-Aid Highways 2035 Transportation Plans for the District of Maui, Hawaii, and Kauai were developed concurrently in an open and comprehensive process through a series of milestones. The process is described below and shown on Figure 1.
Establish Goals and Objectives – This milestone focused on reviewing existing regulatory and policy requirements related to land transportation, and developing project goals and objectives for the long-range land transportation system.
Gather Data and Develop Model – This milestone included gathering data and information related to the land transportation system and current HDOT programs. A major portion of the task included developing/updating the regional travel demand models, which were the basis for forecasting and assessing future traffic conditions.
Define Future Conditions – Based on the forecasting results and endorsed program definitions, this milestone focused on identifying future system deficiencies and developing the plan priorities and evaluation criteria.
Identify Solutions – This milestone focused on developing potential solutions to address overall plan policies, goals and objectives, and identified transportation needs and deficiencies. Funding sources, allocations, and financing strategies were also identified.
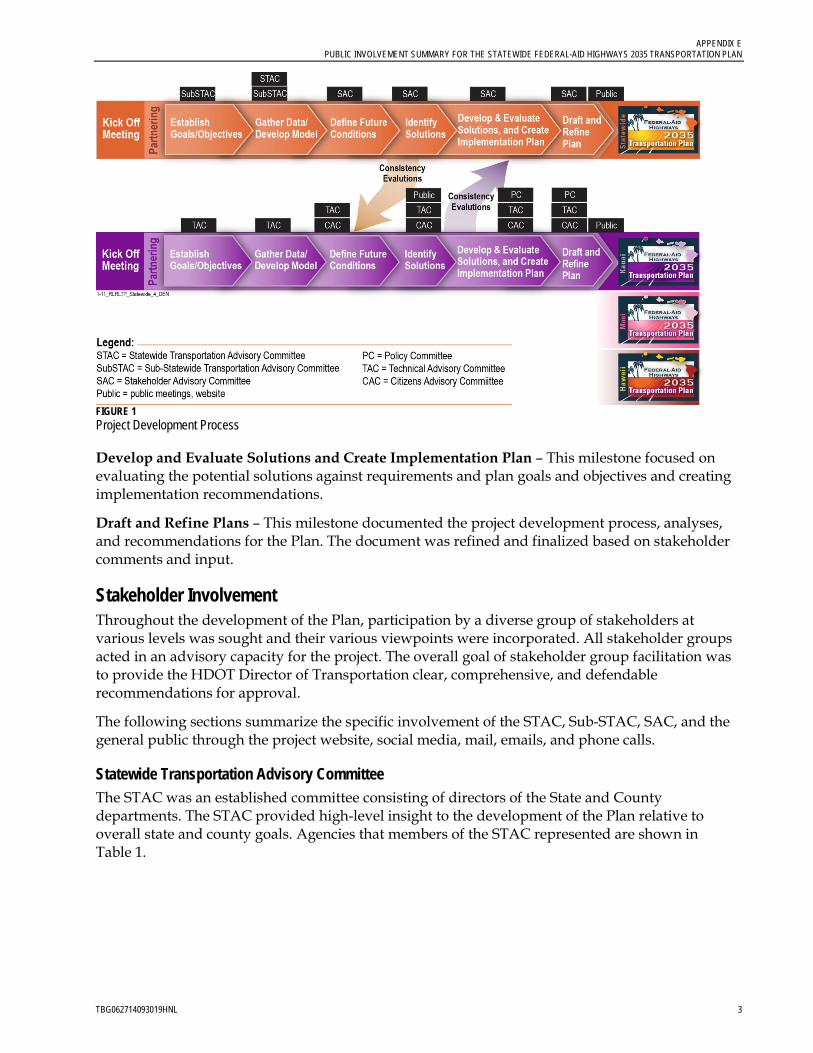
APPENDIX E PUBLIC INVOLVEMENT SUMMARY FOR THE STATEWIDE FEDERAL-AID HIGHWAYS 2035 TRANSPORTATION PLAN
TBG062714093019HNL 3
FIGURE 1 Project Development Process
Develop and Evaluate Solutions and Create Implementation Plan – This milestone focused on evaluating the potential solutions against requirements and plan goals and objectives and creating implementation recommendations.
Draft and Refine Plans – This milestone documented the project development process, analyses, and recommendations for the Plan. The document was refined and finalized based on stakeholder comments and input.
Stakeholder Involvement Throughout the development of the Plan, participation by a diverse group of stakeholders at various levels was sought and their various viewpoints were incorporated. All stakeholder groups acted in an advisory capacity for the project. The overall goal of stakeholder group facilitation was to provide the HDOT Director of Transportation clear, comprehensive, and defendable recommendations for approval.
The following sections summarize the specific involvement of the STAC, Sub-STAC, SAC, and the general public through the project website, social media, mail, emails, and phone calls.
Statewide Transportation Advisory Committee The STAC was an established committee consisting of directors of the State and County departments. The STAC provided high-level insight to the development of the Plan relative to overall state and county goals. Agencies that members of the STAC represented are shown in Table 1.
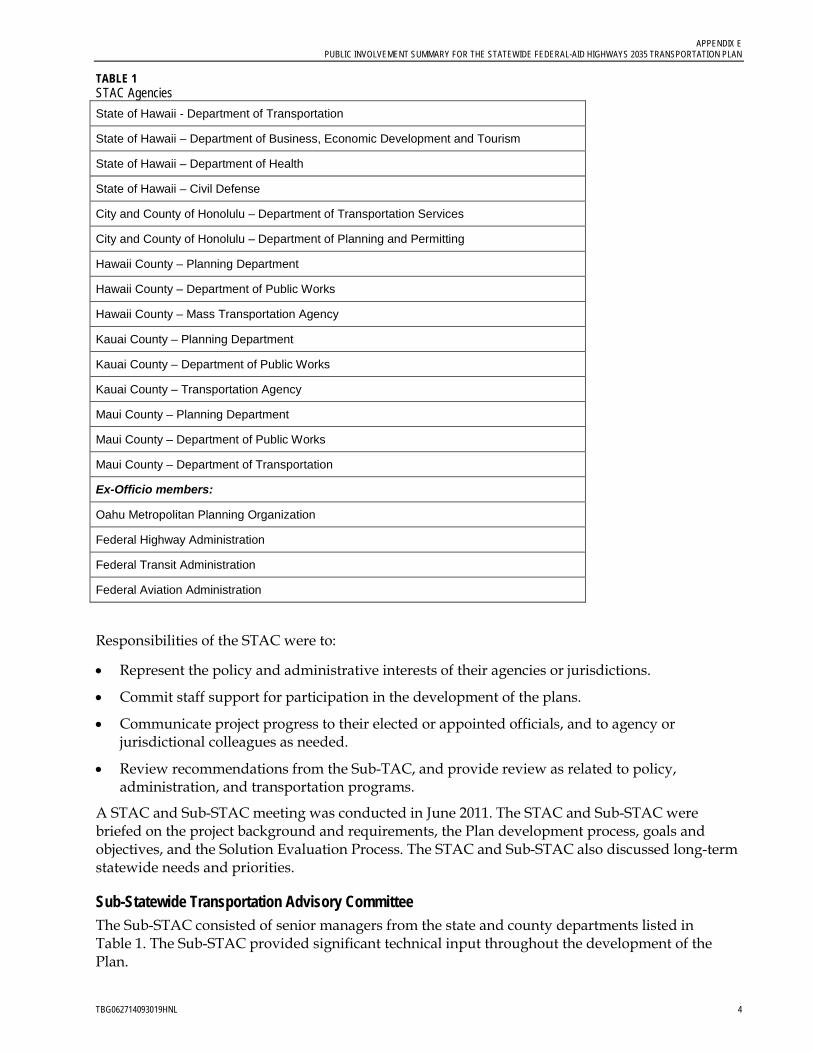
APPENDIX E PUBLIC INVOLVEMENT SUMMARY FOR THE STATEWIDE FEDERAL-AID HIGHWAYS 2035 TRANSPORTATION PLAN
TBG062714093019HNL 4
TABLE 1 STAC Agencies State of Hawaii - Department of Transportation
State of Hawaii – Department of Business, Economic Development and Tourism
State of Hawaii – Department of Health
State of Hawaii – Civil Defense
City and County of Honolulu – Department of Transportation Services
City and County of Honolulu – Department of Planning and Permitting
Hawaii County – Planning Department
Hawaii County – Department of Public Works
Hawaii County – Mass Transportation Agency
Kauai County – Planning Department
Kauai County – Department of Public Works
Kauai County – Transportation Agency
Maui County – Planning Department
Maui County – Department of Public Works
Maui County – Department of Transportation
Ex-Officio members:
Oahu Metropolitan Planning Organization
Federal Highway Administration
Federal Transit Administration
Federal Aviation Administration
Responsibilities of the STAC were to:
• Represent the policy and administrative interests of their agencies or jurisdictions.
• Commit staff support for participation in the development of the plans.
• Communicate project progress to their elected or appointed officials, and to agency or jurisdictional colleagues as needed.
• Review recommendations from the Sub-TAC, and provide review as related to policy, administration, and transportation programs.
A STAC and Sub-STAC meeting was conducted in June 2011. The STAC and Sub-STAC were briefed on the project background and requirements, the Plan development process, goals and objectives, and the Solution Evaluation Process. The STAC and Sub-STAC also discussed long-term statewide needs and priorities.
Sub-Statewide Transportation Advisory Committee The Sub-STAC consisted of senior managers from the state and county departments listed in Table 1. The Sub-STAC provided significant technical input throughout the development of the Plan.
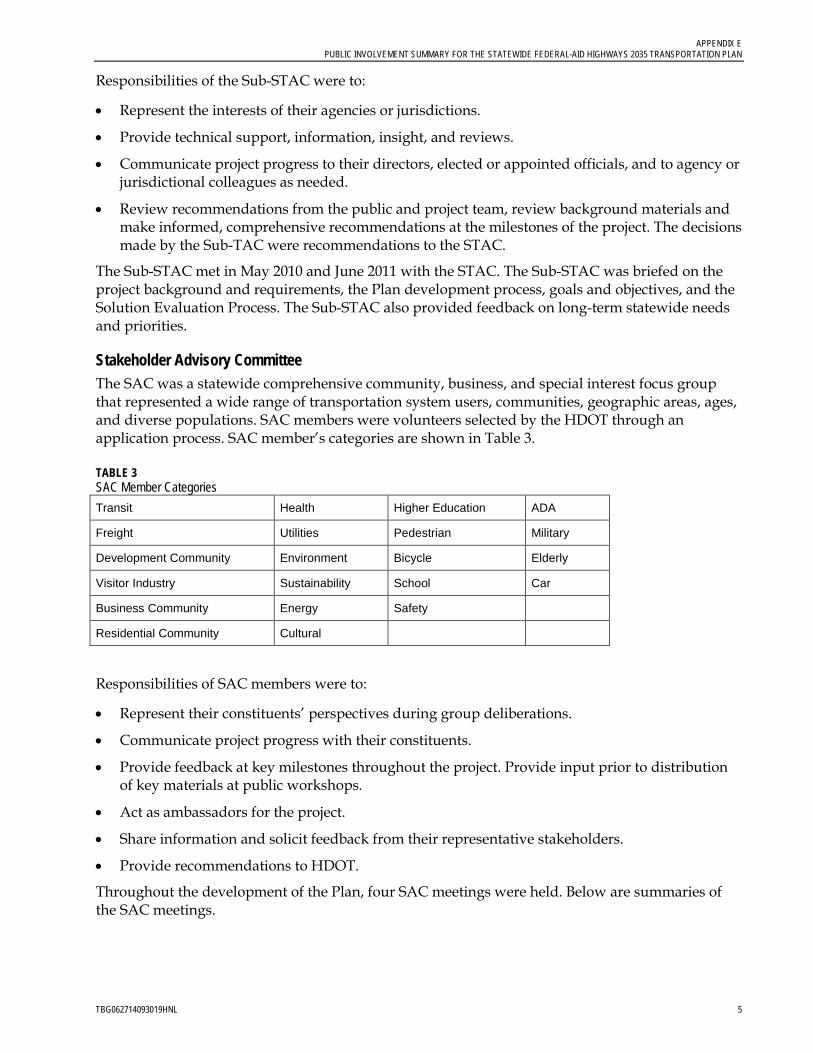
APPENDIX E PUBLIC INVOLVEMENT SUMMARY FOR THE STATEWIDE FEDERAL-AID HIGHWAYS 2035 TRANSPORTATION PLAN
TBG062714093019HNL 5
Responsibilities of the Sub-STAC were to:
• Represent the interests of their agencies or jurisdictions.
• Provide technical support, information, insight, and reviews.
• Communicate project progress to their directors, elected or appointed officials, and to agency or jurisdictional colleagues as needed.
• Review recommendations from the public and project team, review background materials and make informed, comprehensive recommendations at the milestones of the project. The decisions made by the Sub-TAC were recommendations to the STAC.
The Sub-STAC met in May 2010 and June 2011 with the STAC. The Sub-STAC was briefed on the project background and requirements, the Plan development process, goals and objectives, and the Solution Evaluation Process. The Sub-STAC also provided feedback on long-term statewide needs and priorities.
Stakeholder Advisory Committee The SAC was a statewide comprehensive community, business, and special interest focus group that represented a wide range of transportation system users, communities, geographic areas, ages, and diverse populations. SAC members were volunteers selected by the HDOT through an application process. SAC member’s categories are shown in Table 3.
TABLE 3 SAC Member Categories Transit Health Higher Education ADA
Freight Utilities Pedestrian Military
Development Community Environment Bicycle Elderly
Visitor Industry Sustainability School Car
Business Community Energy Safety
Residential Community Cultural
Responsibilities of SAC members were to:
• Represent their constituents’ perspectives during group deliberations.
• Communicate project progress with their constituents.
• Provide feedback at key milestones throughout the project. Provide input prior to distribution of key materials at public workshops.
• Act as ambassadors for the project.
• Share information and solicit feedback from their representative stakeholders.
• Provide recommendations to HDOT.
Throughout the development of the Plan, four SAC meetings were held. Below are summaries of the SAC meetings.

APPENDIX E PUBLIC INVOLVEMENT SUMMARY FOR THE STATEWIDE FEDERAL-AID HIGHWAYS 2035 TRANSPORTATION PLAN
TBG062714093019HNL 6
SAC Meeting #1, November 8, 2010, 9:00 am to noon • Project Overview. The SAC was given an overview of the project: project background, project
purpose, development process, and project framework.
• Goals and Objectives. The SAC reviewed and provided feedback on the goals and objectives for the Plan. Goals and objectives were framed around the federal planning factors to ensure a comprehensive land transportation plan. A draft goals and objectives memo was provided to the SAC
• Future Conditions. The Plan and Policy Review memos were also provided to the SAC. The SAC was asked to provide comments and information on other plans and developments.
SAC Meeting #2, March 4, 2011, 9:00 am to noon • Solution Evaluation Process. A brief overview of the draft solution evaluation and
prioritization process was introduced. The intent was to provide a general overview and obtain comments from the SAC.
• Prioritized Goals and Objectives. The SAC was given a final set of goals and asked to prioritize the goals. The SAC prioritized the goals individually and then an average score was taken for each goal. The SAC discussed the results and adjusted the scores accordingly until a group consensus was reached.
• Travel Demand Model. The SAC examined and provided feedback on the existing transportation networks for the Districts of Maui, Hawaii, and Kauai: functional classification, speed, lanes, and traffic analysis zones. The SAC also discussed and shared input on the future networks and land use assumptions.
SAC Meeting #3, April 2, 2012, 1 pm to 4 pm • Goal Priorities. The SAC provided a final review of the goal prioritization process and results.
• Socioeconomic Data. The SAC reviewed the land use and socioeconomic data and how the data were used to develop the future forecasts. Growth in employment and households was identified and illustrated.
• Travel Demand Model. The SAC reviewed the 2007-based traffic condition and the 2035 no build traffic condition generated by the model. The SAC discussed where the existing capacity deficiencies are and where the future capacity deficiencies are projected.
• Future Needs and Potential Solutions. The SAC reviewed input from the TACs and the first series of public meetings on needs and potential solutions. The SAC validated the potential solutions and provided additional input.
• Solution Evaluation Process. The solution evaluation and prioritization process were discussed in detail. The discussion was focused on the Tier 1 and Tier 2 evaluation, and examples were provided.
SAC Meeting #4, December 13, 2013, 9:00 am to 11:00 am • Draft Plan. The SAC was given an overview of the draft Plan by chapter and asked to provide
comments.
Public Involvement Various methods and tools were used to engage the general public to follow the project’s progress and provide input at specific project milestones.

APPENDIX E PUBLIC INVOLVEMENT SUMMARY FOR THE STATEWIDE FEDERAL-AID HIGHWAYS 2035 TRANSPORTATION PLAN
TBG062714093019HNL 7
Public Meetings Because the Plan was developed concurrently with the Regional Federal-Aid Highways 2035 Transportation Plans for the Districts of Maui, Hawaii, and Kauai, input received at public meetings at the regional level was factored into the formulation of the Plan. Two rounds of public meetings were held on Maui, Hawaii, and Kauai. The public meetings were structured in an interactive format so that attendees were able to share their community values, concerns, opportunities, and priorities, as well as validate information already gathered and provide additional input. The agenda and presentation materials were posted on the project website.
Similarly, because the Plan also incorporated the Oahu Regional Transportation Plan (ORTP) 2035, which was developed by the OahuMPO in spring 2011, extensive public outreach was conducted on Oahu by the OahuMPO. The OahuMPO had a robust public outreach program, which included regular consultation with several committees as well as outreach through its website and social media. The outreach efforts also included stakeholder and focus groups interviews, telephone and web-based surveys, and public meetings. Three regional meetings were held in Kapolei, Mililani, and Downtown Honolulu in summer 2010 to present the candidate projects to Oahu’s citizens. The meeting format was a composite of a presentation and an open house. The meetings provided a forum to gather the public’s input about potential projects and programs to be considered for inclusion in the ORTP 2035. For details, please refer to the ORTP 2035, the ORTP 2035 Technical Report, and additional ORTP 2035 materials posted on the OahuMPO website at http://www.oahumpo.org/plans-and-programs/oahu-regional-transportation-plan-ortp/.
Therefore, instead of holding additional public meetings for the Statewide Plan, other outreach activities were conducted on Oahu to share the draft Plan and solicit public comments. The draft Plan was posted on the website and hard copies were placed at state libraries for public review. Flyers, emails, and a press release were sent out, and a public notice ad was placed on the Star Advertiser to notify the public regarding the review and comment opportunity. Comments were received from several public and private agencies, as well as individuals in regards to consistency, accessibility, nonmotorized improvements, environmental planning, and implementation and funding strategies.
Below are summaries of the public meetings that were held on Maui, Hawaii, and Kauai.
Public Meeting Series #1, February and March 2012 The goals of the first series of public meetings were to introduce the project and gather input on land transportation deficiencies and needs. A presentation was given and followed by a small group exercise to identify the deficiencies and needs. The groups provided their comments on a set of maps and presented their needs to the larger group. Attendees also talked to project staff and provided written and verbal feedback. The specific topics covered during the meeting are described below.
• Project Background and Framework. Attendees were given information on the project background and framework – what the Plan is about, why the Plan is necessary, and how it will be developed. The project management team also explained the Solution Evaluation Process and how it would help identify the priorities.
• Project Status and Information. The project management team reviewed what had been done to date and provided an update on current status. The project management team also went through the existing and forecast socioeconomic data, as well as the present and future travel demands.
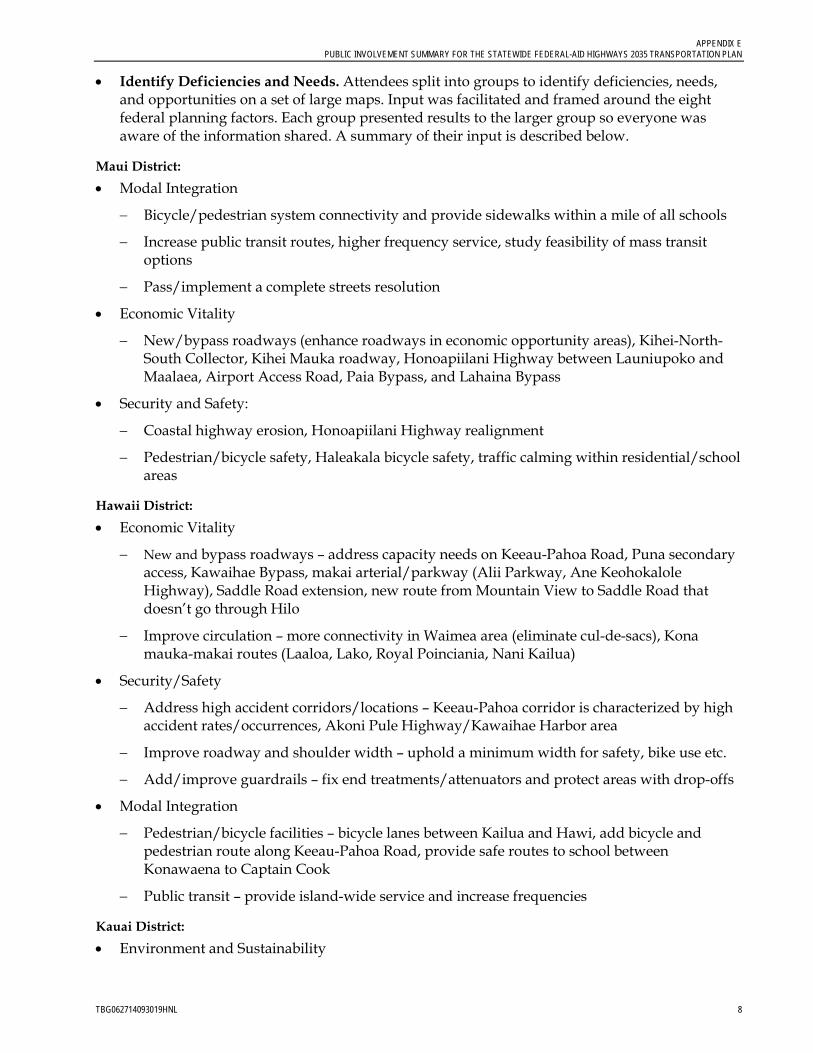
APPENDIX E PUBLIC INVOLVEMENT SUMMARY FOR THE STATEWIDE FEDERAL-AID HIGHWAYS 2035 TRANSPORTATION PLAN
TBG062714093019HNL 8
• Identify Deficiencies and Needs. Attendees split into groups to identify deficiencies, needs, and opportunities on a set of large maps. Input was facilitated and framed around the eight federal planning factors. Each group presented results to the larger group so everyone was aware of the information shared. A summary of their input is described below.
Maui District: • Modal Integration
− Bicycle/pedestrian system connectivity and provide sidewalks within a mile of all schools
− Increase public transit routes, higher frequency service, study feasibility of mass transit options
− Pass/implement a complete streets resolution
• Economic Vitality
− New/bypass roadways (enhance roadways in economic opportunity areas), Kihei-North-South Collector, Kihei Mauka roadway, Honoapiilani Highway between Launiupoko and Maalaea, Airport Access Road, Paia Bypass, and Lahaina Bypass
• Security and Safety:
− Coastal highway erosion, Honoapiilani Highway realignment
− Pedestrian/bicycle safety, Haleakala bicycle safety, traffic calming within residential/school areas
Hawaii District: • Economic Vitality
− New and bypass roadways – address capacity needs on Keeau-Pahoa Road, Puna secondary access, Kawaihae Bypass, makai arterial/parkway (Alii Parkway, Ane Keohokalole Highway), Saddle Road extension, new route from Mountain View to Saddle Road that doesn’t go through Hilo
− Improve circulation – more connectivity in Waimea area (eliminate cul-de-sacs), Kona mauka-makai routes (Laaloa, Lako, Royal Poinciania, Nani Kailua)
• Security/Safety
− Address high accident corridors/locations – Keeau-Pahoa corridor is characterized by high accident rates/occurrences, Akoni Pule Highway/Kawaihae Harbor area
− Improve roadway and shoulder width – uphold a minimum width for safety, bike use etc.
− Add/improve guardrails – fix end treatments/attenuators and protect areas with drop-offs
• Modal Integration
− Pedestrian/bicycle facilities – bicycle lanes between Kailua and Hawi, add bicycle and pedestrian route along Keeau-Pahoa Road, provide safe routes to school between Konawaena to Captain Cook
− Public transit – provide island-wide service and increase frequencies
Kauai District: • Environment and Sustainability

APPENDIX E PUBLIC INVOLVEMENT SUMMARY FOR THE STATEWIDE FEDERAL-AID HIGHWAYS 2035 TRANSPORTATION PLAN
TBG062714093019HNL 9
− Preserve rural/scenic environment and character − Kekaha/Mauka of Kekaha – erosion issues
• Economic Vitality
− New and bypass roadways – Lihue Mauka bypass, Kapaa Relief route
• System Preservation/System Efficiency
− Maintenance of existing system – focus on maintaining/improving the existing system before doing any roadway widening, fund upkeep of the existing infrastructure to minimize the need for reconstruction
− Minimize need for rebuilding
• Modal Integration
− Promote multimodal options – focus on integration of modes and complete streets near population centers
− Expand transit system – coverage and frequency
• Security/Safety
− Disaster preparedness – prepare for extreme weather, heavy rain/runoff − Widen shoulders for emergency use and safety
Public Meeting Series #2, March and April 2014 The goals of the second series of public meetings were to share the draft Plan and get feedback from the public. The first part of the meeting was to provide an overview of the draft Plan by chapter in a presentation format. The second part of the meeting was intended to be a small group exercise, where attendees would simulate a process to prioritize projects and allocate limited funds. Questions and comments were taken throughout the meetings. Attendees also talked to project staff and provided written and verbal feedback.
Maui Public Meeting Maui attendees had the opportunity to do the small group exercise. Attendees were given a budget of $100 to construct a range of land transportation projects that they felt best supported future land transportation goals. The cost of the projects ranged from $2 to $55. General project description, project benefits, and consequences if not built/implemented were provided. Attendees discussed their selection of projects amongst their group and presented their group’s recommendations to the larger group. Table 4 shows the groups’ recommendations on how the funds should be allocated.
TABLE 4 Maui Small Group Exercise Results
Program Group 1 Group 2 Group 3
System Preservation $23 $38 $27
Safety $6 $4 $8
Capacity $55 $10 $45
Congestion $4 $6 $8
Other $12 $12 $12
Total $100 $70 ($30 for contingency)
$100

APPENDIX E PUBLIC INVOLVEMENT SUMMARY FOR THE STATEWIDE FEDERAL-AID HIGHWAYS 2035 TRANSPORTATION PLAN
TBG062714093019HNL 10
In general, the public felt that it is important to add capacity by providing more pedestrian and bicycle facilities, enhance safety by providing refuge islands, traffic calming features, and other innovation solutions, such as roundabouts. The public also felt that it is important to preserve the existing land transportation system. The public felt that the decision-making process is complex and had a greater understanding of the process that the decision-makers need to go through. They expressed a desire to develop ways to increase funding and improve land use decisions.
Other questions and comments raised at the meeting are summarized below.
1. How will the projects be implemented?
Response: This Plan sets the transportation vision and long-term goals and its recommendations are without fiscal constraints. Priorities from the long-range plan will be considered when the mid-range plan is being developed based on fiscal constraints. Both the long-range plan and mid-range plan will provide guidance to and feed projects into the Statewide Transportation Improvement Program (STIP), and ultimately into the project delivery process.
2. Who are the decision-makers?
Response: The decision-makers are the HDOT administration and the state legislature, as well as the County Council.
3. Who are the implementing agencies?
Response: It requires cooperation and coordination of the FHWA, the HDOT, the County, and sometimes the transit agency.
4. Who develops the mid-range plan and the STIP?
Response: The plans are put together by HDOT staff with input from the counties, vetted by the communities, and approved by the HDOT administration.
5. How do you determine the percentage of funds for each county?
Response: The distribution of funds varies every year. Typically, there is a formula to calculate the percentages. Factors include average daily traffic volume, revenue, vehicle miles traveled, and population etc. For federal funded projects, the Federal usually contributes 80 percent and local agency contributes 20 percent.
6. Consider the minimization and mitigation of environmental impacts from construction. Construction near Lahaina destroyed beaches and the coral reefs are dying.
Response: The construction may be an emergency repair project. There is a different process for emergency repair.
7. The Paia Bypass project is critical and it should be a top priority for the region.
8. Is there going to be a public meeting for the mid-range plan?
Response: Public involvement is not required for the development of the mid-range plan. However, public meetings are conducted for the STIP updates. A series of meetings will be held in April and May this year.
Kona Public Meeting In Kona, the public was very engaged. They preferred an interactive presentation of the draft Plan and questions and comments were entertained throughout the evening. The public appreciated the

APPENDIX E PUBLIC INVOLVEMENT SUMMARY FOR THE STATEWIDE FEDERAL-AID HIGHWAYS 2035 TRANSPORTATION PLAN
TBG062714093019HNL 11
engagement and the small group exercise was cancelled to provide more time for comments and discussion by the group as a whole.
Below is a summary of questions and comments received at the meetings.
1. What does “preserve and maintain the existing transportation system” mean?
Response: It means that you maintain your existing transportation system regularly and are doing what’s needed to repair and rehabilitate to keep the system operating. Examples of system preservation projects are overlaying of the pavement and replacement of old signs.
2. Someone asked to verify the socioeconomic data assumptions; especially in the Waimea area. It seems inconsistent from the county’s data.
3. Does the development of the STIP involve the public?
Response: Yes. The HDOT is updating the STIP for Fiscal Year 2015. A series of public meetings will be held in April and May this year.
4. How is this long-range plan linked to the STIP?
Response: The long-range plan and the STIP will be bridged by a mid-range plan, which is fiscally constrained. The mid-range plan provides a roadmap to the future that is consistent with the long-range plan and serves as an opportunity to make any necessary corrections in funding priorities in the STIP.
5. For the Tier 2 Evaluation, how do you know whether or not there are any cultural impacts if you have not done an environmental assessment yet?
Response: The Tier 2 Evaluation criteria were based on documented data. For example, data from the State Historic Preservation Division were used to evaluate if the potential solution will have impacts on archaeological or cultural resources. In addition, this evaluation is just a tool to compare different potential solutions. When the project gets to the project development phase, it still needs to go through the required environmental process.
6. Someone provided validation that the Saddle Road Extension is an important project for the region’s economic vitality.
7. Can we still have a Citizen Advisory Committee (CAC)?
Response: No, not at this point of the process. The project is near completion. The SAC had representatives from the District of Hawaii.
Hilo Public Meeting Hilo attendees had the opportunity to do the small group exercise. Table 5 shows the groups’ recommendations on how the funds should be allocated.
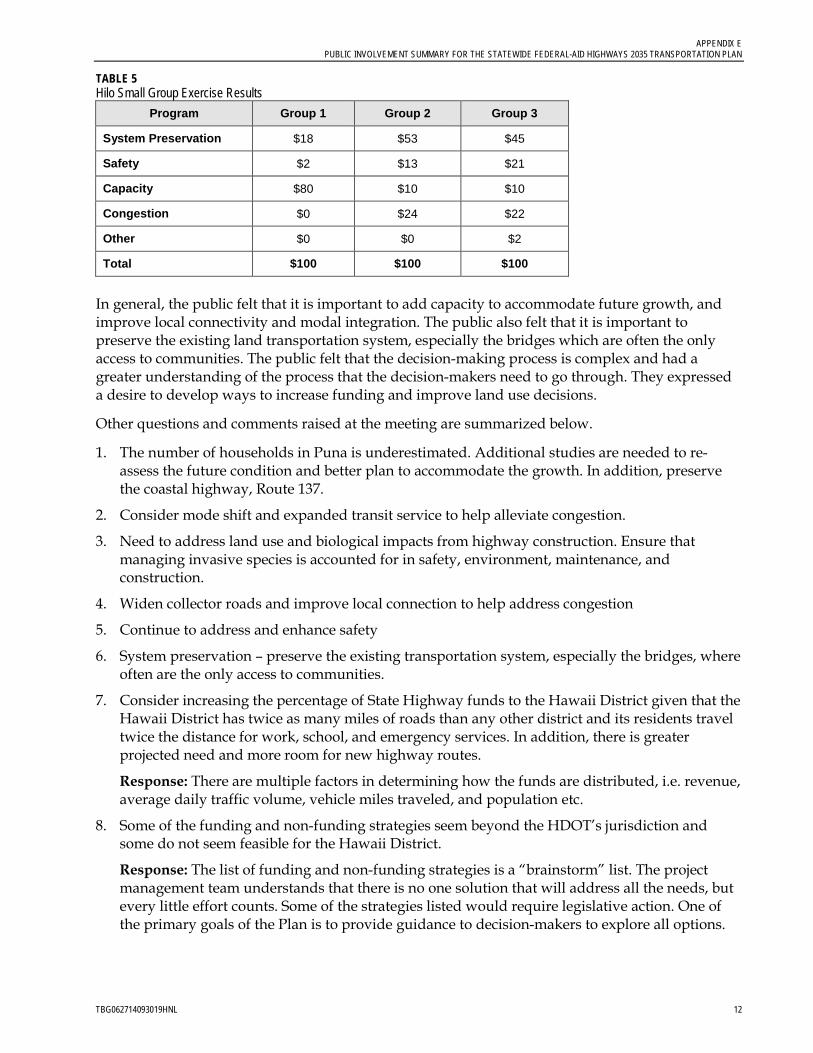
APPENDIX E PUBLIC INVOLVEMENT SUMMARY FOR THE STATEWIDE FEDERAL-AID HIGHWAYS 2035 TRANSPORTATION PLAN
TBG062714093019HNL 12
TABLE 5 Hilo Small Group Exercise Results
Program Group 1 Group 2 Group 3
System Preservation $18 $53 $45
Safety $2 $13 $21
Capacity $80 $10 $10
Congestion $0 $24 $22
Other $0 $0 $2
Total $100 $100 $100
In general, the public felt that it is important to add capacity to accommodate future growth, and improve local connectivity and modal integration. The public also felt that it is important to preserve the existing land transportation system, especially the bridges which are often the only access to communities. The public felt that the decision-making process is complex and had a greater understanding of the process that the decision-makers need to go through. They expressed a desire to develop ways to increase funding and improve land use decisions.
Other questions and comments raised at the meeting are summarized below.
1. The number of households in Puna is underestimated. Additional studies are needed to re-assess the future condition and better plan to accommodate the growth. In addition, preserve the coastal highway, Route 137.
2. Consider mode shift and expanded transit service to help alleviate congestion.
3. Need to address land use and biological impacts from highway construction. Ensure that managing invasive species is accounted for in safety, environment, maintenance, and construction.
4. Widen collector roads and improve local connection to help address congestion
5. Continue to address and enhance safety
6. System preservation – preserve the existing transportation system, especially the bridges, where often are the only access to communities.
7. Consider increasing the percentage of State Highway funds to the Hawaii District given that the Hawaii District has twice as many miles of roads than any other district and its residents travel twice the distance for work, school, and emergency services. In addition, there is greater projected need and more room for new highway routes.
Response: There are multiple factors in determining how the funds are distributed, i.e. revenue, average daily traffic volume, vehicle miles traveled, and population etc.
8. Some of the funding and non-funding strategies seem beyond the HDOT’s jurisdiction and some do not seem feasible for the Hawaii District.
Response: The list of funding and non-funding strategies is a “brainstorm” list. The project management team understands that there is no one solution that will address all the needs, but every little effort counts. Some of the strategies listed would require legislative action. One of the primary goals of the Plan is to provide guidance to decision-makers to explore all options.
APPENDIX E PUBLIC INVOLVEMENT SUMMARY FOR THE STATEWIDE FEDERAL-AID HIGHWAYS 2035 TRANSPORTATION PLAN
TBG062714093019HNL 13
Kauai Public Meeting On Kauai, the public was very engaged. They preferred an interactive presentation of the draft Plan and questions and comments were entertained throughout the evening. The public appreciated the engagement and the small group exercise was cancelled in order to provide more time for comments and discussion by the group as a whole. Questions and comments were taken throughout the meeting. Attendees also talked to project staff and provided written and verbal feedback.
Below is a summary of questions and comments received at the meetings.
1. Invest more funds on transit, which could possibly address both capacity and resiliency issues.
Response: The funding source for transit is different from the highways funding source. Transit projects are funded by the Federal Transit Administration. Funding from FHWA cannot directly fund transit projects. FHWA funds infrastructure projects. The infrastructure (that is, roads) supports transit operation.
2. Can FHWA funds be used to implement/support Travel Demand Management strategies?
Response: Yes.
3. Preserving existing infrastructure in place will not work for the long-term. Instead, we need to reconstruct and relocate our coastal roadways and bridges inland to avoid impacts from shoreline erosion and sea-level rise.
4. Kauai needs more alternative routes (that is, mauka bypass in Kapaa).
5. What’s the meaning of having a $600 million project listed as one of the potential solutions while the projected funds available for Kauai through 2035 is only $630 million?
Response: This Plan is a long-range plan, and recommendations are not based on fiscal constraints. It is an appropriate approach to identify all the deficiencies and needs then develop potential solutions that would address the deficiencies and needs, regardless of its cost. In the next steps, which are developing the mid-range plan and updating the STIP, the state and county will prioritize projects based on fiscal constraints. The HDOT will start working on the mid-range plan after this long-range plan project is done. The HDOT will work with the counties and start off with the priorities from the long-range plan. The next step is the STIP, which is regularly updated. A series of public meetings for the STIP update will be held in April and May this year.
6. Special interest groups throughout the island are very different based on their geographical location. Make sure all voices are heard. It also seems that the hotel rooms/visitor impacts are underestimated on the other side of the island.
Response: When the CAC was formed, geographical representation was taken into consideration.
Project Website A project website (http://www.hawaiilongrangeplan.com) was developed and maintained throughout the plan development process. The project website provided a venue to facilitate two-way communication between the public and the project management team. Through the website, the project management team was able to share project information, announce involvement opportunities, and receive comments and feedback.
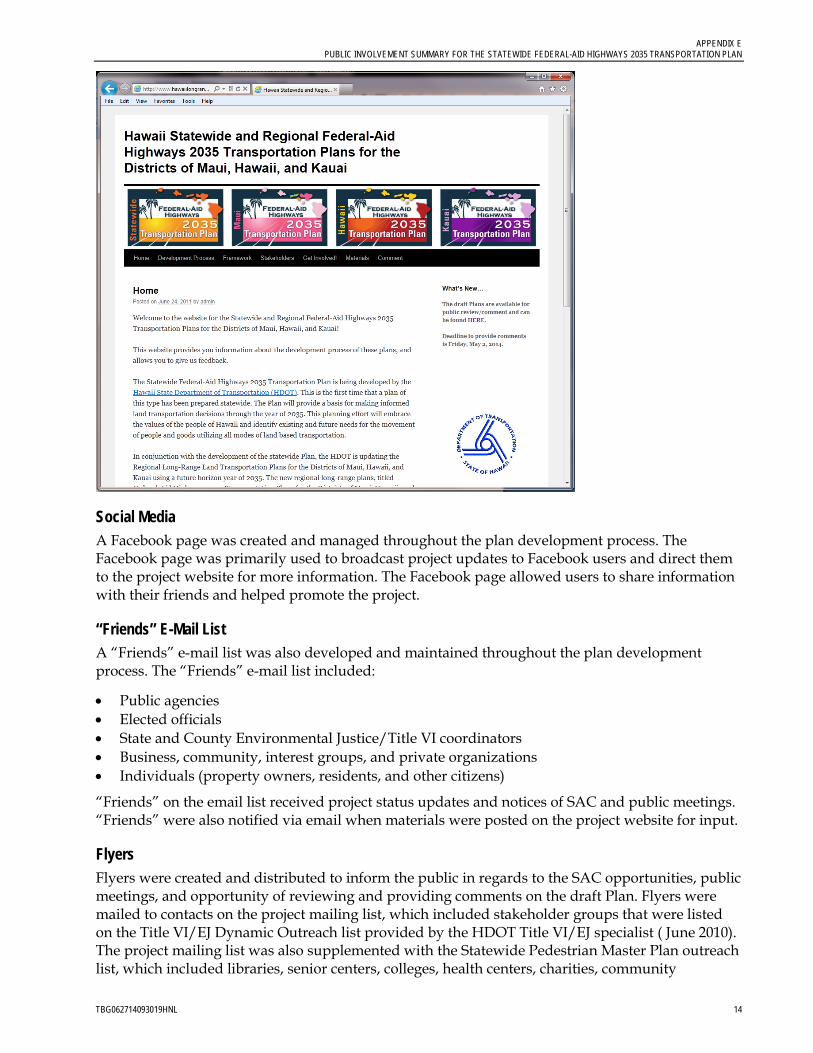
APPENDIX E PUBLIC INVOLVEMENT SUMMARY FOR THE STATEWIDE FEDERAL-AID HIGHWAYS 2035 TRANSPORTATION PLAN
TBG062714093019HNL 14
Social Media A Facebook page was created and managed throughout the plan development process. The Facebook page was primarily used to broadcast project updates to Facebook users and direct them to the project website for more information. The Facebook page allowed users to share information with their friends and helped promote the project.
“Friends” E-Mail List A “Friends” e-mail list was also developed and maintained throughout the plan development process. The “Friends” e-mail list included:
• Public agencies • Elected officials • State and County Environmental Justice/Title VI coordinators • Business, community, interest groups, and private organizations • Individuals (property owners, residents, and other citizens)
“Friends” on the email list received project status updates and notices of SAC and public meetings. “Friends” were also notified via email when materials were posted on the project website for input.
Flyers Flyers were created and distributed to inform the public in regards to the SAC opportunities, public meetings, and opportunity of reviewing and providing comments on the draft Plan. Flyers were mailed to contacts on the project mailing list, which included stakeholder groups that were listed on the Title VI/EJ Dynamic Outreach list provided by the HDOT Title VI/EJ specialist ( June 2010). The project mailing list was also supplemented with the Statewide Pedestrian Master Plan outreach list, which included libraries, senior centers, colleges, health centers, charities, community

APPENDIX E PUBLIC INVOLVEMENT SUMMARY FOR THE STATEWIDE FEDERAL-AID HIGHWAYS 2035 TRANSPORTATION PLAN
TBG062714093019HNL 15
associations/neighborhood boards, related community interest groups, child and family service centers, chambers of commerce, cultural clubs, Office of Hawaiian Affairs, developers, veteran centers, business and professional associations, clinics, and tourism associations. Over 400 stakeholder groups statewide received the flyers.
The flyers were also emailed to the STAC, Sub-STAC, SAC, and related government agencies for distribution.
News Media Outreach and Coordination Public notices were placed on major newspapers statewide to announce the SAC opportunities, public meetings, and opportunity of reviewing and providing comments on the draft Plan. In addition, the HDOT also prepared press releases and reached out to members of the news media to encourage media coverage regarding public involvement opportunities.
Emails, Phone Calls, and Letters Over the course of the Plan’s development, the public was able to provide comments and raise questions through emails, phone calls, and letters. The project management team also reached out by phone and by email to specific stakeholders to get their input.
Additional Approaches for SAC Solicitation In addition to making the announcement through public notices, HDOT press releases, the project website, Facebook page, flyers, and emails, several other approaches were taken concurrently to solicit membership for the SAC. These approaches and efforts are described as follow:
Other Project - Public Meetings The project management team staff attended public meetings for other related projects to promote the SAC opportunities. The project management team staff attended and distributed flyers and applications at the CAC meetings and public meetings for the Statewide Pedestrian Master Plan, and public meetings for the Hawaii Statewide Transportation Plan. The opportunities were also promoted at public meetings for the Oahu Regional Transportation Plan with a project display board and staff to answer questions.
Internet The SAC opportunities were announced on the HDOT Website (http://hawaii.gov/dot).
Focused Outreach Additional outreach was also done to focus on potential candidates, by the project management team and associates. The project management team staff reached out to applicants and colleagues for suggestions on other potential candidates. Several contacts were obtained from the Hawaii Statewide Transportation Plan 2002 CAC List.
The project management team’s Public Involvement Specialists located on the neighbor islands met with the local agencies to brainstorm community members that would potentially be a SAC member. They also met with some candidates and contacted a few other candidates by phone. As a result, 66 applications were received and a comprehensive, well-represented SAC was successfully established.

Appendix FProcess for Solution Evaluation and Results
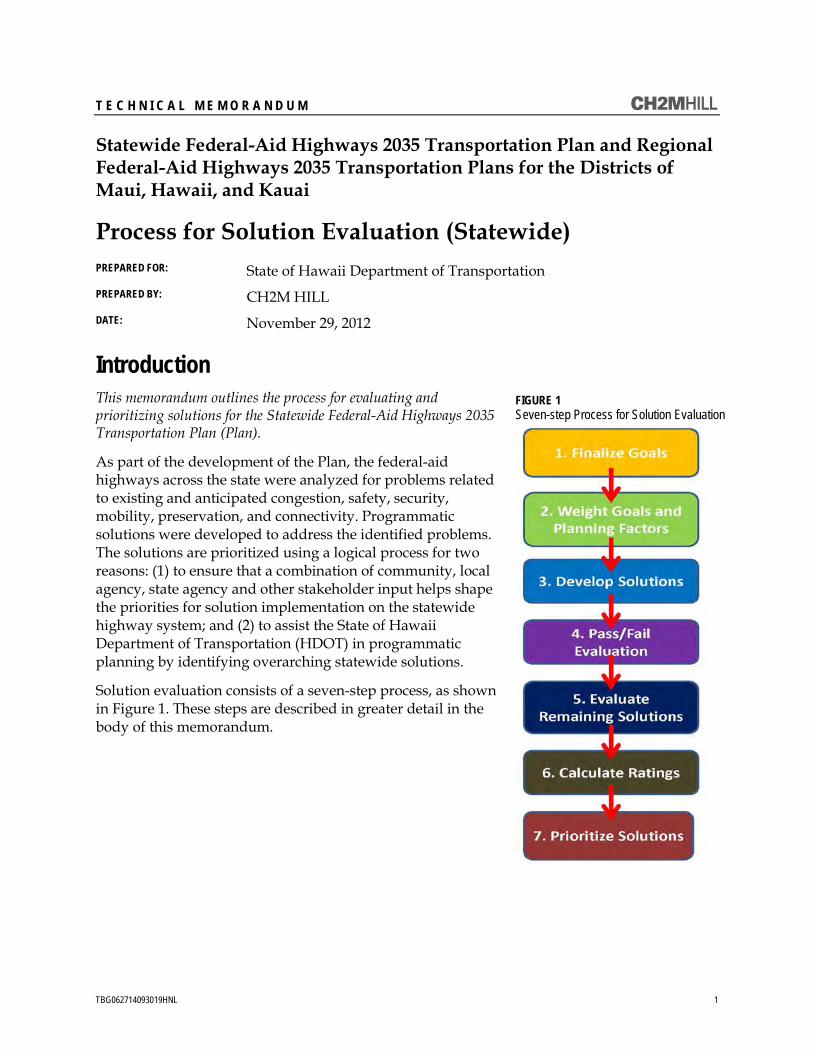
TBG062714093019HNL 1
T E C H N I C A L M E M O R A N D U M Statewide Federal-Aid Highways 2035 Transportation Plan and Regional Federal-Aid Highways 2035 Transportation Plans for the Districts of Maui, Hawaii, and Kauai
Process for Solution Evaluation (Statewide) PREPARED FOR: State of Hawaii Department of Transportation PREPARED BY: CH2M HILL DATE: November 29, 2012
Introduction This memorandum outlines the process for evaluating and prioritizing solutions for the Statewide Federal-Aid Highways 2035 Transportation Plan (Plan).
As part of the development of the Plan, the federal-aid highways across the state were analyzed for problems related to existing and anticipated congestion, safety, security, mobility, preservation, and connectivity. Programmatic solutions were developed to address the identified problems. The solutions are prioritized using a logical process for two reasons: (1) to ensure that a combination of community, local agency, state agency and other stakeholder input helps shape the priorities for solution implementation on the statewide highway system; and (2) to assist the State of Hawaii Department of Transportation (HDOT) in programmatic planning by identifying overarching statewide solutions.
Solution evaluation consists of a seven-step process, as shown in Figure 1. These steps are described in greater detail in the body of this memorandum.
FIGURE 1 Seven-step Process for Solution Evaluation
PROCESS FOR SOLUTION EVALUATION (STATEWIDE)
TBG062714093019HNL 2
Step 1. Finalize Goals and Objectives for the Plans
Goals and objectives set the basic vision for any planning process and provide a framework for evaluating success once the plan has been implemented. The goals and objectives for the Plan are aligned with existing federal legislation (Moving Ahead for Progress in the 21st Century, [MAP-21]), and state and local regulatory and policy requirements. The goals and objectives also incorporate input from stakeholders (community, local agencies, and state agencies). The set of goals and objectives used for the Plan is also used for the Regional Federal-Aid Highways 2035 Transportation Plans for the Districts of Maui, Hawaii, and Kauai.
As described in the remainder of the memo, it is the prioritizing of these goals that may differ between the statewide Plan and each regional plan.
Work with stakeholders resulted in 22 goals, which are organized into eight categories or planning factors. The eight planning factors are consistent with Federal Highways Administration (FHWA) guidance and are listed in no particular order:
• Environment and Sustainability • Modal Integration • System Preservation • Security • Economic Vitality • System Efficiency Management and Operations • Transportation Access Mobility • Safety
A ninth “additional” category is also included to encompass goals that are not directly associated with the federal planning factors.
Table 1 includes the finalized goals, objectives, and strategies categorized by planning factor.
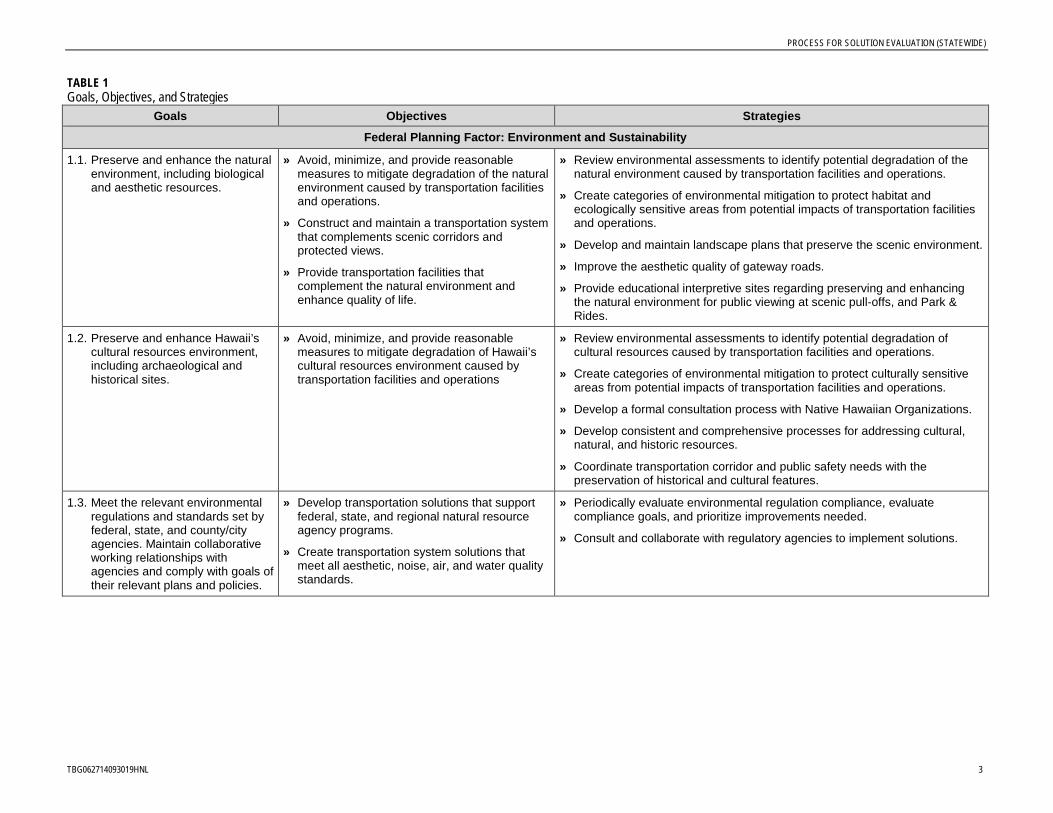
PROCESS FOR SOLUTION EVALUATION (STATEWIDE)
TBG062714093019HNL 3
TABLE 1 Goals, Objectives, and Strategies
Goals Objectives Strategies
Federal Planning Factor: Environment and Sustainability
1.1. Preserve and enhance the natural environment, including biological and aesthetic resources.
» Avoid, minimize, and provide reasonable measures to mitigate degradation of the natural environment caused by transportation facilities and operations.
» Construct and maintain a transportation system that complements scenic corridors and protected views.
» Provide transportation facilities that complement the natural environment and enhance quality of life.
» Review environmental assessments to identify potential degradation of the natural environment caused by transportation facilities and operations.
» Create categories of environmental mitigation to protect habitat and ecologically sensitive areas from potential impacts of transportation facilities and operations.
» Develop and maintain landscape plans that preserve the scenic environment.
» Improve the aesthetic quality of gateway roads.
» Provide educational interpretive sites regarding preserving and enhancing the natural environment for public viewing at scenic pull-offs, and Park & Rides.
1.2. Preserve and enhance Hawaii’s cultural resources environment, including archaeological and historical sites.
» Avoid, minimize, and provide reasonable measures to mitigate degradation of Hawaii’s cultural resources environment caused by transportation facilities and operations
» Review environmental assessments to identify potential degradation of cultural resources caused by transportation facilities and operations.
» Create categories of environmental mitigation to protect culturally sensitive areas from potential impacts of transportation facilities and operations.
» Develop a formal consultation process with Native Hawaiian Organizations.
» Develop consistent and comprehensive processes for addressing cultural, natural, and historic resources.
» Coordinate transportation corridor and public safety needs with the preservation of historical and cultural features.
1.3. Meet the relevant environmental regulations and standards set by federal, state, and county/city agencies. Maintain collaborative working relationships with agencies and comply with goals of their relevant plans and policies.
» Develop transportation solutions that support federal, state, and regional natural resource agency programs.
» Create transportation system solutions that meet all aesthetic, noise, air, and water quality standards.
» Periodically evaluate environmental regulation compliance, evaluate compliance goals, and prioritize improvements needed.
» Consult and collaborate with regulatory agencies to implement solutions.
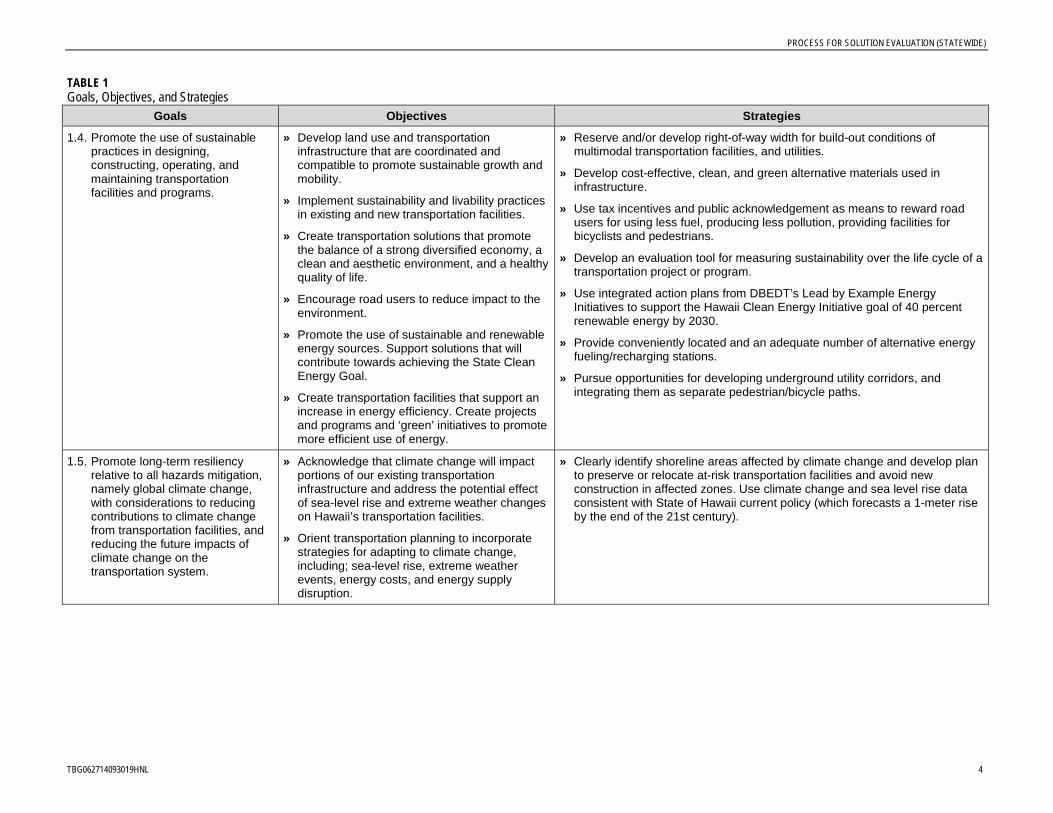
PROCESS FOR SOLUTION EVALUATION (STATEWIDE)
TBG062714093019HNL 4
TABLE 1 Goals, Objectives, and Strategies
Goals Objectives Strategies
1.4. Promote the use of sustainable practices in designing, constructing, operating, and maintaining transportation facilities and programs.
» Develop land use and transportation infrastructure that are coordinated and compatible to promote sustainable growth and mobility.
» Implement sustainability and livability practices in existing and new transportation facilities.
» Create transportation solutions that promote the balance of a strong diversified economy, a clean and aesthetic environment, and a healthy quality of life.
» Encourage road users to reduce impact to the environment.
» Promote the use of sustainable and renewable energy sources. Support solutions that will contribute towards achieving the State Clean Energy Goal.
» Create transportation facilities that support an increase in energy efficiency. Create projects and programs and ‘green’ initiatives to promote more efficient use of energy.
» Reserve and/or develop right-of-way width for build-out conditions of multimodal transportation facilities, and utilities.
» Develop cost-effective, clean, and green alternative materials used in infrastructure.
» Use tax incentives and public acknowledgement as means to reward road users for using less fuel, producing less pollution, providing facilities for bicyclists and pedestrians.
» Develop an evaluation tool for measuring sustainability over the life cycle of a transportation project or program.
» Use integrated action plans from DBEDT’s Lead by Example Energy Initiatives to support the Hawaii Clean Energy Initiative goal of 40 percent renewable energy by 2030.
» Provide conveniently located and an adequate number of alternative energy fueling/recharging stations.
» Pursue opportunities for developing underground utility corridors, and integrating them as separate pedestrian/bicycle paths.
1.5. Promote long-term resiliency relative to all hazards mitigation, namely global climate change, with considerations to reducing contributions to climate change from transportation facilities, and reducing the future impacts of climate change on the transportation system.
» Acknowledge that climate change will impact portions of our existing transportation infrastructure and address the potential effect of sea-level rise and extreme weather changes on Hawaii’s transportation facilities.
» Orient transportation planning to incorporate strategies for adapting to climate change, including; sea-level rise, extreme weather events, energy costs, and energy supply disruption.
» Clearly identify shoreline areas affected by climate change and develop plan to preserve or relocate at-risk transportation facilities and avoid new construction in affected zones. Use climate change and sea level rise data consistent with State of Hawaii current policy (which forecasts a 1-meter rise by the end of the 21st century).
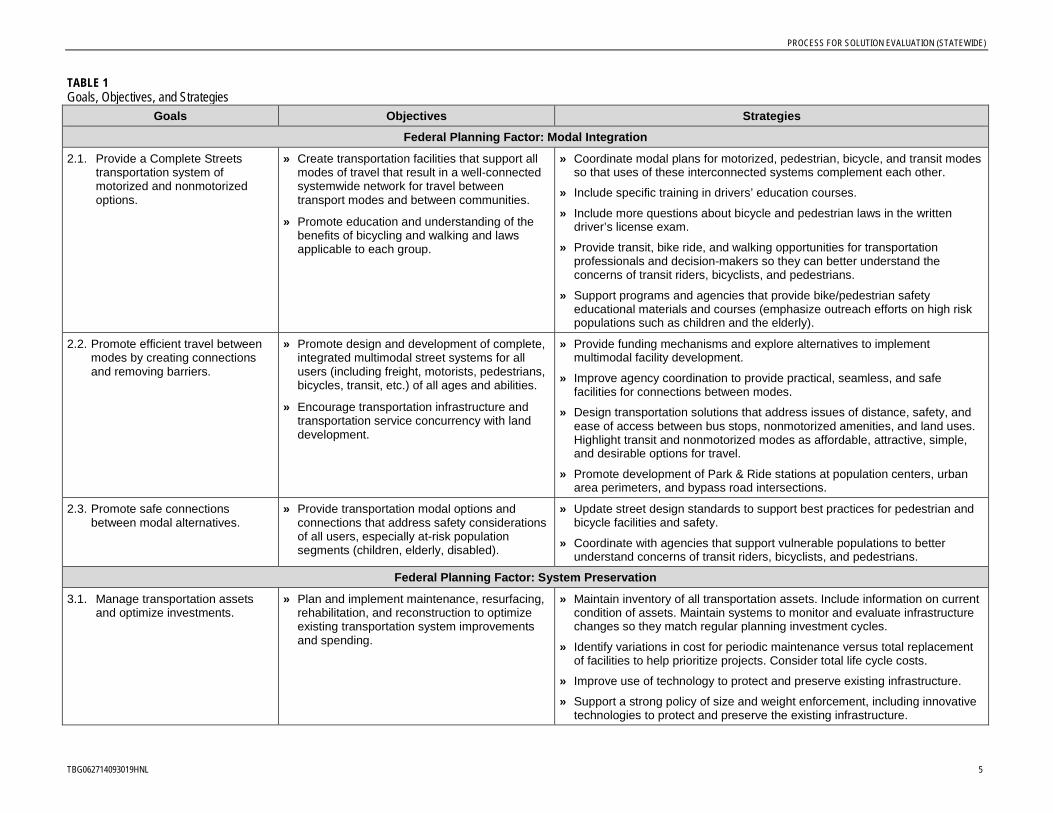
PROCESS FOR SOLUTION EVALUATION (STATEWIDE)
TBG062714093019HNL 5
TABLE 1 Goals, Objectives, and Strategies
Goals Objectives Strategies
Federal Planning Factor: Modal Integration
2.1. Provide a Complete Streets transportation system of motorized and nonmotorized options.
» Create transportation facilities that support all modes of travel that result in a well-connected systemwide network for travel between transport modes and between communities.
» Promote education and understanding of the benefits of bicycling and walking and laws applicable to each group.
» Coordinate modal plans for motorized, pedestrian, bicycle, and transit modes so that uses of these interconnected systems complement each other.
» Include specific training in drivers’ education courses.
» Include more questions about bicycle and pedestrian laws in the written driver’s license exam.
» Provide transit, bike ride, and walking opportunities for transportation professionals and decision-makers so they can better understand the concerns of transit riders, bicyclists, and pedestrians.
» Support programs and agencies that provide bike/pedestrian safety educational materials and courses (emphasize outreach efforts on high risk populations such as children and the elderly).
2.2. Promote efficient travel between modes by creating connections and removing barriers.
» Promote design and development of complete, integrated multimodal street systems for all users (including freight, motorists, pedestrians, bicycles, transit, etc.) of all ages and abilities.
» Encourage transportation infrastructure and transportation service concurrency with land development.
» Provide funding mechanisms and explore alternatives to implement multimodal facility development.
» Improve agency coordination to provide practical, seamless, and safe facilities for connections between modes.
» Design transportation solutions that address issues of distance, safety, and ease of access between bus stops, nonmotorized amenities, and land uses. Highlight transit and nonmotorized modes as affordable, attractive, simple, and desirable options for travel.
» Promote development of Park & Ride stations at population centers, urban area perimeters, and bypass road intersections.
2.3. Promote safe connections between modal alternatives.
» Provide transportation modal options and connections that address safety considerations of all users, especially at-risk population segments (children, elderly, disabled).
» Update street design standards to support best practices for pedestrian and bicycle facilities and safety.
» Coordinate with agencies that support vulnerable populations to better understand concerns of transit riders, bicyclists, and pedestrians.
Federal Planning Factor: System Preservation
3.1. Manage transportation assets and optimize investments.
» Plan and implement maintenance, resurfacing, rehabilitation, and reconstruction to optimize existing transportation system improvements and spending.
» Maintain inventory of all transportation assets. Include information on current condition of assets. Maintain systems to monitor and evaluate infrastructure changes so they match regular planning investment cycles.
» Identify variations in cost for periodic maintenance versus total replacement of facilities to help prioritize projects. Consider total life cycle costs.
» Improve use of technology to protect and preserve existing infrastructure.
» Support a strong policy of size and weight enforcement, including innovative technologies to protect and preserve the existing infrastructure.

PROCESS FOR SOLUTION EVALUATION (STATEWIDE)
TBG062714093019HNL 6
TABLE 1 Goals, Objectives, and Strategies
Goals Objectives Strategies
3.2. Maintain safe, efficient, complete transportation system for the long-term.
» Plan and implement existing system improvements to effectively sustain the overall transportation system’s safe, efficient, and complete operations.
» Maintain a schedule for maintenance, replacement, and reconstruction using asset inventory information.
» Maintain and/or upgrade critical routes (i.e. routes serving as single access to communities with inadequate size/load capacity) and as key emergency evacuation and/or services corridors.
» Maintain an aggressive Preventative Maintenance Program to extend the useful life of current infrastructure.
» Improve coordination of system preservation needs with other infrastructure projects and programs.
» Include impacts related to all hazards mitigation, including global climate change, in assessment of system preservation plans.
Federal Planning Factor: Security
4.1. Plan, maintain, and operate a transportation system that supports evacuation, response and recovery for incidents.
» Reduce travel time during incident responses.
» Improve incident detection and response capabilities, including access and air and sea modal connections.
» Improve coordination with emergency managers and major traffic generators and attractors during the planning and execution phases of an incident response.
» Provide adequate facilities and capacity to support the needs of emergency and evacuation routes.
» Improve flow of information to the traveling public
» Promote and develop alternate route options for existing highways and freeways to allow efficient rerouting of traffic away from the primary incident location.
» Identify and develop strategic evacuation routes that support the multihazard plans.
» Maintain and upgrade key emergency and access routes (i.e., routes serving as single access to communities with inadequate size or load capacity).
» Improve public transportation use for emergency evacuation of nonmobile residents during incidents.
» Improve surveillance systems and upgrade detection equipment (such as cameras or loop sensors on roadways) to reduce incident detection time and response time.
» Implement multiagency training programs so staff are well educated on protocols and procedures during incident response. Ensure appropriate agencies are involved and alerted to incidents in a timely manner. Ensure that program developers and trainers are qualified to develop appropriate procedures.
» Develop a comprehensive outreach mechanism to inform agencies and traffic generators and attractors (e.g., service industries) about incidents.
» Enhance multimedia tools to provide information to the traveling public (such as radio and internet information) and information regarding where they can access information (such as “in case of emergency tune to xxx” variable message signs)

PROCESS FOR SOLUTION EVALUATION (STATEWIDE)
TBG062714093019HNL 7
TABLE 1 Goals, Objectives, and Strategies
Goals Objectives Strategies
4.2. Improve resiliency of the state through the transportation system.
» Plan and design for transportation system resilience to maintain efficient and effective connectivity for communities during recovery periods, including resiliency of the utility systems along transportation corridors.
» Establish a forum with the emergency management community, utility providers, and transportation service and infrastructure users to evaluate the transportation system resiliency.
» Prioritize roads that provide connectivity in rural areas of the state.
Federal Planning Factor: Economic Vitality
5.1. Promote the expansion and diversification of Hawaii’s economy through the efficient and effective use of transportation facilities including movement of people, goods, and services in a safe, energy efficient, and environmentally sound manner.
» Maintain and develop an integrated, efficient, and reliable freight system by ensuring connectivity between air, land, and water (harbor) facilities.
» Develop an integrated, efficient, and reliable multimodal transportation system that is resilient to impacts of rising oil/energy costs and that will meet future transport demands.
» Develop an integrated multimodal system of transportation facilities, services, and information systems that provide for efficient commuter and local resident trips.
» Develop an integrated multimodal system of transportation facilities, services, and information so that intrastate, interstate, and international travelers can travel easily for business and recreation.
» Improve end-user benefits by reducing operating costs and reducing freight delays.
» Maintain and operate an integrated transportation system that supports the economic vitality of all islands, especially locations that can be significantly impacted by small changes in the transportation system (such as Molokai and Lanai).
» Identify and address capacity constrained areas within the transportation system. Prioritize the capacity projects when other strategies are not appropriate.
» Consider transportation alternatives that support arrivals and departures of travelers at all hours of the day; and the communication needs of foreign travelers (multilanguage and universal signs).
» Encourage and promote concurrent improvements in transportation infrastructure to mitigate impacts of all new developments and maintain an efficient transportation system that supports economic vitality.
» Identify specific funding strategies to enhance economic vitality.
» Explore financial strategies that examine fees (revenue sources) that cover all transportation modes.
» Support efficient and effective movement along the transportation system with traveler information, such as signage and real-time multimedia announcements.
» Coordinate schedules and routes of freight transport needs with other transportation system projects to minimize delay and support economic vitality.
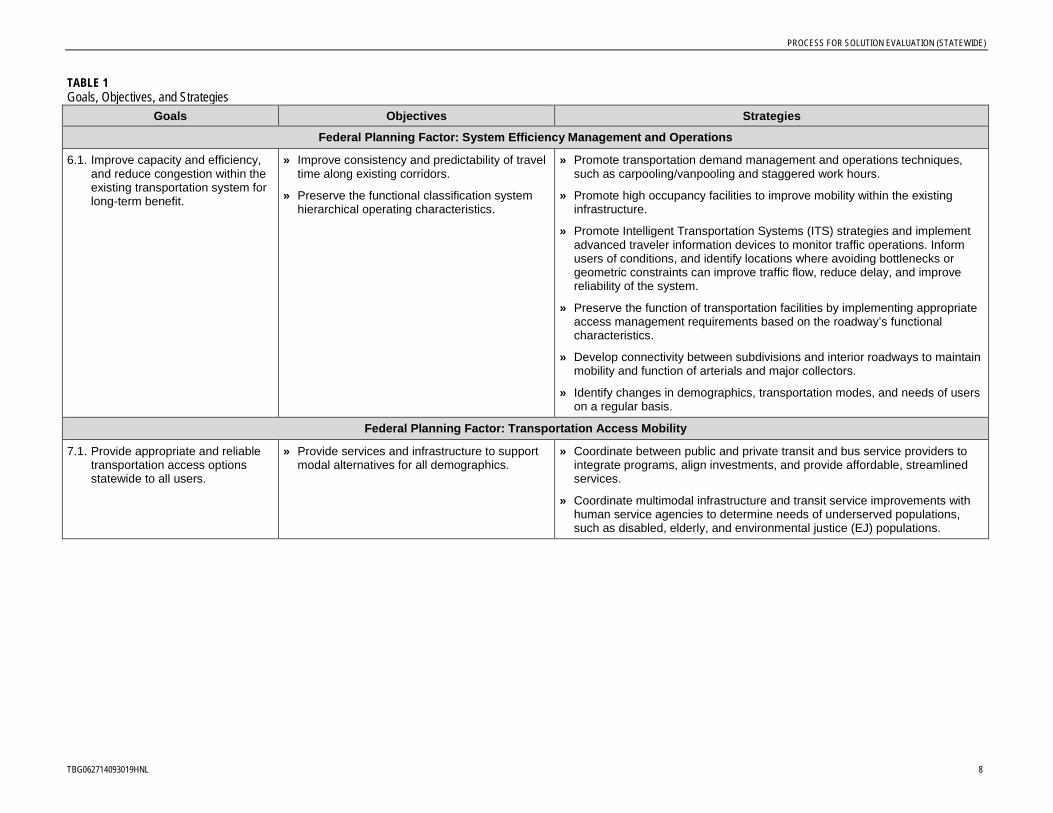
PROCESS FOR SOLUTION EVALUATION (STATEWIDE)
TBG062714093019HNL 8
TABLE 1 Goals, Objectives, and Strategies
Goals Objectives Strategies
Federal Planning Factor: System Efficiency Management and Operations
6.1. Improve capacity and efficiency, and reduce congestion within the existing transportation system for long-term benefit.
» Improve consistency and predictability of travel time along existing corridors.
» Preserve the functional classification system hierarchical operating characteristics.
» Promote transportation demand management and operations techniques, such as carpooling/vanpooling and staggered work hours.
» Promote high occupancy facilities to improve mobility within the existing infrastructure.
» Promote Intelligent Transportation Systems (ITS) strategies and implement advanced traveler information devices to monitor traffic operations. Inform users of conditions, and identify locations where avoiding bottlenecks or geometric constraints can improve traffic flow, reduce delay, and improve reliability of the system.
» Preserve the function of transportation facilities by implementing appropriate access management requirements based on the roadway’s functional characteristics.
» Develop connectivity between subdivisions and interior roadways to maintain mobility and function of arterials and major collectors.
» Identify changes in demographics, transportation modes, and needs of users on a regular basis.
Federal Planning Factor: Transportation Access Mobility
7.1. Provide appropriate and reliable transportation access options statewide to all users.
» Provide services and infrastructure to support modal alternatives for all demographics.
» Coordinate between public and private transit and bus service providers to integrate programs, align investments, and provide affordable, streamlined services.
» Coordinate multimodal infrastructure and transit service improvements with human service agencies to determine needs of underserved populations, such as disabled, elderly, and environmental justice (EJ) populations.
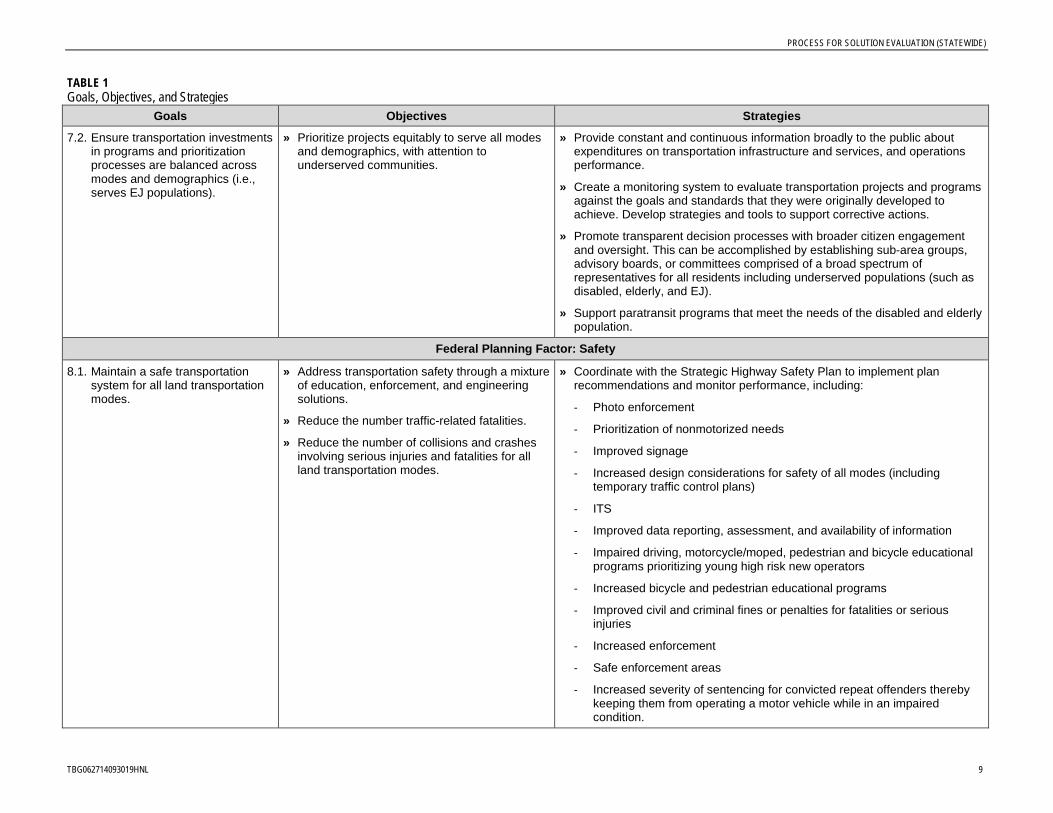
PROCESS FOR SOLUTION EVALUATION (STATEWIDE)
TBG062714093019HNL 9
TABLE 1 Goals, Objectives, and Strategies
Goals Objectives Strategies
7.2. Ensure transportation investments in programs and prioritization processes are balanced across modes and demographics (i.e., serves EJ populations).
» Prioritize projects equitably to serve all modes and demographics, with attention to underserved communities.
» Provide constant and continuous information broadly to the public about expenditures on transportation infrastructure and services, and operations performance.
» Create a monitoring system to evaluate transportation projects and programs against the goals and standards that they were originally developed to achieve. Develop strategies and tools to support corrective actions.
» Promote transparent decision processes with broader citizen engagement and oversight. This can be accomplished by establishing sub-area groups, advisory boards, or committees comprised of a broad spectrum of representatives for all residents including underserved populations (such as disabled, elderly, and EJ).
» Support paratransit programs that meet the needs of the disabled and elderly population.
Federal Planning Factor: Safety
8.1. Maintain a safe transportation system for all land transportation modes.
» Address transportation safety through a mixture of education, enforcement, and engineering solutions.
» Reduce the number traffic-related fatalities.
» Reduce the number of collisions and crashes involving serious injuries and fatalities for all land transportation modes.
» Coordinate with the Strategic Highway Safety Plan to implement plan recommendations and monitor performance, including:
- Photo enforcement
- Prioritization of nonmotorized needs
- Improved signage
- Increased design considerations for safety of all modes (including temporary traffic control plans)
- ITS
- Improved data reporting, assessment, and availability of information
- Impaired driving, motorcycle/moped, pedestrian and bicycle educational programs prioritizing young high risk new operators
- Increased bicycle and pedestrian educational programs
- Improved civil and criminal fines or penalties for fatalities or serious injuries
- Increased enforcement
- Safe enforcement areas
- Increased severity of sentencing for convicted repeat offenders thereby keeping them from operating a motor vehicle while in an impaired condition.
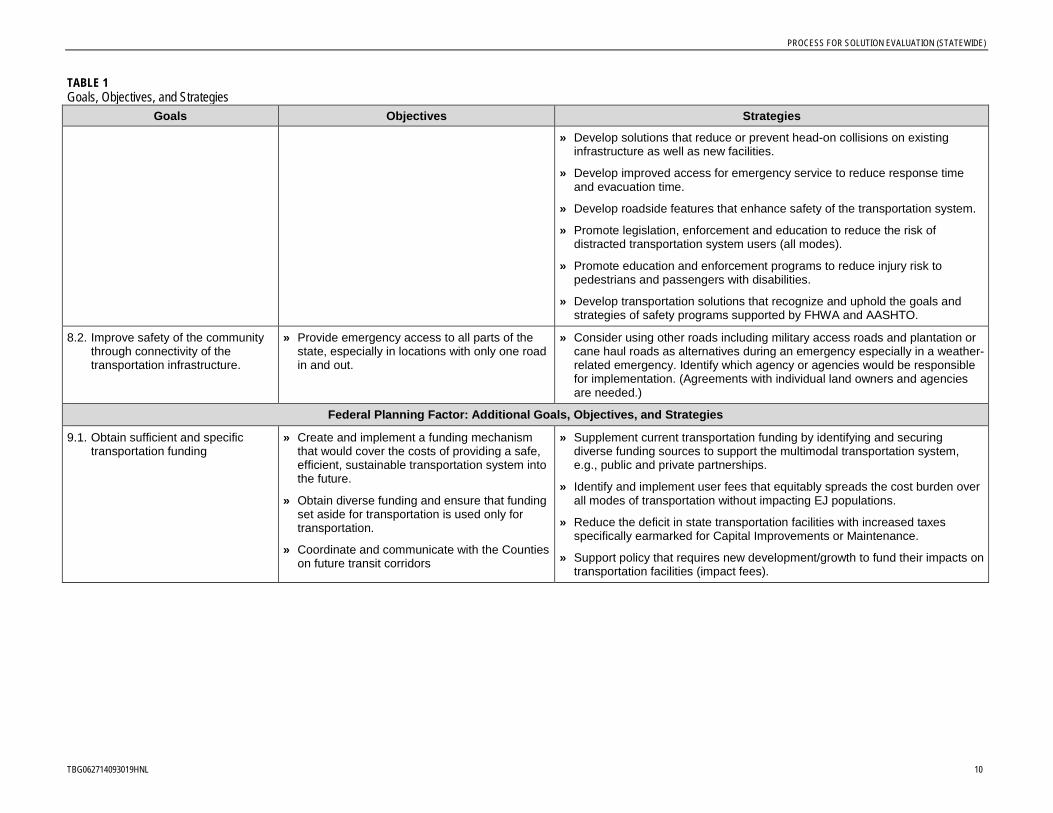
PROCESS FOR SOLUTION EVALUATION (STATEWIDE)
TBG062714093019HNL 10
TABLE 1 Goals, Objectives, and Strategies
Goals Objectives Strategies
» Develop solutions that reduce or prevent head-on collisions on existing infrastructure as well as new facilities.
» Develop improved access for emergency service to reduce response time and evacuation time.
» Develop roadside features that enhance safety of the transportation system.
» Promote legislation, enforcement and education to reduce the risk of distracted transportation system users (all modes).
» Promote education and enforcement programs to reduce injury risk to pedestrians and passengers with disabilities.
» Develop transportation solutions that recognize and uphold the goals and strategies of safety programs supported by FHWA and AASHTO.
8.2. Improve safety of the community through connectivity of the transportation infrastructure.
» Provide emergency access to all parts of the state, especially in locations with only one road in and out.
» Consider using other roads including military access roads and plantation or cane haul roads as alternatives during an emergency especially in a weather-related emergency. Identify which agency or agencies would be responsible for implementation. (Agreements with individual land owners and agencies are needed.)
Federal Planning Factor: Additional Goals, Objectives, and Strategies
9.1. Obtain sufficient and specific transportation funding
» Create and implement a funding mechanism that would cover the costs of providing a safe, efficient, sustainable transportation system into the future.
» Obtain diverse funding and ensure that funding set aside for transportation is used only for transportation.
» Coordinate and communicate with the Counties on future transit corridors
» Supplement current transportation funding by identifying and securing diverse funding sources to support the multimodal transportation system, e.g., public and private partnerships.
» Identify and implement user fees that equitably spreads the cost burden over all modes of transportation without impacting EJ populations.
» Reduce the deficit in state transportation facilities with increased taxes specifically earmarked for Capital Improvements or Maintenance.
» Support policy that requires new development/growth to fund their impacts on transportation facilities (impact fees).

PROCESS FOR SOLUTION EVALUATION (STATEWIDE)
TBG062714093019HNL 11
TABLE 1 Goals, Objectives, and Strategies
Goals Objectives Strategies
9.2. Optimize project delivery. » Improve coordination of plans and resources.
» Improve efficiency of planning and delivery of projects.
» Plan, develop, and maintain transportation infrastructure within programmed budget amounts.
» From planning through operations, improve coordination and communication between multiple departments, public citizen groups, and agencies to address needs and resources efficiently.
» Provide communications between multiple departments, public citizen groups, and agencies related to status of projects.
» In areas where multiple state and/or federal agencies have authority, create a lead agency to manage overall project reducing delays, redundancies and inefficiencies. Develop procedures and protocol to monitor compliance, cooperation, communication and efficiency.
» Utilize transportation funds efficiently, and maximize revenues.
9.3. Provide on-going planning to assess and address statewide needs.
» Monitor, evaluate, and develop solutions, and adjust program goals on a continuing periodic coordinated basis.
» Continue to implement the 3-C planning process (comprehensive, cooperative and continuing).
9.4. Coordinate use of public right-of-way with other public service providers.
» Continue the safe accommodation and installation of utility facilities within the right-of-way or easement along state highways and federal-aid county highways.
» Coordinate with utility service providers to work together in establishing location, design, and methods for the possible accommodation and installation of utility facilities along state highways and federal aid county highways. Considerations should include, but not be limited to safety, future widening and site specific issues.
» Coordinate and communicate transportation and utility planning efforts to enable development of a coordinated transportation and utility system.
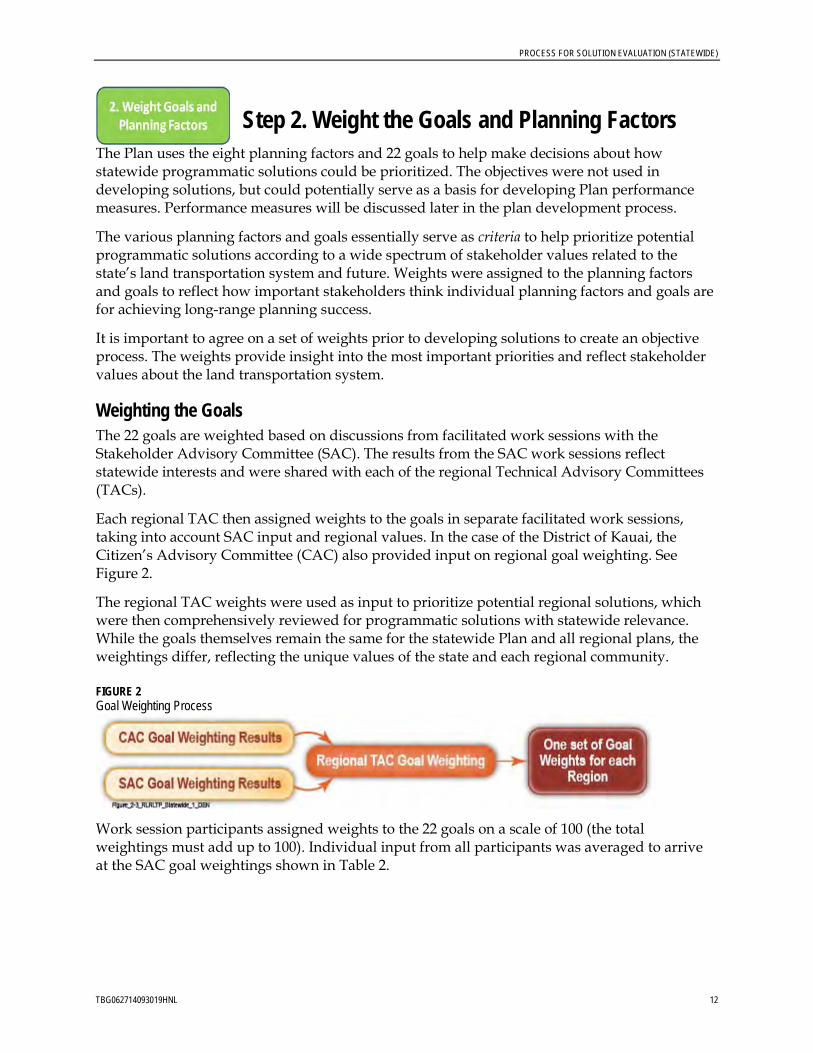
PROCESS FOR SOLUTION EVALUATION (STATEWIDE)
TBG062714093019HNL 12
Step 2. Weight the Goals and Planning Factors The Plan uses the eight planning factors and 22 goals to help make decisions about how statewide programmatic solutions could be prioritized. The objectives were not used in developing solutions, but could potentially serve as a basis for developing Plan performance measures. Performance measures will be discussed later in the plan development process.
The various planning factors and goals essentially serve as criteria to help prioritize potential programmatic solutions according to a wide spectrum of stakeholder values related to the state’s land transportation system and future. Weights were assigned to the planning factors and goals to reflect how important stakeholders think individual planning factors and goals are for achieving long-range planning success.
It is important to agree on a set of weights prior to developing solutions to create an objective process. The weights provide insight into the most important priorities and reflect stakeholder values about the land transportation system.
Weighting the Goals The 22 goals are weighted based on discussions from facilitated work sessions with the Stakeholder Advisory Committee (SAC). The results from the SAC work sessions reflect statewide interests and were shared with each of the regional Technical Advisory Committees (TACs).
Each regional TAC then assigned weights to the goals in separate facilitated work sessions, taking into account SAC input and regional values. In the case of the District of Kauai, the Citizen’s Advisory Committee (CAC) also provided input on regional goal weighting. See Figure 2.
The regional TAC weights were used as input to prioritize potential regional solutions, which were then comprehensively reviewed for programmatic solutions with statewide relevance. While the goals themselves remain the same for the statewide Plan and all regional plans, the weightings differ, reflecting the unique values of the state and each regional community.
FIGURE 2 Goal Weighting Process
Work session participants assigned weights to the 22 goals on a scale of 100 (the total weightings must add up to 100). Individual input from all participants was averaged to arrive at the SAC goal weightings shown in Table 2.
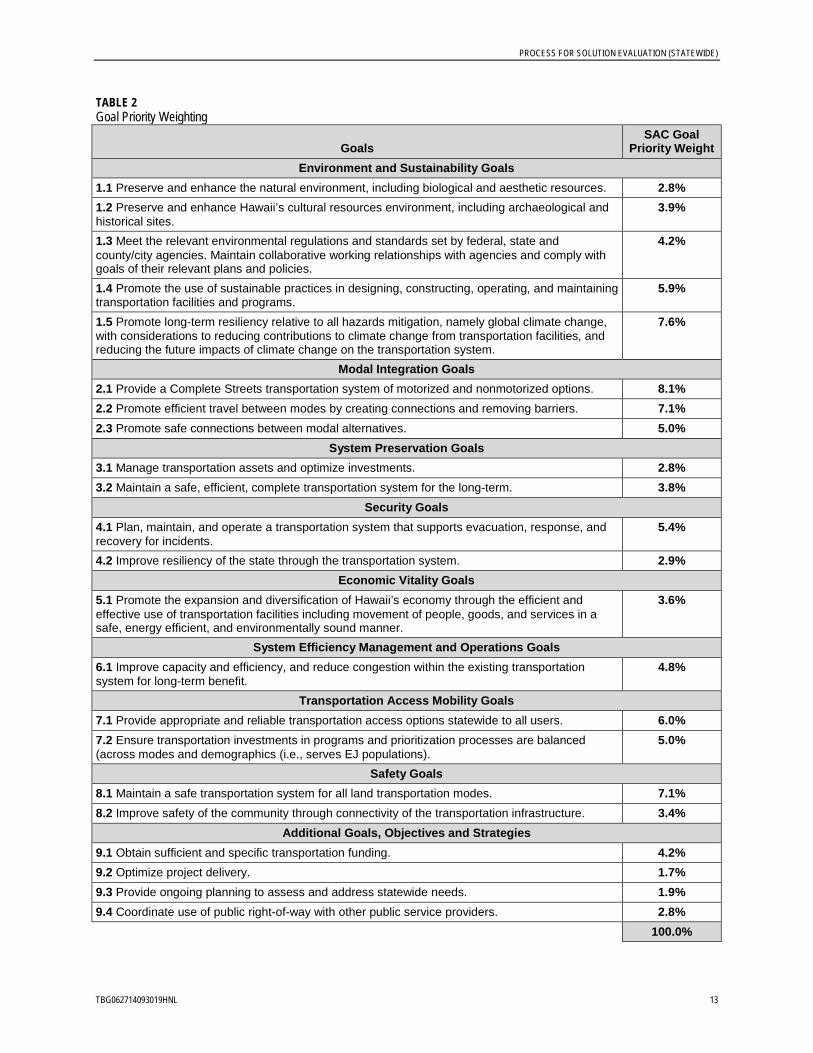
PROCESS FOR SOLUTION EVALUATION (STATEWIDE)
TBG062714093019HNL 13
TABLE 2 Goal Priority Weighting
Goals SAC Goal
Priority Weight Environment and Sustainability Goals
1.1 Preserve and enhance the natural environment, including biological and aesthetic resources. 2.8% 1.2 Preserve and enhance Hawaii’s cultural resources environment, including archaeological and historical sites.
3.9%
1.3 Meet the relevant environmental regulations and standards set by federal, state and county/city agencies. Maintain collaborative working relationships with agencies and comply with goals of their relevant plans and policies.
4.2%
1.4 Promote the use of sustainable practices in designing, constructing, operating, and maintaining transportation facilities and programs.
5.9%
1.5 Promote long-term resiliency relative to all hazards mitigation, namely global climate change, with considerations to reducing contributions to climate change from transportation facilities, and reducing the future impacts of climate change on the transportation system.
7.6%
Modal Integration Goals 2.1 Provide a Complete Streets transportation system of motorized and nonmotorized options. 8.1% 2.2 Promote efficient travel between modes by creating connections and removing barriers. 7.1% 2.3 Promote safe connections between modal alternatives. 5.0%
System Preservation Goals 3.1 Manage transportation assets and optimize investments. 2.8% 3.2 Maintain a safe, efficient, complete transportation system for the long-term. 3.8%
Security Goals 4.1 Plan, maintain, and operate a transportation system that supports evacuation, response, and recovery for incidents.
5.4%
4.2 Improve resiliency of the state through the transportation system. 2.9% Economic Vitality Goals
5.1 Promote the expansion and diversification of Hawaii’s economy through the efficient and effective use of transportation facilities including movement of people, goods, and services in a safe, energy efficient, and environmentally sound manner.
3.6%
System Efficiency Management and Operations Goals 6.1 Improve capacity and efficiency, and reduce congestion within the existing transportation system for long-term benefit.
4.8%
Transportation Access Mobility Goals 7.1 Provide appropriate and reliable transportation access options statewide to all users. 6.0% 7.2 Ensure transportation investments in programs and prioritization processes are balanced (across modes and demographics (i.e., serves EJ populations).
5.0%
Safety Goals 8.1 Maintain a safe transportation system for all land transportation modes. 7.1% 8.2 Improve safety of the community through connectivity of the transportation infrastructure. 3.4%
Additional Goals, Objectives and Strategies 9.1 Obtain sufficient and specific transportation funding. 4.2% 9.2 Optimize project delivery. 1.7% 9.3 Provide ongoing planning to assess and address statewide needs. 1.9% 9.4 Coordinate use of public right-of-way with other public service providers. 2.8% 100.0%

PROCESS FOR SOLUTION EVALUATION (STATEWIDE)
TBG062714093019HNL 14
Weighting the Planning Factors The HDOT program managers assigned weights to each of the eight planning factors in a facilitated work session. This methodology provides a link between the HDOT programs and the long-range transportation goals of the HDOT Highways Division. Weights are based on staff’s understanding of particular HDOT program needs and the future ability of the HDOT to fund those programs based on historical expenditures. These expenditures are derived from historical contracts (the FY2006-2009 Contract Awards) and estimated future spending is based on the FY2011-2014 STIP projects.
Work session participants assigned weights to the eight factors and the additional category on a scale of 100 (the total weightings must add up to 100), as shown in Table 3. The input from all participants was averaged.
The planning factor priority weighting is consistent across all regional plans. Unlike the goal priority weighing, the planning factor weighting does not vary by region.
TABLE 3 Planning Factor Priority Weighting
Planning Factor Priority Weight
Environment and Sustainability 4%
Modal Integration 7%
System Preservation 31%
Security 1%
Economic Vitality 17%
System Efficiency Management and Operations 18%
Transportation Access Mobility 2%
Safety 19%
Additional Goals 1%
TOTAL 100%
Step 3. Develop Solutions Based on stakeholder input, reviews of existing roadway conditions, and forecasted future travel demand, the planning team identified problem areas on the federal-aid highways in each region. Relying on technical engineering and planning knowledge as well as CAC, SAC, and TAC input, comprehensive preliminary lists of potential solutions for the Districts of Maui, Hawaii, and Kauai were developed. The Oahu Regional Transportation Plan (ORTP) 2035 was reviewed for problem areas and potential solutions, which were then compared with the needs and solutions for Maui, Hawaii, and Kauai.
The planning team used this information to develop a list of potential programmatic solutions to address recurring problems. Programmatic solutions involve changes or improvements to address overarching system needs. These solutions would affect more than a specific roadway facility or location; programmatic solutions have an impact statewide and systemwide.

PROCESS FOR SOLUTION EVALUATION (STATEWIDE)
TBG062714093019HNL 15
Step 4. Apply Tier 1 Pass/Fail Evaluation to the Solutions
The list of potential solutions resulting from Step 3 is large. It was necessary to cull the list of solutions to prevent wasted effort for solutions unlikely to be pursued because they were inconsistent with Plan goals and/or the HDOT mission. Therefore, all potential solutions were evaluated against a set of six high-level Tier 1 pass/fail criteria. These Tier 1 pass/fail criteria are consistent with the goals and objectives of the Plan, and are intended to narrow the list of potential programmatic solutions to a set of manageable options.
The project management team (PMT) performed the Tier 1 evaluation for all potential solutions. If a solution failed any of the criteria, it was not advanced forward for further consideration. The Tier 1 evaluation worksheet is shown in Table 4.
TABLE 4 Tier 1 Pass/Fail Criteria
Tier 1 Evaluation Matrix – Pass/Fail
Criteria Pass/Fail
HDOT Highways Mission: Is the solution in alignment with the Hawaii Department of Transportation Highways Division mission?
The mission of the Highways Division is to provide a safe, and efficient and accessible highway system through the use of available resources in the maintenance, enhancement, and support of land transportation facilities.
Plan Goals: Does the solution support one or more of the plan goals as described in the Final Goals, Objectives, and Strategies Memorandum dated November 29, 2012 for the Statewide Federal-Aid Highways 2035 Transportation Plan or the Regional Federal-Aid Highways 2035 Transportation Plans for the Districts of Maui, Hawaii, and Kauai?
Jurisdiction/Significance: Is the solution within the physical and/or operational jurisdiction of the federal-aid highways network or a regionally significant transportation project that is integral to the transportation system as defined by adopted statewide and regional plans?
Completeness: Is the solution complete? Does it account for all necessary investments or actions to ensure the realization of the solution’s objective?
Acceptable: Is the solution implementable and acceptable in terms of applicable laws, regulations, and public policies?
Redundant: Is the need/deficiency already being addressed independent of this planning process?
PROCESS FOR SOLUTION EVALUATION (STATEWIDE)
TBG062714093019HNL 16
Step 5. Apply Tier 2 Evaluation to the Remaining Solutions and Assign Grades
The Tier 2 evaluation is primarily intended for the regional plans to assess remaining solutions at the project level. Each potential project solution was scored against evaluation criteria designed to show how well that solution meets or addresses each of the specific Plan goals. For each goal, each solution was given a score between -2 and +2.
The Tier 2 evaluation criteria grades are as follows:
-2, -1 The solution is contrary to the Plan goal
0 The solution is not directly related or does not impact the Plan goal
1, 2 The solution supports realization of the Plan goal
The grades are intended to show the advantages and disadvantages of the solutions in relation to each other. The grades also provide a means of seeing tradeoffs among the solutions, thereby making the comparative function of the grades more important than the grades themselves.
At the statewide level, broad potential solutions are described qualitatively rather than by specific project facility or specific project location. These high-level solutions have an impact systemwide, and were not evaluated individually nor assigned scores based on individual goal evaluation criteria. Therefore step 5 (Evaluate Remaining Solutions) was not performed for the Statewide Plan.
Step 6. Calculate Ratings For the regional plans, once the evaluation grades for each goal were assigned, they were multiplied by the planning factor weight and the regional goal weight that was developed in Step 2. For each solution for each goal the following formula calculates the Goal Rating:
(Goal Priority Weight X Planning Factor Weight) X Evaluation Grade = Goal Rating
When all ratings were calculated, they were summed for each solution. This resulted in a total solution rating, which can be compared to other total solution ratings for other potential regional project-level solutions.
Sum of Goal Ratings = Total Solution Rating The total solution ratings show how each solution scores compared to other solutions within the same region; but the process also shows the strengths and weaknesses of each solution in terms of the goals (for example, which solutions perform best in terms of safety, which perform best in terms of economic vitality, etc.).
Unlike the regional plans, step 6 (Calculate Ratings) was not performed for the Statewide Federal-Aid Highways 2035 Transportation Plan. The statewide Plan focuses on programmatic, overarching solutions with statewide or systemwide influence. These high-level solutions were not evaluated individually and therefore do not have total solution ratings assigned to them.

PROCESS FOR SOLUTION EVALUATION (STATEWIDE)
TBG062714093019HNL 17
Step 7. Prioritize the Solutions Following the statewide Tier 1 evaluation, potential solutions that consistently met the states priority goals and best addressed the states and regions identified deficiencies were summarized. These potential programmatic solutions were not ranked or used to determine specific recommendations for the Plan. Rather, the potential programmatic solutions will be prioritized and implemented through a series of overarching HDOT Highways Division programs.
These existing programs provide, manage, and maintain infrastructure and services on the states federal-aid roadways. The overarching programs and their subprograms are described in Table 5. Potential statewide solutions that address priority goals of the Plan, and their correlation to the implementing HDOT Highways Division programs, are described below:
• Highway operations and maintenance – Potential solutions for statewide highway maintenance and continuous highway operations fall under the existing System Preservation Program. Solutions include regular maintenance, repair, and upkeep of facilities, removal of vegetation from alongside state highways, drainage improvements, erosion control and landslide protection, and prevention of deterioration of bridge piers and pavement. Highway preservation and maintenance is crucial statewide, especially on the islands belt roads which are often community lifelines. Maintaining the state’s highways aligns with the System Preservation, Security, Safety, and System Efficiency Management and Operations goals of the Plan.
• Capacity and safety improvements for nonmotorized modes – Under the existing Capacity Program, focused improvements for nonmotorized modes could be implemented. Pedestrian and bicycle subprogram capacity improvements include filling in system gaps, creating complete, continuous multimodal networks, increasing connectivity between modes, expanding existing infrastructure to accommodate more users, and providing amenities (such as bicycle racks, benches, rest areas) to attract new users.
The existing Safety Program includes pedestrian and bicycle subprograms that implement safety improvements such as greater separation from motorized modes and increased awareness (in terms of educational campaigns, lighting, signage, etc.) of nonmotorized modes. The System Preservation Program also includes pedestrian and bicycle subprograms, which focus on maintenance, repair, reconstruction, or rehabilitation of deficient nonmotorized facilities. Increasing capacity and improving safety of nonmotorized infrastructure aligns with the Environment and Sustainability, Modal Integration, Safety, and System Efficiency Management and Operations goals of the Plan.
• Emergency access/egress – Potential solutions to improve emergency access to isolated or vulnerable communities include new by-pass roadways or alternate routes for ingress/egress and improved circulation options to alleviate congestion. These solutions fall under the Capacity Program. Solutions to preserve and maintain the resiliency of the existing transportation network fall under the System Preservation Program. This program implements solutions such as resurfacing roadway pavement, reinforcing or relocating roads affected by climate change or shoreline erosion, and rehabilitating or replacing deficient critical bridges and structures before they become unusable. Providing sufficient

PROCESS FOR SOLUTION EVALUATION (STATEWIDE)
TBG062714093019HNL 18
emergency access statewide aligns with the Safety, Security, and System Preservation goals of the Plan.
• Transit infrastructure improvements and service expansion – Improved transit is an identified need statewide. Potential solutions include newer/larger coaches, enhanced bus service on each island (increased service frequencies and expanded route/service coverage areas) and integration of public transit with central hubs to accommodate ridership. Improved user amenities such as weatherproof bus shelters, sheltered bicycle parking, bicycle racks on busses, and bus stop lighting and way-finding signage could also be implemented. Although each county manages their own transit agencies, the Capacity Program provides roadway and nonmotorized access to transit, while the System Preservation Program maintains and repairs the roadways and bridges shared by transit and general purpose vehicles. Statewide transit improvements align with the Modal Integration and Transportation Access Mobility goals of the Plan.
• Congestion relief strategies – The Congestion Program manages and optimizes the performance of existing transportation facilities. Identifying and developing specific congestion relief strategies within the existing highway infrastructure on each island would improve system efficiency. Solutions or strategies that fall under the Congestion Program are often coordinated with solutions under the System Preservation Program and the Safety Program. Potential congestion solutions include the development of new high-occupancy vehicle lanes, bus/transit-only lanes, or peak hour reversible lanes on the state’s most congested highways. Improvements to the existing ITS program could also be explored. Statewide congestion relief solutions align with the Environment and Sustainability, System Preservation, Economic Vitality, and System Efficiency Management and Operations goals of the Plan because they support providing and maintaining an efficient transportation system.
Future Planning and Budgeting This evaluation process is intended to be replicable. Since information, political priorities, funding sources, and state, regional, and local leadership changes, it is important that this process is flexible. Goals, weights, and grading schemes could change over time – but the seven-step process is a defensible solution-prioritization process that can be applied to future planning cycles.
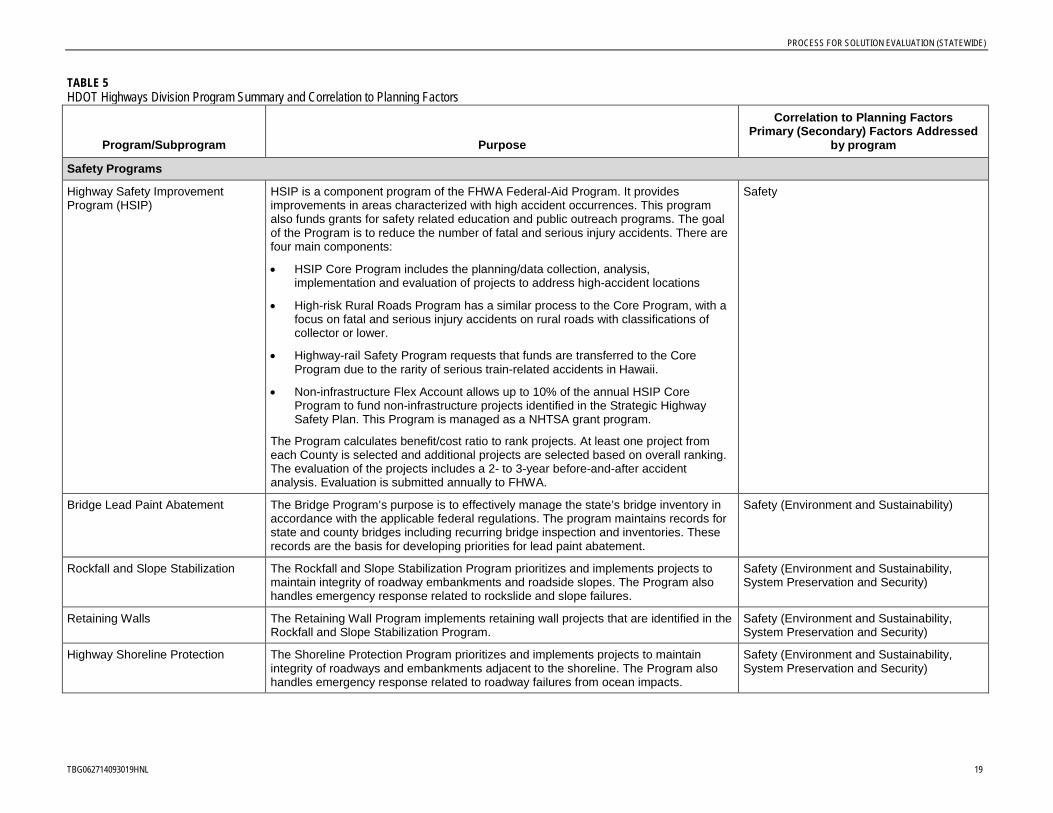
PROCESS FOR SOLUTION EVALUATION (STATEWIDE)
TBG062714093019HNL 19
TABLE 5 HDOT Highways Division Program Summary and Correlation to Planning Factors
Program/Subprogram Purpose
Correlation to Planning Factors Primary (Secondary) Factors Addressed
by program
Safety Programs
Highway Safety Improvement Program (HSIP)
HSIP is a component program of the FHWA Federal-Aid Program. It provides improvements in areas characterized with high accident occurrences. This program also funds grants for safety related education and public outreach programs. The goal of the Program is to reduce the number of fatal and serious injury accidents. There are four main components:
• HSIP Core Program includes the planning/data collection, analysis, implementation and evaluation of projects to address high-accident locations
• High-risk Rural Roads Program has a similar process to the Core Program, with a focus on fatal and serious injury accidents on rural roads with classifications of collector or lower.
• Highway-rail Safety Program requests that funds are transferred to the Core Program due to the rarity of serious train-related accidents in Hawaii.
• Non-infrastructure Flex Account allows up to 10% of the annual HSIP Core Program to fund non-infrastructure projects identified in the Strategic Highway Safety Plan. This Program is managed as a NHTSA grant program.
The Program calculates benefit/cost ratio to rank projects. At least one project from each County is selected and additional projects are selected based on overall ranking. The evaluation of the projects includes a 2- to 3-year before-and-after accident analysis. Evaluation is submitted annually to FHWA.
Safety
Bridge Lead Paint Abatement The Bridge Program’s purpose is to effectively manage the state’s bridge inventory in accordance with the applicable federal regulations. The program maintains records for state and county bridges including recurring bridge inspection and inventories. These records are the basis for developing priorities for lead paint abatement.
Safety (Environment and Sustainability)
Rockfall and Slope Stabilization The Rockfall and Slope Stabilization Program prioritizes and implements projects to maintain integrity of roadway embankments and roadside slopes. The Program also handles emergency response related to rockslide and slope failures.
Safety (Environment and Sustainability, System Preservation and Security)
Retaining Walls The Retaining Wall Program implements retaining wall projects that are identified in the Rockfall and Slope Stabilization Program.
Safety (Environment and Sustainability, System Preservation and Security)
Highway Shoreline Protection The Shoreline Protection Program prioritizes and implements projects to maintain integrity of roadways and embankments adjacent to the shoreline. The Program also handles emergency response related to roadway failures from ocean impacts.
Safety (Environment and Sustainability, System Preservation and Security)

PROCESS FOR SOLUTION EVALUATION (STATEWIDE)
TBG062714093019HNL 20
TABLE 5 HDOT Highways Division Program Summary and Correlation to Planning Factors
Program/Subprogram Purpose
Correlation to Planning Factors Primary (Secondary) Factors Addressed
by program
Guardrail and Shoulder Improvement
The purpose of this program is to provide the motoring public with a better and safer guardrail system which will reduce injuries and increase survivability during crashes. It will also minimize tort liabilities against the state and ensure compliance with FHWA-mandated NCHRP 350 criteria on guardrails, end terminals, bridge railing, bridge end posts, and crash attenuators.
The program identifies areas requiring new guardrail installation or requiring upgrading of existing guardrails and appurtenances with NCHRP-350-compliant hardware. The program also identifies areas requiring paved shoulder improvements which will enhance guardrail functioning and performance.
Safety
Traffic Signal Upgrade The Traffic Signal Upgrade Program focuses on upgrading aging traffic signal equipment to be compatible with current technology and standards. The program coordinates implementation of signal upgrades with other preservation, congestion, and safety projects.
Safety (System Preservation)
Highway Lighting Upgrade The Highway Lighting Upgrade Program focuses on upgrading aging highway lighting equipment to be compatible with current technology, standards, and local requirements including regulations to protect wildlife. The program coordinates implementation of lighting upgrades with other preservation, congestion, and safety projects.
Safety (System Preservation, Environment and Sustainability)
Americans with Disabilities Act The ADA Program focuses on accessibility of curb ramps and sidewalks. (Initially the program was established to address the consent decree ruling – what is the current status of the program?)
Safety (Transportation Access Mobility, Modal Integration)
Pedestrian The Pedestrian Program prioritizes and implements projects to address pedestrian needs. Priorities are identified in the Statewide Pedestrian Master Plan. Priorities were developed to address gaps in the pedestrian system, areas in proximity to high pedestrian land uses, areas with pedestrian-oriented populations and pedestrian accident locations. The Program includes the phased project that upgrades pedestrian signal heads to countdown timer displays.
Safety (Transportation Access Mobility, Modal Integration)
Bicycle The Bicycle Program prioritizes and implements projects to address bicyclists’ needs. Priorities are identified in Bike Plan Hawaii. Bike Plan Hawaii strives to integrate bicycling into the state’s transportation system.
Safety (Transportation Access Mobility, Modal Integration)
System Preservation Programs
Pavement Resurfacing The Pavement Resurfacing Program prioritizes and implements projects that preserve the state transportation system through pavement overlays.
System Preservation (Economic Vitality, Safety)
Pavement Rehabilitation The Pavement Rehabilitation Program prioritizes and implements projects that preserve the state transportation system through pavement repairs.
System Preservation (Economic Vitality, Safety)

PROCESS FOR SOLUTION EVALUATION (STATEWIDE)
TBG062714093019HNL 21
TABLE 5 HDOT Highways Division Program Summary and Correlation to Planning Factors
Program/Subprogram Purpose
Correlation to Planning Factors Primary (Secondary) Factors Addressed
by program
Pavement Reconstruction The Pavement Reconstruction Program prioritizes and implements projects that preserve the state transportation system through pavement reconstruction/replacement.
System Preservation (Economic Vitality, Safety)
Pavement Preventive Maintenance The Pavement Preservation Program prioritizes and implements projects that preserve the state transportation system through preventive pavement maintenance.
System Preservation (Economic Vitality, Safety)
Bridge Replacement The Bridge Program’s purpose is to effectively manage the state’s bridge inventory in accordance with the applicable federal regulations. The program maintains records for state and county bridges including recurring bridge inspection and inventories. These records allow for prioritizing bridges for replacement.
System Preservation (Economic Vitality, Safety)
Bridge Rehabilitation The Bridge Program’s purpose is to effectively manage the state’s bridge inventory in accordance with the applicable federal regulations. The program maintains records for state and county bridges including recurring bridge inspection and inventories. These records allow for prioritizing bridges for rehabilitation including the widening of existing structures.
System Preservation (Economic Vitality, Safety)
Bridge Preventive Maintenance The Bridge Program’s purpose is to effectively manage the state’s bridge inventory in accordance with the applicable federal regulations. The program maintains records for state and county bridges including recurring bridge inspection and inventories. These records allow for prioritizing bridges for preventive maintenance.
System Preservation (Economic Vitality, Safety)
Seismic Retrofit The Bridge Program’s purpose is to effectively manage the state’s bridge inventory in accordance with the applicable federal regulations. The program maintains records for state and county bridges including recurring bridge inspection and inventories. These records allow for prioritizing bridges for seismic retrofit.
System Preservation (Economic Vitality, Safety)
Drainage Improvements The Drainage Program provides upgrades to the existing highway drainage system to maintain roadway integrity and operations. The Program assists the Districts’ maintenance staff with immediate mitigation for existing and/or recurring drainage issues. The Program is intended to be a means to fast track design and construction of small drainage projects statewide.
The Drainage Program solicits potential projects from the Districts biennially. Field investigations are conducted to determine if the project can be funded under the Program. Based on estimated construction cost, design schedule, and urgency of the project, the projects are then programmed into the budget. Programming is done for the next 2-3 fiscal years. Potential drainage projects that are not included in the Program are budgeted using other funding sources.
System Preservation (Environment and Sustainability, Safety)
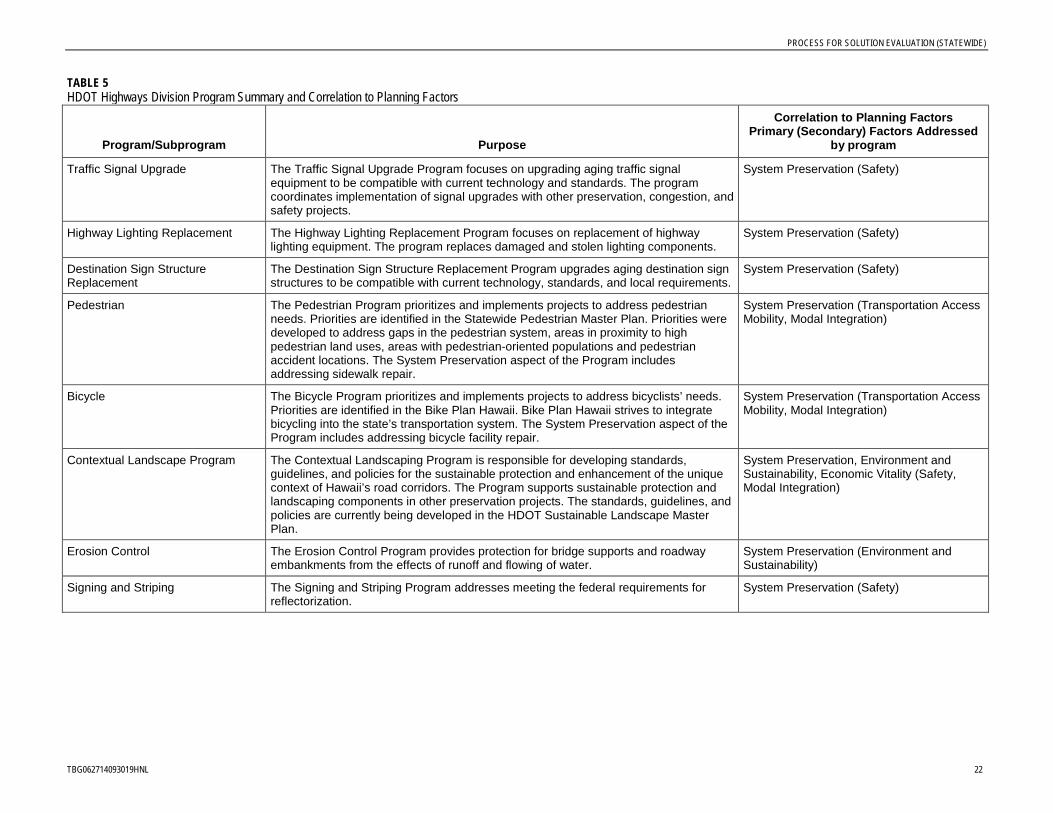
PROCESS FOR SOLUTION EVALUATION (STATEWIDE)
TBG062714093019HNL 22
TABLE 5 HDOT Highways Division Program Summary and Correlation to Planning Factors
Program/Subprogram Purpose
Correlation to Planning Factors Primary (Secondary) Factors Addressed
by program
Traffic Signal Upgrade The Traffic Signal Upgrade Program focuses on upgrading aging traffic signal equipment to be compatible with current technology and standards. The program coordinates implementation of signal upgrades with other preservation, congestion, and safety projects.
System Preservation (Safety)
Highway Lighting Replacement The Highway Lighting Replacement Program focuses on replacement of highway lighting equipment. The program replaces damaged and stolen lighting components.
System Preservation (Safety)
Destination Sign Structure Replacement
The Destination Sign Structure Replacement Program upgrades aging destination sign structures to be compatible with current technology, standards, and local requirements.
System Preservation (Safety)
Pedestrian The Pedestrian Program prioritizes and implements projects to address pedestrian needs. Priorities are identified in the Statewide Pedestrian Master Plan. Priorities were developed to address gaps in the pedestrian system, areas in proximity to high pedestrian land uses, areas with pedestrian-oriented populations and pedestrian accident locations. The System Preservation aspect of the Program includes addressing sidewalk repair.
System Preservation (Transportation Access Mobility, Modal Integration)
Bicycle The Bicycle Program prioritizes and implements projects to address bicyclists’ needs. Priorities are identified in the Bike Plan Hawaii. Bike Plan Hawaii strives to integrate bicycling into the state’s transportation system. The System Preservation aspect of the Program includes addressing bicycle facility repair.
System Preservation (Transportation Access Mobility, Modal Integration)
Contextual Landscape Program The Contextual Landscaping Program is responsible for developing standards, guidelines, and policies for the sustainable protection and enhancement of the unique context of Hawaii’s road corridors. The Program supports sustainable protection and landscaping components in other preservation projects. The standards, guidelines, and policies are currently being developed in the HDOT Sustainable Landscape Master Plan.
System Preservation, Environment and Sustainability, Economic Vitality (Safety, Modal Integration)
Erosion Control The Erosion Control Program provides protection for bridge supports and roadway embankments from the effects of runoff and flowing of water.
System Preservation (Environment and Sustainability)
Signing and Striping The Signing and Striping Program addresses meeting the federal requirements for reflectorization.
System Preservation (Safety)
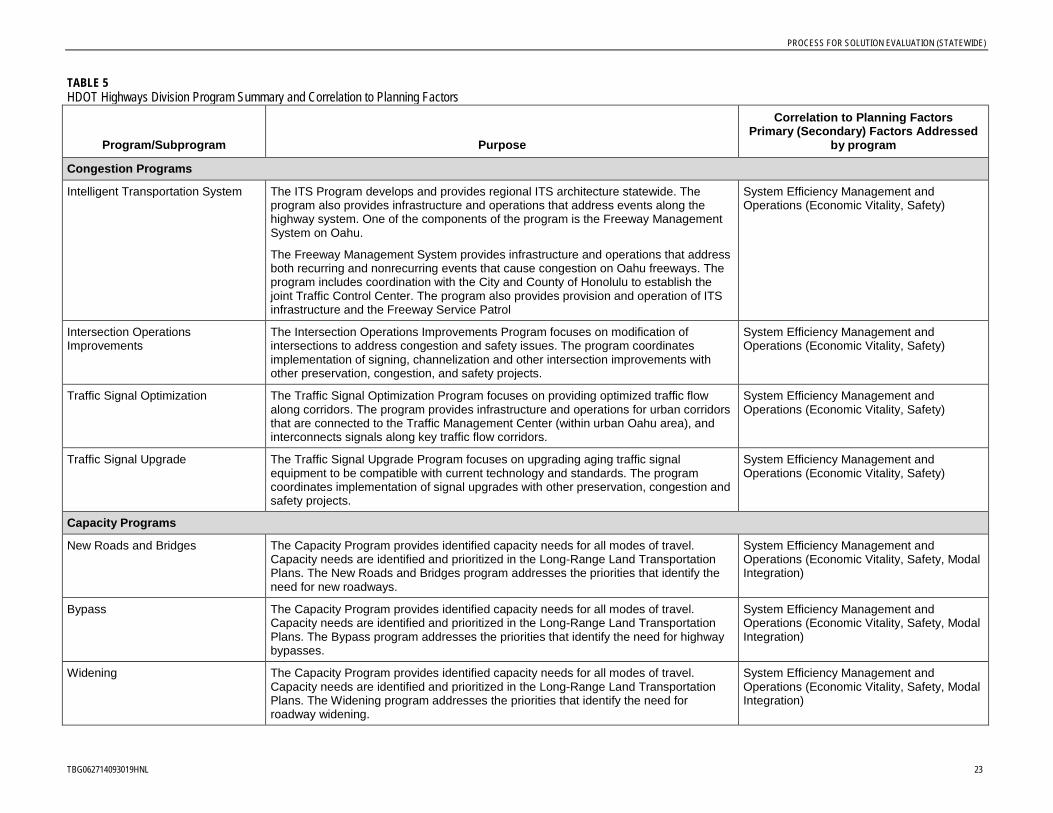
PROCESS FOR SOLUTION EVALUATION (STATEWIDE)
TBG062714093019HNL 23
TABLE 5 HDOT Highways Division Program Summary and Correlation to Planning Factors
Program/Subprogram Purpose
Correlation to Planning Factors Primary (Secondary) Factors Addressed
by program
Congestion Programs
Intelligent Transportation System The ITS Program develops and provides regional ITS architecture statewide. The program also provides infrastructure and operations that address events along the highway system. One of the components of the program is the Freeway Management System on Oahu.
The Freeway Management System provides infrastructure and operations that address both recurring and nonrecurring events that cause congestion on Oahu freeways. The program includes coordination with the City and County of Honolulu to establish the joint Traffic Control Center. The program also provides provision and operation of ITS infrastructure and the Freeway Service Patrol
System Efficiency Management and Operations (Economic Vitality, Safety)
Intersection Operations Improvements
The Intersection Operations Improvements Program focuses on modification of intersections to address congestion and safety issues. The program coordinates implementation of signing, channelization and other intersection improvements with other preservation, congestion, and safety projects.
System Efficiency Management and Operations (Economic Vitality, Safety)
Traffic Signal Optimization The Traffic Signal Optimization Program focuses on providing optimized traffic flow along corridors. The program provides infrastructure and operations for urban corridors that are connected to the Traffic Management Center (within urban Oahu area), and interconnects signals along key traffic flow corridors.
System Efficiency Management and Operations (Economic Vitality, Safety)
Traffic Signal Upgrade The Traffic Signal Upgrade Program focuses on upgrading aging traffic signal equipment to be compatible with current technology and standards. The program coordinates implementation of signal upgrades with other preservation, congestion and safety projects.
System Efficiency Management and Operations (Economic Vitality, Safety)
Capacity Programs
New Roads and Bridges The Capacity Program provides identified capacity needs for all modes of travel. Capacity needs are identified and prioritized in the Long-Range Land Transportation Plans. The New Roads and Bridges program addresses the priorities that identify the need for new roadways.
System Efficiency Management and Operations (Economic Vitality, Safety, Modal Integration)
Bypass The Capacity Program provides identified capacity needs for all modes of travel. Capacity needs are identified and prioritized in the Long-Range Land Transportation Plans. The Bypass program addresses the priorities that identify the need for highway bypasses.
System Efficiency Management and Operations (Economic Vitality, Safety, Modal Integration)
Widening The Capacity Program provides identified capacity needs for all modes of travel. Capacity needs are identified and prioritized in the Long-Range Land Transportation Plans. The Widening program addresses the priorities that identify the need for roadway widening.
System Efficiency Management and Operations (Economic Vitality, Safety, Modal Integration)

PROCESS FOR SOLUTION EVALUATION (STATEWIDE)
TBG062714093019HNL 24
TABLE 5 HDOT Highways Division Program Summary and Correlation to Planning Factors
Program/Subprogram Purpose
Correlation to Planning Factors Primary (Secondary) Factors Addressed
by program
Pedestrian The Pedestrian Program prioritizes and implements projects to address pedestrian needs. Priorities are identified in the Statewide Pedestrian Master Plan. Priorities were developed to address gaps in the pedestrian system, areas in proximity to high pedestrian land uses, areas with pedestrian-oriented populations and pedestrian accident locations. Pedestrian improvements related to Capacity address pedestrian demands and may include new facilities.
Modal Integration (Transportation Access Mobility)
Bicycle The Bicycle Program prioritizes and implements projects to address bicyclists’ needs. Priorities are identified in the Bike Plan Hawaii. Bike Plan Hawaii strives to integrate bicycling into the state’s transportation system. Bicycle improvements related to Capacity address bicycle demands and may include new facilities.
Modal Integration (Transportation Access Mobility)
Environmental Programs
Contextual Landscape Program The Contextual Landscape Program is responsible for developing standards, guidelines and polices for the sustainable protection and enhancement of the unique context of Hawaii’s road corridors. Priorities are currently being developed in the HDOT Statewide Sustainable Landscape Master Plan.
Environment and Sustainability, Economic Vitality, System Preservation (Safety, Modal Integration)
Municipal Separate Storm Sewer System (MS4)
An MS4 permit is acquired on a 5-year timeframe that allows HDOT Highways to discharge storm water runoff. Currently the MS4 is required only on Oahu. The MS4 Program elements address the conditions set forth in the permit. The Program priorities are defined in the permit conditions. The current Program elements include; Environmental Management System, Storm Water Monitoring, Debris Control, Erosion Control, Master Consultant and Highways Divisions Charges.
Environment and Sustainability
Other Programs
Maui Transportation Maui Transportation oversees three grant programs: Maui Bus, Maui Economic Opportunity, which provides paratransit service and Air Ambulance.
Transportation Access Mobility
Hawaii Mass Transit The Hawaii County Mass Transit Agency provides public transportation around the island on the Hele-On bus. In addition, the Transit Agency offers a Shared Ride Taxi program which provides door to door transportation for as little as $2.00 within the urbanized area of Hilo.
Transportation Access Mobility
Kauai Transportation The Kauai Bus operates a public (fixed-route) bus service and a paratransit (door-to-door) bus service from Hanalei to Kekaha daily.
Transportation Access Mobility


Appendix GExpenditure and Funding Summary


T E C H N I C A L M E M O R A N D U M Statewide Federal-Aid Highways 2035 Transportation Plan and Regional Federal-Aid Highways 2035 Transportation Plans for the Districts of Maui, Hawaii, and Kauai
Expenditure and Funding Summary PREPARED FOR: States of Hawaii Department of Transportation
PREPARED BY: CH2M HILL
DATE: October 9, 2012
Introduction An assessment of recent and planned State of Hawaii Department of Transportation, Highways Division (HDOT) expenditures and funding was conducted to aid in the development of the financial element of the Statewide Federal-Aid Highways 2035 Transportation Plan and the Regional Federal-Aid Highways 2035 Transportation Plans for the Districts of Maui, Hawaii, and Kauai. The assessment was performed to illustrate current Highways Division priorities through summaries of implemented and planned Program fund allocations. The summaries will be used as a tool to understand mid- and long-term funding needs, but are not intended to be used to forecast funding trends.
This memorandum summarizes the short-term historical and projected expenditures by Program as of September 2010 at the statewide and district levels. Historical data are presented for federal fiscal years (FFY) 2006-2009 and projected expenditures are presented for FFY 2011-2014.
Historical revenue sources are summarized to identify the level of contribution for various state and federal revenues that fund the HDOT Highways Programs.
Historical and Projected Funding by Program Within the time periods reviewed, HDOT subprograms and projects were programmed under the following overarching Highways Division Programs:
• System Preservation Program – provides regular maintenance, rehabilitation, reconstruction, and replacement of transportation facilities to maintain the overall operations of the transportation system.
• Capacity Program – provides support to address capacity needs for all modes of land transportation through widening of existing facilities or provision of new facilities.
• Congestion Program – manages and optimizes performance of current infrastructure to improve mobility, reliability, and predictability of travel within the existing transportation system.
• Safety Program – provides education, and roadway and roadside infrastructure improvements that reduce the severity and number of crashes. The Safety Program also
TBG062714093019HNL 1
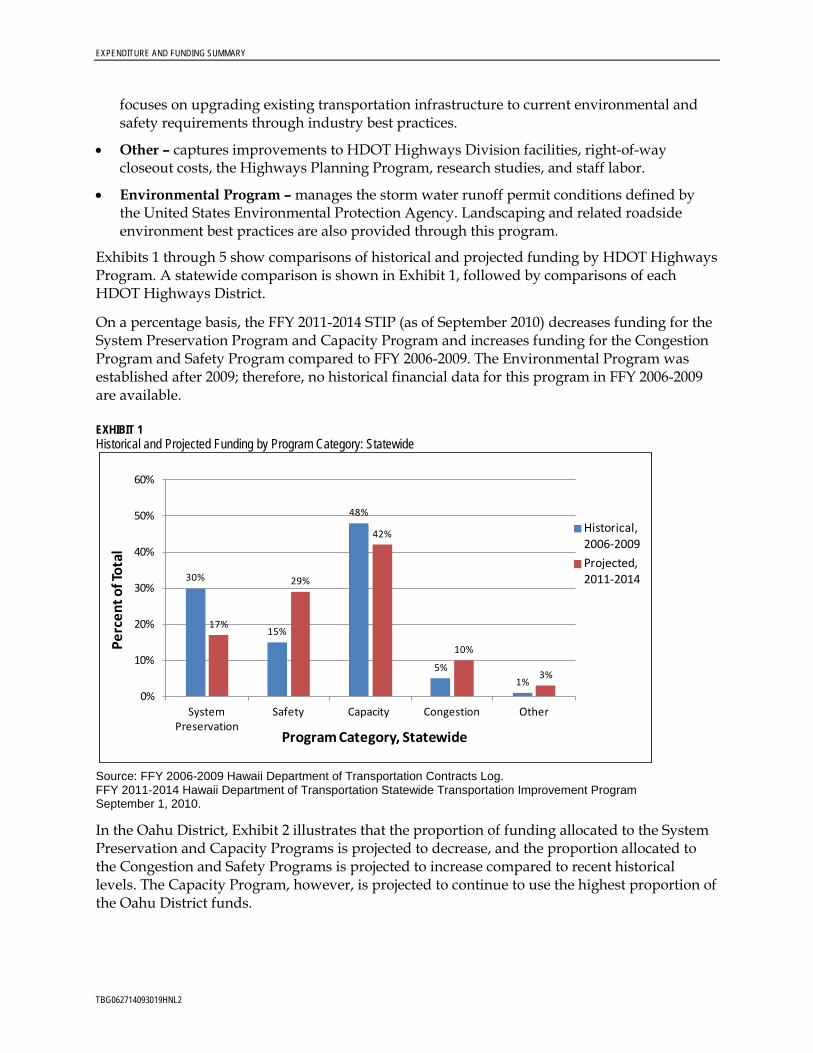
EXPENDITURE AND FUNDING SUMMARY
focuses on upgrading existing transportation infrastructure to current environmental and safety requirements through industry best practices.
• Other – captures improvements to HDOT Highways Division facilities, right-of-way closeout costs, the Highways Planning Program, research studies, and staff labor.
• Environmental Program – manages the storm water runoff permit conditions defined by the United States Environmental Protection Agency. Landscaping and related roadside environment best practices are also provided through this program.
Exhibits 1 through 5 show comparisons of historical and projected funding by HDOT Highways Program. A statewide comparison is shown in Exhibit 1, followed by comparisons of each HDOT Highways District.
On a percentage basis, the FFY 2011-2014 STIP (as of September 2010) decreases funding for the System Preservation Program and Capacity Program and increases funding for the Congestion Program and Safety Program compared to FFY 2006-2009. The Environmental Program was established after 2009; therefore, no historical financial data for this program in FFY 2006-2009 are available.
EXHIBIT 1 Historical and Projected Funding by Program Category: Statewide
Source: FFY 2006-2009 Hawaii Department of Transportation Contracts Log. FFY 2011-2014 Hawaii Department of Transportation Statewide Transportation Improvement Program September 1, 2010.
In the Oahu District, Exhibit 2 illustrates that the proportion of funding allocated to the System Preservation and Capacity Programs is projected to decrease, and the proportion allocated to the Congestion and Safety Programs is projected to increase compared to recent historical levels. The Capacity Program, however, is projected to continue to use the highest proportion of the Oahu District funds.
30%
15%
48%
5%1%
17%
29%
42%
10%
3%
0%
10%
20%
30%
40%
50%
60%
System Preservation
Safety Capacity Congestion Other
Perc
ent o
f Tot
al
Program Category, Statewide
Historical,2006-2009Projected,2011-2014
TBG062714093019HNL2

EXPENDITURE AND FUNDING SUMMARY
Some of the major projects that contribute to the relative increase in Congestion and Safety Program funds include improvements to the congestion freeway management system, the Alapai Transportation Management Center, replacement/rehabilitation of bridges along Kamehameha and Kalanianaole Highways, H-1 guardrail/shoulder improvements, and Highway Safety Improvement Program improvements.
EXHIBIT 2 Historical and Projected Funding by Program Category: Oahu District
Source: FFY 2006-2009 Hawaii Department of Transportation Contracts Log. FFY 2011-2014 Hawaii Department of Transportation Statewide Transportation Improvement Program September 1, 2010.
Exhibit 3 depicts that funding allocations for the Hawaii District are projected to change significantly with the proportion of funds allocated to the Capacity Program increasing, and the proportion of funds allocated to the System Preservation Program decreasing. As of September 2010, the planned Capacity funds are largely programmed for construction of the Saddle Road improvements.
24%
14%
51%
9%
2%
17%
28%
41%
11%
3%
0%
10%
20%
30%
40%
50%
60%
System Preservation
Safety Capacity Congestion Other
Perc
ent o
f Tot
al
Program Category, Oahu
Historical,2006-2009Projected,2011-2014
TBG062714093019HNL 3
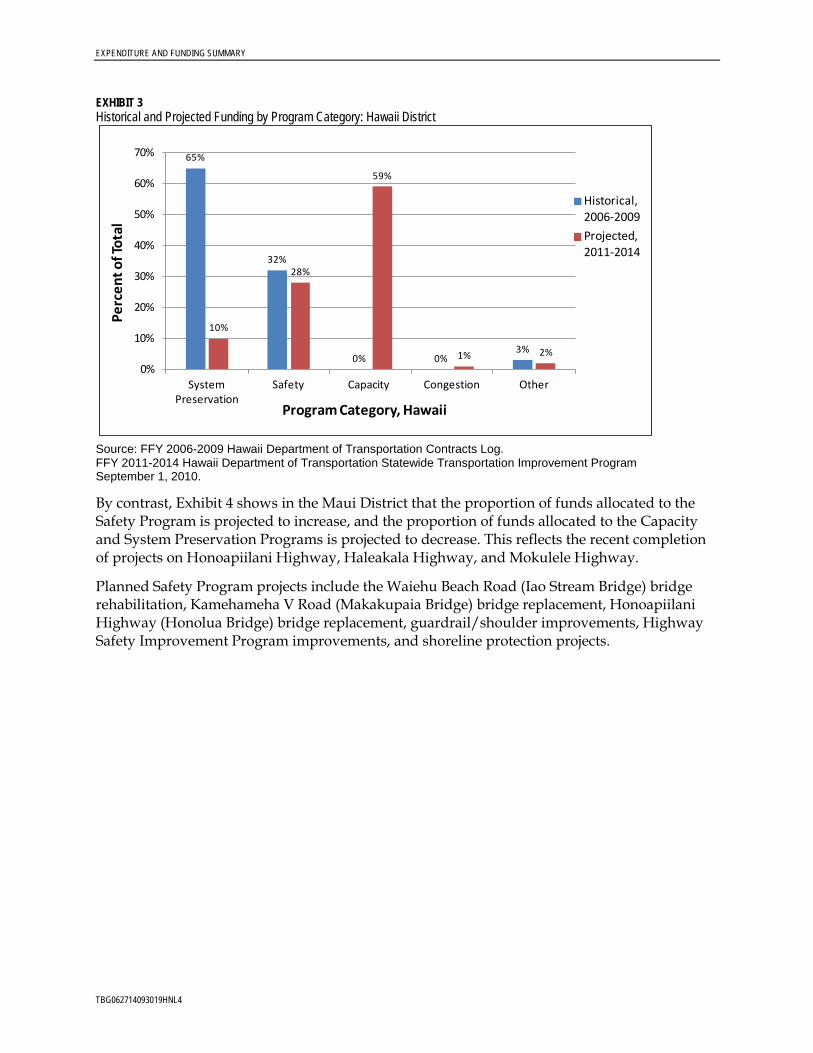
EXPENDITURE AND FUNDING SUMMARY
EXHIBIT 3 Historical and Projected Funding by Program Category: Hawaii District
Source: FFY 2006-2009 Hawaii Department of Transportation Contracts Log. FFY 2011-2014 Hawaii Department of Transportation Statewide Transportation Improvement Program September 1, 2010.
By contrast, Exhibit 4 shows in the Maui District that the proportion of funds allocated to the Safety Program is projected to increase, and the proportion of funds allocated to the Capacity and System Preservation Programs is projected to decrease. This reflects the recent completion of projects on Honoapiilani Highway, Haleakala Highway, and Mokulele Highway.
Planned Safety Program projects include the Waiehu Beach Road (Iao Stream Bridge) bridge rehabilitation, Kamehameha V Road (Makakupaia Bridge) bridge replacement, Honoapiilani Highway (Honolua Bridge) bridge replacement, guardrail/shoulder improvements, Highway Safety Improvement Program improvements, and shoreline protection projects.
65%
32%
0% 0%3%
10%
28%
59%
1% 2%
0%
10%
20%
30%
40%
50%
60%
70%
System Preservation
Safety Capacity Congestion Other
Perc
ent o
f Tot
al
Program Category, Hawaii
Historical,2006-2009Projected,2011-2014
TBG062714093019HNL4
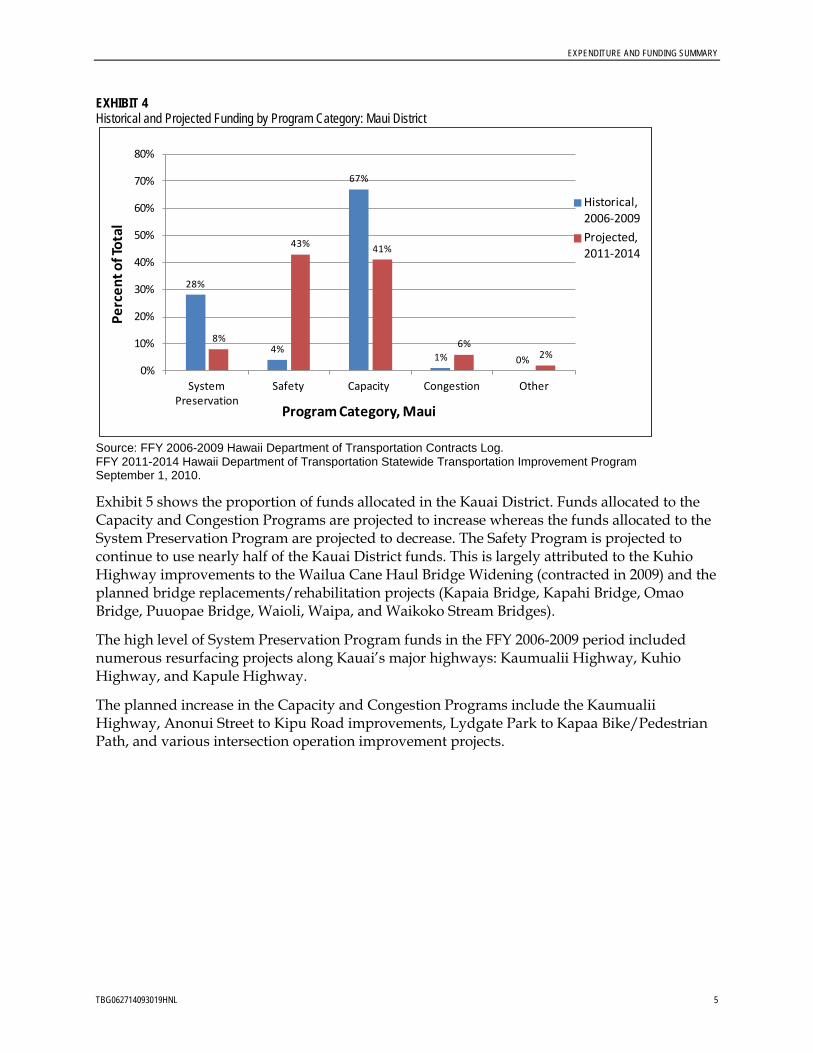
EXPENDITURE AND FUNDING SUMMARY
EXHIBIT 4 Historical and Projected Funding by Program Category: Maui District
Source: FFY 2006-2009 Hawaii Department of Transportation Contracts Log. FFY 2011-2014 Hawaii Department of Transportation Statewide Transportation Improvement Program September 1, 2010.
Exhibit 5 shows the proportion of funds allocated in the Kauai District. Funds allocated to the Capacity and Congestion Programs are projected to increase whereas the funds allocated to the System Preservation Program are projected to decrease. The Safety Program is projected to continue to use nearly half of the Kauai District funds. This is largely attributed to the Kuhio Highway improvements to the Wailua Cane Haul Bridge Widening (contracted in 2009) and the planned bridge replacements/rehabilitation projects (Kapaia Bridge, Kapahi Bridge, Omao Bridge, Puuopae Bridge, Waioli, Waipa, and Waikoko Stream Bridges).
The high level of System Preservation Program funds in the FFY 2006-2009 period included numerous resurfacing projects along Kauai’s major highways: Kaumualii Highway, Kuhio Highway, and Kapule Highway.
The planned increase in the Capacity and Congestion Programs include the Kaumualii Highway, Anonui Street to Kipu Road improvements, Lydgate Park to Kapaa Bike/Pedestrian Path, and various intersection operation improvement projects.
28%
4%
67%
1% 0%
8%
43% 41%
6%2%
0%
10%
20%
30%
40%
50%
60%
70%
80%
System Preservation
Safety Capacity Congestion Other
Perc
ent o
f Tot
al
Program Category, Maui
Historical,2006-2009Projected,2011-2014
TBG062714093019HNL 5

EXPENDITURE AND FUNDING SUMMARY
EXHIBIT 5 Historical and Projected Funding by Program Category: Kauai District
Source: FFY 2006-2009 Hawaii Department of Transportation Contracts Log. FFY 2011-2014 Hawaii Department of Transportation Statewide Transportation Improvement Program September 1, 2010.
Exhibit 6 compares historical and projected funding by District. As shown, the proportion of funds allocated to the Hawaii District is projected to increase, and the proportion allocated to the Maui District is projected to decrease. The relative proportion of funding to the Oahu and Kauai Districts is projected to remain very close to that experienced from FFY 2006-2009.
EXHIBIT 6 Historical and Projected Funding Statewide by District
Source: FFY 2006-2009 Hawaii Department of Transportation Contracts Log. FFY 2011-2014 Hawaii Department of Transportation Statewide Transportation Improvement Program September 1, 2010.
47%49%
0%4%
0%
14%
47%
22%
15%
2%
0%
10%
20%
30%
40%
50%
60%
System Preservation
Safety Capacity Congestion Other
Perc
ent o
f Tot
al
Program Category, Kauai
Historical,2006-2009Projected,2011-2014
52%
32%
8% 8%
51%
13%
26%
10%
0%
10%
20%
30%
40%
50%
60%
Oahu Maui Hawaii Kauai
Perc
ent o
f Tot
al St
ate
Fund
ing
District
Historical,2006-2009Projected,2011-2014
TBG062714093019HNL6

EXPENDITURE AND FUNDING SUMMARY
Exhibit 7 compares historical and projected future funding by Program in dollars. As shown, the Capacity Program has received more funding than any other Program with nearly $350 million in funding. Projected future funding for the Capacity Program is expected to remain similar to that of the recent past. When compared to actual expenditures in FFY 2006-2009, the September 2010 STIP focuses on the Safety Program and the Congestion Program, with a decline projected for the System Preservation Program.
EXHIBIT 7 Funding by Program
Source: FFY 2006-2009 Hawaii Department of Transportation Contracts Log. FFY 2011-2014 Hawaii Department of Transportation Statewide Transportation Improvement Program September 1, 2010.
Exhibit 8 shows a summary of the number of projects funded in each Program from FFY 2006 to 2009 and the number of projects funded from FFY 2011 to 2014. One hundred sixty-five projects were contracted from FFY 2006 to 2009. Nearly 100 projects were contracted under the System Preservation Program. The September 2010 STIP anticipates commencement of 148 projects. The Safety Program is expected to see the largest increase in the number of projects completed from FFY 2011 to 2014. Compared to FFY 2006 to 2009, the current STIP increases the number of projects in all categories except System Preservation.
$0
$50,000,000
$100,000,000
$150,000,000
$200,000,000
$250,000,000
$300,000,000
$350,000,000
$400,000,000
System Preservation
Safety Capacity Congestion Other
Program Category
Total Cost by Program, 2006-2009
Total Cost by Program, 2011-2014
TBG062714093019HNL 7

EXPENDITURE AND FUNDING SUMMARY
EXHIBIT 8 Numbers of Projects by Program
Source: FFY 2006-2009 Hawaii Department of Transportation Contracts Log. FFY 2011-2014 Hawaii Department of Transportation Statewide Transportation Improvement Program September 1, 2010.
Historical State and Federal Revenue Sources HDOT Highways Division relies on funding from state and federal sources to maintain and enhance transportation facilities. Sources of state funding include vehicle surcharges, registration fees, vehicle weight taxes, fuel tax, investment earning, and miscellaneous income. In 2008, the HDOT Highways Division reported operating revenue of approximately $213 million. Exhibit 9 presents a breakdown of state sources of funding in 2008. Fuel tax revenue accounted for 41 percent of HDOT Highways revenues. Vehicle surcharges, weight tax, and registration fees comprised 23 percent, 16 percent, and 10 percent of revenues, respectively.
EXHIBIT 9 Hawaii Department of Transportation Highways Operating Revenue, 2008
Source: HDOT, 2010
0
20
40
60
80
100
120
System Preservation
Safety Capacity Congestion Other
Program Category
Total No. of Projectsby Program, 2006-2009
Total No. of Projectsby Program, 2011-2014
3% $6 mil
23% $49 mil
7% $15 mil
10% $21 mil
16% $34 mil
41% $87 mil
2008 Hawaii DOT Highways Operating Revenues ($213 mil)
Miscellaneous
Vehicle Surcharges
Investment Earnings
Vehicle Registration Fee
Vehicle Weight Tax
Fuel Tax
TBG062714093019HNL8
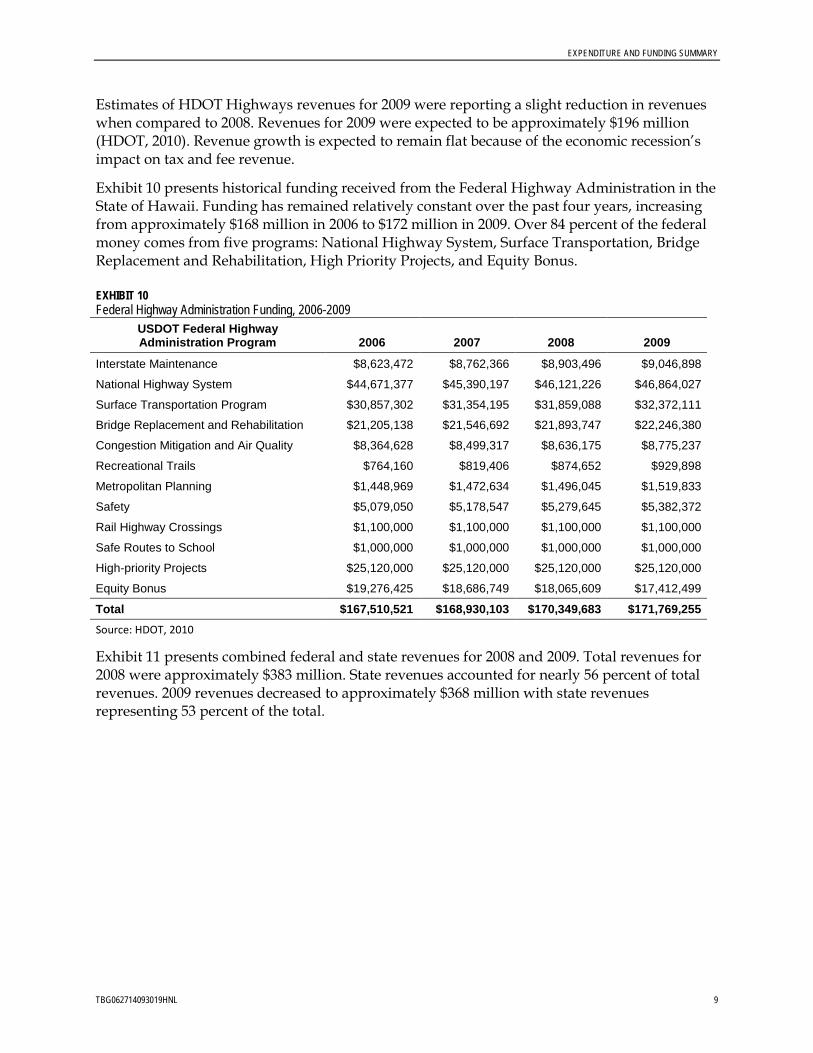
EXPENDITURE AND FUNDING SUMMARY
Estimates of HDOT Highways revenues for 2009 were reporting a slight reduction in revenues when compared to 2008. Revenues for 2009 were expected to be approximately $196 million (HDOT, 2010). Revenue growth is expected to remain flat because of the economic recession’s impact on tax and fee revenue.
Exhibit 10 presents historical funding received from the Federal Highway Administration in the State of Hawaii. Funding has remained relatively constant over the past four years, increasing from approximately $168 million in 2006 to $172 million in 2009. Over 84 percent of the federal money comes from five programs: National Highway System, Surface Transportation, Bridge Replacement and Rehabilitation, High Priority Projects, and Equity Bonus.
EXHIBIT 10 Federal Highway Administration Funding, 2006-2009
USDOT Federal Highway Administration Program 2006 2007 2008 2009
Interstate Maintenance $8,623,472 $8,762,366 $8,903,496 $9,046,898
National Highway System $44,671,377 $45,390,197 $46,121,226 $46,864,027
Surface Transportation Program $30,857,302 $31,354,195 $31,859,088 $32,372,111
Bridge Replacement and Rehabilitation $21,205,138 $21,546,692 $21,893,747 $22,246,380
Congestion Mitigation and Air Quality $8,364,628 $8,499,317 $8,636,175 $8,775,237
Recreational Trails $764,160 $819,406 $874,652 $929,898
Metropolitan Planning $1,448,969 $1,472,634 $1,496,045 $1,519,833
Safety $5,079,050 $5,178,547 $5,279,645 $5,382,372
Rail Highway Crossings $1,100,000 $1,100,000 $1,100,000 $1,100,000
Safe Routes to School $1,000,000 $1,000,000 $1,000,000 $1,000,000
High-priority Projects $25,120,000 $25,120,000 $25,120,000 $25,120,000
Equity Bonus $19,276,425 $18,686,749 $18,065,609 $17,412,499
Total $167,510,521 $168,930,103 $170,349,683 $171,769,255 Source: HDOT, 2010
Exhibit 11 presents combined federal and state revenues for 2008 and 2009. Total revenues for 2008 were approximately $383 million. State revenues accounted for nearly 56 percent of total revenues. 2009 revenues decreased to approximately $368 million with state revenues representing 53 percent of the total.
TBG062714093019HNL 9

EXPENDITURE AND FUNDING SUMMARY
EXHIBIT 11 Total State and Federal Revenues, 2008-2009
Source: HDOT, 2010
Summary This memorandum presents information about Highways Division priorities at the state and district levels as of September 2010 through summaries of implemented and planned Program fund allocations. It includes historical and projected funding by program and by district, thus providing information that can be used as a tool to assess mid- and long-term funding needs, as shown in the FFY 2011-2014 STIP. Comparisons are provided that illustrate the differences between past and proposed future funding priorities.
Statewide, the STIP as of September 2010 is projecting a relative increase in funding for the Congestion and Safety Programs and a relative decrease in funding for the System Preservation and Capacity Programs. By District, the proportion of funding allocated to the Hawaii District is projected to increase, the proportion allocated to the Maui District is projected to decrease, and the proportions allocated to the Oahu and Kauai Districts are projected to remain relatively similar to the recent past.
The HDOT Highways Program is funded by both state and federal sources. In 2008 and 2009, State revenues accounted for nearly 56 percent and 53 percent of total revenues, respectively, with the remainder coming from federal sources.
Fuel taxes are the largest source of state funding accounting for 41 percent of revenues in 2008. Over 84 percent of federal funds come from five programs: National Highway System, Surface Transportation, Bridge Replacement and Rehabilitation, High Priority Projects, and Equity Bonus.
In the future, highway program funding is expected to remain flat because of the economic recession’s impact on state and federal taxes and fees.
$0
$50,000,000
$100,000,000
$150,000,000
$200,000,000
$250,000,000
$300,000,000
$350,000,000
$400,000,000
$450,000,000
2008 2009
Federal
State
TBG062714093019HNL10
EXPENDITURE AND FUNDING SUMMARY
Reference State of Hawaii Department of Transportation (HDOT). 2010. 2035 Hawaii Statewide
Transportation Plan: Issue Paper on Financial Issues. June.
TBG062714093019HNL 11

Appendix HFuture Funding Strategies

TBG062714093019HNL 1
T E C H N I C A L M E M O R A N D U M Statewide and Regional Federal-Aid Highways 2035 Transportation Plans for the Districts of Maui, Hawaii, and Kauai
Future Funding Strategies PREPARED FOR: State of Hawaii Department of Transportation
PREPARED BY: CH2M HILL
DATE: March 2014
Introduction As part of the State of Hawaii Department of Transportation (HDOT) Statewide Transportation Planning Process, policy and planning activities must be coordinated with funding and implementation activities. The purpose of this memorandum is to present a summary of the funding needs for the State of Hawaii’s Highway Fund by outlining long-term program costs through 2035. This memorandum will also identify current and future sources of revenue for the Highway Fund at the statewide and federal level and discuss potential funding shortfalls. Finally, the memorandum will identify funding strategies to meet anticipated needs and provide a discussion of possible contingency measures to mitigate funding gaps.
Current Funding Summary In August 2011, the Expenditure and Funding Summary Technical Memorandum was prepared to illustrate the HDOT Highways Division priorities through summaries of historic implemented/planned program fund allocation. A review of the Statewide Transportation Improvement Program (STIP) project list as of June 2010 was used during the analysis. It should be noted that the STIP has been revised since the completion of the August 2011 memo to reflect the current status of listed projects.
The historic fund allocation summaries were used as a tool for understanding potential mid- and long-term funding needs, but were not intended to be used to forecast funding trends. The memorandum summarized the short-term historical and projected expenditures by program at the statewide and district levels. Historical data were presented for federal fiscal years (FFY) 2006-2009, and short-term projected expenditures were presented for FFY 2011-2014.
Historical revenue was also summarized to identify the level of contribution for various state and federal revenues that fund the HDOT Highways Division’s programs. Land transportation projects are implemented through one of the following overarching HDOT Highways programs:
• System Preservation Program – provides regular maintenance, rehabilitation, reconstruction and replacement of transportation facilities to maintain the overall operations of the transportation system.
• Capacity Program – provides support to address identified capacity needs for all modes of land transportation, from widening existing facilities to constructing new facilities.

FUTURE FUNDING STRATEGIES
TBG062714093019HNL 2
• Congestion Program – manages and optimizes performance of current infrastructure to improve mobility, reliability, and predictability of travel within the existing transportation system.
• Safety Program – provides education, and roadway and roadside infrastructure improvements that reduce the severity and number of crashes. The Safety Program also focuses on upgrading existing transportation infrastructure to current environmental and safety requirements through industry best practices.
• Other – captures improvements to HDOT Highways Division’s facilities, right-of-way closeout costs, the Highways Planning Program, and staff labor.
• Environmental Program – manages the stormwater runoff permit conditions defined by the United States Environmental Protection Agency. Landscaping and related roadside environment best practices are also provided through this program.
Figure 1 compares historical and projected funding for each of the HDOT Highways Division’s programs at the statewide level, as of 2011. On a percentage basis, the FFY 2011-2014 STIP indicates decreased funding for the System Preservation and Capacity programs and increased funding for the Congestion and Safety programs compared to FFY 2006-2009. The Environmental Program was established after 2009; therefore, no historical financial data for this program in FFY 2006-2009 are available.
FIGURE 1 Historical and Projected Funding by Program Category: Statewide
Source: FFY 2006-2009 Hawaii Department of Transportation Contracts Log. FFY 2011-2014 Hawaii Department of Transportation Statewide Transportation Improvement Program September 1, 2010.
Figure 2 compares historical and projected short-term future funding, in dollars, by program. As shown, the Capacity Program received more funding than any other program with nearly $350 million in funding. Short-term projected funding for the Capacity Program is expected to remain similar to FFY 2006-2009. Compared to FFY 2006-2009, the FFY 2011-2014 STIP shows increased focus on the Safety Program and the Congestion Program, with a drop in funding for the System Preservation Program.
30%
15%
48%
5%1%
17%
29%
42%
10%
3%
0%
10%
20%
30%
40%
50%
60%
System Preservation
Safety Capacity Congestion Other
Perc
ent o
f Tot
al
Program Category, Statewide
Historical,2006-2009Projected,2011-2014

FUTURE FUNDING STRATEGIES
TBG062714093019HNL 3
FIGURE 2 Funding by Program
Source: FFY 2006-2009 Hawaii Department of Transportation Contracts Log. FFY 2011-2014 Hawaii Department of Transportation Statewide Transportation Improvement Program September 1, 2010.
Figure 3 shows a summary of the number of funded projects under each program for FFY 2006-2009 and FFY 2011-2014. A total of 165 projects were programmed in FFY 2006-2009. Nearly 100 projects were programmed into the System Preservation Program. A total of 148 projects were programmed in FFY 2011-2014. The Safety Program has the largest increase in the number of projects programmed in FFY 2011-2014 compared to FFY 2006-2009. The STIP shows an increased number of projects in all program categories except System Preservation. However, the number and amount of funding for capacity projects will likely decrease due to the adoption of Moving Ahead for Progress in the 21st Century (MAP-21) in July 2012, which contains no earmarked funds.
FIGURE 3 Numbers of Projects by Program
Source: FFY 2006-2009 Hawaii Department of Transportation Contracts Log. FFY 2011-2014 Hawaii Department of Transportation Statewide Transportation Improvement Program September 1, 2010.
$0
$50,000,000
$100,000,000
$150,000,000
$200,000,000
$250,000,000
$300,000,000
$350,000,000
$400,000,000
System Preservation
Safety Capacity Congestion Other
Total Cost by Program, 2006-2009
Total Cost by Program, 2011-2014
0
20
40
60
80
100
120
System Preservation
Safety Capacity Congestion Other
Total No. of Projects by Program, 2006-2009
Total No. of Projects by Program, 2011-2014
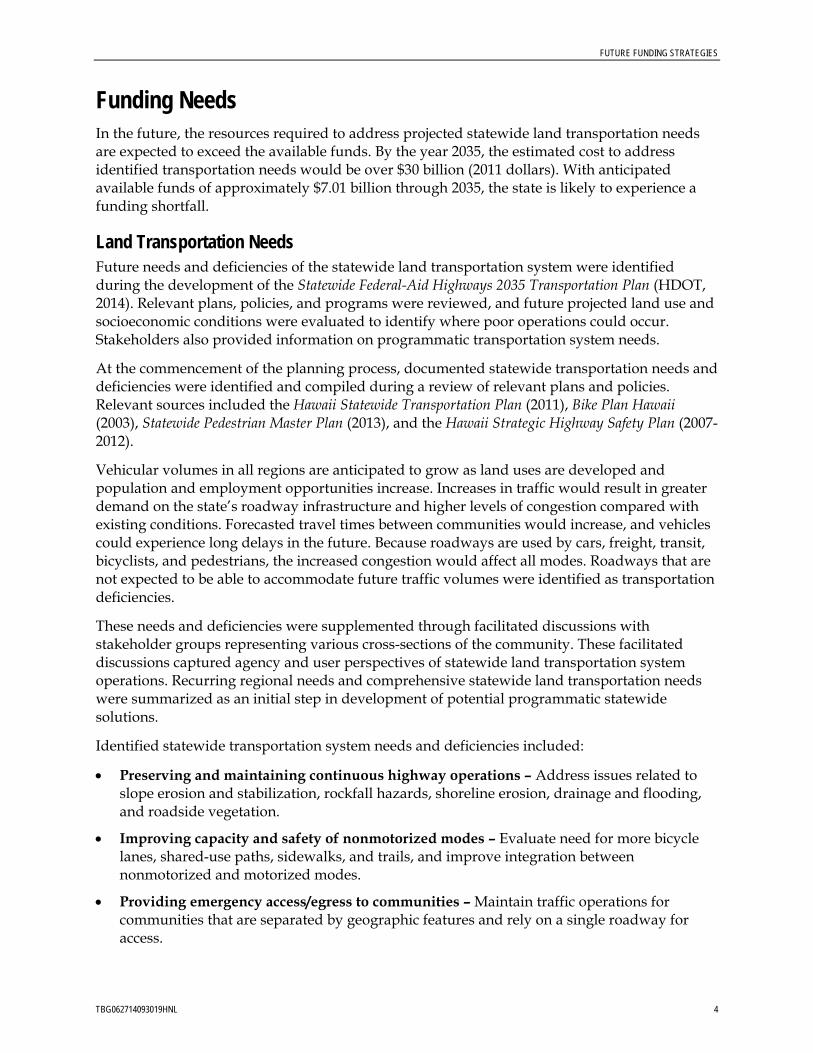
FUTURE FUNDING STRATEGIES
TBG062714093019HNL 4
Funding Needs In the future, the resources required to address projected statewide land transportation needs are expected to exceed the available funds. By the year 2035, the estimated cost to address identified transportation needs would be over $30 billion (2011 dollars). With anticipated available funds of approximately $7.01 billion through 2035, the state is likely to experience a funding shortfall.
Land Transportation Needs Future needs and deficiencies of the statewide land transportation system were identified during the development of the Statewide Federal-Aid Highways 2035 Transportation Plan (HDOT, 2014). Relevant plans, policies, and programs were reviewed, and future projected land use and socioeconomic conditions were evaluated to identify where poor operations could occur. Stakeholders also provided information on programmatic transportation system needs.
At the commencement of the planning process, documented statewide transportation needs and deficiencies were identified and compiled during a review of relevant plans and policies. Relevant sources included the Hawaii Statewide Transportation Plan (2011), Bike Plan Hawaii (2003), Statewide Pedestrian Master Plan (2013), and the Hawaii Strategic Highway Safety Plan (2007-2012).
Vehicular volumes in all regions are anticipated to grow as land uses are developed and population and employment opportunities increase. Increases in traffic would result in greater demand on the state’s roadway infrastructure and higher levels of congestion compared with existing conditions. Forecasted travel times between communities would increase, and vehicles could experience long delays in the future. Because roadways are used by cars, freight, transit, bicyclists, and pedestrians, the increased congestion would affect all modes. Roadways that are not expected to be able to accommodate future traffic volumes were identified as transportation deficiencies.
These needs and deficiencies were supplemented through facilitated discussions with stakeholder groups representing various cross-sections of the community. These facilitated discussions captured agency and user perspectives of statewide land transportation system operations. Recurring regional needs and comprehensive statewide land transportation needs were summarized as an initial step in development of potential programmatic statewide solutions.
Identified statewide transportation system needs and deficiencies included:
• Preserving and maintaining continuous highway operations – Address issues related to slope erosion and stabilization, rockfall hazards, shoreline erosion, drainage and flooding, and roadside vegetation.
• Improving capacity and safety of nonmotorized modes – Evaluate need for more bicycle lanes, shared-use paths, sidewalks, and trails, and improve integration between nonmotorized and motorized modes.
• Providing emergency access/egress to communities – Maintain traffic operations for communities that are separated by geographic features and rely on a single roadway for access.
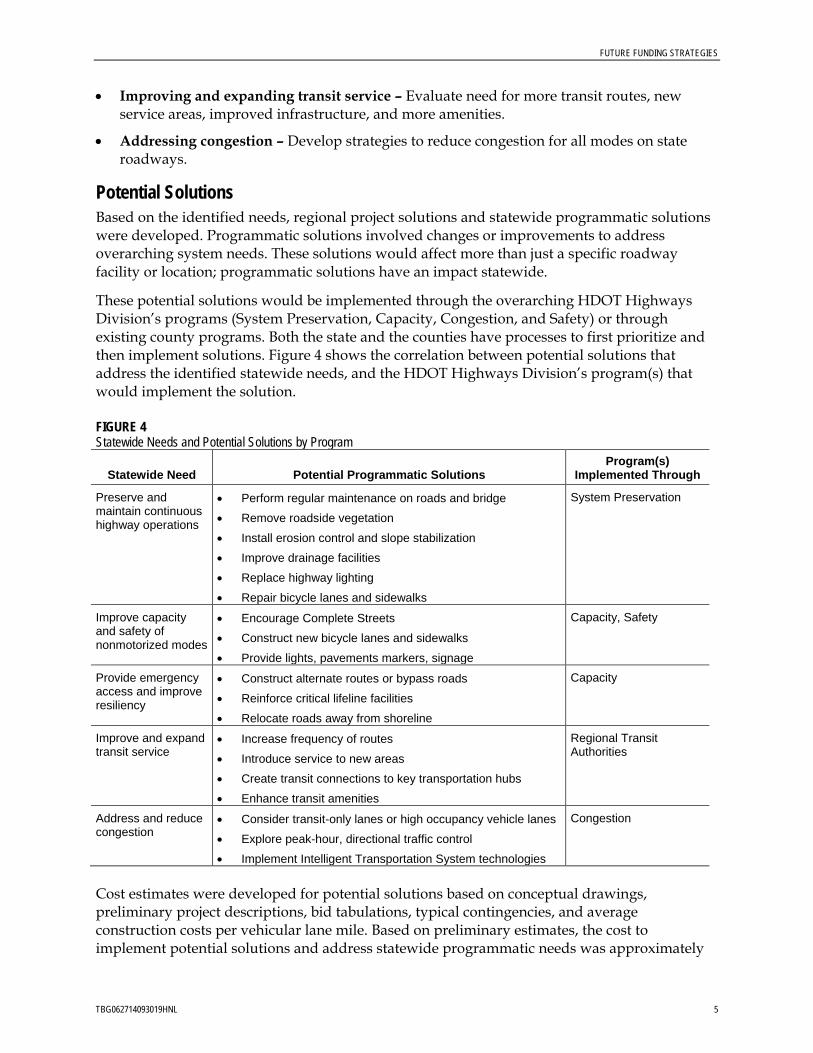
FUTURE FUNDING STRATEGIES
TBG062714093019HNL 5
• Improving and expanding transit service – Evaluate need for more transit routes, new service areas, improved infrastructure, and more amenities.
• Addressing congestion – Develop strategies to reduce congestion for all modes on state roadways.
Potential Solutions Based on the identified needs, regional project solutions and statewide programmatic solutions were developed. Programmatic solutions involved changes or improvements to address overarching system needs. These solutions would affect more than just a specific roadway facility or location; programmatic solutions have an impact statewide.
These potential solutions would be implemented through the overarching HDOT Highways Division’s programs (System Preservation, Capacity, Congestion, and Safety) or through existing county programs. Both the state and the counties have processes to first prioritize and then implement solutions. Figure 4 shows the correlation between potential solutions that address the identified statewide needs, and the HDOT Highways Division’s program(s) that would implement the solution.
FIGURE 4 Statewide Needs and Potential Solutions by Program
Statewide Need Potential Programmatic Solutions Program(s)
Implemented Through
Preserve and maintain continuous highway operations
• Perform regular maintenance on roads and bridge • Remove roadside vegetation
• Install erosion control and slope stabilization • Improve drainage facilities • Replace highway lighting
• Repair bicycle lanes and sidewalks
System Preservation
Improve capacity and safety of nonmotorized modes
• Encourage Complete Streets • Construct new bicycle lanes and sidewalks
• Provide lights, pavements markers, signage
Capacity, Safety
Provide emergency access and improve resiliency
• Construct alternate routes or bypass roads • Reinforce critical lifeline facilities
• Relocate roads away from shoreline
Capacity
Improve and expand transit service
• Increase frequency of routes
• Introduce service to new areas • Create transit connections to key transportation hubs • Enhance transit amenities
Regional Transit Authorities
Address and reduce congestion
• Consider transit-only lanes or high occupancy vehicle lanes • Explore peak-hour, directional traffic control • Implement Intelligent Transportation System technologies
Congestion
Cost estimates were developed for potential solutions based on conceptual drawings, preliminary project descriptions, bid tabulations, typical contingencies, and average construction costs per vehicular lane mile. Based on preliminary estimates, the cost to implement potential solutions and address statewide programmatic needs was approximately

FUTURE FUNDING STRATEGIES
TBG062714093019HNL 6
$30 billion. Figure 5 shows that each of the districts had different transportation deficiencies and therefore different program funding needs.
FIGURE 5 Estimated Costs of Program Needs, by District HDOT Highways Program Oahua Maui Hawaii Kauai
System Preservation $406 M $1.1 B $315 M
Safety $680 M $960 M $595 M
Capacity $1.9 B $4.1 B $2.2 B
Congestion $60 M $405 M $57 M
Other $60 M $795 M $10 M
Total = $30.4 B $16.7 B $3.1 B $7.4 B $3.2 B
a Source: Oahu Metropolitan Planning Organization, 2011.
Inflation Per the HDOT memo (HWY-PS 2.6454) dated December 8, 2007, inflation must be used when developing financial plans that include projects funded by federal dollars in the STIP. The HDOT developed a methodology that used the average inflation rate as reported by Consumer Price Index (CPI) data to estimate a constant inflation rate for all financial planning. Based on the average inflation rate from 2003-2006 as shown in the memo, a constant inflation rate of 4.0 percent (rounded) per year was calculated. The HDOT Highways Staff Services Office is responsible for validating and updating the inflation rate each budget cycle.
Figure 6 presents the inflation rate derived from the HDOT methodology presented in HDOT memo HWY-PS 2.6454.
FIGURE 6 HDOT Project Inflation Factor (2003-2006)
Year Honolulu Index % Change
2003 184.0
2004 188.9 2.7%
2005 195.6 3.5%
2006 201.6 3.2%
Average Difference 3.1%
Rounded Up 4.0%
Source: HDOT, 2007
Based on a review of more recent CPI data for Honolulu, Figure 7 shows an inflation rate of 3.0 percent (rounded) for data between 2008 and 2011.

FUTURE FUNDING STRATEGIES
TBG062714093019HNL 7
FIGURE 7 Projected Inflation Factor (2008-2011)
Year Honolulu Index % Change
2008 228.9
2009 230.0 0.5%
2010 234.9 3.1%
2011 243.6 2.7%
Average Difference 2.1%
Rounded Up 3.0%
Source: United States Department of Labor, Bureau of Labor Statistics, 2012a.
Projecting inflation is an imperfect science, and as an alternative approach to the current HDOT methodology, a longer history of CPI data were reviewed to calculate inflation factors. Looking further back than the most recent four years ensured that the inflation factor was not calculated based on recent booms or busts in the economy, which would cause factors that were too high or too low depending on where the economy was in the cycle.
Reviewing the past 30 years of CPI data for Honolulu (1982 through 2011) provided a similar rate of inflation when compared to the previous four years of data (2008 through 2011). Figure 8 presents the average annual inflation rate for Honolulu and the United States from 1982 to 2011. The national rate averaged approximately 3.0 percent per year over the 30 year time period while the local rate of inflation was slightly higher at 3.3 percent per year.
FIGURE 8 Average 30-year Consumer Price Index
Year Honolulu Index United States Index
1982 97.2 97.7
2011 243.6 227.0
Average Annual Change 3.3% 3.0%
Source: United States Department of Labor, Bureau of Labor Statistics, 2012a-b.
An additional method to estimating inflation was to look at inflation factors developed by a third party that specializes in economic forecasting and analysis, such as IHS Global Insight. IHS Global Insight provides construction labor and pricing forecasts for the United States. As the CPI for Honolulu and the nation tracked fairly closely over the past 30 years, the inflation factors from IHS Global Insight served as a guide for estimating inflationary trends statewide.
Figure 9 presents historical and projected inflation for the United States based on data analyzed by IHS Global Insight in the second quarter of 2012. Inflation for the period between 2009 and 2011 averaged about 1.7 percent while projected inflation for 2011-2014 was estimated at 3.9 percent.
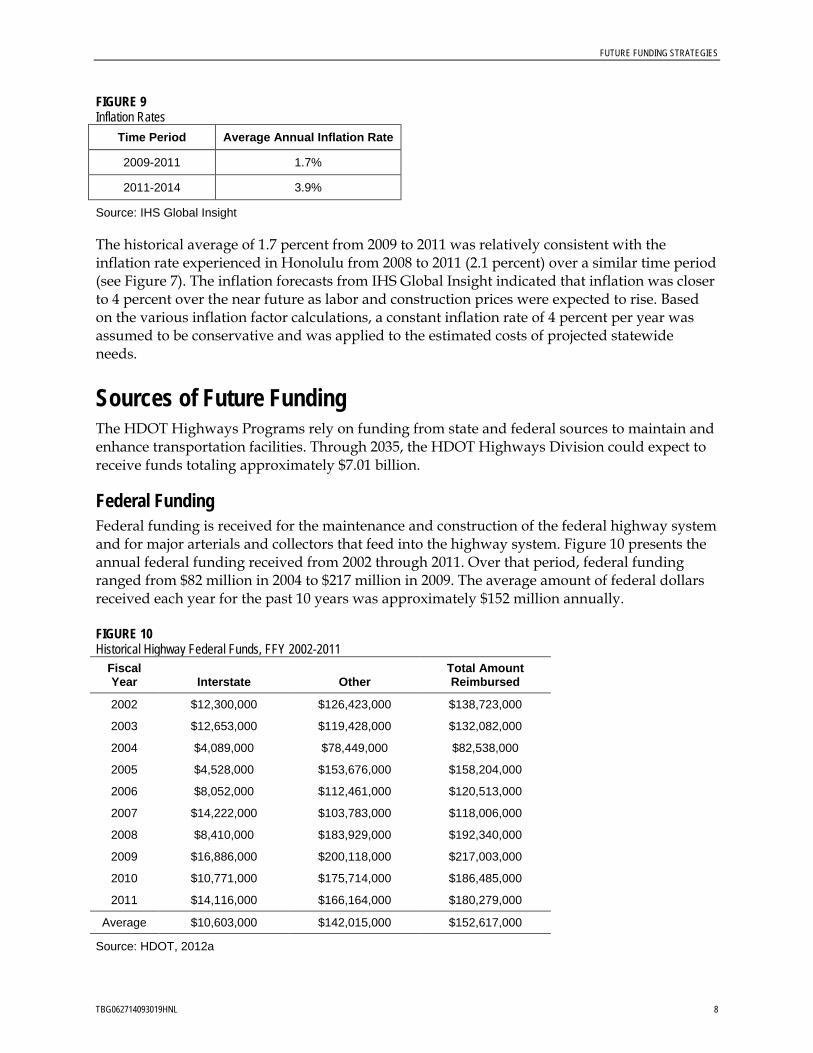
FUTURE FUNDING STRATEGIES
TBG062714093019HNL 8
FIGURE 9 Inflation Rates
Time Period Average Annual Inflation Rate
2009-2011 1.7%
2011-2014 3.9%
Source: IHS Global Insight
The historical average of 1.7 percent from 2009 to 2011 was relatively consistent with the inflation rate experienced in Honolulu from 2008 to 2011 (2.1 percent) over a similar time period (see Figure 7). The inflation forecasts from IHS Global Insight indicated that inflation was closer to 4 percent over the near future as labor and construction prices were expected to rise. Based on the various inflation factor calculations, a constant inflation rate of 4 percent per year was assumed to be conservative and was applied to the estimated costs of projected statewide needs.
Sources of Future Funding The HDOT Highways Programs rely on funding from state and federal sources to maintain and enhance transportation facilities. Through 2035, the HDOT Highways Division could expect to receive funds totaling approximately $7.01 billion.
Federal Funding Federal funding is received for the maintenance and construction of the federal highway system and for major arterials and collectors that feed into the highway system. Figure 10 presents the annual federal funding received from 2002 through 2011. Over that period, federal funding ranged from $82 million in 2004 to $217 million in 2009. The average amount of federal dollars received each year for the past 10 years was approximately $152 million annually.
FIGURE 10 Historical Highway Federal Funds, FFY 2002-2011
Fiscal Year Interstate Other
Total Amount Reimbursed
2002 $12,300,000 $126,423,000 $138,723,000
2003 $12,653,000 $119,428,000 $132,082,000
2004 $4,089,000 $78,449,000 $82,538,000
2005 $4,528,000 $153,676,000 $158,204,000
2006 $8,052,000 $112,461,000 $120,513,000
2007 $14,222,000 $103,783,000 $118,006,000
2008 $8,410,000 $183,929,000 $192,340,000
2009 $16,886,000 $200,118,000 $217,003,000
2010 $10,771,000 $175,714,000 $186,485,000
2011 $14,116,000 $166,164,000 $180,279,000
Average $10,603,000 $142,015,000 $152,617,000
Source: HDOT, 2012a

FUTURE FUNDING STRATEGIES
TBG062714093019HNL 9
Current federal transportation legislation, MAP-21, was adopted in July 2012. It is a long-term highway authorization act and guides transportation policy at the federal level. It includes funding for fiscal years 2013 and 2014, and outlines national goals and transportation performance targets. Beyond 2014, the amount of future federal dollars to be received for the highway system in Hawaii is unknown; therefore, to present a more conservative estimate of future funds, the projected average annual amount of federal funding was assumed to be approximately equal to the average amount received over the past 10 years. This estimated amount was held constant through 2035.
State Funding Historical and projected sources of state funds were obtained from the HDOT annual reports and the 2011 Highway Fund Revenue Bond Official Statement (HDOT, 2012b). Sources of pledged state funding include vehicle surcharges, registration fees, vehicle weight taxes, fuel tax, investment earning, and miscellaneous income. Each major source of revenue is discussed below:
• Highway Fuel License Tax – Currently, the highway fuel tax is $0.17 per gallon of gasoline and diesel oil for highway use and $0.02 per gallon of gasoline, diesel oil, and liquid petroleum gas for non-highway use. The fuel taxes are collected by the Department of Taxation and transferred to the State Highway Fund. In FFY 2011, the highway fuel tax contributed approximately $89.0 million to the State Highway Fund.
• Vehicle Registration Fees – The State vehicle registration fee increased from $25 per vehicle to $45 per vehicle in 2011. In FFY 2011, the registration fees contributed approximately $20.8 million to the State Highway Fund.
• Weight Taxes – All vehicles, including motor vehicles, are assessed an annual State vehicle weight tax. The tax increased in 2011 to $0.0175 per pound. The maximum charge for a vehicle increased to $300 per vehicle. The additional weight tax is expected to result in an increase in net revenues of nearly $33.0 million in FFY 2013. In FFY 2011, weight taxes contributed approximately $33.4 million in revenues to the State Highway Fund.
• Rental/Tour Vehicle Surcharge – The rental/tour vehicle surcharge imposes a daily tax on the rental of all motor vehicles and tour vehicles. In FFY 2011, the rental and tour vehicle surcharge contributed approximately $43.9 million to the State Highway Fund.
• Interest – This is income derived from the investment of Highway Special fund money held by the State. In FFY 2011, interest income was approximately $4.0 million.
• Miscellaneous – Miscellaneous revenues include permit fees, driver license fees, inspection fees, rental fees, and other miscellaneous revenues.
Figure 11 presents historical revenues for the State Highway Fund from FFY 2002 through FFY 2011. Total revenues ranged from approximately $185 million in FFY 2003 to approximately $212 million in FFY 2008. In 2011, the HDOT highways reported operating revenue of approximately $197 million. Fuel taxes, weight taxes, and rental vehicle surcharges were the three largest contributors of revenue each year.

FUTURE FUNDING STRATEGIES
TBG062714093019HNL 10
FIGURE 11 Historical Revenues for Highway Fund, FFY 2002-2011
Source: HDOT, 2012a
Figure 12 presents the breakdown of revenues by source for FFY 2011. Fuel taxes accounted for 45 percent of total revenues while the rental vehicle surcharge accounted for 22 percent of the total.
FIGURE 12 Sources of Revenue for Highway Fund, FFY 2011
Source: HDOT, 2012a
Figure 13 presents projected revenues from state sources from 2012 through 2035. Compared to the operating revenue of just under $200 million in 2011, revenues increased in 2012 to approximately $232 million. This was due to an increase in the weight tax, which generated
$0
$50,000
$100,000
$150,000
$200,000
$250,000
$300,000
2002 2003 2004 2005 2006 2007 2008 2009 2010 2011
Reve
nue
Sour
ce ($
000s
)
Misc.
Interest
Rental/Tour Vehicle SurchargeWeight Taxes
Registration Fees
Fuel Taxes
$89.3 mil , 45%
$20.8 mil , 11%
$33.4 mil , 17%
$43.9 mil , 22%
$4.0 mil , 2% $5.6 mil , 3%
Fuel Taxes
Registration Fees
Weight Taxes
Rental/Tour VehicleSurcharge
Interest
Misc.
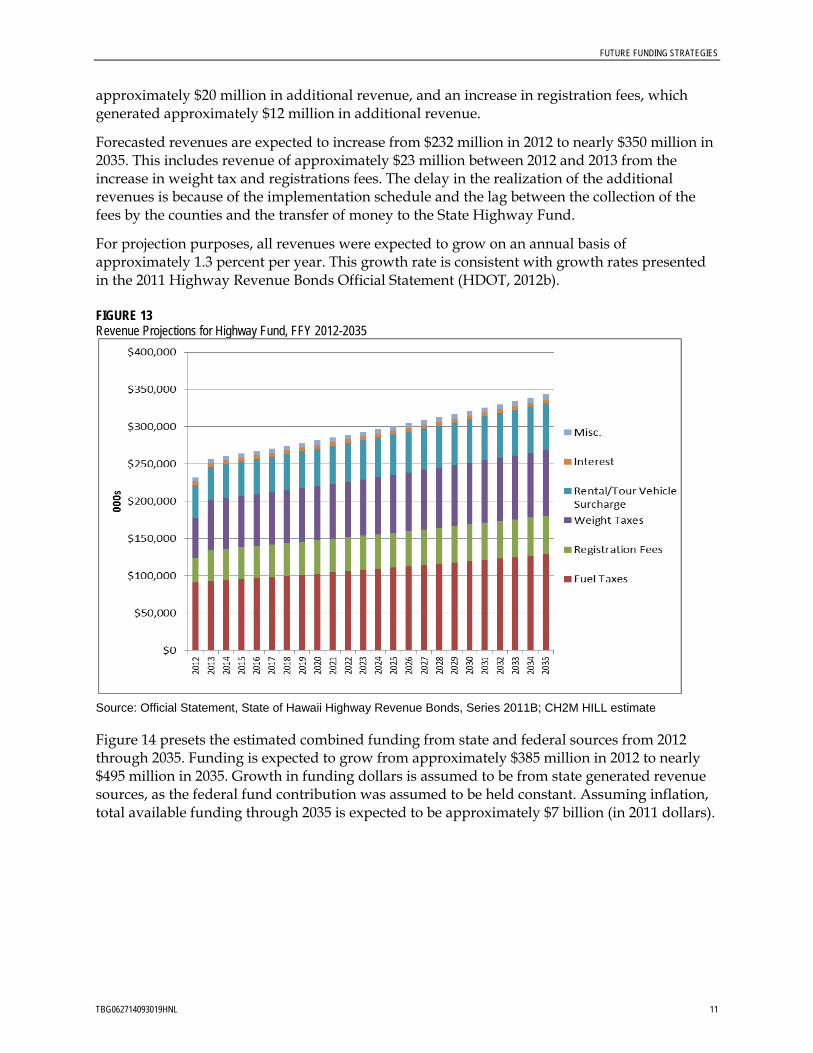
FUTURE FUNDING STRATEGIES
TBG062714093019HNL 11
approximately $20 million in additional revenue, and an increase in registration fees, which generated approximately $12 million in additional revenue.
Forecasted revenues are expected to increase from $232 million in 2012 to nearly $350 million in 2035. This includes revenue of approximately $23 million between 2012 and 2013 from the increase in weight tax and registrations fees. The delay in the realization of the additional revenues is because of the implementation schedule and the lag between the collection of the fees by the counties and the transfer of money to the State Highway Fund.
For projection purposes, all revenues were expected to grow on an annual basis of approximately 1.3 percent per year. This growth rate is consistent with growth rates presented in the 2011 Highway Revenue Bonds Official Statement (HDOT, 2012b).
FIGURE 13 Revenue Projections for Highway Fund, FFY 2012-2035
Source: Official Statement, State of Hawaii Highway Revenue Bonds, Series 2011B; CH2M HILL estimate
Figure 14 presets the estimated combined funding from state and federal sources from 2012 through 2035. Funding is expected to grow from approximately $385 million in 2012 to nearly $495 million in 2035. Growth in funding dollars is assumed to be from state generated revenue sources, as the federal fund contribution was assumed to be held constant. Assuming inflation, total available funding through 2035 is expected to be approximately $7 billion (in 2011 dollars).

FUTURE FUNDING STRATEGIES
TBG062714093019HNL 12
FIGURE 14 Projection of Combined State and Federal Funds, FFY 2012-2035
Sources: HDOT, 2012a; CH2M HILL estimate
Future Funding Plan The current funding outlook indicates a significant gap between estimated transportation needs (over $30 billion) and future available funds (approximately $7.01 billion). Based on historical trends this gap is not expected to close over time, and shortfalls in available dollars will continue to be a key factor in future planning.
Historically, approximately 51 percent of the annual HDOT Highway Division funds were distributed to the Oahu District. The Maui District received on average approximately 23 percent of the HDOT Highway Division funds, while the Hawaii District and the Kauai District received 17 percent and 9 percent, respectively. Assuming future distributions are consistent with past allocations, the expected revenue for each district is shown in Figure 15.
FIGURE 15 Estimated Statewide Revenue and Need, by District HDOT Highways
District Expected Revenue
($B) Estimated Need
($B) Funding Gap
($B)
Oahu $3.6 $16.7 ($13.1)
Maui $1.6 $3.1 ($1.5)
Hawaii $1.2 $7.4 ($6.2)
Kauai $0.6 $3.2 ($2.6)
Total $7.0 $30.4 ($23.4)
The projected revenue is not likely to meet the estimated needs, and a significant funding gap is expected for each district. This situation is not unique to the state of Hawaii, and will require decision-makers to prioritize solutions to ensure effective use of limited funds.
$0
$50,000
$100,000
$150,000
$200,000
$250,000
$300,000
$350,000
$400,000
$450,000
$500,000
2012
2013
2014
2015
2016
2017
2018
2019
2020
2021
2022
2023
2024
2025
2026
2027
2028
2029
2030
2031
2032
2033
2034
2035
000s
Federal
State
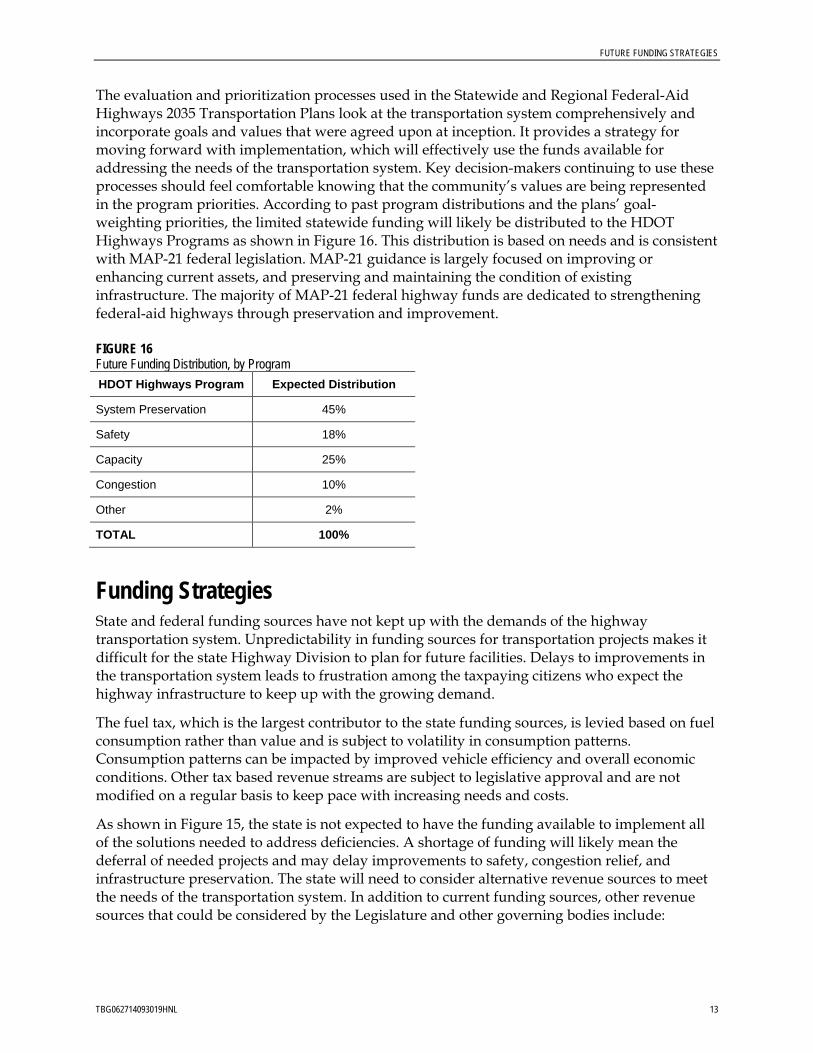
FUTURE FUNDING STRATEGIES
TBG062714093019HNL 13
The evaluation and prioritization processes used in the Statewide and Regional Federal-Aid Highways 2035 Transportation Plans look at the transportation system comprehensively and incorporate goals and values that were agreed upon at inception. It provides a strategy for moving forward with implementation, which will effectively use the funds available for addressing the needs of the transportation system. Key decision-makers continuing to use these processes should feel comfortable knowing that the community’s values are being represented in the program priorities. According to past program distributions and the plans’ goal-weighting priorities, the limited statewide funding will likely be distributed to the HDOT Highways Programs as shown in Figure 16. This distribution is based on needs and is consistent with MAP-21 federal legislation. MAP-21 guidance is largely focused on improving or enhancing current assets, and preserving and maintaining the condition of existing infrastructure. The majority of MAP-21 federal highway funds are dedicated to strengthening federal-aid highways through preservation and improvement.
FIGURE 16 Future Funding Distribution, by Program HDOT Highways Program Expected Distribution
System Preservation 45%
Safety 18%
Capacity 25%
Congestion 10%
Other 2%
TOTAL 100%
Funding Strategies State and federal funding sources have not kept up with the demands of the highway transportation system. Unpredictability in funding sources for transportation projects makes it difficult for the state Highway Division to plan for future facilities. Delays to improvements in the transportation system leads to frustration among the taxpaying citizens who expect the highway infrastructure to keep up with the growing demand.
The fuel tax, which is the largest contributor to the state funding sources, is levied based on fuel consumption rather than value and is subject to volatility in consumption patterns. Consumption patterns can be impacted by improved vehicle efficiency and overall economic conditions. Other tax based revenue streams are subject to legislative approval and are not modified on a regular basis to keep pace with increasing needs and costs.
As shown in Figure 15, the state is not expected to have the funding available to implement all of the solutions needed to address deficiencies. A shortage of funding will likely mean the deferral of needed projects and may delay improvements to safety, congestion relief, and infrastructure preservation. The state will need to consider alternative revenue sources to meet the needs of the transportation system. In addition to current funding sources, other revenue sources that could be considered by the Legislature and other governing bodies include:

FUTURE FUNDING STRATEGIES
TBG062714093019HNL 14
• Mileage-based user fees – Drivers pay a fee based on the number of miles traveled on public roadways. Private roadways would be excluded. Mileage could be tracked through various methods.
• Tolls – Drivers pay a fee each time a specific public roadway is used or a certain bridge is crossed. Toll fees may change based on the time of day. Tolling in Hawaii would require the Legislature to change the current laws that prohibit toll charges.
• Special general excise tax on automotive parts and services – Taxes would be collected through the performance of specific services (such as vehicle inspections or repairs) and the sale of equipment related to motorized vehicles.
• General excise tax increase – A portion of revenue from an increase in the general sales tax could be allocated to transportation improvements and projects.
• Public/private partnerships – An agreement between a private entity and a public agency to deliver transportation projects, typically with greater involvement and risk taken by the private entity.
• Impact fees on new development – Private developers pay a predetermined, per-vehicle fee based on the number of vehicle trips expected to be generated by the potential development.
• Bicycle registration – A bicycle licensing system could be developed, and user fees could be collected based on the type of bicycle registered. Fees could support maintenance and upkeep of bicycle lanes and shared roadways.
• Carbon tax/cap – A fee or tax could be imposed on producers of large amounts of carbon. These producers would pay a fee to “offset” their carbon production.
• Increase current funding sources – Because new sources of funding are difficult to identify, increasing the existing mechanisms – such as raising the rental/tour vehicle surcharge or vehicle weight tax – could generate additional revenue.
• Grant anticipation borrowing – This strategy allows public agencies to borrow against anticipated future federal and/or state revenues to fund capital projects that require large upfront expenditures. Existing programs include Grant Anticipation Revenue Vehicle bonds for highways and Grant Anticipation Note bonds for transit.
• State infrastructure banks and other revolving loan funds – These are lending organizations initially funded with federal grants and/or state funds and operated at the state level. These funds leverage federal and state resources by lending rather than granting federal-aid funds.
• Bonds – Bonds are issued by the state or other agency to finance assets with long useful lives (such as transportation projects). The administering entity issues bonds with a set return on investment, and investors purchase the bonds to help fund transportation projects. Bonds help smooth the impact of a large expensive projects by providing upfront capital, and allowing the state or county to repay over a set amount of time.
• Land swaps and donated lands – Right-of-way costs can be a large portion of total transportation project costs. Working with land owners to swap land for right-of-way or to donate land for a project could reduce project costs. Donated land value could also be used to leverage federal funds.

FUTURE FUNDING STRATEGIES
TBG062714093019HNL 15
Reducing Funding Needs Strategies to reduce funding needs could also be considered by the state to help minimize the future funding gap. By working with public and private entities to reduce the demand on the transportation system, potential needs could be reduced without investing directly into the transportation network. Strategies include:
• Land Use Planning – The demand for auto-based travel can be influenced through land use decisions and urban design. The development of denser, mixed-use areas could lead to greater travel options, and private auto use could decline when the environment is attractive to pedestrians, bicyclists, and transit users. Achieving land use changes requires zoning codes and regulations that allow for mixed uses and flexible design.
• Transportation Demand Management – Multiple strategies to help manage travel demand involve changing the mode of travel (usually from single-occupant, auto-based), the time of travel, or to remove the trip from the network altogether. Demand strategies include:
− Make bicycling attractive – Require bicycle-friendly facilities, such as easily accessed and secure bike parking and storage, showers at destination locations (including employers), and other amenities.
− Make walking attractive – Require sidewalks and pedestrian infrastructure such as mid-block crossings, pedestrian activated signals, and shaded routes. Change land use patterns or zoning codes to create more walkable districts and improve connectivity among pedestrian destinations.
− Make transit attractive – Increase the number of transit routes, expand service hours, and shorten headways to improve the overall transit network. Create transit priority corridors to ensure transit is an attractive option to the single-occupancy vehicle.
− Make ridesharing attractive – Implement education and ride-matching programs to increase the number of people per vehicle. Work with employers and high volume destinations to implement ridesharing programs through incentives such as preferential parking. Explore social media and mobile apps to facilitate connections between program participants.
− Change travel times – Work with employers to implement flexible work schedules to reduce congestion during typical peak travel times.
− Reduce potential trips – Work with employers to implement teleworking to reduce the amount of trips employees take to work.
References IHS Global Insight. Aggregate Price and Wage Forecasts, 2nd Quarter 2012. Paid subscription.
Oahu Metropolitan Planning Organization. 2011. Oahu Regional Transportation Plan 2035. Available at: http://www.oahumpo.org/wp-content/uploads/2013/01/11.1.2AdoptedPlan20110411.pdf. April.
State of Hawaii Department of Transportation (HDOT). 2007. HWY-PS 2.6454. December 8.
State of Hawaii Department of Transportation (HDOT). 2012a. Official Statement, State of Hawaii Highway Revenue Bonds, Series 2011B. Available at:
FUTURE FUNDING STRATEGIES
TBG062714093019HNL 16
http://hawaii.gov/dot/highways/officialstatements/Official%20Statement%202011.pdf. Accessed on August 6, 2012.
State of Hawaii Department of Transportation (HDOT). 2012b. Highways Division Annual Audited Financial Statements, Fiscal Year 2011. Available at: http://hawaii.gov/dot/highways/financials/highways-division-financial-audit-reports. Accessed on September 21, 2012.
State of Hawaii Department of Transportation (HDOT). 2014. Available at: http://www.hawaiilongrangeplan.com/wp-content/uploads/2014/03/Statewide_Cover.pdf. March.
United States Department of Labor, Bureau of Labor Statistics. 2012a. Consumer Price Index, Honolulu. Available at: http://www.bls.gov/cpi/. Accessed on September 21, 2012.
United States Department of Labor, Bureau of Labor Statistics. 2012b. Consumer Price Index, United States. Available at: http://www.bls.gov/cpi/. Accessed on September 21, 2012.