Evaluating Options From a Statewide Perspective
336
6-1 EVALUATING OPTIONS FROM A STATEWIDE PERSPECTIVE The California Water Plan Update BULLETIN 160-98 Sources of water supply must be identified to meet the needs of California’s growing population. Chapters 6-9 discuss potential future water management options. Evaluating Options From a Statewide Perspective A main objective of this California Water Plan update is evaluating, at an appraisal level of detail, how California’s water supply reliability needs could be met through 2020. This chapter outlines the process used to put together the conceptual evaluation and evaluates water management options that are statewide in scope. A brief discussion of methods available to local agencies for financing water management options is also provided. The planning process includes developing regional water management evaluations for each of the State’s ten major hydrologic regions, and integrating those results with statewide water management options to form a summary for the entire State. Development of regional water management evaluations is covered in Chapters 7-9. Statewide water management options include demand reduction measures that many water agencies are expected to implement, and large-scale water supply augmentation measures that would provide supply to multiple beneficiaries in more than one hydrologic region. For example, a large offstream storage reservoir studied under CALFED’s Bay-Delta program is considered a statewide option. A small reservoir project being studied by a local agency to provide benefits only to its service area is not a statewide option. Such local projects are covered in Chapters 7-9. This chapter opens by presenting a balance between California’s water supplies and its water use, illustrating the shortages that would occur if no new water management facilities or programs were developed.
-
Upload
khangminh22 -
Category
Documents
-
view
2 -
download
0
Transcript of Evaluating Options From a Statewide Perspective

6-1 EVALUATING OPTIONS FROM A STATEWIDE PERSPECTIVE
The California Water Plan Update BULLETIN 160-98
Sources of water
supply must be
identified to meet the
needs of California’s
growing population.
Chapters 6-9 discuss
potential future water
management options.
Evaluating Options From aStatewide Perspective
Amain objective of this California Water Plan update is evaluating, at an
appraisal level of detail, how California’s water supply reliability needs
could be met through 2020. This chapter outlines the process used to put
together the conceptual evaluation and evaluates water management options that are
statewide in scope. A brief discussion of methods available to local agencies for financing
water management options is also provided.
The planning process includes developing regional water management evaluations
for each of the State’s ten major hydrologic regions, and integrating those results with
statewide water management options to form a summary for the entire State. Development
of regional water management evaluations is covered in Chapters 7-9.
Statewide water management options include demand reduction measures that
many water agencies are expected to implement, and large-scale water supply augmentation
measures that would provide supply to multiple beneficiaries in more
than one hydrologic region. For example, a large offstream storage
reservoir studied under CALFED’s Bay-Delta program is considered a
statewide option. A small reservoir project being studied by a local agency
to provide benefits only to its service area is not a statewide option.
Such local projects are covered in Chapters 7-9. This chapter opens by
presenting a balance between California’s water supplies and its water
use, illustrating the shortages that would occur if no new water
management facilities or programs were developed.
Quest
More information about the California Department of Water Resources is available at: http://wwwdwr.water.ca.gov/ For a hard copy version of the Bulletin, please call the Publications Office at (916) 653-1097.

6-2EVALUATING OPTIONS FROM A STATEWIDE PERSPECTIVE
The California Water Plan Update BULLETIN 160-98
The water supply and water use information dis-cussed in Chapters 3 and 4 and summarized in Tables3-3, 4-26, and 4-27 is combined into the statewide ap-plied water budget with existing facilities and programsshown in Table 6-1. Regional water budgets with exist-ing facilities and programs are shown in Appendix 6A.The shortages shown in Table 6-1 reflect the Bulletin’sassumption that groundwater overdraft is not availableas a supply.
The average water year shortages at 1995 and2020 levels illustrate the need to develop new facili-ties and programs to improve California’s water supplyreliability. Californians are facing water shortages now,and will face them in the future. As Californians
experienced in 1991 and 1992, drought year short-ages are large. Urban water users faced cutbacks insupply and mandatory rationing, some small ruralcommunities saw their wells go dry, agricultural landswere fallowed, and environmental water supplies werereduced. By 2020, without additional facilities andprograms, these conditions will worsen, reflectingCalifornia’s forecasted population increase. Appen-dix 6B shows forecasted shortages by hydrologicregion, assuming that no new facilities or programswere implemented.
The following section describes the planning pro-cess used in Bulletin 160-98 to evaluate actions thatwould reduce the State’s future water shortages.
TABLE 6-1
California Water Budget with Existing Facilities and Programs (maf)
1995 2020Average Drought Average Drought
Water UseUrban 8.8 9.0 12.0 12.4Agricultural 33.8 34.5 31.5 32.3Environmental 36.9 21.2 37.0 21.3Total 79.5 64.7 80.5 66.0
SuppliesSurface Water 65.1 43.5 65.0 43.4Groundwater 12.5 15.8 12.7 16.0Recycled & Desalted 0.3 0.3 0.4 0.4Total 77.9 59.6 78.1 59.8
Shortage 1.6 5.1 2.4 6.2
Statewide Water Budget
. . .
The process used to evaluate ways to meet California’sfuture water needs drew upon, at an appraisal level ofdetail, techniques of integrated resources planning. IRPevaluates water management options—both demandreduction options and supply augmentation options—against a fixed set of criteria and ranks the options basedon costs and other factors. Although the IRP process in-cludes economic evaluations, it also incorporatesenvironmental, institutional, and social considerationswhich cannot be expressed easily in monetary terms.
The development of likely regional water man-
agement options used information prepared by localagencies. The regional water management optionsevaluations are not intended to replace local planningefforts, but to complement them, by showing the rela-tionships among regional water supplies and waterneeds and the statewide perspective. Local water man-agement options form the basis of the regionalsummaries which are combined into the statewide op-tions evaluation. Figure 6-1 is an index map showinghow the regional summaries are organized in Chap-ters␣ 7-9.
The Bulletin 160-98 Planning Process
. . .

6-3 EVALUATING OPTIONS FROM A STATEWIDE PERSPECTIVE
The California Water Plan Update BULLETIN 160-98
Redding
NorthCoast
SacramentoRiver
San JoaquinRiver
SanFrancisco
Bay
CentralCoast Tulare
LakeSouth
Lahontan
SouthCoast Colorado
River
NorthLahontan
Coastal Regions (Chapter 7)
Interior Regions (Chapter 8)
Eastern Sierra and Colorado RiverRegions (Chapter 9)
FIGURE 6-1
Index to Regional Chapters

6-4EVALUATING OPTIONS FROM A STATEWIDE PERSPECTIVE
The California Water Plan Update BULLETIN 160-98
Major Steps in Planning Process Major steps involved in the Bulletin 160-98
water management options evaluation processincluded:• Identify water demands and existing water sup-
plies on a regional basis.• Compile lists of regional and statewide water
management options.• Use initial evaluation criteria to either retain or
defer options from further evaluation. For op-tions retained for further evaluation, group someby categories and evaluate others individually.
• Identify characteristics of options or option catego-ries, including costs, potential demand reductionor supply augmentation, environmental consider-ations, and significant institutional issues.
• Evaluate each regional option or category of op-tions in light of identified regional characteristicsusing criteria established for this Bulletin. If localagencies have performed their own evaluation,review and compare their evaluation criteria withthose used for the Bulletin.
• Evaluate statewide water management options.• Develop tabulation of likely regional water man-
agement options.• Develop a statewide options evaluation by inte-
grating the regional results.The first step in evaluating regional water man-
agement options was to prepare applied water budgetsfor the study areas to identify the magnitude of poten-tial water shortages for average and drought yearconditions. In addition to identifying shortages, otherwater supply reliability issues in the region were re-viewed. Once the shortages were identified, a list of
local water management options was prepared. Wherepossible, basic characteristics of these options (yields,costs, significant environmental or institutional con-cerns) were identified.
After identifying options, they were compared withthe initial screening criteria shown in the sidebar. Foroptions deferred from further evaluation, the majorreasons for deferral were given. Options retained forfurther evaluation were placed into the followingcategories:• Conservation (urban and agricultural)• Modifications to existing reservoirs/operations• New reservoirs/conveyance facilities• Groundwater/conjunctive use• Water marketing• Water recycling• Desalting (brackish groundwater and seawater)• Other local options• Statewide options
Because each of these categories may contain manyindividual options, some options within each categorywere further combined into groups based upon theirestimated costs. For example, water recycling projectscosting less than $500/af were grouped into one cat-egory. Options were evaluated and scored against theset of fixed criteria shown in the sidebar.
The Bulletin 160-98 options evaluation processrelied heavily upon locally developed information.Methods used to develop this information vary fromone local agency to the next, making direct compari-sons between cost estimates difficult. To make costinformation comparable, a common approach for es-timating unit cost was developed (Appendix 6C).However, due to lack of detailed information, not all
Initial Screening CriteriaThe criteria used for initial screening of water manage-
ment options were:• Engineering—an option was deferred from further evalu-
ation if it was heavily dependent on the development oftechnologies not currently in use, it used inappropriatetechnologies given the regional characteristics (desaltingin the North Lahontan Region), or it did not provide newwater (water recycling in the Central Valley).
• Economic—an option was deferred from further evalua-tion if its cost estimates (including environmental mitiga-tion costs) were extraordinarily high given the region’scharacteristics.
• Environmental—an option was deferred from further evaluationif it had potentially significant unmitigable environmental impactsor involved use of waterways designated as wild and scenic.
• Institutional/Legal—an option was deferred from furtherevaluation if it had potentially unresolvable water rightsconflicts or conflicts with existing statutes.
• Social/Third Party—an option was deferred from furtherevaluation if it had extraordinary socioeconomic impacts,either in the water source or water use areas.
• Health—an option was deferred from further evaluation ifit would violate current health regulations or would posesignificant health threats.

6-5 EVALUATING OPTIONS FROM A STATEWIDE PERSPECTIVE
The California Water Plan Update BULLETIN 160-98
Options Category Evaluation
Evaluation What is Measured? How is it Measured? ScoreCriteria
Engineering Engineering feasibility Increase score for greater reliance upon currenttechnologies
Operational flexibility Increase score for operational flexibility withexisting facilities and/or other options
Drought year supply Increase score for greater drought year yield/reliability
Implementation date Increase score for earlier implementation dateWater quality limitations Increase score for fewer water quality constraints
Engineering Score 0 - 4
Economics Project financial feasibility Increase score for lower overall costs and theability to finance
Project unit cost Increase score for lower overall unit cost(including mitigation costs)
Economics Score 0 - 4
Environmental Environmental risk Increase score for least amount of environmentalrisk
Irreversible commitment of resources Increase score for least amount of irreversiblecommitment of resources
Collective impacts Increase score for least amount of collective impactsProximity to environmentally Increase score for little or no proximity tosensitive resources sensitive resources
Environmental Score 0 - 4
Institutional/Legal Permitting requirements Increase score for least amount of permittingrequirements
Adverse institutional/legal effects upon Increase score for least amount of adversewater source areas institutional/legal effectsAdverse institutional/legal effects upon Increase score for least amount of adversewater use areas institutional/legal effectsStakeholder consensus Increase score for greater amount of stakeholder
consensusInstitutional/Legal Score 0 - 4
Social/Third Party Adverse third party effects upon Increase score for least amount of adverse thirdwater source areas party effectsAdverse third party effects upon Increase score for least amount of adverse thirdwater use areas party effectsAdverse social and community effects Increase score for least amount of adverse social
and community effectsSocial/Third Party Score 0 - 4
Other Benefits Ability to provide benefits in addition Increase score for environmental benefitsto water supply
Increase score for flood control benefitsIncrease score for recreation benefitsIncrease score for energy benefitsIncrease score for additional benefitsIncrease score for improved compliance withhealth and safety regulations
Other Benefits Score 0 - 4
Total Score 0 - 24

6-6EVALUATING OPTIONS FROM A STATEWIDE PERSPECTIVE
The California Water Plan Update BULLETIN 160-98
option costs could be made comparable. Unit cost es-timates took into account capital costs associated withconstruction and implementation (including anyneeded conveyance facilities), annual operations costs,and option yield.
Water management options can serve purposesother than water supply; they can also provide floodcontrol, hydroelectric power generation, environmen-tal enhancement, water quality enhancement, andrecreation. In recognition of the multipurpose ben-efits provided by some water management options, theoptions evaluation scoring process assigned a highervalue to multipurpose options, as shown in the side-bar. However, since the focus of the Bulletin 160 seriesis water supply, cost estimates were based solely on thecosts associated with water supply.
Once options were evaluated and scored, they wereranked according to their scores. This ranking was usedto prepare a tabulation of likely regional water man-agement options, taking into account options that maybe mutually exclusive or could be optimized if imple-mented in conjunction with other options. Dependingon a region’s characteristics, its potential options, andits ability to pay for new options, the tabulation oflikely options may not meet all of a region’s water short-ages (especially in drought years).
This appraisal-level evaluation of options at a state-wide level of detail is based on presently availableinformation. The ultimate implementability of any wa-ter management option is dependent on factors suchas the sponsoring entity’s ability to complete the ap-propriate environmental documentation, obtain thenecessary permits, and finance the proposed action.
Shortage Management
Water agencies may choose to accept less than100␣ percent water supply reliability, especially underdrought conditions, depending on the characteristicsof their service areas. Shortage contingency measuressuch as restrictions on residential outdoor watering ordeficit irrigation for agricultural crops can be used tomeet temporary shortages. Demand hardening is animportant consideration in evaluating shortage con-tingency measures. Implementing water conservationmeasures such as plumbing retrofits and low water uselandscaping reduces the ability of water users to achievefuture drought year water savings through shortagecontingency measures.
Supply augmentation actions (purchasing water
from the DWB) and demand reduction actions (ur-ban rationing and agricultural land fallowing) areavailable to water agencies for coping with shortagesthat exceed planned levels of reliability. Table 6-2 sum-marizes actions taken by some of California’s largerurban water suppliers to respond to water shortages in1991, the driest year of the recent 1987-92 drought.Measures taken by agricultural water agencies and wa-ter users included increased pumping of groundwater,land fallowing, and intra- and interdistrict water trans-fers. The WaterLink system established by WestlandsWater District (described in Chapter 8) is an exampleof an action that could be used by agricultural watersuppliers to facilitate intradistrict water transfers as partof managing shortages.
The impacts of allowing planned shortages to oc-cur in water agency service areas are necessarilysite-specific and must be evaluated by each agency onan individual basis. In urban areas where conservationmeasures have already been put into place to reducelandscape water use, imposing rationing or other re-strictions on landscape water use can create significantimpacts to homeowners, landscaping businesses, andentities that manage large turf areas such as parks andgolf courses. Drought year cutbacks in the agriculturalsector create economic impacts not only to individualgrowers and their employees, but also to local busi-nesses that provide goods and services to the growers.
Using Applied Water Budgets toCalculate New Water Needs
As discussed in Chapter 3, some municipal waste-water discharges, agricultural return flows, and requiredenvironmental instream flows are reapplied severaltimes before finally being depleted from the State’shydrologic system. An applied water budget explicitlyaccounts for this unplanned reuse of water. Becausereapplication has the potential to account for a sub-stantial portion of a region’s water supply, appliedwater budgets may overstate the supply of water actu-ally needed to meet future water demands. Shortagescalculated from an applied water budget must be in-terpreted with caution to determine new water needsfor a region.
The amount of new water required to meet aregion’s future needs depends on several factors,including the region’s applied water shortage, oppor-tunities to reapply water in the region, and the typesof water management options that are implemented

6-7 EVALUATING OPTIONS FROM A STATEWIDE PERSPECTIVE
The California Water Plan Update BULLETIN 160-98
in the region. If no water reapplication opportunitiesexist, then the region’s new water need is equivalent toits applied water shortage. In this case, the new waterneed would be independent of the types of watermanagement options that are implemented. However,if opportunities are available to reapply water in a re-gion, then the region’s new water need is less than itsapplied water shortage. In this case, the new water needdepends on the types of water management optionsthat are implemented.
Not all water management options are createdequal in their ability to meet new water needs. Be-cause supply augmentation options provide new waterto a region, the opportunity exists for the options’effectiveness to be multiplied through reapplication.For example, a supply augmentation option may pro-vide 100 taf of new water to a region. But throughreapplication within the region, the option effectivelymeets applied water demands in excess of 100 taf.Demand reduction options, on the other hand, do notprovide new water to a region. Hence, the opportu-nity does not exist to multiply the options’ effectivenessthrough reapplication. To satisfy an applied water short-age of 100 taf, a demand reduction option mustconserve 100 taf of water.
Calculation of regional and statewide new waterneeds is more complex than computing regional andstatewide applied water shortages—new water needsalso depend on reapplication and implemented watermanagement options. An applied water shortage pro-vides an upper bound on the new water need. A lowerbound on the new water need can be estimated foreach region by assuming that new water supplies arereapplied in the same proportion that existing suppliesare reapplied. Minimum new water needs are com-puted for each region in Appendix 6D.
The tabulations of likely regional water manage-ment options in Chapters 7-9 use minimum new waterneeds as target values for selecting the appropriatenumber of regional options. If a region is unable tomeet minimum new water needs as a result of regionalcharacteristics, lack of potential options, or inabilityto pay for potential options, specifying minimum newwater needs rather than applied water shortages as re-gional target values has no impact on options selection.On the other hand, if a region is able to meet its mini-mum new water needs, this does not necessarilyguarantee that all applied water shortages would bemet. The remaining applied water shortages woulddepend on the selected option mix—the more water
TABLE 6-2
1991 Urban Water Shortage Management
Contingency Measures
ReductionWater Agencya Goalb A B C D E F G H I J K
Alameda County WD 18% ✔ ✔ ✔ ✔ ✔ ✔Contra Costa WD 26% ✔ ✔ ✔ ✔ ✔ ✔ ✔ ✔East Bay MUD 15% ✔ ✔ ✔ ✔ ✔ ✔ ✔ ✔ ✔ ✔LA Dept. of Water and Power 15% ✔ ✔ ✔ ✔ ✔ ✔ ✔ ✔ ✔ ✔MWD of Southern California 31% ✔ ✔ ✔ ✔ ✔ ✔ ✔ ✔MWD of Orange County 20% ✔ ✔ ✔ ✔ ✔ ✔ ✔ ✔ ✔Orange County WD 20% ✔ ✔ ✔ ✔ ✔San Diego Co. Water Authority 20% ✔ ✔ ✔ ✔ ✔ ✔ ✔ ✔ ✔ ✔ ✔City of San Diego 20% ✔ ✔ ✔ ✔ ✔ ✔San Francisco PUC 25% ✔ ✔ ✔ ✔ ✔ ✔ ✔ ✔Santa Clara Valley WD 25% ✔ ✔ ✔ ✔ ✔ ✔ ✔ ✔
A = Rationing G = Broadcast Public InformationB = Mandatory Conservation H = Mailed Public InformationC = Extraordinary Voluntary Conservation I = Water Patrols and CitationsD = Increasing Rate or Surcharges J = Fines and PenaltiesE = Economic Incentives K = Water TransferF = Device Distributiona Agencies listed include both wholesale and retail water agencies and, as a result, the shortage contingency measures available to them are different.b The actual performance of an agency’s drought management may have exceeded the adopted goal. Several of the retail agencies are located within
wholesalers’ boundaries. Contingency measures shown can include both retail and wholesale measures.

6-8EVALUATING OPTIONS FROM A STATEWIDE PERSPECTIVE
The California Water Plan Update BULLETIN 160-98
conservation selected, the greater the remaining ap-plied water shortages would be (as water conservationoptions do not provide reapplication opportunities.)This approach is consistent with the treatment of short-ages in prior water plan updates, which used net water
budgets. Because data in net water budgets factor outreapplied water, net water shortages are essentially thesame as minimum new water needs. Appendix 6E pro-vides a compilation of Bulletin 160-98 net waterbudgets, statewide and by region.
Data on Urban LandscapingAs plumbing code changes designed to reduce interior ur-
ban water use are implemented, a main potential for futureurban water conservation lies in reducing exterior urban wa-ter use—specifically landscape water use. Estimating wateruse reductions from landscape irrigation changes is made dif-ficult by the lack of data on irrigated urban landscaping. Onlya handful of water districts in California have actual data onthe extent of irrigated acreage (residential lots plus large turfareas, such as parks, cemeteries, and golf courses) in theirservice areas, and data are nonexistent at a statewide level.For planning purposes, California’s irrigated urban acreagehas historically been estimated at about one million acres at a1980s/1990s level of development, based on estimated ratiosof landscape acreage to total urban acreage from land use
surveys. Such ratios vary widely by county (the Department’s,for example, vary from percentages in the low teens to al-most 40 percent), and are inherently subject to uncertainty.Water agencies are beginning to evaluate ways to quantifyexisting irrigated urban acreage—aerial photography or sat-ellite imagery, estimated ratios from parcel maps, surveys, orquestionnaires. Estimates of future irrigated landscape acre-age are generally made by increasing an assumed base acreageby ratios of forecasted population growth—which implicitlyassumes no major changes in housing density or single tomultifamily housing ratios.
These uncertainties illustrate the present difficulty of quanti-fying landscape conservation savings, and lack of hard data tosupport planning estimates. Better estimates of urban landscapeacreage would greatly improve future conservation planning.
Demand Reduction Options
. . .
Demand reduction has taken on a key role in theplanning and management of water resources. By mak-ing wise use of water through water conservation, theneed for new sources of supply can be minimized.Many agencies have implemented programs to achievea high level of water use efficiency.
For nearly three decades, Californians have recog-nized the importance of water conservation. Since the1976-77 drought, attention has focused on plans, pro-grams, and measures to encourage efficient use of water.The water conservation options evaluated in this Bul-letin are limited to actions that would have the effectof creating new water supply through reductions inexisting consumptive use or water depletions. (Thepotential for depletion reductions exists where appliedwater would be lost to evapotranspiration, or to a sa-line water body, and could not be beneficiallyreapplied.) The options evaluated in this Bulletin wouldyield depletion reductions above the 2020-level de-mand reduction of 2.3 maf assumed to result fromstatewide implementation of existing BMPs andEWMPs. (Existing BMPs and EWMPs are discussedin Chapter 4.) Quantifying depletion reductions al-
lows the comparison of water conservation options withwater supply augmentation options such as water stor-age or recycling facilities.
The options presented are for planning purposesonly and are not mandated targets. They represent anattempt to quantify potential water savings that maybe achieved by implementing measures beyond cur-rent BMPs and EWMPs. Local water agencies canevaluate these options against other available optionsto assess appropriate actions for their service areas.
Since the purpose of the Department’s Bulletin160 series is to assess water supply benefits, it is thataspect of water conservation that the Bulletin addresses.Water conservation projects may provide additionalbenefits, such as reduction in water treatment costs,reduction in fish entrainment at water supply diver-sion structures, or reduction in nonpoint source runoff.These other benefits are recognized in the Bulletin’soptions evaluation process, as described earlier. As dis-cussed in Chapter 3, the Bulletin treats demandreduction actions on an equal footing with water sup-ply actions. Each action must create water that is newto the State’s hydrologic region.

6-9 EVALUATING OPTIONS FROM A STATEWIDE PERSPECTIVE
The California Water Plan Update BULLETIN 160-98
Although water conservation options will be car-ried out at the local level, they are discussed in thischapter conceptually as statewide demand reductionoptions for simplicity of presentation. Analyses of wa-ter conservation options for each hydrologic region arediscussed in Chapters 7-9.
Urban Water Conservation OptionsAs discussed in Chapter 4, urban water use fore-
casts were calculated from estimates of population,urban per capita water use, and conservation savingsfrom urban BMPs. The Bulletin assumes that urbanBMPs are put into effect by 2020, resulting in an esti-mated 1.5 maf of demand reduction statewide.
The urban water conservation options describedbelow assume a more intensive application of currentBMPs and potential evolution of additional BMPs. Ifall of the options described below were implemented,nearly 1 maf/yr of depletion reduction could theoreti-cally be attained. The level of water conserved fromthese options would vary for each region dependingon current urban water use and the region’s hydrology.Since little or no depletion reductions would beachieved in the Central Valley, urban water conserva-tion options beyond BMPs are deferred for valleyregions. Table 6-3 summarizes statewide urban waterconservation options and the potential depletion re-ductions associated with each option. These optionsare evaluated for each region in Chapters 7-9.
Outdoor Water Use
Ideally, landscape water use could be derived by themethod used for estimating agricultural water use—multiplying water use requirements for differentlandscape types by their corresponding statewide acre-
TABLE 6-3
Urban Depletion Reduction Potential Due to Water Conservation Options Beyond BMPsa (taf)
Opt 1 Opt 2 Opt 3 Opt 4 Opt 5 Opt 6 Opt 7 Opt 8
Region New New & 60 gpcd 55 gpcd 3% 5% 7% 5%Existing
0.8 ET0 Outdoor Indoor Water Use CII Water Use DistributionWater Use Reduction System Losses
North Coast 1 6 3 6 1 2 6 9San Francisco Bay 2 52 38 77 11 18 D 13Central Coast 4 13 8 17 2 3 3 8South Coast 67 246 110 220 30 49 D 84Sacramento River D D D D D D D DSan Joaquin River D D D D D D D DTulare Lake D D D D D D D DNorth Lahontan D 1 D 1 D D D DSouth Lahontan 20 31 7 15 2 4 4 12Colorado River 9 18 2 3 1 2 9 13Total (rounded) 100 370 170 340 50 80 20 140a In some regions, these levels of conservation are already being achieved. Urban water conservation options beyond BMPs would not result in significant, cost-
effective additional reductions in depletion in interior regions and are deferred (D). Only depletion reductions greater than 1 taf are considered in this table.
The greatest potential reductions in urban water use wouldcome from reducing outdoor water use for landscaping. Datafor accurately quantifying present acreage of urban landscaping(or for forecasting future acreage) are virtually non-existenttoday.
Courtesy of Barbara Cross

6-10EVALUATING OPTIONS FROM A STATEWIDE PERSPECTIVE
The California Water Plan Update BULLETIN 160-98
age, and summing the results to obtain a total for irri-gated landscapes in the State. As discussed in the sidebar,no firm numbers are available for statewide irrigatedurban landscape acreage. For this Bulletin, based onwater budget data and projected increases in popula-tion, landscape water use in California is estimated toincrease from about 2.4 maf in 1995 to 3.6 maf in 2020.
The Department estimates that landscape in Cali-fornia will be irrigated on average at 1.0 ET
0 by 2020.
Options to reduce outdoor water use assume that state-wide landscape irrigation could be reduced on averageto 0.8 ET
0 either in new development, or in all devel-
opment. These reductions would be realized throughlandscape water audits and incentive programs by re-tailers. So that the cost of implementing these optionscan be equitably compared with other supply augmen-tation options, the economic evaluations in Chapters7–9 assume that implementation costs are funded bywater purveyors and not by homeowners. This assump-tion implies that water purveyors could choose to carryout landscape water management programs in muchthe same manner as some urban purveyors have imple-mented ultra low flush toilet retrofit programs.
Option 1: Outdoor Water Use in New Develop-ment to 0.8 ET0 . The Model Landscape Ordinanceindicates that a landscape plant factor of 0.8 ET
0 could
be attainable through measures such as proper land-scape and irrigation system design, more intensivelandscape water audit programs, installing automaticrain sensors, better irrigation scheduling, and incen-tive programs tied to an ET-based billing structure.Statewide, about 100 taf/yr of depletion reductionscould be achieved by reducing outdoor water use to0.8 ET
0 at a cost of about $750/af. The ordinance is
directly applicable to new construction; existing land-scaping would require retrofitting.
Option 2: Outdoor Water Use in New and Ex-isting Development to 0.8 ET
0 . This option extends
the provisions of Option 1 to include existing devel-opment. Statewide, about 370 taf/yr of depletionreduction could be achieved by reducing outdoor wa-ter use in new and existing development to 0.8 ET
0.
The cost of this option is difficult to quantify and isgreatly affected by site-specific factors. It is expectedto be high due to the cost involved in retrofittingexisting landscape.
Residential Indoor Water Use
Options to reduce indoor residential water use as-sume that by 2020, indoor water use in the State would
average 65 gallons per capita daily. Options 3 and 4would reduce this average to 60 gpcd and 55 gpcd, re-spectively. These reduced levels of indoor water use couldbe achieved statewide if strong incentive programs, suchas financial incentives for retrofits, were provided. Moreaggressive indoor water audits would be needed. Con-version to horizontal axis washing machines is assumedto occur in 25 percent of all residences under Option 3and 75 percent under Option 4.
Option 3: Reduce Residential Indoor Water Useto 60 gpcd. This option is based on the potential for a3 gpcd reduction in leaks, a 1 gpcd reduction in showerusage, and a 1 gpcd reduction in laundry use. Thesesavings result in an 8 percent reduction of applied waterbeyond current BMPs at the retail level. This optioncould achieve about 170 taf/yr in depletion reductionsat a cost of about $400/af.
Option 4: Reduce Residential Indoor Water Useto 55 gpcd. This option is based on the potential for a5 gpcd reduction in leaks, a 2 gpcd reduction in showerusage, and a 3 gpcd reduction in laundry use. Thesesavings result in a 15 percent reduction of applied waterbeyond current BMPs at the retail level. This optioncould achieve about 340 taf/yr in depletion reductionsat a cost of $600/af.
Interior CII Water Use
Urban BMPs account for 12 to 15 percent reduc-tion in commercial, industrial, and institutional wateruse by 2020. Options 5 and 6 assume that CII water usecould be reduced beyond BMPs with aggressive auditsand information programs by the retailer. These optionscould reduce CII water use by an additional 3 percentand 5 percent. The reduction levels are based on mea-sures with varying payback schedules, and also on anational study funded by EPA which identifies potentialsavings beyond BMPs attainable for various enterprises.
Option 5: Interior CII Water Use by 3 percent.This option is based on measures requiring a five-yearstart up time with payback in two years. The addi-tional 3 percent CII reduction would require increasedwater audits and compliance with existing standardsand regulations. This option could achieve about50␣ taf/yr in depletion reductions, primarily in coastalregions, at a cost of about $500/af.
Option 6: Interior CII Water Use by 5 percent.This option is based on measures requiring an addi-tional five-year start up period with a payback within twoto five years. The additional 5 percent reduction wouldaccrue through increased audits and compliance with

6-11 EVALUATING OPTIONS FROM A STATEWIDE PERSPECTIVE
The California Water Plan Update BULLETIN 160-98
existing standards, and new efficiency standards. About80 taf/yr of depletion reduction could be achieved, pri-marily in the coastal regions, at a cost of $750/af.
Distribution System Losses
The Department estimates that the average unac-counted water in the State’s hydrologic regions rangesbetween 6 and 15 percent. Two percent is attributedto unmetered water use (including water used for con-struction, fire fighting, and for flushing drains andhydrants) and meter errors; therefore, distribution sys-tem losses range between 4 percent and 13 percent.Options to reduce distribution system losses assumethat they could be reduced to 7 and 5 percent state-wide with more aggressive leak detection and repairprograms by the retailer.
Option 7: Distribution System Losses to 7 per-cent. This option assumes that water system auditswould be carried out every three years, leak detec-tion surveys would be conducted from the audits,and repairs would be made. The cost of this option isestimated to be about $200/af. This option wouldachieve about 20 taf/yr of depletion reductions.
Option 8: Distribution System Losses to 5 per-cent. This option assumes full metering of all watersources and points of use, annual water audits, leakdetection of newly constructed pipelines, and system-atic leak detection and repair programs linked to wateraudits. Implementation of this option would achieveabout 140 taf/yr of depletion reduction at a cost of$300/af.
Agricultural Water Conservation OptionsAgricultural water use in the Bulletin’s 2020 fore-
cast is calculated from estimates of crop acreage, unit
applied water, unit ETAW and SAEs. Irrigated cropacreage was 9.5 million acres in 1995 and is expectedto decline to 9.2 million acres by 2020 because of ur-banization (mostly in the South Coast Region and SanJoaquin Valley), westside San Joaquin Valley drainageproblems, and changes in CVP water supply in theCentral Valley.
Bulletin 160-98 assumes that water purveyorsstatewide will implement EWMPs by 2020, as de-scribed in Chapter 4. The resultant demand reductionis included in the Bulletin’s 2020 agricultural wateruse forecast. Statewide implementation of EWMPsresults in about 800 taf/yr of applied water reductionsby 2020, largely from canal lining or piping and othermeasures increasing average on-farm SAE to 73 per-cent. Recent Department studies have shown thataverage SAEs might be increased to 80 percent throughimproved irrigation equipment and irrigation manage-ment practices.
The agricultural water conservation optionsdescribed below were based on attaining SAEsgreater than 73 percent, on average, through imple-mentation of conservation measures in excess ofpresent EWMPs. Average efficiencies of 76, 78, and80 percent were used for the water managementoptions. The Department’s mobile laboratory datahave shown these efficiencies can be achieved incertain locations and with some crops and irriga-tion methods.
Stressing orchards to reduce ET (also referred toas regulated deficit irrigation) was not evaluated as anoption. The RDI method was used successfully dur-ing the drought, but may impact crop yields and needsfurther testing as a long-term management strategy.RDI and other irrigation techniques are discussed inChapter 5.
CALFED Water Conservation PlanningA technical appendix published with CALFED’s March
1998 draft PEIR/PEIS outlined a proposed water conserva-tion approach for urban and agricultural agencies wishing toparticipate in CALFED program benefits. CALFED’s con-servation levels differ from those used in Bulletin 160-98.CALFED’s assumptions represent its vision of future conser-vation goals. Bulletin 160-98 uses the approach of forecast-ing the future based on present conditions. For example,CALFED assumes that new sources of financial assistanceand other incentives would be provided to water agencies to
encourage high levels of conservation. Bulletin 160-98 as-sumes that demand reduction options beyond BMPs andEWMPs must be cost-competitive with supply augmenta-tion options, and that no new subsidies or financial assis-tance programs are provided.
Demand reductions estimated to occur from implementa-tion of CALFED conservation measures were not includedin CALFED’s quantification of new water supplies poten-tially generated by the program. Thus, they are also not in-cluded in the Bulletin 160-98 quantification of potential newsupplies from CALFED.

6-12EVALUATING OPTIONS FROM A STATEWIDE PERSPECTIVE
The California Water Plan Update BULLETIN 160-98
Agricultural demand reduction options are evalu-ated for each hydrologic region and summarized inTable 6-4. The water conserved from these optionsvaries for each region according to prevailing irriga-tion practices and the regional soil types andhydrology. As with urban conservation options, thepurpose of implementing these agricultural conser-vation options is to generate new water supply byreducing depletions. Reducing consumptive useresults in additional water supply only where waterwould otherwise be lost to evapotranspiration or toa saline water body such as the Pacific Ocean. InCalifornia agriculture, this condition exists prima-rily in the Colorado River Region (which drains tothe Salton Sea), parts of the coastal regions, and thewestside of the San Joaquin Valley. In the Sacra-mento River and the San Joaquin River Regions,almost all excess applied irrigation water is reused,ultimately percolating to usable groundwater ordraining back into rivers that flow toward the Delta.
If all of the options discussed below were imple-mented, about 230 taf of depletion reduction couldtheoretically be achieved. In areas where no depletion re-ductions would be achieved by conservation beyondEWMPs (such as the Sacramento and San Joaquin RiverRegions), this additional conservation was deferred as awater supply option. Most of the potential for achievingdepletion reductions through additional agricultural con-
servation occurs in the Colorado River Region. The en-vironmental impacts of such conservation on the SaltonSea must be carefully evaluated. The Salton Sea pro-vides valuable habitat for migratory waterfowl, andalternatives for stabilizing its increasing salinity arenow being studied. Since agricultural drainage pro-vides the bulk of fresh water inflow to the sea, actionsreducing the freshwater inflow may not beimplementable on a large scale.
Irrigation Management (Options 1, 2, and 3)
By 2020, the Department assumes that on-farmSAEs will average 73 percent statewide. Based on mo-bile laboratory studies, average SAE could reach 80percent through programs that include irrigation sys-tem evaluations, better system design, and improvedirrigation systems and management practices. Options1, 2, and 3 represent the depletion reductions thatwould be obtained with improved average SAE at 76,78, and 80 percent, respectively. Increasing average SAEfrom 73 to 76 percent would yield a depletion reduc-tion of about 40 taf/yr statewide at about $100/af.Improving SAE from 73 to 78 percent would increasedepletion reductions to 60 taf/yr statewide at a cost of$250/af. Improving irrigation management from 73to 80 percent SAE would result in statewide depletionreductions of about 80 taf/yr at a cost of $450/af.
TABLE 6-4
Agricultural Depletion Reduction Potential Due to Water Conservation Optionsa Beyond EWMPs (taf)
Opt 1 Opt 2 Opt 3 Option 4 Option 5 Option 6
Region 76% 78% 80%
Seasonal Application Flexible Water Canal Lining and TailwaterEfficiency Delivery Pipingb Recovery
North Coast D D D D D DSan Francisco Bay D D D D D DCentral Coast D D D D D DSouth Coast 4 7 10 D D DSacramento River D D D D D DSan Joaquin River D D D 2 2 2Tulare Lake 7 12 17 D D DNorth Lahontan D D D D D DSouth Lahontan 2 3 5 D D DColorado Riverc 22 36 50 30 45 65Total (rounded) 40 60 80 30 50 70a Implementing options in certain regions would not result in any depletion reduction. These options are deferred (D). Only depletion reductions greater than
1 taf are presented in this table.b Excludes lining of major conveyance facilities (eg., All American Canal, Coachella Canal), which are treated as individual options in the regional water
management chapters.c These options are subject to environmental review to ensure that reduced depletions will not have significant impacts to the Salton Sea.

6-13 EVALUATING OPTIONS FROM A STATEWIDE PERSPECTIVE
The California Water Plan Update BULLETIN 160-98
Water Delivery Flexibility (Option 4)
The manner of water delivery to the farm affectswater use and efficiency of use. Flexible water deliveryallows a farmer to turn water on and off at will. This iscurrently impractical for many gravity flow agricul-tural water delivery systems because of the largevolumes of water that must be delivered. However,some agricultural water agencies have been able to al-low farmers to give shorter notice to the district beforereceiving water and to allow farmers to adjust flow ratesand the duration of the irrigation. Flexible water de-livery beyond that achieved through implementationof existing EWMPs would yield about 30 taf/yr at acost of about $1,000/af.
Canal Lining and Piping (Option 5)
Increased water use efficiency could be achievedby improving on-farm distribution systems beyond thelevel of effort provided in existing EWMPs. Distribu-tion system losses can be reduced by lining open canalsystems or using pipelines. Pipelines would reducedepletions from evaporation and from seepage of ap-plied water to unusable groundwater. (This optionapplies only to canal lining and piping of on-farm de-livery systems. Lining of major conveyance facilitiessuch as the All American Canal and lining of wateragency-owned canals are treated as individual optionsin Chapters 7-9.)
Lining irrigation canal systems in the San JoaquinRiver Region could reduce depletions by about 2 taf/yr in areas that drain into unusable shallow ground-water. Less than 1 taf in annual depletion reductionwould accrue in the Tulare Lake Region because many
irrigation systems on the westside of the valley wherethere is unusable shallow groundwater are already linedor piped. This option could reduce depletions by45␣ taf/yr in the Colorado River Region. It is estimatedthat this option would cost about $1,200/af.
Tailwater and Spill Recovery Systems (Option 6)
This option would improve irrigation efficiencyby the construction of additional tailwater and spillrecovery systems. The tailwater recovery option is onlyapplicable to areas with furrow or border irrigationsystems. Spill recovery systems would lessen the amountof water reaching unusable groundwater and surfacewater by reducing losses from operational spills in irri-gation district delivery canals. About 70 taf/yr ofdepletion reductions could be achieved with this op-tion, primarily in the Colorado River Region, at a costof about $150/af.
Environmental Water ConservationOptions
Unlike the urban and agricultural efforts discussedabove, little formal planning for environmental waterconservation has occurred. Development of a formal pro-gram to evaluate efficient water use on wetlands iscurrently the only active program. DFG, USBR, andUSFWS are working with the Grasslands Resource Con-servation District to develop an interagency program forwater use planning for Central Valley wildlife refuges cov-ered by the CVPIA. The program will include bestmanagement practices for efficient water use. Draft workproducts are expected in 1998. The Bulletin does notquantify options for wetlands water conservation.
Land Retirement in Drainage-Impaired AreasLand retirement has been considered for purposes that in-
clude drainage management and creation of wildlife habitat,as well as for potential water supply gains. Currently, twoprograms have authority to fund land retirement—the CVPIAland retirement program and the San Joaquin Valley Drain-age Relief Program created by State legislation in 1992.USBR’s CVPIA program has significant funding for land re-tirement, as described in Chapters 2 and 4. Retiring drain-age-impaired land on the westside of the San Joaquin Valleywould result in reduction of applied water and depletionsassociated with the current agricultural land use. The use ofthis associated water—whether for agricultural, urban, orenvironmental purposes—would depend on the authority and
purpose of the program implementing the retirement.For illustrative purposes, Bulletin 160-98 quantified demand
reductions associated with two land retirement scenarios onthe westside of the San Joaquin Valley, where some agriculturallands face serious drainage problems and where the existingland retirement programs are authorized to make acquisitions.This analysis is presented to show the demand reductionamounts and potential associated socioeconomic impacts forthese drainage management options. Since the scope of Bulle-tin 160-98 is limited to water supply/demand planning, theBulletin does not include land retirement for drainage pur-poses as a water management option. The results of the landretirement analysis are shown in Appendix 6F.

6-14EVALUATING OPTIONS FROM A STATEWIDE PERSPECTIVE
The California Water Plan Update BULLETIN 160-98
Presently, most active planning for statewide watersupply options is being done either for the CALFED Bay-Delta program or for SWP future supply. In accordancewith CVPIA requirements, an appraisal level water supplyaugmentation report (for replacing the project water dedi-cated to environmental use) was recently prepared for theCVP. There has not been action to implement potentialCVP supply options described in that report, apart frominitiation of a conjunctive use study described later in thischapter. Statewide-level supply augmentation options aredescribed in the following text, and a summary table oftheir potential yield is provided at the end of this section.
Conveyance FacilitiesTwo programs, the SWP Interim South Delta Pro-
gram and the CALFED program, are studyingconveyance actions in and around the Delta. Past stud-ies have evaluated a potential Mid-Valley Canal, a majorconveyance facility to supplement water supplies tothe eastern San Joaquin Valley.
SWP Interim South Delta Program
The Department’s Interim South Delta Programproposes to improve water levels and circulation insouth Delta channels for local agricultural diversions,and to enhance existing delivery capability of the SWPby improving south Delta hydraulic conditions, allow-ing increased diversions into Clifton Court Forebay.This would allow for more frequent use of full pump-ing capacity (10,300 cfs) at the Banks Pumping Plantduring high flows in the Delta, and more operationalflexibility for reducing fishery impacts.
The ISDP partly responds to the proposed settle-ment of a lawsuit brought by the South Delta WaterAgency against the Department and USBR. In theproposed settlement agreement, the three parties com-mitted to develop mutually acceptable long-termsolutions to the water supply problems of water userswithin SDWA. The Department has taken the leadresponsibility for planning and constructing theproject, with cost-sharing provided by USBR.
The ISDP preferred alternative would cost an es-timated $60 million to construct and includes fivecomponents:(1) Construction and operation of a new intake struc-
ture at the northeastern corner of Clifton Court
Forebay, as part of providing greater operationalflexibility in export pumping.
(2) Channel dredging along 4.9 miles of Old Riverjust north of Clifton Court Forebay.
(3) Construction and seasonal operation of a barrier atthe head of Old River in spring and fall to improvefishery conditions for salmon migrating in the SanJoaquin River. (Construction of an Old River fish-ery barrier is included in CVPIA’s list of mandatedfederal environmental restoration actions.)
(4) Construction and operation of three flow controlstructures at Old River, Middle River, and GrantLine Canal to improve existing water level andcirculation patterns for agricultural users in thesouth Delta.
(5) Increased diversions into Clifton Court Fore-bay up to a maximum of 20,430 af daily on amonthly average basis, resulting in the abilityto pump an average of 10,300 cfs at BanksPumping Plant.ISDP could augment SWP supplies by 125 taf/yr
in average years and 100 taf/yr in drought years at a2020 level of demand, based on present studies. Thisfigure does not take into account any new operationalrestrictions that may be imposed on the project as aresult of the environmental review and permitting pro-cess which it is now undergoing. A draft EIR/EIS forthe program was released in July 1996 and ESA con-sultation is ongoing. A final EIR/EIS is scheduled forcompletion in 1999.
CALFED Delta Conveyance
The CALFED Bay-Delta program is carrying out athree-phase process for solutions for the Bay-Delta sys-tem. In Phase I, the program identified the problems inthe Bay-Delta system, developed guiding principles, anddevised three basic alternatives to solving the identifiedproblems. The second phase consisted of preparing aprogrammatic EIR/EIS covering three main alternativesfor conveyance of water across the Delta:• Alternative 1. Water would be conveyed through
the Delta using the current system of channels.• Alternative 2. Water conveyance through the
Delta would be substantially improved by mak-ing significant changes to the existing systemof channels.
Water Supply Augmentation Options
. . .

6-15 EVALUATING OPTIONS FROM A STATEWIDE PERSPECTIVE
The California Water Plan Update BULLETIN 160-98
• Alternative 3. Water conveyance through the Deltawould be substantially improved by making sig-nificant changes to the existing system of channelsand constructing a conveyance facility, isolatedfrom the Delta’s natural channels, to transport partor all of the water intended for export.Each alternative presents options for water storage,
as well as a system for conveying water through and/oraround the Delta. The water storage element could in-clude expanding existing storage, constructing newsurface storage, or conjunctive use and groundwaterbanking. Additional storage would increase flexibility
in operating the Bay-Delta system, allowing operatorsto respond to changing conditions and needs through-out the year, and would help respond to the effects ofdrought. Surface storage could be in the Delta, upstreamof the Delta, or south of the Delta. Groundwater stor-age components include conjunctive use andgroundwater banking programs in the Sacramento andSan Joaquin Valleys and in the Mojave River Basin.
A public review draft of the PEIR/PEIS was re-leased in March 1998. CALFED expects to issue arevised draft PEIR/PEIS by the end of 1998. The re-vised draft would identify CALFED’s draft preferredalternative. The third phase of the CALFED processwould involve staged implementation of the preferredalternative, over a time period perhaps as long as 30years, and would require site-specific compliance withNEPA and CEQA.
In June 1998, it was announced that the seconddraft of CALFED’s PEIR/PEIS would focus on a firststage of program implementation that would be de-fined as the period prior to final action on any majornew surface storage or conveyance projects that mightbe addressed in CALFED’s draft preferred alternative.The first stage was estimated to span seven to ten years.The first stage was to focus on implementation of dem-onstration projects and actions associated withCALFED common program elements (see accompa-nying sidebar) and on further planning for waterstorage and conveyance actions.
The total costs of the CALFED program are dif-ficult to estimate at this time because of its broadscope and programmatic nature, and because deci-sions have not yet been reached about specifics ofimplementation. CALFED’s PEIR/PEIS estimatedtotal program costs as potentially in the range of
CALFED Bay-Delta ProgramCommon Programs
The following six common program elements provide thefoundation for overall improvement in the Bay-Delta system.Each of the individual elements is a major program of its own.• Long-Term Levee Protection Plan—Improve reliability of
the Delta levees to benefit all users of Delta water and land.• Water Quality Program—Reduce point and non-point
source pollution for the benefit of all water uses and theBay-Delta ecosystem.
• Ecosystem Restoration Program—Improve habitat,restore critical flows, and reduce conflict with other
Delta system resources.• Water Use Efficiency Program—Provide for efficient use
of existing water supplies and assure efficient use of anynew supplies developed through the program.
• Water Transfer Policy—Provide a framework to facilitateand encourage a water market to move water among userson a voluntary and compensated basis.
• Watershed Management Coordination—Encourage lo-cally-led watershed management activities that benefitDelta system resources.
Delta levees protect infrastructure such as EBMUD’s MokelumneRiver Aqueduct, highways, railroads, and power transmissionlines.

6-16EVALUATING OPTIONS FROM A STATEWIDE PERSPECTIVE
The California Water Plan Update BULLETIN 160-98
$10 billion, over a program life of several decades.There is presently no information available on whatportion of those costs would be allocated to any newwater supply CALFED would develop.
Mid-Valley Canal
The Mid-Valley Canal was a proposed conveyancefacility to supplement water supplies to the eastern SanJoaquin Valley. With two components—a main branchand a north branch—the canal would convey existingCVP water supply from the Delta to portions ofMerced, Madera, Fresno, Kings, and Tulare Countiesand, by exchange, Kern County.
The main branch of the Mid-Valley Canal wouldconvey water from the Mendota Pool down the eastside of the valley, providing additional water deliveriesto the southern San Joaquin Valley and Tulare LakeBasin. The north branch would divert water out of theMendota Pool to provide additional water deliveriesto the eastern San Joaquin Valley. Water deliveries couldbe provided for conjunctive use and groundwater bank-ing programs, alleviating groundwater overdraftconditions. Improved groundwater conditions throughdelivery of surplus Delta flows could increase the reli-ability of drought year supplies. Because of theuncertainty of Delta exports, this option is deferred fromfurther analysis in this Bulletin as a statewide option.
Surface Storage Facilities
Developing additional surface storage is an impor-tant option for improving statewide water supplyreliability. New facilities could store water for the envi-ronment, agriculture, municipalities, industry, or acombination of these uses. More storage would increaseflexibility in operating the Bay-Delta system, improv-ing operators’ ability to respond to changing conditionsand needs throughout the year. At this time, the onlystatewide-level studies of new surface storage facilitiesare those relating to the CALFED program.
Area of Origin Protections
As described in Appendix 2A, there are explicitstatutory protections for area of origin water develop-ment, with regard to actions taken by SWRCB inadministering water rights and by the Department inproviding SWP supply. These provisions apply to theconstruction and operation of CVP and SWP facili-ties and would apply to any CALFED-related facilitiesconstructed by the projects.
At the time when initial planning was being per-formed for a statewide water resources developmentsystem, the State filed applications for the appropria-tive water rights (including rights to store water) neededfor coordinated development of California’s water re-sources. Some of these State filings were subsequentlyassigned to CVP or SWP facilities, and some to localprojects. SWRCB may not, in acting on water rightapplications for these State filings (e.g., applicationsfor a new surface storage facility), deprive the countyof origin of the water needed for its present and futuredevelopment. Many of these original State filings havenow been assigned and the associated facilities havebeen constructed.
Water Code Sections 11460 et seq. require theDepartment, with regard to construction and opera-tion of the SWP, to not deprive areas of origin, or “anarea immediately adjacent thereto which can conve-niently be supplied with water therefrom,” of the waterreasonably needed for their beneficial uses. Water agen-cies in the area of origin and adjoining areas couldcontract with the Department for SWP supply pursu-ant to this provision. The terms and conditionscontained in the contract would depend on the natureof the agencies’ needs. If the agency wished to becomea SWP contractor on a par with the existing 29 watercontractors, the contract would be negotiated in thesame manner as the existing SWP contracts. An areaof origin agency with different needs might seek a dif-ferent contractual format. For example, an alternativecontractual form might be negotiated for agencies thatcould carry out local conjunctive use programs to re-duce their need for a firm supply from the SWP.Existing SWP contractors pay a share of the costs ofdeveloping SWP supply, plus a transportation chargethat reflects the cost of water delivery to a contractor’sservice area. Actual water supply and transportationcharges for an area of origin contractor would be de-termined by the type of water supply needed and theassociated transportation facilities. To date, no area oforigin agencies have negotiated water supply contractswith the Department.
CALFED Surface Storage
New water supply provided by the CALFED pro-gram would come about by implementing somecombination of surface storage facilities and conjunc-tive use programs (discussed later in this chapter).Bulletin 160-98 describes potential CALFED storagefacilities and their water supply contributions for

6-17 EVALUATING OPTIONS FROM A STATEWIDE PERSPECTIVE
The California Water Plan Update BULLETIN 160-98
illustrative purposes, but does not attempt to identifywhich facility or facilities CALFED might construct.As presently scheduled, CALFED would not beginconstruction of a new surface storage facility until af-ter its initial implementation of common programelements. Given the long lead time associated withmoving forward on large storage facilities, new watersupply from a CALFED facility may not be availableby the Bulletin’s 2020 planning horizon. The poten-tial new water supply provided by CALFED storage(quantified later in this chapter) is necessarily a place-holder, as no decision has yet been made on a draftpreferred alternative. Quantification of CALFED ac-tions for Bulletin 160-98 is based on informationprovided in CALFED’s March 1998 first draft PEIS/PEIR and supporting technical appendices.
For illustrative purposes, the Bulletin’s discussionof new CALFED storage facilities treats some of thefacilities as if they were part of the SWP, to provide abenchmark for calculating their yields via operationsstudies. Many of these sites have been studied histori-cally as potential SWP future water supply facilities,and data available for them reflect that intended pur-pose. The Bulletin’s treatment of these facilities aspotential components of the SWP is to facilitate theirquantification, and is not intended to be a proposal asto the agency that would actually finance, construct,and own them. To date, there has been no determina-tion of how any new supplies developed by CALFEDwould be allocated.
The following sections present an overview of thelocations where new CALFED surface storage facili-ties could be developed.
Surface Storage Upstream of the Delta. Review ofpotential statewide surface storage options upstream ofthe Delta revealed that most of the water developmentpotential of the eastern Delta and San Joaquin River tribu-taries is likely to be dedicated to local plans. TheSacramento River Basin presents nearly all the potentialfor additional development to meet statewide needs.
The Sacramento River Basin produces nearly one-third of California’s surface runoff. About 16 maftotal reservoir storage throughout the basin regulatesmuch of that runoff to support extensive agriculturaldevelopment within the region, and also providessignificant water supply for export to other regions fromCVP and SWP facilities. A potential remains for de-veloping additional storage in the basin, as evidencedby frequent winter outflows in excess of in-basin andDelta needs.
Over the past century, hundreds of potential res-ervoir storage sites have been examined encompassingevery significant tributary of the Sacramento RiverBasin. The most economical and practicable of thosewere developed, the largest of which are Shasta,Oroville, Berryessa, Almanor, Folsom, and NewBullards Bar. Options for additional storage are pri-marily past project proposals that were not developed.
The average annual surplus outflow in the Sacra-mento River Basin is about 9 maf. While this suggestspotential for additional storage development, much ofthe surplus runoff occurs during short periods in yearsof exceptional flood runoff. For example, a maximumdaily flow of about 600,000 cfs flowed past Sacramentoduring the floods of February 1986 and January 1997.New storage capacity could be developed to capture asmall fraction of this surplus. Prospects for the develop-ment of additional onstream surface storage reservoirsare discussed in the sidebar.
Besides the onstream reservoir sites proposed overthe years, many potential offstream storage sites havebeen investigated to develop surplus water in the upperSacramento River Basin. Major planning on suchprojects began in the 1970s, in the wake of wild andscenic rivers legislation that effectively eliminated addi-tional development of the North Coast rivers. By then,it was also apparent that new storage sites on the Sacra-mento River were not environmentally feasible, soattention shifted to various onstream tributary reservoirsand to offstream sites. With one exception (TuscanButtes Reservoir on Inks Creek, north of Red Bluff ),the most promising offstream storage sites investigatedduring this time lay west of the river from the StonyCreek Basin (Newville and Glenn Reservoirs) south(from Colusa and Sites Reservoirs) to the Putah CreekBasin (enlarged Lake Berryessa). All these projects wouldrequire conveyance facilities to divert surplus flow (usu-ally during flood periods) from the Sacramento River,some with potential pump lifts of 300 to 900 feet.(CALFED’s studies of storage options are presently ex-amining whether existing facilities such as theTehama-Colusa Canal could be modified to serve asconveyance facilities for some of the potential offstreamstorage sites.) Offstream storage projects of this type canbe sited to minimize environmental impacts within theinundation area, but diversions from the river involveengineering and environmental challenges.
There has been a revival of interest in otheroffstream storage possibilities, some new and some thatappeared in the Department’s Bulletin 3, The Califor-

6-18EVALUATING OPTIONS FROM A STATEWIDE PERSPECTIVE
The California Water Plan Update BULLETIN 160-98
nia Water Plan, in 1957. Among the latter is a poten-tial local project, Waldo Reservoir, to store surplus YubaRiver water diverted from the existing EnglebrightReservoir. Similar proposals have been developed to
store surplus American River water from Folsom Res-ervoir in the nearby Deer Creek or Laguna CreekBasins. Offstream storage projects of this type are at-tractive because they eliminate the need for onstream
Prospects for Onstream Surface StorageUpstream of the Delta
The seven areas outlined below contribute more than 80percent of Sacramento River Basin runoff. The remainingrunoff originates within the substantial valley floor area andadjacent low- elevation foothills. With few exceptions, streamsdraining this area are ephemeral, flowing only during andfollowing storms. No consideration has been given toonstream storage on these minor tributaries or nearby valleyfloor areas, except for discussion of possible winter storage inrice fields.
Upstream from Shasta Dam
About 26 percent of basin runoff originates in this 6,700-square mile tributary area, primarily in the Pit, McCloud,and upper Sacramento Rivers. The availability of water tosupport additional storage has long been recognized. In the1930s, Shasta Dam planners considered a larger project, butopted for construction of storage downstream at the TableMountain or Iron Canyon sites near Red Bluff. When thedownstream dam proved environmentally unacceptable, al-ternatives examined eventually included enlarging ShastaDam. New storage upstream is possible, but sites are limitedby steep topography and extensive existing power develop-ment of the Pit and McCloud systems.
Upper Sacramento River Tributaries, Shasta Dam toRed Bluff
This large, but low-elevation, area contributes about one-eighth of Sacramento River Basin runoff. The principal tribu-taries (in descending order of runoff) are Cottonwood, Cow,Clear, and Battle Creeks. Clear Creek is fully developed byWhiskeytown Lake (a CVP facility). Several reservoir sites havebeen investigated on the other tributaries, with primary em-phasis on Cottonwood Creek. Previously studied reservoir sitesare available in this area, but none have proven viable.
Feather River
This is the Sacramento River’s largest tributary and con-tributes 20 percent of basin runoff, an annual average of about4.5 maf. Lake Oroville at 3.5 maf regulates Feather Riverflows in most years, but the huge spills in wet years show thatthe river could support additional storage. Enlargement ofLake Oroville has not been considered practical and the fewupstream sites identified in the past have fallen by the way-side for various environmental and economic reasons. Noserious planning attention has been devoted to major reser-voir storage in the Feather River Basin since construction ofOroville Dam.
Yuba and Bear Rivers
The Yuba River constitutes 11 percent of Sacramento RiverBasin runoff, but is substantially diminished by power diver-sions to the adjacent Bear and Feather Rivers. Still, a signifi-cant potential for additional storage remains. Proposals forlarge reservoirs at the Marysville (or nearby Narrows) site havebeen discussed in the past 40 years. Upstream developmentpotential is restrained by extensive existing power facilitiesand diversions. The Bear River is small, but its runoff is bol-stered by the diversions from the Yuba River.
American River
With 12 percent of Sacramento Basin runoff, the Ameri-can River could support more than the 1.0 maf of storageprovided by Folsom Lake and the nearly 0.5 maf of upperbasin storage. For the past decade, recognition of a floodinghazard along the lower American River has added urgency tofinding options, including enlarging Folsom Lake andconstructing additional storage upstream at Auburn. The con-troversy over Auburn Dam prompted reappraisal of storagesites farther upstream and on the South Fork, but none ap-peared to justify follow-up attention.
Westside Tributaries South of Cottonwood Creek
The principal tributaries in this group are (from southto north): Putah, Cache, Stony, Thomes, Elder, and RedBank Creeks. The existing Lake Berryessa, which has anunusually high storage/inflow ratio, fully develops PutahCreek. Clear Lake and Indian Valley Reservoir provideabout 0.6 maf of active storage in the upper Cache CreekBasin, but only modest potential exists for additional stor-age in the lower basin. East Park, Stony Gorge, and BlackButte Reservoirs partially control Stony Creek, but somesurplus water remains. Thomes, Elder, and Red BankCreeks are presently uncontrolled; Thomes Creek contrib-utes about two-thirds of the runoff from this northern trio.Potential reservoir sites have been considered on the vari-ous westside tributaries, principally within the Stony/Thomes Basins.
Other Tributaries, Feather River to Red Bluff
From south to north, the major streams of this group areButte, Big Chico, Deer, Mill, and Antelope Creeks. Thesedrainages are narrow, steep canyons with good sustained sum-mer flows. Past studies have identified a few small potentialstorage sites, but none are considered practical because ofenvironmental considerations (primarily anadromous fish andwilderness issues).

6-19 EVALUATING OPTIONS FROM A STATEWIDE PERSPECTIVE
The California Water Plan Update BULLETIN 160-98
reservoirs and divert from existing facilities upstreamfrom current anadromous fishery habitat.
To illustrate how specific surface storage projectsupstream of the Delta compare with one another, Bul-letin 160-98 planning criteria were used to screen andevaluate the reservoir sites (Appendix 6G). CALFED isperforming its own evaluation of possible storage sites.An initial screening may be included in its final PEIS/PEIR. More detailed evaluations of the remaining siteswould be carried out after CALFED begins to imple-ment initial elements of the common programs.
Off-Aqueduct Surface Storage South of theDelta. Off-aqueduct surface storage south of theDelta has been investigated for many years.CALFED’s storage evaluations include reviewing off-aqueduct storage.
The CVP and SWP operate by releasing waterfrom upstream reservoirs, which flows through theDelta and is diverted, together with unstored flowsavailable for export, by the projects’ pumping plantslocated in the south Delta. Storage south of the Deltais provided by San Luis Reservoir, a joint SWP/CVPfacility in the San Joaquin Valley. Water pumped atthe Banks and Tracy Pumping Plants is transported toSan Luis Reservoir during the winter and early springand later delivered to agricultural and urban water con-tractors. Additional storage south of the Delta wouldincrease water availability through greater capture ofsurplus winter runoff, as well as provide for greaterflexibility in operating the projects.
Dependable water supplies from the SWP are es-timated at about 3.1 and 2.1 maf for average anddrought years, respectively. Operation studies show thatunder 2020 level of demand, there is a 25 percentchance of delivering full entitlement in any given yearwith existing facilities. Operation studies show similarCVP delivery capabilities to its Delta export servicearea. (See Chapter 3 for discussion of SWP and CVPoperations.) Additional off-aqueduct storage southof the Delta would increase water supply reliability ofboth projects.
In addition to increasing water supply reliabilityfor both projects, more off-aqueduct storage south ofthe Delta would allow flexibility in pumping from theDelta. This flexibility would allow for shifting of Deltapumping toward months when the impacts of Deltadiversions on fisheries are at their lowest. Having ad-ditional storage south of the Delta would allow theprojects to operate efficiently by taking advantage oftimes when maximum pumping is permissible.
Operation of the SWP and CVP is governed by sev-eral limiting factors including available water supplies,demands on these supplies by project contractors, Deltawater quality standards, instream flow requirements, andconveyance capability. The availability of water suppliesvaries with natural conditions and upstream development.Winter floods can produce Delta flow rates of up to sev-eral hundred thousand cfs, while summer rates can be aslow as a few thousand cfs. Annual Delta inflow variessubstantially, ranging from more than 70 maf in wet yearsto less than 7 maf in drought years.
Since the 1950s, alternative off-aqueduct storagereservoir sites south of the Delta have been investi-gated by the Department. An agreement between theState and federal governments was signed in 1961 forconstruction and operation of San Luis Reservoir, ajoint-use offstream storage facility completed in 1968.Before completion of San Luis Reservoir, it was recog-nized that additional storage south of the Delta wasneeded. As a result, a Delta storage development pro-gram was authorized by legislative action in 1963-64,and work started to analyze the remaining potentialoff-aqueduct storage sites in the San Joaquin Valley.Under this program a cursory examination of poten-tial sites identified the Kettleman Plain, Los Banos,and Sunflower sites for more in-depth study. Kettlemanand Sunflower Reservoir sites were dropped after re-connaissance level review because of their physicalcharacteristics. The Los Banos site was deemed satis-factory for further study, and a 1966 reportrecommended additional geological exploration.
In the 1970s, a Delta alternatives study reviewedall drainages south of the Delta and selected Los Va-queros, Los Banos Grandes, and Sunflower Reservoirsfor further studies. In a 1976 Delta alternatives memo-randum report, the Sunflower site was again eliminatedwhen compared with the other sites on the basis oflow storage availability and marginal foundation con-ditions. The Los Vaqueros site in Contra Costa Countywas included in the Department’s proposed Delta pro-gram and was part of a comprehensive watermanagement program proposed for authorization via1977-78 legislation. (LBG was an alternative to LosVaqueros in that legislation.) After that legislation failedpassage, Los Vaqueros was included with the Periph-eral Canal in SB 200. LBG was not specificallymentioned in SB 200, but the bill provided for addi-tional off-aqueduct storage south of the Delta. In 1980,SB 200 was signed into law, but was overruled by vot-ers in the 1982 general election.

6-20EVALUATING OPTIONS FROM A STATEWIDE PERSPECTIVE
The California Water Plan Update BULLETIN 160-98
The Department initiated a more comprehensiveinvestigation of alternative off-aqueduct storage reser-voirs south of the Delta in 1983, and after an initialexamination of 18 storage sites, completed a recon-naissance report on 13 potential San Joaquin Valleysites. The study recommended that LBG be investi-gated to determine its most cost-effective size, and itsengineering, economic, financial, and environmentalfeasibility. In 1984, the Legislature unanimously ap-proved Assembly Bill 3792, authorizing LBG as afacility of the SWP. The Department released a draftEIR and a feasibility report on LBG in 1990.
Since the 1990 reports, increased restrictions onDelta pumping and rising costs have prompted recon-sideration of the LBG proposal. Given the uncertaintyof future Delta exports and the reluctance of some SWPcontractors to participate in the project, the Depart-ment reevaluated the feasibility and optimal size ofadditional off-aqueduct storage. A subsequent Alter-native South-of-the-Delta Offstream ReservoirReconnaissance Study identified all alternative reservoirsites south of the Delta by cursory examination of alltopographic possibilities. An overview of sites studiedin the past is provided in Appendix 6G.
In-Delta Storage. CALFED has also consideredin-Delta storage. A private developer has proposed awater storage project involving four islands in the Delta.The project would divert and store water on two of
the islands (Bacon Island and Webb Tract) as reservoirislands, and seasonally divert water to create and en-hance wetlands for wildlife habitat on the other twoislands (Bouldin Island and Holland Tract). The de-veloper would improve and strengthen levees on allfour islands and install additional siphons and pumpson the perimeters of the reservoir islands.
The developer’s project would divert surplus Deltainflows, or would manage transferred or banked waterfor later sale and/or release for Delta export or to meetBay-Delta water quality or flow requirements. The res-ervoir islands would be designed to provide a totalestimated initial capacity of 238 taf—118 taf from Ba-con Island and 120 taf from Webb Tract—at amaximum pool elevation of 6 feet above mean sea level.
A draft EIR/EIS for the Delta Wetlands Projectwas completed in September 1995. SWRCB held waterrights hearings in 1997. Issues included water qualityconcerns, levee integrity, seepage impacts on adjacent is-lands, and fishery impacts. SWRCB is currently reviewingand evaluating the evidence to develop a draft decision.
Multipurpose Storage Facilities
Most reservoirs are constructed to serve multiplepurposes. As discussed in Chapter 3, multipurposereservoirs are often operated to prioritize certain usesor to balance competing uses during different times ofthe year. Good planning policy dictates that new sur-face storage facilities be designed to accommodate asmany purposes—such as water supply, flood control,hydropower generation, fish and wildlife enhancement,water quality management, and recreation—as arepracticable.
Although Bulletin 160 is focused on evaluation ofwater supply options, this focus is not intended tominimize the need to consider the other benefits po-tentially available from reservoir sites—especially floodcontrol. The January 1997 flooding, the largest andmost extensive flood disaster in the State’s history, dem-onstrated the urgent need to improve flood protectionlevels throughout the Central Valley. The 1997 FinalReport of the Governor’s Flood Emergency Action Teamcontained a variety of recommendations for improv-ing emergency response management and floodprotection in the Central Valley.
The 1997 floods highlighted a fundamental factof Central Valley geography—the valley floor is rela-tively flat, and only an extensive system of leveesconfines floodwaters to those areas where people would
The Los Banos Grandes damsite area, looking westerly towardthe Coast Range.

6-21 EVALUATING OPTIONS FROM A STATEWIDE PERSPECTIVE
The California Water Plan Update BULLETIN 160-98
prefer that they remain. At the beginning of the valley’sdevelopment in the Gold Rush era, much of the valleyfloor was an inland sea during the winter months andtravel was possible only by boat. This condition wasonce again experienced on a localized scale in 1997,when numerous levee breaks occurred throughout thevalley. Although more emphasis is being given to flood-plain management and prevention of futuredevelopment in flood-prone areas, extensive urban de-velopment has already occurred in areas that rely onlevees for flood protection. Efforts to improve floodprotection for these urban areas necessarily includeevaluation of upstream storage alternatives—reoperation or enlargement of existing reservoirs andconstruction of new reservoirs.
From a flood control standpoint, there are locationswithin the Sacramento and San Joaquin River systemswhere additional storage (onstream, or perhaps offstreamwith appropriate diversion and pumping capability) wouldbe particularly useful. Communities in the SacramentoValley with greatest need for additional flood protectioninclude the Yuba City/Marysville and Sacramento/WestSacramento areas, as identified in the 1997 Final Reportof the Governor’s Flood Emergency Action Team. An en-larged Shasta Lake could provide additional managementof flood flows on the Sacramento mainstem. The needfor more flood control storage on the Yuba River has beenevaluated for some time, in conjunction with reservoirsites such as the old Marysville site, or the more recentParks Bar alternative. The proposed Auburn Dam on theAmerican River, selected as the preferred flood protec-tion alternative by the State Reclamation Board, wouldprovide much-needed flood protection for the Sacramento
area, which has one of the lowest levels of flood protec-tion of any metropolitan area in the nation.
In the San Joaquin Valley, urbanized areas need-ing additional protection are those affected by floodingon the mainstem San Joaquin River and on its largesttributary, the Tuolumne River. In the January 1997flood event, runoff at New Don Pedro Dam on theTuolumne River and Friant Dam on the San JoaquinRiver exceeded the flood control capability of both res-ervoirs. On the Tuolumne River, it appears that newupstream reservoirs are a less likely flood control op-tion, given the basin’s existing storage development.Enlarging Friant Dam (or constructing its offstreamalternative) would be the most probable new storagedevelopment option for the San Joaquin River.
Bulletin 160-98 includes Auburn Dam and FriantDam enlargement as statewide options likely to beimplemented (by CALFED or by others) by 2020. Ac-cording to CALFED, the capital cost of a 2.3 mafAuburn Dam would be about $2.3 billion in 1995dollars. According to USBR, the cost of raising FriantDam by 140 feet with 500 taf additional storage isabout $580 million. (This estimate, in 1997 dollars,does not include costs associated with purchasing prop-erty, the cost of relocating utilities, and mitigationcosts.) Potential yields associated with these projectswere estimated through operations studies. A 2.3 mafAuburn Reservoir is estimated to provide 620 taf inaverage years and 370 taf in drought years. An enlargedFriant Dam is estimated to provide 90 taf in averageyears. As noted in Appendix 6G, an enlarged ShastaLake would provide major water supply and other ben-efits, but additional studies of its costs andenvironmental impacts would be needed before the
The January 1997 flooding in the Central Valley emphasizedthe vulnerability of lands protected by levees.
High technology (circa 1900) being used to construct aSacramento River levee south of the then-downtown area.
Courtesy of California State Library.

6-22EVALUATING OPTIONS FROM A STATEWIDE PERSPECTIVE
The California Water Plan Update BULLETIN 160-98
project could proceed to implementation. It is recom-mended that feasibility-level studies of enlarging Shastabe initiated to quantify its costs and benefits. Prelimi-nary studies show that a 9 maf enlargement of Shastawould yield about 760 taf in average years and 940 tafin drought years.
Groundwater and Conjunctive UseThe potential sustainable water supply that could
be derived from groundwater storage is constrainedby the water available to recharge the storage, the avail-able storage capacity, and the wheeling capability ofthe conveyance facilities. In most areas the sources ofrecharge are natural percolation from overlying streams,infiltration of precipitation, deep percolation of ap-plied irrigation water, and seepage from irrigationcanals and ditches. In some areas, these sources areaugmented by artificial recharge.
Potential for Conjunctive Use in theCentral Valley
Plans for local development of additional ground-water and conjunctive use programs are covered inChapters 7–9. This section reviews the potential forgroundwater development and conjunctive use as ele-ments of statewide water management, concentratingon the potential for augmenting supplies of the majorState or federal water projects. As noted earlier, con-junctive use programs are also a component ofCALFED’s storage evaluations.
Sacramento Valley. As noted in the previous dis-cussion of surface storage facilities, the SacramentoRiver Basin constitutes most of the potential for addi-tional water development to meet statewide demands.Just as surface storage reservoirs are being evaluated todevelop a portion of the basin’s surplus runoff (about9 maf ), managed conjunctive use programs are beingevaluated to the same end.
Although there is a tendency to think of Sacra-mento Valley groundwater in terms of a homogeneousunderground reservoir that fluctuates gradually withwet and dry cycles, the reality is more complex. Whilemuch of the Sacramento Valley groundwater basin isinterconnected, aquifer structure is far from uniformand horizontal movement of groundwater is slow. Dif-ferences in groundwater conditions exist from one areaof the valley to another. Even within a small subarea,groundwater resources can range from abundance toscarcity within a few miles.
Potential conjunctive use programs must be evalu-
ated on a site-specific basis, just as surface water stor-age facilities are evaluated. In concept, SacramentoValley conjunctive use programs would operate by en-couraging existing surface water diverters to makegreater use of groundwater resources during droughtperiods. The undiverted surface water would becomeavailable for other users, and groundwater extractionswould be replaced during subsequent wetter periodsthrough natural recharge, direct artificial recharge, orin-lieu recharge (supply of additional surface water topermit a reduction of normal groundwater pumping).
The DWB provides an example of conjunctive usein the Sacramento Valley. In 1991, 1992, and 1994,the DWB executed contracts to compensate Sacra-mento Valley agricultural water districts for reducingtheir diversions of surface water. Most of the reducedsurface water diversions were made up by increasedgroundwater extractions from existing wells. The 1994program in this area was the largest, amounting toapproximately 100 taf. The DWB program included agroundwater monitoring component to evaluate theeffects of increased extractions on neighboring non-participating groundwater users. Such monitoringprograms would be an important component of fu-ture conjunctive use programs.
San Joaquin Valley. Potential conjunctive useprojects in the San Joaquin Valley would involve recharg-ing empty groundwater storage space for later withdrawal.Although aquifer storage capacity is available (over50␣ maf), a lack of recharge water limits opportunity forconjunctive operation. Even with Delta improvements,prospects for additional groundwater conjunctive use stor-age south of the Delta are limited. From the standpointof statewide water supply, the areas of conjunctive usepotential are those within reach (either directly or throughexchange) of the California Aqueduct or CVP facilities.Examples of projects studied in the past include the KernWater Bank and the Stanislaus/Calaveras River Basin pro-gram. The Kern Water Bank project, described inChapter␣ 8, was initially developed by the Departmentand was subsequently turned over to the KWB Author-ity. The KWB is discussed as a local water managementoption for the Tulare Lake Region in Chapter 8.
The Department and USBR, in coordination withlocal agencies, evaluated the possibility of a conjunc-tive use project in the Stanislaus/Calaveras River Basin.SEWD and CSJWCD proposed a conjunctive useproject in 1986 for their CVP interim water supplycontracts (155 taf/yr). The districts would divert CVPsurface water supply in wet years and would pump

6-23 EVALUATING OPTIONS FROM A STATEWIDE PERSPECTIVE
The California Water Plan Update BULLETIN 160-98
groundwater and divert South Gulch Reservoir sup-plies in drought years. Water would be stored in theproposed South Gulch Reservoir, an offstream storagereservoir near the Calaveras River, in wet years. Indrought years the districts would allow the water to bereleased to the Stanislaus River for fishery needs, wa-ter quality improvement in the southern Deltachannels, and CVP and SWP water supply improve-ment. Subsequent enactment of CVPIA and issuanceof SWRCB’s Order WR 95-6 substantially reduced thequantities of surface water available to SEWD andCSJWCD. The Department deferred further partici-pation in this program as a source of SWP supply. Localagencies are continuing to evaluate other conjunctiveuse programs in this area, as described in Chapter 8.
Recent Groundwater Studies withStatewide Scope
The Department is evaluating conjunctive use op-portunities that could provide future water suppliesfor the SWP. USBR suggested that conjunctive usecould be a major option for CVP water users in its1995 report to Congress, Least-Cost CVP Yield IncreasePlan. CALFED is examining conjunctive use oppor-tunities as part of its storage evaluations.
SWP Conjunctive Use Studies. The Department’sinvestigation of Sacramento Valley conjunctive use po-tential for additional SWP supply is following three
Recharge facilities in the Kern Water Bank area. Levees andconveyance facilities have been constructed to manage spreadingof water in the recharge areas.
parallel tracks. The first track is an evaluation of thelegal and institutional framework to define potentialprojects and their limitations. The second track is aninventory of water supply infrastructure, water use, andhydrogeologic characteristics of the valley to identifyareas most suitable for conjunctive use projects. Thethird track is a pre-feasibility investigation of specificpotential projects. Where appropriate, these studies rec-ommend more comprehensive feasibility studies, ordevelopment of small scale demonstration and testingprojects. One such project under evaluation, the Ameri-can Basin conjunctive use project, is discussed in thesidebar. Under the terms of Monterey Agreement con-tract amendments now in place for most SWP watercontractors, only those contractors interested in receiv-ing supplies from the project would participate in it.Since no other SWP conjunctive use projects are cur-rently in active planning, the yield of the potentialAmerican Basin project is used as a surrogate for theyield of SWP conjunctive use programs.
Least-Cost CVP Yield Increase Plan. USBR’s1995 yield increase plan evaluated possible actions toreplace the water supply that CVPIA dedicated to en-vironmental purposes. The plan identified conjunctiveuse as offering the largest potential, estimating thatactive recharge in the Central Valley would yield over800 taf/yr. A regional groundwater model characteriz-ing the Central Valley was used to identify potentialsites for active recharge programs. Table 6-5 lists po-tential yield estimates from the study. Yield estimatesfor active recharge programs were based on the avail-ability of floodflows on adjacent rivers. Local watersupply availability has almost always limited the po-tential of a particular site. Implementation ofconjunctive use options would require additional fea-sibility investigations and identification of potentialenvironmental impacts.
Madera Ranch Project. As described in Chap-ter 8, USBR is in initial stages of evaluating aconjunctive use project known as the Madera Ranchproject, which might yield up to 70 taf/yr. Water sup-plies for the project would come from excess flowsavailable at the Delta for export. USBR, in coopera-tion with the San Luis and Delta-Mendota Authority,has completed a preliminary investigation of theproject and is now evaluating land acquisition. Sincesupplies from the potential project would be providedonly to one group of CVP contractors and not CVP-wide, the project is discussed as a local project inChapter 8.

6-24EVALUATING OPTIONS FROM A STATEWIDE PERSPECTIVE
The California Water Plan Update BULLETIN 160-98
TABLE 6-5
CVP Yield Increase Plan Conjunctive Use Options
Potential Evaluated AnnualGeneral Site Locations Source(s) of Water Activity Capacitya (taf) Yieldb (taf)
Region 1
E of Anderson Upper Sacramento River Active recharge 60 15
Region 2
SW and W of Orland, Tehama- Upper Sacramento River Active recharge 360 90Colusa Canal and vicinity
Within Glenn County Groundwater Developable yield N/A 55
Region 3
S of Chico, near Wheatland, Feather and Bear Rivers and Active recharge 280 85E of Sutter Bypass, and NE of Dry Creek (north ofRio Linda Sacramento)
Within Yuba County Groundwater Developable yield N/A 25
Region 4
NW of Woodland and SW Cache Creek, Sacramento Active recharge 120 30of Davis (near Dixon), Yolo RiverBypass nearby
Region 5
NE of Galt, SE of Elk Grove, American (using Folsom South Active recharge 400 185SE of Lodi, and S of Manteca Canal), Cosumnes, Mokelumne,
Calaveras, and Stanislaus Rivers
Region 6
NW of Volta and at Oro Loma Delta-Mendota Canal, Active recharge 275 200California Aqueduct
Region 7
N of Modesto Stanislaus or Tuolumne Rivers Active recharge 100 20
Region 8
E of Atwater, NE of Merced, Merced, Chowchilla, Fresno, Active recharge 350 140W of La Vina, and NE of Red Top and San Joaquin Rivers
Region 9
none identified
Region 10
N of Raisin City, S of Kingsburg, Kings, Kaweah, and Tule Rivers Active recharge unknown 125S of Hanford, W of Visalia, andSW of Tipton
Region 11
W of McFarland, and SW of Kern River, California Aqueduct Active recharge 500 50Bakersfield
a Capacity is taken to be the amount of water that can be recharged and extracted over any area without causing a water level fluctuation of more than 30 feetcompared to historical water levels and has been estimated using a large-scale regional model. Values are not maximums and are used for comparisonpurposes.
b Location(s) descriptions are reflective of general areas where active recharge programs were estimated to be feasible. Each reference to a city or town represents asingle site (NW of Woodland and SW of Davis refers to two potential site areas). Many regions have multiple sites where active recharge is possible.

6-25 EVALUATING OPTIONS FROM A STATEWIDE PERSPECTIVE
The California Water Plan Update BULLETIN 160-98
CALFED Conjunctive Use Component. CAL-FED is evaluating conjunctive use potential as part ofits storage component. The CALFED conjunctive useprogram will not identify specific projects, but will at-tempt to identify potential for groundwater developmentand provide technical support to voluntary local con-junctive use projects. CALFED is defining operatingrules and assumptions in order to evaluate potential watersupply benefits. Storage for conjunctive use is currentlyassumed to be 250 taf in the Sacramento Valley and500 taf in the San Joaquin Valley. Groundwater with-drawal and recharge capacities of 500 cfs are beingassumed. Groundwater withdrawal is being assumed totake place only in drought years. Potential water supplybenefits of the CALFED conjunctive use program havenot been quantified at this time.
Water MarketingWater agencies are increasingly including market-
ing as a component of their future resources mix—notjust as a drought management technique, but as asource of supply in normal water years. It is becomingincreasingly common to see local agency plans with amenu of marketing alternatives which include one-timespot transfers, short or long-term agreements fordrought year marketing, and long-term agreements foraverage year water marketing.
In this update of the California Water Plan, watermarketing may include:
• A permanent sale of a water right by the waterright holder.
• A lease from the water right holder (who retainsthe water right), allowing the lessee to use the waterunder specified conditions over a specified periodof time.
• A sale or lease of a contractual right to water sup-ply. Under this arrangement, the ability of the holderto transfer a contractual water right is usually con-tingent upon receiving approval from the supplier.An example of this type of arrangement is a sale orlease by a water agency that receives its supply fromthe CVP, SWP, or other water wholesaler.One common concern with marketing proposals
is that only real water is sold, and that marketing ofpaper water is avoided (see sidebar). The difference isthat real water involves a change in the place and typeof an existing use without harming another legal userof water, while paper water might involve sale of waterthat would not otherwise be beneficially used duringthe period of the proposed marketing arrangement.Another common concern is third-party impacts as-sociated with proposed marketing arrangements. Thisconcern must be addressed as appropriate on a site-specific basis for proposed transfers.
For water marketing options identified as likelyto be implemented, Bulletin 160-98 water budgetsshow increases in supply for the gaining regions andreflect corresponding reductions in demand in regions
Feasibility Study for American BasinConjunctive Use Project
The Department has completed a feasibility investigationof the American Basin conjunctive use project. Discussionsare under way with local project participants and potentiallyparticipating SWP contractors. If negotiations are success-ful, CEQA/NEPA compliance and permit acquisition wouldfollow, and initial project operation might begin in 2001.The project area is in southeastern Sutter County, westernPlacer County, and northwestern Sacramento County. Localwater purveyors participating in the project could includeSouth Sutter Water District, Natomas-Central Mutual Wa-ter Company, Pleasant Grove-Verona Mutual Water Com-pany, and Placer County Water Agency. Three of the fourpotential participants have a surface water supply within theproject area from either the Bear or Sacramento River sys-tems, and one relies on groundwater.
As evaluated in the feasibility study, the project could de-velop about 55 taf of water during drought periods to supple-ment diminished SWP surface water supplies, depending on
the number of agencies participating in the project. In thefeasibility study, costs of the drought year supply for the SWPwere estimated to be on the order of $150/af.
The 40-30-30 Index (see description in Chapter 3) wouldbe used to determine when project recharge and recoverywould occur. When the index is classified as above normal orwet, project recharge would occur. Recharge would be ac-complished by in lieu means, which would require deliveryof SWP water to those in the project area that use groundwa-ter. Construction of new facilities to deliver SWP water fromthe Feather River to each project participant’s service areawould be required. When the index is classified as dry orcritical, project recovery would occur by groundwater substi-tution. Groundwater substitution would involve each districtforgoing part of its normal surface water supply, by leaving itin the river for use by others. Reductions in surface watersupply would be supplemented by extracting groundwaterthat was placed in the aquifer system earlier.

6-26EVALUATING OPTIONS FROM A STATEWIDE PERSPECTIVE
The California Water Plan Update BULLETIN 160-98
from which water is being transferred, if specific par-ticipants have been identified and the options are largeenough to be visible in the water budgets. Presently,the only marketing arrangements that fit this categoryare those associated with the draft CRB 4.4 Plan.
One of the larger potential water marketing pro-grams identified in Bulletin 160-98 is CVPIA wateracquisition for instream flows and wildlife refuges.Impacts of different levels of supplemental water ac-quisition were described in USBR’s draft CVPIA PEIS,which did not identify a preferred quantity of wateracquisition. At this time, no long-term purchase agree-ments have been executed—CVPIA supplementalwater acquired to date has been purchased on a year-to-year basis. It is not possible to identify how andwhere the supplemental water would be obtained inthe future, or what other water demands might be re-duced as a result of CVPIA water acquisition.
Sources of Water for Marketing
The increased attention to marketing following the1987-92 drought brought clear recognition that watermarketing alone does not create new supplies—it is aprocess by which supplies developed by other meansare moved to a new place of use. In any water market-ing agreement, the reliability of the supply acquired bythe transferee depends upon the specific details of theagreement and the relative priority of the water rightsinvolved. Potential sources of water that have been most
often considered for marketing are described below:Land Fallowing. A potential source of water for
marketing is to forgo growing crops in a given area andmove the water that would have been consumed to adifferent service area. Although there can be some diffi-culty in quantifying the amount of water made availableand its impact on the economy of local agricultural com-munities, land fallowing is a proven demand reductiontechnique. Land fallowing may be undertaken on ei-ther a permanent basis (land retirement) or only duringdrought periods in various forms of shortage contin-gency programs. Drawbacks of fallowing includepotential impacts on non-participating third parties.
Crop Shifts. Some of the third party effects of fal-lowing could be reduced by substituting crops thatconsume less water for those that would use more. Forexample, safflower might be planted in place of toma-toes, or wheat in place of corn. The substituted crop isusually less profitable for the grower, so the potentialbuyer provides an appropriate incentive payment. Sucharrangements can produce real water savings, but theyintroduce a further layer of complexity and uncertainty.(For example, how can it be demonstrated that thehigher water-using crop would really have been plantedin the absence of the arrangement? And, what are therelated effects on groundwater recharge and drainagecontributions to downstream surface supplies?) Cropshift proposals were solicited by the Department forthe 1991 DWB, but played a limited role. Because
Is That Real Water?The initial rush of enthusiasm for water marketing stimu-
lated much discussion about supposedly unused water. Somewater users in the State hold rights (statutory or contractual)to more water than they currently use to meet their needs.Why not sell those rights to others?
Such arrangements looked attractive to both prospective sellersand buyers. The sellers would receive payment for something theywere not using, while the buyers would meet urgent water needs.This view, however, overlooks the fact that water to meet the trans-ferred rights has been part of the basin supply all along, and hasalmost always been put to use by downstream water right holdersor is supporting an environmental need. This type of marketingarrangement became known as a “paper water” deal: the moneygoes to the seller, while the water is sold to the buyer from thesupply of an uninvolved third party.
A similar outcome can result from some water conserva-tion measures. Changes in irrigation management can reducedrainage outflow that otherwise contributes to the supply of
downstream users or meets an instream need. Proposals tomarket water saved through such drainage reduction can alsorepresent paper water.
The California Water Code includes a number of provi-sions to regulate and facilitate marketing arrangements (Wa-ter Code Sections 1435, 1706, 1725, 1736, 1810d), as wellas a “no-injury” clause that prohibits transfers that would harmanother legal user of the water. This clause is the basis forprohibiting sale of paper water.
In analyzing water marketing and water conservation pro-posals, the Department uses the terms real water and newwater to contrast with paper water. Real water is water notderived at the expense of any other lawful user, i.e., waterthat satisfies the Water Code’s no injury criterion. New wateris water not previously available, created by reducing irrecov-erable losses or outflow to the ocean or inland salt sinks. Newwater, by definition, must be real, but not all real water isnew. For example, water made available through land fallow-ing is real (because it reduces ETAW), but not new.

6-27 EVALUATING OPTIONS FROM A STATEWIDE PERSPECTIVE
The California Water Plan Update BULLETIN 160-98
crop acreage is market driven, the ability to do largescale crop shifts is limited. Crop shifts are thus expectedto have a small role in water marketing.
Water Conservation and Water Recycling.Where conservation or recycling options result in realwater savings, conserved water may be available formarketing to other users. Recent proposals to marketconserved water have mostly occurred in the agricul-tural sector, where considerable confusion hassometimes resulted over the distinction between re-ducing applied water and producing real water savings.Most of California’s irrigated areas overlie usablegroundwater basins and are linked by networks of sur-face streams and drains. Water leaving one area usuallycontributes to the supply of other areas or, in the Cen-tral Valley, to required Delta outflow. Under suchconditions, real water savings result by reducing con-sumptive use or by reducing losses to saline sinks.
From a statewide perspective, opportunities formarketing conserved water occur primarily in areassuch as the Imperial Valley, where agricultural drain-age water flows to the Salton Sea. (Agricultural runoffentering the sea supplies the relatively fresher waterneeded to sustain the sea’s biological resources. Theability to market conserved water that would other-wise flow to the sea must take into considerationimpacts of such transfer on the sea.)
From a local perspective, however, the situationmay be different. For example, Sacramento Valley con-servation measures that reduce agricultural drainagemake more water available for use in the conservingarea—but at the expense of downstream users. Localdistricts in such areas have substantial incentive to prac-tice conservation to improve the utility of their existingsupplies, but the potential for creating real water forsale to others is limited.
Water recycling in coastal urban areas can create newwater, and there is often a potential market for this wateramong other urban users for landscape or turf irrigation.These sales typically entail multi-jurisdictional partner-ships, since the recycled water is most often provided bya wastewater treatment agency but is distributed or sup-plied to end users by one or more water agencies.
Groundwater Substitution. Many Californiagrowers have rights and access to surface water sup-plies, even though their land may overlie productivegroundwater basins. In such cases, a grower may agreeto forgo use of surface water rights for a period, substi-tuting groundwater instead. The unused surface waterthen becomes available for marketing to other users. This
technique was tested during the DWBs of 1991, 1992,and 1994. Under favorable conditions (where wells andpumps are already installed), it can produce consider-able water on relatively short notice. One major concernwith groundwater substitution is the potential impacton neighboring non-participating pumpers. Substantialmonitoring is needed to assure there are no unreason-able third-party impacts. Another consideration withgroundwater substitution is that additional pumpingmay induce recharge that depletes usable streamflow.Only that portion of groundwater replenished from fu-ture surplus flows is really a new supply. Furtherexperience will be needed to define the potential of thissource, resolve concerns over impacts on nearby pump-ers and regional surface supplies, and explore possibilitiesfor constructing recharge facilities.
Surface Storage Withdrawals. Existing reservoirswithin California have a combined storage capacity ofapproximately 40 maf. These facilities are operated by awide spectrum of entities for a variety of water supply,flood control, power, and recreation objectives. At anygiven time, water may be stored somewhere in the sys-tem that is not planned to be released, but could bemade available to meet urgent needs, subject to compli-ance with existing water rights. Such withdrawals comeat a price—usually a reduction of power generation orrecreational usage, or increased risk of future water sup-ply shortage. Payments to the reservoir owner implicitlyinclude a component to compensate for reduced ben-efits, increased risk, and other costs. Surface storagewithdrawals are easily quantified and clearly representreal water, provided the storage is refilled from futuresurplus flows. Storage withdrawals played an importantrole in recent transfers; the refill constraints were handledthrough a contract clause whereby reservoir ownersagreed to defer refill until a time of future high runoffwhen there would be no detrimental effect on otherwater users. In the long run, the prospects for such ar-rangements will tend to diminish as water demandsincrease in the reservoirs’ primary service areas.
Prospects for Water Marketing
Water marketing will continue to play a role inmeeting California’s water needs, but there will be acontinuing shift in emphasis toward systemwide ap-praisal of impacts and growing recognition of the needto protect the rights of all lawful water users. Watermarketing programs (and land retirement or fallow-ing programs that may be used to supply water forsale) are often controversial in the area where the trans-

6-28EVALUATING OPTIONS FROM A STATEWIDE PERSPECTIVE
The California Water Plan Update BULLETIN 160-98
ferred water would originate because of potential third-party impacts. Mechanisms for evaluation and approvalof water marketing arrangements have been developed,and will likely continue to evolve. For example, USBRdeveloped guidelines for implementing sale of CVP wa-ter under CVPIA; the California Water Code directs theDepartment to facilitate voluntary exchanges and trans-fers of water; and 1992 changes to State law authorizedwater suppliers (local public agencies and private watercompanies) to contract with water users to reduce or elimi-nate water use for a specified period of time, and to sellthe water to other water suppliers and users.
The ability to carry out marketing is dependent
on conveyance provided by California’s existing rivers,canals, and pipelines. Agencies planning to use long-term marketing arrangements as part of their core watersupplies must have access to reliable conveyance forthese supplies. The California Water Code requires thatpublic agencies make available unused conveyance ca-pacity if fair compensation is paid and other conditionsare met (see sidebar). The CVP and SWP wheel waterfor marketing; only the SWP can convey water fromthe Central Valley to the highly urbanized South CoastRegion. A long-term Delta fix is necessary for provid-ing reliable conveyance of acquired supplies across theDelta. Actions that constrain agencies’ abilities to con-
Water Code Section 1810 et seq.1810. Notwithstanding any other provision of law, nei-
ther the state, nor any regional or local public agency maydeny a bona fide transferor of water the use of a water con-veyance facility which has unused capacity, for the period oftime for which that capacity is available, if fair compensationis paid for that use, subject to the following:
(a) Any person or public agency that has a long-term wa-ter service contract with or the right to receive water fromthe owner of the conveyance facility shall have the right touse any unused capacity prior to any bona fide transferor.
(b) The commingling of transferred water does not resultin a diminution of the beneficial uses or quality of the waterin the facility, except that the transferor may, at the transferor’sown expense, provide for treatment to prevent the diminu-tion, and the transferred water is of substantially the samequality as the water in the facility.
(c) Any person or public agency that has a water servicecontract with or the right to receive water from the owner ofthe conveyance facility who has an emergency need may uti-lize the unused capacity that was made available pursuant tothis section for the duration of the emergency.
(d) This use of a water conveyance facility is to be made with-out injuring any legal user of water and without unreasonablyaffecting fish, wildlife, or other instream beneficial uses and with-out unreasonably affecting the overall economy or the environ-ment of the county from which the water is being transferred.
1811. As used in this article, the following terms shall havethe following meanings:
(a) “Bona fide transferor” means a person or public agencyas defined in Section 20009 of the Government Code with acontract for sale of water which may be conditioned uponthe acquisition of conveyance facility capacity to convey thewater that is the subject of the contract.
(b) “Emergency” means a sudden occurrence such as astorm, flood, fire, or an unexpected equipment outage im-pairing the ability of a person or public agency to make waterdeliveries.
(c) “Fair compensation” means the reasonable charges in-curred by the owner of the conveyance system, including capi-tal, operation, maintenance, and replacement costs, increasedcosts from any necessitated purchase of supplemental power,and including reasonable credit for any offsetting benefitsfor the use of the conveyance system.
(d) “Replacement costs” means the reasonable portion ofcosts associated with material acquisition for the correctionof unrepairable wear or other deterioration of conveyancefacility parts which have an anticipated life which is less thanthe conveyance facility repayment period and which costsare attributable to the proposed use.
(e) “Unused capacity” means space that is available withinthe operational limits of the conveyance system and whichthe owner is not using during the period for which the trans-fer is proposed and which space is sufficient to convey thequantity of water proposed to be transferred.
1812. The state, regional, or local public agency owningthe water conveyance facility shall in a timely manner deter-mine the following:
(a) The amount and availability of unused capacity.(b) The terms and conditions, including operation and
maintenance requirements and scheduling, quality require-ments, term or use, priorities, and fair compensation.
1813. In making the determinations required by this ar-ticle, the respective public agency shall act in a reasonablemanner consistent with the requirements of law to facilitatethe voluntary sale, lease, or exchange of water and shall sup-port its determinations by written findings. In any judicialaction challenging any determination made under this ar-ticle the court shall consider all relevant evidence, and thecourt shall give due consideration to the purposes and poli-cies of this article. In any such case the court shall sustain thedetermination of the public agency if it finds that the deter-mination is supported by substantial evidence.
1814. This article shall apply to only 70 percent of theunused capacity.

6-29 EVALUATING OPTIONS FROM A STATEWIDE PERSPECTIVE
The California Water Plan Update BULLETIN 160-98
vey water across the Delta limit their ability to enterinto marketing arrangements.
As more agencies rely on water marketing to bal-ance future demand and supply, and as severallarge-scale environmental restoration programs beginacquiring water for fishery and habitat purposes, com-petition for available water will increase. The availabilityof water for sale in marketing programs is inherentlylimited by the willingness of the existing water rightsholders to participate in such programs. Table 6-6shows a few larger marketing arrangements proposed
in water agency planning documents to illustrate themagnitude of purchases being considered.
The following sections describe some specific wa-ter marketing proposals. Many local agencies mayintend to buy water on the spot market as needed torespond to service area demands, but do not have agree-ments or defined programs in place at this time.
Drought Year Marketing
Marketing Involving SWP Facilities. The DWBprogram is a water purchasing and allocation programthat allows the Department to purchase water fromwilling sellers and market the water to buyers underspecific critical needs allocation guidelines. The DWB’sEIR established the bank as a 5 to 10 year program.Chapter 3 describes past DWB activities. The quanti-ties and prices of water made available in previous yearsthrough surplus reservoir releases, groundwater sub-stitution, and land fallowing programs are summarizedin Table 6-7. Past experience suggests that about250␣ taf/yr could be allocated in the future throughsimilar programs; this quantity is used for the futuresupplies associated with the DWB.
The Department had proposed a supplementalwater purchase program to increase water supply reli-ability for SWP contractors. A draft programmatic EIRfor the six-year program originally proposed transferof up to 400 taf of water in drought years. The waterwould be purchased from willing sellers and providedto participating SWP contractors. After a number ofpublic workshops, the Department reevaluated theprogram and eliminated its groundwater component.Without the groundwater component, the maximumsupply available for transfer would have been 200 taf/yr. Additional public comments received on the draftPEIR raised issues that would need to be addressed
Water marketing depends on the availability of conveyance forthe transferred water. For example, the East Branch of theCalifornia Aqueduct is the only inter-regional conveyancefacility serving rapidly urbanizing areas in the southwesterncorner of the Mojave Desert. Availability of aqueduct capacitywould dictate the conditions under which transfers to this areacould occur.
TABLE 6-6
Sample of Potential Water Purchases (taf)
Average Drought
Drought Water Bank — 250CVPIA Interim Water Acquisition Program 365 365Zone 7 Water Agency 50 50Alameda County Water District 15 25Contra Costa Water District 50 40Santa Clara Valley Water District 100 100Westlands Water District 200 200Metropolitan Water District of Southern California — 300San Diego County Water Authority 200 200Total 980 1,530

6-30EVALUATING OPTIONS FROM A STATEWIDE PERSPECTIVE
The California Water Plan Update BULLETIN 160-98
in site-specific environmental documents. The Depart-ment withdrew the draft PEIR due to the difficulty ofaddressing site-specific concerns in a programmatic en-vironmental analysis and after reevaluating thepotential benefits of the program. The supplementalwater purchase program is not considered as a futurewater management option in the Bulletin.
Semitropic Water Storage District has developeda groundwater storage program with a maximum stor-age capacity of 1 maf and maximum annual extractionof 223 taf. Under this program, a banking partner maycontract with SWSD to deliver its SWP water or otherwater supplies to SWSD for in-lieu groundwater re-charge. At the contractor’s request, groundwater wouldbe extracted and delivered to the California Aqueductor would be pumped by SWSD farmers in exchangefor SWP entitlement deliveries. Currently, MWDSCand SCVWD have long-term agreements with SWSDfor 350 taf of storage for each district. ACWD has asimilar agreement for 50 taf of storage, as does Z7WAfor 43 taf. There is about 200 taf of capacity availablefor other banking partners and for increased commit-ments by existing partners. Participants are notrestricted to SWP contractors, although access to theSWP’s conveyance system is necessary. This program,discussed in more detail in Chapter 8, is considered amarketing arrangement in this Bulletin because of thepossible exchange of SWSD’s SWP entitlement forbanked SWP water. The cost of recharging and ex-tracting this water is about $175/af.
A similar marketing agreement has been reachedby Arvin-Edison WSD and MWDSC for up to 350␣ tafof storage in Arvin-Edison’s groundwater basin. About60 taf would be withdrawn and delivered to MWDSCthrough the California Aqueduct in drought years at acost of about $200/af, exclusive of delivery costs tomember agencies.
Marketing Involving CVP Facilities. Historically,users of CVP water have made intra-district, and some-times inter-district transfers of project supply. The 1992enactment of CVPIA provided the authority to mar-ket project water outside of project boundaries tononproject water users.
The San Luis & Delta-Mendota Water Authority,which represents 32 urban and agricultural water dis-tricts on the west side of the San Joaquin Valley and inSan Benito and Santa Clara Counties, has developedan agreement that will help its members cope withwater supply uncertainties. Under a three-way agree-ment between the authority, SCVWD, and USBR,participating member districts (shortage year provid-ers) can receive some of SCVWD’s federal waterallocation in normal and above-normal water years inexchange for committing to make available a share ofthe shortage year provider’s federal allocation duringdrought years. The agreement, which does not requireany additional exports from the Delta, will be an in-ternal reallocation of existing federal supplies to allowgreater flexibility in meeting urban and agriculturalwater demands.
Specifically, SCVWD will provide 100 taf of wa-ter within a 10-year period for reallocation by USBRto shortage year providers. In exchange, shortage yearproviders will provide SCVWD with shortage yearprotection. The agreement directs USBR to reallocatedrought year supplies (not to exceed an annual total of14.3 taf) so that at least 97.5 taf is delivered to SCVWDin years when the CVP’s urban water deliveries are75␣ percent or less of contract entitlement. As part ofthe agreement, SCVWD will optimize its use of non-CVP water supplies, which will benefit all CVPirrigation water service contractors in the Delta ex-port service area. Westlands Water District and SanLuis Water District have already agreed to become
TABLE 6-7
Drought Water Bank Summary
Source of Drought Water Bank Water (taf)
Year Purchase Surplus Groundwater Fallowing Total AmountPrice ($/af) Reservoir Substitution Sources Allocateda
Storage (taf)
1991 125 147 259 415 821 3901992 50 32 161 0 193 1591994 50 33 189 0 222 174a Amount allocated for urban, agricultural, and environmental uses. This represents the actual supply developed by the bank after conveyance and fish and
wildlife requirements were met.

6-31 EVALUATING OPTIONS FROM A STATEWIDE PERSPECTIVE
The California Water Plan Update BULLETIN 160-98
shortage year providers; other authority members mayalso enter into the agreement over time.
CVPIA authorized marketing of project wateroutside the CVP service area, subject to numerousspecified conditions, including a right of first refusalby existing CVP water users within the service area.As of this writing, no marketing arrangements haveeither been approved or implemented under this pro-vision. One proposed transfer that had been discussedwas between Arvin-Edison WSD and MWDSC.
Marketing Involving Colorado River Aqueduct.In its 1996 session, the Arizona Legislature enactedlegislation establishing the Arizona Water BankingAuthority. The Authority is authorized to purchase un-used Colorado River water and to store it ingroundwater basins to meet future needs. Conveyanceto storage areas is provided by the Central ArizonaProject. The legislation further provided that the Au-thority may enter into agreements with California andNevada agencies to bank water in Arizona basins, withspecific limitations. Under this legislation, future in-terstate banking in Arizona would have a maximumdrought year yield of 100 taf. As described in Chapter9, federal regulations to implement interstate bankingare being promulgated.
As discussed and quantified in Chapters 7 and 9,a variety of arrangements are being examined as partof the development of CRB’s draft 4.4 Plan. Land fal-lowing programs could be implemented to providewater for marketing to urban areas during droughtperiods, as demonstrated by one test program con-ducted in the Colorado River Region. In 1992,MWDSC began a two-year land fallowing test pro-gram with Palo Verde Irrigation District. Farmers inPVID fallowed about 20,000 acres of land. The savedwater, about 93 taf/yr, was stored in Lake Mead forfuture use by MWDSC. (The water was subsequentlyreleased when flood control releases were made fromLake Mead). MWDSC paid each farmer $1,240 perfallowed acre, making the costs of the water toMWDSC about $135/af. It is expected that similarprograms could be implemented in the future by agen-cies in the South Coast Region and Colorado RiverRegion to provide about 100 taf during drought years.
Every Year Marketing
Permanent Sales. The Monterey Agreement pro-vides that 130 taf of SWP agricultural entitlement besold to urban contractors on a willing buyer-willingseller basis. Several sales of entitlement have already
been implemented. KCWA permanently sold 25 taf/yrof entitlement to MWA and is in the process of finaliz-ing the permanent sale of 7 taf/yr to Z7WA. KCWA isarranging sale of additional entitlement to Castaic LakeWater Agency. As with the SWP, marketing of contrac-tual entitlements among CVP contractors is occurring.The CVP drought year reallocation agreement describedabove represents a new approach to marketing amongproject water users.
CVPIA Interim Water Acquisition Program.Sales of developed supplies for environmental purposes(where the transfer occurs as part of a willing buyer-willing seller arrangement, and not as the result of aregulatory action) are a relatively recent occurrence.Under the CVPIA supplemental water provisions, USBRestablished an interim water acquisition program thatwas in effect from October 1995 through February 1998.Water was acquired to meet near-term fishery and ref-uge water supply needs while long-term planning forsupplemental water acquisition continued.
As provided in the program’s environmental docu-mentation, USBR could acquire up to 100 taf annuallyon each of the Stanislaus, Tuolumne, and Merced Riv-ers. Acquired water would be used for instream flowson the three rivers, and for flow and water quality im-provements on the San Joaquin River. The specificquantities of water to be acquired each year and asso-ciated release patterns would depend upon projectedflow conditions in the individual rivers, and projectedflow and water quality conditions in the San JoaquinRiver at Vernalis. USBR would also acquire up to 13␣ tafof water annually from the Sacramento and FeatherRiver Basins for Sacramento Valley wildlife refuges.Likewise, up to 52 taf would be purchased annuallyfrom willing sellers in the San Joaquin Valley for ref-uges there.
CVPIA AFRP Water Acquisition Program.USBR’s 1997 draft PEIS analyzed four alternatives forlong-term acquisition of fishery and refuge waters.• Alternative 1. No water would be acquired to
meet fish and wildlife targets.• Alternative 2. AFRP water would be acquired an-
nually from willing sellers on the Stanislaus(60␣ taf/yr), Tuolumne (60 taf/yr), and MercedRivers (50 taf/yr) and on Upper Sacramento Rivertributary creeks that support spring-run salmonpopulations. Acquisition amounts on the tribu-tary creeks were not quantified in the PEIS.Acquired water would be managed to meet tar-get instream flows and would also be used toimprove flows in the Delta. The acquired AFRPwater could not be exported by the CVP or SWP.

6-32EVALUATING OPTIONS FROM A STATEWIDE PERSPECTIVE
The California Water Plan Update BULLETIN 160-98
Refuge water supply would be acquired to pro-vide the incremental difference between Level2 and Level 4 refuge supply requirements. An-nual water acquisition in the Sacramento River,San Joaquin River, and Tulare Lake Regionswould be about 30 taf, 80 taf, and 20 taf, re-spectively.
• Alternative 3. AFRP water would be acquired an-nually from willing sellers on the Yuba (100 taf/yr), Mokelumne (70 taf/yr), Calaveras (40 taf/yr),Stanislaus (200 taf/yr), Tuolumne (200 taf/yr), andMerced Rivers (200 taf/yr) and on Upper Sacra-mento River tributary creeks for in-stream flows.As in Alternative 2, acquisition amounts on thetributary creeks were not quantified in the PEIS.The acquired AFRP water would not be managedfor increased flows through the Delta. Therefore,it could be exported if Order WR 95-6 conditionswere met. Refuge water would be acquired to meetLevel 4 requirements in the same quantities as de-scribed in Alternative 2.
• Alternative 4. AFRP water would be acquired an-nually for instream flow as under Alternative 3.Acquired water would be managed to meet targetinstream flows and to improve flows in the Delta.Therefore, the acquired water could not be ex-ported by the CVP or SWP. Refuge water wouldbe acquired for Level 4 water supplies in the samemanner as described in Alternative 2.To help put the magnitude of these amounts into
perspective, the draft PEIS estimates a reduction of142,000 acres of irrigated agricultural land would beneeded to provide CVPIA water acquisitions underAlternative 4, entailing water acquisition costs of upto $120 million per year. Approximately 21,000 acreswould be fallowed in the Sacramento River Region,118,000 acres would be fallowed in the San JoaquinRiver Region, and 3,000 acres would be fallowed inthe Tulare Lake Region. Since USBR has not yet iden-tified a preferred alternative or specific proposals fortransfers, Bulletin 160-98 does not include these
CVPIA transfers in the water budgets. To the extentthat the acquired water reduces demands by other waterusers, the water acquisition would have minimal netimpact on the water budgets.
Colorado River Marketing Arrangements. Wa-ter agencies in the South Coast Region will continueto pursue programs to offset the reduction in exist-ing supplies resulting from California reducing its useof Colorado River water. This subject is covered indetail in Chapter 9. MWDSC and IID have alreadyimplemented an agreement to transfer conservedwater to urban users in the South Coast Region; asimilar agreement was recently executed by SDCWAand IID. Both of these arrangements represent long-term transfers of core supplies. The next step inimplementing the IID/SDCWA arrangement ispreparation of environmental documentation. Onceimplemented, transferred amounts would increaseover time (up to a 75-year term) to a maximum of200 taf annually. In order to convey the acquiredwater, SDCWA negotiated a wheeling agreement withMWDSC for use of capacity in MWDSC’s ColoradoRiver Aqueduct.
Water Recycling and Desalting
Water Recycling
The Department, in cooperation with theWateReuse Association of California conducted awater recycling survey as described in Chapter 3.Table␣ 6-8 shows 2020 base level of water recyclingand potential future options. These options repre-sent potential maximum levels of recycling. Not alloptions are expected to be implemented, due to eco-nomic and other considerations.
New water supply would be generated by waterrecycling where the outflow of water treatment plantswould otherwise enter a salt sink or the Pacific Ocean.In the Central Valley and other inland communities,outflow from wastewater treatment plants is discharged
TABLE 6-8
2020 Level Water Recycling Options and
Resulting New Water Supply (taf)
Projects Total New WaterWater Recycling Supply
Base 577 407
Potential options 835 655
Total 1,412 1,062

6-33 EVALUATING OPTIONS FROM A STATEWIDE PERSPECTIVE
The California Water Plan Update BULLETIN 160-98
into streams and groundwater basins and is generallyreapplied. Recycling of such outflow would not gen-erate new water supplies. All new recycled water isexpected to be produced in coastal regions—the SanFrancisco Bay, Central Coast, and South Coast regions.
Water agencies in the South Coast Region are con-cerned that the lack of future high-quality water forblending supplies, or the cost of desalting recycled wa-ter, could affect implementation of future waterrecycling facilities. Due to extensive use of ColoradoRiver water and groundwater supplies that are rela-tively high in TDS, salt management is an importantconsideration in marketing recycled water in the re-gion. Salt management options include blendingColorado River water and groundwater supplies withother sources such as SWP water, or treating (i.e., de-salting) the recycled water to reduce its salt content.MWDSC and its member agencies and USBR arecooperating in a salinity management study. Thestudy’s initial phase focuses on identifying problemsand salinity management needs of MWDSC’s servicearea. This study is discussed in Chapter 7.
Table 6-9 shows potential water recycling optionsby hydrologic region. Two major water recycling pro-grams being planned are the Bay Area regional waterrecycling program and the Southern California com-prehensive water reclamation and reuse study, discussedin detail in Chapter 7.
Desalting
Today, California has more than 150 desaltingplants providing fresh water for municipal, industrial,power, and other uses. The freshwater capacity of these
plants totals about 66 taf annually, a 100 percent in-crease since 1990. Common feedwater sources fordesalting plants include brackish groundwater, munici-pal and industrial wastewater, and seawater.Groundwater recovery currently makes up the major-ity of desalting plant capacity, 45 taf/yr. Wastewaterdesalting accounts for 13 taf/yr and seawater desaltingaccounts for 8 taf/yr of total capacity.
Groundwater recovery and wastewater recyclingwill be the primary uses of desalting in California inthe foreseeable future. (The use of desalting in waste-water treatment plants is part of water recycling and isincluded in the water recycling section.) Improvementsin membrane technology will spur considerable growthin these areas, as discussed in Chapter 5. Seawater de-salting is expected to grow very slowly.
Groundwater Recovery. High TDS and nitratelevels are common groundwater quality problems.Groundwater recovery programs can be designedto treat mineralized groundwater or groundwaterwith nitrate contamination, as shown in theexamples given in Chapter 5. Currently, mostgroundwater recovery programs under consider-ation are located in the South Coast Region(excluding groundwater recovery sole ly toremediate contamination at hazardous waste sites).Some of the polluted water must be treated andsome can be blended with better quality waterto meet water quality standards. The potential an-nual contribution of groundwater recovery by year2020 is about 110 taf, with 95 taf in the SouthCoast Region. Options are discussed in the regionalchapters.
TABLE 6-9
Potential 2020 Water Recycling Optionsby Hydrologic Region (taf)
Total New WaterWater Recycling Supply
North Coast 15 0San Francisco Bay 101 91Central Coast 39 37South Coast 639 527Sacramento River 6 0San Joaquin River 7 0Tulare Lake 25 0North Lahontan 0 0South Lahontan 3 0Colorado River 0 0Total 835 655
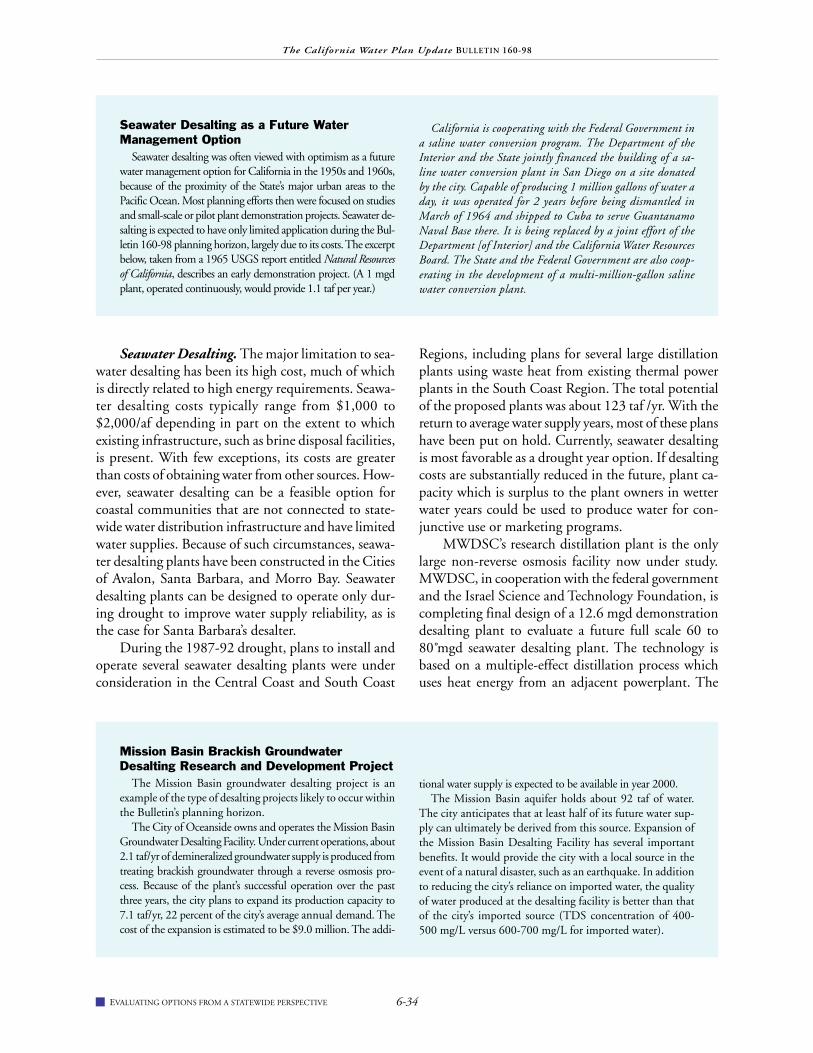
6-34EVALUATING OPTIONS FROM A STATEWIDE PERSPECTIVE
The California Water Plan Update BULLETIN 160-98
Seawater Desalting. The major limitation to sea-water desalting has been its high cost, much of whichis directly related to high energy requirements. Seawa-ter desalting costs typically range from $1,000 to$2,000/af depending in part on the extent to whichexisting infrastructure, such as brine disposal facilities,is present. With few exceptions, its costs are greaterthan costs of obtaining water from other sources. How-ever, seawater desalting can be a feasible option forcoastal communities that are not connected to state-wide water distribution infrastructure and have limitedwater supplies. Because of such circumstances, seawa-ter desalting plants have been constructed in the Citiesof Avalon, Santa Barbara, and Morro Bay. Seawaterdesalting plants can be designed to operate only dur-ing drought to improve water supply reliability, as isthe case for Santa Barbara’s desalter.
During the 1987-92 drought, plans to install andoperate several seawater desalting plants were underconsideration in the Central Coast and South Coast
Regions, including plans for several large distillationplants using waste heat from existing thermal powerplants in the South Coast Region. The total potentialof the proposed plants was about 123 taf /yr. With thereturn to average water supply years, most of these planshave been put on hold. Currently, seawater desaltingis most favorable as a drought year option. If desaltingcosts are substantially reduced in the future, plant ca-pacity which is surplus to the plant owners in wetterwater years could be used to produce water for con-junctive use or marketing programs.
MWDSC’s research distillation plant is the onlylarge non-reverse osmosis facility now under study.MWDSC, in cooperation with the federal governmentand the Israel Science and Technology Foundation, iscompleting final design of a 12.6 mgd demonstrationdesalting plant to evaluate a future full scale 60 to80␣ mgd seawater desalting plant. The technology isbased on a multiple-effect distillation process whichuses heat energy from an adjacent powerplant. The
Seawater Desalting as a Future WaterManagement Option
Seawater desalting was often viewed with optimism as a futurewater management option for California in the 1950s and 1960s,because of the proximity of the State’s major urban areas to thePacific Ocean. Most planning efforts then were focused on studiesand small-scale or pilot plant demonstration projects. Seawater de-salting is expected to have only limited application during the Bul-letin 160-98 planning horizon, largely due to its costs. The excerptbelow, taken from a 1965 USGS report entitled Natural Resourcesof California, describes an early demonstration project. (A 1 mgdplant, operated continuously, would provide 1.1 taf per year.)
California is cooperating with the Federal Government ina saline water conversion program. The Department of theInterior and the State jointly financed the building of a sa-line water conversion plant in San Diego on a site donatedby the city. Capable of producing 1 million gallons of water aday, it was operated for 2 years before being dismantled inMarch of 1964 and shipped to Cuba to serve GuantanamoNaval Base there. It is being replaced by a joint effort of theDepartment [of Interior] and the California Water ResourcesBoard. The State and the Federal Government are also coop-erating in the development of a multi-million-gallon salinewater conversion plant.
Mission Basin Brackish GroundwaterDesalting Research and Development Project
The Mission Basin groundwater desalting project is anexample of the type of desalting projects likely to occur withinthe Bulletin’s planning horizon.
The City of Oceanside owns and operates the Mission BasinGroundwater Desalting Facility. Under current operations, about2.1 taf/yr of demineralized groundwater supply is produced fromtreating brackish groundwater through a reverse osmosis pro-cess. Because of the plant’s successful operation over the pastthree years, the city plans to expand its production capacity to7.1 taf/yr, 22 percent of the city’s average annual demand. Thecost of the expansion is estimated to be $9.0 million. The addi-
tional water supply is expected to be available in year 2000.The Mission Basin aquifer holds about 92 taf of water.
The city anticipates that at least half of its future water sup-ply can ultimately be derived from this source. Expansion ofthe Mission Basin Desalting Facility has several importantbenefits. It would provide the city with a local source in theevent of a natural disaster, such as an earthquake. In additionto reducing the city’s reliance on imported water, the qualityof water produced at the desalting facility is better than thatof the city’s imported source (TDS concentration of 400-500 mg/L versus 600-700 mg/L for imported water).

6-35 EVALUATING OPTIONS FROM A STATEWIDE PERSPECTIVE
The California Water Plan Update BULLETIN 160-98
Monterey County Water Resources Agency’sCloud Seeding Program
MCWRA initiated a cloud seeding program in 1990 to al-leviate impacts of the drought and has continued the programas a cost-effective way to augment water supplies. MCWRA’sprogram costs were less than $10/af. In addition to airborneseeding, an experimental ground based propane dispenser wasinstalled for rainfall enhancement in 1991. The program wasdesigned to increase rainfall and runoff in the watersheds ofArroyo Seco (a small undammed tributary of the Salinas River)and San Antonio and Nacimiento Reservoirs.
Monterey County relies solely on groundwater and lo-cal surface supplies, and faces chronic groundwater overdraftand seawater intrusion. The area’s semiarid, Mediterranean-style climate provides only marginally sufficient rainfall dur-ing average years to sustain reservoir releases for aquiferrecharge during the summer months. Furthermore, the oc-currence interval and typical productivity of weather systemspassing over the central coast are such that soil mass onlyreaches saturation near the end of the rain event, and theweather system moves on prior to the occurrence of substan-tial runoff. Cloud seeding, in most cases, provides additionalrainfall that converts directly into runoff.
The typical interval for cloud seeding in Monterey Countyis from early November through the end of March. The pri-mary target area is the 650 square miles of combined water-shed above Nacimiento and San Antonio Reservoirs. To thenorth, the Arroyo Seco watershed is a secondary target area.Seeding flights in the early part of the water year cover theentire area, affecting the reservoir drainage areas and ArroyoSeco. This early seeding provides additional runoff to the res-ervoir system as well as added groundwater recharge in theArroyo Seco drainage area. Later in the water year when Ar-royo Seco flows have reached the confluence with the SalinasRiver, flights are rerouted to concentrate the seeding effecton the reservoirs.
The five-year program has experienced varying degreesof success in terms of providing additional water supply. Usu-ally the wetter the storms, the greater the moisture availablefor conversion to precipitation and the more productive theseeding. Overall, evaluations show that rainfall increased abouttwenty percent above normal for the five-year study period.According to MCWRA, no known adverse environmentaleffects have occurred as a result of the project.
goal is to demonstrate that the multiple-effect distilla-tion process can produce desalted seawater at a cost ofless than $1,000/af. If successful, a full scale plant couldproduce about 85 taf/yr.
Weather ModificationWeather modification (cloud seeding) has been
practiced in California for years. Most projects havebeen located on the western slopes of the SierraNevada and in parts of the Coast Range. Before the1987-92 drought, there were about 10 to 12 weathermodification projects operating, with activity increas-ing during dry years. During the drought the numberof projects operating in California had increased to20. Some projects were subsequently dropped and oth-ers suspended operations after the drought ended.
Operators engaged in cloud seeding have found itbeneficial to seed rain bands along the coast and oro-graphic clouds over the mountains. The projects areoperated to increase water supply or hydroelectric powergeneration. Although the amounts of water producedare difficult and expensive to determine, estimates rangefrom a 2 to 15 percent increase in annual precipitation,depending on the number and type of storms seeded.
The Department, on behalf of the SWP, planneda five-year demonstration program of cloud seeding
in the upper Middle Fork Feather River Basin, be-ginning in the 1991-92 season. The program was totest the use of liquid propane injected into cloudsfrom generators on a mountain top. The test pro-gram was terminated after three years due toinstitutional difficulties.
A 1993 USBR feasibility study for a cloud seed-ing program in the watersheds above Shasta and TrinityDams indicated potential for the Trinity River Basin,but cast doubt on the effectiveness of a project forShasta Lake. USBR had proposed a cloud seeding dem-onstration program in the upper Colorado River Basin,but the demonstration program was opposed by theState of Colorado. Presently, USBR is phasing out itsparticipation in weather modification projects.
Cloud seeding is more successful in near-normalwater years, when moisture in the form of storm clouds ispresent to be treated. It is also more effective when com-bined with carryover storage to take full advantage ofadditional precipitation and runoff. Institutional issuesassociated with cloud seeding programs include claimsfrom third-parties who allege damage from flooding orhigh water caused by the cloud seeding program. Becauseof the many legal and institutional difficulties surround-ing third-party impacts, new cloud seeding projects aredeferred from further consideration in this Bulletin.

6-36EVALUATING OPTIONS FROM A STATEWIDE PERSPECTIVE
The California Water Plan Update BULLETIN 160-98
Other Supply Augmentation OptionsThis section discusses several other methods to
augment water supplies. These options are conceptual,or have not yet been widely practiced. Hence, they aredeferred from further evaluation in this Bulletin.
Importing Water from Out of State
Constructing an undersea pipeline, towing waterin giant nylon bags, shipping water by tanker, and tow-ing icebergs have all been suggested to help augmentCalifornia’s water supply by importing water from outof state.
The idea of constructing an undersea pipeline tocarry fresh water from Alaska to California was studiedthree decades ago and was last revisited in 1991. As pro-posed, a 2,600 mile-long suboceanic pipeline would beconstructed along the coastline. The pipeline would besized to carry about 3 maf/yr of Alaskan water from theStikine and/or Copper Rivers, and would terminate ei-ther at Shasta Lake or in Southern California. Apreliminary study estimated that the project would costbetween $110 and $150 billion and take at least 15 yearsto complete. A feasibility study by the CongressionalOffice of Technology Assessment concluded that hugecosts and unanswered engineering problems made theidea of building an undersea pipeline unrealistic.
A proposal to fill giant floating nylon bags withwater and tow them from Alaska to California hadbeen suggested in the past. During the height of themost recent California drought, a California companysought investors to finance a test run. The water wouldbe filtered, chlorinated, and then loaded into floatingbags (the bags float because fresh water is lighter thansalt water). An ocean-going tugboat would tow the bags(each holding about 220 af ) along the coast. This pro-posal did not go forward. In 1996, a privately developedwater bag delivery system was tested on a pilot scalewhen two bags of 2.4 af each were towed from PortAngeles, Washington, to Seattle. Some problemsemerged in the test run. If implemented at a full scale,costs associated with this option would include towing,constructing, operating, and maintaining the loading/unloading docks and pumps to transfer the bagged wa-ter ashore to local treatment and distribution systems.
Shipping water by tankers appears to be the mostfeasible of the water importation options suggested.Marine transport is a proven alternative to land-basedpipelines in the oil industry. A Canadian company isnow arranging to ship water to China via tankers. The
company was granted Alaska’s first water-export permitin 1996. When shipping facilities and a bottling plantare built, the company will begin shipping 390 af/yr ofAlaskan water to China using tankers, retrofitted to foodgrade cargo. The water is to be bottled in a plant to bebuilt by the company and the Chinese government. TheCity of San Diego is considering a marine transportdemonstration project, where a private company wouldtransport up to 20 taf/yr of water from British Colum-bia to the City of San Diego using tankers. Thedemonstration project, if implemented, could providecost and technical data on bulk tanker shipping of wa-ter. The U.S. Ocean Pollution Act of 1990, whichrequired phasing out single-hulled oil tankers, presentedan opportunity to make tankers available for conver-sion into bulk water carriers at reduced costs. Tankerhaulage could provide a flexible delivery system foremergency supply of water for coastal areas in the eventof earthquakes or droughts.
Gray Water
Some residential wastewater can be directly re-used by homeowners as gray water. Gray water canbe used in subsurface systems to irrigate lawns, fruittrees, ornamental trees, and shrubs and flowers (infinite amounts, depending on the plant types beingirrigated). Water from the bathroom sink, washingmachine, bathtub, or shower is generally safe to re-use. Care must be taken so that people and pets donot come in contact with gray water. Food irrigatedby gray water subsurface systems should be rinsedand cooked before being eaten.
Gray water has been used by some homeownersin coastal urban areas during extreme drought to savetheir landscaping. In the past, health concerns and lackof information limited use of gray water. In 1992, theLegislature amended the Water Code to allow graywater systems in residential buildings subject to ap-propriate standards and with the approval of localjurisdictions. There appears to be limited interest inexploring gray water as an option beyond listing itsuse as a potential urban BMP.
Watershed Management on National Forest Lands
National forest lands provide about half of theState’s runoff. A Department study of vegetationmanagement found that thinning trees and shrubs from33,000 acres of foothill watershed above Lake Orovillemight increase average annual runoff by 2.5 taf. USFS

6-37 EVALUATING OPTIONS FROM A STATEWIDE PERSPECTIVE
The California Water Plan Update BULLETIN 160-98
estimates that if national forest management as practicedduring the 1980s had been practiced earlier, the averageannual runoff from national forests would have been in-creased by about 360 taf (an increase of about 1 percent).Without new storage facilities, only a fraction of thisamount would contribute to water supply.
Forest management proposals prepared on behalfof the biomass power industry call for removing excessdead material and invasive species from the forest un-derstory and thinning of the trees themselves. Treethinning would produce fuel for the biomass powerindustry. These proposals attempt to return forests totheir pre-fire exclusion condition, achieving wildfirereduction and wildlife and water supply benefits. Froma water supply perspective, extensive areas of landwould have to be managed to increase statewide watersupplies. The maximum rate of forest evapotranspira-tion is reached at about 65 percent tree and shrub coverdensity. To achieve water savings, it would be neces-sary to thin trees and shrubs to reduce cover to lessthan 65 percent, requiring detailed evaluation of po-tential environmental impacts. Watershed managementwould require ongoing treatment of forest vegetationto prevent loss of water yield due to regrowth of treesand shrubs.
Currently, no local water agencies are actively pur-suing forest management as a component of their futuresupply. The potential environmental impacts and in-stitutional difficulties of establishing a forestmanagement program suggest that it would be carriedout as part of a multipurpose program whose mainobjectives would be timber management or fire sup-pression rather than water supply.
Long-Range Weather Forecasting
Accurate advance weather information—extend-ing weeks, months, and even seasons ahead—wouldbe invaluable for planning all types of water opera-tions. Had it been known, for instance, that 1976 and1977 were going to be extremely dry years, or that thedrought would end in 1977, water operations couldhave been planned somewhat differently and the im-pacts of the drought could have been lessened. Theresponse to the 1987-92 drought could have beenmodified to store more water in the winter of 1986-87 and to use more of the remaining reserves in 1992,the last year of the drought.
The potential benefits of dependable long-rangeweather forecasts could be calculated in hundreds ofmillions of dollars, and their value would be national.
Hence, research programs to investigate and developforecasting capability would most appropriately beconducted at the national level. The National WeatherService routinely issues 30 and 90 day forecasts; theScripps Institution of Oceanography in San Diego(until recently) and Creighton University in Omaha,Nebraska, make experimental forecasts. The predic-tions have not been sufficiently reliable for water projectoperation. Predictions may be improved by researchon global weather patterns, including the El NiñoSouthern Oscillation in the eastern Pacific Ocean.
Summary of Statewide SupplyAugmentation Options
The preceding sections evaluated statewide watermanagement options, including demand reductionmeasures and large-scale water supply augmentationmeasures that would provide supply to multiple ben-eficiaries. Demand reduction and water recyclingoptions are shown in the regional option tabulationsin Chapters 7–9, since these options would be imple-mented by individual local agencies in their serviceareas. Table 6-10 summarizes options likely to be imple-mented by 2020 to meet statewide needs. Because thesestatewide options would provide new water, the op-portunity exists for the options’ effectiveness to bemultiplied through regional reapplication. Therefore,the options would provide regional applied water gainsthat are greater than the gains shown in Table 6-10.
CALFED
Statewide options include actions that could betaken by CALFED to develop new water supplies. Thewater supply yield shown for the CALFED Bay-Deltaprogram’s preferred alternative is necessarily a place-holder, as a final program environmental documentfor the Bay-Delta solution has not been completed.The CALFED placeholder does not address specificsof which upstream of Delta storage facilities might beselected, or how conjunctive use programs might beoperated. The placeholder assumes dual Delta convey-ance (Alternative 3) and approximately 3 maf of storagefacilities, with 1 maf of this storage dedicated for envi-ronmental uses. Project yield and operating criteriawere defined by a DWRSIM operations study. TheCALFED placeholder used for Bulletin 160-98 quan-tification of potential CALFED new water supply doesnot include water use efficiency measures proposed ina technical appendix to CALFED’s March 1998 draft

6-38EVALUATING OPTIONS FROM A STATEWIDE PERSPECTIVE
The California Water Plan Update BULLETIN 160-98
PEIS/PEIR, because the CALFED operations studiesused to quantify program water supply benefits didnot incorporate those demand reductions.
Other Statewide Options
Other likely statewide options include specificprojects to improve SWP water supply reliability, wa-ter marketing through the Department’s DWB, andtwo multipurpose reservoirs. A third potential multi-purpose reservoir option, an enlarged Shasta Lake, wasnot included as a likely option because further studiesare needed to quantify the water supply and flood con-trol benefits associated with different potential reservoirsizes. Preliminary studies suggest that a 9 maf enlarge-ment of Shasta Lake would yield 760 taf in averageyears and 940 taf in drought years. Additional evalua-tion of this option is recommended.
The two multipurpose reservoir projects includedas statewide options – Auburn Reservoir and enlargedMillerton Lake (Friant Dam)—were included as likelyoptions to recognize the interrelationship between wa-ter supply needs and the Central Valley’s flood protectionneeds. It is recognized that both projects may have con-troversial aspects and that neither of them is inexpensive.However, both projects offer enough benefits to justifyserious consideration. The lead time for planning andimplementing any large reservoir project is long, and itwould take almost to this Bulletin’s 2020 planning ho-rizon for the projects to be constructed.
The identity of the specific entity(ies) that mightimplement the two multipurpose reservoir projects isuncertain. USBR, as the owner of the existing FriantDam and as the federal agency having authorization for
operating Auburn, would presumably be a participant.The implementing entity could be a partnership of somecombination of federal/State/local agencies.
Allocating Options Yield Among HydrologicRegions
In Tables 6-11 and 6-12, yields from likely state-wide supply augmentation options were allocatedamong potentially participating hydrologic regionsto illustrate how the supplies might be used. Poten-tial supply from a Friant Dam enlargement wasshown as remaining in the San Joaquin River andTulare Lake Regions, where existing Friant suppliesare used. For Auburn Dam and CALFED, supplywas divided among hydrologic regions served byCVP and SWP facilities. Auburn could also pro-vide supplies for foothill communities that are toosmall to develop projects on their own, as discussedin Chapter 8. (In neither option is it assumed thatthe CVP or SWP would contract for the supply—only that conveyance facilities exist to make thewater available to potential users.) The Bulletinmakes no attempt to allocate costs of these projectsbetween flood protection and water supply.
Uncertainties in the Bulletin Planning Process
Planning about the future is subject to uncertainty.In response to public comments, this section brieflyanalyzes the effects of some uncertainties on the short-age forecasts and potential options presented inBulletin␣ 160-98.
Water use forecasts rely on assumptions about popu-lation growth, urban per-capita water use, land use and
TABLE 6-10
Statewide Supply Augmentation Options Likely to be Implemented by 2020a
Options Potential Gain (taf)
Average Drought
CALFED Bay-Delta Program 100 175SWP Improvements
Interim South Delta Program 125 100Conjunctive Use Programs — 55
Water Marketing (Drought Water Bank) — 250Multipurpose Reservoir Projects
Auburn Dam 620 370Friant Dam Enlargement 90 0
Total 935 950a Demand reduction options are shown in the regional option tabulations in Chapters 7–9. Demand reduction options would be implemented by individual
local agencies in their service areas.

6-39 EVALUATING OPTIONS FROM A STATEWIDE PERSPECTIVE
The California Water Plan Update BULLETIN 160-98
cropping patterns, and environmental water require-ments. Environmental water requirements are the mostdifficult to forecast, as they are driven by regulatory andlegislative processes. Implementation of CVPIA andSWRCB’s Bay-Delta Plan, new ESA restrictions, andFERC relicensing/electric utility deregulation are actionsthat could significantly modify forecasted environmen-tal demands with the Bulletin 160-98 planning period.
In addition to forecasting water demand com-ponents, the Bulletin must also characterize futurewater management options. The CALFED Bay-Deltaprogram and the draft CRB 4.4 Plan are still in de-velopment. These programs have been representedby placeholder throughout the Bulletin. Even if finaldecisions on the programs were made in the near fu-
ture, both are long-term programs that will be imple-mented in phases; some phases may extend beyondthis Bulletin’s planning horizon.
To illustrate the effects of uncertainties on theBulletin’s water budgets, maximum and minimum ap-plied water shortages associated with potentialimplementation of SWRCB’s Bay-Delta water rightsproceeding and CALFED are shown in Table 6-13.For comparison, the Bulletin’s forecasted 2020 appliedwater shortages are 2.4 maf in average years and 6.2␣ afin drought years with existing facilities and programs.As discussed in earlier chapters, there are no data avail-able at this time to quantify site-specific impacts ofnew ESA listings, FERC relicensing, and electric util-ity deregulation.
TABLE 6-11
Likely Statewide Supply Augmentation Options by Hydrologic Region2020 Average Year (taf)
Region CALFED ISDPa Conjunctive DWBb Auburn Friant TotalUsea,b Dam Dam
North Coast — — — — — — —San Francisco Bay — 8 — — — — 8Central Coast 2 1 — — 2 — 5South Coast 15 68 — — 67 — 150Sacramento River — — — — 85 — 85San Joaquin River — — — — — 39 39Tulare Lake 70 35 — — 310 51 466North Lahontan — — — — — — —South Lahontan 12 10 — — 152 — 174Colorado River 1 3 — — 4 — 8Total 100 125 — — 620 90 935a SWP Improvementsb The options provide only drought year supplies
TABLE 6-12
Likely Statewide Supply Augmentation Options by Hydrologic Region
2020 Drought Year (taf)
Region CALFED ISDPa Conjunctive DWB Auburn Friant TotalUsea Dam Dam
North Coast — — — — — — —San Francisco Bay — 7 18 75 — — 100Central Coast 4 1 — 51 1 — 57South Coast 26 54 22 3 39 — 144Sacramento River — — — — 51 — 51San Joaquin River — — — — — — —Tulare Lake 123 28 — 51 185 — 387North Lahontan — — — — — — —South Lahontan 21 7 15 70 91 — 204Colorado River 1 3 — — 3 — 7Total 175 100 55 250 370 — 950a SWP Improvements
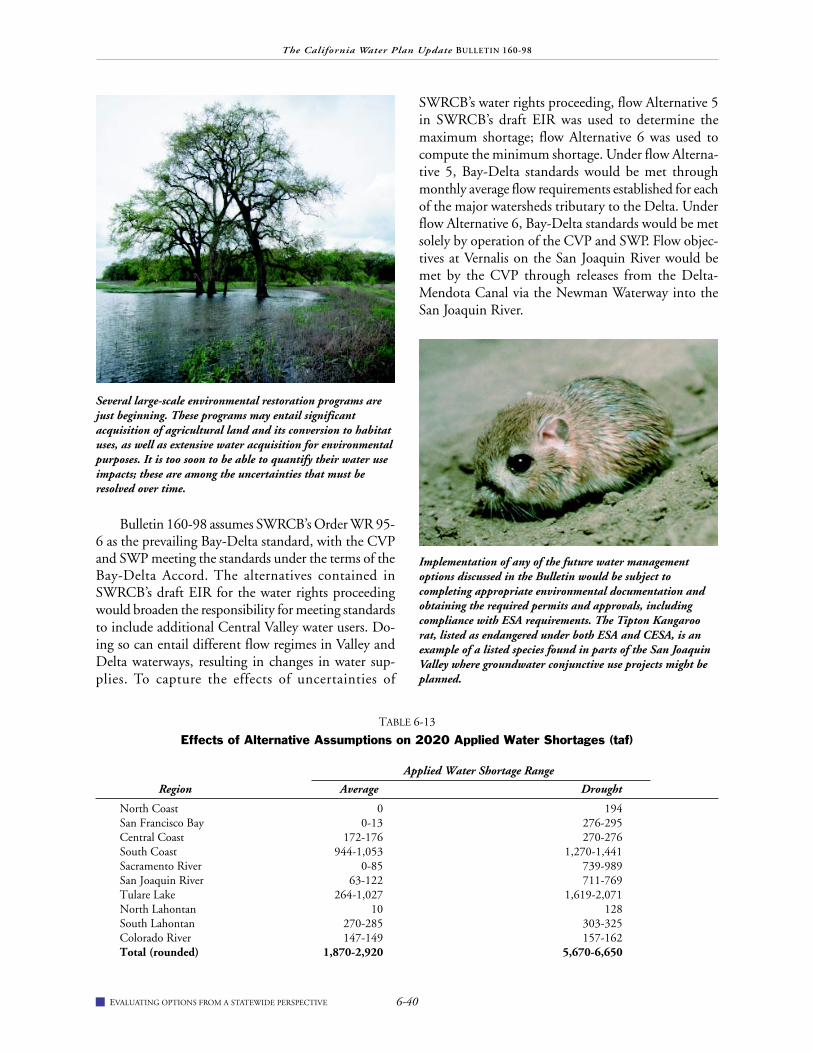
6-40EVALUATING OPTIONS FROM A STATEWIDE PERSPECTIVE
The California Water Plan Update BULLETIN 160-98
Bulletin 160-98 assumes SWRCB’s Order WR 95-6 as the prevailing Bay-Delta standard, with the CVPand SWP meeting the standards under the terms of theBay-Delta Accord. The alternatives contained inSWRCB’s draft EIR for the water rights proceedingwould broaden the responsibility for meeting standardsto include additional Central Valley water users. Do-ing so can entail different flow regimes in Valley andDelta waterways, resulting in changes in water sup-plies. To capture the effects of uncertainties of
SWRCB’s water rights proceeding, flow Alternative 5in SWRCB’s draft EIR was used to determine themaximum shortage; flow Alternative 6 was used tocompute the minimum shortage. Under flow Alterna-tive 5, Bay-Delta standards would be met throughmonthly average flow requirements established for eachof the major watersheds tributary to the Delta. Underflow Alternative 6, Bay-Delta standards would be metsolely by operation of the CVP and SWP. Flow objec-tives at Vernalis on the San Joaquin River would bemet by the CVP through releases from the Delta-Mendota Canal via the Newman Waterway into theSan Joaquin River.
Several large-scale environmental restoration programs arejust beginning. These programs may entail significantacquisition of agricultural land and its conversion to habitatuses, as well as extensive water acquisition for environmentalpurposes. It is too soon to be able to quantify their water useimpacts; these are among the uncertainties that must beresolved over time.
TABLE 6-13
Effects of Alternative Assumptions on 2020 Applied Water Shortages (taf)
Applied Water Shortage Range
Region Average Drought
North Coast 0 194San Francisco Bay 0-13 276-295Central Coast 172-176 270-276South Coast 944-1,053 1,270-1,441Sacramento River 0-85 739-989San Joaquin River 63-122 711-769Tulare Lake 264-1,027 1,619-2,071North Lahontan 10 128South Lahontan 270-285 303-325Colorado River 147-149 157-162Total (rounded) 1,870-2,920 5,670-6,650
Implementation of any of the future water managementoptions discussed in the Bulletin would be subject tocompleting appropriate environmental documentation andobtaining the required permits and approvals, includingcompliance with ESA requirements. The Tipton Kangaroorat, listed as endangered under both ESA and CESA, is anexample of a listed species found in parts of the San JoaquinValley where groundwater conjunctive use projects might beplanned.

6-41 EVALUATING OPTIONS FROM A STATEWIDE PERSPECTIVE
The California Water Plan Update BULLETIN 160-98
For CALFED implementation, the Bulletin’splaceholder assumes dual Delta conveyance (Alterna-tive 3) and approximately 3 maf of surface water storagefacilities. Project yield and operating criteria were de-fined by an operations study which assumed that 1maf of new storage would be operated to meetCALFED’s ecosystem restoration program targets. The
maximum shortage condition results from assumingthat no new water supply is provided by CALFED (nostorage facilities are constructed). The minimum short-age results from assuming approximately 6 maf ofsurface and groundwater storage. (CALFED’s assump-tion for this scenario is that 1.25 maf of new storagewould be operated to meet ERP targets.)
Options for Future Environmental Habitat Enhancement
. . .
A number of programs designed to restore and/or enhance environmental resources are in variousstages of implementation. These programs vary inscope, geographic region, and objective. Some of theseprograms provide environmental water supplies; oth-ers involve structural measures, such as placingspawning gravel or constructing fish screens. Someof these programs are legislatively driven; others haveresulted from collaborative efforts among stakehold-ers. Table 6-14 illustrates the emphasis now beingplaced on environmental restoration actions, by iden-tifying a variety of funding sources available forfishery-related environmental restoration actions.
This section identifies and describes programs ex-pected to provide future environmental benefits. Thissection covers a representative sample, and is notmeant to be a comprehensive listing of all possibili-ties statewide.
Central Valley Project Improvement ActSome CVPIA environmental restoration actions,
such as water acquisition and fish screening, are appli-cable to the entire Central Valley. Site-specific projects,such as construction of the Shasta Dam TCD, are de-scribed in Chapters 7–9.
The May 1997 draft Anadromous Fish RestorationPlan proposed habitat restoration actions such as spawn-ing gravel placement and stream channel restoration,acquisition of land for wildlife habitat, construction offish screens and facilities to improve passage of migrat-ing anadromous fish, and development of plans toprevent habitat degradation due to sedimentation andurbanization. The plan also included target instreamflows for rivers and streams in the Central Valley andthe Delta. The three tools available for USBR to meetthese flow objectives are reoperation of the CVP, dedi-cation and management of 800 taf of CVP yield
annually, and water acquisition. Water acquisition ef-forts were described in the water marketing section ofthis chapter. Tools available to meet CVPIA’s broad goalof doubling anadromous fish populations in the Cen-tral Valley include the many physical habitat restorationactions specified in the act, as well as substantial fund-ing from the CVPIA Restoration Fund and from generalcongressional appropriations.
USBR and USFWS have contributed funding forlocal agency and privately owned fish screen installa-tion projects and planning studies as part of theanadromous fish screening program. About 20 grantshave been executed to date for screening projects andfeasibility studies of screening alternatives. Examplesof completed and pending projects are described inChapter 5. USBR and USFWS have completed twospawning gravel replenishment projects on the Sacra-mento River below Keswick Dam. Additional projectsare being planned for the other rivers authorized inthe act. The gravel replenishment actions are analo-
Restoring and enhancing riparian habitat helps sustain healthypopulations of the species that rely on this habitat. Beavers arean example of a species dependent on riparian habitat.
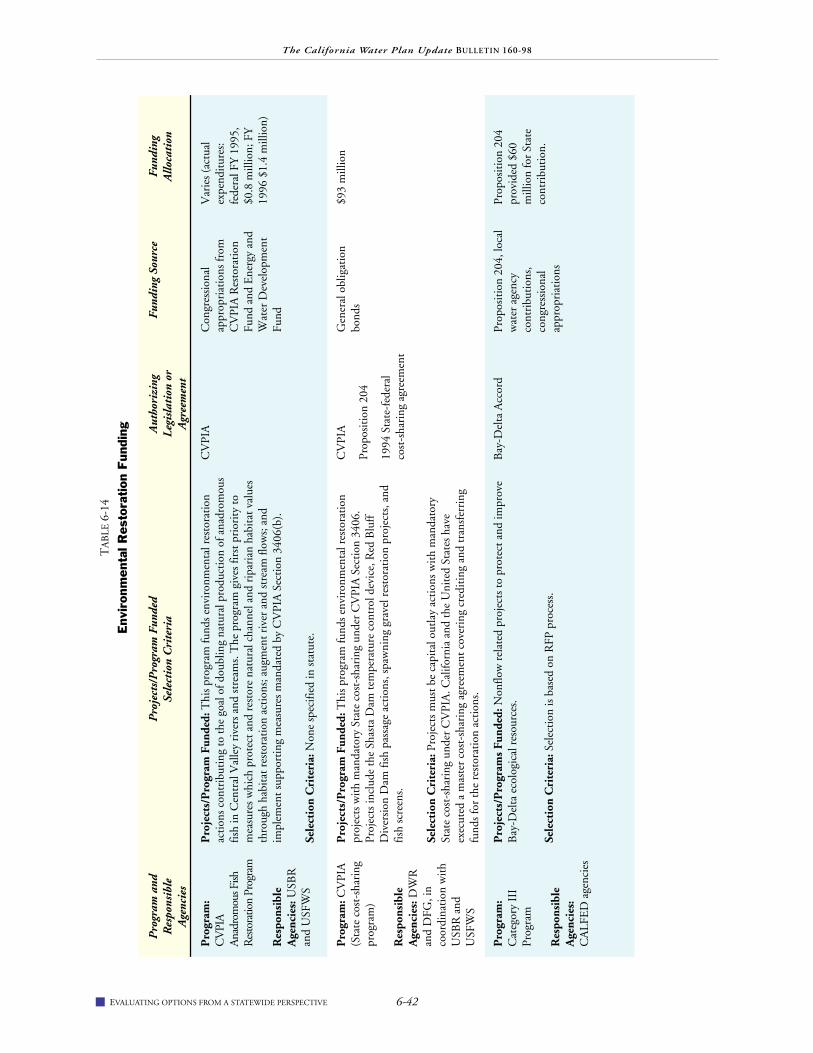
6-42EVALUATING OPTIONS FROM A STATEWIDE PERSPECTIVE
The California Water Plan Update BULLETIN 160-98
Pro
gram
:C
VPI
AA
nadr
omou
s Fish
Res
tora
tion
Prog
ram
Res
pons
ible
Age
ncie
s: U
SBR
and
USF
WS
Pro
ject
s/P
rogr
am F
unde
d: T
his
prog
ram
fund
s en
viro
nmen
tal r
esto
rati
onac
tion
s co
ntri
buti
ng to
the
goal
of d
oubl
ing
natu
ral p
rodu
ctio
n of
ana
drom
ous
fish
in C
entr
al V
alle
y ri
vers
and
str
eam
s. T
he p
rogr
am g
ives
firs
t pri
orit
y to
mea
sure
s w
hich
pro
tect
and
res
tore
nat
ural
cha
nnel
and
rip
aria
n ha
bita
t val
ues
thro
ugh
habi
tat r
esto
rati
on a
ctio
ns; a
ugm
ent r
iver
and
str
eam
flow
s; a
ndim
plem
ent s
uppo
rtin
g m
easu
res
man
date
d by
CV
PIA
Sec
tion
340
6(b)
.
Sele
ctio
n C
rite
ria:
Non
e sp
ecifi
ed in
sta
tute
.
CV
PIA
Con
gres
sion
alap
prop
riat
ions
from
CV
PIA
Res
tora
tion
Fund
and
Ene
rgy
and
Wat
er D
evel
opm
ent
Fund
Var
ies
(act
ual
expe
ndit
ures
:fe
dera
l FY
199
5,$0
.8 m
illio
n; F
Y19
96 $
1.4
mill
ion)
Pro
gram
: CV
PIA
(Sta
te c
ost-
shar
ing
prog
ram
)
Res
pons
ible
Age
ncie
s: D
WR
and
DFG
, in
coor
dina
tion
wit
hU
SBR
and
USF
WS
Pro
ject
s/P
rogr
am F
unde
d: T
his
prog
ram
fund
s en
viro
nmen
tal r
esto
rati
onpr
ojec
ts w
ith
man
dato
ry S
tate
cos
t-sh
arin
g un
der
CV
PIA
Sec
tion
340
6.Pr
ojec
ts in
clud
e th
e Sh
asta
Dam
tem
pera
ture
con
trol
dev
ice,
Red
Blu
ffD
iver
sion
Dam
fish
pas
sage
act
ions
, spa
wni
ng g
rave
l res
tora
tion
pro
ject
s, a
ndfis
h sc
reen
s.
Sele
ctio
n C
rite
ria:
Pro
ject
s m
ust b
e ca
pita
l out
lay
acti
ons
wit
h m
anda
tory
Stat
e co
st-s
hari
ng u
nder
CV
PIA
. Cal
iforn
ia a
nd th
e U
nite
d St
ates
hav
eex
ecut
ed a
mas
ter
cost
-sha
ring
agr
eem
ent c
over
ing
cred
itin
g an
d tr
ansf
erri
ngfu
nds
for
the
rest
orat
ion
acti
ons.
CV
PIA
Prop
osit
ion
204
1994
Sta
te-f
eder
alco
st-s
hari
ng a
gree
men
t
Gen
eral
obl
igat
ion
bond
s$9
3 m
illio
n
Pro
gram
:C
ateg
ory
III
Prog
ram
Res
pons
ible
Age
ncie
s:C
ALF
ED
age
ncie
s
Pro
ject
s/P
rogr
ams
Fund
ed: N
onflo
w r
elat
ed p
roje
cts
to p
rote
ct a
nd im
prov
eB
ay-D
elta
eco
logi
cal r
esou
rces
.
Sele
ctio
n C
rite
ria:
Sel
ecti
on is
bas
ed o
n R
FP p
roce
ss.
TA
BLE
6-1
4
Env
iron
men
tal R
esto
ration
Fun
ding
Pro
gram
and
Pro
ject
s/P
rogr
am F
unde
dA
utho
rizi
ngFu
ndin
g So
urce
Fund
ing
Res
pons
ible
Sele
ctio
n C
rite
ria
Leg
isla
tion
or
Allo
cati
onA
genc
ies
Agr
eem
ent
Prop
osit
ion
204
prov
ided
$60
mill
ion
for
Stat
eco
ntri
buti
on.
Bay
-Del
ta A
ccor
dPr
opos
itio
n 20
4, lo
cal
wat
er a
genc
yco
ntri
buti
ons,
cong
ress
iona
lap
prop
riat
ions

6-43 EVALUATING OPTIONS FROM A STATEWIDE PERSPECTIVE
The California Water Plan Update BULLETIN 160-98
TA
BLE
6-1
4
Env
iron
men
tal R
esto
ration
Fun
ding
(co
ntin
ued)
Pro
gram
and
Pro
ject
s/P
rogr
am F
unde
dA
utho
rizi
ngFu
ndin
g So
urce
Fund
ing
Res
pons
ible
Sele
ctio
n C
rite
ria
Leg
isla
tion
or
Allo
cati
onA
genc
ies
Agr
eem
ent
Pro
gram
:C
ALF
ED
Eco
syst
emR
esto
rati
onPr
ogra
m
Res
pons
ible
Age
ncie
s:C
ALF
ED
agen
cies
Pro
ject
s/P
rogr
am F
unde
d: T
o be
det
erm
ined
, but
cou
ld in
clud
e fis
h sc
reen
s,sp
awni
ng g
rave
l res
tora
tion
pro
ject
s, a
nd r
ipar
ian
habi
tat e
nhan
cem
ent
proj
ects
. The
fund
s ar
e no
t ava
ilabl
e un
til a
n E
IR/E
IS a
nd a
Sta
te-f
eder
al c
ost-
shar
ing
agre
emen
t are
com
plet
ed.
Sele
ctio
n C
rite
ria:
To
be d
eter
min
ed.
Prop
osit
ion
204
Gen
eral
obl
igat
ion
bond
s$3
90 m
illio
n
Pro
gram
:D
elta
Pum
ping
Plan
t Fis
hPr
otec
tion
Agr
eem
ent
(Fou
r-Pu
mps
Agr
eem
ent)
Res
pons
ible
Age
ncie
s: D
WR
and
DFG
Pro
ject
s/P
rogr
am F
unde
d: F
ish
scre
ens,
rea
ring
str
iped
bas
s, g
rave
lre
stor
atio
n pr
ojec
ts, h
atch
ery
and
othe
r ac
tion
s to
ben
efit
aqu
atic
res
ourc
es,
part
icul
arly
sal
mon
and
str
iped
bas
s. G
eogr
aphi
c sc
ope
incl
udes
the
Cen
tral
Val
ley
and
the
Del
ta.
Sele
ctio
n C
rite
ria:
Act
ions
that
ben
efit
aqu
atic
res
ourc
es, p
arti
cula
rly
chin
ook
salm
on, s
teel
head
, and
str
iped
bas
s. P
rior
ity
will
be
give
n to
mea
sure
s on
the
San
Joaq
uin
Riv
er s
yste
m. T
he D
epar
tmen
t and
DFG
sta
ff r
evie
w p
roje
ctpr
opos
als
and
subm
it th
em to
an
advi
sory
com
mit
tee
com
pose
d of
repr
esen
tati
ves
from
SW
P co
ntra
ctor
s an
d th
e en
viro
nmen
tal a
nd fi
shin
gco
mm
unit
ies.
Rec
omm
enda
tion
s ar
e pr
esen
ted
to th
e di
rect
ors
of th
eD
epar
tmen
t and
DFG
for
appr
oval
.
Agr
eem
ent b
etw
een
the
Dep
artm
ent a
nd D
FGto
off
set d
irec
t fis
hlo
sses
in r
elat
ion
toB
anks
Pum
ping
Pla
nt,
date
d D
ecem
ber
1986
SWP
fund
sad
min
iste
red
by th
eD
epar
tmen
t
$15
mill
ion
for
fish
popu
lati
on r
ecov
ery
prog
ram
, and
addi
tion
al a
nnua
lfu
ndin
g to
com
pens
ate
for
annu
al fi
sh lo
sses
caus
ed b
y th
e B
anks
Pum
ping
Pla
nta
Pro
gram
:T
racy
Fis
hA
gree
men
t
Res
pons
ible
Age
ncie
s: U
SBR
and
DFG
Pro
ject
s/P
rogr
am F
unde
d: T
his
agre
emen
t bet
wee
n D
FG a
nd U
SBR
impl
emen
ts m
easu
res
to r
educ
e, o
ffse
t, or
rep
lace
dir
ect l
osse
s of
chi
nook
salm
on a
nd s
trip
ed b
ass
in th
e D
elta
as
a re
sult
of T
racy
Pum
ping
Pla
ntdi
vers
ions
.
Sele
ctio
n C
rite
ria:
A c
omm
itte
e co
mpo
sed
of r
epre
sent
ativ
es fr
om U
SBR
,D
FG, a
nd U
SFW
S sc
reen
s pr
ojec
t pro
posa
ls. P
roje
cts
are
fund
ed u
pon
reco
mm
enda
tion
by
DFG
Dir
ecto
r to
USB
R.
Tra
cy F
ish
Agr
eem
ent
betw
een
USB
R a
ndD
FG, d
ated
Jun
e 19
92
Con
gres
sion
alap
prop
riat
ions
for
oper
atio
ns a
ndm
aint
enan
ce o
f CV
P,ad
min
iste
red
by U
SBR
App
roxi
mat
ely
$1m
illio
n pe
r ye
ar.
USB
R h
as p
rovi
ded
fund
ing
tota
ling
$6.5
mill
ion
duri
ng19
92-9
7

6-44EVALUATING OPTIONS FROM A STATEWIDE PERSPECTIVE
The California Water Plan Update BULLETIN 160-98
Pro
gram
:C
omm
erci
alSa
lmon
Sta
mp
Acc
ount
Res
pons
ible
Age
ncy:
DFG
TA
BLE
6-1
4
Env
iron
men
tal R
esto
ration
Fun
ding
(co
ntin
ued)
Pro
gram
and
Pro
ject
s/P
rogr
am F
unde
dA
utho
rizi
ngFu
ndin
g So
urce
Fund
ing
Res
pons
ible
Sele
ctio
n C
rite
ria
Leg
isla
tion
or
Allo
cati
onA
genc
ies
Agr
eem
ent
Pro
ject
s/P
rogr
am F
unde
d: P
roje
cts
to r
esto
re s
alm
on p
opul
atio
ns th
roug
hha
bita
t res
tora
tion
and
bre
edin
g, a
nd p
roje
cts
whi
ch p
rovi
de p
ublic
edu
cati
onon
the
impo
rtan
ce a
nd b
iolo
gy o
f sal
mon
. Exa
mpl
es o
f elig
ible
res
tora
tion
proj
ects
incl
ude
spaw
ning
gra
vel r
esto
rati
on, b
ank
stab
iliza
tion
, rip
aria
nre
vege
tati
on, f
ish
pass
age
impr
ovem
ent,
inst
alla
tion
of f
ish
ladd
ers
and
scre
ens,
and
shor
t-te
rm s
alm
on b
reed
ing.
Sele
ctio
n C
rite
ria:
Pro
ject
s ar
e ev
alua
ted
base
d on
ben
efit
s to
fish
ery
reso
urce
s, n
eed
for
wor
k in
a p
arti
cula
r w
ater
shed
for
targ
et s
peci
es, a
nd p
roje
ctco
sts.
Pro
ject
pro
posa
ls a
re e
valu
ated
and
pri
orit
ized
firs
t by
DFG
. Pro
ject
s fo
rsa
lmon
hab
itat
res
tora
tion
and
bre
edin
g ar
e se
nt to
the
Com
mer
cial
Sal
mon
Tro
llers
Adv
isor
y C
omm
itte
e. T
here
are
two
suba
ccou
nts
in th
e pr
ogra
m—
aco
mm
erci
al s
alm
on s
tam
p de
dica
ted
acco
unt,
and
an a
ugm
ente
d sa
lmon
sta
mp
dedi
cate
d ac
coun
t. T
he c
omm
erci
al s
alm
on s
tam
p de
dica
ted
acco
unt i
sst
atut
orily
dir
ecte
d to
sal
mon
bre
edin
g. E
xpen
ditu
res
from
the
othe
r ac
coun
tm
ust m
eet t
he r
ecom
men
dati
ons
of th
e ad
viso
ry c
omm
itte
e. F
inal
fund
ing
deci
sion
is b
y th
e D
irec
tor
of D
FG.
Fish
and
Gam
e C
ode
Sect
ions
786
0-78
63th
at im
pose
a s
tam
p fe
eon
com
mer
cial
sal
mon
fishe
rs, a
s w
ell a
sco
mm
erci
al p
asse
nger
salm
on fi
shin
g ve
ssel
oper
ator
s
Ann
ual s
tam
p fe
ew
hich
ran
ges
from
$85
to $
260
depe
ndin
g on
salm
on la
ndin
g
Tot
al a
nnua
lre
venu
e va
ries
from
$340
,000
to ju
stov
er $
1 m
illio
n.
Pro
gram
:C
alifo
rnia
Wild
life,
Coa
stal
and
Park
Lan
dC
onse
rvat
ion
Init
iati
ve(P
ropo
siti
on70
)
Res
pons
ible
Age
ncy:
DFG
Pro
ject
s/P
rogr
am F
unde
d: P
roje
cts
to r
esto
re a
nd e
nhan
ce s
alm
on s
trea
ms,
and
wild
trou
t and
nat
ive
stee
lhea
d ha
bita
t.
Sele
ctio
n C
rite
ria:
Sim
ilar
to s
alm
on s
tam
p pr
ogra
m. P
roje
ct p
ropo
sals
are
init
ially
rev
iew
ed b
y D
FG a
nd th
en s
ent t
o th
e C
omm
erci
al S
alm
on T
rolle
rsA
dvis
ory
Com
mit
tee
and
to th
e Pr
opos
itio
n 70
sub
com
mit
tee
(a s
ix-m
embe
rgr
oup
repr
esen
ting
the
Com
mer
cial
Sal
mon
Tro
llers
Adv
isor
y C
omm
itte
e an
dth
e C
alifo
rnia
Adv
isor
y C
omm
itte
e on
Sal
mon
and
Ste
elhe
ad T
rout
) fo
rfu
ndin
g co
nsid
erat
ion.
Fin
al a
ppro
val f
or fu
ndin
g is
by
the
Dir
ecto
r of
DFG
.
Prop
osit
ion
70 o
f19
88b
Gen
eral
obl
igat
ion
bond
sse
e fo
otno
te
a G
ener
ally
, the
$15
mill
ion
fund
s pr
ojec
ts w
ith
long
-ter
m b
enef
its
to fi
sh, w
hile
the
annu
al a
ccou
nt fu
nds
proj
ects
to r
epla
ce fi
sh lo
st a
nnua
lly a
t the
pum
ping
pla
nt. B
y 19
96, t
he D
epar
tmen
t had
allo
cate
d al
l of t
he $
15 m
illio
n an
dha
d sp
ent a
bout
$6
mill
ion
in a
nnua
l mit
igat
ion
proj
ects
.b
Sta
te F
Y 1
997-
98 w
as th
e la
st y
ear
of fu
ndin
g un
der
Prop
osit
ion
70. D
FG r
ecei
ved
$10
mill
ion
to r
esto
re a
nd e
nhan
ce s
alm
on s
trea
ms,
and
$6
mill
ion
to r
esto
re a
nd e
nhan
ce w
ild tr
out a
nd n
ativ
e st
eelh
ead
habi
tat a
nd r
elat
edpr
ojec
ts.

6-45 EVALUATING OPTIONS FROM A STATEWIDE PERSPECTIVE
The California Water Plan Update BULLETIN 160-98
gous to an operations and maintenance program, wherework would be done periodically on river segmentsidentified as needing more gravel. A monitoring pro-gram would be required, both to identify areas thatare gravel-limited and to evaluate the effectiveness ofthe gravel provided.
Category III ProgramThe Category III funding program was established as
part of the 1994 Bay-Delta Accord to address non-flowfactors affecting the health of the Bay-Delta ecosystem. Asteering committee of agricultural, urban, and environmen-tal stakeholders administered the project selection process
TABLE 6-15
Sample Projects Funded by Category III Program
Project / Program Proponent Category III Funds
Battle Creek Restoration DFG $730,000
Durham Mutual Fish Screen and Fish Ladder Durham Mutual Water Company up to $416,500
M&T/Parrott Pump Relocation and Fish Screen Ducks Unlimited, Inc. $1,550,000
Biologically Integrated Orchard Systems Program Comm. Alliance w/ Family Farmers Fnd. $660,000
Sacramento R. Habitat Restoration (Colusa to Verona) Wildlife Conservation Board $400,000
Suisun Marsh Screening Project Suisun Resource Conservation Dist. up to $950,000
Sacramento River Winter-Run Broodstock Program Pacific Coast Fed. of Fishermen’s Assoc. $300,000
Western Canal Water District Butte Creek Siphon WCWD $2,739,000
Prospect Island Restoration DWR up to $2,535,000
Sacramento R. Habitat Restoration (Verona to Collinsville) DWR/The Reclamation Board $500,000
Princeton Pumping Plant Fish Screens Reclamation District 1004 $75,000
Princeton-Codora-Glenn/Provident ID Fish Screen PCGID/PID $5,575,000
Cosumnes River Preserve (Valensin Acquisition) The Nature Conservancy $1,500,000
Lower Butte Creek Habitat Restoration The Nature Conservancy $130,000
Sherman Island Levee Habitat Demonstration DWR up to $480,000
Ecological Functions of Restored Wetlands in the Delta University of Washington $475,000
Molecular Genetic Identification of Chinook Salmon Bodega Marine Laboratory $450,000Runs, Focused on Spring-Run Integrity
Decker Island Tidal Wetland Enhancement Port of Sacramento $399,000
Yolo Bypass Habitat Restoration Study DFG $226,000
Clear Creek Property Acquisition Assistance BLM up to $211,000
Research Program to Address the Introduction of San Francisco Estuary Institute $197,000Non-Indigenous Aquatic Species
Sacramento River and Major Tributaries Corridor Mapping Calif. State University, Chico $145,200
Fish Screen for Unscreened Diversion on Yuba R. Browns Valley Irrigation District $114,750
Effects of Toxics on Central Valley Chinook Salmon Fox Environmental Management $110,000
Barrier Intake Screen at Wilkins Slough Diversions Reclamation District 108 $100,000
San Joaquin River Main Lift Canal Intake Banta-Carbona Irrigation District $100,000Channel Fish Screen Facility
Adams Dam Fish Screen and Fish Ladder Rancho Esquon Partners up to $100,000
Gorrill Dam Fish Screen and Fish Ladder Gorrill Land Company up to $100,000
Fish Screen Testing for Small Unscreened Diversions Buell and Associates $90,000
Watershed Management Strategy for Butte Creek Calif. State University, Chico $83,000
Establish Battle Creek Watershed Conservancy Western Shasta Resource Consv. Dist. $50,000
Inventory of Rearing Habitat for Juvenile Salmon Calif. State University, Sacramento $24,500
Total $21,515,950

6-46EVALUATING OPTIONS FROM A STATEWIDE PERSPECTIVE
The California Water Plan Update BULLETIN 160-98
in 1995 and 1996. During this period, the program funded32 restoration projects, including land acquisition, fishscreening, habitat restoration, and a toxicity study. In1997, CALFED became the lead agency for imple-menting the Category III program. Program fundingsources include $10 million per year (for 3 years) fromwater users and $60 million from Proposition 204funding. The Ecosystem Roundtable, a subcommitteeof the Bay-Delta Advisory Council, provides input onselection of Category III projects. Table 6-15 is a sam-pling of projects funded through 1997. Often, projectsthat receive part of their funding from the CategoryIII program are also funded in part by CVPIA’s AFRP,the 4-Pumps program, or other restoration programs.
The Prospect Island restoration project is an ex-ample of a project funded by Category III. ProspectIsland, an approximately 1,600-acre tract in theDelta, has a project area of about 1,300 acres in ag-ricultural land use. The project’s objectives are tocreate wetland and shaded riverine aquatic habitat,restore fish and wildlife habitat, and decrease main-tenance costs for the Sacramento Deepwater ShipChannel levee. Actions include flooding the inte-rior of the island to create small internal islands,stabilizing existing levees by flattening the slopes,and planting vegetation to provide erosion control.The project is sponsored by USACE (under WRDASection 1135 authority) and the Department. USBRpurchased the project site with CVPIA funds in1995. After restoration is complete, USFWS willmanage the property in conjunction with the nearbyStone Lakes National Wildlife Refuge. Category IIIhas established an endowment fund of $1.25 mil-lion for long-term project maintenance.
CALFED Bay-Delta EcosystemRestoration Program
CALFED’s Ecosystem Restoration Program is toprovide the foundation for a long-term ecosystem res-toration effort that may take several decades toimplement. The ERP is included in each of the alter-natives being evaluated in the programmatic EIR/EIS.Some proposed actions contained in the plan include:• Breeching levees for intertidal wetlands.• Constructing setback levees to increase floodplain
and riparian corridors.• Limiting further subsidence of Delta islands by
implementing measures such as restoring wetlandsto halt the oxidation of peat soils.
• Controlling introduced species and reducing the
probability of additional introductions.• Acquiring land or water from willing sellers for
ecosystem improvements.• Providing incentives to encourage environmentally
friendly agricultural practices.Congress authorized $430 million over the next
three years for the federal share of CALFED programssuch as Category III and initial implementation of theERP, and appropriated $85 million for federal fiscalyear 1998. Proposition 204 also included $390 mil-lion for implementation of the ERP. This funding willnot be available until after CALFED’s PEIR/EIS hasbeen completed.
CALFED operations studies, in addition to mod-eling storage and conveyance elements, also modelCALFED’s ecosystem restoration common programelement through specification of ERP environmentalflow targets. In the operations studies, water suppliesrequired to meet ERP flow targets are provided fromnew storage facilities dedicated to environmental res-toration. Water acquisitions from willing sellers areassumed to fully meet flow targets when sufficient flowis unavailable from environmental storage releases.
The ERP outlines several environmental flow ob-jectives to support sustainable populations of plant andanimal species in the Bay-Delta. The ERP identifiesmonthly and 10-day flow event targets for Delta out-flow and for many of the river basins within theBay-Delta watershed. As a simplification, CALFED op-erations studies focus on flow targets on the SacramentoRiver at Freeport. (The Freeport flow target is the mostsignificant in terms of total instream flow volume.)Instream flow targets not modeled by the operationsstudies include: Sacramento River at Knights Landing,Feather River at Gridley, Yuba River at Marysville,American River at Nimbus Dam, Stanislaus River atGoodwin Dam, Tuolumne River at LaGrange, andMerced River at Shaffer Bridge. The additional riverflows targeted by the ERP would occur through CVPIAinstream flow requirements, releases from new environ-mental storage created under the CALFED program,and water acquisition from willing sellers.
CALFED operations studies assume that new stor-age volume is split among the three water using sectors.The placeholder study assumes 3 maf of new surfacewater storage, with 1 maf dedicated for environmen-tal water uses. Environmental storage is operated tomaximize average annual yield by not imposingcarryover provisions. Water released from storage tomeet ERP flow targets is not diverted at the Delta.

6-47 EVALUATING OPTIONS FROM A STATEWIDE PERSPECTIVE
The California Water Plan Update BULLETIN 160-98
Other Environmental EnhancementOptions
SWP’s Sherman and Twitchell Islands WildlifeManagement Plans
The objective of the management plans is to controlsubsidence and soil erosion on Twitchell and ShermanIslands, while providing wetland and riparian habitat. Theplans also provide recreational opportunities such as walk-ing trails and wildlife viewing. Subsidence would bereduced by minimizing oxidation and erosion of peat soilson the islands and by replacing present agricultural culti-vation practices with land use management practicesdesigned to stabilize the soil. Altering land use practiceson Twitchell Island could provide up to 3,000 acres ofwetland and riparian habitat.
Fish Protection Agreements
USBR and the Department have entered into agree-ments with DFG to mitigate fish losses at Delta exportfacilities. Subsequent to execution of USBR’s agreementwith DFG, CVPIA directed USBR to substantially up-grade Tracy Pumping Plant’s fish protection facilities andto construct a new screening facility. Planning studiesare now under way for a major upgrade of the existingfacility. The Department’s 4 Pumps agreement with
DFG has funded, or cost-shared in many habitat resto-ration actions upstream of the Delta, as describedpreviously. Discussions are presently ongoing regardingthe possibility of using the remainder of the agreement’scapital outlay funds to construct a fish hatchery on theTuolumne River.
Upper Sacramento River Fisheries and RiparianHabitat Restoration Program
As described in Chapter 2, elements of the 1989plan prepared under this program were incorporated inCVPIA, or are being considered in forums such as theCALFED program. In 1992, the Resources Agency re-convened the SB 1086 Advisory Council. The council’scurrent charge is two-part: to serve in an advisory ca-pacity to State agencies responsible for actions likely toaffect the Upper Sacramento River and adjacent lands,and to complete the council’s earlier work on riparianhabitat protection and management. The goals for thelatter charge include establishing a riparian habitat man-agement area and a governance or management entityfor the area. Recommendations are being developed forthe boundaries of a riparian habitat conservation area,management objectives by river reach, and the type ofgovernance organization that could most effectively carryout the management plan.
Financing Local Water Management Options
. . .
Implementing and maintaining many of the optionsdiscussed in the Bulletin will require a large commitmentof funds. When a local agency is confronted with addi-tional expenditures for water management options, it mustdecide whether the costs of these options will be paidfrom current or accumulated revenues (pay-as-you-go),or be financed with the proceeds of debt repaid from fu-ture revenues. Historically, local water agencies relied onseveral methods for long-term debt financing, includinggeneral obligation bonds, revenue bonds, and assessmentbonds. Innovative long-term debt financing strategies,such as bond pools, are being increasingly used.
Financial costs are different from economic costs.Financial costs are the actual expenditures required bya water agency to repay the debt (with interest) in-curred to finance the capital costs of an option and tomeet operations and maintenance costs. Thus, theobjective of financial feasibility studies is to solve cash
flow problems. In contrast, economic costs reflect thecosts of committing resources needed to construct,operate, and maintain an option for its life, to whom-ever they may accrue. Economic feasibility studies areused to compare the relative merit of options, to de-termine the most economically efficient size orconfiguration of an option, and to allocate costs amongbeneficiaries. It is possible for options to be financiallyfeasible and economically unjustified, or vice versa. Forexample, even though an agency can generate the fundsto pay for an option, this does not necessarily meanthat the option is economically the best of availableoptions. On the other hand, an option may be eco-nomically justified but it cannot be financed becauseof existing debt limitations.
Financial feasibility is becoming an increasinglyimportant consideration in water supply managementplanning for a number of reasons.

6-48EVALUATING OPTIONS FROM A STATEWIDE PERSPECTIVE
The California Water Plan Update BULLETIN 160-98
•␣ Future water demands are expected to exceedpresent supplies. There is thus a need to developwater supply augmentation and demand manage-ment programs.
•␣ Compliance with new EPA and DHS drinkingwater standards is likely to increase capital expen-ditures by municipal water agencies.
•␣ Some water suppliers have deferred maintenanceand/or replacement of aging facilities to the pointwhere increased operation, maintenance, and re-placement costs are being incurred.
•␣ Since the 1980s, the federal government has beenreducing aid to state and local governments forlarge-scale water resources projects, a trend whichis expected to continue.
•␣ Since the early 1990s, the Legislature has been shift-ing property tax revenues away from counties andspecial districts and into the State’s general fund.
Sources of RevenuesWhether capital improvements are funded on a
pay-as-you-go basis or through debt financing, a wa-ter agency must have sufficient revenues to cover capitalcosts as well as ongoing operation and maintenancecosts. The major sources of revenue for publicly-ownedsystems include water rates charged to customers, prop-erty taxes (although use of these has been limited sincepassage of Proposition 13), and benefit assessmentsthrough special improvement districts. (See Chapter 2
for discussion of Proposition 218 and its impacts onassessments.) Because of voter opposition to furthertax increases, local governments have increasingly re-lied upon other revenue sources such as developmentimpact fees from new construction, standby fees, andfees for special services. These alternatives are typicallyonly feasible for agencies with large service areas, sothat income from these fees will be significant and re-liable. Investor-owned water agencies and mutual watercompanies are almost exclusively dependent uponwater rates to generate revenues. Tables 6-16 and 6-17show significant sources of revenue for water agenciesby type of ownership and by agency size.
Financing MethodsThe ability of a public agency to access different fi-
nancing methods depends upon the enabling legislationunder which the agency was formed. Among other things,the enabling legislation will indicate the agency’s:•␣ Authority to issue bonds, the vote required to
authorize issuance, and any limitations on theamounts of bonds or on the amount of indebt-edness;
•␣ Powers and methods of tax assessments, includ-ing whether the assessments are on an ad valorembasis (a tax based on value of property) or are lev-ied according to benefits, and the type of property(land and/or improvements) upon which the as-sessments may be levied;
TABLE 6-17
Significant Sources of Revenue to Water Agencies by Water Agency Size
Revenue Sources Small Intermediate Medium Large
Water Rates X X X XProperty Taxes X X XSpecial Improvement District Assessments X X XDevelopment Impact Fees XCustomer Hookup Fees XSpecial Service Fees X
TABLE 6-16
Significant Sources of Revenue to Water Agencies by Type of Ownership
Revenue Sources Public Investor Mutual
Water Rates X X XProperty Taxes XSpecial Improvement District Assessments XDevelopment Impact Fees XCustomer Hookup Fees XSpecial Service Fees X X

6-49 EVALUATING OPTIONS FROM A STATEWIDE PERSPECTIVE
The California Water Plan Update BULLETIN 160-98
•␣ Revenue sources, including charges, rates or tollsfor service or commodities, or sales and leases ofproperty; and
•␣ Area over which it can collect taxes and/or sell ser-vices or commodities.
Self-Financing
Self-financing is a form of non-debt financing. A wa-ter agency can use reserves generated from accumulatedrevenues and other income to pay for improvements ratherthan incurring debt. The pay-as-you-go approach gener-ally works best for small or recurring capital expendituresthat can be reasonably accommodated in an agency’s an-nual budget. For major capital improvements, a debtfinancing approach would be more appropriate.
Short-Term Debt Financing
Short-term debt financing typically includes bor-rowing instruments with maturities of less than 1 year.Short-term borrowing can be used for cash flow bor-rowing, financing for capital improvements withrelatively short lives, and interim financing for long-termcapital improvements. Revenue and tax anticipationnotes can be used when an agency is experiencing cashflow problems because revenues are occurring unevenlyduring the fiscal year. Revenue and tax anticipation notescan be used to pay current expenses, with note repay-ment coming from revenues received later in thefiscal year. Capital items with relatively short lives canbe financed through the use of commercial paper—short-term, unsecured promissory notes backed by a lineof credit from one or more banks. Short-term financingmethods can provide interim financing for the construc-tion of capital improvements which are planned to befinanced on a permanent basis at a later date. Examplesof interim financing include grant anticipation notes(where the permanent funding could be a grant fromanother government agency) and bond anticipationnotes (where the permanent funding will come throughthe issuance of long term debt such as bonds).
Conventional Long-Term Debt Financing
Conventional long-term debt financing methodsinclude general obligation bonds, revenue bonds, assess-ment bonds, and lease or installment sales agreements, allof which are typically used by publicly owned utilities.
General obligation bonds are used to finance im-provements benefitting the community as a whole, andare secured by the full faith and credit of the agency. Gen-
eral obligation bonds issued by public water agencies aresecured by a pledge of the agency’s ad valorem taxingpower. Passage of Proposition 13 and its requirement fortwo-thirds voter approval have limited the ability of agen-cies to assess additional property taxes which would beneeded to fulfill this pledge, reducing the use of thesebonds. General obligation bond limits are often estab-lished by a water agency’s enabling legislation.
Revenue bonds do not require the agency’s pledgeof full faith and credit. Debt service for these bonds ispaid exclusively from a specific revenue source, suchas the revenue obtained from the operation of the fi-nanced project. Because revenue bonds do not requirevoter approval, they are now more commonly used thangeneral obligation bonds.
Assessment bonds are issued to finance capital im-provements and debt service, are paid throughassessments levied upon real property benefitted by suchimprovements, and are secured by a lien on that prop-erty. Under the Mello-Roos Community Facilities Actof 1982, water agencies may establish a community fa-cilities district and levy a special tax upon land withinthat district. This tax can be used to finance capital im-provements (generally distribution systems), newservices, or to repay bonds issued for such purposes.Passage of Proposition 218 in 1996 substantially changedthe way in which property-related assessments can beimposed by local agencies. In the future, these assess-ments must be subjected to a vote of the property owners.
Lease or installment revenue bonds have becomecommon as taxpayer resistance and State statutes havelimited the taxing and borrowing ability of local agen-cies, thus reducing use of general obligation bonds. InCalifornia, a form of a lease revenue bond is the Certifi-cate of Participation. With a COP, facilities are built oracquired by an agency of the city, and leased to the city,for which the city makes lease payments equal to theprincipal repayment plus interest. A city, non-profitcorporation, or a community redevelopment agencymust be used as the intermediary leasing entity, but thatagency must give the facilities to the city free and clearwithout added expense when the indebtedness is repaid.
Innovative Long-term Debt Financing
New long-term debt financing strategies are be-ing developed to assist water agencies in obtainingfunding for water system improvements. Bond poolsincrease access to bond funds for smaller water agen-cies who might not otherwise be able to obtain funding.Bond pools use a JPA to combine several small bond

6-50EVALUATING OPTIONS FROM A STATEWIDE PERSPECTIVE
The California Water Plan Update BULLETIN 160-98
offerings into a single financial package, minimiz-ing the cost of bond issuance for participating wateragencies. The Association of California Water Agen-cies and the WateReuse Association offer suchfinancial packages.
Privatization occurs when the private sector be-comes involved in design, financing, construction,ownership and/or operation of a public facility such asa water system improvement. Privatization can offeradvantages. For example, it may provide cheaper ormore accessible financing, and it may provide substan-tial tax advantages to the private sector. Privatelyarranged financing may be an attractive option whena publicly owned water agency’s access to the financialmarkets is diminished or nonexistent, as is the case formany smaller utilities.
Another potential opportunity for water agenciesinvolves the provision of funds by one agency for wa-
ter system or on-farm improvements by another agency,in exchange for use of the water conserved. An exampleis the agreement between MWDSC and IID, whereMWDSC is funding IID system improvements in ex-change for a 35-year right to use the waters which havebeen conserved.
Credit Substitution and Enhancement
Although not financing methods, credit substitutionand enhancement can assist local agencies in obtainingfinancing and in lowering the costs of financing. Creditsubstitution occurs when an agency substitutes its owncredit for that of a local agency that is seeking to financea project. The local agency can improve the quality of itsbonds and obtain them at a lower cost. Credit enhance-ment occurs when an agency guarantees that the debtservice obligations will be met, which can be a low-costand effective way for states to assist local agencies.
TABLE 6-18
Major State and Federal Financial Assistance Programs
Program Eligible Projects Administering Agencies
State
Safe Drinking Water Bond Laws Grants/low interest loans for DWR/DHSpublic water system improvements
Water Conservation Bond Laws Low interest loans for water DWR/SWRCBconservation, groundwaterrecharge, local water supply, andwater recycling projects
Agricultural Drainage Water Management Low interest loans for agricultural SWRCBLoan drainage projects
Safe, Clean, Reliable Water Supply Act of Low interest loans and grants for DWR/SWRCB1996 (Proposition 204) water conservation, groundwater
recharge and water recycling projects
Federal
Water and Wastewater Disposal Loans and grants to small Farmers Home AdministrationLoans/Grants communities for water and
wastewater facilities
Community Development Block Grants to large communities for Housing and Urban DevelopmentGrants (HUD) water and wastewater facilities through Department of Housing and
Community Development
Small Business Administration Loans Loans for private water system Small Business Administrationimprovements
Federal/State
Clean Water Act SRF Low interest loans for water SWRCBrecycling projects
Safe Drinking Water Act SRF Low interest loans for public DHSwater system improvements

6-51 EVALUATING OPTIONS FROM A STATEWIDE PERSPECTIVE
The California Water Plan Update BULLETIN 160-98
State and Federal Financial Assistance Programs
State and federal financial assistance programs (loansand grants) are available. These programs target varied ob-jectives including safe drinking water, water conservation,water recycling, and water supply development (for example,groundwater recharge projects). Each of these programshas criteria to determine project eligibility and funding.Most of the state and federal programs do not provide fund-ing to investor-owned and mutual companies because thisis considered to be adding value to privately owned busi-nesses. The 1996 Safe Drinking Water Act reauthorizationmay provide about $12 billion from 1997 through 2003for current and new drinking water programs, including astate revolving fund of $1 billion per year nationally through2003. Table 6-18 shows some major state and federal fi-nancial assistance programs available for water systemimprovements. Proposition 204 included grants to localagencies for a variety of purposes. For example, the De-partment is administering two programs to provide loans(and in some cases, grants) to local agencies for water con-servation/groundwater recharge facilities ($30 million) andlocal projects ($25 million). SWRCB is administering loansfor water recycling.
Relationship Between Financing andWater Agency Ownership and Size
The types of financing available can vary depend-ing upon the ownership and size of the water agencies.These relationships are discussed below. Table 6-19 sum-marizes financing methods by type of ownership.
Table␣ 6-20 illustrates financing methods typically avail-able to water agencies of different sizes. Table 6-21summarizes financial assistance programs by ownershiptype.
Public Water Agencies
In general, public water agencies have access to morefinancing methods than do investor-owned and mu-tual water companies. Many financing instruments willbe tax-exempt for publicly-owned agencies. The largerpublic agencies can issue tax-exempt notes and bonds,assess property taxes, issue special assessment bonds, andenter into public/private partnerships to finance capitalimprovements. A smaller public agency may be unableto secure such financing because either the cost of themethod (such as the cost of issuing bonds) or the amountof funds needed to make improvements exceeds theability of its customers to pay. In these cases, the smalleragencies need to either obtain federal and state assis-tance, if available, or pursue innovative financingmethods. Local public agencies must limit their rates toamounts needed to cover current financing and watercosts—they are not allowed to make a profit.
Investor-Owned Water Utilities
Investor-owned utilities can issue equity stock andsell taxable bonds. The California Public Utilities Com-mission must give authorization prior to the issuanceof stocks or bonds by an investor-owned water com-
TABLE 6-19
Financing Methods Available to Water Agencies by Type of Ownership
Method Public Investor Mutual
Self-Financing X X X
Short-Term FinancingFixed Rate Notes X Xa Xa
Commercial Paper X Xa Xa
Floating Rate Demand Notes X Xa Xa
Conventional Long-Term FinancingEquity Shares or Stock X XBonds (GO and Revenue) X Xa Xa
Lease Revenue X
Innovative Long-Term FinancingBond Pools XPrivatization X XWater transfers X X X
Financial Assistance Programs X Xb Xb
a Taxable instruments.b State and federal loan and grant programs have limited applications for private water agencies.

6-52EVALUATING OPTIONS FROM A STATEWIDE PERSPECTIVE
The California Water Plan Update BULLETIN 160-98
pany. This method of financing is primarily limited tothe larger investor-owned systems. The smaller investor-owned agencies generally do not issue stock and may lackthe rate base that would make other financial methodsfeasible. The CPUC establishes the return on investmentthat investor-owned utilities are allowed to earn as part ofits rate setting authority. Regulated investor-owned utili-ties are not able to accumulate reserves. Utilities may useshort-and long-term taxable bonds and notes.
Mutual Water Companies
A mutual water company is a privately ownedcompany that issues securities in which lot owners
are entitled to one share for each lot they own. Mu-tual water companies have the ability to assessmembers to raise capital. This does not require ap-proval by either the members or an outside agency.The amount of the assessment may be limited, how-ever, by the ability of the customers to pay. As arequirement of formation of a mutual water com-pany, a sinking fund must be established that providescapital replacement of water facilities at the end oftheir useful life. Some of the larger mutual compa-nies may be able to use short- and long-term financinginstruments such as taxable bonds and notes.
TABLE 6-21
Financial Assistance Programs Available to Water Agencies by Type of Ownership
Programs Public Investor Mutual
StateSafe Drinking Water Bond Laws X Xa Xa
Water Conservation Bond Laws XAgricultural Drainage Water Management Loans XCommunity Development Block Grants XState Revolving Fund for Wastewater XState Revolving Fund for Drinking Water X X X
FederalWater and Wastewater Disposal Loans and Grants X XCommunity Development Block Grants XSmall Business Administration Loans Xa Loans only; grants not provided to privately-owned agencies.
TABLE 6-20
Financing Methods Typically Available to Water Agencies by Water Agency Size
Method Small Intermediate Medium Large
Self-Financing X X
Short-Term FinancingFixed Rate Notes XCommercial Paper XFloating Rate Demand Notes X
Conventional Long-Term FinancingEquity Shares or Stock X XBonds (GO and Revenue) XLease Revenue Bonds X
Innovative Long-Term FinancingBond Pools X X X XPrivatization X X X XWater Transfers X X X X
Financial Assistance Programs Xa Xa Xa Xa
a State and federal loan and grant programs have limited applications for private water agencies.

6A-1 APPENDIX 6A
The California Water Plan Update BULLETIN 160-98 Appendix 6A
Regional Water Budgetswith Existing Facilities and Programs
The following tables show the water budgets for each of the State’s ten hydrologic regionswith existing facilities and programs. Water use/supply totals and shortages may not sumdue to rounding.
6A
Quest
More information about the California Department of Water Resources is available at: http://wwwdwr.water.ca.gov/ For a hard copy version of the Bulletin, please call the Publications Office at (916) 653-1097.

6A-2APPENDIX 6A
The California Water Plan Update BULLETIN 160-98Appendix 6A
TABLE 6A-2
San Francisco Bay Region Water Budget with Existing Facilities and Programs (taf)
1995 2020Average Drought Average Drought
Water UseUrban 1,255 1,358 1,317 1,428Agricultural 98 108 98 108Environmental 5,762 4,294 5,762 4,294Total 7,115 5,760 7,176 5,830
SuppliesSurface Water 7,011 5,285 7,067 5,417Groundwater 68 92 72 89Recycled and Desalted 35 35 37 37Total 7,115 5,412 7,176 5,543
Shortage 0 349 0 287
TABLE 6A-1
North Coast Region Water Budget with Existing Facilities and Programs (taf)
1995 2020Average Drought Average Drought
Water UseUrban 169 177 201 212Agricultural 894 973 927 1,011Environmental 19,544 9,518 19,545 9,518Total 20,607 10,668 20,672 10,740
SuppliesSurface Water 20,331 10,183 20,371 10,212Groundwater 263 294 288 321Recycled and Desalted 13 14 13 14Total 20,607 10,491 20,672 10,546
Shortage 0 177 0 194
TABLE 6A-3
Central Coast Region Water Budget with Existing Facilities and Programs (taf)
1995 2020Average Drought Average Drought
Water UseUrban 286 294 379 391Agricultural 1,192 1,279 1,127 1,223Environmental 118 37 118 37Total 1,595 1,610 1,624 1,652
SuppliesSurface Water 318 160 368 180Groundwater 1,045 1,142 1,041 1,159Recycled and Desalted 18 26 42 42Total 1,381 1,328 1,452 1,381
Shortage 214 282 172 270

6A-3 APPENDIX 6A
The California Water Plan Update BULLETIN 160-98 Appendix 6A
TABLE 6A-4
South Coast Region Water Budget with Existing Facilities and Programs (taf)
1995 2020Average Drought Average Drought
Water UseUrban 4,340 4,382 5,519 5,612Agricultural 784 820 462 484Environmental 100 82 104 86Total 5,224 5,283 6,084 6,181
SuppliesSurface Water 3,839 3,196 3,625 3,130Groundwater 1,177 1,371 1,243 1,462Recycled and Desalted 207 207 273 273Total 5,224 4,775 5,141 4,865
Shortage 0 508 944 1,317
TABLE 6A-5
Sacramento River Region Water Budget with Existing Facilities and Programs (taf)
1995 2020Average Drought Average Drought
Water UseUrban 766 830 1,139 1,236Agricultural 8,065 9,054 7,939 8,822Environmental 5,833 4,223 5,839 4,225Total 14,664 14,106 14,917 14,282
SuppliesSurface Water 11,881 10,022 12,196 10,012Groundwater 2,672 3,218 2,636 3,281Recycled and Desalted 0 0 0 0Total 14,553 13,239 14,832 13,293
Shortage 111 867 85 989
TABLE 6A-6
San Joaquin River Region Water Budget with Existing Facilities and Programs (taf)
1995 2020Average Drought Average Drought
Water UseUrban 574 583 954 970Agricultural 7,027 7,244 6,450 6,719Environmental 3,396 1,904 3,411 1,919Total 10,996 9,731 10,815 9,609
SuppliesSurface Water 8,562 6,043 8,458 5,986Groundwater 2,195 2,900 2,295 2,912Recycled and Desalted 0 0 0 0Total 10,757 8,943 10,753 8,898
Shortage 239 788 63 711

6A-4APPENDIX 6A
The California Water Plan Update BULLETIN 160-98Appendix 6A
TABLE 6A-7
Tulare Lake Region Water Budget with Existing Facilities and Programs (taf)
1995 2020Average Drought Average Drought
Water UseUrban 690 690 1,099 1,099Agricultural 10,736 10,026 10,123 9,532Environmental 1,672 809 1,676 813Total 13,098 11,525 12,897 11,443
SuppliesSurface Water 7,888 3,693 7,791 3,593Groundwater 4,340 5,970 4,386 5,999Recycled and Desalted 0 0 0 0Total 12,228 9,663 12,177 9,592
Shortage 870 1,862 720 1,851
TABLE 6A-8
North Lahontan Region Water Budget with Existing Facilities and Programs (taf)
1995 2020Average Drought Average Drought
Water UseUrban 39 40 50 51Agricultural 530 584 536 594Environmental 374 256 374 256Total 942 880 960 901
SuppliesSurface Water 777 557 759 557Groundwater 157 187 183 208Recycled and Desalted 8 8 8 8Total 942 752 950 773
Shortage 0 128 10 128
TABLE 6A-9
South Lahontan Region Water Budget with Existing Facilities and Programs (taf)
1995 2020Average Drought Average Drought
Water UseUrban 238 238 619 619Agricultural 332 332 257 257Environmental 107 81 107 81Total 676 651 983 957
SuppliesSurface Water 322 259 437 326Groundwater 239 273 248 296Recycled and Desalted 27 27 27 27Total 587 559 712 649
Shortage 89 92 270 308

6A-5 APPENDIX 6A
The California Water Plan Update BULLETIN 160-98 Appendix 6A
TABLE 6A-10
Colorado River Region Water Budget with Existing Facilities and Programs (taf)
1995 2020Average Drought Average Drought
Water UseUrban 418 418 740 740Agricultural 4,118 4,118 3,583 3,583Environmental 39 38 44 43Total 4,575 4,574 4,367 4,366
SuppliesSurface Water 4,154 4,128 3,920 3,909Groundwater 337 337 285 284Recycled and Desalted 15 15 15 15Total 4,506 4,479 4,221 4,208
Shortage 69 95 147 158

6A-6APPENDIX 6A
The California Water Plan Update BULLETIN 160-98Appendix 6A

6B-1 APPENDIX 6B
The California Water Plan Update BULLETIN 160-98 Appendix 6B
Applied Water Shortagesby Hydrologic Region
with Existing Facilities and Programs
Tables 6B-1 through 6B-4 show applied watershortages by hydrologic region with existing facilitiesand programs. Water shortages vary widely from re-gion to region. For example, the North Coast and SanFrancisco Bay Regions are not expected to experiencefuture shortages during average years, but will see short-ages in drought years. Most of the State’s remainingregions experience average year and drought year short-ages now, and are forecasted to experience increasedshortages in 2020.
The largest average year shortages are forecastedfor the Tulare Lake and South Coast Regions, areasthat rely heavily on imported water supplies. Futureaverage year shortages in the Tulare Lake Region re-flect groundwater overdraft. Future average yearshortages in the South Coast Region reflect forecastedpopulation growth, plus lower Colorado River sup-plies as California reduces its use of Colorado Riverwater to the State’s basic apportionment.
6B
Quest
More information about the California Department of Water Resources is available at: http://wwwdwr.water.ca.gov/ For a hard copy version of the Bulletin, please call the Publications Office at (916) 653-1097.

6B-2APPENDIX 6B
The California Water Plan Update BULLETIN 160-98Appendix 6B
TABLE 6B-1
Applied Water Shortages by Hydrologic Region (taf), 1995-Level Average Yeara
Region Overdraft Other Total
North Coast 0 0 0
San Francisco Bay 0 0 0
Central Coast 214 0 214
South Coast 0 0 0
Sacramento River 33 78 111
San Joaquin River 239 0 239
Tulare Lake 820 50 870
North Lahontan 0 0 0
South Lahontan 89 0 89
Colorado River 69 0 69
Total (rounded) 1,460 130 1,590a With existing facilities and programs.
TABLE 6B-2
Applied Water Shortages by Hydrologic Region (taf), 1995-Level Drought Yeara
Region Overdraft Other Total
North Coast 0 177 177
San Francisco Bay 0 349 349
Central Coast 214 68 282
South Coast 0 508 508
Sacramento River 33 834 867
San Joaquin River 239 549 788
Tulare Lake 820 1,042 1,862
North Lahontan 0 128 128
South Lahontan 89 3 92
Colorado River 69 26 95
Total (rounded) 1,460 3,690 5,150a With existing facilities and programs.

6B-3 APPENDIX 6B
The California Water Plan Update BULLETIN 160-98 Appendix 6B
TABLE 6B-4
Applied Water Shortages by Hydrologic Region (taf), 2020-Level Drought Yeara
Region Overdraft Other Total
North Coast 0 194 194
San Francisco Bay 0 287 287
Central Coast 102 168 270
South Coast 0 1,317 1,317
Sacramento River 85 904 989
San Joaquin River 63 648 711
Tulare Lake 670 1,181 1,851
North Lahontan 0 128 128
South Lahontan 89 219 308
Colorado River 61 97 158
Total (rounded) 1,070 5,140 6,210a With existing facilities and programs.
TABLE 6B-3
Applied Water Shortages by Hydrologic Region (taf), 2020-Level Average Yeara
Region Overdraft Other Total
North Coast 0 0 0
San Francisco Bay 0 0 0
Central Coast 102 70 172
South Coast 0 944 944
Sacramento River 85 0 85
San Joaquin River 63 0 63
Tulare Lake 670 50 720
North Lahontan 0 10 10
South Lahontan 89 181 270
Colorado River 61 86 147
Total (rounded) 1,070 1,340 2,410a With existing facilities and programs.

6B-4APPENDIX 6B
The California Water Plan Update BULLETIN 160-98Appendix 6B

6C-1 APPENDIX 6C
The California Water Plan Update BULLETIN 160-98 Appendix 6C
Estimating a Water ManagementOption’s Unit Cost
A key consideration in the options evaluation pro-cess is the appraisal of costs, both financial andeconomic. Financial costs are the expenditures requiredto repay debt (with interest) incurred to finance capi-tal costs of a project and to meet operations,maintenance, and replacement costs. Generally, finan-cial costs are spread over a shorter time period thanthe life of the project. In comparison, economic costsreflect the costs of resources committed to the con-struction and operation of a project over its life, whichcan be 50 years or more for many water resources op-tions. It is possible for options to be economicallyfeasible and financially infeasible, or vice versa.
This appendix focuses upon economic costs. Al-though economic costs can be expressed in manydifferent ways, a useful statistic is the economic costper acre-foot of option delivery. The mathematicalcomputation of unit cost is not difficult, but does en-tail several considerations.
Considerations Common to All Options
Data Availability
Cost estimates require extensive data on an option’scosts and its operation under different hydrologic con-ditions. Costs include capital and annual operations,maintenance, and replacement costs. Capital costs areassociated with construction and implementation ofan option (including transportation and treatment fa-cilities). Examples of capital costs include expendituresfor planning, design, right-of-way, construction, andenvironmental mitigation. Capital costs also includeactivation costs (operation and maintenance expendi-tures prior to operations) and reservoir filling costs.
OM&R costs include administration, energy, waterpurchases, water treatment, and replacement costs in-curred during the normal course of project use.
For many options (such as surface water reservoirsand groundwater/conjunctive use projects), hydrologyis key to evaluating the option’s performance. Someoptions are designed to provide maximum deliveriesduring average and wet years and minimal deliveriesduring drought years; others are designed to providemaximum deliveries during drought years with mini-mal deliveries during other years. Some options canprovide a relatively constant supply regardless of wateryear type.
Because this Bulletin focuses on local options, costestimates are dependent upon cost and hydrology dataavailable in existing reports and other documents pre-pared by water agencies. Some difficulties that arise inusing this information include:
• Data are inconsistent among the agencies (differ-ent hydrologic time periods were used).
• Data are missing or incomplete (sometimes capi-tal costs are reported, but not operating costs).
• Data may be available, but information about as-sumptions used in their development is notavailable (reported total capital costs may or maynot include environmental mitigation costs).
• Data were developed at different times (informa-tion on some options is relatively new, while otherdata may be 30 years old).
• Data were developed at different levels of study(appraisal level data are being compared to feasi-bility level data).Since the Bulletin’s intent is to examine options
6C
Quest
More information about the California Department of Water Resources is available at: http://wwwdwr.water.ca.gov/ For a hard copy version of the Bulletin, please call the Publications Office at (916) 653-1097.

6C-2APPENDIX 6C
The California Water Plan Update BULLETIN 160-98Appendix 6C
TABLE 6C-1
Sample Cost Computation
Option Option Delivery Probabilities (%) Capital Annual Variable Unit Cost(taf) Costs Costs (Million$) ($/af)
Average Drought Average Drought (Million $) Average Drought
Groundwater Recharge/ 0 15 80.0 20.0 4.0 0.1 0.6 150Conjunctive Use
Water Transfersa 0 2 80.0 20.0 0.0 0.0 0.5 250
Water Recycling 3 3 80.0 20.0 24.0 0.6 0.6 710
Surface Water Reservoir 10 3 80.0 20.0 80.0 1.0 2.0 730
a Using existing facilities.
from a statewide perspective at an appraisal level ofdetail, the approach used has been to acknowledge thatthese difficulties exist, but to use the available infor-mation. The scope of this Bulletin does not permitdevelopment of new information for all of the optionsfor which data were collected. The Bulletin’s effortsfocused on making costs of the statewide options andlarger local options comparable, where possible.
Assumptions
Two analysis periods were used—a 50-year periodfor capital-intensive options (reservoirs, desaltingplants, conjunctive use facilities) and a 25-year periodfor less capital-intensive options (demand reduction).
The analysis used constant dollars, thus excludingprice changes occurring as a result of inflation. Thetime value of money is represented by a 6 percent dis-count rate. Dollar values are converted to constant1995 dollars using USBR’s cost index or other costindices as appropriate. Statewide probabilities for theoccurrence of drought years and average years are 20and 80 percent, respectively.
Method of Analysis
A spreadsheet was developed for cost computa-tions. Table 6C-1 shows the results of a sample costanalysis for four hypothetical water management op-tions using this spreadsheet.
Considerations Specific toSome Options
Conservation
In order to achieve savings from many demandreduction options (landscape retrofits, toilet retrofits),water users rather than water districts must purchase
additional equipment. Because of the substantial usercosts of some conservation options, they must be ad-dressed in cost estimates. Since the Bulletin 160-98options evaluation process is focused on costs fromthe water agency perspective, it is assumed that costsof demand reduction options are funded by water agen-cies, including reimbursements to water users for costssuch as landscape replacement or sprinkler controllerinstallation.
Water Recycling
Costs of water recycling vary with the intendeduse of the water, due to differences in treatment re-quirements. Costs of recycling projects are highlysite-specific, since costs of associated conveyance anddistribution systems may constitute a large percent ofthe total project cost.
Conjunctive Use Projects
Because conjunctive use projects often involvemany types of facilities and are operated according tochanges in hydrology, computing cost estimates canbe complex. Hydrology is key to the operation of manyconjunctive use projects because usually the rechargeportion of the project is operated in average years andthe extraction portion is operated in drought years.Facilities may not be operated during years where thereis insufficient water for recharge, or when conditionsare too wet to warrant extractions. Although capitalcosts of a conjunctive use project are not significantlyinfluenced by hydrology, annual O&M costs are sen-sitive to hydrology because of pumping costs.
Surface Water Reservoirs
Some reservoirs are operated to maximize watersupplies during average years and others are operated

6C-3 APPENDIX 6C
The California Water Plan Update BULLETIN 160-98 Appendix 6C
for drought years or emergency storage purposes. Al-though the capital cost to construct a reservoir will bethe same regardless of its operation, the cost of watersupply will differ substantially among these operationalmodes. A reservoir’s O&M costs will vary significantlydepending upon whether it provides on-stream or off-stream storage (the latter operation will likely havesubstantial energy costs associated with reservoir fill-ing). Of supply augmentation options, reservoirs aremost likely to provide substantial benefits other thanwater supply, such as recreation, flood control, andpower generation. No attempt is made in this Bulletin
to allocate the costs among different purposes, becausecost allocation goes beyond the Bulletin’s appraisal-levelscope of analysis.
Water Marketing
Water transfer costs shown in the Bulletin are gen-erally those reported by local agencies for their proposedmarketing arrangements. Costs reported by local agen-cies are often the contractual prices contained intransfer agreements. Such costs usually do not includeenvironmental mitigation costs or costs relating tothird-party impacts.

6C-4APPENDIX 6C
The California Water Plan Update BULLETIN 160-98Appendix 6C

6D-1 APPENDIX 6D
The California Water Plan Update BULLETIN 160-98 Appendix 6D
Calculations of lower bound, or minimum, newwater needs from 2020-level applied water budgetshortages are presented by hydrologic region in Tables6D-1 and 6D-2. In an applied water budget, supplyand percent reapplication are defined as:
applied water supply = supply from primary sources+ supply from reapplication ... (1)
percent reapplication = (supply from reapplication /supply from primary sources) x 100 ... (2)
In the tables, percent reapplication is calculatedfor each region from primary supplies and reappliedsupplies (both surface water and groundwater) accord-ing to equation (2). This calculation is performed onlyin planning subareas that are forecasted to experienceshortages in 2020.
Assuming that new supplies from water manage-ment options may be reapplied in the same proportionthat existing primary supplies are reapplied, an appliedwater yield and a percent reapplication for the optionsmay be similarly defined as:
applied water yield = new water supply +reapplication potential ... (3)
percent reapplication = (reapplication potential /new water supply) x 100 ... (4)
By substituting equation (4) into equation (3) andrearranging terms, a regional new water need maybe defined as a function of a regional applied watershortage:
new water need = applied water shortage /(1 + [reapplication potential/100] ) ... (5)
If the potential to reapply new water supplies doesnot exist in a region, then according to equation (5),
the new water need (maximum) is equal to the region’sapplied water shortage. If the potential to fully reap-ply new water supplies exists in a region, then equation(5) defines a minimum new water need. In the tables,the water shortage not due to overdraft (“other” short-age) is adjusted downward by the percent reapplicationin accordance with equation (5). This value is summedwith the overdraft shortage to arrive at the minimumnew water need for the region.
As discussed in Chapter 3, regional supplies gen-erated through groundwater overdraft are excludedfrom the Bulletin 160-98 water budgets because theydo not represent sustainable sources of water supply.Excluding these supplies from the water budgets re-sults in additional regional shortages. However, forclarity of presentation, the regional supplies availablethrough reapplication of overdrafted groundwater sup-plies are not excluded from the water budgets.Therefore, shortages due to overdraft are not adjustedby the percent reapplication in Tables 6D-1 and 6D-2to arrive at regional new water needs.
Based on the data presented in Table 6D-1, theminimum new water required to satisfy 2020 averageyear shortages is approximately 2.2 maf. Similarly, Table6D-2 shows the minimum new water required to sat-isfy 2020 drought year shortages is approximately 5.4maf. As discussed in Chapter 6, not all water manage-ment options are created equal in their ability to meetnew water needs. Demand reduction options, for ex-ample, do not provide new water to a region, and noopportunities exist to multiply their effectivenessthrough reapplication. Therefore, if a region’s optionsmix includes demand reduction options, the region’snew water need will be greater than the minimum need.
Calculation of Minimum New Water Needs
6D
Quest
More information about the California Department of Water Resources is available at: http://wwwdwr.water.ca.gov/ For a hard copy version of the Bulletin, please call the Publications Office at (916) 653-1097.

6D-2APPENDIX 6D
The California Water Plan Update BULLETIN 160-98Appendix 6D
TABLE 6D-1
Minimum New Water Needs by Hydrologic Region: 2020 Average Year
Region Percenta Shortage (taf) Minimum NewReapplication Overdraft Other Water Need (taf)
North Coast — 0 0 0San Francisco Bay — 0 0 0Central Coast 24.1 102 70 159South Coast 12.5 0 944 839Sacramento River 33.3 85 0 85San Joaquin River 16.4 63 0 63Tulare Lake 11.4 670 50 715North Lahontan 5.4 0 10 9South Lahontan 35.8 89 181 223Colorado River 24.6 61 86 130Total (rounded) 16.4 1,070 1,340 2,220a Percent reapplication is computed from supply data for PSAs that are forecasted to experience shortages in 2020.
TABLE 6D-2
Minimum New Water Needs by Hydrologic Region: 2020 Drought Year
Region Percenta Shortage (taf) Minimum NewReapplication Overdraft Other Water Need (taf)
North Coast 38.8 0 194 140San Francisco Bay 0.5 0 287 286Central Coast 17.8 102 168 245South Coast 10.4 0 1,317 1,192Sacramento River 26.3 85 904 801San Joaquin River 17.4 63 648 615Tulare Lake 24.0 670 1,181 1,623North Lahontan 16.5 0 128 110South Lahontan 34.8 89 219 252Colorado River 25.3 61 97 138Total (rounded) 18.8 1,070 5,140 5,400a Percent reapplication is computed from supply data for PSAs that are forecasted to experience shortages in 2020.

6E-1 APPENDIX 6E
The California Water Plan Update BULLETIN 160-98 Appendix 6E
The following tables show the net water budgets for each of the State’s ten hydrologicregions with existing facilities and programs, and then California’s net water budget withexisting facilities and programs. Water use/supply totals and shortages may not sum due torounding.
Net Water Budgets
6E
Quest
More information about the California Department of Water Resources is available at: http://wwwdwr.water.ca.gov/ For a hard copy version of the Bulletin, please call the Publications Office at (916) 653-1097.

6E-2APPENDIX 6E
The California Water Plan Update BULLETIN 160-98Appendix 6E
TABLE 6E-1
North Coast Region Net Water Budget with Existing Facilities and Programs (taf)
1995 2020Average Drought Average Drought
Net Water UseUrban 169 177 201 212Agricultural 683 714 699 740Environmental 19,378 9,393 19,378 9,393Total 20,230 10,283 20,278 10,344
SuppliesSurface Water 20,003 9,887 20,029 9,911Groundwater 214 239 236 261Recycled and Desalted 13 14 13 14Total 20,230 10,139 20,278 10,186
Shortage 0 144 0 158
TABLE 6E-2
San Francisco Region Net Water Budget with Existing Facilities and Programs (taf)
1995 2020Average Drought Average Drought
Net Water UseUrban 1,255 1,358 1,317 1,428Agricultural 87 96 87 95Environmental 1,782 1,284 1,782 1,284Total 3,124 2,738 3,185 2,808
SuppliesSurface Water 3,024 2,267 3,080 2,400Groundwater 65 87 69 84Recycled and Desalted 35 35 37 37Total 3,124 2,389 3,185 2,520
Shortage 0 349 0 287
TABLE 6E-3
Central Coast Region Net Water Budget with Existing Facilities and Programs (taf)
1995 2020Average Drought Average Drought
Net Water UseUrban 243 253 320 334Agricultural 912 975 884 947Environmental 84 22 84 22Total 1,238 1,250 1,288 1,303
SuppliesSurface Water 252 118 301 140Groundwater 754 826 772 861Recycled and Desalted 18 26 42 42Total 1,024 970 1,115 1,043
Shortage 214 280 172 260

6E-3 APPENDIX 6E
The California Water Plan Update BULLETIN 160-98 Appendix 6E
TABLE 6E-5
Sacramento River Region Net Water Budget with Existing Facilities and Programs (taf)
1995 2020Average Drought Average Drought
Net Water UseUrban 765 829 1,139 1,235Agricultural 6,529 7,251 6,436 7,041Environmental 3,845 3,260 3,854 3,263Total 11,139 11,340 11,429 11,538
SuppliesSurface Water 8,814 7,880 9,159 7,895Groundwater 2,229 2,699 2,184 2,769Recycled and Desalted 0 0 0 0Total 11,043 10,579 11,344 10,665
Shortage 96 760 85 873
TABLE 6E-6
San Joaquin River Region Net Water Budget with Existing Facilities and Programs (taf)
1995 2020Average Drought Average Drought
Net Water UseUrban 417 432 673 698Agricultural 5,818 6,284 5,286 5,784Environmental 1,249 831 1,263 845Total 7,484 7,546 7,221 7,328
SuppliesSurface Water 6,190 4,743 6,096 4,696Groundwater 1,055 2,118 1,063 2,026Recycled and Desalted 0 0 0 0Total 7,245 6,861 7,159 6,722
Shortage 239 685 63 606
TABLE 6E-4
South Coast Region Net Water Budget with Existing Facilities and Programs (taf)
1995 2020Average Drought Average Drought
Net Water UseUrban 3,973 3,999 4,943 5,009Agricultural 692 722 421 442Environmental 27 27 31 31Total 4,691 4,748 5,395 5,481
SuppliesSurface Water 3,400 2,758 3,184 2,704Groundwater 1,084 1,274 1,155 1,380Recycled and Desalted 207 207 273 273Total 4,691 4,240 4,612 4,357
Shortage 0 508 783 1,125

6E-4APPENDIX 6E
The California Water Plan Update BULLETIN 160-98Appendix 6E
TABLE 6E-7
Tulare Lake Region Net Water Budget with Existing Facilities and Programs (taf)
1995 2020Average Drought Average Drought
Net Water UseUrban 347 358 514 533Agricultural 7,659 7,817 7,248 7,386Environmental 37 37 39 39Total 8,043 8,211 7,801 7,957
SuppliesSurface Water 6,226 2,894 6,129 2,794Groundwater 957 3,684 962 3,568Recycled and Desalted 0 0 0 0Total 7,183 6,578 7,091 6,361
Shortage 860 1,634 710 1,596
TABLE 6E-8
North Lahontan Region Net Water Budget with Existing Facilities and Programs (taf)
1995 2020Average Drought Average Drought
Net Water UseUrban 32 33 41 42Agricultural 470 514 470 516Environmental 174 136 174 136Total 675 683 685 695
SuppliesSurface Water 531 384 506 378Groundwater 136 171 161 190Recycled and Desalted 8 8 8 8Total 675 564 675 576
Shortage 0 120 10 119
TABLE 6E-9
South Lahontan Region Net Water Budget with Existing Facilities and Programs (taf)
1995 2020Average Drought Average Drought
Net Water UseUrban 160 160 412 412Agricultural 291 291 230 230Environmental 107 81 107 81Total 558 532 750 724
SuppliesSurface Water 244 181 338 234Groundwater 198 232 201 252Recycled and Desalted 27 27 27 27Total 469 440 566 514
Shortage 89 92 184 210

6E-5 APPENDIX 6E
The California Water Plan Update BULLETIN 160-98 Appendix 6E
TABLE 6E-11
California Net Water Budget with Existing Facilities and Programs (maf)
1995 2020Average Drought Average Drought
Net Water UseUrban 7.7 7.9 10.1 10.4Agricultural 27.0 28.5 25.2 26.6Environmental 26.7 15.1 26.8 15.1Total 61.4 51.5 62.0 52.2
SuppliesSurface Water 52.7 35.1 52.6 35.0Groundwater 6.8 11.4 6.9 11.5Recycled and Desalted 0.3 0.3 0.4 0.4Total 59.8 46.9 59.9 46.8
Shortage 1.6 4.7 2.1 5.3
TABLE 6E-10
Colorado River Region Net Water Budget with Existing Facilities and Programs (taf)
1995 2020Average Drought Average Drought
Net Water UseUrban 312 312 526 526Agricultural 3,847 3,847 3,412 3,412Environmental 39 38 44 43Total 4,197 4,196 3,982 3,981
SuppliesSurface Water 4,047 4,021 3,809 3,800Groundwater 66 77 79 79Recycled and Desalted 15 15 15 15Total 4,128 4,113 3,903 3,894
Shortage 69 83 79 88

6E-6APPENDIX 6E
The California Water Plan Update BULLETIN 160-98Appendix 6E

6F-1 APPENDIX 6F
The California Water Plan Update BULLETIN 160-98 Appendix 6F
Land Retirement Analysis inDrainage-Impaired Areas
The San Joaquin Valley Interagency DrainageProgram’s 1990 report stated that 75,000 acres of landwith the worst drainage problems would need to beretired by 2040 unless other actions were taken toimprove drainage problems in the area. Assuming thatland retirement would occur uniformly over time, theBulletin’s 2020 irrigated acreage forecast includes areduction of 45,000 acres of land due to impaireddrainage, as discussed in Chapter 4. Existing or futureprograms in which land is purchased and then takenout of irrigated agriculture could increase the acreagetaken out of production. Considering the region’schronic agricultural water shortages, it is likely thatlocal water agencies would want to keep the water inthe region to improve water supplies for remainingirrigated lands, as is being planned in a pending jointfinancing arrangement between USBR and WWD.
Bulletin 160-98 does not treat land retirement fordrainage purposes as a future demand reductionoption. The Bulletin’s scope is limited to actions whoseprimary intent is demand reduction or water supplyaugmentation. Because land retirement for drainagepurposes would affect water use, the following analy-sis has been provided to quantify water supply impacts.Two land retirement scenarios were evaluated. Sce-nario␣ 1 assumed that the full 75,000 acres ofagricultural lands with the worst drainage problemsrecommended for retirement by 2040 by the inter-agency program would be retired by 2020, adding30,000 acres to the base 45,000 acres included in theDepartment’s 2020 agricultural acreage forecast. Sce-nario 2 assumed the retirement of up to 85,000 acresover the base 45,000 acres for a total of 130,000 re-tired acres. This included the 30,000 acres in Scenario␣ 1
plus other lands in the westside of the San JoaquinValley with a selenium concentration of more than 200ppb in shallow groundwater. For Scenario 2, the 200ppb selenium criterion was used to benchmark acre-age to be retired because of the interagency report’srecommendations. The acreage of land underlain byshallow groundwater has fluctuated over time, reflect-ing hydrologic conditions and the availability of watersupplies in the region. There has been no new region-wide monitoring of selenium in shallow groundwatersince publication of the 1990 report, and changes inthe extent of lands underlain by high selenium ground-water are unknown. (As described in Chapter 4, theinteragency drainage program is in the process of up-dating its 1990 recommendations based on newinformation.)
To help put these acreage values into perspective,in 1997 USBR’s land retirement program issued itsfirst request for proposals from persons who wished toretire land pursuant to the CVPIA program. USBRreceived proposals totaling 31,000 acres. Based on its1998 budget, USBR expects to retire about 12,000acres of the lands proposed, with additional lands ex-pected to be retired in future budget years. In 1998,USBR released an environmental assessment and find-ing of no significant impact for a demonstration projecton about 1,890 acres of lands acquired or planned tobe acquired under the land retirement program. Thedemonstration program would evaluate wildlife habi-tat management actions on the retired lands. Under aseparate agreement with WWD, the agricultural wa-ter supplies associated with the lands would remainwithin WWD, and part of the supplies would be usedto irrigate wildlife habitat. Water used for habitat irri-
6F
Quest
More information about the California Department of Water Resources is available at: http://wwwdwr.water.ca.gov/ For a hard copy version of the Bulletin, please call the Publications Office at (916) 653-1097.

6F-2APPENDIX 6F
The California Water Plan Update BULLETIN 160-98Appendix 6F
gation would be limited to 0.6 af/acre, to avoid deeppercolation of applied water.
Table 6F-1 displays the crops calculated to be re-tired for both scenarios along with the expectedreductions in depletions. Field crops are the primarytypes of crops calculated to be retired, based on Cen-tral Valley Production Model results, with barley,wheat, cotton, and safflower comprising almost 90␣ per-cent of total retired acreage for each option.
The costs of land retirement scenarios are mea-sured by the estimated costs to purchase farmland andremove it from irrigated agricultural production. Table6F-2 shows land retirement costs for either perma-nently taking the farmland out of agriculturalproduction or for taking it out of irrigated agriculturalproduction.
Implementing land retirement programs can becontroversial because of concerns about third-party im-pacts to those who do not benefit from sale of the land
or its associated water supply. (Direct farm incomelosses to growers should be recovered through landpurchase costs.) To illustrate the magnitude of poten-tial third-party impacts, Tables 6F-3 and 6F-4 showeconomic effects of the land retirement scenarios. Theseeffects would need to be addressed in environmentaldocumentation for land retirement programs. Envi-ronmental documentation prepared to date for landretirement activities has not proposed specific mitiga-tion measures for third-party economic impacts. Therehas thus been no basis for allocating costs in additionto the land purchase price to the costs shown in thisanalysis. Third-party impacts associated with managedland retirement programs on the westside of the SanJoaquin Valley would be of particular concern to cityand county governments in the area, because agricul-tural activities provide the dominant source ofemployment in many of the small rural communitieson the westside.
TABLE 6F-2
Costs of Land Retirement (1995 Dollars)
Scenario 1 Scenario 2
Land Retirement Total Annualized Cost Total Annualized CostAssumptions Cost Per Cost Per af of Cost Per Cost Per af of
Acre Per Acrea Depletions Acre Per Acrea Depletions
With No Alternative Uses 1,550 121 55 1,760 138 63With Grazing 1,420 111 51 1,640 128 59a For a 25 year period and 6% discount rate.
TABLE 6F-1
Agricultural Depletion Reductions Due to Land Retirement
Scenario 1 Scenario 2
Crops Land Retired Depletions Land Retired Depletions(acres) (af/yr) (acres) (af/yr)
Alfalfa 2,370 8,560 4,740 17,290Irrigated Pasture 60 220 160 580Barley 3,080 3,880 9,160 11,540Wheat 5,850 8,660 14,980 22,170Cotton 12,830 33,490 41,600 108,580Safflower 4,390 4,430 9,690 9,790Sugar Beets 60 170 350 990Dry Beans 470 900 1,470 2,820Dry Onions 190 500 520 1,370Tomatoes (processing) 480 1,280 1,730 4,600Almonds 110 360 220 690Pistachios 10 20 80 240Wine Grapes 100 220 250 550Total (rounded) 30,000 62,700 85,000 181,200

6F-3 APPENDIX 6F
The California Water Plan Update BULLETIN 160-98 Appendix 6F
TABLE 6F-3
Land Retirement Analysis—Scenario 1 Economic Impacts (1995 Dollars)
Direct, Indirect, Induced EffectsValue of Production Employment
Crops Acres Regionala Statewide Regionala StatewideRetired ($1,000) ($1,000) (person years) (person years)
Alfalfa 2,370 3,980 4,190 56 58Irrigated Pasture 60 50 50 1 1Barley 3,080 1,730 1,960 29 30Wheat 5,850 5,180 5,510 73 77Cotton 12,830 32,480 34,650 535 541Safflower 4,390 3,670 4,000 59 61Sugar Beets 60 120 120 2 2Dry Beans 470 750 850 10 10Dry Onions 190 500 540 7 7Tomatoes (processing) 480 1,590 1,740 22 23Almonds 110 710 770 14 14Pistachios 10 70 70 1 1Wine Grapes 100 500 560 10 10Totals (rounded) 30,000 51,300 55,000 820 830a Includes Fresno, Kern, and Kings Counties.
TABLE 6F-4
Land Retirement Analysis—Scenario 2 Economic Impacts (1995 Dollars)
Direct, Indirect, Induced Effects
Value of Production Employment
Crops Acres Regionala Statewide Regionala StatewideRetired ($1,000) ($1,000) (person years) (person years)
Alfalfa 4,790 8,050 8,460 114 118Irrigated Pasture 160 120 130 2 2Barley 9,160 5,140 5,840 86 88Wheat 14,980 13,240 14,100 187 196Cotton 41,600 105,300 112,350 1,735 1,756Safflower 9,690 8,090 8,830 129 134Sugar Beets 350 680 720 11 12Dry Beans 1,470 1,920 2,180 32 33Dry Onions 520 1,360 1,490 19 19Tomatoes (processing) 1,730 5,740 6,280 80 81Almonds 220 1,380 1,510 26 27Pistachios 80 770 840 15 15Wine Grapes 250 1,250 1,410 24 24Totals (rounded) 85,000 153,000 164,100 2,460 2,510a Includes Fresno, Kern, and Kings Counties.

6F-4APPENDIX 6F
The California Water Plan Update BULLETIN 160-98Appendix 6F

6G-1 APPENDIX 6G
The California Water Plan Update BULLETIN 160-98 Appendix 6G
Review and Evaluation of Statewide-LevelStorage Facilities That Could Be Included in CAL-
FED Alternatives
Evaluation of Onstream Storage OptionsUpstream of the Delta
The initial screening of storage options includedthe 34 reservoir sites shown in Table 6G-1. These siteshave been investigated, so information was availableto support a preliminary assessment. After the initialscreening, 15 remaining options were examined in de-tail. This appraisal relied on previous studies coveringtraditional project formulation, engineering feasibil-ity, cost, and environmental aspects. The older studieswere supplemented by a cursory reexamination of en-vironmental aspects that reflected the most recentinformation on critical habitat, wetlands, endangeredspecies, and cultural resources. Because past studieswere limited, these environmental reexaminations gen-erated few conclusive findings. The larger reservoirson major waterways tend to have the most potentialenvironmental consequences. And, there is a definitecorrelation between the intensity of prior studies andthe number of known potential environmental prob-lem issues. The potential environmental issues at the15 retained options are shown in Table 6G-2.
The appraisal process confirmed that largerprojects tend to have the potential to produce less costlyand more reliable water supply, but have greater po-tential impacts on the environment. There is no oneaccepted method to compare options, particularly thoseof vastly differing size, but clear conclusions emergedfrom assessing options within similar groups.Very Large Onstream Reservoirs (Over 1.0 maf)
With the potential to provide up to 10 maf of
additional storage, an enlarged Lake Shasta is in a classapart; at large sizes, it could provide new storage at afavorable unit cost, but with substantial financial andenvironmental consequences. In the 1.0-2.5 maf range,Auburn Reservoir ranks high, but is burdened withwell-publicized environmental controversies. As dis-cussed in Chapter 3, there is an urgent need for greaterflood protection on the American River, and a dam atAuburn has been identified by the Reclamation Boardas the best flood control alternative. A Thomes-Newville development in the Stony Creek basinremains a possibility, provided it is sized to match itslimited water supply; the site also has potential foroffstream storage of adjacent basin or Sacramento Riverwater.
The Trinity enlargement option involves a newconcept that has not been investigated in detail. Thefundamental premise is sound: divert surplus waterdirectly from Lake Shasta to an enlarged Trinity Lakeon the Trinity River. This would reap some benefits ofenlarging Lake Shasta without the associated major dis-ruptions or relocation costs. The less attractive aspectsinclude a 13-mile tunnel, a 1,500-foot pump lift, andsubstantial energy costs. This option appears to be morecostly than enlarging Lake Shasta, but within the rangeof consideration. More information on environmen-tal aspects would be needed for a better assessment.Experience has shown large projects at this stage oftenharbor unexpected environmental drawbacks. Cur-rently, enlarging Trinity Lake is characterized as a futurepossibility, but not yet thoroughly explored.
6G
Quest
More information about the California Department of Water Resources is available at: http://wwwdwr.water.ca.gov/ For a hard copy version of the Bulletin, please call the Publications Office at (916) 653-1097.

6G-2APPENDIX 6G
The California Water Plan Update BULLETIN 160-98Appendix 6G
TABLE 6G-1
Onstream Storage Options Upstream of the Delta
Stream Reservoir Retain or Reason for DeferralDefer
Cache Creek Wilson Valley Defer Defer due to environmental impacts andconflicts with federal land managementpolicies.
Kennedy Flats Defer Defer due to environmental impacts andconflicts with federal land managementpolicies.
Blue Ridge Defer Defer due to environmental impacts andconflicts with federal land managementpolicies.
Stony Creek Newville (Part of Thomes-Newville RetainComplex)
Thomes Creek Thomes Division Retain(Part of Thomes-Newville Complex)
Paskenta Defer Defer in favor of alternate site in same generalarea.
Elder Creek Gallatin Defer Limited water supply to support significantamount of storage.
Red Bank Creek Schoenfield (Part of Red Bank RetainProject)
S.F. Cottonwood Creek Dippingvat (Part of Red Bank RetainProject)
Rosewood (Dry Creek) Defer Limited water supply to support significantamount of storage.
Tehama Retain
M.F. Cottonwood Creek Fiddlers Retain
Cottonwood Creek Dutch Gulch Retain
N.F. Cottonwood Creek Hulen Retain
Lake Shasta Tributaries Shasta Enlargement Retain
Enlarged Trinity Retain
Squaw Valley (Squaw Valley Cr.) Defer Defer due to high costs and substantialenvironmental impacts.
Kosk (Pit River) Retain
Allen Camp (Pit River) Defer Primarily a local project, not well suited forstatewide supply augmentation.
Little Cow Creek Bella Vista Defer Defer due to high costs and substantialenvironmental impacts.
South Cow Creek Millville Retain
Inks Creek Wing Retain

6G-3 APPENDIX 6G
The California Water Plan Update BULLETIN 160-98 Appendix 6G
TABLE 6G-1
Onstream Storage Options Upstream of the Delta (continued)
Stream Reservoir Retain or Reason for DeferralDefer
Deer Creek Deer Creek Meadows Defer Primarily a local project, not well suited forstatewide supply augmentation. Also doubtfulenvironmental feasibility.
Upper Feather River Abbey Bridge (Red Clover Creek) Defer Primarily a local project, not well suited forstatewide supply augmentation. Also doubtfulenvironmental feasibility.
Dixie Refuge Defer Primarily a local project, not well suited for(Last Chance Creek) statewide supply augmentation. Also doubtful
environmental feasibility.
Yuba River Marysville/Narrows Defer Defer due to high costs and substantialenvironmental impacts.
M.F. Yuba River Freemans Crossing Defer Limited water supply to support significantamount of storage and doubtfulenvironmental feasibility.
Bear River Garden Bar Defer Primarily a local project.
N.F. American River Auburn Retain
American River Folsom Enlargement Retain
S.F. American River Coloma/Salmon Falls Defer Defer due to environmental and social/thirdparty impacts.
Cosumnes River Nashville Retain
Mokelumne River Pardee Enlargement Defer Primarily a local project.
San Joaquin River Millerton Enlargement Retain
Large Onstream Reservoirs (0.5 to 1.0 maf)
Tehama and Dutch Gulch reservoirs in the Cot-tonwood Creek Basin clearly warrant furtherconsideration, possibly at smaller sizes than the 0.7and 0.9 maf considered in the 1983 USACE feasibil-ity study. As an alternative to Dutch Gulch theupstream Fiddlers Reservoir site has promise, but itsoptimum size may be smaller than 0.5 maf.
Raising Friant Dam on the San Joaquin River by120 to 140 feet could more than double the current520 taf capacity of Millerton Lake. While the expan-sion would be expensive, it is the only San JoaquinValley surface storage option that appears to offer po-tential for statewide supply augmentation. EnlargingFriant Dam also would provide flood control benefits.
Kosk Reservoir on the Pit River and NashvilleReservoir on the Cosumnes River appear to offer some
promise for storage in this size range, but scant cur-rent information is available on their cost, water supplyefficacy, or environmental impacts. Reconnaissance re-appraisals could fully assess the practicability of thesesites. The Nashville site appears to have significant en-vironmental issues associated with its construction.
Coloma Reservoir on the South Fork AmericanRiver could provide storage within this size range, butany size over 0.2 maf would inundate the town ofColoma and the Marshall Gold Discovery State His-toric Park (which would require legislativeauthorization under Water Code Section 10001.5).Coloma and the nearby Salmon Falls alternative areunpromising and are deferred from further consider-ation. Marysville and Narrows sites on the Yuba Riveralso are deferred from further consideration becauselocal interests are evaluating a small facility at a nearbysite as a local project.

6G-4APPENDIX 6G
The California Water Plan Update BULLETIN 160-98Appendix 6G
Small-to-Medium-Sized Onstream Reservoirs(0.1 to 0.5 maf)
Options within this range selected for analysis in-cluded three sites on upper Sacramento Valleytributaries that appear to offer acceptable combina-tions of water supply capability, cost, andenvironmental compatibility. The largest of these,Wing Reservoir on Inks Creek with a diversion fromBattle Creek, could provide over 0.4 maf of storage.The other apparently viable options, both near thelower limit of this size range, are the Red Bank Projecton South Fork Cottonwood and Red Bank Creeks,and Millville Reservoir on South Cow Creek. One of
the two on-stream reservoirs developed by the RedBank Project would be used primarily as an offstreamstorage facility. Hulen Reservoir on North Fork Cot-tonwood Creek would be high on the list except itwould inundate a premier deposit of Cretaceous fos-sils. (Medium-sized projects involving CottonwoodCreek water, such as the Fiddlers site, are alternatives,not adjuncts, to the larger downstream Tehama andDutch Gulch storage sites.)
Enlargement of Folsom Lake was among the op-tions considered to provide additional flood controlalong the lower American River. If that enlargementwere practicable, it could provide a valuable incrementof water supply storage (depending on the flood oper-
TABLE 6G-2
Retained Onstream Storage Options and Environmental Issues
Storagea
Reservoir Volume Potential Environmental Issues(maf)
Very Large Reservoirs
Shasta Enlargement up to 14.5 stream/river habitat; wild and scenic rivers; trout fisheries; downstream salmon;downstream seepage and erosion impact; deer; numerous listed and candidatespecies; cultural resources; disruption of established development
Trinity Enlargement 7.2 stream habitat; wetlands/marshes; sensitive plants; eagles; spotted owls;anadromous fish (Trinity and Sacramento Rivers)
Auburn 0.85 - 2.3 stream habitat; wetlands; wildlife; trout; listed amphibian, insect, and plant species;cultural resources; recreation impacts
Thomes-Newville 1.4 - 1.9 deer; stream habitat; cultural resources; possible minor salmon/steelhead runs
Large Reservoirs
Tehama 0.5 - 0.7 riparian habitat; salmon/steelhead; deer; upland game; bald eagles; culturalresources; various listed species possible
Dutch Gulch 0.7 - 0.9 riparian habitat; salmon/steelhead; deer; upland game; bald eagles; culturalresources; various listed species possible
Kosk 0.8 stream habitat; deer; elk; bear; upland game; eagles; spotted owls; trout; Big BendIndian Rancheria
Nashville 0.9 wetland/marsh habitat; stream habitat; deer; upland game
Millerton Enlargement 1.0 - 1.4 stream and upland habitat; disruption of established development
Small to Medium Reservoirs
Wing 0.25 - 0.5 salmon/steelhead (Battle Creek); deer; several listed bird, amphibian, insect,plant species
Red Bank Project 0.35 stream habitat; California red-legged frog; spring-run salmon
Millville 0.1 - 0.25 stream habitat; salmon
Hulen 0.2 - 0.3 fossils; stream habitat
Folsom Enlargement 1.3 stream and upland habitat; eagles; several listed plant species; cultural resources;disruption of established development
Fiddlers 0.2 - 0.5 stream habitat
a Volume shown is total storage volume, including, where applicable, the existing storage capacity of reservoirs to be enlarged.

6G-5 APPENDIX 6G
The California Water Plan Update BULLETIN 160-98 Appendix 6G
ating criteria). That storage would be expensive, so itis unlikely except as an element of a comprehensiveflood control package.
The remaining two medium-sized options are BellaVista Reservoir on Little Cow Creek near Redding andSquaw Valley Reservoir on Squaw Valley Creek nearMcCloud. These projects appear more expensive andmore environmentally disruptive than the competingoptions. Therefore, they are not considered promisingprospects for future development and are deferred fromfurther evaluation.
Evaluation of Offstream Storage OptionsUpstream of the Delta
The initial screening of upstream of Deltaoffstream storage options included the 14 proposalsin Table 6G-3. The initial screening indicated that eightof those warranted further examination, including areview of past studies and a cursory reexamination ofthe latest available environmental information. Thepotential environmental issues identified with the re-tained options are shown in Table 6G-4. Offstreamstorage has an inherent environmental advantage be-cause the reservoirs tend to be on minor tributaries,which reduces impacts on live streams and riparian
habitat. For most of the larger offstream options, thatadvantage must be balanced against the potentiallysevere environmental impacts with diversions frommajor nearby streams. Evaluating the retained optionsfrom that perspective leads to the following generalconclusions.
Very Large Offstream Reservoirs (Over 1.0 maf)
Two of the five very large reservoir options havethe potential to provide more than 4 maf of new stor-age, but not without some considerable environmentaleffects. The existing 1.6 maf Lake Berryessa could beenlarged to provide massive amounts of storage forsurplus flows pumped from the lower reaches of theSacramento River. Past studies have shown the unitcost of storage in the large project sizes would be at-tractive, though a 31-mile conveyance facility with a700-foot pump lift would be required. The financialand energy costs of this conveyance would be enor-mous, as would the environmental consequences.Diversion of around 12,000 cfs from the lower rivercould prove challenging. Under current conditions,offstream storage of Sacramento River water in an en-larged Lake Berryessa does not appear to hold muchpromise in the foreseeable future.
TABLE 6G-3
Offstream Storage Options Upstream of the Delta
Watershed Reservoir Retain or Reason for DeferralDefer
Putah Creek Berryessa Enlargement Retain
Various Sites Retain
Various Colusa Retain
Stony Creek Thomes-Newville Retain
Stony Creek Glenn Retain
S.F. Cottonwood Creek Red Bank Project Retain
Inks Creek Tuscan Buttes Defer Defer due to substantial environmental impacts.
Bear River Waldo Defer Being actively pursued by Yuba CountyWater Agency; not considered for statewide supply.
Deer Creek County Line Defer Defer in favor of alternate site in same general area.
Deer Creek Deer Creek Retain
Laguna Creek Clay Station Retain
Calaveras River Duck Creek Defer Defer due to extraordinarily high costs.
Calaveras River South Gulch Defer Primarily a local project, not well suited for statewidesupply augmentation.
Littlejohns Creek Farmington Enlargement Defer Primarily a local project, not well suited for statewidesupply augmentation.

6G-6APPENDIX 6G
The California Water Plan Update BULLETIN 160-98Appendix 6G
TABLE 6G-4
Retained Offstream Storage Options and Environmental Issues
Reservoir Storage Volume Potential Environmental Issues
(maf)
Very Large Reservoirs
Berryessa Enlargement up to 11.5 additional stream habitat; wetlands; deer and upland game; Putah Creek troutfishery; Sacramento River anadromous fish; listed/sensitive plantspecies; cultural resources; disruption of established agriculture andrecreation; population displacement
Thomes-Newville 1.4 -1.9 deer; stream habitat; cultural resources; possible minor salmon/steelhead runs
Glenn 6.7 - 8.7 stream habitat; wetlands/vernal pools; deer and upland game; deerwinter range; Sacramento River anadromous fish; eagles; culturalresources; population displacement
Sites 1.2 - 1.8 Sacramento River anadromous fish
Colusa 3.0 Sacramento River anadromous fish
Large Reservoirs
Deer Creek 0.6 vernal pools; meadow/marsh habitat; listed bird, invertebrate,insect, and plant species; cultural resources
Small to Medium Reservoirs
Red Bank 0.35 stream habitat; California red-legged frog; spring-run salmon
Clay Station 0.2 stream habitat; wetlands; meadow/marsh habitat; listed bird,invertebrate, insect, and plant species
Similarly, a Glenn Reservoir, a combination ofThomes-Newville Reservoir on the North Fork StonyCreek and Rancheria Reservoir on the mainstem ofStony Creek would provide over 8 maf of storage forsurplus water of the upper Sacramento River. The two-compartment Glenn Reservoir was conceived asterminal storage for exports from the North Coast riv-ers. Following passage of the Wild and Scenic RiversAct of 1972, it was reformulated for offstream storageof water diverted from the Sacramento River. The unitcost of storage appeared reasonable, but controversyover diversions to the Tehama-Colusa Canal cast doubton the environmental feasibility of diverting large flowsto support the large-scale Glenn Reservoir. At this time,a large Glenn Reservoir does not appear to be a likelycandidate for early construction. The smaller Thomes-Newville Reservoir (1.4 to 1.9 maf ) operated as anoffstream storage reservoir remains a possibility.
The other very large offstream storage options,Sites and Colusa Reservoirs, are related, in that the 3maf Colusa Reservoir represents a northward expan-sion of the 1.2 to 1.8 maf Sites Reservoir into theHunter and Logan Creek Basins. Either version of thereservoir would involve minimal environmental im-
pacts within the area of inundation. The drawback isdiverting surplus water from the Sacramento River forstorage. Past proposals have focused on off-season useof the existing Tehama-Colusa Canal diversion facili-ties at Red Bluff Diversion Dam and the Glenn-ColusaIrrigation District pumping plant near Hamilton City.Alternative Sites/Colusa conveyance facilities are nowbeing examined. Although the alternative conveyancefacilities would likely raise costs, the Sites and Colusaoffstream storage options remain the most promising.
Large Offstream Reservoirs (0.5 to 1.0 maf)
Deer Creek Reservoir in northeastern SacramentoCounty is the only upstream of Delta offstream stor-age option within this size range. Past investigators haveexamined a 0.6 maf Deer Creek Reservoir to store sur-plus water from the American River, delivered froman enlargement of the existing northern reaches of theFolsom South Canal. Another version of the projectwas considered for flood control, incorporating a grav-ity diversion direct from Folsom Lake via a new outletat Mormon Island Dike. Major offstream storage inthe Deer Creek area would be ideally suited to developsome of the abundant surplus flow of the American

6G-7 APPENDIX 6G
The California Water Plan Update BULLETIN 160-98 Appendix 6G
River without the difficulties associated with AuburnDam. Also, by diverting directly from Folsom Lake orLake Natoma, this project would avoid the principalconflicts with anadromous fish. Initial studies indicatea Deer Creek offstream storage project would be ex-pensive—with a unit storage cost several times that ofthe lower-cost options.
Small to Medium Offstream Reservoirs(0.1 to 0.5 maf)
Two options fall into this range, the Red BankProject and Clay Station Reservoir. The Red BankProject would consist of a 100 taf Dippingvat Reser-voir and a 250 taf Schoenfield Reservoir. DippingvatReservoir would store water from the South Fork ofCottonwood Creek. Water would be diverted fromDippingvat to Schoenfield Reservoir where it wouldlater be released down Red Bank Creek to the Sacra-mento River. Water could also be released via a newconveyance facility to the Corning Canal or theTehama-Colusa Canal.
The Clay Station Reservoir is a smaller version ofDeer Creek Reservoir, but 8 miles south. Its storagecost would be similar to Deer Creek’s (very high). Withits small size and high cost, Clay Station Reservoir of-fers little promise as a statewide water supply option.
Likely Storage Options Upstreamof the Delta
Figure 6G-1 shows the location of likely surfacestorage options upstream of the Delta. This reappraisalof surface reservoir options identified several that ap-pear to offer the best prospects. Foremost in this group,in order of size, are:
• Colusa Reservoir, 3.0 maf offstream
• Thomes-Newville Reservoir, 1.4 to 1.9 mafoffstream
• Sites Reservoir, 1.2 to 1.8 maf offstream
• Dutch Gulch Reservoir, 0.7 to 0.9 maf onstream(or its upstream alternative, Fiddlers Reservoir, 0.2to 0.5 maf )
• Tehama Reservoir, 0.5 to 0.7 maf onstream
• Wing Reservoir, 0.25 to 0.5 maf onstream (withBattle Creek diversion)
• Red Bank Project, 0.35 maf onstream andoffstream
• Millville Reservoir, 0.1 to 0.25 maf onstream
A second tier of options offers substantial watersupply potential, but with greater environmental im-pacts and/or economic costs that create someuncertainty about their implementability. From a floodcontrol standpoint, enlarged Shasta, Auburn, and en-larged Millerton would provide important benefits. Inorder of size, these sites are:
• Enlarged Lake Berryessa, up to 11.5 maf additionaloffstream
• Enlarged Lake Shasta, up to 10 maf additionalonstream
• Glenn Reservoir, 6.7 to 8.7 maf offstream
• Auburn Reservoir, 0.85 to 2.3 maf onstream
• Thomes-Newville Reservoir, 1.4 to 1.9 mafonstream
• Enlarged Millerton Lake, 0.5 to 0.9 maf additionalonstream
• Enlarged Folsom Lake, 0.37 maf additionalonstreamA third group of options includes one that may be
a viable alternative, but for which limited informationis available. This site might be characterized as “wor-thy of a second look” in the future:
• Kosk Reservoir, 0.8 maf onstream
Operation of Storage Upstream ofthe Delta
Additional surface storage upstream of the Deltawould be effective if operated with major water sup-ply reservoirs in the basin, principally Shasta, Oroville,and Folsom. Under California’s water rights hierarchy,new facilities may store surplus water that is not neededto meet preexisting rights. Since virtually no surpluswater is available during the irrigation season, storagein new projects will be limited to late fall, winter, andearly spring. Most storable flow occurs during periodsof flood runoff. But, under certain conditions, coordi-nated operation with other reservoirs may allowoccasional storage of fall releases made to achieve man-datory flood reservations.
A Sites Reservoir offstream storage facility providesa good example of how a Sacramento Valley surfaceproject could be operated in coordination with otherfacilities. A large Sites Reservoir would provide 1.8 mafof storage in the foothills west of Maxwell. The largeSites Reservoir would be formed by constructing twomain dams on Stone Corral and Funks Creeks andseveral smaller saddle dams along the low divide be-

6G-8APPENDIX 6G
The California Water Plan Update BULLETIN 160-98Appendix 6G
Dutch Gulch
Shasta Enlargement
Kosk
Millville
WingTehamaDippingvat
SchoenfieldThomes - Newville
GlennColusaSites
Auburn
FolsomEnlargementBerryessa
Enlargement
Millerton Enlargement
FIGURE 6G-1
Likely Reservoir Sites Upstream of the Delta

6G-9 APPENDIX 6G
The California Water Plan Update BULLETIN 160-98 Appendix 6G
tween Funks and Hunters Creeks. A larger ColusaReservoir, providing 3.0 maf of storage, would beformed by extending the large Sites Reservoir northinto the Hunters and Logan Creek drainages.
In this configuration, water would be delivered tothe reservoirs by winter use of the existing Tehama-Colusa Canal (which diverts from the river near RedBluff ), and by diversion to the Glenn-Colusa Canal atits pumping site near Hamilton City. A new pumpedintertie would deliver Glenn-Colusa Canal water tothe Tehama-Colusa Canal, from which it would belifted a maximum of about 320 feet to Sites/ColusaReservoirs. In a recently conceived alternative, use ofthe existing diversions would give way in favor of asingle pumping facility south of Chico Landing.
Most of the water available for storage in Sites/Colusa Reservoirs occurs from December throughApril. Whenever water and energy were available, op-erators would make maximum effort to fill Sites/ColusaReservoirs. As seasonal water demands increased, wa-ter would be withdrawn from system reservoirs to meetneeds. Since water would have to be pumped to Sites/Colusa Reservoirs, the optimum operation would fa-vor making the initial withdrawals from onstreamreservoirs with higher ratios of inflow to storage (whichare more likely to refill in the subsequent wet season).At some point, depending on the dryness of the yearand the storage status of other facilities, withdrawalswould be made from Sites/Colusa Reservoirs. To mini-mize potential impacts of the existing diversions onthe Sacramento River fisheries, Sites/Colusa Reservoirswould release water back into the two canals in ex-change for reduced diversions from the river. Sites/Colusa Reservoirs would be drawn to minimum poolonly in a prolonged series of drought years. In wetterperiods, they would operate within a narrow range nearfull.
Evaluation of Off-Aqueduct StorageOptions South of the Delta
In the Department’s recent alternative South ofDelta offstream reservoir reconnaissance study, all geo-graphically possible off-aqueduct reservoir sites on thewest side of the San Joaquin Valley were identified.Alternatives on the east side of the valley were not con-sidered due to the excessive cost of conveyanceconnections to the California Aqueduct. Ninety-sevendam sites in 46 watersheds were evaluated (Table 6G-5) for their potential to economically improve SWP
water supply reliability with minimal environmentaland social impacts. For each potential reservoir site,the capital cost and the potential environmental im-pacts were evaluated and rated at a general level todetermine the sites that should be studied in more detail.
The Department’s study examined a wide rangeof storage volumes to evaluate potentially feasibleprojects based on the future long-term availability ofexports from the Delta and the level of SWP contrac-tor participation. Multiple reservoir sizes wereconsidered for each alternative dam site. Volumes from0.1 to 2 maf of storage were classified into four cat-egories (Table 6G-6).
All sites were evaluated using the same level ofdetail for each of the screening criteria. To evaluateand compare engineering characteristics, site informa-tion was gathered and construction costs wereestimated for each alternative. For this purpose, a ba-sic design configuration was selected. The storagecapacity and water surface area of each reservoir op-tion were calculated. The embankment volumes of eachmain dam and associated saddle dams were calculated.
The capital costs of all reservoir options were basedon previous cost estimates developed for LBG facili-ties. Sixteen categories of cost, including mitigationcosts, were calculated. A rating of the alternatives wasperformed based on estimated capital costs per acre-foot of storage. A unit storage cost of above $3,000/afwas deemed impractical and was used as a thresholdfor deferring alternative sites. After deferring alterna-tives with unit storage costs above the practicalthreshold, 34 dam sites in 18 watersheds were retainedfor further consideration. The unit storage cost for eachof these options was translated to a 100 point system,with 0 points assigned to a unit cost of $3,000/af ofstorage and 100 points to a unit cost of $0/af of stor-age. Unit costs and scores were developed for severalreservoir sizes at each site to cover the potential rangeof storage volume available at each dam site. The unitcosts and scores for the reservoir sizes evaluated at eachdam site were plotted versus volume. Curves weredrawn through the points associated with each damsite to allow interpolation of this information for theentire range of storage volumes available at each damsite.
Environmental criteria were developed by the De-partment and DFG. Factors affecting the degree ofenvironmental sensitivity of each alternative reservoirsite were identified by the Department and DFG, andwere reviewed by USFWS. Six environmental screen-

6G-10APPENDIX 6G
The California Water Plan Update BULLETIN 160-98Appendix 6G
ing criteria were developed. The environmental re-sources information varied among the sites. To ensurethat all the options were evaluated equally, all sites usedthe same level of detail for each of the screening crite-ria. In evaluating wetland resources, USFWS NationalWetland Inventory Maps were used to determine wet-land abundance and types at each site. USGS nationalaerial photographic project maps were used to deter-mine vegetation community abundance and type, andto obtain additional habitat and land use information.Listed and candidate animal and plant species thatcould potentially be found at the alternative sites wereidentified by searching the 1995 DFG Natural Diver-sity Data Base, the fifth edition of the California NativePlant Society’s inventory of rare and endangered vas-cular plants of California, and DFG Wildlife HabitatRelationships System publications.
Economic and environmental sensitivity scoreswere given equal weight and combined to develop ascore for each alternative reservoir site ranging from 0to 100 points. Table 6G-7 shows the combined rank-ing of each alternative reservoir site, sorted by the fourstorage volume categories. Alternative reservoir siteswith the highest scores were selected for each storagevolume category. A minimum of 4 and a maximum of
10 alternative reservoir sites were chosen for each sizecategory to provide a reasonable variety of alternativesfor further evaluation. Using the previously definedcategories, alternative reservoir sites were selected forfurther evaluation. Many of the alternative reservoirsites were selected in more than one size category. Asshown in Table 6G-8, a total of 19 reservoir sites in 10watersheds were retained for more analysis after theinitial evaluation. These sites are shown in Figure 6G-2.
Likely Off-Aqueduct Storage OptionsSouth of the Delta
After a general evaluation, five sites appeared mostfavorable: Garzas Creek, Ingram Canyon, Los Banos
TABLE 6G-6
South of the Delta Off-Aqueduct Storage
Size Categories
Category Storage (maf)
Small 0.1 - 0.25Medium 0.25 - 0.5Large 0.5 - 1.0Very Large 1.0 - 2.0
TABLE 6G-5
Watersheds Identified for South of the Delta Storage Options
Watershed County Watershed County
Arroyo Ciervo Fresno Los Banos Creek MercedArroyo Hondo Fresno Los Gatos Creek FresnoBitter Creek Kern Los Vaqueros Contra CostaBitterwater Valley Kern/San Luis Obispo McKittrick Valley KernBroad Creek Kern Moreno Gulch FresnoBuena Vista Creek Kern Mustang Creek MercedBuena Vista Lake Bed Kern Orestimba Creek StanislausCantua Creek Fresno Ortigalita Creek MercedCapita Canyon Fresno Oso Creek StanislausCastac Valley Kern/Los Angeles Packwood Creek KernDeep Gulch San Joaquin Panoche Hills FresnoDel Puerto Canyon Stanislaus Panoche/Silver Creek Fresno/San BenitoGarzas Creek Stanislaus Pleito Creek KernHospital Creek San Joaquin/Stanislaus Quinto Creek Merced/StanislausIngram Canyon Stanislaus Romero Creek MercedIngram/Kern Canyon Stanislaus Salado Creek MercedKellogg/Marsh Creek Contra Costa Salt Creek Fresno/Kern/MercedKern Canyon Stanislaus San Emigdio Creek KernKettleman Plain Kings San Luis Creek MercedLaguna Seca Creek Merced Sandy Creek KernLittle Panoche Creek Fresno Santiago Creek KernLittle Salado/Crow Creek Stanislaus Sunflower Kings/KernLone Tree Creek San Joaquin Wildcat Canyon Merced/Fresno
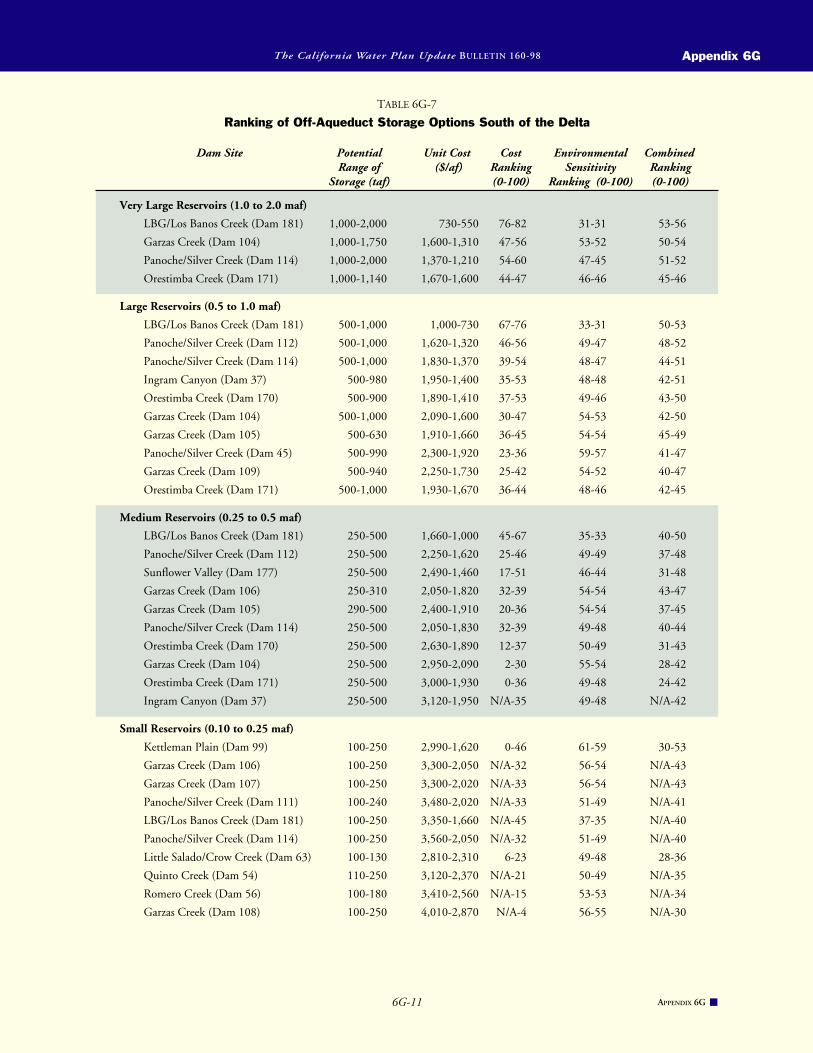
6G-11 APPENDIX 6G
The California Water Plan Update BULLETIN 160-98 Appendix 6G
TABLE 6G-7
Ranking of Off-Aqueduct Storage Options South of the Delta
Dam Site Potential Unit Cost Cost Environmental CombinedRange of ($/af) Ranking Sensitivity Ranking
Storage (taf) (0-100) Ranking (0-100) (0-100)
Very Large Reservoirs (1.0 to 2.0 maf)
LBG/Los Banos Creek (Dam 181) 1,000-2,000 730-550 76-82 31-31 53-56
Garzas Creek (Dam 104) 1,000-1,750 1,600-1,310 47-56 53-52 50-54
Panoche/Silver Creek (Dam 114) 1,000-2,000 1,370-1,210 54-60 47-45 51-52
Orestimba Creek (Dam 171) 1,000-1,140 1,670-1,600 44-47 46-46 45-46
Large Reservoirs (0.5 to 1.0 maf)
LBG/Los Banos Creek (Dam 181) 500-1,000 1,000-730 67-76 33-31 50-53
Panoche/Silver Creek (Dam 112) 500-1,000 1,620-1,320 46-56 49-47 48-52
Panoche/Silver Creek (Dam 114) 500-1,000 1,830-1,370 39-54 48-47 44-51
Ingram Canyon (Dam 37) 500-980 1,950-1,400 35-53 48-48 42-51
Orestimba Creek (Dam 170) 500-900 1,890-1,410 37-53 49-46 43-50
Garzas Creek (Dam 104) 500-1,000 2,090-1,600 30-47 54-53 42-50
Garzas Creek (Dam 105) 500-630 1,910-1,660 36-45 54-54 45-49
Panoche/Silver Creek (Dam 45) 500-990 2,300-1,920 23-36 59-57 41-47
Garzas Creek (Dam 109) 500-940 2,250-1,730 25-42 54-52 40-47
Orestimba Creek (Dam 171) 500-1,000 1,930-1,670 36-44 48-46 42-45
Medium Reservoirs (0.25 to 0.5 maf)
LBG/Los Banos Creek (Dam 181) 250-500 1,660-1,000 45-67 35-33 40-50
Panoche/Silver Creek (Dam 112) 250-500 2,250-1,620 25-46 49-49 37-48
Sunflower Valley (Dam 177) 250-500 2,490-1,460 17-51 46-44 31-48
Garzas Creek (Dam 106) 250-310 2,050-1,820 32-39 54-54 43-47
Garzas Creek (Dam 105) 290-500 2,400-1,910 20-36 54-54 37-45
Panoche/Silver Creek (Dam 114) 250-500 2,050-1,830 32-39 49-48 40-44
Orestimba Creek (Dam 170) 250-500 2,630-1,890 12-37 50-49 31-43
Garzas Creek (Dam 104) 250-500 2,950-2,090 2-30 55-54 28-42
Orestimba Creek (Dam 171) 250-500 3,000-1,930 0-36 49-48 24-42
Ingram Canyon (Dam 37) 250-500 3,120-1,950 N/A-35 49-48 N/A-42
Small Reservoirs (0.10 to 0.25 maf)
Kettleman Plain (Dam 99) 100-250 2,990-1,620 0-46 61-59 30-53
Garzas Creek (Dam 106) 100-250 3,300-2,050 N/A-32 56-54 N/A-43
Garzas Creek (Dam 107) 100-250 3,300-2,020 N/A-33 56-54 N/A-43
Panoche/Silver Creek (Dam 111) 100-240 3,480-2,020 N/A-33 51-49 N/A-41
LBG/Los Banos Creek (Dam 181) 100-250 3,350-1,660 N/A-45 37-35 N/A-40
Panoche/Silver Creek (Dam 114) 100-250 3,560-2,050 N/A-32 51-49 N/A-40
Little Salado/Crow Creek (Dam 63) 100-130 2,810-2,310 6-23 49-48 28-36
Quinto Creek (Dam 54) 110-250 3,120-2,370 N/A-21 50-49 N/A-35
Romero Creek (Dam 56) 100-180 3,410-2,560 N/A-15 53-53 N/A-34
Garzas Creek (Dam 108) 100-250 4,010-2,870 N/A-4 56-55 N/A-30

6G-12APPENDIX 6G
The California Water Plan Update BULLETIN 160-98Appendix 6G
Creek, Orestimba Creek, and Panoche/Silver Creek.As all past studies have shown, Los Banos Creek is themost cost-effective reservoir option considered for sizecategories above 250 taf. The next least costly reser-voir option ranges from about 50 percent moreexpensive for the medium size category up to about100 percent more expensive for the very large category.In the environmental analysis, however, the Los BanosCreek option received the lowest environmental sensi-tivity rating (or had the most potential impacts) of allalternative sites. This could be because there is a greaterlevel of knowledge about this reservoir site. Los BanosCreek was the highest ranked reservoir option basedon total combined rating for reservoir sizes above250␣ taf.
A reservoir at Little Salado-Crow Creek would havea high surface area to storage volume ratio. There wouldbe high evaporation losses, making the site unfavor-
able. Sunflower Reservoir site lies 10 miles west of theCalifornia Aqueduct and would require an extendedconveyance system. Significant seepage rates would alsobe expected at this site. These two sites (in addition toRomero Creek, Kettleman Plain, and Quinto Creek)have small storage capacities. Preliminary modelingresults indicate that the range of additional surface stor-age south of the Delta should be around 500 to2,000␣ taf. The cumulative environmental impacts ofseveral small to medium reservoirs needed to attainthe storage capacity would probably be greater thanone larger reservoir. Therefore, the small to mediumsize reservoir options were deferred.
Enlarging San Luis Reservoir has been consideredfor additional storage, but because of engineering andeconomic criteria, this has been deferred. The integ-rity of an enlarged San Luis Dam has been questioned,and the cost would be high.
TABLE 6G-8
Retained Off-Aqueduct Storage Options
South of the Delta
Watershed Dam Site Reservoir Size CategorySmall Medium Large Very Large
Garzas Creek 104 X X X105 X X106 X X107 X108 X109 X
Ingram Canyon 37 X X
Kettleman Plain 99 X
LBG/Los Banos Creek 181 X X X X
Little Salado/Crow Creek 63 X
Orestimba 170 X X171 X X X
Panoche/Silver Creek 111 X112 X X114 X X X X45 X
Quinto Creek 54 X
Romero Creek 56 X
Sunflower 177 X

6G-13 APPENDIX 6G
The California Water Plan Update BULLETIN 160-98 Appendix 6G
Ingram CanyonLittle Salado/Crow CreekOrestimba CreekGarzas CreekQuinto CreekRomero CreekLos Banos CreekPanoche/Silver CreekKettleman PlainSunflower
Ca
l i f o r ni a
Aq
ue d
u
c t
FIGURE 6G-2.
Off-Aqueduct South of the Delta Watershed Sites

6G-14APPENDIX 6G
The California Water Plan Update BULLETIN 160-98Appendix 6G
Operation of Off-Aqueduct StorageSouth of the Delta
To illustrate how south of Delta offstream storagewould operate, LBG Reservoir is used as a model. Thisexample treats LBG as an SWP facility. To meet CVPservice area needs, USBR could participate with theDepartment in this project.
LBG would be located on Los Banos Creek 6 mileswest of the California Aqueduct in the Los Banos Val-ley area. The main damsite would be about 80 milessouth of the Delta. Facilities would consist of a storagereservoir with associated pump-generating plants andconveyance channels. Delta winter flows would beconveyed through the California Aqueduct andpumped into LBG for storage. Operation of the reser-
voir would be similar to that of San Luis Reservoir,except that LBG would retain about one half to two-thirds of its storage in average years to improve droughtyear water supply reliability of the SWP.
During periods of low Delta inflow, LBG wouldprovide water supplies south of the Delta to reducethe demand for Delta exports. Added flexibility couldpermit the SWP to take advantage of seasonal andshort-term water quality improvements to enhance thequality of delivered supplies. The 1.73 maf LBG Res-ervoir examined in the 1990 feasibility study wouldoperate through a range of about 550 to 750 taf eachyear, filling in the early spring and releasing water tothe California Aqueduct between May and September.

6G-15 APPENDIX 6G
The California Water Plan Update BULLETIN 160-98 Appendix 6G

The California Water Plan Update BULLETIN 160-98
OPTIONS - COASTAL REGIONS7-1
Options for MeetingFuture Water Needs in
Coastal Regions of California
This chapter covers the coastal hydrologic regions of the State: the North Coast,
San Francisco Bay, Central Coast, and South Coast (Figure 7-1). These four
regions make up 29 percent of the State’s land area and were home to 78 per-
cent of the State’s population in 1995.
The Pulgas
Water Temple,
owned by the
City and County
of San Francisco.
FIGURE 7-1
Coastal
HydrologicRegions
Quest
More information about the California Department of Water Resources is available at: http://wwwdwr.water.ca.gov/ For a hard copy version of the Bulletin, please call the Publications Office at (916) 653-1097.

The California Water Plan Update BULLETIN 160-98
OPTIONS - COASTAL REGIONS 7-2
SISKIYOU
HUMBOLDT
TRINITY
SONOMA
MENDOCINO
DELNORTE
MODOC
O R E G O N
Pa
ci
fi
c
Oc
ea
n
LAKECOUNTY
River
River
Mattole
River
EelRiver
TuleLake
Clear LakeReservoir
Navarro
River
verGarcia Dry
Creek
Russian
River
Klam
ath
Scott
River
River
Salmon
River
Smith River
Klamath
RedwoodC
reek TrinityRiver
TrinityLake
Shasta
River
SouthFork
River
LakeSonoma
MeissLake
LowerKlamath
Lake
LakeMendocino
Noyo
ButteC
reek
Mad
Van zen
River
Ri
LakeShastina
River
EelLake
Pillsbury
Du
RuthLake
LewistonLake
SouthFork
Santa Rosa-Sonoma-Petaluma Aqueducts
Clear CreekTunnel
Van ArsdaleDiversion
FIGURE 7-2
North Coast Hydrologic Region

The California Water Plan Update BULLETIN 160-98
OPTIONS - COASTAL REGIONS7-3
Description of the Area
The North Coast Region comprises the PacificOcean coastline from Tomales Bay to the Oregon bor-der, extending inland to the crest of coastal watersheds.The region includes all or large portions of Modoc,Siskiyou, Del Norte, Trinity, Humboldt, Mendocino,Lake, and Sonoma Counties. Small areas of Shasta,Tehama, Glenn, Colusa, and Marin Counties are alsowithin the North Coast Region (Figure 7-2).
Most of the region is comprised of rugged moun-tains; the dominant topographic features are theKlamath Mountains and the Coast Range. Mountainelevations range from 5,000 feet along the coast to morethan 8,000 feet in the Klamath River watershed. Val-ley areas include the high plateau of the Klamath RiverBasin in Modoc County, the Eureka/Arcata area,Hoopa Valley in Humboldt County, Anderson Valley,the Ukiah area, Alexander Valley, and the Santa RosaPlain.
Precipitation in the region varies depending onlocation and elevation. In the Modoc Plateau of theKlamath River Basin, annual precipitation averages 10inches, while higher elevation lands of the Smith RiverBasin in Del Norte County average more than 100inches of rain per year. The southern portion of theregion is drier; Santa Rosa averages about 29 inches ofrain annually.
Most land area in the North Coast Region is for-est or range land. Irrigated agriculture is concentratedin narrow river valleys such as the Russian River Valleyin Sonoma County, and on the high plateau of theKlamath River Basin. The primary crops are pasture,grain, alfalfa, wine grapes, truck crops, and nurserystock. Principal cities in the region include Crescent
City, Yreka, Eureka, Fort Bragg, Ukiah, Santa Rosa,and Rohnert Park. Table 7-1 shows the 1995 popula-tion and irrigated crop acreage in the region and 2020forecasts.
Water Demands and Supplies Because of the water dedicated to the North
Coast’s wild and scenic rivers, environmental water usecomprises the majority of the total water demand inthe North Coast Region. Water shortages are expectedto occur only under drought conditions, as shown inTable 7-2. These water shortages will be mostly in theUSBR’s Klamath Project’s service area and in somesmall coastal communities.
Three existing projects provide much of the NorthCoast’s developed surface water supply—USBR’s Kla-math Project, Humboldt Bay Municipal WaterDistrict’s Ruth Lake, and USACE’s Russian RiverProject. The primary water storage facilities of USBR’sKlamath Project are Upper Klamath Lake, Clear Lake,and Gerber Reservoir. This project was authorized bythe Secretary of the Interior in 1905, and is one of theWest’s earliest reclamation projects. The project’s pri-mary purpose is to store and divert water foragricultural use. The project service area includes morethan 230,000 acres of irrigable lands in Oregon and
TABLE 7-1
Population and Crop Acreage
Population Irrigated Crop Acreage(thousands) (thousands of acres)
1995 606 3232020 835 335
. . .
North CoastHydrologic Region

The California Water Plan Update BULLETIN 160-98
OPTIONS - COASTAL REGIONS 7-4
California. The project also serves four national wild-life areas—the Lower Klamath, Tule Lake, Clear Lake,and Upper Klamath Refuges.
The 48 taf Ruth Lake is Humboldt Bay Munici-pal Water District’s water storage facility on the MadRiver. Downstream Ranney collector wells capturewater released from Ruth Lake for distribution in theEureka-Arcata-McKinleyville area. Humboldt BayMWD is a water wholesaler with seven municipal, twoindustrial, and about 200 miscellaneous water custom-ers.
The Trinity River Division of the CVP developssupply for export to the Central Valley and does notdeliver water in the North Coast Region. USBR con-structed Trinity River facilities in the early 1960s toaugment CVP water supplies in the Central Valley.The principal features of the Trinity Division are Trin-
ity Dam and the 2.4 maf Trinity Lake on the upperTrinity River, Lewiston Dam, the 10.7-mile ClearCreek Tunnel that begins at Lewiston Dam and endsat Whiskeytown Lake in the Sacramento River Basin,Spring Creek Tunnel, and Spring Creek Powerplant.
Exports from the Trinity River to the SacramentoRiver Basin began in 1963. From 1980 through 1995,Trinity River exports averaged 825 taf annually. In1981, the Secretary of the Interior increased instreamflow requirements in the Trinity River from 120 taf to287 taf in drought years, and 340 taf in wet years. In1991, the Secretary of the Interior amended the 1981decision, directing that at least 340 taf be released intothe Trinity River for water years 1992 to 1996, pend-ing completion of a USFWS instream flow study. In1992, CVPIA mandated that the secretarial decisionremain in place until the instream flow study was com-
USBR’s Anderson-Rose Damis located on the Lost Riverin Oregon, just north of thestateline. This KlamathProject facility diverts waterto serve irrigation needs onthe bed of the former TuleLake in California andOregon.
Courtesy of USBR
TABLE 7-2
North Coast Region Water Budget (taf)a
1995 2020Average Drought Average Drought
Water UseUrban 169 177 201 212Agricultural 894 973 927 1,011Environmental 19,544 9,518 19,545 9,518Total 20,607 10,668 20,672 10,740
SuppliesSurface Water 20,331 10,183 20,371 10,212Groundwater 263 294 288 321Recycled and Desalted 13 14 13 14Total 20,607 10,491 20,672 10,546
Shortage 0 177 0 194a Water use/supply totals and shortages may not sum due to rounding.

The California Water Plan Update BULLETIN 160-98
OPTIONS - COASTAL REGIONS7-5
pleted, at which time the study’s recommendationswould be implemented. Currently, a draft Trinity Riverflow evaluation report recommends that 815 taf, 701taf, 636 taf, 453 taf, and 369 taf be released in theTrinity River during extremely wet, wet, normal, dry,and critically dry years, respectively. The water yeartypes are based on Trinity Lake inflow.
Lake Mendocino on the East Fork Russian Rivernear Ukiah and Lake Sonoma on Dry Creek nearGeyserville are the water storage facilities of USACE’sRussian River Project. Sonoma County WA receivesmost of the water from this project and delivers about29 taf/yr to Santa Rosa, Rohnert Park, Cotati, andForestville in the North Coast Region, and another 25taf/yr to Novato, Petaluma, the Valley of the Moon,and Sonoma in the San Francisco Bay Region. TheRussian River Project also regulates flow in the Rus-sian River for agricultural, municipal, and instreamuses within Mendocino and Sonoma Counties, andmunicipal uses in Marin County. Water is divertedfrom the Eel River into Lake Mendocino throughPG&E’s Potter Valley Project.
Local Water ResourcesManagement Issues
Klamath River Fishery Issues
The primary water management issue in the Kla-math River Basin is the restoration of fish populationsthat include listed species such as the Lost River andshortnose suckers, coho salmon, and steelhead trout.
The Lost River sucker is native to Upper Klamath Lakeand its tributaries, and the shortnose sucker is foundin the Lost River, Clear Lake, Tule Lake, and UpperKlamath Lake. Both species spawn during the spring.Higher water levels in Upper Klamath Lake have beenidentified as an aid to recovery of these fisheries. Cohoand steelhead were recently listed, and water supplyimplications will not be known until managementplans are completed and recovery goals are established.
To address the need for greater certainty in projectoperations, USBR began preparing a long-term Kla-math Project operations plan in 1995. Difficult andcomplex issues have delayed completion of the long-term plan. USBR has issued an annual operations planeach year since 1995 as it continues the developmentof the long-term plan. The Klamath River CompactCommission is facilitating discussions on water man-agement alternatives to address ESA and water supplyneeds. This three-member commission was establishedby an interstate compact ratified by Congress in 1957to facilitate integrated management of interstate wa-ter resources and to promote intergovernmentalcooperation on water allocation issues. Members in-clude a representative from the Department, theDirector of the Oregon Water Resources Department,and a presidentially-appointed federal representative.
Trinity River Fish and WildlifeManagement Program
Following completion of the Trinity River Divi-sion, fish populations in the Trinity River Basindeclined dramatically. The Resources Agency estab-
Trinity Dam and TrinityLake. Releases from thereservoir are reregulated atLewiston Dam, 7 milesdownstream on the TrinityRiver. At Lewiston, water iseither released back to theTrinity River or divertedthrough the Clear CreekTunnel into the SacramentoRiver Basin.
Courtesy of USBR

The California Water Plan Update BULLETIN 160-98
OPTIONS - COASTAL REGIONS 7-6
lished a statewide task force in 1967 to develop a pro-gram to improve the fishery. One of the mostsignificant problems identified was sedimentation fromGrass Valley Creek. In 1980, PL 96-335 authorizedconstruction of Buckhorn Mountain Debris Dam onGrass Valley Creek, as well as sediment dredging inthe Trinity River below Grass Valley Creek. In 1984,PL 98-541 authorized the Trinity River fish and wild-life management program, providing $57 million(excluding Buckhorn Mountain Debris Dam and sedi-ment dredging costs) to implement actions to restorefish and wildlife populations in the Trinity River Ba-sin to pre-project levels. Congress authorized anadditional $15 million in 1993 for purchase of17,000 acres of the Grass Valley Creek watershed andits restoration. PL 104-143 in 1996 extended the pro-gram three years to October 1, 1998, to allowexpenditure of funds previously authorized, but notyet appropriated. Reauthorization of the program iscurrently under consideration. A draft EIS/EIR is be-ing prepared to address proposed streamflow changesand mainstem Trinity River restoration actions.
Water Supplies of Small Coastal Communities
The town of Klamath in Del Norte County ob-tains its water supply from two wells adjacent to theKlamath River. During the recent drought, seawaterintrusion forced the Klamath Community ServicesDistrict to use an upstream private well in the HoopaCreek drainage area. All of Klamath’s water supply in1995 was obtained from the private well, and no wa-ter was pumped from Klamath CSD’s wells. In 1996,Klamath CSD pumped adequate supplies from its twowells, but seawater intrusion during dry years remainsa problem. Although the Hoopa Creek drainage areahas adequate groundwater supplies, Klamath CSD doesnot have funding to construct an additional well.
The town of Smith River, 13 miles north of Cres-cent City, takes its water supply from wells alongRowdy Creek. Water demands in the town of SmithRiver are expected to exceed the capacity of the town’sdelivery system if projected growth occurs. (Growthfrom Brookings, a popular Oregon retirement and re-sort community about 7 miles north of the stateline,is affecting Smith River.) There are no plans to up-grade Smith River’s water system.
Growth in the Crescent City area is creating theneed to expand the city’s water distribution system,which consists of a Ranney collector well on the SmithRiver and a 50,000 gallon storage tank. The Ranney
collector can produce about 7.8 taf/yr, but the capac-ity of the existing transmission and storage system isonly about 4.5 taf/yr. Crescent City is planning to addnew mains, a new pump station, one additional boosterpump, and a 4 mg storage tank. The upgraded systemwill produce 5.9 taf/yr. The estimated cost is $6.7 mil-lion. A second phase will make additional distributionsystem improvements. These new conveyance facili-ties should meet the city’s demands through 2007.
The Weaverville Community Services District inTrinity County serves about 1,370 metered connec-tions. In average water years, demands within thedistrict are met with existing supplies from East andWest Weaver Creeks. During drought years, water ra-tioning and building moratoria were needed to reducedemands. In response to drought year demands, a newdiversion of up to 3 cfs from the Trinity River wasconstructed. The Weaverville area is expected to haveadequate water supplies to meet demands over the next30 years.
Trinity County Water Works District #1 is inves-tigating a wastewater treatment and reuse project forthe Hayfork area. The project would treat wastewaterfrom individual septic systems, and would eliminateseptic tank seepage into local streams. The district’sfeasibility study identified a gravity collection systemwith an oxidation pond and two marsh areas as thebest alternative for wastewater treatment. The projectwould treat 160 af annually, and could reuse the treatedwater to irrigate agricultural lands or landscaping. Theestimated cost for this project is $8.9 million.
The City of Rio Dell obtains its water from a wellon property owned by the Eel River Sawmill. Pen-tachlorophenol has been detected in groundwater onthe sawmill’s property, although not in the city’s wellwater. Rio Dell is planning to find an alternate watersupply. The most likely alternative will be treated sur-face water from the Eel River.
The City of Fort Bragg experiences water short-ages during drought years. The water sources for thecity are direct diversions from surface water sources.During average rainfall years, water rights from thesesources are enough to meet the city’s demands to theyear 2020. Supplies are inadequate to meet the city’sneeds during drought years and to maintain instreamflows required by DFG. DHS issued an order in 1991prohibiting new demands on the water system untiladequate water supplies were developed. The city hasbeen investigating alternate sources of supply and hasimplemented water conservation measures and im-

The California Water Plan Update BULLETIN 160-98
OPTIONS - COASTAL REGIONS7-7
proved existing system capacity. As a result of thesecorrective measures DHS lifted its order in 1993 andallowed the city to begin issuing building permits, sub-ject to restrictions including no net increase inconsumption and implementation of a conservationand retrofit program.
Groundwater use is constrained by limitations inaquifer storage capacity in some coastal communities.Wells on low terraces near the ocean are potentiallyvulnerable to seawater intrusion. The town ofMendocino is completely dependent on individualwells. A local survey conducted in 1986 showed thatabout 10 percent of the wells go dry every year and 40percent go dry during drought years. In 1986, waterwas trucked in during summer and fall to help reduceshortages. The Mendocino Community Services Dis-trict investigated new water supply sources, includingwells in the Big River aquifer and desalting. To date,no acceptable water source has been identified. In 1990,town residents approved developing a public watersystem if an adequate water source could be found.The district is currently collecting hydrogeological dataon the groundwater basin.
Russian River Environmental Restoration Actions
Water quality issues and barriers to fish migrationare of concern in the Russian River Basin. No future
water supply shortages are forecasted for the basin, al-though actions taken to protect recently listedsalmonids may affect existing or future diversions. ARussian River Action Plan, prepared by SonomaCounty WA in 1997, provides a regional assessmentof needs in the watershed and identifies fishery habi-tat restoration projects in need of funding. TheSWRCB is promoting a coordinated Russian Riverfishery restoration plan.
In 1997, NMFS listed coho salmon and steelheadtrout as threatened along part of the Central Califor-nia coast that includes the Russian River Basin. SCWA,USACE, and NMFS signed an agreement to establisha framework for consultation under Section 7 of theESA. Under the agreement, USACE and SCWA willjointly review information on their respective Russianriver activities to determine impacts to critical habitat.
The Eel-Russian River Commission, composed ofcounty supervisors from Humboldt, Mendocino,Sonoma, and Lake Counties, provides a regional fo-rum for agencies and groups to stay informed aboutprojects and issues affecting the Eel and Russian Riv-ers. The Commission, formed in 1978 under a jointpowers agreement among the counties, was to aid inimplementing an Eel-Russian River watershed conser-vation and development plan. A regional issue currentlybeing addressed by the Commission is the review of a
Currently, the main waterissues in the Russian River
Basin are related towatershed management
and environmentalrestoration programs.
Lupine Photo

The California Water Plan Update BULLETIN 160-98
OPTIONS - COASTAL REGIONS 7-8
draft 10-year fishery study by PG&E for its PotterValley Project, required as a condition of a 1983 FERClicense.
A proposed SCWA project would allow fish pas-sage through a flood control structure on MatanzasCreek in downtown Santa Rosa. The original struc-ture, constructed in the early 1960s, does not permitfish passage. SCWA also proposes to install a fish lad-der at Healdsburg Dam on the Russian River, a smallflashboard dam used in the summer to create a recre-ational pool.
City of Santa Rosa Long-Term Wastewater Project
In early 1998 the City of Santa Rosa selected analternative that would recharge depleted geothermalfields in the Geysers area with treated wastewater aspart of its long-term wastewater recycling program.Under this alternative, the Santa Rosa Subregional Sew-erage System will pump about 11 mgd of treatedwastewater to the Geysers for injection into thesteamfields. This amount is a little less than half theflow the treatment system is expected to produce atbuildout. The project is intended to eliminate weather-related problems of the city’s current disposal systemand minimize treated wastewater discharges into theRussian River. The project consists of pipeline trans-mission and distribution systems and is scheduled tobe completed by 2001.
SCWA Water Supply and Transmission Project
Sonoma County WA is preparing an EIR to de-velop additional water supply as well as to expand itsexisting water transmission system. The project willbe implemented under an agreement among SCWAand its water contractors. Components of the projectinclude water conservation, increased use of the Rus-sian River Project, and expansion and revised operationof the water transmission system. Water conservationis planned to provide additional savings of 6.6 taf. TheRussian River component will allow for increasing di-versions from 75 to 101 taf from the Russian River.This increased use of the Russian River Project waterwill require construction of additional diversion andconveyance facilities, including new diversion loca-tions. The project will continue to meet existinginstream flow requirements associated with theSWRCB’s Decision 1610 and will require new waterrights applications to SWRCB. The transmission sys-tem component has two elements—facilities to divertand treat Russian River Project water, and transmis-
sion system improvements allowing for delivery of upto 167 taf/yr. The final EIR is scheduled for late 1998.
Potter Valley Project
PG&E’s Potter Valley Project diverts water fromthe Eel River to the East Fork of the Russian River forpower generation and downstream agricultural andmunicipal water use. The project consists of Scott Damand Lake Pillsbury, Van Arsdale Diversion Dam andtunnel, and the Potter Valley Powerplant. The projectdiverts about 159 taf of water and generates about 60million kWh of energy annually. Releases are limitedby required minimum flows on the Eel River and byrequirements to maintain reservoir levels in LakePillsbury during the summer recreation season. Un-der the FERC relicensing process, PG&E has beenmeeting with State and federal agencies to developinstream flow recommendations for the Eel River.Diversions from the Eel River are being evaluated inlight of ongoing efforts to restore Eel River fisheries.PG&E is also trying to secure additional operatingrevenue from the project and, if unsuccessful, may sellor abandon the project. Local agencies have expressedinterest in acquiring the project if it were to be sold.
Water Management Options forthe North Coast Region
Table 7-3 shows a list of options for the region,and the results of an initial screening of the options.The retained options were evaluated (Table 7A-1 inAppendix 7A) based on a set of fixed criteria discussedin Chapter 6.
Water Conservation
Urban. Urban water demand forecasts for 2020 as-sume that BMPs are in place; consequently, only thoseurban conservation efforts which exceed BMPs are con-sidered as options. All urban conservation options wereretained. Reducing outdoor water use to 0.8 ETo in newdevelopment would attain about 1 taf /yr of depletionreductions, while extending this measure to include ex-isting development would reduce depletions by about 6taf/yr. Reducing residential indoor water use to 60 and55 gpcd would reduce depletions by 3 and 6 taf/yr, re-spectively. Reducing commercial, institutional, andindustrial water use an additional 3 and 5 percent wouldattain 1 and 2 taf/yr of depletion reductions, respectively.Reducing distribution system losses to 7 and 5 percentwould reduce depletions by 6 and 9 taf/yr.

The California Water Plan Update BULLETIN 160-98
OPTIONS - COASTAL REGIONS7-9
TABLE 7-3
North Coast Region List of Water Management Options
Option Retain Reason for Deferralor Defer
Conservation
Urban
Outdoor Water Use to 0.8 ETo
Retain
Indoor Water Use Retain
Interior CII Water Use Retain
Distribution System Losses Retain
Agricultural
Seasonal Application Efficiency Improvements Defer No significant depletion reductions attainable.
Flexible Water Delivery Defer No significant depletion reductions attainable.
Canal Lining and Piping Defer No significant depletion reductions attainable.
Tailwater Recovery Defer No significant depletion reductions attainable.
Modify Existing Reservoirs/Operations
Ewing Reservoir Enlargement Defer No demand for additional supply.
New Reservoirs/Conveyance Facilities
Boundary Reservoir - Lost River, Oregon Defer Low yields, high cost.
Beatty Reservoir - Sprague River, Oregon Defer High cost, archaeological resources, and suckerhabitat.
Chiloquin Narrows Reservoir - Sprague River, Defer High cost, archaeological resources, and suckerOregon habitat.
Montague Reservoir - Shasta River Defer Low yields, high cost.
Grenada Ranch Reservoir - Little Shasta River Defer Low yields, poor dam site and reservoir geology,high cost.
Table Rock Reservoir - Little Shasta River Defer No surplus water, no local interest.
Highland Reservoir - Moffett Creek Defer Low yields, high cost.
Callahan Reservoir - Scott River Defer Low yields, high cost, no local interest.
Grouse Creek Reservoir - E.F. Scott River Defer Reservoir seepage, high cost, no local interest.
Etna Reservoir - French Creek Defer Low yields, high cost, no local interest.
Mugginsville Reservoir - Mill Creek Defer Low yields, excessive cost.
Various sites in Noyo/Navarro River Basins Defer No local interest in offstream storage; unfavorableenvironmental conditions.
Long/Round/Aspen Valley Reservoirs - Defer Excessive capital cost, questionable reservoirKlamath River geology.
Georgia-Pacific Wood Waste Disposal Site Defer Site not available.
Georgia-Pacific Replacement Site Defer Unfavorable geotechnical conditions.
Georgia-Pacific Site No. 3 Defer Unfavorable geotechnical conditions.
Newman Gulch Site Defer Unfavorable geotechnical conditions.
Large reservoir at Boddy Property Site Defer Excessive capital cost.
Smaller reservoir (at Boddy property site or Defer Excessive capital cost.alternate location)
Waterfall Gulch Intake Improvement Defer Biological, instream flow concerns.
South Basin (City of Fort Bragg) Defer Water rights issues.

The California Water Plan Update BULLETIN 160-98
OPTIONS - COASTAL REGIONS 7-10
Agricultural. The 2020 agricultural water de-mand forecasts assume that EWMPs are in place. Aswith the urban water management options, only thoseagricultural conservation efforts which exceed EWMPsare considered as options. Agricultural conservationoptions were deferred from evaluation for this regionbecause they provide little potential to create new wa-ter (reduce depletions).
Modifying Existing Reservoirs or Operations
Trinity County Water Works District #1 has con-sidered raising Ewing Dam, which was designed to beraised up to 12 feet to meet future water supply needs.Raising the dam 12 feet to increase reservoir capacityfrom 800 af to 1.45 taf and modifying the spillwayand outlet works would cost $1.5 million. Plans toenlarge the reservoir were halted when Hayfork’s pri-mary employer (a lumber mill) closed, reducing thedistrict’s customer base by about 10 percent.
New Reservoirs and Conveyance Facilities
Onstream Storage. Eleven onstream reservoirs inthe Klamath River Basin were evaluated and deferred,
mainly because of high costs and relatively low yields.Cursory investigations of these projects were completedby USBR, the Department, or the Oregon Water Re-sources Department. Recent studies completed by theCity of Fort Bragg identified potential onstream reser-voir sites in the Noyo River watershed; however, thesesites were deferred due to environmental and economicconcerns.
Offstream Storage. USBR investigated threeoffstream reservoirs in Oregon’s Long, Aspen, andRound Valleys adjacent to Upper Klamath Lake. Theseoffstream storage plans were deferred due to high costs.
In 1993, the City of Fort Bragg moved forwardwith preliminary plans and work on an environmen-tal impact report on what was then its preferredlong-term project, which included a 1.5 taf offstreamreservoir. Several promising locations were investigated,but geotechnical investigations indicated that all ex-cept one of the sites was unsuitable. Further detailedinvestigations and cost estimates for the most favor-able site indicated the site was infeasible due to excessivecosts. A smaller reservoir (about 1 taf ) was evaluated,but was also not feasible.
TABLE 7-3
North Coast Region List of Water Management Options (continued)
Option Retain Reason for Deferralor Defer
Groundwater/Conjunctive UseNew wells Retain
Water Marketing— — —
Water Recycling
City of Fort Bragg Defer Unfavorable costs due to lack of potential userswithin a reasonable distance.
Desalting
Brackish GroundwaterCity of Fort Bragg Project Retain
Seawater
City of Fort Bragg Project Defer Excessive cost.
Other Local Options— — —
Statewide Options— — See Chapter 6.

The California Water Plan Update BULLETIN 160-98
OPTIONS - COASTAL REGIONS7-11
Groundwater Development or Conjunctive Use
Surface water sources meet most of the water needsin the coastal regions. Communities with water short-age problems continue to look for possible groundwatersources and well locations to provide adequate sup-plies at reasonable cost. Although groundwater qualityis generally good, supplies are limited by aquifer stor-age capacity. For example, Fort Bragg began a testprogram in 1994 to identify possible well sites, but nosignificant groundwater supply was found. The cityhas drilled test wells along the Noyo River about twomiles upstream of its mouth, and is studying the po-tential development of a small production well. Itappears that the product water may be brackish.
Water Recycling
The City of Fort Bragg had considered a waterrecycling project which involved using tertiary treatedwastewater to replace potable water used at a lumberprocessing plant. However, water conservation effortsby the plant reduced its water demand by more than50 percent, rendering this option uneconomical. Otherwater recycling projects planned in the region wouldnot generate a source of new supply from a statewideperspective. There are several projects planned whichwould produce about 15 taf of recycled water annu-ally to serve local water management needs foragricultural, environmental, and for landscape irriga-tion purposes.
Desalting
Interest in desalting for Fort Bragg increased whenfeasibility studies showed it was economically competi-tive with storage alternatives. The city evaluated tworeverse osmosis alternatives—one involving seawaterand one involving brackish water. Both plant designswould produce about 1 taf of potable water in droughtyears. Major cost components for the seawater plantwould include the ocean intake structure, feedwaterpipeline to the plant, and plant equipment. The brack-ish groundwater plant would require wells, well fieldcollection piping, and a feedwater pipeline into theplant. The city is conducting more detailed studies toidentify the location of brackish water sources and brinedisposal options.
Other Local Options
Fort Bragg has investigated other alternatives thathave not proven to be feasible. These alternatives in-clude improving the city’s diversion from Waterfall
Gulch and new surface water sources in the SouthBasin. Lowering the intake structure at Waterfall Gulchwould capture an additional 110 af/yr, but presentsbiological and instream flow concerns. New surfacewater sources have been identified, but these sourceshad water rights issues.
Options Likely to be Implementedin North Coast Region
Water supplies are not available to meet all of theregion’s 2020 water demands in drought years. Droughtyear applied water shortages are forecasted to be 194taf. No average year shortages are forecasted for 2020.Ranking of retained water management options forthe North Coast Region is summarized in Table 7-4.Table 7-5 summarizes options that can likely be imple-mented by 2020 to relieve the shortages.
The majority of shortages in the region are agri-cultural and are expected to occur in the KlamathProject area. The economics of crop production havea major influence on the extent to which growers canafford drought year water supply improvements. Ad-ditional groundwater development is a possibility insome areas of the Klamath Project, but there are littledata available to evaluate this option. The ability tochange cropping patterns in the northern part of theregion is limited by the area’s climatic conditions. Thereare no quantifiable options available to meet agricul-tural shortages.
Urban water conservation options could provide18 taf/yr in water savings. Small communities alongthe coast generally do not have the financial resourcesto construct major water supply projects, and there-fore will continue to investigate new groundwatersupplies.

The California Water Plan Update BULLETIN 160-98
OPTIONS - COASTAL REGIONS 7-12
TABLE 7-5
Options Likely to be Implemented by 2020 (taf)North Coast Region
Average Drought
Applied Water Shortagea 0 194
Options Likely to be Implemented by 2020Conservation — 18Modify Existing Reservoirs/Operations — —New Reservoirs/Conveyance Facilities — —Groundwater/Conjunctive Use — —Water Marketing — —Recycling — —Desalting — —Other Local Options — —Statewide Options — —Expected Reapplication — —Total Potential Gain — 18
Remaining Applied Water Shortage 0 176a Majority of shortages in this region are agricultural. Most agricultural shortages in this region are expected to occur in the Klamath Project area.
TABLE 7-4
Options Ranking for North Coast Region
Optiona Rank Cost ($/af) Potential Gain (taf)Average Drought
Conservation
UrbanOutdoor Water Use to 0.8 ET
o - New Development M 750 1 1
Outdoor Water Use to 0.8 ETo -New and Existing Development M b 6 6
Indoor Water Use (60 gpcd) M 400 3 3Indoor Water Use (55 gpcd) M 600 6 6Interior CII Water Use (3%) M 500 1 1Interior CII Water Use (5%) M 750 2 2Distribution System Losses (7%) M 200 6 6Distribution System Losses (5%) M 300 9 9
Groundwater/Conjunctive UseNew wells - Fort Bragg and other small coastal communities H 150 c c
Agricultural Groundwater Development M b b b
Desalting
Brackish GroundwaterCity of Fort Bragg Project L 770 1 1
a All or parts of the amounts shown for highlighted options have been included in Table 7-5.b Data not available to quantify.c Less than 1 taf.

The California Water Plan Update BULLETIN 160-98
OPTIONS - COASTAL REGIONS7-13

The California Water Plan Update BULLETIN 160-98
OPTIONS - COASTAL REGIONS 7-14
FIGURE 7-3.
San Francisco Bay Hydrologic Region
SONOMA
SOLANO
CONTRA COSTA
ALAMEDA
SANTA CLARASAN MATEO
MARIN
SAN FRANCISCO
NAPA
Pa
ci
fi
c
Oc
ea
n
San FranciscoBay
San PabloBay
River
Sonoma
Aqueduct
SantaRosa -
Petaluma
Aqueduct
LakeCurry
LakeHennessey
NorthBay Aqueductah
BrionesReservoir
PilarcitosLake
San AndreasLake
CrystalSprings
Reservoir
CreekAla eda
LakeChabot
UpperSan Leandro
Reservoir
SouthBay
duct
San PabloReservoir
SoulajuleReservoir
StaffordLake
NicasioReservoir
KentLake Alpine
Lake
LakeDel Valle
ArroyoD
el
Valle
Napa
AndersonLake
LexingtonReservoir
CaleroReservoir
CoyoteLake
Coyote
Creek
Aque
South Canal
Put
Contra CostaCanal
MokelumneAqueduct
Hetch HetchyAqueduct
Santa ClaraConduit
m
San AntonioReservoir
GuadalupeRiver

The California Water Plan Update BULLETIN 160-98
OPTIONS - COASTAL REGIONS7-15
Description of the AreaThe San Francisco Bay Region (Figure 7-3) ex-
tends from southern San Mateo County north toTomales Bay in Marin County, and inland to theconfluence of the Sacramento and San Joaquin Riversnear Collinsville. The eastern boundary follows thecrest of the Coast Range. The region includes all ofSan Francisco and portions of Marin, Sonoma, Napa,Solano, San Mateo, Santa Clara, Contra Costa, andAlameda Counties. The San Francisco Bay Region isdivided into the North Bay and South Bay planningsubareas. Geographic features include the Marin andSan Francisco Peninsulas; San Francisco, Suisun, andSan Pablo Bays; and the Santa Cruz Mountains, DiabloRange, Bolinas Ridge, and Vaca Mountains of theCoast Range. Streams flow into the bays or to the Pa-cific Ocean.
The climate within the region varies significantlyfrom west to east. The coastal areas are typically cooland often foggy. The inland valleys and interior por-tions of San Francisco Bay are warmer, with aMediterranean-like climate. The average annual pre-cipitation in the region is 31 inches, ranging from 13inches in Pittsburg to 48 inches at Kentfield, north-east of Mount Tamalpais in Marin County.
The region is highly urbanized and includes theSan Francisco, Oakland, and San Jose metropolitanareas. Agricultural acreage is mostly in the north, withthe predominant crop being grapes. In the south, morethan half of the irrigated acres are in high-value spe-cialty crops, such as artichokes or flowers. Table 7-6summarizes the population and irrigated crop acreagefor the region.
Water Demands and Supplies
Table 7-7 shows the water budget for the San Fran-cisco Bay Region. Environmental water demands,primarily Bay-Delta outflow, account for most of theSan Francisco Bay Region’s water use. Water demandsfor Suisun Marsh are also included in environmentalwater needs. As shown in the table, water shortagesare forecast only for drought years.
North Bay
Municipal and industrial water use will continueto grow as the population in the North Bay grows.The fastest growing communities have been munici-palities in southwestern Solano County, such asFairfield and Benicia. Growth in the larger communi-ties of Sonoma and Napa Counties, such as Petalumaand Napa, has also been fairly rapid (more than 20 per-cent during the 1980s). Growth in Marin County hasbeen slow, initially because of a water connection mora-torium administered by Marin Municipal WD in the1970s, and more recently because of the lack of landavailable for development. Marin MWD imposed asecond moratorium on water service connections dur-ing the 1987-92 drought. It was lifted in 1993 withthe adoption of an integrated water supply program
TABLE 7-6
Population and Crop Acreage
Population Irrigated Crop Acreage(thousands) (thousands of acres)
1995 5,780 652020 7,025 65
. . .
San Francisco BayHydrologic Region

The California Water Plan Update BULLETIN 160-98
OPTIONS - COASTAL REGIONS 7-16
and the signing of a new Russian River water supplycontract.
The Suisun Marsh is the only managed wetlandin the North Bay that requires deliveries of fresh wa-ter. Its annual applied water demand is expected toremain constant at 150 taf. Other environmental de-mands include instream flows in Walker and LagunitasCreeks in Marin County.
Table 7-8 lists major water suppliers within theNorth Bay, along with their primary sources of sup-ply. Each of these agencies serves a number ofmunicipalities or water retailers. Groundwater andsmall locally developed supplies serve the remainderof the water users in the area. Table 7-9 lists local agencywater supply reservoirs (with capacity greater than10 taf ) serving the North Bay.
• Sonoma County WA, which wholesales waterthroughout Sonoma and Marin Counties, is fore-casting no water shortages through 2020, and isnot looking at water supply reliability enhance-ment options.
• Marin MWD was once one of the most vulner-able water suppliers in the State. The district hasnegotiated a supplemental water supply contractwith Sonoma County WA for 10 taf and now ex-pects to have a more reliable supply as it developsinfrastructure to import additional Russian Riverwater.
• Napa County Flood Control and Water Conser-vation District has a contract for SWP water witha maximum entitlement of 25 taf/yr. The City andCounty of Napa are examining water supply en-
Vineyard acreage in theNapa and Sonoma Valleysis among the State’s mostexpensive agricultural realestate. Grapes—winegrapes, table grapes, andraisin grapes—are one ofCalifornia’s top dollarvalue crops.
TABLE 7-7
San Francisco Bay Region Water Budget (taf)a
1995 2020Average Drought Average Drought
Water UseUrban 1,255 1,358 1,317 1,428Agricultural 98 108 98 108Environmental 5,762 4,294 5,762 4,294Total 7,115 5,760 7,176 5,830
SuppliesSurface Water 7,011 5,285 7,067 5,417Groundwater 68 92 72 89Recycled and Desalted 35 35 37 37Total 7,115 5,412 7,176 5,543
Shortage 0 349 0 287a Water use/supply totals and shortages may not sum due to rounding.

The California Water Plan Update BULLETIN 160-98
OPTIONS - COASTAL REGIONS7-17
hancement options to ensure future supply reli-ability.
• Solano County WA anticipates a water supplydeficiency as municipalities in the western part ofthe county urbanize rapidly without developingadditional water supply sources. Solano CountyWA’s 1995 SWP supply was about 21 taf. Theagency’s annual SWP entitlement is 42 taf. Beniciais the most vulnerable of the agency’s service areasto drought conditions because it is entirely depen-dent on SWP water. Fairfield also is forecastingfuture drought year shortages. Vallejo has its ownsupply from the Delta, which is now conveyedthrough North Bay Aqueduct facilities.
South Bay
The South Bay is highly urbanized—about 16 per-cent of the State’s population lives in 2 percent of theState’s land area. A minor portion of South Bay wateruse is for agriculture. Hayward Marsh is the only iden-tified environmental water use within the South Bay.The marsh, part of the Hayward Regional Shoreline,has an annual freshwater use of approximately 10 tafof reclaimed wastewater from Union Sanitation Dis-trict. Industrial water use for cooling is primarilyassociated with independently produced industrial
supplies along the Carquinez Strait.Table 7-10 lists the major water suppliers in the
South Bay and their primary sources of supply. Thoseareas not served by the listed suppliers get their waterfrom groundwater and from small locally developedsurface supplies. Alameda County Water District, Zone
TABLE 7-8
Major North Bay Water Suppliers
Agency Primary Source of Supply
Sonoma County WA Russian River ProjectMarin MWD Local surface and Sonoma County WA contractNapa County FC&WCD Local surface and SWPSolano County WA Solano Project and SWP
TABLE 7-9
Local Agency Reservoirs Serving the North Bay
Agency Reservoir Capacity Year Region(taf) Constructed
USACE/Sonoma CWAa Mendocino 119 1922 North CoastUSACE/Sonoma CWAa Sonoma 381 1982 North CoastPacific Gas & Electric Pillsbury 73 1921 North CoastMarin MWD Kent 33 1953/1982b San Francisco BayMarin MWD Nicasio 22 1960 San Francisco BayMarin MWD Soulajule 11 1979 San Francisco BayCity of Napa Hennessey 31 1946 San Francisco BayCity of Vallejo Curry 11 1926 San Francisco Baya USACE built Lake Mendocino and Lake Sonoma primarily for flood control. Sonoma County WA operates the facilities for water supply and holds water rights for the supply.b A 16.5 taf reservoir was initially constructed in 1953. The dam was raised in 1982, nearly doubling the capacity.
The SWP’s North Bay Aqueduct terminates at the NapaTurnout Reservoir, a 22 af storage tank. Napa County FloodControl and Water Conservation District is the contractor forthis water supply.

The California Water Plan Update BULLETIN 160-98
OPTIONS - COASTAL REGIONS 7-18
7 Water Agency, and Santa Clara Valley Water Dis-trict recharge and store local and imported surface waterin local groundwater basins. Each of the major wateragencies supplies several municipalities or water retail-ers. Table 7-11 lists local agency water supply reservoirs(with capacity greater than 10 taf ) serving the SouthBay.• SFPUC provides water to more than 2.3 million
people in San Francisco, San Mateo, Santa Clara,and Alameda Counties, and is forecasting droughtyear shortages through 2020. In 1990 and 1991,wholesale and retail customers received 25 percentsupply reductions (based on historical use). In1991, SFPUC adopted, but did not implement, a45 percent rationing plan. Recently revised
instream flow requirements in the Tuolumne RiverBasin have reduced the available Hetch Hetchysupply. The city’s studies indicate that the annualyield of the Hetch Hetchy system has droppedfrom 336 taf to 271 taf.
• SCVWD, which supplies water to about 1.7 mil-lion people, provides water to 16 municipal andindustrial retailers as well as to agricultural usersin Santa Clara County. A number of these retail-ers also contract with SFPUC for water from HetchHetchy. The district possesses one of the most di-verse supplies in the State, with imported stateproject and federal project water, locally developedsurface supplies, and extensive groundwater re-charge programs. Some of the retail agencies in
TABLE 7-10
Major South Bay Water Suppliers
Agency Primary Source of Supply
San Francisco PUC Hetch Hetchy project and local surfaceSanta Clara Valley WD Local surface, groundwater, CVP, and SWPAlameda County WD Local surface, groundwater, SWP, and Hetch Hetchy projectZone 7 WA Local surface, groundwater, and SWPEast Bay MUD Mokelumne River project and local surfaceContra Costa WD CVP and local surface
TABLE 7-11
Local Surface Reservoirs Serving the South Bay
Agency Reservoir Capacity Year Region(taf) Constructed
San Francisco PUC Lloyd 273 1956 San Joaquin RiverSan Francisco PUC Eleanor 27 1918 San Joaquin RiverSan Francisco PUC Hetch Hetchy 341 1923 San Joaquin RiverSan Francisco PUC Calaveras 97 1925 San Francisco BaySan Francisco PUC Crystal Springs 58 1888 San Francisco BaySan Francisco PUC San Andreas 19 1870 San Francisco BaySan Francisco PUC San Antonio 50 1964 San Francisco Bay
East Bay MUD Camanche 417 1963 San Joaquin RiverEast Bay MUD Pardee 198 1929 San Joaquin RiverEast Bay MUD San Pablo 39 1920 San Francisco BayEast Bay MUD Briones 61 1964 San Francisco BayEast Bay MUD Chabot 10 1892 San Francisco BayEast Bay MUD Upper San Leandro 41 1977 San Francisco Bay
Contra Costa WD Los Vaquerosa 100 1998 San Joaquin River
Santa Clara Valley WD Calero 10 1935 San Francisco BaySanta Clara Valley WD Coyote 23 1936 San Francisco BaySanta Clara Valley WD Leroy Anderson 89 1950 San Francisco BaySanta Clara Valley WD Lexington 20 1953 San Francisco Baya Reservoir provides emergency storage and water quality regulation. Does not develop local supply.

The California Water Plan Update BULLETIN 160-98
OPTIONS - COASTAL REGIONS7-19
the district are vulnerable to drought deficienciesimposed by the SWP, CVP, and Hetch HetchyProject. These deficiencies may be intensified bydiminished local runoff during drought condi-tions.
• ACWD serves a population of 292,000 in south-western Alameda County, adjacent to SanFrancisco Bay. ACWD’s Niles Cone groundwaterbasin supply is augmented by SWP and HetchHetchy supplies. The district is vulnerable todrought deficiencies imposed by SWP or SFPUC.
• Zone 7 WA delivers water in the Liver-more-Almaden Valley in eastern Alameda County,serving communities such as Dublin, Livermore,and Pleasanton, as well as agricultural and indus-trial customers. Z7WA has an annual SWPentitlement of 46 taf.
• EBMUD provides water to 1.2 million people inthe remainder of northern Alameda County, andpart of western Contra Costa County. Virtuallyall of the water used by EBMUD comes from the577-square-mile watershed of the MokelumneRiver, which collects runoff from Alpine, Amador,and Calaveras Counties, on the west slope of theSierra Nevada. EBMUD has water rights for upto 364 taf/yr from the Mokelumne River. In aver-age years, district reservoirs in the East Bay capturean additional 30 taf from local watershed runoff.In drought years, evaporation and other reservoirlosses may exceed local runoff.
• CCWD delivers municipal and industrial waterthroughout central and eastern Contra Costa
County. Deliveries from CCWD go up duringdroughts as industrial diverters stop diverting withtheir own Delta water rights (because of waterquality constraints) and use CCWD’s CVP sup-plies instead. CCWD’s 195 taf/yr CVP contractwas recently renegotiated to include operation ofLos Vaqueros Reservoir, completed in 1998. Un-der its new CVP contract CCWD will receive75 percent of the contract amount, or 85 percent
State Highway 280 parallelsSan Francisco’s Upper and
Lower Crystal SpringsReservoirs in San Mateo
County. The reservoirs arelocated on the San Andreas
fault zone.
Santa Clara Valley Water District operates an extensivesystem of groundwater recharge facilities, some of which areincorporated into a regional system of recreational walking/biking trails.

The California Water Plan Update BULLETIN 160-98
OPTIONS - COASTAL REGIONS 7-20
of historical use, during drought periods. Undersevere drought conditions, the CVP supply maybe reduced to 75 percent of historical use. CCWDhas a smaller locally developed source at MallardSlough, with an associated right to take up to26.7 taf/yr. Diversions from Mallard Slough areunreliable due to poor water quality. The averageannual diversion from this source over the past20 years was only 5.6 taf.Small independent water systems, such as those
along the San Mateo coast, also suffer water supplyreliability problems during droughts. These systemsoften rely on a single source, such as groundwater, anddo not have connections to the larger systems in theBay Area.
Local Water ResourcesManagement Issues
Bay-Delta Estuary
The CALFED Bay-Delta Program and the 1995SWRCB Water Quality Control Plan for the San Fran-cisco Bay/Sacramento-San Joaquin Delta Estuary arediscussed in Chapters 2, 4, and 6. CALFED’s ecosys-tem restoration program could restore wetlands andriparian habitats in the Delta. Other ERP actions in
the region could include protection and enhancementof agricultural lands for wildlife, focusing on agricul-tural land and water management practices that wouldincrease wildlife habitat value, and discouraging de-velopment of ecologically important agricultural landsfor urban or industrial uses in the Delta, Suisun Marsh,and north San Francisco Bay.
Suisun Marsh
In 1995, USBR, DWR, DFG, and the SuisunResource Conservation District began negotiations toupdate the Suisun Marsh Preservation Agreement. In1996, the negotiators agreed in principle to 10 jointactions designed to lower soil salinity on Suisun Marshmanaged wetlands (especially in the Marsh’s westernhalf ) and to use water more efficiently. SWRCB willreview western Suisun Marsh water quality objectivesand water rights issues as part of its Bay-Delta waterrights proceeding. More information on the SuisunMarsh can be found in Chapters 2, 4, and 6.
Local Water Agency Issues
North Bay. The primary water supply source forSonoma County Water Agency, the Russian River, isin the North Coast Hydrologic Region. Issues relatedto SCWA and the Russian River are discussed in theNorth Coast Region portion of this chapter. Issues fac-ing other major water suppliers in the North Bay arediscussed below.
In 1995, SWRCB issued Decision WR 95-17,establishing instream flow requirements in LagunitasCreek watershed. Marin MWD estimates that the de-cision will diminish its supply by 3 taf annually duringdrought years. In the past, Marin MWD examineddesalting as an option to augment its water supply,studying construction of a 10 mgd reverse osmosisdesalting plant near the western end of the San RafaelBridge. The plant’s annual yield would be approxi-mately 10 taf at a cost of $1,900/af. The desaltingproject was included in a 1991 bond measure that wasnot approved by the voters. The following year, a bondmeasure for new facilities to bring more Russian Riverwater to Marin County passed, and Marin MWD’sneed for the desalting option diminished. The newMarin MWD Russian River facilities will be on lineby 2020. Since the district has all the necessary per-mits, this water source is not listed as a future optionbut is included in the district’s base supply.
Napa County voters approved a local ordinancein 1998 which established a 0.5 percent sales tax to
CCWD’s Los Vaqueros Dam under construction. Thereservoir, completed in 1998, does not provide new watersupply, but provides terminal storage for CCWD’s existingsupply and improves service area water quality.
Courtesy of CCWD

The California Water Plan Update BULLETIN 160-98
OPTIONS - COASTAL REGIONS7-21
fund a Napa County flood protection and watershedimprovement expenditure plan. The goal of the planwas to “provide flood protection, save lives, protectproperty, restore the Napa River, Napa Creek, and othertributaries, maintain economic vitality, and enhanceriparian environments”. The Napa River and NapaCreek Project, a cooperative effort with USACE, isdesigned to provide 100-year flood protection for theCity of Napa and environmental restoration. Theseobjectives will be achieved by creating a flood bypasschannel and wetlands; removal, redesign and replace-ment of floodway obstructions; elevation andrelocation of homes; and construction of set-back leveesand floodwalls. The design is intended to provide floodprotection while allowing the river to meander throughwide riparian zones. In other actions, funds would beprovided for flood protection, environmental enhance-ment, and water supply reliability improvements forother communities and unincorporated areas of theCounty.
USBR and Solano County Water Agency havebeen involved in water rights actions on Putah Creekupstream and downstream of USBR’s Solano Projectfacilities. In 1995, a settlement agreement was reachedwith water users in Lake and Napa Counties upstreamof Lake Berryessa. The agreement establishes limits onfuture water development in the Lake Berryessa wa-tershed and allocates water for the upstream users. Acourt-appointed watermaster will monitor water usesand enforce the terms of the settlement agreement.
Downstream of the Solano Project, disputes cen-
ter around environmental water use and riparian wa-ter rights. The Putah Creek Council brought suit in1990 against Solano Project water users to increaseflows in the lower reaches of the creek. In 1996, theSacramento County Superior Court ruled on instreamflow requirements for Putah Creek downstream fromSolano Diversion Dam, where water is diverted toPutah South Canal for delivery to agricultural landsand to communities in Solano County. The judgmentcited the public trust doctrine as well as California Fishand Game code requirements and required higher (andyear-round) flows from the creek into the Yolo By-pass. SCWA estimates the additional requirements areapproximately 10 taf during an average year and 20taf during a dry year. Solano County interests are ap-pealing the judgment, which has been stayed until theappeal is heard. USBR is seeking an out-of-court settle-ment of the case. Under the Superior Court judgment,Solano County water users would be responsible formeeting the instream flow requirements in the down-stream portion of the creek. Solano County water usershave asked SWRCB to participate in the settlementprocess so that regulation of riparian diversions can beincluded in the final instream flow requirements forthe creek.
SCWA’s contract with USBR for Solano Projectwater supply will expire in 1999. The contract is re-newable, but the terms and conditions of the contractwill be renegotiated. SCWA will then need to renego-tiate its contracts with Solano Project member entities.
SCWA has entered into a multi-year banking and
Although lands in the SuisunMarsh are managed primarilyto provide waterfowl habitat,
a variety of mammals arefound there as well.

The California Water Plan Update BULLETIN 160-98
OPTIONS - COASTAL REGIONS 7-22
exchange agreement with Mojave Water Agency in theSouth Lahontan and Colorado River regions. Duringwet years, SCWA can bank up to 10 taf of its annualSWP entitlement in MWA’s groundwater basin. Dur-ing dry years, SCWA can take part of MWA’s SWPentitlement in exchange (up to half the banked amountwith a maximum of 10 taf/yr). SCWA pays for part ofthe transportation cost to convey the water to MWA.
Solano County water agencies are monitoring useof groundwater from the Putah Fan/Tehama Forma-tion groundwater basin because of concerns about thecondition of the shared basin. The City of Vacaville,Solano Irrigation District, Maine Prairie Water Dis-trict, and Reclamation District 2068 have implementedAB 3030 groundwater management plans. SCWA hasinitiated a groundwater monitoring and data collec-tion program. Vacaville, SID, Dixon, and SolanoCounty developed a 1995 agreement to cooperativelymitigate any adverse conditions related to the basin.
South Bay. San Francisco Public Utility Commis-sion and the Bay Area Water Users Association (SFPUCBay Area Water contractors) are cooperatively devel-oping a water supply master plan for the PUC’s retailand wholesale service areas. Phase 1 of the three-phaseplan was recently completed. The preliminary list ofwater supply options to be considered in Phase 2 in-cludes:• Short- and long-term Central Valley water trans-
fers.• Conjunctive use / groundwater banking within the
Hetch Hetchy system (Tuolumne River Basin andareas adjacent to the aqueduct).
• Transfers within the Hetch Hetchy system.• Additional surface storage within the Hetch
Hetchy system.• Conjunctive use / groundwater banking within the
Bay Area system.• Transfers within the Bay Area system.• Additional surface storage within the Bay Area
system.• Desalting.• Other local projects.
Phase 2 will ultimately produce a master plan forthe PUC system and is scheduled for completion in1999. Phase 3, the implementation phase of the mas-ter plan, will include environmental review, design, andconstruction of plan elements. Construction is antici-pated to begin as early as 2001.
Without improvements to its water supply reli-ability, SCVWD is forecasted to face the largest drought
year shortages in the San Francisco Bay Region. Thedistrict released an integrated water resources plan inDecember 1996 to address water supply reliabilitythrough 2020. The primary components of the pre-ferred strategy include water banking, water transfers,water recycling, and water conservation. Componentsare scheduled to be phased into operation as necessaryto meet increasing demands. Implementation of spe-cific components is designed to be flexible, with a listof contingency strategies to meet changing conditions.The plan is to be updated every three to five years.
Alameda County Water District is continuing tomonitor and manage saline water intrusion in itsbayside aquifers. The district depends upon the NilesCone groundwater basin, which includes at least threedistinct aquifers, for district supplies. The district re-charges locally developed water and imported surfacewater to the basin and extracts recharged supplies. Priorto ACWD’s import of surface supplies in the 1960s,the upper two aquifers were overpumped, causing sa-line intrusion into the basin. In 1974, ACWD beganits aquifer reclamation program, which includes ninewells designed to extract and discharge saline ground-water from the basin. Because of further intrusion ofsaline water during the recent drought, operations havebeen modified to pump and dispose of greater quanti-ties of saline water. In 1992, a reconnaissance level studywas conducted to evaluate the feasibility of desaltingwater pumped from extraction wells, and blending itwith groundwater and imported surface water. Thisdesalting option is discussed in the following section.
ACWD is developing a groundwater model tosimulate the effectiveness of its aquifer reclamation pro-gram, movement of saline water, and remediation ofthe basin. Because runoff from the Alameda Creek wa-tershed is used to recharge the groundwater basin,ACWD is working with upstream agencies and theRWQCB to ensure that water quality in AlamedaCreek is not compromised due to development or otheractivities in the watershed.
Zone 7 WA has initiated a water supply masterplan program EIR to meet projected water needs. Pre-liminary estimates indicate a need for 40 to 50 taf ofadditional water supply by 2020. The water supplyprogram will include imported surface water transfers,conservation, water recycling, and purchase of theSouth Bay Aqueduct’s currently unused conveyancecapacity.
In a separate planning effort, Z7WA has beenworking with local developers on a water transfer agree-

The California Water Plan Update BULLETIN 160-98
OPTIONS - COASTAL REGIONS7-23
ment to provide water to 9,500 new homes inDougherty Valley, in southern Contra Costa County.A small portion of the Dougherty Valley developmentis within EBMUD’s existing service area. After Con-tra Costa County approved the development in 1992,EBMUD indicated that it could not reliably providewater service to all 11,000 new customers. Ultimately,EBMUD agreed to provide service to Dougherty Val-ley over a lengthy development period, with thecondition that developers try to find another source ofwater. The developers negotiated with Berrenda MesaWater District, a member agency of Kern County WA,to purchase 7 taf of currently unused SWP entitle-ment water. Dublin San Ramon Services Districtagreed to be the water retailer and Z7WA, a whole-saler of SWP water, will treat and deliver water fromthe South Bay Aqueduct. In addition to paying for theentitlement water and connection fees from Z7WAand DSRSD, developers have agreed to pay Z7WA anadditional $18 million for the wholesale service.DSRSD and Z7WA anticipate that the arrangementwill result in lower water costs to existing customersand improved reliability. Another condition of theagreement stated that the project could not use exist-ing local Z7WA storage space (primarily the LivermoreValley groundwater basin). Z7WA completed an agree-ment with Semitropic Water Storage District for 43taf of groundwater storage, which is also being pur-chased by the developers. In wet years, excess waterfrom Berrenda Mesa WD will be delivered to SWSDand stored in the groundwater basin. In drought years,Z7WA would receive SWP water in exchange throughthe SBA.
After the Z7WA / Dougherty Valley arrangementwas finalized, the City of Livermore and environmen-tal interests sued Z7WA in an effort to stop similarfuture arrangements. (The city is one of Z7WA’s pri-mary contractors.) A major concern of the plaintiffs isthat Z7WA’s water supply reliability will be diminished.
EBMUD’s board approved a water supply actionplan in 1995 to meet the objectives of its 1993 watersupply management program EIR for improving sup-ply reliability in its service area. The action plan’srecommendation was to construct a Folsom SouthCanal connection to EBMUD’s Mokelumne Aque-duct, to allow the district to use its CVP contract forup to 150 taf/yr of American River water. The projectwould be designed to operate in accordance with theAlameda County Superior Court’s 1990 Hodge Deci-sion, which confirmed the district’s right to divert its
contract amount subject to the court’s physical solu-tion for instream flow requirements in the LowerAmerican River.
In November 1997, EBMUD and USBR releaseda draft EIR/EIS with two alignment alternatives forconveying American River water and one no projectalternative. One alternative incorporates a concept de-veloped by Sacramento County, the City ofSacramento, and EBMUD to construct a joint diver-sion facility near the American River’s confluence withthe Sacramento River. American River water wouldbe diverted near the confluence and would be pumpedback to the City of Sacramento’s Fairbairn Water Treat-ment Plant. A portion of this water would continueon to the Folsom South Canal where it would be con-veyed to the Mokelumne Aqueduct via a pipelineextension from the end of the canal. Water for Sacra-mento County would be treated at the Fairbairn WaterTreatment Plant and conveyed to local water users.
In 1997, San Joaquin County interests proposeda groundwater storage project that would allowEBMUD to store surface water in San Joaquin Countyaquifers and would provide significant benefits to SanJoaquin County water users. A joint powers authorityof San Joaquin County water agencies hopes to ini-tiate a pilot project to help assess the feasibility of thisconjunctive use proposal. EBMUD has agreed to pro-vide water for the project and is retaining thisalternative for consideration to provide more out-of-service area storage and improved supply reliabilityduring droughts. However, a conjunctive use alterna-tive was not included in EBMUD’s draft EIR forconveyance of its CVP contract supply.
EBMUD has also been involved in negotiationsrelated to instream flows in the Mokelumne River.EBMUD’s 1981 FERC license for operation of hy-dropower facilities at Pardee and Camanche Reservoirsincorporated an existing instream flow agreement be-tween the district and the DFG. During the 1987-92drought, poor fishery conditions on the MokelumneRiver and fish losses at the district’s Camanche fishhatchery prompted FERC to evaluate fishery flows.FERC issued a final EIS in November 1993, whichwas opposed by all the involved parties. Subsequentnegotiations led to preparation of a settlement agree-ment by EBMUD, DFG, and USFWS which wassubmitted to FERC for review in June 1997. EBMUDhas already implemented the agreement’s flows whichsignificantly impact the district’s water supply.EBMUD estimates that its 2020 shortage with the new

The California Water Plan Update BULLETIN 160-98
OPTIONS - COASTAL REGIONS 7-24
agreement flows would increase from 130 taf to 185taf. The district will continue to pursue reliability en-hancement options to meet the expected increasedshortage.
Contra Costa Water District is facing several is-sues with its CVP supply, which is its primary supplysource. CCWD’s CVP contract is scheduled to expirein 2010, but CVPIA established financial penaltiesfor not committing to review by 1997. The district isweighing the potential loss of supply associated withrenewal against the financial penalties, and expects thatthe reliability of its 195 taf contractual supply will bereduced due to CVPIA implementation.
Bay Area Regional Water Recycling Program
With passage of Title 16 of PL 102-575 in 1992,USBR joined with Bay Area water and wastewateragencies to fund a study of regional water recyclingpotential. The Bay Area regional water recycling pro-gram (formerly Central California regional waterrecycling program) was established in 1993 to developa regional partnership for maximizing Bay Area waterrecycling. The program is sponsored jointly by USBR,the Department, and 13 Bay Area water and waste-water agencies. During the first phase of the program,completed in April 1996, participating agencies ex-plored potential uses for water recycled from Bay Areawastewater treatment plants. The feasibility studyshowed that a regional approach would be produc-tive.
A major component of the 1996 feasibility studywas assessment of potential recycled water use in theCentral Valley and other locations outside the BayArea. The study determined that marketing the re-cycled water for agricultural use in the Central Valleywas not feasible. A regional water recycling masterplan, now in preparation, will focus on recycled watermarkets in the Bay Area. A limited assessment of agri-cultural uses immediately south of Santa Clara Countywill be made, but no further assessment of CentralValley uses will be included. Another major compo-nent of the feasibility study was the assessment ofoptions to improve recycled water quality with respectto salinity. Two options originally assessed will not beincluded in the master plan—on-site agricultural saltmanagement and management of agricultural drainage.
Water quality, especially salinity levels, will needto be managed to ensure the feasibility of Bay Areawater recycling. The master plan will consider meth-ods to control salt at the point of origin, including
controlling infiltration of saline groundwater into agen-cies’ pipelines. Other salt control methods to beconsidered include regulation of water softeners, con-trol of industrial discharges, and treatment.
Water Management Optionsfor the San Francisco Bay Region
Table 7-12 shows a list of options for the region,and the results of an initial screening of the options.The retained options were evaluated (Table 7A-2 inAppendix 7A) based on a set of fixed criteria discussedin Chapter 6.
Conservation
Urban. Urban water demand forecasts for 2020assume that BMPs are in place; consequently, onlythose urban conservation efforts which exceed theBMPs are considered as options. All urban conserva-tion options were retained. Reducing outdoor wateruse to 0.8 ET
o in new development would attain about
2 taf/yr of depletion reductions, while extending thismeasure to include existing development would reducedepletions by about 52 taf/yr. Reducing residential in-door water use to 60 and 55 gpcd would attaindepletion reductions of 38 and 77 taf/yr, respectively.Reducing commercial, institutional, and industrialwater use by an additional 3 percent and 5 percentwould attain 11 and 18 taf/yr of depletion reductions,respectively. About 13 taf/yr of depletion reductionswould be attained by reducing distribution systemlosses to 5 percent.
Agricultural. As with urban demand forecasts,agricultural water demand forecasts for 2020 assumethat EWMPs are in place and only those efforts whichexceed the EWMPs are considered as options. Due tothe relatively small amount of irrigated acreage in theregion and the high SAE attained on average through-out the region, no significant depletion reductionswould accrue.
Modify Existing Reservoirs/Operations
Napa County Flood Control and Water Conser-vation District has considered reservoir enlargementoptions which would provide additional offstream stor-age for Napa River flows. In the South Bay, SCVWDhas evaluated enlarging Leroy Anderson Reservoir,which could increase SCVWD’s annual supply byabout 25 taf. EBMUD has had several proposals toenlarge both of its Mokelumne River reservoirs. The

The California Water Plan Update BULLETIN 160-98
OPTIONS - COASTAL REGIONS7-25
TABLE 7-12
San Francisco Bay Region List of Water Management Options
Option Retain Reason for Deferralor Defer
Conservation
Urban
Outdoor Water Use to 0.8ETo
Retain
Indoor Water Use Retain
Interior CII Water Use Retain
Distribution System Losses Retain
Agricultural
Seasonal Application Efficiency Improvements Defer No significant depletion reductions attainable.
Flexible Water Delivery Defer No significant depletion reductions attainable.
Canal Lining and Piping Defer No significant depletion reductions attainable.
Tailwater Recovery Defer No significant depletion reductions attainable.
Modify Existing Reservoirs/Operations
Enlarge Lake Hennessey / Napa River Diversion Retain
Enlarge Bell Canyon Reservoir Retain
Enlarge Bell Canyon Reservoir/ RetainNapa River Diversion
Enlarge Pardee Reservoir Retain
Enlarge Camanche Reservoir Retain
Enlarge Briones Reservoir Defer Geologic hazards.
Enlarge Chabot Reservoir Defer Substantial residential development.
Enlarge Leroy Anderson Reservoir Retain
Upgrade Milliken Treatment Plant Retain
Reoperate Rector Reservoir Retain
New Reservoirs/Conveyance Facilities
Chiles Creek Reservoir Project/ RetainNapa River Diversion
Enlarge Lake Hennessey /Chiles Creek Project / RetainNapa River Diversion
Carneros Creek Reservoir / Napa River Diversion Retain
Upper Del Valle Reservoir Retain
Buckhorn Dam and Reservoir Retain
Upper Kaiser Reservoir Retain
Upper Buckhorn Reservoir Retain
Middle Bar Reservoir Retain(Amador & Calaveras Counties)
Duck Creek Offstream Reservoir Retain
Devils Nose Project (Amador County) Retain
Clay Station Reservoir (Sacramento County) Defer Wetlands, endangered species.
Alamo Creek Reservoir Defer Substantial residential development.
Bolinger Reservoir Defer Substantial residential development.
Cull Canyon Dam Defer Substantial residential development.
Canada del Cierbo Reservoir Defer Storage cost too high ($16,000/af).
Curry Canyon Reservoir Defer Substantial residential development.

The California Water Plan Update BULLETIN 160-98
OPTIONS - COASTAL REGIONS 7-26
TABLE 7-12
San Francisco Bay Region List of Water Management Options (continued)
Option Retain Reason for Deferralor Defer
Lower Kaiser Reservoir Defer Storage cost too high ($9,000/af).
Bailey Road Reservoir Defer Storage cost too high ($21,000/af).
EBMUD American River Supply Retain
Groundwater/Conjunctive Use
EBMUD/San Joaquin County Conjunctive Use Defer Under discussion; not yet defined.
Milliken Creek Conjunctive Use Retain
Lake Hennessey /Conn Creek Conjunctive Use Retain
Recharge Dumbarton Quarry Pits Defer Unsuitable geologic conditions.
Sunol Valley Groundwater Recharge Defer Limited aquifer production.
Water Marketing
Napa/Solano County WA Exchange Defer SCWA is not interested in exchange.
Solano County WA Defer No proposals identified at this time.
Contra Costa WD Defer No proposals identified at this time.
Zone 7 WA/Kern County WA Retain
Santa Clara Valley WD/SLDMWA Retain
Water Recycling
Bel Marin Keys Golf Course - North Marin RetainWater District
Black Point Golf Links - North Marin Water RetainDistrict
Central Marin Water Recycling Project - Marin RetainMWD
Golf Course Irrigation, City Park Irrigation - RetainNorth San Mateo CSD
Hercules/Franklin Canyon WRP-Phase 2 - RetainEBMUD
Industrial Use - Central Contra Costa Sanitary RetainDistrict
Lamorinda - Central Contra Costa Sanitary RetainDistrict
Nonpotable Wastewater Reuse Master Plan - RetainUnion Sanitation District
Phase 1 Water Reclamation Program - Alameda RetainCounty WD
Phase 2 Water Reclamation Program - Alameda RetainCounty WD
San Francisco Water Recycling Master Plan Retain
San Ramon Valley Recycled Water Program - RetainDSRSD/EBMUD
San Ramon Valley Water Recycling Project - RetainEBMUD
South Bay Water Recycling Project - City of RetainSanta Clara
South Bay Water Recycling Project - San Jose Retain
Zone 1 - Central Contra Costa Sanitary District Retain

The California Water Plan Update BULLETIN 160-98
OPTIONS - COASTAL REGIONS7-27
improvement of system yields associated with theseprojects has not been determined.
Reoperating Rector Reservoir in Napa Countywould provide an increase of approximately 1.2 taf/yrin system yield. NCFC&WCD is also considering amodification of its Milliken Water Treatment Plant,which would generate a small increase (450 af ) in itsannual water supply.
Table 7-15
New Reservoirs and Conveyance FacilitiesTen new reservoirs were evaluated for Bay Area
water agencies. NCFC&WCD investigated severaldiversion and storage projects, including Chiles CreekReservoir Project and Carneros Creek ReservoirProject. The viability of these offstream storage projectsdepends upon the district’s ability to make Napa Riverdiversions. (SWRCB has declared the Napa River to
TABLE 7-12
San Francisco Bay Region List of Water Management Options (continued)
Option Retain Reason for Deferralor Defer
Desalting
Brackish Groundwater
Alameda County WD Aquifer Recovery Project Retain
Seawater
Marin Municipal WD Desalting Project Retain
Other Local Options
New Surface Water Diversion from Sacramento RetainRiver by Cities of Benicia, Fairfield, & Vacaville
Statewide Options
— — See Chapter 6.
USBR’s Folsom South Canalwas designed to convey water
from the American Riverbelow Nimbus Dam to
central San Joaquin County.Only part of the canal was
actually constructed, and thecanal now terminates in
southeastern SacramentoCounty.
Courtesy of USBR

The California Water Plan Update BULLETIN 160-98
OPTIONS - COASTAL REGIONS 7-28
be fully appropriated during parts of the year.) Someagencies, including ACWD, have examined an UpperDel Valle Reservoir Project. EBMUD has consideredthree new storage reservoirs in its service area and twonew reservoirs in the Mokelumne Basin (Middle Barand Devils Nose projects). These storage options havebeen inactive since EBMUD’s focus on its supplemen-tal water supply project.
As discussed previously, EBMUD and USBR re-leased a draft EIR/EIS in 1997 for EBMUD’s diversionof its American River CVP supply. EBMUD estimatesthat it would receive 112 taf and 70 taf in average anddroughts years, respectively. (The draft EIR/EIS evalu-ates alternatives for conveyance of the water. Projectyield remains the same in either of the conveyance al-ternatives.)
Groundwater Development or Conjunctive Use
EBMUD is continuing discussions with SanJoaquin County interests for a joint groundwater stor-age/conjunctive use project. EBMUD’s CVP contractwater could be stored in San Joaquin County ground-water basins prior to being diverted into EBMUD’sMokelumne River Aqueduct in northeast San JoaquinCounty. This option was considered in EBMUD’s1995 Water Supply Action Plan, but not included inEBMUD’s draft EIR for conveyance of its CVP con-tract supply. The yield is currently undefined.
Only two groundwater or conjunctive use optionsin Table 7-12 were retained for further evaluation.NCFC&WCD has two proposals to construct con-junctive use facilities adjacent to existing surface waterfacilities. The proposed Milliken Creek conjunctive useproject would allow the City of Napa and the SilveradoCountry Club to share surface and groundwater sup-plies, and would provide an additional drought yearyield of 1.9 taf. The proposed Lake Hennessey/ConnCreek conjunctive use project would make the City ofNapa’s surface water available to agricultural users inexchange for rights to pump groundwater duringdroughts. This option would provide an estimated 5 tafduring drought years.
Water Marketing
Agencies throughout the Bay Area are proposingto negotiate for new or additional water imports intothe region. Most of these proposals are preliminary.Water transfer proposals by SCWA, CCWD, andZ7WA all include transfers from as-yet-unnamed Sac-ramento Valley water users. The actual amount of water
available through these proposals is unknown and thecompetition for transfers will certainly impact bothprice and availability. A likely option for Z7WA is thepermanent transfer of 7 taf of SWP entitlement fromKCWA, as provided for in SWP’s Monterey Amend-ments.
Several agencies in the region already have bank-ing and exchange agreements with agencies in theTulare Lake, South Lahontan, and Colorado River re-gions. These agreements among SWP contractorsinvolve exchanges of SWP entitlement. ACWD,Z7WA, and SCVWD are participating in SWSD’sgroundwater banking program and have long-termcontracts for 50, 43, and 350 taf of storage, respec-tively. SWP entitlement would be delivered to SWSDfor groundwater recharge in wet years and SWSD, amember agency of KCWA, would forego a portion ofits entitlement in dry years in exchange. SCWA has asimilar agreement with MWA in San BernardinoCounty for up to 10 taf.
SCVWD has also entered into a three-way trans-fer agreement with the San Luis Delta-Mendota WaterAuthority and USBR. Under this option, participat-ing member agencies of SLDMWA may receive someof SCVWD’s CVP water allocation in normal andabove-normal water years, in exchange for commit-ting to make available a share of their CVP allocationduring drought years. This option would provideSCVWD with up to 14 taf in drought years and isdiscussed in more detail in Chapter 6.
Water Recycling
The 1995 water recycling survey identified 16water recycling options in the San Francisco Bay Re-gion, with a total potential 2020 yield of 101 taf. Theaverage price of recycled water from these optionswould be just over $500/af, with a range from $100 toover $2,000/af. The most common use for recycledwater would be for landscape irrigation. A few optionswere proposed for industrial or agricultural use.
One consideration in evaluating water recyclingproposals is that a number of options may be proposedfor the same wastewater treatment plant. These op-tions depend upon different distribution systems andare therefore considered separately for this report. Someof the larger projects with their associated 2020 yieldinclude the South Bay water recycling program(31 taf ), the Central Contra Costa Sanitary Districtindustrial use project (20 taf ), the San Francisco waterrecycling management plan (12 taf ), and the San

The California Water Plan Update BULLETIN 160-98
OPTIONS - COASTAL REGIONS7-29
Ramon Valley recycled water project (10 taf ). Most ofthe remaining water recycling options have 2020 yieldsin the range of 1 to 4 taf.
Desalting
Alameda County WD has evaluated the potentialfor desalting brackish water to allow increased use ofgroundwater. Water pumped from the district’s aqui-fer recovery project wells would be desalted andblended with groundwater and Hetch Hetchy waterto provide a quality consistent with other sources ofsupply. The plant would produce 9 taf/yr at a cost ofabout $500/af.
In the past, Marin MWD examined seawater de-salting as an option to augment its water supply. Thedistrict studied constructing a 10 mgd reverse osmosisdesalting plant. The plant’s annual production wouldbe approximately 10 taf at a cost of $1,900/af.
Other Local Options
Solano County WA and its member agencies havebeen examining several surface water managementprojects to improve their water supply reliability. Oneproposal is to apply for additional water rights fromthe Sacramento River. The Cities of Benicia, Fairfield,and Vacaville have filed an application with theSWRCB to divert an additional 31 taf/yr. The waterwould be conveyed to the cities via the North BayAqueduct. (Vacaville is in the Sacramento River Re-gion and its share is 8.5 taf/yr).
Statewide Options
Statewide water supply augmentation options arediscussed and quantified in Chapter 6.
Options Likely to be Implemented inSan Francisco Bay Region
Water supplies are not available to meet all of theregion’s 2020 water demands in drought years. Ap-plied water shortages are forecasted to be 287 taf. Noaverage year water shortages are forecasted for 2020.Ranking of retained water management options forthe San Francisco Bay Region is summarized in Table7-13. Table 7-14 summarizes options that can likelybe implemented by 2020 to relieve the shortages.
Implementation of BMPs will continue through2020 and is reflected in the base demand levels forurban water use. Urban conservation options likely tobe implemented, based on costs and feasibility, would
provide an estimated 57 taf/yr in water savings in theregion.
Agencies throughout the region have ambitiousplans for water recycling as a future water supply op-tion. These options could provide an additional 24 taf/yr to the region by 2020. EBMUD’s American Riversupply would augment drought year supplies by 70 taf.Water marketing agreements being negotiated withCentral Valley agencies will likely add 19 taf/yr in thenear future. Statewide options including SWP im-provements and drought water bank would likelyaugment drought supplies by 100 taf.
Many South Bay water purveyors’ systems are in-terconnected, reflecting a common reliance on theSWP, CVP, and Hetch Hetchy facilities for their watersupplies. CCWD and SCVWD are connected to theDelta via CVP facilities. In addition, piping to facili-tate connections between EBMUD and CCWD andthe City of Hayward is in place for emergency trans-fers. (These connections are of limited capacity to allowfor transfers in a catastrophic event.) SCVWD,ACWD, and Z7WA are connected by the SWP’s SouthBay Aqueduct. SFPUC now has a permanent connec-tion to the SWP, to allow it to take delivery of watertransfers wheeled by the SWP. These interconnectionsfacilitate water transfers and are positive factors in waterresources management in the South Bay.

The California Water Plan Update BULLETIN 160-98
OPTIONS - COASTAL REGIONS 7-30
TABLE 7-13
Options Ranking for San Francisco Bay Region
Optiona Rank Cost ($/af) Potential Gain (taf)Average Drought
Conservation
Urban
Outdoor Water Use to 0.8 ETo- New Development M 750 2 2
Outdoor Water Use to 0.8 ETo-New and Existing Development L b 52 52
Indoor Water Use (60 gpcd) M 400 38 38
Indoor Water Use (55 gpcd) M 600 77 77
Interior CII Water Use (3%) M 500 11 11
Interior CII Water Use (5%) M 750 18 18
Distribution System Losses (5%) M 300 13 13
Modify Existing Reservoirs/Operations
Enlarge Lake Hennessey /Napa River Diversion M 630 12 -
Enlarge Bell Canyon Reservoir M b b 2
Enlarge Bell Canyon Reservoir/Napa River Diversion M b b 4
Enlarge Pardee Reservoir M b b 30
Enlarge Camanche Reservoir M b b 15
Enlarge Leroy Anderson Reservoir M 4,400 b 25
Upgrade Milliken Treatment Plant M 1,770 1 1
Reoperate Rector Reservoir M 800 - 1
New Reservoirs/Conveyance Facilities
Chiles Creek Reservoir Project/Napa River Diversion L 1,170 12 -
Enlarge Lake Hennessey/Chiles Creek Project/ L 1,030 15 -Napa River Diversion
Carneros Creek Reservoir/Napa River Diversion L 2,100 12 -
Upper Del Valle Reservoir M 1,600 5 2
Buckhorn Dam and Reservoir M b b 23
Upper Kaiser Reservoir M b b 6
Upper Buckhorn Reservoir L b b 3
Middle Bar Reservoir L b b 15
Duck Creek Offstream Reservoir L b b 15
Devils Nose Project L b b 23
EBMUD American River Supply M 850 112 70
Groundwater/Conjunctive Use
Milliken Creek Conjunctive Use H 150 - 2
Lake Hennessey/Conn Creek Conjunctive Use H 280 - 5
Water Marketing
Z7WA/KCWA (7 taf entitlement) H b 7 5
SCVWD/SLDMWA H b - 14

The California Water Plan Update BULLETIN 160-98
OPTIONS - COASTAL REGIONS7-31
TABLE 7-14
Options Likely to be Implemented by 2020 (taf)San Francisco Bay Regiona
Average Drought
Applied Water Shortage 0 287
Options Likely to be Implemented by 2020 Conservation - 57 Modify Existing Reservoirs/Operations - - New Reservoirs/Conveyance Facilities - 70 Groundwater/Conjunctive Use - 7 Water Marketing - 19 Recycling - 24 Desalting - 9 Other Local Options - - Statewide Options - 100 Expected Reapplication - 1
Total Potential Gain - 287
Remaining Applied Water Shortage 0 0
TABLE 7-13
Options Ranking for San Francisco Bay Region (continued)
Optiona Rank Cost ($/af) Potential Gain (taf)Average Drought
Water Recycling
Group 1 (Cost < $500/af) H 500 24 24
Group 2 (Cost $500/af - $1,000/af) M 1,000 20 20
Group 3 (Cost > $1,000/af) M 1,500 46 46
Desalting
Brackish Groundwater
Alameda County Water District Aquifer Recovery Project H 510 9 9
Seawater
Marin Municipal Water District Desalting Project L 1,900 10 10
Other Local Options
New Surface Water Diversion from Sacramento River by M b 22 22Cities of Benicia, Fairfield, & Vacavillec
Statewide Options
See Chapter 6.
a All or parts of the amounts shown for the highlighted options have been included in Table 7-14.b Data not available to quantify.c The three cities have applied for 31 taf/yr of supplemental water, part of which would be used in the Sacramento River Region.
a Implementing options to reduce drought year shortages would provide more water than is needed to meet average year needs. In average years, this water could be available for transfer to other regions, or some options could be operated at less than their full capacity.

The California Water Plan Update BULLETIN 160-98
OPTIONS - COASTAL REGIONS 7-32
FIGURE 7-4.
Central Coast Hydrologic Region
SANBENITO
MONTEREY
SAN LUIS OBISPO
SANTABARBARA
SANTACRUZ
Loch LomondReservoirSan
LorenzoRiver
UvasReservoir
Pacheco Tunneland Conduit
Carmel Salinas
River
Pajaroer
San
Benito
River
SanAntonio
River
NacimientoRiver
NacimientoReservoir
EstrellaRiverSalinas
River Santa MargaritaLake
San
JuanCreek
Santa MariaRiver
Cuyama
River
TwitchellReservoir
River GilbralterReservoir
JamesonLake
LopezLake
Ynez
San AntonioReservoir
Whale RockReservoir
Sisquoc
RiverSanta
Whale RockConduit
HollisterConduit
Santa ClaraConduit
San Luis ObispoConduit
Riv
Coastal Branch ofCalifornia Aqueduct
CachumaReservoir
BigSur er
Riv
erR
iv
South
Coast Conduit
Pa
ci
fi
c
Oc
ea
n

The California Water Plan Update BULLETIN 160-98
OPTIONS - COASTAL REGIONS7-33
Description of the Area
The Central Coast Region (Figure 7-4) extendsfrom southern San Mateo County in the north to SantaBarbara County in the south. The region includes thesouthern tip of San Mateo County, part of Santa ClaraCounty, most of San Benito County, all of Santa Cruz,Monterey, San Luis Obispo and Santa Barbara Coun-ties, and the northwestern tip of Ventura County. Themajor topographic features include Monterey andMorro Bays; the Pajaro, Salinas, Carmel, Santa Maria,Santa Ynez and Cuyama Valleys; the Coast Range, andthe coastal plain of Santa Barbara County. The regionis divided into two planning subareas: Northern (in-cluding all counties except San Luis Obispo and SantaBarbara) and Southern (San Luis Obispo and SantaBarbara Counties). Summer temperatures are coolalong the coastline and warmer inland. In the winter,temperatures remain cool along the coast but becomecooler inland. Annual precipitation ranges from about10 inches on valley floors at the south end of the re-gion to as much as 50 inches on some of the highestpeaks. The year-round frost-free climate of the coastalvalleys makes them ideal for production of specialtycrops such as strawberries and artichokes.
The principal population centers in the region areSanta Cruz, Hollister, Salinas, Monterey, Paso Robles,San Luis Obispo, Santa Maria, Goleta, and Santa Bar-bara. Intensive agriculture is found in the Salinas andPajaro Valleys in the north and the Santa Maria andlower Santa Ynez Valleys in the south. Agriculturalacreage has remained fairly stable during recent years,although urban development is encroaching on somevalley agricultural lands. In the Pajaro and Salinas Val-leys, the major crops include vegetables, specialty crops,
and cut flowers. Wine grape acreage has increased inthe upper Salinas Valley. The flower seed industry inLompoc Valley is thriving and attracts many touristseach year. Parts of the upper Salinas Valley and CarrizoPlain are dry-farmed to produce grains. Table 7-15shows the region’s population and crop acreage for 1995and 2020.
Major economic activities include tourism,agricultural-related processing, and government and
The Pajaro and Salinas Valleys are known for theirproduction of specialty crops. Castroville is sometimes calledthe artichoke capital of the world.
. . .
Central CoastHydrologic Region

The California Water Plan Update BULLETIN 160-98
OPTIONS - COASTAL REGIONS 7-34
service sector employment. Oil production and trans-portation sites onshore and offshore are important tothe economies of Santa Barbara and San Luis ObispoCounties. San Luis Obispo County has major thermalpowerplants at Diablo Canyon and Morro Bay. Mili-tary facilities include Hunter-Liggett MilitaryReservation, Vandenberg Air Force Base, and CampSan Luis Obispo.
Water Demands and Supplies
The water budget for the Central Coast Region isshown in Table 7-16. Groundwater is the primarysource of water supply in the region, followed by localsurface water. CVP water supply is delivered to thenorthern part of the region from San Luis Reservoir.SWP Coastal Branch deliveries to the southern part ofthe region began in 1997. Most of the water shortagein the region is due to groundwater overdraft, althoughthe overdraft is expected to lessen with SWP water de-liveries and decreased agricultural demands.
Northern PSA
This planning subarea includes Santa CruzCounty, Pajaro Valley, the Monterey Peninsula, and
Salinas Valley. Water agencies include MontereyCounty Water Resources Agency, Monterey PeninsulaWater Management District, Marina Coast Water Dis-trict, California-American Water Company (Carmel),Pajaro Valley Water Management Agency, City of SantaCruz, and San Benito County Flood Control andWater Conservation District.
The Northern PSA is comprised of a number ofmedium-to-small independent watersheds. There islimited infrastructure for water transfers among thewatersheds and from outside the region. The only waterimport from outside the region comes from CVP’s SanFelipe Unit, which imports 53 taf/yr into southernSanta Clara and San Benito Counties.
Groundwater is the primary water source for thesubarea. Groundwater recharge is provided by thePajaro, Salinas, and Carmel Rivers, and by Arroyo Seco.San Clemente and Los Padres Dams on the CarmelRiver (Monterey County), San Antonio Dam on theSan Antonio River (Monterey County), andNacimiento Dam on the Nacimiento River (San LuisObispo County) are the region’s main surface waterstorage facilities. Water impounded in these reservoirsis managed to provide groundwater recharge.
Southern PSA
The largest water agencies in the southern PSAare two countywide agencies—the San Luis ObispoCounty Flood Control and Water Conservation Dis-trict and the Santa Barbara County Flood Control andWater Conservation District. The Central Coast Wa-ter Authority was formed in 1991 to construct, manage,and operate Santa Barbara County’s 42 mile portion
TABLE 7-15
Population and Crop Acreage
Population Irrigated Crop Acreage(thousands) (thousands of acres)
1995 1,347 5722020 1,946 570
TABLE 7- 16
Central Coast Region Water Budget (taf)a
1995 2020Average Drought Average Drought
Water UseUrban 286 294 379 391Agricultural 1,192 1,279 1,127 1,223Environmental 118 37 118 37Total 1,595 1,610 1,624 1,652
SuppliesSurface Water 318 160 368 180Groundwater 1,045 1,142 1,041 1,159Recycled and Desalted 18 26 42 42Total 1,381 1,328 1,452 1,381
Shortage 214 282 172 270a Water use/supply totals and shortages may not sum due to rounding.

The California Water Plan Update BULLETIN 160-98
OPTIONS - COASTAL REGIONS7-35
of the Coastal Aqueduct. Many small retail agenciesand small municipalities provide their own water sup-plies.
The major source of water in the two counties iscoastal groundwater basins. SLOCFC&WCD andSBCFC&WCD contract with the Department forSWP water. The two agencies have contractual entitle-ments totaling 70.5 taf/yr. Due to the 1987-92drought, three seawater desalting plants were con-structed in the region. The City of Morro Bay’s planthas an annual capacity of 670 af and is used whengroundwater supplies are limited during dry periods.The City of Santa Barbara’s plant has an annual capac-ity of 7.5 taf and is on standby. (Although the SantaBarbara plant only operated briefly in 1992, it is con-sidered in the base water budget as a drought yearsupply under 1995 level of development, and as anaverage and drought year supply in 2020.) The plantat San Simeon Beach State Park has minimal capacity(45 af ) and is also on standby.
There are two USBR projects in the subarea. TheCachuma Project provides Santa Ynez River water tothe Santa Barbara area; main project facilities are the205 taf Cachuma Reservoir (Bradbury Dam) and theSouth Coast Conduit. The Santa Maria Project pro-vides Cuyama River water for irrigation use in the SantaMaria area; main project facilities are Twitchell Damand Reservoir (240 taf ). Another federal reservoir,
USACE’s 26 taf Santa Margarita Lake (Salinas Dam)provides supply for the City of San Luis Obispo.
Local Water ResourcesManagement Issues
Seawater Intrusion
With Central Coast’s limited surface supply andfew surface water storage facilities, the growing demandfor water is causing an increased dependence on theregion’s groundwater resources. Because groundwaterextractions have exceeded groundwater replenishment,seawater has advanced into some coastal freshwateraquifers, degrading water quality. Seawater intrusionis a major concern in the region.
Several decades of over-pumping groundwaterhave caused seawater intrusion in the aquifers that sup-ply the Salinas Valley with nearly 100 percent of itsfresh water. Seawater has intruded almost 6 miles in-land into the 180-foot aquifer and two miles inlandinto the 400-foot deep aquifer. This intrusion has ren-dered the groundwater too salty for either municipalor agricultural use. Replenishment of groundwater oc-curs primarily from percolation of surface water fromthe Salinas River and its tributaries. The constructionof Nacimiento and San Antonio Dams in 1957 and1965, respectively, has increased replenishment but has
DWR’s extension of theCoastal Branch to serveSan Luis Obispo and SantaBarbara Counties providesan imported surface watersupply that can help reduceoverdraft of coastalgroundwater basins.

The California Water Plan Update BULLETIN 160-98
OPTIONS - COASTAL REGIONS 7-36
not stopped seawater intrusion. In 1994, SWRCB be-gan investigating the Salinas Valley. The SWRCBsuggested that adjudication may be necessary if thelocal agencies could not halt the seawater intrusion.
In 1998, the MCWRA and the MRWPCA jointlycompleted a $78 million Salinas Valley reclamationproject and Castroville seawater intrusion project.These projects consist of a 19.5 taf/yr tertiary treat-ment plant and a distribution system that will providerecycled water to 12,000 acres of Castroville area farms.During the low irrigation demand periods in winter,early spring and late fall, recycled water will supplymost of the water needed for irrigation. During latespring, summer, and early fall, growers will receive ablend of recycled water and groundwater. The projectswill reduce groundwater pumping in the project area,thus reducing seawater intrusion. Additionally, theprojects will reduce the amount of secondary-treatedwastewater discharged to the Monterey Bay NationalMarine Sanctuary. The sanctuary is a federally-pro-tected aquatic ecosystem extending from Point Reyesto San Luis Obispo with abundant marine resourcesincluding kelp forests, marine mammals, and sea andshore birds.
MCWRA is preparing an EIR and preliminarydesign for a Salinas Valley water project to solve sea-water intrusion and nitrate contamination. Majorcomponents of the project include dam modificationsand reservoir reoperation, river conveyance and diver-sion facilities, groundwater recharge, storage forrecycled water, distribution systems, and conservation.The project also will include management strategiesto address nitrate contamination problems.
Seawater intrusion is also a problem facing thePajaro Valley. Pajaro Valley Water Management Agencyis preparing environmental documents to address wa-ter management issues facing the valley, followingadoption of a basin management plan in 1993. Theplan includes projects to develop local supplies, re-charge groundwater, import new water, and adoptconservation measures to help solve groundwater over-draft and attendant seawater intrusion problems.Failing to implement the plan could result in inter-vention by SWRCB, potentially resulting in basinadjudication and restrictions on extractions. PVWMAis working closely with SWRCB to address ground-water overdraft problems, and SWRCB has reserved$5 million in low interest loan money from the Propo-sition 204 Seawater Intrusion Control Fund to helpassist PVWMA in implementing its basin management plan.
Local Water Agency IssuesSanta Cruz County relies mostly on surface water
diversions. Drought years pose a threat of water ra-tioning and shortages because of the lack of adequatestorage facilities. Seawater intrusion is a concern forgroundwater users. For example after years of stableconditions, groundwater quality in municipal wells inthe Soquel-Aptos area began to degrade in 1993-94.Soquel Creek Water District, the largest purveyor inthis part of the county, relies primarily on groundwa-ter. As measured in monitoring wells along theMonterey Bay coastline, groundwater quality degradednoticeably in less than 4 years, with chloride concen-trations increasing from 20 to 40 mg/L to about 250to 2,500 mg/L. These conditions occurred despite thedistrict’s managing its extractions to maintain coastalgroundwater levels above sea level and decreasing itspumping.
Between urban growth and growth in tourism, theMonterey Peninsula is expected to experience morefrequent shortages in drought years. Water supply forthe area comes from the Carmel River, which has rela-tively little developed storage. In its Monterey Peninsulawater supply project final EIR/EIS, MPWMD chosethe 24 taf New Los Padres Reservoir on the CarmelRiver as its preferred alternative for meeting futurewater needs. The proposed reservoir would expand thePeninsula’s water supply and help protect and restorenatural resources on the Carmel River, by providinginstream flows. However, voters defeated bonds for theproject in a 1995 election. MPWMD staff prepared awater supply alternatives plan in 1996 which includedrecommendations for expanded groundwater produc-tion, additional recycled water use, desalting, andadditional conservation programs.
In 1995, SWRCB determined that Cal-Am wasdiverting approximately 10.7 taf/yr out of the CarmelRiver Basin without valid water rights. SWRCB or-dered that diversions from the river be reduced, andthat sources outside of the basin be developed. One ofthese sources could be additional groundwater produc-tion from the Seaside Basin, but use of this basin as areplacement for diversions from the Carmel River isbeing challenged in litigation. SWRCB indicated thatNew Los Padres Reservoir should be reconsidered toenhance Carmel River habitat values and to providefor Cal-Am’s water supply. In 1996, Cal-Am decidedto proceed with the New Los Padres Reservoir, butwith a reduced urban yield of 10.7 taf to support onlyexisting water needs, without providing supplies for

The California Water Plan Update BULLETIN 160-98
OPTIONS - COASTAL REGIONS7-37
future growth. The remainder of the reservoir’s supplywould be used for instream flow enhancement.
The City of San Luis Obispo has been pursuing aSalinas Reservoir expansion project to supplement itswater supply. The existing reservoir is owned byUSACE and is managed by SLOCFC&WCD. Theexpansion project involves installing spillway gates toexpand the storage capacity from about 24 taf to 42taf. The proposed project would increase the city’s an-nual water supply by about 1.6 taf, but would supplyonly a portion of the city’s expected future water de-mands. An initial draft EIR was issued in late 1993. Arevised draft EIR was issued in May 1997.
Seawater Desalting
Current municipal seawater desalting capacity inthe Central Coast Region is almost entirely based onthe City of Santa Barbara’s desalting plant (7.5 taf/yr).The remainder of the plants are small, less than 750 af/yr in capacity. During the 1987-92 drought, a num-ber of seawater desalting projects were anticipated, butthe return of average water years put most of theseplants on hold. Only Santa Barbara, Morro Bay, andthe San Simeon Beach State Park installed plants be-cause of the drought. Proposed bonds for a 3 mgdseawater desalting plant for Monterey Peninsula Wa-ter Management District were rejected by voters in1992. The plants in Santa Barbara and San Simeonare on standby. The plant at Morro Bay is used onlyduring dry periods when groundwater supplies are lim-ited.
In response to seawater intrusion in its ground-water basin, the Marina Coast Water Districtcompleted a 300,000 gpd (340 af/yr) seawater desalt-ing plant in 1997. The plant produces about 14 percentof the district’s water supply.
Water Management Optionsfor the Central Coast Region
Table 7-17 shows a list of options for the region,and the results of an initial screening of the options.
The Monterey Bay NationalMarine Sanctuary is home
to a variety of species.
The Cuyama River has its headwaters in northwesternVentura County and flows onto the Cuyama Valley floor inSan Luis Obispo and Santa Barbara Counties. As suggestedby this photo, the river’s flow is ephemeral. Valley agricultureis supported by groundwater.

The California Water Plan Update BULLETIN 160-98
OPTIONS - COASTAL REGIONS 7-38
TABLE 7-17
Central Coast Region List of Water Management Options
Option Retain Reason for Deferralor Defer
Conservation
Urban
Outdoor Water Use to 0.8ETo
Retain
Indoor Water Use Retain
Interior CII Water Use Retain
Distribution System Losses Retain
Agricultural
Seasonal Application Efficiency Improvements Defer No significant depletion reductions attainable.
Flexible Water Delivery Defer No significant depletion reductions attainable.
Canal Lining and Piping Defer No significant depletion reductions attainable.
Tailwater Recovery Defer No significant depletion reductions attainable.
Modify Existing Reservoirs/Operations
Modify Nacimiento Spillway Retain
Inter-Lake Tunnel - Nacimiento/San Antonio Defer Alternative to preferred Nacimiento spillwayReservoirs modification.
Enlargement of Salinas Reservoir Retain
Enlargement of Cachuma Reservoir Retain
Enlargement of Lopez Reservoir Defer Excessive unit cost.
New Reservoirs/Conveyance Facilities
College Lake Retain
Bolsa De San Cayetano Reservoir Defer Fishery and foundation issues; excessive cost.
Corncob Canyon Reservoir Defer High level of housing development in canyon.
Pescadero Reservoir Defer Fishery and foundation issues; excessive cost.
Gabilan Creek Dam Defer Questionable water supply.
Feeder Streams (Various Sites) Retain
Chalone Canyon Dam Defer Questionable water supply.
Vaqueros Canyon Dam Defer Questionable water supply.
New Los Padres Reservoir Retain
Nacimiento Pipeline Retain
Arroyo Seco Dam Defer Impacts to environment, residential andcommercial development.
Barloy Dam Defer Questionable water supply.
Mathews Dam Defer Questionable water supply.
Jerret Dam Defer Questionable water supply.
New San Clemente Reservoir Defer Strong regulatory agency objections.
San Clemente Creek Reservoir Defer High probability of inundating spotted owl habitat.
Cachagua Reservoir Defer Questionable supply and located outsideMPWMD boundaries.
Canada Reservoir Defer Questionable geological conditions at dam site.
Klondike Dam Defer Located near active faults; inundation of residentialdevelopment.
Chupines Creek Reservoir Defer Questionable supply and located outsideMPWMD boundaries.
Pine Creek Defer Potential impacts to environmentally sensitiveareas.

The California Water Plan Update BULLETIN 160-98
OPTIONS - COASTAL REGIONS7-39
TABLE 7-17
Central Coast Region List of Water Management Options (continued)
Option Retain Reason for Deferralor Defer
Buckeye Creek Defer Located near active faults; unsuitable damfoundation.
Lower Jack Defer Environmental impacts; riparian oak grassland.
Santa Rita Defer Environmental impacts; riparian oak grassland.
Camuesa and Salsipuedes Reservoirs Defer Environmental impacts; presence of endangeredspecies.
Hot Springs, New Gilbraltar, and Round Defer Insufficient yield, high unit cost of water.Corral Reservoirs
Groundwater/Conjunctive Use
College Lake Injection/Extraction Wells Retain
Increase Groundwater Development in RetainSeaside Basin
Seaside Conjunctive Use Defer Insufficient yield.
Salinas River Well System Defer Will not produce supply without implementingother new supply component.
Storage and Infiltration Basins/Recharge Defer Questionable water supply.
Upper/Lower Carmel Valley Well Development Defer Questionable water supply.
Water Marketing
CVP (San Felipe Project Extension) Retain
SWP (Coastal Branch/Salinas River/Nacimiento Defer No current local interest.transfer)
Water Recycling
Aquifer Storage/Recovery - Monterey County RetainWater Resources Agency
Castroville Seawater Intrusion Project expansion Retain
Santa Cruz Water Reuse Project - Pajaro Valley RetainWMA
SSLOCSD Reclamation Project - City of Arroyo RetainGrande
SVWD Recycled Water Plant - Scotts Valley RetainWater District
Urban Reuse Project - Monterey Regional Water RetainPollution Control Agency
Watsonville Water Resue Project - Pajaro Valley RetainWMA
Injected Treated Water/Carmel River Mouth Defer Health concerns.
Desalting
Brackish Groundwater
City of Santa Cruz Retain
Seawater
Monterey Peninsula Water Management District Retain

The California Water Plan Update BULLETIN 160-98
OPTIONS - COASTAL REGIONS 7-40
The retained options were evaluated (Table 7A-3 inAppendix 7A) based on a set of fixed criteria discussedin Chapter 6.
Water Conservation
Urban. Urban water demand forecasts for 2020assume that BMPs are in place; consequently, onlythose urban conservation efforts which exceed BMPsare considered as options. Reducing outdoor water useto 0.8 ET
o in new development would attain about
4 taf/yr of depletion reductions, while extending thismeasure to include existing development would reducedepletions by about 13 taf/yr. Reducing residential in-door water use to 60 and 55 gpcd would reducedepletions by 8 and 17 taf/yr, respectively. ReducingCII water use by an additional 3 and 5 percent wouldattain 2 taf and 3 taf of depletion reductions per year,respectively. Reducing distribution system losses to 7and 5 percent would save 3 and 8 taf/yr.
Agricultural. The 2020 agricultural water demandforecasts assume that EWMPs are in place. As withthe urban water management options, only those ag-ricultural conservation efforts which exceed EWMPsare considered as options. Agricultural conservationoptions were deferred for this region, because no sig-nificant depletion reductions would be achieved. Excessapplied irrigation water recharges aquifers in the ma-jor agricultural areas.
Modify Existing Reservoirs or Operations
In the Northern PSA, most of these options in-volve Nacimiento and San Antonio Reservoirs. Theoptions include raising and widening the spillway atNacimiento Reservoir, constructing a tunnel or pipe-line between the two reservoirs, and changing reservoiroperation rules. Any combination of these reservoirmodification options would likely be combined withother options (such as improved conveyance facilities
or groundwater recharge projects). Some of these op-tions are estimated to cost about $100/af—raising andwidening the spillway at Nacimiento Reservoir is onesuch option. Sediment removal may provide a verysmall amount of additional supply, and MPWMD isstudying the effectiveness of sediment removal fromits existing reservoirs (Los Padres and San Clemente).
There are two proposals for reservoir enlargementsin the Southern PSA. The Salinas Reservoir enlarge-ment project would install a radial gate to raise thespillway height 19 feet above its existing elevation, in-creasing the reservoir’s storage capacity by about 18 taf,and the City of San Luis Obispo’s annual yield by al-most 2 taf. In Santa Barbara County raising USBR’sBradbury Dam (Cachuma Reservoir) 50 feet for addi-tional water supply plus an additional 40 feet for floodsurcharge storage could result in an additional annualyield of 17 taf at a cost of about $1,200/af. The reser-voir would serve coastal areas and the Santa Ynez Valley.
New Reservoirs and Conveyance Facilities
In the Pajaro Valley, constructing a 27-foot highdam at the existing College Lake drainage pump housewould create a 10 taf reservoir. The reservoir could besupplied with natural runoff and a supplemental 25 cfsdiversion from Corralitos Creek during the winter. Itsannual yield of 3.4 taf could be supplied to the coastalor inland distribution systems through a 5-mile,30-inch diameter pipeline. The cost of this option isestimated to be under $400/af. Other reservoir op-tions include Corncob Canyon and Pescadero Creek,both of which could store up to 10 taf; new water sup-plies produced by either of these options are estimatedto cost about $600/af. Bolsa De San Cayetano (esti-mated to cost $640/af ) could store up to 4 taf. Theselatter three options were deferred, as shown in Table 7-17.
A dam on Arroyo Seco was removed from furtherconsideration as a water supply project, although
TABLE 7-17
Central Coast Region List of Water Management Options (continued)
Option Retain Reason for Deferralor Defer
Other Local Options
Weather modification Defer Difficult to quantify.
Salinas River Diversion and Distribution Project Retain
Statewide Options
— — See Chapter 6.

The California Water Plan Update BULLETIN 160-98
OPTIONS - COASTAL REGIONS7-41
MCWRA may evaluate it as a flood control project.The Monterey Peninsula could receive up to 24 taf/yrfrom the proposed New Los Padres Reservoir, at a costof about $400/af. This new reservoir would inundatethe existing Los Padres Dam on the Carmel River. Al-though bonds to fund this option were rejected in a1995 election, Cal-Am announced its intentions toproceed with a reformulated version of the project with11 taf of annual yield at a cost of $800/af. SWRCB’srequirements that Cal-Am provide a new firm supplyfor existing uses and improve fishery habitat in theCarmel River make New Los Padres a likely futureproject.
SLOCFC&WCD has an annual 17.5 taf entitle-ment from Nacimiento Reservoir, only about 1.3 tafof which is now used. A pipeline would be needed todistribute the remaining 16.2 taf to 18 water purvey-ors. The preferred pipeline alignment would gothrough the communities of Paso Robles, Templeton,Atascadero, Santa Margarita, and San Luis Obispo andterminate near Avila Beach. This option is not affectedby reservoir modifications under consideration byMCWRA.
There are opportunities to import purchased wa-ter wheeled through the CVP or SWP into theNorthern PSA. In the Pajaro Valley, an option involvesconnecting a pipeline to USBR’s San Felipe Unit, whichserves CVP water from San Luis Reservoir to SantaClara and San Benito Counties. PVWMA could con-nect to the San Felipe Unit by constructing a 22-milepipeline from the Watsonville Turnout. This 42-inchdiameter pipeline with a capacity of 75 cfs would beable to deliver a maximum of 20 taf/yr. PVWMA doesnot have a CVP water service contract. CVPIA bannedexecution of new water service contracts for an indefi-nite period of time. The average annual yield of aconnection to the San Felipe system is estimated to be13 taf, if a source of purchased water could be found.Northern Monterey County could also benefit from aSan Felipe extension because of its close proximity tothe Pajaro Valley.
Groundwater Development and Conjunctive Use
Because groundwater is the primary water sourcefor the Central Coast Region, many options have agroundwater recharge component alone or in combi-nation with surface water development projects. In thePajaro Valley, options include the Pajaro recharge ca-nal (1.5 taf annually) and the College Lake injection/extraction wells (seven wells to inject diverted surface
runoff currently captured in College Lake). These wellswould be used to extract groundwater during droughtyears when deliveries of San Felipe water are reduced.On the Monterey Peninsula, the Seaside groundwaterbasin has the potential to produce an additional 1 taf/yr. This option may be pursued if legal challenges areresolved, because of SWRCB’s order which encour-ages the maximum use of supplies from Seaside toreduce diversions from the Carmel River. Another op-tion would be to retrofit existing wells in the SeasideBasin to accomplish both injection and extraction, toincrease storage and to use Carmel River and othersupplies more efficiently. This option would include aseries of new wells and a pipeline system from inlandareas (Fort Ord) to the Monterey Peninsula. The sys-tem would be operated primarily for drought yearsupply. Yields and costs of this option are unknown atpresent.
In Santa Cruz County, options include several newwells and deep brackish groundwater wells (with re-verse osmosis treatment facilities) in the northern coastarea. The new wells would provide an additional wa-ter supply of about 3 taf while the brackish wells wouldbe used for drought contingency. The groundwaterresources of the north county could be increased bydeveloping small local recharge projects, such as re-tention basins. However, the incremental yield of theseprojects would be small since the soils in the area aresandy and runoff is already minimal. There are nophysical facilities available for artificial recharge in theSouthern PSA, but there are some potential sites alongcoastal streams in San Luis Obispo County where ad-ditional runoff could be used for recharginggroundwater basins.
Water Marketing
In the Salinas Valley, SWP water from the CoastalBranch could be purchased and either traded with SanLuis Obispo County for that county’s existing entitle-ment to Nacimiento reservoir water or delivereddirectly through a pipeline constructed at theaqueduct’s crossing of the Salinas River. There are pres-ently no local agencies seeking water marketingarrangements using this approach.
PVWMA is evaluating options for assignment ofCVP water from project agricultural water contrac-tors and opportunities for participation with SCVWDand San Benito County Flood Control and WaterConservation District (existing CVP San Felipe Divi-sion contractors) in water marketing arrangements.
The California Water Plan Update BULLETIN 160-98
OPTIONS - COASTAL REGIONS 7-42
Water Recycling
For the Northern PSA, water recycling optionsinclude an aquifer storage and recovery program whichwould use injection wells to store recycled water pro-duced during the winter, and then would extract thiswater for irrigation in the Castroville area during thesummer months. This program has an estimated an-nual yield of up to 8.3 taf.
In the Pajaro Valley, a 12 or 18 mgd recycling plantwould be constructed adjacent to the existingWatsonville Wastewater Treatment Plant. The 12 mgdplant (about 13.4 taf annually) would treat water fromthe Watsonville area; the 18 mgd plant (about 20.1 tafannually) would treat water from both Watsonville andSanta Cruz. The 18 mgd option would require con-structing a pipeline from Santa Cruz to Watsonville totransport treatment plant effluent.
On the Monterey Peninsula, the Carmel AreaWastewater District/Pebble Beach Community Ser-vices District treatment plant could be expanded toprovide more recycled water (up to 100 af annually)for use on golf courses, open space, or cemeteries. In1992, local water agencies studied potential marketsfor recycled water produced by the regional recyclingplant near Marina. Potential uses of recycled water inFort Ord, Seaside, and other Monterey Peninsula com-munities having a potential annual demand of up to 1taf were identified, but the uses were deemed economi-cally infeasible at that time. This study is currentlybeing updated to reflect the conversion of Fort Ord tocivilian use.
For the Southern PSA, recycled water projects havebeen proposed in conjunction with construction of newor expanded municipal wastewater treatment plants.In coastal areas—such as San Luis Obispo Bay, Estero,and south San Luis Obispo County—treated waste-water is discharged to the ocean, and reusing thewastewater would help reduce water supply shortages.(In the City of San Luis Obispo and in communitiesalong the Salinas River, the wastewater recharges thegroundwater basin.)
Planned recycling projects in Santa BarbaraCounty include the Santa Barbara regional water re-use project, which would provide 1.6 taf of recycledwater annually for landscape irrigation within the Cityof Santa Barbara, Montecito Water District, andSummerland County Water District. This projectwould replace potable water being used for irrigation.Other potential projects involve expanding Lompoc’ssecondary treatment facilities and Santa Barbara’s ter-
tiary treatment facilities for an additional annual yieldof 2 taf by the year 2000.
Desalting
Several coastal cities in the region have identifieddesalting options for additional water supply. The Cityof Santa Cruz is conducting a feasibility study on a4.5 taf/yr brackish groundwater desalting plant tosupplement local water supplies. The Cambria and SanSimeon community services districts had plans, re-cently put on hold, to jointly construct a 320 af/yr(with ultimate capacity of 1.3 taf annually) seawaterdesalting plant. Monterey Peninsula Water Manage-ment District’s plans for a 3.4 taf/yr seawater desaltingplant were defeated by voters in the 1992 election.
Other Local Options
In the Salinas Valley, a Salinas River diversion anddistribution project is being planned to transfer up to35 taf/yr to northern Salinas Valley to halt seawaterintrusion. In the Northern PSA, MCWRA has aweather modification program which targets the wa-tersheds of the Nacimiento and San Antonio Riversand the Arroyo Seco. MCWRA estimates that increasedannual flows into reservoirs ranged from about 8 tafto 68 taf between 1990 to 1994. San Luis Obispo be-gan a 3-year cloud seeding program in January 1991to produce more runoff in the Salinas and Lopez Wa-tersheds. Although this program has ended, futureprograms may be a possibility. Future weather modifi-cation options are difficult to quantify and are notevaluated in this Bulletin. Weather modification pro-grams are often operated on a year-to-year basis bywater agencies, and usually not reliable supply sourcesin drought years due to a lack of storm systems to seed.
Statewide Options
Statewide water supply augmentation options arediscussed and quantified in Chapter 6.
Options Likely to be Implementedin Central Coast Region
Water supplies are not available to meet all of theregion’s 2020 water demands in average or droughtyears. Applied water shortages are forecasted to be172 taf and 270 taf in average and drought years, re-spectively. Ranking of retained water managementoptions for the Central Coast Region is summarizedin Table 7-18. Table 7-19 summarizes options that canlikely be implemented by 2020 to relieve the shortages.

The California Water Plan Update BULLETIN 160-98
OPTIONS - COASTAL REGIONS7-43
TABLE 7-18
Options Ranking for Central Coast Region
Optiona Rank Cost ($/af) Potential Gain (taf)Average Drought
Conservation
Urban
Outdoor Water Use to 0.8ETo - New Development M 750 4 4
Outdoor Water Use to 0.8ETo- New and Existing Development M b 13 13
Indoor Water Use (60 gpcd) M 400 8 8
Indoor Water Use (55 gpcd) M 600 17 17
Interior CII Water Use (3%) M 500 2 2
Interior CII Water Use (5%) M 750 3 3
Distribution System Losses (7%) M 200 3 3
Distribution System Losses (5%) M 300 8 8
Modify Existing Reservoirs/Operations
Modify Nacimiento Spillway H 120 20 b
Enlargement of Salinas Reservoir M 400 2 b
Enlargement of Cachuma Reservoir L 1,200 17 b
New Reservoirs/Conveyance Facilities
College Lake M 350 3 -
Feeder Streams (Various Sites) M 400 b b
New Los Padres Reservoir M 800 11 11Nacimiento Pipeline M 950 16 16
Groundwater/Conjunctive Use
College Lake Injection/Extraction Wells M 130 2 2
Increase Groundwater Development in Seaside Basin L 410 1 1
Water Marketing
CVP (San Felipe Project Extension) M 580 13 2
Water Recycling
Group 1 (Cost < $500/af) H 500 29 29
Group 2 (Cost $500/af - $1,000/af) M 1,000 8 8
Desalting
Brackish Groundwater
City of Santa Cruz L 1,100 5 5
Seawater
Monterey Peninsula WMD L 1,700 3 3
Other Local Options
Salinas River Diversion and Distribution Project M b 35 b
Statewide Options
See Chapter 6.
a All or parts of the amounts shown for highlighted options have been included in Table 7-19.b Data not available to quantify.

The California Water Plan Update BULLETIN 160-98
OPTIONS - COASTAL REGIONS 7-44
The urban water conservation options beyondBMPs that would likely be implemented would add32 taf/yr in depletion reductions in the region. Addi-tional reliance on water recycling will be likely in thefuture to alleviate shortages. Additional water recyclingin the region could produce 29 taf/yr of new watersupply. Recycled water would be used for landscap-ing, direct agricultural application, and groundwaterrecharge.
In the Pajaro Valley, options that would likely beimplemented by 2020 would include a pipeline toconnect to the CVP’s San Felipe Unit to provide anopportunity for water transfers.
Modifying existing reservoirs or constructing newreservoirs are likely options for the region. One likelyoption to augment water supplies in the Salinas Valleywould be to modify Nacimiento’s spillway. Raising thespillway 6.5 feet would increase storage capacity by34 taf, increasing the reservoir’s yield by about 20 taf.
Other spillway modifications are also being evaluatedto allow more water to be released throughout the yearfor recharge. A long-term water management plan forthe Monterey Peninsula would likely include construc-tion of the proposed New Los Padres Dam, whichcould augment supplies by 11 taf/yr.
In San Luis Obispo County, current planning fo-cuses on the Nacimiento pipeline, which would conveya portion of the county’s entitlement of 17.5 taf/yrfrom Lake Nacimiento in northern San Luis ObispoCounty. Communities potentially receiving suppliesfrom this option include the City of San Luis Obispoand Cayucos (through an exchange of water fromNacimiento and Whale Rock Reservoirs). In addition,the communities of Paso Robles, Templeton, andAtascadero may also receive supplies for groundwaterrecharge.
If implemented, the identified options would stillleave remaining shortages in drought years of 100 taf.
TABLE 7-19
Options Likely to be Implemented by 2020 (taf)
Central Coast Region
Average Drought
Applied Water Shortage 172 270
Options Likely to be Implemented by 2020Conservation 32 32Modify Existing Reservoirs/Operations 22 a
New Reservoirs/Conveyance Facilities 27 27Groundwater/Conjunctive Use 2 2Water Marketing 13 2Recycling 29 29Desalting – –Other Local Options 35 a
Statewide Options 5 57Expected Reapplication 7 21
Total Potential Gain 172 170
Remaining Applied Water Shortage 0 100a Data not available to quantify.

The California Water Plan Update BULLETIN 160-98
OPTIONS - COASTAL REGIONS7-45

The California Water Plan Update BULLETIN 160-98
OPTIONS - COASTAL REGIONS 7-46
FIGURE 7-5
South Coast Hydrologic Region
VENTURA
LOS ANGELES
ORANGE
SAN DIEGO
RIVERSIDE
M E X I C O
SAN BERNARDINO
LakeCasitas
River
Ventura
BouquetReservoir
PyramidLake
CastaicLake
LakePiru
Santa ClaraRiver
ChatsworthReservoir
Los AngelesReservoir
Sespe
Creek
Piru
Creek
SanLuis
ReyRiver
SanD
iego
duct
LakeHenshaw
HansenReservoir
TujungaBi
gCan
San Diego River
Otay
SweetwaterReservoir
LowerOtayReservoir
MorenaLake
BarrettLake
River
Sweet
Rive
rEl CapitanReservoir
San VicenteReservoir
LakeHodgesSan
uito River
SanD
iegoA
queduct
SepulvedaReservoir
water
San GabrielReservoir
Santa FeReservoir
WhittierNarrowsReservoir
Los
AngelesR
iver
PradoReservoir
LakeMathews
Big BearLake
LakePerris
San
JacintoRiver
Colorado RiverAqueduct
Sant
a
Ana
LakeElsinore
RailroadCanyonReservoir
LakeSkinner
VailLake
LakeHemet
MorrisReservoir
CuyamacaLake
yon
Aque
River
East Branch ofCalifornia Aqueduct
Dieg
West Branch ofCalifornia Aqueduct
Los AngelesAqueduct
Colorado RiverAqueduct
San
iel
Rive
r
Gab
r
Pa
ci
fi
c
O
ce
an

The California Water Plan Update BULLETIN 160-98
OPTIONS - COASTAL REGIONS7-47
Description of the Area
The South Coast is California’s most urbanizedhydrologic region (Figure 7-5). Although it covers onlyabout 7 percent of the State’s total land area, it is hometo roughly 54 percent of the State’s population. Ex-tending eastward from the Pacific Ocean, the region isbounded by the Santa Barbara-Ventura County lineand the San Gabriel and San Bernardino Mountainson the north, and a combination of the San JacintoMountains and low-elevation mountain ranges in cen-tral San Diego County on the east, and the Mexicanborder on the south. Topographically, the region iscomprised of a series of broad coastal plains, gentlysloping interior valleys, and mountain ranges of mod-erate elevations. The largest mountain ranges in theregion are the San Gabriel, San Bernardino, SanJacinto, Santa Rosa, and Laguna Mountains. Peak el-evations are generally between 5,000 and 8,000 feetabove sea level; however, some peaks are nearly11,000 feet high.
The climate of the region is Mediterranean-like,with warm dry summers followed by mild winters. Inthe warmer interior, maximum temperatures duringthe summer can be over 90oF. The moderating influ-ence of the ocean results in lower temperatures alongthe coast. During winter, temperatures rarely descendto freezing except in the mountains and some interiorvalley locations.
About 80 percent of the precipitation occurs dur-ing the four-month period from December throughMarch. Average annual rainfall can range from 10 to15 inches on the coastal plains and 20 to 45 inches inthe mountains. Precipitation in the highest mountainscommonly occurs as snow. In most years, snowfall is
sufficient to support winter sports in the San Bernar-dino and San Gabriel Mountains.
There are several prominent rivers in the region,including the Santa Clara, Los Angeles, San Gabriel,Santa Ana, Santa Margarita, and San Luis Rey. Somesegments of these rivers have been intensely modifiedfor flood control. Natural runoff of the region’s streamsand rivers averages around 1.2 maf annually.
The largest cities in the region are Los Angeles,San Diego, Long Beach, Santa Ana, and Anaheim. Al-though highly urbanized, about one-third of theregion’s land is publicly owned. About 2.3 million acresis public land, of which 75 percent is national forest.Irrigated crop acreage accounts for a small percent ofland use. Table 7-20 shows the region’s population andcrop acreage for 1995 and 2020.
Water Demands and SuppliesSince the turn of the century, extensive water de-
velopment has been carried out in the South CoastRegion. Steady expansion of population and of theeconomy led to the demands and financial resourcesto build large water supply projects for importing wa-ter to the region. In 1913, the Los Angeles Aqueductbegan importing water from the Owens Valley to theSouth Coast Region. Los Angeles diversions from the
TABLE 7-20
Population and Crop Acreage
Population Irrigated Crop Acreage(thousands) (thousands of acres)
1995 17,299 3132020 24,327 190
. . .
South CoastHydrologic Region

The California Water Plan Update BULLETIN 160-98
OPTIONS - COASTAL REGIONS 7-48
Mono Basin began in 1940 when the LAA was ex-tended by about 11 miles (a second conduit was addedin 1970). In 1941, MWDSC completed its ColoradoRiver Aqueduct, which now provides about 25 per-cent of the region’s supply. SWP began delivering waterfrom the Delta to the South Coast Region in 1972.Table 7-21 shows the water budget for the region.
Los Angeles Aqueduct
The Los Angeles Department of Water and Powerowns and operates the LAA which diverts both sur-face and groundwater from the Owens Valley andsurface water from the Mono Basin. The combinedcarrying capacity of the aqueduct system is about760 cfs, or about 550 taf/yr. An average of 400 taf/yrof water is delivered through the LAA with a record534 taf in 1983. Court-ordered restrictions on diver-
sions from the Mono Basin and Owens Valley havereduced the amount of water the City of Los Angelescan divert (see South Lahontan Region).
Colorado River Aqueduct
MWDSC was created in 1928 to construct andoperate the Colorado River Aqueduct to deliver Colo-rado River water to Southern California. MWDSCwholesales water supplies from the Colorado River andthe SWP to water agencies throughout Southern Cali-fornia.
MWDSC and its 27 member agencies (Table 7-22) serve 95 percent of the South Coast Region. Someagencies rely solely on MWDSC for their water sup-ply, while many, like the City of Los Angeles, rely onMWDSC to supplement existing supplies. Betweenits fiscal years 1970 and 1994, the City of Los Angeles
Although the South CoastRegion has been extensivelyurbanized, some species ofwildlife have learned tocoexist with suburbandevelopment. The region’sremaining riparian areasstill support such commonmammals as skunks andraccoons.
TABLE 7-21
South Coast Region Water Budget (taf)a
1995 2020Average Drought Average Drought
Water UseUrban 4,340 4,382 5,519 5,612Agricultural 784 820 462 484Environmental 100 82 104 86Total 5,224 5,283 6,084 6,181
SuppliesSurface Water 3,839 3,196 3,625 3,130Groundwater 1,177 1,371 1,243 1,462Recycled and Desalted 207 207 273 273Total 5,224 4,775 5,141 4,865
Shortage 0 508 944 1,317a Water use/supply totals and shortages may not sum due to rounding.

The California Water Plan Update BULLETIN 160-98
OPTIONS - COASTAL REGIONS7-49
purchased an average of 130 taf/yr from MWDSC,about 20 percent of the City’s total water supply. In1996, almost 90 percent (447 taf) of San Diego CountyWater Authority’s total water supply was purchasedfrom MWDSC.
MWDSC has received Colorado River water since1941 under contracts with USBR. These contracts haveallowed the diversion of 1.21 maf/yr, as well as 180 taf/yr of surplus water when available. (The maximumcapacity of the CRA is 1.3 maf/yr.) California’s basicapportionment of Colorado River water is 4.4 maf/yrplus one-half of any surplus water, when available. Inthe past, California was able to use hydrologic sur-pluses and the amount apportioned to, but not usedby, Nevada and Arizona. With completion of the Cen-tral Arizona Project and Arizona’s 1996 enactment of
a state groundwater banking act, Arizona’s use hasreached it basic apportionment. California’s reductionof Colorado River use from current levels to 4.4 maf /yr has significant implications for the South Coast Re-gion. (See the issues section below and the ColoradoRiver Region in Chapter 9). California’s Colorado Riveruse reached a high of 5.4 maf in 1974, and has variedfrom 4.5 maf to 5.3 maf annually over the past 10 years.
State Water Project
Local agencies contracting with the SWP for partof their supplies are shown in Table 7-23.
MWDSC is the largest SWP contractor, with anannual entitlement of more than 2 maf. In 1992,Castaic Lake Water Agency assumed the SWP con-tract of Devil’s Den Water District in the Tulare Lake
For much of its length,LADWP’s aqueduct skirts
the eastern flank of theSierra Nevada.
TABLE 7-22
Metropolitan Water District of Southern California Member Agencies
Cities Municipal Water Districts Water Authority
Anaheim Calleguas San Diego CountyBeverly Hills Central BasinBurbank Chino BasinCompton CoastalFullerton EasternGlendale FoothillLong Beach Las VirgenesLos Angeles Orange CountyPasadena Three ValleysSan Fernando West BasinSan Marino Upper San Gabriel ValleySanta Ana Western of Riverside CountySanta MonicaTorrance

The California Water Plan Update BULLETIN 160-98
OPTIONS - COASTAL REGIONS 7-50
Region, increasing Castaic’s entitlement to 54.2 taf.Within the San Bernardino Valley Municipal WaterDistrict service area, groundwater is the major watersource, and hence the district has used little of its SWPwater. Ventura County Flood Control District alsorelies mostly on groundwater and has taken deliveryof SWP supply only twice, during the drought in 1990and 1991. San Gorgonio Pass Water Agency (whichalso serves a portion of the Colorado River Region)lacks the facilities to take delivery of SWP water, andto date has received no supply from the SWP.
The Department is working with the SGPWA andSBVMWD to extend the East Branch of the Califor-nia Aqueduct to SGPWA, which serves the BanningPass area of Riverside County (including the commu-
nities of Banning and Beaumont), and to provide sys-tem improvements to SBVMWD. The Notice ofDetermination for the final supplemental EIR was filedin March 1998. The project will be constructed in twophases. Phase I construction is scheduled to begin inlate 1998 and to be completed by late 2000. A secondphase will be constructed to serve the Mentone area ifdemand increases.
Local Surface Water Supplies
Table 7-24 lists major local storage reservoirs inthe region. Most of the larger reservoirs in the regionhave water supply as their primary purpose. However,several of the larger water supply reservoirs do not de-velop local supply—they are the terminal facilities ofthe major conveyance facilities that import water tothe region.
Table 7-25 lists local water supply reservoirs inMWDSC’s service area with at least 10 taf storage ca-pacity.
About 96 percent of San Diego County’s popula-tion resides within SDCWA’s service area. SDCWA, awholesale water agency, purchases imported water fromMWDSC and delivers the water to its 23 memberagencies (Table 7-26) in the western third of San Di-ego County through two aqueduct systems. SDCWA’smaximum annual delivery was 647 taf in 1990. Mostof San Diego’s in-county water supplies are from localagencies’ surface reservoirs. Twenty-four surface reser-voirs are located within its service area, with a combinedcapacity of approximately 569 taf. Some reservoirs areconnected to SDCWA’s aqueduct system and can re-ceive imported water in addition to surface runoff. In1995, local water sources provided 118 taf, or 23 per-cent of the water used in SDCWA’s service area. (Since1980, local surface water supplies have ranged from33 taf to 174 taf annually.)
TABLE 7-23
State Water Project Contractors in the South Coast Region
Agency Contract SWP DeliveriesEntitlement (taf) in 1995 (taf)
Castaic Lake WA 54.2 27.2San Bernardino Valley MWD 102.6 0.7San Gabriel Valley MWD 28.8 12.9San Gorgonio Pass WA 17.3 0MWDSC 2,011.5 436.0Ventura County FCD 20.0a 0a Ventura County FCD subleases 1.85 taf/yr to MWDSC.
The Department’s A.D. Edmonston Pumping Plant liftsCalifornia Aqueduct water 1,926 feet across the TehachapiMountains to serve Southern California. The maximumplant capacity is 4,480 cfs.

The California Water Plan Update BULLETIN 160-98
OPTIONS - COASTAL REGIONS7-51
TABLE 7-24
Major Reservoirs in the South Coast Regiona
Reservoir Owner Capacity Primary(taf) Purpose
Casitas USBR 254 Water SupplyLake Piru United WCD 88 Water SupplyPyramid DWR 171 Water SupplyCastaic DWR 324 Water SupplyBig Bear Lake Big Bear MWD 73 Water SupplyPerris DWR 132 Water SupplyMathews MWDSC 182 Water SupplyVail Rancho California WD 51 Water SupplyHenshaw Vista ID 52 Water SupplySan Vicente City of San Diego 90 Water SupplyEl Capitan City of San Diego 113 Water SupplyMorena City of San Diego 50 Water SupplyWhittier Narrows USACE 67 Flood ControlPradob USACE 188 Flood ControlSeven Oaks (under construction) USACE 146 Flood ControlEastside (under construction) MWDSC 800 Water Supplya Reservoirs with capacity greater than 50 taf.b 26 taf of storage capacity is used for water supply purposes, for downstream groundwater recharge.
TABLE 7-25
Reservoirs Owned by Water Retailers in MWDSC’s Service Areaa
Reservoir Agency Capacity (taf)Bard Calleguas MWD 10Vail Rancho California 51Hemet Lake Hemet MWD 14Westlake Las Virgenes MWD 10Los Angeles City of Los Angeles 10Stone Canyon City of Los Angeles 11Santiago Irvine Ranch WD & Serrano ID 25Henshaw Vista ID 52Barrett City of San Diego 38El Capitan City of San Diego 113Lake Hodges City of San Diego 34Morena City of San Diego 50Lower Otay City of San Diego 50San Vicente City of San Diego 90Sutherland City of San Diego 30Loveland South Bay ID 25Sweetwater South Bay ID 28Railroad Canyon Temescal Water Company 12a Reservoirs with capacity of at least 10 taf.

The California Water Plan Update BULLETIN 160-98
OPTIONS - COASTAL REGIONS 7-52
TABLE 7-26
San Diego County Water Authority Member Agencies
CitiesDel MarEscondidoNational CityOceansidePowaySan Diego
Water DistrictsHelixOtaySan DieguitoVallecitos
Municipal Water DistrictsCarlsbadOlivenhainPadre DamRainbowRamonaRincon Del DiabloValley CenterYuima
Irrigation DistrictsSanta FeSouth BayVista
Public Utility DistrictFallbrook
ReservationPendleton Military
Ex-Officio MemberSan Diego County
The City of San Diego’sMurray Dam, shown underconstruction in 1917, is amultiple arch concrete damimpounding a 6 taf reservoir.The wooden stave pipelinebelow conveyed supplies forthe Cuyamaca WaterCompany.
Courtesy of Water Resources Center
Archives, University of California, Berkeley
Groundwater Supplies
Groundwater is a major local supply source in theremaining counties in MWDSC’s service area. For ex-ample local supplies developed by individual retailagencies, primarily groundwater, presently account forabout 50 percent of Orange County’s water use. Thereare numerous groundwater basins (Figure 7-6) alongthe coast and inland valleys of the region. Many ofthese basins are actively managed by public agenciesor have been adjudicated by the courts. Some ground-water basins are as large as several hundred square milesin area and have a capacity exceeding 10 maf. TheSouth Coast’s current estimated annual groundwateruse is about 1.2 maf. Recharge occurs from natural in-filtration along river valleys, but in many cases facilitieshave been constructed to recharge local, imported, orrecycled supplies. For example, in average years theLos Angeles Department of Public Works intention-

The California Water Plan Update BULLETIN 160-98
OPTIONS - COASTAL REGIONS7-53
FIGURE 7-6
South Coast Groundwater Basins
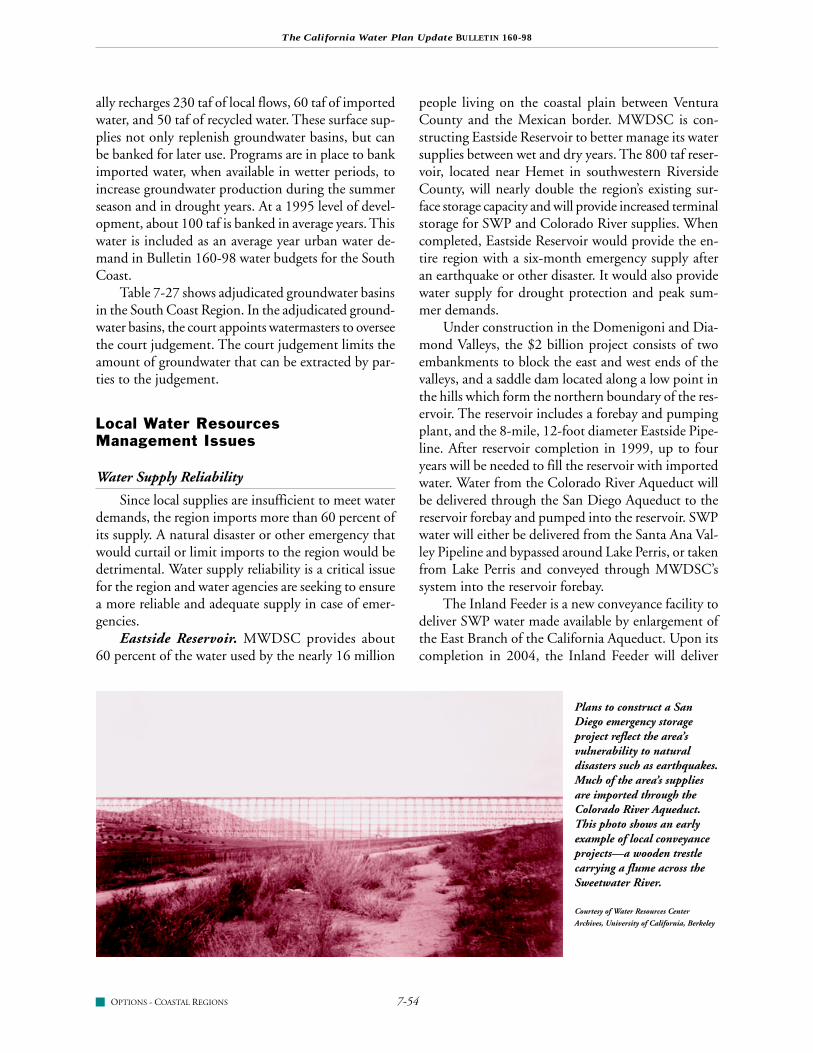
The California Water Plan Update BULLETIN 160-98
OPTIONS - COASTAL REGIONS 7-54
ally recharges 230 taf of local flows, 60 taf of importedwater, and 50 taf of recycled water. These surface sup-plies not only replenish groundwater basins, but canbe banked for later use. Programs are in place to bankimported water, when available in wetter periods, toincrease groundwater production during the summerseason and in drought years. At a 1995 level of devel-opment, about 100 taf is banked in average years. Thiswater is included as an average year urban water de-mand in Bulletin 160-98 water budgets for the SouthCoast.
Table 7-27 shows adjudicated groundwater basinsin the South Coast Region. In the adjudicated ground-water basins, the court appoints watermasters to overseethe court judgement. The court judgement limits theamount of groundwater that can be extracted by par-ties to the judgement.
Local Water ResourcesManagement Issues
Water Supply Reliability
Since local supplies are insufficient to meet waterdemands, the region imports more than 60 percent ofits supply. A natural disaster or other emergency thatwould curtail or limit imports to the region would bedetrimental. Water supply reliability is a critical issuefor the region and water agencies are seeking to ensurea more reliable and adequate supply in case of emer-gencies.
Eastside Reservoir. MWDSC provides about60 percent of the water used by the nearly 16 million
people living on the coastal plain between VenturaCounty and the Mexican border. MWDSC is con-structing Eastside Reservoir to better manage its watersupplies between wet and dry years. The 800 taf reser-voir, located near Hemet in southwestern RiversideCounty, will nearly double the region’s existing sur-face storage capacity and will provide increased terminalstorage for SWP and Colorado River supplies. Whencompleted, Eastside Reservoir would provide the en-tire region with a six-month emergency supply afteran earthquake or other disaster. It would also providewater supply for drought protection and peak sum-mer demands.
Under construction in the Domenigoni and Dia-mond Valleys, the $2 billion project consists of twoembankments to block the east and west ends of thevalleys, and a saddle dam located along a low point inthe hills which form the northern boundary of the res-ervoir. The reservoir includes a forebay and pumpingplant, and the 8-mile, 12-foot diameter Eastside Pipe-line. After reservoir completion in 1999, up to fouryears will be needed to fill the reservoir with importedwater. Water from the Colorado River Aqueduct willbe delivered through the San Diego Aqueduct to thereservoir forebay and pumped into the reservoir. SWPwater will either be delivered from the Santa Ana Val-ley Pipeline and bypassed around Lake Perris, or takenfrom Lake Perris and conveyed through MWDSC’ssystem into the reservoir forebay.
The Inland Feeder is a new conveyance facility todeliver SWP water made available by enlargement ofthe East Branch of the California Aqueduct. Upon itscompletion in 2004, the Inland Feeder will deliver
Plans to construct a SanDiego emergency storageproject reflect the area’svulnerability to naturaldisasters such as earthquakes.Much of the area’s suppliesare imported through theColorado River Aqueduct.This photo shows an earlyexample of local conveyanceprojects—a wooden trestlecarrying a flume across theSweetwater River.
Courtesy of Water Resources Center
Archives, University of California, Berkeley

The California Water Plan Update BULLETIN 160-98
OPTIONS - COASTAL REGIONS7-55
TABLE 7-27
Adjudicated Groundwater Basins in the South Coast Region
Court Name Filed in Final Watermaster Basin Name, CountyCourt Decision
Upper Los Angeles 1955 1979 Superior Court appointee San Fernando Valley Basin (entireRiver Area watershed), Los Angeles County
Raymond Basin 1937 1944 Raymond Basin Management Northwest part of San GabrielBoard Valley Basin, Los Angeles County
Main San Gabriel 1968 1973 9-Member Board appointed by San Gabriel Valley Basin, excludingBasin the Los Angeles County Superior Raymond Basin, Los Angeles
Court County
Central Basin 1962 1965 DWR Northeast part of Coastal Plain ofLos Angeles County Basin, LosAngeles County
West Coast Basin 1946 1961 DWR Southwest part of Coastal Plain ofLos Angeles County Basin, LosAngeles County
Puente 1985 1985 Two consultants, one Southwest part of San Gabrielrepresenting the Walnut Valley Valley Basin, Los Angeles CountyWD and Rowland WD; and onefor the City of Industry andIndustry Urban DevelopmentAgency; and a third neutral party
Santa Margarita 1951 1966 U.S. District Court appointee The entire Santa Margarita RiverRiver Watershed watershed, including Santa
Margarita Coastal, Murrieta-Temecula and Anza-Cahuillagroundwater basins, San Diego andRiverside Counties
Santa Paula Basin 1991 1996 3 person Technical Advisory Sub-basin of Santa Clara River,Committee from United Water Ventura CountyConservation District, City ofVentura, and Santa Paula BasinPumpers Association
Chino Basin 1978 1978 9-Member Board Chino Basin, northwest part ofUpper Santa Ana Valley Basin, SanBernardino and Riverside Counties
Cucamonga Basin N/A 1958 Cucamonga County WD and Cucamonga Basin, north-centralSan Antonio Water Company part of Upper Santa Ana Valley
Basin, San Bernardino County
San Bernardino 1963 1969 One representative each from Northeast part of Upper Santa AnaBasin Area Western Municipal Water Basin, San Bernardino and
District and San Bernardino Riverside CountiesValley Municipal Water District

The California Water Plan Update BULLETIN 160-98
OPTIONS - COASTAL REGIONS 7-56
water by gravity to Eastside Reservoir via 43.7 miles oftunnels and pipeline that start at Devil Canyon andtie into the CRA and Eastside Pipeline. The InlandFeeder will provide system reliability by linking to-gether the SWP and Colorado River systems, and willimprove water quality by allowing greater blending ofSWP and Colorado River waters.
San Diego Emergency Water Storage Project.SDCWA does not own or operate treatment or stor-age facilities. It has a contractual agreement with theCity of San Diego to store up to 40 taf of water in SanVicente and Lower Otay Reservoirs. To increase localsupplies that would be available during times of emer-gency, SDCWA has proposed an emergency storageproject that could increase the county’s total water stor-age by 90 taf. Use of the project would be limited toemergency situations, such as prolonged drought orcatastrophic failure of the San Diego Aqueduct duringan earthquake. Although not a water supply develop-ment project, the emergency water storage projectwould provide incidental local supply benefits by al-lowing capture of additional winter runoff.
Four project alternatives were evaluated. All in-volved increased surface storage and new distributionsystems. Three alternatives additionally involved res-ervoir reoperation.• San Vicente stand-alone. Expand San Vicente
Reservoir by raising the dam 83 feet to contain90.1 taf of emergency storage.
• Moosa Canyon construction/Lake Hodgesreoperation. Construct a new dam at Moosa Can-yon to hold 68 taf and reoperate Lake Hodges toprovide 22 taf.
• San Vicente expansion and reoperation. Raise thedam by 65 feet, adding 68 taf of emergency stor-age and reoperate the reservoir to provide anadditional 22 taf.
• Olivenhain construction, Lake Hodgesreoperation, and San Vicente expansion. Build anew 320-foot high dam at the Olivenhain site tocreate 18 taf of emergency storage (24 taf totalcapacity, with 4 taf reserved for OlivenhainMWD). Reoperate Lake Hodges to provide an ad-ditional 20 taf and raise San Vicente Dam by54 feet to hold an additional 52 taf.The preferred alternative is the Olivenhain-
Hodges-San Vicente project. A new reservoir wouldbe constructed about 1 mile northwest of Lake Hodgesin conjunction with Olivenhain Municipal Water Dis-trict. Olivenhain Reservoir, which would also serve as
operational storage for Olivenhain MWD, would beconnected to Lake Hodges by a 1.5-mile pipeline. SanVicente Dam would be raised from 234 feet to288 feet. The Olivenhain-Hodges-San Vicente projectwould add 90 taf of emergency storage capacity. Thefinal EIR was certified in 1996. In 1997, USACE is-sued a record of decision on the final EIS and a permitfor the project under Section 404 of the federal CleanWater Act. Construction of the $550 million projectis scheduled to begin in 1999 and be completed by2011. SDCWA has agreements with the City of SanDiego regarding joint use of San Vicente Reservoir andLake Hodges, and with Olivenhain MWD concern-ing joint use of the Olivenhain Reservoir. (OlivenhainMWD had planned to construct a 5 to 8 taf reservoirat the site for its own use if SDCWA did not go for-ward with a joint project.) Olivenhain MWD wouldconstruct a 20 mgd water treatment plant (to be ex-panded to 80 mgd ultimately) in conjunction withstorage at Olivenhain reservoir.
Management of California’sColorado River Water
A major water management issue facing the SouthCoast Region is California’s use of Colorado River waterin excess of its basic annual apportionment of 4.4 maf.In the past, Arizona and Nevada were not using thefull amount of their annual apportionments, and Cali-fornia was able to use the amount apportioned to, butnot used by, Nevada and Arizona, and to use wet yearsurplus flows. As described in more detail in Chapter9, the Colorado River Board’s draft 4.4 Plan describeshow California would reduce its use of river water overtime.
The draft CRB 4.4 Plan includes actions thatwould be taken in two phases. The first phase, extend-ing from the present to 2010 or 2015, would comprisethose actions that are now in some stage of planningand implementation. These programs are intended toreduce California’s annual use of Colorado River wa-ter to about 4.6 to 4.7 maf. The second phase wouldcomprise actions that have not yet been formulatedand quantified. Examples of phase one actions includethe SDCWA/IID transfer, lining of parts of the All-American and Coachella Canals, and groundwaterbanking projects associated with surplus ColoradoRiver water that could be conveyed in MWDSC’s aq-ueduct. Examples of potential phase two actionsinclude proposals to desalt water in Salton Sea tribu-taries and to convey the treated water to the South

The California Water Plan Update BULLETIN 160-98
OPTIONS - COASTAL REGIONS7-57
Coast Region. (Actions such as agricultural water con-servation programs or desalting proposals that wouldreduce the amount of fresh water inflow to the SaltonSea are subject to environmental review to ensure thatthey will not significantly affect the sea. A descriptionof the Salton Sea and its environmental resources isprovided in Chapter 9.)
The draft CRB 4.4 Plan would in essence reduceCalifornia’s use of Colorado River water in agriculturalareas in the Colorado River Region, transfer conservedColorado River water to the South Coast Region forurban use, and define how water from wet year sur-pluses (and the unused apportionments of other states,when available) could be used to help keep the Colo-rado River Aqueduct full. When California is limitedto its basic apportionment of 4.4 maf, MWDSC wouldonly be able to exercise its fourth priority right to 550taf, as compared to maximum aqueduct capacity of1.3 maf.
Mono Basin
The City of Los Angeles’ water diversions fromMono Basin lowered Mono Lake’s water level by morethan 40 feet since 1941 and also increased the lake’ssalinity. (See the South Lahontan Region in Chapter 9for more detailed discussion of Mono Lake issue.) In1994, SWRCB adopted Water Right Decision 1631amending the city’s water rights for diverting waterfrom Mono Basin. The decision restricts diversionsfrom the basin to increase and maintain Mono Lake’slevel to 6,391 feet above sea level. During the periodof Mono Lake’s transition to the 6,391-foot level (esti-mated to take about 20 years), the maximum amountof water that Los Angeles can divert from the basin is16 taf/yr. Long-term Los Angeles diversions from theMono Basin are projected to be about 31 taf/yr afterMono Lake has reached the 6,391-foot level, or one-third of the city’s historical diversions from the MonoBasin.
Restoration of Coastal Wetlands and Estuaries
Ballona Wetlands Preserve. Although the ma-jority of California’s wetlands habitat is found in theCentral Valley and San Francisco Bay area, there aresignificant wetlands in the South Coast, as describedbelow. The Ballona wetlands is one of the more well-known South Coast wetlands.
The Ballona Wetlands Preserve, located in LosAngeles County near Marina Del Rey, is one of thefew tidal marshes in Southern California. It is a com-
plex of estuary, lagoon, salt marsh, freshwater marsh,and dune habitats. It provides nesting grounds formigrating waterfowl, supports a variety of plant, fish,and animal life, and is home to two endangered spe-cies—Belding’s Savannah sparrow and the Californialeast tern. The present Ballona wetlands is a small rem-nant of what existed in the early 1800s, when thewetlands comprised more than 2,000 acres. At thepresent time, it has been reduced to a little more than180 acres.
The Ballona Wetlands Preserve was the subject ofa long-running debate among private property own-ers and environmental groups that began in 1984 whenthe California Coastal Commission approved a landuse plan to develop the wetlands. In the years that fol-lowed, the parties negotiated a settlement to litigationover the development. The settlement provides for:• Restoration of 190 acres of salt marsh habitat. Plans
are underway to provide the eastern portion of thesalt marsh with full tidal flow and expanded habi-tat for sub-tidal and mudflat organisms. Thewestern portion would be provided with mutedtidal flow to protect and enhance existing saltmarsh habitat for pickleweed and the Belding’s Sa-vannah sparrow.
• A 34-acre freshwater marsh.• A 25-acre corridor of riparian habitat along
Centinela Creek. This area will potentially pro-vide appropriate vegetation for the least Bell’s vireoand a wide variety of other birds which nest inriparian trees.
• Restoration of 48 acres of upland, bluff edge, andcoastal strand habitat.When completed, the Ballona Wetlands Preserve
will be one of the largest wildlife sanctuaries in anymajor U.S. city.
Santa Monica Bay. Santa Monica Bay extendsabout 50 miles from Point Hume to Palos Verdes Point.A coordinated effort to improve the Santa Monica Bayecosystem began with establishment of the SantaMonica Bay restoration project. SMBRP was includedin the Clean Water Act’s National Estuary Program in1988, and was charged with assessing the bay’s prob-lems and with producing a bay restoration plan.Implementation of the plan, approved by the Gover-nor in 1994, and by the Administrator of EPA in 1995,is currently under way.
Prado Wetlands Project. OCWD owns2,150 acres behind Prado Dam in Riverside Countywhere the district operates constructed freshwater wet-

The California Water Plan Update BULLETIN 160-98
OPTIONS - COASTAL REGIONS 7-58
lands to reduce the nitrogen concentration of riverwater. USACE’s Prado Flood Control Basin is oper-ated primarily for flood control. Under an agreementwith USACE and USFWS, OCWD uses 25.75 taf ofthe reservoir’s capacity for water supply. OCWD di-verts Santa Ana River water through 465 acres ofconstructed wetlands for biochemical nitrogen removal.Because Santa Ana River water provides much of therecharge for Orange County’s coastal plain groundwa-ter basin, nitrogen removal is important to improvingwater quality.
The Prado wetlands are home to several rare andendangered bird and waterfowl species. As part of thethree party agreement, OCWD set aside more than226 acres as habitat for the endangered least Bell’s vireoand southwestern willow flycatcher.
Flood Control
As noted earlier, groundwater constitutes most ofthe local water supply in the region. Local surface wa-ter resources are relatively limited. In the LosAngeles-Orange County coastal strip, most of the riv-ers and streams that drain to the Pacific Ocean havebeen developed primarily for flood control purposes,rather than for surface water supply. (Some of thesereservoirs are operated to provide surface flows forgroundwater recharge.) A few of the existing floodcontrol reservoirs are now being evaluated for theirpotential to provide some, albeit small, water supplybenefits, usually by reoperation of the facilities to en-hance groundwater recharge and provide limitedyear-round storage. Several of these facilities are dis-cussed in the water management options section. Beloware a few examples of flood control-related water man-agement issues in the region.
Los Angeles River. USACE, in cooperation withLos Angeles County, has constructed an extensive net-
work of flood control facilities on the Los Angeles River,which passes through one of the most intensively ur-banized areas in the South Coast Region. (In fact,discussions on transportation issues in the region some-times mention converting the existing concrete channelinto a freeway or high-occupancy-vehicle transit route.)USACE’s flood control facilities on the Los AngelesRiver and its tributaries include 5 major dams, 22 de-bris basins, and 470 miles of channel modifications.
Flood control operations in coastal Southern Cali-fornia and their interaction with reservoir operationsfor water supply typically differ from those in North-ern California. The Sierran reservoirs in the CentralValley that provide most of California’s developed sur-face water supply are, as a broad generalization,operated from a water supply standpoint to managesnowmelt runoff that occurs over a period of severalmonths, and to hold large volumes of carryover stor-age throughout the year. Flood control reservoirs incoastal Southern California are operated to provideshort-term detention (days to weeks) of peak flows fromrainfloods. Many of these reservoirs impound ephem-eral streams, or streams whose runoff is so small thatlittle water supply benefit is available.
USACE’s facilities on the Los Angeles River weredesigned to provide temporary detention of peak flows,allowing the floodflows to be released to the PacificOcean without exceeding downstream channel capaci-ties. Continually increasing water demands in theSouth Coast Region have prompted reevaluting op-erations of some of the larger facilities, to determine iftheir operations could be modified to provide limitedadditional water supply. One example is a 67 taf floodcontrol detention basin impounded by Whittier Nar-rows Dam on Rio Hondo, a Los Angeles Rivertributary, described in the water management optionssection.
An aerial view of theconstructed wetlands behindPrado Dam.
Courtesy of Orange County Water District

The California Water Plan Update BULLETIN 160-98
OPTIONS - COASTAL REGIONS7-59
Santa Ana River. The Santa Ana River has beenchannelized for almost its entire length throughout thehighly urbanized part of Orange County, from theriver’s mouth near Costa Mesa upstream to the vicin-ity of Yorba Linda. Prado Dam, located in the Coronaarea between the Chino Hills and the Santa Ana Moun-tains, impounds a large flood control detention basin.USACE has constructed several flood control featuresof the Santa Ana mainstem project, with the most re-cent facility of that project being Seven Oaks Dam.The 550-foot high Seven Oaks Dam is under con-struction about 35 miles upstream from Prado Damand will have a gross storage capacity of about 146 taf.
The existing 134-foot high earthfill Prado Damhas a storage capacity of 188 taf. OCWD manages thewater supply provided by the dam for groundwaterrecharge. Future plans entail enlarging Prado’s capac-ity to 363 taf for flood control and water supply storage.After Prado Dam is enlarged, OCWD would proposeto raise the reservoir’s minimum pool level to increasewater supply benefits. Enlargement would be accom-panied by development of a new flood forecastingsystem for the reservoir. The district is currently un-dertaking a feasibility study with USACE to evaluatepotential water supply gains from Prado’s enlargement.Modifying flood control operations would provide anadditional 3 to 5 taf of annual supply for groundwaterrecharge.
Salinity Management Actions
Imported Colorado River water is a significantsource of supply for the South Coast Region. The to-tal dissolved solids concentration in imported waterhas water management implications for the region,affecting the feasibility of water recycling and ground-water recharge programs. Because residential use ofwater increases TDS concentration, water recycledfrom a moderately high TDS source water can resultin unacceptably high TDS concentrations. Ground-water recharge potential may be restricted because theRWQCB has established TDS requirements for re-charge water in some groundwater basins, to protectexisting basin water quality.
In 1996, USBR and MWDSC began a joint sa-linity management study to develop information tosupport adoption of regional salinity managementpolicies by MWDSC and to coordinate interagencyaction to solve salinity problems. The study’s initialphase focused on identifying problems and salinitymanagement needs in MWDSC’s service area.
Phase I identified the average TDS concentrationof MWDSC’s Colorado River water in 1996 as beingabout 700 mg/L, and average TDS of MWDSC’s SWPsupplies as being about 300 mg/L. The City of LosAngeles’ water supply from the eastern Sierra Nevadahad significantly lower TDS concentration, typicallyabout 160 mg/L. TDS levels in local groundwater sup-plies in the South Coast Region vary considerably,ranging from 200 mg/L (Cucamonga Basin near Up-land) to more than 1,000 mg/L (Arlington Basin nearCorona). Table 7-28 shows groundwater supplies bysalinity.
Local sources of salinity also contribute signifi-cantly. Municipal and industrial use of water addbetween 250 to 500 mg/L of TDS to wastewater. Keysources of local salts include water softeners (typicallycontributing from 5 to 10 percent of the salt load) andindustrial processes.
The long-term salt balance of South Coast ground-water basins is an important management problem.Smaller basins like the Arlington and Mission ground-water basins were abandoned for municipal supplybecause of high salinity levels. These basins have onlyrecently been restored through construction of desalt-ing projects. Blending SWP and Colorado Riversupplies or using the SWP’s relatively low TDS sup-plies for groundwater replenishment has been a goalin some areas. However, without an ocean outfall orstream discharge, some inland agencies that reusewastewater have salt accumulation problems in theirgroundwater basins. Some inland agencies have accessto a brine line for exporting salt and concentratedwastes to a coastal treatment plant and ocean outfall,while others have not found construction of a brineline economical.
During droughts when use of recycled waterprojects and marginal quality groundwater are mostimportant, some local supplies may be constrained bywater quality problems. Concerns about wastewaterTDS have grown with the expansion of water recy-
TABLE 7-28
Salinity of South Coast Region GroundwaterSupplies
Annual Production TDS Percent(maf) (mg/L)
<500 1.06 78500 to 1,000 0.15 11>1,000 0.15 11Total 1.36 100

The California Water Plan Update BULLETIN 160-98
OPTIONS - COASTAL REGIONS 7-60
cling programs. In general, TDS more than 1,000 mg/Lis a quality problem for irrigation and industrial reusecustomers.
The MWDSC/USBR study’s second phase willevaluate regional applications of four TDS manage-ment options: local water service control, importedwater source control, desalting, and blending.
Groundwater Issues
San Gabriel and San Fernando Valleys. Ground-water contamination in the San Gabriel Valley and SanFernando Valley Basins has come from many sourcesdating back to the 1940s. Each basin has four areas onEPA’s Superfund list.
More than 30 square miles of groundwater underthe San Gabriel Valley Basin may be contaminated.Contamination from volatile organic compounds wasfirst detected in 1979 when Aerojet Electrosystems inAzusa sampled nearby wells in Valley County WaterDistrict. Subsequently, DHS initiated a well samplingprogram to assess the extent of contamination. By1984, 59 wells were found to be contaminated withhigh levels of VOCs. The most prevalent contaminantswere trichloroethene, perchloroethylene, and carbontetrachloride.
The San Gabriel Basin Water Quality Authoritywas created by the Legislature in 1993 to be the agencyresponsible for remediating groundwater contamina-tion in San Gabriel Valley. The authority’s mission isto plan and implement groundwater quality manage-ment programs and to protect the basin from futurecontamination. The SGBWQA is governed by a 5-member board, comprised of one member from eachof the overlying municipal water districts, one from acity with prescriptive water pumping rights and onefrom a city without prescriptive water pumping rights.(The three municipal water districts are San GabrielValley MWD, Three Valleys MWD, and Upper SanGabriel Valley MWD.)
Currently, four areas of the basin are of concern:Whittier Narrows, Puente Basin, Baldwin Park/Azusa,and El Monte/South El Monte. The SGBWQA is in-volved in groundwater cleanup projects in these areas.The Whittier Narrows and Puente Basins are also be-ing managed by EPA under its Superfund program.Another concern is that contamination in the SouthEl Monte area might migrate from the San GabrielBasin through Whittier Narrows and into the CentralBasin.
The Arrow Well Treatment Plant in Baldwin Park
was the first project implemented by SGBWQA, witha $1.3 million construction grant from SWRCB. Theproject, completed in 1992, extracts about 3 taf/yr ofcontaminated groundwater, treats the water, and dis-tributes it to customers. The Big Dalton WellTreatment Project was the second in a series of projectsfocusing on contamination problems in the BaldwinPark area. The facility, designed to extract and treatapproximately 4 taf/yr of contaminated groundwater,is part of a three-well barrier to stop migration of con-taminated groundwater. The Monrovia Wells projectcurrently treats approximately 4.6 taf/yr of contami-nated groundwater with airstripping, giving the Cityof Monrovia the ability to use water from contami-nated aquifers while preventing the spread ofcontamination to adjacent clean aquifers. In 1996, leg-islation was enacted extending SGBWQA’s authorityto remediate groundwater contamination in the SanGabriel Basin through July 1, 2002.
About 50 percent of the water supply wells in theeastern portion of the San Fernando Valley Basin werefound to be contaminated with volatile organic com-pounds. Many of the wells have been shut down. TheRWQCB is investigating area-wide sources of ground-water contamination for four Superfund sites in theSan Fernando Valley Basin. Interim clean-up measuresinclude groundwater pumping and treatment.
Actions taken to address groundwater contami-nation included a basin-wide Superfund investigation,completed in 1992. The study included installation of87 monitoring wells, development of a basin-widegroundwater flow model, and evaluation of the extentof contamination. Presently, two large-scale plants arein operation—the North Hollywood Treatment Plant(2,000 gpm) which uses aeration with GAC scrubbingand the Burbank Operable Unit (9,000 gpm) whichuses aeration with GAC scrubbing and liquid-phaseGAC polishing units. The Pollock Wells TreatmentPlant (3,000 gpm) is under construction with a start-up date in 1998, and two additional plants, the 5,000gpm Glendale Operable Unit and the 13,500 gpmHeadworks Wells Treatment Plant, are in the planning/preliminary design phase. These plants will collectivelytreat over 48 taf/yr of San Fernando Basin’s ground-water supply. The basin provides urban water supplyfor Los Angeles, Burbank, Glendale, and La Crescenta.
San Bernardino Valley. As late as the 1940s, thelowest portion of San Bernardino Valley was largelymarshlands with abundant springs. Downtown SanBernardino is located over a confined aquifer which

The California Water Plan Update BULLETIN 160-98
OPTIONS - COASTAL REGIONS7-61
experiences high groundwater levels. Buildings haveexperienced seepage of water into basements or groundfloors. High groundwater conditions increase soil liq-uefaction potential in an area that could be affected bymovement along the Cucamonga, San Jacinto, or SanAndreas Faults. The presence of unreinforced masonrybuildings above the confined aquifer increases the riskof damage in the event of liquefaction.
The Bunker Hill Basin groundwater extractionproject involves extracting groundwater from the ba-sin to lower groundwater levels, thereby reducingseismic risks. The water could potentially be sold tohelp offset project costs. Groundwater extraction forthis project will not exceed the perennial yield of theSan Bernardino Basin (which includes both BunkerHill and Lytle Creek Basins). The ultimate goal of theextraction project is to reduce the unacceptably highgroundwater levels in the basin. A suggested minimumdepth target of 30 feet below ground surface in theconfined zone would minimize the risk of liquefac-tion and other adverse impacts associated with highgroundwater. One plan being considered is for SanBernardino Valley Municipal Water District to pumpbetween 20 taf/yr and 70 taf/yr, with larger volumesbeing extracted as necessary after exceptionally wetseasons.
Ventura County. Groundwater is the main watersupply for agricultural and urban use in much of thecoastal plain of Ventura County, including OxnardPlain. Seawater intrusion was initially observed in thelate 1940s, following the widespread development ofagriculture and food processing in the Oxnard Plain.Increasing water demands in the 1940s led to over-draft of groundwater aquifers underlying the plain.
In the 1990s demand has decreased due to agri-cultural and urban water conservation measures.Recent estimates show an approximate balance betweenextractions and recharge because of increased artificialrecharge and a reduction in groundwater extractionrequired by Fox Canyon Groundwater ManagementAgency. The agency adopted ordinances requiringmeter installation on wells extracting more than 50 af/yr, and restricting drilling of new wells in some areas.
In 1991, United Water Conservation District com-pleted construction of the Freeman Diversionimprovement project on Santa Clara River. This projectincreased average annual diversions from the river from40 taf to 60 taf. The diverted water is used for ground-water recharge and irrigation, reducing agriculturaldemand for groundwater.
Southern California Comprehensive WaterReclamation and Reuse Study
In 1993 USBR, seven local agencies and the De-partment began evaluating the feasibility of regionalwater recycling in Southern California. The seven par-ticipating local agencies are: Central and West BasinMunicipal Water Districts, City of Los Angeles, Cityof San Diego, MWDSC, SDCWA, Santa Ana WaterProject Authority, and South Orange County Recla-mation Authority. Regional planning would takeadvantage of potential surpluses of recycled water whichcould serve needs in areas throughout Southern Cali-fornia. The plan of study called for a three-part, six-yearcomprehensive effort to identify a regional recyclingsystem and develop potential projects.
The study has identified regional and area-widewater recycling potential for 20 and 50 year planninghorizons. An economic distribution model will be usedto maximize the allocation of recycled water at mini-mum cost throughout the region.
Water Marketing
The highly urbanized South Coast Region reliessubstantially on imported water. Water wholesalersserving the region expect to acquire part of their fu-ture supplies from water marketing arrangements,using the Colorado River Aqueduct and California Aq-ueduct to convey the acquired water.
A difficulty associated with future supply fromwater marketing arrangements—as opposed to fromfixed facilities such as reservoirs or water recyclingplants—is the greater uncertainty involved in forecast-ing future contractual arrangements for transfers. Forexample, SDCWA recently released a request for pro-posals for entities interested in selling water both on ashort-term or long-term basis. Details of marketingarrangements developed would depend on specificterms and conditions negotiated for each arrangement.An urban agency may plan to acquire water from agri-cultural users in the Central Valley or the ColoradoRiver Region, but terms and conditions of the trans-fers are subject to negotiation with potential sellers andthe availability of conveyance. There are many ways tostructure marketing arrangements—long-term agree-ments for base year transfers that occur every yearregardless of hydrology, drought year transfers tied tospecific hydrologic criteria, or transfer options that maybe exercised based on negotiated criteria. Marketingmay also be accomplished through short-term (one year

The California Water Plan Update BULLETIN 160-98
OPTIONS - COASTAL REGIONS 7-62
or less) agreements on the spot market. Of note in theSouth Coast Region, local agencies are now planningto use water transfers for part of their base supplies, achange from past years when marketing arrangementswere viewed as primarily drought year supplies.
An example of a base year transfer is the SDCWA/IID transfer described in Chapter 9. The two agenciesexecuted an agreement in 1998 for a long-term trans-fer that would build up over time to 200 taf/yr.SDCWA would need to use MWDSC’s ColoradoRiver Aqueduct to convey the transferred water to theSouth Coast Region. SDCWA and MWDSC havenegotiated an initial wheeling agreement.
New Conveyance Facilities from ColoradoRiver Region to South Coast Region
SDCWA has been studying the feasibility of con-structing a new aqueduct from the Imperial Valley toits service area. Two alternatives have been consid-ered—an aqueduct on the U.S. side of the internationalborder that would be used to convey Colorado Riverwater acquired through marketing arrangements withwater users in the Colorado River Region, and a jointaqueduct on the Mexican side of the border with theCity of Tijuana. SDCWA has completed the first phaseof a feasibility study for the U.S. alignment; Proposi-tion 204 authorizes funding for further feasibility-levelstudy of conveyance alternatives. In addition to theusual engineering and environmental considerationsassociated with large-scale conveyance projects, theability to implement this project would be affected bythe other Colorado River Basin states’ concerns abouta new California diversion on the river, and by inter-national considerations involved in financing andconstructing a project with the Mexican government.
Water marketing arrangements establishedthrough the draft CRB 4.4 Plan would be a source ofwater for a new conveyance facility. Other sources couldresult from responses to SDCWA’s 1998 request forproposals for short-term and long-term marketing ar-rangements. While new conveyance may be a possibleoption for the South Coast Region in the long term,the time required to implement such a large scaleproject and the schedule presently contemplated forimplementing the draft CRB 4.4 Plan suggest that afacility would not be constructed within the Bulletin160-98 planning horizon.
Mexican Border Environmental Quality Issues
Tijuana’s excess sewage has plagued San Diego area
beaches since the 1930s. During frequent failures ofTijuana’s inadequate, antiquated sewage treatment sys-tem, millions of gallons of raw sewage have been carriedacross the border through the Tijuana River to its es-tuary in San Diego County. San Diego’s first attemptto alleviate this problem was in 1965, when the cityagreed to treat Tijuana’s wastewater on an emergencybasis. In 1983, the United States and Mexico signedan agreement stating that Mexico would modernizeand expand Tijuana’s sewage and water supply systemand build a 34 mgd sewage treatment plant. Mexicoreceived a grant for $46.4 million from the Inter-American Development Bank to help finance theexpansion and was to spend an additional $11 millionto build a wastewater treatment plant 5 miles south ofthe border. The plant became fully operational in 1988.
In 1990, the United States and Mexico, throughthe International Boundary and Water Commission,agreed to construct international wastewater treatmentfacilities in the United States to solve continuing bor-der sanitation problem. Facilities included a 25 mgdsecondary treatment plant at a site just north of theinternational border and a 3.5 mile ocean outfall. Con-struction of the first phase of the international plant, a25 mgd advanced primary treatment plant is beingcompleted. Construction of the secondary phase of theinternational plant is on hold pending the completionof a supplemental environmental impact statement onalternative methods of secondary treatment. The sec-ond phase is expected to be complete by December2000.
EPA and IBWC have completed a supplementalEIS on interim options for discharge of effluent fromthe international plant prior to completion of the oceanoutfall and the secondary treatment component of theplant. The preferred option is a combination of dis-charging the effluent to the City of San Diego’smetropolitan sewerage system and constructing a de-tention basin to hold flows for discharge duringoff-peak hours.
Water Management Optionsfor South Coast Region
Southern California’s challenge in managing itswater resources is driven by one of the most funda-mental realities of the West—it is an arid region. Themajor water agencies in the South Coast Region areextensively involved in water resources managementplanning. A mixture of water management options will

The California Water Plan Update BULLETIN 160-98
OPTIONS - COASTAL REGIONS7-63
be needed to replace California’s reduced supply fromthe Colorado River and to offer long-term reliabilityto the region. Table 7-29 shows a list of options for theregion, and the results of an initial screening of theoptions. The retained options were evaluated (Table7A-4 in Appendix 7A) based on a set of fixed criteriadiscussed in Chapter 6.
Water Conservation
Urban. Urban water demand forecasts for 2020assume that BMPs are in place; consequently, onlythose urban conservation efforts which exceed BMPsare considered as options. Reducing outdoor water useto 0.8 ETo in new development would attain 67 taf/yrof depletion reductions, while extending this measureto include existing development would reduce deple-tions by 246 taf/yr. Reducing residential indoor wateruse to 60 and 55 gpcd would reduce depletions by110 and 220 taf/yr, respectively. Reducing commer-cial, institutional, and industrial water use by anadditional 3 percent and 5 percent would attain 30taf/yr and 49 taf/yr of depletion reductions, respec-tively. Reducing system losses to 5 percent wouldreduce depletions by 84 taf/yr.
Agricultural. The 2020 agricultural water demandforecasts assume that EWMPs are in place. As withthe urban water management options, only those ag-ricultural conservation efforts which exceed EWMPsare considered as options. Agricultural water conser-vation options are limited in the region because of therelatively high SAEs that currently exist, the relianceon high cost, pressurized potable water or groundwa-ter, and the limited agricultural acreage. Improvingirrigation management to raise SAEs to 76, 78, and80 percent in the South Coast would reduce deple-tions by 4, 7, and 10 taf/yr, respectively. Flexible waterdeliveries are deferred because most of the water ap-plied for agriculture is delivered on-demand in theregion. Canal lining and piping are deferred becauseof the absence of open canal systems in the region.The spill recovery and tailwater systems option is de-ferred because of the relatively small acreage underfurrow or border irrigation in the region.
Modify Existing Reservoirs or Operations
USACE operates flood control reservoirs in theLos Angeles and San Gabriel River Basins of Los An-geles County. Water conservation benefits could berealized if storage was established in these reservoirs
for temporarily impounding storm flows for later re-lease to downstream recharge facilities. The Los AngelesCounty Department of Public Works and USACE areevaluating the potential for reoperating USACE floodcontrol reservoirs. Preliminary studies have indicatedthat an additional 17 taf of conservation storage is pos-sible, and USACE is currently performing a feasibilitystudy expected to conclude in 1998.
Prado Dam. As discussed in the water manage-ment issues section, construction of Seven Oaks Damon the Santa Ana River and pending enlargement ofthe existing Prado Dam create an opportunity to in-crease water supply storage in Prado Reservoir forrecharging Orange County groundwater basins. Modi-fying Prado Reservoir’s flood control operation wouldprovide an additional 3 to 5 taf of annual supply forgroundwater recharge.
Hansen and Lopez Dams. Hansen Dam onTujunga Wash and Lopez Dam on Pacoima Wash aresmall USACE flood control detention reservoirs (es-sentially debris basins) located on adjoining drainagesin Los Angeles County, in the San Gabriel Mountainsabove Pacoima. The combined storage capacity of thetwo reservoirs is about 25 taf. Los Angeles County hascooperated with USACE in completion of a recon-naissance study (1994) and preparation of afeasibility-level study to evaluate possible water sup-ply benefits from reoperating the reservoirs for limitedwater supply storage. The feasibility study is sched-uled to be completed in 1998.
Santa Fe and Whittier Narrows Dams. SantaFe Dam (32 taf storage capacity) on the San GabrielRiver and Whittier Narrows Dam (67 taf storage ca-pacity) on Rio Hondo are USACE dams that impoundflood control detention basins in Los Angeles County.The county cooperated with USACE in a 1994 re-connaissance study and feasibility-level evaluation ofpossible water supply benefits from reoperating thereservoirs to provide limited water supply storage. Thefeasibility study, scheduled to be completed in 1998,is examining allowing a permanent water conservationpool to be maintained at Santa Fe Dam and expand-ing the existing conservation storage pool at WhittierNarrows.
New Reservoirs
In an average year, about 200 taf of storm runofffrom the Los Angeles River flows to the ocean. A pro-posed freshwater reservoir project in Long Beach wouldinclude an inflatable weir across the Los Angeles River

The California Water Plan Update BULLETIN 160-98
OPTIONS - COASTAL REGIONS 7-64
TABLE 7-29
South Coast Region List of Water Management Options
Option Retain Reason for Deferralor Defer
Conservation
Urban
Outdoor Water Use to 0.8ETo
Retain
Indoor Water Use Retain
Interior CII Water Use Retain
Distribution System Losses Retain
Agricultural
Seasonal Application Efficiency Improvements Retain
Flexible Water Delivery Defer No significant depletion reductions attainable.
Canal Lining and Piping Defer No significant depletion reductions attainable.
Tailwater Recovery Defer No significant depletion reductions attainable.
Modify Existing Reservoirs/Operations
Reoperate Prado Dam Retain
Reoperate Hansen and Lopez Dams Retain
Reoperate Santa Fe and Whittier Narrows Dams Retain
New Reservoirs/Conveyance Facilities
Freshwater Reservoir in Long Beach Harbor Retain
New Aqueduct from Imperial Valley to San Diego Defer Interstate issues.
Groundwater/Conjunctive Use
Local Groundwater Banking/Conjunctive Use Retain
Water Marketing
Castaic Lake Water Agency Retain
Water Recycling
Alamitos Barrier - Los Angeles County Sanitation RetainDistricts
Alamitos Barrier Recycled Water Project - Water RetainReplenishment District
Carlsbad Water Reclamation Plan - Encina Basin - RetainP2 - Carlsbad MWD
Castaic Lake Water Agency Reclaimed Water RetainMaster Plan - LACSD
Central City/Elysian Park Water Recycling Project Retain- LADWP
City of Escondido Regional Water Recycling RetainProgram
City of Poway - Escondido Expansion Retain
City of Poway - S.D. Expansion Retain
City of West Covina - LACSD Retain
Dominguez Gap Barrier Recycled Water Project - RetainWater Replenishment District

The California Water Plan Update BULLETIN 160-98
OPTIONS - COASTAL REGIONS7-65
TABLE 7-29
South Coast Region List of Water Management Options (continued)
Option Retain Reason for Deferralor Defer
E. Thornton Ibbetson Century Recycled Water RetainProject - City of Downey
East Valley Water Recycling Project Expansion - RetainLADWP
El Toro Water District Reclamation Retain
Esteban Torres Water Recycling Project - Central RetainBasin MWD
Green Acres-Phase 2 - Orange County WD Retain
Headworks Water Recycling Project - LADWP Retain
Irvine Ranch Water District Retain
Los Angeles Harbor Water Recycling Project - RetainLADWP
Montebello Forebay Advanced Treatment Plant - RetainWater Replenishment District
Non-domestic Irrigation System - Capistrano RetainValley Water District
North City Reclamation Plant - Poway Resources RetainExpansion - City of Poway
North San Diego County Reclamation Project RetainPhase 2 - Leucadia County WD
OCR Project - CSDOC - Orange County RetainSanitation District
Orange County Regional Reclamation Project - RetainOrange County Water District
Puente Hills/Rose Hills Reclaimed Water District RetainSystem - LACSD
San Elijo Joint Powers Authority - Santa Fe RetainIrrigation District
San Elijo Joint Powers Authority WRF Retain
San Gabriel Valley Groundwater Recharge RetainDemonstration - LACSD
San Pasqual Groundwater Management Program - RetainCity of San Diego
Sepulveda Basin Water Recycling Project - RetainLADWP
South Bay Water Reclamation Project - City of RetainSan Diego
Verdugo-Scholl-Brand Project - City of Glendale Retain
Water Repurification Project - City of San Diego Retain
West Basin Recycling Project-Phase 2 - West Basin RetainMWD
West Los Angeles Extension Expansion - West RetainBasin MWD
Westside Water Recycling Project - LADWP Retain
Whittier Narrows Recreation Area - Los Angeles RetainCounty Sanitation Districts

The California Water Plan Update BULLETIN 160-98
OPTIONS - COASTAL REGIONS 7-66
TABLE 7-29
South Coast Region List of Water Management Options (continued)
Option Retain Reason for Deferralor Defer
Desalting
Brackish Groundwater
Capistrano Beach Desalter Retain
Huntington Beach Colored Water Retain
IRWD Colored Water Treatment Project Retain
Laguna Beach GW Treatment Project Retain
Mesa Colored Water Project Retain
Oceanside Desalter No. 2 Retain
OCWD Undetermined Colored Water Projects Retain
Corona/Temescal Basin Desalter Retain
Otay/Sweetwater Desalter Retain
Perris Basin Desalter Retain
Rubidoux/Western Desalter Retain
San Dieguito Basin Desalter Retain
San Juan Basin Desalter No. 2 Retain
San Pasqual Basin Desalter Retain
Santee/El Monte Basin Desalter Retain
Sweetwater Desalter No.2 Retain
Tijuana River Valley Desalter Retain
Torrance Elm Ave. Facility Retain
West Basin Desalter No. 2 Retain
West Basin Desalter No. 3 Retain
Western/Bunker Basin Treatment Project Retain
Winchester/Hemet Desalter Retain
Seawater
Reverse Osmosis Facilities at South Bay RetainPowerplant
Reverse Osmosis Facilities at Encina Powerplant Retain
Reverse Osmosis Facilities at Alamitos Powerplant Retain
Multiple-effect Distillation Process Retain
Other Local Options
Draft CRB 4.4 Plan Retain
Multipurpose Flood Control Basins Retain
Statewide Options
— — See Chapter 6.

The California Water Plan Update BULLETIN 160-98
OPTIONS - COASTAL REGIONS7-67
near its mouth, to direct some of the storm flows intointakes along existing river levees. From the intakes,the storm flow would be pumped or flow by gravityvia culverts or tunnels to an offshore reservoir. Thereservoir site would be in the vicinity of the existingLong Beach Breakwater in San Pedro Bay. Reservoirdikes would be constructed in the bay with a diaphragmwall constructed through the dikes to prevent leakageof fresh water through the walls of the dam. A bulb offresh water would be maintained at the bottom of thereservoir to repel seawater. The reservoir could be sizedto store 100 taf to 300 taf of storm water during thewet season. This captured storm water could subse-quently be distributed for a number of uses, with themost likely use being groundwater recharge. A finalfeasibility report was issued in March 1998.
The option analyzed consisted of a 100 taf reser-voir sited within San Pedro Bay supplying theMontebello Forebay spreading grounds with 71 to129 taf/yr. The annual cost of the water would be about$1,700/af at 71 taf of supply, decreasing to $1,000/afat 129 taf of supply. Expansion of the project to useadditional captured storm water runoff would maxi-mize the reservoir yield at 172 taf/yr, decreasing theannual cost to $800/af.
Groundwater Development and Conjunctive Use
As a result of MWDSC’s seasonal storage servicepricing program, local agencies are storing importedwater in groundwater basins and increasing theirgroundwater use during the summer and duringdrought years. It is estimated that an average of 100 taf/yr of groundwater supply is now produced as a resultof MWDSC’s discount pricing for winter season de-liveries. The program provides imported water at anaverage discount of $125/af during the winter.
MWDSC had identified the potential for 200 taf ofadditional groundwater production during drought years.To accomplish this additional drought year production,about 600 taf of dedicated storage capacity within thelocal basins may be required. The cost of the water wouldbe about $350/af. MWDSC is working with CalleguasMunicipal Water District on a Las Posas Basin aquiferstorage and recovery project. CMWD would develop upto 300 taf of storage in the lower aquifer system of theLas Posas groundwater basin. The project currently pro-vides 70 taf of water supply in drought years, which hasbeen included as 2020 supply in the water budget.MWDSC is pursuing an additional 130 taf/yr of ground-water production in the region.
Water Marketing
Water from the Colorado River Region. Severalwater marketing arrangements are being planned orimplemented as part of the draft CRB 4.4 Plan. Thesearrangements are described in the section on imple-menting the draft CRB 4.4 Plan.
Water from the Central Valley. More than halfof California’s agricultural water use is in the CentralValley. The California Aqueduct could be used for vol-untary transfers of some of this water to the SouthCoast. It is estimated that potential future marketingarrangements from the Central Valley to the SouthCoast Region could be about 200 taf/yr. Voluntarymarketing arrangements would be developed throughoption agreements, storage programs, and purchasesof water through the drought water bank or other simi-lar spot markets.
MWDSC is currently banking water withSemitropic Water Storage District under a long-termtransfer agreement to store up to 350 taf. The agree-ment allows MWDSC to deliver available SWP waterin wetter years to SWSD for in-lieu groundwater re-charge. In drought years SWSD would release its SWPallocation to MWDSC, and if necessary pump ground-water back into the California Aqueduct to meet itsobligations. The drought year yield would be about60 taf/yr.
A long-term agreement has been completed be-tween MWDSC and Arvin-Edison Water StorageDistrict to store up to 350 taf of water for MWDSCin Arvin-Edison’s groundwater basin. Water bankedin this program would be provided by both MWDSCand AEWSD. MWDSC would withdraw about 60 tafin drought years under this program.
As specified in the Monterey Amendment, agri-cultural contractors will make available up to 130 tafof annual SWP entitlement for permanent transfer tourban contractors, on a voluntary basis. Berrenda-MesaWater District has already completed the transfer of25 taf of entitlement to MWA. Similar permanenttransfers could be negotiated in the South Coast Re-gion. Castaic Lake Water Agency is preparing an EIRfor the proposed transfer of 40 taf of SWP entitlementfrom Wheeler Ridge-Maricopa Water Storage District,a member agency of KCWA. The CLWA service areaincludes the Santa Clarita Valley in northwestern LosAngeles County and extends into eastern VenturaCounty.

The California Water Plan Update BULLETIN 160-98
OPTIONS - COASTAL REGIONS 7-68
Implementing the CRB’s Draft 4.4 PlanThe draft CRB 4.4 Plan would reduce California’s
use of Colorado River to the State’s basic apportion-ment while using marketing arrangements and otheroptions to keep a full Colorado River Aqueduct forthe South Coast. Phase one elements of the draft CRB4.4 Plan that have been quantified and would providewater supplies for the South Coast are described be-low. More detail on the draft plan and its elements isprovided in Chapter 9. Chapter 9 also presents an over-view of how the use of Colorado River water isapportioned among the basin states and among Cali-fornia entities.
Bulletin 160-98 water budgets assume that theSouth Coast Region’s 2020 base supply from the Colo-rado River will be limited to MWDSC’s fourth priorityright of 550 taf, plus any marketing arrangements thathave already been implemented (i.e., 107 taf from theMWDSC/IID agreement described in Chapter 3).Actions taken as part of the draft CRB 4.4 Plan to fillthe CRA’s remaining capacity are treated as future op-tions in the water budgets. As described in Chapter 9(and shown in Table 9-25), the base water demandforecasts for Bulletin 160-98 include implementationof EWMPs. This conserved water would be anothersource of water for Colorado River/South Coast mar-keting arrangements, in addition to those actions thatBulletin 160-98 categorizes as water management op-tions.
Water management options contained in phaseone of the draft CRB 4.4 Plan include the SDCWA/IID water transfer, MWDSC intrastate groundwaterbanking programs, interstate groundwater banking inArizona, drought year land fallowing programs (suchas an MWDSC/PVID program), lining parts of theAll American and Coachella Canals, and agriculturalwater conservation beyond EWMP implementation.As described in Chapter 9, potential South Coast sup-plies from these options are assumed to be madeavailable for the region after shortages due to ground-water overdraft in the Colorado River Region have beenbalanced out.
The draft CRB 4.4 Plan further proposes criteriafor reoperating Colorado River system reservoirs. TheColorado River has a high ratio of storage capacity toaverage annual runoff. Projections of consumptive usefor the upper basin states suggest that those states willnot attain full use of their Compact apportionmentsuntil 2060. USBR’s surplus declarations to date havenot adversely impacted the other states’ use of their
apportionments—reservoir flood control releases weremade in 1997 and 1998. The more significant impedi-ment to implementing revised operating guidelineswould be concerns of the other basin states about im-pacts of an extended period of reoperation on the abilityto avoid future shortages. Reservoir reoperation is notnumerically evaluated in Bulletin 160-98, becauseimplementing new operations criteria would requireagreement of USBR and the remaining basin states,and there is presently no generally accepted proposalavailable for quantification.
Water management options in phase two of thedraft CRB 4.4 Plan have not yet been quantified;implementation of some may extend beyond the Bul-letin 160-98 planning horizon. Examples of phase twoactions include desalting tributary inflows to the SaltonSea or weather modification programs. For example,USBR had developed a 1993 proposed pilot programto evaluate cloud seeding potential in the upper basin,but had not implemented the program because of op-position from the upper basin states. Large-scaleweather modification programs are typically difficultto implement due to institutional and third-party con-cerns.
Water Recycling
Since the 1970s, Southern California has been aleader in developing water recycling projects. Recycledwater is currently used for applications that includegroundwater recharge, hydraulic barriers to seawaterintrusion, landscape and agricultural irrigation, anddirect use in industry. Currently some 80 local recy-cling projects are producing about 210 taf/yr of newwater supply. It is estimated that these existing projectswill provide an additional 70 taf /yr of water supply byyear 2020.
Almost 40 new water recycling projects were evalu-ated as future water supply augmentation options forthe region. Water recycling could potentially increaseby 639 taf by 2020, yielding about 527 taf of newwater. The price of recycled water from these optionsranges from $180/af to more than $2,500/af. This largerange is due to the individual characteristics of pro-posed projects—some entail major capital costs forconstruction of new treatment plants while others mayinvolve only distribution systems from an existingplant. For example, projects designed for groundwa-ter recharge are often located near the treatmentplant—reducing the costs for distribution. As anotherexample, projects that are designed for landscape irri-

The California Water Plan Update BULLETIN 160-98
OPTIONS - COASTAL REGIONS7-69
gation or direct industrial uses will generally be higherin cost because of the extensive distribution systemneeded for delivery.
In an effort to broaden the potential applicationof recycled water to include indirect potable use, theCity of San Diego has conducted research into ad-vanced treatment and ultimate use of recycled wateras a supplement to potable water supplies. This indi-rect potable reuse concept has been termedrepurification by San Diego. The City of San Diego iscurrently working on a water repurification project(described in Chapter 5) that would produce about16 taf/yr of repurified water to augment local supplies.The repurified water would be stored in the San VicenteReservoir and blended with local runoff and importedwater.
To evaluate and compare recycling options withother water management options, the water recyclingoptions were grouped by cost into three groups. Group
I included those options which cost under $500/af;Group II included those options which cost between$500 and $1,000/af; and Group III included thoseoptions which cost more than $1,000/af. The costsused to group these projects are based on the costs re-ported by local agencies in the Department’s 1995water recycling survey. (These costs are not likely tohave all been calculated on the same basis by the localproject sponsors.) The local agencies’ costs were usedto judge the order of magnitude of proposed projects’ costs.
A proposed Orange County regional water recy-cling project is being developed jointly by the OrangeCounty Water District and County Sanitation Dis-tricts of Orange County. Wastewater currentlydischarged into the Pacific Ocean would be recycledto supplement Orange County’s potable supplies. Thetreated wastewater would be used to recharge an aqui-fer along the Santa Ana River, in lieu of using importedwater provided by MWDSC. A plant to treat second-
San Diego Area Water Reclamation Programs
The San Diego County Water Authority and its member agencies are engaged in a long-term effort to reduce regionalreliance on imported water supplies. Water recycling is critical to the success of that effort. Two major programs are currentlyunderway.
The San Diego Area water reclamation program is a system of interconnected reclamation facilities designed to serve southernand central San Diego County. When completed, the program will serve an area of more than 700 square miles and add morethan 60 taf/yr to the San Diego region’s local water supply. Summarized below are the eight participating agencies and eachagency’s planned reuse. Facilities to be constructed include up to ten new or expanded water recycling plants, a water repurificationfacility, and hundreds of miles of recycled water delivery pipelines.
Agency New Water Supply (taf/yr)
City of Escondido 3.2City of Poway 2.3City of San Diego 26.9City of San Diego/San DiegoCounty Water Authority 15.0Otay Water District 2.9Padre Dam Municipal Water District 1.9Sweetwater Authority 7.2Tia Juana Valley County Water District 2.2Total 61.6
Padre Dam MWD has completed construction of its treatment facility, and has begun delivery of recycled water. The Cityof San Diego’s North City water recycling plant and distribution system have also been completed and are delivering recycledwater.
The North San Diego County Area water recycling project will provide more than 15 taf/yr of recycled water to northerncoastal and inland San Diego County. The project is a cooperative effort of Carlsbad and Olivenhain MWDs, the LeucadiaCounty Water District and the San Elijo JPA. When completed, the system of interconnected recycling facilities will serve anarea of more than 100 square miles, from the coastal communities of Carlsbad, Encinitas and Solana Beach inland to the SanDieguito River Valley. Facilities to be constructed include three new or expanded water recycling facilities, about 65 miles ofrecycled water delivery pipeline and associated pump stations and storage facilities, and new groundwater recharge and extractionfacilities.

The California Water Plan Update BULLETIN 160-98
OPTIONS - COASTAL REGIONS 7-70
ary effluent produced by an existing wastewater treat-ment plant would be constructed, with a transmissionpipeline to convey the recycled water to existing spread-ing basins located in the Orange County Forebay inAnaheim. Some recycled water would also be injectedinto a seawater intrusion barrier in Fountain Valley.Another benefit would be that water recycling woulddecrease the total wastewater treatment discharge tothe ocean, which would eliminate or delay the needfor a new or expanded ocean outfall. Phase I is plannedto produce 50 taf/yr of recycled water by 2002. PhasesII and III would produce an additional 50 taf/yr by2020, reducing Orange County’s dependence on im-ported water.
Desalting
Groundwater. Recovery of mineralized ground-water supplies is an important resource strategy forSouthern California. This resource option is usuallyexpensive—because it involves sophisticated technolo-gies and high energy costs. Some groundwater recoveryprojects serve the dual purpose of managing migra-tion of plumes to prevent further contamination ofusable aquifers.
Groundwater desalting plants currently operatinginclude Santa Ana Watershed Project Authority’s Ar-lington Desalter (6.7 taf ), the City of Oceanside’sOceanside Desalter No.1 (2.2 taf ), and West BasinMWD’s West Basin Desalter No.1 (1.7 taf ). Construc-tion of Sweetwater Authority’s groundwaterdemineralization plant (3.6 taf) in the Sweetwater RiverValley began in 1998. Plans are to expand the plant toproduce an additional 4 taf. Additional plants and plantexpansions are being planned or constructed through-out the coastal areas of the Los Angeles Basin, with anestimated total installed capacity of 33 taf/yr by 2000.The estimated total net groundwater recovery poten-tial in the South Coast is about 150 taf/yr.
The Santa Ana Watershed Project Authority wasformed in 1972 to plan and operate facilities to pro-tect water quality in the Santa Ana River’s watershed.The authority is a joint powers agency composed ofthe five larger water districts that share the watershed—Chino Basin Municipal Water District, EasternMunicipal Water District, Orange County Water Dis-trict, San Bernardino Valley Municipal Water District,and Western Municipal Water District. SAWPA oper-ates a brine disposal line which facilitates disposal ofwaste brine from regional desalting plants and oper-ates the Arlington Desalter.
While increases in groundwater recovery are tech-nically feasible, they are challenged by the need fordevelopment of new brine lines (or alternative brinedisposal options) for inland projects as well as require-ments for replenishment in certain groundwater basins.Approximately 20 potential groundwater recoveryprojects were evaluated with a net yield of 95 taf/yr.Supply costs range from $300/af to $900/af. Thegroundwater recovery projects are grouped by cost intotwo groups, those projects less than $500/af and thosemore than $500/af.
Seawater. Seawater desalting is sometimes de-scribed as the ultimate solution to Southern California’swater supply shortfall. Although there is often publicsupport for this resource, seawater desalting is currentlylimited by high costs, environmental impacts of brinedisposal, and siting considerations. Based on currenttechnology, the costs for desalting seawater for potableuse ranges from about $1,000 to $2,000/af dependingon the type of treatment and the distribution systemthat would be required to deliver the water. Althoughhigh costs may currently limit this resource, seawaterdesalting may prove to be an important strategy in thefuture. MWDSC, with joint funding from the U.S.Government and Israel Science and Technology Foun-dation, recently embarked on a demonstration project
Brackish Water ReclamationDemonstration Facility
The Port Hueneme Water Agency was formed to developand operate a brackish water desalting demonstration facilityfor its member agencies, all of whom are located in VenturaCounty. The BWRDF is the cornerstone of the program toimprove water quality and reliability and reduce groundwaterextractions and seawater intrusion in the Oxnard Plain.BWRDF will provide a full-scale demonstration of side-by-
side operation of three brackish water desalting technologies(reverse osmosis, nanofiltration, and electrodialysis reversal).The feasibility of using desalting concentrate for wetlandsenhancement is also being studied. Construction of the projecthas begun and is expected to be completed in 1998. Thetotal capital costs are estimated to be $15.2 million.

The California Water Plan Update BULLETIN 160-98
OPTIONS - COASTAL REGIONS7-71
using a multiple-effect distillation process, as describedin Chapter 5.
In the past, SDCWA has evaluated the possibilityof constructing two reverse osmosis desalting facilitiesin conjunction with the proposed repowering of theSan Diego Gas and Electric South Bay Powerplant andthe Encina Powerplant. The capacity of the two plantswould total 20 taf/yr. The City of Long Beach and theCentral Basin MWD are also collaborating on a studyof a reverse osmosis plant with 5.6 taf annual capacityto be located at Southern California Edison’s AlamitosPowerplant.
Other Local Options
Chino Basin Water Conservation District has pre-pared a scoping report on the construction andoperation of multipurpose storm water detention andgroundwater recharge basins. The proposed projectinvolves San Bernardino County Flood ControlDistrict’s plans for additional flood control facilities inthe City of Ontario. SBCFCD plans to construct astorm water conduit to convey water to existing mul-tipurpose flood control and groundwater rechargebasins and to develop a new flood control detentionbasin. Converting the proposed single-purpose basininto a flood control and groundwater recharge basincould provide additional water supply benefits for theChino Basin. Although the volume of water to be con-served and developed by these projects is relatively small(about 1 taf ), the projects meet specific local needs.
Statewide Options
Statewide water supply augmentation options arediscussed and quantified in Chapter 6.
Options Likely to be Implementedin South Coast Region
Water supplies are not available to meet all of theregion’s 2020 water demands in average or droughtyears. Applied water shortages are forecasted to be 944and 1,317 taf in average and drought years, respec-tively. Ranking of retained water management optionsfor the South Coast Region is summarized in Table 7-30. Table 7-31 summarizes options that can likely beimplemented by 2020 to relieve the shortages. Theseshortages are primarily attributed to increased urbandemands and reduced Colorado River supplies.
To meet the water shortages, water agencies in theSouth Coast Region are planning to implement addi-
tional conservation programs, water recycling, andgroundwater recovery, as well as water marketing andother water supply augmentation options. Demandreduction options such as urban conservation are cur-rently an important program for all water agencies inthe South Coast. Supply augmentation options to beimplemented would include the draft CRB 4.4 Planand a combination of local and statewide options.
Implementation of BMPs and EWMPs will con-tinue through 2020 and is reflected in the base demandlevels for urban and agricultural water use. Additionalconservation options likely to be implemented, basedon costs and feasibility, would provide 91 taf/yr indepletion reduction.
The South Coast Region will increase its relianceon water marketing as Colorado River supplies are re-duced. Options in the first phase of the draft CRB 4.4Plan could make available up to 172 taf in averageyears and 410 taf in drought years for transfer to theSouth Coast Region. Additional banking and market-ing arrangements, as well as permanent transfer of SWPentitlement, are likely options for the region, amount-ing to 37 taf and 27 taf in average and drought years,respectively.
Local groundwater conjunctive use programs willlikely add 130 taf of production in drought years. Wa-ter recycling will continue to be a source of water supplyfor Southern California. New projects could providean additional 367 taf/yr by 2020. Groundwater de-salting projects could provide an additional 27 taf/yr.

The California Water Plan Update BULLETIN 160-98
OPTIONS - COASTAL REGIONS 7-72
TABLE 7-30
Options Ranking for South Coast Region
Optiona Rank Cost ($/af) Potential Gain (taf)Average Drought
Conservation
Urban
Outdoor Water Use to 0.8 ETo - New Development M 750 67 67
Outdoor Water Use to 0.8 ETo -New and Existing Development L b 246 246
Indoor Water Use (60 gpcd) M 400 110 110
Indoor Water Use (55 gpcd) M 600 220 220
Interior CII Water Use (3%) M 500 30 30
Interior CII Water Use (5%) M 750 49 49
Distribution System Losses (5%) M 300 84 84
Agricultural
Seasonal Application Efficiency Improvements (76%) H 100 4 4
Seasonal Application Efficiency Improvements (78%) M 250 7 7
Seasonal Application Efficiency Improvements (80%) M 450 10 10
Modify Existing Reservoirs/Operations
Reoperate Prado Dam H 60 5 5
Reoperate Hansen and Lopez Dams M b b b
Reoperate Santa Fe and Whittier Narrows Dams M b b b
New Reservoirs/Conveyance Facilities
Freshwater Reservoir in Long Beach Harbor L 1,000 172 —
Groundwater/Conjunctive Use
Local Groundwater Banking/Conjunctive Use H 350 — 130
Water Marketing
Castaic Lake WA/Kern County WA (40 taf entitlement) H — 37 27
Water Recycling
Group 1 (Cost < $500/af) H 500 391 391
Group 2 (Cost $500/af- $1,000/af) M 1,000 75 75
Group 3 (Cost > $1,000/af) M 1,500 61 61
DesaltingBrackish Groundwater
Group 1 (Cost < $500/af) M 500 27 27
Group 2 (Cost $500/af- $1,000/af) M 1,000 68 68Seawater
Reverse Osmosis Facilities at South Bay Powerplant L 920 5 5
Reverse Osmosis Facilities at Encina Powerplant L 1,220 15 15
Reverse Osmosis Facilities at Alamitos Powerplant L 1,700 6 6
Multiple-Effect Distillation Process L <1000 85 85
Other Local Options
Multipurpose Flood Control Basins H b c c
Draft Colorado River Board 4.4 Plan H 230 172 410
Statewide Options
See Chapter 6.
a All or parts of the amounts shown for highlighted options have been included in Table 7-31.b Data not available to quantify.c Less than 1 taf.

The California Water Plan Update BULLETIN 160-98
OPTIONS - COASTAL REGIONS7-73
TABLE 7-31
Options Likely to be Implemented by 2020 (taf) South Coast Region
Average Drought
Applied Water Shortage 944 1,317
Options Likely to be Implemented by 2020Conservation 91 91Modify Existing Reservoirs/Operations 5 5New Reservoirs/Conveyance Facilities - -Groundwater/Conjunctive Use - 130Water Marketing 37 27Recycling 367 367Desalting 27 27Colorado River Board’s Draft 4.4 Plan 172 410Statewide Options 150 144Expected Reapplication 95 116
Total Potential Gain 944 1,317
Remaining Applied Water Shortage 0 0

The California Water Plan Update BULLETIN 160-98
OPTIONS - COASTAL REGIONS 7-74

APPENDIX 7A7A-1
The California Water Plan Update BULLETIN 160-98 Appendix 7A
7AOptions Evaluations for Coastal Regions
Quest
More information about the California Department of Water Resources is available at: http://wwwdwr.water.ca.gov/ For a hard copy version of the Bulletin, please call the Publications Office at (916) 653-1097.

7A-2APPENDIX 7A
The California Water Plan Update BULLETIN 160-98Appendix 7A
TA
BLE
7A
-1
Opt
ions
Eva
luat
ion
Nor
th C
oast
Reg
ion
Eva
luat
ion
Scor
esO
ptio
nE
ngin
eeri
ngE
cono
mic
sE
nvir
on-
Inst
itut
iona
l/So
cial
/O
ther
Ove
rall
Ran
km
enta
lL
egal
Thi
rd P
arty
Ben
efit
sSc
ore
Con
serv
atio
n
Urb
an
Out
door
Wat
er U
se -
New
Dev
elop
men
t3
24
22
114
M
Out
door
Wat
er U
se -
New
and
Exi
stin
g3
14
22
113
MD
evel
opm
ent
Indo
or W
ater
Use
(60
gpc
d)3
34
22
115
M
Indo
or W
ater
Use
(55
gpc
d)2
24
22
113
M
Inte
rior
CII
Wat
er U
se (
3%)
33
42
21
15M
Inte
rior
CII
Wat
er U
se (
5%)
32
41
21
13M
Dis
trib
utio
n Sy
stem
Los
ses
(7%
)3
44
22
116
M
Dis
trib
utio
n Sy
stem
Los
ses
(5%
)2
34
22
114
M
Gro
undw
ater
/Con
junc
tive
Use
New
wel
ls -
For
t Bra
gg a
nd o
ther
sm
all
34
44
30
18H
coas
tal c
omm
unit
ies
Agr
icul
tura
l Gro
undw
ater
Dev
elop
men
t3
13
33
013
M
Des
alti
ng
Bra
ckis
h G
roun
dwat
er
Cit
y of
For
t Bra
gg p
roje
ct3
13
22
011
L

APPENDIX 7A7A-3
The California Water Plan Update BULLETIN 160-98 Appendix 7A
TA
BLE
7A
-2
Opt
ions
Eva
luat
ion
San
Fra
ncis
co B
ay R
egio
n
Eva
luat
ion
Scor
esO
ptio
nE
ngin
eeri
ngE
cono
mic
sE
nvir
on-
Inst
itut
iona
l/So
cial
/O
ther
Ove
rall
Ran
km
enta
lL
egal
Thi
rd P
arty
Ben
efit
sSc
ore
Con
serv
atio
n
Urb
anO
utdo
or W
ater
Use
- N
ew D
evel
opm
ent
32
42
21
14M
Out
door
Wat
er U
se -
New
and
Exi
stin
g3
14
12
112
LD
evel
opm
ent
Indo
or W
ater
Use
(60
gpc
d)3
34
22
115
MIn
door
Wat
er U
se (
55 g
pcd)
22
42
21
13M
Inte
rior
CII
Wat
er U
se (
3%)
33
42
21
15M
Inte
rior
CII
Wat
er U
se (
5%)
32
41
21
13M
Dis
trib
utio
n Sy
stem
Los
ses
(5%
)2
34
22
114
M
Mod
ify
Exi
stin
g R
eser
voir
s/O
pera
tion
s
Enl
arge
Lak
e H
enne
ssey
/ N
apa
Riv
er D
iver
sion
32
23
31
14M
Enl
arge
Bel
l Can
yon
Res
ervo
ir3
22
23
214
ME
nlar
ge B
ell C
anyo
n R
eser
voir
/ N
apa
Riv
er3
12
33
113
MD
iver
sion
Enl
arge
Par
dee
Dam
32
22
23
14M
Enl
arge
Cam
anch
e D
am3
22
22
314
ME
nlar
ge L
eroy
And
erso
n R
eser
voir
30
23
32
13M
Upg
rade
Mill
iken
Tre
atm
ent P
lant
30
34
41
15M
Reo
pera
te R
ecto
r R
eser
voir
31
33
41
15M
New
Res
ervo
irs/
Con
veya
nce
Faci
litie
sC
hile
s C
reek
Res
ervo
ir P
roje
ct /
Nap
a R
iver
30
23
31
12L
Div
ersi
on
Enl
arge
Lak
e H
enne
ssey
/ C
hile
s C
reek
Proj
ect /
Nap
a R
iver
Div
ersi
on3
02
23
111
L
Car
nero
s C
reek
Res
ervo
ir /
Nap
a R
iver
Div
ersi
on3
01
23
110
LU
pper
Del
Val
le R
eser
voir
30
23
32
13M
Buc
khor
n D
am a
nd R
eser
voir
31
12
33
13M
Upp
er K
aise
r R
eser
voir
31
13
33
14M

7A-4APPENDIX 7A
The California Water Plan Update BULLETIN 160-98Appendix 7A
TA
BLE
7A
-2
Opt
ions
Eva
luat
ion
San
Fra
ncis
co B
ay R
egio
n (c
ontinu
ed)
Eva
luat
ion
Scor
esO
ptio
nE
ngin
eeri
ngE
cono
mic
sE
nvir
on-
Inst
itut
iona
l/So
cial
/O
ther
Ove
rall
Ran
km
enta
lL
egal
Thi
rd P
arty
Ben
efit
sSc
ore
New
Res
ervo
irs/
Con
veya
nce
Faci
litie
s (c
onti
nued
)
Upp
er B
uckh
orn
Res
ervo
ir3
11
12
311
L
Mid
dle
Bar
Res
ervo
ir3
11
22
211
LD
uck
Cre
ek O
ffst
ream
Res
ervo
ir3
11
22
312
L
Dev
ils N
ose
Proj
ect
31
12
21
10L
EB
MU
D A
mer
ican
Riv
er S
uppl
y4
13
33
216
M
Gro
undw
ater
/Con
junc
tive
Use
Mill
iken
Cre
ek C
onju
ncti
ve U
se3
43
34
118
H
Lake
Hen
ness
ey /
Con
n C
reek
Con
junc
tive
Use
43
43
41
19H
Wat
er M
arke
ting
Zon
e 7
WA
/KC
WA
44
44
30
19H
SCV
WD
/SLD
MW
A4
44
43
019
H
Wat
er R
ecyc
ling
Gro
up 1
(C
ost <
$50
0/af
)4
33
33
117
H
Gro
up 2
(C
ost $
500/
af -
$1,
000/
af)
42
33
31
16M
Gro
up 3
(C
ost >
$1,
000/
af)
40
33
31
14M
Des
alti
ng
Bra
ckis
h G
roun
dwat
erA
lam
eda
Cou
nty
WD
Aqu
ifer
Rec
over
yPr
ojec
t4
23
33
217
H
Seaw
ater
Mar
in M
unic
ipal
WD
Des
alti
ng P
roje
ct3
02
03
19
L
Oth
er L
ocal
Opt
ions
New
Sur
face
Wat
er D
iver
sion
from
Sac
ram
ento
Riv
er b
y C
ities
of B
enic
ia, F
airf
ield
, & V
acav
ille
33
22
30
13M
Stat
ewid
e O
ptio
ns
See
Cha
pter
6.

APPENDIX 7A7A-5
The California Water Plan Update BULLETIN 160-98 Appendix 7A
TA
BLE
7A
-3
Opt
ions
Eva
luat
ion
Cen
tral
Coa
st R
egio
n
Eva
luat
ion
Scor
esO
ptio
nE
ngin
eeri
ngE
cono
mic
sE
nvir
on-
Inst
itut
iona
l/So
cial
/O
ther
Ove
rall
Ran
km
enta
lL
egal
Thi
rd P
arty
Ben
efit
sSc
ore
Con
serv
atio
nU
rban
Out
door
Wat
er U
se -
New
Dev
elop
men
t3
24
22
114
M
Out
door
Wat
er U
se -
New
and
Exi
stin
g3
14
22
113
MD
evel
opm
ent
Indo
or W
ater
Use
(60
gpc
d)3
34
22
115
M
Indo
or W
ater
Use
(55
gpc
d)2
24
22
113
M
Inte
rior
CII
Wat
er U
se (
3%)
33
42
21
15M
Inte
rior
CII
Wat
er U
se (
5%)
32
41
21
13M
Dis
trib
utio
n Sy
stem
Los
ses
(7%
)3
44
22
116
M
Dis
trib
utio
n Sy
stem
Los
ses
(5%
)2
34
22
114
M
Mod
ify
Exi
stin
g R
eser
voir
s/O
pera
tion
s
Mod
ify
Nac
imie
nto
Spill
way
34
44
40
19H
Enl
arge
Sal
inas
Res
ervo
ir3
33
33
015
M
Enl
arge
Cac
hum
a R
eser
voir
20
33
30
11L
New
Res
ervo
irs/
Con
veya
nce
Faci
liti
es
Col
lege
Lak
e2
32
13
213
M
Feed
er S
trea
ms
(Var
ious
Sit
es)
23
32
30
13M
New
Los
Pad
res
Res
ervo
ir3
13
23
315
M
Nac
imie
nto
Pipe
line
41
33
30
14M
Gro
undw
ater
/Con
junc
tive
Use
Col
lege
Lak
e In
ject
ion/
Ext
ract
ion
Wel
ls3
43
33
016
M
Incr
ease
Gro
undw
ater
Dev
elop
men
t in
33
21
20
11L
Seas
ide
Bas
in
Wat
er M
arke
ting
CV
P (S
an F
elip
e Pr
ojec
t E
xten
sion
)3
23
23
114
M

7A-6APPENDIX 7A
The California Water Plan Update BULLETIN 160-98Appendix 7A
TA
BLE
7A
-3
Opt
ions
Eva
luat
ion
Cen
tral
Coa
st R
egio
n (c
ontinu
ed)
Eva
luat
ion
Scor
esO
ptio
nE
ngin
eeri
ngE
cono
mic
sE
nvir
on-
Inst
itut
iona
l/So
cial
/O
ther
Ove
rall
Ran
km
enta
lL
egal
Thi
rd P
arty
Ben
efit
sSc
ore
Wat
er R
ecyc
ling
Gro
up 1
(C
ost
< $5
00/a
f)4
33
33
117
H
Gro
up 2
(C
ost
$500
/af -
$1,
000/
af)
42
33
31
16M
Des
alti
ngB
rack
ish
Gro
undw
ater
Cit
y of
San
ta C
ruz
30
32
30
11L
Seaw
ater
Mon
tere
y Pe
nins
ula
Wat
er3
03
12
09
LM
anag
emen
t Dis
tric
t
Oth
er L
ocal
Opt
ions
Salin
as R
iver
Div
ersi
on a
nd3
23
32
215
MD
istr
ibut
ion
Proj
ect
Stat
ewid
e O
ptio
ns
See
Cha
pter
6.

APPENDIX 7A7A-7
The California Water Plan Update BULLETIN 160-98 Appendix 7A
TA
BLE
7A
-4
Opt
ions
Eva
luat
ion
Sou
th C
oast
Reg
ion
Eva
luat
ion
Scor
esO
ptio
nE
ngin
eeri
ngE
cono
mic
sE
nvir
on-
Inst
itut
iona
l/So
cial
/O
ther
Ove
rall
Ran
km
enta
lL
egal
Thi
rd P
arty
Ben
efit
sSc
ore
Con
serv
atio
nU
rban
Out
door
Wat
er U
se -
New
Dev
elop
men
t3
24
22
114
M
Out
door
Wat
er U
se -
New
and
Exi
stin
g3
14
12
112
LD
evel
opm
ent
Indo
or W
ater
Use
(60
gpc
d)3
34
22
115
M
Indo
or W
ater
Use
(55
gpc
d)2
24
22
113
M
Inte
rior
CII
Wat
er U
se (
3%)
33
42
21
15M
Inte
rior
CII
Wat
er U
se (
5%)
32
41
21
13M
Dis
trib
utio
n Sy
stem
Los
ses
(5%
)2
34
22
114
MA
gric
ultu
ral
SAE
Im
prov
emen
ts (
76%
)3
43
43
118
H
SAE
Im
prov
emen
ts (
78%
)3
33
32
115
M
SAE
Im
prov
emen
ts (
80%
)2
33
22
113
M
Mod
ify
Exi
stin
g R
eser
voir
s/O
pera
tion
s
Reo
pera
te P
rado
Dam
34
43
30
17H
Reo
pera
te H
anse
n an
d Lo
pez
Dam
s3
33
23
014
M
Reo
pera
te S
anta
Fe
and
Whi
ttie
r N
arro
ws
Dam
s3
33
23
115
M
New
Res
ervo
irs/
Con
veya
nce
Faci
litie
s
Fres
hwat
er R
eser
voir
in L
ong
Bea
ch H
arbo
r2
12
23
010
L
Gro
undw
ater
/Con
junc
tive
Use
Loca
l Gro
undw
ater
Ban
king
/Con
junc
tive
Use
43
43
40
18H
Wat
er M
arke
ting
Cas
taic
Lak
e W
ater
Age
ncy
44
44
30
19H
Wat
er R
ecyc
ling
Gro
up 1
(C
ost <
$50
0/af
)4
33
33
117
H
Gro
up 2
(C
ost $
500/
af -
$1,
000/
af)
42
33
31
16M
Gro
up 3
(C
ost >
$1,
000/
af)
40
33
31
14M

7A-8APPENDIX 7A
The California Water Plan Update BULLETIN 160-98Appendix 7A
TA
BLE
7A
-4
Opt
ions
Eva
luat
ion
Sou
th C
oast
Reg
ion
(con
tinu
ed)
Eva
luat
ion
Scor
esO
ptio
nE
ngin
eeri
ngE
cono
mic
sE
nvir
on-
Inst
itut
iona
l/So
cial
/O
ther
Ove
rall
Ran
km
enta
lL
egal
Thi
rd P
arty
Ben
efit
sSc
ore
Des
alti
ngB
rack
ish
Gro
undw
ater
Gro
up 1
(C
ost <
$50
0/af
)3
33
33
116
M
Gro
up 2
(C
ost $
500/
af -
$1,
000/
af)
32
33
31
15M
Seaw
ater
Rev
erse
Osm
osis
Fac
iliti
es a
t Sou
th B
ay P
ower
plan
t2
12
33
011
L
Rev
erse
Osm
osis
Fac
iliti
es a
t Enc
ina
Pow
erpl
ant
20
23
30
10L
Rev
erse
Osm
osis
Fac
iliti
es a
t Ala
mit
os P
ower
plan
t2
02
33
010
L
Mul
tipl
e-ef
fect
Dis
tilla
tion
Pro
cess
11
23
30
10L
Oth
er L
ocal
Opt
ions
Dra
ft C
RB
4.4
Pla
n4
43
33
320
H
Mul
tipu
rpos
e Fl
ood
Con
trol
Bas
ins
33
33
33
18H
Stat
ewid
e O
ptio
ns
See
Cha
pter
6.

APPENDIX 7A7A-9
The California Water Plan Update BULLETIN 160-98 Appendix 7A

The California Water Plan Update BULLETIN 160-98
OPTIONS - INTERIOR REGIONS8-1
Options for MeetingFuture Water Needs in
Interior Regions of California
This chapter covers the interior regions of the State: the Sacramento River,
San Joaquin River, and Tulare Lake Hydrologic Regions (Figure 8-1).
These regions constitute the Central Valley, which makes up about 38
percent of the State’s land area and almost 80 percent of the State’s irrigated acres.
The SWP’s
California
Aqueduct.
TABLE 8-
InteriorHydrologicRegions
FIGURE 8-1
SacramentoRiver
TulareLake
San JoaquinRiver
SacramentoRiver
TulareLake
San JoaquinRiver
Quest
More information about the California Department of Water Resources is available at: http://wwwdwr.water.ca.gov/ For a hard copy version of the Bulletin, please call the Publications Office at (916) 653-1097.

The California Water Plan Update BULLETIN 160-98
OPTIONS - INTERIOR REGIONS 8-2
FIGURE 8-2
Sacramento River Hydrologic Region
MODOC
SHASTA
TEHAMA
GLENN
LAKE
COLUSA
BUTTE
YUBA
SUTTER
NEVADA
SIERRA
SACR
AM
ENTO
YOLO
PLACER
PLUMAS
SISKIYOU
LASSEN
NAPA
SOLANO
EL DORADO
O R E G O N
GooseLake
Creek
Cloud
Thomes
LakeAlmanor
Battle
Cotton
Creek
wood
Mill
Deer
Creek
Elder Creek
Black ButteReservoir
Stony GorgeReservoir
Creek
LakeOroville
Nor
thFo
rkFe
athe
r River
Mid
dle Fork
Feather
FolsomLake
FeatherR
iver
ClearLake Indian Valley
Reservoir
LakeBerryessa
Riv
er
Cow
Creek
River
LakeDavis
Creek
YubaRiver French Meadows
Reservoir
con
Rive
r
RiverBear
North
MiddleFork
Fork
South Fork
EnglebrightReservoir
Camp Far WestReservoir
ShastaLake
Corning C
anal
Clear
WhiskeytownLake Creek
Ash
Pit Rive
r
South
Fork
Amer canRive
r
Cache
Creek
Putah
Creek
toR
iver
LakeNatoma
East ParkReservoir
Creek
Big SageReservoir
Mc
Union ValleyReservoir
Hell HoleReservoir
Folsom SouthCanal
Sacr
amen
toRi
ver
AntelopeLake
FrenchmanLake
Big Chico
Cre
ek
Butte
Cre
ek
Glenn-
usaC
anal
Clear CreekTunnel
ThermalitoFacilities
Putah SouthCanal
North BayAqueduct
Red BluffDiversion Dam
KeswickDam
Ston
y Cree
k
South Fork
i
North
Middle ForkFork
Rubi
New BullardsBar Reservoir
SacraTehama-ColusaCanal
men
lC
o

The California Water Plan Update BULLETIN 160-98
OPTIONS - INTERIOR REGIONS8-3
Description of the AreaThe Sacramento River Region, the drainage area
of the Sacramento River and its tributaries, extends300 miles from the Oregon border south to Collinsvillein the Delta (Figure 8-2). The crest of the Sierra Ne-vada forms the eastern border of the Sacramento RiverRegion, while the western side is defined by the crestof the Coast Range. The southern portion includesthe American River watershed and the northern Delta.The Sacramento River Region includes all or largeportions of Modoc, Siskiyou, Lassen, Shasta, Tehama,Glenn, Plumas, Butte, Colusa, Sutter, Yuba, Sierra,Nevada, Placer, Sacramento El Dorado, Yolo, Solano,Lake, and Napa Counties. Small areas of Amador andAlpine Counties are also within the Sacramento RiverRegion. The State’s largest river, the Sacramento, flowsthe length of the valley before entering the Delta. TheSacramento Valley is comprised of eight planning sub-areas, all of which are hydrologically connected by theSacramento River.
The region is defined by two distinct features—the foothill and mountain areas of the Sierra Nevada,Cascade, and Coast Ranges, and the valley floor. Moun-tain elevations range from 5,000 feet along the coastto more than 10,000 feet in the Sierra Nevada. Theelevation of the valley floor gradually decreases from500 feet in the Redding area to just below sea level inthe Delta.
Precipitation in the region varies substantiallydepending on location and elevation. In the foothilland higher mountain areas, precipitation ranges from40 to more than 80 inches annually. The valley re-ceives less rainfall, with average annual rainfall forRedding and Sacramento being 35 inches and 18
inches, respectively. The mountain areas have cold, wetwinters with snow contributing runoff for summerwater supply. The valley has mild winters and dry, hotsummers.
Base year and future population and crop acreagefor the region are provided in Table 8-1. Most of theregion’s population growth is expected to occur in thesouthern part of the region in Sacramento, Placer, ElDorado, Sutter, Yolo, and Solano Counties. The Sac-ramento metropolitan area and surroundingcommunities are expected to experience significantpopulation growth, as is the Yuba City-Marysville areain Sutter and Yuba Counties. The region includes ex-tensive irrigated agricultural acreage. Rice, irrigatedpasture, alfalfa, grain, fruits, nuts, and tomatoes ac-count for about 80 percent of the irrigated crop acreage.Irrigated acreage in the region is expected to changelittle during the planning period.
Water Demands and SuppliesWater shortages are expected to occur under aver-
age and drought conditions, as shown in Table 8-2.The 1995-level average year shortage reflects thatgroundwater overdraft is not treated as a source of sup-ply. Most of the drought year water shortage is
TABLE 8-1
Population and Crop Acreage
Population Irrigated Crop Acreage(thousands) (thousands of acres)
1995 2,372 2,1392020 3,813 2,150
. . .
Sacramento RiverHydrologic Region

The California Water Plan Update BULLETIN 160-98
OPTIONS - INTERIOR REGIONS 8-4
associated with agricultural water use, primarily on thevalley floor area north of Sacramento.
Excluding supplies dedicated to environmentalpurposes, surface water accounts for about 70 percentof the region’s average year water supply. Groundwa-ter provides the remaining supply. During droughtyears, additional groundwater is pumped to compen-sate for reduced surface water supplies. The region has43 major reservoirs, with a combined storage capacityof almost 16 maf. About half of this surface capacity iscontained in the CVP’s Shasta Lake and the SWP’sLake Oroville.
CVP Water Supply
Most of the water delivered by CVP facilities inthe Sacramento River Region is for agricultural use.Sacramento and Redding receive part of their watersupply from CVP facilities.
The Tehama-Colusa and Corning Canals, suppliedfrom Red Bluff Diversion Dam on the SacramentoRiver, deliver CVP water to agricultural users and towildlife refuges. The Tehama-Colusa Canal extends 110miles south of RBDD, terminating south of Dunniganin Yolo County. The Corning Canal extends 25 milessouth of RBDD, terminating near Corning. Together,the canals serve about 160,000 acres of land in Tehama,Glenn, Colusa, and Yolo Counties. CVP contractorsand water rights settlement users also make direct di-versions from the Sacramento River. Some of the largerwater agencies receiving CVP supplies are listed in Table8-3. The supplies shown include, where applicable,both project water and water rights settlement (basesupply) water.
Releases from Folsom Reservoir on the AmericanRiver serve Delta and CVP export needs, as well asproviding supplies to agencies in the Sacramento met-ropolitan area. The City of Sacramento is the largestwater rights contractor on the American River, with acontract for almost 300 taf/yr. Placer County WaterAgency, one of the largest American River project wa-ter contractors, also holds a water rights settlementcontract for 120 taf/yr. EBMUD holds the largest con-tract for project water on the American River system(150 taf/yr), which it had originally planned to receivevia an extension of the existing Folsom South Canal.(EBMUD’s American River supply is described in
The 3.5 maf Lake Oroville is the largest of the SWP’s storagefacilities.
TABLE 8-2
Sacramento River Region Water Budget (taf)a
1995 2020Average Drought Average Drought
Water UseUrban 766 830 1,139 1,236Agricultural 8,065 9,054 7,939 8,822Environmental 5,833 4,223 5,839 4,225Total 14,664 14,106 14,917 14,282
SuppliesSurface Water 11,881 10,022 12,196 10,012Groundwater 2,672 3,218 2,636 3,281Recycled and Desalted 0 0 0 0Total 14,553 13,239 14,832 13,293
Shortage 111 867 85 989a Water use/supply totals and shortages may not sum due to rounding.

The California Water Plan Update BULLETIN 160-98
OPTIONS - INTERIOR REGIONS8-5
Chapter 7.) Jenkinson Lake (Sly Park Dam) and SugarPine Reservoir serve communities in the foothills eastof Sacramento.
Supply from Other Federal Water Projects
Monticello Dam in Napa County impounds PutahCreek to form Lake Berryessa, the principal water stor-age facility of USBR’s Solano Project. The projectprovides urban and agricultural water supply to SolanoCounty (partly in the Sacramento River Region andpartly in the San Francisco Bay Region) and agricul-tural water supply to the University of California atDavis in Yolo County. Napa County uses about 1 per-cent of the supply for developments around LakeBerryessa.
Solano County Water Agency is the regional wa-ter contractor for both the federal Solano Project andthe SWP. Within the Sacramento River Region, SCWAmember entities with contracts for Solano Project wa-
ter include the City of Vacaville (which also receivesSWP water and uses groundwater), Solano IrrigationDistrict and Maine Prairie Water District. (The Citiesof Fairfield, Vallejo, and Suisun City in the San Fran-cisco Bay Region have SCWA contracts for SolanoProject water, as discussed in Chapter 7.) SID con-tracts for 141 taf/yr of Solano Project water from SCWAand delivers it to agricultural users in Solano County.
SWP Water Supply
Lake Davis, Frenchman Lake, and Antelope Lakeare located on Feather River tributaries in PlumasCounty and are used primarily for recreation, but alsoprovide water supply to the City of Portola and to lo-cal agencies having water rights agreements with theDepartment. Lake Oroville and Thermalito Afterbayalso provide supply within the region. Local agenciesthat receive water rights water delivered throughThermalito Afterbay include Western Canal WaterDistrict, Richvale Irrigation District, Biggs-WestGridley Water District, Butte Water District, and SutterExtension Water District. Agencies in the region hold-ing long-term contracts for SWP supply are PlumasCounty Flood Control and Water Conservation Dis-trict, Butte County, Yuba City, and SCWA. SCWAreceives its SWP supply from the Delta through theNorth Bay Aqueduct.
Local Surface Water Supply
Water stored and released from Clear Lake andIndian Valley Reservoir into Cache Creek is diverted
Monticello Dam,impounding Lake Berryessa,
is the principal feature ofUSBR’s Solano Project.
Solano Irrigation Districtwas formed in 1948 to
sponsor construction of areclamation project to serve
Solano County.
TABLE 8-3
Major Sacramento River CVP Water Users
Agency Total Supplies fromCVP Facilities (taf)
Anderson-Cottonwood ID 175.0Glenn-Colusa ID 825.0Natomas Central MWC 120.2Princeton-Codora-Glenn ID 67.8Reclamation District 108 232.0Reclamation District 1004 71.4Sutter Mutual WC 268.0

The California Water Plan Update BULLETIN 160-98
OPTIONS - INTERIOR REGIONS 8-6
by the Yolo County Flood Control and Water Conser-vation District for irrigation in Yolo County. Since1950, the district has diverted an average of 130 tafannually at Capay Diversion Dam on lower CacheCreek. No water supply from these sources was avail-able during the 1977 and 1990 drought years.
In Sutter County and in western Placer County,agricultural water is supplied by South Sutter WaterDistrict from Camp Far West Reservoir on the lowerBear River. SSWD also purchases surface water fromNevada Irrigation District to supplement irrigators’groundwater supplies. NID’s supplies come from itsreservoirs on the Yuba-Bear River system. Yuba Riversupplies have also been developed by Yuba County Wa-ter Agency, which owns the 966 taf New Bullards BarReservoir, the river’s largest reservoir.
The Sacramento metropolitan area, served by morethan 20 water purveyors, is the largest urban area inthe Sacramento Region and is also the largest urbansurface water user. Within Sacramento County, theCity of Sacramento relies primarily on surface water(approximately 80 to 90 percent); water purveyors inunincorporated areas use both surface water andgroundwater. The City of Sacramento diverts its CVPwater supply from the American River at H Street,and also diverts from the confluence of the Americanand Sacramento Rivers. The City of Folsom takes sur-face water from Folsom Lake.
Groundwater Supply
Most groundwater used in the region comes fromalluvial aquifers on the valley floor. The SacramentoValley is a major groundwater basin, with an estimated114 maf of water in storage at depths of up to 600feet. (Only a portion of this amount can be economi-cally used, however.) Well yields in alluvial areas varysignificantly depending on location; pumping ratestypically range from 100 to 4,000 gpm. Foothill com-munities using groundwater generally rely on fracturedrock sources having yields lower than those found invalley floor alluvium.
Redding supplements its CVP surface water sup-ply with groundwater. Smaller communities in thenorthern and central Sacramento Valley, such as Ander-son, Red Bluff, Marysville, Olivehurst, Wheatland,Willows, Corning, and Williams, rely almost entirelyon groundwater and have adequate supplies to meetlocal demands for the foreseeable future. Woodland,Davis, and Dixon are completely dependent ongroundwater. Most residents in unincorporated areasrely on groundwater.
In the Sacramento metropolitan area, groundwa-ter is used by the Cities of Sacramento and Galt,Sacramento County, and local water agencies. Twoareas of overdraft exist in Sacramento County, one nearMcClellan Air Force Base and the other in the ElkGrove area.
Local Water ResourcesManagement Issues
Sierra Nevada Foothills Water Supply
Urbanization of agricultural lands in the CentralValley is an issue currently attracting public attention.An alternative to urban development on valley flooragricultural lands is increasing development on non-arable lands in the adjoining Sierra Nevada foothills.However, the foothill areas also have land use and wa-ter supply concerns associated with developmentpressure, particularly for communities within commut-ing distance of the valley’s major population centers.
Historically the rural foothill counties have hadeconomies based on natural resource development(ranching and logging). Tourism is becoming increas-ingly important. Although individual foothillcommunities have experienced relatively high growthrates, the area’s overall population is small, and futuredevelopment is constrained by the high percentage of
Cache Creek, with Capay Diversion Dam in foreground.Clear Lake and Mount Konocti are in the background.

The California Water Plan Update BULLETIN 160-98
OPTIONS - INTERIOR REGIONS8-7
federal lands managed by the USFS and the NationalPark Service.
Although extensive development of large-scalewater projects has occurred in the foothills, that devel-opment serves downstream urban and agriculturalwater users. The foothills’ local water supply infrastruc-ture is limited, with some water users still being servedby open ditch and flume systems dating back to goldrush-era mining operations. The area’s developmentpattern of small, geographically dispersed populationcenters and its lack of a financial base for major capitalimprovement projects constrains the ability to inter-connect individual water systems and to developcentralized sources of water supplies, limiting optionsfor water marketing. The area’s small population trans-lates into high per capita costs for water supplyimprovements. Many individual residences and sub-division developments rely on self-suppliedgroundwater from wells tapping fractured rock aqui-fers. Groundwater resources from fractured rocksources are highly variable in terms of water quantityand quality, and are an uncertain source for large-scaleresidential development.
Management of existing water supplies, especiallymeeting increasingly stringent drinking water qualityrequirements, is a challenge for some foothill watersystems. As with water supply, interconnections forwater treatment purposes are difficult due to geographicand topographic constraints. System consolidations arealso complicated by the relatively large percentage ofthe foothill population living in unincorporated areas,and the correspondingly high number of small, inde-pendent water systems. Historically, many isolateddevelopments relying on groundwater as a source ofsupply also used septic tank systems for waste disposal.Eventually, some of these systems experience ground-water contamination problems, requiring a new watersupply or connection to a regional wastewater system,if one exists.
Conveyance system reliability is a concern in foot-hill areas where sources of surface supply are oftenlimited. Conveyance facilities are vulnerable to local-ized flooding and earthquake or landslide damage.After the 1997 floods, a landslide destroyed a 30-footsection of Georgetown Divide Public Utility District’scanal which supplied water to 9,000 customers in sixtowns in rural El Dorado County. Nearby, El DoradoIrrigation District also lost the use of a flume divertingfrom the American River due to another landslide. Thedistrict is currently developing alternatives to repair or
replace the flume. EID has released a draft EIR for theproject, and is proposing to make temporary canal re-pairs to allow for 40 cfs summer deliveries untilpermanent repairs can be made.
The communities of Cohasset and Forest Ranchin Butte County are considering building a pipelineto convey part of Butte County’s SWP supply to ur-ban users east of Chico. During extended droughtconditions some of the wells serving the area have gonedry, requiring that water be hauled by truck. Also inButte County, the Department’s Division of Safety ofDams reduced the allowable operating capacity of Para-dise Irrigation District’s Magalia Reservoir because ofseismic safety concerns. The 2.9 taf capacity reservoiris impounded by a hydraulic fill dam built in 1918.Restoring the 1.5 taf reduction in storage capacity isestimated to cost about $10 million.
Through 2020, no average year water shortagesare anticipated in the entire Sierra foothill area stretch-ing from Modoc County on the north to Kern Countyon the south and including adjacent parts of the Cas-cade Range foothills. Drought year shortages in 2020are forecast to be 220 taf, over 60 percent of which areassociated with agricultural water use. The area’s lim-ited payment capacity and its need for drought yearsupplies suggests that participation in regional watersupply projects with larger water agencies is a viableoption. Although local agencies have evaluated a num-ber of new reservoir projects in the past (see watermanagement options section), these projects have notgone forward.
Foothill Area Water Supplyfrom American River Basin
El Dorado County water agencies have made sev-eral attempts to develop local supplies in the AmericanRiver Basin, in anticipation of their service area’s fu-ture water needs. Originally, USBR’s multipurposeAuburn Dam was to provide local supply. When Au-burn Dam did not go forward, EID and El DoradoCounty Water Agency proposed a joint water supplyand hydropower project in the late 1970s. The SouthFork American River project would have included alarge dam at the Alder Creek site, Texas Hill Reservoiron Weber Creek, two diversion dams, and severalpowerplants. When the SOFAR project did not proveto be financially feasible, a small Alder Creek Reser-voir project with a storage capacity of 31 taf wasinvestigated. In 1993, EDCWA released a final EIRfor water supply development in EID’s service area.

The California Water Plan Update BULLETIN 160-98
OPTIONS - INTERIOR REGIONS 8-8
Alternatives included a 7.5 taf/yr CVP water servicecontract for deliveries from Folsom Reservoir (autho-rized in PL 101-514), the El Dorado project, TexasHill Reservoir, Small Alder Reservoir, and the WhiteRock project. The preferred alternative was identifiedas a combination of the water service contract, the ElDorado project, and the White Rock project.
EDCWA subsequently executed the CVP waterservice contract and EID sought to implement the ElDorado project, a proposal to acquire rights to con-sumptively use water that had been developed byPG&E for hydropower generation. In 1996, SWRCB’sDecision 1635 approved EID’s water rights filing for17 taf/yr of consumptive use from PG&E’s Caples,Aloha, and Silver Lakes on the South Fork of theAmerican River and its tributaries, based in part on aPG&E agreement to sell facilities of the hydropowerproject to EID. Several other water right holders peti-tioned SWRCB to reconsider its decision. EID andPG&E subsequently went to litigation over the sale ofthe facilities, and EID’s EIR for the El Dorado projectwas found inadequate by a Superior Court judge. Theproject is currently on hold.
EID’s White Rock project is a diversion and con-veyance project that would build about 4.5 miles ofpipeline, connecting a proposed treatment plant withan existing Sacramento Municipal Utility District pen-stock. The project would allow more efficient use ofEl Dorado project water, but would not provide addi-tional water supply.
Alternatives to meeting GDPUD’s future waterneeds were identified in a 1992 planning report thatexamined a potential reservoir project on CanyonCreek. The reservoir project was found to be
unaffordable for the service area. The most promisingoption to meet future water demands in GDPUD’sservice area is to divert and convey CVP water fromthe American River (as part of EDCWA’s CVP waterservice contract authorized by PL 101-514). The ad-ditional supplies would be 7.5 and 5.6 taf for averageand drought years, respectively.
In the 1990s, USBR conducted an American Riverwater resources investigation to evaluate local area watersupply options that would replace the water supplythat was to have been provided by the original multi-purpose Auburn Dam. The study proposed twoalternatives for meeting municipal and agricultural wa-ter supply needs in portions of Sacramento, SanJoaquin, El Dorado, Placer, and Sutter Countiesthrough 2030—a conjunctive use alternative and anAuburn Dam alternative. Three alternative AuburnReservoir sizes were studied: 430 taf, 900 taf, and 1,200taf. The final EIS for this investigation was completedin 1997. In May 1998, USBR issued a record of deci-sion to not proceed with federal actions to meet futurewater needs in the study area.
Sacramento Area Water Forum
The Sacramento Area Water Forum was formedin 1993 to discuss ways to accommodate two co-equalobjectives, providing water supply for the area’s planneddevelopment and preserving fishery, wildlife, recre-ational, and aesthetic values of the lower AmericanRiver. Forum membership includes the Cities of Sac-ramento, Galt, and Folsom; County of Sacramento;more than twenty urban and agricultural water agen-cies; several environmental groups; and representativesfrom the business community and other community
Many foothill areas areserved by conveyance systemsthat had their origins in goldrush-era mining systems.Another reminder of theregion’s mining history is theringtail, also known as the“miner’s cat”. Some earlysettlers kept ringtails as pets,to control mice. The ringtaillives in rocky and woodedareas in the foothills and invalley riparian areas.

The California Water Plan Update BULLETIN 160-98
OPTIONS - INTERIOR REGIONS8-9
groups. In 1995 the forum began meeting jointly withwater interests in Placer and El Dorado Counties.
Working together, they developed proposed draftrecommendations for their objectives, releasing a DraftRecommendations for a Water Forum Agreement in 1997.The proposed solution included seven elements:• Increased surface water diversions• Actions to meet customers’ needs while reducing
diversion impacts on the Lower American Riverin drier years
• Support for an improved pattern of fishery flowreleases from Folsom Reservoir
• Lower American River habitat management• Water conservation• Groundwater management• Water Forum successor effort
Generally, water interests would increase their di-versions from the American River in average and wetyears and decrease diversions in drought years. PCWAwould release stored water from its reservoirs on theMiddle Fork of the American River for many of theparticipating water agencies during drought years asreplacement water for their decreased American Riverdiversions. PCWA’s participation in these agreementsis dependent upon SWRCB approval for changes toconditions of its existing water rights.
The proposal calls for conjunctively managingsurface and groundwater supplies to help control de-clining groundwater levels in parts of SacramentoCounty, and for implementing water conservationmeasures. An example of the regional cooperation forstabilizing groundwater levels is a joint pipeline projectbeing carried out by San Juan Water District andNorthridge Water District. SJWD has completed thefirst phase and NWD has completed the second phaseof a joint pipeline project which will provide surfacewater to northern Sacramento County water purvey-ors. Phase III would extend the pipeline to the RioLinda WD, McClellan AFB, the westerly Citizen’sUtilities service area, and Natomas Central MutualWater Company area. By providing surface water sup-plies, the retail purveyors along the pipeline route canreduce their dependence on groundwater, allowing thegroundwater basin to recharge.
Colusa Basin Drainage District
A 1995 study by the Colusa Basin Drainage Dis-trict identified projects to meet six objectives: protectagainst flood and drainage damages, preserve and en-hance agricultural production, capture surface or storm
water for increased water supplies, facilitate ground-water recharge to help reduce overdraft and landsubsidence, improve and enhance wetland and ripar-ian habitat, and improve water quality. Some projectsselected for feasibility and preliminary design studieshave potential water supply benefits—two smallonstream reservoirs and one groundwater rechargeproject. These projects are described in the discussionof water management options. Much of the presentsupply for agricultural water users in the Colusa Basincomes from return flows from CVP water contractors.These irrigation return flows have become an increas-ingly unreliable supply for Colusa Basin Drain divertersas a result of increased water conservation measures byupstream water users.
Groundwater Management Actions
The Sierra Valley Groundwater Management Dis-trict adopted an ordinance in 1980 limiting the amountof groundwater extraction in Sierra Valley. A legal chal-lenge led to a repeal of the ordinance by the SVGMD.The district has since focused its efforts on monitor-ing the basin’s groundwater levels and requestingvoluntary reductions in extractions.
In 1992, the Tehama County Board of Supervi-sors amended its county code to enact urgencyordinances prohibiting groundwater mining within thecounty and extraction of groundwater for export with-out a permit from the board. In 1996, the TehamaCounty Flood Control and Water Conservation Dis-trict adopted a resolution of intent to develop acountywide AB 3030 plan and prepared a draft planto serve as the basis for developing agreements withgroundwater users.
Butte County has enacted two ordinances regu-lating groundwater extraction. The purpose of oneordinance was to “attempt to reduce potential well in-terference problems to existing wells and potentialadverse impacts to the environment which could becaused by the construction of new wells or the repairor deepening of existing wells. . . .” The ordinancelimited pumping rates to 50 gpm per acre. The ordi-nance also established well spacing requirements basedon well pumping capacity; spacing requirements rangefrom 450 feet for a 1,000 gpm well to 2,600 feet for a5,000 gpm well. The other ordinance was approvedby voters in 1996 and regulated export of groundwa-ter out of the county and substitution of groundwaterfor surface water when surface water is sold. The ordi-nance gave the Butte County Water Commission

The California Water Plan Update BULLETIN 160-98
OPTIONS - INTERIOR REGIONS 8-10
permitting authority over groundwater export orgroundwater substitution.
Glenn County enacted a groundwater ordinancein 1977. This ordinance required a permit to exportgroundwater outside the county. A permit can be is-sued only if it is found that export will not result inoverdraft, adverse impacts to water levels, or waterquality degradation. The Board of Supervisors mayimpose permit conditions. Glenn County is prepar-ing an AB 3030 groundwater management plan thatis expected to be completed in 1998.
American River Flood Protection
Following the floods of February 1986, USACEreanalyzed American River basin hydrology and con-cluded that Folsom Dam did not provide an adequatelevel of flood protection to the downstream Sacramentoarea, significantly less than the 250-year protectionestimated in the late 1940s when Folsom Dam wasdesigned. Local, State, and federal agencies workedtogether to identify ways to provide additional floodprotection for the American River Basin. In Decem-ber 1991, an American River watershed investigationfeasibility report and EIR/EIS were completed, pre-senting flood protection alternatives. The reportrecommended a flood control detention dam near Au-burn. In 1992, Congress directed USACE to performadditional flood control studies. Three main alterna-tives were evaluated. Two of the alternatives wouldincrease flood control storage in Folsom Lake, modifythe dam’s spillway and outlet works, and improvedownstream levees. The third alternative would con-struct a detention dam at Auburn, with downstreamlevee improvements. USACE studies identified the de-tention dam as the plan that maximized national
economic benefits. The State Reclamation Board en-dorsed the detention dam as the best long-term solutionto reliably provide greater than 1-in-200 year floodprotection. In 1996, USACE recommended deferringa decision on long-term solutions and proceeding withthe levee improvements common to all three alterna-tives. Congress authorized $57 million in 1996 forconstruction of the levee improvements.
The Central Valley’s January 1997 flood disasterprompted another examination of American Riverhydrology. Based on that hydrologic review, the 1986and 1997 floods are now considered to be about 60-year events. The 1997 flooding also triggered paybackprovisions of the Sacramento Area Flood ControlAgency’s agreement with USBR, under which USBRsets aside up to 270 taf of additional winter flood con-trol space in Folsom Lake. (This additional floodcontrol space in the reservoir raises Sacramento’s levelof protection to about a 77-year event level.) Becausethe January 1997 flood event was followed by an un-usually dry spring, reoperation of Folsom Lake foradditional flood control resulted in a loss of supply toUSBR. The federal government and SAFCA purchased100 taf to offset the loss of supply—50 taf from YCWA,35 taf from PCWA, and 15 taf from GCID.
In its Resolution No. 98-04, the ReclamationBoard restated its conclusion that the best long-termengineering solution to reliably provide greater than1-in-200 year flood protection is to develop additionalflood detention storage at Auburn. As an incrementalmeasure to increase the level of flood protection, theBoard also voted to support SAFCA’s Folsom Modifi-cation Plan, described in SAFCA’s February 1998report Next Steps for Flood Control along the AmericanRiver. This plan, costing $75 to $140 million, would
Sacramento River Flood Control ProjectCongress authorized the Sacramento River Flood Control
Project in 1917 after a series of major Sacramento Valley floodsin the late 1800s and early 1900s. The project was built withlocal, State, and federal funding. The project includes levees,overflow weirs, bypass channels, and channel enlargements.Overflow weirs allow excess water in the main river channelto flow into bypasses in the Sutter Basin and Yolo Basin. Thebypass system was designed to carry 600,000 cfs of floodwaterpast Sacramento—110,000 cfs in the Sacramento Riverthrough downtown Sacramento and West Sacramento, and
the remainder in the Yolo Bypass. The system has workedexceedingly well over the years.
The capability of the SRFCP was improved uponcompletion of Shasta Dam in 1945 and Folsom Dam in 1956.The Feather and Yuba River systems did not share in theSRFCP’s flood control benefits; however, supplementalprotection was provided by the completion of Oroville Damon the Feather River in 1968 and New Bullards Bar Dam onthe Yuba River in 1970. These are large multipurposereservoirs in which flood control functions share space withwater supply functions.

The California Water Plan Update BULLETIN 160-98
OPTIONS - INTERIOR REGIONS8-11
increase flood protection to approximately a 1-in-110year level. In addition, the Board strongly urgedSAFCA to advocate federal flood insurance for all resi-dents and businesses in the Sacramento area havingless than a 1-in-200 year level of flood protection. Asof July 1998, SAFCA was seeking congressional au-thorization for USACE participation in Folsom Dammodifications and downstream levee enlargements. TheBoard currently does not support raising and strength-ening the levees downstream from the dam, and wouldnot support State cost-sharing in this effort. Two com-peting flood control bills, HR 4111 and HR 3698, arepending before Congress. HR 4111 would authorizeconstruction of a small flood control dam, while HR3698 would rely mostly on levee improvements forflood protection for the Sacramento area.
Yuba River Flood Protection
The Marysville-Yuba City area, located at theconfluence of the Feather and Yuba Rivers, relies onlevees for much of its flood protection. New BullardsBar Reservoir on the Yuba River, the only Yuba RiverBasin reservoir with dedicated flood control storage,
regulates less than half the river’s runoff. The middleand south forks of the Yuba River, and Deer Creek,have no dedicated flood storage. A large reservoir site(the former Marysville project, and similar sites nearthe Yuba River Narrows) was studied by USACE,YCWA, the Department, and others at various timesin the 1950s and through the 1980s for both watersupply and flood control purposes.
USACE, in cooperation with the State Reclama-tion Board and YCWA, conducted a feasibility studyof water resources problems and opportunities in theYuba River Basin in 1991, after a 1990 reconnaissancestudy identified a significant flood threat. Preliminaryalternatives included modifying existing levees, imple-menting nonstructural measures, constructing a largeor small bypass, reregulating existing flood storage atOroville and New Bullards Bar Reservoirs, providingnew flood storage at Englebright Reservoir, raisingEnglebright Dam and reregulating flood storage atEnglebright and New Bullards Bar Reservoirs, andconstructing a single purpose or multipurpose reser-voir at the Parks Bar or Narrows damsites. Therecommended plan in USACE’s 1998 Yuba River Ba-
The City of Sacramentoexperienced several major
floods during its early years.The following description
of the floods of 1862 is takenfrom the journal of William
Brewer, a member ofthe California State
Geological Survey. “Such a desolate scene I hopenever to see again. Most of the
city is still under water, andhas been for three months. ...Not a road leading from the
city is passable, business is at adead standstill, everything
looks forlorn and wretched.Many houses have partially
toppled over... some havebeen carried from their
foundations, several streets(now avenues of water) areblocked up with houses thathave floated in them, dead
animals lie about hereand there. . . .”
Courtesy of California
State Library

The California Water Plan Update BULLETIN 160-98
OPTIONS - INTERIOR REGIONS 8-12
sin Investigation final feasibility report and EIR/EISwas to modify existing levees along the Yuba andFeather Rivers. In response to the significant floodproblems experienced in the Marysville-Yuba City areaduring the January 1997 flood, YCWA began a newinvestigation of flood control alternatives. The multi-year study will examine a range of alternatives,including storage facilities such as the Parks Bar site.During the 1997 flood event, 35,000 people wereevacuated from the Marysville area and 75,000 peoplewere evacuated downstream in Sutter County.
Sacramento River MainstemFlood Protection and Water Supply
Enlargement of Shasta Reservoir has been exam-ined in the past by USBR and the Department as awater supply option. Reservoir enlargement would alsoprovide additional flood protection on the SacramentoRiver mainstem. When the project was last reviewedin the 1980s (at a cursory level of detail), its financialcosts were high, reflecting the project’s magnitude (upto 10 maf of additional storage capacity). Railroad andhighway relocations were a substantial cost item. Inthe wake of the January 1997 flooding, there was re-newed interest in reexamining Shasta’s enlargement,and in considering a range of potential reservoir sizes.USBR conducted a preliminary study for the CAL-FED program, reviewing three options. One optionwould raise the dam 6 feet to add 300 taf of storage ata cost of $123 million. Raising the dam 100 feet wouldadd 4 maf of storage and cost $3.9 billion. Raising the
dam 200 feet would add 9.3 maf of storage and cost$5.8 billion. Enlarging Shasta as a statewide water man-agement option could provide the opportunity for localagencies in the region to participate in the project, es-pecially smaller agencies that lack the resources todevelop new local projects themselves.
Putah Creek Adjudication
USBR’s Solano Project stores and diverts waterfrom Putah Creek. Solano Project operations are sub-ject to a condition reserving water for users upstreamof Monticello Dam in Lake Berryessa. In 1990, twoproject water users (SID and SCWA) commenced anaction in Solano County Superior Court to determineall rights to the use of water from Putah Creek and itstributaries. Among other issues, the action required adetermination of how rights can be exercised amongUSBR and upstream water users. An agreement wasnegotiated among SID, SCWA, USBR, and upstreamwater users. In 1996, the SWRCB adopted Order WR96-2, amending appropriative water rights in the up-per Putah Creek watershed to be consistent with thenegotiated agreement.
Fish Passage at Red Bluff Diversion Dam
USBR’s Red Bluff Diversion Dam, completed in1966, spans the Sacramento River. The dam divertsriver water into the Tehama-Colusa and Corning Ca-nals, supplying irrigation and wildlife refuge water.Severe fishery declines in the upper river during the1970s and 1980s, were partly attributed to the dam
Flooding on the AmericanRiver in 1986 and againin 1997 severely tested leveesystem capabilities. Releasesfrom Folsom Dam in 1986actually exceeded designcapacity of the levee system.In 1997, voluntaryevacuation advisories wereissued for some parts of theSacramento metropolitanarea. This photo shows theAmerican River at theH Street bridge.

The California Water Plan Update BULLETIN 160-98
OPTIONS - INTERIOR REGIONS8-13
and the canal intake screens. The dam delayed upstreampassage of migrating adult salmon and steelhead anddisoriented downstream migrating juveniles, whichmade them vulnerable to predation by squawfish. Theoriginal fish screens also permitted passage of manyjuvenile fish into the canals.
In 1986, USBR began raising the gates of the dambetween December and March to allow unimpededfish passage. The gates-up period has been expandedin response to ESA requirements for winter-runchinook salmon; the current objective is to raise thegates for eight consecutive months (September 15 toMay 15) each year to allow unimpeded fish passage.New drum fish screens and bypasses were installed atthe canal headworks in 1991 and are now operatingsuccessfully. As discussed in Chapter 2, USBR andUSFWS are operating a research pumping plant at thedam to evaluate the effects of different pump types onfish. The plant supplies a limited amount of water tothe canals during the eight months when the dam gatesare raised.
Glenn-Colusa Irrigation District Fish Screen
The 175,000 acre Glenn-Colusa Irrigation Dis-trict has the largest diversion on the mainstemSacramento River, with a maximum capacity of 3,000cfs. GCID may divert up to 825 taf from April throughOctober for irrigation supply. GCID also conveys CVPwater to three national wildlife refuges—Sacramento,Delevan, and Colusa.
GCID’s pumping plant is located on a river sidechannel upstream of Hamilton City, near Chico. DFGconstructed a 40-drum rotary screen fish barrier at theplant’s intake in 1982, to prevent entrainment of ju-venile fish. The fish barrier did not perform as intended,resulting in an unacceptably high rate of juvenile fishmortality. ESA listing of the winter-run chinooksalmon resulted in a 1991 court order restrictingGCID’s pumping and requiring installation of a newfish screen. CVPIA required DOI to improve fish pas-sage at the pumping plant. GCID installed a temporaryflat-plate screen in 1993 while a permanent solutionwas being developed. An environmental documentidentifying a preferred fish passage alternative—a newflat-plate screen with a river gradient control facilityin the main channel of the Sacramento River—wasreleased in 1997. Construction of the new screen be-gan in 1998.
Fish and Wildlife RestorationActivities in the Sacramento Valley
Many fishery restoration actions or projects areongoing in the Sacramento Valley. Some of the largerprojects are described below.
Mill and Deer Creeks support spring-run chinooksalmon, a candidate species under the California ESA.In 1995, State legislation restricted future water de-velopment on the creeks, to protect salmon habitat.In addition, local landowners formed the Mill and DeerCreek Watershed Conservancies. The conservancies
USBR’s Red Bluff DiversionDam, with gates raised. Thedam was designed to divert
Sacramento River water intothe Tehama-Colusa Canal.The intake channel for the
Corning Canal PumpingPlant connects to the
Tehama-Colusa Canal.

The California Water Plan Update BULLETIN 160-98
OPTIONS - INTERIOR REGIONS 8-14
Local agencies have made extensive efforts to improve ButteCreek fish passage, in response to declines in the populationof spring-run chinook salmon.
A 1917 construction photoof Anderson-CottonwoodIrrigation District’s diversiondam on the Sacramento River.Flashboards are installedduring the irrigation seasonto raise the river’s water levelfor diversions to ACID’s maincanal. ACID’s diversion is oneof many Sacramento RiverBasin sites under study forfish passage Improvements.
Courtesy of Water Resources Center Archives,
University of California, Berkeley
have begun a watershed planning and managementprocess, with funding assistance from an EPA grant.The Department has participated with Mill Creeklandowners in a test project to construct wells to pro-vide groundwater supplies in lieu of creek diversionsfor irrigation during spring fish migration periods. Asimilar project is being negotiated with Deer Creekwater users.
Big Chico Creek supports a small population ofspring-run salmon, and some fall-run salmon. M&TChico Ranch and Parrott Ranch pumps were relocated
from the creek to the Sacramento River in 1996 toeliminate reverse flows at the mouth of the creek. Otherfishery improvement actions—modification of smalltemporary dams and a permanent fish ladder, reveg-etation of Lindo Channel, and development of a fisherymanagement plan—are being investigated.
Butte Creek is presently receiving considerable fish-ery restoration attention. The creek has a largespring-run salmon population and also supports a smallfall run. Recent fishery restoration efforts on ButteCreek began in 1993 when Western Canal Water Dis-trict and private landowners agreed to remove the PointFour Diversion Dam near Nelson. M&T Chico Ranchand DFG agreed to install a new fish ladder and fishscreens at the Parrott-Phelan Dam in 1995. M&TChico Ranch also dedicated 40 cfs of instream flowfor fishery needs on Butte Creek. WCWD installed asiphon under Butte Creek in 1998, allowing removalof its two main dams and two smaller downstreamdams from the creek. The siphon separates WCWD’scanal system from Butte Creek and eliminates fishlosses previously caused by creek diversion. Work be-gan in 1998 on fishery facility modifications toDurham Mutual, Adams, and Gorrill Dams. The Na-ture Conservancy and California WaterfowlAssociation are evaluating diversion dams in the ButteSlough and Sutter Bypass for potential fish passage im-provements.
Pelger Mutual Water Company and Maxwell Irri-gation District installed fish screens on theirSacramento River diversions in 1994. Princeton-Codora-Glenn Irrigation District and Provident

The California Water Plan Update BULLETIN 160-98
OPTIONS - INTERIOR REGIONS8-15
Irrigation District started construction on a newscreened pumping plant on the Sacramento River,which is expected to be operational in 1998. Reclama-tion District 108 started building its new fish screenat its Wilkins Slough Diversion on the SacramentoRiver in 1997. The new screen is expected to be op-erational in 1999. Reclamation District 1004 iscompleting final design and will begin constructionon its new fish screen and pumping facility in 1998.Natomas Central Mutual Water Company will soonbegin feasibility studies for a large screening projecton the lower Sacramento River. On the Yuba River,Browns Valley Irrigation District will install a fish screenin 1998.
Clear Creek is another location in the SacramentoRiver Basin where fishery restoration work has beenperformed. Additional planned work includes fish pas-sage around McCormick-Saeltzer Dam, gravelplacement, and sediment control. Much of the ripar-ian land along Clear Creek below WhiskeytownReservoir has been acquired by BLM and the WildlifeConservation Board to preserve its habitat values.
Other Sacramento River Region streams with en-vironmental restoration studies underway are BattleCreek and Lower Stony Creek. Potential restorationwork at Battle Creek includes studies of fish passage,instream flows, screened diversions, and hatchery mod-ernization. Glenn County is seeking funding forplanning of a Lower Stony Creek watershed restora-tion program.
Water Needs for Rice Field Flooding
Sacramento Valley rice fields provide overwinter-ing areas for about one-third of all migrating waterfowlin California. Historically, many farmers in the Sacra-mento Valley have flooded harvested rice fields toattract waterfowl for hunting. Additional rice acreageis now being flooded for rice straw decomposition, dueto air quality restrictions on burning rice straw. Mostflooding of harvested rice lands begins in mid-Octo-ber and continues into November. Flooded conditionsare usually maintained through March. In 1994-95,the Department studied three Sacramento Valley plan-ning subareas (Northwest Valley, Central Basin West,and Central Basin East) to evaluate fall and winter wateruse. The study area included approximately123,000 acres of flooded rice land. The estimated ap-plied water requirement was 260 taf or about 2 af/acre; the estimated ETAW was 107 taf. Fields used forwaterfowl hunting have higher water demands than
those used for rice straw decomposition. Water de-mands for flooding to decompose rice straw maydecrease in the future if growers are able to find com-mercial uses for rice straw.
Water Management Optionsfor the Sacramento River Region
Water management options in the SacramentoRiver Region have been extensively investigated by fed-eral, State and local governments over the last 70 years.Many of the federal and State options were exploredfor their potential to augment CVP or SWP water sup-plies. Some projects, once studied as statewide options,are now being reconsidered for meeting future localwater supply and flood control needs in the SacramentoRiver Region. Most large onstream and offstream res-ervoirs are beyond the development capacity of localwater agencies, and are being considered as CALFEDoptions, described in Chapter 6.
Table 8-4 shows a list of options for the region,and the results of an initial screening of the options.The retained options were evaluated (Table 8A-1 inAppendix 8A) based on a set of fixed criteria discussedin Chapter 6.
Water Conservation
Urban. Urban water demand forecasts for 2020 as-sume that BMPs are in place; consequently, only thoseurban conservation efforts which exceed BMPs are con-sidered as options. Urban conservation options weredeferred from detailed evaluation because they providelittle cost-effective potential to create new water throughdepletion reductions in the Sacramento River Region.
Agricultural. The 2020 agricultural water demandforecasts assume that EWMPs are in place. As withthe urban water management options, only those ag-ricultural conservation efforts which exceed EWMPsare considered as options. Agricultural conservationoptions were deferred. Water that is not consumed byevapotranspiration is recoverable either as surface orgroundwater for reapplication downstream.
Modify Existing Reservoirs/Operations
Two reservoir enlargement options were deferredin initial screening. Enlargement of Camp Far WestReservoir was deferred based on economic criteria. ALower Bear River expansion project that would increasethe storage of Lower Bear Reservoir by more than 26taf was deferred because of several uncertainties includ-

The California Water Plan Update BULLETIN 160-98
OPTIONS - INTERIOR REGIONS 8-16
TABLE 8-4
Sacramento River Region List of Water Management Options
Option Retain Reason for Deferralor Defer
Conservation
Urban
Outdoor Water Use to 0.8 ETo
Defer No significant depletion reductions attainable.
Indoor Water Use Defer No significant depletion reductions attainable.
Interior CII Water Use Defer No significant depletion reductions attainable.
Distribution System Losses Defer No significant depletion reductions attainable.
Agricultural
Seasonal Application Efficiency Improvements Defer No significant depletion reductions attainable.
Flexible Water Delivery Defer No significant depletion reductions attainable.
Canal Lining and Piping Defer No significant depletion reductions attainable.
Tailwater Recovery Defer No significant depletion reductions attainable.
Modify Existing Reservoirs/Operations
Enlarge Camp Far West Reservoir Defer Economics.
Lower Bear River Expansion Project Defer Uncertainties with water rights issues.
Reoperate Caples, Aloha, and Silver Lakes Retain
New Reservoirs/Conveyance Facilities
Wilson Creek Reservoir (Glenn County) Defer Undetermined yields; primarily flood controlproject.
Golden Gate Reservoir (Funks Creek, Defer Undetermined yields; primarily flood controlColusa County) project.
Dry Creek Reservoir (Lake County) Retain
Bear Creek Reservoir (Colusa County) Defer Environmental concerns. Conflicts with federalland management policies.
Wilson Valley Reservoir (Lake County) Defer Environmental concerns. Conflicts with federalland management policies.
Garden Bar Reservoir (Placer and Nevada Counties) Defer Economics.
Long Bar Reservoir (Yuba County) Defer Undetermined yields; primarily hydropowerproject.
Wambo Bar Reservoir (Yuba County) Defer Undetermined yields; primarily hydropowerproject.
Marysville Dam (Yuba County) Defer Undetermined yields; economics.
Blue Ridge Reservoir (Yolo County) Defer Environmental concerns. Conflicts with federalland management policies.
Thurston Lake Pump-Storage Project Retain(Lake County)
Parks Bar Reservoir (Yuba County) Retain
Waldo Reservoir (Yuba County) Retain
White Rock Project (El Dorado County) Defer Reoperation of existing supply; would not providenew water supply.
Texas Hill Reservoir (El Dorado County) Retain
Small Alder Reservoir (El Dorado County) Retain
Canyon Creek Reservoir (Georgetown) Defer Excessive costs.
GDPUD Diversion from American River Retain

The California Water Plan Update BULLETIN 160-98
OPTIONS - INTERIOR REGIONS8-17
ing water rights issues, coordination with PG&E (thereservoir’s owner), and lack of definitive estimates ofthe project’s drought year supply.
The water management issues section describedseveral projects for EID’s service area. The El DoradoProject would offer an annual yield of 17 taf for EIDthrough consumptive use of water developed for hy-dropower at PG&E facilities (Caples, Aloha, and SilverLakes). No new diversion facilities would be requiredfor the project. Implementation of the El DoradoProject is currently on hold pending negotiations withproject opponents.
New Reservoirs
An extensive reevaluation of onstream andoffstream Sacramento Valley reservoir sites is beingconducted by the CALFED Bay-Delta program. Chap-ter 6 discusses reservoir sites (such as the offstream SitesReservoir) being evaluated as statewide water supplyoptions for CALFED.
Onstream Storage. Local efforts to develop Ameri-can River Basin water supply for rapidly growingfoothill communities were described previously. Mostrecently, EID and EDCWA considered the Texas Hilland Small Alder Reservoir sites, but EDCWA did notinclude them as preferred alternatives in its plan forEID’s service area. The drought year yields from thesereservoirs have been estimated at 9.4 taf and 11.3 taf,respectively. If implementation of EDCWA’s preferredalternative does not proceed, these options may stillbe viable. GDPUD has examined a reservoir projecton Canyon Creek. The 17 taf reservoir site, locatedbetween the Middle and South Forks of the AmericanRiver, would have an estimated drought year yield of6 taf. This project was not cost-competitive with otheroptions available to GDPUD.
The Colusa Basin Drainage District has investi-gated two small reservoirs as part of its integratedwatershed management project—a 2.2 taf WilsonCreek Reservoir west of Orland in Glenn County, and
TABLE 8-4
Sacramento River Region List of Water Management Options (continued)
Option Retain Reason for Deferralor Defer
Groundwater/Conjunctive Use
New Wells (Redding, Butte, and Colusa Basins) Retain
USBR/Ducks Unlimited Conjunctive Use Defer Would not create new water supply.
Big Valley Conjunctive Use (Lake County) Retain
Orland-Artois Groundwater Recharge Basin Defer Lack of project data, no yields determined.
Adobe Creek Detention Structure (Lake County) Defer Negative environmental impacts.
Water Recycling
Water recycling options Defer Water recycling options would not generate newwater supply.
Desalting
Brackish Groundwater
— — —
Seawater
— — —
Other Local Options
New Surface Water Diversion from Sacramento RetainRiver and Cache Creek by YCFC&WCD
New Surface Water Diversion from Sacramento RetainRiver by Cities of Benicia, Fairfield, and Vacaville
Statewide Options
— — See Chapter 6.
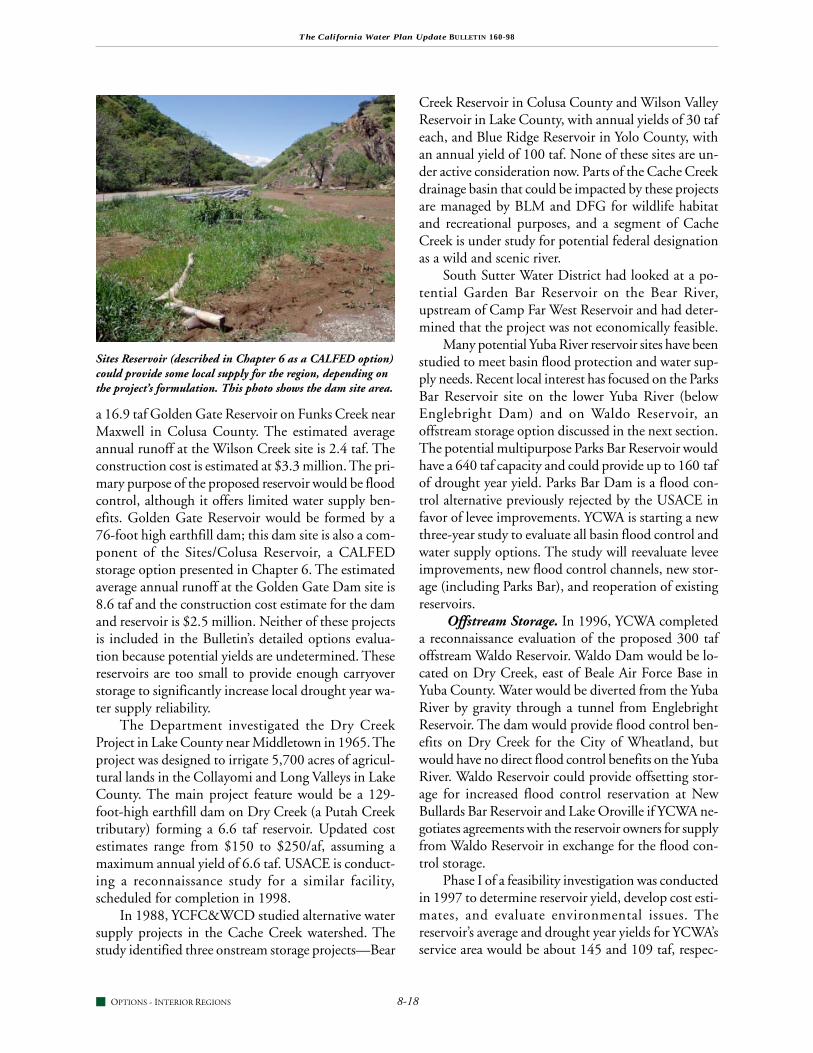
The California Water Plan Update BULLETIN 160-98
OPTIONS - INTERIOR REGIONS 8-18
a 16.9 taf Golden Gate Reservoir on Funks Creek nearMaxwell in Colusa County. The estimated averageannual runoff at the Wilson Creek site is 2.4 taf. Theconstruction cost is estimated at $3.3 million. The pri-mary purpose of the proposed reservoir would be floodcontrol, although it offers limited water supply ben-efits. Golden Gate Reservoir would be formed by a76-foot high earthfill dam; this dam site is also a com-ponent of the Sites/Colusa Reservoir, a CALFEDstorage option presented in Chapter 6. The estimatedaverage annual runoff at the Golden Gate Dam site is8.6 taf and the construction cost estimate for the damand reservoir is $2.5 million. Neither of these projectsis included in the Bulletin’s detailed options evalua-tion because potential yields are undetermined. Thesereservoirs are too small to provide enough carryoverstorage to significantly increase local drought year wa-ter supply reliability.
The Department investigated the Dry CreekProject in Lake County near Middletown in 1965. Theproject was designed to irrigate 5,700 acres of agricul-tural lands in the Collayomi and Long Valleys in LakeCounty. The main project feature would be a 129-foot-high earthfill dam on Dry Creek (a Putah Creektributary) forming a 6.6 taf reservoir. Updated costestimates range from $150 to $250/af, assuming amaximum annual yield of 6.6 taf. USACE is conduct-ing a reconnaissance study for a similar facility,scheduled for completion in 1998.
In 1988, YCFC&WCD studied alternative watersupply projects in the Cache Creek watershed. Thestudy identified three onstream storage projects—Bear
Creek Reservoir in Colusa County and Wilson ValleyReservoir in Lake County, with annual yields of 30 tafeach, and Blue Ridge Reservoir in Yolo County, withan annual yield of 100 taf. None of these sites are un-der active consideration now. Parts of the Cache Creekdrainage basin that could be impacted by these projectsare managed by BLM and DFG for wildlife habitatand recreational purposes, and a segment of CacheCreek is under study for potential federal designationas a wild and scenic river.
South Sutter Water District had looked at a po-tential Garden Bar Reservoir on the Bear River,upstream of Camp Far West Reservoir and had deter-mined that the project was not economically feasible.
Many potential Yuba River reservoir sites have beenstudied to meet basin flood protection and water sup-ply needs. Recent local interest has focused on the ParksBar Reservoir site on the lower Yuba River (belowEnglebright Dam) and on Waldo Reservoir, anoffstream storage option discussed in the next section.The potential multipurpose Parks Bar Reservoir wouldhave a 640 taf capacity and could provide up to 160 tafof drought year yield. Parks Bar Dam is a flood con-trol alternative previously rejected by the USACE infavor of levee improvements. YCWA is starting a newthree-year study to evaluate all basin flood control andwater supply options. The study will reevaluate leveeimprovements, new flood control channels, new stor-age (including Parks Bar), and reoperation of existingreservoirs.
Offstream Storage. In 1996, YCWA completeda reconnaissance evaluation of the proposed 300 tafoffstream Waldo Reservoir. Waldo Dam would be lo-cated on Dry Creek, east of Beale Air Force Base inYuba County. Water would be diverted from the YubaRiver by gravity through a tunnel from EnglebrightReservoir. The dam would provide flood control ben-efits on Dry Creek for the City of Wheatland, butwould have no direct flood control benefits on the YubaRiver. Waldo Reservoir could provide offsetting stor-age for increased flood control reservation at NewBullards Bar Reservoir and Lake Oroville if YCWA ne-gotiates agreements with the reservoir owners for supplyfrom Waldo Reservoir in exchange for the flood con-trol storage.
Phase I of a feasibility investigation was conductedin 1997 to determine reservoir yield, develop cost esti-mates, and evaluate environmental issues. Thereservoir’s average and drought year yields for YCWA’sservice area would be about 145 and 109 taf, respec-
Sites Reservoir (described in Chapter 6 as a CALFED option)could provide some local supply for the region, depending onthe project’s formulation. This photo shows the dam site area.

The California Water Plan Update BULLETIN 160-98
OPTIONS - INTERIOR REGIONS8-19
tively. The cost of water if served in the area of originwould be about $110/af. Phase II of the study beganin 1998 and includes analyses of alternatives. Prepara-tion of environmental documentation would begin in2000 if the project appeared feasible. Environmentalissues include flooding of a portion of the SpencevilleWildlife and Recreation Area, remediation of an aban-doned copper mine, and instream flows. (Thepreliminary cost estimates include removal of minetailings and site remediation in accordance with regu-latory requirements.)
A 1988 YCFC&WCD study investigated a po-tential offstream storage project at Thurston Lake, anatural lake in the Clear Lake watershed. The ThurstonLake pump-storage project was to develop a new wa-ter supply and reduce flooding at Clear Lakecommunities. The project would provide storage ofup to 300 taf and yield 60 taf/yr. Water would bepumped from Clear Lake into Thurston Lake duringperiods of high runoff, reducing downstream floodflows. Preliminary investigations suggest that substan-tial leakage at the site would occur and that potentialwater quality problems could result from high boronlevels in Thurston Lake.
New Conveyance Facilities
The White Rock conveyance project would divertand convey South Fork American River water fromSMUD’s White Rock Penstock to EID’s proposed BrayWater Treatment Plant near Diamond Springs. Thediversion could be made under a 1957 contract and a1961 supplemental agreement with SMUD, if waterrights were granted by SWRCB to EDCWA and EID.The maximum quantity of water that could be divertedannually is about 40 taf. The project would not gener-ate new water.
Groundwater Developmentor Conjunctive Use
Groundwater is expected to be the primary localoption for increasing valley floor water supplies northof Sacramento within this Bulletin’s planning horizon.Where supplies are plentiful and of adequate quality,groundwater has a cost advantage over new reservoirs.Groundwater can be developed incrementally by indi-vidual farms and domestic users, or by water purveyors.Data are not available to quantify the availability ofadditional groundwater development.
USBR, in cooperation with Ducks Unlimited,studied a conjunctive use project within GCID to pro-
vide long-term groundwater supply to supplementavailable surface water for rice straw decompositionand waterfowl habitat. In wet years, surplus SacramentoRiver water would be pumped into GCID’s convey-ance system for delivery to recharge areas. The studyconcluded that the project would not provide newwater supply.
The Lake County Flood Control and Water Con-servation District is investigating a small conjunctiveuse project in Big Valley near Kelseyville. This projectwould modify the primary spillway structure of High-land Creek Reservoir to increase storage. The conservedwater would be released downstream during the springand fall for groundwater recharge. Current estimatesindicate a project yield of 400 af/yr at a cost of about$30/af. Because the yield would be less than 1 taf/yr,the project was not shown in the list of options likelyto be implemented for the region.
The Colusa Basin Drainage District is investigat-ing the Orland-Artois groundwater recharge projectin southern Glenn County. Water would be deliveredto an abandoned quarry via the Tehama-Colusa Canalduring periods of high Sacramento River flows. Pre-liminary designs for this project estimate groundwaterrecharge capacity of 1.5 taf per season. The estimatedcost of construction ranges from about $363,000 to$513,000. Evaluation of this option was deferred un-til project yields are determined.
Water Marketing
Intra- and inter-district water transfers have beencommon among CVP water rights settlement contrac-tors on the Sacramento River. Year-to-year transfersamong CVP water users in the region are not consid-ered as new projects for Bulletin 160-98.
Water Recycling
As with conservation, recycling is not a source ofnew supply in the Sacramento River Region from astatewide perspective. Recycling is a potentially im-portant water source for local purposes, but does notcreate new water. Several small water recycling projectsserve local water needs for agricultural, environmen-tal, and landscape irrigation purposes. In the 1995 baseyear, about 12.5 taf of wastewater was recycled in theregion, an amount expected to increase to 14.5 taf by 2020.
Other Local Options
YCFC&WCD has filed water right applicationsfor supplemental water from the Sacramento River for

The California Water Plan Update BULLETIN 160-98
OPTIONS - INTERIOR REGIONS 8-20
Davis, Woodland, and Winters, and for agriculturaland fishery uses at UC Davis. YCFC&WCD also filedan application to divert water from Cache Creek forgroundwater recharge and to replace groundwater cur-rently being used for irrigation. About 95 taf has beenrequested under the two applications.
SCWA and its member agencies are examiningseveral surface water management projects. One po-tential project is an intertie connecting a SolanoIrrigation District irrigation canal with the SWP’sNorth Bay Aqueduct. Another potential SCWA projectinvolves permanent or long-term water transfers. TheCities of Fairfield and Benicia in the San FranciscoBay Region and Vacaville in the Sacramento RiverRegion have filed a water right application for supple-mental water from the Sacramento River, seeking 12,10.5, and 8.5 taf/yr, respectively.
Statewide Options
Statewide water supply augmentation options arediscussed and quantified in Chapter 6.
Options Likely to be Implementedin the Sacramento River Region
Water supplies are not available to meet all of theregion’s 2020 water demands in average or droughtyears. Applied water shortages are forecasted to be 85taf and 989 taf in average and drought years, respec-tively. Ranking of retained water management optionsfor the Sacramento River Region is summarized inTable 8-5. Table 8-6 summarizes options that can likelybe implemented by 2020 to relieve the shortages.
Costs of new reservoir projects are often prohibi-tive for agricultural water users, especially when the
TABLE 8-5
Options Ranking for Sacramento River Region
Optiona Rank Cost ($/af) Potential Gain (taf)Average Drought
Modify Existing Reservoirs/Operations
Reoperate PG&E Reservoirs L b b 17
New Reservoirs/Conveyance Facilities
Dry Creek Reservoir (Lake County) L 200 7 b
Thurston Lake Pump-Storage Project M 390 b 60
Parks Bar Reservoir (Yuba County) H b b 160
Waldo Reservoir (Yuba County) H 110 145 109
Texas Hill Reservoir (El Dorado County) L b b 9
Small Alder Reservoir (El Dorado County) L b b 11
GDPUD Diversion from American River M b 8 6
Groundwater/Conjunctive Use
New Wells (Redding, Butte, and Colusa Basins) H b b b
Big Valley Conjunctive Use H 30 — c
Other Local Options
New Surface Water Diversion from Sacramento River and M b 95 95
Cache Creek by YCFC&WCD
New Surface Water Diversion from Sacramento River by M b 8 8
cities of Benicia, Fairfield, and Vacavillea All or parts of the amounts shown for highlighted options have been included in Table 8-6.b Data not available to quantify.c Less than 1 taf.

The California Water Plan Update BULLETIN 160-98
OPTIONS - INTERIOR REGIONS8-21
TABLE 8-6
Options Likely to be Implemented by 2020 (taf)Sacramento River Region
Average Drought
Applied Water Shortage 85 989
Options Likely to be Implemented by 2020Conservation — —Modify Existing Reservoirs/Operations — —New Reservoirs/Conveyance Facilitiesa — 160Groundwater/Conjunctive Use — —Water Marketing — —Recycling — —Desalting — —Other Local Options — —Statewide Options 85 51Expected Reapplication — 56
Total Potential Gainb 85 267
Remaining Applied Water Shortage 0 722a Average year yield of Parks Bar Reservoir has not been quantified.b With construction of Parks Bar Reservoir, average water year needs of region would be exceeded, although there is a substantial drought year shortage. In average water years, the surplus water could be available for use in other regions.
supplies are needed primarily for drought year short-ages. However, Yuba River onstream storage at the ParksBar site or offstream storage at Waldo Reservoir arepromising options. Parks Bar in particular could re-duce the flood threat to the Yuba City-Marysville areaand downstream levee systems on the Feather and Sac-ramento Rivers. Parks Bar could provide a drought yearyield of 160 taf. Likewise, a 2.3 maf Auburn Dam
would provide the Sacramento metropolitan area withsubstantial flood protection as well as augment theregion’s average year and drought year supplies by 85taf and 51 taf, respectively. If options shown in Table8-6 are implemented, average water year needs of theregion would be fully met, although a drought yearshortage would remain.

The California Water Plan Update BULLETIN 160-98
OPTIONS - INTERIOR REGIONS 8-22
FIGURE 8-3
San Joaquin River Hydrologic Region
EL DORADO
AMADOR
ALPINE
MARIPOSA
MERCED
MADERA
CALAVERAS
SAN JOAQUIN
CONTRA COSTA
TUOLUMNE
STANISLAUS
FRESNO
SACRAMENTO
SAN BENITO
Cosumnes River
Dry
Creek
Creek
umnePardeeReservoir
CamancheReservoir
New HoganReservoir
Mokelumne
Aqueduct
New MelonesLake
BeardsleyLake
Nor
thFo
rk
Spicer MeadowsReservoir
South Fork
Creek FarmingtonReservoir
TullochLake
Hetch HetchyReservoir
LloydLake
DonnellsLake
LakeMcClure
Merced
New Don PedroLake River
Tuolumne River
Nor
thFo
rk
JenkinsonLake
Lower Bear RiverReservoir
HetchHetchyStanislaus River
ModestoReservoir
TurlockLake
River
Aqueduct
Tuolumne
Littlejohns
San LuisReservoir
Los BanosCreek
Reservoir
O NeillForebay
Delta
Mendota
Canal
San
Joaquin
River
Merced
River
BearCreek
EastmanLake
OwensCreek
Chowchilla River
Fresno River
HensleyLake
Mammoth PoolReservoir
LakeThomas A. Edison
FlorenceLake
HuntingtonLake
ShaverLake
BassLake
RedingerLake
MillertonLake
SouthFork
SanJoaquin River
Little PanocheCreek Reservoir
CliftonCourt
Forebay
South BayAqueduct
TracyPumpingPlant
San
LuisCanal
Friant-KernCanal
PachecoTunnel
MendotaPool
FolsomSouthCanal
California
duct
MaderaCanal
Contra CostaCanal
Mokel
River
Aque

The California Water Plan Update BULLETIN 160-98
OPTIONS - INTERIOR REGIONS8-23
Description of the Area
The San Joaquin River Region is bordered on theeast by the crest of the Sierra Nevada and on the westby the coastal mountains of the Diablo Range (Fig-ure 8-3). It extends from the Delta and the CosumnesRiver watershed to the San Joaquin River watershednear Fresno. All or portions of counties within the studyarea include Alameda, Alpine, Amador, Calaveras,Contra Costa, El Dorado, Fresno, Madera, Mariposa,Merced, Sacramento, San Benito, San Joaquin,Stanislaus, and Tuolumne.
Summer temperatures are usually hot in the val-ley, and slightly cooler in the Delta and upland areas.In the winter, temperatures are usually moderate inthe valley and cool in the Delta and upland areas. An-nual precipitation on the valley floor ranges from about17 inches in the north to 9 inches in the south.
The principal population centers are the Cities ofLodi, Stockton, Tracy, Modesto, Turlock, Merced, andMadera. The northwest part of the area, including Tracyand surrounding communities, is experiencing rapidgrowth as workers in the San Francisco Bay area ac-cept the longer commute from the valley in exchangefor the affordable housing. Table 8-7 shows the 1995and 2020 population and crop acreage for the region.
TABLE 8-7
Population and Crop Acreage
Population Irrigated Crop Acreage(thousands) (thousands of acres)
1995 1,592 2,0052020 3,025 1,935
TABLE 8-8
San Joaquin River Region Water Budget (taf)a
1995 2020Average Drought Average Drought
Water UseUrban 574 583 954 970Agricultural 7,027 7,244 6,450 6,719Environmental 3,396 1,904 3,411 1,919Total 10,996 9,731 10,815 9,609
SuppliesSurface Water 8,562 6,043 8,458 5,986Groundwater 2,195 2,900 2,295 2,912Recycled and Desalted 0 0 0 0Total 10,757 8,943 10,753 8,898
Shortage 239 788 63 711a Water use/supply totals and shortages may not sum due to rounding.
. . .
San Joaquin RiverHydrologic Region

The California Water Plan Update BULLETIN 160-98
OPTIONS - INTERIOR REGIONS 8-24
Irrigated crop acreage in the area is forecasted todecrease, primarily due to urban development on ag-ricultural lands. The primary crops are alfalfa, corn,cotton, deciduous fruit and nuts, grain, grapes, andpasture. Major employers include agriculture, foodprocessing, and service sector businesses.
The area has many wildlife refuge and wetlandareas. The Grasslands area, in western Merced County,is the largest contiguous block of wetlands in the Cen-tral Valley and is an important wintering ground for
migratory waterfowl and shorebirds on the Pacific Fly-way. Wetlands and wildlife areas include managedwetlands on Delta islands, Grassland Resource Con-servation District, Los Banos Wildlife Area, MercedNational Wildlife Refuge, North Grasslands WildlifeArea, San Luis National Wildlife Refuge, and VoltaWildlife Area. (In 1996, Kesterson National WildlifeRefuge and San Luis National Wildlife Refuge merged,with the combined refuge keeping the San Luis name.)Of the total wetlands in the region, about 40,700 acresare privately owned.
Water Demands and SuppliesTable 8-8 summarizes the region’s water demands
and supplies. Significant 1995-level and 2020-levelwater shortages occur in both average and droughtyears.
Surface Water
Much of the valley floor area receives its water sup-ply from Sierra Nevada reservoirs. Some Sierra Nevadafacilities—such as San Francisco’s system andEBMUD’s system—export water from the region toserve communities in the San Francisco Bay Region.Agricultural lands west of the San Joaquin Valley troughare mostly served by the CVP. Agricultural lands inthe northwest corner of the region receive their watersupply by direct diversion from Delta waterways. Inthe foothill and mountain areas, water is either diverteddirectly from streams and lakes or from local storagereservoirs and conveyance facilities.
Flood protection in theCosumnes River floodplainhas historically been providedonly by privately-ownedlevees. As shown here, ruralresidential development inthe floodplain has relied onthis limited protection.
San Francisco’s Hetch Hetchy Reservoir in Yosemite NationalPark. The reservoir is impounded by O’Shaughnessy Dam.

The California Water Plan Update BULLETIN 160-98
OPTIONS - INTERIOR REGIONS8-25
In north to south order, the major Sierra Nevadarivers draining to the valley floor in this region are theCosumnes, Mokelumne, Calaveras, Stanislaus,Tuolumne, Merced, Chowchilla, Fresno, and SanJoaquin Rivers. The San Joaquin River, which formsthe southerly boundary of the region, flows westwardout of the mountains then turns north and flows inthe valley trough to the Delta.
The Cosumnes River, one of the smaller SierraNevada rivers, is unique in that it has no significantreservoirs on its entire length, although it has local ir-rigation diversions. (USBR’s Jenkinson Lake is locatedon Sly Park Creek, a tributary to the Cosumnes River.)Riparian lands along the lower river are managed as anature preserve. Flood protection needs on theCosumnes River were highlighted by the January 1997floods, when numerous breaks in private levees on thevalley floor caused widespread local flooding. As dis-cussed in the following section, proposals for a managedfloodway are under consideration.
The Mokelumne River system includes some hy-droelectric power development in the upper watershed,but the major reservoirs are EBMUD’s Camanche andPardee Reservoirs, which develop water supply for ur-ban communities in the San Francisco Bay Region.Woodbridge Diversion Dam on the Mokelumne Rivernear Lodi diverts irrigation water from the river toWoodbridge Irrigation District.
The 317 taf New Hogan Reservoir, the only largereservoir on the Calaveras River, was constructed bythe USACE to provide flood protection and water sup-ply for the Stockton area. New Hogan maintains a floodcontrol reservation of up to 165 taf. To the south ofNew Hogan on Littlejohns Creek, USACE constructedFarmington Reservoir to provide additional flood pro-tection for the Stockton area. Stockton East WaterDistrict provides the City of Stockton with supply fromNew Hogan. As part of its New Melones water con-veyance project, SEWD constructed facilities linkingFarmington Reservoir on Littlejohns Creek toGoodwin Dam on the Stanislaus River.
The CVP’s 2.4 maf New Melones Reservoir is thelargest reservoir on the Stanislaus River. Up to 450 tafof New Melones’ capacity is reserved for flood controlstorage. Upstream from New Melones are BeardsleyReservoir (98 taf ) and Donnells Reservoir (64 taf ),owned jointly by Oakdale Irrigation District and SouthSan Joaquin Irrigation District. Downstream from NewMelones are Tulloch Reservoir (67 taf ) and GoodwinReservoir (0.5 taf ), also owned by OID and SSJID.
SSJID also owns the nearby 35 taf Woodward Reser-voir on Simmons Creek. By virtue of an agreementwith USBR, OID and SSJID have the ability to store200 taf in New Melones Reservoir. USBR has enteredinto contracts with SEWD and Central San JoaquinWater Conservation District for New Melones watersupply. SEWD holds a contract for 75 taf/yr of in-terim supply from New Melones. CSJWCD has CVPcontracts for 80 taf/yr, 31 taf of which is interim sup-ply. (Interim supply in this context means supplies thatare available until future in-basin demands require useof the water.) USBR must also use New Melones tomeet SWRCB San Joaquin River salinity standards atVernalis. As discussed in the following section, enact-ment of CVPIA and management of project waterdedicated for environmental purposes have createdconflicts in meeting the multiple needs that NewMelones was intended to serve.
The Tuolumne River (largest of the San JoaquinRiver tributaries) was developed by three local agen-cies and the City and County of San Francisco, whichconstructed Hetch Hetchy Reservoir (360 taf ), LakeLloyd (268 taf ) on Cherry Creek, and Lake Eleanor(26 taf ) on Eleanor Creek. San Francisco also partici-pated with Modesto and Turlock Irrigation Districtsin the construction of New Don Pedro Reservoir. (Thereservoir is owned by the irrigation districts, but SanFrancisco has a water storage agreement with them.)This 2 maf reservoir impounds supplies which are di-verted into MID’s and TID’s canal systems at LaGrange Dam. Each district has a small regulatory andoffstream storage reservoir on its mainline canal down-stream from La Grange—the 29 taf Modesto Reservoir
The 479 foot-high New Exchequer Dam is a rockfill dam.

The California Water Plan Update BULLETIN 160-98
OPTIONS - INTERIOR REGIONS 8-26
and the 46 taf Turlock Lake. MID serves lands northof the Tuolumne River, and TID serves lands to thesouth of the river.
New Exchequer Dam impounds Merced ID’s 1maf Lake McClure, the only large water supply reser-voir on the Merced River. Merced ID has two smalldams downstream regulating flow into its canal sys-tem. In 1997, Mariposa Public Utility Districtcompleted a small water diversion project on theMerced River. The project included constructing 8miles of 12-inch pipeline to convey Merced River wa-ter to the town of Mariposa and surrounding areas.
The Chowchilla and Fresno Rivers are small rela-tive to their northern neighbors. Each river has onlyone significant water supply reservoir. Buchanan Damon the Chowchilla River impounds the 150 tafEastman Lake, and Hidden Dam on the Fresno Riverimpounds the 90 taf Hensley Lake. Both dams wereconstructed by the USACE, but their operations wereintegrated with the CVP. Chowchilla Water Districtholds a water supply contract for Eastman Lake sup-ply, while Hensley Lake supply is contracted to MaderaIrrigation District.
USBR’s Friant Dam on the San Joaquin Riverimpounds the 521 taf Millerton Lake. Several hydro-power reservoirs are located in the river’s upperwatershed above Friant; however, the only consump-tive use of water associated with them is reservoirevaporation. Total system storage including Millerton
Lake is 1.1 maf. CVP water released from Friant Damis diverted into the Madera Canal to the north and theFriant-Kern Canal (to the Tulare Lake HydrologicRegion) to the south. Chowchilla and Madera Irriga-tion Districts are the largest CVP water contractorson the Madera Canal. Central California IrrigationDistrict’s Mendota Dam, located on the San JoaquinRiver at its confluence with Fresno Slough/North ForkKings River, forms Mendota Pool, from which morethan 20 agricultural water agencies divert their sup-plies. As mentioned in Chapter 3, CVP exchangecontractors divert Delta-Mendota water from the poolto compensate for the impacts of Friant Dam construc-tion on their prior rights to San Joaquin River water.CVP water delivered to the Mendota Pool from TracyPumping Plant is the source of supply for nearbyUSFWS national wildlife refuges.
Surface water supplies for the part of this regionwest of the San Joaquin Valley trough are providedlargely by the CVP, through the Delta-Mendota Ca-nal and the San Luis Canal reach of the CaliforniaAqueduct. CVP contractors receiving DMC suppliesin the northern part of the region are small agricul-tural water agencies. The City of Tracy, with a contractfor 10 taf/yr, is the only urban CVP water user in thenorthern end. Oak Flat Water District is the only SWPcontractor served from the California Aqueduct withinthis region, with a maximum contract entitlement of5.7 taf. The California Aqueduct and DMC carry waterfrom the Delta into San Luis Reservoir for storage andlater delivery. San Luis Reservoir marks the beginningof the State-federal joint use San Luis Canal. Landsadjacent to the San Luis Canal downstream from thereservoir are part of the CVP’s service area, and receivetheir water supply through contracts with USBR. SanLuis Water District is one of the larger CVP contrac-tors in this area, receiving its supplies through boththe DMC and the SLC.
The northwest corner of this region, including thecommunities of Byron, Brentwood, and Thornton,receives much of its water supply via direct diversionof surface water from Delta waterways. Local watersupply agencies include East Contra Costa IrrigationDistrict and Byron-Bethany Irrigation District.
Groundwater
Groundwater is an important source of supply forthe region. Many urban areas rely solely on ground-water for their supply. Groundwater overdraft occursin much of the valley floor.
CCID, USBR, and others have evaluated the possibility ofreplacing Mendota Dam with a new facility to improve thestructure’s operational capabilities. The original dam at thissite was constructed in the 1880s by the Miller et LuxCorporation.

The California Water Plan Update BULLETIN 160-98
OPTIONS - INTERIOR REGIONS8-27
Local Water ResourcesManagement IssuesCosumnes River Flood Management
The Cosumnes River is unique among Sierra Ne-vada rivers for its lack of dams and related waterdevelopment features. Efforts are ongoing to preserveand restore a riparian corridor along the river’s pathon the valley floor; the relationship of those efforts torecently emphasized floodplain management needs isbeing evaluated.
The Cosumnes River Preserve was established in1987 to protect existing stands of valley oak riparianforest and to restore native habitat in flood-prone ag-ricultural fields. The preserve, located betweenSacramento and Stockton, is a cooperative effort oforganizations including the Nature Conservancy,Ducks Unlimited, BLM, the Department, DFG, Wild-life Conservation Board, and Sacramento County.
The lack of upstream flood control on theCosumnes River and the resulting periodic floodinghave limited urban development in the lower water-shed. Much of the agricultural land in the river’s lowerwatershed is protected by private levees which experi-enced numerous breaks during the January 1997floods. Nonstructural alternatives for flood control arebeing investigated, such as breaching levees and estab-lishing levee setbacks to provide more area for floodwaters to spread. Private lands have been identified forpossible acquisition, subject to the willingness of sell-ers and the availability of funds.
Integrity of Delta Levees
Delta islands are protected by more than 1,000miles of levees, and commonly lie 10 to 15 feet belowsea level. Failure of these levees could occur as the re-sult of earthquakes or floods, gradual deterioration,and/or improper maintenance. Composed largely ofpeat soils, many islands are vulnerable to seepage andsubsidence. Subsidence of peat soils and settling of leveefoundations increase the risk of levee failure.
Looking upstream at theCalifornia Aqueduct (left
side of photo) and the Delta-Mendota Canal (right side).Bethany Reservoir is in the
upper left corner.
Oak trees at the Cosumnes River Preserve.

The California Water Plan Update BULLETIN 160-98
OPTIONS - INTERIOR REGIONS 8-28
The CALFED Bay-Delta Program identified theDelta levee system as an important resource. Theprogram’s strategy for improving its levee system in-tegrity is to implement a Delta levee protection planthat would address levee maintenance, stabilization,subsidence reduction, emergency levee management,beneficial reuse of dredged material, and establishmentof habitat corridors.
Interim South Delta Programand Temporary Barriers Project
In 1990, the Department, USBR and the SouthDelta Water Agency agreed to a draft settlement of a1982 lawsuit by SDWA against the Department andUSBR. The draft agreement focused on short-term andlong-term actions to resolve agricultural water supplyproblems in the south Delta and included provisionsto test and construct barrier facilities in certain southDelta channels. The testing program, referred to as theSouth Delta temporary barriers project, was initiatedin 1991. Its objectives were short-term improvementof water conditions for the south Delta and the devel-opment of data for the design of permanent barriers.Long-term actions would be implemented through theInterim South Delta Program described in Chapter 6.ISDP’s purpose is to improve water levels and circula-tion in south Delta channels for local agriculturaldiversions and to enhance the existing water deliverycapability of the SWP through improved south Deltahydraulics. ISDP’s preferred alternative would cost anestimated $54 million to construct and includes fivecomponents: constructing a new intake structure atClifton Court Forebay; dredging a 4.9-mile reach ofOld River; constructing flow control structures at OldRiver, Middle River, and Grant Line Canal; construct-ing an operable fish barrier at the head of Old River tobenefit San Joaquin River salmon; and increasing di-versions into Clifton Court Forebay to maximizepumping at Banks Pumping Plant.
EBMUD’s Mokelumne River Aqueduct traverses the southernDelta.
Under the Department’stemporary barriers program,small berms have beenseasonally installed in theSouth Delta to improvechannel water levels andwater quality for Deltairrigators. A seasonal fisherybarrier at the head of OldRiver is also installed as partof this program.

The California Water Plan Update BULLETIN 160-98
OPTIONS - INTERIOR REGIONS8-29
A draft EIR/EIS for ISDP was released in August1996. The final EIR/EIS is scheduled for completionin late 1998. Meanwhile, installation and removal oftemporary barriers in the south Delta continues. Thenumber of temporary barriers installed and the instal-lation schedule varies with hydrologic conditions andendangered species concerns.
San Joaquin County Groundwater Overdraft
Eastern San Joaquin County has a long history ofdeclining groundwater levels. Groundwater extractionto meet agricultural and urban demands has createdtwo pronounced pumping depressions since the late1940s and early 1950s. The larger depression is be-tween the Mokelumne River and the Stanislaus River.The center of this depression is east of Stockton, wheregroundwater levels can be more than 70 feet below sealevel following the irrigation season. This pumping de-pression caused poorer water quality from the Deltato migrate toward the City of Stockton. Several mu-nicipal wells in west Stockton have been abandonedbecause of the decline in groundwater quality. Theother groundwater depression is between theCosumnes River and the Mokelumne River, extend-ing north into Sacramento County. Groundwater levelshere are more than 30 feet below sea level.
The Department recently completed a study ofeastern San Joaquin County as part of a Stanislaus-Calaveras conjunctive use project. Data developed forthis study suggested that the annual overdraft in theeastern San Joaquin County was about 70 taf, at a 1990level of development. A later study completed by USBRas part of its American River water resources investi-gation estimated overdraft to be about 130 taf at a 2030level of development. This study concluded that 77taf/yr of additional supply would be needed to pre-vent migration of poor quality water into the Stocktonarea. Several overdraft management options are beingconsidered, all of which require substituting surfacewater supplies for groundwater use. USBR proposedtwo major alternatives for providing future water sup-ply—a conjunctive use alternative and a multipurposeAuburn Dam. In its 1998 record of decision for thestudy, USBR decided that it would not take furtheraction to meet study area future water needs.
San Joaquin County filed a water rights applica-tion for an American River diversion of 322 taf in wetyears via the Folsom South Canal. The existing canalwould be extended, and would be used to providesupplemental supplies to reduce groundwater overdraft.
San Joaquin County is also interested in participatingin a conjunctive use project with EBMUD, in whichEBMUD’s American River CVP water would be storedin local groundwater basins prior to being diverted intothe Mokelumne River Aqueduct. This approach wasconsidered in EBMUD’s 1995 water supply action plandescribed in the San Francisco Bay Region (Chapter7), but was not included in EBMUD’s draft EIR forconveyance of its CVP supply.
Penn Mine Remediation
Penn Mine is an abandoned copper/zinc mine firstworked in the 1860s. Major activity at the site occurredin the early 1900s and during World War II. Minestormwater runoff and acidic drainage historically en-tered the Mokelumne River near Campo Seco, aboveEBMUD’s Camanche Reservoir, and caused fish killsin the river from the 1930s through the 1970s.EBMUD, in conjunction with DFG and the CentralValley RWQCB, made surface drainage improvementson the mine property and constructed Mine Run Damin 1978 to provide storage and to control part of themine runoff. EBMUD and the RWQCB began onsiteneutralization and treatment of acid mine drainage in1993. Litigation against EBMUD and the RWQCBby environmental organizations led to a negotiatedagreement for long-term site remediation. An EIR/EIScompleted in 1997 calls for excavation and removal ofmine waste materials at the site, removal of Mine RunDam, further site regrading, and revegetation.
Conservation Storage in Farmington Reservoir
USACE completed a reconnaissance study ofStockton metropolitan area flood control needs in1997, in cooperation with the City of Stockton, SanJoaquin County, and Stockton East Water District. Thestudy evaluated modifying Farmington Reservoir toprovide carryover storage. USACE also completed aconjunctive use study in 1997, evaluating FarmingtonReservoir’s potential to reduce groundwater overdraftin eastern San Joaquin County. Three alternatives wereevaluated, including reservoir reoperation to allow year-round diversions at Rock Creek, dam modification forseasonal water storage, and dam modification for long-term water storage. (SEWD operates a Rock Creekdiversion structure downstream of Farmington Damto convey CVP water from the Stanislaus River to itsservice area during the irrigation season.) USACE’sstudy showed that reoperating Farmington for year-round diversions at Rock Creek and groundwater

The California Water Plan Update BULLETIN 160-98
OPTIONS - INTERIOR REGIONS 8-30
recharge would be the best alternatives for improvingmanagement of available water supplies fromLittlejohns Creek and the Stanislaus River. If additionalStanislaus River water supplies became available toSEWD through CVP water deliveries, flood controlreleases from New Melones, or water marketing, stor-age in Farmington Reservoir might enhance other watermanagement actions. A USACE study prepared in the1980s suggested that Farmington Reservoir could beenlarged by as much as 160 taf for conservation storage.
SEWD identified two other actions to augmentsurface supplies—more groundwater recharge and ashort-term transfer of 30 taf from Oakdale IrrigationDistrict and South San Joaquin Irrigation District. Thedistricts are preparing an EIR to market up to 30 taf/yr of their surface supply for 10 years, using existingconveyance facilities.
New Melones ReservoirWater Supply and Operations
SEWD and CSJWCD began constructing facili-ties in 1991 to convey 155 taf of interim CVP contractsupply from New Melones Reservoir to their serviceareas. Much of the imported water was to be used toreduce local groundwater overdraft. Because of changesin the operation of New Melones Reservoir, little in-terim CVP water has been delivered to the two districts.
Enactment of CVPIA and the issuance of SWRCBOrder WR 95-6, increased project water requirementsfor environmental purposes. Table 8-9 shows the quan-tities of environmental supplies provided from NewMelones releases.
As discussed in Chapter 2, allocation of responsi-bility for meeting SWRCB Order WR 95-6 flowrequirements is now pending in a water rights hearingbefore the Board. One alternative for meeting SanJoaquin River flow requirements is the Vernalis adap-tive management plan, negotiated among the river’swater users for sharing their responsibilities for actionssuch as providing spring pulse flows. USBR is pres-ently analyzing how VAMP implementation wouldaffect New Melones operations.
Additionally, USBR and USFWS plan to conductan appraisal-level temperature control study for NewMelones Reservoir, as called for in CVPIA. The studywill identify structural or nonstructural alternatives tocontrol water temperatures in the river downstreamfrom the dam.
Urban Growth Pressuresfrom San Francisco Bay Area
San Joaquin Valley communities within commut-ing distance of the San Francisco Bay area are experiencingrapid growth, as persons who work in the Bay Area areattracted by lower housing costs in the Valley. Duringthe real estate boom of the late 1980s and early 1990s,there was considerable local concern over water supplyavailability for proposed new towns on the western edgeof the valley. At least nine new communities had beenproposed in southwestern San Joaquin County, an areawhere additional groundwater development is constrainedby both quality and quantity of supply. Few of these com-munities were ultimately approved by local land useplanning authorities. One proposed community, NewJerusalem, was initially approved, but an amendment tothe county’s general plan is being processed to removethe community from the plan. Mountain House is oneof the few new towns actually being developed.
Burrowing owls are ground-dwelling owls found in opengrassland areas and around cultivated fields. Increasingurbanization in the San Joaquin Valley will reduce thehabitat available for these owls.

The California Water Plan Update BULLETIN 160-98
OPTIONS - INTERIOR REGIONS8-31
East County Water Supply Study
The East County Water Management Associationis an organization of eleven cities and local agencies ineastern Contra Costa County—Antioch, Brentwood,Pittsburg, Byron-Bethany ID, East Contra Costa ID,Contra Costa County WA, Contra Costa WD, DiabloWD, Delta Diablo Sanitation District, Contra CostaCounty Sanitation District No.19, and Ironhouse Sani-tary District. In response to urban growth pressures,the association conducted a study to identify and evalu-ate potential water management strategies for meetingthe east county’s future water needs. The study identi-fied a variety of potential supplies to meet future waterdemands through 2040 including in-county surfacewater, in-county groundwater, recycled water, watertransfers from outside the county, conjunctive use, andwater conservation.
Because the area has access to surface water sup-plies through CVP contracts and local diversions, studyresults indicated that in-county surface water suppliescould meet future water demands in average years.Shortages would occur after 2010 in drought years.Current study area groundwater use is about 14.5 taf/yr. Some areas (such as Brentwood, Discovery Bay,Bethel Island, and Hotchkiss Tract) depend entirelyon groundwater. Others (such as Pittsburg, Antioch, andDWD) use groundwater to supplement surface watersupplies. Groundwater quality problems in the easterncounty may limit future groundwater development.
The study evaluated three water supply scenarios:• Maximized local pooling of surface water supplies.
This concept would require negotiation of newagreements for long-term transfer of surplus wa-ter supplies from two agricultural districts (ECCIDand BBID) to agencies serving urban areas, andchanges to the place of use/purpose of use in ex-isting water rights.
• Continued groundwater pumping with maximizedlocal pooling of surface water supplies.
• Continued groundwater pumping with existinglevels of local pooling of surface water supplies.The second scenario ranked the highest among
the three scenarios. Spot water transfers and short-termdemand reduction would provide drought year sup-ply for this scenario. Recommendations made in thestudy included:• ECWMA should commission a comprehensive
groundwater study of the east county area. Thestudy should focus on groundwater quantity andquality, and interactions between surface water andgroundwater supplies. An in-county conjunctiveuse program to manage drought year shortagesshould be evaluated.
• An aquifer storage and recovery program shouldbe investigated in the Randall-Bold water treat-ment plant area, in the event that ECWMAmember agencies are required to limit their Deltadiversions at some times of the year.
• ECWMA members should construct dual waterdistribution systems to facilitate future use of re-cycled water in all water service areas within theeast county.
• Interties between water treatment plant serviceareas increase reliability and flexibility duringemergencies. The Cities of Pittsburg and Antioch,CCWD, and DWD should discuss potential in-tertie benefits associated with CCWD’s reliabilityimprovement project.
Los Banos Grandes Reservoir Studies
The Department has studied potential SWPoffstream storage sites south of the Delta, as describedin Chapter 6. These studies led to a December 1990Los Banos Grandes Facilities Feasibility Report, whichrecommended construction of a 1.7 maf reservoir andassociated facilities on Los Banos Creek in westernMerced County. The Department has placed thisproject on hold pending a CALFED decision on Delta
TABLE 8-9
New Melones Releases for CVPIA Environmental Purposes (taf)
Water Yeara Dedicated Water Supplemental Water Total
1993 140.9 0.0 140.91994 22.7 45.1 67.81995 146.3 4.2 150.5
1996 113.4 0.0 113.4
1997 79.9 50.0 129.9a USBR’s water year is from March through February.

The California Water Plan Update BULLETIN 160-98
OPTIONS - INTERIOR REGIONS 8-32
improvements. The project could then be reevaluatedin consideration of those improvements and of theneeds and financial capabilities of SWP contractors.
Merced Area Conjunctive Use Study
In 1993, the City of Merced and Merced Irriga-tion District began a two-year water supply planningprocess for eastern Merced County through 2030. Thegoals of the study were to manage groundwater, pro-vide a reliable water supply for cities, protect andenhance the economic base of the region, protectMID’s water rights, and maintain consensus for theplan. The advisory committee selected a groundwaterrecharge option as the preferred alternative. Thegroundwater basin would be operated in combinationwith a surface water storage and conveyance system.Studies to determine groundwater recharge quantitiesand locations are currently underway.
Agricultural Drainage
Significant efforts have been made to manage sa-line drainage water in the region. Closure of San LuisDrain has made it essential for agricultural districts tomanage irrigation applications as efficiently as possibleonsite until a regional solution for drainage manage-ment and disposal is developed. Some agricultural
water districts in the region discharge drainage waterto the San Joaquin River. Much of the salt and sele-nium loading in the river originate from GrasslandWD’s canals and from two sloughs tributary to theriver—Mud and Salt Sloughs.
Grasslands Bypass Channel Project . Agriculturaldrainage from the Grasslands Basin historically dis-charged to natural channels that meandered throughGrasslands Water District. Flows in these channelseventually reach the San Joaquin River via Mud andSalt Sloughs. In an attempt to manage selenium loadsentering the San Joaquin River, USBR is operating a5-year Grasslands bypass demonstration project. A two-mile long channel was constructed to intercept drainagewater that would otherwise flow towards GrasslandsWater District. The new channel carries drainage wa-ter to the existing San Luis Drain, allowing the drainagewater to discharge to the San Joaquin River. An agree-ment for reopening part of the San Luis Drain wassigned by USBR and the San Luis and Delta-MendotaWater Authority. The agreement established a drain-age incentive fee system to provide monetary incentivesfor reducing selenium loads discharged to the drain(see sidebar). The project became operational in 1996and has significantly reduced salt and selenium loadsentering Grasslands Water District and Salt Slough.
Grasslands Bypass Project Drainage Fee System
The fee system has tiered charges based on percent exceedance of monthly and annual selenium loads. These load targets arein accordance with RWQCB waste discharge requirements for agricultural drain water. If load targets are exceeded by morethan 20 percent in any given year, the project may be terminated at the discretion of the USBR. An interim review of projectperformance will be conducted after two years of operation.
Monthly Fees for Percent Exceedance(Dollars)
Year 0.1 - 10% 10.1 - 15% 15.1 - 20% 20.1 - 25% 25+ %1 700 1,400 2,100 2,800 2,8002 1,200 2,200 3,200 4,200 4,2003 5,200 7,600 10,100 12,500 12,5004 6,800 10,100 13,400 16,700 16,7005 8,300 12,500 16,700 20,800 20,800
Annual Fees for Percent Exceedance(Dollars)
Year 0.1 - 5% 5.1 - 10% 10.1 - 15% 15.1 - 20% 20+%1 25,000 50,000 75,000 100,000 100,0002 44,000 79,000 115,000 150,000 150,0003 63,000 92,000 121,000 150,000 150,0004 81,000 121,000 160,000 200,000 200,0005 100,000 150,000 200,000 250,000 250,000
The California Water Plan Update BULLETIN 160-98
OPTIONS - INTERIOR REGIONS8-33
San Joaquin River Real Time Drainage Moni-toring Program. Participants in the San Joaquin RiverManagement Program set up a network of telemeteredflow and salinity monitoring stations on the SanJoaquin River. Data from the stations were linked to aflow model of the San Joaquin River and its tributar-ies. Information from the model was distributed towater managers by e-mail. A demonstration of the real-time monitoring effort was carried out in 1996.Grasslands Water District managers were informed thatthe model predicted a major increase in river flow. Thedistrict discharged a significant amount of high salin-ity water from its waterfowl ponds by partially drainingthem during the high flow event. This timed dischargeresulted in better quality water in the San Joaquin Riverlater that spring. A significant portion of the salt loadfrom Grasslands had already passed through the sys-tem by the time agricultural diversions began. In 1997,CALFED approved Category III funding to imple-ment a 2-year program to expand the monitoringnetwork. The program is scheduled to begin in fall1998.
Enlargement of Friant Dam
At 520 taf, Millerton Lake has a small storage ca-pacity relative to the San Joaquin River’s average annualflow. Enlargement of Friant Dam has been consideredin the past to augment regional water supplies. Re-cently, needs for fishery flows and improvedmanagement of winter/spring floodwaters have beenemphasized. USBR evaluated the potential yield of rais-ing Friant Dam about 140 feet in the 1980s. TheResources Agency’s 1995 SJRMP Plan recommendedthat enlarging Friant be studied for multipurpose use.Assembly Joint Resolution 7 in 1997 urged the fed-eral government to promptly evaluate raising FriantDam. Raising Friant Dam would provide water sup-plies for CVP water users and downstream ripariandiverters, for SWRCB salinity and fishery flow require-ments at Vernalis, and for dilution of agriculturaldrainage flows discharged to the river. These supplieswould be obtained by storing surplus winter floodwa-ters, increasing flood protection levels for landsdownstream. An issue that would need to be addressedis instream flows in the river immediately downstreamfrom the dam, as described below.
Instream Flow Requirements Below Friant Dam
In 1988, the Natural Resources Defense Councilfiled a suit in U.S. District Court, seeking an injunc-
tion and declaratory judgment to prevent USBR fromrenewing long-term CVP water supply contracts with-out preparing environmental documentation and torequire releases for instream uses from Friant Dam,based on Fish and Game Code Section 5937 and thepublic trust doctrine. The legal issues were:• Does federal law require USBR to renew the wa-
ter contracts subject to NEPA and ESA review?• Does Fish and Game Code Section 5937 apply to
federal projects?• Has CVPIA preempted Fish and Game Code Sec-
tion 5937?The court found that CVPIA’s passage had not
caused the NEPA and ESA claims to be moot, norhad CVPIA preempted the plaintiff ’s claim under theFish and Game Code. The court also ruled that USBRfailed to comply with Section 7 of the ESA when itrenewed contracts without consulting with federalwildlife regulatory agencies. The court declared all con-tracts renewed before CVPIA enactment invalid. Thecase was appealed to the Ninth Circuit Court of Ap-peals which upheld the District Court’s ruling.
In a setting apart from the litigation, the FriantWater Users Authority, Natural Resources DefenseCouncil, and Pacific Coast Federation of Fishermen’sAssociations have agreed to pursue mutually accept-able restoration activities on the San Joaquin River.Initially, the group has agreed to work on riparian habi-tat restoration along a 150-mile reach of the river fromFriant Dam to the Merced River confluence. The ob-jectives of the effort are to implement a plan forrestoring a continuous riparian corridor in the studyreach and to construct riparian habitat restorationprojects.
Environmental Restoration Activitiesin the San Joaquin River Basin
Many restoration actions are being evaluated forthe San Joaquin River system. Examples of completedactions include:• A spawning gravel restoration project on the lower
Stanislaus River was completed in 1996. Thisproject consisted of constructing riffles and plac-ing gravel for salmon spawning habitat at threesites, river miles 47.4, 50.4, and 50.9.
• A spawning gravel restoration project belowCrocker-Huffman Dam on the Merced River wascompleted in 1990 and repaired in 1996.
• The Magneson Pond isolation project on theMerced River, completed in 1996, consisted of iso-

The California Water Plan Update BULLETIN 160-98
OPTIONS - INTERIOR REGIONS 8-34
lating a gravel pit from the river and replacingspawning gravel.
• The M. J. Ruddy spawning gravel project was com-pleted in 1993 on the Tuolumne River. Anotherproject was completed in 1996 to construct chan-nels above the M. J. Ruddy project, to equalizeriver flows to protect the spawning habitat fromwashout.
• The La Grange spawning riffle project, completedin 1994, consisted of constructing riffles and plac-ing spawning gravel at three sites along theTuolumne River.
• Funds from the SWP Four-Pumps Agreement havebeen used since 1994 to support one DFG war-den assigned to enforce fishing regulations (reducepoaching of anadromous fish) on the San JoaquinRiver system.
• Temporary fish barriers have been constructed andremoved on a seasonal basis every year at Hills Ferryon the San Joaquin River (downstream of themouth of Merced River) and at the head of OldRiver in the Delta.
• Implementation of the CVPIA dedicated waterprovision and the Bay-Delta Accord have increasedSan Joaquin River instream flows. Spring pulseflows have also been provided.
• The 1996 Tuolumne River FERC settlementagreement among Turlock ID, Modesto ID, Cityand County of San Francisco, DFG, and othersincreased instream flows from New Don PedroReservoir, extended and supplemented fish moni-toring requirements, and provided for non-flowfish habitat improvement measures.Several programs are under way to provide addi-
tional fishery benefits in the region. Examples ofongoing fishery restoration projects include:• The Category III program has contributed fund-
ing for a feasibility study of screening atBanta-Carbona Irrigation District’s Main Lift Ca-nal intake channel on the San Joaquin River.
• Plans for construction of Tuolumne Fish Hatch-ery are under way, although several environmentalhurdles need to be addressed before a final deci-sion is made to build the fish hatchery. Land forthe hatchery was acquired by the Four-Pumps pro-gram in 1996.
• USBR is preparing plans to replace CCID’sMendota Dam. Replacement of the dam wouldimprove fish passage and provide increased watersupply to Mendota NWR.
• DFG and USFWS plan to restore the channel ofa six-mile stretch of the Tuolumne River by isolat-ing or filling gravel pits along the river andrestoring spawning gravel habitat.
San Joaquin River Parkway Development
The San Joaquin River Conservancy is a Stateagency charged with acquiring and managing publiclands within the San Joaquin River Parkway. The goalof the conservancy is to preserve and enhance the SanJoaquin River’s biological diversity, protect its culturaland natural resources, and provide educational andrecreational opportunities to local communities.
The San Joaquin River Parkway includes the SanJoaquin River and about 5,900 acres of land on bothsides of the river, and extends about 22 miles fromFriant Dam downstream to the Highway 99 crossingof the river. The parkway is planned as a riparian cor-ridor with trails for hiking, horseback riding, andbiking; boating access points; wildlife areas; and edu-cation areas. Approximately 1,900 acres are located inMadera County and 4,000 acres in Fresno County, ofwhich approximately 1,600 acres are in public owner-ship. The conservancy, working with the WildlifeConservation Board and the San Joaquin River Park-way and Conservation Trust, has been making landacquisitions for the parkway. Other completed projectsinclude habitat restoration efforts and construction of5 miles of a multiple-use recreation trail.
January 1997 San JoaquinRiver Region Flood Event
The January 1997 flood event was notable for itssustained rainfall intensity, the volume of floodwater,and the extent of the storm pattern—from the Or-egon border down to the southern end of the Sierra.Over a three day period, warm moist winds from thesouthwest blew over the Sierra Nevada, pouring over30 inches of rain on watersheds already saturated byone of the wettest Decembers on record. The volumeof runoff exceeded the flood control capacity of NewDon Pedro Reservoir and Millerton Lake. Althoughthe peak flood release from New Don Pedro Dam wasless than half the peak Tuolumne River inflow of120,000 cfs, it was more than six times the downstreamchannel’s flood control limit of 9,000 cfs. In all, thirty-six levee failures occurred along the San Joaquin Riversystem, along with extensive damage related to highflows and inundation. Most of the damage occurred

The California Water Plan Update BULLETIN 160-98
OPTIONS - INTERIOR REGIONS8-35
downstream of the Tuolumne River confluence.The primary flood control issue facing the San
Joaquin River Region is the lack of flood channel ca-pacity. Channels and levees are generally designed for50-year flood protection. Insufficient channel capac-ity is especially problematic in the lower San JoaquinRiver below the Merced River. At the lower end of thesystem, sediment deposition continues to raise the riverbed and reduce channel capacity. Sediment depositionalso promotes vegetation growth, thereby increasingchannel roughness and further impeding flows. Asurban development occurs on lands formerly used foragriculture, the need for higher levels of flood protec-tion becomes more important.
The 1997 Final Report of the Flood Emergency Ac-tion Team to the Governor detailed severalrecommendations and possible actions for the SanJoaquin River watershed, such as:• A USACE reconnaissance study for the Tuolumne
River to evaluate constructing a flood control im-poundment on Dry Creek, restrictingdevelopment in the floodplain, and developingoffstream flood storage to be integrated with wa-ter supply storage.
• Acquisition of flood-prone lands (largely agricul-tural lands) in Stanislaus County which could beadded to USFWS’s San Joaquin National Wild-life Refuge. The lands would be managed to allowperiodic flooding, and would provide temporarystorage of flood peaks. A similar approach couldbe taken at the West Bear Creek Unit of the SanLuis National Wildlife Refuge, where floodflowscould be temporarily stored on existing refugelands.
• Increasing the capacity of the lower San JoaquinRiver by measures such as channel dredging, set-back levees, and improving bridge crossings.
Water Management Optionsfor the San Joaquin River Region
Table 8-10 shows a list of options for the region,and the results of an initial screening of the options.The retained options were evaluated (Table 8A-2 inAppendix 8A) based on a set of fixed criteria discussedin Chapter 6.
Water Conservation
Urban. Urban water demand forecasts for 2020assume that BMPs are in place; consequently, only
those urban conservation efforts which exceed BMPsare considered as options. Urban water conservationoptions were deferred from detailed evaluation becausethey provide little cost-effective potential to create newwater through depletion reductions.
Agricultural. The 2020 agricultural water demandforecasts assume that EWMPs are in place. As withthe urban water management options, only those ag-ricultural conservation efforts which exceed EWMPsare considered as options. Changes in irrigation man-agement practices to attain SAEs of 76 to 80 percentwould yield less than 1 taf/yr depletion reduction. Flex-ible water delivery, canal lining and piping, andtailwater recovery could each yield 2 taf/yr depletionreduction.
Modify Existing Reservoirs
Various agencies have looked at raising or modi-fying existing water supply and/or multipurposereservoirs. USACE and SEWD are evaluating modifi-cations or reoperation of Farmington Reservoir. Localrunoff, plus New Melones or American River supplies,could be used to fill an enlarged reservoir.
New Reservoirs
Onstream Storage. Amador County WaterAgency developed preliminary proposals for the IrishHill and Volcano Reservoir projects. Irish Hill Reser-voir, on Dry Creek, would serve areas near Ione withup to 23.7 taf of drought year supply. Volcano Reser-voir, on Sutter Creek, would serve the communities ofSutter Creek and Amador City, in addition to provid-ing flood control benefits for Sutter Creek. Theestimated drought year supply would be 14.7 taf. Stud-ies on both projects are inactive.
Amador County has participated in studies of thelarger Middle Bar and Devils Nose reservoir projects.Alternatives for Middle Bar included a low and highdam, with drought year supplies of 12 taf and 159 taf,respectively. The larger Middle Bar Dam has been con-sidered by EBMUD as a water supply option for itsservice area in the San Francisco Bay Region. The res-ervoir, however, could provide some local supply toAmador, Calaveras, and possibly San Joaquin Coun-ties. A number of obstacles such as water rights, a FERClicense, and financing would need to be addressed be-fore proceeding with the project. The proposed DevilsNose project would be a hydroelectric power projectwith incidental water supply benefits, along the northfork and mainstem of the Mokelumne River. As con-

The California Water Plan Update BULLETIN 160-98
OPTIONS - INTERIOR REGIONS 8-36
TABLE 8-10
San Joaquin River Region List of Water Management Options
Option Retain Reason for Deferralor Defer
Conservation
UrbanOutdoor Water Use to 0.8 ET
oDefer No significant depletion reductions attainable.
Indoor Water Use Defer No significant depletion reductions attainable.
Interior CII Water Use Defer No significant depletion reductions attainable.
Distribution System Losses Defer No significant depletion reductions attainable.
Agricultural
Seasonal Application Efficiency Improvements Defer No significant depletion reductions attainable.
Flexible Water Delivery Retain
Canal Lining and Piping Retain
Tailwater Recovery Retain
Modify Existing Reservoirs/OperationsReoperate/Enlarge Farmington Reservoir Retain
New Reservoirs/Conveyance Facilities
Montgomery Reservoir Offstream Storage Retain(Merced County)
Fine Gold Creek Offstream Storage Retain(Madera County)
Irish Hill Reservoir (Amador County) Retain
Volcano Reservoir (Amador County) Defer Geologic constraints.
Middle Bar Reservoir (Amador County) Retain
Devils Nose Reservoir (Amador County) Retain
Cape Cod Reservoir (Cosumnes River) Defer Major storage unlikely on Cosumnes River.
Bakers Ford Reservoir (Cosumnes River) Defer Major storage unlikely on Cosumnes River.
Mid-Valley Canal Defer Questionable water supply availability.
Groundwater/Conjunctive Use
EBMUD/San Joaquin County Conjunctive Use Defer Under discussion; not yet defined.Stockton East WD RetainMadera Ranch Retain
Water RecyclingWater recycling options Defer Water recycling options would not generate new
water supply in this region.
Desalination
Brackish Groundwater
Agricultural Drainage Defer No present local agency plans.
Seawater
— — —
Other Local Options
— — —
Statewide Options— — See Chapter 6.

The California Water Plan Update BULLETIN 160-98
OPTIONS - INTERIOR REGIONS8-37
ceived, the project would include a 470-foot high damat the Devils Nose site upstream from PG&E’s TigerCreek Forebay and below Salt Springs Reservoir. Thereservoir would have a capacity of 145 taf. Water fromthe reservoir would be released via a 3-mile tunnel to apowerhouse with 41 mW of installed capacity. Theproposed Devils Nose project was later merged with aproposed Cross County project, which included a con-veyance system from Tiger Creek Afterbay to a 79 mWCross County Powerhouse. Preliminary operation stud-ies indicate a system yield of 23 to 30 taf/yr. EBMUDhad also considered participation in the project. Theproject is currently dormant.
The Cosumnes River project was examined jointlyby El Dorado, Sacramento, Amador, and San JoaquinCounties as a multipurpose project. The proposal in-cluded up to six reservoirs with hydroelectric powergeneration, flood control, and recreation to providesupplemental water supply benefits. Average year yieldof the project was estimated at 170 taf. The projectwould include a 300 taf Cape Cod Reservoir and a185 taf Bakers Ford Reservoir. The Cosumnes River isone of the few remaining undeveloped Sierra Nevadarivers. Interest in preserving the river’s free-flowingcharacteristics and the difficulties associated with ob-taining a FERC license would make large-scale waterdevelopment on the river unlikely. Project planning isinactive.
Offstream Storage. USBR studied a 240 taf res-ervoir to store spills from Lake McClure. The proposedMontgomery Reservoir would be constructed on DryCreek, north of the confluence of Merced River andDry Creek, near the community of Snelling. Waterwould be conveyed by a two-way facility from MercedFalls Diversion Dam to Montgomery Reservoir. Re-leases would be used to improve instream flows and tomaintain lower water temperatures for fall-run chinooksalmon in the Merced River. Montgomery Reservoirwould also provide additional flood protection in theSan Joaquin River. About $3 million and three yearswould be required to complete the feasibility study andenvironmental review. The project, including the res-ervoir, conveyance, pumping, and appurtenant facilitieshas been estimated to cost about $135 million. Theyield is estimated to be 35 taf during drought years.The drought year cost of this option is estimated to be$300/af. The project was recommended for furtherstudy in SJRMP’s Plan.
In 1989, Madera Irrigation District asked USBRto investigate a 350 taf offstream storage project on
Fine Gold Creek, a San Joaquin River tributary. Sur-plus flood flows would be pumped from Millerton Laketo the reservoir for water supply and power genera-tion. Potential benefits also include fisheryenhancements and flood protection. The average yearyield is estimated to be 42 taf. According to MID’s1991 preliminary cost estimate, the project would costin excess of $500 million. Project evaluation and in-vestigation was estimated at $3 million, and at least 3years would be required to complete feasibility andenvironmental investigations. The Fine Gold Creekproject, although not originally formulated as such, isessentially an alternative to enlarging Friant Dam.
New Conveyance Facilities
Since the 1970s, several feasibility studies havebeen conducted on importing additional Delta sup-plies to reduce groundwater overdraft in the SanJoaquin Valley. USBR’s 1981 A Report on the Mid-Val-ley Canal Feasibility Investigation examined thepossibility of constructing a canal that would supplyportions of Madera, Merced, Fresno, Kings, Tulare,and Kern Counties with additional imported water.
The report suggested that water from the Deltacould be conveyed to O’Neill Forebay using availablecapacity in the California Aqueduct. From O’Neill, aportion of the water would be delivered to MendotaPool by an enlarged Delta-Mendota Canal, while theremainder would be conveyed to Kern County usingavailable capacity in the California Aqueduct. To pro-vide water to the rest of the service area, the proposalcalled for the construction of two branches of a newfacility called the Mid-Valley Canal. The main branchwould lift water from the Mendota Pool and carry itsoutheast to Fresno, Kings, and Tulare Counties.Madera and Merced Counties would receive their sup-ply via a north branch, also diverting from MendotaPool. Introduction of this additional water supply tothe San Joaquin River Region could reduce ground-water overdraft and enhance wetlands, wildlife habitat,and recreation.
USBR initially identified a firm annual water sup-ply in the Delta of approximately 500 taf available forexport to the proposed service area. It was later deter-mined that this supply was unavailable due to increasedDelta outflow requirements and curtailment of pro-posed expansion of CVP facilities. Subsequentenactment of CVPIA and issuance of SWRCB OrderWR 95-6 further limited available CVP water supply.

The California Water Plan Update BULLETIN 160-98
OPTIONS - INTERIOR REGIONS 8-38
Groundwater Development or Conjunctive Use
Urban and agricultural water users have relied onboth surface and groundwater supplies. Many localwater purveyors use surface water allocations, pur-chased water, and excess flood water for groundwaterrecharge. Natural waterways, local agency canals, andState and federal conveyance facilities create opportu-nities for groundwater recharge, storage andconjunctive use programs.
EBMUD is continuing discussions with SanJoaquin County interests for a joint groundwater stor-age/conjunctive use project. This option is part ofEBMUD’s water supply action plan described in Chap-ter 7; its yield is undefined at this time.
SEWD has proposed to construct a groundwaterrecharge facility at the northern terminus of the lowerFarmington Canal. The canal would be extended aboutone-half mile, and a series of recharge basins con-structed. The proposed facility could include up to 45five-acre recharge basins, which could provide a com-bined recharge rate of 100 cfs. Estimated capital costsfor the facility are about $14.25 million.
USBR and SLDMWA are investigating a proposedwater banking project at Madera Ranch, southwest ofthe City of Madera. This storage facility would receivesurplus water from the Delta for recharge. Water storedduring wet years could be pumped in drought yearsfor environmental, urban, and agricultural uses. Therecharge pond area would be 3,500 acres and the po-tential storage capability is estimated to be about 390taf. When available, flows in the Delta would be con-veyed to Mendota Pool for diversion to the project ata rate of up to 400 cfs. Withdrawal capacity from theaquifer would be about 200 cfs, with average annualyield of about 70 taf at a cost of $226/af.
Phase I of the investigation, including geologic test-ing, and review of legal, financial, and environmentalissues, was completed in April 1998. USBR recom-mends proceeding to Phase 2, pending discussions withthe landowner. Two options would be examined inPhase 2. One would be a multi-year commitment tolease the facilities and services developed by the land-owner. A second would be for USBR to purchaseMadera Ranch property and develop a water bankingfacility.
Water Recycling
Most municipal and industrial water use in theSan Joaquin River Region occurs on the east side ofthe San Joaquin Valley. Wastewater is generally spread
for groundwater recharge. Wastewater that is directlyor indirectly discharged to the San Joaquin River be-comes available for downstream uses, including Deltaoutflow requirements. Because of extensive reapplica-tion, no water recycling options within the basin qualifyas new sources of supply from a regional viewpoint.
Several small water recycling projects serve localwater management or wastewater disposal needs. Re-cycled water is currently used for golf course or pastureirrigation. The City of Stockton proposes to use re-cycled water for irrigation, groundwater storage, ortransfer to possible future storage reservoirs such as amodified Farmington Reservoir.
Desalting
Many studies have explored saline groundwaterdesalting on the west side of the San Joaquin Valley.The Department has been involved in three such stud-ies: a wastewater treatment evaluation facility inFirebaugh, a Los Banos demonstration desalting facil-ity, and an Adams Avenue agricultural drainage researchcenter. These studies indicated that production costsfor treating agricultural drainage water were about$1,000/af. As discussed in Chapter 5, desalting costsare directly related to feedwater salinity. Today’s costsfor brackish groundwater treatment are in the rangeof $500 to $1,000/af, depending on feedwater salinityand the level of infrastructure already in place. Table8-11 compares the salinity of various water sources.
The approximately 30 taf/yr of agricultural drain-age water now collected for the Grasslands BypassProject represents a source of brackish water availablefor treatment. Technology is available to treat the wa-ter, which would present a new supply to the region(as well as a means to improve San Joaquin River qual-ity). For such a project to be feasible, a brine disposalsolution would have to be found, as well as projectparticipants. No such arrangements are currently un-der negotiation.
Statewide Options
Statewide water supply augmentation options arediscussed and quantified in Chapter 6.
Options Likely to be Implementedin the San Joaquin River Region
Water supplies are not available to meet all of theregion’s 2020 water demands in average or droughtyears. Applied water shortages are forecasted to be

The California Water Plan Update BULLETIN 160-98
OPTIONS - INTERIOR REGIONS8-39
63 taf and 711 taf in average and drought years, re-spectively. Ranking of retained water managementoptions for the San Joaquin River Region is summa-rized in Table 8-12. Table 8-13 summarizes optionsthat can likely be implemented by 2020 to relieve theshortages.
Reoperating Farmington Reservoir in conjunction
TABLE 8-11
Comparison of Salinity of Water Sources
Water Source Representative Weight ofSolids in 1 Acre-foot of Water
Mono Lake 110 tonsSalton Sea 60 tonsSeawater 48 tonsBrackish Groundwater (3,000 mg/L TDS) 4 tonsColorado River at Parker Dam 1 tonCalifornia Aqueduct at Banks Pumping Plant 500 pounds
with SEWD’s plans for conjunctive use could augmentsupplies by 22 taf in average years and 8 taf in droughtyears.
Constructing Montgomery Reservoir could aug-ment local drought year supplies by about 35 taf. As astatewide option, enlarging Friant Dam could provide39 taf of additional average year supply for the region.

The California Water Plan Update BULLETIN 160-98
OPTIONS - INTERIOR REGIONS 8-40
TABLE 8-12
Options Ranking for San Joaquin River Region
Optiona Rank Cost ($/af) Potential Gain (taf)Average Drought
Conservation
Agricultural
Flexible Water Delivery L 1,000 2 2
Canal Lining and Piping L 1,200 2 2
Tailwater Recovery H 150 2 2
Modify Existing Reservoirs/Operations
Reoperate Farmington Reservoir (surface supply only) H b 7 5
Enlarge Farmington Reservoir M 350 17 8
New Reservoirs/Conveyance Facilities
Montgomery Reservoir Offstream Storage H 300 b 35
Fine Gold Creek Offstream Storage M b 42 b
Irish Hill Reservoir L 430 33 24
Middle Bar Reservoir L b — 159
Devils Nose Reservoir L b b 25
Groundwater/Conjunctive Use
Stockton East WD (includes reoperating Farmington) H 100 22 8
Madera Ranch M 230 — 70
Statewide OptionsSee Chapter 6.
a All or parts of the amounts shown for highlighted options have been included in Table 8-13.b Data not available to quantify.

The California Water Plan Update BULLETIN 160-98
OPTIONS - INTERIOR REGIONS8-41
TABLE 8-13
Options Likely to be Implemented by 2020 (taf)San Joaquin River Region
Average Drought
Applied Water Shortage 63 711
Options Likely to be Implemented by 2020Conservation 2 2Modify Existing Reservoirs/Operations — —New Reservoirs/Conveyance Facilities — 35Groundwater/Conjunctive Use 22 8Water Marketing — —Recycling — —Desalting — —Other Local Options — —Statewide Options 39 —Expected Reapplication — 8
Total Potential Gain 63 53
Remaining Applied Water Shortage 0 658

The California Water Plan Update BULLETIN 160-98
OPTIONS - INTERIOR REGIONS 8-42
FIGURE 8-4
Tulare Lake Hydrologic Region
FRESNO
KINGS
KERN
TULARE
CourtrightReservoir
WishonReservoir
LakeKaweah
Nor
th
Fork
Middle
South
St. Johns River
Kings
River
Midd
le
Sout
hForkFork
Nor
th
Fork
Fork
Fork
Big Dry CreekReservoir
Pine FlatLake
Kings
Rive
r
Slough
Fresno
Tule
Deer
SuccessLakeRiver
CreekSouth
NorthCanal
California
Aqueduct
Panoche Creek
Los GatosCreek
Kern
River
Fork
Fork
Ker
nR
iver
Sout
hFo
rk
Buena VistaLakebed
IsabellaLake
Friant KernCanal
Coalinga
CoastalAqueduct
TulareLakebed
Cross ValleyCanal
Kern RiverIntertie
Kaweah
Riv
er
JamesBypass

The California Water Plan Update BULLETIN 160-98
OPTIONS - INTERIOR REGIONS8-43
Description of the Area
The Tulare Lake Region includes the southern halfof the San Joaquin Valley and the uplands that sur-round it (Figure 8-4). The San Joaquin River watershedforms the northern boundary of the region, and theTehachapi Mountains form the southern boundary.The region is bounded to the east by the Sierra Ne-vada crest and by the Temblor Range to the west. Theclimate in the valley varies from fog shrouded wintersto long, hot summers. The valley typically receivesabout 6 to 11 inches of rainfall annually, while averageprecipitation in the mountains range from 12 to 36inches, mostly in the form of snow. Most of the region’spopulation is located on the east side of the valley. Thearea includes several rapidly growing cities, the largestof which are Fresno, Bakersfield, and Visalia. Otherpopulation centers include Hanford, Clovis, Tulare,Porterville, and Delano. Table 8-14 shows 1995 and2020 populations and crop acreages.
The major employment sectors in Tulare LakeRegion are based on agriculture, although the petro-leum industry is important in parts of the valley’s westside and in Kern County. In the sparsely populatedareas on the west side of the valley, industrial waterdemands for petroleum recovery and production ex-
ceed municipal water demands. Most of the land areain the valley not devoted to urban and industrial pur-poses is used for agriculture. The predominant crop iscotton, followed by permanent orchards and vineyards.Major orchard crops are almonds and pistachios. Othermajor crops are alfalfa and pasture, grain, corn, andfield and truck crops.
This region receives runoff from four main riverbasins—the Kings, Kaweah, Tule, and Kern. The prin-cipal flood control and regulatory reservoirs for theserivers are Pine Flat Lake, Lake Kaweah, Success Lake,
The Friant-Kern Canal extends southwards from FriantDam, serving lands on the eastern side of the San JoaquinValley. The canal is almost 152 miles long, and has amaximum capacity of 5,000 cfs.
. . .
TABLE 8-14
Population and Crop Acreage
Population Irrigated Crop Acreage(thousands) (thousands of acres)
1995 1,738 3,1272020 3,296 2,985
Tulare LakeHydrologic Region

The California Water Plan Update BULLETIN 160-98
OPTIONS - INTERIOR REGIONS 8-44
and Isabella Lake. Major water conveyance facilitiesfor the area include the California Aqueduct, theFriant-Kern Canal, and the Cross Valley Canal. Waterdistricts within the region have developed an exten-sive network of canals, channels, and pipelines todeliver these water sources to users. Under normal con-ditions, the region has no natural outlet to the ocean.During high runoff years, excess water flows down theKings River north fork channel toward Mendota Pooland on to the San Joaquin River. In the wettest yearsKings River floodwaters reach the Tulare Lake via thesouth fork of the river. Excess runoff from the Kaweahand Tule Rivers also flows into Tulare Lakebed, flood-ing leveed agricultural fields.
The Tulare, Buena Vista, and Kern Lakebeds, oncethe region’s drainage sinks, have been converted toagricultural use. Small areas in Buena Vista Lakebedare used for regulation of irrigation waters. Since 1977,excess snowmelt runoff from the Kern River has beentransported to the California Aqueduct via the KernRiver Intertie to alleviate flooding.
The region has several managed wetlands areas,including Pixley National Wildlife Refuge, Kern Na-tional Wildlife Refuge, and Mendota WildlifeManagement Area.
Water Demands and Supplies
Table 8-15 shows regional water demands andsupplies. Shortages at a 1995 level of development inaverage water year conditions represent the region’s 820taf of groundwater overdraft and 50 taf of shortages inWestlands Water District’s service area.
Under 1995-level average hydrologic conditions,local surface supplies from the Kings, Kaweah, Tule,and Kern River systems are the most significant sourcesof surface water to the region. The next largest surfacewater source is the CVP, which delivers water throughthe joint State-federal San Luis Canal, Coalinga Ca-nal, Friant-Kern Canal, and Cross Valley Canal. Theother major source of surface water is the SWP.
The majority of the region’s SWP supply is con-tracted to Kern County Water Agency. KCWA’s SWPsupply is distributed to fourteen of its member agen-cies; the largest entitlements go to WheelerRidge-Maricopa Water Storage District, Berrenda MesaWater District, Belridge Water Storage District, andLost Hills Water District. Since these four districts havelimited (or no) groundwater supply, each relies almostentirely on SWP supplies to meet its water demands.Most other KCWA member agencies have Kern River,Friant-Kern Canal, Cross Valley Canal, or groundwa-ter supplies available. Part of the City of Bakersfield’swater supplies come from the SWP, via KCWA.
The Friant-Kern Canal conveys CVP supply to24 long-term contractors in the region. Among thelargest contractors for Friant-Kern supply are Arvin-Edison Water Storage District, Lower Tule RiverIrrigation District, and Delano-Earlimart IrrigationDistrict. The San Luis Canal also distributes CVP sup-ply, most of which goes to Westlands Water District.With an allocation of 1,150 taf/yr, Westlands WaterDistrict is CVP’s largest contractor. Westlands suppliesprimarily agricultural users; however, about 5.5 taf/yris supplied to urban users such as Lemoore Naval AirStation. (Even with a full CVP contract supply,
The Buena Vista AquaticRecreation Area, operated byKern County, is located atthe north end of the formerBuena Vista Lakebed. TheCalifornia Aqueduct (seencrossing the top of the photo,at the base of Elk Hills) skirtsthe lakebed’s western edge.

The California Water Plan Update BULLETIN 160-98
OPTIONS - INTERIOR REGIONS8-45
Westlands purchases about 200 taf/yr from othersources to meet its growers’ normal crop needs.)
Arvin-Edison Water Storage District and KCWAentered into agreements in 1974 for participation inthe Cross Valley Canal. AEWSD also entered into waterexchange agreements with ten agencies in the Friant-Kern Canal service area. The exchange water isdelivered through the California Aqueduct and theCross Valley Canal to AEWSD facilities. AEWSD re-ceives 128 taf annually of exchange water and makesavailable to exchange entities the first 174 taf of itsClass I and Class II CVP entitlements from the Friant-Kern Canal.
Including overdraft, 2020 average year groundwa-ter extraction is forecasted to be about 5.1 maf for theregion. Since groundwater provides a buffer for fluc-
tuating year-to-year surface supplies, its availability isof great importance to the region. Although urban useis expected to increase about 410 taf by 2020, ground-water overdraft is expected to decrease 150 taf (from820 taf to 670 taf ) within the planning horizon due todeclining agricultural use. Most of the urban water usein the region is served from groundwater, although theCities of Fresno and Clovis are taking actions to begintreating surface water supplies.
Local Water ResourcesManagement Issues
Groundwater Overdraft
Annual fluctuations in groundwater levels varywith availability of surface water. About 70 percent of
The Kern River nearOildale, at the edge of the
Sierra Nevada foothills.
TABLE 8-15
Tulare Lake Region Water Budget (taf)a
1995 2020Average Drought Average Drought
Water Use Urban 690 690 1,099 1,099
Agricultural 10,736 10,026 10,123 9,532Environmental 1,672 809 1,676 813
Total 13,098 11,525 12,897 11,443
SuppliesSurface Water 7,888 3,693 7,791 3,593Groundwater 4,340 5,970 4,386 5,999Recycled and Desalted 0 0 0 0
Total 12,228 9,663 12,177 9,592
Shortage 870 1,862 720 1,851a Water use/supply totals and shortages may not sum due to rounding.

The California Water Plan Update BULLETIN 160-98
OPTIONS - INTERIOR REGIONS 8-46
the region’s overdraft occurs in the Kings-Kaweah-TuleRivers planning subarea. Urban water demands in thesubarea are met almost exclusively by groundwater.Agricultural development in the subarea includes645,000 acres of permanent crops. Overdraft in theregion is mitigated to a certain extent by planned re-charge programs, over-irrigating crops in wet years, andallowing seepage from unlined canal systems.
Groundwater Banking Programs
The Department, in cooperation with KCWA andlocal water districts, began developing the Kern WaterBank conjunctive use program in 1985 as a compo-nent of the SWP. The proposed KWB programconsisted of eight separate projects or elements. The
Kern Fan Element was to be constructed on landsowned by the Department. Pursuant to the SWP’sMonterey Amendment, the KFE was subsequentlytransferred to the Kern Water Bank Authority.
Semitropic Water Storage District is participatingin an in lieu groundwater banking project withMWDSC, SCVWD, ACWD, and Z7WA. Thisproject involves expanding SWSD’s conveyance sys-tem, so that areas normally relying on groundwaterwill have surface water available in wet years. SWSDwater users will receive excess surface water from itsbanking partners’ SWP supply in wet years. In drieryears, SWSD would release its SWP allocation to itspartners and, if necessary, pump groundwater back intothe California Aqueduct to meet its obligations. Themaximum storage capacity of SWSD’s groundwaterbasin is 1 maf. Commitments have been made forabout 80 percent of the project. The remaining 200taf of storage is available to other potential bankingpartners or for expansion of commitments by existingpartners.
MWDSC and Arvin-Edison Water Storage Dis-trict completed negotiations on a 350 taf waterbanking/exchange program. Water banked in this pro-gram would be provided by both AEWSD andMWDSC. AEWSD would provide up to 150 taf ofits supplies to MWDSC, depending on the quantityof new water yield developed by the program.MWDSC would provide the remaining portion of thewater supplies from its own sources. AEWSD will con-struct 500-600 acres of new infiltration basins, 15 newextraction wells, and a 4.5 mile pipeline intertie with theCalifornia Aqueduct.
Agricultural Drainage
Much of the Tulare Lake Region’s agriculturally
The former Tulare Lakebed has been reclaimed for farming.Floodwaters from the Sierra now reach the lakebed only inthe wettest years.
California Aqueduct inforeground with the gatesat the Kern River Intertie,which was constructed toallow Kern Riverfloodwaters to enter theaqueduct. (In 1995, theintertie was operated inreverse under emergencyconditions, to protect theaqueduct from overtoppingdue to upstream floodinflows.) The design flow forthe intertie is 3,500 cfs.

The California Water Plan Update BULLETIN 160-98
OPTIONS - INTERIOR REGIONS8-47
rich westside must contend with high groundwatertables and drainage problems. Typically, applied irri-gation water builds up above semi-impervious claylayers, creating a shallow, unconfined aquifer of gen-erally poor to unusable quality. Efforts of the SanJoaquin Valley Interagency Drainage Program toaddress westside drainage problems are described inChapter 4.
Arroyo Pasajero andOther Westside Cross-Drainages
The Department, USBR, and USACE are com-pleting a 5-year feasibility study to identify long-termsolutions to flooding and sedimentation problemsthreatening the California Aqueduct at its crossing ofArroyo Pasajero. The SWP’s problems at this uncon-trolled ephemeral stream are similar to those beingexperienced by others in the area. Arroyo flows duringthe 1995 flood washed out a bridge on Interstate 5,resulting in the deaths of 7 motorists. Long-term so-lutions currently under consideration for the SWPinclude a substantial increase in floodwater and sedi-ment storage. The Department is also investigating asimilar problem 20 miles north of Arroyo Pasajero atthe Cantua Creek stream group. These streams presentsimilar flooding and sedimentation problems for theAqueduct.
Kings River Fishery Restoration Actions
Kings River Conservation District and the KingsRiver Water Association are cooperating with USACEin a feasibility study of Kings River fishery habitat
improvements associated with USACE’s Pine FlatDam. The study is evaluating impacts of originalproject construction, riparian habitat restoration down-stream of the dam, potential operating strategies tominimize lake level fluctuations during spawning pe-riods, and temperature control methods for troutpopulations. One component of the study includes anew multi-level intake structure for the reservoir, tobetter manage downstream river temperatures. USACEis also implementing a related project to install a by-pass at the dam’s powerplant so that releases can bemade through the existing penstocks when the tur-bines are not in operation. This project will providetemperature control for the downstream trout fishery.
Water Management Optionsfor the Tulare Lake Region
Table 8-16 shows a list of options for the region,and the results of an initial screening of the options.The retained options were evaluated (Table 8A-3 inAppendix 8A) based on a set of fixed criteria discussedin Chapter 6.
Water ConservationUrban. Urban water demand forecasts for 2020
assume that BMPs are in place; consequently, onlythose urban conservation efforts which exceed BMPsare considered as options. Urban conservation optionswere deferred from evaluation because they providelittle cost-effective potential to create new waterthrough depletion reductions in the Tulare Lake Re-gion.
Advances in well drillingtechnology were key to large-
scale development ofgroundwater in the CentralValley. This photo show the
state of technology circa1914.
Courtesy of Water Resources Center Archives,
University of California, Berkeley

The California Water Plan Update BULLETIN 160-98
OPTIONS - INTERIOR REGIONS 8-48
TABLE 8-16
Tulare Lake Region List of Water Management Options
Option Retain Reason for Deferralor Defer
Conservation
Urban
Outdoor Water Use to 0.8 ETo
Defer No significant depletion reductions attainable.
Indoor Water Use Defer No significant depletion reductions attainable.
Interior CII Water Use Defer No significant depletion reductions attainable.
Distribution System Losses Defer No significant depletion reductions attainable.
Agricultural
Seasonal Application Efficiency Improvements Retain
Flexible Water Delivery Defer Already highly developed; no significant depletionreductions attainable.
Canal Lining and Piping Defer No additional depletion reductions attainable.
Tailwater Recovery Defer No additional depletion reductions attainable.
Modify Existing Reservoirs/Operations
Enlarge Pine Flat Dam Retain
Enlarge Lake Kaweah (Terminus Dam) Retain
Enlarge Success Lake Defer Being enlarged for flood control, not water supply.
New Reservoirs/Conveyance Facilities
Rodgers Crossing Project Defer Segment of Kings River designated as a specialmanagement area, under the Wild and ScenicRivers Act.
Mill Creek Reservoir Defer Cost too high.
Mid-Valley Canal Defer Questionable water supply availability.
Groundwater/Conjunctive Use
City of Clovis Expansion of Recharge Facilities Retain
Kaweah River Delta Corridor Defer Minimal yield.Enhancement Recharge
Kern Water Bank Authority Recharge Facilities Retain
Buena Vista WSD Recharge Retain
Cawelo Water District Recharge Retain
Water Marketing
SLDMWA Internal Reallocation of CVP Supply Retain
Water Recycling
Water recycling options Defer Water recycling options would not generate newwater supply.
Desalting
Brackish Groundwater
Agricultural Drainage Defer No present local agency plans.
Seawater
— — —

The California Water Plan Update BULLETIN 160-98
OPTIONS - INTERIOR REGIONS8-49
Agricultural. The 2020 agricultural water demandforecasts assume that EWMPs are in place. As withthe urban water management options, only those ag-ricultural conservation efforts which exceed EWMPsare considered as options.
Improving irrigation scheduling would increaseSAE to 76 percent, reducing depletions by 7 taf/yr.System improvements including pressure regulationand filtration and better irrigation scheduling wouldincrease SAE to 78 percent and reduce depletions by12 taf/yr. To reach 80 percent SAE, conversion to moreefficient irrigation systems would be needed, reducingdepletions by 17 taf/yr. Flexible water delivery is de-ferred because existing delivery systems in the regionare highly developed, and further improvements wouldresult in little depletion reduction at a high cost. Ca-nal lining is deferred because areas in the region wherelining and piping could reduce water depletions (thewest side of the valley) already have such improvements.Tailwater recovery is not a significant future optionbecause extensive tailwater recovery already occurs inthe region.
TABLE 8-17
Modifying ExistingReservoirs and New Reservoirs
Additional Storage in Kings River Basin. PineFlat Dam, completed in 1954, is a USACE flood con-trol project that also provides supplemental watersupply to Kings River Basin water users. In 1974, theKings River Conservation District commissioned amaster plan to evaluate local solutions to flood controland water supply problems. This study identified threeprojects to improve storage and regulate Kings Riverflows. In order of cost-effectiveness, they were enlarge-ment of Pine Flat Dam, Rodgers Crossing project, andMill Creek project.
A 1989 USACE reconnaissance study investigatedKings River Basin flood control and water supply op-portunities. After screening several alternatives,enlargement of Pine Flat Dam was retained for fur-ther study. A 15-foot increase of gross pool heightappeared to have the best benefit/cost ratio. This al-ternative would increase the reservoir’s storage capacityabout 92.8 taf and provide an average of 12.7 taf/yr of
Flooding from ArroyoPasajero spreads out as
sheetflow over the lowerportion of the Arroyo’s
alluvial fan. The Arroyo’speriodic flooding closes
State Highway 269 andthreatens the integrity of the
California Aqueduct.
TABLE 8-16
Tulare Lake Region List of Water Management Options (continued)
Option Retain Reason for Deferralor Defer
Other Local Options
— — —
Statewide Options
— — See Chapter 6.

The California Water Plan Update BULLETIN 160-98
OPTIONS - INTERIOR REGIONS 8-50
additional average year yield. The major benefit wouldbe flood control. The alternative was not economicallyfeasible at the time. The Rodgers Crossing project, aproposed reservoir located upstream of Pine Flat Res-ervoir, was rendered infeasible when the damsite wasincluded in a river segment subsequently designatedas wild and scenic.
Mill Creek is a small, uncontrolled, intermittentstream tributary to the Kings River below Pine FlatDam. The creek’s 77,000 acre watershed produces anaverage annual runoff of approximately 30 taf. Heavylocal rainstorm events occasionally result in flows inexcess of 10,000 cfs, high enough to cause damagealong the Kings River channel downstream. In the1970s, USACE studied the feasibility of constructinga dam on Mill Creek, just upstream of its confluencewith the Kings River. The benefits of such a projectwould include additional flood protection, water con-servation, power generation, and recreation. Theproposed reservoir would have a capacity in excess of600 taf and would be directly linked with Pine FlatReservoir by a tunnel, allowing the reservoirs to beoperated conjunctively. In wet years, Kings River wa-ter that would flood agricultural lands in TulareLakebed could be diverted and stored in Mill CreekReservoir. USACE’s studies indicated that the projectwas not economically viable.
Additional Storage in Kaweah River Basin. LakeKaweah is located on the Kaweah River about 20 mileseast of Visalia. Terminus Dam, completed in 1962 bythe USACE, provides flood protection and irrigationwater supply to downstream users. A draft USACEfeasibility report investigated continuing flood controlproblems and water resource needs on the KaweahRiver and identified three alternative solutions—en-large Terminus Dam, construct a flood detention damon Dry Creek above Lake Kaweah, or construct a res-
ervoir on Dry Creek with a connecting tunnel to LakeKaweah. Upon further study, only Terminus enlarge-ment was considered feasible due to environmental andcultural impacts of facilities on Dry Creek. EnlargingTerminus Dam would involve raising the spillway, in-creasing flood control storage by about 42 taf. On anaverage annual basis, the study estimates that in-basinirrigation water supply would increase by 8.4 tafthrough better regulation of flood flows. Congressauthorized enlargement of Terminus Dam in the Wa-ter Resources Development Act of 1996. Constructionis tentatively scheduled to begin in 2000 and to becompleted in 2002. The Terminus Dam enlargementis projected to have a capital cost of about $37 million.
Additional Storage in Tule River Basin. In re-sponse to flood protection problems experiencedduring large storms, Tulare County and the Tule RiverAssociation requested USACE to consider providingadditional storage in the basin by enlarging SuccessLake. Success Lake is estimated to provide about a 55-year level of protection for the City of Porterville. A1992 reconnaissance study found that a 10-foot in-crease in gross pool height with a correspondingincreased storage capacity of 28 taf was the preferredalternative. The enlargement would provide a 100-yearlevel of flood protection and increase irrigation watersupply by 2.8 taf annually. USACE entered into a fea-sibility cost-sharing agreement with Lower Tule RiverID for updating the 1992 study and for preparing anEIR/EIS. The draft feasibility study and EIR/EIS arescheduled to be released in 1998. Since the reservoirenlargement’s primary purpose is flood control, theproject is not considered further in this chapter as awater supply option.
New Conveyance Facilities
The Mid-Valley Canal and the constraints on itsimplementation were discussed in the San JoaquinRiver Hydrologic Region. The conveyance project ispresently not feasible because it has no water supply.
Groundwater Development or Conjunctive Use
Many water districts and cities in the region useexcess surface water allocations, purchased water, andfloodwater for groundwater recharge. Local distribu-tion systems and CVP and SWP conveyance facilitiescreate opportunities for agencies to exchange and pur-chase surface supplies for groundwater recharge.Opportunities for groundwater recharge or conjunc-tive use projects are limited in some parts of the region,
Westlands Water DistrictDistribution System
Westlands Water District is the CVP’s largest watercontractor. Among Central Valley agricultural waterdistricts, WWD is unique both for its size (almost 1,000square miles) and for its irrigation distribution system—which is based entirely on pipelines, rather than opencanals. Altogether the distribution system has over 1,000miles of buried pipe, varying in diameter from 10 to 96inches. The basic design flow rate for each farm deliverysystem is 1 cfs per 80 acres.

The California Water Plan Update BULLETIN 160-98
OPTIONS - INTERIOR REGIONS8-51
such as the west side of the valley, because of near-surface poor quality groundwater.
The City of Clovis has an agreement with FresnoIrrigation District entitling the city to an average of14.9 taf of Kings River water and 1.1 taf of Class IIwater from Millerton Lake. Currently, the city’s sur-face water supply is used exclusively for groundwaterrecharge. Existing facilities can recharge approximately7.8 taf/yr. As the city expands into surrounding agri-cultural lands and acquires additional water supplies,average annual surface supplies are expected to increaseto 30.1 taf by 2015. With this increase in supply, thecity is developing new recharge sites to recharge anadditional 3.5 taf/yr.
Visalia plans to develop new wells as its water needsgrow, estimating that 15 additional wells will be nec-essary to meet average year water demands in 2020.Visalia is also working with the Kaweah Delta WaterConservation District and Tulare County on a KaweahRiver Delta corridor study to investigate multiple usesites for groundwater recharge, floodwater manage-ment, and habitat restoration. The study is currentlyin the feasibility stage. The project would include re-charge basins with a storage capacity of about 750 af.A demonstration project has been proposed to modelintegration of the multiple uses.
Pursuant to Monterey Agreement contract amend-ments and the transfer of the KFE, KWBA has beenoperating about 3,000 acres of recharge basins underan emergency CEQA exemption and an interim ESASection 7 consultation, allowing the authority to re-charge winter floodwaters. Since May 1995, KWBAhas recharged about 700 taf on behalf of its memberagencies. KWBA prepared a 75-year habitat conserva-tion plan/natural community conservation plancovering the use of the 20,000-acre property. The HCPsets aside about 10,000 acres for habitat purposes. ESAlisted species found in the project area include the kitfox, kangaroo rat, and blunt-nosed leopard lizard.KWBA plans to expand the recharge facility to 6,800acres. The cost for this expansion, including additionalconveyance structures, is about $30 million.
Buena Vista Water Storage District is planning toconstruct up to 200 acres of additional facilities to storeexcess Kern River water. The new facilities are esti-mated to cost about $250,000.
Cawelo Water District recently entered into anagreement with Texaco Inc. for water generated dur-ing oil recovery. A significant amount of water istrapped in oil bearing zones. The quality of much of
this water is good, once it has been separated from theoil. The agreement negotiated by Texaco and CWDmade possible the construction of an 8 mile pipelineto carry as much as 25 taf/yr of this water to the dis-trict. Additionally, Cawelo purchased almost 90 acresof land straddling Poso Creek in 1996. The districtwill allow the land to be flooded during high flows toenhance groundwater recharge. Work will begin shortlyon a feasibility study to address the district’s long-termplans for more recharge facilities.
Water Marketing
As described in Chapter 6, the San Luis and Delta-Mendota Water Authority has negotiated an internalreallocation of its members’ CVP supplies with USBR.Under this agreement, participating member agenciesof SLDMWA may exchange wet year supplies fordrought year supplies with SCVWD. Westlands Wa-ter District has initiated a short-term buy-back programfor its water users who wish to sell their unused alloca-tion or other supply to the district. The buy-backprogram would be implemented only if WWD hadnot finalized transfers from other sources to meet itstotal supplemental water needs. Marketing under thisprogram would be intra-regional. WWD is also cur-rently preparing a draft programmatic EIR onpurchasing and transferring up to 200 taf/yr to its ser-vice area. Because details on proposed transfers are notyet available, this program is not included in the watermanagement options evaluation.
Looking at the upstream face of Terminus Dam, with theoutlet works structure in the background.

The California Water Plan Update BULLETIN 160-98
OPTIONS - INTERIOR REGIONS 8-52
Urban and agriculturaldevelopment havereduced the habitatavailable to the SanJoaquin Valley kit fox,a listed species.
Water Marketing—WaterLink ProgramIn 1996, an electronic water marketing system went
on-line in Westlands Water District. The WaterLinksystem was designed by the University of CaliforniaBerkeley and Davis campuses, the Natural HeritageInstitute, and farmers and water district staff. The projectwas funded by a grant from USBR. WaterLink allowsdistrict growers to use their home computers to postand read bids, access information on average prices andtrading volumes, and negotiate transactions. WaterLinkcan also be used to schedule water deliveries andeventually to obtain water account balances, a featurethat will enable water users to manage their watersupplies more effectively. WaterLink is an intra-netsystem, available only to district growers, to allow themto make internal trades of in-district supplies.
Water Recycling and Desalting
In the Tulare Lake Region, most urban water useoccurs on the east side of the San Joaquin Valley. Waste-water produced from urban use is generally rechargedto groundwater basins where it reduces groundwateroverdraft, or is extracted for other uses. No water recy-cling projects in the region qualify as new sources ofsupply from a regional perspective. As discussed in theSan Joaquin River Region section, options for desalt-ing agricultural drainage water were deferred for theTulare Lake Region.
Statewide Options
Statewide water supply augmentation options arediscussed and quantified in Chapter 6.
Options Likely to be Implemented inthe Tulare Lake Region
Water supplies are not available to meet all of theregion’s 2020 water demands in average or droughtyears. Applied water shortages are forecasted to be 720taf and 1,851 taf in average and drought years, respec-tively. Ranking of retained water management optionsfor the Tulare Lake Region is summarized in Table 8-17. Table 8-18 summarizes options that can likely beimplemented by 2020 to relieve the shortages.
Improvements in agricultural irrigation demandmanagement will likely occur over the entire region,although much of the region is already efficient in itsagricultural water management. Areas where furtherefficiency improvements will have the most effect willbe where agricultural lands overlie shallow groundwa-
ter of poor quality. The west side of the valley will re-ceive the most benefits from irrigation waterconservation practices. These practices could reducedepletion annually by 17 taf if system upgrades areemployed to increase SAEs to 80 percent.
The portion of the region’s 2020 water shortageattributable to groundwater overdraft is estimated tobe 670 taf. Several plans exist to expand recharge fa-cilities or to construct new ones.
The region’s local surface supplies have alreadybeen extensively developed and further developmentopportunities are limited. Modification of existing fa-cilities through the enlargement of Lake Kaweah andPine Flat Lake could produce about 21 taf/yr of addi-tional yield for irrigation supply.

The California Water Plan Update BULLETIN 160-98
OPTIONS - INTERIOR REGIONS8-53
TABLE 8-17
Options Ranking for Tulare Lake Region
Optiona Rank Cost ($/af) Potential Gain (taf)Average Drought
Conservation
Agricultural
Seasonal Application Efficiency Improvements (76%) H 100 7 7
Seasonal Application Efficiency Improvements (78%) M 250 12 12
Seasonal Application Efficiency Improvements (80%) M 450 17 17
Modify Existing Reservoirs/Operations
Enlarge Pine Flat Dam H 470 13 b
Enlarge Lake Kaweah (Terminus Dam) H 370 8 b
Groundwater/Conjunctive Use
City of Clovis Expansion of Recharge Facilities H 280 — 11
Kern Water Bank Authority Recharge Facilities H 60 — 339
Buena Vista Water Storage District Recharge H 75 — 29
Cawelo Water District Water Banking Project H 50 — 13
Water Marketing
SLDMWA internal reallocation of CVP supply H b 10 —
Statewide Options
See Chapter 6.
a All or parts of the amounts shown for highlighted options have been included in Table 8-18.b Data not available to quantify.
TABLE 8-18
Options Likely to be Implemented by 2020 (taf)
Tulare Lake Region
Average Drought
Applied Water Shortage 720 1,851
Options Likely to be Implemented by 2020Conservation 17 17Modify Existing Reservoirs/Operations 21 —New Reservoirs/Conveyance Facilities — —Groundwater/Conjunctive Use — 392Water Marketing 10 —Recycling — —Desalting — —Other Local Options — —Statewide Options 466 387Expected Reapplication 4 187
Total Potential Gain 518 983
Remaining Applied Water Shortage 202 868

The California Water Plan Update BULLETIN 160-98
OPTIONS - INTERIOR REGIONS 8-54

8A-1 APPENDIX 8A
The California Water Plan Update BULLETIN 160-98 Appendix 8A
8AOptions Evaluations for Interior Regions
Quest
More information about the California Department of Water Resources is available at: http://wwwdwr.water.ca.gov/ For a hard copy version of the Bulletin, please call the Publications Office at (916) 653-1097.

8A-2APPENDIX 8A
The California Water Plan Update BULLETIN 160-98Appendix 8A
TA
BLE
8A
-1
Opt
ions
Eva
luat
ion
Sac
ram
ento
Riv
er R
egio
n
Eva
luat
ion
Scor
esO
ptio
nE
ngin
eeri
ngE
cono
mic
sE
nvir
on-
Inst
itut
iona
l/So
cial
/O
ther
Ove
rall
Ran
km
enta
lL
egal
Thi
rd P
arty
Ben
efit
sSc
ore
Mod
ify
Exi
stin
g R
eser
voir
s/O
pera
tion
s
Reo
pera
te P
G&
E R
eser
voir
s3
32
01
09
L
New
Res
ervo
irs/
Con
veya
nce
Faci
litie
sD
ry C
reek
Res
ervo
ir (
Lake
Cou
nty)
33
21
30
12L
Thu
rsto
n La
ke P
ump-
Stor
age
Proj
ect
23
22
22
13M
Park
s B
ar R
eser
voir
(Y
uba
Cou
nty)
32
23
34
17H
Wal
do R
eser
voir
(Y
uba
Cou
nty)
32
23
34
17H
Tex
as H
ill R
eser
voir
32
22
21
12L
Smal
l Ald
er R
eser
voir
32
22
21
12L
GD
PUD
Div
ersi
on fr
om A
mer
ican
Riv
er3
33
33
015
M
Gro
undw
ater
/Con
junc
tive
Use
New
Wel
ls (
Red
ding
, But
te, a
nd C
olus
a B
asin
s)4
43
43
018
HB
ig V
alle
y C
onju
ncti
ve U
se3
43
23
217
H
Oth
er L
ocal
Opt
ions
New
Sur
face
Wat
er D
iver
sion
from
33
22
30
13M
Sacr
amen
to R
iver
and
Cac
he C
reek
by
YC
FC&
WC
D
New
Sur
face
Wat
er D
iver
sion
from
Sac
ram
ento
33
22
30
13M
Riv
er b
y C
itie
s of
Ben
icia
, Fai
rfie
ld, a
nd V
acav
ille
Stat
ewid
e O
ptio
nsSe
e C
hapt
er 6
.

8A-3 APPENDIX 8A
The California Water Plan Update BULLETIN 160-98 Appendix 8A
TA
BLE
8A
-2
Opt
ions
Eva
luat
ion
San
Joa
quin
Riv
er R
egio
n
Eva
luat
ion
Scor
esO
ptio
nE
ngin
eeri
ngE
cono
mic
sE
nvir
on-
Inst
itut
iona
l/So
cial
/O
ther
Ove
rall
Ran
km
enta
lL
egal
Thi
rd P
arty
Ben
efit
sSc
ore
Con
serv
atio
n
Agr
icul
tura
l
Flex
ible
Wat
er D
eliv
ery
30
33
21
12L
Can
al L
inin
g an
d Pi
ping
30
33
21
12L
Tai
lwat
er R
ecov
ery
34
33
31
17H
Mod
ify
Exi
stin
g R
eser
voir
s/O
pera
tion
s
Reo
pera
te F
arm
ingt
on R
eser
voir
33
32
33
17H
Enl
arge
Far
min
gton
Res
ervo
ir2
33
23
316
M
New
Res
ervo
irs/
Con
veya
nce
Faci
litie
s
Mon
tgom
ery
Res
ervo
ir O
ffst
ream
Sto
rage
33
32
33
17H
Fine
Gol
d C
reek
Off
stre
am S
tora
ge3
22
23
315
M
Iris
h H
ill R
eser
voir
32
21
31
12L
Mid
dle
Bar
Res
ervo
ir3
11
22
211
L
Dev
ils N
ose
Res
ervo
ir3
11
22
110
L
Gro
undw
ater
/Con
junc
tive
Use
Stoc
kton
Eas
t WD
33
42
33
18H
Mad
era
Ran
ch3
34
22
216
M
Stat
ewid
e O
ptio
ns
See
Cha
pter
6.

8A-4APPENDIX 8A
The California Water Plan Update BULLETIN 160-98Appendix 8A
TA
BLE
8A
-3
Opt
ions
Eva
luat
ion
Tul
are
Lake
Reg
ion
Eva
luat
ion
Scor
esO
ptio
nE
ngin
eeri
ngE
cono
mic
sE
nvir
on-
Inst
itut
iona
l/So
cial
/O
ther
Ove
rall
Ran
km
enta
lL
egal
Thi
rd P
arty
Ben
efit
sSc
ore
Con
serv
atio
n
Agr
icul
tura
l
SAE
Im
prov
emen
ts (
76%
)3
43
43
118
H
SAE
Im
prov
emen
ts (
78%
)3
33
32
115
M
SAE
Im
prov
emen
ts (
80%
)2
33
22
113
M
Mod
ify
Exi
stin
g R
eser
voir
s/O
pera
tion
s
Enl
arge
Pin
e Fl
at D
am3
33
43
218
H
Enl
arge
Lak
e K
awea
h (T
erm
inus
Dam
)3
33
43
319
H
Gro
undw
ater
/Con
junc
tive
Use
Cit
y of
Clo
vis
Exp
ansi
on o
f Rec
harg
e Fa
cilit
ies
43
43
40
18H
Ker
n W
ater
Ban
k A
utho
rity
Rec
harg
e Fa
cilit
ies
44
33
40
18H
Bue
na V
ista
Wat
er S
tora
ge D
istr
ict R
echa
rge
44
34
30
18H
Caw
elo
Wat
er D
istr
ict R
echa
rge
44
44
40
20H
Wat
er M
arke
ting
SCV
WD
/SLD
MW
A R
eallo
cati
on4
44
43
019
H
Stat
ewid
e O
ptio
ns
See
Cha
pter
6.

8A-5 APPENDIX 8A
The California Water Plan Update BULLETIN 160-98 Appendix 8A

The California Water Plan Update BULLETIN 160-98
OPTIONS - EASTERN SIERRA AND COLORADO RIVER REGIONS9-1
Options for MeetingFuture Water Needs in
Eastern Sierra and ColoradoRiver Regions of California
T his chapter covers the North and South Lahontan
Hydrologic Regions in the eastern Sierra, and the
Colorado River Hydrologic Region (Figure 9-1). These sparsely
populated regions constitute 33 percent of the State’s land area.
USBR’s Parker
Dam on the
Colorado River.

The California Water Plan Update BULLETIN 160-98
OPTIONS - EASTERN SIERRA AND COLORADO RIVER REGIONS 9-2
FIGURE 9-2
North Lahontan Hydrologic Region
NEVADA
SIERRA
PLACER
EL DORADO
ALPINE
TUOLUMNE
LASSEN
MODOC
O R E G O N
NE
VA
DA
UpperLake
EagleLake
HoneyLake
Rive
r
LakeTahoe
Tru
ckee
Pine
Creek
MiddleAlkali
Lake
FallenLeafLake
TwinLakes
BridgeportReservoir
E.ke
rW
al
W.
Wal
ker
Long
ValleyC
reek
Susan River
HorseLake
W. Fork
E. ForkCarson River
Riv
er
StampedeReservoir
Prosser CreekReservoir
BocaReservoir
Martis CreekReservoir
DonnerLake
IndependenceLake

The California Water Plan Update BULLETIN 160-98
OPTIONS - EASTERN SIERRA AND COLORADO RIVER REGIONS9-3
Description of the AreaThe North Lahontan Region has two planning
subareas (Figure 9-2), the Lassen Group and the Al-pine Group. The Lassen Group PSA consists of Lassenand Modoc Counties. This high desert area is arid,with relatively flat valley areas adjacent to mountains.Valley elevations are about 4,000 and 4,500 feet forHoney Lake and Surprise Valleys. The Warner Moun-tains, which form the western boundary of SurpriseValley, range in elevation from about 7,000 to morethan 9,000 feet. Annual precipitation ranges from aslittle as 4 inches in Surprise Valley in Modoc Countyto over 50 inches in the mountains of the Susan Riverwatershed in Lassen County. The Alpine Group PSAincludes parts of Sierra, Nevada, Placer, El Dorado,Alpine, and Mono Counties. The subarea includes theTruckee, Carson, and Walker River drainages. Theserivers originate at high elevations on the eastern slopesof the Sierras and flow to terminal lakes or desert sinksin Nevada. Annual precipitation ranges from 8 inchesin the valleys to more than 70 inches in the Sierra(much of this amount is snow).
The Lassen Group PSA is rural and sparsely popu-lated. The City of Susanville is the largest populationcenter in the subarea. In the Alpine PSA, more than90 percent of the population lives in the Lake Tahoe
and Truckee areas. The City of South Lake Tahoe andTown of Truckee are the largest communities in thesubarea. The Tahoe-Truckee region has many part-timeresidents and visitors during the summer and winterrecreational seasons, reflecting the importance of tour-ism to the area. Tourism and related recreationalopportunities are vital to the region’s economy and tomuch of the region’s service-sector employment.
Cattle ranching is the main agricultural land usein the Lassen Group PSA. Irrigated land acreage is small(less than 4 percent of the region’s land area). Com-mercial crop production is limited because of the shortgrowing season. Pasture and alfalfa are the dominantirrigated crops. About 75 percent of the region’s irri-gated land is in Modoc and Lassen Counties, and mostof the remainder is in the Carson and Walker RiverBasins in Alpine and Mono Counties. Irrigated landsin the Carson and Walker River Basins are almost ex-clusively pasture at elevations above 5,000 feet. Mostof the uplands areas are federally owned and managedas national forest lands. Table 9-1 shows populationand crop acreage for the region.
Water Demands and SuppliesThe water budget for the North Lahontan Region
is shown in Table 9-2. Agricultural water demands aregenerally met with local surface water supplies, whenavailable. Throughout the northern portions of theregion, runoff is typically scant and stream flow de-creases rapidly after the snowpack melts in the higherelevations.
No major changes in North Lahontan Region wa-ter use are anticipated within the Bulletin’s planninghorizon. Irrigated agriculture is constrained by climate
TABLE 9-1
Population and Crop Acreage
Population Irrigated Crop Acreage(thousands) (thousands of acres)
1995 84 1612020 125 165
. . .
North LahontanHydrologic Region

The California Water Plan Update BULLETIN 160-98
OPTIONS - EASTERN SIERRA AND COLORADO RIVER REGIONS 9-4
and by economically available water supplies. A smallamount of agricultural expansion is expected, but onlyin areas that can support minor additional groundwa-ter development. Likewise, the modest need for
additional municipal supplies can be met by expand-ing present surface systems or increasing groundwateruse. Drought year shortages are caused by a reductionin surface water supplies for agriculture and an increasein unit crop irrigation requirements for pasture andalfalfa. No urban water shortages are forecast.
Most of Susanville’s water supply comes fromgroundwater and from Cady and Bagwell Springs. Thecity has not experienced any water supply shortagesnor does it expect any shortages within the next20 years.
The Honey Lake Valley Groundwater Basin is aninterstate groundwater basin. The California portionof the basin is about 45 miles long and 10 to 15 mileswide. Groundwater extracted from the basin is usedmainly for irrigation. Groundwater use in the basinappears to be near the basin’s perennial yield. A 1987agreement among the Department, the State of Ne-vada, and USGS resulted in a study of the groundwaterflow system in eastern Honey Lake Valley. Upon con-clusion of the study in 1990, the Nevada State Engineerruled that only about 13 taf could be safely transferredfrom Nevada’s portion of the basin for proposed newwater development for Washoe County in Nevada. TheNevada out-of-basin transfer project has not beenimplemented.
The 7,840-acre Honey Lake Wildlife Area is onthe north edge of Honey Lake about 20 miles south-east of Susanville. The HLWA consists of intensivelymanaged wetlands, cropped fields, and uplands adja-cent to the 60,000-acre Honey Lake. It providesimportant habitat for migratory waterfowl, sandhill
A majority of the land in the North Lahontan Region isowned by the federal government, managed primarily byUSFS and BLM. National forest lands provide habitat formany species of wildlife, including some of California’s largermammals.
TABLE 9-2
North Lahontan Region Water Budget (taf)a
1995 2020Average Drought Average Drought
Water UseUrban 39 40 50 51Agricultural 530 584 536 594Environmental 374 256 374 256Total 942 880 960 901
SuppliesSurface Water 777 557 759 557Groundwater 157 187 183 208Recycled and Desalted 8 8 8 8Total 942 752 950 773
Shortage 0 128 10 128a Water use/supply totals and shortages may not sum due to rounding.

The California Water Plan Update BULLETIN 160-98
OPTIONS - EASTERN SIERRA AND COLORADO RIVER REGIONS9-5
cranes, and other birds migrating on the Pacific Fly-way. During the irrigation season, most of HLWA’swater supply comes from Willow Creek and its tribu-taries. HLWA has adjudicated water rights,administered by the Department, as established in the1940 Susan River Decree. Groundwater at the refugeis used for crop irrigation, for maintaining wetlandswater levels, and for domestic purposes.
The Truckee River originates above Lake Tahoe.The river’s flow downstream from Tahoe City is con-trolled by a small dam on the lake’s outlet. The riverflows through northeastern California and northwest-ern Nevada and terminates in Pyramid Lake, locatedwithin the Pyramid Lake Indian Reservation in Ne-vada. Additional Truckee River Basin storage facilitiesare listed in Table 9-3.
Most of the water supply developed by TruckeeRiver Basin reservoirs is used in Nevada to meet urbandemands in the Reno/Sparks area, irrigation demands,and fish and wildlife requirements in the lower TruckeeRiver in Nevada and in Pyramid Lake. On average,about one-third of the Truckee River’s annual flow isdiverted through the Truckee Canal in Nevada to irri-gate land in the Carson Division of USBR’s NewlandsProject near Fallon, Nevada.
Truckee River operations have evolved in responseto litigation, negotiation, court decrees, agreements,and legislation. The 1915 Truckee River General Elec-tric Decree and the 1935 Truckee River Agreement
form the basis of current river operations. The 1944Orr Ditch Decree established individual water rightsin Nevada and, by incorporating the Truckee RiverAgreement, provided criteria for operating the federalreservoirs to serve those rights.
Modification of Truckee River operations occurredwhen two Pyramid Lake fish species were listed underthe ESA. Cui-ui, the Indian name for a species of suckerfound only in Pyramid Lake, were listed as an endan-gered species in 1967. Lahontan cutthroat trout wereinitially listed as endangered in 1970 and were subse-quently reclassified as threatened in 1975. USBR’sStampede Reservoir, constructed in 1970 to serve irri-gation and municipal uses, is operated to provide waterfor these fish, as required by a 1982 federal court deci-sion. Proposed changes in Truckee River operationsare described in the following water management is-sues section.
In the Truckee Basin within California, the urbanwater use occurs in and around the Town of Truckee,and is supplied by Truckee Donner PUD. TDPUD isthe largest purveyor in the basin, accounting for abouthalf of the water delivered to commercial and residen-tial customers; its supplies are derived fromgroundwater. The Martis Valley groundwater basin isthe principal source of water supply. The areas ofNorthstar, Squaw Valley, and Glenshire use ground-water from smaller basins or from fractured rocksources. The developed area around Donner Lake is
TABLE 9-3
Major Reservoirs in the Truckee River Basin in California
Reservoir Owner Operator Usable Construction Height Drainage AreaStorage (taf) Datea (Feet) (Square Miles)
Tahoe Sierra Pacific Truckee-Carson 744.6 1913 18 506Power Companyb Irrigation District
Donner Sierra Pacific Sierra Pacific 9.5 1927 14 14Power Company/ Power CompanyTruckee-CarsonIrrigation Dist.
Martis Creekc USACE USACE 20.4 1971 113 40
Prosser Creek USBR USBR 29.8 1962 163 50
Independence Sierra Pacific Sierra Pacific 17.5 1939 31 8Power Company Power Company
Stampede USBR USBR 226.5 1970 239 136
Boca USBR Washoe County 41.1 1937 116 172Water ConservationDistrict
a Date existing dam was completed.b USBR manages the facilities under easement from Sierra Pacific Power Company.c Flood control storage only.

The California Water Plan Update BULLETIN 160-98
OPTIONS - EASTERN SIERRA AND COLORADO RIVER REGIONS 9-6
served by surface water. Future water demands in theTruckee Basin are not expected to exceed theinterstate allocations contained in the Truckee-Carson-Pyramid Lake Water Rights Settlement Act (PL101-618), which limits the basin’s annual use to 32 taf.
On the California side of the Lake Tahoe Basin,South Tahoe PUD, Tahoe City PUD, and North TahoePUD account for most of the water delivered to urbanusers. Water is supplied from the lake and from ground-water sources. The interstate allocation for California’sLake Tahoe Basin in PL 101-618 would limit futurewater use in the basin to 23 taf of gross diversions,which represents the basin’s estimated future waterneeds at its full development. Future development inthe Lake Tahoe Basin is strictly limited by the bistateTahoe Regional Planning Agency to protect the basin’senvironmental quality. In both the Truckee and TahoeBasins, water use for snowmaking at the area’s ski re-sorts has been addressed in the interstate allocations.
Urban development in the Carson and WalkerRiver Basins is minimal and is clustered around thetowns of Markleeville in Alpine County and Bridge-port in Mono County. More than 90 percent of thewatershed on the California side is federally owned,primarily under the management of the Toiyabe Na-tional Forest. Groundwater is the source of supply forindividual users and small community systems locatedin valley areas. In the upper watershed, communitiesmay lack suitable sites to locate wells and thereforemust depend on surface water sources. The Town ofMarkleeville depends on surface water and experienceda water shortage in 1989 when the stream that sup-plies the community went dry. Water had to be piped
4 miles from another creek to the town’s treatmentplant.
In the upper Carson River watershed, water isstored in several very small alpine reservoirs originallyconstructed to supply irrigation needs. Much of thiswater is still used for irrigation downstream in Ne-vada. The largest of the alpine reservoirs is HeenanLake on Monitor Creek, tributary to the East ForkCarson River, with a capacity of nearly 3 taf. TheCarson River supports a popular recreational trout fish-ery in the upper watershed. DFG has used HeenanLake for raising Lahontan cutthroat trout to stock atother locations throughout the Sierra. DFG currentlymanages State-owned lands adjacent to Heenan Lakeand has arranged to purchase water on an annual basisto maintain a minimum reservoir pool for fish rearing.
Two special-purpose reservoirs were constructedin the upper Carson watershed to receive treated waste-water effluent exported from South Tahoe PUD in theLake Tahoe Basin. (Disposal of treated wastewaterwithin the Lake Tahoe Basin was banned to help pro-tect the lake’s clarity.) Beginning in the 1960s,wastewater effluent was delivered to Indian Creek Res-ervoir for subsequent release to agricultural users as asupplemental irrigation supply. In 1989, exports (about5 taf/yr) were redirected to Harvey Place Reservoir.Indian Creek Reservoir is now used for freshwater rec-reation.
In addition to several small reservoirs in the upperwatershed, the Walker River watershed has two largereservoirs—Topaz Reservoir (an offstream storage fa-cility on the West Walker) and Bridgeport Reservoiron the East Walker. Both of the large reservoirs were
USBR’s Stampede Reservoiris the second largest reservoirin the Truckee River Basin.Lake Tahoe is the largestreservoir in the basin.
Courtesy of USBR

The California Water Plan Update BULLETIN 160-98
OPTIONS - EASTERN SIERRA AND COLORADO RIVER REGIONS9-7
built by Walker River Irrigation District to sustain sum-mer irrigation flows in its service area downstream inNevada. WRID holds California water rights to store57.6 taf of West Walker water, plus 200 af of localinflow, in Topaz Reservoir. WRID can store up to 39.7taf in Bridgeport Reservoir. SWRCB has establishedinstream flow and minimum reservoir pool require-ments at Bridgeport, in response to fish kills thatoccurred during the last drought. Both reservoirs arepopular local recreational destinations.
Part of the East Fork Carson River—approximately10 miles from the town of Markleeville to the Califor-nia/Nevada state line—has been added to theCalifornia wild and scenic river system. On the WestWalker River, approximately 37 river miles have alsobeen given State designation. The designated reach isfrom Tower Lake at the headwaters downstream to theconfluence with Rock Creek, and about 1 mile ofLeavitt Creek.
As occurred in the Truckee River Basin, water rightdisputes in the Carson and Walker River Basins weresettled with federal court decrees. The 1980 AlpineDecree on the Carson River and the 1936 Decree C-125 on the Walker River control most river operations.The decrees established surface water rights, includ-ing reservoir storage rights, of water users in bothCalifornia and Nevada. However, the decrees onlyquantify individual water rights of parties to the liti-gation and did not address rights perfected under state
USBR’s Prosser CreekReservoir is one of theTruckee River system
reservoirs whose operationwould be covered
by the TROA.
law by others—not all existing water uses are necessar-ily covered in the decrees. PL 101-618 established aninterstate allocation in the Carson River Basin; the Cali-fornia allocation corresponds to existing water uses.
Local Water ResourcesManagement Issues
Truckee River Operating Agreement
Negotiation of a proposed Truckee River Operat-ing Agreement and preparation of its draft EIR/EIShave been the major water management activities inthe region. A new operating agreement for the TruckeeRiver is required by PL 101-618. Negotiation of a pro-posed TROA and preparation of an EIR/EIS for theTROA began in 1991. The draft EIR/EIS was releasedfor public review in 1998 and is expected to be com-pleted in 1999.
PL 101-618 settled years of disputes over Truckeeand Carson River waters by making an interstate allo-cation between California and Nevada. It also settledcertain tribal water right claims and provided for wa-ter supplies for specified environmental purposes inNevada. The act allocated 23 taf annually to Califor-nia in the Lake Tahoe Basin and 32 taf annually in theTruckee River Basin below Lake Tahoe. The act allo-cated water corresponding to existing Carson RiverBasin water uses to California. The remainder of the

The California Water Plan Update BULLETIN 160-98
OPTIONS - EASTERN SIERRA AND COLORADO RIVER REGIONS 9-8
Truckee and Carson River supply was allocated toNevada.
When executed, the TROA would establish riveroperations procedures to meet water rights on theTruckee River and to enhance spawning flows in thelower Truckee River for cui-ui and Lahontan cutthroattrout. TROA would provide for management of waterwithin the Truckee Basin in California, includinginstream flow requirements and reservoir storage forfishery and recreation uses, and would include proce-dures for coordinating releases and exchanges of wateramong the watershed’s reservoirs. TROA would be-come the exclusive federal regulation governing releasesof water stored in Lake Tahoe, Martis Creek, ProsserCreek, Stampede, and Boca Reservoirs. The agreementwould provide an accounting procedure for surface andgroundwater diversions in California’s part of theTruckee Basin and would establish criteria to mini-mize short-term reductions in river flow potentiallycaused by future well construction near the river.
In 1993, an agreement was signed by Sierra Pa-cific Power Company, Washoe County WaterConservation District, and Sierra Valley Water Com-pany settling a dispute about when the water companywas required to stop diverting water from the LittleTruckee River. This agreement, which resolves disputesthat had often occurred during droughts, is being in-corporated into the proposed TROA.
Walker River
Recent activities in the Walker River Basin havefocused on the declining level of Walker Lake in Ne-vada and the resulting impact on the lake’s fishery.Because Walker Lake is a terminal sink, salts accumu-late as the lake water evaporates. Declining lake levelshave resulted in most Great Basin terminal sinks be-ing too saline to support fisheries. Walker Lake is oneof three terminal lakes in Nevada that support fish life.The water level at Walker Lake has declined from anelevation of about 4,080 feet in 1882 to 3,944 feet in1994; salinity has increased during the same periodfrom about 2,500 mg/L TDS to 13,300 mg/L TDS.
In most years, Walker River is the primary sourceof inflow to Walker Lake. Flow in the river comes fromrunoff in the Sierra in California. Upstream agricul-tural diversions have contributed to reduced inflows,resulting in a declining lake level and increased lakesalinity. If the trend continues, the Lahontan cutthroatand the tui chub (an important food source for the
trout) may not be able to survive in the lake. To main-tain lake salinity at the current level, about 33 taf/yrmore inflow is needed. Even with a stable lake level,salinity will slowly increase because Walker Lake hasno natural outlet. A solution to Walker Lake problemscould affect water users in California and Nevada.Potential tribal water rights claims on the Nevada sideof the basin could also affect existing water users.
Lake Tahoe
Lake Tahoe’s clarity has been declining as increas-ing development around the shoreline increases thesediment load and nutrients reaching the lake. Nutri-ents, such as nitrogen and phosphorous used in lawnor golf course fertilizers, can enter the lake in the formof storm water runoff. Nutrients promote growth ofalgae, reducing clarity. Clarity of lakes is measured bythe depth to which a Secchi disk, a small plastic diskof specific size, is visible. In the late 1960s, averageSecchi disk visibility in Lake Tahoe was about 100 feet.Now the figure is closer to 70 feet.
Programs to manage Lake Tahoe water quality byregulating development and preventing pollutants fromreaching the lake are being implemented at the fed-eral, state, and local levels. The Tahoe RegionalPlanning Agency, a bistate agency created by Congress,sets regional environmental standards, issues land usepermits (including conditions to protect water qual-ity), and takes enforcement actions throughout thebasin. TRPA’s regional plan provides for achievementand maintenance of environmental targets by manag-ing growth and development. In addition to itsregulatory activities, TRPA carries out a capital im-provement program to repair environmental damagedone before its regional plan was adopted. TRPA hasidentified nearly $500 million in capital improvementsneeded to achieve environmental targets. Federal, state,and local governments have invested nearly $90 mil-lion in erosion control, storm water drainage, streamzone restoration, public transit, and other capitalprojects. Over 70 percent of the land in the Tahoe Basinis controlled by the USFS’s Lake Tahoe Basin Man-agement Unit. The LTBMU has implemented awatershed restoration program and a land acquisitionprogram to prevent development of sensitive privatelands.
In recent years, federal and state agencies have in-creased funding to protect the environment of LakeTahoe. The State of Nevada approved a $20 million

The California Water Plan Update BULLETIN 160-98
OPTIONS - EASTERN SIERRA AND COLORADO RIVER REGIONS9-9
bond measure to perform erosion control and othermeasures on the east side of the lake. In California,Proposition 204 provides $10 million in bond fundsfor land acquisition and programs to control soil ero-sion, restore watersheds, and preserve environmentallysensitive lands.
Leviathan Mine
Leviathan Mine, an abandoned sulfur mine locatedin Alpine County, is one of the most significant aban-doned mine sites in the region. From 1863 to 1952,operations at the site involved tunnel mining. Later,the site was converted to an open-pit operation. Un-der this operation, tailings and overburden materialwere placed in (or washed into) streams, creating wa-ter pollution problems with acid mine drainage andmetals. The mine was ultimately abandoned, leavingan open pit, waste and spoil areas, and surface waterdrainage and erosion problems. Neither the owner northe county had the resources to clean up the site.
In 1980, SWRCB approved a pollution abatementproject for Leviathan Mine. The remediation projectincluded channeling Leviathan Creek, filling and re-grading the mine pit, excavating and regrading thewaste dump, creating onsite evaporation ponds, regrad-ing the spoil areas, and improving drainage. The Stateacquired the site in 1983 and the project was com-pleted in 1985. Although the project reduced theamount of acid mine drainage reaching the creek, con-tamination problems still occur today from pondoverflows, acidic springs, seepage, and erosion. TheRWQCB is currently involved in activities to furtherreduce the pollution.
Sierra Nevada Ecosystem Project
The Sierra Nevada Ecosystem Project was an as-sessment of forests, key watersheds, and significantnatural areas on federal lands. In 1996, the Universityof California released its Sierra Nevada Ecosystem Study,the result of a three year, congressionally-mandatedstudy of the entire Sierra Nevada, with primary em-phasis on gathering and analyzing data to assistCongress in future management of the mountain range.The study stated that “excluding the hard-to-quantifypublic good value of flood control and reservoir-basedrecreation, the hydroelectric generating, irrigation, andurban use values of water are far greater than the com-bined value of all other commodities produced in theSierra Nevada.” The report estimated the value of wa-
ter at 60 percent of that of all commodities producedin the foothills and mountains of the Sierra Nevada.
January 1997 Flood Event
The January 1997 flood was among the most sig-nificant floods on record in the North LahontanRegion. Lake Tahoe recorded its highest level since1917 at an elevation of 6,229.39 feet. This elevationwas the lake’s highest since the 1935 Truckee RiverAgreement, which limited the operating range of LakeTahoe’s surface elevation to between 6,223.0 feet (itsnatural rim) and 6,229.1 feet. Flood damage occurredalong the Truckee’s channel immediately downstreamfrom the lake, although the greatest economic dam-ages occurred in the Reno-Sparks area. In California,flooding in downtown Truckee caused the closure ofmajor highways. Downstream from Truckee, the riverwashed away Floriston Dam, a diversion dam used bySierra Pacific Power Company to divert water to itsrun-of-river hydroelectric plant at Farad.
Stream flows along the Carson and Walker Riversystems exceeded previous flood records. Flows alongthe East Fork Carson River at Markleeville and WestFork Carson River at Woodfords peaked at 21,000 cfsand 8,000 cfs, respectively, considerably above therecord peak flows attained in 1963 and in excess of a100-year flood event for these reaches of the river. TheEast Walker River near Bridgeport and West WalkerRiver near Coleville peaked at 1,810 cfs and 6,220 cfs,respectively, also above previously record flows. InMono County, about 8 miles of U.S. Highway 395were washed out, isolating the communities of Colevilleand Walker. At the lower mouth of the Walker Can-yon, homes and properties in the community of Walkerwere damaged when the West Walker River spilled itsbanks.
Water Management Optionsfor the North Lahontan Region
Table 9-4 shows a list of options for the region,and the results of an initial screening of the options.The retained options were evaluated (Table 9A-1 inAppendix 9A) based on a set of fixed criteria discussedin Chapter 6. Potential options to augment water sup-plies during drought conditions are water conservation,groundwater pumping, and reservoir construction.Land is idled during droughts if water is not available.In Mono County, cutbacks in surface water deliveries

The California Water Plan Update BULLETIN 160-98
OPTIONS - EASTERN SIERRA AND COLORADO RIVER REGIONS 9-10
TABLE 9-4
North Lahontan Region List of Water Management Options
Option Retain Reason for Deferralor Defer
Conservation
Urban
Outdoor Water Use to 0.8 ETo Retain
Indoor Water Use Retain
Interior CII Water Use Defer No significant depletion reductions attainable.
Distribution System Losses Defer No significant depletion reductions attainable.
Agricultural
Seasonal Application Efficiency Improvements Defer No significant depletion reductions attainable.
Flexible Water Delivery Defer No significant depletion reductions attainable.
Canal Lining and Piping Defer No significant depletion reductions attainable.
Tailwater Recovery Defer No significant depletion reductions attainable.
Modifying Existing Reservoirs/Operations
— — —
New Reservoirs/Conveyance Facilities
Petes Valley Reservoir Defer High costs.
Willard Creek Reservoir Defer High costs.
Goat Mountain Reservoir Defer High costs.
Crazy Harry Gulch Reservoir Defer High costs.
Honey Lake Dike and Reservoir Defer Water quality inadequate for agriculture. Very lowyields with large estimated capital costs.
Long Valley Creek Reservoir Defer Very little firm yield.
Hope Valley Reservoir Defer High costs.
Leavitt Meadows Reservoir Defer Site is located on the West Walker River, upstreamof a reach designated as wild and scenic. Alsosubject to interstate water issues with Nevada.
Pickle Meadow Reservoir Defer Same concerns as Leavitt Meadows site.
Roolane Reservoir Defer Same concerns as Leavitt Meadows site.
Mountain Lakes Reservoir Defer Same concerns as Leavitt Meadows site.
Groundwater/Conjunctive Use
Agricultural Groundwater Development Retain
Eastside Warner Mountain Recharge Defer DFG concerns about potential wildlife impactshave diminished local interest in a pilot programand/or reconnaissance level planning study.
Water Marketing— — —
Water RecyclingWater recycling options Defer Water recycling options would not generate new
water supply in this region.

The California Water Plan Update BULLETIN 160-98
OPTIONS - EASTERN SIERRA AND COLORADO RIVER REGIONS9-11
during the recent drought resulted in pasture not be-ing irrigated.
Water Conservation
Urban. Urban water demand forecasts for 2020assume that BMPs are in place; consequently, onlythose urban conservation efforts which exceed BMPsare considered as options. Urban conservation optionsin this region provide little potential for depletion re-ductions. Reducing outdoor water use to 0.8 ETo innew and existing development would only conserveabout 1 taf/yr. Likewise, reducing indoor water use to55 gpcd would conserve about 1 taf/yr.
Agricultural. The 2020 agricultural water demandforecasts assume that EWMPs are in place. As withthe urban water management options, only those ag-ricultural conservation efforts which exceed EWMPsare considered as options. The efficiency of border ir-rigation systems used for alfalfa and pasture can beimproved through leveling fields and better managingapplications. No significant depletion reductions areexpected in the region, however, since most alfalfa ir-rigation occurs in Honey Lake Valley where excessapplied irrigation water recharges the groundwater basin.
New Reservoirs or Conveyance Facilities
In 1992, the Department investigated six potentialreservoir sites in Lassen County that could provide up to20 taf of storage. Sites were located on the Susan River,Willow Creek, and Long Valley Creek. An analysis of
project costs indicates that the reservoirs were not eco-nomically feasible for agricultural water users in the region.
In the late 1950s and early 1960s, the Depart-ment examined potential reservoir sites in MonoCounty that could serve agricultural lands in Califor-nia. USBR, USGS, NRCS, and WRID have studiedthese and other potential sites in California that couldprovide water for Nevada uses. Projects that serve Ne-vada only are not included as options. The fourpotential sites in Mono County located on the WestWalker River have similar economic constraints as thesites in Lassen County. They are also subject to interstatewater rights concerns.
Groundwater Developmentor Conjunctive Use
Although groundwater is available in the largervalleys used for irrigated agriculture, water needs areusually met from surface water. Groundwater cannotbe economically used to replace surface water uses be-cause of pumping costs.
Modoc County Resource Conservation Districtinvestigated groundwater recharge on six creeks whichdrain the east slopes of the Warner Mountains in Sur-prise Valley. This project would recharge the alluvialfans using existing stream channels or constructed re-charge facilities. Experimental construction of rechargeareas on one or two of the creeks was proposed, butpotential environmental impacts and lack of fundingprevented implementation. This option was deferred.
TABLE 9-4
North Lahontan Region List of Water Management Options (continued)
Option Retain Reason for Deferralor Defer
Desalting
Brackish Groundwater— — —
Seawater— — —
Other Local Options— — —
Statewide Options— — —

The California Water Plan Update BULLETIN 160-98
OPTIONS - EASTERN SIERRA AND COLORADO RIVER REGIONS 9-12
TABLE 9-6
Options Most Likely to be Implemented by 2020 (taf)
North Lahontan Region
Average Drought
Applied Water Shortagea 10 128
Options Likely to be Implemented by 2020Conservation — —Modify Existing Reservoirs/Operations — —New Reservoirs/Conveyance Facilities — —Groundwater/Conjunctive Use — —Water Marketing — —Recycling — —Desalting — —Other Local Options — —Statewide Options — —Expected Reapplication — —
Remaining Applied Water Shortage 10 128a Majority of shortages in this region are agricultural.
Options Likely to be Implementedin the North Lahontan Region
Water supplies are not available to meet all ofthe region’s 2020 water demands in average ordrought years. Applied water shortages are forecastedto be 10 taf and 128 taf in average and droughtyears, respectively. Ranking of retained water man-agement options for the North Lahontan Region is
TABLE 9-5
Options Ranking for North Lahontan Region
Option Rank Cost ($/af) Potential Gain (taf)Average Drought
Conservation
UrbanOutdoor Water Use to 0.8 ET
o– New and Existing Development M a 1 1
Indoor Water Use (55 gpcd) M 600 1 1
Groundwater/Conjunctive UseAgricultural Groundwater Development M a a a
a Data not available to quantify.
summarized in Table 9-5. Table 9-6 summarizes op-tions that can likely be implemented by 2020 to relievethe shortages.
Although groundwater could be developed to helpmeet drought year water needs, it is not ranked highlydue to its cost. During droughts, pasture irrigation willprobably continue to be curtailed.

The California Water Plan Update BULLETIN 160-98
OPTIONS - EASTERN SIERRA AND COLORADO RIVER REGIONS9-13

The California Water Plan Update BULLETIN 160-98
OPTIONS - EASTERN SIERRA AND COLORADO RIVER REGIONS 9-14
FIGURE 9-3
South Lahontan Hydrologic Region
MONO
INYO
SAN BERNARDINO
KERN
LOS ANGELES
N E V A D A
MO J A V E
D E S E R T
GrantLake
LakeCrowley
Amar
River
FairmontReservoir
HaiweeReservoir
River
MonoLake
Mo
River
SilverwoodLake
Owens
jave
gosa
Los AngelesAqueduct
West Branch ofCalifornia Aqueduct East Branch of
California Aqueduct
SilverLake
SodaLake
TinemahaReservoir

The California Water Plan Update BULLETIN 160-98
OPTIONS - EASTERN SIERRA AND COLORADO RIVER REGIONS9-15
Description of the Area
The South Lahontan Region encompasses the areafrom the drainage divide between the Walker Riverand Mono Lake Basin to the divide south of the MojaveRiver (Figure 9-3). The region is bordered on the eastby the Nevada stateline and on the west by the crest ofthe southern Sierra Nevada and San Gabriel Moun-tains. The region includes all of Inyo County and partsof Mono, San Bernardino, Kern, and Los AngelesCounties. Prominent geographic features of the regionare Owens Valley and Death Valley. The region con-tains the highest and lowest points in the lower 48states—Mount Whitney (elevation 14,495 feet) andDeath Valley (elevation 282 feet below mean sea level).
The region includes several closed drainage ba-
sins and many desert valleys containing central playas,or dry lakes. Major waterbodies in the region are, fromnorth to south, Mono Lake, Owens River, and MojaveRiver. The Amargosa River contains water only dur-ing rare flash floods. Floodwaters in the Amargosa Riverwould eventually flow south to a sink area at the SilverLake and Soda Lake Playas. This sink area is also theterminus of the Mojave River, which flows eastwardfrom its headwaters in the San Bernardino Mountainsacross the Mojave Desert to the playa lakes. Averageannual precipitation for the region’s valleys ranges be-tween 4 and 10 inches. Death Valley receives only1.9 inches annually. The Sierra Nevada can receive upto 50 inches annually, much of it in the form of snow.In some years, the community of Mammoth Lakes canhave snow accumulations of more than 10 feet.
The Joshua Tree,a member of
the yucca family,is endemic to the
Mojave Desert.
. . .
South LahontanHydrologic Region

The California Water Plan Update BULLETIN 160-98
OPTIONS - EASTERN SIERRA AND COLORADO RIVER REGIONS 9-16
Although sparsely populated, the region containssome rapidly growing urban areas, including the Cit-ies of Lancaster and Palmdale in Antelope Valley (LosAngeles County) and the Cities of Victorville, Hesperia,and Apple Valley in San Bernardino County. Manyresidents in these areas have chosen a long commuteto the greater Los Angeles area in exchange for afford-able housing. Future population growth in the regionis expected to be concentrated in communities withincommuting distance of the Los Angeles area. Bishop,Ridgecrest, and Barstow are other population centersin the region. The economies of these and other smalltowns in the eastern part of the region are tied to theregion’s military facilities and other governmental em-ployers, and to providing services for travelers and tourists.
Public lands constitute about 75 percent of theregion’s area, providing a major recreational resource.Popular destinations in the region include the MonoLake area, June Lakes and Mammoth Lakes, InyoNational Forest, Death Valley National Monument,and the recently created Mojave National Preserve.Only about 1 percent of the region’s land is used forurban and agricultural purposes. Most of the irrigatedacreage, primarily alfalfa and pasture, is in theMono-Owens PSA. (This PSA includes Owens Val-ley, the Lake Crowley area northwest of Bishop, andHammil and Fish Lake Valleys.) Some deciduous or-chard acreage is found in the western part of the region.Table 9-7 shows population and crop acreage for theregion.
Major perennial waterbodies in the region areMono Lake and Owens River. Since relatively littlesurface water is available in the rest of the region, theregion’s environmental water use is concentrated in theMono Lake-Owens Valley corridor. The major envi-ronmental water use requirements are associated withmaintenance of Mono Lake levels and fishery instreamflow requirements for the Owens River system. DFGoperates four fish hatcheries in the Mono-Owens area:Mt. Whitney, Big Springs, Hot Creek, and Black RockHatcheries.
The largest surface water development in the re-gion is the Los Angeles Aqueduct and its associatedfacilities, described in the following section. There arealso a few relatively small, high-elevation dams oper-ated by Southern California Edison fornonconsumptive hydropower purposes. These damsdo not provide water supply for the region. SWP’s75 taf Lake Silverwood on the East Branch of the Cali-fornia Aqueduct regulates and stores imported water.
Water Demands and Supplies The water budget for the South Lahontan Re-
gion is shown in Table 9-8. Increased environmentalwater demands from recently settled court actions in-volving LADWP’s water diversions from the OwensValley and Mono Lake are reflected in the base waterbudget. A pending order issued by an air pollutioncontrol district in 1997 could increase environmentalwater demands in the region. This increase is not in-cluded in the water budget because final action hasnot yet been taken (see the local water resources man-agement issues section).
Los Angeles Aqueduct
The Los Angeles Aqueduct is the region’s majorwater development feature, although it does not servewater to the region. In 1913, the first pipeline of LAAwas completed and began conveying water from OwensValley to the City of Los Angeles. The aqueduct wasextended north of the Mono Basin and diversions be-The Owens River, with the Sierra Nevada in the background.
TABLE 9-7
Population and Crop Acreage
Population Irrigated Crop Acreage(thousands) (thousands of acres)
1995 713 612020 2,019 45

The California Water Plan Update BULLETIN 160-98
OPTIONS - EASTERN SIERRA AND COLORADO RIVER REGIONS9-17
gan in 1940. A second pipeline was completed in 1970,increasing the aqueduct’s annual delivery capacity toabout 550 taf/yr. Both aqueducts terminate at the 10taf Los Angeles Reservoir in the South Coast Region.The first aqueduct begins at the intake on Lee ViningCreek and the second begins at Haiwee Reservoir.
There are eight reservoirs in the LAA system witha combined storage capacity of about 323 taf (Table9-9). These reservoirs were constructed to store andregulate flows in the aqueduct. The northernmost res-ervoir is Grant Lake in Mono County. Six of the eight
reservoirs are located in the South Lahontan Region.Bouquet and Los Angeles Reservoirs are in the SouthCoast Region.
Water from both aqueducts passes through 12powerplants on its way to Los Angeles. The annualenergy generated is over 1 billion kWh, enough to sup-ply the needs of 220,000 homes.
State Water Project
The East Branch of the California Aqueduct fol-lows the northern edge of the San Gabriel Mountains,bringing imported water to Silverwood Lake. Table 9-10 shows SWP contractors in the region and theircontractual entitlements.
Antelope Valley-East Kern Water Agency, the larg-est SWP contractor in the region, serves 5 major and16 small municipal agencies, as well as Edwards AFB,Palmdale Air Force Plant 42, and U.S. Borax andChemical Facilities. AVEK was formed to bring im-ported water into the area.
Mojave Water Agency was created in 1960 in re-sponse to declining groundwater levels in the area.Communities within MWA’s boundaries have nosource of supply other than groundwater. Communi-
TABLE 9-8
South Lahontan Region Water Budget (taf)a
1995 2020Average Drought Average Drought
Water UseUrban 238 238 619 619Agricultural 332 332 257 257Environmental 107 81 107 81Total 676 651 983 957
SuppliesSurface Water 322 259 437 326Groundwater 239 273 248 296Recycled and Desalted 27 27 27 27Total 587 559 712 649
Shortage 89 92 270 308a Water use/supply totals and shortages may not sum due to rounding.
TABLE 9-9
Los Angeles Aqueduct System Reservoirs
Reservoir Capacity (taf) County
Grant 47 MonoCrowley 183 MonoPleasant Valley 3 InyoTinemaha 6 InyoHaiwee 39 InyoFairmont 0.5 Los AngelesBouquet 34 Los AngelesLos Angeles 10 Los Angeles
TABLE 9-10
SWP Contractors in the South Lahontan Region
Contractor Annual Entitlement (taf) 1995 Deliveries (taf)
Antelope Valley-East Kern WA 138.4 47.3Crestline-Lake Arrowhead WA 5.8 0.4Littlerock Creek ID 2.3 0.5Mojave WA 75.8 8.7Palmdale WD 17.3 7.0

The California Water Plan Update BULLETIN 160-98
OPTIONS - EASTERN SIERRA AND COLORADO RIVER REGIONS 9-18
ties served by MWA include Barstow, Apple Valley,Hesperia, and Victorville. While most of MWA’s ser-vice area is within the South Lahontan Region, theservice area extends into the Colorado River Hydro-logic Region (the Lucerne and Johnson Valleys andthe Morongo Basin). Part of MWA’s SWP entitlement(7.3 taf ) is allocated to that area.
MWA has taken little of its SWP entitlement todate, due to lack of conveyance facilities. In 1994,MWA completed its Morongo Basin pipeline, a 71-mile pipeline with a capacity of 100 cfs from the SWP’sEast Branch to the Mojave River (7 miles) and then20 cfs to Morongo Basin and Johnson Valley. This pipe-line allows MWA to bring SWP water into part of itslarge (almost 5,000 square miles) service area. In 1997,MWA began construction of its 71-mile Mojave RiverPipeline (94 cfs capacity) to bring imported water toBarstow and neighboring cities. The El Mirage Aque-duct is the next proposed addition to its distributionsystem. The aqueduct would deliver approximately 4taf of imported water annually from the East Branchto the westernmost subarea of the Mojave River Basinnear El Mirage. Imported water would be used to re-charge the area’s overdrafted groundwater basin.
In 1997, MWA and Berrenda Mesa Water Dis-trict (a member agency of KCWA) concluded thepermanent transfer of 25 taf of SWP annual entitle-ment, thereby increasing MWA’s total annualentitlement to 75.8 taf.
Local Surface Water SuppliesThe Mammoth Community Water District sup-
plies the town of Mammoth Lakes, located at thenorthern end of the region. About 70 percent ofMCWD’s supply comes from Lake Mary, the largestof a number of small alpine lakes in the Mono LakesBasin. At present, the remainder of MCWD’s supplycomes from groundwater. Although MCWD serves apermanent population of only about 5,000 people, itsaverage daily population is about 13,000, with peakweekends and holiday periods reaching 30,000 peopleper day. These wide fluctuations in service levels abovethe base population are typical of the recreational andresort communities in the area.
Although the Mojave River appears on maps as amajor waterway in the region, it is an ephemeral streamfor much of its length. Local communities extractgroundwater, which is recharged by river flows, butdo not directly divert significant amounts of surfacewater from the river. There is one dam on the MojaveRiver at the base of the San Bernardino Mountains—Mojave River Forks Dam, a 90 taf USACE floodcontrol facility.
The 3.5 taf capacity Littlerock Reservoir provideswater supply to Littlerock Creek Irrigation District andto Palmdale Water District. PWD funded most of arecent seismic rehabilitation of the 1924-vintage damin exchange for control of the water supply for 50 years.Water from Littlerock Reservoir may be released intoa ditch that conveys flows to PWD’s Lake Palmdale, a4.2 taf storage reservoir.
In the San Bernardino Mountains, Lake Arrow-head, owned by the Arrowhead Lake Association, is a48 taf reservoir providing recreational opportunitiesand water supply for lakeshore residents.
Groundwater Supplies
Historically the South Lahontan Region has re-lied mostly on groundwater, which is the only watersupply available in most parts of the region. Ground-water basin capacities in the Mojave River and AntelopeValley PSAs, for example, total about 70 maf each.(Economically usable storage is significantly less thanthis amount.) Water quality influences groundwateruse. Some areas in the Mono-Owens area have highlymineralized groundwater due to geothermal activity,while saline groundwater is not uncommon in areasnear playa lakes.
The Mojave River groundwater basin is a largealluvial formation in the Mojave Desert, the only local
Littlerock Reservoir is one of the few surface water storagefacilities in the Mojave Desert area. The original dam at thissite was a multi-arch concrete structure. This photo shows thedam after its seismic rehabilitation.

The California Water Plan Update BULLETIN 160-98
OPTIONS - EASTERN SIERRA AND COLORADO RIVER REGIONS9-19
water source for residents in the western third of SanBernardino County (part of the basin is in the Colo-rado River Region). The Mojave River andgroundwater basin act as one water source, with theriver recharging the basin and groundwater discharg-ing in several places to provide surface flows in theriver. The basin is divided into subareas athydrogeologic boundaries including the Helendale andWaterman Faults. The operational storage capacity ofthe basin is about 4.9 maf; currently there is about3.0 maf of water in storage. The basin has experienceddeclining groundwater levels due to overextractions (seeMojave River adjudication section).
The Antelope Valley groundwater basin underliesthe closed drainage in the westernmost part of theMojave Desert in northern Los Angeles and southeast-
ern Kern Counties. It provides most of the local watersupplies to users in the high desert from the San GabrielMountains to the Sierras, including Edwards Air ForceBase. Agricultural pumping from the basin has declinedfor several decades while urban extraction has increaseddue to rapid population growth.
Local Water ResourcesManagement Issues
Owens Valley Area
In 1972, Inyo County filed suit against the Cityof Los Angeles, claiming that increased groundwaterpumping for the second aqueduct was harming theOwens Valley environment. Inyo County asked thatLADWP’s groundwater pumping be analyzed in an
Surface water is found inmost desert waterways only
after infrequent storms. Iflocal groundwater resourcesare not sufficient to supply
an area’s needs, water mustbe imported to augment local
supplies. This photo showsthe Mojave River bed at
Red Rock Canyon.
Searles LakeThe Mojave Desert has numerous playa lakes, dry or
semi-dry lakebeds that occupy topographic low points inclosed drainage basins. Playa lakes contain surface wateronly briefly after the region’s infrequent rains. Theremay, however, be high groundwater levels immediatelybeneath an apparently dry lakebed. Groundwater foundnear these lakebeds is usually too mineralized for mostbeneficial uses, because salts have been concentrated inlakebed deposits during evaporation of the surfacewaters. Searles Lake in northwestern San BernardinoCounty is an example of an extremely mineralized playalake.
Within geologic time, California’s climate was muchwetter than it is today. During the late QuaternaryPeriod, the Owens River flowed into several (now dry)
lakes in the Mojave Desert, filling Searles Lake to a depthof over 600 feet. Long-term deposition of evaporates in thelakebed created thick layers of salts and borate minerals.These deposits have been the basis of extensive miningoperations at the lake, estimated to have produced morethan $1 billion worth of mineral commodities.
Borax mining at the lakebed began as early as 1874.Current mining techniques entail pumping brines fromlakebed sediments and processing them at onsite chemicalplants to produce commodities such as sodium carbonate,sodium borate, and sodium sulfate. These chemicals areused in the manufacture of drugs, dyes, glass, glazes, paper,soap, detergent, enamel, chemical products, abrasives,gasoline additives, fire retardants, and metal alloys.

The California Water Plan Update BULLETIN 160-98
OPTIONS - EASTERN SIERRA AND COLORADO RIVER REGIONS 9-20
EIR. LADWP prepared an EIR in 1976 and anotherin 1979, both of which the Third District Court ofAppeals found inadequate. In 1983, Inyo County andLADWP decided to work together to develop an EIRand water management plan to settle the litigation.
A third EIR was prepared jointly by LADWP andInyo County and released in 1990. In 1991, both par-ties executed a long-term water management agreementdelineating how groundwater pumping and surfacewater diversions would be managed to avoid signifi-cant decreases in vegetation, water-dependentrecreational uses and wildlife habitat. Several entitieschallenged the adequacy of the EIR and in 1993 weregranted amici curiae status by the Court of Appeals,allowing them to enter in the EIR review process. Anagreement was subsequently executed in 1997, end-ing 25 years of litigation between Los Angeles and InyoCounty.
LADWP and Inyo County have begun discussionson how to implement provisions of the agreementsand EIR. Timelines for many provisions have alreadybeen developed and plans for major activities such asrewatering the Lower Owens River are under review.
Surface water diversions for Owens Valley agri-culture from the Owens River began in the 1800s. TheLos Angeles Aqueduct was completed in 1913. OwensLake became a dry lakebed by 1929. On windy days,airborne particulates from the dry lakebed violate airquality standards in the southern Owens Valley. In1997, the Great Basin Unified Air Pollution ControlDistrict ordered the City of Los Angeles to implementcontrol measures at Owens Lake to mitigate the dustproblems. Under the order, 8,400 acres of lakebedwould be permanently flooded with a few inches ofwater, another 8,700 acres would be planted with grassand irrigated, and 5,300 acres would be covered witha four-inch layer of gravel. This order could reducethe city’s diversions by 51 taf/yr or about 15 percentof its supply. In July 1998, a compromise was reachedwhen LADWP agreed to begin work at Owens Lakeby 2001 and to ensure that federal clean air standardswould be met by 2006. In turn, the APCD agreed toscale back the improvements sought in its 1997 order.Under this agreement, LADWP’s dust-control strat-egy may include shallow flooding, vegetation planting,and gravel placement. The implementation schedulerequires that 6,400 acres of lakebed be treated by theend of 2001. By the end of 2006, an additional 8,000acres would be treated, plus any additional lakebednecessary to bring particulate counts into compliance
with federal air quality standards. The plan hinges onfinal approval from the Los Angeles City Council, theAPCD’s board, and the State Air Resources Board. Theagreement also requires EPA to grant a 5-year exten-sion of Clean Air Act requirements that direct statesto abate particulate pollution by 2001 or seek an ex-tension until 2006.
Mono Basin
Mono Lake, located east of Yosemite National Parkat the base of the eastern Sierra Nevada, is the secondlargest lake completely within California. It is recog-nized as a valuable environmental resource. The lakeis famous for its tufa towers and spires, structuresformed by years of mineral deposition by its salinewaters. The lake has no outlet. There are two islandsin the lake that provide a protected breeding area forlarge colonies of California gulls and a haven for mi-grating waterfowl.
Much of the water flowing into Mono Lake comesfrom snowmelt runoff. Since 1941, LADWP has di-verted water from Lee Vining, Walker, Parker, and RushCreeks into tunnels and pipelines that carry the waterto the Owens Valley drainage. There it is conveyed,together with Owens River flows, to Los Angeles viathe LAA.
Diversions from its tributaries lowered MonoLake’s water level from elevation 6,417 feet in 1941 toa historic low of 6,372 feet in 1981. With decreasedinflow of fresh water, the lake’s salinity increased dra-matically. When water levels drop to 6,375 feet orlower, a land bridge to Negit Island is created, allow-ing predators to reach gull rookeries; this first happenedin 1978 and again during the 1987-92 drought.
As a result of these impacts, the lake and its tribu-taries have been the subject of extensive litigationbetween the City of Los Angeles and environmentalgroups since the late 1970s. In 1983, the CaliforniaSupreme Court ruled that SWRCB has authority toreexamine past water allocation decisions and the re-sponsibility to protect public trust resources wherefeasible. SWRCB issued a final decision on Mono Lake(Decision 1631) in 1994. The amendments toLADWP’s water right licenses are set forth in the or-der accompanying the decision.
The order sets instream flow requirements for fishin each of the four streams from which LADWP di-verts water. The order also establishes water diversioncriteria to protect wildlife and other environmentalresources in the Mono Basin. These water diversion

The California Water Plan Update BULLETIN 160-98
OPTIONS - EASTERN SIERRA AND COLORADO RIVER REGIONS9-21
criteria prohibit export of water from Mono Basin untilthe lake level reaches 6,377 feet, and restrict MonoBasin water exports to allow the lake level to rise to anelevation of 6,391 feet in about 20 years. Once thewater level of 6,391 feet is reached, it is expected thatLADWP will be able to export about 31 taf/yr of wa-ter from the basin. The order requires LADWP toprepare restoration plans for the four streams fromwhich it diverts and to restore part of the waterfowlhabitat which was lost due to lake level decline. In May1997, parties to the restoration planning process pre-sented a signed settlement on Mono Basin restorationto the SWRCB. If approved, the settlement wouldguide restoration activities and annual monitoringthrough 2014. Parties to the settlement includeLADWP, the Mono Lake Committee, DFG, StateLands Commission, DPR, California Trout, NationalAudubon Society, USFS, BLM, and The Trust forPublic Land.
Key features of stream restoration plan includerestoring peak flows to Rush, Lee Vining, Walker, andParker Creeks; reopening abandoned channels in RushCreek; and developing a monitoring plan. One of therestoration actions required by SWRCB—bypassingsediment around LADWP diversion dams—was de-ferred for further analysis. The waterfowl habitatrestoration plan proposes that a Mono Basin water-fowl habitat restoration foundation administer a $3.6million trust established by LADWP. Five of the par-ties to the agreement would serve as initial membersof the foundation. Activities would include annualmonitoring, restoring open water habitat adjacent tothe lake, and rewatering Mill Creek. LADWP wouldcontinue its brine shrimp productivity studies, openseveral channels on Rush Creek, and make its MillCreek water rights available for rewatering Mill Creek,based on the recommendations of the foundation.
The plans are being considered by SWRCB and adecision is expected at the end of 1998.
Mojave River Adjudication
The Mojave River groundwater basin has experi-enced overdraft since the early 1950s, with the largestincrease in overdraft occurring in the 1980s. About 80percent of basin recharge comes from the Mojave River.In 1990, the City of Barstow filed a complaint in Su-perior Court against the City of Adelanto seeking anaverage annual guaranteed flow of 30 taf to mitigatereduced runoff and declining groundwater levels in theBarstow area. The complaint also requested a writ of
mandate against MWA to compel it to import waterfrom the SWP. MWA filed a cross-complaint request-ing a determination of water rights in the basin.
In 1991, the court ordered that the litigation beplaced on hold to give parties time to negotiate a settle-ment and to develop a solution to the overdraft. AMojave Basin adjudication committee was formed tofacilitate data gathering and to draft a stipulated judg-ment and physical solution. The court’s final rulingon basin adjudication was issued in January 1996. Inits ruling, the court emphasized that the area has beenin overdraft for decades and that MWA must alleviateoverdraft through conservation and purchase of supple-mental water. MWA was appointed as the basinwatermaster.
The adjudication stipulated that any party pump-ing more than 10 af/yr became a party to the judgmentand is bound by it. The judgment stated that each partyhas a right to its base annual production, which wasits highest usage between 1986 and 1990. The judg-ment also required MWA to reduce this amount by atleast 5 percent each year for four years as one way toachieve a physical solution to the longstanding over-draft. Any party exceeding its annual allotment mustpurchase replenishment water from MWA or fromother parties to the judgment. If there is still overdraftafter the end of the first five years of the stipulatedjudgment, water use in overdrafted subareas will befurther reduced. The judgment recognized five basinsubareas and required that if an upstream subarea doesnot meet its obligation to a downstream subarea, theupstream area must pay for supplemental water.
Supplemental water for the Mojave River Basinwill come from MWA’s SWP entitlement, or fromwater marketing arrangements, and will be deliveredthrough the California Aqueduct. In March 1997,MWA began constructing its Mojave River pipeline,extending about 71 miles from the California Aque-duct to Newberry Springs, a rural community east ofBarstow. MWA also recently purchased the permanentright to 25 taf of additional SWP annual entitlement,nearly a 50 percent increase from the agency’s previ-ous entitlement. The combination of reducedpumping, increased SWP deliveries and other imports,and new delivery facilities are expected to reduce over-draft in the basin.
Antelope Valley Water Management
The Antelope Valley Water Group was formed in1991 to provide coordination among valley water agen-

The California Water Plan Update BULLETIN 160-98
OPTIONS - EASTERN SIERRA AND COLORADO RIVER REGIONS 9-22
cies and other interested entities. AVWG membersinclude the Cities of Palmdale and Lancaster, EdwardsAFB, AVEK, Antelope Valley United Water PurveyorsAssociation, Los Angeles County Waterworks Districts,PWD, Rosamond Community Services District, andLos Angeles County. AVWG completed an AntelopeValley water resources study in 1995 to address regionalwater management issues.
The study evaluated the valley’s existing and fu-ture water supplies from groundwater, the SWP,Littlerock Reservoir, and recycling, and compared thesesupplies with projected water demands. The study con-cluded that water supply reliability is low in the studyarea—full 1998 demands would be met only half thetime without overdrafting groundwater resources. Thestudy recommended water conservation, recycling, andconjunctive use measures to reduce expected shortages.The study identified three sites (two on AmargosaCreek and one on Littlerock Creek) with high poten-tial for groundwater recharge through spreading andidentified SWP water, recycled water, and local runoffas potential recharge sources. The study also identi-fied several potential groundwater injection sites withinexisting Los Angeles County Waterworks and PWDmunicipal wellfields. Treated SWP water was identi-fied as a potential recharge source.
In 1996, PWD adopted a water facilities masterplan for its service area, updating a 1988 plan. PWDrelies on three water sources: Littlerock Reservoir, lo-cal groundwater, and SWP water. The plan indicatesthat about 40 percent of PWD supply is from ground-water. Declining groundwater levels have been a localconcern in the Palmdale area, although extractionspresently appear to be within the basin’s perennial yield.The plan also indicates that existing supplies are in-sufficient to meet drought demands. Average yearshortages are projected to occur by 2005.
To meet drought year demands, the plan calls forthe construction of up to 12 new production wells.The plan’s draft EIR identified declining groundwaterlevels as an unavoidable impact of constructing newwells. Mitigation measures recommended includedconservation and drought year demand reduction, con-junctive use programs (as identified in the AntelopeValley water resources study), acquisition of an addi-tional 3.1 taf/yr of SWP entitlement, participation inwater transfers, and development of recycled water.
Interstate Groundwater Basins
California and Nevada share three interstate
groundwater basins in the South Lahontan Region:Fish Lake Valley, crossed by Highway 168 east ofWestgard Pass; Pahrump Valley, located to the east ofDeath Valley; and Mesquite Valley, just south ofPahrump Valley. Groundwater extraction on the Cali-fornia side of the border supports small-scaleagricultural development, largely for alfalfa. PahrumpValley is the most populated of the three valleys; mostof its development is located in Nevada around thecommunity of Pahrump. Pahrump and Mesquite Val-leys are within about 35 miles of the rapidly growingLas Vegas metropolitan area. In the early 1990s, theSouthern Nevada Water Authority proposed export-ing groundwater from several rural counties in centralNevada to help meet Las Vegas’ rapidly increasing needfor water. Opposition by rural Nevada counties toSNWA’s proposal caused SNWA to defer this project.Inyo County residents have historically been concernedabout the proximity of Las Vegas to the interstate ba-sins, although no new interstate issues have come upsince SNWA’s proposed project.
Water Management Options for theSouth Lahontan Region
Table 9-11 shows a list of options for the region,and the results of an initial screening of the options.The retained options were evaluated (Table 9A-2 inAppendix 9A) based on a set of fixed criteria discussedin Chapter 6.
Water Conservation
Urban. Urban water demand forecasts for 2020assume that BMPs are in place; consequently, onlythose urban conservation efforts which exceed BMPsare considered as options. Reducing outdoor water useto 0.8 ETo in new development would attain 20 taf/yrof depletion reductions, while extending this measureto include existing development would reduce deple-tions by 31 taf/yr. Reducing residential indoor wateruse to 60 and 55 gpcd would attain depletion reduc-tions of 7 and 15 taf/yr, respectively. Reducing CIIwater use by an additional 3 and 5 percent would at-tain 2 and 4 taf/yr of depletion reductions, respectively.Reducing distribution system losses to 7 and 5 per-cent would save 4 and 12 taf/yr, respectively.
Agricultural. The 2020 agricultural water demandforecasts assume that EWMPs are in place. As withthe urban water management options, only those ag-ricultural conservation efforts which exceed EWMPs

The California Water Plan Update BULLETIN 160-98
OPTIONS - EASTERN SIERRA AND COLORADO RIVER REGIONS9-23
TABLE 9-11
South Lahontan Region List of Water Management Options
Option Retain Reason for Deferralor Defer
ConservationUrban
Outdoor Water Use to 0.8ETo RetainIndoor Water Use RetainInterior CII Water Use RetainDistribution System Losses Retain
AgriculturalSeasonal Application Efficiency Improvements RetainFlexible Water Delivery Defer No significant depletion reductions attainable.Canal Lining and Piping Defer No significant depletion reductions attainable.Tailwater Recovery Defer No significant depletion reductions attainable.
Modify Existing Reservoirs/OperationsRemove Sediment from Littlerock Reservoir Defer Excessive costs for additional yield.
New Reservoirs/Conveyance Facilities— — —
Groundwater/Conjunctive Use— — —
Water MarketingMojave Water Agency RetainPalmdale Water District Retain
Water RecyclingWater recycling options Defer Water recycling options in this region do not
generate new water supply.
DesaltingBrackish Groundwater
— — —Seawater
— — —
Other Local OptionsLine Palmdale Ditch Defer No net increase in supply.Reduce Outflow to Playa Lakes Defer Restrictions on use of flows that provide recharge
to overdraft basins. Costs are high and waterquality is poor.
Statewide Options— — See Chapter 6.
are considered as options. It is estimated that watersavings of 2, 3, and 5 taf/yr could be achieved in thisregion, by improving SAE to 76, 78, and 80 percent,respectively. Options for flexible water delivery andcanal lining and piping are not feasible in this regionbecause most water supply comes from individual wellswith minimal conveyance facilities.
Modify Existing Reservoirs or Operations
Sediment has accumulated in Littlerock Reservoirand minor additional yield could be realized by re-moving the sediment. Studies are now under way toevaluate the costs and benefits of this option. Prelimi-nary estimates indicate that the cost of this option isin the order of $2,000/af. Because of the high costs,this option was deferred.

The California Water Plan Update BULLETIN 160-98
OPTIONS - EASTERN SIERRA AND COLORADO RIVER REGIONS 9-24
New Reservoirs or Conveyance Facilities
There are no proposed new reservoir developmentsin this region. The region’s aridity and consequent lackof surface water resources make new reservoirs infea-sible. Future local water resources development willbe based on groundwater sources.
Water Marketing
The California Aqueduct could convey purchasedwater to MWA’s distribution system to supply some ofthe region’s rapidly urbanizing areas. MWA has en-tered into a multi-year banking and exchangeagreement with Solano County Water Agency. Dur-ing wet years, SCWA can bank up to 10 taf of its annualSWP entitlement in MWA’s groundwater basin. Dur-ing drought years, SCWA can take part of MWA’s SWPentitlement in exchange (up to half the banked amountwith a maximum of 10 taf/yr). MWA is also pursuingtwo demonstration water marketing projects of 2 tafeach. PWD is seeking to purchase 3.1 taf/yr of SWPentitlement from Central Valley agricultural waterpurveyors. Other voluntary marketing arrangementscould be developed through option agreements, stor-age programs, and purchases of water through theDWB or other spot markets.
Capacity has been developed to store additionalimported supplies in the Mojave River Basin at MWA’sRock Springs groundwater recharge facility nearHesperia. Additional recharge facilities in the Barstowarea are in the final planning stages, which would fur-ther increase MWA’s ability to take delivery of importedsupplies when its Mojave River Aqueduct is completed.Sufficient basin storage is available to store water inwet years when more SWP supplies or purchased sup-plies might be available.
Water Recycling
Water recycling options are deferred for this re-gion because planned projects would not generate newsupply.
Other Local Options
The ditch that conveys water from Littlerock Res-ervoir to Palmdale Lake has an estimated 20 percentconveyance loss, which could be reduced by canal lin-ing. Canal lining would reduce groundwater rechargeby approximately 1 taf/yr, resulting in no net increasein water supply. This option was deferred.
Some flow of the Mojave River reaches Soda Lakewhere the flow is lost to evaporation. Annual outflow
past Afton Canyon averages 8.4 taf. However, the ba-sin adjudication restricts use of flows that providerecharge to downstream subareas of the basin that arein overdraft. Reducing outflow to Soda Lake was de-ferred as an option.
Likewise, local storm runoff collects in many smallplayas throughout the basin. These playas generallydo not contribute to groundwater recharge, due to thelow permeability of playa soils. Water collected in theplayas evaporates, rather than recharging groundwa-ter. Diversion or collection of runoff to playas andrecharging it to groundwater basins could increasegroundwater supplies by eliminating the evaporation.Six dry lakebeds could potentially store an additional1.8 taf once every five years. Costs for this option are$1,000 to $3,300/af. Water quality at the playas is gen-erally poor, with high levels of salts and minerals. Thisoption was deferred.
Statewide Options
Statewide water supply augmentation options arediscussed and quantified in Chapter 6.
Options Likely to be Implementedin the South Lahontan Region
Water supplies are not available to meet all of theregion’s 2020 water demands in average or droughtyears. Applied water shortages are forecasted to be 270taf in average years and 308 taf in drought years. Mostof the region’s shortage will be in the Mojave Riverplanning subarea. Water shortages in the AntelopeValley subarea are forecast only in drought years. Rank-ing of retained water management options for theSouth Lahontan Region is summarized in Table 9-12.Table 9-13 summarizes options that can likely be imple-mented by 2020 to relieve the shortages. The optionslikely to be implemented in this region include SWPsupplies and water transfers conveyed by the Califor-nia Aqueduct.

The California Water Plan Update BULLETIN 160-98
OPTIONS - EASTERN SIERRA AND COLORADO RIVER REGIONS9-25
TABLE 9-13
Options Most Likely to be Implemented by 2020 (taf)
South Lahontan Region
Average Drought
Applied Water Shortage 270 308
Options Likely to be Implemented by 2020Conservation 56 56Modify Existing Reservoirs/Operations - -New Reservoirs/Conveyance Facilities - -Groundwater/Conjunctive Use - -Water Marketing 7 6Recycling - -Desalting - -Other Local Options - -Statewide Options 174 204Expected Reapplication 33 42
Total Potential Gain 270 308
Remaining Applied Water Shortage 0 0
TABLE 9-12
Options Ranking for South Lahontan Region
Optiona Rank Cost ($/af) Potential Gain (taf)Average Drought
Conservation
UrbanOutdoor Water Use to 0.8 ET
o-New Development M 750 20 20
Outdoor Water Use to 0.8 ETo-New and Existing Development M b 31 31
Indoor Water Use (60 gpcd) M 400 7 7Indoor Water Use (55 gpcd) M 600 15 15Interior CII Water Use (3%) M 500 2 2Interior CII Water Use (5%) M 750 4 4Distribution System Losses (7%) M 200 4 4Distribution System Losses (5%) M 300 12 12
AgriculturalSeasonal Application Efficiency Improvements (76%) H 100 2 2Seasonal Application Efficiency Improvements (78%) M 250 3 3Seasonal Application Efficiency Improvements (80%) M 450 5 5
Water MarketingMojave Water Agency H b 4 4Palmdale Water District (3.1 taf SWP entitlement) H b 3 2
Statewide OptionsSee Chapter 6.
a All or parts of the amounts shown for highlighted options have been included in Table 9-13.b Data not available to quantify.

The California Water Plan Update BULLETIN 160-98
OPTIONS - EASTERN SIERRA AND COLORADO RIVER REGIONS 9-26
FIGURE 9-4
Colorado River Hydrologic Region
RIVERSIDE
IMPERIAL
SAN BERNARDINO
SAN DIEGO AR
IZ
ON
A
M E X I C O
UT
AH
wat
River
Coachella
Canal
Alam
o
er
AllAmerican
Canal
New
River
LakeHavasu
Copper BasinReservoir
Gene WashReservoir
Rive
rAqueduct
Colora
do
River
Colorado
White er
SaltonSea
Riv
ImperialDam

The California Water Plan Update BULLETIN 160-98
OPTIONS - EASTERN SIERRA AND COLORADO RIVER REGIONS9-27
Description of the Area
The Colorado River Region encompasses thesoutheastern corner of California. The region’s north-ern boundary, a drainage divide, begins along thesouthern edge of the Mojave River watershed in theVictor Valley area of San Bernardino County andextends northeast across the Mojave Desert to the Ne-vada stateline. The southern boundary is the Mexicanborder. A drainage divide forms the jagged westernboundary through the San Bernardino, San Jacinto,and Santa Rosa Mountains, and the Peninsular Ranges(including the Laguna Mountains). The Nevadastateline and the Colorado River (the boundary withArizona) delineate the region’s eastern boundary (Fig-ure 9-4).
Covering over 12 percent of the total land area inthe State, the region is California’s most arid. It in-cludes volcanic mountain ranges and hills; distinctivesand dunes; broad areas of Joshua tree, alkali scrub,and cholla communities; and elevated river terraces.Much of the region’s topography consists of flat plainspunctuated by hills and mountain ranges. The SanAndreas fault traverses portions of the Coachella andImperial Valleys. A prominent topographic feature isthe Salton Trough in the south-central part of the re-gion.
The climate for most of the region is subtropicaldesert. Average annual precipitation is much higher inthe western mountains than in the desert areas. Win-ter snows generally fall above 5,000 feet; snow depthscan reach several feet at the highest levels during win-ter. Most of the precipitation in the region falls duringthe winter; however, summer thunderstorms can pro-duce rain and local flooding. Despite its dry climate
and rugged terrain, the region contains large and pro-ductive agricultural areas and popular vacation resorts.Table 9-14 shows the region’s population and cropacreage for 1995 and 2020.
TABLE 9-14
Population and Crop Acreage
Population Irrigated Crop Acreage(thousands) (thousands of acres)
1995 533 7492020 1,096 750
Coachella Valley date palms. The Colorado River Region isthe main location in California where dates are grown forcommercial production.
. . .
Colorado RiverHydrologic Region

The California Water Plan Update BULLETIN 160-98
OPTIONS - EASTERN SIERRA AND COLORADO RIVER REGIONS 9-28
Most of the population is concentrated in theCoachella and Imperial Valleys. Major cities in theCoachella Valley include Palm Springs, Indio, and PalmDesert. Other urban centers in the region are the Cit-ies of El Centro, Brawley, and Calexico in ImperialValley; the Cities of Beaumont and Banning in theSan Gorgonio Pass area; and the Cities of Needles andBlythe along the Colorado River.
Agriculture is an important source of income forthe region. Almost 90 percent of the developed pri-vate land is used for agriculture, most of which is inthe Imperial, Coachella, and Palo Verde Valleys. Theprimary crops are alfalfa, winter vegetables, springmelons, table grapes, dates, Sudan grass, and wheat.Recreation and tourism are another important sourceof income for the region. In Coachella Valley, the PalmSprings area and adjoining communities are an im-portant resort and winter golf destination. Recreationalopportunities provided by the more than 100 golfcourses in the Coachella Valley, water-based recreationon the Colorado River and Salton Sea, and desertcamping all contribute to the area’s economy.
Water Demands and SuppliesTable 9-15 shows the water budget for the Colo-
rado River Region. Agricultural water demand makesup the majority of the water use in the region. Thereare two major areas where water is used for wildlifehabitat in the region, the Salton Sea National WildlifeRefuge and the Imperial Wildlife Area. There are alsoseveral private wetlands.
About 90 percent of the region’s water supply isfrom surface deliveries from the Colorado River
(through the All American and Coachella Canals, lo-cal diversions, and the Colorado River Aqueduct bymeans of an exchange for SWP water). Other suppliesare from groundwater, SWP water, local surface water,and recycled water. Bulletin 160-98 base year ground-water overdraft in the region was estimated to be about70 taf and occurs in the Coachella Valley.
Major water agencies in the region are the PaloVerde Irrigation District, Imperial Irrigation District,Coachella Valley Water District, Bard Water District,Mojave Water Agency, Desert Water Agency, and SanGorgonio Pass Water Agency.
The region’s primary shortages with existing sup-plies are expected to occur in the Coachella planningsubarea because of groundwater overdraft. (In the fu-ture, reduction in California’s Colorado River wateruse to the State’s basic apportionment creates an aver-age year shortage of as much as 0.9 maf in the SouthCoast Region. This 2020 shortage is shown in theSouth Coast water budget.)
Supplies from the Colorado River
Most of the water supply in the region comes fromthe Colorado River, an interstate (and international)river whose use is apportioned among the seven Colo-rado River Basin states by a complex body of statutes,decrees, and court decisions known collectively as thelaw of the river. Table 9-16 summarizes key elementsof the law of the river. USBR acts as the watermasterfor the Colorado River, and all users of Colorado Riverwater must contract with USBR for their supplies. Fig-ure 9-4 shows the locations of key Colorado Riverstorage and conveyance facilities.
TABLE 9-15
Colorado River Region Water Budget (taf)a
1995 2020Average Drought Average Drought
Water UseUrban 418 418 740 740Agricultural 4,118 4,118 3,583 3,583Environmental 39 38 44 43Total 4,575 4,574 4,367 4,366
SuppliesSurface Water 4,154 4,128 3,920 3,909Groundwater 337 337 285 284Recycled and Desalted 15 15 15 15Total 4,506 4,479 4,221 4,208
Shortage 69 95 147 158a Water use/supply totals and shortages may not sum due to rounding.

The California Water Plan Update BULLETIN 160-98
OPTIONS - EASTERN SIERRA AND COLORADO RIVER REGIONS9-29
TABLE 9-16
Key Elements of the Law of the River
Document Date Main Purpose
Colorado River Compact 1922 Equitable apportionment of the water from the Colorado River systembetween the two basins. The Upper Basin and the Lower Basin are eachprovided a basic apportionment of 7.5 maf annually of consumptive use.The Lower Basin is given the right to increase its consumptive use anadditional 1 maf annually.
Boulder Canyon Project Act 1928 Authorized USBR to construct Boulder (Hoover) Dam and the AllAmerican Canal (including the Coachella Canal), and gave congressionalconsent to the Colorado River Compact. Also provided that all users ofColorado River water must enter into a contract with USBR for use of thewater.
California Limitation Act 1929 Limited California’s share of the 7.5 maf annually apportioned to theLower Basin to 4.4 maf annually, plus no more than half of any surpluswaters.
Seven Party Agreement 1931 An agreement among PVID, IID, CVWD, MWDSC, City of LosAngeles, City of San Diego, and County of San Diego to recommend tothe Secretary of Interior how to divide use of California’s apportionmentamong the California water users. Details are shown in Table 9-17.
U.S. - Mexican Treaty 1944 Guarantees Mexico a supply of 1.5 maf annually of Colorado River water.
U.S. Supreme Court Decree in 1964 Apportions water from the mainstream of the Colorado River among theArizona v. California, et al. Lower Division states. When the Secretary determines that 7.5 maf of
mainstream water is available, it is apportioned 2.8 maf to Arizona, 4.4maf to California, and 0.3 maf to Nevada. Also quantifies tribal waterrights for specified tribes, including 131,400 af for diversion in California.
Colorado River Basin Project Act 1968 Requires Secretary of the Interior to prepare long-range operating criteriafor major Colorado River reservoirs.
U.S. Supreme Court Decree in 1979 Quantifies Colorado River mainstream present perfected rights in theArizona v. California, et al. Lower Basin states.
Hoover Dam andLake Mead. Lake Mead and
Lake Powell are the largest ofthe Colorado River system
reservoirs.
Courtesy of USBR

The California Water Plan Update BULLETIN 160-98
OPTIONS - EASTERN SIERRA AND COLORADO RIVER REGIONS 9-30
Within California, local agencies’ apportionmentsof Colorado River water were established under theSeven Party Agreement (Table 9-17), which has beenincorporated into water delivery contracts which theSecretary of the Interior has executed with Californiawater users. Uses occurring within a state are chargedto that state’s allocation. Thus, federal water uses oruses associated with federal reserved rights (e.g., tribalwater rights) must also be accommodated withinCalifornia’s basic apportionment of 4.4 maf/yr plusone-half of any available surplus water.
The major local agencies in California using Colo-rado River water in the Colorado River Region are
TABLE 9-17
Annual Apportionment of Use of Colorado River Water(all amounts represent consumptive use)
Interstate/International
Upper Basin States 7.5 maf(Wyoming, Utah, Colorado, New Mexico, small portion of Arizona)
Lower Basin States 7.5 maf(Arizona, Nevada, California)
Arizona 2.8 mafNevada 0.3 mafCalifornia 4.4 maf
Republic of Mexicoa 1.5 maf
a Plus 200 taf of surplus water, when available. Water delivered to Mexico must meet specified salinity requirements.
Intrastate (Seven Party Agreement)b
Priority 1 Palo Verde Irrigation District (based on area of 104,500 acres).
Priority 2 Lands in California within USBR’s Yuma Project (not to exceed 25,000 acres).
Priority 3 Imperial Irrigation District and lands served from the All American Canal in Imperial and Coachella Valleys,and Palo Verde Irrigation District for use on 16,000 acres in the Lower Palo Verde Mesa.
Priorities 1 through 3 collectively are not to exceed 3.85 maf/yr. There is no specified division of that amount among thethree priorities.
Priority 4 MWDSC for coastal plain of Southern California-550,000 af/yr.
Priority 5 An additional 550,000 af/yr to MWDSC, and 112,000 af/yr for the City and County of San Diegoc.
Priority 6 Imperial Irrigation District and lands served from the All American Canal in Imperial and Coachella Valleys,and Palo Verde Irrigation District for use on 16,000 acres in the Lower Palo Verde Mesa, for a total not toexceed 300,000 af/yr.
Total of Priorities 1 through 6 is 5.362 maf/yr.
Priority 7 All remaining water available for use in California, for agricultural use in California’s Colorado River Basin.
b Indian tribes and miscellaneous present perfected right holders that are not identified in California’s Seven Party Agreement have the right to divert up to approximately 85 taf /yr (equating to about 50 taf/yr of consumptive use) within California’s 4.4 maf basic apportionment. These users are presently consumptively using approximately 32 taf/yr (assuming about 25 taf/yr of unmeasured return flow).c Subsequent to execution of the Seven Party Agreement, San Diego executed a separate agreement transferring its apportionment to MWDSC.
PVID, BWD, IID, and CVWD. The ReservationDivision of USBR’s Yuma Project provides water toColorado River Indian tribes in California. The re-mainder of California’s Colorado River water use occursin the South Coast Region (Chapter 7). Figure 9-5 is aplot of Lower Basin states’ apportionments comparedwith historical Colorado River water use. As shown inthe figure, California’s use has historically exceeded itsbasic apportionment, because California has been al-lowed to divert Arizona’s and Nevada’s unusedapportionments, and to divert surplus water. Withcompletion of the Central Arizona Project and the1996 enactment of a state groundwater banking act,

The California Water Plan Update BULLETIN 160-98
OPTIONS - EASTERN SIERRA AND COLORADO RIVER REGIONS9-31
Arizona used more than its basic apportionment in1997. Reduction of California’s Colorado River usefrom current levels to 4.4 maf annually (when surpluswater is not available) has significant water manage-ment implications for the South Coast Region. Incalendar year 1996, actual consumptive use of theLower Basin states (without considering USBR’s un-measured return flow credit of 239 taf ) was:
Nevada 241 tafArizona 2,813 tafCalifornia 5,256 tafTotal Lower Basin 8,310 taf
Within the Colorado River Region, IID, BWD,and PVID receive virtually all of their supplies fromthe Colorado River. IID and CVWD’s Colorado Riversupplies are diverted into USBR’s All American Canalat Imperial Dam; CVWD is served from the CoachellaBranch of the AAC. PVID diverts via the Palo VerdeCanal from the Colorado River near Blythe. BWDreceives its supplies from facilities of USBR’s YumaProject, which serves lands in both California and Ari-zona.
The interstate allocations provided in the 1922Compact were made after a period of relatively wethydrology on the Colorado River. Some have suggestedthat the allocations overstate the river’s normally avail-
TABLE 9-18
Estimated Colorado River Flow and Usesa
maf
Average Flow (1906-95)Upper Basin 15.1Lower Basin 1.4
Total 16.5
Current UsesUpper Basin 3.8Lower Basin (mainstem)b 7.5Mexico 1.5Mainstem Evaporation and Losses 1.9
Total 14.7
Average Flow into ReservoirStorage (16.5 - 14.7) 1.8a Prepared by the CRB.b Reflects restriction on MWDSC’s diversion as Central Arizona Project and Southern Nevada Water System increase diversions to Arizona’s and Nevada’s basic apportionments.
able water supply, even without consideration of sub-sequent calls on that water supply for tribal water rightsand endangered species fishery water needs. Table 9-18 provides an overview of average river hydrology.While consumptive use from the mainstem in theLower Basin is assumed to be its basic apportionmentof 7.5 maf, Upper Basin use is still well below its Colo-rado River Compact apportionment. Current
Basic Apportionment and Consumptive Use ofMainstem Colorado River in Lower Basin
FIGURE 9-5V
olu
me
in
ma
f
California Use
Arizona Use
Nevada Use
California BasicApportionment
Arizona BasicApportionment
Nevada BasicApportionment
1970
0
1
2
3
4
5
6
1975 1980 1985 1990 1995

The California Water Plan Update BULLETIN 160-98
OPTIONS - EASTERN SIERRA AND COLORADO RIVER REGIONS 9-32
USBR’s Imperial Dam onthe Colorado River. Thestructures in the foregroundare a series of desilting basinsused to reduce the sedimentload of river water before itenters the All AmericanCanal.
Courtesy of USBR
TABLE 9-19
SWP Contractors in the Colorado River Region
Maximum AnnualAgency Contract Entitlement (taf) SWP Deliveries in 1995 (taf)
Coachella Valley WD 23.1 23.1Desert Water Agency 38.1 38.1Mojave Water Agencya 75.8 8.7San Gorgonio Pass Water Agency 17.3 0a Contract entitlement covers both South Lahontan and Colorado River Regions; 7.3 taf of this amount is allocated to Colorado River Region.
projections are that the Upper Basin will not reach itsfull Compact apportionment until after 2060.
Supplies from Other Sources
Local agencies contracting with the SWP for partof their supplies are shown in Table 9-19.
Neither CVWD nor DWA have facilities to takedirect delivery of SWP water. Instead, both agencieshave entered into exchange agreements with MWDSC,whereby MWDSC releases water from its ColoradoRiver Aqueduct into the Whitewater River for storagein the upper Coachella Valley groundwater basin. Inturn, MWDSC takes delivery of an equal amount ofthe agencies’ SWP water. San Gorgonio Pass WaterAgency, which serves the Banning/Beaumont area, also
lacks the facilities to take delivery of SWP water, andto date has received no actual supply from the SWP.SGPWA will receive SWP supply when the Depart-ment completes its extension of the East Branch of theCalifornia Aqueduct in 2000.
Groundwater, local surface water, and water recy-cling provide the remaining supplies for this region.CVWD, working with DWA, has an active ground-water recharge program for the upper end of theCoachella Valley (generally, the urbanized part of thevalley). CVWD recharges groundwater with importedColorado River supplies and with Whitewater Riverflows using percolation ponds constructed in theWindy Point area. CVWD and DWA levy extractionfees on larger groundwater users in the upper Coachella

The California Water Plan Update BULLETIN 160-98
OPTIONS - EASTERN SIERRA AND COLORADO RIVER REGIONS9-33
Valley. Imperial Valley, the largest water-using area inthe region, does not have significant supplies of usablegroundwater.
Local Water ResourcesManagement Issues
Management of California’sColorado River Water
The major water management issue in this regionis California’s use of Colorado River water in excess ofits basic annual apportionment of 4.4 maf. In the past,Arizona and Nevada were not using the full amountof their basic apportionments, and in accordance withthe law of the river, California was able to use theamount apportioned to, but not used by, Nevada andArizona. Discussions among the seven basin states andten Colorado River Indian Tribes over changes to Colo-rado River operating criteria and ways for Californiato reduce its Colorado River water use began as earlyas 1991. The drought in Northern California promptedCalifornia to request that USBR make surplus wateravailable, so that maximum use could be made of Colo-rado River water in Southern California. Thesediscussions over changes to reservoir operations and howsurplus or shortage conditions could be established con-tinued for a time in a forum known as the “7/10 process.”
More recently, the California local agencies, work-ing through the Colorado River Board of California,have been developing a proposal for discussion withthe other basin states to illustrate how, over time, Cali-fornia would reduce its use to the basic apportionmentof 4.4 maf/yr. Drafts of the proposal, known as theColorado River Board draft 4.4 Plan, have been sharedwith the other states. Efforts are being made to reachintrastate consensus on the plan in 1998. As Bulletin160-98 goes to press, the most current version of thedraft plan is the December 1997 version. The follow-ing text is based on that version.
As currently formulated, the draft plan would beimplemented in two phases. The first phase (betweenthe present and 2010 or 2015) would entail imple-menting already identified measures (such as waterconservation and transfers) to reduce California’s Colo-rado River water use to about 4.6 to 4.7 maf/yr. Thesecond phase would implement additional measuresto reduce California’s use to its basic annual 4.4 mafapportionment in those years when neither surpluswater nor other states’ unused apportionments wasavailable. One of the fundamental assumptions madein the plan is that MWDSC’s Colorado River Aque-duct will be kept full, by making water transfers fromagricultural users in the Colorado River Region to ur-ban water users in the South Coast Region. (TheColorado River Aqueduct’s capacity is a maximum of
Imperial Irrigation District,formed in 1911, acquired
conveyance facilitiesconstructed by a bankruptprivately owned irrigation
company. In 1918, IIDconstructed Rockwood
Heading (shown here) on theoriginal canal system.
Keeping the canal systemfrom being choked by the
Colorado River’s highsediment loading was
difficult; note the dredgeshown in the background.These early facilities weresubsequently replaced bythe All American Canal.
Courtesy of Imperial Irrigation District.

The California Water Plan Update BULLETIN 160-98
OPTIONS - EASTERN SIERRA AND COLORADO RIVER REGIONS 9-34
1.3 maf/yr. However, as shown in Table 9-17,MWDSC has a fourth priority right to only 550 tafannually—the remaining capacity of the aqueduct hashistorically been filled with unused apportionmentwater of other entities or with water from hydrologicsurpluses.)
In the December 1997 draft plan, specific actionswere included in the first phase: core water transfers(every year water transfers) such as the existing IID/MWDSC agreement and the proposed IID/SDCWAtransfer; seepage recovery from unlined sections of theAll American and Coachella Canals; drought year wa-ter transfers similar to the PVID/MWDSC pilotproject; groundwater banking in Arizona; and conjunc-tive use of groundwater in areas such as the CoachellaValley. The actions are described in more detail below.The draft plan recognizes that transfers of conservedwater must be evaluated in the context of preservingthe Salton Sea’s environmental resources, and also thatplan elements must address environmental impacts onthe lower Colorado River and its listed species.
Other actions to occur as part of the first phasewould include implementation of the San Luis ReyIndian water rights settlement authorized in PL 100-675 and implementation of measures to administeragricultural water entitlements within the first threepriorities of the Seven Party Agreement. Examples ofsuch measures include quantifying amounts of waterconserved or transferred, and annually reconciling wateruse with water allocations (e.g., overrun accounting).
An important element of the CRB draft 4.4 plan
is the concept that existing reservoir operating criteriabe changed by USBR to make optimum use of theriver’s runoff and available basin storage capacity. Cali-fornia agencies developed new proposed operatingcriteria that are included in the draft plan. The draftplan contemplates that changes in operating criteriawould be part of both the first and second phases. Theother basin states have been cautious in their reactionto California’s proposals for reservoir reoperation, andhave suggested, for example, that new criteria shouldnot be implemented until California has prepared theenvironmental documents and executed the agreementsthat would be needed to begin implementation of theplan. (In its 1995 five-year review of Colorado Riveroperating criteria, USBR had announced that itplanned no changes to existing criteria.)
The second phase of the CRB draft 4.4 plan wouldinclude additional average year and drought year wa-ter transfers. Specifics on these transfers would bedeveloped during the first phase of plan implementa-tion. One suggested component is construction ofdesalting facilities on rivers tributary to the sea, to di-vert and treat agricultural drainage water that wouldotherwise enter the sea. The treated water could beconveyed to urban water users in the South Coast Re-gion via the Colorado River Aqueduct. As with anyalternative that would reduce the amount of relativelyfresh water reaching the sea, the environmental im-pacts of this approach would require careful evaluation.Other components of the second phase would includefurther transfers of conserved agricultural water to the
USBR’s Parker Dam on theColorado River impoundsLake Havasu. At thislocation, the Colorado Riverforms the stateline betweenCalifornia and Arizona.MWDSC’s Colorado RiverAqueduct and the CentralArizona Project divert fromLake Havasu.
New Parker Dam photo

The California Water Plan Update BULLETIN 160-98
OPTIONS - EASTERN SIERRA AND COLORADO RIVER REGIONS9-35
South Coast and further work on reservoir operatingcriteria. Implementation of some elements of phasetwo of the plan may extend beyond the Bulletin 160-98 planning horizon.
Tribal Water Rights
Colorado River Indian Tribes. As a result of the1964 U.S. Supreme Court decree in Arizona v. Cali-fornia, California’s basic apportionment of ColoradoRiver water was quantified and five lower ColoradoRiver Indian Tribes were awarded 905 taf of annualdiversions, 131 taf of which were allocated for diver-sion in and chargeable to California pursuant to a latersupplemental decree.
In 1978, the tribes asked the court to grant themadditional water rights, alleging that the U.S. failed toclaim a sufficient amount of irrigable acreage, calledomitted lands, in the earlier litigation. The tribes alsoraised claims called boundary land claims for morewater based on allegedly larger reservation boundariesthan had been assumed by the court in its initial award.In 1982, the special master appointed by the SupremeCourt to hear these claims recommended that addi-tional water rights be granted to the Indian tribes. In1983, however, the Supreme Court rejected the claimsfor omitted lands from further consideration and ruledthat the claims for boundary lands could not be re-solved until disputed boundaries were finallydetermined. Three of the five tribes—Fort MojaveIndian Tribe, Quechan Indian Tribe, and ColoradoRiver Indian Tribe—are pursuing additional waterrights related to the boundary lands claims. A settle-ment has been reached on the Fort Mojave claim andmay soon be reached on the CRIT claim. Both settle-ments would then be presented to the special master.The Quechan claim has been rejected by the special
master on the grounds that any such claim was neces-sarily disposed of as part of a Court of Claimssettlement entered into by the tribe in a related matterin the mid-1980s. As with all claims to water from themainstem of the Colorado River and any determina-tion by the special master, only the U.S. Supreme Courtitself can make the final ruling.
If both the Fort Mojave and CRIT settlementswere approved, the tribes would receive water rightsin addition to the amounts granted them in the 1964decree.
San Luis Rey Indian Water Rights SettlementAct. The San Luis Rey Indian Water Rights SettlementAct (Public Law No. 100-675; 102 Stat. 4000 [1988])is to provide for the settlement of the reserved waterrights claims of the La Jolla, Rincon, San Pasqual,Pauma, and Pala Bands of Mission Indians. Litigation(affecting the interests of the United States, the Cityof Escondido, the Escondido Mutual Water Company,the Vista Irrigation District, and the Bands) and pro-ceedings before the Federal Energy RegulatoryCommission involved tribal water rights claims to thewaters of the San Luis Rey River and questions aboutthe validity of rights-of-way granted by the U.S. acrosstribal and allotted lands. The act authorizes and di-rects the Secretary of the Interior to arrange for a 16 taf/yr supplemental supply of water to benefit the Bandsand the local communities. This supply can be ob-tained either from water development from publiclands in California outside the service area of the CVP,from water salvaged as the result of lining part of theAAC or Coachella Canal, or through a contract withMWDSC. Title II of PL 100-675 authorized the Sec-retary of the Interior to line parts of the canals, andpermitted the Secretary to enter into an agreement oragreements with PVID, IID, CVWD, and/orMWDSC for the construction or funding. The act didnot authorize appropriation of federal funds for canallining.
Water Conservation Programs
There have been several large-scale water conser-vation actions involving Colorado River water users,as shown in Table 9-20.
Salton Sea
The present day Salton Sea was formed in 1905,when Colorado River water flowed through a break ina canal that had been constructed along the U.S./Mexi-can border to divert the river’s flow to agricultural lands
Colorado River Board of CaliforniaThe Colorado River Board of California is the State
agency responsible for administering California’sColorado River water allocation, and for dealing withthe other basin states on river management issues. TheBoard is composed of six members representing theCalifornia agencies who were signatories to the 1931Seven-Party Agreement, two public members, and twoex-officio members (the directors of the Department andDFG). The six local agencies represented on the CRBare CVWD, IID, LADWP, MWDSC, PVID, andSDCWA. CRB’s office and staff are located in Glendale.

The California Water Plan Update BULLETIN 160-98
OPTIONS - EASTERN SIERRA AND COLORADO RIVER REGIONS 9-36
in the Imperial Valley. Until that break was repaired in1907, the full flow of the river was diverted into theSalton Sink, a structural trough whose lowest point isabout 278 feet below sea level. Within geologic time,the Colorado River’s course has altered several times.At times, the river discharged to the Gulf of Californiaas it does today. At other times it flowed into the SaltonSink. Lake Cahuilla, the most recent of several prehis-toric lakes to have occupied the Salton Sink, dried upsome 300 years ago.
Over the long term, the sea’s elevation has graduallyincreased, going from a low on the order of -250 feetin the 1920s to its present level of about -226 feet.The sea’s maximum elevation in recent years was -225.6in 1995. Since some shoreline areas are relatively flat,
a small change in elevation can result in a large differ-ence in the extent of shoreline submerged. Levees havebeen constructed to protect adjacent farmland andstructures at some sites along the shoreline; the remain-ing managed acreage of the Salton Sea NationalWildlife Refuge is also protected from the sea by levees.
The Salton Sea is the largest lake located entirelywithin California, with a volume of about 7.5 maf atits present elevation of -226 feet. The sea occupies aclosed drainage basin—if there were no inflows tomaintain lake levels, its waters would evaporate as didthose of prehistoric Lake Cahuilla. The area’s averageannual precipitation is 3 inches or less, while averageannual evaporation is in excess of 5 feet. The sea re-ceives over 1 maf of inflow annually, primarily from
TABLE 9-20
Existing Colorado River Region Water Conservation Actions
Year Action Participants Comments/Status Estimated Savings
1980 Line 49 miles of USBR, Project completed. 132 taf/yrCoachella Branch CVWD,of All American MWDSCCanal
1988 IID distribution IID, MWDSC Multi-year agreement, extends 107 taf/yr in 1998system into 2033. Projects MWDSC hasimprovements funded include canal lining,and on-farm regulatory reservoir and spillwater interceptor canal construction,management tailwater return systems, non-actions leak gates, 12-hour delivery of
water, drip irrigation systems,linear-move irrigation systems,and system automation.MWDSC has funded over$150 million for conservationprogram costs through 1997.
1992 Groundwater MWDSC, Test program to bank up to MWDSC and SNWA havebanking in CAWCD, 300 taf. stored 139 taf in ArizonaArizona SNWA groundwater basins.
1992 PVID land PVID, Project completed. Two-year Total of 186 taf wasfallowing MWDSC land fallowing test program. made available from the
Covered 20,215 acres in PVID. program, although the waterMWDSC paid $25 million to was subsequently releasedfarmers over a two-year period. from Lake Mead when
flood control releases weremade from the reservoir.
1995 Partnership USBR, Provides, among other things, N/Aagreement CVWD for studies to optimize reasonable
beneficial use of water in thedistrict.

The California Water Plan Update BULLETIN 160-98
OPTIONS - EASTERN SIERRA AND COLORADO RIVER REGIONS9-37
agricultural drainage. The largest sources of inflow(about 80 percent of the total) are the New and AlamoRivers which drain agricultural lands in the Mexicaliand Imperial Valleys and flow into the sea’s southernend. The New River also receives untreated and mini-mally treated wastewater flows from the Mexicali area;monitoring results generally indicate that pollution as-sociated with wastewater discharges does not reach thesea because of its distance from the Mexican border.
In 1924, President Coolidge issued an executiveorder withdrawing seabed lands lying below elevation-244 feet for the purpose of receiving agricultural drain-age water. That order was expanded in 1928 to landsbelow elevation -220 feet. The sea supports water-basedrecreational activities, and has had a popular corvinafishery. During the 1950s, the highest per capita sportfishing catches in California were from the Salton Sea.Over the years, concerns about the sea’s salinity havebeen voiced in the context of maintaining the recre-ational fishery that was established with introducedspecies able to tolerate high salinities.
The sea also provides important wintering habitat
for many species of migratory waterfowl and shore-birds, including some species whose diets are basedexclusively on the fish in the sea. Wetlands near thesea and adjoining cultivated agricultural lands offer theavian population a mix of habitat types and food sourc-es. An area at the sea’s south end was established as anational wildlife refuge in 1930, although most of thatarea is now under water as a result of the sea’s risingelevation. Some of the 380 bird species wintering inthe area include pelicans, herons, egrets, cranes, cor-morants, ibises, ducks, grebes, falcons, plovers, avocets,sandpipers, and gulls. The Salton Sea is considered tobe a major stopover point for birds migrating on thePacific Flyway, and has one of the highest levels of birddiversity of refuges in the federal system.
Historically, salinity has been the water qualityconstituent of most concern at the sea. Present levelsare about 44,000 mg/L TDS (seawater is about35,000 mg/L TDS). This high level of salinity reflectslong- term evaporation and concentration of saltsfound in its inflow. Selenium has been a more recentconstituent of interest, due to its implications for
A false-color infrared satellitephoto of the Salton Sea
(January 1998 Landsat 5).The irrigated areas in
Imperial Valley are clearlyvisible to the south of the sea,
as are the Algodones Dunesto the southeast. The Cityof Mexicali and irrigated
acreage in the MexicaliValley can also be seen.

The California Water Plan Update BULLETIN 160-98
OPTIONS - EASTERN SIERRA AND COLORADO RIVER REGIONS 9-38
aquatic species. Although selenium levels in the watercolumn in the sea are less than the federal criterion of5ug/L, this concentration can be exceeded in seabedsediment and in influent agricultural drainage water.Agricultural drain flows also contribute significantnutrient loading to the sea, which supports large algalblooms at some times of the year. These algal bloomshave contributed to odor problems and low dissolvedoxygen levels in some areas of the sea.
Over the years, USBR and others have consideredpotential solutions to stabilize the sea’s salinity and el-evation. Most recently, the Salton Sea Authority (a jointpowers authority consisting of Riverside and ImperialCounties, IID, and CVWD) and others have beenperforming appraisal level evaluations of some of thefrequently suggested alternatives. Categories of alter-natives considered include:• Diking off part(s) of the sea to create evaporation
pond(s) adjoining the primary water body. Thisapproach would divert part of the sea’s water intomanaged impoundments, where the water wouldbe concentrated into a brine and the salts wouldeventually be removed. The facilities would besized to maintain a primary waterbody at somedesired salinity concentration and elevation. Thedesired salinity concentration would probably benear that of ocean water (or slightly greater) tomaintain the recreational fishery.
• Pumping Salton Sea water and exporting it to someother location. Possible discharge locations include
nearby dry desert lakebeds (to create evaporationponds), evaporation ponds to be constructed nearthe sea, the Gulf of California, or the LagunaSalada in Mexico.
• Building treatment facilities (such as a desaltingplant) to remove salts from inflows to the sea.
• Importing fresh water to the sea. The most appar-ent source would be the Colorado River, but onlyin years when flood control releases were beingmade in excess of U.S. needs.Maintaining a viable Salton Sea has several water
management implications. First will be the actionsneeded to stabilize the sea’s salinity in the near-term,such as the Authority’s diking proposal. Eventually, along-term solution will need to be developed. A widerange of costs has been mentioned for a long-term so-lution, including amounts in the billion-dollar range.Some of the possible long-term solutions suggestedwould entail constructing facilities in Mexico, bring-ing a greater level of complexity to theirimplementation. Other water management programsin the region, such as proposals to transfer conservedagricultural water supplies, will have to be evaluatedin terms of their impacts on the sea. Recent proposalsto desalt water in the Alamo or New Rivers and totransport that water in the Colorado River Aqueductto the South Coast for urban water supply have raisedconcerns about maintaining the sea’s environmentalproductivity. Such proposals might be implementedas part of the second phase of CRB’s draft 4.4 Plan.(In 1997, CVWD filed an application with theSWRCB for water rights to storm water flows anddrainage flows in the Whitewater River at the sea’snorthern end. MWDSC made a similar filing for agri-cultural drainage flowing into the sea’s southern end.)
Congressional legislation introduced in 1998would authorize expenditure of federal funds for amulti-year study of the sea’s resources and potentialsolutions for managing its salinity.
Coachella Valley Groundwater Overdraft
Most PSAs within the Colorado River Region havesufficient water to meet future water needs, with theexception of Coachella Valley. Groundwater overdraftis occurring in the upper (urbanized) part of the val-ley; DWA and CVWD have been managing extractionsin that basin to minimize future overdraft. Importedsurface water at the upper end of the valley has pro-vided a source of recharge water.
Groundwater overdraft is also occurring in the
Roadrunners are one of the bird species found year-round inthe Salton Sea area.

The California Water Plan Update BULLETIN 160-98
OPTIONS - EASTERN SIERRA AND COLORADO RIVER REGIONS9-39
lower (agricultural) portion of the valley, an area thatroughly coincides with CVWD’s Improvement Dis-trict No.1. CVWD estimates that actual 1995 wateruse within the district was about 520 taf, part of whichwas supplied by overdrafting the groundwater basin.(Irrigators in the lower valley are supplied by surfacewater from the Coachella Canal and by groundwater.)The district is in the process of preparing a groundwa-ter management plan for the lower valley, and hasconsidered alternatives including basin adjudication,water conservation, water recycling, and direct or inlieu recharge with water imported from the ColoradoRiver or from the SWP. CVWD estimates that over-draft in the lower valley is about 170 taf/yr. Overdraftcalculated from Bulletin 160-98 water budgets is 70taf/yr for the upper and lower valley combined.
Lower Colorado RiverEnvironmental Water Issues
Listed fish species on the mainstem of the Colo-rado River include the Colorado squawfish, razorbacksucker, humpback chub, and bonytail chub. Restora-tion actions to protect these fish may affect reservoiroperation and streamflow in the mainstem and tribu-taries. Other species of concern in the basin includethe bald eagle, Yuma clapper rail, belted kingfisher,southwestern willow flycatcher, and Kanab ambersnail.
In 1993, USFWS published a draft recovery imple-mentation plan for endangered fish in the upperColorado River Basin. The draft plan included pro-tecting instream flows, restoring habitat, reducingimpacts of introduced fish and sportsfish management,conserving genetic integrity, monitoring habitat and
populations, and increasing public awareness of therole and importance of native fish.
Problems facing native fish in the mainstem Colo-rado River and its tributaries will not be easily resolved.For example, two fish species in most danger of ex-tinction, the bonytail chub and razorback sucker, arenot expected to survive in the wild. Although therewas a commercial razorback fishery until 1950, in re-cent years most stream and reservoir fisheries in thebasin have been managed for non-native fish. Thesemanagement practices have harmed residual popula-tions of natives. Many native fish are readily propagatedin hatcheries, and thus recovery programs include cap-tive broodstock programs to maintain the species.Reestablishing wild populations from hatchery stockswill have to be managed in concert with programs tomanage river habitat. For example, although 15 mil-lion juvenile razorback suckers were planted in Arizonastreams from 1981-90, the majority of these plantedfish were likely eaten by introduced predators. In 1994,the states of Colorado, Wyoming, and Utah reachedan agreement with USFWS on protocols for stockingnon-native fish in the Upper Basin—stocking proto-cols consistent with native fish recovery efforts. In aprogram which began in 1989, USBR and other stateand federal agencies have cooperated to capture, rear,and successfully reintroduce about 15,000 razorbacksucker larvae in Lake Mojave.
Instream flows in the mainstem and key tributar-ies are being evaluated as components of native fishrecovery efforts. State and federal agencies are conduct-ing studies to estimate base flow and flushing flowneeds for listed and sensitive species in various river
Groundwater recharge pondsat Windy Point, to the east
of San Gorgonio Pass inRiverside County. Water
from the Whitewater River,along with Colorado River
Aqueduct supplies exchangedfor SWP deliveries of
CVWD and DWA, providesrecharge in the upper
Coachella Valley area.

The California Water Plan Update BULLETIN 160-98
OPTIONS - EASTERN SIERRA AND COLORADO RIVER REGIONS 9-40
reaches. An example of flushing flow evaluation oc-curred in the spring of 1996 when releases from GlenCanyon Dam were increased for several days to at-tempt to redistribute sediment and create shallow waterhabitat in the mainstem below the dam.
In a 1997 court action involving the southwest-ern willow flycatcher, an environmental group filed alawsuit against USBR and USFWS under the ESA’scitizen suit provisions. The group alleged that USBR’soperation of Lake Mead was endangering theflycatcher’s habitat at the upper end of Lake Mead.The federal district court for Arizona ruled in favor ofUSBR, but the environmental group appealed the dis-trict court’s decision to the Ninth Circuit Court ofAppeals. The appellate court subsequently declined tohear the case, letting the district court’s decision stand.
Lower Colorado RiverMulti-Species Conservation Program
In 1995, DOI executed partnership agreementswith California, Nevada, and Arizona to develop amulti-species conservation program for ESA-listed spe-cies and many non-listed, but sensitive, species withinthe 100-year floodplain of the lower Colorado River,from Glen Canyon Dam downstream to the Mexicanborder. In 1996, a joint participation agreement wasexecuted to provide funding for the program. USFWShas designated the LCRMSCP steering committee asan ecosystem conservation and recovery implementa-tion team pursuant to ESA. The steering committee iscomposed of representatives from the three states, DOI,Indian tribes, water agencies, power agencies, environ-mental organizations, and others.
The conservation program will work toward re-covery of listed and sensitive species while providingfor current and future use of Colorado River waterand power resources, and includes USBR’s ColoradoRiver operations and maintenance actions for the lowerriver. Over 100 species will be considered in the pro-gram, including the southwestern willow flycatcher,Yuma clapper rail, and the four listed fish species men-tioned above. Developing the program is estimated totake three years. Costs of program development andimplementation of selected interim conservation mea-sures, estimated at $4.5 million, are to be equally splitbetween DOI and the nonfederal partners.
USBR initiated a formal Section 7 consultationprocess with USFWS, who issued a five-year biologi-cal opinion on USBR operation and maintenance
activities from Lake Mead to the southerly interna-tional boundary with Mexico in 1997. USBR hasestimated that the cost of implementing the biologicalopinion’s reasonable and prudent alternatives and mea-sures could be as high as $26 million.
The steering committee is currently participatingin funding several interim conservation measures.These include a razorback sucker recovery program atLake Mojave, restoration of Deer Island near Parker,Arizona, and a “Bring Back the Natives” program spon-sored by the National Fish and Wildlife Foundation.
Water Management Optionsfor the Colorado River Region
The only forecasted shortages within the Colo-rado River region are those resulting from groundwateroverdraft in Coachella Valley. Implementing the draftCRB 4.4 Plan entails developing options in the Colo-rado River Region to keep MWDSC’s Colorado RiverAqueduct flowing at its full capacity, as describedearlier. The reduction in California’s use of ColoradoRiver water to the basic 4.4 maf apportionment re-duces the supply available to California by as much as0.9 maf/yr.
Table 9-21 shows a list of options for the region,and the results of an initial screening of the options.The retained options were evaluated (Table 9A-3 inAppendix 9A) based on a set of fixed criteria discussedin Chapter 6. These options could be used for imple-menting the draft CRB 4.4 Plan and for reducing theColorado River Region’s groundwater overdraft.
Water Conservation
Urban. Urban water demand forecasts for 2020assume that BMPs are in place; consequently, onlythose urban conservation efforts which exceed BMPsare considered as options. All urban conservation op-tions were retained. Reducing outdoor water use to0.8 ETo in new development would attain 9 taf/yr ofdepletion reductions, while extending this measure toinclude existing development would reduce depletionsby 18 taf/yr. Reducing indoor water use to 60 gpcdand 55 gpcd would reduce depletions by 2 and 3 taf/yr, respectively. Reducing commercial, institutional,and industrial water use by 3 percent and 5 percentwould save 1 and 2 taf/yr, respectively. Reducing dis-tribution system losses to 7 and 5 percent would resultin 9 and 13 taf/yr of depletion reductions, respectively.
Agricultural. The 2020 agricultural water demandforecasts assume that EWMPs are in place. As with

The California Water Plan Update BULLETIN 160-98
OPTIONS - EASTERN SIERRA AND COLORADO RIVER REGIONS9-41
TABLE 9-21
Colorado River Region List of Water Management Options
Option Retain Reason for Deferralor Defer
Conservation
Urban
Outdoor Water Use to 0.8ETo Retain
Indoor Water Use Retain
Interior CII Water Use Retain
Distribution System Losses Retain
Agricultural
Seasonal Application Efficiency Improvements Retain
Flexible Water Delivery Retain
Canal Lining and Piping Retain
Tailwater Recovery Retain
Modify Existing Reservoirs/Operations
Reoperating Colorado River System Reservoirs Defer Concurrence of USBR and other basin states notyet obtained.
New Reservoirs/Conveyance Facilities
Additional Conveyance Capacity for Colorado Defer California’s current excess use of Colorado RiverRiver Water water.
Groundwater/Conjunctive Use
Groundwater Recharge Project at East Mesa Defer Scoped as one-time program.
Water Marketing
Interstate banking Retain
Intrastate banking and transfers Retain
Land fallowing program Retain
Water Recycling
Water recycling options Defer Water recycling options would not generate newwater supply.
Desalting
Brackish Groundwater
— — —
Seawater
— — —
Other Local Options
Desalting local drainage water Defer To be evaluated in phase 2 of draft CRB 4.4 Plan.
Lining All American Canal Retain
Additional Lining of Coachella Canal Retain
Weather Modification Defer Complicated by interstate management issues.
Statewide Options
— — See Chapter 6.

The California Water Plan Update BULLETIN 160-98
OPTIONS - EASTERN SIERRA AND COLORADO RIVER REGIONS 9-42
the urban water management options, only those ag-ricultural conservation efforts which exceed EWMPsare considered as options. Improving seasonal appli-cation efficiency to 80 percent from the base of73 percent could reduce depletions by 50 taf/yr. Im-proving flexible water delivery, canal lining (on-farmand distribution system), and tailwater recovery sys-tems could together realize 140 taf/yr in depletionreductions. However, the ability to implement con-servation options that would reduce the amount offresh water inflow to the Salton Sea must be evaluatedon a project-specific basis. Goals for preservation ofthe sea’s environmental resources may limit the extentof feasible conservation measures.
Land Fallowing. Programs such as the Palo Verdetest land fallowing program could be implemented toprovide water for transfer to urban areas in the SouthCoast Region during drought periods. In 1992,MWDSC conducted a two-year land fallowing testprogram with PVID. Under this program, growers inPVID fallowed about 20,000 acres of land. The savedwater, about 93 taf/yr, was stored in Lower ColoradoRiver reservoirs for future use by MWDSC (the waterwas later released when Colorado River flood controlreleases were made from Lake Mead). MWDSC paideach grower $1,240 per fallowed acre, making the costof the water to MWDSC about $135/af. Similar pro-grams could be implemented in the future to provideabout 100 taf/yr during drought years. Future landfallowing agreements would need to consider the avail-ability of storage for the transferred water.
Potential Sources ofWater for Intrastate Marketing
The ability to market conserved water has already
been demonstrated in the region. Table 9-22 summa-rizes some potential sources of water for intrastatetransfers. Such transfers could make up some of theshortages in the South Coast Region resulting fromCalifornia reducing its use to California’s basic appor-tionment of 4.4 maf.
Construction of additional conveyance capacityfrom the Colorado River Region to the South CoastRegion has been a recent subject of discussion. Propo-sition 204 provides funding for a feasibility study of anew conveyance facility from the Colorado River tothe South Coast Region. Conveyance facilities men-tioned include a new aqueduct from the Imperial Valleyarea to San Diego (on the United States side of theborder), as well as San Diego’s participation in enlarg-ing the existing aqueduct serving Tijuana, Mexico.Tijuana’s situation is similar to San Diego’s, in thatTijuana is seeking to expand its urban supplies by ne-gotiating transfer of agricultural water from theMexicali Valley. Figure 9-6 is a map of the U.S. - Mexi-can border area, showing the area’s larger water facilities.A preliminary engineering study of constructing a newcanal from Imperial Valley to SDCWA’s service areahas been prepared for SDCWA. Additional work, in-cluding geotechnical exploration and environmentalstudies, would be needed to evaluate the project’s fea-sibility. The preliminary study highlighted the need toevaluate desalting the water that the aqueduct wouldsupply, to enable San Diego’s continued reliance on ahigh level of water recycling. New conveyance facili-ties from the Colorado River Region to the South CoastRegion have been deferred from evaluation in Bulle-tin 160-98 because it does not appear that they wouldbe constructed within the Bulletin’s planning horizon,given the other basin states’ concerns about California’s
TABLE 9-22
Potential Colorado River Water Conservation Programs
Program Participants Comments/Status Estimated Savings
Lining of All USBR, IID Authorized by PL 100-675. Final EIS/EIR Not implemented yet.American Canal CVWD, MWDSC published. Preferred alternative is constructing Potential of 67.7 taf/yr
a new, lined parallel canal. savings.
Agreement for a IID, SDCWA SCDWA and IID executed an agreement in Not implemented yet -long-term transfer 1998. Initial agreement negotiated for wheeling up to 200 taf/yr savings.of up to 200 taf/yr water in MWDSC’s Colorado Aqueduct.
EIR/EIS not yet prepared.
Additional lining USBR, others Authorized by PL 100-675. Draft EIR/EIS Not implemented yet.of Coachella Canal issued. Potential of 25.68 taf/yr
savings.

The California Water Plan Update BULLETIN 160-98
OPTIONS - EASTERN SIERRA AND COLORADO RIVER REGIONS9-43
FIGURE 9-6
U.S.-Mexican Border Region
All American
Colorado
River
ImperialBeach
El Centro
Alamo
River
New
River
Canal
Calexico
Coachella
River
ImperialDam
LagunaDam
Colorado
River
SanLuis Rey
RiverSanD
iego
San VicenteReservoir
Aqueducts
Lower OtayReservoir
San Diego
Gila
SaltonSea
SenatorWashDam
AR
IZO
NA
OR
NIA
CA
LIF
CALIFORNIA
Pa
ci
fi
cO
ce
an
Gulfof
California
RodriguezReservoir
Tecate
Rio de
las
Palmas
Ensenada
RioSan
Carlos
Rio Santo Tomas
Rio
San
Antonio
San LuisMexicali
MorelosDam
Yuma
Tijuana
CanalAlamo
LagunaSalada
Riv
er
El CarrizoReservoir
Rio Colorado -Tijuana Aqueduct
Cienega de Santa Clara
River
Tiju
MEXICO
MEXICO
ARIZONA
Aqu
educ
t
Canal
ana
Color
ado

The California Water Plan Update BULLETIN 160-98
OPTIONS - EASTERN SIERRA AND COLORADO RIVER REGIONS 9-44
use of Colorado River water and the international com-plexities associated with a joint project with Mexicanagencies.
SDCWA and IID have been negotiating a poten-tial transfer of water saved due to extraordinaryconservation measures within IID. The agencies ini-tially executed a 1995 MOU concerning negotiationof a transfer agreement, followed by 1998 executionof an agreement specifying the transfer’s terms and con-ditions. The agreement has a minimum 45-year term,and can be extended for an additional 30 years. Aninitial transfer of 20 taf would begin in 1999, with theannual quantity of transferred water increasing to amaximum of 200 taf. In order to transfer the acquiredwater, SDCWA (a member agency of MWDSC) hasnegotiated an initial wheeling agreement withMWDSC for use of capacity in MWDSC’s ColoradoRiver Aqueduct. Environmental documentation for thetransfer is pending.
Past conservation projects in the region have in-cluded land fallowing, canal lining, distribution systemreservoir and spill interceptor canal construction, andirrigation distribution system improvements. Someproposed projects to recover canal seepage include:• Lining part of the All American Canal. Public
Law 100-675 authorized the Secretary of the In-terior to line the canal or to otherwise recover canalseepage, using construction funds from PVID,IID, CVWD, or MWDSC. USBR’s environmen-tal documentation evaluated a parallel canalalternative, several in-place lining alternatives, anda well field alternative, and concluded that the pre-ferred alternative was the construction of aconcrete-lined canal parallel to 23 miles of the ex-isting canal. The parallel canal alternative has thepotential to conserve an estimated 67.7 taf annu-ally of Colorado River water. Recently, the wellfield alternative has been reevaluated and foundto be infeasible. The well field alternative, althoughless expensive than canal lining, has been set asidebecause of international concerns about ground-water extraction near the border.
• Lining the Remaining Section of the CoachellaCanal. This project would involve lining the remain-ing 33.4 miles of the Coachella Canal, which losesabout 32.4 taf/yr through seepage. Four alternativesthat have been identified are conventional lining,underwater lining, parallel canal, and no action. It isestimated that the preferred alternative, conventionallining, would conserve 25.7 taf/yr.
Intrastate Groundwater Recharge or Banking
IID has proposed a groundwater recharge projectat East Mesa in the Imperial Valley. The proposed re-charge project would divert a portion of flood controlreleases from Lake Mead to a recharge site or sites lo-cated along the alignment of the old, unlined CoachellaCanal. (The old canal was abandoned when an adja-cent lined canal was constructed.) IID estimates thatup to 20 taf could be recharged in 1998. IID prepareda mitigated negative declaration for a one-time pro-gram in 1998, when flood control releases areoccurring. Since Colorado River flood control releaseshave historically been infrequent, future water supplyfor such a recharge program would be available onlyoccasionally. This option was scoped as a one-timeproject and is not considered as a 2020-level option inBulletin 160-98.
MWDSC has executed agreements with three en-tities to study the potential of groundwater bankingarrangements that would involve storing surplus Colo-rado River water, when available, in groundwater basinsnear its Colorado River Aqueduct. The water wouldbe withdrawn for use in the South Coast in droughtyears. An agreement with Cadiz Land Company cov-ered a potential project that would entail constructinga 35-mile pipeline from the Cadiz Valley/Fenner Val-ley area, and diverting up to 100 taf/yr of surplusColorado River water to storage. Estimated availablegroundwater storage capacity is 500 taf, with droughtyear withdrawal capability of 100 taf. This arrange-ment could additionally have a marketing component;perhaps 20 to 30 taf/yr of recharge in Cadiz and FennerValleys could be blended with Colorado River waterand delivered to the South Coast Region. An agree-ment with Catellus Development Company covered apotential groundwater storage site in the Mojave Desertwith an estimated capacity of 600 taf. The withdrawalcapability of this site is estimated at about 150 taf/yr.A third agreement was with CVWD. CVWD is pres-ently performing pilot studies to estimate recharge andwithdrawal capabilities in the lower valley. (MWDSCand CVWD have already been evaluating increasedrecharge at the upper end of the valley, in theWhitewater River drainage basin.)
Technical studies of the feasibility of these projectsremain to be completed, and environmental documen-tation has not yet been prepared. It appears likely thatat least 100 taf/yr of drought year supplies could beprovided through this group of potential storage sites.

The California Water Plan Update BULLETIN 160-98
OPTIONS - EASTERN SIERRA AND COLORADO RIVER REGIONS9-45
Interstate Banking/ConservationUnder an existing agreement between MWDSC
and the Central Arizona Water Conservation District,MWDSC can store a limited amount of ColoradoRiver water in Arizona for future use. The SouthernNevada Water Authority is also participating in theprogram. The agreement stipulates that MWDSC andSNWA can store up to 300 taf in central Arizonathrough the year 2000. As of 1997, MWDSC hasplaced 89 taf in storage and SNWA has placed 50 tafin storage, for a total of 139 taf. About 90 percent ofthe stored water can be recovered, contingent uponthe declaration of a surplus. When MWDSC is ableto draw on this source, it can divert up to a maximumof 15 taf in any one month. The stored water wouldbe made available by Arizona foregoing the use of partof its normal supply from Central Arizona Project.MWDSC plans to recover the stored water at times inthe future when its Colorado River Aqueduct diver-sions may be limited. Like the East Mesa projectdescribed in the preceding section, this interstateproject was a one-time action, and is not considered asa 2020-level option in Bulletin 160-98.
In its 1996 session, the Arizona Legislature en-acted legislation establishing the Arizona WaterBanking Authority. The Authority is authorized to pur-chase unused Colorado River water and to store it ingroundwater basins to meet future needs. Conveyanceto storage areas is provided by the Central ArizonaProject. The legislation further provided that the Au-thority may enter into agreements with California andNevada agencies to bank water in Arizona basins, withthe following limitations:• Regulations governing interstate banking would
need to be promulgated by the Secretary of theInterior.
• The Arizona Department of Water Resources findsthat DOI’s regulations adequately protect Arizona’srights to Colorado River water.
• The ability to bank interstate water would be subor-dinate to banking of water to supply Arizona needs.
• Interstate banking would be precluded in yearswhen Arizona is using its full apportionment of2.8 maf (including water being delivered to Ari-zona for banking by Arizona agencies), unlesssurplus conditions were declared for the river sys-tem.
• Interstate withdrawals from the bank are limitedto 100 taf/yr, although there is no statutory limi-tation on annual deposits.
Under this legislation, future interstate bankingin Arizona would have a maximum annual yield of100 taf. However, Arizona may effectively limit with-drawals in drought years by declining to decrease itsdiversions of surface water to allow recovery of thebanked water. USBR released draft rules and regula-tions for the interstate banking program for publiccomment in December 1997, and is presently review-ing the public comments.
Reoperating Colorado River System Reservoirs
Member agencies represented by the CRB havediscussed proposing reservoir operating criteria to theSecretary of the Interior that would benefit Californiawhile protecting the apportionments of the other ba-sin states and satisfying Mexican treaty obligations.Such criteria would also constitute part of the packageof actions for California to transition its use of riverwater from current levels to 4.4 maf/yr. Operationsstudies have evaluated specific shortage and surpluscriteria for the river system, including selection of de-sired probabilities for water supply reliability andreservoir operating elevations.
Results of the operations studies performed byCRB and by USBR suggest that there could be mini-mal hydrologic risk to using reservoirreoperation—particularly as a limited-term measureto help California reduce its Colorado River use—asa water management option for this region. Asdescribed in Chapter 3, the Colorado River has a highratio of storage capacity to average annual runoff. Pro-jections of consumptive use for the upper basin statessuggest that those states will not attain full use of theircompact apportionments until after year 2060. USBR’ssurplus declarations to date have not adverselyimpacted the other states’ use of their apportion-ments—for example, flood control releases were madeboth in 1997 and 1998, and are expected in 1999.The more significant impediment to implementingreoperation would be concerns of the other basin statesabout impacts of an extended period of reoperationon future shortages, considering the river’s variable yearto year runoff.
For Bulletin 160-98, reservoir reoperation is notevaluated as a water management option and no nu-merical evaluation is made, since consensus of USBRand the basin states has not yet been obtained.
Weather Modification
A fundamental management issue associated with

The California Water Plan Update BULLETIN 160-98
OPTIONS - EASTERN SIERRA AND COLORADO RIVER REGIONS 9-46
Colorado River water supplies is the apparent over-statement of the Compact apportionment relative tothe river’s historical hydrology. There have been pro-posals over the years to augment the river’s base flowto provide additional supplies. For example, USBR haddeveloped a proposed pilot program in 1993 to evalu-ate cloud seeding potential in the Upper Basin. TheState of Colorado did not favor moving ahead withthis program.
Weather modification has recently been raisedagain as part of a possible menu of options to resolveCalifornia’s use in excess of the 4.4 maf basic appor-tionment, although no specific proposals have beenmade. In concept, this option would entail cloud seed-ing in the Upper Basin to increase runoff, and mightyield a 5 percent increase in base flow from the areaseeded. Large-scale weather modification projects aretypically difficult to implement due to institutionaland third-party concerns, and can require several yearsof study and testing prior to being placed in opera-tional status. Weather modification on the ColoradoRiver is also complicated by interstate managementissues. This option has been deferred for these reasons.
Options for Coachella Valley
As discussed earlier, MWDSC has executed anagreement with CVWD to study banking of surplusColorado River water, when available, in the lowerCoachella Valley. Banking programs typically entailputting more water into the groundwater basin thanis extracted, to address losses and to avoid potentiallocalized impacts to existing basin pumpers. Over thelong term this extra recharge would help stabilizegroundwater basin levels. CVWD is presently in theplanning stages of expanding its existing pilot recharge/extraction site in the lower valley. CVWD also plansto form a groundwater replenishment district to helpmanage overdraft.
MWDSC and CVWD are evaluating additional re-charge possibilities in the Whitewater River drainage atthe north end of the valley. Water recharged in this areacould come from surplus Colorado River flows, from year-to-year purchases of SWP water or purchase of SWPentitlement, or from other water marketing arrangementsthat could take advantage of SWP/CRA conveyance. Forexample, CVWD purchased about 39 taf of water fromother SWP contractors in 1996, on a one-time basis.Additional recharge possibilities in the Whitewater drain-age have not yet been quantified, and are not evaluatedfurther in Bulletin 160-98.
CVWD could, as other SWP urban water con-tractors are doing, participate in the permanent transferof agricultural entitlement water provided for in theMonterey Agreement contract amendments. CVWDcould also purchase water from other sources, by wayof exchange with MWDSC, subject to negotiation ofconveyance in the SWP and CRA. Since no specificproposals are currently pending, this option is notquantified in the Bulletin.
Statewide Options
Statewide water supply augmentation options arediscussed and quantified in Chapter 6.
Options Likely to be Implementedin the Colorado River Region
Applied water shortages are forecasted to be 147taf in average years and 158 taf in drought years. Rank-ing of retained water management options for theColorado River Region is summarized in Table 9-23.Table 9-24 summarizes options that can likely be imple-mented by 2020 to relieve the shortages.
Options identified for this region will likely beused for reducing Coachella Valley overdraft and formanaging water to benefit the South Coast Region, ascalled for in CRB’s draft 4.4 Plan. An evaluation ofthese options is shown in Table 9A-3 in Appendix 9A.Bulletin 160-98 assumes that water made available byoption implementation is first allocated to reduce over-draft within the region, and that remaining water isthen available for use in the South Coast Region.
For readers interested in comparing Bulletin 160-98 options with the draft CRB 4.4 Plan, Table 9-25summarizes the Bulletin’s findings in a format similarto that used in the draft CRB 4.4 Plan. There is animportant differences between the two documents—Bulletin 160-98 assumes that water conservation dueto EWMP implementation occurs as part of base de-mand forecasts and not as an optional measure. Actionsthat may be implemented as part of phase two of thedraft CRB 4.4 Plan are not shown in the table, becausethey have not yet been formulated and quantified.

The California Water Plan Update BULLETIN 160-98
OPTIONS - EASTERN SIERRA AND COLORADO RIVER REGIONS9-47
TABLE 9-23
Options Ranking for Colorado River Region
Optiona Rank Cost ($/af) Potential Gain (taf)Average Drought
Conservation
Urban
Outdoor Water Use to 0.8 ETo- New Development M 750 9 9
Outdoor Water Use to 0.8 ETo-New and Existing Development M b 18 18
Indoor Water Use (60 gpcd) M 400 2 2
Indoor Water Use (55 gpcd) M 600 3 3
Interior CII Water Use (3%) M 500 1 1
Interior CII Water Use (5%) M 750 2 2
Distribution System Losses (7%) M 200 9 9
Distribution System Losses (5%) M 300 13 13
Agricultural
Seasonal Application Efficiency Improvements (76%) H 100 22 22
Seasonal Application Efficiency Improvements (78%) M 250 36 36
Seasonal Application Efficiency Improvements (80%) M 450 50 50
Flexible Water Delivery L 1,000 30 30
Canal Lining and Piping L 1,200 45 45
Tailwater Recovery H 150 65 65
Water Marketing
Intrastate Banking H b — 100
Interstate Banking M b — 50
Land Fallowing Program M 140 — 100
Other Local Options
Lining All American Canal H 120 68 68
Additional Lining of Coachella Canal H b 26 26
Statewide Options
See Chapter 6.a All parts of the amounts shown for the highlighted options have been included in Table 9-24.b Data not available to quantify.

The California Water Plan Update BULLETIN 160-98
OPTIONS - EASTERN SIERRA AND COLORADO RIVER REGIONS 9-48
TABLE 9-24
Options Likely to be Implemented by 2020 (taf)Colorado River Regiona
Potential Gain (taf)
Average Drought
Applied Water Shortage 147 158
Options Likely to be Implemented by 2020Conservationb 215 215Modify Existing Reservoirs/Operation — —New Reservoirs/Conveyance Facilities — —Groundwater/Conjunctive — —Water Marketing — 250Recycling — —Desalting — —Other Local Options 94 94Statewide Options 8 7Expected Reapplication 2 2
Total Potential Gain 319 568
Remaining Applied Water Shortage 0 0a Options in excess of regional needs to reduce groundwater overdraft are available for implementing the draft CRB 4.4 Plan in South Coast Region.b Water supply for San Diego CWA/IID transfer provided by agricultural conservation which could be any mix of base demand forecast EWMP implementation (210 taf) and future agricultural conservation options (190 taf).
TABLE 9-25
Future Actions Described in Bulletin 160-98 That Could be Part of Draft CRB 4.4 Plan Implementationa
Action Potential Gain (taf)
Average Drought
Agricultural conservationb to meet SDCWA/IID Agreement 200 200Other agricultural conservationb from EWMP implementation and optional conservation measures 200 200Intrastate groundwater banking from MWDSC agreements with Cadiz, Catellus, or Coachella — 100Interstate groundwater banking from Arizona groundwater bank — 50Possible future land fallowing agreement between MWDSC and PVID — 100Lining All American Canal 68 68Additional lining of Coachella Canal 26 26Statewide Options 8 7Total 502 751a Since this table shows future actions, it does not include the 1980 Coachella Canal lining, 1988 MWDSC/IID agreement, or 1992 MWDSC/CACWD/ SNWA agreement described earlier in this chapter.b These actions are subject to environmental review to ensure that reduced depletions will not have significant impacts to the Salton Sea.

9A-1 APPENDIX 9A
The California Water Plan Update BULLETIN 160-98 Appendix 9A
9AOptions Evaluations for Eastern Sierra
and Colorado River Regions
Quest
More information about the California Department of Water Resources is available at: http://wwwdwr.water.ca.gov/ For a hard copy version of the Bulletin, please call the Publications Office at (916) 653-1097.

9A-2APPENDIX 9A
The California Water Plan Update BULLETIN 160-98Appendix 9A
TA
BLE
9A
-1
Opt
ions
Eva
luat
ion
Nor
th L
ahon
tan
Reg
ion
Eva
luat
ion
Scor
esO
ptio
nE
ngin
eeri
ngE
cono
mic
sE
nvir
on-
Inst
itut
iona
l/So
cial
/O
ther
Ove
rall
Ran
km
enta
lL
egal
Thi
rd P
arty
Ben
efit
sSc
ore
Con
serv
atio
n
Urb
an
Out
door
Wat
er U
se -
New
and
31
42
21
13M
Exi
stin
g D
evel
opm
ent
Indo
or W
ater
Use
(55
gpc
d)2
24
22
113
M
Gro
undw
ater
/Con
junc
tive
Use
Agr
icul
tura
l Gro
undw
ater
Dev
elop
men
t3
13
33
013
M

9A-3 APPENDIX 9A
The California Water Plan Update BULLETIN 160-98 Appendix 9A
TA
BLE
9A
-2
Opt
ions
Eva
luat
ion
Sou
th L
ahon
tan
Reg
ion
Eva
luat
ion
Scor
esO
ptio
nE
ngin
eeri
ngE
cono
mic
sE
nvir
on-
Inst
itut
iona
l/So
cial
/O
ther
Ove
rall
Ran
km
enta
lL
egal
Thi
rd P
arty
Ben
efit
sSc
ore
Con
serv
atio
n
Urb
an
Out
door
Wat
er U
se -
New
Dev
elop
men
t3
24
22
114
M
Out
door
Wat
er U
se -
New
and
31
42
21
13M
Exi
stin
g D
evel
opm
ent
Indo
or W
ater
Use
(60
gpc
d)3
34
22
115
M
Indo
or W
ater
Use
(55
gpc
d)2
24
22
113
M
Inte
rior
CII
Wat
er U
se (
3%)
33
42
21
15M
Inte
rior
CII
Wat
er U
se (
5%)
32
41
21
13M
Dis
trib
utio
n Sy
stem
Los
ses
(7%
)3
44
22
116
M
Dis
trib
utio
n Sy
stem
Los
ses
(5%
)2
34
22
114
M
Agr
icul
tura
l
SAE
Im
prov
emen
ts (
76%
)3
43
43
118
H
SAE
Im
prov
emen
ts (
78%
)3
33
32
115
M
SAE
Im
prov
emen
ts (
80%
)2
33
22
113
M
Wat
er M
arke
ting
Moj
ave
Wat
er A
genc
y4
44
43
019
H
Palm
dale
Wat
er D
istr
ict
44
44
30
19H
Stat
ewid
e O
ptio
ns
See
Cha
pter
6.

9A-4APPENDIX 9A
The California Water Plan Update BULLETIN 160-98Appendix 9A
TA
BLE
9A
-3
Opt
ions
Eva
luat
ion
Col
orad
o R
iver
Reg
ion
Eva
luat
ion
Scor
esO
ptio
nE
ngin
eeri
ngE
cono
mic
sE
nvir
on-
Inst
itut
iona
l/So
cial
/O
ther
Ove
rall
Ran
km
enta
lL
egal
Thi
rd P
arty
Ben
efit
sSc
ore
Con
serv
atio
n
Urb
anO
utdo
or W
ater
Use
- N
ew D
evel
opm
ent
32
42
21
14M
Out
door
Wat
er U
se -
New
and
Exi
stin
g3
14
22
113
MD
evel
opm
ent
Res
iden
tial
Ind
oor
Wat
er U
se (
60 g
pcd)
33
42
21
15M
Res
iden
tial
Ind
oor
Wat
er U
se (
55 g
pcd)
22
42
21
13M
Inte
rior
CII
Wat
er U
se (
3%)
33
42
21
15M
Inte
rior
CII
Wat
er U
se(
5%)
32
41
21
13M
Dis
trib
utio
n Sy
stem
Los
ses
(7%
)3
44
22
116
M
Dis
trib
utio
n Sy
stem
Los
ses
(5%
)2
34
22
114
M
Agr
icul
tura
la
SAE
Im
prov
emen
ts (
76%
)3
43
43
118
HSA
E I
mpr
ovem
ents
(78
%)
33
33
21
15M
SAE
Im
prov
emen
ts (
80%
)2
33
22
113
M
Flex
ible
Wat
er D
eliv
ery
30
33
21
12L
Can
al L
inin
g an
d Pi
ping
30
33
21
12L
Tai
lwat
er R
ecov
ery
34
33
31
17H
Wat
er M
arke
ting
Inte
rsta
te B
anki
ng3
33
23
014
MIn
tras
tate
Ban
king
33
33
32
17H
Land
Fal
low
ing
Prog
ram
33
43
21
16M
Oth
er L
ocal
Opt
ions
Lini
ng th
e A
ll A
mer
ican
Can
al3
43
24
319
HA
ddit
iona
l Lin
ing
of C
oach
ella
Can
al3
43
24
319
H
Stat
ewid
e O
ptio
ns
See
Cha
pter
6.
a Im
plem
enta
bilit
y su
bjec
t to
envi
ronm
enta
l im
pact
rev
iew
on
Salto
n Se
a.

9A-5 APPENDIX 9A
The California Water Plan Update BULLETIN 160-98 Appendix 9A

10-1 CONCLUSIONS
The California Water Plan Update BULLETIN 160-98
The 1848
discovery of
gold at Sutter’s
Mill on the
American River
led to California’s
statehood in 1850.
California
celebrates its
sesquicentennial
in 2000.
This chapter assesses California’s water future, based on today’s conditions and
on options being considered by California’s water purveyors. The
Department’s Bulletin 160 series does not forecast a particular vision or pre-
ferred future (such as statewide use of xeriscape landscaping or favoring production of
certain agricultural crops over others), but instead attempts to forecast the most probable
future based on today’s data, economic conditions, and public policies.
Although no forecast can be perfect, several key trends appear inevitable. California’s
population will increase dramatically by 2020. How growth is accommodated and the land
use planning decisions made by cities and counties have important implications for future
urban and agricultural water use. California’s agricultural acreage is forecasted to decline
slightly by 2020 (reflecting the State’s increasing urbanization), as is its agri-
cultural water use. California agriculture is still anticipated to lead the nation’s
agricultural production because of advantages such as climate and proximity
to domestic and export markets. As the State’s population expands, greater
attention will be directed to preserving and restoring California ecosystems
and to maintaining the natural resources which have attracted so many people
to California.
This chapter begins by reviewing water supply and demand information
and the statewide applied water budget with existing facilities and programs
presented in Chapter 6. Water management options identified as likely to
be implemented in Chapters 6-9 are then tabulated and included in a state-
Conclusions
Miners in the Sierra,
painting by Charles Nahl and
Frederick Wenderoth, 1851.
Courtesy of Smithsonian Institution
Quest
More information about the California Department of Water Resources is available at: http://wwwdwr.water.ca.gov/ For a hard copy version of the Bulletin, please call the Publications Office at (916) 653-1097.

10-2CONCLUSIONS
The California Water Plan Update BULLETIN 160-98
wide applied water budget with options. The chapterends with an evaluation of how actions planned bywater purveyors statewide would affect forecasted wa-ter shortages, and a summary of key findings.
Future with Existing Facilitiesand Programs
Table 10-1 repeats the California water budgetwith existing facilities and programs shown in Chap-ter 6. (Regional water budgets with existing facilitiesand programs are shown in Appendix 6A and in theregional chapters.)
Water Supply
As described in Chapter 3, Bulletin 160-98 waterbudgets do not account for the State’s entire water sup-ply and use. Less than one-third of the State’sprecipitation is quantified in the water budgets. Pre-cipitation provides California with nearly 200 maf oftotal water supply in average years. Of this renewablesupply, about 65 percent is depleted through evapora-tion and transpiration by vegetation. This large volumeof water (approximately 130 maf) is excluded fromBulletin 160 water supply and water use calculations.The remaining 35 percent stays in the State’s hydro-logic system as runoff.
Over 30 percent of the State’s runoff is not explic-itly designated for urban, agricultural, or environmentaluses. Similar to precipitation depletions by vegetation,non-designated runoff is excluded from the Bulletin160 water supply and water use calculations.
The State’s remaining runoff is available as renew-able water supply for urban, agricultural, andenvironmental uses in the Bulletin 160 water budgets.
About 65 percent of the precipitation that falls onCalifornia’s land surface is consumed through evaporationand transpiration by vegetation. The remaining 35 percentcomprises the water supply that may be managed or ded-icated for urban, agricultural, and environmental purposes.
In addition to this supply, Bulletin 160 water budgetsinclude a few supplies that are not generated by intr-astate precipitation. These supplies include importsfrom the Colorado and Klamath Rivers and new sup-plies generated by water recycling and desalting.
The State’s 1995-level average year applied watersupply—from intrastate sources, interstate sources, andreturn flows—is about 78 maf. Even assuming a re-duction in Colorado River supplies to California’s4.4␣ maf basic apportionment, average year statewidesupply is projected to increase 0.2 maf by 2020 with-out additional water supply options. This projectedincrease in water supply is due mainly to higher CVPand SWP deliveries in response to higher 2020 level
TABLE 10-1
California Water Budget with Existing Facilities and Programs (maf)
1995 2020Average Drought Average Drought
Water UseUrban 8.8 9.0 12.0 12.4Agricultural 33.8 34.5 31.5 32.3Environmental 36.9 21.2 37.0 21.3Total 79.5 64.7 80.5 66.0
SuppliesSurface Water 65.1 43.5 65.0 43.4Groundwater 12.5 15.8 12.7 16.0Recycled and Desalted 0.3 0.3 0.4 0.4Total 77.9 59.6 78.1 59.8
Shortage 1.6 5.1 2.4 6.2

10-3 CONCLUSIONS
The California Water Plan Update BULLETIN 160-98
demands (for example, from CVP urban water usersin the Central Valley and from SWP urban water us-ers in the South Coast and South Lahontan Regions).Additional groundwater extraction and facilities nowunder construction will also provide new supplies. TheState’s 1995-level drought year supply is about 60 maf.Drought year supply is projected to increase slightlyby 2020 without future water supply options, for thesame reasons that average year supplies are expected toincrease.
Bulletin 160-98 estimates statewide groundwateroverdraft of about 1.5 maf/yr at a 1995 level of devel-opment. Increasing overdraft in the 1990s reverses thetrend of basin recovery seen in the 1980s. Most in-creases are occurring in the San Joaquin and TulareLake Regions, due primarily to Delta export restric-tions associated with SWRCB’s Order WR 95-6, ESArequirements, and reductions in CVP supplies.
Water recycling is a small, yet growing, element ofCalifornia’s water supply. At a 1995 level of develop-ment, water recycling and desalting produce about0.3␣ maf/yr of new water (reclaiming water that wouldotherwise flow to the ocean or to a salt sink), up sig-nificantly from the 1990 annual supply of new water.The California Water Code urges wastewater treatmentagencies located in coastal areas to recycle as much oftheir treated effluent as possible, recognizing that thiswater supply would otherwise be lost to the State’shydrologic system. Greater recycled water productionat existing treatment plants and additional production
USBR’s Corning Pumping Plant diverts water from theTehama-Colusa Canal into the Corning Canal, whichsupplies agricultural users in southern Tehama County.California’s Central Valley provides about 80 percent ofthe State’s agricultural production.
at plants now under construction are expected to in-crease new recycled and desalted supplies by nearly30␣ percent to 0.4 maf/yr by 2020.
Water Demand
California’s estimated demand for water at a 1995level of development is about 80 maf in average yearsand 65 maf in drought years. California’s water de-mand in 2020 is forecasted to reach 81 maf in averageyears and 66 maf in drought years. California’s increas-ing population is a driving force behind increasingwater demands.
California’s population is forecasted to increase to47.5 million people by 2020 (about 15 million peoplemore than the 1995 base). Forty-six percent of theState’s population increase is expected to occur in theSouth Coast Region. Even with extensive water con-servation, urban water demand will increase by about3.2 maf in average years. (Bulletin 160-98 assumes thatall urban and agricultural water agencies will imple-ment BMPs and EWMPs by 2020, regardless ofwhether they are cost-effective for water supply pur-poses.)
Irrigated crop acreage is expected to decline by325,000 acres—from the 1995 level of 9.5 million acresto a 2020 level of 9.2 million acres. Reductions in fore-casted irrigated acreage are due primarily to urbanencroachment and to impaired drainage on lands inthe western San Joaquin Valley. Increases in water useefficiency combined with reductions in irrigated agri-cultural acreage are expected to reduce average yearwater demand by about 2.3 maf by 2020. Shifts fromlower to higher value crops are expected to continue,with an increase in permanent plantings such as or-chards and vineyards. This trend would tend to hardenagricultural demands associated with permanentplantings, making it less likely that this acreage wouldbe temporarily fallowed during droughts.
Average and drought year water needs for envi-ronmental use are forecasted to increase only slightlyby 2020. Drought year environmental water needs areconsiderably lower than average year environmentalwater needs, reflecting the variability of unimpairedflows in wild and scenic rivers. North Coast wild andscenic rivers constitute the greatest component of en-vironmental water demands. CVPIA implementation,Bay-Delta requirements, new ESA restrictions, andFERC relicensing could significantly modify environ-mental demands within the Bulletin 160-98 planningperiod.

10-4CONCLUSIONS
The California Water Plan Update BULLETIN 160-98
Water Shortages
The shortage shown in Table 10-1 for 1995 aver-age water year conditions reflects the Bulletin’sassumption that groundwater overdraft is not avail-able as a supply. Groundwater overdraft represents asignificant portion of the 2020 average water year short-age. Forecasted water shortages vary widely from regionto region, as shown in Table 10-2 and presented graphi-cally in Figure 10-1. For example, the North Coastand San Francisco Bay regions are not expected to ex-perience future shortages during average water yearsbut are expected to see shortages in drought years. Mostof the State’s remaining regions experience average yearand drought year shortages now, and are forecasted toexperience increased shortages in 2020. The largestfuture shortages are forecasted for the Tulare Lake andSouth Coast regions, areas that rely heavily on importedwater supplies. These regions are also where some ofthe greatest increases in population are expected to oc-cur.
As discussed in Chapter 6, there are uncertaintiesassociated with the magnitude of forecasted shortages.Chapter 6 presented a range of potential shortageamounts for programs whose uncertainties could bequantified—CALFED and SWRCB Bay-Delta waterright actions. Other uncertainties cannot be quanti-fied now—impacts of future ESA listings and FERCrelicensing. Furthermore, the evaluation of water man-agement options performed for the Bulletin was basedon the options’ present affordability to local agencies.Circumstances that increase or decrease options’affordability will correspondingly affect forecastedshortages.
What is apparent is that Californians face water
shortages now, and will face increasing shortages inthe future. The shortages shown in Table 10-2 high-light the need for future water management actions toreduce the gap between forecasted supplies and de-mands. As Californians experienced during the mostrecent drought (especially in 1991 and 1992), droughtyear shortages are large. Urban residents faced cutbacksin supply and mandatory rationing, some small ruralcommunities saw their wells go dry, agricultural landswere fallowed, and environmental water supplies werereduced. By 2020, without additional facilities andprograms, these conditions will worsen.
Water shortages have direct and indirect economicconsequences. Direct consequences include costs toresidential water users to replace landscaping lost dur-ing droughts, costs to businesses that experience watersupply cutbacks, or costs to growers who fallow landbecause supplies are not available. Indirect conse-
Finding reliable water supplies for the more than 15 millionnew Californians will be a challenge for the State’s waterpurveyors. Almost half of the State’s forecasted 2020 populationincrease is expected to occur in the South Coast Region.
TABLE 10-2
Applied Water Shortages by Hydrologic Region (taf) with Existing Facilities and Programs
1995 2020Region Average Drought Average Drought
North Coast 0 177 0 194San Francisco Bay 0 349 0 287Central Coast 214 282 172 270South Coast 0 508 944 1,317Sacramento River 111 867 85 989San Joaquin River 239 788 63 711Tulare Lake 870 1862 720 1,851North Lahontan 0 128 10 128South Lahontan 89 92 270 308Colorado River 69 95 147 158Total (rounded) 1,590 5,150 2,410 6,210

10-5 CONCLUSIONS
The California Water Plan Update BULLETIN 160-98
AVERAGE YEAR
DROUGHT YEAR
North Coast
South Coast
NorthLahontan
SouthLahontan
SacramentoRiver
SanFrancisco
Bay
San JoaquinRiver
CentralCoast
Tulare Lake
Colorado River
0194
85989
63711
10128
270308
7201,851
172270
0 287
147158
9441,317
FIGURE 10-1
2020 Shortages by Hydrologic Region with Existing Facilities and Programs (taf)

10-6CONCLUSIONS
The California Water Plan Update BULLETIN 160-98
Reservoir Reoperation for Flood Control
The January 1997 floods demonstrated that CentralValley flood protection needs improvement. The 1997 FinalReport of the Governor’s Flood Emergency Action Team identifiedmany actions that could be taken to increase valley floodprotection, including better emergency preparedness,floodplain management actions, levee system improvements,construction of new floodways, temporary storage offloodwaters on wildlife refuges, reoperation or enlargementof existing reservoirs to increase flood storage, andconstruction of new reservoirs. The latter two actions have
water supply implications. Reoperating existing reservoirs toprovide greater flood control storage usually comes at theexpense of water supply. Reoperation is particularlyproblematical in the San Joaquin River Basin, where watersupplies are already limited. As more demands are placed onexisting water supplies, reservoir reoperation will becomeincreasingly difficult to implement. In contrast, enlargingreservoirs or constructing new reservoirs can provide bothwater supply and flood control benefits.
quences include decisions by businesses and growersnot to locate or to expand their operations in Califor-nia, and reductions in the value of agricultural lands.Other consequences of shortages are less easily mea-sured in economic terms—loss of recreational activitiesor impacts to environmental resources, for example.
Summary of Options Likelyto be Implemented
The options summarized in this section representwater purveyors’ strategies for meeting future needs.This information relies heavily on actions identifiedby local water agencies, which collectively provideabout 70 percent of the State’s developed water sup-ply. As described earlier, water management optionslikely to be implemented were selected based on a rank-ing process that evaluated factors such as technicalfeasibility, cost, and environmental considerations. Thisprocess is most effective in hydrologic regions wherelocal agencies have prepared plans for meeting futureneeds in their service areas. Affordability is a key fac-
tor for local agencies in deciding the extent to whichthey wish to invest in alternatives to improve their waterservice reliability. Water agencies must balance costsand quantity of supply (and sometimes quality of sup-ply) based on their service area needs.
The Bulletin 160 series focuses on water supply.The statewide compilation of likely options has notbeen tailored to meet other water-related objectivessuch as flood control, hydropower generation, recre-ation, or nonpoint source pollution control. Theevaluation process used to select likely options rankedthe options based on their ability to provide multiplebenefits, as described in Chapter 6. For example, oneaspect of the relationship between water supply andflood control needs is illustrated in the sidebar on res-ervoir reoperation.
The results shown in Table 10-3 were obtained byadding statewide options identified as likely in Chap-ter 6 to regional options identified as likely inChapters␣ 7-9.
Options shown in Table 10-3 include demand re-
The January 1997 flood disaster was the largest in the State’s history. Flooding forced more than 120,000 people from theirhomes, and over 55,000 people were housed in temporary shelters. Nearly 300 square miles of agricultural land were flooded.Livestock and wildlife were trapped by the flooding.

10-7 CONCLUSIONS
The California Water Plan Update BULLETIN 160-98
TABLE 10-3
Summary of Options Likely to be Implemented by 2020, by Option Type (taf)
Option Type Average Drought
Local Demand Reduction Options 507 582
Local Supply Augmentation OptionsSurface Water 110 297Groundwater 24 539Water Marketing 67 304Recycled and Desalted 423 456
Statewide Supply OptionsCALFED Bay-Delta Program 100 175SWP Improvements 117 155Water Marketing (Drought Water Bank) — 250Multipurpose Reservoir Projects 710 370
Expected Reapplication 141 433
Total Options 2,199 3,561
duction beyond BMP and EWMP implementation in-cluded in Table 10-1. Future demand reduction optionsare options that would produce new water supplythrough reduction of depletions. For these optionalwater conservation measures to have been identifiedas likely, they must be competitive in cost with watersupply augmentation options.
Local supply augmentation options comprise thelargest potential new drought year source of water forCalifornia. (Local options include implementation ofthe draft CRB 4.4 Plan to reduce California’s use ofColorado River water.) In Table 10-3 and in the waterbudgets, only water marketing options that result in achange of place of use of the water (from one hydro-logic region to another), or a change in type of use(e.g., agricultural to urban) have been included. Con-siderably more marketing options have been describedin earlier chapters than are shown in the water bud-gets, reflecting local agencies’ plans to purchase futuresupplies from sources yet to be identified. Where theparticipants in a proposed transfer are known, the sell-ing region’s average year or drought year supply hasbeen reduced in the water budgets. Presently, the onlytransfers with identified participants that are largeenough to be visible in the water budgets are thoseassociated with the draft CRB 4.4 Plan. Water agen-cies’ plans to acquire water through marketingarrangements will depend on their ability to find sell-ers and on the level of competition for water purchasesamong water agencies and environmental restorationprograms (such as CVPIA’s AFRP or CALFED’s ERP).
Possible statewide options include actions that
could be taken by CALFED to develop new water sup-plies. The timing and extent of new water supplies thatCALFED might provide are uncertain at the time ofthe Bulletin’s printing. Bulletin 160-98 uses a place-holder analysis for new CALFED water supplydevelopment to illustrate the potential magnitude ofnew water supply the program might provide. Theplaceholder does not address specifics of which sur-face storage facilities might be selected, since this levelof detail is not available. Water supply uncertaintiesassociated with CALFED’s selection of a draft preferredalternative were discussed in Chapter 6.
Other statewide options include specific projectsto improve SWP water supply reliability, the State’sdrought water bank, and two multipurpose reservoirs.A third potential multipurpose reservoir option, anenlarged Shasta Lake, was recommended for furtherstudy because additional work is needed to quantifybenefits and costs associated with different reservoirsizes.
The two multipurpose reservoir projects includedas statewide options—Auburn Reservoir and enlargedMillerton Lake (Friant Dam)—were included to em-phasize the interrelationship between water supplyneeds and the Central Valley’s flood protection needs.Both reservoir sites offer significant flood protectionbenefits. Both projects have controversial aspects, andneither of them is inexpensive. However, they meritserious consideration. The lead time for planning andimplementing any large reservoir project is long, andit would take almost to the Bulletin 160-98 2020 plan-ning horizon for these projects to be constructed.

10-8CONCLUSIONS
The California Water Plan Update BULLETIN 160-98
The potential future water management optionssummarized in this section are still being planned. Theirimplementation is subject to completion of environ-mental documents, permit acquisition, compliancewith regulatory requirements such as those of ESA,and availability of funding. The permitting processeswill address mitigating environmental impacts and re-solving third-party impacts. If water managementoptions are delayed or rendered infeasible as a result ofthese processes, or if their costs are increased to thepoint that the options are no longer affordable for thelocal sponsors, statewide shortages will be correspond-ingly affected.
Implementing new watermanagement options must
be done in accordancewith environmental
protection requirements,including requirements
for protection of species ofspecial concern,
such as this badger.
Implementing Future WaterManagement Options
Table 10-4 was developed by combining the re-gional and statewide analyses of water managementoptions with the water budget with existing facilitiesand programs (Table 10-1). Table 10-4 illustrates theeffect these options would have on future shortages.(Appendix 10A shows regional water budgets withoption implementation.) The table indicates that wa-ter management options now under consideration bywater purveyors throughout the State will not reduceshortages to zero in 2020. The difference between av-
TABLE 10-4
California Water Budget with Options Likely to be Implemented (maf)
1995 2020Average Drought Average Drought
Water UseUrban 8.8 9.0 11.8 12.1Agricultural 33.8 34.5 31.3 32.1Environmental 36.9 21.2 37.0 21.3Total 79.5 64.7 80.1 65.5
SuppliesSurface Water 65.1 43.5 66.4 45.4Groundwater 12.5 15.8 12.7 16.5Recycled and Desalted 0.3 0.3 0.8 0.9Total 77.9 59.6 79.9 62.8
Shortage 1.6 5.1 0.2 2.7

10-9 CONCLUSIONS
The California Water Plan Update BULLETIN 160-98
erage year and drought year water shortages is signifi-cant. Water purveyors generally consider shortages inaverage years as basic deficiencies that should be cor-rected through long-term demand reduction or supplyaugmentation measures. Shortages in drought yearsmay be managed by such long-term measures in com-bination with short-term actions used only duringdroughts. Short-term measures could include purchasesfrom the State’s drought water bank, urban water ra-tioning, or agricultural land fallowing. Agencies mayevaluate the marginal costs of developing new suppliesand conclude that the cost of their development ex-ceeds that of shortages to their service areas, or exceedsthe cost of implementing contingency measures suchas transfers or rationing. As water agencies implementincreasing amounts of water conservation in the fu-ture (especially plumbing fixture changes), there willbe a correspondingly lessened ability to implementshort-term drought response actions such as ration-ing. Demand hardening will influence agencies’decisions about their future mix of water managementactions.
Ability to pay is another consideration. Large ur-ban water agencies frequently set high water servicereliability goals and are able to finance actions neces-sary to meet the goals. Agencies supplying small ruralcommunities may not be able to afford expensiveprojects. Small communities have limited populationsover which to spread capital costs and may have diffi-culty obtaining financing. If local groundwaterresources are inadequate to support expected growth,these communities may not be able to afford projectssuch as pipelines to bring in new surface water sup-plies. Small rural communities that are geographicallyisolated from population centers cannot readily inter-
connect with other water systems.Agricultural water agencies may be less able to pay
for capital improvements than urban water agencies.Much of the State’s earliest large-scale water develop-ment was for agriculture, and irrigation works wereconstructed at a time when water development wasinexpensive by present standards. Agricultural userstoday may not be able to compete with urban usersfor development of new supplies. Some agriculturalwater users have historically been willing to acceptlower water supply reliability in return for less expen-sive water supplies. It may be less expensive for someagricultural users to idle land in drought years ratherthan to incur capital costs of new water supply devel-opment. This can be particularly true for regions facedwith production constraints such as short growing sea-sons or lower quality lands — areas where the dominantwater use may be irrigated pasture. In areas such as theNorth Lahontan Region, for example, local agenciesgenerally do not have plans for new programs or fa-cilities to reduce agricultural water shortages in droughtyears. Table 10-5 shows forecasted shortages by hy-drologic region to illustrate the effects of optionimplementation on a regional basis. The same infor-mation is presented graphically in Figure 10-2.
Local agencies that expect to have increased fu-ture demands generally do more water supply planningthan do agencies whose demands remain relatively level.Most agricultural water agencies are not planning forgreater future demands, although some agencies areexamining ways to improve reliability of their existingsupplies. Cost considerations limit the types of optionsavailable to many agricultural users. The agriculturalsector has thus developed fewer options that could beevaluated in statewide water supply planning. Many
TABLE 10-5
Water Shortages by Hydrologic Region With Likely Options (taf)
1995 2020Region Average Drought Average Drought
North Coast 0 177 0 176San Francisco Bay 0 349 0 0Central Coast 214 282 0 100South Coast 0 508 0 0Sacramento River 111 867 0 722San Joaquin River 239 788 0 658Tulare Lake 870 1,862 202 868North Lahontan 0 128 10 128South Lahontan 89 92 0 0Colorado River 69 95 0 0Total (rounded) 1,590 5,150 210 2,650

10-10CONCLUSIONS
The California Water Plan Update BULLETIN 160-98
AVERAGE YEAR
DROUGHT YEAR
North Coast
South Coast
NorthLahontan
SouthLahontan
SacramentoRiver
SanFrancisco
Bay
San JoaquinRiver
CentralCoast
Tulare Lake
Colorado River
0176
0722
0658
10128
00
202868
0100
0 0
00
00
FIGURE 10-2
2020 Shortages by Hydrologic Region with Likely Options (taf)

10-11 CONCLUSIONS
The California Water Plan Update BULLETIN 160-98
options have been generated from planning performedby urban agencies, reflecting Urban Water Manage-ment Planning Act requirements that urban watersuppliers with 3,000 or more connections, or that de-liver over 3 taf of water per year, prepare plans showinghow they will meet service area needs.
Geography plays a role in the feasibility of imple-menting different types of options, and not solely withrespect to the availability of surface water and ground-water supplies. Water users in the Central Valley, BayArea, and Southern California having access to majorregional conveyance facilities have greater opportuni-ties to rely on water marketing arrangements andconjunctive use options than do water users isolatedfrom the State’s main water infrastructure.
Bulletin 160-98 Findings
Bulletin 160-98 forecasts water shortages in Cali-fornia by 2020, as did the previous water plan update.The water management options identified in the Bul-letin as likely to be implemented by 2020 would reduce,but not completely eliminate future shortages. Wateragencies faced with meeting future needs must deter-mine how those needs can be met within the statutoryand regulatory framework affecting water use decisions,including how the needs can be met in a manner equi-table to existing water users. Land use planningdecisions made by cities and counties—locations wherefuture growth will or will not be allowed, housing den-sities, preservation goals for open space or agriculturalreserves—will have a significant influence onCalifornia’s future water demands. Good coordinationamong local land use planning agencies and water agen-cies, as well as among water agencies themselves at aregional level, will facilitate finding solutions to meet-ing future needs.
Bulletin 160-98 makes no specific recommenda-tions regarding how California water purveyors shouldmeet the needs of their service areas. It is the waterpurveyors themselves who must make these decisions.The purpose of Bulletin 160-98 is to forecast the fu-ture based on today’s conditions. Clearly, differentagencies and individuals have different perspectivesabout how the future should be shaped. The CALFEDdiscussions, for example, illustrate conflicting valuesamong individuals and agencies.
There is not one magic bullet for meetingCalifornia’s future water needs—not new reservoirs,not new conveyance facilities, not more groundwater
extraction, not more water conservation, not morewater recycling. Each of these options has its place.The most frequently used methods of providing newwater supplies have changed with the times, reflectingchanging circumstances. Much of California’s earlywater development was achieved by constructing res-ervoirs and diverting surface water. Advances intechnology, in the form of deep well turbine pumps,allowed substantial groundwater development. Morerecent improvements in water treatment technologyhave made water recycling and desalting feasible op-tions. Today, water purveyors have an array of watermanagement options available to meet future watersupply reliability needs. The magnitude of potentialshortages, especially drought year shortages, demon-strates the urgency of taking action. The do-nothingalternative is not an alternative that will meet the needsof 47.5 million Californians in 2020.
California water agencies have made great stridesin water conservation since the 1976-77 drought. Bul-letin 160-98 forecasts substantial demand reductionfrom implementing presently identified urban BMPsand agricultural EWMPs, and assumes a more rigor-ous level of implementation than water agencies arenow obligated to perform. Presently, less than half ofCalifornia’s urban population is served by retailers thathave signed the urban MOU for water conservationmeasures. Less than one-third of California’s agricul-tural lands are served by agencies that have signed thecorresponding agricultural MOU. Bulletin 160-98 as-sumes that all water purveyors statewide willimplement BMPs and EWMPs by 2020, even if theactions are not cost-effective from a water supply per-spective. Water conservation offers multipurposebenefits such as reduced urban water treatment costsand potential reduction of fish entrainment at diver-sion structures. The Bulletin also identifies as likelyadditional demand reduction measures that would cre-ate new water and would be cost-competitive withsupply augmentation options. These optional demandreductions are almost as large as the average year watersupply augmentation options planned by local agen-cies.
California water agencies have also made greatstrides in water recycling. By 2020, total recycling couldpotentially be almost 1.4 maf, which would exceedthe goal expressed in Section 13577 of the Water Codethat total recycling statewide be 1 maf by 2010. (Thepotential 2020 total recycling of 1.4 maf would beequivalent to about 2 percent of the State’s 2020 wa-

10-12CONCLUSIONS
The California Water Plan Update BULLETIN 160-98
ter supply.) Water recycling offers multipurpose ben-efits, such as reduction of treatment plant dischargesto waterbodies. Cost is a limiting factor in implement-ing recycling projects. When economic considerationsare taken into account, the potential new water sup-ply (water new to the State’s hydrologic system) fromrecycling is forecasted to be about 0.8 maf.
Clearly, conservation and recycling alone are notsufficient to meet California’s future needs. Bulletin160-98 has included all of the conservation and recy-cling measures likely to be implemented by 2020.Adding supply augmentation options identified byCalifornia’s water purveyors still leaves a shortfall inmeeting forecasted demands. Review of local agencies’likely supply augmentation options shows that rela-tively few larger-scale or regional programs are in activeplanning, especially among small and mid-size wateragencies. This outcome reflects local agencies’ concernsabout perceived implementability constraints associ-ated with larger-scale options, and their affordability.
In the interests of maintaining California’s vibranteconomy, it is important that the State of Californiatake an active role in assisting water agencies in meet-ing their future needs. New storage facilities are animportant part of the mix of options needed to meetCalifornia’s future needs. Just as water conservation andrecycling provide multiple benefits, storage facilitiesoffer flood control, power generation, and recreationin addition to water supply benefits. The devastatingJanuary 1997 floods in the Central Valley emphasizedthe need for increased attention to flood control. Apartfrom CALFED’s investigation of storage alternatives,little planning is currently being done for storageprojects that would meet regional or statewide needs.It is important for small and mid-size water agencieswho could not develop such facilities on their own tohave access to participation in regional projects. Themore diversified water agencies’ sources of supply are,the better their odds of improved water supply reli-ability.
An appropriate State role would be for the De-partment to take the lead in performing feasibilitystudies of potential storage projects—not on behalf ofthe SWP, but on behalf of all potentially interestedwater agencies. State funding support is needed to iden-tify likely projects, so that local agencies may determinehow those projects might benefit their service areas.In concept, the Department could use State fundingto complete project feasibility studies, permitting, andenvironmental documentation for likely new storage
facilities, removing uncertainties that would preventsmaller water agencies from funding planning studiesthemselves. This concept is not new. Historically, De-partment investigations into the State’s water resources(for example, Bulletin 3, the original California WaterPlan) formulated projects that were later built by localagencies.
Agencies wishing to participate in projects shownto be feasible in Department studies would repay theirshare of the State planning costs as a condition of par-ticipation in a project. Feasible projects would likelybe constructed by a consortium of local agencies act-ing through a joint powers agreement or othercontractual mechanism. The water users would be re-sponsible for construction costs.
Meeting California’s future needs will require co-operation among all levels of government—federal,State, and local. Likewise, all three of California’s wa-ter-using sectors—agricultural, environmental, andurban—must work together to recognize each others’legitimate needs and to seek solutions to meeting theState’s future water shortages. When the Bay-DeltaAccord was signed in 1994, it was hailed as a truce inone of the State’s longstanding water wars. The Ac-cord, and the efforts by California agencies to negotiatea resolution to interstate and intrastate Colorado Riverwater issues, represent a new spirit of fostering coop-eration and consensus rather than competition andconflict. Such an approach will be increasingly neces-sary, given the magnitude of the water shortages facingCalifornia. Mutual accommodation of each others’needs is especially important in drought years, whenwater purveyors face the greatest water supply chal-lenges. With continued efforts to prepare for the future,California can have safe and reliable water supplies forurban areas, adequate long-term water supplies tomaintain the State’s agricultural economy, and resto-ration and protection of fish and wildlife habitat.

10A-1 APPENDIX 10A
The California Water Plan Update BULLETIN 160-98 Appendix 10A
10ARegional Water Budgets with
Likely Options
The following tables show the water budgets for each of the State’s ten hydrologic regionswith options identified as likely. Water use/supply totals and shortages may not sum due torounding.
Quest
More information about the California Department of Water Resources is available at: http://wwwdwr.water.ca.gov/ For a hard copy version of the Bulletin, please call the Publications Office at (916) 653-1097.

10A-2APPENDIX 10A
The California Water Plan Update BULLETIN 160-98Appendix 10A
TABLE 10A-3
Central Coast Region Water Budget with Options (taf)
1995 2020Average Drought Average Drought
Water UseUrban 286 294 347 359Agricultural 1,192 1,279 1,127 1,223Environmental 118 37 118 37Total 1,595 1,610 1,592 1,620
SuppliesSurface Water 318 160 477 287Groundwater 1,045 1,142 1,043 1,161Recycled and Desalted 18 26 71 71Total 1,381 1,328 1,592 1,519
Shortage 214 282 0 100
TABLE 10A-2
San Francisco Bay Region Water Budget with Options (taf)
1995 2020Average Drought Average Drought
Water UseUrban 1,255 1,358 1,317 1,371Agricultural 98 108 98 108Environmental 5,762 4,294 5,762 4,294Total 7,115 5,760 7,176 5,773
SuppliesSurface Water 7,011 5,285 7,067 5,607Groundwater 68 92 72 96Recycled and Desalted 35 35 37 70Total 7,115 5,412 7,176 5,773
Shortage 0 349 0 0
TABLE 10A-1
North Coast Region Water Budget with Options (taf)
1995 2020Average Drought Average Drought
Water UseUrban 169 177 201 194Agricultural 894 973 927 1,011Environmental 19,544 9,518 19,545 9,518Total 20,607 10,668 20,672 10,722
SuppliesSurface Water 20,331 10,183 20,371 10,212Groundwater 263 294 288 321Recycled and Desalted 13 14 13 14Total 20,607 10,491 20,672 10,546
Shortage 0 177 0 176

10A-3 APPENDIX 10A
The California Water Plan Update BULLETIN 160-98 Appendix 10A
TABLE 10A-4
South Coast Region Water Budget with Options (taf)
1995 2020Average Drought Average Drought
Water UseUrban 4,340 4,382 5,435 5,528Agricultural 784 820 455 477Environmental 100 82 104 86Total 5,224 5,283 5,993 6,090
SuppliesSurface Water 3,839 3,196 4,084 3,832Groundwater 1,177 1,371 1,243 1,592Recycled and Desalted 207 207 667 667Total 5,224 4,775 5,994 6,090
Shortage 0 508 0 0
TABLE 10A-5
Sacramento River Region Water Budget with Options (taf)
1995 2020Average Drought Average Drought
Water UseUrban 766 830 1,139 1,236Agricultural 8,065 9,054 7,939 8,822Environmental 5,833 4,223 5,839 4,225Total 14,664 14,106 14,917 14,282
SuppliesSurface Water 11,881 10,022 12,282 10,279Groundwater 2,672 3,218 2,636 3,281Recycled and Desalted 0 0 0 0Total 14,553 13,239 14,918 13,560
Shortage 111 867 0 722
TABLE 10A-6
San Joaquin River Region Water Budget with Options (taf)
1995 2020Average Drought Average Drought
Water UseUrban 574 583 954 970Agricultural 7,027 7,244 6,448 6,717Environmental 3,396 1,904 3,411 1,919Total 10,996 9,731 10,813 9,607
SuppliesSurface Water 8,562 6,043 8,497 6,029Groundwater 2,195 2,900 2,317 2,920Recycled and Desalted 0 0 0 0Total 10,757 8,943 10,814 8,949
Shortage 239 788 0 658

10A-4APPENDIX 10A
The California Water Plan Update BULLETIN 160-98Appendix 10A
TABLE 10A-7
Tulare Lake Region Water Budget with Options (taf)
1995 2020Average Drought Average Drought
Water UseUrban 690 690 1,099 1,099Agricultural 10,736 10,026 10,106 9,515Environmental 1,672 809 1,676 813Total 13,098 11,525 12,880 11,426
SuppliesSurface Water 7,888 3,693 8,292 4,167Groundwater 4,340 5,970 4,386 6,391Recycled and Desalted 0 0 0 0Total 12,228 9,663 12,678 10,558
Shortage 870 1,862 202 868
TABLE 10A-8
North Lahontan Region Water Budget with Options (taf)
1995 2020Average Drought Average Drought
Water UseUrban 39 40 50 51Agricultural 530 584 536 594Environmental 374 256 374 256Total 942 880 960 901
SuppliesSurface Water 777 557 759 557Groundwater 157 187 183 208Recycled and Desalted 8 8 8 8Total 942 752 950 773
Shortage 0 128 10 128
TABLE 10A-9
South Lahontan Region Water Budget with Options (taf)
1995 2020Average Drought Average Drought
Water UseUrban 238 238 568 568Agricultural 332 332 252 252Environmental 107 81 107 81Total 676 651 927 901
SuppliesSurface Water 322 259 651 578Groundwater 239 273 248 296Recycled and Desalted 27 27 27 27Total 587 559 926 901
Shortage 89 92 0 0

10A-5 APPENDIX 10A
The California Water Plan Update BULLETIN 160-98 Appendix 10A
TABLE 10A-10
Colorado River Region Water Budget with Options (taf)
1995 2020Average Drought Average Drought
Water UseUrban 418 418 715 715Agricultural 4,118 4,118 3,393 3,393Environmental 39 38 44 43Total 4,575 4,574 4,152 4,151
SuppliesSurface Water 4,154 4,128 3,852 3,852Groundwater 337 337 285 284Recycled and Desalted 15 15 15 15Total 4,506 4,479 4,152 4,151
Shortage 69 95 0 0

10A-6APPENDIX 10A
The California Water Plan Update BULLETIN 160-98Appendix 10A

A-1 ABBREVIATIONS AND ACRONYMS
The California Water Plan Update BULLETIN 160-98
Abbreviations and Acronyms
AAB Assembly Bill
AAC All American Canal
ACID Anderson-Cottonwood Irrigation District
ACWD Alameda County Water District
AD allowable depletion
ADWR Arizona Department of Water Resources
AEWSD Arvin-Edison Water Storage District
af acre-foot/acre-feet
AFB Air Force Base
AFRP Anadromous fish restoration program(or plan)
AMD acid mine drainage
AOP advanced oxidation process
APCD air pollution control district
ARP aquifer reclamation program
ARWI American River Watershed Investigation
ARWRI American River Water ResourcesInvestigation
ASR aquifer storage and recovery
AVEK Antelope Valley-East Kern Water Agency
AVWG Antelope Valley Water Group
BBARWRP Bay Area regional water recycling program
BAT best available technology
BBID Byron-Bethany Irrigation District
BDAC Bay-Delta Advisory Council
B/C benefit-to-cost (ratio)
BLM Bureau of Land Management
BMP Best management practice
BVWSD Buena Vista Water Storage District
BWD Bard Water District
BWRDF Brackish water reclamation demonstrationfacility
CCAL-AM California-American Water Company
Cal/EPA California Environmental ProtectionAgency
CALFED State (CAL) and federal (FED) agenciesparticipating in Bay-Delta Accord
CAP Central Arizona Project
CAWCD Central Arizona Water ConservationDistrict
CCID Central California Irrigation District
CCMP Comprehensive conservation andmanagement plan
CCWD Colusa County Water District orContra Costa Water District
CDI capacitive deionization
CEQA California Environmental Quality Act
CESA California Endangered Species Act
cfs cubic feet per second
CII commercial, industrial, and institutional
CIMIS California irrigation managementinformation system
CLWA Castaic Lake Water Agency
CMWD Calleguas Municipal Water District
COA Coordinated Operation Agreement
COG Council of Governments
CMO crop market outlook
COP certificate of participation
CPUC California Public Utilities Commission
CRA Colorado River Aqueduct
CRB Colorado River Board
CRIT Colorado River Indian Tribes
CSD community services district
CSIP/SVRP Castroville Seawater Intrusion Project/Salinas Valley Reclamation Project
CSJWCD Central San Joaquin Water ConservationDistrict
CUWCC California Urban Water ConservationCouncil
Quest
More information about the California Department of Water Resources is available at: http://wwwdwr.water.ca.gov/ For a hard copy version of the Bulletin, please call the Publications Office at (916) 653-1097.

A-2ABBREVIATIONS AND ACRONYMS
The California Water Plan Update BULLETIN 160-98
CVHJV Central Valley Habitat Joint Venture
CVP Central Valley Project
CVPIA Central Valley Project Improvement Act
CVPM Central Valley production model
CVWD Coachella Valley Water District
CWA Clean Water Act
CWD Coastal Water District,Cawelo Water District, orcounty water district
DD-1485 State Water Resources Control Board Water
Right Decision 1485
DAU detailed analysis unit
DBCP dibromochloropropane
DBP disinfection by-products
DCID Deer Creek Irrigation District
D/DBP disinfectant/disinfection by-product
DDT dichloro diphenyl trichloroethane
DEIR draft environmental impact report
DEIS draft environmental impact statement
DFA California Department of Foodand Agriculture
DFG California Department of Fish and Game
DHS California Department of Health Services
DMC Delta-Mendota Canal
DOE Department of Energy
DOF California Department of Finance
DOI Department of the Interior
DPR Department of Parks and Recreation orDepartment of Pesticide Regulation
DU distribution uniformity
DWA Desert Water Agency
DWB DWR’s Drought Water Bank
DWD Diablo Water District
DWR California Department of Water Resources
DWRSIM DWR’s operations model for SWP/CVPsystem
EEBMUD East Bay Municipal Utility District
ec electrical conductivity
ECCID East Contra Costa Irrigation District
ECWMA East County Water ManagementAssociation
ED electrodialysis
EDB ethylene dibromide
EDCWA El Dorado County Water Agency
EDF Environmental Defense Fund
EDR electrodialysis reversal
EID El Dorado Irrigation District
EIR environmental impact report
EIS environmental impact statement
ENSO El Niño Southern Oscillation cycle
EPA U.S. Environmental Protection Agency orEnergy Policy Act of 1992
ERP ecosystem restoration program or plan
ESA Endangered Species Act
ESP emergency storage project
ESU evolutionarily significant unit
ESWTR Enhanced Surface Water Treatment Rule
ET evapotranspiration
ETo
reference evapotranspiration
ETAW evapotranspiration of applied water
EWMP efficient water management practice
FFAIRA Federal Agriculture Improvement and
Reform Act
FC&WCD flood control and water conservation district
FCD flood control district
FERC Federal Energy Regulatory Commission
FY fiscal year
GGAC granular activated carbon
GBUAPCD Great Basin Unified Air PollutionControl District
GCID Glenn-Colusa Irrigation District
GDPUD Georgetown Divide Public Utility District
GO general obligation
gpcd gallons per capita per day
gpf gallons per flush
gpm gallons per minute
HHCP habitat conservation plan
HLWA Honey Lake Wildlife Area
HR House Resolution
HUD Department of Housing andUrban Development
A-3 ABBREVIATIONS AND ACRONYMS
The California Water Plan Update BULLETIN 160-98
IIBWC International Boundary and
Water Commission
ICR information collection rule
ID irrigation district or improvement district
IE irrigation efficiency
IEP Interagency Ecological Program
IID Imperial Irrigation District
IOT intake opportunity time
IRP integrated resources planning
IRWD Irvine Ranch Water District
ISDP Interim South Delta Program
JJPA joint powers authority
KKCWA Kern County Water Agency
KPOP Klamath Project Operations Plan
KRCC Klamath River Compact Commission
KWB Kern Water Bank
KWBA Kern Water Bank Authority
kWh kilowatt hour
LLAA Los Angeles Aqueduct
LADWP Los Angeles Department ofWater and Power
LAFCO local agency formation commission
LBG Los Banos Grandes
LCRMSCP Lower Colorado River Multi-SpeciesConservation Program
LEPA low-energy precision application
LMMWC Los Molinos Mutual Water Company
LTBMU Lake Tahoe Basin Management Unit
Mm meter
maf million acre-feet
MCL maximum contaminant level
MCWD Marina Coast Water District or MammothCommunity Water District
MCWRA Monterey County Water Resources Agency
MF microfiltration or Middle Fork
mgd million gallons per day
mg/L milligrams per liter
M&I municipal & industrial
MID Madera Irrigation District,Maxwell Irrigation District,Merced Irrigation District, orModesto Irrigation District
MMWC McFarland Mutual Water Company
MMWD Marin Municipal Water District
MOU memorandum of understanding
MPWMD Monterey Peninsula Water ManagementDistrict
MRWPCA Monterey Regional Water Pollution ControlAgency
MTBE methyl tertiary butyl ether
MUD municipal utility district
mW megawatt
MWA Mojave Water Agency
MWD municipal water district
MWDOC Municipal Water District of Orange County
MWDSC Metropolitan Water District of SouthernCalifornia
NNAWMP North American Waterfowl
Management Plan
NCFC&WCD Napa County Flood Control and WaterConservation District
NCMWC Natomas-Central Mutual Water Company
NED national economic development (plan)
NEPA National Environmental Policy Act
NF nanofiltration or North Fork
NGO non-governmental organization
NID Nevada Irrigation District
NISA National Invasive Species Act
NMFS National Marine Fisheries Service
NOAA National Oceanic and AtmosphericAdministration
NOP notice of preparation
NPDES national pollutant discharge eliminationsystem
NPDWR national primary drinking water regulations
NRCS Natural Resources Conservation Service
NTU Nephelometric Turbidity Unit
NWD Northridge Water District
NWR National Wildlife Refuge

A-4ABBREVIATIONS AND ACRONYMS
The California Water Plan Update BULLETIN 160-98
OOCWD Orange County Water District
OID Oakdale Irrigation District
O&M operations and maintenance
PPAC powdered activated carbon
PAH polynuclear aromatic hydrocarbon
PCB polychlorinated biphenyl
PCE perchloroethylene
PCGID/PID Princeton-Codora-Glenn IrrigationDistrict/Provident Irrigation District
PCWA Placer County Water Agency
PEIR programmatic environmental impact report
PEIS programmatic environmental impactstatement
PG&E Pacific Gas and Electric Company
PGVMWC Pleasant Grove-Verona Mutual WaterCompany
PL Public Law
PMWC Pelger Mutual Water Company
ppb parts per billion
PROSIM USBR’s operations model for the CVP/SWP
PSA planning subarea
psi pounds per square inch
PTA packed-tower aeration
PUC public utility commission
PUD public utility district
PVID Palo Verde Irrigation District orPleasant Valley Irrigation District
PVWMA Pajaro Valley Water Management Agency
PWD Palmdale Water District
RRBDD Red Bluff Diversion Dam
RCD resource conservation district
RD reclamation district
RDI regulated deficit irrigation
RO reverse osmosis
RWQCB Regional Water Quality Control Board
SSAE seasonal application efficiency
SAFCA Sacramento Area Flood Control Agency
SAWPA Santa Ana Watershed Project Authority
SB Senate Bill
SBCFC&WCD Santa Barbara County Flood Control andWater Conservation District
SBVMWD San Bernardino Valley Municipal WaterDistrict
SCCWRRS Southern California comprehensive waterreclamation and reuse study
SCE Southern California Edison
SCVWD Santa Clara Valley Water District
SCWA Solano County Water Agency orSonoma County Water Agency
SDCWA San Diego County Water Authority
SDWA Safe Drinking Water Act orSouth Delta Water Agency
SEIS supplemental environmental impactstatement
SEWD Stockton East Water District
SF South Fork
SFBJV San Francisco Bay Joint Venture
SFEP San Francisco Estuary Project
SFPUC San Francisco Public Utility Commission
SFWD San Francisco Water Department
SGPWA San Gorgonio Pass Water Agency
SID Solano Irrigation District
SJBAP San Joaquin Basin Action Plan
SJRMP San Joaquin River Management Plan(or Program)
SLC San Luis Canal
SLD San Luis Drain
SLDMWA San Luis & Delta-Mendota Water Authority
SLOCFC&WCD San Luis Obispo County Flood Control andWater Conservation District
SMBRP Santa Monica Bay restoration project
SMUD Sacramento Municipal Utility District
SNWA Southern Nevada Water Authority
SOC synthetic organic compound
SOFAR South Fork American River (project)
SPPC Sierra Pacific Power Company
SRCD Suisun Resource Conservation District
SRF state revolving fund
SRFCP Sacramento River Flood Control Project
SRI Sacramento River index
SSA Salton Sea Authority
SSJID South San Joaquin Irrigation District
SSWD South Sutter Water District

A-5 ABBREVIATIONS AND ACRONYMS
The California Water Plan Update BULLETIN 160-98
STPUD South Tahoe Public Utility District
SVGMD Sierra Valley GroundwaterManagement District
SVOC semi-volatile organic compound
SVRID Stanford Vina Ranch Irrigation District
SVRP Salinas Valley reclamation project
SWP State Water Project
SWPP source water protection program orsupplemental water purchase program
SWRCB State Water Resources Control Board
SWSD Semitropic Water Storage District
Ttaf thousand acre-feet
TCC Tehama-Colusa Canal
TCD temperature control device
TCE trichloroethylene
TDPUD Tahoe Donner Public Utility District
TDS total dissolved solids
THM trihalomethane
TID Turlock Irrigation District
TID-MID Turlock Irrigation District andModesto Irrigation District
TOC total organic carbon
TROA Truckee River Operating Agreement
TRPA Tahoe Regional Planning Agency
UUC University of California
UCD University of California at Davis
UF ultrafiltration
ULFT ultra low flush toilet
USBR U.S. Bureau of Reclamation
USACE U.S. Army Corps of Engineers
USEPA U.S. Environmental Protection Agency
USFS U.S. Forest Service
USFWS U.S. Fish and Wildlife Service
USGS U.S. Geological Survey
UV ultraviolet
UWCD United Water Conservation District
VVAMP Vernalis adaptive management plan
VOC volatile organic compound
WWA water agency, water authority, or
wildlife area
WCD water conservation district
WCWD Western Canal Water District
WD water district
WMD water management district
WMI watershed management initiative
WQA water quality authority
WQCP water quality control plan
WR 95-6 SWRCB Order WR 95-6
WRCD Westside Resource Conservation District
WRDA Water Resources Development Act
WRF water reclamation facility orwater recycling facility
WRID Walker River Irrigation District
WSD water storage district
WTP water treatment plant
WWD Westlands Water District
WWTP wastewater treatment plant
YYCFC&WCD Yolo County Flood Control and
Water Conservation District
YCWA Yuba County Water Agency
ZZ7WA Zone 7 Water Agency

i
The California Water Plan Update BULLETIN 160-98
DE
PA
RTM
ENT OF WATER RESOU
RC
ES
STATE OF CALIFORNIACALIFORNIA
WATER PLAN UPDATE
BULLETIN 160-98
Volume 2November 1998
Pete WilsonGovernor
Douglas P. WheelerSecretary for ResourcesThe Resources Agency
David N. KennedyDirector
Department of Water Resources
Quest
More information about the California Department of Water Resources is available at: http://wwwdwr.water.ca.gov/ For a hard copy version of the Bulletin, please call the Publications Office at (916) 653-1097.

ii
The California Water Plan Update BULLETIN 160-98
Department of Water Resources, Sacramento, 1998
Copies of Bulletin 160-98 may be purchased for $25 from:California Department of Water Resources
P. O. Box 942836Sacramento, CA 94236-0001
Make checks payable to: Department of Water ResourcesCalifornia residents add current sales tax
C

iii
The California Water Plan Update BULLETIN 160-98
Chapter 6. Evaluating Options From a Statewide PerspectiveStatewide Water Budget .............................................................................................................................. 6-2
The Bulletin 160-98 Planning Process ........................................................................................................ 6-2
Major Steps in Planning Process ........................................................................................................... 6-4
Shortage Management .......................................................................................................................... 6-6
Using Applied Water Budgets to Calculate New Water Needs .............................................................. 6-6
Demand Reduction Options ....................................................................................................................... 6-8
Urban Water Conservation Options ..................................................................................................... 6-9
Outdoor Water Use ....................................................................................................................... 6-9
Residential Indoor Water Use ...................................................................................................... 6-10
Interior CII Water Use ................................................................................................................. 6-10
Distribution System Losses .......................................................................................................... 6-11
Agricultural Water Conservation Options .......................................................................................... 6-11
Irrigation Management (Options 1, 2, and 3) .............................................................................. 6-12
Water Delivery Flexibility (Option 4) .......................................................................................... 6-13
Canal Lining and Piping (Option 5) ............................................................................................ 6-13
Tailwater and Spill Recovery Systems (Option 6) ......................................................................... 6-13
Environmental Water Conservation Options ...................................................................................... 6-13
Water Supply Augmentation Options ....................................................................................................... 6-14
Conveyance Facilities ......................................................................................................................... 6-14
SWP Interim South Delta Program ............................................................................................. 6-14
CALFED Delta Conveyance ........................................................................................................ 6-14
Mid-Valley Canal ......................................................................................................................... 6-16
Surface Storage Facilities ..................................................................................................................... 6-16
Area of Origin Protections ........................................................................................................... 6-16
CALFED Surface Storage ............................................................................................................ 6-16
Multipurpose Storage Facilities .................................................................................................... 6-20
Groundwater and Conjunctive Use .................................................................................................... 6-22
Potential for Conjunctive Use in the Central Valley ..................................................................... 6-22
Recent Groundwater Studies with Statewide Scope ...................................................................... 6-23
Water Marketing ............................................................................................................................... 6-25
Sources of Water for Marketing ................................................................................................... 6-26
Prospects for Water Marketing ..................................................................................................... 6-27
Drought Year Marketing .............................................................................................................. 6-29
Every Year Marketing ................................................................................................................... 6-31
Water Recycling and Desalting ........................................................................................................... 6-32
Water Recycling ........................................................................................................................... 6-32
Contents. . .

iv
The California Water Plan Update BULLETIN 160-98
Desalting ..................................................................................................................................... 6-33
Weather Modification ........................................................................................................................ 6-35
Other Supply Augmentation Options ................................................................................................. 6-36
Importing Water from Out of State ............................................................................................. 6-36
Gray Water .................................................................................................................................. 6-36
Watershed Management on National Forest Lands ...................................................................... 6-36
Long-Range Weather Forecasting ................................................................................................. 6-37
Summary of Statewide Supply Augmentation Options ....................................................................... 6-37
CALFED ..................................................................................................................................... 6-37
Other Statewide Options ............................................................................................................. 6-38
Allocating Options Yield Among Hydrologic Regions ................................................................. 6-38
Uncertainties in the Bulletin Planning Process ............................................................................. 6-38
Options for Future Environmental Habitat Enhancement ........................................................................ 6-41
Central Valley Project Improvement Act ............................................................................................. 6-41
Category III Program ......................................................................................................................... 6-45
CALFED Bay-Delta Ecosystem Restoration Program ......................................................................... 6-46
Other Environmental Enhancement Options ..................................................................................... 6-47
SWP’s Sherman and Twitchell Islands Wildlife Management Plans .............................................. 6-47
Fish Protection Agreements .......................................................................................................... 6-47
Upper Sacramento River Fisheries and Riparian Habitat Restoration Program ............................. 6-47
Financing Local Water Management Options ........................................................................................... 6-47
Sources of Revenues ........................................................................................................................... 6-48
Financing Methods ............................................................................................................................. 6-48
Self-Financing .............................................................................................................................. 6-49
Short-Term Debt Financing ......................................................................................................... 6-49
Conventional Long-Term Debt Financing ................................................................................... 6-49
Innovative Long-Term Debt Financing ........................................................................................ 6-49
Credit Substitution and Enhancement ......................................................................................... 6-50
State and Federal Financial Assistance Programs........................................................................... 6-51
Relationship Between Financing and Water Agency Ownership and Size ........................................... 6-51
Public Water Agencies .................................................................................................................. 6-51
Investor-Owned Water Utilities ................................................................................................... 6-51
Mutual Water Companies ............................................................................................................ 6-52
Appendix 6A. Regional Water Budgets with Existing Facilities and Programs............................................6A-1
Appendix 6B. Applied Water Shortages by Hydrologic Region with Existing Facilities and Programs ....... 6B-1
Appendix 6C. Estimating a Water Management Option’s Unit Cost ........................................................ 6C-1
Appendix 6D. Calculation of Minimum New Water Needs ..................................................................... 6D-1
Appendix 6E. Net Water Budgets ............................................................................................................. 6E-1

v
The California Water Plan Update BULLETIN 160-98
Appendix 6F. Land Retirement Analysis in Drainage-Impaired Areas ........................................................ 6F-1
Appendix 6G. Review and Evaluation of Statewide-Level Storage Facilities That Could Be Included inCALFED Alternatives .............................................................................................................................. 6G-1
Chapter 7. Options for Meeting Future Water Needs inCoastal Regions of CaliforniaNorth Coast Hydrologic Region ................................................................................................................. 7-3
Description of the Area ........................................................................................................................ 7-3
Water Demands and Supplies ............................................................................................................... 7-3
Local Water Resources Management Issues ........................................................................................... 7-5
Klamath River Fishery Issues .......................................................................................................... 7-5
Trinity River Fish and Wildlife Management Program ................................................................... 7-5
Water Supplies of Small Coastal Communities .............................................................................. 7-6
Russian River Environmental Restoration Actions ......................................................................... 7-7
City of Santa Rosa Long-Term Wastewater Project ........................................................................ 7-8
SCWA Water Supply and Transmission Project .............................................................................. 7-8
Potter Valley Project ....................................................................................................................... 7-8
Water Management Options for the North Coast Region .................................................................... 7-8
Water Conservation ....................................................................................................................... 7-8
Modifying Existing Reservoirs or Operations ............................................................................... 7-10
New Reservoirs and Conveyance Facilities ................................................................................... 7-10
Groundwater Development or Conjunctive Use .......................................................................... 7-11
Water Recycling ........................................................................................................................... 7-11
Desalting ..................................................................................................................................... 7-11
Other Local Options .................................................................................................................... 7-11
Options Likely to be Implemented in North Coast Region ................................................................ 7-11
San Francisco Bay Hydrologic Region ....................................................................................................... 7-15
Description of the Area ...................................................................................................................... 7-15
Water Demands and Supplies ............................................................................................................. 7-15
North Bay .................................................................................................................................... 7-15
South Bay .................................................................................................................................... 7-17
Local Water Resources Management Issues ......................................................................................... 7-20
Bay-Delta Estuary ........................................................................................................................ 7-20
Suisun Marsh ............................................................................................................................... 7-20
Local Water Agency Issues ........................................................................................................... 7-20
Bay Area Regional Water Recycling Program ............................................................................... 7-24
Water Management Options for the San Francisco Bay Region .......................................................... 7-24
Conservation ............................................................................................................................... 7-24
Modify Existing Reservoirs/Operations ........................................................................................ 7-24
New Reservoirs and Conveyance Facilities ................................................................................... 7-27

vi
The California Water Plan Update BULLETIN 160-98
Groundwater Development or Conjunctive Use .......................................................................... 7-28
Water Marketing .......................................................................................................................... 7-28
Water Recycling ........................................................................................................................... 7-28
Desalting ..................................................................................................................................... 7-29
Other Local Options .................................................................................................................... 7-29
Statewide Options ....................................................................................................................... 7-29
Options Likely to be Implemented in San Francisco Bay Region ........................................................ 7-29
Central Coast Hydrologic Region ............................................................................................................. 7-33
Description of the Area ...................................................................................................................... 7-33
Water Demands and Supplies ............................................................................................................. 7-34
Northern PSA .............................................................................................................................. 7-34
Southern PSA .............................................................................................................................. 7-34
Local Water Resources Management Issues ......................................................................................... 7-35
Seawater Intrusion ....................................................................................................................... 7-35
Local Water Agency Issues ........................................................................................................... 7-36
Seawater Desalting ....................................................................................................................... 7-37
Water Management Options for the Central Coast Region ................................................................ 7-37
Water Conservation ..................................................................................................................... 7-40
Modify Existing Reservoirs or Operations .................................................................................... 7-40
New Reservoirs and Conveyance Facilities ................................................................................... 7-40
Groundwater Development and Conjunctive Use ........................................................................ 7-41
Water Marketing .......................................................................................................................... 7-41
Water Recycling ........................................................................................................................... 7-42
Desalting ..................................................................................................................................... 7-42
Other Local Options .................................................................................................................... 7-42
Statewide Options ....................................................................................................................... 7-42
Options Likely to be Implemented in Central Coast Region .............................................................. 7-42
South Coast Hydrologic Region ................................................................................................................ 7-47
Description of the Area ...................................................................................................................... 7-47
Water Demands and Supplies ............................................................................................................. 7-47
Los Angeles Aqueduct .................................................................................................................. 7-48
Colorado River Aqueduct ............................................................................................................ 7-48
State Water Project ....................................................................................................................... 7-49
Local Surface Water Supplies ....................................................................................................... 7-50
Groundwater Supplies ................................................................................................................. 7-52
Local Water Resources Management Issues ......................................................................................... 7-54
Water Supply Reliability .............................................................................................................. 7-54
Management of California’s Colorado River Water ...................................................................... 7-56
Mono Basin ................................................................................................................................. 7-57

vii
The California Water Plan Update BULLETIN 160-98
Restoration of Coastal Wetlands and Estuaries ............................................................................. 7-57
Flood Control .............................................................................................................................. 7-58
Salinity Management Actions ...................................................................................................... 7-59
Groundwater Issues ...................................................................................................................... 7-60
Southern California Comprehensive Water Reclamation and Reuse Study ................................... 7-61
Water Marketing .......................................................................................................................... 7-61
New Conveyance Facilities from Colorado River Region to South Coast Region ......................... 7-62
Mexican Border Environmental Quality Issues ............................................................................ 7-62
Water Management Options for South Coast Region ......................................................................... 7-62
Water Conservation ..................................................................................................................... 7-63
Modify Existing Reservoirs or Operations .................................................................................... 7-63
New Reservoirs ............................................................................................................................ 7-63
Groundwater Development and Conjunctive Use ........................................................................ 7-67
Water Marketing .......................................................................................................................... 7-67
Implementing the CRB’s Draft 4.4 Plan ...................................................................................... 7-68
Water Recycling ........................................................................................................................... 7-68
Desalting ..................................................................................................................................... 7-70
Other Local Options .................................................................................................................... 7-71
Statewide Options ....................................................................................................................... 7-71
Options Likely to be Implemented in South Coast Region ................................................................. 7-71
Appendix 7A. Options Evaluations for Coastal Regions ............................................................................7A-1
Chapter 8. Options for Meeting Future Water Needsin Interior Regions of CaliforniaSacramento River Hydrologic Region ......................................................................................................... 8-3
Description of the Area ........................................................................................................................ 8-3
Water Demands and Supplies ............................................................................................................... 8-3
CVP Water Supply ........................................................................................................................ 8-4
Supply from Other Federal Water Projects ..................................................................................... 8-5
SWP Water Supply ........................................................................................................................ 8-5
Local Surface Water Supply ............................................................................................................ 8-5
Groundwater Supply ...................................................................................................................... 8-6
Local Water Resources Management Issues ........................................................................................... 8-6
Sierra Nevada Foothills Water Supply ............................................................................................ 8-6
Foothill Area Water Supply from American River Basin ................................................................. 8-7
Sacramento Area Water Forum ...................................................................................................... 8-8
Colusa Basin Drainage District ...................................................................................................... 8-9
Groundwater Management Actions ............................................................................................... 8-9
American River Flood Protection ................................................................................................. 8-10
Yuba River Flood Protection ........................................................................................................ 8-11

viii
The California Water Plan Update BULLETIN 160-98
Sacramento River Mainstem Flood Protection and Water Supply................................................. 8-12
Putah Creek Adjudication ............................................................................................................ 8-12
Fish Passage at Red Bluff Diversion Dam ..................................................................................... 8-12
Glenn-Colusa Irrigation District Fish Screen ............................................................................... 8-13
Fish and Wildlife Restoration Activities in the Sacramento Valley ................................................ 8-13
Water Needs for Rice Field Flooding............................................................................................ 8-15
Water Management Options for the Sacramento River Region ........................................................... 8-15
Water Conservation ..................................................................................................................... 8-15
Modify Existing Reservoirs/Operations ........................................................................................ 8-15
New Reservoirs ............................................................................................................................ 8-17
New Conveyance Facilities ........................................................................................................... 8-19
Groundwater Development or Conjunctive Use .......................................................................... 8-19
Water Marketing .......................................................................................................................... 8-19
Water Recycling ........................................................................................................................... 8-19
Other Local Options .................................................................................................................... 8-19
Statewide Options ....................................................................................................................... 8-20
Options Likely to be Implemented in the Sacramento River Region ................................................... 8-20
San Joaquin River Hydrologic Region ....................................................................................................... 8-23
Description of the Area ...................................................................................................................... 8-23
Water Demands and Supplies ............................................................................................................. 8-24
Surface Water ............................................................................................................................... 8-24
Groundwater ............................................................................................................................... 8-26
Local Water Resources Management Issues ......................................................................................... 8-27
Cosumnes River Flood Management ........................................................................................... 8-27
Integrity of Delta Levees .............................................................................................................. 8-27
Interim South Delta Program and Temporary Barriers Project ..................................................... 8-28
San Joaquin County Groundwater Overdraft ............................................................................... 8-29
Penn Mine Remediation ............................................................................................................. 8-29
Conservation Storage in Farmington Reservoir ............................................................................ 8-29
New Melones Reservoir Water Supply and Operations ................................................................ 8-30
Urban Growth Pressures from San Francisco Bay Area ................................................................. 8-30
East County Water Supply Study ................................................................................................. 8-31
Los Banos Grandes Reservoir Studies ........................................................................................... 8-31
Merced Area Conjunctive Use Study ............................................................................................ 8-32
Agricultural Drainage .................................................................................................................. 8-32
Enlargement of Friant Dam ......................................................................................................... 8-33
Instream Flow Requirements Below Friant Dam .......................................................................... 8-33
Environmental Restoration Activities in the San Joaquin River Basin ........................................... 8-33
San Joaquin River Parkway Development .................................................................................... 8-34

ix
The California Water Plan Update BULLETIN 160-98
January 1997 San Joaquin River Region Flood Event ................................................................... 8-34
Water Management Options for the San Joaquin River Region .......................................................... 8-35
Water Conservation ..................................................................................................................... 8-35
Modify Existing Reservoirs .......................................................................................................... 8-35
New Reservoirs ............................................................................................................................ 8-35
New Conveyance Facilities ........................................................................................................... 8-37
Groundwater Development or Conjunctive Use .......................................................................... 8-38
Water Recycling ........................................................................................................................... 8-38
Desalting ..................................................................................................................................... 8-38
Statewide Options ....................................................................................................................... 8-38
Options Likely to be Implemented in the San Joaquin River Region .................................................. 8-38
Tulare Lake Hydrologic Region ................................................................................................................. 8-43
Description of the Area ...................................................................................................................... 8-43
Water Demands and Supplies ............................................................................................................. 8-44
Local Water Resources Management Issues ......................................................................................... 8-45
Groundwater Overdraft ............................................................................................................... 8-45
Groundwater Banking Programs .................................................................................................. 8-46
Agricultural Drainage .................................................................................................................. 8-46
Arroyo Pasajero and Other Westside Cross-Drainages .................................................................. 8-47
Kings River Fishery Restoration Actions ...................................................................................... 8-47
Water Management Options for the Tulare Lake Region .................................................................... 8-47
Water Conservation ..................................................................................................................... 8-47
Modifying Existing Reservoirs and New Reservoirs ...................................................................... 8-49
New Conveyance Facilities ........................................................................................................... 8-50
Groundwater Development or Conjunctive Use .......................................................................... 8-50
Water Marketing .......................................................................................................................... 8-51
Water Recycling and Desalting .................................................................................................... 8-52
Statewide Options ....................................................................................................................... 8-52
Options Likely to be Implemented in the Tulare Lake Region ............................................................ 8-52
Appendix 8A. Options Evaluations for Interior Regions ............................................................................8A-1
Chapter 9. Options for Meeting Future Water Needs in Eastern Sierra and ColoradoRiver Regions of CaliforniaNorth Lahontan Hydrologic Region ........................................................................................................... 9-3
Description of the Area ........................................................................................................................ 9-3
Water Demands and Supplies ............................................................................................................... 9-3
Local Water Resources Management Issues ........................................................................................... 9-7
Truckee River Operating Agreement .............................................................................................. 9-7
Walker River .................................................................................................................................. 9-8
Lake Tahoe .................................................................................................................................... 9-8

x
The California Water Plan Update BULLETIN 160-98
Leviathan Mine .............................................................................................................................. 9-9
Sierra Nevada Ecosystem Project .................................................................................................... 9-9
January 1997 Flood Event ............................................................................................................. 9-9
Water Management Options for the North Lahontan Region .............................................................. 9-9
Water Conservation ..................................................................................................................... 9-11
New Reservoirs or Conveyance Facilities ...................................................................................... 9-11
Groundwater Development or Conjunctive Use .......................................................................... 9-11
Options Likely to be Implemented in the North Lahontan Region .................................................... 9-12
South Lahontan Hydrologic Region .......................................................................................................... 9-15
Description of the Area ...................................................................................................................... 9-15
Water Demands and Supplies ............................................................................................................. 9-16
Los Angeles Aqueduct .................................................................................................................. 9-16
State Water Project ....................................................................................................................... 9-17
Local Surface Water Supplies ....................................................................................................... 9-18
Groundwater Supplies ................................................................................................................. 9-18
Local Water Resources Management Issues ......................................................................................... 9-19
Owens Valley Area ....................................................................................................................... 9-19
Mono Basin ................................................................................................................................. 9-20
Mojave River Adjudication .......................................................................................................... 9-21
Antelope Valley Water Management ............................................................................................ 9-21
Interstate Groundwater Basins ..................................................................................................... 9-22
Water Management Options for South Lahontan Region ................................................................... 9-22
Water Conservation ..................................................................................................................... 9-22
Modify Existing Reservoirs or Operations .................................................................................... 9-23
New Reservoirs or Conveyance Facilities ...................................................................................... 9-24
Water Marketing .......................................................................................................................... 9-24
Water Recycling ........................................................................................................................... 9-24
Other Local Options .................................................................................................................... 9-24
Statewide Options ....................................................................................................................... 9-24
Options Likely to be Implemented in the South Lahontan Region ..................................................... 9-24
Colorado River Hydrologic Region ........................................................................................................... 9-27
Description of the Area ...................................................................................................................... 9-27
Water Demands and Supplies ............................................................................................................. 9-28
Supplies from the Colorado River ................................................................................................ 9-28
Supplies from Other Sources ........................................................................................................ 9-32
Local Water Resources Management Issues ......................................................................................... 9-33
Management of California’s Colorado River Water ...................................................................... 9-33
Tribal Water Rights ...................................................................................................................... 9-35
Water Conservation Programs ...................................................................................................... 9-35

xi
The California Water Plan Update BULLETIN 160-98
Salton Sea .................................................................................................................................... 9-35
Coachella Valley Groundwater Overdraft ..................................................................................... 9-38
Lower Colorado River Environmental Water Issues ..................................................................... 9-39
Lower Colorado River Multi-Species Conservation Program ........................................................ 9-40
Water Management Options for the Colorado River Region .............................................................. 9-40
Water Conservation ..................................................................................................................... 9-40
Potential Sources of Water for Intrastate Marketing ..................................................................... 9-42
Intrastate Groundwater Recharge or Banking............................................................................... 9-44
Interstate Banking/Conservation .................................................................................................. 9-45
Reoperating Colorado River System Reservoirs ............................................................................ 9-45
Weather Modification .................................................................................................................. 9-45
Options for Coachella Valley ....................................................................................................... 9-46
Statewide Options ....................................................................................................................... 9-46
Options Likely to be Implemented in the Colorado River Region ...................................................... 9-46
Appendix 9A. Options Evaluations for Eastern Sierra and Colorado River Regions ...................................9A-1
Chapter 10. ConclusionsFuture with Existing Facilities and Programs ...................................................................................... 10-2
Water Supply ............................................................................................................................... 10-2
Water Demand ............................................................................................................................ 10-3
Water Shortages ........................................................................................................................... 10-4
Summary of Options Likely to be Implemented ................................................................................. 10-6
Implementing Future Water Management Options ............................................................................ 10-8
Bulletin 160-98 Findings .................................................................................................................. 10-11
Appendix 10A. Regional Water Budgets with Likely Options .................................................................10A-1
Abbreviations and Acronyms ....................................................................... A-1
Glossary ................................................................................................... G-1
TablesTable 6-1. California Water Budget with Existing Facilities and Programs ................................................... 6-2
Table 6-2. 1991 Urban Water Shortage Management .................................................................................. 6-7
Table 6-3. Urban Depletion Reduction Potential Due to Water Conservation Options Beyond BMPs ....... 6-9
Table 6-4. Agricultural Depletion Reduction Potential Due to Water Conservation OptionsBeyond EWMPs ....................................................................................................................................... 6-12
Table 6-5. CVP Yield Increase Plan Conjunctive Use Options .................................................................. 6-24
Table 6-6. Sample of Potential Water Purchases ........................................................................................ 6-29
Table 6-7. Drought Water Bank Summary ................................................................................................ 6-30
Table 6-8. 2020 Level Water Recycling Options and Resulting New Water Supply ................................... 6-32
Table 6-9. Potential 2020 Water Recycling Options by Hydrologic Region ............................................... 6-33

xii
The California Water Plan Update BULLETIN 160-98
Table 6-10. Statewide Supply Augmentation Options Likely to be Implemented by 2020 ........................ 6-38
Table 6-11. Likely Statewide Supply Augmentation Options by Hydrologic Region, 2020 Average Year ... 6-39
Table 6-12. Likely Statewide Supply Augmentation Options by Hydrologic Region, 2020 Drought Year . 6-39
Table 6-13. Effects of Alternative Assumptions on 2020 Applied Water Shortages .................................... 6-40
Table 6-14. Environmental Restoration Funding ...................................................................................... 6-42
Table 6-15. Sample Projects Funded by Category III Program .................................................................. 6-45
Table 6-16. Significant Sources of Revenue to Water Agencies by Type of Ownership ............................... 6-48
Table 6-17. Significant Sources of Revenue to Water Agencies by Water Agency Size ................................ 6-48
Table 6-18. Major State and Federal Financial Assistance Programs .......................................................... 6-50
Table 6-19. Financing Methods Available to Water Agencies by Type of Ownership ................................. 6-51
Table 6-20. Financing Methods Typically Available to Water Agencies by Water Agency Size .................... 6-52
Table 6-21. Financial Assistance Programs Available to Water Agencies by Type of Ownership ................. 6-52
Table 6A-1. North Coast Region Water Budget with Existing Facilities and Programs ..............................6A-2
Table 6A-2. San Francisco Bay Region Water Budget with Existing Facilities and Programs ......................6A-2
Table 6A-3. Central Coast Region Water Budget with Existing Facilities and Programs ............................6A-2
Table 6A-4. South Coast Region Water Budget with Existing Facilities and Programs ...............................6A-3
Table 6A-5. Sacramento River Region Water Budget with Existing Facilities and Programs ......................6A-3
Table 6A-6. San Joaquin River Region Water Budget with Existing Facilities and Programs ......................6A-3
Table 6A-7. Tulare Lake Region Water Budget with Existing Facilities and Programs ................................6A-4
Table 6A-8. North Lahontan Region Water Budget with Existing Facilities and Programs ........................6A-4
Table 6A-9. South Lahontan Region Water Budget with Existing Facilities and Programs .........................6A-4
Table 6A-10. Colorado River Region Water Budget with Existing Facilities and Programs ........................6A-5
Table 6B-1. Applied Water Shortages by Hydrologic Region, 1995-Level Average Year ............................. 6B-2
Table 6B-2. Applied Water Shortages by Hydrologic Region, 1995-Level Drought Year ............................ 6B-2
Table 6B-3. Applied Water Shortages by Hydrologic Region, 2020-Level Average Year ............................. 6B-3
Table 6B-4. Applied Water Shortages by Hydrologic Region, 2020-Level Drought Year ............................ 6B-3
Table 6C-1. Sample Cost Computation ................................................................................................... 6C-2
Table 6D-1. Minimum New Water Needs by Hydrologic Region, 2020 Average Year .............................. 6D-2
Table 6D-2. Minimum New Water Needs by Hydrologic Region, 2020 Drought Year ............................ 6D-2
Table 6E-1. North Coast Region Net Water Budget with Existing Facilities and Programs ........................ 6E-2
Table 6E-2. San Francisco Region Net Water Budget with Existing Facilities and Programs ...................... 6E-2
Table 6E-3. Central Coast Region Net Water Budget with Existing Facilities and Programs ...................... 6E-2
Table 6E-4. South Coast Region Net Water Budget with Existing Facilities and Programs ........................ 6E-3
Table 6E-5. Sacramento River Region Net Water Budget with Existing Facilities and Programs ................ 6E-3
Table 6E-6. San Joaquin River Region Net Water Budget with Existing Facilities and Programs ............... 6E-3
Table 6E-7. Tulare Lake Region Net Water Budget with Existing Facilities and Programs ......................... 6E-4
Table 6E-8. North Lahontan Region Net Water Budget with Existing Facilities and Programs .................. 6E-4
Table 6E-9. South Lahontan Region Net Water Budget with Existing Facilities and Programs .................. 6E-4
Table 6E-10. Colorado River Region Net Water Budget with Existing Facilities and Programs ................. 6E-5

xiii
The California Water Plan Update BULLETIN 160-98
Table 6E-11. California Net Water Budget with Existing Facilities and Programs ..................................... 6E-5
Table 6F-1. Agricultural Depletion Reductions Due to Land Retirement .................................................. 6F-2
Table 6F-2. Costs of Land Retirement ...................................................................................................... 6F-2
Table 6F-3. Land Retirement Analysis—Scenario 1 Economic Impacts .................................................... 6F-3
Table 6F-4. Land Retirement Analysis—Scenario 2 Economic Impacts .................................................... 6F-3
Table 6G-1. Onstream Storage Options Upstream of the Delta ............................................................... 6G-2
Table 6G-2. Retained Onstream Storage Options and Environmental Issues ............................................ 6G-4
Table 6G-3. Offstream Storage Options Upstream of the Delta ............................................................... 6G-5
Table 6G-4. Retained Offstream Storage Options and Environmental Issues ........................................... 6G-6
Table 6G-5. Watersheds Identified for South of the Delta Storage Options ............................................ 6G-10
Table 6G-6. South of the Delta Off-Aqueduct Storage Size Categories ................................................... 6G-10
Table 6G-7. Ranking of Off-Aqueduct Storage Options South of the Delta ........................................... 6G-11
Table 6G-8. Retained Off-Aqueduct Storage Option South of the Delta ................................................ 6G-12
Table 7-1. Population and Crop Acreage ..................................................................................................... 7-3
Table 7-2. North Coast Region Water Budget ............................................................................................. 7-4
Table 7-3. North Coast Region List of Water Management Options ........................................................... 7-9
Table 7-4. Options Ranking for North Coast Region ................................................................................ 7-12
Table 7-5. Options Likely to be Implemented by 2020, North Coast Region............................................ 7-12
Table 7-6. Population and Crop Acreage ................................................................................................... 7-15
Table 7-7. San Francisco Bay Region Water Budget .................................................................................. 7-16
Table 7-8. Major North Bay Water Suppliers ............................................................................................ 7-17
Table 7-9 . Local Agency Reservoirs Serving the North Bay ...................................................................... 7-17
Table 7-10. Major South Bay Water Suppliers ........................................................................................... 7-18
Table 7-11. Local Surface Reservoirs Serving the South Bay ...................................................................... 7-18
Table 7-12. San Francisco Bay Region List of Water Management Options .............................................. 7-25
Table 7-13. Options Ranking for San Francisco Bay Region ..................................................................... 7-30
Table 7-14. Options Likely to be Implemented by 2020, San Francisco Bay Region ................................. 7-31
Table 7-15. Population and Crop Acreage ................................................................................................. 7-34
Table 7-16. Central Coast Region Water Budget ....................................................................................... 7-34
Table 7-17. Central Coast Region List of Water Management Options ..................................................... 7-38
Table 7-18. Options Ranking for Central Coast Region ............................................................................ 7-43
Table 7-19. Options Likely to be Implemented by 2020, Central Coast Region........................................ 7-44
Table 7-20. Population and Crop Acreage ................................................................................................. 7-47
Table 7-21. South Coast Region Water Budget ......................................................................................... 7-48
Table 7-22. Metropolitan Water District of Southern California Member Agencies .................................. 7-49
Table 7-23. State Water Project Contractors in the South Coast Region .................................................... 7-50
Table 7-24. Major Reservoirs in the South Coast Region .......................................................................... 7-51
Table 7-25. Reservoirs Owned by Water Retailers in MWDSC’s Service Area ........................................... 7-51
Table 7-26. San Diego County Water Authority Member Agencies ........................................................... 7-52

xiv
The California Water Plan Update BULLETIN 160-98
Table 7-27. Adjudicated Groundwater Basins in the South Coast Region ................................................. 7-55
Table 7-28. Salinity of South Coast Region Groundwater Supplies ........................................................... 7-59
Table 7-29. South Coast Region List of Water Management Options ....................................................... 7-64
Table 7-30. Options Ranking for South Coast Region .............................................................................. 7-72
Table 7-31. Options Likely to be Implemented by 2020, South Coast Region .......................................... 7-73
Table 7A-1. Options Evaluation North Coast Region ...............................................................................7A-2
Table 7A-2. Options Evaluation San Francisco Bay Region .......................................................................7A-3
Table 7A-3. Options Evaluation Central Coast Region .............................................................................7A-5
Table 7A-4. Options Evaluation South Coast Region ................................................................................7A-7
Table 8-1. Population and Crop Acreage ..................................................................................................... 8-3
Table 8-2. Sacramento River Region Water Budget ..................................................................................... 8-4
Table 8-3. Major Sacramento River CVP Water Users ................................................................................ 8-5
Table 8-4. Sacramento River Region List of Water Management Options ................................................. 8-16
Table 8-5. Options Ranking for Sacramento River Region ........................................................................ 8-20
Table 8-6. Options Likely to be Implemented by 2020, Sacramento River Region .................................... 8-21
Table 8-7. Population and Crop Acreage ................................................................................................... 8-23
Table 8-8. San Joaquin River Region Water Budget .................................................................................. 8-23
Table 8-9. New Melones Releases for CVPIA Environmental Purposes ..................................................... 8-31
Table 8-10. San Joaquin River Region List of Water Management Options............................................... 8-36
Table 8-11. Comparison of Salinity of Water Sources ................................................................................ 8-39
Table 8-12. Options Ranking for San Joaquin River Region ..................................................................... 8-40
Table 8-13. Options Likely to be Implemented by 2020, San Joaquin River Region ................................. 8-41
Table 8-14. Population and Crop Acreage ................................................................................................. 8-43
Table 8-15. Tulare Lake Region Water Budget .......................................................................................... 8-45
Table 8-16. Tulare Lake Region List of Water Management Options......................................................... 8-48
Table 8-17. Options Ranking for Tulare Lake Region ............................................................................... 8-53
Table 8-18. Options Likely to be Implemented by 2020, Tulare Lake Region ........................................... 8-53
Table 8A-1. Options Evaluation Sacramento River Region .......................................................................8A-2
Table 8A-2. Options Evaluation San Joaquin River Region .......................................................................8A-3
Table 8A-3. Options Evaluation Tulare Lake Region .................................................................................8A-4
Table 9-1. Population and Crop Acreage ..................................................................................................... 9-3
Table 9-2. North Lahontan Region Water Budget ....................................................................................... 9-4
Table 9-3. Major Reservoirs in the Truckee River Basin in California .......................................................... 9-5
Table 9-4. North Lahontan Region List of Water Management Options ................................................... 9-10
Table 9-5. Options Ranking for North Lahontan Region .......................................................................... 9-12
Table 9-6. Options Likely to be Implemented by 2020, North Lahontan Region...................................... 9-12
Table 9-7. Population and Crop Acreage ................................................................................................... 9-16
Table 9-8. South Lahontan Region Water Budget ..................................................................................... 9-17
Table 9-9. Los Angeles Aqueduct System Reservoirs .................................................................................. 9-17

xv
The California Water Plan Update BULLETIN 160-98
Table 9-10. SWP Contractors in the South Lahontan Region ................................................................... 9-17
Table 9-11. South Lahontan Region List of Water Management Options ................................................. 9-23
Table 9-12. Options Ranking for South Lahontan Region ........................................................................ 9-25
Table 9-13. Options Likely to be Implemented by 2020, South Lahontan Region .................................... 9-25
Table 9-14. Population and Crop Acreage ................................................................................................. 9-27
Table 9-15. Colorado River Region Water Budget .................................................................................... 9-28
Table 9-16. Key Elements of the Law of the River ..................................................................................... 9-29
Table 9-17. Annual Apportionment of Use of Colorado River Water ........................................................ 9-30
Table 9-18. Estimated Colorado River Flow and Uses ............................................................................... 9-31
Table 9-19. SWP Contractors in the Colorado River Region .................................................................... 9-32
Table 9-20. Existing Colorado River Region Water Conservation Actions ................................................. 9-36
Table 9-21. Colorado River Region List of Water Management Options ................................................... 9-41
Table 9-22. Potential Colorado River Water Conservation Programs ......................................................... 9-42
Table 9-23. Options Ranking for Colorado River Region ......................................................................... 9-47
Table 9-24. Options Likely to be Implemented by 2020, Colorado River Region ..................................... 9-48
Table 9-25. Future Actions Described in Bulletin 160-98 That Could be Part ofDraft CRB 4.4 Plan Implementation ........................................................................................................ 9-48
Table 9A-1. Options Evaluation North Lahontan Region .........................................................................9A-2
Table 9A-2. Options Evaluation South Lahontan Region ..........................................................................9A-3
Table 9A-3. Options Evaluation Colorado River Region ...........................................................................9A-4
Table 10-1. California Water Budget with Existing Facilities and Programs ............................................... 10-2
Table 10-2. Applied Water Shortages by Hydrologic RegionWith Existing Facilities and Programs ....................................................................................................... 10-4
Table 10-3. Summary of Options Likely to be Implemented by 2020, by Option Type ............................ 10-7
Table 10-4. California Water Budget with Options Likely to be Implemented .......................................... 10-8
Table 10-5. Water Shortages by Hydrologic Region With Likely Options ................................................. 10-9
Table 10A-1. North Coast Region Water Budget with Options ...............................................................10A-2
Table 10A-2. San Francisco Bay Region Water Budget with Options ......................................................10A-2
Table 10A-3. Central Coast Region Water Budget with Options .............................................................10A-2
Table 10A-4. South Coast Region Water Budget with Options ...............................................................10A-3
Table 10A-5. Sacramento River Region Water Budget with Options .......................................................10A-3
Table 10A-6. San Joaquin River Region Water Budget with Options ......................................................10A-3
Table 10A-7. Tulare Lake Region Water Budget with Options ................................................................10A-4
Table 10A-8. North Lahontan Region Water Budget with Options .........................................................10A-4
Table 10A-9. South Lahontan Region Water Budget with Options .........................................................10A-4
Table 10A-10. Colorado River Region Water Budget with Options ........................................................10A-5
FiguresFigure 6-1. Index to Regional Chapters ....................................................................................................... 6-3
Figure 6G-1. Likely Reservoir Sites Upstream of the Delta ....................................................................... 6G-8

xvi
The California Water Plan Update BULLETIN 160-98
Figure 6G-2. Off-Aqueduct South of the Delta Watershed Sites ............................................................. 6G-13
Figure 7-1. Coastal Hydrologic Regions ...................................................................................................... 7-1
Figure 7-2. North Coast Hydrologic Region ............................................................................................... 7-2
Figure 7-3. San Francisco Bay Hydrologic Region ..................................................................................... 7-14
Figure 7-4. Central Coast Hydrologic Region. .......................................................................................... 7-32
Figure 7-5. South Coast Hydrologic Region .............................................................................................. 7-46
Figure 7-6. South Coast Groundwater Basins ............................................................................................ 7-53
Figure 8-1. Interior Hydrologic Regions ...................................................................................................... 8-1
Figure 8-2. Sacramento River Hydrologic Region ....................................................................................... 8-2
Figure 8-3. San Joaquin River Hydrologic Region ..................................................................................... 8-22
Figure 8-4. Tulare Lake Hydrologic Region ............................................................................................... 8-42
Figure 9-1. Eastern Sierra and Colorado River Hydrologic Regions ............................................................. 9-1
Figure 9-2. North Lahontan Hydrologic Region ......................................................................................... 9-2
Figure 9-3. South Lahontan Hydrologic Region ........................................................................................ 9-14
Figure 9-4. Colorado River Hydrologic Region ......................................................................................... 9-26
Figure 9-5. Basic Apportionment and Consumptive Use of Mainstem Colorado River in Lower Basin ..... 9-31
Figure 9-6. U.S.-Mexican Border Region .................................................................................................. 9-43
Figure 10-1. 2020 Shortages by Hydrologic Region with Existing Facilities and Programs ........................ 10-5
Figure 10-2. 2020 Shortages by Hydrologic Region with Likely Options ................................................ 10-10
SidebarsInitial Screening Criteria ............................................................................................................................. 6-4
Options Category Evaluation ...................................................................................................................... 6-5
Data on Urban Landscaping ....................................................................................................................... 6-8
CALFED Water Conservation Planning ................................................................................................... 6-11
Land Retirement in Drainage-Impaired Areas ........................................................................................... 6-13
CALFED Bay-Delta Program Common Programs .................................................................................... 6-15
Prospects for Onstream Surface Storage Upstream of the Delta ................................................................. 6-18
Feasibility Study for American Basin Conjunctive Use Project .................................................................. 6-25
Is That Real Water? ................................................................................................................................... 6-26
Water Code Section 1810 et seq. ............................................................................................................... 6-28
Seawater Desalting as a Future Water Management Option ...................................................................... 6-34
Mission Basin Brackish Groundwater Desalting Research and Development Project ................................. 6-34
Monterey County Water Resources Agency’s Cloud Seeding Program ....................................................... 6-35
San Diego Area Water Reclamation Programs ........................................................................................... 7-69
Brackish Water Reclamation Demonstration Facility ................................................................................. 7-70
Sacramento River Flood Control Project ................................................................................................... 8-10
Grasslands Bypass Project Drainage Fee System ........................................................................................ 8-32
Westlands Water District Distribution System .......................................................................................... 8-50
Water Marketing—WaterLink Program .................................................................................................... 8-52

xvii
The California Water Plan Update BULLETIN 160-98
Searles Lake............................................................................................................................................... 9-19
Colorado River Board of California .......................................................................................................... 9-35
Reservoir Reoperation for Flood Control .................................................................................................. 10-6

G-1 GLOSSARY
The California Water Plan Update BULLETIN 160-98
GlossaryAactive storage capacity the usable reservoir capacity
available for seasonal or cyclic water storage. It isgross reservoir capacity minus inactive storage ca-pacity.
afterbay a reservoir that regulates fluctuating dis-charges from a hydroelectric power plant or apumping plant.
agricultural drainage (1) the process of directing ex-cess water away from root zones by natural or ar-tificial means, such as by using a system of drainsplaced below ground surface level; also called sub-surface drainage; (2) the water drained away fromirrigated farmland.
alluvium unconsolidated soil strata deposited by flow-ing water.
anadromous fish that spend a part of their life cyclein the sea and return to freshwater streams tospawn.
applied water demand the quantity of water deliv-ered to the intake of a city’s water system or fac-tory, the farm headgate or other point of measure-ment, or a marsh or other wetland, either directlyor by incidental drainage flows. For instream use,it is the portion of the stream flow dedicated toinstream use or reserved under the federal or Statelegislation.
aquifer a geologic formation that stores water andyields significant quantities of water to wells orsprings.
arid a term describing a climate or region in whichprecipitation is so deficient in quantity or occursso infrequently that intensive agricultural produc-tion is not possible without irrigation.
artificial recharge addition of surface water to agroundwater reservoir by human activity, such asputting surface water into spreading basins.
average annual runoff for a specified area is the av-erage value of annual runoff volume calculated fora selected period of record, at a specified location,such as a dam or stream gage.
average year water demand demand for water un-der average hydrologic conditions for a definedlevel of development.
Bbest management practice (BMP) a generally ac-
cepted practice for some aspect of natural resourcesmanagement, such as water conservation measures,drainage management measures, or erosion con-trol measures. Most frequently used in this Bulle-tin to refer to water conservation measures adoptedby the California Urban Water Conservation Coa-lition.
biota living organisms of a region, as in a stream orother body of water.
brackish water water containing dissolved mineralsin amounts that exceed normally acceptable stan-dards for municipal, domestic, and irrigation uses.Considerably less saline than sea water.
bromide a salt which naturally occurs in small quan-tities in sea water; a compound of bromine.
Cchaparral a major vegetation type in California char-
acterized by dense evergreen shrubs with thick,hardened leaves.
Quest
More information about the California Department of Water Resources is available at: http://wwwdwr.water.ca.gov/ For a hard copy version of the Bulletin, please call the Publications Office at (916) 653-1097.

G-2GLOSSARY
The California Water Plan Update BULLETIN 160-98
closed basin a basin whose topography prevents sur-face outflow of water.
confined aquifer a water-bearing subsurface stratumthat is bounded above and below by formationsof impermeable, or relatively impermeable, soil orrock.
conjunctive use the operation of a groundwater basinin combination with a surface water storage andconveyance system. Water is stored in the ground-water basin for later use by intentionally recharg-ing the basin during years of above-average watersupply.
DDecision 1485 operating criteria standards for op-
erating the CVP and SWP under Water Right De-cision 1485 for the Sacramento-San Joaquin Deltaand Suisun Marsh, adopted by the State WaterResources Control Board in August 1978.
Decision 1631 a water right decision specifying re-quired Mono Lake levels, adopted by the StateWater Resources Control Board in 1994.
deep percolation percolation of (irrigation) waterthrough the ground and beyond the lower limitof the root zone of plants into groundwater.
demand management alternatives water manage-ment programs—such as water conservation ordrought rationing—that reduce demand for wa-ter.
dependable supply the average annual quantity ofwater that can be delivered during a drought pe-riod.
depletion the water consumed within a service areaand no longer available as a source of supply. Foragriculture and wetlands, it is ETAW (and ET offlooded wetlands) plus irrecoverable losses. Forurban water use, it is ETAW (water applied to land-scaping or home gardens), sewage effluent thatflows to a salt sink, and incidental ET losses. Forinstream use, it is the amount of dedicated flowthat reaches a salt sink.
desalting a process to reduce the salt concentration ofsea water or brackish water.
detailed analysis unit (DAU) the smallest study areaused by the Department for analyses of water de-mand and supply. Generally defined by hydrologic
features or boundaries of organized water serviceagencies. In major agricultural areas, a DAU typi-cally includes 100,000 to 300,000 acres.
discount rate the interest rate used to calculate thepresent value of future benefits and future costs orto convert benefits and costs to a common timebasis.
dissolved organic compounds carbon-based sub-stances dissolved in water.
dissolved oxygen (DO) the amount of oxygen dis-solved in water or wastewater, usually expressedin milligrams per liter, parts per million, or per-cent of saturation.
distribution uniformity (DU) a measure of the varia-tion in the amount of water applied to the soilsurface throughout an irrigated area, expressed asa percent.
drainage area the area of land from which water drainsinto a river; for example, the Sacramento RiverBasin, in which all land area drains into the Sacra-mento River. Also called watershed or river basin.
drought condition hydrologic conditions during adefined period when rainfall and runoff are muchless than average.
drought year supply the average annual supply of awater development system during a defineddrought period.
Eefficient water management practice (EWMP) an
agricultural water conservation measure, such asthose adopted under the MOU regarding waterconservation.
effluent wastewater or other liquid, treated or in itsnatural state, flowing from a treatment plant orprocess.
environmental water the water for wetlands, for theinstream flow in a major river or in the Bay-Delta,or for a designated wild and scenic river
estuary the lower course of a river entering the seawhere tidal action meets river flow.
evapotranspiration (ET) the quantity of water tran-spired (given off ), retained in plant tissues, andevaporated from plant tissues and surrounding soilsurfaces.

G-3 GLOSSARY
The California Water Plan Update BULLETIN 160-98
evapotranspiration of applied water (ETAW) theportion of the total evapotranspiration which isprovided by irrigation and landscape watering.
Ffirm yield the maximum annual supply from of a
water development project under drought condi-tions, for some specified level of demands.
forebay a reservoir at the intake of a pumping plantor power plant to stabilize water levels; also a stor-age basin for regulating water for percolation intogroundwater basins.
fry a recently hatched fish.
Ggray water waste water from a household or small
commercial establishment. Gray water does notinclude water from a toilet, kitchen sink, dish-washer, washing machine, or water used for wash-ing diapers.
gross reservoir capacity the total storage capacity avail-able in a reservoir for all purposes, from the stre-ambed to the normal maximum operating level.Includes dead (or inactive) storage, but excludessurcharge (water temporarily stored above the el-evation of the top of the spillway).
groundwater water that occurs beneath the land sur-face and fills the pore spaces of the alluvium, soil,or rock formation in which it is situated.
groundwater basin a groundwater reservoir, definedby an overlying land surface and the underlyingaquifers that contain water stored in the reservoir.In some cases, the boundaries of successively deeperaquifers may differ and make it difficult to definethe limits of the basin.
groundwater overdraft the condition of a ground-water basin in which the amount of water with-drawn by pumping exceeds the amount of waterthat recharges the basin over a period of years dur-ing which water supply conditions approximateaverage conditions.
groundwater recharge the natural or intentional in-filtration of surface water into the zone of satura-tion (i.e., into groundwater).
groundwater storage capacity volume of void spacethat can be occupied by water in a given volumeof a formation, aquifer, or groundwater basin.
groundwater table the upper surface of the zone ofsaturation, in an unconfined aquifer.
Hhardpan a layer of nearly impermeable soil beneath a
more permeable soil, formed by natural chemicalcementation of the soil particles.
head ditch the water supply ditch at the head of anirrigated field.
hydraulic barrier a barrier developed in an estuaryby release of fresh water from upstream reservoirsto prevent intrusion of seawater into the body offresh water. Also, a barrier created by injecting freshwater to control seawater intrusion in an aquifer,or created by water injection to control migrationof contaminants in an aquifer.
hydrologic balance an accounting of all water inflowto, water outflow from, and changes in water stor-age within a hydrologic unit over a specified pe-riod of time.
hydrologic basin the drainage area upstream from agiven point on a stream.
hydrologic region a study area consisting of multipleplanning subareas. California is divided into 10hydrologic regions.
Iinstream use use of water within its natural water-
course as specified in an agreement, water rightspermit, etc. For example, the use of water for navi-gation, recreation, fish and wildlife, aesthetics, andscenic enjoyment.
irrecoverable losses the water lost to a salt sink or lostby evaporation or evapotranspiration from a con-veyance facility or drainage canal, or in fringe ar-eas of cultivated fields.
irrigated acreage land area that is irrigated, which isequivalent to total irrigated crop acreage minusthe amount of acreage that was multiple-cropped.
irrigation return flow applied water that is not tran-spired, evaporated, or infiltrated into a ground-water basin but that returns to a surface water body.

G-4GLOSSARY
The California Water Plan Update BULLETIN 160-98
Lland subsidence the lowering of the natural land sur-
face due to groundwater (or oil and gas) extrac-tion.
laser land leveling precision leveling of cultivatedfields to improve irrigation efficiency.
laterals the part of an irrigation districts’s deliverysystem that conveys water from the district’s maincanals to turnouts for farmers’ fields
leaching the flushing of salts from the soil by the down-ward percolation of applied water.
leaching requirement the theoretical amount of irri-gation water that must pass (leach) through thesoil beyond the root zone to keep soil salinitywithin acceptable levels for sustained crop growth.
level of development in a planning study, the practiceof holding water demands constant at some speci-fied level so that hydrologic variability can be stud-ied.
Mmaximum contaminant level (MCL) the highest
drinking water contaminant concentration allowedunder federal and State Safe Drinking Water Actregulations.
moisture stress a condition of physiological stress in aplant caused by lack of water.
multipurpose project a project, usually a reservoir,designed to serve more than one purpose, andwhose costs are normally allocated among the dif-ferent functions it provides. For example, a projectthat provides water supply, flood control, and gen-erates hydroelectricity.
NNational Pollutant Discharge Elimination System
(NPDES) a provision of Section 402 of the fed-eral Clean Water Act that established a permittingsystem for discharges of waste materials to watercourses.
net water demand (net water use) the amount ofwater needed in a water service area to meet allrequirements. It is the sum of evapotranspirationof applied water in an area, the irrecoverable lossesfrom the distribution system, and the outflow leav-ing the service area; does not include reuse of wa-ter within a service area.
nonpoint source waste water discharge other thanfrom point sources. See also point source.
nonreimbursable costs the part of project costs allo-cated to general statewide or national beneficialpurposes and funded from general revenues, ratherthan by water users.
normalized demand the process of adjusting actualwater use in a given year to account for unusualevents such as dry weather conditions, governmentprice support programs for agriculture, rationingprograms, or other unusual conditions.
Ooverdraft see groundwater overdraft.
Ppathogens viruses, bacteria, or other organisms that
cause disease.
perched groundwater groundwater supported by azone of material of low permeability located abovean underlying main body of groundwater.
perennial yield the maximum quantity of water thatcan be annually withdrawn from a groundwaterbasin over a long period of time (during whichwater supply conditions approximate average con-ditions) without developing an overdraft condi-tion.
permeability the capability of soil or other geologicformations to transmit water.
phytoplankton minute plants, such as algae, that livesuspended in bodies of water.
planning subarea (PSA) an intermediately-sizedstudy area used by the Department, consisting ofmultiple detailed analysis units.
point source a specific site from which wastewater orpolluted water is discharged into a water body.
pollution (of water) the alteration of the physical,chemical, or biological properties of water by theintroduction of any substance into water that ad-versely affects any beneficial use of water.
project yield the water supply attributed to all fea-tures of a project, including integrated operationof units that could be operated individually.
pump lift the distance between the groundwater tableand the overlying land surface.

G-5 GLOSSARY
The California Water Plan Update BULLETIN 160-98
pumped storage project a hydroelectric powerplantand reservoir system using an arrangementwhereby water released for generating energy dur-ing peak load periods is stored and pumped backinto the upper reservoir, usually during periods ofreduced power demand.
pump-generating plant a plant which can eitherpump water or generate electricity, depending onthe direction of water flow.
Rrecharge basin a surface facility constructed to infil-
trate surface water into a groundwater basin.
recycled water urban wastewater that becomes suit-able, as a result of treatment, for a specific benefi-cial use. Also called reclaimed water. See also wa-ter recycling.
return flow the portion of withdrawn water not con-sumed by evapotranspiration or system losseswhich returns to its source or to another body ofwater.
reuse the additional use of previously used water. Asused in this report, it is not water that has beenrecycled for beneficial use at a wastewater treat-ment plant.
reverse osmosis a method to remove salts and otherconstituents from water by forcing water throughmembranes.
riparian located on the banks of a stream or otherbody of water. Riparian water rights are rights heldby landowners adjacent to a natural waterbody.
runoff the volume of surface flow from an area.
Ssalinity generally, the concentration of mineral salts
dissolved in water. Salinity may be expressed interms of a concentration or as an electrical con-ductivity. When describing salinity influenced byseawater, salinity often refers to the concentrationof chlorides in the water. See also total dissolvedsolids.
salinity intrusion the movement of salt water into abody of fresh water. It can occur in either surfacewater or groundwater bodies.
salmonid fish species belonging to the salmon family,including salmon and trout.
salt sink a saline body of water, such as the ocean.
salt-water barrier a physical facility or method ofoperation designed to prevent the intrusion of saltwater into a body of fresh water (see hydraulicbarrier).
Seasonal Application Efficiency (SAE) the sum ofETAW and cultural water requirements dividedby applied water.
seepage the gradual movement of a fluid into, through,or from a porous medium.
self-produced water a water supply (often from wells)developed and used by an individual or entity. Alsocalled “self-supplied water.”
service area the geographic area served by a wateragency.
soluble minerals naturally occurring substances ca-pable of being dissolved.
spreading basin see recharge basin.
spreading grounds see recharge basin.
supply augmentation alternatives water managementprograms—such as reservoir construction orgroundwater extraction—that increase supply.
surface supply water supply from streams, lakes, andreservoirs.
Ttailwater applied irrigation water that runs off the
end of a field. Tailwater is not necessarily lost; itcan be collected and reused on the same or adja-cent fields.
tertiary treatment in wastewater treatment, the ad-ditional treatment of effluent beyond that of sec-ondary treatment to obtain higher quality of ef-fluent.
total dissolved solids (TDS) a quantitative measureof the residual minerals dissolved in water that re-main after evaporation of a solution. Usually ex-pressed in milligrams per liter. Abbreviation: TDS.See also salinity.
transpiration an essential physiological process inwhich plant tissues give off water vapor to the at-mosphere.
trihalomethane (THM) a chlorinated halogen com-pound such as chloroform, carbon tetrachlorideor bromoform.

G-6GLOSSARY
The California Water Plan Update BULLETIN 160-98
Uunimpaired flow the flow past a specified point on a
natural stream that is unaffected by stream diver-sion, storage, import, export, return flow, orchange in use caused by modifications in land use.
Wwastewater domestic or municipal sewage or efflu-
ent from an industrial process.
water quality description of the chemical, physical,and biological characteristics of water, usually inregard to its suitability for a particular purpose oruse.
water recycling the treatment of urban wastewater toa level rendering it suitable for a specific benefi-cial use.
water service reliability the degree to which a waterservice system can successfully manage water short-ages.
watershed see drainage basin.
water table see groundwater table.
water transfers marketing arrangements that can in-clude the permanent sale of a water right by thewater right holder; a lease of the right to use waterfrom the water right holder; the sale or lease of acontractual right to water supply.
water year a continuous 12-month period for whichhydrologic records are compiled and summarized.Different agencies may use different calendar pe-riods for their water years.

G-7 GLOSSARY
The California Water Plan Update BULLETIN 160-98

i
The California Water Plan Update BULLETIN 160-98
CONVERSION FACTORS
Quantity To convert from To metric unit Multiply To convert to customary unit customary customary unit,
unit by multiply metricunit by
Length inches (in) millimeters (mm)● 25.4 0.03937inches (in) centimeters (cm) 2.54 0.3937feet (ft) meters (m) 0.3048 3.2808miles (mi) kilometers (km) 1.6093 0.62139
Area square inches (in2) square millimeters (mm2) 645.16 0.00155square feet (ft2) square meters (m2) 0.092903 10.764acres (ac) hectares (ha) 0.40469 2.4710square miles (mi2) square kilometers (km2) 2.590 0.3861
Volume gallons (gal) liters (L) 3.7854 0.26417million gallons (106 gal) megaliters (ML) 3.7854 0.26417cubic feet (ft3) cubic meters (m3) 0.028317 35.315cubic yards (yd3) cubic meters (m3) 0.76455 1.308acre-feet (ac-ft) thousand cubic meters (m3 x 103) 1.2335 0.8107acre-feet (ac-ft) hectare-meters (ha - m)■ 0.1234 8.107thousand acre-feet (taf ) million cubic meters (m3 x 106) 1.2335 0.8107thousand acre-feet (taf ) hectare-meters (ha - m)■ 123.35 0.008107million acre-feet (maf) billion cubic meters (m3 x 109)◆ 1.2335 0.8107million acre-feet (maf) cubic kilometers (km3) 1.2335 0.8107
Flow cubic feet per second (ft3/s) cubic meters per second (m3/s) 0.028317 35.315gallons per minute (gal/min) liters per minute (L/min) 3.7854 0.26417gallons per day (gal/day) liters per day (L/day) 3.7854 0.26417million gallons per day (mgd) megaliters per day (ML/day) 3.7854 0.26417acre-feet per day (ac-ft/day) thousand cubic meters per day (m3 x 103/day) 1.2335 0.8107
Mass pounds (lb) kilograms (kg) 0.45359 2.2046tons (short, 2,000 lb) megagrams (Mg) 0.90718 1.1023
Velocity feet per second (ft/s) meters per second (m/s) 0.3048 3.2808
Power horsepower (hp) kilowatts (kW) 0.746 1.3405
Pressure pounds per square inch (psi) kilopascals (kPa) 6.8948 0.14505head of water in feet kilopascals (kPa) 2.989 0.33456
Specific capacity gallons per minute per foot liters per minute per meter of drawdown 12.419 0.08052of drawdown
Concentration parts per million (ppm) milligrams per liter (mg/L) 1.0 1.0
Electrical conductivity micromhos per centimeter microsiemens per centimeter (mS/cm) 1.0 1.0
Temperature degrees Fahrenheit (˚F) degrees Celsius (˚C) (˚F - 32)/1.8 (1.8 x ˚C) + 32
● When using “dual units,” inches are normally converted to millimeters (rather than centimeters).■ Not used often in metric countries, but is offered as a conceptual equivalent of customary western U.S. practice (a standard depth of water
over a given area of land).◆ ASTM Manual E380 discourages the use of billion cubic meters since that magnitude is represented by giga (a thousand million) in other
countries. It is shown here for potential use for quantifying large reservoir volumes (similar to million acre-feet).
OTHER COMMON CONVERSION FACTORS
1 cubic foot=7.48 gallons=62.4 pounds of water 1 acre-foot=325,900 gallons=43,560 cubic feet
1 cubic foot per second (cfs)=450 gallons per minute (gpm) 1 million gallons=3.07 acre-feet
1 cfs=646,320 gallons a day=1.98 ac-ft a day 1 million gallons a day (mgd)=1,120 ac-ft a year
Quest
More information about the California Department of Water Resources is available at: http://wwwdwr.water.ca.gov/ For a hard copy version of the Bulletin, please call the Publications Office at (916) 653-1097.