Georgia - Statewide Variety Testing
96
The Georgia Agricultural Experiment Stations Annual Publication 100-8 College of Agricultural and Environmental Sciences July 2016 The University of Georgia Georgia 2015-2016 Small Grain Performance Tests John D. Gassett, Dustin Dunn, Henry Jordan, Jr., and J. LaDon Day Editors Wheat Oat Rye Triticale Barley Ryegrass Department of Crop and Soil Sciences Griffin Campus
-
Upload
khangminh22 -
Category
Documents
-
view
1 -
download
0
Transcript of Georgia - Statewide Variety Testing
The Georgia Agricultural Experiment Stations Annual Publication 100-8 College of Agricultural and Environmental Sciences July 2016 The University of Georgia
Georgia2015-2016 Small Grain
Performance TestsJohn D. Gassett, Dustin Dunn, Henry
Jordan, Jr., and J. LaDon Day Editors
Wheat Oat Rye
Triticale Barley Ryegrass
Department of Crop and Soil SciencesGriffin Campus
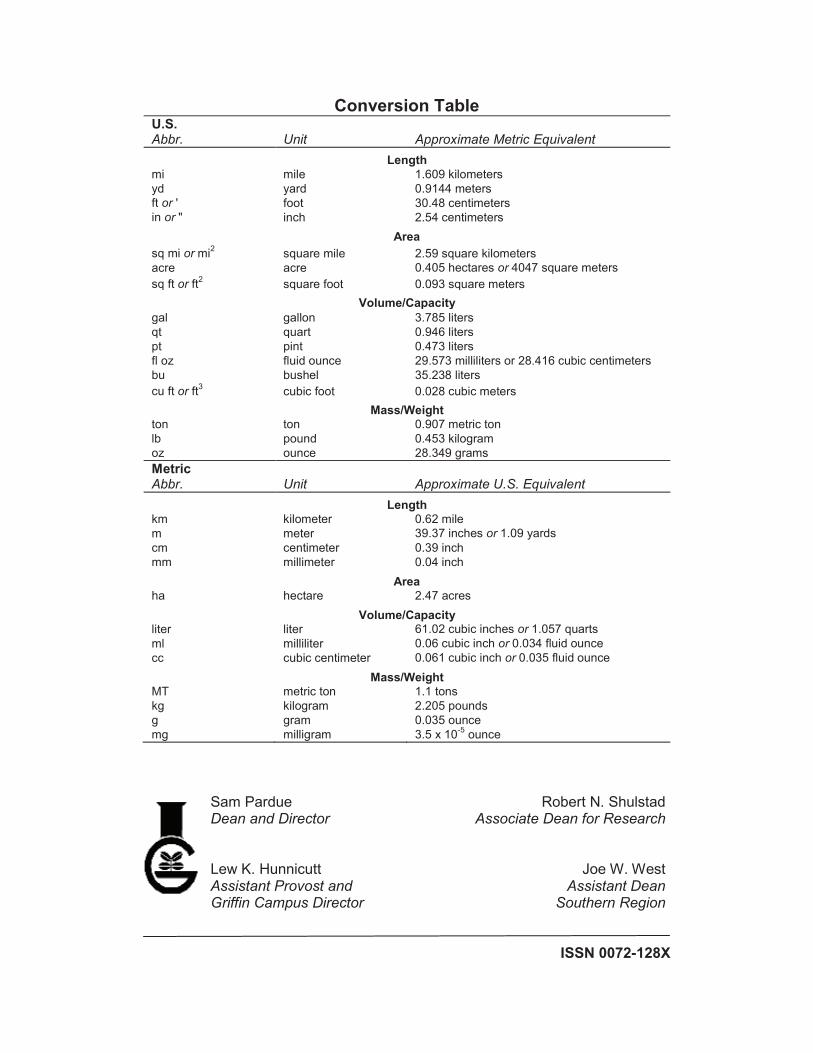
Conversion TableU.S.Abbr. Unit Approximate Metric Equivalent
Lengthmi mile 1.609 kilometersyd yard 0.9144 metersft or ' foot 30.48 centimetersin or " inch 2.54 centimeters
Areasq mi or mi2 square mile 2.59 square kilometersacre acre 0.405 hectares or 4047 square meterssq ft or ft2 square foot 0.093 square meters
Volume/Capacitygal gallon 3.785 litersqt quart 0.946 literspt pint 0.473 litersfl oz fluid ounce 29.573 milliliters or 28.416 cubic centimetersbu bushel 35.238 literscu ft or ft3 cubic foot 0.028 cubic meters
Mass/Weightton ton 0.907 metric tonlb pound 0.453 kilogramoz ounce 28.349 gramsMetricAbbr. Unit Approximate U.S. Equivalent
Lengthkm kilometer 0.62 milem meter 39.37 inches or 1.09 yardscm centimeter 0.39 inchmm millimeter 0.04 inch
Areaha hectare 2.47 acres
Volume/Capacityliter liter 61.02 cubic inches or 1.057 quartsml milliliter 0.06 cubic inch or 0.034 fluid ouncecc cubic centimeter 0.061 cubic inch or 0.035 fluid ounce
Mass/WeightMT metric ton 1.1 tonskg kilogram 2.205 poundsg gram 0.035 ouncemg milligram 3.5 x 10⁻⁵ ounce
Sam Pardue Robert N. ShulstadDean and Director Associate Dean for Research
Lew K. Hunnicutt Joe W. WestAssistant Provost and Assistant DeanGriffin Campus Director Southern Region
ISSN 0072-128X
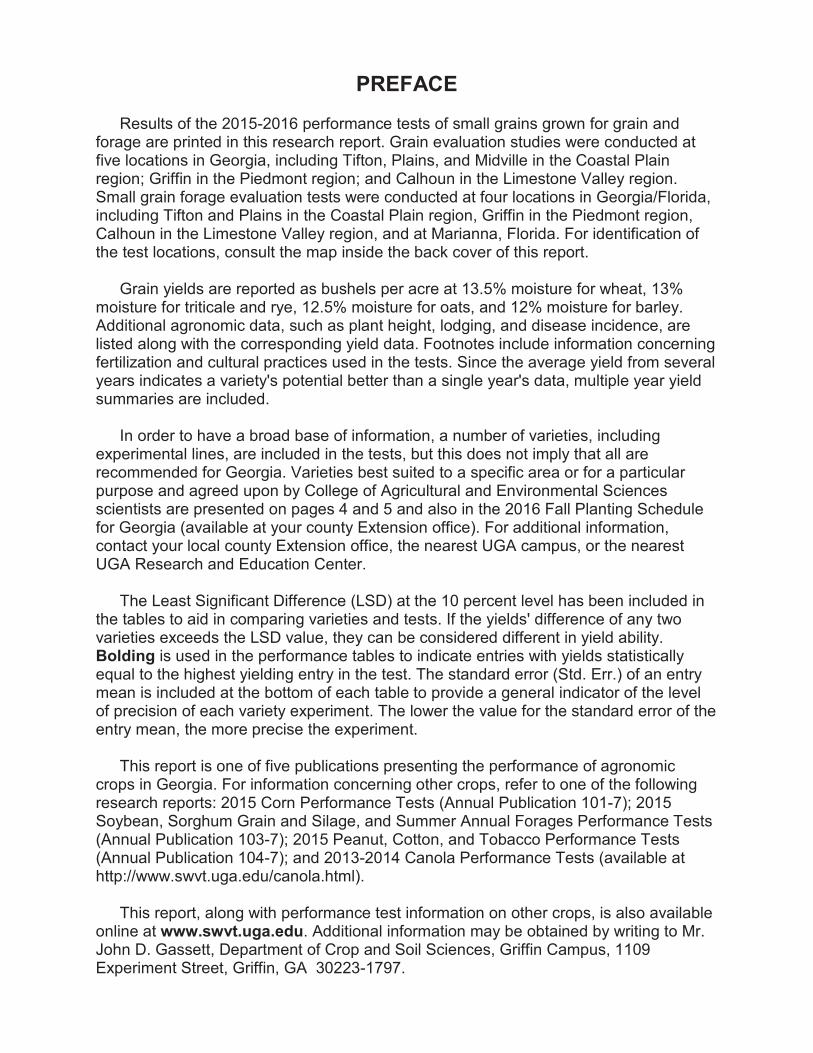
PREFACE
Results of the 2015-2016 performance tests of small grains grown for grain and forage are printed in this research report. Grain evaluation studies were conducted at five locations in Georgia, including Tifton, Plains, and Midville in the Coastal Plain region; Griffin in the Piedmont region; and Calhoun in the Limestone Valley region. Small grain forage evaluation tests were conducted at four locations in Georgia/Florida, including Tifton and Plains in the Coastal Plain region, Griffin in the Piedmont region, Calhoun in the Limestone Valley region, and at Marianna, Florida. For identification of the test locations, consult the map inside the back cover of this report.
Grain yields are reported as bushels per acre at 13.5% moisture for wheat, 13%moisture for triticale and rye, 12.5% moisture for oats, and 12% moisture for barley. Additional agronomic data, such as plant height, lodging, and disease incidence, are listed along with the corresponding yield data. Footnotes include information concerning fertilization and cultural practices used in the tests. Since the average yield from several years indicates a variety's potential better than a single year's data, multiple year yield summaries are included.
In order to have a broad base of information, a number of varieties, including experimental lines, are included in the tests, but this does not imply that all are recommended for Georgia. Varieties best suited to a specific area or for a particular purpose and agreed upon by College of Agricultural and Environmental Sciences scientists are presented on pages 4 and 5 and also in the 2016 Fall Planting Schedule for Georgia (available at your county Extension office). For additional information, contact your local county Extension office, the nearest UGA campus, or the nearest UGA Research and Education Center.
The Least Significant Difference (LSD) at the 10 percent level has been included in the tables to aid in comparing varieties and tests. If the yields' difference of any two varieties exceeds the LSD value, they can be considered different in yield ability. Bolding is used in the performance tables to indicate entries with yields statistically equal to the highest yielding entry in the test. The standard error (Std. Err.) of an entry mean is included at the bottom of each table to provide a general indicator of the level of precision of each variety experiment. The lower the value for the standard error of the entry mean, the more precise the experiment.
This report is one of five publications presenting the performance of agronomic crops in Georgia. For information concerning other crops, refer to one of the following research reports: 2015 Corn Performance Tests (Annual Publication 101-7); 2015 Soybean, Sorghum Grain and Silage, and Summer Annual Forages Performance Tests (Annual Publication 103-7); 2015 Peanut, Cotton, and Tobacco Performance Tests (Annual Publication 104-7); and 2013-2014 Canola Performance Tests (available at http://www.swvt.uga.edu/canola.html).
This report, along with performance test information on other crops, is also available online at www.swvt.uga.edu. Additional information may be obtained by writing to Mr. John D. Gassett, Department of Crop and Soil Sciences, Griffin Campus, 1109 Experiment Street, Griffin, GA 30223-1797.
Cooperators
Dr. M. A. Babar, North Florida Research & Education Center, Quincy, Florida.Mr. A. Black, Southeast Research & Education Center, Midville, Georgia.
Dr. A. R. Blount, North Florida Research & Education Center, Marianna, Florida.Dr. J. W. Buck, Plant Pathology Department, Griffin Campus, Griffin, Georgia.Dr. G. D. Buntin, Entomology Department, Griffin Campus, Griffin, Georgia.
Mr. G. Granade, Field Research Services, Griffin Campus, Georgia.Dr. I. Flitcroft, Crop & Soil Sciences Department, Griffin Campus, Griffin, Georgia.
Dr. J. W. Johnson, Crop & Soil Sciences Department, Griffin Campus, Griffin, Georgia.Mr. S. R. Jones, Southwest Research & Education Center, Plains, Georgia.
Dr. R. D. Lee, Crop & Soil Sciences Department, Tifton Campus, Tifton, Georgia.Dr. A. Martinez, Plant Pathology Diagnostics Lab, Griffin Campus, Griffin, Georgia.
Dr. M. Megoum, Crop & Soil Sciences Department, Griffin Campus, Griffin, Georgia.Mr. P. C. Worley, Northwest Research & Education Center, Calhoun, Georgia.Mr. J. Youmans, Plant Pathology Department, Griffin Campus, Griffin, Georgia.
Contributors
The following individuals contributed to the gathering of data and the preparation of this report: D. Bland, R. Brooke, K. Cobb, A. Coy, T. Dunn, M. Flynn, D. Gordon, G. Henderson, W. Jacobs, J. Jones, W. Jones, C. Marchant, B. McCranie, R. Milton, D. Pearce, T. Robinson, G. South, T. Strickland, J. Stubbs, S. Sutton, G. Ware, and B. Weldy.
CONTENTSThe Season .................................................................................................................................................1
2015-2016 Rainfall....................................................................................................................................1
Small Grain Cultural Practices .................................................................................................................3Characteristics of Varieties, 2016.............................................................................................................7Small Grain Updates
Diseases ...................................................................................................................................................8Insects.......................................................................................................................................................9
Grain Test ResultsWheat
State Variety TrialsTifton, Georgia: Wheat Grain Performance, 2015-2016.........................................................................12Tifton, Georgia: Late-Planted Wheat Grain Performance, 2015-2016 ...................................................15Plains, Georgia: Wheat Grain Performance, 2015-2016 ........................................................................16Plains, Georgia: Wheat Grain Performance with Foliar Fungicide, 2015-2016......................................18Plains, Georgia: Effect of Fungicide on Wheat Grain Yield, 2015-2016.................................................20Plains, Georgia: Late-Planted Wheat Grain Performance, 2015-2016 ..................................................22Plains, Georgia: Late-Planted Wheat Grain Performance with Foliar Fungicide, 2015-2016 ................23Plains, Georgia: Effect of Fungicide on Late-Planted Wheat Grain Yield, 2015-2016 ...........................24Midville, Georgia: Wheat Grain Performance, 2015-2016......................................................................25Midville, Georgia: Late-Planted Wheat Grain Performance, 2015-2016 ................................................27Griffin, Georgia: Wheat Grain Performance, 2015-2016 ........................................................................28Calhoun, Georgia: Wheat Grain Performance, 2015-2016 ....................................................................31Summary of Wheat Yields: Georgia, 2015-2016 with Two- and Three-Year Averages.........................34Summary of Late-Planted Wheat Yields: Georgia, 2015-2016 with Two- and Three-Year Averages ...36
Uniform Southern TestsPlains, Georgia: Uniform Southern Soft Red Winter Wheat Nursery, 2015-2016..................................37Griffin, Georgia: Uniform Southern Soft Red Winter Wheat Nursery, 2015-2016 ..................................38
Triticale and RyeTifton, Georgia: Triticale and Rye Grain Perfomance, 2015-2016 .........................................................39Plains, Georgia: Triticale Grain Performance, 2015-2016......................................................................40Midville, Georgia: Triticale Grain Performance, 2015-2016....................................................................41Griffin, Georgia: Triticale and Rye Grain Performance, 2015-2016 .......................................................42Summary of Triticale Yields: Georgia, 2015-2016 with Two- and Three-Year Averages.......................44Summary of Rye Yields: Georgia, 2015-2016 with Two- and Three-Year Averages.............................45
OatTifton, Georgia: Oat Grain Performance, 2015-2016 .............................................................................46Plains, Georgia: Oat Grain Performance, 2015-2016.............................................................................47Midville, Georgia: Oat Grain Performance, 2015-2016 ..........................................................................48Griffin, Georgia: Oat Grain Performance, 2015-2016.............................................................................49Calhoun, Georgia: Oat Grain Performance, 2015-2016 .........................................................................50Summary of Oat Yields: Georgia, 2015-2016 with Two- and Three-Year Averages .............................51
BarleyPlains, Georgia: Barley Grain Performance, 2015-2016 ........................................................................52Calhoun, Georgia: Barley Grain Performance, 2015-2016.....................................................................53Summary of Barley Yields: Georgia, 2015-2016 with Two- and Three-Year Averages .........................54Griffin, Georgia: USDA-ARS Uniform Winter Barley Trial, 2015-2016 ...................................................55
Forage Test Results
Wheat ForageTifton, Georgia: Wheat Forage Performance, 2015-2016 ......................................................................56Plains, Georgia: Wheat Forage Performance, 2015-2016 .....................................................................57Griffin, Georgia: Wheat Forage Performance, 2015-2016......................................................................58Marianna, Florida: Wheat Forage Performance, 2015-2016..................................................................59Statewide Summary: Wheat Forage Yields, 2015-2016 with Two- and Three-Year Averages .............60
Triticale and Rye ForageTifton, Georgia: Triticale and Rye Forage Performance, 2015-2016 .....................................................61Plains, Georgia: Triticale and Rye Forage Performance, 2015-2016.....................................................62Griffin, Georgia: Triticale and Rye Forage Performance, 2015-2016.....................................................63Marianna, Florida: Triticale and Rye Forage Performance, 2015-2016 .................................................64Statewide Summary: Triticale and Rye Forage Yields, 2015-2016
with Two- and Three-Year Averages.................................................................................................65
Triticale SilageTifton, Georgia: Triticale Silage Performance, 2015-2016 ................................................................66Griffin, Georgia: Triticale Silage Performance, 2015-2016................................................................67Statewide Summary: Triticale Silage Yields, 2015-2016 with Two- and Three-Year Averages .......68
Oat ForageTifton, Georgia: Oat Forage Performance, 2015-2016...........................................................................69Plains, Georgia: Oat Forage Performance, 2015-2016 ..........................................................................70Griffin, Georgia: Oat Forage Performance, 2015-2016 ..........................................................................71Marianna, Florida: Oat Forage Performance, 2015-2016.......................................................................72Statewide Summary: Oat Forage Yields, 2015-2016 with Two- and Three-Year Averages ..................73
Ryegrass ForageTifton, Georgia: Ryegrass Forage Performance, 2015-2016 .................................................................74Plains, Georgia: Ryegrass Forage Performance, 2015-2016.................................................................76Griffin, Georgia: Ryegrass Forage Performance, 2015-2016.................................................................78Calhoun, Georgia: Ryegrass Forage Performance, 2015-2016.............................................................80Marianna, Florida: Ryegrass Forage Performance, 2015-2016 .............................................................82Statewide Summary: Ryegrass Forage Yields, 2015-2016 with Two- and Three-Year Averages.........84
Sources of Seed for the 2015-2016 Small Grains Performance Tests ........................86
John D. Gassett is the program director of statewide variety testing, Henry Jordan, Jr. is a research professional III, and J. LaDon Day is a research scientist in the Department of Crop and Soil Sciences, Griffin Campus, Griffin, Georgia 30223-1797. Dustin G. Dunn is a research professional III in the Department of Crop and Soil Sciences, Tifton Campus, Tifton, Georgia 31793-5766.
2015-2016 SMALL GRAIN PERFORMANCE TESTS
Edited by John D. Gassett, Dustin G. Dunn,Henry Jordan Jr., and J. LaDon Day
The Season
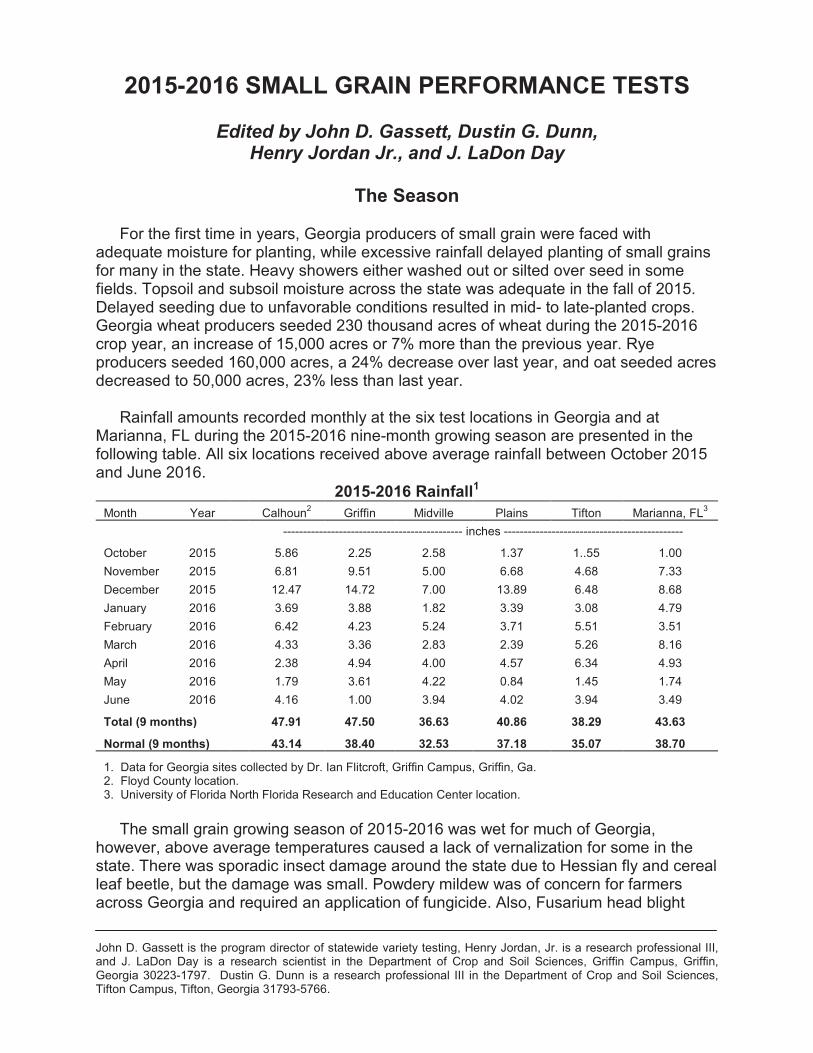
For the first time in years, Georgia producers of small grain were faced with adequate moisture for planting, while excessive rainfall delayed planting of small grains for many in the state. Heavy showers either washed out or silted over seed in some fields. Topsoil and subsoil moisture across the state was adequate in the fall of 2015. Delayed seeding due to unfavorable conditions resulted in mid- to late-planted crops. Georgia wheat producers seeded 230 thousand acres of wheat during the 2015-2016 crop year, an increase of 15,000 acres or 7% more than the previous year. Rye producers seeded 160,000 acres, a 24% decrease over last year, and oat seeded acres decreased to 50,000 acres, 23% less than last year.
Rainfall amounts recorded monthly at the six test locations in Georgia and at Marianna, FL during the 2015-2016 nine-month growing season are presented in the following table. All six locations received above average rainfall between October 2015 and June 2016.
2015-2016 Rainfall1Month Year Calhoun2 Griffin Midville Plains Tifton Marianna, FL3
--------------------------------------------- inches ---------------------------------------------
October 2015 5.86 2.25 2.58 1.37 1..55 1.00November 2015 6.81 9.51 5.00 6.68 4.68 7.33December 2015 12.47 14.72 7.00 13.89 6.48 8.68January 2016 3.69 3.88 1.82 3.39 3.08 4.79February 2016 6.42 4.23 5.24 3.71 5.51 3.51March 2016 4.33 3.36 2.83 2.39 5.26 8.16April 2016 2.38 4.94 4.00 4.57 6.34 4.93May 2016 1.79 3.61 4.22 0.84 1.45 1.74June 2016 4.16 1.00 3.94 4.02 3.94 3.49
Total (9 months) 47.91 47.50 36.63 40.86 38.29 43.63
Normal (9 months) 43.14 38.40 32.53 37.18 35.07 38.70
1. Data for Georgia sites collected by Dr. Ian Flitcroft, Griffin Campus, Griffin, Ga.2. Floyd County location.3. University of Florida North Florida Research and Education Center location.
The small grain growing season of 2015-2016 was wet for much of Georgia, however, above average temperatures caused a lack of vernalization for some in the state. There was sporadic insect damage around the state due to Hessian fly and cereal leaf beetle, but the damage was small. Powdery mildew was of concern for farmers across Georgia and required an application of fungicide. Also, Fusarium head blight
Annual Publication 100-8 • Georgia 2015-2016 Small Grain Performance Tests2
disease caused economic damage for the third year in a row due to the cold, wet weather during anthesis. Crown rust in oats was a concern for oat producers for a fourth year in a row.
During 2016, Georgia wheat producers harvested 135,000 acres of wheat grain,55,000 acres or 29% less than 2015. This acreage of wheat produced 8.74 million bushels, a 22% decrease from last year. Twenty thousand acres of oats were harvested for grain during 2016, which is a decrease of 5,000 acres under the previous year. Forty thousand acres of rye were harvested for grain, an increase of 33% over the previous year. Rye production in Georgia is primarily for forage and as a cover crop.
Annual Publication 100-8 • Georgia 2015-2016 Small Grain Performance Tests 3
SMALL GRAIN CULTURAL PRACTICES
R. Dewey LeeExtension Agronomist, Tifton, Georgia
Fertilization
Soil samples should be taken from all fields used for planting in small grains, whether for grain or grazing. Testing the soil before planting helps to determine the amount and type of fertilizer needed to produce a small grain crop. This practice may prevent excessive expenditures where the soil fertility level is very high, and it ensures that the nutritional needs of the crop are met.
Lime should be applied to maintain the soil pH at a target pH of 6.0. If the small grains are to be grazed or if magnesium (Mg) levels are low, dolomitic lime (high Mg) should be used. Adequate amounts of lime should be applied to the previous crop to ensure that the soil pH is in the desired range prior to planting small grains. If soil tests indicate the need for lime, it should be applied as soon as possible in order to allow adequate time for the soil pH change to occur (usually two to three months or more, depending on the fineness of grind).
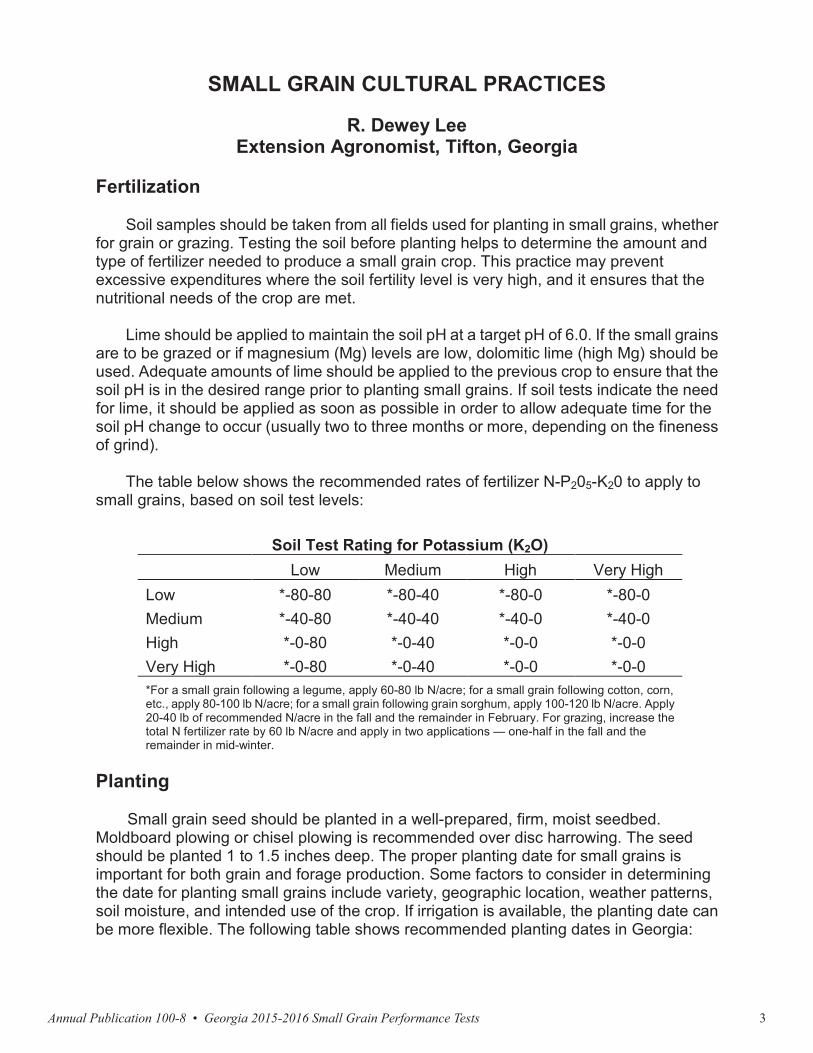
The table below shows the recommended rates of fertilizer N-P205-K20 to apply to small grains, based on soil test levels:
Soil Test Rating for Potassium (K2O)Low Medium High Very High
Low *-80-80 *-80-40 *-80-0 *-80-0Medium *-40-80 *-40-40 *-40-0 *-40-0High *-0-80 *-0-40 *-0-0 *-0-0Very High *-0-80 *-0-40 *-0-0 *-0-0*For a small grain following a legume, apply 60-80 lb N/acre; for a small grain following cotton, corn, etc., apply 80-100 lb N/acre; for a small grain following grain sorghum, apply 100-120 lb N/acre. Apply 20-40 lb of recommended N/acre in the fall and the remainder in February. For grazing, increase the total N fertilizer rate by 60 lb N/acre and apply in two applications — one-half in the fall and the remainder in mid-winter.
Planting
Small grain seed should be planted in a well-prepared, firm, moist seedbed. Moldboard plowing or chisel plowing is recommended over disc harrowing. The seed should be planted 1 to 1.5 inches deep. The proper planting date for small grains is important for both grain and forage production. Some factors to consider in determining the date for planting small grains include variety, geographic location, weather patterns, soil moisture, and intended use of the crop. If irrigation is available, the planting date can be more flexible. The following table shows recommended planting dates in Georgia:
Annual Publication 100-8 • Georgia 2015-2016 Small Grain Performance Tests4
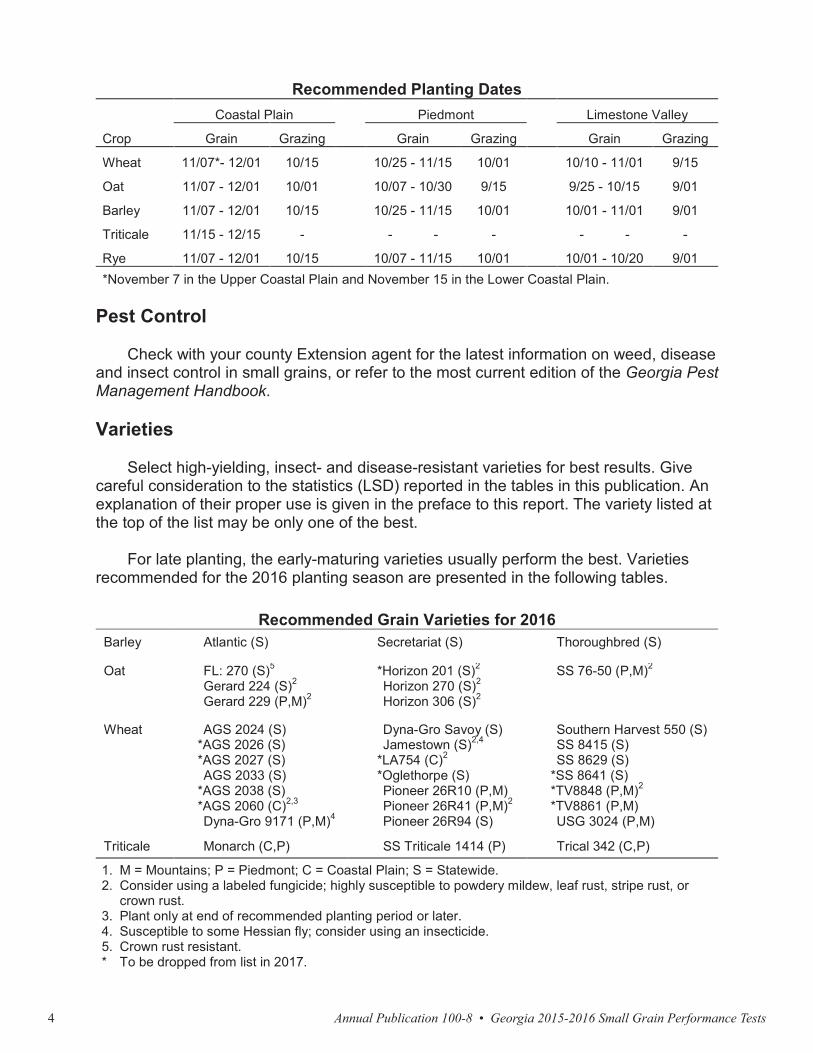
Recommended Planting DatesCoastal Plain Piedmont Limestone Valley
Crop Grain Grazing Grain Grazing Grain Grazing
Wheat 11/07*- 12/01 10/15 10/25 - 11/15 10/01 10/10 - 11/01 9/15
Oat 11/07 - 12/01 10/01 10/07 - 10/30 9/15 9/25 - 10/15 9/01
Barley 11/07 - 12/01 10/15 10/25 - 11/15 10/01 10/01 - 11/01 9/01
Triticale 11/15 - 12/15 - - - - - - -
Rye 11/07 - 12/01 10/15 10/07 - 11/15 10/01 10/01 - 10/20 9/01*November 7 in the Upper Coastal Plain and November 15 in the Lower Coastal Plain.
Pest Control
Check with your county Extension agent for the latest information on weed, diseaseand insect control in small grains, or refer to the most current edition of the Georgia Pest Management Handbook.
Varieties
Select high-yielding, insect- and disease-resistant varieties for best results. Give careful consideration to the statistics (LSD) reported in the tables in this publication. An explanation of their proper use is given in the preface to this report. The variety listed at the top of the list may be only one of the best.
For late planting, the early-maturing varieties usually perform the best. Varieties recommended for the 2016 planting season are presented in the following tables.
Recommended Grain Varieties for 2016Barley Atlantic (S) Secretariat (S) Thoroughbred (S)
Oat FL: 270 (S)5
Gerard 224 (S)2
Gerard 229 (P,M)2
*Horizon 201 (S)2
Horizon 270 (S)2
Horizon 306 (S)2
SS 76-50 (P,M)2
Wheat AGS 2024 (S)*AGS 2026 (S)*AGS 2027 (S)AGS 2033 (S)
*AGS 2038 (S)*AGS 2060 (C)2,3
Dyna-Gro 9171 (P,M)4
Dyna-Gro Savoy (S)Jamestown (S)2,4
*LA754 (C)2
*Oglethorpe (S)Pioneer 26R10 (P,M)Pioneer 26R41 (P,M)2
Pioneer 26R94 (S)
Southern Harvest 550 (S)SS 8415 (S)SS 8629 (S)
*SS 8641 (S)*TV8848 (P,M)2
*TV8861 (P,M)USG 3024 (P,M)
Triticale Monarch (C,P) SS Triticale 1414 (P) Trical 342 (C,P)
1. M = Mountains; P = Piedmont; C = Coastal Plain; S = Statewide. 2. Consider using a labeled fungicide; highly susceptible to powdery mildew, leaf rust, stripe rust, or
crown rust. 3. Plant only at end of recommended planting period or later.4. Susceptible to some Hessian fly; consider using an insecticide.5. Crown rust resistant.* To be dropped from list in 2017.
Annual Publication 100-8 • Georgia 2015-2016 Small Grain Performance Tests 5
Recommended Forage Varieties for 2016Oat *Horizon 201 (S)
Horizon 306 (S)Okay (S)NF402 (S)
RAM LA99016 (S)SS 76-50 (S)
Wheat AGS 2038 (S)Dyna-Gro Savoy (C)
*Oglethorpe (P,M)*Roberts (P,M)2
Southern Harvest 550 (S)3
*SS 8641 (S)
Rye Bates RS4 (S)Elbon (S)
FL 104 (S)Florida 401 (C)2
Oklon (S)Wrens Abruzzi (S)
Triticale Monarch (C,P) SS Triticale 1414 (S) Trical 342 (C,P)
Ryegrass Attain (S)Big Boss (S)
*Diamond T (S)*Earlyploid (S)Flying AFria (S)
Grazer (P,M)Jackson (P,M)Lonestar (S)Marshall (S)Maximus (S)Nelson (S)
Passerel Plus (S)Prine (S)TAMTBO (S)Tetrastar (S) Winterhawk (S)
1. M = Mountains; P = Piedmont; C = Coastal Plain; S = Statewide.2. Suitable for early planting. 3. Susceptible to some Hessian fly; consider using an insecticide.* To be dropped from list in 2017.
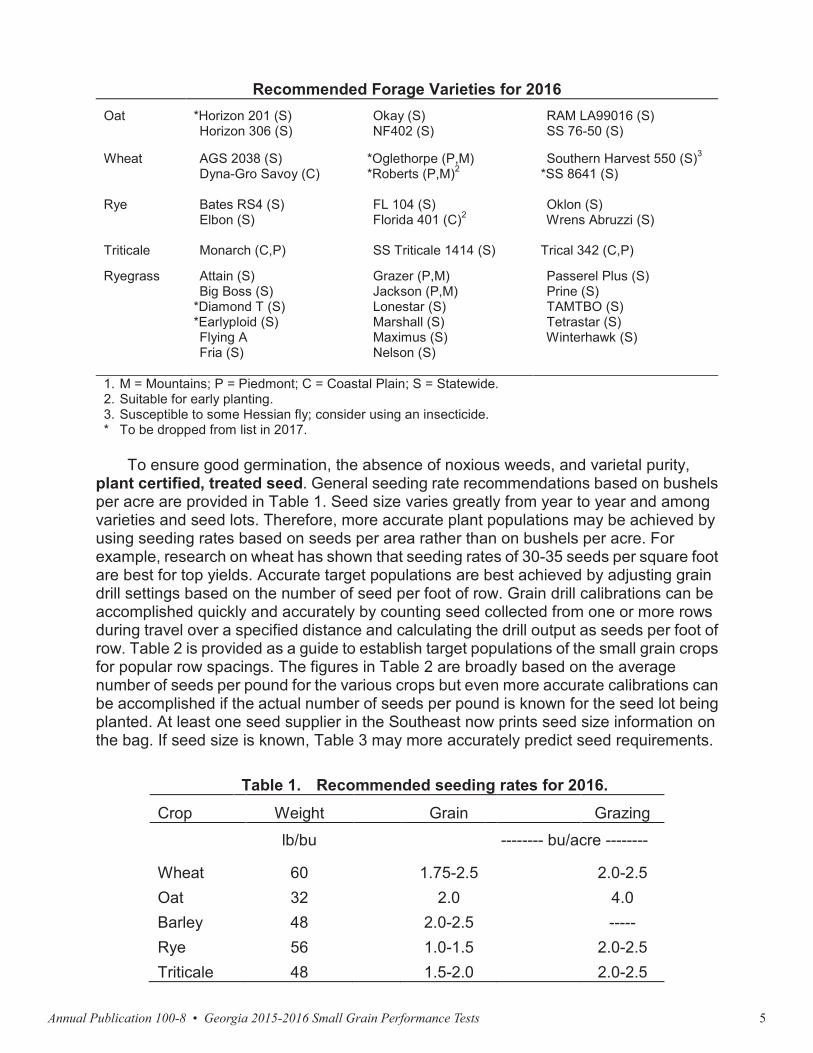
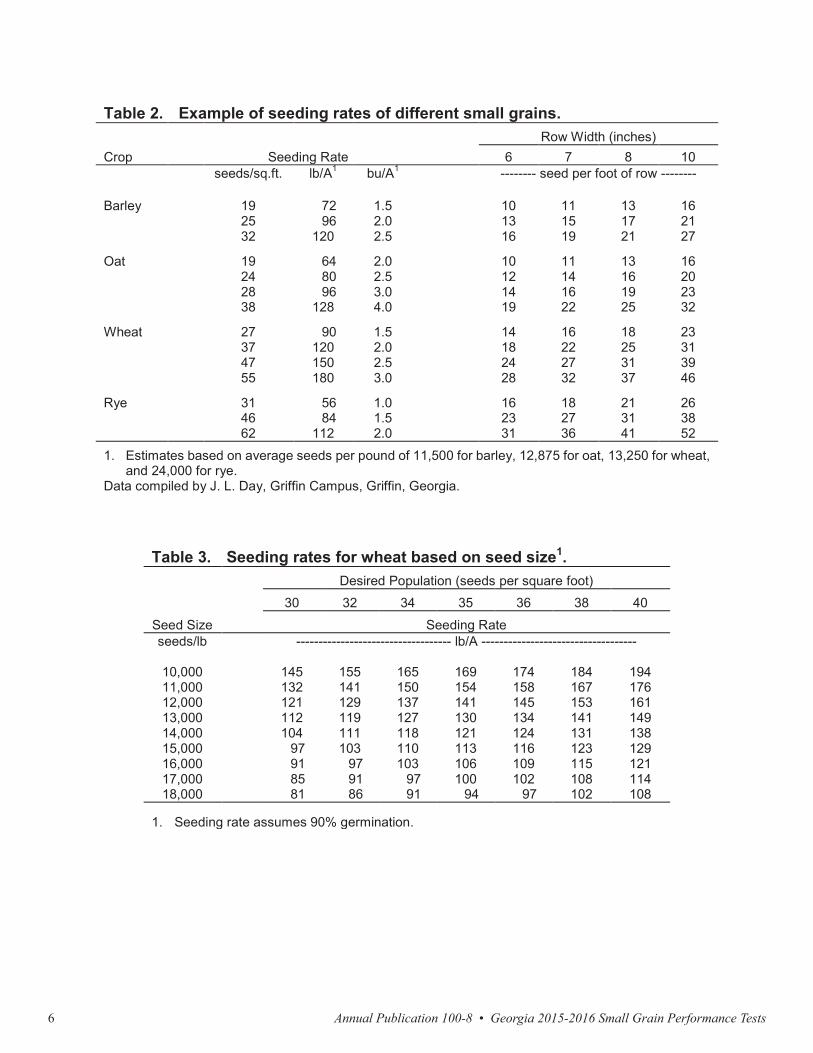
To ensure good germination, the absence of noxious weeds, and varietal purity,plant certified, treated seed. General seeding rate recommendations based on bushels per acre are provided in Table 1. Seed size varies greatly from year to year and among varieties and seed lots. Therefore, more accurate plant populations may be achieved by using seeding rates based on seeds per area rather than on bushels per acre. For example, research on wheat has shown that seeding rates of 30-35 seeds per square foot are best for top yields. Accurate target populations are best achieved by adjusting grain drill settings based on the number of seed per foot of row. Grain drill calibrations can be accomplished quickly and accurately by counting seed collected from one or more rows during travel over a specified distance and calculating the drill output as seeds per foot of row. Table 2 is provided as a guide to establish target populations of the small grain crops for popular row spacings. The figures in Table 2 are broadly based on the average number of seeds per pound for the various crops but even more accurate calibrations can be accomplished if the actual number of seeds per pound is known for the seed lot being planted. At least one seed supplier in the Southeast now prints seed size information on the bag. If seed size is known, Table 3 may more accurately predict seed requirements.
Table 1. Recommended seeding rates for 2016.
Crop Weight Grain Grazing
lb/bu -------- bu/acre --------
Wheat 60 1.75-2.5 2.0-2.5Oat 32 2.0 4.0Barley 48 2.0-2.5 -----Rye 56 1.0-1.5 2.0-2.5Triticale 48 1.5-2.0 2.0-2.5
Annual Publication 100-8 • Georgia 2015-2016 Small Grain Performance Tests6
Table 2. Example of seeding rates of different small grains.Row Width (inches)
Crop Seeding Rate 6 7 8 10seeds/sq.ft. lb/A1 bu/A1 -------- seed per foot of row --------
Barley 192532
7296
120
1.52.02.5
101316
111519
131721
162127
Oat 19242838
648096
128
2.02.53.04.0
10121419
11141622
13161925
16202332
Wheat 27374755
90120150180
1.52.02.53.0
14182428
16222732
18253137
23313946
Rye 314662
5684
112
1.01.52.0
162331
182736
213141
263852
1. Estimates based on average seeds per pound of 11,500 for barley, 12,875 for oat, 13,250 for wheat, and 24,000 for rye.
Data compiled by J. L. Day, Griffin Campus, Griffin, Georgia.
Table 3. Seeding rates for wheat based on seed size1.Desired Population (seeds per square foot)
30 32 34 35 36 38 40
Seed Size Seeding Rateseeds/lb ----------------------------------- lb/A -----------------------------------
10,00011,00012,00013,00014,00015,00016,00017,00018,000
145132121112104
97918581
155141129119111103
979186
165150137127118110103
9791
169154141130121113106100
94
174158145134124116109102
97
184167153141131123115108102
194176161149138129121114108
1. Seeding rate assumes 90% germination.

Annual Publication 100-8 • Georgia 2015-2016 Small Grain Performance Tests 7
CHARACTERISTICS OF VARIETIES, 2016Wheat
Resistance
Brand-VarietyLeafRust
StripeRust
GlumeBlotch
PowderyMildew BYD1 SBWM2
HeadScab
HessianFly
TestWt Maturity
StrawStrength
Vernal.Requir. Awned
AGS 2024 good good fair good fair good fair fair good medium good medium yesAGS 2026 good good good good fair good poor good* good medium fair short noAGS 2027 good good good good fair good fair good* good medium fair medium noAGS 2033 good good good good fair good fair good good medium good medium yesAGS 2035 good good fair fair fair good fair good good medium good short yesAGS 2038 good good fair good fair good fair fair good med. late good medium yesAGS 2060 good good good poor fair fair fair good good early fair short yesDyna-Gro 9171 fair good good fair fair good good poor fair late good long yesDyna-Gro Savoy good good good good fair good fair good* good early good short noJamestown good good fair good fair good good poor good medium good short yesLA754 good good fair poor fair poor fair good good early good short yesOglethorpe good good good fair fair good fair good* good medium fair short noPioneer 26R10 fair good good fair fair good fair good good late good long yesPioneer 26R20 poor poor - fair good good good good good late good long yesPioneer 26R41 fair good fair good good fair good good* good late good long yesPioneer 26R94 good good fair good fair good fair good good medium good short yesSouthern Harvest 550 good good good good fair good fair fair good medium good medium noSS 8415 fair good - good fair good good good* good late good long noSS 8629 fair good fair fair fair good good good* good medium fair medium yesSS 8641 good good fair good fair good poor good good medium good medium noTV8525 poor fair good fair fair good good poor good late good long yesTV8535 fair fair good fair good good good poor fair late good long yesTV8848 poor fair good fair good good fair good fair late good long yesTV8861 fair good good good fair good fair good good late good med. long yesUSG 3024 good good good good fair good poor fair good medium good medium yesTriticaleMonarch good - - good good - - fair fair early good short yesSS Triticale 1414 good - - good good - - fair fair early good shortTrical 342 good - - good good - - fair fair early good short yes
1. Barley yellow dwarf virus.2. Soilborne wheat mosaic virus.* Resistant to Bio-Type L.
OatResistance
Brand-VarietyCrownRust BYD1
ColdHardiness Maturity
TestWeight
StrawStrength
FL 720 good fair good early good goodGerard 224 poor fair good medium good fairGerard 229 poor fair good medium good fairHorizon 201 poor fair good medium fair fairHorizon 270 poor fair good medium good goodHorizon 306 poor fair good medium good goodSS 76-50 poor fair good medium good good1, Barley yellow dwarf virus.
BarleyResistance
Brand-VarietyGlumeBlotch
SpotBlotch Scald
HessianFly Maturity
TestWeight
HeadType
Atlantic good good good fair medium good awnedNomini fair good good fair medium fair awnedPrice fair good good fair medium fair awnedSecretariat good good good fair medium good awnedThoroughbred good good good fair late good awned
Annual Publication 100-8 • Georgia 2015-2016 Small Grain Performance Tests8
SMALL GRAIN UPDATES
DISEASES
James W. Buck, Alfredo Martinez-Espinoza, and John D. YoumansDepartment of Plant PathologyGriffin Campus, Griffin, Georgia
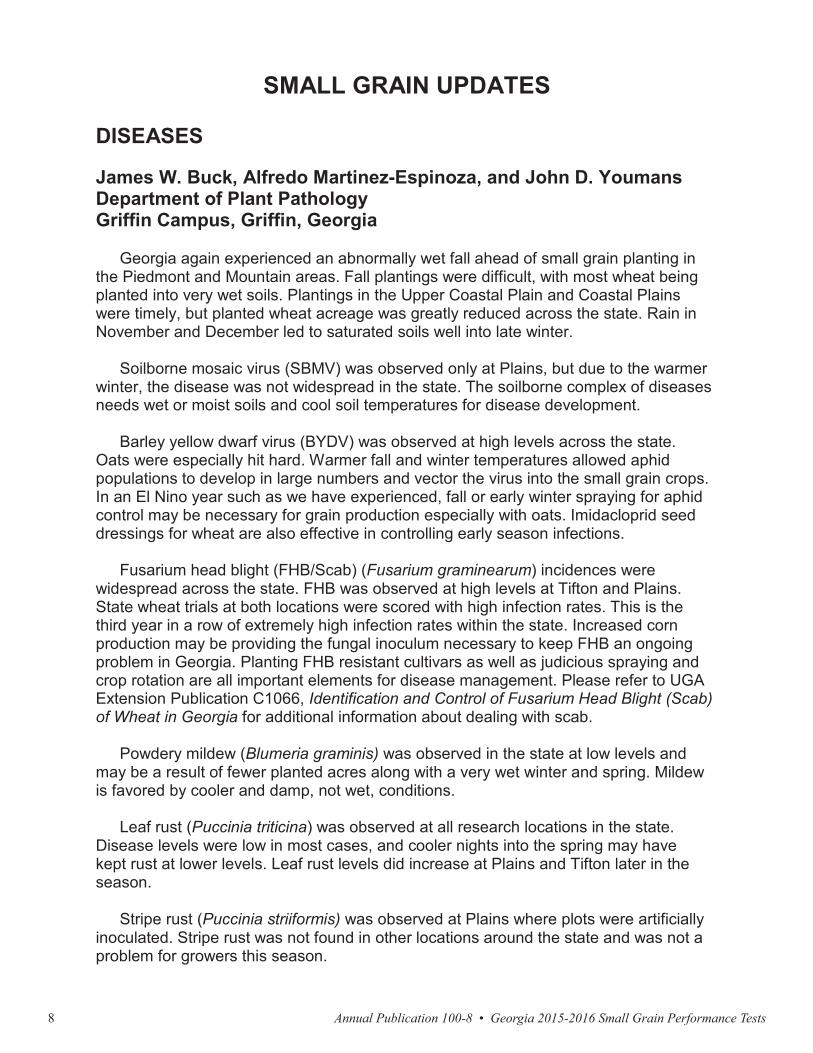
Georgia again experienced an abnormally wet fall ahead of small grain planting in the Piedmont and Mountain areas. Fall plantings were difficult, with most wheat being planted into very wet soils. Plantings in the Upper Coastal Plain and Coastal Plains were timely, but planted wheat acreage was greatly reduced across the state. Rain in November and December led to saturated soils well into late winter.
Soilborne mosaic virus (SBMV) was observed only at Plains, but due to the warmer winter, the disease was not widespread in the state. The soilborne complex of diseases needs wet or moist soils and cool soil temperatures for disease development.
Barley yellow dwarf virus (BYDV) was observed at high levels across the state. Oats were especially hit hard. Warmer fall and winter temperatures allowed aphid populations to develop in large numbers and vector the virus into the small grain crops. In an El Nino year such as we have experienced, fall or early winter spraying for aphid control may be necessary for grain production especially with oats. Imidacloprid seed dressings for wheat are also effective in controlling early season infections.
Fusarium head blight (FHB/Scab) (Fusarium graminearum) incidences were widespread across the state. FHB was observed at high levels at Tifton and Plains. State wheat trials at both locations were scored with high infection rates. This is the third year in a row of extremely high infection rates within the state. Increased corn production may be providing the fungal inoculum necessary to keep FHB an ongoing problem in Georgia. Planting FHB resistant cultivars as well as judicious spraying and crop rotation are all important elements for disease management. Please refer to UGA Extension Publication C1066, Identification and Control of Fusarium Head Blight (Scab) of Wheat in Georgia for additional information about dealing with scab.
Powdery mildew (Blumeria graminis) was observed in the state at low levels and may be a result of fewer planted acres along with a very wet winter and spring. Mildew is favored by cooler and damp, not wet, conditions.
Leaf rust (Puccinia triticina) was observed at all research locations in the state. Disease levels were low in most cases, and cooler nights into the spring may have kept rust at lower levels. Leaf rust levels did increase at Plains and Tifton later in the season.
Stripe rust (Puccinia striiformis) was observed at Plains where plots were artificially inoculated. Stripe rust was not found in other locations around the state and was not a problem for growers this season.
Annual Publication 100-8 • Georgia 2015-2016 Small Grain Performance Tests 9
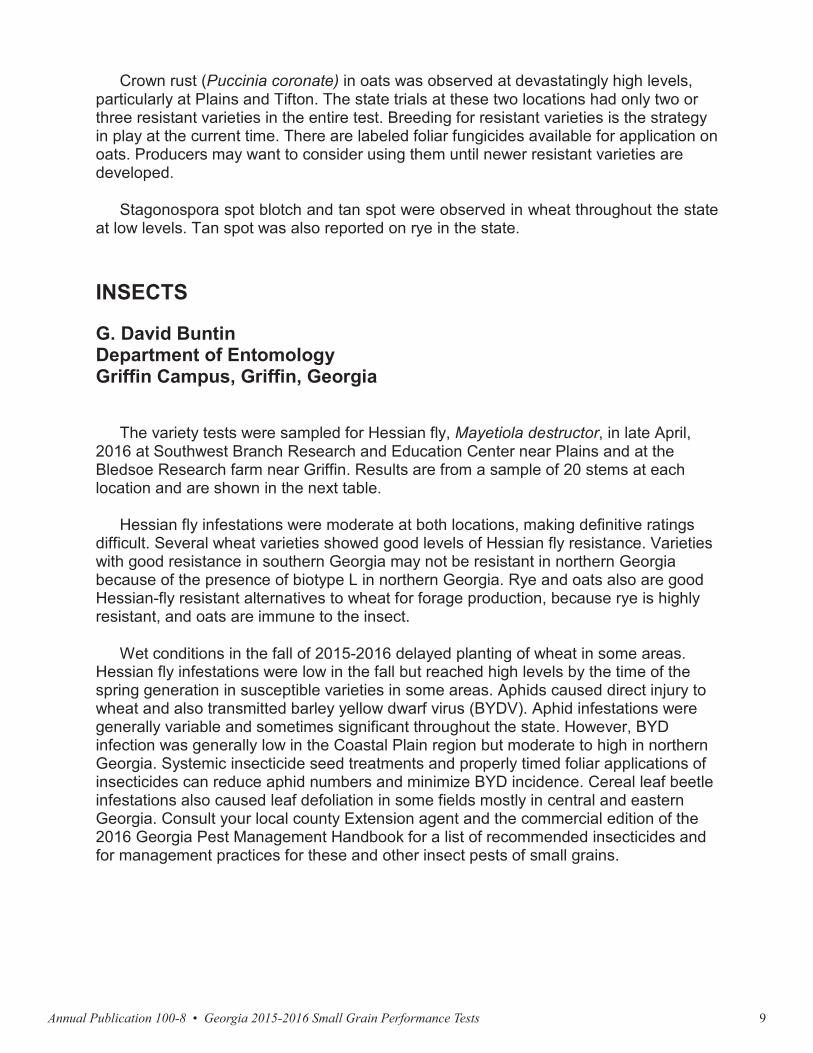
Crown rust (Puccinia coronate) in oats was observed at devastatingly high levels,particularly at Plains and Tifton. The state trials at these two locations had only two or three resistant varieties in the entire test. Breeding for resistant varieties is the strategy in play at the current time. There are labeled foliar fungicides available for application on oats. Producers may want to consider using them until newer resistant varieties are developed.
Stagonospora spot blotch and tan spot were observed in wheat throughout the state at low levels. Tan spot was also reported on rye in the state.
INSECTS
G. David BuntinDepartment of EntomologyGriffin Campus, Griffin, Georgia
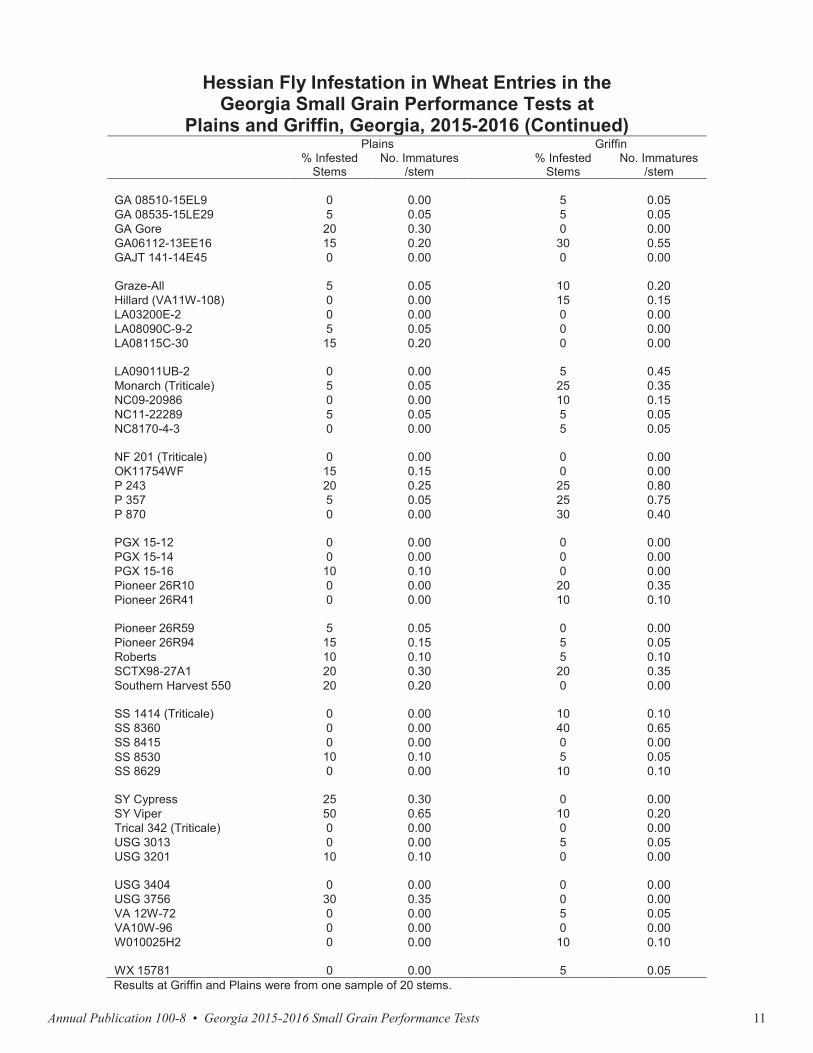
The variety tests were sampled for Hessian fly, Mayetiola destructor, in late April, 2016 at Southwest Branch Research and Education Center near Plains and at the Bledsoe Research farm near Griffin. Results are from a sample of 20 stems at each location and are shown in the next table.
Hessian fly infestations were moderate at both locations, making definitive ratings difficult. Several wheat varieties showed good levels of Hessian fly resistance. Varieties with good resistance in southern Georgia may not be resistant in northern Georgia because of the presence of biotype L in northern Georgia. Rye and oats also are good Hessian-fly resistant alternatives to wheat for forage production, because rye is highly resistant, and oats are immune to the insect.
Wet conditions in the fall of 2015-2016 delayed planting of wheat in some areas. Hessian fly infestations were low in the fall but reached high levels by the time of the spring generation in susceptible varieties in some areas. Aphids caused direct injury to wheat and also transmitted barley yellow dwarf virus (BYDV). Aphid infestations were generally variable and sometimes significant throughout the state. However, BYD infection was generally low in the Coastal Plain region but moderate to high in northern Georgia. Systemic insecticide seed treatments and properly timed foliar applications of insecticides can reduce aphid numbers and minimize BYD incidence. Cereal leaf beetle infestations also caused leaf defoliation in some fields mostly in central and eastern Georgia. Consult your local county Extension agent and the commercial edition of the 2016 Georgia Pest Management Handbook for a list of recommended insecticides and for management practices for these and other insect pests of small grains.

Annual Publication 100-8 • Georgia 2015-2016 Small Grain Performance Tests10
Hessian Fly Infestation in Wheat Entries in theGeorgia Small Grain Performance Tests at
Plains and Griffin, Georgia, 2015-2016Plains Griffin
% InfestedStems
No. Immatures/stem
% InfestedStems
No. Immatures/stem
154 (Triticale) 5 0.05 15 0.20AgriMAXX 415 10 0.10 0 0.00AgriMAXX 446 20 0.35 5 0.35AgriMAXX EXP1674 0 0.00 0 0.00AGS 2024 5 0.05 0 0.00
AGS 2033 5 0.05 0 0.00AGS 2038 10 0.15 0 0.00AGS 2040 40 1.35 25 0.25AGS 3000 (LA 06146E-P4) 0 0.00 0 0.00AR01040-4-1 25 0.45 30 0.35
ARGA 04510-11E24 30 0.40 5 0.05Dyna-Gro 9171 5 0.05 40 0.75Dyna-Gro 9522 25 0.25 5 0.10Dyna-Gro 9642 0 0.00 10 0.15Dyna-Gro Savoy 0 0.00 10 0.10
EXP 3536 5 0.05 0 0.00FL 001143 Triticale 20 0.20 5 0.05FL 01008 (Triticale) 0 0.00 5 0.05FL 08128 (Triticale) 0 0.00 15 0.15GA 04434-12LE28 0 0.00 25 0.55
GA 051102-13LE43 0 0.00 25 0.45GA 051207-14E53 5 0.05 0 0.00GA 05450-15EL52 30 0.40 15 0.20GA 05450-15LE41 30 0.50 5 0.05GA 061082-13E24 5 0.05 30 0.35
GA 061086-14LE23 0 0.00 0 0.00GA 061096-14E3 20 0.20 0 0.00GA 061157-15LE44 10 0.10 20 0.30GA 061158-14LE11 10 0.15 0 0.00GA 061349-13LE29 0 0.00 25 0.30
GA 061349-13LE31 15 0.20 0 0.00GA 061471-15LE38 25 0.25 5 0.05GA 06283-15LE25 40 0.60 5 0.10GA 06474-15EL56 25 0.35 0 0.00GA 071012-14E6 0 0.00 5 0.05
GA 071171-15EL64ES8 10 0.20 10 0.10GA 07144-15LE16 0 0.00 10 0.25GA 07192-14E9 15 0.15 15 0.35GA 071969-14LE24 0 0.00 40 0.65GA 07353-14E19 15 0.15 10 0.15
GA 081104-15EL23 5 0.05 10 0.25GA 081113-15EL8 0 0.00 0 0.00GA 081446-15EL47 0 0.00 5 0.05GA 08261-15EL7 10 0.10 20 0.20GA 08391-15EL19 0 0.00 0 0.00
Annual Publication 100-8 • Georgia 2015-2016 Small Grain Performance Tests 11
Hessian Fly Infestation in Wheat Entries in theGeorgia Small Grain Performance Tests at
Plains and Griffin, Georgia, 2015-2016 (Continued)Plains Griffin
% InfestedStems
No. Immatures/stem
% InfestedStems
No. Immatures/stem
GA 08510-15EL9 0 0.00 5 0.05GA 08535-15LE29 5 0.05 5 0.05GA Gore 20 0.30 0 0.00GA06112-13EE16 15 0.20 30 0.55GAJT 141-14E45 0 0.00 0 0.00
Graze-All 5 0.05 10 0.20Hillard (VA11W-108) 0 0.00 15 0.15LA03200E-2 0 0.00 0 0.00LA08090C-9-2 5 0.05 0 0.00LA08115C-30 15 0.20 0 0.00
LA09011UB-2 0 0.00 5 0.45Monarch (Triticale) 5 0.05 25 0.35NC09-20986 0 0.00 10 0.15NC11-22289 5 0.05 5 0.05NC8170-4-3 0 0.00 5 0.05
NF 201 (Triticale) 0 0.00 0 0.00OK11754WF 15 0.15 0 0.00P 243 20 0.25 25 0.80P 357 5 0.05 25 0.75P 870 0 0.00 30 0.40
PGX 15-12 0 0.00 0 0.00PGX 15-14 0 0.00 0 0.00PGX 15-16 10 0.10 0 0.00Pioneer 26R10 0 0.00 20 0.35Pioneer 26R41 0 0.00 10 0.10
Pioneer 26R59 5 0.05 0 0.00Pioneer 26R94 15 0.15 5 0.05Roberts 10 0.10 5 0.10SCTX98-27A1 20 0.30 20 0.35Southern Harvest 550 20 0.20 0 0.00
SS 1414 (Triticale) 0 0.00 10 0.10SS 8360 0 0.00 40 0.65SS 8415 0 0.00 0 0.00SS 8530 10 0.10 5 0.05SS 8629 0 0.00 10 0.10
SY Cypress 25 0.30 0 0.00SY Viper 50 0.65 10 0.20Trical 342 (Triticale) 0 0.00 0 0.00USG 3013 0 0.00 5 0.05USG 3201 10 0.10 0 0.00
USG 3404 0 0.00 0 0.00USG 3756 30 0.35 0 0.00VA 12W-72 0 0.00 5 0.05VA10W-96 0 0.00 0 0.00W010025H2 0 0.00 10 0.10
WX 15781 0 0.00 5 0.05Results at Griffin and Plains were from one sample of 20 stems.

Annual Publication 100-8 • Georgia 2015-2016 Small Grain Performance Tests12
Brand-Variety3-Year
Average2-Year
Average Rank Yield1TestWt Ht
HeadDate
PowderyMildew2
LeafRust3
FHB/Scab4
bu/acre lb/bu in mo/day rating % rating
Dyna-Gro Savoy 79.9 77.0 4 104.8 58.1 35 03/27 0 0 3GA 04434-12LE28 76.7 73.9 25 95.3 57.1 41 04/05 0 8 4AGS 2024 75.4 75.9 2T 106.3 57.1 37 04/01 0 0 5AGS 2033 75.2 74.4 8 99.1 60.2 39 04/04 0 0 1GA 061349-13LE31 74.3 74.3 12 98.2 58.1 39 04/06 3 0 2
Southern Harvest 550 73.7 72.0 17 97.1 56.8 39 04/01 0 0 4AGS 2040 72.7 70.5 24T 95.6 59.5 39 03/31 0 0 2GA 06112-13EE16 72.4 67.3 29 91.7 58.4 36 03/24 0 0 0LA3200E-2 72.2 66.7 18 96.9 60.5 39 04/02 0 15 1GA 061349-13LE29 70.1 67.7 41 86.5 55.9 38 04/10 0 0 0
GA 051102-13LE43 69.5 66.9 26 95.1 59.1 39 04/07 0 0 0SY Cypress 68.8 65.5 34 89.6 57.4 35 03/27 2 10 0Pioneer 26R94 68.6 66.7 19 96.8 60.1 41 03/31 0 0 2GA 061082-13E24 66.9 61.3 44 84.0 55.5 34 04/04 2 0 3SS 8629 66.5 64.0 45 82.0 53.0 37 04/07 1 35 0
SS 8415 63.9 54.4 50 75.0 52.5 40 04/11 0 10 0AGS 2038 60.4 57.1 31 90.6 57.6 43 04/02 0 0 5Pioneer 26R41 60.1 50.9 53 70.2 56.2 38 04/14 2 18 0USG 3404 53.5 48.0 58 61.2 54.4 40 04/16 2 40 0SS 8360 51.3 37.7 64 37.3 51.2 37 04/17 2 45 0
Pioneer 26R10 49.9 36.8 61 57.2 51.6 39 04/15 4 40 0P 870 43.7 37.9 62 55.7 51 37 04/16 1 28 0P 357 34.1 24.2 66 25.3 23.1 36 04/15 3 33 0GA 07353-14E19 . 73.9 3 105.9 59.0 38 03/28 2 0 0GA 061096-14E3 . 71.1 33 89.9 60.5 39 04/03 0 1 1
GA 07192-14E9 . 70.2 15 97.6 57.8 40 03/27 2 0 0Hilliard . 68.4 14 97.90 56.4 43 04/08 0 28 0GAJT 141-14E45 . 67.7 23 95.8 57.7 37 04/03 0 0 5GA 071012-14E6 . 67.5 27 93.7 58.3 35 03/26 0 0 0GA 061158-14LE11 . 67.1 20T 96.6 59.0 41 04/07 1 0 1
GA 07169-14LE24 . 66.5 5 103.0 55.3 40 04/07 1 5 5GA 051207-14E53 . 64.9 36 89.0 56.2 42 04/07 2 0 3SCTX 98-27A1 . 64.8 35 89.5 55.1 37 03/31 2 8 3VA10W-96 . 64.1 30T 90.8 58.0 42 04/08 0 0 0SS 8530 . 61.3 40T 87.0 54.3 42 04/09 1 6 0
W 010025 H2 . 59.2 47 81.3 55.5 43 04/07 3 3 4GA 061086-14LE23 . 57.7 39 87.2 60.8 43 04/08 0 3 0NC09-20986 . 54.8 48 79.2 59.1 40 04/03 0 15 33756 . 48.1 57 62.8 54.3 41 04/14 2 30 026R59 . 44.0 55 67.0 52.7 36 04/15 0 40 0
Wheat
Grain Test Results
Tifton, Georgia:Wheat Grain Performance, 2015-2016
Yield1 2016 Data
---- bu/acre ----
Annual Publication 100-8 • Georgia 2015-2016 Small Grain Performance Tests 13
Brand-Variety3-Year
Average2-Year
Average Rank Yield1TestWt Ht
HeadDate
PowderyMildew2
LeafRust3
FHB/Scab4
bu/acre lb/bu in mo/day rating % rating
Dyna-Gro Savoy 79.9 77.0 4 104.8 58.1 35 03/27 0 0 3GA 04434-12LE28 76.7 73.9 25 95.3 57.1 41 04/05 0 8 4AGS 2024 75.4 75.9 2T 106.3 57.1 37 04/01 0 0 5AGS 2033 75.2 74.4 8 99.1 60.2 39 04/04 0 0 1GA 061349-13LE31 74.3 74.3 12 98.2 58.1 39 04/06 3 0 2
Southern Harvest 550 73.7 72.0 17 97.1 56.8 39 04/01 0 0 4AGS 2040 72.7 70.5 24T 95.6 59.5 39 03/31 0 0 2GA 06112-13EE16 72.4 67.3 29 91.7 58.4 36 03/24 0 0 0LA3200E-2 72.2 66.7 18 96.9 60.5 39 04/02 0 15 1GA 061349-13LE29 70.1 67.7 41 86.5 55.9 38 04/10 0 0 0
GA 051102-13LE43 69.5 66.9 26 95.1 59.1 39 04/07 0 0 0SY Cypress 68.8 65.5 34 89.6 57.4 35 03/27 2 10 0Pioneer 26R94 68.6 66.7 19 96.8 60.1 41 03/31 0 0 2GA 061082-13E24 66.9 61.3 44 84.0 55.5 34 04/04 2 0 3SS 8629 66.5 64.0 45 82.0 53.0 37 04/07 1 35 0
SS 8415 63.9 54.4 50 75.0 52.5 40 04/11 0 10 0AGS 2038 60.4 57.1 31 90.6 57.6 43 04/02 0 0 5Pioneer 26R41 60.1 50.9 53 70.2 56.2 38 04/14 2 18 0USG 3404 53.5 48.0 58 61.2 54.4 40 04/16 2 40 0SS 8360 51.3 37.7 64 37.3 51.2 37 04/17 2 45 0
Pioneer 26R10 49.9 36.8 61 57.2 51.6 39 04/15 4 40 0P 870 43.7 37.9 62 55.7 51 37 04/16 1 28 0P 357 34.1 24.2 66 25.3 23.1 36 04/15 3 33 0GA 07353-14E19 . 73.9 3 105.9 59.0 38 03/28 2 0 0GA 061096-14E3 . 71.1 33 89.9 60.5 39 04/03 0 1 1
GA 07192-14E9 . 70.2 15 97.6 57.8 40 03/27 2 0 0Hilliard . 68.4 14 97.90 56.4 43 04/08 0 28 0GAJT 141-14E45 . 67.7 23 95.8 57.7 37 04/03 0 0 5GA 071012-14E6 . 67.5 27 93.7 58.3 35 03/26 0 0 0GA 061158-14LE11 . 67.1 20T 96.6 59.0 41 04/07 1 0 1
GA 07169-14LE24 . 66.5 5 103.0 55.3 40 04/07 1 5 5GA 051207-14E53 . 64.9 36 89.0 56.2 42 04/07 2 0 3SCTX 98-27A1 . 64.8 35 89.5 55.1 37 03/31 2 8 3VA10W-96 . 64.1 30T 90.8 58.0 42 04/08 0 0 0SS 8530 . 61.3 40T 87.0 54.3 42 04/09 1 6 0
W 010025 H2 . 59.2 47 81.3 55.5 43 04/07 3 3 4GA 061086-14LE23 . 57.7 39 87.2 60.8 43 04/08 0 3 0NC09-20986 . 54.8 48 79.2 59.1 40 04/03 0 15 33756 . 48.1 57 62.8 54.3 41 04/14 2 30 026R59 . 44.0 55 67.0 52.7 36 04/15 0 40 0
Wheat
Grain Test Results
Tifton, Georgia:Wheat Grain Performance, 2015-2016
Yield1 2016 Data
---- bu/acre ----
Brand-Variety3-Year
Average2-Year
Average Rank Yield1TestWt Ht
HeadDate
PowderyMildew2
LeafRust3
FHB/Scab4
bu/acre lb/bu in mo/day rating % rating
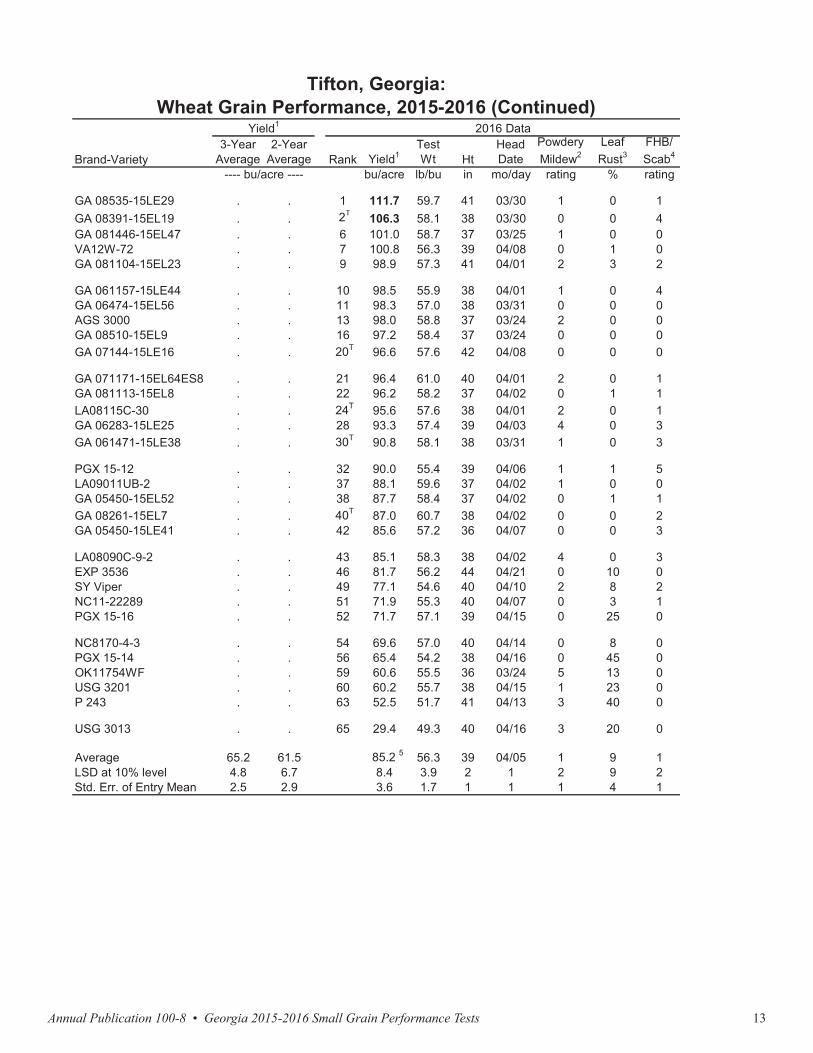
GA 08535-15LE29 . . 1 111.7 59.7 41 03/30 1 0 1GA 08391-15EL19 . . 2T 106.3 58.1 38 03/30 0 0 4GA 081446-15EL47 . . 6 101.0 58.7 37 03/25 1 0 0VA12W-72 . . 7 100.8 56.3 39 04/08 0 1 0GA 081104-15EL23 . . 9 98.9 57.3 41 04/01 2 3 2
GA 061157-15LE44 . . 10 98.5 55.9 38 04/01 1 0 4GA 06474-15EL56 . . 11 98.3 57.0 38 03/31 0 0 0AGS 3000 . . 13 98.0 58.8 37 03/24 2 0 0GA 08510-15EL9 . . 16 97.2 58.4 37 03/24 0 0 0GA 07144-15LE16 . . 20T 96.6 57.6 42 04/08 0 0 0
GA 071171-15EL64ES8 . . 21 96.4 61.0 40 04/01 2 0 1GA 081113-15EL8 . . 22 96.2 58.2 37 04/02 0 1 1LA08115C-30 . . 24T 95.6 57.6 38 04/01 2 0 1GA 06283-15LE25 . . 28 93.3 57.4 39 04/03 4 0 3GA 061471-15LE38 . . 30T 90.8 58.1 38 03/31 1 0 3
PGX 15-12 . . 32 90.0 55.4 39 04/06 1 1 5LA09011UB-2 . . 37 88.1 59.6 37 04/02 1 0 0GA 05450-15EL52 . . 38 87.7 58.4 37 04/02 0 1 1GA 08261-15EL7 . . 40T 87.0 60.7 38 04/02 0 0 2GA 05450-15LE41 . . 42 85.6 57.2 36 04/07 0 0 3
LA08090C-9-2 . . 43 85.1 58.3 38 04/02 4 0 3EXP 3536 . . 46 81.7 56.2 44 04/21 0 10 0SY Viper . . 49 77.1 54.6 40 04/10 2 8 2NC11-22289 . . 51 71.9 55.3 40 04/07 0 3 1PGX 15-16 . . 52 71.7 57.1 39 04/15 0 25 0
NC8170-4-3 . . 54 69.6 57.0 40 04/14 0 8 0PGX 15-14 . . 56 65.4 54.2 38 04/16 0 45 0OK11754WF . . 59 60.6 55.5 36 03/24 5 13 0USG 3201 . . 60 60.2 55.7 38 04/15 1 23 0P 243 . . 63 52.5 51.7 41 04/13 3 40 0
USG 3013 . . 65 29.4 49.3 40 04/16 3 20 0
Average 65.2 61.5 85.2 5 56.3 39 04/05 1 9 1LSD at 10% level 4.8 6.7 8.4 3.9 2 1 2 9 2Std. Err. of Entry Mean 2.5 2.9 3.6 1.7 1 1 1 4 1
Tifton, Georgia:Wheat Grain Performance, 2015-2016 (Continued)
Yield1 2016 Data
---- bu/acre ----

Annual Publication 100-8 • Georgia 2015-2016 Small Grain Performance Tests14
3. Leaf rust data collected on May 4, 2016.
Planted:Harvested:Seeding Rate:Soil Type:Soil Test:Fertilization:
Management:
Previous Crop:
Bolding indicates entries yielding equal to highest yielding entry within a column based on Fisher's protected LSD (P = 0.10).
Disked, moldboard plowed, and rototilled; Harmony Extra used for weed control; 1000 lb lime/acre.Soybeans.
Test conducted by D. Dunn, R. Brooke, B. McCranie, and G. South.
June 1, 2016.22 seeds per foot in 7" rows.Dothan loamy sand.P = Low, K = Low, and pH = 6.0.Preplant: 40 lb N, 100 lb P2O5, and 110 lb K2O/acre.Topdress: 100 lb N/acre.
4. Fusarium head blight (FHB/Scab) rating 1 - 10; data collected on May 4, 2016.
Tifton, Georgia:Wheat Grain Performance, 2015-2016 (Continued)
November 23, 2015.
1. Yields calculated as 60 pounds per bushel at 13.5% moisture.2. Powdery mildew rating 1 - 10; data collected on March 30, 2016.
5. C.V. = 8.4%, and df for EMS = 210.

Annual Publication 100-8 • Georgia 2015-2016 Small Grain Performance Tests 15
3. Leaf rust data collected on May 4, 2016.
Planted:Harvested:Seeding Rate:Soil Type:Soil Test:Fertilization:
Management:
Previous Crop:
Bolding indicates entries yielding equal to highest yielding entry within a column based on Fisher's protected LSD (P = 0.10).
Disked, moldboard plowed, and rototilled; Harmony Extra used for weed control; 1000 lb lime/acre.Soybeans.
Test conducted by D. Dunn, R. Brooke, B. McCranie, and G. South.
June 1, 2016.22 seeds per foot in 7" rows.Dothan loamy sand.P = Low, K = Low, and pH = 6.0.Preplant: 40 lb N, 100 lb P2O5, and 110 lb K2O/acre.Topdress: 100 lb N/acre.
4. Fusarium head blight (FHB/Scab) rating 1 - 10; data collected on May 4, 2016.
Tifton, Georgia:Wheat Grain Performance, 2015-2016 (Continued)
November 23, 2015.
1. Yields calculated as 60 pounds per bushel at 13.5% moisture.2. Powdery mildew rating 1 - 10; data collected on March 30, 2016.
5. C.V. = 8.4%, and df for EMS = 210.
Brand-Variety3-Year
Average2-Year
Average Rank Yield1TestWt Ht
HeadDate
bu/acre lb/bu in mo/day
GA 06112-13EE16 60.2 54.6 3 89.8 60.1 35 04/01SY Cypress 56.2 52.4 4 88.8 58.6 35 04/07Pioneer 26R94 54.4 49.3 7 84.5 58.5 40 04/07AGS 2040 . 53.7 6 86.0 60.0 37 04/03GAJT 141-14E45 . . 1 92.5 57.8 37 04/06
LA3200E-2 . . 2 90.1 54.9 36 04/07AGS 2024 . . 5 88.7 58.0 38 04/08AGS 2038 . . 8 83.4 57.6 44 04/08AGS 3000 . . 9 82.8 59.5 36 04/01
Average 56.9 52.5 87.4 2 58.3 37 04/05LSD at 10% level 2.8 N.S.3 N.S. N.S. 2 1Std. Err. of Entry Mean 1.1 1.9 3.4 2.0 1 1
Planted:Harvested:Seeding Rate:Soil Type:Soil Test:Fertilization:
Management:Previous Crop:
Test conducted by D. Dunn, R. Brooke, B. McCranie, and G. South.
3. The F-test indicated no statistical difference at the alpha = 0.10 probability level; therefore, an LSD value was not calculated.Bolding indicates entries yielding equal to highest yielding entry within a column based on Fisher's protected LSD (P = 0.10).
December 10,2015.May 25, 2016.22 seeds per foot in 7" rows.Dothan loamy sand.P = Low, K = Low, and pH = 6.0.Preplant: 40 lb N, 100 lb P2O5, and 110 lb K2O/acre.Topdress: 100 lb N/acre.Disked, moldboard plowed, and rototilled; Harmony Extra used for weed control.Soybeans.
2. C.V. = 7.8%, and df for EMS = 24.
Tifton, Georgia:Late-Planted Wheat Grain Performance, 2015-2016
Yield1 2016 Data
----- bu/acre -----
1. Yields calculated as 60 pounds per bushel at 13.5% moisture.

Annual Publication 100-8 • Georgia 2015-2016 Small Grain Performance Tests16
Brand-Variety3-Year
Average2-Year
Average Rank Yield1TestWt Ht
HeadDate
PowderyMildew2
LeafRust3
StripeRust4
bu/acre lb/bu in mo/day rating % rating
Dyna-Gro Savoy 89.4 84.2 1 101.1 58.9 33 03/29 0 0 0GA 06112-13EE16 85.0 80.3 2 97.4 59.5 35 03/27 0 0 0AGS 2024 81.4 74.5 10T 86.4 57.4 34 04/02 0 3 0AGS 2033 79.8 72.4 20 79.4 58.6 36 04/05 0 0 1LA3200E-2 78.1 72.3 10T 86.4 58.9 36 04/05 0 10 0
Pioneer 26R94 76.1 70.2 16 82.3 58.6 38 04/01 0 13 0GA 051102-13LE43 75.1 67.2 25T 76.6 58.0 38 04/08 0 0 0AGS 2040 75.0 70.0 19 79.9 59.6 35 04/01 0 0 0GA 061349-13LE29 74.8 68.6 29 74.3 54.3 36 04/09 0 0 0GA 061082-13E24 74.7 66.6 42 69.2 53.6 34 04/06 0 10 0
GA 04434-12LE28 74.0 64.8 39 70.5 52.9 38 04/06 0 10 0SS 8629 73.9 65.6 32 73.7 52.6 33 04/07 1 10 0GA 061349-13LE31 73.3 61.7 44 68.8 56.2 37 04/08 0 0 1Southern Harvest 550 72.8 65.0 34 72.7 52.4 36 04/04 0 0 0AGS 2038 71.4 63.7 22T 78.5 56.0 41 04/06 0 0 0
Pioneer 26R41 70.8 66.3 43 68.9 57.2 34 04/19 0 5 0SS 8415 70.1 56.1 54 59.2 53.6 36 04/12 0 10 1USG 3404 62.2 52.1 57 54.7 53.7 38 04/19 0 10 0Pioneer 26R10 61.7 50.3 58 54.3 53.0 37 04/19 0 28 0SS 8360 60.3 48.7 63 39.2 53.6 34 04/20 0 20 0
SY Cypress 60.2 56.6 48 64.5 56.4 32 04/03 0 13 2P 870 58.6 51.8 62 46.8 52.9 34 04/20 1 8 0P 357 43.5 29.1 64 26.0 51.2 32 04/20 0 30 0GA 071012-14E6 . 76.4 9 87.9 59.3 34 03/31 0 20 0GA 07353-14E19 . 75.6 5 88.9 59.0 36 03/31 0 0 0
GA 051207-14E53 . 70.4 15 82.5 56.4 39 04/07 2 5 1GAJT 141-14E45 . 70.3 14 82.8 56.5 34 04/06 0 0 0GA 07192-14E9 . 70.1 12 83.8 55.9 37 04/01 0 0 0GA 07169-14LE24 . 68.5 24T 76.9 54.0 36 04/07 0 5 0Hilliard . 68.1 25T 76.6 57.2 38 04/11 0 0 0
GA 061096-14E3 . 67.6 30 74.1 58.7 36 04/03 0 0 0VA10W-96 . 65.2 28 74.4 58.9 38 04/11 0 0 0GA 061158-14LE11 . 62.8 41 70.2 56.4 37 04/07 0 0 1GA 061086-14LE23 . 62.6 33 72.8 59.7 40 04/09 0 0 0Pioneer 26R59 . 60.8 53 61.9 53.6 34 04/18 0 6 0
SCTX 98-27A1 . 60.0 47T 66.7 53.0 33 04/03 0 20 0NC09-20986 . 56.3 50 63.4 59.8 38 04/08 0 10 1USG 3756 . 51.1 60 53.3 55.1 37 04/14 1 18 2SS 8530 . 47.8 49 64.2 54.6 36 04/10 0 0 4W 010025 H2 . 36.9 61 50.3 53.2 38 04/07 0 0 8
GA 081446-15EL47 . . 3 93.4 59.7 36 03/29 0 1 1GA 06474-15EL56 . . 4 89.1 56.3 34 04/01 0 0 0GA 08535-15LE29 . . 6 88.8 58.4 38 04/05 0 0 0GA 081113-15EL8 . . 7 88.7 57.0 37 04/05 0 0 0GA 061471-15LE38 . . 8 88.4 58.7 38 04/05 1 0 0
Plains, Georgia:Wheat Grain Performance, 2015-2016
Yield1 2016 Data
---- bu/acre ----
Annual Publication 100-8 • Georgia 2015-2016 Small Grain Performance Tests 17
Brand-Variety3-Year
Average2-Year
Average Rank Yield1TestWt Ht
HeadDate
PowderyMildew2
LeafRust3
StripeRust4
bu/acre lb/bu in mo/day rating % rating
Dyna-Gro Savoy 89.4 84.2 1 101.1 58.9 33 03/29 0 0 0GA 06112-13EE16 85.0 80.3 2 97.4 59.5 35 03/27 0 0 0AGS 2024 81.4 74.5 10T 86.4 57.4 34 04/02 0 3 0AGS 2033 79.8 72.4 20 79.4 58.6 36 04/05 0 0 1LA3200E-2 78.1 72.3 10T 86.4 58.9 36 04/05 0 10 0
Pioneer 26R94 76.1 70.2 16 82.3 58.6 38 04/01 0 13 0GA 051102-13LE43 75.1 67.2 25T 76.6 58.0 38 04/08 0 0 0AGS 2040 75.0 70.0 19 79.9 59.6 35 04/01 0 0 0GA 061349-13LE29 74.8 68.6 29 74.3 54.3 36 04/09 0 0 0GA 061082-13E24 74.7 66.6 42 69.2 53.6 34 04/06 0 10 0
GA 04434-12LE28 74.0 64.8 39 70.5 52.9 38 04/06 0 10 0SS 8629 73.9 65.6 32 73.7 52.6 33 04/07 1 10 0GA 061349-13LE31 73.3 61.7 44 68.8 56.2 37 04/08 0 0 1Southern Harvest 550 72.8 65.0 34 72.7 52.4 36 04/04 0 0 0AGS 2038 71.4 63.7 22T 78.5 56.0 41 04/06 0 0 0
Pioneer 26R41 70.8 66.3 43 68.9 57.2 34 04/19 0 5 0SS 8415 70.1 56.1 54 59.2 53.6 36 04/12 0 10 1USG 3404 62.2 52.1 57 54.7 53.7 38 04/19 0 10 0Pioneer 26R10 61.7 50.3 58 54.3 53.0 37 04/19 0 28 0SS 8360 60.3 48.7 63 39.2 53.6 34 04/20 0 20 0
SY Cypress 60.2 56.6 48 64.5 56.4 32 04/03 0 13 2P 870 58.6 51.8 62 46.8 52.9 34 04/20 1 8 0P 357 43.5 29.1 64 26.0 51.2 32 04/20 0 30 0GA 071012-14E6 . 76.4 9 87.9 59.3 34 03/31 0 20 0GA 07353-14E19 . 75.6 5 88.9 59.0 36 03/31 0 0 0
GA 051207-14E53 . 70.4 15 82.5 56.4 39 04/07 2 5 1GAJT 141-14E45 . 70.3 14 82.8 56.5 34 04/06 0 0 0GA 07192-14E9 . 70.1 12 83.8 55.9 37 04/01 0 0 0GA 07169-14LE24 . 68.5 24T 76.9 54.0 36 04/07 0 5 0Hilliard . 68.1 25T 76.6 57.2 38 04/11 0 0 0
GA 061096-14E3 . 67.6 30 74.1 58.7 36 04/03 0 0 0VA10W-96 . 65.2 28 74.4 58.9 38 04/11 0 0 0GA 061158-14LE11 . 62.8 41 70.2 56.4 37 04/07 0 0 1GA 061086-14LE23 . 62.6 33 72.8 59.7 40 04/09 0 0 0Pioneer 26R59 . 60.8 53 61.9 53.6 34 04/18 0 6 0
SCTX 98-27A1 . 60.0 47T 66.7 53.0 33 04/03 0 20 0NC09-20986 . 56.3 50 63.4 59.8 38 04/08 0 10 1USG 3756 . 51.1 60 53.3 55.1 37 04/14 1 18 2SS 8530 . 47.8 49 64.2 54.6 36 04/10 0 0 4W 010025 H2 . 36.9 61 50.3 53.2 38 04/07 0 0 8
GA 081446-15EL47 . . 3 93.4 59.7 36 03/29 0 1 1GA 06474-15EL56 . . 4 89.1 56.3 34 04/01 0 0 0GA 08535-15LE29 . . 6 88.8 58.4 38 04/05 0 0 0GA 081113-15EL8 . . 7 88.7 57.0 37 04/05 0 0 0GA 061471-15LE38 . . 8 88.4 58.7 38 04/05 1 0 0
Plains, Georgia:Wheat Grain Performance, 2015-2016
Yield1 2016 Data
---- bu/acre ----Brand-Variety
3-YearAverage
2-YearAverage Rank Yield1
TestWt Ht
HeadDate
PowderyMildew2
LeafRust3
StripeRust4
bu/acre lb/bu in mo/day rating % rating
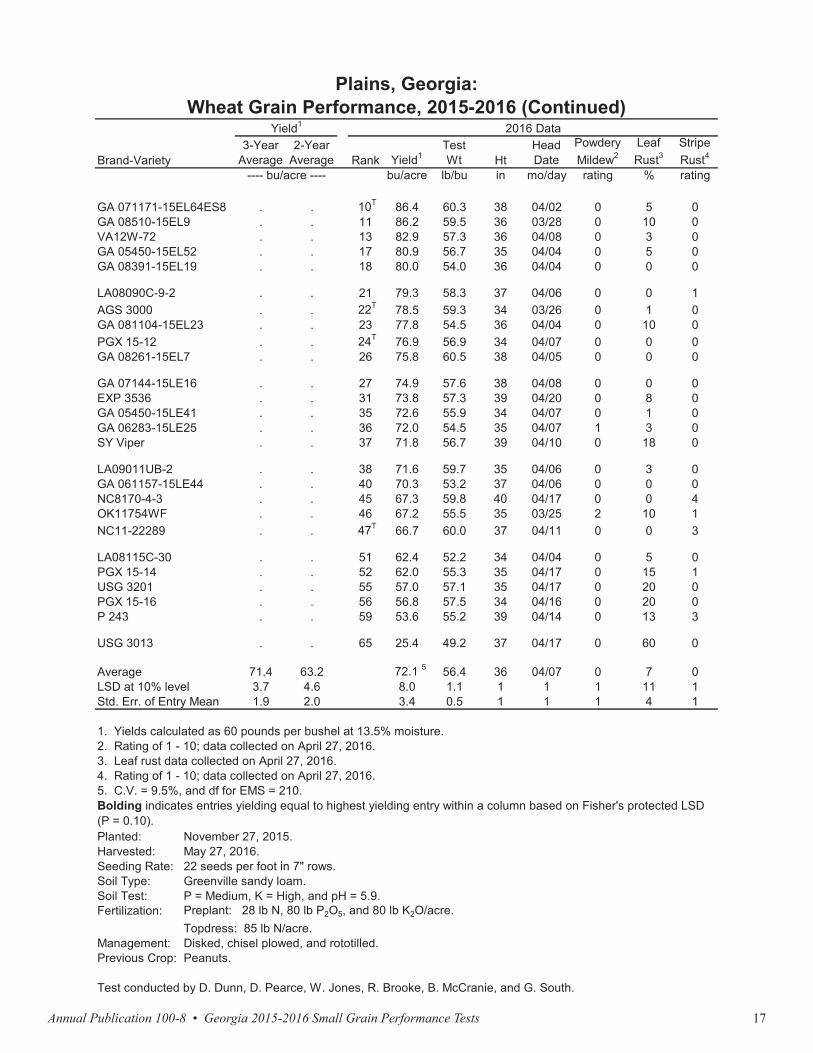
GA 071171-15EL64ES8 . . 10T 86.4 60.3 38 04/02 0 5 0GA 08510-15EL9 . . 11 86.2 59.5 36 03/28 0 10 0VA12W-72 . . 13 82.9 57.3 36 04/08 0 3 0GA 05450-15EL52 . . 17 80.9 56.7 35 04/04 0 5 0GA 08391-15EL19 . . 18 80.0 54.0 36 04/04 0 0 0
LA08090C-9-2 . . 21 79.3 58.3 37 04/06 0 0 1AGS 3000 . . 22T 78.5 59.3 34 03/26 0 1 0GA 081104-15EL23 . . 23 77.8 54.5 36 04/04 0 10 0PGX 15-12 . . 24T 76.9 56.9 34 04/07 0 0 0GA 08261-15EL7 . . 26 75.8 60.5 38 04/05 0 0 0
GA 07144-15LE16 . . 27 74.9 57.6 38 04/08 0 0 0EXP 3536 . . 31 73.8 57.3 39 04/20 0 8 0GA 05450-15LE41 . . 35 72.6 55.9 34 04/07 0 1 0GA 06283-15LE25 . . 36 72.0 54.5 35 04/07 1 3 0SY Viper . . 37 71.8 56.7 39 04/10 0 18 0
LA09011UB-2 . . 38 71.6 59.7 35 04/06 0 3 0GA 061157-15LE44 . . 40 70.3 53.2 37 04/06 0 0 0NC8170-4-3 . . 45 67.3 59.8 40 04/17 0 0 4OK11754WF . . 46 67.2 55.5 35 03/25 2 10 1NC11-22289 . . 47T 66.7 60.0 37 04/11 0 0 3
LA08115C-30 . . 51 62.4 52.2 34 04/04 0 5 0PGX 15-14 . . 52 62.0 55.3 35 04/17 0 15 1USG 3201 . . 55 57.0 57.1 35 04/17 0 20 0PGX 15-16 . . 56 56.8 57.5 34 04/16 0 20 0P 243 . . 59 53.6 55.2 39 04/14 0 13 3
USG 3013 . . 65 25.4 49.2 37 04/17 0 60 0
Average 71.4 63.2 72.1 5 56.4 36 04/07 0 7 0LSD at 10% level 3.7 4.6 8.0 1.1 1 1 1 11 1Std. Err. of Entry Mean 1.9 2.0 3.4 0.5 1 1 1 4 1
Planted:Harvested:Seeding Rate:Soil Type:Soil Test:Fertilization:
Management:Previous Crop:
Preplant: 28 lb N, 80 lb P2O5, and 80 lb K2O/acre.Topdress: 85 lb N/acre.Disked, chisel plowed, and rototilled.Peanuts.
Test conducted by D. Dunn, D. Pearce, W. Jones, R. Brooke, B. McCranie, and G. South.
P = Medium, K = High, and pH = 5.9.
---- bu/acre ----
1. Yields calculated as 60 pounds per bushel at 13.5% moisture.2. Rating of 1 - 10; data collected on April 27, 2016.3. Leaf rust data collected on April 27, 2016.4. Rating of 1 - 10; data collected on April 27, 2016.5. C.V. = 9.5%, and df for EMS = 210.Bolding indicates entries yielding equal to highest yielding entry within a column based on Fisher's protected LSD(P = 0.10).
November 27, 2015.May 27, 2016.22 seeds per foot in 7" rows.Greenville sandy loam.
Yield1 2016 Data
Plains, Georgia:Wheat Grain Performance, 2015-2016 (Continued)
Annual Publication 100-8 • Georgia 2015-2016 Small Grain Performance Tests18
Brand-Variety3-Year
Average2-Year
Average Rank Yield1TestWt Ht Lodg.
HeadDate
bu/acre lb/bu in % mo/day
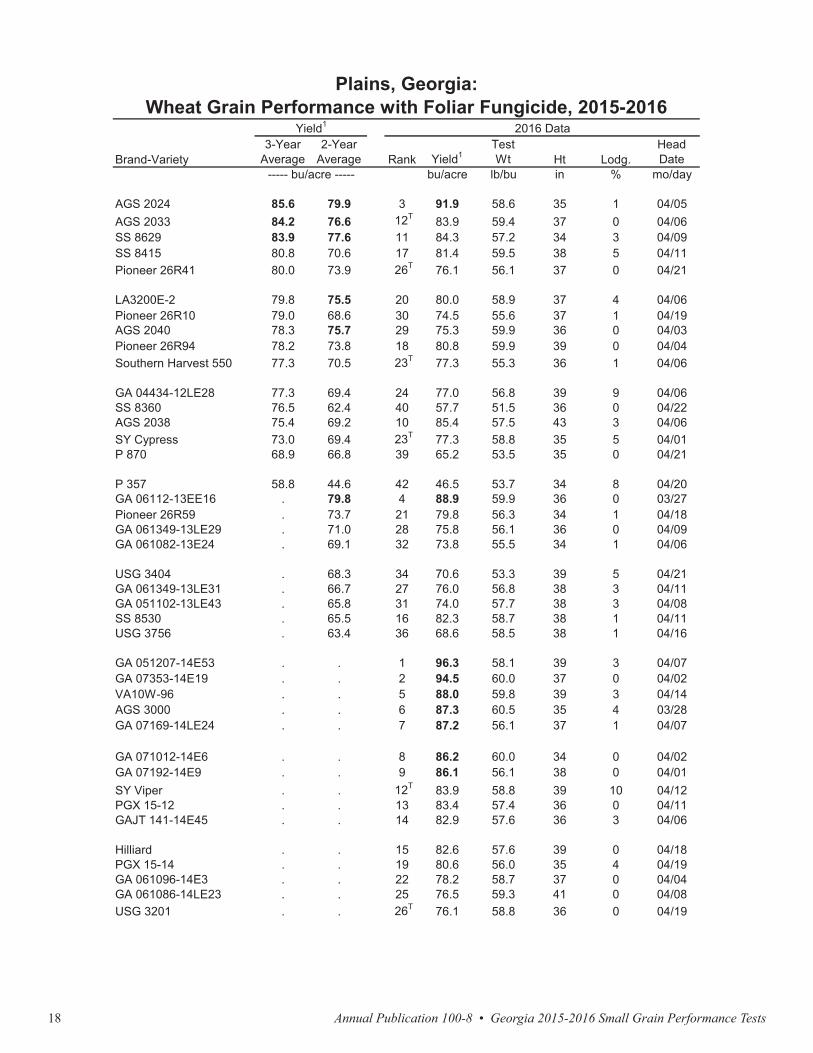
AGS 2024 85.6 79.9 3 91.9 58.6 35 1 04/05AGS 2033 84.2 76.6 12T 83.9 59.4 37 0 04/06SS 8629 83.9 77.6 11 84.3 57.2 34 3 04/09SS 8415 80.8 70.6 17 81.4 59.5 38 5 04/11Pioneer 26R41 80.0 73.9 26T 76.1 56.1 37 0 04/21
LA3200E-2 79.8 75.5 20 80.0 58.9 37 4 04/06Pioneer 26R10 79.0 68.6 30 74.5 55.6 37 1 04/19AGS 2040 78.3 75.7 29 75.3 59.9 36 0 04/03Pioneer 26R94 78.2 73.8 18 80.8 59.9 39 0 04/04Southern Harvest 550 77.3 70.5 23T 77.3 55.3 36 1 04/06
GA 04434-12LE28 77.3 69.4 24 77.0 56.8 39 9 04/06SS 8360 76.5 62.4 40 57.7 51.5 36 0 04/22AGS 2038 75.4 69.2 10 85.4 57.5 43 3 04/06SY Cypress 73.0 69.4 23T 77.3 58.8 35 5 04/01P 870 68.9 66.8 39 65.2 53.5 35 0 04/21
P 357 58.8 44.6 42 46.5 53.7 34 8 04/20GA 06112-13EE16 . 79.8 4 88.9 59.9 36 0 03/27Pioneer 26R59 . 73.7 21 79.8 56.3 34 1 04/18GA 061349-13LE29 . 71.0 28 75.8 56.1 36 0 04/09GA 061082-13E24 . 69.1 32 73.8 55.5 34 1 04/06
USG 3404 . 68.3 34 70.6 53.3 39 5 04/21GA 061349-13LE31 . 66.7 27 76.0 56.8 38 3 04/11GA 051102-13LE43 . 65.8 31 74.0 57.7 38 3 04/08SS 8530 . 65.5 16 82.3 58.7 38 1 04/11USG 3756 . 63.4 36 68.6 58.5 38 1 04/16
GA 051207-14E53 . . 1 96.3 58.1 39 3 04/07GA 07353-14E19 . . 2 94.5 60.0 37 0 04/02VA10W-96 . . 5 88.0 59.8 39 3 04/14AGS 3000 . . 6 87.3 60.5 35 4 03/28GA 07169-14LE24 . . 7 87.2 56.1 37 1 04/07
GA 071012-14E6 . . 8 86.2 60.0 34 0 04/02GA 07192-14E9 . . 9 86.1 56.1 38 0 04/01SY Viper . . 12T 83.9 58.8 39 10 04/12PGX 15-12 . . 13 83.4 57.4 36 0 04/11GAJT 141-14E45 . . 14 82.9 57.6 36 3 04/06
Hilliard . . 15 82.6 57.6 39 0 04/18PGX 15-14 . . 19 80.6 56.0 35 4 04/19GA 061096-14E3 . . 22 78.2 58.7 37 0 04/04GA 061086-14LE23 . . 25 76.5 59.3 41 0 04/08USG 3201 . . 26T 76.1 58.8 36 0 04/19
Plains, Georgia:Wheat Grain Performance with Foliar Fungicide, 2015-2016
Yield1 2016 Data
----- bu/acre -----
Annual Publication 100-8 • Georgia 2015-2016 Small Grain Performance Tests 19
Brand-Variety3-Year
Average2-Year
Average Rank Yield1TestWt Ht Lodg.
HeadDate
bu/acre lb/bu in % mo/day
AGS 2024 85.6 79.9 3 91.9 58.6 35 1 04/05AGS 2033 84.2 76.6 12T 83.9 59.4 37 0 04/06SS 8629 83.9 77.6 11 84.3 57.2 34 3 04/09SS 8415 80.8 70.6 17 81.4 59.5 38 5 04/11Pioneer 26R41 80.0 73.9 26T 76.1 56.1 37 0 04/21
LA3200E-2 79.8 75.5 20 80.0 58.9 37 4 04/06Pioneer 26R10 79.0 68.6 30 74.5 55.6 37 1 04/19AGS 2040 78.3 75.7 29 75.3 59.9 36 0 04/03Pioneer 26R94 78.2 73.8 18 80.8 59.9 39 0 04/04Southern Harvest 550 77.3 70.5 23T 77.3 55.3 36 1 04/06
GA 04434-12LE28 77.3 69.4 24 77.0 56.8 39 9 04/06SS 8360 76.5 62.4 40 57.7 51.5 36 0 04/22AGS 2038 75.4 69.2 10 85.4 57.5 43 3 04/06SY Cypress 73.0 69.4 23T 77.3 58.8 35 5 04/01P 870 68.9 66.8 39 65.2 53.5 35 0 04/21
P 357 58.8 44.6 42 46.5 53.7 34 8 04/20GA 06112-13EE16 . 79.8 4 88.9 59.9 36 0 03/27Pioneer 26R59 . 73.7 21 79.8 56.3 34 1 04/18GA 061349-13LE29 . 71.0 28 75.8 56.1 36 0 04/09GA 061082-13E24 . 69.1 32 73.8 55.5 34 1 04/06
USG 3404 . 68.3 34 70.6 53.3 39 5 04/21GA 061349-13LE31 . 66.7 27 76.0 56.8 38 3 04/11GA 051102-13LE43 . 65.8 31 74.0 57.7 38 3 04/08SS 8530 . 65.5 16 82.3 58.7 38 1 04/11USG 3756 . 63.4 36 68.6 58.5 38 1 04/16
GA 051207-14E53 . . 1 96.3 58.1 39 3 04/07GA 07353-14E19 . . 2 94.5 60.0 37 0 04/02VA10W-96 . . 5 88.0 59.8 39 3 04/14AGS 3000 . . 6 87.3 60.5 35 4 03/28GA 07169-14LE24 . . 7 87.2 56.1 37 1 04/07
GA 071012-14E6 . . 8 86.2 60.0 34 0 04/02GA 07192-14E9 . . 9 86.1 56.1 38 0 04/01SY Viper . . 12T 83.9 58.8 39 10 04/12PGX 15-12 . . 13 83.4 57.4 36 0 04/11GAJT 141-14E45 . . 14 82.9 57.6 36 3 04/06
Hilliard . . 15 82.6 57.6 39 0 04/18PGX 15-14 . . 19 80.6 56.0 35 4 04/19GA 061096-14E3 . . 22 78.2 58.7 37 0 04/04GA 061086-14LE23 . . 25 76.5 59.3 41 0 04/08USG 3201 . . 26T 76.1 58.8 36 0 04/19
Plains, Georgia:Wheat Grain Performance with Foliar Fungicide, 2015-2016
Yield1 2016 Data
----- bu/acre ----- Brand-Variety3-Year
Average2-Year
Average Rank Yield1TestWt Ht Lodg.
HeadDate
bu/acre lb/bu in % mo/day
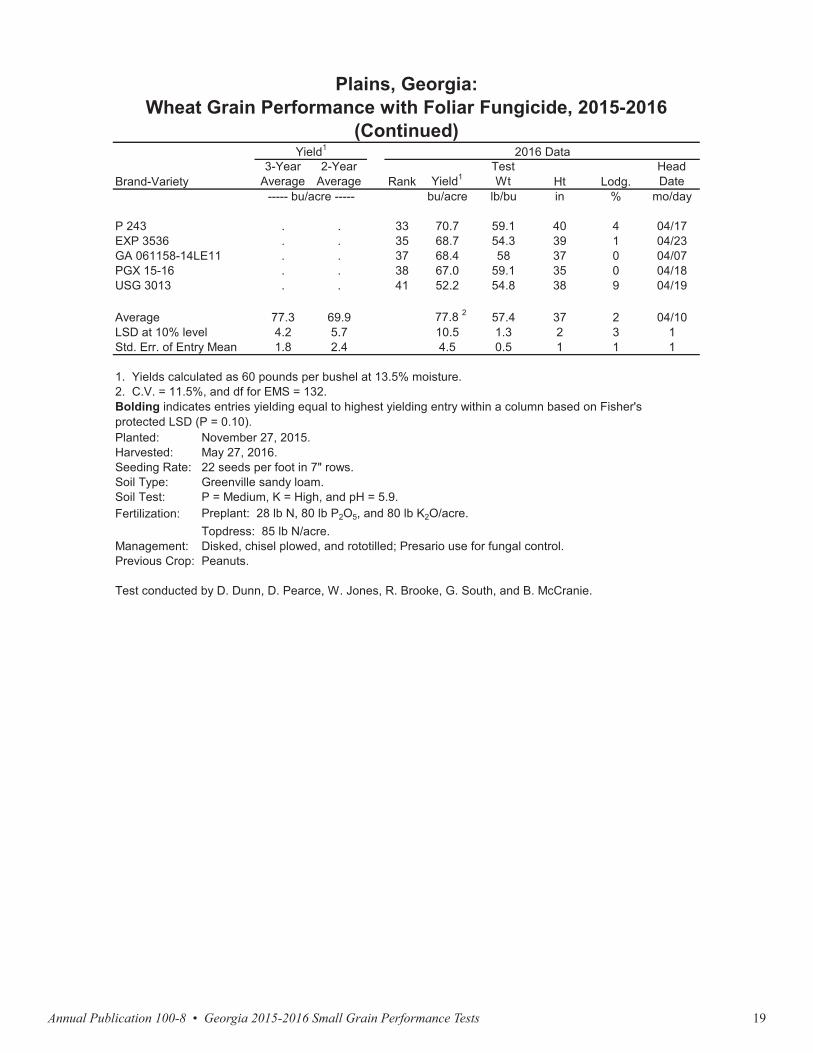
P 243 . . 33 70.7 59.1 40 4 04/17EXP 3536 . . 35 68.7 54.3 39 1 04/23GA 061158-14LE11 . . 37 68.4 58 37 0 04/07PGX 15-16 . . 38 67.0 59.1 35 0 04/18USG 3013 . . 41 52.2 54.8 38 9 04/19
Average 77.3 69.9 77.8 2 57.4 37 2 04/10LSD at 10% level 4.2 5.7 10.5 1.3 2 3 1Std. Err. of Entry Mean 1.8 2.4 4.5 0.5 1 1 1
Planted:Harvested:Seeding Rate:Soil Type:Soil Test:Fertilization:
Management:Previous Crop: Peanuts.
Test conducted by D. Dunn, D. Pearce, W. Jones, R. Brooke, G. South, and B. McCranie.
22 seeds per foot in 7" rows.Greenville sandy loam.P = Medium, K = High, and pH = 5.9.Preplant: 28 lb N, 80 lb P2O5, and 80 lb K2O/acre.Topdress: 85 lb N/acre.Disked, chisel plowed, and rototilled; Presario use for fungal control.
May 27, 2016.
Plains, Georgia:Wheat Grain Performance with Foliar Fungicide, 2015-2016
(Continued)Yield1 2016 Data
----- bu/acre -----
1. Yields calculated as 60 pounds per bushel at 13.5% moisture.2. C.V. = 11.5%, and df for EMS = 132.Bolding indicates entries yielding equal to highest yielding entry within a column based on Fisher's protected LSD (P = 0.10).
November 27, 2015.

Annual Publication 100-8 • Georgia 2015-2016 Small Grain Performance Tests20
Brand-Variety no fungicide2 fungicide3
bu/acre % rating % rating
GA 06112-13EE16 97.4 88.9 -8.5 -8.7 0 0 0GA 07353-14E19 88.9 94.5 5.6 6.3 0 0 0GA 071012-14E6 87.9 86.2 -1.7 -1.9 0 20 0AGS 2024 86.4 91.9 5.5 6.3 0 3 0LA3200E-2 86.4 80.0 -6.4 -7.4 0 10 0
GA 07192-14E9 83.8 86.1 2.3 2.7 0 0 0GAJT 141-14E45 82.8 82.9 0.1 0.1 0 0 0GA 051207-14E53 82.5 96.3 13.7 16.7 2 5 1Pioneer 26R94 82.3 80.8 -1.5 -1.8 0 13 0AGS 2040 79.9 75.3 -4.6 -5.8 0 0 0
AGS 2033 79.4 83.9 4.6 5.8 0 0 1AGS 2038 78.5 85.4 6.9 8.8 0 0 0AGS 3000 78.5 87.3 8.9 11.3 0 1 0GA 07169-14LE24 76.9 87.2 10.2 13.3 0 5 0PGX 15-12 76.9 83.4 6.6 8.5 0 0 0
Hilliard 76.6 82.6 5.9 7.7 0 0 0GA 051102-13LE43 76.6 74.0 -2.5 -3.3 0 0 0VA10W-96 74.4 88.0 13.6 18.2 0 0 0GA 061349-13LE29 74.3 75.8 1.5 2.0 0 0 0GA 061096-14E3 74.1 78.2 4.1 5.5 0 0 0
EXP 3536 73.8 68.7 -5.1 -6.9 0 8 0SS 8629 73.7 84.3 10.6 14.5 1 10 0GA 061086-14LE23 72.8 76.5 3.7 5.1 0 0 0Southern Harvest 550 72.7 77.3 4.6 6.3 0 0 0SY Viper 71.8 83.9 12.1 16.8 0 18 0
GA 04434-12LE28 70.5 77.0 6.4 9.1 0 10 0GA 061158-14LE11 70.2 68.4 -1.8 -2.6 0 0 1GA 061082-13E24 69.2 73.8 4.5 6.6 0 10 0Pioneer 26R41 68.9 76.1 7.1 10.4 0 5 0GA 061349-13LE31 68.8 76.0 7.2 10.4 0 0 1
SY Cypress 64.5 77.3 12.8 19.8 0 13 2SS 8530 64.2 82.3 18.2 28.3 0 0 4PGX 15-14 62.0 80.6 18.6 30.0 0 15 1USG 26R59 61.9 79.8 17.9 29.0 0 6 0SS 8415 59.2 81.4 22.2 37.4 0 10 1
USG 3201 57.0 76.1 19.1 33.5 0 20 0PGX 15-16 56.8 67.0 10.2 17.9 0 20 0USG 3404 54.7 70.6 16 29.2 0 10 0Pioneer 26R10 54.3 74.5 20.3 37.3 0 28 0P 243 53.6 70.7 17 31.7 0 13 3
--------- bu/acre ---------
Plains, Georgia:Effect of Fungicide on Wheat Grain Yield, 2015-2016
Yield1Difference
with FungicideChange
with FungicideLeafRust4
StripeRust4
PowderyMildew4

Annual Publication 100-8 • Georgia 2015-2016 Small Grain Performance Tests 21
Brand-Variety no fungicide2 fungicide3
bu/acre % rating % rating
GA 06112-13EE16 97.4 88.9 -8.5 -8.7 0 0 0GA 07353-14E19 88.9 94.5 5.6 6.3 0 0 0GA 071012-14E6 87.9 86.2 -1.7 -1.9 0 20 0AGS 2024 86.4 91.9 5.5 6.3 0 3 0LA3200E-2 86.4 80.0 -6.4 -7.4 0 10 0
GA 07192-14E9 83.8 86.1 2.3 2.7 0 0 0GAJT 141-14E45 82.8 82.9 0.1 0.1 0 0 0GA 051207-14E53 82.5 96.3 13.7 16.7 2 5 1Pioneer 26R94 82.3 80.8 -1.5 -1.8 0 13 0AGS 2040 79.9 75.3 -4.6 -5.8 0 0 0
AGS 2033 79.4 83.9 4.6 5.8 0 0 1AGS 2038 78.5 85.4 6.9 8.8 0 0 0AGS 3000 78.5 87.3 8.9 11.3 0 1 0GA 07169-14LE24 76.9 87.2 10.2 13.3 0 5 0PGX 15-12 76.9 83.4 6.6 8.5 0 0 0
Hilliard 76.6 82.6 5.9 7.7 0 0 0GA 051102-13LE43 76.6 74.0 -2.5 -3.3 0 0 0VA10W-96 74.4 88.0 13.6 18.2 0 0 0GA 061349-13LE29 74.3 75.8 1.5 2.0 0 0 0GA 061096-14E3 74.1 78.2 4.1 5.5 0 0 0
EXP 3536 73.8 68.7 -5.1 -6.9 0 8 0SS 8629 73.7 84.3 10.6 14.5 1 10 0GA 061086-14LE23 72.8 76.5 3.7 5.1 0 0 0Southern Harvest 550 72.7 77.3 4.6 6.3 0 0 0SY Viper 71.8 83.9 12.1 16.8 0 18 0
GA 04434-12LE28 70.5 77.0 6.4 9.1 0 10 0GA 061158-14LE11 70.2 68.4 -1.8 -2.6 0 0 1GA 061082-13E24 69.2 73.8 4.5 6.6 0 10 0Pioneer 26R41 68.9 76.1 7.1 10.4 0 5 0GA 061349-13LE31 68.8 76.0 7.2 10.4 0 0 1
SY Cypress 64.5 77.3 12.8 19.8 0 13 2SS 8530 64.2 82.3 18.2 28.3 0 0 4PGX 15-14 62.0 80.6 18.6 30.0 0 15 1USG 26R59 61.9 79.8 17.9 29.0 0 6 0SS 8415 59.2 81.4 22.2 37.4 0 10 1
USG 3201 57.0 76.1 19.1 33.5 0 20 0PGX 15-16 56.8 67.0 10.2 17.9 0 20 0USG 3404 54.7 70.6 16 29.2 0 10 0Pioneer 26R10 54.3 74.5 20.3 37.3 0 28 0P 243 53.6 70.7 17 31.7 0 13 3
--------- bu/acre ---------
Plains, Georgia:Effect of Fungicide on Wheat Grain Yield, 2015-2016
Yield1Difference
with FungicideChange
with FungicideLeafRust4
StripeRust4
PowderyMildew4
Brand-Variety no fungicide2 fungicide3
bu/acre % % % %
USG 3756 53.3 68.6 15.3 28.7 1 18 2P 870 46.8 65.2 18.3 39.2 1 8 0SS 8360 39.2 57.7 18.5 47.1 0 20 0P 357 26.0 46.5 20.4 78.5 0 30 0USG 3013 25.4 52.2 26.8 105.4 0 60 0
Average 69.2 77.8 8.6 16.6 0 9 1LSD at 10% level 8.0 10.5 12.7 21.0 - -Std. Err. of Entry Mean 3.4 4.5 5.4 9.0 - -
3. Presario fungicide applied to control fungal diseases.4. Disease data of wheat plots untreated with fungicide.Bolding indicates entries yielding equal to highest yielding entry within a column based on Fisher's protected LSD (P = 0.10).
Changewith Fungicide
LeafRust4
StripeRust4
PowderyMildew4
--------- bu/acre ---------
2. Yield data of wheat plots untreated with fungicide.
Plains, Georgia:Effect of Fungicide on Wheat Grain Yield, 2015-2016
(Continued)Yield1
Differencewith Fungicide
1. Yields calculated as 60 pounds per bushel at 13.5% moisture.
Annual Publication 100-8 • Georgia 2015-2016 Small Grain Performance Tests22
Brand-Variety3-Year
Average2-Year
Average Rank Yield1TestWt Ht Lodg.
HeadDate
bu/acre lb/bu in % mo/day
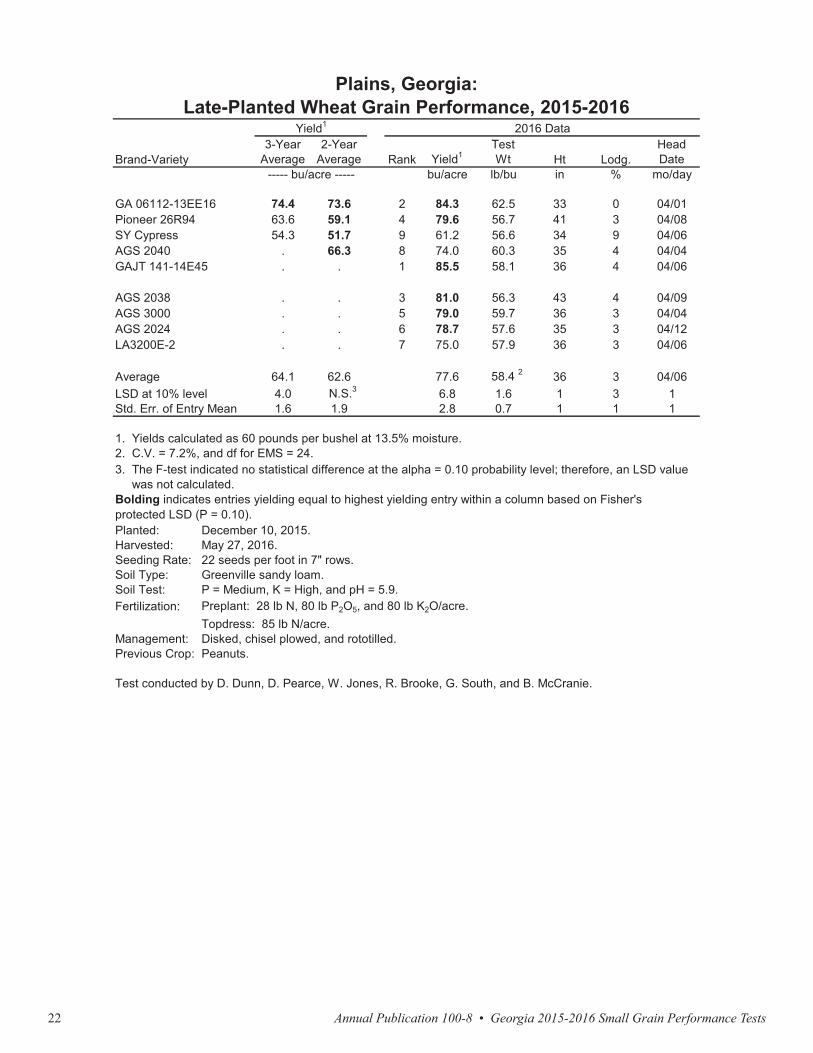
GA 06112-13EE16 74.4 73.6 2 84.3 62.5 33 0 04/01Pioneer 26R94 63.6 59.1 4 79.6 56.7 41 3 04/08SY Cypress 54.3 51.7 9 61.2 56.6 34 9 04/06AGS 2040 . 66.3 8 74.0 60.3 35 4 04/04GAJT 141-14E45 . . 1 85.5 58.1 36 4 04/06
AGS 2038 . . 3 81.0 56.3 43 4 04/09AGS 3000 . . 5 79.0 59.7 36 3 04/04AGS 2024 . . 6 78.7 57.6 35 3 04/12LA3200E-2 . . 7 75.0 57.9 36 3 04/06
Average 64.1 62.6 77.6 58.4 2 36 3 04/06LSD at 10% level 4.0 N.S.3 6.8 1.6 1 3 1Std. Err. of Entry Mean 1.6 1.9 2.8 0.7 1 1 1
Planted:Harvested:Seeding Rate:Soil Type:Soil Test:Fertilization:
Management:Previous Crop:
Test conducted by D. Dunn, D. Pearce, W. Jones, R. Brooke, G. South, and B. McCranie.
3. The F-test indicated no statistical difference at the alpha = 0.10 probability level; therefore, an LSD value was not calculated.Bolding indicates entries yielding equal to highest yielding entry within a column based on Fisher's protected LSD (P = 0.10).
December 10, 2015.May 27, 2016.22 seeds per foot in 7" rows.Greenville sandy loam.P = Medium, K = High, and pH = 5.9.Preplant: 28 lb N, 80 lb P2O5, and 80 lb K2O/acre.Topdress: 85 lb N/acre.Disked, chisel plowed, and rototilled.Peanuts.
2. C.V. = 7.2%, and df for EMS = 24.
Plains, Georgia:Late-Planted Wheat Grain Performance, 2015-2016
Yield1 2016 Data
----- bu/acre -----
1. Yields calculated as 60 pounds per bushel at 13.5% moisture.
Annual Publication 100-8 • Georgia 2015-2016 Small Grain Performance Tests 23
Brand-Variety3-Year
Average2-Year
Average Rank Yield1TestWt Ht Lodg.
HeadDate
bu/acre lb/bu in % mo/day
GA 06112-13EE16 74.4 73.6 2 84.3 62.5 33 0 04/01Pioneer 26R94 63.6 59.1 4 79.6 56.7 41 3 04/08SY Cypress 54.3 51.7 9 61.2 56.6 34 9 04/06AGS 2040 . 66.3 8 74.0 60.3 35 4 04/04GAJT 141-14E45 . . 1 85.5 58.1 36 4 04/06
AGS 2038 . . 3 81.0 56.3 43 4 04/09AGS 3000 . . 5 79.0 59.7 36 3 04/04AGS 2024 . . 6 78.7 57.6 35 3 04/12LA3200E-2 . . 7 75.0 57.9 36 3 04/06
Average 64.1 62.6 77.6 58.4 2 36 3 04/06LSD at 10% level 4.0 N.S.3 6.8 1.6 1 3 1Std. Err. of Entry Mean 1.6 1.9 2.8 0.7 1 1 1
Planted:Harvested:Seeding Rate:Soil Type:Soil Test:Fertilization:
Management:Previous Crop:
Test conducted by D. Dunn, D. Pearce, W. Jones, R. Brooke, G. South, and B. McCranie.
3. The F-test indicated no statistical difference at the alpha = 0.10 probability level; therefore, an LSD value was not calculated.Bolding indicates entries yielding equal to highest yielding entry within a column based on Fisher's protected LSD (P = 0.10).
December 10, 2015.May 27, 2016.22 seeds per foot in 7" rows.Greenville sandy loam.P = Medium, K = High, and pH = 5.9.Preplant: 28 lb N, 80 lb P2O5, and 80 lb K2O/acre.Topdress: 85 lb N/acre.Disked, chisel plowed, and rototilled.Peanuts.
2. C.V. = 7.2%, and df for EMS = 24.
Plains, Georgia:Late-Planted Wheat Grain Performance, 2015-2016
Yield1 2016 Data
----- bu/acre -----
1. Yields calculated as 60 pounds per bushel at 13.5% moisture.
Brand-Variety3-Year
Average2-Year
Average Rank Yield1TestWt Ht Lodg.
HeadDate
bu/acre lb/bu in % mo/day
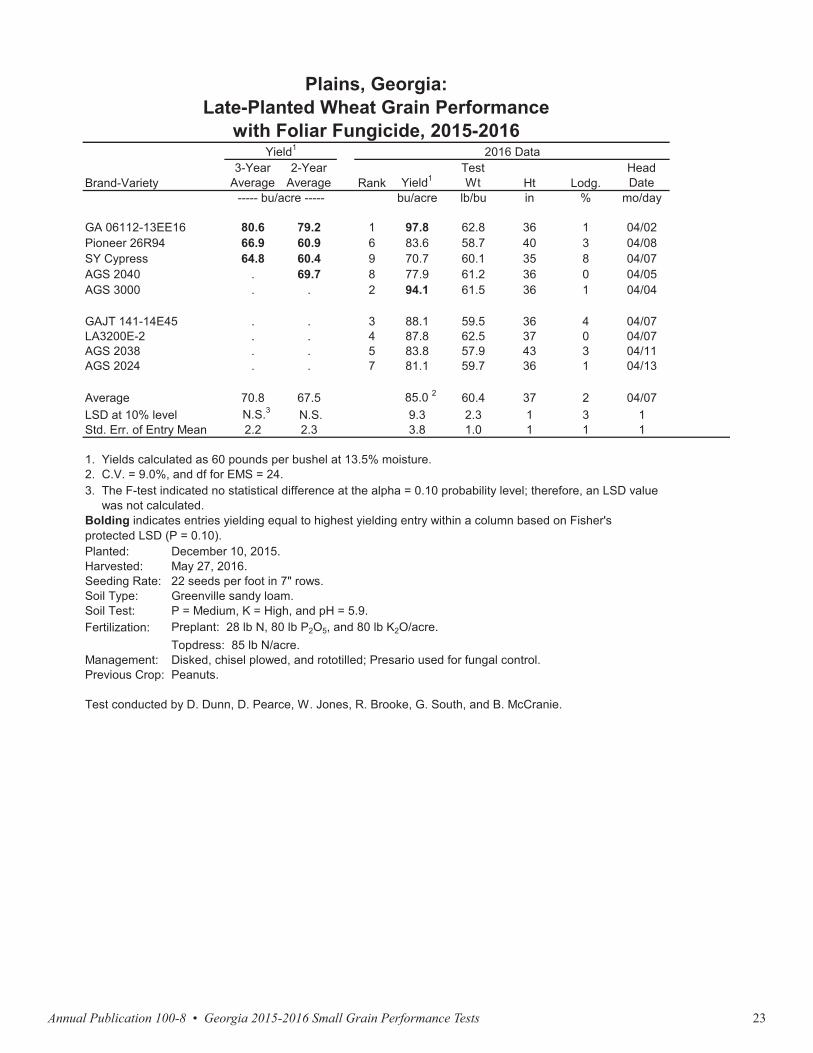
GA 06112-13EE16 80.6 79.2 1 97.8 62.8 36 1 04/02Pioneer 26R94 66.9 60.9 6 83.6 58.7 40 3 04/08SY Cypress 64.8 60.4 9 70.7 60.1 35 8 04/07AGS 2040 . 69.7 8 77.9 61.2 36 0 04/05AGS 3000 . . 2 94.1 61.5 36 1 04/04
GAJT 141-14E45 . . 3 88.1 59.5 36 4 04/07LA3200E-2 . . 4 87.8 62.5 37 0 04/07AGS 2038 . . 5 83.8 57.9 43 3 04/11AGS 2024 . . 7 81.1 59.7 36 1 04/13
Average 70.8 67.5 85.0 2 60.4 37 2 04/07LSD at 10% level N.S.3 N.S. 9.3 2.3 1 3 1Std. Err. of Entry Mean 2.2 2.3 3.8 1.0 1 1 1
Planted:Harvested:Seeding Rate:Soil Type:Soil Test:Fertilization:
Management:Previous Crop:
Test conducted by D. Dunn, D. Pearce, W. Jones, R. Brooke, G. South, and B. McCranie.
3. The F-test indicated no statistical difference at the alpha = 0.10 probability level; therefore, an LSD value was not calculated.Bolding indicates entries yielding equal to highest yielding entry within a column based on Fisher's protected LSD (P = 0.10).
December 10, 2015.May 27, 2016.22 seeds per foot in 7" rows.Greenville sandy loam.P = Medium, K = High, and pH = 5.9.Preplant: 28 lb N, 80 lb P2O5, and 80 lb K2O/acre.Topdress: 85 lb N/acre.Disked, chisel plowed, and rototilled; Presario used for fungal control.Peanuts.
2. C.V. = 9.0%, and df for EMS = 24.
Plains, Georgia:Late-Planted Wheat Grain Performance
with Foliar Fungicide, 2015-2016Yield1 2016 Data
----- bu/acre -----
1. Yields calculated as 60 pounds per bushel at 13.5% moisture.
Annual Publication 100-8 • Georgia 2015-2016 Small Grain Performance Tests24
Difference ChangeBrand-Variety no fungicide2 fungicide3 with fungicide with fungicide
bu/acre %
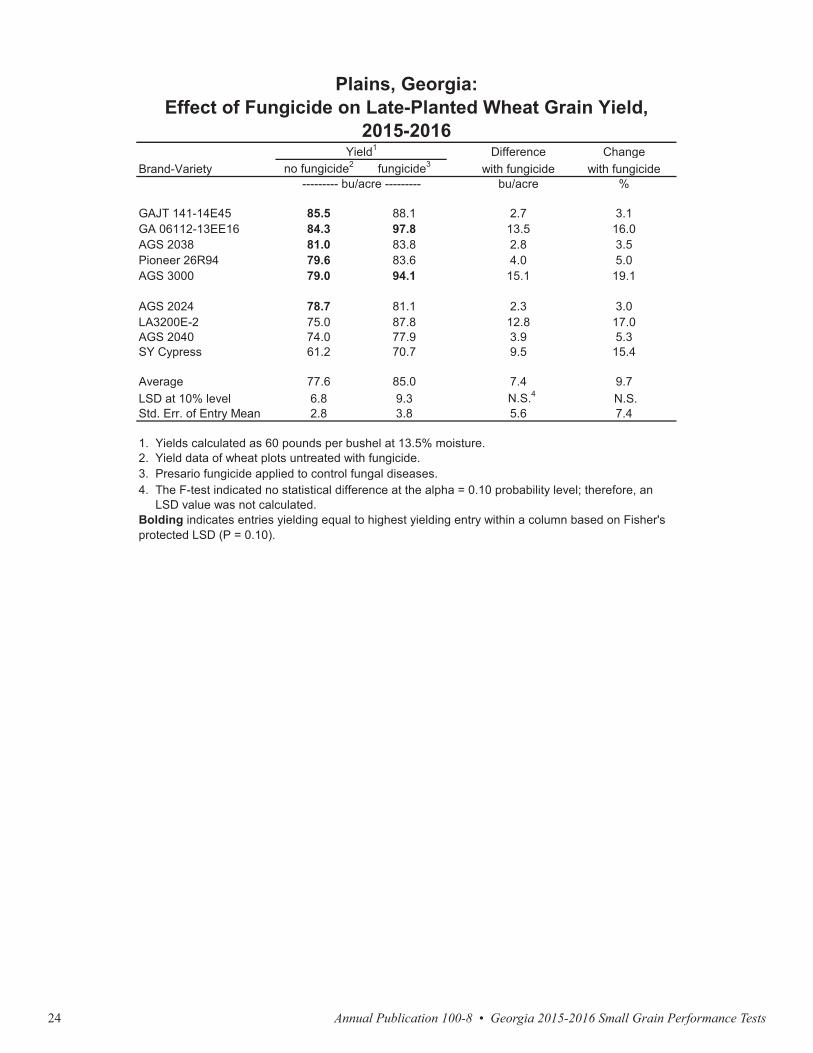
GAJT 141-14E45 85.5 88.1 2.7 3.1GA 06112-13EE16 84.3 97.8 13.5 16.0AGS 2038 81.0 83.8 2.8 3.5Pioneer 26R94 79.6 83.6 4.0 5.0AGS 3000 79.0 94.1 15.1 19.1
AGS 2024 78.7 81.1 2.3 3.0LA3200E-2 75.0 87.8 12.8 17.0AGS 2040 74.0 77.9 3.9 5.3SY Cypress 61.2 70.7 9.5 15.4
Average 77.6 85.0 7.4 9.7LSD at 10% level 6.8 9.3 N.S.4 N.S.Std. Err. of Entry Mean 2.8 3.8 5.6 7.4
Bolding indicates entries yielding equal to highest yielding entry within a column based on Fisher's protected LSD (P = 0.10).
2. Yield data of wheat plots untreated with fungicide.
4. The F-test indicated no statistical difference at the alpha = 0.10 probability level; therefore, an LSD value was not calculated.
Plains, Georgia:Effect of Fungicide on Late-Planted Wheat Grain Yield,
2015-2016Yield1
--------- bu/acre ---------
1. Yields calculated as 60 pounds per bushel at 13.5% moisture.
3. Presario fungicide applied to control fungal diseases.
Brand-Variety3-Year
Average2-Year
Average Rank Yield1TestWt Ht Lodg.
HeadDate
bu/acre lb/bu in % mo/day
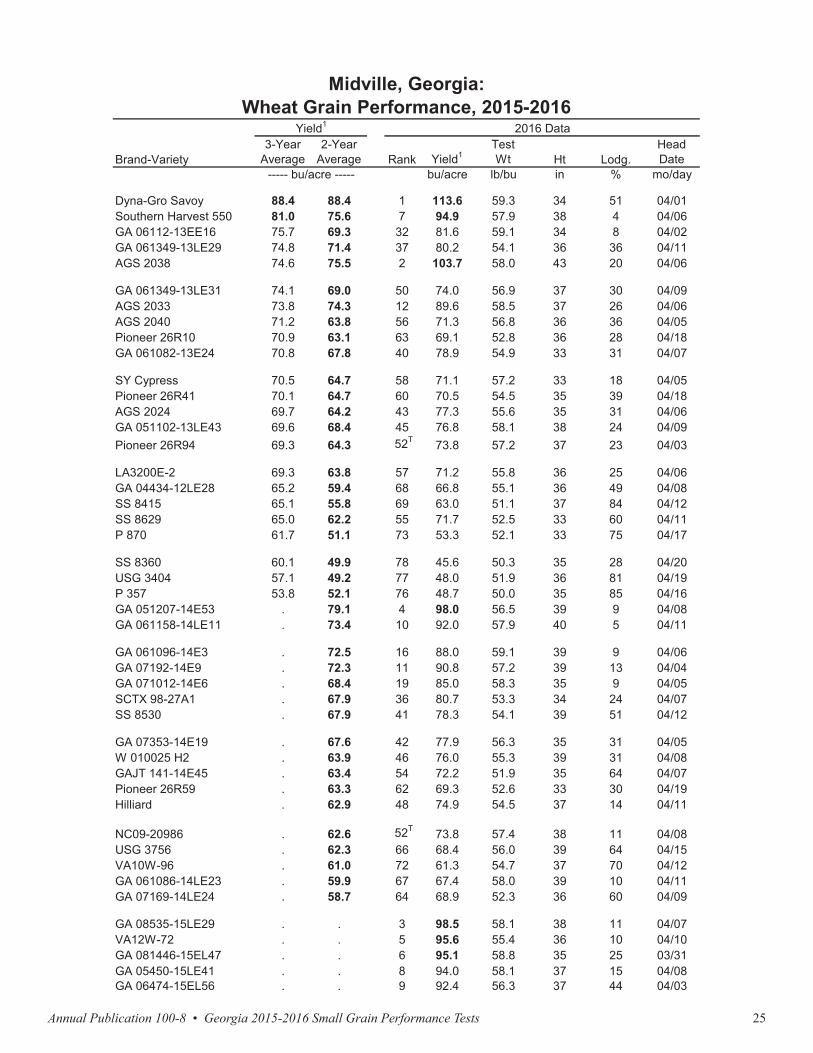
Dyna-Gro Savoy 88.4 88.4 1 113.6 59.3 34 51 04/01Southern Harvest 550 81.0 75.6 7 94.9 57.9 38 4 04/06GA 06112-13EE16 75.7 69.3 32 81.6 59.1 34 8 04/02GA 061349-13LE29 74.8 71.4 37 80.2 54.1 36 36 04/11AGS 2038 74.6 75.5 2 103.7 58.0 43 20 04/06
GA 061349-13LE31 74.1 69.0 50 74.0 56.9 37 30 04/09AGS 2033 73.8 74.3 12 89.6 58.5 37 26 04/06AGS 2040 71.2 63.8 56 71.3 56.8 36 36 04/05Pioneer 26R10 70.9 63.1 63 69.1 52.8 36 28 04/18GA 061082-13E24 70.8 67.8 40 78.9 54.9 33 31 04/07
SY Cypress 70.5 64.7 58 71.1 57.2 33 18 04/05Pioneer 26R41 70.1 64.7 60 70.5 54.5 35 39 04/18AGS 2024 69.7 64.2 43 77.3 55.6 35 31 04/06GA 051102-13LE43 69.6 68.4 45 76.8 58.1 38 24 04/09Pioneer 26R94 69.3 64.3 52T 73.8 57.2 37 23 04/03
LA3200E-2 69.3 63.8 57 71.2 55.8 36 25 04/06GA 04434-12LE28 65.2 59.4 68 66.8 55.1 36 49 04/08SS 8415 65.1 55.8 69 63.0 51.1 37 84 04/12SS 8629 65.0 62.2 55 71.7 52.5 33 60 04/11P 870 61.7 51.1 73 53.3 52.1 33 75 04/17
SS 8360 60.1 49.9 78 45.6 50.3 35 28 04/20USG 3404 57.1 49.2 77 48.0 51.9 36 81 04/19P 357 53.8 52.1 76 48.7 50.0 35 85 04/16GA 051207-14E53 . 79.1 4 98.0 56.5 39 9 04/08GA 061158-14LE11 . 73.4 10 92.0 57.9 40 5 04/11
GA 061096-14E3 . 72.5 16 88.0 59.1 39 9 04/06GA 07192-14E9 . 72.3 11 90.8 57.2 39 13 04/04GA 071012-14E6 . 68.4 19 85.0 58.3 35 9 04/05SCTX 98-27A1 . 67.9 36 80.7 53.3 34 24 04/07SS 8530 . 67.9 41 78.3 54.1 39 51 04/12
GA 07353-14E19 . 67.6 42 77.9 56.3 35 31 04/05W 010025 H2 . 63.9 46 76.0 55.3 39 31 04/08GAJT 141-14E45 . 63.4 54 72.2 51.9 35 64 04/07Pioneer 26R59 . 63.3 62 69.3 52.6 33 30 04/19Hilliard . 62.9 48 74.9 54.5 37 14 04/11
NC09-20986 . 62.6 52T 73.8 57.4 38 11 04/08USG 3756 . 62.3 66 68.4 56.0 39 64 04/15VA10W-96 . 61.0 72 61.3 54.7 37 70 04/12GA 061086-14LE23 . 59.9 67 67.4 58.0 39 10 04/11GA 07169-14LE24 . 58.7 64 68.9 52.3 36 60 04/09
GA 08535-15LE29 . . 3 98.5 58.1 38 11 04/07VA12W-72 . . 5 95.6 55.4 36 10 04/10GA 081446-15EL47 . . 6 95.1 58.8 35 25 03/31GA 05450-15LE41 . . 8 94.0 58.1 37 15 04/08GA 06474-15EL56 . . 9 92.4 56.3 37 44 04/03
Midville, Georgia:Wheat Grain Performance, 2015-2016
Yield1 2016 Data
----- bu/acre -----
Annual Publication 100-8 • Georgia 2015-2016 Small Grain Performance Tests 25
Difference ChangeBrand-Variety no fungicide2 fungicide3 with fungicide with fungicide
bu/acre %
GAJT 141-14E45 85.5 88.1 2.7 3.1GA 06112-13EE16 84.3 97.8 13.5 16.0AGS 2038 81.0 83.8 2.8 3.5Pioneer 26R94 79.6 83.6 4.0 5.0AGS 3000 79.0 94.1 15.1 19.1
AGS 2024 78.7 81.1 2.3 3.0LA3200E-2 75.0 87.8 12.8 17.0AGS 2040 74.0 77.9 3.9 5.3SY Cypress 61.2 70.7 9.5 15.4
Average 77.6 85.0 7.4 9.7LSD at 10% level 6.8 9.3 N.S.4 N.S.Std. Err. of Entry Mean 2.8 3.8 5.6 7.4
Bolding indicates entries yielding equal to highest yielding entry within a column based on Fisher's protected LSD (P = 0.10).
2. Yield data of wheat plots untreated with fungicide.
4. The F-test indicated no statistical difference at the alpha = 0.10 probability level; therefore, an LSD value was not calculated.
Plains, Georgia:Effect of Fungicide on Late-Planted Wheat Grain Yield,
2015-2016Yield1
--------- bu/acre ---------
1. Yields calculated as 60 pounds per bushel at 13.5% moisture.
3. Presario fungicide applied to control fungal diseases.
Brand-Variety3-Year
Average2-Year
Average Rank Yield1TestWt Ht Lodg.
HeadDate
bu/acre lb/bu in % mo/day
Dyna-Gro Savoy 88.4 88.4 1 113.6 59.3 34 51 04/01Southern Harvest 550 81.0 75.6 7 94.9 57.9 38 4 04/06GA 06112-13EE16 75.7 69.3 32 81.6 59.1 34 8 04/02GA 061349-13LE29 74.8 71.4 37 80.2 54.1 36 36 04/11AGS 2038 74.6 75.5 2 103.7 58.0 43 20 04/06
GA 061349-13LE31 74.1 69.0 50 74.0 56.9 37 30 04/09AGS 2033 73.8 74.3 12 89.6 58.5 37 26 04/06AGS 2040 71.2 63.8 56 71.3 56.8 36 36 04/05Pioneer 26R10 70.9 63.1 63 69.1 52.8 36 28 04/18GA 061082-13E24 70.8 67.8 40 78.9 54.9 33 31 04/07
SY Cypress 70.5 64.7 58 71.1 57.2 33 18 04/05Pioneer 26R41 70.1 64.7 60 70.5 54.5 35 39 04/18AGS 2024 69.7 64.2 43 77.3 55.6 35 31 04/06GA 051102-13LE43 69.6 68.4 45 76.8 58.1 38 24 04/09Pioneer 26R94 69.3 64.3 52T 73.8 57.2 37 23 04/03
LA3200E-2 69.3 63.8 57 71.2 55.8 36 25 04/06GA 04434-12LE28 65.2 59.4 68 66.8 55.1 36 49 04/08SS 8415 65.1 55.8 69 63.0 51.1 37 84 04/12SS 8629 65.0 62.2 55 71.7 52.5 33 60 04/11P 870 61.7 51.1 73 53.3 52.1 33 75 04/17
SS 8360 60.1 49.9 78 45.6 50.3 35 28 04/20USG 3404 57.1 49.2 77 48.0 51.9 36 81 04/19P 357 53.8 52.1 76 48.7 50.0 35 85 04/16GA 051207-14E53 . 79.1 4 98.0 56.5 39 9 04/08GA 061158-14LE11 . 73.4 10 92.0 57.9 40 5 04/11
GA 061096-14E3 . 72.5 16 88.0 59.1 39 9 04/06GA 07192-14E9 . 72.3 11 90.8 57.2 39 13 04/04GA 071012-14E6 . 68.4 19 85.0 58.3 35 9 04/05SCTX 98-27A1 . 67.9 36 80.7 53.3 34 24 04/07SS 8530 . 67.9 41 78.3 54.1 39 51 04/12
GA 07353-14E19 . 67.6 42 77.9 56.3 35 31 04/05W 010025 H2 . 63.9 46 76.0 55.3 39 31 04/08GAJT 141-14E45 . 63.4 54 72.2 51.9 35 64 04/07Pioneer 26R59 . 63.3 62 69.3 52.6 33 30 04/19Hilliard . 62.9 48 74.9 54.5 37 14 04/11
NC09-20986 . 62.6 52T 73.8 57.4 38 11 04/08USG 3756 . 62.3 66 68.4 56.0 39 64 04/15VA10W-96 . 61.0 72 61.3 54.7 37 70 04/12GA 061086-14LE23 . 59.9 67 67.4 58.0 39 10 04/11GA 07169-14LE24 . 58.7 64 68.9 52.3 36 60 04/09
GA 08535-15LE29 . . 3 98.5 58.1 38 11 04/07VA12W-72 . . 5 95.6 55.4 36 10 04/10GA 081446-15EL47 . . 6 95.1 58.8 35 25 03/31GA 05450-15LE41 . . 8 94.0 58.1 37 15 04/08GA 06474-15EL56 . . 9 92.4 56.3 37 44 04/03
Midville, Georgia:Wheat Grain Performance, 2015-2016
Yield1 2016 Data
----- bu/acre -----

Annual Publication 100-8 • Georgia 2015-2016 Small Grain Performance Tests26
Brand-Variety3-Year
Average2-Year
Average Rank Yield1TestWt Ht Lodg.
HeadDate
bu/acre lb/bu in % mo/day
GA 061471-15LE38 . . 13 88.8 56.7 37 34 04/05AGS 3000 . . 14 88.6 59.6 36 34 03/30PGX 15-14 . . 15 88.2 53.4 36 55 04/18GA 06283-15LE25 . . 17 87.5 56.2 36 50 04/09EXP 3536 . . 18 85.1 54.7 40 31 04/19
GA 071171-15EL64ES8 . . 30 83.4 61.2 37 19 04/05LA09011UB-2 . . 31T 81.9 58.1 35 41 04/07OK11754WF . . 31T 81.9 58.4 38 13 03/28GA 081104-15EL23 . . 33 81.5 54.2 36 25 04/05GA 061157-15LE44 . . 34 81.3 55.2 36 30 04/05
LA08115C-30 . . 35 81.2 57.3 35 23 04/05GA 05450-15EL52 . . 38 80.0 57.4 36 11 04/07GA 08261-15EL7 . . 39 79.9 59.3 40 21 04/07GA 08510-15EL9 . . 44 77.0 58.3 35 31 03/30LA08090C-9-2 . . 47 75.2 56.2 36 34 04/09
GA 08391-15EL19 . . 49 74.4 53.4 36 36 04/08GA 07144-15LE16 . . 51 73.9 55.8 38 45 04/11PGX 15-16 . . 53 73.0 57.2 36 79 04/17P 243 . . 59 71.0 56.6 40 73 04/15GA 081113-15EL8 . . 61 69.8 54.2 34 53 04/06
SY Viper . . 65 68.8 55.6 38 75 04/11PGX 15-12 . . 70 62.6 53.7 35 18 04/10USG 3201 . . 71 62.5 54.4 35 50 04/17NC8170-4-3 . . 74 52.9 53.6 38 88 04/15NC11-22289 . . 75 50.2 52.4 35 63 04/07
USG 3013 . . 79 35.4 49.0 36 86 04/17
Average 69.6 65.4 76.5 2 55.7 36 37 04/08LSD at 10% level 9.0 N.S.3 19 2.8 2 24 -Std. Err. of Entry Mean 3.9 4.8 8.1 1.2 1 10 -
Planted:Harvested:Seeding Rate:Soil Type:Soil Test:Fertilization:
Management:
Previous Crop:
Subsoiled, field cultivated, and rototilled; Harmony and Express used for weed control;1000 lb/acre lime.Fallow.
Test conducted by D. Dunn, R. Brooke, G. South, and B. McCranie.
June 1, 2016.22 seeds per foot in 7" rows.Dothan sandy loam.P = High, K = Medium, and pH = 6.0.Preplant: 37 lb N, 119 lb P2O5, and 70 lb K2O/acre.Topdress: 100 lb N/acre.
November 24, 2015.
Midville, Georgia:Wheat Grain Performance, 2015-2016 (Continued)
Yield1 2016 Data
----- bu/acre -----
1. Yields calculated as 60 pounds per bushel at 13.5% moisture.2. C.V. = 21.2%, and df for EMS = 210.3. The F-test indicated no statistical difference at the alpha = 0.10 probability level; therefore, an LSD value was not calculated.Bolding indicates entries yielding equal to highest yielding entry within a column based on Fisher's protected LSD (P = 0.10).
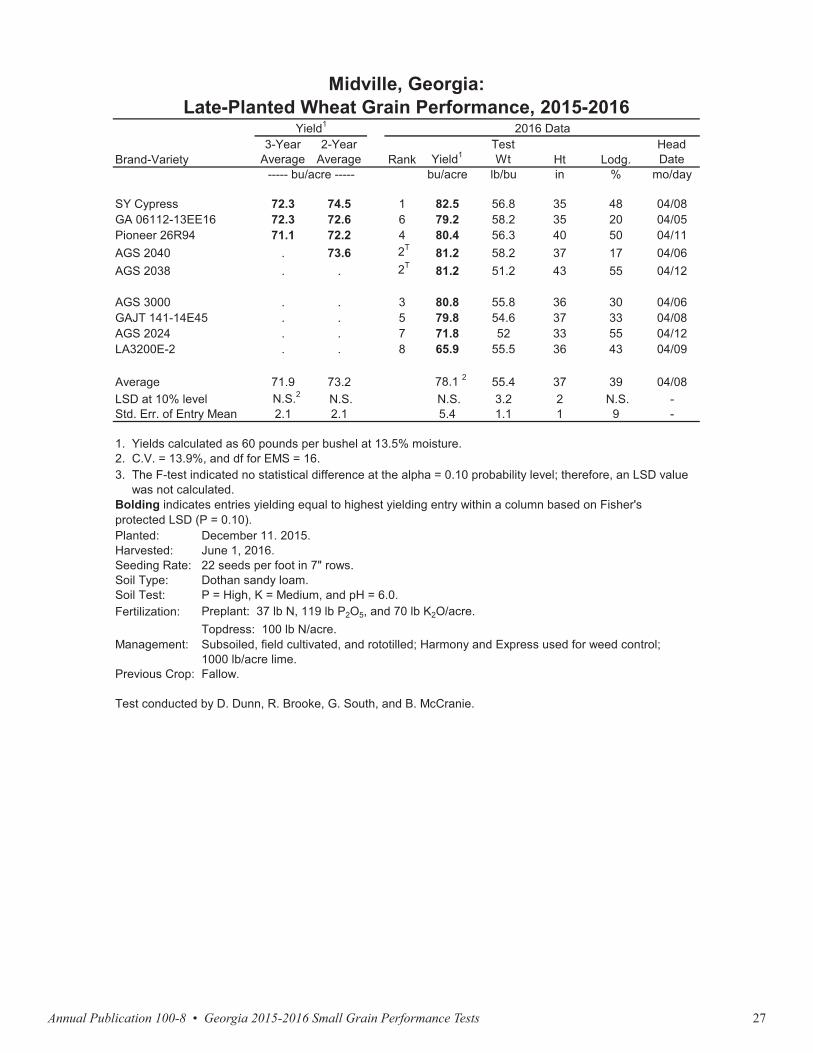
Annual Publication 100-8 • Georgia 2015-2016 Small Grain Performance Tests 27
Brand-Variety3-Year
Average2-Year
Average Rank Yield1TestWt Ht Lodg.
HeadDate
bu/acre lb/bu in % mo/day
SY Cypress 72.3 74.5 1 82.5 56.8 35 48 04/08GA 06112-13EE16 72.3 72.6 6 79.2 58.2 35 20 04/05Pioneer 26R94 71.1 72.2 4 80.4 56.3 40 50 04/11AGS 2040 . 73.6 2T 81.2 58.2 37 17 04/06AGS 2038 . . 2T 81.2 51.2 43 55 04/12
AGS 3000 . . 3 80.8 55.8 36 30 04/06GAJT 141-14E45 . . 5 79.8 54.6 37 33 04/08AGS 2024 . . 7 71.8 52 33 55 04/12LA3200E-2 . . 8 65.9 55.5 36 43 04/09
Average 71.9 73.2 78.1 2 55.4 37 39 04/08LSD at 10% level N.S.2 N.S. N.S. 3.2 2 N.S. -Std. Err. of Entry Mean 2.1 2.1 5.4 1.1 1 9 -
Planted:Harvested:Seeding Rate:Soil Type:Soil Test:Fertilization:
Management:
Previous Crop:
Test conducted by D. Dunn, R. Brooke, G. South, and B. McCranie.
3. The F-test indicated no statistical difference at the alpha = 0.10 probability level; therefore, an LSD value was not calculated.Bolding indicates entries yielding equal to highest yielding entry within a column based on Fisher's protected LSD (P = 0.10).
December 11. 2015.June 1, 2016.22 seeds per foot in 7" rows.Dothan sandy loam.P = High, K = Medium, and pH = 6.0.Preplant: 37 lb N, 119 lb P2O5, and 70 lb K2O/acre.Topdress: 100 lb N/acre.Subsoiled, field cultivated, and rototilled; Harmony and Express used for weed control;1000 lb/acre lime.Fallow.
2. C.V. = 13.9%, and df for EMS = 16.
Midville, Georgia:Late-Planted Wheat Grain Performance, 2015-2016
Yield1 2016 Data
----- bu/acre -----
1. Yields calculated as 60 pounds per bushel at 13.5% moisture.
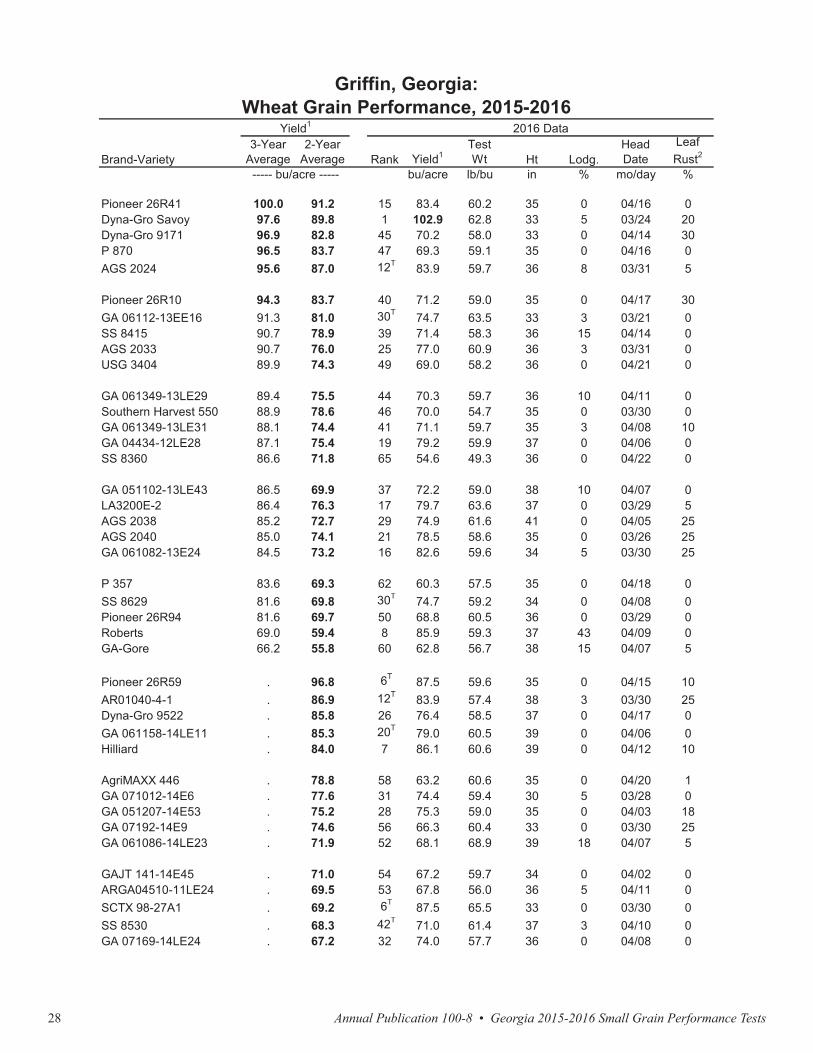
Annual Publication 100-8 • Georgia 2015-2016 Small Grain Performance Tests28
Brand-Variety3-Year
Average2-Year
Average Rank Yield1TestWt Ht Lodg.
HeadDate
LeafRust2
bu/acre lb/bu in % mo/day %
Pioneer 26R41 100.0 91.2 15 83.4 60.2 35 0 04/16 0Dyna-Gro Savoy 97.6 89.8 1 102.9 62.8 33 5 03/24 20Dyna-Gro 9171 96.9 82.8 45 70.2 58.0 33 0 04/14 30P 870 96.5 83.7 47 69.3 59.1 35 0 04/16 0AGS 2024 95.6 87.0 12T 83.9 59.7 36 8 03/31 5
Pioneer 26R10 94.3 83.7 40 71.2 59.0 35 0 04/17 30GA 06112-13EE16 91.3 81.0 30T 74.7 63.5 33 3 03/21 0SS 8415 90.7 78.9 39 71.4 58.3 36 15 04/14 0AGS 2033 90.7 76.0 25 77.0 60.9 36 3 03/31 0USG 3404 89.9 74.3 49 69.0 58.2 36 0 04/21 0
GA 061349-13LE29 89.4 75.5 44 70.3 59.7 36 10 04/11 0Southern Harvest 550 88.9 78.6 46 70.0 54.7 35 0 03/30 0GA 061349-13LE31 88.1 74.4 41 71.1 59.7 35 3 04/08 10GA 04434-12LE28 87.1 75.4 19 79.2 59.9 37 0 04/06 0SS 8360 86.6 71.8 65 54.6 49.3 36 0 04/22 0
GA 051102-13LE43 86.5 69.9 37 72.2 59.0 38 10 04/07 0LA3200E-2 86.4 76.3 17 79.7 63.6 37 0 03/29 5AGS 2038 85.2 72.7 29 74.9 61.6 41 0 04/05 25AGS 2040 85.0 74.1 21 78.5 58.6 35 0 03/26 25GA 061082-13E24 84.5 73.2 16 82.6 59.6 34 5 03/30 25
P 357 83.6 69.3 62 60.3 57.5 35 0 04/18 0SS 8629 81.6 69.8 30T 74.7 59.2 34 0 04/08 0Pioneer 26R94 81.6 69.7 50 68.8 60.5 36 0 03/29 0Roberts 69.0 59.4 8 85.9 59.3 37 43 04/09 0GA-Gore 66.2 55.8 60 62.8 56.7 38 15 04/07 5
Pioneer 26R59 . 96.8 6T 87.5 59.6 35 0 04/15 10AR01040-4-1 . 86.9 12T 83.9 57.4 38 3 03/30 25Dyna-Gro 9522 . 85.8 26 76.4 58.5 37 0 04/17 0GA 061158-14LE11 . 85.3 20T 79.0 60.5 39 0 04/06 0Hilliard . 84.0 7 86.1 60.6 39 0 04/12 10
AgriMAXX 446 . 78.8 58 63.2 60.6 35 0 04/20 1GA 071012-14E6 . 77.6 31 74.4 59.4 30 5 03/28 0GA 051207-14E53 . 75.2 28 75.3 59.0 35 0 04/03 18GA 07192-14E9 . 74.6 56 66.3 60.4 33 0 03/30 25GA 061086-14LE23 . 71.9 52 68.1 68.9 39 18 04/07 5
GAJT 141-14E45 . 71.0 54 67.2 59.7 34 0 04/02 0ARGA04510-11LE24 . 69.5 53 67.8 56.0 36 5 04/11 0SCTX 98-27A1 . 69.2 6T 87.5 65.5 33 0 03/30 0SS 8530 . 68.3 42T 71.0 61.4 37 3 04/10 0GA 07169-14LE24 . 67.2 32 74.0 57.7 36 0 04/08 0
Griffin, Georgia:Wheat Grain Performance, 2015-2016
Yield1 2016 Data
----- bu/acre -----Brand-Variety
3-YearAverage
2-YearAverage Rank Yield1
TestWt Ht Lodg.
HeadDate
LeafRust2
bu/acre lb/bu in % mo/day %
NC09-20986 . 61.1 55 66.4 60.6 40 5 04/09 0W 010025 H2 . 49.5 64 56.6 53.1 35 3 04/07 18GA 081104-15EL23 . . 2 92.8 63.2 36 10 03/26 25GA 081446-15EL47 . . 3 89.4 61.4 36 5 03/26 0GA 061157-15LE44 . . 4 88.8 61.4 38 0 03/06 0
PGX 15-14 . . 5T 87.7 58.6 36 0 04/14 0GA 08510-15EL9 . . 5T 87.7 58.8 36 0 03/26 0AgriMAXX Exp 1674 . . 9 85.7 58.8 35 5 04/14 0GA 06283-15LE25 . . 10 84.9 62.4 37 0 03/31 25WX15781 . . 11 84.8 63.5 40 0 04/16 25
LA08115C-30 . . 13 83.6 58.1 35 3 03/26 20GA 081113-15EL8 . . 14 83.5 61.0 37 3 04/04 0VA12W-72 . . 18 79.4 59.6 36 0 04/10 25Dyna-Gro 9642 . . 20T 79.0 61.8 37 5 04/20 0GA 07144-15LE16 . . 22 77.8 61.0 39 5 04/09 0
GA 08391-15EL19 . . 23 77.7 61.0 34 10 03/31 5GA 05450-15LE41 . . 24 77.4 61.3 33 3 04/08 20EXP 3536 . . 27 76.3 59.1 38 0 04/16 25USG 3201 . . 33T 73.0 61.6 37 0 04/16 0GA 061471-15LE38 . . 33T 73.0 62.9 35 0 03/30 0
USG 3756 . . 34 72.9 60.8 39 5 04/16 0PGX 15-16 . . 35 72.7 60.7 37 3 04/18 20GA 061096-14E3 . . 36T 72.3 59.3 35 0 03/29 30GA 071171-15EL64ES8 . . 36T 72.3 60.5 35 5 03/29 1AGS 3000 . . 38 72.0 59.4 32 0 03/24 0
NC11-22289 . . 42T 71.0 60.6 38 8 04/10 15LA09011UB-2 . . 43 70.9 65.1 35 8 04/04 0NC8170-4-3 . . 48 69.1 59.3 40 18 04/14 0SY Viper . . 51 68.4 58.0 38 0 04/14 0AgriMAXX 415 . . 57 64.7 61.1 35 0 04/17 20
P 243 . . 59 63.1 58.6 37 3 04/16 15GA 05450-15EL52 . . 61 62.4 60.0 34 0 04/03 5USG 3013 . . 63 60.1 57.0 38 5 04/19 0
Average 87.7 75.3 75.1 3 59.9 36 4 04/07 16LSD at 10% level 7.9 N.S.4 12.9 N.S. 2 N.S. 2 N.S.Std. Err. of Entry Mean 3.4 4.4 5.5 2.1 1 4 1 4
----- bu/acre -----
Yield1 2016 Data
Griffin, Georgia:Wheat Grain Performance, 2015-2016 (Continued)

Annual Publication 100-8 • Georgia 2015-2016 Small Grain Performance Tests 29
Brand-Variety3-Year
Average2-Year
Average Rank Yield1TestWt Ht Lodg.
HeadDate
LeafRust2
bu/acre lb/bu in % mo/day %
NC09-20986 . 61.1 55 66.4 60.6 40 5 04/09 0W 010025 H2 . 49.5 64 56.6 53.1 35 3 04/07 18GA 081104-15EL23 . . 2 92.8 63.2 36 10 03/26 25GA 081446-15EL47 . . 3 89.4 61.4 36 5 03/26 0GA 061157-15LE44 . . 4 88.8 61.4 38 0 03/06 0
PGX 15-14 . . 5T 87.7 58.6 36 0 04/14 0GA 08510-15EL9 . . 5T 87.7 58.8 36 0 03/26 0AgriMAXX Exp 1674 . . 9 85.7 58.8 35 5 04/14 0GA 06283-15LE25 . . 10 84.9 62.4 37 0 03/31 25WX15781 . . 11 84.8 63.5 40 0 04/16 25
LA08115C-30 . . 13 83.6 58.1 35 3 03/26 20GA 081113-15EL8 . . 14 83.5 61.0 37 3 04/04 0VA12W-72 . . 18 79.4 59.6 36 0 04/10 25Dyna-Gro 9642 . . 20T 79.0 61.8 37 5 04/20 0GA 07144-15LE16 . . 22 77.8 61.0 39 5 04/09 0
GA 08391-15EL19 . . 23 77.7 61.0 34 10 03/31 5GA 05450-15LE41 . . 24 77.4 61.3 33 3 04/08 20EXP 3536 . . 27 76.3 59.1 38 0 04/16 25USG 3201 . . 33T 73.0 61.6 37 0 04/16 0GA 061471-15LE38 . . 33T 73.0 62.9 35 0 03/30 0
USG 3756 . . 34 72.9 60.8 39 5 04/16 0PGX 15-16 . . 35 72.7 60.7 37 3 04/18 20GA 061096-14E3 . . 36T 72.3 59.3 35 0 03/29 30GA 071171-15EL64ES8 . . 36T 72.3 60.5 35 5 03/29 1AGS 3000 . . 38 72.0 59.4 32 0 03/24 0
NC11-22289 . . 42T 71.0 60.6 38 8 04/10 15LA09011UB-2 . . 43 70.9 65.1 35 8 04/04 0NC8170-4-3 . . 48 69.1 59.3 40 18 04/14 0SY Viper . . 51 68.4 58.0 38 0 04/14 0AgriMAXX 415 . . 57 64.7 61.1 35 0 04/17 20
P 243 . . 59 63.1 58.6 37 3 04/16 15GA 05450-15EL52 . . 61 62.4 60.0 34 0 04/03 5USG 3013 . . 63 60.1 57.0 38 5 04/19 0
Average 87.7 75.3 75.1 3 59.9 36 4 04/07 16LSD at 10% level 7.9 N.S.4 12.9 N.S. 2 N.S. 2 N.S.Std. Err. of Entry Mean 3.4 4.4 5.5 2.1 1 4 1 4
----- bu/acre -----
Yield1 2016 Data
Griffin, Georgia:Wheat Grain Performance, 2015-2016 (Continued)
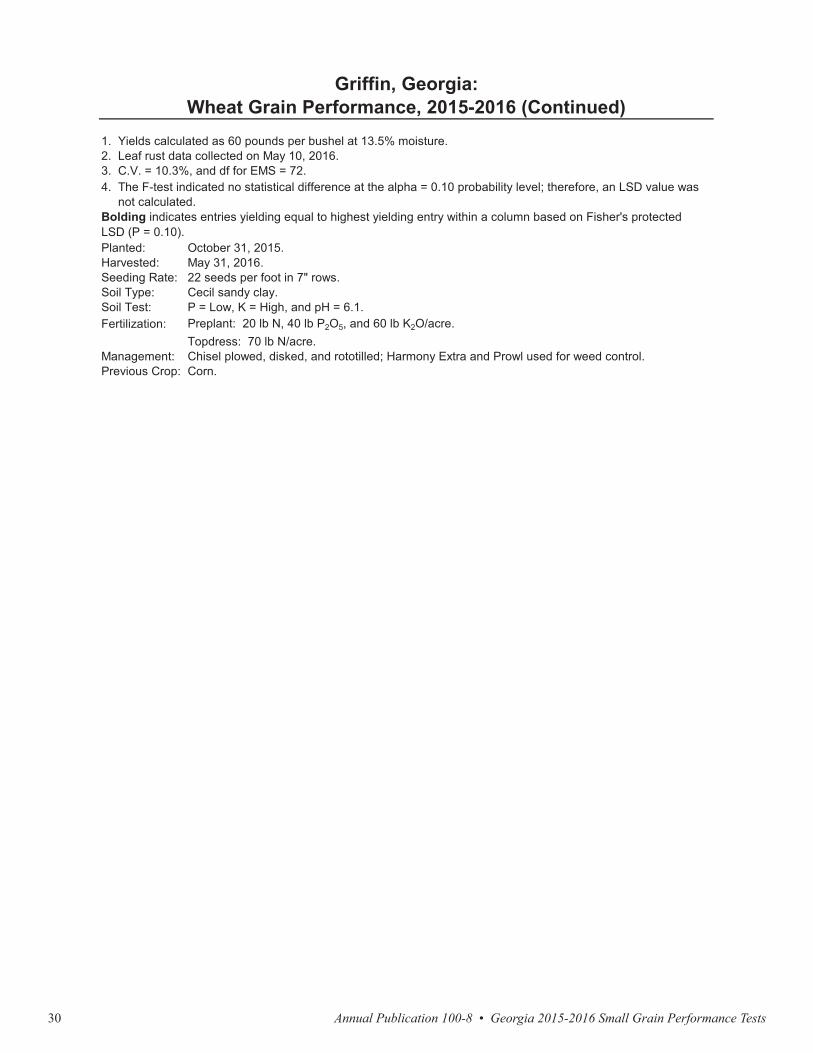
Annual Publication 100-8 • Georgia 2015-2016 Small Grain Performance Tests30
Planted:Harvested:Seeding Rate:Soil Type:Soil Test:Fertilization:
Management:Previous Crop:
Preplant: 20 lb N, 40 lb P2O5, and 60 lb K2O/acre.Topdress: 70 lb N/acre.Chisel plowed, disked, and rototilled; Harmony Extra and Prowl used for weed control.Corn.
P = Low, K = High, and pH = 6.1.
Griffin, Georgia:Wheat Grain Performance, 2015-2016 (Continued)
1. Yields calculated as 60 pounds per bushel at 13.5% moisture.2. Leaf rust data collected on May 10, 2016.3. C.V. = 10.3%, and df for EMS = 72.4. The F-test indicated no statistical difference at the alpha = 0.10 probability level; therefore, an LSD value was not calculated.Bolding indicates entries yielding equal to highest yielding entry within a column based on Fisher's protected LSD (P = 0.10).
October 31, 2015.May 31, 2016.22 seeds per foot in 7" rows.Cecil sandy clay.
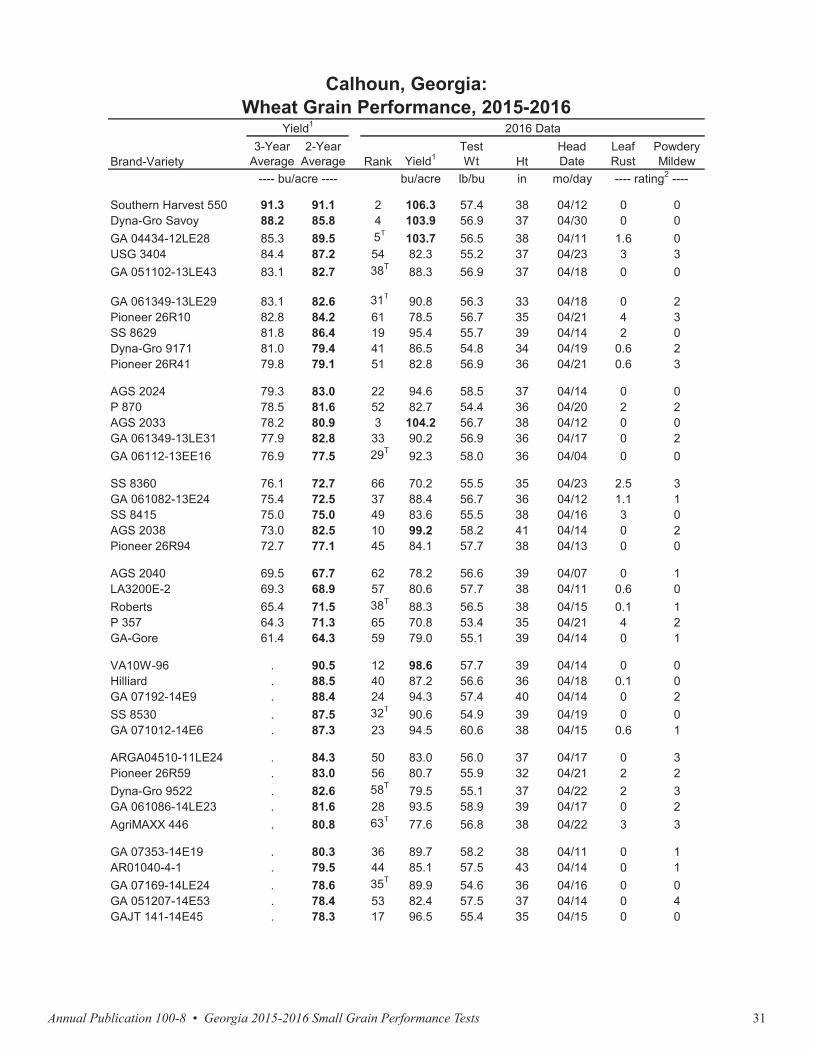
Annual Publication 100-8 • Georgia 2015-2016 Small Grain Performance Tests 31
Brand-Variety3-Year
Average2-Year
Average Rank Yield1TestWt Ht
HeadDate
LeafRust
PowderyMildew
bu/acre lb/bu in mo/day
Southern Harvest 550 91.3 91.1 2 106.3 57.4 38 04/12 0 0Dyna-Gro Savoy 88.2 85.8 4 103.9 56.9 37 04/30 0 0GA 04434-12LE28 85.3 89.5 5T 103.7 56.5 38 04/11 1.6 0USG 3404 84.4 87.2 54 82.3 55.2 37 04/23 3 3GA 051102-13LE43 83.1 82.7 38T 88.3 56.9 37 04/18 0 0
GA 061349-13LE29 83.1 82.6 31T 90.8 56.3 33 04/18 0 2Pioneer 26R10 82.8 84.2 61 78.5 56.7 35 04/21 4 3SS 8629 81.8 86.4 19 95.4 55.7 39 04/14 2 0Dyna-Gro 9171 81.0 79.4 41 86.5 54.8 34 04/19 0.6 2Pioneer 26R41 79.8 79.1 51 82.8 56.9 36 04/21 0.6 3
AGS 2024 79.3 83.0 22 94.6 58.5 37 04/14 0 0P 870 78.5 81.6 52 82.7 54.4 36 04/20 2 2AGS 2033 78.2 80.9 3 104.2 56.7 38 04/12 0 0GA 061349-13LE31 77.9 82.8 33 90.2 56.9 36 04/17 0 2GA 06112-13EE16 76.9 77.5 29T 92.3 58.0 36 04/04 0 0
SS 8360 76.1 72.7 66 70.2 55.5 35 04/23 2.5 3GA 061082-13E24 75.4 72.5 37 88.4 56.7 36 04/12 1.1 1SS 8415 75.0 75.0 49 83.6 55.5 38 04/16 3 0AGS 2038 73.0 82.5 10 99.2 58.2 41 04/14 0 2Pioneer 26R94 72.7 77.1 45 84.1 57.7 38 04/13 0 0
AGS 2040 69.5 67.7 62 78.2 56.6 39 04/07 0 1LA3200E-2 69.3 68.9 57 80.6 57.7 38 04/11 0.6 0Roberts 65.4 71.5 38T 88.3 56.5 38 04/15 0.1 1P 357 64.3 71.3 65 70.8 53.4 35 04/21 4 2GA-Gore 61.4 64.3 59 79.0 55.1 39 04/14 0 1
VA10W-96 . 90.5 12 98.6 57.7 39 04/14 0 0Hilliard . 88.5 40 87.2 56.6 36 04/18 0.1 0GA 07192-14E9 . 88.4 24 94.3 57.4 40 04/14 0 2SS 8530 . 87.5 32T 90.6 54.9 39 04/19 0 0GA 071012-14E6 . 87.3 23 94.5 60.6 38 04/15 0.6 1
ARGA04510-11LE24 . 84.3 50 83.0 56.0 37 04/17 0 3Pioneer 26R59 . 83.0 56 80.7 55.9 32 04/21 2 2Dyna-Gro 9522 . 82.6 58T 79.5 55.1 37 04/22 2 3GA 061086-14LE23 . 81.6 28 93.5 58.9 39 04/17 0 2AgriMAXX 446 . 80.8 63T 77.6 56.8 38 04/22 3 3
GA 07353-14E19 . 80.3 36 89.7 58.2 38 04/11 0 1AR01040-4-1 . 79.5 44 85.1 57.5 43 04/14 0 1GA 07169-14LE24 . 78.6 35T 89.9 54.6 36 04/16 0 0GA 051207-14E53 . 78.4 53 82.4 57.5 37 04/14 0 4GAJT 141-14E45 . 78.3 17 96.5 55.4 35 04/15 0 0
Calhoun, Georgia:Wheat Grain Performance, 2015-2016
Yield1 2016 Data
---- bu/acre ---- ---- rating2 ----

Annual Publication 100-8 • Georgia 2015-2016 Small Grain Performance Tests32
Brand-Variety3-Year
Average2-Year
Average Rank Yield1TestWt Ht
HeadDate
LeafRust
PowderyMildew
bu/acre lb/bu in mo/day
GA 061158-14LE11 . 76.4 58T 79.5 57.5 37 04/19 0 0W 010025 H2 . 73.9 47 83.8 55.8 38 04/14 0.1 1NC09-20986 . 66.7 63T 77.6 56.7 39 04/14 1.1 0SCTX 98-27A1 . 66.6 35T 89.9 55.5 35 04/08 0.1 2GA 061096-14E3 . 63.7 67 70.0 56.4 37 04/12 0 2
GA 08391-15EL19 . . 1 106.5 58.1 38 04/15 0.1 1SY Viper . . 5T 103.7 56.3 39 04/18 0.1 3PGX 15-12 . . 6 101.2 57.8 38 04/16 0 1GA 06474-15EL56 . . 7 100.9 55.5 37 04/10 0 0PGX 15-16 . . 8 99.4 58.5 36 04/20 0.1 1
GA 061157-15LE44 . . 9 99.3 56.9 37 04/13 0 0LA08115C-30 . . 11 98.8 57.3 38 04/09 1.6 1GA 081446-15EL47 . . 13 97.9 57.7 38 04/10 0 0GA 08535-15LE29 . . 14 97.0 57.3 39 04/13 0 1GA 05450-15EL52 . . 15 96.7 57.7 38 04/09 0 1
EXP 3536 . . 16 96.6 56.6 38 04/21 0 1WX15781 . . 18 96.0 57.2 37 04/22 0 0GA 08261-15EL7 . . 20 95.2 59.1 40 04/13 0 2GA 081104-15EL23 . . 21 94.9 55.5 39 04/10 0 0GA 06283-15LE25 . . 25T 94.2 58.8 38 04/13 0 2
GA 05450-15LE41 . . 25T 94.2 57.2 37 04/14 0 0GA 071171-15EL64ES8 . . 26 94.1 58.8 40 04/10 0 1LA09011UB-2 . . 27 93.8 57.8 36 04/11 0 0GA 08510-15EL9 . . 29T 92.3 57.7 40 04/09 0 0GA 07144-15LE16 . . 30 91.1 57.2 37 04/16 0 0
PGX 15-14 . . 31T 90.8 53.9 35 04/20 2.5 2GA 081113-15EL8 . . 32T 90.6 56.8 39 04/11 0 2VA12W-72 . . 34 90.1 55.9 36 04/14 0 0NC8170-4-3 . . 35T 89.9 58.1 40 04/21 0 0P 243 . . 39T 87.7 56.0 41 04/18 0 2
GA 061471-15LE38 . . 39T 87.7 58.4 40 04/15 0 1USG 3201 . . 42 86.1 58.0 34 04/21 2 4AgriMAXX Exp 1674 . . 43 85.2 54.7 33 04/21 2 1USG 3756 . . 46T 83.9 56.3 40 04/19 0.1 3Dyna-Gro 9642 . . 46T 83.9 55.0 36 04/19 1.5 1
AgriMAXX 415 . . 48 83.7 56.8 37 04/21 1.6 3AGS 3000 . . 55 81.0 58.1 37 04/07 0 0LA08090C-9-2 . . 58T 79.5 58.2 37 04/17 0 2NC11-22289 . . 60 78.8 57.8 37 04/16 0 0OK11754WF . . 64 74.4 55.8 36 04/05 0 3
USG 3013 . . 68 60.2 54.2 37 04/22 3.5 3
Average 77.3 79.4 89.0 3 56.8 37 04/15 0.6 1LSD at 10% level 5.5 N.S.4 8.2 1.4 2 5 0.9 1Std. Err. of Entry Mean 2.3 2.7 3.5 0.6 1 2 0.4 1
Yield1 2016 Data
---- bu/acre ---- ---- rating2 ----
Calhoun, Georgia:Wheat Grain Performance, 2015-2016 (Continued)
Annual Publication 100-8 • Georgia 2015-2016 Small Grain Performance Tests 33
Brand-Variety3-Year
Average2-Year
Average Rank Yield1TestWt Ht
HeadDate
LeafRust
PowderyMildew
bu/acre lb/bu in mo/day
GA 061158-14LE11 . 76.4 58T 79.5 57.5 37 04/19 0 0W 010025 H2 . 73.9 47 83.8 55.8 38 04/14 0.1 1NC09-20986 . 66.7 63T 77.6 56.7 39 04/14 1.1 0SCTX 98-27A1 . 66.6 35T 89.9 55.5 35 04/08 0.1 2GA 061096-14E3 . 63.7 67 70.0 56.4 37 04/12 0 2
GA 08391-15EL19 . . 1 106.5 58.1 38 04/15 0.1 1SY Viper . . 5T 103.7 56.3 39 04/18 0.1 3PGX 15-12 . . 6 101.2 57.8 38 04/16 0 1GA 06474-15EL56 . . 7 100.9 55.5 37 04/10 0 0PGX 15-16 . . 8 99.4 58.5 36 04/20 0.1 1
GA 061157-15LE44 . . 9 99.3 56.9 37 04/13 0 0LA08115C-30 . . 11 98.8 57.3 38 04/09 1.6 1GA 081446-15EL47 . . 13 97.9 57.7 38 04/10 0 0GA 08535-15LE29 . . 14 97.0 57.3 39 04/13 0 1GA 05450-15EL52 . . 15 96.7 57.7 38 04/09 0 1
EXP 3536 . . 16 96.6 56.6 38 04/21 0 1WX15781 . . 18 96.0 57.2 37 04/22 0 0GA 08261-15EL7 . . 20 95.2 59.1 40 04/13 0 2GA 081104-15EL23 . . 21 94.9 55.5 39 04/10 0 0GA 06283-15LE25 . . 25T 94.2 58.8 38 04/13 0 2
GA 05450-15LE41 . . 25T 94.2 57.2 37 04/14 0 0GA 071171-15EL64ES8 . . 26 94.1 58.8 40 04/10 0 1LA09011UB-2 . . 27 93.8 57.8 36 04/11 0 0GA 08510-15EL9 . . 29T 92.3 57.7 40 04/09 0 0GA 07144-15LE16 . . 30 91.1 57.2 37 04/16 0 0
PGX 15-14 . . 31T 90.8 53.9 35 04/20 2.5 2GA 081113-15EL8 . . 32T 90.6 56.8 39 04/11 0 2VA12W-72 . . 34 90.1 55.9 36 04/14 0 0NC8170-4-3 . . 35T 89.9 58.1 40 04/21 0 0P 243 . . 39T 87.7 56.0 41 04/18 0 2
GA 061471-15LE38 . . 39T 87.7 58.4 40 04/15 0 1USG 3201 . . 42 86.1 58.0 34 04/21 2 4AgriMAXX Exp 1674 . . 43 85.2 54.7 33 04/21 2 1USG 3756 . . 46T 83.9 56.3 40 04/19 0.1 3Dyna-Gro 9642 . . 46T 83.9 55.0 36 04/19 1.5 1
AgriMAXX 415 . . 48 83.7 56.8 37 04/21 1.6 3AGS 3000 . . 55 81.0 58.1 37 04/07 0 0LA08090C-9-2 . . 58T 79.5 58.2 37 04/17 0 2NC11-22289 . . 60 78.8 57.8 37 04/16 0 0OK11754WF . . 64 74.4 55.8 36 04/05 0 3
USG 3013 . . 68 60.2 54.2 37 04/22 3.5 3
Average 77.3 79.4 89.0 3 56.8 37 04/15 0.6 1LSD at 10% level 5.5 N.S.4 8.2 1.4 2 5 0.9 1Std. Err. of Entry Mean 2.3 2.7 3.5 0.6 1 2 0.4 1
Yield1 2016 Data
---- bu/acre ---- ---- rating2 ----
Calhoun, Georgia:Wheat Grain Performance, 2015-2016 (Continued)
Planted:Harvested:Seeding Rate:Soil Type:Soil Test:Fertilization:
Management:
Previous Crop: Fallow.
Test conducted by H. Jordan, G. Ware, J. Stubbs, and T. Dunn.
22 seeds per foot in 7" rows.Waynesboro loam.P = Medium, K = High, and pH = 6.3.Preplant: 25 lb N, 50 lb P2O5, and 75 lb K2O/acre.Topdress: 70 lb N/acre.Chisel plowed, disked, and rototilled; Harmony Extra and Prowl H2O used for weed control;1.5 ton lime/acre.
June 7, 2016.
Calhoun, Georgia:Wheat Grain Performance, 2015-2016 (Continued)
1. Yields calculated as 60 pounds per bushel at 13.5% moisture.2. Rating of 1 - 10; data collected on May 5, 2016.3. C.V. = 7.9%, and df for EMS = 240.4. The F-test indicated no statistical difference at the alpha = 0.10 probability level; therefore, an LSD value was not calculated.Bolding indicates entries yielding equal to highest yielding entry within a column based on Fisher's protected LSD (P = 0.10).
November 17, 2015.
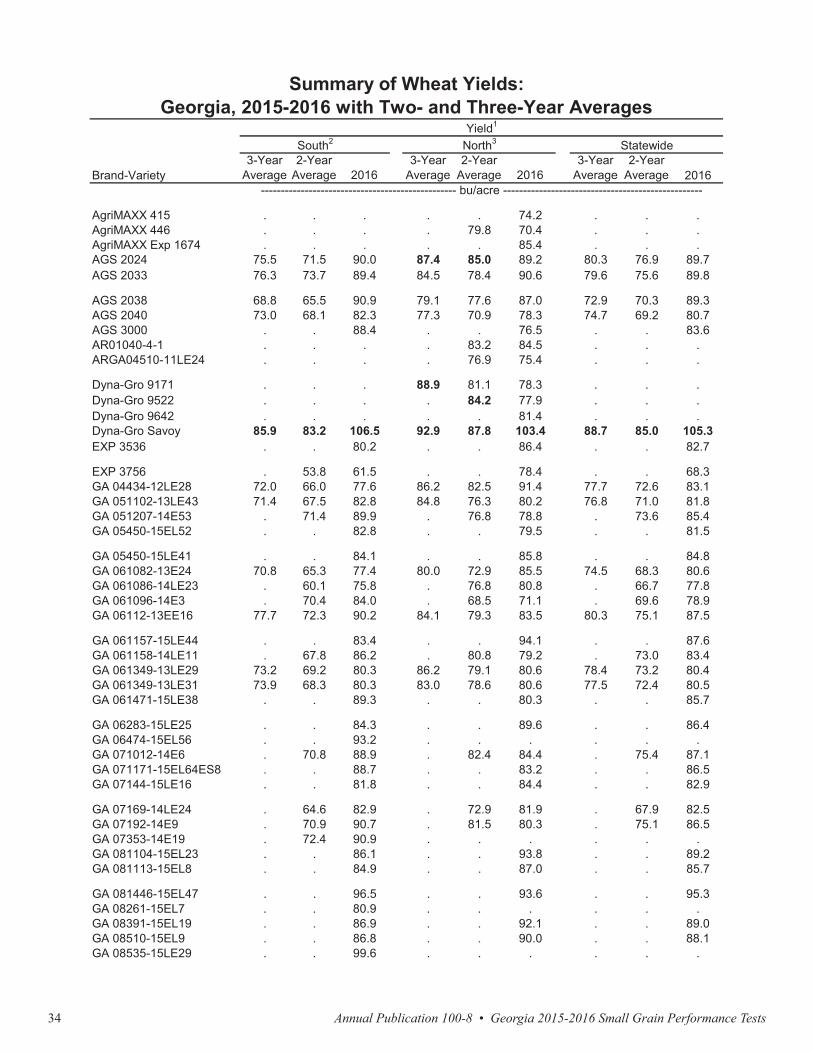
Annual Publication 100-8 • Georgia 2015-2016 Small Grain Performance Tests34
Brand-Variety3-Year
Average2-Year
Average 20163-Year
Average2-Year
Average 20163-Year
Average2-Year
Average 2016
AgriMAXX 415 . . . . . 74.2 . . .AgriMAXX 446 . . . . 79.8 70.4 . . .AgriMAXX Exp 1674 . . . . . 85.4 . . .AGS 2024 75.5 71.5 90.0 87.4 85.0 89.2 80.3 76.9 89.7AGS 2033 76.3 73.7 89.4 84.5 78.4 90.6 79.6 75.6 89.8
AGS 2038 68.8 65.5 90.9 79.1 77.6 87.0 72.9 70.3 89.3AGS 2040 73.0 68.1 82.3 77.3 70.9 78.3 74.7 69.2 80.7AGS 3000 . . 88.4 . . 76.5 . . 83.6AR01040-4-1 . . . . 83.2 84.5 . . .ARGA04510-11LE24 . . . . 76.9 75.4 . . .
Dyna-Gro 9171 . . . 88.9 81.1 78.3 . . .Dyna-Gro 9522 . . . . 84.2 77.9 . . .Dyna-Gro 9642 . . . . . 81.4 . . .Dyna-Gro Savoy 85.9 83.2 106.5 92.9 87.8 103.4 88.7 85.0 105.3EXP 3536 . . 80.2 . . 86.4 . . 82.7
EXP 3756 . 53.8 61.5 . . 78.4 . . 68.3GA 04434-12LE28 72.0 66.0 77.6 86.2 82.5 91.4 77.7 72.6 83.1GA 051102-13LE43 71.4 67.5 82.8 84.8 76.3 80.2 76.8 71.0 81.8GA 051207-14E53 . 71.4 89.9 . 76.8 78.8 . 73.6 85.4GA 05450-15EL52 . . 82.8 . . 79.5 . . 81.5
GA 05450-15LE41 . . 84.1 . . 85.8 . . 84.8GA 061082-13E24 70.8 65.3 77.4 80.0 72.9 85.5 74.5 68.3 80.6GA 061086-14LE23 . 60.1 75.8 . 76.8 80.8 . 66.7 77.8GA 061096-14E3 . 70.4 84.0 . 68.5 71.1 . 69.6 78.9GA 06112-13EE16 77.7 72.3 90.2 84.1 79.3 83.5 80.3 75.1 87.5
GA 061157-15LE44 . . 83.4 . . 94.1 . . 87.6GA 061158-14LE11 . 67.8 86.2 . 80.8 79.2 . 73.0 83.4GA 061349-13LE29 73.2 69.2 80.3 86.2 79.1 80.6 78.4 73.2 80.4GA 061349-13LE31 73.9 68.3 80.3 83.0 78.6 80.6 77.5 72.4 80.5GA 061471-15LE38 . . 89.3 . . 80.3 . . 85.7
GA 06283-15LE25 . . 84.3 . . 89.6 . . 86.4GA 06474-15EL56 . . 93.2 . . . . . .GA 071012-14E6 . 70.8 88.9 . 82.4 84.4 . 75.4 87.1GA 071171-15EL64ES8 . . 88.7 . . 83.2 . . 86.5GA 07144-15LE16 . . 81.8 . . 84.4 . . 82.9
GA 07169-14LE24 . 64.6 82.9 . 72.9 81.9 . 67.9 82.5GA 07192-14E9 . 70.9 90.7 . 81.5 80.3 . 75.1 86.5GA 07353-14E19 . 72.4 90.9 . . . . . .GA 081104-15EL23 . . 86.1 . . 93.8 . . 89.2GA 081113-15EL8 . . 84.9 . . 87.0 . . 85.7
GA 081446-15EL47 . . 96.5 . . 93.6 . . 95.3GA 08261-15EL7 . . 80.9 . . . . . .GA 08391-15EL19 . . 86.9 . . 92.1 . . 89.0GA 08510-15EL9 . . 86.8 . . 90.0 . . 88.1GA 08535-15LE29 . . 99.6 . . . . . .
------------------------------------------------- bu/acre --------------------------------------------------
Summary of Wheat Yields:Georgia, 2015-2016 with Two- and Three-Year Averages
Yield1
South2 North3 Statewide
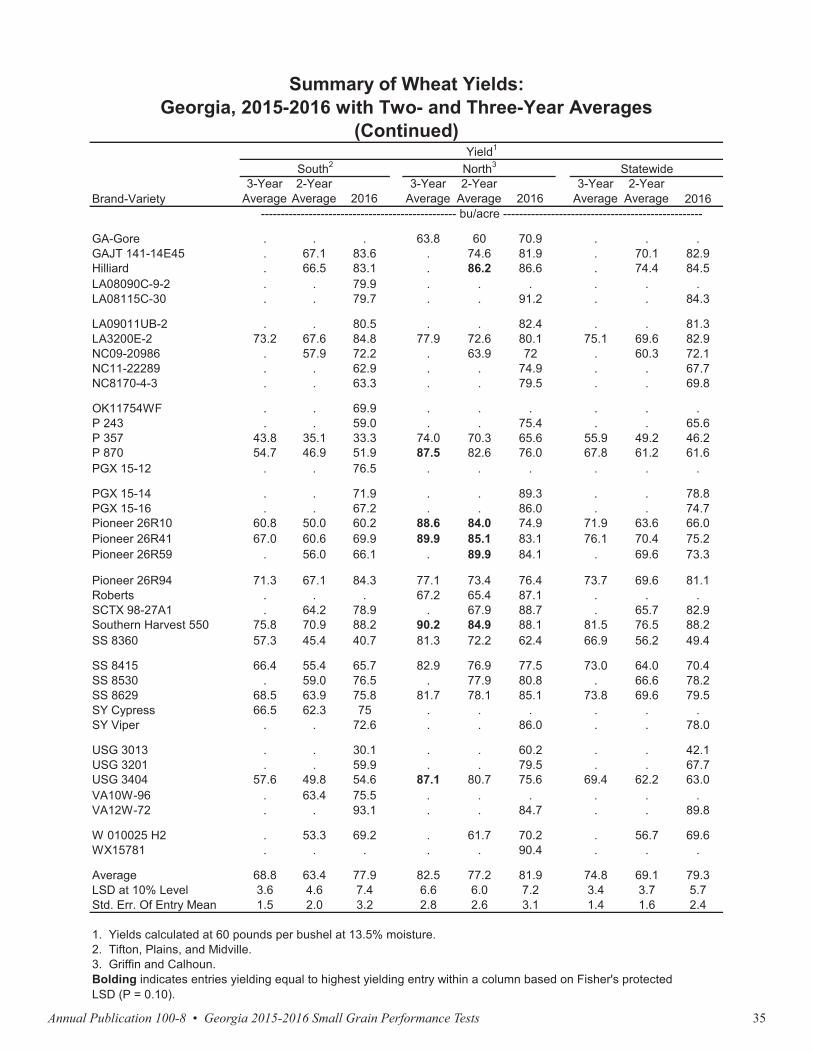
Annual Publication 100-8 • Georgia 2015-2016 Small Grain Performance Tests 35
Brand-Variety3-Year
Average2-Year
Average 20163-Year
Average2-Year
Average 20163-Year
Average2-Year
Average 2016
GA-Gore . . . 63.8 60 70.9 . . .GAJT 141-14E45 . 67.1 83.6 . 74.6 81.9 . 70.1 82.9Hilliard . 66.5 83.1 . 86.2 86.6 . 74.4 84.5LA08090C-9-2 . . 79.9 . . . . . .LA08115C-30 . . 79.7 . . 91.2 . . 84.3
LA09011UB-2 . . 80.5 . . 82.4 . . 81.3LA3200E-2 73.2 67.6 84.8 77.9 72.6 80.1 75.1 69.6 82.9NC09-20986 . 57.9 72.2 . 63.9 72 . 60.3 72.1NC11-22289 . . 62.9 . . 74.9 . . 67.7NC8170-4-3 . . 63.3 . . 79.5 . . 69.8
OK11754WF . . 69.9 . . . . . .P 243 . . 59.0 . . 75.4 . . 65.6P 357 43.8 35.1 33.3 74.0 70.3 65.6 55.9 49.2 46.2P 870 54.7 46.9 51.9 87.5 82.6 76.0 67.8 61.2 61.6PGX 15-12 . . 76.5 . . . . . .
PGX 15-14 . . 71.9 . . 89.3 . . 78.8PGX 15-16 . . 67.2 . . 86.0 . . 74.7Pioneer 26R10 60.8 50.0 60.2 88.6 84.0 74.9 71.9 63.6 66.0Pioneer 26R41 67.0 60.6 69.9 89.9 85.1 83.1 76.1 70.4 75.2Pioneer 26R59 . 56.0 66.1 . 89.9 84.1 . 69.6 73.3
Pioneer 26R94 71.3 67.1 84.3 77.1 73.4 76.4 73.7 69.6 81.1Roberts . . . 67.2 65.4 87.1 . . .SCTX 98-27A1 . 64.2 78.9 . 67.9 88.7 . 65.7 82.9Southern Harvest 550 75.8 70.9 88.2 90.2 84.9 88.1 81.5 76.5 88.2SS 8360 57.3 45.4 40.7 81.3 72.2 62.4 66.9 56.2 49.4
SS 8415 66.4 55.4 65.7 82.9 76.9 77.5 73.0 64.0 70.4SS 8530 . 59.0 76.5 . 77.9 80.8 . 66.6 78.2SS 8629 68.5 63.9 75.8 81.7 78.1 85.1 73.8 69.6 79.5SY Cypress 66.5 62.3 75 . . . . . .SY Viper . . 72.6 . . 86.0 . . 78.0
USG 3013 . . 30.1 . . 60.2 . . 42.1USG 3201 . . 59.9 . . 79.5 . . 67.7USG 3404 57.6 49.8 54.6 87.1 80.7 75.6 69.4 62.2 63.0VA10W-96 . 63.4 75.5 . . . . . .VA12W-72 . . 93.1 . . 84.7 . . 89.8
W 010025 H2 . 53.3 69.2 . 61.7 70.2 . 56.7 69.6WX15781 . . . . . 90.4 . . .
Average 68.8 63.4 77.9 82.5 77.2 81.9 74.8 69.1 79.3LSD at 10% Level 3.6 4.6 7.4 6.6 6.0 7.2 3.4 3.7 5.7Std. Err. Of Entry Mean 1.5 2.0 3.2 2.8 2.6 3.1 1.4 1.6 2.4
1. Yields calculated at 60 pounds per bushel at 13.5% moisture.2. Tifton, Plains, and Midville.3. Griffin and Calhoun.Bolding indicates entries yielding equal to highest yielding entry within a column based on Fisher's protectedLSD (P = 0.10).
Summary of Wheat Yields:Georgia, 2015-2016 with Two- and Three-Year Averages
(Continued)Yield1
South2 North3 Statewide
------------------------------------------------- bu/acre --------------------------------------------------
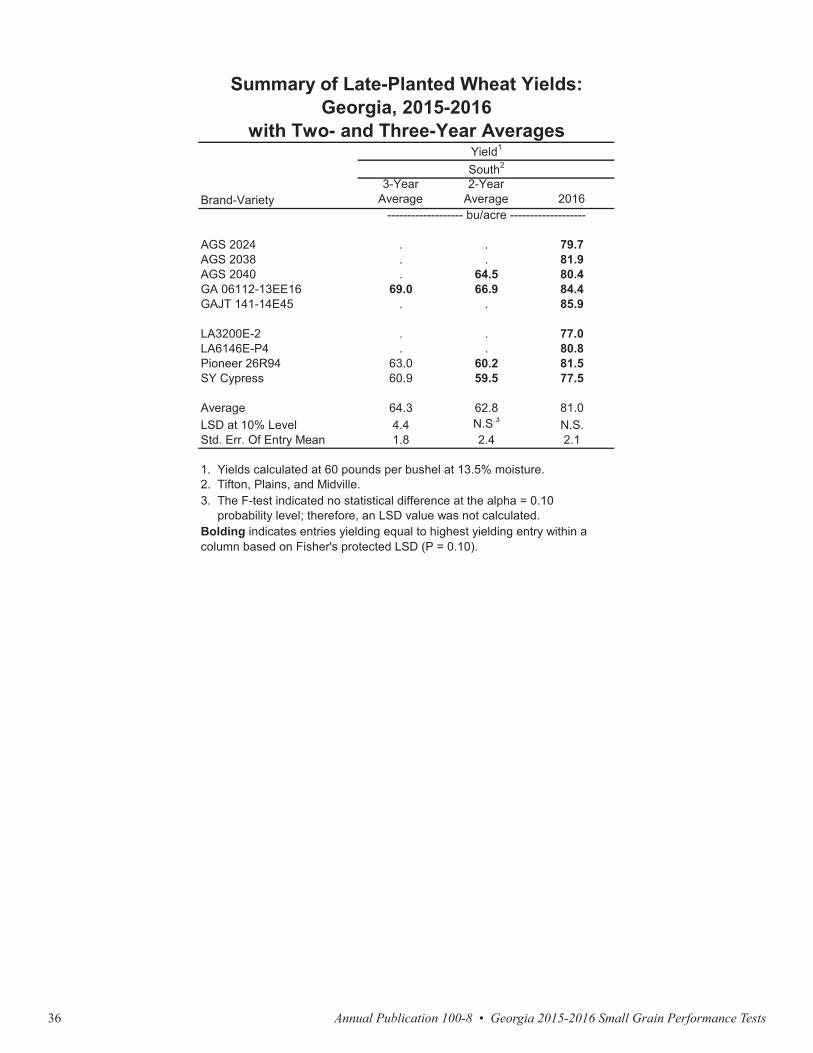
Annual Publication 100-8 • Georgia 2015-2016 Small Grain Performance Tests36
Brand-Variety3-Year
Average2-Year
Average 2016
AGS 2024 . . 79.7AGS 2038 . . 81.9AGS 2040 . 64.5 80.4GA 06112-13EE16 69.0 66.9 84.4GAJT 141-14E45 . . 85.9
LA3200E-2 . . 77.0LA6146E-P4 . . 80.8Pioneer 26R94 63.0 60.2 81.5SY Cypress 60.9 59.5 77.5
Average 64.3 62.8 81.0LSD at 10% Level 4.4 N.S.3 N.S.Std. Err. Of Entry Mean 1.8 2.4 2.1
3. The F-test indicated no statistical difference at the alpha = 0.10 probability level; therefore, an LSD value was not calculated.Bolding indicates entries yielding equal to highest yielding entry within acolumn based on Fisher's protected LSD (P = 0.10).
Summary of Late-Planted Wheat Yields:Georgia, 2015-2016
with Two- and Three-Year AveragesYield1
South2
------------------- bu/acre -------------------
1. Yields calculated at 60 pounds per bushel at 13.5% moisture.2. Tifton, Plains, and Midville.
Brand-Variety Yield1Test
WeightHeadDate Height Leaf Rust Stripe Rust
bu/acre lb/bu Julian days2 in
MD09W272-8-4-14-6 92.0 61.3 104 37 0 0GA07353-14E19 89.5 60.7 103 37 0 0MD09W272-8-4-14-8 87.2 61.1 104 36 0 0VA12W-68 85.1 59.2 103 37 0 0MD07W478-14-5 84.7 60.1 96 38 1 2
TX-EL2 83.2 59.8 96 37 0 0VA13W-124 82.3 58.1 98 35 0 0MD09W272-8-4-13-3-15 81.3 61.9 102 36 0 0VA12W-72 80.9 58.8 105 35 0 0GA071012-14E6 80.8 60.4 92 34 1 1
GAJT141-14E45 79.7 59.7 100 35 0 0Hilliard 75.8 57.1 106 39 0 0TN1604 72.3 57.1 121 37 0 2LA09011UB-2 71.4 62.4 106 34 0 6GA051207-14E53 70.8 58.8 102 41 0 4
LA08115C-30 70.3 59.1 96 36 3 0Jamestown 70.1 62.1 92 32 1 0AR06473-9-4-4 66.3 61.6 91 35 5 0Pioneer Brand 26R41 65.2 56.6 103 34 0 0TX12D4768 64.7 61.8 90 40 9 2
LA08090C-9-2 60.7 59.1 101 38 0 3DH11SRW8-48 60.5 60.1 107 37 0 9AR06024-7-2 59.4 62.6 99 42 0 0NC11-22289 55.8 62.6 107 40 1 5VA13W-38 43.9 59.1 106 34 . 5
NC10034-11 40.1 58.1 110 33 0 8KWS 081 33.2 . 118 38 3 7AGS 2000 30.1 . 96 34 0 9KWS 060 23.6 . 118 30 0 9TN1601 19.8 . 118 34 . 9
KWS 083 17.6 . 120 29 9ES14-0618 17.2 . 113 35 . 0TN1602 16.6 . 106 31 . 9
Average 61.6 4 60.1 104 36 1 3LSD at 5% Level 12.8
Planted:Harvested:Seeding Rate:Soil Type:Fertilization:Comments:
Preplant: 15 lb N/acre. Topdress: 80 lb N/acre.
Test conducted by M. Mergoum, J. Johnson, S. Sutton, B. Lopez, and J. Youmans.
Problems occurred for some varieties due to long vernalization and susceptibility tostripe rust and leaf rust.
Bolding indicates entries yielding equal to highest yielding entry within a column based on Fisher's protected LSD (P = 0.10).
3. Rating: 0 = resistant to 9 = very resistant.
November 24, 2015.May 25, 2016.22 seeds per foot in 7" rows.Greenville sandy loam.
Plains, Georgia:Uniform Southern Soft Red Winter Wheat Nursery, 2015-2016
1. Yields calculated as 60 pounds per bushel.
4. C.V. = 10.0%.
------ rating3 ------
2. Days from January 1.
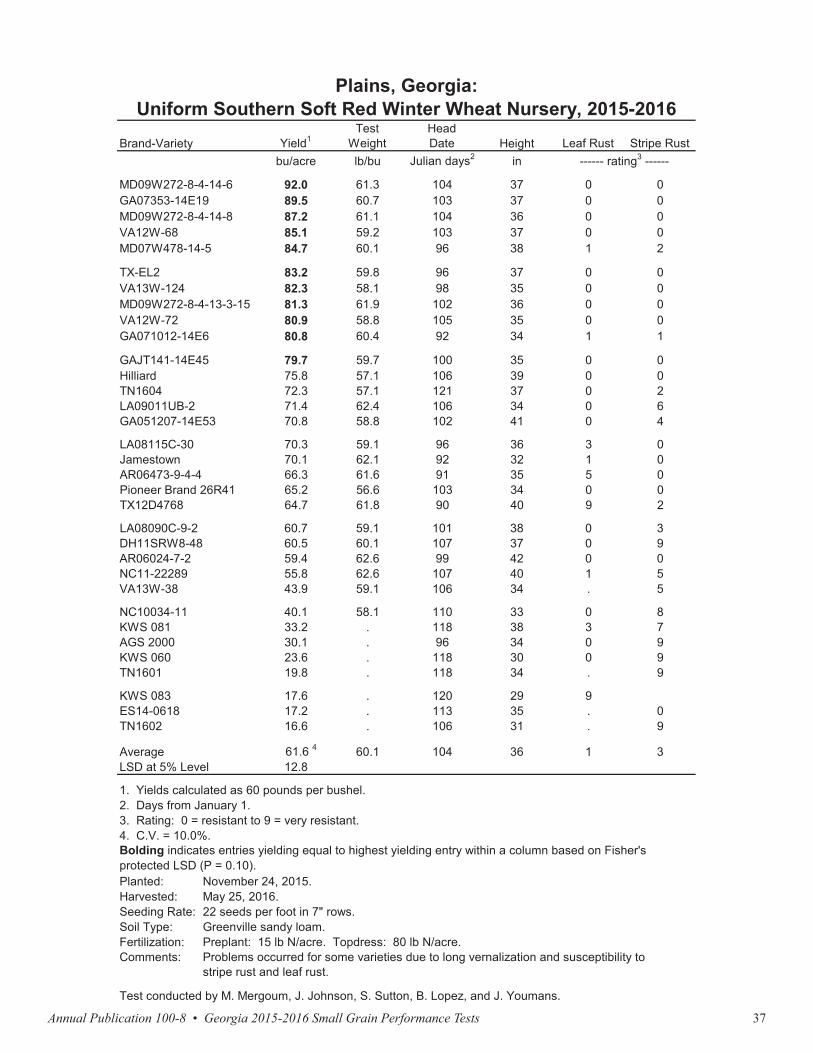
Annual Publication 100-8 • Georgia 2015-2016 Small Grain Performance Tests 37
Brand-Variety Yield1Test
WeightHeadDate Height Leaf Rust Stripe Rust
bu/acre lb/bu Julian days2 in
MD09W272-8-4-14-6 92.0 61.3 104 37 0 0GA07353-14E19 89.5 60.7 103 37 0 0MD09W272-8-4-14-8 87.2 61.1 104 36 0 0VA12W-68 85.1 59.2 103 37 0 0MD07W478-14-5 84.7 60.1 96 38 1 2
TX-EL2 83.2 59.8 96 37 0 0VA13W-124 82.3 58.1 98 35 0 0MD09W272-8-4-13-3-15 81.3 61.9 102 36 0 0VA12W-72 80.9 58.8 105 35 0 0GA071012-14E6 80.8 60.4 92 34 1 1
GAJT141-14E45 79.7 59.7 100 35 0 0Hilliard 75.8 57.1 106 39 0 0TN1604 72.3 57.1 121 37 0 2LA09011UB-2 71.4 62.4 106 34 0 6GA051207-14E53 70.8 58.8 102 41 0 4
LA08115C-30 70.3 59.1 96 36 3 0Jamestown 70.1 62.1 92 32 1 0AR06473-9-4-4 66.3 61.6 91 35 5 0Pioneer Brand 26R41 65.2 56.6 103 34 0 0TX12D4768 64.7 61.8 90 40 9 2
LA08090C-9-2 60.7 59.1 101 38 0 3DH11SRW8-48 60.5 60.1 107 37 0 9AR06024-7-2 59.4 62.6 99 42 0 0NC11-22289 55.8 62.6 107 40 1 5VA13W-38 43.9 59.1 106 34 . 5
NC10034-11 40.1 58.1 110 33 0 8KWS 081 33.2 . 118 38 3 7AGS 2000 30.1 . 96 34 0 9KWS 060 23.6 . 118 30 0 9TN1601 19.8 . 118 34 . 9
KWS 083 17.6 . 120 29 9ES14-0618 17.2 . 113 35 . 0TN1602 16.6 . 106 31 . 9
Average 61.6 4 60.1 104 36 1 3LSD at 5% Level 12.8
Planted:Harvested:Seeding Rate:Soil Type:Fertilization:Comments:
Preplant: 15 lb N/acre. Topdress: 80 lb N/acre.
Test conducted by M. Mergoum, J. Johnson, S. Sutton, B. Lopez, and J. Youmans.
Problems occurred for some varieties due to long vernalization and susceptibility tostripe rust and leaf rust.
Bolding indicates entries yielding equal to highest yielding entry within a column based on Fisher's protected LSD (P = 0.10).
3. Rating: 0 = resistant to 9 = very resistant.
November 24, 2015.May 25, 2016.22 seeds per foot in 7" rows.Greenville sandy loam.
Plains, Georgia:Uniform Southern Soft Red Winter Wheat Nursery, 2015-2016
1. Yields calculated as 60 pounds per bushel.
4. C.V. = 10.0%.
------ rating3 ------
2. Days from January 1.
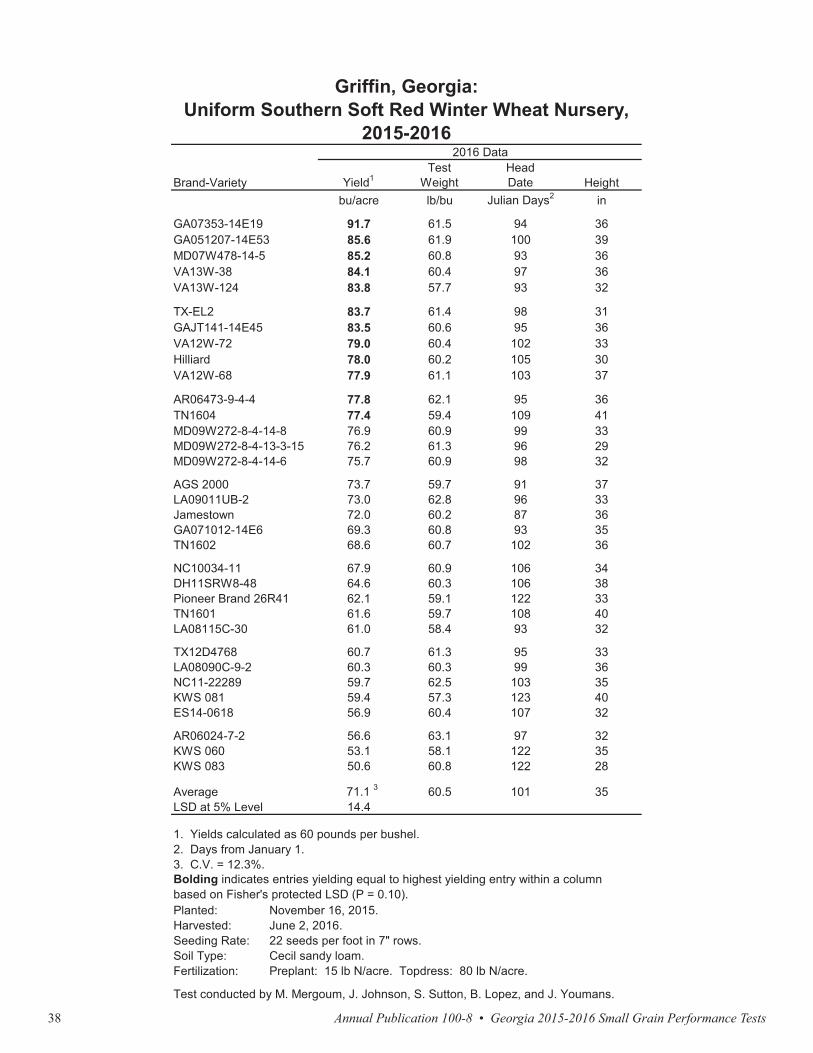
Annual Publication 100-8 • Georgia 2015-2016 Small Grain Performance Tests38
Brand-Variety Yield1Test
WeightHeadDate Height
bu/acre lb/bu Julian Days2 in
GA07353-14E19 91.7 61.5 94 36GA051207-14E53 85.6 61.9 100 39MD07W478-14-5 85.2 60.8 93 36VA13W-38 84.1 60.4 97 36VA13W-124 83.8 57.7 93 32
TX-EL2 83.7 61.4 98 31GAJT141-14E45 83.5 60.6 95 36VA12W-72 79.0 60.4 102 33Hilliard 78.0 60.2 105 30VA12W-68 77.9 61.1 103 37
AR06473-9-4-4 77.8 62.1 95 36TN1604 77.4 59.4 109 41MD09W272-8-4-14-8 76.9 60.9 99 33MD09W272-8-4-13-3-15 76.2 61.3 96 29MD09W272-8-4-14-6 75.7 60.9 98 32
AGS 2000 73.7 59.7 91 37LA09011UB-2 73.0 62.8 96 33Jamestown 72.0 60.2 87 36GA071012-14E6 69.3 60.8 93 35TN1602 68.6 60.7 102 36
NC10034-11 67.9 60.9 106 34DH11SRW8-48 64.6 60.3 106 38Pioneer Brand 26R41 62.1 59.1 122 33TN1601 61.6 59.7 108 40LA08115C-30 61.0 58.4 93 32
TX12D4768 60.7 61.3 95 33LA08090C-9-2 60.3 60.3 99 36NC11-22289 59.7 62.5 103 35KWS 081 59.4 57.3 123 40ES14-0618 56.9 60.4 107 32
AR06024-7-2 56.6 63.1 97 32KWS 060 53.1 58.1 122 35KWS 083 50.6 60.8 122 28
Average 71.1 3 60.5 101 35LSD at 5% Level 14.4
Planted:Harvested:Seeding Rate:Soil Type:Fertilization: Preplant: 15 lb N/acre. Topdress: 80 lb N/acre.
Test conducted by M. Mergoum, J. Johnson, S. Sutton, B. Lopez, and J. Youmans.
Bolding indicates entries yielding equal to highest yielding entry within a column based on Fisher's protected LSD (P = 0.10).
November 16, 2015.June 2, 2016.22 seeds per foot in 7" rows.Cecil sandy loam.
Griffin, Georgia:Uniform Southern Soft Red Winter Wheat Nursery,
2015-20162016 Data
1. Yields calculated as 60 pounds per bushel.
3. C.V. = 12.3%.2. Days from January 1.
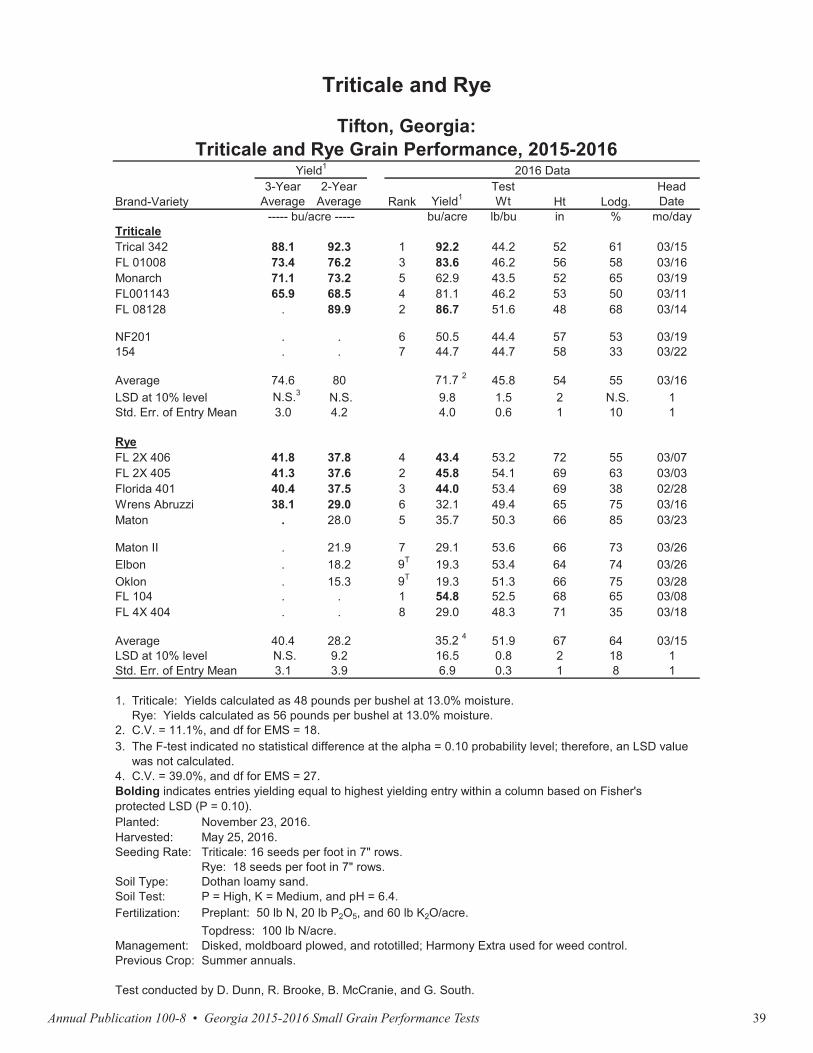
Annual Publication 100-8 • Georgia 2015-2016 Small Grain Performance Tests 39
Brand-Variety Yield1Test
WeightHeadDate Height
bu/acre lb/bu Julian Days2 in
GA07353-14E19 91.7 61.5 94 36GA051207-14E53 85.6 61.9 100 39MD07W478-14-5 85.2 60.8 93 36VA13W-38 84.1 60.4 97 36VA13W-124 83.8 57.7 93 32
TX-EL2 83.7 61.4 98 31GAJT141-14E45 83.5 60.6 95 36VA12W-72 79.0 60.4 102 33Hilliard 78.0 60.2 105 30VA12W-68 77.9 61.1 103 37
AR06473-9-4-4 77.8 62.1 95 36TN1604 77.4 59.4 109 41MD09W272-8-4-14-8 76.9 60.9 99 33MD09W272-8-4-13-3-15 76.2 61.3 96 29MD09W272-8-4-14-6 75.7 60.9 98 32
AGS 2000 73.7 59.7 91 37LA09011UB-2 73.0 62.8 96 33Jamestown 72.0 60.2 87 36GA071012-14E6 69.3 60.8 93 35TN1602 68.6 60.7 102 36
NC10034-11 67.9 60.9 106 34DH11SRW8-48 64.6 60.3 106 38Pioneer Brand 26R41 62.1 59.1 122 33TN1601 61.6 59.7 108 40LA08115C-30 61.0 58.4 93 32
TX12D4768 60.7 61.3 95 33LA08090C-9-2 60.3 60.3 99 36NC11-22289 59.7 62.5 103 35KWS 081 59.4 57.3 123 40ES14-0618 56.9 60.4 107 32
AR06024-7-2 56.6 63.1 97 32KWS 060 53.1 58.1 122 35KWS 083 50.6 60.8 122 28
Average 71.1 3 60.5 101 35LSD at 5% Level 14.4
Planted:Harvested:Seeding Rate:Soil Type:Fertilization: Preplant: 15 lb N/acre. Topdress: 80 lb N/acre.
Test conducted by M. Mergoum, J. Johnson, S. Sutton, B. Lopez, and J. Youmans.
Bolding indicates entries yielding equal to highest yielding entry within a column based on Fisher's protected LSD (P = 0.10).
November 16, 2015.June 2, 2016.22 seeds per foot in 7" rows.Cecil sandy loam.
Griffin, Georgia:Uniform Southern Soft Red Winter Wheat Nursery,
2015-20162016 Data
1. Yields calculated as 60 pounds per bushel.
3. C.V. = 12.3%.2. Days from January 1.
Brand-Variety3-Year
Average2-Year
Average Rank Yield1TestWt Ht Lodg.
HeadDate
bu/acre lb/bu in % mo/dayTriticaleTrical 342 88.1 92.3 1 92.2 44.2 52 61 03/15FL 01008 73.4 76.2 3 83.6 46.2 56 58 03/16Monarch 71.1 73.2 5 62.9 43.5 52 65 03/19FL001143 65.9 68.5 4 81.1 46.2 53 50 03/11FL 08128 . 89.9 2 86.7 51.6 48 68 03/14
NF201 . . 6 50.5 44.4 57 53 03/19154 . . 7 44.7 44.7 58 33 03/22
Average 74.6 80 71.7 2 45.8 54 55 03/16LSD at 10% level N.S.3 N.S. 9.8 1.5 2 N.S. 1Std. Err. of Entry Mean 3.0 4.2 4.0 0.6 1 10 1
RyeFL 2X 406 41.8 37.8 4 43.4 53.2 72 55 03/07FL 2X 405 41.3 37.6 2 45.8 54.1 69 63 03/03Florida 401 40.4 37.5 3 44.0 53.4 69 38 02/28Wrens Abruzzi 38.1 29.0 6 32.1 49.4 65 75 03/16Maton . 28.0 5 35.7 50.3 66 85 03/23
Maton II . 21.9 7 29.1 53.6 66 73 03/26Elbon . 18.2 9T 19.3 53.4 64 74 03/26Oklon . 15.3 9T 19.3 51.3 66 75 03/28FL 104 . . 1 54.8 52.5 68 65 03/08FL 4X 404 . . 8 29.0 48.3 71 35 03/18
Average 40.4 28.2 35.2 4 51.9 67 64 03/15LSD at 10% level N.S. 9.2 16.5 0.8 2 18 1Std. Err. of Entry Mean 3.1 3.9 6.9 0.3 1 8 1
Planted:Harvested:Seeding Rate:
Soil Type:Soil Test:Fertilization:
Management:Previous Crop:
Test conducted by D. Dunn, R. Brooke, B. McCranie, and G. South.
Dothan loamy sand.P = High, K = Medium, and pH = 6.4.Preplant: 50 lb N, 20 lb P2O5, and 60 lb K2O/acre.Topdress: 100 lb N/acre.Disked, moldboard plowed, and rototilled; Harmony Extra used for weed control.Summer annuals.
Triticale and Rye
Triticale: 16 seeds per foot in 7" rows.Rye: 18 seeds per foot in 7" rows.
Tifton, Georgia:Triticale and Rye Grain Performance, 2015-2016
Yield1 2016 Data
----- bu/acre -----
1. Triticale: Yields calculated as 48 pounds per bushel at 13.0% moisture. Rye: Yields calculated as 56 pounds per bushel at 13.0% moisture.2. C.V. = 11.1%, and df for EMS = 18.3. The F-test indicated no statistical difference at the alpha = 0.10 probability level; therefore, an LSD value was not calculated.4. C.V. = 39.0%, and df for EMS = 27.Bolding indicates entries yielding equal to highest yielding entry within a column based on Fisher's protected LSD (P = 0.10).
November 23, 2016.May 25, 2016.
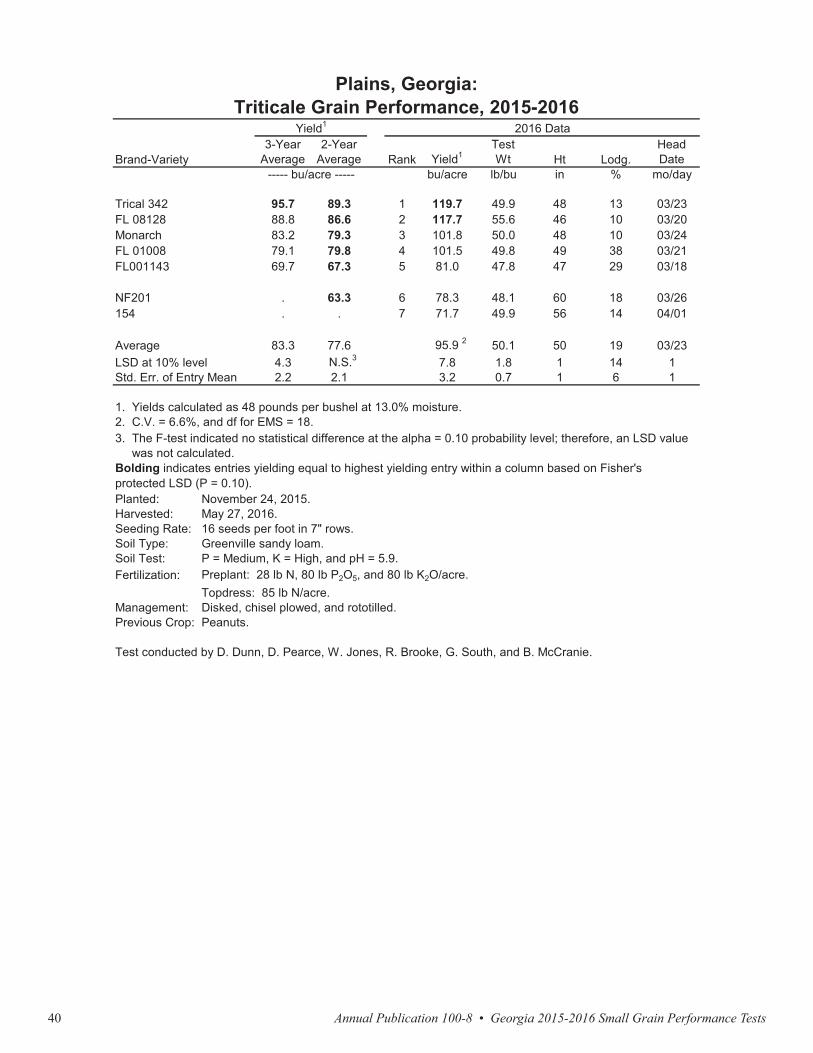
Annual Publication 100-8 • Georgia 2015-2016 Small Grain Performance Tests40
Brand-Variety3-Year
Average2-Year
Average Rank Yield1TestWt Ht Lodg.
HeadDate
bu/acre lb/bu in % mo/day
Trical 342 95.7 89.3 1 119.7 49.9 48 13 03/23FL 08128 88.8 86.6 2 117.7 55.6 46 10 03/20Monarch 83.2 79.3 3 101.8 50.0 48 10 03/24FL 01008 79.1 79.8 4 101.5 49.8 49 38 03/21FL001143 69.7 67.3 5 81.0 47.8 47 29 03/18
NF201 . 63.3 6 78.3 48.1 60 18 03/26154 . . 7 71.7 49.9 56 14 04/01
Average 83.3 77.6 95.9 2 50.1 50 19 03/23LSD at 10% level 4.3 N.S.3 7.8 1.8 1 14 1Std. Err. of Entry Mean 2.2 2.1 3.2 0.7 1 6 1
Planted:Harvested:Seeding Rate:Soil Type:Soil Test:Fertilization:
Management:Previous Crop:
Test conducted by D. Dunn, D. Pearce, W. Jones, R. Brooke, G. South, and B. McCranie.
3. The F-test indicated no statistical difference at the alpha = 0.10 probability level; therefore, an LSD value was not calculated.Bolding indicates entries yielding equal to highest yielding entry within a column based on Fisher's protected LSD (P = 0.10).
November 24, 2015.May 27, 2016.16 seeds per foot in 7" rows.Greenville sandy loam.P = Medium, K = High, and pH = 5.9.Preplant: 28 lb N, 80 lb P2O5, and 80 lb K2O/acre.Topdress: 85 lb N/acre.Disked, chisel plowed, and rototilled.Peanuts.
2. C.V. = 6.6%, and df for EMS = 18.
Plains, Georgia:Triticale Grain Performance, 2015-2016
Yield1 2016 Data
----- bu/acre -----
1. Yields calculated as 48 pounds per bushel at 13.0% moisture.
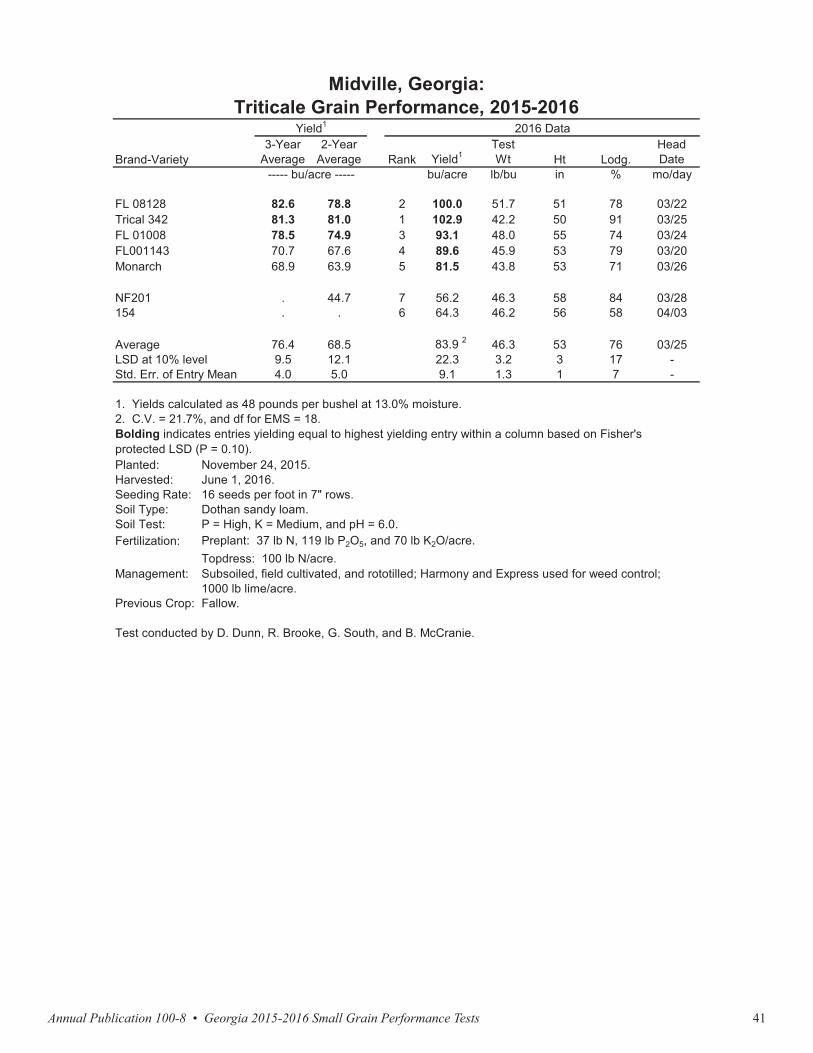
Annual Publication 100-8 • Georgia 2015-2016 Small Grain Performance Tests 41
Brand-Variety3-Year
Average2-Year
Average Rank Yield1TestWt Ht Lodg.
HeadDate
bu/acre lb/bu in % mo/day
Trical 342 95.7 89.3 1 119.7 49.9 48 13 03/23FL 08128 88.8 86.6 2 117.7 55.6 46 10 03/20Monarch 83.2 79.3 3 101.8 50.0 48 10 03/24FL 01008 79.1 79.8 4 101.5 49.8 49 38 03/21FL001143 69.7 67.3 5 81.0 47.8 47 29 03/18
NF201 . 63.3 6 78.3 48.1 60 18 03/26154 . . 7 71.7 49.9 56 14 04/01
Average 83.3 77.6 95.9 2 50.1 50 19 03/23LSD at 10% level 4.3 N.S.3 7.8 1.8 1 14 1Std. Err. of Entry Mean 2.2 2.1 3.2 0.7 1 6 1
Planted:Harvested:Seeding Rate:Soil Type:Soil Test:Fertilization:
Management:Previous Crop:
Test conducted by D. Dunn, D. Pearce, W. Jones, R. Brooke, G. South, and B. McCranie.
3. The F-test indicated no statistical difference at the alpha = 0.10 probability level; therefore, an LSD value was not calculated.Bolding indicates entries yielding equal to highest yielding entry within a column based on Fisher'sprotected LSD (P = 0.10).
November 24, 2015.May 27, 2016.16 seeds per foot in 7" rows.Greenville sandy loam.P = Medium, K = High, and pH = 5.9.Preplant: 28 lb N, 80 lb P2O5, and 80 lb K2O/acre.Topdress: 85 lb N/acre.Disked, chisel plowed, and rototilled.Peanuts.
2. C.V. = 6.6%, and df for EMS = 18.
Plains, Georgia:Triticale Grain Performance, 2015-2016
Yield1 2016 Data
----- bu/acre -----
1. Yields calculated as 48 pounds per bushel at 13.0% moisture.
Brand-Variety3-Year
Average2-Year
Average Rank Yield1TestWt Ht Lodg.
HeadDate
bu/acre lb/bu in % mo/day
FL 08128 82.6 78.8 2 100.0 51.7 51 78 03/22Trical 342 81.3 81.0 1 102.9 42.2 50 91 03/25FL 01008 78.5 74.9 3 93.1 48.0 55 74 03/24FL001143 70.7 67.6 4 89.6 45.9 53 79 03/20Monarch 68.9 63.9 5 81.5 43.8 53 71 03/26
NF201 . 44.7 7 56.2 46.3 58 84 03/28154 . . 6 64.3 46.2 56 58 04/03
Average 76.4 68.5 83.9 2 46.3 53 76 03/25LSD at 10% level 9.5 12.1 22.3 3.2 3 17 -Std. Err. of Entry Mean 4.0 5.0 9.1 1.3 1 7 -
Planted:Harvested:Seeding Rate:Soil Type:Soil Test:Fertilization:
Management:
Previous Crop:
Preplant: 37 lb N, 119 lb P2O5, and 70 lb K2O/acre.Topdress: 100 lb N/acre.Subsoiled, field cultivated, and rototilled; Harmony and Express used for weed control;1000 lb lime/acre.Fallow.
Test conducted by D. Dunn, R. Brooke, G. South, and B. McCranie.
P = High, K = Medium, and pH = 6.0.
Midville, Georgia:Triticale Grain Performance, 2015-2016
Yield1 2016 Data
----- bu/acre -----
1. Yields calculated as 48 pounds per bushel at 13.0% moisture.2. C.V. = 21.7%, and df for EMS = 18.Bolding indicates entries yielding equal to highest yielding entry within a column based on Fisher's protected LSD (P = 0.10).
November 24, 2015.June 1, 2016.16 seeds per foot in 7" rows.Dothan sandy loam.
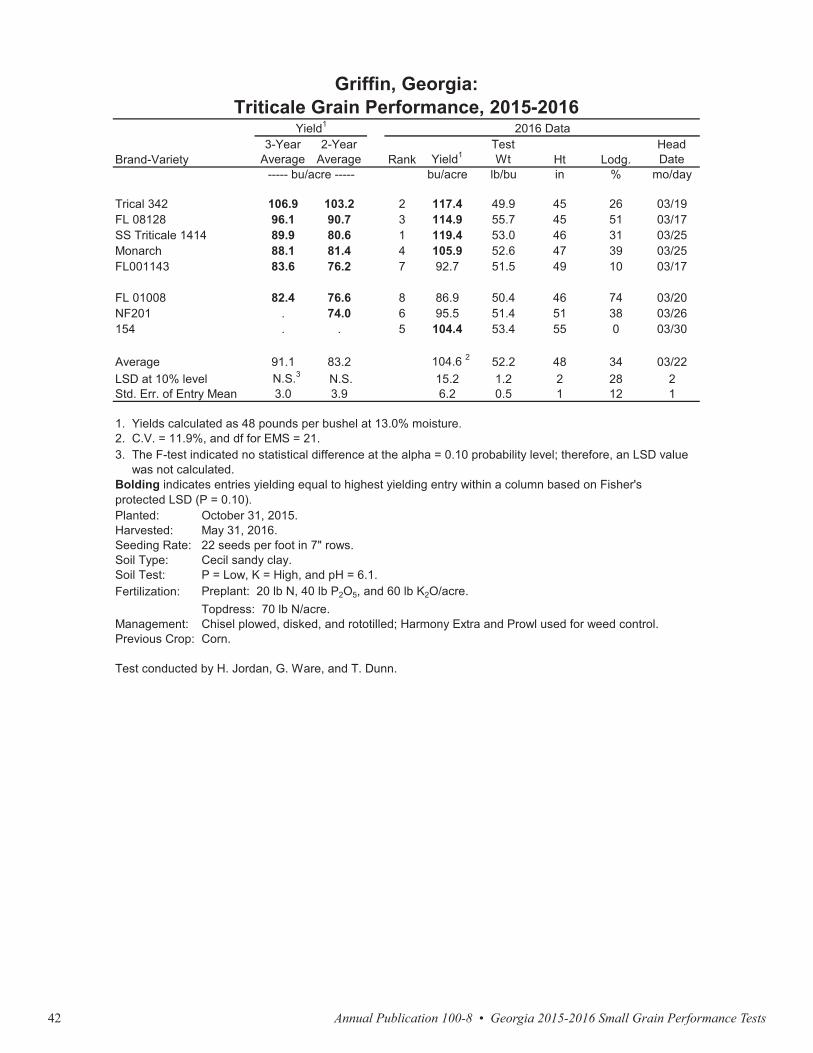
Annual Publication 100-8 • Georgia 2015-2016 Small Grain Performance Tests42
Brand-Variety3-Year
Average2-Year
Average Rank Yield1TestWt Ht Lodg.
HeadDate
bu/acre lb/bu in % mo/day
Trical 342 106.9 103.2 2 117.4 49.9 45 26 03/19FL 08128 96.1 90.7 3 114.9 55.7 45 51 03/17SS Triticale 1414 89.9 80.6 1 119.4 53.0 46 31 03/25Monarch 88.1 81.4 4 105.9 52.6 47 39 03/25FL001143 83.6 76.2 7 92.7 51.5 49 10 03/17
FL 01008 82.4 76.6 8 86.9 50.4 46 74 03/20NF201 . 74.0 6 95.5 51.4 51 38 03/26154 . . 5 104.4 53.4 55 0 03/30
Average 91.1 83.2 104.6 2 52.2 48 34 03/22LSD at 10% level N.S.3 N.S. 15.2 1.2 2 28 2Std. Err. of Entry Mean 3.0 3.9 6.2 0.5 1 12 1
Planted:Harvested:Seeding Rate:Soil Type:Soil Test:Fertilization:
Management:Previous Crop:
Test conducted by H. Jordan, G. Ware, and T. Dunn.
3. The F-test indicated no statistical difference at the alpha = 0.10 probability level; therefore, an LSD value was not calculated.Bolding indicates entries yielding equal to highest yielding entry within a column based on Fisher's protected LSD (P = 0.10).
October 31, 2015.May 31, 2016.22 seeds per foot in 7" rows.Cecil sandy clay.P = Low, K = High, and pH = 6.1.Preplant: 20 lb N, 40 lb P2O5, and 60 lb K2O/acre.Topdress: 70 lb N/acre.Chisel plowed, disked, and rototilled; Harmony Extra and Prowl used for weed control.Corn.
2. C.V. = 11.9%, and df for EMS = 21.
Griffin, Georgia:Triticale Grain Performance, 2015-2016
Yield1 2016 Data
----- bu/acre -----
1. Yields calculated as 48 pounds per bushel at 13.0% moisture.
Annual Publication 100-8 • Georgia 2015-2016 Small Grain Performance Tests 43
Brand-Variety3-Year
Average2-Year
Average Rank Yield1TestWt Ht Lodg.
HeadDate
bu/acre lb/bu in % mo/day
Trical 342 106.9 103.2 2 117.4 49.9 45 26 03/19FL 08128 96.1 90.7 3 114.9 55.7 45 51 03/17SS Triticale 1414 89.9 80.6 1 119.4 53.0 46 31 03/25Monarch 88.1 81.4 4 105.9 52.6 47 39 03/25FL001143 83.6 76.2 7 92.7 51.5 49 10 03/17
FL 01008 82.4 76.6 8 86.9 50.4 46 74 03/20NF201 . 74.0 6 95.5 51.4 51 38 03/26154 . . 5 104.4 53.4 55 0 03/30
Average 91.1 83.2 104.6 2 52.2 48 34 03/22LSD at 10% level N.S.3 N.S. 15.2 1.2 2 28 2Std. Err. of Entry Mean 3.0 3.9 6.2 0.5 1 12 1
Planted:Harvested:Seeding Rate:Soil Type:Soil Test:Fertilization:
Management:Previous Crop:
Test conducted by H. Jordan, G. Ware, and T. Dunn.
3. The F-test indicated no statistical difference at the alpha = 0.10 probability level; therefore, an LSD value was not calculated.Bolding indicates entries yielding equal to highest yielding entry within a column based on Fisher's protected LSD (P = 0.10).
October 31, 2015.May 31, 2016.22 seeds per foot in 7" rows.Cecil sandy clay.P = Low, K = High, and pH = 6.1.Preplant: 20 lb N, 40 lb P2O5, and 60 lb K2O/acre.Topdress: 70 lb N/acre.Chisel plowed, disked, and rototilled; Harmony Extra and Prowl used for weed control.Corn.
2. C.V. = 11.9%, and df for EMS = 21.
Griffin, Georgia:Triticale Grain Performance, 2015-2016
Yield1 2016 Data
----- bu/acre -----
1. Yields calculated as 48 pounds per bushel at 13.0% moisture.
A rye grain trial was planted at this location on October 31, 2015. However, drift from glyphosate reduced yield and increased thevariability in and among plots. After careful analysis and review ofthe data, it is the opinion of the editors that the results of this trial maynot accurately reflect the genetic performance potential of all the testentries. Since this data is not useful for making decisions and couldbe misleading if used in making variety selections, it will not be presented in the publication.
Griffin, Georgia:Rye Grain Performance, 2015-2016
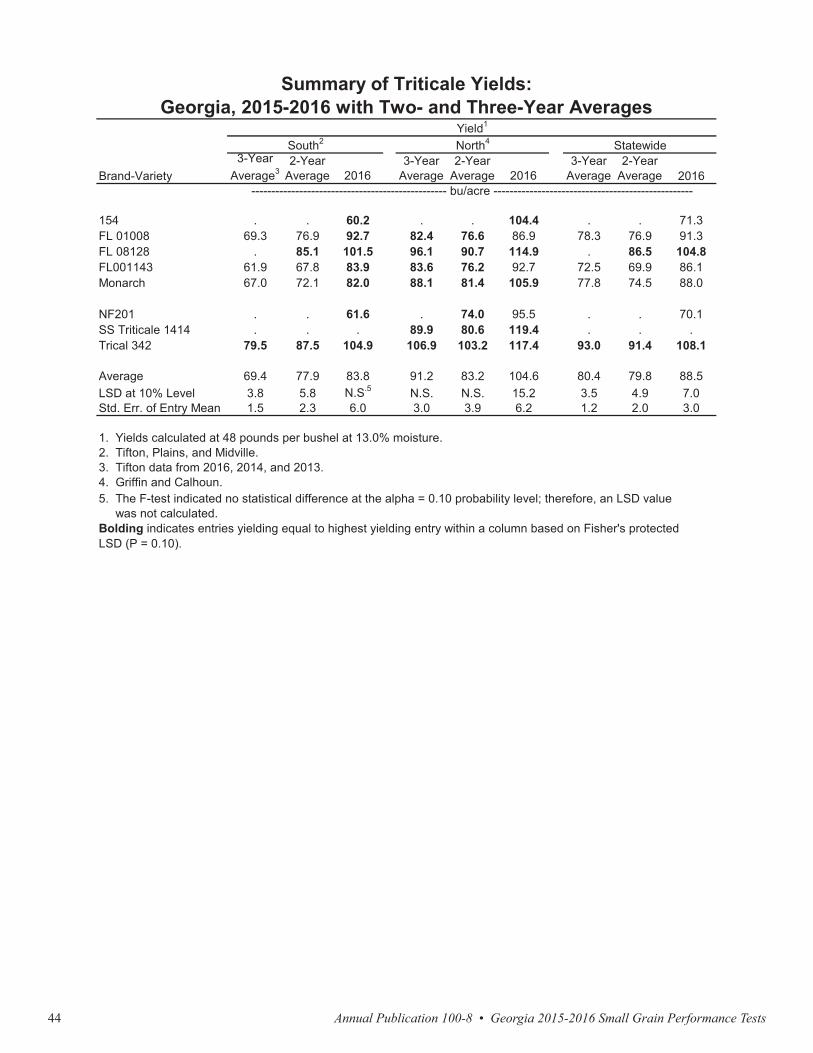
Annual Publication 100-8 • Georgia 2015-2016 Small Grain Performance Tests44
Brand-Variety3-Year
Average32-Year
Average 20163-Year
Average2-Year
Average 20163-Year
Average2-Year
Average 2016
154 . . 60.2 . . 104.4 . . 71.3FL 01008 69.3 76.9 92.7 82.4 76.6 86.9 78.3 76.9 91.3FL 08128 . 85.1 101.5 96.1 90.7 114.9 . 86.5 104.8FL001143 61.9 67.8 83.9 83.6 76.2 92.7 72.5 69.9 86.1Monarch 67.0 72.1 82.0 88.1 81.4 105.9 77.8 74.5 88.0
NF201 . . 61.6 . 74.0 95.5 . . 70.1SS Triticale 1414 . . . 89.9 80.6 119.4 . . .Trical 342 79.5 87.5 104.9 106.9 103.2 117.4 93.0 91.4 108.1
Average 69.4 77.9 83.8 91.2 83.2 104.6 80.4 79.8 88.5LSD at 10% Level 3.8 5.8 N.S.5 N.S. N.S. 15.2 3.5 4.9 7.0Std. Err. of Entry Mean 1.5 2.3 6.0 3.0 3.9 6.2 1.2 2.0 3.0
3. Tifton data from 2016, 2014, and 2013.
------------------------------------------------- bu/acre --------------------------------------------------
Summary of Triticale Yields:Georgia, 2015-2016 with Two- and Three-Year Averages
Yield1
South2 North4 Statewide
1. Yields calculated at 48 pounds per bushel at 13.0% moisture.2. Tifton, Plains, and Midville.
4. Griffin and Calhoun.5. The F-test indicated no statistical difference at the alpha = 0.10 probability level; therefore, an LSD value was not calculated.Bolding indicates entries yielding equal to highest yielding entry within a column based on Fisher's protectedLSD (P = 0.10).

Annual Publication 100-8 • Georgia 2015-2016 Small Grain Performance Tests 45
Brand-Variety3-Year
Average32-Year
Average 20163-Year
Average2-Year
Average 20163-Year
Average2-Year
Average 2016
154 . . 60.2 . . 104.4 . . 71.3FL 01008 69.3 76.9 92.7 82.4 76.6 86.9 78.3 76.9 91.3FL 08128 . 85.1 101.5 96.1 90.7 114.9 . 86.5 104.8FL001143 61.9 67.8 83.9 83.6 76.2 92.7 72.5 69.9 86.1Monarch 67.0 72.1 82.0 88.1 81.4 105.9 77.8 74.5 88.0
NF201 . . 61.6 . 74.0 95.5 . . 70.1SS Triticale 1414 . . . 89.9 80.6 119.4 . . .Trical 342 79.5 87.5 104.9 106.9 103.2 117.4 93.0 91.4 108.1
Average 69.4 77.9 83.8 91.2 83.2 104.6 80.4 79.8 88.5LSD at 10% Level 3.8 5.8 N.S.5 N.S. N.S. 15.2 3.5 4.9 7.0Std. Err. of Entry Mean 1.5 2.3 6.0 3.0 3.9 6.2 1.2 2.0 3.0
3. Tifton data from 2016, 2014, and 2013.
------------------------------------------------- bu/acre --------------------------------------------------
Summary of Triticale Yields:Georgia, 2015-2016 with Two- and Three-Year Averages
Yield1
South2 North4 Statewide
1. Yields calculated at 48 pounds per bushel at 13.0% moisture.2. Tifton, Plains, and Midville.
4. Griffin and Calhoun.5. The F-test indicated no statistical difference at the alpha = 0.10 probability level; therefore, an LSD value was not calculated.Bolding indicates entries yielding equal to highest yielding entry within a column based on Fisher's protectedLSD (P = 0.10).
Brand-Variety3-Year
Average32-Year
Average4 20163-Year
Average2-Year
Average 20163-Year
Average2-Year
Average 2016
FL 2X 406 41.8 37.8 43.4 . . . 41.8 37.8 43.4FL 2X 405 41.3 37.6 45.8 . . . 41.3 37.6 45.8Florida 401 40.4 37.5 44.0 . . . 40.4 37.5 44.0Wrens Abruzzi 38.1 29.0 32.1 . . . 38.1 29.0 32.1Elbon . 18.2 19.3 . . . . 18.2 19.3
FL 104 . . 54.8 . . 54.8FL 4X 404 . . 29.0 . . . . . 29.0Maton . 28.0 35.7 . . . . 28.0 35.7Maton II . 21.9 29.1 . . . . 21.9 29.1Oklon . 15.3 19.3 . . . . 15.3 19.3
Average 40.4 28.2 35.3 . . . 40.4 28.2 35.3LSD at 10% Level N.S.6 N.S. 16.5 . . . N.S. N.S. 16.5Std. Err. of Entry Mean 3.1 3.9 6.9 . . . 3.1 3.9 6.9
--------------------------------------------------- bu/acre ----------------------------------------------------
Summary of Rye Yields:Georgia, 2015-2016 with Two- and Three-Year Averages
Yield1
South2 North5 Statewide
Bolding indicates entries yielding equal to highest yielding entry within a column based on Fisher's protectedLSD (P = 0.10).
1. Yields calculated at 56 pounds per bushel at 13.0% moisture.2. Tifton.3. Tifton data from 2016, 2014, and 2013.4. Titon data from 2016 and 2014.5. Griffin; no data available for 2016.6. The F-test indicated no statistical difference at the alpha = 0.10 probability level; therefore, an LSD value was not calculated.
Annual Publication 100-8 • Georgia 2015-2016 Small Grain Performance Tests46
An oat variety grain trial was planted at this location on September 23, 2015. However, crown rust disease and lodging during the growing season resultedin some very low grain yields and considerable variation in performancewithin and among plots in the test. After careful analysis and review of thedata, it is the opinion of the editors that the results of this trial may notaccurately reflect the genetic performance potential of all the test entries. Since this data is not useful for making decisions and could be misleadingif used in making variety selections, it will not be presented in the publication.
Oat
Tifton, Georgia:Oat Grain Performance, 2015-2016
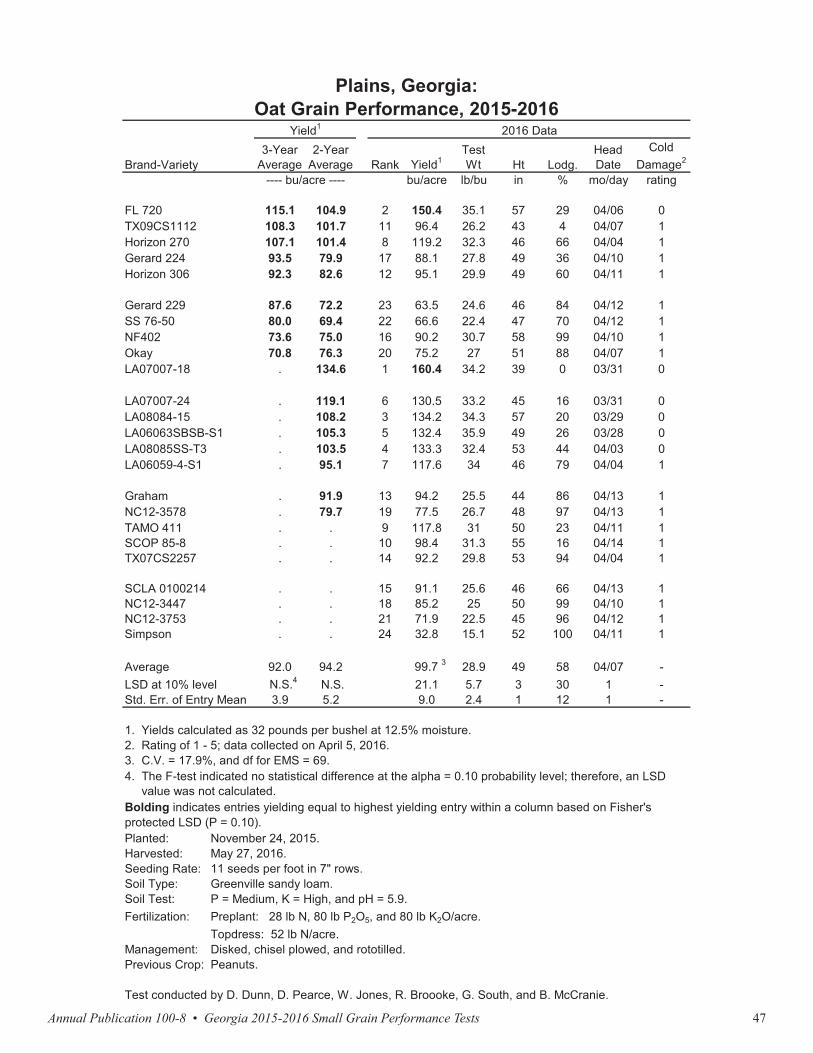
Annual Publication 100-8 • Georgia 2015-2016 Small Grain Performance Tests 47
An oat variety grain trial was planted at this location on September 23, 2015. However, crown rust disease and lodging during the growing season resultedin some very low grain yields and considerable variation in performancewithin and among plots in the test. After careful analysis and review of thedata, it is the opinion of the editors that the results of this trial may notaccurately reflect the genetic performance potential of all the test entries. Since this data is not useful for making decisions and could be misleadingif used in making variety selections, it will not be presented in the publication.
Oat
Tifton, Georgia:Oat Grain Performance, 2015-2016
Brand-Variety3-Year
Average2-Year
Average Rank Yield1TestWt Ht Lodg.
HeadDate
ColdDamage2
bu/acre lb/bu in % mo/day rating
FL 720 115.1 104.9 2 150.4 35.1 57 29 04/06 0TX09CS1112 108.3 101.7 11 96.4 26.2 43 4 04/07 1Horizon 270 107.1 101.4 8 119.2 32.3 46 66 04/04 1Gerard 224 93.5 79.9 17 88.1 27.8 49 36 04/10 1Horizon 306 92.3 82.6 12 95.1 29.9 49 60 04/11 1
Gerard 229 87.6 72.2 23 63.5 24.6 46 84 04/12 1SS 76-50 80.0 69.4 22 66.6 22.4 47 70 04/12 1NF402 73.6 75.0 16 90.2 30.7 58 99 04/10 1Okay 70.8 76.3 20 75.2 27 51 88 04/07 1LA07007-18 . 134.6 1 160.4 34.2 39 0 03/31 0
LA07007-24 . 119.1 6 130.5 33.2 45 16 03/31 0LA08084-15 . 108.2 3 134.2 34.3 57 20 03/29 0LA06063SBSB-S1 . 105.3 5 132.4 35.9 49 26 03/28 0LA08085SS-T3 . 103.5 4 133.3 32.4 53 44 04/03 0LA06059-4-S1 . 95.1 7 117.6 34 46 79 04/04 1
Graham . 91.9 13 94.2 25.5 44 86 04/13 1NC12-3578 . 79.7 19 77.5 26.7 48 97 04/13 1TAMO 411 . . 9 117.8 31 50 23 04/11 1SCOP 85-8 . . 10 98.4 31.3 55 16 04/14 1TX07CS2257 . . 14 92.2 29.8 53 94 04/04 1
SCLA 0100214 . . 15 91.1 25.6 46 66 04/13 1NC12-3447 . . 18 85.2 25 50 99 04/10 1NC12-3753 . . 21 71.9 22.5 45 96 04/12 1Simpson . . 24 32.8 15.1 52 100 04/11 1
Average 92.0 94.2 99.7 3 28.9 49 58 04/07 -LSD at 10% level N.S.4 N.S. 21.1 5.7 3 30 1 -Std. Err. of Entry Mean 3.9 5.2 9.0 2.4 1 12 1 -
Planted:Harvested:Seeding Rate:Soil Type:Soil Test:Fertilization:
Management:Previous Crop:
Test conducted by D. Dunn, D. Pearce, W. Jones, R. Broooke, G. South, and B. McCranie.
Greenville sandy loam.P = Medium, K = High, and pH = 5.9.Preplant: 28 lb N, 80 lb P2O5, and 80 lb K2O/acre.Topdress: 52 lb N/acre.Disked, chisel plowed, and rototilled.Peanuts.
11 seeds per foot in 7" rows.
Plains, Georgia:Oat Grain Performance, 2015-2016
Yield1 2016 Data
---- bu/acre ----
1. Yields calculated as 32 pounds per bushel at 12.5% moisture.2. Rating of 1 - 5; data collected on April 5, 2016.3. C.V. = 17.9%, and df for EMS = 69.4. The F-test indicated no statistical difference at the alpha = 0.10 probability level; therefore, an LSD value was not calculated.Bolding indicates entries yielding equal to highest yielding entry within a column based on Fisher's protected LSD (P = 0.10).
November 24, 2015.May 27, 2016.

Annual Publication 100-8 • Georgia 2015-2016 Small Grain Performance Tests48
Brand-Variety3-Year
Average2-Year
Average Rank Yield1TestWt Ht Lodg.
HeadDate
bu/acre lb/bu in % mo/day
TX09CS1112 107.3 95.5 6 81.2 22.6 43 79 04/12FL 720 93.8 86.9 3 102.5 25.5 57 86 04/10Horizon 270 92.7 85.1 7 79.7 28.5 51 100 04/07Gerard 224 87.4 78.1 14 61.7 22.3 48 100 04/12Gerard 229 83.5 52.9 23 13.6 25.4 41 100 04/14
Horizon 306 82.6 71.9 13 63.3 26.1 50 100 04/13SS 76-50 82.6 68.6 18 46.9 18.2 45 100 04/14Okay 58.0 43.6 22 28.9 9.9 51 100 04/11NF402 55.6 51.7 19 40.7 25.3 55 100 04/12LA07007-18 . 101.5 1 126.6 32.7 42 69 04/04
LA07007-24 . 88.5 2 109.0 29.4 49 79 04/04LA08085SS-T3 . 82.1 4 93.7 30.4 54 91 04/04NC12-3578 . 81.8 11 67.3 22.9 50 100 04/15Graham . 81.1 16 51.6 24.4 47 100 04/14LA06059-4-S1 . 72.9 9 70.6 31.3 48 94 04/06
LA06063SBSB-S1 . 71.9 5 92.7 31.9 52 78 04/04LA08084-15 . 64.9 12 63.6 23.8 57 63 04/03TX07CS2257 . . 8 75.7 26.4 54 100 04/07TAMO 411 . . 10 68.1 25.4 48 94 04/13SCOP 85-8 . . 15 53.5 24.0 54 100 04/15
NC12-3753 . . 17 51.0 20.6 50 100 04/14SCLA 0100214 . . 20 31.2 17.4 45 100 04/14NC12-3447 . . 21 30.4 19.4 49 100 04/10Simpson . . 24 13.0 26.1 51 100 04/14
Average 82.6 75.2 63.2 2 24.6 49 93 04/10LSD at 10% level 8.7 N.S.3 12.6 2.0 2 14 2Std. Err. of Entry Mean 3.7 3.7 5.3 0.8 1 6 1
Planted:Harvested:Seeding Rate:Soil Type:Soil Test:Fertilization:
Management:
Previous Crop:
Test conducted by D. Dunn, R. Brooke, G. South, and B. McCranie.
3. The F-test indicated no statistical difference at the alpha = 0.10 probability level; therefore, an LSD value was not calculated.Bolding indicates entries yielding equal to highest yielding entry within a column based on Fisher's protected LSD (P = 0.10).
November 24, 2015.June 1, 2016.11 seeds per foot in 7" rows.Dothan loamy soil.P = High, K = Medium, and pH = 6.0.Preplant: 37 lb N, 119 lb P2O5, and 70 lb K2O/acre.Topdress: 100 lb N/acre.Subsoiled, field cultivated, and rototilled: Harmony and Express used for weed control;1000 lb lime/acre.Fallow.
2. C.V. = 16.9%, and df for EMS = 69.
Midville, Georgia:Oat Grain Performance, 2015-2016
Yield1 2016 Data
----- bu/acre -----
1. Yields calculated as 32 pounds per bushel at 12.5% moisture.
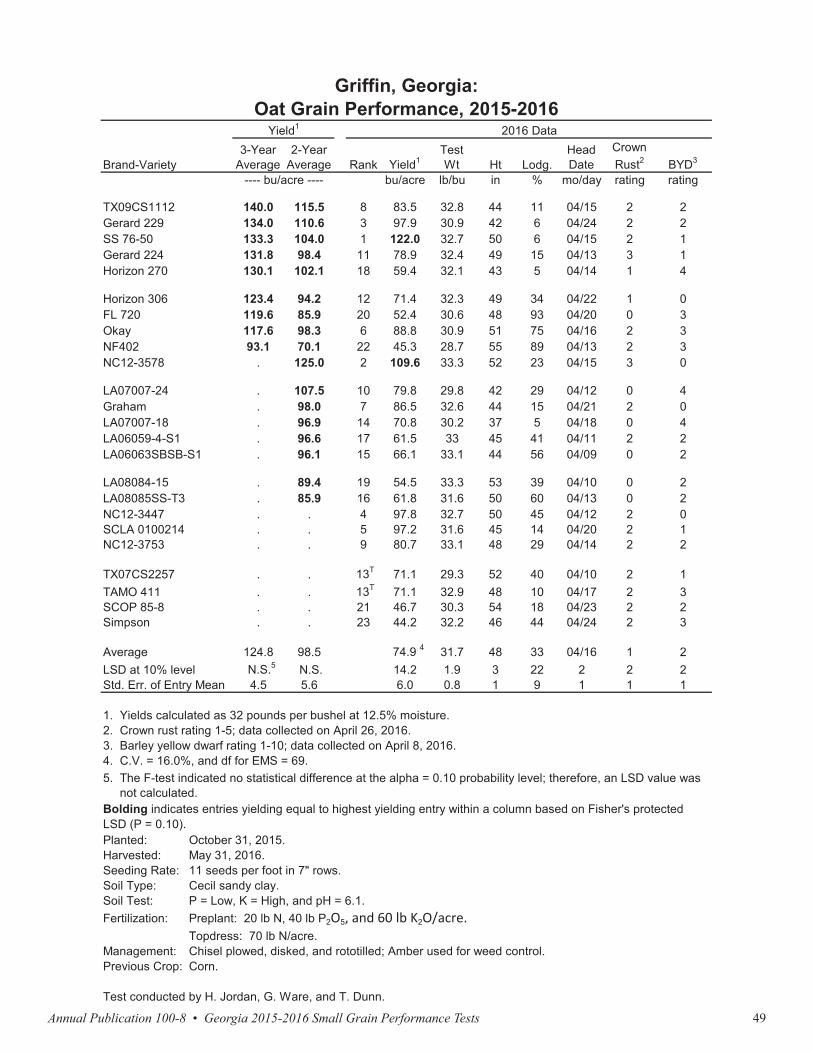
Annual Publication 100-8 • Georgia 2015-2016 Small Grain Performance Tests 49
Brand-Variety3-Year
Average2-Year
Average Rank Yield1TestWt Ht Lodg.
HeadDate
bu/acre lb/bu in % mo/day
TX09CS1112 107.3 95.5 6 81.2 22.6 43 79 04/12FL 720 93.8 86.9 3 102.5 25.5 57 86 04/10Horizon 270 92.7 85.1 7 79.7 28.5 51 100 04/07Gerard 224 87.4 78.1 14 61.7 22.3 48 100 04/12Gerard 229 83.5 52.9 23 13.6 25.4 41 100 04/14
Horizon 306 82.6 71.9 13 63.3 26.1 50 100 04/13SS 76-50 82.6 68.6 18 46.9 18.2 45 100 04/14Okay 58.0 43.6 22 28.9 9.9 51 100 04/11NF402 55.6 51.7 19 40.7 25.3 55 100 04/12LA07007-18 . 101.5 1 126.6 32.7 42 69 04/04
LA07007-24 . 88.5 2 109.0 29.4 49 79 04/04LA08085SS-T3 . 82.1 4 93.7 30.4 54 91 04/04NC12-3578 . 81.8 11 67.3 22.9 50 100 04/15Graham . 81.1 16 51.6 24.4 47 100 04/14LA06059-4-S1 . 72.9 9 70.6 31.3 48 94 04/06
LA06063SBSB-S1 . 71.9 5 92.7 31.9 52 78 04/04LA08084-15 . 64.9 12 63.6 23.8 57 63 04/03TX07CS2257 . . 8 75.7 26.4 54 100 04/07TAMO 411 . . 10 68.1 25.4 48 94 04/13SCOP 85-8 . . 15 53.5 24.0 54 100 04/15
NC12-3753 . . 17 51.0 20.6 50 100 04/14SCLA 0100214 . . 20 31.2 17.4 45 100 04/14NC12-3447 . . 21 30.4 19.4 49 100 04/10Simpson . . 24 13.0 26.1 51 100 04/14
Average 82.6 75.2 63.2 2 24.6 49 93 04/10LSD at 10% level 8.7 N.S.3 12.6 2.0 2 14 2Std. Err. of Entry Mean 3.7 3.7 5.3 0.8 1 6 1
Planted:Harvested:Seeding Rate:Soil Type:Soil Test:Fertilization:
Management:
Previous Crop:
Test conducted by D. Dunn, R. Brooke, G. South, and B. McCranie.
3. The F-test indicated no statistical difference at the alpha = 0.10 probability level; therefore, an LSD value was not calculated.Bolding indicates entries yielding equal to highest yielding entry within a column based on Fisher's protected LSD (P = 0.10).
November 24, 2015.June 1, 2016.11 seeds per foot in 7" rows.Dothan loamy soil.P = High, K = Medium, and pH = 6.0.Preplant: 37 lb N, 119 lb P2O5, and 70 lb K2O/acre.Topdress: 100 lb N/acre.Subsoiled, field cultivated, and rototilled: Harmony and Express used for weed control;1000 lb lime/acre.Fallow.
2. C.V. = 16.9%, and df for EMS = 69.
Midville, Georgia:Oat Grain Performance, 2015-2016
Yield1 2016 Data
----- bu/acre -----
1. Yields calculated as 32 pounds per bushel at 12.5% moisture.
Brand-Variety3-Year
Average2-Year
Average Rank Yield1TestWt Ht Lodg.
HeadDate
CrownRust2 BYD3
bu/acre lb/bu in % mo/day rating rating
TX09CS1112 140.0 115.5 8 83.5 32.8 44 11 04/15 2 2Gerard 229 134.0 110.6 3 97.9 30.9 42 6 04/24 2 2SS 76-50 133.3 104.0 1 122.0 32.7 50 6 04/15 2 1Gerard 224 131.8 98.4 11 78.9 32.4 49 15 04/13 3 1Horizon 270 130.1 102.1 18 59.4 32.1 43 5 04/14 1 4
Horizon 306 123.4 94.2 12 71.4 32.3 49 34 04/22 1 0FL 720 119.6 85.9 20 52.4 30.6 48 93 04/20 0 3Okay 117.6 98.3 6 88.8 30.9 51 75 04/16 2 3NF402 93.1 70.1 22 45.3 28.7 55 89 04/13 2 3NC12-3578 . 125.0 2 109.6 33.3 52 23 04/15 3 0
LA07007-24 . 107.5 10 79.8 29.8 42 29 04/12 0 4Graham . 98.0 7 86.5 32.6 44 15 04/21 2 0LA07007-18 . 96.9 14 70.8 30.2 37 5 04/18 0 4LA06059-4-S1 . 96.6 17 61.5 33 45 41 04/11 2 2LA06063SBSB-S1 . 96.1 15 66.1 33.1 44 56 04/09 0 2
LA08084-15 . 89.4 19 54.5 33.3 53 39 04/10 0 2LA08085SS-T3 . 85.9 16 61.8 31.6 50 60 04/13 0 2NC12-3447 . . 4 97.8 32.7 50 45 04/12 2 0SCLA 0100214 . . 5 97.2 31.6 45 14 04/20 2 1NC12-3753 . . 9 80.7 33.1 48 29 04/14 2 2
TX07CS2257 . . 13T 71.1 29.3 52 40 04/10 2 1TAMO 411 . . 13T 71.1 32.9 48 10 04/17 2 3SCOP 85-8 . . 21 46.7 30.3 54 18 04/23 2 2Simpson . . 23 44.2 32.2 46 44 04/24 2 3
Average 124.8 98.5 74.9 4 31.7 48 33 04/16 1 2LSD at 10% level N.S.5 N.S. 14.2 1.9 3 22 2 2 2Std. Err. of Entry Mean 4.5 5.6 6.0 0.8 1 9 1 1 1
Planted:Harvested:Seeding Rate:Soil Type:Soil Test:Fertilization:
Management:Previous Crop: Corn.
Test conducted by H. Jordan, G. Ware, and T. Dunn.
11 seeds per foot in 7" rows.Cecil sandy clay.P = Low, K = High, and pH = 6.1.Preplant: 20 lb N, 40 lb P2O5, and 60 lb K2O/acre.Topdress: 70 lb N/acre.Chisel plowed, disked, and rototilled; Amber used for weed control.
May 31, 2016.
Griffin, Georgia:Oat Grain Performance, 2015-2016
Yield1 2016 Data
---- bu/acre ----
1. Yields calculated as 32 pounds per bushel at 12.5% moisture.2. Crown rust rating 1-5; data collected on April 26, 2016.3. Barley yellow dwarf rating 1-10; data collected on April 8, 2016.4. C.V. = 16.0%, and df for EMS = 69.5. The F-test indicated no statistical difference at the alpha = 0.10 probability level; therefore, an LSD value was not calculated.Bolding indicates entries yielding equal to highest yielding entry within a column based on Fisher's protected LSD (P = 0.10).
October 31, 2015.
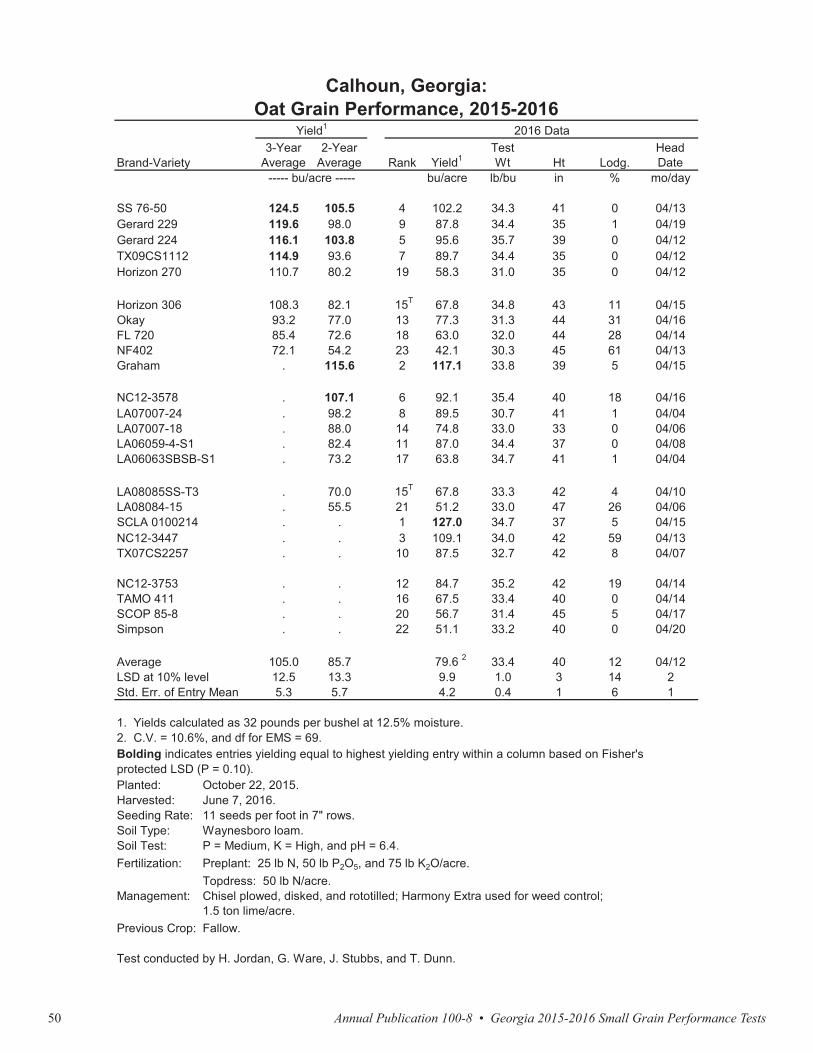
Annual Publication 100-8 • Georgia 2015-2016 Small Grain Performance Tests50
Brand-Variety3-Year
Average2-Year
Average Rank Yield1TestWt Ht Lodg.
HeadDate
bu/acre lb/bu in % mo/day
SS 76-50 124.5 105.5 4 102.2 34.3 41 0 04/13Gerard 229 119.6 98.0 9 87.8 34.4 35 1 04/19Gerard 224 116.1 103.8 5 95.6 35.7 39 0 04/12TX09CS1112 114.9 93.6 7 89.7 34.4 35 0 04/12Horizon 270 110.7 80.2 19 58.3 31.0 35 0 04/12
Horizon 306 108.3 82.1 15T 67.8 34.8 43 11 04/15Okay 93.2 77.0 13 77.3 31.3 44 31 04/16FL 720 85.4 72.6 18 63.0 32.0 44 28 04/14NF402 72.1 54.2 23 42.1 30.3 45 61 04/13Graham . 115.6 2 117.1 33.8 39 5 04/15
NC12-3578 . 107.1 6 92.1 35.4 40 18 04/16LA07007-24 . 98.2 8 89.5 30.7 41 1 04/04LA07007-18 . 88.0 14 74.8 33.0 33 0 04/06LA06059-4-S1 . 82.4 11 87.0 34.4 37 0 04/08LA06063SBSB-S1 . 73.2 17 63.8 34.7 41 1 04/04
LA08085SS-T3 . 70.0 15T 67.8 33.3 42 4 04/10LA08084-15 . 55.5 21 51.2 33.0 47 26 04/06SCLA 0100214 . . 1 127.0 34.7 37 5 04/15NC12-3447 . . 3 109.1 34.0 42 59 04/13TX07CS2257 . . 10 87.5 32.7 42 8 04/07
NC12-3753 . . 12 84.7 35.2 42 19 04/14TAMO 411 . . 16 67.5 33.4 40 0 04/14SCOP 85-8 . . 20 56.7 31.4 45 5 04/17Simpson . . 22 51.1 33.2 40 0 04/20
Average 105.0 85.7 79.6 2 33.4 40 12 04/12LSD at 10% level 12.5 13.3 9.9 1.0 3 14 2Std. Err. of Entry Mean 5.3 5.7 4.2 0.4 1 6 1
Planted:Harvested:Seeding Rate:Soil Type:Soil Test:Fertilization:
Management:
Previous Crop:
Preplant: 25 lb N, 50 lb P2O5, and 75 lb K2O/acre.Topdress: 50 lb N/acre.Chisel plowed, disked, and rototilled; Harmony Extra used for weed control; 1.5 ton lime/acre.Fallow.
Test conducted by H. Jordan, G. Ware, J. Stubbs, and T. Dunn.
P = Medium, K = High, and pH = 6.4.
Calhoun, Georgia:Oat Grain Performance, 2015-2016
Yield1 2016 Data
----- bu/acre -----
1. Yields calculated as 32 pounds per bushel at 12.5% moisture.2. C.V. = 10.6%, and df for EMS = 69.Bolding indicates entries yielding equal to highest yielding entry within a column based on Fisher's protected LSD (P = 0.10).
October 22, 2015.June 7, 2016.11 seeds per foot in 7" rows.Waynesboro loam.
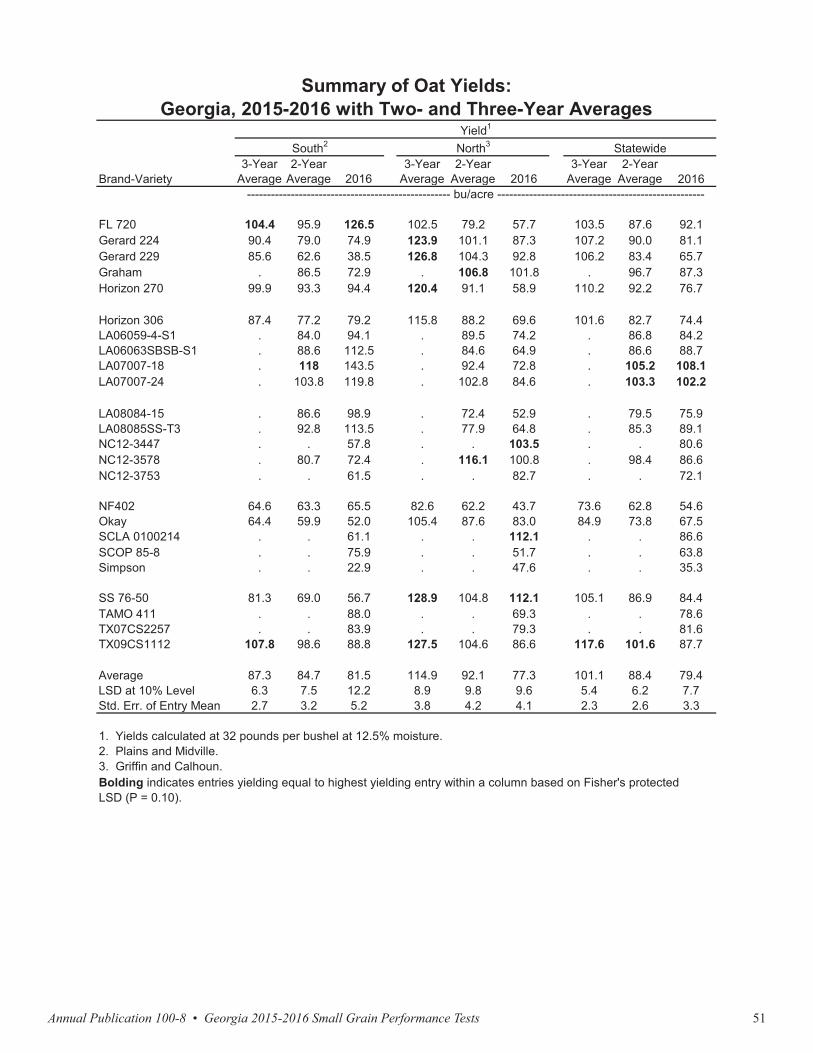
Annual Publication 100-8 • Georgia 2015-2016 Small Grain Performance Tests 51
Brand-Variety3-Year
Average2-Year
Average Rank Yield1TestWt Ht Lodg.
HeadDate
bu/acre lb/bu in % mo/day
SS 76-50 124.5 105.5 4 102.2 34.3 41 0 04/13Gerard 229 119.6 98.0 9 87.8 34.4 35 1 04/19Gerard 224 116.1 103.8 5 95.6 35.7 39 0 04/12TX09CS1112 114.9 93.6 7 89.7 34.4 35 0 04/12Horizon 270 110.7 80.2 19 58.3 31.0 35 0 04/12
Horizon 306 108.3 82.1 15T 67.8 34.8 43 11 04/15Okay 93.2 77.0 13 77.3 31.3 44 31 04/16FL 720 85.4 72.6 18 63.0 32.0 44 28 04/14NF402 72.1 54.2 23 42.1 30.3 45 61 04/13Graham . 115.6 2 117.1 33.8 39 5 04/15
NC12-3578 . 107.1 6 92.1 35.4 40 18 04/16LA07007-24 . 98.2 8 89.5 30.7 41 1 04/04LA07007-18 . 88.0 14 74.8 33.0 33 0 04/06LA06059-4-S1 . 82.4 11 87.0 34.4 37 0 04/08LA06063SBSB-S1 . 73.2 17 63.8 34.7 41 1 04/04
LA08085SS-T3 . 70.0 15T 67.8 33.3 42 4 04/10LA08084-15 . 55.5 21 51.2 33.0 47 26 04/06SCLA 0100214 . . 1 127.0 34.7 37 5 04/15NC12-3447 . . 3 109.1 34.0 42 59 04/13TX07CS2257 . . 10 87.5 32.7 42 8 04/07
NC12-3753 . . 12 84.7 35.2 42 19 04/14TAMO 411 . . 16 67.5 33.4 40 0 04/14SCOP 85-8 . . 20 56.7 31.4 45 5 04/17Simpson . . 22 51.1 33.2 40 0 04/20
Average 105.0 85.7 79.6 2 33.4 40 12 04/12LSD at 10% level 12.5 13.3 9.9 1.0 3 14 2Std. Err. of Entry Mean 5.3 5.7 4.2 0.4 1 6 1
Planted:Harvested:Seeding Rate:Soil Type:Soil Test:Fertilization:
Management:
Previous Crop:
Preplant: 25 lb N, 50 lb P2O5, and 75 lb K2O/acre.Topdress: 50 lb N/acre.Chisel plowed, disked, and rototilled; Harmony Extra used for weed control; 1.5 ton lime/acre.Fallow.
Test conducted by H. Jordan, G. Ware, J. Stubbs, and T. Dunn.
P = Medium, K = High, and pH = 6.4.
Calhoun, Georgia:Oat Grain Performance, 2015-2016
Yield1 2016 Data
----- bu/acre -----
1. Yields calculated as 32 pounds per bushel at 12.5% moisture.2. C.V. = 10.6%, and df for EMS = 69.Bolding indicates entries yielding equal to highest yielding entry within a column based on Fisher's protected LSD (P = 0.10).
October 22, 2015.June 7, 2016.11 seeds per foot in 7" rows.Waynesboro loam.
Brand-Variety3-Year
Average2-Year
Average 20163-Year
Average2-Year
Average 20163-Year
Average2-Year
Average 2016
FL 720 104.4 95.9 126.5 102.5 79.2 57.7 103.5 87.6 92.1Gerard 224 90.4 79.0 74.9 123.9 101.1 87.3 107.2 90.0 81.1Gerard 229 85.6 62.6 38.5 126.8 104.3 92.8 106.2 83.4 65.7Graham . 86.5 72.9 . 106.8 101.8 . 96.7 87.3Horizon 270 99.9 93.3 94.4 120.4 91.1 58.9 110.2 92.2 76.7
Horizon 306 87.4 77.2 79.2 115.8 88.2 69.6 101.6 82.7 74.4LA06059-4-S1 . 84.0 94.1 . 89.5 74.2 . 86.8 84.2LA06063SBSB-S1 . 88.6 112.5 . 84.6 64.9 . 86.6 88.7LA07007-18 . 118 143.5 . 92.4 72.8 . 105.2 108.1LA07007-24 . 103.8 119.8 . 102.8 84.6 . 103.3 102.2
LA08084-15 . 86.6 98.9 . 72.4 52.9 . 79.5 75.9LA08085SS-T3 . 92.8 113.5 . 77.9 64.8 . 85.3 89.1NC12-3447 . . 57.8 . . 103.5 . . 80.6NC12-3578 . 80.7 72.4 . 116.1 100.8 . 98.4 86.6NC12-3753 . . 61.5 . . 82.7 . . 72.1
NF402 64.6 63.3 65.5 82.6 62.2 43.7 73.6 62.8 54.6Okay 64.4 59.9 52.0 105.4 87.6 83.0 84.9 73.8 67.5SCLA 0100214 . . 61.1 . . 112.1 . . 86.6SCOP 85-8 . . 75.9 . . 51.7 . . 63.8Simpson . . 22.9 . . 47.6 . . 35.3
SS 76-50 81.3 69.0 56.7 128.9 104.8 112.1 105.1 86.9 84.4TAMO 411 . . 88.0 . . 69.3 . . 78.6TX07CS2257 . . 83.9 . . 79.3 . . 81.6TX09CS1112 107.8 98.6 88.8 127.5 104.6 86.6 117.6 101.6 87.7
Average 87.3 84.7 81.5 114.9 92.1 77.3 101.1 88.4 79.4LSD at 10% Level 6.3 7.5 12.2 8.9 9.8 9.6 5.4 6.2 7.7Std. Err. of Entry Mean 2.7 3.2 5.2 3.8 4.2 4.1 2.3 2.6 3.3
1. Yields calculated at 32 pounds per bushel at 12.5% moisture.2. Plains and Midville.3. Griffin and Calhoun.Bolding indicates entries yielding equal to highest yielding entry within a column based on Fisher's protectedLSD (P = 0.10).
Summary of Oat Yields:Georgia, 2015-2016 with Two- and Three-Year Averages
Yield1
South2 North3 Statewide
--------------------------------------------------- bu/acre ----------------------------------------------------
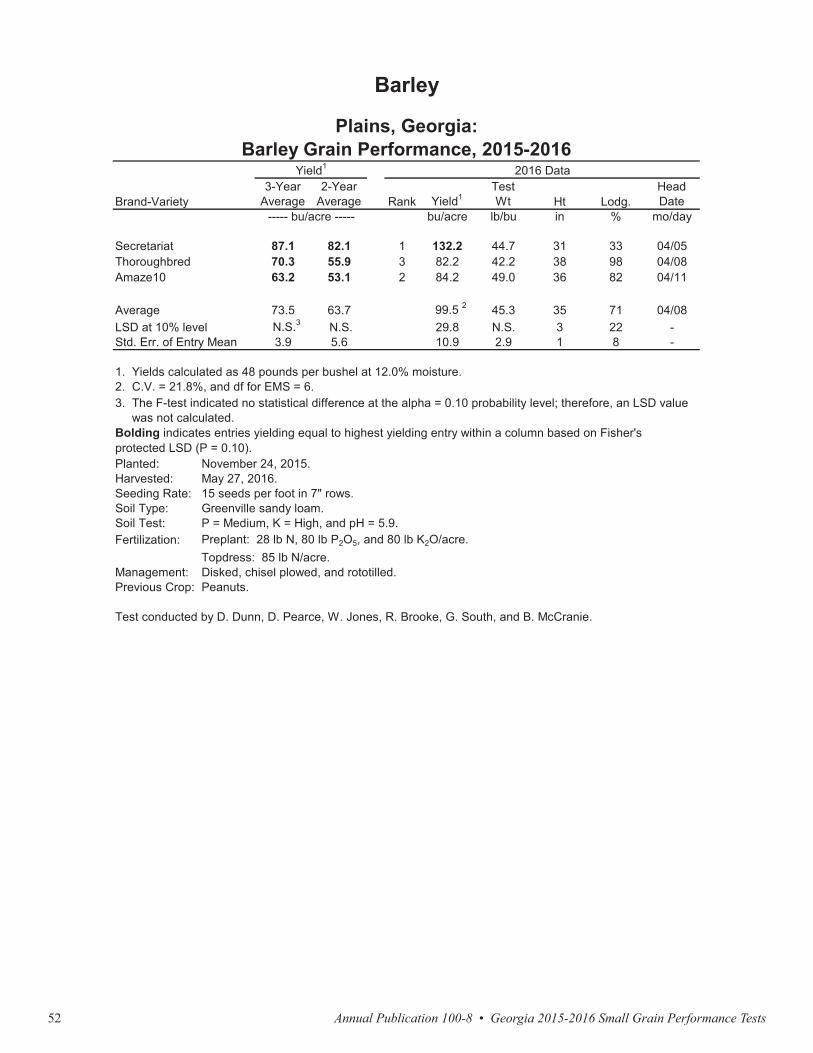
Annual Publication 100-8 • Georgia 2015-2016 Small Grain Performance Tests52
Brand-Variety3-Year
Average2-Year
Average Rank Yield1TestWt Ht Lodg.
HeadDate
bu/acre lb/bu in % mo/day
Secretariat 87.1 82.1 1 132.2 44.7 31 33 04/05Thoroughbred 70.3 55.9 3 82.2 42.2 38 98 04/08Amaze10 63.2 53.1 2 84.2 49.0 36 82 04/11
Average 73.5 63.7 99.5 2 45.3 35 71 04/08LSD at 10% level N.S.3 N.S. 29.8 N.S. 3 22 -Std. Err. of Entry Mean 3.9 5.6 10.9 2.9 1 8 -
Planted:Harvested:Seeding Rate:Soil Type:Soil Test:Fertilization:
Management:Previous Crop:
Test conducted by D. Dunn, D. Pearce, W. Jones, R. Brooke, G. South, and B. McCranie.
3. The F-test indicated no statistical difference at the alpha = 0.10 probability level; therefore, an LSD valuewas not calculated.
Bolding indicates entries yielding equal to highest yielding entry within a column based on Fisher's protected LSD (P = 0.10).
November 24, 2015.May 27, 2016.15 seeds per foot in 7" rows.Greenville sandy loam.P = Medium, K = High, and pH = 5.9.Preplant: 28 lb N, 80 lb P2O5, and 80 lb K2O/acre.Topdress: 85 lb N/acre.Disked, chisel plowed, and rototilled.Peanuts.
2. C.V. = 21.8%, and df for EMS = 6.
Barley
Plains, Georgia:Barley Grain Performance, 2015-2016
Yield1 2016 Data
----- bu/acre -----
1. Yields calculated as 48 pounds per bushel at 12.0% moisture.
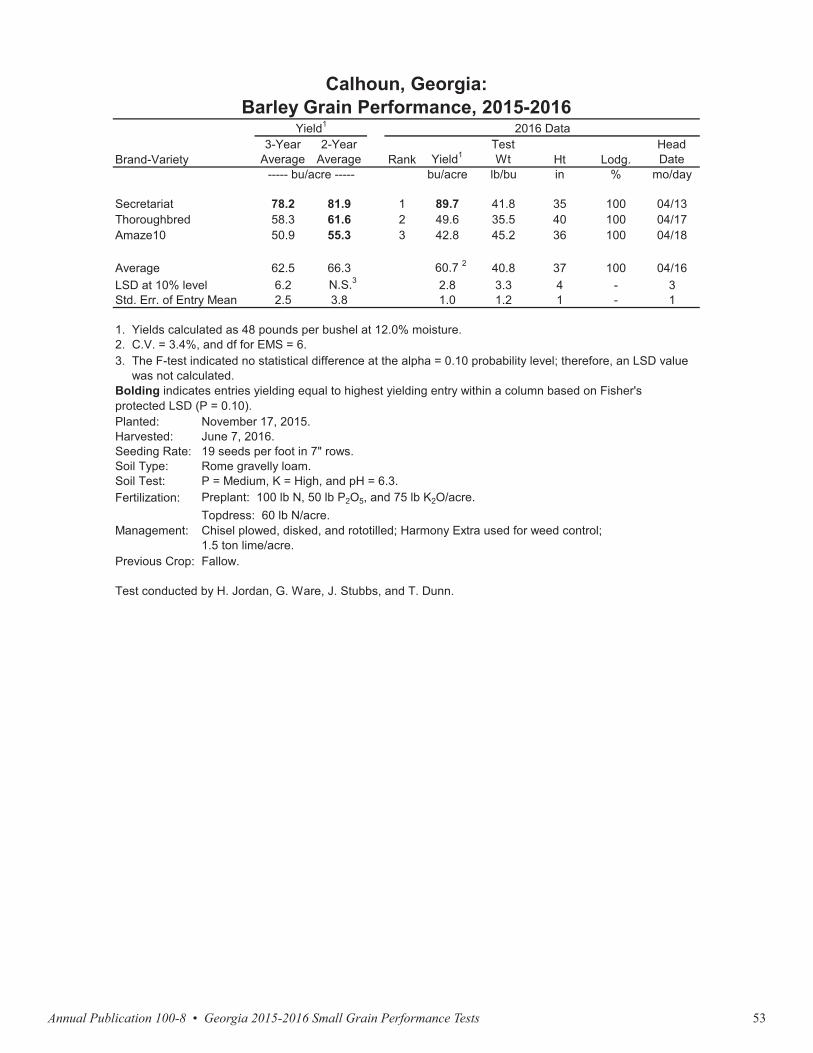
Annual Publication 100-8 • Georgia 2015-2016 Small Grain Performance Tests 53
Brand-Variety3-Year
Average2-Year
Average Rank Yield1TestWt Ht Lodg.
HeadDate
bu/acre lb/bu in % mo/day
Secretariat 87.1 82.1 1 132.2 44.7 31 33 04/05Thoroughbred 70.3 55.9 3 82.2 42.2 38 98 04/08Amaze10 63.2 53.1 2 84.2 49.0 36 82 04/11
Average 73.5 63.7 99.5 2 45.3 35 71 04/08LSD at 10% level N.S.3 N.S. 29.8 N.S. 3 22 -Std. Err. of Entry Mean 3.9 5.6 10.9 2.9 1 8 -
Planted:Harvested:Seeding Rate:Soil Type:Soil Test:Fertilization:
Management:Previous Crop:
Test conducted by D. Dunn, D. Pearce, W. Jones, R. Brooke, G. South, and B. McCranie.
3. The F-test indicated no statistical difference at the alpha = 0.10 probability level; therefore, an LSD value was not calculated.Bolding indicates entries yielding equal to highest yielding entry within a column based on Fisher's protected LSD (P = 0.10).
November 24, 2015.May 27, 2016.15 seeds per foot in 7" rows.Greenville sandy loam.P = Medium, K = High, and pH = 5.9.Preplant: 28 lb N, 80 lb P2O5, and 80 lb K2O/acre.Topdress: 85 lb N/acre.Disked, chisel plowed, and rototilled.Peanuts.
2. C.V. = 21.8 %, and df for EMS = 6.
Barley
Plains, Georgia:Barley Grain Performance, 2015-2016
Yield1 2016 Data
----- bu/acre -----
1. Yields calculated as 48 pounds per bushel at 12.0% moisture.
Brand-Variety3-Year
Average2-Year
Average Rank Yield1TestWt Ht Lodg.
HeadDate
bu/acre lb/bu in % mo/day
Secretariat 78.2 81.9 1 89.7 41.8 35 100 04/13Thoroughbred 58.3 61.6 2 49.6 35.5 40 100 04/17Amaze10 50.9 55.3 3 42.8 45.2 36 100 04/18
Average 62.5 66.3 60.7 2 40.8 37 100 04/16LSD at 10% level 6.2 N.S.3 2.8 3.3 4 - 3Std. Err. of Entry Mean 2.5 3.8 1.0 1.2 1 - 1
Planted:Harvested:Seeding Rate:Soil Type:Soil Test:Fertilization:
Management:
Previous Crop:
Test conducted by H. Jordan, G. Ware, J. Stubbs, and T. Dunn.
3. The F-test indicated no statistical difference at the alpha = 0.10 probability level; therefore, an LSD value was not calculated.Bolding indicates entries yielding equal to highest yielding entry within a column based on Fisher's protected LSD (P = 0.10).
November 17, 2015.June 7, 2016.19 seeds per foot in 7" rows.Rome gravelly loam.P = Medium, K = High, and pH = 6.3.Preplant: 100 lb N, 50 lb P2O5, and 75 lb K2O/acre.Topdress: 60 lb N/acre.Chisel plowed, disked, and rototilled; Harmony Extra used for weed control; 1.5 ton lime/acre.Fallow.
2. C.V. = 3.4%, and df for EMS = 6.
Calhoun, Georgia:Barley Grain Performance, 2015-2016
Yield1 2016 Data
----- bu/acre -----
1. Yields calculated as 48 pounds per bushel at 12.0% moisture.
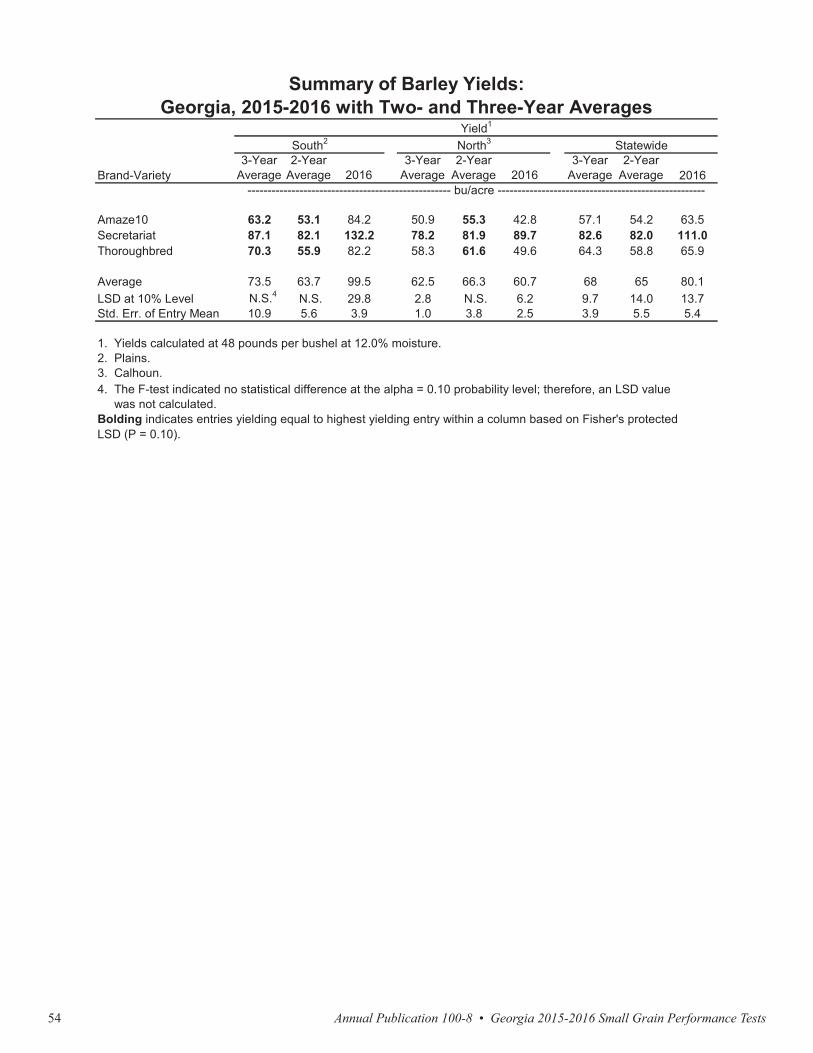
Annual Publication 100-8 • Georgia 2015-2016 Small Grain Performance Tests54
Brand-Variety3-Year
Average2-Year
Average 20163-Year
Average2-Year
Average 20163-Year
Average2-Year
Average 2016
Amaze10 63.2 53.1 84.2 50.9 55.3 42.8 57.1 54.2 63.5Secretariat 87.1 82.1 132.2 78.2 81.9 89.7 82.6 82.0 111.0Thoroughbred 70.3 55.9 82.2 58.3 61.6 49.6 64.3 58.8 65.9
Average 73.5 63.7 99.5 62.5 66.3 60.7 68 65 80.1LSD at 10% Level N.S.4 N.S. 29.8 2.8 N.S. 6.2 9.7 14.0 13.7Std. Err. of Entry Mean 10.9 5.6 3.9 1.0 3.8 2.5 3.9 5.5 5.4
--------------------------------------------------- bu/acre ----------------------------------------------------
Summary of Barley Yields:Georgia, 2015-2016 with Two- and Three-Year Averages
Yield1
South2 North3 Statewide
1. Yields calculated at 48 pounds per bushel at 12.0% moisture.2. Plains.3. Calhoun.4. The F-test indicated no statistical difference at the alpha = 0.10 probability level; therefore, an LSD value was not calculated.Bolding indicates entries yielding equal to highest yielding entry within a column based on Fisher's protectedLSD (P = 0.10).
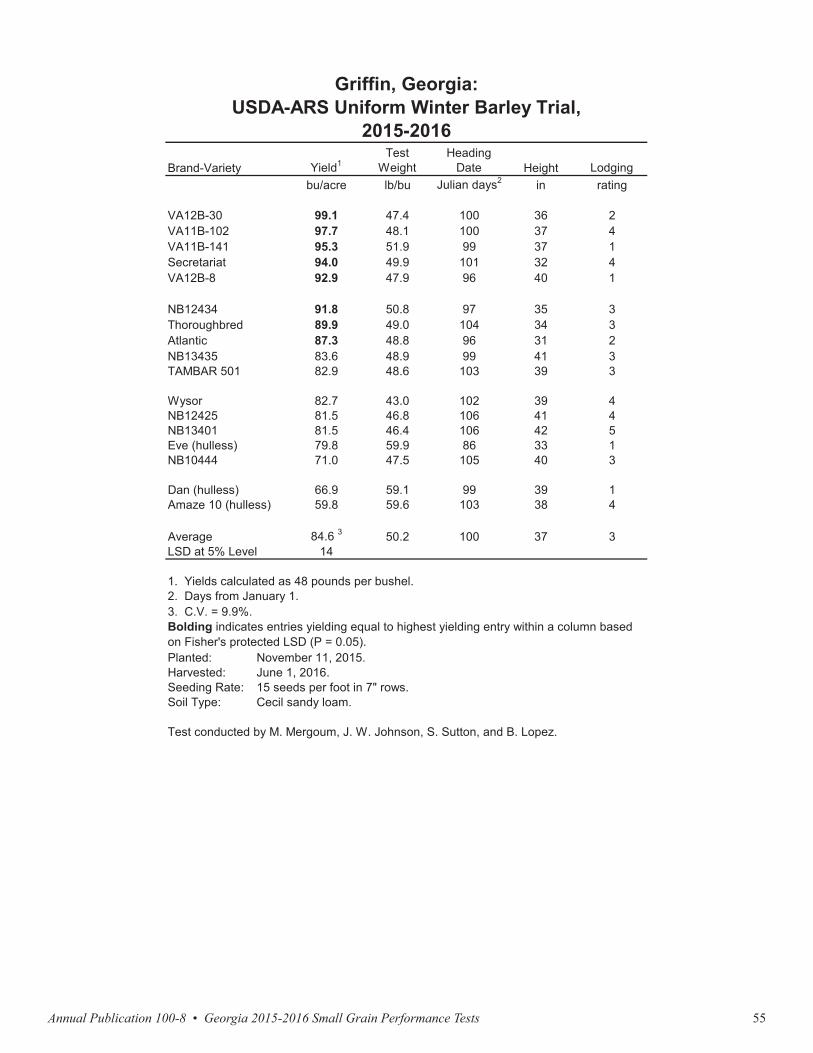
Annual Publication 100-8 • Georgia 2015-2016 Small Grain Performance Tests 55
Brand-Variety3-Year
Average2-Year
Average 20163-Year
Average2-Year
Average 20163-Year
Average2-Year
Average 2016
Amaze10 63.2 53.1 84.2 50.9 55.3 42.8 57.1 54.2 63.5Secretariat 87.1 82.1 132.2 78.2 81.9 89.7 82.6 82.0 111.0Thoroughbred 70.3 55.9 82.2 58.3 61.6 49.6 64.3 58.8 65.9
Average 73.5 63.7 99.5 62.5 66.3 60.7 68 65 80.1LSD at 10% Level N.S.4 N.S. 29.8 2.8 N.S. 6.2 9.7 14.0 13.7Std. Err. of Entry Mean 10.9 5.6 3.9 1.0 3.8 2.5 3.9 5.5 5.4
--------------------------------------------------- bu/acre ----------------------------------------------------
Summary of Barley Yields:Georgia, 2015-2016 with Two- and Three-Year Averages
Yield1
South2 North3 Statewide
1. Yields calculated at 48 pounds per bushel at 12.0% moisture.2. Plains.3. Calhoun.4. The F-test indicated no statistical difference at the alpha = 0.10 probability level; therefore, an LSD value was not calculated.Bolding indicates entries yielding equal to highest yielding entry within a column based on Fisher's protectedLSD (P = 0.10).
Brand-Variety Yield1Test
WeightHeading
Date Height Lodgingbu/acre lb/bu Julian days2 in rating
VA12B-30 99.1 47.4 100 36 2VA11B-102 97.7 48.1 100 37 4VA11B-141 95.3 51.9 99 37 1Secretariat 94.0 49.9 101 32 4VA12B-8 92.9 47.9 96 40 1
NB12434 91.8 50.8 97 35 3Thoroughbred 89.9 49.0 104 34 3Atlantic 87.3 48.8 96 31 2NB13435 83.6 48.9 99 41 3TAMBAR 501 82.9 48.6 103 39 3
Wysor 82.7 43.0 102 39 4NB12425 81.5 46.8 106 41 4NB13401 81.5 46.4 106 42 5Eve (hulless) 79.8 59.9 86 33 1NB10444 71.0 47.5 105 40 3
Dan (hulless) 66.9 59.1 99 39 1Amaze 10 (hulless) 59.8 59.6 103 38 4
Average 84.6 3 50.2 100 37 3LSD at 5% Level 14
Planted:Harvested:Seeding Rate:Soil Type:
June 1, 2016.15 seeds per foot in 7" rows.Cecil sandy loam.
Test conducted by M. Mergoum, J. W. Johnson, S. Sutton, and B. Lopez.
Griffin, Georgia:USDA-ARS Uniform Winter Barley Trial,
2015-2016
1. Yields calculated as 48 pounds per bushel.2. Days from January 1.3. C.V. = 9.9%.Bolding indicates entries yielding equal to highest yielding entry within a column based on Fisher's protected LSD (P = 0.05).
November 11, 2015.

Annual Publication 100-8 • Georgia 2015-2016 Small Grain Performance Tests56
Brand-Variety 12/21/15 1/20/16 2/19/16 3/11/16 3/31/16 2016 2-Yr Avg
AGS 2033 1470 904 1405 1830 1557 7165 5457Graze-All 806 1046 1372 1862 2004 7090 5908AGS 2024 1361 926 1699 1917 991 6893 .SS 8415 1057 871 1307 1601 2037 6872 5520GA 04434-12LE28 1144 817 1350 1655 1688 6654 4736
GA 061349-13LE29 915 1133 1155 1514 1841 6556 .Pioneer 26R10 1067 871 991 1144 2418 6491 .Pioneer 26R41 882 784 1100 1448 2276 6490 .SS 8629 860 708 1198 1623 2026 6414 5730GA 051102-13LE43 1046 610 1067 1514 1993 6229 .
GA 061349-13LE31 1067 632 1176 1437 1862 6174 .GA 061082-13E24 795 773 1274 1993 1296 6131 .GA 06112-13EE16 1198 991 1568 1710 664 6131 .Dyna-Gro Savoy 882 795 1612 2200 588 6076 4471Pioneer 26R94 893 861 1405 2015 839 6012 4769
Dyna-Gro 9171 904 730 1067 1187 1993 5880 .Southern Harvest 550 1089 664 1285 1851 980 5870 4323AGS 2038 1089 621 1601 1949 534 5794 .OK11754WF 468 621 1557 1688 1013 5347 .
Average 1000 808 1326 1691 1505 6330 1 5114LSD at 10% Level 338 N.S.2 237 235 314 519 N.S.Std. Err. of Entry Mean 143 127 100 99 133 219 179
Planted:Seeding Rate:Soil Type:Soil Test:Fertilization:
Management:Previous Crop:
Dry Matter YieldHarvest Date Season Totals
-------------------------------------------- lb/acre --------------------------------------------
Test conducted by D. Dunn, R. Brooke, B. McCranie, and G. South.
Summer annuals.
Wheat Forage
P = High, K = Medium, and pH = 6.4.Preplant: 50 lb N, 20 lb P2O5, and 60 lb K2O/acre.Topdress: 50 lb N/acre after 1st, 2nd, 3rd, and 4th harvests.Disked, moldboard plowed, and rototilled.
1. C.V. = 6.3%, and df for EMS = 48.2. The F-test indicated no statistical difference at the alpha = 0.10 probability level; therefore, an LSD value was not calculated.Bolding indicates entries yielding equal to highest yielding entry within a column based on Fisher's protected LSD (P = 0.10).
October 23, 2015.27 seed/foot in 7" rows.Tifton loamy sand.
Tifton, Georgia:Wheat Forage Performance, 2015-2016
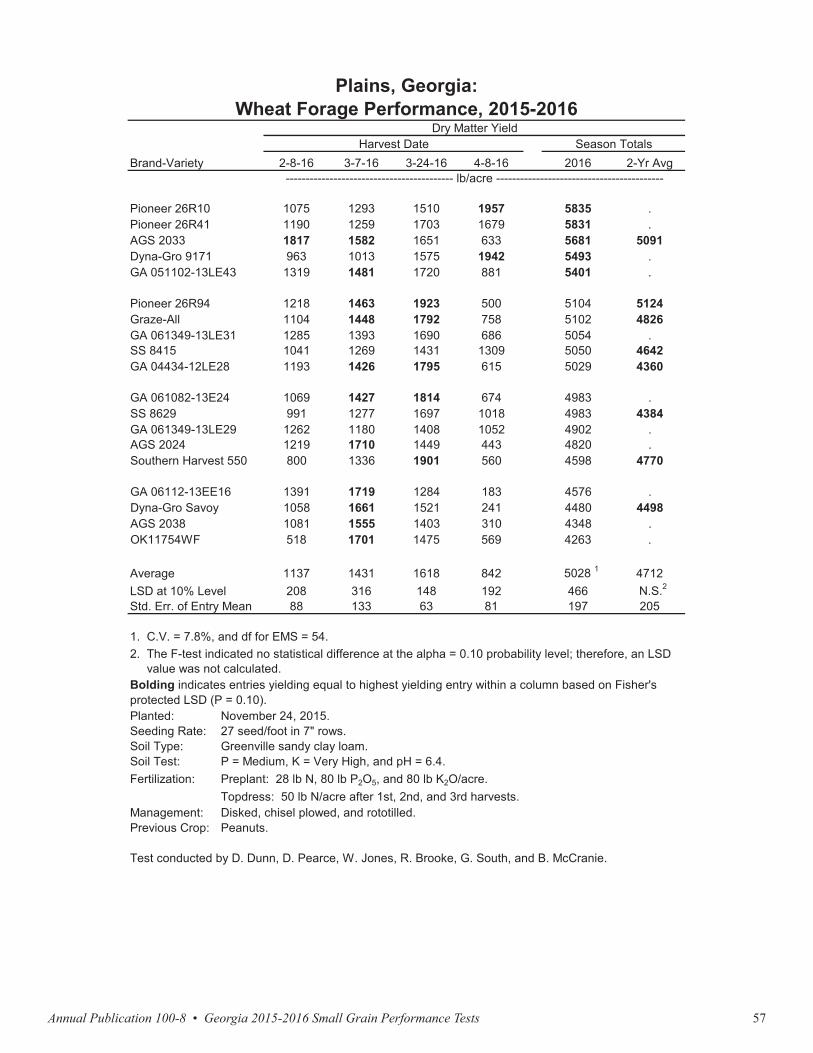
Annual Publication 100-8 • Georgia 2015-2016 Small Grain Performance Tests 57
Brand-Variety 12/21/15 1/20/16 2/19/16 3/11/16 3/31/16 2016 2-Yr Avg
AGS 2033 1470 904 1405 1830 1557 7165 5457Graze-All 806 1046 1372 1862 2004 7090 5908AGS 2024 1361 926 1699 1917 991 6893 .SS 8415 1057 871 1307 1601 2037 6872 5520GA 04434-12LE28 1144 817 1350 1655 1688 6654 4736
GA 061349-13LE29 915 1133 1155 1514 1841 6556 .Pioneer 26R10 1067 871 991 1144 2418 6491 .Pioneer 26R41 882 784 1100 1448 2276 6490 .SS 8629 860 708 1198 1623 2026 6414 5730GA 051102-13LE43 1046 610 1067 1514 1993 6229 .
GA 061349-13LE31 1067 632 1176 1437 1862 6174 .GA 061082-13E24 795 773 1274 1993 1296 6131 .GA 06112-13EE16 1198 991 1568 1710 664 6131 .Dyna-Gro Savoy 882 795 1612 2200 588 6076 4471Pioneer 26R94 893 861 1405 2015 839 6012 4769
Dyna-Gro 9171 904 730 1067 1187 1993 5880 .Southern Harvest 550 1089 664 1285 1851 980 5870 4323AGS 2038 1089 621 1601 1949 534 5794 .OK11754WF 468 621 1557 1688 1013 5347 .
Average 1000 808 1326 1691 1505 6330 1 5114LSD at 10% Level 338 N.S.2 237 235 314 519 N.S.Std. Err. of Entry Mean 143 127 100 99 133 219 179
Planted:Seeding Rate:Soil Type:Soil Test:Fertilization:
Management:Previous Crop:
Dry Matter YieldHarvest Date Season Totals
-------------------------------------------- lb/acre --------------------------------------------
Test conducted by D. Dunn, R. Brooke, B. McCranie, and G. South.
Summer annuals.
Wheat Forage
P = High, K = Medium, and pH = 6.4.Preplant: 50 lb N, 20 lb P2O5, and 60 lb K2O/acre.Topdress: 50 lb N/acre after 1st, 2nd, 3rd, and 4th harvests.Disked, moldboard plowed, and rototilled.
1. C.V. = 6.3%, and df for EMS = 48.2. The F-test indicated no statistical difference at the alpha = 0.10 probability level; therefore, an LSD value was not calculated.Bolding indicates entries yielding equal to highest yielding entry within a column based on Fisher's protected LSD (P = 0.10).
October 23, 2015.27 seed/foot in 7" rows.Tifton loamy sand.
Tifton, Georgia:Wheat Forage Performance, 2015-2016
Brand-Variety 2-8-16 3-7-16 3-24-16 4-8-16 2016 2-Yr Avg
Pioneer 26R10 1075 1293 1510 1957 5835 .Pioneer 26R41 1190 1259 1703 1679 5831 .AGS 2033 1817 1582 1651 633 5681 5091Dyna-Gro 9171 963 1013 1575 1942 5493 .GA 051102-13LE43 1319 1481 1720 881 5401 .
Pioneer 26R94 1218 1463 1923 500 5104 5124Graze-All 1104 1448 1792 758 5102 4826GA 061349-13LE31 1285 1393 1690 686 5054 .SS 8415 1041 1269 1431 1309 5050 4642GA 04434-12LE28 1193 1426 1795 615 5029 4360
GA 061082-13E24 1069 1427 1814 674 4983 .SS 8629 991 1277 1697 1018 4983 4384GA 061349-13LE29 1262 1180 1408 1052 4902 .AGS 2024 1219 1710 1449 443 4820 .Southern Harvest 550 800 1336 1901 560 4598 4770
GA 06112-13EE16 1391 1719 1284 183 4576 .Dyna-Gro Savoy 1058 1661 1521 241 4480 4498AGS 2038 1081 1555 1403 310 4348 .OK11754WF 518 1701 1475 569 4263 .
Average 1137 1431 1618 842 5028 1 4712LSD at 10% Level 208 316 148 192 466 N.S.2
Std. Err. of Entry Mean 88 133 63 81 197 205
Planted:Seeding Rate:Soil Type:Soil Test:Fertilization:
Management:Previous Crop:
Greenville sandy clay loam.
Plains, Georgia:Wheat Forage Performance, 2015-2016
Dry Matter YieldHarvest Date Season Totals
------------------------------------------ lb/acre ------------------------------------------
1. C.V. = 7.8%, and df for EMS = 54.2. The F-test indicated no statistical difference at the alpha = 0.10 probability level; therefore, an LSD value was not calculated.Bolding indicates entries yielding equal to highest yielding entry within a column based on Fisher's protected LSD (P = 0.10).
November 24, 2015.27 seed/foot in 7" rows.
Test conducted by D. Dunn, D. Pearce, W. Jones, R. Brooke, G. South, and B. McCranie.
P = Medium, K = Very High, and pH = 6.4.Preplant: 28 lb N, 80 lb P2O5, and 80 lb K2O/acre.Topdress: 50 lb N/acre after 1st, 2nd, and 3rd harvests.Disked, chisel plowed, and rototilled.Peanuts.

Annual Publication 100-8 • Georgia 2015-2016 Small Grain Performance Tests58
Griffin, Georgia:Wheat Forage Performance, 2015-2016
A wheat variety forage trial was planted at this location on October 24, 2015. However, ryegrass competition due to the lack of control with labeled herbicides during the growing season resulted in only two harvests and considerable variation in performance within and among plots in the test. After careful analysis and review of the data, it is the opinion of the editors that the results of this trial may not accurately reflect the genetic performance potential of all the test entries. Since this data is not useful for making decisions and could be misleading if used in making variety selections, it will not be presented in thepublication.
Annual Publication 100-8 • Georgia 2015-2016 Small Grain Performance Tests 59
Griffin, Georgia:Wheat Forage Performance, 2015-2016
A wheat variety forage trial was planted at this location on October 24, 2015. However, ryegrass competition due to the lack of control with labeled herbicides during the growing season resulted in only two harvests and considerable variation in performance within and among plots in the test. After careful analysis and review of the data, it is the opinion of the editors that the results of this trial may not accurately reflect the genetic performance potential of all the test entries. Since this data is not useful for making decisions and could be misleading if used in making variety selections, it will not be presented in thepublication.
Marianna, Florida:Wheat Forage Performance, 2015-2016
A wheat variety forage trial was planted at this location on October 30, 2015. However, due to heavy rainfall during early November, experimental plots were washed out, silted over, and/or drowned rendering little to no results. Therefore, there are no results to publish.
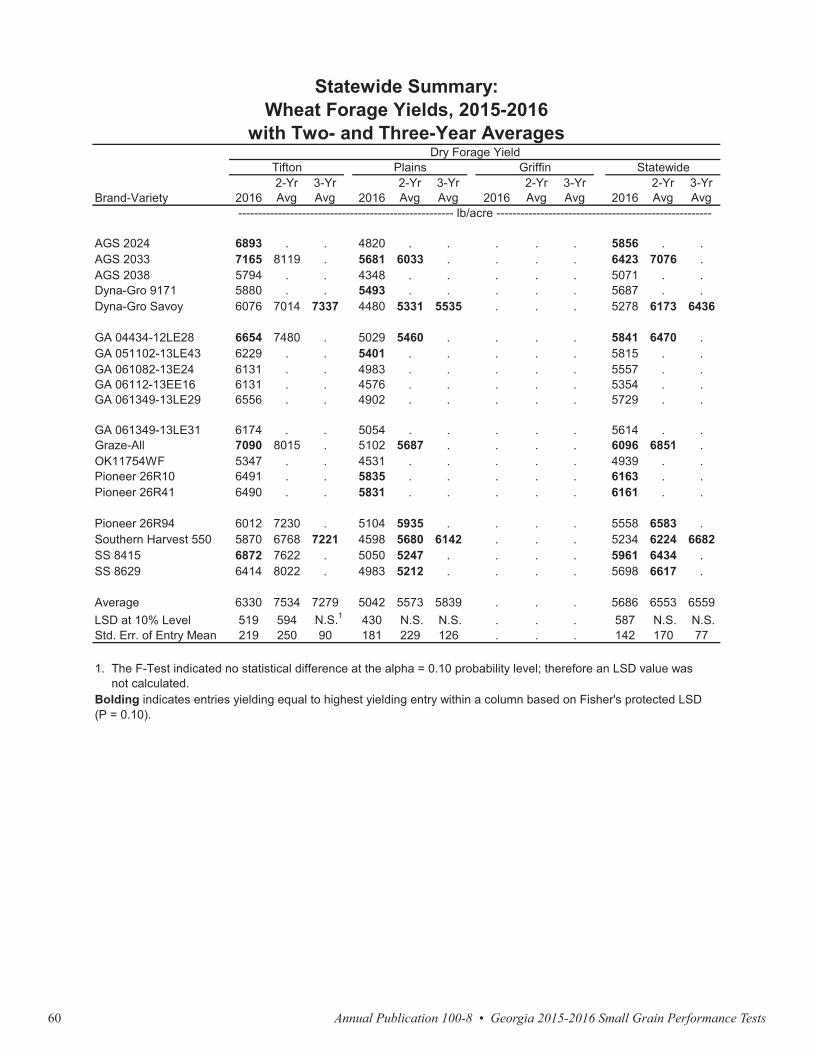
Annual Publication 100-8 • Georgia 2015-2016 Small Grain Performance Tests60
Brand-Variety 20162-YrAvg
3-YrAvg 2016
2-YrAvg
3-YrAvg 2016
2-YrAvg
3-YrAvg 2016
2-YrAvg
3-YrAvg
AGS 2024 6893 . . 4820 . . . . . 5856 . .AGS 2033 7165 8119 . 5681 6033 . . . . 6423 7076 .AGS 2038 5794 . . 4348 . . . . . 5071 . .Dyna-Gro 9171 5880 . . 5493 . . . . . 5687 . .Dyna-Gro Savoy 6076 7014 7337 4480 5331 5535 . . . 5278 6173 6436
GA 04434-12LE28 6654 7480 . 5029 5460 . . . . 5841 6470 .GA 051102-13LE43 6229 . . 5401 . . . . . 5815 . .GA 061082-13E24 6131 . . 4983 . . . . . 5557 . .GA 06112-13EE16 6131 . . 4576 . . . . . 5354 . .GA 061349-13LE29 6556 . . 4902 . . . . . 5729 . .
GA 061349-13LE31 6174 . . 5054 . . . . . 5614 . .Graze-All 7090 8015 . 5102 5687 . . . . 6096 6851 .OK11754WF 5347 . . 4531 . . . . . 4939 . .Pioneer 26R10 6491 . . 5835 . . . . . 6163 . .Pioneer 26R41 6490 . . 5831 . . . . . 6161 . .
Pioneer 26R94 6012 7230 . 5104 5935 . . . . 5558 6583 .Southern Harvest 550 5870 6768 7221 4598 5680 6142 . . . 5234 6224 6682SS 8415 6872 7622 . 5050 5247 . . . . 5961 6434 .SS 8629 6414 8022 . 4983 5212 . . . . 5698 6617 .
Average 6330 7534 7279 5042 5573 5839 . . . 5686 6553 6559LSD at 10% Level 519 594 N.S.1 430 N.S. N.S. . . . 587 N.S. N.S.Std. Err. of Entry Mean 219 250 90 181 229 126 . . . 142 170 77
------------------------------------------------------ lb/acre ------------------------------------------------------
1. The F-Test indicated no statistical difference at the alpha = 0.10 probability level; therefore an LSD value was not calculated.Bolding indicates entries yielding equal to highest yielding entry within a column based on Fisher's protected LSD(P = 0.10).
Statewide Summary:Wheat Forage Yields, 2015-2016
with Two- and Three-Year AveragesDry Forage Yield
Tifton Plains Griffin Statewide
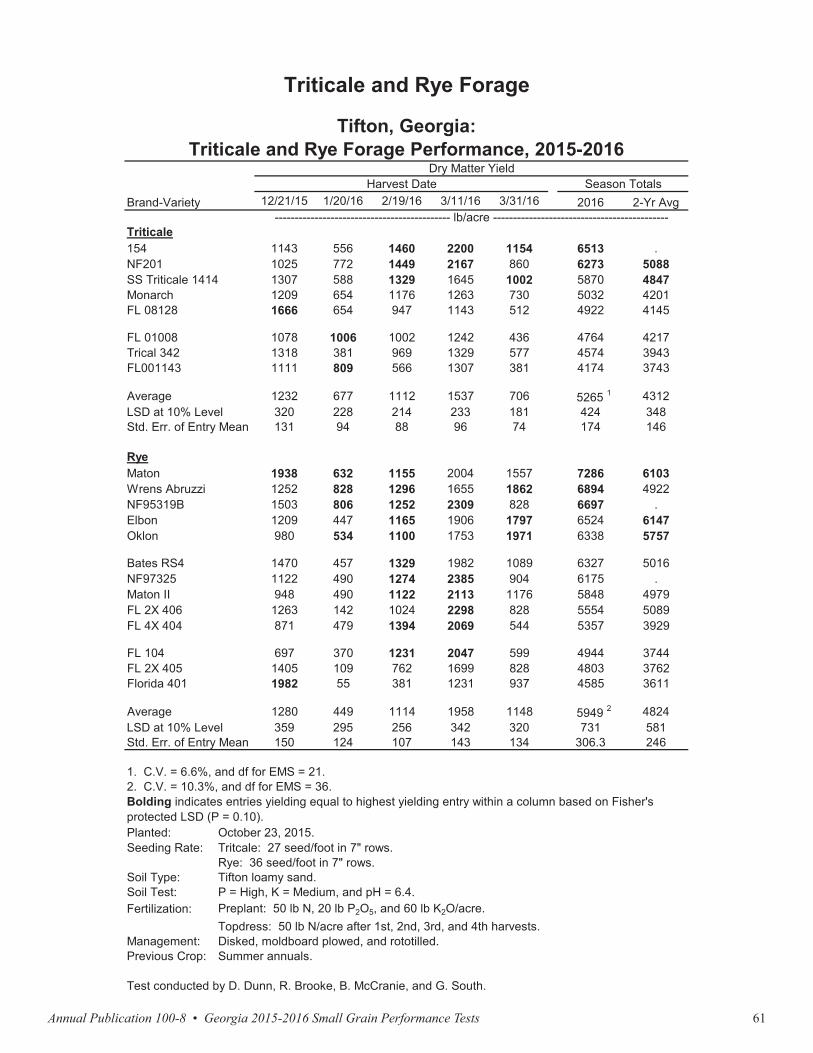
Annual Publication 100-8 • Georgia 2015-2016 Small Grain Performance Tests 61
Brand-Variety 20162-YrAvg
3-YrAvg 2016
2-YrAvg
3-YrAvg 2016
2-YrAvg
3-YrAvg 2016
2-YrAvg
3-YrAvg
AGS 2024 6893 . . 4820 . . . . . 5856 . .AGS 2033 7165 8119 . 5681 6033 . . . . 6423 7076 .AGS 2038 5794 . . 4348 . . . . . 5071 . .Dyna-Gro 9171 5880 . . 5493 . . . . . 5687 . .Dyna-Gro Savoy 6076 7014 7337 4480 5331 5535 . . . 5278 6173 6436
GA 04434-12LE28 6654 7480 . 5029 5460 . . . . 5841 6470 .GA 051102-13LE43 6229 . . 5401 . . . . . 5815 . .GA 061082-13E24 6131 . . 4983 . . . . . 5557 . .GA 06112-13EE16 6131 . . 4576 . . . . . 5354 . .GA 061349-13LE29 6556 . . 4902 . . . . . 5729 . .
GA 061349-13LE31 6174 . . 5054 . . . . . 5614 . .Graze-All 7090 8015 . 5102 5687 . . . . 6096 6851 .OK11754WF 5347 . . 4531 . . . . . 4939 . .Pioneer 26R10 6491 . . 5835 . . . . . 6163 . .Pioneer 26R41 6490 . . 5831 . . . . . 6161 . .
Pioneer 26R94 6012 7230 . 5104 5935 . . . . 5558 6583 .Southern Harvest 550 5870 6768 7221 4598 5680 6142 . . . 5234 6224 6682SS 8415 6872 7622 . 5050 5247 . . . . 5961 6434 .SS 8629 6414 8022 . 4983 5212 . . . . 5698 6617 .
Average 6330 7534 7279 5042 5573 5839 . . . 5686 6553 6559LSD at 10% Level 519 594 N.S.1 430 N.S. N.S. . . . 587 N.S. N.S.Std. Err. of Entry Mean 219 250 90 181 229 126 . . . 142 170 77
------------------------------------------------------ lb/acre ------------------------------------------------------
1. The F-Test indicated no statistical difference at the alpha = 0.10 probability level; therefore an LSD value was not calculated.Bolding indicates entries yielding equal to highest yielding entry within a column based on Fisher's protected LSD(P = 0.10).
Statewide Summary:Wheat Forage Yields, 2015-2016
with Two- and Three-Year AveragesDry Forage Yield
Tifton Plains Griffin Statewide
Brand-Variety 12/21/15 1/20/16 2/19/16 3/11/16 3/31/16 2016 2-Yr Avg
Triticale154 1143 556 1460 2200 1154 6513 .NF201 1025 772 1449 2167 860 6273 5088SS Triticale 1414 1307 588 1329 1645 1002 5870 4847Monarch 1209 654 1176 1263 730 5032 4201FL 08128 1666 654 947 1143 512 4922 4145
FL 01008 1078 1006 1002 1242 436 4764 4217Trical 342 1318 381 969 1329 577 4574 3943FL001143 1111 809 566 1307 381 4174 3743
Average 1232 677 1112 1537 706 5265 1 4312LSD at 10% Level 320 228 214 233 181 424 348Std. Err. of Entry Mean 131 94 88 96 74 174 146
RyeMaton 1938 632 1155 2004 1557 7286 6103Wrens Abruzzi 1252 828 1296 1655 1862 6894 4922NF95319B 1503 806 1252 2309 828 6697 .Elbon 1209 447 1165 1906 1797 6524 6147Oklon 980 534 1100 1753 1971 6338 5757
Bates RS4 1470 457 1329 1982 1089 6327 5016NF97325 1122 490 1274 2385 904 6175 .Maton II 948 490 1122 2113 1176 5848 4979FL 2X 406 1263 142 1024 2298 828 5554 5089FL 4X 404 871 479 1394 2069 544 5357 3929
FL 104 697 370 1231 2047 599 4944 3744FL 2X 405 1405 109 762 1699 828 4803 3762Florida 401 1982 55 381 1231 937 4585 3611
Average 1280 449 1114 1958 1148 5949 2 4824LSD at 10% Level 359 295 256 342 320 731 581Std. Err. of Entry Mean 150 124 107 143 134 306.3 246
Planted:Seeding Rate:
Soil Type:Soil Test:Fertilization:
Management:Previous Crop:
Triticale and Rye Forage
Tifton loamy sand.
Tifton, Georgia:Triticale and Rye Forage Performance, 2015-2016
Dry Matter YieldHarvest Date Season Totals
-------------------------------------------- lb/acre --------------------------------------------
1. C.V. = 6.6%, and df for EMS = 21.2. C.V. = 10.3%, and df for EMS = 36.Bolding indicates entries yielding equal to highest yielding entry within a column based on Fisher's protected LSD (P = 0.10).
October 23, 2015.Tritcale: 27 seed/foot in 7" rows.Rye: 36 seed/foot in 7" rows.
Test conducted by D. Dunn, R. Brooke, B. McCranie, and G. South.
P = High, K = Medium, and pH = 6.4.Preplant: 50 lb N, 20 lb P2O5, and 60 lb K2O/acre.Topdress: 50 lb N/acre after 1st, 2nd, 3rd, and 4th harvests.Disked, moldboard plowed, and rototilled.Summer annuals.
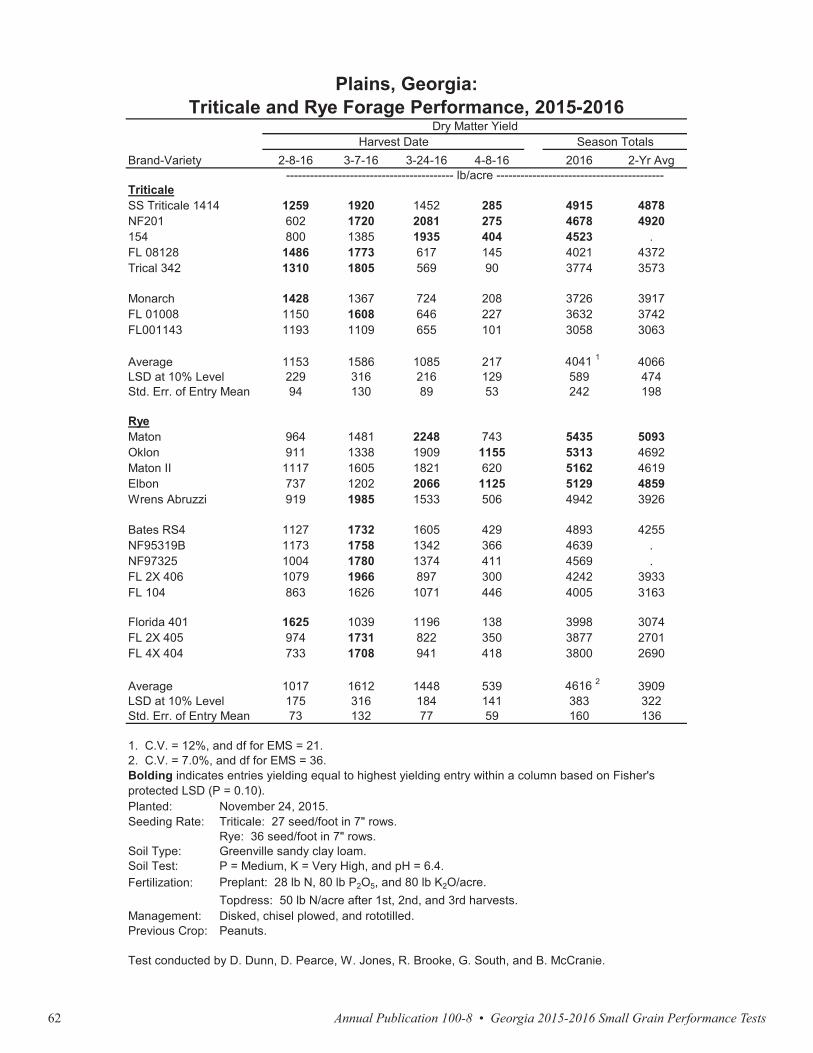
Annual Publication 100-8 • Georgia 2015-2016 Small Grain Performance Tests62
Brand-Variety 2-8-16 3-7-16 3-24-16 4-8-16 2016 2-Yr Avg
TriticaleSS Triticale 1414 1259 1920 1452 285 4915 4878NF201 602 1720 2081 275 4678 4920154 800 1385 1935 404 4523 .FL 08128 1486 1773 617 145 4021 4372Trical 342 1310 1805 569 90 3774 3573
Monarch 1428 1367 724 208 3726 3917FL 01008 1150 1608 646 227 3632 3742FL001143 1193 1109 655 101 3058 3063
Average 1153 1586 1085 217 4041 1 4066LSD at 10% Level 229 316 216 129 589 474Std. Err. of Entry Mean 94 130 89 53 242 198
RyeMaton 964 1481 2248 743 5435 5093Oklon 911 1338 1909 1155 5313 4692Maton II 1117 1605 1821 620 5162 4619Elbon 737 1202 2066 1125 5129 4859Wrens Abruzzi 919 1985 1533 506 4942 3926
Bates RS4 1127 1732 1605 429 4893 4255NF95319B 1173 1758 1342 366 4639 .NF97325 1004 1780 1374 411 4569 .FL 2X 406 1079 1966 897 300 4242 3933FL 104 863 1626 1071 446 4005 3163
Florida 401 1625 1039 1196 138 3998 3074FL 2X 405 974 1731 822 350 3877 2701FL 4X 404 733 1708 941 418 3800 2690
Average 1017 1612 1448 539 4616 2 3909LSD at 10% Level 175 316 184 141 383 322Std. Err. of Entry Mean 73 132 77 59 160 136
Planted:Seeding Rate:
Soil Type:Soil Test:Fertilization:
Management:Previous Crop:
Test conducted by D. Dunn, D. Pearce, W. Jones, R. Brooke, G. South, and B. McCranie.
P = Medium, K = Very High, and pH = 6.4.Preplant: 28 lb N, 80 lb P2O5, and 80 lb K2O/acre.Topdress: 50 lb N/acre after 1st, 2nd, and 3rd harvests.Disked, chisel plowed, and rototilled.Peanuts.
Greenville sandy clay loam.
Plains, Georgia:Triticale and Rye Forage Performance, 2015-2016
Dry Matter YieldHarvest Date Season Totals
------------------------------------------ lb/acre ------------------------------------------
1. C.V. = 12%, and df for EMS = 21.2. C.V. = 7.0%, and df for EMS = 36.Bolding indicates entries yielding equal to highest yielding entry within a column based on Fisher's protected LSD (P = 0.10).
November 24, 2015.Triticale: 27 seed/foot in 7" rows.Rye: 36 seed/foot in 7" rows.
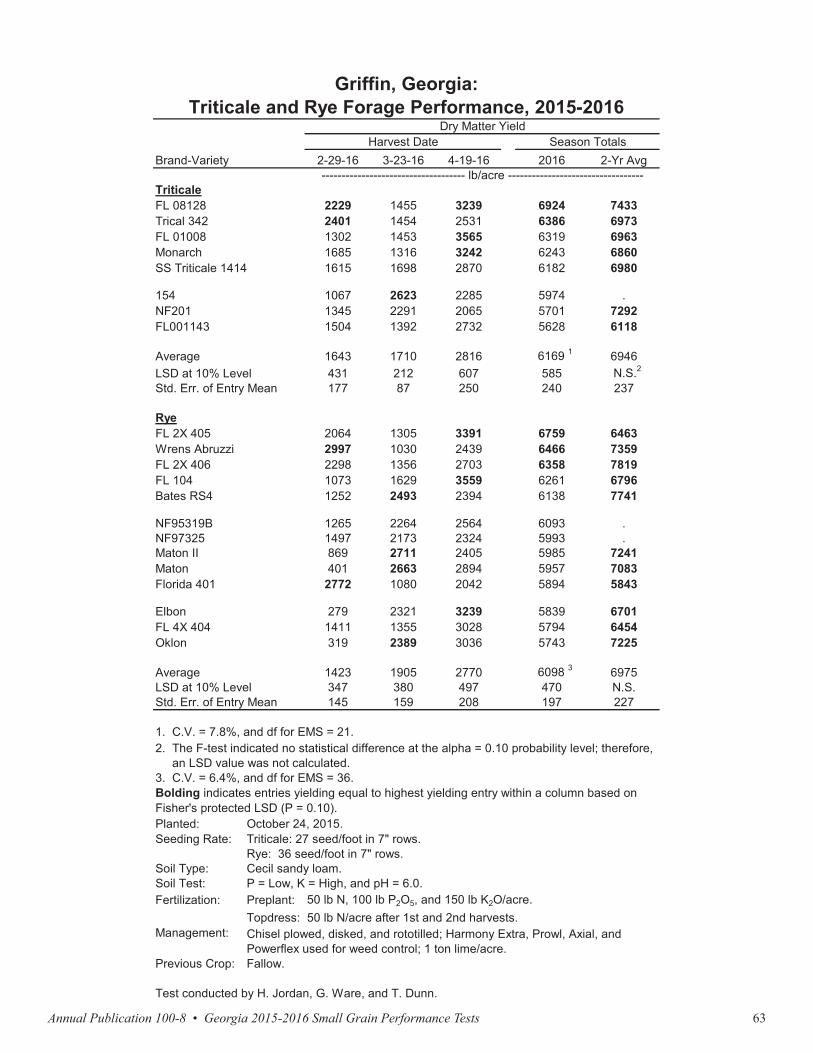
Annual Publication 100-8 • Georgia 2015-2016 Small Grain Performance Tests 63
Brand-Variety 2-8-16 3-7-16 3-24-16 4-8-16 2016 2-Yr Avg
TriticaleSS Triticale 1414 1259 1920 1452 285 4915 4878NF201 602 1720 2081 275 4678 4920154 800 1385 1935 404 4523 .FL 08128 1486 1773 617 145 4021 4372Trical 342 1310 1805 569 90 3774 3573
Monarch 1428 1367 724 208 3726 3917FL 01008 1150 1608 646 227 3632 3742FL001143 1193 1109 655 101 3058 3063
Average 1153 1586 1085 217 4041 1 4066LSD at 10% Level 229 316 216 129 589 474Std. Err. of Entry Mean 94 130 89 53 242 198
RyeMaton 964 1481 2248 743 5435 5093Oklon 911 1338 1909 1155 5313 4692Maton II 1117 1605 1821 620 5162 4619Elbon 737 1202 2066 1125 5129 4859Wrens Abruzzi 919 1985 1533 506 4942 3926
Bates RS4 1127 1732 1605 429 4893 4255NF95319B 1173 1758 1342 366 4639 .NF97325 1004 1780 1374 411 4569 .FL 2X 406 1079 1966 897 300 4242 3933FL 104 863 1626 1071 446 4005 3163
Florida 401 1625 1039 1196 138 3998 3074FL 2X 405 974 1731 822 350 3877 2701FL 4X 404 733 1708 941 418 3800 2690
Average 1017 1612 1448 539 4616 2 3909LSD at 10% Level 175 316 184 141 383 322Std. Err. of Entry Mean 73 132 77 59 160 136
Planted:Seeding Rate:
Soil Type:Soil Test:Fertilization:
Management:Previous Crop:
Test conducted by D. Dunn, D. Pearce, W. Jones, R. Brooke, G. South, and B. McCranie.
P = Medium, K = Very High, and pH = 6.4.Preplant: 28 lb N, 80 lb P2O5, and 80 lb K2O/acre.Topdress: 50 lb N/acre after 1st, 2nd, and 3rd harvests.Disked, chisel plowed, and rototilled.Peanuts.
Greenville sandy clay loam.
Plains, Georgia:Triticale and Rye Forage Performance, 2015-2016
Dry Matter YieldHarvest Date Season Totals
------------------------------------------ lb/acre ------------------------------------------
1. C.V. = 12%, and df for EMS = 21.2. C.V. = 7.0%, and df for EMS = 36.Bolding indicates entries yielding equal to highest yielding entry within a column based on Fisher's protected LSD (P = 0.10).
November 24, 2015.Triticale: 27 seed/foot in 7" rows.Rye: 36 seed/foot in 7" rows.
Brand-Variety 2-29-16 3-23-16 4-19-16 2016 2-Yr Avg
TriticaleFL 08128 2229 1455 3239 6924 7433Trical 342 2401 1454 2531 6386 6973FL 01008 1302 1453 3565 6319 6963Monarch 1685 1316 3242 6243 6860SS Triticale 1414 1615 1698 2870 6182 6980
154 1067 2623 2285 5974 .NF201 1345 2291 2065 5701 7292FL001143 1504 1392 2732 5628 6118
Average 1643 1710 2816 6169 1 6946LSD at 10% Level 431 212 607 585 N.S.2
Std. Err. of Entry Mean 177 87 250 240 237
RyeFL 2X 405 2064 1305 3391 6759 6463Wrens Abruzzi 2997 1030 2439 6466 7359FL 2X 406 2298 1356 2703 6358 7819FL 104 1073 1629 3559 6261 6796Bates RS4 1252 2493 2394 6138 7741
NF95319B 1265 2264 2564 6093 .NF97325 1497 2173 2324 5993 .Maton II 869 2711 2405 5985 7241Maton 401 2663 2894 5957 7083Florida 401 2772 1080 2042 5894 5843
Elbon 279 2321 3239 5839 6701FL 4X 404 1411 1355 3028 5794 6454Oklon 319 2389 3036 5743 7225
Average 1423 1905 2770 6098 3 6975LSD at 10% Level 347 380 497 470 N.S.Std. Err. of Entry Mean 145 159 208 197 227
Planted:Seeding Rate:
Soil Type:Soil Test:Fertilization: Preplant:
Topdress:Management:
Previous Crop:
Test conducted by H. Jordan, G. Ware, and T. Dunn.
2. The F-test indicated no statistical difference at the alpha = 0.10 probability level; therefore, an LSD value was not calculated.3. C.V. = 6.4%, and df for EMS = 36.Bolding indicates entries yielding equal to highest yielding entry within a column based on Fisher's protected LSD (P = 0.10).
October 24, 2015.Triticale: 27 seed/foot in 7" rows.Rye: 36 seed/foot in 7" rows.Cecil sandy loam.P = Low, K = High, and pH = 6.0.
50 lb N, 100 lb P2O5, and 150 lb K2O/acre.50 lb N/acre after 1st and 2nd harvests.
Chisel plowed, disked, and rototilled; Harmony Extra, Prowl, Axial, and Powerflex used for weed control; 1 ton lime/acre.Fallow.
1. C.V. = 7.8%, and df for EMS = 21.
Griffin, Georgia:Triticale and Rye Forage Performance, 2015-2016
Dry Matter YieldHarvest Date Season Totals
------------------------------------ lb/acre ----------------------------------
Annual Publication 100-8 • Georgia 2015-2016 Small Grain Performance Tests64
Triticale and rye variety forage trials were planted at this location on October 30, 2015. However, due to heavy rainfall during early November, experimental plots were washed out, silted over, and/or drowned rendering little to no results. Therefore, there are no results to publish.
Marianna, Florida:Triticale and Rye Forage Performance, 2015-2016
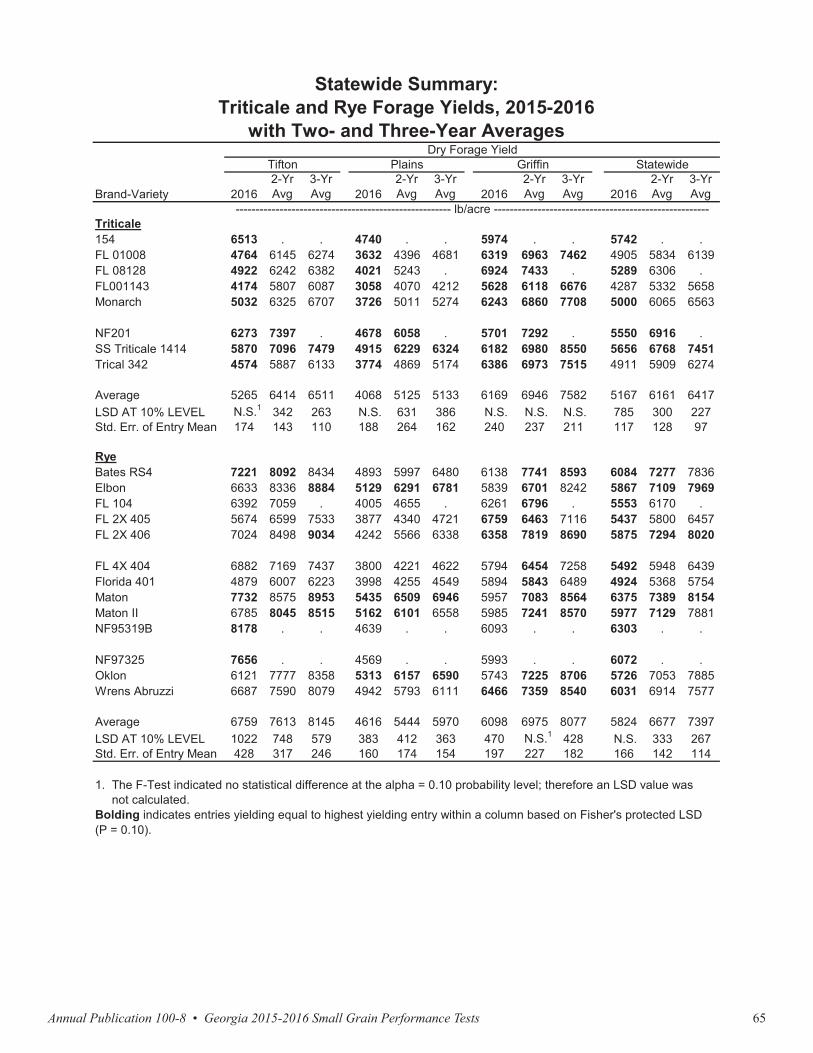
Annual Publication 100-8 • Georgia 2015-2016 Small Grain Performance Tests 65
Triticale and rye variety forage trials were planted at this location on October 30, 2015. However, due to heavy rainfall during early November, experimental plots were washed out, silted over, and/or drowned rendering little to no results. Therefore, there are no results to publish.
Marianna, Florida:Triticale and Rye Forage Performance, 2015-2016
Brand-Variety 20162-YrAvg
3-YrAvg 2016
2-YrAvg
3-YrAvg 2016
2-YrAvg
3-YrAvg 2016
2-YrAvg
3-YrAvg
Triticale154 6513 . . 4740 . . 5974 . . 5742 . .FL 01008 4764 6145 6274 3632 4396 4681 6319 6963 7462 4905 5834 6139FL 08128 4922 6242 6382 4021 5243 . 6924 7433 . 5289 6306 .FL001143 4174 5807 6087 3058 4070 4212 5628 6118 6676 4287 5332 5658Monarch 5032 6325 6707 3726 5011 5274 6243 6860 7708 5000 6065 6563
NF201 6273 7397 . 4678 6058 . 5701 7292 . 5550 6916 .SS Triticale 1414 5870 7096 7479 4915 6229 6324 6182 6980 8550 5656 6768 7451Trical 342 4574 5887 6133 3774 4869 5174 6386 6973 7515 4911 5909 6274
Average 5265 6414 6511 4068 5125 5133 6169 6946 7582 5167 6161 6417LSD AT 10% LEVEL N.S.1 342 263 N.S. 631 386 N.S. N.S. N.S. 785 300 227Std. Err. of Entry Mean 174 143 110 188 264 162 240 237 211 117 128 97
RyeBates RS4 7221 8092 8434 4893 5997 6480 6138 7741 8593 6084 7277 7836Elbon 6633 8336 8884 5129 6291 6781 5839 6701 8242 5867 7109 7969FL 104 6392 7059 . 4005 4655 . 6261 6796 . 5553 6170 .FL 2X 405 5674 6599 7533 3877 4340 4721 6759 6463 7116 5437 5800 6457FL 2X 406 7024 8498 9034 4242 5566 6338 6358 7819 8690 5875 7294 8020
FL 4X 404 6882 7169 7437 3800 4221 4622 5794 6454 7258 5492 5948 6439Florida 401 4879 6007 6223 3998 4255 4549 5894 5843 6489 4924 5368 5754Maton 7732 8575 8953 5435 6509 6946 5957 7083 8564 6375 7389 8154Maton II 6785 8045 8515 5162 6101 6558 5985 7241 8570 5977 7129 7881NF95319B 8178 . . 4639 . . 6093 . . 6303 . .
NF97325 7656 . . 4569 . . 5993 . . 6072 . .Oklon 6121 7777 8358 5313 6157 6590 5743 7225 8706 5726 7053 7885Wrens Abruzzi 6687 7590 8079 4942 5793 6111 6466 7359 8540 6031 6914 7577
Average 6759 7613 8145 4616 5444 5970 6098 6975 8077 5824 6677 7397LSD AT 10% LEVEL 1022 748 579 383 412 363 470 N.S.1 428 N.S. 333 267Std. Err. of Entry Mean 428 317 246 160 174 154 197 227 182 166 142 114
------------------------------------------------------ lb/acre ------------------------------------------------------
1. The F-Test indicated no statistical difference at the alpha = 0.10 probability level; therefore an LSD value was not calculated.Bolding indicates entries yielding equal to highest yielding entry within a column based on Fisher's protected LSD(P = 0.10).
Statewide Summary:Triticale and Rye Forage Yields, 2015-2016
with Two- and Three-Year AveragesDry Forage Yield
Tifton Plains Griffin Statewide

Annual Publication 100-8 • Georgia 2015-2016 Small Grain Performance Tests66
Dry Greenin % tons/acre
University of Florida FL 01008 4.6 17.4 63 26 3.4 03/17Southern States SS Triticale 1414 4.6 18.8 53 25 3.1 03/20Syngenta Seed,Inc FL001143 4.5 16.1 56 28 3.4 03/12Syngenta Seed,Inc Trical 342 4.4 17.2 55 26 3.1 03/16University of Florida FL 08128 4.3 16.8 54 26 3.4 03/15
Syngenta Seed,Inc Monarch 4.0 16.2 53 25 2.9 03/20OGI NF201 3.6 16.7 60 21 2.6 03/21Syngenta Seed,Inc 154 3.5 16.3 54 21 . 03/21
Average 4.2 1 16.9 2 56 25 3.1 03/17LSD at 10% Level 0.4 N.S.3 2 1 0.7 -Std. Err. of Entry Mean 0.2 0.7 1 1 0.3 -
Planted:Harvested:Seeding Rate:Soil Type:Soil Test:Fertilization:Previous Crop:Management:
2-Yr AvgDry Yield
HeadDate
Company orBrand Nane
Variety Nameor Number
Forage Yield PlantHeight
DryMatter
Disked, chisel plowed, and rototilled.
Test conducted by D. Dunn, R. Brooke, B. McCranie, and G. South.
Triticale Silage
March 31, 2016.27 seeds/acre in 30" rows.Tift sandy loam.P = High, K = Medium, and pH = 6.4.50 lb N, 20 lb P2O5, and 60 lb K2O/acre as preplant; 100 lb N/acre as topdress.Summer annuals.
tons/acre
1. CV = 7.7%, and df for EMS = 21.2. CV = 8.0%, and df for EMS = 21.3. The F-test indicated no statistical differences at the alpha = 0.10 probability level; therefore an LSD value was not calculated.Bolding indicates entries yielding equal to highest yielding entry within a column based on Fisher's protected LSD (P = 0.10).
November 23, 2015.
Tifton, Georgia:Triticale Silage Performance, 2015-2016
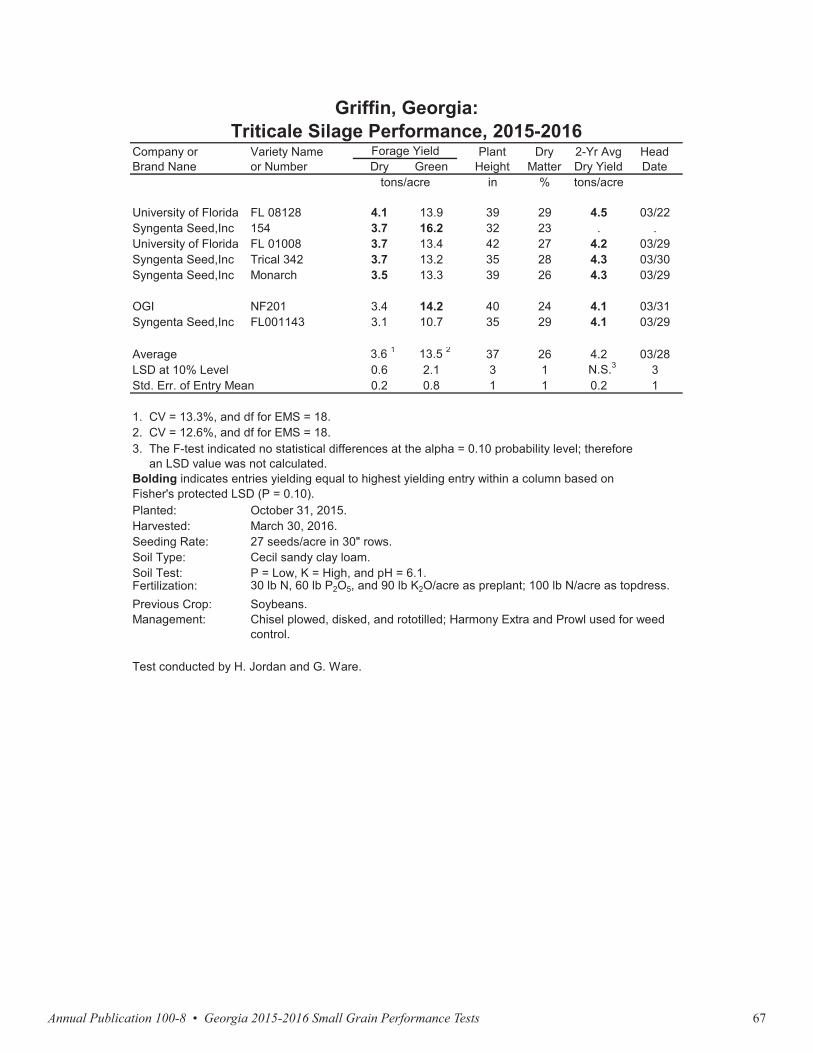
Annual Publication 100-8 • Georgia 2015-2016 Small Grain Performance Tests 67
Dry Greenin % tons/acre
University of Florida FL 01008 4.6 17.4 63 26 3.4 03/17Southern States SS Triticale 1414 4.6 18.8 53 25 3.1 03/20Syngenta Seed,Inc FL001143 4.5 16.1 56 28 3.4 03/12Syngenta Seed,Inc Trical 342 4.4 17.2 55 26 3.1 03/16University of Florida FL 08128 4.3 16.8 54 26 3.4 03/15
Syngenta Seed,Inc Monarch 4.0 16.2 53 25 2.9 03/20OGI NF201 3.6 16.7 60 21 2.6 03/21Syngenta Seed,Inc 154 3.5 16.3 54 21 . 03/21
Average 4.2 1 16.9 2 56 25 3.1 03/17LSD at 10% Level 0.4 N.S.3 2 1 0.7 -Std. Err. of Entry Mean 0.2 0.7 1 1 0.3 -
Planted:Harvested:Seeding Rate:Soil Type:Soil Test:Fertilization:Previous Crop:Management:
2-Yr AvgDry Yield
HeadDate
Company orBrand Nane
Variety Nameor Number
Forage Yield PlantHeight
DryMatter
Disked, chisel plowed, and rototilled.
Test conducted by D. Dunn, R. Brooke, B. McCranie, and G. South.
Triticale Silage
March 31, 2016.27 seeds/acre in 30" rows.Tift sandy loam.P = High, K = Medium, and pH = 6.4.50 lb N, 20 lb P2O5, and 60 lb K2O/acre as preplant; 100 lb N/acre as topdress.Summer annuals.
tons/acre
1. CV = 7.7%, and df for EMS = 21.2. CV = 8.0%, and df for EMS = 21.3. The F-test indicated no statistical differences at the alpha = 0.10 probability level; therefore an LSD value was not calculated.Bolding indicates entries yielding equal to highest yielding entry within a column based on Fisher's protected LSD (P = 0.10).
November 23, 2015.
Tifton, Georgia:Triticale Silage Performance, 2015-2016 Dry Green
in % tons/acre
University of Florida FL 08128 4.1 13.9 39 29 4.5 03/22Syngenta Seed,Inc 154 3.7 16.2 32 23 . .University of Florida FL 01008 3.7 13.4 42 27 4.2 03/29Syngenta Seed,Inc Trical 342 3.7 13.2 35 28 4.3 03/30Syngenta Seed,Inc Monarch 3.5 13.3 39 26 4.3 03/29
OGI NF201 3.4 14.2 40 24 4.1 03/31Syngenta Seed,Inc FL001143 3.1 10.7 35 29 4.1 03/29
Average 3.6 1 13.5 2 37 26 4.2 03/28LSD at 10% Level 0.6 2.1 3 1 N.S.3 3Std. Err. of Entry Mean 0.2 0.8 1 1 0.2 1
Planted:Harvested:Seeding Rate:Soil Type:Soil Test:Fertilization:Previous Crop:Management:
October 31, 2015.
Griffin, Georgia:Triticale Silage Performance, 2015-2016
Company orBrand Nane
Variety Nameor Number
Forage Yield PlantHeight
DryMatter
2-Yr AvgDry Yield
HeadDate
tons/acre
1. CV = 13.3%, and df for EMS = 18.2. CV = 12.6%, and df for EMS = 18.3. The F-test indicated no statistical differences at the alpha = 0.10 probability level; therefore an LSD value was not calculated.Bolding indicates entries yielding equal to highest yielding entry within a column based on Fisher's protected LSD (P = 0.10).
Chisel plowed, disked, and rototilled; Harmony Extra and Prowl used for weedcontrol.
Test conducted by H. Jordan and G. Ware.
March 30, 2016.27 seeds/acre in 30" rows.Cecil sandy clay loam.P = Low, K = High, and pH = 6.1.30 lb N, 60 lb P2O5, and 90 lb K2O/acre as preplant; 100 lb N/acre as topdress.Soybeans.
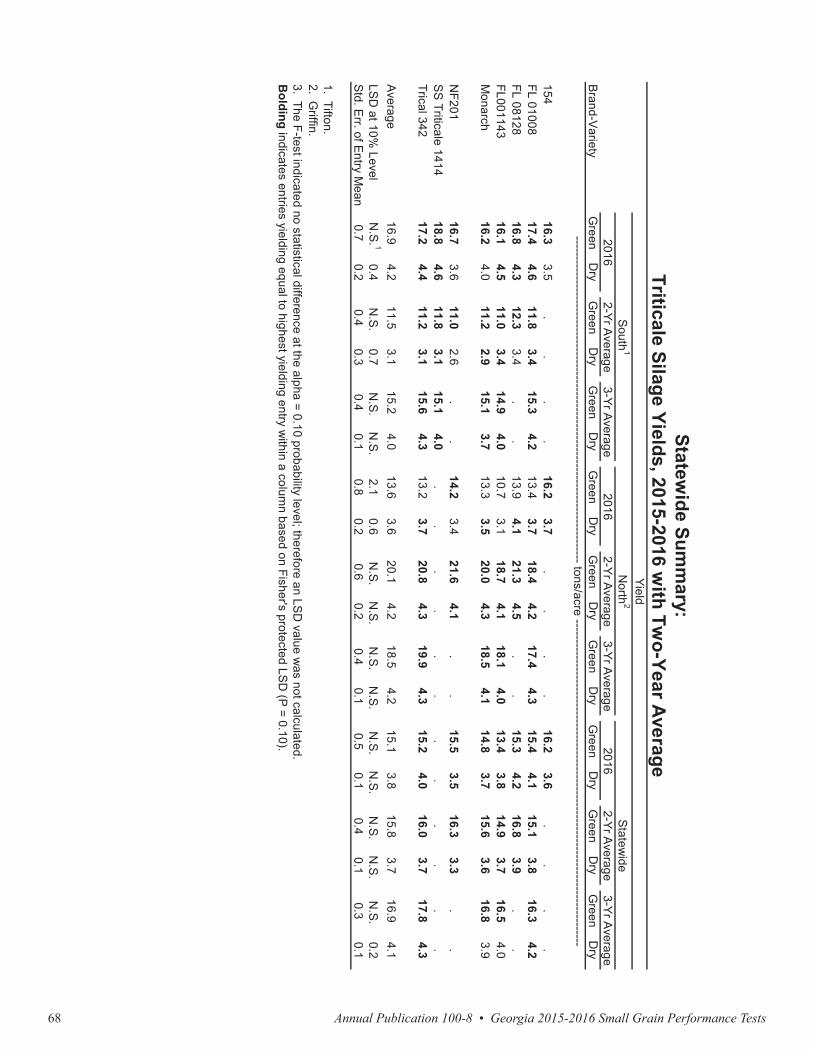
Annual Publication 100-8 • Georgia 2015-2016 Small Grain Performance Tests68
Brand-V
arietyG
reenD
ryG
reenD
ryG
reenD
ryG
reenD
ryG
reenD
ryG
reenD
ryG
reenD
ryG
reenD
ryG
reenD
ry
15416.3
3.5.
..
.16.2
3.7.
..
.16.2
3.6.
..
.FL 01008
17.44.6
11.83.4
15.34.2
13.43.7
18.44.2
17.44.3
15.44.1
15.13.8
16.34.2
FL 0812816.8
4.312.3
3.4.
.13.9
4.121.3
4.5.
.15.3
4.216.8
3.9.
.FL001143
16.14.5
11.03.4
14.94.0
10.73.1
18.74.1
18.14.0
13.43.8
14.93.7
16.54.0
Monarch
16.24.0
11.22.9
15.13.7
13.33.5
20.04.3
18.54.1
14.83.7
15.63.6
16.83.9
NF201
16.73.6
11.02.6
..
14.23.4
21.64.1
..
15.53.5
16.33.3
..
SS
Triticale 141418.8
4.611.8
3.115.1
4.0.
..
..
..
..
..
.Trical 342
17.24.4
11.23.1
15.64.3
13.23.7
20.84.3
19.94.3
15.24.0
16.03.7
17.84.3
Average
16.94.2
11.53.1
15.24.0
13.63.6
20.14.2
18.54.2
15.13.8
15.83.7
16.94.1
LSD
at 10% Level
N.S
. 10.4
N.S
.0.7
N.S
. N
.S.
2.10.6
N.S
. N
.S.
N.S
. N
.S.
N.S
. N
.S.
N.S
. N
.S.
N.S
.0.2
Std. E
rr. of Entry M
ean0.7
0.20.4
0.30.4
0.10.8
0.20.6
0.20.4
0.10.5
0.10.4
0.10.3
0.1
1. Tifton.2. G
riffin.
Statewide Sum
mary:
Triticale Silage Yields, 2015-2016 with Tw
o-Year AverageYield
South
1N
orth2
Statew
ide
Bolding indicates entries yielding equal to highest yielding entry w
ithin a column based on Fisher's protected LS
D (P
= 0.10).
3-Yr Average
20162-Yr A
verage3-Yr A
verage
---------------------------------------------------------------------------------- tons/acre ----------------------------------------------------------------------------------
3. The F-test indicated no statistical difference at the alpha = 0.10 probability level; therefore an LSD
value was not calculated.
20162-Yr A
verage3-Yr A
verage2016
2-Yr Average
Brand-Variety 12/21/15 1/20/16 2/19/16 3/11/16 3/31/16 2016 2-Yr Avg
Okay 1775 1492 1372 2058 1481 8179 7219NF402 1982 1176 1056 1884 1764 7863 7001TX07CS2257 1558 1525 1220 2004 1514 7819 .Horizon 306 1808 1198 1176 1928 1688 7798 6756LA08084-15 2080 1144 1318 1797 1449 7787 6238
TAMO 411 1601 1438 1350 1917 1459 7764 6585RAM LA99016 1633 1340 1013 1884 1830 7699 6773LA06059-4-S1 1743 1209 1122 1895 1568 7535 6237TAMO 606 1590 1340 1296 1753 1481 7460 6549FL 720 1873 1231 1187 1939 1209 7438 .
Gerard 229 1329 1470 991 1383 2113 7285 .Horizon 270 1895 1253 1187 1558 1351 7243 6133SS 76-50 1263 1285 1361 1808 1449 7166 6325Gerard 224 1568 1242 1242 1688 1241 6980 5987LA06063SBSB-S1 1732 980 1056 1786 1079 6632 5712
Legend 567 1601 1035 1122 1634 871 6262 .LA08085SS-T3 1318 839 980 1601 1394 6131 5410
Average 1667 1247 1179 1795 1467 7355 1 6379LSD at 10% Level 258 181 165 272 216 548 384Std. Err. of Entry Mean 109 76 70 115 91 231 163
Planted:Seeding Rate:Soil Type:Soil Test:Fertilization:
Management:Previous Crop:
Test conducted by D. Dunn, R. Brooke, B. McCranie, and G. South.
1. C.V. = 6.3%, and df for EMS = 48.Bolding indicates entries yielding equal to highest yielding entry within a column based on Fisher's protected LSD (P = 0.10).
October 23, 2015.30 seed/foot in 7" rows.Tifton loamy sand.P = High, K = Medium, and pH = 6.4.
Oat Forage
Preplant: 50 lb N, 20 lb P2O5, and 60 lb K2O/acre.Topdress: 50 lb N/acre after 1st, 2nd, 3rd, and 4th harvests.Disked, moldboard plowed, and rototilled.Summer annuals.
Tifton, Georgia:Oat Forage Performance, 2015-2016
Dry Matter YieldHarvest Date Season Totals
-------------------------------------------- lb/acre --------------------------------------------
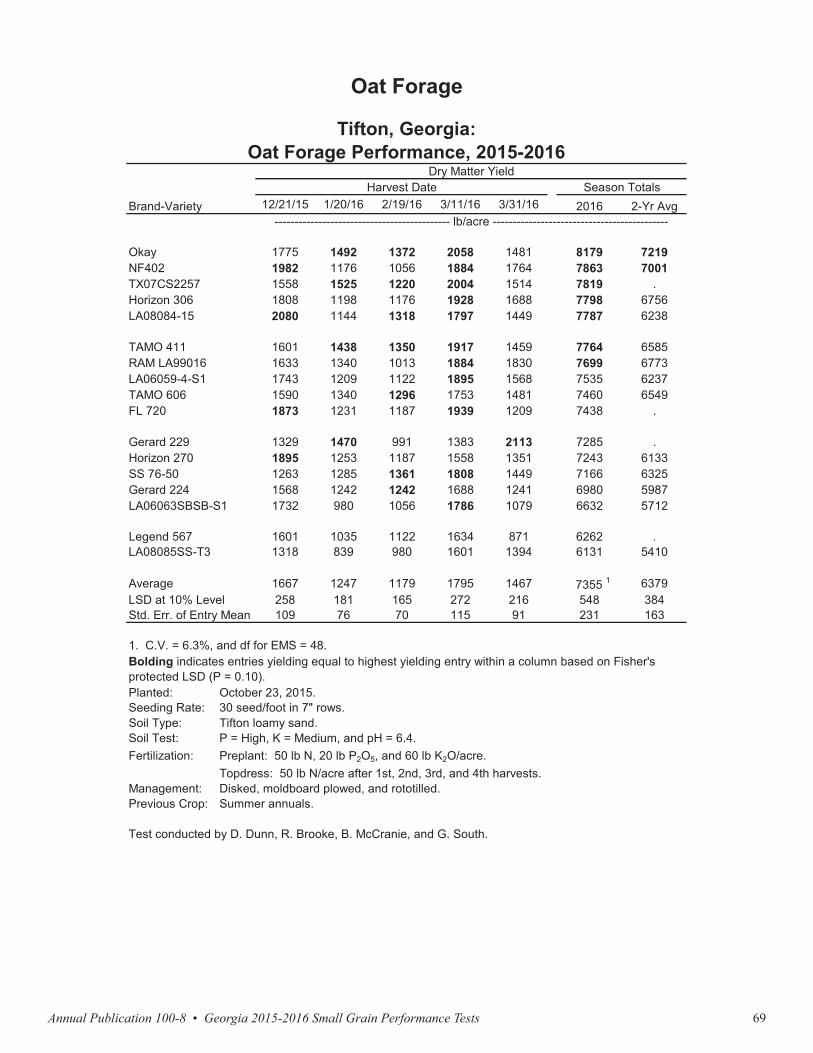
Annual Publication 100-8 • Georgia 2015-2016 Small Grain Performance Tests 69
Brand-Variety 12/21/15 1/20/16 2/19/16 3/11/16 3/31/16 2016 2-Yr Avg
Okay 1775 1492 1372 2058 1481 8179 7219NF402 1982 1176 1056 1884 1764 7863 7001TX07CS2257 1558 1525 1220 2004 1514 7819 .Horizon 306 1808 1198 1176 1928 1688 7798 6756LA08084-15 2080 1144 1318 1797 1449 7787 6238
TAMO 411 1601 1438 1350 1917 1459 7764 6585RAM LA99016 1633 1340 1013 1884 1830 7699 6773LA06059-4-S1 1743 1209 1122 1895 1568 7535 6237TAMO 606 1590 1340 1296 1753 1481 7460 6549FL 720 1873 1231 1187 1939 1209 7438 .
Gerard 229 1329 1470 991 1383 2113 7285 .Horizon 270 1895 1253 1187 1558 1351 7243 6133SS 76-50 1263 1285 1361 1808 1449 7166 6325Gerard 224 1568 1242 1242 1688 1241 6980 5987LA06063SBSB-S1 1732 980 1056 1786 1079 6632 5712
Legend 567 1601 1035 1122 1634 871 6262 .LA08085SS-T3 1318 839 980 1601 1394 6131 5410
Average 1667 1247 1179 1795 1467 7355 1 6379LSD at 10% Level 258 181 165 272 216 548 384Std. Err. of Entry Mean 109 76 70 115 91 231 163
Planted:Seeding Rate:Soil Type:Soil Test:Fertilization:
Management:Previous Crop:
Test conducted by D. Dunn, R. Brooke, B. McCranie, and G. South.
1. C.V. = 6.3%, and df for EMS = 48.Bolding indicates entries yielding equal to highest yielding entry within a column based on Fisher's protected LSD (P = 0.10).
October 23, 2015.30 seed/foot in 7" rows.Tifton loamy sand.P = High, K = Medium, and pH = 6.4.
Oat Forage
Preplant: 50 lb N, 20 lb P2O5, and 60 lb K2O/acre.Topdress: 50 lb N/acre after 1st, 2nd, 3rd, and 4th harvests.Disked, moldboard plowed, and rototilled.Summer annuals.
Tifton, Georgia:Oat Forage Performance, 2015-2016
Dry Matter YieldHarvest Date Season Totals
-------------------------------------------- lb/acre --------------------------------------------
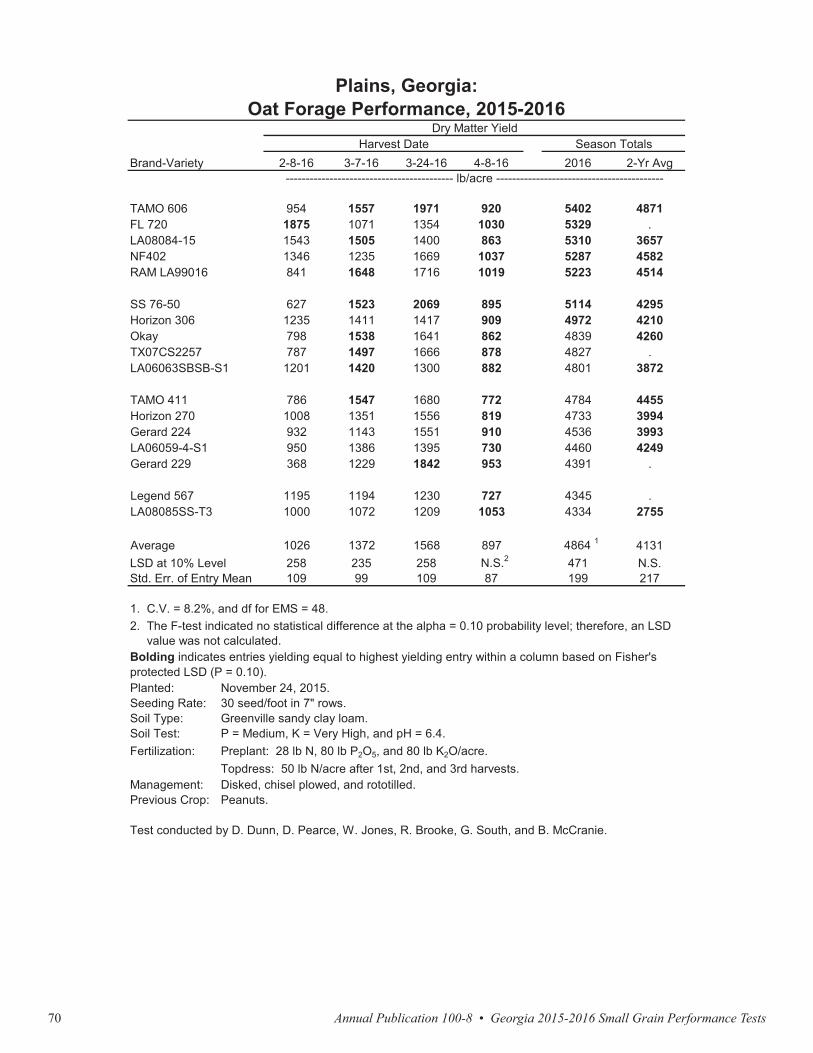
Annual Publication 100-8 • Georgia 2015-2016 Small Grain Performance Tests70
Brand-Variety 2-8-16 3-7-16 3-24-16 4-8-16 2016 2-Yr Avg
TAMO 606 954 1557 1971 920 5402 4871FL 720 1875 1071 1354 1030 5329 .LA08084-15 1543 1505 1400 863 5310 3657NF402 1346 1235 1669 1037 5287 4582RAM LA99016 841 1648 1716 1019 5223 4514
SS 76-50 627 1523 2069 895 5114 4295Horizon 306 1235 1411 1417 909 4972 4210Okay 798 1538 1641 862 4839 4260TX07CS2257 787 1497 1666 878 4827 .LA06063SBSB-S1 1201 1420 1300 882 4801 3872
TAMO 411 786 1547 1680 772 4784 4455Horizon 270 1008 1351 1556 819 4733 3994Gerard 224 932 1143 1551 910 4536 3993LA06059-4-S1 950 1386 1395 730 4460 4249Gerard 229 368 1229 1842 953 4391 .
Legend 567 1195 1194 1230 727 4345 .LA08085SS-T3 1000 1072 1209 1053 4334 2755
Average 1026 1372 1568 897 4864 1 4131LSD at 10% Level 258 235 258 N.S.2 471 N.S.Std. Err. of Entry Mean 109 99 109 87 199 217
Planted:Seeding Rate:Soil Type:Soil Test:Fertilization:
Management:Previous Crop:
Greenville sandy clay loam.
Plains, Georgia:Oat Forage Performance, 2015-2016
Dry Matter YieldHarvest Date Season Totals
------------------------------------------ lb/acre ------------------------------------------
1. C.V. = 8.2%, and df for EMS = 48.2. The F-test indicated no statistical difference at the alpha = 0.10 probability level; therefore, an LSD value was not calculated.Bolding indicates entries yielding equal to highest yielding entry within a column based on Fisher's protected LSD (P = 0.10).
November 24, 2015.30 seed/foot in 7" rows.
Test conducted by D. Dunn, D. Pearce, W. Jones, R. Brooke, G. South, and B. McCranie.
P = Medium, K = Very High, and pH = 6.4.Preplant: 28 lb N, 80 lb P2O5, and 80 lb K2O/acre.Topdress: 50 lb N/acre after 1st, 2nd, and 3rd harvests.Disked, chisel plowed, and rototilled.Peanuts.
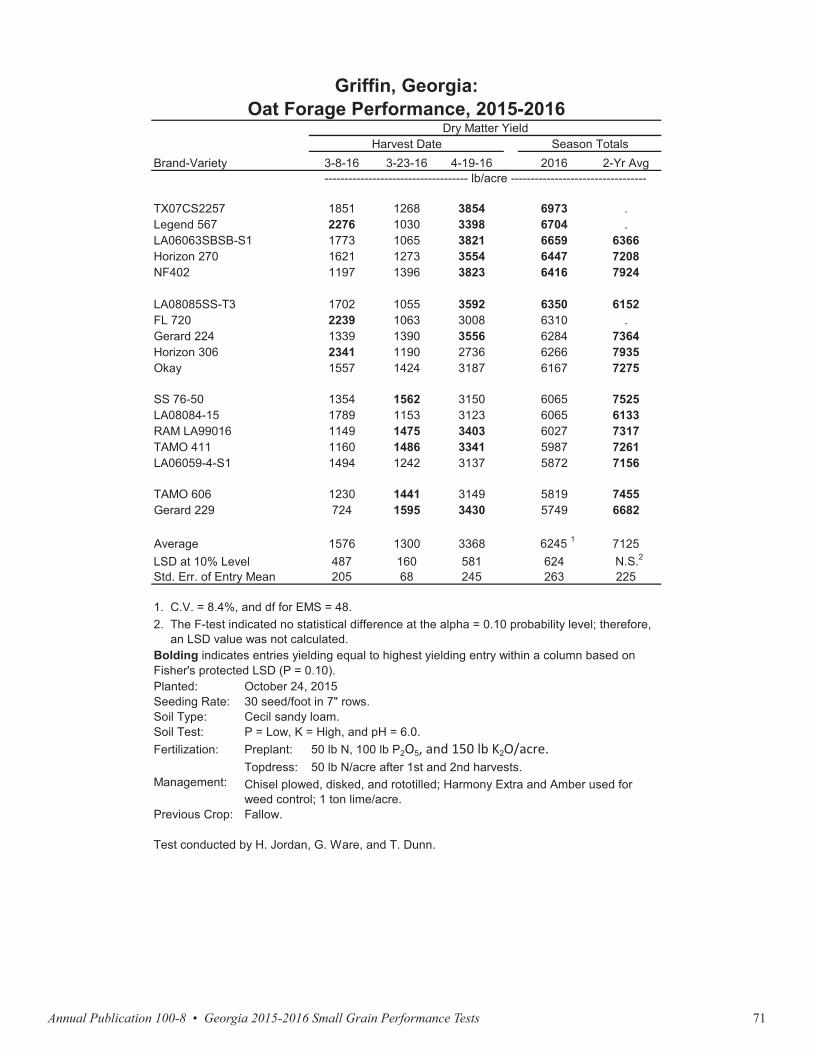
Annual Publication 100-8 • Georgia 2015-2016 Small Grain Performance Tests 71
Brand-Variety 2-8-16 3-7-16 3-24-16 4-8-16 2016 2-Yr Avg
TAMO 606 954 1557 1971 920 5402 4871FL 720 1875 1071 1354 1030 5329 .LA08084-15 1543 1505 1400 863 5310 3657NF402 1346 1235 1669 1037 5287 4582RAM LA99016 841 1648 1716 1019 5223 4514
SS 76-50 627 1523 2069 895 5114 4295Horizon 306 1235 1411 1417 909 4972 4210Okay 798 1538 1641 862 4839 4260TX07CS2257 787 1497 1666 878 4827 .LA06063SBSB-S1 1201 1420 1300 882 4801 3872
TAMO 411 786 1547 1680 772 4784 4455Horizon 270 1008 1351 1556 819 4733 3994Gerard 224 932 1143 1551 910 4536 3993LA06059-4-S1 950 1386 1395 730 4460 4249Gerard 229 368 1229 1842 953 4391 .
Legend 567 1195 1194 1230 727 4345 .LA08085SS-T3 1000 1072 1209 1053 4334 2755
Average 1026 1372 1568 897 4864 1 4131LSD at 10% Level 258 235 258 N.S.2 471 N.S.Std. Err. of Entry Mean 109 99 109 87 199 217
Planted:Seeding Rate:Soil Type:Soil Test:Fertilization:
Management:Previous Crop:
Greenville sandy clay loam.
Plains, Georgia:Oat Forage Performance, 2015-2016
Dry Matter YieldHarvest Date Season Totals
------------------------------------------ lb/acre ------------------------------------------
1. C.V. = 8.2%, and df for EMS = 48.2. The F-test indicated no statistical difference at the alpha = 0.10 probability level; therefore, an LSD value was not calculated.Bolding indicates entries yielding equal to highest yielding entry within a column based on Fisher's protected LSD (P = 0.10).
November 24, 2015.30 seed/foot in 7" rows.
Test conducted by D. Dunn, D. Pearce, W. Jones, R. Brooke, G. South, and B. McCranie.
P = Medium, K = Very High, and pH = 6.4.Preplant: 28 lb N, 80 lb P2O5, and 80 lb K2O/acre.Topdress: 50 lb N/acre after 1st, 2nd, and 3rd harvests.Disked, chisel plowed, and rototilled.Peanuts.
Brand-Variety 3-8-16 3-23-16 4-19-16 2016 2-Yr Avg
TX07CS2257 1851 1268 3854 6973 .Legend 567 2276 1030 3398 6704 .LA06063SBSB-S1 1773 1065 3821 6659 6366Horizon 270 1621 1273 3554 6447 7208NF402 1197 1396 3823 6416 7924
LA08085SS-T3 1702 1055 3592 6350 6152FL 720 2239 1063 3008 6310 .Gerard 224 1339 1390 3556 6284 7364Horizon 306 2341 1190 2736 6266 7935Okay 1557 1424 3187 6167 7275
SS 76-50 1354 1562 3150 6065 7525LA08084-15 1789 1153 3123 6065 6133RAM LA99016 1149 1475 3403 6027 7317TAMO 411 1160 1486 3341 5987 7261LA06059-4-S1 1494 1242 3137 5872 7156
TAMO 606 1230 1441 3149 5819 7455Gerard 229 724 1595 3430 5749 6682
Average 1576 1300 3368 6245 1 7125LSD at 10% Level 487 160 581 624 N.S.2
Std. Err. of Entry Mean 205 68 245 263 225
Planted:Seeding Rate:Soil Type:Soil Test:Fertilization: Preplant:
Topdress:Management:
Previous Crop:
P = Low, K = High, and pH = 6.0.
Griffin, Georgia:Oat Forage Performance, 2015-2016
Dry Matter YieldHarvest Date Season Totals
------------------------------------ lb/acre ----------------------------------
1. C.V. = 8.4%, and df for EMS = 48.2. The F-test indicated no statistical difference at the alpha = 0.10 probability level; therefore, an LSD value was not calculated.Bolding indicates entries yielding equal to highest yielding entry within a column based on Fisher's protected LSD (P = 0.10).
October 24, 201530 seed/foot in 7" rows.Cecil sandy loam.
50 lb N, 100 lb P2O5, and 150 lb K2O/acre.50 lb N/acre after 1st and 2nd harvests.
Chisel plowed, disked, and rototilled; Harmony Extra and Amber used forweed control; 1 ton lime/acre.Fallow.
Test conducted by H. Jordan, G. Ware, and T. Dunn.
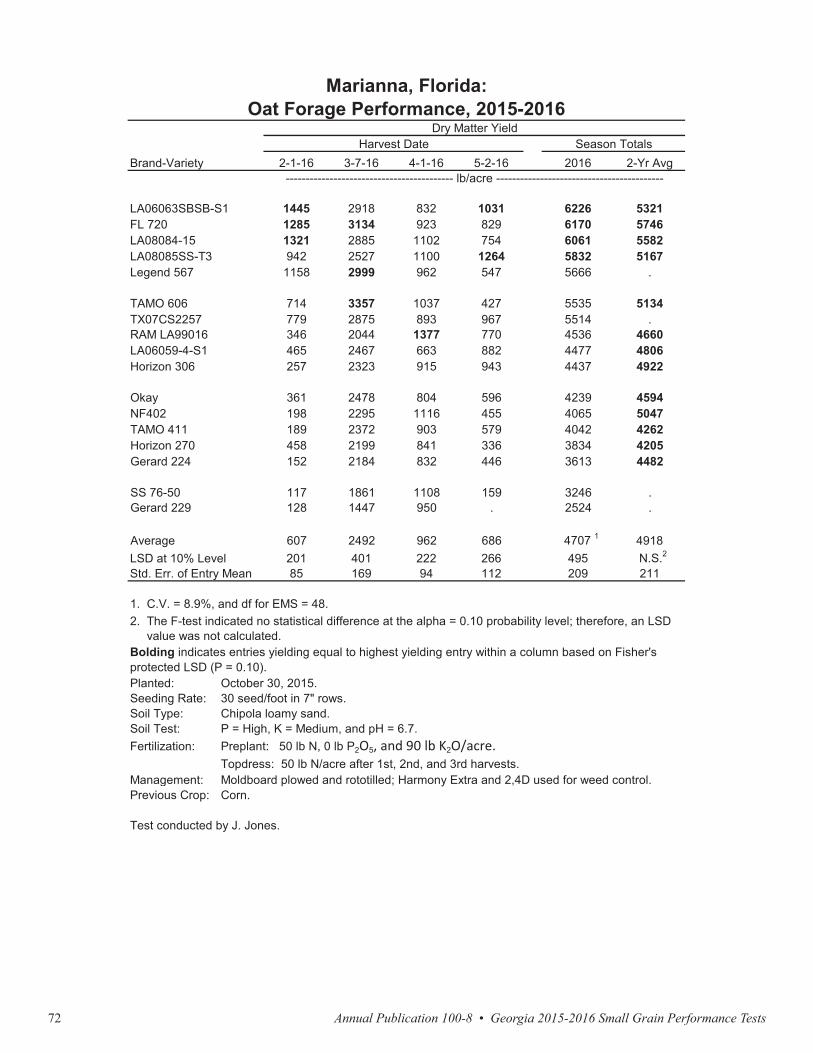
Annual Publication 100-8 • Georgia 2015-2016 Small Grain Performance Tests72
Brand-Variety 2-1-16 3-7-16 4-1-16 5-2-16 2016 2-Yr Avg
LA06063SBSB-S1 1445 2918 832 1031 6226 5321FL 720 1285 3134 923 829 6170 5746LA08084-15 1321 2885 1102 754 6061 5582LA08085SS-T3 942 2527 1100 1264 5832 5167Legend 567 1158 2999 962 547 5666 .
TAMO 606 714 3357 1037 427 5535 5134TX07CS2257 779 2875 893 967 5514 .RAM LA99016 346 2044 1377 770 4536 4660LA06059-4-S1 465 2467 663 882 4477 4806Horizon 306 257 2323 915 943 4437 4922
Okay 361 2478 804 596 4239 4594NF402 198 2295 1116 455 4065 5047TAMO 411 189 2372 903 579 4042 4262Horizon 270 458 2199 841 336 3834 4205Gerard 224 152 2184 832 446 3613 4482
SS 76-50 117 1861 1108 159 3246 .Gerard 229 128 1447 950 . 2524 .
Average 607 2492 962 686 4707 1 4918LSD at 10% Level 201 401 222 266 495 N.S.2
Std. Err. of Entry Mean 85 169 94 112 209 211
Planted:Seeding Rate:Soil Type:Soil Test:Fertilization:
Management:Previous Crop:
Chipola loamy sand.
Marianna, Florida:Oat Forage Performance, 2015-2016
Dry Matter YieldHarvest Date Season Totals
------------------------------------------ lb/acre ------------------------------------------
1. C.V. = 8.9%, and df for EMS = 48.2. The F-test indicated no statistical difference at the alpha = 0.10 probability level; therefore, an LSD value was not calculated.Bolding indicates entries yielding equal to highest yielding entry within a column based on Fisher's protected LSD (P = 0.10).
October 30, 2015.30 seed/foot in 7" rows.
Test conducted by J. Jones.
P = High, K = Medium, and pH = 6.7.Preplant: 50 lb N, 0 lb P2O5, and 90 lb K2O/acre.Topdress: 50 lb N/acre after 1st, 2nd, and 3rd harvests.Moldboard plowed and rototilled; Harmony Extra and 2,4D used for weed control.Corn.

Annual Publication 100-8 • Georgia 2015-2016 Small Grain Performance Tests 73
Brand-Variety 20162-YrAvg
3-YrAvg 2016
2-YrAvg
3-YrAvg 2016
2-YrAvg
3-YrAvg 2016
2-YrAvg
3-YrAvg
FL 720 7438 8544 8469 5329 4718 4885 6310 6311 5588 6359 6524 6314Gerard 224 6980 8225 . 4567 4662 . 6284 7364 . 5944 6750 .Gerard 229 7285 . . 4391 . . 5749 6682 . 5808 . .Horizon 270 7243 8311 . 4733 4664 . 6447 7208 . 6141 6728 .Horizon 306 7798 9184 . 4972 4951 . 6266 7935 . 6345 7357 .
LA06059-4-S1 7535 8197 . 4460 4924 . 5872 7156 . 5956 6759 .LA06063SBSB-S1 6632 7678 . 4801 4319 . 6659 6366 . 6031 6121 .LA08084-15 7787 8274 . 5310 3771 . 6065 6133 . 6387 6060 .LA08085SS-T3 6131 7174 . 4334 2820 . 6350 6152 . 5605 5382 .Legend 567 6262 . . 4345 . . 6704 . . 5770 . .
NF402 7863 9206 9380 5287 5590 5775 6416 7924 7366 6522 7573 7507Okay 8179 9588 9592 4839 5229 5599 6167 7275 6917 6395 7364 7369RAM LA99016 7699 8772 8869 5223 5058 5399 6027 7317 6541 6316 7049 6936SS 76-50 7166 8220 8750 5114 4829 5233 6065 7525 6895 6115 6858 6959TAMO 411 7764 8725 . 4784 5196 . 5987 7261 . 6178 7061 .
TAMO 606 7460 8716 . 5402 5617 . 5819 7455 . 6227 7263 .TX07CS2257 7819 . . 4827 . . 6973 . . 6540 . .
Average 7355 8487 9012 4866 4739 5378 6245 7071 6662 6155 6775 7017LSD at 10% Level 548 466 382 469 N.S.1 N.S. 624 N.S. 330 N.S. N.S. 445Std. Err. of Entry Mean 231 198 160 198 204 169 263 220 138 134 121 90
------------------------------------------------------ lb/acre ------------------------------------------------------
1. The F-Test indicated no statistical difference at the alpha = 0.10 probability level; therefore an LSD value was not calculated.Bolding indicates entries yielding equal to highest yielding entry within a column based on Fisher's protected LSD(P = 0.10).
Statewide Summary:Oat Forage Yields, 2015-2016
with Two- and Three-Year AveragesDry Forage Yield
Tifton Plains Griffin StatewideBrand-Variety 2-1-16 3-7-16 4-1-16 5-2-16 2016 2-Yr Avg
LA06063SBSB-S1 1445 2918 832 1031 6226 5321FL 720 1285 3134 923 829 6170 5746LA08084-15 1321 2885 1102 754 6061 5582LA08085SS-T3 942 2527 1100 1264 5832 5167Legend 567 1158 2999 962 547 5666 .
TAMO 606 714 3357 1037 427 5535 5134TX07CS2257 779 2875 893 967 5514 .RAM LA99016 346 2044 1377 770 4536 4660LA06059-4-S1 465 2467 663 882 4477 4806Horizon 306 257 2323 915 943 4437 4922
Okay 361 2478 804 596 4239 4594NF402 198 2295 1116 455 4065 5047TAMO 411 189 2372 903 579 4042 4262Horizon 270 458 2199 841 336 3834 4205Gerard 224 152 2184 832 446 3613 4482
SS 76-50 117 1861 1108 159 3246 .Gerard 229 128 1447 950 . 2524 .
Average 607 2492 962 686 4707 1 4918LSD at 10% Level 201 401 222 266 495 N.S.2
Std. Err. of Entry Mean 85 169 94 112 209 211
Planted:Seeding Rate:Soil Type:Soil Test:Fertilization:
Management:Previous Crop:
Chipola loamy sand.
Marianna, Florida:Oat Forage Performance, 2015-2016
Dry Matter YieldHarvest Date Season Totals
------------------------------------------ lb/acre ------------------------------------------
1. C.V. = 8.9%, and df for EMS = 48.2. The F-test indicated no statistical difference at the alpha = 0.10 probability level; therefore, an LSD value was not calculated.Bolding indicates entries yielding equal to highest yielding entry within a column based on Fisher's protected LSD (P = 0.10).
October 30, 2015.30 seed/foot in 7" rows.
Test conducted by J. Jones.
P = High, K = Medium, and pH = 6.7.Preplant: 50 lb N, 0 lb P2O5, and 90 lb K2O/acre.Topdress: 50 lb N/acre after 1st, 2nd, and 3rd harvests.Moldboard plowed and rototilled; Harmony Extra and 2,4D used for weed control.Corn.
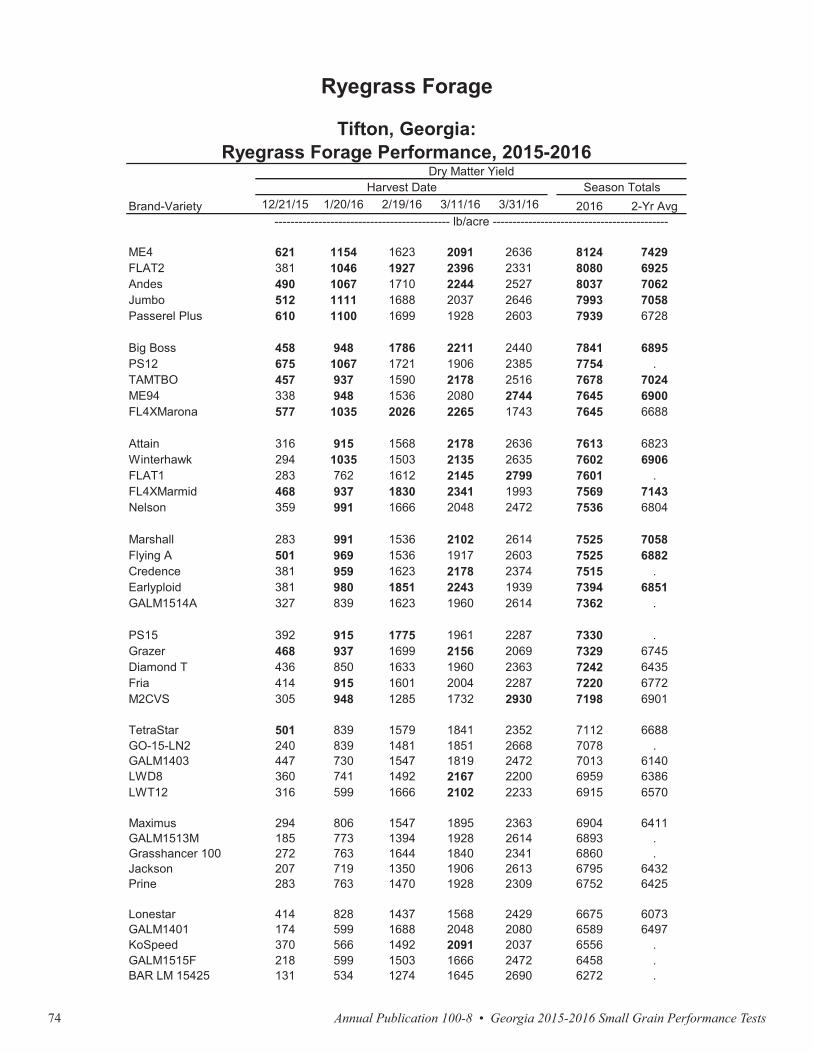
Annual Publication 100-8 • Georgia 2015-2016 Small Grain Performance Tests74
Brand-Variety 12/21/15 1/20/16 2/19/16 3/11/16 3/31/16 2016 2-Yr Avg
ME4 621 1154 1623 2091 2636 8124 7429FLAT2 381 1046 1927 2396 2331 8080 6925Andes 490 1067 1710 2244 2527 8037 7062Jumbo 512 1111 1688 2037 2646 7993 7058Passerel Plus 610 1100 1699 1928 2603 7939 6728
Big Boss 458 948 1786 2211 2440 7841 6895PS12 675 1067 1721 1906 2385 7754 .TAMTBO 457 937 1590 2178 2516 7678 7024ME94 338 948 1536 2080 2744 7645 6900FL4XMarona 577 1035 2026 2265 1743 7645 6688
Attain 316 915 1568 2178 2636 7613 6823Winterhawk 294 1035 1503 2135 2635 7602 6906FLAT1 283 762 1612 2145 2799 7601 .FL4XMarmid 468 937 1830 2341 1993 7569 7143Nelson 359 991 1666 2048 2472 7536 6804
Marshall 283 991 1536 2102 2614 7525 7058Flying A 501 969 1536 1917 2603 7525 6882Credence 381 959 1623 2178 2374 7515 .Earlyploid 381 980 1851 2243 1939 7394 6851GALM1514A 327 839 1623 1960 2614 7362 .
PS15 392 915 1775 1961 2287 7330 .Grazer 468 937 1699 2156 2069 7329 6745Diamond T 436 850 1633 1960 2363 7242 6435Fria 414 915 1601 2004 2287 7220 6772M2CVS 305 948 1285 1732 2930 7198 6901
TetraStar 501 839 1579 1841 2352 7112 6688GO-15-LN2 240 839 1481 1851 2668 7078 .GALM1403 447 730 1547 1819 2472 7013 6140LWD8 360 741 1492 2167 2200 6959 6386LWT12 316 599 1666 2102 2233 6915 6570
Maximus 294 806 1547 1895 2363 6904 6411GALM1513M 185 773 1394 1928 2614 6893 .Grasshancer 100 272 763 1644 1840 2341 6860 .Jackson 207 719 1350 1906 2613 6795 6432Prine 283 763 1470 1928 2309 6752 6425
Lonestar 414 828 1437 1568 2429 6675 6073GALM1401 174 599 1688 2048 2080 6589 6497KoSpeed 370 566 1492 2091 2037 6556 .GALM1515F 218 599 1503 1666 2472 6458 .BAR LM 15425 131 534 1274 1645 2690 6272 .
Ryegrass Forage
Tifton, Georgia:Ryegrass Forage Performance, 2015-2016
Dry Matter YieldHarvest Date Season Totals
-------------------------------------------- lb/acre --------------------------------------------

Annual Publication 100-8 • Georgia 2015-2016 Small Grain Performance Tests 75
Brand-Variety 12/21/15 1/20/16 2/19/16 3/11/16 3/31/16 2016 2-Yr Avg
ME4 621 1154 1623 2091 2636 8124 7429FLAT2 381 1046 1927 2396 2331 8080 6925Andes 490 1067 1710 2244 2527 8037 7062Jumbo 512 1111 1688 2037 2646 7993 7058Passerel Plus 610 1100 1699 1928 2603 7939 6728
Big Boss 458 948 1786 2211 2440 7841 6895PS12 675 1067 1721 1906 2385 7754 .TAMTBO 457 937 1590 2178 2516 7678 7024ME94 338 948 1536 2080 2744 7645 6900FL4XMarona 577 1035 2026 2265 1743 7645 6688
Attain 316 915 1568 2178 2636 7613 6823Winterhawk 294 1035 1503 2135 2635 7602 6906FLAT1 283 762 1612 2145 2799 7601 .FL4XMarmid 468 937 1830 2341 1993 7569 7143Nelson 359 991 1666 2048 2472 7536 6804
Marshall 283 991 1536 2102 2614 7525 7058Flying A 501 969 1536 1917 2603 7525 6882Credence 381 959 1623 2178 2374 7515 .Earlyploid 381 980 1851 2243 1939 7394 6851GALM1514A 327 839 1623 1960 2614 7362 .
PS15 392 915 1775 1961 2287 7330 .Grazer 468 937 1699 2156 2069 7329 6745Diamond T 436 850 1633 1960 2363 7242 6435Fria 414 915 1601 2004 2287 7220 6772M2CVS 305 948 1285 1732 2930 7198 6901
TetraStar 501 839 1579 1841 2352 7112 6688GO-15-LN2 240 839 1481 1851 2668 7078 .GALM1403 447 730 1547 1819 2472 7013 6140LWD8 360 741 1492 2167 2200 6959 6386LWT12 316 599 1666 2102 2233 6915 6570
Maximus 294 806 1547 1895 2363 6904 6411GALM1513M 185 773 1394 1928 2614 6893 .Grasshancer 100 272 763 1644 1840 2341 6860 .Jackson 207 719 1350 1906 2613 6795 6432Prine 283 763 1470 1928 2309 6752 6425
Lonestar 414 828 1437 1568 2429 6675 6073GALM1401 174 599 1688 2048 2080 6589 6497KoSpeed 370 566 1492 2091 2037 6556 .GALM1515F 218 599 1503 1666 2472 6458 .BAR LM 15425 131 534 1274 1645 2690 6272 .
Ryegrass Forage
Tifton, Georgia:Ryegrass Forage Performance, 2015-2016
Dry Matter YieldHarvest Date Season Totals
-------------------------------------------- lb/acre --------------------------------------------
Brand-Variety 12/21/15 1/20/16 2/19/16 3/11/16 3/31/16 2016 2-Yr Avg
KoWinearly 163 381 1361 1982 2341 6229 .BAR LM 15427 283 610 1122 1459 2483 5957 .BAR LM 15426 163 447 1285 1481 2363 5739 .Meroa 250 599 1263 1285 2091 5489 4827PPG-TAR113 44 44 174 577 1688 2527 .
Average 356 825 1542 1944 2400 7068 1 6683LSD at 10% Level 221 276 260 312 236 935 597Std. Err. of Entry Mean 94 118 111 133 101 399 255
Planted:Seeding Rate:Soil Type:Soil Test:Fertilization:
Management:Previous Crop:
Topdress: 50 lb N/acre after 1st, 2nd, 3rd, and 4th harvests.Disked, moldboard plowed, and rototilled.Summer annuals.
Test conducted by D. Dunn, R. Brooke, B. McCranie, and G. South.
Bolding indicates entries yielding equal to highest yielding entry within a column based on Fisher's protected LSD (P = 0.10).
October 23, 2015.50 lb/acre in 7" rows.Tifton loamy sand.
Tifton, Georgia:Ryegrass Forage Performance, 2015-2016
(Continued)
P = High, K = Medium, and pH = 6.4.Preplant: 50 lb N, 20 lb P2O5, and 60 lb K2O/acre.
Dry Matter YieldHarvest Date Season Totals
-------------------------------------------- lb/acre --------------------------------------------
1. C.V. = 11.3%, and df for EMS = 132.
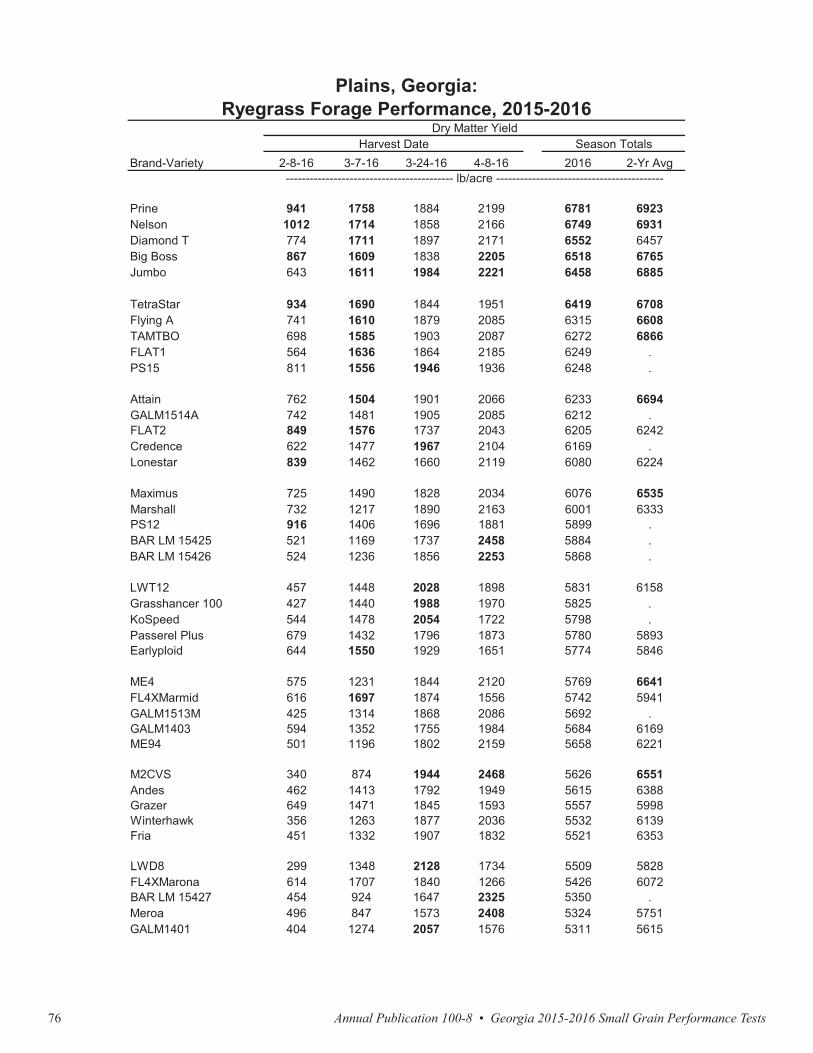
Annual Publication 100-8 • Georgia 2015-2016 Small Grain Performance Tests76
Brand-Variety 2-8-16 3-7-16 3-24-16 4-8-16 2016 2-Yr Avg
Prine 941 1758 1884 2199 6781 6923Nelson 1012 1714 1858 2166 6749 6931Diamond T 774 1711 1897 2171 6552 6457Big Boss 867 1609 1838 2205 6518 6765Jumbo 643 1611 1984 2221 6458 6885
TetraStar 934 1690 1844 1951 6419 6708Flying A 741 1610 1879 2085 6315 6608TAMTBO 698 1585 1903 2087 6272 6866FLAT1 564 1636 1864 2185 6249 .PS15 811 1556 1946 1936 6248 .
Attain 762 1504 1901 2066 6233 6694GALM1514A 742 1481 1905 2085 6212 .FLAT2 849 1576 1737 2043 6205 6242Credence 622 1477 1967 2104 6169 .Lonestar 839 1462 1660 2119 6080 6224
Maximus 725 1490 1828 2034 6076 6535Marshall 732 1217 1890 2163 6001 6333PS12 916 1406 1696 1881 5899 .BAR LM 15425 521 1169 1737 2458 5884 .BAR LM 15426 524 1236 1856 2253 5868 .
LWT12 457 1448 2028 1898 5831 6158Grasshancer 100 427 1440 1988 1970 5825 .KoSpeed 544 1478 2054 1722 5798 .Passerel Plus 679 1432 1796 1873 5780 5893Earlyploid 644 1550 1929 1651 5774 5846
ME4 575 1231 1844 2120 5769 6641FL4XMarmid 616 1697 1874 1556 5742 5941GALM1513M 425 1314 1868 2086 5692 .GALM1403 594 1352 1755 1984 5684 6169ME94 501 1196 1802 2159 5658 6221
M2CVS 340 874 1944 2468 5626 6551Andes 462 1413 1792 1949 5615 6388Grazer 649 1471 1845 1593 5557 5998Winterhawk 356 1263 1877 2036 5532 6139Fria 451 1332 1907 1832 5521 6353
LWD8 299 1348 2128 1734 5509 5828FL4XMarona 614 1707 1840 1266 5426 6072BAR LM 15427 454 924 1647 2325 5350 .Meroa 496 847 1573 2408 5324 5751GALM1401 404 1274 2057 1576 5311 5615
Plains, Georgia:Ryegrass Forage Performance, 2015-2016
Dry Matter YieldHarvest Date Season Totals
------------------------------------------ lb/acre ------------------------------------------
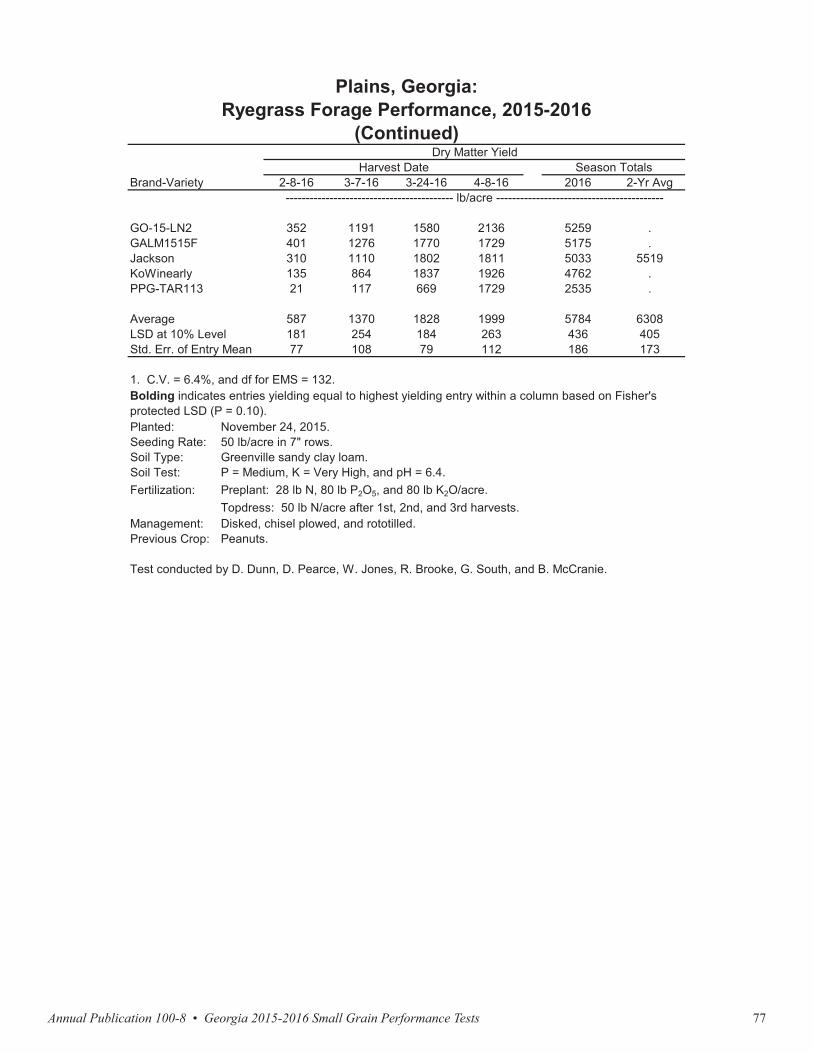
Annual Publication 100-8 • Georgia 2015-2016 Small Grain Performance Tests 77
Brand-Variety 2-8-16 3-7-16 3-24-16 4-8-16 2016 2-Yr Avg
Prine 941 1758 1884 2199 6781 6923Nelson 1012 1714 1858 2166 6749 6931Diamond T 774 1711 1897 2171 6552 6457Big Boss 867 1609 1838 2205 6518 6765Jumbo 643 1611 1984 2221 6458 6885
TetraStar 934 1690 1844 1951 6419 6708Flying A 741 1610 1879 2085 6315 6608TAMTBO 698 1585 1903 2087 6272 6866FLAT1 564 1636 1864 2185 6249 .PS15 811 1556 1946 1936 6248 .
Attain 762 1504 1901 2066 6233 6694GALM1514A 742 1481 1905 2085 6212 .FLAT2 849 1576 1737 2043 6205 6242Credence 622 1477 1967 2104 6169 .Lonestar 839 1462 1660 2119 6080 6224
Maximus 725 1490 1828 2034 6076 6535Marshall 732 1217 1890 2163 6001 6333PS12 916 1406 1696 1881 5899 .BAR LM 15425 521 1169 1737 2458 5884 .BAR LM 15426 524 1236 1856 2253 5868 .
LWT12 457 1448 2028 1898 5831 6158Grasshancer 100 427 1440 1988 1970 5825 .KoSpeed 544 1478 2054 1722 5798 .Passerel Plus 679 1432 1796 1873 5780 5893Earlyploid 644 1550 1929 1651 5774 5846
ME4 575 1231 1844 2120 5769 6641FL4XMarmid 616 1697 1874 1556 5742 5941GALM1513M 425 1314 1868 2086 5692 .GALM1403 594 1352 1755 1984 5684 6169ME94 501 1196 1802 2159 5658 6221
M2CVS 340 874 1944 2468 5626 6551Andes 462 1413 1792 1949 5615 6388Grazer 649 1471 1845 1593 5557 5998Winterhawk 356 1263 1877 2036 5532 6139Fria 451 1332 1907 1832 5521 6353
LWD8 299 1348 2128 1734 5509 5828FL4XMarona 614 1707 1840 1266 5426 6072BAR LM 15427 454 924 1647 2325 5350 .Meroa 496 847 1573 2408 5324 5751GALM1401 404 1274 2057 1576 5311 5615
Plains, Georgia:Ryegrass Forage Performance, 2015-2016
Dry Matter YieldHarvest Date Season Totals
------------------------------------------ lb/acre ------------------------------------------ Brand-Variety 2-8-16 3-7-16 3-24-16 4-8-16 2016 2-Yr Avg
GO-15-LN2 352 1191 1580 2136 5259 .GALM1515F 401 1276 1770 1729 5175 .Jackson 310 1110 1802 1811 5033 5519KoWinearly 135 864 1837 1926 4762 .PPG-TAR113 21 117 669 1729 2535 .
Average 587 1370 1828 1999 5784 6308LSD at 10% Level 181 254 184 263 436 405Std. Err. of Entry Mean 77 108 79 112 186 173
Planted:Seeding Rate:Soil Type:Soil Test:Fertilization:
Management:Previous Crop:
Topdress: 50 lb N/acre after 1st, 2nd, and 3rd harvests.Disked, chisel plowed, and rototilled.Peanuts.
Test conducted by D. Dunn, D. Pearce, W. Jones, R. Brooke, G. South, and B. McCranie.
Preplant: 28 lb N, 80 lb P2O5, and 80 lb K2O/acre.
Dry Matter YieldHarvest Date Season Totals
------------------------------------------ lb/acre ------------------------------------------
1. C.V. = 6.4%, and df for EMS = 132.Bolding indicates entries yielding equal to highest yielding entry within a column based on Fisher's protected LSD (P = 0.10).
November 24, 2015.50 lb/acre in 7" rows.Greenville sandy clay loam.P = Medium, K = Very High, and pH = 6.4.
Plains, Georgia:Ryegrass Forage Performance, 2015-2016
(Continued)
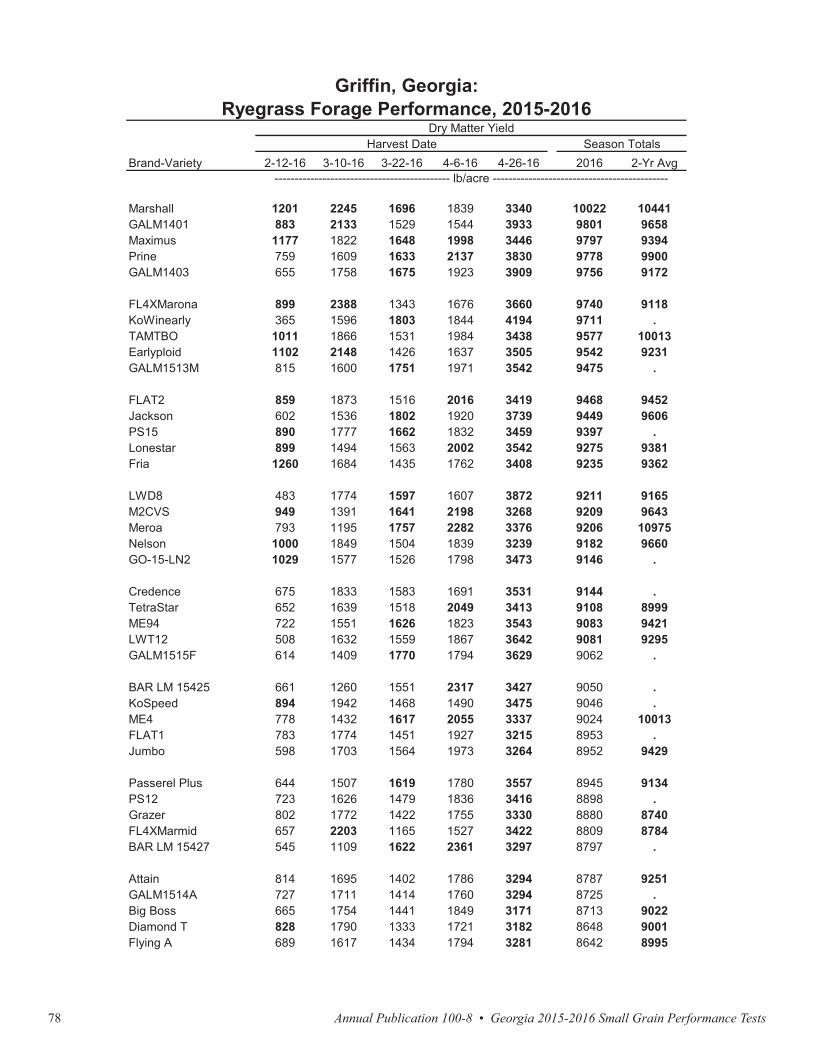
Annual Publication 100-8 • Georgia 2015-2016 Small Grain Performance Tests78
Brand-Variety 2-12-16 3-10-16 3-22-16 4-6-16 4-26-16 2016 2-Yr Avg
Marshall 1201 2245 1696 1839 3340 10022 10441GALM1401 883 2133 1529 1544 3933 9801 9658Maximus 1177 1822 1648 1998 3446 9797 9394Prine 759 1609 1633 2137 3830 9778 9900GALM1403 655 1758 1675 1923 3909 9756 9172
FL4XMarona 899 2388 1343 1676 3660 9740 9118KoWinearly 365 1596 1803 1844 4194 9711 .TAMTBO 1011 1866 1531 1984 3438 9577 10013Earlyploid 1102 2148 1426 1637 3505 9542 9231GALM1513M 815 1600 1751 1971 3542 9475 .
FLAT2 859 1873 1516 2016 3419 9468 9452Jackson 602 1536 1802 1920 3739 9449 9606PS15 890 1777 1662 1832 3459 9397 .Lonestar 899 1494 1563 2002 3542 9275 9381Fria 1260 1684 1435 1762 3408 9235 9362
LWD8 483 1774 1597 1607 3872 9211 9165M2CVS 949 1391 1641 2198 3268 9209 9643Meroa 793 1195 1757 2282 3376 9206 10975Nelson 1000 1849 1504 1839 3239 9182 9660GO-15-LN2 1029 1577 1526 1798 3473 9146 .
Credence 675 1833 1583 1691 3531 9144 .TetraStar 652 1639 1518 2049 3413 9108 8999ME94 722 1551 1626 1823 3543 9083 9421LWT12 508 1632 1559 1867 3642 9081 9295GALM1515F 614 1409 1770 1794 3629 9062 .
BAR LM 15425 661 1260 1551 2317 3427 9050 .KoSpeed 894 1942 1468 1490 3475 9046 .ME4 778 1432 1617 2055 3337 9024 10013FLAT1 783 1774 1451 1927 3215 8953 .Jumbo 598 1703 1564 1973 3264 8952 9429
Passerel Plus 644 1507 1619 1780 3557 8945 9134PS12 723 1626 1479 1836 3416 8898 .Grazer 802 1772 1422 1755 3330 8880 8740FL4XMarmid 657 2203 1165 1527 3422 8809 8784BAR LM 15427 545 1109 1622 2361 3297 8797 .
Attain 814 1695 1402 1786 3294 8787 9251GALM1514A 727 1711 1414 1760 3294 8725 .Big Boss 665 1754 1441 1849 3171 8713 9022Diamond T 828 1790 1333 1721 3182 8648 9001Flying A 689 1617 1434 1794 3281 8642 8995
Griffin, Georgia:Ryegrass Forage Performance, 2015-2016
Dry Matter YieldHarvest Date Season Totals
-------------------------------------------- lb/acre --------------------------------------------
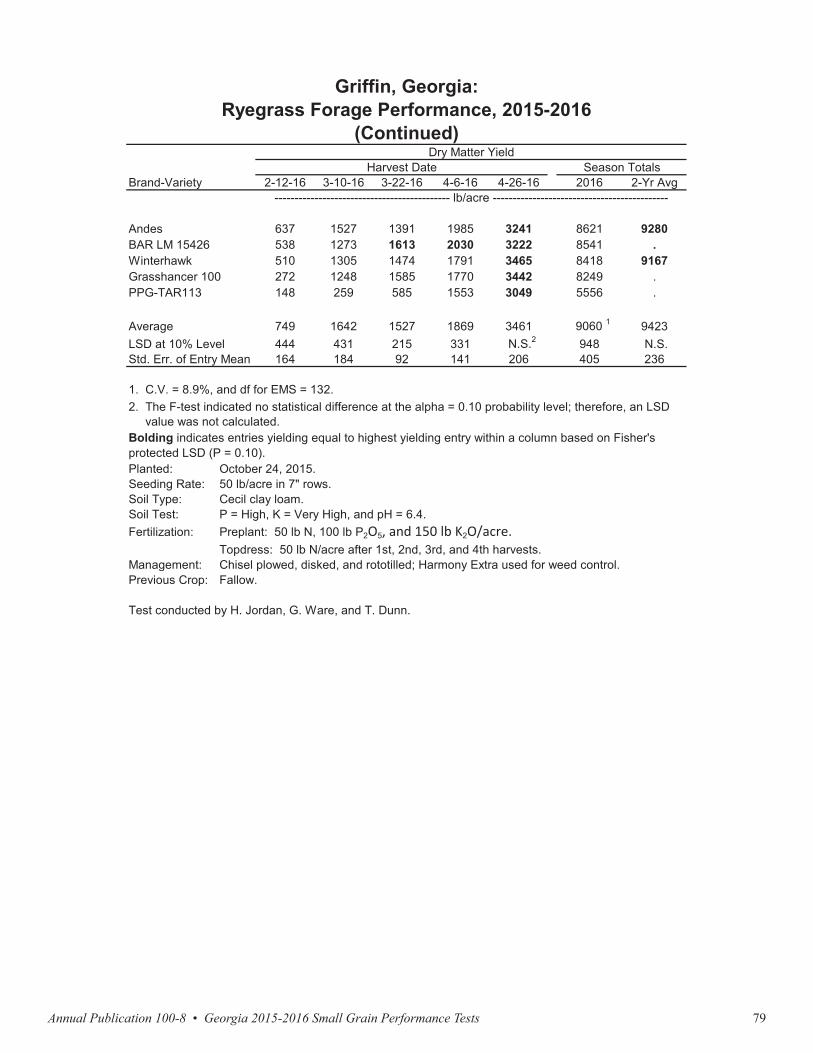
Annual Publication 100-8 • Georgia 2015-2016 Small Grain Performance Tests 79
Brand-Variety 2-12-16 3-10-16 3-22-16 4-6-16 4-26-16 2016 2-Yr Avg
Marshall 1201 2245 1696 1839 3340 10022 10441GALM1401 883 2133 1529 1544 3933 9801 9658Maximus 1177 1822 1648 1998 3446 9797 9394Prine 759 1609 1633 2137 3830 9778 9900GALM1403 655 1758 1675 1923 3909 9756 9172
FL4XMarona 899 2388 1343 1676 3660 9740 9118KoWinearly 365 1596 1803 1844 4194 9711 .TAMTBO 1011 1866 1531 1984 3438 9577 10013Earlyploid 1102 2148 1426 1637 3505 9542 9231GALM1513M 815 1600 1751 1971 3542 9475 .
FLAT2 859 1873 1516 2016 3419 9468 9452Jackson 602 1536 1802 1920 3739 9449 9606PS15 890 1777 1662 1832 3459 9397 .Lonestar 899 1494 1563 2002 3542 9275 9381Fria 1260 1684 1435 1762 3408 9235 9362
LWD8 483 1774 1597 1607 3872 9211 9165M2CVS 949 1391 1641 2198 3268 9209 9643Meroa 793 1195 1757 2282 3376 9206 10975Nelson 1000 1849 1504 1839 3239 9182 9660GO-15-LN2 1029 1577 1526 1798 3473 9146 .
Credence 675 1833 1583 1691 3531 9144 .TetraStar 652 1639 1518 2049 3413 9108 8999ME94 722 1551 1626 1823 3543 9083 9421LWT12 508 1632 1559 1867 3642 9081 9295GALM1515F 614 1409 1770 1794 3629 9062 .
BAR LM 15425 661 1260 1551 2317 3427 9050 .KoSpeed 894 1942 1468 1490 3475 9046 .ME4 778 1432 1617 2055 3337 9024 10013FLAT1 783 1774 1451 1927 3215 8953 .Jumbo 598 1703 1564 1973 3264 8952 9429
Passerel Plus 644 1507 1619 1780 3557 8945 9134PS12 723 1626 1479 1836 3416 8898 .Grazer 802 1772 1422 1755 3330 8880 8740FL4XMarmid 657 2203 1165 1527 3422 8809 8784BAR LM 15427 545 1109 1622 2361 3297 8797 .
Attain 814 1695 1402 1786 3294 8787 9251GALM1514A 727 1711 1414 1760 3294 8725 .Big Boss 665 1754 1441 1849 3171 8713 9022Diamond T 828 1790 1333 1721 3182 8648 9001Flying A 689 1617 1434 1794 3281 8642 8995
Griffin, Georgia:Ryegrass Forage Performance, 2015-2016
Dry Matter YieldHarvest Date Season Totals
-------------------------------------------- lb/acre -------------------------------------------- Brand-Variety 2-12-16 3-10-16 3-22-16 4-6-16 4-26-16 2016 2-Yr Avg
Andes 637 1527 1391 1985 3241 8621 9280BAR LM 15426 538 1273 1613 2030 3222 8541 .Winterhawk 510 1305 1474 1791 3465 8418 9167Grasshancer 100 272 1248 1585 1770 3442 8249 .PPG-TAR113 148 259 585 1553 3049 5556 .
Average 749 1642 1527 1869 3461 9060 1 9423LSD at 10% Level 444 431 215 331 N.S.2 948 N.S.Std. Err. of Entry Mean 164 184 92 141 206 405 236
Planted:Seeding Rate:Soil Type:Soil Test:Fertilization:
Management:Previous Crop:
Test conducted by H. Jordan, G. Ware, and T. Dunn.
2. The F-test indicated no statistical difference at the alpha = 0.10 probability level; therefore, an LSD value was not calculated.Bolding indicates entries yielding equal to highest yielding entry within a column based on Fisher's protected LSD (P = 0.10).
October 24, 2015.50 lb/acre in 7" rows.Cecil clay loam.P = High, K = Very High, and pH = 6.4.Preplant: 50 lb N, 100 lb P2O5, and 150 lb K2O/acre.Topdress: 50 lb N/acre after 1st, 2nd, 3rd, and 4th harvests.Chisel plowed, disked, and rototilled; Harmony Extra used for weed control.Fallow.
1. C.V. = 8.9%, and df for EMS = 132.
Griffin, Georgia:Ryegrass Forage Performance, 2015-2016
(Continued)Dry Matter Yield
Harvest Date Season Totals
-------------------------------------------- lb/acre --------------------------------------------

Annual Publication 100-8 • Georgia 2015-2016 Small Grain Performance Tests80
Brand-Variety 2-11-16 3-9-16 4-5-16 5-2-16 5-27-16 2016 2-Yr Avg
KoSpeed 1277 1146 5334 2741 1413 11910 .TetraStar 1253 1348 5031 2481 1729 11842 12400TAMTBO 1517 1310 4415 2586 1967 11795 12168PS15 1132 1309 4903 2541 1873 11758 .Attain 1441 1399 4607 2530 1771 11747 11609
GALM1513M 881 1302 5271 2658 1625 11737 .Prine 976 1342 4805 2668 1925 11716 11962LWD8 1254 1255 5120 2492 1560 11681 12327GALM1403 1479 1437 4787 2136 1795 11634 11402Earlyploid 1210 1246 4667 2736 1683 11542 11600
Fria 1551 1283 4709 2264 1730 11537 12619ME94 856 1240 5325 2330 1787 11536 12335PS12 1794 1014 4578 2484 1653 11523 .Nelson 1462 1107 4549 2420 1929 11466 12044FLAT1 1122 1361 4474 2503 1939 11399 .
Marshall 771 906 5590 2258 1868 11393 12593M2CVS 636 979 5257 2487 2032 11389 12435GALM1514A 1409 1106 4681 2481 1700 11377 .Big Boss 1294 1243 4405 2405 2021 11367 11764Grazer 1171 1317 4667 2428 1779 11362 11877
FLAT2 912 1249 4727 2606 1855 11349 11826FL Red 4x LATE 1342 1314 4622 2503 1565 11345 .ME4 949 1037 5269 2229 1853 11338 12270Maximus 1777 1273 4304 2292 1691 11337 11752BAR LM 15426 541 1220 4564 2770 2211 11306 .
Jumbo 1056 1260 4364 2690 1909 11278 12059GALM1401 585 1054 5384 2575 1629 11226 11325Credence 883 1144 4500 2553 2094 11173 .Winterhawk 784 1263 4767 2371 1976 11160 12565GO-15-LN2 882 1251 5153 2174 1676 11135 .
Passerel Plus 997 1027 4932 2123 2048 11126 11228Diamond T 864 1078 4593 2555 2031 11120 11381LWT12 831 1372 4662 2503 1742 11109 11964Lonestar 1041 991 5050 2240 1786 11108 11063BAR LM 15425 960 1240 4547 2360 1983 11090 .
Meroa 749 786 4849 2907 1787 11079 11447KoWinearly 568 1305 5122 2485 1574 11053 .Grasshancer 100 1212 1434 4680 2231 1447 11003 .FL4XMarmid 1245 1231 4295 2696 1441 10906 11393Andes 640 1309 4650 2328 1862 10788 11955
Calhoun, Georgia:Ryegrass Forage Performance, 2015-2016
Dry Matter YieldHarvest Date Season Totals
-------------------------------------------- lb/acre --------------------------------------------

Annual Publication 100-8 • Georgia 2015-2016 Small Grain Performance Tests 81
Brand-Variety 2-11-16 3-9-16 4-5-16 5-2-16 5-27-16 2016 2-Yr Avg
KoSpeed 1277 1146 5334 2741 1413 11910 .TetraStar 1253 1348 5031 2481 1729 11842 12400TAMTBO 1517 1310 4415 2586 1967 11795 12168PS15 1132 1309 4903 2541 1873 11758 .Attain 1441 1399 4607 2530 1771 11747 11609
GALM1513M 881 1302 5271 2658 1625 11737 .Prine 976 1342 4805 2668 1925 11716 11962LWD8 1254 1255 5120 2492 1560 11681 12327GALM1403 1479 1437 4787 2136 1795 11634 11402Earlyploid 1210 1246 4667 2736 1683 11542 11600
Fria 1551 1283 4709 2264 1730 11537 12619ME94 856 1240 5325 2330 1787 11536 12335PS12 1794 1014 4578 2484 1653 11523 .Nelson 1462 1107 4549 2420 1929 11466 12044FLAT1 1122 1361 4474 2503 1939 11399 .
Marshall 771 906 5590 2258 1868 11393 12593M2CVS 636 979 5257 2487 2032 11389 12435GALM1514A 1409 1106 4681 2481 1700 11377 .Big Boss 1294 1243 4405 2405 2021 11367 11764Grazer 1171 1317 4667 2428 1779 11362 11877
FLAT2 912 1249 4727 2606 1855 11349 11826FL Red 4x LATE 1342 1314 4622 2503 1565 11345 .ME4 949 1037 5269 2229 1853 11338 12270Maximus 1777 1273 4304 2292 1691 11337 11752BAR LM 15426 541 1220 4564 2770 2211 11306 .
Jumbo 1056 1260 4364 2690 1909 11278 12059GALM1401 585 1054 5384 2575 1629 11226 11325Credence 883 1144 4500 2553 2094 11173 .Winterhawk 784 1263 4767 2371 1976 11160 12565GO-15-LN2 882 1251 5153 2174 1676 11135 .
Passerel Plus 997 1027 4932 2123 2048 11126 11228Diamond T 864 1078 4593 2555 2031 11120 11381LWT12 831 1372 4662 2503 1742 11109 11964Lonestar 1041 991 5050 2240 1786 11108 11063BAR LM 15425 960 1240 4547 2360 1983 11090 .
Meroa 749 786 4849 2907 1787 11079 11447KoWinearly 568 1305 5122 2485 1574 11053 .Grasshancer 100 1212 1434 4680 2231 1447 11003 .FL4XMarmid 1245 1231 4295 2696 1441 10906 11393Andes 640 1309 4650 2328 1862 10788 11955
Calhoun, Georgia:Ryegrass Forage Performance, 2015-2016
Dry Matter YieldHarvest Date Season Totals
-------------------------------------------- lb/acre -------------------------------------------- Brand-Variety 2-11-16 3-9-16 4-5-16 5-2-16 5-27-16 2016 2-Yr Avg
Jackson 517 1175 4935 2339 1742 10707 11266Flying A 1007 1160 4809 2290 1366 10632 10940FL4XMarona 1338 1220 4144 2642 1255 10598 10503GALM1515F 726 949 5402 2001 1475 10553 .BAR LM 15427 446 780 4356 2734 2001 10317 .
FL PEER 948 1120 4366 2129 1439 10002 11905FL ME 752 1139 4304 2276 944 9415 .FL ER 650 1103 4053 2658 774 9238 9818PPG-TAR113 191 69 2687 2162 1291 6400 .
Average 1018 1167 4720 2450 1719 11073 1 11744LSD at 10% Level 606 326 582 369 325 1025 814Std. Err. of Entry Mean 259 139 248 158 139 438 348
Planted:Seeding Rate:Soil Type:Soil Test:Fertilization:
Management:
Previous Crop:
Calhoun, Georgia:Ryegrass Forage Performance, 2015-2016
(Continued)
Preplant: 25 lb N, 50 lb P2O5, and 75 lb K2O/acre.
Dry Matter YieldHarvest Date Season Totals
-------------------------------------------- lb/acre --------------------------------------------
1. C.V. = 7.9%, and df for EMS = 144.Bolding indicates entries yielding equal to highest yielding entry within a column based on Fisher's protected LSD (P = 0.10).
October 22, 2015.50 lb/acre in 7" rows.Waynesboro loam.P = Very High, K = Very High, and pH = 5.8.
Topdress: 50 lb N/acre after 1st, 2nd, 3rd, and 4th harvests.Chisel plowed, disked, and rototilled; Harmony Extra used for weed control; 1.5 ton lime/acre.Corn.
Test conducted by H. Jordan, G. Ware, and T. Dunn.
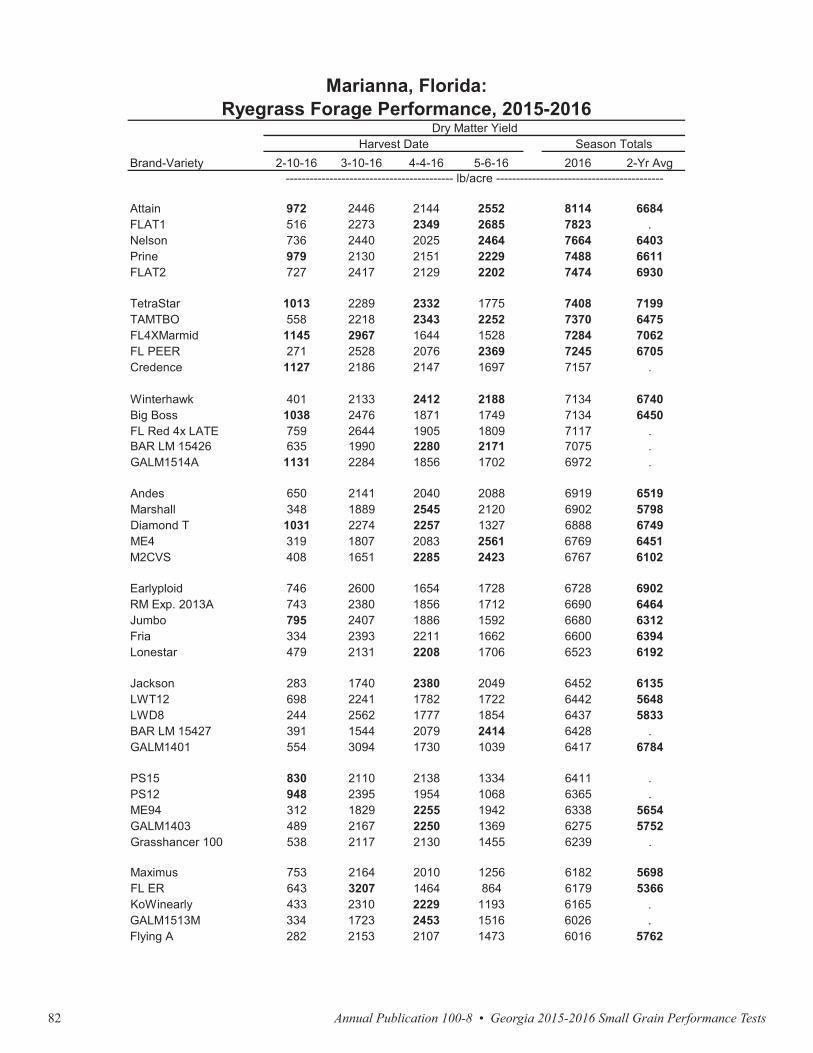
Annual Publication 100-8 • Georgia 2015-2016 Small Grain Performance Tests82
Brand-Variety 2-10-16 3-10-16 4-4-16 5-6-16 2016 2-Yr Avg
Attain 972 2446 2144 2552 8114 6684FLAT1 516 2273 2349 2685 7823 .Nelson 736 2440 2025 2464 7664 6403Prine 979 2130 2151 2229 7488 6611FLAT2 727 2417 2129 2202 7474 6930
TetraStar 1013 2289 2332 1775 7408 7199TAMTBO 558 2218 2343 2252 7370 6475FL4XMarmid 1145 2967 1644 1528 7284 7062FL PEER 271 2528 2076 2369 7245 6705Credence 1127 2186 2147 1697 7157 .
Winterhawk 401 2133 2412 2188 7134 6740Big Boss 1038 2476 1871 1749 7134 6450FL Red 4x LATE 759 2644 1905 1809 7117 .BAR LM 15426 635 1990 2280 2171 7075 .GALM1514A 1131 2284 1856 1702 6972 .
Andes 650 2141 2040 2088 6919 6519Marshall 348 1889 2545 2120 6902 5798Diamond T 1031 2274 2257 1327 6888 6749ME4 319 1807 2083 2561 6769 6451M2CVS 408 1651 2285 2423 6767 6102
Earlyploid 746 2600 1654 1728 6728 6902RM Exp. 2013A 743 2380 1856 1712 6690 6464Jumbo 795 2407 1886 1592 6680 6312Fria 334 2393 2211 1662 6600 6394Lonestar 479 2131 2208 1706 6523 6192
Jackson 283 1740 2380 2049 6452 6135LWT12 698 2241 1782 1722 6442 5648LWD8 244 2562 1777 1854 6437 5833BAR LM 15427 391 1544 2079 2414 6428 .GALM1401 554 3094 1730 1039 6417 6784
PS15 830 2110 2138 1334 6411 .PS12 948 2395 1954 1068 6365 .ME94 312 1829 2255 1942 6338 5654GALM1403 489 2167 2250 1369 6275 5752Grasshancer 100 538 2117 2130 1455 6239 .
Maximus 753 2164 2010 1256 6182 5698FL ER 643 3207 1464 864 6179 5366KoWinearly 433 2310 2229 1193 6165 .GALM1513M 334 1723 2453 1516 6026 .Flying A 282 2153 2107 1473 6016 5762
Marianna, Florida:Ryegrass Forage Performance, 2015-2016
Dry Matter YieldHarvest Date Season Totals
------------------------------------------ lb/acre ------------------------------------------
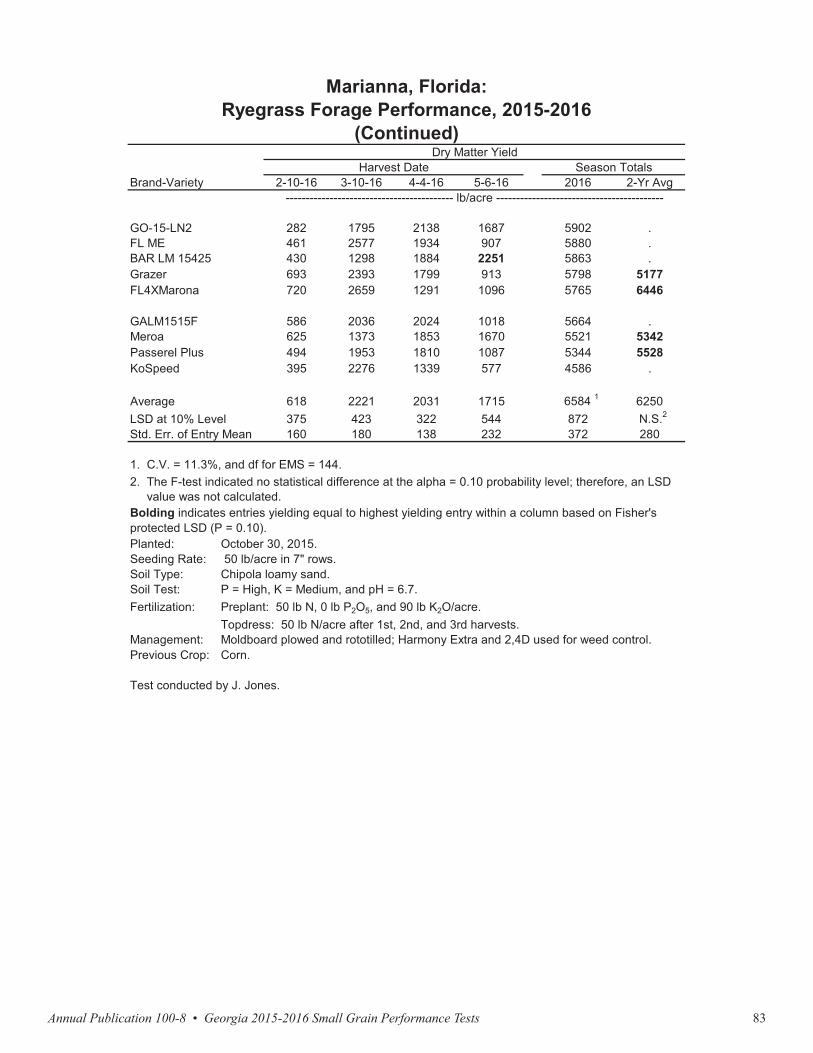
Annual Publication 100-8 • Georgia 2015-2016 Small Grain Performance Tests 83
Brand-Variety 2-10-16 3-10-16 4-4-16 5-6-16 2016 2-Yr Avg
Attain 972 2446 2144 2552 8114 6684FLAT1 516 2273 2349 2685 7823 .Nelson 736 2440 2025 2464 7664 6403Prine 979 2130 2151 2229 7488 6611FLAT2 727 2417 2129 2202 7474 6930
TetraStar 1013 2289 2332 1775 7408 7199TAMTBO 558 2218 2343 2252 7370 6475FL4XMarmid 1145 2967 1644 1528 7284 7062FL PEER 271 2528 2076 2369 7245 6705Credence 1127 2186 2147 1697 7157 .
Winterhawk 401 2133 2412 2188 7134 6740Big Boss 1038 2476 1871 1749 7134 6450FL Red 4x LATE 759 2644 1905 1809 7117 .BAR LM 15426 635 1990 2280 2171 7075 .GALM1514A 1131 2284 1856 1702 6972 .
Andes 650 2141 2040 2088 6919 6519Marshall 348 1889 2545 2120 6902 5798Diamond T 1031 2274 2257 1327 6888 6749ME4 319 1807 2083 2561 6769 6451M2CVS 408 1651 2285 2423 6767 6102
Earlyploid 746 2600 1654 1728 6728 6902RM Exp. 2013A 743 2380 1856 1712 6690 6464Jumbo 795 2407 1886 1592 6680 6312Fria 334 2393 2211 1662 6600 6394Lonestar 479 2131 2208 1706 6523 6192
Jackson 283 1740 2380 2049 6452 6135LWT12 698 2241 1782 1722 6442 5648LWD8 244 2562 1777 1854 6437 5833BAR LM 15427 391 1544 2079 2414 6428 .GALM1401 554 3094 1730 1039 6417 6784
PS15 830 2110 2138 1334 6411 .PS12 948 2395 1954 1068 6365 .ME94 312 1829 2255 1942 6338 5654GALM1403 489 2167 2250 1369 6275 5752Grasshancer 100 538 2117 2130 1455 6239 .
Maximus 753 2164 2010 1256 6182 5698FL ER 643 3207 1464 864 6179 5366KoWinearly 433 2310 2229 1193 6165 .GALM1513M 334 1723 2453 1516 6026 .Flying A 282 2153 2107 1473 6016 5762
Marianna, Florida:Ryegrass Forage Performance, 2015-2016
Dry Matter YieldHarvest Date Season Totals
------------------------------------------ lb/acre ------------------------------------------ Brand-Variety 2-10-16 3-10-16 4-4-16 5-6-16 2016 2-Yr Avg
GO-15-LN2 282 1795 2138 1687 5902 .FL ME 461 2577 1934 907 5880 .BAR LM 15425 430 1298 1884 2251 5863 .Grazer 693 2393 1799 913 5798 5177FL4XMarona 720 2659 1291 1096 5765 6446
GALM1515F 586 2036 2024 1018 5664 .Meroa 625 1373 1853 1670 5521 5342Passerel Plus 494 1953 1810 1087 5344 5528KoSpeed 395 2276 1339 577 4586 .
Average 618 2221 2031 1715 6584 1 6250LSD at 10% Level 375 423 322 544 872 N.S.2
Std. Err. of Entry Mean 160 180 138 232 372 280
Planted:Seeding Rate:Soil Type:Soil Test:Fertilization:
Management:Previous Crop:
Test conducted by J. Jones.
2. The F-test indicated no statistical difference at the alpha = 0.10 probability level; therefore, an LSD value was not calculated.Bolding indicates entries yielding equal to highest yielding entry within a column based on Fisher's protected LSD (P = 0.10).
October 30, 2015. 50 lb/acre in 7" rows.Chipola loamy sand.P = High, K = Medium, and pH = 6.7.Preplant: 50 lb N, 0 lb P2O5, and 90 lb K2O/acre.Topdress: 50 lb N/acre after 1st, 2nd, and 3rd harvests.Moldboard plowed and rototilled; Harmony Extra and 2,4D used for weed control.Corn.
1. C.V. = 11.3%, and df for EMS = 144.
Marianna, Florida:Ryegrass Forage Performance, 2015-2016
(Continued)Dry Matter Yield
Harvest Date Season Totals
------------------------------------------ lb/acre ------------------------------------------
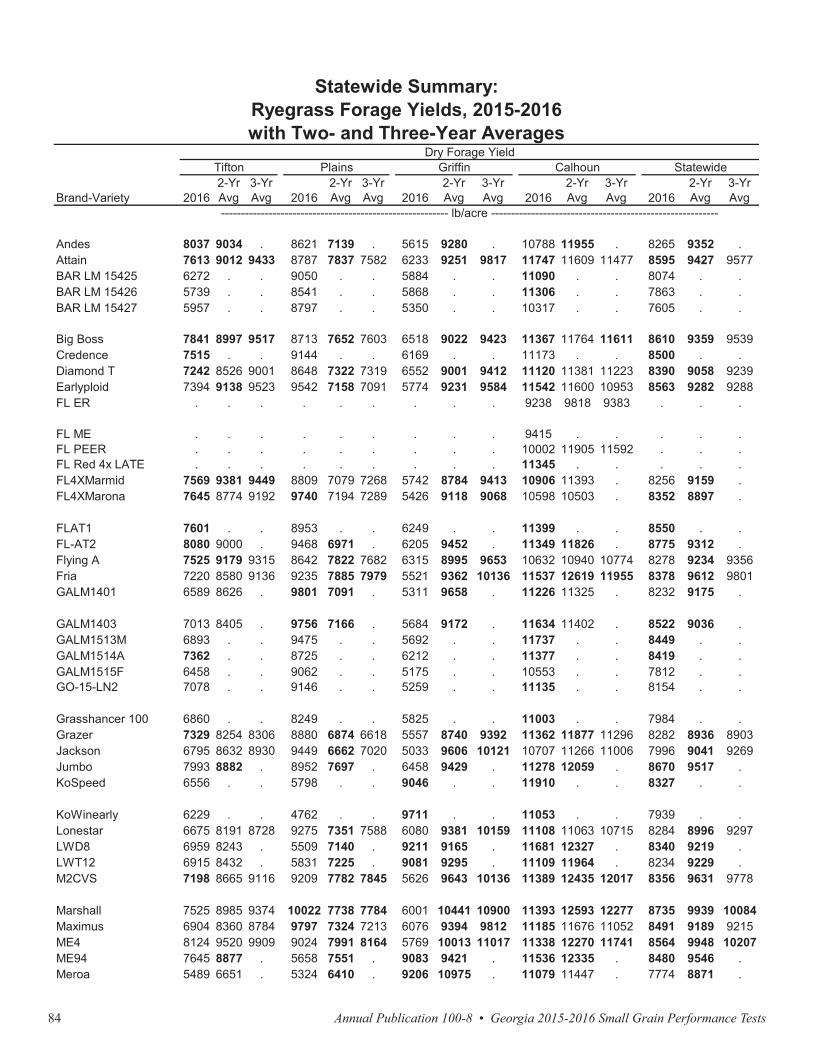
Annual Publication 100-8 • Georgia 2015-2016 Small Grain Performance Tests84
Brand-Variety 20162-YrAvg
3-YrAvg 2016
2-YrAvg
3-YrAvg 2016
2-YrAvg
3-YrAvg 2016
2-YrAvg
3-YrAvg 2016
2-YrAvg
3-YrAvg
Andes 8037 9034 . 8621 7139 . 5615 9280 . 10788 11955 . 8265 9352 .Attain 7613 9012 9433 8787 7837 7582 6233 9251 9817 11747 11609 11477 8595 9427 9577BAR LM 15425 6272 . . 9050 . . 5884 . . 11090 . . 8074 . .BAR LM 15426 5739 . . 8541 . . 5868 . . 11306 . . 7863 . .BAR LM 15427 5957 . . 8797 . . 5350 . . 10317 . . 7605 . .
Big Boss 7841 8997 9517 8713 7652 7603 6518 9022 9423 11367 11764 11611 8610 9359 9539Credence 7515 . . 9144 . . 6169 . . 11173 . . 8500 . .Diamond T 7242 8526 9001 8648 7322 7319 6552 9001 9412 11120 11381 11223 8390 9058 9239Earlyploid 7394 9138 9523 9542 7158 7091 5774 9231 9584 11542 11600 10953 8563 9282 9288FL ER . . . . . . . . . 9238 9818 9383 . . .
FL ME . . . . . . . . . 9415 . . . . .FL PEER . . . . . . . . . 10002 11905 11592 . . .FL Red 4x LATE . . . . . . . . . 11345 . . . . .FL4XMarmid 7569 9381 9449 8809 7079 7268 5742 8784 9413 10906 11393 . 8256 9159 .FL4XMarona 7645 8774 9192 9740 7194 7289 5426 9118 9068 10598 10503 . 8352 8897 .
FLAT1 7601 . . 8953 . . 6249 . . 11399 . . 8550 . .FL-AT2 8080 9000 . 9468 6971 . 6205 9452 . 11349 11826 . 8775 9312 .Flying A 7525 9179 9315 8642 7822 7682 6315 8995 9653 10632 10940 10774 8278 9234 9356Fria 7220 8580 9136 9235 7885 7979 5521 9362 10136 11537 12619 11955 8378 9612 9801GALM1401 6589 8626 . 9801 7091 . 5311 9658 . 11226 11325 . 8232 9175 .
GALM1403 7013 8405 . 9756 7166 . 5684 9172 . 11634 11402 . 8522 9036 .GALM1513M 6893 . . 9475 . . 5692 . . 11737 . . 8449 . .GALM1514A 7362 . . 8725 . . 6212 . . 11377 . . 8419 . .GALM1515F 6458 . . 9062 . . 5175 . . 10553 . . 7812 . .GO-15-LN2 7078 . . 9146 . . 5259 . . 11135 . . 8154 . .
Grasshancer 100 6860 . . 8249 . . 5825 . . 11003 . . 7984 . .Grazer 7329 8254 8306 8880 6874 6618 5557 8740 9392 11362 11877 11296 8282 8936 8903Jackson 6795 8632 8930 9449 6662 7020 5033 9606 10121 10707 11266 11006 7996 9041 9269Jumbo 7993 8882 . 8952 7697 . 6458 9429 . 11278 12059 . 8670 9517 .KoSpeed 6556 . . 5798 . . 9046 . . 11910 . . 8327 . .
KoWinearly 6229 . . 4762 . . 9711 . . 11053 . . 7939 . .Lonestar 6675 8191 8728 9275 7351 7588 6080 9381 10159 11108 11063 10715 8284 8996 9297LWD8 6959 8243 . 5509 7140 . 9211 9165 . 11681 12327 . 8340 9219 .LWT12 6915 8432 . 5831 7225 . 9081 9295 . 11109 11964 . 8234 9229 .M2CVS 7198 8665 9116 9209 7782 7845 5626 9643 10136 11389 12435 12017 8356 9631 9778
Marshall 7525 8985 9374 10022 7738 7784 6001 10441 10900 11393 12593 12277 8735 9939 10084Maximus 6904 8360 8784 9797 7324 7213 6076 9394 9812 11185 11676 11052 8491 9189 9215ME4 8124 9520 9909 9024 7991 8164 5769 10013 11017 11338 12270 11741 8564 9948 10207ME94 7645 8877 . 5658 7551 . 9083 9421 . 11536 12335 . 8480 9546 .Meroa 5489 6651 . 5324 6410 . 9206 10975 . 11079 11447 . 7774 8871 .
--------------------------------------------------------- lb/acre ---------------------------------------------------------
Statewide Summary:Ryegrass Forage Yields, 2015-2016with Two- and Three-Year Averages
Dry Forage YieldTifton Plains Griffin Calhoun Statewide
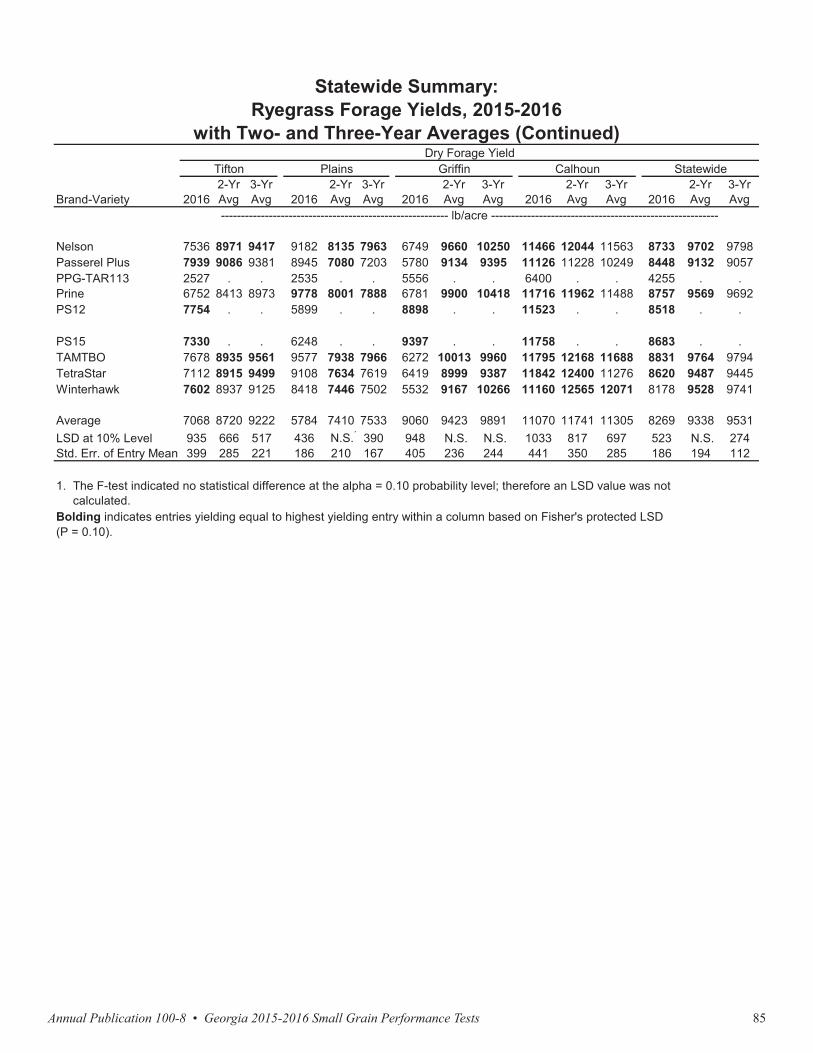
Annual Publication 100-8 • Georgia 2015-2016 Small Grain Performance Tests 85
Brand-Variety 20162-YrAvg
3-YrAvg 2016
2-YrAvg
3-YrAvg 2016
2-YrAvg
3-YrAvg 2016
2-YrAvg
3-YrAvg 2016
2-YrAvg
3-YrAvg
Andes 8037 9034 . 8621 7139 . 5615 9280 . 10788 11955 . 8265 9352 .Attain 7613 9012 9433 8787 7837 7582 6233 9251 9817 11747 11609 11477 8595 9427 9577BAR LM 15425 6272 . . 9050 . . 5884 . . 11090 . . 8074 . .BAR LM 15426 5739 . . 8541 . . 5868 . . 11306 . . 7863 . .BAR LM 15427 5957 . . 8797 . . 5350 . . 10317 . . 7605 . .
Big Boss 7841 8997 9517 8713 7652 7603 6518 9022 9423 11367 11764 11611 8610 9359 9539Credence 7515 . . 9144 . . 6169 . . 11173 . . 8500 . .Diamond T 7242 8526 9001 8648 7322 7319 6552 9001 9412 11120 11381 11223 8390 9058 9239Earlyploid 7394 9138 9523 9542 7158 7091 5774 9231 9584 11542 11600 10953 8563 9282 9288FL ER . . . . . . . . . 9238 9818 9383 . . .
FL ME . . . . . . . . . 9415 . . . . .FL PEER . . . . . . . . . 10002 11905 11592 . . .FL Red 4x LATE . . . . . . . . . 11345 . . . . .FL4XMarmid 7569 9381 9449 8809 7079 7268 5742 8784 9413 10906 11393 . 8256 9159 .FL4XMarona 7645 8774 9192 9740 7194 7289 5426 9118 9068 10598 10503 . 8352 8897 .
FLAT1 7601 . . 8953 . . 6249 . . 11399 . . 8550 . .FL-AT2 8080 9000 . 9468 6971 . 6205 9452 . 11349 11826 . 8775 9312 .Flying A 7525 9179 9315 8642 7822 7682 6315 8995 9653 10632 10940 10774 8278 9234 9356Fria 7220 8580 9136 9235 7885 7979 5521 9362 10136 11537 12619 11955 8378 9612 9801GALM1401 6589 8626 . 9801 7091 . 5311 9658 . 11226 11325 . 8232 9175 .
GALM1403 7013 8405 . 9756 7166 . 5684 9172 . 11634 11402 . 8522 9036 .GALM1513M 6893 . . 9475 . . 5692 . . 11737 . . 8449 . .GALM1514A 7362 . . 8725 . . 6212 . . 11377 . . 8419 . .GALM1515F 6458 . . 9062 . . 5175 . . 10553 . . 7812 . .GO-15-LN2 7078 . . 9146 . . 5259 . . 11135 . . 8154 . .
Grasshancer 100 6860 . . 8249 . . 5825 . . 11003 . . 7984 . .Grazer 7329 8254 8306 8880 6874 6618 5557 8740 9392 11362 11877 11296 8282 8936 8903Jackson 6795 8632 8930 9449 6662 7020 5033 9606 10121 10707 11266 11006 7996 9041 9269Jumbo 7993 8882 . 8952 7697 . 6458 9429 . 11278 12059 . 8670 9517 .KoSpeed 6556 . . 5798 . . 9046 . . 11910 . . 8327 . .
KoWinearly 6229 . . 4762 . . 9711 . . 11053 . . 7939 . .Lonestar 6675 8191 8728 9275 7351 7588 6080 9381 10159 11108 11063 10715 8284 8996 9297LWD8 6959 8243 . 5509 7140 . 9211 9165 . 11681 12327 . 8340 9219 .LWT12 6915 8432 . 5831 7225 . 9081 9295 . 11109 11964 . 8234 9229 .M2CVS 7198 8665 9116 9209 7782 7845 5626 9643 10136 11389 12435 12017 8356 9631 9778
Marshall 7525 8985 9374 10022 7738 7784 6001 10441 10900 11393 12593 12277 8735 9939 10084Maximus 6904 8360 8784 9797 7324 7213 6076 9394 9812 11185 11676 11052 8491 9189 9215ME4 8124 9520 9909 9024 7991 8164 5769 10013 11017 11338 12270 11741 8564 9948 10207ME94 7645 8877 . 5658 7551 . 9083 9421 . 11536 12335 . 8480 9546 .Meroa 5489 6651 . 5324 6410 . 9206 10975 . 11079 11447 . 7774 8871 .
--------------------------------------------------------- lb/acre ---------------------------------------------------------
Statewide Summary:Ryegrass Forage Yields, 2015-2016with Two- and Three-Year Averages
Dry Forage YieldTifton Plains Griffin Calhoun Statewide
Brand-Variety 20162-YrAvg
3-YrAvg 2016
2-YrAvg
3-YrAvg 2016
2-YrAvg
3-YrAvg 2016
2-YrAvg
3-YrAvg 2016
2-YrAvg
3-YrAvg
Nelson 7536 8971 9417 9182 8135 7963 6749 9660 10250 11466 12044 11563 8733 9702 9798Passerel Plus 7939 9086 9381 8945 7080 7203 5780 9134 9395 11126 11228 10249 8448 9132 9057PPG-TAR113 2527 . . 2535 . . 5556 . . 6400 . . 4255 . .Prine 6752 8413 8973 9778 8001 7888 6781 9900 10418 11716 11962 11488 8757 9569 9692PS12 7754 . . 5899 . . 8898 . . 11523 . . 8518 . .
PS15 7330 . . 6248 . . 9397 . . 11758 . . 8683 . .TAMTBO 7678 8935 9561 9577 7938 7966 6272 10013 9960 11795 12168 11688 8831 9764 9794TetraStar 7112 8915 9499 9108 7634 7619 6419 8999 9387 11842 12400 11276 8620 9487 9445Winterhawk 7602 8937 9125 8418 7446 7502 5532 9167 10266 11160 12565 12071 8178 9528 9741
Average 7068 8720 9222 5784 7410 7533 9060 9423 9891 11070 11741 11305 8269 9338 9531LSD at 10% Level 935 666 517 436 N.S.1 390 948 N.S. N.S. 1033 817 697 523 N.S. 274Std. Err. of Entry Mean 399 285 221 186 210 167 405 236 244 441 350 285 186 194 112
--------------------------------------------------------- lb/acre ---------------------------------------------------------
1. The F-test indicated no statistical difference at the alpha = 0.10 probability level; therefore an LSD value was not calculated.Bolding indicates entries yielding equal to highest yielding entry within a column based on Fisher's protected LSD(P = 0.10).
Statewide Summary:Ryegrass Forage Yields, 2015-2016
with Two- and Three-Year Averages (Continued)Dry Forage Yield
Tifton Plains Griffin Calhoun Statewide
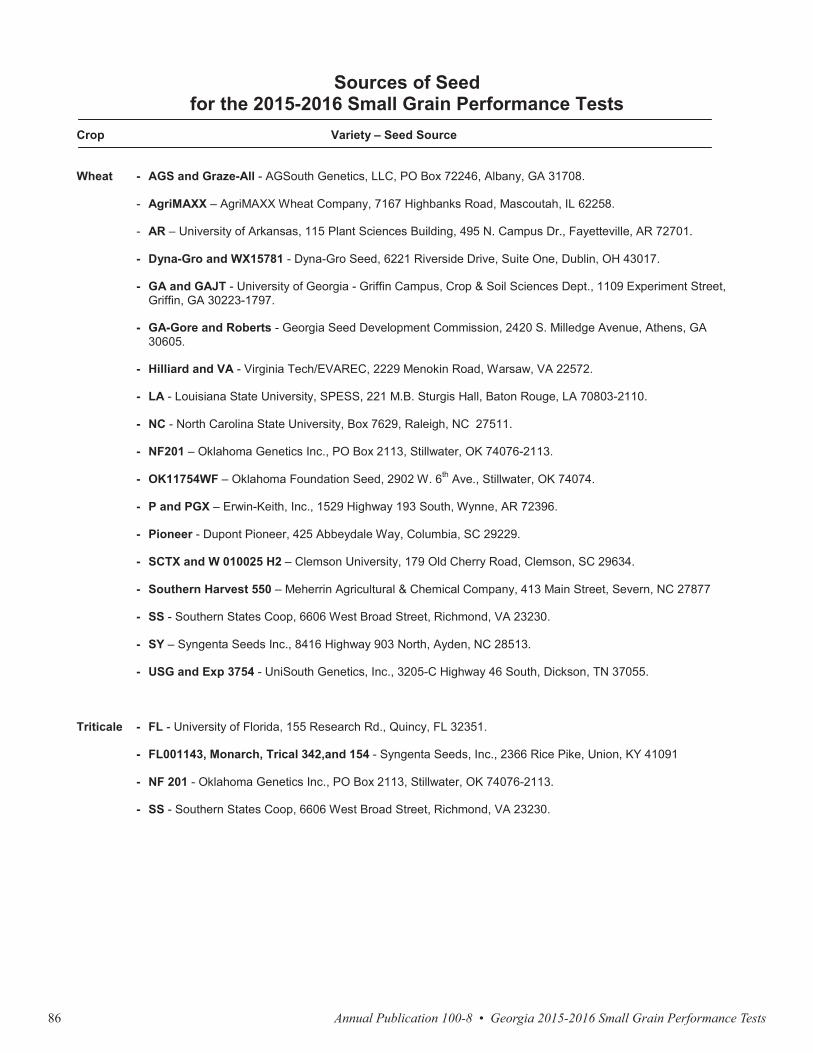
Annual Publication 100-8 • Georgia 2015-2016 Small Grain Performance Tests86
Sources of Seedfor the 2015-2016 Small Grain Performance Tests
Crop Variety – Seed Source
Wheat - AGS and Graze-All - AGSouth Genetics, LLC, PO Box 72246, Albany, GA 31708.
- AgriMAXX – AgriMAXX Wheat Company, 7167 Highbanks Road, Mascoutah, IL 62258.
- AR – University of Arkansas, 115 Plant Sciences Building, 495 N. Campus Dr., Fayetteville, AR 72701.
- Dyna-Gro and WX15781 - Dyna-Gro Seed, 6221 Riverside Drive, Suite One, Dublin, OH 43017.
- GA and GAJT - University of Georgia - Griffin Campus, Crop & Soil Sciences Dept., 1109 Experiment Street, Griffin, GA 30223-1797.
- GA-Gore and Roberts - Georgia Seed Development Commission, 2420 S. Milledge Avenue, Athens, GA30605.
- Hilliard and VA - Virginia Tech/EVAREC, 2229 Menokin Road, Warsaw, VA 22572.
- LA - Louisiana State University, SPESS, 221 M.B. Sturgis Hall, Baton Rouge, LA 70803-2110.
- NC - North Carolina State University, Box 7629, Raleigh, NC 27511.
- NF201 – Oklahoma Genetics Inc., PO Box 2113, Stillwater, OK 74076-2113.
- OK11754WF – Oklahoma Foundation Seed, 2902 W. 6th Ave., Stillwater, OK 74074.
- P and PGX – Erwin-Keith, Inc., 1529 Highway 193 South, Wynne, AR 72396.
- Pioneer - Dupont Pioneer, 425 Abbeydale Way, Columbia, SC 29229.
- SCTX and W 010025 H2 – Clemson University, 179 Old Cherry Road, Clemson, SC 29634.
- Southern Harvest 550 – Meherrin Agricultural & Chemical Company, 413 Main Street, Severn, NC 27877
- SS - Southern States Coop, 6606 West Broad Street, Richmond, VA 23230.
- SY – Syngenta Seeds Inc., 8416 Highway 903 North, Ayden, NC 28513.
- USG and Exp 3754 - UniSouth Genetics, Inc., 3205-C Highway 46 South, Dickson, TN 37055.
Triticale - FL - University of Florida, 155 Research Rd., Quincy, FL 32351.
- FL001143, Monarch, Trical 342,and 154 - Syngenta Seeds, Inc., 2366 Rice Pike, Union, KY 41091
- NF 201 - Oklahoma Genetics Inc., PO Box 2113, Stillwater, OK 74076-2113.
- SS - Southern States Coop, 6606 West Broad Street, Richmond, VA 23230.
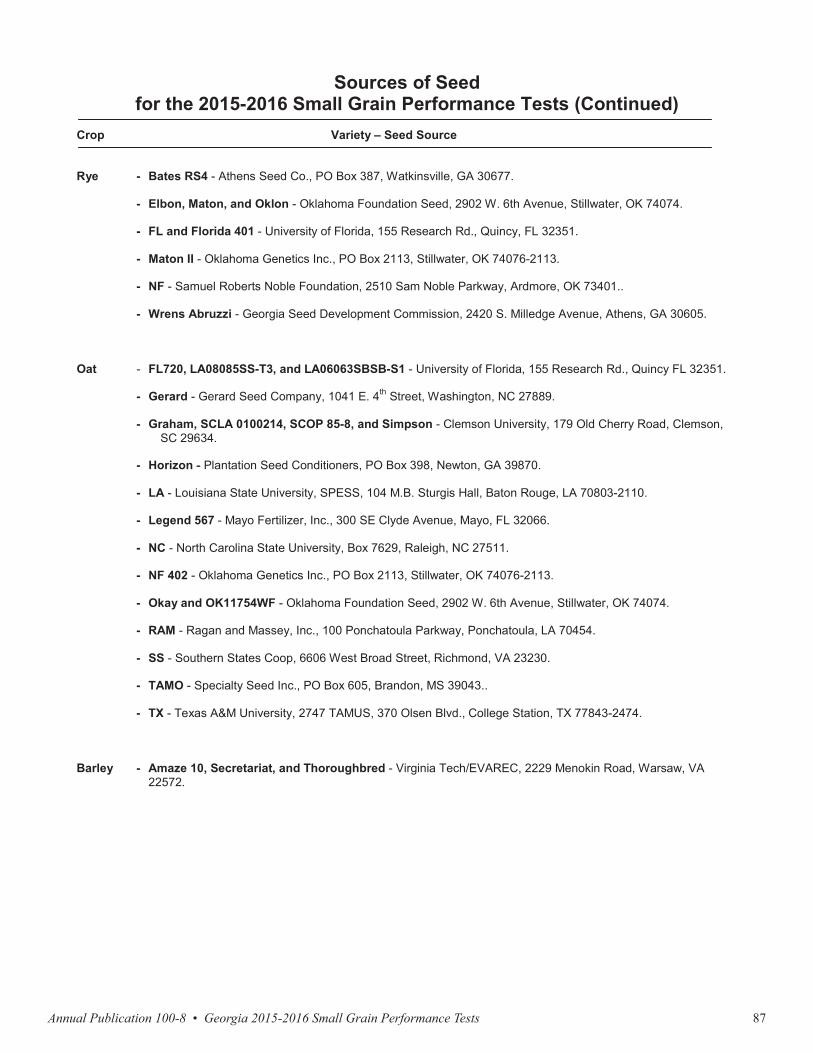
Annual Publication 100-8 • Georgia 2015-2016 Small Grain Performance Tests 87
Sources of Seedfor the 2015-2016 Small Grain Performance Tests (Continued)
Crop Variety – Seed Source
Rye - Bates RS4 - Athens Seed Co., PO Box 387, Watkinsville, GA 30677.
- Elbon, Maton, and Oklon - Oklahoma Foundation Seed, 2902 W. 6th Avenue, Stillwater, OK 74074.
- FL and Florida 401 - University of Florida, 155 Research Rd., Quincy, FL 32351.
- Maton II - Oklahoma Genetics Inc., PO Box 2113, Stillwater, OK 74076-2113.
- NF - Samuel Roberts Noble Foundation, 2510 Sam Noble Parkway, Ardmore, OK 73401..
- Wrens Abruzzi - Georgia Seed Development Commission, 2420 S. Milledge Avenue, Athens, GA 30605.
Oat - FL720, LA08085SS-T3, and LA06063SBSB-S1 - University of Florida, 155 Research Rd., Quincy FL 32351.
- Gerard - Gerard Seed Company, 1041 E. 4th Street, Washington, NC 27889.
- Graham, SCLA 0100214, SCOP 85-8, and Simpson - Clemson University, 179 Old Cherry Road, Clemson, SC 29634.
- Horizon - Plantation Seed Conditioners, PO Box 398, Newton, GA 39870.
- LA - Louisiana State University, SPESS, 104 M.B. Sturgis Hall, Baton Rouge, LA 70803-2110.
- Legend 567 - Mayo Fertilizer, Inc., 300 SE Clyde Avenue, Mayo, FL 32066.
- NC - North Carolina State University, Box 7629, Raleigh, NC 27511.
- NF 402 - Oklahoma Genetics Inc., PO Box 2113, Stillwater, OK 74076-2113.
- Okay and OK11754WF - Oklahoma Foundation Seed, 2902 W. 6th Avenue, Stillwater, OK 74074.
- RAM - Ragan and Massey, Inc., 100 Ponchatoula Parkway, Ponchatoula, LA 70454.
- SS - Southern States Coop, 6606 West Broad Street, Richmond, VA 23230.
- TAMO - Specialty Seed Inc., PO Box 605, Brandon, MS 39043..
- TX - Texas A&M University, 2747 TAMUS, 370 Olsen Blvd., College Station, TX 77843-2474.
Barley - Amaze 10, Secretariat, and Thoroughbred - Virginia Tech/EVAREC, 2229 Menokin Road, Warsaw, VA 22572.
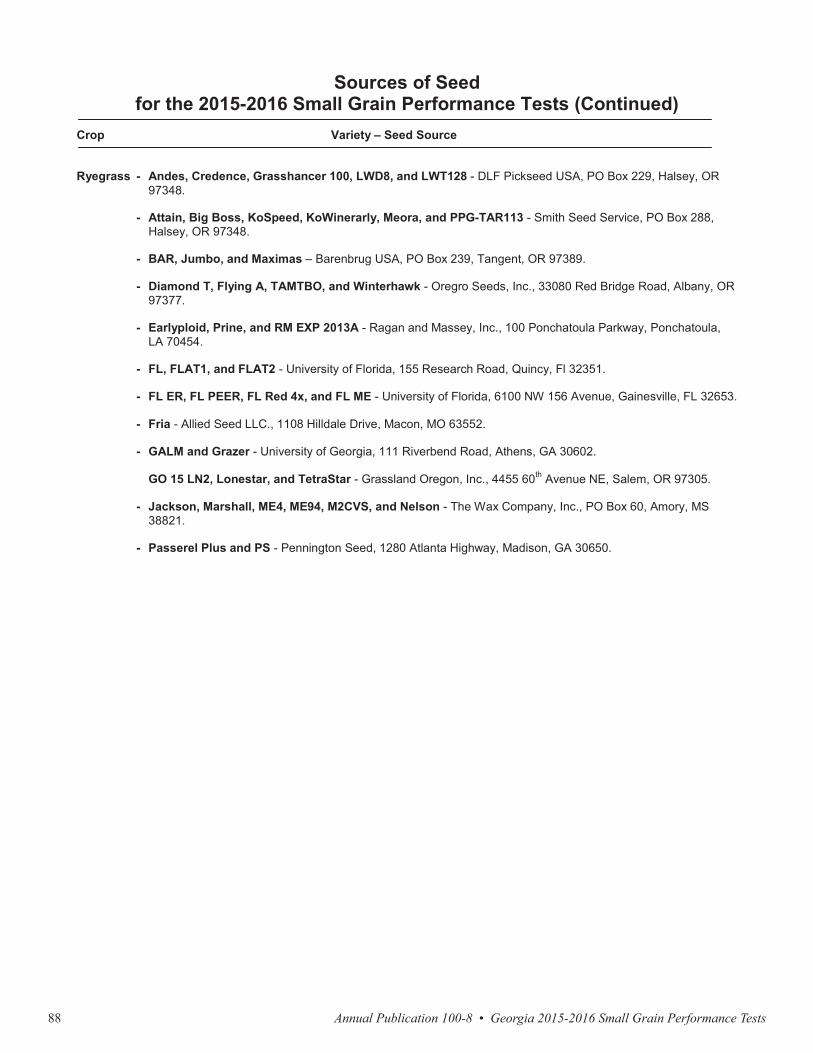
Annual Publication 100-8 • Georgia 2015-2016 Small Grain Performance Tests88
Sources of Seedfor the 2015-2016 Small Grain Performance Tests (Continued)
Crop Variety – Seed Source
Ryegrass - Andes, Credence, Grasshancer 100, LWD8, and LWT128 - DLF Pickseed USA, PO Box 229, Halsey, OR 97348.
- Attain, Big Boss, KoSpeed, KoWinerarly, Meora, and PPG-TAR113 - Smith Seed Service, PO Box 288, Halsey, OR 97348.
- BAR, Jumbo, and Maximas – Barenbrug USA, PO Box 239, Tangent, OR 97389.
- Diamond T, Flying A, TAMTBO, and Winterhawk - Oregro Seeds, Inc., 33080 Red Bridge Road, Albany, OR 97377.
- Earlyploid, Prine, and RM EXP 2013A - Ragan and Massey, Inc., 100 Ponchatoula Parkway, Ponchatoula, LA 70454.
- FL, FLAT1, and FLAT2 - University of Florida, 155 Research Road, Quincy, Fl 32351.
- FL ER, FL PEER, FL Red 4x, and FL ME - University of Florida, 6100 NW 156 Avenue, Gainesville, FL 32653.
- Fria - Allied Seed LLC., 1108 Hilldale Drive, Macon, MO 63552.
- GALM and Grazer - University of Georgia, 111 Riverbend Road, Athens, GA 30602.
GO 15 LN2, Lonestar, and TetraStar - Grassland Oregon, Inc., 4455 60th Avenue NE, Salem, OR 97305.
- Jackson, Marshall, ME4, ME94, M2CVS, and Nelson - The Wax Company, Inc., PO Box 60, Amory, MS 38821.
- Passerel Plus and PS - Pennington Seed, 1280 Atlanta Highway, Madison, GA 30650.
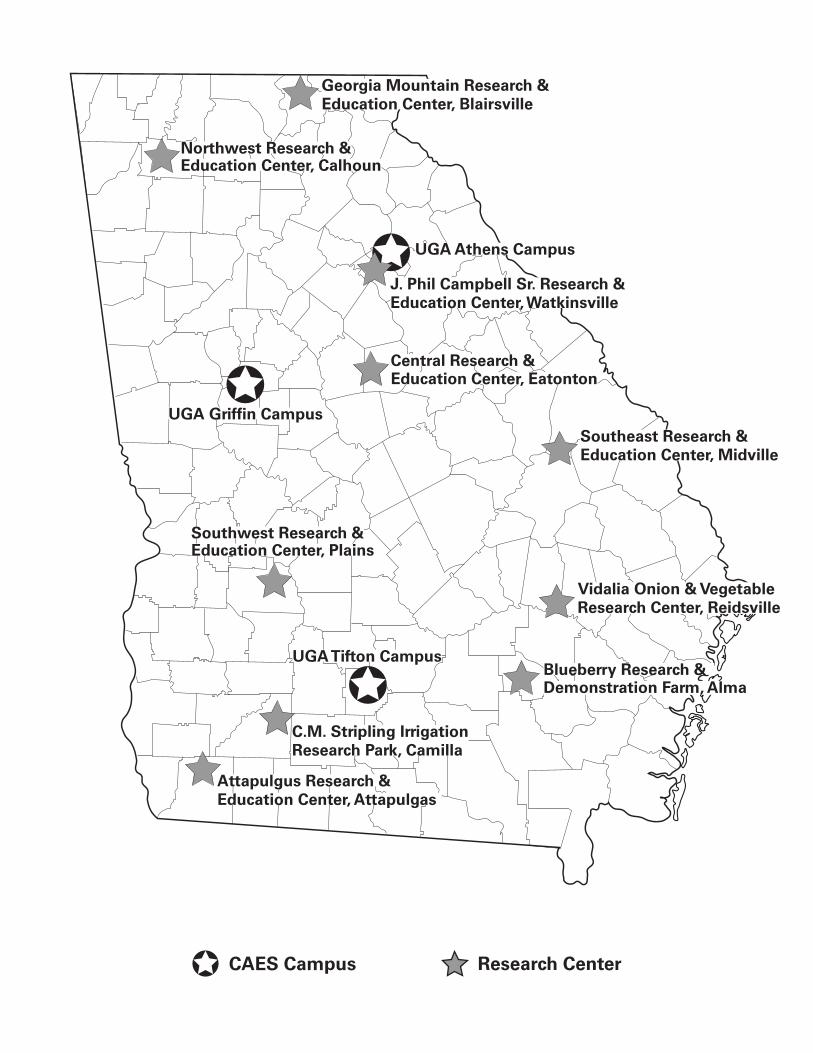
Research CenterCAES Campus
Georgia Mountain Research & Education Center, Blairsville
Education Center, CalhounNorthwest Research &
UGA Athens Campus
UGA Griffin Campus
UGA Tifton Campus
Central Research & Education Center, Eatonton
J. Phil Campbell Sr. Research & Education Center, Watkinsville
Southeast Research & Education Center, Midville
Education Center, PlainsSouthwest Research &
Vidalia Onion & Vegetable Research Center, Reidsville
Blueberry Research & Demonstration Farm, Alma
C.M. Stripling Irrigation Research Park, Camilla
Education Center, AttapulgasAttapulgus Research &

University of GeorgiaAgricultural Experiment StationsAthens, Georgia 30602Robert Shulstad, Associate Dean
PublicationPenalty for Private Use $300
ADDRESS CORRECTION REQUESTED
Published by the University of Georgia in cooperation with Fort Valley State University, the U.S. Department of Agriculture, and counties of the state. For more information, contact your local UGA Cooperative Extension office.
The University of Georgia is committed to principles of equal opportunity and affirmative action.
“CERTIFIED SEED DOESN’T COST ... IT PAYS”
HERE’S WHY:• Known performance of varieties adapted to
your area.• A pedigree record that begins with the
release of breeder seed and continues until it reaches the consumer as certified (blue tag) seed.
• Field inspected for trueness to variety and inseparable from other crop and weed seed.
• Certified seed can only be conditioned in an approved facility.
• Certified seed must meet high quality standards as to germination and purity.
• Free of noxious weeds.
The planting of CERTIFIED SEED eliminates many of the risks associated with crop production. For
sources of certified seed, contact your local county Extension agent or the Georgia Crop Improvement
Association, Inc. at 706-542-2351.