Statewide Airfield - NET
106
Statewide Airfield NOVEMBER 2019 FLORIDA DEPARTMENT OF TRANSPORTATION AVIATION AND SPACEPORTS OFFICE Pavement Management Program DISTRICT 6
-
Upload
khangminh22 -
Category
Documents
-
view
0 -
download
0
Transcript of Statewide Airfield - NET

Statewide Airfield
N OV E M B E R 2 0 1 9
F L O R I DA D E PA RT M E N T O F T R A N S P O RTAT I O NAV I AT I O N A N D S PA C E P O RT S O F F I C E
Pavement Management Program
D I S T R I C T 6

Florida Department of Transportation
Statewide Airfield Pavement Management Program
Prepared by: FDOT Aviation and Spaceports Office 605 Suwannee Street Tallahassee, Florida 32399-0450

Table of Contents Executive Summary ....................................................................................................... 9
Program Background .................................................................................................. 9
Summary of Results .................................................................................................. 10 Pavement Condition Index (Latest Inspection) ..................................................................... 10 Runway Pavement Condition Index ..................................................................................... 10 Major Rehabilitation Planning .............................................................................................. 13
Summary of District 6 ............................................................................................... 14 Chapter 1 – Introduction .............................................................................................. 16
1.1 Background ......................................................................................................... 16
1.2 Statewide Airfield Pavement Management Program (SAPMP) Update .............. 16
1.3 Organization ........................................................................................................ 17 1.3.1 Florida Department of Transportation Aviation and Spaceports Office Program Manager
.......................................................................................................................................... 17 1.3.2 Participating Florida Public-Use and Publicly Owned Airports ...................................... 18 1.3.3 Florida Department of Transportation District Offices ................................................... 18 1.3.4 Consultant.................................................................................................................. 18
1.4 Purpose of District Pavement Evaluation Report .............................................. 20
1.5 History of the Program ........................................................................................ 20
1.6 Federal Aviation Administration (FAA) .............................................................. 22
1.7 FDOT SAPMP Objectives and Components ....................................................... 22 1.7.1 Program Objectives .................................................................................................... 22 1.7.2 Program Components ................................................................................................. 22
1.8 References........................................................................................................... 26
Chapter 2 – Methodology ............................................................................................. 28
2.1 Airfield Pavement Database ................................................................................ 28
2.2 Airfield Pavement System Inventory .................................................................. 28 2.2.1 Pavement Management Program Network Definition Terminology ................................ 29
2.3 Airfield Pavement Structure................................................................................ 31 2.3.1 Pavement Structure Types.......................................................................................... 31
2.4 Airfield Pavement Work History ......................................................................... 33 2.4.1 Airfield Pavement Record Keeping .............................................................................. 33
2.5 Airfield Pavement Traffic .................................................................................... 33
2.6 Airfield Pavement Condition Index (PCI) Survey ............................................... 33 2.6.1 PCI Survey Methodology ............................................................................................ 33 2.6.2 Pavement Distress Types ........................................................................................... 35 2.6.3 PCI Survey Inspection Procedures .............................................................................. 39 2.6.4 Updates to the ASTM D5340-12 ................................................................................. 40
Chapter 3 – Airfield Pavement System Inventory ....................................................... 43

3.1 Airfield Pavement Network Information ............................................................. 43 3.1.1 Previous and/or Anticipated Airfield Pavement Construction ........................................ 43 3.1.2 Estimated Pavement Age............................................................................................ 44 3.1.3 Functional Use Classification ...................................................................................... 45
Chapter 4 – Airfield Pavement Condition .................................................................... 48
4.1 Airfield Pavement Condition Index (Latest Inspection) ..................................... 48 4.1.1 District-Level Analysis ................................................................................................ 48 4.1.2 PCI by Functional Use ................................................................................................ 48 4.1.3 PCI by Surface Type .................................................................................................. 50
4.2 Forecasted Pavement Conditions....................................................................... 51 4.2.1 Performance Models and Prediction Curves ................................................................ 51 4.2.2 Network-Level Pavement Condition Forecast .............................................................. 51 4.2.3 Runway-Level Pavement Condition Forecast............................................................... 52 4.2.4 Taxiway-Level Pavement Condition Forecast .............................................................. 52 4.2.5 Apron-Level Pavement Condition Forecast .................................................................. 53 4.2.6 Forecasted PCI Considerations .................................................................................. 53
Chapter 5 – Localized Maintenance and Repair Planning .......................................... 55
5.1 Localized Maintenance and Repair ..................................................................... 55
5.2 Localized Maintenance and Repair Policy.......................................................... 56
5.3 Localized Maintenance and Repair Analysis and Recommendations ............... 59
Chapter 6 – Major Rehabilitation Planning .................................................................. 62
6.1 Major Rehabilitation ............................................................................................ 62 6.1.1 Critical PCI ................................................................................................................. 64 6.1.2 FDOT Recommended Minimum Service-Level PCI ...................................................... 64
6.2 Major Rehabilitation Policy ................................................................................. 65 6.2.1 Major Rehabilitation Pavement Section Development .................................................. 65 6.2.2 Major Rehabilitation Planning-Level Unit Costs ........................................................... 67
6.3 Major Rehabilitation Needs ................................................................................. 68 6.3.1 10-Year Unconstrained Budget Major Rehabilitation Needs ......................................... 69
Chapter 7 – Conclusion ................................................................................................ 71
7.1 Recommendations .............................................................................................. 71 7.1.1 Continued PCI Survey Inspections .............................................................................. 71 7.1.2 Localized Maintenance and Repair ............................................................................. 71 7.1.3 Major Rehabilitation.................................................................................................... 71 7.1.4 Pavement Management System .................................................................................. 71
7.2 Supporting Documents ....................................................................................... 72 Airfield Pavement Condition Index Exhibits .......................................................................... 72 Airfield Pavement Major Rehabilitation Exhibits ................................................................... 72
7.3 Conclusion .......................................................................................................... 72

Appendix A District Section Condition Report
Appendix B Pavement Condition Index Exhibits
Appendix C Airfield Pavement Major Rehabilitation Tables
Appendix D Major Rehabilitation Exhibits

List of Figures
Figure E-3 Runway Condition ...................................................................................... 11
Figure E-4 Runway Pavement Condition Index Comparison to FDOT Minimum PCI . 11
Figure E-6 PCI by Pavement Functional Use by Airport ............................................. 12
Figure 1.2 Florida Aviation System (Facilities with Pavement) and FDOT Districts .. 17
Figure 1.7.2 (a) Typical Pavement Condition Life Cycle ............................................. 23
Figure 1.7.2 (b) General Pavement Treatments by Condition Range ......................... 24
Figure 1.7.2 (c) Flexible Asphalt Concrete .................................................................. 25
Figure 1.7.2 (d) Rigid Portland Cement Concrete ....................................................... 25
Figure 3.1.2 Average Age of Pavements at Inspection ............................................... 44
Figure 3.1.3 (a) District Pavement Area by Functional Classification Use ................. 45
Figure 3.1.3 (b) Functional Classification Use by Area by Airport ............................. 46
Figure 4.1.2 (a) PCI by Pavement Functional Use by Airport ..................................... 49
Figure 4.1.2 (b) PCI by Pavement Functional Use ....................................................... 50
Figure 4.1.3 PCI by Pavement Surface Type ............................................................... 50
Figure 6.1 (a) Major Rehabilitation Planning Decision Diagram, PCI ≤ Critical PCI ... 62
Figure 6.1 (b) Major Rehabilitation Planning Decision Diagram, PCI > Critical PCI .. 63

List of Tables
Table E-1 Pavement Condition Index Summary (Last Inspection) –by Airport .......... 10
Table E-2 Runway Pavement Condition Index by Airport ........................................... 10
Table E-5 District Summary of Area by Use by Airport............................................... 12
Table E-7 Major Rehabilitation Planning Year 1 .......................................................... 13
Table E-8 Major Rehabilitation Planning 10-Year (2018-2029) .................................... 13
Table E-9 Major Rehabilitation Needs by Airport (2018-2029) .................................... 13
Table E-10 Year 1 Runway Major Rehabilitation Needs .............................................. 14
Table 2.2.1 Airfield Pavement Database Network Definition Terminology ................. 30
Table 2.6.2 (a) Pavement Distress Types – Flexible Asphalt Concrete-Surfaced
Airfields ........................................................................................................................ 35
Table 2.6.2 (b) Pavement Distresses Possible Causes – Flexible Asphalt Concrete-
Surfaced Airfields ........................................................................................................ 36
Table 2.6.2 (c) Pavement Distresses Possible Effects – Flexible Asphalt Concrete-
Surfaced Airfields ........................................................................................................ 36
Table 2.6.2 (d) Pavement Distresses – Rigid Portland Cement Concrete-Surfaced
Airfields ........................................................................................................................ 37
Table 2.6.2 (e) Pavement Distresses Possible Causes – Rigid Portland Cement
Concrete-Surfaced Airfields ........................................................................................ 38
Table 2.6.2 (f) Pavement Distresses Possible Effects – Rigid Portland Cement
Concrete-Surfaced Airfields ........................................................................................ 38
Table 2.6.3 (a) Recommended Sample Rate Schedule for Flexible Asphalt Concrete 39
Table 2.6.3 (b) Recommended Sample Rate Schedule for Rigid Portland Cement
Concrete ....................................................................................................................... 39
Table 2.6.4 Summary of Updates to ASTM D5340-12 .................................................. 41
Table 3.1.3 Functional Classification Use by Area by Airport .................................... 45
Table 4.1.1 Latest Condition – Summary by Airport ................................................... 48
Table 4.2.2 Forecasted Network Pavement Performance ........................................... 51

Table 4.2.3 Forecasted Runway Pavement Performance ............................................ 52
Table 4.2.4 Forecasted Taxiway Pavement Performance............................................ 52
Table 4.2.5 Forecasted Apron Pavement Performance ............................................... 53
Table 5.2 (a) Localized Maintenance and Repair – Flexible Asphalt Concrete .......... 56
Table 5.2 (b) Localized Maintenance and Repair – Rigid Portland Cement Concrete 57
Table 5.2 (c) Localized M&R Planning-Level Unit Costs – Flexible Asphalt Concrete
...................................................................................................................................... 59
Table 5.2 (d) Localized M&R Planning-Level Unit Costs – Rigid Portland Cement
Concrete ....................................................................................................................... 59
Table 5.3 Summary of Localized M&R Planning Needs by Airport ............................. 60
Table 6.1.2 FDOT Recommended Minimum Service-Level PCI ................................... 64
Table 6.2.1 (a) Conceptual Pavement Section for Major Rehabilitation – Flexible
Asphalt Concrete .......................................................................................................... 65
Table 6.2.1 (b) Conceptual Pavement Section for Major Rehabilitation – Rigid
Portland Cement Concrete ........................................................................................... 66
Table 6.2.2 Major Rehabilitation Planning-Level Unit Cost by Pavement Type ......... 67
Table 6.3 Summary of District Year 1 Major Rehabilitation Needs ............................. 68
Table 6.3.1(a) Summary of 10-Year Major Rehabilitation Needs by Airport ............... 69
Table 6.3.1. (b) 10-Year Major Rehabilitation Needs by Airport .................................. 69

Executive Summary

Executive Summary | 9
Executive Summary
Program Background
Airport airfield pavement infrastructure facilities represent a large capital investment in the
Florida Airport System. Timely and appropriate maintenance and strategic rehabilitation
are essential as repair costs increase significantly in proportion to deterioration. Airport
pavement distresses can also contribute to the development of loose debris and
decreased ride quality, which can be a safety concern for aircraft operations.
In 2016, the Florida Department of Transportation (FDOT) Aviation and Spaceports Office
(ASO) selected Kimley-Horn and Associates, Inc. with subconsultants Airfield Pavement
Management Systems, LLC and AVCON, Inc. to provide professional services in support
of FDOT in the continued efforts of performing a system update to the Statewide Airfield
Pavement Management Program (SAPMP). This work is to be completed from fiscal year
2016 through fiscal year 2019. The SAPMP has 95 public use airport facilities throughout
the seven FDOT Districts that participate in the system update. The results of this system
update are presented in this report and can be utilized by FDOT and the Federal Aviation
Administration (FAA) to identify, prioritize, and schedule pavement maintenance, repair,
and major rehabilitation projects.
Pavement condition was assessed utilizing the pavement condition index (PCI)
methodology as defined in the FAA Advisory Circular 150/5380-7B “Airport Pavement
Management Program (PMP)” using the documented procedures set forth by ASTM
D5340-12 “Standard Test Method for Airport Pavement Condition Index Surveys.”
Pavement deterioration, in accordance with the ASTM D5340-12, was characterized in
terms of distinct distress types, severity level of distress, and quantity of distress. This
information is utilized to calculate a PCI numeric that represents the overall condition of
the pavement in a numeric index that ranges from 0 (a condition category of FAILED) to
100 (GOOD). The PCI methodology analyzes an overall measure of the pavement
condition and provides an indication of the degree of maintenance, repair, or rehabilitation
efforts that will be required to sustain functional pavement.
The tasks required for the system update at each participating airport consist of the
following:
Obtain recent and anticipated airfield pavement construction work data.
Update airport airfield pavement system inventory records (construction histo ry,
identification, geometry, and facility classification).
Perform PCI Survey Inspections at each participating airport.
Update the FDOT SAPMP PAVERTM database system.
Update the FDOT SAPMP GIS Airfield Navigation GPS enabled Maps.
Update airfield pavement performance models and pavement condition forecasting.
Identification of planning-level maintenance, repair, and major rehabilitation to
address pavement needs based on functional PCI analysis.
Development of planning-level opinion of probable construction costs for pavement
rehabilitation.

Executive Summary | 10
Summary of Results
PAVEMENT CONDITION INDEX (LATEST INSPECTION)
Ta b le E- 1 Pa vem e nt Con d i t i o n I n de x S umm a ry ( La s t I ns p ec t i o n) –b y Ai r po r t
Network ID
Airport Type
Area-Weighted Pavement Condition Index (PCI)
Runway Taxiway Taxilane Apron Overall Airfield
PCI PCI PCI PCI PCI
EYW PR 100 52 - 71 74
MTH GA 51 63 - 59 58
OPF RL 55 61 38 56 58
TMB RL 70 73 - 68 70
TNT GA 50 59 - 42 54
X51 GA 70 59 - 64 65
OVERALL DISTRICT 62 63 38 62 62
PCI Rating Scale Good Satisfactory Fair Poor Very Poor Serious Failed
PCI Values 100-86 85-71 70-56 55-41 40-26 25-11 10-0
RUNWAY PAVEMENT CONDITION INDEX
Ta b le E- 2 Ru n wa y Pav em en t Co n di t i on I n d ex by Ai r po r t
Network ID
Airport Type
Branch ID Branch Name Length (Feet)
Width (Feet)
Area-Weighted
PCI PCI Rating
Below FDOT Minimum PCI of 75
EYW PR RW 9-27 RUNWAY 9-27 5,076 100 100 GOOD
MTH GA RW 7-25 RUNWAY 7-25 5,008 100 51 POOR X
OPF RL RW 12-30 RUNWAY 12-30 6,800 150 48 POOR X
OPF RL RW 9L-27R RUNWAY 9L-27R 8,002 150 56 FAIR X
OPF RL RW 9R-27L RUNWAY 9R-27L 4,309 100 65 FAIR X
TMB RL RW 13-31 RUNWAY 13-31 4,001 150 70 FAIR X
TMB RL RW 9L-27R RUNWAY 9L-27R 5,003 150 72 SATISFACTORY X
TMB RL RW 9R-27L RUNWAY 9R-27L 6,000 150 70 FAIR X
TNT GA RW 9-27 RUNWAY 9-27 10,499 150 50 POOR X
X51 GA RW 10-28 RUNWAY 10-28 3,000 75 67 FAIR X
X51 GA RW 18-36 RUNWAY 18-36 3,999 100 72 SATISFACTORY X

Executive Summary | 11
Fi g u re E- 3 Ru n way Co n di t i o n
Fi g u re E- 4 Ru n way Pa v em en t Co nd i t io n I n de x Com p ar i s o n to FDOT Mi nim um PCI
9%
91%
FDOT District 6 Runway Condition
Runways Above FDOT Minimum Service Level PCI 75
Runways Below FDOT Minimum Service Level PCI 75
100
5148
56
65
7072
70
50
6772
0
25
50
75
100
EY
W -
RW
9-2
7
MT
H -
RW
7-2
5
OP
F -
RW
12-3
0
OP
F -
RW
9L-2
7R
OP
F -
RW
9R
-27L
TM
B -
RW
13-3
1
TM
B -
RW
9L-2
7R
TM
B -
RW
9R
-27L
TN
T -
RW
9-2
7
X51 -
RW
10-2
8
X51 -
RW
18-3
6
Bra
nch
Are
a-W
eig
hte
d P
CI
Individual Runway Facilities
Runway Pavement Condition Comparison to FDOT Minimum Service Level PCI

Executive Summary | 12
Ta b le E- 5 Di s t r i c t S umm a ry o f Ar ea b y Us e b y Ai rp o r t
Network ID
Airport Type
Pavement Area (Square Feet)
Runway Taxiway Taxilane Apron Overall
EYW PR 480,000 396,469 - 893,776 1,770,245
MTH GA 500,800 395,290 - 772,709 1,668,799
OPF RL 2,656,123 4,838,092 107,164 3,387,007 10,988,386
TMB RL 2,250,750 2,343,728 - 2,679,999 7,274,477
TNT GA 1,575,000 1,770,734 - 49,500 3,395,234
X51 GA 625,125 540,814 - 462,380 1,628,319
OVERALL DISTRICT 8,087,798 10,285,127 107,164 8,245,371 26,725,460
Fi g u re E- 6 PCI by Pav em en t F u n ct i o n al Us e b y Ai r po r t
38
71
59
56
68
42
64
52
63
61
73
59
59
100
51
55
70
50
70
0 20 40 60 80 100 120
EYW
MTH
OPF
TMB
TNT
X51
Pavement Condition IndexPCI
Air
port
Runway
Taxiway
Apron
Taxilane

Executive Summary | 13
MAJOR REHABILITATION PLANNING
Ta b le E- 7 M aj or Re h a bi l i t a t i on Pl a n ni n g Y ea r 1
Network ID Airport Type
Weighted-Average PCI
Average Rating Year 1 Major Rehabilitation
EYW PR 74 SATISFACTORY $ 10,691,000
MTH GA 58 FAIR $ 11,245,000
OPF RL 58 FAIR $ 83,932,000
TMB RL 70 FAIR $ 12,906,000
TNT GA 54 POOR $ 21,508,000
X51 GA 65 FAIR $ 6,416,000
OVERALL DISTRICT 62 FAIR $ 146,698,000 *All planning cost values have been rounded to the nearest thousand-dollar.
Ta b le E- 8 M aj or Re h a bi l i t a t i on Pl a n ni n g 10 -Y ea r ( 2 0 18 - 20 2 9)
Network ID Airport Type
Weighted-Average PCI
Average Rating 10-Year Major Rehabilitation
EYW PR 74 SATISFACTORY $ 10,691,000
MTH GA 58 FAIR $ 11,735,000
OPF RL 58 FAIR $ 97,638,000
TMB RL 70 FAIR $ 49,428,000
TNT GA 54 POOR $ 22,892,000
X51 GA 65 FAIR $ 9,927,000
OVERALL DISTRICT 62 FAIR $ 202,311,000 *All planning cost values have been rounded to the nearest thousand-dollar.
Ta b le E- 9 M aj or Re h a bi l i t a t i on Nee d s by Ai rp o r t ( 2 0 18 - 20 2 9)
Major Rehabilitation ($ in Millions)
Network ID 2018 2019 2020 2021 2022 2023 2024 2025 2026 2027 2028 2029
EYW - - 10.69M 0M 0M 0M 0M 0M 0M 0M 0M 0M
MTH - - 11.25M 0.26M 0M 0M 0M 0M 0.05M 0.08M 0.1M 0M
OPF - - 83.93M 2.04M 0.11M 3.43M 0.11M 6.47M 0.62M 0.92M 0M 0M
TMB - - 12.91M 0M 3.95M 9.44M 11.83M 5.25M 1.27M 0.17M 2.33M 2.29M
TNT 21.51M 1.34M 0M 0M 0M 0M 0.05M 0M 0M 0M - -
X51 6.42M 2.42M 0M 0M 0.08M 0.14M 0M 0.05M 0.81M 0M - -
DISTRICT 27.92M 3.76M 118.77M 2.3M 4.15M 13.01M 11.99M 11.77M 2.76M 1.16M 2.43M 2.29M
Additional design-level investigation in accordance to the FAA Advisory Circulars
will be required to identify specific areas within each section that are subject to
reconstruction, mill and overlay, and PCC restoration. The work and budgets
identified are intended for the planning level not the design level. Areas identified as
mill and overlay may in fact require select areas of reconstruction should load -
based distresses observed warrant it. It is important to state that the project specific
design level efforts are necessary in determining the final rehabilitative construction
activity and project limits. In certain cases, adjacent or nearby Sections may not
have deteriorated to a PCI level that would warrant “major rehabilitation” but are
deteriorated enough to be considered for inclusion as a combined project.

Executive Summary | 14
Runway projects, based on pavement conditions at or below the Critical PCI of 65, which
the District should consider as immediate needs, are listed as follows. These are not all
the needs at each participating airport within the District and may not be the individual
airport’s priority but should be considered in development of funding programs. Table E-10
below highlights Runway pavement sections that have current PCI values at or below the
Critical PCI of 65.
T a b le E- 1 0 Y ea r 1 Ru n wa y M a jo r Re ha b i l i t a t i o n Ne e d s
Network ID
Branch Name Sections with Major Rehabilitation in Year 1 Major
Rehabilitation Cost
EYW RUNWAY 9-27 ***No Major Rehabilitation*** $ -
MTH RUNWAY 7-25 6105, 6110 $ 3,598,000
OPF RUNWAY 12-30 6205, 6210 $ 10,492,000
OPF RUNWAY 9L-27R 6105, 6110, 6115, 6120, 6125, 6130 $ 10,886,000
OPF RUNWAY 9R-27L 6410 $ 956,000
TMB RUNWAY 13-31 ***No Major Rehabilitation*** $ -
TMB RUNWAY 9L-27R 6104, 6109, 6126 $ 383,000
TMB RUNWAY 9R-27L 6302 $ 951,000
TNT RUNWAY 9-27 6105, 6110 $ 11,919,000
X51 RUNWAY 10-28 ***No Major Rehabilitation*** $ -
X51 RUNWAY 18-36 6110 $ 1,287,000 *All planning cost values have been rounded to the nearest thousand-dollar.
Summary of District 6
Pavement Condition Index surveys were performed for airfield pavement facilities for the
following airports located in District 6.
▪ EYW, Key West International Airport
▪ MTH, The Florida Keys Marathon Airport
▪ OPF, Miami-Opa Locka Executive Airport
▪ TMB, Miami Executive Airport
▪ TNT, Dade-Collier Training and Transition Airport
▪ X51, Miami Homestead General Aviation Airport
Miami International Airport (MIA), which is managed by the Dade County Aviation
Department, declined to participate in the FDOT SAPMP update and therefore was not
included in the inspection efforts as part of this program update.
District 6’s overall area-weighted Pavement Condition Index (PCI) is at a 62, a condition
rating of “Fair”. Table E-1: Condition Summary by Airport above represents the results
of the PCI inspection at each airport within the District. The overall area-weighted average
PCI values for the participating airport facilities in District 6 ranged from 54 (Poor) to 74
(Satisfactory). Specific individual airport results are identified in the individual Airport
Pavement Evaluation Reports provided to each airport.

Chapter 1

Chapter 1 – Introduction | 16
Chapter 1 – Introduction
1.1 Background
The State of Florida has 128 public airports of which 100 public-use airports are
recognized as part of the Federal Aviation Administration’s (FAA) National Plan of
Integrated Airport Systems (NPIAS) that are vital to the Florida economy as well as the
economy of the United States. The Florida Aviation System (FAS) provides opportunities
for the State to capitalize on an increasingly global marketplace. Florida’s system of
commercial service and general aviation (GA) airports are important to businesses
throughout the entire State. Air travel is essential to tourism, Florida’s number one
industry.
There are millions of square feet of pavement infrastructure that consists of runways,
taxiways, aprons, ramps, and other areas of airports that are vital to the support and
safety of aircraft operations. Timely pavement maintenance, repair and major rehabilitation
of these pavements will support the airport in operating safely, efficiently, economically
and without excessive down time.
In general, adherence to the FAA Advisory Circulars are mandatory for all projects funded
with federal grant monies through the Airport Improvement Program (AIP) and with
revenue from the Passenger Facilities Charges (PFC) Program. Further information is
detailed in FAA Grant Assurance No. 11 “Pavement Maintenance ,” No. 34 “Policies,
Standards, and Specifications,” and PFC Assurance No. 9 “Standards and Specifications.”
The Florida Department of Transportation (FDOT) performs the Statewide Airfield
Pavement Management Program (SAPMP) System Updates for the benefit of participating
public-use and publicly owned airports through the Aviation and Spaceports Office (ASO).
The SAPMP addresses the requirements of maintaining an effective pavement
management program for the participating airports at the network level. Network-level
management of pavement assets provides insight for short-term and long-term budget
needs, understanding of the overall condition of the network (current and future), and
pavement facilities that are subject for project consideration. A network-level evaluation
can be supportive in the identification of maintenance, repair, and major rehabilitation
needs and budgetary planning-level opinions of probable construction costs.
1.2 Statewide Airfield Pavement Management Program (SAPMP)
Update
In 1992, the FDOT established the Statewide Airf ield Pavement Management Program
(SAPMP) to provide program managers, District Aviation and Spaceports Offices, and
airport operators a system to proactively manage airport airfield pavement infrastructure
within the Florida Aviation System. The SAPMP performs network-level Pavement
Condition Index (PCI) survey inspections for airport facilities that are categorized as
General Aviation (GA), Reliever (RL), and Commercial (PR). Currently, the program
consists of 95 actively participating public-use airports with pavement facilities and
provides users with comprehensive data to better manage pavement assets.

Chapter 1 – Introduction | 17
Fi g u re 1 .2 Fl o r i d a Avi at io n S y s t em ( Fa ci l i t i es wi th Pa vem e nt ) a nd FDOT Dis t r i c t s
In 2016, the Florida Department of Transportation Aviation and Spaceports Office
contracted Kimley-Horn and Associates, Inc. along with subconsultants Airfield Pavement
Management Systems, LLC and AVCON, Inc. to provide professional services in support
of FDOT in the continued efforts of performing a system update to the SAPMP. This work
is to be completed from fiscal year 2016 through fiscal year 2019.
1.3 Organization
1.3.1 FLORIDA DEPARTMENT OF TRANSPORTATION AVIATION AND
SPACEPORTS OFFICE PROGRAM MANAGER
The FDOT Aviation and Spaceports Office (ASO) Aviation Engineering Manager serves as
the Program Manager (ASO-PM) for the SAPMP. The ASO-PM monitors the work
performed by the designated Consultant for the program. The ASO-PM has review and

Chapter 1 – Introduction | 18
approval authority for each program task and manages the program’s day -to-day details
and pertinent updates.
The ASO-PM reports updates and milestones to the FDOT State Aviation and Spaceports
Manager and Development Administrator.
1.3.2 PARTICIPATING FLORIDA PUBLIC-USE AND PUBLICLY OWNED
AIRPORTS
The airports are the end-user and beneficiary of the SAPMP. The SAPMP provides a
specific Airport Pavement Evaluation Report that meets the requirements of the FAA
Advisory Circular 150/5380-7B “Airport Pavement Management Program (PMP) .”
Individual participating airports will be provided a final Airport Pavement Evaluation Report
by the designated Consultant that is specific to each airport’s airfield pavement condition
index survey. The ASO-PM has full authority and final approval of each report prior to
finalization. In advance of each PCI survey and prior to completion of each Airport
Pavement Evaluation Report, participating airports are asked to provide the necessary
record documentation for the proper analysis efforts. Relevant record documentation
artifacts may consist of but are not limited to: Airport Layout Plans (ALP), Construction Bid
Tabulations, As-Built Construction Drawings, Engineer’s Reports, and/or field pavement
inspection reports.
1.3.3 FLORIDA DEPARTMENT OF TRANSPORTATION DISTRICT
OFFICES
The seven (7) FDOT District Offices, specifically the Aviation representatives (currently
the Freight and Logistics personnel), provide essential support to the SAPMP update and
the ASO-PM. Each District supports the SAPMP’s on-going efforts by providing local
construction cost information throughout the State. The construction cost information,
typically consisting of plans and bid tabulations, are used as the basis of the development
maintenance, repair, and major rehabilitation opinions of probable construction costs for
planning purposes. Each District Office receives copies of individual Airport Pavement
Evaluation Reports for the participating airport facilities located within their respective
Districts.
1.3.4 CONSULTANT
The Consultant, Kimley-Horn and Associates, Inc., provides technical and administrative
support to the ASO-PM for the SAPMP update. The support consists of airfield pavement
system inventory updates, performance of PCI Surveys in accordance with ASTM D5340-
12 “Standard Test Method for Airport Pavement Condition Index Surveys,” evaluation
and reporting of the pavement condition in accordance with the FAA Advisory Circular
150/5380-7B “Airport Pavement Management Program (PMP) .”
The Consultant Team consists of Kimley-Horn, Airfield Pavement Management Systems,
LLC., and AVCON, Inc.
A brief description of the general scope of work undertaken to update the SAPMP includes
but is not limited to:

Chapter 1 – Introduction | 19
Research and evaluation of existing record documentation was performed to
identify construction projects that have taken place since the most recent major
update of the SAPMP. This data is used to update the pavement inventory and
network definition.
An update to the existing Network Definition Map was made to reflect geometric
changes, pavement composition updates, and section characterization.
Furthermore, an update to the PCI Survey sample units were made to reflect the
field investigation efforts.
A functional pavement evaluation with PCI Survey inspections was completed
on all airfield pavements maintained by the Airport. The PCI Survey procedure, as
defined by ASTM D5340-12, was used as the basis of the functional pavement
evaluation. For this specific evaluation, the sample units defined by prior studies
were inspected as to better develop performance models for prediction curves.
Pavement subject to construction or anticipated construction during scheduled PCI
Survey inspection or within 2 years were omitted from inspection based on
confirmation of airport personnel.
Condition Analysis was performed based on the distress data observed, rated,
measured, and recorded in accordance with the ASTM D5340-12 for the calculation
of PCI values and ratings. The results of the current condition analysis were used
in concert with the historic PCI Survey data and construction work history to
develop performance models to forecast future PCI values for each section for a
10-year study duration.
Maintenance, Repair, and Rehabilitation Planning was performed predicated on
the results of the condition analysis with updated policies and planning-level unit
costs. The policies, or M&R policies, have been updated to reflect standard
practices for maintenance, repair, and major rehabilitation as defined by the FAA
AC 150/5380-6C “Guidelines and Procedures for Maintenance of Airport
Pavements.” Planning-level unit costs were developed based on representative
construction bid tabulations provided by participating airports. The bid tabulations
consisted of limited airfield pavement construction projects that took place between
2009 and 2015 at participating airports.

Chapter 1 – Introduction | 20
1.4 Purpose of District Pavement Evaluation Report
The District pavement evaluation report discusses the work performed, a summary of
findings, condition analysis results, and recommendations for maintenance, repair, and
major rehabilitation (M&R) planning associated with the SAPMP system update. It also
briefly describes the procedures used to ensure that the appropriate engineering and
scientific standards of care, quality, budget, schedules, and safety requirements were
implemented during the performance of this work.
This document is intended to serve as a summary of the District’s participating airports
airfield pavement facility condition and long-term major rehabilitation needs. Furthermore,
the purpose of this District Summary document is to provide:
Information on the pavement management principles, objectives, and methods
used to update the existing program;
Provide the average results of the PCI survey and analysis at each Distr ict’s
participating airport.
Provide the results of the maintenance level activities and major rehabilitation
analysis identified for the immediate Year-1 needs and long-term 10-Year project
needs on an airport and District-wide basis.
The identification of rehabilitation needs has been determined at the planning level.
Design-level investigation is recommended prior to developing construction-level
design documents and budgets.
In compliance with FAA Grant Assurances 11 and 19; the FDOT SAPMP provides airports
with airfield pavement evaluation reports in accordance with FAA AC 150/5380-7B Airport
Pavement Management Program (PMP) and AC 150/5380-6C Guidelines and
Procedures for Maintenance of Airport Pavements. The application of the results of a
PCI survey are for planning purposes and are limited to the visual observation of
deteriorated pavements in limited sampling; design-level investigation is recommended in
accordance with the FAA procedures defined in AC 5320-6F Airport Pavement Design
and Evaluation and AC 150/5370-11B Use of Nondestructive Testing in the
Evaluation of Airport Pavements. The aforementioned ACs provide the design-level
material properties of in-situ pavement and subgrade layers for the determination of
appropriate rehabilitation actions. The FDOT Statewide Airfield Pavement Management
Program is organized to provide airports with planning-level data and does not intend to
preclude the responsible engineer in performing the appropriate level of investigation and
analysis in determining the appropriate design details of a pavement rehabilitation. It
would not be advisable to solely base design-level rehabilitation without the appropriate
level of investigation and determination of pavement deterioration beyond that of a visual
functional condition assessment.
1.5 History of the Program
In 1992, the FDOT implemented the SAPMP to understand the pavement conditions at
public airports in the FAS, systematically update pavement infrastructure information, and
assist airport operators with recommendations of pavement maintenance, repair, and
major rehabilitation needs. The 1992 SAPMP implementation provided the FDOT and the

Chapter 1 – Introduction | 21
participating airports valuable information for establishing and performing timely and
appropriate pavement rehabilitation.
During the 1992-1993 implementation and again during the 1998-1999 updates; the
SAPMP performed the development with proprietary software for pavement management
system analysis. This development allowed for the creation of pavement management
database file system populated with airport attributes and condition data. The pavement
management database was used to establish maintenance, repair, and rehabilitation
policies; consider planning-level unit costs; and develop recommendations for performing
pavement maintenance. This system, known as AIRPAV, was initially developed during
the 1992-1993 SAPMP implementation for the analysis of distress data. The AIRPAV
system was used again in the 1998-1999 SAPMP update.
In 2004, the SAPMP system update included the review of the AIRPAV software compared
to other industry available non-proprietary software packages. As a result of this review,
MicroPAVERTM (currently known as PAVERTM) was selected for implementation of the
system update. MicroPAVERTM was developed by the U.S. Army Corps of Engineers
Construction Engineering Research Laboratory for pavement management. Data from the
1998-1999 FDOT SAPMP update, which was built upon the initial 1992-1993
implementation of AIRPAV, was reviewed and converted to be compatible with the
MicroPAVERTM system. This data conversion included all documented pavement facilities,
classifications, types, histories, geometries, PCI condition data and pertinent attributes
gathered from airport feedback at the time. This information was used to develop the
inventory of each participating airport’s pavement facilities in a consistent format. This was
the development of Airfield Pavement Network Definition Exhibits. These inventory
exhibits visually depicted the branch, section, and sample units that were based upon the
pavement construction history and composition information provided by each airport.
In the 2006-2008 system update, the SAPMP was updated again with continued use of the
MicroPAVERTM system. Based on the distress data collected, a maintenance repair and
major rehabilitation planning program was developed for each airport. As part of this
SAPMP update, the procedures for the inspection and the collection of the pavement
distress data were documented, and an interactive website
(http://www.dot.state.fl.us/aviation/pavement.shtm) was established for input of data.
In the 2010-2012 system update, the SAPMP was updated using new global positioning
system (GPS) integrated technology to digitally collect pavement distress data. Interactive
geographic information system (GIS) map files were developed from updated Airfield
Pavement Network Definition Exhibits to aid pavement condition inspectors in the
collection of sample distress data. The data collected was utilized to develop pavement
performance models to predict future pavement PCI values and make recommendations
for major rehabilitation.
In the 2013-2015 system update, the SAPMP integrated PAVERTM and FieldInspectorTM
with the use of GPS and GIS capable field tablets. Furthermore, the update included
continued adherence to the ASTM D5340-12 “Standard Test Method for Airport
Pavement Condition Index Surveys.” The ASTM update consisted of refinement of

Chapter 1 – Introduction | 22
distress definition types and deduction values for select asphalt concrete and Portland
Cement Concrete distresses.
1.6 Federal Aviation Administration (FAA)
Currently, airports participating in the Airport Improvement Program (AIP) Grant Program
are required by the FAA to develop and implement a pavement maintenance program to
be eligible for funding (FAA Advisory Circular 150/5380-6C “Guidelines and Procedures
for Maintenance of Airport Pavements” and 150/5380-7B “Airport Pavement
Management Program (PMP)”). This program requires detailed inspection of airfield
pavement conditions by trained personnel. The inspections are required to be performed
at least once a year using the PASER method or every three years if the pavement is
inspected as defined by the PCI survey procedure in accordance with the ASTM D5340-12
“Standard Test Method for Airport Pavement Condition Index Surveys.”
In general, adherence to the Advisory Circulars are mandatory for all projects funded with
federal grant monies through the AIP program and with revenue from the Passenger
Facilities Charges (PFC) Program. Further information is detailed in FAA Grant Assurance
No. 11 “Pavement Maintenance,” No. 34 “Policies, Standards, and Specifications,” and
PFC Assurance No. 9 “Standards and Specifications.”
1.7 FDOT SAPMP Objectives and Components
The FDOT SAPMP is a program that provides the FAS support in implementing and/or
maintaining a network-level Pavement Management Program in a consistent and regularly
scheduled manner.
In accordance with FAA AC150/5380-7B “Airport Pavement Management Program
(PMP)” an effective Pavement Management Program consists of a system that achieves
specific objectives. The FDOT SAPMP objectives are as follows:
1.7.1 PROGRAM OBJECTIVES
1 A systematic means for collecting and storing information regarding existing pavement
structure and condition.
2 An objective and repeatable system for evaluating pavement condition.
3 Procedures for predicting future pavement condition.
4 Procedures for modeling both past and future pavement performance conditions.
5 Procedures to determine the budget requirements to meet management objectives,
such as the maintenance, repair, and major rehabilitation budget required to keep a
pavement at a specified PCI level or the budget required to improve to target PCI
level.
6 Procedures for formulating and prioritizing maintenance, repair, and major
rehabilitation projects.
The objectives are accomplished by the following components:
1.7.2 PROGRAM COMPONENTS
A. Database

Chapter 1 – Introduction | 23
B. Pavement Inventory
C. Pavement Structure
D. Pavement Work History
E. Pavement Condition Data
F. Pavement Performance Modeling for the Prediction/Forecast of PCI
G. Maintenance, Repair, and Major Rehabilitation Policies and Budget Simulation
A well-maintained network-level pavement management program may provide airport staff
a better understanding of the airfield pavement performance for developing and planning
for specific maintenance, repair, and major rehabilitation projects. The understanding of
specific distress types and severities will assist the airport in addressing pavement
maintenance and repair with the appropriate treatments as defined by the FAA Advisory
Circular 150/5380-6C “Guidelines and Procedures for Maintenance of Airport
Pavements.” The development of projects with an understanding of system inventory,
deterioration details, and pavement condition forecasts may assist airport staff in
developing practical rehabilitation actions and budgets. Furthermore, the understanding of
pavements’ past performance and forecasted condition may assist airport staff in
addressing pavement rehabilitation in a timely and cost-effective manner. Figure 1.7.2 (a)
Typical Pavement Condition Life Cycle, which is based on the FAA Advisory Circular
150/5380-7B “Airport Pavement Management Program (PMP) .” Figure 1.7.2 (a)
Typical Pavement Condition Life Cycle, depicts a general duration of a pavement
section and identifies the ideal condition to perform rehabilitative treatments at an optimal
cost rather than allowing significant increase in rate of deterioration that would result in
increased costs.
Fi g u re 1 .7 . 2 ( a ) Typ ic a l Pav em e nt Co n di t i o n Li fe Cy c le
*Figure is for conceptual purposes only – unit costs are not specific to airfield pavements (AC vs PCC).

Chapter 1 – Introduction | 24
Figure 1.7.2 (b) General Pavement Treatments by Condition Range depicts generic
flexible asphalt concrete (AC) pavement treatments that are effective at specific condition
ranges. This graphic is a general concept and will vary based on pavement surface type
and overall composition. The intent is to convey various treatment types that would be
effective based on the condition of the pavement along the deterioration model.
Fi g u re 1 . 7 . 2 ( b ) Ge ne r al Pa vem e nt Tr e atm e nt s by Co n d i t io n Ra n g e
Pavement maintenance, repair, and major rehabilitation would be quite anticipatory if all
pavements behaved as depicted in Figures 1.7.2 (a) and 1.7.2 (b), however pavement
condition performance vary significantly based on several factors. Factors that contribute
to a pavement section’s condition and deterioration performance may include: functional
design life, material type, material construction quality, climatic conditions, aircraft loading
type and frequency, non-aircraft loading type and frequency, maintenance history,
subgrade conditions, and other infrastructure in the vicinity. The list of factors is not all -
inclusive of all factors that may contribute to a pavement’s life cycle, it is intended to
clarify that unique conditions certainly will affect a pavement’s deterioration.
Figures 1.7.2 (c) and Figure 1.7.2 (d) depict visual conditions of pavement facilities, for
both AC and PCC respectively, with approximated PCI ranges and corresponding repair
and rehabilitation measures.

Chapter 1 – Introduction | 25
Fi g u re 1 .7 . 2 ( c ) Fl e xi bl e As p ha l t Co n cr e t e
Fi g u re 1 .7 . 2 ( d ) Ri g id Po r t l an d Cem e nt Co n cr e te

Chapter 1 – Introduction | 26
1.8 References
The following reference documents were referenced as specific guidelines and procedures
for maintaining airport pavements; establishing an effective pavement maintenance
program; and identifying specific pavement distresses, probable causes of distresses,
inspection guidelines, and recommended methods of repair:
ASTM D5340-12 “Standard Test Method for Airport Pavement Condition Index
Surveys.”
FAA Advisory Circular 150/5380-7B “Airport Pavement Management Program.”
FAA Advisory Circular 150/5380-6C “Guidelines and Procedures for Maintenance of
Airport Pavements.”
FAA Advisory Circular 150/5320-6F “Airport Pavement Design and Evaluation.”
Department of the Air Force, Air Force Civil Engineer Center “Engineering
Technical Letter (ETL) 14-3: Preventive Maintenance Plan (PMP) for Airfield
Pavements.”
Unified Facilities Criteria (UFC) 3-260-16FA 16 “Airfield Pavement Condition
Survey Procedures Pavements.”
Unified Facilities Criteria (UFC) 3-260-03 “Airfield Pavement Evaluation.”
Pavement Management for Airports, Roads, and Parking Lots 2nd Edition, M.Y.
Shahin.

Chapter 2

Chapter 2 – Methodology | 28
Chapter 2 – Methodology An effective pavement management program incorporates the regular collection of
pavement condition information and communication of information to appropriate
sponsors. This chapter of the report defines the specific methods utilized as part of the
SAPMP System Update to meet the requirements of an effective pavement management
system as defined by the FAA Advisory Circular 150/5380-7B “Airport Pavement
Management Program (PMP).”
2.1 Airfield Pavement Database
The SAPMP program has historically utilized PAVERTM (formerly MicroPAVERTM); the
current update has maintained the use of the PAVERTM 7.0 version of the software. The
PAVERTM software application was developed by the U.S. Army Construction Engineering
Research Laboratory sponsored by the FAA, Federal Highway Administration, U.S. Army,
U.S. Air Force, and the U.S. Navy to meet the objectives of an effective pavement
management system. The SAPMP consists of a network-level database of the airport’s
airfield pavement facilities that are part of the program. PAVERTM can achieve the
following pavement management objectives: a manageable inventory system, the analysis
of the current condition of pavements in accordance with the ASTM D5340, the
development of pavement performance models to forecast conditions, and the
development of maintenance, repair, and major rehabilitation recommendations based on
budgetary scenarios.
PAVERTM inventory management is based on a tiered organizational structure that
consists of networks, branches, and sections, with the sect ion being the smallest unit of
management. Critical elements of an effective pavement management program are
maintained within the network-level PAVERTM database. These elements typically consist
of pavement inventory characteristics, pavement structure, work history, historic condition
records, and analytical customization.
The SAPMP System Update consisted of the conversion of the previous database from a
PAVERTM version 6.5 to a version 7.0.
2.2 Airfield Pavement System Inventory
An airfield pavement system inventory typically maintains the location of all runways,
taxiways, and aprons; geometric characteristics; type of pavement structure, year of
construction and/or last major rehabilitation; and general composition details of the
pavement.
The pavement inventory for an airport’s airfield is an assembly of pavement infrastructure
information that builds an inventory of branches and sections that codifies the airport’s
airfield pavement network. General geometry characteristics, estimated length, width ,
functional classification, pavement surface type, and operational function are among the
characteristics identified at this initial phase in the pavement management process. The
development of a pavement inventory that reasonably reflects the airport’s airfield
pavement facilities that are maintained by the airport provides a defined scope of the
Chapter 2 – Methodology | 29
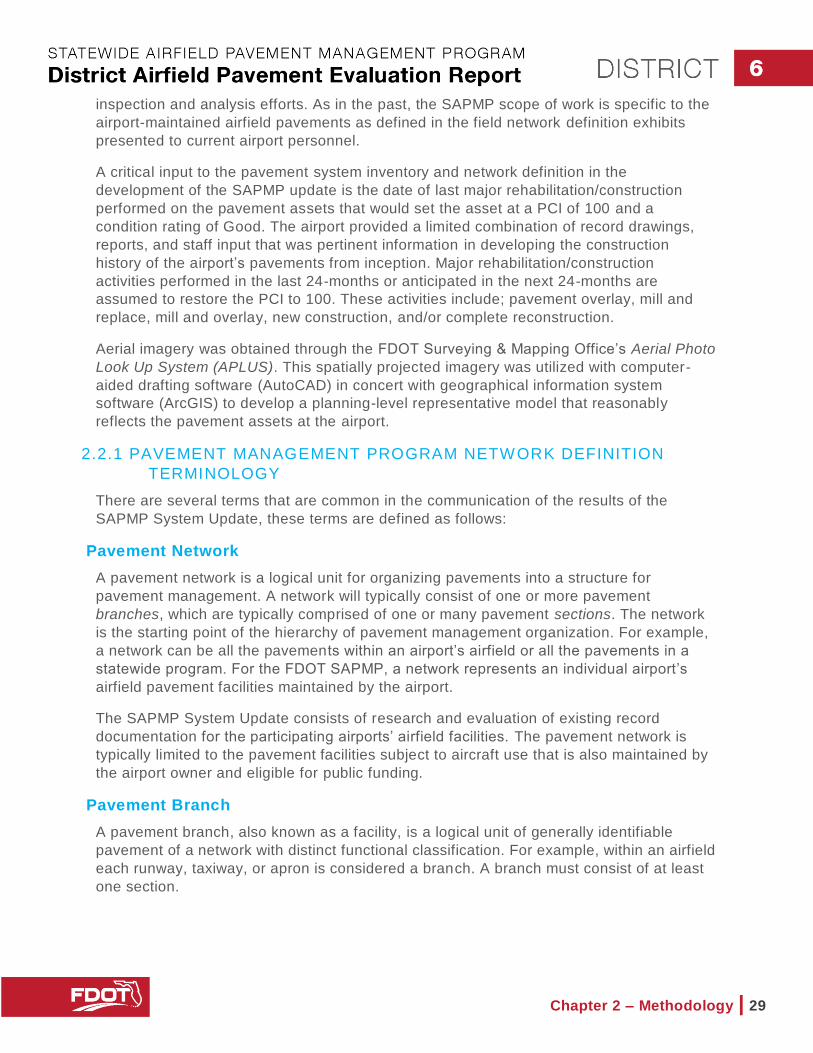
inspection and analysis efforts. As in the past, the SAPMP scope of work is specific to the
airport-maintained airfield pavements as defined in the field network definition exhibits
presented to current airport personnel.
A critical input to the pavement system inventory and network definition in the
development of the SAPMP update is the date of last major rehabilitation/construction
performed on the pavement assets that would set the asset at a PCI of 100 and a
condition rating of Good. The airport provided a limited combination of record drawings,
reports, and staff input that was pertinent information in developing the construction
history of the airport’s pavements from inception. Major rehabilitation/construction
activities performed in the last 24-months or anticipated in the next 24-months are
assumed to restore the PCI to 100. These activities include; pavement overlay, mill and
replace, mill and overlay, new construction, and/or complete reconstruction.
Aerial imagery was obtained through the FDOT Surveying & Mapping Office’s Aerial Photo
Look Up System (APLUS). This spatially projected imagery was utilized with computer-
aided drafting software (AutoCAD) in concert with geographical information system
software (ArcGIS) to develop a planning-level representative model that reasonably
reflects the pavement assets at the airport.
2.2.1 PAVEMENT MANAGEMENT PROGRAM NETWORK DEFINITION
TERMINOLOGY
There are several terms that are common in the communication of the results of the
SAPMP System Update, these terms are defined as follows:
Pavement Network
A pavement network is a logical unit for organizing pavements into a structure for
pavement management. A network will typically consist of one or more pavement
branches, which are typically comprised of one or many pavement sections. The network
is the starting point of the hierarchy of pavement management organization. For example,
a network can be all the pavements within an airport’s airfield or all the pavements in a
statewide program. For the FDOT SAPMP, a network represents an individual airport’s
airfield pavement facilities maintained by the airport.
The SAPMP System Update consists of research and evaluation of existing record
documentation for the participating airports’ airfield facilities. The pavement network is
typically limited to the pavement facilities subject to aircraft use that is also maintained by
the airport owner and eligible for public funding.
Pavement Branch
A pavement branch, also known as a facility, is a logical unit of generally identifiable
pavement of a network with distinct functional classification. For example, within an airfield
each runway, taxiway, or apron is considered a branch. A branch must consist of at least
one section.

Chapter 2 – Methodology | 30
Pavement Section
A pavement section, also known as a feature, is the most specific management unit when
considering the application and selection of maintenance, repair, and/or major
rehabilitation treatments on an area of pavement within a branch. Each branch consists of
at least one section but may consist of more if pavement feature characteristics are
distinct throughout the branch. Characteristics considered when subdividing branches into
sections include, but are not limited to: pavement structure, type, age, condition, and
function; traffic composition and frequency (current and future); geometric location;
construction history; and other related infrastructure features (e.g. drainage). A pavement
section is defined as a subordinate of a pavement branch, which is a subordinate of a
“parent” pavement network.
Pavement Sample Unit
A pavement sample unit is a subdivision of a pavement section that has a standard size
range: twenty (20) continuous slabs (±8 slabs) for Portland Cement Concrete (PCC)
pavement and 5,000 contiguous square feet (±2,000 ft2) for flexible asphalt concrete (AC)
or porous friction course pavements.
Ta b le 2 . 2 . 1 A ir f i e l d Pa vem e nt Da t ab a se Ne t wor k De f in i t io n Te rm in ol o g y
PMS Network Level Common Definition Airport Example
Network Overall pavement assets maintained by the Airport
“Tallahassee International Airport – Airfield Pavements”
Branch Name Commonly defined asset name as established by Airport and by use
“Runway 18-36”
Branch ID Codified shorthand name for commonly defined asset established for database identification
“RW 18-36”
RW, Branch Use, “Runway” 18-36, Runway Facility
Section ID
Codified identification for pavement asset that is distinct by the following:
• Pavement Composition
• Construction Work History
• Aircraft Traffic
• Condition Records
“6105”
Sample Unit
A numeric identification of an area of pavement (5,000±2,000 SF of AC or 20±8 slabs of PCC) that has been inspected in accordance with ASTM D5340-12.
“300”

Chapter 2 – Methodology | 31
2.3 Airfield Pavement Structure
2.3.1 PAVEMENT STRUCTURE TYPES
Airport airfield pavements are constructed to provide adequate support f or the loads
imposed by aircraft and produce a firm, stable, smooth, all-year, all-weather surface free
of debris or other particles that may be blown or dislocated by propeller wash or jet blast.
Typical pavement planning and design requires coordination of factors that include but are
not limited to; subgrade conditions, material layer types, aircraft fleet mix (type, frequency,
and traffic growth), and functional use. A pavement structure is composed of constructed
layers that consist of subgrade, subbase, base course, structural courses, and surfaces
courses. For the FDOT SAPMP, two major pavement structure types are classified for
evaluation and analysis: Flexible Asphalt Concrete Surface and Rigid Portland Cement
Concrete Surface. Additionally, Composite Structures known as Whitetopping Pavements
are also present at limited airports within the Florida Airports System; these unique
pavement structures are evaluated separately.
Flexible Asphalt Concrete Surface
A pavement comprised of aggregate mixture with an asphalt cement binder. The FDOT
SAPMP consists of three (3) asphalt concrete surface types: Asphalt Concrete (AC),
Asphalt Concrete Overlaid on Asphalt Concrete (AAC), and Asphalt Concrete Overlaid on
Portland Cement Concrete (APC).
Asphalt Concrete (AC)
A flexible pavement section consisting of aggregate mixture with asphalt cement
binder layered on engineered base course material that is layered on subbase and
subgrade soil material.
Asphalt Concrete Overlaid on Asphalt Concrete (AAC)
A flexible pavement section consisting of aggregate mixture with asphalt cement
binder layered on an existing flexible AC pavement section. Flexible airfield
pavement sections are AAC when a pavement rehabilitation consists of a pavement
milling operation and a resurfacing of asphalt layers; or a direct overlay of asphalt
concrete without surface preparation.
Asphalt Concrete Overlaid on Portland Cement Concrete (APC)
A flexible pavement section consisting of aggregate mixture with asphalt cement
binder layered on an existing Rigid PCC pavement section. This unique pavement
composition may result in distinct pavement distress manifestations known as
reflective joint cracking.
Chapter 2 – Methodology | 32
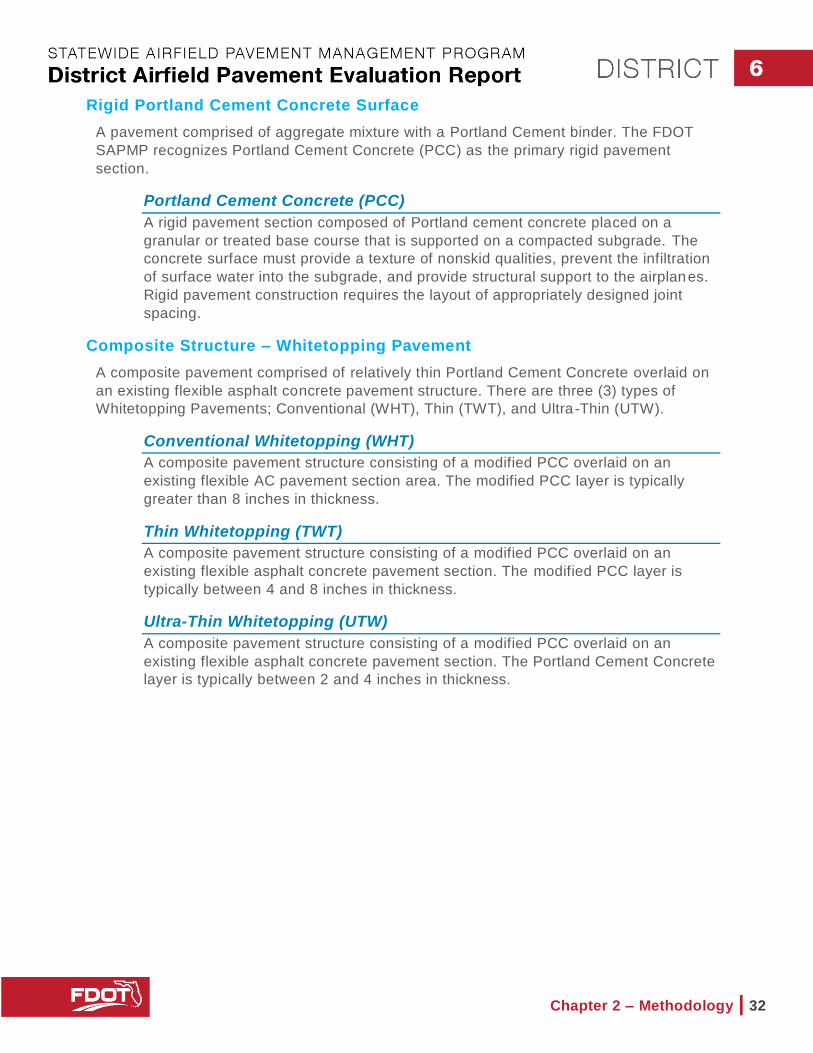
Rigid Portland Cement Concrete Surface
A pavement comprised of aggregate mixture with a Portland Cement binder. The FDOT
SAPMP recognizes Portland Cement Concrete (PCC) as the primary rigid pavement
section.
Portland Cement Concrete (PCC)
A rigid pavement section composed of Portland cement concrete placed on a
granular or treated base course that is supported on a compacted subgrade. The
concrete surface must provide a texture of nonskid qualities, prevent the infiltration
of surface water into the subgrade, and provide structural support to the airplanes.
Rigid pavement construction requires the layout of appropriately designed joint
spacing.
Composite Structure – Whitetopping Pavement
A composite pavement comprised of relatively thin Portland Cement Concrete overlaid on
an existing flexible asphalt concrete pavement structure. There are three (3) types of
Whitetopping Pavements; Conventional (WHT), Thin (TWT), and Ultra-Thin (UTW).
Conventional Whitetopping (WHT)
A composite pavement structure consisting of a modified PCC overlaid on an
existing flexible AC pavement section area. The modified PCC layer is typically
greater than 8 inches in thickness.
Thin Whitetopping (TWT)
A composite pavement structure consisting of a modified PCC overlaid on an
existing flexible asphalt concrete pavement section. The modified PCC layer is
typically between 4 and 8 inches in thickness.
Ultra-Thin Whitetopping (UTW)
A composite pavement structure consisting of a modified PCC overlaid on an
existing flexible asphalt concrete pavement section. The Portland Cement Concrete
layer is typically between 2 and 4 inches in thickness.

Chapter 2 – Methodology | 33
2.4 Airfield Pavement Work History
2.4.1 AIRFIELD PAVEMENT RECORD KEEPING
It is strongly recommended that airports maintain records of all airfield construction and
maintenance related to the pavement facilities. A history of all maintenance and repair
performed and its associated costs (construction and soft costs) can provide valuable
information on the effectiveness of various treatments on pavements. An airport should
maintain detailed records of maintenance (routine, emergency, and proactive) activities.
The records should consist of the following:
1. Location and Limits of Work.
2. Types and Severity of Distresses Repaired.
3. Type of Work.
4. Cost of Work.
5. Supporting Documents (contract documents, construction drawings, specifications,
bid tabulations, repair product, photograph records, etc.).
2.5 Airfield Pavement Traffic
A pavement section is typically designed to meet the needs of the user (airlines, air cargo,
general aviation, and/or military) in providing a safe, smooth, operational surface.
Pavement deterioration generally occurs gradually through increased roughness and/or
fatigue cracking caused by successive and heavy aircraft traffic.
This study does not consist of a study or analysis of each individual airport’s airfield
aircraft fleet mix or traffic operations. However, it is strongly recommended that airports
incorporate the requirements of FAA Advisory Circular 150/5320-6F Airport Pavement
Design and Evaluation when developing design-level rehabilitation activities. The AC
provides guidance on incorporation of aircraft traffic fleet mix data.
2.6 Airfield Pavement Condition Index (PCI) Survey
2.6.1 PCI SURVEY METHODOLOGY
In adherence to the FAA Advisory Circular 150/5380-7B “Airport Pavement Management
Program (PMP),” the FDOT SAPMP utilizes the PCI Survey Method of inspection to
collect pavement distress data and analyze the condition. The PCI Survey Inspection
procedure is a visual statistical sampling of pavements for recording primary distress types
(e.g. cracking and deformation), associated severities, and quantities as defined by the
ASTM D5340-12. This effort is the primary means of obtaining and recording pavement
distress data. The survey inspection consists primarily of visual inspection of pavement
surfaces for signs of distress and deterioration resulting from loading (aircraft) and
environmental influences.
A visual pavement condition survey provides an indication of the cause and rate of
deterioration of a pavement section from a functional point of view and can be an indicator
of structural distress. The functional condition analysis assesses the rating of the
operational surface. A visual PCI Survey Inspection does not predict the remaining
structural life of a pavement section, or its ability to support loads. The functional condition

Chapter 2 – Methodology | 34
determined by the PCI method can provide a cost-effective means to plan for pavement
rehabilitation projects. The timely application of pavement rehabilitation may lead to the
extension of functional life of individual pavement sections. This method varies from
structural evaluation; functional condition is limited to visually observed distresses and
indicative modes of pavement deterioration. A formal structural evaluation analyzes
subsurface conditions, material characteristics, and qualitative pavement structure
attributes. A structural evaluation may consist of; subsurface geotechnical exploration,
falling weight deflectometer testing, petrographic testing, material coring, and/or flexural
testing.

Chapter 2 – Methodology | 35
2.6.2 PAVEMENT DISTRESS TYPES
For each section, the severity and quantity of defined distresses are recorded and then
analyzed in accordance with the ASTM D5340-12 standard. The standard identifies 17
distinct flexible asphalt concrete distress types and 16 distinct rigid Portland Cement
Concrete distress types.
Ta b le 2 . 6 . 2 (a ) Pa vem e nt Di s t re s s Ty p es – Fl e xi ble Asp h al t Co nc r e t e - S ur f ac e d A ir f i e l ds
Distress Common Distress
Mechanisms
Alligator Cracking Load / Fatigue
Bleeding Construction Quality/ Mix
Design
Block Cracking Climate / Age
Corrugation Load / Construction Quality
Depression Load / Subsurface
Jet Blast Aircraft
Joint Reflection - Cracking Climate / Subsurface Pavement
/ Traffic Load
Longitudinal/Transverse Cracking Climate / Construction Quality
Oil Spillage Aircraft / Vehicle
Patching Utility / Pavement Repair / Age
Polished Aggregate Repeated Traffic Loading
Raveling Climate / Age
Rutting Load / Fatigue
Shoving PCC Pavement Growth /
Movement
Slippage Cracking Load / Pavement Bond / Mix
Design
Swelling Climate / Subsurface
Weathering Climate / Age

Chapter 2 – Methodology | 36
Ta b le 2 . 6 . 2 (b ) Pa vem e nt Di s t re s se s Pos s i b le Ca u se s – Fl e xi bl e Asp h al t Co n cr e t e - S u rf ac e d
A i r f i e l ds
Classification by Possible Causes
Load Climate / Durability Moisture / Drainage Others
Alligator Cracking
Corrugation Depression Patching of
Load-based distress
Polished Aggregate
Rutting Slippage
Cracking
Bleeding Block Cracking Joint Reflection
Cracking L/T Cracking Patching of climate /
durability-caused distresses
Shoving from PCC Raveling Weathering Swelling
Alligator Cracking Depression Patching of
moisture / drainage caused distress
Swelling Raveling Weathering
Oil Spillage Jet Blast
Erosion Polished
Aggregate
Ta b le 2 . 6 . 2 (c ) Pav em e nt Di s t re ss e s Pos s i bl e Ef f ec t s – F le xi b le As p ha l t Co n c re te - Su rf a c ed
A i r f i e l ds
Classification by Possible Effects
Roughness Skid / Hydroplaning
Potential FOD Potential
Rate of Deterioration and Maintenance Requirements
Corrugation Depression Rutting Shoving of
asphalt pavement
Swelling Raveling Weathering
Bleeding Depression Polished
Aggregate Rutting
Block Cracking
Joint Reflection Cracking
L/T Cracking Slippage
Cracking
All Distresses

Chapter 2 – Methodology | 37
Ta b le 2 . 6 . 2 (d ) Pa vem e nt Di s t re s se s – R ig i d Por t la n d Cem e nt Con c re te - S ur fa c ed Ai r f i e ld s
Distress Common Distress
Mechanisms
Blowup Climate / ASR
Corner Break Load Repetition / Curling
Stresses
Linear Cracking Load Repetition / Curling
Stresses / Shrinkage Stresses
Durability Cracking Freeze-Thaw Cycling
Joint Seal Damage Material Deterioration /
Construction Quality / Age
Small Patch Pavement Repair
Large Patch/Utility Cut Utility / Pavement Repair
Popout Freeze-Thaw Cycling / ASR /
Material Quality
Pumping Load Repetition / Poor Joint
Sealant
Scaling Construction Quality / Freeze-
Thaw Cycling
Faulting Subgrade Quality / ASR / Inadequate Load Transfer
Shattered Slab Overloading
Shrinkage Cracking Construction Quality / Climate
Joint Spalling
Load Repetition / Infiltration of Incompressible Material /
Deterioration of Dowel (Load Transfer) Bars
Corner Spalling
Load Repetition / Infiltration of Incompressible Material /
Deterioration of Dowel (Load Transfer) Bars
Alkali-Silica Reaction (ASR) Construction Quality / Climate /
Chemical Reaction
Chapter 2 – Methodology | 38
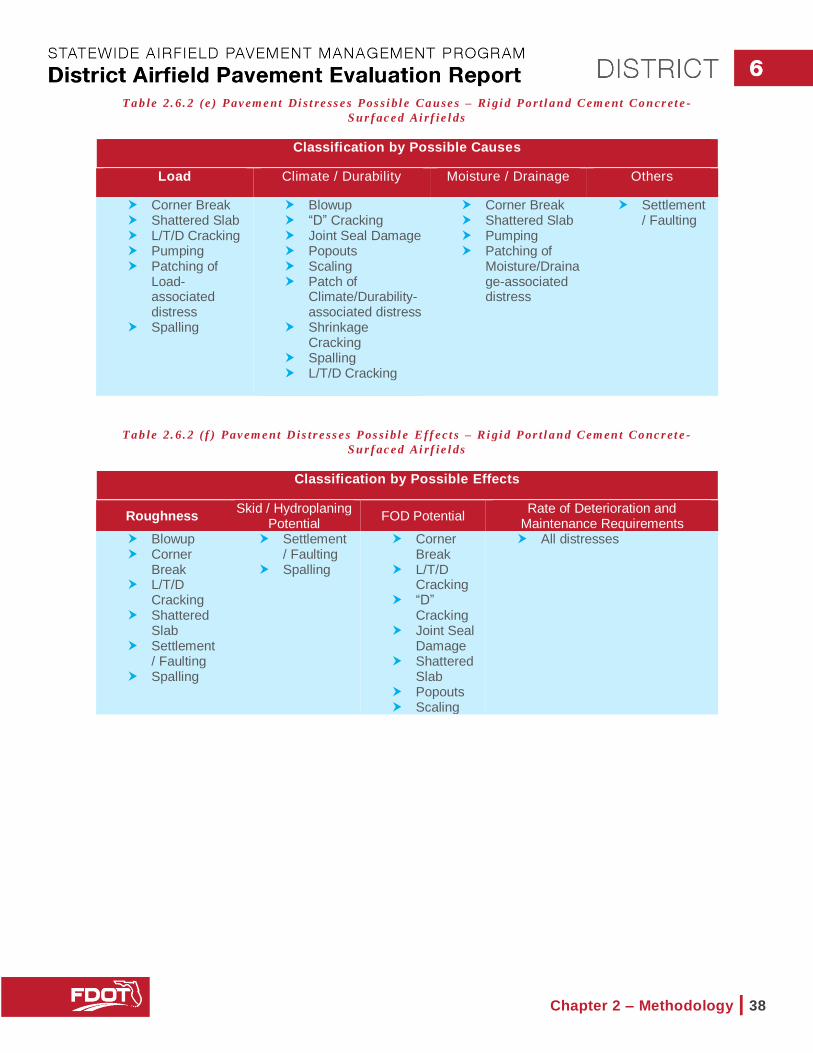
Ta b le 2 . 6 . 2 (e ) Pav em e nt Di s t re ss e s Pos s i bl e Ca u se s – Ri gi d Po r t l a n d Cem e nt Co n cr e t e -
S u r f ac e d Ai r f i e l ds
Classification by Possible Causes
Load Climate / Durability Moisture / Drainage Others
Corner Break Shattered Slab L/T/D Cracking Pumping Patching of
Load-associated distress
Spalling
Blowup “D” Cracking Joint Seal Damage Popouts Scaling Patch of
Climate/Durability-associated distress
Shrinkage Cracking
Spalling L/T/D Cracking
Corner Break Shattered Slab Pumping Patching of
Moisture/Drainage-associated distress
Settlement / Faulting
Ta b le 2 . 6 . 2 ( f ) Pav em e nt Dis t r e ss e s Pos s i bl e Ef f e c t s – R i gi d Por t l a n d Cem en t Co nc r e t e -
S u r f ac e d Ai r f i e l ds
Classification by Possible Effects
Roughness Skid / Hydroplaning
Potential FOD Potential
Rate of Deterioration and Maintenance Requirements
Blowup Corner
Break L/T/D
Cracking Shattered
Slab Settlement
/ Faulting Spalling
Settlement / Faulting
Spalling
Corner Break
L/T/D Cracking
“D” Cracking
Joint Seal Damage
Shattered Slab
Popouts Scaling
All distresses
Chapter 2 – Methodology | 39
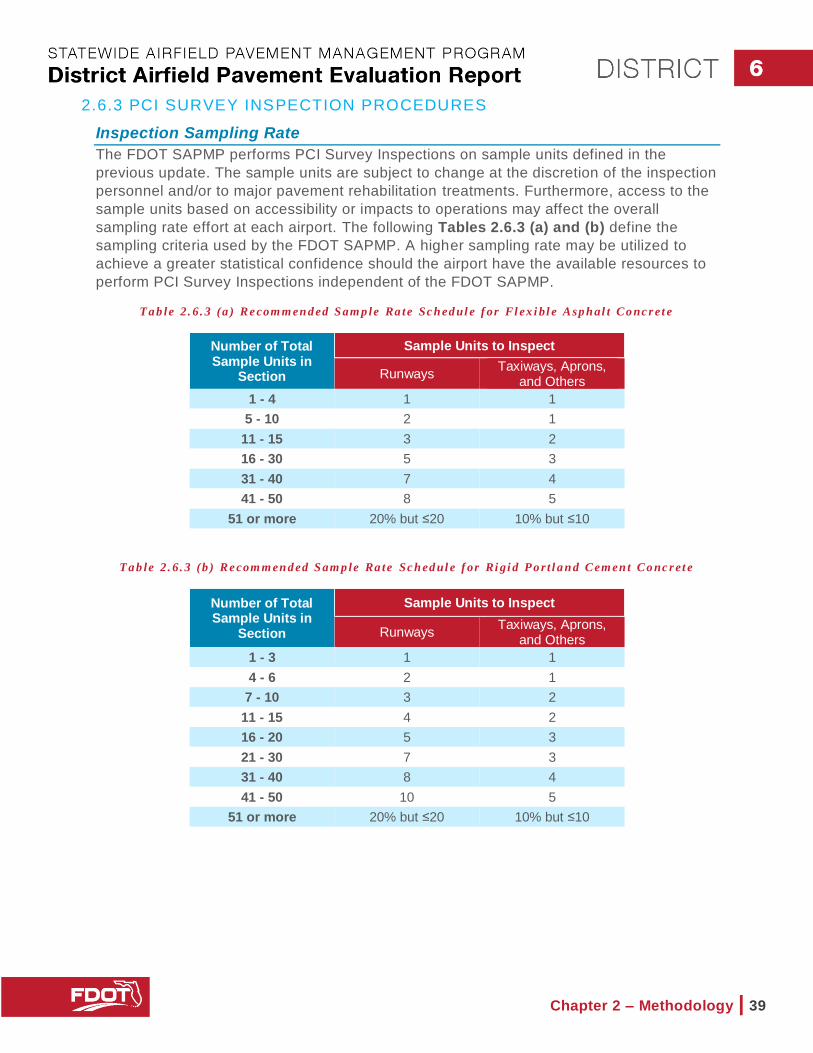
2.6.3 PCI SURVEY INSPECTION PROCEDURES
Inspection Sampling Rate
The FDOT SAPMP performs PCI Survey Inspections on sample units defined in the
previous update. The sample units are subject to change at the discretion of the inspection
personnel and/or to major pavement rehabilitation treatments. Furthermore, access to the
sample units based on accessibility or impacts to operations may affect the overall
sampling rate effort at each airport. The following Tables 2.6.3 (a) and (b) define the
sampling criteria used by the FDOT SAPMP. A higher sampling rate may be utilized to
achieve a greater statistical confidence should the airport have the available resources to
perform PCI Survey Inspections independent of the FDOT SAPMP.
Ta b le 2 . 6 . 3 (a ) Re com m en d ed S am p le Ra te Sc h ed ul e f or Fl ex i bl e Asp h al t Co nc r e t e
Number of Total Sample Units in
Section
Sample Units to Inspect
Runways Taxiways, Aprons,
and Others
1 - 4 1 1
5 - 10 2 1
11 - 15 3 2
16 - 30 5 3
31 - 40 7 4
41 - 50 8 5
51 or more 20% but ≤20 10% but ≤10
Ta b le 2 . 6 . 3 (b ) Re com m en d ed S am p le Ra te Sc h ed ul e f or Ri gi d Po r t l a n d Cem en t Co nc r e t e
Number of Total Sample Units in
Section
Sample Units to Inspect
Runways Taxiways, Aprons,
and Others
1 - 3 1 1
4 - 6 2 1
7 - 10 3 2
11 - 15 4 2
16 - 20 5 3
21 - 30 7 3
31 - 40 8 4
41 - 50 10 5
51 or more 20% but ≤20 10% but ≤10

Chapter 2 – Methodology | 40
2.6.4 UPDATES TO THE ASTM D5340-12
Airfield pavement distresses and conditions were surveyed in accordance with the
methods outlined in FAA Advisory Circular 150/5380-6C and ASTM D5340-12. These
procedures define distress type, severity, and quantity for sampling areas within each
defined pavement section area to analyze and determine the PCI value and condition
rating. During the 2013-2015 System Update, the incorporation of the significant changes
to the ASTM D5340 (version D5340-12) resulted in adjusted pavement condition indices
on pavement sections subject to the distress types updated. Furthermore, the revision of
the PCI deduction curves and the separation of distress types from the original, such as
Weathering and Raveling, have in select cases increased the PCI value of the section
without any rehabilitation performed.
Flexible Asphalt Concrete Pavement Distress Updates
The previous methodology which featured “(52) Weathering and Raveling” distress has
been separated into two distresses “(52) Raveling” and “(57) Weathering .” Previously,
areas that were recorded as “Weathering and Raveling” were considered as one distress
with a high deduction. Based on the updated methodology, in certain situations where
“Weathering” only exists and does not meet the definition of “Raveling ,” the PCI deduction
is not as high as the former “Weathering and Raveling.” Therefore, areas identified only as
“(57) Weathering” based on current ASTM standards, which were previously identified as
“(52) Weathering and Raveling,” may be subject to an improvement in PCI. In instances
where pavement PCI has increased due to this update, it is not due to an improvement in
actual condition, however indicative of the adjusted distress deterioration effects.
Rigid Portland Cement Concrete Pavement Distress Updates
The previous methodology defined “(70) Scaling” as a distress that consisted of surface
deterioration caused by construction defects, material defects, and environmental factors.
The distress included Alkali-Silica Reaction, also known as ASR. The current methodology
has separated Alkali-Silica Reaction as a distress identified as “(76) Alkali-Silica Reaction
/ ASR.” As a result, the previous “(70) Scaling” numerical deduction contribution to the PCI
has been reduced. Previous inspections that recorded “(70) Scaling,” and currently do not
exhibit “(76) Alkali-Silica Reactivity / ASR” may potentially see an increase in PCI.
Additionally, “(73) Shrinkage Cracks” has been redefined as “(73) Shrinkage Cracking”.
Shrinkage Cracking is characterized in two forms; drying shrinkage and plastic shrinkage.
Drying shrinkage occurs over time as moisture leaves the pavement, it develops when
hardened pavement continues to shrink as excess water not needed for cement hydration
evaporates. It forms when subsurface resistance to the shrinkage is present and may
extend through the entire depth of the slab. Plastic shrinkage can be caused by both
atmospheric conditions and construction. Plastic shrinkage caused by atmospheric
conditions develops when there is rapid loss of water in the surface of recently placed
pavement. High winds or low humidity are contributing factors to evaporation. These
shrinkage cracks can appear as a series of parallel cracks, usually 1 to 3 feet apart and do
not extend very deep into the pavement’s surface. Plastic shrinkage caused by
construction can form from over finishing/overworking of the pavement during
construction. These shrinkage cracks appear as a series of inter-connected hairline
cracks, or pattern cracking, and are often observed throughout most of the slab surface.
This condition is also referred to as map cracking or crazing.

Chapter 2 – Methodology | 41
Ta b le 2 . 6 . 4 S umm a ry o f Up da t es t o AS TM D5 3 4 0 -1 2
Distress Updates to Reflect ASTM 5340-12
Use and Surface
Type Updated Distress
Former Distress in Prior to 5340-10
Deduction Curve
Potential Effect
AC/AAC/APC Airfield
(52) Raveling - Low (52) Weathering and
Raveling - Low No
Change N/A
(52) Raveling - Medium (52) Weathering and Raveling - Medium
No Change
N/A
(52) Raveling - High (52) Weathering and
Raveling - High No
Change N/A
(57) Weathering - Low N/A – was part of
‘Weathering and Raveling’ New
Increase in PCI with no maintenance
(57) Weathering - Medium
N/A – was part of ‘Weathering and Raveling’
New Increase in PCI with
no maintenance
(57) Weathering - High N/A – was part of
‘Weathering and Raveling’ New
Increase in PCI with no maintenance
PCC Airfield (70) Scaling - Low
(70) Scaling, Map Cracking, and Crazing -
Low New
Increase in PCI with no maintenance
(70) Scaling - Medium (70) Scaling, Map
Cracking, and Crazing - Medium
New Increase in PCI with
no maintenance
(70) Scaling - High (70) Scaling, Map
Cracking, and Crazing - High
New Increase in PCI with
no maintenance
(76) Alkali Silica Reaction – Low
N/A – was part of ‘Scaling, Map Cracking,
and Crazing’ New
Increase in PCI with no maintenance
(76) Alkali Silica Reaction – Medium
N/A – was part of ‘Scaling, Map Cracking,
and Crazing’ New
Increase in PCI with no maintenance
(76) Alkali Silica Reaction – High
N/A – was part of ‘Scaling, Map Cracking,
and Crazing’ New
Increase in PCI with no maintenance
(73) Shrinkage Cracking
(73) Shrinkage Cracking No
Change
Prior distress types identified as ‘Scaling,
Map Cracking, and Crazing’ may now be
identified as ‘Shrinkage Cracking’

Chapter 3

Chapter 3 – Airfield Pavement System Inventory | 43
Chapter 3 – Airfield Pavement System
Inventory A significant element of an effective airfield pavement management system is the
appropriate record keeping of changes due to construction or operational use of the
pavement facilities. This chapter discusses the inventory data collected from the airport
and summarizes network-level characteristics of the airport’s airfield pavements. At the
start of each FDOT SAPMP System Update, all airports are asked to review the existing
Airfield Pavement Network Definition exhibit for accuracy. Furthermore, participating
airports are asked to provide documentation for any recent or anticipated construction
related to their airfield pavements.
3.1 Airfield Pavement Network Information
3.1.1 PREVIOUS AND/OR ANTICIPATED AIRFIELD PAVEMENT
CONSTRUCTION
A significant element to the development and update of the SAPMP has been to identify
recent and anticipated construction activity that affects the pavement composition and
performance. With cooperation from airport personnel, the project team was able to gather
airport specific information that included changes in pavement geometry, new or
reconstructed pavements since the last inspection and anticipated pavement rehabilitation
that would negate the findings of a visual inspection done in the short term. At the
beginning of each phase for this update, FDOT SAPMP participants responded to the
Aviation and Spaceports Office with project specific information on the recent and
anticipated work. In addition to the construction activity, updates to pavement facility
designators (i.e. re-designation, magnetic declination, and/or decommissioning) were
reported. Lastly, the project team leaders performing field inspections confirm with airport
staff on site previous, recent, and anticipated construction projects that may affect the
airfield pavement facilities.
This information was considered in conjunction with aerial imagery provided by FDOT
during the updating of pavement section areas on each airport’s Airfield Pavement
Network Definition Exhibit. The previous, recent, and anticipated construction activity
information provided by airport staff has been graphically depicted relative to the branch,
section, and sample unit definition on the Airfield Pavement System Inventory Exhibit for
each participating airport. This information was also included in the PAVER da tabase
updates for the SAPMP.
The airports provided a limited combination of record drawings, reports, and staff input
that was pertinent information in developing the construction history of the airport’s
pavements from inception. Major rehabilitation/construction activities performed in the last
24-months or anticipated in the next 24-months are assumed to restore the PCI to 100.
These activities include: pavement overlay, mill and replace, mill and overlay, new
construction, and/or complete reconstruction. These pavements were not formally subject
to a PCI Survey and actual conditions may vary. Furthermore, any localized maintenance

Chapter 3 – Airfield Pavement System Inventory | 44
or repair performed that would improve the PCI will be considered in the condition
analysis, if performed within inspection areas.
The Airfield Pavement Network Definition Exhibit provides details to the PCI Survey
inspection efforts. The exhibit identifies the pavement facilities, surface type, section
definition, and sample unit delineation.
The Airfield Pavement System Inventory Exhibit provides details to the work history
updates communicated by each Airport. The Exhibit provides the approximate limits of
recent and/or anticipated construction on the airfield pavement facilities. The limits are
based on documentation provided by the Airports and, if constructed, observed in the field.
3.1.2 ESTIMATED PAVEMENT AGE
Standard pavement design practice considers a design life of a 20-year period. Design
inputs typically require subgrade soil conditions, pavement section layer material
characteristics, and anticipated loading (aircraft fleet mix) for the design-life period. Based
on the review of the historic airfield pavement construction, Figure 3.1.2 summarizes the
average age of the pavement sections at the time of the PCI survey inspection. Age is
determined to be the number of years since any major construction activity has occurred.
This is intended to be a rough estimate based on interpretation of the limited data
available at the time of report.
Fi g u re 3 .1 . 2 Ave r ag e Ag e of Pa v em en ts a t I ns p ec t i o n
1,209,516
2,127,617
1,231,212
2,922,899
3,889,336
7,406,344
2,052,411 2,020,207
273,654
1,288,769
2,303,495
-
1,000,000
2,000,000
3,000,000
4,000,000
5,000,000
6,000,000
7,000,000
8,000,000
Pavem
ent A
rea (
SF
)
Age Band (Years)
Average Age of Pavement at Time of Inspection
00-02
03-05
06-10
11-15
16-20
21-25
26-30
31-35
36-40
41-50
Over 50

Chapter 3 – Airfield Pavement System Inventory | 45
The estimation of the pavement age is based on information requested and provided by
participating airports. Additionally, data collected in the prior system updates since 1992
have been relied upon.
3.1.3 FUNCTIONAL USE CLASSIFICATION
Pavements are subject to varying aircraft loading patterns based on utilization and overall
operations. For this SAPMP Update, the following categories of airfield functional use
have been identified and associated with the following possible pavement branch facilities:
Apron, Runway, Taxiway, and Taxilane. Table 3.1.3 summarizes the identified pavements’
functional use by area by airport. The pavement areas reviewed exclude shoulder
pavement facilities. Separately, Figure 3.1.3 (a) depicts the district airfield pavement
areas by facility use, and Figure 3.1.3 (b) provides a breakdown of airfield pavement area
by facility use at each participating airport for the District.
Ta b le 3 . 1 . 3 Fu n ct i o n al C l as s i f i c at i o n Us e by Ar e a b y A ir p or t
Network ID
Airport Type
Pavement Area (Square Feet)
Runway Taxiway Taxilane Apron Overall
EYW PR 480,000 396,469 - 893,776 1,770,245
MTH GA 500,800 395,290 - 772,709 1,668,799
OPF RL 2,656,123 4,838,092 107,164 3,387,007 10,988,386
TMB RL 2,250,750 2,343,728 - 2,679,999 7,274,477
TNT GA 1,575,000 1,770,734 - 49,500 3,395,234
X51 GA 625,125 540,814 - 462,380 1,628,319
OVERALL DISTRICT 8,087,798 10,285,127 107,164 8,245,371 26,725,460
Fi g u re 3 .1 . 3 ( a ) Dis t r i c t Pav em e nt Ar ea b y Fu n ct io n a l C la ss i f i c a t i o n Use
0.1
8.2
10.3
8.1
0.0 2.0 4.0 6.0 8.0 10.0 12.0
Dis
tric
t 6
Pavement Area(Millions of Sq. Ft)
Runway
Taxiway
Apron
Taxilane

Chapter 3 – Airfield Pavement System Inventory | 46
Fi g u re 3 .1 . 3 ( b ) Fu nc t i o n al C l as s i f i ca t i o n Us e by Ar e a b y A ir p or t
*All areas are rounded to the nearest 0.1 Million Square Feet.
0 2 4 6 8 10 12
EYW
MTH
OPF
TMB
TNT
X51
Pavement Area(Millions of Sq. Ft)
Air
port
Runway
Taxiway
Apron
Taxilane

Chapter 4

Chapter 4 – Airfield Pavement Condition | 48
Chapter 4 – Airfield Pavement
Condition The examination of specific distress types (with causes attributed to load, climate, or other
defined distress mechanism), determination of the severity of distress, and determination
of the quantity of distress manifestation are required in the computation of a PCI value.
The PCI provides valuable information that can be used to determine the existing condition
of the pavement, possible cause of the pavement deterioration, and eventually aid in the
planning of the rehabilitation of pavements. It should be noted that the PCI method of
pavement condition evaluation is strictly a visual and functional evaluation. Further
evaluation of the pavement condition may be necessary for design and/or project -level
determination of pavement rehabilitation.
4.1 Airfield Pavement Condition Index (Latest Inspection)
4.1.1 DISTRICT-LEVEL ANALYSIS
The following Table 4.1.1 summarizes the pavement condition analysis at each airport
within the District based on the most recent PCI Survey inspection results.
Ta b le 4 . 1 . 1 Lat es t Co n di t i on – S umm ar y b y A ir p or t
Network ID
Airport Type
Area-Weighted Pavement Condition Index (PCI)
Runway Taxiway Taxilane Apron Overall Airfield
PCI PCI PCI PCI PCI
EYW PR 100 52 - 71 74
MTH GA 51 63 - 59 58
OPF RL 55 61 38 56 58
TMB RL 70 73 - 68 70
TNT GA 50 59 - 42 54
X51 GA 70 59 - 64 65
OVERALL DISTRICT 62 63 38 62 62
PCI Rating Scale Good Satisfactory Fair Poor Very Poor Serious Failed
PCI Values 100-86 85-71 70-56 55-41 40-26 25-11 10-0
4.1.2 PCI BY FUNCTIONAL USE
Pavements are subject to varying aircraft loading patterns based on utilization and overall
operations. For this SAPMP Update, the following categories of airfield functional use
have been identified and associated with the following possible pavement branch facilities:
Apron, Runway, Taxiway, and Taxilane. Figure 4.1.2 (a) graphically depicts the PCI for
each pavement functional use (Apron, Runway, Taxiway, and Taxilane) at each
participating airport within the District. The pavement areas reviewed exclude shoulder
pavement facilities. Separately, Figure 4.1.2 (b) depicts the District’s area-weighted PCI
for each pavement functional use.

Chapter 4 – Airfield Pavement Condition | 49
Fi g u re 4 .1 . 2 ( a ) PCI by Pa v em en t Fu nc t i o n al Us e b y Ai r po r t
38
71
59
56
68
42
64
52
63
61
73
59
59
100
51
55
70
50
70
0 20 40 60 80 100 120
EYW
MTH
OPF
TMB
TNT
X51
Pavement Condition IndexPCI
Air
port
Runway
Taxiway
Apron
Taxilane

Chapter 4 – Airfield Pavement Condition | 50
Fi g u re 4 .1 . 2 ( b ) PCI by Pa v em en t Fu nc t i o n al Us e
4.1.3 PCI BY SURFACE TYPE
Pavement facility surface types considered for the SAPMP update consist of the four
common types within the Florida Airport System: Portland Cement Concrete (PCC),
Asphalt Concrete Overlaid on Portland Cement Concrete Pavement (APC), Asphalt
Concrete Pavement (AC), and Asphalt Concrete Overlaid on Asphalt Concrete (AAC).
Figure 4.1.3 summarizes the PCI determined based on the various pavement types within
the participating District airports. Whitetopping, a composite pavement type that consists
of a thin concrete overlay on asphalt concrete pavement exists at certain airports within
the Florida Airport System and is discussed within the specific individual airport pavement
evaluation report document for those airports.
Fi g u re 4 .1 . 3 PCI by Pa v em en t S ur f ac e Typ e
38
62
63
62
0 10 20 30 40 50 60 70 80 90 100
Taxilane
Apron
Taxiway
Runway
Pavement Condition IndexPCI
68
70
66
57
0 10 20 30 40 50 60 70 80 90 100
PCC
APC
AAC
AC
Pavement Condition IndexPCI
Su
rface T
yp
e

Chapter 4 – Airfield Pavement Condition | 51
4.2 Forecasted Pavement Conditions
4.2.1 PERFORMANCE MODELS AND PREDICTION CURVES
Pavement Performance Models are developed from the distress data and historic
construction records collected for the SAPMP. This data is consolidated in a database and
organized by inspection/construction date, pavement type, age, and pavement use. The
pavement Performance Models are used to develop broad Prediction Curves, alternatively
known as deterioration curves or family curves. These Prediction Curves are utilized to
developed forecasted PCI values based on historic trends and statistical models.
4.2.2 NETWORK-LEVEL PAVEMENT CONDITION FORECAST
The following Table 4.2.2 depicts the network-level pavement condition forecast for each
airport within the District. The forecasted conditions are for a 10-year duration starting in
January 2020 through January 2029.
Ta b le 4 . 2 . 2 Fo re c as te d Net wo r k Pav em en t Per f orm a nc e
Network ID
Program Year
Overall Airport Area-Weighted PCI
2020 2021 2022 2023 2024 2025 2026 2027 2028 2029
EYW 72 69 66 64 61 59 56 54 52 49
MTH 57 55 53 51 49 47 45 43 41 40
OPF 57 56 55 53 52 51 50 49 48 47
TMB 70 68 67 65 64 63 62 60 59 58
TNT 48 46 44 42 40 38 37 35 33 31
X51 60 59 57 56 54 53 52 50 49 48
DISTRICT 61 59 57 56 54 53 52 50 49 48

Chapter 4 – Airfield Pavement Condition | 52
AIKEN MUNICIPAL AIRPORT
(AIK)
4.2.3 RUNWAY-LEVEL PAVEMENT CONDITION FORECAST
The following Table 4.2.3 depicts the runway-level pavement condition forecast for each
airport within the District. The forecasted conditions are for a 10-year duration starting in
January 2020 through January 2029.
Ta b le 4 . 2 . 3 Fo re c as te d Ru n way Pa v em en t Per f orma n c e
Network ID
Program Year
Overall Runway Branch Area-Weighted PCI
2020 2021 2022 2023 2024 2025 2026 2027 2028 2029
EYW 96 93 90 87 84 82 80 79 78 76
MTH 50 47 44 41 38 35 32 29 27 24
OPF 54 53 52 50 49 48 47 46 45 44
TMB 70 69 68 67 66 65 65 64 63 62
TNT 42 39 36 33 30 27 25 22 19 16
X51 65 64 62 60 59 58 57 56 55 54
DISTRICT 59 57 56 54 52 51 49 48 46 45
4.2.4 TAXIWAY-LEVEL PAVEMENT CONDITION FORECAST
The following Table 4.2.4 depict the taxiway-level pavement condition forecast for each
airport within the District. The forecasted conditions are for a 10-year duration starting in
January 2020 through January 2029.
Ta b le 4 . 2 . 4 Fo re c as te d Ta xi wa y Pav em en t Per f orm a nc e
Network ID
Program Year
Overall Taxiway Branch Area-Weighted PCI
2020 2021 2022 2023 2024 2025 2026 2027 2028 2029
EYW 51 49 47 45 42 40 37 34 30 27
MTH 62 61 59 58 56 55 53 52 51 49
OPF 60 59 58 57 56 55 54 53 52 51
TMB 72 71 70 69 67 66 65 64 63 62
TNT 55 54 52 51 50 49 48 47 46 45
X51 56 54 53 52 50 49 47 46 44 43
DISTRICT 61 60 59 58 57 55 54 53 52 51

Chapter 4 – Airfield Pavement Condition | 53
AIKEN MUNICIPAL AIRPORT
(AIK)
4.2.5 APRON-LEVEL PAVEMENT CONDITION FORECAST
The following Table 4.2.5 depict the apron-level pavement condition forecast for each
airport within the District. The forecasted conditions are for a 10-year duration starting in
January 2020 through January 2029.
Ta b le 4 . 2 . 5 Fo re c as te d Ap ro n Pa v em en t Per fo rm an c e
Network ID
Program Year
Overall Apron Branch Area-Weighted PCI
2020 2021 2022 2023 2024 2025 2026 2027 2028 2029
EYW 68 65 62 60 57 55 52 50 47 45
MTH 58 56 55 53 52 50 49 47 46 45
OPF 56 54 53 51 50 48 47 45 44 43
TMB 67 65 63 61 59 58 56 54 52 50
TNT 34 32 29 26 24 21 19 16 13 11
X51 60 58 56 55 53 52 50 48 47 45
DISTRICT 61 59 57 56 54 52 50 49 47 45
4.2.6 FORECASTED PCI CONSIDERATIONS
As FDOT continues to update the SAPMP with future PCI Survey inspections and
assembly of airfield pavement construction work history, the performance models will be
further refined. With the refinement of additional PCI and work history data points, the
forecasting of pavement conditions will continue to better reflect the performance trends of
airfield pavements in the Florida Airports System. Forecasted or predicted pavement
conditions for the airport are intended for planning purposes only. Design-level
recommendations for pavement rehabilitation and/or reconstruction will require the
appropriate application of the procedures defined in FAA AC 150/5320-6F Airport
Pavement Design and Evaluation and AC 150/5370-11B Use of Nondestructive
Testing in the Evaluation of Airport Pavements to determine structural and/or functional
conditions at the time of project.

Chapter 5
Chapter 5 – Localized Maintenance and Repair Planning | 55
Chapter 5 – Localized Maintenance and
Repair Planning General Maintenance and Rehabilitation (M&R) methods are characterized under three
broad categories: localized maintenance and repair, global treatments, and major
rehabilitation.
Localized Maintenance and Repair includes patching and crack sealing.
Global Treatments include surface seals and rejuvenators for flexible pavements.
Major Rehabilitation includes overlays, significant slab replacement, and
reconstruction.
This chapter discusses the FDOT SAPMP Localized Maintenance and Repair Planning
approach. Proactive localized maintenance and repair, specifically preservation, is highly
recommended to the airports. However, it is certainly recognized that once pavements
have deteriorated below a certain condition, the facility would benefit from more
substantial rehabilitation in lieu of localized efforts. Chapter 6 Major Rehabilitation
Planning discusses the addressing of pavements through timely rehabilitation once it has
deteriorated below a critical PCI where localized repairs may not be as cost effective.
5.1 Localized Maintenance and Repair
Localized maintenance and repair is best applied as a conservation measure and is
oftentimes applied to slow the rate of deterioration of distressed pavements; however, may
be applied as a temporary corrective measure in isolated areas. Localized maintenance
and repair can be applied either as a safety (“stopgap”) measure or preventive measure.
Example distress types subject to localized preventive maintenance and repair may
consist of low-severity longitudinal and transverse cracking and low-severity weathering.
In many cases however, localized stopgap repair is applied as a safety measure to
address high-severity distress manifestations when major rehabilitation is not funded for a
given section with a PCI value below critical PCI. Some agencies may elect to define both
types; preventative and stopgap, as localized maintenance.
Localized Stopgap/Safety Maintenance and Repair
Localized Stopgap or Safety Maintenance and Repair is defined as the localized distress
repair needed to keep pavements operational in a safe condition. These activities are
typically applied to high-severity distresses or distresses affecting operational activities.
Typical pavement section PCIs will range from 0 to 65.
Localized Preventive Maintenance and Repair
Localized Preventive Maintenance and Repair is defined as distress maintenance
activities performed with the primary objective of slowing the rate of deterioration. These
activities typically include crack sealing and patching. Typical pavement section PCIs will
be above 65.

Chapter 5 – Localized Maintenance and Repair Planning | 56
5.2 Localized Maintenance and Repair Policy
The resulting Localized Maintenance and Repair recommendations are identified based on
the policy defined in Table 5.2 (a) and Table 5.2 (b), for flexible asphalt concrete and rigid
Portland cement concrete pavements, respectively. The activities identified were based on
the research of practical pavement treatments in consideration of the FAA AC 150/5380-
6C “Guidelines and Procedures for Maintenance of Airport Pavements” and the FDOT
Airfield Pavement Distress Repair Manual. Additionally, the Engineering Technical
Letter (ETL) 14-3: Preventive Maintenance Plan (PMP) for Airfield Pavements was
referenced for conservative application of pavement treatments. The Localized
Maintenance and Repair Policy and associated planning-level unit costs were developed in
consideration of a network-level analysis – it is strictly intended to provide a glimpse of the
condition of the airport pavements with a limited PCI survey effort.
The developed Localized Maintenance and Repair Policy and associated planning-level
unit costs were based on a statewide consideration of pavement treatments and review of
state construction costs for both Airfield Pavements and from the FDOT Historical Cost
Information archives. Furthermore, a consideration of limited repair quantities was factored
in the determination of conservative planning-level unit costs. The identified Localized
maintenance activities for both preventive and stopgap activities are based on a statewide
network approach; project-specific evaluation and maintenance quantities should be
developed prior to any construction.
Ta b le 5 . 2 (a ) Loc a l i ze d Ma i nt e na n c e an d Re p ai r – F le x ib le As p h al t Co nc re te
Distress Severity Description Code Work Type Work Unit
41 Low ALLIGATOR CR FDOT-PA-AF FDOT - PATCHING - AC FULL DEPTH SqFt
41 Medium ALLIGATOR CR FDOT-PA-AF FDOT - PATCHING - AC FULL DEPTH SqFt
41 High ALLIGATOR CR FDOT-PA-AF FDOT - PATCHING - AC FULL DEPTH SqFt
42 N/A BLEEDING FDOT-MO-PV FDOT - MONITOR N/A
43 Low BLOCK CR FDOT-MO-PV FDOT - MONITOR N/A
43 Medium BLOCK CR FDOT-CS-AC FDOT - CRACK SEALING - AC Ft
43 High BLOCK CR FDOT-PA-AP FDOT - PATCHING - AC PARTIAL DEPTH SqFt
44 Low CORRUGATION FDOT-ML-AC FDOT - MILLING - AC SqFt
44 Medium CORRUGATION FDOT-ML-AC FDOT - MILLING - AC SqFt
44 High CORRUGATION FDOT-PA-AF FDOT - PATCHING - AC FULL DEPTH SqFt
45 Low DEPRESSION FDOT-PA-AF FDOT - PATCHING - AC FULL DEPTH SqFt
45 Medium DEPRESSION FDOT-PA-AF FDOT - PATCHING - AC FULL DEPTH SqFt
45 High DEPRESSION FDOT-PA-AF FDOT - PATCHING - AC FULL DEPTH SqFt
46 N/A JET BLAST FDOT-PA-AP FDOT - PATCHING - AC PARTIAL DEPTH SqFt
47 Low JT REF. CR FDOT-MO-PV FDOT - MONITOR N/A
47 Medium JT REF. CR FDOT-CS-AC FDOT - CRACK SEALING - AC Ft
47 High JT REF. CR FDOT-CS-AC FDOT - CRACK SEALING - AC Ft
48 Low L & T CR FDOT-MO-PV FDOT - MONITOR N/A
48 Medium L & T CR FDOT-CS-AC FDOT - CRACK SEALING - AC Ft

Chapter 5 – Localized Maintenance and Repair Planning | 57
Distress Severity Description Code Work Type Work Unit
48 High L & T CR FDOT-CS-AC FDOT - CRACK SEALING - AC Ft
49 N/A OIL SPILLAGE FDOT-PA-AP FDOT - PATCHING - AC PARTIAL DEPTH SqFt
50 Low PATCHING FDOT-MO-PV FDOT - MONITOR N/A
50 Medium PATCHING FDOT-PA-AF FDOT - PATCHING - AC FULL DEPTH SqFt
50 High PATCHING FDOT-PA-AF FDOT - PATCHING - AC FULL DEPTH SqFt
51 N/A POLISHED AG FDOT-SS-LO FDOT - SURFACE SEAL SqFt
52 Low RAVELING FDOT-SS-LO FDOT - SURFACE SEAL SqFt
52 Medium RAVELING FDOT-PA-AP FDOT - PATCHING - AC PARTIAL DEPTH SqFt
52 High RAVELING FDOT-PA-AP FDOT - PATCHING - AC PARTIAL DEPTH SqFt
53 Low RUTTING FDOT-MO-PV FDOT - MONITOR N/A
53 Medium RUTTING FDOT-PA-AF FDOT - PATCHING - AC FULL DEPTH SqFt
53 High RUTTING FDOT-PA-AF FDOT - PATCHING - AC FULL DEPTH SqFt
54 Low SHOVING FDOT-MO-PV FDOT - MONITOR N/A
54 Medium SHOVING FDOT-ML-AC FDOT - MILLING - AC SqFt
54 High SHOVING FDOT-PA-AF FDOT - PATCHING - AC FULL DEPTH SqFt
55 N/A SLIPPAGE CR FDOT-PA-AP FDOT - PATCHING - AC PARTIAL DEPTH SqFt
56 Low SWELLING FDOT-MO-PV FDOT - MONITOR N/A
56 Medium SWELLING FDOT-PA-AF FDOT - PATCHING - AC FULL DEPTH SqFt
56 High SWELLING FDOT-PA-AF FDOT - PATCHING - AC FULL DEPTH SqFt
57 Low WEATHERING FDOT-MO-PV FDOT - MONITOR N/A
57 Medium WEATHERING FDOT-SS-LO FDOT - SURFACE SEAL SqFt
57 High WEATHERING FDOT-PA-AP FDOT - PATCHING - AC PARTIAL DEPTH SqFt
Ta b le 5 . 2 (b ) Loc a l i ze d Ma i nt e na n c e an d Re p ai r – R i gi d Por t l a nd Cem en t Co nc re te
Distress Severity Description Code Work Type Work Unit
61 Low BLOW-UP FDOT-PA-PP FDOT - PATCHING - PCC PARTIAL DEPTH SqFt
61 Medium BLOW-UP FDOT-PA-PF FDOT - PATCHING - PCC FULL DEPTH SqFt
61 High BLOW-UP FDOT-SL-PC FDOT - SLAB REPLACEMENT - PCC SqFt
62 Low CORNER BREAK FDOT-CS-PC FDOT - CRACK SEALING - PCC Ft
62 Medium CORNER BREAK FDOT-PA-PF FDOT - PATCHING - PCC FULL DEPTH SqFt
62 High CORNER BREAK FDOT-PA-PF FDOT - PATCHING - PCC FULL DEPTH SqFt
63 Low LINEAR CR FDOT-MO-PV FDOT - MONITOR N/A
63 Medium LINEAR CR FDOT-CS-PC FDOT - CRACK SEALING - PCC Ft
63 High LINEAR CR FDOT-PA-PP FDOT - PATCHING - PCC PARTIAL DEPTH SqFt
64 Low DURABIL. CR FDOT-MO-PV FDOT - MONITOR N/A
64 Medium DURABIL. CR FDOT-PA-PF FDOT - PATCHING - PCC FULL DEPTH SqFt
64 High DURABIL. CR FDOT-SL-PC FDOT - SLAB REPLACEMENT - PCC SqFt
65 Low JT SEAL DMG FDOT-JS-PC FDOT - JOINT SEAL - PCC Ft

Chapter 5 – Localized Maintenance and Repair Planning | 58
Distress Severity Description Code Work Type Work Unit
65 Medium JT SEAL DMG FDOT-JS-PC FDOT - JOINT SEAL - PCC Ft
65 High JT SEAL DMG FDOT-JS-PC FDOT - JOINT SEAL - PCC Ft
66 Low SMALL PATCH FDOT-MO-PV FDOT - MONITOR N/A
66 Medium SMALL PATCH FDOT-PA-PP FDOT - PATCHING - PCC PARTIAL DEPTH SqFt
66 High SMALL PATCH FDOT-PA-PP FDOT - PATCHING - PCC PARTIAL DEPTH SqFt
67 Low LARGE PATCH FDOT-MO-PV FDOT - MONITOR N/A
67 Medium LARGE PATCH FDOT-PA-PF FDOT - PATCHING - PCC FULL DEPTH SqFt
67 High LARGE PATCH FDOT-PA-PF FDOT - PATCHING - PCC FULL DEPTH SqFt
68 N/A POPOUTS FDOT-PO-FL FDOT - POPOUT FILLER SqFt
69 N/A PUMPING FDOT-SB-PC FDOT – SLAB STABILIZATION - PCC SqFt
70 Low SCALING FDOT-MO-PV FDOT - MONITOR N/A
70 Medium SCALING FDOT-PA-PP FDOT - PATCHING - PCC PARTIAL DEPTH SqFt
70 High SCALING FDOT-SL-PC FDOT - SLAB REPLACEMENT - PCC SqFt
71 Low FAULTING FDOT-MO-PV FDOT - MONITOR N/A
71 Medium FAULTING FDOT-GR-PP FDOT - GRINDING (LOCALIZED) Ft
71 High FAULTING FDOT-GR-PP FDOT - GRINDING (LOCALIZED) Ft
72 Low SHAT. SLAB FDOT-CS-PC FDOT - CRACK SEALING - PCC Ft
72 Medium SHAT. SLAB FDOT-SL-PC FDOT - SLAB REPLACEMENT - PCC SqFt
72 High SHAT. SLAB FDOT-SL-PC FDOT - SLAB REPLACEMENT - PCC SqFt
73 N/A SHRINKAGE CR FDOT-MO-PV FDOT - MONITOR N/A
74 Low JOINT SPALL FDOT-CS-PC FDOT - CRACK SEALING - PCC Ft
74 Medium JOINT SPALL FDOT-PA-PP FDOT - PATCHING - PCC PARTIAL DEPTH SqFt
74 High JOINT SPALL FDOT-PA-PP FDOT - PATCHING - PCC PARTIAL DEPTH SqFt
75 Low CORNER SPALL FDOT-CS-PC FDOT - CRACK SEALING - PCC Ft
75 Medium CORNER SPALL FDOT-PA-PP FDOT - PATCHING - PCC PARTIAL DEPTH SqFt
75 High CORNER SPALL FDOT-PA-PP FDOT - PATCHING - PCC PARTIAL DEPTH SqFt
76 Low ASR FDOT-MO-PV FDOT - MONITOR N/A
76 Medium ASR FDOT-PA-PF FDOT - PATCHING - PCC FULL DEPTH SqFt
76 High ASR FDOT-SL-PC FDOT - SLAB REPLACEMENT - PCC SqFt

Chapter 5 – Localized Maintenance and Repair Planning | 59
Ta b le 5 . 2 (c ) Loc al i ze d M& R Pl a n ni n g- Le ve l Uni t Co s t s – F le xi b le As p h al t Con c re te
Code Work Type Work Unit
GA Airport Reliever Airport
Primary Airport
(Cost/Work Unit)
(Cost/Work Unit)
(Cost/Work Unit)
FDOT-SS-LO FDOT - SURFACE SEAL SqFt $0.55 $0.55 $0.55
FDOT-ML-AC FDOT - MILLING - AC SqFt $2.00 $2.00 $2.00
FDOT-CS-AC FDOT - CRACK SEALING - AC Ft $3.00 $3.00 $3.00
FDOT-MO-PV FDOT - MONITOR N/A $0.00 $0.00 $0.00
FDOT-PA-AF FDOT - PATCHING - AC FULL DEPTH SqFt $6.00 $9.00 $12.50
FDOT-PA-AP FDOT - PATCHING - AC PARTIAL DEPTH SqFt $3.00 $4.00 $5.50
Ta b le 5 . 2 (d ) Loc a l i ze d M& R P la n ni n g -Le ve l Uni t Co s t s – R ig i d Por t l a nd Cem e nt Con c re te
Code Work Type Work Unit
GA Airport Reliever Airport
Primary Airport
(Cost/Work Unit)
(Cost/Work Unit)
(Cost/Work Unit)
FDOT-PA-PF FDOT - PATCHING - PCC FULL DEPTH SqFt $100.00 $150.00 $185.00
FDOT-SL-PC FDOT - SLAB REPLACEMENT - PCC SqFt $30.00 $30.00 $30.00
FDOT-SB-PC FDOT - SLAB STABILIZATION - PCC SqFt $30.00 $30.00 $30.00
FDOT-PA-PP FDOT - PATCHING - PCC PARTIAL DEPTH SqFt $72.00 $72.00 $72.00
FDOT-PO-FL FDOT - POPOUT FILLER SqFt $0.05 $0.05 $0.05
FDOT-GR-PP FDOT - GRINDING (LOCALIZED) Ft $2.00 $2.00 $2.00
FDOT-CS-PC FDOT - CRACK SEALING - PCC Ft $4.25 $4.25 $4.25
FDOT-MO-PV FDOT - MONITOR N/A $0.00 $0.00 $0.00
FDOT-JS-PC FDOT - JOINT SEAL - PCC Ft $2.75 $2.75 $2.75
*PCC Patching (Full Depth and Partial Depth) consider high-early-strength and high-performing repair material.
5.3 Localized Maintenance and Repair Analysis and
Recommendations
The SAPMP provides a planning-level estimation of Localized Maintenance and Repair
based on the results of the latest PCI Survey Inspection performed at the airport. Based
on the limited sample units inspected, a statistical extrapolation of distresses at the
section level is used to estimate the quantities of recommended repair activities based on
the policies defined in 5.2 Localized M&R Policy. The PCI Survey Inspections did not
consist of 100% inspection of all sample units; therefore, the section-level distress
quantities used to estimate the Localized Maintenance and Repair needs are for
conceptual planning purposes. The accuracy of the extrapolated distresses, and therefore
work quantities, is subject to the amount of sample units inspected and the concentration
of distress types observed in sample units. Localized Preventive Maintenance and Repair
is typically applied to pavements that are in a condition at or above the Critical PCI of 65.
Localized Stopgap Maintenance and Repair is typically applied to pavements that are
below the Critical PCI of 65. It is recommended that airport staff evaluate the application of
Localized Maintenance and Repair in concert with the planning of Major Rehabilitation
efforts identified in Chapter 6 Major Rehabilitation Planning. Pavements with Stopgap

Chapter 5 – Localized Maintenance and Repair Planning | 60
recommendations that are subject to near-term Major Rehabilitation efforts may remove
the need to perform localized maintenance efforts.
The following Table 5.3 summarizes the anticipated Localized Maintenance and Repair
needs based on the PCI Survey Inspection efforts performed at each airport within the
District as part of this SAPMP System Update. The following table depicts planning-level
costs rounded for summary purposes.
Ta b le 5 . 3 S umm ar y o f Loc al i ze d M& R Pl a n ni n g Ne e d s by Ai r po r t
Network ID Localized Preventive Localized Stopgap TOTAL Localized Maintenance
EYW $ 1,790 $ 979,990 $ 981,780
MTH $ 24,010 $ 1,036,090 $ 1,060,100
OPF $ 578,690 $ 8,825,480 $ 9,404,170
TMB $ 1,695,670 $ 1,060,340 $ 2,756,010
TNT $ 87,050 $ 3,035,930 $ 3,122,980
X51 $ 156,910 $ 760,160 $ 917,070
DISTRICT $ 2,544,120 $ 15,697,990 $ 18,242,110

Chapter 6

Chapter 6 – Major Rehabilitation Planning | 62
Chapter 6 – Major Rehabilitation
Planning
6.1 Major Rehabilitation
Major rehabilitation is recommended to correct or improve structural deficiencies and/or
functional deterioration for pavement sections within a network. Often, when pavements
are subject to significant changes in the aircraft fleet mix (frequency and type), major
rehabilitation is required to provide a pavement section to meet the traffic demand. Major
rehabilitation is recommended when a pavement section falls below the Critical PCI value
that is defined during the system customization or if a pavement section has a significant
observation of load-related distress. Observation of any load-related distress potentially
indicates that the section may be structurally deficient or that the aircraft loads being
applied to the pavement section are different than what the section was designed for.
Figures 6.1 (a) and 6.1 (b) depict the decision process for major rehabilitation project
identification with the assumption of available funds. Should funding be unavailable for
pavement sections in need of major rehabilitation, the airport may elect to apply the
appropriate localized stopgap repair.
Fi g u re 6 .1 ( a ) M aj o r Re ha b i l i t a t i o n P la n n in g De ci s i o n Di ag r am , PCI ≤ Cr i t i c al PCI

Chapter 6 – Major Rehabilitation Planning | 63
Fi g u re 6 . 1 ( b ) M aj o r Re ha b i l i t a t i o n P la n n in g De ci s i o n Di ag r am , PCI > Cr i t i ca l PCI

Chapter 6 – Major Rehabilitation Planning | 64
6.1.1 CRITICAL PCI
For the FDOT SAPMP the development of a major rehabilitation program is based on the
Critical PCI concept. The Critical PCI concept assumes that it is more cost-effective to
maintain pavements above, rather than below their critical PCI. It is assumed that once a
pavement section deteriorates to the Critical PCI value that it is more cost-effective to
complete a major rehabilitation project rather than continuing to apply preventive
maintenance. This method includes defining the Critical PCI and introducing major
rehabilitation work types.
Identification of annual and long-range Major Rehabilitation work plans are typically based
on the Critical PCI concept. The Critical PCI is defined as the PCI value at which the rate
of loss (deterioration) increases with time, or the cost of applying localized maintenance
and repair increases or is not effective. A Critical PCI is usually within a range of 55 and
70; the following procedure is standard approach in developing a specific Critical PCI:
1. Develop a pavement performance model and refine a prediction model for
the pavements considered.
2. Select a localized maintenance and repair policy to be used in developing a
work plan.
3. Apply the selected localized policy to the pavement sections for a range of
PCI.
4. Compute the unit cost per area for each PCI range.
5. Plot the cost versus the PCI.
6. Determine the Critical PCI based on the point where the cost is insignificant.
The FDOT SAPMP defines the Critical PCI at 65 – this is based on the historic trends in
pavement performance and Statewide planning efforts.
6.1.2 FDOT RECOMMENDED MINIMUM SERVICE-LEVEL PCI
The FDOT has recommended Minimum Service-Level PCI for airports’ airfield
pavements based on the following characteristics; airport type within FDOT SAPMP,
branch use, and expected aircraft operations. For the purposes of Major Rehabilitation,
the Critical PCI is typically the threshold condition that triggers major construction,
however it is recommended that the airports maintain the Minimum Service-Level PCI with
a combination of Localized Maintenance and Repair and timely Major Rehabilitation. Table
6.1.2 summarizes the FDOT Recommended Minimum Service-Level PCI.
Ta b le 6 . 1 . 2 FDOT Re c omm en d e d M i nim um S e rv ice - Lev el PCI
Use FDOT Recommended Minimum Service Level PCI
Critical PCI Primary Airports
Regional Reliever Airports
General Aviation Airports
Runway 75 75 75 65
Taxiway 70 65 65 65
Apron 65 65 60 65
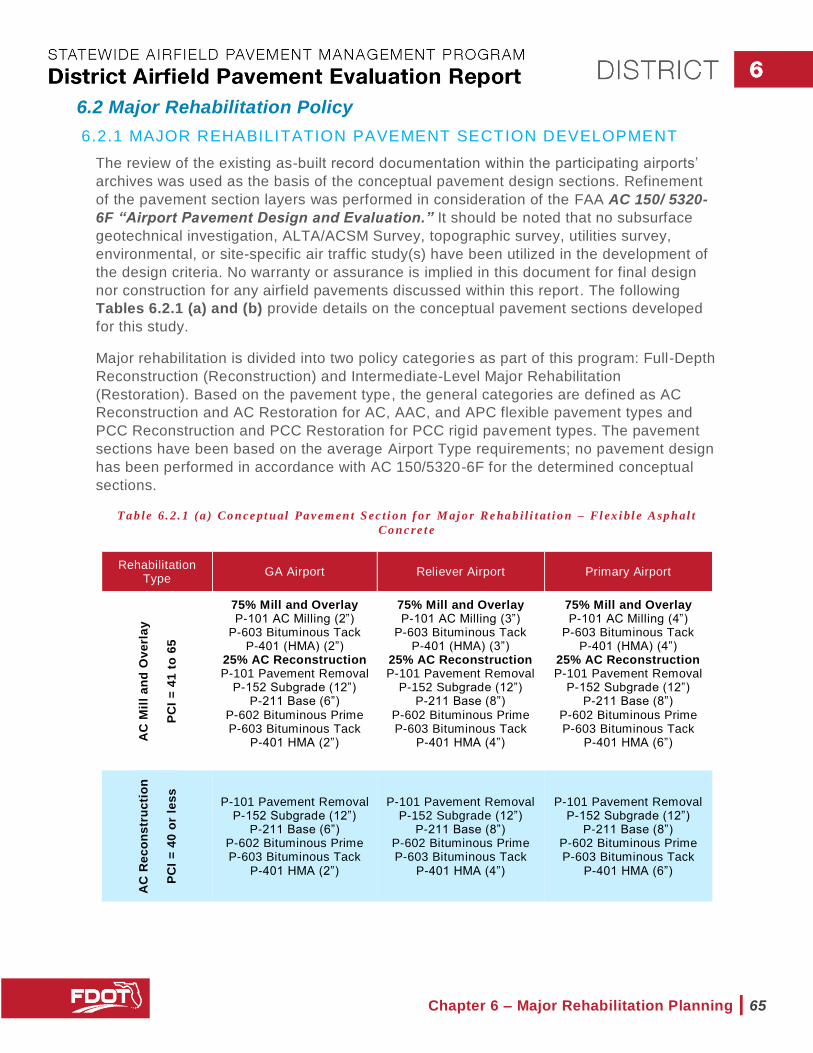
Chapter 6 – Major Rehabilitation Planning | 65
6.2 Major Rehabilitation Policy
6.2.1 MAJOR REHABILITATION PAVEMENT SECTION DEVELOPMENT
The review of the existing as-built record documentation within the participating airports’
archives was used as the basis of the conceptual pavement design sections. Refinement
of the pavement section layers was performed in consideration of the FAA AC 150/ 5320-
6F “Airport Pavement Design and Evaluation.” It should be noted that no subsurface
geotechnical investigation, ALTA/ACSM Survey, topographic survey, utilities survey,
environmental, or site-specific air traffic study(s) have been utilized in the development of
the design criteria. No warranty or assurance is implied in this document for final design
nor construction for any airfield pavements discussed within this report. The following
Tables 6.2.1 (a) and (b) provide details on the conceptual pavement sections developed
for this study.
Major rehabilitation is divided into two policy categories as part of this program: Full-Depth
Reconstruction (Reconstruction) and Intermediate-Level Major Rehabilitation
(Restoration). Based on the pavement type, the general categories are defined as AC
Reconstruction and AC Restoration for AC, AAC, and APC flexible pavement types and
PCC Reconstruction and PCC Restoration for PCC rigid pavement types. The pavement
sections have been based on the average Airport Type requirements; no pavement design
has been performed in accordance with AC 150/5320-6F for the determined conceptual
sections.
Ta b le 6 . 2 . 1 (a ) Co n ce pt u al Pa v em en t S ec t i o n f o r M aj o r Re ha b i l i t a t i o n – Fl ex i bl e Asp h al t
Co n c re t e
Rehabilitation Type
GA Airport Reliever Airport Primary Airport
AC
Mil
l a
nd
Ov
erl
ay
PC
I =
41
to
65
75% Mill and Overlay P-101 AC Milling (2”)
P-603 Bituminous Tack P-401 (HMA) (2”)
25% AC Reconstruction P-101 Pavement Removal
P-152 Subgrade (12”) P-211 Base (6”)
P-602 Bituminous Prime P-603 Bituminous Tack
P-401 HMA (2”)
75% Mill and Overlay P-101 AC Milling (3”)
P-603 Bituminous Tack P-401 (HMA) (3”)
25% AC Reconstruction P-101 Pavement Removal
P-152 Subgrade (12”) P-211 Base (8”)
P-602 Bituminous Prime P-603 Bituminous Tack
P-401 HMA (4”)
75% Mill and Overlay P-101 AC Milling (4”)
P-603 Bituminous Tack P-401 (HMA) (4”)
25% AC Reconstruction P-101 Pavement Removal
P-152 Subgrade (12”) P-211 Base (8”)
P-602 Bituminous Prime P-603 Bituminous Tack
P-401 HMA (6”)
AC
Re
co
ns
tru
cti
on
PC
I =
40
or
les
s
P-101 Pavement Removal P-152 Subgrade (12”)
P-211 Base (6”) P-602 Bituminous Prime P-603 Bituminous Tack
P-401 HMA (2”)
P-101 Pavement Removal P-152 Subgrade (12”)
P-211 Base (8”) P-602 Bituminous Prime P-603 Bituminous Tack
P-401 HMA (4”)
P-101 Pavement Removal P-152 Subgrade (12”)
P-211 Base (8”) P-602 Bituminous Prime P-603 Bituminous Tack
P-401 HMA (6”)

Chapter 6 – Major Rehabilitation Planning | 66
Ta b le 6 . 2 . 1 (b ) Co n ce pt u al Pa v em en t S ec t i o n f o r M aj o r Re ha b i l i t a t i o n – Ri gi d Por t l a n d Cem en t
Co n c re t e
Rehabilitation Type
GA Airport Reliever Airport Primary Airport
PC
C R
es
tora
tio
n
P
CI
= 4
1 t
o 6
5
P-101 Pavement Removal P-605 Joint Seal Repair
P-152 Subgrade (6”) P-211 Base (if needed,
typical) (6”) P-501 Rigid PCC (10”)
*Select Slabs (25%)
**Crack Seal and Limited Patching
P-101 Pavement Removal P-605 Joint Seal Repair P-152 Subgrade (12”)
P-211 Base (if needed, typical) (6”)
P-501 Rigid PCC (15”)
*Select Slabs (25%) **Crack Seal and Limited
Patching
P-101 Pavement Removal P-605 Joint Seal Repair P-152 Subgrade (12”)
P-211 Base (if needed, typical) (6”)
P-501 Rigid PCC (16”)
*Select Slabs (25%) **Crack Seal and Limited
Patching
PC
C R
ec
on
str
uc
tio
n
P
CI
= 4
0 o
r le
ss
P-101 Pavement Removal P-605 Joint Seal Repair
P-152 Subgrade (6”) P-211 Base (6”)
P-501 Rigid PCC (10”)
P-101 Pavement Removal P-605 Joint Seal Repair P-152 Subgrade (12”)
P-211 Base (6”) P-501 Rigid PCC (14”)
P-101 Pavement Removal P-605 Joint Seal Repair P-152 Subgrade (12”)
P-211 Base (6”) P-501 Rigid PCC (17”)
The identification of rehabilitation needs and conceptual pavement sections have
been determined at the planning level. Design-level investigation is recommended
prior to developing construction-level design documents and budgets.
In compliance with FAA Grant Assurances 11 and 19, the FDOT SAPMP provides airports
with airfield pavement evaluation reports in accordance with FAA AC 150/5380-7B
Airport Pavement Management Program (PMP) and AC 150/5380-6C Guidelines and
Procedures for Maintenance of Airport Pavements. The application of the results of a
PCI survey are for planning purposes and are limited to the visual observation of
deteriorated pavements in limited sampling; design-level investigation is recommended in
accordance with the FAA procedures defined in AC 5320-6F Airport Pavement Design
and Evaluation and AC 150/5370-11B Use of Nondestructive Testing in the
Evaluation of Airport Pavements. The aforementioned ACs provide the design-level
material properties of in-situ pavement and subgrade layers for the determination of
appropriate rehabilitation actions. The FDOT SAPMP is organized to provide airports with
planning-level data and does not intend to preclude the responsible engineer in performing
the appropriate level of investigation and analysis in determining the appropriate design
details of a pavement rehabilitation. It would not be advisable to solely base design -level
rehabilitation without the appropriate level of investigation and determination of pavement
deterioration beyond that of a visual functional condition assessment.
The recommendations identified in the Major Rehabilitation Needs consider the FAA AC
150/5370-10H Standard Specifications for Construction of Airports when determining the
appropriate materials and methods implemented for construction projects, such as
pavement rehabilitation, on airports. It should be noted that the AC 150/5370-10H

Chapter 6 – Major Rehabilitation Planning | 67
Standard Specifications for Construction of Airports was updated in December of 2018.
Design-level determination of project specific specifications based on the AC should be
developed by the Airport when performing applicable construction projects.
6.2.2 MAJOR REHABILITATION PLANNING-LEVEL UNIT COSTS
Planning-level opinion of probable construction unit costs developed for this System
Update was based on archived bid tabulations and records from airfield pavement projects
provided by participating airports. A review of cost trends and cost factors have been
incorporated to assist airports in planning for project budgets. Neither FDOT nor the
Consultant Team has control over the cost of labor, materials, equipment, or over the
Contractor's methods of determining prices or over competitive bidding or market
conditions. Opinions of probable construction costs provided herein are based on the
information known to FDOT at this time and represent only the Consultant Team’s
judgment as a design professional familiar with the construction industry. This report
cannot and does not guarantee that proposals, bids, or actual construction costs will not
vary from its opinions of probable construction costs.
Ta b le 6 . 2 . 2 Ma jo r Re h ab i l i t a t io n P l a nn i ng - Le v el Un i t Cos t b y Pav em e nt Ty pe
Major Rehabilitation PCI Range GA Airport Reliever Airport Primary Airport
(Cost per SF) (Cost per SF) (Cost per SF)
AC Mill and Overlay 41-65 $ 7.00 $ 9.50 $ 11.00
AC Reconstruction 0-40 $ 9.00 $ 12.50 $ 14.00
PCC Restoration 41-65 $ 10.00 $ 13.50 $ 17.00
PCC Reconstruction 0-40 $ 15.00 $ 20.00 $ 23.00 Planning-level opinion of probable construction unit costs consider factors for non -pavement improvements, QA/QC
testing, and administrative costs.

Chapter 6 – Major Rehabilitation Planning | 68
6.3 Major Rehabilitation Needs
The objective of the major pavement rehabilitation needs analysis is to provide planning-
level projects within an airport’s airfield pavement network. Major rehabilitation activities
are recommended when a pavement section has deteriorated below the Critical PCI value,
a point at which localized maintenance and repair activities may not be the most cost -
effective solution. In addition, major rehabilitation is also recommended when the Section
PCI is at or above the Critical PCI but the section has significant load-related PCI
distresses. Identification of rehabilitation needs is done at the Airfield Pavement Network
Definition’s section level. This however does not limit the airport from further refining limits
of project planning areas.
Major rehabilitation is identified within the FDOT SAPMP as major construction activity
that would result in an improvement or resetting of the pavement section’s PCI to a value
of 100. Major rehabilitation recommendations (AC Restoration, AC Reconstruction, PCC
Restoration, and PCC Reconstruction) should be considered as planning-level only.
Additional design-level investigation in accordance to the FAA Advisory Circulars will be
required. Recommendations identified within this planning document do not imply final
design. Table 6.3 identifies the overall planning-level costs for each airport based on the
total sections requiring major rehabilitation due to its PCI being below the Critical PCI of
65 or having substantial load-based distresses.
Ta b le 6 . 3 S umm ar y o f Dis t r i c t Y ea r 1 Ma j or Re h ab i l i t a t i o n Nee d s
Network ID Airport Type
Weighted-Average PCI
Average Rating Year 1 Major Rehabilitation
EYW PR 74 SATISFACTORY $ 10,691,000
MTH GA 58 FAIR $ 11,245,000
OPF RL 58 FAIR $ 83,932,000
TMB RL 70 FAIR $ 12,906,000
TNT GA 54 POOR $ 21,508,000
X51 GA 65 FAIR $ 6,416,000
OVERALL DISTRICT 62 FAIR $ 146,698,000 *All values have been rounded to the nearest thousand-dollar.

Chapter 6 – Major Rehabilitation Planning | 69
6.3.1 10-YEAR UNCONSTRAINED BUDGET MAJOR REHABILITATION
NEEDS
An unconstrained budget (unlimited budget) is performed for a 10-year duration to identify
pavement rehabilitation needs based on current or forecasted PCI values deteriorating
below the Critical PCI. FDOT recognizes airports are constrained by budgets and does not
intend to convey an unrealistic approach of addressing pavement rehabilitation. The intent
of the 10-Year Major Rehabilitation Needs analysis is to identify pavements that will
warrant rehabilitation. It is highly recommended that airport staff utilize this information in
support of the development of a practical Capital Improvement Program based on
priorities, further design/project-level investigation, and budgetary constraints. The
following Table 6.3.1 (a) and Table 6.3.1 (b) summarize all identified major rehabilitation
needs for each airport within the District forecasted for the next 10-year period. It should
be noted that the following table depicts planning-level costs and have been rounded for
planning purposes.
Ta b le 6 . 3 . 1 ( a ) S umm ar y o f 10 -Ye a r M a jo r Re h ab i l i t a t i o n Ne ed s b y A ir p or t
Network ID Airport Type
Weighted-Average PCI
Average Rating 10-Year Major Rehabilitation
EYW PR 74 SATISFACTORY $ 10,691,000
MTH GA 58 FAIR $ 11,735,000
OPF RL 58 FAIR $ 97,638,000
TMB RL 70 FAIR $ 49,428,000
TNT GA 54 POOR $ 22,892,000
X51 GA 65 FAIR $ 9,927,000
OVERALL DISTRICT 62 FAIR $ 202,311,000 *All values have been rounded to the nearest thousand-dollar.
Ta b le 6 . 3 . 1 . ( b) 1 0 -Ye ar M aj o r Re ha bi l i ta t i o n Ne ed s b y A ir p o r t
Major Rehabilitation ($ in Millions)
Network ID 2018 2019 2020 2021 2022 2023 2024 2025 2026 2027 2028 2029
EYW - - 10.69M 0M 0M 0M 0M 0M 0M 0M 0M 0M
MTH - - 11.25M 0.26M 0M 0M 0M 0M 0.05M 0.08M 0.1M 0M
OPF - - 83.93M 2.04M 0.11M 3.43M 0.11M 6.47M 0.62M 0.92M 0M 0M
TMB - - 12.91M 0M 3.95M 9.44M 11.83M 5.25M 1.27M 0.17M 2.33M 2.29M
TNT 21.51M 1.34M 0M 0M 0M 0M 0.05M 0M 0M 0M - -
X51 6.42M 2.42M 0M 0M 0.08M 0.14M 0M 0.05M 0.81M 0M - -
DISTRICT 27.92M 3.76M 118.77M 2.3M 4.15M 13.01M 11.99M 11.77M 2.76M 1.16M 2.43M 2.29M
*All values have been rounded to the nearest ten-thousand-dollar.

Chapter 7

Chapter 7 – Conclusion | 71
Chapter 7 – Conclusion
7.1 Recommendations
7.1.1 CONTINUED PCI SURVEY INSPECTIONS
It is recommended that the airport continue to perform regularly scheduled PCI Survey
inspections in accordance with the ASTM D5340-12 (or latest edition) to monitor the
condition of the airfield pavement facilities.
A high priority should be considered for continuous maintenance record keeping and re -
inspection of all the airport’s maintained pavement facilities to ensure continued safe
aircraft operations. A series of scheduled periodic inspections must be carried out for an
effective maintenance program. Re-inspection of pavements should be scheduled in a
timely manner to ensure that all areas, particularly those that may not come under day-to-
day observation, are thoroughly evaluated and reported.
7.1.2 LOCALIZED MAINTENANCE AND REPAIR
While deterioration of the pavements due to usage and exposure to the environment
cannot be completely prevented, applying timely and effective maintenance efforts can
slow the anticipated rate of deterioration. Lack of adequate and timely maintenance is the
significant factor in pavement deterioration.
It is recommended that airport sponsors coordinate with their respective Airport
Maintenance staff and Airport Engineer when developing project-level maintenance and
repair efforts.
7.1.3 MAJOR REHABILITATION
Chapter 6 – Major Rehabilitation Planning identified major pavement rehabilitation project
needs from 2018-2029. The identification of the rehabilitation needs was performed at the
section level for manageable project areas with the assumption of an unconstrained
budget scenario. Given the uncertainty in the airport-specific budget information and
prioritization goals, the unconstrained budget scenario was performed to evaluate the
worst-case scenario and identify all the inspected pavements’ needs in a 10-year period.
Certainly, it is understood that most airports are faced with constrained budgets; further
evaluation of projects based on prioritization, operational criticality, funding availability,
and practicality is recommended.
7.1.4 PAVEMENT MANAGEMENT SYSTEM
The following recommendations are made to fully implement an effective pavement
management program for the airport:
Develop a detailed preventive maintenance program for the airport .
Further refine and implement the identified 10-year major rehabilitation needs.
Maintain detailed records on pavement maintenance, construction, and inspection .

Chapter 7 – Conclusion | 72
Maintain records on major pavement construction projects (year, scope, cost, and
construction documents).
7.2 Supporting Documents
AIRFIELD PAVEMENT CONDITION INDEX EXHIBITS
The Airfield Pavement Condition Index Exhibits are located in Appendix B Pavement
Condition Index Exhibits. The exhibits are a visual summary of the latest conditions
calculated from the results of the PCI Survey performed at each airport. The PCI values
are identified in the exhibits and are graphically represented using the standard ASTM
D5340-12 colors for condition rating categories.
AIRFIELD PAVEMENT MAJOR REHABILITATION EXHIBITS
The Airfield Pavement Major Rehabilitation Exhibits are located in Appendix D Major
Rehabilitation Exhibits. The exhibits have been prepared based on the section condition
analysis, pavement condition forecasts, and major rehabilitation needs analysis. The
exhibits graphically depict the inventory with the associated rehabilitation type activity,
program year, and the planning-level costs. The area limits, rehabilitation type, and
planning-level costs should not be considered a design-level recommendation. A
tabulation of the 10-Year Major Rehabilitation is located in Appendix C Airfield
Pavement Major Rehabilitation Table.
7.3 Conclusion
The FDOT SAPMP Update 2016-2019 was completed for the airports on behalf of the
FDOT ASO in accordance with the Advisory Circulars 150/5380-7B “Airport Pavement
Management Program (PMP)” and 150/5380-6C “Guidelines and Procedures for
Maintenance of Airport Pavements.” FDOT’s implementation of the SAPMP has assisted
public airports with this requirement in performing PCI survey inspections and analysis in
accordance with the ASTM D5340-12 “Standard Test Method for Airport Pavement
Condition Index Surveys.”

Appendix A
District Section Condition Report

Section Condition Report10/16/2019 Page 1 of 10
PCIAge AtInspec
tion
LastInspection
Date
True Area(SqFt)
LanesRankUseSurfaceLast Const.
DateSection IDBranch ID
FDOT NetworkId: EYWPavement Database:
47167/29/201934,810.000PAPRONAAC1/1/20034105AP E
42167/29/201937,772.000PAPRONAAC1/1/20034130AP E
44167/29/2019145,771.000PAPRONAAC1/1/20034145AP E
35167/29/201916,824.000PAPRONAC1/1/20034150AP E
58147/29/201951,364.000PAPRONAAC1/1/20054155AP E
100010/1/2018370,379.000PAPRONPCC10/1/20184160AP E
55167/29/2019162,131.000PAPRONAC1/1/20034205AP W
58137/29/201960,960.000PAPRONAC1/1/20064215AP W
62147/29/201913,765.000PAPRONAC1/1/20054220AP W
10004/1/2018312,000.000PRUNWAYAAC4/1/20186105RW 9-27
10004/1/2018168,000.000PRUNWAYAAC4/1/20186110RW 9-27
42167/29/2019184,302.000PTAXIWAYAAC1/1/2003105TW A
42167/29/201957,310.000PTAXIWAYAAC1/11/2003110TW A
6157/29/20192,531.000PTAXIWAYPCC1/1/2014165TW A10
43167/29/20192,633.000PTAXIWAYAC1/1/2003170TW A11
100010/1/20181,525.000PTAXIWAYPCC10/1/2018172TW A11
8857/29/20191,991.000PTAXIWAYPCC1/1/2014150TW A7
8857/29/20191,992.000PTAXIWAYPCC1/1/2014155TW A8
100010/1/20184,194.000PTAXIWAYPCC10/1/2018160TW A9
10004/1/201819,096.000PTAXIWAYAAC4/1/2018205TW B
46167/29/201920,821.000PTAXIWAYAAC1/1/2003210TW B
10004/1/20189,642.000PTAXIWAYAAC4/1/2018305TW C
51167/29/201910,524.000PTAXIWAYAAC1/1/2003310TW C
10004/1/20189,324.000PTAXIWAYAAC4/1/2018505TW D
43167/29/201916,297.000PTAXIWAYAAC1/1/2003510TW D
10004/1/201816,396.000PTAXIWAYAAC4/1/2018605TW E
50167/29/201937,891.000PTAXIWAYAAC1/1/2003610TW E
PAVER 7.0 ™Pavement Management System
Appendix A - 1

Section Condition Report10/16/2019 Page 2 of 10
PCIAge AtInspec
tion
LastInspection
Date
True Area(SqFt)
LanesRankUseSurfaceLast Const.
DateSection IDBranch ID
FDOT NetworkId: MTHPavement Database:
65207/30/201935,198.000TAPRONAC1/1/19994505AP E
50207/30/201917,050.000TAPRONAC1/1/19994510AP E
10003/1/201730,304.000PAPRONAC3/1/20174515AP E
63367/30/2019269,634.000PAPRONAC1/1/19834105AP FLGHT C
28367/30/20194,020.000PAPRONPCC1/1/19834110AP FLGHT C
55537/30/201931,238.000PAPRONAC1/1/19664115AP FLGHT C
56217/30/201918,521.000PAPRONAAC1/1/19984120AP FLGHT C
78207/30/201914,266.000PAPRONAC12/25/19994125AP FLGHT C
10001/1/20178,289.000PAPRONPCC1/1/20174130AP FLGHT C
40297/30/2019112,985.000PAPRONAC1/1/19904305AP JET CTR
80327/30/20197,543.000PAPRONPCC1/1/19874308AP JET CTR
52207/30/201960,631.000PAPRONAC12/25/19994315AP JET CTR
57417/30/201920,012.000PAPRONAAC1/1/19784205AP TERM
46207/30/201918,371.000PAPRONAC1/1/19994210AP TERM
60257/30/201987,363.000PAPRONPCC1/1/19944220AP TERM
67207/30/201937,284.000PAPRONAC12/25/19994405AP T-HAN
50347/30/2019375,600.000PRUNWAYAAC1/1/19856105RW 7-25
56347/30/2019125,200.000PRUNWAYAAC1/1/19856110RW 7-25
62217/30/2019252,877.000PTAXIWAYAAC1/1/1998105TW A
62207/30/201950,654.000PTAXIWAYAC12/25/1999115TW A
53217/30/201910,711.000PTAXIWAYAAC1/1/1998151TW B
58217/30/20196,247.000PTAXIWAYAAC1/1/1998205TW C
56217/30/20193,873.000PTAXIWAYAAC1/1/1998210TW C
49217/30/20199,290.000PTAXIWAYAAC1/1/1998305TW D
71217/30/20197,468.000PTAXIWAYAAC1/1/1998310TW D
75217/30/20195,537.000PTAXIWAYAAC1/1/1998152TW E
64217/30/20195,103.000PTAXIWAYAAC1/1/1998155TW E
79217/30/201943,530.000PTAXIWAYAC1/1/1998405TW E
PAVER 7.0 ™Pavement Management System
Appendix A - 2

Section Condition Report10/16/2019 Page 3 of 10
PCIAge AtInspec
tion
LastInspection
Date
True Area(SqFt)
LanesRankUseSurfaceLast Const.
DateSection IDBranch ID
FDOT NetworkId: OPFPavement Database:
35187/22/2019263,317.000PAPRONAAC1/2/20014105AP CENTER
27647/22/2019205,407.000PAPRONPCC1/1/19554110AP CENTER
72107/22/201945,995.000PAPRONPCC1/1/20094112AP CENTER
9347/22/201961,129.000PAPRONAAC7/1/20154115AP CENTER
9857/22/201938,830.000PAPRONPCC1/1/20144122AP CENTER
18647/22/201935,700.000PAPRONPCC1/1/19554125AP CENTER
20647/22/201912,508.000PAPRONPCC1/1/19554130AP CENTER
29647/22/201935,672.000PAPRONPCC1/1/19554135AP CENTER
49157/22/201918,019.000PAPRONPCC6/1/20044136AP CENTER
6077/22/201972,314.000PAPRONAAC1/1/20124140AP CENTER
51187/22/201937,559.000PAPRONAAC1/2/20014145AP CENTER
43337/22/201949,389.000PAPRONAC1/1/19864205AP E
36317/22/2019209,760.000PAPRONAC1/1/19884210AP E
7357/22/2019260,110.000PAPRONAC1/1/20144215AP E
8757/22/201973,845.000PAPRONAC1/1/20144220AP E
54337/22/2019126,677.000PAPRONAC1/1/19864225AP E
51337/22/201919,060.000PAPRONAC1/1/19864230AP E
17747/22/201936,290.000PAPRONAC1/1/19454231AP E
41347/22/2019695,920.000PAPRONAC1/1/19854305AP NE
9337/22/2019302,367.000PAPRONAAC9/1/20164315AP NE
39347/22/2019118,793.000PAPRONAC1/1/19854505AP T-HANG
33747/22/201953,737.000PAPRONAC1/1/19454507AP T-HANG
71117/22/201977,168.000PAPRONAAC1/1/20084509AP T-HANG
57347/22/201988,298.000PAPRONAC1/1/19854510AP T-HANG
45257/22/201926,770.000PAPRONAC1/1/19944515AP T-HANG
8157/22/201996,743.000PAPRONAAC1/1/20144520AP T-HANG
9337/22/2019325,630.000PAPRONAC1/1/20164525AP T-HANG
45257/22/2019643,500.000PRUNWAYAC1/1/19946205RW 12-30
49257/22/2019321,750.000PRUNWAYAC1/1/19946210RW 12-30
9277/22/201918,000.000PRUNWAYAAC6/29/20126215RW 12-30
9477/22/20199,000.000PRUNWAYAAC6/29/20126220RW 12-30
9077/22/201918,500.000PRUNWAYAAC6/29/20126225RW 12-30
9077/22/20199,250.000PRUNWAYAAC6/29/20126230RW 12-30
8867/22/20199,250.000PRUNWAYAPC5/6/20136102RW 9L-27R
59307/22/201915,750.000PRUNWAYAPC1/1/19896105RW 9L-27R
8567/22/201920,350.000PRUNWAYAPC5/6/20136107RW 9L-27R
61307/22/201931,856.000PRUNWAYAPC1/1/19896110RW 9L-27R
53107/22/2019350,000.000PRUNWAYAAC1/1/20096115RW 9L-27R
56307/22/2019700,000.000PRUNWAYAAC1/1/19896120RW 9L-27R
64307/22/201915,850.000PRUNWAYAPC1/1/19896125RW 9L-27R
60307/22/201932,104.000PRUNWAYAPC1/1/19896130RW 9L-27R
8267/22/20199,250.000PRUNWAYAPC5/6/20136135RW 9L-27R
7967/22/201920,813.000PRUNWAYAPC5/6/20136140RW 9L-27R
69177/22/2019330,300.000PRUNWAYAAC1/2/20026405RW 9R-27L
56177/22/2019100,600.000PRUNWAYAAC1/2/20026410RW 9R-27L
38747/22/2019107,164.000PTAXILANEAC1/1/19451670TL P
9437/22/201953,312.000PTAXIWAYAAC9/1/2016202TW B
56347/22/201916,728.000PTAXIWAYAC1/1/1985205TW B
9337/22/20194,748.000PTAXIWAYAAC9/1/2016210TW B
49347/22/20197,653.000PTAXIWAYAC1/1/1985215TW B
54307/22/20194,608.000PTAXIWAYAAC1/1/1989305TW C
PAVER 7.0 ™Pavement Management System
Appendix A - 3

Section Condition Report10/16/2019 Page 4 of 10
8957/22/201933,038.000PTAXIWAYAAC1/1/2014310TW C
8857/22/20195,722.000PTAXIWAYAAC1/1/2014312TW C
8057/22/201918,950.000PTAXIWAYAAC1/1/2014315TW C
45317/22/2019101,022.000PTAXIWAYAC1/1/1988320TW C
8867/22/20197,440.000PTAXIWAYAC1/1/2013327TW C
49317/22/201913,347.000PTAXIWAYAC1/1/1988330TW C
49257/22/201930,808.000PTAXIWAYAAC1/1/1994405TW D
47257/22/201971,495.000PTAXIWAYAC1/1/1994410TW D
54257/22/201987,770.000PTAXIWAYAC1/1/1994415TW D
55307/22/20196,116.000PTAXIWAYAAC1/1/1989505TW E
63527/22/201940,471.000PTAXIWAYAC1/1/1967510TW E
50187/22/2019192,006.000PTAXIWAYAAC1/2/2001515TW E
84277/22/20199,942.000PTAXIWAYAC1/1/1992520TW E
53307/22/20194,608.000PTAXIWAYAAC1/1/1989605TW F
8857/22/201932,630.000PTAXIWAYAAC1/1/2014610TW F
63177/22/201914,748.000PTAXIWAYAAC1/1/2002615TW F
8947/22/20195,620.000PTAXIWAYAAC1/1/2015630TW F
8147/22/201942,867.000PTAXIWAYAAC1/1/2015635TW F
64307/22/20194,620.000PTAXIWAYAAC1/1/1989705TW G
8957/22/201933,147.000PTAXIWAYAAC1/1/2014710TW G
8857/22/201911,179.000PTAXIWAYAAC1/1/2014715TW G
60447/22/201911,084.000PTAXIWAYAC1/1/1975717TW G
61537/22/201948,730.000PTAXIWAYAC1/1/1966720TW G
66447/22/201982,424.000PTAXIWAYAC1/1/1975722TW G
47257/22/201916,579.000PTAXIWAYAC1/1/1994725TW G
62257/22/201982,966.000PTAXIWAYAC1/1/1994730TW G
62447/22/2019121,482.000PTAXIWAYAC1/1/1975735TW G
59257/22/201911,329.000PTAXIWAYAC1/1/1994740TW G
67177/22/201911,850.000PTAXIWAYAAC1/1/2002745TW G
65107/22/201936,541.000PTAXIWAYAAC1/1/2009805TW H
46537/22/201941,939.000PTAXIWAYAC1/1/1966806TW H
68107/22/2019146,625.000PTAXIWAYAAC1/1/2009815TW H
8747/22/2019148,588.000PTAXIWAYAAC1/1/2015820TW H
66107/22/201923,324.000PTAXIWAYAAC1/1/2009823TW H
60107/22/201927,651.000PTAXIWAYAAC1/1/2009824TW H
53257/22/201989,179.000PTAXIWAYAC1/1/1994825TW H
57257/22/201989,179.000PTAXIWAYAC1/1/1994826TW H
57347/22/201922,875.000PTAXIWAYAC1/1/1985835TW H
8947/22/201923,075.000PTAXIWAYAAC1/1/2015840TW H
53107/22/201924,981.000PTAXIWAYAAC1/1/2009845TW H
68107/22/201929,637.000PTAXIWAYAAC1/1/2009846TW H
55307/22/201912,262.000PTAXIWAYAC1/1/1989855TW H
51307/22/20194,608.000PTAXIWAYAAC1/1/19891005TW J
9157/22/201933,038.000PTAXIWAYAAC1/1/20141010TW J
69277/22/201922,454.000PTAXIWAYAC1/1/19921015TW J
54277/22/201919,915.000PTAXIWAYAC1/1/19921025TW J
39547/22/201919,750.000PTAXIWAYAC1/1/19651030TW J
10005/1/201922,300.000PTAXIWAYAAC5/1/20191035TW J
53257/22/201957,601.000PTAXIWAYAC1/1/19941040TW J
59447/22/201916,875.000PTAXIWAYPCC1/1/19751410TW N
7857/22/201913,336.000PTAXIWAYAPC1/1/20141412TW N
9257/22/20197,149.000PTAXIWAYAPC1/1/20141415TW N
8857/22/2019104,780.000PTAXIWAYAAC1/1/20141420TW N
58187/22/2019212,770.000PTAXIWAYAAC6/1/20011422TW N
8957/22/2019179,250.000PTAXIWAYAAC1/1/20141423TW N
9047/22/201928,200.000PTAXIWAYAAC1/1/20151425TW N
PAVER 7.0 ™Pavement Management System
Appendix A - 4

Section Condition Report10/16/2019 Page 5 of 10
66447/22/201937,642.000PTAXIWAYPCC1/1/19751430TW N
68447/22/201959,701.000PTAXIWAYPCC1/1/19751435TW N
70447/22/201958,242.000PTAXIWAYPCC1/1/19751405TW N1
62277/22/201927,346.000PTAXIWAYAC1/1/19921605TW P
64277/22/201946,478.000PTAXIWAYAC1/1/19921615TW P
61277/22/2019194,846.000PTAXIWAYAC1/1/19921620TW P
8397/22/20194,522.000PTAXIWAYAAC1/1/20101623TW P
62177/22/201913,111.000PTAXIWAYAAC1/1/20021625TW P
50177/22/201995,088.000PTAXIWAYAAC1/1/20021630TW P
86187/22/20195,213.000PTAXIWAYAAC1/1/20011633TW P
46317/22/201920,800.000PTAXIWAYAC1/1/19881640TW P
48127/22/2019107,175.000PTAXIWAYAAC1/1/20071645TW P
7747/22/20198,040.000PTAXIWAYAC1/1/19451650TW P
70127/22/20197,774.000PTAXIWAYAAC1/1/20071653TW P
49347/22/201921,542.000PTAXIWAYAC1/1/19851655TW P
8237/22/201943,446.000PTAXIWAYAAC9/1/20161660TW P
9237/22/201957,543.000PTAXIWAYAAC9/1/20161665TW P
8297/22/20197,989.000PTAXIWAYAAC1/1/20101803TW R
69177/22/201911,751.000PTAXIWAYAAC1/1/20021805TW R
65177/22/201939,059.000PTAXIWAYAAC1/1/20021810TW R
50257/22/201924,074.000PTAXIWAYAC1/1/19941905TW S
46257/22/201928,125.000PTAXIWAYAAC1/1/19941920TW S
8397/22/201913,004.000PTAXIWAYAAC1/1/20101925TW S
9247/22/201926,928.000PTAXIWAYAAC1/1/20151930TW S
9447/22/201930,114.000PTAXIWAYAAC1/1/20151935TW S
48257/22/2019483,018.000PTAXIWAYAC1/1/19942005TW T
52257/22/201950,517.000PTAXIWAYAC1/1/19942025TW T2
47257/22/201945,497.000PTAXIWAYAC1/1/19942020TW T3
51257/22/2019106,822.000PTAXIWAYAC1/1/19942010TW T8
66257/22/201955,249.000PTAXIWAYAC1/1/19942505TW V
46537/22/2019157,256.000PTAXIWAYAC1/1/19662610TW Y
58257/22/20199,287.000PTAXIWAYAAC1/1/19942615TW Y
40257/22/2019117,770.000PTAXIWAYAC1/1/19942620TW Y
56537/22/201927,058.000PTAXIWAYAC1/1/19662605TW Y1
55537/22/201921,687.000PTAXIWAYAC1/1/19662640TW Y2
46537/22/201941,211.000PTAXIWAYAC1/1/19662650TW Y3
48257/22/201934,246.000PTAXIWAYAC1/1/19942630TW Y7
PAVER 7.0 ™Pavement Management System
Appendix A - 5

Section Condition Report10/16/2019 Page 6 of 10
PCIAge AtInspec
tion
LastInspection
Date
True Area(SqFt)
LanesRankUseSurfaceLast Const.
DateSection IDBranch ID
FDOT NetworkId: TMBPavement Database:
73137/24/2019840,000.000PAPRONAAC1/1/20064205AP N
65137/24/201972,000.000PAPRONAAC1/1/20064215AP N
56257/24/201997,500.000PAPRONAAC1/1/19944220AP N
52207/24/201969,490.000PAPRONAC12/25/19994225AP N
37207/24/201918,795.000PAPRONAC12/25/19994230AP N
9247/24/201919,200.000PAPRONAC1/1/20154235AP N
86207/24/20199,600.000PAPRONPCC12/25/19994305AP NE
60207/24/201919,797.000PAPRONAC12/25/19994310AP NE
65207/24/201921,176.000PAPRONAC12/25/19994315AP NE
86207/24/20199,216.000PAPRONPCC12/25/19994320AP NE
64207/24/201949,524.000PAPRONAC12/25/19994325AP NE
68207/24/20192,700.000PAPRONPCC12/25/19994330AP NE
64217/24/2019192,000.000PAPRONAC1/1/19984105AP S
70217/24/2019253,679.000PAPRONAAC1/1/19984110AP S
71217/24/2019825,309.000PAPRONAAC1/1/19984115AP S
56207/24/201935,371.000TAPRONAC12/25/19994125AP S
33207/24/201919,714.000PAPRONAC12/25/19994130AP S
56207/24/201929,788.000PAPRONAC12/25/19994135AP S
48207/24/201943,331.000PAPRONAC12/25/19994140AP S
58207/24/201945,220.000PAPRONAC12/25/19994410AP SE
8857/24/20196,589.000PAPRONAC6/1/20144415AP SE
68157/24/2019400,200.000PRUNWAYAAC1/1/20046205RW 13-31
74157/24/2019200,100.000PRUNWAYAAC1/1/20046210RW 13-31
60227/24/201920,000.000PRUNWAYAC1/1/19976104RW 9L-27R
72547/24/2019460,000.000PRUNWAYAC1/1/19656105RW 9L-27R
63227/24/201910,000.000PRUNWAYAC1/1/19976109RW 9L-27R
75547/24/2019230,000.000PRUNWAYAC1/1/19656110RW 9L-27R
62227/24/201910,100.000PRUNWAYAC1/1/19976126RW 9L-27R
70227/24/201920,200.000PRUNWAYAC1/1/19976131RW 9L-27R
6487/24/2019100,000.000PRUNWAYAC1/1/20116302RW 9R-27L
7187/24/201920,000.000PRUNWAYAAC1/1/20116304RW 9R-27L
69227/24/2019460,000.000PRUNWAYAAC1/1/19976305RW 9R-27L
70227/24/201920,100.000PRUNWAYAC1/1/19976306RW 9R-27L
7187/24/201950,000.000PRUNWAYAC1/1/20116307RW 9R-27L
7187/24/201910,000.000PRUNWAYAAC1/1/20116309RW 9R-27L
75227/24/2019230,000.000PRUNWAYAAC1/1/19976310RW 9R-27L
71227/24/201910,050.000PRUNWAYAC1/1/19976311RW 9R-27L
79137/24/201912,843.000PTAXIWAYAAC1/1/2006270TW 1
78127/24/201919,697.000PTAXIWAYAAC1/1/2007350TW 15
84127/24/201911,992.000PTAXIWAYAAC1/1/2007360TW 16
78127/24/20197,706.000PTAXIWAYAAC1/1/2007365TW 16
81127/24/201912,809.000PTAXIWAYAAC1/1/2007370TW 17
67137/24/201919,697.000PTAXIWAYAAC1/1/2006260TW 2
71137/24/201919,697.000PTAXIWAYAAC1/1/2006250TW 3
74137/24/201919,697.000PTAXIWAYAAC1/1/2006240TW 4
79137/24/201919,697.000PTAXIWAYAAC1/1/2006230TW 5
77137/24/201919,697.000PTAXIWAYAAC1/1/2006220TW 6
74147/24/201918,557.000PTAXIWAYAAC1/1/2005210TW 7
PAVER 7.0 ™Pavement Management System
Appendix A - 6

Section Condition Report10/16/2019 Page 7 of 10
10006/1/20198,250.000PTAXIWAYAAC6/1/2019103TW A
10006/1/20199,750.000PTAXIWAYAC6/1/2019104TW A
79147/24/2019261,575.000PTAXIWAYAAC1/1/2005105TW A
71147/24/201918,500.000PTAXIWAYAAC1/1/2005108TW A
10006/1/201930,745.000PTAXIWAYAAC6/1/2019110TW A1
83547/24/201950,475.000PTAXIWAYAC1/1/1965120TW A3
72207/24/201926,792.000PTAXIWAYAC12/25/1999124TW A4
68547/24/201932,146.000PTAXIWAYAC1/1/1965125TW A4
62207/24/201944,691.000PTAXIWAYAC12/25/19991005TW AP NE
57207/24/201942,727.000PTAXIWAYAC12/25/19991105TW AP SE
57217/24/20197,744.000PTAXIWAYAC1/1/1998810TW C
67217/24/2019138,069.000PTAXIWAYAC1/1/1998910TW C
62217/24/20197,838.000PTAXIWAYAC1/1/1998905TW C1
54227/24/201917,567.000PTAXIWAYAAC1/1/1997320TW C3
51547/24/2019192,147.000PTAXIWAYAC1/1/1965405TW D
10006/1/201918,131.000PTAXIWAYAC6/1/2019407TW D
10006/1/201925,838.000PTAXIWAYAAC6/1/2019410TW D
10006/1/20199,750.000PTAXIWAYAC6/1/2019412TW D
70127/24/201941,823.000PTAXIWAYAAC1/1/2007525TW D
8387/24/201956,119.000PTAXIWAYAC1/1/2011503TW E
80127/24/2019220,186.000PTAXIWAYAAC1/1/2007505TW E
74127/24/201930,930.000PTAXIWAYAAC1/1/2007507TW E
83127/24/201932,963.000PTAXIWAYAAC1/1/2007510TW E
72127/24/201917,500.000PTAXIWAYAAC1/1/2007535TW E
7587/24/201954,092.000PTAXIWAYAC1/1/2011513TW E1
72207/24/201938,537.000PTAXIWAYAC12/25/1999516TW E1
7377/24/201919,201.000PTAXIWAYAAC1/1/2012515TW E2
70127/24/201950,475.000PTAXIWAYAAC1/1/2007520TW E3
65237/24/201926,267.000PTAXIWAYAC1/1/1996527TW E5
60207/24/201926,192.000PTAXIWAYAC12/25/1999529TW E6
73207/24/201932,146.000PTAXIWAYAAC1/1/1999530TW E6
77217/24/201957,730.000PTAXIWAYAAC1/1/1998605TW F
82547/24/201950,475.000PTAXIWAYAC1/1/1965115TW G
60547/24/201950,475.000PTAXIWAYAC1/1/1965415TW G
74137/24/201951,622.000PTAXIWAYAAC1/1/2006705TW G
68227/24/201917,106.000PTAXIWAYAC1/1/1997710TW G
68127/24/2019119,042.000PTAXIWAYAAC1/1/2007815TW H
70217/24/20194,802.000PTAXIWAYAC1/1/1998805TW H3
74127/24/201918,456.000PTAXIWAYAAC1/1/2007330TW H4
81127/24/201917,255.000PTAXIWAYAAC1/1/2007340TW H5
62227/24/201917,644.000PTAXIWAYAAC1/1/1997310TW J
48547/24/201950,463.000PTAXIWAYAC1/1/1965420TW J
10006/1/2019117,403.000PTAXIWAYAC6/1/20192305TW W
PAVER 7.0 ™Pavement Management System
Appendix A - 7

Section Condition Report10/16/2019 Page 8 of 10
PCIAge AtInspec
tion
LastInspection
Date
True Area(SqFt)
LanesRankUseSurfaceLast Const.
DateSection IDBranch ID
FDOT NetworkId: TNTPavement Database:
42264/10/201749,500.000PAPRONAAC1/1/19914105AP N
55224/10/2017525,000.000PRUNWAYAAC1/1/19956105RW 9-27
48224/10/20171,050,000.0PRUNWAYAAC1/1/19956110RW 9-27
54184/10/2017733,373.000PTAXIWAYAAC1/1/1999105TW A
58184/10/201775,225.000PTAXIWAYAAC1/1/1999110TW A
62184/10/201775,225.000PTAXIWAYAAC1/1/1999180TW A
30494/10/201768,780.000PTAXIWAYAC1/1/1968120TW A1
71184/10/20176,394.000PTAXIWAYAAC1/1/1999123TW A1
75264/10/20177,437.000PTAXIWAYAAC1/1/1991126TW A1
75264/10/2017107,503.000PTAXIWAYAAC1/1/1991130TW A2
75264/10/2017187,363.000PTAXIWAYAAC1/1/1991140TW A3
64264/10/2017187,363.000PTAXIWAYAAC1/1/1991150TW A4
67264/10/2017107,503.000PTAXIWAYAAC1/1/1991160TW A5
46494/10/201768,780.000PTAXIWAYAC1/1/1968170TW A6
65184/10/20176,394.000PTAXIWAYAAC1/1/1999173TW A6
57264/10/20177,437.000PTAXIWAYAAC1/1/1991176TW A6
66264/10/201783,610.000PTAXIWAYAAC1/1/1991205TW B
59264/10/20175,222.000PTAXIWAYAAC1/1/1991210TW B
47264/10/201743,125.000PTAXIWAYAAC1/1/1991215TW B
PAVER 7.0 ™Pavement Management System
Appendix A - 8

Section Condition Report10/16/2019 Page 9 of 10
PCIAge AtInspec
tion
LastInspection
Date
True Area(SqFt)
LanesRankUseSurfaceLast Const.
DateSection IDBranch ID
FDOT NetworkId: X51Pavement Database:
65554/11/201785,048.000PAPRONAC1/1/19624205AP N
78184/11/2017109,902.000PAPRONAC1/1/19994305AP NE
58504/11/2017255,472.000PAPRONAC1/1/19674105AP NW
72124/11/201711,958.000PAPRONAC1/1/20054110AP NW
67234/11/2017224,925.000PRUNWAYAAC1/1/19946205RW 10-28
10006/1/20159,000.000PRUNWAYAAC6/1/20156102RW 18-36
88244/11/2017191,000.000PRUNWAYAAC1/1/19936105RW 18-36
54504/11/2017183,750.000PRUNWAYAC1/1/19676110RW 18-36
8184/11/20177,250.000PRUNWAYAAC1/1/20096112RW 18-36
10006/1/20159,200.000PRUNWAYAAC6/1/20156115RW 18-36
56504/11/201714,699.000PTAXIWAYAC1/1/1967160TW A
45504/11/201713,738.000PTAXIWAYAC1/1/1967205TW A
73234/11/20175,600.000PTAXIWAYAAC1/1/1994210TW A
66554/11/2017121,199.000PTAXIWAYAC1/1/1962215TW A
75234/11/20176,000.000PTAXIWAYAAC1/1/1994220TW A
47504/11/20175,369.000PTAXIWAYAC1/1/1967260TW A
48504/11/20175,369.000PTAXIWAYAC1/1/1967270TW A
55554/11/20174,273.000PTAXIWAYAC1/1/1962280TW A
59554/11/20174,069.000PTAXIWAYAC1/1/1962290TW A
51474/11/20174,189.000PTAXIWAYAC1/1/1970295TW A
51554/11/20176,237.000PTAXIWAYAC1/1/1962230TW A1
62234/11/20172,971.000PTAXIWAYAAC1/1/1994235TW A1
44554/11/201711,520.000PTAXIWAYAC1/1/1962240TW A2
49554/11/20176,135.000PTAXIWAYAC1/1/1962250TW A3
76234/11/20172,869.000PTAXIWAYAAC1/1/1994255TW A3
43164/11/201710,104.000PTAXIWAYAAC1/1/2001305TW AP
61504/11/2017192,408.000PTAXIWAYAC1/1/1967105TW B
49504/11/201713,513.000PTAXIWAYAC1/1/1967180TW B
70234/11/201720,223.000PTAXIWAYAAC1/1/1994110TW B1
49504/11/201721,223.000PTAXIWAYAC1/1/1967120TW B2
43504/11/201712,237.000PTAXIWAYAC1/1/1967130TW B3
49504/11/201715,569.000PTAXIWAYAC1/1/1967140TW B4
56504/11/20176,211.000PTAXIWAYAC1/1/1967150TW B5
9184/11/201710,114.000PTAXIWAYAAC1/1/2009155TW B5
49604/11/201724,975.000PTAXIWAYAC1/1/1957400TW C
PAVER 7.0 ™Pavement Management System
Appendix A - 9

Section Condition Report (Summary)
WeightedAverage PCI
StandardDeviation PCI
ArithmeticAverage PCI
Number ofSections
Total Area (SqFt)Average Age at
InspectionAge Category
10/16/2019
FDOTPavement Database:
Page 10 of 10
100.000.00100.00211,209,516.0000-02
87.776.8687.59342,127,617.00403-05
66.1911.5276.03301,231,212.00806-10
71.558.4071.60352,922,899.001311-15
54.8012.7957.53583,889,336.001816-20
58.3910.2960.41637,406,344.002321-25
60.329.7360.46282,052,411.002826-30
45.499.6250.47172,020,207.003331-35
62.4917.5045.502273,654.003636-40
57.119.2254.35231,288,769.004841-50
55.6818.3249.48332,303,495.005850+
62.8117.9165.5034426,725,460.0123ALL
PAVER 7.0 ™Pavement Management System
Appendix A - 10

Appendix B
Pavement Condition Index Exhibits

RUNWAY 9-27 100' X 5,076'
9
27
RW 9-27
AP E
TWC
TW A
TWB
TWD
TWE
AP W
LEGEND
TW A
AP S
RW 13-31
"SECTION NO.""PCI NO."
NORTH
KEY
WES
TIN
TER
NA
TIO
NAL
AIRP
ORT
-EYW
CO
NDI
TIO
NIN
DEX
EXH
IBIT
003
-AIR
FIEL
DPA
VEM
ENT
4150PCI = 35
150PCI = 88
155PCI = 88
160PCI = 100
172PCI = 100
205PCI = 100
305PCI = 100
4160PCI = 100
505PCI = 100
605PCI = 100
6105PCI = 100
6110PCI = 100
165PCI = 61
4155PCI = 58
4215PCI = 58
4220PCI = 62
105PCI = 42
110PCI = 42
170PCI = 43
210PCI = 46
310PCI = 51
4105PCI = 47
4130PCI = 42
4145PCI = 44
4205PCI = 55
510PCI = 43
610PCI = 50

RUNWAY 7-25 100' X 5,008'
7
25
TW B
TW A
TW C
TW A
TW D
TW E
RW 7-25
AP T-HAN
AP JET CTR
AP TERM
AP FLGHT C
AP E
AP E
TW E
LEGEND
TW A
AP S
RW 13-31
"SECTION NO.""PCI NO."
NORTH
THE
FLO
RIDA
KEY
SM
ARA
THO
NIN
TER
NATI
ON
ALA
IRPO
RT-M
THC
ON
DITI
ON
IND
EXEX
HIB
IT00
3-A
IRFI
ELD
PAVE
MEN
T
4130PCI = 100
152PCI = 75
310PCI = 71
405PCI = 79
4125PCI = 78
4308PCI = 80
105PCI = 62
115PCI = 62
155PCI = 64
205PCI = 58
210PCI = 56
4105PCI = 63
4120PCI = 56
4205PCI = 57
4220PCI = 60
4405PCI = 67
4505PCI = 65
6110PCI = 56
151PCI = 53
305PCI = 49
4115PCI = 55
4210PCI = 46
4315PCI = 52
4510PCI = 50
6105PCI = 50
4515PCI = 100
4305PCI = 40
4110PCI = 28

27L
30
129L
27R
9R
RUNWAY 9L-27R 150' x 8,002'
RUNWAY 9R-27L 100' x 4,309'
RUNWAY 12-30 150' x 6,800'
NOT INSPECTED -PROPERTY OF U.S.
COAST GUARD
ABANDONEDPAVEMENT
PRIVATELYMAINTAINED APRON
RW12-30 A
PE
AP NE
TWB
TWC
TWC
TWD
TWD
TWE
TWE
TWF
TWF
T WG
T WG
T WG
T WG
T WH
T WH
TWJ
TW N TW N
TW P TW P
TW R
TW S
TWT
TWT
TWT2
TWT3
TWJ
TW V
TW YTW Y
TWY1
TWY3 TW Y
TWY7
TWT8
AP
E
TWN
1
AP NE
NOT INSPECTED
TWY2
LEGEND
TW A
AP S
RW 13-31
"SECTION NO.""PCI NO."
MIA
MI-
OPA
LOC
KA
EXEC
UTIV
EAI
RPO
RT-O
PFC
ON
DITI
ON
IND
EXEX
HIB
IT00
3-A
IRFI
ELD
PAVE
MEN
T
NORTH
4125PCI = 18
4115PCI = 93
4122PCI = 98
4220PCI = 87
4315PCI = 93
4525PCI = 93
6215PCI = 92
6220PCI = 94
6225PCI = 90
6230PCI = 90
6102PCI = 88
210PCI = 93
310PCI = 89
312PCI = 88
327PCI = 88
610PCI = 88
630PCI = 89
710PCI = 89
715PCI = 88
820PCI = 87
840PCI = 89
1010PCI = 91
1415PCI = 92
1420PCI = 88
1423PCI = 89
1425PCI = 90
1665PCI = 92
1930PCI = 92
1935PCI = 94
4112PCI = 72
1803PCI = 82
4509PCI = 71
6125PCI = 64
823PCI = 66
846PCI = 68
1430PCI = 66
1810PCI = 65
745PCI = 67
1620PCI = 61
722PCI = 66
735PCI = 62
805PCI = 65
1422PCI = 58
1605PCI = 62
6110PCI = 61
615PCI = 63
730PCI = 62
824PCI = 60
510PCI = 63
720PCI = 61
835PCI = 57
4140PCI = 60
1625PCI = 62
2615PCI = 58
6105PCI = 59
6130PCI = 60
6410PCI = 56
717PCI = 60
205PCI = 56
740PCI = 59
1410PCI = 59
1653PCI = 70
4510PCI = 57
6120PCI = 56
826PCI = 57
2605PCI = 56
4145PCI = 51
405PCI = 49
320PCI = 45
410PCI = 47
1645PCI = 48
215PCI = 49
330PCI = 49
1655PCI = 49
1920PCI = 46
725PCI = 47
2020PCI = 47
2630PCI = 48
4205PCI = 43
6205PCI = 45
1640PCI = 46
806PCI = 46
2610PCI = 46
2650PCI = 46
4515PCI = 45
4305PCI = 41
4110PCI = 27
4135PCI = 29
4507PCI = 33
4105PCI = 35
305PCI = 54
315PCI = 80
505PCI = 55
415PCI = 54
515PCI = 50
520PCI = 84
605PCI = 53
635PCI = 81
705PCI = 64
815PCI = 68
825PCI = 53
845PCI = 53
1005PCI = 51
855PCI = 55
1015PCI = 69
1025PCI = 54
1030PCI = 39
1035PCI = 100
1040PCI = 53
1405PCI = 70
1412PCI = 78
1435PCI = 68
1615PCI = 64
1623PCI = 83
1630PCI = 50
1633PCI = 86
1660PCI = 82
1670PCI = 38
1805PCI = 69
1905PCI = 50
1925PCI = 83
2005PCI = 48
2010PCI = 51
2025PCI = 52
2505PCI = 66
2620PCI = 40
2640PCI = 55
4130PCI = 20
4136PCI = 49
4210PCI = 36
4215PCI = 73
4230PCI = 51
4225PCI = 54
4231PCI = 17
4505PCI = 39
4520PCI = 81
6107PCI = 85
6115PCI = 53
6135PCI = 82
6140PCI = 79
6210PCI = 49
6405PCI = 69
1650PCI = 7
202PCI = 94

LEGEND
TW A
AP S
RW 13-31
"SECTION NO.""PCI NO."
NORTH
MIA
MIE
XEC
UTI
VEAI
RPO
RT-T
MB
CO
NDI
TIO
NIN
DEX
EXH
IBIT
003
-AIR
FIEL
DPA
VEM
ENT
103PCI = 100
104PCI = 100
110PCI = 100
407PCI = 100
410PCI = 100
412PCI = 100
2305PCI = 100
4235PCI = 92
4305PCI = 86
4320PCI = 86
4415PCI = 88
105PCI = 79
108PCI = 71
115PCI = 82
120PCI = 83
124PCI = 72
210PCI = 74
220PCI = 77
230PCI = 79
240PCI = 74
250PCI = 71
270PCI = 79
330PCI = 74
340PCI = 81
350PCI = 78
360PCI = 84
365PCI = 78
370PCI = 81
503PCI = 83
505PCI = 80
507PCI = 74
510PCI = 83
513PCI = 75
515PCI = 73
516PCI = 72
530PCI = 73
535PCI = 72
605PCI = 77
705PCI = 74
4115PCI = 71
4205PCI = 73
6105PCI = 72
6110PCI = 75
6210PCI = 74
6304PCI = 71
6307PCI = 71
6309PCI = 71
6310PCI = 75
6311PCI = 71
125PCI = 68
260PCI = 67
310PCI = 62
415PCI = 60
520PCI = 70
525PCI = 70
527PCI = 65
529PCI = 60
710PCI = 68
805PCI = 70
810PCI = 57
815PCI = 68
905PCI = 62
910PCI = 67
1005PCI = 62
1105PCI = 57
4105PCI = 64
4110PCI = 70
4125PCI = 56
4135PCI = 56
4215PCI = 65
4220PCI = 56
4310PCI = 60
4315PCI = 65
4325PCI = 64
4330PCI = 68
4410PCI = 58
6104PCI = 60
6109PCI = 63
6126PCI = 62
6131PCI = 70
6205PCI = 68
6302PCI = 64
6305PCI = 69
6306PCI = 70
320PCI = 54
405PCI = 51
420PCI = 48
4140PCI = 48
4225PCI = 52
4130PCI = 33
4230PCI = 37

SWAMPBUGGY
PARKING
AP NTW
A6
TWA
TW A
TWA4
TWA3
TW A
TWB
TWA2
TWA1
TWA
RW 9-27 RW 9-27
TWA5
279
RUNWAY 9-27 150' x 10,499'
LEGEND
TW A
AP S
RW 13-31
"SECTION NO.""PCI NO."
NORTH
DA
DE-
CO
LLIE
RTR
AIN
ING
AN
DTR
ANSI
TIO
NAI
RPO
RT-T
NTC
ON
DITI
ON
IND
EXEX
HIB
IT00
3-A
IRFI
ELD
PAVE
MEN
T
105PCI = 54110
PCI = 58
120PCI = 30
123PCI = 71
126PCI = 75
130PCI = 75 140
PCI = 75 150PCI = 64
160PCI = 67
170PCI = 46
173PCI = 65
176PCI = 57
180PCI = 62
205PCI = 66
6105PCI = 55 6110
PCI = 48
210PCI = 59
215PCI = 47
4105PCI = 42

RW 18-36
RW
10-2
8
TW A3
TW A2
TWA
TW A1
TWA
TWB5
TW B
TWB4
TWB3
TWB2
TWB1
AP
N
AP
NW
28
10
18
36
TWA
RU
NW
AY
10-2
830
00'x
75'
RUNWAY 18-36 3999' x 100'
FOUNDATIONCONC . BLDG.
SKYDIVEMIAMI, INC.
AUTO PARKING
TW AP
AP
NE
LEGEND
TW A
AP S
RW 13-31
"SECTION NO.""PCI NO."
NO
RTH
MIA
MIH
OM
ESTE
AD
GEN
ERA
LAV
IATI
ON
AIRP
ORT
-X51
CO
NDI
TIO
NIN
DEX
EXH
IBIT
003
-AIR
FIEL
DPA
VEM
ENT
105PCI = 61
6205PCI = 67
205PCI = 45
160PCI = 56
400PCI = 49
110PCI = 70
4105PCI = 58
260PCI = 47
215PCI = 66
4305PCI = 78
4205PCI = 65
6112PCI = 81
6102PCI = 100
6105PCI = 88
6110PCI = 54
6115PCI = 100
230PCI = 51
180PCI = 49
140PCI = 49
155PCI = 91
150PCI = 56
280PCI = 55
270PCI = 48
4110PCI = 72
120PCI = 49
130PCI = 43
295PCI = 51
220PCI = 75
235PCI = 62
240PCI = 44
250PCI = 49
255PCI = 76
290PCI = 59
210PCI = 73
305PCI = 43

Appendix C
Airfield Pavement Major Rehabilitation Tables

Appendix C | 1
T a b l e C - 1 – 1 0 - Y e a r M a j o r R e h a b i l i t a t i o n P l a n n i n g N e e d s
Program Year
Network ID
Branch ID Section
ID Surface Area (SF)
PCI Before
Rehabilitation Type Planning Cost
Dade-Collier Training and Transition Airport (TNT)
2018 TNT AP N 4105 AAC 49,500 42 AC Restoration $ 446,000
2018 TNT RW 9-27 6105 AAC 525,000 55 AC Restoration $ 3,676,000
2018 TNT RW 9-27 6110 AAC 1,050,000 48 AC Restoration $ 8,243,000
2018 TNT TW A 105 AAC 733,373 54 AC Restoration $ 5,134,000
2018 TNT TW A 110 AAC 75,225 58 AC Restoration $ 527,000
2018 TNT TW A 180 AAC 75,225 62 AC Restoration $ 527,000
2018 TNT TW A1 120 AC 68,780 30 AC Reconstruction $ 620,000
2018 TNT TW A4 150 AAC 187,363 64 AC Restoration $ 1,312,000
2018 TNT TW A6 170 AC 68,780 46 AC Restoration $ 553,000
2018 TNT TW A6 173 AAC 6,394 65 AC Restoration $ 45,000
2018 TNT TW A6 176 AAC 7,437 57 AC Restoration $ 53,000
2018 TNT TW B 210 AAC 5,222 59 AC Restoration $ 37,000
2018 TNT TW B 215 AAC 43,125 47 AC Restoration $ 335,000
2019 TNT TW A5 160 AAC 107,503 67 AC Restoration $ 753,000
2019 TNT TW B 205 AAC 83,610 66 AC Restoration $ 586,000
2024 TNT TW A1 123 AAC 6,394 71 AC Restoration $ 45,000
Key West International Airport (EYW)
2020 EYW AP E 4105 AAC 34,810 47 AC Restoration $ 431,000
2020 EYW AP E 4130 AAC 37,772 42 AC Restoration $ 526,000
2020 EYW AP E 4145 AAC 145,771 44 AC Restoration $ 1,941,000
2020 EYW AP E 4150 AC 16,824 35 AC Reconstruction $ 236,000
2020 EYW AP E 4155 AAC 51,364 58 AC Restoration $ 565,000
2020 EYW AP W 4205 AC 162,131 55 AC Restoration $ 1,784,000
2020 EYW AP W 4215 AC 60,960 58 AC Restoration $ 671,000
2020 EYW AP W 4220 AC 13,765 62 AC Restoration $ 152,000
2020 EYW TW A 105 AAC 184,302 42 AC Restoration $ 2,512,000
2020 EYW TW A 110 AAC 57,310 42 AC Restoration $ 781,000
2020 EYW TW A10 165 PCC 2,531 61 PCC Restoration $ 44,000
2020 EYW TW A11 170 AC 2,633 43 AC Restoration $ 36,000
2020 EYW TW B 210 AAC 20,821 46 AC Restoration $ 258,000
2020 EYW TW C 310 AAC 10,524 51 AC Restoration $ 116,000
2020 EYW TW D 510 AAC 16,297 43 AC Restoration $ 217,000
2020 EYW TW E 610 AAC 37,891 50 AC Restoration $ 421,000
Miami Executive Airport (TMB)
2020 TMB AP N 4215 AAC 72,000 65 AC Restoration $ 685,000
2020 TMB AP N 4220 AAC 97,500 56 AC Restoration $ 927,000
2020 TMB AP N 4225 AC 69,490 52 AC Restoration $ 661,000
2020 TMB AP N 4230 AC 18,795 37 AC Reconstruction $ 235,000
2020 TMB AP NE 4310 AC 19,797 60 AC Restoration $ 189,000
2020 TMB AP NE 4315 AC 21,176 65 AC Restoration $ 202,000
2020 TMB AP NE 4325 AC 49,524 64 AC Restoration $ 471,000
2020 TMB AP S 4105 AC 192,000 64 AC Restoration $ 1,825,000
2020 TMB AP S 4125 AC 35,371 56 AC Restoration $ 337,000
2020 TMB AP S 4130 AC 19,714 33 AC Reconstruction $ 247,000
2020 TMB AP S 4135 AC 29,788 56 AC Restoration $ 283,000

Appendix C | 2
Program Year
Network ID
Branch ID Section
ID Surface Area (SF)
PCI Before
Rehabilitation Type Planning Cost
2020 TMB AP S 4140 AC 43,331 48 AC Restoration $ 444,000
2020 TMB AP SE 4410 AC 45,220 58 AC Restoration $ 430,000
2020 TMB RW 9L-27R 6104 AC 20,000 60 AC Restoration $ 191,000
2020 TMB RW 9L-27R 6109 AC 10,000 63 AC Restoration $ 96,000
2020 TMB RW 9L-27R 6126 AC 10,100 62 AC Restoration $ 96,000
2020 TMB RW 9R-27L 6302 AC 100,000 64 AC Restoration $ 951,000
2020 TMB TW AP NE 1005 AC 44,691 62 AC Restoration $ 425,000
2020 TMB TW AP SE 1105 AC 42,727 57 AC Restoration $ 406,000
2020 TMB TW C 810 AC 7,744 57 AC Restoration $ 74,000
2020 TMB TW C1 905 AC 7,838 62 AC Restoration $ 75,000
2020 TMB TW C3 320 AAC 17,567 54 AC Restoration $ 167,000
2020 TMB TW D 405 AC 192,147 51 AC Restoration $ 1,826,000
2020 TMB TW E5 527 AC 26,267 65 AC Restoration $ 250,000
2020 TMB TW E6 529 AC 26,192 60 AC Restoration $ 249,000
2020 TMB TW G 415 AC 50,475 60 AC Restoration $ 480,000
2020 TMB TW J 310 AAC 17,644 62 AC Restoration $ 168,000
2020 TMB TW J 420 AC 50,463 48 AC Restoration $ 516,000
2022 TMB AP NE 4330 PCC 2,700 68 PCC Restoration $ 37,000
2022 TMB AP S 4110 AAC 253,679 70 AC Restoration $ 2,411,000
2022 TMB TW 2 260 AAC 19,697 67 AC Restoration $ 188,000
2022 TMB TW C 910 AC 138,069 67 AC Restoration $ 1,312,000
2023 TMB AP S 4115 AAC 825,309 71 AC Restoration $ 7,841,000
2023 TMB TW A4 125 AC 32,146 68 AC Restoration $ 306,000
2023 TMB TW G 710 AC 17,106 68 AC Restoration $ 163,000
2023 TMB TW H 815 AAC 119,042 68 AC Restoration $ 1,131,000
2024 TMB AP N 4205 AAC 840,000 73 AC Restoration $ 7,981,000
2024 TMB RW 13-31 6205 AAC 400,200 68 AC Restoration $ 3,803,000
2024 TMB TW H3 805 AC 4,802 70 AC Restoration $ 46,000
2025 TMB RW 9R-27L 6305 AAC 460,000 69 AC Restoration $ 4,371,000
2025 TMB TW D 525 AAC 41,823 70 AC Restoration $ 398,000
2025 TMB TW E3 520 AAC 50,475 70 AC Restoration $ 480,000
2026 TMB RW 9R-27L 6304 AAC 20,000 71 AC Restoration $ 191,000
2026 TMB RW 9R-27L 6309 AAC 10,000 71 AC Restoration $ 96,000
2026 TMB TW 3 250 AAC 19,697 71 AC Restoration $ 188,000
2026 TMB TW A 108 AAC 18,500 71 AC Restoration $ 176,000
2026 TMB TW A4 124 AC 26,792 72 AC Restoration $ 255,000
2026 TMB TW E1 516 AC 38,537 72 AC Restoration $ 367,000
2027 TMB TW E 535 AAC 17,500 72 AC Restoration $ 167,000
2028 TMB TW 4 240 AAC 19,697 74 AC Restoration $ 188,000
2028 TMB TW 7 210 AAC 18,557 74 AC Restoration $ 177,000
2028 TMB TW E 507 AAC 30,930 74 AC Restoration $ 294,000
2028 TMB TW E1 513 AC 54,092 75 AC Restoration $ 514,000
2028 TMB TW E2 515 AAC 19,201 73 AC Restoration $ 183,000
2028 TMB TW E6 530 AAC 32,146 73 AC Restoration $ 306,000
2028 TMB TW G 705 AAC 51,622 74 AC Restoration $ 491,000
2028 TMB TW H4 330 AAC 18,456 74 AC Restoration $ 176,000
2029 TMB RW 13-31 6210 AAC 200,100 74 AC Restoration $ 1,902,000
2029 TMB RW 9L-27R 6131 AC 20,200 70 AC Restoration $ 192,000

Appendix C | 3
Program Year
Network ID
Branch ID Section
ID Surface Area (SF)
PCI Before
Rehabilitation Type Planning Cost
2029 TMB RW 9R-27L 6306 AC 20,100 70 AC Restoration $ 191,000
Miami Homestead General Aviation Airport (X51)
2018 X51 AP N 4205 AC 85,048 65 AC Restoration $ 596,000
2018 X51 AP NW 4105 AC 255,472 58 AC Restoration $ 1,789,000
2018 X51 RW 18-36 6110 AC 183,750 54 AC Restoration $ 1,287,000
2018 X51 TW A 160 AC 14,699 56 AC Restoration $ 103,000
2018 X51 TW A 205 AC 13,738 45 AC Restoration $ 114,000
2018 X51 TW A 260 AC 5,369 47 AC Restoration $ 43,000
2018 X51 TW A 270 AC 5,369 48 AC Restoration $ 41,000
2018 X51 TW A 280 AC 4,273 55 AC Restoration $ 30,000
2018 X51 TW A 290 AC 4,069 59 AC Restoration $ 29,000
2018 X51 TW A 295 AC 4,189 51 AC Restoration $ 30,000
2018 X51 TW A1 230 AC 6,237 51 AC Restoration $ 44,000
2018 X51 TW A1 235 AAC 2,971 62 AC Restoration $ 21,000
2018 X51 TW A2 240 AC 11,520 44 AC Restoration $ 98,000
2018 X51 TW A3 250 AC 6,135 49 AC Restoration $ 46,000
2018 X51 TW AP 305 AAC 10,104 43 AC Restoration $ 87,000
2018 X51 TW B 105 AC 192,408 61 AC Restoration $ 1,347,000
2018 X51 TW B 180 AC 13,513 49 AC Restoration $ 101,000
2018 X51 TW B2 120 AC 21,223 49 AC Restoration $ 158,000
2018 X51 TW B3 130 AC 12,237 43 AC Restoration $ 106,000
2018 X51 TW B4 140 AC 15,569 49 AC Restoration $ 116,000
2018 X51 TW B5 150 AC 6,211 56 AC Restoration $ 44,000
2018 X51 TW C 400 AC 24,975 49 AC Restoration $ 186,000
2019 X51 RW 10-28 6205 AAC 224,925 67 AC Restoration $ 1,575,000
2019 X51 TW A 215 AC 121,199 66 AC Restoration $ 849,000
2022 X51 AP NW 4110 AC 11,958 72 AC Restoration $ 84,000
2023 X51 TW B1 110 AAC 20,223 70 AC Restoration $ 142,000
2025 X51 RW 18-36 6112 AAC 7,250 81 AC Restoration $ 51,000
2026 X51 AP NE 4305 AC 109,902 78 AC Restoration $ 770,000
2026 X51 TW A 210 AAC 5,600 73 AC Restoration $ 40,000
Miami-Opa Locka Executive (OPF)
2020 OPF AP CENTER 4105 AAC 263,317 35 AC Reconstruction $ 3,292,000
2020 OPF AP CENTER 4110 PCC 205,407 27 PCC Reconstruction $ 4,109,000
2020 OPF AP CENTER 4125 PCC 35,700 18 PCC Reconstruction $ 715,000
2020 OPF AP CENTER 4130 PCC 12,508 20 PCC Reconstruction $ 251,000
2020 OPF AP CENTER 4135 PCC 35,672 29 PCC Reconstruction $ 714,000
2020 OPF AP CENTER 4136 PCC 18,019 49 PCC Restoration $ 262,000
2020 OPF AP CENTER 4140 AAC 72,314 60 AC Restoration $ 688,000
2020 OPF AP CENTER 4145 AAC 37,559 51 AC Restoration $ 357,000
2020 OPF AP E 4205 AC 49,389 43 AC Restoration $ 581,000
2020 OPF AP E 4210 AC 209,760 36 AC Reconstruction $ 2,623,000
2020 OPF AP E 4225 AC 126,677 54 AC Restoration $ 1,204,000
2020 OPF AP E 4230 AC 19,060 51 AC Restoration $ 182,000
2020 OPF AP E 4231 AC 36,290 17 AC Reconstruction $ 454,000
2020 OPF AP NE 4305 AC 695,920 41 AC Restoration $ 8,601,000
2020 OPF AP T-HANG 4505 AC 118,793 39 AC Reconstruction $ 1,485,000
2020 OPF AP T-HANG 4507 AC 53,737 33 AC Reconstruction $ 672,000

Appendix C | 4
Program Year
Network ID
Branch ID Section
ID Surface Area (SF)
PCI Before
Rehabilitation Type Planning Cost
2020 OPF AP T-HANG 4510 AC 88,298 57 AC Restoration $ 839,000
2020 OPF AP T-HANG 4515 AC 26,770 45 AC Restoration $ 299,000
2020 OPF RW 12-30 6205 AC 643,500 45 AC Restoration $ 7,253,000
2020 OPF RW 12-30 6210 AC 321,750 49 AC Restoration $ 3,239,000
2020 OPF RW 9L-27R 6105 APC 15,750 59 AC Restoration $ 150,000
2020 OPF RW 9L-27R 6110 APC 31,856 61 AC Restoration $ 303,000
2020 OPF RW 9L-27R 6115 AAC 350,000 53 AC Restoration $ 3,326,000
2020 OPF RW 9L-27R 6120 AAC 700,000 56 AC Restoration $ 6,651,000
2020 OPF RW 9L-27R 6125 APC 15,850 64 AC Restoration $ 151,000
2020 OPF RW 9L-27R 6130 APC 32,104 60 AC Restoration $ 305,000
2020 OPF RW 9R-27L 6410 AAC 100,600 56 AC Restoration $ 956,000
2020 OPF TL P 1670 AC 107,164 38 AC Reconstruction $ 1,340,000
2020 OPF TW B 205 AC 16,728 56 AC Restoration $ 159,000
2020 OPF TW B 215 AC 7,653 49 AC Restoration $ 76,000
2020 OPF TW C 305 AAC 4,608 54 AC Restoration $ 44,000
2020 OPF TW C 320 AC 101,022 45 AC Restoration $ 1,121,000
2020 OPF TW C 330 AC 13,347 49 AC Restoration $ 133,000
2020 OPF TW D 405 AAC 30,808 49 AC Restoration $ 307,000
2020 OPF TW D 410 AC 71,495 47 AC Restoration $ 752,000
2020 OPF TW D 415 AC 87,770 54 AC Restoration $ 834,000
2020 OPF TW E 505 AAC 6,116 55 AC Restoration $ 59,000
2020 OPF TW E 510 AC 40,471 63 AC Restoration $ 385,000
2020 OPF TW E 515 AAC 192,006 50 AC Restoration $ 1,852,000
2020 OPF TW F 605 AAC 4,608 53 AC Restoration $ 44,000
2020 OPF TW F 615 AAC 14,748 63 AC Restoration $ 141,000
2020 OPF TW G 705 AAC 4,620 64 AC Restoration $ 44,000
2020 OPF TW G 717 AC 11,084 60 AC Restoration $ 106,000
2020 OPF TW G 720 AC 48,730 61 AC Restoration $ 463,000
2020 OPF TW G 725 AC 16,579 47 AC Restoration $ 175,000
2020 OPF TW G 730 AC 82,966 62 AC Restoration $ 789,000
2020 OPF TW G 735 AC 121,482 62 AC Restoration $ 1,155,000
2020 OPF TW G 740 AC 11,329 59 AC Restoration $ 108,000
2020 OPF TW H 805 AAC 36,541 65 AC Restoration $ 348,000
2020 OPF TW H 806 AC 41,939 46 AC Restoration $ 453,000
2020 OPF TW H 824 AAC 27,651 60 AC Restoration $ 263,000
2020 OPF TW H 825 AC 89,179 53 AC Restoration $ 848,000
2020 OPF TW H 826 AC 89,179 57 AC Restoration $ 848,000
2020 OPF TW H 835 AC 22,875 57 AC Restoration $ 218,000
2020 OPF TW H 845 AAC 24,981 53 AC Restoration $ 238,000
2020 OPF TW H 855 AC 12,262 55 AC Restoration $ 117,000
2020 OPF TW J 1005 AAC 4,608 51 AC Restoration $ 44,000
2020 OPF TW J 1025 AC 19,915 54 AC Restoration $ 190,000
2020 OPF TW J 1030 AC 19,750 39 AC Reconstruction $ 247,000
2020 OPF TW J 1040 AC 57,601 53 AC Restoration $ 548,000
2020 OPF TW N 1410 PCC 16,875 59 PCC Restoration $ 228,000
2020 OPF TW N 1422 AAC 212,770 58 AC Restoration $ 2,022,000
2020 OPF TW P 1605 AC 27,346 62 AC Restoration $ 260,000
2020 OPF TW P 1615 AC 46,478 64 AC Restoration $ 442,000
2020 OPF TW P 1620 AC 194,846 61 AC Restoration $ 1,852,000
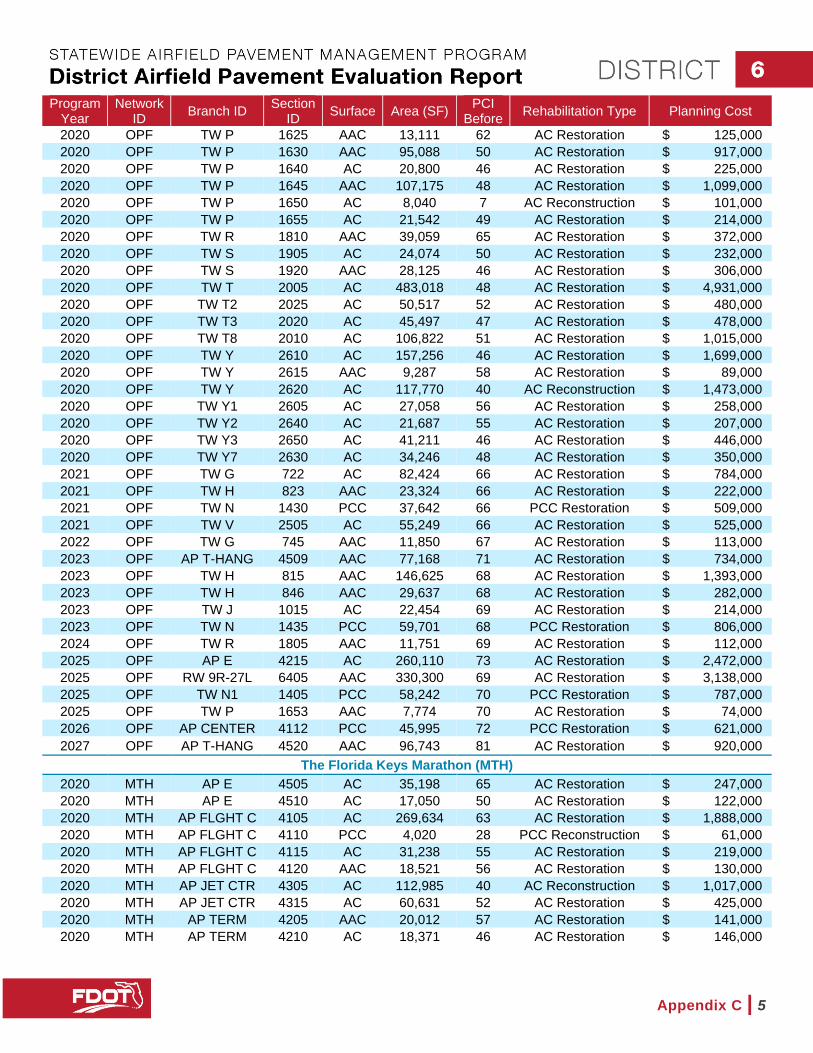
Appendix C | 5
Program Year
Network ID
Branch ID Section
ID Surface Area (SF)
PCI Before
Rehabilitation Type Planning Cost
2020 OPF TW P 1625 AAC 13,111 62 AC Restoration $ 125,000
2020 OPF TW P 1630 AAC 95,088 50 AC Restoration $ 917,000
2020 OPF TW P 1640 AC 20,800 46 AC Restoration $ 225,000
2020 OPF TW P 1645 AAC 107,175 48 AC Restoration $ 1,099,000
2020 OPF TW P 1650 AC 8,040 7 AC Reconstruction $ 101,000
2020 OPF TW P 1655 AC 21,542 49 AC Restoration $ 214,000
2020 OPF TW R 1810 AAC 39,059 65 AC Restoration $ 372,000
2020 OPF TW S 1905 AC 24,074 50 AC Restoration $ 232,000
2020 OPF TW S 1920 AAC 28,125 46 AC Restoration $ 306,000
2020 OPF TW T 2005 AC 483,018 48 AC Restoration $ 4,931,000
2020 OPF TW T2 2025 AC 50,517 52 AC Restoration $ 480,000
2020 OPF TW T3 2020 AC 45,497 47 AC Restoration $ 478,000
2020 OPF TW T8 2010 AC 106,822 51 AC Restoration $ 1,015,000
2020 OPF TW Y 2610 AC 157,256 46 AC Restoration $ 1,699,000
2020 OPF TW Y 2615 AAC 9,287 58 AC Restoration $ 89,000
2020 OPF TW Y 2620 AC 117,770 40 AC Reconstruction $ 1,473,000
2020 OPF TW Y1 2605 AC 27,058 56 AC Restoration $ 258,000
2020 OPF TW Y2 2640 AC 21,687 55 AC Restoration $ 207,000
2020 OPF TW Y3 2650 AC 41,211 46 AC Restoration $ 446,000
2020 OPF TW Y7 2630 AC 34,246 48 AC Restoration $ 350,000
2021 OPF TW G 722 AC 82,424 66 AC Restoration $ 784,000
2021 OPF TW H 823 AAC 23,324 66 AC Restoration $ 222,000
2021 OPF TW N 1430 PCC 37,642 66 PCC Restoration $ 509,000
2021 OPF TW V 2505 AC 55,249 66 AC Restoration $ 525,000
2022 OPF TW G 745 AAC 11,850 67 AC Restoration $ 113,000
2023 OPF AP T-HANG 4509 AAC 77,168 71 AC Restoration $ 734,000
2023 OPF TW H 815 AAC 146,625 68 AC Restoration $ 1,393,000
2023 OPF TW H 846 AAC 29,637 68 AC Restoration $ 282,000
2023 OPF TW J 1015 AC 22,454 69 AC Restoration $ 214,000
2023 OPF TW N 1435 PCC 59,701 68 PCC Restoration $ 806,000
2024 OPF TW R 1805 AAC 11,751 69 AC Restoration $ 112,000
2025 OPF AP E 4215 AC 260,110 73 AC Restoration $ 2,472,000
2025 OPF RW 9R-27L 6405 AAC 330,300 69 AC Restoration $ 3,138,000
2025 OPF TW N1 1405 PCC 58,242 70 PCC Restoration $ 787,000
2025 OPF TW P 1653 AAC 7,774 70 AC Restoration $ 74,000
2026 OPF AP CENTER 4112 PCC 45,995 72 PCC Restoration $ 621,000
2027 OPF AP T-HANG 4520 AAC 96,743 81 AC Restoration $ 920,000
The Florida Keys Marathon (MTH)
2020 MTH AP E 4505 AC 35,198 65 AC Restoration $ 247,000
2020 MTH AP E 4510 AC 17,050 50 AC Restoration $ 122,000
2020 MTH AP FLGHT C 4105 AC 269,634 63 AC Restoration $ 1,888,000
2020 MTH AP FLGHT C 4110 PCC 4,020 28 PCC Reconstruction $ 61,000
2020 MTH AP FLGHT C 4115 AC 31,238 55 AC Restoration $ 219,000
2020 MTH AP FLGHT C 4120 AAC 18,521 56 AC Restoration $ 130,000
2020 MTH AP JET CTR 4305 AC 112,985 40 AC Reconstruction $ 1,017,000
2020 MTH AP JET CTR 4315 AC 60,631 52 AC Restoration $ 425,000
2020 MTH AP TERM 4205 AAC 20,012 57 AC Restoration $ 141,000
2020 MTH AP TERM 4210 AC 18,371 46 AC Restoration $ 146,000

Appendix C | 6
Program Year
Network ID
Branch ID Section
ID Surface Area (SF)
PCI Before
Rehabilitation Type Planning Cost
2020 MTH AP TERM 4220 PCC 87,363 60 PCC Restoration $ 874,000
2020 MTH RW 7-25 6105 AAC 375,600 50 AC Restoration $ 2,721,000
2020 MTH RW 7-25 6110 AAC 125,200 56 AC Restoration $ 877,000
2020 MTH TW A 105 AAC 252,877 62 AC Restoration $ 1,771,000
2020 MTH TW A 115 AC 50,654 62 AC Restoration $ 355,000
2020 MTH TW B 151 AAC 10,711 53 AC Restoration $ 75,000
2020 MTH TW C 205 AAC 6,247 58 AC Restoration $ 44,000
2020 MTH TW C 210 AAC 3,873 56 AC Restoration $ 28,000
2020 MTH TW D 305 AAC 9,290 49 AC Restoration $ 68,000
2020 MTH TW E 155 AAC 5,103 64 AC Restoration $ 36,000
2021 MTH AP T-HAN 4405 AC 37,284 67 AC Restoration $ 261,000
2026 MTH TW D 310 AAC 7,468 71 AC Restoration $ 53,000
2027 MTH AP JET CTR 4308 PCC 7,543 80 PCC Restoration $ 76,000
2028 MTH AP FLGHT C 4125 AC 14,266 78 AC Restoration $ 100,000

Appendix D
Major Rehabilitation Exhibits

RUNWAY 9-27 100' X 5,076'
9
27
RW 9-27
AP E
TWC
TW A
TWB
TWD
TWE
AP W
LEGEND
PROGRAM YEAR
"PROGRAM YEAR""BRANCH":"SECTION"
"REHAB ACTIVITY""EST. COST"
TW A
AP S
RW 13-31
NORTH
KEY
WES
TIN
TER
NA
TIO
NAL
AIRP
ORT
-EYW
MAJ
OR
REH
ABIL
ITAT
ION
EXHI
BIT
004
-AIR
FIEL
DPA
VEM
ENT
FY 2020AP E: 4105
AC RESTORATION$0.43 M
FY 2020AP E: 4130
AC RESTORATION$0.53 M
FY 2020AP E: 4145
AC RESTORATION$1.94 M
FY 2020AP E: 4150
AC RECONSTRUCTION$0.24 M
FY 2020AP E: 4155
AC RESTORATION$0.57 M
FY 2020AP W: 4205
AC RESTORATION$1.78 M
FY 2020AP W: 4215
AC RESTORATION$0.67 M
FY 2020AP W: 4220
AC RESTORATION$0.15 M
FY 2020TW A: 105
AC RESTORATION$2.51 M
FY 2020TW A: 110
AC RESTORATION$0.78 M
FY 2020TW A10: 165
PCC RESTORATION$0.04 M
FY 2020TW A11: 170
AC RESTORATION$0.04 M
FY 2020TW B: 210
AC RESTORATION$0.26 M
FY 2020TW C: 310
AC RESTORATION$0.12 M
FY 2020TW D: 510
AC RESTORATION$0.22 M
FY 2020TW E: 610
AC RESTORATION$0.42 M

RUNWAY 7-25 100' X 5,008'
7
25
TW B
TW A
TW C
TW A
TW D
TW E
RW 7-25
AP T-HAN
AP JET CTR
AP TERM
AP FLGHT C
AP E
AP E
TW E
LEGEND
PROGRAM YEAR
"PROGRAM YEAR""BRANCH":"SECTION"
"REHAB ACTIVITY""EST. COST"
TW A
AP S
RW 13-31
NORTH
THE
FLO
RIDA
KEY
SM
ARA
THO
NIN
TER
NATI
ON
ALA
IRPO
RT-M
THM
AJO
RR
EHAB
ILIT
ATIO
NEX
HIBI
T00
4-A
IRFI
ELD
PAVE
MEN
T
FY 2026TW D: 310
AC RESTORATION$0.05 M
FY 2027AP JET CTR: 4308
PCC RESTORATION$0.08 M
FY 2028AP FLGHT C: 4125AC RESTORATION
$0.1 M
FY 2021AP T-HAN: 4405
AC RESTORATION$0.26 M
FY 2020AP E: 4505
AC RESTORATION$0.25 M
FY 2020AP E: 4510
AC RESTORATION$0.12 M
FY 2020AP FLGHT C: 4105AC RESTORATION
$1.89 M
FY 2020AP FLGHT C: 4110
PCC RECONSTRUCTION$0.06 M
FY 2020AP FLGHT C: 4115AC RESTORATION
$0.22 M
FY 2020AP FLGHT C: 4120AC RESTORATION
$0.13 M
FY 2020AP JET CTR: 4305
AC RECONSTRUCTION$1.02 M
FY 2020AP JET CTR: 4315AC RESTORATION
$0.43 M
FY 2020AP TERM: 4205
AC RESTORATION$0.14 M
FY 2020AP TERM: 4210
AC RESTORATION$0.15 M
FY 2020AP TERM: 4220
PCC RESTORATION$0.87 M
FY 2020RW 7-25: 6105
AC RESTORATION$2.72 M
FY 2020RW 7-25: 6110
AC RESTORATION$0.88 M
FY 2020TW A: 105
AC RESTORATION$1.77 M
FY 2020TW A: 115
AC RESTORATION$0.36 M
FY 2020TW B: 151
AC RESTORATION$0.08 M
FY 2020TW C: 205
AC RESTORATION$0.04 M
FY 2020TW C: 210
AC RESTORATION$0.03 M
FY 2020TW D: 305
AC RESTORATION$0.07 M
FY 2020TW E: 155
AC RESTORATION$0.04 M

27L
30
129L
27R
9R
RUNWAY 9L-27R 150' x 8,002'
RUNWAY 9R-27L 100' x 4,309'
RUNWAY 12-30 150' x 6,800'
NOT INSPECTED -PROPERTY OF U.S.
COAST GUARD
ABANDONEDPAVEMENT
PRIVATELYMAINTAINED APRON
RW12-30 A
PE
AP NE
TWB
TWC
TWC
TWD
TWD
TWE
TWE
TWF
TWF
T WG
T WG
T WG
T WG
T WH
T WH
TWJ
TW N TW N
TW P TW P
TW R
TW S
TWT
TWT
TWT2
TWT3
TWJ
TW V
TW YTW Y
TWY1
TWY3 TW Y
TWY7
TWT8
AP
E
TWN
1
AP NE
NOT INSPECTED
TWY2
LEGEND
PROGRAM YEAR
"PROGRAM YEAR""BRANCH":"SECTION"
"REHAB ACTIVITY""EST. COST"
TW A
AP S
RW 13-31
MIA
MI-
OPA
LOC
KA
EXEC
UTIV
EAI
RPO
RT-O
PFM
AJO
RR
EHAB
ILIT
ATIO
NEX
HIBI
T00
4-A
IRFI
ELD
PAVE
MEN
T
NORTH
FY 2022TW G: 745
AC RESTORATION$0.11 M
FY 2023AP T-HANG: 4509
AC RESTORATION$0.73 M
FY 2025AP E: 4215
AC RESTORATION$2.47 M
FY 2026AP CENTER: 4112
PCC RESTORATION$0.62 M
FY 2027AP T-HANG: 4520
AC RESTORATION$0.92 M
FY 2021TW G: 722
AC RESTORATION$0.78 M
FY 2024TW R: 1805
AC RESTORATION$0.11 M
FY 2020AP CENTER: 4105
AC RECONSTRUCTION$3.29 M
FY 2020AP CENTER: 4110
PCC RECONSTRUCTION$4.11 M
FY 2020AP CENTER: 4125
PCC RECONSTRUCTION$0.72 M
FY 2020AP CENTER: 4130
PCC RECONSTRUCTION$0.25 M
FY 2020AP CENTER: 4135
PCC RECONSTRUCTION$0.71 M
FY 2020AP CENTER: 4136
PCC RESTORATION$0.26 M
FY 2020AP CENTER: 4140AC RESTORATION
$0.69 M
FY 2020AP CENTER: 4145AC RESTORATION
$0.36 M
FY 2020AP E: 4205
AC RESTORATION$0.58 M
FY 2020AP E: 4210
AC RECONSTRUCTION$2.62 M
FY 2020AP E: 4225
AC RESTORATION$1.2 M
FY 2020AP E: 4230
AC RESTORATION$0.18 M
FY 2020AP E: 4231
AC RECONSTRUCTION$0.45 M
FY 2020AP NE: 4305
AC RESTORATION$8.6 M
FY 2020AP T-HANG: 4505
AC RECONSTRUCTION$1.49 M
FY 2020AP T-HANG: 4507
AC RECONSTRUCTION$0.67 M
FY 2020AP T-HANG: 4510
AC RESTORATION$0.84 M
FY 2020AP T-HANG: 4515
AC RESTORATION$0.3 M
FY 2020RW 12-30: 6205
AC RESTORATION$7.25 M
FY 2020RW 12-30: 6210
AC RESTORATION$3.24 M
FY 2020RW 9L-27R: 6105
AC RESTORATION$0.15 M
FY 2020RW 9L-27R: 6110
AC RESTORATION$0.3 M
FY 2020RW 9L-27R: 6115
AC RESTORATION$3.33 M
FY 2020RW 9L-27R: 6120
AC RESTORATION$6.65 M
FY 2020RW 9L-27R: 6125
AC RESTORATION$0.15 M
FY 2020RW 9L-27R: 6130
AC RESTORATION$0.31 M
FY 2020RW 9R-27L: 6410
AC RESTORATION$0.96 M
FY 2020TL P: 1670
AC RECONSTRUCTION$1.34 M
FY 2020TW B: 205
AC RESTORATION$0.16 M
FY 2020TW B: 215
AC RESTORATION$0.08 M
FY 2020TW C: 305
AC RESTORATION$0.04 M
FY 2020TW C: 320
AC RESTORATION$1.12 M
FY 2020TW C: 330
AC RESTORATION$0.13 M
FY 2020TW D: 405
AC RESTORATION$0.31 M
FY 2020TW D: 410
AC RESTORATION$0.75 M
FY 2020TW D: 415
AC RESTORATION$0.83 M
FY 2020TW E: 505
AC RESTORATION$0.06 M
FY 2020TW E: 510
AC RESTORATION$0.39 M
FY 2020TW E: 515
AC RESTORATION$1.85 M
FY 2020TW F: 605
AC RESTORATION$0.04 M
FY 2020TW F: 615
AC RESTORATION$0.14 M
FY 2020TW G: 705
AC RESTORATION$0.04 M
FY 2020TW G: 717
AC RESTORATION$0.11 M
FY 2020TW G: 720
AC RESTORATION$0.46 M
FY 2020TW G: 725
AC RESTORATION$0.18 M
FY 2020TW G: 730
AC RESTORATION$0.79 M
FY 2020TW G: 735
AC RESTORATION$1.16 M
FY 2020TW G: 740
AC RESTORATION$0.11 M
FY 2020TW H: 805
AC RESTORATION$0.35 M
FY 2020TW H: 806
AC RESTORATION$0.45 M
FY 2020TW H: 824
AC RESTORATION$0.26 M
FY 2020TW H: 825
AC RESTORATION$0.85 M
FY 2020TW H: 826
AC RESTORATION$0.85 M
FY 2020TW H: 835
AC RESTORATION$0.22 M
FY 2020TW H: 845
AC RESTORATION$0.24 M
FY 2020TW H: 855
AC RESTORATION$0.12 M
FY 2020TW J: 1005
AC RESTORATION$0.04 M
FY 2020TW J: 1025
AC RESTORATION$0.19 M
FY 2020TW J: 1030
AC RECONSTRUCTION$0.25 M
FY 2020TW J: 1040
AC RESTORATION$0.55 M
FY 2020TW N: 1410
PCC RESTORATION$0.23 M
FY 2020TW N: 1422
AC RESTORATION$2.02 M
FY 2020TW P: 1605
AC RESTORATION$0.26 M
FY 2020TW P: 1615
AC RESTORATION$0.44 M
FY 2020TW P: 1620
AC RESTORATION$1.85 M
FY 2020TW P: 1625
AC RESTORATION$0.13 M
FY 2020TW P: 1630
AC RESTORATION$0.92 M
FY 2020TW P: 1640
AC RESTORATION$0.23 M
FY 2020TW P: 1645
AC RESTORATION$1.1 M
FY 2020TW P: 1650
AC RECONSTRUCTION$0.1 M
FY 2020TW P: 1655
AC RESTORATION$0.21 M
FY 2020TW R: 1810
AC RESTORATION$0.37 M
FY 2020TW S: 1905
AC RESTORATION$0.23 M
FY 2020TW S: 1920
AC RESTORATION$0.31 M
FY 2020TW T: 2005
AC RESTORATION$4.93 M
FY 2020TW T2: 2025
AC RESTORATION$0.48 M
FY 2020TW T3: 2020
AC RESTORATION$0.48 M
FY 2020TW T8: 2010
AC RESTORATION$1.02 M
FY 2020TW Y: 2610
AC RESTORATION$1.7 M
FY 2020TW Y: 2615
AC RESTORATION$0.09 M
FY 2020TW Y: 2620
AC RECONSTRUCTION$1.47 M
FY 2020TW Y1: 260
5AC RESTORATION$0.26 M
FY 2020TW Y2: 2640
AC RESTORATION$0.21 M
FY 2020TW Y3: 2650
AC RESTORATION$0.45 M
FY 2020TW Y7: 2630
AC RESTORATION$0.35 M
FY 2021TW H: 823
AC RESTORATION$0.22 M
FY 2021TW N: 1430
PCC RESTORATION$0.51 M
FY 2021TW V: 2505
AC RESTORATION$0.53 M
FY 2023TW H: 815
AC RESTORATION$1.39 M
FY 2023TW H: 846
AC RESTORATION$0.28 M
FY 2023TW J: 1015
AC RESTORATION$0.21 M
FY 2023TW N: 1435
PCC RESTORATION$0.81 M
FY 2025RW 9R-27L: 6405
AC RESTORATION$3.14 M
FY 2025TW N1: 1405
PCC RESTORATION$0.79 M
FY 2025TW P: 1653
AC RESTORATION$0.07 M

LEGEND
PROGRAM YEAR
"PROGRAM YEAR""BRANCH":"SECTION"
"REHAB ACTIVITY""EST. COST"
TW A
AP S
RW 13-31
NORTH
MIA
MIE
XEC
UTI
VEAI
RPO
RT-T
MB
MAJ
OR
REH
ABIL
ITAT
ION
EXHI
BIT
004
-AIR
FIEL
DPA
VEM
ENT
FY 2020AP N: 4225
AC RESTORATION$0.66 M
FY 2020AP N: 4230
AC RECONSTRUCTION$0.24 M
FY 2020AP NE: 4310
AC RESTORATION$0.19 M
FY 2020AP NE: 4315
AC RESTORATION$0.2 M
FY 2020AP NE: 4325
AC RESTORATION$0.47 M
FY 2020AP S: 4105
AC RESTORATION$1.83 M
FY 2020AP S: 4125
AC RESTORATION$0.34 M
FY 2020AP S: 4130
AC RECONSTRUCTION$0.25 M
FY 2020AP S: 4135
AC RESTORATION$0.28 M
FY 2020AP S: 4140
AC RESTORATION$0.44 M
FY 2020AP SE: 4410
AC RESTORATION$0.43 M
FY 2020RW 9L-27R: 6104
AC RESTORATION$0.19 M
FY 2020AP N: 4220
AC RESTORATION$0.93 M
FY 2020AP N: 4215
AC RESTORATION$0.69 M
FY 2020RW 9R-27L: 6302
AC RESTORATION$0.95 M
FY 2020TW AP NE: 1005
AC RESTORATION$0.43 M
FY 2020TW AP SE: 1105
AC RESTORATION$0.41 M
FY 2020TW C: 810
AC RESTORATION$0.07 M
FY 2020TW C1: 905
AC RESTORATION$0.08 M
FY 2020TW C3: 320
AC RESTORATION$0.17 M
FY 2020TW D: 405
AC RESTORATION$1.83 M
FY 2020TW E5: 527
AC RESTORATION$0.25 M
FY 2020TW E6: 529
AC RESTORATION$0.25 M
FY 2020TW G: 415
AC RESTORATION$0.48 M
FY 2020TW J: 310
AC RESTORATION$0.17 M
FY 2020TW J: 420
AC RESTORATION$0.52 M
FY 2020RW 9L-27R: 6126
AC RESTORATION$0.1 M
FY 2020RW 9L-27R: 6109
AC RESTORATION$0.1 M
FY 2022AP NE: 4330
PCC RESTORATION$0.04 M
FY 2022AP S: 4110
AC RESTORATION$2.41 M
FY 2022TW 2: 260
AC RESTORATION$0.19 M
FY 2022TW C: 910
AC RESTORATION$1.31 M
FY 2023AP S: 4115
AC RESTORATION$7.84 M
FY 2023TW A4: 125
AC RESTORATION$0.31 M
FY 2023TW G: 710
AC RESTORATION$0.16 M
FY 2023TW H: 815
AC RESTORATION$1.13 M
FY 2024AP N: 4205
AC RESTORATION$7.98 M
FY 2024RW 13-31: 6205
AC RESTORATION$3.8 M
FY 2024TW H3: 805
AC RESTORATION$0.05 M
FY 2025RW 9R-27L: 6305
AC RESTORATION$4.37 M
FY 2025TW D: 525
AC RESTORATION$0.4 M
FY 2025TW E3: 520
AC RESTORATION$0.48 M
FY 2026RW 9R-27L: 6304
AC RESTORATION$0.19 M
FY 2026RW 9R-27L: 6309
AC RESTORATION$0.1 M
FY 2026TW 3: 250
AC RESTORATION$0.19 M
FY 2026TW A: 108
AC RESTORATION$0.18 M
FY 2026TW A4: 124
AC RESTORATION$0.26 M
FY 2026TW E1: 516
AC RESTORATION$0.37 M
FY 2027TW E: 535
AC RESTORATION$0.17 M
FY 2028TW 4: 240
AC RESTORATION$0.19 M
FY 2028TW 7: 210
AC RESTORATION$0.18 M
FY 2028TW E: 507
AC RESTORATION$0.29 M
FY 2028TW E1: 513
AC RESTORATION$0.51 M
FY 2028TW E2: 515
AC RESTORATION$0.18 M
FY 2028TW E6: 530
AC RESTORATION$0.31 M
FY 2028TW G: 705
AC RESTORATION$0.49 M
FY 2028TW H4: 330
AC RESTORATION$0.18 M
FY 2029RW 13-31: 6210
AC RESTORATION$1.9 M
FY 2029RW 9L-27R: 6131
AC RESTORATION$0.19 M
FY 2029RW 9R-27L: 6306
AC RESTORATION$0.19 M

SWAMPBUGGY
PARKING
AP NTW
A6
TWA
TW A
TWA4
TWA3
TW A
TWB
TWA2TW
A1
TWA
RW 9-27 RW 9-27
TWA5
279
RUNWAY 9-27 150' x 10,499'
LEGEND
PROGRAM YEAR
"PROGRAM YEAR""BRANCH":"SECTION"
"REHAB ACTIVITY""EST. COST"
TW A
AP S
RW 13-31
NORTH
DA
DE-
CO
LLIE
RTR
AIN
ING
AN
DTR
ANSI
TIO
NAI
RPO
RT-T
NTM
AJO
RR
EHAB
ILIT
ATIO
NEX
HIBI
T00
4-A
IRFI
ELD
PAVE
MEN
T
FY 2018TW B: 215
AC RESTORATION$0.34 M
FY 2018AP N: 4105
AC RESTORATION$0.45 M
FY 2018TW A: 105
AC RESTORATION$5.13 M
FY 2018RW 9-27: 6110
AC RESTORATION$8.24 M
FY 2018RW 9-27: 6105
AC RESTORATION$3.68 M
FY 2018TW A6: 170
AC RESTORATION$0.55 M
FY 2018TW A1: 120
AC RECONSTRUCTION$0.62 M
FY 2018TW A4: 150
AC RESTORATION$1.31 M
FY 2019TW B: 205
AC RESTORATION$0.59 M
FY 2019TW A5: 160
AC RESTORATION$0.75 M
FY 2018TW A6: 173
AC RESTORATION$0.05 M
FY 2018TW A6: 176
AC RESTORATION$0.05 M
FY 2018TW A: 180
AC RESTORATION$0.53 M
FY 2018TW B: 210
AC RESTORATION$0.04 M
FY 2024TW A1: 123
AC RESTORATION$0.05 M
FY 2018TW A: 110
AC RESTORATION$0.53 M

RW 18-36
RW
10-2
8
TW A3
TW A2
TWA
TW A1
TWA
TWB5
TW B
TWB4
TWB3
TWB2
TWB1
AP
N
AP
NW
28
10
18
36
TWA
RU
NW
AY
10-2
830
00'x
75'
RUNWAY 18-36 3999' x 100'
FOUNDATIONCONC . BLDG.
SKYDIVEMIAMI, INC.
AUTO PARKING
TW AP
AP
NE
LEGEND
PROGRAM YEAR
"PROGRAM YEAR""BRANCH":"SECTION"
"REHAB ACTIVITY""EST. COST"
TW A
AP S
RW 13-31
NO
RTH
MIA
MIH
OM
ESTE
AD
GEN
ERA
LAV
IATI
ON
AIRP
ORT
-X51
MAJ
OR
REH
ABIL
ITAT
ION
EXHI
BIT
004
-AIR
FIEL
DPA
VEM
ENT
FY 2019RW 10-28: 6205
AC RESTORATION$1.58 M
FY 2026AP NE: 4305
AC RESTORATION$0.77 M
FY 2023TW B1: 110
AC RESTORATION$0.14 M
FY 2018TW A: 205
AC RESTORATION$0.11 M
FY 2018TW B: 180
AC RESTORATION$0.10 M
FY 2018AP NW: 4105
AC RESTORATION$1.79 M
FY 2018AP N: 4205
AC RESTORATION$0.60 M
FY 2018TW C: 400
AC RESTORATION$0.19 M
FY 2018TW B: 105
AC RESTORATION$1.35 M
FY 2019TW A: 215
AC RESTORATION$0.85 M
FY 2018TW A: 160
AC RESTORATION$0.10 M
FY 2018TW A: 295
AC RESTORATION$0.03 M
FY 2018TW A1: 230
AC RESTORATION$0.04 M
FY 2018TW A: 280
AC RESTORATION$0.03 M
FY 2018TW B2: 120
AC RESTORATION$0.16 M
FY 2018TW B3: 130
AC RESTORATION$0.11 M
FY 2018TW B4: 140
AC RESTORATION$0.12 M
FY 2018TW B5: 150
AC RESTORATION$0.04 M
FY 2018TW A1: 235
AC RESTORATION$0.02 M
FY 2018TW A3: 250
AC RESTORATION$0.05 M
FY 2018TW A2: 240
AC RESTORATION$0.10 M
FY 2018TW A: 260
AC RESTORATION$0.04 M
FY 2018TW A: 270
AC RESTORATION$0.04 M
FY 2018TW A: 290
AC RESTORATION$0.03 M
FY 2018TW AP: 305
AC RESTORATION$0.09 M
FY 2018RW 18-36: 6110
AC RESTORATION$1.29 M
FY 2022AP NW: 4110
AC RESTORATION$0.08 M
FY 2026TW A: 210
AC RESTORATION$0.04 M
FY 2018TW A1: 230
AC RESTORATION$0.04 M
"REHAB ACTIVITY""EST. COST"
FY 2025RW 18-36: 6112
AC RESTORATION$0.05 M

F L O R I DA D E PA RT M E N T O F T R A N S P O RTAT I O NAV I AT I O N A N D S PA C E P O RT S O F F I C E
D I S T R I C T 6