HB854 Statewide Housing Study - Virginia.gov
426
HB854 Statewide Housing Study — Current Efforts, Future Needs, New Strategies January 2022
-
Upload
khangminh22 -
Category
Documents
-
view
1 -
download
0
Transcript of HB854 Statewide Housing Study - Virginia.gov

HB854 StatewideHousing Study—Current Efforts, Future Needs, New StrategiesJanuary 2022

2

Contents
About this report 11
Executive summary 13
Preface 29
I INTRODUCTION 35
Part 1 Overview 37
1 Why affordability matters 39
1.1 How do we define affordable housing? . . . . . . . . . . . . . . . . . . . . . . . . . . . . . 39
1.2 Why is housing important? . . . . . . . . . . . . . . . . . . . . . . . . . . . . . . . . . . . 41
1.3 How can we make housing more affordable? . . . . . . . . . . . . . . . . . . . . . . . . . 43
2 Public opinion of housing 45
2.1 Measuring how Virginians and Americans feel about housing . . . . . . . . . . . . . . . 45
2.2 Public opinion on affordable housing in the Commonwealth . . . . . . . . . . . . . . . 46
2.3 Public opinion on affordable housing across the nation . . . . . . . . . . . . . . . . . . . 48
3 Analysis of regional housing studies 51
3.1 Introduction . . . . . . . . . . . . . . . . . . . . . . . . . . . . . . . . . . . . . . . . . . . . 51
3.2 Common themes . . . . . . . . . . . . . . . . . . . . . . . . . . . . . . . . . . . . . . . . . 52
3

4 CONTENTS
4 Virginia’s housing markets 55
4.1 Large Metro Housing Markets . . . . . . . . . . . . . . . . . . . . . . . . . . . . . . . . . 57
4.2 Small Metro Housing Markets . . . . . . . . . . . . . . . . . . . . . . . . . . . . . . . . . 59
4.3 Rural Housing Markets . . . . . . . . . . . . . . . . . . . . . . . . . . . . . . . . . . . . . 61
5 How we use data 63
5.1 Common data sources . . . . . . . . . . . . . . . . . . . . . . . . . . . . . . . . . . . . . . 63
5.2 Common terms . . . . . . . . . . . . . . . . . . . . . . . . . . . . . . . . . . . . . . . . . . 65
II ENGAGEMENT 69
Part 2 Overview 71
6 SAG and steering committee involvement 73
6.1 Stakeholder Advisory Group . . . . . . . . . . . . . . . . . . . . . . . . . . . . . . . . . . 73
6.2 Steering committee . . . . . . . . . . . . . . . . . . . . . . . . . . . . . . . . . . . . . . . . 74
7 Provider survey 77
7.1 Methods . . . . . . . . . . . . . . . . . . . . . . . . . . . . . . . . . . . . . . . . . . . . . . 77
7.2 Profile of respondents . . . . . . . . . . . . . . . . . . . . . . . . . . . . . . . . . . . . . . 77
7.3 Community housing needs . . . . . . . . . . . . . . . . . . . . . . . . . . . . . . . . . . . 81
7.4 Assessment of current housing programs and policies . . . . . . . . . . . . . . . . . . . 83
7.5 Racial equity . . . . . . . . . . . . . . . . . . . . . . . . . . . . . . . . . . . . . . . . . . . 86
7.6 COVID-19 impact and response . . . . . . . . . . . . . . . . . . . . . . . . . . . . . . . . 89
8 Focus groups 95
8.1 Methods . . . . . . . . . . . . . . . . . . . . . . . . . . . . . . . . . . . . . . . . . . . . . . 95
8.2 Priorities, concerns, and solutions . . . . . . . . . . . . . . . . . . . . . . . . . . . . . . . 96
9 Public housing authority survey 101

CONTENTS 5
9.1 Methods . . . . . . . . . . . . . . . . . . . . . . . . . . . . . . . . . . . . . . . . . . . . . . 101
9.2 Waiting lists for PHA housing assistance programs . . . . . . . . . . . . . . . . . . . . . 102
10 Client survey 105
11 Experts and power users 107
III RESEARCH AND FINDINGS 111
Part 3 Overview 113
12 Demographic trends 115
12.1 Population and migration . . . . . . . . . . . . . . . . . . . . . . . . . . . . . . . . . . . . 116
12.2 Racial and ethnic diversity . . . . . . . . . . . . . . . . . . . . . . . . . . . . . . . . . . . 122
12.3 Age and generations . . . . . . . . . . . . . . . . . . . . . . . . . . . . . . . . . . . . . . . 127
12.4 Household trends . . . . . . . . . . . . . . . . . . . . . . . . . . . . . . . . . . . . . . . . . 133
13 Economic trends 139
13.1 Labor force . . . . . . . . . . . . . . . . . . . . . . . . . . . . . . . . . . . . . . . . . . . . 140
13.2 Jobs and wages . . . . . . . . . . . . . . . . . . . . . . . . . . . . . . . . . . . . . . . . . . 144
13.3 Household incomes . . . . . . . . . . . . . . . . . . . . . . . . . . . . . . . . . . . . . . . 149
13.4 Poverty . . . . . . . . . . . . . . . . . . . . . . . . . . . . . . . . . . . . . . . . . . . . . . . 152
14 Housing inventory and production 155
14.1 Housing production . . . . . . . . . . . . . . . . . . . . . . . . . . . . . . . . . . . . . . . 156
14.2 Structure type . . . . . . . . . . . . . . . . . . . . . . . . . . . . . . . . . . . . . . . . . . . 161
14.3 Age and quality . . . . . . . . . . . . . . . . . . . . . . . . . . . . . . . . . . . . . . . . . . 166
15 Homeownership market 173
15.1 Virginia’s homeowners . . . . . . . . . . . . . . . . . . . . . . . . . . . . . . . . . . . . . . 174

6 CONTENTS
15.2 Homeownership rate . . . . . . . . . . . . . . . . . . . . . . . . . . . . . . . . . . . . . . . 180
15.3 Home prices and supply . . . . . . . . . . . . . . . . . . . . . . . . . . . . . . . . . . . . . 184
15.4 Affordability . . . . . . . . . . . . . . . . . . . . . . . . . . . . . . . . . . . . . . . . . . . . 188
15.5 Mortgage trends . . . . . . . . . . . . . . . . . . . . . . . . . . . . . . . . . . . . . . . . . 192
16 Rental market 195
16.1 Virginia’s renters . . . . . . . . . . . . . . . . . . . . . . . . . . . . . . . . . . . . . . . . . 196
16.2 Rental prices and supply . . . . . . . . . . . . . . . . . . . . . . . . . . . . . . . . . . . . . 202
16.3 Affordability . . . . . . . . . . . . . . . . . . . . . . . . . . . . . . . . . . . . . . . . . . . . 207
16.4 Assisted rental housing . . . . . . . . . . . . . . . . . . . . . . . . . . . . . . . . . . . . . 211
17 Housing instability and homelessness 217
17.1 Impact of COVID-19 . . . . . . . . . . . . . . . . . . . . . . . . . . . . . . . . . . . . . . . 217
17.2 Mortgage delinquency . . . . . . . . . . . . . . . . . . . . . . . . . . . . . . . . . . . . . . 220
17.3 Evictions . . . . . . . . . . . . . . . . . . . . . . . . . . . . . . . . . . . . . . . . . . . . . . 222
17.4 Homelessness . . . . . . . . . . . . . . . . . . . . . . . . . . . . . . . . . . . . . . . . . . . 225
18 Projections 233
18.1 Statewide projections . . . . . . . . . . . . . . . . . . . . . . . . . . . . . . . . . . . . . . 234
18.2 Market area projections . . . . . . . . . . . . . . . . . . . . . . . . . . . . . . . . . . . . . 235
18.3 Age projections . . . . . . . . . . . . . . . . . . . . . . . . . . . . . . . . . . . . . . . . . . 238
18.4 Discussion . . . . . . . . . . . . . . . . . . . . . . . . . . . . . . . . . . . . . . . . . . . . . 239
19 Neighbor state comparisons 241
19.1 Homeownership affordability . . . . . . . . . . . . . . . . . . . . . . . . . . . . . . . . . . 242
19.2 Rental affordability . . . . . . . . . . . . . . . . . . . . . . . . . . . . . . . . . . . . . . . . 243

CONTENTS 7
IV ANALYSIS OF EXISTING PROGRAMS 245
Part 4 Overview 247
20 Affordable rental housing production 249
20.1 Findings . . . . . . . . . . . . . . . . . . . . . . . . . . . . . . . . . . . . . . . . . . . . . . 250
20.2 Program successes . . . . . . . . . . . . . . . . . . . . . . . . . . . . . . . . . . . . . . . . 252
20.3 Program challenges . . . . . . . . . . . . . . . . . . . . . . . . . . . . . . . . . . . . . . . 254
20.4 Recommendations . . . . . . . . . . . . . . . . . . . . . . . . . . . . . . . . . . . . . . . . 255
21 Rental assistance and eviction prevention 263
21.1 Findings . . . . . . . . . . . . . . . . . . . . . . . . . . . . . . . . . . . . . . . . . . . . . . 264
21.2 Program successes . . . . . . . . . . . . . . . . . . . . . . . . . . . . . . . . . . . . . . . . 268
21.3 Program challenges . . . . . . . . . . . . . . . . . . . . . . . . . . . . . . . . . . . . . . . 270
21.4 Recommendations . . . . . . . . . . . . . . . . . . . . . . . . . . . . . . . . . . . . . . . . 271
22 Homeownership and counseling 277
22.1 Findings . . . . . . . . . . . . . . . . . . . . . . . . . . . . . . . . . . . . . . . . . . . . . . 278
22.2 Program successes . . . . . . . . . . . . . . . . . . . . . . . . . . . . . . . . . . . . . . . . 281
22.3 Program challenges . . . . . . . . . . . . . . . . . . . . . . . . . . . . . . . . . . . . . . . 282
22.4 Recommendations . . . . . . . . . . . . . . . . . . . . . . . . . . . . . . . . . . . . . . . . 284
23 Rehabilitation and accessibility 289
23.1 Findings . . . . . . . . . . . . . . . . . . . . . . . . . . . . . . . . . . . . . . . . . . . . . . 290
23.2 Program successes . . . . . . . . . . . . . . . . . . . . . . . . . . . . . . . . . . . . . . . . 292
23.3 Program challenges . . . . . . . . . . . . . . . . . . . . . . . . . . . . . . . . . . . . . . . 293
23.4 Recommendations . . . . . . . . . . . . . . . . . . . . . . . . . . . . . . . . . . . . . . . . 296
24 Community revitalization and capacity building 303
24.1 Findings . . . . . . . . . . . . . . . . . . . . . . . . . . . . . . . . . . . . . . . . . . . . . . 304

8 CONTENTS
24.2 Program successes . . . . . . . . . . . . . . . . . . . . . . . . . . . . . . . . . . . . . . . . 306
24.3 Program challenges . . . . . . . . . . . . . . . . . . . . . . . . . . . . . . . . . . . . . . . 308
24.4 Recommendations . . . . . . . . . . . . . . . . . . . . . . . . . . . . . . . . . . . . . . . . 310
25 Homelessness assistance and prevention 319
25.1 Findings . . . . . . . . . . . . . . . . . . . . . . . . . . . . . . . . . . . . . . . . . . . . . . 320
25.2 Program successes . . . . . . . . . . . . . . . . . . . . . . . . . . . . . . . . . . . . . . . . 322
25.3 Program challenges . . . . . . . . . . . . . . . . . . . . . . . . . . . . . . . . . . . . . . . 323
25.4 Recommendations . . . . . . . . . . . . . . . . . . . . . . . . . . . . . . . . . . . . . . . . 325
V FOCUSED RECOMMENDATIONS 329
Part 5 Overview 331
26 State-funded rental assistance 333
26.1 Background . . . . . . . . . . . . . . . . . . . . . . . . . . . . . . . . . . . . . . . . . . . . 333
26.2 Rationale . . . . . . . . . . . . . . . . . . . . . . . . . . . . . . . . . . . . . . . . . . . . . . 334
26.3 Findings . . . . . . . . . . . . . . . . . . . . . . . . . . . . . . . . . . . . . . . . . . . . . . 335
26.4 Recommendations . . . . . . . . . . . . . . . . . . . . . . . . . . . . . . . . . . . . . . . . 342
27 Utility rate reduction 347
27.1 Background . . . . . . . . . . . . . . . . . . . . . . . . . . . . . . . . . . . . . . . . . . . . 347
27.2 Findings . . . . . . . . . . . . . . . . . . . . . . . . . . . . . . . . . . . . . . . . . . . . . . 348
27.3 Recommendations . . . . . . . . . . . . . . . . . . . . . . . . . . . . . . . . . . . . . . . . 362
28 Property tax reduction 371
28.1 Background . . . . . . . . . . . . . . . . . . . . . . . . . . . . . . . . . . . . . . . . . . . . 371
28.2 Findings . . . . . . . . . . . . . . . . . . . . . . . . . . . . . . . . . . . . . . . . . . . . . . 372
28.3 Recommendations . . . . . . . . . . . . . . . . . . . . . . . . . . . . . . . . . . . . . . . . 376

CONTENTS 9
29 Bond financing options 383
29.1 Background . . . . . . . . . . . . . . . . . . . . . . . . . . . . . . . . . . . . . . . . . . . . 383
29.2 Findings . . . . . . . . . . . . . . . . . . . . . . . . . . . . . . . . . . . . . . . . . . . . . . 384
29.3 Recommendations . . . . . . . . . . . . . . . . . . . . . . . . . . . . . . . . . . . . . . . . 389
30 Addressing racial equity in housing across Virginia 399
30.1 The current landscape . . . . . . . . . . . . . . . . . . . . . . . . . . . . . . . . . . . . . . 400
30.2 What’s happening now . . . . . . . . . . . . . . . . . . . . . . . . . . . . . . . . . . . . . . 403
30.3 The path forward must expand engagement . . . . . . . . . . . . . . . . . . . . . . . . . 407
30.4 Recommended strategies for addressing racial disparities . . . . . . . . . . . . . . . . . 407
30.5 Emerging best practices in other regions . . . . . . . . . . . . . . . . . . . . . . . . . . . 410
VI APPENDIX 413
A Survey methods 415
A.1 Statewide provider survey . . . . . . . . . . . . . . . . . . . . . . . . . . . . . . . . . . . . 415
A.2 Public housing authority survey . . . . . . . . . . . . . . . . . . . . . . . . . . . . . . . . 415
A.3 Client survey . . . . . . . . . . . . . . . . . . . . . . . . . . . . . . . . . . . . . . . . . . . 415
B Data methodology 417
B.1 Quantifying the availability of “starter homes” in Virginia . . . . . . . . . . . . . . . . . 417
B.2 Determining the income needed to afford the median home sales price . . . . . . . . . 417
B.3 Estimating the cost of a state-funded rental assistance program . . . . . . . . . . . . . . 418
C Program fact sheets 419
C.1 Affordable rental housing production . . . . . . . . . . . . . . . . . . . . . . . . . . . . . 419
C.2 Rental assistance and eviction prevention . . . . . . . . . . . . . . . . . . . . . . . . . . 419
C.3 Homeownership and counseling . . . . . . . . . . . . . . . . . . . . . . . . . . . . . . . . 420
C.4 Rehabilitation and accessibility . . . . . . . . . . . . . . . . . . . . . . . . . . . . . . . . 420

10 CONTENTS
C.5 Community revitalization and capacity building . . . . . . . . . . . . . . . . . . . . . . 421
C.6 Homelessness assistance and prevention . . . . . . . . . . . . . . . . . . . . . . . . . . . 421

About this report
This is the print version of the HB854 Statewide Housing Study, a report commissioned by theVirginia General Assembly to investigate housing needs across the Commonwealth and makes rec-ommendations to state housing agencies, the General Assembly, and Governor’s Office for improvinghousing affordability and opportunity for all Virginians.
The final report was delivered to lawmakers in January 2022 and is available on the Reports to theGeneral Assembly Portal page of the Division of Legislative Automated Systems (DLAS) website.
An HTML-based website version of this report is also available on the Department of Housing andCommunity Development website (www.dhcd.virginia.gov). The data visualizations on this websiteare interactive dashboards and allow users to explore charts in more detail.
11

12 CONTENTS

EXECUTIVE SUMMARY
House Bill 854 (HB854) directed Virginia Housing and the Department of Housing and Community Development (DHCD) to complete a statewide study on affordable housing. Pursuant to that requirement, this report is the product of extensive research and engagement to understand Virginia’s current affordable housing landscape and to chart a path forward that recognizes the importance of affordable housing to all Virginians.
BACKGROUND
Virginia Housing and DHCD are joint authors for this report. These agencies also received support from an external Stakeholder Advisory Group and the nonprofit organization HousingForward Virginia (HFV).
Per the bill’s requirements, Virginia Housing and DHCD assembled a Stakeholder Advisory Group (SAG) of thirty-nine housing experts who represented a wide range of regions, industries, and demographics. Members shaped the report’s priorities, participated in subgroups on specific policy issues, and helped design recommendations.
To aid both agency staff and SAG members, HFV was engaged as a research partner. HFV is a nonprofit, nonpartisan research and education organization that regularly supports housing studies throughout the Commonwealth. HFV contributed by administering surveys, analyzing data, and researching best practices.
HB854 Statewide Housing StudyCurrent Efforts, Future Needs, New Strategies
January 2022
1HB854 Statewide Housing Study Executive Summary

HB854 asked stakeholders to determine the current and future housing needs of Virginians, including the availability of affordable housing across the state. Data from federal, state, and other sources were compiled, analyzed, and translated into major findings for the following topics.
2 HB854 Statewide Housing Study
RESEARCH AND FINDINGS
Demographic trends
The demographics of Virginia will continue to evolve, but persistent disparities between generations and racial and ethnic groups require continued efforts to ensure opportunity for all.
Virginia’s population growth over the past decade has concentrated along the Urban Crescent, which includes Northern Virginia, Richmond, and Hampton Roads. These areas are consistently increasing in diversity.
A dramatic rise in the older adult population will call for new senior housing opportunities across all parts of the Commonwealth.
Virginians born in this new century are much more racially and ethnically diverse than previous generations.
Housing options in Virginia should adapt to shrinking household sizes among both owners and renters in nearly every part of the state.
Three fastest growing regions from 2010 to 2020
U.S. Census Bureau, Population Estimates Program and Decennial Census P.L. 94-171 Redistricting Data.
Northern Virginia 14.2%
Richmond 10.7%
Northern Shenandoah Valley 9.9%
Increase in number of Virginians over the age of 55 from 2010 to 2019
U.S. Census Bureau, American Community Survey, 2010-2019 5-year estimates, Table B01001.
Over half (53%) of all Virginians 24 and under in the Urban Crescent are Black, Hispanic, Asian, multiracial, or another non-white race.U.S. Census Bureau, American Community Survey, 2010-2019 5-year estimates, Table B01001.
U.S. Census Bureau, American Community Survey, 2010-2019 5-year estimates, Table B08202.
Household sizes with largest growthfrom 2010 to 2019
1-person
+ 7.4%2-person
+ 6.4%
+ 549,000

3Executive Summary
RESEARCH AND FINDINGS
Economic trends
Despite strong growth in the face of two major recessions, new economic opportunities in Virginia are not equally distributed.
Jobs rebounded quickly in metropolitan areas following the Great Recession and COVID-19 pandemic, but total employment levels in rural Virginia have consistently declined since 2008.
Black and brown Virginians suffered a much higher rate of pandemic-related job losses compared to white Virginians and also consistently have lower average household incomes.
Many of the state’s fastest-growing job sectors, such as healthcare support occupations, offer below-average wages. These workers will have less income available for rent or mortgage.
Total job loss in rural Virginia fromJanuary 2008 to August 2021
U.S. Bureau of Labor Statistics,Local Area Unemployment Statistics.
Over 26,000 jobs
Median household income
U.S. Census Bureau, American Community Survey, 2010-2019 5-year estimates, Table B19013.
$86,612White,
non-Hispanic$69,220
Hispanic $53,896Black
Healthcare support occupations
U.S. Bureau of Labor Statistics, Occupational Employment and Wage Statistics, May 2010 and May 2020.
Job growth since 2010 Median annual wage in 2020
61% $28,090

RESEARCH AND FINDINGS
Housing inventory and production
Housing production has yet to recover to pre-Recession levels, while population and job growth continues.
About 30,000 new homes are built in Virginia each year.
However, this rate is about half the annual production from the mid-2000s.
4 HB854 Statewide Housing Study
Statewide population growth remains several percentage points above the increase in housing supply, even as shrinking average household sizes require more homes per person.
Even in the Urban Crescent, Virginia’s housing supply is predominantly detached single-family homes. These are also the most common new homes built, along with larger apartment buildings.
Townhomes and small-scale apartments—which can be more affordable by design—remain relatively rare.
Virginia’s annual housing production peaked in 2004 and has not caught pace since.
U.S. Census Bureau, Annual Building Permit Survey.
2004
63,215Building permits
2020
33,813Building permits
Population growthsince 2008
Housing supply growthsince 2008
U.S. Census Bureau, Population Estimates Program and Decennial Census P.L. 94-171 Redistricting Data.
10.2% 8.7%
Residential building permitsby structure type since 2010
U.S. Census Bureau, Annual Building Permit Survey.
67.9%
30.6%Large multifamily(5+ units)
Small multifamily(2-4 units)
Single-family
1.5%

5Executive Summary
RESEARCH AND FINDINGS
Homeownership market
Virginia’s homeownership rate is consistently higher than the national average, but recent declines may continue without a proactive response to changing demographics and market conditions.
Compared to the average Virginian, homeowners in the Commonwealth are older, more affluent, and more white.
As of August 2021, the average single-family home in Virginia sold for $355,000—an increase over 30 percent from five years prior.
Limited supply—especially of smaller homes equally sought after by young buyers and downsizing baby boomers—has lifted prices and kept homeownership out of the reach of many.
Homeownership among young adults is declining, while in many small and rural markets, a majority of homeowners are more than 55 years old.
Virginia’s Black-white homeownership gap
U.S. Census Bureau, American Community Survey, 2010-2019 5-year estimates, Table B25003.
73% 48%White homeownershiprate
Black homeownershiprate
Homeownership rate for 25 to 44 year olds
U.S. Census Bureau, American Community Survey, 2010-2019 5-year estimates, Table B25007.
58%2010
50% 2019
Months of single-family home supply available
Virginia REALTORS®.
August 2016
6 monthsAugust 2021
1.6 months
“Starter home” sales as share of all transactionsStarter homes are those affordable to households earning 80% of Area Median Income or below
Virginia REALTORS®.
47%2013 41% 2021

RESEARCH AND FINDINGS
Rental market
Many low-income renters continue to be cost-burdened as the deficit of affordable rentals grows and demand is ever-increasing.
Four in five renters below 50 percent of their Area Median Income are cost-burdened. This is more than a quarter of a million households in Virginia—and that number continues to rise.
6 HB854 Statewide Housing Study
Over half of Virginia’s approximately 170,000 publicly-supported rental apartments rely on Low-Income Housing Tax Credits from Virginia Housing. Without intervention, three-quarters of these could be lost to expiring affordability restrictions by 2040.
The current supply of federal Housing Choice Vouchers is inadequate to meet the need. For every household with a voucher, another seven are eligible but do not have one. Tens of thousands of low-income Virginians remain on waiting lists.
Number of new affordable apartments needed to eliminate cost burden among Virginia’s low-income renters
U.S. Department of Housing and Urban Development, Comprehensive Housing Affordability Strategy, 2013-2017 5-year estimates, Table 7.
+ 300,000
Potential loss of publicly-supported affordable rental units without additional investment between now and 2040
63,450homes
National Housing Preservation Database.
Housing Choice Voucher supply and demand
327,228Cost-burdened
low-incomerenters
56,496On HCV waitlists
45,587HCVs in-use
U.S. Department of Housing and Urban Development, Geospatial Data Storefront and Comprehensive Housing Affordability Strategy, 2013-2017 5-year estimates, Table 7.

7Executive Summary
RESEARCH AND FINDINGS
Housing instability and homelessness
COVID-19 could undo Virginia’s progress in reducing homelessness and stably housing tens of thousands of Virginians.
Point-in-Time counts across Virginia have shown a general decline in observed homelessness—fewer than 6,000 individuals in 2020—although this was a slight uptick from 2019.
On the other hand, housing instability among Virginia’s school-age children has increased in the past decade.
COVID-19 has put thousands of low-income Virginians behind on rent payments, which in turn put landlords at risk of missing their mortgage payments.
Virginia’s national best practice for delivering rental assistance to both parties offers policy solutions to ensure long-term housing stability.
Homeowners in Virginia have fared better since the Great Recession and even during the pandemic, due in part to the federal foreclosure moratorium from March 2020 to July 2021.
Decline in homelessness from 2015 to 2020
Virginia Department of Housing and Community Development.
Veterans
604
395
Persons with substance use disorders
Survivors of domestic violence
1,039
551
1,101
654
Students living in a hotel, doubled up with another family, or otherwise homeless
+ 17,000William & Mary School of Education, Project HOPE.
(2019-2020school year)
In August 2021, nearly one in five (18.5%) Virginia households were behind on rent or mortgage and at risk of eviction or foreclosure.
To date, the Virginia Rent Relief Program has:
U.S. Census Bureau, Household Pulse Survey.
Processed over $477 million in assistance
Assisted more than 70,900 households
Virginia Department of Housing and Community Development.Data provided from program inception through October 31, 2021.
Statewide mortgage delinquency rate(90 or more days delinquent)
7.0%Jan 2010
1.4%Dec 2020 4.0%Jan 2015
Consumer Financial Protection Bureau, Mortgage Performance Trends, 2021.

RESEARCH AND FINDINGS
Projections
Many low-income renters continue to be cost-burdened as the deficit of affordable rentals grows and demand is ever-increasing.
Virginia will likely reach a population of 10 million by 2040—with growth continuing to be concentrated in the Urban Crescent.
8 HB854 Statewide Housing Study
The share of seniors in Virginia will grow faster than all other age groups, creating major shifts in housing demand, healthcare needs, and the workforce.
Beyond these clearly significant forecasts, policymakers should use caution with population projections current as of this report.
Findings should be reevaluated when the latest 2020 Census figures are incorporated into new population predictions published by the University of Virginia Weldon Cooper Center for Public Service in 2022.
Minimum number of new homes needed each year to meet projected growth through 2040
By 2040, the number of Virginians age 75 or above will have doubled (+116%) from 2010.
Based on calculations of data from University of Virginia Weldon Cooper Center for Public Service.
+ 25,000
University of Virginia Weldon Cooper Center for Public Service.

9Executive Summary
EFFECTIVENESS OF CURRENT PROGRAMS
Per HB854 requirements, stakeholders reviewed the wide array of affordable housing programs currently offered by state agencies. More than thirty different programs—organized into six categories—were analyzed to determine their successes, challenges, and opportunities for improvement.
OVERVIEW
Results from an assessment of practitioners indicate Virginia’s current housing efforts generally work well and should be continually strengthened and enhanced to fully meet needs across the state.
Over nearly 12 months, the SAG received feedback from hundreds of housing stakeholders across the state through surveys, focus groups, large and small “issue area” meetings, and one-on-one dialogues.
This engagement showed that Virginia’s two housing agencies are widely respected by housing providers, Virginians being served by program, administrators, developers, investors, real estate agents, lenders, and a range of other participants in Virginia’s affordable housing ecosystem.
These two agencies—their staff, policies, programs, and processes—were consistently credited for the substantial achievements and progress that the state has made in addressing affordable housing needs. Indeed, both organizations rise to the top when compared with their sister agencies in other states.
The recommendations in this report, which flow from these stakeholders, should be viewed in that context. In fact, one of the many virtues cited by providers was the openness of these agencies to hearing feedback and their commitment to constant improvement. The confidence that stakeholders have in Virginia Housing and DHCD fueled many of the suggestions that are offered.

EFFECTIVENESS OF CURRENT PROGRAMS
10 HB854 Statewide Housing Study
Affordable rental housing production programs
Virginia’s affordable rental housing production efforts have been key to housing thousands of low-income Virginians.
• Virginia Housing’s Low-Income Housing Tax Credit program, working in conjunction with gap financing options like those provided by the Virginia Housing Trust Fund, produces nearly all new affordable rental housing in every corner of the state. However, the needs of cost-burdened renters continue to outpace production.
• Market conditions and local land use consistently put constraints on the availability and timing of new supply.
Recommended strategies include increasing the Virginia Housing Trust Fund and similar resources, expanding program flexibility to maximize investments, and exploring a pilot program for additional supportive housing units in new affordable rental developments.
Rental assistance and eviction prevention programs
Virginia has made major strides to get assistance to low-income renters and unstably housed persons, in addition to addressing the eviction crisis.
• As of September 2021, the Virginia Rent Relief Program has helped more than 70,900 low-income households stay housed during the COVID-19 pandemic. The Commonwealth’s efficiency in deploying these federal funds is a nationally-recognized best practice for helping tenants and landlords.
• The State Rental Assistance Program (SRAP) operated by the Department of Behavioral Health and Developmental Services (DBHDS) has consistently outmatched its own goals for providing housing assistance to renters with developmental disabilities so they can live in integrated housing within their communities.
Recommended strategies include project-basing a share of Housing Choice Vouchers administered by Virginia Housing, continuing to scale up SRAP, and reducing eligibility barriers for assistance programs per national best practices.

11Executive Summary
EFFECTIVENESS OF CURRENT PROGRAMS
Homeownership and counseling programs
Homeownership programs in Virginia have successfully focused on the demand-side by helping low- and moderate-income households achieve homeownership. However, the lack of inventory remains the biggest impediment to homeownership opportunities for Virginians.
• Virginia Housing continues to assist and increase the number of first-time homebuyers taking advantage of their programs, particularly buyers of color. However, the scale of this progress alone is not enough to close the Black-white homeownership gap.
• Tight market conditions and increasing construction costs are driving up prices, preventing prospective buyers with limited savings from competing. This reduces the overall effectiveness of assistance programs.
Recommended strategies include developing a statewide “starter home” initiative, increasing homeownership funding in existing competitive affordable housing programs, expanding outreach to Black institutions and networks, and increasing the involvement of for-profit developers.
Rehabilitation and accessibility programs
A wide range of programs help Virginians improve the quality of their homes. Streamlining and expanding these efforts would make safe, efficient, and accessible housing a reality for thousands more.
• Rehabilitation and accessibility programs are generally effective thanks to their range and compatibility.
• However, these efforts often require providers to leverage other private funds, such as philanthropic gifts and individual donations, to effectively meet their community’s needs.
Recommended strategies include expanding the Neighborhood Assistance Program, increasing program resources, streamlining administration, and addressing downstream issues like workforce and contractor capacity.

EFFECTIVENESS OF CURRENT PROGRAMS
12 HB854 Statewide Housing Study
Community revitalization andcapacity building programs
Virginia Housing and DHCD invest in local capacity to drive local solutions that create new housing opportunities.
• Using both federal and state dollars, a suite of community revitalization and capacity building programs foster creative approaches to meet the unique housing needs of Virginia’s diverse communities.
• Capacity building programs, especially those offered by Virginia Housing, strengthen affordable housing providers and make them resilient to future challenges.
• Opportunities for improvement are primarily administrative: these include better alignment of applications and project timelines, technical assistance, and streamlining the closing process.
Recommendations include expanding the successful Vibrant Community Initiative, aligning state revitalization efforts with local public housing revitalization goals, encouraging more inclusive land use strategies, and facilitating greater involvement of developers and contractors who are Black and brown.

13Executive Summary
EFFECTIVENESS OF CURRENT PROGRAMS
Homelessness assistance and prevention programs
Historic investments to reduce homelessness are making significant headways. Sustaining these efforts—and pivoting to more permanent solutions—could help overcome persistent challenges.
• Stable and increasing investments in the Virginia Homelessness Solutions Program and Homeless Reduction Grant, which are supported with both federal and state funding, have yielded clearly measurable successes. Point-in-Time counts of those experiencing homelessness have steadily declined over the past decade, although ongoing impacts of the COVID-19 pandemic could change this trajectory.
• The supply of housing available for persons transitioning out of homelessness is inadequate and is now a programmatic priority. Community resistance, financing limitations, and land use restrictions serve as barriers to ending homelessness.
Recommended strategies include increasing the supply of deeply affordable housing, expanding long-term rental assistance options, increasing inter-agency collaboration, and better integrating housing services in criminal processing and educational systems.
These options would build upon the existing inter-agency, inter-secretariat collaborative efforts of the Governor’s Coordinating Council on Homelessness and Housing for Vulnerable Populations.

HB854 POLICY FOCUS AREAS
14 HB854 Statewide Housing Study
HB854 specified four housing policy areas for stakeholders to generate new solutions:
1. A state-funded rental assistance program,2. Utility rate reduction,3. Property tax reduction, and4. Bond financing options.
Stakeholders, along with both state housing agencies, unanimously agreed to add racial equity as a fifth focus area for significant recommendations.
These new housing initiatives may be needed to guarantee long-lasting affordability and address racial equity in the Commonwealth’s housing market.
State-funded rental assistance
A new state-funded rental assistance program could build on proven strategies to reduce housing instability and increase opportunities for low-income households.
• Over 300,000 low-income renters in Virginia are cost-burdened—a challenge faced disproportionately by Black, brown, and senior households.
• Current federal rental assistance and the supply of affordable rentals in Virginia do not satisfy the need thousands of low-income individuals and families have for housing assistance.
Stakeholders recommend a statewide rental assistance program that prioritizes Virginians below 50 percent of Area Median Income and those experiencing housing instability, reduces barriers experienced in federal assistance programs, focuses on equity and efficiency, and ensures resident success through choice, mobility counseling, and landlord involvement.

15Executive Summary
HB854 POLICY FOCUS AREAS
Utility rate reduction
Rising utility costs are contributing to housing unaffordability across Virginia. Addressing those costs may help ease the burden.
• Electricity, gas, water, and other essential utility costs strain the budgets of low-income Virginians—as well as those of affordable housing providers working to build and preserve units across the state.
• COVID-19 demonstrated that reliable high-speed internet access is critical for work, education, and healthcare for families. However, more than one-in-three households earning less than $20,000 do not have internet access in Virginia.
Although state law and regulatory precedent disallow rate reduction carve outs for affordable housing, Virginia could address these challenges by unifying current and new efforts supported by expanded state and federal funding, helping localities reduce up-front utility costs for affordable housing, bolstering current energy efficiency measures, and leveraging the Commonwealth’s substantial new broadband investments to increase internet access and affordability for residents in affordable housing.
Stakeholders endorse a new amendment to the state constitution that would enable—not require—local governments to use a wide range of alternative real estate tax relief structures for properties used for affordable housing and homelessness services. Potential solutions include full and partial exemptions, abatements, and Payment in Lieu of Tax (PILOT) programs.
To address assessment challenges, stakeholders recommend minor code changes, along with expanded outreach to local assessors, to reduce these difficulties.
Property tax reduction
Real estate taxes often challenge the viability of affordable housing efforts in Virginia. State lawmakers could consider a constitutional amendment and stronger guidance to local assessors as efforts to reduce such burdens.
• Property taxes on affordable housing generate needed revenue for localities, but they can often serve as a barrier to development and preservation.
• While current state code directs local assessors to account for rent restrictions in some types of affordable rental housing, providers must frequently appeal incorrect valuations. This often leads to wasted efforts and continuing burdens on projects.

HB854 POLICY FOCUS AREAS
16 HB854 Statewide Housing Study
Bond financing options
Bond financing is a critical tool Virginia uses to support affordable housing. Expanding and improving its use could help affordable housing production and preservation.
• The majority of Virginia’s Private Activity Bond allocation is used to create both affordable rental and homeownership opportunities. The Governor’s Pool has increasingly been used to support multifamily rental housing bonds.
• Localities in Virginia rarely use their general obligation bonding capacity to support housing.
Addressing racial equity
Inequity in housing outcomes persists across racial lines in Virginia. Embracing new and proven strategies can help address disparities in homeownership, rental affordability, and housing stability.
• While better than the national average, Virginia has a wide homeownership rate gap that leaves Black households 25 points behind white households. The discriminatory policies, actions, and attitudes which led to this disparity also mean Black Virginians have higher rates of cost burden, live in poorer-quality housing, more often experience homelessness, or are housing insecure.
• Racial inequity exists on both sides of the housing equation; ownership of production and development companies, along with nonprofit leadership, are predominantly white.
• Both Virginia Housing and DHCD have successfully expanded their initiatives to advance fair housing goals, including improving access to homeownership for Black Virginians.
Virginia Housing and DHCD could continue and expand their bond efforts by monitoring allocation trends, increasing “gap” funding resources, and supporting beneficial changes to federal law currently being considered by Congress.
Recommended strategies for increasing local bonds for housing may include sharing best practices, incentivizing bond issuance (and similar local housing investments) within current programs, and exploring state funds to match and leverage any new local housing bonds.
Continued efforts to address racial equity in housing will require Black and brown-led long-term engagement, as well as continued statewide leadership.
Recommended strategies to address these racial disparities in housing seek to expand Black access to homeownership, help mitigate the effects of gentrification, increase success and choice in rental assistance programs, and ensure that equity is considered at all levels of the housing industry.

Preface
Background
In the 2020 Regular Session of the General Assembly, legislators unanimously approvedHouse Bill854, which directed the state to begin this statewide study on affordable housing. HB854 was signedby Governor Ralph Northam into the Acts of Assembly (Chapter 482) on March 27, 2020.
The full text of House Bill 854 is available on the Virginia LIS website.
The bill directs the Commonwealth’s two housing agencies—the Department of Housing and Com-munity Development (DHCD) and Virginia Housing—to “study ways to incentivize” affordable hous-ing in the state. To accomplish this, HB854 requests these organizations to:
• Determine the quantity and quality of affordable housing and workforce housing across theCommonwealth,
• Conduct a review of current programs and policies to determine the effectiveness of currenthousing policy efforts,
• Develop an informed projection of future housing needs in the Commonwealth and determinethe order of priority of those needs, and
• Make recommendations for the improvement of housing policy in the Commonwealth.
The bill also requires the study to consider recommendations for:
• A [new] Virginia rent subsidy program to work in conjunction with the federal Housing ChoiceVoucher Program,
• Utility rate reduction for qualified affordable housing,• Real property tax reduction for qualified affordable housing for localities that desire to providesuch an incentive,
• Bond financing options for qualified affordable housing, and• Existing programs to increase the supply of qualified affordable housing.
When work began on this report, the agencies and stakeholders agreed to add two more elementsreflective of the major societal and economic shifts of 2020:
29

30 CONTENTS
• The immediate and long-term impact of the COVID-19 pandemic on housing needs, programs,and providers, and
• Efforts to address racial equity in housing across Virginia.
The original completion date for this study was the first day of the 2021 Regular Session. However,three days after signingHB854, Governor Northam issued a statewide Stay at Home order to limit theinitial spread of COVID-19 in Virginia.
Lawmakers subsequently granted a 12-month extension to the report deadline following increasedworkloads of agency staff in response to the pandemic. This final reportwas delivered to theGovernorand the General Assembly in December 2021.
Outline
This report is organized into five major parts, described below.
Part 1: Introduction
• Part 1 introduces the major concepts, frames, and terms used throughout the study. This in-cludes why housing affordability is important and how it can be measured. In addition, Part 1provides a brief outline of previous housing studies and public opinion of housing, along withdescriptions of data and geographic housing markets used for analysis.
Part 2: Engagement
• Part 2 shares the outcomes of various engagement efforts conducted throughout the HB854process. This included the convening of a Stakeholder Advisory Group (SAG) per the bill’s re-quirements, and numerous surveys, focus groups, and interviews.
Part 3: Research and Findings
• Part 3 describes the major demographic, economic, and housing trends impacting housingavailability and affordability across Virginia. The report uses the most recently available datato make determinations about the current quantity and quality of affordable housing in Vir-ginia. This part also provides an approximation of future housing needs and priorities, whileacknowledging the impact of COVID-19 on projections.
Part 4: Analysis of Existing Programs
• Part 4 reviews the current successes and challenges of existing housing programs administeredby the Department of Housing and Community Development and Virginia Housing. That anal-ysis informed the development of recommendations for sustaining and improving these initia-tives.

CONTENTS 31
Part 5: Focused Topic Recommendations
• Part 5 covers the four new policy proposals outlined in HB854: 1) a state-funded rental assis-tance program, 2) real property tax reduction, 3) utility rate reduction, and 4) bond financingoptions in support of qualified affordable housing in Virginia. It also includes recommendedstrategies for addressing racial inequities in housing across Virginia.
Report process
Work on this report began in the summer of 2020 when DHCD and Virginia Housing assembled aStakeholder Advisory Group (SAG), per HB854 requirements, to guide the study. Prior to the firstmeeting of this group, DHCD and Virginia Housing engaged HousingForward Virginia to serve asthe primary consultant to help the SAG complete this report.
HousingForward Virginia (HFV) is a nonprofit, nonpartisan research and education organizationdedicated to expanding housing affordability in theCommonwealth. HFV regularly supports housingstudies throughout the state and helps train local government officials, nonprofit providers, devel-opers, and other stakeholders on affordable housing issues.
The SAG first met in November 2020. Between then and October 2021, SAG members participatedin dozens of meetings in small and large groups to review data, analyze program information, andmake recommendations to fulfill the bill’s requirements.
In September 2021, HFV completed a full report draft. Following review by agency staff, the Secretaryof Commerce and Trade, SAG members, and other stakeholders, HFV completed the final report inDecember 2021.
Table 1 lists the organizations and groups responsible for creating this study, along with each of theirroles.

32 CONTENTS
Table 1: Organizations involved in this report
Organization Role
Department of Housingand CommunityDevelopment
Virginia’s housing and community development agency. Providedstaff support, expertise, and program data to support study effort.
Virginia Housing Virginia’s state housing finance agency. Provided staff support,expertise, and program data to support study effort.
Stakeholder AdvisoryGroup
Affordable housing experts and practitioners from across Virginiarecruited to guide and contribute to this report.
HousingForward Virginia Research and education nonprofit engaged to conduct and draftreport.
Secretary of Commerceand Trade
Cabinet-level office responsible for final review of report.
What this report does and does not cover
This study focuses on the effectiveness of state-level programs in addressing the Commonwealth’shousing needs. This includes the challenges those programs face and the need for additional pro-grams to fully meet those needs.
There are several factors that impact housing affordability in Virginia that are not addressed in depthwithin this study. These topics include:
• Local zoning and land use regulations,• Federal housing program design and eligibility,• Economic and workforce development efforts, and• Transportation policy and investments.
While these factors are important to consider, and are mentioned throughout where relevant, theywere beyond the scope of this study.
Concurrent state housing studies
Several other state-level housing studies will also be completed in 2021:
• DHCDcompleted a report on accessory dwellingunits (ADUs) inNovember 2021, as requiredbyHouse Bill 2053 from the 2021 General Assembly Special Session I. This study evaluated waysthe state might support ADUs as a “strategy to address the Commonwealth’s growing demandfor affordable and market-rate housing.”1
1Reports to the General Assembly, RD629 - State of the Market and Local Policy: Accessory Dwelling Units in the Com-monwealth of Virginia – November 2021.

CONTENTS 33
• The Joint Legislative Audit and Review Commission (JLARC) recently completed “Review of theCommonwealth’s Housing Needs” as authorized by the Commission on November 16, 2020.This study also analyzed state housing programs, but it went go beyond the scope of HB854 byassessing challenges local land use regulations present to affordable housing options.
• The Virginia Housing Alliance is conducting an update of its State of Supportive Housing Report,which will consist of an estimate of supportive housing demand for populations in need (ex-cluding individuals with intellectual and developmental disabilities). This update will includerecommendations to address the overall statewide supportive housing needs.

34 CONTENTS

Part I
INTRODUCTION
35


Part 1 Overview
Part 1 includes the following chapters:
1 Why affordability matters
Chapter 1 explains the basics of housing affordability, makes the case for addressing high housingcosts to make our communities more successful, and demonstrates the basic mechanisms availablefor making housing more affordable across Virginia.
2 Public opinion of housing
Chapter 2 describes results fromnumerous public opinion polls in recent years that have asked ques-tions about housing affordability and opportunity. These findings help make the case for increasedand sustained actions to solve housing challenges in the Commonwealth.
3 Analysis of prior housing studies
Chapter 3 collects the major community engagement themes from over a dozen regional and localhousing studies completed across Virginia in the past several years. This information will help poli-cymakers understand the types of housing challenges Virginians across the Commonwealth are ex-periencing.
4 Virginia’s housing markets
Chapter 4 outlines the three levels of geographic regions across Virginia used to describe housingneeds and trends in different parts of the Commonwealth. The Research and Findings part of thisreport (Part 3) uses these market and submarket categories.
37

38
5 How we use data
Chapter 5 introduces the most common data sources used for this study and the definitions for de-mographic categories, such as race and ethnicity identifiers, used throughout the report.

Chapter 1
Why affordability matters
This chapter explains the basics of housing affordability, makes the case for addressing high housingcosts to make our communities more successful, and demonstrates the basic mechanisms availablefor making housing more affordable across Virginia.
1.1 How do we define affordable housing?
Affordable housing is not a specific type of housing. Rather it is housing within the financial reach ofVirginians across the full spectrum of incomes and budgets. But how do we measure what is afford-able?
1.1.1 Household cost burden
There aremultiple ways ofmeasuring housing affordability. One keymetric is the U.S. Department ofHousing and Urban Development’s (HUD) 30 percent rule. This is a simple ratio that states housingis affordable when an individual or family pays no more than 30 percent of their gross householdincome on regular housing costs, including rent or mortgage and basic utilities.
If someone is paying more than 30 percent of gross household income on housing costs, then thehousehold is cost-burdened. If an owner or renter spends more than 50 percent of gross income onhousing, the household is severely cost-burdened.
Cost-burdened households have less to spend on other necessities such as groceries, healthcare, andtransportation. When expenses stretch budgets to the breaking point, families and individuals makesacrifices to stay in their home that risk their health and well-being.
39

40 CHAPTER 1. WHY AFFORDABILITY MATTERS
1.1.2 Community affordability
Affordability is not limited to the expense of an individual home; it extends to the surrounding neigh-borhood and community. Communities that offer a range of housing options ensure that there areenough homes for all types of households, regardless of income or circumstance.
The most common way to measure the affordability of a community is to compare household in-comes with the cost of homes to buy or rent. Housing disparities limit a community’s capacity tothrive; incomes must be adequate to offer residents a range of housing options without becomingcost-burdened.
To better understand where needs and gaps exist in housingmarkets, researchers can define the abil-ity of a household to pay for housing by comparing their income to a regional average. HUD deter-mines this Area Median Income (AMI) each year for every community in the country using data fromthe U.S. Census Bureau.
Official AMI limits for communities are published on the HUD website. Current 2021 limits areeffective until April 2022.
Areamedian income is a useful way to conceptualize the full range of housing needs and solutions ina community. For example, inmost areas, households earning 100 percent of AMI or above generallyhave fewer challenges finding and affording their homes.
Households with incomes at or slightly below 80 percent AMI (“low-income”) might have less costburden, but have trouble saving enough to buy their first home.
Households with incomes near 50 percent AMI (“very low-income” or “VLI”) aremuchmore likely torent and have challenges finding good-quality apartments with rents that match their budget.
Households with incomes below 30 percent AMI (“extremely low-income” or “ELI”) have the mosttrouble securing stable, affordable homes.
Figure 1.1 shows these income ranges overlaid on some of the most common housing types and pub-lic programs used by households in those categories. This is commonly referred to as the housingspectrum.

1.2. WHY IS HOUSING IMPORTANT? 41
Figure 1.1: The housing spectrum
Policymakers also useAMI to help direct housing assistance programs tohouseholdswith the greatestneeds. For example, most down-payment grants for first-time homebuyers are limited to householdsearning less than 80 percent AMI. Many rental assistance programs cap eligibility at 50 percent AMIor 60 percent AMI.
1.2 Why is housing important?
Housing is foundational for households, communities, and economies.
Affordable housing helps build wealth.
Owning a home remains themost important way for Americans to build wealth. For nearly a century,homeownership has been the best pathway for households to achieve housing security, accumulatewealth, and pass wealth on to the next generation. Federal policy continues to endorse and promotehomeownership via government-backed mortgages and the mortgage interest deduction.
As homeownership becomes increasingly difficult for many to achieve—especially in the wake of the2008 housing crisis and Great Recession—affordable housing for all emerges as a core economicissue. Renters who are not cost-burdened have greater financial security and can save more of theirincome to plan for future expenses.
Why housing is important for wealth-building:
• Across the country, the average homeowner has 40 times the total household wealth of the av-erage renter. (Bhutta et al., 2020)
• Research has shown that households paying affordable rents in Low-Income Housing TaxCredit (LIHTC) units were able to double their discretionary spending, allowing them to covernecessities like health insurance, pay down debt, or increase their savings. (Local InitiativesSupport Corporation, 2010)

42 CHAPTER 1. WHY AFFORDABILITY MATTERS
Better homes lead to better health.
A safe and stable home is essential for a healthy life. When we are able to comfortably afford ourhomes, we are able to spend money on food, health care, and other resources that affect health out-comes. The security of an affordable quality home also alleviates the stress of precarious circum-stances that burden residents’ physical and mental health.
The COVID-19 pandemic has centered attention on the role of housing in individual and publichealth. Without a safe home, many people cannot effectively quarantine. This increases the spreadof communicable disease within a household and in the community.
Why housing is important for health:
• Numerous studies have demonstrated a link between overcrowding and the spread of infectiousdiseases, like COVID-19. (Gray, 2021) When a home is too small for a family, they are in muchcloser contact and are unable to properly quarantine.
• Researchers at Brown University found that counties with a higher percentage of poorhousing—particularly overcrowded and without plumbing—had a higher incidence of andmortality associated with COVID-19. (Ahmad et al., 2020)
• Substandard housing conditions—such as lead paint, overcrowding, and poor plumbing—arethree times more likely to impact Black households than white, non-Hispanic households andreduce their health outcomes. (Matthew, Rodrigue, & Reeves, 2016) (Boulware, 2020)
• According to the American Health Homes Survey, Black households are more likely to havelead-basedpaint hazards in their homes (45percent) than theirwhite counterparts (32percent).(Ashley, Friedman, & Pinzer, 2011)
Better housing options alleviate transportation challenges.
Housing and transportation are inextricably linked becausewherewe live often determines ourmodeand cost of travel to reach basic necessities, like grocery stores and medical care. Transportation istypically a household’s second largest expenditure after housing.
When housing is easily connected to conveniences like grocery stores, child care, or healthcare facil-ities, we aremore likely to opt to walk or use public transit reducing transportation expenses. Diversehousing like apartments, townhomes, duplexes, and manufactured home communities offer optionsthat allow residents to choose a lifestyle that meets their needs and wants.
Why housing is important for transportation:
• Households in the Washington, DC Metropolitan Statistical Area (MSA) spend an average of$12,939 on transportation per year. The average share of total income these households spendon transportation and housing is 41 percent. (Center for Neighborhood Technology, 2021)
• Manymodest-wage jobs are not efficiently located near lower-cost housing, according to a spa-tial analysis of employment and housing in the Richmond region by Virginia CommonwealthUniversity. (Jacobson, Suen, MacKenzie, & Fasulo, 2017)
A strong housing industry supports Virginia’s economy.

1.3. HOW CANWEMAKE HOUSING MORE AFFORDABLE? 43
Building more homes means more jobs. The housing industry provides thousands of jobs through-out Virginia. From real estate agents that sell homes, developers that buy and plan, builders thatconstruct, lenders that help finance, and nonprofits that serve their clients, the housing industrysupports a robust economy in Virginia.
More housing also means that Virginia can better accommodate its workforce. Affordable places tolive that match available wages and salaries will attract talented people to Virginia’s employers andcommunities.
Why housing is important for our economy:
• Virginia’s housing industry accounted for $28.1 billion in direct economic output in 2015 ac-cording to a report from the Governor’s Housing Policy Advisory Council. Housing is the sixth-largest private sector industry in the Commonwealth. (Virginia Coalition of Housing and Eco-nomic Development Researchers, 2017)
• Housing supports more than 314,000 jobs across the state and helps pay more than $14 billionin total wages.
1.3 How can wemake housing more affordable?
Policymakers can help keep housing costs reasonable by supporting new affordable housing and bymaking current housing more affordable. Both approaches are necessary and complimentary.
Supporting new affordable housing increases the supply of homes available to buy or rent at pricesthat are within reach of moderate-income and low-income households. Both the public sector andprivate market help accomplish this. Governments can change regulations and provide funding toallow for-profit and nonprofit builders to create new affordable homes.
Examples of these supply-side solutions include:
• Local land use reforms to allow lower-cost housing types,• Project-based rental assistance attached to specific apartments,• Development subsidies, tax credits, and other incentives in exchange for creating below-markethomes, and
• Alternative tenure models, such as community land trusts.
Virginia’s housing agencies help create new affordable homes with programs that address:
• Affordable rental housing production (see Chapter 20),• Community revitalization and capacity building (see Chapter 24), and• Homelessness assistance and prevention (see Chapter 25).
These initiatives build and preserve thousands of affordable homes each year.

44 CHAPTER 1. WHY AFFORDABILITY MATTERS
Making current housing more affordable is accomplished by providing a wide range of assistancepackages to households who need help paying their rent, mortgage, or utility bills; who are looking tobuy their first home; who are facing housing instability; or who need physical improvements to theirhomes.
Governments can help serve these households with a range of demand-side solutions, including:
• Tenant-based rental assistance (such as Housing Choice Vouchers),• Homebuyer down payment grants and government-backed mortgages,• Eviction prevention and diversion programs, and• Investments in energy efficiency, weatherization, and accessibility improvements for currenthomeowners.
Virginia’s housing agencies help lower housing costs for currency homeowners and renters with pro-grams that address:
• Rental assistance and eviction prevention (see Chapter 21),• Homeownership and counseling (see Chapter 22),• Rehabilitation and accessibility (see Chapter 23), and• Homelessness assistance and prevention (see Chapter 25).
These efforts help tens of thousands of Virginians with their housing needs each year.

Chapter 2
Public opinion of housing
This chapter describes results from numerous public opinion polls in recent years which have askedquestions about housing affordability and opportunity. These findings help make the case for in-creased and sustained actions to solve housing challenges in the Commonwealth.
2.1 Measuring how Virginians and Americans feel about housing
Public opinion polling in recent years has foundbroad agreement that housing affordability is a prob-lem. This pollinghas also discovered robust support for policies andprograms to address it. While thetwomost recent polls surveying only Virginians predate the COVID-19 outbreak, another two nation-wide polls performed during the pandemic suggest increasing recognition of the need and supportfor more long-term government investment in affordable housing.
For instance, a national public opinionpoll commissionedby theOpportunity Starts atHome campaignand conducted byHart ResearchAssociates in June 2020 found that 86 percent of respondents “agreethat the pandemic has demonstrated that the government needs to investmore in affordable housingover the long term.”
In short, the COVID-19 pandemic and its ensuing economic crisis have revealed and exacerbatedissues of housing affordability and stability that pervaded Virginia and the country long before 2020.
More than four in five Americans think that the COVID-19 pandemic showed the importance ofpublic investments in affordable housing. (Opportunity Starts at Home, 2020)
This chapter is a synthesis and summary of the two Virginia-focused housing affordability polls: onecommissioned by the Campaign for Housing and Civic Engagement (CHACE) and conducted in 2017by the Judy Ford Wason Center for Public Policy at Christopher Newport University (CNU), and theother conducted in 2019 by the Center for Public Policy at Virginia CommonwealthUniversity (VCU).It concludes with results frommore recent national polls to fill in what Virginians’ current attitudes
45

46 CHAPTER 2. PUBLIC OPINION OF HOUSING
about affordable housing and related issues might be since experiencing the pandemic and its eco-nomic fallout.
2.2 Public opinion on affordable housing in the Commonwealth
2.2.1 2017 CHACE poll
Respondents of the 2017 CHACE poll (509 registered Virginia voters surveyed) and the 2019 VCUpoll (816 adults in Virginia surveyed) broadly agreed that housing affordability is an important issueand supported possible measures to address affordability and related issues. (Campaign for Housingand Civic Engagement, 2017)
The CHACE survey—which offers a statewide view of public opinion and attitudes among registeredvoters—reported significant majority support for values affirming housing equity and programs:
• More than three-quarters (79.4 percent) agree that having an adequate supply of housing op-tions in their community is important to them.
• Most respondents (82.1 percent) believe that people working in their community should be ableto afford to live in their community.
• More than three-quarters (78 percent) support the preservation of the Virginia Housing TrustFund, its use specifically to address homelessness (80.3 percent), and its expansion to assist inthe costs of aging-in-place modifications (87 percent).
• The majority of those surveyed (84 percent) support the state’s use of incentives and financialresources to encourage Virginia utilities to increase their funding for energy efficiency pro-grams for their customers.
• An overwhelmingmajority (89 percent) support requiringVirginia utility companies to achievegreater energy savings for their customers.
Smaller majorities of respondents:
• Supported paying a 50 cent surcharge on their monthly utility bill to fund the provision offinancial support for weatherization programs for low-income residents,
• Believed that affordability contributes to the economic success of their community,• Agreed that ending homelessness should be an important government priority,• Agreed that local and state governments should work to provide housing opportunities for fam-ilies whose incomes are a barrier to quality housing, and
• Indicated that they aremore likely to support a candidate for political officewhomakes housingaffordability a priority.
2.2.2 2019 VCU poll
The VCU poll collected and presented public perspectives about housing affordability at variousscales and units of analysis. (Fasulo, 2019) A key finding of this study is the dissonance between

2.2. PUBLIC OPINION ON AFFORDABLE HOUSING IN THE COMMONWEALTH 47
respondents’ perceptions of housing affordability in their own communities in Virginia versus theirperceptions of housing affordability at a national level.
Overall, the poll found that:
• While 78 percent of the Virginians surveyed identified housing affordability as a current prob-lem in the United States, just 57 percent regarded it as a problem where they live, and only 33percent believed it was a very serious local problem.
• At the regional scale, 47 percent of respondents in the South Central region said it was a veryserious problem where they live, followed by 41 percent of respondents in Northern Virginia.
• On the other hand, substantial shares of respondents in the Northwest (55 percent), Tidewaterregion (51 percent), andWest regions (40 percent) said affordability was not a problem in theirrespective areas.
Survey responses also aligned within racial groups:
• 42 percent of non-white respondents reported that affordability is a very serious problemwherethey live compared to 28 percent of white respondents who said the same.
Educational attainment also influences perceptions of housing affordability:
• 41 percent of college graduates see it as a very serious problem in their area, but just 29 percentof respondents with some college and 28 percent of those with a high school education or lessshare this view.
Party identification also divides public perception of affordability:
• 57 percent of Democrats and 51 percent of Independents agree that housing affordability is avery serious problem, compared to 31 percent of Republicans reporting the same.
Respondents’ sense of their own housing stability also contrasted according to race and income:
• While 55 percent of white respondents reported feeling very stable in their current housingsituation, only 32 percent of non-white respondents did as well.
• Just 40 percent of respondents earning a family income of less than $50,000 reported feelingfairly stable and secure compared to 54 percent of thosewith incomes of $50,000 to $100,000.
• The poll also found substantial disparities in housing cost burdens along racial and class linesacross Virginia, which other research confirms. (See Chapter 30.)
The poll included questions specifically addressing homeownership affordability:

48 CHAPTER 2. PUBLIC OPINION OF HOUSING
• Of the 41 percent of the samplewho rent or livewith their parents or in someother arrangement,70 percent said they aspire to own a home, 22 percent said that they do not, and 8 percent saidthat they do not know.
• The main barriers to buying a home included limited options within their budget (22 percent),a poor credit history (18 percent), lack of down payment (15 percent), and existing debt (11 per-cent).
The results also illustrate the widely known racial gap in homeownership that persists across thecountry:
• Two-thirds of white respondents owned their home, compared to 49 percent of non-white re-spondents.
Finally, the majority of respondents to this poll indicated their endorsement of changing rent andeviction policies to address problems of housing affordability and stability:
• In particular, 75 percent of respondents supported changing landlord-tenant laws to increasethe length of time that renters have to pay past-due rent to 14 days.1
• 78 percent said they would support legislation making it easier for tenants to withhold rentfrom landlords who fail to make necessary repairs in a specified amount of time.
2.3 Public opinion on affordable housing across the nation
In the midst of worsening housing unaffordability and instability during the COVID-19 pandemic,national public opinion on policies to reverse the trend sustained or even gained strength acrossthe political spectrum. A poll commissioned by Opportunity Starts at Home found that 63 percent ofthose surveyed agreed that housing affordability is a “serious problem” in the area where they live, anincrease of 24 percentage points since 2016. (Opportunity Starts at Home, 2020)
These responses apply to immediate action to stem housing instability resulting from the pandemic(such as emergency rental assistance, more funding for homeless assistance programs to minimizecrowding, and a uniform, nationwide eviction moratorium) as well as to longer-term solutions tothese housing problems that the pandemic crisis exposed and exacerbated.
Over two-thirds of respondents said they wanted the government to “make major housing invest-ments even if it means increasing the deficit.” However, only 49 percent of Republicans agreed withthis view compared to 79 percent of Democrats and 76 percent of Independents.
A December 2020 survey by Data for Progress—which polled 1,116 “likely voters” nationally—foundsubstantial support for a public option for housing in addition to increased government support foraffordable housing access and stability. (Winter, 2021)
1New COVID-19 protections in Virginia law do allow 14 days for a tenant to make a missed payment. This is in effectuntil July 1, 2022. (Va. Code Ann. § 55.1-1245)

2.3. PUBLIC OPINION ON AFFORDABLE HOUSING ACROSS THE NATION 49
When asked if they would be in favor of a “proposal where cities or counties build new, affordablehousing that people can then rent fromandwhichwould compete with private housing options,” over75 percent of Democratic voters said would be, while 64 percent of Independent/third-party votersand 37 percent of Republican voters agreed.
The Opportunity Starts at Home campaign also conducted the most recent national opinion poll onhousing in June and July of 2021. (Opportunity Starts at Home, 2021) That poll again found thatAmericans overwhelmingly support investments in affordable housing:
• Three in four (74 percent) favor programs to expand the supply of homes affordable to low-income persons.
• Four in five (82 percent) believe the government should increase efforts to end homelessness.• Nine in ten (92 percent) agree that “stable, affordable housing” is important to a person’s well-being.
Over half of low-income, Black, and Hispanic respondents to this poll said housing is one of themostimportant factors for well-being.

50 CHAPTER 2. PUBLIC OPINION OF HOUSING

Chapter 3
Analysis of regional housing studies
This chapter collects the major community engagement themes from over a dozen regional and lo-cal housing studies completed across Virginia in the past several years. This information will helppolicymakers understand the types of housing challenges Virginians across the Commonwealth areexperiencing.
3.1 Introduction
Thismeta-analysis of community engagement includeshousing studies completedbetween2013 and2021 for more than twenty regions and localities across Virginia. The aim of this analysis is:
1. Determine whether each housing study contained a community engagement component,2. Identify the specific methods used and the key findings in studies that did incorporate com-
munity engagement, and3. Aggregate and summarize themain themes that emerge across the studies’ community engage-
ment findings.
Of thehousing studies reviewed,most appeared to incorporate community engagement in some form.The extent of community engagement ranged from broad community feedback through public sur-veys to targeted input through interviews or focus groups with selected stakeholders.
Some study reports and other materials mention the use of community engagement methods, yet donot include an explicit presentation or discussion of the findings from such input.
The themes identified and discussed here draw specifically with varying levels of detail from com-munity input, when available, in the following regions and localities (with report date and externallink to published study):
• Alexandria (December 2013)
51

52 CHAPTER 3. ANALYSIS OF REGIONAL HOUSING STUDIES
• Arlington (September 2015)• Northern Shenandoah Valley (October 2018)• Fairfax County (2018)• City of Falls Church (August 2019)• Farmville/Prince Edward County (September 2019)• Richmond Region (January 2020)• Bath County (March 2020)• Richlands (April 2020)• City of Martinsville (July 2020)• Fredericksburg Region/George Washington Region (October 2020)• Roanoke Valley-Alleghany Region (December 2020)• James City County (2020)• Prince William County (2020)• Harrisonburg (February 2021)• Goochland County (April 2021)• New River Valley Region (April 2021)• Loudoun County (June 2021)
3.2 Common themes
3.2.1 Housing options for seniors
Many of the study areas are home to aging populations, and a common theme that emerged was thelack of housing options that enable seniors to age-in-place or age-in-community. For the former, thismeans policies and programs that support the renovation and adaptation of residents’ current homesto make their homes more accessible as they age.
Community input also raised the broader need for senior housing options to enable aging-in-community, particularly in more rural parts of Virginia, as older adults seek to downsize to homes inmore centrally located areas that are walkable and amenity-rich.
3.2.2 Affordable homeownership opportunities
In most of the community-engaged studies, residents and stakeholders voiced a need for afford-able homeownership opportunities for first-time homebuyers, particularly young people and single-parent households who work in the area, and prospective employees. This theme overlaps with hous-ing options for seniors, as aging Virginians compete with first-time homebuyers for smaller for-salehomes. The particular price points considered affordable vary by region.
For instance, the median annual salary for the Farmville/Prince Edward County region’s “most com-mon job types” is $35,647, which would require a price point of about $135,000 for affordable home-ownership. Survey respondents in Goochland County reported unmet demand for affordable home-ownership opportunities under $300,000 and under $200,000. Bath County’s stakeholder inputrevealed a lack of “[f]or-sale homes at price points ‘in the middle’ (between approximately $100,000

3.2. COMMON THEMES 53
and $200,000).”
3.2.3 Lack of multifamily rental housing, both subsidized andmarket-rate
Community input across all study areas identified shortages in rental housing affordable to a rangeof income levels. Many studies only cite supply gaps in subsidized affordable housing and workforcehousing as key challenges, while others report a strong need for new market-rate rental housing
Community input in the Northern Shenandoah Valley, the Farmville/Prince Edward County region,and the New River Valley Region all indicated rental supply issues related to those areas’ college stu-dent populations. TheNorthern Shenandoah Valley report noted a dearth of housing options tomeetstudent demand, while the two other regions’ studies raised concerns about an insufficient supply ofhousing for nonstudents, largely due to students’ “domination of the rental market.”
3.2.4 Greater diversity of housing types
This theme necessarily reflects and interconnects with the preceding themes and does not requireextensive discussion. However, community input in a number of studies revealed an explicit desirefor more diverse—and denser—housing options to meet the needs of a range of current and futureresidents.
3.2.5 Repairs, maintenance, and utilities of existing housing stock
These issues are grouped together, as they all affect housing cost burdens and quality. A number ofstudies raised the challenge of aging and substandard housing stock and the inability of homeownersto afford maintenance, repairs, and rehabilitation. Additionally, lack of access to quality, reliablebroadband service emerged from community input as a prominent issue in Goochland County andthe Roanoke Valley-Alleghany Region.

54 CHAPTER 3. ANALYSIS OF REGIONAL HOUSING STUDIES

Chapter 4
Virginia’s housing markets
This chapter outlines the three levels of geographic regions across Virginia used to describe housingneeds and trends in different parts of the Commonwealth. The Research and Findings part of thisreport (Part 3) uses these market and submarket categories.
To illustrate important housing trends throughout the Commonwealth, this report presents data ac-cording to three tiers of market groups aggregated by city/county and described below.
At the highest level, Virginia is divided into three major categories: Large Metro Housing Markets(the “urban crescent”), Small Metro Housing Markets1, and Rural Housing Markets. This report willoften abbreviate these markets to Large Markets, Small Markets, and Rural Markets.
Within each of these major categories are distinct housing markets that generally correspond withfamiliar metro regions; for example, Hampton Roads, Charlottesville, and Southwest.
Finally, each market is divided further into submarkets that reflect nuances within each market. Forexample, the Richmond market is divided into its urban core, suburbs, and exurbs, while the Chesa-peake Bay is divided into the Northern Neck/Middle Peninsula and the Eastern Shore.
1These markets are sometimes referred to as the “reverse crescent” of Virginia. However, this is not a commonly usedterm and is therefore not applied in this report.
55

56 CHAPTER 4. VIRGINIA’S HOUSING MARKETS
Figure 4.1: Virginia’s housing market groups, markets, and submarkets used in this report

4.1. LARGE METRO HOUSING MARKETS 57
4.1 Large Metro Housing Markets
Characteristics of these markets include:
• Moderate-high population density and population growth,• High housing costs that are rising faster than incomes, contributing to high levels of cost bur-den,
• High land costs and shortage of land available for residential development,• Economic andhousehold growth pressures pushing residential development into lower densityperipheral exurban localities,
• Large commuting range with significant transportation pressures related to household growth,• Significant need for higher density and multifamily residential development, and• Concentrated poverty and limited access to affordable housing in areas of opportunity.

58 CHAPTER 4. VIRGINIA’S HOUSING MARKETS
Figure 4.2: Large Markets: submarkets and localities

4.2. SMALL METRO HOUSING MARKETS 59
4.2 Small Metro Housing Markets
Characteristics of these markets include:
• Moderate-to-low population density and population growth,• Moderate housing costs which are rising faster than incomes for low-to-moderate incomehouseholds, and high cost burden among lower income groups,
• Higher homeownership rates than in Large Metro markets but limited new housing construc-tion to accommodate first-time buyer needs,
• Rising land costs and shortage of land available for residential development,• Residential development being pushed into lower density peripheral exurban localities, result-ing in larger commuting ranges and increased transportation pressures,
• Aging population and limited affordable senior housing options, and• Significant differential between owner and renter incomes leading to continued concentrationof poverty and limited access to opportunity for low-income households, especially minoritypopulations—though on a more limited scale than in Large Metro markets.

60 CHAPTER 4. VIRGINIA’S HOUSING MARKETS
Figure 4.3: Small Markets: submarkets and localities

4.3. RURAL HOUSING MARKETS 61
4.3 Rural Housing Markets
Characteristics of these markets include:
• Low density,• Low growth or declining population,• A rapidly aging population,• Low household income and income insufficient to support new housing development, exceptfor limited custom home development,
• Weak private-sector housing industry (finance/development/real estate) due to weakereconomies, low income levels, and lack of adequate economies of scale,
• Higher reliance on manufactured housing than other markets,• Aging and deteriorating housing inventory,• Inadequate new housing production to support quality housing options (which is a major bar-rier to new economic development), and
• Limited affordable senior housing options.
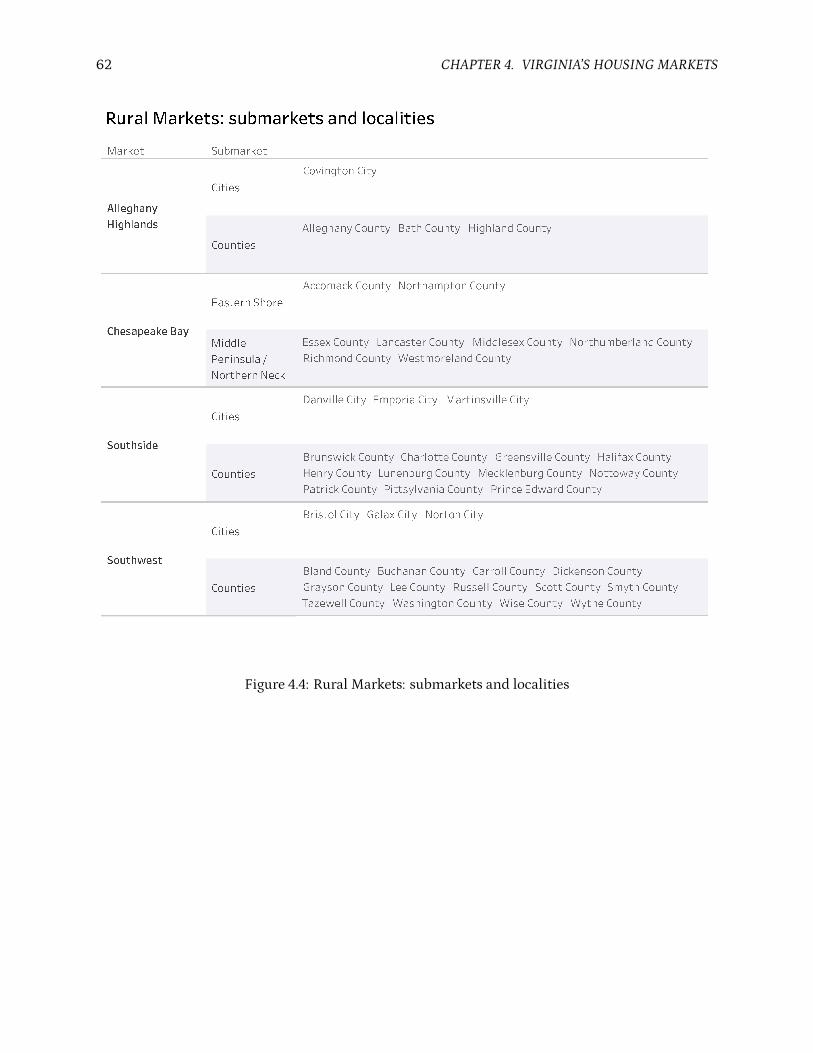
62 CHAPTER 4. VIRGINIA’S HOUSING MARKETS
Figure 4.4: Rural Markets: submarkets and localities

Chapter 5
How we use data
This chapter introduces the most common data sources used for this study and the definitions fordemographic categories, such as race and ethnicity identifiers, used throughout the report.
5.1 Common data sources
Below is a description of some of the most common data sources that inform this study.
American Community Survey
The American Community Survey (ACS) is an ongoing survey program of the U.S. Census Bureau.The ACS collects information about the nation’s social, economic, housing, and demographic char-acteristics on an annual basis. This information provides the most-up-to-date estimates betweendecennial censuses.
This study uses two types of ACS data:
1. 5-Year Estimates are averages across a five-year period. This type of data is available for allgeographic levels. Although it is the least current data, it is considered the most reliable due toits large sample size.
2. 1-Year Estimates are averages across a 12 month period. This type of data is available only forareas with populations of 65,000 or more people. Although less reliable because it uses thesmallest sample size, this data is the most current. This report uses 1-Year Estimates whenreporting median dollar amounts to avoid the distortion created by calculating medians overseveral years (as in the case of 5-Year Estimates).
Building Permits Survey
The Building Permits Survey is a program of the U.S. Census Bureau that provides national, state, andlocal data on new privately-owned residential construction. The survey releases data on an annual
63

64 CHAPTER 5. HOWWE USE DATA
and monthly basis. Information collected by the survey includes the number of buildings, numberof housing units, and permit valuation by size of the structure.
Comprehensive Housing Affordability Strategy
The U.S. Census Bureau creates custom tabulations of ACS data and provides them to HUD on anannual basis. Known as Comprehensive Housing Affordability Strategy (CHAS) data, they indicatethe extent of housing problems and needs throughout the nation.
CHAS data are the primary source of information regarding housing cost burden. Although releasedon an annual basis, CHAS data do lag behind more current ACS estimates. At the time of this report,the most recent CHAS data release was for the 5-Year Estimate period from 2013 to 2017.
HomeMortgage Disclosure Act
TheHomeMortgageDisclosureAct (HMDA) requires thatfinancial institutionsmaintain, report, anddisclose loan-level information about mortgages. This information provides a level of transparencyaround home lending and informs policy decisions. All publicly published data is de-identified toprotect applicant and borrower privacy. Data collected through HMDA includes demographic infor-mation about applicants and details about the loan and the home-to-be-purchased.
HUD Point-in-Time and Housing Inventory Count
HUD requires that Continuums of Care (CoC) conduct and report an annual count of people experi-encing homelessness within their service areas. These counts include people experiencing homeless-ness currently in emergency shelters, transitional housing, and Safe Havens on a single night, as wellas unsheltered people experiencing homelessness observed on-the-street. These counts are referredto as Point-in-Time (PIT) counts.
TheHousing InventoryCount (HIC) is aPIT inventory of provider programswithin aCoC that providebeds and units dedicated to people experiencing homelessness or who were homeless at entry. Thisincludes emergency shelters, transitional housing, rapid re-housing, Safe Havens, and permanentsupportive housing.
Local Area Unemployment Statistics
The Local Area Unemployment Statistics (LAUS) program is a program of the U.S. Bureau of LaborStatistics. This program producesmonthly and annual employment, unemployment, and labor forcedata for all geographic levels of the country.
National Housing Preservation Database
The National Housing Preservation Database (NHPD) is a partnership between the National Low-Income Housing Coalition (NLIHC) and Public and Affordable Housing Research Corporation(PAHRC). The NHPD provides property-level and subsidy-level data from nine different HUD andUSDA data sources in a single database.
Population and Housing Units Estimates Program
The Population Estimates Program (PEP) is a program of the U.S. Census Bureau that provides an

5.2. COMMON TERMS 65
informed estimation of population and housing units for all states and counties on an annual ba-sis. The U.S. Census Bureau estimates resident populations and housing units each year following adecennial census by using the measures of population change and components of housing change.
Other survey programs such as the ACS andAmericanHousing Survey (AHS) use the data as controls.Population estimates from PEP inform federal funding allocations.
Project HOPE Education for Homeless Children and Youth
The William and Mary School of Education’s Project HOPE serves as the administrator of Virginia’sProgram for the Education of Homeless Children and Youth on behalf of the Virginia Department ofEducation. Project HOPE tracks the number of homeless children and youth enrolled in Virginia’spublic schools based on the Department of Education’s definition of homelessness.
Occupational Employment andWage Statistics
The Occupational Employment and Wage Statistics (OEWS) program is a product of the U.S. Bureauof Labor Statistics. OEWSprovides annual employment andwage estimates for roughly 800differentoccupations in the United States.
Virginia Association REALTORS®Multiple Listing Service
A Multiple Listing Service (MLS) is a real estate database used by licensed REALTORS® to facilitatethe buying and selling of homes in the United States. These systems provide a dynamic snapshot ofhome prices and home sales, as well as information on the characteristics of those homes. VirginiaREALTORS® provided statewide data fromMLS databases across the Commonwealth.
Weldon Cooper Center for Public Service Population Projections
The University of Virginia’s Weldon Cooper Center for Public Service produces population projec-tions for the Commonwealth of Virginia and its cities, counties, and large towns. The center alsoproduces population projections for all fifty U.S. states and the District of Columbia. Federal agen-cies, state governments, businesses, and nonprofit entities now use these projections for their par-ticular planning and research needs because the U.S. Census Bureau stopped producing state-levelpopulation projections this past decade.
5.2 Common terms
The following list provides definitions for several data categories used throughout this study:
5.2.1 Race
Whenreferring to a specific race, that race is non-Hispanic. For example, Blackhouseholds are specif-ically Black, non-Hispanic households, unless specified otherwise.
Another race most often refers to the U.S. Census Bureau’s category of “Some Other Race,” which

66 CHAPTER 5. HOWWE USE DATA
includes all responses not included in thewhite, Non-Hispanic, Black orAfricanAmerican, AmericanIndian and Alaska Native, Asian, and Native Hawaiian and Other Pacific Islander categories. Forvisual clarity, we often aggregate American Indian and Alaska Native andNative Hawaiian andOtherPacific Islander—a small proportion of the data—into the “Another race” category.
Multiracial refers to the U.S. Census Bureau’s category of “Two or More Races.”
Hispanic is referred to throughout this study in place of “Hispanic or Latino.” Hispanic and Latinoare both pan-ethnic terms used to describe people living in the United States who identify as beingfrom Spain or from Spanish-speaking countries and from Latin American countries regardless oflanguage. We recognize that there are distinctions between the two terms; however, for the sake ofbrevity and consistency we use the term Hispanic.
White, non-Hispanic refers to individuals who do not identify as Hispanic or Latino and who havereported their race as “white” only.
5.2.2 Housing
Area median income (AMI) is the midpoint of a region’s income distribution (i.e., half the house-holds in a region earnmore than that figure while the other halfmake less). AMI is used frequently asa benchmark to set income limits in housing policy. HUD sets different AMI levels based on differentgeographic areas and household sizes.
Cost-burdened refers to a household that spends more than 30 percent of their gross householdincome on housing costs, including utilities. For greater nuance, a household that spends more than50 percent is severely cost-burdened.
Home(s) refers to what the U.S. Census Bureau defines as “housing units.” A housing unit is a house,apartment, a group of rooms, or a single room occupied or intended for occupancy as separate livingquarters.
Household refers to all individuals that reside under a single roof. A household typically comprisesa family, but can include non-related individuals that live together.
Householder refers to the primary individual owning or renting a home. This individual may beeither spouse if the household consists of a married couple.
Manufactured home refers to a factory-built home that is fully built on a chassis. These homes arebuilt tomeet standards promulgated by theU.S. Department ofHousing andUrbanDevelopment (the“HUD Code”).
Modular home (or a prefabricated home) is a home that is built to near completion (typically 80 to90 percent) and then transported to a location and fully assembled on site. These homes are built tostate and local building codes.
Multifamily refers to a building that contains more than one housing unit. For the purposes of thisstudy, different multifamily densities are defined as follows:

5.2. COMMON TERMS 67
• Small-scale multifamily is a building that consists of 2 to 19 housing units. This includesduplexes, triplexes, and other similar buildings of three stories or fewer.
• Medium-scalemultifamily is a building that consists of 20 to 49 housing units. This typicallyincludes low-rise and mid-rise apartments.
• Large-scalemultifamily is a building that consists of 50 ormore housing units. This typicallyincludes mid-rise and high-rise apartments.
5.2.3 Income
Extremely low-income (ELI) households are households that earn 30 percent of AMI or below.
Very low-income (VLI) households are households that earn between 31 and 50 percent AMI.
Low-income (LI) households are households that earn between 51 and 80 percent AMI.
Asset Limited, Income Constrained, Employed (ALICE) is a term used to describe working house-holds that are not technically in poverty, but are unable to afford all the basic necessities like housing,food, and health care.
More information about ALICE, including specific methodology, can be found on the United for AL-ICE campaign website. This effort is led by the United Way of Northern New Jersey; multiple UnitedWay affiliates in Virginia also participate as partners.
5.2.4 Age
Generation Z (or Gen-Zers) generally refers to people born between 1997 and now. As of 2021, thesepeople are under 24 years old.
Millennial(s) generally refers to a person or people born between 1981 and 1996. As of 2021, thesepeople are 25 to 40 years old.
GenerationX (or Gen-Xers) generally refers to people born between 1965 and 1980. As of 2021, thesepeople are 41 to 56 years old.
Baby boomer(s) generally refers to a person or people born between 1946 and 1964. As of 2021, thesepeople are 57 to 75 years old.
Silent generation generally refers to people born between 1928 and 1945. As of 2021, these peopleare 76 to 93 years old.

68 CHAPTER 5. HOWWE USE DATA

Part II
ENGAGEMENT
69


Part 2 Overview
Part 2 includes the following chapters:
6 SAG and steering committee involvement
Chapter 6 provides an overview of the SAG and steering committee roles during the HB854 studyprocess.
7 Provider survey
Chapter 7 summarizes the housing provider survey that HousingForward Virginia designed in con-sultation with the steering committee. The results showcase the opinions of more than 400 practi-tioners and advocates across the Commonwealth.
8 Focus groups
Chapter 8 outlines the focus groups conducted by HousingForward Virginia to better understandhousing needs and challenges across the Commonwealth. These findings complement the results ofthe provider survey.
9 Public housing authority survey
Chapter 9 summarizes the public housing authority survey that HousingForward Virginia circulatedamong public housing authorities across the Commonwealth to collect information on the demandfor housing assistance in their communities.
71

72
10 Client survey
Chapter 10 provides an overview of the programclient survey thatHousingForwardVirginia designedand the Virginia Housing Alliance deployed. The survey intended to collect direct feedback on cur-rent housing programs from users who have applied for and/or received assistance through theseinitiatives.
11 Experts and power users
Chapter 11 provides readers with a summary of the additional experts and practitioners who providedtestimony to the SAG, steering committee, and HousingForward Virginia during the HB854 studyprocess.

Chapter 6
SAG and steering committee involvement
This chapter provides an overview of the SAG and steering committee roles during the HB854 studyprocess.
6.1 Stakeholder Advisory Group
The Stakeholder Advisory Group (SAG)—mandated byHB854 and composed of housing experts fromacross Virginia—guided this study. As directed by the bill, the SAGmembership included:
“individuals with expertise in land development, construction, affordable housing, real estatefinance, tax credit syndication, and other areas of expertise as determined by the Department ofHousing and Community Development and the Virginia Housing and Development Authority,and at least one resident of an affordable housing property.”
The SAG’s purpose was to:
“(i) determine the quantity and quality of affordable housing and workforce housing across theCommonwealth, (ii) conduct a review of current programs and policies to determine the effec-tiveness of current housing policy efforts, (iii) develop an informed projection of future housingneeds in the Commonwealth and determine the order of priority of those needs, and (iv) makerecommendations for the improvement of housing policy in the Commonwealth.”
The SAG met five times between November 2021 and October 2021 to discuss and provide feedbackon the recommendations. HousingForward Virginia and the steering committee prepared memosand other meeting materials to inform and support the SAG decision-making process.
The SAG formed six subgroups to discuss the specific focus areas that HB854 identifies. The topicalsubgroups addressed: data and research, state rental subsidy, utility rate reduction, real property taxreduction, bond financing, and existing programs.
73

74 CHAPTER 6. SAG AND STEERING COMMITTEE INVOLVEMENT
These teams investigated their topics by consulting experts and practitioners, reviewing best prac-tices from across the nation, and assessing data prepared by HousingForward Virginia and the steer-ing committee. Each subgroup reported their findings and initial recommendations to the SAG forreview, meeting the specific tasks that HB854 charged the SAG with accomplishing:
• Data and researchmet one time to develop plans for collecting, analyzing, and presenting therange of datameeting the legislative research requirements to “determine the quantity and qualityof affordable housing and workforce housing across the Commonwealth . . . [and] . . . develop aninformed projection of future housing needs in the Commonwealth and determine the order of priorityof those needs.”
• State-funded rental assistancemet five times to study best practices from across the nationand provide recommendations for lawmakers to consider the creation of “a Virginia rent subsidyprogram to work in conjunction with the federal Housing Choice Voucher Program.”
• Utility rate reductionmet five times to explore newmethods for the state to lower energy costsin the development and operation of affordable housing, per HB854’s requirement to study“utility rate reduction for qualified affordable housing.”
• Real property tax reductionmet five times to propose solutions that give communities the au-thority to lower expenses for affordable housing through “real property tax reduction for qualifiedaffordable housing for localities that desire to provide such an incentive.”
• Bond financing met four times to evaluate how the state uses its debt authority to supporthousing production and recommend additional “bond financing options for qualified affordablehousing.”
• Existing programsmet twice as a full group and once within six smaller groups to examine thestrengths, weaknesses, and opportunities for improvement for the dozens of “existing programsto increase the supply of qualified affordable housing.”
Table 6.1 lists all members of the SAG.
6.2 Steering committee
Team members from Virginia Housing and the Department of Housing and Community Develop-ment comprised the SAG steering committee. The steering committee guided and oversaw theHB854study and worked closely with HousingForward Virginia staff to manage the SAG and its subgroups.
Table 6.2 lists all members of the steering committee.

6.2. STEERING COMMITTEE 75
Table 6.1: Stakeholder Advisory Group members
Member Organization
Phillip Agee Virginia TechAnn Bevan Virginia Department of Medical Assistance ServicesAllison Bogdanovic Virginia Supportive Housing / Virginia Housing Alliance (board chair)Matt Bruning Virginia Bankers AssociationHeather Crislip Housing Opportunities Made Equal of Virginia
David Cooper Woda CooperAndrew Clark Home Builders Association of VirginiaMatt Crookshank City of RoanokeJoe Fortier Acme Panel CompanyJ. Conrad Garcia Virginia LISC
Deborah Garcia-Gratacos Your Home NowMortgageBrian Gordon Apartment and Office Building Association of Metropolitan WashingtonMichelle Gowdy Virginia Municipal LeagueRandy Grumbine Virginia Manufactured and Modular Housing AssociationTracey Hardney-Scott Richmond Virginia Branch NAACP
Bernard Harkless Lynx VenturesGreta Harris Better Housing CoalitionErica Holmes Virginia Association of Housing Counselors / St. Joseph’s VillaAndy Van Horn Dweck PropertiesEarl Howerton Southside Outreach Group
Nina Janopaul Arlington Partnership for Affordable HousingBrian Koziol Virginia Housing AllianceMichelle Krocker Northern Virginia Affordable Housing AllianceSteve Lawson Lawson CompaniesJoe Lerch Virginia Association of Counties
Bob Margolis TM AssociatesChristie Marra Virginia Poverty Law CenterChristine Morris LISC Hampton RoadsBob Newman Vibrant Communities Drive Change (VCDC)Carmen Romero Arlington Partnership for Affordable Housing
Monty Salyer Wise County Redevelopment and Housing AuthorityJennifer Schwartz National Council of State Housing AgenciesSarah Stedfast NewTowne MortgageLisa Sturtevant Virginia REALTORS®TJ Thompson “HEARD” participant and Gilpin Court resident
Karen Wilds Newport News Redevelopment and Housing AuthorityMichelle Winters The Alliance For Housing SolutionsMichael Wong Harrisonburg Redevelopment and Housing AuthorityKristin Yavorsky Virginia Department of Behavioral Health and Developmental Services

76 CHAPTER 6. SAG AND STEERING COMMITTEE INVOLVEMENT
Table 6.2: Steering committee members
Member Agency
Llewellyn Anderson Virginia HousingDJ Benway Virginia HousingDemas Boudreaux Virginia HousingArt Bowen Virginia HousingFabrizio Fasulo Virginia Housing
Mike Hawkins Virginia HousingMarshall Jones Virginia HousingBarry Merchant Virginia HousingTammy Neale Virginia HousingToni Ostrowski Virginia Housing
Neal Rogers Virginia HousingAnton Shaw Virginia HousingFrances Stanley Virginia HousingMike Urban Virginia HousingLyndsi Austin DHCD
Kristen Dahlman DHCDKaycee Ensign DHCDWillie Fobbs, Jr. DHCDPam Kestner DHCD

Chapter 7
Provider survey
The purpose of this document is to provide readers with a summary of the housing provider surveythat HousingForward Virginia designed in consultation with the steering committee. The resultsshowcase the opinions of more than 400 practitioners and advocates across the Commonwealth.
7.1 Methods
HousingForward, with support from Virginia Housing and the Department of Housing and Commu-nity Development (DHCD), surveyed a diverse and representative range of stakeholders. The surveycollected input from users of state housing programs to address four core topics:
1. Community housing needs,2. Efficacy of current state efforts to promote affordable housing,3. Racial disparities in housing, and4. Impact of COVID-19 on these providers and their clients.
An online form was used to collect survey responses from November 11, 2020 to January 25, 2021.This timeframe overlapped with the COVID-19 pandemic and the increased national attention onsystemic racism and social injustice.
The survey period also coincided with federal, state, local, and private economic interventions in-cluding the federal CARES Act, the Consolidated Appropriations Act, and the CDC Eviction Morato-rium. Survey results reflect respondents’ pressing concerns related to pandemic consequences andunderlying, exacerbated societal inequities laid bare.
7.2 Profile of respondents
Respondents could select multiple options to describe their locality, organization, and housing areaof focus; therefore the data represents the number of “touches” a single respondent has with a geo-
77

78 CHAPTER 7. PROVIDER SURVEY
graphic area, organization type, or housing location. A total of 408 respondents submitted completedresponses.
Figure 7.1: Geographic representation of respondents
Respondents represented all geographic regions of Virginia, and their numbers were commensuratewith regional population distribution, including the LargeMetro HousingMarkets of the urban cres-cent.
The survey results initially may seem to underrepresent the urban crescent—which accounts for 73percent of Virginia’s population—because 54 percent of respondents reported serving at least onelocality within it. However, the survey’s geographic menu included the possible selections of “other”and “statewide,” the latter accounting for more than a fifth of all touches, so it is reasonable to inferthat the survey fairly reflects the Commonwealth’s regions and residents.

7.2. PROFILE OF RESPONDENTS 79
Figure 7.2: Regional representation of survey responses and population
Overall, nonprofit housing developers, operators, and/or service providers are the most representedcategory of respondent, a majority of whom operate in Large Markets within the urban crescent (57of 408). Local governments, homeless service providers, for-profit housing builders/developers, andreal estate professionals round out the top five organization types from Large Markets.

80 CHAPTER 7. PROVIDER SURVEY
Figure 7.3: Organizational representation of respondents
Nonprofits were also the most represented of all market groups in regions beyond the Large MetroHousing Markets, except in the category of “statewide” where financial institutions were the mosttouched industry group. Some of the least touched industries and regions are the “Other” marketcategory, financial institutions (especially in rural areas), and public housing authorities in SmallMetro and Rural Housing Markets.
Nearly two-thirds (64percent) of respondentswork in rental housing, andmore thanhalf (58percent)work in homeownership. Homelessness was the least represented housing area at just 37 percent ofrespondents.

7.3. COMMUNITY HOUSING NEEDS 81
Figure 7.4: Housing area served by respondent
7.3 Community housing needs
The survey asked respondents to rate the challenges they face in their particular service area. Respon-dents rated challenges such as “cost ofmaterials” and “price of homes” on a four-point scale from onebeing “not a problem” to four being a “major problem.”

82 CHAPTER 7. PROVIDER SURVEY
Figure 7.5: Housing issues identified by respondents
Major takeaways
• A majority of respondents found all listed issues except for “building codes and inspections” tobe either a moderate or major problem. Across nearly all housing areas and regions, respon-dents identified the “Amount, location, and type of housing” and the costs associated with thathousing as a “major problem.”
• Respondents identified “funding availability” and “site/land availability” as significant factorsfor homelessness, supportive housing, and rental housing. The “quality/age of existing inven-tory” for rental housing stood out as an issue, particularly in Rural Housing Markets.
• Survey results indicate that “renters” and “unhoused/vulnerable” populations were notably af-fected by and preoccupied with the pandemic’s consequences.
• While half of respondents did indicate “moderate” to “extreme” concern over homeownershipopportunities over the next year, over 90 percent expressed the same concern over “homeless-ness” issues, 75 percent for “supportive housing,” and 65 percent for “rental housing” opportu-nities.
• “Homelessness” was the most significant issue across all industry sectors and geographic mar-kets.
• Real estate professionals and housing counseling providers are the only industry groups report-ing more concern for “senior and age-restricted housing” opportunities than for “homeowner-ship” opportunities.
• Respondents from most industry categories identified “racial disparities in housing” as the

7.4. ASSESSMENT OF CURRENT HOUSING PROGRAMS AND POLICIES 83
most influential factor affecting “homeownership” access and “homelessness.”• Of all respondents, local governments indicated the least concern for “homelessness.”• Public housing authorities (PHAs) indicated more concern for “rental housing” opportunities;real estate professionals and “others” showed a higher level of concern for “supportive housing.”
• Across geographic regions, respondents from Small Markets appear the least concerned about“homelessness” and observe significant racial disparities in both “homeownership” and “rentalhousing” opportunities.
7.4 Assessment of current housing programs and policies
To open a section on state-level housing programs, respondents first identified the state-level pro-grams with which they have direct experience. Each program fell within seven broad program cate-gories. If a respondent selected at least one program within one of these broad program categories,they then responded to open-ended questions on that program’s broad category.
Figure 7.6: Programs used by respondents
Questions addressed programeffectiveness, ease or difficulty of use, COVID-19 impact, and program-matic responsiveness to racial inequities in housing.

84 CHAPTER 7. PROVIDER SURVEY
Figure 7.7: Program area effectiveness and need for improvement
Major takeaways
• A majority of the respondents had experience with broad-based housing and community de-velopment assistance and rental assistance/eviction and foreclosure prevention programs. Re-spondents generally felt that all program areas were “moderately effective” in both meetingcurrent housing needs and furthering their organizational missions.
• However, respondents also generally indicated a need for “some improvement” to “significantimprovement” to better serve housing needs. Only those respondents familiar with housingcounseling and education programs suggested that those programs needed a “little improve-ment” to “some improvement”; this includes 69 percent of housing counseling providers sug-gesting “some improvement.”
• A high number of respondents indicated a need for “significant improvement” or a “completeredesign” for homelessness prevention, special needs housing, and broad-based housing andcommunity development assistance programs.
• The most frequently cited internal challenge among program areas was “limited staff capacityto implement program,” with two exceptions:
– “Program guidelines and fund uses are overly restrictive” is the greatest internal challengefor home purchase assistance, homelessness prevention, and special needs housing pro-grams.
– “Administrative burden” is the highest-ranked internal challenge for affordable rentalhousing development programs.

7.4. ASSESSMENT OF CURRENT HOUSING PROGRAMS AND POLICIES 85
• “Difficulty marketing to potential clients” was the most frequently cited external challenge, es-pecially for programs that involved direct assistance to clients.
• “Citizen opposition (e.g. NIMBY-ism)” ranked high as an external challenge for the two housingproduction programs (affordable rental housing development and broad-based housing andcommunity development assistance programs).
• “Limited support from elected officials” ranked as the greatest external challenge for homeless-ness prevention and special needs housing programs.
• The COVID-19 pandemic had the greatest negative impacts on homelessness prevention, spe-cial needs housing, and rental assistance/eviction and foreclosure prevention programs.
• Respondents did not identify any broad program addressing racial inequities in housing.• When prompted for additional detail on needed improvements, respondents did not providesufficient detail, but many cited similar priorities:
– Greater flexibility in eligibility requirements,– More information and awareness of existing programs,– Support in increasing local organizational capacity to assist local communities (e.g., fund-
ing and/or technical assistance), and– Increased funding for existing programs.
Figure 7.8: Program challenges faced by users

86 CHAPTER 7. PROVIDER SURVEY
7.5 Racial equity
AlthoughHB854doesnot explicitly address racial equity, anhonest anduseful examinationof afford-able housing programs cannot exclude it. Centuries of racism, segregation, disenfranchisement, andredlining and other discriminatory practices have shaped Virginia’s communities, and their legacyof inequity constrains the potential of Black households today.
The murder of George Floyd in May 2020 sparked an international call for racial justice heard re-soundingly in theCommonwealth. The SAGand steering committee recognized that this studywouldachieve its intended goals only if it brought racial disparities in housing into the conversation.
For the purposes of this survey, “racial disparities” refers to any disproportionate challenges, oppor-tunities, and outcomes that disadvantage households of color attempting to access and secure high-quality housing.
Figure 7.9: Perceived significance of racial disparities in housing
Major takeaways
• Of the aggregated housing areas, respondents found the greatest significance of racial dispari-ties for “homeownership” and “homelessness.”
• When comparing the individual geographicmarket groups, only SmallMetro HousingMarketsindicated more significant disparities in “homeownership” than “homelessness.” Large Metro

7.5. RACIAL EQUITY 87
Housing Markets, Rural Housing Markets, statewide, and “other” areas perceived “homeless-ness” as having significant disparities.
• Notably, homeless services providers indicated “homeownership” hadmore significant dispar-ities than “homelessness.” Real estate professionals and financial institutions found more dis-parity in “homelessness” than “homeownership.”
• Most respondents believed “senior and age- restricted housing” to have the least significantracial disparities, except for local governments, who perceived “homelessness” as having theleast significant racial disparities.
• Respondents deemed three programsmost effective at addressing racial inequities: home pur-chase assistance, housing counseling and education, and rental assistance/evictions and fore-closure prevention programs.
• LargeMarkets, however, singled out home purchase and rehabilitation programs asmore effec-tive, while Small and Rural Markets regard rental assistance and broad based community anddevelopment programs as most effective. Statewide, rental assistance/eviction and foreclosureprevention programs topped the list.
Because this study overlappedwith thefirst eightmonths of the pandemic, it is not possible to know ifrespondents would have assessed these programs differently in the absence of a global public healthcrisis.
More than half of respondents (216 out of 404) indicated that their organization has not developedand implemented any specificprogramor effort to address racial inequities in their service area. Only15 percent of respondents (60 respondents) indicated that they did have a specific program, while 32percent were “unsure.”
When prompted to provide more detail on their racial equity programs, forty-eight respondents pro-vided a written response to this question. Responses included policies on diversity and inclusion,training, and Diversity, Equity, and Inclusion (DEI) committees.
While several respondents did identify specific racial equity programs, there weremany respondentsthat referred to existing programs such as the Community Reinvestment Act (CRA) or permanentsupportive housing (PSH) programs that significantly help Black households due to disproportionaterepresentation among target populations.
Seventeen respondents specifically mentioned a focus on homeownership to address racialinequities. These included programs focused on homebuyer education, grant programs, andrent-to-own programs.

88 CHAPTER 7. PROVIDER SURVEY
Figure 7.10: Program ability to address racial inequities in housing
Half of respondents said these programs were “moderately effective,” five regarded them as“extremely effective,” and no respondents found them to be “not at all effective.”
198 respondents wrote a response to the prompt: “What state-level resources or support do you feelyour organization needs to address racial gaps in housing within your service area?” Of these re-sponses, 12 frequently mentioned themes emerged:
1. Expansion of programs/funding,2. Creation of new programs,3. Response to barriers to housing,4. Marketing/outreach,5. Internal capacity training/support,6. Data/knowledge,7. Impact/goal tracking,8. Reform local land use,9. Homeownership,10. Workforce/economic development,11. Nothing additional, and12. Uncertain.

7.6. COVID-19 IMPACT AND RESPONSE 89
7.6 COVID-19 impact and response
The Virginia General Assembly passed HB854 in March 2020 just as the COVID-19 pandemic be-gan to sweep across the United States. While many experts anticipated the pandemic’s impacts onaffordable housing, the general public was largely unaware of how much COVID-19 would affect thenational housing market and housing conditions in their own communities. The public health cri-sis has disproportionately devastated low- and moderate-income renters, the majority of which areBlack and Brown households.
HB854 did not include—indeed could not have included—language addressing the COVID-19 pan-demic’s impact on Virginia’s affordable housing. Virginia Housing and DHCD subsequently deter-mined that theHB854-mandated study should examine state-level housing programswithin the con-text of this unprecedented and catastrophic economic and public health crisis.
Figure 7.11: Housing area concern due to COVID-19
The survey asked several questions about COVID-19’s impact on core housing services and state-levelprograms. Questions also probed the greatest concerns among respondents and the importance ofspecific resources to manage the long-term repercussions of COVID-19.

90 CHAPTER 7. PROVIDER SURVEY
Figure 7.12: Service disruption due to COVID-19
Major takeaways
• Homelessness was the top concern for the coming year with 75 percent of respondents describ-ing themselves as “extremely concerned.” Supportive housing, rental housing opportunities,senior and age-restricted housing, and homeownership followed homelessness in order of sig-nificance. These results were consistent across geographic markets and categories (except for-profit housing developers, none of whom responded to the prompt).
• Respondents also indicated significant pandemic impacts to homelessness prevention and spe-cial needs housing programs.
• All organization types across all regions believed that core housing and housing related servicessuffered as a result of the pandemic; a large proportion of homeless service providers, housingcounselor providers, and nonprofit housing developers, operators, and/or service providers allsignaled that their services bore “significant” to “very significant” impact.
• In all cases, respondents felt the worst of the pandemic’s effects occurred fromMarch throughMay2020compared to the current periodofNovember toDecember2020. Thismay reflect thefederal stimulus packages and emergencyhousing relatedpolicy enacted and extendedbetweenthe onset of COVID-19 and the end of 2020.
• A larger proportion of respondents (35 percent) rated the disruption as “somewhat” significantin later 2020 as compared to 26 percent in March 2020. This also suggests an adaptation topandemic conditions over time. The pandemic continues to disrupt service delivery at least“somewhat” for an overwhelming majority of respondent organizations.

7.6. COVID-19 IMPACT AND RESPONSE 91
• Respondents ranked CARES Act grants (and presumably other federal stimulus funds) as themost important source of financial relief needed for service provision since the pandemicbegan. Respondents rated local government funds (also bolstered by federal support) as“significant” to “very significant.” Similarly, respondents identified “new funding to supportchange/expanded programs” as the most important resource for continued service.
Figure 7.13: Concerns about COVID-19

92 CHAPTER 7. PROVIDER SURVEY
Figure 7.14: Negative impact of COVID-19
Thirty-five respondents identified other sources of COVID-19 financial relief important to their or-ganization’s operations:
• Several respondents reiterated the CARES Act and local government funding through specificprograms such as small business loan programs or economic development grants.
• Four respondents specifically mentioned Virginia Housing’s COVID-19 Grants.• Other respondents noted local support fromchurches, other nonprofit organizations, and foun-dations.
• One respondent referred to funding from the Department of Behavioral Health and Develop-mental Services (DBHDS) that provided flexibility when other sources of funding did not.

7.6. COVID-19 IMPACT AND RESPONSE 93
Figure 7.15: Importance of resources to overcome COVID-19
When asked to provide additional comments about COVID-19’s impact on housing, 100 respondentsprovided a written response. Eleven major themes frequently arose:
1. Funding,2. Successful policy/program interventions,3. Deferred/delayed programs,4. Staff/volunteer reductions,5. Housing supply/development issues,6. Long-term needs/opportunities,7. Client needs/concerns,8. Economic concerns,9. Homelessness,10. Eviction moratorium, and11. No major impact/unsure.

94 CHAPTER 7. PROVIDER SURVEY

Chapter 8
Focus groups
This chapter outlines the focus groups conducted by HousingForward Virginia to better understandhousing needs and challenges across the Commonwealth. These findings complement the results ofthe provider survey.
8.1 Methods
Virginia Housing and DHCD often seek feedback from program users in both formal and informalsettings, including focus groups, in order to improve program delivery and outcomes.
In February 2021, HousingForward Virginia invited 151 individuals frommore than 50 organizationsto participate in focus groups to discuss housing needs in their communities and the capacity ofstate housing programs tomeet them. HousingForward assigned 58 individuals to nine focus groups;each group represented a distinct category of organization with an average focus group size of sixparticipants.
HousingForward asked participants to provide feedback on state-level housing programs they use,the impact of COVID-19 on community housing needs and programs, and efforts to address racialinequities. All meetings occurred virtually due to the ongoing COVID-19 pandemic.
The concerns expressed by the focus group participants reflect the stress and uncertainty of theCOVID-19 pandemic.
Participants raised concerns related to federal housing programs and standards as well as state-levelprograms. Participants’ impressions of the effectiveness of Virginia’s programs often revealed incom-plete knowledge of all available state programs and limited understanding of the Commonwealth’sprogrammatic jurisdiction. However, these observations contribute to the usefulness of the focusgroups’ feedback, which provides a valuable overview of the priorities, concerns, and needs of hous-ing providers in Virginia.
95

96 CHAPTER 8. FOCUS GROUPS
8.2 Priorities, concerns, and solutions
The nine categorical focus groups produced clear highlights:
8.2.1 Nonprofit housing organizations focused on the general population
Housing priorities and concerns
• Preservation and rehabilitation of existing affordable housing stock,• Assistance for families at risk of eviction and foreclosure, and• Rental market pressures driving unaffordability.
How the Commonwealth can help
• Coordinate outreach more extensively for the announcement of funding and resources,• Increase resources to scale-up programs to meet overwhelming need and to build capacity ofgrassroots organizations,
• Update compartmentalized programs to offer more holistic approaches, and• Preserve market-rate affordable housing through incentives for landlords.
8.2.2 Nonprofithousingorganizations focusedonpermanent supportivehousingandspecial needs populations
Housing priorities and concerns
• Inadequate resources to address the overwhelming need for affordable rental housing,• Initial roll out of the Virginia Rent Relief Program (e.g., multiple policy changes and capacity ofsmall local nonprofits to administer at the local level),
• Extremely low-income households, especially those on fixed incomes (e.g., persons with dis-abilities, seniors, etc.),
• Increase in seniors in need of assistance now and in the future,• Federal Fair Market Rents (FMR) are not truly representative of the market,• CDC Eviction Moratorium’s impact on vacancy rates (i.e., the extreme scarcity of housing thatmight otherwise be available for vulnerable populations),
• Impending wave of evictions when the CDC Eviction Moratorium ends, and• Uncertainty of funding after emergency pandemic allocations are used.
How the Commonwealth can help
• Assist homeless service providers interested in developing affordable housing,

8.2. PRIORITIES, CONCERNS, AND SOLUTIONS 97
• Increase the supply of permanent supportive housing accessible housing for persons with am-bulatory disabilities, and
• Diversify affordable housing solutions (e.g., resident-ownedmanufactured home communities,inclusionary zoning, flexible requirements on funding, etc.).
8.2.3 For-profit housing organizations
Housing priorities and concerns
• Nine percent Low-Income Housing Tax Credit (LIHTC) deals are complicated and not cost ef-fective for small- and mid-sized developers,
• One funding round per year makes it difficult to mitigate risks, and• Hidden costs at the local level are stifling affordable development (e.g., development standards,planning process inefficiencies, etc.).
How the Commonwealth can help
• Evaluate the possibility of multiple LIHTC funding rounds,• Incentivize local cap fees such as water and sewer to reduce initial construction costs,• Advocate local approval of a set number of new housing units per year, and• Encourage affordable development in communities of opportunity.
8.2.4 Real estate professionals
Housing priorities and concerns
• Insufficient financing options for essential workers,• Need for home-buying education for potential home buyers,• Loan disqualification of existing homes, especially in rural areas,• Credit and debt accumulation or lack of credit as cause of racial homeownership gap, and• Pandemic-driven demand and constraint on supply.
How the Commonwealth can help
• Provide for greater ability to couple first mortgages with financing for renovations, and• Offer more resources for homebuyer education and readiness planning.
8.2.5 Financial institutions
Housing priorities and concerns

98 CHAPTER 8. FOCUS GROUPS
• High median incomes in the Northern Virginia region creating high income limits for afford-able housing programs,
• Subsequent need for assistance for moderate income households, leaving extremely and verylow-income families competing for assistance,
• Disparate guidelines and requirements across localities making it difficult to connect clientswith products and assistance that meet their needs,
• Difficult documentation of assets in the mortgage lending process for households relying oncash transactions because they do not have traditional bank accounts,
• Some households who may qualify for a mortgage lack cash or savings to cover down paymentand/or closing costs, and
• Inadequate for-sale housing inventory limiting options for first-time and low-income homebuyers.
How the Commonwealth can help
• Adjust income limits for certain programs to help more moderate income households,• Develop a centralized source for learning about home purchase assistance resources at the stateand local levels,
• Emphasize education for home buying, asset management, etc., and• Increase resources to cover both down payment and closing cost assistance.
8.2.6 Public housing authorities
Housing priorities and concerns
• Households making 50 to 80 percent AMI who do not have access to many resources,• Inadequate assisted-living facilities for low- and moderate-income senior and other specialneeds households,
• Weak connections between housing and healthcare industries, and• Reluctance of landlords to participate in the Housing Choice Voucher program.
How the Commonwealth can help
• Allocate more Private Activity Bonds (PAB) to public housing authorities (PHAs),• Assist PHAs, especially small ones, on PAB deals to accelerate affordable housing development,• Consider increasing the Housing Authority Pool for nine percent LIHTC credits at VirginiaHousing,
• Provide greater resources to help small- andmid-sized developers build capacity to be compet-itive, and
• Support greater communication and cooperation between Housing Choice Voucher adminis-trators.

8.2. PRIORITIES, CONCERNS, AND SOLUTIONS 99
8.2.7 Housing counselors
Housing priorities and concerns
• Language and cultural barriers to housing assistance for immigrants,• Limited understanding of tenants’ rights and protections among both landlords and tenants,and
• Homeowners at-risk of foreclosure.
How the Commonwealth can help
• Increase marketing and outreach efforts in hard-to-reach communities to inform individualsabout housing assistance available,
• Foster greater collaboration between agencies,• Bolster the development and delivery of hybrid counseling and education programs (i.e., virtualand in-person), and
• Support development of infrastructure to support programs, such as transportation and broad-band access, that often obstruct service delivery.
8.2.8 Homelessness service providers
Housing priorities and concerns
• Inadequate quantity and locations of shelters,• Housing instability as consequence of constrained housing supply,• Seniors and those with substance use disorders, serious mental illness, and other disabilities,and
• Maintenance level of pandemic-level resources.
How the Commonwealth can help
• Increase state-level funding for homelessness prevention and assistance programs,• Enhance flexibility with funding (e.g., to develop permanent supportive housing, to administerservices, to pay for one-time housing costs, etc.), and
• Provide resources for racial equity training within organizations.
8.2.9 Local governments
Housing priorities and concerns
• State-level assistance with NIMBY-ism and local land use issues (e.g., inclusionary zoning) toaddress affordable housing needs and racial inequities,

100 CHAPTER 8. FOCUS GROUPS
• Rental assistance to benefit tenants and landlords during and after the pandemic,• Pandemic’s impact on housing vacancy rates (i.e., unavailability of housing for those most inneed), and
• Impact of broadband access on affordability.
How the Commonwealth can help
• Increase resources to address staff capacity at the local- and state-level (e.g., funds to hire ad-ditional staff, technical assistance, etc.),
• Create centralized resource of available programs and clarification of viable local policies incontext of the Dillon Rule,
• Lead on racial equity initiatives and coordination among localities, and• Align requirements of Virginia Housing and DHCD programs (e.g., income limits, householdtype, etc.).

Chapter 9
Public housing authority survey
This chapter summarizes the public housing authority survey that HousingForward Virginia circu-lated among public housing authorities across the Commonwealth to collect information on the de-mand for housing assistance in their communities.
9.1 Methods
FromFebruary toMarch 2021, HousingForward Virginia distributed an online survey to public hous-ing authorities (PHAs) to understand the scope of their affordable housing portfolios and allocationof federal Housing Choice Vouchers. HousingForward Virginia, with assistance from the Virginia As-sociation of Housing and Community Development Officials (VAHCDO), received feedback from 22out of 33 HUD Direct Voucher Administrators.
The survey results illuminate the shortage of rental units and assistance to low-income householdsdespite existing resources. Both PHAs and rental assistance programs often allow waiting lists, but ifall existing PHA units were available to be leased, there still would be a deficit of 7,415 units to meetthe waiting lists.
The PHA survey did not account for Project-based Vouchers and Rental Assistance Demonstration(RAD) units, which provide additional affordable units; administrators noted that there are waitinglists for these types of assistance as well.
One administrator observed that the current private housing market is not just making it extremelydifficult for voucher holders to locate and lease units, it is also raising per unit costs. Another PHAadministrator explained that they operate just over 260 conventional apartments with rents cappedat 80 percent AMI without any subsidy in an attempt to provide “maximum stock” for the area’s low-income households.
101

102 CHAPTER 9. PUBLIC HOUSING AUTHORITY SURVEY
Figure 9.1: Geographic coverage of PHAs surveyed
9.2 Waiting lists for PHA housing assistance programs
All waiting lists are current as of March 2021.
Virginia has a deficit of 40,718 units and 32,498 rental assistance vouchers across 32 localities.
9.2.1 Public housing units
A majority of PHAs (82 percent) had open public housing waiting lists in early 2021. Two out of 22authorities did not own and manage public housing units.
• Total units owned and managed: 12,5361• Waiting list: 16,7202
11,060 units are public housing units that have been converted to RAD.2Less than 200 waiting list households are for RAD.

9.2. WAITING LISTS FOR PHA HOUSING ASSISTANCE PROGRAMS 103
9.2.2 LIHTC units
Half of authorities (50 percent) had open LIHTC waiting lists in early 2021. Thirty-six percent ofauthorities had no LIHTC units.
• Total units owned and managed: 4,047• Waiting list: 7,278
9.2.3 Housing Choice Vouchers
Amajority of authorities (64 percent) had open HCV waiting lists in early 2021. Thirty-six percent ofauthorities expected to open waiting lists in 2022 and beyond.
• Total HCVs allocated: 30,731• Total HCVs in use: 27,781• Waiting list: 32,498

104 CHAPTER 9. PUBLIC HOUSING AUTHORITY SURVEY

Chapter 10
Client survey
This chapter provides an overview of the program client survey that HousingForward Virginia de-signed and the Virginia Housing Alliance deployed. The survey intended to collect direct feedbackon current housing programs from users who have applied for and/or received assistance throughthese initiatives.
Summary
At the recommendation of the SAG,HousingForward sought feedback from individualswhomayhavereceived assistance from state housing programs to provide additional context for the effectivenessof programs. Virginia Housing Alliance, HousingForward Virginia, and other partners developed anddistributed an online survey fromMay to June 2021.
The survey received 1,313 completed responses, but was compromised by the interference of an au-tomated software program or “bot.” The survey partners determined from repetitive responses, sus-picious email addresses, and random country IP addresses that 93 percent of the responses were notvalid, leaving 91 legitimate responses. Fifteen service and/or housing providers, identified by theiremail addresses, had taken the survey, further limiting analysis of the results.
The survey was also limited by a low response rate despite a financial incentive and availability ofSpanish language and hard copy versions. It also could not incorporate verification that respondentshad received housing assistance from a state program.
The HB854 client survey sample size is too small to fairly represent the number of individuals thatreceive housing assistance from state agencies. The client survey outcome and the barriers to its ef-fective implementation demonstrate a need for well-planned and on-going communication betweenthe Commonwealth and housing assistance recipients whose experiences and input would informregular program adjustments to best meet the needs of target populations.
Recommendations for sustained engagement are included in Chapter 30.
105

106 CHAPTER 10. CLIENT SURVEY

Chapter 11
Experts and power users
This chapter provides readers with a summary of the additional experts and practitioners who pro-vided testimony to the SAG, steering committee, and HousingForward Virginia during the HB854study process.
Rental assistance experts
To provide the rental assistance subgroup with information on national best practices and lessonslearned, HousingForward Virginia spoke with or invited the following individuals to speak to thesubgroup:
• Danilo Pelletiere, Washington, D.C. Department of Housing and Community Development• Hammere Gebreyes, District of Columbia Housing Authority• Maxwell Ruppersburg, Georgia Department of Behavioral Health and Developmental Disabili-ties
• Cecilia Woodworth, Massachusetts Office of Community Development• Steve DiLella, Connecticut Department of Housing• Dan Threet, National Low Income Housing Coalition• Jillian Fox, Corporation for Supportive Housing
Utility experts
To provide the utility rate reduction subgroup with a clear understanding of the regulatory environ-ment and scope of existing public and provider-based assistance programs, HousingForward Virginiaspoke with or invited the following individuals to speak to the subgroup:
• Kyle Rosner, Deputy Broadband Advisor, Commonwealth of Virginia
107

108 CHAPTER 11. EXPERTS AND POWER USERS
• Tommy Oliver and Nick Banka, Roanoke Gas• Petrina Jones Wrobleski and Bryan Stogdale, Columbia Gas• Morgan Whayland and Tyler Lake, Virginia Natural Gas• Todd House, Andrew Lawson, and Scott McGeary, Washington Gas• Lisa FaJohn and Elizabeth Rhyne, Dominion Energy• Arlen Bolstad and Kim Pate, Virginia State Corporation Commission
Bond financing experts
To provide the bond financing subgroup with information on the legal framework and scope of bondactivities by Virginia’s state and local governments, HousingForward Virginia spoke with or invitedthe following individuals to speak to the subgroup:
• Kyle Flanders, Virginia Department of Housing and Community Development• Megan Martz Gilliland, Kauffman & Canoles, P.C.• Hil Richardson, Virginia Housing• Mike Urban, Virginia Housing
Property tax expert
To provide the real property tax reduction subgroup with information on the legal framework andscope of bond activities by Virginia’s state and local governments, HousingForward Virginia invitedthe following individual to speak to the subgroup:
• Lane Pearson, Fleckenstein & Associates, P.C.
Existing program experts
To adequately understand the strengths, challenges, and opportunities for current state housing pro-grams, HousingForward Virginia spoke with or invited the following individuals to speak to the ex-isting programs subgroup:
• Andy Kegley, HOPE, Inc.• Ari Severe, TM Associates• Dianna Bowser, Southside Community Development and Housing Corporation• Jake Powell, Community Housing Partners• Jennifer Jacobs, Albemarle Housing Improvement Program• Jillian Fox, Corporation for Supportive Housing• John Bolton, LISC Virginia• Kelly King Horne, Homeward

109
• Linda Melton, Fulton Bank• MatthewMorgan, project:HOMES• Meghann Cotter, Micah Ecumenical Ministries• Samantha Brown, Community Housing Partners• Sunshine Mathon, Piedmont Housing Alliance• Tonya Irizarry, Virginia Credit Union

110 CHAPTER 11. EXPERTS AND POWER USERS

Part III
RESEARCH AND FINDINGS
111


Part 3 Overview
Part 3 includes the following chapters:
12 Demographic trends
Chapter 12 explains Virginia’s major demographic trends over the past decade. The size, movement,diversity, and age of the population all affect the number and types of households (both current andnew) and the kinds of housing they need.
13 Economic trends
Chapter 13 shows Virginia’s major economic trends over the past decade. Jobs, wages, householdincomes, and poverty rates all help explain the financial health of Virginians and contribute signifi-cantly to their ability to find housing that meets their budgets.
14 Housing inventory and production
Chapter 14 evaluates high-level trends in Virginia’s housing stock, including overall production rela-tive to population and job growth, along with the type, size, age, and quality of the places Virginianscall home.
15 Homeownership market
Chapter 15 analyzes the state’s homeownershipmarket and current characteristics of Virginians whoown their home or are seeking to purchase a home.
113

114
16 Rental market
Chapter 16 analyzes the state’s rental market and current characteristics of Virginians who rent theirhome. It also provides data on the scope and distribution of apartments that use some form of publicassistance to reduce rents to make themmore affordable.
17 Housing instability and homelessness
Chapter 17 presents trends on mortgage delinquency, eviction filings, and homelessness throughoutVirginia. Intervention to prevent these crises must be a priority; inaction compounds stresses onsocial infrastructure like healthcare and education.
18 Projections
Chapter 18 uses the latest available population projections for the state to estimate housing demandin the coming decade. It also discusses the limitations of such data and the need to generate newestimates as post-pandemic census figures are available.
19 Neighbor state comparisons
Chapter 19 compares Virginia’s challenges and progress on housing affordability with its neighboringstates in the South andMid-Atlantic. The data contextualizes the Commonwealth’s current situationfor a broader perspective.

Chapter 12
Demographic trends
This chapter explains Virginia’smajor demographic trends over the past decade. The size,movement,diversity, and age of the population all affect the number and types of households (both current andnew) and the kinds of housing they need.
Highlights
Major takeaways in this chapter include:
• The 2020 U.S. Census recorded Virginia’s population at 8,654,542 residents, an increase ofmore than half a million in a decade and a full percent increase since 2019, reversing the pre-vious slowing trend in annual growth.
• Metro areas are gaining population while rural areas are losing residents. The Northern Vir-ginia suburbs, theRichmond region, and theNorthernShenandoahValley are growing themostrapidlywhile themost pronounced losses have been in Southside, Southwest, and theAlleghanyHighlands.
• Natural increase and international immigration are driving population growth, not residentsmoving from other states.
• Virginia is becomingmore ethnically and racially diverse, especiallywithin younger age groups.Non-white population growthoutpaces that of thewhite population, particularly inmetro areas.
• Virginia is aging. The over-55 cohort is the largest age group in the state, increasing demand forsmaller houses—particularly ones suitable for aging-in-place—from renters and owners alike.
115

116 CHAPTER 12. DEMOGRAPHIC TRENDS
12.1 Population andmigration
Finding 1: Virginia is growing, but that growthmay be slowing.
The number of new Virginians added per year has been getting smaller, although last year’sCensus count may buck the trend.
Figure 12.1: Total population of Virginia
Virginia’s population surpassed eight million just over ten years ago. Since then, the Commonwealthaddedmore than half a million new residents. While Virginia continues to grow, the relative numberof new residents has been getting smaller each year. Up until 2019, population estimates showedVirginia’s growth rate waning nearly every year.
That trendmay be changing. In April 2021, the U.S. Census Bureau released the state apportionmentresults from the 2020 Census, which tallied the Commonwealth’s population at 8,654,542—morethan a full percent increase from the 2019 estimate.
The U.S. Census Bureau has additional information on the changes that Virginia has experiencedfrom the 2010 Census to the 2020 Census here. Interactive dashboards created by the U.S. CensusBureau allow you to explore changes at the locality level in terms of population, diversity, and age.

12.1. POPULATION ANDMIGRATION 117
Finding 2: Manymore people are living in metro areas than a decade ago.
Rural communities across the Commonwealth continue to lose population.
Figure 12.2: Population change by market name
Virginia’s population growth is not evenly distributed; large portions of theCommonwealth are losingresidents. Every Large and SmallMetroHousingMarket has grown since 2010, especially those alongthe urban crescent and throughout the Shenandoah Valley. The three fastest growingmetro areas arethe Northern Virginia suburbs, the Richmond region, and the Northern Shenandoah Valley.
Over the same period, Virginia’s rural population has consistently declined. The most pronouncedlosses have been in Southside, Southwest, and the Alleghany Highlands. However, 2020 Censuscounts showed that recent estimates for rural Virginia may have overestimated population losses ofthe past decade. The Chesapeake Bay, Southside, and Southwestmarkets all had above-expected pop-ulation counts in last year’s decennial census.

118 CHAPTER 12. DEMOGRAPHIC TRENDS
Figure 12.3: Population change by submarket
Populations also shifted dramatically within markets. By sorting metro areas into submarkets, it ispossible to explore the types of communities with the largest population increases and decreases.Since 2010, the highest population growth—more than 14 percent—has occurred in lower densityareas along the I-95 corridor, dense urban cores in Northern Virginia, and suburban localities sur-rounding major cities.
Lower-density urban cores have seen the smallest relative growth (just below three percent) amongall submarkets in major metro areas. These are the central cities in the Richmond-Petersburg areaand Hampton Roads.
Within smaller markets, both cities and their surrounding counties are growing, although cities havea slight edge. Three of the four rural submarkets are shrinking, with the largest declines occurring insmall cities and counties not along the Chesapeake Bay.

12.1. POPULATION ANDMIGRATION 119
Finding 3: Virginia is growing from natural increases and international immigration,not people moving from other states.
However, births are declining and net domestic migration is trending positive.
Figure 12.4: Components of population change
The basic components of population change include births, deaths, and migration—both domesticand international. The net difference between births and deaths is the “natural” increase or decreasein population.
Since 2010, Virginia’s population growth has been entirely the result of natural increases and immi-gration from other countries. Since 2014, more Virginians have moved to another state than otherAmericans have moved to Virginia.
However, figures from the last fewyears show that the state’s natural population increases are slowing.The domestic migration “deficit” is getting smaller, and foreign migration numbers have declinedsharply. If these recent trends continue, in the near future population growthmay be drivenmore byindividuals and families moving to Virginia from other states.

120 CHAPTER 12. DEMOGRAPHIC TRENDS
Figure 12.5: Components of population change by market group
Natural increases and foreignmigration are driving population growth in LargeMetro HousingMar-kets. Domestic and foreignmigration is driving growth in SmallMetroHousingMarkets. While RuralHousingMarkets have seen a small increase in immigrants from other nations, they are experiencingboth natural population decline (more deaths than births) and domestic migration deficits.

12.1. POPULATION ANDMIGRATION 121
Figure 12.6: Components of population change by market name
From 2010 to 2019, births and foreign immigration in the urban crescent has driven Virginia’s pop-ulation growth. Hampton Roads experienced a larger natural increase than Richmond, but Rich-mond was the only market to see major growth from people moving into Virginia from other states.SmallMarkets in the Shenandoah Valley also experienced slight net increases in domesticmigration.Thesemarkets, including Charlottesville andWinchester, have attractedmore residents over the pastdecade.

122 CHAPTER 12. DEMOGRAPHIC TRENDS
12.2 Racial and ethnic diversity
Finding 1: Virginia is steadily becoming more diverse.
The non-white population has seenmore growth than the white population.
Figure 12.7: Non-white population change
Although amajority of Virginians (60 percent) identified aswhite in the 2020Census, growth amongthe non-white population is outpacing white population growth. This is especially true in the Largeand Small Metro HousingMarkets of Virginia where on average the non-white population has grownby more than 50 percent, while the white population across all markets has declined.
Race and ethnicity in the 2020 Census
The greater-than-expected rise in the non-white population—and commensurate shrinking of thewhite population—surprised researchers when the 2020 Census results were released.
This phenomenon is very likely in part because of the changingways Americans are choosing to iden-tify their race and ethnicity.

12.2. RACIAL AND ETHNIC DIVERSITY 123
Figure 12.8: Population change by race
In the 2010 Census, just over 71 percent of Virginians identified themselves as white. That num-ber steadily declined over the past decade as the Commonwealth continued to becomemore diverse,falling to just above 69 percent in the 2019 population estimates.
However, that share dropped significantly—to 60 percent—in the 2020 Census. Last year, largershares of Virginians chose to identify themselves as multiracial (up to 8.2 percent from 2.5 percentin 2010) or of another race (up to 5.7 percent from less than one percent in 2010).
Over this same period, the share of Virginians who are Black remained just below 20 percent, and theshare of those who are Asian increased steadily from 5.6 percent to 7.1 percent.

124 CHAPTER 12. DEMOGRAPHIC TRENDS
Finding 2: Hispanics are driving population growth across the Commonwealth.
The Hispanic population is outpacing non-Hispanics in all market areas of Virginia.
Figure 12.9: Population change by race
Like much of the United States, the Hispanic population in Virginia is seeing major growth. Hispan-ics in rural Virginia are compensating for the decline in non-Hispanics. Without this growth, RuralHousing Markets in Virginia would suffer further from a shrinking workforce and tax base.
The Hispanic population has increased by 63 percent in Small Metro HousingMarkets from 2010 to2020, the largest percent change in Virginia.

12.2. RACIAL AND ETHNIC DIVERSITY 125
Finding 3: Immigration to Virginia is a big factor in recent growth.
Naturalized U.S. citizens are contributing to growth throughout Virginia.
Figure 12.10: Immigrant population change
In 2019, approximately 12 percent of Virginia’s population was born in another country. The largestshare of Virginia’s foreign born population (42 percent) was from Asia while 36 percent was fromLatin America. Much of Virginia’s immigrant population comprises naturalized citizens who are asignificant factor in population growth in all three housing markets in Virginia.

126 CHAPTER 12. DEMOGRAPHIC TRENDS
Figure 12.11: Change in foreign-born population in neighboring states

12.3. AGE AND GENERATIONS 127
12.3 Age and generations
Finding 1: Virginia is getting older.
Baby boomers are the main group aging in Virginia, but millennials aren’t far behind.
Figure 12.12: Change in population by age group
Virginia’s population shifts by age resemble a barbell, with all the growth occurring at the ends of thespectrum. The largest growing age cohort over the last ten years is 55 and over, especially “young”seniors between 65 and 74. There are also 100,000 more elderly Virginians who are 75 and olderand who have more specific housing needs. The number of middle-age Virginians—between 35 and54—has declined, while the 25 to 34 cohort showed strong gains as millennials fully graduate intoadulthood.

128 CHAPTER 12. DEMOGRAPHIC TRENDS
Finding 2: Rural communities have much higher average ages thanmetro regions.
Smaller college towns keep some non-metro areas of Virginia youthful.
Figure 12.13: Median age in cities and counties
The average age of Virginia’s statewide population is 38 years, but is 45 years in communities aroundthe Chesapeake Bay, in the Alleghany Highlands, and throughout Southwest Virginia. These ruralareas continue to age at a much faster rate than their more populous counterparts in other parts ofthe state.
Some of the youngest areas of the state are actually outside of the urban crescent, including collegetowns and cities in the New River Valley (Blacksburg and Radford) and Central Valley (Harrisonburgand Lexington). However, most younger-than-average localities are located in Northern Virginia andHampton Roads.

12.3. AGE AND GENERATIONS 129
Finding 3: Both Large and Small Metro Markets are aging faster than Rural HousingMarkets.
This age wave has major housing implications.
Figure 12.14: Percent change in age group
Most rural communities inVirginia are losing population on thewhole but gainingnumbers of peopleover 55—mainly due to current residents aging into retirement. However, these gains aremuchmoresignificant in both Large and Small Markets in the rest of the state, especially in the 65 to 74 cohort.
Many of these urban and suburban Virginians are looking to downsize as they reach their senioryears. This increases competition for an insufficient number of smaller homes. Less affluent and lessmobile seniors—especially those with disabilities—face challenges of accessibility and maintenanceneeds.

130 CHAPTER 12. DEMOGRAPHIC TRENDS
Finding 4: More seniors generally means smaller households.
As baby boomers age, they continue to live with their spouse or to live alone.
Figure 12.15: Living arrangements of Virginia’s seniors
Most seniors continue to live alone or with their spouse though there has been a small increase inthe number of seniors living with extended family. Married or single seniors living independentlyexperience both sides of the housing stability coin: while they may now need “less house” to livecomfortably, caring for themselves or eachotherwill become increasingly difficult as they agewithoutyounger household members to provide care.
As a result, many mobile senior households are seeking smaller homes in denser areas, especiallyneighborhoods near services and amenities. This stock is also popular with young adults seekingtheir first home to purchase, setting up high levels of demand.

12.3. AGE AND GENERATIONS 131
Finding 5: Disabilities among seniors are more common in rural communities.
These seniors face greater challenges accessing services and safe housing.
Figure 12.16: Share of seniors with a disability
In 2012, more than 330,000 Virginians over 65 had a disability. As of 2019, that number had in-creased to 410,000. Many of those seniors are in Southwest and Southside, where more than one infive older adults have a disability.
In these less dense areas, seniors must travel further to shop, visit family, and get healthcare. Manytypes of disabilities make those necessary daily activities even more challenging, especially whenpublic transportation is limited. Older housing in rural areas is often less accessible and in need ofmore maintenance than newer homes in other parts of the state.

132 CHAPTER 12. DEMOGRAPHIC TRENDS
Finding 6: Virginia’s youth is increasingly diverse.
Over half of young Virginians in Large Metro Housing Markets are now persons of color.
Figure 12.17: Younger population by race and ethnicity
Large Markets have the most racially and ethnically diverse population of children and college-ageadults. There is also a large and growing diverse youth cohort in SmallMarkets. The youth populationin rural Virginia is becoming increasingly diverse aswell due to a larger share of the Black population.Overall, the strongest growth is in Hispanic and multiracial youth.

12.4. HOUSEHOLD TRENDS 133
12.4 Household trends
Finding 1: Household sizes are shrinking in Small Metro and Rural Housing Markets.
Larger households are seeing the greatest growth in Large Metro Housing Markets.
Figure 12.18: Change in household size
While households of all sizes are seeing rapid growth in Large Markets in Virginia, the same cannotbe said for other parts of the Commonwealth. The largest declines in household size are happeningin the rural areas of Virginia, where overall population declines are occurring in large part due to lossof economic opportunities and an aging population.
In SmallMarkets, three-or-more person households are stagnatingwhile one- and two-person house-holds are seeing the greatest growth. The growth of one-person households in rural areas has out-paced all other household sizes—likely in large part to an increase in seniors living alone.

134 CHAPTER 12. DEMOGRAPHIC TRENDS
Finding 2: Renters have smaller households than owners.
The average size of renter households is also decreasing more rapidly than the average size ofowner households.
Figure 12.19: Average household size by tenure
Large Markets have had the largest average household sizes for both owners and renters, but thosesizes have declined significantly since 2010. Renter households in Small Markets have also gottensmaller, while owner-occupied households in those areas have stayed about the same size. The size ofrenter households in Rural Markets has not changed significantly, but owner households there havebucked the trend and increased in size steadily over the last decade.

12.4. HOUSEHOLD TRENDS 135
Finding 3: The share of adult children living with their parents continues to climb.
Except in Hampton Roads, Large and SmallMetro HousingMarkets are experiencingmoderateincreases in the number of adult children living with their parents.
Figure 12.20: Change in living arrangements
As home prices and rents have continued to increase, many adults are finding it hard to find afford-able housing on their own. There have been moderate increases in the number of adults living withtheir parents in nearly every large and small metro area in Virginia except for Hampton Roads.
In rural Virginia, the shift in household composition has been primarily toward shared living ar-rangements of nonrelatives.

136 CHAPTER 12. DEMOGRAPHIC TRENDS
Finding 4: There are now many more older homeowners—and fewer younger ones—than a decade ago.
Renter households have increased across all ages.
Figure 12.21: Household formation by age group and tenure
Over the past ten years, older homeowners accounted for the largest increase in new households inVirginia. Conversely, the largest decrease in newhouseholds is among young andmiddle-aged home-owners. This can be attributed to baby boomer homeowners aging into older cohorts and to the mil-lennials’ low ownership rates. This may be due partly to the ability of higher-wealth older adultsto outcompete less wealthy younger buyers for homes, especially smaller homes in highly desirablemarkets.
In contrast, growth in renter households is steadily increasing across all ages between 25 and 74. Thisindicates a demand for rental housing options attractive and accessible to every age group.

12.4. HOUSEHOLD TRENDS 137
Figure 12.22: Change in households by age group and tenure
Over the past decade, each major market group has seen a decrease in young homeowners and anincrease in homeowners over the age of 65. Out of all the housing markets, Rural Markets had thegreatest loss of non-senior homeowners. This reflects the overall trend of shrinking populations inrural areas and population growth in urban and suburban areas. There also has been a significantincrease in middle-age and older renter households in both Large and Small Markets.

138 CHAPTER 12. DEMOGRAPHIC TRENDS
Finding 5: Hispanic, Asian, and Multiracial Virginians are the only groups with morehomeowners now than in 2010.
Similar growth among renter households has kept homeownership rates from rising.
Figure 12.23: Household growth by race and ethnicity and tenure
The increase in renters across all age groups also applies to all racial and ethnic categories in Virginia.Although there are now over 40,000 more white renter households, they experienced the smallestgrowth compared to 2010. Hispanic, Asian, and Multiracial Virginians saw the largest relative in-crease in renter households. These three groups are also the only Virginians who saw real increasesin the number of homeowners since 2010.
However, the homeownership gap has not narrowed for most racial and ethnic groups, especiallyfor Hispanic and Multiracial Virginians, due to a concurrent rise in renters that outpaces the rise inhomeowners.

Chapter 13
Economic trends
This chapter shows Virginia’s major economic trends over the past decade. Jobs, wages, householdincomes, and poverty rates all help explain the financial health of Virginians, which determines theirability to find housing that meets their budgets.
Highlights
Major takeaways in this chapter include:
• Despite strong growth in the face of two major recessions, new economic opportunities in Vir-ginia are not equally distributed.
• Jobs rebounded quickly in metropolitan areas following the Great Recession and COVID-19pandemic, but total employment levels in rural Virginia have consistently declined since 2008.
• Black and brown Virginians suffered a much higher rate of pandemic-related job losses com-pared to white Virginians. They also consistently have below-average household incomes.
• Many of the state’s fastest-growing job sectors, such as healthcare support occupations, com-mand below-average wages. These workers will have less income available for rent ormortgage.
• Employment and income trends are exacerbating inequality: Projected job growth is in occupa-tional sectors with widely disparate earnings, andwage growth remains concentrated in alreadyhigh-earning occupations and regions.
139

140 CHAPTER 13. ECONOMIC TRENDS
13.1 Labor force
Finding 1: Virginia’s metro areas account for all job growth over the past two decades.
Rural Markets never recovered from the Great Recession.
Figure 13.1: Change in total employment
The Commonwealth added almost 900,000new jobs from 2000 to 2020. During that time Virginialost 200,000 jobs to the foreclosure-driven Great Recession from 2008 to 2010. Most of Virginia re-bounded after the downturn; the state added 60,000 new jobs each year on average between January2010 and February 2021. But in March 2021, Virginia entered lockdown in response to the spreadof COVID-19. Job losses were immediate and historic, exceeding 400,000 within weeks. However, alarge number of those jobs returned over the past year.
While Large Markets saw the highest job growth levels, their Small Market counterparts were not farbehind. Prior to the pandemic, these areas had 20 percent more jobs than in 2000. Rural Marketssaw stagnant growth in the 2000s followed by steady declines after the Great Recession.

13.1. LABOR FORCE 141
Finding 2: Since the start of the pandemic, Rural Housing Markets and some SmallMetro Housing Markets have fared better with job recovery.
Large Metro Housing Markets—and some Small Metro Housing Markets—are still well belowpre-pandemic employment levels.
Figure 13.2: Pandemic job recovery
Economic recovery has been uneven across the state since the lifting of initial state-level pandemicrestrictions and the rollout of the state’s vaccination effort. The Northern Shenandoah Valley/Winchester Metropolitan Statistical Area (MSA) and the Chesapeake Bay are two areas seeingthe fastest return to pre-pandemic employment levels. Regions recovering more slowly includeotherwise healthy metro markets such as Richmond and Charlottesville as well as remote areas likethe Alleghany Highlands.
Overall, the three Large Markets are still far from full recovery. Small Markets and Rural Marketsvary; some are faring better than their more populous counterparts in the urban crescent, but as ofJune 2021, others still have employment levels that are down about 10 percent from pre-pandemiclevels.

142 CHAPTER 13. ECONOMIC TRENDS
Finding 3: Despite recent recovery, rural Virginia still has higher unemployment levels.
Non-metro areas may have fared better over the past year, but they have not recovered frompre-pandemic job losses.
Figure 13.3: Unemployment rate by market name
Virginia enjoyed low unemployment rates across most of the state prior to the pandemic and its eco-nomic fallout. Many lost jobs now have been restored and filled, and the statewide unemploymentrate is 4.5 percent as of June 2021.
Across the state, nearly all markets are within a point of this state average. Within the urban crescent,Hampton Roads and Richmond have higher unemployment thanNorthern Virginia. Unemploymentin Small Markets is relatively low except for the Lynchburg area. Every Rural Market has unemploy-ment above the state average, especially Southside at 5.5 percent.

13.1. LABOR FORCE 143
Finding 4: Non-white Virginians experience unemployment at much higher rates.
Pandemic job losses in 2020 hurt Virginians of color the most.
Figure 13.4: Unemployment rate by race and ethnicity
Unemployment across Virginia is not equally distributed across race and ethnicity. Nearly a decadeago, the 10 percent unemployment rate for Black Virginians was almost double the rate for whiteVirginians. Unemployment for Hispanic Virginians varied prior to the pandemic, but generally ex-ceeded the rate for whites. Asian Virginians experienced the lowest unemployment rates amongma-jor race/ethnic groups.
The unemployment situation is fluid as the pandemic recovery continues, but based on available2020 averages, Virginians of color lost jobs at a much higher rate than white Virginians. Black andHispanic unemployment soared above nine percent, and Asian unemployment was not far behind,but the white unemployment rate barely exceeded five percent.

144 CHAPTER 13. ECONOMIC TRENDS
13.2 Jobs and wages
Finding 1: Customer-service jobs are the most common positions filled by workers inVirginia.
These workers have been front and center during the pandemic.
Figure 13.5: Ten most common jobs in Virginia in 2010 and 2020
Retail salesperson, cashier, and food service worker remain in the top fivemost common occupationsin Virginia. These relatively low-pay positions have been a policymaking focus as communities re-open and restart their economies. Other common positions that have stayed in the top ten are officeclerk, customer service representative, janitor, stocker, and general manager.
Software developer, a traditionally higher-earning role, emerged as the fourth most common job inthe state by 2020. However, the “software developers” occupation code did not exist in 2010 so jobsin that category likely were classified under other codes.

13.2. JOBS ANDWAGES 145
Finding 2: The fastest growing job groups are a tale of two income brackets.
The two fastest growing sectors have low wages while others in the top five pay well.
Figure 13.6: Wages for top five fastest growing job sectors
Since 2010, the two fastest growing sectors have been healthcare support and transportation andmaterial moving. As of 2020, themedian annual wages for all jobs in both categories were well below$35,000. At the same time, Virginia saw strong growth in three other sectors: life, physical, andsocial science; business andfinancial operations; and computer andmathematical. Positions in thesecategories are more likely to require advanced degrees and additional training and correspondinglycommand higher salaries ranging from $79,240 to $102,840.

146 CHAPTER 13. ECONOMIC TRENDS
Finding 3: Future jobs in Virginia will focus on computers, food, and healthcare.
These important positions have a wide range of salaries.
Figure 13.7: Job sectors with highest projected growth
The Virginia Employment Commission expects the Commonwealth to add more than 260,000 newjobs between now and 2028. Nearly every major occupational sector will see increases, but the topeight are shown above. High-tech computer-based jobs will see the greatest net increase followed byfood preparation and service. Though a diverse economy requires that both are strong sectors, theiraverage wages and educational requirements contrast significantly.
The personal care and service, healthcare practitioners, and healthcare support sectors are all pro-jected to grow significantly. The state’s aging population will contribute to the increase in demandfor these services.
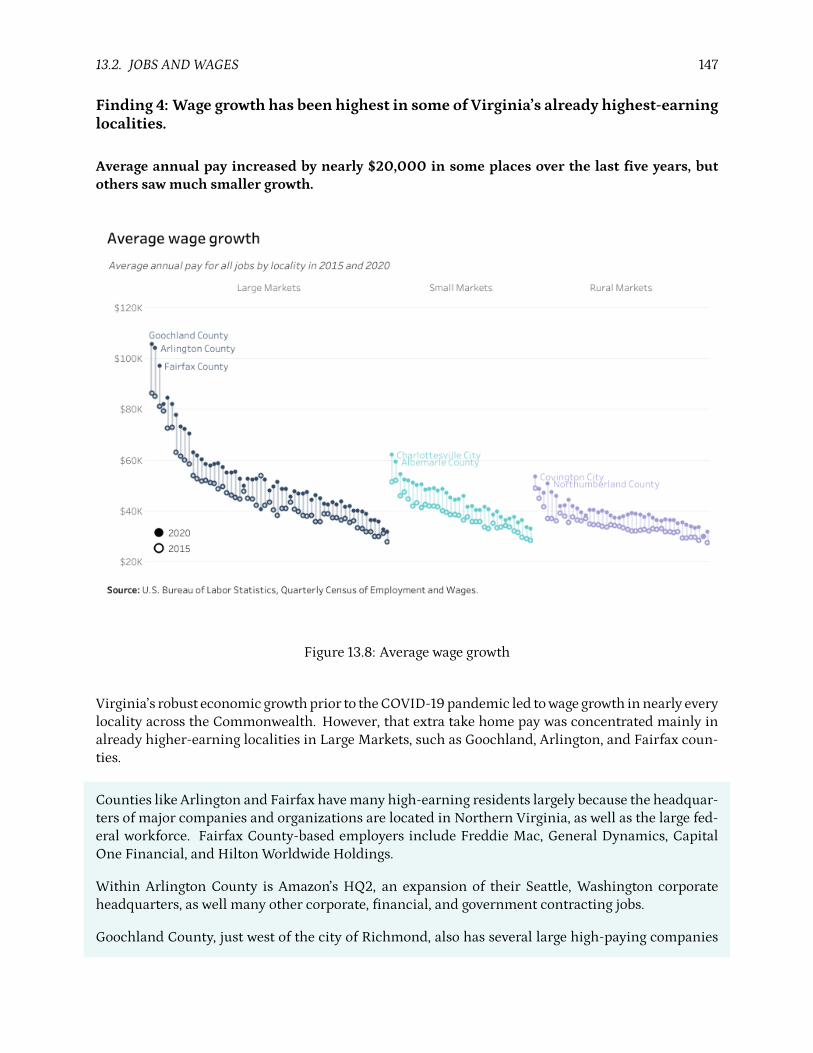
13.2. JOBS ANDWAGES 147
Finding 4: Wage growth has been highest in some of Virginia’s already highest-earninglocalities.
Average annual pay increased by nearly $20,000 in some places over the last five years, butothers sawmuch smaller growth.
Figure 13.8: Average wage growth
Virginia’s robust economic growthprior to theCOVID-19pandemic led towage growth innearly everylocality across the Commonwealth. However, that extra take home pay was concentrated mainly inalready higher-earning localities in Large Markets, such as Goochland, Arlington, and Fairfax coun-ties.
Counties like Arlington and Fairfax havemany high-earning residents largely because the headquar-ters of major companies and organizations are located in Northern Virginia, as well as the large fed-eral workforce. Fairfax County-based employers include Freddie Mac, General Dynamics, CapitalOne Financial, and Hilton Worldwide Holdings.
Within Arlington County is Amazon’s HQ2, an expansion of their Seattle, Washington corporateheadquarters, as well many other corporate, financial, and government contracting jobs.
Goochland County, just west of the city of Richmond, also has several large high-paying companies

148 CHAPTER 13. ECONOMIC TRENDS
withmajor footprints. These include the Capital OneWest Creek campus, CarMax headquarters, andthe Luck Stone Corporation.
Some Small Markets, including Charlottesville and Albemarle County, experienced significant aver-age wage increases. The lowest-earning localities in SmallMarkets—those with average annual wagesnear or below$40,000—generally saw the smallest growth in take homepay as did the lowest-earninglocalities in Large Metro Housing Markets.
In nearly every locality in Rural Markets, average annual wages do not exceed $40,000. Whilemost wage increases since 2015 were modest, some localities saw relatively high gains, particularlyNorthumberland County on the Northern Neck.
Finding 5: Wage growth is not the same across all industries.
Higher-paying industries are seeing the greatest wage increase.
Figure 13.9: Average annual wage by industry
Jobs in information, finance, and professional services have the highest-paid workers in the Com-monwealth. However, the salaries for these occupations vary widely depending on market area. In

13.3. HOUSEHOLD INCOMES 149
the Large Markets, such jobs pull in well over $80,000 a year, but similar positions in the same in-dustries command two-thirds to half of that in other parts of the state.
Scarce natural resource and mining jobs are the highest-paying occupations in Rural Markets, withaverage wages of approximately $55,000 in October 2020. Aside from these few well-paying jobs,most industries in rural areas have similar average wages to each other—largely ranging between$47,000 for financial activity jobs and $39,000 for education and health services jobs.
Wages for the lowest-paying industry—leisure and hospitality—are the most compressed across themarket groups. Many jobs in this sector pay at or slightly above the minimum wage, and many haveless than full-time hours. However, the second quarters of 2020 shownotable relative wage increasesfor these jobs. This may be due in part to employers offering higher wages to entice workers back totheir jobs during reopening phases.
13.3 Household incomes
Finding 1: Black Virginians make significantly less money.
There are major income disparities between Black households and other racial and ethnicgroups in Virginia.
Figure 13.10: Median household incomes by race and ethnicity

150 CHAPTER 13. ECONOMIC TRENDS
Incomes for all racial and ethnic groups have been on a steady rise over the past decade, but dispari-ties in income have persisted. Income inequalities between racial groups will continue to perpetuatedisparities in housing if not addressed.
In 2019, the median Black household income was only $53,896, while White, non-Hispanic house-holdsmade roughly $30,000more than that, andAsian householdsmade over 50 percentmore thanBlack households.
There are wide disparities in income between different Asian origin groups. In the U.S., Indians hada median household income of $119,000 in 2019, compared to $70,000 for Vietnamese householdsand $44,000 for Burmese households. (Budiman & Ruiz, 2021)
When looking at data on Asians or Hispanics, it is important to keep in mind that “Asian” and“Hispanic” or “Latino” are panethnic terms—meaning that multiple ethnicities are grouped togetherbased on a commonality such as geographic area or language.
The experiences of people of different countries of origin often vary dramatically, despite beinggrouped under the same pan-ethnic label.
Nuances do exist across the Commonwealth, with the widest income disparities occurring in North-ern Virginia. But Black households and Hispanic households are consistently represented at the lowend of median household income.
Figure 13.11: Local median household incomes by race and ethnicity

13.3. HOUSEHOLD INCOMES 151
Finding 2: Incomes across the Commonwealth are unevenly distributed by tenure.
The majority of owner households make over $75,000 while most renters make less than$50,000.
Figure 13.12: Household income distribution by tenure
The share of renters and owners making higher incomes increased from 2010 to 2019. But thoseincreases have not been evenly distributed; homeowner incomes have continued to skew towards$100,000 or more while renter incomes only reach the $50,000 to $74,999 range.
Although there has been a rise in the number of renters making higher incomes, there still remains asignificant number of renters who are making less than $15,000. These renter households continueto be in high need of assistance to make their way out of poverty.

152 CHAPTER 13. ECONOMIC TRENDS
13.4 Poverty
Finding 1: Black Virginians experience poverty at a disproportionately high rate.
White and Asian Virginians have the lowest poverty rates.
Figure 13.13: Poverty rate by race and ethnicity
Compared to the overall poverty rate of Virginia, many people of color experience poverty at a muchhigher rate. From 2010 to 2019, nearly one in every five Black Virginians was below the FederalPoverty Level. The poverty rate of Black Virginians in 2019 (18 percent) was over two times thatof white, non-Hispanic Virginians (8 percent) and Asian Virginians (7 percent). Hispanics also ex-perienced relatively high poverty rates (14 percent)—three percent points above the overall Virginiapoverty rate of 11 percent.
These poverty rates have major equity implications for Black and Hispanic Virginians. As these dis-parities in poverty have persisted for over a decade, the need to address the economic conditions ofpeople of color in Virginia is a critical path to racial equity.

13.4. POVERTY 153
Finding 2: Young people below 24 years of age are more likely to experience poverty inVirginia.
While the poverty rate among all age groups has remained steady, young Virginians are dispro-portionately represented in poverty.
Figure 13.14: Poverty rate by age
Compared to any other age group, Virginians under 24 years of age experience poverty at dispropor-tionate rates. In 2019, 14 percent of the population under 18 and 20 percent of 18 to 24 year olds werebelow the Federal Poverty Level, while all other age groups had a poverty rate below 10 percent.
The low number of seniors in poverty can be attributed to federal assistance programs such as Medi-care and Social Security Income, while the 25 to 44 and 45 to 64 year old age groups have a highproportion of working adults. However, the under 18 population with a 14 percent poverty rate showsa high need of support for families with children in poverty.
The 18 to 24 year old age group consists of a high number of college age students who technicallymeetthe poverty criteria, but are not living in actual poverty because they are receiving familial supportthat is not counted as income.
For context, the presence of college students living off campus has the ability to increase poverty ratesin localities with large or multiple universities by 10 or more percentage points. (Benson & Bishaw,

154 CHAPTER 13. ECONOMIC TRENDS
2018) (Rorem & Juday, 2016)
Finding 3: Asset Limited, Income Constrained, Employed households are growing out-side of Large Metro Housing Markets in Virginia.
While Asset Limited, Income Constrained, Employed (ALICE) households are decreasing over-all, the number of ALICE households is increasing in Small Metro and Rural Housing Markets.
Figure 13.15: Asset Limited, Incomed Constrained, Employed (ALICE) households
ALICE is a term increasingly used to describe households that earn above the Federal Poverty Levelbut are unable to afford the basic necessities to live comfortably. These households often do notqualify for assistance programs because they do not meet the income requirements. In 2018, justover 900,000 households in Virginia qualified as ALICE.
While Virginia’s statewide number of ALICE households has decreased in recent years, the rate is notconsistent across regions. ALICE households have been increasing in Small and Rural Markets inVirginia where households often live in areas where basic necessities are not easily accessible.

Chapter 14
Housing inventory and production
This chapter evaluates high-level trends inVirginia’s housing stock. That includes overall productionrelative to population and job growth and the type, size, age, and quality of the places Virginians callhome.
Highlights
Major takeaways in this chapter include:
• Housing production has yet to recover to pre-Recession levels, while population and job growthcontinues.
• About 30,000 new homes are built in Virginia each year. However, this rate is about half theannual production from the mid-2000s.
• Statewide population growth remains several percentage points above the increase in housingsupply, even as shrinking average household sizes require more homes per person. This gap isdriven by Large Metro Housing Markets.
• Virginia’s housing supply is predominantly detached single-family homes, even throughoutmuch of the urban crescent. These are also the most common new homes built, along withlarger apartment buildings.
• Townhomes and small-scale apartments—which can be more affordable by design—are a verysmall fraction of the supply added in recent decades.
• On average, Virginia’s housing stock is aging. Older homes—with potential health and safetyshortcomings—are more prevalent in cities and rural areas.
• Overcrowded homes—with more than one person per room—are rare, but are much more fre-quently occupied by low-income renters.
155

156 CHAPTER 14. HOUSING INVENTORY AND PRODUCTION
14.1 Housing production
Finding 1: More than 30,000 new homes are built in the state each year.
However, thatproduction is roughlyhalf thenumberof annualhousing starts inVirginiaduringthe mid-2000s.
Figure 14.1: Annual building permits by structure type
The Building Permits Survey data collected by theU.S. Census Bureau only disaggregatesmultifamilybuildings into three types:
• Two-family buildings,• Three- and four-family buildings, and• Five-or-more family buildings.
This is different from the categorization of multifamily buildings used in other parts of this report.Note: When using Building Permit Survey data this report classifies small multifamily as 2-4 unitsand large multifamily as 5-or-more units.

14.1. HOUSING PRODUCTION 157
The average annual number of building permits for the last decade has stayed around 30,000,roughly equivalent to the number of homes currently in the City of Lynchburg. Those figures mayseem large, but they are just above half of the annual permits filed across the state in the early 2000s.During that last building boom, Virginia was adding between 50,000 and 60,000 new homes peryear—closer in size to today’s Spotsylvania County.
Finding 2: Most new homes are built in suburbs throughout the urban crescent.
In Small Metro and Rural Housing Markets, production is in counties—not cities.
Figure 14.2: Cumulative building permits
The largest share of new homes built in the Commonwealth since 2000 are in suburban submarketsin the urban crescent, along with counties in Small and Rural Markets. Many of these are single-family homes built prior to 2008. For every home built in an Urban Core in a Large Market or in asmall or rural city,more than three were built in metro suburbs.

158 CHAPTER 14. HOUSING INVENTORY AND PRODUCTION
Finding 3: Virginia is adding people faster than homes.
Since 2008, housing production continues to lag behind population growth.
Figure 14.3: Population and housing growth in Virginia
Since the Great Recession, the Commonwealth’s population has grown more than ten percent, cap-tured by a stronger-than-expected count in the 2020 Census. At the same time, the total housingsupply across the state increased by just under nine percent. This underproduction—combined withgeneral trends toward smaller household sizes—increases demand for existing homes.

14.1. HOUSING PRODUCTION 159
Finding 4: The population-housing gap is driven by Large Metro Housing Markets.
Housing production in Small Metro and Rural HousingMarkets is generally keeping pace withpopulation growth.
Figure 14.4: Population and housing growth by market growth
Housing underproduction relative to population growth is most significant in Virginia’s Large Mar-kets as new construction remains well behind pre-2008 levels throughout the urban crescent.
In Small Markets, population and housing growth have mostly aligned at around six percent since2008. In Rural Markets—where population is declining—housing production remained commensu-rately low but still slightly positive until 2020. The recent 2020 Census count showed an unexpect-edly low two percent decline in housing units in rural Virginia since 2008.

160 CHAPTER 14. HOUSING INVENTORY AND PRODUCTION
Finding 5: Prior to COVID-19, Virginia was adding manymore jobs than homes.
Between 2009 and 2019, job growth outpaced the number of new individual housing unitsadded across the state.
Figure 14.5: Job-housing imbalance
Economic growth—and the jobs that follow—are a major component of housing demand. Virginia’seconomy recovered relatively well from the 2008-2010 Great Recession, adding over 12 percent ad-ditional jobs by 2019. Over that same period, the number of individual housing units available tobecome home to workers, their families, and all other Virginians increased by just under six and ahalf percent.
The job losses resulting from thepandemic’s economic crisis inverted the annual ratio of employmentto housing unit estimate for 2020, butmany of those jobs subsequently returned and have been filledas of summer 2021.

14.2. STRUCTURE TYPE 161
14.2 Structure type
Finding 1: Most Virginians live in single-family homes.
Multifamily apartments account for fewer than one in four homes.
Figure 14.6: Housing type by tenure
Virginia is predominantly a single-family home state. Almost three in four of all households—including 40 percent of renters—live in detached or attached single-family homes. Though attachedtownhomes may be common in some more dense areas, they are still outnumbered five times bydetached single-family homes statewide. Most Virginians do not share walls with their neighbors.
This arrangement is not by chance. In the early 20th century, localities in Virginia (and across thenation) began adopting zoning ordinances that regulated land uses. Whilemany of these new restric-tions attempted to promote public health and welfare by separating noxious activities from residen-tial areas, they were just as commonly used to segregate communities by race and class via single-family only zoning. The history of this activity in Virginia—and its continued legacy—were the sub-ject of a recent paper by the McGuireWoods Zoning and Segregation Work Group, which can be readin full here.

162 CHAPTER 14. HOUSING INVENTORY AND PRODUCTION
The prevalence of single-family zoning over the past century has also contributed to car-orientedsuburban sprawl. When localities limit the diversity of housing options available to build (includingsmaller homes, townhomes, and multifamily buildings), more land per home is needed. As a result,nearly all communities built-out in Virginia after the Second World War are difficult to navigate byanything other than a personal vehicle. Traveling by foot to an adjacent neighborhood, or the grocerystore, is nearly impossible on foot. These auto-dependent areas contribute to longer commutes, morecongestion and pollution, and greater transportation spending.
Multifamily homes are muchmore likely to be leased rather than owned as condominium units; justfive percent of all owners live in either a small or large multifamily building. Nearly half of renters(46 percent) live in large apartment buildings with five or more units.
A small but similarly-sized share of owners (five percent) and renters (four percent) live in manufac-tured homes throughout the state.
Finding 2: Single-family and larger multifamily buildings make up nearly all newhomes in Virginia.
Small-scale apartments are rarely built.
Figure 14.7: Cumulative building permits by structure type

14.2. STRUCTURE TYPE 163
Home builders in Virginia continue to build what is already most familiar: single-family homes andlarge apartment buildings. Since 2000, the rate of single-family production has more than tripledthat of multifamily production. However, while the pace of multifamily construction has remainedsteady over the past two decades, single-family output has slowed relative to pre-recession levels.
Over the same past 20 years, developers and builders produced fewer than 14,000units of smallmul-tifamily homes (2-4 units per building) across the state—less than two percent of all new homes built.These buildings, which make up a significant portion of rental homes available in older cities acrossVirginia, are often considered the “missing middle” homes along with other small-scale apartmentcomplexes.
Finding 3: Single-family homes are the most common housing type built across thestate.
Only in Small Metro Housing Markets are multifamily homes becoming more common.
Figure 14.8: Share of building permits by structure type
Single-family production outpaces multifamily starts even in Large Markets. Throughout the urbancrescent, nearly four in five homes built before 2008 were single-family. That share was higher inSmall and Rural Markets.

164 CHAPTER 14. HOUSING INVENTORY AND PRODUCTION
Three important trends emerged after the Great Recession. First, themultifamily share of productionin Large Markets expanded to nearly 40 percent (although that trend later ended according to 2020permit data). Second, the multifamily share of production in Small Markets has grown from around20 percent to almost 40 percent. Third, the already small share of apartment construction in RuralMarkets has declined to a negligible amount.
Finding 4: Small Metro HousingMarkets are playing catch-up tomeet new demand forapartments.
Multifamily production in Large Metro Housing Markets has remained relatively consistentsince 2000.
Figure 14.9: Multifamily share of all building permits
The increase in newmultifamily buildings is most visibly dramatic in Northern Virginia, Richmond,and Hampton Roads. While those three Large Markets are certainly home to the highest net countsof new apartments, as of 2020 they are behind four of Virginia’s six Small Markets in terms of theshare of new homes that are multifamily.
Notably, new apartment construction is relatively strongest in the Blacksburg-Christiansburg,Roanoke, and Lynchburg areas, especially since 2010. In 2020, more than three-quarters of all newhomes built in the Blacksburg-Christiansburg market were multifamily, likely the result of demand

14.2. STRUCTURE TYPE 165
from students at Virginia Tech and Radford University. In Charlottesville—another Small Marketanchored by a university—apartments account for well over a third of all new homes built since2010.
Throughout the urban crescent, apartment construction is more prevalent in core cities, but overallfewer thanone in threenewhomes are apartments. Single-familyhomes still dominatehousing startsin these areas.
Finding 5: About 2,000 newmanufactured homes are added in the state each year.
Those deliveries are a fraction of 1990s levels.
Figure 14.10: Manufactured and modular home deliveries
Factory-built homes may be relatively uncommon statewide, but they are an affordable solution forthousands of Virginians, especially in rural communities across Southside and Southwest. Through-out the 1990s, Virginia added about 6,000 newmanufactured homes per year delivered from facto-ries both inside and outside the state. Beginning in the 2000s, those deliveries began declining assite-built housing became more abundant and affordable. Since then, total annual deliveries haveremained near or below 2,000.
While most manufactured homes built between mid-century and the 1990s were single-section,

166 CHAPTER 14. HOUSING INVENTORY AND PRODUCTION
larger multi-section homes became increasingly common by the 2000s when they accounted forwell over half of new deliveries.
As of 2013, Virginia Manufactured and Modular Housing Association (VAMMHA) also began esti-mating modular home deliveries. These units are composed of multiple factory-built sections thatare assembled on site and conform to state building code rather than HUDmanufactured home reg-ulations. Several hundred have shipped out across the state annually in recent years.
14.3 Age and quality
Finding 1: The average home in Virginia is about 40 years old.
Renters have slightly older homes than homeowners.
Figure 14.11: Age of housing stock
Most Virginians live in homes built between 1970 and 2009. Housing production across those fourdecades was fairly consistent and significantly more plentiful than during any other time period.Still, there currently aremanymore occupied homes built prior to 1970 than homes built after 2009.

14.3. AGE AND QUALITY 167
The average Virginian—who is about 38 years old—is probably living in a home built around the sametime they were born.
There are small but noticeable differences between the age of homes occupied by owners and renters.This is mostly the result of higher single-family home production in the 1990s and 2000s and thegrowth in homeownership that followed.
Finding 2: Older homes are more common in cities while newer homes are in the sub-urbs.
The Eastern Shore and rural counties also have older-than-average homes.
Figure 14.12: Age of housing stock by submarket
More than half of all homes in Small Market and rural cities, Urban Cores, and the Eastern Shorewere built before 1980. Small and RuralMarket counties, along with theMiddle Peninsula/NorthernNeck, also have large shares of older housing stock. These submarkets include both high-demandareas (such as many metro cities with pre-World War II homes) and lower density, lower demandcommunities.
Submarkets with the youngest housing stock are the places where production has been highest overthe past two decades—primarily the suburban corridor along the urban crescent.

168 CHAPTER 14. HOUSING INVENTORY AND PRODUCTION
Finding 3: Homes in Southwest Virginia aremuchmore likely to bemore than 40 yearsold.
This housing predates laws prohibiting lead paint.
Figure 14.13: Pre-1980 housing stock
Lead paint exposure remains a serious public health risk, especially for young children. Voluntaryphasing out of lead paint began in 1950, but a full ban did not take effect until 1980 so any homesmore than 40 years old continue to pose a risk.
Across the state, the highest shares of this older housing stock are in Rural and Small Markets in theSouthwest and Shenandoah Valley. In the Allegheny Highlands, almost three-quarters of all homeswere built before 1980.

14.3. AGE AND QUALITY 169
Finding 4: Homes without plumbing or kitchen facilities are rare but unequally dis-tributed.
Virginians with lower incomes more commonly live in homes without basic necessities.
Figure 14.14: Households without plumbing or kitchen facilities by tenure
Virginia has diligently worked over the past several decades to bring sanitary indoor plumbing to allhomes across the state through publicly-assisted upgrades and private investments. Today only aboutone percent of all homes lack full plumbing and/or kitchen facilities.
However, housing still in need of these critical upgrades is typically occupied by extremely and verylow-income Virginians, particularly renters and rural homeowners.

170 CHAPTER 14. HOUSING INVENTORY AND PRODUCTION
Finding 5: Low-income renters aremost likely to live in homes too small for their fam-ilies.
Overcrowded homes are a community health risk.
Figure 14.15: Overcrowded households
A home is considered overcrowdedwhen there are toomany people per room. While definitions vary,the common “overcrowded” threshold is 1.0 persons per roomand the “very overcrowded” threshold is1.5 persons per room. People living in overcrowded conditions are more likely to experience physicaland mental health issues—including an increased likelihood of disease transmission.
Overcrowded homes are relatively rare across Virginia, representing just two percent of all house-holds, or approximately 61,000 households. Most overcrowded households are in LargeMarkets andoccupied by renters with incomes below 50 percent AMI. Homeowners in other markets, especiallythose outside of the urban crescent, are the least likely to live in overcrowded homes.

14.3. AGE AND QUALITY 171
Figure 14.16: Overcrowding by race and ethnicity
Overcrowded housing conditions are more likely to be experienced by Hispanics and persons of An-other Race—which includes Indigenous peoples—than any other group. While overcrowding condi-tions have been rising for all groups, this rise has been more greatly felt by households identifyingas Multiracial, Asian, and Hispanic. These three groups experienced a one percentage point or morerise in the share of overcrowded housing units from 2010 to 2019, while Black and white householdssaw nearly no change.

172 CHAPTER 14. HOUSING INVENTORY AND PRODUCTION

Chapter 15
Homeownership market
This chapter analyzes the state’s homeownership market and current characteristics of Virginianswho own their home or are seeking to purchase a home.
Highlights
Major takeaways in this chapter include:
• Virginia’s homeownership rate is consistently higher than the national average, but may con-tinue recent declines without a proactive response to changing demographics andmarket con-ditions.
• Compared to the average Virginian, homeowners in the Commonwealth are older, more afflu-ent, and more white. In many Small and Rural Markets, most homeowners are more than 55years old.
• As of August 2021, the average single-family home in Virginia sold for $355,000—an increaseover 30 percent from five years prior. Home prices are rising far faster than renters’ averageincomes.
• Limited supply—especially of smaller homes equally sought after by young buyers and down-sizing baby boomers—has lifted prices and kept homeownership out of the reach of many.
• Homeowners are less likely to be cost-burdened than renters. However, homeowners whoare low-income, who live alone, or who are Black and brown are all disproportionatelycost-burdened.
173

174 CHAPTER 15. HOMEOWNERSHIP MARKET
15.1 Virginia’s homeowners
Finding 1: Three in four homeowners live with their family.
Rural homeowners are slightly more likely to live alone.
Figure 15.1: Owner household types
Married-couple households aremuchmore likely to be able to afford ahomebecause of the additionalincome when both spouses are in the paid workforce. This holds true particularly in Virginia’s Largeand Small Markets, where over half of homeowners are in married-couple households. Married-couple households are also the most common living arrangement in Rural Markets (56 percent), butrural residents are more likely than their Large and Small Market counterparts to live with otherfamily members (13 percent) or alone (28 percent).

15.1. VIRGINIA’S HOMEOWNERS 175
Finding 2: Most homeowners live in one-person or two-person households.
But unlike renters, homeowners are more likely to share their home than to live alone.
Figure 15.2: Owner household size
Most homeowners in the Commonwealth live in one-person or two-person households, but there arevariations in household size acrossmarket groups. In LargeMarkets, Virginia homeowners aremuchmore likely to live in larger households—most likely due to increasing economic opportunities foryoung families in these areas. Rural and Small Markets have greater shares of smaller households.

176 CHAPTER 15. HOMEOWNERSHIP MARKET
Finding 3: Homeowners are getting older.
Virginia’s oldest homeowners are in rural communities.
Figure 15.3: Owner household age
The aging of homeowners in Small Metro and Rural Housing Markets is contributing to smallerhousehold sizes. In these areas, residents 55 and older make up a greater share of the population,and they also have increased in number.
Homeowners in Virginia are increasingly older adults; unaffordable home prices have locked outmany millennial and younger Generation X would-be homebuyers.

15.1. VIRGINIA’S HOMEOWNERS 177
Finding 4: Homeowners of color are uncommon in Virginia.
Even in diverse markets, over two-thirds of homeowners are white.
Figure 15.4: Owner race and ethnicity
Homeowners in Virginia are more likely to be white, even in diverse areas of the Commonwealth.Although white Virginians make up a majority of the population, the low number of homeowners ofcolor signals a key consequence of centuries of racial inequity.
For example, 21 percent of all households in Large Markets are Black, but they account for only 15percent of the homeowners.

178 CHAPTER 15. HOMEOWNERSHIP MARKET
Finding 5: Metro homeowners have above-average incomes.
Over half of homeowners in the urban crescent earn more than six figures.
Figure 15.5: Owner household income
Income inequality among homeowners in Virginia is most significant in Large and Small MetroHousingMarkets where a greater proportion of homeowners make $100,000 ormore across incomegroups. There is greater income uniformity in Rural Housing Markets where homeowner incomesare distributed almost evenly across all income groups.

15.1. VIRGINIA’S HOMEOWNERS 179
Finding6: Homeowners aremore likely tohaveabachelor’s degreeorhigher inVirginiametro areas.
Over half of homeowners in the urban crescent have a bachelor’s degree or higher.
Figure 15.6: Owner educational attainment
Higher educational attainment often leads to higher income and with it, greater ability to afford ahome. In Virginia, disparities in homeownership among residents of different educational back-grounds are more pronounced in Large Markets. Over half of homeowners (53 percent) in the urbancrescent and just over one in three Small Market homeowner households have a bachelor’s degree orhigher.

180 CHAPTER 15. HOMEOWNERSHIP MARKET
15.2 Homeownership rate
Finding 1: Prior to COVID-19, homeownership in Virginia was increasing for the firsttime in more than a decade.
Recovery from theGreat Recession and the increase in renting has slowed the rate of homeown-ership across most of the country.
Figure 15.7: Homeownership rate in Virginia
From 2010 to 2016, homeownership decreased in many states as they recovered from the impactsof the Great Recession and housing costs rose. Virginia’s homeownership rate—almost 68 percentbefore the pandemic—was slightly higher than the national average, but a full six points below whatit was before 2008.
Virginia’s homeownership rate began to plateau around 2015 following a steady decline since thestart of the recession in 2008. By 2018, homeownership was on the rise again until the COVID-19pandemic hit in early 2020.
Although the U.S. Census Bureau’s homeownership estimates for Virginia were above 72 percent inthe second and third quarters of 2020, the rate dropped bymore than four points by the first quarterof 2021, followed by another sharp increase of several points. This volatility is likely the result of

15.2. HOMEOWNERSHIP RATE 181
changeddata collectionprocedures during the pandemic forHousingVacancies andHomeownership(CPS/HVS) estimates.
Finding 2: Homeownership has been declining slightly in almost every part of the state.
The biggest drops have been in Large Metro Housing Markets, but that trendmay be over.
Figure 15.8: Homeownership rate by market name
Homeownership in Virginia is most prevalent in Rural Markets, followed by Large Markets and thenSmall Markets. However, in nearly every market homeownership rates continued to decline in theyears following the Great Recession. While that drop is beginning to level off in Large Markets andsome Small Markets, homeownership in most rural areas is still decreasing.

182 CHAPTER 15. HOMEOWNERSHIP MARKET
Finding 3: The racial homeownership gap remains wide in Virginia.
ThroughoutVirginia, non-whitehouseholdsare far less likely tobehomeowners—butVirginia’sBlack and brown homeownership rates are better than the national average.
Figure 15.9: Homeownership rate by race and ethnicity
The barriers to homeownership formany households of color are deeply rooted in the systemic injus-tices of Virginia’s and the nation’s past. For generations these injustices have compounded the barri-ers for Black and brown families to build generational equity andwealth thatmanywhite householdshave been able to pass on to their children and grandchildren.
The wide homeownership gap between Black and brown households and their white counterparts inall parts of Virginia is a clear holdover from these injustices, especially in Large Markets that expe-rienced redlining. In these communities, the gap has widened to 26 points; white households have ahomeownership rate of 73 percent while Black households have a 47 percent homeownership rate.
However, in a national comparsion, Black Virginians aremore likely to be homeowners. The nationalhomeownership rate for Black households sits at 42 percent, six percentage points behind the home-ownership rate of Black Virginians.
Most racial and ethnic groups generally have experienced a decrease in homeownership except inSmall and Rural Markets where Hispanic homeownership rates are increasing significantly. In ru-

15.2. HOMEOWNERSHIP RATE 183
ral Virginia, Hispanic households have increased their homeownership rate to 52 percent from 40percent in a decade.
Finding 4: Fewer millennial and Generation X Virginians are becoming homeownersover time.
There has been an overall decline in homeownership among all age groups, but millennials—who already have a low homeownership rate—have experienced themost significant decreases.
Figure 15.10: Homeownership rate by age group
Statewide, the average homeowner is getting older. Millennials (born between 1981 and 1997) con-tinue to struggle to achieve homeownership. Social and economic factors—such as student loan debtand delayed household formation—are influencing this development. Delayed homeownership cancontribute significantly to growing inequity between younger and older generations.
Throughout Virginia the homeownership gap betweenmillennials and older age groups is 20 percentor greater. This holds true in Small andRuralMarkets aswell as in LargeMarketswhere housing costsare rapidly increasing.
The number of Generation X homeowners (those born between 1965 and 1980) has also been de-clining across all markets, though not as dramatically as for millennials. The decline may indicate

184 CHAPTER 15. HOMEOWNERSHIP MARKET
a new preference for renting, but it also reflects increasing barriers to homeownership such as debtaccumulation, rising housing costs, and low supply of homes for sale.
15.3 Home prices and supply
Finding 1: It is hard to buy a home in Virginia today.
The average home in the state now costs more than $300,000.
Figure 15.11: Median sales price and months of supply
Home prices in Virginia steadily recovered after the Great Recession. By 2016, themedian sales priceacross the state regularly exceeded $250,000. In the summer of 2017, the average homeprice cracked$300,000 for the first time. Initial fears about a slump during the pandemic in 2020 were soondispelled as average prices stayed well above $310,000, driven by historically low interest rates, lowinventory, and a homebuyer pool relatively unscathed by pandemic job losses.
High demand for nearly all types of housing has dramatically reduced available supply. Before 2016,Virginia was comfortably above six months of supply. That figure soon began to decline, and was justabove one month in early 2021.

15.3. HOME PRICES AND SUPPLY 185
Finding 2: Starter home inventory is decreasing.
Homes affordable to buyers earning less than 80 percent AMI are becoming hard to find.
Figure 15.12: Availability of starter homes in Virginia
In all parts of Virginia except for the Southwest, the number of homes that are affordable to house-holds making 80 percent AMI has decreased since 2013. These “starter homes” are generally smallerand slightly older, making them traditionally more affordable than newer homes coming onto themarket.
In Arlington County, for example, 80 percent AMI equated to an annual household income of$65,850 in fiscal year 2021. Themaximumhome price affordable to these households was $356,745,but in fiscal year 2021 only 16 percent of homes sold were at or below this price. Conversely, in thecity of Petersburg, where 80 percent AMI was $57,600, 97 percent of homes sold in fiscal year 2021were at $312,050 or below.
The most pronounced market decreases in starter home stock have occurred in the Northern Valley(20 percent decrease), Central Valley (17 percent decrease), and Chesapeake Bay Markets (16 percentdecrease). In Northern Virginia, where the percentage of starter homes was already low at 27 percent,the share of starter homes has declined to just above 20 percent.

186 CHAPTER 15. HOMEOWNERSHIP MARKET
Finding 3: New home sizes are not matching the need for starter homes.
The number of owner-occupied homes with four or more bedrooms has been rising, whilesmaller homes have been decreasing.
Figure 15.13: Owner housing units by number of bedrooms
Fewer bedrooms in a home oftenmean amore affordable price. But the share of owner housing unitswith fewer than four bedrooms has largely been in decline in Virginia, except in rural areas where thenumber of single room occupancy or one bedroom homes has been on the rise since 2012.
The decline of homes with fewer bedrooms means fewer options for young, single, and/or first-timehome buyers, but also for low- and moderate-income couples just starting a family.

15.3. HOME PRICES AND SUPPLY 187
Finding 4: Virginia’s supply of manufactured homes, a vital path to affordable home-ownership, is declining.
Lower cost factory-built homes are less common today than in the past.
Figure 15.14: Owner housing units by structure type
The number of owner-occupied manufactured homes has declined sharply across the Common-wealth, especially in rural Virginia where the manufactured homes segment of owner-occupiedhousing stock dropped from nearly 20 percent to just 16 percent in 2019.
While the reduction of low-quality manufactured homes is an overall good for many communities,manufactured homes are not being replaced with newer, better quality manufactured homes.
Modern manufactured homes are not only an affordable alternative to traditional site-built homes,but their quality is far from that of their pre-1980 predecessors. In spite of these benefits, manufac-turedhomes continue to carry the stigma of undesirable, unsafe housing that doesnnot hold its value.Yet 21st century manufactured housing offers the promise of homeownership to those for whom itis otherwise out of reach and a solution to the affordable housing crisis, particularly as the cost ofsite-built construction rises.

188 CHAPTER 15. HOMEOWNERSHIP MARKET
15.4 Affordability
Finding 1: Cost burden among low-income homeowners remains high.
The share of cost-burdened very low-income and extremely low-income homeowners haslargely remained unchanged since 2010.
Figure 15.15: Owner cost burden by income
Housing cost burden for homeownersmakingmore than 50 percent AMI has been decreasing acrossVirginia, but this trend does not hold for homeowners with lower incomes. The share of homeownersmaking 50 percent AMI or less who are cost-burdened has remained steady since 2010.
Worse yet, over half of ELI homeowners (57 percent) are severely cost-burdened (spendingmore thanhalf of their income on housing costs). For these households, staying stably housed is critical whenincomes are already barely enough to cover the basic necessities.
While improving housing affordability for these households is an important piece of the puzzle, im-proving overall economic conditions for ELI and VLI households must be a priority. Onemajor issueis the lack of savings and retirement income that makes rising property taxes, utilities, and repairs aheavy burden for older homeowners. Their income post-retirement is insufficient to cover ongoinghousing costs, especially if they still carry a mortgage and/or have significant deferred maintenance.

15.4. AFFORDABILITY 189
When these difficulties are compounded by the death of a spouse and the loss of their income, single-owner households face exceptionally high cost burdens.
Finding 2: Homeowners living alone are disproportionately cost-burdened.
The lack of extra income from a partner or family member drastically impacts homeowners inVirginia.
Figure 15.16: Owner cost burden by household type
The share of senior homeowners (62 years or over) living alone who are cost-burdened—35 percentin 2017—has largely remained the same since 2010 (36 percent). Senior homeowners living alonealso have the greatest percentage of severely cost-burdened households at 17 percent in 2017.
Households with single adults (below 62 years old) living alone or sharing a home with non-relativesexperience substantial cost burden. In 2017, nearly a third of non-elderly, non-family households (32percent) were cost-burdened—a decrease from 39 percent in 2010, but still a significant portion ofhouseholds.
A non-family household is a single-person living alone or where that person shares a home withpeople to whom they are not related. For example, a single adult living alone or three college students

190 CHAPTER 15. HOMEOWNERSHIP MARKET
renting an off-campus apartment are both considered non-family households.
Cost burden has decreased since 2010 for most household types, but not for seniors. Senior home-owners living alone and those living with family members have seen very little change in their shareof cost-burdened households.
Finding 3: Black and Hispanic homeowners are disproportionately cost-burdened.
All homeowners of color are more likely to be cost-burdened than their white counterparts.
Figure 15.17: Owner cost burden by race and ethnicity
Cost-burdened households put homeowners and their families at risk when theymustmake difficultchoices between making a mortgage payment or putting food on the table. As of 2017, just over 22percent of all homeowners in Virginia were cost-burdened.
The rate of cost-burdened households is much higher for Hispanic homeowners (31 percent) andBlack homeowners (30 percent) than it is for white homeowners (20 percent). All other minoritiesalso have higher-than-average homeowner cost burden rates.

15.4. AFFORDABILITY 191
The rate of cost-burdened households among homeowners of color has declined since 2010; the like-liest cause of this change is the transition of previously cost-burdened homeowners to becomingrenters as the result of the foreclosure crisis and subsequent recession.
Finding 4: Renter incomes are barring households from reaching homeownership.
In almost every locality in Virginia, there is a major gap between the median renter householdincome and the income needed to afford the median home price.
Figure 15.18: Income needed to afford median home prices
Having an adequate income is crucial to securing a homemortgage, butmany renters’ current incomefalls far short of the income needed to afford the median home price. In localities where there arelarge renter populations, the gap is especially wide.
Homeownership is still often out of reach even in localities where median renter household incomeis high; in Fairfax County the median renter household income is $80,858, but in the fourth quarterof 2019 a renter needed an income of $114,473 to afford the median home price. The affordabilityand income gap exacerbate inequities for the large number of Black and brown renters.

192 CHAPTER 15. HOMEOWNERSHIP MARKET
15.5 Mortgage trends
Finding 1: Black and Multiracial home mortgage applicants in Virginia are twice aslikely to be denied a loan than white applicants.
Barriers to a home mortgage will continue to perpetuate inequities in homeownership if notaddressed.
Figure 15.19: Denial rates for mortgage applications by race
In 2020, white applicants received 80 percent of approved home purchase loans while Black appli-cants received just 10 percent of approved home purchase loans.
Black applicants are disproportionately denied a loan in Virginia compared to white applicants. In2020, Black applicants had a denial rate of 12 percent followed byMultiracial applicants at 11 percent,while the denial rate for white applicants was six percent.

15.5. MORTGAGE TRENDS 193
Finding 2: High debt levels and poor credit are the biggest barriers for Virginians look-ing to buy a home.
Overhalf of applicants for ahomepurchase loanweredenieddue to either their debt-to-incomeratio or their credit history.
Figure 15.20: Principal loan denial reason by race
Regardless of an applicant’s race, debt-to-income (DTI) ratio and credit history were the most citedreasons that a lender denied an application for a home purchase loan in Virginia. DTI representsthe combination of inadequate wages and common types of debt like student loans that hindermanyVirginians’ homeownership aspirations.
When a lender cites an applicant’s credit history as a reason for a loan application denial, it doesnot necessarily indicate past failure to make payments on debt; instead it sometimes is evidenceof the “credit invisibility” that saddles individuals with little to no credit history. According to theConsumer Financial Protection Bureau, this invisibility is much more common among Black andHispanic Americans. (Brevoort, Grimm, & Kambara, 2015)
Although DTI and credit history were the major reasons for loan denial for all racial groups, BlackVirginians are six percentmore likely to be denied a loan because of their DTI and seven percentmorelikely to be denied a loan due to their credit history than are white Virginians.

194 CHAPTER 15. HOMEOWNERSHIP MARKET
Finding 3: Black millennials are less likely to receive a home purchase loan than theircounterparts.
Only 61 percent of originated loans for Black applicants were for an applicant younger than 45years old.
Figure 15.21: Loan origination by age and race
Purchasing a home later in life hasmajor implications for long termwealth-building; delayed home-ownership for Black Virginians and the lower number of young Black homeowners will contributeto the Commonwealth’s persistent racial wealth gap for generations. Although millennials garneredthe majority of loans (61 percent) of all Black applicants from 2018 to 2020, all other racial groupsexceeded this rate for the same age category.

Chapter 16
Rental market
This chapter analyzes the state’s rental market and current characteristics of Virginians who renttheir homes. It also provides data on the scope and distribution of apartments supported by forms ofpublic assistance that reduce rents to make themmore affordable.
Highlights
Major takeaways in this chapter include:
• The age and income of the average renter in Virginia has increased, likely due in part to fewerhomeownership opportunities.
• Limited apartment supply, especially in high-growth areas, continues to tighten vacancy ratesand raise rents.
• Many low-income renters continue to be cost-burdenedas thedeficit of affordable rentals growsand demand is ever-increasing.
• There are over 300,000 cost-burdened renters who have very low incomes—resulting in a cor-responding gap of over 300,000 deeply affordable rental units in Virginia.
• Over half of Virginia’s approximately 170,000 publicly-supported rental apartments rely onLow-Income Tax Credits from Virginia Housing. Three-quarters of these could be lost to expir-ing affordability restrictions by 2040.
• The current supply of federal Housing Choice Vouchers is inadequate to meet the need; tens ofthousands of low-income Virginians remain on waiting lists.
195

196 CHAPTER 16. RENTAL MARKET
16.1 Virginia’s renters
Finding 1: A range of household types are common among renters.
Most renters live either by themselves or with their family.
Figure 16.1: Renter household types
No specific household type is dominant among renter households in Virginia, but renters in Virginiaaremuchmore likely to live with another family member or by themselves when compared to home-owners.

16.1. VIRGINIA’S RENTERS 197
Finding 2: Renters generally have small household sizes.
Over a third of all renters in the state live alone.
Figure 16.2: Renter household size
Throughout Virginia—and particularly in Small and Rural Markets—renters are more likely thanhomeowners to live alone or with one other person. There are few distinctions in renter householdsize across market groups though Large Markets are more likely to have larger-sized renter house-holds than other market groups.

198 CHAPTER 16. RENTAL MARKET
Finding 3: Older Generation X and baby boomer households are increasingly rentingacross Virginia.
The number of renters aged 45 years or older is outpacing the growth of younger renters in allVirginia housing markets.
Figure 16.3: Renter household age
Across the United States there has been amajor relative increase in the number of baby boomers whoare choosing or being forced to rent. In Virginia the number of seniors (65 years and older) who arerenting has increased by over 20 percent in Large and Small Markets.
Baby boomers often have higher incomes, and their demand for rental housing is driving the high-end rental market. (Sisson, 2017) (Mitra, 2019) High demand and low supply continue to influenceprices that are out of reach for low- and moderate-income families.

16.1. VIRGINIA’S RENTERS 199
Finding 4: Most renters across Virginia are white.
However, there are more renters of color than white renters in the urban crescent.
Figure 16.4: Renter race and ethnicity
Because Virginia’s population is majority white, white renters still account for a large proportion ofrenter households in the Commonwealth. However, people of color make up a larger proportion ofrenters than they do homeowners. Renter households are the most racially and ethnically diverse inLarge Markets where households of color make up a majority of renters.

200 CHAPTER 16. RENTAL MARKET
Finding 5: Renter income in Virginia is more evenly distributed than homeowner in-come.
While higher-income renters are common in Large Metro Housing Markets, most renters else-where are likely to earn relatively little.
Figure 16.5: Renter household income
Compared to the distribution of homeowner incomes, renter household incomes are much moreevenly distributed. Increased preference for renting’s flexibility and high barriers to homeowner-ship have increased the number of renters across Virginia, even among high income earners.
Renter income varies much more in Large Markets where households are widely distributed acrossincome groups and where luxury rentals are more available. High-income Northern Virginia locali-ties like Loudoun County also push renter incomes higher in Large Markets.
By contrast, in Small and RuralMarkets renter households aremore likely to earn less than $25,000.While housing costs are lower in these communities, very low incomes make it difficult for manyrenters to save money and pay for unexpected expenses.

16.1. VIRGINIA’S RENTERS 201
Finding 6: Renters have diverse educational backgrounds in Virginia.
In Virginia’s Large and Small Metro Housing Markets, renters often have some college experi-ence or higher.
Figure 16.6: Renter educational attainment
Renters have diverse educational backgrounds in Virginia’s Small and Large Markets, but renters inRural Markets are less likely to have a bachelor’s degree. The percentage of renter households with abachelor’s degree or higher has been on the rise since 2010. From2010 to 2019, the number of renterhouseholds with a bachelor’s degree or higher has increased by 41 percent, while lower educationalattainment households have declined or remained stagnant in recent years.

202 CHAPTER 16. RENTAL MARKET
16.2 Rental prices and supply
Finding 1: Apartments are becoming more expensive in every part of the state.
Small Metro Housing Markets have the largest relative gains in higher-cost units.
Figure 16.7: Change in gross rent
The number of apartments with gross rents below $700 has decreased across Virginia in the lastdecade—especially in Large Markets—and apartments with higher gross rents have increased sub-stantially. Small Markets have seen the most growth in higher-cost units; units with rents between$1,250 and $2,000 more than doubled from 2010 to 2019. High-cost rental units have increasedeven in Rural Markets.

16.2. RENTAL PRICES AND SUPPLY 203
Finding 2: Actual rents have increasedmore than renter incomes, but inflation adjust-ments flip the trend.
Average renter incomes have increased sharply in recent years.
Figure 16.8: Median gross rent and median renter income
An analysis of Virginia’s rent and income trends without adjusting for inflation suggests that rentincreases have outpaced the growth in renter incomes. But adjusting to real dollars indicates thatmedian gross rents have declined in Virginia since 2011 after rising from 2005 to 2010. At the sametime, renter incomes have actually trended upward.
This complexity is likely the result of several factors, including Consumer Price Index (CPI) adjust-ments based on national averages, increased prevalence of upper-income renters who still have trou-ble buying homes in tight markets, and the absence of a true statewide rental market.

204 CHAPTER 16. RENTAL MARKET
Finding 3: Rental vacancy rates are tightening across the state.
Lower vacancy rates make it more difficult to find a home.
Figure 16.9: Rental vacancy rates
Rental vacancy rates are dropping throughout Virginia. Large Markets are experiencing the mostdramatic vacancy rate decline—from seven percent to five percent in the past decade. Low rental va-cancy rates tighten the rentalmarket andmake itmore difficult for low-income renters to compete forhousing. Declining vacancy rates have major implications for housing affordability and underscoreimbalances in supply and demand.
During the ongoing COVID-19 pandemic, rental vacancy rates across the nation have dropped to his-toric lows. By second quarter of 2021, Virginia’s rental vacancy rate was 4.4 percent, the 14th lowestrate in the country—with Vermont having the lowest at 1.8 percent andNorthDakota having the high-est at 12.9 percent.
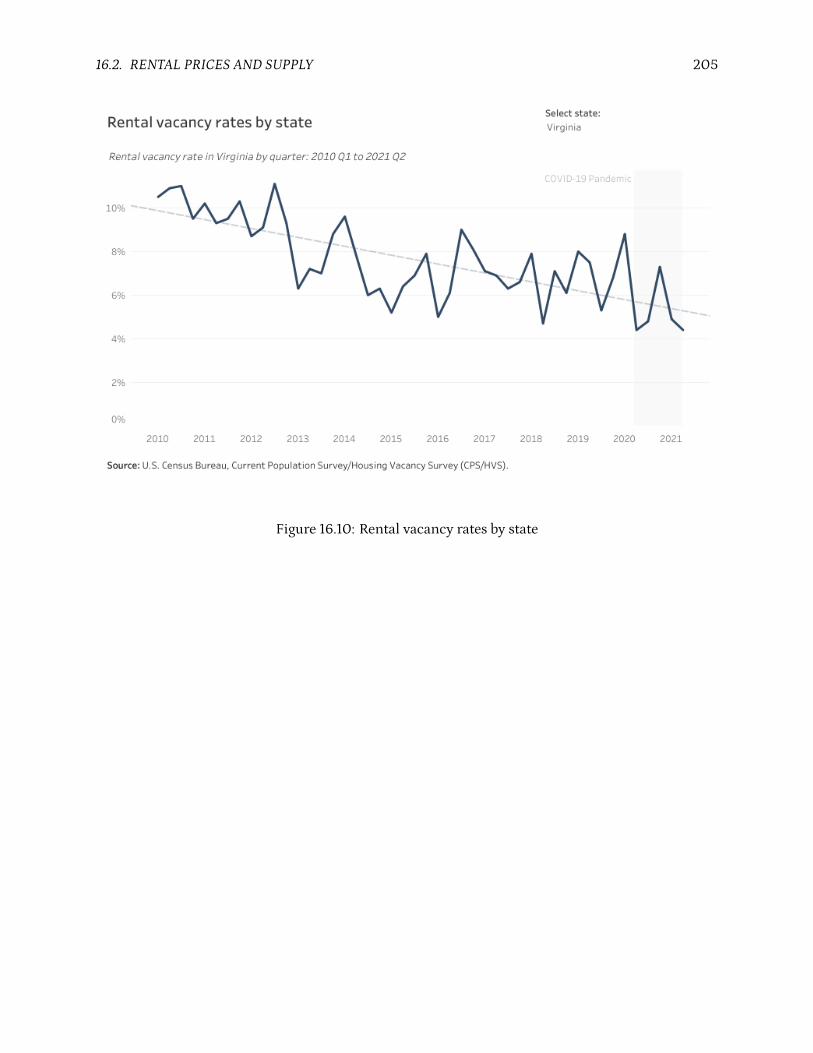
16.2. RENTAL PRICES AND SUPPLY 205
Figure 16.10: Rental vacancy rates by state

206 CHAPTER 16. RENTAL MARKET
Finding 4: Single-family detached homes are an important source of rental housing,especially in rural Virginia.
In Rural Housing Markets, single-family detached homes made up half of the rental housingstock in 2019.
Figure 16.11: Renter housing units by structure type
Few opportunities for dense development and increasing barriers to homeownership have acceler-ated the demand for single-family rentals (SFR) in Virginia’s Rural Markets where half of all rentalhousing consists of single-family detached homes.
Single-family detached homes also make up a significant portion of the rental housing stockelsewhere—23 percent in Large Markets and 24 percent in Small Markets. Freddie Mac has notedthat SFR are helping to fill major gaps in the multifamily market by offering options for largerhouseholds and those wanting to live in a single-family home but unable to purchase one. (FreddieMac Multifamily, 2018)
Although SFRs are an important source of rental housing and an expanding slice of investor anddeveloper portfolios, they also reduce the stock of for-sale homes. This causes supply to fall short ofhigh demand, driving home prices even higher.

16.3. AFFORDABILITY 207
16.3 Affordability
Finding 1: Housing cost burden for Black andHispanic renters in Virginia continues torise.
While all other racial groups have experienced a decrease in their share of cost-burdenedrenters, Black and Hispanic or Latino renter cost burden has increased since 2010.
Figure 16.12: Renter cost burden by race and ethnicity
The pandemic exacerbated affordability challenges for many renters of color who often worked onthe frontlines in essential yet low paying jobs. Nearly half of Black and Hispanic renters were cost-burdened in 2017; diminished hours and lost jobs during the pandemic put a large number of rentersof color at risk of eviction and homelessness.
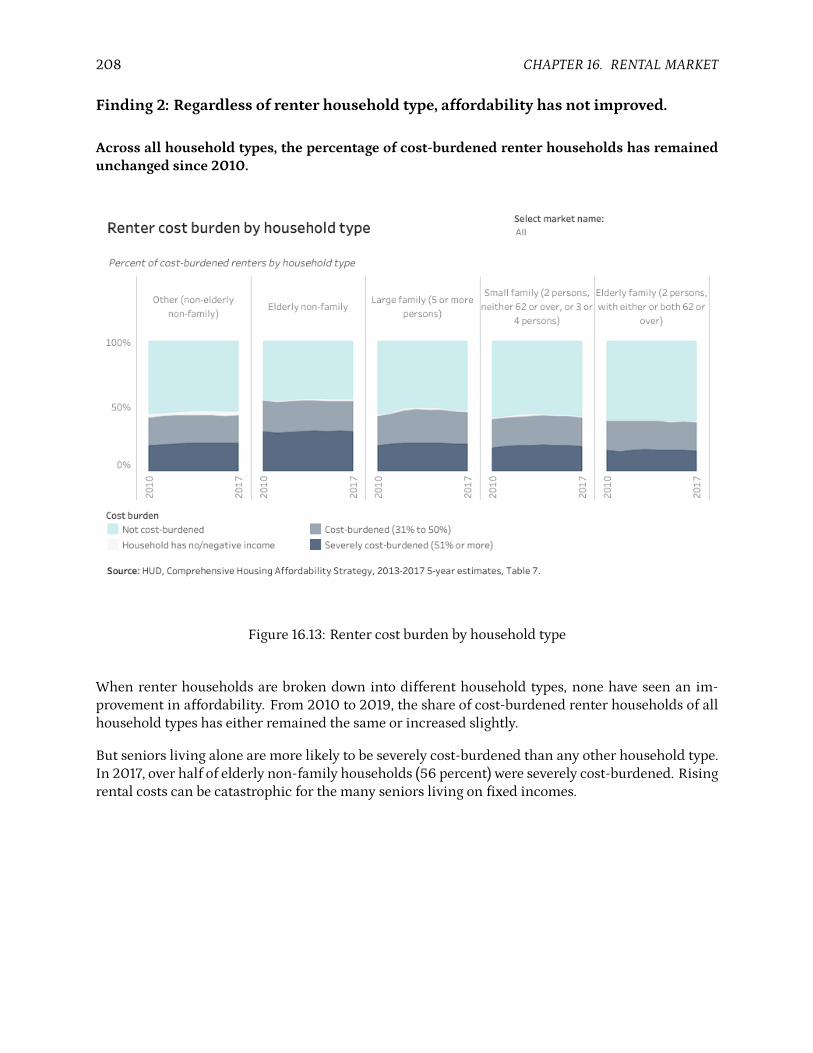
208 CHAPTER 16. RENTAL MARKET
Finding 2: Regardless of renter household type, affordability has not improved.
Across all household types, the percentage of cost-burdened renter households has remainedunchanged since 2010.
Figure 16.13: Renter cost burden by household type
When renter households are broken down into different household types, none have seen an im-provement in affordability. From 2010 to 2019, the share of cost-burdened renter households of allhousehold types has either remained the same or increased slightly.
But seniors living alone are more likely to be severely cost-burdened than any other household type.In 2017, over half of elderly non-family households (56 percent) were severely cost-burdened. Risingrental costs can be catastrophic for the many seniors living on fixed incomes.

16.3. AFFORDABILITY 209
Finding 3: Housing cost burden is on the rise for nearly all households with below-average incomes.
Despite little change in the total percentage of cost-burdened renters, the share of cost-burdened renters for low-income andmoderate-income households has risen.
Figure 16.14: Renter cost burden by income
An assessment of cost burden by income group brings the rise in unaffordable rentals into focus.Households making less than 100 percent AMI are increasingly becoming cost-burdened. This shiftis most apparent for low-income (51 to 80 percent AMI) and moderate-income (81 to 100 percentAMI) households. Between 2010 and 2017, the share of cost-burdened low-income renters grew sixpercent and the share of cost-burdened moderate-income renters increased four percent.
Affordability for ELI households (less than or equal to 30 percent AMI) and VLI households (31 to 50percent AMI) is even worse. Over 80 percent of ELI and VLI households are cost-burdened, while 65percent of ELI households are severely cost-burdened.
While ELI and VLI households most urgently need affordable rental housing, the increasing numberof low- and moderate-income renter households that are cost-burdened signals an advancing crisisdemanding attention.

210 CHAPTER 16. RENTAL MARKET
Finding 4: The supply of deeply affordable rental housing has decreased since 2010.
ELI and VLI households increasingly reside in homes that are not affordable to them.
Figure 16.15: Renter housing affordability match
Comprehensive Housing Affordability Strategy data can present the income of households based onAMI and the affordability of the housing unit they occupy. This association indicates if a householdis matched to a housing unit that is affordable to them.
Based on this data, nearly 300,000 low-income Virginia renter households occupied a home thatwas not affordable to them in 2017. This spotlights a shortfall of roughly 300,000 units affordableto households making less than 80 percent AMI and an inadequate housing supply for householdsmakingmore than 80 percent AMI. Many households making 80 percent AMI reside in rental hous-ing that would be affordable to those with lower incomes, further squeezing out lower-income house-holds from affordable housing.

16.4. ASSISTED RENTAL HOUSING 211
16.4 Assisted rental housing
Finding 1: There aremore than 170,000publicly-supported affordable rental homes inVirginia.
Over half of these apartments receive Low-IncomeHousing Tax Credits fromVirginia Housing.
Figure 16.16: Federally-supported rental units in Virginia
According to the National Housing Preservation Database, 171,370 rental homes in the Common-wealth receive subsidies to lower their rents. Many different programs support these subsidies anda significant number of affordable apartments are individually supported by multiple subsidies, butthe LIHTC is the most common form of assistance.
LIHTCs provide a tax incentive to housing developers to construct or rehabilitate rental housing andreserve a certain number of units for VLI and ELI households. Virginia has approximately 91,599rental homes supported by LIHTCs provided by Virginia Housing.
But in 2017, more than 300,000 cost-burdened renter households weremaking less than 50 percentAMI. This represents a massive gap in affordability for a significant number of Virginians.
Most of the state’s LIHTC units are located in LargeMarkets where most low-income renters live and

212 CHAPTER 16. RENTAL MARKET
where apartments (of all types and prices) are more common. In rural areas, where there are fewerlow-income renters and multifamily developments, the preservation and replacement of existing af-fordable housing stock is often a more urgent need than significantly expanding supply.
For example, homes supported byUSDARuralDevelopment subsidies, particularly Section 515 rentalproperties, are at-risk due to owner opt-outs from affordability restrictions and the decrease in over-all USDA rental assistance funding. Further loss of dedicated affordable rentals in rural Virginiawill place additional pressure on already sparse Housing Choice Vouchers, whose recipients relyon single-family rental homes that are less likely to meet the program’s Housing Quality Standards(HQS).
All types of entities are involved in the production of affordable housing in Virginia—including forprofit organizations. But a large portion of federally-supported rental housing projects have not re-ported their organization type—an important data point to understanding the landscape of affordablehousing.
Finding2: Without additional subsidy, Virginia is at risk of losingnearly threequartersof its LIHTC housing stock by 2040.
By 2040, over 60,000 of Virginia’s LIHTC housing units could lose their affordability restric-tions.
Figure 16.17: Expiring LIHTC affordability restrictions in Virginia

16.4. ASSISTED RENTAL HOUSING 213
Although LIHTC aids the construction and rehabilitation of housing units in Virginia, the programdoes notmandate the permanent affordability of those units. Program participation requires amini-mum 15-year compliance period, and Virginia Housing’s LIHTC program generally requires 30 yearsof compliance through a 15-year extended use period. After that time, owners can convert income-restricted units to market rate.
Whilemany properties remain affordable after the initial compliance period—and some are expectedto remain affordable after the 30-year period—there is always a risk that properties will convert tomarket rate without additional allocations of tax credits or subsidies.
By 2040, almost three quarters of LIHTC units will reach the end of the 30-year affordability period.While the potential loss of affordable units is a priority, the physical condition of these 30-year oldproperties also deserves attention.
Some LIHTC programs in other states require affordability compliance beyond 30 years. For exam-ple, California has a mandatory 55-year extended use period for nine percent tax credits, and majorincentives for the same compliance term from four percent tax credits.

214 CHAPTER 16. RENTAL MARKET
Finding 3: Housing Choice Vouchers make homes affordable to more than 45,000renters in Virginia.
Public housing authorities, Virginia Housing, and local administrators all help deliver thesevouchers.
Figure 16.18: Housing Choice Vouchers in Virginia
The Housing Choice Voucher (HCV) program, which is a major component of federal assistanceknown as “Section 8,” is the federal government’s major program for addressing the affordablehousing needs of VLI households. The program provides rental assistance to qualifying householdsthat are then able to choose their type and location of housing as long as it meets certain criteria.
As of August 12, 2021, there were 45,587 HCVs in Virginia. Given the number of renters making lessthan 50 percent AMI in 2017, this translates to roughly twelve vouchers per 100 VLI or ELI renterhouseholds. While there is a greater share of HCVs in LargeMarkets to meet the need, Small Marketsdo not have a comparable share of HCVs for their low-income renter households.

16.4. ASSISTED RENTAL HOUSING 215
Finding 4: Tens of thousands of Virginians remain on voucher waiting lists.
The scale of federal rental assistance is not enough tomeet the demand fromVLI renter house-holds.
Figure 16.19: Demand for Housing Choice Vouchers in Virginia
The HB854 public housing authority survey reported that there were just over 56,000 householdson waiting lists for public housing, LIHTC units, or HCVs. The survey did not include all PHAs inVirginia so this number is an undercount of households on PHA waiting lists.
When compared to the number of estimated cost-burdened renter households making 50 percentAMI or less in 2017, the current number of HCVs does not come close to meeting the total need forassistance, which will only continue to worsen if ignored.

216 CHAPTER 16. RENTAL MARKET

Chapter 17
Housing instability and homelessness
This chapter presents trends on mortgage delinquency, eviction filings, and homelessness through-out Virginia. Intervention to prevent these crises must be a priority; inaction compounds stresses onsocial infrastructure like healthcare and education.
Highlights
Major takeaways in this chapter include:
• COVID-19 has put thousands of low-income Virginians behind on rent payments—risking anextended eviction crisis.
• Homeowners in Virginia have fared better since the Great Recession and even during the pan-demic, so far. As of December 2020, mortgage delinquency rates remain below 2 percent—likely helped by the federal foreclosure moratorium.
• Point-in-Time counts across Virginia have shown a general decline in observed homelessness—less than 6,000 individuals in 2020—although this was a slight uptick from 2019.
• On the other hand, housing instability among Virginia’s school-age children has increased inthe past decade. Over 17,000 enrolled students experienced homelessness during the 2019-2020 school year.
• Black Virginians are disproportionately represented in counts of persons experiencing home-lessness. In 2020, over 50 percent of Virginians experiencing homelessness were Black.
• Supportive housing needs remain high. The number of available units fails to match the de-mand to safely provide homes for individuals requiring additional support, like case manage-ment and health services.
17.1 Impact of COVID-19
In May 2020, the U.S. Census Bureau began the Household Pulse Survey (HPS) to measure the socialand economic impacts of the COVID-19 pandemic on American households. As of August 2021, the
217

218 CHAPTER 17. HOUSING INSTABILITY AND HOMELESSNESS
HPS is still active and has collected responses covering 34 weeks. This rich time-series data—whichis available at the national and state levels—is a valuable tool for tracking how COVID-19 continuesto impact Americans’ daily lives.
Along with questions about healthcare, food insecurity, school disruptions, employment status, andtransportation, the HPS also asks several questions about household spending and housing insecu-rity that indicate a household’s ability to make rent or mortgage payments. These prompts allowresearchers and policymakers to understand the scope of real and potential housing instability intheir state.
Finding 1: Many Virginians are still struggling to make their budgets work.
A quarter of adults still have major trouble paying for usual household expenses.
Figure 17.1: Difficulty paying for usual household expenses during COVID-19
Since the HPS began asking respondents this question in late August 2020, two to three out of everytenVirginians have reported that it has been somewhat or very difficult to pay their regular householdexpenses. Prior to March 2021, this share hovered around 30 percent; since then it has decreasedslightly to around 25 percent.

17.1. IMPACT OF COVID-19 219
Finding 2: Without continued rent andmortgage relief intervention, thousands of Vir-ginians may find themselves without a home.
Ofhouseholds behind on their rent ormortgage, about one-third believe eviction or foreclosureis likely.
Figure 17.2: Housing insecurity during COVID-19
From weeks one to 12 of the HPS, the Census asked respondents if they missed the previous month’srent or mortgage payment or if they had slight or no confidence in their ability to pay the comingmonth’s rent or mortgage on time. From May to July 2020, about 20 percent of Virginia adults con-firmed that one of those situations applied to their household.
Beginning inweek 13 of theHPS, the Census separated the housing insecurity question into two ques-tions. First, they asked if respondents missed last month’s rent ormortgage payment and if they haveslight or no confidence in their ability to pay next month’s payment on time. Households meetingboth these conditions represent about five percent to eight percent of all Virginians.
Second, the survey asked respondents who are behind on their rent or mortgage whether eviction orforeclosure is likely in the next twomonths. Over the last year about 30 percent said they were, whichamounts to roughly 100,000Virginians (although the statisticalmargin of error for this subsamplingis very high).

220 CHAPTER 17. HOUSING INSTABILITY AND HOMELESSNESS
17.2 Mortgage delinquency
Homeowners can fall behind on their mortgage payments when they lose their job, have unexpectedexpenses, or confront a number of other financial challenges. Homeowners may be able to work withtheir lenders to get back on track, but sometimes delinquency is too severe and leads to foreclosure.
Although detailed foreclosure data is not publicly available, the Consumer Financial Protection Bu-reau (CFPB) tracks mortgage delinquencies on a large sample of loans across the country. This infor-mation can indicate how many homeowners are beginning to have trouble paying for their homes.
Finding 1: Mortgagedelinquencyhasbeen steadilydeclining inVirginia since theGreatRecession.
Prior to COVID-19, more than 97 percent of all homeowners were making their payments ontime.
Figure 17.3: Mortgage delinquency in Virginia
Mortgage delinquency in Virginia has declined steadily since the Great Recession when rates wereas high as seven percent and foreclosures were common. Overall delinquency rates for Virginia’shomeowners more than a month behind on their payments have since fallen to between two and

17.2. MORTGAGE DELINQUENCY 221
three percent in 2020.
Virginia’s delinquency rate recently fell to well below two percent as a result of the Federal HousingFinance Agency (FHFA) foreclosure moratorium and mortgage forbearance policies established as aresult of the COVID-19 pandemic. Policymakers should continue to monitor the financial health ofhomeowners in 2021, especially as federal protections may expire before mortgage assistance fundshave been fully disbursed.
Finding 2: Metro areas were hit unequally by foreclosures in 2008, but all have mademajor recoveries.
Most areas of Virginia have delinquency rates well below four percent.
Figure 17.4: Mortgage delinquency by region
In the years following the 2008 foreclosure crisis, many parts of Virginia saw sustained mortgagedelinquency rates above six percent, especially the Northern Virginia, Roanoke, Virginia Beach, andRichmondMSAs. Other parts of the Commonwealth had less severe delinquency during that period,but they still experienced rates above four percent even after 2012.
Between 2013 and 2020, homeowners throughout the state generally recovered well. Delinquencyrates in most regions were near two percent before the FHFA mortgage forbearance and foreclosure

222 CHAPTER 17. HOUSING INSTABILITY AND HOMELESSNESS
moratorium took effect in March 2020. The Northern Virginia and Richmond MSAs in particularsaw some of the steepest declines in delinquency compared to their post-2008 peaks.
17.3 Evictions
In 2016, Virginia gained national attention when the Princeton Eviction Lab published data rankingfive Virginia cities in the top ten for eviction rates in the nation. Virginia’s overrepresentation in thedata prompted massive response from policymakers and advocates, resulting in new laws to cap latefees on rent, source of income protections, and wider education on tenant rights.
Important context for eviction data in this section:
We use the Princeton Eviction Lab data for Virginia to show historical trends because it is the mostcomplete time-series for eviction filings and judgements. A full description of theirmethodology canbe found on their website.
For eviction records after 2017, we use civil case records fromdistrict courts compiled by the VirginiaSupreme Court and made available by virginiacourtdata.org.
In both datasets, evictions are based on court records, and do not always represent actual physicalevictions carried out by sheriff’s offices. In many cases, renters who receive an eviction judgementwill move prior to intervention by law enforcement.
However, research reliably demonstrates that court-administrative data (eviction filings and judge-ments) significantly undercounts involuntarymovesmade by tenants when facing the threat of evic-tion or lease non-renewal. (Desmond, Gershenson, & Kiviat, 2015) (Nelson, Garboden, McCabe, &Rosen, 2021)
These “informal evictions” are more difficult to record, but may account for well over 60 percent of allforced moves in the United States. (Gromis & Desmond, 2021)

17.3. EVICTIONS 223
Finding 1: Eviction rates in Virginia stayed above five percent from 2000 to 2016.
That rate is several points higher than the national average.
Figure 17.5: Eviction rate in Virginia
Virginia’s eviction rate, as calculated byTheEvictionLab at PrincetonUniversity, has remained abovefive percent since 2000. As of 2016 (the most recent statewide annual data currently available), theCommonwealth’s eviction rate was five and one-tenth percent: There was one unlawful detainer thatended with a judgement for the plaintiff (landlord) for every twenty renter households.
What is an unlawful detainer?
An unlawful detainer is the legal name for an eviction notice filed by a landlord to the local districtcourt. The process is outlined in the Virginia Residential Landlord and Tenant Act (§ 55.1-1200 etseq.).
A landlordmust deliver awrittennotice to the tenant beforefiling anunlawful detainerwith the court.At the initial court appearance, the judgemay immediately grant possession to the landlord, which isrecorded as a judgement against the tenant. (Tenants may also contest the charge and request a trialat a future court date.)

224 CHAPTER 17. HOUSING INSTABILITY AND HOMELESSNESS
If a “default” judgement is issued in the initial appearance, or if a judgement is issued at the latertrial, the court directs the sheriff’s office to conduct a formal eviction within a certain time. However,tenants may appeal this decision to the circuit court within ten days of the decision.
Finding 2: New eviction filings during COVID-19 are a fraction of pre-pandemic levels.
Pandemic eviction protections have vastly decreased but not eliminated new filings.
Figure 17.6: Statewide eviction filings since January 2019
In 2019, landlords filed about 12,000 new unlawful detainers every month in district courts acrossthe state. Those levels persisted in the first two months of 2020 until the onset of COVID-19 pan-demic and the subsequent moratorium on most legal proceedings issued by the Virginia SupremeCourt on March 17, 2020. This order halted nearly all unlawful detainer cases. Fewer than 6,000new evictions were filed in March 2020 and just under 900 in April 2020.
Monthly filings then slowly increased through the summer, nearly reaching 5,000 in August. OnSeptember 4, 2020, the Centers for Disease Control announced a national moratorium on evictionsfor households who affirm their inability to pay because of pandemic-related reasons.

17.4. HOMELESSNESS 225
While the moratorium’s implementation unfolded in September and October, landlords filed nearly16,000 new unlawful detainers across Virginia. New filings have since declined as state law requireslandlords to apply for rent relief before an eviction can occur, and the state is disbursing millions ofdollars in emergency rent relief; filings remained below 2,500 per month through March 2021 (thelatest statewide court data available).
17.4 Homelessness
Without affordable housing options, many people are at risk of housing instability that can lead di-rectly to homelessness. Slowly improving wages outstripped by rapidly growing housing costs areputting low-income andmoderate-income households under pressure to afford food, clothing, med-ical care, and transportation.
A variety of often co-occurring factors precipitate homelessness. Whether homelessness lasts a fewdays or years, its consequences long outlast its duration.

226 CHAPTER 17. HOUSING INSTABILITY AND HOMELESSNESS
Finding 1: Point-in-Time counts show a gradual decline in the number of homeless Vir-ginians.
However, that number increased in 2020 for the first time in years.
Figure 17.7: Point-in-Time homelessness count for Virginia
In January 2020, the annual HUD Point-in-Time (PIT) count found that 5,957 individuals were ex-periencing homelessness in Virginia. This was a 34 percent decrease from the total number in 2010,when the Virginia PIT count had its highest count at homeless 9,080 persons. Since 2010, the num-ber of persons experiencing homelessness inVirginia captured by the PIT counts has been on a steadydecline, with a slight uptick from 2019 to 2020.
While the decreasing numbers are good news for Virginia, PIT numbers do not account for everyonein unstable housing situations. PIT counts only measure the number of people who are in shelters,transitional housing, or identified on the street as experiencing homelessness. This count missesthose who are not literally homeless according to HUD’s definition, but are instead precariouslyhoused (e.g., people temporarily staying with family or friends or living in motels and those incar-cerated or in treatment facilities who have nowhere else to reside).

17.4. HOMELESSNESS 227
Finding 2: Black Virginians disproportionately experience homelessness.
Black Virginiansmake up about 19 percent of Virginia’s population but account for 50 percentof those experiencing homelessness.
Figure 17.8: Point-in-Time homelessness count by race
In 2020, the majority of individuals experiencing homelessness in Virginia were Black (53 percent),identified as male (60 percent), and were over the age of 24 (73 percent). This trend has been consis-tent for at least the past five years.
The disproportionate representation of Blackmen experiencing homelessness is a racial justice issuethat can be linked to centuries of discrimination in housing, criminal justice, education, healthcare,and the economy. Lack of access to quality healthcare and incarceration are conditions that oftencontribute to homelessness and that are frequently common to the experience of Black and brownAmericans.
In metro areas like Hampton Roads and Richmond, where urban renewal and redlining displacedand divested Black homeowners, nearly seven in ten persons experiencing homelessness are Black.

228 CHAPTER 17. HOUSING INSTABILITY AND HOMELESSNESS
Finding 3: Homelessness among school-age children is on the rise.
Despite declining Point-in-Time counts, homelessness among enrolled students has been onthe rise since the 2008-2009 school year.
Figure 17.9: School-age children experiencing homelessness in Virginia
Through Title VII of the McKinney-Vento Homeless Assistance Act, the Department of Educationtracks additional information on children and youths experiencing homelessness who are enrolledin local school districts. The Department of Education defines homelessness differently by includingchildren and youths who do not typically meet the HUD definition of literal homelessness. This dataprovides additional context to the issue of homelessness in the Commonwealth.
Whereas PIT counts have seen a decrease, McKinney-Vento counts of students experiencing home-lessness have been on the rise for more than a decade; 17,496 of Virginia’s students experiencedhomelessness during the 2019-2020 school year compared to nearly 13,000 students during the2008-2009 school year.

17.4. HOMELESSNESS 229
Finding 4: There is a substantial need for more permanent supportive housing acrossthe Commonwealth.
In 2020, the Corporation for Supportive Housing (CSH) estimated a permanent supportivehousing need of at least 20,000 units.
Figure 17.10: Demand for supportive housing in Virginia
CSH conducts an annual permanent supportive housing (PSH) needs assessment based on publiclyavailable data at the national level. CSH provides a snapshot of subpopulations that have needs con-sistent with PSH who are involved in the following systems: homelessness, justice, aging, mentalhealth, substance use, intellectual and developmental disability, and child welfare. Across these sub-populations, CSH estimates that there was an unduplicated PSH total need of 21,750 units in Virginiain 2020.

230 CHAPTER 17. HOUSING INSTABILITY AND HOMELESSNESS
Finding 5: Homelessness among certain vulnerable populations has declined signifi-cantly.
Point-in-Time counts for veterans, those with chronic substance use disorders, and survivorsof domestic violence have seenmajor declines since 2015.
Figure 17.11: Subpopulations experiencing declines in observed homelessness
According to the Department of Veteran Affairs, Virginia is among three states and 82 localities thathave effectively ended veteran homelessness. Virginia announced this milestone in November 2015,under Governor Terry McAuliffe’s administration, when Virginia met the federal definition of “ef-fectively ending homelessness among military veterans.” (National Alliance to End Homelessness,2018) This definition states that Virginia had no homeless veterans with the exception of those whowere offered housing but refused it.
As of January 2020, there were 395 homeless veteran households in Virginia, most of whom foundplacements in emergency shelters.
While homelessness among survivors of domestic violence has declined significantly since 2015,many survivors still need emergency shelter and permanent housing. In 2020, there were 405 re-quests for shelter for those fleeing domestic violence when shelters were full. (Virginia Sexual and

17.4. HOMELESSNESS 231
Domestic Violence Action Alliance, 2020)
Two in three families exiting shelters did not have stable housing plans in place (i.e., they either re-turned to the home where the abuser was present, exited to unstable housing such as living with afriend/relative or another shelter, or left the area), or their plans were unknown.
The decline in individuals with substance use disorders experiencing homelessness could be largelyattributed to the “Housing First” approach championed by HUD, as well as DHCD, which no longerrequires sobriety or being in treatment as a condition of housing.
Access to treatment programs has also grown substantially since 2017 due to the Virginia Medicaidagency’s implementation of Addiction, Recovery, and Treatment Services (ARTS).
An independent evaluation by Virginia Commonwealth University School of Medicine showed that63 percent out of 734 individuals using ARTS experienced improved housing conditions. (Cunning-ham et al., 2021)

232 CHAPTER 17. HOUSING INSTABILITY AND HOMELESSNESS
Finding 6: Thenumber of permanent supportive housing beds has been slowly increas-ing, but still does not meet demand.
When compared to PIT counts, the gap in PSH units for the chronically homeless has been nar-rowing.
Figure 17.12: Point-in-Time count and permanent supportive housing beds
Virginia has been steadily increasing its supply of PSH in the last decade. Virginia has doubled thenumber of PSH beds reported by Continuums of Care (CoC), from 2,164 reported year-round PSHbeds in 2010 to 4,660 in 2020.
Although this is a major increase, the supply of PSH is still not enough to cover the number of peopleexperiencing homelessness. In 2020, there was a gap of at least 1,297 PSH beds. While it may appearthat Virginia could exceed its supply of PSH beds according to its PIT count, the assessment of PSHneeds must include populations outside of CoC systems. As noted by CSH, the estimated need forPSH units is greater than 20,000.

Chapter 18
Projections
This chapter uses the latest available population projections for the state to estimate housing demandin the coming decade. It also discusses the limitations of such data and the need to generate newestimates as post-pandemic census figures are made available.
Highlights
Major takeaways in this chapter include:
• Virginia will likely reach a population of 10 million by 2040—with growth continuing to beconcentrated in the urban crescent.
• The share of seniors in Virginia will grow faster than all other age groups, creating major shiftsin housing demand and the workforce.
• Policymakers should reevaluate projections when the latest 2020 Census figures are incorpo-rated into new population predictions published by the University of Virginia Weldon CooperCenter for Public Service in 2022.
233

234 CHAPTER 18. PROJECTIONS
18.1 Statewide projections
Finding 1: Virginia will add about 60,000 new residents each year between now and2040.
That translates to about 25,000 new homes needed annually.
Figure 18.1: Statewide population counts and projections
Based on the most recent population projections published by the Weldon Cooper Center for PublicService at the University of Virginia, the Commonwealth will have a total population near 9.9millionin 2040. If the averagehousehold size stays slightly less than2.5 persons, thismeans that Virginiawillneed to build approximately 25,000 more homes each year to accommodate this growth. However,these projections do not yet incorporate the results of the 2020 Census.

18.2. MARKET AREA PROJECTIONS 235
18.2 Market area projections
Finding 1: Most new Virginians will live in the urban crescent.
Small Metro Housing Markets will also grow while Rural Housing Markets will continue to de-cline in numbers.
Figure 18.2: Population projections by market group
Population growth from 2020 to 2040 is expected to be most rapid in Large Markets, where the totalpopulation will reach just over 1.7 million by 2040. Small Markets will see growth but at a slowerpace, reaching a quarter of amillion people by 2040. On the other hand, Rural Markets are projectedto lose 14 percent of their population by 2040.
These shifts in population will have major economic consequences that will impact housing supplyand demand across Virginia.

236 CHAPTER 18. PROJECTIONS
Finding 2: Northern Virginia will continue to be the fastest-growing market.
The Northern Valley, Charlottesville, and Richmond also will grow by more than 15 percent inthe next two decades.
Figure 18.3: Population projections by market name
The most rapid growth will occur in four markets in Virginia: Northern Virginia, the Northern Val-ley, Charlottesville, and Richmond. These four markets will see their populations grow by over 15percent between 2020 and 2040. Northern Virginia will see the most rapid growth, with the popu-lation growing by over 25 percent within two decades, while Hampton Roads, one of Virginia’s mostpopulous regions, will see relatively slow growth.
All Rural Markets will see population declines, with the Alleghany Highlands expected to experiencethe greatest population loss at over 15 percent.

18.2. MARKET AREA PROJECTIONS 237
Finding 3: Most growth will be in suburbs along Interstate 95.
High-densityparts ofNorthernVirginiawill grow,while othermajor cities in theurbancrescentmight not grow at all.
Figure 18.4: Population projections by submarket
Breaking down population projections by submarkets shows that the greatest growth will occur inthe suburban areas of Virginia. Prior to 2020, these areas have seen growth as urban cores becomeincreasingly unaffordable and this trend is expected to continue. Suburban areas in proximity to In-terstate 95 will see themost increases asWashington, D.C. commuters continue to search for housingconvenient to their work.

238 CHAPTER 18. PROJECTIONS
18.3 Age projections
Finding 1: Future growth is strongest among children, young adults, and seniors.
The number of Virginians 75 and over will double between 2010 and 2040.
Figure 18.5: Population projections by age group
Although Virginia’s youngest residents will continue to increase in number, the segment of the pop-ulation expanding most dramatically will be the oldest; the number of Virginians 65 and older willnearly double in the next two decades. This age-based demographic divergence will have major im-plications for the Commonwealth’s housing and workforce. The needs of seniors will be a prioritystatewide issue.
At the same time, there will be increased demand for housing for Generation Z and millennials, whoare often locked out of the homeownership market due to high home prices and economic burdenssuch as student and automobile loan debt. For younger generations looking to form families, thesecosts coupled with potential child care costs further put home purchase out of reach.

18.4. DISCUSSION 239
Finding 2: Older Virginians will be more common in every part of the state.
Only Large and Small Metro Housing Markets will experience population growth of youngerresidents.
Figure 18.6: Population projections by age group and market group
Generation Z’s expansion will not be evenly distributed across Virginia’s market groups. YoungerVirginians increasingly will reside in Virginia’s Large and Small Markets, while Rural Markets willlosemuch of their younger population. The loss of young people in rural parts of the Commonwealthwill be detrimental to rural economies in need of a workforce.
The growth in the population 75 andoverwill be significant in allmarket groups, and 75-and-overwillbe the only age group to increase in Rural Markets. The greatest growth will occur in Large Marketswhere this age group will nearly double in number from 2020 to 2040.
18.4 Discussion
HB854 asks for “an informed projection of future housing needs in the Commonwealth.” While the en-gagement results and data included in this report help paint that picture, another common methodfor estimating future housing needs is to project actual household growth in addition to the standard

240 CHAPTER 18. PROJECTIONS
population projections analyzed above.
In many cases, these household projections are disaggregated by age, race/ethnicity, and/or incometo help researchers and policymakers better anticipate and prepare for future needs. Such estimatesapply various methodologies to a series of demographic data, especially decennial census counts,annual population estimates, and other details from products like the American Community Survey.
What about projections by race and ethnicity?
In the past, the Weldon Cooper Center published race and ethnicity projections alongside projec-tions by age groups. However, the center ended production of these estimates several years ago. Re-searchers cite both the way people identify and how the Census Bureau collects data as the majorreasons why it is difficult to produce accurate projections by race and ethnicity today.
Although the specific methods for household projections can vary, each is an arithmetic model withinputs and outputs. The accuracy of the outputs depends on the quality of the inputs. Unfortunately,the current timing of data availability in 2021 means that high-quality inputs are not available toproduce reliably accurate estimates for future household growth in the Commonwealth.
This is the result of pandemic-related delays in the 2020 Census data releases and the timing of theHB854 deadline, which falls prior to the first release of American Community Survey data collectedduring the pandemic. The next expected release of high-quality population projections from theWeldon Cooper Center (which will incorporate the 2020 Census results) is early 2022.
New household projections for Virginia, its regions, and its localities cannot be completed until laterin 2022. These projections should incorporate:
• 2020 Census data on population and housing units, released in August 2021,• 2016-2020 American Community Survey 5-year estimates, and its associated Public Use Mi-crodata Sample (PUMS), to be released in early 20221,
• Newpopulation projections for Virginia and its localities, published by theWeldonCooperCen-ter, to be released in early 2022, and
• Best practices on household projection methodology, for which there is no universally recog-nized standard.
1The Census Bureau will not release 2020 American Community Survey 1-year estimates because the results did notmeet their data quality standards, due to low response rates during the COVID-19 pandemic. Instead, it will release “Ex-perimental Estimates” that use a novel weighting methodology.

Chapter 19
Neighbor state comparisons
This chapter compares Virginia’s challenges and progress on housing affordability with its neigh-boring states in the South and Mid-Atlantic. The data contextualizes the Commonwealth’s currentsituation for a broader perspective.
241

242 CHAPTER 19. NEIGHBOR STATE COMPARISONS
19.1 Homeownership affordability
Figure 19.1: Neighbor state comparisons for homeowner households
Virginia ranks third out of seven states for homeowners who are cost-burdened. One in five home-owner households in Virginia were cost-burdened in 2017; inMaryland nearly one in four homeown-ers were cost-burdened as were barely one in four homeowners in Delaware.
Virginia had the second highest median household income for homeowners in 2019 at $91,110 andthe second highest Zillow Home Value Index (a measure of the typical home value) at $318,902.
Virginia has a lower homeownership rate compared to its neighbors in the Mid-Atlantic and theSouth—except for North Carolina—but Virginia’s Black-white homeownership gap is narrower thanit is in North Carolina.

19.2. RENTAL AFFORDABILITY 243
19.2 Rental affordability
Figure 19.2: Neighbor state comparison for renter households
Although Virginia has relatively higher renter household incomes than a majority of its neighbors,its rents are also comparatively high.
Median renter household income—$48,085—is higher than that of Virginia’s neighbors, but it is onlyabout half that of Virginia’s homeowner median household.

244 CHAPTER 19. NEIGHBOR STATE COMPARISONS

Part IV
ANALYSIS OF EXISTING PROGRAMS
245


Part 4 Overview
Part 4 includes the following six chapters, which assess groupings of current state housing initiatives.Each section presents the major findings, successes, and challenges associated with those programsand then offers recommendations for lawmakers and program administrators to make these initia-tives more efficient and impactful.
20 Affordable rental housing production
Chapter 20 covers four programs that incentivize the production and preservation of affordablerental apartments.
21 Rental assistance and eviction prevention
Chapter 21 covers six programs that provide direct assistance to renters, including efforts createdspecifically to reduce evictions.
22 Homeownership and counseling
Chapter 22 covers seven programs created to expand homeownership among low- to moderate-income households in the Commonwealth.
23 Rehabilitation and accessibility
Chapter 23 covers seven programs that help current homeowners and renters improve the quality,efficiency, and accessibility of their homes.
247

248
24 Community revitalization and capacity building
Chapter 24 covers five programs created to support major community revitalization efforts throughhousing and to strengthen the capacity of nonprofit housing organizations across the state.
25 Homelessness assistance and prevention
Chapter 25 covers six programs that support efforts to assist persons experiencing homelessness andto build infrastructure to make homelessness rare, brief, and non-recurring.

Chapter 20
Affordable rental housing production
This chapter covers four programs that incentivize the production and preservation of affordablerental apartments.
Highlights
Major takeaways in this chapter include:
• According to providers, the Commonwealth’s four main affordable rental housing programsmaximize effectiveness with flexibility, adaptability, responsiveness, and targeted financing.
• The Low-Income Housing Tax Credit is Virginia’s dominant engine for affordable rentals; 75percent of LIHTC households are very low-income or extremely low-income, earning less than50 percent AMI.
• The needs of cost-burdened households continue to exceed the combined capacity of programsto meet the demand.
• Primary program challenges include restrictive local land use policies andwidespread commu-nity resistance to affordable housing development. At best, such difficulties delay productionand increase costs. At worst, they stop new affordable homes altogether.
• These initiatives can be improved by increasing investments in programs focused on deeplyaffordable rental housing, and by leveraging existing strategies and best practices like incomeaveraging in LIHTC development.
• Creating new programs, such as developing a version of the Wasington, D.C. Local Rent Sup-plement Program and fostering greater minority-led developer involvement, can support thedevelopment of and greater access to deeply affordable rentals in Virginia.
Programs in this grouping
Virginia Housing
249

250 CHAPTER 20. AFFORDABLE RENTAL HOUSING PRODUCTION
• Low-Income Housing Tax Credit (LIHTC)• Mixed Used / Mixed Income• Multifamily Lending Program
Department of Housing and Community Development
• Affordable and Special Needs Housing
20.1 Findings
These findings are based on data provided by VirginiaHousing, DHCD, and other sources on the scaleof these programs, demographic information on their beneficiaries, and other trends.
Finding 1
The LIHTC program is the largest engine for affordable rental housing production and preser-vation in Virginia.
Figure 20.1: LIHTC allocation and units funded

20.1. FINDINGS 251
LIHTC produces thousands of affordable rental units across Virginia. In the last five credit-awardcycle years, the program has produced as many as 7,234 units to a low of 4,319 units. The growth ofthe Virginia Housing Trust Fund and the Virginia Housing Opportunity Credit enacted in early 2021have the potential to increase production across the Commonwealth.
Finding 2
Over 75 percent of all households in Virginia’s LIHTC apartments earn less than 50 percentAMI.
Figure 20.2: Profile of LIHTC households
Although LIHTC can serve households making up to 60 percent AMI, LIHTC units in Virginia areserving those households who are most in need of affordable housing. Over 75 percent of LIHTCunits serve ELI and VLI households in Virginia.

252 CHAPTER 20. AFFORDABLE RENTAL HOUSING PRODUCTION
Finding 3
In spite of Virginia’s prolific affordable rental development programs, the need consistentlyeclipses the supply.
Figure 20.3: Cost-burdened renters by AMI and LIHTC units
The number of active LIHTC units in Virginia has been increasing steadily over the last decade. Butthe number of cost-burdened renter households has remained consistently well above the number ofaffordable units supported by LIHTC, even with additional subsidies like Housing Choice Vouchers.
20.2 Program successes
These successes are based on feedback collected from the statewide provider survey, focus groups,and conversations with experienced users of these programs.

20.2. PROGRAM SUCCESSES 253
Success 1
There is robust transparency in the LIHTC scoring system.
Overall, affordable rental housing developers are satisfied with Virginia Housing’s transparent pro-cess for scoring applications using the Qualified Allocation Plan (QAP).
Success 2
The flexibility of Virginia Housing’s REACH program is a major asset.
Funds from the REACH program positively impact the underlying loans formultifamily projects andhelpmake these deals less costly. This can take the form of reduced interest rates and/or loans amor-tized over 35 years.
Success 3
Virginia Housing is responsive to feedback from developers and advocates on the Qualified Al-location Plan.
Developers and advocates frequently cited Virginia Housing’s consistent adjustments to the QAP asa major advantage in dealing with the LIHTC program. The QAP adjustments allow the program tokeep pacewith shifting economic conditions aswell as changes to other affordable housing resources.
Success 4
Virginia Housing adapts extremely well to federal actions that impact the LIHTC program.
Virginia Housing effectivelymonitors and addresses federal actions and events that may have an im-pact on the LIHTC program (e.g., their proactive response to potential reductions in credit valuationas a result of the Tax Cuts and Jobs Act of 2017).
Success 5
Virginia commits a large amount of its Private Activity Bonds for affordable housing develop-ment.
Virginia has designed the Private Activity Bond (PAB) allocation system so that the PAB allocation iscompletely expended every year. In the last decade, this has meant that nearly all of the allocation isused for housing—either multifamily four percent bond deals or Mortgage Credit Certificates.

254 CHAPTER 20. AFFORDABLE RENTAL HOUSING PRODUCTION
The multifamily bond program carries the extra benefit that investors generate additional equity tofurther reduce the cost of this housing. The result is that no multifamily bond proposals have beendenied because of a shortage of bond allocation—and Virginia renters benefit from the additionalequity generated from the tax credits.
Success 6
State-level programs to address permanent supportive housing needs have been improving interms of program guidelines and increases in the critical Virginia Housing Trust Fund.
DHCD’s Affordable and Special Needs Housing Program (ASNH) provides higher per unit awardsfor targeting special needs/permanent supportive housing (PSH); this beneficial prioritization rec-ognizes the particular underwriting needs of these types of projects.
During the past few years, the LIHTCpool for PSHprojects and the 10 percent PSH leasing preferencerequirement in the QAP years have supported the development of more housing for this population.
20.3 Program challenges
These challenges are based on feedback collected from the statewide provider survey, focus groups,and conversations with experienced users of these programs.
Challenge 1
Developers and advocates need additional support in addressing NIMBY-ism at the local level.
Despite some progress on this issue, many affordable rental housing developers and housing advo-cates experience strong community opposition to new housing, especially apartments that use someform of rental assistance and/or that are serving a population that is the subject of misperceptions.At best, this opposition can delay projects and increase costs and at worst, it can derail proposalsentirely.
Challenge 2
Local land use restrictions lead to limited site availability and higher acquisition costs whenland is available.
As a result, affordable housing developers must search longer for land and pay exorbitant prices forsites when they become available. These delays and expenses stymie the addition of new affordablerental supply, especially in high-cost areas where those homes are badly needed.

20.4. RECOMMENDATIONS 255
Challenge 3
The interest rate on ASNH loans can be an issue for certain projects.
The ASNH interest rate is a three percent “must pay” interest-only loan with repayment of principaldeferred. However, DHCD lowers this rate for most nonprofit organizations. Upwards of 90 percentof the ASNH loans are at a rate less than three percent and most nonprofits have rates ranging fromone-half percent to one percent.
Some for-profit providers have suggested that the interest rate should be even more flexible, giventhe type of the project and the households that are targeted. Rates that are too high can reduce initialfeasibility and/or cut cashflow during operations and delay payment of the developer fee.
Challenge 4
Households in LIHTC units are still cost-burdened.
There are relatively high levels of rent burden inmany LIHTC communities. This means that house-holds are frequently paying more than 30 percent of their income for rent and utilities. Almost halfof households living in LIHTC housing are below 30 percent AMI and most of them have some typeof rental assistance; rent burdens are falling primarily on the households above that income level.
Challenge 5
The QAP does not always reflect the specific needs of the local community. Those needs mayvary from area to area.
One stakeholder noted that housing developers are adept at adjusting their plans to meet scoringcriteria. This survival instinct to adhere strictly to the QAP guidelines tomaximize scoringmay stiflecertainneeds or types of projects. (e.g., it is difficult to get awards for larger projects). Somedevelopersalso expressed that the current QAP may lead to excessive design/construction standards that driveup the cost of apartments.
20.4 Recommendations
These recommendations synthesize the findings, successes, and challenges identified for this clusterof programs. They offer a roadmap to a future where these state initiatives are efficient, impactful,and best serve Virginians who need greater housing opportunities.

256 CHAPTER 20. AFFORDABLE RENTAL HOUSING PRODUCTION
Recommendation 1
Expand support for increasing supply of apartments available and affordable to very low in-come households earning less than 50 percent AMI.
Why this is needed:
• The majority of Virginia’s renter households in affordable apartments have incomes below 50percent AMI, and they still commonly experience cost burden becausemost rents set by LIHTCprogram guidelines remain higher than they can afford (i.e., at 60 percent AMI).
• As of 2017, more than 300,000 cost-burdened renter households in Virginia with incomesbelow 50 percent AMI—over three times the number of active LIHTC apartments.
• Householdswith incomes below50percentAMI are themost severely disadvantaged in seekingquality, affordable rentals. While there is an overall shortage of affordable apartments acrossall incomes, the gap between the affordable supply and the number of VLI households seekingthose units is greater than for other income groups.
Who is responsible:
• Virginia Housing• Department of Housing and Community Development• General Assembly• Governor• Congress and the federal administration• Virginia Housing Alliance and advocates
How to accomplish:
Virginia can act to expand existing state programs, especially the Virginia Housing Trust Fund. Pro-viding housing formore VLI households using a deep subsidy is expensive andwill require the alloca-tion of new resources, such as an expansion of services. A state sponsored rental assistance program—also recommended in Chapter 26 this report—could be one additional valuable tool to meet needsusing state resources.
Congress and the federal administration are also considering proposals that would expand produc-tion of deeply affordable rentals through the expansion of federal rental assistance, the NationalHousing Trust Fund, the LIHTC program, and other avenues. The scale of federal dollars potentiallyavailable for this effort is considerable and essential to begin meeting the full need for affordablerental homes.
Education and advocacy of elected officials at both the state and federal levels will be a key elementin accomplishing this recommendation.

20.4. RECOMMENDATIONS 257
Recommendation 2
Monitor, report, and expand the use of income averaging across LIHTC developments. Thisrelatively new option has the potential to create housing that has greater income mixing andthe opportunity to include more apartments that are targeted to households below 50 percentAMI, where needs are greatest.
What is income averaging?
TheAffordableHousingCredit Improvement Act of 2016 altered income restrictions in LIHTCdevel-opments to allow for some units at 80 percent AMI, as long as the overall average of incomes acrossan entire development is equal to 60 percent AMI. Benefits of this option are described inmore detailbelow.
Why this is needed:
• Virginia has a severe shortage of apartments that are affordable to individuals and families withincomes below 50 percent AMI. Income averaging is a strategy that can begin to address thisneed.
• Income averaging can address community uneasiness and other concerns about poverty con-centration. While such perceptions are often not founded on an accurate understanding of theLIHTC program or the program’s residents, communities with positive regard for “workforcehousing” are more likely to welcome households up to 80 percent AMI (balanced with house-holds at lower incomes).
• Income averaging is not widely adopted because of the current complexity of its administra-tion and management. Investors are not yet fully confident that income averaging is a positiveopportunity and they avoid investment risk, including recapture if noncompliance occurs.
Who is responsible:
• Virginia Housing• LIHTC owners and managers• Virginia Housing Alliance and advocates
How to accomplish:
More data and reporting are needed to bring greater clarity to the issue of income averaging and toencourage its use. This may require enhanced guidance from the IRS and compliance safe harbors.It will require increased technical assistance tomanagers and education of investors once the invest-ment risk can be reduced and clarified.

258 CHAPTER 20. AFFORDABLE RENTAL HOUSING PRODUCTION
Recommendation 3
Form a task force to design and propose a statewide program similar to the District ofColumbia’s Local Rent Supplement Program (LRSP).
Why this is needed:
• The LRSP was created in 2007 and provides rental assistance to households with incomes be-low 30 percent AMI who are most at risk of homelessness and who frequently have a need foradditional services to keep them stably housed.
• The LRSP operates like the Housing Choice Voucher program except that it is more deeply in-come targeted. The program makes up the difference between what a family can afford (30percent of income) and the rent.
• LSRP assistance can be tenant-based, project-based, or organization-based.• It is frequently used as part of a supportive housing program and is an important tool in pre-venting homelessness.
Who is responsible:
• Virginia Housing• Department of Housing and Community Development• Department of Behavioral Health and Developmental Services• Virginia Department of Social Services• Homelessness service providers• Virginia Housing Alliance and advocates
How to accomplish:
Stakeholders recommend a task force of representatives from the above groups to explore the feasi-bility of a program similar to LSRP that would helpmeet needs of individuals and families advancingfrom homelessness and ELI households. This initiative relates to a companion recommendation fora state-supported rental assistance program. Depending on that outcome, this LSRP-modeled initia-tive could fold into a broader rental assistance program as a focal component.
Recommendation 4
Consider lower interest rates for ASNH funding, especially with respect to projects that servespecial needs and/or ELI populations.
Why this is needed:
• Some providers are unable to use the lower ASNH interest rate on certain projects where itwould significantly help.

20.4. RECOMMENDATIONS 259
• Inflexibility on the rate can reduce initial feasibility and/or cut cashflow during operations anddelay payment of developer fees that support the sustainability of many nonprofit providers.
• Lower or zero interest rate loans would also enable rent reduction and/or the securing of addi-tional debt to close gaps in the capital budget.
Who is responsible:
• Department of Housing and Community Development• ASNH program users
How to accomplish:
DHCD and providers should engage in an informed discussion on the benefits and disadvantagesof ASNH loans payment and how to potentially reconcile their inherent competing interests. Theinterest-only ASNH loans developers pay back to DHCD return directly to the Virginia Housing TrustFund, but the payments, though more generous than other sources, can hinder some developmentprojects. DHCD, with input from affordable housing developers, should evaluate whether ASNH candeliver greater loan term flexibility that would remove impediments to smaller, more challengingprojects.
Recommendation 5
Conduct overhauls of the QAP every five to six years to make adjustments that account for im-portant macroeconomic and demographic trends to reconsider basic program requirementsand targeting.
Why this is needed:
• Currently the QAP undergoesmodifications every other year. These adjustments can be signif-icant or incremental. Stakeholders recommend that Virginia Housing consider a “zero base”overhaul periodically that would respond to major economic, social, demographic shifts andchanges in other issue areas.
• Stakeholders also saw this type of review as one that would allow for renewed conversationabout components of the program that otherwise are considered to be “settled law.” An examplecitedwas the progression of design and construction standards, which individually seem logicaland desirable but periodically require a comprehensive, aggregated assessment.
Who is responsible:
• Virginia Housing• Developers, lenders, investors, consultants, other program users• Local governments• Virginia Housing Alliance and advocates

260 CHAPTER 20. AFFORDABLE RENTAL HOUSING PRODUCTION
How to accomplish:
VirginiaHousing already has an effective system for feedback and review of theQAP. This system canalso provide a broader review over a longer period of time and with the development of several “largeissue” focus groups.
Recommendation 6
VirginiaHousing should consider allowing30 to 45 year amortization for certainnewconstruc-tion and rehabilitation projects.
Why this is needed:
• Longer amortization periods are available in certain USDA-Rural Development loan productsas well as some HUD and FHA loans. Longer amortization periods reduce debt service andimprove project feasibility. They may also create the opportunity for reduced rents and/or foradditional debt to close gaps in the project budget.
Who is responsible:
• Virginia Housing• Multifamily developers and loan program users
How to accomplish:
Virginia Housing already has an advisory group in place for its multifamily programs. The sameadvisory group or a separate dedicated group could address amortization periods.
Virginia Housing may need to clearly articulate the financial risks associated with longer terms bal-anced with the benefits. Developers need to clarify the benefit of enhanced amortization within Vir-ginia Housing’s loan program if other existing long term amortization programs can already be usedas an alternative.
Recommendation 7
VirginiaHousing andDHCD should recruitmoreminority-led developers to participate in pro-grams.
Why this is needed:
• The affordable housing development industry does not have adequate representation from forprofit andnonprofitdevelopment groups that areBlack, Indigenous, people of color (BIPOC) led

20.4. RECOMMENDATIONS 261
and governed. Many minority development groups are under-capitalized and under-staffed;they have difficulty accessing affordable housing programs that often rely on experience andtrack record as key factors in scoring and selection.
• Affordable housing developers often work with properties and/or neighborhoods where thereis a high minority population. The inclusion of BIPOC-led organizations in this work will havea positive impact on resident and community support.
Who is responsible:
• Virginia Housing• Department of Housing and Community Development• Minority development groups• Other minority participants in the housing industry• NAACP, Urban League, and other associations representing minority interests
How to accomplish:
Virginia Housing and DHCD should collaborate in this effort since their constituencies overlap tosome degree.
VirginiaHousing has an internal process underway, including staff additions, to enhance its outreachto the minority community and better serve that population through its programs. Stakeholders feltthat Virginia Housing should augment this effort to reach and encourage minority developers.
Chapter 30 includes a series of suggested strategies to begin addressing racial disparities in housingin Virginia. One strategy is the use of Racial Equity Impact Assessments (REIAs) to evaluate programsand activities to determine barriers to minority participation. The city of Chicago and the state ofOregon have used REIAs to examine their QAPs; one outcome has been proposals to increase BIPOCdeveloper/contractor participation in these programs.
Recommendation 8
Virginia Housing should conduct a comprehensive review of all active Low-Income HousingTax Credit properties to assess the potential risk of LIHTC units exiting the affordable housingsupply.
Why this is needed:
• VirginiaHousing’s LIHTCprogramcurrently has a 30-year affordability commitment, but afterthe initial 15-year compliance period, property owners can increase rents.
• Virginia’s LIHTC affordable stock is facing a loss of nearly three quarters of its active units (over60,000 units) by 2040 due to current existing affordability expirations.
• Current data provided by the National Housing Preservation Database is inconsistent or lack-ing in regards to property ownership (i.e., whether a nonprofit or for-profit organization ownsand/or manages a property).

262 CHAPTER 20. AFFORDABLE RENTAL HOUSING PRODUCTION
Who is responsible:
• Virginia Housing
How to accomplish:
Virginia Housing should survey all active LIHTC properties and provide a report on how many arenonprofit owned or have a nonprofit right-of-first-refusal (ROFR) for an accurate assessment of prop-erties at-risk of conversion to market rate.
Virginia Housing should also explore other ways to expand compliance periods within the QAP andother regulations. Many other states have established longer compliance requirements through ex-tended use periods. California requires a 55-year extended use period for nine percent tax creditprojects, while 4 percent tax credit projects frequently receive a basis boost by agreeing to a 55-yearextended use period.1
1California Tax Credit Allocation Committee, Program Overview.

Chapter 21
Rental assistance and evictionprevention
This chapter covers six programs that provide direct assistance to renters, including efforts createdspecifically to reduce evictions.
Highlights
Major takeaways in this chapter include:
• Virginia’s array of programs has a track record of achievement before and since the COVID-19public health crisis, with most assistance reaching Very Low-Income households.
• DHCD’s Rent Relief Program far outpaced other states in its rapid disbursement of federalEmergency Rental Assistance funds in 2021.
• DBHDS’s State Rental Assistance Program has consistently outmatched its own goals for pro-viding housing assistance to renters with developmental disabilities so they can live withincommunities.
• The Communities of Opportunity Tax Credit Program, designed to serve metro areas, has un-tapped potential that new source of income protections may redirect.
• Primary challenges for these programs include longwait lists, restrictive eligibility criteria, anda decline in quality market affordable housing.
• Supporting a state-funded, non-emergency rental assistance program, continuing to investin DBHDS housing assistance programs, reducing barriers to assistance, and leveraging newsource of income protections will further help many renters in Virginia stay stably housedduring increase, as well as increase economic opportunity.
263

264 CHAPTER 21. RENTAL ASSISTANCE AND EVICTION PREVENTION
Programs in this grouping
Virginia Housing
• Housing Choice Voucher (Virginia Housing-administered)
Department of Housing and Community Development
• Communities of Opportunity Tax Credit (COPTC)• Virginia Eviction Reduction Pilot (VERP)• Virginia Rent Relief Program (RRP)
Department of Behavioral Health and Developmental Services
• Permanent Supportive Housing - Serious Mental Illness• State Rental Assistance Program (SRAP)
Virginia Department of Social Services
• Low-Income Home Energy Assistance Program (LIHEAP)
21.1 Findings
These findings are based on data provided by VirginiaHousing, DHCD, and other sources on the scaleof these programs, demographic information on their beneficiaries, and other trends.

21.1. FINDINGS 265
Finding 1
Virginia has been a leader in its disbursement of Emergency Rental Assistance funds throughthe Virginia Rent Relief Program.
Figure 21.1: Emergency Rental Assistance funding and disbursement by state
In its Emergency Rental Assistance Program (ERA) Monthly Compliance Report, the U.S. Treasurydata compared the program’s first-round (ERA 1) total Allocation, Award, and Disbursement to thetotal rent, rental arrears, and utilities paid; the comparison demonstrated that Virginia’s Rent ReliefProgram (RRP) led a majority of states in its disbursement rate (62 percent).
While this does not account for funds disbursed before January 2021, Virginia’s rapid disbursementof rent relief funds has been exemplary. As of October 31, 2021, the RRPhas servedmore than 70,900unique low-income households.

266 CHAPTER 21. RENTAL ASSISTANCE AND EVICTION PREVENTION
Finding 2
Since its launch in 2015, Virginia has consistently exceeded its target in providing community-based, independent housing for persons with developmental disabilities that were covered bythe Settlement Agreement.
Figure 21.2: Housing options for target population in Settlement Agreement
Virginia’s Department of Behavioral Health and Developmental Services has consistently exceededits target outcome for the number of adults in the Target Population of the Settlement Agreementliving in independent housing.1
DBHDShas been able to do this thanks to the StateRental Assistance Program (SRAP), which providestenant-based rental assistance to individuals with developmental disabilities (IDD) so that they maylive integrated within communities.
SRAP has been able to take pressure off Virginia Housing-administered Housing Choice Vouchersand local PHA Housing Choice Vouchers, which had supported the IDD population.
1In 2012, the Commonwealth and the Department of Justice entered a Settlement Agreement following a civil rightsinvestigation into state institutions for persons with developmental and intellectual disabilities. The Final Order and Set-tlement Agreement, along with annual reports, are available on the DBHDS website.

21.1. FINDINGS 267
Finding 3
Even before source of income protections were enshrined in state law, the Communities of Op-portunity Tax Credit Program was underutilized.
Figure 21.3: Communities of Opportunity Tax Credit program
The Communities of Opportunity Tax Credit Program (COPTC) operates in Virginia’s three majormetropolitan areas where HCV recipients are concentrated. However, the program has consistentlyreceived a low number of applications with an increase only in the past two years. New source ofincome protections offer an opportunity to redirect the COPTC toward encouraging landlords to in-crease unit energy efficiency and affordability.2
2HB6 Virginia Fair Housing Law; unlawful discriminatory housing practices, sources of funds. 2020 Regular Session,Virginia General Assembly.

268 CHAPTER 21. RENTAL ASSISTANCE AND EVICTION PREVENTION
Finding 4
Successful investments in supportive housing assistance lead to significant reductions in statehospital costs.
Figure 21.4: Fiscal savings from permanent supportive housing interventions
PSH-SMI follows national best practices that help reduce costs outside of homelessness systems. InVirginia, a recent DBHDS study showed that the state hospital costs for a cohort of 809 individualswho entered supportive housing at least one year beforeMarch 2020were reduced by 76 percent oneyear after moving into supportive housing. This equated to a total state hospital cost reduction ofmore than $12.2 million and a 59 percent reduction in hospitalizations from 180 to 73 after move-in.(Virginia Department of Behavioral Health and Developmental Services, 2020)
21.2 Program successes
These successes are based on feedback collected from the statewide provider survey, focus groups,and conversations with experienced users of these programs.

21.2. PROGRAM SUCCESSES 269
Success 1
Tenant-based rental assistance in Virginia reaches households most-in-need.
The majority of households served by Virginia’s tenant-based rental assistance programs make 50percent AMI or below. These households benefit greatly from resources that assist them in remainingstably housing—lowering the risk of eviction and homelessness.
Success 2
Virginia has been a national leader in its efforts to disburse emergency rental assistance inresponse to COVID-19.
Although some survey respondents and focus group participants had issues with the initial deploy-ment of Virginia’s RRP, Virginia has been able to quickly disburse EmergencyRental Assistance fundsfrom the U.S. Treasury. Virginia has disbursed funds to over 70,900 households, most of which arehouseholds at 50 percent AMI or below.
Virginia has consistently ranked in the top tier of states for expenditure of funds by deploying a dualtrack design that engages both housing agencies—one responsible for direct assistance to individualrenters and the other for larger scale transactions with landlords that include payments for rent inarrears for multiple tenants.
Success 3
Virginia’s response to the eviction crisis has been historic, even before COVID-19.
In November 2018, Governor Northam signed Executive Order 25 (PDF) that set several housing pri-orities for Virginia, including reducing the rate of evictions. The order cited eviction reduction ini-tiatives such as “diversion and prevention programs,” “potential pilot programs that provide evictionrelief,” and “counseling and education services.”
The General Assembly passed additional legislation during the 2019 legislative session to mitigateevictions by requiring landlords to provide written leases, extending the time tenants can pay theirrents, and limiting actions that landlords can take against a tenant.
Three years before Governor Northam’s Executive Order, Governor McAuliffe announced that Vir-ginia was the first state in the nation to meet HUD’s criteria for “effectively ending veteran’s home-lessness.” Thismeant that Virginia had put systems in place that would immediatelymake assistanceavailable to any veteran who became homeless.
During the 2020 Special Session, the General Assembly and the Governor allocated $3.3 million toimplement a Virginia Eviction Reduction Pilot (VERP). This program focuses on local and regionalsystems to prevent evictions. The pandemic delayed final approval of the $3.3 million until fall of

270 CHAPTER 21. RENTAL ASSISTANCE AND EVICTION PREVENTION
2020 and the implementation of VERP until March 2021. Therefore, an evaluation of VERP was notcompleted as part of this report.
21.3 Program challenges
These challenges are based on feedback collected from the statewide provider survey, focus groups,and conversations with experienced users of these programs.
Challenge 1
Over 32,000 applicants remain on HCV waitlists due to limited federal program funding.
The HB854 public housing authority survey indicated that as of early 2021 there were over 32,000applicants on HCV waitlists; this count did not include the waitlists of eleven additional PHAs thatdid not respond to the survey. Many of these waitlists have been closed for years. Limited federalfunding for the programprevents additionalHCVallocation, leaving tens of thousands of low-incomeVirginians without assistance.
Challenge 2
Eligibility criteria for HCVs can be too restrictive.
Stakeholders, survey respondents, and focus group participants that work with HCVs often cited therestrictive eligibility criteria of the federal HCV program. These restrictions include criminal back-ground restrictions and immigration status, which prevent assistance from reaching households thatare at risk of housing instability and related crises that further jeopardize their economic and socialwell-being.
Challenge 3
The effectiveness of rental assistance depends on greater access to affordable units.
The substantial shortfall of rental assistance tomeet the demand of low-income Virginians is not theonly impediment to its success. The inadequate supply of affordable housing units is themost urgentchallenge to the program’s effectiveness; voucher holders competing on the openmarket simply havetoo few options. Theymay fail to find a home, settle for a less desirable neighborhood, opt for a homewith chronic maintenance needs or substandard conditions, or select a home with a rent above thepayment standard. This last possibility means that a household could still be rent-burdened despitethe HCV.

21.4. RECOMMENDATIONS 271
Challenge 4
The quality and quantity of market-rate affordable housing (“naturally occurring affordablehousing” or NOAH) is declining.
Across Virginia, older rental units—which are often affordable because market dynamics drive theirprices lower—are continuously aging. The declining quality of these homes impacts residents’ healthand quality of life, but it also often means that housing costs are higher due to an aging home’s de-teriorating condition and outdated systems. Owners face the choice of either raising rents to coverthe costs of maintenance and upgrades or redeveloping the properties, further shrinking the supplyof affordable housing. In fast-growing areas of the Commonwealth like Northern Virginia, this trendhas already led to major losses in the supply of lower-cost, unsubsidized apartments.
Many rental assistance recipients occupy these “Class B” and “Class C” buildings, which are far morecommon than affordable apartments with project-based rent subsidies in Virginia and across thecountry.
This challenge also extends to older single-family and manufactured home rentals in rural Virginia,which often have high levels of deferred maintenance that lead to poor living conditions.
Challenge 5
Geographic coverage for local HCV providers can complicate voucher delivery.
Local providers of HCVs administered by Virginia Housing have significant overlap in their geo-graphic coverage. Several localities in Central Virginia and the Middle Peninsula are served by twoor even three local providers. This agency overlap in multiple localities can cause redundancies andconfusion for potential clients.
21.4 Recommendations
These recommendations synthesize the findings, successes, and challenges identified for this clusterof programs. They offer a roadmap to a future where these state initiatives effectively and efficientlyserve Virginians who need greater housing opportunities.
Recommendation 1
VirginiaHousing should explorenational best practices for project-basing someVirginiaHous-ing administered HCVs.
Why this is needed:

272 CHAPTER 21. RENTAL ASSISTANCE AND EVICTION PREVENTION
• Project basing ofHCVs is a strategy to incentivize the development of newor rehabilitatedhous-ing that expands the supply of high quality affordable apartments. Virginia Housing shouldexplore national best practices for project-basing some of their HCVs to help develop a reliablesupply of place-based affordable rental units. This would ensure a steady supply of deeply af-fordable rental units in the jurisdictions of local voucher administrators, which often serve lesspopulous areas with fewer rental options than urban PHAs.
• Most PHAs in the state follow a practice of allocating a portion of their HCVs to project-basedhousing. In some cases, these PHAs conduct an RFP for vouchers in advance of the annual LI-HTC application cycle. This has the benefit of locking in some LIHTCunits as deeply affordablebecause of the rental assistance.
Who is responsible:
• Virginia Housing• Local HCV administrators
How to accomplish:
Stakeholders suggest thatVirginiaHousing consultwith other statewideHCVadministrators toweighthe benefits and the drawbacks of implementing project-basing. Virginia Housing should also exam-ine the impact on housing supply, especially the ability to stimulate new construction in areas witha severe supply shortage.
Localities that serve as administrators should participate in this discussion, which should include theopportunity to target new housing to high-need populations identified by the locality. If approved,Virginia Housing and the local administrator could allocate project-based assistance through jointlyoffered RFPs.
Recommendation 2
Continue to scale up state funding for the DBHDS SRAP targeted rental assistance programsand to expand populations eligible for assistance.
Why this is needed:
• Virginia’s existing targeted rental assistance programs (State Rental Assistance Program (SRAP)and Permanent Supportive Housing-Serious Mental Illness (PSH-SMI)) have been effective inreducing homelessness for individuals within the Settlement Agreement population.
• By increasing the ability of these proven effective programs to house individuals in the Set-tlement Agreement and other populations with supportive housing needs, the Commonwealthwill not only continue to be in compliance with the Settlement Agreement, but will also helpaddress statewide homelessness and the state psychiatric hospital bed crisis.
Who is responsible:

21.4. RECOMMENDATIONS 273
• General Assembly• Department of Behavioral Health and Developmental Services
How to accomplish:
Between 2017 and 2020, the General Assembly allocated between $1.5 million and $2.6 million peryear for SRAP out of the general fund. In 2021 SRAP received a large increase in funding, bringingits total budget to nearly $4.7 million. The General Assembly can sustain and expand on this fundinglevel by allocating necessary funds during future state budget cycles.
Recommendation 3
Reduce voucher program eligibility barriers for assistance by following best practices fromother states.
Why this is needed:
• Easing such barriers (e.g., criminal history and immigration status documentation) would ac-knowledge racial injustices across other systems and work toward their elimination. Whenrental assistance is available for persons facing numerous structural challenges—such as Vir-ginians exiting criminal processing systems—they can more steadily focus on finding successwith their jobs, family, and community.
Who is responsible:
• Virginia Housing• Department of Behavioral Health and Developmental Services• Local HCV administrators
How to accomplish:
Virginia’s HCV program should reduce eligibility barriers for assistance by following best practicesfrom other states. The reduction of barriers should alsomirror, when possible, the recommendationsincluded for the new state-funded rental assistance program described in Chapter 26 of this report.Those considerations include immigration status, debt status, eviction record, and other factors thatcommonly prevent households from receiving rental assistance.
Recommendation 4
Support the creation of a state-funded rental assistance program as outlined in Chapter 26 ofthis report.
Why this is needed:

274 CHAPTER 21. RENTAL ASSISTANCE AND EVICTION PREVENTION
• A state-funded rental assistance program will help fill the gap in assistance not met by the fed-eral government while continuing to support low-income and moderate-income renter house-holds post-pandemic to prevent evictions and homelessness.
Who is responsible:
• Virginia Housing• Department of Housing and Community Development• Department of Behavioral Health and Developmental Services• General Assembly• Governor
How to accomplish:
The administration—through its housing agencies and DBHDS—should work with the General As-sembly to enact legislation that creates a state-funded rental assistance program, as recommendedin Chapter 26. That larger state rental assistance program could include a component that servesVirginians with developmental disabilities or severe mental illness and other populations identifiedand served by DBHDS’s targeted housing programs.
Recommendation 5
Eliminate or transform the Communities of Opportunity Tax Credit Program.
Why this is needed:
• The COPTC program is small in terms of the amount of tax credits available and has not ex-perienced much demand. Few landlords have applied and been approved to receive credits fortheir participation in the program. Now that source of income protection is part of Virginia’sfair housing law, the program could pivot to other similar efforts that expand housingmobility.
Who is responsible:
• General Assembly• Department of Housing and Community Development
How to accomplish:
The COPTC may be eliminated in order to transfer resources to other rental assistance efforts. Al-ternatively, lawmakers may explore transforming it to operate more effectively in a rental marketwhere source of income protection is now law. The tax credit could instead incentivize other neededactions by landlords and property owners, such as rehabilitating lower-quality apartments and pre-serving those as below-market units .

21.4. RECOMMENDATIONS 275
Policymakers can choose either option, but each scenario should assure that revisions to this programdo not generate unintended consequences.

276 CHAPTER 21. RENTAL ASSISTANCE AND EVICTION PREVENTION

Chapter 22
Homeownership and counseling
This chapter covers seven programs created to expand homeownership among low- to moderate-income households in the Commonwealth.
Highlights
Major takeaways in this chapter include:
• The share of Virginia Housing’s first-time homebuyer borrowers of color has been increasingin the last five years. Nearly all Virginia Housing borrowers also now benefit from MortgageCredit Certificates, a dramatic shift in a short period of time that further lowers housing costsfor homeowners.
• Homeownership projects compete with a high number of rental projects for Affordable andSpecial NeedsHousing (ASNH) funds and represent only a small share of that awarded funding.
• For-profit housing developers are an untapped resource among these programs; their partici-pation in ASNH could help boost production.
• Supply and demand shifts continue to stifle greater numbers of first-time buyers. Senior citi-zenswithout affordable downsizing options stay in their homes longer, keeping thosehomesoutof the market, while the market cannot produce adequate starter homes and middle-moderateincome homes due to restrictive land use policies and other challenges.
• Expanding equitable homeownership opportunities in Virginia can be accomplished by devel-oping a statewide “starter home” initiative, increasinghomeownership funding in existing com-petitive affordable housing programs, expanding outreach to Black institutions and networks,and increasing the involvement of for-profit developers.
Programs in this grouping
Virginia Housing
277

278 CHAPTER 22. HOMEOWNERSHIP AND COUNSELING
• Homebuyer Education• Home Purchase Loans / SPARC• Mortgage Credit Certificates• REACH - Housing Counseling
Department of Housing and Community Development
• Affordable and Special Needs Housing (ASNH)• Down Payment Assistance
22.1 Findings
These findings are based on data provided by VirginiaHousing, DHCD, and other sources on the scaleof these programs, demographic information on their beneficiaries, and other trends.

22.1. FINDINGS 279
Finding 1
Virginia Housing has increasingly served first-time homebuyers of color.
Figure 22.1: Virginia Housing first-time homebuyers by race
The share of Virginia Housing’s first-time homebuyer borrowers of color has been increasing in thelast five years. Even with a higher percentage of borrowers choosing not to indicate their race, thenumber of borrowers of color—particularly Black borrowers—receiving Virginia Housing loans hasincreased from 24 percent in fiscal year 2016 to 27 percent in the first through third quarters of fiscalyear 2021.

280 CHAPTER 22. HOMEOWNERSHIP AND COUNSELING
Finding 2
Homeownership awards have represented a small percentage of overall ASNH funding since2017.
Figure 22.2: ANSH homeownership funding as share of total
ASNH began awarding funding to homeownership projects in 2017. However, homeownershipproject awards have made up a small percentage of total ASNH funding awards—from a high of16 percent in 2019 to a low of six percent in 2020. This is a result of homeownership projectscompeting with a high number of rental projects for ASNH funding.

22.2. PROGRAM SUCCESSES 281
Finding 3
The share of Virginia Housing borrowers taking advantage of Mortgage Credit Certificates hasconsistently increased.
Figure 22.3: Virginia Housing homebuyers using MCCs
Early in the rollout of the Mortgage Credit Certificate (MCC) program, fewer than one in four home-buyers with Virginia Housing loans took advantage of the certificate. From 2016 to 2020 that sharedrastically increased to 80 percent. Today, nearly all Virginia Housing borrowers avail themselves ofan MCC.
22.2 Program successes
These successes are based on feedback collected from the statewide provider survey, focus groups,and conversations with experienced users of these programs.

282 CHAPTER 22. HOMEOWNERSHIP AND COUNSELING
Success 1
Overall, users and administrators feel that homeownership programs work well.
Virginia Housing and DHCD offer a robust set of programs that assist households seeking homeown-ership. The stakeholders agreed that these efforts are effectively designed, targeted, and adminis-tered.
Success 2
State-level programs have increasingly served households of color.
In Virginia, there is a significant gap between Black and white homeownership rates. For the pastfew years, there has been steady progress in increasing the number of persons of color accessingassistance from state homeownership initiatives.
22.3 Program challenges
These challenges are based on feedback collected from the statewide provider survey, focus groups,and conversations with experienced users of these programs.
Challenge 1
Almost all programs focus on the demand side by assisting with purchase of a home.
All of the state-level homeownership programs—except for DHCD’s Affordable and Special NeedsHousing (ASNH) program andAcquire, Renovate, and Sell (ARS)—focus primarily on improving buy-ers’ readiness to buy a home. These programs provide support on the demand side of the market.
However, the supply side of the market lacks adequate existing or under-construction starter homestomeet that demand. Increasing demand side assistance without supply side balance can exacerbatethis problem as more buyers chase scarcer and increasingly pricey homes.
Challenge 2
Virginia’s major metropolitan areas need more starter homes for first-time and moderate-income buyers.
Providers working in the homeownership market have consistently mentioned the lack of starterhomes for young families and first-time homebuyers. These homes are priced closer to $150,000

22.3. PROGRAM CHALLENGES 283
and are lacking in Virginia’s major metropolitan areas.
Additionally, there is a shortage of homes priced in the low to mid $200,000s for moderate-incomebuyers. This amplifies the pressure on the low end of the market because moderate-income buyerswho cannot afford to buy above their price range subsequently out-compete lower-income buyers forscarce starter homes.
Local land use policies—including large lot requirements and minimum home sizes—are a majorbarrier to these home types by constraining the development of smaller, less expensive homes.
Challenge 3
Different eligibility requirements and application schedules make it difficult to layer muchneeded assistance.
It is often necessary to layer different sources of down payment assistance tomeetminimum require-ments or to reducemonthly payments. These types of assistance can have different requirements anddifferent application schedules.
For example, the Federal Home Loan Bank (FHLB) of Atlanta’s down-payment program targets spe-cific household types such as veterans and first responders and operates through FHLB partner lend-ing institutions that usually link these to their own loan products.
Challenge 4
Homeownership and rental projects compete side by side for ASNH funding.
ASNH awards funding to affordable housing developers through a competitive application processwith a maximum Virginia Housing Trust Fund loan of $750,000. Homeownership projects competewith rental projects under the same scoring criteria, which makes it difficult for some homeowner-ship projects to garner funding.
Challenge 5
ASNH homeownership awards have been exclusively used by nonprofit developers.
Since ASNH began funding homeownership projects in 2017, nearly all applicants for homeowner-ship projects have been nonprofit housing developers. For-profit developers have not been active inthe program because most are not active in the low-cost starter homemarket and/or they are less in-clined to partner with government programs. Such developers could become an important resourcein scaling up ASNH-funded homeownership.

284 CHAPTER 22. HOMEOWNERSHIP AND COUNSELING
Challenge 7
Student debt and other major underwriting challenges prevent many millennials—especiallymillennials of color—from achieving homeownership.
High debt-to-income ratios for young Black households, often due to student debt, are a primaryreason for loan denials. Addressing student debt creatively through flexible underwriting is an im-portant objective for many stakeholders. Other sectors of state government must address additionalunderwriting challenges such as auto debt (through efficient, affordable transportation alternatives)and child care costs (with state support for early childhood development/education).
There is also a large age gap between white and Black first time buyers: white homebuyers enter themarket at much earlier ages. This has significant implications for narrowing the wealth gap becausehomeownership is the primary path to wealth-building for middle-class Americans, and first timehomebuyers in their mid-20s have an equity advantage over first time homebuyers older by a decadeor more.
Challenge 8
Seniors are staying in low value homes longer because they have no affordable alternatives.
The lack of affordable homes most suitable for seniors has downstream impacts on the homeowner-ship market. Many seniors are staying in low value homes longer because they have no alternativesthat are affordable or designed for aging-in-place. This is stalling theflowof lower cost existinghomesinto the market.
Challenge 9
There is still a widespreadmisperception that amortgage requires a 20 percent down payment.
Stakeholders pointed out that many aspiring homebuyers believe that they must be able to afford a20 percent down payment. Expanded education efforts must demonstrate that first time buyers canpurchase a home with a much lower percentage down payment.
22.4 Recommendations
These recommendations synthesize the findings, successes, and challenges identified for this clus-ter of programs. They offer a roadmap to a future where these state initiatives most effectively andefficiently serve Virginians who need greater housing opportunities.

22.4. RECOMMENDATIONS 285
Recommendation 1
Develop a substantial, statewide starter home initiative with a capital subsidy to reduce thehome price.
Why this is needed:
• Stakeholders and survey respondents noted supply issues related to homes priced for millen-nials and young families.
• High land and construction costs, barriers at the local-level, and the higher profitability ofmoreexpensive homes are making it more challenging for developers to build smaller-sized homesthat are economically feasible.
Who is responsible:
• Virginia Housing• Department of Housing and Community Development• General Assembly• Governor• Homebuilder and REALTOR® associations• Localities• Habitat for Humanity and other nonprofit providers
How to accomplish:
Important considerations for a statewide starter home program are below.
• The amount of subsidy needed would vary by region.• The developer would receive the subsidy at the time of construction.• The program could be structured similar to the Vibrant Community Initiative as a partnershipbetween Virginia Housing and DHCD, with joint proposals from localities and developers.
• Localities would provide land, greater density, expedited processing, and/or other local incen-tives.
• To ensure long term benefits, this state investment should place homes in a program that pro-vides for permanent affordability, such as deed restricted, shared equity, or community landtrust. The house will remain a starter home for decades and provide homeownership opportu-nities for many first time buyer households.
• This initiative should launch statewide with a substantial multi-year fund allocation and a goalto produce 1,000 units over three years.

286 CHAPTER 22. HOMEOWNERSHIP AND COUNSELING
Recommendation 2
Createa separateapplication, scoring template, and fundingpool forhomeownershipproposalswithin the ASNH program.
Why this is needed:
• The current ASNH design allows for proposals to develop both rental and homeownershipprojects, but the two compete against each other.
• Competition between these different types of projects is likely to be inequitable. Rental housingproposals may have an advantage because they typically are able to serve lower incomes andusually leverage significantly more funding than do homeownership proposals.
Who is responsible:
• Department of Housing and Community Development• Homeownership providers• Other interested parties
How to accomplish:
Stakeholders encourage DHCD to develop greater separation within ASNH between homeownershipand rental proposals by working with providers of both to customize the process and make it morespecifically relevant to each tenure type. This could include the development of a homeownershipwork group to advise DHCD on program parameters, application format, and scoring criteria.
DHCD should also consider establishing a separate funding pool for homeownership proposalswithin ASNH. This would allow the agency to begin to make fund allocations in proportion to overallgoals separately for homeownership and rental housing development.
Recommendation 3
Expand outreach to Black institutions and networks to promote homebuyer education and re-sources.
Why this is needed:
• There is a homeownership gap in Virginia between Black and white households. This gap hasnot declined significantly over the past decade and is only marginally better than it was 50years ago when the Fair Housing Act became law.
• Outreach customized to Black and Brown homebuyers requires non-traditional avenues andmethods.

22.4. RECOMMENDATIONS 287
Who is responsible:
• Virginia Housing• Department of Housing and Community Development• Homeownership providers and counselors• Organizations, churches, and networks within the BIPOC community
How to accomplish:
Virginia Housing has implemented an aggressive campaign to reach minority homebuyers over thepast few years—including adding new staff dedicated to that assignment. Stakeholders encourageVirginia Housing and partners to continue and expand outreach to Black institutions and networksacross the Commonwealth to promote homebuyer education and resources and to glean informationabout other challenges Black Virginians face when seeking a home.
A suggested strategy elsewhere in this report is to set measurable goals for penetrating this market interms of counseling, applications, and home purchases.
Recommendation 4
Recruit more for-profit single-family developers to apply for ASNH homeownership assistanceto increase production of lower cost homes.
Why this is needed:
• The ASNH program has been used almost exclusively by nonprofit homeownership organiza-tions like Habitat for Humanity. While these mission driven organizations are an importantpart of the delivery system for affordable homes, privatemarket participation is needed to bringthis program to scale.
• For-profit developers and homebuilders are generally better capitalized and can build fasterthan their counterparts in the nonprofit sector.
• There is an extreme shortage of low-cost starter homes in the marketplace.
Who is responsible:
• Department of Housing and Community Development• Home Builders Association of Virginia (HBAV)• Other developer and construction associations (e.g., Urban Land Institute)
How to accomplish:
DHCD should recruit and direct an advisory group of homebuilders and developers to review theprogram design and identify barriers to participation. Revisions to the program design should:

288 CHAPTER 22. HOMEOWNERSHIP AND COUNSELING
• Accommodate the needs of for profit builders and expand outreach and education through theHBAV and local home builder chapters,
• Encourage partnerships between nonprofit providers and for profit developers,• Recruit localities, builders, counseling organizations, and lenders to partner collaboratively toproduce and sell more starter homes, and
• Increase the fund allocation to this program as a further incentive to grow greater levels ofindustry participation.
Recommendation 5
Conduct assessment of down payment assistance programs to explore further alignment ofterms and eligibility across programs.
Why this is needed:
• Many down payment assistance (DPA) programs exist in the state with federal, state, local andprivate funding. Many of these are not aligned in terms of eligibility, amount of assistance, andapplication cycles.
• Affordable homeownershipproviders struggle to layer these sources of assistance together. Thiscan be time consuming and frustrating for the provider and confusing to the homebuyer.
Who is responsible:
• Virginia Housing• Department of Housing and Community Development• Down payment program providers
How to accomplish:
DHCD and Virginia Housing should jointly coordinate this effort. Program administrators from bothagencies should:
• Conduct a survey of down payment assistance programs and compare all relevant program cri-teria,
• Survey homeownership providers to determine themost important challenges that they face inaccessing and combining these resources for an individual buyer,
• Convene a meeting of DPA providers to discuss variations in approach,• Propose a more standardized set of requirements and processes, and• Negotiate changes as possible to bring greater uniformity, consistency, and ease of access.

Chapter 23
Rehabilitation and accessibility
This chapter covers seven programs that help current homeowners and renters improve the quality,efficiency, and accessibility of their homes.
Highlights
Major takeaways in this chapter include:
• Rehabilitation and accessibility programs are generally effective thanks to their range and com-patibility.
• However, these efforts nearly always require providers to leverage other private funds, suchas philanthropic gifts and individual donations, to come close to meeting their community’sneeds.
• Other obstacles include the high cost of necessary improvements, a shortage of qualified con-tractors, and lack of centralized administration of programs that must be deployed in tandem.
• Expansion of the Neighborhood Assistance Program, increasing program resources, streamlin-ing administration, and addressing downstream issues like workforce and contractor capacitycan help guarantee safe and accessible housing for all Virginians.
Programs in this grouping
Virginia Housing
• Granting Freedom• Rental Unit Accessibility Modification (RUAM)
Department of Housing and Community Development
289

290 CHAPTER 23. REHABILITATION AND ACCESSIBILITY
• Acquire, Renovate, and Sell (ARS)• Emergency Home and Accessibility Repair (EHARP)• Indoor Plumbing Rehabilitation (IPR)• Lead Hazard Reduction• Liveable Home Tax Credit• Weatherization Assistance Program (WAP)
23.1 Findings
These findings are based on data provided by VirginiaHousing, DHCD, and other sources on the scaleof these programs, demographic information on their beneficiaries, and other trends.
Finding 1
TheWeatherizationAssistanceProgramconsistently reachesover a thousandhouseholds everyyear.
Figure 23.1: Homes served by Weatherization Assistance Program

23.1. FINDINGS 291
Between 2016 and 2019, WAP served more than 1,000 households across the state each year. Thatnumber unfortunately dropped to fewer than 400 in 2020 due to the COVID-19 pandemic. Programadministrators stated that the successful program was on track for a productive 2020 if not for theeconomic shutdowns and quarantine protocols that disrupted WAP providers.
Finding 2
The scale of the Indoor Plumbing Rehabilitation program is small compared to the need.
Figure 23.2: Homes served by Indoor Plumbing Rehabilitation program
Homes without indoor plumbing are rare in Virginia—currently around 10,000—and represent asmall percentage of the state’s total housing stock. The count may also include many homes that arenot lived in year-round. However, the main program aimed at bringing indoor plumbing to full-timeresidences still only serves a limited number of clients each year. Since 2016, the annual number ofhouseholds served has not exceeded 50.

292 CHAPTER 23. REHABILITATION AND ACCESSIBILITY
Figure 23.3: Housing units lacking plumbing facilities in Virginia
23.2 Program successes
These successes are based on feedback collected from the statewide provider survey, focus groups,and conversations with experienced users of these programs.
Success 1
There are a wide range of programs in this cluster that address a spectrum of needs.
These varied programs (including several new energy efficiency programs currently being imple-mented at DHCD) are available to assist homeowners as well as the owners of rental properties.

23.3. PROGRAM CHALLENGES 293
Success 2
Service providers often use more than one of these programs in conjunction with each other.
Providers often pair WAP with EHARP as it is common for the weatherization crew to encounteremergency repair needs when they begin work on a house. Coordination is critical to meeting theclient’s needs because the funds have narrowly defined eligible uses.
Success 3
Program users do not report significant challenges associated with the funding cycles andschedules for these programs.
According to users, application timelines and funding cycles for these programs generally match up.This alignment helps providers coordinate when applying for funds.
Success 4
Most of these programs are compatible with manufactured homes—including homes that arelocated in a park setting where the occupant owns the home but rents the lot.
Oldermanufactured homes—especially single-wide homes built prior to 1976whenHUD establishedconstruction standards—are some of the worst quality and least energy efficient homes in the state.These programs sometimes enable housing providers to replace severely deteriorated homes and re-pair and weatherize those that are still livable.
Success 5
Nonprofit providers have been successful in leveraging these programswith local funding fromcities and counties, philanthropy, local companies, and individual donors.
The aggregated funding from these programs is not adequate to meet needs. Providers have to seekmatching funds from a wide range of sources. The availability of these programs establishes a foun-dation so local funders are confident that their contributions will achieve more by leveraging statedollars.
23.3 Program challenges

294 CHAPTER 23. REHABILITATION AND ACCESSIBILITY
These challenges are based on feedback collected from the statewide provider survey, focus groups,and conversations with experienced users of these programs.
Challenge 1
Several of these programs are funded at very low levels and do not provide administrative sup-port.
The small level of funding in programs such as EHARP and IPR limit their impact compared to theoutsized needs. The limited funding also discourages organizations from participating if they are notassured of sufficient funding to support a sustainable line of business.
Challenge 2
Low or no administrative fees make it more challenging to serve clients who are more remote.
Single-family rehab and repair are administratively costly to carry out. This is compounded whenworking in a rural area where client homes may be separated by significant distances.
Challenge 3
Accessibility improvements exceed the costs of making basic changes to the home, especiallyin multifamily structures.
Several providers noted that the maximum grant per home was not sufficient to cover rehab costsnecessary for many accessibility projects because making the home fully usable by a person with adisability requires more than one measure.
Virginia Housing recently increased the maximum awards for their Granting Freedom and RentalUnit AccessibilityModification programs by 33 percent (from $6,000 to $8,000), which should helpconsiderably.
Challenge 4
Greater administrativeflexibility of programswould enhance success since providers oftenusethem in combination. More uniform requirements would further enhance the ability to fullymeet the needs of clients.
Program requirements such as income eligibility, property eligibility, permitted use of funds, grantand loan documentation, property inspection, work descriptions, and a host of other program proce-

23.3. PROGRAM CHALLENGES 295
dures can and do vary from one source of funding to another. This complicates the already difficultprocess of addressing critical home repair and rehab needs for the provider.
Challenge 5
Waiting lists for services can be extraordinarily long. Many clients live in dangerous and un-healthy conditions while waiting to move up the list.
Longwaiting lists are an indication of themismatch between resources allocated to this program areaand the scale of needs in communities across Virginia. Poor housing quality is widespread in theCommonwealth from the largest urban centers to the most remote rural regions. One organizationnoted that Indoor Plumbing Rehabilitation wait times can range from anywhere from six months toseveral years—a long time to be without proper running water.
Challenge 6
Qualified contractors are difficult to find, especially in less populated areas. Smaller jobs ex-acerbate this obstacle.
The construction industry has a labor shortage. (U.S. Chamber of Commerce, 2021) This is true acrossthe board from large new construction projects to small-scale single family rehabilitation. Small, re-mote jobs are difficult to accomplishwhendemand for contractors is exceptionally high. The extremeshortage also increases the likelihood of participation of less qualified contractors and/or those per-forming lower quality work.
Challenge 7
Repair, rehab, weatherization, and accessibility are often scattered across different providersmaking comprehensive service delivery difficult and confusing for clients.
Different agencies andnonprofit organizations often administer these otherwise interconnected pro-grams. For example, DHCD has a select group of qualified WAP providers, but many of them maynot engage in large scale single-family home rehab. This administrative compartmentalization com-pounds the difficulty of matching resources with varying program requirements.

296 CHAPTER 23. REHABILITATION AND ACCESSIBILITY
Challenge 8
Most clients are homeowners. Assisting renters, especially in scattered locations, ismuchmorechallenging.
Rental households also cope with housing that is often in much worse condition than that of home-owners, yet most rehab and repair resources focus on homeowners. Small, widely scattered projectsand “mom and pop” ownership complicate and impede improvements to rental properties.
Owner-landlords frequently do not wish to participate or are unwilling to guarantee affordability fora lengthy period of time. There are no easy solutions to overcoming these obstacles, but administra-tors could begin by working with localities to incentivize good code enforcement that may encouragegreater participation by small landlords.
23.4 Recommendations
These recommendations synthesize the findings, successes, and challenges identified for this clusterof programs. They offer a roadmap to a future where these state initiatives are efficient, impactful,and best serve Virginians who need greater housing opportunities.
Recommendation 1
Expand the Neighborhood Assistance Program (NAP) with an emphasis on donations to sup-port low-income rehab and repair. Increased access to grant funds and the greater flexibility ofprivate funding would support program administrators and advance their work.
The Neighborhood Assistance Act is found in Va. Code Ann. § 58.1-439.18 et seq. This act hasbeen amended many times to change the focus and requirements, and it would need to be amendedto specifically reference a new focus on rehab and repair. The General Assembly sets the amountavailable for the NAP program in its annual budget.
Why this is needed:
• It is difficult to estimate the number of substandard and severely deteriorated homes in thestate. The U.S. Census Bureau stopped characterizing housing as “substandard” decades ago,limiting the data sets that can serve as substitutes (such as age of structure). Program admin-istrators, local planners, and code officials provide the best available anecdotal information.These reports do indicate that dilapidated housing is ubiquitous in the state and predictablyaffects primarily low-income households.

23.4. RECOMMENDATIONS 297
• Experienced providers report that the flexibility of private funds makes them the most usefulresource for administering rehab and repair programs. They can fill gaps in public programs,including covering the cost of program operations.
• The NAP program increases incentives for private individuals and corporations to make dona-tions to these types of activities.
Who is responsible:
• Virginia Department of Social Services• Department of Housing and Community Development• Appropriate secretariat• General Assembly
How to accomplish:
Any expansion of the NAP should incorporate the following features:
1. Additional, permanent funds dedicated to and earmarked for housing,2. Inclusion of a geographic component in the funding distribution methodology to attract both
nonprofits and donors in underserved areas, and3. A distinction between regular and housing credits in recipient applications and documentation
of credits to ensure their use for housing purposes.
Recommendation 2
Expand and promote workforce training programs—in partnership with education and eco-nomic development organizations—to increase the number of qualified contractors and work-ers able to participate in these residential rehab programs.
Why this is needed:
• The housing industry has a severe shortage of skilled construction workers, which slowsprogress and raises costs. Recent efforts to identify and deport undocumented workers hasmade the problem worse. (East, Luck, Mansour, & Velasquez, 2018)
• Workforce training programs are limited (especially those reaching minorities and other dis-advantaged individuals). This inadequacy exists across many of the relevant trades includingcarpenters, roofers, plumbers, electricians, and HVAC workers.
• Construction jobs are in high demand and offer the opportunity for good wages and benefits,including health insurance.
Who is responsible:
• Virginia Housing

298 CHAPTER 23. REHABILITATION AND ACCESSIBILITY
• Department of Housing and Community Development• Workforce training programs• State and local home builder organizations• Construction trade unions
How to accomplish:
Industry stakeholders and workforce development programs must partner to create and expandtraining programs for new residential construction initiatives at the local level. Incentives to largenonprofit and for-profit housing developers and housing program administrators would thenmotivate them to hire graduates of these programs.
Recommendation 3
Determinehowprogramswith relatively low funding or complex administrative fundingmech-anisms can be reconfigured or augmented to help cover the necessary program managementcosts for the local providers.
Why this is needed:
• Providers must have ways to cover their administrative costs or they will opt for programs thatoffer greater opportunities for higher fees rather than participate in repair and rehab programs.
• Smaller scale rehab and repair programs are inherently inefficient; they require a high level ofeffort per dollar expended as compared to larger programs like multifamily development andrehab.
• In the absence of fees that are sufficient to cover costs, providers will not operate rehab/repairprograms at scale, instead investing minimal effort to limit their losses.
Who is responsible:
• Virginia Housing• Department of Housing and Community Development• Large scale rehab and repair providers
How to accomplish:
Virginia Housing and DHCD should collaborate with high volume rehab/repair providers to analyzeactual costs of program administration, adjust fees as needed, and track production changes in re-sponse to higher fees.

23.4. RECOMMENDATIONS 299
Recommendation 4
Regularlymonitor the cost caps for accessibility improvements—especially for certainpropertytypes (like multifamily) and/or markets where costs can easily exceed current caps.
Why this is needed:
• When a provider needs to leverage greater resources to complete a project, they will produceless as their effort outweighs the return, and the project becomes less sustainable.
Who is responsible:
• Virginia Housing• Department of Housing and Community Development• Providers with the potential to scale to higher volume
How to accomplish:
Virginia Housing and DHCD should develop a cost database for providers that will track total im-provement costs over time by type of structure, location, and detailed description of improvementsand that will document completed improvements as well as those not completed because of lack offunding.
Recommendation 5
Determine whether smaller programs can be combined; a provider could easily access a rangeof separate funding sources with a single application cycle.
Why this is needed:
• Many of the programs in this cluster share similar objectives; in any area of policy, programstend to multiply as new initiatives join existing programs. New initiatives typically target agap in an existing program or group of programs. This can lead to a confusing and unwieldycollection of individual programs covering the entire spectrum of needs.
• The goals of small programs (e.g., the Livable Home Tax Credit) often align with those of othersin the same cluster; there are opportunities to consolidate similar efforts when a program lackssubstantial new funding to individually scale up.
• Program consolidation will simplify access for providers and beneficiaries and will streamlineprogram administration for the housing agency for greater efficiency and consistency.
• Conformity of guidelines and funding cycles as a result of program consolidation will improvethe experience of program users.
• Program organization within a single agency staff division contributes to consistency and effi-ciency.

300 CHAPTER 23. REHABILITATION AND ACCESSIBILITY
• State-fundedprogramshavemoreflexibility to allow for consolidation than federallymandatedprograms.
Who is responsible:
• Department of Housing and Community Development• Virginia Housing• Virginia Department of Social Services• Rehab and repair providers
How to accomplish:
Program administrators from responsible agencies should direct an assessment of grouped programsin conjunction with providers. This evaluation will identify irreconcilable conflicts and opportuni-ties to combine initiatives where conflicts can be overcome. Each program requires periodic reviewswith a “zero base” approach that considers how an agency would administer and implement a pro-gram if starting from scratch; incrementalism often shapes programs without deliberate analysis ofneeded fundamental adjustments.
DHCD’s current effort to combine its Housing and Community Development divisions into a singlework group offers a promising opportunity to rethink the design and delivery of programs that itadministers as well as those that it collaborates with Virginia Housing to operate.
Recommendation 6
Take advantage of incoming Housing Innovations in Energy Efficiency (HIEE) funds by reserv-ing certain proceeds for a large pool of flexible, easily deployed dollars to support rehab andaccessibility activities.
DHCD’s HIEE program makes energy efficiency upgrades to new and existing residential buildingsto reduce energy bills for low-income Virginians. HIEE is funded through proceeds collected fromRegional Greenhouse Gas Initiative (RGGI) auctions. DHCD will dedicate approximately 50 percentof those proceeds to HIEE.
Why this is needed:
• Proceeds from the Regional Greenhouse Gas Initiative (RGGI) have begun to contribute signif-icant new funds to the state that can be used for improving energy efficiency.
• Virginia already has existing programs that are directed at this goal. RGGI funds can be used toexpand activity in these existing programs, making it easier for providers to access these fundsand allowing greater scale and efficiency in using them.

23.4. RECOMMENDATIONS 301
Who is responsible:
• Department of Housing and Community Development
How to accomplish:
DHCD should continue with its current planning efforts for these dollars, which includes allocatingthese new dollars to expand existing efforts like WAP and ASNH that already work well.
Recommendation 7
Expand resources for IPR and broaden program eligibility to homes in very poor condition thatthreaten the health and safety of residents.
Why this is needed:
• The overall funding for basic rehab of single family dwellings is too limited to meet needs.• Home rehab is one of the most fundamental housing needs in the Commonwealth. The state’slargest initiative, Indoor Plumbing andRehabilitation, is verymodest with an annual allocationof approximately $3 million.
• IPRadjustments recentlyhavepermittedmore rehab (IPR-Flex), but increases to program fund-ing allocations have not kept pace with expansion of eligible uses.
• Theprogramstill focuses on anarrow subset of deteriorated, unsafe housing—thosehomeswithincomplete plumbing or a failing septic system.
• Additional resources and an expanded, coordinated administrative structure are necessary tomeet the nearly universal need in all jurisdictions.
• Asmore local governments in Virginia begin tomake resources available for housing (includingAmericanRescuePlan funds over thenext fewyears), the statemust build stronger partnershipswith entitlement communities to support the rehab and repair of homes. Such partnershipsare currently much more developed with the construction and rehab of larger rental housingcommunities.
Who is responsible:
• Virginia Housing• Department of Housing and Community Development• Localities• Other local funders, including corporate and philanthropic donors• General Assembly
How to accomplish:

302 CHAPTER 23. REHABILITATION AND ACCESSIBILITY
Additional resources are necessary for the rehab and repair of homes occupied by low income andmoderate income Virginians. This will take action by the General Assembly to increase funding forthe Virginia Housing Trust Fund, with a subsequent allocation from the fund to this effort.
Other solutions that do not require additional state appropriation may include the combination ofIPR and scattered-site CommunityDevelopmentBlockGrant (CDBG) projects, aswell as partnershipswith CDBG entitlement communities for rehab initiatives using existing state and local financialresources.
As noted earlier, few accurate data sources exist to quantify this need. DHCD should work with lo-cal planning and building officials to develop estimates of needs that can help to justify additionalfunding.
Nearly all of the funds that support this activity are grant funds. Virginia Housing should explore thepotential to supplement these grant funds with deferred debt that would be due on sale; if feasible,this could lead to a significant boost to activity.

Chapter 24
Community revitalization and capacitybuilding
This chapter covers five programs created to supportmajor community revitalization efforts throughhousing and to strengthen the capacity of nonprofit housing organizations across the state.
Highlights
Major takeaways in this chapter include:
• Using both federal and state dollars, a suite of community revitalization and capacity buildingprograms foster creative approaches to meet the unique housing needs of Virginia’s diversecommunities.
• Capacity building programs, especially those offered by Virginia Housing, strengthen afford-able housing providers and make them resilient to future challenges.
• Opportunities for improvement are primarily administrative: these include better alignmentof applications and project timelines, technical assistance, ease of entry, and streamlining theclosing process.
• Expanding the successful Vibrant Community Initiative, aligning state revitalization effortswith local public housing revitalization goals, encouraging more inclusive land use strategies,and greater involvement of BIPOC developers and contractors are all ways to enhance theseprograms.
Programs in this grouping
Virginia Housing
• Capacity Building Grants
303

304 CHAPTER 24. COMMUNITY REVITALIZATION AND CAPACITY BUILDING
• Community Impact Grants (CIG)• Predevelopment Loan Program (PDL)
Department of Housing and Community Development
• Community Development Block Grant (CDBG)• Vibrant Communities Initiative (VCI)
24.1 Findings
These findings are based on data provided by VirginiaHousing, DHCD, and other sources on the scaleof these programs, demographic information on their beneficiaries, and other trends.
Finding 1
Virginia’s Community Development Block Grant (CDBG) allocation significantly helps ELI andVLI households of color in non-entitlement communities.
Figure 24.1: Race of persons served by CDBG funds

24.1. FINDINGS 305
Across non-metro areas of the Commonwealth, DHCD’s CDBG funds used for housing-related activ-ities are more likely to serve Black Virginians than any other race.
Figure 24.2: Income of households served by CDBG funds
Federal CDBG dollars are restricted to 80 percent AMI and below, so all funds benefit householdswith low incomes. However, DHCD’s CDBG funds are used primarily to serve VLI households (thosebelow 50 percent AMI) and ELI households (those below 30 percent AMI).

306 CHAPTER 24. COMMUNITY REVITALIZATION AND CAPACITY BUILDING
Finding 2
Since 2016, Virginia Housing has awarded over $13 million in grants and loans to support af-fordable housing providers in Virginia.
Figure 24.3: Virginia Housing Community Outreach program awards
Virginia Housing helps build the capacity of affordable housing providers across the state by offeringPredevelopment Loans, Community Impact Grants, and organizational Enhanced Capacity Buildinggrants. These community outreach programs each serve a unique purpose and supplement moretraditional forms of federal and state funding.
24.2 Program successes
These successes are based on feedback collected from the statewide provider survey, focus groups,and conversations with experienced users of these programs.

24.2. PROGRAM SUCCESSES 307
Success 1
The Vibrant Communities Initiative (VCI) supports transformational projects.
Stakeholders expressed positive views of VCI as a model of how the state can facilitate projects thatresult in change at a significant scale. These projects can catalyze long term neighborhood improve-ment by encouraging similar successful efforts on nearby sites.
VCI also demonstrates the value that the state can bring to a problem by combining resources on thefront end, rather than leaving it to the developers to shop for them one at a time.
Success 2
Virginia Housing’s Community Impact Grant (CIG) has beenwell received as a flexible tool thatworks across many different regions of the state to accomplish different objectives.
Stakeholders value the CIG program particularly for its flexibility that allows for its wide applicationsupporting a variety of projects. Stakeholders appreciate the program’s support for innovations suchas manufactured housing and other construction strategies. The CIGs also have financed a broad ar-ray of creative approaches to help communities strategically address their unique affordable housingchallenges.
Success 3
CDBG funds can be game-changing for rural communities.
Funding for community development projects in rural areas is not widely available. The non-entitlement CDBG program is unique in the scale of grant funding that it can bring to the table.Stakeholders saw it as an excellent tool for offsetting site development and utility extensions forrural projects—which have costs that often render a project infeasible.
Success 4
Virginia Housing and DHCD recognize that outreach to localities is important. They under-stand the value of this engagement and dedicate staff time to it.
Local governments are critical partners in the development of affordable housing for numerous rea-sons. They control land use, manage community expectations, provide access to utilities, and provideresources in the form of financial assistance and processing incentives. However, these communitiesneed help in developing project concepts and understanding what type of state assistance is accessi-ble.

308 CHAPTER 24. COMMUNITY REVITALIZATION AND CAPACITY BUILDING
Stakeholders were extremely complimentary of the staff time and resources dedicated by both statehousing agencies to community outreach and assistance.
Success 5
Capacity Building grants are helping many organizations with diverse needs, especially strate-gic planning and capacity building at smaller nonprofits.
As resources for affordable housing increase, affordable housing sponsors face the fundamental chal-lenge of bolstering their own capacity to deliver services. Stakeholders enthusiastically recognizedVirginia Housing and DHCD for their commitment to capacity building through organizational sup-port, project planning, and pre-development assistance.
24.3 Program challenges
These challenges are based on feedback collected from the statewide provider survey, focus groups,and conversations with experienced users of these programs.
Challenge 1
There is a need to provide technical assistance to projects that are at the conceptual stage priorto application for major funding like the VCI.
Stakeholders recommend that housing agencies sustain and increase support andadvisory services tolocalities anddeveloperswho areworking to assemble large scale, complex projects requiring fundingwithin the next year. Shepherding these projects on a path toward feasibility is a priority, especiallyin an environment where the resources essential to project success are only expected to rise.
Challenge 2
Stakeholders new to housing projects need a more navigable, well-defined initial process forbringing projects to Virginia Housing and DHCD.
Some local stakeholders indicated difficulty in determining where to find information and whichstaff person to contact depending on the project they are planning. Other stakeholders suggested amore clearly defined entry point for technical assistance and support, especially for localities whoseemployees may be less familiar with state housing agency staff and organizational structure.

24.3. PROGRAM CHALLENGES 309
Challenge 3
The Predevelopment Loan Program closing process can be too complex; limited project eligi-bility can lock out otherwise worthy applicants.
Several stakeholders noted that the Predevelopment Loan Program is time consuming and its ap-proval process lacks clarity. The closing process can be too complicated for the size of the trans-actions. There is a natural balance between the need for flexible predevelopment support and thelender’s need for repayment; a reevaluation of this balance could lead to a retooled model that iseasier to use and more successful.
The design of the Predevelopment Loan Program should be revisited in consultation with housingdevelopers—especially nonprofits and small for-profits.
Challenge 4
Some perceive the Capacity Building Grant sphere as too complex or over-prescribed.
Over the lastfive years, VirginiaHousinghasdeveloped a capacity building initiative aimedat helpingnonprofit organizations grow their ability to be successful developers and administrators of afford-able housing. Its wide use by the nonprofit community underscores the need for it. The nonprofitsector’s growth in capacity may certainly be credited, at least in part, to the array of assistance theprogram has provided.
In the last several years, the capacity building initiative has added a number of new funding tiers.Some stakeholders expressed concern that the flexibility that characterized the earlier program is be-coming more rigid. They emphasized the widely differing circumstances of providers and suggesteda return to more of a negotiated technical support package.
Challenge 5
Knowledge and usage of the Vibrant Communities Initiative (VCI) is low in non-entitlementareas.
The VCI can be an important resource for smaller communities in rural areas. There is a need formore communication about VCI with these communities where VCI is not widely understood as inlarger metro areas. These smaller communities are also likely to need greater assistance with projectplanning and development.

310 CHAPTER 24. COMMUNITY REVITALIZATION AND CAPACITY BUILDING
Challenge 6
Funds within this cluster are less commonly used for single-family homeownership programs.They are predominately used for major multifamily andmixed-use projects.
Stakeholders appreciated the transformative nature ofmany of these largermixed-use developmentsthat frequently include a diverse rental housing component. Given the importance of creating home-ownership opportunities, especially for BIPOC participants, stakeholders agreed that projects withhomeownership components should be encouraged. A new source of assistance focused on home-ownership would also enhance the current mix of resources.
Challenge 7
Timingof programavailability andapplications can sometimesbe challenging, especiallywhenprojects also use federal funds.
Projects that employ federal funds are complex, and they inevitably include a wide range of resourcesin building the layered funding structure. When resources come from federal, state, and privatesources, developers and localities face challenges with application schedules and project timing thatcomplicate the process of fully funding the project.
24.4 Recommendations
These recommendations synthesize the findings, successes, and challenges identified for this clusterof programs. They offer a roadmap to a future where these state initiatives are efficient, impactful,and best serve Virginians who need greater housing opportunities.
Recommendation 1
Establish a VCI planning grant or similar funds to support smart, strategic planning efforts forlarge-scale projects in their infancy.
Why this is needed
• Stakeholders strongly supported this initiative primarily because these projects are high im-pact, and the state has innovatively assembled a variety of resources in one location, so thedeveloper does not need to navigate multiple access points. Agencies should develop and de-ploy a planning grant specific to VCI to increase and improve applications. This would also helpput smaller jurisdictions on a more competitive footing with larger, more experienced teams.

24.4. RECOMMENDATIONS 311
• The planning grant program widely used with CDBG for many years may be an applicable pro-totype. HUDalso deploys planning grants to localities andPHAs that are seeking funding underthe Choice Neighborhoods Initiative; a similar state option would helpfully supplement thoseefforts in communities with public housing.
• Virginia Housing recently made awards to planning district commissions (PDCs) in the statewith the purpose of encouraging them to develop stronger relationships with affordable hous-ing providers.1 If this effort proves successful, PDCs might also be helpful planning partnersfor future VCI proposals.
Who is responsible:
• Virginia Housing• Department of Housing and Community Development• Planning district commissions• Localities
How to accomplish:
Virginia Housing and DHCD should allocate funds to the VCI for project planning using the earliercited models. Depending on project scale, these grants could run from 12 to 24 months with pre-scribed deliverables included in the VCI application. A scoring incentive for planning grant recip-ients could encourage organizations to use the grant to shape more realistic and feasible proposals.Virginia Housing could position its CIG program to be used more frequently to support the develop-ment of VCI applications.
Recommendation 2
Design a “central intake” for localities or developers when they have an affordable housingproject proposal—whether complex like VCI, simple as with a single development, or for in-novations in systems and construction methods.
Why this is needed:
• Stakeholders report that rural (non-entitlement) areas have less knowledge about state housingagency programs and fewer relevant staff positions.
• A clearer path with guidance on appropriate contacts for specific issues would foster a morelevel playing field for potential applicants.
• Program staff are extremely knowledgeable and helpful. Providing more direct access to themfor more developers would benefit the program.
Who is responsible:1“Virginia Housing Announces $40 Million in Grant Funding for PDCs.” Virginia Housing. July 13, 2021. (PDF)

312 CHAPTER 24. COMMUNITY REVITALIZATION AND CAPACITY BUILDING
• Virginia Housing• Department of Housing and Community Development• Localities• Virginia Municipal League (VML), Virginia First Cities, and Virginia Association of Counties(VACO)
How to accomplish:
DHCDandVirginiaHousing shouldworkwith local governments and their associations to determinepreferred processes and needs for localities. This assessment would then inform a collaboration withlocalities, trade associations, local developers, and program administrators to craft an intake processfor technical assistance and supportmore accessible for those unfamiliar with the programs and newto affordable housing development.
Recommendation 3
To expand the use of pre-development loans, Virginia Housing should consider design changesto increase flexibility in program guidelines, timelines, closing process and reporting.
Why this is needed:
• Some stakeholders noted that the current Predevelopment LoanProgramwould bemorewidelyused if it had greater flexibility and offered a more timely, less complicated processing andclosing experience. The purpose of the predevelopment assistance is to allow a more thinlycapitalized developer to expend the funds needed to assemble a viable project application in atimely and efficient manner.
• Architecture, legal, appraisal, and engineering are the types of expenses thatmust be paid at thefront end of the development process—often before the fate of the application is determined.
• The challenge with any predevelopment loan program is balancing loan risk with the need tofund activities before feasibility is established.
Who is responsible:
• Virginia Housing• Program users, especially smaller nonprofit and for-profit developers
How to accomplish:
Virginia Housing should engage program users to determine if there are design shifts that will makethe programmore user friendly. This should include an assessment of whether a change in the fund-ing source—such as HUD’s Housing Trust Fund—would facilitate greater flexibility.

24.4. RECOMMENDATIONS 313
Recommendation 4
Continue and expand efforts to encourage and fund more VCI projects in non-entitlement ar-eas.
Why this is needed:
• VCI projects have tended to be large scale and complex. Urban areas are more likely to have thepotential to identify and develop these types of projects that may have multiple objectives anda range of participants and funding sources.
• While non-entitlement area projects are likely to be smaller, they also can be transformative fortheir neighborhoods. These areas will likely need more assistance from the state in developingprojects that will be able to compete with those that are assembled by the more experiencedteams in metro areas.
Who is responsible:
• Virginia Housing• Department of Housing and Community Development• Small (non-entitlement) localities• Virginia Municipal League (VML) and Virginia Association of Counties (VACO)
How to accomplish:
Virginia Housing and DHCD should expand outreach and education about VCI using networks thatconnect with smaller communities (e.g., Rural Planning Caucus of Virginia). The agencies shouldalso build stronger technical assistance functions specifically for smaller communities and consideran emphasis on planning grants for rural communities seeking assistance with a project.
Recommendation 5
AllowVCI awards to be used overmultiple years to help large, complex projects, especially thoserelying on other major sources of funding.
Why this is needed:
• VCI encourages large scale, complex projects that can have a transformational impact on theircommunities. Often these projects take many years to achieve. Projects may have two or morephases that are crucial to a successful outcome. VCI awards that span the full timeframe of theproject may enhance such efforts.
• Multiple year funding fromVCImay enable programparticipants to leverage additional outsidefunding and potentially secure multi-year commitments from other sources.

314 CHAPTER 24. COMMUNITY REVITALIZATION AND CAPACITY BUILDING
Who is responsible:
• Virginia Housing• Department of Housing and Community Development• Public and private VCI funders
How to accomplish:
Virginia Housing and DHCD should review VCI applications for the past several years, interview theteams that developed them, and assess howmulti-year financing would have affected the project andinfluenced other funding sources. The agencies should then convene other VCI funders to discussapproaches to longer term commitments to multiple year projects. These may include multi-yearfunding that is based upon the achievement of milestones within prescribed timeframes. Such in-centives could motivate and add urgency to project development.
Recommendation 6
Expand and encourage use of programs (particularly VCI and CIG) for homeownership, espe-cially as a tool to support wealth-building in historically Black neighborhoods.
Why this is needed:
• Most VCI work focuses on mixed-use, mixed-income projects where rental housing is the keyresidential component of the project. In recent years, an overheated homeownership market—especially in larger metro areas—has left behind lower-income potential homebuyers as themarket has served primarily middle- and upper-income buyers.
• The homeownership gap between Black and white households has grown over the last decade.• VCI applications should incentivize mixed income homeownership. They should also encour-age neighborhood revitalization with increased homeownership as an anchor activity.
Who is responsible:
• Virginia Housing• Department of Housing and Community Development• Localities• Other local funders
How to accomplish:
DHCDandVirginiaHousing could adapt programs to facilitate rapid acquisition of properties and/orlarge down payments, potentially with revolving loan funds. The agencies should develop best prac-tice standards and examples of redevelopment and revitalization projects that prioritize affordablehomeownership.

24.4. RECOMMENDATIONS 315
VCI training and education should include more examples of homeownership, and each funding cy-cle should include some homeownership proposals. Scoring incentives for local land donations forhomeownership would accelerate these projects.
Recommendation 7
Consider LIHTC set-asides for VCI and similar projects to ensure assets are leveraged and tosimplify layering and timing challenges.
Why this is needed:
• LIHTCs are one of the most competitive funding sources for affordable housing in the nation.Competition for LIHTCs is high and assembling and submitting an LIHTC application is costly.
• A set-aside of credits for high-ranking VCI applications simplify the VCI process and make itmore likely that projects will be successfully funded in a timely manner.
Who is responsible:
• Virginia Housing
How to accomplish:
Virginia Housing should seek feedback during the next QAP comment period to determine supportfor linking LIHTCs to the VCI process.
Recommendation 8
Coordinate with the Virginia Association of Housing and Community Development Officials toalign state efforts for public housing revitalization with the programs in this cluster.
Why this is needed:
• The replacement or revitalization of large, aging public housing communities is one of themostpressing problems in the Commonwealth. Residents often endure poor living conditions thatare especially detrimental to the health and well-being of the many children who grow up inthese communities and who are at a significant disadvantage compared to their peers in higherquality, better located housing.
• HUD is supporting the transformation of public housing and shifting the funding platform tothemore reliable Section 8mechanism through the Rental Assistance Demonstration program(RAD) and through Section 18 - Demolitions/Dispositions.

316 CHAPTER 24. COMMUNITY REVITALIZATION AND CAPACITY BUILDING
• Replacement and revitalizationof public housing is quantifiable andachievable. Theoldest andworst public housing in the state are the large projects built in the 1970s and earlier. Many ofthem have already been revitalized and replaced, but a significant number remain—just under10,000 units scattered across Virginia’s large metro areas. A concentrated effort could replaceand rehabilitate them within a decade—bringing an end to this legacy from an earlier era offederal housing policy.
Who is responsible:
• Virginia Housing• Department of Housing and Community Development• Virginia Association of Housing and Community Development Officials (VAHCDO)• Public housing authorities (PHAs)• Localities
How to accomplish:
Public housing revitalization is a complex and expensive undertaking. The revitalization programsthat make up this cluster are well positioned to aid this process. Virginia Housing has already priori-tized this work through the PHA pool in the LIHTC program as well as a set-aside of REACH fundingfor these types of projects.
Building on this base, state housing agencies should engage directlywith localities andPHAs and seekways in which this suite of state programs can support existing public housing revitalization plans aswell as assist in developing new plans where needed.
Recommendation 9
State government should work with localities to remove land use barriers and encourage moreinclusive land use strategies.
Why this is needed:
• Land use policies, including zoning, have been frequently identified by stakeholders as one ofthe key barriers to production of affordable housing in many communities.
Who is responsible:
• State government• Localities• Other applicants for community revitalization funds

24.4. RECOMMENDATIONS 317
How to accomplish:
State government officials should begin a dialogue with localities seeking funding for communityrevitalization to understand their land use policies and whether they encourage or inhibit affordablehousing development. Agencies could create a menu of best practices in land use policies that areinclusionary and help support projects supported by these programs. New incentives in the reviewand scoring of VCI and other revitalization funding could also encourage local adoption of policiesthat facilitate affordability.
Recommendation 10
Recruit higher participation by minority developers and contractors.
Why this is needed:
• The BIPOC community is underrepresented in the housing development industry, parallelingthe lag between Black and Brown households and white households for access to high quality,affordable housing.
• Change in who is developing, building, managing, and selling housing will occur only with in-tentional efforts.
• Capacity building and technical support efforts to date have not been effective in substantiallyincreasing minority participation in the industry.
Who is responsible:
• Virginia Housing• Department of Housing and Community Development• Home Builders Association of Virginia• Virginia REALTORS®• Urban Land Institute and other industry leaders
How to accomplish:
DHCDandVirginiaHousing should apply scoring incentives to proposals submitted by organizationswith BIPOC leadership and/or proposals which demonstrate a measurable commitment to racial eq-uity.
The agencies should also focus onminority developers and community development corporations forcapacity building, offer robust technical assistance and funding over a sustained period, and fosterpartnerships with experienced developers.
Additional objectives include:
• Expansion and increased funding of current initiatives to grow minority participation in theindustry,

318 CHAPTER 24. COMMUNITY REVITALIZATION AND CAPACITY BUILDING
• Establishment of goals in conjunction with developers, builders, lenders, housing authorities,nonprofits, real estate agents, and others, and
• Annual progress reports to measure improvement.

Chapter 25
Homelessness assistance and prevention
This chapter covers six programs that support efforts to assist persons experiencing homelessnessand to build infrastructure to make homelessness rare, brief, and non-recurring.
Highlights
Major takeaways in this chapter include:
• Virginia’s stable and increasing investments in the Virginia Homelessness Solutions Programand the Housing Trust Fund - Homeless Reduction Grant have yielded clearly measurable suc-cesses, as Point-in-Time counts of those experiencing homelessness have steadily declined overthe past decade.
• The overall supply of housing available for persons transitioning out of homelessness is inad-equate and is now a programmatic priority. Community resistance, financing limitations, andland use restrictions all impede more permanent solutions to end homelessness.
• Tomake lastingprogress, state efforts should focus on increasing the supply of deeply affordablehousing, expanding long-term rental assistance options, increasing inter-agency collaboration,and better integrating housing services in criminal processing and educational systems.
Programs in this grouping
Department of Housing and Community Development
• Affordable and Special Needs Housing (ASNH)• Housing Opportunities for Persons with AIDS/HIV (HOPWA)• Virginia Homelessness Solutions Program (VHSP)• Virginia Housing Trust Fund - Homeless Reduction Grant (HTF-HRG)
319

320 CHAPTER 25. HOMELESSNESS ASSISTANCE AND PREVENTION
Department of Behavioral Health and Developmental Services
• Permanent Supportive Housing - Serious Mental Illness (PSH-SMI)• State Rental Assistance Program (SRAP)
25.1 Findings
These findings are based on data provided by VirginiaHousing, DHCD, and other sources on the scaleof these programs, demographic information on their beneficiaries, and other trends.
Finding 1
Virginia has continued to increase its investments in programs to end homelessness.
Figure 25.1: Virginia’s investment in homelessness assistance and prevention
In 2020, the Commonwealth invested nearly $15 million in its two major homelessness preventionprograms: the Virginia Homelessness Solutions Program and the Housing Trust Fund - HomelessReduction Grant.

25.1. FINDINGS 321
While the state’s General Fund allocation to VHSP has remained steady in recent years, the mostsignificant increases have occurred in the amount of Virginia Housing Trust Fund dollars in supportof HTF-HRG.
Finding 2
Virginia’s investments have resulted in significant decreases in the number of persons experi-encing homelessness.
Figure 25.2: Point-in-Time homelessness count for Virginia
Coordination by DHCD and local Continuums of Care (CoC) has significantly decreased the numberof observed persons experiencing homelessness in Virginia. Point-in-Time (PIT) counts have de-creased 34 percent from just over 9,000 homeless individuals in 2010 to fewer than 6,000 in 2020.

322 CHAPTER 25. HOMELESSNESS ASSISTANCE AND PREVENTION
Finding 3
Funding for permanent supportive housingunder theHomelessReductionGrant has increasedsignificantly since the 2017-2018 program year.
Figure 25.3: Virginia Housing Trust Fund - Homeless Reduction Grant funding by use
In the 2018-2019 program year, DHCD awarded funding to 13 permanent supportive housing (PSH)projects. This award was a major increase from the previous year where DHCD awarded $360,000across five projects. This pivot represents a significant investment in permanent solutions to endhomelessness.
25.2 Program successes
These successes are based on feedback collected from the statewide provider survey, focus groups,and conversations with experienced users of these programs.

25.3. PROGRAM CHALLENGES 323
Success 1
Virginia’s increasing commitment to end homelessness is noteworthy.
Virginia’s commitments to homelessness prevention over the past decade are impressive and worthhighlighting. State government now plays a lead role in reducing homelessness throughout the Com-monwealth and commits historic levels of funding to address these challenges.
Success 2
Homelessness prevention programs are well-coordinated in Virginia.
Virginia’s strong collaboration by state and local providers includes coordinating a variety of fed-eral resources. For instance, the VHSP application is modeled on the federal process, which reducesobstacles and allows for strategic investments. Funding can cover dedicated staff and critical admin-istrative and data needs.
Success 3
The HTF-HRG reimbursement process has worked well during the program’s lifespan.
Stakeholders and program administrators report that once HTF-HRG funds have been awarded, thereimbursement process runs smoothly. Funds also can cover supportive services and administrativestaffing costs, which are not always covered by funding sources, but are much needed.
25.3 Program challenges
These challenges are based on feedback collected from the statewide provider survey, focus groups,and conversations with experienced users of these programs.
Challenge 1
Expanding the supply and spectrum of housing options has become a greater priority, and re-quires more support.
Increased funding levels have been pivotal to decreasing the number of persons experiencing home-lessness, and funding—if current levels are sustained—is now less of a problem than it was a decadeago. The current pressing issue is the challenge of expanding the full spectrum of available housingoptions to meet the needs of those experiencing homelessness.

324 CHAPTER 25. HOMELESSNESS ASSISTANCE AND PREVENTION
The supply of housing affordable and attainable to persons exiting homelessness is extremely lim-ited. This includes both income-restricted housing and privately owned market-rate housing. Ad-ditionally, there are few state-supported incentives for private landlords to lease to tenants exitinghomelessness, forcing providers to use privately-raised dollars instead.
Themajority of persons exitinghomelessness donot need a full suite of PSHofferings. There is a needto explore other models, such as single room occupancy (SRO) units and similar units with sharedcommon spaces. However, local land use policies are often a major barrier to this.
Challenge 2
Despite increased collaboration, the homelessness system still has some components that aresiloed.
Although state agencies, the Continuum of Care (CoC) program, and other providers collaborate ef-fectively, there are still major opportunities for homelessness programs to integrate more fully intothe broader housing and service delivery sectors. One example is the need for the PSH-SMI programto increase collaboration with CoCs.
Homelessness providers oftendealwith thedownstreameffects of challenges that emerge in the crim-inal processing and education systems. Althoughproviders understand these connections, legislatorsand policymakers need to be better informed andmore aware of the need for structural reform to endthe root causes of housing instability.
Challenge 3
Some program design aspects hinder homeless service provider effectiveness.
Providers noted that programs operating on a reimbursement basis are challenging for homelessnessproviders who have large-scale costs like property acquisitions and hotel reimbursements.
As acquisition and construction costs rise, limits on project capital for some programs are becomingan issue. Providers would like to see these capital limits raised to reduce the need for additionalfunding sources for capital costs.
Challenge 4
NIMBYism at the local level can delay or derail efforts to combat homelessness.
“Not in my backyard” sentiments are most often expressed bymembers of the general public, but arealso endemic in local officials when there is a vacuum of information. According to many providers,city and county managers are often unaware of how CoCs and associated homelessness preventionand assistance efforts actually work.

25.4. RECOMMENDATIONS 325
Challenge 5
Financing and overly restrictive local land use policies increase the barriers to providers.
Many projects aimed at reducing homelessness face challenges due to funding or financing and localland use regulations. These barriers increase the obstructions service providers confront in attempt-ing to address homelessness in their communities.
25.4 Recommendations
These recommendations synthesize the findings, successes, and challenges identified for this clusterof programs. They offer a roadmap to a future where these state initiatives are efficient, impactful,and best serve Virginians who need greater housing opportunities.
Recommendation 1
Virginia’s support to end homelessness should expand permanent solutions by increasing thesupply of deeply affordable housing and expanding long-term rental assistance options.
Why this is needed:
Thenumber and variety of deeply affordable housing units for persons exiting homelessness remainslow. Service providers struggle to find units that not only meet the needs of their clients but are alsopriced affordably. These supply issues are stalling efforts to end homelessness.
Who is responsible:
• Department of Housing and Community Development• Virginia Housing• Department of Behavioral Health and Developmental Services• Virginia Department of Social Services• General Assembly• Governor
How to accomplish:
DHCDshould use increases in theHTF to sustain and expand its deployment ofHRG funds for invest-ments in permanent supportive housing. The state should encourage localities to amend local landuse policies to allow for different types of housing that support persons experiencing homelessness.

326 CHAPTER 25. HOMELESSNESS ASSISTANCE AND PREVENTION
Recommendation 2
When possible, allow for more flexibility in the expenditure of homelessness funds followingCOVID-19.
Why this is needed:
• Service providers often cited overly restrictive funds as a major barrier to addressing the needsof their clients and stably housing persons experiencing or exiting homelessness. This oftenresulted from federal funding rules that require changes in HUD programs, which DHCD isthen responsible for administering.
• Providers also cited a lack of sufficient funding for supportive services often necessary to helpaddress homelessness and transition clients into stable housing.
• Although the abundance of homelessness-related funding allocated during the COVID-19 pan-demic alleviated some of these restrictions and gave providers additional flexibility, pandemic-related funding increases are not likely to stay permanent.
Who is responsible:
• Department of Housing and Community Development
How to accomplish:
DHCD should allow homeless service providers to use awarded funds on other services and resourcesthat meet additional needs of individuals experiencing homelessness, unless DHCD is constrainedby federal requirements.
For example, incentives to landlords to rent to people exiting homelessness are an eligible expensefor Emergency Services Grant-CARES Act (ESG-CV) funds under the Virginia COVID HomelessnessEmergency Response Program. This use should be codified permanently and not be limited to pan-demic emergency response.
Recommendation 3
Expand existing education and professional development networks to include local officials,community service boards, and other social service providers.
Why this is needed:
• Stakeholders outside of the homelessness system are not well informed about how homeless-ness assistance and prevention programs work and the people the programs serve.
Who is responsible:

25.4. RECOMMENDATIONS 327
• Local government officials (e.g., city councils, boards of supervisors, and county administrators)• Local community service boards• Local departments of social services• Department of Behavioral Health and Developmental Services• Virginia Department of Social Services• Managed care organizations (MCO)• Virginia Housing Alliance and advocates• Department of Housing and Community Development
How to accomplish:
Virginia should support and incentivize the inclusion of non-traditional stakeholders in professionaldevelopment, education, and networking events held by groups like Virginia Housing Alliance. Thiscan be done through greater promotion of these events and opportunities through housing and socialservices networks.
Recommendation 4
Integrate housing services in criminal processing and educational systems more comprehen-sively to strengthen homelessness assistance and prevention efforts.
Why this is needed:
• Prevention of homelessness can bemore successful in upstream systems where at-risk individ-uals and families are first identified.
• Early identification and prevention in criminal processing, foster care, and educational sys-tems can lessen pressures on CoCs and more effectively address homelessness among justice-involved populations and students at risk of or currently experiencing homelessness.
Who is responsible:
• Department of Housing and Community Development• Department of Criminal Justice Services (VDCJS)• Virginia Department of Education (VDOE)• Department of Behavioral Health and Developmental Services• Virginia Department of Social Services• Continuums of Care and Local Planning Groups (LPG)• Governor
How to accomplish:
Frontline agencies—DHCD, DBHDS, DCJS, VDOE, and other stakeholders— should establish and fos-ter regular inter-agency communication and develop solutions to common challenges of housing

328 CHAPTER 25. HOMELESSNESS ASSISTANCE AND PREVENTION
vulnerable populations. This should involve identifying opportunities to better integrate housingservices in educational systems and improve discharge planning in criminal processing systems tostrengthen homelessness prevention.
Recommendation 5
Shift grant programsaway fromreimbursementmodels to facilitate faster delivery of funds andmore sustainable cash flows for providers.
Why this is needed:
• The current reimbursement process through HTF-HRG requires homeless service providers tocover carrying costs before being reimbursed. This can create instability in nonprofit balancesheets, especially for those that depend heavily on government resources.
Who is responsible:
• Department of Housing and Community Development
How to accomplish:
DHCD should transition from reimbursement models to facilitate faster delivery of funds and moresustainable cash flows for providers. DHCD should also reduce or eliminate interest charged on bor-rowed money to cover services prior to reimbursement. Alternatively, they could explore whetherinterest can be reimbursed as an allowable administrative cost.

Part V
FOCUSED RECOMMENDATIONS
329


Part 5 Overview
Part 5 includes the following chapters:
26 State-funded rental assistance
Chapter 26 addresses HB854’s requirement to propose recommendations for “a Virginia rent subsidyprogram to work in conjunction with the federal Housing Choice Voucher program.”
27 Utility rate reduction
Chapter 27 addresses HB854’s requirement to propose recommendations for “utility rate reduction forqualified affordable housing.”
28 Property tax reduction
Chapter 28 addresses HB854’s requirement to propose recommendations for “real property tax reduc-tion for qualified affordable housing for localities that desire to provide such an incentive.”
29 Bond financing options
Chapter 29 addresses HB854’s requirement to propose recommendations for “bond financing optionsfor qualified affordable housing.”
30 Addressing racial equity in housing across Virginia
Chapter 30 provides recommendations to policymakers for reducing racial disparities in housing.While not specifically referenced in the text of HB854, the steering committee and SAG unanimously
331

332
agreed that the report should include this topic.

Chapter 26
State-funded rental assistance
This chapter addresses HB854’s requirement to propose recommendations for “a Virginia rent subsidyprogram to work in conjunction with the federal Housing Choice Voucher program.”
Highlights
Major takeaways in this chapter include:
• A new state-funded rental assistance programwould build on proven strategies to reduce hous-ing instability and increase opportunities for low-income households.
• Over 300,000 low-income renters in Virginia are cost-burdened—a challenge faced dispropor-tionately by Black, brown, and senior households.
• Current federal rental assistance and the supply of affordable rentals in Virginia still pale incomparison to the need thousands of low-income individuals and families have for housingassistance.
• Stakeholders recommend a statewide rental assistance program that prioritizes Virginians be-low 50 percent of their Area Median Income and those experiencing housing instability, re-duces barriers to assistance that often leave Virginians behind in federal assistance programs,focuses on equity and efficiency, and ensures resident success through choice, mobility coun-seling, and landlord involvement.
26.1 Background
HB854 requested the SAG to:
“. . . consider the following proposals as well as other proposals it considers advisable duringthe course of its analysis and deliberations: . . . a Virginia rent subsidy program to work inconjunction with the federal Housing Choice Voucher program . . .”
333

334 CHAPTER 26. STATE-FUNDED RENTAL ASSISTANCE
The subgroup initially divided into two panels focused separately on rental assistance for permanentsupportive housing (PSH) and a general rental assistance program (i.e., strictly assistance based onhousehold income). The panel quickly realized that the complexity of PSH and initiatives alreadyunderway to assess statewide PSH needs required dedicated attention beyond the scope of this study.Therefore, a single subgroup addressed a state-funded rental assistance program.
The need for PSH units and rental assistance remains high. Organizations addressing this demandare supported by a range of programs:
• Department of Housing and Community Development (DHCD)
– Affordable and Special Needs Housing (ASNH)
• Department of Behavioral Health and Developmental Services (DBHDS)
– State Rental Assistance Program (SRAP)– Permanent Supportive Housing - Serious Mental Illness (PSH-SMI)
• Other sources
– Section 811 Project Rental Assistance Program– “Mainstream” Housing Choice Vouchers– Auxiliary Grant Supportive Housing– Continuums of Care Rental Assistance
This state-funded rental assistance proposal concentrates on households making less than 30 per-cent area median income (AMI), which are extremely low-income households (ELI). The TechnicalAssistance Council notes that households that often need supportive housing are also ELI house-holds. (O’Hara & Yates, 2015) A state-funded rental assistance program dedicated to ELI householdscan assist households that would benefit from PSH and those that do not need PSH.
26.2 Rationale
Rental assistance is a nationally-recognized best practice to help low-income households remain sta-bly housed at a time when wages are stagnating, the wealth gap is widening, and rents are rising.(Salviati, Popov, Warnock, & Szini, 2021) (Horowitz, Igielnik, Kochhar, Horowitz, & Arditi, 2020)
Rental assistance covers a portion of a household’s rent to prevent eviction and homelessness, whichdo not just harm those evicted and experiencing homeless but ultimately exact long-term costs tocommunities and local governments.
Federal rental assistance
The Housing Choice Voucher program (Section 8), created in 1974, is designed to help low-incomefamilies move from impoverished neighborhoods to neighborhoods of opportunity. The programassists qualified families to afford the cost of housing in the private market.

26.3. FINDINGS 335
In Virginia, federal Housing Choice Vouchers (HCVs) are administered by Virginia Housing (throughlocal agency partners) and public housing authorities (PHAs), which receive HCV allocations directlyfrom the U.S. Department of Housing and Urban Development (HUD).
State rental assistance
State-funded programs have existed since 1966, when Massachusetts became the first to implementa rental assistance program, predating the federal Section 8 Housing Choice Voucher Program. Pro-grams such as the Massachusetts Rental Voucher Program (MRVP) and the recent D.C. Flexible RentSubsidy Program (D.C. Flex) offer valuable lessons for the design and implementation of a Virginiarental assistance program.
In the Commonwealth, DBHDS operates two relatively small and targeted rental assistance programsfor persons with more complex needs: State Rental Assistance Program (SRAP) and Permanent Sup-portive Housing - Serious Mental Illness (PSH-SMI). These initiatives are reviewed in more detail inChapter 21.
Need for rental assistance
Three out of four families who are eligible for housing assistance do not receive federal rental assis-tance. (Center on Budget and Policy Priorities, 2021) The demand far exceeds the supply that hasbeen appropriated by Congress. When funding runs out, long waiting lists close and often remainclosed for years. Emergency rental assistance in Virginia has helped to stabilize thousands of house-holds during the COVID-19 pandemic, but even before the pandemic low income renters were oftenone missed paycheck away from housing instability.
In 2017, roughly 400,000 low-income renter households in Virginia were cost-burdened. In 2020,about 106,000 Virginia households received federal housing assistance1 and an additional 86,600lived in Low-Income Housing Tax Credit (LIHTC) apartments.2 A Virginia rental assistance programcould help close the substantial gap in assistance for low-income households.
26.3 Findings
26.3.1 Renter cost burden in Virginia
Comprehensive Housing Affordability Strategy (CHAS) data are calculated by the U.S. Census Bureauand are based on theAmericanCommunity Survey (ACS). TheU.S. Department ofHousing andUrbanDevelopment (HUD) disseuminates this data to local governments and other organizations to helpthem understand the extent of housing problems and needs in their community. A large portion ofthis data focuses on cost-burdened households.
The most recent data release was on August 25, 2020 for the 2013-2017 5-year estimate period.1Includes public housing, Housing Choice Vouchers, Project-Based Section 8, and other HUD-assisted income-
restricted rental housing programs.2HUD Picture of Subsidized Households; Virginia Housing list of existing LIHTC properties.

336 CHAPTER 26. STATE-FUNDED RENTAL ASSISTANCE
Income levels used by CHAS and other affordability data:
• Low-income (LI) is defined as above 50 percent but below 80 percent AMI.• Very low-income (VLI) is defined as above 30 percent but below 50 percent AMI.• Extremely low-income (ELI) is defined as below or equal to 30 percent area median income(AMI)
Major takeaways
Cost burden is highest among renters with the lowest incomes.
Nearly half a million renter households (45 percent) in Virginia are cost burdened. ELI renterhouseholds are disproportionately cost-burdened; 85 percent are cost-burdened and 65 percent areseverely cost-burdened. The majority (80 percent) of VLI renter households are cost-burdened, andalmost half of LI renter households are cost-burdened.
While the total share of renters with cost burden in Virginia has remained largely unchanged since2010, National Low Income Housing Coalition (NLIHC) research indicates that ELI households whowere severely cost-burdened rose to 71 percent in 2019, compared to 62 percent in 2017.
Virginian renters of color have higher cost burden
• Over half of Hispanic, Black, and American Indian renter households in Virginia are cost-burdened.
• One in four Hispanic and Black renter households in Virginia are severely cost-burdened.• The number of Hispanic and Black renter households that are cost-burdened has been on therise since 2010.
26.3.2 Publicly supported rental homes in Virginia
The Public and Affordable Housing Research Corporation (PAHRC) provides a snapshot of eachstate’s publicly supported rental housing, often funded by multiple sources from different levels ofgovernment. Preservation of publicly supported rental housing with affordability restrictions due toexpire over the next 30 years is also a priority.
Click here to view PAHRC’s 2021 Preservation Profile for Virginia.

26.3. FINDINGS 337
Major takeaways
• PAHRC estimates that in 2020 there were 125,020 rental units supported by public subsidy inVirginia.
• The majority (66 percent) of affordable rental housing units are supported by LIHTC.• Nearly 5,000 existing publicly supported rental housing units (four percent of the total) are atrisk of expiring affordability restrictions in the next five years.
• Overhalf (52percent) of existing publicly supported rental housingunits that have affordabilityrestrictions expiring in the next five years (2,489) are also assisted by Section 8 contracts.
• PAHRC estimates that there is a 157,087 unit shortage of rentals affordable and available to ELIrenters.
26.3.3 Available and affordable rental homes in Virginia
NLIHC annually analyzes the availability of rental housing that is affordable to ELI and other incomegroups. The analysis presents either a surplus or deficit of housing that is affordable to these incomegroups.
Click here to view NLIHC’s profile for Virginia from their latest “The Gap” report.
Major takeaways
Virginia has a deficit of nearly 300,000 affordable and available units for households at or below 50percent AMI. This includes a deficit of 148,720 for ELI households and 149,300 for VLI households.
For every 100 ELI households, there are only 39 available units that are affordable and available tothem. Only 63 units are affordable and available for every 100 VLI households.
26.3.4 Virginia public housing authority housing stock and waitlists
The PHA survey conducted for this report, which collected information on waitlists for affordablehousing programs run by PHAs in Virginia, is described in Chapter 9. Important considerations fromthat survey for this chapter are below.
Major takeaways
• There is a deficit of 40,718 units and 32,498 rental assistance vouchers across 32 localities inVirginia.
• Public housing has 16,270 applicants on waiting lists across the 22 PHAs, with the majority ofpublic housing applications open.

338 CHAPTER 26. STATE-FUNDED RENTAL ASSISTANCE
• LIHTC housing has 7,278 applicants on waiting lists, with ten PHAs having open applicationsand three opening applications in the next one to four years.
• Voucher programs have 32,498 applicants on waiting lists, with the majority having open ap-plications as of April 2021.
26.3.5 Profile of public housing residents and HCV recipients
HUD collects information on public housing residents and Housing Choice Voucher recipients usingForm 50058, a module within the reporting system used by public housing authorities. HUD usesForm 50058 data to produce a Resident Characteristics Report (RCR) summarizing general informa-tion on households living in public housing or receiving either tenant- or project-based vouchers.
Information on Virginia’s public housing residents and HCV recipients is available on the followingdashboard:

26.3. FINDINGS 339
Figure 26.1: Profile of public housing residents and HCV recipients
Regional variations do exist among residents and recipients, but the publicly available data does notallow for a comprehensive breakdown between PHAs and localities.
HUD provides additional information on households that use housing assistance programs throughits Picture of Subsidized Households dataset.
Major takeaways
• The majority of project-based voucher recipients in Virginia have an average annual incomeof $13,415 and contribute an average of $315 of their monthly income toward housing. Thirty-seven percent of households are female-headed households with children. The majority of re-cipients (82 percent) are Black.

340 CHAPTER 26. STATE-FUNDED RENTAL ASSISTANCE
• Tenant-based voucher recipients have a slightly higher average annual income of $14,964 andon average pay $352 of theirmonthly income towardhousing costs. Forty-two percent of house-holds are female-headed households with children and 73 percent of recipients are Black.
26.3.6 Lessons learned from other rental assistance programs
NLIHC maintains a database of State and Locally Funded Rental Housing Programs that was regu-larly updated before the COVID-19 pandemic. NLIHC staff identified in the updated database fivestatewide tenant-based rental subsidy programs that serve the general population. NLIHC providedthe subgroupwith an extensive list of programs across the nation that involve state-funded long-termrental assistance.
General takeaways
The following are high-level recommendations noted by NLIHC for state rental assistance programs.
• Most successful programs have a permanent source of funding rather than annual appropria-tions.
• Tenant-based assistance can be deployed more quickly than project-based assistance.• Programs aremore adaptable to state-level needswhennot tied to federalHCV. Connecticut hasbeen able to work within the confines of the federal HCV model by allowing for more flexibil-ity in how it is administered at the state-level, including the use of third-party administratorsinstead of PHAs, waiving citizenship requirements at the state-level, and offering greater flex-ibility on criminal background checks.
• Only four states (Connecticut, Hawaii, Massachusetts, and New Jersey) and the District ofColumbia have long-term state-funded rental assistance programs that serve populationsbased on income. Some of these programs have additional targeting and eligibility require-ments (e.g., 75 percent of participants must be ELI, persons experiencing homelessness or atrisk of homelessness, etc.). The majority of these programs are modeled after the federal HCVprogram. A state-level department or authority administers most of these programs.
• Time-limited vouchers are unwise because households are unable to improve their wages with-out significant time invested in workforce development, education, and other commitments.Even after improvements in employment, sustained stability requires a longer timeline.
• Setting priorities and preferences for voucher applicants can be difficult because explainingand verifying criteria can be difficult.
Policy takeaways
Specific lessons regarding policy design include the following four takeaways.
• Programmatic changes (e.g., payment standard levels and utility allowances) are politically andfinancially difficult to implement. Policymakers should endeavor to make appropriate deci-sions during the initial design phase.

26.3. FINDINGS 341
• Opportunities exist to leverage the knowledge base of Section 8 administrators and beneficia-ries. These organizations and individuals should be engaged throughout the design of develop-ment of a state rental assistance program.
• Virginia should consider flexibility and reasonable accommodations built into initial policydesign to account for unknown market conditions and household needs in the future.
• Programadministrators highly recommend thedevelopment of an administrative plan for staterental assistance programs written in accessible, plain language.
TheMassachusetts Rental Voucher ProgramAdministrative Plan (PDF) is a useful example of a plain-language guidebook.
Funding takeaways
The following are relevant examples and lessons from other states for funding their rental assistanceprograms.
• TheDistrict of Columbia’s Local Rent Supplement Program (LRSP) uses itsHousing ProductionTrust Fund, which is permanently funded through deed and recordation taxes.
• New Jersey’s program blends both trust fund funding and appropriations.• It is important to contextualize the high cost of providing rental assistance by providing anestimate of the number of households served or impacted by rental assistance. State long-termfunding builds confidence in the program (i.e., budget in two- to three-year cycles).
• Disbursement of funds takes time; necessary phases include applicant selection and screeningand time for participants to find units, and/or for projects to be constructed.
• Connecticut’s Rental Assistance Program administrator recommends that general income-based assistance programs be tied to education and support; workforce development andeducation programs increase wages.
Provisions and standards takeaways
Additional lessons for program standards and best practices include the following four takeaways.
• Most programs use the 30 percent payment standard, but some are flexible (between 25 to 40percent) depending on the household type and/or income.
• Vouchers must be tracked at the tenant/household level to inform spending and policy deci-sions.
• Electronic access to state databases is essential to verify income for quality assurance. (Exam-ples include TANF, unemployment benefits, and Medicaid.)
• Centralized online applications improve usability for applicants and agencies.

342 CHAPTER 26. STATE-FUNDED RENTAL ASSISTANCE
26.4 Recommendations
The state-funded rental assistance program subgroup met four times in early 2021 to discuss thepotential design of an initiative to work in conjunction with the federal Housing Choice Voucherprogram. The subgroupmade the following recommendations—based onmember input and consul-tation with national experts—to the full HB854 SAG and steering committee.
Recommendation 1
Develop a rental assistance program based on the federal Housing Choice Voucher program,with expanded eligibility, flexibility, and increased efficiencies.
A rental assistance programmodeled after the federal program reduces the time and effort requiredto develop and implement new guidance and rules. The current program is effective in providinghouseholds with assistance, but there are areas of the program that can be more efficient and modi-fications to eligibility requirements that would ensure all Virginia residents can access assistance.
The subgroup recommends that the program should:
• Include both tenant-based and project-based vouchers to allow for flexibility inmeeting house-hold needs: allocate voucher type based on federal standards (up to 20 percent of total vouchersmay be project-based), butmonitor demand for project-based vouchers and allow for the abilityto modify allocation in response to demand,
• Use existing HUD income limits based on AMI and household size to maintain consistencyacross affordable housing programs,
• Consider an administrative structure that is commensurate with the scale of the program (op-tions include overlaying over the existing HCV administrative structure, etc.),
• Allow for assistance regardless of immigration status, housing authority debt status, evictionrecord, and criminal background to ensure that households most in need receive assistance3,
• Allow funding to be used towards security deposits and application fees, and• Use HUD’s updated housing quality standards (NSPIRE) and allow for administrators to con-tract home inspections to qualified contractors.
Recommendation 2
Target households making 50 percent AMI or below, with the majority of allocation for house-holds at or below 30 percent AMI.
Most of the cost-burdened renter households in Virginia are those earning 50 percent AMI or be-low. The federal program is inadequate to meet these substantial needs. Households at or below 30
3The subgroup recommends using the Office of Attorney General’s Model Policy for Tenant Screening (PDF) for guid-ance on criminal background status

26.4. RECOMMENDATIONS 343
percent AMI often have supportive housing needs which can put further pressure on household fi-nances. Development of a state-funded rental assistance program should consider dedicating annualvoucher allocation (both project- and tenant-based) to serve persons with supportive housing needs.4
The subgroup recommends that the program should:
• Allocate the majority of vouchers to ELI households,• Vouchers intended to support persons experiencing homelessness or at-risk of homelessnessshould be coordinated through the Continuum of Care and Balance of State Local PlanningGroup in each area of Virginia to ensure effective prioritization of vouchers and coordinationwith existing efforts and local resources,
• Prioritize householdsmost in need as identified by the Continuumof Care and Balance of StateLocal Planning Group’s established Coordinated Entry/Centralized Assessment prioritizationprocess, and
• Require smaller percentage of income dedicated toward rent for ELI households (rather thanthe standard 30 percent), which would allow for greater savings and spending on necessitieslike food and transportation.
Recommendation 3
Implement a statewide program at-scale.
Rental assistance is a proven method to reduce homelessness and to eliminate the obstacles manylow-income households face on a daily basis.
Rental assistance expands opportunities for low-income families.
The Center on Budget and Policy Priorities conducted a literature review on the benefits of rentalassistance. (Fischer, Rice, & Mazzara, 2019) Overall, rental assistance is a major tool for bringingpeople out of poverty and increasing opportunities for better economic and personal well-being.
Based on their findings, rental assistance has been found to:
• Reduce the share of families living in shelters or experiencing homelessness by 75 percent,• Reduce the share of families living in overcrowded housing by more than half,• Lift three million people above the poverty line in 2018—a significant share of which were se-niors and children,
• Increase positive outcomes for young children—allowing families to move to lower-povertyneighborhoods, and
4The allocation of vouchers dedicated to individuals with supportive housing needs can be estimated through Contin-uums of Care and Local Planning Group Homeless Management Information Systems. While HMIS may not account forall persons for which supportive housing may be beneficial, there is potential opportunity to increase coordination withcriminal processing systems and other institutional systems to connect individuals to CoC/LPG coordinated entry systemsto be assessed for emergency shelter or permanent housing placement.

344 CHAPTER 26. STATE-FUNDED RENTAL ASSISTANCE
• Improvehealth outcomes for childrenandadults by reducing the stress causedbyhomelessnessand housing instability that can exacerbate chronic health conditions.
This subgroup believes there is no need for a pilot program to demonstrate the effectiveness of rentalassistance in Virginia. The scale of the program is largely dependent on funding levels, which mustalso consider administrative costs. An effective and efficient program requires additional training,staff, and systems.
Funding example for statewide rental assistance program:
The Massachusetts Rental Voucher Program (MRVP) received $100 million through a budget allo-cation in fiscal year 2019, providing an average assistance of $922 per voucher per month to 8,535households in the same fiscal year.5 TheMRVP projects that the fiscal year 2020 administrative feeswill be $5,393,770 out of its total projected spending of $114,981,967—afive percent share. The budgetallocates about one percent to supportive services subsidy.
The subgroup recommends that the program should:
• Use a stepped implementation process at the regional-level to work out program issues,• Allocate funding towards administration and additional support services for special needs pop-ulations (e.g., seniors, persons with disabilities, victims of domestic violence, etc.),
• Consider equity and cost-effectiveness when developing a program at-scale, and• Use the following broad estimates on households assisted and costs (Table 26.1) to make a de-cision on program scale.
Investing in rental assistance would reduce the total public and private costs of evictions.
These projected cost ranges—from $73million to $258million per year—are significantly lower thanrecent estimates for the total immediate and downstream costs of evictions in Virginia. According tothe RVA Eviction Lab at VCU, the total cost of the 70,600 evictions across the state in 2018 is between$483 million and $1.26 billion. (DeLeon, Howell, & Teresa, 2021)
Recommendation 4
Ensure resident success throughchoice,mobility counseling, and landlordoutreach/incentives.
Whilemany rental assistance programrecipientsmaywant to staywithin their existing communities,some may want to relocate to areas where they can take advantage of new economic and educational

26.4. RECOMMENDATIONS 345
Table 26.1: Possible funding scenarios for new state-funded rental assistance program
Scenario Scale Description Householdsserved
Cost range
1 Targeted:Homeless
Addresses the needs of all specialneeds households identified byPoint-in-Time counts. Prioritizeshouseholds most-in-need who areexperiencing homelessness. Norental assistance is provided forhouseholds that are notexperiencing homelessness or atrisk of homelessness.
4551 $73M to $85M
2 Targeted: ELI Covers 50 percent of special needshouseholds in both metropolitanand rural areas, while also providingassistance to several thousand ELIhouseholds.
9844 $112M to $134M
3 Targeted:ELI-VLI
Widens previous scenario to VLIhouseholds currently paying morethah half of their income on rent(severely cost-burdened).
13080 $154M to $185M
4 Targeted:Homeless andELI-VLI
Maximizes assistance by addressingthe needs of all special needshouseholds and a portion ofcost-burdened of ELI and VLIhouseholds.
16700 $216M to$258M
opportunities. However, many low-income households face obstacles in finding and securing hous-ing in these areas.
The newly enacted source of income protection for Virginia allows recipients to use rental assistancewherever they choose without being legally denied housing solely because they have a voucher.6 As-sistance throughout the process can also expand recipients’ options of where to live; this includeshelp with searching for housing, understanding their rights as tenants, and navigating issues in anew neighborhood or between landlords and tenants.
The subgroup recommends that the program should:
• Take into account the expansion of mobility counseling programs with funding levels,• Require administrators within metropolitan areas to provide mobility counseling,• Incentivize the use of Small Area FairMarket Rents for public housing authorities inmetropoli-tan areas (e.g., priority allocation for metropolitan public housing authorities using SAFMR),
• Address portability of tenant-based assistance across housing authority service areas, and• Consider additional landlord incentives beyond the Communities of Opportunity Tax Creditfor the acceptance of vouchers.
6As of July 1, 2020, Virginia Fair Housing Law now includes “source of funds” as a protected class. (Va. Code Ann. §36-96.1, et seq.) Landlords may not deny an application based on how that prospective renter intends to pay their rent.This includes, for example, renters with Housing Choice Vouchers.

346 CHAPTER 26. STATE-FUNDED RENTAL ASSISTANCE

Chapter 27
Utility rate reduction
This chapter addresses HB854’s requirement to propose recommendations for “utility rate reductionfor qualified affordable housing.”
Highlights
Major takeaways in this chapter include:
• Electricity, gas, water, and other essential utility costs strain the budgets of low-incomeVirginians—as well as those of affordable housing providers working to build and preserveunits across the state.
• COVID-19 demonstrated that reliable high-speed internet access is critical for work, education,and healthcare for families. However, more than one-in-three households earning less than$20,000 do not have internet access in Virginia.
• State law and regulatory precedent disallow specific rate reduction carve outs for affordablehousing.
• Instead, Virginia can address these challenges by unifying current and new efforts supportedby expanded state and federal funding, helping localities reduce up-front utility costs for af-fordable housing, bolstering current energy efficiency measures, and leveraging the Common-wealth’s substantial new broadband investments to increase internet access and affordabilityfor residents in affordable housing.
27.1 Background
HB854 requests the SAG to:
“. . . consider the following proposals as well as other proposals it considers advisable during
347

348 CHAPTER 27. UTILITY RATE REDUCTION
the course of its analysis and deliberations: . . . utility rate reduction for qualified affordablehousing. . .”
Utilities are an important but often overlooked aspect of affordable housing. They contribute to up-front development costs and then affect affordability through regular service bills for residents andproperty owners. While mortgage or rent is the main source of a housing cost burden, sometimeshouseholds must also dedicate a large share of their income on basic services like electricity and gas.
Different formulas calculate this financial hardship and measure affordability. (Brown, Soni, Lapsa,& Southworth, 2020) For the purposes of this report, “energy cost burden” refers to the share of ahousehold’s income spent specifically on home energy bills. When this burden is too large, it con-tributes to greater housing insecurity, primarily for low-incomehouseholdswith less spendingpower.
The subgroup concentrated on household energy burden, which includes the group’s suggested solu-tions to reduce costs associated with the development and preservation of energy efficient affordablehousing. The subgroup also addressed access to and affordability of high-quality internet service toresidents of affordable housing, as internet has proven to be an essential household utility.
27.2 Findings
27.2.1 Household utility cost trends in Virginia
The threshold for energy cost burden is six percent of household income. (Fisher SheehanandColton,2021) This calculation includes all costs associated with energy used by the home (e.g., electricity andnatural gas), but excludes other utilities like trash collection and internet.
Households paying more than six percent of their income for their home energy bills are at muchgreater risk of being unable to meet all other necessary expenses. According to tabulations of theConsumer Expenditure Survey by the Harvard Joint Center for Housing Studies:
“Severely cost-burdened renter households in the bottom expenditure quartile (a proxy for lowestincome) spent 38 percent less on food and 40 percent less on healthcare in 2018 than otherwisesimilar renters with housing they could afford.” (Joint Center for Housing Studies, 2021)
Energy cost burden disproportionately impacts low-income households as, on average, they spendten percent or more of their income on utilities compared to the five percent or less spent bymiddle-and upper-income households. In 2020, Virginians below 50 percent of the Federal Poverty Levelspent 31 percent of their income on home energy bills alone.

27.2. FINDINGS 349
Figure 27.1: Energy cost burden in Virginia by poverty level
This disproportionate energy cost burden is partly due to low-income households occupying less ef-ficient homes and apartments. Over 57 percent of all households below 50 percent AMI in the statelive in homes built more than 40 years ago.1
1U.S. Department of Housing and Urban Development, Comprehensive Housing and Affordability Strategy, 2013-20175-year estimates, Table 12.

350 CHAPTER 27. UTILITY RATE REDUCTION
Figure 27.2: Energy cost burden by tenure, structure type, and AMI
As of 2019, themedianmonthly rent in Virginia for a home built prior to 1940was $670 less than thatof one built in the past five years.2 Data from the National Renewable Energy Laboratory show thatVirginians earning less than 50 percent AMI who live in older housing—particularly single-familyhomes and mobile homes—have the highest energy burdens.
2U.S. Census Bureau, American Community Survey, 1-year estimates. Table B25111.

27.2. FINDINGS 351
Figure 27.3: Energy cost burden by tenure, year home built, and AMI
High cost burdens can reduce a household’s ability to use electricity, heat or cool their home, or evenhave running water. Some households choose between paying utility bills and paying mortgage orrent, or other essential expenses. This in turn contributes to high levels of housing instability, in-cluding evictions and foreclosures.
27.2.2 Utility rate and expenditure trends
On average, the nominal retail price of residential electricity in Virginia has increased annually byroughly 0.18 cents per kilowatt-hour from 1990 to 2019. When adjusting the price using the Con-sumer Price Index (CPI) of electricity for urban consumers in U.S. cities, the real price of electricityhas decreased by 0.30 percent on average per year during the same period.3
3The Consumer Price Index (CPI) is a measure of the average change over time in the prices paid by urban consumersfor a market basket of consumer goods and services. Indexes are available for the U.S. and various geographic areas.

352 CHAPTER 27. UTILITY RATE REDUCTION
Figure 27.4: Average retail price of electricity by sector in Virginia
The average bills for residentialwater and sewer (wastewater) have similarly increased in recent years.In 2020, the typical customer in Virginia paid more than $80 for both water and sewer, or roughly$25 more than the average for 2010.

27.2. FINDINGS 353
Figure 27.5: Residential water and wastewater bills in Virginia
27.2.3 Internet as a utility
The COVID-19 pandemic has demonstrated that high-speed internet is a vital tool in everyday life.As a result, disparities in broadband access exacerbate existing inequity throughout Virginia.
The statewide provider survey, focus groups, and discussion within this subgroup all identified equi-table access to broadband as a need for low-income households and residents in affordable housing.
Across the Commonwealth, more than one-in-three households earning less than $20,000 do nothave internet access, compared to fewer than one-in-twenty households earning $75,000 or more.

354 CHAPTER 27. UTILITY RATE REDUCTION
Figure 27.6: Households without internet in Virginia
There also is a broadband divide by race in Virginia: 30 percent of Black households in the state donot have high-speed home internet access compared to 23 percent of Hispanic households and 19percent of white households. (Alliance for Excellent Education, 2020)
Although Virginia does not currently recognize broadband internet as a “utility” alongside electricand gas service, in 2018 Governor Northam committed the state to achieving universal broadbandaccess by 2028. (Pew Charitable Trusts, 2021) Commonwealth Connect—a state-led comprehensiveeffort to expand the scale and impact of broadband investments—supports this initiative.
Commonwealth Connect promotes solutions in three main areas:
1. State policy changes to remove barriers and support infrastructure,2. Financial, planning, technical, and other assistance to local governments, and3. Grants to communities to spur solutions via public-private partnerships. (CommonwealthCon-
nect, 2018)
Since 2017, the Commonwealth has awarded $140 million and connected 124,000 locations to ad-dress broadband accessibility throughout Virginia.
Broadband investments funded by the CARES Act

27.2. FINDINGS 355
In October 2020, Virginia dedicated $30 million of federal CARES Act dollars to projects that willexpand broadband access and affordability across the state. As of spring 2021, the state has funded71 projects throughout 50 localities. Some relevant examples include:
• An investment of $4million for the City of Hopewell to provide free publicWi-Fi networks for747 affordable housing units. This project created eight miles of fiber with 250 access pointsthroughout the city.
• An investment of $750,000 for the Portsmouth Broadband Authority to build awirelessmeshnetwork for 1,065 public housing units. The funds also supported several additional publicWi-Fi hotspots with a total of 173 access points throughout the city. (Commonwealth Connect,2021)
Alongwith these affordability-focused projects in urban areas, CARESAct funding supported 45 “lastmile” projects to expandbroadband access in predominantly rural areas. These investments to deployphysical infrastructure are the state’s priority in the coming years.
Other recent state actions
Broadband expansion was a key topic during the 2021 General Assembly session. Virginia developedtwo new pilot programs and passed legislation to expand broadband access and close disparity gaps.
The first program authorizes the Virginia Department of Social Services (VDSS) to design a programto expand reliable internet access for low-income residents by providing themwith up to $15 in reim-bursement costs monthly. VDSS was required to report its recommendations by November 1, 2021.4
The second program requires DHCD to create a programwithin the Virginia Telecommunication Ini-tiative (VATI) where public broadband authorities are permitted to apply for program funds withoutprivate sector investment.5
Lawmakers also adopted a third bill which authorizes school boards to appropriate funds for the ex-pansion and operation of broadband for educational purposes.6 School boards may partner withprivate broadband service providers and subsidize broadband for qualifying households.
Additionally, GovernorNorthamand theGeneral Assembly have appropriated $700million inAmer-ican Rescue Plan funding to expand universal broadband coverage. This investment accelerated theGovernor’s 10-year goal for achieving universal internet access from 2028 to 2024.
What are other states doing? Over the past year, nearly every state in the nation has taken up or isconsidering new legislation to expand broadband or make it more affordable. These bills, includinga handful specifically related to affordable housing, are listed on the National Conference of StateLegislatures website.
4Appropriation Act - Item 359 L, 2021 Special Session I, Virginia General Assembly.5HB1923 Broadband capacity; expands existing pilot program, municipal broadband authorities. 2021 Special Session
I, Virginia General Assembly.6SB1225 Broadband services; school boards to appropriate funds for expansion of services for education. 2021 Special
Session I, Virginia General Assembly.

356 CHAPTER 27. UTILITY RATE REDUCTION
Internet and LIHTC
As of today, none of the methods to calculate utility allowances for LIHTC developments includebroadband internet as a utility for residents. Internet costs are categorized alongside telephone, cable,andothernon-essential utilities; without any changes, simply adding internet to LIHTCutility allowanceswould lower total rent collected and add additional up-front costs.
However, many states do encourage internet infrastructure for new LIHTC units. For example, Vir-ginia Housing currently awards points in its 2019-2020 Qualified Allocation Plan for internet asfollows:
• One point awarded “if each unit is provided with the necessary infrastructure for high-speedInternet/broadband service.”
• Four points awarded “if free Wi-Fi access is provided in the community room and such access isrestricted to resident only usage.”
• Six points awarded “if each unit is provided with free individual high-speed Internet access.”
If developers receive additional support to offset initial costs, they likelywill pursue these pointsmorefrequently as internet continues to rise in importance and becomes a significant market advantage.
27.2.4 Regulatory environment
TheStateCorporationCommission (SCC) regulates rates formost electric and gas utilities inVirginia.Title 56 of theCode of Virginia enumerates how the statemay regulate the rate-setting and operationsof these utilities.
Due to prevailing state law and regulatory precedent, a standalone rate reduction for affordable hous-ing is not feasible inVirginia. The subgroup reached this conclusion followingmultiple conversationswith SCC officials and utility providers.
The subgroup has found no evidence that any other state provides a separate rate classification foraffordable housing.7 This applies to both electric and gas utilities.
27.2.5 Relevant state utility and energy programs
COVID-19 assistance
Following the onset of the COVID-19 pandemic, providers of electric, gas, water, and sewer utilitieswere subject to:
• A shut-off moratorium preventing termination of service due to unpaid bills8,7Based on HousingForward Virginia research and conversation with the National Housing Trust.8This moratorium began on March 16, 2020 and expired on October 5, 2020.

27.2. FINDINGS 357
• Establishment of emergency debt repayment plans for customersmore than 30 days behind ontheir bills, and
• Debt forgiveness for customers using CARES Act funding from the federal government.
Utilities have also been encouraging customers to take advantage of LIHEAP funds and provider pro-grams such as Dominion Energy’s EnergyShare.
Low-Income Home Energy Assistance Program (VDSS)
The Low IncomeHomeEnergy Assistance Program (LIHEAP) is a federally-funded resource that cov-ers “costs associated with home energy bills, energy crises, weatherization and energy-related minorhome repairs.”9
VDSS administers LIHEAP in Virginia. Households are eligible for LIHEAP funds if they earn lessthan 130 percent of the Federal Poverty Level or 60 percent of Virginiamedian income if using fundsfor weatherization.
Virginia received more than $87.8 million in LIHEAP funds in fiscal year 2021 and $23.3 million insupplemental funds from the CARES Act. Across Virginia in fiscal year 2019, LIHEAP provided heat-ing assistance to 102,858 households, cooling assistance to 65,196 households, and crisis assistanceto 16,592 households.10
Weatherization Assistance Program (DHCD)
The Weatherization Assistance Program (WAP) helps provide energy efficiency upgrades to low-income households. Funds are provided by the U.S. Department of Energy (DOE) and are used toinstall insulation, repair heating and cooling systems, and other energy-saving uses.
Prior to 2020 and the COVID-19 pandemic, WAP funded nearly $5 million in weatherization activi-ties across the state, reaching more than 1,200 households annually.
Percentage of Income Payment Program (VDSS and DHCD)
In 2021 the General Assembly passed legislation to begin the Percentage of Income Payment Program(PIPP).11 PIPP limits the total electric bills for eligible low-income customers of DominionEnergy andAppalachian Power and directs customers to other resources to alleviate their energy cost burden.VDSS, with help from DHCD, will begin drafting program regulations this year.
In the bill, lawmakers also asked the state to conduct a gap analysis and determine what service gaps,if any, continue to exist for PIPP-eligible customers.12 VDSS will be the lead agency and partner withDHCD on the weatherization component. VDSS will direct the subsidy program.
Utility sponsored and administered programs
Private utilities in Virginia offer charitable programs to provide utility assistance to customers in9U.S. Department of Health & Human Services Low Income Home Energy Assistance Program (LIHEAP)10Virginia LIHEAP FY2019 State Profile (PDF)11HB230 Percentage of Income Payment Program and Fund; DHCD&DSS to adopt rules, etc., for adoption. 2021 Special
Session I, Virginia General Assembly.12Va. Code Ann. § 56-585.6. “Universal service fee; Percentage of Income Payment Program and Fund.” Section D.

358 CHAPTER 27. UTILITY RATE REDUCTION
need. Private donations, usually from ratepayer voluntary contributions, typically fund these unreg-ulated programs. One well-known example is the Dominion Energy EnergyShare program, whichprovides bill payment assistance and weatherization services.
Dominion Energy and Appalachian Power have also just recently expanded their energy efficiencyprogram offerings pursuant to Va. Code Ann. § 56-585.1, referred to as “Phase VIII” initiatives intheir demand side management (DSM) program.
• Dominion Energy’s new programs were approved in July 2020; they include Residential/Non-Residential Multifamily energy efficiency, Residential Home Retrofit, Residential Manufac-tured Housing, and Residential New Construction programs.13
• Appalachian Power’s approved new programs include Low-Income Single Family, Low-IncomeMultifamily, and ENERGY STARManufactured Home programs.14
Regional Greenhouse Gas Initiative and Housing Innovations in Energy Efficiency (DHCD)
The Regional Greenhouse Gas Initiative (RGGI) is a cap-and-trade program designed to reduce cli-mate pollution from fossil fuel power plants. Virginia joinedRGGI in 2020, bringing the total numberof participant states to eleven across the eastern seaboard. By capping emissions, RGGI requires en-ergy producers to either reduce pollution or buy allowances at auction. Funds raised at RGGI auctionsflow to the states. According to DHCD:
“Legislation passed by the Virginia General Assembly authorizes proceeds from these auctionsto be used for community flood preparedness, coastal resilience and energy efficiency programsfor affordable housing. DHCD will administer approximately 50 percent of the auction pro-ceeds through [the Housing Innovations in Energy Efficiency (HIEE) program], with technicalassistance from the Department of Mines, Minerals, and Energy (DMME).”15
The Housing Innovations in Energy Efficiency (HIEE) program expands energy efficiency measuresin residential buildings to benefit low-income Virginians. DHCD formed a HIEE Stakeholder Advi-sory Group in 2020 to establish priorities and craft guidelines for the program.
Virginia’s first RGGI auction in March 2021 produced $21.7 million in proceeds to the Common-wealth. For fiscal year 2021 these funds have been distributed through DHCD’s Affordable and Spe-cial Needs Housing (ASNH) program and the Weatherization Assistance Program (WAP).
On July 8, 2021, Governor Northam announced more than $21 million in 24 new ASNH loans foraffordable housing projects across Virginia. This includes $6.2 million in HIEE funds to supportenergy efficiency and renewable energy upgrades.
13Programdescriptions are found inDirect Testimony ofMichael T. Hubbardfiled 12/3/2019 (PUR-2019-00201 startingon p. 46).
14Program descriptions are in “Exhibit 3 - Direct Testimony of Kelly Marlow” filed 9/30/2019 (PUR-2019-00122).15DHCD Housing Innovations in Energy Efficiency website.

27.2. FINDINGS 359
Beginning in January 2022, lawmakers will receive an annual report on RGGI participation and funddistribution jointly prepared by DHCD, the Department of Conservation and Recreation DCR, andDepartment of Energy.16 The partner agencies will update and deliver this report annually.
27.2.6 Impact of utility costs on affordable housing development
Utility hookup fees
Initial fees for water, wastewater, and other basic infrastructure can be a significant hard cost foraffordable housing developers. These expenses are rolled into the project’s financing, increasing thelevel of debt service needed, and adding to the eventual rent or sales price amounts. Since 2010, thestatewide average water and wastewater hookup costs have steadily risen.
Figure 27.7: Water and wastewater hookup fees in Virginia
Table 27.1 shows example development fees for two small residential projects in the City of Fairfax:a 13-unit single-family home development and a 9-unit townhome development.17 In both cases,wastewater, water, and service connection fees account for the majority of municipal residential de-velopment costs.
16Va. CodeAnn. § 10.1-1330. “(Effective until October 1, 2021) CleanEnergy andCommunity FloodPreparedness.” (Note:the Department of Mines, Minerals, and Energy changed its name to the Department of Energy in May 2021.)
17“Fee Waivers for Affordable Housing.” Fairfax City Council Work Session. September 22, 2020.

360 CHAPTER 27. UTILITY RATE REDUCTION
Table 27.1: Examples of local development fees for two residential projects from the City of Fairfax
Fee Avery Park (13 single-family) Johnson Crest (9 townhomes)
Land useapplication
$16,800 $13,330
Site plan $30,657 $18,966Zoning permits $858 $495Building/tradepermits
$28,905 $14,555
Wastewater $103,636 $71,748
Water $56,160 $38,880Water serviceconnection
$7,670 $5,310
Total utility fees $167,466 ($12,882 per unit) $115,938 ($12,882 per unit)Total all fees $244,686 ($18,822 per unit) $163,284 ($18,143 per unit)
The Code of Virginia does allow localities to waive a wide range of fees for affordable housing devel-opment.18 A locality that has adopted an ordinancemay give these waivers or reductions to nonprofitor private-sector entities.
To date, very few localities are known to have waiver or reduction policies using the authority grantedin Va. Code Ann § 15.2-958.4. The City of Charlottesville will reduce water and sewer connection feesby up to 75 percent for certain projects, and Arlington County is studying proposals.
Ongoing utility costs in multifamily properties
Utility bills for multifamily apartment buildings can be paid several different ways. In some cases,each unit has individual meters and tenants pay independently. Alternatively, the building may bemaster-metered where the owner pays the entire property bill and builds the cost into the price ofrent. In many cases, multiple utilities are metered and billed differently in the same property.
Efforts to encourage energy efficiency and conservation inmultifamily properties are often challeng-ing. When utilities aremetered individually and paid by tenants, building owners have few reasons tomake energy improvements in the building. When utilities aremaster-metered, the pricing structureusually gives tenants little incentive to conserve their energy use. This market failure is called a splitincentive.
18Va. Code Ann § 15.2-958.4. “Waiver of certain fees for affordable housing.”

27.2. FINDINGS 361
Figure 27.8: Sample monthly energy costs for all-electric multifamily building
When multifamily properties have income and rent restrictions as part of affordable rental housingprograms, such as LIHTC, utility payment becomes more complex. In buildings where some or allutilities are paid by tenants, property managers must reduce the net rent to account for these pay-ments to keep the overall housing costs for residents affordable. Specifics vary with each program,but this calculated reduction is generally referred to as the utility allowance.
The complicatedmethods for estimating utility allowances in affordable rental properties are beyondthe scope of this report, but policymakersmust understand that utility allowances can help overcomesplit incentives by giving owners a pathway to cover the costs of and gain savings from efficiencyimprovements. Virginia’s affordable rental housing stock represents an important opportunity todeploy energy efficiency investments.
27.2.7 Utility needs vary by region
The geography and climate of Virginia’s diverse physiographic region—from the southwestern Ap-palachian Plateau to the Coastal Plain—influence utility needs and how they are met. The variedtypes of necessary utility infrastructure and energy efficiency upgrades present unique challengesand costs.
Examples of regional challenges include:

362 CHAPTER 27. UTILITY RATE REDUCTION
• Variability in the fixed fees for the 32 electric utility providers across the state, composed ofthree investor-owned companies, 13 cooperatives, and 16 non-jurisdictional operators; Feesrange from $4 to $35 per month.
• Wide cost ranges for water andwastewater fees. According to the 32nd Annual VirginiaWater andWastewater Rate Report (2020) from Draper Aden Associates, the lowest and highest combinedcharges forwater connection servicewere $88 and$32,910while the lowest andhighest chargesfor wastewater connection were $25 and $21,600.
• Varied geographic, climate, and socioeconomic conditions influence seasonal and periodic res-idential energy demand.
27.3 Recommendations
In early 2021 the HB854 utility rate reduction subgroup met four times to discuss how Virginia canexpand its efforts to reduce utility costs and energy cost burdens for affordable housing developersand residents. Based on discussions with experts from across the Commonwealth and input frommembers of the subgroup, the subgroup makes the following recommendations.
Recommendation 1
Take advantage of increased resources to unify state support for energy efficiency andhousehold-based utility assistance.
Virginia should strategically organize, prioritize, and deploy new federal and state funds available forresidential energy efficiency and utility assistance. Since HB854 was first drafted in early 2020, anumber of important developments have occurred that dramatically changed the landscape of utili-ties and housing:
• COVID-19 pandemic has had long-term impacts including an economic downturn,• The CARES Act, American Rescue Plan, and other major federal relief packages include signif-icant rounds of funding for utility assistance, weatherization, and energy efficiency,
• RGGI participation will generate funds for DHCD to use for increased energy efficiency mea-sures in affordable housing, and
• PIPP will reduce energy cost burdens for low-income customers of Dominion Energy and Ap-palachian Power.
These changes require state policymakers and program administrators to holistically evaluate whereand how to use these new resources while meeting needs without wasteful duplication of services.
Strategy 1.1
Direct increased resources to expand current programs into markets and demographics that are currentlyunderserved by utility and efficiency efforts. These include single-family rentals, non-subsidizedmultifamily,

27.3. RECOMMENDATIONS 363
and manufactured homes.
According to analysis by the Oak Ridge National Laboratory, the three major underserved marketsfor energy assistance are:
1. Multifamily and other rental housing due to the split incentive problem,2. Rural communities due to lower density, different energy sources, limited provider capacity,
and higher infrastructure costs per capita, and3. Manufacturedandmobilehomesdue to lowerhousehold incomes, nonstandard tenure (espe-
cially in mobile home parks), concentration in rural areas, and highly inefficient constructionin older units.
When evaluating needs and redesigning programs, policymakers should create specific plans to bringsolutions to these underserved markets. This work will complement ongoing work by DHCD andVDSS to conduct a gap analysis as required by HB2330, which enables the PIPP program. Accordingto that bill, this analysis may:
“. . . review the needs of PIPP-eligible customers and whether gaps remain in serving suchcustomers that are not already served by existing and available federal, state, local, or nonprofitprograms to meet the energy reduction obligations of this section.”
Action items:
Task 1.1.1: Leverage program analysis in Chapter 23 to evaluate eligibility barriers and/or fund limi-tations specific to underserved markets.
• Who: SAG, steering committee
Task 1.1.2: Develop specific recommendations for any necessary changes to existing programs andneeded new programs. These recommendations should incorporate all known information about therange of new funding streams for these activities. One possible example: deployment of RGGI fundsto increase weatherization network capacity in rural areas via investments in workforce training.
• Who: SAG, steering committee
Task 1.1.3: Share relevant findings and recommendations from the HB854 study with DHCD andVDSS as they undertake gap analysis study per legislative requirements.
• Who: SAG, steering committee

364 CHAPTER 27. UTILITY RATE REDUCTION
Recommendation 2
Explore mechanisms to reduce up-front utility costs for the creation and preservation of dedi-cated affordable housing.
The subgroup seeks to solve challenges associated with both high initial costs for water, sewer, andother residential infrastructure, as well as total energy use of projects over their lifespans. Thesestrategies will lower expenses for developers or owners and reduce rents and utility bills for residents.
Strategy 2.1
Link funding streams between federal, state, and local resources for reducing initial utility hookup costs (andnecessary upgrades to older infrastructure) in affordable housing.
Resources for affordable housing development and local infrastructure investments have expandedsignificantly over the past several years, primarily due to federal pandemic relief packages. Statepolicymakers and local officials should find ways to strategically use these dollars—and other asso-ciated incentives—to help reduce upfront utility costs for affordable housing without placing unduepressure on municipal revenue streams.
Action items:
Task 2.1.1: Explore mechanisms for Virginia to establish incentives within housing, community de-velopment, and relatedprograms to reward localities that provideutility discounts to affordablehous-ing developers. Determine eligibility and prioritization criteria, potential funding sources, and anyadditional legislative authority needed. Incentives should establish a rational basis for assistancebased on costs and needs within different regions and markets.
• Who: DHCD, Virginia Housing
Task2.1.2:Monitor federal and state guidance for use ofAmericanRescuePlandollarsmade availablefor local infrastructure investments (e.g., Capital Projects Fund).
• Who: DHCD, Virginia Housing, local government associations
Strategy 2.2
Collaborate with localities and the General Assembly to expand tools available for reducing utility hook upcosts rather than mandate fee waivers for affordable housing.

27.3. RECOMMENDATIONS 365
Statewide mandates for localities to lower or waive utility hookup costs and other fees for affordablehousing risk counterproductive outcomes. Regional and market variations in infrastructure costswould be a barrier to uniform statewide fee limits or discounts, and mandatory cost reductions limitthe ability of localities to provide debt service on bonds.
Voluntary waiver options for localities and incentives to increase levels of state community develop-ment and housing funds to participating jurisdictions are more likely to reduce energy cost burdens.
Action items:
Task 2.2.1: Monitor the findings and recommendations from the recently completed Commission onLocal Government study on mandatory local tax exemptions.
• Who: DHCD, Virginia Housing
Task 2.2.2: Examine the scope and impacts of local policies created under the authority of Va. CodeAnn. § 15.2-958.4 (Waiver of certain fees for affordable housing). Determine whether this legislationis working as intended, or if additional education/guidance is needed.
• Who: DHCD
Task 2.2.3: Consider changes to scoring systems for state funding to localities to award greater pointsfor jurisdictions that have policies to lower utility fees for affordable housing.
• Who: DHCD, Virginia Housing
Recommendation 3
Increase the long-term energy efficiency of new and existing affordable housing units with ex-panded strategies.
The goal of these strategies is to lower energy costs for both tenants and housing providers to makehousing more affordable.
Strategy 3.1
Bolster energy efficiency incentives for LIHTC developments to align with national best practices.
The LIHTC program is the largest producer of dedicated affordable apartments in the country and inVirginia. LIHTC can deliver high-quality, energy efficient units using best practices and technology.

366 CHAPTER 27. UTILITY RATE REDUCTION
Over the past decade Virginia Housing, developers, advocates, and other stakeholders have grown theproportion of energy-efficient affordable homes. Virginia can sustain this momentum and advancethe goal of long-term energy efficiency in affordable housing with critical next steps.
Action items:
Task 3.1.1: Develop a strategy to expand greater coordination between Virginia Housing, developers,and utility providers.
Follow the lead of Connecticut, Minnesota, Pennsylvania, and other states that require an energyrebate analysis to explorewhat energy incentives a projectmay be eligible for that can be incorporatedinto the development plans.
Coordination with major utility providers should focus on the newmultifamily efficiency programs.
• Who: Virginia Housing
Task 3.1.2: Explore potential uses for the newVirginia Housing Opportunity Tax Credit to expand ca-pacity of developers to incorporate efficiencymeasures and renewable energy investments in LIHTCprojects receiving allocations.
In the 2021 Special Session I, lawmakers approved SB1197 to establish the Virginia Housing Oppor-tunity Tax Credit in Va. Code Ann. § 58.1-439.29 and § 58.1-439.30. This new state income tax creditwill work in conjunction with the federal LIHTC program to create more affordable rental homes inthe Commonwealth. Virginia Housing is currently drafting regulations (PDF) for this program.
Examples of new uses for credits might include on/off-site solar, geothermal, and smart thermostats.
• Who: Virginia Housing
Strategy 3.2
Deploy other forms of state support to help developers strengthen their commitments to energy efficiency inaffordable housing construction and operation.
In addition to reducing initial hookup costs, new federal and state resources for affordable housingand energy efficiency should strategically provide funds to developers for the building and mainte-nance of homes that are friendly to both the environment and household budgets.
Action items:
Task 3.2.1: Support and monitor DHCD’s use of RGGI funds (via Home Innovation in Energy Effi-ciency) for builders to go above and beyond current code requirements.

27.3. RECOMMENDATIONS 367
Other innovative uses for these funds may include large-scale offsite solar and behind-the-meterstorage.
• Who: DHCD
Task 3.2.2: Support the efforts of Dominion Energy and Appalachian Power to roll out new efficiencyprograms to low-income households, especially those living in non-subsidized market-affordablerental housing.
State housing agencies and other partners may help connect property owners and managers withthese resources.
• Who: DHCD, Virginia Housing
Strategy 3.3
Determine how residential and commercial Property Assessed Clean Energy can support new/existing af-fordable housing; recommend potential enhancements to state law.
Property Assessed Clean Energy (PACE) programs are an innovative solution to finance green in-vestments for new and existing buildings. Localities with PACE programs for commercial (C-PACE)and/or residential (R-PACE) allow property owners to pay back the cost of certain improvements thatimprove energy efficiency or reduce carbon emissions via real estate assessments. The PACE lienruns with the property regardless of changes in ownership.
There are only a handful of relatively new PACE programs in Virginia. State policymakers shouldcontinue to monitor and support these programs to specifically evaluate how they can effectivelyserve affordable housing developers and operators.
Action items:
Task 3.3.1: Monitor the ongoing efforts of the Virginia Department of Energy to create a statewideR-PACE program for localities to opt into. (See Appropriation Act - Item 125 E, 2021 Special SessionI, Virginia General Assembly.)
• Who: Virginia Department of Energy
Task 3.3.2: Work with the Virginia PACE Authority and other necessary partners to determine howmany affordable housing properties have used C-PACE.

368 CHAPTER 27. UTILITY RATE REDUCTION
Investigate specific barriers and successes with these case studies andmake necessary recommenda-tions for the expanded use of PACE programs by affordable housing developers and owners.
• Who: Virginia Department of Energy
Recommendation 4
Leverage current state broadband initiatives to expand access and affordability of high-speedinternet for affordable housing residents.
Internet service is a daily necessity for nearly all households in Virginia. Almost 92 percent of allrenters say that high-speed internet is “important” or “very important.” (National Multifamily Hous-ing Council, 2020) Renters aremuch less likely than homeowners to have reliable broadband in theirhomes—especially persons of color, low-income households, and people in rural communities. (Gal-lagher & O’Brien, 2021)
Although the state is making significant strides to bring broadband to more people, many challengesand gaps remain. There are now more resources than ever to meet Governor’s Northam goal of fullbroadband access by 2024, and state policymakers should take advantage of this momentum to en-sure residents of affordable housing are not left behind.
One important distinction in this discussion is broadband access versus affordability. Solutions toexpand access focus on new infrastructure in rural areas and other underserved places. Increasingaffordability—especially for low-income customers—typically involves direct household subsidies ormaking network access free.
Another important consideration is the urban and rural divide. In denser cities and suburbs, wherebroadband infrastructure may already be common, expanding access and affordability via free Wi-Fi and other connection types is highly effective. In non-metro areas without widespread wirelessaccess, extending infrastructure and coverage of household connectivity requires more subsidy.
Strategy 4.1
Align state and local efforts to expand broadband access so that new and existing affordable housing hasreliable, affordable, high-quality internet.
Action items:
Task 4.1.1: Determine what types of projects and activities are eligible to be funded by federal dollarsset aside for broadband in the American Rescue Plan.

27.3. RECOMMENDATIONS 369
• Who: DHCD, Secretary of Commerce and Trade
Task 4.1.2: Survey LIHTC developers to evaluate whether current QAP points for internet access area meaningful incentive, or if alternative approaches to expand broadband in LIHTC buildings areneeded.
• Who: Virginia Housing
Task 4.1.3: Identify a permanent funding source for the types of projects coordinated by Governor’sOfficewith CARESAct subsidy. These include rural last-mile, freeWi-Fi in public housing, and otherinitiatives.
Ensure localities are a major partner in such future projects; encourage participating jurisdictions tohave a permanent role in the maintenance of new systems when applicable.
• Who: DHCD, Secretary of Commerce and Trade
Strategy 4.2
Increase broadband affordability by promoting current assistance and urban construction programs to res-idents and operators of affordable housing.
Action items:
Task 4.2.1: Monitor design and rollout of pilot VDSS internet assistance program in late 2021. Iden-tify potential ways for affordable housing residents to learn about and apply for this assistance whenmade available.
Encourage VDSS to market program specifically among tenants via public housing authorities, HCVadministrators, and other housing providers.
• Who: DHCD, Virginia Housing, Virginia Association of Housing and Community DevelopmentOfficials (VAHCDO), others
Task 4.2.2: Ensure all eligible affordable housing residents are given the opportunity to apply for theFCC’s two internet affordability programs:
1. Lifeline, which provides a $9.25 per month discount, and

370 CHAPTER 27. UTILITY RATE REDUCTION
2. Emergency Broadband Benefit, which provides up to $50 per month.
• Who: DHCD, Virginia Housing, VAHCDO, others
Task 4.2.3: Engagemarketing and communication professionals to establish simple, clearmessagingto promote household internet affordability programs in affordable housing communities.
Draw on lessons from utility providers and social service organizations who struggled to effectivelycommunicate important relief program information throughout the pandemic.
Partner with owners and operators of affordable housing (and low-cost non-subsidized housing) todistribute materials among residents.
One best practice example of this outreach is the Affordable Housing Broadband Initiative in NewYork.
• Who: DHCD, Virginia Housing, VAHCDO, VDSS, others

Chapter 28
Property tax reduction
This chapter addresses HB854’s requirement to propose recommendations for “real property tax re-duction for qualified affordable housing for localities that desire to provide such an incentive.”
Highlights
Major takeaways in this chapter include:
• Property taxes on affordable housing generate needed revenue for localities, but they can oftenserve as a barrier to development and preservation.
• Stakeholders endorse a new amendment to the state constitution that would enable—notrequire—local governments to use a wide range of alternative real estate tax schemes forproperties used for affordable housing and homelessness services. Potential solutions includefull and partial exemptions, abatements, and Payment in Lieu of Tax (PILOT) programs.
• While current state code directs local assessors to account for rent restrictions in some typesof affordable rental housing, providers must often appeal incorrect valuations, leading to sunkcosts. Minor code changes, alongwith expanded outreach to local assessors, would significantlyreduce these challenges.
28.1 Background
HB854 requests the SAG to:
“. . . consider the following proposals as well as other proposals it considers advisable duringthe course of its analysis and deliberations: . . . real property tax reduction for qualifiedaffordable housing for localities that desire to provide such an incentive . . .”
371

372 CHAPTER 28. PROPERTY TAX REDUCTION
Local real estate taxes are one of the many costs of creating affordable housing, but are also the pri-mary revenue generator for local governments. Property tax reductions allow municipalities to sup-port affordable housing for the duration of the benefit, replacing or supplementing upfront capitalsubsidies.
28.2 Findings
28.2.1 Tax reductionmechanisms
In Virginia, localities can reduce real estate tax burdens through tax exemption or tax abatement.
Tax exemption
A tax exemption on a property makes it “immune from real estate taxation” within a county, city, ortown.1 A locality can grant an exemption to certain properties or property owners only if the local gov-ernment has been so authorized by the Virginia Constitution and/or an act of the General Assembly.Depending on statute, exemptions may be total or partial.
Tax abatement
A tax abatement reduces the taxable value of a property for a prescribed period usually as an incentiveto conduct significant repair, rehabilitation, or construction. The taxable amount is locked into a pre-improvement value for a period of time, as established by an ordinance. This temporarily reduces thetax burden, helping the property owner finance needed upgrades to a structure, or in some cases, atotal replacement.2
Both mechanisms may be considered as “property tax reductions” in accordance with HB854. Thissubgroup will explore exemption and abatement mechanisms in its recommendations.
Tax exemption and tax abatement are distinct from tax credits, which are generally dollar-for-dollarreductions in tax liability for earned income. Although different forms of tax influence housing de-velopment andhousingmarkets, this report focuses on reducing taxes associatedwithproperty valuesrather than incomes.
28.2.2 Constitutional and legal framework
Constitutional provisions
The Virginia Constitution provides localities with options for exempting residential real estate undercertain conditions:3
1Va. Code Ann. § 58.1-3604. “Tax exemption information.”2In some cases, “partial tax exemption” and “tax abatement” are used interchangeably. For the purposes of this report,
“tax abatement” will refer specifically to temporary real estate tax reductions that expire after a period of time.3Va. Const. Art X, § 6. Exempt property.

28.2. FINDINGS 373
• A total or partial exemption for dwellings owned and occupied by persons not less than 65 yearsof age or persons permanently and totally disabled. Localities may establish “income or finan-cial worth limitations, or both” to set eligibility criteria for exemptions.
• A partial exemption for real estate “whose improvements . . . have undergone substantial reno-vation, rehabilitation or replacement” or real estate “with new structures and improvements inconservation, redevelopment, or rehabilitation areas.”
Mandatory property tax exemptions study
In early 2021, state lawmakers asked theCommission onLocal Government to study “thefiscal effectsof mandatory property tax exemptions on the capacity of local governments to deliver essential ser-vices to the public.” (See: Appropriation Act - Item 359 #4c, 2021 Special Session I, Virginia GeneralAssembly.)
The report was completed in November 2021 and includes recommendations to mitigate any detri-mental effects created by these requirements.
Proposed 2021 constitutional amendment
In 2021, Delegate Jeffrey Bourne proposed a constitutional amendment to authorize localities to ex-empt certain affordable housing from real property taxes.4 The resolution was passed by in commit-tee. As drafted, it would have amended Section 6 of Article X of the state constitution as follows:
“The General Assembly may by general law authorize the governing body of any county, city,town, or regional government to provide for the exemption from local real property taxation, ora portion thereof, within such restrictions and upon such conditions as may be prescribed, ofreal estate on which affordable housing, as defined by the General Assembly, is constructed.”
Current state code
In accordance with constitutional provisions, state law provides localities with specific guidance onhousing-related exemption and abatement options. Relevant examples include:
§ 36-157 et seq. Housing Revitalization Zone Act.
The passage of the Housing Revitalization Zone Act in 2000 intended to create performance-basedgrants to encourage rehabilitation of designated residential zones by private sector investment. Atleast one quarter of real estate tax revenues from such areas would then be reserved for additionalinvestments in those zones. The unfunded program has never been implemented.
§ 58.1-3219.4. Partial exemption for structures in redevelopment or conservation areas or rehabilitationdistricts.
4HJ616 Constitutional amendment; real property tax exemption for affordable housing. 2021 Session, Virginia GeneralAssembly.

374 CHAPTER 28. PROPERTY TAX REDUCTION
In 2006 lawmakers authorized local governments to grant partial real estate tax exemptions for:5
• (i) new structures located in redevelopment or conservation areas or rehabilitation districts,and
• (ii) other improvements to real estate located in redevelopment or conservation areas or re-habilitation districts.
Local ordinances establish such districts and areas. Exemption amounts are based on a share of theincrease in an eligible property’s assessed value. Many localities across Virginia currently use thisprovision to encourage residential revitalization in certain neighborhoods. In 2020 lawmakers ex-tended the maximum possible exemption period from 15 years to 30 years.6
§ 58.1-3220. Partial exemption for certain rehabilitated, renovated or replacement residential structures.
Similar to § 58.1-3219.4, this provision authorizes local governments to grant partial real estate taxexemptions for certain properties with structures more than 15 years old that undergo “substantialrehabilitation, renovation or replacement for residential use.” Localities can establish eligibility cri-teria in an ordinance. This code has been amended numerous times since its inception over 40 yearsago.
§ 58.1-3221. Partial exemption for certain rehabilitated, renovated or replacement commercial or industrialstructures.
Drafted and adopted in conjunction with § 58.1-3220, this code allows localities to grant similar par-tial real estate tax exemptions for properties that undergo “substantial rehabilitation, renovation orreplacement for commercial or industrial use.” Buildings must be at least 20 years old, or 15 yearsold if located in an enterprise zone or technology zone pursuant to § 58.1-3850. No language in thissection precludes “commercial use” from includingmultifamily apartment andmixed-use buildings.
§ 58.1-3622. Habitat for Humanity and local affiliates or subsidiaries thereof.
Passed in 2000, this code classifies nonprofitHabitat forHumanity entities as “charitable and benev-olent” organizations that are exempt from local real estate taxes. State lawmakers derive their au-thority to grant this exemption from Article X, Section 6 (a) (6) of the Constitution of Virginia. Localgovernments must pass a resolution for Habitat affiliates to receive this exemption.
The scale, scope, and effectiveness of these various provisions have never been systematically studiedor evaluated, particularly with respect to their ability to spur additional investments in housing andlower housing costs.
5SB358 Real estate tax; exemption in redevelopment or conservation areas, etc. 2006 Session, Virginia General Assem-bly.
6SB727 Real estate tax; exemption for property in redevelopment or conservation areas. 2020 Session, Virginia GeneralAssembly.

28.2. FINDINGS 375
28.2.3 State guidance to assessors for affordable housing
Va. Code Ann. § 58.1-3295 directs localities to assess below-market rate (affordable) rental housingafter considering:
1. Restrictions on rent values,2. Restrictions on title transfers and “other restraints” on future sale, and3. “Actual operating expenses” and other relevant expenditures.
These considerations ensure that the owners of affordable rental housing are levied real estate taxescommensurate with the actual rent amounts collected rather than fair market values. This shouldreduce the tax burden on these properties.
Multiple owners have expressed concern that local assessors have neglected to follow these provisionscorrectly, resulting in burdensome real estate taxes relative to actual operating revenue. Tax assessorsin different jurisdictions sometimes approach this valuation differently, complicating developmentfor entities that work across more than one locality.
One affordable rental provider interviewed for this report testified they spend about 100 hours eachyear on appeals and hearings just to get their properties correctly valued by localities.
Current code does not cover all types of affordable rental housing found in the state:
Covered by § 58.1-3295:
• Low-Income Housing Tax Credit (both nine percent and four percent)• Project-based Vouchers• HUD 236• HUD 241f• HUD 221(d)3
Not covered by § 58.1-3295:
• USDA Rural Development (Section 515)• HUD 202• HUD 811• Rental Assistance Demonstration (RAD)• Properties that are entirely funded/supported by localities
28.2.4 Impact of high tax burdens on affordable housing
Based on stakeholder interviews and research, this subgroup finds that:

376 CHAPTER 28. PROPERTY TAX REDUCTION
• In Virginia, real estate taxes often average five to ten percent of an affordable housing prop-erty’s expenses. This can translate to roughly one month’s rent for tenants, increasing theirrent burdens.
• Property tax reductions can have significant impact because developers and owners can lever-age reductions into total financing for the property, lowering overall debt and reducing rents.At current low interest rates, this leverage can be ten to one; however, any tax reduction mustbe long-term for underwriting purposes.
• Lowering operating expenses through tax reductions raises net operating income, increasingmortgage proceeds available to pay down debt.
28.3 Recommendations
In early 2021, theHB854 property tax reduction subgroupmet four times to discuss how the state canlower real estate tax burdens for affordable housing. Based on discussions with experts from acrossthe state and input frommembers of the subgroup, the subgroup makes the following recommenda-tions.
Recommendation 1
Give localities more tools to reduce tax burdens on dedicated affordable housing serving low-income Virginians.
Rather than enacting statewide mandates, the General Assembly should pursue measures that givecities and counties new, flexible policy options for reducing real estate tax burdens on affordablehousing properties. These solutions require changes to both the Constitution of Virginia and statecode.
Strategy 1.1
Support a new amendment to the state constitution allowing localities, at their option, to set up a Paymentin Lieu of Taxes (PILOT) program or similar abatement/exemption options for affordable housing.
PILOT initiatives allow affordable housing developers and localities to enter intomutually beneficialagreements that lower property tax burdens. Current Virginia law does not give localities properauthority to establish PILOT programs for affordable housing. It is already common practice for newaffordable rental housing in Maryland and other states.
While PILOT programs may be the most common solution enabled by this proposal, the subgroupsuggests that any amendment language be flexible enough to allow other similar types of relief poli-cies.

28.3. RECOMMENDATIONS 377
Action items:
Task 1.1.1: Draft language for an amendment to the Constitution of Virginia that:
• Explicitly permits all localities in Virginia to adopt ordinances that allow alternative real estateproperty tax collection schemes for properties used as affordable housing,
• Is written to broadly permit PILOT programs, abatements, exemptions, and other similar solu-tions that allow localities flexibility and options,
• Sets a minimum floor of 15 years for any period of tax reduction by local programs,• Considers pro-rata tax relief to provide greater relief as deeper affordability is offered (coveringmixed-income housing, and properties with units under inclusionary zoning programs, whichmay have some units rented above 80 percent AMI), and
• References definitions of affordable housing in state code if necessary.
Options for defining affordable housing are below.
• Who: Advocates and lawmakers
Task 1.1.2: Determine whether this amendment would require any reference to a definition or def-initions of affordable housing in state code. Subgroup members recommend that any definition—whether current or new—should at a minimum:
• Cover all existing types of publicly-assisted multifamily rental housing, including LIHTC,USDA-RD Section 515, and others,
• Include as eligible uses affordable homeownership programs, homelessness services, and com-munity land trusts and other shared-equity ownership models,
• Not be restricted to new construction only, and• Defer most specific definitions/criteria to localities as they create ordinances under this newauthority.
Currently, Va. Code Ann. § 15.2-2201 provides the following definition of affordable housing forlocalities to use in the creation of land use and zoning regulations:
“…housing that is affordable to households with incomes at or below the area median income, provided thatthe occupant pays nomore than thirty percent of his gross income for gross housing costs, including utilities.For the purpose of administering affordable dwelling unit ordinances authorized by this chapter, local gov-ernments may establish individual definitions of affordable housing and affordable dwelling units includingdetermination of the appropriate percent of area median income and percent of gross income.”
• Who: Advocates and lawmakers

378 CHAPTER 28. PROPERTY TAX REDUCTION
Strategy 1.2
Allow localities more flexibility to provide tax incentives that support affordable manufactured home com-munities and the replacement of older, poor-quality mobile homes with new units.
Manufactured home communities (MHCs) are one of the largest sources of unsubsidized affordablehousing across the country and inVirginia. These propertieswould bemostly excluded from the solu-tions described in Strategy 1.1 because they do not receive public assistance and do not have dedicatedaffordability restrictions.
State policymakers can still create greater opportunities for localities to improve and preserve thesecommunities through advantageous tax treatments.
Action items:
Task 1.2.1: Mandate localities to assess manufactured homes in lot-lease communities (e.g., mobilehome parks) as real estate rather than as personal property. This would enshrine an already commonpractice across the state, and help homeowners pay lower tax rates.
• Who: Advocates and lawmakers
Task 1.2.2: Amend state code to allow localities to waive or reduce disposal fees for obsolete, unin-habitablemanufactured homes. Consider expanding such incentives to other/all types of vacant anddistressed properties.
• Who: Advocates and lawmakers
Task 1.2.3: Allow localities to offer certain tax breaks and other incentives (e.g., waiver of recorda-tion fees) to nonprofit organizations and resident cooperatives who purchase a manufactured homecommunity with the intent to preserve its current use.
May also expand eligibility to private owners in certain scenarios, such as enforceable commitmentsto tenant protections and/or infrastructure investments. Duty to Serve quality criteria for MHCs(drafted by Fannie Mae) could be useful standards to apply.
• Who: Advocates and lawmakers
Task 1.2.4: Consider expansion of any affordable housing definition established by Strategy 1.1 to in-clude manufactured home communities owned and operated by mission-oriented entities with cer-tain affordability provisions, as well as manufactured home subdivisions.
• Who: Advocates and lawmakers

28.3. RECOMMENDATIONS 379
Task 1.2.5: Allow localities to offer reduced taxes, fees, and hookup costs for newmanufactured homesubdivisions. Possible mechanism is amending Va. Code Ann. § 15.2-958.4.
• Who: Advocates and lawmakers
Task 1.2.6: Study potential for localities to use tax-increment financing (TIF) districts specific tomanufactured home communities to fund strategic investments in these neighborhoods. TIF fundscould be used for:
• Water, septic, and other necessary infrastructure upgrade,• Replacement unit assistance funds,• Relocation funds for displaced residents, and• Park preservation activities.
Example: Living Cully Community-Led Development District in Portland, Oregon.
• Who: HousingForward Virginia, Manufactured Home Community Coalition of Virginia, andother stakeholders
Task 1.2.7: Study potential for statewide tax credit (rather than tax abatement) that covers a signif-icant portion of cost associated with replacement of obsolete mobile homes with new, high-qualitymanufactured homes.
• Who: HousingForward Virginia, Manufactured Home Community Coalition of Virginia, andother stakeholders
Strategy 1.3
Streamline, improve, and promote current state code sections that allow localities to reduce tax burdens foraffordable housing in certain districts.
The Code of Virginia currently includes numerous districts that localities may establish (under cer-tain conditions) which permit special tax treatment of specific developments. Real estate tax abate-ments are the most common option allowed. While affordable housing development has an impor-tant connection to many of these districts, the number and complexity of these districts can make itdifficult to make those links.
To date, the state has not conducted a comprehensive review of these districts. This subgroup is un-able to make specific recommendations without an analysis. State policymakers should commission

380 CHAPTER 28. PROPERTY TAX REDUCTION
a study that assesses the timeline, scale, and impact of these districts. Such a study should considerrepositioning special districts to promote affordable housing development in high opportunity areasrather than only in communities with historically low levels of investment.
Action items:
Task 1.3.1: Determine the preferredmethod for commissioning and undertaking this study. Possibleentities thatwould be responsible for overseeing thiswork include theVirginiaHousingCommission.
Evaluate whether state housing staff could complete the necessary research or would require a con-sultant such as a university.
Estimate state budget implications and prioritize work relative to other agency activities.
• Who: DHCD and Virginia Housing
Task 1.3.2: Outline study components and research questions to be addressed. Report should cover:
• Original goals of each district,• Number per applicable locality for each district type,• Scope of housing development or operation benefitting from each district,• Timeframe of local adoption of these districts,• Analysis of strengths, weaknesses, and opportunities, and• Recommendations for changes to state code.
The report would be delivered to the General Assembly and appropriate stakeholders.
• Who: DHCD and Virginia Housing
Recommendation 2
Promote fair, accurate, and predictable tax assessment of affordable housing.
Both developers and operators of affordable housing properties have highlighted significant chal-lenges with the assessment process for rent-restricted communities. These problems stem from in-sufficient language in state code. Policymakers should resolve this issue by amending code, and es-tablishing a permanent system to resolve future conflicts.

28.3. RECOMMENDATIONS 381
Strategy 2.1
Strengthen Va. Code Ann. § 58.1-3295 to include additional affordable housing types.
The current section of state code that directs local real estate assessors to use a specific income-basedapproach for rent-restricted affordable housing needs revision. The code should be amended to coverall types of rental housing that use subsidies to serve households below 80 percent AMI.
Action items:
Task 2.1.1: Draft new language to replace certain sections of Va. Code § 58.1-3295 with a broaderdefinition of affordable housing.
The new definition should use one of the following solutions.
1. Explicitly reference the major forms of affordable rental housing excluded in the current code,including:
• USDA Rural Development,• HUD Section 202,• HUD Section 811,• Rental Assistance Demonstration, and others.
2. Align with any possible definition of affordable housing proposed above in Task 1.1.2 of thischapter.
Either route will significantly expand the number of properties covered under this requirement.
• Who: Advocates and lawmakers
Strategy 2.2
Create a standing statewide committee or task force to monitor and promote fair assessment of affordablehousing by localities.
Rental housing practitioners have catalogued specific challenges related to incorrect valuation of af-fordable housing by local assessment officials. Providers pay a larger amount of real estate taxes onthese misvalued properties than state code actually requires.
Along with the necessary change to state code described in Strategy 2.1 of this chapter, policymak-ers should create a new permanent task force that offers additional training, resources, education,

382 CHAPTER 28. PROPERTY TAX REDUCTION
and conflict resolution opportunities. This group will work to achieve greater consistency and pre-dictability for the assessment of affordable housing.
Action items:
Task 2.2.1: Gather stakeholders to determine the most appropriate apparatus of state government tofulfill this task.
These stakeholders should include:
• State Department of Taxation• Auditor of Public Accounts• Virginia Association of Commissioners of Revenue• Virginia Housing Commission staff• Affordable housing developers and owners• DHCD and Virginia Housing
Other stakeholder may be added as appropriate.
• Who: Advocates and lawmakers
Task 2.2.2: Propose major elements of this new entity, including:
• Membership criteria and appointment process,• Mission, roles, and responsibilities,• Conflict resolution process (between property owners and localities),• Ability to levy penalties to localities with multiple substantiated complaints,• Meeting schedule, and• Permanent funding levels needed in the state budget to sustain staffing and operations of thisbody.
Lawmakers would ultimately be responsible for funding this entity.
• Who: Advocates and lawmakers

Chapter 29
Bond financing options
This chapter addressesHB854’s requirement to propose recommendations for “bond financing optionsfor qualified affordable housing.”
Highlights
Major takeaways in this chapter include:
• Nearly all of Virginia’s Private Activity Bond allocation is used to create both affordable rentaland homeownership opportunities. The Governor’s Pool has increasingly been used to supportmultifamily rental housing bonds.
• Virginia Housing and the Department of Housing and Community Development shouldcontinue and expand these efforts by monitoring allocation trends, increasing “gap” fundingresources, and supporting beneficial changes to federal law currently being considered byCongress.
• On the other hand, localities in Virginia rarely use their general obligation bonding capacityto support housing. The state can kindle more of this activity by sharing best practices, incen-tivizing local bond issuance (and similar local housing investments) within current programs,and exploring state funds to match and leverage any new local housing bonds.
29.1 Background
HB854 requests the SAG to:
“. . . consider the following proposals as well as other proposals it considers advisable during thecourse of its analysis and deliberations: . . . bond financing options for qualified affordablehousing . . .”
383

384 CHAPTER 29. BOND FINANCING OPTIONS
Bond financing of affordable housing is a critical tool in Virginia. Much of Virginia’s productionof affordable rental housing is financed through bonds issued by Virginia Housing. Public housingauthorities also issue bonds to finance rental housing. Some of the bonds issued by Virginia Housingand PHAs carry with them tax credits that can be converted into equity that helps reduce rents.
Many types of bonds and bond financing strategies exist, but not all are in use in Virginia.
29.2 Findings
29.2.1 Private Activity Bonds
DHCD manages Virginia’s cap for tax-exempt Private Activity Bonds (PAB). The state annually re-ceives a nearly $900million allocation of bonding authority from the federal government for PABs.
PABs serve a variety of purposes in different states. The majority of PABs in Virginia are used forhousing. Recent analysis from Novogradac shows that Virginia consistently has been among the topten states for total PAB volume dedicated to multifamily housing. (Lawrence, 2021)
Multifamily four percent bonds
Virginia Housing and public housing authorities issue multifamily bonds with four percent Low-Income Housing Tax Credit (LIHTC) allocations. These bonds contribute to the total PAB cap.
Multifamily mixed income bonds
This is a variation of the bonds above. As PABs, they too come under the state bond cap. Under IRSrules, at least 20 percent of units must serve households at 50 percent AMI or 40 percent of unitsmust serve households at 60 percent AMI; these bonds are commonly known as either “80/20” or“60/40.”
In the most common application of multifamily mixed income bonds, 100 percent of units servehouseholds at 60 percent AMI in order to maximize the equity from the Low-Income Housing TaxCredits attached to the affordable units. Truly “mixed income” multifamily projects that includemarket rate and tax credit units in the same building are rare.
Single-family Mortgage Revenue Bonds and Mortgage Credit Certificates
MortgageRevenueBonds (MRBs)financemortgages to low- andmoderate-incomehouseholds for thepurchase of newor existing homes. They are included in the state bond cap. Following the foreclosurecrisis, the IRS allowed the substitution of Mortgage Credit Certificates (MCCs) in place of MRBs dueto disruptions in the bond market. Virginia Housing has used MCCs since 2015 and has not issuedMRBs since that time.
501(c)(3) bonds
A nonprofit 501(c)(3) organization can issue 501(c)(3) bonds for an eligible purpose though generallythey must be credit enhanced. The current spread between taxable financings and tax exempt bonds

29.2. FINDINGS 385
is not significant enough to incentivize the use of these bonds. Few if any have been issued in Virginiain recent years.
29.2.2 Taxable bonds
State-level taxable bonds are uncapped and primarily used by Virginia Housing for the constructionand/or acquisition of affordable multifamily housing. Both nonprofit and for-profit developers mayuse this financing.
29.2.3 Local bond options
The primary use of housing bonds at the local government level has been the issuance of PABs byPHAs for affordablemultifamily development. These bonds are included in the state bond cap. Thereare several PHAs in the state that regularly issue such bonds; some issue bonds only within their ju-risdiction while others issue them for projects in any locality that invites them. Examples includeHarrisonburg Redevelopment and Housing Authority and Suffolk Redevelopment and Housing Au-thority.
General obligation bonds
General obligation (GO) bonds are the second type of local bonding used for housing. Article VII, sec-tion 10 of the Constitution of Virginia provides the necessary authority—and limitations—for cities,counties, and towns to issue general obligation bonds. The Virginia Public Finance Act (Va Code Ann.§ 15.2-2600 through 15.2-2663) provides further guidance.
Virginia localities have rarely used GO bonds for housing, though their use for housing is becomingmore common inother states. Issuanceshave instead largely funded investments inpublic education,transportation, and infrastructure.
Some of the cases where Virginia localities issued bonds specifically related to housing include:
1. In 1983, the City of Charlottesville issued bonds for housing improvements in the Vinegar Hillneighborhood. Although a lawsuit claimed the city did not have authority to use its bondingcapacity for housing activities (which benefitted a private developer involved in the revitaliza-tion project), the Virginia Supreme Court ultimately upheld the issuance because the projectserved a public purpose. (See: Charlottesville v. De Haan, 228 Va. 578, 323 S.E.2d 131 (1984))
2. In 2006, theCity ofHarrisonburgmade a loan of $3.5million in bondproceeds to theHarrison-burg Redevelopment and Housing Authority to renovate public housing units. In 2014, the cityissued refunding bonds and entered into a memorandum of understanding with HRHA to fa-cilitate repayment.
3. In 2008, the City of Alexandria issued $12 million in bonds for the acquisition, construction,remodeling, and repairing of affordable housing, as well as the acquisition of necessary landand equipment; then issued $1.5 million in bonds in 2012 for public housing replacement used

386 CHAPTER 29. BOND FINANCING OPTIONS
in conjunction with Low-Income Housing Tax Credits. The city issued another $4.4 million in2017 to fund the redevelopment of one homeless shelter and the construction of another.
Local government authority to issue bonds in Virginia
Cities, counties, and towns in Virginia can only borrow money when the state constitution or statelaw explicitly confers that authority or implies it. The Public Finance Act and/or a locality’s charteroutlines a locality’s power to borrow.
The Constitution of Virginia sets limits on local borrowing powers based on type of locality (i.e., cities,towns, and counties):
• Article VII, section 10(a) of Constitution states that cities and towns may incur debt up to 10%of assessed value of real estate without referendum (some exceptions apply).
• Article VII, section 10(b) of Constitution states that counties must approve most debt by refer-endum, but does not establish a total debt limit.1
29.2.4 State bond cap allocation trends
Virginia’s annual PAB cap is determined by 20 U.S. Code § 146 (Internal Revenue Code). In 2020,the state’s total PAB allocation was $896,229,495. This amount has increased two to three percentannually on average over the past decade.
Each year the total allocation is divided into four pools. Va. Code Ann. § 15.2-5002 sets the amountallocated to each pool:
Table 29.1: Statutory bond allocation by pool according to Va. Code Ann. § 15.2-5002
Pool Amount Use
Virginia Housing 43% Affordable rental and homeownershipIndustrial Development 25% Manufacturing and other exempt projectsGovernor’s (”stateallocation”)
18% Housing, manufacturing facilities, andother exempt projects
Local Housing Authorities 14% Affordable rental
Note: “Exempt” projects include 1) waste disposal and energy production facilities, 2) water and irri-gation facilities, 3) mass commuting facilities, and 4) heating and cooling facilities as defined by Va.Code Ann. § 15.2-5000.
The state is not statutorily committed to exhausting the individual pool allocations each year, butDHCD and Virginia Housing ensure that unused individual pool allocations flow to Virginia Housing
1The cap on county debt limits is driven more by desire to maintain certain bond ratings from rating agencies.

29.2. FINDINGS 387
to be fully used. The annual bond allocation data fromDHCD in Figure 29.1 show that the Governor’s,Industrial Development, and Local Housing Authorities pools rarely use their full allocations. Since2017, the Local Housing Authority pool has been fully expended and the Governor’s pool increasinglysupports multifamily rental housing bonds.
Figure 29.1: Private Activity Bond use trends in Virginia
When these pools are not depleted, the remainder is reallocated to Virginia Housing pursuant to Va.Code Ann. § 15.2-5004. Virginia Housing uses this additional allocation to support theirmultifamilyand single-family homeownership bonding activity, which subsequently total much more than theiractual pool allocation. When Virginia Housing is unable to convert the entirety of a single year’sbond allocation into housing uses, they “carry forward” the remaining balance into the next year inthe form of Mortgage Credit Certificates.
29.2.5 Virginia Housing Mortgage Credit Certificates
Since 2015, Virginia Housing’s remaining bond cap supports Mortgage Credit Certificates (MCCs).These provide a dollar-for-dollar credit against the homeowner’s tax liability. The credit amount isten percent of the homebuyer’s annual mortgage interest.
MCCs are used in conjunction with Virginia Housingmortgage loans as well as non-VH loans. MCCsare available only to income eligible households and the sales pricemust fall under the program limit.

388 CHAPTER 29. BOND FINANCING OPTIONS
The program targets first time homebuyers (or those who have not owned a home in the previousthree years). In fiscal year 2020, 6,841 buyers received MCCs—up from 892 in fiscal year 2016.
ThroughMCC conversion, the Commonwealth uses its entire PAB allocation and prevents the recap-ture of the remaining bond cap by the Treasury Department. This can and does occur in other stateswhen carry forward bond allocation is not used within three years.
Figure 29.2: Share of annual PAB allocation for housing uses
The current arrangement also means that the majority of Virginia’s PAB cap is used for affordablehomeownership and rental initiatives. Most of the bond allocation between 2014 and 2016 consistedof MCCs; since 2017, expanded use of the Local Housing Authorities pool has increased the share ofPABs used for affordable rental.
29.2.6 Role of local general obligation bonds for housing
GO bonds issued by localities have several advantages compared to other financial tools and re-sources:
• GO bonds can be structured with greater flexibility than current tax exempt bond offerings.Localities may align bond uses with the greatest housing needs in the community.

29.3. RECOMMENDATIONS 389
• Fundsmay be applied to a wide range of housing needs—not just affordablemultifamily rental.This includes homeownership and homelessness services.
• Localities may offer bond proceeds as grants, deferred loans, and other award mechanisms.• Flexibility allows GO bonds to fill specific financing gaps created by limited resources fromother housing development programs, especially in high-cost markets or underserved commu-nities.
Other states widely use local GO bonds for housing; in 2020, the City of Charlotte, North Carolinaissued $50 million in housing bonds. Charlotte described their purpose:
“Housing bonds fund the city’s Housing Diversity Program to increase the supply of safe, qual-ity and affordable housing for low- and moderate-income residents throughout Charlotte. TheHousing Diversity Program not only addresses the need for new construction, it also helps pre-serve existing housing through rehabilitation of both single- andmultifamily housing units. Thisfunding leverages other public, private and nonprofit dollars to increase the supply and acces-sibility of housing in the community.”2
In 2021, the City of Raleigh, North Carolina issued an $80 million housing bond. They describedtheir program:
“City Council directed the housing staff to look at two affordable housing bond options for theNovember 2020 ballot. The City formed an Affordable Housing Bond Advisory Committee onJanuary 21, 2020 to identify options and gather public input for a Fall 2020 bond referendum.
Raleigh residents gave overwhelming support, with 72 percent of those voting in favor of thebond.
Bond Priorities
• Provide generally equal geographic distribution with project investments,• Provide a range of housing types and income levels in coordination with Wake County,• Include new units and rehabilitated units where financially viable,• Seek innovative development partnerships, and• Pursue projects and acquisition opportunities near planned transit routes like Bus RapidTransit.”3
29.3 Recommendations
In early 2021, the HB854 bond financing options subgroup met four times to discuss how the statecan expand its efforts to use bonds to support the creation and preservation of affordable housing.Based on discussions with experts from across the state and input from the subgroup’s members, thesubgroup makes the following recommendations.
2City Bonds, City of Charlotte.3Affordable Housing Bond, City of Raleigh.

390 CHAPTER 29. BOND FINANCING OPTIONS
Recommendation 1
Support the expansion of PABs for affordable rental housing using the four percent LIHTCbonds. Virginia Housing and public housing authorities issue these bonds.
Strategy 1.1
Continue to monitor allocation trends within the state PAB allocation.
At this time, there is no competition for allocation between housing and non-housing uses; nearlyall of the allocation is used for housing, but circumstances could change. For example, a widening ofthe gap between taxable and tax-exempt interest rates could fuel more use of PAB allocation for non-housing uses. Such a shift would necessitate an analysis to fully understand the relative economicand other benefits to the state of each use and to guide any changes to the allocation formula.
The Industrial Development allocation has received little use in the past five years. A ten percentallocation to Industrial Development would have covered the demand every year for the past decade.The use of PABs for housing concurrently grew at a rapid pace. The four percent housing bonds—because of their attached housing credit—bring additional private investment to the state that otherPAB uses do not automatically generate. The Governor’s allocation is available for any eligible useand has been regularly tapped for multifamily bonds.
Action items:
Task 1.1.1: Explore possible uses of the allocation for Industrial Development to better understandthe benefits as compared to housing bonds. Engage in discussion and information exchange withIndustrial Development practitioners.
• Who: DHCD, Virginia Housing
Task 1.1.2.: Develop information about the equity generated from investors that use the four percentLIHTC. Educate policymakers and legislators about this benefit.
• Who: DHCD, Virginia Housing, and other stakeholders
Task 1.1.3: Assess what macro-economic changes would potentially shift demand within the PABallocation to Industrial Development.
• Who: DHCD, Virginia Housing, and other stakeholders
Task 1.1.4: Research legislative and rulemaking requirements related to any future shifts in alloca-tion.
• Who: DHCD, Virginia Housing, and other stakeholders

29.3. RECOMMENDATIONS 391
Strategy 1.2
Increase use of affordable housing resources as gap funding to support the increased production of fourpercent LIHTC bond projects (i.e., expanded geography, types and sizes of projects, etc.).
As resources continue to increase, both Virginia Housing and DHCD should enhance their scor-ing and selection processes to facilitate the development of more four percent LIHTC bond projectsthroughout the state. While programs are currentlymeeting the demand for PABs for rental housing,the provision of new sources of soft debt, low interest funding, and other subsidy types will expandthe demand for bonds. In particular, the new Virginia Housing Opportunity Credit should be con-sidered as a way to expand use of the four percent LIHTC bonds by pairing the state credit with thesetransactions.
Action items:
Task 1.2.1: Identify programswhere scoring shiftsmight be beneficial to incentivizing and increasingthe feasibility of four percent bond projects, especially in regions where they have not been used.
• Who: DHCD, Virginia Housing
Task 1.2.2: Identify local barriers to increased use of four percent LIHTC bonds for rental housingdevelopment. Conduct deeper analysis of energy burden by income and housing stock to identifygreatest needs across Virginia.
• Who: DHCD, Virginia Housing, and other stakeholders
Task 1.2.3: Meet with local housing authorities that are active four percent LIHTC bond conduits todetermine any additional recommendations for removing barriers and improving project feasibility.
• Who: DHCD, Virginia Housing
Task 1.2.4: Monitor the development of the Virginia HousingOpportunity Credit programduring thelegislative follow-up that will be required in the 2022General Assembly session to clear up legislativeambiguities. Suggest strategies whereby the new state housing credit can support the production ofmore four percent bond projects.
• Who: DHCD, Virginia Housing, advocates, and other stakeholders

392 CHAPTER 29. BOND FINANCING OPTIONS
Strategy 1.3
Support beneficial changes to federal laws, particularly the Affordable Housing Credit Improvement Act of2021 (AHCIA) that expands the LIHTC program and reduces the “50 percent test.”
Action items:
Task 1.3.1: Prepare a summary of how the changes in the AHCIA will benefit Virginia.
• Who: Virginia Housing Alliance, advocates, and other stakeholders
Task 1.2.2: Determine the level of support for this legislation from the administration and its prioritylevel.
• Who: Virginia Housing Alliance, advocates, and other stakeholders
Task 1.2.3: Prepare a recommendation encouraging support of the AHCIA by the administration,elected officials, local governments, and associations.
• Who: Virginia Housing Alliance, advocates, and other stakeholders
Additional considerations for Recommendation 1
The state’s allocation of PABs to permitted uses was last adjusted in 2008. A further change in 2012allows unused bond cap to flow to Virginia Housing in the second half of each year. As a result, Vir-ginia’s volume cap has always been fully expended. Virginia Housing is able to carry forward anyunused cap to the next year and uses conversion to MCCs each year as a way to ensure that the fullcap is used and none is returned to the federal government.
Virginia Housing has not issuedMortgage Revenue Bonds since 2012 and has usedMCCs since 2015to assist low- and-moderate income homebuyers. The bond allocation process is managed by DHCDin accordance with regulations promulgated by the department.
Therehas been little demand for theuse of PABs for the IndustrialDevelopment pool and four percenthousing bonds have the added benefit of federal tax credits that generate equity for affordable rentalhousing development—something that non-housing bonds do not do.
While use of PABs for multifamily has been growing recently, experts predict that demand for theexpansion of PABs for affordable rental housing using four percent LIHTC bonds is about to increasefor several reasons:
• A recent change in federal law fixes the companion tax credit at four percent, when it had pre-viously floated at a much lower rate. This means the credit will generate more equity to the

29.3. RECOMMENDATIONS 393
project. More equitymeans that projectswill have to support less debt, improving the feasibilityof proposals especially in markets where rents are lower or there is a shortage of gap financing.
• Another prospective change at the federal level would adjust the 50 percent test to 25 percent.Congress is currently considering thebipartisanAHCIA,which includes a change thatwillmakeit possible to use bonds for projects that previously could not meet the 50 percent test or wouldneed to use the bonds only for short term—so called “bond burning.” If this shift occurs, itwill expand the number of projects that benefit from four percent LIHTC bond financing andincrease the amount of equity that canbe generated for affordable rental housing. AHCIAwouldalso increase the nine percent LIHTC volume by 50 percent.
• Gap financing to help with project feasibility is increasing substantially; the Virginia HousingTrust Fund, HOME funding, National Housing Trust Fund, local trust funds, energy efficiencyfunds, and many more sources are rising.
• The new Virginia Housing Opportunity Credit can provide new equity, improve feasibility, andfund more projects.
All of these new resources will make it possible to develop four percent LIHTC projects in lower rentmarkets across the state. They also will support smaller projects and other types of targeted projectsthat have been difficult or infeasible under current restrictions.
During the first Special Session of 2021, the General Assembly passed the Virginia Opportunity TaxCredit; the Governor subsequently signed the legislation, and it took effect July 1, 2021. This creditis a significant new housing resource for Virginia. The program’s design—still under development—will provide issuance of $15 million in credits annually, similar to the federal LIHTC. The programbegins in 2021 and has a five year sunset that will require re-enactment. The intent of the legislationis twofold: to support the development of more income and rent-restricted apartments in Virginia,and to support some apartments with rents that will serve Virginia families with very-low incomes.
Four percent LIHTC bond projects tend to be in urban areas with stronger markets and higher rentsbecause they offer a lower subsidy than the nine percent LIHTC program. Serving very low-incomehouseholds is difficult without significant gap funding such as grants and low interest or deferredloans. The subgroup considered whether the new state credit could expand the use of four percentLIHTC bonds and what program design features could accomplish this goal.
Recommendation 2
Increase understanding of the use of local general obligation bonds for affordable housing atboth the state and local level.
GO bonds, unlike PABs, are backed by the full faith and credit of the locality—not from the revenuegenerated by the project. The proceeds from a GO bond for housing could be used in a variety of waysto support affordable housing in a community.
Virginia localities have not embraced this strategy though other states frequently use local bonds forhousing. Schools, public buildings, infrastructure, and other uses have beenhigher priorities for localdebt. As housing challenges continue to increase and as affordable housing becomes a higher priorityissue within communities, localities may reevaluate this approach.

394 CHAPTER 29. BOND FINANCING OPTIONS
Strategy 2.1
Disseminate to localities best practice information and examples from other states on the use of local generalobligation bonds for affordable housing.
The Virginia Resources Authority (VRA) is currently the lead on working with localities on debt fi-nanced projects. Additional research is needed to see what impediments exist to allowing this assis-tance.
Action items:
Task 2.1.1: Identify and explore existing resources and capacities at the state level that could providethis type of technical support. Review other examples in other states that might present a model.
• Who: DHCD, Virginia Housing, and other stakeholders
Task 2.1.2: Discuss the recommendation with departments and offices that might be candidates forthis service to determine interest, capacity, and additional resources needed.
• Who: DHCD, Virginia Housing, and other stakeholders
Strategy 2.2
Consider how state housing programs could support localities that generate resources for affordable housingthrough the issuance of bonds or from local budgets.
Potential incentives shouldnot be exclusively tied toGObonds alone and should reflect similar effortsto support housing through local housing trust funds and other locally-generated investments.
Action items:
Task2.2.1: Reviewexisting state fundingprograms to identify those thatmight beused in conjunctionwith local housing resources.
• Who: DHCD, Virginia Housing, and other stakeholders
Task 2.2.2: Discuss possible incentives with the appropriate agencies or funders, including the VRAand Department of Taxation, on impediments to GO utilization by localities.
• Who: DHCD, Virginia Housing, and other stakeholders

29.3. RECOMMENDATIONS 395
Task 2.2.3: Identify and meet with localities that might consider GO bonds for housing (and similarefforts) to determine the types of incentives from the state that would be helpful.
• Who: DHCD, Virginia Housing, and other stakeholders
Task 2.2.4: Suggest several specific state incentives to encourage and facilitate local initiatives viabonds and general funds.
• Who: DHCD, Virginia Housing, and other stakeholders
Strategy 2.3
Consider the development of state housing resources that would match local bonds for housing, enablinglocalities to leverage their programs and bring more resources to the community.
Action items:
Task 2.3.1: Identify existing and new potential sources formatching or leveraged funding to pair withlocal housing bond funded initiatives.
• Who: DHCD, Virginia Housing, and other stakeholders
Task 2.3.2: Discuss options with appropriate state agencies or funders to determine feasibility.
• Who: DHCD, Virginia Housing, and other stakeholders
Additional considerations for Recommendation 2
Virginia localities have rarely used GO bonds for housing though other states commonly do. TheVirginia Supreme Court has upheld the legality of GO bonds for housing.
The state constitution caps the amount of GO bonds that a city can have outstanding as a percentageof their taxable base. Counties are not cap-restricted but generally must have bond issues approvedby referendum.
As a result, most localities have preferred to issue bonds for issues such as infrastructure, schools,parks or other public/community uses. Localities also carefully monitor their debt to achieve andpreserve a high bond rating that allows for ready access to capital markets at low interest cost.

396 CHAPTER 29. BOND FINANCING OPTIONS
Recommendation 3
Encourage localities to provide property tax incentives for the development of affordable hous-ing including property tax abatement programs and housing tax increment financing (TIF)zones.
Localities can establish these zones for a variety of purposes including preservation of “naturally oc-curring affordable housing” (NOAH), development of newaffordable rental or ownershiphousing, de-velopment of mixed income housing, and preservation of existing assisted housing. The state shouldencourage these local initiatives through the following strategies:
Strategy 3.1
Disseminate to localities best practice information and examples from other states on the use of property taxabatements and TIF districts with a housing focus.
Action items:
Task 3.1.1: Identify and explore existing resources and capacities at the state level that could providethis type of technical support. Review other examples in other states that might present a model.
• Who: DHCD, Virginia Housing, and other stakeholders
Task 3.1.2: Discuss the recommendation with departments, offices that might be candidates for thisservice to determine interest, capacity and additional resources needed.
• Who: DHCD, Virginia Housing, and other stakeholders
Strategy 3.2
Provide bonus points or other scoring preferences within the LIHTC QAP and other state housing programsfor applicants within qualified housing TIFs.
Action items:
Task3.2.1: Reviewexisting state fundingprograms to identify those thatmight beused in conjunctionwith local housing TIF districts.
• Who: DHCD, Virginia Housing, and other stakeholders

29.3. RECOMMENDATIONS 397
Task 3.2.2: Discuss options for preferences or priorities with the appropriate agencies or funders.
• Who: DHCD, Virginia Housing, and other stakeholders
Task 3.2.3: Identify and meet with localities that might consider housing TIF districts to determinethe types of incentives from the state that would be helpful.
• Who: DHCD, Virginia Housing, and other stakeholders
Task 3.2.4: Suggest several specific state incentives to encourage and facilitate local housing TIFs.
• Who: DHCD, Virginia Housing, and other stakeholders
Strategy 3.3
Consider how state housing programs could support localities that generate resources for affordable housingthrough the use of property tax incentives and qualified housing TIFs.
Action items:
Task 3.3.1: Identify existing and new potential sources formatching or leveraged funding to pair withlocal tax abatements and housing TIFs.
• Who: DHCD, Virginia Housing, and other stakeholders
Task 3.3.2: Discuss options with appropriate state agencies or funders to determine feasibility.
• Who: DHCD, Virginia Housing, and other stakeholders
Strategy 3.4
Establish the standards that the TIF district must meet in order to qualify for state incentives.

398 CHAPTER 29. BOND FINANCING OPTIONS
Action items:
Task 3.4.1: Review housing TIFs in other states to determine best practices. Propose minimum stan-dards for TIF eligibility for state incentives (e.g., retention of all tax increases and level of housingaffordability).
• Who: DHCD, Virginia Housing, and other stakeholders
Task3.4.2: Discuss optionswith appropriate state agencies or funders to determinemethods for com-petition or other distribution of resources.
• Who: DHCD, Virginia Housing, and other stakeholders
Additional considerations for Recommendation 3
Housing TIFs can address a variety of goals, including: the construction of new affordable hous-ing, the preservation of at-risk rental housing, and the preservation of affordable homeownershipin neighborhoods that are rapidly gentrifying.
The National Housing Conference has a summary of housing TIF best practices at their website.

Chapter 30
Addressing racial equity in housingacross Virginia
This chapter provides recommendations to policymakers for reducing racial disparities in housing.While not specifically referenced in the text of HB854, the steering committee and Stakeholder Ad-visory Group unanimously agreed that the report should include this topic.
Highlights
Major takeaways in this chapter include:
• While better than the national average, Virginia has a wide gap in homeownership rates thatleaves Black households 25 points behind white households.
• Historical patterns of discrimination also produce inequities inwealth andwell-being for Blackhouseholds: they are more likely to be cost-burdened, to live in poor quality housing, to losetheir housing, or to have few options of where to live.
• Racial inequity exists on both sides of the housing equation: ownership of production and de-velopment companies and leadership of nonprofits are predominantly white.
• Both Virginia Housing and the Department of Housing and Community Development haveexpanded programs and efforts to advance fair housing goals, including improving access tohomeownership for Black Virginians.
• Continued efforts to address racial equity in housing will require Black and brown-led long-term engagement, as well as continued statewide leadership.
• Strategies to address these racial disparities in housing seek to expand Black access to home-ownership, help mitigate the effects of gentrification, increase success and choice in rental as-sistance programs, and ensure that equity is considered at all levels of the housing industry.
399

400 CHAPTER 30. ADDRESSING RACIAL EQUITY IN HOUSING ACROSS VIRGINIA
30.1 The current landscape
30.1.1 Why wemust act
While the language in HB854 does not specifically address the issue of racial disparities in housing,the SAG agreed that the study should incorporate an analysis of racial equity in housing and thatevery work group should include it in their issue area discussion.
Racial disparities in housing are as widespread throughout Virginia as they are nationally. The legacyof slavery and 150 years of public policy and private discriminationhave left Virginianswho are BlackorAfricanAmerican and other persons of color disadvantagedwith respect to housing conditions andstatus.
The history of redlining and race-based federal mortgage programs, deed restrictions based on race,predatory lending programs, and discriminatory property appraisals contribute to many inequitiesthat the Commonwealth must continue to address.
30.1.2 The Black-white homeownership gap
The homeownership rate for Black Americans across the country is the same as more than 50 yearsago when the Fair Housing Act was signed. That rate—44 percent—is 30 points below that of whiteAmericans.
Although Virginia’s minority homeownership gap is the fifth smallest among all states, it remains fartoo wide. Only 48 percent of Black households in Virginia own their home compared to 73 percent oftheir white counterparts—a 25-point difference.

30.1. THE CURRENT LANDSCAPE 401
Figure 30.1: Historical homeownership rate by race and ethnicity
Unfortunately, the situation has worsened over the last decade as Black homeowners were moreseverely affected by the mortgage and foreclosure crisis that triggered the great recession in 2008.With home equity being the largest source of wealth-generation for middle class Americans, theracial homeownership gap is a principal contributor to the large wealth gap that separates white andBlack Virginians.
30.1.3 Black renters pay more
Astudy conducted in2018 found thatBlack voucherholders pay a rent premiumfor the samehousingas their white counterparts in the same neighborhood. (Early, Carrillo, & Olsen, 2019) More specifi-cally, researchers concluded that the premium was roughly 2.5 percent more than white householdsin neighborhoods where the racial composition is more than 60 percent white.
The disparate cost burden experienced byBlack renters can be seenhere inVirginia, where 53percentof Black renters are cost-burdened compared to 41 percent of white renters.

402 CHAPTER 30. ADDRESSING RACIAL EQUITY IN HOUSING ACROSS VIRGINIA
30.1.4 Black households experience greater housing insecurity
Racial disparities exist beyond rents but to the experiences Black households face in securing andmaintaining housing, as well. The Brookings Institute found that “[e]victions, regardless of otherfactors, take place in greater density in Black-majority neighborhoods.” (Romer, Perry, & Broady,2021) The impact of eviction on households can further contribute to stress and financial strain onhouseholds, household instability, and homelessness.
The Household Pulse Survey conducted by the U.S. Census Bureau sheds further light on housingsituation disparities—showing that Black and Hispanic households were most likely to lose incomeduring the pandemic, in turn causing greater difficulty in keeping up with rent payments. Duringweek 15 of the survey, Black households were twice as likely than white households to be behind ontheir rent than white households and to report. (Wedeen, 2021)
Although representing only 13 percent of the country’s population, Black Americans experiencehomelessness at a greater rate than any other race or ethnic group. Thirty-nine percent of peopleexperiencing homelessness are Black, whilemore than 50 percent of homeless families with childrenare Black. (National Alliance to End Homelessness, 2018)
30.1.5 Poorer housing conditions among Black Americans impact health and well-being
Racial segregation has had a profound impact on Black health. The remnants of redlining still impactBlack neighborhoods where disinvestment has led to lower quality infrastructure and a lack of com-munity amenities like healthy food, economic opportunities, and health care. (Richardson & Meier,2020)
One study has found that Black households were nearly two times more likely to live in a home withsevere physical problems. (Krieger & Higgins, 2002) Poor housing conditions contribute to poorerhealth conditions, including respiratory infections, asthma, lead poisoning, physical injuries, andmental illness.
Another study found that Black households are overly represented in neighborhoods with high toxicconcentration levels, and higher pollution burdens than other racial or ethnic groups. (Downey &Hawkins, 2008)
30.1.6 Black households have less access to neighborhoods of their choice
Persistent residential segregation continues to block many Black households from greater economicopportunities. Continued underinvestment and devaluation in predominantly Black neighborhoodsimpede not only personal well-being and wealth accumulation, but also social mobility. (Loh, Coes,& Buthe, 2020)
Long-standing land use policies that block diverse types of housing that can be afforded by diversepeople prevent many Black households from living in neighborhoods with better schools, economicopportunities, and community resources.

30.2. WHAT’S HAPPENING NOW 403
30.1.7 Racial disparities in the housing industry
In launching their national racial equity initiative, Enterprise Community Partners notes that theAmerican housing industry needs reform as well. Nationally, only two percent of development com-panies are Black-led. Even among community development corporations, fewer than one in five aregoverned by persons who are Black or African American despite the fact that many focus their workin communities of color. Just one and a half percent of real estate assets under management arecontrolled by minority-owned firms.
According to the statewide provider survey completed for this report (see Chapter 7), the majorityof respondents (53 percent) indicated that their organization had not developed and implementedany specific program or effort to address racial inequities in their service area and 32 percent wereunsure if their organization had done so. The challenge is not just to reduce inequities in alloca-tion of housing assistance but also to bring parity to housing production including ownership andleadership of housing development companies. The goal must be the same for housing nonprofitleadership, board membership, and staffing so that these organizations truly reflect and representthe communities they serve.
30.2 What’s happening now
30.2.1 Virginia Housing
Virginia Housing has increasingly addressed racial disparities in housing in a variety of ways, includ-ing the expansion of programmatic and staff capacity dedicated to equitable housing outcomes.
For example, home purchase assistance programs (mortgage loans, counseling, down payment as-sistance, and Mortgage Credit Certificates) primarily target first-time homebuyers and underservedpopulations. Raising the visibility of Virginia Housing’s first-time homebuyer programs and servicesin underserved communities is crucial to expanding access—a challenge that continues to shape theircommunications and marketing efforts.
This includes the production of omni-channel ads targetingmulticultural audiences or stakeholderswith a specific focus on reaching Black markets. Virginia Housing also must collaborate with profes-sional organizations that serveminority businesses or advocate for greater access to homeownershipwhile strengthening their existing partnerships.
As of March 2021, 40 percent of the more than 53,000 Virginia homeowners with Virginia Housingfirst mortgage loans were racial and/or ethnic minorities; 29.9 percent were Black, and 10.2 percentwere Hispanic or Latino. These estimates may underreport service to underserved populations since8.8 percent of borrowers chose not to indicate their racial/ethnic identity. Figures 30.2 and30.3 showtrends in the racial makeup of participants in the mortgage loan and MCC programs.

404 CHAPTER 30. ADDRESSING RACIAL EQUITY IN HOUSING ACROSS VIRGINIA
Figure 30.2: Virginia Housing first-time homebuyers by race

30.2. WHAT’S HAPPENING NOW 405
Figure 30.3: Virginia Housing homebuyers using MCCs by race
30.2.2 Department of Housing and Community Development
DHCD’s programs focus on historically economically-disadvantaged communities, serving those at80 percent AMI or less. For example, the Affordable and Special Needs Housing (ASNH) program—which provides gap financing for affordable and special needs housing—prioritizes housing projectsfor the most vulnerable (50 percent AMI or less) but can provide gap financing for projects that in-clude incomes up to 80 percent AMI.
DHCD has programs dedicated to weatherization of multifamily and single-family units up to 80percent AMI, homeless solutions grants, eviction prevention, subsidized energy efficient housing forlow-income Virginians, funding for broadband access, and emergency rental assistance. The broad-band team has been working with the Governor’s office on an equity data dashboard to highlightbroadband access and affordability.
The Housing Innovations in Energy Efficiency (HIEE) program uses proceeds from the RegionalGreenhouse Gas Initiative (RGGI) for low-income energy efficiency programs and subsidies for moreenergy efficient housing for low-income Virginians. The program prioritizes historically econom-ically disadvantaged communities and will collect and analyze data to expand these initiatives inunderserved communities.
The Virginia Rent Relief program is currently working with a grantee to increase outreach and en-

406 CHAPTER 30. ADDRESSING RACIAL EQUITY IN HOUSING ACROSS VIRGINIA
gagement in communities of color to create awareness of the program and help provide technicalassistance for tenants especially those with barriers to applying for assistance such as language anddisability.
The Homeownership Down Payment and Closing Cost Assistance Program is a flexible gap financ-ing program administered by DHCD that provides opportunities for first-time homebuyers to obtainhomes that are safe, decent, and accessible. The long-term goal is sustainable housing and growth inpersonal wealth and equity for low-income Virginians.
Figure 30.4: DHCD Down Payment Assistance recipients by race
DHCD also updates a yearly Consolidated Action Plan as required by the U.S. Department of Housingand Urban Development. The consolidated plan includes DHCD’s plan to promote and affirmativelyfurther fair housing across its programs and guidelines.
DHCD is currently working with the Virginia Center for Inclusive Communities to identify chal-lenges; to ensure that staff, policies, and systems are aligned; and to continually strengthen program-matic areas in response to racial disparities in housing and other areas.

30.3. THE PATH FORWARDMUST EXPAND ENGAGEMENT 407
30.3 The path forwardmust expand engagement
The SAG supports a broad-based approach to racial equity in housing that addresses the entire hous-ing development process from the types of homes and apartment communities that are built to wherethey’re built, who builds them, and the impact on household budgets and wealth generation for theirresidents.
The group also emphasized that while this process is just beginning, those leading it must be guidedby key principles:
Principle 1
Black and brown-led long-term engagement should drive solutions.
• A single program, initiative, or strategy will not solve this complex, entrenched problem; it de-mands a range of varied programs.
• Black and brown voices must inform decision-making at every step. The SAG recommendsimplementing a long term, community engagement process thatwill informanddirect housinginitiatives as they develop in the coming years.
• This outreach should include affordable housing consumers, community and political leaders,pastors and congregations, civic organizations, HBCUs, Hispanic Serving Institutions (HSIs),sororities, fraternities, small businesses, city and county administrators, and advocacy organi-zations.
Principle 2
Continued statewide leadership is necessary.
• The Commonwealth should establish high-level advisory boards that guide the launch of out-reach initiatives, receive feedback, and ensure inclusivity as programs are designed and imple-mented. These bodies include the:
– Latino Advisory Board,– African American Advisory Board, and– Virginia Asian Advisory Board.
30.4 Recommended strategies for addressing racial disparities
The SAG reviewed a range of housing initiatives that may be useful first steps to address equity inhousing.

408 CHAPTER 30. ADDRESSING RACIAL EQUITY IN HOUSING ACROSS VIRGINIA
Strategy 1
Expand down payment assistance and supplemental initiatives to lower home loan principal amounts.
Inadequate savings for down payment and closing costs is a significant barrier for many prospectiveBlack homebuyers. The racial wealth gap is significant, and the lack of generational wealth ofteneliminates for Black homebuyers the possibility of family assistance that is more common for whitefirst-time homebuyers.
BothDHCDandVirginiaHousinghavedownpayment assistanceprograms that close the gapbetweenthe maximum allowed loan-to-value ratio and the full purchase cost (including down payment). AllVirginia Housing borrowers are eligible for this form of assistance via down payment assistance, sec-ond mortgages, and grant programs. These are successful initiatives that, if expanded, would benefitmore households of color especially those with limited savings.
However, policymakers may also want to explore additional solutions to provide deeper assistancethat lowers principal loan amounts to affordable levels. Such programs also would help buyers whoseincomes are insufficient to afford most home prices in their community. Deeper subsidies to reduceprincipals reduce the size of the loan needed and therefore lower monthly mortgage payments.
Strategy 2
Offer property tax relief for long-term owners in transitional neighborhoods.
One of the challenges facing older minority homeowners in neighborhoods where property valuesare rising quickly is the burden of higher taxes that potentially accelerate gentrification by puttingeconomic pressure on some residents to leave their homes. These homeowners may be struggling tomaintain older homes while also paying increased property taxes. Althoughmany communities haveadopted tax reduction programs for seniors, homeowners who are slightly below the age cut-off forthese programs may face financial challenges to stay in their homes.
Strategy 3
Support community land trusts, co-ops, deed restrictions and other shared equity programs
Community land trusts (CLTs) and other “shared equity” types of programs are an important toolin restraining rising home values in neighborhoods that are undergoing transition. A CLT limitsthe increase in the home value so that the property remains affordable to future buyers; homes in agentrifying neighborhood can remain affordable to a stream of future buyers. CLT and other sharedequity housing are one way to ensure long term economic and racial diversity in neighborhoods thatare experiencing strong market pressures.
These programs are not the right answer for every buyer as they limit the equity growth and poten-tial wealth-generation for individual families. However, CLTs are the answer for households thatwould otherwise be unable to access homeownership through other programs. Those householdsthat stabilize and increase their economic status can move on after five to six years to conventional

30.4. RECOMMENDED STRATEGIES FOR ADDRESSING RACIAL DISPARITIES 409
homeownership and free up the CLT house for another first-time homebuyer.
Strategy 4
Support security deposit assistance and eligibility screening reform for Housing Choice Vouchers.
Chapter 26 explores some aspects of the Housing Choice Voucher (HCV) program that can negativelyimpact minority applicants and eliminate or reduce participation in the program. Minority appli-cants are less likely than white applicants to have sufficient funds for security deposits; a programdesigned to reduce the barrier of a cash requirement for an applicant, including security depositsand utility deposits, can increase program access for people of color.
Because Black persons have been incarcerated at higher rates than whites, criteria that restrict orpreclude program eligibility based on arrest/incarceration history and status can also disproportion-ately affect minority applicants and become an insurmountable barrier for ex-offenders who are at-tempting re-entry. More flexibility in tenant screening criteria—such as criminal record checks andpayment/eviction records—can benefit some minority applicants and overcome bias in the system.
Strategy 5
Expand mobility programs for Housing Choice Voucher recipients.
Mobility programs offer low-income families of color the opportunity to move away from neighbor-hoods with high concentrations of poverty to “communities of opportunity” with better schools andimproved access to jobs, services and neighborhood amenities. These programs combine HCVs withvoluntary intensive counseling and wraparound services.
Baltimore, Maryland has one of the oldest and most successful mobility programs in the country. Itbegan with a fair housing lawsuit in 1995 and has helped over 5,000 families relocate from publichousing to higher opportunity neighborhoods throughout the Baltimore metro area. The Richmondregion is home to a smaller program that is administered by Housing Opportunities Made Equal ofVirginia. These programs require a combination of HCVs and funds to support counselors and otherservices to families.
To ensure households maintain stable housing after relocation assistance has ended, programsshould work with the household to provide sufficient follow-up services and support for up to five toseven years as needed.
Strategy 6
Seek greater participation in affordable housing by developers, contractors, nonprofits, and other organiza-tions that are BIPOC-owned or led.
Strategies to address and reduce disparities within housing must deploy at all levels from policies onpaper to programs on the ground. At the program level, this includes identification and prioritization

410 CHAPTER 30. ADDRESSING RACIAL EQUITY IN HOUSING ACROSS VIRGINIA
of households and provision of services. At the organizational and policy setting level, this includesensuring that leaders and decision makers reflect and represent the communities served.
Entities led by BIPOC Virginians (including BIPOC-owned companies, BIPOC-governed nonprofits,and other BIPOC-led organizations) should be prioritized for opportunities to design, develop, build,finance, manage, or sell affordable housing. It is imperative that program implementation activelyengage people of color and elevate their expertise that comes only from lived experience. This willrequire intensive efforts to build capacity, expand access to capital, and develop leadership. Goals forminority participation must be strengthened and selection processes must be reviewed to uncoverbarriers to minority success.
30.5 Emerging best practices in other regions
Whilemany communities across the country are beginning to discuss restorative housing initiatives,few have successfully implemented such programs. Policy makers and advocates are in the earlystages of determining the legal and effective crafting of these programs. There are several examplesthat are worth noting where communities outside of Virginia have created programs intentionallydesigned to repair racial injustices through housing. These include:
Evanston, Illinois
Local Reparations Restorative Housing Program
The city of Evanston, Illinois (a northern suburb of Chicago) became the first community in the na-tion to formally adopt a reparations program focused on housing. In Evanston, Black households inthe community between 1919 and 1969 are eligible for grants of $25,000 that can be used for homerepair, downpayments, andmortgage payments. The city established a $10million fundwith revenuegenerated by a new city tax on recreational marijuana.
Chicago, Illinois
Racial Equity Impact Assessment
The city of Chicago commissioned a Racial Equity Impact Assessment (REIA) for their Qualified Al-location Plan (QAP). The QAP guides the allocation of LIHTCs. (Chicago receives its own allocationseparate from the State of Illinois.) The REIA examines the QAP through a racial equity lens to de-termine how the policy affects racial and ethnic groups.
The result is a series of recommendations that address issues including wealth-building, increasedopportunities for developers and contractors of color, tenant screening criteria that may adverselyaffect Black and Brown households. The Chicago QAP is the first in the nation to do this.

30.5. EMERGING BEST PRACTICES IN OTHER REGIONS 411
Boston, Massachusetts
STASH Program
Saving Towards Affordable and Sustainable Homeownership (STASH) is a matched savings programthat targets first generation homebuyers. The program’s main goals include closing the racial home-ownership gap and increasing assets and the affordability and stability of homes for first-generation,first-time homebuyers with low-to-moderate incomes.
STASH provides homebuyer education and a matched savings of $2,000 for a down payment on ahouse in Massachusetts. Participants in the program must be a first-generation homeowner in theUnited States. The programdefines a first-generation homebuyer as someonewho does not currentlyown a home and has not previously owned a home; whose parents and/or legal guardian do not cur-rently own a home and have not previously owned a home; and whose spouse, if applicable, does notcurrently own a home and has not previously owned a home.

412 CHAPTER 30. ADDRESSING RACIAL EQUITY IN HOUSING ACROSS VIRGINIA

Part VI
APPENDIX
413


Appendix A
Survey methods
This chapter provides links to the actual collection instruments used for the statewide provider sur-vey, the public housing authority survey, and the client survey conducted for this report. The resultsof these surveys are covered in Part 2. All links are PDF documents.
A.1 Statewide provider survey
This survey was built in QuestionPro and was conducted electronically.
Virginia Housing Programs and Policies Survey (PDF)
HousingForward Virginia also compiled a content analysis of responses to open-ended questions inthis survey.
Open-Ended Question Content Analysis (PDF)
A.2 Public housing authority survey
This survey was built in QuestionPro and was conducted electronically.
Virginia Public Housing Authority Survey (PDF)
A.3 Client survey
This survey was built in QuestionPro and was conducted electronically. Printed versions were alsomade available and distributed to housing providers throughout the Commonwealth.
Client Engagement Survey (PDF)
415

416 APPENDIX A. SURVEY METHODS

Appendix B
Data methodology
This chapter provides links to documents that explain specific methodologies used for data analysisin this report. All links are PDF documents.
B.1 Quantifying the availability of “starter homes” in Virginia
This analysis estimates the number and share of homes sold in Virginia jurisdictions that could bedefined as “starter homes.” The goal is to better understand how options for first-time home buyersvary across the Commonwealth and how the inventory of starter homes has changed over the pasteight years. Sales data from the Virginia REALTORS® and income data from the U.S. Department ofHousing and Urban Development are used.
Results of this analysis are in Chapter 15.
Data methodology: Quantifying the availability of “starter homes” in Virginia (PDF)
B.2 Determining the income needed to afford the median home salesprice
This analysis was used to make comparisons between the median renter household incomes and in-comeneeded to afford themedianhome sales price inVirginia localities. This analysiswas conductedusing American Community Survey data on median renter household incomes at the locality-levelin Virginia, as well as median sales price data from the Virginia REALTORS®.
Results of this analysis are in Chapter 15.
Data methodology: Determining the income needed to afford the median home sales price (PDF)
417

418 APPENDIX B. DATA METHODOLOGY
B.3 Estimating the cost of a state-funded rental assistance program
This analysis provides a general estimation of four possible scale options for a state-funded rentalassistance program in Virginia. The scenarios are based on general assumptions about assistanceamounts and administrative costs.
Results of this analysis are in Chapter 26.
Estimating the cost of a state-funded rental assistance program (PDF)

Appendix C
Program fact sheets
This appendix provides links to fact sheets on each state housing program evaluated in this report.A total of 32 fact sheets are provided. The successes, challenges, and recommendations for theseprograms are covered in Part 4. All links are PDF documents.
C.1 Affordable rental housing production
Virginia Housing
• Low-Income Housing Tax Credit (LIHTC)• Mixed Used / Mixed Income• Multifamily Lending Program
Department of Housing and Community Development
• Affordable and Special Needs Housing
C.2 Rental assistance and eviction prevention
Virginia Housing
• Housing Choice Voucher (Virginia Housing-administered)
Department of Housing and Community Development
419

420 APPENDIX C. PROGRAM FACT SHEETS
• Communities of Opportunity Tax Credit (COPTC)• Virginia Eviction Reduction Pilot (VERP)• Virginia Rent Relief Program (RRP)
Department of Behavioral Health and Developmental Services
• Permanent Supportive Housing - Serious Mental Illness• State Rental Assistance Program (SRAP)
Virginia Department of Social Services
• Low-Income Home Energy Assistance Program (LIHEAP)
C.3 Homeownership and counseling
Virginia Housing
• Homebuyer Education• Home Purchase Loans / SPARC• Mortgage Credit Certificates• REACH - Housing Counseling
Department of Housing and Community Development
• Affordable and Special Needs Housing (ASNH)• Down Payment Assistance
C.4 Rehabilitation and accessibility
Virginia Housing
• Granting Freedom• Rental Unit Accessibility Modification (RUAM)
Department of Housing and Community Development
• Acquire, Renovate, and Sell (ARS)

C.5. COMMUNITY REVITALIZATION AND CAPACITY BUILDING 421
• Emergency Home and Accessibility Repair (EHARP)• Indoor Plumbing Rehabilitation (IPR)• Lead Hazard Reduction• Liveable Home Tax Credit• Weatherization Assistance Program (WAP)
C.5 Community revitalization and capacity building
Virginia Housing
• Capacity Building Grants• Community Impact Grants (CIG)• Predevelopment Loan Program (PDL)
Department of Housing and Community Development
• Community Development Block Grant (CDBG)• Vibrant Communities Initiative (VCI)
C.6 Homelessness assistance and prevention
Department of Housing and Community Development
• Affordable and Special Needs Housing (ASNH)• Housing Opportunities for Persons with AIDS/HIV (HOPWA)• Virginia Homelessness Solutions Program• Virginia Housing Trust Fund - Homeless Reduction Grant
Department of Behavioral Health and Developmental Services
• Permanent Supportive Housing - Serious Mental Illness• State Rental Assistance Program

422 APPENDIX C. PROGRAM FACT SHEETS

References
Ahmad, K., Erqou, S., Shah, N., Nazir, U., Morrison, A. R., Choudhary, G., & Wu, W.-C. (2020, 11).Association of poor housing conditions with covid-19 incidence and mortality across us coun-ties. PLOS ONE, 15, e0241327. Retrieved from https://dx.plos.org/10.1371/journal.pone.0241327 doi: 10.1371/journal.pone.0241327
Alliance for Excellent Education. (2020). Students of color caught in the homework gap. Retrievedfrom https://futureready.org/wp-content/uploads/2020/07/HomeworkGap_FINAL7.20.2020.pdf
Ashley, P. J., Friedman, W., & Pinzer, E. A. (2011, 4). American healthy homes survey lead and arsenicfindings. Retrieved from https://www.hud.gov/sites/documents/AHHS_REPORT.PDF
Benson, C., & Bishaw, A. (2018). When many college students live off campus, poverty rategoes up. Retrieved from https://www.census.gov/library/stories/2018/10/off-campus-college-students-poverty.html
Bhutta, N., Bricker, J., Chang, A., Dettling, L., Goodman, S., Hsu, J., …Windle, R. (2020, 10). Changes inu.s. family finances from2016 to 2019: Evidence from the survey of consumer finances. FederalReserve Bulletin, 106(5). Retrieved from https://www.federalreserve.gov/publications/files/scf20.pdf doi: 10.17016/bulletin.2020.106
Boulware, L. E. (2020, 8). Race disparities in the covid-19 pandemic—solutions lie in policy, notbiology. JAMA Network Open, 3. doi: 10.1001/jamanetworkopen.2020.18696
Brevoort, K., Grimm, P., & Kambara, M. (2015, 5). Data point: Credit invisibles.Brown, M. A., Soni, A., Lapsa, M. V., & Southworth, K. (2020, 3). Low-income energy affordability:
Conclusions from a literature review (No. ORNL/TM-2019/1150). Retrieved from https://info.ornl.gov/sites/publications/Files/Pub124723.pdf
Budiman, A., & Ruiz, N. (2021, 3). Key facts about asian origin groups in the u.s.Retrieved from https://www.pewresearch.org/fact-tank/2021/04/29/key-facts-about-asian-origin-groups-in-the-u-s/
Campaign for Housing and Civic Engagement. (2017). New poll shows virginians strongly favor poli-cies that make housing more affordable. Retrieved from https://chaceva.org/2017/09/27/housing-poll/
Center for Neighborhood Technology. (2021). Cbsa: Washington-arlington-alexandria, dc-va-md-wvh+t fact sheet. Retrieved from https://htaindex.cnt.org/fact-sheets/?focus=cbsa&gid=220
Center on Budget and Policy Priorities. (2021, 7). 3 in 4 low-income renters needing rental assistancedo not receive it. Retrieved from https://www.cbpp.org/research/housing/three-out-of-four-low-income-at-risk-renters-do-not-receive-federal-rental-assistance
Commonwealth Connect. (2018). Commonwealth connect plan 1 report on commonwealthconnect 2.0: Governor northam’s 2020 plan to connect virginia contents. Retrievedfrom https://commonwealthconnect.virginiainteractive.org/sites/default/files/
423

424 REFERENCES
CIT%20Documents/Commonwealth%20Connect%20Report.pdfCommonwealth Connect. (2021). Broadband cares act award summary. Retrieved from
https://www.commonwealthconnect.virginia.gov/sites/default/files/broadband-cares-act-award-summary.pdf
Cunningham, P., Mueller, M., Britton, E., Pham, H., Guerra, L., Saunders, H., … Dihwa, V.(2021, 7). Addiction and recovery treatment services: Access, utilization, and quality ofcare 2016-2019. Retrieved from https://hbp.vcu.edu/media/hbp/policybriefs/pdfs/FinalARTS3yearcomprehensivereportforPublishing_07142021(1).pdf
DeLeon, C., Howell, K. L., & Teresa, B. F. (2021). The public cost of eviction in richmond and virginia: Re-sponse versus prevention. Retrieved from https://rampages.us/rvaevictionlab/research/measuring-the-public-cost-of-evictions/
Desmond, M., Gershenson, C., & Kiviat, B. (2015, 6). Forced relocation and residential instabilityamong urban renters. Social Service Review, 89. doi: 10.1086/681091
Downey, L., & Hawkins, B. (2008). Race, income, and environmental inequality in the united states.Sociological Perspectives, 51, 759-781. doi: 10.1525/sop.2008.51.4.759
Early, D. W., Carrillo, P. E., & Olsen, E. O. (2019). Racial rent differences in u.s. housing markets: Evidencefrom the housing voucher program (Vol. 59) (No. 4). Retrieved from https://onlinelibrary.wiley.com/doi/abs/10.1111/jors.12422 doi: https://doi.org/10.1111/jors.12422
East, C. N., Luck, P., Mansour, H., & Velasquez, A. (2018, 4). The Labor Market Effects of ImmigrationEnforcement (No. 11486). Retrieved from https://ideas.repec.org/p/iza/izadps/dp11486.html
Fasulo, F. (2019, 8). More than three in four virginians see housing affordability as a problem inamerica today. Retrieved from https://news.vcu.edu/article/More_than_three_in_four_Virginians_see_housing_affordability
Fischer, W., Rice, D., & Mazzara, A. (2019, 12). Research shows rental assistance reduceshardship and provides platform to expand opportunity for low-income families. Retrievedfrom https://www.cbpp.org/research/housing/research-shows-rental-assistance-reduces-hardship-and-provides-platform-to-expand
Fisher Sheehan and Colton. (2021). Home energy affordability gap. Retrieved from http://www.homeenergyaffordabilitygap.com/index.html
Freddie Mac Multifamily. (2018). Spotlight on underserved markets: Single-family rental: Anevolving market. Retrieved from https://mf.freddiemac.com/docs/single-family-rental-markets.pdf
Gallagher, M., & O’Brien, M. (2021, 3). How landlords can help close the digital divide for their tenants.Retrieved from https://housingmatters.urban.org/articles/how-landlords-can-help-close-digital-divide-their-tenants
Gray, N. (2021). Problem: Overcrowding. Retrieved from https://www.city-journal.org/nycr-overcrowding-is-a-factor-in-covid-infection
Gromis, A., & Desmond, M. (2021). Estimating the prevalence of eviction in the united states: Newdata from the 2017 american housing survey. Cityscape, 23, 279-290. Retrieved from https://www.jstor.org/stable/27039963
Horowitz, J. M., Igielnik, R., Kochhar, R., Horowitz, J., & Arditi, T. (2020, 1). Most americanssay there is too much economic inequality in the u.s., but fewer than half call it a top pri-ority. Retrieved from https://www.pewresearch.org/social-trends/2020/01/09/most-americans-say-there-is-too-much-economic-inequality-in-the-u-s-but-fewer-than-half-call-it-a-top-priority/
Jacobson, T., Suen, I.-S., MacKenzie, M., & Fasulo, F. (2017). Understanding the jobs-affordable housingbalance in the richmond region.

REFERENCES 425
Joint Center for Housing Studies. (2021). America’s rental housing 2020. Retrieved from https://www.jchs.harvard.edu/americas-rental-housing-2020
Krieger, J., & Higgins, D. L. (2002, 5). Housing and health: Time again for public health action.American Journal of Public Health, 92. doi: 10.2105/AJPH.92.5.758
Lawrence, P. (2021, 7).Multifamily private activity bond issuance reached record high of 16.4 billion in 2019.Retrieved from https://www.novoco.com/notes-from-novogradac/multifamily-private-activity-bond-issuance-reached-record-high-164-billion-2019
Local Initiatives Support Corporation. (2010, 06). Affordable housing for families andneighborhoods. Retrieved from https://www.lisc.org/media/filer_public/81/84/8184dd3f-ea67-40f2-82fb-6f8d7687df8f/052417_report_affordable_housing_families_neighborhoods_enterprise.pdf
Loh, T. H., Coes, C., & Buthe, B. (2020, 12). Separate and unequal: Persistent residen-tial segregation is sustaining racial and economic injustice in the u.s. Retrieved fromhttps://www.brookings.edu/essay/trend-1-separate-and-unequal-neighborhoods-are-sustaining-racial-and-economic-injustice-in-the-us/
Matthew, D. B., Rodrigue, E., & Reeves, R. V. (2016, 10). Time for justice: Tackling race inequali-ties in health and housing. Retrieved from https://www.brookings.edu/research/time-for-justice-tackling-race-inequalities-in-health-and-housing/
Mitra, M. (2019, 8). Baby boomers’ wealth is 12 times greater compared to millennials. here’swhy. Retrieved from https://www.cnbc.com/2019/08/08/baby-boomers-wealth-is-12-times-greater-compared-to-millennials.html
National Alliance to EndHomelessness. (2018, 11). Ending veteran homelessness in virginia: A statewidecollaboration. Retrieved from https://endhomelessness.org/resource/ending-veteran-homelessness-virginia-statewide-collaboration/
NationalMultifamilyHousingCouncil. (2020, 11). 2020nmhc / kingsley apartment resident preferencesreport. Retrieved from https://www.nmhc.org/research-insight/research-report/nmhc-kingsley-apartment-resident-preferences-report/
Nelson, K., Garboden, P., McCabe, B. J., & Rosen, E. (2021, 9). Evictions: The comparative analysisproblem. Housing Policy Debate, 31. doi: 10.1080/10511482.2020.1867883
O’Hara, A., & Yates, J. (2015). Creating new integrated permanent supportive housing opportunities for elihouseholds: A vision for the future of the national housing trust fund. Retrieved from www.tacinc.org
Opportunity Starts at Home. (2020, 6). Poll: The public highly concerned about hous-ing instability during covid-19; expects major action from congress. Retrieved fromhttps://www.opportunityhome.org/poll-the-public-highly-concerned-about-housing-instability-during-covid-19-expects-major-action-from-congress/
Opportunity Starts atHome. (2021, 9).Newpoll reveals strong bipartisan support for action on housing af-fordability. Retrieved from https://www.opportunityhome.org/new-poll-reveals-strong-bipartisan-support-for-action-on-housing-affordability/
Pew Charitable Trusts. (2021, 3). Virginia aims for universal broadband access by 2028. Re-trieved from https://www.pewtrusts.org/en/research-and-analysis/articles/2021/03/24/virginia-aims-for-universal-broadband-access-by-2028
Richardson, J., &Meier, H. C. S. (2020). The lasting impact of historic ”redlining” on neighborhood health:Higher prevalence of covid-19 risk factors. Retrieved from https://ncrc.org/holc-health/
Romer, C., Perry, A. M., & Broady, K. (2021, 8). The coming eviction crisis will hit black communitiesthe hardest. Retrieved from https://www.brookings.edu/research/the-coming-eviction-crisis-will-hit-black-communities-the-hardest/
Rorem, A., & Juday, L. (2016, 3). Census brief: Poverty and postsecondary students in college towns.
https://www.cnbc.com/2019/08/08/baby-boomers-wealth-is-12-times-greater-compared-to-millennials.html

426 REFERENCES
University of Virginia Demographics Research Group.Salviati, C., Popov, I., Warnock, R., & Szini, L. (2021, 9). Apartment list national rent report. Retrieved
from https://www.apartmentlist.com/research/national-rent-dataSisson, P. (2017, 10). Aging baby boomers still want it all, including luxe urban apartment liv-
ing. Retrieved from https://archive.curbed.com/2017/10/24/16526158/real-estate-apartment-baby-boomers-senior-living
U.S. Chamber of Commerce. (2021, 9). U.s. chamber of commerce commercial construction index –q3 2021. Retrieved from https://www.uschamber.com/report/us-chamber-of-commerce-commercial-construction-index-q3-2021
Virginia Coalition of Housing and Economic Development Researchers. (2017). Addressing the impactof housing for virginia’s economy: A report for virginia’s housing policy advisory council. Retrievedfrom www.vchr.vt.edu/VirginiaHousingEconomicLinkages
Virginia Department of Behavioral Health and Developmental Services. (2020, 11). Permanent sup-portive housing: Outcomes and impact (item322 z.2). Retrieved from https://rga.lis.virginia.gov/Published/2020/RD619/PDF
Virginia Sexual andDomestic Violence ActionAlliance. (2020). Sexual violence services in virginia - va-data report 1/1/2020-12/31/2020. Retrieved from https://www.vadata.org/public_reports.html
Wedeen, S. (2021, 1). Black and hispanic renters face greatest threat of eviction in pandemic. Re-trieved from https://www.jchs.harvard.edu/blog/black-and-hispanic-renters-face-greatest-threat-eviction-pandemic
Winter, E. (2021, 1). Memo: Voters want a public option for broadband, child care and housing. Re-trieved from https://www.dataforprogress.org/memos/public-option-for-broadband-child-care-housing