Washington State Affordable Housing Portfolio Study
105
Washington State Affordable Housing Portfolio Study A study of the physical condition of the Housing Trust Fund and Low Income Housing Tax Credit portfolios Prepared for Washington State Department of Commerce and Washington State Housing Finance Commission By Housing Development Center March 2015
-
Upload
khangminh22 -
Category
Documents
-
view
1 -
download
0
Transcript of Washington State Affordable Housing Portfolio Study
Washington State Affordable Housing Portfolio Study A study of the physical condition of the Housing Trust Fund
and Low Income Housing Tax Credit portfolios
Prepared for Washington State Department of Commerce and Washington State Housing Finance Commission
By Housing Development Center
March 2015
Table of Contents
Executive Summary ....................................................................................................... 3 Introduction ................................................................................................................ 12 The Physical Condition of Our Affordable Housing .................................................... 15 How Will We Pay for Needed Improvements? .......................................................... 21 The Role of Public Funders ......................................................................................... 28 Strategies for Sustainability ........................................................................................ 32
Appendices
A. Prior Work and References .................................................................................. 37 B. Methodology ........................................................................................................ 38 C. Physical Characteristics of the Portfolio ............................................................... 56 D. List of Properties in Study Universe ..................................................................... 66 E. Letter to Owners from Commerce and the Commission ..................................... 78 F. Capital Needs Survey ............................................................................................ 79 G. American Society of Testing and Materials (ASTM) Rehabilitation Categories ... 97 H. Capital Needs Assessment Template ................................................................... 99 I. Expected Useful Life Table, Abridged from On‐Site Insight ............................... 100 J. Key Points and Trends from Capital Needs Assessments, Prepared by
Walsh Construction Co./WA ............................................................................... 101

Executive Summary 3
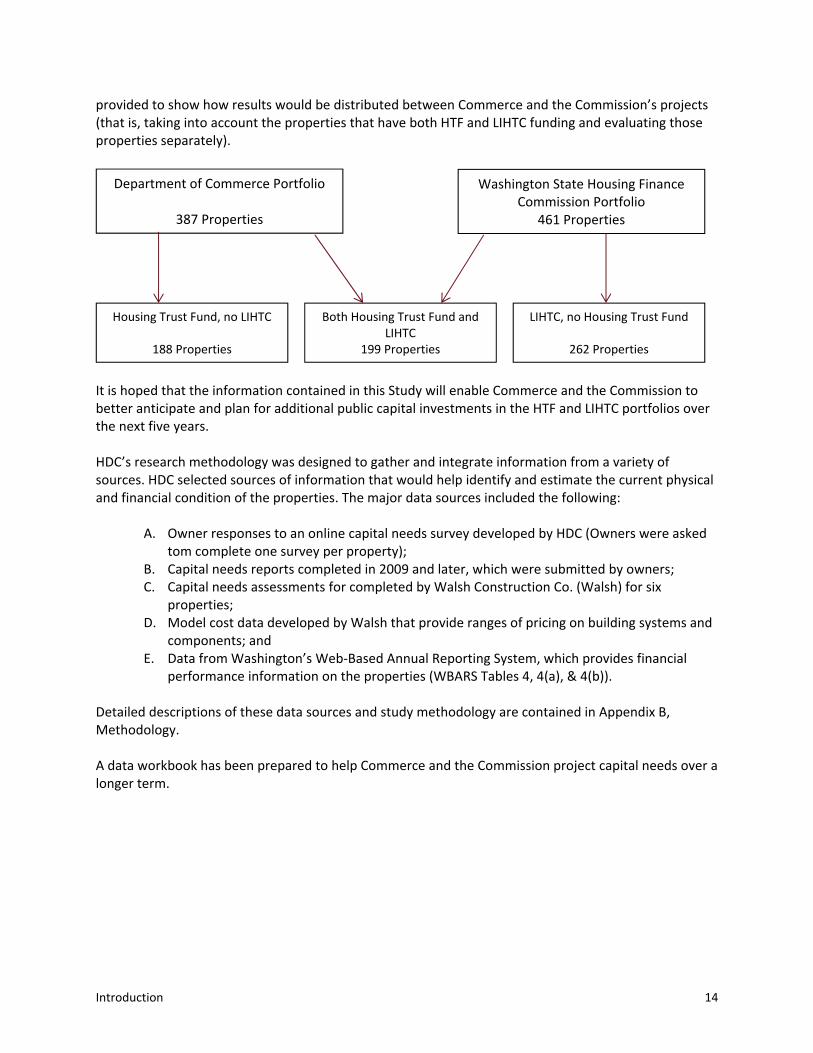
Executive Summary The Washington State Department of Commerce (Commerce) and Washington State Housing Finance Commission (the Commission) jointly commissioned Housing Development Center (HDC) to conduct the Washington State Affordable Housing Portfolio Study (the WSAHPS or the Study). The goal of the Study is to examine the need for additional capital investments in rental properties funded by the Housing Trust Fund (HTF) and Low Income Housing Tax Credit (LIHTC) programs. The Study focuses on the expected needs of Commerce’s and the Commission’s multifamily housing portfolios over the next five years. It also estimates the financial capacity of project owners to address those needs. Finally, the Study seeks to estimate resources required of Commerce and the Commission in order to preserve its investments in the stock of affordable housing. The state has invested HTF and LIHTC resources to help create or preserve over 1,656 properties across Washington, totaling over 78,000 units. Given limited study resources, Commerce and the Commission elected to focus this Study on those properties most likely to represent the bulk of needed reinvestment over the next five years. Consequently, the Study was limited to properties that are 10 or more years old and have 10 or more dwelling units, because it is assumed that this segment of the portfolio is most likely to have the greatest capital needs and capital needs costs per property. The Study also excluded emergency shelters, transitional housing and dormitory‐style projects such as seasonal farmworker housing. Though equally important to the state’s housing mission, these types of projects are distinct from typical multifamily projects and are less likely to have project resources to support their capital needs costs. This delineation by age, project size and project use yielded a Study universe of 649 properties containing approximately 38,000 units. Within this Study universe, the properties can be divided by agency: Commerce’s projects (with and without LIHTC), the Commission’s projects (with and without HTF), or by funding type (HTF only, LIHTC only, or both HTF and LIHTC). The Study found that overall, properties’ needs and their abilities to address those needs varied more significantly by funding type (HTF, LIHTC or both) than by agency. Therefore, this Study discusses the findings primarily by funding type, although additional information is provided to show how results would be distributed between Commerce and the Commission’s projects (that is, taking into account the properties that have both HTF and LIHTC funding and evaluating those properties separately).
Department of Commerce Portfolio
387 Properties
Washington State Housing Finance Commission Portfolio
461 Properties
Housing Trust Fund, no LIHTC
188 Properties
Both Housing Trust Fund andLIHTC
199 Properties
LIHTC, no Housing Trust Fund
262 Properties

Executive Summary 4
It is hoped that the information contained in this Study will enable Commerce and the Commission to better anticipate and plan for additional public capital investments in the HTF and LIHTC portfolios over the next five years.
Brief Note on HDC’s Research Methodology HDC’s research methodology was designed to gather and integrate information from a variety of sources. HDC selected sources of information that would help identify and estimate the current physical and financial condition of the properties. The major data sources included the following:
A. Owner responses to an online capital needs survey developed by HDC (owners were asked to complete one survey per property);
B. Capital needs reports completed in 2009 and later, which were submitted by owners; C. Capital needs assessments, completed by Walsh Construction Co. (Walsh), for six properties; D. Model cost data developed by Walsh that provide ranges of pricing on building systems and
components; and E. Data from Washington’s Web‐Based Annual Reporting System, which provides financial
performance information on the properties (WBARS Tables 4, 4(a), & 4(b)). Detailed descriptions of these data sources and study methodology are contained in Appendix B, Methodology. A data workbook has been prepared to help Commerce and the Commission project capital needs over a longer term.
The Physical Condition of Our Affordable Housing HDC estimates that the 649 properties in the Study universe are facing minimum capital costs and related soft costs of approximately $391 million for the five‐year period ending in 2019. This equates to an average of $10,330 per unit across the portfolio, which contains nearly 38,000 units. “Capital costs” refers to expenditures for the replacement or rejuvenation of major building systems such as roofs, heating and cooling mechanisms, elevators, etc. “Related soft costs” are the architecture, project management and other expenses involved with the above‐described work. HDC’s estimate includes an inflation factor to account for expected cost increases during the five‐year period. (These capital and soft costs are collectively referred to as Capital Needs Costs in this Study.) As shown below, properties financed by the HTF had the highest per‐unit capital needs, while LIHTC‐only projects had the lowest per‐unit capital needs, on average:

Executive Summary 5
Capital Needs Costs Per Property and Per Unit by Funding Source(s)
Funding Source
Capital Needs Costs Properties in Study Units in Study
Total % of Total Avg. Per Unit1 Count % of Study Count % of Study
HTF only $80,600,533 21% $13,921 188 29% 5,790 15%
LIHTC only $198,465,276 51% $9,226 262 40% 21,512 57%
Both $111,557,831 29% $10,610 199 31% 10,514 28%
Total $390,623,639 100% $10,330 649 100% 37,816 100%
Department of Commerce Portfolio: The 387 properties that were financed with HTF dollars (with or without LIHTCs) have about $192 million in Capital Needs Costs.
Washington State Housing Finance Commission Portfolio: The 461 properties that were financed with LIHTCs (with or without HTF) have about $310 million in Capital Needs Costs.
Compared to Commerce’s portfolio, the Commission’s portfolio has greater capital needs because it is larger (461 properties compared to 387 properties) and because it contains more units overall and more units per project, on average. Indeed, the Commission’s portfolio has almost twice as many units as Commerce’s portfolio: 32,026 units compared to 16,304 units. The average number of units per project in the Commission’s portfolio is 69, compared to 42 for Commerce’s portfolio.
Overlap of HTF and LIHTC projects: Since there are 199 properties that were funded with both HTF and LIHTC (representing $112 million in Capital Needs Costs), adding the numbers in the top two bullets together does not provide a portfolio total. 2
The Capital Needs Cost estimate for the Study universe was derived from a combination of known costs and extrapolated costs, explained in Appendix B, Methodology. The estimate is conservative because the Study methodology, consistent with internationally recognized American Society for Testing and Materials (ASTM) models, focused on major building systems and, unless specifically included by project owners, did not include elective upgrades (e.g., to increase energy efficiency) or the costs of routine interior upgrades. In addition, the Capital Needs Costs identified in the Study do not represent the total needs of the HTF and LIHTC portfolios. This is because, first, the Study excludes emergency shelters, transitional housing and dormitory‐style projects such as seasonal farmworker housing from the HTF portfolio; and, second, there may be some properties in the HTF or LIHTC portfolio that are less than 10 years old with “premature” capital needs, most typically due to construction defects or very limited rehabilitation completed at acquisition. The per‐unit averages are low, also, since there are a number of properties in
1 These average per‐unit numbers are based on the entire Study portfolio including properties with capital needs ranging from none to much higher than average. There are more detailed calculations provided below that focus on only those properties in the Study portfolio with projected Capital Needs Costs within the five‐year period. 2 To obtain the capital need number in the matrix above, one would subtract the jointly funded projects from the Commerce and Commission portfolio numbers: ($192 million plus $310 million minus $112 million equals @$390 million).

Executive Summary 6
each funding category that do not have capital needs. If those properties are excluded from the totals, the average Capital Needs Costs per project and per unit increase.
How Will Needed Improvements Be Paid For? Rent‐restricted affordable housing properties provide homes for more than 77,000 households across Washington. These properties represent a significant public investment by local, state and national funders. As with market‐rate properties, affordable housing building systems (roofs, siding, windows and heating systems, etc.) need replacement over time. However, affordable housing faces some unique challenges when it comes to paying for these improvements. With deed restrictions limiting rent increases, affordable housing owners cannot generally use market‐rate strategies such as property sales or large rent increases to fund long‐term capital needs (these deed restrictions may even survive the sale of properties). Furthermore, the restricted rents on affordable housing, intended to achieve an important affordability mission, also mean less cash flow from operations to support refinances or to directly pay for capital improvements. For properties targeted to very low‐income residents, restricted rents in combination with rising operating costs may result in gradually declining financial viability, even in well‐managed properties. Without sufficient routine maintenance and proper capital infusion, it is possible that significant portions of the public sector’s initial public investment, especially investments in those properties with the lowest rents serving the poorest households, will be lost. Although most affordable housing properties set aside reserves to address upcoming capital needs, this Study found that most of the properties in the study universe have insufficient reserves to meet expected capital needs over the next five years. In fact, only four percent of the properties have sufficient funds in their replacement reserves to cover 75% to 100% of projected capital needs. Another 25% of the properties have reserve funds sufficient to cover 25% to 50% of five‐year capital needs. The vast majority of the properties will need to rely on resources other than reserve funds to maintain the viability of the housing units. In addition to using property replacement reserves, if a property has high net operating income (due, for instance, to low existing debt levels) or if a property has a high current interest rate on one or more of its loans, refinancing the primary loan may be an option. HDC found that refinance is an option for about 228 properties—about 35% of the Study universe. However only 189 of these 228 properties can fully cover their capital needs through refinancing. For the remaining 89 properties, proceeds from refinancing would cover only a portion of the capital needs costs. For purposes of this estimate, the Study considered refinance as an option when the net proceeds from the refinance were greater than the Capital Needs Costs less replacement reserves. The Study found that projects funded with LIHTCs are more likely to be able use this refinancing strategy than are properties financed only with HTF dollars. Many HTF properties serve populations of 30% area median income (AMI) and below. With such low rental revenues, these properties are much less likely to have sufficiently high net operating income to support a refinancing that would cover their full Capital Needs Costs. This is true whether the properties’ fitness for refinancing is assessed from a valuation perspective or a net operating income perspective.

Executive Summary 7
The Role of Public Funders HDC estimates that the properties in the Study are facing a collective financing gap of approximately $201 million to address their five‐year (2015 – 2019) Capital Needs Costs. HDC modeled the amount that could be raised through property refinancing using a moderately conservative loan with a 15‐year loan term, a 30‐year amortization period and a 5.5% interest rate. For purposes of this analysis, Commerce, the Commission and HDC recognize that these loans would need to be refinanced again at the end of their 15‐year terms. Using these loan terms, HDC calculated that approximately $190 million could be raised by applying property reserves and funds from refinancing, where feasible, to address the properties’ capital costs and related expenses. The analysis assumes all existing must‐pay debt is retired. Subtracting the $190 million in funds that could be provided through property resources from the $391 million in five‐year (2015 – 2019) Capital Needs Costs results in a remaining need or gap of $201 million from other than property resources, as shown in the calculation below:
Financing Gap Assuming a 15‐
Year Loan
Capital Needs Costs $390,623,638
Property Resources ‐$189,744,995
Total Financing Gap $200,878,643
Given the larger number of units in the LIHTC portfolio, but higher capital needs and lower ability to realize capital from refinancing in the HTF‐only portfolio, the financing gap was found to be evenly distributed among HTF and LIHTC properties. The Study includes a detailed methodology and a description of the physical characteristics of the portfolios as appendices.
Preservation Strategies To meet the needs of low‐income Washington households, rents for affordable housing need to follow increases in incomes rather than mirroring overall increases experienced in the real estate market. Financing program requirements impose limits on annual rent increases. At most, rental revenues can increase as AMI limits rise. However, operating expenses are not restricted, and affordable housing properties age just as market properties do. Affordable housing owners are frequently squeezed between the competing objectives of keeping housing affordable for low‐income households and keeping it decent, safe and attractive. Both Commerce and the Commission have limited resources to assist with funding for capital improvements. Washington’s challenge is how to make the best use of the variety of tools available to preserve the state’s affordable housing. For the most part, both Commerce and the Commission are already employing the strategies described below. These strategies are described here to show the range of options available and how the options are being implemented.

Executive Summary 8
There may be properties, however, for which reinvestment is not feasible or desirable, likely due to a combination of project characteristics and market forces (for example, a substantially over‐leveraged property that has high capital needs in a weak market area). In such cases, Commerce and the Commission may choose not to invest additional funds, especially given that Washington’s resources could be better used to preserve other units that are in better condition physically, in a better location and do not have as many financial impediments to improved performance. Such properties may be candidates for transfer, sale or disposition by the project sponsor.
Strategies for Commerce’s HTF Portfolio Commerce has some flexibility in the recapitalization strategies it chooses to employ. However, Commerce’s options are constrained by the fact that the very low‐income population living in HTF properties pay rent amounts that do not generate sufficient surplus cash above annual operating expenses to cover long‐term capital expenses. Commerce is considering establishing a portfolio preservation program so that funding of preservation is not in direct competition with funding of new projects. Provided capital funds are available for this purpose, this strategy will help the state achieve both its goals of ensuring the existing portfolio is maintained while creating new units for unmet housing needs. In addition, specific components of an intentional, proactive preservation strategy could include:
Subordination of HTF debt. Leveraging private capital—using partial public funding to attract private dollars, where possible—is a key part of a preservation strategy. To do this will sometimes require subordination of HTF and other public debt. Subordination is a process by which a creditor is placed in a lower priority for the collection of its debt from its debtor’s assets. Generally, the creditor’s position remains subordinate whether the debt is collected from project cash flow or at the time of sale. Such a strategy will help owners meet loan‐to‐value requirements of private lenders, enabling existing projects to leverage private capital and therefore reducing the gap financing sought from public funders. Commerce regularly employs the strategy of debt subordination when new funds are being committed for capital improvements; however, this strategy only works for projects that have the financial capacity to support additional private debt payments.
Changing terms of HTF debt. Commerce has the discretion to defer must‐pay HTF loan payments. This strategy frees up net operating income to service additional private debt for capital improvement costs, and for building replacement reserve balances. Deferring required HTF loan payments would reduce the demand for new public dollars to fill the financing gap, though it would reduce loan repayment income to Commerce. Employing this strategy would require a public policy decision and a balanced approach, as Commerce depends on loan repayments to fund the operating costs of the HTF and to finance other non‐capital program activities.
Reinvestment with HTF. Another option is for the state legislature to commit new dollars to recapitalize existing projects within the HTF portfolio. Several states have established, or are considering establishing, set‐asides to fund the preservation of existing projects. Compared to new construction, this is typically a more cost effective approach for maximizing the supply of

Executive Summary 9
affordable housing, since the land is already owned. It also minimizes displacement of low‐income residents and disinvestment in communities across Washington.
Syndication through bundling smaller properties for LIHTC transactions. Smaller HTF properties can be “bundled” together so that the project achieves sufficient scale to be financed utilizing either 9% or 4% federal low‐income housing tax credits (LIHTCs). See the section below for more information on how 9% and 4% LIHTC projects can be structured.
Strategies for the LIHTC Portfolio The Commission oversees several sources of funds that may potentially be used in recapitalization projects. In general, LIHTC owners have greater capacity to manage recapitalization activities due to the larger size of their holdings and staff. The challenge the Commission faces is how best to deploy its resources to achieve both preservation and new production goals. However, innovative financing will not solve the preservation problem, since 9% LIHTC resources are limited and 4% LIHTC resources are best utilized in specific types and scopes of projects.
Use of 4% LIHTCs with bond financing. Increasingly, owners are using 4% LIHTCs accessed through the sale of tax‐exempt private activity bonds. LIHTC equity through a 4% transaction can cover between 25% and 35% of total project costs (including acquisition) based on what we know about typical previous deals. This represents a significant source of private financing to address capital needs without tapping into limited state and local public resources. Though this financing technique can be complex and costly, 4% LIHTCs are generally more readily available than 9% LIHTCs. Practically, there are some constraints on effectively using 4% LIHTCs. Generally, investors are seeking equity investment opportunities of at least $3 million per project. For properties undertaking rehabilitation work costing an average of $25,000 per unit, this requires at least 120 units to attract investors. For properties undertaking major rehabilitation (e.g., $65,000 in per‐unit costs), a stand‐alone property at 75 units may be viable, but will likely require additional public investment that is prohibitive. Bundling multiple properties into a single 4% LIHTC transaction is also a strategy being utilized by owners with multiple properties needing rehabilitation on a similar timeline.
New 9% LIHTC allocation. Competitive 9% LIHTCs are a significant source of funding for preservation projects, typically funding 75% or more of total renovation costs. Although use of the federally limited 9% LIHTC resource on preservation of existing affordable housing reduces LIHTC funds available for new production, the cost of rehabilitation is generally less than new construction. Therefore rehabilitation frequently uses less LIHTCs per unit than new production. Nine percent tax credits are a good resource for projects with high levels of capital needs, when use of 4% LIHTCs would leave a significant funding gap. As discussed in the “Strategies for Commerce’s HTF Portfolio” section, states are establishing, or considering establishing, set‐asides for preservation of existing projects. However, some states are adopting policies that target allocation of 9% LIHTC only to preservation projects which cannot preserve existing rent‐restricted housing through 4% LIHTC allocations and/or other resources. In recognition of the competing demands for the scarce 9% tax credit, in 2014 the Commission established a set‐aside of the 9% tax credit for preservation and recapitalization projects.

Executive Summary 10
Combining 4% and 9% LIHTCs. Some developers are combining 9% and 4% LIHTCs, particularly on larger properties, allowing owners to target these different LHTC models toward units that maximize the best of each financing strategy. Use of this financing structure requires dividing properties into separate ownership entities, which increases the complexity and transaction costs for projects. However, through this model, owners have used 9% LIHTCs on units with higher rehabilitation needs and/or lower rents, while using 4%s LIHTCs to address lower levels of rehabilitation on a higher number of higher‐rent units. This is a strategy that warrants some exploration as a recapitalization option for some properties.
Strategies Involving Local Funders A sound portfolio recapitalization strategy for both portfolios must take into account the role of local public funders in addressing the portfolios’ upcoming capital needs. Local government bodies, such as counties and municipalities, loan money to projects from their allocations of federal dollars and from other funding sources. The HTF and other local public funders often agree to defer their must‐pay debt, which increases the borrowing capacity of properties and, consequently, further reduces the properties’ financing gaps. A unified and coordinated approach to the preservation of affordable rental housing will continue to be an important part of the solution.
Strategies for Owners Over half of the properties in the Study universe are owned by entities with large portfolios, having 10 or more properties with funding from Commerce and/or the Commission. Owners with large portfolios are likely to the strong management and financial capacity required to undertake complex deal structuring activities. Owners with larger portfolios can move reserves among properties to match anticipated capital needs; this strategy could help delay refinancing or requests for gap financing from public funders. Owners with larger portfolios can also bundle properties, utilizing a common refinancing plan. Refinancing multiple properties at one time may reduce soft costs and allow for more favorable types of financing that are generally not feasible for small single‐property transactions. Bundling rehabs may create some economies of scale. Bundling may also allow a stronger property to support properties with financial challenges and/or inability to support additional debt.
Future Considerations There is a $201 million gap between known financing resources and the five‐year Capital Needs Costs of the projects examined in this Study. This gap can be covered only in part by the strategies discussed above; the larger part must be covered by new public resources or by reallocating existing public resources. The gap can be closed over time, but it should be noted that as properties in the portfolio age, other properties will have Capital Needs Costs that cannot be covered by project resources alone. Washington’s public funders should continue to explore strategies that will reduce this financing gap for new projects coming on‐line, including the following: Consider the life cycle costs of building elements, not just the upfront costs. Even though this Study did not find any predictive relationship between capital needs and any other factors except the number of years since a project was placed in service, there are building components that do not last as long as others. In assessing the cost of any one building component, it is important to not just consider its upfront cost, but its maintenance cost over the years and its replacement cost once it wears out.

Executive Summary 11
When underwriting new projects, use larger replacement reserve set‐aside amounts and (continue to) require that the replacement reserve deposits increase annually to keep up with inflation. Given that this Study found that a very small percentage of projects have adequate replacement reserves (only 8% will be able to cover 50% or more of their estimated capital costs through replacement reserves), it is important to reconsider underwriting and regulatory guidelines relative to annual replacement reserve deposits and increase the amounts that projects set aside for future capital needs. Funding replacement reserves at a level high enough to meet the whole of a project’s Capital Needs Costs is typically unrealistic; however, even a marginal increase to replacement reserve set‐aside amounts on new projects will improve the overall risk profile and financial health of Washington’s affordable housing portfolio. Balance the needs of projects with high financing gaps with the needs of projects with lower financing gaps to maximize the number of units of affordable housing that can be preserved. Commerce and the Commission will need to consider targeting scarcer public resources, such as 9% LIHTCs, toward projects with higher financing gaps. Given scarce resources, the needs of the projects, particularly high‐need projects may need to be spread out over time since they will utilize such significant public dollars. Commerce and the Commission will have to also balance high‐need populations and high‐need geographic areas. There may also be opportunities to nudge some developments toward longer‐term sustainability with smaller per‐project investments, given that, for 75% (275 of 365) of the projects with financing gaps, the gap is less than $600,000, and for almost two‐thirds the gap is less than $300,000. Recognize and acknowledge that affordable housing needs to be recapitalized periodically and does not have the same degree of access to private capital that market‐rate housing enjoys. With restrictions on both rent increases and the sale of properties, affordable housing owners cannot generally use market‐rate strategies such as property sales or large rent increases to fund long‐term capital needs. Furthermore, the restricted rents on affordable housing mean that less cash flow from operations and from replacement reserves is available to cover the properties’ long‐term Capital Needs Costs. Restricted rents, particularly for properties serving very low‐income residents, may result in gradually declining financial viability, even in well‐managed properties. It should be assumed that public dollars will be needed to recapitalize a portion of the state’s portfolio every year. Washington will need to set funds aside and reinvest them to preserve the existing housing.

Introduction 12
Introduction According to the National Housing Trust, for every new affordable home developed, two are lost due to deterioration, abandonment or conversion to more expensive housing.3 Affordable housing policymakers and practitioners have found that to maximize the supply of affordable housing, extending the useful life of existing housing through recapitalization/rehabilitation is, generally speaking, more cost‐effective than building new housing. After all, repairing or replacing worn‐out building systems in an existing structure often costs less than building a similar structure new, and does not require the purchase of expensive land. Maintaining the existing affordable housing supply is a critical piece of an overall strategy to meet the growing housing needs of Washington’s residents. Over the past 30 years, the State of Washington has supported the development of a large inventory of affordable housing, and a sophisticated industry has grown around it. Many affordable housing owners in Washington are at the forefront of the field nationally, and they have developed significant asset management capacity. Despite all of these successes, Washington faces many of the challenges that other states face in the effort to preserve existing affordable housing. One of the most critical challenges is how to maintain the physical condition of affordable housing properties so as to ensure they continue to provide high‐quality homes for low‐income residents. Publicly assisted affordable housing properties have unique challenges in paying for necessary capital improvements. Project revenues are restricted due to required rent limits, so owners are typically not able to pay for major repairs from cash flow. Moreover, owners are often unable to take out loans to finance rehabilitation because revenues are insufficient to service the debt. Though most affordable properties are required to make regular deposits into special savings accounts, known as replacement reserves, to save for repairs and replacements, these amounts are typically not adequate to cover the whole of these costs. Unlike affordable housing, market‐rate properties are often improved when the real estate changes hands. When an owner sells a non‐restricted property, the purchaser will commonly obtain financing to make needed repairs and upgrades and then increase rents to service the debt. Affordable properties are typically held by the same owner for a lengthy period, so required improvements must be financed in other ways. The Washington State Department of Commerce (Commerce) and Washington State Housing Finance Commission (the Commission) have a shared interest in the long‐term sustainability of the state’s inventory of affordable housing. Both entities provide necessary and critical resources for the development and preservation of affordable housing. Commerce awards moneys from the Housing Trust Fund (HTF), a State resource that provides capital financing to projects that provide housing to low‐income and special‐needs households. The Commission finances affordable housing using a variety of programs including the federal Low Income Housing Tax Credit program, which provides equity to developers, and through the issuance of tax‐exempt and taxable bonds. As part of their responsibilities, Commerce and the Commission oversee compliance obligations relating to both the physical condition and the long‐term affordability of the properties in their portfolios.
3 “Why Preserve Affordable Housing?” National Housing Trust, http://www.nhtinc.org/why_preserve_affordable_homes.php.

Introduction 13
Since 1987, together and separately, Commerce and the Commission have invested HTF and LIHTC resources in 1,656 properties totaling over 78,000 units across the state. As of 2015, over half of these units have been operating for more than a decade, and many of the properties will require some level of rehabilitation in the future in order to maintain their habitability. As with market‐rate rental housing, the eventual need for recapitalization is certain. However, because of self‐imposed and publicly mandated affordability restrictions affordable housing owners cannot rely on typical market recapitalization strategies of selling properties, instituting rent increases or taking on private debt to support these repairs. To prepare for the increasing needs of these properties, Commerce and the Commission are trying to anticipate what amount of public reinvestment owners will seek. A better understanding of the portfolios’ upcoming capital needs and ability to self‐finance those needs will assist Commerce and the Commission in prioritizing their future‐year resources. Commerce and the Commission jointly commissioned Housing Development Center (HDC) to conduct the Washington State Affordable Housing Portfolio Study (the WSAHPS or the Study). The goal of the Study is to examine the need for additional capital investments in rental properties funded by the HTF and LIHTC programs. The Study focused on the expected needs of Commerce’s and the Commission’s multifamily housing portfolios over the next five years. It also estimates the financial capacity of project owners to address those needs. Finally, the Study seeks to estimate resources required of Commerce and the Commission in order to preserve its investments in the stock of affordable housing. Specifically, the Study measured the properties’ current and projected capital needs costs over the next five years and compared these costs with the properties’ replacement reserve balances and their ability to raise additional loan proceeds. The difference between the available and needed proceeds is the financing gap for the portfolio. The financing gap represents the additional resources that may be needed from Commerce or the Commission in order to preserve their investments in the portfolio. The Study does not address the anticipated need for reinvestment over a term beyond five years, but the methodology applied here can be used to perform periodic updates to this Study’s estimates. Given limited Study resources, Commerce and the Commission elected to focus this Study on those properties most likely to represent the bulk of needed reinvestment over the next five years. The scope of the Study was limited to properties in the HTF and LIHTC portfolios that are 10 or more years old and have 10 or more dwelling units, because it is assumed that this segment of the portfolio will have the greatest capital needs and capital needs costs per property. The Study also excluded emergency shelters, transitional housing and dormitory‐style projects such as seasonal farmworker housing. Though important to the state’s housing mission, these types of projects are distinct from typical multifamily projects and are less likely to have project resources to support their capital needs costs. This delineation by age, project size and project use yields a Study universe of 649 properties containing approximately 38,000 units.4 Within this Study universe, the properties can be compared by agency (Commerce’s projects, with and without LIHTC versus the Commission’s projects, with and without HTF) and by funding type (HTF only, LIHTC only, or both HTF and LIHTC). The Study found that overall, properties’ needs and their abilities to address those needs varied more significantly by funding type (HTF, LIHTC or both) than by agency. Therefore, the Study discusses the findings primarily by funding type, although additional information is
4 Of the 649 properties in the Study universe, 387 properties are in the HTF portfolio and 461 are in the LIHTC portfolio. (There is an overlap of 199 properties which were funded with both HTF and LIHTC, as shown in the chart on the next page.)
Introduction 14
provided to show how results would be distributed between Commerce and the Commission’s projects (that is, taking into account the properties that have both HTF and LIHTC funding and evaluating those properties separately). It is hoped that the information contained in this Study will enable Commerce and the Commission to better anticipate and plan for additional public capital investments in the HTF and LIHTC portfolios over the next five years. HDC’s research methodology was designed to gather and integrate information from a variety of sources. HDC selected sources of information that would help identify and estimate the current physical and financial condition of the properties. The major data sources included the following:
A. Owner responses to an online capital needs survey developed by HDC (Owners were asked tom complete one survey per property);
B. Capital needs reports completed in 2009 and later, which were submitted by owners; C. Capital needs assessments for completed by Walsh Construction Co. (Walsh) for six
properties; D. Model cost data developed by Walsh that provide ranges of pricing on building systems and
components; and E. Data from Washington’s Web‐Based Annual Reporting System, which provides financial
performance information on the properties (WBARS Tables 4, 4(a), & 4(b)). Detailed descriptions of these data sources and study methodology are contained in Appendix B, Methodology. A data workbook has been prepared to help Commerce and the Commission project capital needs over a longer term.
Department of Commerce Portfolio
387 Properties
Washington State Housing Finance Commission Portfolio
461 Properties
Housing Trust Fund, no LIHTC
188 Properties
Both Housing Trust Fund andLIHTC
199 Properties
LIHTC, no Housing Trust Fund
262 Properties

The Physical Condition of Our Affordable Housing 15
The Physical Condition of Our Affordable Housing The Cost to Preserve Our Affordable Housing HDC estimates that the 649 properties in the Study universe5 are facing minimum capital costs and related soft costs of approximately $391 million for the five‐year period ending in 2019. This equates to an average of $10,330 per unit across the portfolio, which contains nearly 38,000 units. “Capital costs” refers to expenditures for the replacement or rejuvenation of major building systems such as roofs, heating and cooling mechanisms, elevators, etc. “Related soft costs” are the architecture, project management and other expenses involved with the above‐described work. HDC’s estimate includes an inflation factor to account for expected cost increases during the five‐year period. (These capital and soft costs are collectively referred to as Capital Needs Costs in this Study.) As shown below, the properties financed by the HTF had the highest per unit capital needs, while LIHTC only projects had the lowest per‐unit capital needs, on average:
Capital Needs Costs Per Property and Per Unit by Funding Source(s)
Funding Source
Capital Needs Costs Properties in Study Units in Study
Total % of Total Avg. Per Unit6 Count % of Study Count % of Study
HTF only $80,600,533 21% $13,921 188 29% 5,790 15%
LIHTC only $198,465,276 51% $9,226 262 40% 21,512 57%
Both $111,557,831 29% $10,610 199 31% 10,514 28%
Total $390,623,639 100% $10,330 649 100% 37,816 100%
Department of Commerce Portfolio: The 387 properties that were financed with HTF dollars (with or without LIHTCs) have about $192 million in Capital Needs Costs.
Washington State Housing Finance Commission Portfolio: The 461 properties that were financed with LIHTCs (with or without HTF) have about $310 million in Capital Needs Costs.
Overlap of HTF and LIHTC projects: Since there are 199 properties that were funded with both HTF and LIHTC (representing $112 million in Capital Needs Costs), adding the numbers in the two bullets above does not provide a portfolio total.7
5 The Study universe properties in the HTF and LIHTC portfolios that are 10 or more years old with 10 or more units. 6 These average per unit numbers are based on the entire Study portfolio of properties including properties with capital needs ranging from none to much higher than average.. The average per unit could understate (or overstate) the amount of Capital Needs Cost for any one particular unit in the Study, There are more detailed calculations provided below that on only those properties in the Study portfolio with projected Capital Needs Costs within the five‐year period 7 To obtain the capital need number in the matrix above, one would subtract the jointly funded projects from the Commerce and Commission portfolio numbers: ($192 million plus $310 million minus $112 million equals @$390 million).
The Physical Condition of Our Affordable Housing 16
Compared to Commerce’s portfolio, the Commission’s portfolio’s has greater capital needs because it is larger (461 properties compared to 387 properties) and because it contains more units overall and more units per project, on average. Indeed, the Commission’s portfolio has almost twice as many units as Commerce’s portfolio: 32,026 units as compared to 16,304 units. The average number of units per project in the Commission’s portfolio is 69, compared to 42 for Commerce’s portfolio. (These averages include the 199 properties that overlap the two portfolios. Averaging the units in the Commission’s and Commerce’s portfolios only would result in an 82 average unit size per LIHTC‐only project in the Commission’s portfolio and a 31 average unit size per HTF‐only project in Commerce’s portfolio.)
The $391 million estimate is for current and anticipated Capital Needs Costs for the 649 properties in the combined HTF and LIHTC portfolios. This estimate was derived from a combination of known costs and extrapolated costs, explained in Appendix B, Methodology. The estimate is conservative because the Study methodology, consistent with internationally recognized American Society for Testing and Materials (ASTM) models focused on major building systems and, unless specifically included by project owners, did not include elective upgrades (e.g., to increase energy efficiency) or the costs of routine interior upgrades that are customarily handled through funding from operations. In addition, this Study finding does not represent the total Capital Needs Costs of the HTF and LIHTC portfolios. This is because, first, the Study excludes emergency shelters, transitional housing and dormitory‐style projects, such as seasonal farmworker housing from the HTF portfolio; and, second, there may be some properties in the HTF or LIHTC portfolio that are less than 10 years old with “premature” capital needs, most typically due to construction defects or very limited rehabilitation completed at acquisition. The per‐unit averages should also be considered to be low, since there are a number of properties in each funding category that do not yet have capital needs. If those properties are excluded from the totals, the average Capital Needs Costs per project and per unit increase.
HTF and LIHTC Capital Needs Costs As shown in the table above, the average per unit cost for HTF projects is higher than the average per unit cost for LIHTC projects. There are several possible reasons for this. HDC ran a multiple regression equation to investigate whether there is any relationship between funding source and capital cost estimates8. The model found that properties funded only by HTF (without LIHTCs) had 39% higher total costs per unit when compared to properties with LIHTCs. Further investigation showed that the difference in capital needs costs across funding sources is attributable to the difference in average project size (that is, LIHTC properties have a greater number of units, on average). The average size of an HTF project is 31 units, compared to 82 units for a LIHTC project. Smaller projects have fewer units over which to spread fixed costs. Smaller projects also have proportionately more building envelope area which results in higher exterior costs per unit. Conversely, LIHTC‐funded projects have higher total capital needs costs than HTF funded projects primarily because there are more projects and substantially more units funded with LIHTCs within the study group.
8 The regression equation is provided in Appendix B: Methodology.
The Physical Condition of Our Affordable Housing 17
Properties without Anticipated Capital Needs through 2019 HDC found that a subset of the HTF and LIHTC portfolios did not have any capital needs and prepared an estimate that a total of 155 properties (approximately 9,300 units) in the 649‐property Study universe will not require capital investments in the next five years. To calculate this portfolio estimate, HDC started with the Capital Needs Survey responses, which indicated that 74 out of the 310 properties for which HDC received responses are not expected to have capital needs requiring attention in the next five years. This is equal to 24% of the 310 properties. To estimate the number of properties in the remaining 339 properties in the Study universe that may not have five‐year Capital Needs Costs, HDC applied the 24% factor to these properties. Approximately 81 additional properties in this portion of the Study universe are assumed to not have five‐year capital needs. The portions of properties without five‐year Capital Needs Costs in the two segments of the portfolio were added together to obtain the 155 property estimate for the entire portfolio.
Study Focus – Properties with Capital Needs The remainder of the Study findings and the discussion below focus on the portion of the portfolio (76% of the portfolio, representing 494 properties and 28,495 units) that are expected to have capital needs through 2019.
Per‐Project and Per‐Unit Costs Excluding the properties without capital needs results in an average Capital Needs Costs of $801,000 per property and $16,000 per unit. The costs include hard construction costs, construction contingency and soft development costs, and are adjusted for inflation.

The Physical Condition of Our Affordable Housing 18
The table above shows that over 50% of the projects with capital needs have Capital Needs Costs of less than $500,000 per project and approximately 70% of the projects with capital needs have Capital Needs Costs of less than $750,000 per project. Many of the projects with Capital Needs Costs of under half a million dollars are small properties. The average property size of projects with less than $500,000 in Capital Needs Costs is 27 units, as compared to an average property size of 58 units for all 649 projects. The average per‐unit amounts are lower than what is typically seen in a full rehabilitation because some of the projects do not have capital needs in the next five years that are sufficient to justify a full rehabilitation. Smaller total Capital Needs Costs can frequently be addressed without the complexity and consequent soft costs that come with assembling equity and debt, whereas larger Capital Needs Costs cannot. Some sponsors with limited project costs may also elect to defer capital investments until more comprehensive rehabilitation can be undertaken. About 80% of projects funded through Commerce are facing Capital Needs Costs of less than $750,000 per project for the five‐year time period. About 65% of projects funded by the Commission have Capital Needs Costs of less than $750,000, yet LIHTC projects have a broader range of per‐project Capital Needs Costs. Thirty‐four (34) LIHTC properties (7% of the LIHTC portfolio) have Capital Needs Costs of more than $2 million in the next five years, while 18 HTF properties (5% of the HTF portfolio) have Capital Needs Costs of more than $2 million in that same time frame.
3043 40
9 15 91
26
5137
17
41
25 3
55
48
23
9
7
41
0
20
40
60
80
100
120
140
160Number of Projects
Capital Needs Costs per Project
Number of Projects per Funding Source by Capital Needs per Project
HTF
LIHTC
Both
n=494

The Physical Condition of Our Affordable Housing 19
Approximately 72% of the portfolio had Capital Needs Costs of between $10,000 and $20,000 per unit, and 88% of the portfolio had Capital Needs Costs of up to $20,000 per unit. A much smaller proportion of the portfolio (11%) had Capital Needs Costs between $20,000 and $80,000 per unit, and an even smaller proportion of the portfolio (less than 1%) had Capital Needs Costs between $80,000 and $300,000 per unit. Also, although most HTF projects have smaller Capital Needs Costs per project (compared to LIHTC projects), the per‐unit costs are significantly higher due to distributing the costs over a relatively smaller number of units. There are four HTF projects with per‐unit Capital Needs Costs greater than $80,000. HTF projects have higher per‐unit Capital Needs Costs, but, because they have, on average, fewer units than LIHTC projects, the cost per HTF project is lower.
Analysis to Determine Which Factors Affect Costs HDC ran regression analyses to estimate the relationship between Capital Needs Costs and several factors, including funding source, project size, placed‐in‐service (PIS) date, location, average cash flow per unit, project type (new construction or acquisition/rehab) and others. A full list of factors and regression techniques used is included in Appendix B: Methodology. Generally, a regression analysis is a statistical process for estimating the relationships among variables. It allows researchers to model and analyze several variables, while focusing on the relationship between a dependent variable and one or more independent variables. A regression analysis helps us understand how the typical value of the dependent variable changes when any one of the independent variables is varied, while the other independent variables are held fixed. A regression analysis shows correlations among variables, but does not define causation.
33
9321
123
165
11
024
98
22
3
0
50
100
150
200
250
300
350
400
<$10,000 $10k‐$20k $20k‐$80k $80k‐$300k
Number of Projects
Capital Needs Costs per Unit
Number of Projects per Funding Source by Capital Needs Cost per Unit
HTF
LIHTC
Both
n=494

The Physical Condition of Our Affordable Housing 20
Based on the regression models, HDC found that the strongest predictor of whether property owners are likely to be able to cover their outstanding and upcoming capital expenses is the number of years since placed in service. This is not a surprising finding. As building systems and components age they approach the end of their expected useful lives and need to be replaced, incurring costs. This Study did not find any predictive relationship between capital needs and other factors, such as number of units, owner portfolio size, location and funding source. Number of years since a major capitalization is the most highly correlated factor of those examined. This finding suggests that the need for recapitalization is standard in publicly assisted affordable housing, just as it is in market‐rate housing. As properties age, they will require rehabilitation, regardless of any mitigating circumstances. However, market‐rate housing does not face the same challenges as affordable housing. Market‐rate housing is able to appraise at a higher value because it is not revenue‐restricted; therefore, owners of market‐rate housing typically sell or refinance in order to address capital needs. Owners of affordable housing typically do not have these options because of long‐term restrictions placed on the properties by funders, which have the dual effect of reducing appraisal values and limiting cash flow available for property improvements. The multiple regressions also found that for each additional unit of bedroom density9, capital costs per unit increase by 34%. Again, it is not surprising that units with more bedrooms will tend to have higher costs. See the Methodology appendix for more description of the regression findings.
9 Bedroom density is defined in this Study as the average number of bedrooms per unit in a property.

How Will We Pay for Needed Improvements? 21
How Will We Pay for Needed Improvements? Rent‐restricted affordable housing properties provide homes for more than 77,000 households across Washington. These properties represent a significant public investment by local, state and national funders. As with market‐rate properties, affordable housing building systems (roofs, siding, windows and heating systems, etc.) need replacement over time. However, affordable housing faces some unique challenges when it comes to paying for these improvements. With deed restrictions limiting rent increases, affordable housing owners cannot generally use market rate strategies such as property sales or large rent increases to fund long‐term capital needs (these deed restrictions may even survive the sale of properties). Furthermore, the restricted rents on affordable housing, intended to achieve an important affordability mission, also mean less cash flow from operations to support refinances or to directly pay for capital improvements. For properties targeted to very‐low income residents, restricted rents in combination with rising operating costs may result in gradually declining financial viability, even in well‐managed properties. Without sufficient routine maintenance and proper capital infusion, it is possible that significant portions of the public sector’s initial public investment, especially investments in those properties with the lowest rents serving the poorest households, will be lost. Although most affordable housing properties set aside reserves to address upcoming capital needs, this Study found that most of the properties in the study universe have insufficient reserves to meet expected capital needs over the next five years. In fact, only four percent of the properties have sufficient funds in their replacement reserves to cover 75% to 100% of projected capital needs. Another 25% of the properties have reserve funds sufficient to cover 25% to 50% of five‐year capital needs. The vast majority of the properties will need to rely on other resources other than reserve funds to maintain the viability of the housing units. In addition to property replacement reserves, if a property has high net operating income (due, for instance, to low existing debt levels) or if a property has a high current interest rate on one or more of its loans, refinancing the primary loan may be an option. HDC found that refinance is an option for about 228 properties–about 35% of the Study universe. However only 189 of these 228 properties can fully cover their capital needs through refinancing. For the remaining 89 properties, proceeds from refinancing would cover only a portion of the capital needs costs. For purposes of this estimate, the Study considered refinance as an option when the net proceeds from the refinance were greater than the Capital Needs Costs less replacement reserves. The Study found that projects funded with LIHTCs are more likely to be able use this refinancing strategy than are properties financed only with HTF dollars. Many HTF properties serve populations of 30% area median income (AMI) and below. With such low rental revenues, these properties are much less likely to have sufficiently high net operating income to support a refinancing that would cover their full Capital Needs Costs. This is true whether the properties’ fitness is assessed from a valuation perspective or a net operating income perspective. There are several potential sources of funds to pay for needed improvements to a given property. These sources include the property’s replacement reserves, surplus cash flow and loan proceeds from refinancing the property. Of course, the circumstances of different properties will vary depending upon the cost of repairs, the balance of replacement reserve accounts, operating cash flow, property valuation based on restricted rents, and credit worthiness of the property owner. We expect that owners will first utilize their own resources before seeking assistance from the state or other public
How Will We Pay for Needed Improvements? 22
agencies. Thus, the estimated $391 million in Capital Needs Costs will not be borne by the public sector alone. The following is a closer look at the sources of funds for capital improvements.
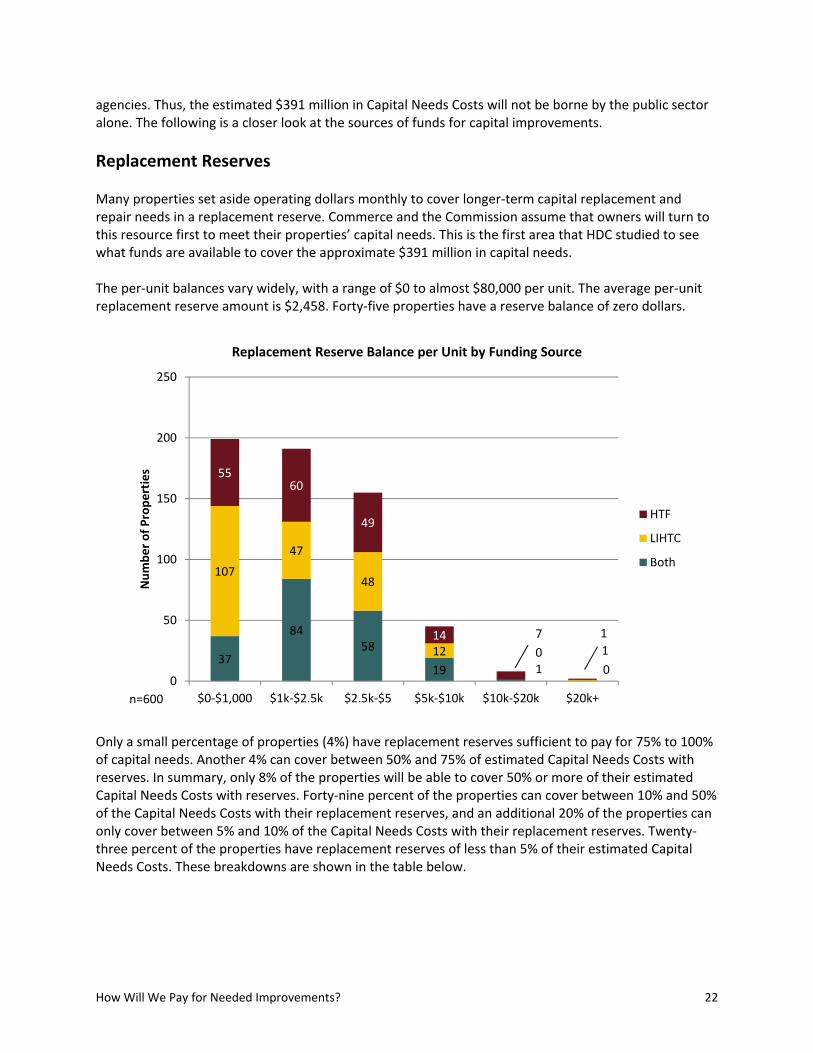
Replacement Reserves Many properties set aside operating dollars monthly to cover longer‐term capital replacement and repair needs in a replacement reserve. Commerce and the Commission assume that owners will turn to this resource first to meet their properties’ capital needs. This is the first area that HDC studied to see what funds are available to cover the approximate $391 million in capital needs. The per‐unit balances vary widely, with a range of $0 to almost $80,000 per unit. The average per‐unit replacement reserve amount is $2,458. Forty‐five properties have a reserve balance of zero dollars.
Only a small percentage of properties (4%) have replacement reserves sufficient to pay for 75% to 100% of capital needs. Another 4% can cover between 50% and 75% of estimated Capital Needs Costs with reserves. In summary, only 8% of the properties will be able to cover 50% or more of their estimated Capital Needs Costs with reserves. Forty‐nine percent of the properties can cover between 10% and 50% of the Capital Needs Costs with their replacement reserves, and an additional 20% of the properties can only cover between 5% and 10% of the Capital Needs Costs with their replacement reserves. Twenty‐three percent of the properties have replacement reserves of less than 5% of their estimated Capital Needs Costs. These breakdowns are shown in the table below.
37
8458
19 1 0
107
47
48
12 0 1
5560
49
14 7 1
0
50
100
150
200
250
$0‐$1,000 $1k‐$2.5k $2.5k‐$5 $5k‐$10k $10k‐$20k $20k+
Number of Properties
Replacement Reserve Balance per Unit by Funding Source
HTF
LIHTC
Both
n=600

How Will We Pay for Needed Improvements? 23
Percentage of properties with sufficient replacement reserves to pay for 75% – 100% of capital needs 4%
Percentage of properties with sufficient replacement reserves to pay for 50% – 75% of capital needs 4%
Percentage of properties with sufficient replacement reserve to pay for between 10% – 50% of capital needs 49%
Percentage of properties with sufficient replacement reserve to pay for between 5% – 10% of capital needs 20%
Percentage of properties with sufficient replacement reserves to pay for 5% or less of capital needs 23%
Clearly, replacement reserves alone will not be sufficient to pay for the properties’ capital improvements. To determine reserve balances, HDC started with owners’ responses to the Capital Needs Survey. Replacement reserve balances for 283 properties as of May 2014 were provided by owners. For the remainder of the properties, HDC used the 2013 replacement reserve ending balances from the Web‐Based Annual Report System (WBARS), a system used to submit annual project reports to both Commerce and the Commission. (According to the data in WBARS, 45 properties have a zero replacement reserve balance.) There was no data provided by owners or available in WBARS on replacement reserve balances on 49 of the properties. Thus, HDC has replacement reserve balance information for 600 properties in the Study sample.
The chart above contains information about 527 properties, which is the number of properties with capital needs and for which HDC has replacement reserve balance data.
Refinancing with Private Debt By refinancing existing loans and taking advantage of lower interest rates, some property owners may obtain additional funds to help pay Capital Needs Costs. For affordable housing properties, the ability to take on new debt is constrained by net operating income (revenues less operating expenses) and by
2032
64
39
9 8
5744
41
34
7 3
4531
45
33
4 11
0
20
40
60
80
100
120
140
160
Less than 5% 5%‐10% 10%‐25% 25%‐50% 50%‐75% 75%‐100%
Number of Properties
Replacement Reserve Balance as a Percent of Capital Needs Costs by Funding Source
HTF
LIHTC
Both
n=527

How Will We Pay for Needed Improvements? 24
loan‐to‐value requirements since appraisers use net operating income in the income method of valuation. Since both methods of determining how much new debt a property can take on tie back to net operating income, for the purposes of the modeling in this Study, HDC assumed that debt coverage ratios will be the limiting factor in obtaining new debt. Many of the properties in the Study (44% or 244 out of 557) were shown to have the ability to service less than $50,000 in debt annually. A further breakdown indicates that 158 of these 244 properties have the ability to service less than $25,000 in debt annually. The remaining 86 properties have the ability to service between $25,000 and $49,999 in debt annually. Properties funded by LIHTCs tend to have more cash available to service debt than properties funded by HTF. Fifty‐five properties did not have sufficient net operating income in the last two years to model a refinancing scenario. Twenty‐eight of those properties were funded with HTF only, 25 were funded with both HTF and LIHTCs, and two were funded with LIHTCs only.
HDC analyzed opportunities to refinance the existing debt on properties for the purpose of taking out equity to pay for capital needs. To estimate the ability of properties in the Study to realize additional capital through refinancing, HDC used the average net operating income over the last two years, as reported in WBARS, and an initial debt coverage ratio of 1.20 to size potential new loans. This process is detailed in the Methodology appendix. After determining the amount of debt that the properties could service based on average net operating income, HDC chose a moderately conservative loan product to estimate the ability of properties to realize additional capital through refinancing. Current conventional multifamily mortgage terms are roughly 6% for a 30‐year fixed‐rate loan; however, many owners are using shorter‐term or variable‐rate loan products to refinance for smaller
0
50
100
150
200
250
<$50k $250k $500k $750k $1m+
Number of Properties
Annual Amount Available to Service Debt* by Funding Source
HTF
LIHTC
Both
* at 1.20 debt coverage ratio

How Will We Pay for Needed Improvements? 25
improvement projects or to improve net cash flow10. Given the range of loan products available (ranging from 30‐year to 10‐year loan terms and with higher to lower interest rates dependent upon the loans’ terms, HDC chose to model the amount that could be raised through property refinancing using a loan with a 15‐year loan term, a 30‐year amortization period and a 5.5% interest rate. For the purposes of this analysis, HDC assumed that the properties would refinance the loan balloon due at the end of the 15‐year loan term with a loan with comparable terms.
Surplus/Gap Analysis HDC estimates that the properties in the Study are facing a collective financing gap of approximately $201 million to address their five‐year (2015 – 2019) Capital Needs Costs. HDC calculated the ability of each property to pay for its Capital Needs Costs. Sources of funds for this calculation are the new potential loan amount and the replacement reserve balance. Uses of funds are the “must‐pay” debt balances that must be paid off in refinancing and the capital needs costs. This analysis determined whether refinancing could generate any equity to pay for Capital Needs Costs. The sources and uses of funds chart below depicts the surplus/gap analysis used:
Surplus/Gap Analysis
Sources
New Loan Based on DCR (A)
Replacement Reserves (B)
Uses
Existing Must‐Pay Debt (C)
Capital Needs Costs (D)
Net Proceeds (A + B) – (C + D) = Surplus or (Gap)
Findings from this analysis may be found in the following Financing Gap section.
Projects’ Ability to Refinance HDC found that refinancing is a potential option for 228 properties, or 35% of the total properties in the Study and 46% of the properties in the Study with capital needs anticipated in the next five years. Refinance is considered an option when the Net Proceeds from the Surplus/Gap Analysis shown above are greater than the capital needs costs less replacement reserves. This finding is an estimate only, as there may be extenuating circumstances making refinancing infeasible that are beyond the scope of this Study. Of the 228 properties that have the capacity to refinance, proceeds from refinance covers the full Capital Needs Costs for 139 properties. For the remaining 89 properties, proceeds from refinancing cover only a portion of the Capital Needs Costs.
10 Also, bond financing and FHA‐insured loans often generate interest rates below conventional loans, and some owners will
likely refinance with tax‐exempt bonds in order to access equity through 4% LIHTCs. These additional options indicate that this refinancing analysis is slightly conservative (i.e., more properties may be able refinance with slightly better terms).

How Will We Pay for Needed Improvements? 26
HDC modeled the amount that could be raised through properties’ refinancing using a moderately conservative loan with a 15‐year loan term, a 30‐year amortization period and a 5.5% interest rate. For the purposes of this analysis, HDC assumed that the properties would refinance the loan balloon due at the end of the term at year 15 with a loan with comparable terms. Projects with low must‐pay debt balances and those with high net operating income are the most likely to be able to use refinancing as a strategy for securing private funding for Capital Needs Costs. Projects funded with LIHTCs are more likely to be able to refinance in order to address capital needs.
Funding Source
Properties with Ability to Refinance
Total Properties
Properties with Ability to Refinance as a Percentage of Total Properties
HTF 45 188 24%
LIHTC 121 262 46%
Both 62 199 31%
Total 228 649 35%
It would be reasonable to assume that older projects would have paid down enough principal on must‐pay debt that they would be able to take out equity. In fact, the opposite appears to be the case: the older the project, the less likely it is to be able to be refinanced. Within the Study universe, projects that were placed in service 10‐14 years ago (the most recent category of projects) are most likely to be able to refinance to raise capital for Capital Needs Costs. Greater age does not seem to be associated with a greater ability to refinance.
Years since Placed in Service for Properties with Ability to Refinance
Years Since Placed in Service (PIS)
HTF LIHTC Both Total
Count % of HTF Projects
Count % of LIHTC
ProjectsCount
% of Both Projects
Count % of All Projects
10‐14 years 9 20% 59 49% 39 63% 107 47%
15‐19 years 21 47% 52 43% 20 32% 93 41%
20‐24 years 10 22% 9 7% 3 5% 22 10%
25+ years 5 11% 1 1% 0 0% 6 2%
Total 45 100% 121 100% 62 100% 228 100%
Number of units does not demonstrate a consistent correlation with the ability to realize new capital through refinancing, indicating other factors likely override the expected advantage of project scale. While larger projects funded with LIHTCs are more likely to realize new capital through refinancing private must‐pay debt, the same does not hold true for projects funded with HTF, as shown in the table below. Likely factors such as level of capital needs, bedroom density or targeted rent levels may be overriding the expected impact of project size.

How Will We Pay for Needed Improvements? 27
Size of Properties with Ability to Refinance
Number of Units
HTF LIHTC Both Total
Count % of HTF in
unit categoryCount
% of LIHTC in unit category
Count % of Both in
unit category Count
% of All in unit
category
10 ‐ 29 27 60% 14 12% 18 29% 59 26%
30 ‐ 59 16 36% 36 30% 27 44% 79 35%
60 ‐ 89 1 2% 15 12% 3 5% 19 8%
90 ‐ 119 0 0% 10 8% 5 8% 15 7%
120 + 1 2% 46 38% 9 15% 56 25%
Total 45 100% 121 100% 62 100% 228 100%
Properties with No Gap HDC estimates that approximately 44% of the 649 properties in the Study universe will be able to pay for their Capital Needs Costs in the next five years through project‐generated resources. Almost 24% of the Study universe of properties is expected to have little to no major capital expenses through 2019, while another 20% should be able to cover the Capital Needs Costs through use of reserves and/or refinancing. These properties have property resources (the $190 million total cited above) sufficient to meet their Capital Needs Costs. Listed below is the expected number of properties by funding source expected to have no gap and require no additional public funds in the next five years. (Calculations assume a loan with a 15‐year term, 30‐year amortization period and a 5.5% interest rate, as described above.)
Funding Source
Projects Without Capital Needs Costs
Projects With Capital Needs Costs but No Gap
Count Percent Count Percent
HTF only 36 23% 27 21%
LIHTC only 63 41% 74 57%
Both 56 36% 28 22%
Total 155 100% 129 100%
As discussed earlier in this report, projects with LIHTCs represent approximately 71% of the total properties in the Study, while HTF properties with no LIHTCs represent 29%. Therefore, as shown above, a higher percentage of LIHTC properties, as compared to HTF properties, are estimated to have the resources to pay for their Capital Needs Costs over the next five years. About 45% of properties funded with LIHTCs are expected to have the resources to cover their five‐year Capital Needs Costs, compared to just over a quarter of properties funded with HTF.

The Role of Public Funders 28
The Role of Public Funders Commerce, the Commission and HDC chose to model the amount that could be raised through property refinancing using a moderately conservative loan with a 15‐year loan term, a 30‐year amortization period and a 5.5% interest rate, and assuming a standard 1.20 debt service coverage ratio. For the purposes of this analysis, HDC assumed that the properties would refinance the loan balloons due at the end of 15 years with a loan with comparable terms. Using these loan terms, HDC calculated that a net amount of approximately $190 million could be raised by applying property reserves and funds from refinancing (net of retiring all existing must‐pay debt) to the properties’ Capital Needs Cost estimates. Subtracting the $190 million in funds that could be provided through property resources from the $391 million in five‐year (2015 – 2019) Capital Needs Costs results in a gap of $201 million, as shown in the calculation below:
Financing Gap Assuming a 15‐
Year Loan
Capital Needs Costs $390,623,638
Property Resources ‐$189,744,995
Total Financing Gap $200,878,643
Therefore, this Study estimates that the properties in the Study are facing a collective financing gap of approximately $201 million to address their five‐year (2015 – 2019) Capital Costs. This financing gap represents a need for public reinvestments of approximately $550,000 per project, or approximately $12,500 per unit11. The average is for those properties in the Study universe that have Capital Needs Costs in the next five years and also have a financing gap after replacement reserves and proceeds from the modeled refinancing scenario are taken into account.
11 If this financing gap were averaged across the full 649 project Study universe, the per project and per unit amounts would be
lower.

The Role of Public Funders 29
Funding Source
Study Universe Properties with NoCapital Needs Costs
Properties with Capital Needs Costs but No Gap
Properties with Capital Needs Costs and Gap
Count Percent Count Percent Count Percent Count Percent
HTF only 188 29% 36 23% 28 22% 124 34%
LIHTC only 262 40% 63 41% 74 57% 125 34%
Both 199 31% 56 36% 27 21% 116 32%
Total 649 100% 155 100% 129 100% 365 100%
Financing Gap for HTF and LIHTC Projects The financing gap was found to be evenly distributed among HTF and LIHTC properties, according to each funding sources’ share of properties in the Study universe.
Department of Commerce Portfolio: The 387 properties that were financed with HTF (with or without LIHTCs) have a financing gap of approximately $121 million.
Projects with Capital Needs Costs and Gap
56%
Projects with Capital Needs Costs but No
Gap20%
Projects with No Capital Needs Costs
24%
Properties' Ability to Cover Capital Needs
63 properties
56 props.
HTF only
LIHTC only
Both
124 properties
125 properties
116 properties
28 props.
74 properties
27 props.
36 props.

The Role of Public Funders 30
Washington State Housing Finance Commission Portfolio: The 461 properties that were financed with LIHTCs (with or without HTF) have a financing gap of approximately $145 million.
Jointly Funded HTF and LIHTC projects: The 199 properties in the Study that were financed with both HTF and LIHTC have a financing gap of approximately $65 million. (Since this is the overlapping portion of Commerce and the Commission’s portfolios, subtracting this $65 million from the numbers in the two bullets above provides the portfolio total.)
Funding Source (% of Study)
Financing Gap Assuming a15‐Year Loan
Gap % of Total
HTF 29% $55,618,747 28%
LIHTC 40% $79,712,887 40%
Both 31% $65,547,010 33%
Total 100% $200,878,643 100%
About 75% of the properties with a gap (275 of the 365 properties with a gap) have a five year (2015 through 2019) financing gap of less than $600,000; almost two‐thirds (177 properties) have a gap less than $300,000. Of the remaining 90 properties, most of the properties’ gaps are clustered between $600,000 and $2 million. There are 50 projects, or 14% of the properties with a financing gap, with a gap of greater than $1 million. A gap as high as this can only be met by a complete project recapitalization.
The above chart shows the financing gaps for 365 properties. This is the number of properties with Capital Needs Costs in the next five years that also have a financing gap. In other words, of the 494
1117
25
814 17
3
4
2 3 12 3 1
9
19
21
16 812
8
3
1 4
15
5 3
23
23
29
87
8
6
3
1 2
7
1 3
0
10
20
30
40
50
60
70
80
Number of Properties
Properties with Capital Needs and Financing Gap by Size of Gap
HTF
LIHTC
Both
n=365
The Role of Public Funders 31
properties with Capital Needs Costs, 365 have a financing gap after replacement reserves and proceeds from the modeled refinancing scenario are taken into account.
Financing Gap for the HTF Portfolio Of the 387 properties in the Study universe funded by the HTF (with and without LIHTCs), 240 (62%) are estimated to need gap financing in the next five years. Fifty‐five properties (14%) are estimated to be able to cover their anticipated costs, and 92 properties (about 24%) are not expected to have Capital Needs Costs prior to 2019. The average per‐property financing gap for the 240 properties with HTF funding (with and without LIHTCs) that have Capital Needs Costs and a financing gap is $507,000.
Financing Gap for LIHTC Portfolio Of the 461 properties in the Study universe financed with LIHTCs (with or without HTF funding), 241 properties (52%) are estimated to need gap financing in the next five years. One hundred nineteen properties (119 or about 26%) of the 461 properties funded with LIHTCs are not anticipated to have Capital Needs Costs through 2019. About 101 (22%) of the properties funded with LIHTCs are expected to be able to cover their Capital Needs Costs. Properties in the LIHTC portfolio that are more than 10 years old are facing a collective Capital Needs Cost financing gap of approximately $145 million through 2019. The average per property financing gap is $593,000. The LIHTC portfolio has a smaller percent of total properties with a financing gap than the HTF portfolio; however, the properties that do have a financing gap tend to have larger gaps, due to larger project size.
Financing Gap for HTF and LIHTC Portfolio For the 199 properties financed with both HTF and LIHTCs, 116 properties (or 58% of properties in this category) will need gap financing in the next five years. The per‐project average financing gap is $550,000. About 14% of properties with Capital Needs Costs will be able to pay for them with property resources and about 28% of these 199 properties are not anticipated to have capital needs through 2019.
Strategies for Sustainability 32
Strategies for Sustainability To meet the needs of low‐income Washington households, rents for affordable housing need to follow increases in incomes rather than mirroring overall increases experienced in the real estate market. Because financing program requirements impose limits on annual rent increases, at most, rental revenues can at most increase as area median income limits rise. However, operating expenses are not restricted and affordable housing properties age just as market properties do. Affordable housing owners are frequently squeezed between the competing objectives of keeping housing affordable for low‐income households and keeping it decent, safe and attractive. HDC estimates that the 649 HTF and LIHTC properties in the Study universe are facing a collective financing gap of approximately $201 million to address their five‐year (2015 – 2019) Capital Needs. Costs. The financing gap represents the estimated Capital Needs Costs minus estimated property resources to pay for those costs. The gap is what will likely be sought from public funders such as Commerce and the Commission. This section of the Study is intended to describe, in broad terms, some strategies for a public agency response to the identified gap.
Current Preservation Policies Both Commerce and the Commission have limited resources to assist with funding for capital improvements. Commerce evaluates requests for funding on a case‐by‐case basis and uses the tools at its disposal to reinvest in projects that are projected to be operationally, financially and physically sustainable, and to primarily address health and safety improvements. The Commission considers applications for 9% LIHTCs from owners of projects that have credits and are beyond the 15‐year LIHTC compliance period. Typically, these properties have major building systems that need to be replaced or refurbished. A new tax credit funding allocation is one of the major ways to recapitalize older, affordable housing projects. The need for credit financing is evaluated based on the property’s current market conditions, the community’s affordable housing needs, and the sources of funding available. In structuring the new deal Commerce and the Commission typically maintain the existing income and set‐aside requirements for the remaining years of the regulatory agreement or covenant already in place, but will consider modifications if the owner can demonstrate that they cannot meet the existing commitments due to changing market conditions, unforeseen events or other factors that threaten the financial viability of the property. The commitments made as part of the new financing commence when the term of the old requirements expire – assuming that the older requirements are more restrictive than the new requirements. Nine percent LIHTCs are, by their nature, competitive and limited. It is not possible to award 9% LIHTCs to every property in need of additional funding, nor is every property appropriate for this type of funding. Washington’s challenge is how to make the best use of the variety of tools available to preserve the state’s affordable housing. For the most part, both Commerce and the Commission are already employing the strategies described below. These strategies are described here to show the range of options available and how the options have been implemented. There may be properties, however, for which reinvestment is not feasible or desirable, likely due to a combination of project characteristics and market forces (for example, a substantially over‐leveraged property that has substantial capital needs in a weak market area). In such cases, Commerce and the

Strategies for Sustainability 33
Commission may choose not to invest additional funds, especially given that Washington’s resources could be better used to preserve other units that are in better condition physically, in a better location and do not have as many financial impediments to improved performance. Such properties may be candidates for transfer, sale or disposition by the project sponsor.
Strategies for Commerce’s HTF Portfolio Commerce has some flexibility in the recapitalization strategies it chooses to employ. However, Commerce’s options are constrained by the fact that the very low‐income population living in HTF properties pay rent amounts that do not generate sufficient surplus cash above annual operating expenses to cover long‐term capital expenses. Commerce is considering establishing a portfolio preservation program so that funding of preservation is not in direct competition with new projects. Provided capital funds are available for this purpose, this strategy will help the state achieve both its goals of ensuring the existing portfolio is maintained while creating new units for unmet housing needs. In addition, specific components of an intentional, proactive preservation strategy could include:
Subordination of HTF debt. Leveraging private capital – using partial public funding to attract private dollars – where possible is a key part of a preservation strategy. To do this will sometimes require subordination of HTF and other public debt. Subordination is a process by which a creditor is placed in a lower priority for the collection of its debt from its debtor’s assets, generally both from project cash flow as well as at the time of sale. Such a strategy will help owners meet loan‐to‐value requirements of private lenders, enabling existing projects to leverage private capital and therefore reducing the gap financing sought from public funders. Commerce regularly employs the strategy of debt subordination when new funds are being committed for capital improvements; however, this strategy only works for projects that have the financial capacity to support additional private debt payments.
Changing terms of HTF debt. Commerce has the discretion to defer must‐pay HTF loan payments. This strategy frees up net operating income to service additional private debt for capital improvement costs, and for building replacement reserve balances. Deferring required HTF loan payments would reduce the demand for new public dollars to fill the financing gap, while recognizing it would reduce loan repayment income to Commerce. Employing this strategy will require a public policy decision and a balanced approach, as Commerce depends on loan repayments to fund the operating costs of the HTF and to finance other non‐capital program activities.
Reinvestment with HTF. Another option is for the state legislature to commit new dollars to recapitalize existing projects within the HTF portfolio. Several states have established, or are considering establishing set‐asides to fund the preservation of existing projects. Compared to new construction, this is typically a more cost effective approach for maximizing the supply of affordable housing since the land is already owned. It also minimizes displacement of low‐income residents and disinvestment in communities across Washington.

Strategies for Sustainability 34
Syndication through Bundling Smaller Properties for LIHTC Transactions. Smaller HTF properties can be “bundled” together so that the project achieves sufficient scale to be financed utilizing either 9% or 4% federal low‐income housing tax credits (LIHTC). See the section below for more information on how 9% or 4% LIHTC projects can be structured.
Strategies for LIHTC Portfolio The Commission oversees several sources of funds that may potentially be used in recapitalization projects. In general, LIHTC owners have greater capacity to manage recapitalization activities due to the larger size of their holdings and staff. The challenge the Commission faces is how best to deploy its resources to achieve both preservation and new production goals. However, innovation alone will not solve the preservation problem, since 9% LIHTC resources are also limited and 4% LIHTC are best utilized in specific types and scopes of projects.
Use of 4% LIHTCs with bond financing. Increasingly, owners are evaluating and pursuing the use of 4% LIHTCs accessed through the sale of tax‐exempt private activity bonds. LIHTC equity through a 4% transaction can cover between 25% and 35% of total project costs (including acquisition). This represents a significant source of private financing to address capital needs without tapping into limited state and local public resources. Though this financing technique can be complex and costly, the 4% LIHTCs are generally more readily available than 9% LIHTCs. Practically, there are some constraints to effectively utilize 4% LIHTCs. Generally, investors are seeking equity investment opportunities of at least $3 million per project. For properties undertaking rehabilitation work costing an average of $25,000 per unit, this requires at least 120 units to attract investors. For properties undertaking major rehabilitation (e.g., $65,000 per unit), a stand‐alone property at 75 units may be viable, but will likely require additional public investment that is prohibitive. Bundling multiple properties into a single LIHTC transaction is also a strategy being utilized by owners with multiple properties needing rehabilitation on a similar timeline.
New 9% LIHTC allocation. Competitive 9% LIHTCs are a significant source of funding for preservation projects, typically funding 75% or more of total renovation costs. Although use of the federally limited 9% LIHTC resource on preservation of existing affordable housing reduces LIHTC funds available for new production; the cost of rehabilitation is generally less than new construction. Therefore, rehabilitation frequently uses less LIHTCs per unit than new production. Nine percent tax credits are a good strategy for projects with high levels of capital needs, when use of 4% LIHTCs would leave a significant funding gap. As discussed in the “Strategies for Commerce’s HTF Portfolio” section, states are establishing or considering establishing, set‐asides for preservation of existing projects. However, some states are adopting policies that target allocation of 9% LIHTC only to preservation projects which cannot preserve existing rent restricted housing through 4% LIHTC allocations and/or other resources. In recognition of the competing demands for the scarce 9% tax credit, in 2014 the Commission established a set‐aside of the 9% tax credit for preservation and recapitalization projects.
Combining 4% and 9% LIHTCs. Some developers are combining 9% and 4% LIHTCs, particularly on larger properties, allowing owners to target these different LHTC models toward units that maximize the best of each financing strategy. Use of this financing structure requires dividing properties into

Strategies for Sustainability 35
separate ownership entities, which increases the complexity and transaction costs for projects. However, through this model, owners have used 9% LIHTCs on units with higher rehabilitation needs and/or lower rents, while using 4%s LIHTCs to address lower levels of rehabilitation on a higher number of higher rent units. This is a strategy that warrants some exploration as a recapitalization option for some properties.
Strategies Involving Local Funders A strategy for both portfolios involves a discussion of the role of local public funders in addressing the portfolios’ upcoming capital needs. Local government bodies, such as counties and municipalities, loan money to projects from their allocation of federal dollars and from other funding sources. The HTF and other local public funders often agree to defer their must‐pay debt, which increases the borrowing capacity of properties and, consequently, further reduces the properties’ financing gap. A unified and coordinated approach to the preservation of affordable rental housing will continue to be an important part of the solution.
Strategies for Owners Over half of the properties in the Study universe are owned by entities with large portfolios, having 10 or more properties with funding from Commerce and/or the Commission. Owners with large portfolios are likely to have a more sophisticated set of strategies at their disposal because of their management and financial capacity to undertake complex deal structuring activities. Owners with larger portfolios can move reserves among properties to match anticipated capital needs; this strategy could help delay refinancing or requests for gap financing from public funders. Owners with larger portfolios can also bundle properties, utilizing a common refinancing plan. Refinancing multiple properties at one time may reduce soft costs and allow for more favorable types of financing that are generally not feasible for small single‐property transactions. Bundling rehabs may create some economies of scale. Bundling may also allow a stronger property tosupport properties with financial challenges and/or inability to support additional debt. Projects funded with LIHTCs are more likely to be able to utilize these strategies, as LIHTC properties tend to be owned by entities with larger portfolios. Forty‐five percent of the properties funded with HTF only (without LIHTCs) are owned by entities that have fewer than five properties that have received funding from Commerce and/or the Commission. In contrast, nearly 60% of properties funded with LIHTCs are owned by entities with 10 or more properties that have received funding from Commerce and/or the Commission. The smaller capacity of HTF project owners restricts the range of strategies to pay for existing and upcoming capital needs.
Future Considerations Consider the life cycle costs of building elements, not just the upfront costs. Even though this Study did not find any predictive relationship between capital needs and any other factors except the number of years since a project was placed in service, there are building components that have been found to not last as long as others. In assessing the cost of any one building component, it is important to not just consider its upfront cost, but its maintenance cost over the years and its replacement cost once it wears out.

Strategies for Sustainability 36
When underwriting new projects, use larger replacement reserve set‐aside amounts and (continue to) require that the replacement reserve deposits increase annually to keep up with inflation. Given that this Study found that very a small percentage of projects have adequate replacement reserves (only 8% will be able to cover 50% or more of their estimated capital costs through replacement reserves), it is important to reconsider underwriting and regulatory guidelines relative to annual replacement reserve deposits and increase the amounts that projects set aside for future capital needs. It is not likely that all of a project’s Capital Needs Costs can be met through replacement reserves, but the overall risk profile and financial health of Washington’s affordable housing portfolio will be improved by setting aside more dollars in replacement reserves. Balance the needs of projects with high financing gaps with those projects with lower financing gaps to maximize the number of units of affordable housing that can be preserved. Commerce and the Commission will need to consider targeting scarcer public resources, such as 9% LIHTCs, toward projects with higher financing gaps. The solutions for high‐need projects may also need to be staggered over time since they will utilize such significant public dollars. Commerce and the Commission will have to balance high need populations and high need geographic areas that have projects with high financing gaps. There may also be opportunities to nudge some developments toward longer‐term sustainability with smaller per project investments, given that, for 75% of the projects with financing gaps, the gap is less than $600,000, with almost two‐thirds of those projects’ gaps less than $300,000. Recognize and acknowledge that affordable housing needs to be recapitalized periodically and does not have the same degree of access to private capital that market rate housing enjoys. With restrictions on both rent increases and the sale of properties, affordable housing owners cannot generally use market rate strategies such as property sales or large rent increases to fund long‐term capital needs. Furthermore, the restricted rents on affordable housing means that less cash flow from operations and from replacement reserves is available to cover the properties’ long‐term Capital Needs Costs. Restricted rents, particularly for properties serving very low‐income residents, may result in gradually declining financial viability, even in well‐managed properties. It should be assumed that public dollars will be needed to recapitalize a portion of the state’s portfolio every year, set funds aside and reinvest them to preserve the existing housing.

Appendix A: Prior Work and References 37
Appendix A: Prior Work and References “An Analysis of the Capital Needs of Seattle’s Affordable Housing Portfolio.” Housing Development Center, August 2008. http://www.housingdevelopmentcenter.org/resources/other/ “An Assessment of the Financial Sustainability of King County’s Affordable Housing Rental Portfolio.” Impact Capital and Housing Development Center, February 2009. http://www.housingdevelopmentcenter.org/resources/other/ “Diamonds in the Rough: the Best of Times and Worst of Times for Preservation Deals.” National Housing & Rehabilitation Association, Tax Credit Advisor, June 2012. http://nhtinc.org/downloads/tcajune2012_preservation.pdf Washington Low Income Housing Preservation, National Housing Trust, November 2010. http://www.nhtinc.org/downloads/wa_preservation.pdf Building Enclosure Rehabilitation Guide: Multiunit Residential Wood‐Framed Buildings. RDH Building Sciences, Inc. http://www.oregon.gov/ohcs/hd/mfh/pdfs/building_enclosure_rehab_guide_combined_final.pdf State‐Sponsored Housing Portfolio Capital Plan, Recap Real Estate Advisors, March 2014. http://www.chfa.org/Press%20Room/Press%20Releases/pressreleaseviewer.aspx?id=528 “What Happens to Low‐Income Housing Tax Credit Properties at Year 15 and Beyond?” U.S. Department of Housing and Urban Development, Office of Policy Development and Research, August 2012. http://www.huduser.org/portal/publications/hsgfin/lihtc_report2012.html “Affordable Housing Cost Study”, Washington State Department of Commerce, September 2009. “Increasing the Cost‐Effectiveness of Housing Trust Fund Investments.” Washington State Department of Commerce, November 2012. http://www.commerce.wa.gov/Documents/Housing‐Trust‐Fund‐Cost‐Effectiveness‐FINAL‐11‐14.pdf
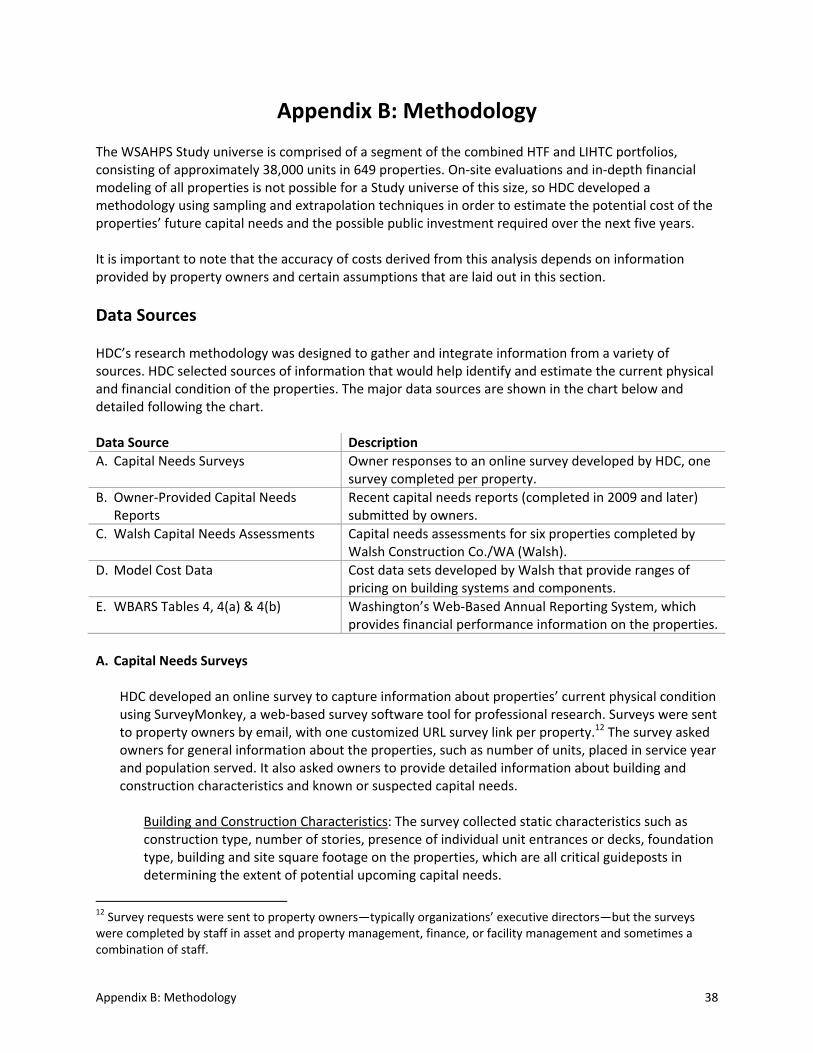
Appendix B: Methodology 38
Appendix B: Methodology The WSAHPS Study universe is comprised of a segment of the combined HTF and LIHTC portfolios, consisting of approximately 38,000 units in 649 properties. On‐site evaluations and in‐depth financial modeling of all properties is not possible for a Study universe of this size, so HDC developed a methodology using sampling and extrapolation techniques in order to estimate the potential cost of the properties’ future capital needs and the possible public investment required over the next five years. It is important to note that the accuracy of costs derived from this analysis depends on information provided by property owners and certain assumptions that are laid out in this section.
Data Sources HDC’s research methodology was designed to gather and integrate information from a variety of sources. HDC selected sources of information that would help identify and estimate the current physical and financial condition of the properties. The major data sources are shown in the chart below and detailed following the chart. Data Source Description
A. Capital Needs Surveys Owner responses to an online survey developed by HDC, one survey completed per property.
B. Owner‐Provided Capital Needs Reports
Recent capital needs reports (completed in 2009 and later) submitted by owners.
C. Walsh Capital Needs Assessments Capital needs assessments for six properties completed by Walsh Construction Co./WA (Walsh).
D. Model Cost Data Cost data sets developed by Walsh that provide ranges of pricing on building systems and components.
E. WBARS Tables 4, 4(a) & 4(b) Washington’s Web‐Based Annual Reporting System, which provides financial performance information on the properties.
A. Capital Needs Surveys
HDC developed an online survey to capture information about properties’ current physical condition using SurveyMonkey, a web‐based survey software tool for professional research. Surveys were sent to property owners by email, with one customized URL survey link per property.12 The survey asked owners for general information about the properties, such as number of units, placed in service year and population served. It also asked owners to provide detailed information about building and construction characteristics and known or suspected capital needs.
Building and Construction Characteristics: The survey collected static characteristics such as construction type, number of stories, presence of individual unit entrances or decks, foundation type, building and site square footage on the properties, which are all critical guideposts in determining the extent of potential upcoming capital needs.
12 Survey requests were sent to property owners—typically organizations’ executive directors—but the surveys were completed by staff in asset and property management, finance, or facility management and sometimes a combination of staff.

Appendix B: Methodology 39
Known or Suspected Capital Needs: Owners were asked to provide details about known capital needs and were asked to submit any recent reports substantiating those needs (see B, below). Owners were also asked to describe any suspected capital needs. The survey asked questions regarding common tenant maintenance requests and the condition of building siding, among others. HDC used these prompts to deduce the potential upcoming capital needs.
HDC received survey responses on 316 properties, or 49% of the Study universe, with responses from 96 different owners across the state (representing 44% of all owners of properties in the Study universe).
B. Owner‐provided Capital Needs Reports
As part of the survey request, HDC asked owners to submit any property‐specific capital needs assessments or reports completed within the last five years—2009 and later. The reports vary in quality and thoroughness, and include full‐scale CNAs, seismic reports, inspections, and reserve analyses. Some were conducted in‐house and some were completed by third parties, such as architects or contractors. Most contained estimates of probable costs in a yearly time series. Owners submitted capital needs reports for 119 properties, and approximately 110 of those capital needs reports contained sufficient scope and cost information. HDC received capital needs reports for about 17% of the properties or 13% of the units in the Study universe.
C. Walsh Capital Needs Assessments
Walsh Construction Co./WA (Walsh) was commissioned to complete six capital needs assessments (CNAs) on a sample of the Study universe to better understand the existing physical conditions of the Study universe. Walsh is a general contractor with offices in Seattle, WA and Portland, OR with extensive experience in multi‐family housing construction. Since 2002, Walsh has built 211 multi‐unit residential projects with over 17,000 units and a total construction value of over $2 billion. The six selected properties are representative of the Study universe in terms of location, number of units, original funding source, owner portfolio size, age, and number of stories. Walsh completed these CNAs using a CNA template developed by HDC, with input from Walsh. The CNA template format is based on standards developed by the American Society for Testing and Materials (ASTM), an international organization that publishes technical standards for a wide range of materials and processes. Three of the six properties selected for Walsh CNAs already had a recent capital needs report. This allowed us to field‐test the CNA Template against the owner‐provided CNAs. The Walsh CNAs served as a demonstration model of proper analysis, including a process and a template, which is provided to Commerce and the Commission as a deliverable for this Study.
D. Model Cost Data
Walsh developed model cost data sets used to assign costs to the capital needs described by owners in the Capital Needs Surveys. For example, if an owner responded that a property’s vinyl windows need to be replaced, applying the model cost data to the information collected in the Capital Needs Survey enabled us to estimate what those windows will cost. Walsh developed model cost data sets

Appendix B: Methodology 40
for low‐, mid‐, and high‐rise properties. See the Capital Costs Modeling subsection of this methodology for further detail on this process.
E. Washington’s Web‐Based Annual Reporting System, Tables 4, 4(a) & 4(b)
The Web‐Based Annual Reporting System (WBARS) is an online reporting system for affordable housing used by Washington State public funders for financial and compliance reporting. Table 4 includes the income and expense report, replacement and operating reserve information and loan balances. HDC received WBARS Table 4, 4(a) and 4(b) data for all 649 properties in the Study universe for 2011, 2012 and 2013.
Levels of Reliability of Capital Needs Costs HDC derived the capital needs cost estimate of $391 million from a combination of known costs identified through capital needs studies and by owners, and estimated costs based on standardized building system life expectancies and costs. Based on available information, HDC derived capital needs costs for the properties in the Study using one of five sources of data or methods for each of the 649 properties. Each source or method has a different level of presumed reliability and certainty associated with its cost estimates.
Cost Derivation Method Reliability Properties Units
Count Percent Count Percent
1) Walsh Capital Needs Assessments High 6 1% 338 1%
2) Owner‐Provided Capital Needs Reports High 111 17% 4,851 13%
3) Owner Estimates Varies 89 14% 4,297 11%
4) HDC Capital Cost Modeling Medium 104 16% 5,082 13%
5) Cost Extrapolation Low 339 52% 23,248 61%
Total 649 100% 37,816 100%
HDC has detailed, property‐specific information for approximately 48% of the 649 properties; therefore, the costs associated with these properties have a higher level of accuracy. For the 52% of properties for which HDC does not have property‐specific information, HDC made certain assumptions, detailed in this Methodology appendix, and applied costs to those properties based on known property characteristics. Each of the cost derivation methods are described briefly here and in greater detail in this appendix.
1) Walsh Capital Needs Assessments. These costs were calculated by Walsh, a respected general contractor, using consistent methodologies and cost information. These are presumed to have the highest level of reliability.
2) Owner‐Provided Capital Needs Reports. These costs were standardized from capital needs
reports. This information is presumed to also have a high level of reliability, due to the property specific nature of the condition assessment and consistent application of cost data.
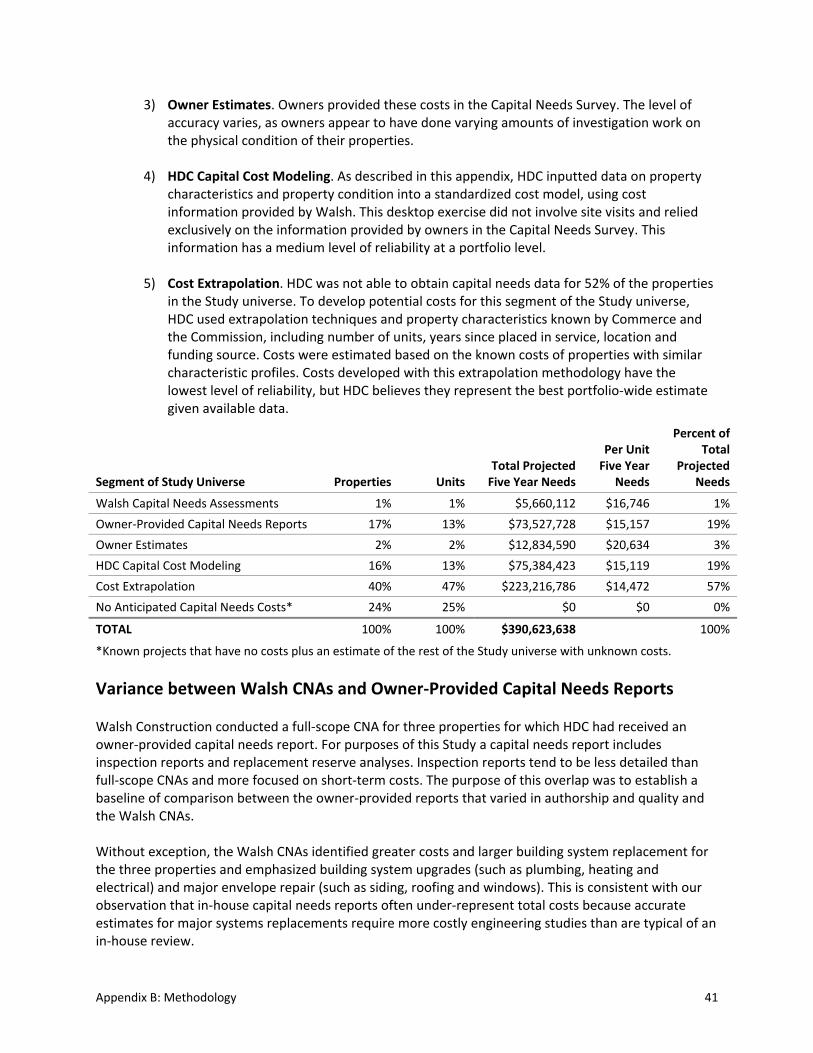
Appendix B: Methodology 41
3) Owner Estimates. Owners provided these costs in the Capital Needs Survey. The level of accuracy varies, as owners appear to have done varying amounts of investigation work on the physical condition of their properties.
4) HDC Capital Cost Modeling. As described in this appendix, HDC inputted data on property
characteristics and property condition into a standardized cost model, using cost information provided by Walsh. This desktop exercise did not involve site visits and relied exclusively on the information provided by owners in the Capital Needs Survey. This information has a medium level of reliability at a portfolio level.
5) Cost Extrapolation. HDC was not able to obtain capital needs data for 52% of the properties
in the Study universe. To develop potential costs for this segment of the Study universe, HDC used extrapolation techniques and property characteristics known by Commerce and the Commission, including number of units, years since placed in service, location and funding source. Costs were estimated based on the known costs of properties with similar characteristic profiles. Costs developed with this extrapolation methodology have the lowest level of reliability, but HDC believes they represent the best portfolio‐wide estimate given available data.
Variance between Walsh CNAs and Owner‐Provided Capital Needs Reports Walsh Construction conducted a full‐scope CNA for three properties for which HDC had received an owner‐provided capital needs report. For purposes of this Study a capital needs report includes inspection reports and replacement reserve analyses. Inspection reports tend to be less detailed than full‐scope CNAs and more focused on short‐term costs. The purpose of this overlap was to establish a baseline of comparison between the owner‐provided reports that varied in authorship and quality and the Walsh CNAs. Without exception, the Walsh CNAs identified greater costs and larger building system replacement for the three properties and emphasized building system upgrades (such as plumbing, heating and electrical) and major envelope repair (such as siding, roofing and windows). This is consistent with our observation that in‐house capital needs reports often under‐represent total costs because accurate estimates for major systems replacements require more costly engineering studies than are typical of an in‐house review.
Segment of Study Universe Properties Units Total Projected Five Year Needs
Per Unit Five Year
Needs
Percent of Total
Projected Needs
Walsh Capital Needs Assessments 1% 1% $5,660,112 $16,746 1%
Owner‐Provided Capital Needs Reports 17% 13% $73,527,728 $15,157 19%
Owner Estimates 2% 2% $12,834,590 $20,634 3%
HDC Capital Cost Modeling 16% 13% $75,384,423 $15,119 19%
Cost Extrapolation 40% 47% $223,216,786 $14,472 57%
No Anticipated Capital Needs Costs* 24% 25% $0 $0 0%
TOTAL 100% 100% $390,623,638 100%
*Known projects that have no costs plus an estimate of the rest of the Study universe with unknown costs.

Appendix B: Methodology 42
The owner‐provided reports identified substantially more interior work than the Walsh CNAs. Even so, the owner‐provided capital needs reports identified costs that were proportionate to their representation in the sample—most of the costs are for interiors instead of for systems replacement. Including the costs for rehabilitating unit interiors is important and we believe well‐represented within the Study sample. Commerce, the Commission and HDC were concerned initially, and the reason that the Walsh CNAs were commissioned is that the larger building system replacement costs are frequently underrepresented in CNAs because of the additional engineering expertise (for example, structural, civil engineering, mechanical, electrical, and plumbing subspecialties) needed to assess the needs and determine the needs’ costs. The additional expertise that is required makes the CNA much more expensive.
Data Analysis HDC first examined whether the portion of the properties responding to the Capital Needs Survey is representative of the Study universe based on number of units, size of owner portfolio, funding source and location. HDC analyzed the 316 owner responses to the Capital Needs Survey, largely in relation to how owners responded to the question “do you expect funds from property operations and replacement reserves will be able to adequately address the property’s capital needs for the next five years?” HDC correlated their response to the question by many factors, including:
Number of units in property
Size of owner portfolio
Age (since original construction and since placed in service)
Funding sources
Project type (new or acquisition/rehab)
If rehab, rehab hard cost per unit
Location
Low‐, mid‐, or high‐rise
Average cash flow per unit (over three years)
Outstanding must‐pay debt balance Results of these analyses may be found below in the Data Available for Study Universe subsection of this methodology and in the Portfolio Characteristics appendix.
Regression Methodology In order to better understand the impact of financial performance and building characteristics on five‐year capital needs costs per unit, HDC conducted a regression analysis on the sample data. Complete financial data, construction characteristics and capital needs costs was available for 233 properties. Data Transformations All categorical variables were coded 1 if a specified characteristic was present and coded 0 otherwise. Data was then entered into R, a freely available statistical software package that is commonly used in business applications. The next step was to correct any skewed variables, and HDC performed a log‐

Appendix B: Methodology 43
transform of the dependent variable—capital needs cost per unit—in order to achieve a normal distribution. Data Modeling HDC investigated the relationship between the capital needs costs per unit (the dependent variable) and the variables listed in Table 1. The first step was to estimate simple single linear regression equations for each one of the variables listed in Table 1, using the ordinary least squares estimation technique. The purpose of this step is to establish if there is a relationship between the dependent variable (capital needs costs per unit) and a single explanatory variable.
Table 1. Variables Used in Regression Modeling
Financial and General Property Variables
Name Description
Units Total number of units in property
Bedroom density Average number of bedrooms per unit in property
Portfolio size Portfolio size of owner of property
Funding source HTF, LIHTC or Both
Location West or east of the Cascades
Last PIS Number of years since last placed in service
Average cash flow Average annual cash flow for 2010 through 2013
Debt Total must‐pay debt per unit
Project type New construction or acquisition/rehabilitation
Number of floors Average number of floors per building
Physical Risk Factor Variables
Name Description
Construction type Wood frame construction
Foundation type Slab‐on‐grade foundation
Siding type Vinyl or cementitious
Age of roof 20+ years old
Window type Aluminum
Heating type Wall heater or electric baseboard
Ventilation No continuous ventilation in units
Decks Presence of individual unit decks
Construction date Property originally constructed between 1985 and 2005
HDC then utilized a technique called “best subset regression”, or BSR, to model the combined effects of the variables from Table 1 on the dependent variable. The advantage of this technique is that it provides a model estimate using every possible combination of input variables and allows for the selection of the best model according to various criteria. HDC elected to choose the model with the highest adjusted R‐squared value as the most meaningful for understanding the relationships between building and financial variables and the total cost variable. The adjusted R‐squared value is a common choice for determining the overall fit of a multiple regression model because it increases only if a newly added variable explains enough additional variation in the response variable to compensate for the loss in degrees of freedom in the model. Conversely, adding more variables will always increase the simple r‐squared correlation coefficient, thus making it a less meaningful indicator when trying to choose between potential models. The regression equations used were:

Appendix B: Methodology 44
Costs = β₀ + β₁ (Bdrm) + β₂ (PortLg) + β₃ (FundHTF) + β₄ (Loc) + β₅ (PIS) + β₆ (Cash) +
β₇ (Debt) + β₈ (Prtype) + β9 (Numflr) + α (Eq. 1)
Where,
Costs = Natural log of the total five‐year costs per unit calculated by HDC Bdrm = Average bedroom density PortLg = Dummy variable equal to 1 if the property owner has 10 or more properties in their
portfolio FundHTF = Dummy variable equal to 1 if the primary funding type is HTF only and 0 otherwise Loc = Dummy variable equal to 1 for west of the cascades and 0 for east PIS = Number of years since property was last placed in service Cash = Average cash flow for the property over the period 2010‐201313 Debt = Total required hard debt per unit Prtype = Dummy variable equal to 1 if the property was new construction and 0 for rehab Numflr = Average number of floors per building Costs = β₀ + β₁ (Bdrm) + β₂ (PortMd) + β₃ (FundHTF) + β₄ (Cash) + β₅ (Debt) + β₆ (Numflr) +
β₇ (Found) + β₈ (Side) + β9 (Wind) + β10 (Heat) + β11 (Consdt) + α (Eq. 2)
Where,
Costs = Natural log of the total five‐year costs per unit calculated by HDC Bdrm = Average bedroom density PortMd = Dummy variable equal to 1 if the property owner has five to nine properties in their
portfolio FundHTF = Dummy variable equal to 1 if the primary funding type is HTF only and 0 otherwise Cash = Average cash flow for the property over the period 2010‐201314 Debt = Total required hard debt per unit Numflr = Average number of floors per building Found = Dummy variable equal to 1 if foundation type is slab‐on‐grade and 0 otherwise Side = Dummy variable equal to 1 if siding type is vinyl or cementitious and 0 otherwise Wind = Dummy variable equal to 1 if window type is aluminum and 0 otherwise Consdt = Dummy variable equal to 1 if property was built between 1985‐2005 and 0 otherwise
Regression Results Simple Single Regression Results for the single regression estimates for the financial variables and other general building characteristics are shown in Table 2 below. The coefficients shown below are from the model output, and the percentage change column reflects the interpretation of the model coefficients.15 As can be
13 Some of the properties had missing financial information for some of the years. For these properties, the average was taken of the available years in this range, or if only one year was available then this was used. 14 See Footnote 9, above. 15 Because HDC took the log of the dependent variable, it was necessary to transform the coefficients in order to achieve a meaningful interpretation. This was done utilizing the following formula: Percentage change in Y = (eβi ‐1)*100.

Appendix B: Methodology 45
seen, the only variable with statistical significance, at the 10 percent level, is project type. In this case, new construction properties have, on average, 21 percent lower total costs than rehabilitation properties. Table 2. Regression Output for Single Estimation Models – Financial and General Property Variables
Variable Name Coefficient Percent
Change in Y P‐Value Significance
Level
Average cash flow 0.000049 0.0% 0.189 ‐
Bedroom density 0.129560 13.8% 0.182 ‐
Debt ‐0.000004 0.0% 0.264 ‐
Funding Source: HTF 0.189840 20.9% 0.223 ‐
Funding Source: LIHTC ‐0.054920 ‐5.3% 0.753 ‐
Last PIS 0.019540 2.0% 0.102 ‐
Location: West 0.024170 2.4% 0.868 ‐
Number of floors 0.016720 1.7% 0.203 ‐
Portfolio Size: 10+ ‐0.001923 ‐0.2% 0.991 ‐
Portfolio Size: 5‐9 ‐0.212971 ‐19.2% 0.316 ‐
Project type: NC ‐0.233400 ‐20.8% 0.082 10%
Total units per property ‐0.001369 ‐0.1% 0.340 ‐
Results for the single regression estimates for HDC’s building characteristics risk factors are shown in Table 2 below. There were three variables that showed statistically significant relationships with total costs: construction date, heating type, and siding type. However, heating type was the only risk factor with a significant relationship that was in the expected direction.16 In this case, if a property had either electric baseboard or cadet wall heaters as their primary heating system, then it had nearly 50 percent higher total costs per unit on average than properties without those systems.
Table 3. Regression Output for Single Estimation Models – Physical Risk Factors
Variable Name Coefficient Percent
Change in Y P‐Value Significance
Level
Age of roof 0.322880 38.1% 0.151 ‐
Construction date ‐0.02676 ‐2.6% 0.051 10%
Construction type ‐0.052290 ‐5.1% 0.821 ‐
Foundation type ‐0.011440 ‐1.1% 0.935 ‐
Heating type 0.402500 49.6% 0.091 10%
Individual unit decks 0.132170 14.1% 0.345 ‐
Siding type ‐0.332800 ‐28.3% 0.032 5%
Continuous ventilation 0.102000 10.7% 0.465 ‐
Window type 0.233300 26.3% 0.300 ‐
16 Construction date and siding type both showed statistically significant relationships with total cost, but were in the opposite direction as anticipated. The results indicate that properties built between the years of 1985‐2005 had 2.6% less total costs than properties built outside that range. Likewise, properties with vinyl or cementitious siding were shown to have 28.3 percent less total costs than those with other siding types.

Appendix B: Methodology 46
Multiple Regression Model HDC modeled one multiple regression equation using only the financial and general property variables from Table 1 and one using the entire set of variables. For the subset of financial and general property variables, the BSR technique indicated that the model with nine variables would yield the highest adjusted R‐squared value. Overall, the adjusted R‐squared value for the model is .051, which is relatively low and indicates that the predictive capability of the overall model is weak. While it is not uncommon to encounter such relatively low adjusted R‐squared values in real‐world regression applications, it is important to consider when using the model to extrapolate findings outside of the sample range. Although the overall predictive power for the model is weak, the individual coefficient estimates are still meaningful if they exhibit statistical significance. The summary information for the nine variables used in the model is presented in Table 4. Four variables showed statistical significance, with two each at the 10 and five percent levels.
Table 4. Multiple Regression Model Results, Financial and General Property Variables
Variable Name Coefficient Percent
Change in Y P‐Value Significance
Level
Bedroom density 0.2920 33.9% 0.013 5%
Portfolio Size: 10+ 0.2719 31.2% 0.090 10%
Funding Source: HTF 0.3255 38.5% 0.060 10%
Location: West 0.2223 24.9% 0.194 ‐
Last PIS 0.0177 1.8% 0.159 ‐
Average cash flow 0.0001 0.0% 0.112 ‐
Debt 0.0000 0.0% 0.285 ‐
Project type: New Cons ‐0.3301 ‐28.1% 0.040 5%
Number of floors 0.0198 2.0% 0.138 ‐
The most significant variables were project type and bedroom density. In a multiple regression model, the coefficients are estimated while holding all other variables in the model constant. This means for each additional unit of bedroom density, the total costs per unit for the property will go up on average of 34 %, holding all other characteristics constant. Likewise, new construction properties will have 20 percent lower costs per unit than rehabilitation properties, holding all other variables constant. For the variables at the 10% level, it can be seen that large portfolio owners have 31% higher total costs per unit compared to small and medium sized portfolios. In addition, properties with HTF funding only will have 39% higher total costs per unit when compared to properties with either LIHTC funding or both funding types. HDC also modeled a multiple regression equation using the BSR technique on the full set of variables from Table 1. The overall adjusted R‐squared value of 0.102 for the full model is an improvement in predictive power from the model discussed above, but in absolute terms still remains fairly weak. The results for the individual coefficients for the full model are presented in Table 5. There are more statistically significant variables in this model compared to the result from Table 4.17
17 The reason that the coefficient or the significance level for a variable might change from one model to the next is that results are affected by which variables are included in the model. As discussed above, the results need to be interpreted as a percentage change in the dependent variable holding all other variables constant. Consequently, any variable left out of the equation is not held constant and may interact with the included variables’ coefficients.
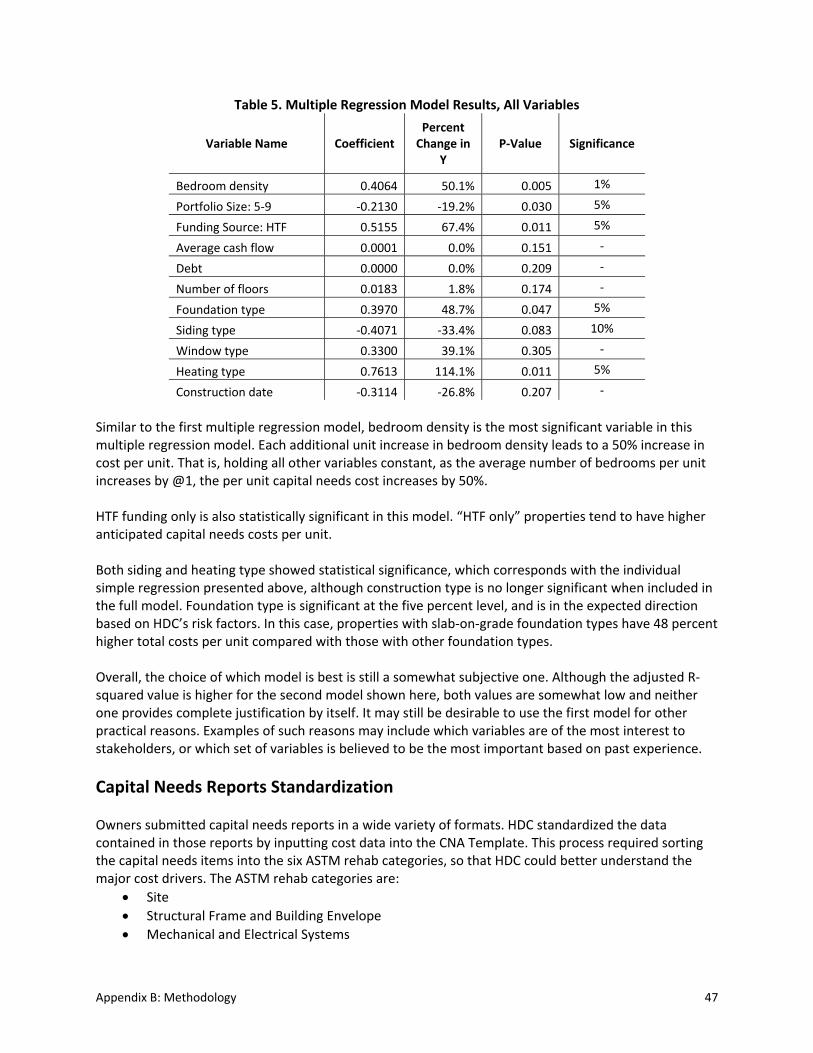
Appendix B: Methodology 47
Table 5. Multiple Regression Model Results, All Variables
Variable Name Coefficient Percent Change in
Y P‐Value Significance
Bedroom density 0.4064 50.1% 0.005 1%
Portfolio Size: 5‐9 ‐0.2130 ‐19.2% 0.030 5%
Funding Source: HTF 0.5155 67.4% 0.011 5%
Average cash flow 0.0001 0.0% 0.151 ‐
Debt 0.0000 0.0% 0.209 ‐
Number of floors 0.0183 1.8% 0.174 ‐
Foundation type 0.3970 48.7% 0.047 5%
Siding type ‐0.4071 ‐33.4% 0.083 10%
Window type 0.3300 39.1% 0.305 ‐
Heating type 0.7613 114.1% 0.011 5%
Construction date ‐0.3114 ‐26.8% 0.207 ‐
Similar to the first multiple regression model, bedroom density is the most significant variable in this multiple regression model. Each additional unit increase in bedroom density leads to a 50% increase in cost per unit. That is, holding all other variables constant, as the average number of bedrooms per unit increases by @1, the per unit capital needs cost increases by 50%. HTF funding only is also statistically significant in this model. “HTF only” properties tend to have higher anticipated capital needs costs per unit. Both siding and heating type showed statistical significance, which corresponds with the individual simple regression presented above, although construction type is no longer significant when included in the full model. Foundation type is significant at the five percent level, and is in the expected direction based on HDC’s risk factors. In this case, properties with slab‐on‐grade foundation types have 48 percent higher total costs per unit compared with those with other foundation types. Overall, the choice of which model is best is still a somewhat subjective one. Although the adjusted R‐squared value is higher for the second model shown here, both values are somewhat low and neither one provides complete justification by itself. It may still be desirable to use the first model for other practical reasons. Examples of such reasons may include which variables are of the most interest to stakeholders, or which set of variables is believed to be the most important based on past experience.
Capital Needs Reports Standardization Owners submitted capital needs reports in a wide variety of formats. HDC standardized the data contained in those reports by inputting cost data into the CNA Template. This process required sorting the capital needs items into the six ASTM rehab categories, so that HDC could better understand the major cost drivers. The ASTM rehab categories are:
Site
Structural Frame and Building Envelope
Mechanical and Electrical Systems

Appendix B: Methodology 48
Vertical Transportation
Life Safety and Fire Protection, and
Interiors. Then, HDC input the cost data from the capital needs reports in a yearly time series format in order to show when costs are anticipated. Finally, HDC standardized the inflation rate used. An inflation rate of 3.10% was used, which is the national average of the 20‐city historical construction cost index published by Engineering News‐Record. The index started collecting data in 1990. Our model uses a flat rate of 3.10% for costs through 2014, and then compounds that rate starting in 2015.
Capital Costs Modeling Many owners provided detailed information about their properties’ physical condition in the Capital Needs Survey. They indicated which building components are likely to require repair and/or replacement within the next five years, but in many cases they did not provide cost estimates. In order to approximate costs, HDC developed a Capital Costs Modeling method, described below. Using this method, HDC estimated the potential costs of the outstanding and upcoming capital needs for properties without capital needs reports. HDC used the Capital Costs Modeling method to estimate costs for 121 properties, based on property needs, building characteristics and quantity information identified in the Capital Needs Survey. HDC generated costs associated with repairs and replacements occurring within the next five years. HDC included costs when:
owners indicated repair or replacement is needed;
there was a low initial level of investment, as indicated by total rehab costs per unit; and
building age or age of component suggests repair or replacement will be needed (e.g., if a roof is 18 years old, roof replacement was included in the total costs).
There are four steps in the Capital Cost Modeling method. First, Walsh Construction Co. developed model cost data sets for building components, per measurement (square foot or linear foot), per each item, or per dwelling unit. Second, HDC interpreted owner survey comments and defined the scope of work required using the CNA Template cost categories outlined above. Next, HDC applied Walsh’s model cost data to the scope of work by property. Finally, HDC specified other work required by applying cost premiums to properties that are expected to also require seismic, accessibility or energy efficiency upgrades attributable to projects undergoing major rehabilitation. Except for upgrades expected as requirements of major rehabs and ventilation work described below, this model presumes replacement or repair of existing building systems and does not assume any elective upgrades such as energy improvements. Consequently, estimated costs should be regarded as conservative. Assumptions Used in Applying Costs Owners provided building information such as construction type, foundation type, building component materials and certain quantities (number of units, number of bedrooms, number of buildings, number of stories, building square footage and site square footage). Along with this building information, Walsh’s

Appendix B: Methodology 49
model cost data sets and the owner‐identified capital needs, HDC applied costs using the following assumptions:
Site work. HDC used Google Maps to estimate site drainage. Google Maps images were available for about 60% of the properties.
Roof. HDC used cost per square foot for flat, gabled, pitched/shed and hip configurations with bituminous, composition and/or membrane materials.
Siding. HDC specified cementitious to replace vinyl and asbestos shingle. HDC used cost per square foot for cementitious, masonry and wood and the following table for deriving square footage per unit.
Bedroom#
Square Feet
Dimen‐sions
External Cladding
Windows#
Windows SF Siding SF
0 625 25x25 450 2 24 426
1 800 20x40 540 3 36 504
2 1000 25x40 585 4 48 537
3 1200 30x40 640 5 60 580
Windows. HDC specified vinyl to replace aluminum. For all windows, HDC assumed a typical size of 2’ x 3’. HDC used the table below to estimate number of windows per unit.
Bedrooms Windows #
0 2
1 3
2 4
3 5
Plumbing‐kitchen. Because it is more expensive to plumb buildings with many floors, HDC specified dwelling unit costs for low, medium and high levels of scope for low‐, mid‐, and high‐rise buildings.
Plumbing‐bath. Similar to kitchen plumbing, HDC specified low, medium and high levels of scope for each of low‐, mid‐ and high‐rise buildings to derive per bathroom costs based on the table below.
Bedrooms Baths #
0 1
1 1
2 1
3 2
Elevator. HDC specified elevator replacement costs based on low‐, mid‐, and high‐rise buildings.
Heating. HDC used cost per each item for electric baseboards, wall heaters, forced air and hot water boilers.
Electrical. HDC specified per unit electrical costs for low, medium and high levels of scope for low‐, mid‐ and high‐rise buildings.

Appendix B: Methodology 50
Ventilation. When owners indicated that neither continuous ventilation nor adequate kitchen and bath ventilation controls were present, HDC specified externally‐vented fans for low‐, mid‐, and high‐rise buildings.
Water intrusion. Measures to fix and prevent water intrusion were specified per square foot for low, medium and high scopes of work and for low‐, mid‐ and high‐rise buildings. Water intrusion was explicitly identified by owners in only a few instances; in most cases, measures to deal with water intrusion were included in costs when HDC inferred it was an issue.
Upgrades. Where appropriate, HDC applied cost premiums to account for substantial upgrade work that would need to be undertaken in the event of a major rehab. Upgrades include seismic retrofitting, accessibility conversions, energy improvements, historic renovation and hazardous material remediation. Cost premiums are in the form of percent overlays on overall hard construction costs.
HDC focused on developing costs for outstanding and anticipated capital needs for major building systems, such as envelope and mechanicals, excluding typical interior upgrades that are customarily handled through funding from operations, typically on unit turnover. To build our capital needs estimate, HDC based its information on timing of building systems replacement on one of two factors:
1. Standard expected useful life of building systems. The building industry uses standards for the expected useful life of specific building systems. HDC used Expected Useful Life Tables for multifamily housing developed for Fannie Mae by On‐Site Insight of Boston, Mass. (see Appendix I) to estimate replacement schedule, except as specified below.
2. Reduced expected useful life. Specific building characteristics have been found to present more vulnerability to reduced building system life expectancies, impacting key cost areas. These vulnerabilities may result in reduced life expectancy either because of an industry history of higher frequency of construction defects, or because of increased vulnerability to under‐maintenance. While a few of these vulnerable building systems are discussed and analyzed for the Study universe, for the purposes of projecting capital needs and associated costs, this Study presumes the full life expectancy of these building systems unless a reduced life expectancy has been identified either through an owner‐provided capital needs report, or cited by an owner in the Capital Needs Survey.
Extrapolation HDC received no information from owners for339 out of 649 properties‐just over half of the Study universe. For this segment of the Study universe, HDC relied solely on data provided by Commerce and the Commission. In order to estimate the potential capital needs of these properties, HDC extrapolated the per‐unit costs along a number of property attributes. HDC applied average per unit capital costs data to the 339 properties with unknown capital costs across the following equally‐weighed factors:
Years since placed in service
Funding source

Appendix B: Methodology 51
Number of units
Location
Costing Assumptions The cost discussions to this point have focused on capital costs. To estimate the total costs to complete this work, including soft costs, construction contingencies, and inflation factors, HDC made several key assumptions to estimate the total sources of funds needed to address anticipated capital needs over the next five years.18 Soft Costs Regardless of the extent of work required, every capital project will carry some costs of development, known as soft costs. Soft costs typically include permitting expenses, architectural fees, financing fees, required reserves, and due diligence costs such as survey and environmental reports. Full‐scope rehabs with large hard construction costs frequently require multiple funding sources, which in turn require additional dollars for attorneys, accountants, consultants and owners (in the form of developer fees). Public policies relating to green building, prevailing wage, MWESB contracting and other local requirements can also contribute to a project’s soft costs. The State of Washington caps the amount of architect and engineer (A/E) fees that state capital projects can incur. The Office of Financial Management’s limits recognize that any state capital project under $1M should have a negotiated fee amount. This is in recognition of the fact that there are fixed transaction costs associated with even small projects and that fees should be specific to the scope of work.19 The Affordable Housing Cost Study, a report that was researched and authored by Washington State’s Department of Commerce in 2009, examined the costs of HTF projects and found that soft costs accounted for an average 23% of total development costs in the Study sample of 65 projects. HDC’s 2014 analysis of 14 recent projects from 10 owners identified soft costs as representing 26% of total costs. HDC also looked at small rehabs with total development costs of under $600,000 and determined that, depending on project complexity, soft costs accounted for between $25,000 and $60,000. For this Study, HDC used a tiered approach to assigning soft costs, depending on the scale of construction proposed. HDC assumed that every rehab project will require a minimum transaction cost. For this Study, HDC assumed a minimum transaction cost of $40,000. Once hard construction costs were estimated to be $250,000 or greater, HDC replaced the flat transaction fee with a 16% soft cost factor. Finally, once hard costs were estimated to be $2 million or greater, HDC assumed a soft cost factor of 26%.
Minimum Transaction Cost $40,000
Minimum Small Project Cost $250,000
18 Washington Department of Commerce and Washington State Housing Finance Commission have been provided a copy of a workbook with data from the Washington State Affordable Housing Portfolio Study and can use this workbook to change assumptions and model different scenarios. 19 Washington State Office of Financial Management, Capital budget instructions. http://www.ofm.wa.gov/budget/instructions/capital.asp

Appendix B: Methodology 52
Small Project ‐ Soft Cost Factor 16%
Minimum Large Project Cost $2,000,000
Large Project ‐ Soft Cost Factor 26%
Inflation Factor HDC used a hard cost inflation rate of 3.10%. This inflation rate is applied to costs over time to account for increases in labor and materials costs. The rate was established by referencing the national average of the 20‐city historical construction cost index published by Engineering News‐Record, which started collecting data in 1990. Our model uses a flat rate of 3.10% for costs through 2014, and then compounds that rate starting in 2015.
Existing Debt HDC has detailed debt information on only 270 of the properties in the Study universe, equating to a 42% sample. For these 270 properties, HDC has enough information to determine the amount of must‐pay private debt that will have to be paid off in the event of a refinance. For these properties, the character of the public debt is also known, i.e., whether it is required, conditional or deferred. HDC modeled the potential net dollars from refinancing using two different methodologies:
1. For the 270 properties with known debt information, HDC subtracted the actual 12/31/2013 ending balances from all must‐pay private debt and a 1% prepayment penalty from the amount of new debt the property could theoretically support based on NOI and a DCR of 1.20 in year 1. This methodology yields the most accurate picture of net proceeds from a refinance because the outstanding loan balances are known on 270 properties.
2. For the 379 properties without known debt information, HDC used the same extrapolation techniques as were used to establish capital needs costs. HDC applied average per unit hard debt balance data to the 379 properties across the following equally‐weighed factors:
Years since placed in service
Funding source
Number of units
Location After applying the derived debt balance estimates to the 379 properties, HDC used the same methodology of subtracting the estimated debt balances from the amount of new debt the property could theoretically support based on NOI and a DCR of 1.20 in year 1. This technique generated high theoretical existing debt balances for many properties. Without knowing the cost of retiring must‐pay private debt, HDC made assumptions about how much debt properties are carrying.20
20 These assumptions are included in the Washington Affordable Housing Portfolio Study data workbook provided to Commerce and Commission staff. Staff can use this workbook to change assumptions and model different scenarios.

Appendix B: Methodology 53
Financial Analysis HDC used outstanding debt information collected in the Capital Needs Survey and operating information from WBARS to determine each property’s ability to self‐finance identified capital needs with property‐level resources.
Replacement reserves. HDC analyzed per unit replacement reserve balances and looked at total reserves as a percent of capital needs costs.
Ability to refinance. To estimate the ability of properties in the Study to realize additional capital through refinancing, HDC used the average net operating income over the last two years, as reported in WBARS and a debt service coverage ratio of 1.20 in year 1 to size new loans.
Retiring private, must‐pay debt. HDC estimated each property’s ability to refinance its must‐pay private debt by assuming that the new loan would be used to pay for capital needs and also to pay off the existing, private, must‐pay loan balance. Because outstanding debt information was not available for all properties in the Study universe, HDC used an extrapolation technique to derive an estimated loan balance. This technique is detailed in the Existing Debt subsection of this methodology.
New loan terms. As detailed in the Property Resources to Pay for Capital Needs section, HDC modeled three loan products with different interest rates and terms.
Gap required. For each property, subtracting capital needs costs and current debt balances from the new loan amount and replacement reserves resulted in a positive or negative number. Positive numbers indicate that properties are likely to be able to handle their capital needs over the next five years. Negative numbers indicate a gap that might need to be filled with public investment from Commerce, the Commission or both.
Sources of Funds After identifying the outstanding and upcoming capital needs costs in the next five years, HDC modeled the potential project‐level resources available to cover those costs. Using WBARS data, HDC evaluated potential net funds through refinancing private debt and using available reserves as sources to cover capital improvements:
A Replacement Reserves
B New Loan Based on DCR
C Existing Debt
D Capital Needs Costs
A+B‐C‐D Gap
As with the costing assumptions, this Study’s financing assumptions can be easily manipulated in the Washington State Affordable Housing Portfolio Study data workbook.
Data Available for Study Universe HDC received surveys for nearly half of the properties in the Study universe. For a voluntary and time consuming survey, this is a very good participation rate. HDC requested any available recent capital needs reports from owners and received reports for about 17% of the Study universe. (Note that the

Appendix B: Methodology 54
properties for which HDC received capital needs reports represent a subset of the properties for which HDC received Capital Needs Survey responses, so there is adequate information for about 32% of the Study universe and very good information for about 17% of the Study universe, for a total of 49%.)
Number of Properties % of Study Universe
Study universe 649 100%
Responded to survey 316 49%
and submitted capital needs report 111 17%
Received no information on capital needs 333 51%
Limiting Factors in the Research Methodology Incomplete information. HDC does not have information about capital needs for 51% of the Study universe (333 properties) because owners did not respond to the survey and did not submit a capital needs report. The only information HDC has for these properties was provided to us by Commerce and the Commission, which includes number of units, placed in service date, funding source, owner portfolio size, location, and WBARS Table 4 financial reporting data. Possibility of imperfect sampling and extrapolation. To compensate for incomplete information, HDC used sampling and extrapolation techniques to apply what is known about a portion of the Study universe to the rest of the Study universe. HDC took many factors into consideration, including funding source, number of units, years since the property was placed in service, size of owner portfolio, original construction year, location and bedroom density in calculating estimates. It is possible that more qualitative factors that were not taken into consideration, such as maintenance practices, are more predictive of capital needs. Inaccurate information. The Study’s findings rely heavily on information received from owners through the Capital Needs Survey. The survey was sent to executive directors and, most of the time, was distributed to staff members such as asset managers, facility managers, developers, fiscal managers and property managers. Some of the surveys were also completed by staff from third‐party property management companies. Because the survey requested different kinds of information—loan balances and initial construction materials—in many cases, input was provided by multiple staff members. This opens the possibility of inconsistent or inaccurate data entry.
316333
Responded to Capital NeedsSurvey
Responded to Survey andsubmitted a capital needsreport
Received no information oncapital needs
Appendix B: Methodology 55
Disclaimers General. The estimates provided in this Study are limited by the accuracy and completeness of owner survey information and the applicability of cost data to a range of construction conditions. Scope of rehab work. HDC included capital needs costs for major building systems, such as envelope and mechanicals. HDC did not include costs for minor interior items, as these are customarily handled through funding from operations, typically on unit turnover. No elective upgrades included. Cost estimates from this Study include repair or replacement of existing building systems and expected upgrades, such as seismic and historical work. Estimates do not include elective upgrades, such as energy improvements, code upgrades, and reprogramming of space to improve marketability and resident satisfaction, which are often typical of major rehabilitation projects. No property‐specific estimates. This Study should not be relied on for estimates for any specific property. The methodology used to translate owner comments into a dollar value is intended to provide a portfolio‐wide estimate, and HDC acknowledges that this methodology does not provide the depth or accuracy of site‐specific inspections. Owners need to conduct property‐specific analyses of both capital condition and financial performance to plan for their portfolios.

Appendix C: Physical Characteristics of the Portfolio 56
Appendix C: Physical Characteristics of the Portfolio The Study universe consists of 649 properties containing 37,816 housing units. HDC included properties that were placed in service 10 or more years ago and have 10 or more units; therefore, in general, the properties are older and larger than all of the properties financed with HTF and/or LIHTCs. This section describes the general characteristics and construction characteristics of the Study universe.
General Characteristics Data Available for Study Universe Build Year Half of the Study universe (on which data is available)21 was originally built more than 20 years ago. Nearly 20% of the properties were constructed more than 50 years ago, and half of those were built over 100 years ago. Some of the older properties were likely acquired and rehabilitated for use as affordable housing. Starting in the 1990s, there was a dramatic rise in new construction with layered financing. The chart below shows the age since original construction by funding source, regardless of when that funding source was used to place the project in service as affordable housing.
Placed In Service Commerce and the Commission have historically had differing definitions of placed in service (PIS). In the LIHTC program, placed in service year represents the first year that the building was available for occupancy by residents. Until recently, Commerce defined placed in service year as the year in which a project was complete and 90 percent occupied. With assistance from Commerce, HDC reconciled the PIS dates used for this analysis.
21 The portion of the Study universe on which data is available was around 49% of the total properties in the Study (roughly 315 or 316 out of the 649 properties in the Study).
51
25
6 4 4 2
40
1710 9
15 12
68
10 135 5
19
0
10
20
30
40
50
60
70
80
11 ‐ 20 21 ‐ 30 31 ‐ 40 41 ‐ 50 51 ‐100 100 +
Number of Properties
Years Since Original Construction by Funding Source
LIHTC HTF Bothn=315

Appendix C: Physical Characteristics of the Portfolio 57
On the whole, properties in the HTF portfolio were placed in service longer ago than the LIHTC portfolio. There is evidence of unreliable data in the placed in service dates HDC received in the Capital Needs Surveys. HDC attempted to reconcile the owner‐provided placed in service dates with the information provided by Commerce and the Commission, but there may be some minor inaccuracies likely due to differing definitions of PIS. Funding Source Forty percent of the properties in the Study universe were funded with LIHTCs (but not HTF), 29% with HTF (but not LIHTCs), and about a third of the properties in the Study universe received funding from both HTF and LIHTCs. There are 74 more properties financed with LIHTCs only than with HTF only.
Funding Source Properties Units
Count Percent Count Percent
HTF only 188 29% 5,790 15%
LIHTCs only 262 40% 21,512 57%
HTF & LIHTCs 199 31% 10,514 28%
Total 649 100% 37,816 100%
Property Size and Funding Source Most of the properties have low unit counts, with just over 40% having between 10 and 29 units. Almost three‐quarters of the properties have fewer than 60 units. The majority of properties that were financed with both HTF and LIHTCs have fewer than 60 units. Most of the smaller properties were funded with HTF only, while most of the larger properties were financed with LIHTCs only.
51
79
44
9
96106
52
3
120
58
16 10
20
40
60
80
100
120
140
10‐14 years 15‐19 years 20‐24 years 25+ years
Number of Properties
Years Since Placed In Service by Funding Source
HTF
LIHTC
Both
n=635

Appendix C: Physical Characteristics of the Portfolio 58
Portfolio Size Most of the owners of the 649 properties have large portfolios.22 Over half of the properties are owned by an entity with more than 10 properties with funding from Commerce and/or the Commission.
Portfolio Size* Count Percent
1‐4 properties 201 31%
5‐9 properties 107 16%
10+ properties 341 53%
Total 649 100%
*With financing from Commerce and/or the Commission.
Portfolio Size and Property Size A surprising number of the larger properties—those with over 120 units, in particular—are owned by owners who have fewer than five properties financed through Commerce or the Commission.
22 ‘Owners’ in this context means the sponsor organizations or general partners and not the single‐asset ownership entity (e.g., partnership or LLC).
267
214
46 40
82
0
50
100
150
200
250
300
10 ‐ 29 30 ‐ 59 60 ‐ 89 90 ‐ 119 120 +
Number of Properties
Number of Units in Property
Property Unit Count Across Funding Source
Both
LIHTC
HTF
n=649

Appendix C: Physical Characteristics of the Portfolio 59
Project Type The majority of properties in the Study universe are new construction, as opposed to acquisition/rehab projects. Fifty‐eight percent of the properties are new construction and 42% are acquisition/rehab.
89
56
17 1128
5035
8 2 12
127 124
21 26
43
0
20
40
60
80
100
120
140
10 ‐ 29 30 ‐ 59 60 ‐ 89 90 ‐ 119 120 +
Number of Properties
Property Unit Count by Portfolio Size
n=649

Appendix C: Physical Characteristics of the Portfolio 60
Project Type by Location The vast majority of acquisition/rehab projects are located in the western part of the state, where most of the older properties and population centers are located. Twenty‐five percent of the properties are located in the eastern part of the state.23
23 The eastern part of the state includes properties in Adams, Asotin, Benton, Chelan, Columbia, Douglas, Ferry, Franklin, Garfield, Grant, Kittitas, Klickitat, Lincoln, Okanogan, Pend Oreille, Stevens, Spokane, Walla Walla, Whitman and Yakima counties.
83
183
113105
79 86
0
20
40
60
80
100
120
140
160
180
200
HTF LIHTC Both
Number of Properties
Project Type by Funding Source
New Construction
Acquisition/Rehab
n=649

Appendix C: Physical Characteristics of the Portfolio 61
To generalize, a most prevalent property in the Study universe was newly constructed in the 1990s, has fewer than 60 units, was financed by both HTF and LIHTCs, is located west of the Cascades, and is owned by an entity with more than 10 properties.
Construction Characteristics To better assess the potential capital needs of the Study universe, HDC asked owners to provide information about the initial construction characteristics of their properties. HDC received information for about one‐half of the Study universe. As some owners left questions blank (presumably because the answer was unknown to the respondent), the total number of responses varies from question to question.
Standard Expected Useful Life of Building Systems Siding The material used for siding has a significant impact on its expected life cycle. Brick or tile typically has the longest life cycle, vinyl has among the shortest, and cementitious has a mid‐range life cycle. Given improvements in vinyl siding quality and installation standards, the life expectancy may vary by installation date, and certainly by vulnerability variables discussed below. However, with an industry average of 20 years, understanding the portion of the properties that have vinyl siding is a cost driver. Forty‐two percent of the properties for which HDC received survey responses have vinyl siding. This indicates that for upcoming major rehabs, many properties may require some envelope replacement to upgrade siding.
118
261
45
225
0
50
100
150
200
250
300
East West
Number of Properties
Location
Project Type by Location
New construction
Acquisition/rehab
n=649

Appendix C: Physical Characteristics of the Portfolio 62
EIFS, or exterior insulation finishing system, is a type of synthetic stucco that has not performed well in the wetter areas of the Pacific Northwest because moisture penetration often becomes trapped in the wall system, leading to rot. Windows Seventy‐eight percent of the properties for which HDC received survey responses have vinyl windows. Though vinyl is a low‐maintenance and durable material for windows, vinyl windows have a shorter lifespan than other materials such as fiberglass, particularly for early models with lighter gauge vinyl. After vinyl, the next most common window material in the Study universe is aluminum. Aluminum windows are very durable, yet not energy‐efficient due to their tendency to transfer heat and cold. Aluminum windows are also more vulnerable to condensation issues, unless the interior moisture levels are kept very low.
Roofing Almost one‐half of the properties for which HDC received survey responses have gabled or hipped, composition roofs that are between 10 and 20 years old. Gabled and hip roofs tend to have a more complex design, which can increase replacement cost.
42%
25%
17%
13%3%
Siding Type
Vinyl
Wood
Masonry
Cementitious
EIFSn=282
78%
12%
5%4%
Window Material
Vinyl
Aluminum
Wood
Fiberglassn=311

Appendix C: Physical Characteristics of the Portfolio 63
Heating Most of the properties have wall heaters or electric baseboards. Wall heaters, while not costly, do have limited expected useful life of 15 years. It is not known whether the heating units have been replaced since placed in service or upgraded to energy‐efficient models.
45%
28%
24%
3%
Roof Type
Gabled
Flat
Pitched/shed
Hipn=309
75%
14%
9%
2%Roof Material
Composition
Membrane
Bituminous/built up
Othern=298
12%
11%
66%
10%
Age of Roof
< 5 years old
5‐10 years old
10‐20 years old
20+ years oldn=309
44%
44%
12%
Heating Type
Cadet/wall heater
Electric baseboard
Forced air
n=262

Appendix C: Physical Characteristics of the Portfolio 64
Building Systems Vulnerable to Reduced Expected Useful Life Both construction defects and under‐maintenance have contributed to significant recapitalization costs of both market rate and affordable properties. While not inherent to the construction type, either poor installation and/or under‐maintenance can significantly reduce the life cycle of building envelopes, structural components and interior finishes, particularly in the more humid areas west of the Cascades. This Study looked at four vulnerability areas, based on cost drivers that had material impact in prior capital needs studies: construction type, foundation type, presence of unit decks, and properties built during an era of high production and new materials (1985 to 2005). While building failures may be infrequent, their high cost impact could have a significant impact on actual capital needs of the portfolio over time, so particular analysis focused on building type and foundation type. As stated in the Methodology appendix, HDC included the cost of replacement of vulnerable building systems that had not yet reached their expected useful life only when owners identified a problem in the Capital Needs Survey. Construction and Foundation Type HDC asked owners about their properties’ construction type because this can be an indicator of the type and extent of potential capital needs. Construction type relates to the materials used for the structural frame and interior/exterior load‐bearing walls. Based on industry experience, wood‐frame buildings are more dependent on routine and preventative maintenance practices that extend the useful life of building systems and components than concrete or steel framed structures. Without proper initial construction detailing and maintenance during operations, wood‐frame buildings can experience more significant damage from water intrusion and have more challenges from unregulated heat and moisture, particularly in regions with high humidity. Similarly, properties with certain foundation types, specifically slab‐on‐grade, may present challenges because of more vulnerability to negative site grading issues, mostly due to more limited clearances and the natural building settling process. That said, concern about wood‐frame construction and slab‐on‐grade foundation is not always warranted. With proper initial construction and maintenance practices, the buildings can be serviceable for the duration of their expected useful life. HDC evaluated these two construction characteristics to see if there was variation in the frequency of their use across the state and to help inform our capital needs estimates.
87% 93%
0%
20%
40%
60%
80%
100%
West East
Number of Properties
Construction Type by Location
Wood frame Unreinforced masonry Concrete Steel framen=299

Appendix C: Physical Characteristics of the Portfolio 65
The vast majority of the properties for which HDC received survey responses are wood‐frame construction. Likewise, 50% of properties in the West, and 61% in the East are estimated to have slab‐on‐grade construction. Though there is little variation in the construction type, there is more variation in in foundation type.
The high percentages of wood‐frame and slab‐on‐grade buildings present a vulnerability to water damage, although not a certainty of such. There is no material difference in either construction type or foundation type across the state, but climate conditions west of the Cascades likely increase the vulnerability of properties in the West to water damage.
20% 19%
50% 61%
9%7%
21% 13%
0%
20%
40%
60%
80%
100%
West East
Number of Properties
Foundation Type by Location
Crawl space Slab on grade Combination Basementn=311

Property Name CityNumber of
Units
Placed in
Service Year
Funding
Source5th & Jefferson Residential Housing Spokane 43 2001 HTF
Airways Transitional Housing Moses Lake 12 2010 HTF
Aki Kurose II Seattle 36 1999 LIHTC
Aki Kurose Village (Stone View) Seattle 26 1999 LIHTC
Alaska House Seattle 105 2004 LIHTC
Alder House South Bend 35 1995 HTF
Alderbrook Apartments Kent 206 2000 LIHTC
Alderwood Court Apartments Lynnwood 130 2003 LIHTC
Alma Gamble Seattle 12 2001 Both
Aloha Inn Seattle 66 1991 HTF
Alpine Ridge Mount Vernon 60 1993 LIHTC
Alpine Ridge Apartments Bothell 42 2000 LIHTC
Alsaker‐Grace Court Village Spokane Valley 60 1996 HTF
AMS ‐ Adams, Motley and Stafford Apartments Tacoma 17 1994 HTF
Andrew's Arms Issaquah 14 1992 Both
Andrew's Heights Bellevue 24 1994 HTF
Angle Lake Court SeaTac 80 2003 Both
Annobee Apartments, The Tacoma 43 2000 LIHTC
Anthem Park at Uptown Village Vancouver 58 2004 Both
Arbor Heights Seattle 97 2003 Both
Arbor Ridge Assisted Living Project Vancouver 60 2002 Both
Arbor Ridge Senior Housing (Hazel Dell Senior Housing) Vancouver 45 2002 HTF
ARC Project Spokane 24 1996 HTF
Arion Court Seattle 37 1994 HTF
Arrowhead Park Apartments Lakewood 42 1994 LIHTC
Ashwood Court Bellevue 51 1999 Both
Auburn Court Apartments Auburn 296 1998 LIHTC
Auburn Manor Apartments Auburn 25 2000 Both
Austen Manor Clarkston 30 1996 HTF
Autumn Ridge II Wapato 24 1997 LIHTC
Avalon Mutual Housing Seattle 15 2001 HTF
Avondale Court Apartments Spokane 26 1993 HTF
Avondale Park Redmond 53 2004 Both
Azalea Place Vancouver 12 2003 HTF
B & B Apts Olympia 16 1992 HTF
Bailey‐Boushay House Seattle 35 1991 HTF
Baird Springs Apartments Ephrata 25 2000 LIHTC
Balfour Place Seattle 200 1994 LIHTC
Bays Water Apartments Tacoma 34 1996 LIHTC
Bayview Apartments Anacortes 46 2003 Both
Beachwood Marysville 25 1999 Both
Beacon Manor Ferndale 51 1999 LIHTC
Bell Hotel/New Basin Inn Ephrata 14 2010 HTF
Bellevue/Olive Apartments Seattle 48 1995 Both
Belltown Senior Apartments Seattle 25 2003 Both
Belmont Apartment Walla Walla 21 1998 HTF
Benson East Duplexes Kent 32 2004 HTF
Bergan Place Apartments Seattle 38 1987 HTF
Bernadette Place Spokane 6 2001 HTF
Birch Street Apartments Quincy 26 2001 LIHTC
Boardwalk Apartments Olympia 284 2000 LIHTC
Boundary Village Blaine 24 2003 Both
Boylston‐Howell Seattle 30 1996 HTF
Appendix D. List of Properties in Study Universe
66

Property Name CityNumber of
Units
Placed in
Service Year
Funding
SourceBrandenwood Apartments Bellevue 60 1990 LIHTC
Brewster Apartments Seattle 35 1995 HTF
Briarwood Commons Ellensburg 176 1998 LIHTC
Bridge Creek I Apartments Everett 22 1987 HTF
Bridge Creek II Apartments Bellingham 31 1998 HTF
Bristol Square II Lynnwood 96 1994 LIHTC
Brookstone/Brookside Spokane Valley 82 2002 LIHTC
Buchanan Place Seattle 12 2002 HTF
Bucheit Garden Apartments Kent 15 1998 HTF
Buena Nueva Buena 26 2003 Both
Bunkhouse Seattle 60 2001 HTF
Burke Gilman Place Apartments Seattle 113 1985 LIHTC
Burke‐Gilman Gardens Seattle 15 1997 HTF
Bush Hotel Seattle 96 1997 Both
Byron/Wetmore Seattle 12 1993 Both
Cal Anderson House Seattle 24 1995 HTF
Cambridge Apartments Seattle 152 2001 HTF
Cambridge Cove Oak Harbor 37 1991 LIHTC
Candlewood Manor Conversion Olympia 103 1955 HTF
Cannon House Seattle 120 2001 HTF
Capehart ‐ Wherry Apartments Moses Lake 50 2002 LIHTC
Caribou Trails Apartments Okanogan 24 1998 HTF
Carlisle Court Spokane 11 1997 HTF
Carriage Place Apartments Olympia 50 1995 LIHTC
Casa del Sol Sunnyside 26 2002 LIHTC
Casa Guadalupe Chelan 31 1995 HTF
Casa Pacifica Seattle 65 1998 LIHTC
Casas Salvadas Spokane 25 1997 Both
Cascade Court Seattle 98 1994 Both
Cascade Terrace Vancouver 6 1996 HTF
Cascade Woods ‐ Phase I Vancouver 66 1992 LIHTC
Cascade Woods ‐ Phase II Vancouver 48 1993 LIHTC
Cascadia Village Apartments Vancouver 51 2003 Both
Cascadian Apartments Bellevue 198 1995 LIHTC
Cate Apartments Seattle 31 2003 Both
Catherine Johnson Court Spokane Valley 36 1996 Both
Cedar Heights Apartments Port Orchard 50 2001 Both
Cedar Landing Apartments Marysville 131 2000 LIHTC
Cedar Pointe Auburn 89 1990 LIHTC
Cedar Ridge Apartments Auburn 48 2000 LIHTC
Cedar River Court Apartments Renton 100 1995 LIHTC
Cedar Village Auburn 24 1998 HTF
Cedarwood I Apartments Lake Stevens 30 2003 Both
Cedarwood II Lake Stevens 40 2003 Both
Cedarwood IV Lake Stevens 38 2003 HTF
Centennial Apartments Seattle 30 1999 HTF
Centerwood Seattle 12 2001 HTF
Central Colville Apartments Colville 26 1999 Both
Central Park Place Vancouver 124 1999 Both
Chalet Apartments Bellevue 18 2004 Both
Chaparral Apartments Moses Lake 26 2000 LIHTC
Chehalis Valley Apartments Chehalis 26 1999 LIHTC
Chestnut Grove Senior Apartments Moses Lake 22 1992 LIHTC
Chestnut Manor Yakima 47 1991 HTF
Chinook Hotel Kelso 21 1996 HTF
City Multiplex Project Spokane 26 1995 HTF
67

Property Name CityNumber of
Units
Placed in
Service Year
Funding
SourceClarke Court Aberdeen 26 1998 LIHTC
Clarkston Gardens Clarkston 26 1996 LIHTC
Clarkston Manor Clarkston 12 1998 LIHTC
Clean House Apartments Yakima 22 1999 HTF
Cocoon Complex Trans Shelter Everett 20 1994 HTF
Colby Crest Apartments Everett 64 1993 LIHTC
College Glen Lacey 164 1996 LIHTC
Collins Apartments Rehabilitation Effort (CARE) Spokane 39 1999 HTF
Colonial Apartments Tacoma 44 1994 Both
Colonial Gardens Shoreline 72 1999 LIHTC
Colorado Apartments East Wenatchee 26 1998 LIHTC
Columbia Apartments Colville 12 1991 HTF
Commerce Building Everett 48 1995 Both
Committee on Housing Seattle 17 1994 HTF
Commonwealth Apartments Tacoma 12 1994 Both
Compass Center Transitional Housing Program Seattle 34 1998 Both
Conservatory Place Apartments II Tacoma 51 1999 LIHTC
Conservatory Place I Apartments Tacoma 40 1998 LIHTC
Cornerstone Apartments Yakima 121 1994 LIHTC
Coronado Springs Apartments Seattle 335 2003 LIHTC
Corridor Apartments Centralia 21 2002 LIHTC
Cottonwood Glen Clarkston 20 1999 LIHTC
Cottonwood Springs II Davenport 18 1999 HTF
Country Run Apartments Kelso 100 2000 Both
Court View Apartments Spokane 14 1992 HTF
Courtside Apartments Olympia 210 1997 LIHTC
Covington Commons Vancouver 40 2000 Both
Cowlitz Terrace Kelso 19 1992 LIHTC
Creekside Apartments Shelton 18 1999 LIHTC
Creekside Cottages College Place 25 2000 Both
Creekside Meadows Sumas 20 2014 LIHTC
Crescent Village Wenatchee 18 1995 HTF
Crestline Apartments Kirkland 22 1996 LIHTC
Danwood Apartments Silverdale 40 2001 Both
David Colwell Building Seattle 126 2000 LIHTC
Deaconess Apartments Wenatchee 26 2002 LIHTC
Deer Run at Northpointe Spokane 114 2003 LIHTC
Deer Run Terrace Bellingham 42 2014 LIHTC
Delridge Heights‐Multi‐Family Preservation II Seattle 12 2002 HTF
Denice Hunt Townhomes Seattle 30 1997 HTF
Desert Haven Othello 26 2004 Both
Desert Rose Terrace Benton City 26 2001 Both
Devonshire Apartments Seattle 62 1993 HTF
Discovery View Port Townsend 48 1993 LIHTC
Domingo Viernes Apartments Seattle 57 2004 Both
Dorothy Arnold Giesecke Place Bellingham 21 1998 HTF
Dorothy Day Residence Seattle 41 1999 Both
Duplex Hsg for DD Individuals Puyallup 11 1996 HTF
Eagle Crest Estates Spokane 21 2014 HTF
Eagle Pointe Village Cathlamet 17 1998 HTF
Eaglepointe Apartments Spokane Valley 140 1998 LIHTC
Eagles, The Seattle 44 1996 LIHTC
East Valley Senior Housing Spokane Valley 50 2003 Both
East Village Omak 26 2001 LIHTC
Eastern Hotel Seattle 47 1998 Both
Easternwood Family Housing Bothell 18 1994 Both
68
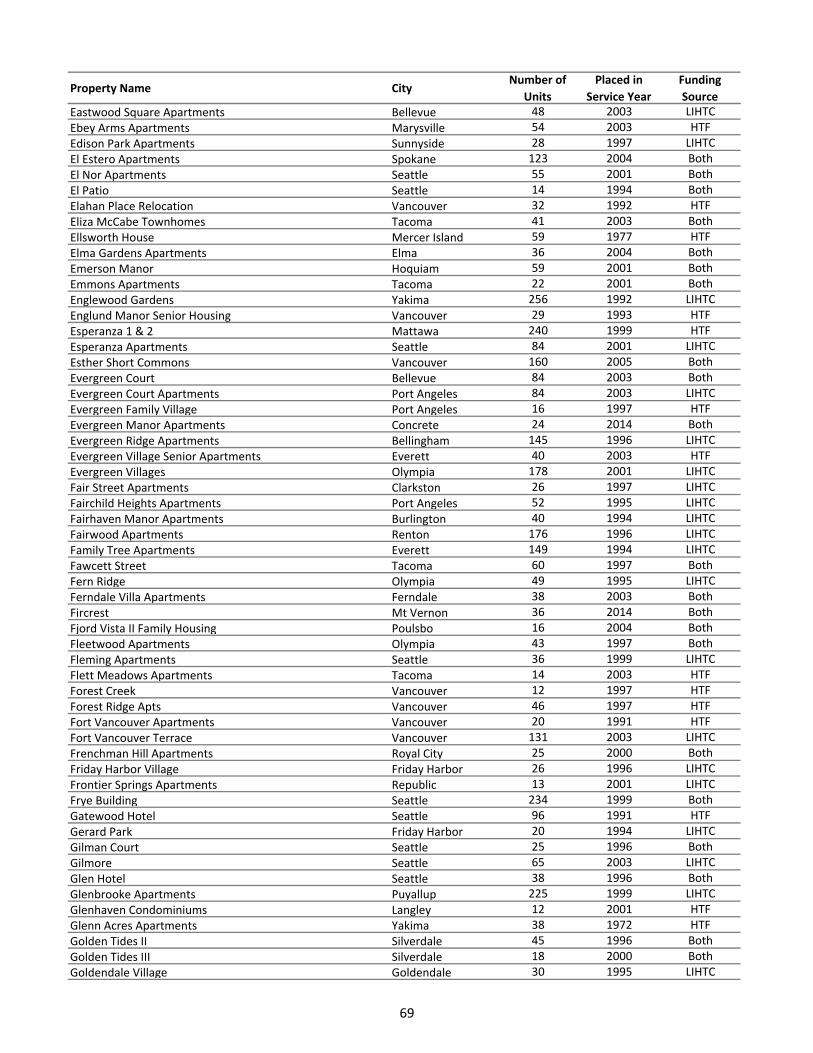
Property Name CityNumber of
Units
Placed in
Service Year
Funding
SourceEastwood Square Apartments Bellevue 48 2003 LIHTC
Ebey Arms Apartments Marysville 54 2003 HTF
Edison Park Apartments Sunnyside 28 1997 LIHTC
El Estero Apartments Spokane 123 2004 Both
El Nor Apartments Seattle 55 2001 Both
El Patio Seattle 14 1994 Both
Elahan Place Relocation Vancouver 32 1992 HTF
Eliza McCabe Townhomes Tacoma 41 2003 Both
Ellsworth House Mercer Island 59 1977 HTF
Elma Gardens Apartments Elma 36 2004 Both
Emerson Manor Hoquiam 59 2001 Both
Emmons Apartments Tacoma 22 2001 Both
Englewood Gardens Yakima 256 1992 LIHTC
Englund Manor Senior Housing Vancouver 29 1993 HTF
Esperanza 1 & 2 Mattawa 240 1999 HTF
Esperanza Apartments Seattle 84 2001 LIHTC
Esther Short Commons Vancouver 160 2005 Both
Evergreen Court Bellevue 84 2003 Both
Evergreen Court Apartments Port Angeles 84 2003 LIHTC
Evergreen Family Village Port Angeles 16 1997 HTF
Evergreen Manor Apartments Concrete 24 2014 Both
Evergreen Ridge Apartments Bellingham 145 1996 LIHTC
Evergreen Village Senior Apartments Everett 40 2003 HTF
Evergreen Villages Olympia 178 2001 LIHTC
Fair Street Apartments Clarkston 26 1997 LIHTC
Fairchild Heights Apartments Port Angeles 52 1995 LIHTC
Fairhaven Manor Apartments Burlington 40 1994 LIHTC
Fairwood Apartments Renton 176 1996 LIHTC
Family Tree Apartments Everett 149 1994 LIHTC
Fawcett Street Tacoma 60 1997 Both
Fern Ridge Olympia 49 1995 LIHTC
Ferndale Villa Apartments Ferndale 38 2003 Both
Fircrest Mt Vernon 36 2014 Both
Fjord Vista II Family Housing Poulsbo 16 2004 Both
Fleetwood Apartments Olympia 43 1997 Both
Fleming Apartments Seattle 36 1999 LIHTC
Flett Meadows Apartments Tacoma 14 2003 HTF
Forest Creek Vancouver 12 1997 HTF
Forest Ridge Apts Vancouver 46 1997 HTF
Fort Vancouver Apartments Vancouver 20 1991 HTF
Fort Vancouver Terrace Vancouver 131 2003 LIHTC
Frenchman Hill Apartments Royal City 25 2000 Both
Friday Harbor Village Friday Harbor 26 1996 LIHTC
Frontier Springs Apartments Republic 13 2001 LIHTC
Frye Building Seattle 234 1999 Both
Gatewood Hotel Seattle 96 1991 HTF
Gerard Park Friday Harbor 20 1994 LIHTC
Gilman Court Seattle 25 1996 Both
Gilmore Seattle 65 2003 LIHTC
Glen Hotel Seattle 38 1996 Both
Glenbrooke Apartments Puyallup 225 1999 LIHTC
Glenhaven Condominiums Langley 12 2001 HTF
Glenn Acres Apartments Yakima 38 1972 HTF
Golden Tides II Silverdale 45 1996 Both
Golden Tides III Silverdale 18 2000 Both
Goldendale Village Goldendale 30 1995 LIHTC
69

Property Name CityNumber of
Units
Placed in
Service Year
Funding
SourceGowe Court Apartments Kent 50 1998 LIHTC
Graham/Terry Apartments Seattle 121 1992 Both
Grand Hotel, The Yakima 51 2001 LIHTC
Greenbrier Heights Family/ DASH Bellevue 50 2003 Both
Greenbrier Heights Senior Woodinville 50 2004 Both
Greenwood Home Seattle 11 2000 HTF
Griffin Glen Bremerton 96 1996 LIHTC
Guse Summit View Apartments Spokane 27 1993 HTF
Haddon Hall Seattle 55 1996 HTF
Hamilton Place Senior Living Bellingham 94 1998 LIHTC
Hampton Heights Apartments Tukwila 114 1996 LIHTC
Harbor Ridge Apartments Oak Harbor 31 1993 LIHTC
Harborview Apartments Bellingham 18 2014 Both
Hardeson Commons Everett 20 1992 HTF
Harmony House East Snohomish 12 1999 HTF
Harmony House North Marysville 15 1991 HTF
Harrison Apartments Seattle 19 2001 Both
Harrison Apartments Everett 12 1994 HTF
Harrison House Apartments Kent 94 2004 LIHTC
Harrison Village Centralia 31 1996 LIHTC
Hart Terrace Spokane 72 1992 LIHTC
Harvest Manor Apartments Othello 42 1999 Both
Harvest Ridge Apartments Grandview 24 2004 Both
Harvey Apartments Seattle 20 1999 HTF
Haven House Everett 12 1999 HTF
Hazel Plaza I Seattle 16 1991 HTF
Heather Apts Seattle 24 2000 HTF
Heather Commons Bellingham 24 2000 Both
Heather Commons II Bellingham 14 2001 Both
Heatherstone Kennewick 224 1997 LIHTC
Heatherwood Apartments Mill Creek 266 2004 LIHTC
Heg House Seattle 11 1994 Both
Helen V Apartments Seattle 38 2003 Both
Hemlock Court Longview 47 1994 LIHTC
Heritage Apartments Port Orchard 56 2002 LIHTC
Heritage Court Grandview 17 1993 LIHTC
Heritage Glen East Wenatchee 35 2002 HTF
Heritage Grove Apartments Renton 56 1995 LIHTC
Heritage Heights Apartments Spokane 62 1997 LIHTC
Heritage Park Bothell 77 1999 LIHTC
Heritage Woods Apartments Redmond 59 1995 LIHTC
Heron Landing Kenmore 51 2001 Both
Heron Run Kenmore 46 2002 Both
HFG ‐ Sites 2, 3, 4 & 5 (Home For Good Transfer) Lynnwood 16 1996 HTF
Hidden Hills University Place 216 2002 LIHTC
Hidden Pines Spokane Valley 26 2001 Both
Hidden Village and Spiritwood Bellevue 208 1993 HTF
Highland Commons I Port Angeles 55 1997 Both
Highland Commons II Port Angeles 44 2013 LIHTC
Highland Court Apartments Renton 25 1998 Both
Highland Gardens Apartments Issaquah 51 1998 Both
Hillcrest Park Apartments Seattle 20 1998 HTF
Hillside Garden Townhomes Tacoma 26 2003 Both
Hillside Park Tonasket 30 1991 LIHTC
Hillside Terrace Phase I Tacoma 21 2003 Both
Hillside Terrace Phase II Tacoma 25 2004 Both
70

Property Name CityNumber of
Units
Placed in
Service Year
Funding
SourceHilltop Ridge Port Angeles 35 1999 LIHTC
Holden Vista Apartments Seattle 16 1995 HTF
Holly Park III Seattle 219 2004 Both
Holly Park Phase II Seattle 96 2001 Both
Holly Park Redevelopment Project Seattle 305 1998 Both
Holly Village Senior Living Everett 149 2002 LIHTC
Homestead Apartments Forks 16 1997 HTF
Hope House Spokane 59 2003 HTF
Hopelink Place Bellevue 20 2000 HTF
Horizons West Olympia 24 1995 HTF
Hostmark at Village Cove Poulsbo 120 2004 LIHTC
Housing Hope Village Everett 19 1997 Both
Housing Hope Village Expansion Everett 12 2004 Both
International District Village Square ‐ Legacy House Seattle 75 1998 HTF
International House Seattle 99 2004 LIHTC
Jefferson Apartments Tacoma 42 1992 HTF
Jensen Block Seattle 30 1997 Both
JG Commons Senior Housing Project Vashon 21 2002 HTF
Julie Apartments Seattle 47 2001 LIHTC
Juniper Wood Issaquah 20 1991 HTF
Kent Manor Kennewick 51 1998 LIHTC
Kerner‐Scott House Seattle 40 1998 Both
Kirkland Plaza Kirkland 24 1977 HTF
Kneeland Park Shelton 21 1996 LIHTC
Knoblock Apartments Dayton 26 2000 LIHTC
Krislen Apts Yelm 24 1997 HTF
Kulshan Residences Mount Vernon 38 2001 Both
L & S Cedar Center Chewelah 24 1991 LIHTC
L & S Chewelah Meadows Chewelah 14 1994 LIHTC
L & S Fir Meadows Deer Park 20 1991 LIHTC
L & S The Falls Kettle Falls 17 1994 LIHTC
L & S The Highlands Colville 36 1995 LIHTC
L & S Willow Glen Newport 24 1990 LIHTC
La Casa de San Jose Mount Vernon 50 2001 Both
La Casa de San Juan Diego Woodland 51 2004 Both
La Casa de Santa Rosa Sedro‐Woolley 15 2002 Both
La Follette Place Mount Vernon 11 1997 HTF
Labateyah Youth Home Seattle 25 1992 HTF
Lake Stevens Manor Lake Stevens 33 2003 Both
Lake Village East Lake Stevens 30 2003 Both
Lake Washington Apartments Seattle 366 1998 Both
Lake Woods II Senior Apartments Everett 51 1996 Both
Lakeland Pointe Moses Lake 26 1998 LIHTC
Lakeland Pointe II Apartments Moses Lake 26 2003 LIHTC
Lakeview Apartments Seattle 59 2001 LIHTC
Lakewood Meadows Apartments Lakewood 168 2002 LIHTC
Lamplighter Apartments Yakima 16 2000 HTF
Larkin Place Bellingham 101 1998 LIHTC
Larned Apartments Seattle 33 1992 Both
Las Brisas del Mar Apartments Seattle 10 1995 HTF
Laurel Heights Port Townsend 51 2004 LIHTC
Laurelwood Gardens Federal Way 92 1999 LIHTC
Lee Plaza Port Angeles 48 2000 Both
LeRoy Helms Center Seattle 11 2003 HTF
Lervick Family Village Stanwood 13 1996 HTF
Lewiston Hotel Seattle 54 1986 Both
71

Property Name CityNumber of
Units
Placed in
Service Year
Funding
SourceLexy Manor Oak Harbor 26 1998 LIHTC
Liberty Bay Apartments Bremerton 16 2001 Both
Lincoln Court Apartments Seattle 29 2004 HTF
Lincoln Hill Apartments Phase II Stanwood 41 1994 HTF
Lincoln Way Apartments Lynnwood 50 1998 Both
Lincoln Way Apartments ‐ Phase 2 Lynnwood 50 2001 Both
Linda Vista Toppenish 30 1994 HTF
Little Bear Creek Elder Apartments & Senior Center Bellingham 29 2000 HTF
Local Apartments Pasco 44 1980 LIHTC
Logan Park Sedro‐Woolley 47 2003 LIHTC
Longfellow/Westwood Court Cooperative Seattle 45 2001 Both
Lummi Homes I Bellingham 24 2002 LIHTC
Lund Pointe Port Orchard 24 1995 LIHTC
Lynnwood Rotary Center Lynnwood 122 1997 Both
Lyon Building Seattle 64 1997 Both
Madison Apartments, The Seattle 73 2000 LIHTC
Madrona House Burien 11 2000 HTF
Madrona Manor Port Orchard 40 1998 Both
Madrona Manor Oak Harbor 50 1996 LIHTC
Magnolia Villa Lacey 21 2000 Both
Manresa Apartments Lakewood 20 2000 HTF
Maple Crossing Apartments Maple Valley 76 1994 LIHTC
Maple Knoll Vancouver 148 1999 LIHTC
Maple Lane Estates Kent 24 1994 HTF
Maple Leaf Meadows Arlington 22 2003 HTF
Maple Leaf Townhouses Yakima 26 2000 LIHTC
Maple Street Apartments Wenatchee 52 2003 LIHTC
Mariposa Apartments Federal Way 194 2002 LIHTC
Mariposa Park Yakima 26 1999 Both
Marketplace Apartments Vancouver 173 1998 LIHTC
Martin Court Seattle 42 2004 Both
Marysville Studios Marysville 18 2004 Both
Matsusaka Townhomes Tacoma 26 1994 Both
Max Hale Center Bremerton 53 1996 Both
McKinney Manor Seattle 64 1997 HTF
McMurray Park Phase II Richland 100 1997 Both
Meadowbrook View Seattle 50 2003 Both
Meadows Annex Yakima 20 1995 LIHTC
Meadows II Senior Everett 51 1999 Both
Meadows III Senior Apartments Everett 51 2000 Both
Meadows on Lea Hill, The Auburn 90 1995 LIHTC
Meadows Senior Apartments Everett 51 1998 Both
Mercer Court Seattle 24 1996 LIHTC
Meridian Court Apartments Federal Way 200 1997 LIHTC
Mill Pointe Apartments Everett 193 2001 LIHTC
Miller Park Apts Seattle 12 1998 HTF
Mitchell Place Apts Federal Way 50 2003 Both
MLK New Look Senior Housing Tacoma 49 2002 LIHTC
Monroe Villa Monroe 22 2003 Both
Morning Sun Park Manson 19 2000 Both
Morningside Senior Apartments Omak 20 1993 LIHTC
Moses Lake Meadows Moses Lake 26 1999 LIHTC
Mount Baker Apartments Bellingham 85 1999 LIHTC
Mountain Meadows Assisted Living Leavenworth 28 1997 HTF
Mountain View Apartments Tukwila 50 2002 Both
New Beginnings Transitional Housing Seattle 17 1997 HTF
72

Property Name CityNumber of
Units
Placed in
Service Year
Funding
SourceNew Ground Bothell Bothell 14 1991 HTF
New Life Villa I Mabton 26 2002 Both
Nike Manor Kent 42 1997 HTF
Norman Mitchell Manor Seattle 22 1999 Both
Norris Place Burlington 50 1996 LIHTC
North River Apartments East Wenatchee 26 1998 LIHTC
North Valley Apartments Omak 24 1992 LIHTC
North Valley II Omak 23 1995 LIHTC
Northaven II Assisted Living Seattle 40 1992 HTF
Northbrook Place Bellingham 78 1992 LIHTC
Northcliff Terrace Apartments Spokane 87 1995 LIHTC
Northlake Grove Cooperative Kenmore 24 1997 Both
Northridge Apartments Zillah 21 1993 LIHTC
Northwest Passage Apartments Port Townsend 18 1996 HTF
Northwood Manor Pullman 51 1998 LIHTC
Norwegian Wood Apartments Gig Harbor 40 2004 Both
Nor'West Village Port Townsend 30 2003 LIHTC
NP Hotel Seattle 63 1994 Both
Nueva Primavera Yakima 38 1999 HTF
Nuuanu Pali Apartments Seattle 19 2002 HTF
Oak Bay Station Oak Harbor 180 1997 LIHTC
Oak Harbor Estates Oak Harbor 42 2003 Both
Oak Manor Apts Seattle 15 1996 HTF
Oak Tin Apartment Seattle 21 1990 HTF
Oakes Avenue Commons Cooperative Everett 20 2000 Both
Oakland Apartments Bellingham 20 2002 Both
Oasis Apartments Othello 31 2003 Both
OK Hotel Seattle 44 2004 LIHTC
Oleta Apartments, The Seattle 34 2002 Both
Olympic Apartments Mount Vernon 30 2003 Both
Olympic Pointe Apartments Port Orchard 51 1996 LIHTC
Olympic Pointe II Apartments Port Orchard 26 1997 LIHTC
Orchard Bluff Port Orchard 88 1997 HTF
Orchard Glen Vancouver 80 2000 Both
Orchard Hills Apartments Richland 142 1994 LIHTC
Oregon Place Apartments Seattle 39 2001 Both
Oroville Gardens Oroville 24 2001 HTF
Outlook, The Pullman 51 1997 LIHTC
Oxford Square Lynnwood 120 1999 LIHTC
Pacific Courtyard Tacoma 46 2003 HTF
Pacific Crest Everett 120 2014 LIHTC
Pacific Crest Apartments Tacoma 24 1994 LIHTC
Pacific Hotel Seattle 112 1995 Both
Pacific Inn Apartments Bellevue 118 1998 LIHTC
Pacific Sands Apartments Long Beach 28 1994 LIHTC
Palouse Cove Senior Housing Palouse 12 1998 HTF
Palouse Trace Pullman 51 1996 LIHTC
Park Place Napavine 51 2001 LIHTC
Park Place Apartments Kent 51 2001 LIHTC
Park Tower Spokane 184 1999 HTF
Parkside Apartments Everett 203 2002 LIHTC
Parkview Apartments Kennewick 22 1978 LIHTC
Parkview Apartments Othello 22 2004 HTF
Parkway Apartments Federal Way 208 2002 LIHTC
Patrician Apts Spokane 17 1993 HTF
Pelican Place Moses Lake 19 2004 LIHTC
73

Property Name CityNumber of
Units
Placed in
Service Year
Funding
SourcePepperwood Senior Apartments Lynnwood 25 2004 Both
Pheasant Run Othello 30 1996 LIHTC
Pilchuck I Apartments Marysville 30 2003 HTF
Pinecrest Apartments Pasco 54 2001 LIHTC
Pioneer Park Connell 51 1996 LIHTC
Plum Court Family Apartments Kirkland 66 2004 Both
Plum Meadows Apartments Vancouver 162 2004 Both
Plymouth Place Seattle 73 2003 Both
Port Orchard Vista Port Orchard 42 2004 Both
Prairie Run Apartments Yelm 32 2002 Both
President Apartments Mount Vernon 38 1996 HTF
Priest Rapids Apartments Mattawa 26 2002 LIHTC
Prince Court Apartments Bellingham 25 1998 Both
Puyallup Silvercrest Puyallup 41 1995 HTF
Quail Ridge Apartments Kennewick 51 1997 LIHTC
Quail Run Apartments Vancouver 129 2003 LIHTC
Quilceda Meadows Marysville 17 2004 HTF
Rainier View Apartments Puyallup 25 2000 Both
Rainier View I Enumclaw 48 1999 Both
Rainier View II Enumclaw 36 1999 Both
Rainier Vista Senior Apartments Pacific 75 2003 LIHTC
Raspberry Ridge Burlington 51 2002 Both
Ravenna School Seattle 39 1999 LIHTC
Raymond Eagle's Building Raymond 16 2001 HTF
Raymond House Raymond 30 1993 LIHTC
Regency Park Bellingham 228 2001 LIHTC
Residential Housing‐Dev Disabled Renton 24 1991 HTF
Resurrection Village (Cambridge Court) Bellevue 20 1995 HTF
Rex Hotel Seattle 30 1994 HTF
River House Apartments Lynden 50 1998 Both
River Mountain Village Newport 42 2001 HTF
Riverdale Heights Raymond 32 1996 LIHTC
Riverside III Apartments Aberdeen 20 2003 HTF
Riverside Landing Apartments Bothell 50 1998 LIHTC
Riverwalk Point I Spokane 52 2003 Both
Rock Cove Assisted Living Facility Stevenson 30 1998 HTF
Rockwood Terrace Washougal 62 2000 LIHTC
Rosecreek Apartments Arlington 100 2000 LIHTC
Rosewood Apartments Friday Harbor 18 1999 LIHTC
Royal Hills Apartments Renton 284 2001 LIHTC
Sage Terrace Lakewood 107 2002 LIHTC
Salem Village Mount Vernon 47 1998 Both
Salisbury Court Kirkland 12 1993 HTF
San Isidoro Plaza Granger 26 2001 Both
San Juan Commons Port Townsend 51 1999 LIHTC
Sand Point Family Housing Seattle 27 1999 Both
Sandalwood Apartments Toppenish 20 2002 LIHTC
Sandstone Apartments Kennewick 120 1995 LIHTC
Santos Place Seattle 42 1999 Both
Scattered Site Duplexes Spokane 16 1997 HTF
Scattered Site Rental Project Spokane 11 1996 HTF
Seabreeze Townhouses Blaine 11 2014 LIHTC
Seaview Apartments Des Moines 72 1999 LIHTC
Security House Seattle 107 1999 Both
Seneca Apartments Seattle 32 1998 LIHTC
Shared Housing Program Lynnwood 14 1995 HTF
74

Property Name CityNumber of
Units
Placed in
Service Year
Funding
SourceSi View Enumclaw 20 1999 Both
Silver Springs Apartments Kent 251 2001 LIHTC
Silverwood Anacortes 24 1994 LIHTC
Silverwood Park Apartments Des Moines 135 1991 LIHTC
Similkameen Park Oroville 21 2000 Both
Skagit Village Apartments Mt Vernon 36 2003 Both
Somerset Gardens East Bellevue 90 2000 Both
Somerset Gardens West Bellevue 108 2000 Both
Sommerset Apartments Yakima 47 2003 HTF
Sortun Court Townhouses Seattle 16 1999 HTF
South Hill Commons Spokane 58 2001 LIHTC
Southcreek Apartments Centralia 52 2004 LIHTC
Southwood Square Apartments Kent 104 2002 Both
Spencer Court Apartments Renton 74 1993 LIHTC
Spokane Homes I Ford 25 2004 LIHTC
Sprague Crossing Spokane Valley 25 2003 Both
Springfield Meadows Vancouver 290 2002 LIHTC
Spruce Park Apartments Seattle 45 1995 HTF
SRO Housing for Homeless Tacoma 33 1996 Both
St Johns Court Centralia 12 1993 HTF
St. Charles Apartments Seattle 64 2004 Both
St. Charles Place Oroville 23 1994 LIHTC
Starliter Apartments Seattle 30 1995 HTF
Steeple Chase Apartments Vancouver 111 1995 LIHTC
Stepping Stones Program Spokane 30 2004 HTF
Sterling Meadows Apartments Bellingham 51 2002 Both
Stewart Court Apartments Seattle 65 2002 LIHTC
Stillwater Redmond 16 1996 HTF
Stonegate Apartments Pasco 200 2004 LIHTC
Straley House Seattle 12 1989 HTF
Stuart Place Olympia 36 1995 LIHTC
Summer Ridge Lacey 116 2000 Both
Summerglen Mount Vernon 152 1997 LIHTC
Summit Apartments Tacoma 171 2000 LIHTC
Sumner Commons Senior Housing Sumner 34 2004 Both
Sun Tower Assisted Living Program Yakima 44 2000 HTF
Sunbelt Apts Sequim 17 1997 HTF
Suncrest Village Sequim 36 1995 LIHTC
SunRay Court Spokane 10 1996 HTF
Sunrise Court Development Aberdeen 13 1991 Both
Sunset Garden Apartments Puyallup 279 2003 LIHTC
Sunset Pointe Apartments Renton 36 1995 LIHTC
Sunset Ridge Apartments East Wenatchee 32 1998 Both
Surina Meadows Friday Harbor 20 1993 LIHTC
Sylvester Apartments Longview 35 1995 HTF
Tahoma View Tacoma 50 1999 Both
Tashiro‐Kaplan Artist Housing Seattle 50 2004 Both
Tate Mason Seattle 97 1998 LIHTC
Teal Pointe Apartments Vancouver 120 2003 LIHTC
Terrace Apartments Des Moines 27 2001 LIHTC
Terrace Hill Apartments Redmond 18 1975 HTF
Terrace Manor East Wenatchee 51 1998 LIHTC
The Commons (Grandview) Grandview 30 2000 HTF
Third Avenue Apartments Quincy 26 2004 LIHTC
Three Homes for CMI Hoquiam 15 1993 HTF
Tilton River Court Morton 14 1972 HTF
75

Property Name CityNumber of
Units
Placed in
Service Year
Funding
SourceTitus Court Apartments Kent 101 1996 LIHTC
Titusville Station Kent 19 1991 HTF
Townhouse Apartments Port Angeles 12 2001 HTF
Trailside Village Everett 250 2001 Both
Transitional Housing Tacoma 17 1993 HTF
Transitional Living Center Spokane 16 2013 HTF
Traugott Terrace Seattle 50 2003 Both
Tri‐Cities Terrace I Housing Project Richland 60 2002 HTF
Tri‐Park Residential Tacoma 21 1993 LIHTC
Triplex Project Spokane 33 1998 HTF
Tschirley Crossing Spokane Valley 26 2003 Both
Tschirley Crossing ‐ Phase II Green Acres 38 2004 Both
Twelve Pines Apartments Everett 80 2001 LIHTC
Twin Ponds Apartments Arlington 134 2000 LIHTC
Tyler Square, Phase I Tacoma 12 1996 HTF
Tyler Street Family Campus Tacoma 15 2004 HTF
Tyree Scott Apartments Seattle 21 2004 Both
Union Hotel Seattle 52 1994 Both
University Village Youth & Family Seattle 12 1996 HTF
Valley Commons Apartments Sunnyside 24 2000 LIHTC
Valley Commons II Apartments Sunnyside 27 2003 LIHTC
Valley West Cowiche/Tieton 23 1994 HTF
Vasa Creek Woods Apartments Bellevue 51 2001 LIHTC
Veranda Green Seattle 150 1997 LIHTC
Vermont Inn Seattle 177 1994 LIHTC
Veterans Transitional Housing Project Shoreline 26 2004 HTF
Victorian Place II Des Moines 20 1999 HTF
Victorian Row Apartments Seattle 14 1993 LIHTC
Viewcrest Village Apartments Bremerton 300 2003 LIHTC
Viewmont East Port Orchard 77 2002 LIHTC
Views at Madison Phase I Seattle 45 2003 Both
Views at Madison, Condo A Seattle 25 2002 HTF
Views at Madison, Condo B Seattle 26 2002 LIHTC
Villa Apartments Seattle 62 1999 Both
Villa Kathleen Burlington 24 2014 HTF
Villa Park Townhomes Seattle 43 1998 HTF
Villa Santa Maria ‐ Mattawa Mattawa 45 2004 Both
Village Apartments Spokane Valley 36 2000 Both
Village at Overlake Station Redmond 308 2001 Both
Village Home Bainbridge Island 11 1998 HTF
Villas of Bridge Creek, The Vancouver 103 2002 LIHTC
Vineyard Apartments Mattawa 36 2003 LIHTC
Vineyard Apartments, The Grandview 28 1999 LIHTC
Vineyard II Apartments Grandview 24 2001 LIHTC
Vintage at Bremerton Senior Living Bremerton 143 2001 LIHTC
Vintage at Vancouver Vancouver 154 2004 LIHTC
Vista del Sol Sunnyside 12 1994 HTF
Vista Park Homes Brewster 24 1999 Both
Vivian McLean Place Seattle 19 2001 Both
VOA'S Crosswalk/Flaherty House & Alexandria House Spokane 11 1990 HTF
Wahluke Slope Apartments Mattawa 26 2000 Both
Washington Grocery Building Bellingham 36 1999 Both
Washington School Apartments Walla Walla 24 1998 Both
Webster Court Apartments Kent 92 1994 LIHTC
Westfall Village Apartments Spokane 110 1997 LIHTC
Westlake Apartments Maple Valley 72 1994 LIHTC
76

Property Name CityNumber of
Units
Placed in
Service Year
Funding
SourceWestside Estates Tacoma 448 1997 LIHTC
Westview Apartments Lopez Island 18 1990 LIHTC
Westview Villa Cle Elum 26 2003 Both
Westwood Crossing Marysville 133 1997 LIHTC
Wheatlands Apartments Connell 19 1990 LIHTC
Whispering Pines Apartments Lynnwood 240 1996 LIHTC
Whispering Rivers Apartments Twisp 22 1994 LIHTC
Whisperwood Apartments Seattle 126 2004 LIHTC
White River Apartments Auburn 24 2001 HTF
White River Garden Auburn 24 2003 Both
Whitman Court Senior Housing Preservation Project Walla Walla 49 2003 HTF
Wilbur Manor Apartments Walla Walla 38 1997 LIHTC
Willamette Court Apartments Federal Way 100 1998 LIHTC
William Booth Center Seattle 50 1992 HTF
Willow Creek Apartments Bellingham 16 1996 Both
Willow Park Sunnyside 30 1991 LIHTC
Willows Annex Yakima 14 1999 LIHTC
Wilton Apts Spokane 52 1995 HTF
Windermere North & South Spokane 16 1999 HTF
Windsong Apartments Poulsbo 36 2004 HTF
Windsor Heights SeaTac 326 1999 Both
Winterhill Apartments Marysville 149 1998 LIHTC
Winton Woods Phase II Poulsbo 43 1993 LIHTC
Wintonia Hotel Seattle 92 1994 Both
Wisteria Manor Vancouver 24 2002 Both
Woodlake Manor I Snohomish 22 2003 Both
Woodlake Manor II Snohomish 36 2003 Both
Woodland Greens Lynnwood 240 2000 LIHTC
Woodlands at Forbes Lake Kirkland 110 2004 LIHTC
Woodridge Park Seattle 201 1996 LIHTC
WoodRose Apartments Bellingham 197 2002 LIHTC
Woodruff Heights Phase I Spokane 26 2000 Both
YMCA Building Project Seattle 20 2000 LIHTC
Y's Transitions Vancouver 24 1999 HTF
YWCA Family Village Redmond 20 1993 Both
YWCA Opportunity Place Seattle 145 2004 Both
77

STATE OF WASHINGTON
DEPARTMENT OF COMMERCE 1011 Plum Street SE • PO Box 42525 • Olympia, Washington 98504-2525 • (360) 725-4000
www.commerce.wa.gov
April 24, 2014
Dear Affordable Housing Owner:
The Washington State Department of Commerce (Commerce) and Washington State Housing Finance Comm1ss1on (WSHFC) have a shared mterest m the long-term sustamab11ity of the state's mventory of affordable housing. Obtaining a clear picture of the need for additional capital investments in the existing portfolio is a high priority for both agencies. To that end, Commerce and WSHFC have jointly undertaken a Washington State Affordable Housing Portfolio Study. We have contracted with Housing Development Center to conduct this study over the next several months.
The goal of the Washington State Affordable Housing Portfolio Study is to gain a better understanding of the anticipated capital needs of projects within the Housing Trust Fund (HTF) and Low Income Housing Tax Credit (LIHTC) multifamily housing portfolios. The study will assess the physical condition of portfolio· properties that are 10 or more years old and develop an estimate of their capital needs costs. The assessment will include an examination of contributing risk factors, including financial capacity of projects to address their future capital needs, This information will enable Commerce and WSHFC to better anticipate and plan for additional capital investments in the HTF and LIHTC portfolios over the next five years.
We need your help in this effort!
Your organization is the owner of a project or projects to be included in the Washington State Affordable Housing Portfolio Study. Within the next few days, you will receive a survey by email from Housing Development Center asking you to provide information about the physical conditions of these properties.
Please take the time to complete this survey and return it by Friday, May 16, 2014. We know that this is a short turn-around, but your participation is essential to the success of this project. Survey data will provide critical information about the scope of rehabilitation needs in existing projects and will assist Commerce and WSHFC in developing strategies and prioritizing funding to preserve the state's affordable housing portfolio.
If you have. any questions about the survey, please contact Emily Schelling at Housing Development Center at 503-335-3668 or [email protected]. Thank you in advance for your cooperation.
Sincerely,
~{'"d tktct4-~u{.L-u
Janet Masella Managing Director, Housing Finance Unit Washington State Department of Commerce
Paul Fitzgerald Director, Asset Management & Compliance Division Washington State Housing Finance Commission
78
emilys
Typewritten Text
Appendix E. Letter to Owners from Commerce and the Commission
emilys
Typewritten Text
emilys
Typewritten Text
emilys
Typewritten Text
emilys
Typewritten Text

Page 1
Washington State Affordable Housing Portfolio Study<br>Washington State Affordable Housing Portfolio Study<br>Washington State Affordable Housing Portfolio Study<br>Washington State Affordable Housing Portfolio Study<br>
Please complete this survey on one computer. Respondents may reenter the survey at any time to continue where they left off and update their responses, as long as they are doing so from the same computer. We estimate it will take between 30 and 60 minutes per property to complete this survey. Please contact Emily Schelling at [email protected] or 5033353668 with any questions or concerns. Thank you!
Welcome
79
emilys
Typewritten Text
emilys
Typewritten Text
emilys
Typewritten Text
Appendix F. Capital Needs Survey
emilys
Typewritten Text
emilys
Typewritten Text
emilys
Typewritten Text
emilys
Typewritten Text
emilys
Typewritten Text
emilys
Typewritten Text
emilys
Typewritten Text
emilys
Typewritten Text
emilys
Typewritten Text
emilys
Typewritten Text
emilys
Typewritten Text
emilys
Typewritten Text

Page 2
Washington State Affordable Housing Portfolio Study<br>Washington State Affordable Housing Portfolio Study<br>Washington State Affordable Housing Portfolio Study<br>Washington State Affordable Housing Portfolio Study<br>
1. Property name
2. Owner name
3. Name of person completing this survey
4. Contact email
5. Total number of units in property
6. Total number of bedrooms in property
General Information
7. Target population, if applicable. Please select all that apply.
General Disabled (not
specified disabled setaside in contract)
gfedc
Developmentally Disabled
gfedc
Chronic Mental Illness
gfedc
Physically Challenged
gfedc
Mentally Ill/Chemically
Addicted
gfedc
Traumatic Brain Injury
gfedc
People Living with HIV/AIDS
gfedc
Elderly
gfedc
Frail Elderly
gfedc
Domestic Violence Survivors
gfedc
Substance Abusers/In Recovery
gfedc
Veterans
gfedc
At Risk Homelessness
gfedc
Transitional
gfedc
Homeless Family
gfedc
Homeless Individual
gfedc
Large Households
gfedc
Farmworker
gfedc
Multiple Special Needs (not
specified multiple special needs setaside in contract)
gfedc
80

Page 3
Washington State Affordable Housing Portfolio Study<br>Washington State Affordable Housing Portfolio Study<br>Washington State Affordable Housing Portfolio Study<br>Washington State Affordable Housing Portfolio Study<br>
1. Year property was originally built
2. Original Placed In Service (PIS) year Note: PIS year refers to the beginning of the property's depreciation period.
3. Last PIS, if different from original
4. Project type
5. Rehab hard cost per unit (if applicable)
6. LIHTCfinanced property?
7. If LIHTC, when is Year 15?
8. Sources of public funding currently in place at the property Please check all that apply.
Property Age & Funding Sources
New Construction
nmlkj
Substantial Rehab (>$50k/unit)
nmlkj
Moderate Rehab ($20$50k/unit)
nmlkj
Light Rehab (<$20k/unit)
nmlkj
Yes
nmlkj
No
nmlkj
LIHTCs
gfedc
Housing Trust Fund
gfedc
Taxexempt bonds
gfedc
Local funds
gfedc
Other (please specify)
81

Page 4
Washington State Affordable Housing Portfolio Study<br>Washington State Affordable Housing Portfolio Study<br>Washington State Affordable Housing Portfolio Study<br>Washington State Affordable Housing Portfolio Study<br>
1. Number of buildings
2. Number of floors per building If buildings have different numbers of floors, enter the average number of floors per building for the property.
3. Total site area square footage
4. Total building square footage
5. Elevator?
6. Do you have asbuilt drawings from original construction or any architectural drawings for this property?
7. Construction type
8. Foundation type
Building Information
Yes
nmlkj
No
nmlkj
Yes
nmlkj
No
nmlkj
Concrete
nmlkj
Steel frame
nmlkj
Unreinforced masonry
nmlkj
Wood frame
nmlkj
Other (please specify)
Basement
nmlkj
Crawl space
nmlkj
Slab on grade
nmlkj
Combination
nmlkj
82

Page 5
Washington State Affordable Housing Portfolio Study<br>Washington State Affordable Housing Portfolio Study<br>Washington State Affordable Housing Portfolio Study<br>Washington State Affordable Housing Portfolio Study<br>
9. Siding type
10. Age of roof
11. Roof type (primary)
12. Roof material
Asbestos shingle
nmlkj
Cementitious
nmlkj
EFIS
nmlkj
Masonry
nmlkj
Vinyl
nmlkj
Wood
nmlkj
Other (please specify)
< 5 years old
nmlkj
510 years old
nmlkj
1020 years old
nmlkj
20+ years old
nmlkj
Flat
nmlkj
Gabled
nmlkj
Hip
nmlkj
Pitched/shed
nmlkj
Bituminous/built up
nmlkj
Composition
nmlkj
Membrane
nmlkj
Slate
nmlkj
Standing seam metal
nmlkj
Wood shake
nmlkj
Other (please specify)
83

Page 6
Washington State Affordable Housing Portfolio Study<br>Washington State Affordable Housing Portfolio Study<br>Washington State Affordable Housing Portfolio Study<br>Washington State Affordable Housing Portfolio Study<br>13. Window material
14. Heating type
15. Continuous ventilation in units?
16. If "No" or "Don't know" to question 14, are there controls (timers or sensors) for the bathroom?
17. If "No" or "Don't know" to question 14, how does the kitchen hood exhaust?
18. Unit exterior entrances
19. Patio doors
Aluminum
nmlkj
Fiberglass
nmlkj
Vinyl
nmlkj
Wood
nmlkj
Electric baseboard
nmlkj
Cadet/wall heater
nmlkj
Cove electric
nmlkj
Forced air
nmlkj
Other (please specify)
Yes
nmlkj
No
nmlkj
Don't know
nmlkj
Yes
nmlkj
No
nmlkj
Externally vented
nmlkj
Recirculating
nmlkj
None
nmlkj
Yes
nmlkj No
nmlkj Mix
nmlkj
Yes
nmlkj No
nmlkj Mix
nmlkj
84

Page 7
Washington State Affordable Housing Portfolio Study<br>Washington State Affordable Housing Portfolio Study<br>Washington State Affordable Housing Portfolio Study<br>Washington State Affordable Housing Portfolio Study<br>
20. Individual unit decks
21. Fire sprinklers present
22. Historic property
23. Known hazardous materials
Yes
nmlkj No
nmlkj Mix
nmlkj
Yes
nmlkj No
nmlkj
Yes
nmlkj No
nmlkj
Yes
nmlkj No
nmlkj
85

Page 8
Washington State Affordable Housing Portfolio Study<br>Washington State Affordable Housing Portfolio Study<br>Washington State Affordable Housing Portfolio Study<br>Washington State Affordable Housing Portfolio Study<br>
1. Do you have a Capital Needs Assessment (CNA) from 2009 or later?
Capital Needs Assessments
Yes
nmlkj
No
nmlkj
86

Page 9
Washington State Affordable Housing Portfolio Study<br>Washington State Affordable Housing Portfolio Study<br>Washington State Affordable Housing Portfolio Study<br>Washington State Affordable Housing Portfolio Study<br>
Please email the CNA to [email protected] or upload to Dropbox and share a link with [email protected]. Thank you.
1. What was the purpose of the CNA? What prompted you to commission it?
Please email the CNA to [email protected] or upload to Dropbox and share a link with [email protected]. Thank you.
Capital Needs Assessments (cont'd)
Acquisition
nmlkj
Financial milestone/condition of financing
nmlkj
Known or suspected problem
nmlkj
Routine
nmlkj
Other (please specify)
87

Page 10
Washington State Affordable Housing Portfolio Study<br>Washington State Affordable Housing Portfolio Study<br>Washington State Affordable Housing Portfolio Study<br>Washington State Affordable Housing Portfolio Study<br>
Please complete this section if you do not have a CNA from 2009 or later.
1. Does your property have any known or suspected capital needs?
2. What are the key areas that come up repeatedly in tenant maintenance calls?
3. Are any units offline for deferred maintenance?
4. Are there any major systems that you think may need to be replaced in the next 5 years?
Capital Needs
55
66
Yes
nmlkj
No
nmlkj
If yes, please describe
55
66
Yes
nmlkj
No
nmlkj
If yes, please explain
55
66
Elevator
gfedc
Heating
gfedc
Plumbing
gfedc
Electrical
gfedc
Other (please specify)
88

Page 11
Washington State Affordable Housing Portfolio Study<br>Washington State Affordable Housing Portfolio Study<br>Washington State Affordable Housing Portfolio Study<br>Washington State Affordable Housing Portfolio Study<br>5. Any other important information about this property's capital needs?
55
66
89

Page 12
Washington State Affordable Housing Portfolio Study<br>Washington State Affordable Housing Portfolio Study<br>Washington State Affordable Housing Portfolio Study<br>Washington State Affordable Housing Portfolio Study<br>
Please complete this section if you do not have a CNA from 2009 or later.
1. Have you noticed any moisture staining or organic growth near window frames, ceilings, doors, or near the base of external walls?
2. Have you noticed high humidity in the units?
3. Have tenants ever complained about moisture issues in their apartments?
4. Do tenants have difficulty closing and locking their windows?
EnvelopeRelated Questions
Yes
nmlkj
No
nmlkj
If yes, please explain
55
66
Yes
nmlkj
No
nmlkj
If yes, please explain
55
66
Yes
nmlkj
No
nmlkj
If yes, please explain
55
66
Yes
nmlkj
No
nmlkj
If yes, please explain
55
66
90

Page 13
Washington State Affordable Housing Portfolio Study<br>Washington State Affordable Housing Portfolio Study<br>Washington State Affordable Housing Portfolio Study<br>Washington State Affordable Housing Portfolio Study<br>
5. Does any siding, porch, deck, etc. have contact with soil?
6. Are there any site drainage issues? Is there puddling/standing water?
7. Are there any roof leaks or failed gutters?
Yes
nmlkj
No
nmlkj
If yes, please explain
55
66
Yes
nmlkj
No
nmlkj
If yes, please explain
55
66
Yes
nmlkj
No
nmlkj
If yes, please explain
55
66
91

Page 14
Washington State Affordable Housing Portfolio Study<br>Washington State Affordable Housing Portfolio Study<br>Washington State Affordable Housing Portfolio Study<br>Washington State Affordable Housing Portfolio Study<br>
Please complete this section if you do not have a CNA from 2009 or later.
Possible Upgrades Needed
1. If a major rehabilitation is required, which of the following would need substantial investment to bring to code?
Yes NoDon't know
Seismic nmlkj nmlkj nmlkj
ADA nmlkj nmlkj nmlkj
Sprinklering, exiting, fire alarms
nmlkj nmlkj nmlkj
Public safety/CPTED nmlkj nmlkj nmlkj
Energy codes nmlkj nmlkj nmlkj
92

Page 15
Washington State Affordable Housing Portfolio Study<br>Washington State Affordable Housing Portfolio Study<br>Washington State Affordable Housing Portfolio Study<br>Washington State Affordable Housing Portfolio Study<br>
1. What is the property's current replacement reserve balance?
2. What is the property's average annual replacement reserve contribution for the last 3 years?
3. What is the property's average annual replacement reserve withdrawal for the last 3 years?
4. In general, do you think funds from building operations and replacement reserves will be able to adequately address the building's capital needs for the next 5 years?
Replacement Reserves
Yes
nmlkj
No
nmlkj
If not, what do you think the gap will be?
55
66
93

Page 16
Washington State Affordable Housing Portfolio Study<br>Washington State Affordable Housing Portfolio Study<br>Washington State Affordable Housing Portfolio Study<br>Washington State Affordable Housing Portfolio Study<br>
Please enter information for each loan currently in place.
Debt Obligations
1. Loan #1:Lender
Beginning Balance
Date of First Payment
Amortization Period
Term
Interest Rate
Balance as of 12/31/2013
2. Loan #2:Lender
Beginning Balance
Date of First Payment
Amortization Period
Term
Interest Rate
Balance as of 12/31/2013
3. Loan #3:Lender
Beginning Balance
Date of First Payment
Amortization Period
Term
Interest Rate
Balance as of 12/31/2013
94

Page 17
Washington State Affordable Housing Portfolio Study<br>Washington State Affordable Housing Portfolio Study<br>Washington State Affordable Housing Portfolio Study<br>Washington State Affordable Housing Portfolio Study<br>
4. Loan #4:Lender
Beginning Balance
Date of First Payment
Amortization Period
Term
Interest Rate
Balance as of 12/31/2013
5. What are the terms of the loans listed above?
Payment Required (hard)Payment Conditional
(e.g., cash flow)
Payment Deferred (repayment waived if
affordability requirements are maintained)
Loan #1
nmlkj nmlkj nmlkj
Loan #2
nmlkj nmlkj nmlkj
Loan #3
nmlkj nmlkj nmlkj
Loan #4
nmlkj nmlkj nmlkj
95

Page 18
Washington State Affordable Housing Portfolio Study<br>Washington State Affordable Housing Portfolio Study<br>Washington State Affordable Housing Portfolio Study<br>Washington State Affordable Housing Portfolio Study<br>
Thank you very much for taking the time to complete this survey!
Thank you
96
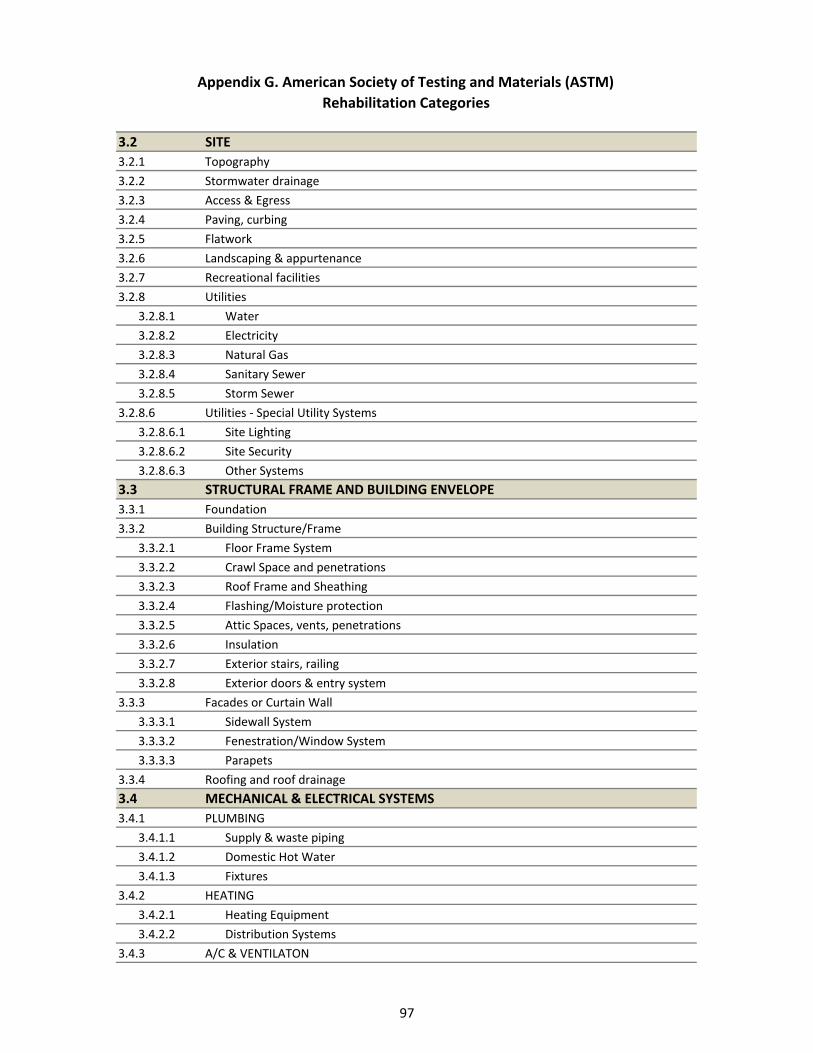
3.2 SITE
3.2.1 Topography
3.2.2 Stormwater drainage
3.2.3 Access & Egress
3.2.4 Paving, curbing
3.2.5 Flatwork
3.2.6 Landscaping & appurtenance
3.2.7 Recreational facilities
3.2.8 Utilities
3.2.8.1 Water
3.2.8.2 Electricity
3.2.8.3 Natural Gas
3.2.8.4 Sanitary Sewer
3.2.8.5 Storm Sewer
3.2.8.6 Utilities ‐ Special Utility Systems
3.2.8.6.1 Site Lighting
3.2.8.6.2 Site Security
3.2.8.6.3 Other Systems
3.3 STRUCTURAL FRAME AND BUILDING ENVELOPE
3.3.1 Foundation
3.3.2 Building Structure/Frame
3.3.2.1 Floor Frame System
3.3.2.2 Crawl Space and penetrations
3.3.2.3 Roof Frame and Sheathing
3.3.2.4 Flashing/Moisture protection
3.3.2.5 Attic Spaces, vents, penetrations
3.3.2.6 Insulation
3.3.2.7 Exterior stairs, railing
3.3.2.8 Exterior doors & entry system
3.3.3 Facades or Curtain Wall
3.3.3.1 Sidewall System
3.3.3.2 Fenestration/Window System
3.3.3.3 Parapets
3.3.4 Roofing and roof drainage
3.4 MECHANICAL & ELECTRICAL SYSTEMS
3.4.1 PLUMBING
3.4.1.1 Supply & waste piping
3.4.1.2 Domestic Hot Water
3.4.1.3 Fixtures
3.4.2 HEATING
3.4.2.1 Heating Equipment
3.4.2.2 Distribution Systems
3.4.3 A/C & VENTILATON
Appendix G. American Society of Testing and Materials (ASTM)
Rehabilitation Categories
97

3.4.3.1 Equipment
3.4.3.1.1 Filtration/Quality Control
3.4.3.1.2 Exhaust
3.4.3.1.3 Compressors/air handlers
3.4.3.2 Distribution Systems
3.4.3.3 Control Systems
3.4.4 ELECTRICAL
3.4.4.1 Service & metering
3.4.4.2 Electrical distribution
3.4.4.3 Lighting ‐ Common Area
3.4.4.4 Lighting ‐ Units
3.4.4.5 Telecommunications systems
3.4.4.6 Aluminum Wiring
3.5 VERTICAL TRANSPORTATION
3.5 Elevator
3.6 LIFE SAFETY/FIRE PROTECTION
3.6.1 Sprinklers & standpipes
3.6.2 Alarm Systems
3.6.2.1 Common Areas
3.6.2.2 Tenant Spaces
3.6.3 Other Systems
3.7 INTERIOR ELEMENTS
3.7.1 Common Areas
3.7.1.1 Offices
3.7.1.2 Access ways, corridors, meeting places
3.7.1.3 Laundry
3.7.1.4 Indoor recreation & equipment
3.7.1.5 Maintenance & storage
3.7.2 Tenant Spaces
3.7.2.1 Finishes, walls & floors
3.7.2.2 Appliances
3.7.2.3 Bath fixtures & specialties
3.7.2.4 Kitchen fixtures & specialties
3.7.2.5 Millwork, casework, cabinets
3.7.2.6 Closet systems
3.7.2.7 Window treatments
98

Appendix H. Capital Needs Assessment Template
Project Name 30 YR CAPITAL NEEDS
Inflation rate 3.0%
Reserve Account Growth Rate 1.0%
Total Number of Units 0
Scope of workQuantity of
item
Type of
Measure
ment
Cost per Type
of Measure
Replacement
Cost
Estimated
Useful Life
Replace
Cycle
Years of life
remaining
% Life
Remaining
Annual
Deposit/unit
3.2 SITE 3.2.1 Topography No deficiencies noted. 50 1 0%
3.2.2 Stormwater drainage No deficiencies noted. 50 1 0%
3.2.3 Access&Egress No deficiencies noted. 30 1 0%
3.2.4 Paving, curbing No deficiencies noted. 25 1 0%
3.2.5 Flatwork No deficiencies noted. 30 1 0%
3.2.6 Landscaping & appurtenance No deficiencies noted. 50 1 0%
3.2.7 Recreational facilities No deficiencies noted. 15 1 0%
3.2.8 Utilities
3.2.8.1 Water No deficiencies noted. 40 1 0%
3.2.8.2 Electricity No deficiencies noted. 40 1 0%
3.2.8.3 Natural Gas No deficiencies noted. 40 1 0%
3.2.8.4 Sanitary Sewer No deficiencies noted. 50 1 0%
3.2.8.5 Storm Sewer No deficiencies noted. 50 1 0%
3.2.8.6 Utilities ‐ Special Utility Systems 1
3.2.8.6.1 Site Lighting No deficiencies noted. 25 1 0%
3.2.8.6.2 Site Security No deficiencies noted. 15 1 0%
3.2.8.6.3 Other Systems No deficiencies noted. 1
3.3 STRUCTURAL FRAME AND BUILDING ENVELOPE3.3.1 Foundation No deficiencies noted. 50 1 0%
3.3.2 Building Structure/Frame 1
3.3.2.1 Floor Frame System No deficiencies noted. 50 1 0%
3.3.2.2 Crawl Space and penetrations No deficiencies noted. 1
3.3.2.3 Roof Frame and Sheathing No deficiencies noted. 50 1 0%
3.3.2.4 Flashing/Moisture protection No deficiencies noted. 25 1 0%
3.3.2.5 Attic Spaces, vents, penetrations No deficiencies noted. 1
3.3.2.6 Insulation No deficiencies noted. 50 1 0%
3.3.2.7 Exterior stairs, railing No deficiencies noted. 1
3.3.2.8 Exterior doors & entry system No deficiencies noted. 1
3.3.3 Facades or Curtain Wall 1
3.3.3.1 Sidewal System No deficiencies noted. 1
3.3.3.2 Fenestration/Window System No deficiencies noted. 30 1 0%
3.3.3.3 Parapets No deficiencies noted. 50 1 0%
3.3.4 Roofing and roof drainage No deficiencies noted. 1
3.4 MECHANICAL & ELECTRICAL SYSTEMS3.4.1 PLUMBING
3.4.1.1 Supply & waste piping No deficiencies noted. 50 1 0%
3.4.1.2 Domestic Hot Water No deficiencies noted. 1
3.4.1.3 Fixtures No deficiencies noted. 20 1 0%
3.4.2 HEATING
3.4.2.1 Heating Equipment No deficiencies noted. 1
3.4.2.2 Distribution Systems No deficiencies noted. 50 1 0%
3.4.3 A/C & VENTILATON
3.4.3.1 Equipment No deficiencies noted. 1
3.4.3.1.1 Filtration/Quality Control No deficiencies noted. 15 1 0%
3.4.3.1.2 Exhaust No deficiencies noted. 15 1 0%
3.4.3.1.3 Compressors/air handlers No deficiencies noted. 15 1 0%
3.4.3.2 Distribution Systems No deficiencies noted. 50 1 0%
3.4.3.3 Control Systems No deficiencies noted. 1
3.4.4 ELECTRICAL
3.4.4.1 Service & metering No deficiencies noted. 50 1 0%
3.4.4.2 Electrical distribution No deficiencies noted. 50 1 0%
3.4.4.3 Lighting ‐ Common Area No deficiencies noted. 25 1 0%
3.4.4.4 Lighting ‐ Units No deficiencies noted. 20 1 0%
3.4.4.5 Telecommunications systems No deficiencies noted. 15 1 0%
3.4.4.6 Aluminum Wiring No deficiencies noted. 1
3.5 VERTICAL TRANSPORTATION3.5 Elevator No deficiencies noted. 1
3.6 LIFE SAFETY/FIRE PROTECTION3.6.1 Spinklers & standpipes No deficiencies noted. 50 1 0%
3.6.2 Alarm Systems No deficiencies noted. 1
3.6.2.1 Common Areas No deficiencies noted. 15 1 0%
3.6.2.2 Tenant Spaces No deficiencies noted. 15 1 0%
3.6.3 Other Systems No deficiencies noted.
3.7 INTERIOR ELEMENTS3.7.1 Common Areas 1
3.7.1.1 Offices No deficiencies noted. 1
3.7.1.2 Access ways, corridors, meeting places No deficiencies noted. 1
3.7.1.3 Laundry No deficiencies noted. 1
3.7.1.4 Indoor recreation & equipment No deficiencies noted. 1
3.7.1.5 Maintenance & storage No deficiencies noted. 1
3.7.2 Tenant Spaces
3.7.2.1 Finishes, walls & floors No deficiencies noted. 1
3.7.2.2 Appliances No deficiencies noted. 15 1 0%
3.7.2.3 Bath fixtures & specialties No deficiencies noted. 20 1 0%
3.7.2.4 Kitchen fixtures & specialties No deficiencies noted. 20 1 0%
3.7.2.5 Millwork, casework, cabinets No deficiencies noted. 20 1 0%
3.7.2.6 Closet systems No deficiencies noted. 1
3.7.2.7 Window treatments No deficiencies noted. 1
CNA Category
99

Component Years Action
Site Drainage 50+ Repair/replace
Curbing 30 Repair/replace
Roof
Asphalt shingles 20 Replace
Built‐Up 20 Replace
Membrane 20 Replace
Metal 40 Replace
Slate 50 Replace
Wood shingles 20 Replace
Siding
Brick/Block 40 Repoint
Vinyl 30 Replace
Wood 5 Prep and paint
EFIS 5 Prep and paint
Windows 30 Replace/upgrade
Plumbing 20 Repair/replace
Elevator 15‐25 Repair
Heating
Electric fan coil (cadet) 15 Replace
Baseboard 15 Replace
Forced air 15 Repair
Boiler 22‐30 Repair/replace
Electrical 50+ Replace
Ventilation 20 Repair/replace
Appendix I. Expected Useful Life Table
Abridged from On‐Site Insight
100

Capital Needs Assessment
WASHINGTON STATE AFFORDABLEHOUSING PORTFOLIO STUDYPrepared For: Washington State Department of CommerceWashington State Housing Finance Commission
Prepared By: Derek JohnsonWalsh Construction Company509 Fairview AveSeattle, WA, 98109(206) 547-4008
Inspection Dates7/1/2014 - 7/31/2014
101
emilys
Typewritten Text
Appendix J. Key Points and Trends from Capital Needs Assessments, Prepared by Walsh Construction Co.
emilys
Typewritten Text
emilys
Typewritten Text
emilys
Typewritten Text

WSAHPS Introduction 8-29-14
This assessment meets the ASTM standard E2018-01 for Capital Needs Assessments, and FNMA Physical Needs Assessment Guidance. This report provides recommendations, preliminary cost estimates, and
priorities for remedying major deficiencies, updating aging major components, and undertaking further detailed investigations. Inspection were visual only. No destructive testing was performed.
Property Management for each property accompanied and managed the site inspections. The inspection team conducted the physical needs inspections. This report reflects the conditions and remaining service life of each of the properties.
The intent of the inspection and report is to determine the general condition of the 6 properties and its major components, to flag any major problems, and to document any deferred maintenance or repair concerns.
INTRODUCTION
General Description of Work Performed
Washington State Housing Finance Commission and the Department of Commerce commissioned the inspection of 6 properites, representative of the Trust Fund's 38,000+ units throughout Washington State. 3 properites were located in
Seattle, 2 in Spokane Valley and 1 in Vancouver. Derek Johnson, (Walsh Construction Company) has prepared this report based upon inspections that took place over a 3 week period (14 July thru 1 August 2014). The 6 properties consisted
of 339 residential units and 11 buildings.
Inspections were carried out prioritizing unit interior inspections first, in order to minimize the impact on the tenants and maintenance staff. Each day the inspection team would arrive at each of the properties early to get a head start on
documenting site and exterior conditions. At the prescribed time, unit inspections were conducted. After interior inspections were complete, the inspection team would then complete the exterior and site conditions. Included in the
inspection were the crawl spaces and attic spaces.
2
1 - 2 - 6 -
3 -
4 - 5 -
102

WSAHPS METHODOLOGY 8-29-14
Definitions
Normally we differentiate between maintenance and capital costs. For the purpose of this report Washington State is interested in total costs to fully rehabilitate properties
to bring to 'like new condition regardless of whether costs are being paid from operating or capital accounts, or whether they are done at turnover or at major rehabilitation.
Maintenance Costs: Annual property replacement and repair costs contracted out or performed internally to include: interior painting, floor coverings, window treatments on
turnover; common area painting, and floor coverings as needed; missing or damaged window screens, broken windows (at cost to tenant) as needed; unit bi-fold door
replacement, door hardware, plumbing trim as needed; and all water heaters and appliances. Capital Costs: Other property replacement and/or repair costs contracted out or
performed internally including roofing, exterior siding, building trim, exterior paint, door and window replacement, parking lot resurfacing, and replacement of major systems
in the building.
For the purpose of this report, we have collapsed (combined) Immediate and current Needs into costs needed within 12 months. Immediate Needs of course are those
conditions creating a substantial health, safety concern or a conditions that must be rectified soon to avoid additional significant damage (durability). Current Needs are
generally less crucial than those listed as immediate, but necessary to bring the property to a satisfactory condition but do not present an immediate health or safety need.
These are costs of systems that are expected to wear out in the middle term. Also included in this category are capital investments that, with expected rises in energy and
utility costs and more stringent Building and Housing Codes, might be justifiable in terms of lowered operating costs over the long term.
Key Associated Term Definitions
0 Excellent Excellent, maintained in "as new" condition; 0% Expired
1 Above Average Above Average; Approximately 20% expired (Not new but not average)
2 Average Average, in satisfactory condition, standard for this type of building; Approximately 40% expired.
3 Fair Fair, in working or usable condition but in need of maintenance; Approximately 60% expired
4 Poor Poor, neglected condition; Approximately 80% expired.
5 Repair/Replacement Replace; Life Safety, abused, vandalized, damaged, unsightly, in need of Replacement; 100% Expired
Each item or scope includes an estimate of the Expected Useful Life (EUL). EUL references the Fannie Mae 2013 Expected Useful Life Table.
Remaining Useful Life (RUL), the quantity, and cost over the period of analysis.
Expected Useful Life / Service Life
Remaining Useful Life / Service Life
Maintenance / Capital
Ratings
Cost Assessments: Our replacement costs consider published cost data from RS Means, information supplied by owners, current construction costs as experienced by Walsh Construction as a general contractor performing in excess of $250M
of construction annually, pricing with local area subcontractors, and using published Washington State Residential Prevailing wage rates. When possible architectural plans for the properties were used to obtain counts and quantities. If no
plans were present, then general measurements and counts were made during the site visits in sufficient detail and accuracy to determine complete general takeoffs for each property. Using these takeoffs combined with unit pricing, we
determined the approximate cost of the repair or replacement of materials, components and/or systems.
Estimating Service Life: The Fannie Mae expected useful life table is the benchmark applied. Determing actual remaining useful life (service life) of products, materials, systems is an iterative process. Normally a survey would be issued prior to
the site inspections. However, there were time constraints to get to the properties and inspect quickly. Property Management accompanied the inspector during the inspections. Surveys consisted of conversations with property
management during the inspections. When necessary we obtained work order logs and discuss to determine service life and discussed with previous contractors of the install dates on products and components. If there was no specific
documentation on a product or material - the inspector used their best judgement on the condition of the product, component using the ratings below in relation to the expected life of the product.
Immediate & Current Needs (12 month)
Antcipated Capital Replacement Activities Needed within 2-20
Years
Inspection Methodology:
Surveyed Areas: Include residential units, public and common areas such a parking facilities and the grounds in general, corridors and walkways, laundry facilities, apartment building roofs, accessible dwelling units and equipment rooms. No
destructive testing was done. For the purpose of this report and meeting ASTM E 2018-08 requirements, the surveyed areas have been grouped into 6 categories: 1) Site 2) Structural Frame and Building Envelope, 3) Mechanical and Electrical
Systems, 4) Vertical Transportation, 5) Life Safety/Fire Protection, 6) Interiors
Survey
25% of total units and building types. See Exhibit 7f (Units Inspected) for additional information.
Terms
References: The assessment and methodology are based upon the following references: Fannie Mae Physical Needs Assessment and Guidance to the Property Evaluator dated 17Jul92, ASTM E 2018-08, Standard Guide for Property Condition
Assessments: Baseline Property Condition Assessment Process published; and Fannie Mae Expected Useful Life Tables. and other industry standards and metrics.
3103

104
djohnson
Comment
Key Points & Trends
djohnson
Comment
Property Key Points: 1 - Property1 – Tenant Population - transitional family housing - is much different from the other properties. Overall much more abusive to the interior finishes, with a turnover rate between every 18 – 24 months. 2 – Property2 – 1914 Historic Building, renovated in 1996. The building has many large single-pane operable windows which negatively impacts indoor air quality, comfort, quality of life, social equity, durability and service life of the building plus operating and maintenance cost. Work on this building is at the commercial wage rate. 3 - Property3 – 10 years old with serious building envelope issues - moisture intrusion. Relative humidity in Vancouver and in Western Washington in general, is among the highest in the nation. 4 – Property4 – 14 years old. Relative humidity in Spokane and East of the Cascades is generally low and forgiving. However vinyl cladding, moisture protection and flashings are poorly done at best which has decreased the service life of the building envelope by at least 10 years. 5 – Property5 – 18 years old. Elderly home. Tenant’s impact on the interiors is negligible. If anything needs to get replaced it's generally because the product/component/system has served well beyond it’s service life and has reached failure or has become dated. 6 – Property6 – 11 years old. Single Family Unit. The Stucco exterior wall system is ready for cleaning, painting and caulking.
djohnson
Comment
Trends: 1) Tenant Populations - Various populations types can dramatically increase or decrease the service life of products, equipment and systems. Transitional Housing - the service life is reduced. Typical family Housing is the average. Elderly homes the service life can be much higher. 2) Time to Renovate: Renovations should occur at the time when the Building Envelope has reached or slightly exceeded it's intended service life. Cladding in general is excellent at concealing what is happening at the Weather Resistive Barrier. Not replacing the cladding at this time can result a substantially increased construction costs. 3) Building Envelope: Out of the 6 categories: Structural Frame and Building Envelope is the category that poses the greatest challenge to properties. Building Envelope expertise needs to be required in all phases of a project's life: Design, Construction (Supervision and Installation), Post- Construction (Maintenance and monitoring). Western Washington has some of the highest relative humidity in the nation. 2 components are essential to a healthy building: 1) Durable Building Envelope - Air Barrier, Rain Screen, Exterior Insulation. 2) Good Ventilation - a variable speed continuous system that the tenants cannot alter. 4) Everything Else: Out of the 6 categories - properties in general do very well with 5 of them - 1) Site, 3) Mechanical and Electrical Systems, 4) Vertical Systems, 5) Life Safety/Fire Protection, 6) Interiors. 5) Building Performance: All of these properties are energy inefficient, all built to code which is the minimum standard, no air barrier, minimum insulation, minimal thermal performance, etc. The first benefit of improved building performance is durability which provides increased service life. The second and third benefits are increased operational savings and decreased maintenance savings. These long term savings are substantial and largely discounted in the design and pre-construction process. A marginal invest in the building envelope will provide substantial savings. All of the properties viewed can provide approximately $400-1000 savings per unit per year. Design and Pre-construction needs to take a closer look at understanding costs and savings as they relate to the Total Cost of Ownership during design and pre-construction.
emilys
Typewritten Text
emilys
Typewritten Text
emilys
Typewritten Text
emilys
Typewritten Text
emilys
Typewritten Text
emilys
Typewritten Text
emilys
Typewritten Text
emilys
Typewritten Text
emilys
Typewritten Text

105
djohnson
Comment
Trends (Continued): 7) Window Replacement for Historic Buildings: Windows are a big issue for Historic Buildings : These buildings are generally the least energy efficient and serving a different use than originally intended. Current Historic Landmarks policy does not allow the replacement of windows. This policy is discriminatory in nature to a disadvantaged and often fragile population, although unintended. The tenants and owners are paying unnecessary long term operating and maintenance costs due to this policy. There are additional negative effects on indoor air quality, quality of life, social equity and justice, building durability and service life. There are 2 alternatives: 1) Adding Storm Windows or 2) Refurbishing Windows. Storm Windows do nothing for extending the service life or the durability of the building - and is essentially a waste of money. Refurbishing windows does improve the durability somewhat, and can dramatically improve the thermal performance of the building. However, the premium to refurbish these windows is substantial. Current pricing (Aug 2014) for Refurbishing Windows for a Historic Building is approximatley $220/sf. Replacing the windows with a new window that meets historical guidelines (e.g. H-Windows/ EcoTrust Building in Portland) is closer to $135/sf. The premium for refurbishing windows is at least 160%. For 1 current project in Seattle, which is smaller than Property2, this equates to a total premium of $578,000. If the windows could simply be replaced for windows that meet historical guidelines, this $578,000 could be better spent on providing additional units, amenities and services. There are 2nd and 3rd order effects that are not included or accounted for in the premium above. Improving the windows is the first step to improving the building envelope for Historic Buildings. For instance, If you improve the windows, then the exterior walls can be insulated from the interior and the thermal performance of the building envelope as a whole can be easily tripled. (If the windows are not improved and the exterior walls are insulated, then there is no thermal improvement for the envelope as the heat loss is directly through the windows.) If the thermal performance of the building envelope is tripled, then MEP systems can be dramatically reduced and optimized into high efficiency systems that provide maximum operational and maintenance savings to the property. The combined savings will be approximately in the range of $600-1000 per unit per year. Washington State has already invested in Historic Properties, such as Property2 and a number of others. If the state has invested, then the state is already committed. The state needs to fully commit and fund projects that deal with the windows - refurbished or replaced. Washington State should further consider a policy for it's portfolio of Historic Buildings that by-passes current Historic Landmarks requirements and allows 100% replacement of windows in lieu of refurbishing windows, with the only Historic Requirement that the replacement window is deemed a suitable replacement by the Historic Commission. This is a state, county, city, and tax payer - all of which are paying the total cost of this bad policy. This is an issue the state needs to address quickly.
djohnson
Comment
Key Points - Overview
emilys
Typewritten Text
emilys
Typewritten Text
AndrewA
Typewritten Text
djohnson
Comment
SEE ASTM Reserve Model w/HUD modifications for further detailed conditions and useful life.