A stable G-quartet binds to a huntingtin protein fragment containing expanded polyglutamine tracks
11
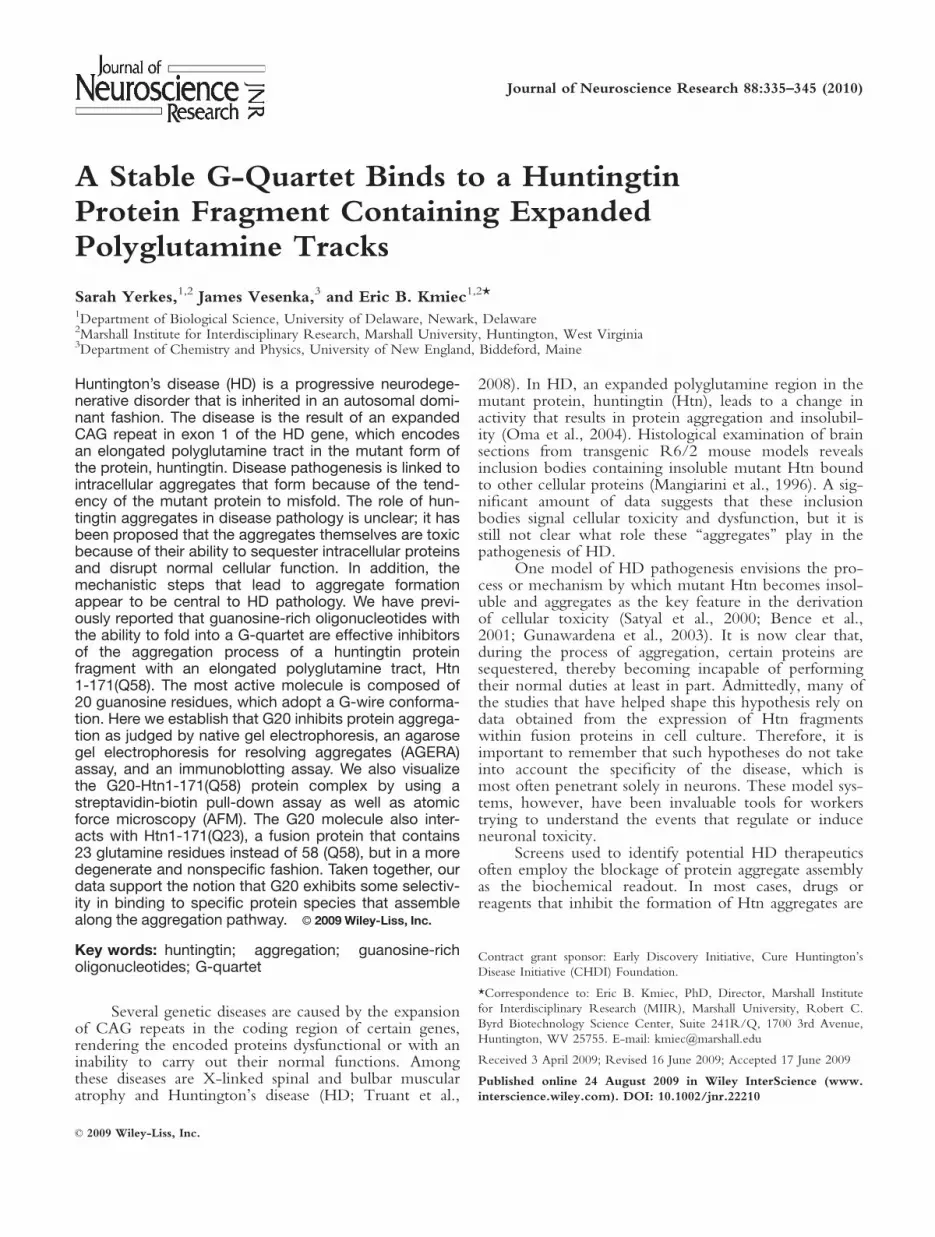
A Stable G-Quartet Binds to a Huntingtin Protein Fragment Containing Expanded Polyglutamine Tracks Sarah Yerkes, 1,2 James Vesenka, 3 and Eric B. Kmiec 1,2 * 1 Department of Biological Science, University of Delaware, Newark, Delaware 2 Marshall Institute for Interdisciplinary Research, Marshall University, Huntington, West Virginia 3 Department of Chemistry and Physics, University of New England, Biddeford, Maine Huntington’s disease (HD) is a progressive neurodege- nerative disorder that is inherited in an autosomal domi- nant fashion. The disease is the result of an expanded CAG repeat in exon 1 of the HD gene, which encodes an elongated polyglutamine tract in the mutant form of the protein, huntingtin. Disease pathogenesis is linked to intracellular aggregates that form because of the tend- ency of the mutant protein to misfold. The role of hun- tingtin aggregates in disease pathology is unclear; it has been proposed that the aggregates themselves are toxic because of their ability to sequester intracellular proteins and disrupt normal cellular function. In addition, the mechanistic steps that lead to aggregate formation appear to be central to HD pathology. We have previ- ously reported that guanosine-rich oligonucleotides with the ability to fold into a G-quartet are effective inhibitors of the aggregation process of a huntingtin protein fragment with an elongated polyglutamine tract, Htn 1-171(Q58). The most active molecule is composed of 20 guanosine residues, which adopt a G-wire conforma- tion. Here we establish that G20 inhibits protein aggrega- tion as judged by native gel electrophoresis, an agarose gel electrophoresis for resolving aggregates (AGERA) assay, and an immunoblotting assay. We also visualize the G20-Htn1-171(Q58) protein complex by using a streptavidin-biotin pull-down assay as well as atomic force microscopy (AFM). The G20 molecule also inter- acts with Htn1-171(Q23), a fusion protein that contains 23 glutamine residues instead of 58 (Q58), but in a more degenerate and nonspecific fashion. Taken together, our data support the notion that G20 exhibits some selectiv- ity in binding to specific protein species that assemble along the aggregation pathway. V V C 2009 Wiley-Liss, Inc. Key words: huntingtin; aggregation; guanosine-rich oligonucleotides; G-quartet Several genetic diseases are caused by the expansion of CAG repeats in the coding region of certain genes, rendering the encoded proteins dysfunctional or with an inability to carry out their normal functions. Among these diseases are X-linked spinal and bulbar muscular atrophy and Huntington’s disease (HD; Truant et al., 2008). In HD, an expanded polyglutamine region in the mutant protein, huntingtin (Htn), leads to a change in activity that results in protein aggregation and insolubil- ity (Oma et al., 2004). Histological examination of brain sections from transgenic R6/2 mouse models reveals inclusion bodies containing insoluble mutant Htn bound to other cellular proteins (Mangiarini et al., 1996). A sig- nificant amount of data suggests that these inclusion bodies signal cellular toxicity and dysfunction, but it is still not clear what role these ‘‘aggregates’’ play in the pathogenesis of HD. One model of HD pathogenesis envisions the pro- cess or mechanism by which mutant Htn becomes insol- uble and aggregates as the key feature in the derivation of cellular toxicity (Satyal et al., 2000; Bence et al., 2001; Gunawardena et al., 2003). It is now clear that, during the process of aggregation, certain proteins are sequestered, thereby becoming incapable of performing their normal duties at least in part. Admittedly, many of the studies that have helped shape this hypothesis rely on data obtained from the expression of Htn fragments within fusion proteins in cell culture. Therefore, it is important to remember that such hypotheses do not take into account the specificity of the disease, which is most often penetrant solely in neurons. These model sys- tems, however, have been invaluable tools for workers trying to understand the events that regulate or induce neuronal toxicity. Screens used to identify potential HD therapeutics often employ the blockage of protein aggregate assembly as the biochemical readout. In most cases, drugs or reagents that inhibit the formation of Htn aggregates are Contract grant sponsor: Early Discovery Initiative, Cure Huntington’s Disease Initiative (CHDI) Foundation. *Correspondence to: Eric B. Kmiec, PhD, Director, Marshall Institute for Interdisciplinary Research (MIIR), Marshall University, Robert C. Byrd Biotechnology Science Center, Suite 241R/Q, 1700 3rd Avenue, Huntington, WV 25755. E-mail: [email protected] Received 3 April 2009; Revised 16 June 2009; Accepted 17 June 2009 Published online 24 August 2009 in Wiley InterScience (www. interscience.wiley.com). DOI: 10.1002/jnr.22210 Journal of Neuroscience Research 88:335–345 (2010) ' 2009 Wiley-Liss, Inc.
-
Upload
independent -
Category
Documents
-
view
0 -
download
0
Transcript of A stable G-quartet binds to a huntingtin protein fragment containing expanded polyglutamine tracks
A Stable G-Quartet Binds to a HuntingtinProtein Fragment Containing ExpandedPolyglutamine Tracks
Sarah Yerkes,1,2 James Vesenka,3 and Eric B. Kmiec1,2*1Department of Biological Science, University of Delaware, Newark, Delaware2Marshall Institute for Interdisciplinary Research, Marshall University, Huntington, West Virginia3Department of Chemistry and Physics, University of New England, Biddeford, Maine
Huntington’s disease (HD) is a progressive neurodege-nerative disorder that is inherited in an autosomal domi-nant fashion. The disease is the result of an expandedCAG repeat in exon 1 of the HD gene, which encodesan elongated polyglutamine tract in the mutant form ofthe protein, huntingtin. Disease pathogenesis is linked tointracellular aggregates that form because of the tend-ency of the mutant protein to misfold. The role of hun-tingtin aggregates in disease pathology is unclear; it hasbeen proposed that the aggregates themselves are toxicbecause of their ability to sequester intracellular proteinsand disrupt normal cellular function. In addition, themechanistic steps that lead to aggregate formationappear to be central to HD pathology. We have previ-ously reported that guanosine-rich oligonucleotides withthe ability to fold into a G-quartet are effective inhibitorsof the aggregation process of a huntingtin proteinfragment with an elongated polyglutamine tract, Htn1-171(Q58). The most active molecule is composed of20 guanosine residues, which adopt a G-wire conforma-tion. Here we establish that G20 inhibits protein aggrega-tion as judged by native gel electrophoresis, an agarosegel electrophoresis for resolving aggregates (AGERA)assay, and an immunoblotting assay. We also visualizethe G20-Htn1-171(Q58) protein complex by using astreptavidin-biotin pull-down assay as well as atomicforce microscopy (AFM). The G20 molecule also inter-acts with Htn1-171(Q23), a fusion protein that contains23 glutamine residues instead of 58 (Q58), but in a moredegenerate and nonspecific fashion. Taken together, ourdata support the notion that G20 exhibits some selectiv-ity in binding to specific protein species that assemblealong the aggregation pathway. VVC 2009 Wiley-Liss, Inc.
Key words: huntingtin; aggregation; guanosine-richoligonucleotides; G-quartet
Several genetic diseases are caused by the expansionof CAG repeats in the coding region of certain genes,rendering the encoded proteins dysfunctional or with aninability to carry out their normal functions. Amongthese diseases are X-linked spinal and bulbar muscularatrophy and Huntington’s disease (HD; Truant et al.,
2008). In HD, an expanded polyglutamine region in themutant protein, huntingtin (Htn), leads to a change inactivity that results in protein aggregation and insolubil-ity (Oma et al., 2004). Histological examination of brainsections from transgenic R6/2 mouse models revealsinclusion bodies containing insoluble mutant Htn boundto other cellular proteins (Mangiarini et al., 1996). A sig-nificant amount of data suggests that these inclusionbodies signal cellular toxicity and dysfunction, but it isstill not clear what role these ‘‘aggregates’’ play in thepathogenesis of HD.
One model of HD pathogenesis envisions the pro-cess or mechanism by which mutant Htn becomes insol-uble and aggregates as the key feature in the derivationof cellular toxicity (Satyal et al., 2000; Bence et al.,2001; Gunawardena et al., 2003). It is now clear that,during the process of aggregation, certain proteins aresequestered, thereby becoming incapable of performingtheir normal duties at least in part. Admittedly, many ofthe studies that have helped shape this hypothesis rely ondata obtained from the expression of Htn fragmentswithin fusion proteins in cell culture. Therefore, it isimportant to remember that such hypotheses do not takeinto account the specificity of the disease, which ismost often penetrant solely in neurons. These model sys-tems, however, have been invaluable tools for workerstrying to understand the events that regulate or induceneuronal toxicity.
Screens used to identify potential HD therapeuticsoften employ the blockage of protein aggregate assemblyas the biochemical readout. In most cases, drugs orreagents that inhibit the formation of Htn aggregates are
Contract grant sponsor: Early Discovery Initiative, Cure Huntington’s
Disease Initiative (CHDI) Foundation.
*Correspondence to: Eric B. Kmiec, PhD, Director, Marshall Institute
for Interdisciplinary Research (MIIR), Marshall University, Robert C.
Byrd Biotechnology Science Center, Suite 241R/Q, 1700 3rd Avenue,
Huntington, WV 25755. E-mail: [email protected]
Received 3 April 2009; Revised 16 June 2009; Accepted 17 June 2009
Published online 24 August 2009 in Wiley InterScience (www.
interscience.wiley.com). DOI: 10.1002/jnr.22210
Journal of Neuroscience Research 88:335–345 (2010)
' 2009 Wiley-Liss, Inc.

chosen for further analyses and development. Using suchan (Mazumder et al., 1996) approach, we identified agroup of DNA oligonucleotides (ODNs) with thecapacity to block the aggregation of the huntingtin frag-ment fusion protein, GST-Htn1-171(Q58) (Wang et al.,2005). Some of the candidate molecules identified inthis biochemical screen were also active in blocking theformation of inclusion bodies in HEK-293 cells (Skogenet al., 2006; Illuzzi et al., 2009). The most effectiveODNs were found to be those containing extendedlengths of guanosine residues capable of folding intoG-quartets (Guschlbauer et al., 1990; Cheng and VanDyke, 1997). G-quartets are known to function asaptamers by binding to cellular proteins with high affin-ity and inhibiting function (Stull and Szoka, 1995;Cheng and Van Dyke, 1997; Jing et al., 2000, 2005;Skogen et al., 2006). In particular, Stat3 activity isaltered when it binds an aptamer that forms a G-quartetconformation (Jing et al., 2003, 2005), whereas otherG-quartet aptamers have been shown to modulate theactivity of HIV-1 integrase proteins (Mazumder et al.,1996). Unique G-rich oligonucleotides (GROs) areknown to have antiproliferative properties in severaltypes of mammalian cells (Bates et al., 1999; Xu et al.,2001). Most recently, Michalowski et al. (2008) used aseries of DNA aptamers in the form of G-quadruplexesto block HIV-1 reverse transcriptase activity in diversestrains of HIV and SIV. Thus, G-quartet aptamers, orGROs in general, are now being pursued as potentialdrug candidates for treating a variety of human diseases.
As stated above, DNA aptamers that form G-quar-tets block the aggregation of GST-Htn1-171(Q58)(Skogen et al., 2006), but the mechanism by which inhi-bition takes place has not been elucidated. We hypothe-sized that these GROs, and in particular G20, a 20-basemonomeric sequence of guanine, may interact directlywith GST-Htn1-171(Q58). Such a reaction could dis-rupt the misfolding of the mutant Htn protein, therebyaffecting protein aggregate assembly. To test this notion,we carried out a series of biochemical, immunological,and structurally based assays by first enabling interactionbetween G20 and GST-Htn1-171(Q58) and then moni-toring the development of product complexes. In thispaper, we provide evidence for direct interactionbetween a huntingtin fragment protein and a G-quartetDNA molecule that self-assembles into a higher orderstructure known as a G-wire.
MATERIALS AND METHODS
Circular Dichroism Spectroscopy
Circular dichroism spectra of 15 lM oligonucleotidesamples in 10 mM KCl were recorded on an Aviv model 202spectrometer. Measurements were performed at 248C using a0.1-cm path-length quartz cuvette (Hellma). The CD spectrawere obtained by taking the average of two scans made at1-nm intervals from 200 to 320 nm and subtracting the base-line value corresponding to that of buffer alone. Spectral dataare expressed in units of millidegree.
Biochemical Aggregation Assay
To analyze the inhibition of aggregation by GROs, abiochemical assay was employed. The fusion protein GST-Htn1-171(Q58) was incubated for 45 min at room tempera-ture with thrombin (1 U/1 lg protein) at a concentration of10 lg/ml in a buffer of 50 mM Tris-HCl, pH 8, 100 mMNaCl, 2.5 mM CaCl2, and 1 mM EDTA, to cleave betweenthe huntingtin and GST. As indicated by Wang et al. (2005),this fragment consists of the amino-terminal 171 amino acidswith a tract of 58 glutamine residues fused to GST. The pro-tein mix was then centrifuged at 13,000g at 48C for 35 minto remove any aggregates that had already formed. The pro-tein was added to wells containing 0.5–60 lM GROs or con-trol ODNs or 10 lM Congo red in the buffer describedabove with 100 mM KCl replacing NaCl. The 0-hr controlwas stopped immediately; after 24 hr of incubation at roomtemperature, the remaining reactions were stopped by adding10% SDS/50 mM 2-mercaptoethanol and heating to 998Cfor 5 min. The mixture was diluted in 13 PBS and thenfiltered through a cellulose acetate membrane (Osmonics)using the Easy-Titer ELIFA system (Pierce, Rockford, IL),followed by a 2% SDS wash. After blocking in 5% milk/13PBS-0.05% Tween, the membrane was incubated with a spe-cific antihuntingtin antibody (HP1; 1:1,000 dilution), followedby incubation with a peroxidase-conjugated goat anti-rabbitantibody (Sigma, St. Louis, MO; 1:40,000 dilution) andchemiluminescence reagent (ECL Plus; Amersham, ArlingtonHeights, IL).
Native Gel
Samples of purified fusion protein GST-Htn1-171(Q58)were incubated for 45 min at room temperature with throm-bin (0.2 U/1 lg protein) at decreasing concentrations in abuffer of 50 mM Tris-HCl, pH 8, 100 mM NaCl, 2.5 mMCaCl2, and 1 mM EDTA. Samples were centrifuged at13,000g for 30 min at 48C and further incubated with G20 orT20 for 18 hr at RT. Reactions were placed in native 23sample buffer (500 mM Tris-HCl, pH 6.8, 100% glycerol)and loaded on a 10% nondenaturing acrylamide gel. The gelwas run for 1 hr in non-SDS running buffer (12.4 mM Tris,125.2 mM glycine, 0.3 mM SDS), and the samples weretransferred to a pdf membrane in a wet transfer apparatus(Bio-Rad, Hercules, CA). The membrane was blocked in 5%milk/13 TBS-0.05% Tween, then incubated with an anti-huntingtin antibody (HP1; 1:1,000 dilution), followed byincubation with a peroxidase-conjugated goat anti-rabbit anti-body (Sigma; 1:20,000 dilution) and chemiluminescencereagent (ECL Plus; Amersham).
AGERA
Pure GST-Htn1-171(Q58) samples were prepared at aconcentration of 0.25 mg/ml in a buffer of 50 mM Tris-HCl,pH 8, 100 mM NaCl, 2.5 mM CaCl2, and 1 mM EDTA.They were incubated with thrombin (0.2 U/1 lg protein)for 45 min to cleave the GST tag and then centrifuged(at 13,000g) to remove any preformed aggregates. They werethen incubated with increasing concentrations of G20 or100 lM Congo red for 18 hr at room temperature. Samples
336 Yerkes et al.
Journal of Neuroscience Research

were run on a 2% agarose gel in SDS running buffer andtransferred to a PDF membrane with a Bio-Rad dry transferapparatus. The membrane was blocked in 5% milk/13 TBS-0.05% Tween, then incubated with an antihuntingtin antibody(HP1; 1:1,000), followed by incubation with peroxidase-con-jugated goat anti-rabbit antibody (Sigma; 1:20,000 dilution)and chemiluminescence reagent (ECL Plus; Amersham). Amore detailed description of the AGERA protocol can befound in Weiss et al. (2008).
Pull-down Assays
Pure GST-Htn1-171(Q58) samples were prepared atspecified concentration in a buffer of 50 mM Tris-HCl, pH 8,100 mM NaCl, 2.5 mM CaCl2, and 1 mM EDTA and incu-bated with thrombin (0.2 U/lg protein) for 45 min, thencentrifuged to remove preformed aggregates. Samples wereallowed to aggregate (incubated at room temperature) for 0,2, 4, 6, 10, or 18 hr before addition of oligonucleotide. Theywere then incubated with 15 lM biotinylated G20 for 18 hrat room temperature in buffer (50 mM Tris-HCl, pH 8,100 mM NaCl, 2.5 mM CaCl2, and 1 mM EDTA). Strepta-vidin beads (Invitrogen, Carlsbad, CA) were added in a 50%slurry and incubated at room temperature for 45 min whileshaking. The beads were recovered by low-speed centrifuga-tion and washed with TE buffer, binding buffer (10 mM Tris-HCl, pH 8.0, 40 mM KCl, 1 mM DTT, 6% glycerol, 0.05%NP-40), and 13 PBS. Bound G20 and protein were elutedby boiling in 23 sample buffer at 958C for 5 min. Sampleswere run on a 10% SDS-polyacrylamide gel, then transferredto a PDF membrane in a wet transfer apparatus. The mem-brane was blocked with 5% milk/TBS-0.05% Tween, incu-bated with an antihuntingtin antibody (HP1; 1:1,000), andincubated with a peroxidase-conjugated goat anti-rabbit anti-body (Sigma; 1:20,00 dilution) and chemiluminescencereagent (ECL Plus; Amersham).
Atomic Force Microscopy
G20 G-wire DNA was prepared at different concentra-tions in deionized water, adsorbed onto freshly cleaved mica,incubated for 10 min, and flash dried without rinsing with drynitrogen. No reaction buffer was used in the preparation forimaging. Htn samples were prepared according to the sameprotocol as biochemical assays; 0.75 lg/ll Htn was incubatedin 0.2 U thrombin/lg Htn for 30 min in reaction buffer(50 mM Tris HCl, pH 8.0, 100 mM KCl, 2.5 mM CaCl2,and 1 mM EDTA) and centrifuged at 15,000g for 30 min andincubated at room temperature. Samples of the supernatantwere isolated after different incubation times (t 5 0, 2, 4, 6,8, 16, 24, 48, and 96 hr) with and without the additionG-wire DNA. Samples were prepared for AFM imagingaccording to the following procedure. A few microliters of su-pernatant was diluted 1/10 in reaction buffer and adsorbedonto freshly cleaved mica for 10 min at room temperature,rinsed with 1 ml deionized water, and flash dried with drynitrogen for AFM imaging. Htn and G20 interactions wereimaged after diluting G20 down to 15 lM for 10 min in Htn(final concentration 0.71 lg/ll). An aliquot of the mixturewas diluted 1/10 in reaction buffer and adsorbed onto freshly
cleaved mica for 10 min at room temperature, rinsed with1 ml deionized water, and flash dried with dry nitrogen forAFM imaging. The samples were imaged on a Digital Instru-ments (Santa Barbara, CA) Nanoscope IIIa controller andMultimode atomic force microscope with a variety of general-purpose and sharp AFM probes (probe and scanning detailsfor each image are described in the figure legends). AFMprobes used included Nanoprobe (www.veeco.com), Micro-masch (http://www.spmtips.com/), ‘‘Hi-ResC’’ diamond-likecarbon probes, and Nanoworld cvd single-wall carbon nano-tubes (www.nanoworld.com). Images were captured in dryhelium after at least 6 hr of equilibration of fresh probe atroom temperature and ‘‘false engagement’’ scanning to reducepiezoelectric hysteresis and thermal drift. Off-line analysis wasaccomplished with Nanoscope software or Image SXM 1.82(http://www.imagesxm.org.uk).
RESULTS
Guanine-rich oligonucleotides (GROs) form com-plex four-stranded structures by planar stacking of G-tet-rads (Davis, 2004). Some GROs have been shown toassemble themselves into higher order molecular com-plexes, such as the ‘‘frayed-wire’’ and the ‘‘G-lego’’(Biyani and Nishigaki, 2005). Telomeric G-quadruplexesoften fold into a cubic array of parallel and antiparallelconformations held together by distinct regions or loopsconsisting of thymidine residues (for review see Phanet al., 2006). Our group has been studying the biologicalfunction of a GRO that self-assembles into a supermo-lecular structure known as a G-wire (Marsh and Hen-derson, 1994a; Marsh et al., 1995a). This moleculecomprises 20 guanosine residues synthesized in a linearfashion. Analyses of this molecule by circular dichroism,at various concentrations, reveals a standard spectral pat-tern predicted for complexes of DNA that assume theG-quartet conformation (Fig. 1a). A maximal ellipticityis found at 264 nm, and a minimum ellipticity is foundat 240 nm. As the concentration of the GRO is raised,the magnitude of both peaks is increased in a dose-dependent fashion, implying that a more stable confor-mation (G-wire) is present at higher concentrations(Biyani and Nishigaki, 2005). This interpretation is basedon the construction of parallel wires consisting of over-lapping residues of guanosine, in this case 20Gs. The sta-bility of the GRO, assembled in a putative G-wirestructure, was analyzed by increasing the temperaturefrom 248C to 998C. Samples were placed in an Avivmodel 202 spectrometer. Circular dichroism (CD) spec-tra and the elliptical profile were obtained at each tem-perature. As can be seen in Figure 1b, the pattern doesnot change, indicating a high degree of stability for theG20 molecule in the quadruplex form. The structure ofthis GRO (G20) was imaged on mica using AFM withquadruplexes being flash-dried from deionized water.
G20 DNA is pictured in Figure 1c in a concen-trated form with high-resolution details of complexstructures with an average height of 1.9 6 0.1 nm. G20spontaneously forms into G-quartet quadruplex ‘‘G-
G-Quartet Binds to Mutant Huntingtin Fragment 337
Journal of Neuroscience Research

wire’’ DNA without the need of stabilizing counter-ions(Marsh et al., 1995b). The concentrated G20 can interactto form higher order structures (horizontal thick arrow).Also evident are incomplete quadruplex DNA formation(vertical thin arrow), and the high-resolution of thisimage is partially because of the high surface density ofG-wire DNA of uniform height. Under these condi-tions, the apical AFM probe asperities can detect subtledetails while the sample is supported by the surroundingstructure (Mou et al., 1995). The cross-section of Figure1d (at the black line, Fig. 1c) presents the uniformity ofG-wire height (1.9 nm). At these high concentrations, itis not possible to identify individual G-wire strands.
At lower G20 concentrations, individual G-wire‘‘strands’’ become evident (Fig. 1e). The wires have an
average length of 70 6 30 nm and continue to presentan average height 1.9 6 0.1 nm. The widths of the G-wire molecules are artificially broadened by the finitegeometry of the AFM probe (Vesenka et al., 1992).Although some higher order structures (thick arrow) areformed, the majority of the G-wires appear to take onthe more common rod-like appearance (thin arrow).The cross-section in Figure 1f (black line with coloredarrows in Fig. 1e) provides persuasive evidence of thevery uniform G-wire cross-section. Importantly, the G-wires are easily identified by their rod-like structure andconsistent length and diameters. Thus, by several mea-surements, we conclude that the G20 molecule adopts aG-quartet configuration and can assemble into structuresmost closely resembling G wires.
Fig. 1. Analyses of G20 molecule by circular dichroism. a: Variousconcentrations of G20 are examined, and it appears that a standardspectral pattern predicted for complexes of DNA that assume the G-quartet conformation is present. A maximal ellipticity is found at 264nm, and a minimum ellipticity is found at 240 nm. b: The spectralpattern of G20 at 15 lM was examined over a temperature range of24–998C. The standard spectral pattern for a G-quadruplex remainsstable as the temperature increases. c: G20 DNA at 225 lM in water,adsorbed onto freshly cleaved mica, incubated for 10 min, and flashdried with dry nitrogen. Average height was 1.9 6 0.1 nm. TheG20 spontaneously form into G-quartet quadruplex ‘‘G-wire’’ DNA(Marsh et al., 1995b), without the need for stabilizing counter-ions.The G-wires formed in the absence of counter-ions are more com-plex than those reported elsewhere. The concentrated G20 can inter-act to form higher order structures (thick arrows). Probably also seenin this high-resolution image are incomplete quadruplex DNA for-
mation (thin arrows). Higher resolution is easier to achieve withhigh-density samples having uniform height (Mou et al., 1995). Tipspeed 0.5 lm/sec, diamond-like carbon whisker tip, resonant fre-quency 165 kHz. d: Cross-section of typical G-wires (line in c),indicating uniform height of 1.9 nm. Length scale same as in c.e: G20 DNA at 22.5 lM in water, adsorbed onto freshly cleavedmica, incubated for 10 min, and flash dried with dry nitrogen. Aver-age length was 70 6 30 nm, average height 1.9 6 0.1 nm. Thewidth of the molecules is artificially broadened by the finite geometryof the AFM probe (Vesenka et al., 1992). Some higher order struc-tures (thick arrow) are formed with a rod-like appearance (thinarrow). False-color height scale at far right is same for c,e. Tip speed2.0 lm/sec, diamond-like carbon whisker tip, resonant frequency306 kHz. f: Cross-section of typical G wires (line in e) indicatinguniform height of 1.9 nm. Length scale same as in e.
338 Yerkes et al.
Journal of Neuroscience Research

Inhibition of GST-Htn1-171(Q58) AggregateFormation Using Biochemical Endpoints
In our previous work, we used a GST-Htn1-171(Q58) fusion protein, consisting of a GST tag fusedto a fragment of huntingtin consisting of the first 171amino acids and a tract of 58 glutamine residues(Parekh-Olmedo et al., 2004; Wang et al., 2005; Skogenet al., 2006). Cleavage of the GST tag produces a pro-tein that can assemble into complexes resembling aggre-gates; these can be detected by trapping on a celluloseacetate membrane filter. The filter trap assay assumesthat large complexes are retained by the filter whilesmaller complexes, lower multimers, and monomers passthrough. Thus, immunoblotting the filters can reveal theamount of protein that has accumulated in some form ofaggregate, and a reduction in trapped protein will signalan inhibition of fragment aggregation. In our previouswork, dot blotting, using antibodies raised against theHtn fragment (Wang et al., 2005), confirmed that G20inhibited aggregation of this fusion protein. We nowextend these observations by testing G20 for the inhibi-tion of aggregate formation in a dose-dependent fashion.Figure 2a shows the dose response of G20 as it reducesthe amount of GST-Htn1-171(Q58) fusion proteintrapped on the filter. These results support our earlierdata in which a G-quartet was found to inhibit somedegree of aggregation of an Htn fusion protein.
To confirm results obtained in immunoblottingassays, disruption of aggregate formation was visualizedby gel electrophoresis. We chose three concentrations ofG20 and incubated each with Htn fragment after cleav-age with thrombin. Samples were incubated for 18 hrand then electrophoresed through 10% acrylamide undernondenaturing conditions. The gel was then transferredto nitrocellulose paper and blotted with an antibody(HP1) directed against amino acids 80–113. Fully aggre-gated Htn fragment will not enter the polyacrylamidegel sufficiently to allow transfer to the nitrocellulose fil-ter paper (Wang et al., 2005). Thus, the presence of pro-tein within the gel indicates a disruption in the forma-tion of large aggregated complexes. In Figure 2b, weobserve a series of protein bands in each of the lanescontaining G20. For one Htn concentration (0.75 lg/ll), we observe an array of fragment complexes rangingfrom monomeric size �75 kDa to a size that does notenter the gel. This repetitive pattern of proteins maysignal a monomeric, dimeric configuration of GST-Htn1-171(Q58). It is important to note that a specificproportion of Htn to G20 concentration is required formaximal activity, hinting that a protein–ODN interac-tion could rely on fairly precise stoichiometry. Thesedata also confirm the inhibitory activity of G20 in theaggregation process as was seen in the immunoblot assay.
Next, we employed a recently developed techniqueknown as agarose gel electrophoresis for resolving aggre-gates (AGERA) to investigate protein complexation ingreater detail (Weiss et al., 2008). This assay allowsdetection of small aggregates that might pass through a
membrane filter, a so-called ‘‘intermediate species of ag-gregate.’’ To view these complexes via AGERA, wemixed GST-Htn1-171(Q58), cleaved from GST byincubation with thrombin, with varying amounts ofG20. After 18 hr, the samples were electrophoresedthrough 2% agarose in a buffer containing SDS accord-ing to Weiss et al. (2008). The gel was transferred tonitrocellulose paper and probed with HP1 to detect thepresence (and size) of protein complexes. Figure 3 illus-trates the results of these reactions: a distinct populationof aggregated Htn fragment is observed migrating half-way down the gel in the reaction lacking G20 (0 lM).As the concentration of G20 is increased, the amount ofintermediate-sized aggregates seen in these lanes corre-spondingly decreases. A known Htn aggregate inhibitor,Congo red, was used as a positive control, and the lanecontaining that reaction mixture shows no intermediateaggregates of GST-Htn1-171(Q58). Thus, Congo redinhibited formation of aggregates in this reaction as pre-dicted, validating the assay system. Taken together, our
Fig. 2. a: Dot blot analysis of the effect of increasing concentrationsof G20 on aggregation of GST-Htn1-171(Q58). The 0-hr controlrepresents samples that were stopped immediately after addition ofprotein, the 24-hr samples were incubated in the absence of oligo-nucleotide, and the reaction was stopped 24 hr later. b: Native gelelectrophoresis analysis of the affect of G20 on aggregation of GST-Htn1-171(Q58). Samples of decreasing concentration of GST-Htn1-171(Q58) were incubated for 20 hr in the presence or absence ofoligonucleotide. Disruption of aggregation is evident by sampleentering the native gel during electrophoresis.
G-Quartet Binds to Mutant Huntingtin Fragment 339
Journal of Neuroscience Research

data suggest that G20 inhibits aggregate formation of theGST-Htn1-171(Q58) fragment protein in a gel systemthat can identify intermediate aggregate species.
G20 Binds to GST-Htn1-171(Q58) Protein in aPurified System
We asked, based on the activity of G20 in blockingaggregate formation, whether the oligonucleotide isbinding directly to the Htn fragment protein. To addressthis question, we carried out a biotin pull-down experi-ment in which biotinylated G20 is mixed with purifiedand cleaved GST-Htn1-171(Q58) at varying levels for18 hr. Streptavidin beads are then used to capture thebound and unbound G20. After separation and isolation,the nucleoprotein complexes were boiled to elute G20,and the protein content was profiled by SDS-PAGE.Visualization of GST-Htn1-171(Q58) was carried out byWestern blotting using HP1. Figure 4a shows that theHtn is in fact captured when a specific concentration ofprotein (0.75 lg/ll) is present in the reaction mixture.For comparison, we carried out the same experimentusing a different fusion fragment; GST-Htn1-171(Q23)is identical to the Q58 protein, except that it contains aglutamine repeat of 23 instead of 58. The results of thispull-down experiment reveals a more degenerate G20binding profile; GST-Htn1-171(Q23) is captured byG20 in range of 1.5–0.5 lg/ll. Once again, however,
the highest level of binding is facilitated at an ODNconcentration of 0.75 lg/ll, mimicking the resultsobtained with GST-Htn1-171(Q58). Because equivalentlevels of GST-Htn1-171(Q23) and GST-Htn1-171(Q58)were used, there is an approximate 2.5-fold higher num-ber of protein molecules in the Q23 reaction mixturecompared with the Q58 reaction. All of our resultsstrongly suggest that G20 can bind to Htn (Q23 andQ58), albeit perhaps with different affinities or by differ-ent mechanisms.
GST-Htn1-171(Q58 or Q23) protein aggregationis a dynamic process that is likely to be concentrationdependent, so we wondered whether the biotinylatedG20 would capture a unique species that is created tran-siently during the assembly process. One might predictthat such unique species would be transient and bothtime and concentration dependent. We carried out anexperiment to see whether unique, preferred species ofthe GST-Htn1-171(Q58) protein are bound by G20.This protein was incubated at three separate concentra-tions (0.5, 1.0, and 1.5 lg/ll) for various times up to 18hr, enabling aggregation to take place, and at specifictime points 15 lM G20 was added. The mixture wasallowed to continue incubating for an additional 18 hr.In experimental design, these reaction mixtures variedonly in the time when fragment protein aggregationtook place; the incubation time with G20 was the samefor each point. All samples were mixed with streptdavi-din beads, followed by protein elution, SDS-PAGE, andWestern blotting as described for the experiments repre-sented in Figure 4. The controls for this experiment aretaken from samples incubated for 18 hr so that they arerepresentative of species present in solution at the timepoints when the oligonucleotide is actually added to thesample. All samples appearing in the gel are SDS soluble,insofar as each reaction mixture bound by streptavidinbeads is boiled in an SDS-containing buffer for 5 minprior to loading. As can be seen in Figure 5, at the twolower concentrations, soluble control proteins are identi-fiable in the blot but at the highest concentration (1.5lg/ll); no soluble protein is visible in the control lane.This is due, in all likelihood, to the degree and size ofthe aggregated complex of protein formed at the 36-hr
Fig. 3. Agarose gel electrophoresis for resolving aggregates analysisfor the inhibition of macroaggregates by G20. Samples were incu-bated in the presence or absence of oligonucleotide for 20 hr. Congored (CR) is a positive control for the inhibition of aggregation. Gelresolves aggregates of very large molecular weight. Decreased amountof sample with increased amounts of G20 indicates a decrease inlarge-molecular-weight aggregates.
Fig. 4. a: Analysis of G20-Htn1-171(Q58) interaction by a biotinpull-down assay. Samples of decreasing concentration of protein wereincubated for 20 hr in the presence of biotinylated G20. Interactionwith G20 was assayed by ‘‘pulling down’’ the biotinylated oligonu-cleotide with streptavidin beads and then analyzed by Western blot-ting for Htn 1-171. The presence of protein on the blot indicates adirect interaction with G20. b: Analysis of G20-Htn1-171(Q23)interaction by a biotin pull-down assay, analyzed in the same way asfor a.
340 Yerkes et al.
Journal of Neuroscience Research
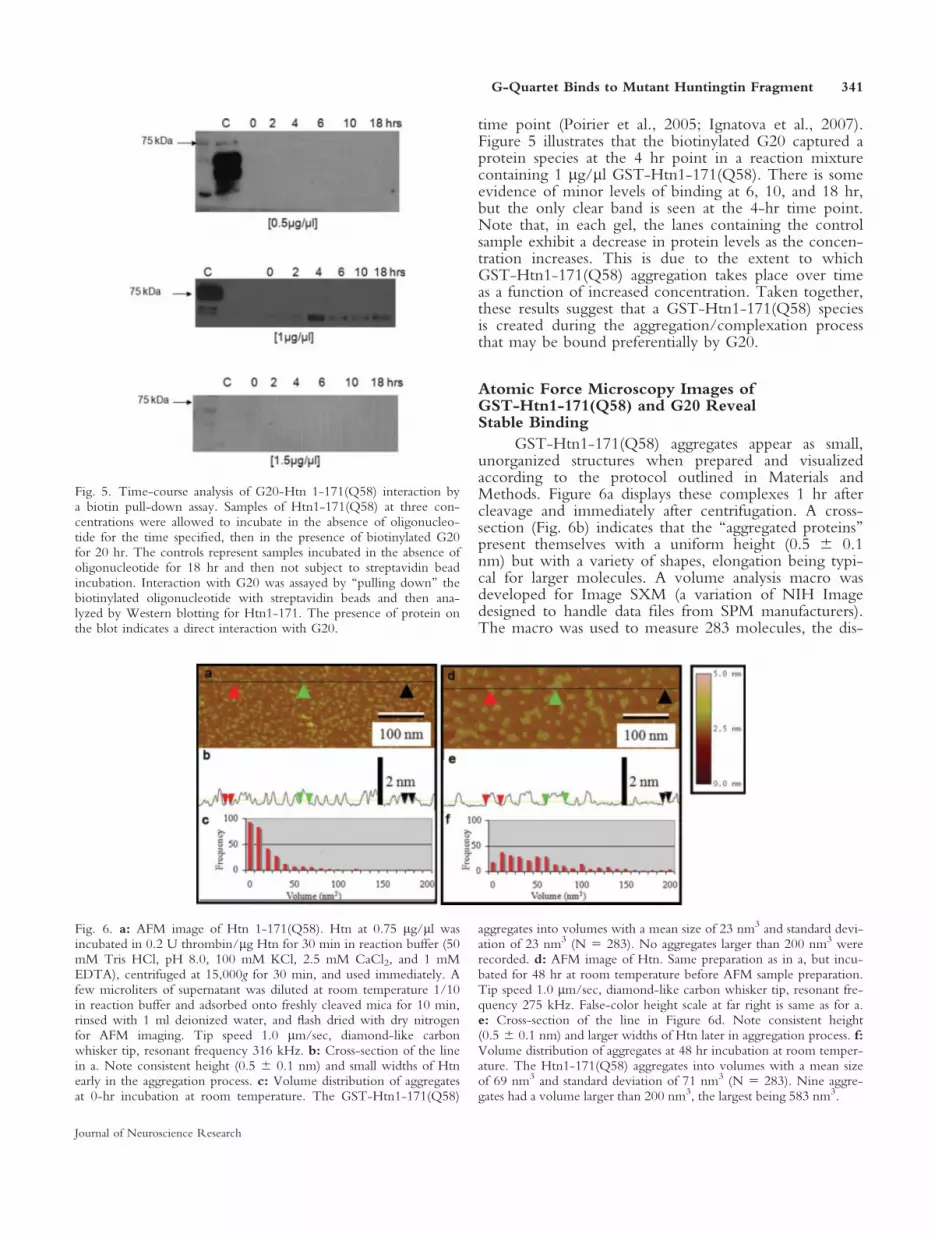
time point (Poirier et al., 2005; Ignatova et al., 2007).Figure 5 illustrates that the biotinylated G20 captured aprotein species at the 4 hr point in a reaction mixturecontaining 1 lg/ll GST-Htn1-171(Q58). There is someevidence of minor levels of binding at 6, 10, and 18 hr,but the only clear band is seen at the 4-hr time point.Note that, in each gel, the lanes containing the controlsample exhibit a decrease in protein levels as the concen-tration increases. This is due to the extent to whichGST-Htn1-171(Q58) aggregation takes place over timeas a function of increased concentration. Taken together,these results suggest that a GST-Htn1-171(Q58) speciesis created during the aggregation/complexation processthat may be bound preferentially by G20.
Atomic Force Microscopy Images ofGST-Htn1-171(Q58) and G20 RevealStable Binding
GST-Htn1-171(Q58) aggregates appear as small,unorganized structures when prepared and visualizedaccording to the protocol outlined in Materials andMethods. Figure 6a displays these complexes 1 hr aftercleavage and immediately after centrifugation. A cross-section (Fig. 6b) indicates that the ‘‘aggregated proteins’’present themselves with a uniform height (0.5 6 0.1nm) but with a variety of shapes, elongation being typi-cal for larger molecules. A volume analysis macro wasdeveloped for Image SXM (a variation of NIH Imagedesigned to handle data files from SPM manufacturers).The macro was used to measure 283 molecules, the dis-
Fig. 5. Time-course analysis of G20-Htn 1-171(Q58) interaction bya biotin pull-down assay. Samples of Htn1-171(Q58) at three con-centrations were allowed to incubate in the absence of oligonucleo-tide for the time specified, then in the presence of biotinylated G20for 20 hr. The controls represent samples incubated in the absence ofoligonucleotide for 18 hr and then not subject to streptavidin beadincubation. Interaction with G20 was assayed by ‘‘pulling down’’ thebiotinylated oligonucleotide with streptavidin beads and then ana-lyzed by Western blotting for Htn1-171. The presence of protein onthe blot indicates a direct interaction with G20.
Fig. 6. a: AFM image of Htn 1-171(Q58). Htn at 0.75 lg/ll wasincubated in 0.2 U thrombin/lg Htn for 30 min in reaction buffer (50mM Tris HCl, pH 8.0, 100 mM KCl, 2.5 mM CaCl2, and 1 mMEDTA), centrifuged at 15,000g for 30 min, and used immediately. Afew microliters of supernatant was diluted at room temperature 1/10in reaction buffer and adsorbed onto freshly cleaved mica for 10 min,rinsed with 1 ml deionized water, and flash dried with dry nitrogenfor AFM imaging. Tip speed 1.0 lm/sec, diamond-like carbonwhisker tip, resonant frequency 316 kHz. b: Cross-section of the linein a. Note consistent height (0.5 6 0.1 nm) and small widths of Htnearly in the aggregation process. c: Volume distribution of aggregatesat 0-hr incubation at room temperature. The GST-Htn1-171(Q58)
aggregates into volumes with a mean size of 23 nm3 and standard devi-ation of 23 nm3 (N 5 283). No aggregates larger than 200 nm3 wererecorded. d: AFM image of Htn. Same preparation as in a, but incu-bated for 48 hr at room temperature before AFM sample preparation.Tip speed 1.0 lm/sec, diamond-like carbon whisker tip, resonant fre-quency 275 kHz. False-color height scale at far right is same as for a.e: Cross-section of the line in Figure 6d. Note consistent height(0.5 6 0.1 nm) and larger widths of Htn later in aggregation process. f:Volume distribution of aggregates at 48 hr incubation at room temper-ature. The Htn1-171(Q58) aggregates into volumes with a mean sizeof 69 nm3 and standard deviation of 71 nm3 (N 5 283). Nine aggre-gates had a volume larger than 200 nm3, the largest being 583 nm3.
G-Quartet Binds to Mutant Huntingtin Fragment 341
Journal of Neuroscience Research

tribution of which can be seen in Figure 6c. At ‘‘t 5 0’’incubation time (immediately following centrifugation)the volumes exhibit with a mean value of 23 nm3, withstandard deviation of 23 nm3 (N 5 283). No aggregatesrecorded were larger than 200 nm3.
After 48 hr of incubation at room temperature, avery different picture of GST-Htn1-171(Q58) emerges.These complexes have a more ‘‘raft-like’’ appearance onthe substrate in a variety of sizes that, as can be seen inFigure 6d; a cross- section is displayed in Figure 6e. Thelatter shows the aggregates continue to have a consistentheight (0.5 6 0.1 nm). Figure 6f indicates that the poly-glutamine aggregates into volumes with a mean size of69 nm3 and standard deviation of 71 nm3 (N 5 283).Nine aggregates had a volume larger than 200 nm3, thelargest being 583 nm3. These rafts on average are threetimes the size of the protein sample taken from the super-natant immediately after centrifugation. The rafts alsohave a greater size distribution. The self-assembly of theGST-Htn1-171(Q58) is likely driven by presence of poly-glutamine tracts within the protein. Some disassembly islikely taking place during the short incubation periodwhile the sample is being prepared for AFM imaging.Therefore, we suggest that the GST-Htn1-171(Q58) pic-tured here is likely to underestimate the actual sizes ofthe protein rafts. Figure 7a is another field of view of thesame sample seen in Figure 6a intended for use in com-parison with Figure 7c. Figure 7c is an image of a samplereaction in which G20 DNA was added at a concentra-tion of 15 lM and allowed to incubate for 10 min at the
same concentration with GST-Htn1-171(Q58) as in thebiochemical assay. The sample was then diluted 1/10 inreaction buffer and immediately adsorbed onto freshlycleaved mica for AFM imaging. Again, the dilution aidsin the identification of distinct aggregates and G-wires.Note that every G-wire has a GST-Htn1-171(Q58) raftsurrounding it, but not all rafts are associated withG-wires. This image provides evidence of an interactionbetween the G-wires and Htn fusion protein.
The cross-section (Fig. 7b) identifies a consistentheight of the Htn fragment protein (0.5 6 0.1 nm) con-tained within the aggregates. The cross-section in Figure7d strengthens the argument that the G-wires are inter-acting with the Htn 1-171(Q58), because the cross-sections of the G-wires reveal an approximate height of2.4 6 0.1 nm, which is in stark contrast to Figure 1e,f,which show that the G-wires alone have a uniformheight of 1.9 6 0.1 nm. The rafts seen in Figure 7d alsohave a height of 0.5 6 0.1 nm (cross-section notshown). Because the G-wires appear oriented on thesurface of mica, because of an interaction among theG-wires, mica, and a tethering ion found in the buffer(Vesenka et al., 2007), the G-wires probably lay downfirst, and the Htn protein is assembled over and aroundthem.
DISCUSSION
Guanosine-rich oligonucleotides can self-assembleinto higher order structures based on their tendency to
Fig. 7. a: AFM image of Htn1-171(Q58) aggregates. Htn at 0.75lg/ll incubated in 0.2 U thrombin/lg for 30 min in reaction buffer.The sample was centrifuged at 15,000g for 30 min, and the superna-tant was incubated for 48 hr at room temperature. Samples for AFMimaging were made by diluting a few microliters of supernatant atroom temperature 1/10 in reaction buffer and adsorbed onto freshlycleaved mica for 10 min, rinsed with 1 ml deionized water, and flashdried with dry nitrogen. Tip speed 1.0 lm/sec, diamond-like carbonwhisker tip, resonant frequency 275 kHz. b: A cross-section of a(black line with colored arrows) indicates an average height of about0.5 6 0.1 nm for the aggregates. Three randomly selected aggregatesare identified. Same length scale as in a. c: AFM image of Htn1-171(Q58) and G20 G-wire DNA. Same sample preparation as in a.
After 8 hr of incubation, the supernatant was diluted to 0.71 lg/llin 15 lM G20 in reaction buffer for 10 min. This sample was thendiluted 1/10 in reaction buffer and adsorbed onto freshly cleavedmica for 10 min, rinsed with 1 ml deionized water, and flash driedwith dry nitrogen. All G-wire DNA is found to interact with Htn1-171(Q58) aggregates, as can be seen from the cross-sections. Freeaggregates were also visible over the surface and look like the ‘‘mats’’in a. Tip speed 2.0 lm/sec, single-wall carbon nanotube tip, resonantfrequency 298 kHz. False-color height scale at far right is same as fora. d: Total height of G-wire DNA 2.4 6 0.2 nm (green and blackarrows). Shoulders (red arrows) of G-wires show aggregates of height0.5 6 0.1 nm. Same length scale as in c.
342 Yerkes et al.
Journal of Neuroscience Research

form G-quartets. We have been analyzing the biologicalactivities of a GRO composed of 20 guanosine residues(G20). This quadraplex, known as a G-wire, has beenfound to block the aggregation potential of several fusionproteins containing expanded poly-Q regions (Skogenet al., 2006). One of these proteins is a fragment of thehuntingtin protein (Htn) containing the first 171 aminoacids with a stretch of 58 glutamines and expressed invitro from a construct that has been used widely inscreens for inhibitors of Htn aggregation (Wang et al.,2005). In our laboratory, several G-quartets were foundto block the formation of these aggregates and inclusionsbodies in mammalian cells (Parekh-Olmedo et al.,2004); among these, G20 displayed the highest level ofactivity. In the current work, we find that G20 associateswith Htn fragment proteins Htn(Q58) and Htn(23). Ourconclusions, based on the results of biochemical andmolecular analyses, including filter-binding, gel, AGERA,and pull-down assays as well as atomic force microscopyprovide a potential explanation for the inhibitory actionof G20.
G20 exhibits a traditional ellipticity with theextended peak at 264 nm, indicating that G-quartets areforming spontaneously and that more complex structuresare part of a fairly uniform population. At the very least,the CD data suggest that a large percentage of the G20molecules assembles into a higher order G-quartet con-formation. These data are supported by the images gen-erated by AFM, which reveal a uniform height (1.9 nm)within the population of oligonucleotides (Biyani andNishigaki, 2005). When the assembled G-quartets arestressed by heat, very little disruption of the macromo-lecular structure is observed, suggesting that the confor-mations adopted by G20 molecules are stabilized by basestacking of adjacent quadraplex units (Marsh and Hen-derson, 1994b; Biyani and Nishigaki, 2005). Naturallyoccurring G-rich sequences that are known to formG-wire DNA (Burge et al., 2006) require monovalentcations to stabilize the G-quartet structure (Howardet al., 1977). The quadruplex DNA formed from G20sequence appears to be unusually stable, because it formsG-wire DNA in the absence of cations. Figure 1c,eshows images of 220 lM and 22 lM G20 forming G-wire DNA that have been deposited on freshly cleavedmica diluted only in deionized water. The synthesis,purification, and lyophilization of the G20 oligomerseffectively remove all ions. The primary and secondarystructure of DNA are not affected by adsorption ontomica, although the tertiary structure is known tobe affected by ionic concentration (Lyubchenko andShlyakhtenko, 1997; Dingley et al., 2005). The presenceof divalent cations is essential for binding DNA to mica(Vesenka et al., 1992), and these cations are known tocause alignment of quadruplex DNA along the hexagonalatomic structure of mica surface (Vesenka et al., 2007).The orientation of the G-wires can also be seen in Figure7c because of the presence of Ca21 in the reaction buffer.
Results from the biochemical assays support ourprevious conclusions that G20 inhibits the formation of
large protein aggregates that are unable to pass through acellulose membrane filter (Skogen et al., 2006). We usedan agarose-gel assay (AGERA) to visualize complexesthat pass through the filter and found that G20 reducedthe amount of these so-called intermediate aggregates(Weiss et al., 2008) in a dose-dependent fashion. Solubleproteins in the monomeric form or low-multimericform migrate through the gel quickly and hence are notresolved. For example, Congo red-treated samples donot resolve in AGERA, as previously reported (Weisset al., 2008), indicating that the population of Congored-treated molecules consists primarily of monomers. Incontrast, G20-treated samples contain a mixed popula-tion of protein monomers and multimers, insofar assome protein is detectable in the lanes of the gel. Thesedata also indicate that the inhibition of aggregationexhibited by Congo red may take place at an earlierstage of protein aggregation than the activity of the G20.This interpretation is consistent with the data presentedin Figure 5, where G20 pulls down a complex formedafter 4 hr of protein assembly (incubation). We do notyet know the status of the multimers or the arrangementof these proteins, but the population is likely to containearly-stage members of the fully aggregated complex.AFM images (Fig. 6) support this notion; the G-wiresare decorated with discernible layers in the form of pro-tein rafts. Clearly, G20 binds the GST-Htn1-171(Q58)and GST-Htn1-171(Q23). Thus, at the concentration(15 lM) at which we first discovered the inhibitoryactivity of G20, we again 1) detect no aggregatedprotein species on the dot blot; 2) see primarily mono-meric, dimeric, or trimeric species on the native gel;and 3) visualize complex intermediates in AGERA. Ourdata strongly suggest that G20 inhibits Htn1-171(Q58)aggregation.
The pull-down binding experiments with thestreptavidin-biotin system reveal that G20 binds to bothfusion constructs (Q58 and Q23). In reactions that con-tain the Q58 protein, the binding appears to be moresensitive to concentration and time of assembly. Theseobservations have led us to hypothesize that whateverpart of Q58 that interacts with G20 must be reflectivetemporarily of a natural part of the Q23 protein. Thisconcept is outlined in Figure 8. We hypothesize that,during the aggregation/assembly process of GST-Htn1-171(Q58), a domain or surface that resembles the GST-Htn1-171(Q23) protein materializes for a brief time andthat, this domain/face/structure is actually the preferredbinding site for the G20 molecule. This native facemight be preferentially recognized by the G20, because,in our pull-down experiments, G20 interacts with theQ23 protein in a much more degenerate way in termsof protein concentration (Fig. 4). This face exists foronly a brief period of time and at specific concentrationduring the Q58 assembly process. If this is true, it wouldaccount for the selective binding of a species of GST-Htn1-171(Q58) by G20 (Takahashi et al., 2008). Severalstudies have suggested that a gain of function for mutantHtn may result from a gain of structure (Ross and Poirier,
G-Quartet Binds to Mutant Huntingtin Fragment 343
Journal of Neuroscience Research

2005; Takahashi et al., 2008). Structural changes couldbe in a dynamic equilibrium with certain ones appearingonly transiently, some of which might be the toxic,insoluble forms or intermediates along the assemblypathway. Certain configurations could then be recogniz-able to the G20, leading to an association that resultsultimately in detectable binding. It may well be thatthe G20 interacts with a soluble oligomer prior to itsimmersion into a more rigid aggregated complex. Basedon the results of the pull-down experiments and theAFM images, it might well be that larger complexesof GST-Htn1-171(Q58) are not a preferred bindingsubstrate.
GST-Htn1-171(Q58) forms aggregates over thecourse of 48 hr as viewed by AFM (Fig. 6). It is difficultto characterize fully the large complexes, but it is likelythat the fusion proteins coalesce and grow in volume.There appears to be no change in average height amongthe less well aggregated groups at 0 time and the larger,more fully aggregated groups seen at 48 hr. Theso-called 48 hr rafts are larger than the individual proteinor groups imaged at 0 hr. Obviously, the rafts have a
large variance in size but do appear to expand as a func-tion of concentration (data not shown; for review seeRoss and Poirier, 2005), so we make no definitive state-ments about the kinetics of assembly of the fusion pro-tein, although it is clear from these data that the G20/G-wire structure interacts stably with the Htn fragmentprotein in our system. Experiments are now underwayto define these interactive sites. From a practical stand-point, G20 could be used as a probe to identify and/orisolate various early members of the Htn aggregationpathway. Alternatively, if the binding domain of theG20 is more precisely defined, then it may become pos-sible to think about a way to utilize this information todesign an effective therapeutic approach for HD.
ACKNOWLEDGMENT
We thank Dr. Elizabeth Adams for valuable sugges-tions with applications using atomic force microscopy.
REFERENCES
Bates PJ, Kahlon JB, Thomas SD, Trent JO, Miller DM. 1999. Antipro-
liferative activity of G-rich oligonucleotides correlates with protein
binding. J Biol Chem 274:26369–26377.
Bence NF, Sampat RM, Kopito RR. 2001. Impairment of the ubiqui-
tin-proteasome system by protein aggregation. Science 292:1552–1555.
Biyani M, Nishigaki K. 2005. Structural characterization of ultra-stable
higher-ordered aggregates generated by novel guanine-rich DNA
sequences. Gene 364:130–138.
Burge S, Parkinson GN, Hazel P, Todd AK, Neidle S. 2006. Quadru-
plex DNA: sequence, topology and structure. Nucleic Acids Res 34:
5402–5415.
Cheng AJ, Van Dyke MW. 1997. Oligodeoxyribonucleotide length and
sequence effects on intramolecular and intermolecular G-quartet forma-
tion. Gene 197:253–260.
Davis JT. 2004. G-quartets 40 years later: from 50-GMP to molecular
biology and supramolecular chemistry. Angew Chem Int Ed Engl 43:
668–698.
Dingley AJ, Peterson RD, Grzesiek S, Feigon J. 2005. Characterization
of the cation and temperature dependence of DNA quadruplex hydro-
gen bond properties using high-resolution NMR. J Am Chem Soc
127:14466–14472.
Gunawardena S, Her LS, Brusch RG, Laymon RA, Niesman IR, Gorde-
sky-Gold B, Sintasath L, Bonini NM, Goldstein LS. 2003. Disruption
of axonal transport by loss of huntingtin or expression of pathogenic
polyQ proteins in Drosophila. Neuron 40:25–40.
Guschlbauer W, Chantot JF, Thiele D. 1990. Four-stranded nucleic acid
structures 25 years later: from guanosine gels to telomer DNA. J Bio-
mol Struct Dyn 8:491–511.
Howard FB, Frazier J, Miles HT. 1977. Stable and metastable forms of
poly(G). Biopolymers 16:791–809.
Ignatova Z, Thakur AK, Wetzel R, Gierasch LM. 2007. In-cell aggrega-
tion of a polyglutamine-containing chimera is a multistep process initi-
ated by the flanking sequence. J Biol Chem 282:36736–36743.
Illuzzi J, Yerkes S, Parekh-Olmedo H, Kmiec EB. 2009. DNA breakage
and induction of DNA damage response proteins precede the appear-
ance of visible mutant huntingtin aggregates. J Neurosci Res 87:733–
747.
Jing N, De Clercq E, Rando RF, Pallansch L, Lackman-Smith C, Lee S,
Hogan ME. 2000. Stability-activity relationships of a family of G-tetrad
forming oligonucleotides as potent HIV inhibitors. A basis for anti-HIV
drug design. J Biol Chem 275:3421–3430.
Fig. 8. Schematic overview of G20 binding to Htn-1-171(Q58). Asevident in Figure 5, G20 binds preferentially to a species of Htn-1-171(Q58) that is present after approximately 4 hr of aggregation withsamples at a 1.0 lg/ll concentration. G20 does not exhibit a bindinginteraction in identical experiments conducted with higher (1.5 lg/ll) and lower (0.5 lg/ll) concentrations of GST-Htn-1-171(Q58).We propose that the preferred binding substrate of G20-Htn bindingis an early species of GST-Htn-1-171(Q58) along the pathway ofaggregation. This ‘‘optimal binding species’’ appears at approximately4 hr of GST-Htn-1 171(Q58) aggregation when the concentration is1.0 lg/ll. At the higher concentration, Htn aggregation occurs tooquickly for G20 binding to occur, and the species is hidden; at lowerconcentration, aggregation occurs too slowly, and the ‘‘optimal bind-ing species’’ may never form during the 18-hr time period. Datafrom Figure 5 indicate that aggregation in the (1.5 lg/ll) samplesoccurs quickly because the control sample is SDS insoluble after18 hr of incubation. This observation may indicate that larger aggre-gate complexes have formed, whereas, in the lower concentrationsamples, the controls remain SDS soluble.
344 Yerkes et al.
Journal of Neuroscience Research

Jing N, Li Y, Xu X, Sha W, Li P, Feng L, Tweardy DJ. 2003. Targeting
Stat3 with G-quartet oligodeoxynucleotides in human cancer cells.
DNA Cell Biol 22:685–696.
Jing N, Sha W, Li Y, Xiong W, Tweardy DJ. 2005. Rational drug
design of G-quartet DNA as anti-cancer agents. Curr Pharm Des 11:
2841–2854.
Lyubchenko YL, Shlyakhtenko LS. 1997. Visualization of supercoiled
DNA with atomic force microscopy in situ. Proc Natl Acad Sci USA
94:496–501.
Mangiarini L, Sathasivam K, Seller M, Cozens B, Harper A, Hethering-
ton C, Lawton M, Trottier Y, Lehrach H, Davies SW, Bates GP.
1996. Exon 1 of the HD gene with an expanded CAG repeat is suffi-
cient to cause a progressive neurological phenotype in transgenic mice.
Cell 87:493–506.
Marsh TC, Henderson E. 1994a. G-wires: self-assembly of a telomeric
oligonucleotide, d(GGGGTTGGGG), into large superstructures. Bio-
chemistry 33:10718–10724.
Marsh TC, Henderson E. 1994b. G-wires: self-assembly of a telomeric
oligonucleotide, d(GGGGTTGGGG), into large superstructures. Bio-
chemistry 33:10718–10724.
Marsh TC, Vesenka J, Henderson E. 1995a. A new DNA nanostructure,
the G-wire, imaged by scanning probe microscopy. Nucleic Acids Res
23:696–700.
Marsh TC, Vesenka J, Henderson E. 1995b. A new DNA nanostructure,
the G-wire, imaged by scanning probe microscopy. Nucleic Acids Res
23:696–700.
Mazumder A, Neamati N, Ojwang JO, Sunder S, Rando RF, Pommier
Y. 1996. Inhibition of the human immunodeficiency virus type 1 inte-
grase by guanosine quartet structures. Biochemistry 35:13762–13771.
Michalowski D, Chitima-Matsiga R, Held DM, Burke DH. 2008. Novel
bimodular DNA aptamers with guanosine quadruplexes inhibit phylo-
genetically diverse HIV-1 reverse transcriptases. Nucleic Acids Res 36:
7124–7135.
Mou J, Czajkowsky DM, Zhang Y, Shao Z. 1995. High-resolution
atomic-force microscopy of DNA: the pitch of the double helix. FEBS
Lett 371:279–282.
Oma Y, Kino Y, Sasagawa N, Ishiura S. 2004. Intracellular localization
of homopolymeric amino acid-containing proteins expressed in mam-
malian cells. J Biol Chem 279:21217–21222.
Parekh-Olmedo H, Wang J, Gusella JF, Kmiec EB. 2004. Modified sin-
gle-stranded oligonucleotides inhibit aggregate formation and toxicity
induced by expanded polyglutamine. J Mol Neurosci 24:257–267.
Phan AT, Kuryavyi V, Patel DJ. 2006. DNA architecture: from G to Z.
Curr Opin Struct Biol 16:288–298.
Poirier MA, Jiang H, Ross CA. 2005. A structure-based analysis of hun-
tingtin mutant polyglutamine aggregation and toxicity: evidence for a
compact beta-sheet structure. Hum Mol Genet 14:765–774.
Ross CA, Poirier MA. 2005. Opinion: what is the role of protein aggre-
gation in neurodegeneration? Nat Rev Mol Cell Biol 6:891–898.
Satyal SH, Schmidt E, Kitagawa K, Sondheimer N, Lindquist S, Kramer
JM, Morimoto RI. 2000. Polyglutamine aggregates alter protein folding
homeostasis in Caenorhabditis elegans. Proc Natl Acad Sci USA 97:
5750–5755.
Skogen M, Roth J, Yerkes S, Parekh-Olmedo H, Kmiec E. 2006. Short
G-rich oligonucleotides as a potential therapeutic for Huntington’s dis-
ease. BMC Neurosci 7:65.
Stull RA, Szoka FC Jr. 1995. Antigene, ribozyme and aptamer nucleic
acid drugs: progress and prospects. Pharm Res 12:465–483.
Takahashi T, Kikuchi S, Katada S, Nagai Y, Nishizawa M, Onodera O.
2008. Soluble polyglutamine oligomers formed prior to inclusion body
formation are cytotoxic. Hum Mol Genet 17:345–356.
Truant R, Atwal RS, Desmond C, Munsie L, Tran T. 2008. Hunting-
ton’s disease: revisiting the aggregation hypothesis in polyglutamine
neurodegenerative diseases. FEBS J 275:4252–4262.
Vesenka J, Guthold M, Tang CL, Keller D, Delaine E, Bustamante C.
1992. Substrate preparation for reliable imaging of DNA molecules
with the scanning force microscope. Ultramicroscopy 42–44:1243–
1249.
Vesenka J, Bagg D, Wolff A, Reichert A, Moeller R, Fritzsche W. 2007.
Auto-orientation of G-wire DNA on mica. Colloids Surf B Biointerfa-
ces 58:256–263.
Wang J, Gines S, MacDonald ME, Gusella JF. 2005. Reversal of a full-
length mutant huntingtin neuronal cell phenotype by chemical inhibi-
tors of polyglutamine-mediated aggregation. BMC Neurosci 6:1.
Weiss A, Klein C, Woodman B, Sathasivam K, Bibel M, Regulier E,
Bates GP, Paganetti P. 2008. Sensitive biochemical aggregate detection
reveals aggregation onset before symptom development in cellular and
murine models of Huntington’s disease. J Neurochem 104:846–858.
Xu X, Hamhouyia F, Thomas SD, Burke TJ, Girvan AC, McGregor
WG, Trent JO, Miller DM, Bates PJ. 2001. Inhibition of DNA replica-
tion and induction of S phase cell cycle arrest by G-rich oligonucleo-
tides. J Biol Chem 276:43221–43230.
G-Quartet Binds to Mutant Huntingtin Fragment 345
Journal of Neuroscience Research