Automatic workflow for the classification of local DNA conformations
Upload
khangminh22Category
view
2download
0
Huntingtin Exon 1 Conformationsand Aggregation in the Absence
and Presence ofMacromolecular Crowders
andSmall Molecules
A dissertation Submitted in partial fulfillment of the requirements forthe degree of Dr. rer. nat. (Doctor rerum Naturalium) in the Facultyof Chemistry and Biochemistry at Ruhr-University Bochum, Germany
Shivang Vachharajani
from
Ahmedabad, India
October 13, 2016


The work presented in the dissertation was conducted in the period from January 2012to October 2016 at the chair of Physical Chemistry II at the Faculty of Chemistryand Biochemistry, Ruhr-University Bochum, Germany
Statutory Declaration
I hereby declare that the dissertation entitled ”Huntingtin Exon 1 Conformationsand Aggregation in the Absence or Presence of Macromolecular Crowders and SmallMolecules” is my original work and has been written with no other sources and aidsthan quoted, and has not been submitted to any other examination body in thepresent form or in similar form for an award of an academic degree.
Shivang Vachharajani
December 1, 2016
Supervisor: Jun. Prof. Dr. Simon EbbinghausReferee: Jun. Prof. Dr. Simon EbbinghausCo-referee: Prof. Dr. Christian Herrmann


Most people say that it is the intellect which makes a great scientist.They are wrong: it is character
Albert Einstein


Acknowledgements
I would like to take this opportunity and mention all the people whose support orcriticism have helped me during the completion of this thesis. Firstly, I would like toexpress my gratitude to Jun. Prof. Dr. Simon Ebbinghaus for giving me the oppor-tunity to pursue research in the first place. I thank him for his guidance in the work.I am grateful to him for his critical assessment and suggestions for my presentationsin the meetings and for my thesis.I record my obligation to Prof. Christian Herrmann for being a co-referee and allow-ing me for the use of his laboratory equipments.I would like to acknowledge Tobias Voepel for setting up the protein purification sys-tem which was a great help for my project. I thank him for proof reading of mythesis and helpful discussions. I would like to thank Abhishek Sharma for help andinsightful discussions throughout the PhD duration.I thank, Michael Senske for technical help in AFM, CD, freeze drying. I thank Stef-fen Buening for the help in learning microscope setup, David Gnutt (Great scientistfrom Castrop-Rauxel!) for interesting discussions, Mimi Gao for help and discussions,Magdalena Gross, Oliver Brylski for proof-reading the introduction of my thesis.I thank Gundula Talbot, Ulla Knieper, Sabine Weiss, Sylke Kohlpoth for the admin-istrative work.I wish to acknowledge the help I received from the members of the group of Prof.Christian Herrmann; Klaus Koch, Sergii Shydlovskyi and the women of the group whoare Swaantje Brinkmann, Semra Ince, Miriam Kutsch, Vijayalakshmi Annamalai.I would like to thank Prof. Dr. Guenter von Kiedrowski for allowing me to useMALDI. I thank Dr. Volker Patzke for the demonstration of that technique. I amgrateful to Prof. Dr. Rolf Heumann and Prof. Dr. Matthias Roegner for allowing meto use sonicator and CD spectrometer respectively.I have a very good cause to thank Heman Aggrawal (Dr. rer. pol.). I am indebted tohim for interesting discussions over vast topics like politics, philosophy, anthropology,yoga, spirituality, industrialization, history, music and what not! These discussionsessions have expanded the limits of my relatively closed scientific mind, which ishaving and will have a profound effect on what I will do in the future.I must thank Abhishek Sharma for being a great companion throughout my journeyas a PhD student.I would like to specially thank Wolfgang Schwendler and his USC athletics traininggroup for giving me a wonderful time on the track and for helping me improving mytimes. He has always been very kind to me despite my irregularities in the training.I am indebted to Michael Senske for an interesting non-scientific conversations whiledoing experiments. I thank him for making me aware how great vfl Bochum 1848 is!I may not follow its matches but I will preserve a vfl scarf (Because it has RUB printon the other side!)I record my thanks for Luv Sharma for interesting discussions on politics and onquantum mechanics during second year of my PhD.I would like to thank Tobias Voepel, Konrad Meister, Sarah Schaefer, Lukas Knake

for being socially more interactive in the group.I would like to thank Simon Ebbinghaus for inviting in his marriage, the Germanwedding! and also for supervising my cross country skiing in Kaprun. Now I knowthat I should keep my body weight to the front while skiing!I would like to acknowledge the organizations running Sikh temple; Gurdwara DasmeshDarbar Essen e.V. and Hindu temple; Kultureller Verein afghanischer Hindus inDeutschland e.V. for giving India-like feelings on sundays, specially in terms of food!I wish to thank Ayub Pathan for being a good company and helping me in movingout from the apartment during my writing times. I would like to thank Ravi Tripathifor keeping me motivated during the initial writing times. I would like to thank MohitSharma, Viren Patni (Bapu), Praful Manurao, Shyam, Devendra Mani, Sumit Mittal,Vinay Sharma, Suryank Sharma, Himanshu Aggrawal (Panda), Rahul Goel (Goli),Tushar Deshpande, Kavita Gaadhe for making memories in my journey as PhD stu-dent.The most important debts are often reserved for the last, and this thesis is not dif-ferent in that sense. I dedicate this thesis to my parents, Naishadh and AradhanaVachharajani who supported all my decisions of my career from the very begining. Iam indebted for the unconditional love and care I received from my brothers, Prerakand Devang and my bhabhi, Mahatta.


Contents
1 Motivation 1
2 Introduction 32.1 Protein folding and aggregation: general perspectives . . . . . . . . . 32.2 Protein aggregation of IDPs . . . . . . . . . . . . . . . . . . . . . . . 42.3 Huntingtin . . . . . . . . . . . . . . . . . . . . . . . . . . . . . . . . . 9
2.3.1 Huntingtin exon1 . . . . . . . . . . . . . . . . . . . . . . . . . 102.3.2 Conformational changes on polyQ extension . . . . . . . . . . 112.3.3 Aggregation mechanisms . . . . . . . . . . . . . . . . . . . . . 13
2.4 Effects of cosolutes on protein aggregation . . . . . . . . . . . . . . . 152.4.1 Effects of macromolecular crowding . . . . . . . . . . . . . . . 152.4.2 Effects of osmolytes . . . . . . . . . . . . . . . . . . . . . . . . 17
2.5 Chemical modulators of aggregation . . . . . . . . . . . . . . . . . . . 18
3 Materials and Methods 213.1 UV-visible spectroscopy . . . . . . . . . . . . . . . . . . . . . . . . . 21
3.1.1 Circular dichroism principles . . . . . . . . . . . . . . . . . . . 223.1.2 Fluorescence principles . . . . . . . . . . . . . . . . . . . . . . 26
3.2 GST htt exon1 Q(n) . . . . . . . . . . . . . . . . . . . . . . . . . . . 303.2.1 Plasmid constructs . . . . . . . . . . . . . . . . . . . . . . . . 303.2.2 GST htt exon1 Q(n) protein purification . . . . . . . . . . . . 303.2.3 Protein gel electrophoresis . . . . . . . . . . . . . . . . . . . . 323.2.4 Protein concentration estimation . . . . . . . . . . . . . . . . 333.2.5 AFM . . . . . . . . . . . . . . . . . . . . . . . . . . . . . . . . 333.2.6 Th-T fluorescence assay . . . . . . . . . . . . . . . . . . . . . 333.2.7 Removal of GST tag from the GST-fused protein . . . . . . . 343.2.8 CD spectroscopy . . . . . . . . . . . . . . . . . . . . . . . . . 34
3.3 FRET Htt exon 1 Q(n) . . . . . . . . . . . . . . . . . . . . . . . . . . 343.3.1 Plasmid constructs . . . . . . . . . . . . . . . . . . . . . . . . 343.3.2 Fluorophore-tagged htt exon1 Q(n) Purification . . . . . . . . 353.3.3 Protein concentration estimation . . . . . . . . . . . . . . . . 373.3.4 Matrix-Assisted Laser Desorption/Ionization (MALDI) . . . . 383.3.5 Fluorescence spectroscopy . . . . . . . . . . . . . . . . . . . . 39
i

CONTENTS
3.3.6 Fluorescence microscopy . . . . . . . . . . . . . . . . . . . . . 39
4 Results and Discussion 414.1 Huntingtin exon1 characterization . . . . . . . . . . . . . . . . . . . . 41
4.1.1 Multimeric states of htt exon1 . . . . . . . . . . . . . . . . . . 414.1.2 Mutant htt has more helical content . . . . . . . . . . . . . . 444.1.3 Fluorophore-labelled htt exon1 Q(n) . . . . . . . . . . . . . . 47
4.2 Huntingtin exon1 aggregation kinetics . . . . . . . . . . . . . . . . . . 534.2.1 Thioflavin-T aggregation assay . . . . . . . . . . . . . . . . . 534.2.2 Effects of macromolecular crowders and osmolytes . . . . . . . 55
4.3 Effects of molecular tweezers . . . . . . . . . . . . . . . . . . . . . . . 63
5 Summary and Conclusion 66
Bibliography 69
Appendix A: Supplimentary Figures 89
Appendix B: List of Abbreviations 95
Appendix C: List of Tables 97
Appendix D: List of Figures 98
ii
Chapter 1
Motivation
The huntingtin exon 1 proteins with longer polyglutamine (PolyQ) stretch (>36Q)are able to form amyloid aggregates in the brain of the mouse model. It is stillnot clear what kind of conformational changes occur when a polyQ stretch is ex-tended. There are numerous studies performed on synthetic peptides containing apolyQ stretch. Some studies indicate a disordered structure of polyQ peptides re-gardless of the polyQ length, whereas, some studies indicate that the polyQ stretchgains helical or beta structures on the extension. There is also no consensus overthe aggregation pathway which is followed by polyQ peptides. Some studies suggestthat the aggregation proceeds simply via monomer addition without formation ofnon-amyloid oligomeric species, whereas, other studies suggest the involvement of αhelix-rich oligomers on the way to amyloid formation. These studies are performedon synthetic polyQ peptides with no exact sequence of htt exon1, and many of theminvolve the treatment with organic solvents. There are very few attempts made tostudy the full length recombinant htt exon1 without any fusion tags. For developingan effective inhibition strategy, structural characterization of htt exon1 is essential.Additionally, this knowledge may also be extended to other polyQ disorders involvingpolyQ proteins like ataxin or atrophin. In the presented work, the first objective wascharacterization of full length htt exon1 proteins. The characterization was performedby gel electrophoresis, circular dichroism (CD) spectroscopy, atomic force microscopy(AFM) and fluorescence spectroscopy.The characterization of htt exon1 was performed under physiological buffer sys-tem. However, the cell is highly crowded with a heterogeneous mixture of differentmacromolecules like proteins, nucleic acids and lipids. It also possesses several smallmolecules like amino acids and their derivatives, sugars and salts. There is not muchknown about the effects of such macro- and micromolecules on the htt exon1. Suchstudy can reveal interesting relationship between htt exon1 conformations and its ag-gregation propensity. It can also give hints on the conformations possessed by httexon1 inside highly crowded cellular environment. The second objective was to studyconformational changes and aggregation propensity of htt exon1 in the presence ofan artificial crowder and osmolytes. The conformational changes were reported by
1

CHAPTER 1. MOTIVATION
fluorescence resonance energy transfer (FRET) and aggregation behaviour was mon-itored by thioflavin-T binding assay.The third objective of this thesis was to study the effects of a special class of molecules,known as Molecular tweezers. Molecular tweezers are shown to bind the lysines(∼Ka 5000M−1) in the protein molecules. By binding to lysines, they are shownto disrupt the hydrophobic and electrostatic interactions involved in self-associationof aggregation-prone proteins like IAPP, p53 and α-synuclein. Molecular tweezerswhich can bind to lysine residues may inhibit the aggregation of mutant htt exon1by binding to lysines present in the N-terminal of htt exon1. The conformationalchanges imparted by molecular tweezers were probed by CD spectroscopy. The ef-fects of molecular tweezers on the aggregation of mutant htt exon1 were checked bythioflavin-T binding assay.The structural insights achieved in the study performed here add to our knowledge ofthe htt exon1 aggregation pathways and its possible conformational ensemble insidethe cell. It also gives direction to further develop a more effective phrmacophore forthe htt aggregation inhibition.
2

Chapter 2
Introduction
2.1 Protein folding and aggregation: general per-
spectives
As we consider the living bodies from unicellular prokaryotic to multicellular eukary-otic systems, the number of biological processes involved in making them functiongets higher. This very high number is making them able to perform diverse tasks, oneof them can be reading of this text by the reader at this very moment. These com-plex processes require great diversity of biomolecules. This diversity of biomoleculescan be observed majorly in proteins, carbohydrates, lipids and in their combinationslike lipoproteins, glycoproteins and glycolipids. Proteins being the workforce and themost diverse molecules, are interesting to study structurally. Protein molecules attaintheir uniqueness by their individual sequence resulting in combinations of secondarystructure elements forming particular domains. There are currently 235858 domainsclassified as per CATH classification [1]. These different stable folded structures arein equilibrium with less stable unfolded sequences with partially folded intermediates.The molten globule state of protein which is experimentally characterized possessesthese kinds of partially folded intermediate states [2, 3]. Due to genetic factors likemutations or environmental stress factors like pH changes or oxidative stress there is ashift in equilibrium. Due to this shift, higher population of less stable partially folded/ partially unfolded structures become susceptible to aggregation [4, 5, 6]. However,there is a class of proteins in which protein molecules do not possess distinct foldedform. These are termed as intrinsically disordered proteins (IDPs). In eukaryotes,33% of different proteins are intrinsically disordered [7]. Despite the lack of knownordered structure, they are found to play important roles in regulatory processes likein transcription as transcription factors or in cellular transport [8]. Without any par-ticular folding structure, IDPs behave simply as amino acid polymers which are notas soluble as globular proteins in the aqueous environment of the cell. As a resultof this, these proteins are more sensitive to mutations, making them vulnerable toaggregation. The conformations of these IDPs can be modelled as a random walk
3

CHAPTER 2. INTRODUCTION
chain model. This demands to study the disordered systems more with the aspectsof polymer physics [9]. On the other hand, there are also folded proteins reported toaggregate when they are unfolded to partially unfolded intermediates [10].
With already defined code in the primary sequence (CB Anfinsen, 1972 [11]), pro-teins find a unique stable conformation in aqueous solvent. Experimentally [12, 13]and by simulation [14, 15], it has been shown that the hydrophobic collapse of apolypeptide chain is associated with the early events in protein folding. In hydropho-bic collapse, the contact between aqueous solvent and the hydrophobic pockets isminimized. The driving force of the hiding hydrophobic pockets could be a gain oftranslational entropy of water molecules [16] or the tendency of the system for themaintenance of the water matrix around the protein molecule itself [17]. Despite sim-ple governing principles, protein folding is not a one step process, it can involve aseries of intermediate steps. Most proteins fold through partially folded metastableintermediates. These intermediates are responsible for the ruggedness of the proteinfolding free energy landscape [18]. These states represent the local minima in Figure2.1. However, it is not necessary that there is a fixed path for one protein to fold.There can also be different parallel trajectories for the attainment of a native struc-ture [19, 20] (Figure 2.1, black solid lines). The upper end of the trajectories (Figure2.1) represents high-energy unfolded states with astronomically large (C Levinthal,1969 [21]) conformational space, the lower end represents low-energy folded nativestate. According to Bryngelson et al. ([22]) who proposed the idea of a folding fun-nel energy landscape, the pathways to folding get reduced once the glass transitionpoint is passed (Figure 2.1, black lines). The partially folded or misfolded intermedi-ates are prone to aggregate. Under stress conditions like pH or temperature changes,folded proteins get partially unfolded or unfolded protein get partially folded [4]. Theinner hydrophobic residues become exposed to outer aqueous environment in theseintermediates. Along with the attempt of being refolded back to the situation also en-courages the exposed hydrophobic patches to interact and form oligomers and amyloidor amorphous aggregates [23] (Figure 2.1, white lines).
2.2 Protein aggregation of IDPs
Besides natively folded proteins, natively unfolded proteins are also involved in pro-tein misfolding and aggregation. These intrinsically disordered proteins (IDPs) areassociated with protein aggregation disorders. They have low complexity sequencesand have more hydrophillic groups [24]. These kind of proteins are involved in variousdiseases like Alzheimer’s, Parkinson’s, Huntington’s, prion or amyotropic lateral scle-rosis. These disorders are grouped as amyloidoses, as in these disorders, proteins formamyloid kind of highly ordered aggregates. The process of aggregation correlates wellwith cell death but it is not yet clear which of the many monomeric and multimericspecies are actually toxic. Amyloid aggregates are very stable and exist as corss-β
4

2.2. PROTEIN AGGREGATION OF IDPS
Figure 2.1: Graphical presentation protein folding / aggregation theories:The black lines represent few of the possible folding pathways and the white linesrepresent few of the possible aggregation pathways. Drawn with CorelDRAW X6(Corel corp., Canada)
5

CHAPTER 2. INTRODUCTION
structure in which the β strands are perpendicular to the fibril axis [25, 26, 27]. It isnow believed that formation of an amyloid kind of aggregate is an inherent propertyof the peptide backbone [28]. However, not all but only some of the proteins areobserved to form amyloid aggregates. This could mean that the proteins that do notaggregate have a very high energy barrier (Figure 2.1, white lines) for formation ofan amyloid aggregate [29]. The proteins which are reported to aggregate have eithersome mutation or have the kind of sequence features which lowers the energy barrierfor the formation of amyloid aggregate [30]. These mutations can be expansions ofthe polyQ tract in ataxin, huntingtin (htt) or in the other proteins involved in polyQdisorders; A30P, A53T and E46K mutations in α-synuclein [31]; E22G, E22Q andD23N mutations in amyloid beta (Abeta) [32].
Above mentioned proteins which are involved in aggregation disorders lack promi-nent secondary structure. Despite lack of ordered structure in these IDPs, they possessthe ability to form transient secondary structures which are observed while bindingwith specific binding partner [33]. Ideally, a disordered chain should behave like astatistical coil. Dimensions of statistical coil can be measured as hydrodynamic ra-dius (Rh) or radius of gyration (Rg). According to the Flory theory in a good solvent,these radii should scale with N0.59, where N is no. of segments (Amino acids in case ofprotein). These IDPs possess relatively hydrophillic amino acids, therefore an aque-ous solvent is a good solvent for them. However, disordered Aβ monomers scale withN0.44 [34] which is much less than what it should be for a statistical coil in good sol-vent, indicating formation of compact structures by Aβ monomers [35]. These kindof compact structures are also observed with other IDPs like polyQ stretch in htt[36] or α-synuclein [4]. Abeta (Aβ) fragments Aβ40 and Aβ42, are the main cleavedfragments responsible for the aggregation [37]. Aβ has a disordered hydrophillic N-terminal, followed by the domain with hydrophobic-hydrophillic-hadrophobic regions.N-terminal and central regions are found to be in disordered or PPII helical forms[38]. Transiently, central hydrophillic regions have been found in formation of hairpinloop and flanking hydrophobic regions in the formation of hairpin legs [39]. This hair-pin conformation is proposed to be one of the folding nuclei before the aggregationprocess [39]. This way the monomer becomes the critical point in the aggregationprocess. However, there is also a report concluding that it is the dimer which isresponsible for misfolding of Aβ and consequently, the aggregation. This study wasconducted by combination of AFM and MD simulations [40]. According to this study,as the monomer approaches dimer formation, the monomer conformational space isrestricted which then results in intermolecular interaction and misfolding [40] An-other IDP, α-synuclein which is associated with Parkinson’s Disease (PD), is foundto aggregate in the dopaminergic neurons in substantia nigra in the brains of thepatients suffering from PD [41]. A protein, α-synuclein plays an important role inthe pathology of PD. α-synuclein is a 140 amino acid long protein consisting of threedomains; N-terminal region (1-60), hydrophobic NAC domain (61-95), C-terminal do-main (96-140). The N-terminal region contains α helical lipid binding domain [42].
6

2.2. PROTEIN AGGREGATION OF IDPS
All clinically reported mutations are located in this region. The central NAC domainis crucial for aggregation capabilities of α-synuclein [43]. The C-terminal domain isrich in proline highly charged amino acids like glutamate and aspartate. This highlyhydrophillic C-terminus keeps the highly hydrophobic and amyloidogenic NAC do-main solublized. α-synuclein forms more compact structures than expected for therandom coil [44]. This is because of long range interactions of the NAC domain andthe C-terminus as well as electrostatic interaction between N- and C-terminus [45].Recently, a five layered β strand models have been suggested which couples NACdomain and imperfect repeat, KTK(E/Q)GV [46]. All the charged residues in theserepeats are oriented in such a way that they form salt bridges with the solvent. Thisway of coupling helps in stabilization of α-synuclein fibrils. Like Aβ, α-synuclein ex-ists in helical form in the apolar environment like lipid membranes [42]. The toxicα helix-rich oligomeric intermediates are observed recently with α-synuclein proteins[47]. These isolated oligomers are observed with the help of AFM, CD spectroscopyand FTIR [47]. These helix-rich oligomers are observed with Aβ, IAPP, polyQ pro-teins [48] on way to fibril formation [49]. In aqueous environment, in vitro α-synucleinexists in random coil structure [44], however, recent findings suggest that it exists asa helical tetramer inside cell which does not aggregate but destabilization of which isresponsible for pathophysiology [50]. Islet Amyloid Polypeptide (IAPP) is a polypep-tide hormone which is involved in glucose homeostasis, forms amyloid aggregates inthe β cells in the pancreas [51]. This leads to the death of these cells in type IIdiabetes. IAPP peptide is an IDP however, it can form transiently helical structureswhile interacting with negatively charged residues of the membrane [52, 53]. IAPP is37-residue long peptide in which the residues 20-29 are important for the amyloid for-mation [54]. In NMR study, this short region is reported to be disordered in the finalfibrillar form though [55]. However, later it is reported that this region forms β sheetin an oligomeric intermediate which turns into a disordered loop in final fibrils [56].Despite the region, 20-29 being involved in the facilitation of aggregate formation,N- and C-terminal region play an important role in the formation of higher orderedcoiled aggregates [57]. Huntingtin (htt) is an IDP implicated in Huntington’s disorder(HD). Htt is a large, 348 kDa protein which contains a polyQ stretch in its first exon.On the expansion of polyQ stretch, htt becomes aggregation prone. There are somestudies suggesting that it is the N-terminal helix which self-associates and brings thepolyQ stretch together [48, 58]. This leads to backbone-backbone and side chain-sidechain interaction [59], rearranging into the β sheet which can be observed in the finalaggregates. Similar to IAPP, it is proposed that N- and C-terminus are important forthe formation of higher ordered aggregate structure [60, 61, 62]. Other groups studiedthe physical properties of polyQ peptides in the detail, observing that polyQ stretchesprefer chain-chain interactions over chain-solvent interactions [36, 63]. Despite this,there is not much known about the critical nucleus or critical conformation which canbe responsible for the aggregation process and the resultant toxicity from any of theoligomeric intermediates.
7

CHAPTER 2. INTRODUCTION
Despite differing in sequence and aggregation mechanism, the proteins which areinvolved in the aggregation share many common features like low complexity domainsor lower hydrophobicity which results in intrinsic disorder of the involved proteins.Some of the involved IDPs also have an ability to form transient secondary structures.These transient secondary structures gets stabilized upon binding to specific bindingpartners or on self-association. These IDPs also have a common tendency to bein collapsed structures in an aqueous solvent. These IDPs contain heterogeneousensemble of conformational states due to the lack of any stable folded structure. Thisflexibility of IDPs makes it difficult to characterize by the techniques requiring stableelectron density like X-ray crystallography. However, CD and NMR are shown to be apromising attempt to deduce the roles of monomeric or oligomeric intermediate speciesin IDPs like α-synuclein [4, 64], aβ [65, 66], htt [67, 68]. Despite these, there are notenough experimental evidences for the critical nucleus for the aggregation process andmuch of the contribution comes from the molecular dynamics (MD) simulations data[69, 70, 71]. Htt exon1 can be an interesting protein to study as there is a possibilityto observe gradual changes in the structure of the protein as polyQ length expandsfrom normal to mutant length. Moreover, despite its importance in the htt toxicity,not much data are available on the htt exon1 conformations and aggregation. In thenext chapter, we will review htt in more detail.
8

2.3. HUNTINGTIN
2.3 Huntingtin
Htt is 3144 amino acids long multi-domain protein. The huge size of the htt pro-tein makes it very difficult to express and purify in sufficient quantities to performaggregation studies. Secondary structure of full length htt is less well characterized.However, bioinformatic analysis reveals that full length htt contains many HEAT re-peats [72]. These HEAT repeats contain antiparallal α helices separated by disorderedregions [73]. These HEAT repeats play an important role in mediating protein-proteininteractions [73]. Due to the proteins’ largely disordered nature, it is also difficult tocrystalize and to gain insight into the conformations. Htt also has no precise homol-ogy to any other proteins which also makes it difficult to track the normal functions ofthe protein. However, it is found to interact with cytoskeleton proteins, transcriptionfactors or proteins involved in vesicle transport, apoptosis and cell signaling, reviewednicely in [74] (See figure 2.2). Some of these functions are impaired in huntington’sdisease (HD) which is associated with the mutation in htt exon1 [75]. Htt exon1contains a highly polymorphic polyglutamine (polyQ) sequence, the length of whichis found to be 4-36 in healthy person [76]. There is a pathogenic threshold of 36glutamine repeats, a polyQ extension higher than 36 can lead to aggregation of theprotein which results into the sequestration of other proteins and consequently inclu-sion formation in the brain of the patients suffering from HD [77]. Htt exon1 alone orlonger cleaved fragments are found in these inclusions. Htt exon1 is 90 amino acidslong and it is enough to form amyloid invitro and evolves the disease phenotype in themouse brain [78]. These features of the exon1 are essential to study and to understandthe pathological mechanisms behind the mutant huntingtin toxicity.
Transport vesicle/autophagosome/endosome/lysosome
Microtubule
Htt
Dynein complex HAP-1
Dynactin complex
Kinesin-I
_+
BDNF/APP/GABA Retc.
Figure 2.2: Htt functions in cellular trafic regulation: Htt orchestrates the cel-lular transport functions by organising associated cytoskeleton motor proteins. Imageadapted from [74] and redrawn with the author’s permission.
9

CHAPTER 2. INTRODUCTION
2.3.1 Huntingtin exon1
Htt exon1 consists of a 17 amino acids long N-terminal region (N17), a polyQ stretchand a polyP-rich domain. The N17 domain consists of nuclear export signal whichcontrols the trafficking of htt exon1 [79]. It includes many sites for post transla-tional modifications (PTMs) like acetylation, phosphorylation [80], ubiquitination,SUMOylation [81]. These PTMs have different effects on the toxicity of htt exon1;Ubiquitination directs mutant htt exon1 for degradation and reduces its toxicity [81].On the other hand, SUMOylation leads to increase in the toxicity by increasing thenucleus retention of mutant htt exon1 and by preventing the proteosomal degradationof mutant htt exon1 [81]. The N17 domain exists as an amphipathic α helix in thelipid bilayer as shown by solution and solid-state NMR approach [68]. This α helicalN17 induces membrane insertion of htt exon1 [68]. The N17 domain is also shownto be in the disordered structure in htt exon1 monomer which turns helical on self-association or when it is inserted into the membrane [82]. This is how N17 also playsan important role in htt aggregation by mediating inter-helical association before be-ing converted into β sheet-rich aggregates [83]. Several studies are also performed onthe N17-deleted htt exon1 or on N17-deleted polyQ peptides and these peptides showlower aggregation propensity compared to their full length counterparts [62] whichsignifies the role of N17 in increasing the aggregation. Chaperonin TRiC is shownto bind the N17 and to reduce the aggregation [61]. However, higher aggregationdoes not necessarily mean higher toxicity. In fact, there are reports which state thatN17 association ensure the formation of ordered amyloid fibrils which is shown in factto act as a protective mechanism against deleterious effects of amorphous oligomers[62]. Trylska et al. have shown the N17 region in two helix bundles in pathogenicand non-pathogenic variants of the htt exon1 [84]. Followed by the N17 region isthe ployQ tract. The polyQ tract is present in more than 60 human proteins [85].The normal functions of polyQ tract is not known properly but the proteins con-taining those stretches are found to be associated with transcriptional regulation [86]or vesicular transport [87, 88]. Numerous studies are conducted on polyQ peptides[36, 89, 63, 90]. The challenge to study polyQ peptides is the low solubility of thepolyQ chain. Regardless of the structure of polyQ stretch in monomer, the final aggre-gates have the β sheets of the polyQ stretch [59, 91]. Earlier studies performed on httexon1 show polyQ repeat dependence of formation of aggregates [78]. These studiessuggest that a conformational change in longer polyQ is responsible for the observa-tion of pathogenic threshold. Perutz et al. proposed a polar zipper model for polyQrepeats in which the polyQ tract forms backbone-backbone and sidechain-sidechainH-bonds. Later, the same group suggested a beta-helix model for polyQ repeats inwhich polyQ tract above 36 repeats is able to form two rounds of beta-helix structurewhich then facilitates aggregate formation [92]. This model is also supported by simu-lation studies [93]. However, NMR, CD and X-ray crystallography studies performedreveal the polyQ domain in various conformations like random coil [94, 95, 63, 96], αhelix [96] and also β hairpin [97]. Early CD studies show the structure of polyQ as
10

2.3. HUNTINGTIN
Table 2.1: CD and NMR reported structures of htt exon1
Peptide Technic Secondary structureHttEx1 Q23/Q42 CD Disordered [67]Thioredoxin-Q(n) CD mixture of helix and random coil
more helix on expansion [103]GST-Q22/Q41 CD and NMR Random coil [95]K2Q40K2 CD mixture of helix and random coil [60]Q10 CD random coil [104]Q8-Q24 CD random coil [63]HttNTQ(3-37) CD mixture of helix and random coil
more helix on expansion [83]HttQ25,Htt Q72 CD In higher polyQ more Coiled coils [105]
being disordered [94]. Later NMR studies prove the disordered nature of polyQ, eventhat of the pathogenic length [95]. Disordered nature of the polyQ tract presents dif-ficulties in obtaining crystals. However, Kim et al. successfully obtained the crystalsof MBP fused htt exon1 Q17 and htt exon1 Q36H3 [96, 97]. These crystals report αhelical N17 region as mentioned earlier. The polyQ tract in these crystals adopts αhelix to variable lengths and then extended further as a loop. In one of the crystalsof htt exon1 Q36H3, β hairpin structure is also found in polyQ tract. Histidines areinserted in the htt exon1 Q36 to facilitate crystallization [97]. PolyQ tract is fol-lowed by polyP-rich region. PolyP repeats have a high tendency to adopt PPII helixstructure. PPII helical structure is involved in mediating protein-protein [98] andprotein-nucleic acid [99] interactions. PolyP-rich region is shown to interact with theWW domain of Histone H3 lysine 36 methyltransferase (Hypb/Setd2) protein [100].This methyltransferase plays an important role for embryonic vasculogenesis [101]. Itis proposed that the interaction between WW domain and polyP-rich region gets im-paired in mutated htt [101]. The impairment of this interaction and the interactionswith other WW and SH3 [102] domain containing proteins are a few of the factorsresponsible for HD pathology. In htt, PolyP-rich region is found to adopt extendedstructure in the crystals [96]. This neighbouring polyP-rich region reduces the ag-gregation propensity of polyQ peptides [60] and it helps in increasing the saturationconcentration [62] of polyQ peptides.
2.3.2 Conformational changes on polyQ extension
There is a high correlation between the polyglutamine length and the aggregationability of the protein [78, 106]. The threshold of 36 consecutive glutamine residues isfound for the development of phenotypes in the patients suffering from huntngton’sdisease [107]. It is then proposed by Perutz et al. that polyQ lengths higher than36 are able to form stable β sheet structures [108]. Later, the same group propose βhelix model for the pathogenic lengths of polyQ [92] which is supported by simulation
11

CHAPTER 2. INTRODUCTION
N17 PolyQ PolyP-rich
Alpha helix Alpha helix-loop transition Extended loop
Htt Exon1 Q17
Htt Exon1 Q36 structuresBeta hairpin
Figure 2.3: Reported crystal structures of htt exon1: Htt exon1: PDB ID -3IOW; Htt exon1 Q36: PDB ID - 4FE8 (Left), PDB ID: 4FEB (Right). The presentedmodels were designed with UFSC Chimera 1.11.1
studies [93]. These β structures are stabilized by hydrogen bonding between peptidebackbone and the glutamine side chains [92, 109]. The studies conducted on isolatedpolyQ peptides [63, 110, 90, 89] and the studies conducted on polyQ tracts flankedby N17 [83, 62] and polyP-rich domains [60, 62] have given different results. Theperformed studies on the isolated polyQ tracts are not consistent. CD and NMR dataof isolated polyQ tracts without the flanking sequences suggest disordered nature ofpolyQ tract [63, 110, 95]. On the other hand, there are also some reports includingsome reporting X-ray structures observed α helical structures of polyQ tract [96, 103,97] (See Table 2.1). The peptides having polyQ lengths lower than the threshold arealso found to form the amyloids [90]. Also, no obvious conformational changes areobserved on higher polyQ lengths [110, 63]. The longer polyQ tract simply lead toincreased number of sites for the binding of anti-polyQ antibody which led to theproposal of the linear lattice model [111]. According to this model, as the disorderedpolyQ tract becomes longer the probability of binding with the abnormal interactionpartners increases which could be responsible for the toxic effect on the cell machinery.These data are against the predictions that after the polyQ threshold there is anysignificant conformational change [92]. The data reporting on end to end distance [36]
12

2.3. HUNTINGTIN
and hydrodynamic radii [63] suggest that polyQ stretches adopt collapsed structuresin the aqueous environment. The reason for adoption of collapsed conformations ishigher polyQ chain-chain interactions than chain-solvent interaction [36, 112]. Thethreshold length of polyQ is variable in different polyglutamine disorders which alsomeans that the sequence context plays an important role in setting up the thresholdfor the polyQ tract besides the polyQ length. FRET-based study [113] and recentantibody-based FRET study on polyQ proteins along with the flanking sequences[114] indicate that structural rigidity is acquired in longer polyQ proteins. The gainof structure in longer polyQ tract is responsible for the rigidity [113]. A Small angleX-ray scattering study of htt exon1-3B5H10 complex reveal two stranded compactstructure of polyQ strech [115].
2.3.3 Aggregation mechanisms
Concentration-dependent aggregation studies done by Kar et al. [90] on the simplepolyQ peptides without the flanking sequence reveals that the critical nucleus sizeof the polyQ peptides depends on the polyQ length. The critical nucleus is either asingle molecule or cluster of molecules which is the most energetic species in proteinaggregation pathway [116, 117]. Because of its instability, it rapidly dissociates intosmaller species. Once the critical nucleus is formed, further addition of monomers arefavoured over dissociation. Shorter polyQ peptides are shown to proceed the aggrega-tion process via dimeric or tetrameric critical nuclei, whereas, longer polyQ peptideshave a monomeric critical nucleus [90]. The high energy conformations involved inthe critical nucleus formation can just be one of the very rare probable conformationsin peptide’s conformational ensemble. Due to extremely small concentration, it is notpossible to observe it physically but it possibly exists as small β structure (Figure 2.4a [90]) or as compact statistical coil with some part of the sequence extended (Figure2.4 b) and available for interaction with other molecules [90]. In fact, in a study byThakur and Wetzel [118], polyQ tract containing β turn inducer, Pro-Gly is shown toaggregate faster than the simple polyQ sequences. Longer polyQ peptides can formstabilized β structures within single molecules and do not require more monomers toform critical nucleus. Shorter polyQ peptides need nucleus size of dimers or tetramersto form stabilized β structure which can further favourably recruit monomers for ag-gregate formation. From these studies on the simple polyQ sequences, a monomericnucleation mechanism has been proposed for the the longer polyQ sequences. Thismeans that the highly unfavourable conformational changes in the monomeric speciesare responsible for triggering the aggregation [117]. And this conformational changescan be either extention of compact statistical coil or the formation of β structureswithin a monomer [90].
However, the studies conducted on the polyQ peptides with the flanking sequences,yield a modified aggregation pathway. Studies performed on polyQ peptide with N17region and ”polyP like” region by Thakur and Sahoo et al. [48, 82], has shown N17mediated aggregation pathway in which the aggregation process is initiated by helical
13

CHAPTER 2. INTRODUCTION
Figure 2.4: Schemetic diagram of proposed nucleation mechanisms forpolyQ aggregation: Disordered monomer forms thermodynamically unfavourableconformation (n*) which then recruits self or the initial disordered monomer andthe resulting elongation process is favoured over dissociation [90]. The unfavourablehigh energy conformtion can be beta haipin (Pathway - a) or an elongated disorderedchain (Pathway - b). PolyQ peptides containing N17 domain lead to N17-mediatedinter-helical association (Pathway - c) which then leads to critical nucleus formationfollowed by further addition of oligomeric species resulting into the formation of higherordered structures and consequently β sheet-rich fibrils are formed [58]. The templetsites for monomer addition is highlighted in red. Drawn with CorelDRAW X6 (Corelcorp., Canada).
14

2.4. EFFECTS OF COSOLUTES ON PROTEIN AGGREGATION
oligomers formed by inter-helical association of N17 domain which are disorderedin monomeric form (Figure 2.4, c). These N17 mediated α helical association isfacilitated by wan der Waal’s interactions between hydropathic sides of amphipathicN17 helix. In expanded polyQ proteins, α helix-rich oligomers increase the localconcentration of polyQ stretches [58], however, it is claimed [90] that the rest of thepolyQ mediated mechanism remains the same as reported with the simple polyQsequences [110, 117, 90].
2.4 Effects of cosolutes on protein aggregation
Protein conformational equilibrium is affected by the densely packed cellular en-vironment. This highly crowded cellular environment includes mainly two classesof molecules 1) macromolecules like proteins, nucleic acids, lipids or 2) the smallmolecules like sugars, salts, amino acids and their derivatives. Macromolecular crow-ders and osmolytes can be considered as important classes of cosolutes present insidethe cell [119]. In stressed conditions, the cell accumulates some of the small moleculesto stabilize the protein molecules. These molecules are termed as osmolytes whichinclude sugars like trehalose, arginine and amino acids or their derivatives like glycine,proline, sarcosine and betaine. These macro- or micro-molecules have considerable ef-fect on the stability of the protein molecules which requires the study of the moleculeof interest inside the cell or in cell-like environment. There are not many studies con-ducted on the effects of cosolutes on the aggregation of huntingtin. However, manystudies have reported the effects of macromolecular crowding and osmolytes on theprotein aggregation. Some of the studies of protein aggregation in the presence ofcrowders and osmolytes are mentioned in Table 2.2 and Table 2.3, respectively.
2.4.1 Effects of macromolecular crowding
To mimic the cellular crowding, several inert, water soluble and branched polymerslike Ficoll, dextran, PEG are used. Ficoll and dextran are highly branched sugarpolymers. The effects of crowders on the protein molecules are mostly stabilizing.The stabilizing effects of crowding result from the compaction of the protein, shiftingthe equilibrium towards the folded state. The compaction of the protein moleculesis due to the excluded volume effect by the crowding agents [120] (Figure 2.5). Be-sides excluded volume effect, the conformations of a molecule of interest can also getaffected by direct interactions with the macromolecules. Due to the fact that thenature of the biomolecules present in cells are different, their interaction with thebiomolecule of interest can also differ. These interactions include steric-repulsion,van der Waals and electrostatic. Among these interactions hard core repulsions domi-nate, however, other chemical interactions (soft interactions) are also important [121].Steric repulsions are stabilizing, whereas, attractive interactions are destabilizing [122]which is why macromolecular crowders mostly have stabilizing effects on the proteinmolecules. Most biophysical studies are performed under dilute solution which does
15

CHAPTER 2. INTRODUCTION
Excluded volume
Protein molecule(Compact form)
Protein molecule(Extended form)
Macromolecular crowder
Figure 2.5: Excluded volume effect: In order to maximize its entropy (To in-crease free volume available for the cosolute), the protein molecule tries to reduce theexcluded volume (White area). This is possible when a protein molecule reduces itsradius. The resulting compact polypeptide chain can now invade more space betweenthe crowding molecule. As a result of this, the excluded volume gets reduced (Topfigure: from left to right). The resulting effects of excluded volume can be folding orself-association (Bottom figure), Drawn with CorelDRAW X6 (Corel corp., Canada)
not mimic the highly crowded cellular environment well. High crowding by differentbiomolecules can change the environment directly or indirectly by changing the solventproperties. To mimic the excluded volume effects of the cellular environment (Figure2.5), sugar polymers like Ficoll or dextran are widely used in higher concentration.These crowders are known to stabilize the proteins by entropic effects, however, recentdata suggests that enthalpic contributions can also dominate [123]. The changes inthe solvent properties induced about by high concentration of crowders also plays animportant role in protein stability [124]. Crowding has an impact on the structure
16

2.4. EFFECTS OF COSOLUTES ON PROTEIN AGGREGATION
Table 2.2: Reported qualitative effects of crowding agents on IDPs
IDPs Crowders In vitro EffectscFos, p27Kip1 Dextran, Ficoll70 No significant
conformational change [126]N protein of BPTI Compaction [127]bacteriophage λα-casein, MAP2c Dextran, Ficoll70 Minor changes like localp21Cip1 structure ordering [128]ProTα, TC1 Dextran70, Ficoll70 Minor changes like localα-synuclein structure ordering,
segmental motion retains [125]
of the protein. In globular proteins, crowding does not seem to affect the structureor radius of gyration. However, malleable disordered chains of IDPs get affected bycrowding to different extent. In some cases it does not affect or causes minor changesin the structure or in some it induces formation of helical structure or β sheets [125](See Table 2.2).
2.4.2 Effects of osmolytes
Osmolytes are the small molecules which are produced inside cells in high concen-tration to counteract stress conditions. Different substances which are classified asosmolytes include polyhydric alcohols, amino acids and their derivatives, urea andits derivatives. Osmolytes are shown to favour compact conformations in the proteinmolecules. These stabilizing effects of osmolytes are widely reported.Like macromolecular crowders, osmolytes also get excluded from the the water-proteininterface. The unfavourable interaction between osmolytes and protein molecules leadto preferential hydration of protein surface [129]. In addition to excluded volume effectwhich is entropically driven, osmolytes are also shown affect the protein molecules’stability enthalpically ([130, 131]. This means that chemical properties of individualosmolytes also need to be taken into account and not just the size and concentration,while studying their effects on biomolecules. In other words, these cosolutes can notbe treated just as inert spheres, their relative affinities for the water network and theprotein surface need to be considered as well.Osmolytes exert different effects on different proteins which are prone to aggregate.There have been differential effects of osmolytes observed on IDPs (Summarized inTable 2.3). TMAO favours partially ordered structure in intrinsically disordered tau,and this partially ordered structure is prone to aggregate [132]. Partially orderedstructure is also favoured in case of α-synuclein in the presence of low concentrationof TMAO. However, high concentration of TMAO favoured folded α helical oligomers,the proposed physiological form of α-synuclein. The effects of some osmolytes on httexon1 are already reported [133]. Glycine-Betaine has shown to increase the fibrila-
17

CHAPTER 2. INTRODUCTION
Table 2.3: Reported qualitative effects of osmolytes on IDPs
Osmolyte IDPs In vitro EffectsTMAO Tau Increased aggregation [132]TMAO, Proline Htt exon1 Increased amorphous aggregation [133]
α-synuclein Increased formation of aggregates/ folded oligomers [135]
Glucocorticoid Compaction and increasedreceptor fragment aggregation [136]Glucagon Increased aggregation [137]
Glycine Glucagon Increased aggregation [137]Glycine-betaine htt exon1 Increased aggregation [133]Sarcosine Glucagon Increased aggregation [137]Sucrose Glucagon No effect [137]
Tau Aggregation inhibition
tion of htt exon1, whereas, proline and TMAO have shown to redirect the amyloidaggregation pathway by formation of amorphous aggregates. These different effectswere attributed to different transfer free energies, the free energy changes involvingtransfer of amino acid side chains and the peptide backbone [133] [134].
2.5 Chemical modulators of aggregation
So far, there is no drug available to treat HD. Different strategies are applied forthe prevention of disorder like treatment with biological chaperons, antisense oligonu-cleotides or small molecules. The first two approaches additionally require efficientdrug delivery system, as they present various challanges like bioavailability, allericreactions or crossing of blood brain barrier. Targetting the aggregation with smallmolecules then remains a better approach. Because Htt aggregation and toxicity arerelated, the chemical moiety needs to be developed which can effectively inhibit httaggregation. There are various classes of small molecules studied on the aggregationof htt. Different categories include small peptides [138, 139], polyphenolic compounds[140], benzothiazoles [141] and phenothiazines [142] (Figure 2.6). The aggregationmodulators other than the peptides studied so far, are the selection from the chemicallibrary of natural compounds. The mechanism of action of these compounds are notunderstood well, moreover, some of these molecules are also shown to be less effectivein further studies [143]There is a special class of chemicals, known as, Molecular tweezers. Molecular tweez-ers are shown to modify the aggregation of many proteins. Molecular tweezers havebeen employed in several studies investigating the proteins which are aggregatinglike α-synuclein [144], IAPP [145], p53 [146]. Molecular tweezers were specially de-signed for binding at lysine or arginine residues in the protein molecules. Lysine and
18

2.5. CHEMICAL MODULATORS OF AGGREGATION
O
PO
O
O
O
P O
O
O
2Na+
2Na+
O
PO
O
O
O
P O
O
O
2Na+
2Na+
CLR01 CLR03
O
O
HO
OH
OH
OH
OH
OH
OH
OH
O
S
N
HO
NH2
PGL-135EGCG
Figure 2.6: Structures of chemical modulators: EGCG (Epigallocatechin gal-late) is polyphenolic compound, PGL-135 is a benzothaizole derivative. CLR01 andCLR03 are molecular tweezers. CLR01 molecule contains the charged phosphategroup flanked by large hydrophobic moieties. CLR03 molecule lacks these hydropho-bic ”arms”. The structures are drawn with the ChemBioDraw Ultra 13.0.
19

CHAPTER 2. INTRODUCTION
arginine residues in the protein molecules are involved in several important biolog-ical processes like histones modification, ubiquitination, vescicular transport, RNArecognition process for trancription regulation. Molecular tweezers have a very highaffnity (∼Ka 5000M−1) for a lysine residue [147]. Molecular tweezers composed of atorus-shaped electron-rich cavity with negatively charged phosphonate group in thecenter (Figure 2.6, CLR01). The general mechanism of the tweezers in preventing theamyloid aggregation is to interfere with the hydrophobic and electrostatic interactionsin amyloid assembly. Molecular tweezers do so by binding to lysine residues involvedin such interactions in amyloid formation [148].
20
Chapter 3
Materials and Methods
3.1 UV-visible spectroscopy
Electromagnetic radiation (EMR) is classified in different regions depending upontheir wavelength and the properties exhibited by them. Classically, these regions inEMR are considered as waves and according to quantum theory, these regions possessparticles with different energies. Classically speaking, the light waves having longerwavelength have lower energy. These different waves are able to interact and pass theenergy to atoms or molecules. Depending on the amount of energy that is passed,they are able to affect translational, rotational, vibrational and electronic states inthese molecules. Higher energy waves like ultra-violet or visible waves affect elec-tronic states (Figure 3.6 S0, S1 states) and are responsible for electronic transitions.Infrared waves (IR) affect vibrational states (Figure 3.6 V1, V2..states) and are re-sponsible for vibrational transitions. Low energy waves like far-IR, microwaves affectrotational states (Figure 3.6 r1, r2..) and are responsible for rotational transitionsin molecules. Focusing on UV-visible spectroscopy, it deals with perturbing the elec-tronic arrangement of molecules. Electrons are organized in variety of ways in spacetermed as molecular orbitals. These molecular orbitals are of different kinds depend-ing on their symmetry around two atomic nuclei. Sigma (σ) and pi symmetry are thetwo major ones which will be discussed here. Sigma (σ) symmetry in σ-orbitals havethe symmetry around the internuclear axis and there is no nodal plane in betweenwhere the probability of finding electrons becomes zero. Pi symmetry in pi orbitals isnot symmetric around the internuclear axis. There is a nodal plane in between, per-pendicular to internuclear axis where the probability of finding an electron becomeszero. In a peptide chromophore, the nodal plane would be that of the peptide bonditself (Figure 3.3, red planes). To accommodate the excess energy provided to theseorbitals, these both molecular orbitals also have their high energy states; σ* and pi*.In these high energy orbitals, a nodal plane is generated in σ* orbital and a secondnodal plane is generated in pi* orbital (Figure 3.3, blue plane). Additionally, thereare also non-bonding orbitals (n) filled with lone pairs of electrons. Upon absorptionof UV-visible light, different transitions can occur depending on the energy absorbed;
21

CHAPTER 3. MATERIALS AND METHODS
pi to pi*, n to pi*, n to σ*, σ to σ*.
3.1.1 Circular dichroism principles
Now coming back to the light which is electromagnetic radiation, it consists of electricand magnetic vectors perpendicular to each other propagating in direction perpen-dicular to both of them. These vectors are oriented in all directions which is calledunpolarized light (Figure 3.1). These vectors can also be made to polarize in oneplane. These are called plane polarized light (Figure 3.1). It has been observed thatsome molecules can selectively absorb some of the components of these vectors andare able to rotate the plane of plane polarized light. This property of rotating lightdepends on chirality of a molecule. If a molecule can be superimposed on its mirrorimage then all the molecules oriented as its mirror image will cancel out the electricand magnetic vectors, this is called an achiral molecule. These molecules will notrotate the plane of plane polarized light. Now if a molecule cannot be superimposedon its mirror image then it is called a chiral molecule and this phenomenon is calledchirality. Due to chirality in a molecule, the electric or magnetic vectors will not becancelled out, this will result in characteristic rotation of plane of plane polarizedlight. The vectors of plane polarized light can also be thought of as the sum of thevectors of two perpendicular In-phase plane polarized lights. In-phase means thatboth vectors attains maximum value, zero value and minimum value at the same timewhich means that there is a phase difference of 0 between two plane polarized lights.When the phase difference 90 is created then between the two plane polarized lightsthen their summation will generate circularly polarized light (Figure 3.1). Dependingupon the phase difference of 90 or -90, left or right circularly polarized light will begenerated. In three dimensional space, the left and right circularly polarized light willpropagate as a left- and right-handed helix. Now, the summation of both the syn-chronized left and right circularly polarized light will generate the vectors oscilatingin one plane (Figure 3.2, left). Chiral molecules or the molecules with an assymmetricspatial arrangement, e.g. helical peptide, can absorb left and right circularly polar-ized light differently. The differential absorption of left and right circulaly polarizedlight will disrupt synchronization and both the lights will be out-of-phase. Now, thesummation of both out-of-phase circularly polarized light will generate the ellipticallypolarized light, as the resulting vector will trace out an elliptical path in three di-mensional space. The major axis of the resulting ellipse will be however, same as theaxis of the resulting vector from the summation of in-phase, synchronized left andright circularly polarized light. This phenomenon is called circular dichroism (CD).The molecules with different extinction coefficients for the left and right circularlypolarized light also have different refractive indices for both kinds of light, this willslow down one of the circularly polarized lights. Retardation of one of the circularlypolarized lights will rotate the major axis of the resulting elliptically polarized light(Figure 3.2, right). This retardation is wavelength-dependent and this phenomenonis called optical rotatory dispersion (ORD). This is how different absorption coeffi-
22

3.1. UV-VISIBLE SPECTROSCOPY
Figure 3.1: Two dimentional representation of the vectors of unpolarizedand different kinds of polarized light
cients and different refractive indices for both left and right circularly polarized lightwill generate rotated elliptically polarized light. The angle α is an optical rotation ofpolarized light (ORD) and the tangent of the angle θ is a measure of ellipticity whichis basically the ratio of major and minor axis of the resulting ellipse (CD).
[θ]mol = 100 × θ/(C × l) (3.1)
[θ]mre = 100 × θ/(C ×N × l) (3.2)
[θ]mol is molar ellipticity, C is the concentration in molarity, l is the pathlength incm, [θ]mre is mean residue ellipticity, N is no. of residues which is no. of aminoacids in case of protein. In an amide chromophore in peptide backbone, there aremainly two types of transitions observed: n to pi* and pi to pi* (Figure 3.3). 2Px
orbitals of carbon, oxygen and nitrogen combine to form three orthogonal orbitals: pi0,pi+ and pi−. pi+ is strong bonding orbital, pi0 is almost non-bonding. The energyof these transitions is associated with the movement of charges; circular or lineardisplacement of charges. Circular displacement of charge generates a magnetic dipolemoment which can be called as magnetic transition. Both or either of the transitionsare responsible for optical activity. In an amide chromophore, n and pi* orbitalsare orthogonal to each other which makes n to pi* electric transition forbidden butit involves circular charge displacement which makes it magnetically permitted, thisresults in low absorbance but high optical activity. The magnetic transition dipolemoment is oriented in the direction of the carbonyl bond. On the other side, a pito pi* transition is associated with linear charge displacement, which is electricallypermitted but magnetically forbidden. An n to pi* transition is located around 220nm, whereas, pi0 to pi* and pi+ to pi* transitions are located at 190 nm and 140
23

CHAPTER 3. MATERIALS AND METHODS
Figure 3.2: Front view of circularly polarized light (Left) and ellipticallypolarized light (Right)
nm respectively. In some cases, these transitions get coupled with each other whichare called exciton coupling [149]. These couplings depend on the how the peptidechromophores are arranged in space; in form of an α helix, β strand or as a randomcoil. From an α helix, the negative peak at 222 nm results from n to pi* transition(Figure 3.4, blue squares) [150]. The positive peak at 190 nm and negative peak at 208nm result from exciton splitting of pi0 to pi* transition by coupling of this transitionbetween different peptide groups. The band at 190 nm is polarized perpendicular tothe helix axis and the band at 208 nm is polarized parallel to the helix axis. The pi+to pi* transition gives a positive peak around 140 nm. The β sheet shows a negativeband at 215 nm corresponding to n to pi* transition (Figure 3.4, red circles). Theamplitude observed at 215 nm comes from exciton splitting by n to pi* and pi to pi*transition coupling in different peptide groups. The positive band at 198 nm comesfrom pi0 to pi* transition. The disordered peptide shows a weak positive peak ataround 215 nm which is as a consequence of n to pi* transition. The weakness ofpeak is because of lack of mixing between n to pi* and pi to pi* transition. Thestrong negative peak around 197 nm is the result of a pi0 to pi* transition.
24

3.1. UV-VISIBLE SPECTROSCOPY
Figure 3.3: Transitions observed in the amide chromophore in peptidebackbone: Red and blue planes are the nodal planes parallel and perpendicular toamide bond respectively
180 190 200 210 220 230 240
n→π*
π→π*
II π→π*
π→π*
π→π*
n→π*
n→π*
π→π*
ll
Alpha helical
Beta sheet
2-1
θ(d
eg
•cm
•dm
ol
)m
re
Wavelength (nm)Wavelength (nm)
Elli
ptic
ity
195 205 215 225 235 245
10000
8000
6000
4000
2000
0
-2000
-4000
-6000
-8000
-10000
Figure 3.4: Individual Gaussian peaks of α helix transitions (Left) and thespectra of α helix-rich and β sheet-rich protein samples (Right): Gaussianpeaks are just graphic presentation for explanation purpose. The spectrum of α helix-rich sample is from the sample, htt exon1 Q55. The spectrum of β sheet rich proteinsample is from the sample, recombinantly fused two fluorophores; AcGFP1-mCherry
25

CHAPTER 3. MATERIALS AND METHODS
3.1.2 Fluorescence principles
Fluorescence is the emission of light from a molecule after the absorption of electro-magnetic radiation. The emitted light has a longer wavelength than the absorbedradiation. Fluorescence is a nanosecond process which involves electronic transitionfrom ground state (S0) to higher energy level which can be termed as an excited sin-glet state (S1) (Figure 3.6). In the excited state, it relaxes to lowest vibrational stateof the excited state in picosecond timescales. This relaxation occurs mostly throughpassing of energy to proximal solvent molecules in form of non-radiative energy. Afterrelaxation, the electron returns to the ground state. During this transition, it givesup the excess energy in form of photons. These photons have lower energy than theones which were absorbed, this results in the emission of light with longer wavelength.The shift of emission spectrum to longer wavelength is called as Stokes shift [151].The observation that the excitation spectrum and the emission spectrum are mirrorimages led to the conclusion that the vibrational levels pattern in the ground stateand in the excited state is the same. In Figure 3.5 (left), AcGFP1 and mCherryabsorption and emission spectra are shown. In an excited state, electron moves awayfrom the nucleus and this should change the vibrational pattern and consequently,the emission spectrum. However, according to the Franck-Condon principle (Figure3.5, Right), a nucleus is too slow to respond to such a fast transition, and this keepsthe vibrational level spacing the same even in the excited state. Some fluorophoreschange their reactivity in excited state which can lead to formation of dimer or ionizedspecies or charge transfer complexes [152]. These fluorophores are the exceptions tothe ”mirror image rule” and have different absorption and emission spectra. Some-times, the fluorescence of the fluorophore can also be quenched by another substanceor fluorophore. This results in a decrease of the fluoroscence. This happens because of
Figure 3.5: The absorption and emission spectra of AcGFP1 and mCherry(Left), Franck-Condon principle (Right)
26

3.1. UV-VISIBLE SPECTROSCOPY
overlapping of the absorption spectrum of the quencher with the emission spectrum ofthe fluorophore. Now if the quencher itself also has the fluorescence then this energytransfer leads to emission of light from another fluorophore. In such a phenomenon,the first fluorophore can be referred as donor and the second fluorophore to which theenergy is passed on, can be termed as an acceptor fluorophore. This process is termedas Resonance energy transfer (RET) which is popularly termed as fluorescence reso-nance energy transfer (FRET) (Figure 3.6). However, one should keep in mind thatin the resonance energy transfer, the transfer of energy is only through long-rangedipole coupling and there is no reabsorption of emitted photon. It is long range nonradiative transfer. For the energy transfer to occur, emission spectrum of the donorfluorophore should overlap the absorption spectrum of the acceptor fluorophore [153].Some more factors on which the energy transfer rate depends on are the distance be-tween donor fluorophore and acceptor fluorophore (r), quantum yield of donor (QD),relative orientation of donor and acceptor fluorophore (κ2). The value of orientation
FRET
Vibrational relaxation
Absorp
tion
Donor
fluore
scence
Acce
pto
r flu
ore
scence
Abso
rption
S0D
S1D
S1A
S0AV1
V2
V5
r1
r4
.
.
..
Non-r
adia
tive d
eca
y
Non-r
adia
tive
deca
y
Figure 3.6: Principle of FRET: S0D and S1D represents donor ground state andexcited states. S0A and S1A represents acceptor ground state and excited states. V1,V2..V5 represent vibrational states. Curved arrows represent vibrational relaxation
factor (κ2) is assumed to be 2/3 in case of biomolecules [154]. Mostly in all the knownfluorophores, the transition is between S0 and S1, however, it is also possible that insome cases, the electrons get excited to S2 state. In such cases, the electron imme-diately returns to the lowest vibration state of S1 through non-radiative relaxationand then returns to the ground state through emission. In these cases, the excita-tion spectrum do not resemble the emission spectrum. There are different chemical
27

CHAPTER 3. MATERIALS AND METHODS
CyclizationHO
HN O
NHHO
NH
O
O
HON
NHHO
N
O
O
HON
NHHO
N
O
O
-H2O
O2
Oxidation
Serine
GlycineTyrosine
Figure 3.7: Mechanism of fluorescence in SYG chromophore
classes of fluorophores: xanthine derivatives, cyanine derivatives, acridine derivatives,fluorescent proteins etc. The fluorophores used in this thesis are fluoroscent proteins:AcGFP1 and mCherry. AcGFP1 is derived from the jellyfish Aequorea coerulescensand mCherry is derived from coral, Discosoma species [155]. These fluorophores havethe chromophore buried in the strong β barrel structure of the protein [156]. Thechromophore which has been found in these fluorescent proteins is made up of threeamino acids; serine, tyrosine and glycine (SYG) in case of AcGFP1 and methionine,tyrosine and glycine (MYG) in case of mCherry protein. This system leads to forma-tion of imidazolidinone ring system upon dehydration which forms fluorescent oxidizedversion upon excitation (Figure 3.7) [157]. The FRET effciency can be calculated bythe following relationship
E = R60/(R
60 + r6) (3.3)
E is energy transfer efficiency, R0 is frster distance which describes the spectral overlapof donor emission and acceptor excitation spectra. r is the distance between donorand acceptor fluorophore
Thioflavin-T Fluorescence Thioflavin-T belongs to a class of molecules calledmolecular rotors which shows increased fluorescence when the microenvironment re-stricts the intramolecular rotation [158]. Molecular rotors have a charge donor group
28

3.1. UV-VISIBLE SPECTROSCOPY
and a charge accepting group connected by C-C bond within a molecule. The rota-
S
N+
N
S
N+
N
TICT state
Charge transfer
Vibrational relaxation
Ab
sorp
tion
fluo
resc
en
ce
S0
LE
TICT
S ’0
No
n-r
ad
iativ
ere
laxa
tion
Non-radiativ
e
relaxation
Figure 3.8: Twisted internal charge transfer (TICT) dynamics of Th-T:Th-T shows strong fluorescence at 482 nm in the presence of the environment whichdoes not torsional relaxation into TICT state. Torsional relaxation is achieved bycharge transfer and twisting of benzothiazole and dimethylaminobenzine rings. LErepresents locally excited state. Drawn with CorelDRAW X6 (Corel corp., Canada)
tion about C-C bond changes the relative planarity of two moieties. Perpendicularorientation of these two moieties is accompanied by electron transfer [159]. This stateis known as twisted internal charge transfer (TICT) state which is non-fluorescent. InTh-T, benzothiazole and dimethylaminobenzine are the two moieties responsible forthe formation of charge transfer complex. The twisting of these two moieties occurthrough rotation of single C-C bond between them (Figure 3.8). In the excited state,the process of twisting becomes barrierless [159] and this results in formation of TICTstate. This is the reason of Th-T being non-fluorescent in aqueous solution. Mea-surements of Th-T fluorescence in viscous media or in the presence of highly orderedamyloid, revealed high fluorescence of Th-T. The rigidity acquired in viscous mediaor in the cavities of amyloid aggregates restrict the rotation of central C-C bond ofTh-T to TICT state and keeps charge transfer complex in locally excited state (LE)
29

CHAPTER 3. MATERIALS AND METHODS
which results into higher fluorescence in the presence of amyloid aggregates.
3.2 GST htt exon1 Q(n)
3.2.1 Plasmid constructs
The plasmid constructs for the expression of GST-htt exon1 Q20, GST-htt exon1 Q32and GST-htt exon1 Q55 were received as a kind gift from the group of Prof. Dr. ErichWanker, Max Delbrck center (MDC), Berlin. The inserts are present in the vectorpGEX-6P1. The insert contains the cDNA sequence for the expression of GST tag,PreScission protease cleavage site, LEVLFQGP which is followed by vector-derivedsequence GSHMDYKDDDDKSGSGIRIR, followed by htt exon1 sequence.
GST LEVLFQGPLGSHMDYKDDDDKSGSGIRIR MAETLEKMMKAFESLKSFQ(n)P(11)QLPQPPPQLQPLLPQPQP(10)GPAVAEPLHRP
Figure 3.9: GST-htt-exon1 Q (n): The arrow indicates the site of cleavage
Plasmid isolation and transformation The plasmids were received in Dh10βcells. The plasmids pGEX-6P1 Htt Q(20/32/55) were isolated by alkaline lysis methodusing miniprep kit (Qiagen). For protein purification, they were transformed intoE.Coli BL21
3.2.2 GST htt exon1 Q(n) protein purification
GST-htt exon1 Q(n) construct is inside the vector pGEX-6P1 with Ampicillin resis-tance gene. GST-htt exon1 Q(n) is expressed in E.coli BL21 (Stratagene) in LuriaBertani broth (LB broth) growth medium (Sigma Aldrich) containing 100 µg/mlAmpicillin. The cells were grown to an OD600 of 0.6 at 37oC, 120 rpm and wereinduced with 0.5 mM (AppliChem GmbH) overnight at 18oC. Cells were pelleteddown at 4700 g, 15 min. (Sorvall RC-6 centrifuge). Cell pellet was re-suspended inlysis buffer (10mM PBS, 1 mM DTT (AppliChem GmbH), protease inhibitor cock-tail (Sigma-Aldrich), pH 7.4). The pellet was lysed using sonicator (Bandelin) withsix cycles, each cycle composed of 50 Seconds with 0.5 Seconds of the burst and 0.5Seconds of rest. The resulting lysate was centrifuged at 20,000 g for 1 hour at 4oC.The lysate was passed through the column GSTrap FF 5 ml (GE healthcare) at therate of 0.5-1 ml/min. The column was then washed with the 50 ml washing buffer(10 mM PBS, 1 mM DTT). The protein was then eluted with the elution buffer (50mM Tris, 140 mM NaCl, 1 mM DTT, 10 mM reduced glutathione, pH 8). Purifiedprotein was dialyzed against 10 mM PBS, pH 7.4. Protein aliquots were stored in 10mM PBS, 10% glycerol.
30
3.2. GST HTT EXON1 Q(N)
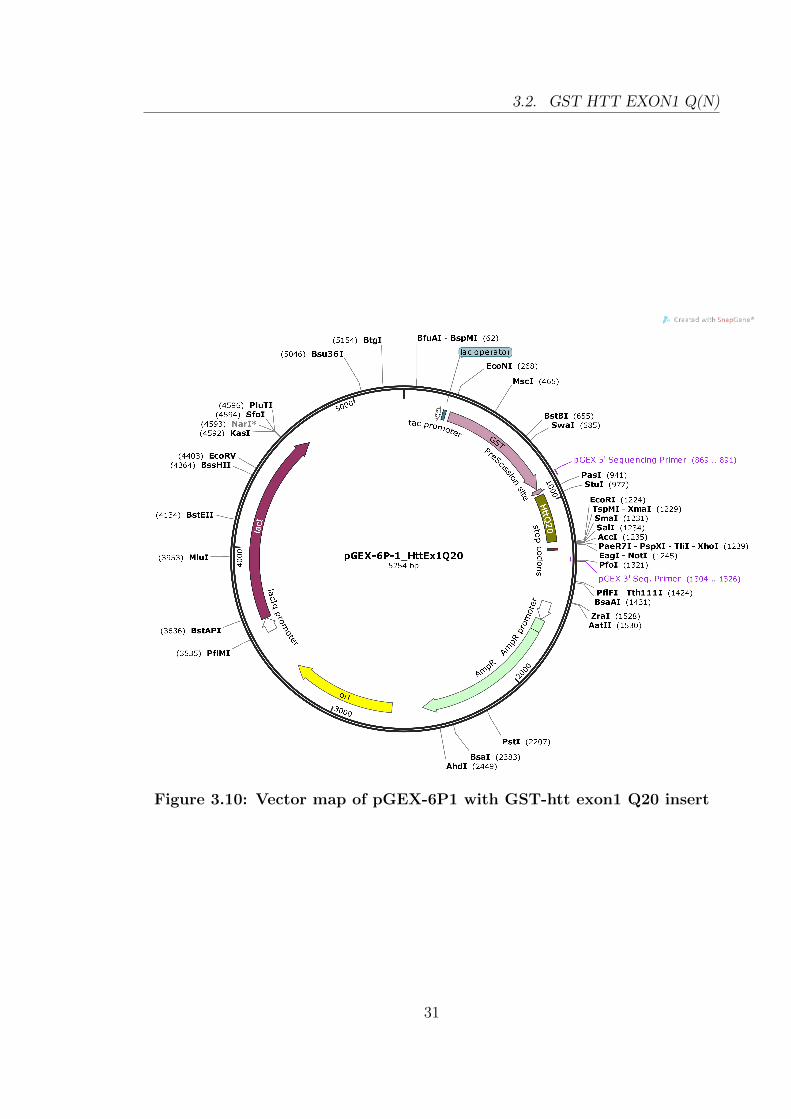
Figure 3.10: Vector map of pGEX-6P1 with GST-htt exon1 Q20 insert
31

CHAPTER 3. MATERIALS AND METHODS
3.2.3 Protein gel electrophoresis
SDS PAGE The acrylamide gel was polymerized between the glass plates separatedby 1.5 mm spacer. For filling the casting chamber (Bio-rad) up to 3/4th of the volume,total 8 ml of Resolving gel was prepared by mixing 2 ml of resolving gel buffer, 3.2 mlof water, 2.67 ml of Acrylamide solution, 80 µ l of 10 % W/V SDS, 40µ l of 10% W/VAPS, 4µl of TEMED. The solution was immediately added into the chamber and thesurface was covered with thin layer of water. After resolving gel was polymerized,4 ml of stacking gel was prepared by mixing 1 ml of stacking gel buffer, 2.46 ml ofwater, 0.532 ml of Acrylamide solution, 20µl of 10% W/V APS and 4µl of TEMED.Composition of the buffers used are mentioned in Table 3.1.
Table 3.1: Buffers composition used in SDS-PAGE
Acrylamide solution 30% W/V Acrylamide/Bis-acrylamide (37.5/1)Resolving gel buffer 1.5 M Tris-HCl, pH 8.8Stacking gel buffer 0.5 M Tris-HCl, pH 6.8Loading buffer 200 mM Tris-HCl (pH 6.8), 400 mM DTT,4X 0.4% Bromophenol blue, 40% GlycerolRunning buffer 25 mM Tris-base, 192 mM Glycine, 0.1% SDSTransfer buffer 25 mM Tris-base, 192 mM Glycine, 0.05 % SDS∗, 20% Methanol
* used only while transferring high molecular weight aggregates
Western Blot The SDS PAGE gel was removed from electrophoresis chamber (Bio-rad) and was put on the membrane. The gel and the membrane were covered with theblotting sheets and sponges on both sides. This whole stack was put in the transferchamber filled with transfer buffer under the constant voltage of 30 V overnight. Thewhole transfer module was kept at 4oC. After transfer, The membrane was incubatedwith 5 % solution of skimmed milk for 1 hour at room temperature to cover the non-specific binding sites to which primary antibody can bind and can give backgroundstaining. The primary antibody was incubated for 1.5 hour which is followed by wash-ing the membrane with TBS-T four times for 5 min each time. Primary antibodiesused here, are MW1, MW7 (Developmental Studies Hybridoma Bank, University ofIowa, USA) and 3B5H10 (Sigma-Aldrich). The dilutions used are mentioned in Ta-ble 3.2. After primary antibody incubation, secondary antibody was incubated for 1hour at room temperature. The washing step with TBS-T is repeated. The proteinsamples were finally stained with CN/DAB substrate (Thermofisher Scientific) 1 mlof CN/DAB substrate was mixed with 9 ml of hydrogen peroxide. The solution wasfiltered and was poured on the membrane. The bands were developed within fiveminutes.
32

3.2. GST HTT EXON1 Q(N)
Table 3.2: Antibodies used western blot analysis
Antibody (dilution used) Isotype Immunogen FormPrimary antibodyMW1 (1:100) IgG2 DRPLA-19Q Cell lysateMW7 (1:250) IgM Htt exon1-67Q Cell lysateSecondary antibodyAnti-mouse IgG (1:1000)a Whole IgG PurifiedAnit-mouse IgM µ-chain specific (1:1000)b Whole IgG Purifieda. For MW1b. For MW7
3.2.4 Protein concentration estimation
The concentration of protein was estimated by bradford’s method using ComassiePlus assay kit (Thermo Scientific). The assay was performed as per the manufaturer’sprotocol. The protein was incubated with the reagent for 15 min. for obtaining thestable signal. The absorbance was read at 595 nm using the plate reader (CLARIOstarBMG Labtech). The concentration of sample was calculated using BSA standardcurve using BSA samples supplied with the kit.
3.2.5 AFM
The cleavage of 25 µM of GST-htt exon1 Q55 and subsequent aggregation was startedby the addition of PreScission protease (1 unit /100 µ g of protein. The cleavedsample was deposited over the freshly cleaved mica surface (Ted pella inc., USA).The solution was dried under a stream of nitrogen. AFM images were acquired withthe scaning probe controller Dulcinea AFM (Nanotec Electronica, Spain), operated atroom temperature. Scan rate was kept at 1-3 lines/sec. The free oscillation amplitudewas kept around 12 14 nm and the setpoint was adjusted to 70 85 % of the targetamplitude. SCD-18 (MicroMasch) cantilever was used. Image processing was doneusing NanoScope Analysis and WSxM. Representative gaussian fits are shown foraggregates’ size determination.
3.2.6 Th-T fluorescence assay
Protein aliquots were thawn on ice. Glycerol was removed by exchanging the bufferwith 10 mM PBS, pH 7.4 through mini protein concentrators (Amicon ultra 0.5).Protein samples were centrifuged at 20,000 g for 3 hour to remove aggregates. Top80% of supernatant was used for the experiment. Protein was cleaved for 1 houron ice by adding 1 unit of PreScission protease per 6 µg of protein at 4 µM proteinconcentration. After 1 hour of cleavage, osmolyte or crowder or aggregation modulatorof interest was added along with remaining buffer and monitoring of Th-T fluorescence
33

CHAPTER 3. MATERIALS AND METHODS
was started using the plate reader (CLARIOstar BMG Labtech). The concentrationof Th-T used was 5 µM. The excitation wavelength was kept at 445 nm and theemission wavelength was kept at 490 nm. Data points were collected at every 10 min.
Data fitting The ThT assay data is normalized by dividing all the values with theinitial baseline value. The model equation for fitting is Boltzmann sigmoid function,
I(t) = Ai +Bi × t+Af +Bf × t
(1 + exp( t50−t)k
)(3.4)
t0 = t50 − 2/k (3.5)
k (1/time) is the apparent rate constant, t50 is half time for aggregation, Lag time t0is a lag time, Ai and Bi are the value and the slop of the initial baseline, Af and Bf
are the value and the slop of the final baseline.
3.2.7 Removal of GST tag from the GST-fused protein
E.Coli cells containing GST-htt exon 1 Q(n) plasmids were grown, lysed as describedin previous section. The supernatant of the lysate was bound to the glutathione-sepharose matrix (GE healthcare) for 4 hour at 4oC. The matrix was washed withwashing buffer (10 mM PBS, 1 mM DTT, pH 7.4). GST tag was removed from httexon 1 Q55 by incubating the matrix with PreScission protease (GE Healthcare).One unit of PreScission protease was added per 100 g of protein. The cleavage wasperformed for 6 hour at 4oC. The supernatant was collected, centrifuged at 20,000 gfor 2 hour at 4oC and was used immediately for the CD experiments.
3.2.8 CD spectroscopy
Far UV-CD spectra were measured using JASCO J-810 spectrometer. Each spectrumwas measured at 25C with data pitch of 0.5 nm, bandwidth of 2 nm, DIT of 8 secand using the curvette of the pathlength of 1 mm. Each spectrum was averaged over5-7 times. Protein concentration was measured by using scopes method. The corre-sponding blank spectrum was subtracted. Secondary structure was estimated usingsecondary structure analysis tool from JASCO. Yangs database [160] was used for theestimation of the secondary structure which was already provided in JASCO analysissoftware. For molecular tweezer experiments, CLR01 and CLR03 were obtained fromProf. Gal Bitan (David Geffen School of Medicine at UCLA, USA)
3.3 FRET Htt exon 1 Q(n)
3.3.1 Plasmid constructs
The pDream 2.1 vector was kindly supplied by Gruebele group (University of Illinoisat Urbana-Champaign, USA). This vector contains cytomegalovirus (CMV) and T7
34
3.3. FRET HTT EXON 1 Q(N)
promotor sequences for the expression in mammalian and bacterial cells. The vec-tor has His-tag for protein purification. This vector contains the genes of AcGFP1(Clontech) and mcherry (Clontech) at 5’and 3’ end of phosphoglycerate kinase (PGK),respectively. Htt exon 1 cDNA with different polyQ lengths (Q17, Q38, Q58, Q93) wasinserted in place of . The NdeI restriction site between AcGFP1 and PGK was changedto EcoRV for cloning htt inserts. The sequences for htt exon1 (Q17/Q38/Q58) wereobtained by cutting out the exon1 sequences from HttEx1Q(n)-mCFP/mYFP insertsin pEGFP-N1 plasmids. Htt exon 1 Q93 was synthesized and ligated with mpDream2.1 vector by Genscript Inc. The control construct with only fluorophore inserts(Q0) was generated by inserting flexible glycine amino acid in between AcGFP1 andmCherry. This results in the protein, AcGFP1-DIGKL-mCherry. DI and KL are re-striction site-derived amino acids. The sequencing of the plasmids was performed atBiochemistry sequencing service, Ruhr-University Bochum using capillary sequencer3130xl Genetic Analyzer (Applied Biosystems).
3.3.2 Fluorophore-tagged htt exon1 Q(n) Purification
The constructs, Fluorophore-tagged htt exon1 with different polyQ length had AcGFP1tag at the N-terminal and had the mcherry cherry tag at the C-terminal. Fluorophore-tagged htt exon1 Q(n) construct is cloned inside the vector pDream 2.1 with Ampi-cillin resistance gene. The proteins were expressed in E.coli BL21 (Stratagene) inLuria Broth (LB broth) growth medium (Sigma-Aldrich) containing 100 µg/ml Ampi-cillin. The cells were grown to an OD600 0.6 at 37oC, 120 rpm and were induced with0.5 mM IPTG (AppliChem GmbH) overnight at 18oC. Cells were pelleted down at5000 rpm, 15 min. (Sorvall RC-6 centrifuge). Cell pellet was re-suspended in lysisbuffer (10 mM PBS, 1 mM DTT (AppliChem GmbH), protease inhibitor cocktail(Sigma-Aldrich), pH 7.4). The pellet was lysed using sonicator (Bandelin) with sixcycles, each cycle composed of 50 seconds with 0.5 seconds of the burst and 0.5 secondsof rest. The resulting lysate was centrifuged at 20,000 g for 1 hour at 4oC. The lysatewas passed through the column HisTrap FF 5 ml (GE healthcare) at the rate of 0.5-1ml/min. The column was then washed with the 50 ml washing buffer (10mM PBS,1 mM DTT). The protein was then eluted with the elution buffer having 4 differentconcentrations of imidazole (50 mM, 100 mM, 300 mM, 500 mM in 10 mM PBS, 1mM DTT, pH 7.4). The purified, his-tagged AcGFP1-htt exon1 Q17-mCherry (Q17),AcGFP1-htt exon1 Q36-mCherry (Q36) and AcGFP1-htt exon1 Q58-mCherry (Q58)were a mixture of full length protein with both the fluorophores and AcGFP1-taggedhtt exon1 protein with truncated mCherry. These degraded impurities can be seen inMALDI (Figure 3.12a), native PAGE (Figure 3.12b) and MW7 western blot (Figure3.12c). The most pure fractions with less degraded impurities were pooled and passedfrom Superdex PG-75 size exclusion column to remove cleaved GFP-htt Q(n) withmissing mcherry. However, The fractions with missing mcherry were saved for themeasurement as AcGFP1 only samples. The fractions were checked in SDS-PAGE(Figure 3.13a) and the fractions corresponding to full length protein were pooled.
35

CHAPTER 3. MATERIALS AND METHODS
Figure 3.11: Vector map of mpDream2.1 with AcGFP1-HttEx1Q17-mCherry insert
36

3.3. FRET HTT EXON 1 Q(N)
20
40
60
20000 30000 40000 50000 60000 70000
m/z
Q0
Q17
Q36Q58
I (a
.u.)
Q0 Q17Q36 Q58 M Q17 Q36 Q58
10070
55
25
kDa
a) b) c)
Q93
Figure 3.12: Fluorophore-tagged htt exon1 Q(n) affinity purification: a)MALDI data for his-tagged purified protein samples, b) 10 % polyacrylamide nativegel, c) MW7-probed western blot of his-tagged purified protein samples.
The purified proteins were dialyzed against 10 mM PBS, pH 7.4. 10 % glycerol wasadded and stored at −20oC. After purification of full length protein with both the flu-orophores, the fluorophore labelling ratios were checked by measuring absorbance ofAcGFP1 and mCherry (Figure 3.13b). The relative amount of AcGFP1 to mCherrywas found to be the same for all Q lengths except for the protein sample with miss-ing htt exon1 (Q0), where it was slightly higher than the rest of the samples. Thereason behind lower mCherry absorbance in the protein samples with htt exon1 couldbe the influence of htt exon1 on the conformation of mCherry, this kind of influenceon neighbouring domains is already reported with the huntingtin’s influence on myo-globin [161]. Nevertheless, the fluorophore labelling ratio was the same among polyQfragments. The calibration of size exclusion column was performed using standardsranging from 6.5 kDa to 75 kDa (Calibration kit, GE lifescience). The dead volumeof the column was determined by running dextran though the column (Figure 3.14).
3.3.3 Protein concentration estimation
For calculating fluorophore concentration, the extinction coefficient used for AcGFP1(474/505) is 32500 M−1cm−1 and for mCherry (584/610), it is 72000 M−1cm−1. Pro-tein concentration was used in the range of 0.5 µM to 2 µM. For majority of exper-iments 2 µM of protein concentration was used (All concentration calculations comefrom the absorbance of AcGFP1 fluorophore)
37

CHAPTER 3. MATERIALS AND METHODS
0
0,2
0,4
0,6
0,8
1
1,2
1,4
400 450 500 550 600
Q0
Q17
Q36
Q58
AcGFP1
kDa
85
50
ꜛꜛ
kDa
85 ꜛꜛ50
M M M1 2 3 4 5 6 7 8 9 1 2 3 4 5 6 7 8 9 1 2 3 4 5 6 7 8 9
a)
b)
Fluorophores Absorbance
Wavelength / nm
Absorb
ance (
Norm
aliz
ed)
Figure 3.13: SEC Purification: SDS-PAGE analysis of the fractions of size exclu-sion chromatography of the samples containing polyQ stretch of 17 (left), 36 (center)and 58 (middle). The second lane (left gel) contains non-purified htt exon1 Q17 sam-ple. All other lanes have the fractions or MW marker. Earlier fractions were morepure in uncleaved protein, whereas later fractions eluted the degraded samples withmissing mCherry. The degraded Q17 sample with missing mCherry was used as GFPonly reference (boxed band). e) AcGFP1 and mCherry absorbance to compare therelative donor to acceptor labelling among the protein samples.
3.3.4 Matrix-Assisted Laser Desorption/Ionization (MALDI)
The matrix used was sinapinic acid. 0.5 µl of sinapinic acid was deposited and airdried on the sample deposit area on the plate. 0.5 µl of the protein sample was placed,dried, followed by one more layer of the matrix. After drying of the sample, the platewas placed in the chamber. MALDI MS spectra were measured using linear positiveion mode (Autoflex II; N2-laser: 337 nm, Bruker Daltonics). The mass spectrometerwas caliberated using caliberation standards, Apomyoglobin, Aldolase, Albumin with(M+H)+ 16.95, 39.21, 66.43, respectively (Sigma-aldrich, ProteoMassTM)
38

3.3. FRET HTT EXON 1 Q(N)
0
5
10
15
20
25
30 40 50 60 70 80 90 100 110
Volume ( ml)
Ab
sorb
an
ce (
mA
U)
Caliberation standards
Dextrane Blue
Q17 FRET
Figure 3.14: SEC column calibration: Column dead volume was measured bypassing dextrane blue (blue). Column was caliberated using low molecular weightstandards (GE healthcare). First peak of Q17 (black) indicates high molecular weightoligomers, followed by second peak of monomers with the tail of truncated proteinwith missing mCherry.
3.3.5 Fluorescence spectroscopy
D/A ratios were measured on the 384 well plates (Corning) plate reader (CLARIOstarBMG Labtech). The measurement parameters are mentioned in the Table 3.3.
Table 3.3: Wavelength parameters used in spectroscopic measurements
Fluorophore: Excitation/Emission Wavelength: Excitation/EmissionAcGFP1/AcGFP1 (D) 470-15/515-20AcGFP1/mCherry (A) 470-15/620-20mCherry/mCherry (dA) 570-20/620-20
3.3.6 Fluorescence microscopy
In vitro protein samples were pipetted in the small channel of µ-SlideVI0.1 (IbidiGmbH). These slides have the channel thickness of 100 M . The samples were then
39

CHAPTER 3. MATERIALS AND METHODS
excited with LED (Manufactured by Zeiss), viewed under inverted microscope (Ax-ioObserver Z1, Carl-Zeiss) at different temperatures. The samples were imaged usinghigh speed camera (AxioCam HS) Different temperatures were induced by infraredlaser (2200 nm, m2k laser). The filter sets (Zeiss) used for the measurement are men-tioned in the table 3.4. The parameters used in during the experiment are mentionedin Table 3.5. The collected images were saved with help of AxioVision software whichwere then analyzed by ImageJ.
Table 3.4: Filter sets used in the microscopic measurements
Fluorophore channel Excitation Beam Splitter EmissionAcGFP1(D) 470-27 DFT 490 + 575 512-30mCherry (A) 556-25 FT 565 630-98
Table 3.5: Experimental parameters used in the microscopic measurements
Parameter valueLED intensity 5%Camera binning 2X2 or 3X3Magnification 20X (0.48 M/pixel)Exposure time 15-30 ms
40

Chapter 4
Results and Discussion
4.1 Huntingtin exon1 characterization
4.1.1 Multimeric states of htt exon1
Gel electrophoresis techniques can yield information about the approximate molecu-lar weight and multimeric states of proteins. Western blot analysis by probing withdifferent antibodies helps in identifying accesibility of epitopes present on proteinmolecules. This can assist to get conformational detail of the protein. To check forthe relative population of monomeric and multimeric species among htt exon1 pro-teins with different polyQ lengths, htt exon1 proteins were analysed with SDS PAGEand western blot. Three different proteins were used: Htt exon1 Q20, Htt exon1 Q32and Htt exon1 Q55.For facilitation of protein purification, GST tag fused constructs were used for theprotein purification. The GST tag was later cleaved just before the experiments.The purified protein samples, GST-Htt exon1 Q20, GST-Htt exon1 Q32 and GST-Htt exon1 Q55 and their cleaved products were detected by silver staining of theSDS-PAGE and by western blot. Different antibodies recognize different epitopes.The antibodies used were MW7, 3B5H10 and MW1. These antibodies are raisedagainst polyQ proteins like DRPLA-19Q and Htt N-terminal fragments (See methodssection). MW7 can recognize the polyP epitope, whereas, 3B5H10 and MW1 canidentify the polyQ epitope [162, 163]. The intact fusion proteins were detected at themolecular weight range of 40-55 kDa (Figure 4.1). Due to high content of glutamineand proline residues, the intact and cleaved htt fragments remained highly unchargedwhich led to less binding of SDS [164]. Because of inefficient denaturation, htt exon1fragments did not denature uniformly and completely and moved as multiple bands ata size corresponding to a larger molecular weight (lower black reference lines, Figure4.1). Recently, Vieweg et al. also observed similar mobility issues with the htt exon1fragments [164]. The completely unstained white area seen on the blot correspondto GST monomers, dimers and trimers. Wherever, GST protein was present on theblot, the primary antibodies could not bind non-specifically. Everywhere else on the
41

CHAPTER 4. RESULTS AND DISCUSSION
MW 7 3B5H10
Uncleaved Cleaved
Q20 Q32 Q55Q20 Q32 Q55 Q20 Q32 Q55
70
5540
25
15
35
kDa Q20 Q32 Q55
Silver stainAb/Stain
25
55
15
Q55
M
M
a)
b)
kDa Q55
70
55
35
kDa Q20 Q32 Q55M Q20 Q32 Q55
c)
HttE
x1 m
on
o/d
i-mers
Ag
gre
ga
tes
GS
T-H
ttEx1
Q(n
)G
ST
M
70
5540
25
15
35
kDa
MW 1Ab
Uncleaved Cleaved
25
MW7
Uncleaved Cleaved
Figure 4.1: GST-Htt exon1 Q(n) western blot analysis: a) GST-Htt exon1Q(n) proteins before and after 20 h of cleavage. The reaction was stopped after 20h by heating in the presence of SDS loading buffer. In MW7 blots, the transparentarrows indicate the SDS-resistant aggregates in stacking gel part which are also seenin silver stained gel as dark brown smear. In 3B5H10 blot, black reference lines showthe presence of probable monomers or dimers of htt exon1 Q(n). In silver stained gel,GST monomers, oligomers and htt exon1 Q32 and Q55 aggregates were identified.b) MW1 blot of GST-htt exon1 Q55 before and after cleavage. c) MW7 blot ofincompletely cleaved GST-Htt exon1 Q(n) protein. The arrows indicate the probablemonomer or dimer of htt exon1 protein samples. The black lines in the blot indicateoligomers.
42

4.1. HUNTINGTIN EXON1 CHARACTERIZATION
membrane, the antibodies bound non-specifically and gave background staining. Thecleaved htt exon1 Q (n) were detected as multiple bands as monomers (Figure 4.1a)(lower black reference lines), dimers, tetramers (Figure 4.1c) (upper black referencelines), oligomers or aggregates (Figure 4.1a) (Transparent arrows). The theoreticalmolecular weight of cleaved htt exon1 Q20, Q32 and Q55 variants are 12.7 kDa, 14.2kDa and 17.1 kDa respectively. In all three exon1 fragments, the bands correspondingto monomers were detected on 3B5H10 the blot (Figure 4.1a), with a slight smear ofdimers in Q32 and Q55 fragments. Monomers of htt exon1 Q55 were also detectedby the MW1 antibody (Figure 4.1b). The blots and a gel presented in figure 4.1a arefrom the same samples. In one more experiment with a better resolved MW7 blot(Figure 4.1c), monomers were detected in case of Q20 and Q32 sample (Solid arrows)but not in case of the Q55 sample. Here, Q32 and Q55 samples showed clear bands ofpossibly trimers and tetramers (Upper black reference lines). Q55 monomers mightbe aggregated rapidly and were not detected in any of the MW7 blots. In addition tothese, Q32 and Q55 variant showed the presence of high molecular weight oligomersor aggregates in the stacking gel part of MW7 blot (Indicated by transparent arrows).Variety of aggregates of Q55 sample were observed also under atomic force microscope(AFM) (Figure 5.3b). Htt exon1 Q20 did not form any SDS-resistant aggregates, asseen in silver staining of a polyacrylamide gel. The cleaved GST tag showed a bandfor the monomer at 25 kDa and higher bands corresponding to dimer and trimer, asseen in silver staining. Silver staining, however could not detect low molecular weightspecies in any of the htt fragments for unknown reason.The concentration of htt exon1 proteins in the western blot analysis were in the rangeof 20 µM. Under same experimental conditions and the concentration, Q20 fragmentdid not show any evidence for the high molecular weight species. Q20 fragment re-mained mostly in monomeric form. Whereas Q32 and Q55 fragments formed oligomersand aggregates additionally. The interesting result here is that polyQ epitopes werenot identified in high molecular weight species (Figure 4.1a, third blot from left, Fig-ure 4.1b), this could mean that the polyQ conformations are different in low and highmolecular weight species. PolyQ conformation could be that of the β sheet and alsocould be buried in the core of the aggregate, however, in monomeric species polyQstretches were accessible to interact with the antibody. As a result of this, monomericand not multimeric states were detected in all polyQ lengths.There have been some attempts made to identify the changes in the conformations ofmultimeric states in the mutant htt exon1 by using a western blot approach [165, 166].Pingwei et al. studied the affinity of the MW1 antibody from htt exon1 16Q to httexon 46Q [111]. Increase of the affinity with increase of polyQ length suggested thatlonger polyQ simply has more number of epitopes and there should not be conforma-tional changes from shorter to longer stretches of polyQ. In the result presented here,both the MW1 and the 3B5H10 antibody were able to identify Q55 exon1 fragment.The MW1 antibody is produced against the protein having 19 Q repeats [163] and the3B5H10 is produced against the the protein with 67 Q repeats [163]. Despite of anti-bodies production against the antigens of different polyQ lengths, both the antibodies
43

CHAPTER 4. RESULTS AND DISCUSSION
could identify longer Q55 fragment. Moreover, 3B5H10 antibody could identify themonomeric conformations of all the polyQ lengths studied here, this means that theremay not be significant conformational differences between shorter and longer polyQmonomeric stretches. Legleiter et al. have performed western blot analysis of theGST-htt exon1 Q53 reaction using polyQ antibodies (MW1-5, 3B5H10), C-terminalantibody MW8 [163, 165]. These antibodies recognize different epitopes in htt exon1Q53 [165]. PolyP epitope was not recognized efficiently in htt exon1 Q53 monomer[165].In the results presented here polyP epitopes were recognized in the Q20 and Q32fragment but not in Q55 fragment (MW7 blots). The western blot analysis showspolyQ dependent oligomer and aggregate formation. PolyP stretches are exposed inthe aggregates and can be detected, whereas, polyQ stretches are either buried in thecore of aggregates or altered and not detected.
4.1.2 Mutant htt has more helical content
After studying the relative monomers and multimers population from electrophoreticanalysis, it was necessary to know the corresponding changes in the secondary struc-ture content of htt exon1 proteins. In case of htt, the toxicity depends also on themultimeric states of the htt, it is crucial to know the secondary structure contentof oligomeric or monomeric species. CD spectroscopy can give characteristic signalscorresponding different secondary structures present in the proteins.For conducting CD spectroscopy, GST fused proteins were cleaved, the GST tag wasremoved from the solution. The cleaved htt exon1 fragments were measured. A signif-icant structural difference was observed between normal (Q20 and Q32) and mutant(Q55) peptide fragments (Figure 4.2a). Q20 and Q32 htt exon1 showed minimum nearto 200 nm which indicates the mainly disordered structure of the peptide fragment.Q55 htt exon1 had one major negative peak at 209 nm and a second minor peak at222 nm which are characteristic peaks of α helical elements. The CD spectra of httexon1 Q55 did not change at least for 24 h., and the concentration of soluble fractionof protein was also same which indicates that there was no aggregation proceedingwhile acquiring the spectra. Only after 22 days of storage at 4oC, there was a slightincrease of α helix structures observed (Figure 4.2b). For the analysis of the secondarystructure in more detail, secondary structure content was estimated from the analysissoftware provided by JASCO. In the analysis, it was observed that α helix contentincreased progressively from Q20 to Q55 fragment (Figure 4.2c).Additionally, temperature-induced structural loss of htt exon1 was studied with thehelp of CD spectroscopy. The difference spectra of the samples at 5oC and at 35oCrevealed loss of signal at around 209 nm and at 220 nm - 225 nm (Figure 4.3). Thenegative ellipticity at 209 nm and 222 nm corresponds to α helix secondary structure.The loss of the signal at 35oC may correspond to loss of helical structure.Singer et al. [67] chemically synthesized and more recently, Vieweg et al. recombi-
nantly produced full length htt exon1 [164]. Both the studies confirmed the mostly
44

4.1. HUNTINGTIN EXON1 CHARACTERIZATION
Htt exon1 Q20
Htt exon1 Q32
Htt exon1 Q55
Wavelength (nm) Wavelength (nm)
2-1
θ(d
eg•c
m•d
mol
)m
re
a) b)
200 210 220 230 240 250200 210 220 230 240 250
3500
1500
-500
-2500
-4500
-6500
-8500
3000
1000
-1000
-3000
-5000
-7000
-9000
-11000
-13000
0
20
40
60
80
100Q20
Q32
Q55
Seco
ndary
str
uctu
re [%
]
Helix Beta Turn Random
c)
2-1
θ(d
eg•c
m•d
mol
)m
re
Q55 aggregates resuspended in TFA:HFIP solution
Q55 aggregates resuspended in PBS
Figure 4.2: Htt exon1 Q(n) secondary structure: a) CD spectra of htt exon1Q20, htt exon1 Q32, htt exon1 Q55. b) CD spectra of htt exon1 Q55 immediatelyafter cleavage (Black) and after 23 days of incubation at 4oC (Orange). c) Secondarystructure estimation of htt exon1 fragments, htt exon1 Q55 fragment’s pellet resus-pended in phosphate buffer (Black bar) and resuspended in 1.25 %V/V TFA:HFIP(1:1 volume ratio) mixture (Grey bar).
45

CHAPTER 4. RESULTS AND DISCUSSION
Wavelength (nm)
‐1500
‐1000
‐500
0
500
1000
200 210 220 230 240 250
Q20
Q32
Δθ
E
lliptic
ity d
iffere
nce)
(
Figure 4.3: Difference spectra of 5oC and 35oC : Htt exon1 Q20 (Purplesquares), htt exon1 Q32 (Blue circles). Y-axis represent the difference of mean residueellipticity (∆θ) between the spectra taken at 5oC and 35oC.
a disordered structure of htt exon1. Additionally both the studies showed the CDminima for htt exon1 fragments at 205 nm. The signal of a disordered peptide shouldshow a minimum at 200 nm, this red shift to 205 nm was suggested due to the effectof two polyP stretches [167]. Singer et al. synthesized htt exon1 Q23 and Q42 whichwere reported to possess disordered structure with some stabilized turns [type (I/III)][67]. No helical characteristics were reported for the mutant huntingtin exon1. Vieweget al. also reported a similar structure pattern for the exon1 up to the polyQ lengthof 43 [164]. The stringent disaggregation protocol [168] followed by all groups mighthave led obtaining of only monomer. From the results obtained here it is clear thatthe expanded version of the exon1 fragment (Q55) composed of significant amountof helical content and that the other two (Q20 and Q32) were in mostly disorderedform. According to western blot analysis data, in case of Q32 and Q55 exon1 frag-ments, there should be presence of oligomers and aggregates along with monomers.For minimization of interference from aggregates species, the protein sample was cen-trifuged with high speed to remove high molecular weight aggregates. Despite theseattempts, the presence of soluble low molecular weight oligomers cannot be avoided.Due to these reasons, the spectra generated by Q32 and Q55 samples showed themixture of monomers and soluble oligomers. From the polyQ peptide studies, Wetzelet al. have shown that the intermediate oligomeric species in the aggregation processare helix-rich [83, 48], this means that Q20 sample composed of mostly disorderedmonomer, Q32 had some amount of oligomers present whereas, Q55 sample had sig-nificant amount of helix-rich oligomers. The samples with mostly monomeric form(Q20 and Q32), showed a loss of signal corresponding to α helix which suggested slightamount of helical structures present in the shorter versions of htt exon1. These helical
46

4.1. HUNTINGTIN EXON1 CHARACTERIZATION
structures may represent the spherical oligomers observed in atomic force microscopy(AFM) (Figure 5.3a)Recently, Sahoo et al. reported the aggregation kinetics of htt exon1 using an HPLCsedimentation assay [58]. According to this data, 50% of htt exon1 Q42 was multi-merized to high molecular weight oligomers in 24 h. No detectable monomers werefound in the expanded polyQ variant, even at 300 pM concentration [58], however,this chemically synthesized peptide fragment did not have the full length proline-richdomain, the lack of which can enhance the aggregation rate of the exon1 [167]. Theyfurther studied full length mutant htt exon1 with eGFP at C-terminus inside cell. Inthe cell, the fluorescence autocorrelation time they found corresponded to tetramers[58]. These kinds of tetrameric species were seen in the MW7 blot (Figure 4.1c, upperblack reference lines) in case of Q32 and Q55 fragments.These data combined with the western blot and CD data suggests that Q55 varianthad mostly helix-rich oligomeric forms. The proportion of these kinds of oligomericspecies increased on polyQ expansion in htt exon1. Htt exon1 Q20 had higher pro-portion of monomeric species which were disordered in nature.
4.1.3 Fluorophore-labelled htt exon1 Q(n)
End to end distance
Another approach to study htt exon1 conformations can be the study of the changesin end to end distance. A change of end to end distance in different variants of httexon1 Q(n) can yield important insights into the conformational changes or solvationof htt exon1 upon polyQ extension. If a polyQ stretch adopts compact conformationsupon extention then it will be indicated by no increase in the end to end distance,however, if a polyQ stretch gets solvated well in the aqueous solvent then extensionof polyQ will yield higher end to end distance. FRET approach was applied for mea-suring changes in end to end distance. This was achieved by labelling the N-terminusand the C-terminus of the htt exon1 with the donor and acceptor fluorophores respec-tively. The donor and acceptor flurophores used were AcGFP1 and mCherry. Theend to end distance changes were reported as the ratio of donor fluorescence to accep-tor fluorescence (D/A). Fluorophore-labelled htt exon1 proteins with three differentlengths of polyQ were studies: Q17, Q36 and Q58. Additionally, a control proteinwas also used with only two fluorophores without htt exon1 in between (Q0).
All the proteins showed lower D/A ratio compared to the D/A ratio shown bythe mixture of AcGFP1 and mCherry proteins (Figure 4.4). The D/A ratio of themixture of AcGFP1 and mCherry should serve as an upper limit for D/A as thereis no intramolecular FRET possible for the mixture. Initial D/A ratio of the controlsample (Q0) with both the fluorophores without htt exon1 was found to be muchlower than all other protein samples as expected. The D/A ratio was found to behigher in Q17 variant compared to control protein, and even higher in Q36 sample,however, in case of Q58 variant, the ratio was found to be significantly lower thanQ36 protein sample, this lowering of D/A means higher energy transfer between the
47

CHAPTER 4. RESULTS AND DISCUSSION
0
20
40
60
80
100
120
Initial D/A
Q0 Q17 Q36 Q58 Q93 AcGFP1 +mCherry
Initia
l D
/A
Figure 4.4: Htt exon1 Q(n) FRET D/A: AcGFP1 to mCherry fluorescenceintensity ratio for fluorophore-labelled protein samples. Last point (Green) representsthe same ratio of the mixture of AcGFP1 and mCherry proteins. Error bars representstandard deviation (SD) of mean; sample size: n=9 for Q0, Q17, Q36, Q58; n=6 forQ93; n=3 for AcGFP1-mCherry mixture
fluorophores which can either be because of closer proximity of N- and C-terminusor because of intermolecular FRET occurring in oligomeric species. Q93 variant wasfound to aggregate with no detectable monomers, as clearly seen in native PAGE(Figure 4.6), consequently, Q93 protein sample showed much lower donor to acceptorfluorescence ratio due to inter-molecular FRET in oligomers.For checking the possibility of intermolecular FRET occuring because of oligomers,size exclusion chromatograms of fluorophore-labelled proteins were examined. Thechromatograms showed the strong peaks at the position of blue dextran (2000 kDa)(Figure 4.5). These peaks correspond to oligomers. The proportion of these oligomerswas higher in longer polyQ samples, as observed in the dramatic rise in the peakarea corresponding to oligomers and decrease in the second peak corresponding tomonomers. In Q93 sample, no peak corresponding to monomers was observed. Themaximum size of the protein which can be resolved with the column superdex pg75 is70 kDa. Because of this upper limit, it is not possible to resolve dimers, tetramers orhigh molecular weight oligomers. The oligomeric peak can correspond to any of thesespecies. The observed high amount of high molecular species here can also be theresult of locally high concentration of the protein sample inside the column matrix.Considering CD approach, again, for the fluorophores-labelled proteins, all the sam-ples showed the dominance of strong β sheet signal indicated by minimum at 218 nmwhich was shifted to 215 nm due to disordered htt exon1 in between (Figure 4.7a).This β sheet signal comes from the β barrel structure of the fluorophores [169, 170].
48

4.1. HUNTINGTIN EXON1 CHARACTERIZATION
Volume (ml
Absorb
ance
(m
Au)
Ć
Č
Ç
Ď
Ð
ĈĆ
ĈČ
ĈÇ
ĈĎ
ĈÐ
ČĆ
ĊĆ ĊD ÇĆ ÇD DĆ DD ĎĆ ĎD ĐĆ ĐD ÐĆ
Ï ĈĐ
Ï DÐ
Ï EĊ
GÑŔPǾMŌ
20
18
16
14
12
10
8
6
4
2
030 35 40 45 50 55 60 65 70 75 80
Q17
Q58
Q93
Dextran
Figure 4.5: Size exclusion chromatography of fluorophore-tagged htt exon1Q(n): Plot of absorbance versus elution volume of Q17 (Solid line), Q58 (Dashedline), Q93 (Dotted line) and dextan (Small dashed line) samples. First peaks around46 ml indicate the position of high molecular weight species. Second peaks around 52ml indicate the position of monomers.
Q0 Q17Q36 Q58 Q93
Figure 4.6: Native PAGE of the fluorophore-labelled htt exon1 proteins:The red bands in the gel indicates the full length protein with both the fluorophores.The lower green bands indicate the protein molecules with missing mCherry. Thesedegraded impurities were later removed by size exclusion column. The Q93 sampleshows only the bands in the stacking gel corresponding to aggregates.
49

CHAPTER 4. RESULTS AND DISCUSSION
On subtracting the backbone fluorophores’ contribution from the exon1 protein sam-ples, Q17 and Q36 variants showed mostly random structure. Q58 sample showeddevelopment of second minimum at 222 nm, this is the characteristic signal of an αhelix, this change in the Q58 signal was however, also noticeable in the unsubtractedspectrum. As discussed in the earlier section that helical structures were the resultof oligomerization. Formation of coiled coil structures can also be a possibility forhigher polyQ proteins [105]. The fluorophore-tagged Q58 protein sample also com-posed significant amount of soluble oligomers.The observed lower D/A was therefore, the result of intermolecular FRET occurringin the oligomers in Q58 sample. The subtracted spectra of Q17 and Q36 samples didnot show any development at 222 nm, this means that Q17 and Q36 samples werepredominantly disordered monomers. This could also be observed in the monotonousincrease in D/A which could be expected from a lengthening of polypeptide chain.Caron et al. [113] and S.Buening [171] have studied htt exon1 end to end changesinside mammalian cells. In the data from Caron et al., there is no significant decreasein the FRET efficiency between Q46 and Q138 samples, this is surprising because theQ138 exon1 fragment would be almost double the sequence length of Q46 fragment.S.Buening also observed no difference among the Q-lengths; Q38, Q93, Q146 despitea significant increase in the chain length [171]. In fact, a slight decrease in D/A ratiowas observed in Q58 comparatively, this could hint to the presence of oligomers inhigher polyQ fragments, however, none of the researchers observed a highly signifi-cant increase in FRET efficiency in Q58 and Q93 fragment as seen here. It was infact, shown by AUC (Aanlytical ultracentrifugation) that the fluorophore labelled httexon1s are monomers (Unpublished data from E. Newcombe). Inside the mammaliancell, however, many factors have to be considered, some of the important factors inthis particular case could be presence of osmolytes, crowding, chaperones [172], posttranslational modifications [80] which can affect the stability the protein. Anotherpossibility could be that the very long polyQ stretches are already not in the FRETrange and no further difference can be observed. Another possibility of observation ofless D/A could also be due to intramolecular FRET occurring because of compactionof a molecule. It has been observed that an increase in the polyQ length leads to anincrease the likelihood of the intrachain interaction which can yield smaller radii oflonger stretched polyQs [63, 36]. The data from S.Buening with the same proteinsused here yielded different D/A ratio pattern among the intra-FRET control and thepolyQ fragments inside Hela cells. All polyQ fragments yielded much higher D/Athan the D/A of the control protein in the cytoplasm (work from S.Buening [171]),some cells expressing mutant htt exon1 showed the presence of inclusion bodies. Theseinclusion bodies showed even less D/A ratios than intramolecular-FRET control (Q0),this is not surprising as anti-parallel arrangement in the tightly packed aggregate willshow higher inter-molecular FRET [173]. On the other side in vitro results presentedin this thesis showed different pattern of D/A ratio than inside the cell. The polyQfragments did not maintain significantly higher D/A as the polyQ length increased.Instead, After Q36 fragment, Q58 and Q93 fragments showed progressive decrease
50

4.1. HUNTINGTIN EXON1 CHARACTERIZATION
in the D/A ratio but still the ratio was much higher than the intra-FRET controlprotein. Simple explanation for this behaviour could be that the in vitro sample hada mixture of monomers and tightly packed aggregates and these aggregates were morein longer length, however, high molecular weight aggregates should get separated inthe rigorous centrifugation process. These aggregates were seen as a red pellet atthe bottom of the tube in the Q58 and Q93 sample, this observation suggested theabsence of high molecular weight aggregates in Q58 and Q93 sample. However, It isalso clear from size exclusion chromatography (Figure 4.5) and native PAGE (Figure4.6) data that Q93 samples only contained the presence of oligomers and aggregateswith no evidence of monomer. D/A ratio of Q93 sample was still much higher thanthe control protein (Q0). Combining these observations, it can be concluded thatthe lowering of D/A ratios in in vitro samples are due to presence of loosely packedoligomers which were not separated in centrifugation process. The different extent oftightness in the aggregates has already been observed by Homo-FRET among eGFPtagged mutant htt fragments inside cells [174]. In fact, much variations observed inthe D/A of inclusion bodies also suggest different extent of compaction among aggre-gates (Unpublished work from S.Buening [171]). The data from fluorophore-taggedproteins suggest that the ability of htt exon1 to aggregate via α helical intermedi-ates is not compromised even after tagging with fluorophores on both the termini.In fact, secondary structure estimation of the fluorophore-tagged htt exon1 also re-vealed progressive increase of α helix as the polyQ length increases (Figure 4.7b). Httexon1 monomers are suggested to orient in both head to head and head to tail fashion[173, 175]. One more possibility of higher FRET is compaction of the monomer. Inrecent years, more and more data accumulating with the suggestion of compact struc-ture for intrinsically disordered proteins [36, 176], some biophysical studies are alsoperformed on the polyQ chain [36]. The polyQ chain is found to favour side chain-backbone or backbone-backbone interactions over side chain-water or backbone-waterinteractions, this makes water a poor solvent for polyQ tracts with higher number ofglutamines and less persistent length. The stretch of polyQ elongates at the scale of0.3 in a poor solvent [36, 177]. According to this theory, Q58 and Q93 samples shouldbe compact monomers, however, in that case D/A also ratios should continue to in-crease and not decrease as seen here. In a molecular dynamics simulation study, longerpolyglutamine is shown to possess more fraction of structured, compact conformations[178]. According to this study and the hypothesis ”superposition of ensembles” [179],longer polyQ tracts shift the equilibrium of polyQ conformational ensemble towardsmore compact states without forming a new structure. In this case, longer polyQtracts may show a lower D/A. From SEC and CD data, it is clear that Q58 samplecontains significant amount of multimeric species. SEC, native-PAGE and CD datashow that Q93 sample contains the most of the protein as oligomers. This suggeststhat along with the intramolecular FRET resulting from compact structures in longerpolyQ, intermolecular FRET is also occuring which is mainly responsible for the lowerD/A ratio.
51

CHAPTER 4. RESULTS AND DISCUSSION
‐10000
‐6000
‐2000
2000
6000
10000
14000
195 205 215 225 235 245
FRET controlQ17Q36Q58Q93
0
50
100Q0
Q17
Q36
Q58
Q93
Seco
ndary
str
uct
ure
[%
]
a)
b)
ǼĊDĆĆĆ
ǼĊĆĆĆĆ
ǼČDĆĆĆ
ǼČĆĆĆĆ
ǼĈDĆĆĆ
ǼĈĆĆĆĆ
ǼDĆĆĆ
Ć
DĆĆĆ
ĈED ČĆD ČĈD ČČD ČĊD ČÇD
2-1
θ(d
eg•c
m•d
mol
)m
re
2-1
θ(d
eg•c
m•d
mol
)m
re
Wavelength (nm)
Wavelength / nm
Fluorophores subtracted spectra
Helix Beta Turn Random
195 205 215 225 235 245
14000
10000
6000
2000
-2000
-6000
-10000
195 205 215 225 235 245
5000
0
-5000
-10000
-15000
-20000
-25000
-30000
-35000
Q0
Q17Q36 Q58 Q93
Figure 4.7: CD spectra of fluorophore-labelled-htt exon1 Q(n) proteins:a) Mean residue ellipticities of Q0 (IntraFRET control-Black)), Q17 (Green), Q36(Orange), Q58 (Red); Inset: Intra-FRET control with only two fluorophores is sub-tracted from each htt proteins resulting in the structure of only htt exon1 in between.b) Secondary structure estimation of fluorophore-labelled htt exon1 (with both thefluorophores included), Error bars represent SD of mean; sample size, n=2.
52

4.2. HUNTINGTIN EXON1 AGGREGATION KINETICS
4.2 Huntingtin exon1 aggregation kinetics
4.2.1 Thioflavin-T aggregation assay
Next, to study the aggregation kinetics of htt exon1, cleaved htt exon1 fragmentswere incubated and monitored over time. For monitoring the aggregation, Th-T wasused as an extrinsic fluorophore reporting on the presence of amyloid aggregates. Httexon1 Q20 did not show any increase in the fluorescence at least up to 17 h (Figure4.10, supplimetary figure 5.2), whereas, Q55 variant already reached the plateau bythat time (Figure 4.8a). The highly branched fibril morphology of Q55 fragment (Sup-plimentry figure 5.3) was in perfect agreement with what is reported in the literature[180]. Htt exon1 Q32 showed time-dependent aggregation, but at ten times higherconcentration than htt exon1 Q55 (Supplimentry figure 5.2). To check for the concen-tration dependence of the aggregation, fused proteins were cleaved and incubated atdifferent concentrations. The lag time was decreased at lower concentration which isa characteristic of a nucleation dependent reaction (Figure 4.8a, Figure 4.8b). Higherconcentration favours higher frequency of collision which leads to more frequent crit-ical nucleus formation, and from that step the aggregation process is favoured moreover dissociation [181]. The aggregation of Q55 fragment in Th-T assay was found tobe much faster than what was observed in CD spectroscopy. The reason for enhancedrate of aggregation could be seeding effects of GST-fused protein [182] dimers whichare not separated from cleaved htt by glutathione-sepharose matrix. In case of CDexperiments, GST tag was separated from the matrix and then studied. In a sepa-rate CD experiment, the GST-htt exon1 Q55 cleavage was performed over time whereGST tag is not separated from the mixture. GST tag remains bound to glutathionematrix and supernatant was observed over time. Within 6 h, the cleaved mutanthtt fragment formed β sheets, as detected by CD signal (Figure 4.8d). Protease wasadded in excess amount, this seeding effect is partly bypassing the lag phase [181],however, under same experimental conditions and the same concentration, these ef-fects should affect the aggregation process equally. The resulting lag phase or reactionrates can be compared within the experiment. The completeness of the cleavage waschecked by running the western blot of different concentrations. After 30 min only, aband corresponding to GST-htt exon1 was disappeared, as seen in MW7 blot (Figure4.8c). While conducting the aggregation experiments, there was a positive correlationof standard deviation of Th-T intensity with time observed. This kind of relation-ship is observed in many traces presented here, this could mean higher number ofaggregates formed with time yield higher standard deviation. It is possible that theaggregates which are undetected by Th-T fluorescence can be detected by observa-tion of standard deviation of Th-T intensity with time. In fact, on observing standarddeviations in Q20 and Q32 samples where Th-T intensity remained constant showedincrease of standard deviation with time (Supplimentary figure 5.5), this confirmedthe aggregation proceeding even in Q20 sample.
53

CHAPTER 4. RESULTS AND DISCUSSION
0 1 2 3 4 50
200
400
600
800
1000
0.000
0.005
0.010
0.015
0.020
0.025
Concentration (µM)
4 µM sample1 µM sample
Ab: MW7
0 30
55 kDa
25 kDa
15 kDa
0 30
Protease:
Time (min):
Lag tim
e (
min
)
Rate
consta
nt
-1 (m
in)
0 1000 2000
1.0
1.5
2.0
2.5
time (min)
1 µM
2 µM
3 µM
4 µM
•▪▲▼
I (n
orm
aliz
ed)
a) b)
c)
Figure 4.8: Cleavage and aggregation of GST fused htt exon1 Q55: a) Th-Tfluorescence assay in the presence of different concentrations of protein. b) Extractedkinetic parameters, Lag time (grey), Rate constant (Blue). Lines are shown to guidethe reader. c) Western blot analysis after 30 min of cleavage of 1 µM and 4 µMsample. After 30 min, fused protein was cleaved and it disappeared completely (55kDa band) d) CD spectra of htt exon1 Q55 before and after cleavage. Error barsrepresent SD; sample size, n=4.
54

4.2. HUNTINGTIN EXON1 AGGREGATION KINETICS
4.2.2 Effects of macromolecular crowders and osmolytes
The effects of macromolecules and osmolytes on the overall compactness of a moleculeand the resulting effects on the aggregation was the next step to study if there is anycorrelation between compact/extended conformations and the aggregation ability.
Macromolecular crowders
As already mentioned in the introduction, the end to end distance of fluorophore-tagged htt exon1 Q (n) proteins were studied under different Ficoll concentrations.The aggregation ability was investigated using Th-T experiments performed on thecleavage reaction of GST-htt exon1 Q55. Ficoll induced monotonous compaction ofall fluorophore-tagged htt exon1 Q(n) protein samples as indicated by a lower D/A(Figure 4.9a). This effect might come from the excluded volume effect [120, 183] ofmacromolecular crowders on biomolecules. To rule out the possibility of intermolecu-lar FRET increasing with higher crowding, D/A ratio of AcGFP1 and mCherry alonewas also studied at different Ficoll concentrations. No change in D/A ratios of thismixture was observed at higher Ficoll concentrations (Figure 4.9a, Blue solid line).Addtionally, concentration dependence of D/A ratios was checked for Q0, Q17 andQ58 samples. There was no difference in D/A ratios observed between undiluted and4 times diluted samples (Supplimentary figure 5.6). These two experiments suggestedthat a decrease of D/A observed on increasing Ficoll concentration was not simplybecause of increase of intermolecular FRET effective concentration of protein. Anintramolecular-FRET control (Q0) sample with missing htt exon1 in between the flu-orophores also showed compaction, albeit to a lesser extent (Figure 4.9a, solid blackline). In this control sample, a five amino acid long sequence, DIGKL was linking theflurophores. The compaction observed could be due to the compaction of this chain[183]. To verify that the observed compaction was caused by an excluded volume effectof the long-chained polysaccharide ficoll, the effect of its monomer, sucrose was stud-ied. The same weight fractions of sucrose instead, showed a slight expansion up to the10% W/V of sucrose (Figure 4.9a, dashed lines). All samples were incubated at 4oCand were observed again after 5 days (Figure 4.9b-4.9e). All the samples containing ahigher percentage of Ficoll showed lowering of D/A (Dashed line) compared to whatwas reported on the first day (Solid line). Less difference was observed in case of theQ17 sample due to lesser aggregation (Figure 4.9b). In sucrose samples, the decreaseof D/A was observed after 5 days but not as dramatic as in the Ficoll samples. To testthe effects of the crowder induced compaction on the aggregation propensity of httexon1, fragments without fluorophores were studied (Figure 4.10). Aggregation of thehtt exon1 proteins was monitored by a Th-T aggregation assay, as described in thesection 4.2.1. The GST fused proteins are cleaved and after 1 hour, when the cleavageis complete, the protein samples are transferred to the buffers containing different con-centrations of Ficoll or sucrose. Htt exon1 Q55 showed a clear decrease of the lag timeunder crowding (Figure 4.10). Htt exon1 Q32 showed aggregation only under highlycrowded solution (30% ficoll). Htt exon Q20 did not show any aggregation in any
55

CHAPTER 4. RESULTS AND DISCUSSION
Figure 4.9: Effect of macromolecular crowder: a) D/A ratios of htt exon1Q(n) (Q17-purple, Q36-green, Q58-orange) samples were measured under differentFicoll (solid lines)/sucrose (dashed lines) concentrations. Intramolecular-FRET con-trol (Q0-black) is the D/A ratio of the fused fluorophores with no htt in between.Intermolecular-FRET control is D/A ratio of AcGFP1 alone and mCherry alone mix-ture (blue). D/A ratios of Ficoll samples were observed after 5 days of Q17 sampleb), Q36 sample c), Q58 sample d) and those of sucrose samples e). The ratios on firstday (solid lines) are compared with those at day 5 (dotted lines). Error bars representSD, sample size, n=3. Lines are shown to guide the reader.
56

4.2. HUNTINGTIN EXON1 AGGREGATION KINETICS
0 500 1000
0.8
1.0
1.2
1.4
Time (min.)
I(norm
aliz
ed)
Q20
Q20 10 % ficoll
Q20 30% ficoll
Q32
Q32 10% ficoll
Q32 30% ficoll
Q55
Q55 2% ficoll
Q55 5% ficoll
Q55 10% ficoll
Q55 30% ficoll•
•••••
•••••
Figure 4.10: Aggregation curves in the presence of ficoll: Th-T fluoroscencewas monitored for the cleavage reaction of GST fused proteins of Q20 (green lines),Q32 (blue lines), Q58 (red lines) samples. At higher Ficoll concentration, the lagphase of Q55 curves shortened. Q32 sample showed a slight rise in Th-T intensity at30% W/V of Ficoll. The solid lines shown are sigmoidal fits. Error bars represent SDof mean, n=5.
conditions (Appendix figure 5.2) . From SEC, only the Q17 sample’s fractions con-taining monomers were pooled which appeared to be mostly disordered structure inthe CD spectroscopy experiments (Figure 4.7). The compaction of Q17 sample shouldrepresent the compaction of a monomer with only negligible contributions from highmolecular weight oligomers or aggregates. Similar extent of compaction even in Q36and in Q58 samples suggested that these samples either had significant monomerspresent or the monomers packed in the oligomers were sensitive to macromolecules.In the Q36 sample, there should be a majority of monomeric and low molecular weightmultimeric species present, however, in case of Q58 fragment, significant amount ofoligomers were present. These oligomers should resist compaction up to a certainextent. Up to, 10% W/V of ficoll, the compaction of Q58 sample was not as much asin the Q17 and Q36 fragment (Figure 4.9a). After 20% W/V of ficoll, Q58 fragmentwas compacted just like other shorter variants. Similar resistance to temperature-induced changes were observed in the Q93 sample imaged with an inverted fluores-cence microscope. In this experiment, the fluorophore-tagged samples were exposedto laser-induced thermal heating. The change of D/A was imaged on heating (Figure4.11). Q17, Q36 and Q58 samples showed temperature-induced changes, whereas, Q0and Q93 sample resisted this change. The Q0 sample had too short chain to observedetactable change upon unfolding or compaction, therefor the D/A ratio of Q0 sampleshould not change. Despite of that, the change of D/A which was observed in case ofQ0 sample can be described as temperature dependent intrinsic response of the indi-vidual fluorophores to the temperature. Q93 samples showed a similar trend as Q0 upto 35oC and then it deviated slightly. The reason could be that already formed rigid
57

CHAPTER 4. RESULTS AND DISCUSSION
0,95
0,97
0,99
1,01
1,03
1,05
1,07
1,09
1,11
25 30 35 40 45 50 55
Q0
Q17
Q36
Q58
Q93
D/A
(n
orm
aliz
ed
)
T emperature /°C
Figure 4.11: Temperature-induced change in fluorophore-tagged htt exon1Q(n): Error bars represent SD of mean; sample size: n=2 for Q0, n=6 for Q17, n=3for Q36, n=3 for Q58, n=4 for Q93.
oligomers or aggregates in the Q93 sample resisted the temperature dependent changeto some extent, and whatever change observed in the lower temperature range wasmostly due to the intrinsic response of the fluorophores to temperature. The intrinsicresponse of a fluorophore is a change in temperature-dependent quantum yield of thefluorophore. The temperature-induced change in D/A observed in the other proteinsamples proceeded in another direction, this could be attributed to the predominanceof a response of monomeric species in lower polyQ proteins. In a similar experimentinside cells [171], it was observed that the diffused cytoplasm, ”non-mature IBs” and”mature IBs” resist the temperature-induced change (compaction) with the ”matureIBs” being the strongest to resist. Mature IBs have rigid aggregates which resist thetemperature-induced change, wheras, diffused cytoplasm does not. In the in vitroresults presented here, Q93 sample should also have rigid oligomers or aggregateswhich does not respond to temprature as other smaller polyQ fragments. Excludedvolume effect can have basically two consequences on biological polymers. One is com-paction, another, can be self-association. The macromolecular crowders are reportedto compact and stabilize the many ordered proteins [184, 185], however, in case ofnatively unfolded proteins, these crowders are reported to increase self-association,[186, 187]. This is because in these proteins, self-association should yield more stablestructure than any compact monomeric form. In natively folded proteins, there ishigh energy barrier for self-associated states [188]. Here, it was also observed thatlonger htt fragments aggregate faster even in slightly higher fraction of crowders. Httexon1 Q55 alone and fluorophore-tagged Q58 fragment showed amount of oligomersor aggregates. Aggregates are mechanically stable structures [189] and it should notbe possible to observe such change in the D/A ratio in the presence of only aggre-gates, this means that there should be loosely packed oligomers along with monomerswhich still could allow compaction of monomers within oligomers. These loosely
58

4.2. HUNTINGTIN EXON1 AGGREGATION KINETICS
packed aggregates should correspond to ”non-mature” aggregates seen inside cells influorophore-tagged htt exon1 Q146 [171]. There are many studies which reports thathtt aggregation proceeds without involvement of non-amyloid intermediates [110, 90].These studies were done on polyQ peptides with missing the N17 region. Thakur etal. [48] and Jayaraman et al.[83] have shown that N17 recruits disordered monomersvia inter-helical association. The increased local concentration of polyglutamine se-quences then leads to formation of β sheet rich aggregates. It is possible that the αhelical signal which was observed in cleaved htt exon1 Q55 and in fluorophore-taggedhtt exon1 Q58 can be attributed to these oligomers. And the compaction observedin the presence of Ficoll could be the compaction of disordered monomers looselypacked in these oligomers. From FRET and light scattering studies Murphy et al.have observed the inverse correlation between persistence length and the aggregationin polyQ peptides [63]. This means that the collapsed structure is associated with anincreased aggregation. For more structural details, Thakur and Wetzel [118] have per-formed a mutational analysis on the polyQ tract and inserted turn inducers and turnbreakers in between the polyQ stretch. Analyzing the aggregation behaviour in vitroand in vivo [118], they proposed the beta-strand/beta-turn model. According to thismodel, the conformation of polyQ with alternate β strand and β turn with seven toeight residues per strand is associated with the polyQ aggregation and toxicity [118].Recently Hoop et al. have performed a solid state NMR study and proposed a modelfor the polyglutamine structure inside the aggregate [109]. The aggregate containsmonomer with intramolecular β hairpins with interdigitated side chains [109]. Dueto this compaction, the oligomers were stabilized. The higher percentage of crowderscould promote compaction of monomers within the oligomer which in turn could formsuch β strand/β turn structures inside. Finally, more and more monomers convertinto such structures within an oligomer and form interdigitated side chains leading tothe development of mature amyloid aggregates.
59

CHAPTER 4. RESULTS AND DISCUSSION
Effect of osmolytes
Crowders exert their effect mainly by excluded volume effect and non-denaturingosmolytes do so with the involvement of enthalpic component by preferentially hy-drating the surface of biomolecules. After observation of htt conformations and theaggregation, in the presence of crowder, it was interesting to observe the same in thepresence of osmolytes. The osmolytes used here are composed of majorly two classesof chemicals; sugars and methylamines. The sugars used here are monosaccharide;glucose and two disaccherides; sucrose and trehalose. Methylamines used here arezwitterions at physiological pH.The sugars either did not change or slightly increased D/A ratio of htt exon1 Q58(Figure 4.12a). On the other hand, except for proline, glycine and methylamines de-creased the D/A ratio of the protein. The preferential binder urea [190] showed anincrease of D/A of htt exon1 Q58. The aggregation assay was performed on GST-fused htt exon1 Q55. Sucrose slightly delayed the aggregation of huntingtin (Figure4.12c). Trehalose had no significant effect on the aggregation. Glycine, sarcosine andbetaine significantly accelerated the aggregation process. Sarcosine was the strongestin its effect on aggregation half time and the rate constant (Appendix figures; Figure5.7, Figure 5.8). Urea did not show any aggregation up to the time the fluorescencemonitored. Urea is expected to bind to the polypeptide backbone and to denatureand expand the protein [190]. Urea can interrupt already formed intramolecular βhairpins [191] in the monomers or in the monomers within the oligomers, this also canresult in the expansion indicated by an increase of D/A. Non-denaturing osmolytes,in general, are not favoured at the protein surface and excluded from the surface[192, 193]. This will preferentially hydrate the unfolded protein surface which desta-bilizes the unfolded state [16, 17] and ultimately leads to partial or complete folding ofthe globular proteins. Htt exon1 does not have a stable fold. The only way to protectthe protein surface from the solvent would then be compaction of polypeptide chainor self-assembly. Lowering of D/A observed was possibly due to compaction of thedisordered chain of htt exon1 Q58. The sugars were not as effective as methylaminesin accelerating the aggregation process. These disparate actions of osmolytes cannotbe explained only by preferential exclusion principle. There is also a contradictorytheory which suggests binding of osmolytes to the native state and thus stabilizingit [194, 195]. Some researchers also claim the combination of preferential exclusionand preferential binding [196, 197]. It has been found that folding or unfolding ofthe protein will depend on the balance between backbone-solvent interaction and sidechain-solvent interaction [197, 134]. In urea, both interactions are favoured whichdenatures the protein, whereas in other osmolytes, these two forces can work againsteach other [198, 197]. It is possible that in sugar solutions, preferential binding mech-anism dominates over preferential exclusion. The polar amide side chains of polyQbackbone can favour interactions with sugars. And sucrose, in this case, binds and sta-bilize the monomer. Such binding effects of trehalose to polar side chains have alreadybeen demonstrated [194, 195]. From the given data, it is not possible to quantitate
60

4.2. HUNTINGTIN EXON1 AGGREGATION KINETICS
and dissect how or if two different mechanisms are operating. But the possible reasoncausing expansion in the presence of sucrose points towards the mechanism other thanjust an excluded volume effect. The alteration of D/A in the presence of osmolytecould also be due to the effects of osmolytes on the fluorophore itself. For checkingthe effects of osmolytes on mCherry, mCherry fluorophore in the fluorophore-taggedQ58 fragment was directly excited and the intensity was observed in the presence ofdifferent osmolytes. The fluorescence of mCherry was not significantly affected byall the osmolytes but in sucrose and in betaine (Figure 4.12b). In 0.5 M sucrose,the mCherry fluorescence was higher than the control. But this effect should lead tolower D/A. Despite this higher mCherry fluorescence, higher D/A was observed incase of full protein, this means that the higher FRET which was observed was notbecause of a sucrose’ effect on mCherry. In case of betaine, lower mCherry intensitywas observed compared to the control. Despite low mCherry fluorescence, lower D/Awas observed in case of betaine. Again, it can be concluded that lower D/A in thepresence of betaine was not due to an effect of betaine on the mCherry fluorophore.The D/A ratio was obtained by exciting donor and by observing the donor and accep-tor emission. While here, the emission of both depends on the donor quantum yield.Consequently, the donor quantum yield will get cancelled out in the ratio, this is thereason why only mCherry was considered for studying the effect of osmolytes.
61

CHAPTER 4. RESULTS AND DISCUSSION
70
72
74
76
78
80
1200
1250
1300
1350
1400
1450
1500
1550
1600
**
**
**
***
**
**I (
a.u
.)
0.2 0.4 0.6
0
200
400
600
Concentration (M)
Sucrose
Trehalose
Glycine
Sarcosine
Betaine
b)
No
osm
olyte
0 .5M
glu
cose
0 .5M
s uc r o
s e
0 .5M
t reh
a l os e
0 .5M
TM
AO
0.5M
pro
l ine
0 .5M
gly
c ine
0 .5M
be ta
ine
0 .5M
c hol in
e
0 .5M
ure
a
No
osm
olyte
0 .5M
glu
cose
0 .5M
s uc r o
s e
0 .5M
t reh
a l os e
0 .5M
TM
AO
0.5M
pro
l ine
0 .5M
gly
c ine
0 .5M
be ta
ine
0 .5M
c hol in
e
0 .5M
ure
a
D/A
c)
t (
min
)5
0
a)
Figure 4.12: Effect of osmolytes: a) D/A ratios of Fluorophore-labelled htt exon1Q58 protein in the presence of different osmolytes; sample size, n=5. b) Effects os-molytes on fluorescence intensity of mCherry; sample size, n=3. c) Th-T assay aggre-gation kinetics: Aggregation half time in the presence of different concentrations anddifferent osmolytes. GST tag was cleaved off from htt exon1 Q55 and the aggregationwas monitored. Sugars delayed the half time (Sucrose-dark green circle) or had noeffect (Trehalose-light green squares), whereas, glycine and its derivatives (Glycine-Orange triangles; Sarcosine-Red inverted triangles; Betaine-Brown diamonds) werefound to reduce the aggregation half time. One-way ANOVA with Tukey’s test formultiple comparison was used. ”*” indicates p ≤ 0.05, ”**” indicates p ≤ 0.01. Errorbars represent SD of mean; sample size, n=4
62
4.3. EFFECTS OF MOLECULAR TWEEZERS
4.3 Effects of molecular tweezers
As already discussed that the N17 region plays an important role in the htt aggrega-tion by initiating self-association followed by helix-rich oligomers [83, 48]. In fact, theresults presented here showed an indication of the presence of such α helical structuresin the mutant htt exon1 alone and even with fluorophore tags. From SEC and initialD/A data also it was clear that these helical structures are associated with the mul-timeric states. Molecular tweezers, as already mentioned in the introduction (See 2.5are lysine binders [199]. Lysine is an important amino acid involved in inter-helicalassociation [200]. The effects of molecular tweezer on the secondary structure of themutant htt exon1 Q55 was investigated by CD spectroscopy. The effect of tweezeron the aggregation was probed by Th-T. For probing structural changes of htt exon1Q55 in the presence of CLR01, CD spectroscopy was used. CLR01 was added inprotein to CLR01 ratio of 1:10 and 1:20. As a control, the spectra of the peptidealone or in the presence of the spacer molecule CLR03 (ratio 1:20) were measured.Upon addition of CLR01, there was an alteration of a spectrum observed (Figure4.13a). The signal intensity at 222 nm was lowered. Additionally, there was a slightshift of 210 minimum observed towards lower wavelengths. These changes could beattributed to a decrease of helical content and to an increase in the disorder of thepeptide. Secondary structure was calculated with the help of JASO’s secondary struc-ture estimation tool using Yang’s reference [201]. Secondary structure analysis clearlyshowed the progressive decrease of helical content on increasing CLR01 concentrationcompared to htt exon1 (Figure 4.13b). Statistically significant differences could beobserved between the controls (Peptide alone or CLR03) and the sample (ratio 1:10and 1:20) with p ≤ 0.01. Along with these studies, REMD simulations were alsoconducted by S.Mittal (Unpublished work). These simulation studies also showed thebinding of tweezers with the lysine residue of the N17 region. This binding led toa decrease of helical content, also seen in the simulations. Thus, experimental andcomputational (Unpublished simulation study by S.Mittal) results evidenced that thebinding of CLR01 induces structural changes in htt exon1, converting the mostly α-helical structure of the N17 domain into a turn or coil conformation.After studying the structural effects of CLR01, it was necessary to study its impact
on the aggregation propensity of mutant htt exon1. For the aggregation experiment,a Th-T aggregation assay was conducted. The htt exon1 Q55 was cleaved off fromthe GST tag and then it was incubated in the absence and the presence of CLR01and CLR03. A decrease in the aggregation rate and the amplitude in the presenceof CLR01 was observed (Figure 4.14). Among two ratios studied, a decrease in theaggregation rate was significantly higher with the molar ratio of 1:20. The effect ofthe spacer molecule, CLR03 was also studied. No inhibition of aggregation was ob-served in the presence of CLR03, in fact, faster aggregation was seen in case of CLR03sample. Such enhancement of aggregation in the presence of CLR03 is already re-ported on Aβ [202]. CLR03 possibly, accelerates the formation of small amorphousaggregates. It is possible that CLR01 also induces the rapid formation of amorphous
63

CHAPTER 4. RESULTS AND DISCUSSION
210 220 230 240 250
-8000
-6000
-4000
-2000
0
2000
Htt exon 1 Q55
Htt exon 1 Q55:CLR01 1:10
Htt exon 1 Q55:CLR01 1:20
Htt exon 1 Q55:CLR03 1:20
Wavelength (nm)
2-1
θ(d
eg•c
m•d
mol
)m
re
0
10
20
30
40
**
ns
***
Helic
al c
onte
nt [%
]
Htt
exon
1 Q
55
Htt
exon
1 Q
55:C
LR01
1:1
0
Htt
exon
1 Q
55:C
LR01
1:2
0
Htt
exon
1 Q
55:C
LR03
1:2
0
a)
b)
Figure 4.13: Effect of Molecular Tweezers: a) Mean residue ellipticities inthe absence and presence of different ratios of protein to tweezers. Ellipticitiy valuedecreased specifically at 222 nm in case of CLR01 samples (Magenta and red lines). b)Secondary structure estimation by use of JSCO analysis software. Y-axis representsα helix content. Error bars represent SD of mean; sample size, n=3.
64

4.3. EFFECTS OF MOLECULAR TWEEZERS
0 500 1000 1500
1.0
1.2
1.4
1.6
Time (min)
Htt exon 1 Q55
Htt exon 1 Q55:CLR01 1:10
Htt exon 1 Q55:CLR01 1:20
Htt exon 1 Q55:CLR03 1:10
Htt exon 1 Q55:CLR03 1:20
I (n
orm
aliz
ed)
Figure 4.14: Effect of Molecular Tweezers: The GST tag was cleaved off andthe aggregation was monitored over time in the absence and presence of tweezers,CLR01 and CLR03. Error bars represent SD of mean; sample size, n=4; sample size,n=3 in case of sample containing CLR03 in 1:20 ratio.
aggregates. But it seems that by binding to lysine, the aggregation inhibition abilitydominates.
In summary, experiments revealed binding of CLR01 which is associated with de-crease of α helical content together with deceleration of aggregation. The bindingof CLR01 to lysine residues leads to a loss in α-helical content of the N17 domain,thereby diminishing the amphipathic nature [61, 84] of the domain, this is in agree-ment with earlier studies that have shown that the amphipathic, helical structure ofthe N17 domain is crucial for its self-association [203, 83]. CLR01 decelerates aggre-gation in a concentration dependent manner in vitro, this confirms the important roleof the N17 domain in aggregation [203, 83]. These findings emphasize that CLR01 isan inhibitor of polyQ related amyloid aggregation. CLR01 binding to the N17 domaincould represent a novel therapeutic approach to treat HD.
65

Chapter 5
Summary and Conclusion
The objectives of the study were: 1) The biophysical characterization of htt exon1and its aggregation reaction. 2) To study the effects of an artificial crowding agentand osmolytes and 3) To study the effects of molecular tweezers. Here, recombinantfull length htt exon1 proteins with three different polyQ lengths were characterized.Western blot and CD spectroscopy data of exon1 with shorter polyQ revealed mostlydisordered structures of the monomer which may represent structure I in Figure 5.1.Western blot, SEC combined with CD spectroscopy did suggest the presence of αhelix-rich oligomers (tetramers and higher order oligomers) in longer polyglutaminelengths which may represent structures II, III, IV in figure 5.1. These results sup-port the model proposed by Wetzel et al. [58] which suggests the involvement of αhelix-rich oligomers on the way to amyloid formation. Western blot, Th-T assaysand AFM data showed that the normal length variants Q20 and Q32 are also ca-pable of oligomerizing and aggregating at detectable levels at higher concentrationsor under higher crowding. This has challenged the theory of structural changes af-ter the crossing of the threshold limit of 36 glutamine repeats. In SEC and nativePAGE, the fluorophore-tagged Q93 variant showed the presence of soluble β sheet-richoligomers which may represent structures V, VI in Figure 5.1. These oligomers weremore rigid than monomers and resisted the temperature-induced change as indicatedin temperature-induced D/A measurements. A concentration-dependent aggregationstudy suggested nucleation-dependent aggregation of full length htt exon1.Study of end to end distance changes in the presence of Ficoll suggested the com-paction of htt exon1. In a parallel study with cleaved htt exon1, higher crowding(2-10% W/V) showed faster aggregation with htt exon1 Q55. Aggregation of Q32variant only under higher crowding (30% W/V), showed that the aggregation-pronecompact structures are induced under crowding (Figure 5.1, structure IV). The os-molytes which compacted the htt exon1 showed faster aggregation and the osmolytesexpanding it slightly delayed (Sugars) or abrogated (Urea) the aggregation, this con-firms the positive correlation of compact structures and enhanced aggregation.Finally, α helix-rich oligomers seen in case of htt exon1 Q55 were targeted with thenovel class of molecules called molecular tweezers. These molecular tweezers found
66

to decrease the helical content of htt exon1, as seen by CD spectroscopy and de-celerated the aggregation indicated by longer lag time in Th-T aggregation assay.Molecular tweezers bind to lysine and disrupt the amphipathicity of the helix, shownby simulation study (Unpublished work from S.Mittal). The experiments performedwith tweezers confirm the role of lysine in inter-helical association of N17. Moleculartweezer has been proved to be an important lead molecule on which further optimiza-tion can be performed.The biophysical characterization of htt exon1 confirmed the disordered monomericstructure and α-helix-rich oligomeric structures of htt exon1. The α-helical structureof these oligomers can be disrupted by molecular tweezers which results into inhibitionof amyloid aggregation. Finally, htt exon1 was observed to form compact structuresin the environment mimicking interior of the cell. These compact structures led toenhanced aggregation suggesting the involvement of compact conformations of httexon1 in the toxicity in HD. More experiments are needed for investigating structuraldetails of the effects of crowders and osmolytes on the htt exon1 by using CD andNMR approach. Further investigation of a role of a polyglutamine backbone and aside chain in differential effects of osmolytes can help more in our understanding ofthermodynamics of polyQ chain. There is no consensus regarding which states ofhtt are toxic; monomeric, oligomeric or aggregates. Many groups investigating toxiceffects of htt point towards diffusible oligomeric states [204]. The effects of moleculartweezer, CLR01 on the toxicity of mammalian cells can be the next experiment tobe undertaken, however, one should be careful about the formation of amorphousoligomers on blocking amyloid pathway, as, polyQ is a sticky chain, and it will findits way to self-associate.
67

CHAPTER 5. SUMMARY AND CONCLUSION
n
n
CrowdingOsmolytes
CLR01
CLR01
I II III
IVV
VIN17
PolyQ
PolyP
CrowdingOsmolytes
Alpha helix
Beta sheet
Figure 5.1: Proposed mechanism of action of crowders, osmolytes anda molecular tweezer, CLR01 : In longer polyQ stretch, disordered monomeris in equilibrium with tetramers [58] (Structure I, II). After, formation of criticalnucleus (Structure III), forward association reaction is favoured more over dissociation[58]. Crowders and osmolytes compact the disodered polypeptide chain and induceβ hairpin structure (Structure IV), the structures which are proposed in [118] whichfurther favours oligomerization and aggregation. Molecular tweezer, CLR01 disruptsthe helical structures (Structure II, III, IV) and their association which does notfavour amyloid formation (Structure VI). Model adapted and redrawn from [58] withauthor’s permission.
68

Bibliography
[1] Ian Sillitoe, Tony E Lewis, Alison Cuff, Sayoni Das, Paul Ashford, Natalie LDawson, Nicholas Furnham, Roman A Laskowski, David Lee, Jonathan G Lees,et al. Cath: comprehensive structural and functional annotations for genomesequences. Nucleic acids research, 43(D1):D376–D381, 2015.
[2] Aaron K Chamberlain, Tracy M Handel, and Susan Marqusee. Detection ofrare partially folded molecules in equilibrium with the native conformation ofrnaseh. Nature structural biology, 3(9):782–787, 1996.
[3] Herman Van Dael Shaun D. Hooke Nicholas D. Woodruff Christopher M. Dob-son Petra Haezebrouck, Marcel Joniau. An equilibrium partially folded stateof human lysozyme at low ph. Journal of Molecular Biology, 246(3):382–387,1995.
[4] Vladimir N Uversky, Jie Li, and Anthony L Fink. Evidence for a partially foldedintermediate in α-synuclein fibril formation. Journal of Biological Chemistry,276(14):10737–10744, 2001.
[5] Michelle KM Chow, Henry L Paulson, and Stephen P Bottomley. Destabi-lization of a non-pathological variant of ataxin-3 results in fibrillogenesis via apartially folded intermediate: a model for misfolding in polyglutamine disease.Journal of molecular biology, 335(1):333–341, 2004.
[6] Mikael J Lindberg, Roberth Bystrom, Niklas Boknas, Peter M Andersen, andMikael Oliveberg. Systematically perturbed folding patterns of amyotrophiclateral sclerosis (als)-associated sod1 mutants. Proceedings of the NationalAcademy of Sciences of the United States of America, 102(28):9754–9759, 2005.
[7] Jakob T Nielsen and Frans AA Mulder. There is diversity in disorderin allchaos there is a cosmos, in all disorder a secret order. Frontiers in molecularbiosciences, 3, 2016.
[8] A Keith Dunker, Celeste J Brown, J David Lawson, Lilia M Iakoucheva,and Zoran Obradovic. Intrinsic disorder and protein function. Biochemistry,41(21):6573–6582, 2002.
69

BIBLIOGRAPHY
[9] Vladimir N Uversky. Natively unfolded proteins: a point where biology waitsfor physics. Protein science, 11(4):739–756, 2002.
[10] Fabrizio Chiti and Christopher M Dobson. Amyloid formation by globularproteins under native conditions. Nature chemical biology, 5(1):15–22, 2009.
[11] Christian B Anfinsen. Studies on the principles that govern the folding of proteinchains, 1972.
[12] Vishwas R Agashe, MCR Shastry, Jayant B Udgaonkar, et al. Initial hydropho-bic collapse in the folding of barstar. Nature, 377(6551):754–757, 1995.
[13] Munehito Arai and Kunihiro Kuwajima. Rapid formation of a molten globuleintermediate in refolding of α-lactalbumin. Folding and Design, 1(4):275–287,1996.
[14] Darwin Alonso, Valerie Daggett, et al. Molecular dynamics simulations of hy-drophobic collapse of ubiquitin. Protein Science, 7(4):860–874, 1998.
[15] Ruhong Zhou, Xuhui Huang, Claudio J Margulis, and Bruce J Berne. Hydropho-bic collapse in multidomain protein folding. Science, 305(5690):1605–1609, 2004.
[16] Yuichi Harano and Masahiro Kinoshita. Large gain in translational entropyof water is a major driving force in protein folding. Chemical physics letters,399(4):342–348, 2004.
[17] Ariel Fernandez. The principle of minimal episteric distortion of the watermatrix and its steering role in protein folding. The Journal of chemical physics,139(8):085101, 2013.
[18] Jose Nelson Onuchic and Peter G Wolynes. Theory of protein folding. Currentopinion in structural biology, 14(1):70–75, 2004.
[19] David J Brockwell and Sheena E Radford. Intermediates: ubiquitous species onfolding energy landscapes? Current opinion in structural biology, 17(1):30–37,2007.
[20] Tural Aksel and Doug Barrick. Direct observation of parallel folding path-ways revealed using a symmetric repeat protein system. Biophysical journal,107(1):220–232, 2014.
[21] Cyrus Levinthal. How to fold graciously. Mossbauer spectroscopy in biologicalsystems, 67:22–24, 1969.
[22] Joseph D Bryngelson, Jose Nelson Onuchic, Nicholas D Socci, and Peter GWolynes. Funnels, pathways, and the energy landscape of protein folding: asynthesis. Proteins: Structure, Function, and Bioinformatics, 21(3):167–195,1995.
70

BIBLIOGRAPHY
[23] Massimo Stefani. Protein misfolding and aggregation: new examples in medicineand biology of the dark side of the protein world. Biochimica et Biophysica Acta(BBA)-Molecular Basis of Disease, 1739(1):5–25, 2004.
[24] Vladimir N Uversky. Intrinsically disordered proteins from a to z. The interna-tional journal of biochemistry & cell biology, 43(8):1090–1103, 2011.
[25] Laurence Bonar, Alan S Cohen, and Martha M Skinner. Characterization ofthe amyloid fibril as a cross-β protein. Experimental Biology and Medicine,131(4):1373–1375, 1969.
[26] Margaret Sunde and Colin Blake. The structure of amyloid fibrils by electronmicroscopy and x-ray diffraction. Advances in protein chemistry, 50:123–159,1997.
[27] Michael R Sawaya, Shilpa Sambashivan, Rebecca Nelson, Magdalena I Ivanova,Stuart A Sievers, Marcin I Apostol, Michael J Thompson, Melinda Balbirnie,Jed JW Wiltzius, Heather T McFarlane, et al. Atomic structures of amyloidcross-&bgr; spines reveal varied steric zippers. Nature, 447(7143):453–457, 2007.
[28] Massimo Stefani and Christopher M Dobson. Protein aggregation and aggregatetoxicity: new insights into protein folding, misfolding diseases and biologicalevolution. Journal of molecular medicine, 81(11):678–699, 2003.
[29] Linda R De Young, Anthony L Fink, and Ken A Dill. Aggregation of globularproteins. Accounts of chemical research, 26(12):614–620, 1993.
[30] Michelle KM Chow, Andrew M Ellisdon, Lisa D Cabrita, and Stephen P Bot-tomley. Polyglutamine expansion in ataxin-3 does not affect protein stabil-ity implications for misfolding and disease. Journal of Biological Chemistry,279(46):47643–47651, 2004.
[31] Mihael H Polymeropoulos, Christian Lavedan, Elisabeth Leroy, Susan E Ide,Anindya Dehejia, Amalia Dutra, Brian Pike, Holly Root, Jeffrey Rubenstein,Rebecca Boyer, et al. Mutation in the α-synuclein gene identified in familieswith parkinson’s disease. science, 276(5321):2045–2047, 1997.
[32] Kazuma Murakami, Kazuhiro Irie, Akira Morimoto, Hajime Ohigashi, MayumiShindo, Masaya Nagao, Takahiko Shimizu, and Takuji Shirasawa. Neurotoxic-ity and physicochemical properties of aβ mutant peptides from cerebral amy-loid angiopathy implication for the pathogenesis of cerebral amyloid angiopathyand alzheimer’s disease. Journal of Biological Chemistry, 278(46):46179–46187,2003.
[33] Peter E Wright and H Jane Dyson. Linking folding and binding. Current opinionin structural biology, 19(1):31–38, 2009.
71

BIBLIOGRAPHY
[34] Jens Danielsson, Juri Jarvet, Peter Damberg, and Astrid Graslund. Trans-lational diffusion measured by pfg-nmr on full length and fragments of thealzheimer aβ (1–40) peptide. determination of hydrodynamic radii of randomcoil peptides of varying length. Magnetic Resonance in Chemistry, 40(13):S89–S97, 2002.
[35] S Zhang, K Iwata, MJ Lachenmann, JW Peng, S Li, ER Stimson, Y-A Lu,AM Felix, JE Maggio, and JP Lee. The alzheimer’s peptide aβ adopts a col-lapsed coil structure in water. Journal of structural biology, 130(2):130–141,2000.
[36] Scott L Crick, Murali Jayaraman, Carl Frieden, Ronald Wetzel, and Rohit VPappu. Fluorescence correlation spectroscopy shows that monomeric polyglu-tamine molecules form collapsed structures in aqueous solutions. Proceedings ofthe National Academy of Sciences, 103(45):16764–16769, 2006.
[37] Dennis J Selkoe. Normal and abnormal biology of the beta-amyloid precursorprotein. Annual review of neuroscience, 17(1):489–517, 1994.
[38] Roland Riek, Peter Guntert, Heinz Dobeli, Beat Wipf, and Kurt Wuthrich.Nmr studies in aqueous solution fail to identify significant conformational dif-ferences between the monomeric forms of two alzheimer peptides with widelydifferent plaque-competence, aβ (1–40) ox and aβ (1–42) ox. European Journalof Biochemistry, 268(22):5930–5936, 2001.
[39] Axel Abelein, Jan Pieter Abrahams, Jens Danielsson, Astrid Graslund, JuriJarvet, Jinghui Luo, Ann Tiiman, and Sebastian KTS Warmlander. The hairpinconformation of the amyloid β peptide is an important structural motif alongthe aggregation pathway. JBIC Journal of Biological Inorganic Chemistry, 19(4-5):623–634, 2014.
[40] Sandor Lovas, Yuliang Zhang, Junping Yu, and Yuri L Lyubchenko. Molecularmechanism of misfolding and aggregation of aβ (13–23). The journal of physicalchemistry B, 117(20):6175–6186, 2013.
[41] Douglas J Gelb, Eugene Oliver, and Sid Gilman. Diagnostic criteria for parkin-son disease. Archives of neurology, 56(1):33–39, 1999.
[42] W Sean Davidson, Ana Jonas, David F Clayton, and Julia M George. Stabiliza-tion of α-synuclein secondary structure upon binding to synthetic membranes.Journal of Biological Chemistry, 273(16):9443–9449, 1998.
[43] Omar El-Agnaf, Ross Jakes, Martin D Curran, Derek Middleton, Raffaele In-genito, Elisabetta Bianchi, Antonello Pessi, David Neill, and Andrew Wallace.Aggregates from mutant and wild-type α-synuclein proteins and nac peptide in-duce apoptotic cell death in human neuroblastoma cells by formation of β-sheetand amyloid-like filaments. FEBS letters, 440(1-2):71–75, 1998.
72

BIBLIOGRAPHY
[44] Vladimir N Uversky, Jie Li, Pierre Souillac, Ian S Millett, Sebastian Doniach,Ross Jakes, Michel Goedert, and Anthony L Fink. Biophysical properties of thesynucleins and their propensities to fibrillate inhibition of α-synuclein assemblyby β-and γ-synucleins. Journal of Biological Chemistry, 277(14):11970–11978,2002.
[45] Defining Long-Range Order. Local disorder in native α-synuclein using resid-ual dipolar couplings bernado, pau; bertoncini, carlos w.; griesinger, christian;zweckstetter, markus; blackledge. Journal of the American Chemical Society,127(51):17968–17969, 2005.
[46] Liang Xu, Ruth Nussinov, and Buyong Ma. Coupling of the non-amyloid-component (nac) domain and the ktk (e/q) gv repeats stabilize the α-synucleinfibrils. European journal of medicinal chemistry, 2016.
[47] Dhiman Ghosh, Pradeep K Singh, Shruti Sahay, Narendra Nath Jha, Reeba SJacob, Shamik Sen, Ashutosh Kumar, Roland Riek, and Samir K Maji. Struc-ture based aggregation studies reveal the presence of helix-rich intermediateduring [agr]-synuclein aggregation. Scientific reports, 5, 2015.
[48] Ashwani K Thakur, Murali Jayaraman, Rakesh Mishra, Monika Thakur,Veronique M Chellgren, In-Ja L Byeon, Dalaver H Anjum, Ravindra Kodali,Trevor P Creamer, James F Conway, et al. Polyglutamine disruption of thehuntingtin exon 1 n terminus triggers a complex aggregation mechanism. Na-ture structural & molecular biology, 16(4):380–389, 2009.
[49] Andisheh Abedini and Daniel P Raleigh. A role for helical intermediates in amy-loid formation by natively unfolded polypeptides? Physical biology, 6(1):015005,2009.
[50] Tim Bartels, Joanna G Choi, and Dennis J Selkoe. [agr]-synuclein occursphysiologically as a helically folded tetramer that resists aggregation. Nature,477(7362):107–110, 2011.
[51] Per Westermark, Christer Wernstedt, Erik Wilander, David W Hayden, Timo-thy D O’Brien, and Kenneth H Johnson. Amyloid fibrils in human insulinomaand islets of langerhans of the diabetic cat are derived from a neuropeptide-likeprotein also present in normal islet cells. Proceedings of the National Academyof Sciences, 84(11):3881–3885, 1987.
[52] Jefferson D Knight, James A Hebda, and Andrew D Miranker. Conservedand cooperative assembly of membrane-bound α-helical states of islet amyloidpolypeptide. Biochemistry, 45(31):9496–9508, 2006.
[53] Jessica A Williamson and Andrew D Miranker. Direct detection of transientα-helical states in islet amyloid polypeptide. Protein Science, 16(1):110–117,2007.
73

BIBLIOGRAPHY
[54] Christer Betsholtz, Lars Christmansson, Ulla Engstrom, Frederik Rorsman,Viveka Svensson, Kenneth H Johnson, and Per Westermark. Sequence diver-gence in a specific region of islet amyloid polypeptide (iapp) explains differencesin islet amyloid formation between species. FEBS letters, 251(1-2):261–264,1989.
[55] Sorin Luca, Wai-Ming Yau, Richard Leapman, and Robert Tycko. Peptide con-formation and supramolecular organization in amylin fibrils: constraints fromsolid-state nmr. Biochemistry, 46(47):13505–13522, 2007.
[56] Lauren E Buchanan, Emily B Dunkelberger, Huong Q Tran, Pin-Nan Cheng,Chi-Cheng Chiu, Ping Cao, Daniel P Raleigh, Juan J de Pablo, James S Nowick,and Martin T Zanni. Mechanism of iapp amyloid fibril formation involves anintermediate with a transient β-sheet. Proceedings of the National Academy ofSciences, 110(48):19285–19290, 2013.
[57] C Goldsbury, K Goldie, J Pellaud, J Seelig, P Frey, SA Muller, J Kistler, GJSCooper, and U Aebi. Amyloid fibril formation from full-length and fragmentsof amylin. Journal of structural biology, 130(2):352–362, 2000.
[58] Bankanidhi Sahoo, Irene Arduini, Kenneth W Drombosky, Ravindra Kodali,Laurie H Sanders, J Timothy Greenamyre, and Ronald Wetzel. Folding land-scape of mutant huntingtin exon1: Diffusible multimers, oligomers and fibrils,and no detectable monomer. PloS one, 11(6):e0155747, 2016.
[59] Markus S Miettinen, Luca Monticelli, Praveen Nedumpully-Govindan, VolkerKnecht, and Zoya Ignatova. Stable polyglutamine dimers can contain β-hairpinswith interdigitated side chainsbut not α-helices, β-nanotubes, β-pseudohelices,or steric zippers. Biophysical journal, 106(8):1721–1728, 2014.
[60] Anusri Bhattacharyya, Ashwani K Thakur, Veronique M Chellgren, GeethaThiagarajan, Angela D Williams, Brian W Chellgren, Trevor P Creamer, andRonald Wetzel. Oligoproline effects on polyglutamine conformation and aggre-gation. Journal of molecular biology, 355(3):524–535, 2006.
[61] Stephen Tam, Christoph Spiess, William Auyeung, Lukasz Joachimiak, BryanChen, Michelle A Poirier, and Judith Frydman. The chaperonin tric blocks ahuntingtin sequence element that promotes the conformational switch to aggre-gation. Nature structural & molecular biology, 16(12):1279–1285, 2009.
[62] Scott L Crick, Kiersten M Ruff, Kanchan Garai, Carl Frieden, and Rohit VPappu. Unmasking the roles of n-and c-terminal flanking sequences from exon1 of huntingtin as modulators of polyglutamine aggregation. Proceedings of theNational Academy of Sciences, 110(50):20075–20080, 2013.
74
BIBLIOGRAPHY
[63] Robert H Walters and Regina M Murphy. Examining polyglutamine peptidelength: a connection between collapsed conformations and increased aggrega-tion. Journal of molecular biology, 393(4):978–992, 2009.
[64] Wei Wang, Iva Perovic, Johnathan Chittuluru, Alice Kaganovich, Linh TTNguyen, Jingling Liao, Jared R Auclair, Derrick Johnson, Anuradha Landeru,Alana K Simorellis, et al. A soluble α-synuclein construct forms a dynamictetramer. Proceedings of the National Academy of Sciences, 108(43):17797–17802, 2011.
[65] Colin J Barrow, Akikazu Yasuda, Peter TM Kenny, and Michael G Zagorski.Solution conformations and aggregational properties of synthetic amyloid β-peptides of alzheimer’s disease: analysis of circular dichroism spectra. Journalof molecular biology, 225(4):1075–1093, 1992.
[66] Michael G Zagorski and Colin J Barrow. Nmr studies of amyloid. beta.-peptides:proton assignments, secondary structure, and mechanism of an. alpha.-helix. fw-darw.. beta.-sheet conversion for a homologous, 28-residue, n-terminal fragment.Biochemistry, 31(24):5621–5631, 1992.
[67] David Singer, Thomas Zauner, Maika Genz, Ralf Hoffmann, and Thole Zuchner.Synthesis of pathological and nonpathological human exon 1 huntingtin. Journalof Peptide Science, 16(7):358–363, 2010.
[68] Matthias Michalek, Evgeniy S Salnikov, and Burkhard Bechinger. Structureand topology of the huntingtin 1–17 membrane anchor by a combined solutionand solid-state nmr approach. Biophysical journal, 105(3):699–710, 2013.
[69] Buyong Ma and Ruth Nussinov. Simulations as analytical tools to understandprotein aggregation and predict amyloid conformation. Current opinion inchemical biology, 10(5):445–452, 2006.
[70] Albert H Mao, Scott L Crick, Andreas Vitalis, Caitlin L Chicoine, and Rohit VPappu. Net charge per residue modulates conformational ensembles of intrin-sically disordered proteins. Proceedings of the National Academy of Sciences,107(18):8183–8188, 2010.
[71] John E Straub and Devarajan Thirumalai. Principles governing oligomer forma-tion in amyloidogenic peptides. Current opinion in structural biology, 20(2):187–195, 2010.
[72] Miguel A Andrade and Peer Bork. Heat repeats in the huntington’s diseaseprotein. Nature genetics, 11(2):115–116, 1995.
75

BIBLIOGRAPHY
[73] Gareth A Palidwor, Sergey Shcherbinin, Matthew R Huska, Tamas Rasko, Ul-rich Stelzl, Anup Arumughan, Raphaele Foulle, Pablo Porras, Luis Sanchez-Pulido, Erich E Wanker, et al. Detection of alpha-rod protein repeats us-ing a neural network and application to huntingtin. PLoS Comput Biol,5(3):e1000304, 2009.
[74] Frederic Saudou and Sandrine Humbert. The biology of huntingtin. Neuron,89(5):910–926, 2016.
[75] Elena Cattaneo, Dorotea Rigamonti, Donato Goffredo, Chiara Zuccato, Ferdi-nando Squitieri, and Simonetta Sipione. Loss of normal huntingtin function:new developments in huntington’s disease research. Trends in neurosciences,24(3):182–188, 2001.
[76] David C Rubinsztein, Jayne Leggo, Rhian Coles, Elisabeth Almqvist, ValerieBiancalana, Jean-Jacques Cassiman, Kokila Chotai, Margaret Connarty, DavidCraufurd, Anne Curtis, et al. Phenotypic characterization of individuals with30–40 cag repeats in the huntington disease (hd) gene reveals hd cases with 36repeats and apparently normal elderly individuals with 36–39 repeats. Americanjournal of human genetics, 59(1):16, 1996.
[77] Marian DiFiglia, Ellen Sapp, Kathryn O Chase, Stephen W Davies, Gillian PBates, JP Vonsattel, and Neil Aronin. Aggregation of huntingtin in neuronal in-tranuclear inclusions and dystrophic neurites in brain. Science, 277(5334):1990–1993, 1997.
[78] Eberhard Scherzinger, Rudi Lurz, Mark Turmaine, Laura Mangiarini, BirgitHollenbach, Renate Hasenbank, Gillian P Bates, Stephen W Davies, HansLehrach, and Erich E Wanker. Huntingtin-encoded polyglutamine expansionsform amyloid-like protein aggregates in vitro and in vivo. Cell, 90(3):549–558,1997.
[79] T Maiuri, T Woloshansky, J Xia, and R Truant. The huntingtin n17 domainis a multifunctional crm1 and ran-dependent nuclear and cilial export signal.Human molecular genetics, page dds554, 2013.
[80] Randy Singh Atwal, Carly R Desmond, Nicholas Caron, Tamara Maiuri, Jian-run Xia, Simonetta Sipione, and Ray Truant. Kinase inhibitors modulate hunt-ingtin cell localization and toxicity. Nature chemical biology, 7(7):453–460, 2011.
[81] Joan S Steffan, Namita Agrawal, Judit Pallos, Erica Rockabrand, Lloyd C Trot-man, Natalia Slepko, Katalin Illes, Tamas Lukacsovich, Ya-Zhen Zhu, ElenaCattaneo, et al. Sumo modification of huntingtin and huntington’s diseasepathology. Science, 304(5667):100–104, 2004.
76

BIBLIOGRAPHY
[82] Bankanidhi Sahoo, David Singer, Ravindra Kodali, Thole Zuchner, and RonaldWetzel. Aggregation behavior of chemically synthesized, full-length huntingtinexon1. Biochemistry, 53(24):3897–3907, 2014.
[83] Murali Jayaraman, Ravindra Kodali, Bankanidhi Sahoo, Ashwani K Thakur,Anand Mayasundari, Rakesh Mishra, Cynthia B Peterson, and Ronald Wet-zel. Slow amyloid nucleation via α-helix-rich oligomeric intermediates in shortpolyglutamine-containing huntingtin fragments. Journal of molecular biology,415(5):881–899, 2012.
[84] Maciej D lugosz and Joanna Trylska. Secondary structures of native andpathogenic huntingtin n-terminal fragments. The Journal of Physical Chem-istry B, 115(40):11597–11608, 2011.
[85] Stefanie L Butland, Rebecca S Devon, Yong Huang, Carri-Lyn Mead, Ali-son M Meynert, Scott J Neal, Soo Sen Lee, Anna Wilkinson, George S Yang,Macaire MS Yuen, et al. Cag-encoded polyglutamine length polymorphism inthe human genome. BMC genomics, 8(1):1, 2007.
[86] Pamela J Mitchell and Robert Tjian. Transcriptional regulation in mammaliancells by sequence-specific dna binding proteins. Science, 245(4916):371–378,1989.
[87] M Mar Alba and Roderic Guigo. Comparative analysis of amino acid repeatsin rodents and humans. Genome research, 14(4):549–554, 2004.
[88] Paul M Harrison. Exhaustive assignment of compositional bias reveals univer-sally prevalent biased regions: analysis of functional associations in human anddrosophila. BMC bioinformatics, 7(1):1, 2006.
[89] Vijay R Singh and Lisa J Lapidus. The intrinsic stiffness of polyglutaminepeptides. The Journal of Physical Chemistry B, 112(42):13172–13176, 2008.
[90] Karunakar Kar, Murali Jayaraman, Bankanidhi Sahoo, Ravindra Kodali, andRonald Wetzel. Critical nucleus size for disease-related polyglutamine ag-gregation is repeat-length dependent. Nature structural & molecular biology,18(3):328–336, 2011.
[91] Max F Perutz. Glutamine repeats and neurodegenerative diseases: molecularaspects. Trends in biochemical sciences, 24(2):58–63, 1999.
[92] MF Perutz, JT Finch, J Berriman, and A Lesk. Amyloid fibers are water-fillednanotubes. Proceedings of the National Academy of Sciences, 99(8):5591–5595,2002.
[93] Antonello Merlino, Luciana Esposito, and Luigi Vitagliano. Polyglutamine re-peats and β-helix structure: Molecular dynamics study. Proteins: Structure,Function, and Bioinformatics, 63(4):918–927, 2006.
77

BIBLIOGRAPHY
[94] Songming Chen, Valerie Berthelier, Wen Yang, and Ronald Wetzel. Polyg-lutamine aggregation behavior in vitro supports a recruitment mechanism ofcytotoxicity. Journal of molecular biology, 311(1):173–182, 2001.
[95] Laura Masino, Geoff Kelly, Kevin Leonard, Yvon Trottier, and Annalisa Pa-store. Solution structure of polyglutamine tracts in gst-polyglutamine fusionproteins. FEBS letters, 513(2-3):267–272, 2002.
[96] Mee Whi Kim, Yogarany Chelliah, Sang Woo Kim, Zbyszek Otwinowski, andIlya Bezprozvanny. Secondary structure of huntingtin amino-terminal region.Structure, 17(9):1205–1212, 2009.
[97] Meewhi Kim. Beta conformation of polyglutamine track revealed by a crys-tal structure of huntingtin n-terminal region with insertion of three histidineresidues. Prion, 7(3):221–228, 2013.
[98] Brian K Kay, Michael P Williamson, and Marius Sudol. The importance ofbeing proline: the interaction of proline-rich motifs in signaling proteins withtheir cognate domains. The FASEB journal, 14(2):231–241, 2000.
[99] Joshua M Hicks and Victor L Hsu. The extended left-handed helix: A simplenucleic acid-binding motif. Proteins: Structure, Function, and Bioinformatics,55(2):330–338, 2004.
[100] Yong-Guang Gao, Hui Yang, Jian Zhao, Ya-Jun Jiang, and Hong-Yu Hu. Au-toinhibitory structure of the ww domain of hypb/setd2 regulates its interactionwith the proline-rich region of huntingtin. Structure, 22(3):378–386, 2014.
[101] Ming Hu, Xiao-Jian Sun, Yuan-Liang Zhang, Ying Kuang, Chao-Quan Hu, Wei-Li Wu, Shu-Hong Shen, Ting-Ting Du, Hong Li, Fei He, et al. Histone h3 lysine36 methyltransferase hypb/setd2 is required for embryonic vascular remodeling.Proceedings of the National Academy of Sciences, 107(7):2956–2961, 2010.
[102] Yong-Guang Gao, Xian-Zhong Yan, Ai-Xin Song, Yong-Gang Chang, Xue-ChaoGao, Nan Jiang, Qi Zhang, and Hong-Yu Hu. Structural insights into thespecific binding of huntingtin proline-rich region with the sh3 and ww domains.Structure, 14(12):1755–1765, 2006.
[103] Yoshitaka Nagai, Takashi Inui, H Akiko Popiel, Nobuhiro Fujikake, KazuhiroHasegawa, Yoshihiro Urade, Yuji Goto, Hironobu Naiki, and Tatsushi Toda. Atoxic monomeric conformer of the polyglutamine protein. Nature structural &molecular biology, 14(4):332–340, 2007.
[104] Kan Xiong, David Punihaole, and Sanford A Asher. Uv resonance raman spec-troscopy monitors polyglutamine backbone and side chain hydrogen bondingand fibrillization. Biochemistry, 51(29):5822–5830, 2012.
78
BIBLIOGRAPHY
[105] Ferdinando Fiumara, Luana Fioriti, Eric R Kandel, and Wayne A Hendrickson.Essential role of coiled coils for aggregation and activity of q/n-rich prions andpolyq proteins. Cell, 143(7):1121–1135, 2010.
[106] Elizabeth Landrum and Ronald Wetzel. Biophysical underpinnings of the repeatlength dependence of polyglutamine amyloid formation. Journal of BiologicalChemistry, 289(15):10254–10260, 2014.
[107] Berry Kremer, Bernhard Weber, and Michael R Hayden. New insights intothe clinical features, pathogenesis and molecular genetics of huntington disease.Brain Pathology, 2(4):321–335, 1992.
[108] Max F Perutz, Tony Johnson, Masashi Suzuki, and John T Finch. Glutaminerepeats as polar zippers: their possible role in inherited neurodegenerative dis-eases. Proceedings of the National Academy of Sciences, 91(12):5355–5358, 1994.
[109] Cody L Hoop, Hsiang-Kai Lin, Karunakar Kar, Gabor Magyarfalvi, Jonathan MLamley, Jennifer C Boatz, Abhishek Mandal, Jozef R Lewandowski, RonaldWetzel, and Patrick CA Van Der Wel. Huntingtin exon 1 fibrils feature aninterdigitated β-hairpin–based polyglutamine core. Proceedings of the NationalAcademy of Sciences, 113(6):1546–1551, 2016.
[110] Songming Chen, Frank A Ferrone, and Ronald Wetzel. Huntington’s diseaseage-of-onset linked to polyglutamine aggregation nucleation. Proceedings of theNational Academy of sciences, 99(18):11884–11889, 2002.
[111] Pingwei Li, Kathryn E Huey-Tubman, Tiyu Gao, Xiaojun Li, Anthony P West,Melanie J Bennett, and Pamela J Bjorkman. The structure of a polyq–anti-polyq complex reveals binding according to a linear lattice model. Nature struc-tural & molecular biology, 14(5):381–387, 2007.
[112] Hoang T Tran, Albert Mao, and Rohit V Pappu. Role of backbone- solventinteractions in determining conformational equilibria of intrinsically disorderedproteins. Journal of the American Chemical Society, 130(23):7380–7392, 2008.
[113] Nicholas Stephane Caron, Carly Robyn Desmond, Jianrun Xia, and Ray Tru-ant. Polyglutamine domain flexibility mediates the proximity between flank-ing sequences in huntingtin. Proceedings of the National Academy of Sciences,110(36):14610–14615, 2013.
[114] Margherita Verani, Maria Bustamante, Paola Martufi, Manuel Daldin, CristinaCariulo, Lucia Azzollini, Valentina Fodale, Francesca Puglisi, Andreas Weiss,Douglas Macdonald, et al. Conformational modulation mediated by polyglu-tamine expansion in cag repeat expansion disease-associated proteins. Biochem-ical and Biophysical Research Communications, 478(2):949–955, 2016.
79

BIBLIOGRAPHY
[115] Clare Peters-Libeu, Jason Miller, Earl Rutenber, Yvonne Newhouse, Preethi Kr-ishnan, Kenneth Cheung, Danny Hatters, Elizabeth Brooks, Kartika Widjaja,Tina Tran, et al. Disease-associated polyglutamine stretches in monomeric hunt-ingtin adopt a compact structure. Journal of molecular biology, 421(4):587–600,2012.
[116] Frank A Ferrone. Nucleation: the connections between equilibrium and kineticbehavior. Methods in enzymology, 412:285–299, 2006.
[117] Anusri M Bhattacharyya, Ashwani K Thakur, and Ronald Wetzel. Polyg-lutamine aggregation nucleation: thermodynamics of a highly unfavorableprotein folding reaction. Proceedings of the National Academy of Sciences,102(43):15400–15405, 2005.
[118] Ashwani K Thakur and Ronald Wetzel. Mutational analysis of the structuralorganization of polyglutamine aggregates. Proceedings of the National Academyof Sciences, 99(26):17014–17019, 2002.
[119] Shahar Sukenik and Daniel Harries. Insights into the disparate action of os-molytes and macromolecular crowders on amyloid formation. Prion, 6(1):26–31,2012.
[120] Allen P Minton. Influence of excluded volume upon macromolecular structureand associations in crowded media. Current opinion in biotechnology, 8(1):65–69, 1997.
[121] Yaqiang Wang, Mohona Sarkar, Austin E Smith, Alexander S Krois, and Gary JPielak. Macromolecular crowding and protein stability. Journal of the AmericanChemical Society, 134(40):16614–16618, 2012.
[122] George I Makhatadze and Peter L Privalov. Protein interactions with ureaand guanidinium chloride: a calorimetric study. Journal of molecular biology,226(2):491–505, 1992.
[123] Michael Senske, Lisa Tork, Benjamin Born, Martina Havenith, Christian Her-rmann, and Simon Ebbinghaus. Protein stabilization by macromolecular crowd-ing through enthalpy rather than entropy. Journal of the American ChemicalSociety, 136(25):9036–9041, 2014.
[124] Luisa A Ferreira, Pedro P Madeira, Leonid Breydo, Christian Reichardt,Vladimir N Uversky, and Boris Y Zaslavsky. Role of solvent properties ofaqueous media in macromolecular crowding effects. Journal of BiomolecularStructure and Dynamics, 34(1):92–103, 2016.
[125] Elio A Cino, Mikko Karttunen, and Wing-Yiu Choy. Effects of molecularcrowding on the dynamics of intrinsically disordered proteins. PLoS One,7(11):e49876, 2012.
80

BIBLIOGRAPHY
[126] Shannon L Flaugh and Kevin J Lumb. Effects of macromolecular crowdingon the intrinsically disordered proteins c-fos and p27kip1. Biomacromolecules,2(2):538–540, 2001.
[127] Daniel Johansen, Cy MJ Jeffries, Boualem Hammouda, Jill Trewhella, andDavid P Goldenberg. Effects of macromolecular crowding on an intrinsicallydisordered protein characterized by small-angle neutron scattering with con-trast matching. Biophysical journal, 100(4):1120–1128, 2011.
[128] CS Szasz, A Alexa, K Toth, M Rakacs, J Langowski, and P Tompa. Proteindisorder prevails under crowded conditions. Biochemistry, 50(26):5834–5844,2011.
[129] Serge N Timasheff. The control of protein stability and association by weakinteractions with water: how do solvents affect these processes? Annual reviewof biophysics and biomolecular structure, 22(1):67–97, 1993.
[130] Regina Politi and Daniel Harries. Enthalpically driven peptide stabilization byprotective osmolytes. Chemical Communications, 46(35):6449–6451, 2010.
[131] Shahar Sukenik, Liel Sapir, and Daniel Harries. Balance of enthalpy and entropyin depletion forces. Current Opinion in Colloid & Interface Science, 18(6):495–501, 2013.
[132] Francesca Scaramozzino, Dylan W Peterson, Patrick Farmer, JT Gerig, Don-ald J Graves, and John Lew. Tmao promotes fibrillization and micro-tubule assembly activity in the c-terminal repeat region of tau. Biochemistry,45(11):3684–3691, 2006.
[133] Tejas Borwankar, Christoph Rothlein, Gong Zhang, Anne Techen, CarstenDosche, and Zoya Ignatova. Natural osmolytes remodel the aggregation pathwayof mutant huntingtin exon 1. Biochemistry, 50(12):2048–2060, 2011.
[134] Matthew Auton and D Wayne Bolen. Predicting the energetics of osmolyte-induced protein folding/unfolding. Proceedings of the National Academy of Sci-ences of the United States of America, 102(42):15065–15068, 2005.
[135] Vladimir N Uversky, Jie Li, and Anthony L Fink. Trimethylamine-n-oxide-induced folding of α-synuclein. FEBS letters, 509(1):31–35, 2001.
[136] R Kumar, JM Serrette, SH Khan, AL Miller, and EB Thompson. Effects ofdifferent osmolytes on the induced folding of the n-terminal activation domain(af1) of the glucocorticoid receptor. Archives of biochemistry and biophysics,465(2):452–460, 2007.
[137] Francesca Macchi, Maike Eisenkolb, Hans Kiefer, and Daniel E Otzen. Theeffect of osmolytes on protein fibrillation. International journal of molecularsciences, 13(3):3801–3819, 2012.
81

BIBLIOGRAPHY
[138] Yoshitaka Nagai, Nobuhiro Fujikake, Katsuhito Ohno, Hiroyuki Higashiyama,Helena A Popiel, Julia Rahadian, Masamitsu Yamaguchi, Warren J Strittmat-ter, James R Burke, and Tatsushi Toda. Prevention of polyglutamine oligomer-ization and neurodegeneration by the peptide inhibitor qbp1 in drosophila. Hu-man molecular genetics, 12(11):1253–1259, 2003.
[139] Yoan Arribat, Nathalie Bonneaud, Yasmina Talmat-Amar, Sophie Layalle,Marie-Laure Parmentier, and Florence Maschat. A huntingtin peptide inhibitspolyq-huntingtin associated defects. PLoS One, 8(7):e68775, 2013.
[140] Dagmar E Ehrnhoefer, Martin Duennwald, Phoebe Markovic, Jennifer LWacker, Sabine Engemann, Margaret Roark, Justin Legleiter, J LawrenceMarsh, Leslie M Thompson, Susan Lindquist, et al. Green tea (-)-epigallocatechin-gallate modulates early events in huntingtin misfolding andreduces toxicity in huntington’s disease models. Human molecular genetics,15(18):2743–2751, 2006.
[141] Volker Heiser, Sabine Engemann, Wolfgang Brocker, Ilona Dunkel, AnnettBoeddrich, Stephanie Waelter, Eddi Nordhoff, Rudi Lurz, Nancy Schugardt,Susanne Rautenberg, et al. Identification of benzothiazoles as potential polyglu-tamine aggregation inhibitors of huntington’s disease by using an automated fil-ter retardation assay. Proceedings of the National Academy of Sciences, 99(suppl4):16400–16406, 2002.
[142] Emily Mitchell Sontag, Gregor P Lotz, Namita Agrawal, Andrew Tran, RebeccaAron, Guocheng Yang, Mihaela Necula, Alice Lau, Steven Finkbeiner, CharlesGlabe, et al. Methylene blue modulates huntingtin aggregation intermediatesand is protective in huntington’s disease models. The Journal of Neuroscience,32(32):11109–11119, 2012.
[143] Emma Hockly, Jamie Tse, Amy L Barker, Donna L Moolman, Jean-Luc Beu-nard, Adrian P Revington, Kim Holt, Sunny Sunshine, Hilary Moffitt, KirupaSathasivam, et al. Evaluation of the benzothiazole aggregation inhibitors riluzoleand pgl-135 as therapeutics for huntington’s disease. Neurobiology of disease,21(1):228–236, 2006.
[144] Shubhangi Prabhudesai, Sharmistha Sinha, Aida Attar, Aswani Kotagiri,Arthur G Fitzmaurice, Ravi Lakshmanan, Magdalena I Ivanova, Joseph A Loo,Frank-Gerrit Klarner, Thomas Schrader, et al. A novel molecular tweezer in-hibitor of α-synuclein neurotoxicity in vitro and in vivo. Neurotherapeutics,9(2):464–476, 2012.
[145] Dahabada HJ Lopes, Aida Attar, Gayatri Nair, Eric Y Hayden, Zhenming Du,Kirsten McDaniel, Som Dutt, Kenny Bravo-Rodriguez, Sumit Mittal, Frank-Gerrit Klarner, et al. Molecular tweezers inhibit islet amyloid polypeptide as-
82

BIBLIOGRAPHY
sembly and toxicity by a new mechanism. ACS chemical biology, 10(6):1555–1569, 2015.
[146] Gal Herzog, Merav D Shmueli, Limor Levy, Liat Engel, Ehud Gazit, Frank-Gerrit Klarner, Thomas Schrader, Gal Bitan, and Daniel Segal. The lys-specificmolecular tweezer, clr01, modulates aggregation of the mutant p53 dna bindingdomain and inhibits its toxicity. Biochemistry, 54(24):3729–3738, 2015.
[147] Michael Fokkens, Thomas Schrader, and Frank-Gerrit Klarner. A moleculartweezer for lysine and arginine. Journal of the American Chemical Society,127(41):14415–14421, 2005.
[148] Sharmistha Sinha, Zhenming Du, Panchanan Maiti, Frank-Gerrit Klarner,Thomas Schrader, Chunyu Wang, and Gal Bitan. Comparison of three amyloidassembly inhibitors: the sugar scyllo-inositol, the polyphenol epigallocatechingallate, and the molecular tweezer clr01. ACS chemical neuroscience, 3(6):451–458, 2012.
[149] Norma J Greenfield and Gerald D Fasman. Optical activity of simple cyclicamides in solution. Biopolymers, 7(4):595–610, 1969.
[150] Carolyn Cohen and David AD Parry. α-helical coiled coils and bundles: how todesign an α-helical protein. Proteins: Structure, Function, and Bioinformatics,7(1):1–15, 1990.
[151] George Gabriel Stokes. On the change of refrangibility of light. PhilosophicalTransactions of the Royal Society of London, 142:463–562, 1852.
[152] Joseph R Lakowicz and Aleksander Balter. Analysis of excited-state processes byphase-modulation fluorescence spectroscopy. Biophysical chemistry, 16(2):117–132, 1982.
[153] RS Knox. Intermolecular energy migration and fluorescence. Biological Physics,American Institute of Physics, New York, 1993.
[154] Joseph R Lakowicz. Principles of fluorescence spectroscopy. Springer Science &Business Media, 2013.
[155] Arkady F Fradkov, Ying Chen, Li Ding, Ekaterina V Barsova, Mikhail V Matz,and Sergey A Lukyanov. Novel fluorescent protein from discosoma coral and itsmutants possesses a unique far-red fluorescence. FEBS letters, 479(3):127–130,2000.
[156] Mats Ormo, Andrew B Cubitt, Karen Kallio, Larry A Gross, et al. Crystal struc-ture of the aequorea victoria green fluorescent protein. Science, 273(5280):1392,1996.
83

BIBLIOGRAPHY
[157] Haruki Niwa, Satoshi Inouye, Takashi Hirano, Tatsuki Matsuno, Satoshi Ko-jima, Masayuki Kubota, Mamoru Ohashi, and Frederick I Tsuji. Chemical na-ture of the light emitter of the aequorea green fluorescent protein. Proceedingsof the National Academy of Sciences, 93(24):13617–13622, 1996.
[158] Vitali I Stsiapura, Alexander A Maskevich, Valery A Kuzmitsky, Vladimir NUversky, Irina M Kuznetsova, and Konstantin K Turoverov. Thioflavin t as amolecular rotor: fluorescent properties of thioflavin t in solvents with differentviscosity. The Journal of Physical Chemistry B, 112(49):15893–15902, 2008.
[159] Shunsuke Sasaki, Gregor PC Drummen, and Gen-ichi Konishi. Recent advancesin twisted intramolecular charge transfer (tict) fluorescence and related phenom-ena in materials chemistry. Journal of Materials Chemistry C, 4(14):2731–2743,2016.
[160] Jen Tsi Yang, Chuen-Shang C Wu, and Hugo M Martinez. [11] calculation ofprotein conformation from circular dichroism. Methods in enzymology, 130:208–269, 1986.
[161] Motomasa Tanaka, Isao Morishima, Takumi Akagi, Tsutomu Hashikawa, andNobuyuki Nukina. Intra-and intermolecular β-pleated sheet formation inglutamine-repeat inserted myoglobin as a model for polyglutamine diseases.Journal of Biological Chemistry, 276(48):45470–45475, 2001.
[162] Jan Ko, Susan Ou, and Paul H Patterson. New anti-huntingtin monoclonalantibodies: implications for huntingtin conformation and its binding proteins.Brain research bulletin, 56(3):319–329, 2001.
[163] Elizabeth Brooks, Montserrat Arrasate, Kenneth Cheung, and Steven MFinkbeiner. Using antibodies to analyze polyglutamine stretches. TrinucleotideRepeat Protocols, pages 103–128, 2004.
[164] Sophie Vieweg, Annalisa Ansaloni, Zhe-Ming Wang, John B Warner, and Hi-lal A Lashuel. An intein-based strategy for the production of tag-free hunt-ingtin exon 1 proteins enables new insights into the polyglutamine dependenceof httex1 aggregation and fibril formation. Journal of Biological Chemistry,291(23):12074–12086, 2016.
[165] Justin Legleiter, Gregor P Lotz, Jason Miller, Jan Ko, Cheping Ng, Geneva LWilliams, Steve Finkbeiner, Paul H Patterson, and Paul J Muchowski. Mon-oclonal antibodies recognize distinct conformational epitopes formed by polyg-lutamine in a mutant huntingtin fragment. Journal of Biological Chemistry,284(32):21647–21658, 2009.
[166] Fabrice AC Klein, Gabrielle Zeder-Lutz, Alexandra Cousido-Siah, AndreMitschler, Aline Katz, Pascal Eberling, Jean-Louis Mandel, Alberto Podjarny,
84

BIBLIOGRAPHY
and Yvon Trottier. Linear and extended: a common polyglutamine conforma-tion recognized by the three antibodies mw1, 1c2 and 3b5h10. Human moleculargenetics, 22(20):4215–4223, 2013.
[167] Gregory Darnell, Joseph PRO Orgel, Reinhard Pahl, and Stephen C Mered-ith. Flanking polyproline sequences inhibit β-sheet structure in polyglutaminesegments by inducing ppii-like helix structure. Journal of molecular biology,374(3):688–704, 2007.
[168] Songming Chen and Ronald Wetzel. Solubilization and disaggregation of polyg-lutamine peptides. Protein Science, 10(4):887–891, 2001.
[169] Nadya V Pletneva, Vladimir Z Pletnev, Konstantin A Lukyanov, Nadya GGurskaya, Ekaterina A Goryacheva, Vladimir I Martynov, Alexander Wlodawer,Zbigniew Dauter, and Sergei Pletnev. Structural evidence for a dehydratedintermediate in green fluorescent protein chromophore biosynthesis. Journal ofBiological Chemistry, 285(21):15978–15984, 2010.
[170] Xiaokun Shu, Nathan C Shaner, Corinne A Yarbrough, Roger Y Tsien, andS James Remington. Novel chromophores and buried charges control color inmfruits. Biochemistry, 45(32):9639–9647, 2006.
[171] Steffen Bning. Conformational dynamics and aggregation of huntingtin exon 1in living Cell. PhD thesis, Ruhr-University Bochum, Germany, 2015.
[172] Paul J Muchowski and Jennifer L Wacker. Modulation of neurodegeneration bymolecular chaperones. Nature Reviews Neuroscience, 6(1):11–22, 2005.
[173] Toshiaki Takahashi, Shinya Kikuchi, Shinichi Katada, Yoshitaka Nagai,Masatoyo Nishizawa, and Osamu Onodera. Soluble polyglutamine oligomersformed prior to inclusion body formation are cytotoxic. Human molecular ge-netics, 17(3):345–356, 2008.
[174] Vishal Bhardwaj, Mitradas M Panicker, and Jayant B Udgaonkar. Fluores-cence anisotropy uncovers changes in protein packing with inclusion growth ina cellular model of polyglutamine aggregation. Biochemistry, 53(22):3621–3636,2014.
[175] William Andre, Christophe Sandt, Paul Dumas, Philippe Djian, and GuylaineHoffner. Structure of inclusions of huntingtons disease brain revealed by syn-chrotron infrared microspectroscopy: polymorphism and relevance to cytotoxi-city. Analytical chemistry, 85(7):3765–3773, 2013.
[176] Neha Jain, Mily Bhattacharya, and Samrat Mukhopadhyay. Chain collapseof an amyloidogenic intrinsically disordered protein. Biophysical journal,101(7):1720–1729, 2011.
85

BIBLIOGRAPHY
[177] Michael Rubinstein. Polymer physicsthe ugly duckling story: Will polymerphysics ever become a part of proper physics? Journal of Polymer Science PartB: Polymer Physics, 48(24):2548–2551, 2010.
[178] Yanting Wang and Gregory A Voth. Molecular dynamics simulations of polyg-lutamine aggregation using solvent-free multiscale coarse-grained models. Thejournal of physical chemistry B, 114(26):8735–8743, 2010.
[179] Zachary A Levine, Luca Larini, Nichole E LaPointe, Stuart C Feinstein, andJoan-Emma Shea. Regulation and aggregation of intrinsically disordered pep-tides. Proceedings of the National Academy of Sciences, 112(9):2758–2763, 2015.
[180] Paul R Dahlgren, Mikhail A Karymov, John Bankston, Tina Holden, PeterThumfort, Vernon M Ingram, and Yuri L Lyubchenko. Atomic force microscopyanalysis of the huntington protein nanofibril formation. Nanomedicine: Nan-otechnology, Biology and Medicine, 1(1):52–57, 2005.
[181] Wei-Feng Xue, Steve W Homans, and Sheena E Radford. Systematic analysis ofnucleation-dependent polymerization reveals new insights into the mechanismof amyloid self-assembly. Proceedings of the National Academy of Sciences,105(26):8926–8931, 2008.
[182] Donatella Bulone, Laura Masino, David J Thomas, Pier Luigi San Biagio, andAnnalisa Pastore. The interplay between polyq and protein context delays ag-gregation by forming a reservoir of protofibrils. PLoS One, 1(1):e111, 2006.
[183] Andrea Soranno, Iwo Koenig, Madeleine B Borgia, Hagen Hofmann, FranziskaZosel, Daniel Nettels, and Benjamin Schuler. Single-molecule spectroscopy re-veals polymer effects of disordered proteins in crowded environments. Proceed-ings of the National Academy of Sciences, 111(13):4874–4879, 2014.
[184] Margaret S Cheung, Dmitri Klimov, and D Thirumalai. Molecular crowdingenhances native state stability and refolding rates of globular proteins. Pro-ceedings of the National Academy of Sciences of the United States of America,102(13):4753–4758, 2005.
[185] Kenji Sasahara, Peter McPhie, and Allen P Minton. Effect of dextran on proteinstability and conformation attributed to macromolecular crowding. Journal ofmolecular biology, 326(4):1227–1237, 2003.
[186] Larissa A Munishkina, Elisa M Cooper, Vladimir N Uversky, and Anthony LFink. The effect of macromolecular crowding on protein aggregation and amy-loid fibril formation. Journal of Molecular Recognition, 17(5):456–464, 2004.
[187] Ruchira Engel, Adrie H Westphal, Daphne HEW Huberts, Sanne M Nabuurs,Simon Lindhoud, Antonie JWG Visser, and Carlo PM van Mierlo. Macromolec-ular crowding compacts unfolded apoflavodoxin and causes severe aggregation
86

BIBLIOGRAPHY
of the off-pathway intermediate during apoflavodoxin folding. Journal of Bio-logical Chemistry, 283(41):27383–27394, 2008.
[188] Eva Y Chi, Sampathkumar Krishnan, Theodore W Randolph, and John FCarpenter. Physical stability of proteins in aqueous solution: mechanismand driving forces in nonnative protein aggregation. Pharmaceutical research,20(9):1325–1336, 2003.
[189] Filip Meersman and Christopher M Dobson. Probing the pressure–temperaturestability of amyloid fibrils provides new insights into their molecular properties.Biochimica et Biophysica Acta (BBA)-Proteins and Proteomics, 1764(3):452–460, 2006.
[190] Peter J Rossky. Protein denaturation by urea: slash and bond. Proceedings ofthe National Academy of Sciences, 105(44):16825–16826, 2008.
[191] Francisco J Blanco and Luis Serrano. Folding of protein g b1 domain studiedby the conformational characterization of fragments comprising its secondarystructure elements. European Journal of Biochemistry, 230(2):634–649, 1995.
[192] Tsutomu Arakawa and Serge N Timasheff. Preferential interactions of proteinswith solvent components in aqueous amino acid solutions. Archives of biochem-istry and biophysics, 224(1):169–177, 1983.
[193] James C Lee and Serge N Timasheff. The stabilization of proteins by sucrose.Journal of Biological Chemistry, 256(14):7193–7201, 1981.
[194] Guifu Xie and Serge N Timasheff. The thermodynamic mechanism of proteinstabilization by trehalose. Biophysical chemistry, 64(1):25–43, 1997.
[195] Jiang Hong, Lila M Gierasch, and Zhicheng Liu. Its preferential interactionswith biopolymers account for diverse observed effects of trehalose. Biophysicaljournal, 109(1):144–153, 2015.
[196] Gresham T Weatherly and Gary J Pielak. Second virial coefficients as a measureof protein–osmolyte interactions. Protein Science, 10(1):12–16, 2001.
[197] Matthew Auton, Jorg Rosgen, Mikhail Sinev, Luis Marcelo F Holthauzen, andD Wayne Bolen. Osmolyte effects on protein stability and solubility: A balanc-ing act between backbone and side-chains. Biophysical chemistry, 159(1):90–99,2011.
[198] Yufeng Liu and DW Bolen. The peptide backbone plays a dominant role in pro-tein stabilization by naturally occurring osmolytes. Biochemistry, 34(39):12884–12891, 1995.
87
BIBLIOGRAPHY
[199] Peter Talbiersky, Frank Bastkowski, Frank-Gerrit Klarner, and ThomasSchrader. Molecular clip and tweezer introduce new mechanisms of enzymeinhibition. Journal of the American Chemical Society, 130(30):9824–9828, 2008.
[200] James R Arndt, Samaneh Ghassabi Kondalaji, Megan M Maurer, Arlo Parker,Justin Legleiter, and Stephen J Valentine. Huntingtin n-terminal monomericand multimeric structures destabilized by covalent modification of heteroatomicresidues. Biochemistry, 54(28):4285–4296, 2015.
[201] S Yu Venyaminov, IA Baikalov, ZM Shen, CSC Wu, and JT Yang. Circulardichroic analysis of denatured proteins: inclusion of denatured proteins in thereference set. Analytical biochemistry, 214(1):17–24, 1993.
[202] Xueyun Zheng, Deyu Liu, Frank-Gerrit Klarner, Thomas Schrader, Gal Bitan,and Michael T Bowers. Amyloid β-protein assembly: The effect of moleculartweezers clr01 and clr03. The Journal of Physical Chemistry B, 119(14):4831–4841, 2015.
[203] Kamalika Roy Choudhury and Nitai P Bhattacharyya. Chaperone protein hypkinteracts with the first 17 amino acid region of huntingtin and modulates mutanthtt-mediated aggregation and cytotoxicity. Biochemical and biophysical researchcommunications, 456(1):66–73, 2015.
[204] Yujin E Kim, Fabian Hosp, Frederic Frottin, Hui Ge, Matthias Mann, ManajitHayer-Hartl, and F Ulrich Hartl. Soluble oligomers of polyq-expanded hunt-ingtin target a multiplicity of key cellular factors. Molecular Cell, 2016.
88

Appendix A: SupplimentaryFigures
0 200 400 600 800 1000
3
2.5
2
1.5
1
0.5
Time (min)
I (n
orm
aliz
d)
• Q20
• Q32
Figure 5.2: Th-T aggregation curve for the htt exon1 Q20 and htt exon1Q32 aggregation: The GST tag was cleaved off and the aggregation was monitoredover time. Error bars represent SD; sample size, n=4.
89

Supplimentary Figures
Spherical
Annular
BranchedLinear
Spherical
a)
b)
GST-Htt exon1 Q20 cleavage
GST-Htt exon1 Q55 cleavage
Figure 5.3: Atomic Force Microscopy of GST-htt exon1 Q20 (a) and Q55(b) samples after cleavage: GST tag was cleaved off and the aggregates of httexon1 Q20 and htt exon1 Q55 were observed. The aggregates of Q20 sample were notdetected in SDS-PAGE but here it clearly showed spherical structures with the diam-eter of around 80 nm. Q55 sample formed larger and diverse structures of spherical,linear, branched and annular shapes.
90

Supplimentary Figures
Figure 5.4: Gaussian fits of Q55 aggregate strand width (Left), Q55 spher-ical aggregate diameter (Right): The length of strands of fibres is around 1 µM,the width is around 70 nm and the height is ∼8-10 nm. Q55 sample forms spherical,annular, linear and branched aggregates, whereas, Q20 sample forms only sphericalaggregates. The green line indicates the position used for estimating dimention.
0
0,05
0,1
0,15
0,2
0,25
0 500 1000 1500 2000 2500
Q20 exp.1Q20 exp.2Q32 exp.1Q32 exp.2Q55 exp.1Q55 exp.2
Sta
ndard
devi
atio
n
Time (min)
Figure 5.5: Relationship of standard deviation with aggregation reactiontime: Each curve represents an independent experiment (exp1, exp2). The experi-ments where Th-T intensity did not show any rise are marked with arrows. Q20 exp.1also showed a steady increase in SD which cannot be observed here because of largeY-axis scale. The aggregation reactions which were not detected by Th-T binding areshown with the arrows
91

Supplimentary FiguresD
/A n
orm
aliz
ed
Dilution factor
1.1
1.05
1
0.95
0.9
1 1.5 2 2.5 3
Ï Ć
Ï ĈĐ
Ï DÐ
Q0
Q17
Q58
Figure 5.6: Concentration dependence of D/A ratios of fluorophore-labelled proteins: Dilution factor is ”the times diluted”. Error bars represent SDof mean, sample size; n=3.
92

Supplimentary Figures
200 400 600 800 1000
0.9
1.0
1.1
1.2
1.3
Glycine
Time (min.)
I(n
orm
ali
zse
d)
no osmolyte
0.1 M glycine
0.2 M glycine
0.3 M glycine
0.5 M glycine
200 400 600 800 1000
1.0
1.1
1.2
1.3
1.4
Betaine
Time (min.)
I(n
orm
ali
ze
d)
no osmolyte
0.1 M betaine
0.2 M betaine
0.3 M betaine
0.5 M betaine
200 400 600 800 1000
0.9
1.0
1.1
1.2
Sucrose
Time (min.)
I(n
orm
ali
ze
d)
no osmolyte
0.1 M sucrose
0.2 M sucrose
0.3 M sucrose
0.5 M sucrose
200 400 600 800 1000
0.9
1.0
1.1
1.2
1.3
Trehalose
Time (min.)
I(n
orm
ali
ze
d)
no osmolyte
0.1 M trehalose
0.2 M trehalose
0.3 M trehalose
0.5 M trehalose
a) b)
c) d)
200 400 600 800 1000
1.0
1.1
1.2
Time (min.)
I(n
orm
ali
se
d)
no osmolyte
0.1 M sarcosine
0.2 M sarcosine
0.3 M sarcosine
0.5 M sarcosine
Sarcosine
Time (min)Time (min)
Time (min) Time (min)
Time (min)
Figure 5.7: Th-T aggregation curves for htt exon1 Q55 in the presenceof osmolytes: Trehalose and sucrose samples did not show significant change underdifferent concentrations. Error bars represent SD of mean; sample size, n=4.
93
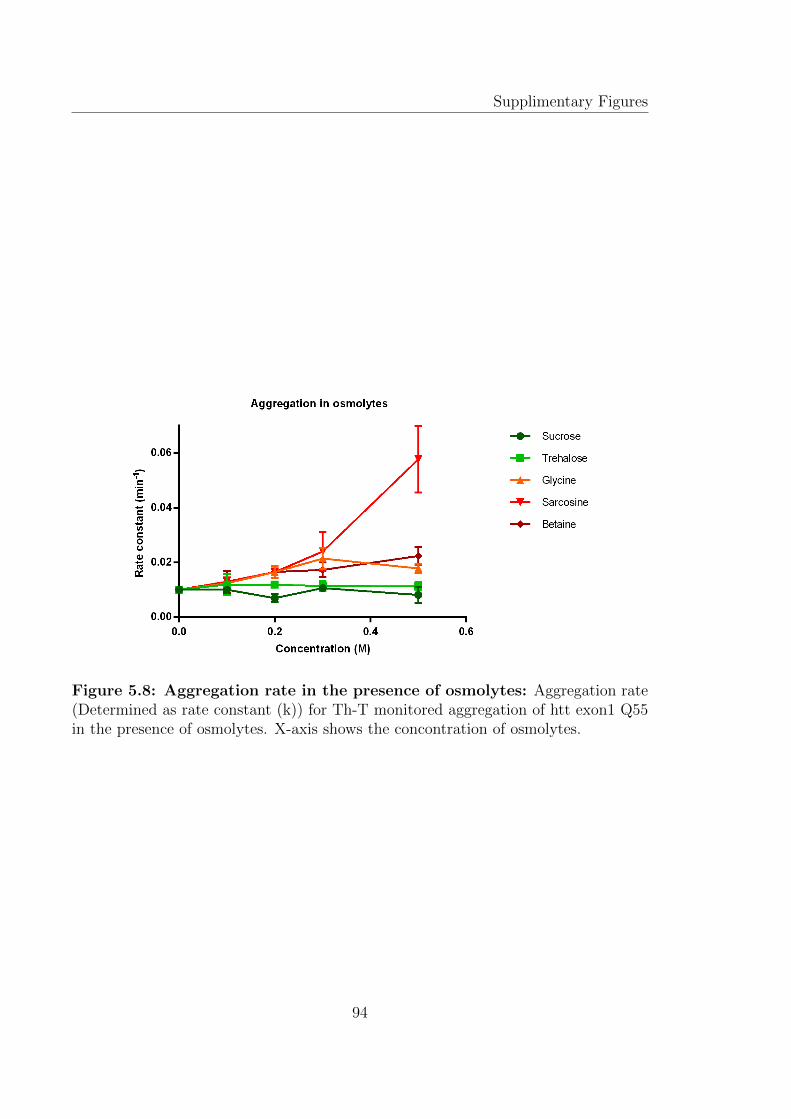
Supplimentary Figures
Figure 5.8: Aggregation rate in the presence of osmolytes: Aggregation rate(Determined as rate constant (k)) for Th-T monitored aggregation of htt exon1 Q55in the presence of osmolytes. X-axis shows the concontration of osmolytes.
94

Appendix B: List of Abbreviations
Abeta Amyloid beta
AFM Atomic force microscopy
BSA Bovine serum albumin
CD Circular dichroism
cDNA Complimentary DNA
CN/DAB Chloronaphthol/Diaminobenzidine
DIGKL Amino acid sequence between AcGFP1 and mCherry in Q0 protein
DNA Deoxyribonucleic acid
DTT Dithiothreitol
FTIR Fourrier transform infrared spectroscopy
GST Glutathione-S transferase
HD Huntington’s disorder
IR Infrared
LED Light emitting diode
MBP Maltose-binding protein
NMR Nuclear magnetic resonance
ORD Optical rotatory dispersion
PAGE Polyacrylamide gel electrophoresis
PBS Phosphate-buffered saline
95

List of Abbreviations
PD Parkinson’s disorder
PolyP Polyproline
PTM Post translational modification
REMD Replica exchange molecular dynamics
RNA Ribonucleic acid
SDS Sodium dodecyl sulphate
SH3 Src homology domain
TBS-T Tris buffered saline with Tween-20
TEMED Tetramethylethylenediamine
Th-T Thioflavin-T
TICT Twisted internal charge transfer
TMAO Trimethylamine N-oxide
TRiC TCP1 Ring complex
WW The domain that mediates protein interactions
96
Appendix C: List of Tables
2.1 CD and NMR reported structures of htt exon1 . . . . . . . . . . . . . 112.2 Reported qualitative effects of crowding agents on IDPs . . . . . . . . 172.3 Reported qualitative effects of osmolytes on IDPs . . . . . . . . . . . 18
3.1 Buffers composition used in SDS-PAGE . . . . . . . . . . . . . . . . . 323.2 Antibodies used western blot analysis . . . . . . . . . . . . . . . . . . 333.3 Wavelength parameters used in spectroscopic measurements . . . . . 393.4 Filter sets used in the microscopic measurements . . . . . . . . . . . 403.5 Experimental parameters used in the microscopic measurements . . . 40
97

Appendix D: List of Figures
2.1 Graphical presentation protein folding / aggregation theories:The black lines represent few of the possible folding pathways and thewhite lines represent few of the possible aggregation pathways. Drawnwith CorelDRAW X6 (Corel corp., Canada) . . . . . . . . . . . . . . 5
2.2 Htt functions in cellular trafic regulation: Htt orchestrates thecellular transport functions by organising associated cytoskeleton mo-tor proteins. Image adapted from [74] and redrawn with the author’spermission. . . . . . . . . . . . . . . . . . . . . . . . . . . . . . . . . 9
2.3 Reported crystal structures of htt exon1: Htt exon1: PDB ID -3IOW; Htt exon1 Q36: PDB ID - 4FE8 (Left), PDB ID: 4FEB (Right).The presented models were designed with UFSC Chimera 1.11.1 . . . 12
2.4 Schemetic diagram of proposed nucleation mechanisms forpolyQ aggregation: Disordered monomer forms thermodynamicallyunfavourable conformation (n*) which then recruits self or the initialdisordered monomer and the resulting elongation process is favouredover dissociation [90]. The unfavourable high energy conformtion canbe beta haipin (Pathway - a) or an elongated disordered chain (Path-way - b). PolyQ peptides containing N17 domain lead to N17-mediatedinter-helical association (Pathway - c) which then leads to critical nu-cleus formation followed by further addition of oligomeric species result-ing into the formation of higher ordered structures and consequently βsheet-rich fibrils are formed [58]. The templet sites for monomer addi-tion is highlighted in red. Drawn with CorelDRAW X6 (Corel corp.,Canada). . . . . . . . . . . . . . . . . . . . . . . . . . . . . . . . . . . 14
2.5 Excluded volume effect: In order to maximize its entropy (To in-crease free volume available for the cosolute), the protein molecule triesto reduce the excluded volume (White area). This is possible when aprotein molecule reduces its radius. The resulting compact polypeptidechain can now invade more space between the crowding molecule. As aresult of this, the excluded volume gets reduced (Top figure: from leftto right). The resulting effects of excluded volume can be folding orself-association (Bottom figure), Drawn with CorelDRAW X6 (Corelcorp., Canada) . . . . . . . . . . . . . . . . . . . . . . . . . . . . . . 16
98

List of Figures
2.6 Structures of chemical modulators: EGCG (Epigallocatechin gal-late) is polyphenolic compound, PGL-135 is a benzothaizole derivative.CLR01 and CLR03 are molecular tweezers. CLR01 molecule containsthe charged phosphate group flanked by large hydrophobic moieties.CLR03 molecule lacks these hydrophobic ”arms”. The structures aredrawn with the ChemBioDraw Ultra 13.0. . . . . . . . . . . . . . . . 19
3.1 Two dimentional representation of the vectors of unpolarizedand different kinds of polarized light . . . . . . . . . . . . . . . 23
3.2 Front view of circularly polarized light (Left) and ellipticallypolarized light (Right) . . . . . . . . . . . . . . . . . . . . . . . . 24
3.3 Transitions observed in the amide chromophore in peptidebackbone: Red and blue planes are the nodal planes parallel andperpendicular to amide bond respectively . . . . . . . . . . . . . . . . 25
3.4 Individual Gaussian peaks of α helix transitions (Left) andthe spectra of α helix-rich and β sheet-rich protein samples(Right): Gaussian peaks are just graphic presentation for explanationpurpose. The spectrum of α helix-rich sample is from the sample, httexon1 Q55. The spectrum of β sheet rich protein sample is from thesample, recombinantly fused two fluorophores; AcGFP1-mCherry . . 25
3.5 The absorption and emission spectra of AcGFP1 and mCherry(Left), Franck-Condon principle (Right) . . . . . . . . . . . . . 26
3.6 Principle of FRET: S0D and S1D represents donor ground state andexcited states. S0A and S1A represents acceptor ground state and ex-cited states. V1, V2..V5 represent vibrational states. Curved arrowsrepresent vibrational relaxation . . . . . . . . . . . . . . . . . . . . . 27
3.7 Mechanism of fluorescence in SYG chromophore . . . . . . . . 28
3.8 Twisted internal charge transfer (TICT) dynamics of Th-T:Th-T shows strong fluorescence at 482 nm in the presence of the envi-ronment which does not torsional relaxation into TICT state. Torsionalrelaxation is achieved by charge transfer and twisting of benzothiazoleand dimethylaminobenzine rings. LE represents locally excited state.Drawn with CorelDRAW X6 (Corel corp., Canada) . . . . . . . . . . 29
3.9 GST-htt-exon1 Q (n): The arrow indicates the site of cleavage . . 30
3.10 Vector map of pGEX-6P1 with GST-htt exon1 Q20 insert . . 31
3.11 Vector map of mpDream2.1 with AcGFP1-HttEx1Q17-mCherryinsert . . . . . . . . . . . . . . . . . . . . . . . . . . . . . . . . . . . 36
3.12 Fluorophore-tagged htt exon1 Q(n) affinity purification: a)MALDI data for his-tagged purified protein samples, b) 10 % polyacry-lamide native gel, c) MW7-probed western blot of his-tagged purifiedprotein samples. . . . . . . . . . . . . . . . . . . . . . . . . . . . . . . 37
99

List of Figures
3.13 SEC Purification: SDS-PAGE analysis of the fractions of size ex-clusion chromatography of the samples containing polyQ stretch of 17(left), 36 (center) and 58 (middle). The second lane (left gel) containsnon-purified htt exon1 Q17 sample. All other lanes have the fractionsor MW marker. Earlier fractions were more pure in uncleaved pro-tein, whereas later fractions eluted the degraded samples with missingmCherry. The degraded Q17 sample with missing mCherry was usedas GFP only reference (boxed band). e) AcGFP1 and mCherry ab-sorbance to compare the relative donor to acceptor labelling amongthe protein samples. . . . . . . . . . . . . . . . . . . . . . . . . . . . 38
3.14 SEC column calibration: Column dead volume was measured bypassing dextrane blue (blue). Column was caliberated using low molec-ular weight standards (GE healthcare). First peak of Q17 (black) in-dicates high molecular weight oligomers, followed by second peak ofmonomers with the tail of truncated protein with missing mCherry. . 39
4.1 GST-Htt exon1 Q(n) western blot analysis: a) GST-Htt exon1Q(n) proteins before and after 20 h of cleavage. The reaction wasstopped after 20 h by heating in the presence of SDS loading buffer. InMW7 blots, the transparent arrows indicate the SDS-resistant aggre-gates in stacking gel part which are also seen in silver stained gel as darkbrown smear. In 3B5H10 blot, black reference lines show the presenceof probable monomers or dimers of htt exon1 Q(n). In silver stainedgel, GST monomers, oligomers and htt exon1 Q32 and Q55 aggregateswere identified. b) MW1 blot of GST-htt exon1 Q55 before and aftercleavage. c) MW7 blot of incompletely cleaved GST-Htt exon1 Q(n)protein. The arrows indicate the probable monomer or dimer of httexon1 protein samples. The black lines in the blot indicate oligomers. 42
4.2 Htt exon1 Q(n) secondary structure: a) CD spectra of htt exon1Q20, htt exon1 Q32, htt exon1 Q55. b) CD spectra of htt exon1 Q55 im-mediately after cleavage (Black) and after 23 days of incubation at 4oC(Orange). c) Secondary structure estimation of htt exon1 fragments,htt exon1 Q55 fragment’s pellet resuspended in phosphate buffer (Blackbar) and resuspended in 1.25 %V/V TFA:HFIP (1:1 volume ratio) mix-ture (Grey bar). . . . . . . . . . . . . . . . . . . . . . . . . . . . . . . 45
4.3 Difference spectra of 5oC and 35oC : Htt exon1 Q20 (Purplesquares), htt exon1 Q32 (Blue circles). Y-axis represent the differ-ence of mean residue ellipticity (∆θ) between the spectra taken at 5oCand 35oC. . . . . . . . . . . . . . . . . . . . . . . . . . . . . . . . . . 46
100

List of Figures
4.4 Htt exon1 Q(n) FRET D/A: AcGFP1 to mCherry fluorescenceintensity ratio for fluorophore-labelled protein samples. Last point(Green) represents the same ratio of the mixture of AcGFP1 and mCherryproteins. Error bars represent standard deviation (SD) of mean; sam-ple size: n=9 for Q0, Q17, Q36, Q58; n=6 for Q93; n=3 for AcGFP1-mCherry mixture . . . . . . . . . . . . . . . . . . . . . . . . . . . . . 48
4.5 Size exclusion chromatography of fluorophore-tagged htt exon1Q(n): Plot of absorbance versus elution volume of Q17 (Solid line),Q58 (Dashed line), Q93 (Dotted line) and dextan (Small dashed line)samples. First peaks around 46 ml indicate the position of high molec-ular weight species. Second peaks around 52 ml indicate the positionof monomers. . . . . . . . . . . . . . . . . . . . . . . . . . . . . . . . 49
4.6 Native PAGE of the fluorophore-labelled htt exon1 proteins:The red bands in the gel indicates the full length protein with both thefluorophores. The lower green bands indicate the protein moleculeswith missing mCherry. These degraded impurities were later removedby size exclusion column. The Q93 sample shows only the bands in thestacking gel corresponding to aggregates. . . . . . . . . . . . . . . . . 49
4.7 CD spectra of fluorophore-labelled-htt exon1 Q(n) proteins:a) Mean residue ellipticities of Q0 (IntraFRET control-Black)), Q17(Green), Q36 (Orange), Q58 (Red); Inset: Intra-FRET control withonly two fluorophores is subtracted from each htt proteins resulting inthe structure of only htt exon1 in between. b) Secondary structure es-timation of fluorophore-labelled htt exon1 (with both the fluorophoresincluded), Error bars represent SD of mean; sample size, n=2. . . . . 52
4.8 Cleavage and aggregation of GST fused htt exon1 Q55: a) Th-Tfluorescence assay in the presence of different concentrations of protein.b) Extracted kinetic parameters, Lag time (grey), Rate constant (Blue).Lines are shown to guide the reader. c) Western blot analysis after 30min of cleavage of 1 µM and 4 µM sample. After 30 min, fused proteinwas cleaved and it disappeared completely (55 kDa band) d) CD spectraof htt exon1 Q55 before and after cleavage. Error bars represent SD;sample size, n=4. . . . . . . . . . . . . . . . . . . . . . . . . . . . . . 54
101

List of Figures
4.9 Effect of macromolecular crowder: a) D/A ratios of htt exon1Q(n) (Q17-purple, Q36-green, Q58-orange) samples were measured un-der different Ficoll (solid lines)/sucrose (dashed lines) concentrations.Intramolecular-FRET control (Q0-black) is the D/A ratio of the fusedfluorophores with no htt in between. Intermolecular-FRET control isD/A ratio of AcGFP1 alone and mCherry alone mixture (blue). D/Aratios of Ficoll samples were observed after 5 days of Q17 sample b),Q36 sample c), Q58 sample d) and those of sucrose samples e). Theratios on first day (solid lines) are compared with those at day 5 (dot-ted lines). Error bars represent SD, sample size, n=3. Lines are shownto guide the reader. . . . . . . . . . . . . . . . . . . . . . . . . . . . . 56
4.10 Aggregation curves in the presence of ficoll: Th-T fluoroscencewas monitored for the cleavage reaction of GST fused proteins of Q20(green lines), Q32 (blue lines), Q58 (red lines) samples. At higher Ficollconcentration, the lag phase of Q55 curves shortened. Q32 sampleshowed a slight rise in Th-T intensity at 30% W/V of Ficoll. The solidlines shown are sigmoidal fits. Error bars represent SD of mean, n=5. 57
4.11 Temperature-induced change in fluorophore-tagged htt exon1Q(n): Error bars represent SD of mean; sample size: n=2 for Q0, n=6for Q17, n=3 for Q36, n=3 for Q58, n=4 for Q93. . . . . . . . . . . . 58
4.12 Effect of osmolytes: a) D/A ratios of Fluorophore-labelled htt exon1Q58 protein in the presence of different osmolytes; sample size, n=5.b) Effects osmolytes on fluorescence intensity of mCherry; sample size,n=3. c) Th-T assay aggregation kinetics: Aggregation half time in thepresence of different concentrations and different osmolytes. GST tagwas cleaved off from htt exon1 Q55 and the aggregation was monitored.Sugars delayed the half time (Sucrose-dark green circle) or had no effect(Trehalose-light green squares), whereas, glycine and its derivatives(Glycine-Orange triangles; Sarcosine-Red inverted triangles; Betaine-Brown diamonds) were found to reduce the aggregation half time. One-way ANOVA with Tukey’s test for multiple comparison was used. ”*”indicates p ≤ 0.05, ”**” indicates p ≤ 0.01. Error bars represent SD ofmean; sample size, n=4 . . . . . . . . . . . . . . . . . . . . . . . . . . 62
4.13 Effect of Molecular Tweezers: a) Mean residue ellipticities in theabsence and presence of different ratios of protein to tweezers. Ellip-ticitiy value decreased specifically at 222 nm in case of CLR01 samples(Magenta and red lines). b) Secondary structure estimation by use ofJSCO analysis software. Y-axis represents α helix content. Error barsrepresent SD of mean; sample size, n=3. . . . . . . . . . . . . . . . . 64
102

List of Figures
4.14 Effect of Molecular Tweezers: The GST tag was cleaved off andthe aggregation was monitored over time in the absence and presence oftweezers, CLR01 and CLR03. Error bars represent SD of mean; samplesize, n=4; sample size, n=3 in case of sample containing CLR03 in 1:20ratio. . . . . . . . . . . . . . . . . . . . . . . . . . . . . . . . . . . . . 65
5.1 Proposed mechanism of action of crowders, osmolytes and amolecular tweezer, CLR01 : In longer polyQ stretch, disorderedmonomer is in equilibrium with tetramers [58] (Structure I, II). After,formation of critical nucleus (Structure III), forward association reac-tion is favoured more over dissociation [58]. Crowders and osmolytescompact the disodered polypeptide chain and induce β hairpin struc-ture (Structure IV), the structures which are proposed in [118] whichfurther favours oligomerization and aggregation. Molecular tweezer,CLR01 disrupts the helical structures (Structure II, III, IV) and theirassociation which does not favour amyloid formation (Structure VI).Model adapted and redrawn from [58] with author’s permission. . . . 68
5.2 Th-T aggregation curve for the htt exon1 Q20 and htt exon1Q32 aggregation: The GST tag was cleaved off and the aggregationwas monitored over time. Error bars represent SD; sample size, n=4. 89
5.3 Atomic Force Microscopy of GST-htt exon1 Q20 (a) and Q55(b) samples after cleavage: GST tag was cleaved off and the ag-gregates of htt exon1 Q20 and htt exon1 Q55 were observed. Theaggregates of Q20 sample were not detected in SDS-PAGE but here itclearly showed spherical structures with the diameter of around 80 nm.Q55 sample formed larger and diverse structures of spherical, linear,branched and annular shapes. . . . . . . . . . . . . . . . . . . . . . . 90
5.4 Gaussian fits of Q55 aggregate strand width (Left), Q55 spher-ical aggregate diameter (Right): The length of strands of fibres isaround 1 µM, the width is around 70 nm and the height is ∼8-10 nm.Q55 sample forms spherical, annular, linear and branched aggregates,whereas, Q20 sample forms only spherical aggregates. The green lineindicates the position used for estimating dimention. . . . . . . . . . 91
5.5 Relationship of standard deviation with aggregation reactiontime: Each curve represents an independent experiment (exp1, exp2).The experiments where Th-T intensity did not show any rise are markedwith arrows. Q20 exp.1 also showed a steady increase in SD whichcannot be observed here because of large Y-axis scale. The aggregationreactions which were not detected by Th-T binding are shown with thearrows . . . . . . . . . . . . . . . . . . . . . . . . . . . . . . . . . . . 91
5.6 Concentration dependence of D/A ratios of fluorophore-labelledproteins: Dilution factor is ”the times diluted”. Error bars representSD of mean, sample size; n=3. . . . . . . . . . . . . . . . . . . . . . . 92
103

List of Figures
5.7 Th-T aggregation curves for htt exon1 Q55 in the presenceof osmolytes: Trehalose and sucrose samples did not show signifi-cant change under different concentrations. Error bars represent SD ofmean; sample size, n=4. . . . . . . . . . . . . . . . . . . . . . . . . . 93
5.8 Aggregation rate in the presence of osmolytes: Aggregation rate(Determined as rate constant (k)) for Th-T monitored aggregation ofhtt exon1 Q55 in the presence of osmolytes. X-axis shows the concon-tration of osmolytes. . . . . . . . . . . . . . . . . . . . . . . . . . . . 94
104
Copyright © 2022 FDOKUMEN