A spectrophotometer-based diffusivity assay reveals that diffusion hindrance of small molecules in...
35
Accepted Manuscript Title: A spectrophotometer-based diffusivity assay reveals that diffusion hindrance of small molecules in extracellular matrix gels used in 3D cultures is dominated by viscous effects Author: Roland Galgoczy Isabel Pastor Adai Colom Alicia Gim´ enez Francesc Mas Jordi Alcaraz PII: S0927-7765(14)00252-5 DOI: http://dx.doi.org/doi:10.1016/j.colsurfb.2014.05.017 Reference: COLSUB 6422 To appear in: Colloids and Surfaces B: Biointerfaces Received date: 13-3-2014 Revised date: 2-5-2014 Accepted date: 9-5-2014 Please cite this article as: R. Galgoczy, I. Pastor, A. Colom, A. Gim´ enez, F. Mas, J. Alcaraz, A spectrophotometer-based diffusivity assay reveals that diffusion hindrance of small molecules in extracellular matrix gels used in 3D cultures is dominated by viscous effects, Colloids and Surfaces B: Biointerfaces (2014), http://dx.doi.org/10.1016/j.colsurfb.2014.05.017 This is a PDF file of an unedited manuscript that has been accepted for publication. As a service to our customers we are providing this early version of the manuscript. The manuscript will undergo copyediting, typesetting, and review of the resulting proof before it is published in its final form. Please note that during the production process errors may be discovered which could affect the content, and all legal disclaimers that apply to the journal pertain.
Transcript of A spectrophotometer-based diffusivity assay reveals that diffusion hindrance of small molecules in...

Accepted Manuscript
Title: A spectrophotometer-based diffusivity assay reveals thatdiffusion hindrance of small molecules in extracellular matrixgels used in 3D cultures is dominated by viscous effects
Author: Roland Galgoczy Isabel Pastor Adai Colom AliciaGimenez Francesc Mas Jordi Alcaraz
PII: S0927-7765(14)00252-5DOI: http://dx.doi.org/doi:10.1016/j.colsurfb.2014.05.017Reference: COLSUB 6422
To appear in: Colloids and Surfaces B: Biointerfaces
Received date: 13-3-2014Revised date: 2-5-2014Accepted date: 9-5-2014
Please cite this article as: R. Galgoczy, I. Pastor, A. Colom, A. Gimenez, F.Mas, J. Alcaraz, A spectrophotometer-based diffusivity assay reveals that diffusionhindrance of small molecules in extracellular matrix gels used in 3D culturesis dominated by viscous effects, Colloids and Surfaces B: Biointerfaces (2014),http://dx.doi.org/10.1016/j.colsurfb.2014.05.017
This is a PDF file of an unedited manuscript that has been accepted for publication.As a service to our customers we are providing this early version of the manuscript.The manuscript will undergo copyediting, typesetting, and review of the resulting proofbefore it is published in its final form. Please note that during the production processerrors may be discovered which could affect the content, and all legal disclaimers thatapply to the journal pertain.

Page 1 of 34
Accep
ted
Man
uscr
ipt
1
A spectrophotometer-based diffusivity assay reveals that diffusion hindrance of small
molecules in extracellular matrix gels used in 3D cultures is dominated by viscous effects
Roland Galgoczya, Isabel Pastorb, Adai Coloma,1, Alicia Giméneza, Francesc Masb, Jordi
Alcaraza,c,*
a Unitat de Biofísica i Bioenginyeria, Facultat de Medicina, Universitat de Barcelona, Barcelona
08036, Spain
b Departament de Química-Física, Institut de Recerca de Química Teòrica i Computacional
(IQTCUB), Universitat de Barcelona, Barcelona 08028, Spain
c CIBER de Enfermedades Respiratorias, Bunyola 07110, Spain
1 Present address: U1006 INSERM, Université Aix-Marseille, 13009 Marseille, France
*Corresponding author:
Jordi Alcaraz
Unitat de Biofísica i Bioenginyeria, Facultat de Medicina, Universitat de Barcelona
Casanova 143, 08036 Barcelona, Spain
Tel: (+34) 93 402 4515; Fax: (+34) 93 403 5278
e-mail: [email protected]
Keywords: diffusion, Matrigel, collagen, fibrin, 3D culture, Stokes-Einstein equation
Word count: 6219 (including references)

Page 2 of 34
Accep
ted
Man
uscr
ipt
2
Abstract
The design of 3D culture studies remains challenging due to the limited understanding of
extracellular matrix (ECM)-dependent hindered diffusion and the lack of simple diffusivity
assays. To address these limitations, we set up a cost-effective diffusivity assay based on a
Transwell plate and the spectrophotometer of a Microplate Reader, which are readily accessible
to cell biology groups. The spectrophotometer-based assay was used to assess the apparent
diffusivity D of FITC-dextrans with molecular weight (4-70 kDa) spanning the physiological
range of signaling factors in a panel of acellular ECM gels including Matrigel, fibrin and type I
collagen. Despite their technical differences, D data exhibited ~15% relative difference with
respect to FRAP measurements. Our results revealed that diffusion hindrance of small particles is
controlled by the enhanced viscosity of the ECM gel in conformance with the Stokes-Einstein
equation rather than by geometrical factors. Moreover, we provided a strong rationale that the
enhanced ECM viscosity is largely contributed to by unassembled ECM macromolecules. We
also reported that gels with the lowest D exhibited diffusion hindrance closest to the large
physiologic hindrance of brain tissue, which has a typical pore size much smaller than ECM gels.
Conversely, sparse gels (≤ 1 mg/ml), which are extensively used in 3D cultures, failed to
reproduce the hindered diffusion of tissues, thereby supporting that dense (but not sparse) ECM
gels are suitable tissue surrogates in terms of macromolecular transport. Finally, the
consequences of reduced diffusivity in terms of optimizing the design of 3D culture experiments
were addressed in detail.

Page 3 of 34
Accep
ted
Man
uscr
ipt
3
1. Introduction
All tissue cells are attached to an extracellular matrix (ECM), which provides the
physiologic fibrillar scaffold required for tissue organization. In addition to mechanical support,
ECM provides biochemical cues that are critical regulators of cellular fate. The recognition of
the important ECM regulatory role in vivo has extended the use of three-dimensional (3D)
cultures based on growing cells embedded in gels of native ECM components [1, 2]. Thus, the
availability of ECM macromolecules from major tissue types including type I collagen (COLI)
and reconstituted basement membrane (rBM, also known as Matrigel or EHS matrix) has
enabled using 3D cultures to study different cell types in a variety of physiopathological
processes such as differentiation, morphogenesis and invasion [3-6].
A major role of ECM in vivo is to hinder the diffusion of soluble signaling factors [7, 8].
Likewise, diffusion hindrance has also been reported in ECM gels used in 3D cultures [5, 9],
although the extent to which gels mimic tissue hindrance is not well established. In addition to
the ECM, hindered diffusion in 3D cultures is contributed by cells. The latter contribution has
been analyzed both experimentally and theoretically, and has been largely attributed to the
geometrical obstacles posed by cells [8, 10, 11]. Likewise, the diffusivity of macromolecules in
free solution and agarose gels have been extensively studied [7, 12, 13]. In contrast, quantitative
analyses of their diffusivity in ECM gels are still scarce, and the physical basis underlying ECM-
dependent hindrance in conditions relevant for 3D cultures remains overall ill defined [8, 10].
In addition to ECM-dependent effects, reduced diffusion depends on the physicochemical
properties of the diffusing particle and on ECM-particle interactions [8, 14]. A major
consequence of these multi-factorial effects is that the design and interpretation of 3D culture

Page 4 of 34
Accep
ted
Man
uscr
ipt
4
experiments require detailed knowledge of the diffusivity of the target signaling factor(s) within
the specific ECM gel. Common approaches to assess diffusivity in gels include fluorescence
recovery after photobleaching (FRAP) and fluorescence correlation spectroscopy (FCS).
However, the latter microscopic approaches are challenging for most cell biology groups
working with 3D cultures, since they require access to expensive instrumentation including a
confocal microscope, expert personnel and advanced numerical analysis tools. Alternatively, a
less challenging approach has been reported in chemotaxis assays in which diffusivity of
fluorescently labelled tracers is assessed by time-lapse fluorescence intensity measurements by
fluorescence microscopy. However, these chemotaxis assays are still limited in that they require
customized sample holders [15, 16].
To overcome the above limitations, we sought to set-up and validate a simple and cost-
effective diffusivity assay based on a sample holder (i.e. Transwell plates) and a fluorescence
recording device (i.e. spectrophotometer in a Microplate Reader) that are easily available in most
cell biology laboratories. Next, we used the spectrophotometer-based assay to assess the
diffusivity of tracer particles (FITC-conjugated dextrans) with molecular weights (Mr) spanning
the physiological range of signaling factors in a panel of ECM gels as used in 3D cultures [17].
Diffusivity data were analyzed to unravel the role of gel density, geometry and viscous friction in
controlling diffusion hindrance. In addition, guidelines to improve the design of 3D cultures in
terms of transport were provided.

Page 5 of 34
Accep
ted
Man
uscr
ipt
5
2. Material and methods
2.1. ECM gels
Gels were prepared at densities known to elicit physiologic responses in 3D culture
studies [3, 5, 6]. rBM solution was used undiluted (12 mg/ml, Cultrex BME, Trevigen). COLI
solution was prepared in serum-free culture medium (SFM) as reported elsewhere [2] to a final
density of either 1 or 3 mg/ml, which were referred to as sparse (1) and dense (3) densities owing
to the proteolytic-independent and dependent cellular invasion observed in these gels,
respectively [6]. Dense fibrin (FIB) was prepared as previously described [2]. For
spectrophotometer-based diffusivity experiments, each gel sample and experimental condition
was prepared in triplicates in Transwell plates (24 Transwell plate, 8 μm pore size, 6.5 mm wide
insert, Corning) that contained two separate units: the top Transwell insert and the bottom lower
Transwell compartment (Fig. 1A). The day of the experiments, 70 μl of either rBM or COLI
solution were added to the bottom of a Transwell insert, loaded into the lower Transwell
compartment, kept in an incubator (37ºC, 95% humidity) for 30 min to enable gelation, and
hydrated with 200 μl SFM. For FIB gels, 70 μl of fibrinogen+thrombin solution were added to
the Transwell insert, kept at room temperature for 5 min, incubated at 37ºC and hydrated with
SFM. The theoretical gel thicknesses were 2 mm, which is commonly used in 3D cultures [17,
18]. For FRAP experiments, 70 μl of each ECM solution were polymerized onto an 8-chamber
culture slide (BD Falcon).
2.2. Spectrophotometer-based diffusivity measurements
The diffusion of FITC-dextrans at 3 different Mr (4, 40 and 70 kDa, referred to as Dex4,
Dex40 and Dex70 thereafter) (Sigma) through gel samples prepared in Transwell Plates was

Page 6 of 34
Accep
ted
Man
uscr
ipt
6
monitored with a Microplate Reader as described in Fig. 1A. Each condition was examined with
a three-step protocol. First, the SFM on top of each Transwell insert was removed and replaced
with 200 μl of 1 mg/ml dextran solution prepared in SFM. Second, each insert was loaded into a
lower Transwell compartment containing 1000 μl SFM. Transwells without gels were used as
negative controls. Third, the dextrans that had diffused throughout the gel to the lower Transwell
compartment were monitored as a function of time by measuring the total fluorescence intensity
in the lower compartment (FPR) with a Microplate Reader (Synergy 2 Multi-Mode Microplate
Reader, BioTek) in fluorescence mode, using wavelength excitation and emission filters of
485/20 nm and 528/20 nm, respectively. For this purpose, inserts were quickly removed and
transferred to an adjacent empty well before FPR readings, and put back into their original
compartments to continue accumulating dextrans. FPR was read at time intervals of 5 min during
the first hour, and of 1 h up to 8 h. Preliminary studies indicated that measuring FPR of each
experimental condition required ~30 s, which was short enough to not compromise the expected
slow monotonic increase of FPR with time, even in the fastest diffusivity conditions. For each
time point, FPR was averaged for all repeated measurements (n=3). Transwells were kept in an
incubator between measurements to minimize water evaporation.
To model our spectrophotometer-based diffusion measurements, we used a common
approach based on considering hydrogels as a porous medium. In these conditions, the one-
dimensional (1D) Fick’s law of diffusion applies
(1)

Page 7 of 34
Accep
ted
Man
uscr
ipt
7
where C(x,t) is the concentration of diffusing particles as a function of time (t) and depth (x), and
and D is the isotropic diffusion coefficient inside the gel. The simplest and most widely used
strategy to solve Eq. (1) for the diffusion of an extended initial particle distribution Co assumes
that the hydrogel is a semi-infinite slab, which corresponds to ,
, and [5, 11, 15], thereby eliciting [19]
(2)
where erfc is the error function complement. Eq. (2) is a suitable approximation to model the
diffusion within a finite-sized material when the thickness of the diffusion layer δ during the
experimental time-window is smaller than that of the material, where δ can be assessed as [15,
20].
(3)
We adapted Eq. (2) to model our measurements as
(4)
where l is the gel depth and Cl(t) is the dextran concentration at x = l. Eq. (4) was fitted to the
average FPR data by nonlinear least-squares fitting (MATLAB, The Mathworks), being l and the
apparent diffusivity D fitting parameters. As initial fitting values we used l = 2 mm and D

Page 8 of 34
Accep
ted
Man
uscr
ipt
8
predicted by the Stokes-Einstein (S-E) equation for water [7]. For each experimental condition,
the time window used to fit Eq. (4) was taken up to 50% of the last FPR data point to guarantee δ
< l. Eq. (4) was also used to assess the time to reach 50% of C0 (t50) by imposing erfc 0.5l/(Dt)1/2
= 0.5 using MATLAB, which elicited
(5)
The effective viscosity η was assessed from D data using the S-E equation [7]
(6)
where kB is the Boltzmann’s constant, T is the absolute temperature, ρ is the particle´s density
and RH is the hydrodynamic radius. The latter was assessed using an empirical relation [21] that
elicited 1.21 nm for Dex4, 4.12 nm for Dex40 and 5.55 nm for Dex70.
2.3. Diffusivity measurements by FRAP
Dex4 solution was added to each ECM gel 3 days before experiments to enable reaching
near-equilibrium concentrations [5] and kept at 37ºC. FRAP measurements were conducted with
a scanning confocal microscope (TCS SP2 UV, Leica). Samples were illuminated with a 10 0.4
NA objective and a 488 nm excitation line from a 30 mW Ar+ laser operating at 8% output
power. Photobleaching of a 40 μm wide circular region-of-interest (ROI) was achieved with a

Page 9 of 34
Accep
ted
Man
uscr
ipt
9
488 and 514 nm excitation line from the Ar+ laser at 100% of relative intensity. The bleaching
time was 1.4 s, and the total ROI fluorescence intensity images after photobleaching were
collected at intervals of 0.28 ms up to 50 s at 512512 pixel resolution using a pinhole of 1 Airy
unit (n=6 per gel type). These settings minimized the fluorescence contribution from the
diffusion of FITC-dextrans along the axial direction and prevented any recovery during
bleaching [22]. FRAP measurements were modeled assuming that the bleached area had a
uniform circular disk profile, which enabled analyzing all the recovery curves with [23]:
(7)
where FROI(t) is the normalized mean fluorescence intensity in the bleached ROI at t, F∞ is the
recovered fluorescence at large t, F0 is the bleached fluorescence intensity right after the bleach,
τD is a characteristic residence time of the diffusing particle in a volume of characteristic length
and I0 and I1 are the modified Bessel Functions. Eq. (7) was nonlinear least-squares fitted to
FRAP measurements with MATLAB, being τD a fitting parameter, which was used to assess the
effective diffusion coefficient as DFRAP = ω2/4τD.DFRAP data were averaged for all repeated
measurements (n=6).
2.4. AFM imaging
To enhance AFM resolution, gels were prepared as in 2.1. and fixed with 1%
glutaraldehyde (Sigma) PBS solution for 30 min to render stiffer gels [24]. Samples were imaged

Page 10 of 34
Accep
ted
Man
uscr
ipt
10
in PBS at room temperature with a commercial AFM (Bioscope I, Veeco) by raster scanning a
V-shaped cantilever (0.01 nN/nm, 20 nm tip radius, MLCT, Veeco) over a scan size of 20-40 μm
at low scan rate ( 0.2 Hz) in contact mode, using a minimum feedback loading force. Images
were obtained in different locations ( 5) of each gel (n=2), and flattened with WSxM software
[25]. For each image, pore edges were outlined manually and their corresponding areas were
assessed with IMAGE J [26]. The pore width (w) for each pore area (A) was calculated as w = 2
(A/π)1/2.
2.5. Statistical analysis
Differences were examined by either Student’s t-test or Mann-Whitney test for not
normally distributed populations (SigmaPlot, Systat Software). Statistical significance was
assumed at P<0.05. Unless otherwise stated, data are given as mean SE.
3. Results
3.1. Validation of the spectrophotometer-based diffusivity assay
A scheme of the spectrophotometer-based diffusivity assay is shown in Fig. 1A. The
maximum gel dextran equilibrium concentration was ~150 μg/ml, which fell within the linear
detection regime of the Microplate Reader as shown in Fig. 1B. The average FPR data
corresponding to the diffusion of Dex4 in all conditions are shown in Fig. 1C, where FPR were
normalized to the maximum fluorescence recorded in SFM. A monotonic increase of normalized
FPR with time was observed even in the fastest diffusivity conditions of Dex4 in sparse COLI,
thereby supporting the feasibility of our approach in ECM gels. In SFM, FPR exhibited a modest

Page 11 of 34
Accep
ted
Man
uscr
ipt
11
and slow decline at longer times after reaching its maximum at ~1-2h. A similar drop in FPR was
observed in wells with a constant dextran concentration of 150 μg/ml examined at the same time
points as in Fig. 1C (data not shown), supporting that it was associated with photobleaching. For
subsequent analysis, only FPR data up to 50% of their final value were used to guarantee δ < l
according to Eq. (3). The corresponding fittings obtained with Eq. (4) are shown in Fig. 1C
(continuous lines). By restricting the analysis of FPR data within the diffusion layer, the time
window used in the fittings in SFM was ~5 min. In these conditions, the drop in FPR due to
photobleaching was negligible (<2%), supporting further the feasibility of our data analysis. As a
guidance, we also included the fittings of the semi-infinite model over the entire data range
(dotted lines). The model captured accurately the dynamics of the intensity data in both time-
windows (r2 0.95). Similar results were obtained with the other dextrans (Suppl. Fig. S1).
Likewise, fitted l values were very close to the theoretical 2 mm in all conditions examined (data
not shown).
D data obtained from the fittings are summarized in Table 1 and Suppl. Table S1, and
were first validated by comparing D assessed in SFM (DSFM) with the corresponding theoretical
values computed with the S-E equation (Do) taking the water viscosity at 37ºC (0.69 mPa·s) [27].
Both DSFM and Do values exhibited a marked linear relationship (r2 = 0.99) (Fig. 1D). We
conducted a second validation by comparing D of Dex4 with the corresponding DFRAP, which
exhibited a linear relationship (r2 = 0.9) (Fig. 1E, illustrative FRAP measurements are shown in
Suppl. Fig. S2). Third, we compared D and DFRAP for all dextrans on dense COLI gels, and
obtained a similarly good linear relationship (r2 = 0.99, Suppl. Fig. S3). In average, the relative
difference between D and correspoding DFRAP data (Table 1) was ~15%. Given the marked

Page 12 of 34
Accep
ted
Man
uscr
ipt
12
technical and sample preparation differences between both techniques, the latter difference was
deemed reasonable and D data were used in subsequent analysis.
3.2. Diffusion hindrance in ECM gels is consistent with the S-E equation
In all ECM gels, D decreased monotonically with Mr (Fig. 2A). Intriguingly, D of dense
FIB was much larger than that of dense COLI and very close to rBM even though rBM was 3-
fold denser than FIB. A decrease of D with Mr in free solution has been previously described in
terms of power-laws (D ~ Mr-α) with a weak exponent α ~ 0.15-0.5 [8, 14]. To check whether a
similar description could be applied to our gel measurements, we fitted a power-law with a
common exponent α simultaneously to all gels. The fittings exhibited a very good agreement
with the experimental data (r2 = 0.99) (Fig. 2A, continuous lines). Fitting parameters were α =
0.34 0.02 (unitless), D = (0.83 0.16)10-5Mr-α for rBM, D = (0.99 0.18)10-5Mr
-α for dense
FIB, D = (2.49 0.42)10-5Mr-α for dense COLI, and D = (3.15 0.52)10-5Mr
-α for sparse
COLI, where the units of D and Mr are cm2/s and Da, respectively. Notably, the fitted α matched
the 1/3 value predicted by the S-E relation in free solution as indicated in Eq. (6). A similar α
was obtained in DFRAP data from dense COLI gels (Suppl. Fig. S4). These findings reveal that,
despite their entangled architecture, ECM gels behave as dilute solutions for particles with
physiologic Mr in terms of diffusion.
3.3. Diffusivity analysis in terms of ECM viscosity
A major consequence of the validity of the S-E equation is that transport is regulated by
viscous friction (Eq. (6)). To examine this possibility more closely, we used D data and Eq. (6)
to assess the effective microscopic viscosity η. In agreement with the S-E relation, η values

Page 13 of 34
Accep
ted
Man
uscr
ipt
13
obtained with different dextrans were very similar for all gels (Fig. 2B and Suppl. Table S1). The
horizontal dashed line is the water viscosity (ηwater) at 37ºC, whereas the thick solid lines
represent the average η for each gel. Maximum η values were obtained in rBM and dense FIB,
and were 3.5-fold larger than that of water. Conversely, η of sparse COLI was similar to ηwater,
whereas η of dense COLI was ~1.5-fold larger than ηwater. Of note, η of dense FIB were similar
to rBM and ~3-fold higher than dense COLI, highlighting that the viscosity of ECM gels (but not
gel density) is predictive of the diffusion hindrance of dextrans with physiological Mr values.
3.4. Diffusivity analysis in terms of ECM geometry
A critical geometrical parameter of hydrogels in terms of diffusion is its average pore
width (w), since geometrical effects are thought to be more relevant as the size of the particles
approaches w [8, 12]. We used AFM imaging to assess w. All gels could be imaged except sparse
COLI owing to its compliance. A representative image obtained in dense COLI is shown in Fig.
3A. Although ECM filaments were somewhat distorted during scanning, they remained stable
enough to enable identifying pores as surface invaginations (Fig. 3A). Image analysis revealed a
log-normal distribution of pore areas (Fig. 3B and Suppl. Fig. S5), which was used to calculate w
(Fig. 3C). w from sparse COLI was included taking values reported elsewhere [28-31] for
completeness’ sake. We found a general reduction of w with gel density. However, unlike
diffusivity, the w range for dense FIB was closer to that of dense COLI than to rBM. Our data
also reveal that the median w were more than 100-fold larger than RH of dextrans, even at the
highest gel density.
3.5. Diffusion hindrance in ECM gels, cells and tissues
Page 14 of 34
Accep
ted
Man
uscr
ipt
14
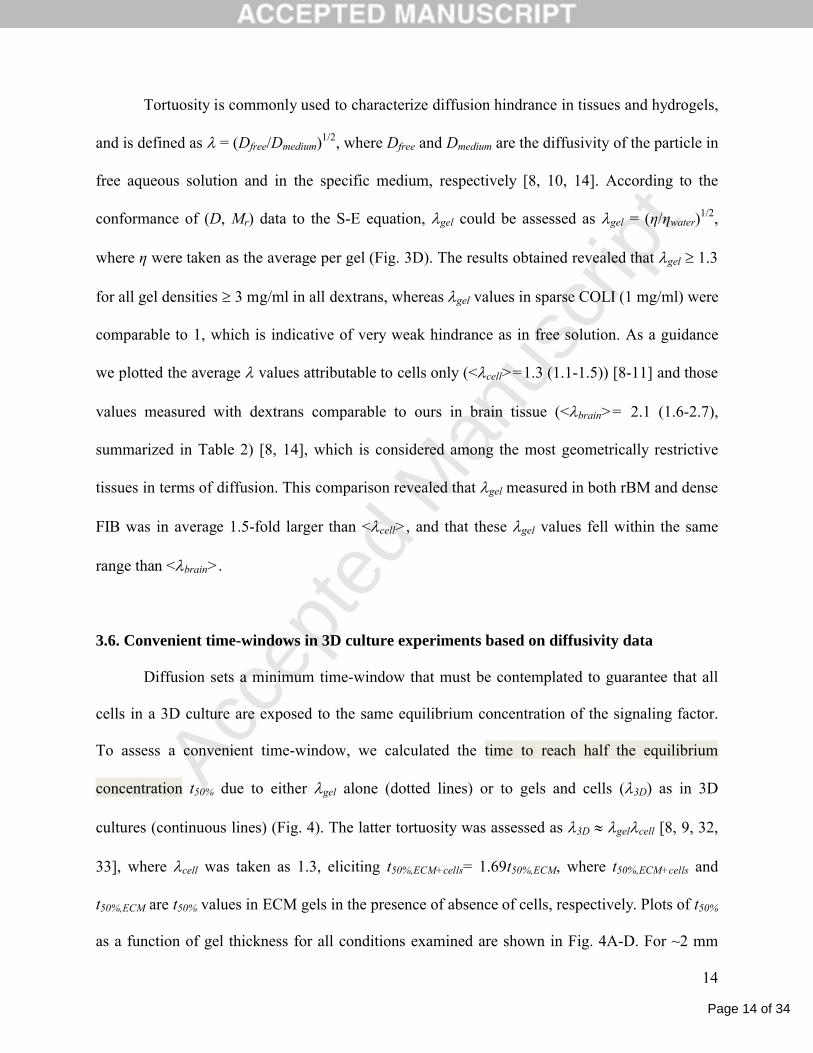
Tortuosity is commonly used to characterize diffusion hindrance in tissues and hydrogels,
and is defined as = (Dfree/Dmedium)1/2, where Dfree and Dmedium are the diffusivity of the particle in
free aqueous solution and in the specific medium, respectively [8, 10, 14]. According to the
conformance of (D, Mr) data to the S-E equation, gel could be assessed as gel = (η/ηwater)1/2,
where η were taken as the average per gel (Fig. 3D). The results obtained revealed that gel 1.3
for all gel densities 3 mg/ml in all dextrans, whereas gel values in sparse COLI (1 mg/ml) were
comparable to 1, which is indicative of very weak hindrance as in free solution. As a guidance
we plotted the average values attributable to cells only (<cell>=1.3 (1.1-1.5)) [8-11] and those
values measured with dextrans comparable to ours in brain tissue (<brain>= 2.1 (1.6-2.7),
summarized in Table 2) [8, 14], which is considered among the most geometrically restrictive
tissues in terms of diffusion. This comparison revealed that gel measured in both rBM and dense
FIB was in average 1.5-fold larger than <cell>, and that these gel values fell within the same
range than <brain>.
3.6. Convenient time-windows in 3D culture experiments based on diffusivity data
Diffusion sets a minimum time-window that must be contemplated to guarantee that all
cells in a 3D culture are exposed to the same equilibrium concentration of the signaling factor.
To assess a convenient time-window, we calculated the time to reach half the equilibrium
concentration t50% due to either gel alone (dotted lines) or to gels and cells (3D) as in 3D
cultures (continuous lines) (Fig. 4). The latter tortuosity was assessed as 3D gelcell [8, 9, 32,
33], where cell was taken as 1.3, eliciting t50%,ECM+cells= 1.69t50%,ECM, where t50%,ECM+cells and
t50%,ECM are t50% values in ECM gels in the presence of absence of cells, respectively. Plots of t50%
as a function of gel thickness for all conditions examined are shown in Fig. 4A-D. For ~2 mm

Page 15 of 34
Accep
ted
Man
uscr
ipt
15
thick gels, t50%,ECM was ~3-4 days for the largest Mr in rBM and dense FIB, whereas it was < 1
day for COLI gels. These values almost doubled when considering the effect of cell, indicating
that considering gel alone underestimates markedly the predicted t50 in 3D cultures.
4. Discussion
A simple and cost-effective method to assess the diffusivity of signaling molecules is
desirable for cell biology groups working with 3D cultures. Our spectrophotometer-based assay
in which the intensity of fluorescently-labelled diffusing particles was analyzed within the
diffusion layer minimized the effects of photobleaching in the widely used FITC-dextrans, and
reported apparent diffusivity values that were ~15% lower in average than those obtained with
FRAP. Comparing our D values with those reported elsewhere for similar dextrans and gels
revealed a relative difference of ≤30% for COLI gels and dense FIB [5, 34, 35]. We could not
find previous D data for dextrans in rBM gels. Instead, the reported diffusivity of gold
nanoparticles in rBM was ~0.110-6 cm2/s [34], which is very close to our D values at the highest
RH (Fig. 2A). Two major factors may account for the moderate discrepancy between our D and
DFRAP values. First, technical differences, since FRAP measured diffusivity of particles initially
at equilibrium within a micrometer-sized region of the sample, whereas our spectrophotometer-
based approach examined diffusion in bulk of particles towards equilibrium. Second, our
theoretical modeling based on the computationally simple solution of Fick´s law under the semi-
infinite slab approximation, which was fitted within the diffusion layer. Moreover, our modeling
assumed that: (1) the concentration above the gel was not decreased during the experiment, and
(2) the diffusivity in the solution below the gel is the same as in the gel. The first assumption
relies on the fact that we fitted Eq. (4) to the diffusion layer, i.e. far before the equilibrium

Page 16 of 34
Accep
ted
Man
uscr
ipt
16
regime. In support of this assumption, a recent study conducted with a chemotaxis assay similar
to ours on COLI gels reported a difference between diffusivity data obtained with the semi-
infinite model applied within the diffusion layer or with Finite-Element (F-E) analysis of 17%
[15], which is very close to the ~15% discrepancy between our D and DFRAP values. The latter
agreement suggests that the correction obtained with F-E analysis is modest, whereas it is much
more computationally demanding. The second assumption is justified by the fact that the
spectrophotometer measured the bulk fluorescence in the lower Transwell compartment, which is
comparable to measuring right at the bottom of the gel (x = l). In addition to technical and
theoretical limitations, the discrepancy between our D data and that reported elsewhere may be
contributed by the different gel preparation and/or ECM source. Despite all these variability
sources, it is remarkable the good agreement between our macroscopic diffusivity data and that
obtained with FRAP and other microscopic assays. Accordingly, our work expands a recent
study that used a Nanodrop spectrophotometer to assess the apparent diffusivity in scleral tissue
[36], and altogether support that spectrophotometer-based assays provide a suitable and cost-
effective alternative to assess the apparent diffusivity in ECM gels used in 3D cultures with
reasonable accuracy.
Previous studies in tissues and non-ECM fibrous networks have attributed diffusion
hindrance to either geometric (steric) or non-geometrical (viscous) effects of the network, or a
combination of both [7, 10, 13, 37]. However, it had remained unclear what ECM effects
dominate diffusion hindrance in conditions relevant for 3D cultures. Our AFM image analysis
reported median ECM pore sizes w ≥ 0.4 µm for all gels (Fig. 3C), in agreement with previous
studies using alternative imaging approaches [28-31, 38]. Since the maximum RH was ~5.5 nm,
dextrans were 2 orders of magnitude smaller than the median w, indicating that they behaved as

Page 17 of 34
Accep
ted
Man
uscr
ipt
17
small molecules in terms of diffusion. In these conditions we provided direct evidence that the
relationship between the apparent D and Mr is well captured by the S-E equation (Fig. 2A). In
further agreement with S-E, we observed a similar viscosity with each dextran for a given gel.
These observations were not anticipated, since the S-E equation was derived for rigid spherical
particles in a Newtonian liquid, which is in marked contrast with the entangled structure of ECM
gels. In qualitative agreement with our findings, previous attempts to examine D dependence on
Mr reported power-law relationships in both FIB and COLI gels [5, 9], although they could not
unambiguously discriminate the 1/3 power-law exponent from other possibilities. These results
reveal that, at least for small particles, ECM gels at densities used in 3D cultures behave as dilute
porous solutions. Moreover, these observations revealed that the enhanced ECM viscosity is the
main physical gel property in controlling the transport of small spherical particles rather than
ECM geometry.
We can envision two potential hydrodynamic effects underlying the enhanced ECM gel
viscosity: (i) a wall effect due to the surface of the ECM scaffold, and (ii) the effect of
unassembled ECM macromolecules. Wall-effects describe the flow reduction in the proximity of
a 2D wall, which increases the effective viscosity of the fluid [39]. This wall-effect predicts that
D should correlate with the median w. However, such prediction was not consistent with the
similar D observed in rBM and dense FIB. Likewise, it could not account for the similar gel
measured in the latter ECM gels and those reported in the extracellular space (ECS) of brain
tissue, whose pore sizes are much smaller than in ECM gels [8]. Alternatively, fluid viscosity is
known to increase in the presence of soluble macromolecules [40, 41]. For dilute solutions, η
increases linearly with the volume fraction occupied by the soluble large macromolecules
(unattach). Although, to our knowledge, unattach in an ECM gel remains unknown, we may assume

Page 18 of 34
Accep
ted
Man
uscr
ipt
18
that it is linear with gel density d as a first approximation. In support of the latter prediction, we
observed a fairly linear relation between η/ηwater obtained in COLI and rBM gels and d (Fig. 5),
which is reasonable considering the large content of collagen IV in rBM. The simplest model
that relates η/ηwater and unattach for rod-like macromolecules like ECM filaments [29] is the Kuhn
model [40, 41], which predicts η/ηwater = 1 + (5/2 + x)unattach, where x is the axial ratio
(length/width) of the rod. Taking a previously suggested value (x = 19) [41] elicited unattach ~
0.01 (sparse COLI), ~ 0.04 (dense COLI), ~ 0.15 (rBM) and ~ 0.11 (dense FIB), which fell
within the theoretical range of unattach data assessed in brain tissue (0.18-0.5) [10]. Of note, the
role of unassembled ECM molecules in enhanced viscosity is further substantiated by previous
observations reporting undistinguishable dextran diffusivities obtained in dense COLI solutions
before and after gelation [9] or in aligned and nonaligned sparse COLI gels [42]. All these
observations strongly support that the enhanced ECS viscosity largely arises from unattached
ECM macromolecules, and that the similar η in rBM and dense FIB is due to their comparable
unattach. Moreover, these findings suggest that current models of diffusion hindrance in hydrogels
should be revisited at least in ECM gels, since they do not consider the contribution of unattach.
Our results may improve the design of 3D culture studies in at least 3 directions. First,
dense rather than sparse gels should be selected, since the latter fail to reproduce physiologic
values even after adding the effect of cell. Second, there is a minimum time-window that must be
contemplated to guarantee that all cells in a 3D culture are exposed to the same equilibrium
concentration of the signaling molecule for a given ECM gel. To assess such suitable time-
windows, we used a simple model to predict t50 values. Noteworthy, our predictions were
consistent with experimental time-windows reported in 3D culture studies (Table 3) [5, 18, 43,
44]. However, our predictions are likely to be an underestimation for soluble signaling

Page 19 of 34
Accep
ted
Man
uscr
ipt
19
molecules, since many ECM components contain binding domains for signaling factors [7, 8].
Third, unwanted diffusion effects due to gel thickness can be minimized by using thinner gels
according to Fig. 4. Thickness effects can be further reduced by preparing 3D cultures in
Transwell inserts and adding the signaling factor both on top of the gel and in the bottom
Transwell compartment. Alternatively, thickness effects may be simply prevented by culturing
cells on top of the ECM gel instead of embedded when appropriate [3].
5. Conclusions
We provided a proof-of-principle that the spectrophotometers in commercial MultiPlate
Readers and Transwell plates provide a simple and cost-effective alternative approach to assess
the apparent diffusivity in ECM gels. Using this approach we found that the S-E relation derived
for Newtonian fluids can be extended to the complex entangled structure of ECM gels.
Accordingly, we clarified that the diffusion hindrance of small particles is regulated by the
enhanced viscosity of the gel rather than by geometric factors, and provided a strong rationale
that this enhanced viscosity is largely contributed by unassembled ECM macromolecules. In
addition, we found that 3D cultures based on dense gels ( 3 mg/ml) were able to reproduce the
large physiologic tortuosity of brain tissue and some tumors, underscoring that they are suitable
tissue surrogates in terms of diffusion. Finally, we provided guidelines to improve the diffusive
effects in 3D cultures.
Acknowledgements
We thank the Confocal Unit (CCiTUB), E. Rius (UB), F. Puig (Parc Taulí) and C. Ghajar
(LBNL) for technical assistance, and I. Pagonabarraga (UB) for critical discussions. We also

Page 20 of 34
Accep
ted
Man
uscr
ipt
20
thank A. Xaubet, N. Reguart (IDIBAPS), D. Navajas and R. Farré (UB) for support. This work
was further supported by grants from the Ministerio de Economía y Competitividad (SAF2009-
13243 and PI13/02368 to JA, CTM2012-39183-C02-02 to FM), Asociación Española Contra el
Cáncer (to JA), Generalitat de Catalunya (2009SGR465 and XRQTC to FM), a Juan de la Cierva
postdoctoral fellowship from Ministerio de Economía y Competitividad (To IP), and a pre-
doctoral fellowship from the Ministerio de Educación (to AG).
Figure captions
Fig. 1. (A) Scheme of the experimental set-up. (B) Average fluorescence recorded with the
Microplate Reader at different Dex4 concentrations. Continuous line indicates a linear regression
fitting (r2 = 0.99). (C) Fluorescence of Dex4 in the lower Transwell compartment measured with
a Microplate Reader as a function of time in a panel of ECM gels. Fluorescence data were
normalized to the maximum fluorescence measured in SFM. Continuous and dotted lines
correspond to the fittings of the semi-infinite model up to either 50% of the last fluorescence data
points or the entire data range, respectively, where the D was a fitting parameter (n = 3). D data
obtained with the former fittings were used in the following sections. (D) Comparison between
experimental DSFM of all dextrans and the corresponding theoretical prediction Do assessed with
the S-E equation. (E) Diffusivity data for Dex4 assessed in all samples with either the
spectrophotometer-based assay or FRAP (n = 6).
Fig. 2. (A) D data as a function of Mr for each ECM gel. Continuous lines correspond to the
simultaneous fitting of a power-law with a fixed exponent for all gels, being the exponent a
fitting parameter. (B) Effective viscosity calculated using Eq. (6) and D data in (A). Dashed lines

Page 21 of 34
Accep
ted
Man
uscr
ipt
21
correspond to the viscosity averaged for all Mr for each gel. Dashed horizontal line represents
water viscosity at 37ºC.
Fig. 3. (A) Representative topographic AFM image of the surface of a dense COLI gel in PBS.
Scale bar corresponds to 5 μm. (B) Frequency distribution of pore areas outlined in the AFM
images. (C) Log-scale box-plot of pore sizes calculated from AFM images (n 85). Data of
sparse COLI gels were reported elsewhere (see section 3.4 for details). ***P<0.005 were
determined by Mann-Whitney test. (D) gel values calculated from η data shown in Fig. 2B.
Horizontal lines indicate the average values reported from cells alone or in the extreme
physiologic hindrance conditions of the brain tissue. *P<0.05, **P<0.01 and ***P<0.005 were
determined by Student’s t-test with respect to sparse COLI.
Fig. 4. Theoretical minimum experimental time-windows in 3D culture experiments as a function
of gel thickness. t50% values were assessed with Eq. (5) as t50% = l22/(1.69Do) using either gel
alone (dotted lines) or 3D gelcell, taking cell = 1.3 (continuous lines) for rBM (A), dense FIB
(B), dense COLI (C) and sparse COLI (D). A different vertical scale between (A,B) and (C,D)
was used for clarity purposes.
Fig. 5. Normalized viscosity with respect to water (Fig. 2B) as a function of gel density. Lines
represent separate linear fittings of either all gels other than dense FIB (continuous) or dense FIB
alone (dashed).

Page 22 of 34
Accep
ted
Man
uscr
ipt
22
References
[1] L.G. Griffith and M.A. Swartz. Nat Rev Mol Cell Biol, 7 (2006) 211-224.[2] A. Colom, R. Galgoczy, I. Almendros, A. Xaubet, R. Farré and J. Alcaraz. J Biomed Mater
Res A, [Epub ahead of print] (2013).[3] J. Alcaraz, R. Xu, H. Mori, C.M. Nelson, R. Mroue, V.A. Spencer, D. Brownfield, D.C.
Radisky, C. Bustamante and M.J. Bissell. EMBO J, 27 (2008) 2829-2838.[4] J. Alcaraz, H. Mori, C.M. Ghajar, D. Brownfield, R. Galgoczy and M.J. Bissell. Integr Biol
(Camb), 3 (2011) 1153-1166.[5] C.M. Ghajar, X. Chen, J.W. Harris, V. Suresh, C.C. Hughes, N.L. Jeon, A.J. Putnam and
S.C. George. Biophys J, 94 (2008) 1930-1941.[6] H. Mori, A.T. Lo, J.L. Inman, J. Alcaraz, C.M. Ghajar, J.D. Mott, C.M. Nelson, C.S. Chen,
H. Zhang, J.L. Bascom, M. Seiki and M.J. Bissell. Development, 140 (2013) 343-352.[7] M.A. Swartz and M.E. Fleury. Annual Review of Biomedical Engineering, Vol 9, Annual
Reviews, Palo Alto, 2007, pp. 229-256.[8] E. Sykova and C. Nicholson. Physiol. Rev., 88 (2008) 1277-1340.[9] S. Ramanujan, A. Pluen, T.D. McKee, E.B. Brown, Y. Boucher and R.K. Jain. Biophys. J.,
83 (2002) 1650-1660.[10] D.A. Rusakov and D.M. Kullmann. Proceedings of the National Academy of Sciences of
the United States of America, 95 (1998) 8975-8980.[11] A. Shkilnyy, P. Proulx, J. Sharp, M. Lepage and P. Vermette. Colloid Surf. B-
Biointerfaces, 93 (2012) 202-207.[12] A. Pluen, P.A. Netti, R.K. Jain and D.A. Berk. Biophys. J., 77 (1999) 542-552.[13] R.J. Phillips. Biophys. J., 79 (2000) 3350-3353.[14] R.G. Thorne, S. Hrabetova and C. Nicholson. Journal of Neurophysiology, 92 (2004) 3471-
3481.[15] A. Vasaturo, S. Caserta, I. Russo, V. Preziosi, C. Ciacci and S. Guido. PLoS One, 7 (2012)
12.[16] P.V. Moghe, R.D. Nelson and R.T. Tranquillo. J. Immunol. Methods, 180 (1995) 193-211.[17] S. Raghavan, C.J. Shen, R.A. Desai, N.J. Sniadecki, C.M. Nelson and C.S. Chen. J. Cell
Sci., 123 (2010) 2877-2883.[18] J.E. Fata, H. Mori, A.J. Ewald, H. Zhang, E. Yao, Z. Werb and M.J. Bissell. Dev Biol, 306
(2007) 193-207.[19] J. Crank, The mathematics of diffusion, 2nd edition ed., Oxford University Press, Oxford,
1975.[20] A.J. Bard and L.R. Faulkner, Electrochemical Methods. Fundamentals and Applications,
2nd Ed. ed., Wiley, New York, 2001.[21] K. Braeckmans, L. Peeters, N.N. Sanders, S.C. De Smedt and J. Demeester. Biophys. J., 85
(2003) 2240-2252.[22] T.K.L. Meyvis, S.C. De Smedt, P. Van Oostveldt and J. Demeester. Pharm. Res., 16 (1999)
1153-1162.[23] I. Pastor, E. Vilaseca, S. Madurga, J.L. Garces, M. Cascante and F. Mas. J. Phys. Chem. B,
114 (2010) 4028-4034; ibid, 114 (2010) 12182[24] M.T. Sheu, J.C. Huang, G.C. Yeh and H.O. Ho. Biomaterials, 22 (2001) 1713-1719.

Page 23 of 34
Accep
ted
Man
uscr
ipt
23
[25] I. Horcas, R. Fernandez, J.M. Gomez-Rodriguez, J. Colchero, J. Gomez-Herrero and A.M. Baro. Review of Scientific Instruments, 78 (2007) 8.
[26] M.D. Abramoff, P.J. Magelhaes and S.J. Ram. Biophotonics Int, 11 (2004) 36:42.[27] L. D.R., CRC Handbook of chemistry and physics, 89th edition ed., CRC Press. Taylor and
Francis Group, LLC., 2008.[28] W. Mickel, S. Munster, L.M. Jawerth, D.A. Vader, D.A. Weitz, A.P. Sheppard, K. Mecke,
B. Fabry and G.E. Schroder-Turk. Biophys J, 95 (2008) 6072-6080.[29] G.P. Raeber, M.P. Lutolf and J.A. Hubbell, Molecularly engineered PEG hydrogels: a
novel model system for proteolytically mediated cell migration, Biophys J, 89 (2005) 1374-1388.
[30] Y.A. Miroshnikova, D.M. Jorgens, L. Spirio, M. Auer, A.L. Sarang-Sieminski and V.M. Weaver. Phys Biol, 8 (2011) 026013.
[31] M.H. Zaman, L.M. Trapani, A. Siemeski, D. Mackellar, H. Gong, R.D. Kamm, A. Wells, D.A. Lauffenburger and P. Matsudaira. Proc Natl Acad Sci U S A, 103 (2006) 10889-10894.
[32] A. Pluen, Y. Boucher, S. Ramanujan, T.D. McKee, T. Gohongi, E. di Tomaso, E.B. Brown, Y. Izumi, R.B. Campbell, D.A. Berk and R.K. Jain. Proceedings of the National Academy of Sciences of the United States of America, 98 (2001) 4628-4633.
[33] R.G. Thorne, A. Lakkaraju, E. Rodriguez-Boulan and C. Nicholson. Proceedings of the National Academy of Sciences of the United States of America, 105 (2008) 8416-8421.
[34] B. Kim, G. Han, B.J. Toley, C.K. Kim, V.M. Rotello and N.S. Forbes. Nat. Nanotechnol., 5 (2010) 465-472.
[35] T. Kihara, J. Ito and J. Miyake. Plos One, 8 (2013).[36] N. Srikantha, F. Mourad, K. Suhling, N. Elsaid, J. Levitt, P.H. Chung, S. Somavarapu and
T.L. Jackson. Exp. Eye Res., 102 (2012) 85-92.[37] B.A. Westrin and A. Axelsson. Biotechnol. Bioeng., 38 (1991) 439-446.[38] Y.L. Yang, L.M. Leone and L.J. Kaufman. Biophys J, 97 (2009) 2051-2060.[39] J. Happel and H. Brenner, Low Reynolds number hydrodynamics: with special applications
to particulate media, Dordretch, The Netherlands, 1991.[40] M.L. Huggins. J. Phys. Chem., 42 (1938) 911-920.[41] R.R. Matheson. Macromolecules, 13 (1980) 643-648.[42] A. Erikson, H.N. Andersen, S.N. Naess, P. Sikorski and C.D. Davies. Biopolymers, 89
(2008) 135-143.[43] C.D. Roskelley, P.Y. Desprez and M.J. Bissell. Proc Natl Acad Sci U S A, 91 (1994)
12378-12382.[44] C.M. Nelson, M.M. Vanduijn, J.L. Inman, D.A. Fletcher and M.J. Bissell. Science, 314
(2006) 298-300.[45] M. Magzoub, S. Jin and A.S. Verkman, Faseb J., 22 (2008) 276-284.[46] L.J. Nugent and R.K. Jain, Cancer Res., 44 (1984) 238-244.[47] L.J. Nugent and R.K. Jain, Microvasc. Res., 28 (1984) 270-274.[48] P.A. Netti, D.A. Berk, M.A. Swartz, A.J. Grodzinsky and R.K. Jain, Cancer Res., 60 (2000)
2497-2503.[49] V.P. Chauhan, R.M. Lanning, B. Diop-Frimpong, W. Mok, E.B. Brown, T.P. Padera, Y.
Boucher and R.K. Jain, Biophys. J., 97 (2009) 330-336.

Page 24 of 34
Accep
ted
Man
uscr
ipt
Diffusion hindrance in extracellular matrix (ECM) gels used in 3D cultures is investigated
A cost-effective and simple spectrophotometer-based diffusivity assay is introduced, and
complemented with FRAP and AFM measurements
Diffusion hindrance is largely controlled by the enhanced ECM viscosity
Unassembled ECM macromolecules may control ECM viscosity
Dense (but not sparse) ECM gels are suitable tissue surrogates in terms of diffusion
Highlights (for review)

Page 25 of 34
Accep
ted
Man
uscr
ipt
Dif
fus
ivit
y , D
(10
-6c
m2/s
)
0 0
0.5
1.0
1.5
2.0
sparse collagen
dense collagen
dense fibrinMatrigel
Molecular Weight (kDa)
0 10 20 30 40 50 60 70 80
0.0 Matrigel
*Graphical Abstract (for review)

Page 26 of 34
Accep
ted
Man
uscr
ipt
0 1 2 3
0
1
2
3
0.5 1.0 1.5 2.0 2.5
0.5
1.0
1.5
2.0
2.5
time, t (h)
0 2 4 6 8
0.0
0.2
0.4
0.6
0.8
1.0
C
SFM
sparse COLI
dense COLI
dense FIB
rBM/MatrigelNo
rmal
ized
flu
ore
scen
ce
inte
nsi
ty
A
FITC-dextransdiluted in SFM
Transwell insertLower Transwellcompartment
SFM + diffused dextrans
ECM gel
Permeable membrane
Bulk fluorescence detection (Microplate Reader)
Figure 1
D E
DS
FM
(10-
6cm
2 /s)
DF
RA
P(1
0-6
cm2 /
s)
D (10-6 cm2/s)D0 (10-6 cm2/s)
0 50 100 150
0
5
10
15
Flu
ore
sc.
Inte
nsi
ty (
104
a.u
.)
Concentration (μg/ml)
B
x
Figure 1

Page 27 of 34
Accep
ted
Man
uscr
ipt
rBM dense FIB dense COLIsparse COLI
Effe
ctiv
e vi
scos
ity, η
(Pa·
s)
0.000
0.001
0.002
0.003
0.004
0.005 4 kDa 40 kDa 70 kDa
0 10 20 30 40 50 60 70 800.0
0.5
1.0
1.5
2.0
Figure 2
sparse COLIdense COLI
dense FIBrBM
A
B
D(1
0-6
cm2 /s
)
Mr (kDa)
ηwater
dense FIB
rBM dense COLI
sparse COLI
Figure 2

Page 28 of 34
Accep
ted
Man
uscr
ipt
1.0
1.3
1.6
1.9
2.2
2.5
<λcell>
<λbrain>
***
*
***
dense FIB
rBM dense COLI
sparse COLI
Gel
tort
uosi
ty, λ
gel
0.1
1
10
0.0
0.5
1.0
1.5
2.0
2.5
3.0
3.5
4.0
4.5
5.0
5.5
6.0
0
10
20
30
40A B
Figure 3
C ***
******
dense FIB
rBM dense COLI
sparse COLI
Pore
siz
e, w
(μm
)
Freq
uenc
y (%
)
Pore area (μm2)
3.7µm
0
D
Figure 3

Page 29 of 34
Accep
ted
Man
uscr
ipt
1.0
1.3
1.6
1.9
2.2
2.5
<λcell>
<λbrain>
***
*
***
dense FIB
rBM dense COLI
sparse COLI
Gel
tort
uosi
ty, λ
gel
D
0.1
1
10
0.0
0.5
1.0
1.5
2.0
2.5
3.0
3.5
4.0
4.5
5.0
5.5
6.0
0
10
20
30
40A B
Figure 3
C ***
******
dense FIB
rBM dense COLI
sparse COLI
3.7µm
0
Pore
siz
e, w
(μm
)
Freq
uenc
y (%
)
Pore area (μm2)
Figure 3 web only

Page 30 of 34
Accep
ted
Man
uscr
ipt
0.0 0.5 1.0 1.5 2.0 2.5 3.0
0
20
40
60
80
100
0.0 0.5 1.0 1.5 2.0 2.5 3.0
0
20
40
60
80
100
0.0 0.5 1.0 1.5 2.0 2.5 3.0
0
50
100
150
200
250
300
0.0 0.5 1.0 1.5 2.0 2.5 3.0
0
50
100
150
200
250
300ECMECM + cells
Dense FIB
rBM
Dense COLI
Sparse COLI
Figure 4
70 kDa
40 kDa
4 kDa
70 kDa
40 kDa
4 kDa
70 kDa
40 kDa
4 kDa
70 kDa
40 kDa
4 kDa
70 kDa
40 kDa
4 kDa
70 kDa
40 kDa
4 kDa
70 kDa40 kDa
4 kDa
70 kDa40 kDa
4 kDa
Hal
f m
axim
um
tim
e, t
50%
(h)
Gel thickness (mm)
Hal
f m
axim
um
tim
e, t
50%
(h)
Hal
f m
axim
um
tim
e, t
50%
(h)
Hal
f m
axim
um
tim
e, t
50%
(h)
C
A
D
B
Figure 4

Page 31 of 34
Accep
ted
Man
uscr
ipt
0 2 4 6 8 10 12 141
2
3
4
5
Figure 5
dense FIB
rBM
dense COLI
sparse COLI
Gel density, d (mg/ml)
Nor
mal
ized
vis
cosi
ty, η
/ηw
ater
Figure 5

Page 32 of 34
Accep
ted
Man
uscr
ipt
Table 1 Diffusivity values obtained with either S-E, the spectrophotometer-based assay within the diffusion layer, or FRAP (mean ± SE)
Dextran Mr (kDa)
Sample D (cm2/s) (S-E)
D (cm2/s) (diffusion layer)
DFRAP (cm2/s)
4kDa rBM (4.7 ± 0.2)×10-7 (7.7 ± 0.3)×10-7
dense FIB (5.5 ± 0.2)×10-7 (3.7 ± 0.6)×10-7
dense COLI (14 ± 2)×10-7 (16 ± 2)×10-7
sparse COLI (17 ± 3)×10-7 (28 ± 2)×10-7
SFM 26×10-7 (19 ± 3)×10-7 (23 ± 4)×10-7
40kDa rBM (2.2 ± 0.1)×10-7 n.a.
dense FIB (2.5 ± 0.1)×10-7 n.a.
dense COLI (6.3 ± 0.4)×10-7 (7.9 ± 0.2)×10-7
sparse COLI (9 ± 1)×10-7 n.a.
SFM 7.6×10⁻⁷ (7 ± 3)×10-7 n.a.
70kDa rBM (1.3 ± 0.1)×10-7 n.a.
dense FIB (2.0 ± 0.5)×10-7 n.a.
dense COLI (4.7 ± 0.6)×10-7 (6.5 ± 0.5)×10-7
sparse COLI (5.7 ± 0.8)×10-7 n.a.
SFM 5.7×10⁻⁷ (5.9 ± 1.7)×10-7 n.a.
Table 1

Page 33 of 34
Accep
ted
Man
uscr
ipt
Table 2 λ tissue values reported in the literature for dextrans and other macromolecules at different Mr Tracer Tissue λ Reference EGF (6.6 kDa) brain 1.8 [14] Dex3 brain (cortex) 1.6-2 [8] Dex3-Dex10 brain 1.8 [14] Dex10 tumor xenograft 1.4-1.7 [45] Different particle typesI normal granulation tissue ~1.1 [46] Different particle typesI tumors xenograft ~1.15 [32] Dex20 normal granulation tissue 2.3 [47] Dex20 tumor implants 1.2 [47] Dex40 brain (cortex) 2.16 [8] Different particle typesII normal granulation tissue ~1.3 [46] Dex40 tumors implants 1.3 [47] Different particle typesII tumors xenograft ~1.5 [32] AlbuminsII tumors xenograft 1.6-2.8 [48] Dex70 brain (cortex) 2.7 [8] Dex40-70 brain 2.2 [14] Albumins (14-66 kDa) brain 2.1-2.5 [14] Different particle typesIII normal granulation tissue ~1.8 [46] Dex70 tumors implants 1.8 [47] Different particle typesIII tumors xenograft ~1.9 [32] AlbuminsIII tumors xenograft 1.6-2.6 [48] IgG (150 kDa) normal skin 1.4 [49] IgG (150 kDa) tumor xenograft 2.5 [49] Iat same RH as Dex4; IIat same RH as Dex40; IIIat same RH as Dex70
Table 2

Page 34 of 34
Accep
ted
Man
uscr
ipt
Table 3 Comparison between predicted t50 and experimental time-windows for selected 3D culture studies Gel Thickness Signaling factor predicted t50 experimental
time-windowII Reference
rBM n.a. Prolactin (22 kDa) ≥ 3 dayI 3 day (β-casein expression)
[43]
rBM ~2 mm TGF-α (17 kDa) ≥ 2.5 dayI 2-3 day (robust branching)
[18]
dense COLI n.a. HGF (~80 kDa) ≥ 2 dayI 1 day (early branching)
[44]
dense FIB n.a. vEGF, bFGF, HGF (~20-80 kDa)
~ 3-5 dayI 7 day (robust branching)
[5]
Ivalues based on a 2 mm gel thickness in Fig. 5; IIt at which physiologic response was detected
Table 3