Investigations of clustering of ions and diffusivity in concentrated aqueous solutions of lithium...
10
Investigations of clustering of ions and diffusivity in concentrated aqueous solutions of lithium chloride by molecular dynamic simulations† Meena B. Singh, Vishwanath H. Dalvi and Vilas G. Gaikar * The interactions between lithium (Li + ) ions, chloride (Cl ) ions and water molecules in aqueous LiCl solutions and their effect on the dynamic and equilibrium properties of the salt solutions have been investigated by molecular dynamics (MD) simulations. The optimized potentials for liquid simulations for all atoms (OPLS-AA) force field have been used to study various properties of lithium chloride solutions for the concentrations, in the range of 0.1 M to 19.28 M. The MD simulation with the OPLS-AA force field gives a fair explanation of many important properties of alkali salt solutions which are in agreement with the experimental results. A microscopic description of LiCl solutions and diffusivity of LiCl obtained by simulation are in good agreement with the experimental data. The MD simulation indicated a strong solvation of monovalent ions in water and cluster formation of the cations at higher salt concentrations. The diffusion coefficient of LiCl decreases depending on the coordination structure of ions that changes with the salt concentration. 1. Introduction Investigating aqueous solutions of metal ions and ionic clusters has been an area of intensive scientic investigations for several decades. 1–4 The anions and cations of various alkali salt solu- tions, in particular, play an important role in nature, and therefore, experimental and theoretical studies of solvation of these monovalent ions have been conducted extensively. 5–8 The various properties of the alkali halide solutions, specically diffusivity, solubility and viscosity have been studied as a function of concentration by both experimental and theoretical methods. 9,10 These studies reveal that the behavior of the metal ions is strongly decided by their size and charge density on the ions. Small metal ions, such as lithium, interact very strongly with water molecules that form a closely held and oriented hydrophilic shell around the metal ion while the larger metal ions show weaker interactions with the neighboring water molecules resulting in formation of a disoriented shell of water molecules around the ion. A macroscopic property of the aqueous solution depends on the alkali salt concentration which shows the effect of ions on the hydrogen bonding of water. The solvation shells of hydrated ions in aqueous solu- tions have been studied by various simulations 11–13 and experi- mental 1,14 techniques. Neutron scattering and X-ray diffraction experiments are done in the past to study the solvation of water molecules around the ions, which proves that the structure of water gets affected by the cation–anion interactions. 15–19 Among alkali metal cations, Li + is the smallest ion having ionic radius of 0.059 nm 20 and bears the highest charge density of 1.86 10 11 Cm 3 . On dissolution of lithium chloride in water, its dissociation and formation of lithium ions causes structural changes in its surrounding which are not observed in other single-charged alkali metal ions, due to which lithium salt solutions exhibit specic physicochemical features such as viscosity, diffusivity and solubility. 21 At innitely dilute concentrations, it shows abnormal properties compared to chlorides of the other alkali metals. 22 Among numerous papers concerning the hydration of alkali metal ions, a majority of the studies addresses the structural aspects of lithium salts in aqueous solutions because of their applications in chemical power sources and in part because of extremely high hygroscopic nature of the lithium halides. 22,23 The energies of the 2s and 2p levels, in the ground state of Li, are very close. The energy of 2s orbital is 520 kJ and that of 2p is 340 kJ. Therefore, sp 3 hybridization arising from involve- ment of vacant 2s and 2p orbitals in the bonding with water molecules can be expected in complexes of lithium ions. The coordination number of a Li + ion is presumably determined by the type of hybridization of its vacant molecular orbitals and correspondingly, the presence of the fairly stable complex Li(H 2 O) 4 + in aqueous solutions was presumed. 23 Smirnov and Trostin 23 also mentioned that the formation of this complex is responsible for the abnormal properties of concentrated aqueous solutions of LiCl. In terms of the solution model, it was Department of Chemical Engineering, Institute of Chemical Technology, Matunga, Mumbai – 400 019, India. E-mail: [email protected]; Fax: +91 22 33611020; Tel: +91 22 33612013 † Electronic supplementary information (ESI) available. See DOI: 10.1039/c4ra15124k Cite this: RSC Adv. , 2015, 5, 15328 Received 24th November 2014 Accepted 26th January 2015 DOI: 10.1039/c4ra15124k www.rsc.org/advances 15328 | RSC Adv., 2015, 5, 15328–15337 This journal is © The Royal Society of Chemistry 2015 RSC Advances PAPER
Transcript of Investigations of clustering of ions and diffusivity in concentrated aqueous solutions of lithium...

RSC Advances
PAPER
Investigations of
Department of Chemical Engineering, Inst
Mumbai – 400 019, India. E-mail: vg.g
33611020; Tel: +91 22 33612013
† Electronic supplementary informa10.1039/c4ra15124k
Cite this: RSC Adv., 2015, 5, 15328
Received 24th November 2014Accepted 26th January 2015
DOI: 10.1039/c4ra15124k
www.rsc.org/advances
15328 | RSC Adv., 2015, 5, 15328–1533
clustering of ions and diffusivity inconcentrated aqueous solutions of lithium chlorideby molecular dynamic simulations†
Meena B. Singh, Vishwanath H. Dalvi and Vilas G. Gaikar*
The interactions between lithium (Li+) ions, chloride (Cl�) ions and water molecules in aqueous LiCl
solutions and their effect on the dynamic and equilibrium properties of the salt solutions have been
investigated by molecular dynamics (MD) simulations. The optimized potentials for liquid simulations for
all atoms (OPLS-AA) force field have been used to study various properties of lithium chloride solutions
for the concentrations, in the range of 0.1 M to 19.28 M. The MD simulation with the OPLS-AA force field
gives a fair explanation of many important properties of alkali salt solutions which are in agreement with
the experimental results. A microscopic description of LiCl solutions and diffusivity of LiCl obtained by
simulation are in good agreement with the experimental data. The MD simulation indicated a strong
solvation of monovalent ions in water and cluster formation of the cations at higher salt concentrations.
The diffusion coefficient of LiCl decreases depending on the coordination structure of ions that changes
with the salt concentration.
1. Introduction
Investigating aqueous solutions of metal ions and ionic clustershas been an area of intensive scientic investigations for severaldecades.1–4 The anions and cations of various alkali salt solu-tions, in particular, play an important role in nature, andtherefore, experimental and theoretical studies of solvation ofthese monovalent ions have been conducted extensively.5–8 Thevarious properties of the alkali halide solutions, specicallydiffusivity, solubility and viscosity have been studied as afunction of concentration by both experimental and theoreticalmethods.9,10 These studies reveal that the behavior of the metalions is strongly decided by their size and charge density on theions. Small metal ions, such as lithium, interact very stronglywith water molecules that form a closely held and orientedhydrophilic shell around the metal ion while the larger metalions show weaker interactions with the neighboring watermolecules resulting in formation of a disoriented shell of watermolecules around the ion. A macroscopic property of theaqueous solution depends on the alkali salt concentrationwhich shows the effect of ions on the hydrogen bonding ofwater. The solvation shells of hydrated ions in aqueous solu-tions have been studied by various simulations11–13 and experi-mental1,14 techniques. Neutron scattering and X-ray diffraction
itute of Chemical Technology, Matunga,
[email protected]; Fax: +91 22
tion (ESI) available. See DOI:
7
experiments are done in the past to study the solvation of watermolecules around the ions, which proves that the structure ofwater gets affected by the cation–anion interactions.15–19
Among alkali metal cations, Li+ is the smallest ion havingionic radius of 0.059 nm 20 and bears the highest charge densityof 1.86 � 1011 C m�3. On dissolution of lithium chloride inwater, its dissociation and formation of lithium ions causesstructural changes in its surrounding which are not observed inother single-charged alkali metal ions, due to which lithium saltsolutions exhibit specic physicochemical features such asviscosity, diffusivity and solubility.21 At innitely diluteconcentrations, it shows abnormal properties compared tochlorides of the other alkali metals.22
Among numerous papers concerning the hydration of alkalimetal ions, a majority of the studies addresses the structuralaspects of lithium salts in aqueous solutions because of theirapplications in chemical power sources and in part because ofextremely high hygroscopic nature of the lithium halides.22,23
The energies of the 2s and 2p levels, in the ground state of Li,are very close. The energy of 2s orbital is �520 kJ and that of 2pis �340 kJ. Therefore, sp3 hybridization arising from involve-ment of vacant 2s and 2p orbitals in the bonding with watermolecules can be expected in complexes of lithium ions. Thecoordination number of a Li+ ion is presumably determined bythe type of hybridization of its vacant molecular orbitals andcorrespondingly, the presence of the fairly stable complexLi(H2O)4
+ in aqueous solutions was presumed.23 Smirnov andTrostin23 also mentioned that the formation of this complex isresponsible for the abnormal properties of concentratedaqueous solutions of LiCl. In terms of the solution model, it was
This journal is © The Royal Society of Chemistry 2015
Paper RSC Advances
assumed that chloride ions replace the water molecules for awide range of concentration of LiCl and form a tetrahedralsurrounding of solvent molecules around Li+ ions.24 The solu-tion properties are then decided by the presence of suchcomplexes rather than individual ions in the solutions. Thecolligative properties of the solutions also are decided by thenumber of the ionic species and their sizes on dynamic timescale of the system.
Molecular Dynamics (MD) simulation is a powerful tool tostudy the materials at molecular level and extensively used toinvestigate; in particular, the aqueous solutions because of thehighly hydrogen-bonded structure of water.13,14 Many effortshave been made for the characterisation and optimization ofenergy parameters used for various alkali metal ions.24,25 MDstudies are also useful for investigating the hydration andcoordination structures of alkali metal ions such as Li+, Na+ andK+.26 But many of these MD studies are restricted to lower saltconcentration range.27,28 MD simulations have also been doneto parameterize force eld for various alkali metal ions.24,29,30
While this work was on, Aragones et al.30 reported radialdistribution functions of Li+ and Cl� ions in aqueous solutionsof LiCl upto 10 M concentration, by using JC force eld andTIP4P/2005 water model. These authors claimed that modiedLorentz–Berthelot (MLB) mixing rules were necessary to get thebetter t of the simulated RDFs with the experimentally31 esti-mated ion pairing parameters. However, we shall show in thepresent simulation that such a modication is not necessary, ifappropriate force eld parameters are used, which otherwisewould bring in an additional scaling factor for the mixing rules.A recent paper by Bouazizi and Nasr32 shows decreasing diffu-sivity of the ions on increasing LiCl concentration in aqueoussolutions due to ion-pairing upto 6 M, however, with muchsmaller box sizes.
The present work involves MD simulation for theLi+$xH20$yCl
� water system to determine the solution phasecoordination number of lithium ions in water and, further itseffect on Li+ diffusivity in aqueous solutions at much higherconcentrations reaching to 19.28 M and larger system size torepresent the behaviour of the system very accurately. Thesestudies are expected to provide detail structural as well as energeticinformation of the solutions of Li salts. Further, we explain in thiswork, the correlation of diffusion coefficient of different species inthe solutions with concentration of LiCl in terms of the clusteringof ions and solvent molecules.
2. Methods
The simulation was conducted in a periodic box and 3D peri-odic boundary conditions were applied.33 Lithium ions, chlo-ride ions and water molecules were initially distributedrandomly in the periodic box. The number of water molecules;lithium cations; and chloride anions in the unit cell wereadjusted to represent 0.11 M to 19.28 M salt concentrations(Table 1).
A GROMACS code which integrates Newton's equations ofmotion for a system of N interacting atoms has been used toperform the MD simulations,34–36
This journal is © The Royal Society of Chemistry 2015
mi
v2ri
vt2¼ Fi ; i ¼ 1;.;N: (1)
The forces (Fi) are the negative derivatives of a potentialfunction V (r1, r2, ., rn):
Fi ¼ � vV
vri(2)
The OPLS-AA parameters for lithium37 and chloride25 ionswere employed to describe the interactions involved in themixture with the SPC/E water model.38 Simulations with TIP4Pwater model were also done to compare the results obtained byboth the water models.39 The OPLS-AA force eld is a combi-nation of electrostatic interactions and Lennard-Jones poten-tial, therefore, also called as modied Lennard-Jones force eldand expressed as:40
B�rij� ¼ 43ij
"�sij
rij
�12
��sij
rij
�6#þ qiqj
rij(3)
where, rij indicates the distance between particles i and j, s and 3
denote the size parameter and energy parameter, respectively,and qi indicates the charge on the ith atom (or ion). Theparameters of the force eld that were used for the simulationare listed in Table 2.
Lorentz–Berthelot (LB) mixing rules were used to dene thepotential parameters for unlike site pairs and expressed as:
sij ¼ si þ sj
2(4)
3ij ¼ ffiffiffiffiffiffiffi3i3j
p(5)
A cut off distance of 10 A was used for the interactionpotential and immediate neighbour's list was updated at everyh time step. The long range electrostatic interactions beyondthe cut off distance of 10 A are treated by particle mesh Ewaldmethod.40,41 In the simulation, the time steps for the integra-tion, temperature coupling and pressure coupling are 2.0 fs, 0.1ps and 2.0 ps, respectively.
Energy minimization of the system (below 1000 kJ mol�1
nm�1) was done by using steepest descent and conjugatedgradient algorithms. Aer the energy minimization, a series ofsystem equilibration runs were performed. At the rst instance,the equilibration of the system under an NVT ensemble wasconducted for 100 ps to stabilize the temperature of system at300 K with position constraints. The next step of equilibrationof pressure was conducted under an NPT ensemble for 100 pswith position restraints. The system gets well-equilibrated at thedesired temperature and pressure aer the equilibration pha-ses, so position restraints were released and the production MDrun was performed for 1 ns for the molecular dynamictrajectory.
The geometry was analyzed for radial distribution functionand coordination number as structural parameters. The radialdistribution function (RDF) measures the probability of
RSC Adv., 2015, 5, 15328–15337 | 15329

Table 1 Details of the periodic boxes used for various MD calculations
[LiCl], M Size of periodic box in nm Number of lithium ions Number of chloride ions Number of water molecules
0.11 4.742 7 7 35590.22 4.747 14 14 35450.346 4.734 22 22 35291.268 4.708 78 78 34172.362 4.684 140 140 32933.364 4.668 193 193 31874.52 4.646 250 250 30735.90 4.621 313 313 29457.01 4.599 360 360 28538.01 4.580 400 400 277310.11 4.561 477 477 261912.03 4.532 540 540 249315.73 4.526 646 646 228116.87 4.531 675 675 222317.89 4.525 700 700 217319.28 4.528 732 732 2109
Table 2 Lennard-Jones and electrostatic parameters for the ion andwater force field
Group Charge sLJ (A)3LJ(kcal mol�1)
OPLS (Li+)37 +1 1.506 0.166OPLS (Cl�)25 �1 4.02 0.71SPC/E (H2O)
38 +0.4238/�0.8476 3.166 0.650TIP4P (H2O)
39 +0.52/�1.04 3.15369 0.6480
Fig. 1 Radial distribution functions for 10.12 M LiCl solution.
Fig. 2 Li–Cl radial distribution function as a function of saltconcentration.
RSC Advances Paper
presence of a given atom a at the origin of a random referenceframe and another atom b located in a spherical shell ofinnitesimal thickness at a distance, r, from the reference atom.The resulting function gab(r), is dened by Hansen and McDo-nald42 as:
xaxbrgabðrÞ ¼1
N
*XNa
i¼1
XNb
j¼1
d�r� ri � rj
�+(6)
15330 | RSC Adv., 2015, 5, 15328–15337
where, xi is the mole fraction of chemical type i, Ni is thenumber of atoms of chemical type i, N is the total number ofatoms, and r is the overall number density. The prime indicatesthat the terms where i ¼ j are excluded when the chemical typesare the same. The composition of the rst coordination sphereof the metal ions in solutions can be determined from the radialdistribution function (RDF) against radial distance r.
The average coordination number, nab, is dened as thenumber of atoms of type b present in a spherical shell ofthickness dr, at a distance r from atom of type a. The averagecoordination number nab can be calculated by integrating gab(r)with respect to r as:42
nab ¼ rb
ðr0
gabðrÞr2dr (7)
where, rb is the number density of atom type b. The radialdistribution function, gab(r) is used for the calculation of thecoordination number in the solution.
Mean square displacement (MSD) function was used tocalculate the dynamic properties of various components. The
This journal is © The Royal Society of Chemistry 2015

Fig. 3 Li–Li radial distribution function plot for different salt concentration. Every curve is shifted by 0.1 in vertical direction from previous one forclarity.
Table 3 Coordination number of lithium ion in aqueous solutions oflithium chloride by (A) X-ray diffraction, (B) neutron diffraction
[LiCl], M r, nmCoordination numberof lithium ion Method
1 0.190 4 B40
6.9 0.195 4 A + B46
6.9 0.195 4 A47
9.3 0.202 4 B48
9.95 0.195 3.3 B49
Paper RSC Advances
mean square displacement (MSD) can be calculated33,43,44 byusing eqn (8)
Di ¼ limt/N
1
6½riðtÞ � rið0Þ�2 (8)
where ri(t) indicates the position of a particle i at time t. Intheory, diffusion coefficients or diffusivity (D) of various atomtypes can be calculated from the slope of the MSD plots, theseslopes can be directly related to the molecular diffusion rate,steeper is the slope, higher is the rate of diffusion.45
3. Results and discussion
The MD simulation results have been analyzed at 298 K for thedynamic properties, structural properties and clusterization oraggregation effect on the system properties and are discussedseparately.
Fig. 4 Cl–Cl radial distribution function plot for different LiCl concentratfor clarity.
This journal is © The Royal Society of Chemistry 2015
Structural properties
Radial distribution function (RDF) and coordination number(CN) function obtained by the MD simulations are useful foridentifying the local structures in the solutions. To get a clearpicture of coordination structure, a specimen RDF plot for 10.12
ions. Every curve is shifted by 0.1 in vertical direction from previous one
RSC Adv., 2015, 5, 15328–15337 | 15331
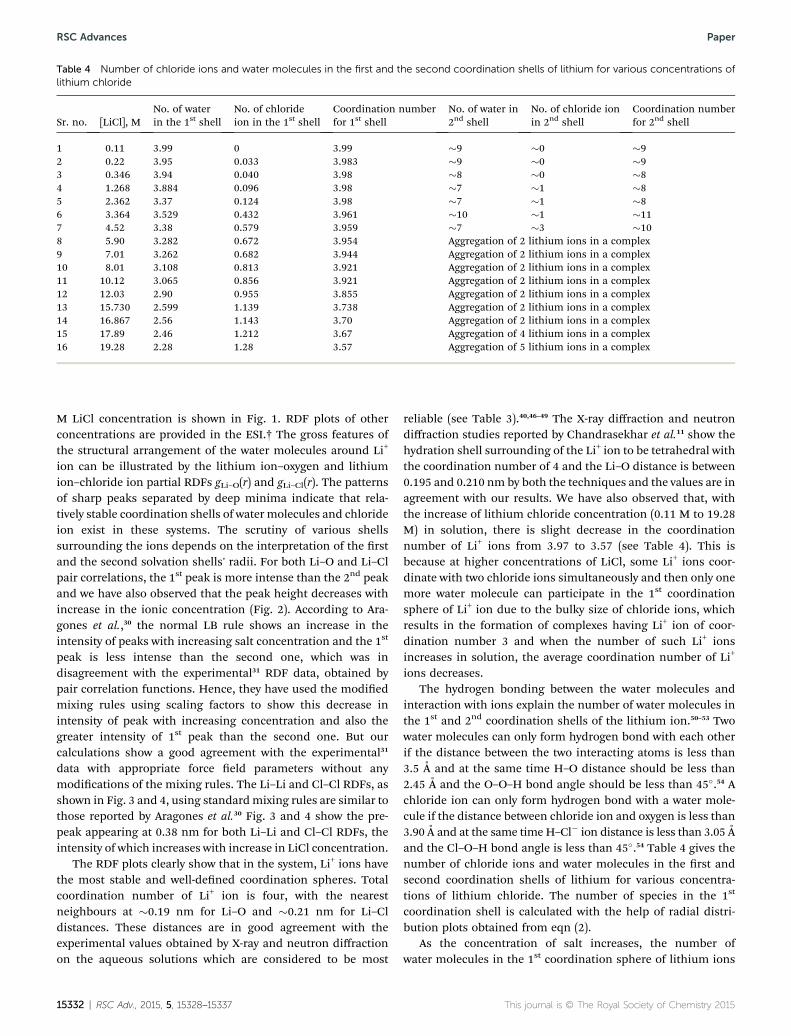
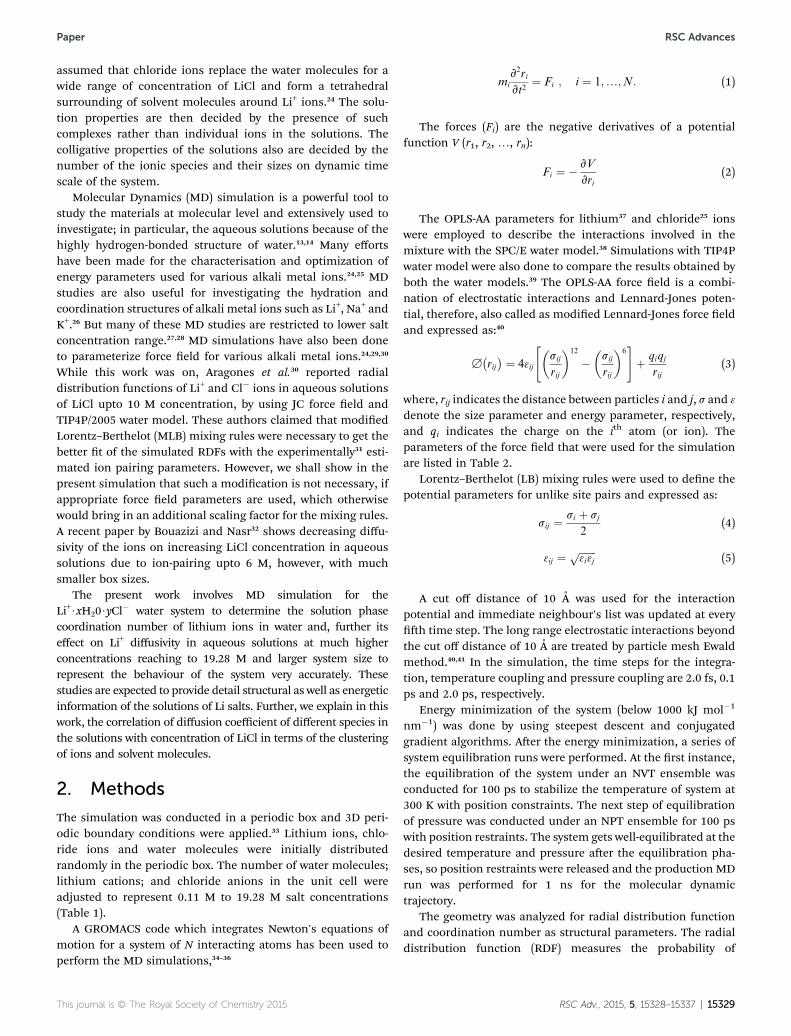
Table 4 Number of chloride ions and water molecules in the first and the second coordination shells of lithium for various concentrations oflithium chloride
Sr. no. [LiCl], MNo. of waterin the 1st shell
No. of chlorideion in the 1st shell
Coordination numberfor 1st shell
No. of water in2nd shell
No. of chloride ionin 2nd shell
Coordination numberfor 2nd shell
1 0.11 3.99 0 3.99 �9 �0 �92 0.22 3.95 0.033 3.983 �9 �0 �93 0.346 3.94 0.040 3.98 �8 �0 �84 1.268 3.884 0.096 3.98 �7 �1 �85 2.362 3.37 0.124 3.98 �7 �1 �86 3.364 3.529 0.432 3.961 �10 �1 �117 4.52 3.38 0.579 3.959 �7 �3 �108 5.90 3.282 0.672 3.954 Aggregation of 2 lithium ions in a complex9 7.01 3.262 0.682 3.944 Aggregation of 2 lithium ions in a complex10 8.01 3.108 0.813 3.921 Aggregation of 2 lithium ions in a complex11 10.12 3.065 0.856 3.921 Aggregation of 2 lithium ions in a complex12 12.03 2.90 0.955 3.855 Aggregation of 2 lithium ions in a complex13 15.730 2.599 1.139 3.738 Aggregation of 2 lithium ions in a complex14 16.867 2.56 1.143 3.70 Aggregation of 2 lithium ions in a complex15 17.89 2.46 1.212 3.67 Aggregation of 4 lithium ions in a complex16 19.28 2.28 1.28 3.57 Aggregation of 5 lithium ions in a complex
RSC Advances Paper
M LiCl concentration is shown in Fig. 1. RDF plots of otherconcentrations are provided in the ESI.† The gross features ofthe structural arrangement of the water molecules around Li+
ion can be illustrated by the lithium ion–oxygen and lithiumion–chloride ion partial RDFs gLi–O(r) and gLi–Cl(r). The patternsof sharp peaks separated by deep minima indicate that rela-tively stable coordination shells of water molecules and chlorideion exist in these systems. The scrutiny of various shellssurrounding the ions depends on the interpretation of the rstand the second solvation shells' radii. For both Li–O and Li–Clpair correlations, the 1st peak is more intense than the 2nd peakand we have also observed that the peak height decreases withincrease in the ionic concentration (Fig. 2). According to Ara-gones et al.,30 the normal LB rule shows an increase in theintensity of peaks with increasing salt concentration and the 1st
peak is less intense than the second one, which was indisagreement with the experimental31 RDF data, obtained bypair correlation functions. Hence, they have used the modiedmixing rules using scaling factors to show this decrease inintensity of peak with increasing concentration and also thegreater intensity of 1st peak than the second one. But ourcalculations show a good agreement with the experimental31
data with appropriate force eld parameters without anymodications of the mixing rules. The Li–Li and Cl–Cl RDFs, asshown in Fig. 3 and 4, using standardmixing rules are similar tothose reported by Aragones et al.30 Fig. 3 and 4 show the pre-peak appearing at 0.38 nm for both Li–Li and Cl–Cl RDFs, theintensity of which increases with increase in LiCl concentration.
The RDF plots clearly show that in the system, Li+ ions havethe most stable and well-dened coordination spheres. Totalcoordination number of Li+ ion is four, with the nearestneighbours at �0.19 nm for Li–O and �0.21 nm for Li–Cldistances. These distances are in good agreement with theexperimental values obtained by X-ray and neutron diffractionon the aqueous solutions which are considered to be most
15332 | RSC Adv., 2015, 5, 15328–15337
reliable (see Table 3).40,46–49 The X-ray diffraction and neutrondiffraction studies reported by Chandrasekhar et al.11 show thehydration shell surrounding of the Li+ ion to be tetrahedral withthe coordination number of 4 and the Li–O distance is between0.195 and 0.210 nm by both the techniques and the values are inagreement with our results. We have also observed that, withthe increase of lithium chloride concentration (0.11 M to 19.28M) in solution, there is slight decrease in the coordinationnumber of Li+ ions from 3.97 to 3.57 (see Table 4). This isbecause at higher concentrations of LiCl, some Li+ ions coor-dinate with two chloride ions simultaneously and then only onemore water molecule can participate in the 1st coordinationsphere of Li+ ion due to the bulky size of chloride ions, whichresults in the formation of complexes having Li+ ion of coor-dination number 3 and when the number of such Li+ ionsincreases in solution, the average coordination number of Li+
ions decreases.The hydrogen bonding between the water molecules and
interaction with ions explain the number of water molecules inthe 1st and 2nd coordination shells of the lithium ion.50–53 Twowater molecules can only form hydrogen bond with each otherif the distance between the two interacting atoms is less than3.5 A and at the same time H–O distance should be less than2.45 A and the O–O–H bond angle should be less than 45�.54 Achloride ion can only form hydrogen bond with a water mole-cule if the distance between chloride ion and oxygen is less than3.90 A and at the same time H–Cl� ion distance is less than 3.05 Aand the Cl–O–H bond angle is less than 45�.54 Table 4 gives thenumber of chloride ions and water molecules in the rst andsecond coordination shells of lithium for various concentra-tions of lithium chloride. The number of species in the 1st
coordination shell is calculated with the help of radial distri-bution plots obtained from eqn (2).
As the concentration of salt increases, the number ofwater molecules in the 1st coordination sphere of lithium ions
This journal is © The Royal Society of Chemistry 2015

Fig. 5 Coordination structures of LiCl at various concentrations inwater.
Paper RSC Advances
decreases monotonically. Lithium ion has a very smallsize; therefore, it generates large local electric eld that helpsin holding the water molecules tightly in a tetrahedralgeometry.
This journal is © The Royal Society of Chemistry 2015
As the concentration of solution increases, negativelycharged Cl� ions start replacing the water molecules from thecoordination shell of Li+ ion, and hence the Li+–O coordinationnumber decreases. A Li+ ion coordinates with three watermolecules and one chloride ion in the concentration range of2.36–8.01 M of lithium chloride in water. The same has alsobeen found from the gas phase micro-solvation studies basedon Density Functional Theory (DFT).55 The primary andsecondary coordination numbers of lithium ion with respect tothe chloride ion increase with the increase in lithium chlorideconcentration as shown in Table 4. There is signicant increasein the secondary coordination number of Li+ ions as comparedto primary coordination number because the interactionbetween the hydrated ions is much more intense than thenaked ion–ion interaction.
Clustering/aggregation effect
Fig. 5 shows that for lower concentrations of LiCl, i.e. less than1.0 M, the 1st and 2nd hydration shells of Li+ ion consist only ofwater molecules. For 2.36M LiCl concentration, twomajor typesof species are seen in the aqueous solutions. For most of the Li+
ions, the Cl� ion is present in only in the 2nd coordination shell,while only few Li+ ions (24%) have Cl� ion present in the 1st
coordination shell. A clear ion pairing effect is observed for theconcentrations ranging from 2.36 M to 4.52 M, i.e. 25–56% ionof Li+ is paired with one Cl� ion in the solution. The 1st
hydration shell of the Li+ ion then consists of one Cl� ion andthree water molecules. Similar observations were reported byChen and Pappu56 and Hassan57 for the ion pairing of otheralkali metal ions at similar concentrations.
For the salt concentrations at and above 1.39 M, rst ionpairing of cation and anion and later clusterization of more ionsin the aqueous phase is observed (Table 5). The number of ionpairs or clusters and size of the clusters, in the given volume ofthe solution, increase with the increase in salt concentration.The size of the cluster is considered in terms of number of Li–Clion pairs present in continuation as if in a linear complexation.For LiCl concentrations from 1.39 M to 8.01 M, the size ofcluster remains mostly the same i.e. in dimer form as Li+–Cl�–Li+, while the number of species forming the cluster increases.For 10.12 M concentration, formation of trimer species, i.e.Li+–Cl�–Li+–Cl�–Li+ is observed, while for 12.03 M to 15.73 MLiCl concentration tetramer species starts appearing in addi-tion to dimer and trimer species. For 16.86 M to 19.28 M LiClconcentration, a population of clusters containing dimers topentamers and even a few hexamer species of Li–Cl, is observed.The complete cluster analysis for all the concentrations of LiClis presented in Table 5. As the concentration of LiCl is increasedfrom 1.27 M to 19.28 M, the percentage of Li+ ions occurring inthe cluster form increases from 18% to 97%, respectively.
In Fig. 6, the estimated density of lithium chloride solutionsfrom the simulation is plotted as a function of salt concentra-tion in the aqueous solution and compared with experimentaldensity values58 and the simulated values reported by Aragoneset al.30 The density values, calculated by simulation using SPC/Ewater model, are accurate upto 4.52 M LiCl. But as the
RSC Adv., 2015, 5, 15328–15337 | 15333
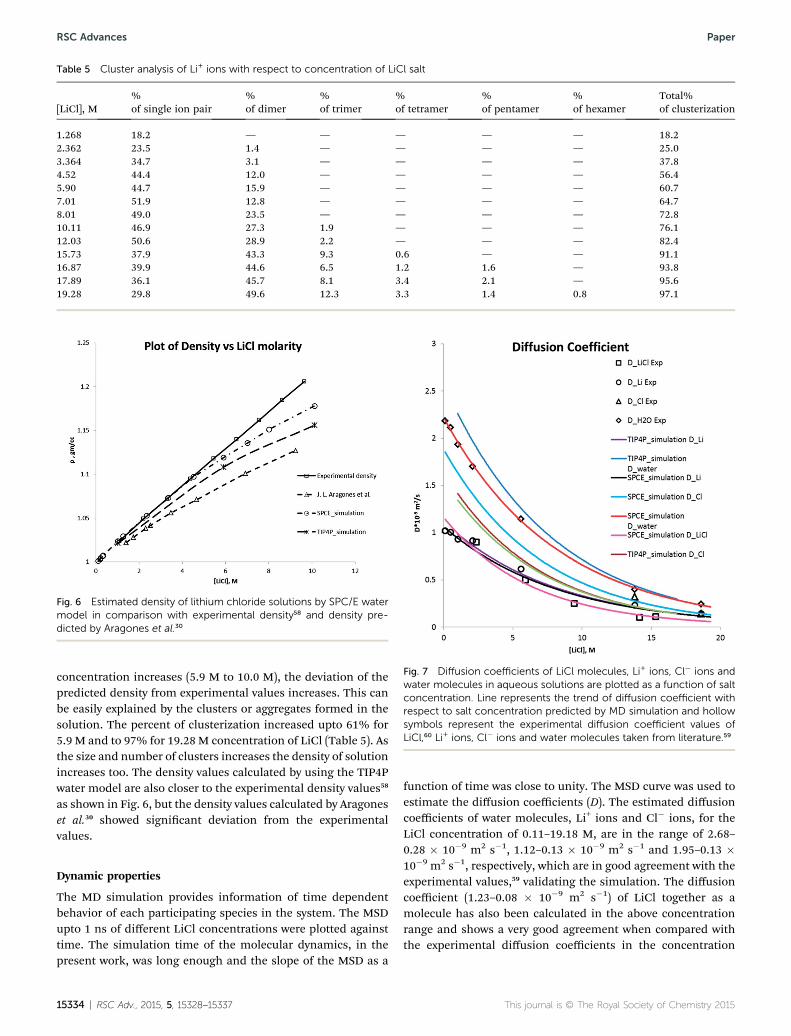
Table 5 Cluster analysis of Li+ ions with respect to concentration of LiCl salt
[LiCl], M%of single ion pair
%of dimer
%of trimer
%of tetramer
%of pentamer
%of hexamer
Total%of clusterization
1.268 18.2 — — — — — 18.22.362 23.5 1.4 — — — — 25.03.364 34.7 3.1 — — — — 37.84.52 44.4 12.0 — — — — 56.45.90 44.7 15.9 — — — — 60.77.01 51.9 12.8 — — — — 64.78.01 49.0 23.5 — — — — 72.810.11 46.9 27.3 1.9 — — — 76.112.03 50.6 28.9 2.2 — — — 82.415.73 37.9 43.3 9.3 0.6 — — 91.116.87 39.9 44.6 6.5 1.2 1.6 — 93.817.89 36.1 45.7 8.1 3.4 2.1 — 95.619.28 29.8 49.6 12.3 3.3 1.4 0.8 97.1
Fig. 6 Estimated density of lithium chloride solutions by SPC/E watermodel in comparison with experimental density58 and density pre-dicted by Aragones et al.30
Fig. 7 Diffusion coefficients of LiCl molecules, Li+ ions, Cl� ions andwater molecules in aqueous solutions are plotted as a function of saltconcentration. Line represents the trend of diffusion coefficient withrespect to salt concentration predicted by MD simulation and hollowsymbols represent the experimental diffusion coefficient values ofLiCl,60 Li+ ions, Cl� ions and water molecules taken from literature.59
RSC Advances Paper
concentration increases (5.9 M to 10.0 M), the deviation of thepredicted density from experimental values increases. This canbe easily explained by the clusters or aggregates formed in thesolution. The percent of clusterization increased upto 61% for5.9 M and to 97% for 19.28 M concentration of LiCl (Table 5). Asthe size and number of clusters increases the density of solutionincreases too. The density values calculated by using the TIP4Pwater model are also closer to the experimental density values58
as shown in Fig. 6, but the density values calculated by Aragoneset al.30 showed signicant deviation from the experimentalvalues.
Dynamic properties
The MD simulation provides information of time dependentbehavior of each participating species in the system. The MSDupto 1 ns of different LiCl concentrations were plotted againsttime. The simulation time of the molecular dynamics, in thepresent work, was long enough and the slope of the MSD as a
15334 | RSC Adv., 2015, 5, 15328–15337
function of time was close to unity. The MSD curve was used toestimate the diffusion coefficients (D). The estimated diffusioncoefficients of water molecules, Li+ ions and Cl� ions, for theLiCl concentration of 0.11–19.18 M, are in the range of 2.68–0.28 � 10�9 m2 s�1, 1.12–0.13 � 10�9 m2 s�1 and 1.95–0.13 �10�9 m2 s�1, respectively, which are in good agreement with theexperimental values,59 validating the simulation. The diffusioncoefficient (1.23–0.08 � 10�9 m2 s�1) of LiCl together as amolecule has also been calculated in the above concentrationrange and shows a very good agreement when compared withthe experimental diffusion coefficients in the concentration
This journal is © The Royal Society of Chemistry 2015

Fig. 8 Primary coordination shell structure of Li+ ion, in which onewater molecule is replaced by the Cl� ion. The water molecules arewithin the distance of primary hydration shell of Cl� ion.
Table 6 Diffusion coefficient of alkali metal ions in water for 0.2 M saltconcentration
Sr. no. Metal ion D � 10�9 m2 s�1 Reference
1 Li+ 1.11 Current work2 Li+ 1.18 Li and Rasaiah13
3 Na+ 1.22 Li and Rasaiah13
4 K+ 2.02 Li and Rasaiah13
5 Rb+ 2.11 Li and Rasaiah13
6 Cs+ 2.00 Li and Rasaiah13
Paper RSC Advances
range of 2.36–15.33 M.60 The diffusion coefficient valuesobtained by using TIP4P water model also have been comparedwith the experimental values (Fig. 7).
The diffusion coefficients for water molecules, Li+ ions andCl� ions from current work and the literature values,59 areplotted as a function of LiCl concentration in Fig. 7. The gureshows that the diffusivities of Li+ ions, Cl� ions and watermolecules decrease with the increase in salt concentration. Thiscan be explained in terms of the size of coordination complex orcluster/aggregate formed by the cation and anions in the saltsolution, as discussed earlier. The increased size of complexdecreases its movement in a given time interval because whenLi+ ions, Cl� ions and water molecules are present in the clusterthey do not diffuse as individual entities, but as a whole clusterand hence the diffusion coefficient of the involved speciesdecreases. At lower concentrations (0.11–0.346 M), there arebasically 13 water molecules including both primary andsecondary coordination spheres in the local structure. As thesalt concentration increases in the solution (1.268–8.01 M),chloride ion becomes part of the primary and secondary coor-dination spheres resulting in an increased size of the coordi-nation structure. When one Cl� ion is present in the 1st
tetrahedral hydration shell of lithium ion, the distance betweenthe chloride ion and the ‘O’ of water molecules is 3.4 A,27 whichis very close to the distance of Cl–O as shown in Fig. 8. Thus,these water molecules also participate in the hydration shell ofthe chloride ion. These water molecules which are both shared
This journal is © The Royal Society of Chemistry 2015
by primary coordination shell of lithium ion as well as that ofthe chloride ion, stick more strongly to Li+ ion and hencediffusion coefficient of Li+ ions decreases. For the concentrationof LiCl, in the range of 2.36 M to 10.12 M, formation of a smallnumber of clusters or aggregation of 2–3 pairs of Li+ and Cl�
ions are observed. At very high concentrations of lithium chlo-ride (12.03 M to 19.28 M), the ions start forming clusters oraggregates containing long chains of –Li�/Cl�/Li�/Cl�–,forming much bulkier complexes. Overall, the simulateddiffusion coefficients in solutions appear reasonable relative tothe empirically estimated values. An increased size thus reducesthe motion and diffusivity of the Li+ ions in the solution. Atlower concentrations of LiCl, the individually hydrated ionstend to move swily because primary cation–water interactionsare much weaker. The cation–anion interaction becomesprominent at higher concentrations of LiCl. Therefore,increased van der Waals forces and ion-dipole attractionbetween cation and water molecules and strong ionic interac-tions between cations and ions in the cluster decrease thediffusivity at higher salt concentrations.
The predicted diffusion coefficient data were tted in anexponential dependence of diffusivity on concentration, i.e.,D(c)¼ Do exp(�kc) and extrapolated to estimate innite dilutiondiffusivity (Do) of the ions and molecules. The Do values for Li
+
ion, Cl� ion, LiCl and water molecules are 1.067 � 10�9 m2 s�1,1.882 � 10�9 m2 s�1, 1.162 � 10�9 m2 s�1 and 2.218 � 10�9 m2
s�1, respectively, which are in good agreement with the diffu-sivity at innite dilution values, i.e., Do,Li+ ¼ 1.22 � 10�9 m2 s�1
and Do,Cl� ¼ 1.77 � 10�9 m2 s�1, reported in literature.27
Diffusion coefficient of Li+ ions is compared with the diffu-sion coefficients of other alkali metal ions in water for 0.2 M saltconcentration in Table 6.13 Diffusion coefficient values of themetal ions follow the order of Li+ < Na+ < Cs+ < K+ < Rb+. Thiseffect can be explained on the basis of the size of ion and itscharge density. As the ionic radius of alkali metal ion increases,the diffusion coefficient also increases. Li+ ion interacts stronglywith water molecules due to its smaller size and highest chargedensity and, therefore, restricts the movement of water, whilethe larger alkali ions such as Cs+, Na+, K+ and Rb+ have ionic sizelarger than Li+ and have low charge density, therefore, interactweakly with water allowing more free movement of and in waterand hence have higher diffusion coefficients.
Extraction of lithium has a great importance, due to itsemerging importance in lithium batteries. Generally lithium isextracted from sea water or salty lake brines.61 But due topresence of other ions, such as sodium and potassium, extrac-tion procedure becomes more complicated. The extraction oflithium from natural resources or exhaust materials is generallybased on membrane separation techniques.61
Mostly, 14-crown-4 derivatives having phenolic or carboxylgroup are used for extraction of Li+ ions through membrane.62
During the extraction of lithium ion through membrane, theconcentration of Li+ ions and Cl� ions increases near theupstream side of the membrane, which is also known asconcentration polarization. As the concentration of ionsincreases, they start forming clusters or aggregates. This in turnwill adversely affect their movement into the membrane phase;
RSC Adv., 2015, 5, 15328–15337 | 15335

RSC Advances Paper
reducing the extraction rate. Therefore, this study of cluster/aggregate formation with respect to concentration may beuseful in understanding the rates of extraction of lithium.
4. Conclusion
MD simulation of aqueous solutions of lithium chloride for awide range of concentration of LiCl (0.11–19.28 M) has providedinformation about the solvation shell structure and coordina-tion of the lithium ions in the solution with the solvent mole-cules and ionic species and their dependence on the saltconcentration. Lithium ion, due to strong electronegativity,binds with water molecules in tetrahedron conformations atlower concentrations. With increase in salt concentration, thecoordination of Cl� with Li+ increases gradually. At still higherconcentrations, the clustering of cation and anions is seenwhich decreases diffusion coefficient of the species involved inthe aggregate. The comparison of the results of density of LiClsolutions and diffusion coefficient of all species in the solutionsshow a good agreement with experimental values.
References
1 G. W. Neilson, R. D. Broadbent, I. Howell and R. H. Tromp, J.Chem. Soc. Faraday Trans., 1993, 89, 2927–2936.
2 H. Ohtaki and T. Radnai, Chem. Rev., 1993, 93, 1157.3 Y. Marcus, Biophys. Chem., 1994, 51, 111.4 S. H. Lee and J. C. Rasaiah, J. Chem. Phys., 1994, 101, 6964.5 D. A. Doyle, J. M. Cabral, R. A. Pfuetzner, A. L. Kuo,J. M. Gulbis, S. L. Cohen, B. T. Chait and R. MacKinnon,Science, 1998, 280, 69.
6 P. Ayotte, G. H. Weddle, J. Kim and M. A. Johnson, J. Am.Chem. Soc., 1998, 120, 12361.
7 L. Guidoni, V. Torre and P. Carloni, Biochemistry, 1999, 38,8599.
8 M. F. Kropman and H. J. Bakker, Science, 2001, 291, 2118.9 Z. S. Nickolov and J. D. Miller, J. Colloid Interface Sci., 2005,287, 572.
10 J. J. Max and C. Chapados, J. Chem. Phys., 2001, 115, 2664.11 J. Chandrasekhar, D. C. Spellmeyer and W. L. Jorgensen, J.
Am. Chem. Soc., 1984, 106, 903.12 M. Migliore, G. Corongiu, E. Clementi and G. C. Lie, J. Chem.
Phys., 1988, 88, 7766.13 S. H. Li and J. C. Rasaiah, J. Phys. Chem., 1996, 100, 1420.14 W. Rudolph, M. H. Brooker and C. C. Pye, J. Phys. Chem.,
1995, 99, 3793.15 A. K. Soper, J. Phys.: Condens. Matter, 1997, 9, 2717.16 J. E. Enderby, S. Cummings, G. J. Herdman, G. W. Neilson,
P. S. Salmon and N. Skipper, J. Phys. Chem., 1987, 91, 5851.17 J. E. Enderby, NATO ASI Ser., Ser. C, 1987, 205, 129.18 M. Yamagami, H. Wakita and T. Yamaguchi, J. Chem. Phys.,
1995, 103, 8174.19 E. V. Vinogradov, P. R. Smirnov and V. N. Trostin, Russ.
Chem. Bull., 2003, 52, 1253–1271.20 R. D. Shannon, Acta Crystallogr., Sect. A: Cryst. Phys., Diffr.,
Theor. Gen. Crystallogr., 1976, 32, 751–767.
15336 | RSC Adv., 2015, 5, 15328–15337
21 F. T. Gucker, D. Stubley and D. J. Hill, J. Chem. Thermodyn.,1977, 9, 987–989.
22 R. G. Bryant, Annu. Rev. Biophys. Biomol. Struct., 1996, 25, 29.23 P. R. Smirnov and V. N. Trostin, Russ. J. Gen. Chem., 2006, 76,
175–182.24 I. S. Joung and T. E. Cheatham III, J. Phys. Chem. B, 2008, 112,
9020–9041.25 K. P. Jensen and W. L. Jorgensen, J. Chem. Theory Comput.,
2006, 2, 1499–1509.26 I. Takashi, B. Mauro and T. Kiyoyuki, J. Chem. Phys., 2007,
126, 034501.27 H. Du, J. C. Rasaiah and J. D. Miller, J. Phys. Chem. B, 2007,
111, 209–217.28 I. S. Joung and T. E. Cheatham III, J. Phys. Chem. B, 2009, 113,
13279–13290.29 M. Fyta, I. Kalcher, J. Dzubiella, L. Vrbka and R. R. Netz, J.
Chem. Phys., 2010, 132, 02491.30 J. L. Aragones, M. Rovere, C. Vega and P. Gallo, J. Phys. Chem.
B, 2014, 118, 7680–7691.31 K. Winkel, M. Seidl, T. Loerting, L. E. Bove, S. Imberti,
V. Molinero, F. Bruni, R. Mancinelli and M. A. Ricci, J.Chem. Phys., 2011, 134, 024515.
32 S. Bouazizi and S. Nasr, J. Mol. Liq., 2014, 197, 77–83.33 M. P. Allen and D. J. Tildesley, Computer Simulations of
Liquids, Clarendon, Oxford, 1987.34 H. J. C. Berendsen, D. van der Spoel and R. van Drunen,
Comput. Phys. Commun., 1995, 91, 43.35 E. Lindahl, B. Hess and D. van der Spoel, J. Mol. Model., 2001,
7, 306.36 H. J. C. Berendsen, J. P. M. Postma, W. F. V. Gusteren,
A. Dinola and J. R. Haak, J. Phys. Chem., 1984, 81, 3684.37 X. Li and Z. Yang, J. Phys. Chem. A, 2005, 109, 4102–4111.38 P. Mark and L. Nilsson, J. Phys. Chem. A, 2001, 105, 9954–
9960.39 M. W. Mahoney and W. L. Jorgensen, J. Chem. Phys., 2001,
115, 10758.40 T. Darden, D. York and L. Pedersen, J. Chem. Phys., 1993, 98,
10089.41 U. Essmann, L. Perera, M. L. Berkowitz, T. Darden, H. Lee
and L. G. Pedersen, J. Chem. Phys., 1995, 103, 8577.42 J. P. Hansen and I. R. McDonald, Theory of Simple Liquids,
Academic, London, 1986.43 S. Koneshan, J. C. Rasaiah, R. M. Lynden-Bell and S. H. Lee,
J. Phys. Chem. B, 1998, 102, 4193.44 S. Chowdhuri and A. J. Chandra, Chem. Phys., 2001, 115,
3732.45 D. Brandell, H. Kasemagi and A. Aabloo, Electrochim. Acta,
2010, 55, 1333–1337.46 A. H. Narten, F. Vaslov and H. A. Levy, J. Chem. Phys., 1973,
58, 5017.47 J. E. Enderby and G. W. Neilson, in Water – A Comprehensive
Treatise, ed. F. Franks, Plenum, 1979, vol. 6, ch. 1.48 T. Yamaguchi, M. Yamagami, H. Ohzono, K. Yamanaka and
H. Wakita, Phys. B, 1995, 213/214(1,), 480.49 J. R. Newsome, G. W. Neilson and J. E. Enderby, J. Phys. C:
Solid State Phys., 1980, 13, L923.50 A. Chandra, J. Phys. Chem., 2003, 107, 3899.
This journal is © The Royal Society of Chemistry 2015

Paper RSC Advances
51 S. Chowdhury and A. Chandra, J. Phys. Chem. B, 2006, 31,159.
52 G. Sutmann and R. Vallauri, J. Phys.: Condens. Matter, 1998,10, 9231.
53 A. Luzar and D. Chandler, Phys. Rev. Lett., 1996, 76, 928;A. Luzar and D. Chandler, Nature, 1996, 379, 53.
54 A. Nag, D. Chakraborty and A. Chandra, J. Chem. Sci., 2008,120, 71–77.
55 K. Yamaji, Y. Makita, H. Watanabe, A. Sonoda, H. Kanoh,T. Hirotsu and K. Ooi, J. Phys. Chem., 2001, 105, 602–613.
56 A. A. Chen and R. V. Pappu, J. Phys. Chem. B, 2007, 111, 6469–6478.
This journal is © The Royal Society of Chemistry 2015
57 S. A. Hassan, J. Phys. Chem. B, 2008, 112, 10573–10584.58 E. Vercher, S. Solsona, M. I. Vazquez and A. Martinez-
Andreu, Fluid Phase Equilib., 2003, 209, 95–111.59 K. Tanaka and M. Nomura, J. Chem. Soc., Faraday Trans. 1,
1987, 83, 1779–1782.60 F. Stallmach, Department of Physics, University of Leipzig,
personal communication.61 T. Hoshino, Desalination, 2013, 317, 11–16.62 T. Araki and H. T. Sukube, Liquid Membranes: Chemical
Applications, CRC Press, Boca Raton, 1990.
RSC Adv., 2015, 5, 15328–15337 | 15337