A simple temperature method for the estimation of
16
A simple temperature method for the estimation of evapotranspiration Temesgen Enku 1,2 and Assefa M. Melesse 3 * 1 Ethiopian Institute of Water Resources, Addis Ababa University, Addis Ababa, Ethiopia 2 School of Civil and Water Resources Engineering, Institute of Technology, Bahir Dar University, Bahir Dar, Ethiopia 3 Department of Earth and Environment, Florida International University, Miami, FL, USA Abstract: Accurate estimation of evapotranspiration (ET) is essential in water resources management and hydrological practices. Estimation of ET in areas, where adequate meteorological data are not available, is one of the challenges faced by water resource managers. Hence, a simplified approach, which is less data intensive, is crucial. The FAO-56 Penman–Monteith (FAO-56 PM) is a sole global standard method, but it requires numerous weather data for the estimation of reference ET. A new simple temperature method is developed, which uses only maximum temperature data to estimate ET. Ten class I weather stations data were collected from the National Meteorological Agency of Ethiopia. This method was compared with the global standard PM method, the observed Piche evaporimeter data, and the well-known Hargreaves (HAR) temperature method. The coefficient of determination (R 2 ) of the new method was as high as 0.74, 0.75, and 0.91, when compared with that of PM reference evapotranspiration (ET o ), Piche evaporimeter data, and HAR methods, respectively. The annual average R 2 over the ten stations when compared with PM, Piche, and HAR methods were 0.65, 0.67, and 0.84, respectively. The Nash–Sutcliff efficiency of the new method compared with that of PM was as high as 0.67. The method was able to estimate daily ET with an average root mean square error and an average absolute mean error of 0.59 and 0.47 mm, respectively, from the PM ET o method. The method was also tested in dry and wet seasons and found to perform well in both seasons. The average R 2 of the new method with the HAR method was 0.82 and 0.84 in dry and wet seasons, respectively. During validation, the average R 2 and Nash–Sutcliff values when compared with Piche evaporation were 0.67 and 0.51, respectively. The method could be used for the estimation of daily ET o where there are insufficient data. Copyright © 2013 John Wiley & Sons, Ltd. KEY WORDS evapotranspiration; air temperature; Penman–Monteith method; Hargreaves method; new simple temperature method; Ethiopia Received 23 April 2012; Accepted 20 August 2013 INTRODUCTION Evapotranspiration (ET) is one of the main components of the hydrologic cycle, and its accurate estimation is essential in agricultural and hydrological practices. In tropical regions of the world, ET is the mechanism via which large volumes of water are circulated between the land–water surface and atmosphere. ET has always been difficult to measure, especially on an ecosystem or watershed spatial scale with a desired level of accuracy. Unlike rainfall and river flow, which can be directly measured, ET is usually estimated on the basis of mass transfer, energy transfer, or water budget methods. Traditional measurements of evaporation by pan evaporation method and lysimeter are mainly for smaller-scale applications and experimental studies. Such methods are also based on assumptions and can be labour and cost intensive. More recently, micrometeorological methods, such as energy balance Bowen ratio and eddy covariance, have found widespread application to mea- sure actual evaporation and have improved our under- standing of the evaporation process (Drexler et al., 2004). These methods are also expensive to run because the initial cost and cost of maintaining the monitoring program can be high. There are different ET estimation methods that are developed and are being used in different regions of the world. Some methods work well in an area where they have been developed. When such approaches are tested in other climatic conditions, their performance is poor. The Penman–Monteith reference evapotranspiration (PM ET o ) is the only globally accepted method, which performs well in many climatic conditions in the world. Many of the methods available are data intensive, or the data they require are not easily available in developing counties. *Correspondence to: Assefa M. Melesse, Department of Earth and Environment, Florida International University, Miami, FL, USA. E-mail: melessea@fiu.edu HYDROLOGICAL PROCESSES Hydrol. Process. 28, 2945–2960 (2014) Published online 17 May 2013 in Wiley Online Library (wileyonlinelibrary.com) DOI: 10.1002/hyp.9844 Copyright © 2013 John Wiley & Sons, Ltd.
Transcript of A simple temperature method for the estimation of

HYDROLOGICAL PROCESSESHydrol. Process. 28, 2945–2960 (2014)Published online 17 May 2013 in Wiley Online Library(wileyonlinelibrary.com) DOI: 10.1002/hyp.9844
A simple temperature method for the estimation ofevapotranspiration
Temesgen Enku1,2 and Assefa M. Melesse3*1 Ethiopian Institute of Water Resources, Addis Ababa University, Addis Ababa, Ethiopia
2 School of Civil and Water Resources Engineering, Institute of Technology, Bahir Dar University, Bahir Dar, Ethiopia3 Department of Earth and Environment, Florida International University, Miami, FL, USA
*CEnE-m
Co
Abstract:
Accurate estimation of evapotranspiration (ET) is essential in water resources management and hydrological practices.Estimation of ET in areas, where adequate meteorological data are not available, is one of the challenges faced by water resourcemanagers. Hence, a simplified approach, which is less data intensive, is crucial. The FAO-56 Penman–Monteith (FAO-56 PM) isa sole global standard method, but it requires numerous weather data for the estimation of reference ET. A new simpletemperature method is developed, which uses only maximum temperature data to estimate ET. Ten class I weather stations datawere collected from the National Meteorological Agency of Ethiopia. This method was compared with the global standard PMmethod, the observed Piche evaporimeter data, and the well-known Hargreaves (HAR) temperature method. The coefficient ofdetermination (R2) of the new method was as high as 0.74, 0.75, and 0.91, when compared with that of PM referenceevapotranspiration (ETo), Piche evaporimeter data, and HAR methods, respectively. The annual average R2 over the ten stationswhen compared with PM, Piche, and HAR methods were 0.65, 0.67, and 0.84, respectively. The Nash–Sutcliff efficiency of thenew method compared with that of PM was as high as 0.67. The method was able to estimate daily ET with an average root meansquare error and an average absolute mean error of 0.59 and 0.47mm, respectively, from the PM ETo method. The method wasalso tested in dry and wet seasons and found to perform well in both seasons. The average R2 of the new method with the HARmethod was 0.82 and 0.84 in dry and wet seasons, respectively. During validation, the average R2 and Nash–Sutcliff values whencompared with Piche evaporation were 0.67 and 0.51, respectively. The method could be used for the estimation of daily ETo
where there are insufficient data. Copyright © 2013 John Wiley & Sons, Ltd.
KEY WORDS evapotranspiration; air temperature; Penman–Monteith method; Hargreaves method; new simple temperaturemethod; Ethiopia
Received 23 April 2012; Accepted 20 August 2013
INTRODUCTION
Evapotranspiration (ET) is one of the main components ofthe hydrologic cycle, and its accurate estimation isessential in agricultural and hydrological practices. Intropical regions of the world, ET is the mechanism viawhich large volumes of water are circulated between theland–water surface and atmosphere. ET has always beendifficult to measure, especially on an ecosystem orwatershed spatial scale with a desired level of accuracy.Unlike rainfall and river flow, which can be directlymeasured, ET is usually estimated on the basis of masstransfer, energy transfer, or water budget methods.Traditional measurements of evaporation by pan
evaporation method and lysimeter are mainly for
orrespondence to: Assefa M. Melesse, Department of Earth andvironment, Florida International University, Miami, FL, USA.ail: [email protected]
pyright © 2013 John Wiley & Sons, Ltd.
smaller-scale applications and experimental studies. Suchmethods are also based on assumptions and can be labourand cost intensive. More recently, micrometeorologicalmethods, such as energy balance Bowen ratio and eddycovariance, have found widespread application to mea-sure actual evaporation and have improved our under-standing of the evaporation process (Drexler et al., 2004).These methods are also expensive to run because theinitial cost and cost of maintaining the monitoringprogram can be high. There are different ET estimationmethods that are developed and are being used indifferent regions of the world. Some methods work wellin an area where they have been developed. When suchapproaches are tested in other climatic conditions, theirperformance is poor. The Penman–Monteith referenceevapotranspiration (PM ETo) is the only globally acceptedmethod, which performs well in many climatic conditionsin the world. Many of the methods available are dataintensive, or the data they require are not easily availablein developing counties.

2946 T. ENKU AND A. M. MELESSE
Food and Agriculture Organization of the UnitedNations (FAO) published a manual in 1998 for estimatingcrop water requirements (Allen and Pereira, 1998) usingthe FAO-56 PM. The FAO-56 PM approach is a physi-cally based approach, which requires measurements ofnumerous weather data including maximum and mini-mum air temperature, maximum and minimum relativehumidity, solar radiation (or sunshine hours), and windspeed at height of 2m. The main limitation for widelyusing the globally accepted FAO-56 PM method is thenumerous required data that are not available at manyweather stations. The quality of these numerous data isalso another problem. Solar radiation data are alwayslacking reliability. Average 24-h wind speed at 2-mheight also has a questionable quality. Relative humiditymeasurement by electronic sensors is commonly full oferrors. But maximum temperature is largely and easilyavailable in many regions of the world. In regions wherethere are insufficient data, a simple temperature method,which requires only temperature data, is important for theestimation of reference ET.The objective of this study was not to develop a new
method, which replaces FAO-56 PM, but to develop anew simple temperature method that uses only maximumtemperature for areas where other climatic parameters arenot available at the desired scale. The FAO-56 PM will beused as a standard method in the development of this newtemperature method. The performance of the model incomparison with that of the well-known methods will beassessed. The ability of the new model to capture theseasonality of ET will be also studied. This new simpletemperature method could be used in areas where thereare insufficient weather data.The specific objectives are to (1) develop an air
temperature-based method for estimating ET, (2) evaluatethe performance of the new approach by comparing it withthe most commonly used complex ET method (PM) andsimple but widely used approach (Hargreaves (HAR)method), (3) evaluate the seasonal variation of simulatedET using dry and wet season temperature data, and (4)validate the performance of the new approach with observedPiche evaporimeter data collected from different parts ofEthiopia, representing different agroclimatological regions.
STUDY AREA AND DATA
Ethiopia is found in the Horn of Africa; it lies betweenabout 3–15�N and 33–48�E. There is high altitudedifference in the country, which ranges from an elevationof about 116m below sea level, in the Dallol depressionof the Afar region, to an elevation of about 4620m abovesea level at Ras Dashen, in the Semien Mountains in thenorthern part of the country. Because of this high altitude
Copyright © 2013 John Wiley & Sons, Ltd.
difference, there is high spatial variability of temperature,whereas seasonal variability of temperature is relatively low.Ethiopia is subdivided into five climatic regimes: moist, drysub-humid, semi-arid, arid, and hyper-arid regimes.The Ethiopian National Meteorological Agency defines
three seasons in Ethiopia: rainy season (June–September),dry season (October–January), and short rainy season(February–May). Camberlin (1997) reported that the Indianmonsoon activity is a major cause for summer rainfallvariability in the East AfricanHighlands. The rainfall seasonover the study area starts in June and ends in October.Majority of the study area receives rain during this summerseason (locally called Kiremit). The rest of the time, itremains relatively dry and hot. The spatial variability ofrainfall attributed to altitudinal differences is substantial.For this study, meteorological data were collected from
the National Meteorological Agency of Ethiopia. Five to15 years of data were collected from ten class I stationsdistributed over Ethiopia. The data collected from thestations include the following: daily maximum andminimum temperature, daily maximum and minimumrelative humidity, sunshine hours, and wind speed at 2m.The elevation of these stations ranges from about 1146m atDire Dawa to 2446m at Debre Markos. The mean annualtemperature in these stations ranges from 16.8 �C at DebreMarkos to 25.7 �C at Dire Dawa. The stations are chosenbecause they represent majority of the climatic regions anddifferent ecosystems in Ethiopia, and they cover majority ofthe latitudes in Ethiopia. These stations lie within 6�N and12.3�N latitudes (Figure 1 and Table I).For this study, ten class I stations with different climatic
settings distributed over Ethiopia have been selected. Therainfall distribution follows altitude; Dire Dawa has thelowest elevations and very hot and dry climatic setting,which receives the lowest mean annual rainfall of 661mmwith standard deviation of 163.6mm among the stations(Table II). On the other hand, Debre Markos has thehighest elevation and relatively cold climatic setting,which receives higher annual rainfall of about 1477mmwith standard deviation of 447.6mm with extendedunimodal type of rainfall. The Bahir Dar station receivesthe highest rainfall among the stations considered withmedium altitude having unimodal rainfall characteristics.Awassa and Arba Minch are located in the rift valleyregion of Ethiopia with bimodal rainfall characteristics,and Dire Dawa represents lowlands and hot climaticsettings. Whereas the Addis Ababa station represents thecentral highlands, the Debre Markos and Bahir Darstations represent north and northwest highlands ofEthiopia. The detailed characteristics of the stations areshown Table I. Referring to the mean temperature, DireDawa and Arba Minch are the hottest stations with meantemperature of 25.7 and 23.8 �C, respectively, whereasDebre Markos is the coldest among the stations with mean
Hydrol. Process. 28, 2945–2960 (2014)

Table I. Background information of stations
Station name
LocationAltitude(m)
Rainfall (mm) % of rainfallRainfalltype
Temperature No.of
yearsLatitude Longitude Mean Std. dev. Kiremit Belg Mean Std. dev.
Addis Ababa 8.59� 38.48� 2386 1219 188.6 75.3 21.8 Bimodal 17.1 1.6 11Adet 11.27� 37.49� 2179 1262 187.5 82 14.5 Unimodal 18.5 1.8 6Arba Minch 6.04� 37.04� 1207 883 162.7 41.3 51.6 Bimodal 23.8 1.5 15Awassa 7.04� 38.3� 1750 996 128.4 55 33.9 Bimodal 20.1 1.4 11Ayehu 10.65� 36.78� 1771 1196 133.2 79.8 18.1 Unimodal 20.3 2.1 5Bahir Dar 11.36� 37.24� 1800 1527 156.6 93.4 6.5 Unimodal 19.8 2.1 14Dangila 11.25� 36.83� 2116 1662 273.7 85 12.9 Unimodal 17.2 1.8 13Debre Markos 10.33� 37.72� 2446 1477 447.6 81 15.2 Unimodal 16.8 1.7 10Dire Dawa 9.36� 41.52� 1180 661 163.6 57 34 Bimodal 25.7 2.8 11Gondar 12.3� 37.25� 2128 1174 79.5 79.9 11.5 Unimodal 20.5 2 8Motta 11.06� 37.88� 2417 1177 160.9 82.1 13.5 Unimodal 17.1 1.8 8
Figure 1. Location map of the study area
2947TEMPERATURE-BASED EVAPOTRANSPIRATION ESTIMATION
temperature of 16.8 �C.TheAddisAbaba andMotta stationsare also colder stations with mean temperature of 17.1 �C.The details are also shown in Table I.The station names, their respective locations, and data
periods are shown in Table I. Short period missed datawere filled by simple averaging, whereas longer periodsof missed data were discarded from further analysis in thisstudy during the calibration period. However, during thevalidation period, missed data were totally discarded from
Copyright © 2013 John Wiley & Sons, Ltd.
further analysis. The distributions of the meteorologicalstations over the study area are shown in Figure 1.Weather data were analysed with statistics of (minimum,
first quartile, median, third quartile, and maximum) valuesof each data collected. The historical minimum temperaturewas recorded at the Ayehu station with the value of�3.5 �Camong the stations, whereas the minimum mean tempera-ture was at the Dangila station with value of 9.2 �C andstandard deviation of 3.4 �C. The historical maximum
Hydrol. Process. 28, 2945–2960 (2014)

Table II. Data statistics of weather variables
Station and periodWeathervariables
Data statistics
Mean Std. dev. Minimum First quartile Median Third quartile Maximum
Addis Ababa (1995–2005) Tmax 23.8 2.3 14.5 22.3 23.8 25.3 30.5Tmin 10.3 2.4 0 9 10.8 12 16.6RH 58.8 15.1 24 46 58 72 97SS 6.7 3.1 0.0 4.2 7.2 9.5 11.9WS 0.6 0.3 0.0 0.3 0.5 0.7 5.4
Adet (2003–2008) Tmax 26.4 2.8 16.5 24.5 26 28.5 32.6Tmin 10.7 2.6 0 9 11 12.5 17.2RH 58.4 18.0 17 44 61 73 97SS 7.4 2.6 0 5.8 8 9.5 11.7WS 0.7 0.3 0.0 0.5 0.7 0.9 2.6
Arba Minch (1997–2005) Tmax 30.4 2.6 22.2 28.6 30.3 32.2 37.5Tmin 17.2 2.1 8.4 16.2 17.5 18.6 24.3RH 62.1 11.4 29 54 63 70 100SS 7.3 3.0 0 5.4 8.1 9.8 11.4WS 0.6 0.3 0 0.4 0.57 0.78 1.87
Awassa (1995–2005) Tmax 27.4 2.5 19 25.6 27.5 29.2 34Tmin 12.9 2.7 0 11.2 13.4 15 19.5RH 66.5 11.2 32 58 69 74 100SS 7.3 2.8 0.0 5.4 7.9 9.7 11.6WS 0.8 0.4 0.0 0.6 0.7 1.0 5.9
Ayehu (2004–2008) Tmax 28.1 3.5 17.0 25.2 28.1 30.8 35.5Tmin 12.5 3.5 �3.5 10.8 13.5 15.0 20.6RH 67.0 15.7 31 53 66 82 99SS 7.0 2.8 0.0 4.9 7.4 9.6 11.2WS 0.6 0.3 0.0 0.5 0.6 0.8 2.3
Bahir Dar (1998–2008) Tmax 27.2 2.5 18.6 25.5 27 29 33.8Tmin 12.7 3.0 2.5 10.6 13.4 14.8 22RH 57.6 15.4 22 45 58 71 94SS 8.0 2.8 0 6.2 8.9 10.2 11.8WS 0.9 0.4 0.0 0.5 0.9 1.1 3.1
Dangila (1996–2008) Tmax 25.1 2.7 15.8 23.2 25 27 32Tmin 9.2 3.4 �0.6 6.5 10 12 16.5RH 66.9 17.7 7 54 71 82 99SS 7.2 2.8 0 5.3 7.8 9.6 11.7WS 0.9 0.3 0.0 0.7 0.9 1.1 2.9
Debre Markos (2002–2011) Tmax 22.9 2.8 13 20.8 23 25 29.7Tmin 10.6 1.9 0 9.5 11 12 16RH 56.6 21.6 7 38 54 78 100SS 7.2 3.2 0 4.7 7.6 10.1 12WS 1.2 0.4 0.0 1.0 1.2 1.4 3.8
Dire Dawa (1995–2005) Tmax 32.4 2.8 20.5 30.8 32.8 34.6 39Tmin 19.1 3.3 4.5 17.4 19.8 22.1 27RH 51.2 12.0 24 44 50 59 97SS 8.5 2.5 0 7.8 9.5 10.5 11.8WS 1.6 0.9 0.0 1.0 1.4 2.2 5.2
Gondar (2004–2008) Tmax 27.4 2.9 17.5 25.2 27.5 29.5 34.4Tmin 13.6 2.1 0 12.5 13.5 14.9 21RH 50.9 20.2 13 34 47 70 91SS 7.5 2.7 0 5.6 8.1 9.9 11.6WS 1.3 0.4 0.0 1.1 1.3 1.5 3.7
Motta (2004–2008) Tmax 21.2 1.3 15.5 20.5 21.5 22 23.8Tmin 11.9 1.5 0 11 11.7 12.7 16RH 75.8 7.0 37 72 76 80 95SS 7.1 2.8 0 5.4 7.6 9.4 11.1WS 1.3 0.3 0.0 1.1 1.3 1.5 2.2
2948 T. ENKU AND A. M. MELESSE
Copyright © 2013 John Wiley & Sons, Ltd. Hydrol. Process. 28, 2945–2960 (2014)

2949TEMPERATURE-BASED EVAPOTRANSPIRATION ESTIMATION
temperature of 39 �C was recorded at Dire Dawa with meanmaximum temperature of 32.4 �C and standard deviation of2.8 �C. The mean maximum sunshine hour was at DireDawa, whereas the mean minimum was at Addis Ababawith values of 8.5 and 6.7 h and standard deviations of 2.5and 3.1 h, respectively. The details of all these weather datastatistics are shown in Table II.
THEORY AND METHODS
Penman–Monteith method
The FAO-56 PM is a physically based approach, whichrequires measurements of air temperature, relativehumidity, solar radiation (or sunshine hours), and windspeed. ETo is the potential ET from a reference surface ofa hypothetical green grass of uniform height, 0.12m, wellwatered and actively growing and has a constant albedoof 0.23 with fixed surface resistance of 70 sm�1 (Allenand Pereira, 1998). After the aerodynamic resistance,ra = 208/u2, and the surface resistance, rs = 70 sm
�1, areestimated, for such a reference crop, the PM equation canbe rewritten as follows:
ETo ¼0:408Δ Rn � Gð Þ þ g 900
Tþ273 u2 es � eað ÞΔþ g 1þ 0:34u2ð Þ (1)
where ETo is reference evapotranspiration (mmday�1);Rn is the net radiation at the crop surface (MJm�2 day�1);G is soil heat flux density (MJm�2 day�1), assumed zeroon daily basis; T is mean daily air temperature at 2-mheight (�C); u2 is wind speed at 2-m height (m s�1); es issaturation vapour pressure (kPa); ea is actual vapourpressure (kPa); es = ea is saturation vapour pressure deficit(kPa); Δ is slope of vapour pressure curve (kPa �C�1); andg is psychrometric constant (kPa �C�1).The FAO-56 PM combination equation (Equation (1))
was proposed as the sole standard method for estimatingETo and for evaluating other equations (Allen et al.,1994a, b; Slavisa, 2005). It has been proved that thisequation could overcome the shortcomings of theprevious methods and provided more consistent valuesin different regions of the world (Liu et al., 1997; Venturaet al., 1999; Du et al., 2000; Rana and Katerji, 2000;Dingman, 2002; Nandagiri and Kovoor, 2005; Temesgenet al., 2005; Bois et al., 2008).
Penman–Monteith sensitivity analysis
A sensitivity analysis is an important technique toimprove one’s understanding of the dominant climaticvariables in the estimation of ETo in an area of interest.ETo is a measure of evaporative power of the atmosphere,which could be estimated from the meteorological dataonly. ‘In humid climate, ETo provides an upper limit for
Copyright © 2013 John Wiley & Sons, Ltd.
actual ET and in an arid climate it indicates the totalavailable energy for actual ET’ (Gong et al., 2006). Asensitivity analysis of the inputs incoming solar radiation,air temperature, relative humidity, and wind speed to PMETo was carried out. These variables were increased anddecreased by 10%, 20%, and 30% from the monthlyaverage values for each run. To understand the sensitivityof the input variables, minimum and maximum temper-ature and relative humidity, averages of air temperatureand relative humidity, and their amplitudes werecalculated (Bois et al., 2008). In this analysis, it wasassumed that the maximum and minimum temperaturewere to increase and decrease simultaneously. For thecomputations of net radiation, solar angles at the 15th dayof each month were assumed. Monthly sensitivityanalysis was carried out at the Bahir Dar station in theyear 2007, and the results are presented.
Simple temperature method
In this study, the FAO-56 PM method was used as astandard method for the development of a new simpletemperature method that uses only maximum temperaturefor the estimation of ETo. This study was based on thesensitivity analysis result of ET over the study area(Temesgen, 2009). Part of the sensitivity analysis ispresented in this paper, which shows that PM ETo isalmost equally sensitive to solar radiation and airtemperature. Solar radiation-based ET models such asthose of Abtew (1996) and the modified Makkink(De Bruin, 1981) were performing well in the estimationof ET over the area. This has called to develop a simpletemperature method that could perform as good asthe radiation methods. Temperature data are easilyavailable than solar radiation data in Ethiopia. It is thissensitivity analysis result, which led to the developmentof a new simple empirical temperature method, thatuses only maximum temperature data for the estimationof ET. Abtew’s (1996) simple equation was definedas follows:
ET ¼ kRs
l(2)
where ET is evapotranspiration (mmday�1), Rs is theincoming solar radiation (MJ m�2 day�1), k is acoefficient with a value of 0.53, and l is a conversionconstant. In developing the new method, Rs wasreplaced by Tmax, as incoming solar radiation andtemperature were equally sensitive to PM ETo, and theconstants k and l were replaced by a new coefficient k.Finally, the new simple empirical temperature method,which we named ‘Enku’s simple temperature method’,was developed as follows:
Hydrol. Process. 28, 2945–2960 (2014)

Table
III.Model
performance
comparisonforthecombinedseasons
Statio
nCoeff.k
Perform
ance
with
PM
Perform
ance
with
HAR
Perform
ance
with
Piche
evaporator
Calib.
Validation
Calib.
Valid.
Validation
R2
NS
AME
RMSE
%Error
No.
ofyears
R2
NS
AME
RMSE
No.
ofyears
R2
R2
R2
NS
No.
ofyears
AddisAbaba
840
0.61
0.52
0.4
0.51
1.7
11—
——
——
0.85
——
——
Adet
950
——
——
100.6
0.23
0.52
0.64
6—
0.88
0.69
0.56
10ArbaMinch
1260
0.54
0.41
0.52
0.65
16
0.6
0.51
0.44
0.55
40.9
0.86
0.61
0.48
4Awassa
1050
0.58
0.31
0.44
0.55
1.0
110.63
0.47
0.41
0.52
30.87
0.88
0.58
0.49
11Ayehu
1180
0.68
0.25
0.52
0.65
3.6
5—
——
——
0.88
——
——
BahirDar
1000
0.61
0.47
0.44
0.56
5.7
110.72
0.68
0.37
0.47
40.81
0.85
0.65
0.51
11Dangila
930
0.67
0.5
0.43
0.53
2—
0.62
0.2
0.54
0.66
20.88
0.91
——
—Debre
Markos
720
0.71
0.57
0.45
0.59
3.85
130.72
0.64
0.4
0.54
30.83
0.87
0.72
0.58
8DireDaw
a1170
0.67
0.66
0.54
0.7
2.5
11—
——
——
——
——
—Gondar
960
0.74
0.67
0.44
0.54
15
0.71
0.65
0.45
0.57
30.75
0.74
0.75
0.38
5Motta
720
0.67
0.5
0.48
0.59
3.2
50.62
0.56
0.5
0.63
30.83
0.85
0.67
0.57
6Average
—0.65
0.49
0.47
0.59
2.65
—0.65
0.49
0.45
0.57
—0.84
0.86
0.67
0.51
—
PM,Penman–M
onteith
;HAR,Hargreaves;NS,Nash–Sutcliff;AME,absolute
meanerror;RMSE,root
meansquare
error.
2950 T. ENKU AND A. M. MELESSE
ETo ¼ Tmaxð Þnk
(3)
where ETo is the reference evapotranspiration (mmday�1);n=2.5, which can be calibrated for local conditions; k is thecoefficient, which can be calibrated for local conditionsranging from about 600 for lower mean annual maximumtemperature areas to 1300 for highermean annual maximumtemperature areas. The coefficient, k, could be approximatedas k=48 *Tmm� 330 for combined wet and dry conditions,k=73*Tmm� 1015 for dry seasons, and k= 38 *Tmm� 63for wet seasons, where Tmm (�C) is the long term daily meanmaximum temperature for the seasons under consideration.The daily mean temperature was used to estimate ETo
and was found not able to simulate the amplitudes. Ourstudy also compared the ETo simulation with theHargreaves method, which uses average daily tempera-ture as an input for ETo simulation.The coefficients of this new method were first
calibrated using the global standard PM ETo method asa true value of ET. With these calibrated coefficients, thenew method was compared with the PM ETo as well asthe Piche evaporimeter data from the stations.This new method was also compared with the known
temperature method. The comparison of the new methodwith the HAR method uses the coefficient of determi-nation (R2). This is because the HAR method alsorequired local calibration of the coefficient over thestudy area.The performance of the method was validated with
different data set from 2 to 6 years of data at differentstations as shown in Table III. The method was alsovalidated at the Adet station, a station not used forcalibration, using 6 years of data after computing thecoefficient (k) from the mean maximum temperature dataof other stations. The method was also compared with theobserved Piche evaporimeter data. Four to 11 years ofobserved Piche evaporimeter data were collected from sixstations. A Piche evaporimeter is described that has onlyone evaporative surface, is constructed from inexpensiveplastic tubing, and from which water loss is measuredgravimetrically. In validating the new method with thePiche data, the millilitre form of the Piche observed datawas converted to millimetre depth, considering the netdisk evaporating area. This conversion was carried out forease of comparison. The performance of the new methodwas compared with the observed Piche data withcoefficient of determination (R2) and Nash–Sutcliff (NS)efficiency. In this comparison, all missed data werediscarded from further analysis.
Hargreaves method
The Hargreaves and Samani (1985) equation is a well-known temperature-based method for the estimation of
Copyright © 2013 John Wiley & Sons, Ltd. Hydrol. Process. 28, 2945–2960 (2014
)
Figure 3. Comparison of long-termmeans of the newmethod versus PMETo
2951TEMPERATURE-BASED EVAPOTRANSPIRATION ESTIMATION
daily ETo. This method requires daily maximum andminimum air temperature, and extraterrestrial solarradiation data. The extraterrestrial solar radiation iscomputed from the information on latitudes of the studysite and Julian day of the year.The Hargreaves and Samani (1985) equation is defined
as follows:
ETo ¼ 0:0023 Tmax � Tminð Þ0:5 Tm � 17:8ð ÞRa (4)
where ETo is daily reference evapotranspiration (mmday�1), Tmax is daily maximum temperature (�C), Tmin isdaily minimum temperature (�C), Tm is daily meantemperature (�C), and Ra is the daily extraterrestrial solarradiation (mmday�1).
Figure 2. Sensitivity analysis of PM ETo to input variables for 4months in different seasons
Copyright © 2013 John Wiley & Sons, Ltd. Hydrol. Process. 28, 2945–2960 (2014)

Figure 4. Combined dry and wet season comparison of the new method with PM
2952 T. ENKU AND A. M. MELESSE
RESULTS AND DISCUSSION
Sensitivity analysis
Sensitivity analysis of the input variables of PM ETo wascarried out in the year 2007 at the Bahir Dar station
Copyright © 2013 John Wiley & Sons, Ltd.
(Temesgen, 2009). The result of sensitivity analysis showedthat solar radiation was found to be the most sensitiveweather variable independent of the seasons of the year. PMETo was also comparably sensitive to air temperature assolar radiation. Wind speed was found to be least sensitive.
Hydrol. Process. 28, 2945–2960 (2014)
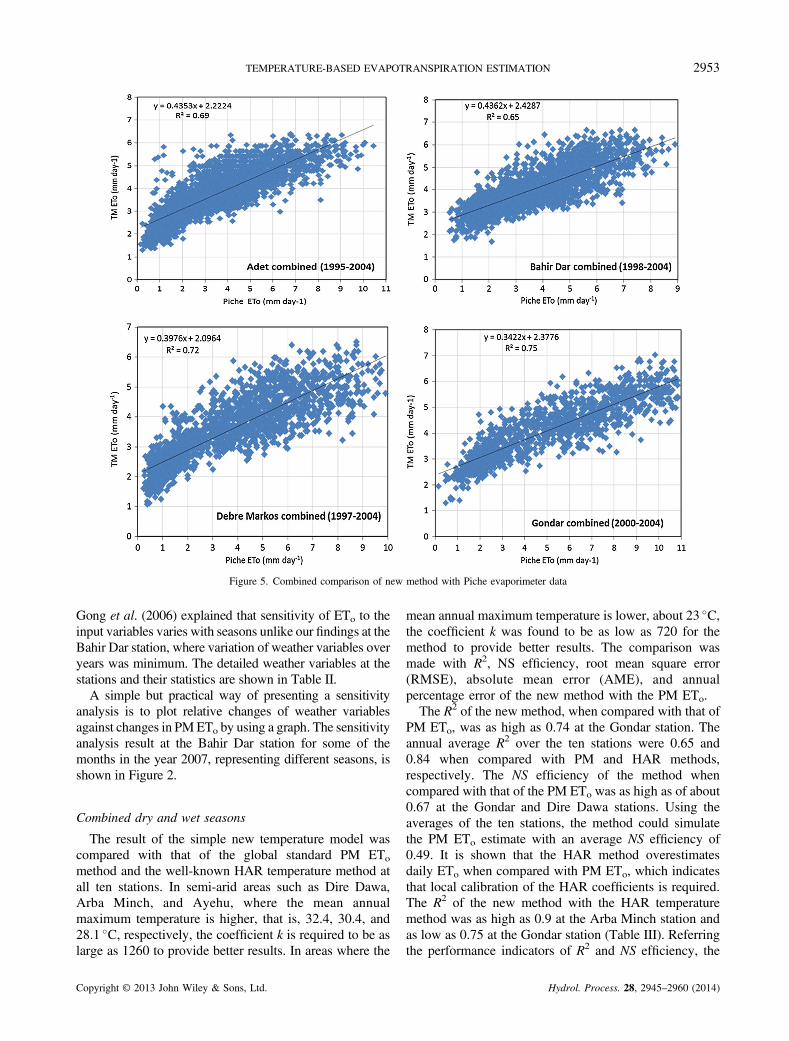
Figure 5. Combined comparison of new method with Piche evaporimeter data
2953TEMPERATURE-BASED EVAPOTRANSPIRATION ESTIMATION
Gong et al. (2006) explained that sensitivity of ETo to theinput variables varies with seasons unlike our findings at theBahir Dar station, where variation of weather variables overyears was minimum. The detailed weather variables at thestations and their statistics are shown in Table II.A simple but practical way of presenting a sensitivity
analysis is to plot relative changes of weather variablesagainst changes in PMETo by using a graph. The sensitivityanalysis result at the Bahir Dar station for some of themonths in the year 2007, representing different seasons, isshown in Figure 2.
Combined dry and wet seasons
The result of the simple new temperature model wascompared with that of the global standard PM ETo
method and the well-known HAR temperature method atall ten stations. In semi-arid areas such as Dire Dawa,Arba Minch, and Ayehu, where the mean annualmaximum temperature is higher, that is, 32.4, 30.4, and28.1 �C, respectively, the coefficient k is required to be aslarge as 1260 to provide better results. In areas where the
Copyright © 2013 John Wiley & Sons, Ltd.
mean annual maximum temperature is lower, about 23 �C,the coefficient k was found to be as low as 720 for themethod to provide better results. The comparison wasmade with R2, NS efficiency, root mean square error(RMSE), absolute mean error (AME), and annualpercentage error of the new method with the PM ETo.The R2 of the new method, when compared with that of
PM ETo, was as high as 0.74 at the Gondar station. Theannual average R2 over the ten stations were 0.65 and0.84 when compared with PM and HAR methods,respectively. The NS efficiency of the method whencompared with that of the PM ETo was as high as of about0.67 at the Gondar and Dire Dawa stations. Using theaverages of the ten stations, the method could simulatethe PM ETo estimate with an average NS efficiency of0.49. It is shown that the HAR method overestimatesdaily ETo when compared with PM ETo, which indicatesthat local calibration of the HAR coefficients is required.The R2 of the new method with the HAR temperaturemethod was as high as 0.9 at the Arba Minch station andas low as 0.75 at the Gondar station (Table III). Referringthe performance indicators of R2 and NS efficiency, the
Hydrol. Process. 28, 2945–2960 (2014)

Figure 6. Combined dry and wet season comparison of the new method with the HAR
2954 T. ENKU AND A. M. MELESSE
new method was able to perform better at the Gondarstation with R2 = 0.74, NS = 0.67, RMSE = 0.54mm,AME = 0.44mm, and annual percentage error = 1% whencompared with the PM ETo (Table III). These results wererepeated during the validation period, and better results
Copyright © 2013 John Wiley & Sons, Ltd.
were observed at some of the stations during thevalidation period (Table III).At the Adet station, the method was validated after
computing the coefficient k from the mean maximumtemperature data. The method was able to estimate PM ETo
Hydrol. Process. 28, 2945–2960 (2014)

Table IV. Dry and wet season model comparisons
Station and period
Performance when compared with PM Performance with HAR
Dry Wet R2
Coeff. k R2 NS AME RMSE Coeff. k R2 NS AME RMSE Dry Wet
Addis Ababa (1995–2005) 850 0.51 0.37 0.39 0.51 770 0.63 0.63 0.3 0.38 0.85 0.85Arba Minch (1997–2005) 1300 0.62 0.52 0.49 0.61 1200 0.52 0.42 0.49 0.6 0.91 0.91Awassa (1995–2005) 1150 0.52 0.32 0.36 0.45 1000 0.66 0.48 0.41 0.53 0.84 0.92Ayehu (2004–2008) 1300 0.61 0.49 0.32 0.42 950 0.64 0.63 0.27 0.33 0.83 0.83Bahir Dar (1998–2011) 1020 0.6 0.52 0.39 0.5 940 0.57 0.57 0.3 0.38 0.81 0.87Dangila (1996–2008) 980 0.65 0.6 0.34 0.44 820 0.57 0.55 0.3 0.38 0.84 0.79Debre Markos (2004–2008) 730 0.61 0.55 0.36 0.46 620 0.56 0.53 0.33 0.41 0.83 0.84Dire Dawa (1995–2005) 1150 0.65 0.5 0.42 0.53 1170 0.42 0.4 0.59 0.76 0.75 0.84Gondar (2004–2008) 1000 0.65 0.63 0.36 0.46 940 0.6 0.59 0.33 0.41 0.75 0.87Motta (2004–2008) 730 0.65 0.57 0.42 0.54 610 0.59 0.44 0.34 0.47 0.83 0.67Average — 0.61 0.51 0.39 0.49 — 0.58 0.52 0.37 0.47 0.82 0.84
PM, Penman–Monteith; HAR, Hargreaves; NS, Nash–Sutcliff; AME, absolute mean error; RMSE, root mean square error.
2955TEMPERATURE-BASED EVAPOTRANSPIRATION ESTIMATION
with R2 = 0.6, RMSE=0.64mm, and AME=0.52mm. Theperformance of the method was tested in terms of R2 andNSwith the Piche evaporation data at the Adet, Motta,Debre Markos, Bahir Dar, and Arba Minch stations using4–11 years of daily data. The new method was able toreproduce the observed Piche evaporation data with averageR2 and NS of 0.67 and 0.51, respectively (Table III).The long-term time series averages of PM and the new
method ETo estimates at different stations were alsocompared in terms of R2 andNS at the stations. The analysisfound R2 and NS of 0.98 and 0.97, respectively (Figure 3).The mean maximum temperature is the function of
incoming solar radiation and is also highly correlated withthe altitudes of the stations in the area. The coefficient ofdetermination between mean maximum temperature andstations altitude was as high as 0.91. The calibratedcoefficient k of the new method was also stronglycorrelated with the altitude of the stations (R2 of 0.81).Hence, the coefficient k could also be estimated fromaltitude data with comparable results, as k =�0.37h+1700, where h is elevation above mean sea level (m).Generally, the method was able to estimate annual ETo
with an annual average error of <2.7% from the PM EToestimations (Table III). The summary of comparison resultsfor the calibration and validations of the new method withPM ETo method, observed Piche evaporimeter data, and theHAR method is presented in Table III.The comparison scatter plots of the new method with
the PM ETo, observed Piche evaporimeter data, and theHAR methods are shown in Figures 4–6, respectively.
Wet and dry season variation
The performance of this simple new temperature modelresult was also tested in the dry and wet seasons for the
Copyright © 2013 John Wiley & Sons, Ltd.
study area. In the unimodal rainfall regimes, complete wetseason is from July to September, and dry season startsfrom November and ends in April. But, in the bimodalrainfall regimes, dry and wet seasons vary from station tostation. At the Dire Dawa station, March, April, July,August, and September are wet months, and November,December, January, and February are dry. At Awassa, drymonths remain the same as of Dire Dawa, but the wetseason starts in April and ends in September, where Mayand June remain partially dry in some dry years. At theArba Minch station, April, May, September, October,and November are wet months, and January, February,June, July, and August are dry months, where othermonths remain partially wet and dry. The method wascompared with the global standard PM ETo method andthe well-known HAR temperature method in the dry andwet seasons at all stations considered.It was found that the model performs slightly different
for the two seasons with a slightly better performance forthe dry season.
Dry seasons. On the basis of temperature from the dryseasons, the new method replicates that of the PM methodresult with an R2 as high as 0.65 at the Dangila, DireDawa, Gondar, and Motta stations and as low as 0.51 atAddis Ababa, with an average R2 value of 0.61 over theten stations. The RMSE and AME of the new method fromthe standard PM method also range from a minimumvalue of 0.42 and 0.32mm at the Ayehu station, tomaximum value of 0.61 and 0.49, respectively at the ArbaMinch station. The average NS efficiency in all thestations was 0.51, whereas it ranges from a maximum of0.63 and a minimum of 0.32 at the Gondar and Awassastations. The R2 comparison of the new method with
Hydrol. Process. 28, 2945–2960 (2014)

Figure 7. Dry season comparison of the new method with the PM
2956 T. ENKU AND A. M. MELESSE
HAR was as high as 0.91 at Arba Minch and as lowas 0.75 at the Gondar and Dire Dawa stations. Theaverage R2 of new method with HAR was 0.82 over thestations. The detailed results are shown in Table IV. Thescatter plots of the dry season’s comparison of the newmethod with the PM and HAR methods are shownFigures 7 and 8.
Copyright © 2013 John Wiley & Sons, Ltd.
Wet seasons. In wet seasons, the new method predictedthe PM method with an R2 as high as 0.66 at the Awassastation and as low as 0.42 at Dire Dawa, with an averageR2 value of 0.58 over the stations. The average NSefficiency in all the stations was 0.52, whereas it rangesfrom a maximum of 0.63 and a minimum of 0.4 at theAddis Ababa and Dire Dawa stations. The RMSE and
Hydrol. Process. 28, 2945–2960 (2014)

Figure 8. Dry season comparison of the new method with the HAR
2957TEMPERATURE-BASED EVAPOTRANSPIRATION ESTIMATION
AME of the new method from the standard PM methodalso range from minimum value of 0.33 and 0.27mm atthe Ayehu station to maximum value of 0.76 and0.59mm, respectively, at the Dire Dawa station. The R2
Copyright © 2013 John Wiley & Sons, Ltd.
comparison of the new method with HAR was as high as0.92 at Awassa and as low as 0.67 at the Motta station.The average R2 of new method with HAR was 0.84 overthe ten stations. During the wet seasons, the new method
Hydrol. Process. 28, 2945–2960 (2014)

Figure 9. Wet season comparison of the new method with the PM
2958 T. ENKU AND A. M. MELESSE
performed relatively poor in terms of R2, but better interms of RMSE, NS, and AME. The detailed results areshown in Table IV. The scatter plots of the wet season’scomparison of the new method with the PM and HARmethods are shown Figures 9 and 10.
Copyright © 2013 John Wiley & Sons, Ltd.
Generally, the method performs well in the study areain both dry and wet seasons with an average R2, NS,RMSE, and AME of 0.61, 0.51, 0.49mm, and 0.39mmin dry seasons and 0.58, 0.52, 0.47mm, and 0.37mm inwet seasons, respectively, when compared with the
Hydrol. Process. 28, 2945–2960 (2014)
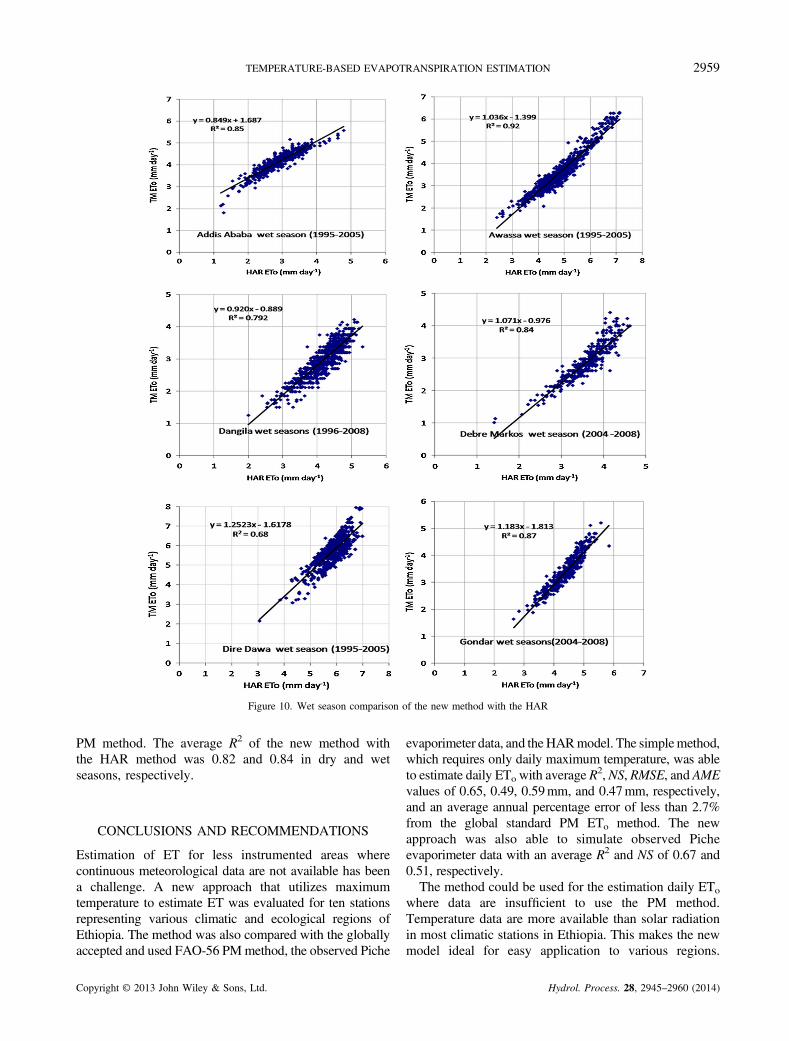
Figure 10. Wet season comparison of the new method with the HAR
2959TEMPERATURE-BASED EVAPOTRANSPIRATION ESTIMATION
PM method. The average R2 of the new method withthe HAR method was 0.82 and 0.84 in dry and wetseasons, respectively.
CONCLUSIONS AND RECOMMENDATIONS
Estimation of ET for less instrumented areas wherecontinuous meteorological data are not available has beena challenge. A new approach that utilizes maximumtemperature to estimate ET was evaluated for ten stationsrepresenting various climatic and ecological regions ofEthiopia. The method was also compared with the globallyaccepted and used FAO-56 PMmethod, the observed Piche
Copyright © 2013 John Wiley & Sons, Ltd.
evaporimeter data, and the HARmodel. The simplemethod,which requires only daily maximum temperature, was ableto estimate daily ETo with average R
2,NS, RMSE, and AMEvalues of 0.65, 0.49, 0.59mm, and 0.47mm, respectively,and an average annual percentage error of less than 2.7%from the global standard PM ETo method. The newapproach was also able to simulate observed Picheevaporimeter data with an average R2 and NS of 0.67 and0.51, respectively.The method could be used for the estimation daily ETo
where data are insufficient to use the PM method.Temperature data are more available than solar radiationin most climatic stations in Ethiopia. This makes the newmodel ideal for easy application to various regions.
Hydrol. Process. 28, 2945–2960 (2014)

2960 T. ENKU AND A. M. MELESSE
Calibration of the coefficients is recommended. If thereare no sufficient data for calibration, the coefficient k canbe approximated as k= 48 * Tmm� 330 for combined wetand dry seasons, k= 73 * Tmm� 1015 for dry seasons, andk= 38 * Tmm� 63 for wet seasons, where Tmm (�C) is themean annual/seasonal maximum temperature. This meth-od is most recommended for the estimation of annual ETo
for hydrologic studies.
ACKNOWLEDGEMENTS
The School of Civil and Water Resources Engineering,Institute of Technology of Bahir Dar University, isacknowledged for financing this work and the EthiopianMeteorological Agency for providing data. The firstauthor is grateful to the Ethiopian Institute of WaterResources, his current institution, for sponsoring his PhDstudy to which he had time and space to write this paper.The authors also thank the three anonymous reviewers fortheir valuable comments.
REFERENCES
Abtew W. 1996. Evapotranspiration measurements and modeling forthree wetland systems in South Florida. In: Water Resources Bulletin32(3): 465–473.
Allen RG, Pereira LS. 1998. Crop evapotranspiration – guidelines forcomputing crop water requirement, Rome, FAO Papers no. 56, Roma.
Allen RG, Smith M, Perrier A, Pereira LS. 1994a. An update for thecalculation of reference evapotranspiration. ICID Bull 43(2): 35–92.
Allen RG, Smith M, Perrier A, Pereira LS. 1994b. An update for thedefinition of reference evapotranspiration. ICID Bull 43(2): 1–34.
Bois B, Pieri P, Van Leeuwen C, Wald L, Huard F, Gaudillere JP, Saur E.2008. Using remotely sensed solar radiation data for reference
Copyright © 2013 John Wiley & Sons, Ltd.
evapotranspiration estimation at a daily time step. Agricultural andForest Meteorology 148(4): 619–630.
Camberlin P. 1997. Rainfall anomalies in the source region of the Nile andtheir connection with the Indian summer monsoon. Journal of Climate10: 1380–1392.
De Bruin HAR. 1981. The determination of (reference crop) evapotrans-piration from routine weather data. Proceedings and Informations,Committee for Hydrological Research 28: 25–37.
Dingman SL. 2002. Physical Hydrology. Prentice Hall: Upper SaddleRiver; 646.
Drexler JZ, Snyder RL, Spano D, Paw KT. 2004. A review of models andmicrometeorological methods used to estimate wetland evapotranspi-ration. Hydrological Processes 18: 2071–2101.
Du YD, Liu ZX, Zhang YF. 2000. Evaluation of two referencecrop evapotranspiration calculation methods. Journal of Henan Agricul-tural University 35(1): 57–31 (In Chinese with English abstract).
Gong L, Xu CY, Chen D, Halldin S, Chen YD. 2006. Sensitivity of thePenman-Monteith reference evapotranspiration to key climatic variablesin the Changjiang (Yangtze River) basin. Journal of Hydrology 329(3-4):620–629.
Hargreaves GH, Samani ZA. 1985. Reference crop evapotranspirationfrom temperature. Applied Engineering in Agriculture 1: 96–99.
Liu Y, Pereira LS, Teixira JL. 1997. Update definition and computation ofreference evapotranspiration comparison with former method. Journalof Hydraulic Engineering 6: 27–33 (In Chinese with English abstract).
Nandagiri L, Kovoor GM. 2005. Sensitivity of the food and agricultureorganization Penman–Monteith evapotranspiration estimates to alterna-tive procedures for estimation of parameters. Journal of Irrigation andDrainage Engineering 131(3): 238–248.
Rana G, Katerji N. 2000. Measurement and estimation of actualevapotranspiration in the field under Mediterranean climate: a review.European Journal of Agriculture 13(2-3): 125–153.
Slavisa T. July/August 2005. Temperature-based approaches for estimat-ing reference evapotranspiration. Journal of Irrigation and DrainageEngineering 131(4): 316–323.
Temesgen EN. 2009. Estimation of evaporation from satellite remotesensing and meteorological data over the Fogera flood plain, Ethiopia,Enschede, MSc thesis ITC, p. 89, 2009.
Temesgen B, Eching S, Davidoff B. 2005. Comparison of some referenceevapotranspiration equations for California. Journal of Irrigation andDrainage Engineering 131(1): 73–84.
Ventura F, Spano D, Duce P. 1999. An evaluation of commonevapotranspiration equations. Irrigation Science 18: 163–170.
Hydrol. Process. 28, 2945–2960 (2014)