A Simple Data Transformation for Estimating Benchmark Doses in Developmental Toxicity Experiments
11
Risk Analysis, Vol. 15, No. 1, 1995 A Simple Data Transformation for Estimating Benchmark Doses in Developmental Toxicity Experiments D. Krewskil-* and Y. ZhdJ Received July 30, 1994 Developmental anomalies induced by toxic chemicals may be identified using laboratory experi- ments with rats, mice or rabbits. Multinomial responses of fetuses from the same mother are often positively correlated, resulting in overdispersion relative to multinomial variation. In this article, a simple data transformation based on the concept of generalized design effects due to Rao-Scott is proposed for dose-response modeling of developmental toxicity. After scaling the original mul- tinomial data using the average design effect, standard methods for analysis of uncorrelated mul- tinomial data can be applied. Benchmark doses derived using this approach are comparable to those obtained using generalized estimating equations with an extended Dirichlet-trinomial covar- iance function to describe the dispersion of the original data. This empirical agreement, coupled with a large sample theoretical justification of the Rao-Scott transformation, confirms the appli- cability of the statistical methods proposed in this article for developmental toxicity risk assess- ment. KEY WORDS: Benchmark dose; developmental toxicity; dose-response; data transformation; overdispersion. 1. INTRODUCTION In developmental toxicity experiments with labo- ratory animals such as rats or mice, pregnant females are usually exposed to one of several doses of the test agent (including a control group at dose zero) during a spec- ified period in gestation. Upon examining the uterine contents of each dam, the status of each conceptus is classified and recorded. A conceptus may either be dead or alive (a death may be due to either an early resorption or fetal mortality), and a live fetus may exhibit one or more malformations. Summary observations from each dam usually include the total number of implants m, the number of prenatal deaths r, the number of live pups s, I Health Protection Branch, Health Canada, Ottawa, Ontario, Canada, KIA OL2. * Department of Mathematics and Statistics, Carleton University, Ot- tawa, Ontario, Canada, KIS 5B6. Current address: Department of Epidemiology and Biostatistics, Col- lege of Public Health, University of South Florida, Tampa, Florida, 33612-3805. and the number of malformed live pups y, yielding a trinomial response (r,y,s - y) conditional on m. The fetal malformation rate y/s and the prenatal death rate r/m = 1 - s/m are of particular interest, measuring teratoge- nicity and embryolethality, respectively. Since observations on implants from the same dam tend to be positively correlated, the trinomial responses @,r,s - r) may exhibit overdispersion relative to mul- tinomial variation. Thus, statistical methods based on the multinomial distribution cannot be directly used to an- alyze developmental toxicity data. Because of the con- straint r + y + (s - y) = m, any two component responses suffice to describe the trinomial response @,r,s - y) after conditioning on the ancillary statistic m. Chen et aZ.(') used a Dirichlet-trinomialdistribution to describe the joint conditional probability P @,r I m) of observing y malformed live fetuses and r prenatal deaths among m implants in a given litter. The use of Dirichlet-tsinomial distribution for simultaneous analysis of prenatal death and fetal malformation extends previous methods for an- alyzing a single endpoint (e.g., the number of fetal mal- 29 02724332/95/0200-09$07.50/1 0 1995 Society for Risk Analysis
Transcript of A Simple Data Transformation for Estimating Benchmark Doses in Developmental Toxicity Experiments
Risk Analysis, Vol. 15, No. 1, 1995
A Simple Data Transformation for Estimating Benchmark Doses in Developmental Toxicity Experiments
D. Krewskil-* and Y. ZhdJ
Received July 30, 1994
Developmental anomalies induced by toxic chemicals may be identified using laboratory experi- ments with rats, mice or rabbits. Multinomial responses of fetuses from the same mother are often positively correlated, resulting in overdispersion relative to multinomial variation. In this article, a simple data transformation based on the concept of generalized design effects due to Rao-Scott is proposed for dose-response modeling of developmental toxicity. After scaling the original mul- tinomial data using the average design effect, standard methods for analysis of uncorrelated mul- tinomial data can be applied. Benchmark doses derived using this approach are comparable to those obtained using generalized estimating equations with an extended Dirichlet-trinomial covar- iance function to describe the dispersion of the original data. This empirical agreement, coupled with a large sample theoretical justification of the Rao-Scott transformation, confirms the appli- cability of the statistical methods proposed in this article for developmental toxicity risk assess- ment.
KEY WORDS: Benchmark dose; developmental toxicity; dose-response; data transformation; overdispersion.
1. INTRODUCTION
In developmental toxicity experiments with labo- ratory animals such as rats or mice, pregnant females are usually exposed to one of several doses of the test agent (including a control group at dose zero) during a spec- ified period in gestation. Upon examining the uterine contents of each dam, the status of each conceptus is classified and recorded. A conceptus may either be dead or alive (a death may be due to either an early resorption or fetal mortality), and a live fetus may exhibit one or more malformations. Summary observations from each dam usually include the total number of implants m, the number of prenatal deaths r, the number of live pups s,
I Health Protection Branch, Health Canada, Ottawa, Ontario, Canada, K I A OL2.
* Department of Mathematics and Statistics, Carleton University, Ot- tawa, Ontario, Canada, KIS 5B6. Current address: Department of Epidemiology and Biostatistics, Col- lege of Public Health, University of South Florida, Tampa, Florida, 33612-3805.
and the number of malformed live pups y, yielding a trinomial response (r,y,s - y) conditional on m. The fetal malformation rate y/s and the prenatal death rate r/m = 1 - s/m are of particular interest, measuring teratoge- nicity and embryolethality, respectively.
Since observations on implants from the same dam tend to be positively correlated, the trinomial responses @,r,s - r) may exhibit overdispersion relative to mul- tinomial variation. Thus, statistical methods based on the multinomial distribution cannot be directly used to an- alyze developmental toxicity data. Because of the con- straint r + y + (s - y) = m, any two component responses suffice to describe the trinomial response @,r,s - y) after conditioning on the ancillary statistic m. Chen et aZ.(') used a Dirichlet-trinomial distribution to describe the joint conditional probability P @,r I m) of observing y malformed live fetuses and r prenatal deaths among m implants in a given litter. The use of Dirichlet-tsinomial distribution for simultaneous analysis of prenatal death and fetal malformation extends previous methods for an- alyzing a single endpoint (e.g., the number of fetal mal-
29 02724332/95/0200-09$07.50/1 0 1995 Society for Risk Analysis
30 Krewski and Zhu
formations y given s) based on the beta-binomial distribution used by Williams,’2) Kupper et a/.,”) and oth- ers. Although the Dirichlet-trinomial distribution allows for overdispersion relative to the trinomial variation, complete specification of such a distribution can be avoided using generalized estimating equations GEES)'^) which require specification of the first two moments of the data only. Whereas Ryan(s) used quasi-likelihood methods with a single constant for all dose groups to inflate the trinomial covariance, Krewski and Zhu(h) em- ployed GEE methods with a generalized Dirichlet-mul- tinomial covariance function to allow for both over- dispersion and underdispersion in joint modeling of fetal malformations and prenatal death. In this paper, we pro- pose a data transformation for dose-response modeling of fetal malformations and prenatal death based on the trinomial observation (y,r,s - y ) given the total number of implants m. This transformation method can, how- ever, be generalized to the case of categorical data such as multiple malformations in each fetus, where the cat- egories may not be mutually exclusive.
In Section 2, the Rao-Sco~’) transformation based on the concept of generalized design effects is described. A theoretical justification of the transformation in the case of large samples is given in Appendix A. Standard statistical methods based on the multinomial distribution can then be applied directly to the transformed data. In Section 3, joint dose-response modeling of the fetal mal- formation and prenatal death rates is discussed, along with methods for the estimation of benchmark doses (BMDs) for use in risk assessment. Direct methods of analysis based on an extended Dirichlet-multinomial co- variance h c t i o n are described for purposes of compar- ison, with the corresponding GEES given in Appendix B. In Section 4, the application of the Rao-Scott trans- formation is illustrated using data from 11 developmen- tal toxicity studies conducted under the U.S. National Toxicology Program. The results obtained using the Rao-Scott transformation compare favorably with those based on a direct analysis of the untransformed data. These empirical and theoretical results confirm the ap- plicability of the Rao-Scott transformation in the anal- ysis of developmental toxicity data.
2. DATA TRANSFORMATION
The Rao-ScotP) transformation is based on the no- tion of design effects used in survey sampling. In sim- plified terms, the design effect is defined as the ratio of the variance under cluster sampling, which induces in-
tracluster correlation, to the variance of the same statistic under simple random sampling where the observations are independent. Under certain conditions, scaling the original data by the design effect effectively eliminates the correlation among the observations. Statistical tech- niques for uncorrelated data may then be used to analyze the transformed data. Fung el for example, used this transformation to develop tests for trend in fetal mal- formation rates observed in developmental toxicity stud- ies.
Consider an experiment with t dose levels 0 = d , < d, < . . . < d, and n, dams assigned to the ith treat- ment group (i = 1, . . . ,t). In the present context of mul- tinomial data, let x, = (JJ,,~,,)~ denote the observed responses on thejth dam in the ith treatment group con- ditional on the number of implants m,. Letting p,l and p,, denote the response rates of fetal malformation and prenatal death, respectively, within the ith treatment group, the expected numbers of malformed fetuses and prenatal deaths are given by
E(x,,lm,> = m,(CL,lrP12)T = “,P, (1)
Denoting the probability of a death occuring by T,, = p,,, the conditional probability of observing a malfor- mation in a live pup is then given by
TTT,, = P J ( 1 - T,,)
with
E(Y,ls,,m,,) = s,=,1
The probabilities T , ~ and IT,^ reflect directly the inci- dences of fetal malformation y,/s, and prenatal death r,/m,. The probability
(2) of either a death or a malformation occurring provides a measure of overall toxicity.
Intralitter correlation in developmental toxicity ex- periments is expressed as extra-multinomial variation in the trinomial responses (y,,r,,) given m,. Such overdis- persion may be characterized by a parametric function such as the extended Dirichlet-trinomial covariance. Al- ternatively, the Rao-Scott transformation may be used to scale the original data so as to eliminate the extra-mul- tinomial variation.
To apply the Rao-Scott transformation, we require consistent estimates of the first two moments of the data. For the ith dose group, consistent estimates of the re- sponse rates plk ( k = 1,2,3) are given by the sample proportions
TZ3 = 1 - (1 - T,l)(l - m,*)
Simple Data Transformation 31
- Yi. p. = - mi ri . p. = - mi. r2
with
i i 3 = 1 - Lil - L i z
where y i . = x: y , , r,. = x7 rij and m i . = z7 m,. A consistent estimate of the average value of the general- ized design effects(') is given by
(3)
where G,fi (k = 1,2,3) are the sample variances of the component responses given by
n.
and
The design effects in (3) in fact measure the degree of variation in the data relative to multinomial variation, with 8, > 1 or 8, < 1 reflecting overdispersion or un- derdispersion, respectively.
The average design effect suggests a multinomial version of the Rao-Scott transformation(8) given by
g,, = G,,?,,) = b,,JD,,r,JDJ
with fi,, = rn,/D,. As is shown in Appendix A, the first two moments of the transformed data E, can be approx- imated by the multinomial mean-variance structure
and
Var(~,Ik,) - fi,[diag(CL,) - P#T1 ( 5 )
provided n, is moderately large. Consequently, standard methods of statistical inference based on the multinomial mean-covariance structure are readily applicable to the data v,,F,,) given 6,. Note that the Rao-Scott transfor- mation is independent of specific form of the covariance function of the response (yg,) given m,.
3. DOSE-RESPONSE MODELING AND BENCHMARK DOSES
We now discuss dose-response modeling of the transformed data (jjv,Fq) given f iq assuming the trinomial mean-variance structure in (4) and (5). We also compare the present method for analyzing the transformed data with that described by Zhu et aZ.(I0) for the original data bij? rij).
3.1. Weibull Models
Following Kodell et aZ.(") and Krewski and Zhu(@, we consider jointly fitting the Weibull dose-response models
mil = ml(di) = 1 - exp[-(a, + bldivl)] (6)
and
miZ = m2(d,) = 1 - exp[-(a, + b2d,r2)] (7)
(a, 2 O,b, 2 0;k = 1,2) to the proportions jj,,/f,, = y,/s, and F J f i , = r,/m,, respectively. Unlike Krewski and Zhu,(6) the number of implants m, is not included in the model as a covariate since this particular covariate does not account for an appreciable proportion of the varia- tion exhibited in the Notice that 1 - exp(-a,) (k = 1,2) is the probability of an anomaly occurring spontaneously in the absence of exposure to the test agent. The Weibull parameter yk determines the shape of the dose-response curve.@)
3.2. Model Fitting and GEES
Since the first two moments of the transformed data can be approximated by those of the trinomial distribu- tion, the method of GEEs can be conveniently used in conjunction with the trinomial covariance function (5) to fit the Weibull models (6) and (7) to the data (jjq,?J
(Appendix B). For the trinomial distribution, the method of GEEs described in Appendix B is equivalent to the maximum likelihood estimation, with the asymptotic dispersion matrix of the maximum likelihood estimates given by the inverse of the Fisher information matrix.
The goodness-of-fit of the model can be evaluated using Pearson chi-squared statistic
32 Krewski and Zhu
". - %,.ij1)2 (7;. - % , . j i , J Z + x2 = i= 2 I h$;, h, . b , 2
which is asymptotically distributed as a chi-squared var- iate with 2t - p degrees of freedom, where p is the number of parameters estimated. Large values of X 2 in- dicate lack of fit.' We note that the applicability of chi- squared statistics as a measure of goodness-of-fit represents an additional advantage of the transformation method in that goodness-of-fit tests for correlated mul- tinomial data are not readily a~ailable.'~)
3.3. Direct Analysis
The performance of the Rao-Scott transformation method may be evaluated in comparison with the method of GEEs based on the extended Dirichlet-trino- mial covariance function(6)
for the conditional distribution P (j,J,r,J ImJ of the orig- inal data. Direct analyses of the untransformed data (y,,r,) given m, were discussed by Ryan(5) using quasi- likelihood methods, and by Krewski and Zhu@) using GEEs and the covariance function.(x) The extended Dir- ichlet-trinomial covariance is quite flexible, including the trinomial distribution (+, = 0), the Dirichlet-trino- mial distribution (4, > 0) and an extended Dirichlet- trinomial distribution when
O > 4 , 2 m a x - { * IJ -";'" ptj
I k = 1, 2, 3 ; m, 2 2
as special cases. It also encompasses the generalized bi- nomial models of Altham,(12) Kupper and Ha~eman,"~) and Paul(I4) in the case of correlated binary data. Since the intralitter correlation coefficient often increases with the dose l e~e l , "~ .~ ) we postulate a unique value 4; for the ith dose group to allow for dose-dependent overdisper- sion. These dispersion parameters {I$~ = 1, . . . , t } are estimated using a set of quadratic GEEs"O) jointly with the GEEs for the regression parameters Or = ( a , b , ~ , ) ~ involved in nk ( k = 1,2).
3.4. Benchmark Doses
The benchmark (BMD) has recently re- ceived considerable attention as a means of quantifying the risk of developmental toxicant^.(^^^^^*) An a-percent BMD is generally defined as a lower confidence limit on the effective dose ED, that elicits an excess risk of 0 < a < 1. The ED,, denoted by d,, is given by the solution to the equation
where ~ ( d ) represents an appropriate dose-response model for an endpoint of interest in developmental tox- icity studies. Under our Weibull model for fetal malfor- mations or prenatal death, we have
where the subscript on the parameters b and y is sup- pressed for simplicity. The ED, for overall toxicity based on the trinomial model n3 = 1 - (1 - r I ) ( I - TJ in ( 2 ) is obtained as the solution to
bldzl + b2dg2 = -log(l - a)
Standard errors for the estimated ED,s can be obtained using the delta method as described by Ryan'5) and Krewski and Zhu(b); these standard errors can then be used to obtain lower confidence limits on ED,, which are the BMDs.
Both Ryan(3 and Krewslu and Zhu(@ showed that BMDs for overall toxicity (i.e., occurrence of either a fetal malformation or a prenatal death) provide more sensitive measures than BMDs associated with a particular single endpoint (fetal malformation or prenatal death). Specifi- cally, the BMDs for overall toxicity are close to the min- imum of those for fetal malformations and prenatal death in the absence of a dose-effect on one of these two end- points. The overall BMD is, however, somewhat lower than the minimum BMD in the presence of strong dose effects on both fetal malformation and prenatal death. Moreover, the estimates of BMDs based on the trinomial model n3 are generally more efficient than those based on the binomial model^.'^,^'
4. APPLICATIONS
4.1. Developmental Toxicity Data
Application of the Rao-Scott transformation dis- cussed in Section 2 is now illustrated using data from
Simple Data Transformation 33
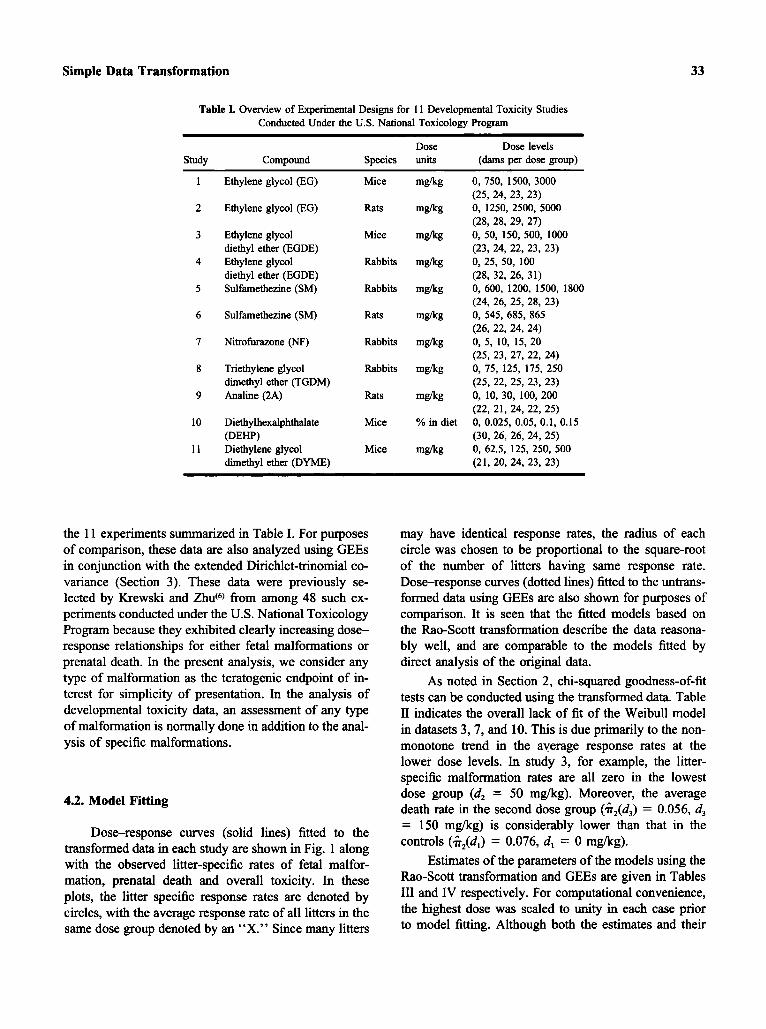
Table I. Overview of Experimental Designs for 1 1 Developmental Toxicity Studies Conducted Under the US . National Toxicology Program
Dose Dose levels Study Compound Species units (dams per dose group)
1 Ethylene glycol (EG) Mice mgkg 0, 750, 1500, 3000 (25, 24, 23, 23)
2 Ethylene glycol (EG) Rats mgkg 0, 1250, 2500, 5000 (28, 28, 29, 27)
3 Ethylene glycol Mice mgkg 0, 50, 150, 500, lo00 (23, 24, 22, 23, 23)
4 Ethylene glycol Rabbits m a g 0, 25, 50, 100 (28, 32, 26, 31)
5 Sulfamethezine (SM) Rabbits mgkg 0, 600, 1200, 1500, 1800 (24, 26, 25, 28, 23)
6 Sulfamethezine (SM) Rats mgkg 0, 545, 685, 865 (26, 22, 24, 24)
7 Nitrofurazone (NF) Rabbits mgkg 0, 5, 10, 15, 20 (25, 23, 27, 22, 24)
8 Triethylene glycol Rabbits mgkg 0, 75, 125, 175, 250 (25, 22, 25, 23, 23)
9 Analine (2A) Rats mgkg 0, 10,30, 100,200 (22, 21, 24, 22, 25)
(30, 26, 26, 24, 25)
(21, 20, 24, 23, 23)
diethyl ether (EGDE)
diethyl ether (EGDE)
dimethyl ether (TGDM)
10 Diethylhexalphthalate Mice YO in diet 0, 0.025, 0.05, 0.1, 0.15
11 Diethylene glycol Mice m a g 0, 62.5, 125, 250, 500 @Em)
dimethyl ether (DYME)
the 11 experiments summarized in Table I. For purposes of comparison, these data are also analyzed using GEEs in conjunction with the extended Dirichlet-trinomial co- variance (Section 3). These data were previously se- lected by Krewski and Zhuc6) from among 48 such ex- periments conducted under the U.S. National Toxicology Program because they exhibited clearly increasing dose- response relationships for either fetal malformations or prenatal death. In the present analysis, we consider any type of malformation as the teratogenic endpoint of in- terest for simplicity of presentation. In the analysis of developmental toxicity data, an assessment of any type of malformation is normally done in addition to the anal- ysis of specific malformations.
4.2. Model Fitting
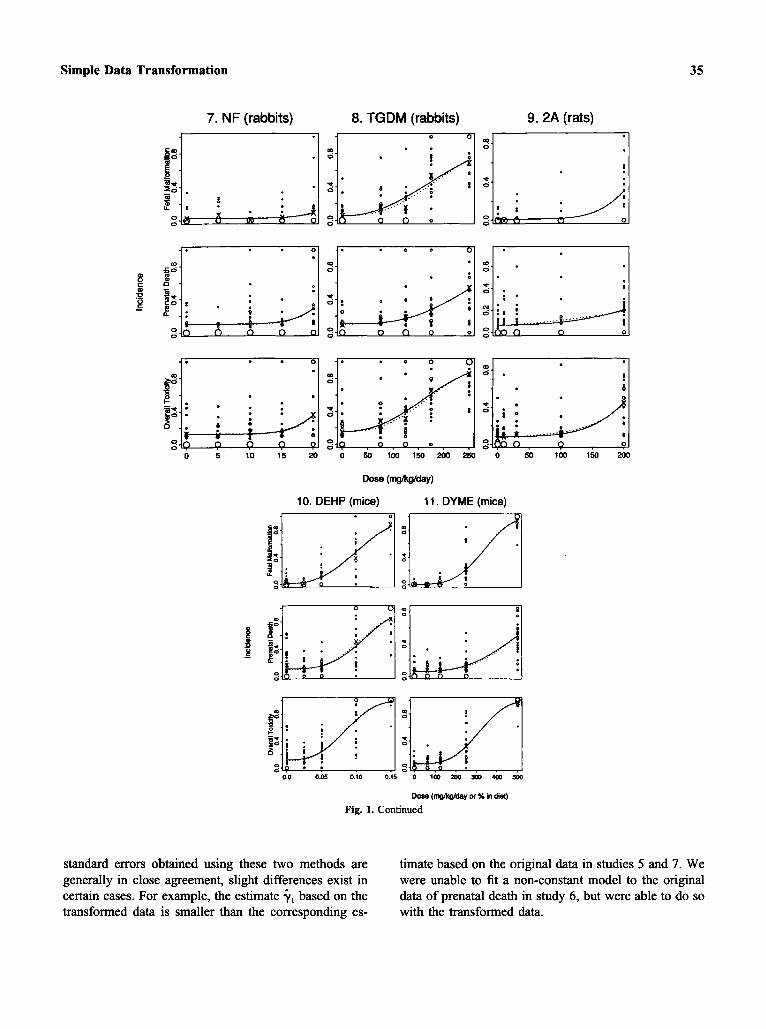
Dose-response curves (solid lines) fitted to the transformed data in each study are shown in Fig. 1 along with the observed litter-specific rates of fetal malfor- mation, prenatal death and overall toxicity. In these plots, the litter specific response rates are denoted by circles, with the average response rate of all litters in the same dose group denoted by an “X.” Since many litters
may have identical response rates, the radius of each circle was chosen to be proportional to the square-root of the number of litters having same response rate. Dose-response curves (dotted lines) fitted to the untrans- formed data using GEEs are also shown for purposes of comparison. It is seen that the fitted models based on the Rao-Scott transformation describe the data reasona- bly well, and are comparable to the models fitted by direct analysis of the original data.
As noted in Section 2, chi-squared goodness-of-fit tests can be conducted using the transformed data. Table I1 indicates the overall lack of fit of the Weibull model in datasets 3,7, and 10. This is due primarily to the non- monotone trend in the average response rates at the lower dose levels. In study 3, for example, the litter- specific malformation rates are all zero in the lowest dose group (d, = 50 mgkg). Moreover, the average death rate in the second dose group (h2(d3) = 0.056, d3 = 150 mgkg) is considerably lower than that in the controls (G2(d,) = 0.076, d, = 0 mgkg).
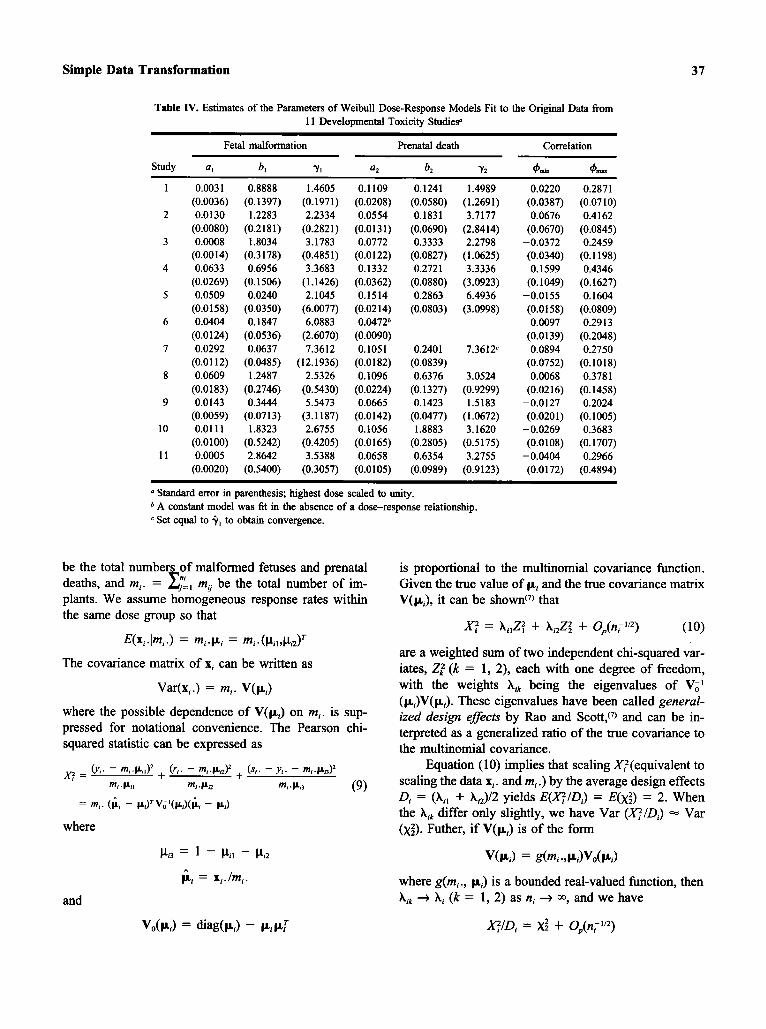
Estimates of the parameters of the models using the Rao-Scott transformation and GEEs are given in Tables I11 and IV respectively. For computational convenience, the highest dose was scaled to unity in each case prior to model fitting. Although both the estimates and their

34 Krewski and Zhu
1. EG (mice) 2. EG (rats) 3. EGDE (mice)
Dose (mgncsldav)
5. SM (rabbits) 6. SM (rats) 4. EGDE (rabbits)
Dose ( W d a y )
Fig. 1. Dose-respome models for 1 1 developmental toxicity studies. Litter-specific response rates are denoted by circles; average response rate withm dose group is denoted by an x; models fitted to the transformed data are denoted by -; models fitted to the priginal data are denoted by -.
Simple Data Transformation 35
7. NF (rabbits) 8. TGDM (rabbits) 9.2A (rats)
0
i* . 0 1 . o 0
2. . : o . .
0 0
0 50 100 150 200
Dose (mgllyllday)
10. DEHP (mice) 11. DYME (mice)
Dose ( m y M % in diet)
Fig. 1. Continued
standard errors obtained using these two methods are generally in close agreement, slight hfferences exist in certain cases. For example, the estimate r, based on the transformed data is smaller than the corresponding es-
timate based on the original data in studies 5 and 7. We were unable to fit a non-constant model to the original data of prenatal death in study 6, but were able to do so with the transformed data.
36 Krewski and Zhu
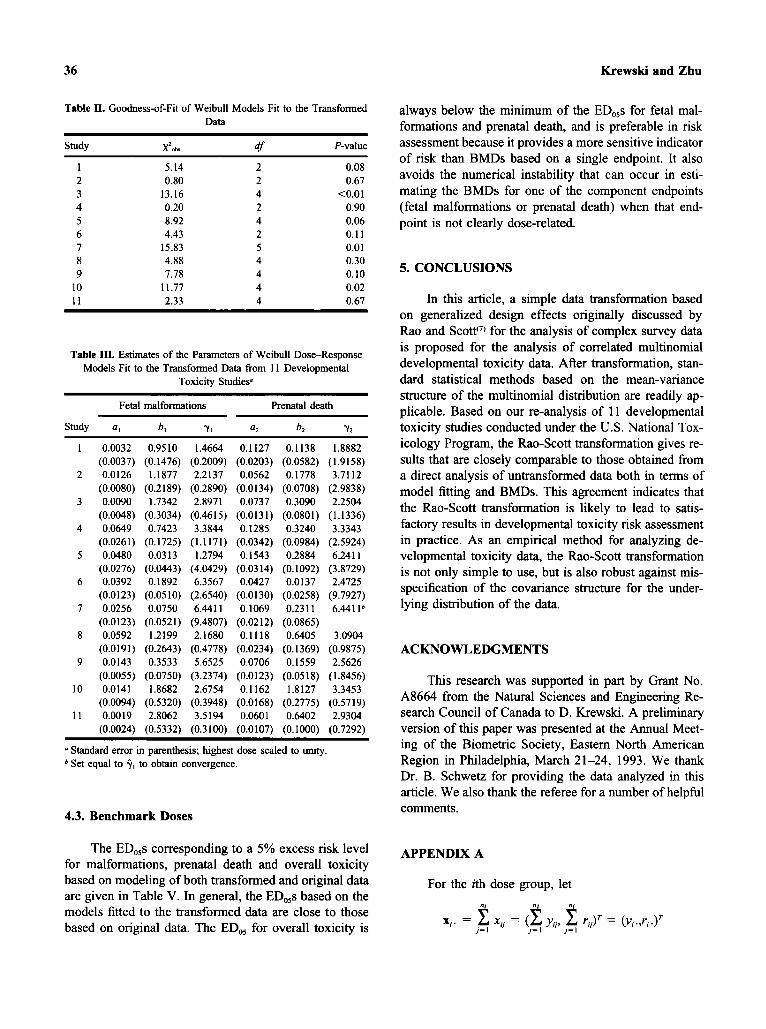
Table 11. Goodness-of-Fit of Weibull Models Fit to the Transformed Data
Study X2& 4 P-value
1 2 3 4 5 6 7 8 9
10 11
5.14 0.80
13.16 0.20 8.92 4.43
15.83 4.88 7.78
11.77 2.33
2 2 4 2 4 2 5 4 4 4 4
0.08 0.67
<0.01 0.90 0.06 0.1 1 0.01 0.30 0.10 0.02 0.67
Table 111. Estimates of the Parameters of Weibull Dose-Response Models Fit to the Transformed Data from 1 1 Developmental
Toxicity Studiesa ~~ ~~~ ~~ ~~
Fetal malformations Prenatal death
Study (I, b, YI a2 b2 Y2
1 0.0032 0.9510 1.4664 0.1127 0.1138 1.8882 (0.0037) (0.1476) (0.2009) (0.0203) (0.0582) (1.9158)
2 0.0126 1.1877 2.2137 0.0562 0.1778 3.7112 (0.0080) (0.2189) (0.2890) (0.0134) (0.0708) (2.9838)
3 0.0090 1.7342 2.8971 0.0737 0.3090 2.2504 (0.0048) (0.3034) (0.4615) (0.0131) (0.0801) (1.1336)
4 0.0649 0.7423 3.3844 0.1285 0.3240 3.3343 (0.0261) (0.1725) (1.1 171) (0.0342) (0.0984) (2.5924)
5 0.0480 0.0313 1.2794 0.1543 0.2884 6.2411 (0.0276) (0.0443) (4.0429) (0.0314) (0.1092) (3.8729)
6 0.0392 0.1892 6.3567 0.0427 0.0137 2.4725 (0.0123) (0.0510) (2.6540) (0.0130) (0.0258) (9.7927)
7 0.0256 0.0750 6.4411 0.1069 0.2311 6.441Ib (0.0123) (0.0521) (9.4807) (0.0212) (0.0865)
8 0.0592 1.2199 2.1680 0.1118 0.6405 3.0904 (0.0191) (0.2643) (0.4778) (0.0234) (0.1369) (0.9875)
9 0.0143 0.3533 5.6525 0.0706 0.1559 2.5626 (0.0055) (0.0750) (3.2374) (0.0123) (0.0518) (1.8456)
10 0.0141 1.8682 2.6754 0.1162 1.8127 3.3453 (0.0094) (0.5320) (0.3948) (0.0168) (0.2775) (0.5719)
11 0.0019 2.8062 3.5194 0.0601 0.6402 2.9304 (0.0024) (0.5332) (0.3100) (0.0107) (0.1000) (0.7292)
a Standard error in parenthesis; highest dose scaled to unity. Set equal to 4, to obtain convergence.
4.3. Benchmark Doses
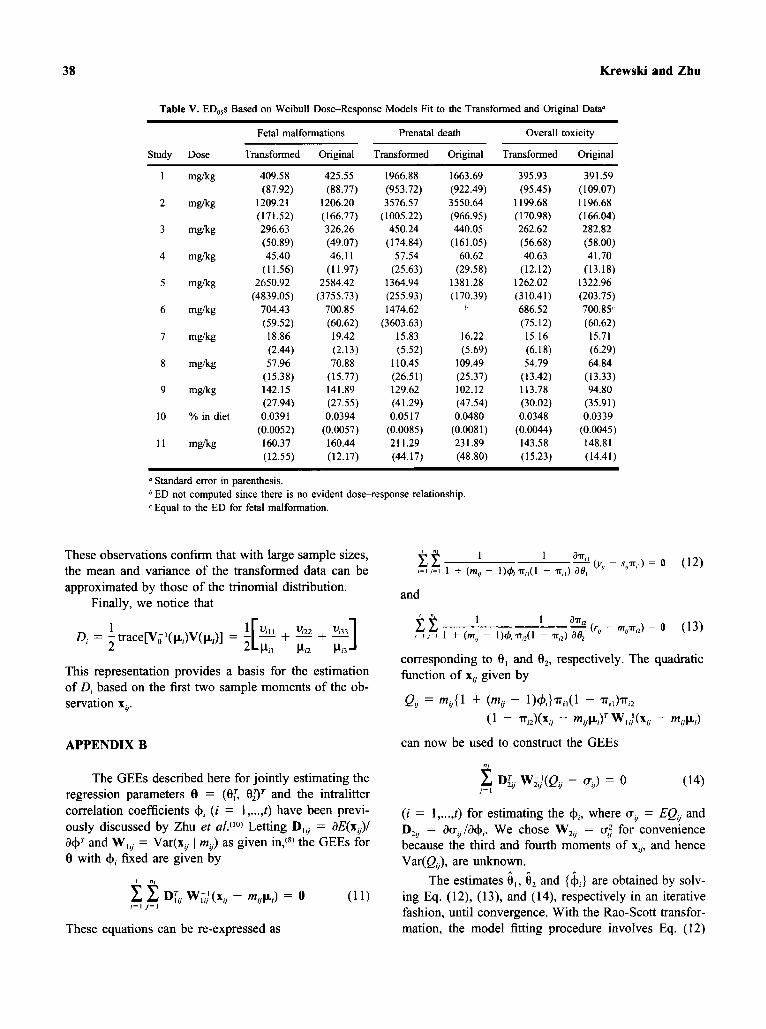
The ED,,s corresponding to a 5% excess risk level for malformations, prenatal death and overall toxicity based on modeling of both transformed and original data are given in Table V. In general, the ED,,s based on the models fitted to the transformed data are close to those based on original data. The ED,, for overall toxicity is
always below the minimum of the ED,,s for fetal mal- formations and prenatal death, and is preferable in risk assessment because it provides a more sensitive indicator of risk than BMDs based on a single endpoint. It also avoids the numerical instability that can occur in esti- mating the BMDs for one of the component endpoints (fetal malformations or prenatal death) when that end- point is not clearly dose-related.
5. CONCLUSIONS
In this article, a simple data transformation based on generalized design effects originally discussed by Rao and Scott!') for the analysis of complex survey data is proposed for the analysis of correlated multinomial developmental toxicity data. After transformation, stan- dard statistical methods based on the mean-variance structure of the multinomial distribution are readily ap- plicable. Based on our re-analysis of 11 developmental toxicity studies conducted under the U.S. National Tox- icology Program, the Rao-Scott transformation gives re- sults that are closely comparable to those obtained from a direct analysis of untransformed data both in terms of model fitting and BMDs. This agreement indicates that the Rao-Scott transformation is likely to lead to satis- factory results in developmental toxicity risk assessment in practice. As an empirical method for analyzing de- velopmental toxicity data, the Rao-Scott transformation is not only simple to use, but is also robust against mis- specification of the covariance structure for the under- lying distribution of the data.
ACKNOWLEDGMENTS
This research was supported in part by Grant No. A8664 from the Natural Sciences and Engineering Re- search Council of Canada to D. Krewslu. A preliminary version of this paper was presented at the Annual Meet- ing of the Biometric Society, Eastern North American Region in Philadelphia, March 21-24, 1993. We thank Dr. B. Schwetz for providing the data analyzed in this article. We also thank the referee for a number of helpfd comments.
APPENDIX A
For the ith dose group, let
Simple Data Transformation 37
Table IV. Estimates of the Parameters of Weibull Dose-Response Models Fit to the Original Data from 11 Developmental Toxicity Studieg
Fetal malformation Prenatal death Correlation
1
2
3
4
5
6
7
8
9
10
11
0.003 1 (0.0036) 0.0130
(0.0080) 0.0008
(0.0014) 0.0633
(0.0269) 0.0509
(0.0158) 0.0404
(0.0124) 0.0292
(0.01 12) 0.0609
(0.0183) 0.0143
(0.0059) 0.01 11
(0.0100) 0.0005
(0.0020)
0.8888 (0.1397) 1.2283
(0.2181) 1.8034
(0.3 178) 0.6956
(0.1506) 0.0240
(0.0350) 0.1847
(0.0536) 0.0637
(0.0485) 1.2487
(0.2746) 0.3444
(0.07 13) 1.8323
(0.5242) 2.8642
(0.5400)
1.4605 (0.1971) 2.2334
(0.2821) 3.1783
(0.4851) 3.3683
(1.1426) 2.1045
(6.0077) 6.0883
(2.6070) 7.3612
(1 2.1936) 2.5326
(0.5430) 5.5473
(3.1187) 2.6755
(0.4205) 3.5388
(0.3057)
0.1109 (0.0208) 0.0554
(0.0131) 0.0772
(0.0122) 0.1332
(0.0362) 0.1514
(0.0214) 0.0472*
(0.0090) 0.1051
(0.0182) 0.1096
(0.0224) 0.0665
(0.0142) 0.1056
(0.0165) 0.0658
(0.0105)
~
0.1241 (0.0580) 0.1831
(0.0690) 0.3333
(0.0827) 0.2721
(0.0880) 0.2863
(0.0803)
1.4989 (1.2691) 3.7177
(2.8414) 2.2798
(1.0625) 3.3336
(3.0923) 6.4936
(3.0998)
0.2401 (0.0839) 0.6376
(0.1327) 0.1423
(0.0477) 1.8883
(0.2805) 0.6354
(0.0989)
7.3612
3.0524 (0.9299) 1.5183
(1.0672) 3.1620
(0.5 175) 3.2755
(0.9123)
0.0220 (0.0387) 0.0676
(0.0670)
(0.0340) 0.1599
-0.0155 (0.0158) 0.0097
(0.0139) 0.0894
(0.0752) 0.0068
(0.0216) -0.0127 (0.020 1)
-0.0269 (0.0108)
-0.0404 (0.01 72)
-0.0372
(0.1049)
0.2871 (0.07 10) 0.41 62
(0.0845) 0.2459
(0.1 198) 0.4346
(0.1627) 0.1604
(0.0809) 0.2913
(0.2048) 0.2750
(0.1018) 0.3781
(0.1458) 0.2024
(0.1005) 0.3683
(0.1707) 0.2966
(0.4894)
Standard error in parenthesis; highest dose scaled to unity.
Set equal to f, to obtain convergence. * A constant model was fit in the absence of a dose-response relationship.
be the total numbers of malformed fetuses and prenatal deaths, and rn,. = x;L, rn, be the total number of im- plants. We assume homogeneous response rates within the same dose group so that
Wh,J = rn,.Pt = m,-(CL,,,CL,)T
Var(X,J = rn,. V(PJ
The covariance matrix of x , can be written as
where the possible dependence of V(p , ) on m,. is sup- pressed for notational convenience. The Pearson chi- squared statistic can be expressed as
h. - m , . ~ , , ) 2 + (r, . - m,.PnY + (sl . - Y , . - m,.po)2 x:= m, .C,I ml .Pa mI.Pi3 (9)
= 4 . (rz, - Pr)=vC?(P,)(rz, - PJ
where
K 3 = 1 - H I - Piz
bi = x,.Int,.
and
is proportional to the multinomial covariance function. Given the true value of p i and the true covariance matrix V(pi ) , it can be that
Xz = AjlZ: + A,Z: + Op(n;LR) (10)
are a weighted sum of two independent chi-squared var- iates, 2: (k = 1, 2), each with one degree of freedom, with the weights A , being the eigenvalues of V;l (pi)V(pi). These eigenvalues have been called generul- ized design eflects by Rao and Scott,C7) and can be in- terpreted as a generalized ratio of the true covariance to the multinomial covariance.
Equation ( 10) implies that scaling X,? (equivalent to scaling the data x i . and mi .) by the average design effects Di = (Ai , + &)I2 yields E ( z / D i ) = E(x:) = 2. When the A, differ only slightly, we have Var (?IDi) = Var (d). Futher, if V(p i ) is of the form
V(PJ = drni.,Pi)VdPi)
where &mi., p i ) is a bounded real-valued function, then A, + hi (k = 1, 2) as ni + to, and we have
38 Krewski and Zhu
Table V. ED,,s Based on Weibull DoseResponse Models Fit to the Transformed and Onginal Data“
Fetal malformations Prenatal death Overall toxicity
Study Dose Transformed Original Transformed Original Transformed Original
1
2
3
4
5
6
7
8
9
10
11
mg/kg 409.58 (87.92)
mg/kg 1209.21 (171.52)
mg/kg 296.63 (50.89)
mg/kg 45.40 ( 1 1.56)
mg/kg 2650.92 (4839.05)
(59.52) mg/kg 18.86
(2.44) m&g 57.96
(15.38) mg/kg 142.15
(27.94) YO in diet 0.0391
(0.0052) mg/kg 160.37
(12.55)
mg/kg 704.43
425.55 (88.77)
1206.20 (166.77) 326.26 (49.07) 46.1 1
(1 1.97) 2584.42
(3755.73) 700.85 (60.62) 19.42 (2.13) 70.88
(15.77) 141.89 (27.55) 0.0394
(0.0057) 160.44 (12.17)
1966.88 (953.72) 3576.57
(1005.22) 450.24
(174.84) 57.54
(25.63) 1364.94 (255.93) 1474.62
(3603.63) 15.83 (5.52)
110.45 (26.51) 129.62 (41.29) 0.05 17
(0.0085) 211.29 (44.17)
1663.69 (922.49) 3550.64 (966.95) 440.05
(161.05) 60.62
(29.58) 1381.28 ( 1 70.39)
b
16.22 (5.69)
109.49 (25.37) 102.12 (47.54) 0.0480
(0.008 1) 23 1.89 (48.80)
395.93
1199.68 (1 70.98) 262.62 (56.68) 40.63
(12.12) 1262.02 (3 10.41) 686.52 (75.12) 15.16 (6.18) 54.79
(13.42) 113.78 (30.02) 0.0348
(0,0044) 143.58 (15.23)
(95.45) 391.59
( 109.07) 1196.68 (1 66.04) 282.82 (58.00) 41.70
(1 3.18) 1322.96 (203.75) 700.85c (60.62) 15.71 (6.29) 64.84
(13.33) 94.80
(35.91) 0.0339
(0.0045) 148.81 ( 14.4 1 )
Standard error in parenthesis. ED not computed since there is no evident dose-response relationship. Equal to the ED for fetal malformation.
These observations confirm that with large sample sizes, the mean and variance of the transformed data can be approximated by those of the trinomial distribution.
Finally, we notice that - - 1 2
D, = -traceW;l(p,)V(pi)] =
This representation provides a basis for the estimation of D, based on the first two sample moments of the ob- servation xu.
APPENDIX B
The GEES described here for jointly estimating the regression parameters 8 = (ef, O a T and the intralitter correlation coefficients +, (i = 1 , ..., t ) have been previ- ously discussed by Zhu et uZ.(Io) Letting D,, = dE(x,)/
and W,, = Var(x, I m,) as given in,@) the GEES for 8 with +, fixed are given by
These equations can be re-expressed as
and
corresponding to 0, and 0,, respectively. The quadratic function of x, given by
e, = m,{l + (my - 1)+,1%(1 - T , J T # 2
(1 - %)(X, - “2,)1JTW;(x, - m,pJ
can now be used to construct the GEES
(i = 1, ..., t ) for estimating the where u, = EQ, and D,, = acr,/a+,. We chose W,, = u; for convenience because the third and fourth moments of x,,, and hence Var(Q,), are unknown.
The estimates &, e2 and {&} are obtained by solv- ing Eq. (12), (13), and (14), respectively in an iterative fashion, until convergence. With the Rao-Scott transfor- mation, the model fitting procedure involves Eq. (12)
Simple Data Transformation 39
and (1 3) only, with the 4, all set to zero in accordance with the trinomial covariance function.
Under mild regularity conditions, the estimates G I , i,, and $, are asympototically normally distributed as each n, + w. The asymptotic covariance matrix of these estimators is given by
where
r I ni 1 - 1
is block-diagonal with the two blocks corresponding to G l and i2, respectively. Hence, 6, and 6, are independent as n, + 03. The standard error of the intralitter correlation coefficients {4,} can be estimated using the lower di- agonal submatrix R,, given by Zhu et ul.,(Io) the sample moments (Q, - aJz are used in a,, in part to guard against misspecification of the higher moments for the &b.(5 . ’9 ,
REFERENCES
1. J. J. Chen, R. L. Kodell, R. B. Howe, and D. W. Gaylor, “Anal- ysis of Trinomial Responses from Reproductive and Developmen- tal Toxicity Experiments,” Biomelrics 47, 1049-1058 (1991).
2. D. A. Williams, “The Analysis of Binary Responses from Toxi- cological Experiments Involving Reproduction and Teratogenic- ity,” Biometrics 31, 949-952 (1975).
3. L. L. Kupper, C. Portier, M. D. Hogan, and E. Yamamoto, “The Impact of Litter Effects on Dose-Response Modeling in Teratol- ogy,” Biometrics 42, 85-98 (1986).
4. K.-Y. Liang and S. Zeger, “Longitudinal Data Analysis Using Generalized Linear Models,” Biometrika 73, 13-22 (1986).
5. L. Ryan, “Quantitative Risk Assessment for Developmental Tox- icity,” Biomenics 48, 163-1 74 (1992).
6. D. Krewski and Y. Zhu, “Applications of Multinomial Dose-Re- sponse Models in Developmental Toxicity Risk Assessment,” Risk Analysis 14, 595409 (1994).
7. J. N. K. Rao and A. J. Scott, “The Analysis of Categorical Data from Complex Sample Surveys: Chi-Squared Tests for Goodness of Fit and Independence in Two-way Tables,” Journal ofthe American Statistical Association 76, 221-229 (198 1).
8. I. N. K. Rao and A. J. Scott, “A Simple Method for Analysis of Clustered Binary Data,” Biometrics 48, 577-585 (1992).
9. K. Y. Fung, D. Krewski, J. N. K. Rao, and A. J. Scott, “Tests for Trend in Developmental Toxicity Experiments with Correlated Binary Data,” Risk Analysis 14, 621430 (1994).
10. Y. Zhu, D. Krewski, and W. H. Ross, “Dose-Response Models for Correlated Multinomial Data from Developmental Toxicity Studies,” Applied Stutisrics 43, 583-598 (1994).
11. R. L. Kodell, R. B. Howe, J. J. Chen, and D. W. Gaylor, “Math- ematical Modeling of Reproductive and Developmental Toxic Ef- fects for Quantitative Risk Assessment,” Risk Analysis 11, 583- 590 (1991).
12. P. M. E. Altham, “Two Generalizations of the Binomial Distri- bution,” Applied Statistics 27, 162-167 (1978).
13. L. L. Kupper and J. K. Haseman, “The Use of a Correlated Bi- nomial Model for the Analysis of Certain Toxicological Experi- ments,” Biometrics 34, 69-76 (1978).
14. S. Paul, “On the Beta-Correlated Binomial (bcb) Distribution: A Three Parameter Generalization of the Binomial Distribution,” Commun. Statist. Theory and Methods 16, 1473-1478 (1987).
15. D. A. Williams, “Estimation Bias Using the Beta-Binomial Dis- tribution in Teratology,” Biometrics 44, 305-309 (1988).
16. K. S. Crump, “A New Method for Determining Allowable Daily Intakes,” Fundamental and Applied Toxicology 4, 854-87 1 (1984).
17. Environmental Protection Agency, “Guidelines for Developmen- tal Toxicity Risk Assessment,” Federal Register 56, 63797- 63826 (1991).
18. J. J. Chen and R. L. Kodell, “Quantitative Risk Assessment for Teratological Effects,” Journal of the American Statistical Asso- ciation 84, 966-971 (1989).
19. D. F. Moore and A. Tsiatis, “Robust Estimation of the Variance in Moment Methods for Extra-Binomial and Extra-Poisson Vari- ation,” Biometrics 47, 383401 (1991).