A Similarity Model for Earthquake Scenarios Comparison
114
POLITECNICO DI MILANO SCUOLA DI INGEGNERIA CIVILE, AMBIENTALE E TERRITORIALE CIVIL ENGINEERING FOR RISK MITIGATION A Similarity Model for Earthquake Scenarios Comparison Support for Emergency Preparedness BY AbdelAziz Mehaseb Abdelaziz Elsayed Elganzory Mohamed ElHusseiny AbdelHameed 767453 762900 19-Sep-12 Supervisors Pierluigi PLEBANI Dipartimento di Elettronica ed Informazione Scira MENONI Dipartimento Di Architettura E Pianificazione Mari Pia BONI Dipartimento Di Ingegneria Strutturale
Transcript of A Similarity Model for Earthquake Scenarios Comparison

POLITECNICO DI MILANO
SCUOLA DI INGEGNERIA CIVILE, AMBIENTALE E TERRITORIALE
CIVIL ENGINEERING FOR RISK MITIGATION
A Similarity Model for Earthquake
Scenarios Comparison Support for Emergency Preparedness
BY
AbdelAziz Mehaseb Abdelaziz Elsayed
Elganzory
Mohamed ElHusseiny AbdelHameed
767453 762900
19-Sep-12
Supervisors
Pierluigi PLEBANI
Dipartimento di Elettronica ed Informazione
Scira MENONI Dipartimento Di Architettura E
Pianificazione
Mari Pia BONI Dipartimento Di Ingegneria
Strutturale

2
2
Table of Contents
List of Figures ..................................................................................................................................................................................... 4
List of Tables ...................................................................................................................................................................................... 5
List of Equations ............................................................................................................................................................................... 5
1. Abstract ....................................................................................................................................................................................... 6
2. Introduction .............................................................................................................................................................................. 7
3. Objective ..................................................................................................................................................................................... 8
4. Earthquake Emergency Preparedness ........................................................................................................................... 9
4.1. Earthquakes Impacts ........................................................................................................................................................ 9
4.2. Earthquakes Challenges ............................................................................................................................................... 11
4.3. Organizational Challenges ........................................................................................................................................... 12
4.4. Emergency Planning Process ..................................................................................................................................... 13
4.5. Organizational Resilience ........................................................................................................................................... 14
5. Solution Methodology ........................................................................................................................................................ 16
5.1. Developing Scenarios .................................................................................................................................................... 16
5.2. Complete Event Scenarios ........................................................................................................................................... 17
5.2.1. Seismic Input ................................................................................................................................................................ 18
5.2.2. Vulnerability Assessment ....................................................................................................................................... 19
5.2.3. Estimation of Buildings Damage ......................................................................................................................... 23
5.3. Emergency Reponses .................................................................................................................................................... 24
5.3.1. Organization and Responsibilities ...................................................................................................................... 24
5.3.2. First Responses ........................................................................................................................................................... 26
5.3.2.1. Damage Assessment Process ........................................................................................................................... 26
6. The Similarity Model Design .......................................................................................................................................... 29
7. Model Application for Salò ............................................................................................................................................... 34
7.1. Strategic Buildings .......................................................................................................................................................... 34
7.2. City Sections ...................................................................................................................................................................... 35
7.3. Complete Event Scenarios ........................................................................................................................................... 36
7.3.1. Scenario 1 ...................................................................................................................................................................... 39
7.3.2. Scenario 2 ...................................................................................................................................................................... 46
7.3.3. Scenario 3 ...................................................................................................................................................................... 53
7.3.4. Scenario 4 ...................................................................................................................................................................... 57
7.3.5. Scenario 5 ...................................................................................................................................................................... 64
7.3.6. Scenario 6 ...................................................................................................................................................................... 68
7.3.7. Scenario 7 ...................................................................................................................................................................... 74

3
3
7.3.8. Scenario 8 ...................................................................................................................................................................... 81
7.3.9. Comparing the Damage Scenarios ...................................................................................................................... 88
7.4. Application of the Model .............................................................................................................................................. 91
8. Conclusions ............................................................................................................................................................................ 95
9. References .............................................................................................................................................................................. 96
10. Appendices ........................................................................................................................................................................ 98
Appendix A ............................................................................................................................................................................. 98
Appendix B ........................................................................................................................................................................... 100
Appendix C ............................................................................................................................................................................ 101
Appendix D ........................................................................................................................................................................... 102
Appendix E ............................................................................................................................................................................ 110
Appendix F ............................................................................................................................................................................ 111
Appendix G ........................................................................................................................................................................... 113

4
List of Figures 4
List of Figures Figure 1 The Harbor of the town Namie next to the Fukushima Power plant ................................................. 10
Figure 2 Evolution of Emergency Response Processes with Time [8] ............................................................... 11
Figure 3 Process of Building Complete Event Scenario ..................................................................................... 17
Figure 4 Example of attenuation law: acceleration Vs distance ....................................................................... 18
Figure 5 Damage Assessment by Fragility Curves [24] ...................................................................................... 23
Figure 6 Cracks Types for Masonry Buildings .................................................................................................... 27
Figure 7 Cracks on Building External Walls ........................................................................................................ 27
Figure 8 Strategic Buildings in Salo .................................................................................................................... 34
Figure 9 Definition of Census Sections in Salò................................................................................................... 35
Figure 10 Epicenters Locations for the Different Seismic Scenarios ................................................................. 37
Figure 11 Map for Buildings Vulnerability Values ............................................................................................. 38
Figure 12 Acceleration vs. distance for the First Scenario ................................................................................ 40
Figure 13 Pga (m/s2) map of First scenario........................................................................................................ 40
Figure 14 Sections Average Damage Map for Scenario 1.................................................................................. 41
Figure 15 Roads Damage Map for First Scenario .............................................................................................. 42
Figure 16 Map for Response Intervention Priority for Scenario 1 .................................................................... 44
Figure 17 Acceleration vs. distance for the Second Scenario ............................................................................ 46
Figure 18 Pga (m/s2) map of Second Scenario .................................................................................................. 47
Figure 19 Sections Average Damage Map for Scenario 2.................................................................................. 48
Figure 20 Roads Damage Map for Scenario no.2 .............................................................................................. 49
Figure 21 Map for Response Intervention Priority for Scenario 2 .................................................................... 51
Figure 22 Acceleration vs. distance for the Third Scenario ............................................................................... 53
Figure 23 Pga (m/s2) map of Third scenario ...................................................................................................... 54
Figure 24 Sections Average Damage Map for Scenario 3.................................................................................. 55
Figure 25 Roads Damage Map for Scenario no.3 .............................................................................................. 56
Figure 26 Acceleration vs. distance for the Forth Scenario ............................................................................... 57
Figure 27 Pga (m/s2) map of forth scenario ...................................................................................................... 58
Figure 28 Sections Average Damage Map for Scenario 4.................................................................................. 59
Figure 29 Roads Damage Map for Scenario no.4 .............................................................................................. 60
Figure 30 Map for Response Intervention Priority for Scenario no.4 ............................................................... 62
Figure 31 Acceleration vs. distance for the Fifth Scenario ................................................................................ 64
Figure 32 Pga (m/s2) map of Scenario no.5 ....................................................................................................... 65
Figure 33 Sections Average Damage Map for Scenario 5.................................................................................. 66
Figure 34 Roads Damage Map for Scenario no.5 .............................................................................................. 67
Figure 35 Pga (m/s2) map for Scenario no.6 ...................................................................................................... 68
Figure 36 Sections Average Damage Map for Scenario 6.................................................................................. 69
Figure 37 Roads Damage Map for Scenario no.6 .............................................................................................. 70
Figure 38 Map for Response Intervention Priority for Scenario no.6 ............................................................... 72
Figure 39 Pga (m/s2) map for Scenario no.7 ..................................................................................................... 74
Figure 40 Buildings Vulnerability Values for Scenario no.7 ............................................................................... 75
Figure 41 Sections Average Damage Map for Scenario 7.................................................................................. 76
Figure 42 Roads Damage Map for Scenario no.7 .............................................................................................. 77
Figure 43 Map for Response Intervention Priority for Scenario no.7 ............................................................... 79
Figure 44 Pga (m/s2) map for Scenario no.8 ...................................................................................................... 81

5
List of Tables 5
Figure 45 Buildings Vulnerability Values Map for Scenario no.8 ...................................................................... 82
Figure 46 Sections Average Damage Map for Scenario 8.................................................................................. 83
Figure 47 Roads Damage Map for Scenario no.8 .............................................................................................. 84
Figure 48 Map for Response Intervention Priority for Scenario no.8 ............................................................... 86
Figure 49 Comparison chart for 6 Scenarios based on average section damage.............................................. 88
Figure 50 Damage Comparison Chart for 3 Scenarios ....................................................................................... 89
Figure 51 Comparison of the Sections Damage when changing Vulnerability ................................................. 90
Figure 52 Data Input for the new Scenario ....................................................................................................... 91
Figure 53 Earthquake Inputs for the New Scenario .......................................................................................... 92
Figure 54 Data Recorded for the Scenario no.1 ................................................................................................ 93
Figure 55 Model Outputs: Number of Homeless people .................................................................................. 94
List of Tables Table 1 Masonry Buildings: Final Score for Vulnerability Index ........................................................................ 22
Table 2 RC Buildings: Final Score for Vulnerability Index .................................................................................. 22
Table 3 Seismic Input for Shaking Scenario ....................................................................................................... 36
Table 4 Damage for Strategic Facilities in the 8 Scenarios ................................................................................ 90
List of Equations
Equation 1 Sabetta-Pugliese Attenuation Law[16] 18
Equation 2 Damage Function of Building Vulnerability Index 20
Equation 3 Estimation of Collapse Value for Seismic Variable 23
Equation 4 Estimation of Damage Values 23
Equation 5 Similarity Function for the Same Geographic Division 30
Equation 6 Similarity Function for Different Geographic Division 30
Equation 7 Similarity Function for Modified Geographic Division 31
Equation 8 Estimation of Similarity Criteria Value 32

6
Abstract 6
1. Abstract
Although the different circumstances of the disasters caused by earthquakes, it can be seen there
are many similarities between those disasters not only in the causes but also in the consequences.
These similarities should be considered during the preparedness for future emergencies to face the
disaster related uncertainties. This requires better understanding of the disaster and continuous
learning from experience in order to achieve a well-prepared and resilient organization.
The goal of this work is to design a model that compares an occurring scenario with different
recorded earthquake scenarios and then retrieves the most similar scenario. This requires either to
develop many seismic scenarios and their corresponding damages, or to use recorded data from
previous earthquake crises. The model helps the decision makers, during emergencies, to choose
the among a predefined response actions to face the occurring earthquake event.
The work was done based on a real case study for the City of Salò, Italy, by using recorded seismic
data for major earthquakes hit the city and then by defining different earthquake scenarios and
estimation of the damages for each one of them. By comparing the estimated data for the different
scenarios, it was possible to define the similarity function based on the key similar parameters
between them. Then by building the model defining all the previously obtained data in the
knowledge base for each scenario. Finally, by using the similarity function it was possible to
retrieve the most similar scenario to any new occurring one.
7
Introduction 7
2. Introduction
Earthquakes disasters cause thousands of deaths and tremendous damage to properties around the
world; they displace tens of thousands of people from their homes and destroy their livelihoods.
Many of the deaths and property losses could be prevented if emergency response plans were
prepared and better information were available and properly managed by organizations involved in
disaster response.
To develop effective response strategies, we should draw an accurate estimate of the future events,
including the capacity to reorganize existing resources, skills, and knowledge to meet unexpected
demands. Boin and Lagadec [1] developed the point that “preparedness is more than simply
planning: it is also about anticipation and developing strategies to ensure organizational resilience
in the event of a crisis presenting itself”.
The subject of emergency management requires particular attention of decision makers and
stakeholders involved in the emergency management to be confident about the technological tools
used to prepare the plan, and to make decisions during the emergency phases. A set of modeling,
simulation, and visualization tools, can be used effectively to improve the emergency response.
Another important set of the modeling developments allow us to model all major aspects of the
disaster event, its impact on population, and the response by the involved agencies. In current
sociopolitical environment, modeling and simulation is being frequently suggested as the key
ingredient for emergency response preparedness.
Using this kind of models, which allows to record data from previous experiences to be used in
preparedness for the future emergencies allows the decision makers in the preparedness phase to
develop their own contingency plan to face a possible earthquake crisis. More important is
highlighting the weaknesses in the system those require special attention to avoid organizational
failure during an emergency.

8
Objective 8
3. Objective
The goal of our work is to design a model that improves the preparedness of organizations deal
with earthquake emergencies, and supports the definition of effective response actions. The model
allows recording data collected from different earthquake events or built seismic scenarios. Then, it
can be used to compare these scenarios with an occurring one, to find the most similar scenario
among the recorded ones. Finally, it retrieves data from the most similar scenario to be used in the
decision making process.
This model provides decision makers in the emergency control room with an image for the
expected consequences of a ground shake just few minutes after it happens. Based on the recorded
data in the knowledge base for other seismic events, decision makers can compare and retrieve the
expected damage similar to the occurring event. This damage will be used to identify the needs in
terms of damage assessment, search and rescue, and sheltering.
This work creates the potential for innovative approaches to collective learning and self-
organization that helps to achieve the following goals:
a. Better organizational preparedness by defining different potential threats, and the
corresponding responses for each threat.
b. Reducing the time needed for crisis management teams to develop appropriate response to
the crisis.
c. Increasing organizational learning by designing a model that uses the recorded information
from previous earthquake disasters to be used for emergency responses in similar disaster
that may happen in the future.
d. Increasing organizational resilience by highlighting points of weaknesses in the
organization that need special attention during the preparedness, this allows for speed
recovery after the crisis.

9
Earthquake Emergency Preparedness 9
4. Earthquake Emergency Preparedness
Perry and Lindell (2003) defined the emergency preparedness: “it refers to the readiness of a
political jurisdiction to react constructively to threats from the environment in a way that
minimizes the negative consequences of impact for the health and safety of individuals and the
integrity and functioning of physical structures and systems.” [2]
4.1. Earthquakes Impacts
“Earthquakes are natural hazards that represent extreme and unavoidable geophysical events
which are difficult to predict and over which the society has little or no control” [3]. Earthquakes
may also trigger other destructive events like landslides, tsunamis, avalanches, or fires, which we
can call as enchained events. A severe earthquake disaster results in large number of deaths,
injuries, and displaced people. Haiti 2010 earthquake resulted in 300,000 of deaths and displaced
over 1.3 million persons [4]. In Tohoku earthquake and Tsunami 2011, the loss estimates
indicated 22,626 persons killed or missing, 107,000 buildings collapsed, and another 111,000
partially collapsed [5]
In addition, earthquakes can lead to huge economical losses as a result of damage to the
infrastructures, commercial buildings, and industrial facilities. For example, the earthquake of
L’Aquila had an overall economic damage about 16 billion Euros [6]. Haiti 2010 earthquake
caused losses of US$7.9 billion, equivalent to 120% of the annual gross domestic product of the
country [4]. A catastrophic earthquake could affect government functions due to the collapse of
governmental facilities and loss of personnel. In Tohoku earthquake, the tsunami killed
community leaders in many communities. In addition, it destroyed governmental buildings,
emergency centers, designated emergency shelters, hospitals, and other emergency facilities and
resources [5].

10
Earthquake Emergency Preparedness 10
Figure 1 The Harbor of the town Namie next to the Fukushima Power plant
before and after the Tsunami
Earthquakes may cause damages to industrial and chemical buildings or nuclear plants, which
may result in:
1. Dispersion and transport of harmful substances through air ,water and soil which is
dangerous for humans and the environment;
2. Fires and explosions.
3. Contamination of water and soil due to the release of the harmful chemical substances.
In the Great 1906 San Francisco Earthquake, more deaths were caused by fire than by the
earthquake itself [7].

11
4.2. Earthquakes Challenges
Immediately after the main shake, the emergency response activities
manage the ongoing situation
is presented. Due to the damage
buried under the debris. In the first 24 hours, the main objective is to search
the debris to save as many lives as possible. Search and rescue activities
themselves who start searching for their relatives and friends.
main shock, very little information
and special needs of the people
Figure 2 Evolution of Emergency Response Processes with Time [
While continuing the search and rescue activities
people who lost their homes.
homeless people and the available places for sheltering and their quality
include tents and materials to build o
protection from the climate, ensuring privacy and dignity, providing personal safety and security.
The emergency response agencies may be confronted by several challenges during this phase.
The possibility of electrical power to be cut, interruption of telecommunications, the destruction
Earthquake Emergency Preparedness
Challenges
after the main shake, the emergency response activities take place in order to
manage the ongoing situation. In Fig.2 [8], the time evolution of the emergency response actions
Due to the damage of a large number of buildings, large number
In the first 24 hours, the main objective is to search
the debris to save as many lives as possible. Search and rescue activities
themselves who start searching for their relatives and friends. During the first hours after the
information is available about the locations of the most damaged areas
special needs of the people.
Evolution of Emergency Response Processes with Time [8]
e search and rescue activities, it is needed to provide suitable shelters for the
people who lost their homes. This requires having sufficient information
homeless people and the available places for sheltering and their quality.
include tents and materials to build or repair homes. The key considerations are
protection from the climate, ensuring privacy and dignity, providing personal safety and security.
The emergency response agencies may be confronted by several challenges during this phase.
ty of electrical power to be cut, interruption of telecommunications, the destruction
Earthquake Emergency Preparedness 11
take place in order to
, the time evolution of the emergency response actions
a large number of buildings, large number of people may be
In the first 24 hours, the main objective is to search for the people under
the debris to save as many lives as possible. Search and rescue activities start by the people
During the first hours after the
about the locations of the most damaged areas
suitable shelters for the
sufficient information about the number of
. Rapid shelter solutions
r repair homes. The key considerations are providing
protection from the climate, ensuring privacy and dignity, providing personal safety and security.
The emergency response agencies may be confronted by several challenges during this phase.
ty of electrical power to be cut, interruption of telecommunications, the destruction

12
Earthquake Emergency Preparedness 12
of roads and railways hinders the emergency response activities. During this time, most of the
affected population needs social assistance in terms of psychology, medicine, sociology, nursing,
and public health. A rapid damage assessment should take place, in order to define the degree of
damage to the residential buildings, infrastructures, historical buildings, and strategic facilities.
By the end of the first week after the main shock, the temporary shelters can be ready for hosting
the homeless people. An important subject is to preserve the safety and security in the entire city
after the disaster. The spread of looting activities is an expected behavior due to the shortage of
food or medical supplies. The objective of the security activities is to maintain the safety on the
streets, control the traffic, and transfer the evacuated people. By this time, the priority should be
given to the temporary facilities for education, health, water supply, electricity,
telecommunications, opening up of roads, public buildings, office buildings, market places etc.
4.3. Organizational Challenges
During the crisis, the organization faces the lack of clear and exact information about the
ongoing situation necessary to make adequate decisions. Comfort L. states, “Information
constitutes the energy that drives a complex system in its process of both internal adoption
among its constituent parts and external exchange with the broader environment” [9]. It is clear
that in a dynamic situation, it is always difficult to manage the amount of information required to
make decisions necessary for effective response from the different parts of the response
organizations. This requires continually developing their own systems to manage the available
information that facilitates information analysis and processing to take the right decisions under
external pressures.
For some organizations, as for example, the public utilities, fire and police departments,
hospitals, railroad and airlines, and parts of the chemical industry, responses to accidents are a
normal part of their everyday activities. During the time of the crises, all or some of these
organizations, come to work together to face the same problem and to achieve the same
organizational goals. Due to the special nature of these organizations of being a temporary
organization, they are confronted with the problem of lack of coordination. Building
coordination between different organizations each of them has its own interests and goals, is
difficult particularly when available resources are low.

13
Earthquake Emergency Preparedness 13
The organization may face the lack of available resources (personnel, equipments, knowledge
…etc) to operate, due to direct damage to facilities, resources, and infrastructures in the shake. In
such situations, some innovative decisions are necessary in order to balance between the
community needs and the available resources. Interruption of local phone lines, and loss of
communications with external authorities; add complexities to the response activities and
obstructs the relief efforts.
As a conclusion, to limit the organizational challenges during disasters, we can introduce some
models that build relationships and coordination between different organizations during normal
times. Such models should continually enhance the organizational learning from previous
disasters by sharing and recording experiences faced in crisis times.
4.4. Emergency Planning Process
“Establishing and maintaining emergency preparedness is a process in the sense that it comes in
being as a result of the activity of drawing up and revising an emergency plan, rather than being
an entity described by that plan” [10]. The plan could be considered as a system that uses the
inputs, which are the available resources, to produce outputs, which are the emergency services.
The effective plan should ensure an efficient performance of the organizational processes during
the crises.
“The approach of emergency planning for environmental hazards is driven by two objectives:
hazard assessment and risk reduction” [2]. During the emergency planning, it is recommended to
analyze the past events and the challenges created by major emergencies. Also, to expect the
possible future events and their impacts on the humans and properties. This assists the
organization to create the required list of resources and the procedures to mobilize these
resources in relatively short period to help in emergency responses. In addition, it is
recommended to have coordination during the preplanning process between the different
organizational departments involved in the emergency management processes. This allows to
work together with different areas of interest to achieve the common organizational goals.

14
Earthquake Emergency Preparedness 14
Perry and Lindell suggested the following 10 characteristics that pre-crisis planning process
should involve [2]:
1. Be based on accurate knowledge of threats and likely human responses.
2. Encourage appropriate action by crisis managers.
3. Encourage flexibility in responses.
4. Prompt inter organizational coordination.
5. Integrate plans for each hazard into a multi hazard approach.
6. Involve the training of relevant personnel.
7. Provide for testing through drills and exercises.
8. Be adaptable as part of an ongoing process adjustments to new circumstances.
9. Be a strong advocate in the face of inevitable resistance to resource commitments for low
probability events.
10. Recognize the difference between crisis planning and crisis management.
4.5. Organizational Resilience
Organizational performance is changing over time, and some changes may occur in the case of
disastrous events like a major earthquake. In this case, the organization may fail; this requires
some resources to be used in order to restore the system’s performance to its normal levels.
Those organizations, which can use their own resources in order to return to their normal level of
performance, are in a much stronger position to deal with the dynamic nature of the disaster.
“Such organizations are capable of converting available generalized resources, such as wealth,
knowledge and technical skill, into appropriately tailored solutions if, as, and when required” [9].
In terms of organizational preparedness for emergencies, “we have three main sets of
organizations: the least prepared, the mid-range prepared, and the highly prepared organizations”
[11]. The least prepared organizations have poor coordination among the employees and the tasks
required from everyone are not clear. They do not consider threats and have poor or no
contingency plans. The moderately prepared organizations, give some consideration to crisis and
the need for plans, although this cannot be seen in the organizational processes. For the highly
prepared organizations, they give high priority to threats and the need for contingency plans. The
organizational processes support the concept of learning from the crisis. In this type, the pre-
crisis planning is clear at all the organizational levels.

15
Earthquake Emergency Preparedness 15
Organizations should facilitate resilience through the following:
i. To build systems for detecting weak and non-conventional parts.
ii. To be able to process relevant information to and from central authorities.
iii. To have the capacity for readiness and mobilization of emergency response units.
iv. To be capable of relating technical matters to strategic issues in order to handle new
types of crises.
Seismic resilience can be achieved by enhancing the ability of the organization to perform during
and after an earthquake. Also, through emergency strategies that effectively cope with and
contain losses and recovery strategies that enable communities to return to levels of pre-disaster
functioning as rapidly as possible. This can be done by developing methodologies those help to
define the points of weaknesses where the system may fail or severely affected during an
earthquake crisis. These methodologies should help in the decision making process during the
crisis in order to return to the normal performance levels in very short time.

16
Solution Methodology 16
5. Solution Methodology
We saw the need for integration of multiple component models required for complete modelling of
a single emergency incident and the capability of modelling other emergency incidents. Building
these kinds of models starts from defining a complete damage scenario for a given seismic input
then we start defining the corresponding responses for that scenario. In order to define the
similarity function, it is necessary to build many complete scenarios. In the following steps, we are
going to present the methodology used in order to design such models in case of earthquake
disaster planning and management.
5.1. Developi Scenarios
It is clear that we cannot produce a single plan that covers all the possible challenges arise from
crisis. This led to the need of modeling the different elements of the crisis and its possible
consequences in order to define the proper actions for the different emergencies.
Porter M. Defined the scenarios as “an internally consistent view of what the future might turn
out to be- not a forecast, but one possible future outcome” [12]. Ringland defined the scenarios
planning as “that part of strategic planning which relates to tools and technologies for managing
the uncertainties of the future” [13]. “Scenarios are an approach to manage the inherited
uncertainties of decisions based on assumptions, rather than on facts, by examining several
alternatives of how the future might unfold and compare the potential consequences of different
future contexts” [14]. In crisis management, scenarios are required in order to define the possible
threats; assess infrastructures vulnerabilities and interdependencies, plan for emergencies, and
decision-making process.
Scenarios start from defining a driving force that hits the system and then to define all the chain
of failures and losses in the system. This process helps to define the expected external threats for
a certain community and the points of weaknesses from which the system may fail. This permits
to use the largest number of data of any quality that are available. Scenarios offer the opportunity
of effectively improving emergency response through finding solutions that can be developed at
the planning stage. They enable to examine the ability and efficiency of organizational strategies
to reduce risks from the external environment.

17
5.2. Complete Event Scenarios
Building a complete event scenario means to give an image about the possible future given an
initial stage, which means to give a path in
complete scenario is the shaking scenario
The distribution of the considered parameters starting from the
surrounding areas is done by the application of suitable
Figure
The choice of the referring events to be used as input for the creation of shaking scenarios is
made after analyzing carefully historical and recent seismicity of the study area
an earthquake shake with its corresponding magnitude and epicenter
presence of any amplification
consider those amplifications.
buildings and infrastructures inside the area under study. The
shaking scenario on the vulnerable buildings,
under study.
Scenarios
Building a complete event scenario means to give an image about the possible future given an
initial stage, which means to give a path in the decision tree. The simplest method
is the shaking scenario as shown in Fig.3.
The distribution of the considered parameters starting from the epicenter
by the application of suitable attenuation models.
Figure 3 Process of Building Complete Event Scenario
The choice of the referring events to be used as input for the creation of shaking scenarios is
made after analyzing carefully historical and recent seismicity of the study area
quake shake with its corresponding magnitude and epicenter, we should consider also
and geophysical factors. If they exist, we shall modify the shake to
consider those amplifications. Then it is necessary to assess the phy
buildings and infrastructures inside the area under study. The result of
on the vulnerable buildings, will be the complete damage scenario for the area
SHAKING SCENARIO
LOCAL EFFECTS
DETAILED SHAKING SCENARIO
PHYSICALVULNERABILITY
DAMAGE SCENARIO
Solution Methodology 17
Building a complete event scenario means to give an image about the possible future given an
The simplest method to build a
of the chosen event to
models.
The choice of the referring events to be used as input for the creation of shaking scenarios is
made after analyzing carefully historical and recent seismicity of the study area. After we choose
e should consider also the
we shall modify the shake to
Then it is necessary to assess the physical vulnerability for
of applying the detailed
will be the complete damage scenario for the area

18
Solution Methodology 18
5.2.1. Seismic Input
The definition of the seismic input is done by defining the earthquake characteristics which are
represented by the magnitudes and the epicenter then by using the attenuation laws to describe
the variation of the seismic parameters (ground acceleration, intensity, …etc) depending on the
distance from the epicenter.
There are a great number of attenuation laws based on different parameters and hypothesis and
we used the Sabetta-Pugliese law [16] that was often used in Italy. This model allows to obtain
the values of many parameters to the site directly (acceleration peak, velocity peak,
displacement peak, Arias Intensity, spectral ordinates etc.).
The chart shown in Fig.4 is a plot of the ground acceleration (a/g) versus the distance of the
epicenter for different earthquake magnitudes.
Figure 4 Example of attenuation law: acceleration Vs distance
depending on magnitude (Sabetta-Pugliese law)[16]
From Fig.4 shown below, it is clear that the highest value of peak ground acceleration is at the
epicenter location and then it will be decreased going far from epicenter according to this
equation: ����� � = � + � + � �����(�� + ℎ�)�/� + ���� + ���� ± � Equation 1 Sabetta-Pugliese Attenuation Law[16]
0.001
0.010
0.100
1.000
0 20 40 60 80 100 120 140 160
Distance [km]
a/g
5 6 7

19
Solution Methodology 19
Where
Y is the quantity to be estimated.
M is the magnitude.
R is the distance (km) from the epicentre.
S1 and S2 are two parameters that relate to the site from a geological point of view (they can be
taken equal zero)
While a, b, c, h, e1, e2, σ (standard deviation), are the parameters that vary depending on the
parameter that will be determined. In our case, we see to obtain Y is the peak ground
acceleration, so we are using the values (a= -1.845, b=0.363, c= -1, e1=0.195, e2=0, h=5, σ =
0.190).
We should consider also the presence of amplification and instability factors like landslides,
rock falls, and liquefactions. These may modify of the shake scenario due to geologic and
geomorphologic effects. Also, it is necessary to define all the hazardous industrial facilities that
may cause induced effects like fires, explosions
5.2.2. Vulnerability Assessment
The vulnerability assessment is usually made in “peace time”; it must not be confused with the
evaluation of the usability assessment post-event. There are many definitions of vulnerability,
depending on the “object” considered and on the point of view assumed in the assessment. It is
possible, for instance, in general to define:
Vulnerability: As the degree to which the humans and environmental systems are likely to
experience damage due to a stress. Specifically, for an earthquake, the concept of vulnerability
defines the propensity to damage that is caused by an earthquake.
There are different ways to define the vulnerability but we are going to consider only the
physical vulnerability.
Physical vulnerability: As the name itself suggests, refers to the fragility to disruption in
physical terms.

20
Solution Methodology 20
There are lots of methodologies to assess vulnerability [19] but we are going to focus only on
the vulnerability index method to assess the physical vulnerability assessment of buildings. The
reason is that the data about the vulnerability used in this work have been calculated using this
method in a previous study [25].
The results of a vulnerability assessment are data, which are useful for:
• Risk analysis for wide areas
• Risk analysis for single object/structure
• Ranking to define priorities for subsequent analysis/intervention for contingency
management plans
5.2.2.1. Vulnerability Index Method
This method is articulated in two steps, each step produces a result; in the first one, a
vulnerability index V is determined, in the second one, a correlation among earthquake
violence and damages, depending on V, is defined.
The evaluation of vulnerability index is done by using vulnerability forms for buildings
(GNDT, early 90’s).There are two levels of forms (applicable to a single building):
• Level 1: collecting data about location, geometry and typology of the building
• Level 2: collecting the data directly useful to evaluate the vulnerability index
All quantities used in this approach are expressed in numerical terms as mentioned below.
Moreover, by imposing that the principal knowledge for implementing this procedure was
based on statistical elaborations of the data, on seismic response calculation and on subjective
expert judgment.
Determination of a relationship between a measure of the structure quality (q), a measure of the
earthquake violence (s) and the damage caused by the earthquake (d)
� = �(�, �)
Equation 2 Damage Function of Building Vulnerability Index
Where:
� q : Is a function of Vulnerability index V
� S:Related to maximum ground acceleration y
� d : The damage index related to the repair cost

21
Solution Methodology 21
First level form (8 sections) as shown in Appendix A
• Form data (province, municipality, form number, team number, date)
• Building location (urban plan data, address, aggregate)
• Geometry (areas, highs: understory, max and min)
• Use (type of use, property, users, …)
• Age of the structure – interventions
• Inside finish state/plants
• Structural typology (vertical, horizontal, stairs, roof)
• Damage level and extension (to be compiled only in case of survey made after an
earthquake)
In the second level forms for masonry buildings; eleven parameters has to be evaluated and the
final value of vulnerability index will be computed as a function of all these parameters. Shown
in Appendix B
Finally, we can obtain the final value for the vulnerability index as a function of all proceeding
steps. For each parameter a score (depend on the class) and a weight are assigned as shown in
the following Table 2
� The product of the score and weight of a parameter carries out the partial index related to that
parameter
� The building vulnerability index (V) is obtained by the sum of the 11 partial indexes
� = � �� ∗ !���
�"�
� V is a number in the range 0.0-382.5 (best � worst situation)
� V is usually normalized in a relative and conventional scale 0 – 100

22
Solution Methodology 22
Parameter Class
Weight A B C D
1 Organization of
resisting system 0 5 20 45 1
2 Quality of Resisting
System 0 5 25 45 0.25
3 Conventional
strength 0 5 25 45 1.5
4 Building Position
&foundation 0 5 25 45 0.75
5 Floors 0 5 15 45 Var.
6 Plan shape 0 5 25 45 0.5
7 Elevation shape 0 5 25 45 Var.
8 Max. dist. walls 0 5 25 45 0.25
9 Roof 0 15 25 45 Var.
10 Non structural
element 0 0 25 45 0.25
11 Present state 0 5 25 45 1
Table 1 Masonry Buildings: Final Score for Vulnerability Index
For the second level forms for R.C. buildings in Appendix C, we have 11 parameters (+1). At
the end, we are supposed to compute the final value of vulnerability index as a function of the
all parameters mentioned before. As shown in Table 3
Parameter Class scores
A B C
1 Type and organization of the
resistant system 0 12 25
2 Quality of the resistant system 0 3 6
3 Conventional strength 3 0 3
4 Building location and
foundations 0 3 6
5 Floor systems 0 3 6
6 Plan shape 0 3 6
7 Elevation shape 0 6 18
8
Connections and critical
elements (connections (beam
column), walls dimensions,
squat elements dimensions,
precast elements joints)
0 3 6
9 Low ductility elements 0 3 6
10 Non Structural Elements 0 3 6
11 Present State 0 6 12
Table 2 RC Buildings: Final Score for Vulnerability Index

23
Solution Methodology 23
“With respect to physical vulnerability of lifelines, they are highly intra- and inter-dependent
systems: conducts and lines can be damaged by collapsing houses or bridges or by landslides
and riverbanks, the movement of which can be triggered by earthquake”[20]. In our work, we
considered only the case of damage to rods due to collapse of buildings or due to landslides and
rock falls.
5.2.3. Estimation of Buildings Damage
To obtain the buildings damage, we need to use the fragility curves [24] that relate the damage
(d) to acceleration (y)
Figure 5 Damage Assessment by Fragility Curves [24]
#� = $��(%&'() #) = [$) + +),-]%�
Equation 3 Estimation of Collapse Value for Seismic Variable
Where
αi = 0.08 βi = 0.01304 αc = 1.53710 βc = 0.00097
γ = 1.80870
u = V.I. + 25
�(#, /) 0 0 ��2 # ≤ #�# − #�#) − #� ��2 #� ≤ # ≤ #)1 ��2 #) ≤ # 6 Equation 4 Estimation of Damage Values

24
Solution Methodology 24
We need to distinguish the parts of damage due to:
1- Events having accelerations <collapse acceleration yc
2- Events having accelerations >collapse acceleration yc
This data is important because it is related to the effect of the risk to the people. After using the
fragility curves, it will be possible to estimate the expected damage to buildings due to a given
seismic input and the building exposure. Then it will be possible to take countermeasures to
reduce the effect of this risk on people and properties.
It is also worth noting that, from the response point of view, we found it is easier to define the
buildings damage in terms of overall section damage. Therefore, we defined the average damage
value for buildings inside each section.
5.3. Emergency Reponses
After developing the different damage scenarios and estimating the expected physical damages
for each scenario, our next step is to define the emergency response plans for those different
scenarios. For each response plan, we shall define:
i. Different stakeholders acting in the emergency response process.
ii. Responsibilities for each emergency response participant.
iii. Actions to be taken by each stakeholder.
iv. Resources used by each partner in the emergency response.
It is necessary also to define for each contingency plan, the contact details for each person of
those involved in the response phase to facilitate reaching them. The accessibility to the critical
facilities and the emergency control room location should be considered as well.
5.3.1. Organization and Responsibilities
The facility that is designated for managing the disaster emergency is the Emergency Control
Room. It is where the Incident Management Team makes decisions to allocate and coordinate
resources, provides for incident communications coordination and directs the overall disaster
emergency response. This forms the “backbone” for community functioning; it enables
communities to respond, provides for the well-being of their residents, and initiates recovery
activities when earthquakes strike.

25
Solution Methodology 25
Civil Protection The civil protection is the overall responsible and main coordinator in the
emergency. They are the access point to external actors. Within, there is a group dedicated for
public relations, which handles all communication with the media as well as requests from the
population. When it comes to important decisions, the civil protection has the last word.
Fire Department The fire department is responsible for the Search and Rescue activity. Its
main function is to be a support unit to the operatives in the field. The fire department in the
emergency helps plan, arranges, and organizes operations to be carried out by the operatives.
Together with the utility companies, the fire department is the main actor in the damage
assessment.
Police: The police have the overall responsibility for the security and accessibility in the area.
The police assist the fire department to make them able to perform their main tasks. They also
assist the civil protection in planning evacuation routes and handling the crowds.
Army: The army provides work force and equipment. They are a support unit which is not
present in the control room but on standby to provide help if requested.
Volunteers A main function is to provide assistance in sheltering and basic supplies (like food
and water and information) to the population. The volunteers are the main actors in the structural
assessment.
Health Department The health department provides urgent medical aid in the field. They
establish medical field posts and field hospitals. They are overall responsible for the medical
support in the disaster area.
Utility Companies A representative of each utility company provides the necessary information
about their own system; they assist in damage reduction, support and reconstruction phases.
In Italy, the national civil protection is a complex organization, which is divided into several
scales; the national, the regional, and the local scale. The organization that is responsible for
controlling the emergency processes at the local scale is called Mixed Operative Centre (COM).
The COM is organized into many functions, each function is activated, or not, depending on the
characteristics of the specific event.

26
Solution Methodology 26
5.3.2. First Responses
The contingency plan should describe the different responses taken during the emergency phase
and the resources needed for each activity. In Fig.2 [8], the time evolution of the first emergency
responses was presented. In our work, we concentrated only of the buildings damage assessment
and this is what we are going to explain how to be done in general.
5.3.2.1. Damage Assessment Process
Immediately after a strong earthquake occurs, thousands of buildings may results damage,
while new shocks can still occur. There is a need to identify the safety of partially damaged
buildings in order to be used during the emergency.
The rapid assessment for safety and usability takes place usually within the 1 to 10 days.
Quickly screen the obviously safe and unsafe infrastructure (definition of red (unsafe), yellow
(restricted use) and green (safe) zones), level ascertain level of damage, detection of hazards,
assess appropriate level of safety and occupancy, security and shoring requirements by using
specific forms [28].
Examine visually the outside of the building (for obvious structural integrity failure like roof
collapse, moving of foundation or walls failing), any damaged part of them (when secure) and
the ground around the building, formal system, placards posted on infrastructure, note made
offsite needing further detailed inspections, unsafe areas cordoned off, central record
maintained. Such action has to be done by specialist like engineers, architects, building
inspectors, experienced building professionals or trained disaster workers on an average
inspection time of 10 to 30 minutes per building.
27
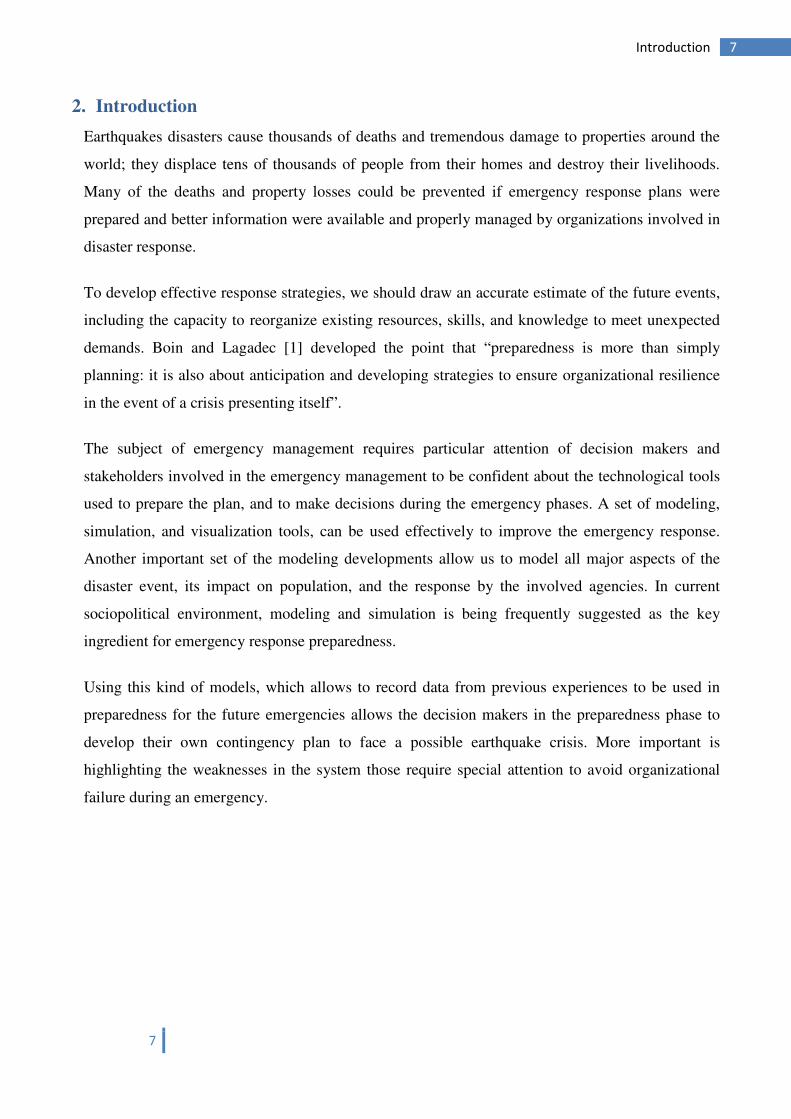
Moreover, a detailed assessment
as identified by rapid inspection or subsequent requests, dealing with critical or essential
facilities in order to identify the need for an engineering evaluation. Such action has to be done
by specialists like structural engineers, architects, building services, geotechnical and
hazardous material specialist on an average inspection time of 1 to 5 hours per building. Formal
Figure 6 Cracks Types for Masonry Buildings
Figure 7 Cracks on Building External Walls
detailed assessment takes place usually within the 2 to 20 days. Further inspection
as identified by rapid inspection or subsequent requests, dealing with critical or essential
facilities in order to identify the need for an engineering evaluation. Such action has to be done
ists like structural engineers, architects, building services, geotechnical and
hazardous material specialist on an average inspection time of 1 to 5 hours per building. Formal
Solution Methodology 27
e usually within the 2 to 20 days. Further inspection
as identified by rapid inspection or subsequent requests, dealing with critical or essential
facilities in order to identify the need for an engineering evaluation. Such action has to be done
ists like structural engineers, architects, building services, geotechnical and
hazardous material specialist on an average inspection time of 1 to 5 hours per building. Formal

28
Solution Methodology 28
system, evaluation of questionable infrastructures, more investigation into framing systems,
revised placards posted on buildings, unsafe areas cordoned off, central record updated.
The outputs of the rapid assessment process are the degree of the building usability for human
and it can be classified according to the following [28]:
i. Usable Building can be used without measures. Small damage, negligible risk for human
life
ii. Usable With Countermeasures Building is damaged, but can be used when short term
countermeasures are taken
iii. Partially Usable Only a part of the building can be safely used
iv. Temporarily Unusable Building to be re-inspected. Unusable until the new inspection.
v. Unusable Building cannot be used due to high structural, non structural or geotechnical
risk for human life. Not necessarily imminent risk of total collapse.
vi. Unusable For External Risk Building could be used, but it cannot due the high risk
caused by external factors (heavy damaged adjacent or facing buildings, possible rock
falls, etc.).
The following table shows some actions to be taken in order to ensure adequate response from
technicians involved in the usability assessment process before and after the earthquake.
Before Earthquake After Earthquake
Education of the engineers from the chamber
of civil Engineering and personnel from the
public works and settlements on damage
assessment produced by the department of
recovery – Damage Assessment Working
Group
• Estimation of Damage Assessment Field
teams
• Execution of the damage assessment on
the impact zone and generating of lists of
householders
• Objection of the house holders to the
results of the assessment within 15 Days
• Repetition of the damage Assessment by
another team for the final results

29
The Similarity Model Design 29
6. The Similarity Model Design
The similarities between different earthquake scenarios can be used in order to expect the
possible consequences of a certain ground shake. The similarity model can be used by the
decision makers, during the earthquake crisis, to estimate the expected consequences to happen
based on the stored information from previous disasters. The similarity model compares the
occurring event with the recorded data and retrieves the most similar event among the recorded
ones. The similarity function gives a rank for each stored scenario starts from the most similar
one to the least similar. Decision makers can use this model to draw action plans for different
emergency responses.
The process of designing the model will start from defining its components that composed of
main three parts: ‘the knowledge base, the similarity function, and the presentation part’. In order
to start the designing process of the model, there should be set of data that was recorded from
either previous disasters, or built earthquake scenarios during the preparedness. The first part
will contain the entire database recorded from the previous events or the designed seismic
scenarios. This part shall contain all the event inputs, damages to buildings, damages to the
infrastructures and losses of human lives.
For each scenario, it will be important also to define the data regarding the emergency response
process like the response intervention priority, tasks and responsibilities for each stakeholder,
and the resources used in order to carry out the emergency management processes. The structure
of these databases should be done in a way that facilitates the data analysis and storage
processes.
The second part will contain the similarity evaluation function that evaluates the similarities
between the recorded seismic scenarios and the occurring one. The function compares the
occurring scenario A with the stored set of scenarios Bi. The definition of similarity function
should consider the following four approaches:
i. When comparing between many scenarios for the same city that has the same city divisions
and the number of divisions are equal. The similarity function will compare each zone in
the new scenario with the corresponding in the stored scenarios and the final similarity
result will be the average value for all zones. In this case the similarity function will be
formulated as follows in Eqn.5:

30
The Similarity Model Design 30
��78(9, :) = �/�2��� ;<�=> − �=?'<@
Equation 5 Similarity Function for the Same Geographic Division
Where
A: The inputs for the new scenario
Bi: The recorded set of scenarios from scenario 1 to scenario i
j: Number of city zones from zone 1 to zone j
Y: The comparison criteria (peak ground acceleration or buildings damage)
For example by using the damage values for sections as a comparison criteria:
Zone New Scenario Recorded Scenario
1 0.337 0.331
2 0.346 0.331
3 0.567 0.530 ��78(9, :) = �/�(|(0.337 − 0.331)|, |(0.346 − 0.331)|, |(0.567 − 0.53)|)
ii. In case of comparing between many scenarios for different cities where the city division is
different, we can evaluate an average value of the comparison criteria for each scenario as a
whole, after that by comparing these average values we can estimate the similarities
between different scenarios. In this case the similarity function could be defined as follows:
��78(9, :) = H�/�. (�=>) − �/�. (�I?')H
Equation 6 Similarity Function for Different Geographic Division
Where
A: The inputs for the new scenario
Bi: The recorded set of scenarios from scenario 1 to scenario i
Y: The comparison criteria (peak ground acceleration or buildings damage)
j: The number of city zones for the occurring scenario from zone 1 to zone j
k: The number of city zones for the recorded scenario from zone 1 to zone k

31
The Similarity Model Design 31
For example by using the damage values for sections as a comparison criteria:
Zone New Scenario Recorded Scenario
1 0.337 0.331
2 0.346 0.331
3 0.567
��78(9, :) = �/�(0.337,0.346,0.567) − �/�(0.331,0.331)
iii. Another situation when comparing different scenarios for the same city but the city
division has been changed. Adding some zones to the others or dividing one zone to many
other zones is a possibility over time especially considering the human activities and
change in population. The similarity function in this case should evaluate the average value
of the comparison criteria for the new zones and compares it with the corresponding value
for the old zone using the formula:
��78(9, :) = �/�2��� ;<�/�(�=>) − �/�(�=?')<@
Equation 7 Similarity Function for Modified Geographic Division
For example, if a certain zone is divided into three parts, we need to calculate the average
value of the comparison criteria for these three parts. Then we compare the average of the
three parts with the value of the initial single zone that was stored before. Then the
similarity function will compare each zone in the new scenario with the corresponding in
the stored scenarios and the final similarity result will be the average value for all zones.
Where
A: The inputs for the new scenario
Bi: The recorded set of scenarios from scenario 1 to scenario i
j: Number of city zones from zone 1 to zone j
Y: The comparison criteria (peak ground acceleration or buildings damage)
The implementation of the similarity function should consider the reliability and confidence
level for the data used in comparison. This can be done by adding a factor called Reliability
Factor (R.F.) that represents the accuracy and reliability for each data input. For example, the
data received from first crisis responders from site has a degree of accuracy differs from the data
received some days after. In addition, the data prepared during peacetime has some level of

32
The Similarity Model Design 32
confidence different from data collected after the shake. This factor can have a value on a scale
from 0-1 from low reliability until fully reliable data.
Another factor should be considered that is the Zone Importance (I) that considers the existence
of a special strategic facility, infrastructure, or high population inside a specific zone. For
example, the existence of a hospital in a specific zone in a recorded scenario gives higher
importance than if the hospital does not exist for another zone. The value of this importance shall
be assigned based on the judgment of decision makers during the peacetime based on their own
evaluation.
The final value of the comparison criteria shall be calculated by: � = �) ∗ �J ∗ K
Equation 8 Estimation of Similarity Criteria Value
Where
Y: The comparison criteria (peak ground acceleration or buildings damage)
Yc: The collected or calculated value for the comparison criteria
For example by using the damage values for sections as a comparison criteria:
Zone New Scenario Recorded Scenario
Yc RF I Y Yc RF I Y
1 0.337 1 1 0.337 0.331 0.95 1.4 0.440
2 0.346 0.8 1.2 0.332 0.331 1 1.2 0.397
3 0.567 0.6 1 0.340 0.53 1 1 0.530
��78(9, :) = �/�(|(0.337 − 0.440)|, |(0.332 − 0.397)|, |(0.340 − 0.530)|)
The output of the similarity function will be the ranking of the recorded scenarios starting by the
most similar one to the least similar. Then based on this ranking we can retrieve the
corresponding data for the most similar scenario regarding the seismic input, damages and
contingency plan. Output data can be presented in the form of maps showing the expected
damage to properties, or losses to human lives for similar scenarios.
The accuracy of the outputs is highly affected by the data structures in which the data stored
about the previous scenarios or the data entered for the new scenario. This is why it is necessary
before using the model to prepare a data structure that is easily to be accessed and used either
during preparedness or during emergency.

33
The Similarity Model Design 33
The chosen values for the reliability factor is dependent on the degree to which the decision
makers are confident about the collected data. The importance factor is highly dependent on the
judgment of the decision maker. Therefore, a tuning is required for the values to be sure about
the obtained results.

34
Model Application for Salò 34
7. Model Application for Salò
In this section, we are going to apply the proposed methodology for developing the similarity
model by using a real case study for the city of Salò. We will start from building many seismic
scenarios and then estimating the damage for each of them. The next step will be to define the
response activities for each scenario and the resources used for each of them. Finally, we design
the similarity model for our case study using the data collected in the previous steps.
7.1. Strategic Buildings
For every contingency plan, it is necessary to define the strategic facilities those may be needed
during emergencies and must be made as efficient as possible to allow for emergency operations,
like search and rescue activities, taking care of victims and evacuation. In the following map, we
show the location for the hospital, police stations, fire station, and different schools. As we can
notice, the major facilities are concentrated in the vulnerable historical city center.
Figure 8 Strategic Buildings in Salo
35
Model Application for Salò 35
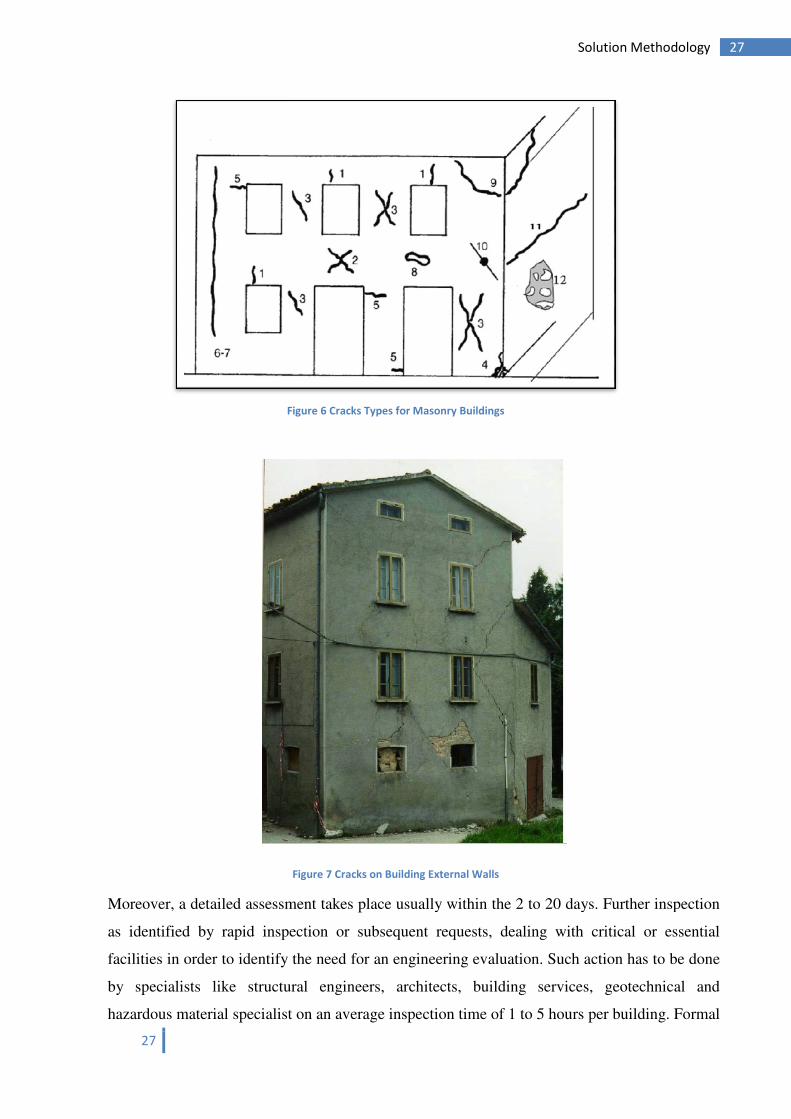
7.2. City Sections
For better and effective management of the emergency response, the city could be divided into
zones. These zones may be characterized by a unique property like in our case that is the
population. In the following Fig.10, we are showing the census sections for Salò municipality.
Those sections were done using the number of population in each part of the city.
Figure 9 Definition of Census Sections in Salò

36
Model Application for Salò 36
7.3. Complete Event Scenarios
We built the scenarios based on three real seismic inputs that were used for scenarios 2, 3&4.for
scenario 1 we used the same epicenter for scenario 3 but modified the magnitude. For scenario 5,
we used the same epicenter for scenario 4 but modified the magnitude to 6.3. For scenario 6, we
used the epicenter of the 1826 earthquake assigning a magnitude of 5.5. For scenarios 7&8, we
used the same seismic input for scenario 6 but with modifying the buildings vulnerability by
decreasing by 30% and increasing by 30% respectively.
We have chosen eight cases for seismic input shown in the following table.
Scenario Magnitude X Y Date
1 4.6 1616945.315 5048374.887 1901
2 4.7 1615518.395 5049570.89 1901
3 5.5 1616945.315 5048374.887 1901
4 5.2 1618363.166 5060072.622 2004
5 6.3 1618363.166 5060072.622 2004
6 5.5 1618280.14 5050686.98 1826
7 5.5 1618280.14 5050686.98 1826
8 5.5 1618280.14 5050686.98 1826
Table 3 Seismic Input for Shaking Scenario
In Fig.10, the location of the different epicenters with respect to the city of Salò is shown. For
scenarios 4&5, the epicenter is a little far from the city center if compared to the other epicenters
for the other scenarios.

37
Model Application for Salò 37
Figure 10 Epicenters Locations for the Different Seismic Scenarios
For each scenario, we used the attenuation laws [16] in order to obtain the spatial change of the
peak ground acceleration corresponds to each earthquake magnitude and epicenter. Then we
used the data for buildings vulnerability values introduced in a vulnerability assessment report
[25] and the presented in a buildings vulnerability map as shown in Fig.11.

38
Model Application for Salò 38
Figure 11 Map for Buildings Vulnerability Values
Then by using the fragility curves, it was possible to define the buildings damage value for each
scenario. The buildings damage was then generalized to define the sections average damage
based on the average value of buildings damage inside each section. Based on the sections
damage, it was possible to estimate approximately the number of affected population for each
section and the damage for roads.
For the calculation of roads interruption, we considered the roads intersect with a collapsed
building (damage >80%) to be interrupted. For the roads crossing through the landslide and the
rock fall area, for the scenarios no. 6,7&8, the exact value for the landslide displacement was
accurately calculated. For the other scenarios we assumed that the landslide displacement will
cause interruption to roads passing through the landslide. For the methods of calculation of
landslide displacement due to earthquakes, refer to [18].
In order to estimate the death and injured on the section level; the correlations between the
number of buildings in the heavily damaged sections and casualties were used as a link for
building a suitable emergency preparedness plans. There are different approaches to estimate the
number of affected people by the earthquake disasters.

39
Model Application for Salò 39
In our calculations for the estimation of number of victims and injured we followed the steps
introduced in reference [26] as follows:
• The number of victims as the 50% of the total present persons in collapsed buildings.
• The number injured people as the 30% of the persons present in the collapsed
buildings and a variable percent (0-50%) of the persons present in the buildings
subjected to damages >30%, calculated by the relationship:
nf = 0.5 (d – 0.3) x a
Where
nf : is the number of the injured people
d: is the damage value
a: the number of persons present in the buildings
The number of homeless people was determined based on the assumption that; if the damage
percentage is higher than 50%, the needs for sheltering can be computed from the relation:
No. of homeless= Total No. of Population- No. of Victims,
And if the percentage of damage is less than 50% there is no need for sheltering. For the
estimated number of victims, injured, and homeless people for all scenarios, refer to Appendix
D.
7.3.1. Scenario 1
7.3.1.1. Seismic Input
By using the attenuation law in Eqn.1 and the earthquake magnitude defined for the first
earthquake scenario, it is possible to define the distribution of the peak ground acceleration
over distance from the epicenter as shown in Fig.12.

40
Model Application for Salò 40
Figure 12 Acceleration vs. distance for the First Scenario
Then we represented peak ground acceleration ranges in circles their center is the epicenter
and the radius is increasing by 0.5 Kilometer. Then by using GIS software, we have
represented the seismic input map as shown in Fig.13.
Figure 13 Pga (m/s2) map of First scenario
0.100
1.000
0 1 2 3 4 5 6 7 8 9 10
a/g
Distance (KM)

41
Model Application for Salò 41
7.3.1.2. Sections Damage
By using the procedure described before for estimation of sections damage, in Fig.14 showing
the average sections damage for Scenario 1. We notice that most of sections have moderate
damage percentage.
Figure 14 Sections Average Damage Map for Scenario 1
7.3.1.3. Roads Damage
In this scenario, the roads interruption happened due to the landslide and rock fall mainly as
the average damage for the buildings is less than 80%. Only some roads are interrupted in the
southern part of the city.

42
Model Application for Salò 42
Figure 15 Roads Damage Map for First Scenario
7.3.1.4. Estimation of Victims and Injuries
Was done based on the method described before in section 7.3.
7.3.1.5. Damage Assessment
In the previous chapters, we defined before the general steps for carrying out the process of
usability assessment, but here we are going to present the process in details identifying the
resources used in each scenario.
As a result, majority of medium level of damage for buildings, the required resources for the
rapid damage assessment are not so much. However, for the detailed damage assessment, there
is a need for large number of teams with their necessary equipments as we can see in the
following two tables.

43
Model Application for Salò 43
Responsibilities
Resources
Men Vehicle Computers Communication
Sce
na
rio
1
Ra
pid
Da
ma
ge
Ass
ess
me
nt
Ma
yo
r • Send Inspection Requests to
COM.
• Request Resources from other
Municipalities.
- - - -
CO
M
Dir
ect
or • Activate the COM
• Monitor the ongoing activities
• Coordinate between different
COM sections
1 - 1 Cell Phone
Usa
bil
ity
Ass
ess
me
nt
Ch
ief
• Make sure of the available
resources
• Assign tasks for the inspection
teams defining the working
zones using list of inspection
requests received.
• Coordinate with other
departments for required
support.
1 - 1 1 Cell Phone
1 Walki Talkie
Insp
ect
ion
Te
am
s
• Preliminary assessment of
damage.
• Providing information for
definitive damage assessment
• Determination of the unsafe
buildings
4
teams
2
person
/team
2
vehicles 4
4 Cell Phone
4 Walki Talkie
Cameras
Usability Forms
Po
lice
an
d
Fir
efi
gh
tin
g • Ensure access and exit for all
emergency services.
• Check streets for dangers and
block the roads using map in
Fig.15
3 men 1 - 2
Megaphone
Log
isti
cs
• Process, organize, and deal with
data received from different
departments.
4 men - 4 4
cell phones

44
Model Application for Salò 44
Figure 16 Map for Response Intervention Priority for Scenario 1

45
Model Application for Salò 45
COM
Section Responsibilities
Resources
Men Vehicle Computer Communication
Sce
na
rio
1
De
tail
ed
Da
ma
ge
Ass
ess
me
nt
CO
M D
ire
cto
r • Monitor the ongoing
activities
• Coordinate between different
COM sections.
• Request sheltering plans for
homeless people.
• Decide Evacuation Plans.
1 - 1 Cell Phone
Usa
bil
ity
Ass
ess
me
nt
Ch
ief
• Make sure of the available
resources
• Assign tasks for the
inspection teams defining the
working zones using the
priority map in Fig.16
• Coordinate with other
departments for required
support
• Check and approve the final
assessment report
1 - 1 Cell Phone
Walki Talkie
Insp
ect
ion
Te
am
s • Determination of the most
damaged zones.
• Detailed assessment of
damage.
• Providing information for
definitive damage
assessment
16
teams
2
persons
/team
8
vehicles 8
8 Cell Phone
8 Walki Talkie
Po
lice
an
d
Fir
efi
gh
tin
g
• Secure, protect and preserve
the scene, and control traffic.
• Check street for dangers and
block the roads.
• Secure dangerous areas and
assist evacuation.
• Ensuring that the partly
damaged houses are vacant
6 men 3 - Megaphone3
Log
isti
cs
• Process, organize, and deal
with data received from
different departments.
8 men - 8 8 cell phones

46
Model Application for Salò 46
7.3.2. Scenario 2
7.3.2.1. Seismic Input
By using the earthquake magnitude for Scenario no.2 and the attenuation law presented in
Eqn.1 it was possible to produce the chart presented in Fig.17.
Figure 17 Acceleration vs. distance for the Second Scenario
Then we represented peak ground acceleration ranges in circles their center is the epicenter
and the radius is increasing by 0.5 Kilometer. Then by using GIS software, we have
represented the seismic input map as shown in Fig.18.
0.100
1.000
0 1 2 3 4 5 6 7 8 9 10
a/g
Distance (KM)

47
Model Application for Salò 47
Figure 18 Pga (m/s2) map of Second Scenario
7.3.2.2. Sections Damage
By using the procedure described before for estimation of sections damage, in Fig.19
showing the average sections damage for Scenario 2. We notice that the majority of sections
have law to moderate damage percentage.

48
Model Application for Salò 48
Figure 19 Sections Average Damage Map for Scenario 2
7.3.2.3. Roads Damage
In this scenario we find out that, the average of damage of the buildings is less that 80% for all
sections and as a result, we do not have any interruption for the entire roads for each section.
Just for sections intersecting with the landslide and the rock fall we have roads interruption as
shown in Fig.20.

49
Model Application for Salò 49
Figure 20 Roads Damage Map for Scenario no.2
7.3.2.4. Estimation of Victims and Injuries
Was done based on the method described before in section 7.3.
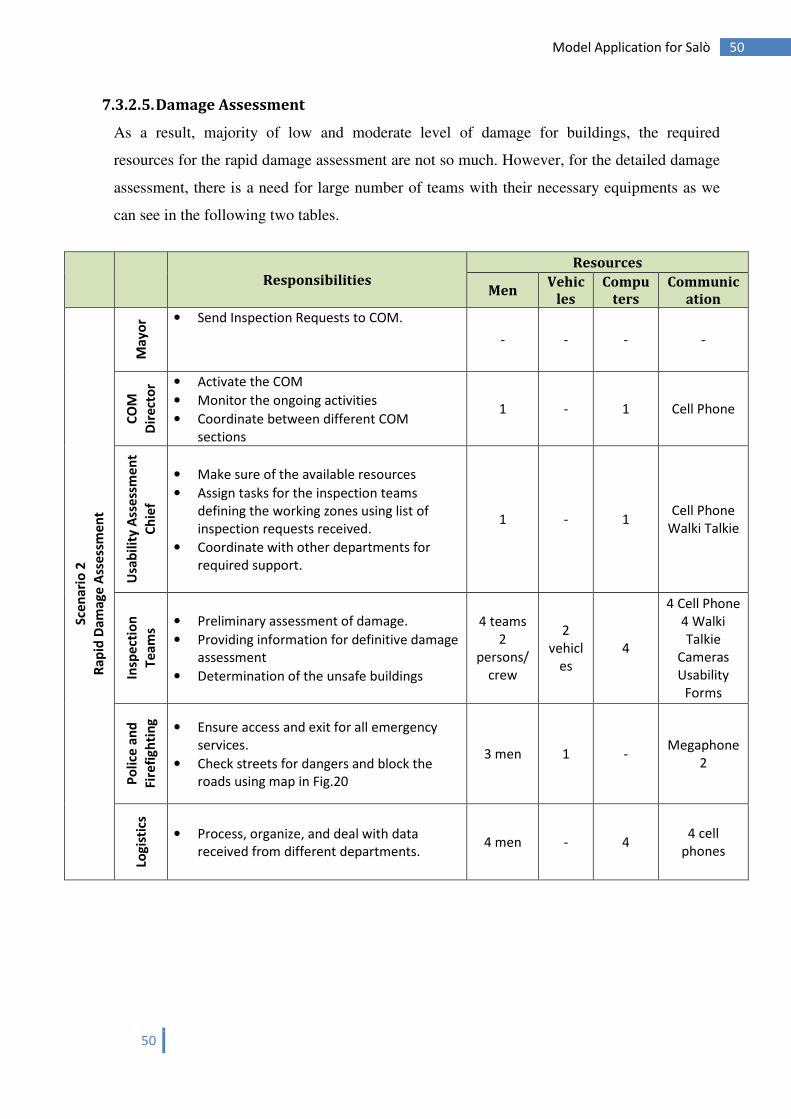
50
Model Application for Salò 50
7.3.2.5. Damage Assessment
As a result, majority of low and moderate level of damage for buildings, the required
resources for the rapid damage assessment are not so much. However, for the detailed damage
assessment, there is a need for large number of teams with their necessary equipments as we
can see in the following two tables.
Responsibilities
Resources
Men Vehic
les
Compu
ters
Communic
ation
Sce
na
rio
2
Ra
pid
Da
ma
ge
Ass
ess
me
nt
Ma
yo
r • Send Inspection Requests to COM.
- - - -
CO
M
Dir
ect
or • Activate the COM
• Monitor the ongoing activities
• Coordinate between different COM
sections
1 - 1 Cell Phone
Usa
bil
ity
Ass
ess
me
nt
Ch
ief
• Make sure of the available resources
• Assign tasks for the inspection teams
defining the working zones using list of
inspection requests received.
• Coordinate with other departments for
required support.
1 - 1 Cell Phone
Walki Talkie
Insp
ect
ion
Te
am
s
• Preliminary assessment of damage.
• Providing information for definitive damage
assessment
• Determination of the unsafe buildings
4 teams
2
persons/
crew
2
vehicl
es
4
4 Cell Phone
4 Walki
Talkie
Cameras
Usability
Forms
Po
lice
an
d
Fir
efi
gh
tin
g
• Ensure access and exit for all emergency
services.
• Check streets for dangers and block the
roads using map in Fig.20
3 men 1 - Megaphone
2
Log
isti
cs
• Process, organize, and deal with data
received from different departments. 4 men - 4
4 cell
phones

51
Model Application for Salò 51
Figure 21 Map for Response Intervention Priority for Scenario 2

52
Model Application for Salò 52
Responsibilities
Resources
Men Vehicle Computers Communication
Sce
na
rio
2
De
tail
ed
Da
ma
ge
Ass
ess
me
nt
CO
M D
ire
cto
r • Monitor the ongoing activities
• Coordinate between different
COM sections.
• Request sheltering plans for
homeless people.
• Decide Evacuation Plans.
1 - 1 Cell Phone
Usa
bil
ity
Ass
ess
me
nt
Ch
ief
• Make sure of the available
resources
• Assign tasks for the inspection
teams defining the working
zones using the priority map in
Fig.21
• Coordinate with other
departments for required
support
• Check and approve the final
assessment report
1 - 1 1 Cell Phone
1 Walki Talkie
Insp
ect
ion
Te
am
s
• Determination of the most
damaged zones.
• Detailed assessment of
damage.
• Providing information for
definitive damage assessment
12
teams
2
persons
/team
6
vehicles 6
6 Cell Phone
6 Walki Talkie
Po
lice
an
d
Fir
efi
gh
tin
g
• Secure, protect and preserve
the scene, and control traffic.
• Check street for dangers and
block the roads.
• Secure dangerous areas and
assist evacuation.
• Ensuring that the partly
damaged houses are vacant
6 men 3 - Megaphone
3
Log
isti
cs
• Process, organize, and deal
with data received from
different departments.
6 men - 6 6
cell phones

53
Model Application for Salò 53
7.3.3. Scenario 3
7.3.3.1. Seismic Input
By using the earthquake magnitude for scenario 3 and the attenuation law presented in Eqn.1
it was possible to produce the chart presented in Fig.22.
Figure 22 Acceleration vs. distance for the Third Scenario
By using the above chart shown in, it was possible to estimate the distribution of acceleration
values over distance. Then we represented the acceleration ranges in circles its center is the
epicenter and the radius is increasing by 0.5 Kilometers. Then by using these acceleration
values GIS software we have drawn the seismic input map.
0.100
1.000
0 1 2 3 4 5 6 7 8 9 10
a/g
Distance (KM)

54
Model Application for Salò 54
Figure 23 Pga (m/s2) map of Third scenario
7.3.3.2. Sections Damage
By using the procedure described before for estimation of sections damage, in Fig.24 showing
the average sections damage for Scenario 3. As we can see in the map in Fig.24, high
percentage of the buildings were collapsed.

55
Model Application for Salò 55
Figure 24 Sections Average Damage Map for Scenario 3
7.3.3.3. Roads Damage
Because of buildings collapse, all the city roads were interrupted which affects the emergency
response activities.

56
Model Application for Salò 56
Figure 25 Roads Damage Map for Scenario no.3
7.3.3.4. Estimation of Victims and Injuries
The number of people affected by the earthquake was calculated using the same steps used in
the previous scenarios. Due to the high percentage of buildings were collapsed, we have very
high number of people were affected by the earthquake in this scenario.
7.3.3.5. Damage Assessment
Due to the first investigations done by the civil protection teams, it was found that all the
buildings were collapsed. So all the efforts were directed towards the search and rescue and
evacuation tasks.

57
Model Application for Salò 57
7.3.4. Scenario 4
7.3.4.1. Seismic Input
By using the earthquake magnitude for scenario 4 and the attenuation law presented in Eqn.1
it was possible to produce the chart presented in Fig.26.
Figure 26 Acceleration vs. distance for the Forth Scenario
By using the above chart shown in Fig.26, it was possible to estimate the distribution of
acceleration values over distance. Then we represented the acceleration ranges in circles its
center is the epicenter and the radius is increasing by 0.5 Kilometers. Then by using these
acceleration values GIS software we have drawn the seismic input map.
0.100
1.000
0 1 2 3 4 5 6 7 8 9 10 11 12 13
a/g
Distance (KM)

58
Model Application for Salò 58
Figure 27 Pga (m/s2) map of forth scenario
7.3.4.2. Sections Damage
By using the procedure described before for estimation of sections damage, in Fig.28
showing the average sections damage for Scenario 4. We notice that the majority of the
sections have low to moderate levels of damage.

59
Model Application for Salò 59
Figure 28 Sections Average Damage Map for Scenario 4
7.3.4.3. Roads Damage
In this specific scenario, we find out that the average of damage of the buildings is less that
80% for all sections and consequently we do not have any interruption for the entire roads due
to buildings collapses, but only we have interruptions due to landslide and rock fall.

60
Model Application for Salò 60
Figure 29 Roads Damage Map for Scenario no.4
7.3.4.4. Estimation of Victims and Injuries
Was done based on the method described before in section 7.3.

61
Model Application for Salò 61
7.3.4.5. Damage Assessment
As a result, majority of low and moderate level of damage for buildings, the required
resources for the rapid damage assessment are not so much. However, for the detailed damage
assessment, there is a need for large number of teams with their necessary equipments as we
can see in the following two tables.
Responsibilities
Resources
Men Vehicle Computers Communication
Sce
na
rio
4
Ra
pid
Da
ma
ge
Ass
ess
me
nt
Ma
yo
r • Send Inspection Requests to
COM. - - - -
CO
M
Dir
ect
or • Activate the COM
• Monitor the ongoing activities
• Coordinate between different
COM sections
1 - 1 1
Cell Phone
Usa
bil
ity
Ass
ess
me
nt
Ch
ief
• Make sure of the available
resources
• Assign tasks for the inspection
teams defining the working
zones using list of inspection
requests received.
• Coordinate with other
departments for required
support.
1 - 1
1
Cell Phone
1
Walki Talkie
Insp
ect
ion
Te
am
s
• Preliminary assessment of
damage.
• Providing information for
definitive damage assessment
• Determination of the unsafe
buildings
4 teams
2
persons
/team
2
vehicles 4
4 Cell Phone
4 Walki Talkie
Cameras
Usability Forms
Po
lice
an
d
Fir
efi
gh
tin
g • Ensure access and exit for all
emergency services.
• Check streets for dangers and
block the roads using map in
Fig.[29]
3 men 1 - Megaphone2
Log
isti
cs
• Process, organize, and deal
with data received from
different departments.
4 men - 4 4 cell phones

62
Model Application for Salò 62
Figure 30 Map for Response Intervention Priority for Scenario no.4

63
Model Application for Salò 63
COM
Sec. Responsibilities
Resources
Men Vehicle Computers Communication
Sce
na
rio
4
De
tail
ed
Da
ma
ge
Ass
ess
me
nt
CO
M D
ire
cto
r • Monitor the ongoing activities
• Coordinate between different
COM sections.
• Request sheltering plans for
homeless people.
• Decide Evacuation Plans.
1 - 1 1
Cell Phone
Usa
bil
ity
Ass
ess
me
nt
Ch
ief
• Make sure of the available
resources
• Assign tasks for the inspection
teams defining the working zones
using the priority map in Fig.30
• Coordinate with other
departments for required support
• Check and approve the final
assessment report
1 - 1 1 Cell Phone
1 Walki Talkie
Insp
ect
ion
Te
am
s
• Determination of the most
damaged zones.
• Detailed assessment of damage.
• Providing information for
definitive damage assessment
12
teams
2
perso
ns/cre
w
6
vehicles 6
6 Cell Phone
6 Walki Talkie
Po
lice
an
d
Fir
efi
gh
tin
g
• Secure, protect and preserve the
scene, and control traffic.
• Check street for dangers and
block the roads.
• Secure dangerous areas and
assist evacuation.
• Ensuring that the partly damaged
houses are vacant
6 men 3 - 3
Megaphone
Log
isti
cs
• Process, organize, and deal with
data received from different
departments.
6 men - 6 6
Cell phones

64
Model Application for Salò 64
7.3.5. Scenario 5
7.3.5.1. Seismic Input
By using the earthquake magnitude for scenario 5 and the attenuation law presented in Eqn.1
it was possible to produce the chart presented in Fig.31.
Figure 31 Acceleration vs. distance for the Fifth Scenario
By using the above chart shown in Fig.31, it was possible to estimate the distribution of
acceleration values over distance. Then we represented the acceleration ranges in circles its
center is the epicenter and the radius is increasing by 0.5 Kilometers. Then by using these
acceleration values GIS software we have drawn the seismic input map.
0.100
1.000
-1 1 3 5 7 9 11 13 15
a/g
Distance (KM)

65
Model Application for Salò 65
Figure 32 Pga (m/s2) map of Scenario no.5
7.3.5.2. Buildings Vulnerability
In this scenario, we used the same values for buildings vulnerability as the previous scenarios.
7.3.5.3. Sections Damage
By using the fragility curves as shown in Eqn.4 it was possible to estimate the damage for
each single building. In this scenario as we can see from damage map in Fig.33, all the city
buildings were collapsed with damage value >80%.

66
Model Application for Salò 66
Figure 33 Sections Average Damage Map for Scenario 5
7.3.5.4. Roads Damage
Road damage and isolation areas have been computed also as mentioned in the previous
scenarios.

67
Model Application for Salò 67
Figure 34 Roads Damage Map for Scenario no.5
In this specific scenario, we find out that the average of damage of the buildings is quiet high
for the most of the area and therefore we expect a majority of road interruption for the roads as
shown in the map.
7.3.5.5. Estimation of Victims and Injuries
The number of people affected by the earthquake was done the same as the previous scenarios.
Due to the high percentage of buildings were collapsed, we have very high number of people
were affected by the earthquake in this scenario.

68
Model Application for Salò 68
7.3.6. Scenario 6
7.3.6.1. Seismic Input
By using the earthquake magnitude for Scenario no.5 and the attenuation law presented in
Eqn.1 it was possible to produce the chart presented in Fig.35.
Figure 35 Pga (m/s2) map for Scenario no.6
Then we represented the acceleration ranges in circles its center is the epicenter and the radius
is increasing by 0.3 Kilometers. Then by using these acceleration values GIS software we
have drawn the seismic input map.
7.3.6.2. Estimation of Sections Damage
By using the procedure described before for estimation of sections damage, in Fig.28 showing
the average sections damage for Scenario 4. We notice that the majority of the sections have
moderately high to high levels of damage.
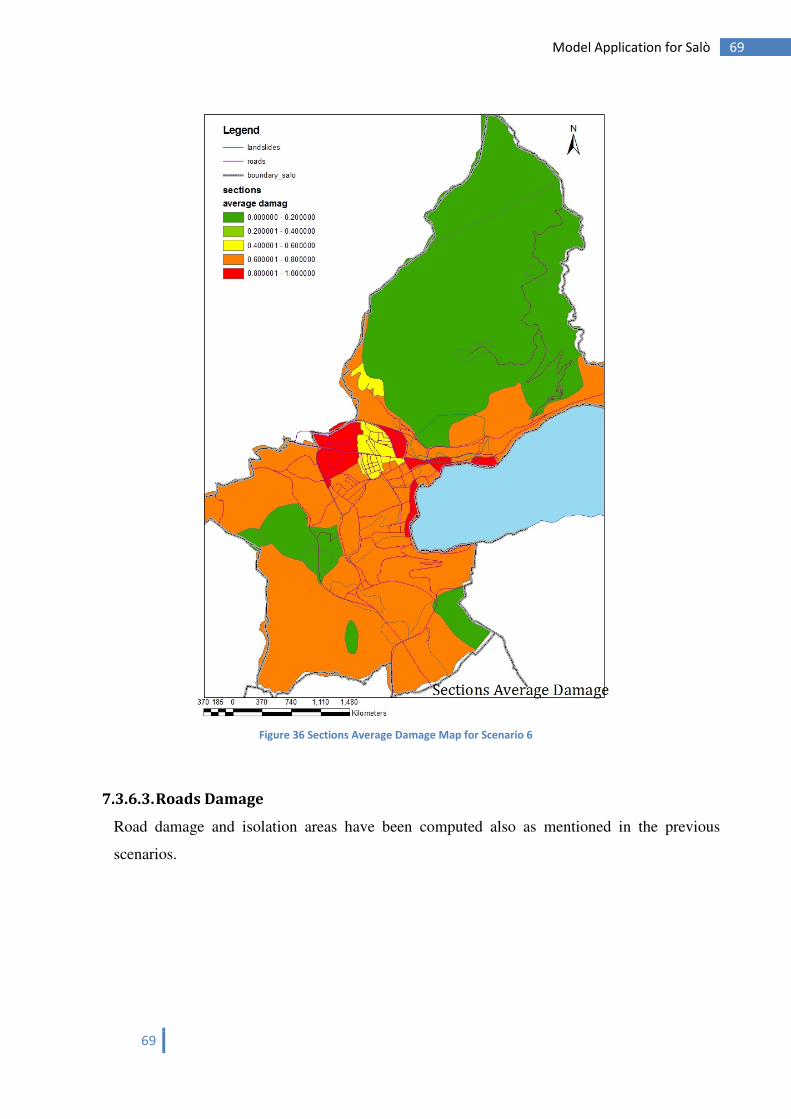
69
Model Application for Salò 69
Figure 36 Sections Average Damage Map for Scenario 6
7.3.6.3. Roads Damage
Road damage and isolation areas have been computed also as mentioned in the previous
scenarios.

70
Model Application for Salò 70
Figure 37 Roads Damage Map for Scenario no.6
In this specific scenario we find out that the average of damage of the buildings is quiet high
for the some of the sections and therefore we expect interruption for the roads as shown in the
map in Fig.37.
7.3.6.4. Estimation of Victims and Injuries
Was done based on the method described before in section 7.3.

71
Model Application for Salò 71
7.3.6.5. Damage Assessment
Responsibilities
Resources
Men Vehicle Computers Communication
Sce
na
rio
6
Ra
pid
Da
ma
ge
Ass
ess
me
nt
Ma
yo
r • Send Inspection Requests to
COM. - - - -
CO
M
Dir
ect
or • Activate the COM
• Monitor the ongoing activities
• Coordinate between different
COM sections
1 - 1 Cell Phone
Usa
bil
ity
Ass
ess
me
nt
Ch
ief
• Make sure of the available
resources
• Assign tasks for the inspection
teams defining the working
zones using list of inspection
requests received.
• Coordinate with other
departments for required
support.
1 - 1 Cell Phone
Walki Talkie
Insp
ect
ion
Te
am
s
• Preliminary assessment of
damage.
• Providing information for
definitive damage assessment
• Determination of the unsafe
buildings
3 teams
2
persons
/team
2
vehicles 3
3 Cell Phone
3 Walki Talkie
Cameras
Usability Forms
Po
lice
an
d
Fir
efi
gh
tin
g • Ensure access and exit for all
emergency services.
• Check streets for dangers and
block the roads using map in
Fig.37
2 men 1 - Megaphone2
Log
isti
cs
• Process, organize, and deal
with data received from
different departments.
2 men - 2 2 cell phones

72
Model Application for Salò 72
Figure 38 Map for Response Intervention Priority for Scenario no.6

73
Model Application for Salò 73
COM
Section Responsibilities
Resources
Men Vehic
les
Compu
ters
Communic
ation
Sce
na
rio
6
De
tail
ed
Da
ma
ge
Ass
ess
me
nt
CO
M D
ire
cto
r • Monitor the ongoing activities
• Coordinate between different COM
sections.
• Request sheltering plans for homeless
people.
• Decide Evacuation Plans.
1 - 1 Cell Phone
Usa
bil
ity
Ass
ess
me
nt
Ch
ief
• Make sure of the available resources
• Assign tasks for the inspection teams
defining the working zones using the
priority map in Fig.38
• Coordinate with other departments for
required support
• Check and approve the final assessment
report
1 - 1 Cell Phone
Walki Talkie
Insp
ect
ion
Te
am
s
• Determination of the most damaged
zones.
• Detailed assessment of damage.
• Providing information for definitive
damage assessment
10 teams
2
persons/
crew
6
vehicl
es
6
6 Cell Phone
6 Walki
Talkie
Po
lice
an
d
Fir
efi
gh
tin
g
• Secure, protect and preserve the scene,
and control traffic.
• Check street for dangers and block the
roads.
• Secure dangerous areas and assist
evacuation.
• Ensuring that the partly damaged houses
are vacant
6 men 3 - Megaphone
3
Log
isti
cs
• Process, organize, and deal with data
received from different departments. 8 men - 8
8 cell
phones

74
Model Application for Salò 74
7.3.7. Scenario 7
7.3.7.1. Seismic Input
We represented acceleration ranges in circles its center is the epicenter and the radius is
increasing by 0.3 Kilometers. Then by using these acceleration values GIS software we have
drawn the seismic input map as shown in Fig.39.
Figure 39 Pga (m/s2) map for Scenario no.7
7.3.7.2. Buildings Vulnerability
In this scenario, we tried to find the effect of changing the vulnerability data on the final
building damages. Therefore, we reduced the buildings vulnerability by 30% from the values
was previously used. The values used for buildings vulnerability for this scenario is presented
in the map in Fig.40.

75
Model Application for Salò 75
Figure 40 Buildings Vulnerability Values for Scenario no.7
7.3.7.3. Estimation of Sections Damage
By using the procedure described before for estimation of sections damage, in Fig.28 showing
the average sections damage for Scenario 4. We notice that the majority of the sections have
moderate to moderate-high levels of damage.

76
Model Application for Salò 76
Figure 41 Sections Average Damage Map for Scenario 7

77
Model Application for Salò 77
7.3.7.4. Roads Damage
Road damage and isolation areas have been estimated also as mentioned in the previous
scenarios and shown below in Fig.42
Figure 42 Roads Damage Map for Scenario no.7
In this specific scenario we find out that the average of damage of the buildings is less that
80% for all sections and as a consequence we don’t have any interruption for the entire roads
due to buildings collapses, but only we have interruptions due to landslide and rock fall.
7.3.7.5. Estimation of Victims and Injuries
Was done based on the method described before in section 7.3.

78
Model Application for Salò 78
7.3.7.6. Damage Assessment
Responsibilities
Resources
Men Vehic
les
Compu
ters
Communic
ation
Sce
na
rio
7
Ra
pid
Da
ma
ge
Ass
ess
me
nt
Ma
yo
r • Send Inspection Requests to COM.
- - - -
CO
M
Dir
ect
or • Activate the COM
• Monitor the ongoing activities
• Coordinate between different COM
sections
1 - 1 Cell Phone
Usa
bil
ity
Ass
ess
me
nt
Ch
ief
• Make sure of the available resources
• Assign tasks for the inspection teams
defining the working zones using list of
inspection requests received.
• Coordinate with other departments for
required support.
1 - 1 Cell Phone
Walki Talkie
Insp
ect
ion
Te
am
s
• Preliminary assessment of damage.
• Providing information for definitive
damage assessment
• Determination of the unsafe buildings
6 teams
2
persons/
crew
3
vehicl
es
3
3 Cell Phone
3 Walki
Talkie
Cameras
Usability
Forms
Po
lice
an
d
Fir
efi
gh
tin
g
• Ensure access and exit for all emergency
services.
• Check streets for dangers and block the
roads using map in Fig.42
4 men 2 - Megaphone
2
Log
isti
cs
• Process, organize, and deal with data
received from different departments. 4men - 4
4 cell
phones

79
Model Application for Salò 79
Figure 43 Map for Response Intervention Priority for Scenario no.7

80
Model Application for Salò 80
COM
Section Responsibilities
Resources
Men Vehic
les
Compu
ters
Communic
ation
Sce
na
rio
7
De
tail
ed
Da
ma
ge
Ass
ess
me
nt
CO
M D
ire
cto
r • Monitor the ongoing activities
• Coordinate between different COM
sections.
• Request for External resources
• Request sheltering plans for homeless
people.
• Decide Evacuation Plans.
1 - 1 Cell Phone
Usa
bil
ity
Ass
ess
me
nt
Ch
ief
• Make sure of the available resources
• Assign tasks for the inspection teams
defining the working zones using the
priority map in Fig.43
• Coordinate with other departments for
required support
• Check and approve the final assessment
report
1 - 1 Cell Phone
Walki Talkie
Insp
ect
ion
Te
am
s
• Determination of the most damaged
zones.
• Detailed assessment of damage.
• Providing information for definitive
damage assessment
20 teams
2
persons/
crew
8
vehicl
es
10
10 Cell
Phone
10 Walki
Talkie
Po
lice
an
d
Fir
efi
gh
tin
g
• Secure, protect and preserve the scene,
and control traffic.
• Check street for dangers and block the
roads.
• Secure dangerous areas and assist
evacuation.
• Ensuring that the partly damaged houses
are vacant
8 men 4 - Megaphone
4
Log
isti
cs
• Process, organize, and deal with data
received from different departments. 16 men - 16
16 cell
phones

81
Model Application for Salò 81
7.3.8. Scenario 8
7.3.8.1. Seismic Input
We represented acceleration ranges in circles its center is the epicenter and the radius is
increasing by 0.3 Kilometers. Then by using these acceleration values GIS software we have
drawn the seismic input map.
Figure 44 Pga (m/s2) map for Scenario no.8
7.3.8.2. Buildings Vulnerability
Like what we did in the last scenario, in this scenario we tried to find the effect of changing
the vulnerability data on the final building damages. Therefore, we increased the buildings
vulnerability by 30% from the initial values presented in the assessment report [25]. The
values used for buildings vulnerability for this scenario is presented in the map in Fig.45.

82
Model Application for Salò 82
Figure 45 Buildings Vulnerability Values Map for Scenario no.8
7.3.8.3. Sections Damage
After estimation of the buildings damages, it was possible to generalize the damage for each
section as shown in Fig.46 for the average damage. It is possible to see that the most damaged
sections are concentrated in the city historical center which includes many of the strategic
facilities.

83
Model Application for Salò 83
Figure 46 Sections Average Damage Map for Scenario 8
7.3.8.4. Roads Damage
Based on the average damage value for each section, we evaluated the status of the roads
going through those sections. The map in Fig.47 is showing the situation of roads in this
scenario.

84
Model Application for Salò 84
Figure 47 Roads Damage Map for Scenario no.8
7.3.8.5. Estimation of Victims and Injuries
Was done based on the method described before in section 7.3.

85
Model Application for Salò 85
7.3.8.6. Damage Assessment
Responsibilities
Resources
Men Vehicle Computers Communication
Sce
na
rio
8
Ra
pid
Da
ma
ge
Ass
ess
me
nt
Ma
yo
r • Send Inspection Requests to COM.
- - - -
CO
M
Dir
ect
or • Activate the COM
• Monitor the ongoing activities
• Coordinate between different COM
sections
1 - 1 Cell Phone
Usa
bil
ity
Ass
ess
me
nt
Ch
ief
• Make sure of the available
resources
• Assign tasks for the inspection
teams defining the working zones
using list of inspection requests
received.
• Coordinate with other departments
for required support.
1 - 1 Cell Phone
Walki Talkie
Insp
ect
ion
Te
am
s
• Preliminary assessment of damage.
• Providing information for definitive
damage assessment
• Determination of the unsafe
buildings
4 teams
2
persons
/team
2 2
4 Cell Phone
4 Walki Talkie
Cameras
Usability Forms
Po
lice
an
d
Fir
efi
gh
tin
g
• Ensure access and exit for all
emergency services.
• Check streets for dangers and block
the roads using map in Fig.47
3 men 2 - Megaphone2
Log
isti
cs
• Process, organize, and deal with
data received from different
departments.
4men - 4 4 cell phones

86
Model Application for Salò 86
Figure 48 Map for Response Intervention Priority for Scenario no.8

87
Model Application for Salò 87
Responsibilities
Resources
Men Vehicle Computers Communication
Sce
na
rio
8
De
tail
ed
Da
ma
ge
Ass
ess
me
nt
CO
M D
ire
cto
r • Monitor the ongoing activities
• Coordinate between different
COM sections.
• Request sheltering plans for
homeless people.
• Decide Evacuation Plans.
1 - 1 1
Cell Phone
Usa
bil
ity
Ass
ess
me
nt
Ch
ief
• Make sure of the available
resources
• Assign tasks for the inspection
teams defining the working
zones using the priority map in
Fig.48
• Coordinate with other
departments for required
support
• Check and approve the final
assessment report
1 - 1
1
Cell Phone
1
Walki Talkie
Insp
ect
ion
Te
am
s
• Determination of the most
damaged zones.
• Detailed assessment of damage.
• Providing information for
definitive damage assessment
8 teams
2
persons
/team
4
vehicle 8
8 Cell Phone
8 Walki Talkie
Po
lice
an
d
Fir
efi
gh
tin
g
• Secure, protect and preserve the
scene, and control traffic.
• Check street for dangers and
block the roads.
• Secure dangerous areas and
assist evacuation.
• Ensuring that the partly
damaged houses are vacant
6men 3 - 3
Megaphone
Log
isti
cs
• Process, organize, and deal with
data received from different
departments.
8 men - 8 8
cell phones

88
88 Model Application for Salò
7.3.9. Comparing the Damage Scenarios
After we completed the eight seismic scenarios, we will try to figure out the comparison criteria
which we can use in the similarity function. Therefore, we developed many graphs between the
different scenarios for different comparison criterion and based on this we will decide the
suitable criterion for comparison.
In the chart shown in Fig.49 we plotted the average sections damage in the first 6 scenarios,
which has the same buildings vulnerability values, versus the sections. We noticed that for the
most of the sections, the trend of the damage change was similar when changing the epicenter
and the magnitude of the seismic input. Therefore we decided to consider peak ground
acceleration as a comparison criteria in our model.
Figure 49 Comparison chart for 6 Scenarios based on average section damage
In Fig.50, we plotted the average damage values for different magnitudes and epicenters. We can
notice that on average, the trend of damage is the same for the three scenarios.
0.000
0.100
0.200
0.300
0.400
0.500
0.600
0.700
0.800
0.900
1.000
0 1 2 3 4 5 6 7 8 9 101112131415161718192021222324252627282930
Se
ctio
n A
ve
rag
e D
am
ag
e
Section
Scenario 1
Scenario2
Scenario 3
Scenario 4
Scenario 5
Scenario 6

89
89 Model Application for Salò
Figure 50 Damage Comparison Chart for 3 Scenarios
Another option for the comparison could be the buildings vulnerability as shown in the chart in
Fig.51. This chart is comparing between scenarios 6,7&8 when changing the vulnerability for the
same seismic inputs and we can see that the damage trend was almost the same for the three
scenarios. Another concern about vulnerability is that when it’s know we can easily estimate the
expected damage using the fragility curves.
Another important criteria in comparing the different scenarios, could be the need to compare
with the damage of strategic facilities. As we can see in the following table 6, the damage for
strategic buildings was consistent with what we found before for the sections average damage.
This means that we can consider a criteria for comparison depends on the damage percentage of
the strategic building.
0.00
0.10
0.20
0.30
0.40
0.50
0.60
0.70
0.80
0.90
1.00
37 15 13 16 12 18 26 2 9 21 24 20 30 22 19 17 11 31 33 35 36 23 25 27 10 7 14 1 0
Scenario1 Scenario2
Scenario4 2 per. Mov. Avg. (Scenario1)
2 per. Mov. Avg. (Scenario2) 2 per. Mov. Avg. (Scenario4)

90
90 Model Application for Salò
Figure 51 Comparison of the Sections Damage when changing Vulnerability
Strategic
Facility
Damage Value for Scenario
1 2 3 4 5 6 7 8
Carabinieri 0.5 0.5 0.9 0.3 0.9 0.7 0.7 0.7
Traffic
Patrol 0.3 0.3 0.9 0.3 0.9 0.5 0.5 0.5
Municipality 0.5 0.5 0.9 0.5 0.9 0.7 0.7 0.7
Local Police 0.5 0.5 0.9 0.5 0.9 0.7 0.7 0.9
Fire Station 0.3 0.3 0.9 0.3 0.9 0.5 0.5 0.5
Hospital 0.5 0.5 0.9 0.5 0.9 0.7 0.7 0.9
Table 4 Damage for Strategic Facilities in the 8 Scenarios
So we chosen the peak ground acceleration as a first input to the comparison criteria which
assists the decision maker just few minutes after the shake to choose the most similar scenario
among the recorded ones. Knowing the epicenter and the magnitude, will be used to calculate the
peak ground acceleration for each section. Further, we can use the peak ground acceleration for
the preliminary estimation of the sections damage based on the recorded data about sections
vulnerability. Sometime after the shake, some data are collected from site about the real damages
for some sections, this can be used to modify the data used before to reevaluate the similarity. By
using the reliability factor, we can modify the degree of accuracy for the data used by time when
receiving more accurate data about the actual situation.
0.00
0.10
0.20
0.30
0.40
0.50
0.60
0.70
0.80
0.90
1.00
26 2 13 21 20 15 18 24 37 12 16 30 19 22 17 23 31 33 36 35 25 9 7 11 27 14 10 1 0
Se
ctio
n A
ve
rag
e D
am
ag
e
Section
Scenario 6
Scenario 7
Scenario 8

91
91 Model Application for Salò
7.4. Application of the Model
First we need to define the model’s knowledge base which contains the data we estimated for the
eight scenarios. In the knowledge base we will record all the data regarding the earthquake
inputs; the magnitudes and coordinates of epicenter for each scenario. The resulting sections
damage, damage for roads, affected population, and the damage of strategic buildings.
Based on the comparison we presented in the previous section, we decided to choose two
comparison criterion. The first is the peak ground acceleration for sections ,and the second is the
average damage for sections. Then we defined the similarity functions using Matlab scripts to
apply the formulas for the similarity functions presented in Section 6 to compare between the
different scenarios (Refer to Appendix F ).
Figure 52 Data Input for the new Scenario

92
92 Model Application for Salò
For any new scenario, it will be required to enter the data regarding the earthquake epicenter and
magnitude, and the coordinates of each zone. The program will calculate the peak ground
acceleration for each zone and then the corresponding damage. The user has the option either to
use calculated damage values by the model or to enter directly the data collected from site if
available.
Figure 53 Earthquake Inputs for the New Scenario
Then the similarity function will compare the new scenario with the recorded and displays the
recorded data for the most similar scenario.

93
93 Model Application for Salò
Figure 54 Data Recorded for the Scenario no.1
In Fig.55 we can see the outputs of the model in case that the scenario no.1 is the most similar
scenario. We can show maps for buildings damage, number of inured or victims, people need
sheltering, and the response intervention priority for different sections.

94
94 Model Application for Salò
Figure 55 Model Outputs: Number of Homeless people

95
95 Conclusions
8. Conclusions
Crisis management consists of three main stages that include: Crisis management before the crisis
takes place, Crisis management at the time of the crisis, Crisis management after the crisis.
Therefore, facing the emergency starts during the peacetime through preparedness and after the
crisis through learning from experience. This kind of models, which we proposed in our work,
supports the concept of being prepared through collecting and analyzing data about different items
involved in the crisis.
The model supports the concept of being prepared through coordinating between different partners
by sharing the lessons learnt from previous crises. Also through building different scenarios, they
prepare themselves for different emergencies and the suitable contingency plan for each
emergency. This allows the organization to plan for and provide the optimum resources that suits
the response for different emergencies. While preparing the model, we found the importance of
assessing the vulnerability for buildings, and different infrastructures in order to discover the
weaknesses, which need to be solved.
The model supports the decision making process in the first moments of emergency through giving
an image for the expected consequences. This reduces the number of uncertainties in the decision
making process. In addition, having an image about the expected consequences of the earthquake
reduces the time needed to decide the action plan for the different emergency teams.
After the crisis, it will support the learning by recording all the data collected during the emergency
in order to be used for the future events. This supports the organizational performance when facing
possible situations similar to those happened in the past and consequently increase the
organizational resilience.
The model can be improved by using real data from different crises in order to be more confident
about the retrieved data. This can be used to add independent comparison criterion to the similarity
function like collapse of a bridge. In addition, it can be used in emergency planning processes by
recording the corresponding contingency plan for different seismic scenario. During the crisis, it
will be possible to retrieve the contingency plan for a scenario similar to the occurring one.

96
96 References
9. References
[1] A.Boin, P.Lagadec(2000), Preparing for the Future: Critical Challenges in Crisis Management.
Journal of Contingencies and Crisis Management, Volume 8,Number 4,November 2000.
[2] W.Perry,K.Lindell(2003), Preparedness for Emergency Response: Guidelines for the Emergency
Planning Process. Disasters,2003, 27(4): 336-350.
[3] S.Sherif, Y. (1991). Earthquake, Risk, Damage and Recovery. Reliability Engineering and System
Safety.
[4] Community-Scale Damage, Disruption, and Early Recovery in the 2010 Haiti Earthquake(2011).
Earthquake Spectra, Volume 27, No. S1, pages S431–S446, October 2011
[5] EERI Special Earthquake Report. Learning from Earthquakes, The March 11,2011, Great Japan
(Tohoku) Earthquake and Tsunami: Societal Dimensions. August 2011
[6] Marincioni F., Appiotti F., Ferretti M., Antinori C., Melonaro P., Pusceddu A., Rosi R.O., Perception
and Communication of Seismic Risk: The 6 April 2009 L’Aquila Earthquake Case Study, Earthquake
Spectra, Volume 28, No. 1, pages 159–183, February 2012.
[7] http://earthquake.usgs.gov/regional/nca/1906/18april/
[8] Lecture notes of Prof. Scira Menoni
http://corsi.metid.polimi.it/col/groups/loadGruppo.jsp;jsessionid=E2F6F6423C4C944D768512D1445B
E8CD.tomcat1?cod_gruppo=089908_105793
[9] Comfort L.K.(1994),Risk and Resilience: Inter-organizational Learning Following the Northridge
Earthquake of January 17,1984
[10] Jones T. H.(1995). Implementing Integrated Emergency Management. Urban Hazard Project,
Research Paper No.2.
[11] McConnell A., Drennan L.(2006), Mission Impossible? Planning and Preparing for Crisis. Journal of
Contingencies and Crisis Management, Volume 14,Number 2,June 2006.
[12] Porter, M. E. (1985). Competitive advantage. New York: Free Press.
[13] Ringland, G. (1998). Scenario planning: Managing for the future. New York: John Wiley.
[14] PI L- S IM_ SIMULATION OF SCENARIOS FOR THE LOMBARDIA-PIEMONTE MACRO-REGION
[15] Comfort L.K., Sungu Y., Johnson D., Dunn M.(2001) Complex Systems in Crisis: Anticipation and
Resilience in Dynamic Environments. Journal of Contingencies and Crisis Management, Volume
9,Number 3,September 2001.
[16] Sabetta F., Pugliese A. Attenuation of peak ground acceleration and velocity from Italian strong
motion record. Bulletin of Seismic Society of America, 77, 1987, p 1491-1513.
[17] Lagadec P.(1997),Learning Process for Crisis Management in Complex Organizations. Journal of
Contingencies and Crisis Management, Volume 5,Number 1,March 1997.

97
97 <
[18] Luzi L., Pergalani F. (1996) Application of statistical and GIS techniques to slope instability zonation
(1:50.000 Fabriano geological map sheet), Soil Dynamic and Earthquake Engineering, Elsevier
Science, vol. 15, 2, pp 83-94
[19] Corsanego, A. and Gavarini C.(1993) Ten years of research into the Seismic Vulnerability of
Constructions in Italy, Annali Di Geiofisica, Vol. XXXVI, N.1, April 1993.
[20] S. Menoni, F. Pergalani, M.P. Boni, V. Petrini (2002).Lifelines earthquake vulnerability assessment: a
systemic approach, Soil Dynamics and Earthquake Engineering ,Volume 22, Issues 9–12, October–December 2002, Pages 1199–1208
[21] Quarantelli E.L. (2007).Problematical Aspects of the Computer Based Information Communication
Revolution with Respect to Disaster Planning and Crisis Managing. University of Delaware, Disaster
Research Center, Preliminary Paper No.35.
[22] Jain S., McLean C.(2003). A Framework for Modeling and Simulation For Emergency Response.
Proceedings of the 2003 Winter Simulation Conference.
[23] Mejri O., Plebani P., SocialEMIS: Improving Emergency Preparedness Through Collaboration(2012).
[24] Grimaz, S., Meroni, F., Petrini, V., Tomasoni, R., and Zonno, G., 1996. Il ruolo dei dati di
danneggiamento del terremoto del Friuli, nello studio di modelli di vulnerabilità sismica degli edifici in
muratura, Proceedings of the Conference on “La scienza e i terremoti-Analisi e prospettive
dall’esperienza del Friuli-1976/1996,” Udine, Italy, pp. 89–96.Fragility Curves
[25] “Determinazione del rischio sismico a fini urbanistici in Lombardia”, Regione Lombardia - C.N.R-
I.R.R.S., 1996.Vulnerability
[26] Petrini V., Boni M.P., Elaborazione di scenari sismici di danno in alcune aree sismiche della toscana,
Dipartimento di Ingegneria Strutturale - Politecnico di Milano, Maggio 2004 Victims
[27] S. Dimova, E. Mola, P. Negro, A.V. Pinto A. Colombo (2004). The Garda Area (Italy) Earthquake of
24 November 2004:A Field Report. Institute for the Protection and Security of the Citizen European
Laboratory for Structural Assessment (ELSA)
[28] Pinto, A. V., Taucer, F. - Editors (2007): Field Manual for post-earthquake damage and safety
assessment and short term countermeasures (AeDES). JRC Scientific and Technical Reports. EUR
22868 EN – 2007.
[29] Boni M.P., Menoni S., Pergalani F., Petrini V. Developing Complete Event Scenarios Starting From
Lifelines Damage Assessment. 12th European Conference on Earthquake Engineering.

98
10. Appendices
Appendix A : FIRST LEVEL FORMFIRST LEVEL FORM
98 Appendices

99
99 Appendices

100
100 Appendices
Appendix B
Second Level Forms for Masonry Buildings

101
101 Appendices
Appendix C
Second Level Forms for R.C. Buildings

102
102 Appendices
Appendix D
Sections Damage Calculations for Different Scenarios
Scenario No.1
Section Min
damage
Average
Damage
Maximum
damage Victims Injured
Need for
sheltering
0 0.33 0.34 0.35 0.00 9.00 0.00
1 0.35 0.35 0.35 0.00 12.00 0.00
2 0.33 0.57 0.73 0.00 43.00 317.00
3 0.00 0.00 0.00 0.00 0.00 0.00
4 0.00 0.00 0.00 0.00 0.00 0.00
5 0.00 0.00 0.00 0.00 0.00 0.00
6 0.00 0.00 0.00 0.00 0.00 0.00
7 0.38 0.38 0.38 0.00 5.00 0.00
8 0.00 0.00 0.00 0.00 0.00 0.00
9 0.32 0.55 0.84 0.00 44.00 355.00
10 0.38 0.38 0.38 0.00 5.00 0.00
11 0.29 0.46 0.75 0.00 25.00 0.00
12 0.33 0.71 0.84 0.00 81.00 394.00
13 0.35 0.78 0.87 0.00 139.00 577.00
14 0.33 0.35 0.73 0.00 10.00 0.00
15 0.71 0.83 0.84 122.00 73.00 121.00
16 0.31 0.74 0.84 0.00 99.00 449.00
17 0.43 0.47 0.76 0.00 20.00 0.00
18 0.35 0.64 0.80 0.00 51.00 298.00
19 0.33 0.49 0.71 0.00 22.00 0.00
20 0.31 0.53 0.71 0.00 28.00 236.00
21 0.33 0.54 0.71 0.00 28.00 228.00
22 0.35 0.50 0.73 0.00 43.00 0.00
23 0.35 0.43 0.73 0.00 47.00 0.00
24 0.33 0.54 0.73 0.00 33.00 271.00
25 0.35 0.41 0.45 0.00 29.00 0.00
26 0.35 0.58 0.76 0.00 40.00 276.00
27 0.36 0.39 0.76 0.00 26.00 0.00
28 0.00 0.00 0.00 0.00 0.00 0.00
29 0.00 0.00 0.00 0.00 0.00 0.00
30 0.45 0.53 0.76 0.00 18.00 157.00
31 0.45 0.45 0.45 0.00 3.00 0.00
32 0.00 0.00 0.00 0.00 0.00 0.00
33 0.45 0.45 0.45 0.00 51.00 0.00
34 0.00 0.00 0.00 0.00 0.00 0.00
35 0.45 0.45 0.45 0.00 5.00 0.00
36 0.45 0.45 0.45 0.00 14.00 0.00
37 0.92 0.92 0.92 81.00 49.00 80.00

103
103 Appendices
Scenario No.2
Section Min damage Average
Damage
Maximum
damage Victims Injured
Need for
sheltering
0 0.79 0.81 0.84 0.00 7.00 0.00
1 0.84 0.84 0.84 0.00 8.00 0.00
2 0.79 0.94 1.00 0.00 37.00 317.00
3 0.00 0.00 0.00 0.00 0.00 0.00
4 0.00 0.00 0.00 0.00 0.00 0.00
5 0.00 0.00 0.00 0.00 0.00 0.00
6 0.00 0.00 0.00 0.00 0.00 0.00
7 0.91 0.91 0.91 0.00 4.00 0.00
8 0.00 0.00 0.00 0.00 0.00 0.00
9 0.77 0.87 1.00 0.00 4.00 0.00
10 0.91 0.91 0.91 0.00 5.00 0.00
11 0.72 0.89 1.00 0.00 7.00 0.00
12 0.79 0.98 1.00 0.00 33.00 0.00
13 0.84 0.99 1.00 0.00 69.00 577.00
14 0.79 0.81 1.00 0.00 9.00 0.00
15 1.00 1.00 1.00 0.00 22.00 0.00
16 0.77 0.99 1.00 0.00 31.00 0.00
17 1.00 1.00 1.00 0.00 21.00 0.00
18 0.84 0.96 1.00 0.00 38.00 298.00
19 0.79 0.89 1.00 0.00 15.00 0.00
20 0.77 0.91 1.00 0.00 23.00 0.00
21 0.79 0.94 1.00 0.00 24.00 228.00
22 0.84 0.94 1.00 0.00 36.00 0.00
23 0.84 1.00 1.00 0.00 45.00 0.00
24 0.79 0.94 1.00 0.00 27.00 0.00
25 0.84 0.95 1.00 0.00 26.00 0.00
26 0.84 0.96 1.00 0.00 35.00 276.00
27 0.84 0.88 1.00 0.00 20.00 0.00
28 0.00 0.00 0.00 0.00 0.00 0.00
29 0.00 0.00 0.00 0.00 0.00 0.00
30 1.00 1.00 1.00 0.00 16.00 0.00
31 1.00 1.00 1.00 0.00 3.00 0.00
32 0.00 0.00 0.00 0.00 0.00 0.00
33 1.00 1.00 1.00 0.00 48.00 0.00
34 0.00 0.00 0.00 0.00 0.00 0.00
35 1.00 1.00 1.00 0.00 4.00 0.00
36 1.00 1.00 1.00 0.00 12.00 0.00
37 1.00 1.00 1.00 0.00 13.00 0.00

104
104 Appendices
Scenario No.3
Section Min
Damage
Average
Damage
Maximum
damage Victims Injured
Need for
sheltering
0 0.33 0.33 0.33 216.00 130.00 215.00
1 0.33 0.33 0.33 243.00 146.00 242.00
2 0.31 0.53 0.67 159.00 96.00 158.00
3 0.00 0.00 0.00 0.00 0.00 0.00
4 0.00 0.00 0.00 0.00 0.00 0.00
5 0.00 0.00 0.00 0.00 0.00 0.00
6 0.00 0.00 0.00 0.00 0.00 0.00
7 0.38 0.38 0.38 51.00 31.00 50.00
8 0.00 0.00 0.00 0.00 0.00 0.00
9 0.27 0.32 0.67 178.00 107.00 177.00
10 0.38 0.38 0.38 52.00 31.00 51.00
11 0.25 0.34 0.59 155.00 93.00 154.00
12 0.33 0.46 0.67 197.00 119.00 197.00
13 0.33 0.54 0.71 289.00 174.00 288.00
14 0.31 0.35 0.71 173.00 104.00 173.00
15 0.46 0.48 0.67 122.00 73.00 121.00
16 0.29 0.44 0.63 225.00 135.00 224.00
17 0.43 0.48 0.74 115.00 69.00 114.00
18 0.35 0.55 0.74 149.00 90.00 149.00
19 0.29 0.44 0.63 108.00 65.00 108.00
20 0.29 0.49 0.63 118.00 71.00 118.00
21 0.31 0.51 0.67 114.00 69.00 114.00
22 0.31 0.47 0.71 214.00 129.00 214.00
23 0.35 0.43 0.74 349.00 210.00 349.00
24 0.31 0.50 0.67 136.00 82.00 135.00
25 0.33 0.40 0.45 262.00 157.00 261.00
26 0.33 0.55 0.71 138.00 83.00 138.00
27 0.33 0.37 0.71 292.00 176.00 292.00
28 0.00 0.00 0.00 0.00 0.00 0.00
29 0.00 0.00 0.00 0.00 0.00 0.00
30 0.43 0.50 0.71 79.00 48.00 78.00
31 0.45 0.45 0.45 15.00 9.00 14.00
32 0.00 0.00 0.00 0.00 0.00 0.00
33 0.43 0.44 0.45 331.00 199.00 331.00
34 0.00 0.00 0.00 0.00 0.00 0.00
35 0.40 0.41 0.43 33.00 20.00 33.00
36 0.43 0.43 0.43 88.00 53.00 88.00
37 0.46 0.46 0.46 81.00 49.00 80.00

105
105 Appendices
Scenario No.4
Section Min
damage
Average
Damage
Maximum
damage Victims Injured
Need for
sheltering
0 0.30 0.30 0.30 0.00 1.00 0.00
1 0.29 0.29 0.30 0.00 0.00 0.00
2 0.29 0.49 0.65 0.00 30.00 0.00
3 0.00 0.00 0.00 0.00 0.00 0.00
4 0.00 0.00 0.00 0.00 0.00 0.00
5 0.00 0.00 0.00 0.00 0.00 0.00
6 0.00 0.00 0.00 0.00 0.00 0.00
7 0.42 0.42 0.42 0.00 6.00 0.00
8 0.00 0.00 0.00 0.00 0.00 0.00
9 0.37 0.43 0.62 0.00 24.00 0.00
10 0.39 0.40 0.42 0.00 6.00 0.00
11 0.29 0.38 0.62 0.00 13.00 0.00
12 0.30 0.45 0.65 0.00 30.00 0.00
13 0.30 0.49 0.65 0.00 56.00 0.00
14 0.29 0.32 0.65 0.00 4.00 0.00
15 0.45 0.47 0.65 0.00 21.00 0.00
16 0.29 0.45 0.62 0.00 33.00 0.00
17 0.33 0.37 0.62 0.00 9.00 0.00
18 0.29 0.49 0.65 0.00 29.00 0.00
19 0.29 0.43 0.65 0.00 14.00 0.00
20 0.29 0.48 0.62 0.00 22.00 0.00
21 0.29 0.47 0.62 0.00 20.00 0.00
22 0.29 0.41 0.62 0.00 24.00 0.00
23 0.29 0.35 0.62 0.00 17.00 0.00
24 0.29 0.46 0.62 0.00 23.00 0.00
25 0.27 0.31 0.35 0.00 4.00 0.00
26 0.27 0.47 0.62 0.00 24.00 0.00
27 0.27 0.30 0.62 0.00 0.00 0.00
28 0.00 0.00 0.00 0.00 0.00 0.00
29 0.00 0.00 0.00 0.00 0.00 0.00
30 0.28 0.36 0.59 0.00 5.00 0.00
31 0.29 0.29 0.29 0.00 0.00 0.00
32 0.00 0.00 0.00 0.00 0.00 0.00
33 0.29 0.29 0.29 0.00 0.00 0.00
34 0.00 0.00 0.00 0.00 0.00 0.00
35 0.28 0.28 0.28 0.00 0.00 0.00
36 0.28 0.28 0.28 0.00 0.00 0.00
37 0.45 0.45 0.45 0.00 13.00 0.00

106
106 Appendices
Scenario No.5
Section Min
damage
Average
Damage
Maximum
damage Victims Injured
Need for
sheltering
0 1.00 1.00 1.00 216.00 130.00 215.00
1 0.90 0.91 1.00 243.00 146.00 242.00
2 0.90 0.97 1.00 159.00 96.00 158.00
3 0.00 0.00 0.00 0.00 0.00 0.00
4 0.00 0.00 0.00 0.00 0.00 0.00
5 0.00 0.00 0.00 0.00 0.00 0.00
6 0.00 0.00 0.00 0.00 0.00 0.00
7 1.00 1.00 1.00 51.00 31.00 50.00
8 0.00 0.00 0.00 0.00 0.00 0.00
9 1.00 1.00 1.00 178.00 107.00 177.00
10 0.90 1.00 1.00 52.00 31.00 51.00
11 0.90 1.00 1.00 155.00 93.00 154.00
12 1.00 1.00 1.00 197.00 119.00 197.00
13 1.00 1.00 1.00 289.00 174.00 288.00
14 0.90 0.99 1.00 173.00 104.00 173.00
15 1.00 1.00 1.00 122.00 73.00 121.00
16 0.90 1.00 1.00 225.00 135.00 224.00
17 1.00 1.00 1.00 115.00 69.00 114.00
18 0.90 0.98 1.00 149.00 90.00 149.00
19 0.90 0.94 1.00 108.00 65.00 108.00
20 0.90 0.95 1.00 118.00 71.00 118.00
21 0.90 0.97 1.00 114.00 69.00 114.00
22 0.90 0.96 1.00 214.00 129.00 214.00
23 0.90 1.00 1.00 349.00 210.00 349.00
24 0.89 0.96 1.00 136.00 82.00 135.00
25 0.86 0.95 1.00 262.00 157.00 261.00
26 0.86 0.96 1.00 138.00 83.00 138.00
27 0.86 0.89 1.00 292.00 176.00 292.00
28 0.00 0.00 0.00 0.00 0.00 0.00
29 0.00 0.00 0.00 0.00 0.00 0.00
30 0.88 0.93 1.00 79.00 48.00 78.00
31 0.93 0.93 0.93 15.00 9.00 14.00
32 0.00 0.00 0.00 0.00 0.00 0.00
33 0.93 0.93 0.93 331.00 199.00 331.00
34 0.00 0.00 0.00 0.00 0.00 0.00
35 0.88 0.88 0.88 33.00 20.00 33.00
36 0.88 0.88 0.88 88.00 53.00 88.00
37 1.00 1.00 1.00 81.00 49.00 80.00

107
107 Appendices
Scenario No.6
Section min damage Average
Damage
Maximum
damage Victims Injured Need for sheltering
0 0.54 0.55 0.55 0.00 54.00 431.00
1 0.55 0.55 0.55 0.00 61.00 485.00
2 0.55 0.82 1.00 159.00 96.00 158.00
3 0.00 0.00 0.00 0.00 0.00 0.00
4 0.00 0.00 0.00 0.00 0.00 0.00
5 0.00 0.00 0.00 0.00 0.00 0.00
6 0.00 0.00 0.00 0.00 0.00 0.00
7 0.62 0.62 0.62 0.00 16.00 101.00
8 0.00 0.00 0.00 0.00 0.00 0.00
9 0.53 0.63 1.00 0.00 59.00 355.00
10 0.52 0.56 0.62 0.00 14.00 103.00
11 0.43 0.61 0.89 0.00 49.00 309.00
12 0.55 0.78 1.00 0.00 94.00 394.00
13 0.54 0.82 1.00 289.00 174.00 288.00
14 0.54 0.57 1.00 0.00 47.00 346.00
15 0.77 0.81 1.00 122.00 73.00 121.00
16 0.43 0.75 1.00 0.00 101.00 449.00
17 0.66 0.70 1.00 0.00 46.00 229.00
18 0.54 0.81 1.00 149.00 90.00 149.00
19 0.54 0.73 1.00 0.00 47.00 216.00
20 0.54 0.81 1.00 118.00 71.00 118.00
21 0.55 0.81 1.00 114.00 69.00 114.00
22 0.55 0.73 1.00 0.00 92.00 428.00
23 0.55 0.67 1.00 0.00 128.00 698.00
24 0.55 0.80 1.00 0.00 68.00 271.00
25 0.56 0.64 0.67 0.00 89.00 523.00
26 0.56 0.84 1.00 138.00 83.00 138.00
27 0.56 0.60 1.00 0.00 89.00 584.00
28 0.00 0.00 0.00 0.00 0.00 0.00
29 0.00 0.00 0.00 0.00 0.00 0.00
30 0.64 0.75 1.00 0.00 36.00 157.00
31 0.66 0.66 0.66 0.00 6.00 29.00
32 0.00 0.00 0.00 0.00 0.00 0.00
33 0.66 0.66 0.66 0.00 119.00 662.00
34 0.00 0.00 0.00 0.00 0.00 0.00
35 0.64 0.64 0.64 0.00 12.00 66.00
36 0.64 0.65 0.66 0.00 31.00 176.00
37 0.79 0.79 0.79 0.00 40.00 161.00

108
108 Appendices
Scenario No.7
Section min damage Average
Damage
Maximum
damage Victims Injured Need for sheltering
0 0.51 0.52 0.52 0.00 48.00 431.00
1 0.52 0.52 0.52 0.00 55.00 485.00
2 0.52 0.72 0.86 0.00 68.00 317.00
3 0.00 0.00 0.00 0.00 0.00 0.00
4 0.00 0.00 0.00 0.00 0.00 0.00
5 0.00 0.00 0.00 0.00 0.00 0.00
6 0.00 0.00 0.00 0.00 0.00 0.00
7 0.55 0.55 0.55 0.00 13.00 101.00
8 0.00 0.00 0.00 0.00 0.00 0.00
9 0.47 0.54 0.86 0.00 43.00 355.00
10 0.46 0.50 0.55 0.00 11.00 103.00
11 0.41 0.55 0.68 0.00 39.00 309.00
12 0.52 0.67 0.86 0.00 73.00 394.00
13 0.51 0.70 0.86 0.00 115.00 577.00
14 0.51 0.54 0.86 0.00 41.00 346.00
15 0.66 0.69 0.86 0.00 48.00 243.00
16 0.41 0.64 0.84 0.00 76.00 449.00
17 0.59 0.62 0.86 0.00 37.00 229.00
18 0.51 0.70 0.86 0.00 60.00 298.00
19 0.51 0.65 0.86 0.00 39.00 216.00
20 0.51 0.71 0.84 0.00 49.00 236.00
21 0.52 0.71 0.86 0.00 47.00 228.00
22 0.52 0.65 0.88 0.00 76.00 428.00
23 0.52 0.60 0.86 0.00 104.00 698.00
24 0.52 0.70 0.86 0.00 55.00 271.00
25 0.53 0.58 0.60 0.00 74.00 523.00
26 0.53 0.74 0.88 0.00 62.00 276.00
27 0.53 0.56 0.88 0.00 77.00 584.00
28 0.00 0.00 0.00 0.00 0.00 0.00
29 0.00 0.00 0.00 0.00 0.00 0.00
30 0.58 0.67 0.88 0.00 29.00 157.00
31 0.59 0.59 0.59 0.00 5.00 29.00
32 0.00 0.00 0.00 0.00 0.00 0.00
33 0.59 0.59 0.59 0.00 97.00 662.00
34 0.00 0.00 0.00 0.00 0.00 0.00
35 0.58 0.58 0.58 0.00 10.00 66.00
36 0.58 0.58 0.59 0.00 25.00 176.00
37 0.67 0.67 0.67 0.00 30.00 161.00

109
109 Appendices
Scenario No.8
Section min damage Average
Damage
Maximum
damage Victims Injured Need for sheltering
0 0.57 0.58 0.58 0.00 61.00 431.00
1 0.58 0.58 0.58 0.00 69.00 485.00
2 0.58 0.85 1.00 159.00 96.00 158.00
3 0.00 0.00 0.00 0.00 0.00 0.00
4 0.00 0.00 0.00 0.00 0.00 0.00
5 0.00 0.00 0.00 0.00 0.00 0.00
6 0.00 0.00 0.00 0.00 0.00 0.00
7 0.62 0.62 0.62 0.00 16.00 101.00
8 0.00 0.00 0.00 0.00 0.00 0.00
9 0.59 0.72 1.00 0.00 75.00 355.00
10 0.58 0.63 0.69 0.00 17.00 103.00
11 0.46 0.69 1.00 0.00 61.00 309.00
12 0.58 0.88 1.00 197.00 119.00 197.00
13 0.57 0.91 1.00 289.00 174.00 288.00
14 0.57 0.60 1.00 0.00 52.00 346.00
15 0.91 0.93 1.00 122.00 73.00 121.00
16 0.46 0.87 1.00 225.00 135.00 224.00
17 0.73 0.76 1.00 0.00 54.00 229.00
18 0.57 0.85 1.00 149.00 90.00 149.00
19 0.57 0.76 1.00 0.00 50.00 216.00
20 0.57 0.82 1.00 118.00 71.00 118.00
21 0.58 0.85 1.00 114.00 69.00 114.00
22 0.58 0.77 1.00 0.00 101.00 428.00
23 0.58 0.74 1.00 0.00 154.00 698.00
24 0.58 0.84 1.00 136.00 82.00 135.00
25 0.59 0.70 0.75 0.00 105.00 523.00
26 0.59 0.87 1.00 138.00 83.00 138.00
27 0.59 0.64 1.00 0.00 100.00 584.00
28 0.00 0.00 0.00 0.00 0.00 0.00
29 0.00 0.00 0.00 0.00 0.00 0.00
30 0.72 0.80 1.00 79.00 48.00 78.00
31 0.73 0.73 0.73 0.00 7.00 29.00
32 0.00 0.00 0.00 0.00 0.00 0.00
33 0.73 0.73 0.73 0.00 144.00 662.00
34 0.00 0.00 0.00 0.00 0.00 0.00
35 0.72 0.72 0.72 0.00 14.00 66.00
36 0.72 0.72 0.73 0.00 38.00 176.00
37 0.92 0.92 0.92 81.00 49.00 80.00

110
110 Appendices
Appendix E: Data for First Scenario
%%First Scenario function [acc1,D1,ne1]=First % insert magnitude of the First scenario M = 4.60; %%Epicenter coordinates of the First scenario scenarioXY=[1616945.315 5048374.887]; %%Read Coordinates of Sections seccordXY=xlsread('First.xlsx','Damage','R2:S39'); %%No. of sections [ne1]=length(seccordXY); %%No. of Population Pop1 =xlsread('First.xlsx','Damage','H2:H39'); RF=ones(ne1,1); %% Reliability Factor I=ones(ne1,1); %% Importance Factor
%%Calculation of the Peak Ground Acceleration for Sections%% for i = 1:ne1 R(i,1) = sqrt(abs((scenarioXY(1)-seccordXY(i,1))^2+(scenarioXY(2)-
seccordXY(i,2))^2)); end Rf = R/1000;
%%Constants for Attenuation Law%% a = -1.845; b = 0.363; c = -1; sigma = 0.19; h = 5; for i = 1:ne1 Y(i,1) = 10^(a + b*M + c*log10(Rf(i,1)^2+h^2)^1/2+ sigma); end acc1=Y*9.80; avgacc=mean(acc1);
%%Calculation of Sections Damage%% D1 = RF.*I.*xlsread('First.xlsx','Damage','G2:G39'); avgDam=mean(D1);
%% Damage of Strategic Facilities DamCritical1 = [0.5;0.3;0.5;0.5;0.3;0.5];
%%Effect on Popluation%% Victims1=xlsread('First.xlsx','Damage','I2:I39'); Injured1 =xlsread('First.xlsx','Damage','J2:J39'); Sheltering = xlsread('First.xlsx','Damage','K2:K39');
%%%% Response SecPr=[xlsread('First.xlsx','Response','A2:A39'),xlsread('First.xlsx','Response',
'C2:C39')];%% Section Response Priority RnkPr=sortrows(SecPr,2);
im= imread('C:\Users\Mohamed\Dropbox\Thesis\22-7-
2012\salo_1901\salo_1901_4.6\sec_homeless.jpg'); im1= imread('C:\Users\Mohamed\Dropbox\Thesis\22-7-
2012\salo_1901\salo_1901_4.6\sec_Priorities.jpg'); imshow(im1)

111
111 Appendices
Appendix F: Similarity Function
clear all close all clc Ns=8; %% Number of Recorded Scenarios %%%%%%%%%%%%%%%%%%%%%%%%%%%%%%%%%%%%%%%%%%%%%%%%%%%%%%% % INPUT: acceleration values for each recorded scenario % %%%%%%%%%%%%%%%%%%%%%%%%%%%%%%%%%%%%%%%%%%%%%%%%%%%%%%% [acc,D,ne]=New; [acc1,D1,ne1]=First; [acc2,D2,ne2]=Second; [acc3,D3,ne3]=Third; [acc4,D4,ne4]=Fourth; [acc5,D5,ne5]=Fifth; [acc6,D6,ne6]=Sixth; [acc7,D7,ne7]=Seventh; [acc8,D8,ne8]=Eigth; acce=[acc1,acc2,acc3,acc4,acc5,acc6,acc7,acc8]; Dmg=[D1,D2,D3,D4,D5,D6,D7,D8]; Nsect=[ne1,ne2,ne3,ne4,ne5,ne6,ne7,ne8];
%%%%%%%%%%%%%%%%%%%%%%%%%%%%%%%%% % Setting up the solving system % %%%%%%%%%%%%%%%%%%%%%%%%%%%%%%%%% %%comparison Criteria cc chooses either to compare for Pga or average %%damage %% cc= 1 Comparison criteria using peak ground Acceleration %% cc=2 Comparison Criteria using Damage for Sections cc=1; for j=1:Ns if ne==Nsect(j) % First approach fsimacc1=zeros(size(Ns),2); fsimDmg1=zeros(size(Ns),2); for i=1:Ns fsimacc1(i,1)=(mean(abs(acc-acce(:,i)))); fsimacc1(i,2)=i; end for i=1:Ns fsimDmg1(i,1)=(mean(abs(D-Dmg(:,i)))); fsimDmg1(i,2)=i; end [RKacc1]=sortrows(fsimacc1,1); [RKDmg1]=sortrows(fsimDmg1,1);
else fsimacc2=zeros(Ns,2); fsimDmg2=zeros(Ns,2); for i=1:Ns fsimacc2(i,1)=abs(mean(acc)-mean(acce(:,i))); fsimacc2(i,2)=i; end [RKacc2]=sortrows(fsimacc2,1); for i=1:Ns fsimDmg2(i,1)=abs(mean(D)-mean(Dmg(:,i))); fsimDmg2(i,2)=i; end [RKDmg2]=sortrows(fsimDmg2,1); end end

112
112 Appendices
if ne==Nsect(j) if cc==1 Rnk=RKacc1(1,2); disp(sprintf('The Similar Scenario is no %d',Rnk)) else Rnk=RKDmg1(1,2); disp(sprintf('The Similar Scenario is no %d',Rnk)) end else if cc==1 Rnk=RKacc2(1,2); disp(sprintf('The Similar Scenario is no %d',Rnk)) else Rnk=RKDmg2(1,2); disp(sprintf('The Similar Scenario is no %d',Rnk)) end end
if Rnk==1 run('First') else if Rnk==2 run('Second'); else if Rnk==3 run('Third') else if Rnk==4 run('Fourth') else if Rnk==5 run('Fifth') else if Rnk==6 run('Sixth') else if Rnk==7 run('Seventh') else run('Eigth') end end end end end end end

113
113 Appendices
Appendix G: Data for New Scenario
function [acc,D,ne]=New %%%%%%%%%%%%%%%%%%%%%%%%%%%%%%%%%%%%%%%%%%%%%%%%%%%%%%% % INPUT: Data for the New Occuring Scenario % %%%%%%%%%%%%%%%%%%%%%%%%%%%%%%%%%%%%%%%%%%%%%%%%%%%%%%%
%%Earthquake Magnitude of the new scenario M =xlsread('Input.xlsx','EQ','D1');
%Epicenter coordinates of the new scenario scenarioXY=xlsread('Input.xlsx','EQ','D3:E3');
%%Coordinates of Sections in New Scenario seccordXY= xlsread('Input.xlsx','C2:D39');
%No. of sections ne=length(seccordXY);
%% Reliability and Importance Factor RF=xlsread('Input.xlsx','F2:F39'); I=xlsread('Input.xlsx','G2:G39');
%%Calculation of Peak Ground Acceleration for the New Scenarios for i = 1:ne R(i,1)=sqrt(abs((scenarioXY(1)-seccordXY(i,1))^2+(scenarioXY(2)-
seccordXY(i,2))^2)); end Rf = R/1000;
%%Constants for Attenuation Law a = -1.845; b = 0.363; c = -1; sigma = 0.19; h = 5; for i = 1:ne Y(i,1) = 10^(a + b*M + c*log10(Rf(i,1)^2+h^2)^1/2+ sigma); end acc = Y*9.80; avgacc = mean(acc);
%%% Computation of the Damage
%% option =1 for Collected Data %% option =2 for Calculated Data option=1;
if option==1 D=RF.*I.*xlsread('Input.xlsx','E2:E39'); else
%%Constants for Fragility Curves alpha = 0.08; beta = 0.01304; alphac =1.53710; betac = 0.00097; gama = 1.80870; VI=xlsread('Input.xlsx','B2:B39');%%Vulnerability Index for Sections 1:ne

114
114 Appendices
for i = 1:ne u(i,1) = VI(i,1)+25; end for i = 1:ne Yi(i,1) = alpha*exp(-beta*u(i,1)); end
for i = 1:ne Yc(i,1) = (alphac*exp(-betac*(u(i,1))^gama))^-1; end
for i = 1:ne if Y(i,1)<=Yi(i,1) D(i,1) = 0; elseif Y(i,1)>=Yc(i,1) D(i,1) = 1; else Yi(i,1)<Y(i,1)<Yc(i,1) D(i,:) = RF(i)*I(i)*(Y(i,1)-Yi(i,1))/(Yc(i,1)-Yi(i,1)); end end Damage =D(i,:); end