Robust non-contact vital signs monitoring using a camera - arXiv
Upload
independentCategory
view
1download
0
Abstract—The accurate identification and recognition of the traffic signs is a challenging problem as the developed systems have to address a large number of imaging problems such as motion artifacts, various weather conditions, shadows and partial occlusion, issues that are often encountered in video traffic sequences that are captured from a moving vehicle. These factors substantially degrade the performance of the existing traffic sign recognition (TSR) systems and in this paper we detail the implementation of a new strategy that entails three distinct computational stages. The first component addresses the robust identification of the candidate traffic signs in each frame of the video sequence. The second component discards the traffic sign candidates that do not comply with stringent shape constraints, and the last component implements the classification of the traffic signs using Support Vector Machines (SVMs). The main novel elements of our TSR algorithm are given by the approach that has been developed for traffic sign classification and by the experimental evaluation that was employed to identify the optimal image attributes that are able to maximize the traffic sign classification performance. The TSR algorithm has been validated using video sequences that include the most important categories of signs that are used to regulate the traffic on the Irish and UK roads, and it achieved 87.6% sign detection, 99.2% traffic sign classification accuracy and 86.7% overall traffic sign recognition.
Index Terms—Traffic signs, Color segmentation, Shape analysis, Image attributes, Support Vector Machines.
I. INTRODUCTION raffic signs have primarily the role to regulate the traffic and to provide information for drivers about road quality, traffic restrictions, warnings, possible
directions, etc. The vast majority of the road (or traffic) signs are standardized and they have distinct shapes and color patterns to allow their easy identification in all weather and illumination conditions. With the increased traffic congestion that was witnessed over the past decades, the correct recognition of the road signs plays an important role in preventing accidents. In particular the signs that regulate the traffic at intersections are of utmost importance since their avoidance can result in collisions with extreme consequences. The robust identification of the road signs is dependent on several physiological and external factors such as weather
Thanh Bui-Minh, Ovidiu Ghita, and Paul F. Whelan are with the School of Electronic Engineering, Dublin City University, Dublin, Ireland (e-mail: [email protected], [email protected], [email protected]).
Trang Hoang is with the Hochiminh City University of Technology, Hochiminh City, Vietnam (e-mail: [email protected]).
conditions and events that lead to driver distraction. The ability of the driver to locate and identify the traffic signs is highly influenced by his/her physical and mental alertness, and the most important risk factors are caused by tiredness, emotional stress or side effects caused by medication [2,5]. Thus, the development of automatic traffic sign recognition (TSR) systems is extremely opportune since such systems have an important role in preventing accidents, save lives and increase the driving performance especially in situations when the road signs are partially occluded/damaged or placed in unexpected locations.
Since the video data captured from a moving vehicle present a large spectrum of adverse factors (motion artifacts, intensity inconsistencies in the optical signal caused by various illumination conditions, highlights, shadows, light emitted by the headlamps of the incoming vehicles and background objects that resemble the color characteristics of particular traffic signs), the robust detection and recognition of the traffic signs generate a challenging task that has been intensively studied during the past two decades. The challenges associated with the video data acquisition process are further enhanced by the car vibrations that are induced by the uneven road surface, changes in the color of the traffic signs that are caused by the long exposure to sunlight [1] and by weather-related factors such as fog, rain and snow. When all of these factors are considered, they generate a wide range of issues that need to be addressed by the traffic sign recognition (TSR) systems.
To this end, various methods for traffic sign recognition have been proposed, where several representative approaches are detailed in references [2,3,5,7,8,10,11,15]. A common element of the published works that addressed the traffic sign recognition is that they were based on specific constraints in relation to the color and shape of the road signs being evaluated. For instance, Escalera et al [8] proposed to initially detect the regions of interests associated with the candidate traffic signs by using color thresholding and then employing the inner part of each candidate region as input for a multilayer perceptron neural network classifier. The experiments were performed using a relative small subset of traffic signs with triangular and circular shapes and results were provided to illustrate the response of the classifier to each type of the traffic sign. A related approach was proposed by Maldonado-Bascón et al [2,4] where in the first step a color segmentation algorithm was applied to extract the road sign candidates using linear SVMs, while in the second stage the candidate regions where classified using Gaussian-kernel SVMs.
A Robust Algorithm for Detection and Classification of Traffic Signs in Video Data
Thanh Bui-Minh, Ovidiu Ghita, Paul F. Whelan, Senior Member, IEEE, and Trang Hoang
T
108
A different solution was proposed by Fleyeh et al [5] where a traffic sign detection method based on the evaluation of the color and shape was first applied to localize and validate the regions of interest that was followed by the calculation of the Zernike and Legendre moments that were used as input for a SVM classifier. Other authors investigated the optimal way to include the color and shape information in the development of TSR systems and a representative study has been detailed in [15]. The authors of [15] indicate that many published algorithms addressed the recognition of narrow categories of traffic signs (where the principal interest was the robust identification of the speed limit signs), and this observation clearly highlights the limitations of the current range of traffic sign recognition systems.
This brief survey on TSR indicates that in spite of the numerous previous studies, the problem of traffic sign recognition is still an ongoing complex problem. Many prior studies were concerned with the identification of the traffic signs in ideal conditions and they generally ignored the TSR problems that may arise when the video data is captured from a moving vehicle in diverse weather conditions. To address several challenges associated with TSR, in our work an important problem was associated with the identification of the image attributes that maximize the results of the multi-class traffic sign classification. To further enhance the performance of the traffic sign classification, we have developed a semantic-based classification approach where distinct classifiers were trained based on the color and shape of the traffic signs.
This paper is organized as follows. Section II presents an overview of the developed traffic sign recognition system. Sections III to V provide details about each computational component of the proposed TSR system. Experimental results are included in Section VI, and conclusions are provided in Section VII.
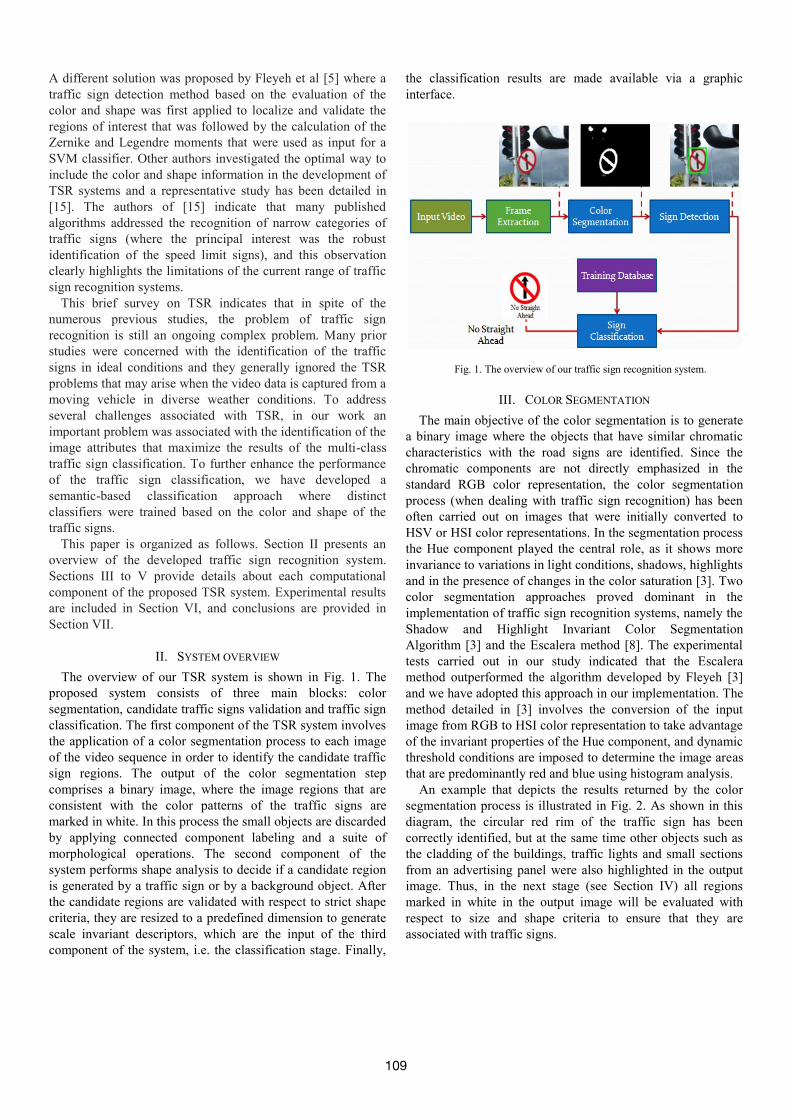
II. SYSTEM OVERVIEW The overview of our TSR system is shown in Fig. 1. The
proposed system consists of three main blocks: color segmentation, candidate traffic signs validation and traffic sign classification. The first component of the TSR system involves the application of a color segmentation process to each image of the video sequence in order to identify the candidate traffic sign regions. The output of the color segmentation step comprises a binary image, where the image regions that are consistent with the color patterns of the traffic signs are marked in white. In this process the small objects are discarded by applying connected component labeling and a suite of morphological operations. The second component of the system performs shape analysis to decide if a candidate region is generated by a traffic sign or by a background object. After the candidate regions are validated with respect to strict shape criteria, they are resized to a predefined dimension to generate scale invariant descriptors, which are the input of the third component of the system, i.e. the classification stage. Finally,
the classification results are made available via a graphic interface.
Fig. 1. The overview of our traffic sign recognition system.
III. COLOR SEGMENTATION The main objective of the color segmentation is to generate
a binary image where the objects that have similar chromatic characteristics with the road signs are identified. Since the chromatic components are not directly emphasized in the standard RGB color representation, the color segmentation process (when dealing with traffic sign recognition) has been often carried out on images that were initially converted to HSV or HSI color representations. In the segmentation process the Hue component played the central role, as it shows more invariance to variations in light conditions, shadows, highlights and in the presence of changes in the color saturation [3]. Two color segmentation approaches proved dominant in the implementation of traffic sign recognition systems, namely the Shadow and Highlight Invariant Color Segmentation Algorithm [3] and the Escalera method [8]. The experimental tests carried out in our study indicated that the Escalera method outperformed the algorithm developed by Fleyeh [3] and we have adopted this approach in our implementation. The method detailed in [3] involves the conversion of the input image from RGB to HSI color representation to take advantage of the invariant properties of the Hue component, and dynamic threshold conditions are imposed to determine the image areas that are predominantly red and blue using histogram analysis.
An example that depicts the results returned by the color segmentation process is illustrated in Fig. 2. As shown in this diagram, the circular red rim of the traffic sign has been correctly identified, but at the same time other objects such as the cladding of the buildings, traffic lights and small sections from an advertising panel were also highlighted in the output image. Thus, in the next stage (see Section IV) all regions marked in white in the output image will be evaluated with respect to size and shape criteria to ensure that they are associated with traffic signs.
109

Fig. 2. An example of red color segmentation for a traffic sign image.
IV. TRAFFIC SIGN VALIDATION
The traffic sign validation consists of two sequential processes. The first process eliminates the small regions that are generated by image noise or by red and blue scene objects that are too small to be used for classification purposes. The second process applies shape analysis to evaluate if the remaining segmented objects are potential traffic signs candidates.
A. Removal of the non-plausible candidate regions The removal of the non-plausible candidate regions from the
image resulting from the color segmentation stage involves a two-stage procedure. The first stage applies a computationally optimized connected component labeling algorithm [9] that allocates a distinct label for each candidate region. Then, in the second stage, a size filtering process is applied to eliminate the candidate regions that do not obey the threshold that is imposed by the minimum size criteria. In our implementation the minimum size of the region was set to 31×31 since regions smaller than this threshold do not carry sufficient information to allow the robust evaluation of their shape or to be used for traffic sign classification. The application of the size filtering process proved a key step in achieving real-time processing, since non-plausible candidate regions are not further evaluated in the next stage of the algorithm.
B. Validation of the traffic sign candidate regions The standardized traffic signs have three distinct shapes:
octagonal, triangular and circular. Therefore, the validation of the candidate regions is conducted to verify several shape measures such as ellipticity, triangularity and rectangularity. The identification of the lines and circles in the color segmented image can be done using methods based on the Hough transform, but this approach is both computationally intensive and impractical, as the size of the candidate regions is not constant. Thus, a better solution is to evaluate the shape of the candidate regions using the Affine Moment Invariant (I1) [6]:
400
2110220
1I (2)
where μ20, μ02 and μ11 are the second order central moments and μ00 is the zero order central moment. The second and the central moments are calculated using the following expression:
),()()(),(
yxfyyxx qp
cyxpq
otherwiseRyxif
yxf 0
),( 1),( c (3)
where ),( yx is the centroid of the candidate region RC. The Affine Moment Invariant I1 is calculated using (2) for each candidate region and the ellipticity (E) and triangularity (T) [6] are determined using the equations (4) and (5), respectively:
otherwise
ifIE
I1216
1216
111
2 I 16 (4)
otherwiseifI
TI1108
1108
111 I 108
(5)
When (4) and (5) are used for shape analysis, an ellipticity value E = 1 corresponds to a perfectly circular shape, while, similarly, a triangularity value T = 1 implies a perfect triangular shape. The rectangularity R is given by the ratio between the area of the candidate region and the area of its minimum bounding rectangle (MBR). Before we calculate these three shape measures, we must verify that the candidate region is uniform (i.e. does not contain any holes). Since the traffic signs have two different colors, one for the rim and the other for the inner part, we recall that only the rim color has been used in the segmentation process. Thus, we applied the convex hull operation to generate a homogenous object. Table I shows the range of values for E, T and R that are used in the process of shape validation. Candidate regions that do not obey these conditions are eliminated. An interesting observation resulting from our experiments is that the {E,T,R} values calculated for octagonal shapes are always in the range limits for circular shapes, thus no additional shape criteria was employed to validate the candidate regions that correspond to octagonal traffic signs.
TABLE I RANGE OF THE {E, T, R} VALUES FOR CIRCULAR AND TRIANGULAR SHAPES
Shape Ellipticity (E)
Triangularity (T)
Rectangularity (R)
Circle/Octagon 0.98 < E < 1.0 T > 0.68 R > 0.69 Triangle E< 0.78 0.91< T< 1.0 0.49< R< 0.7
C. Identification and validation of the traffic signs that are attached to the same pole A problem that often occurs when dealing with the validation
of candidate regions is given by the situations when multiple traffic signs with the same rim color are attached to a common pole and they exhibit mutual occlusion. In these situations the color segmentation process discussed in Section III will generate a single region that contains all traffic signs that are in contact to each other or they show any degree of overlap.
110
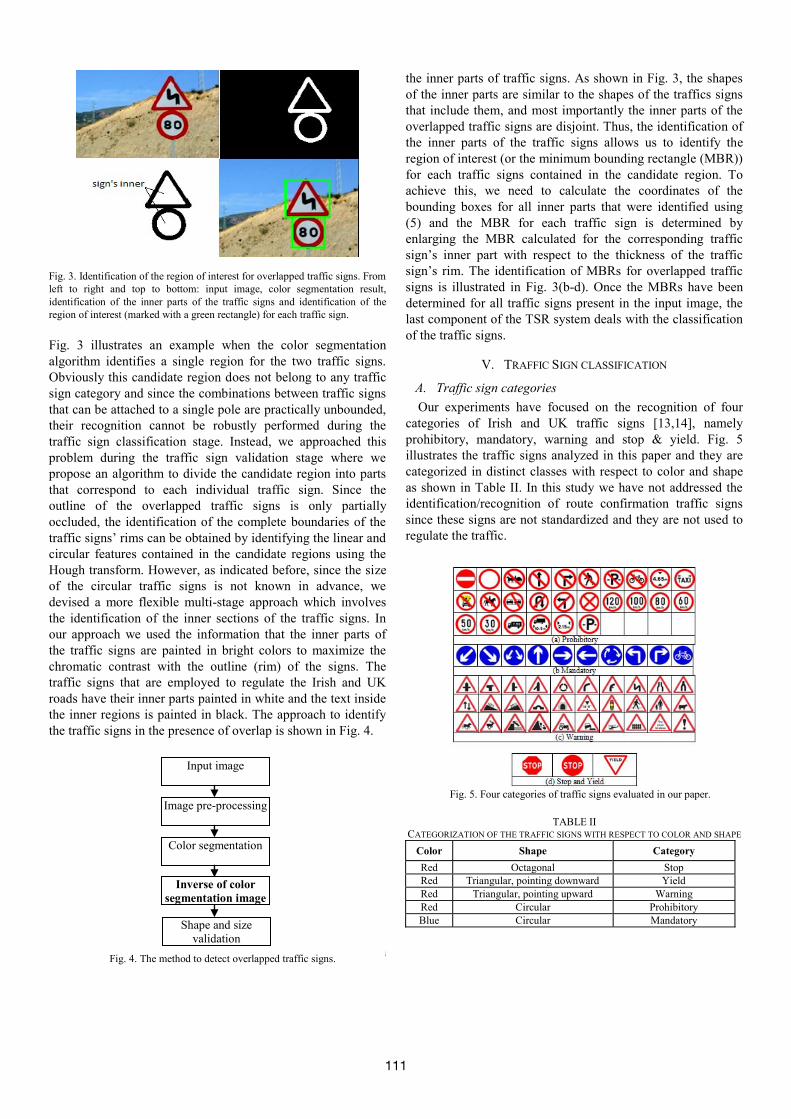
Fig. 3. Identification of the region of interest for overlapped traffic signs. From left to right and top to bottom: input image, color segmentation result, identification of the inner parts of the traffic signs and identification of the region of interest (marked with a green rectangle) for each traffic sign. Fig. 3 illustrates an example when the color segmentation algorithm identifies a single region for the two traffic signs. Obviously this candidate region does not belong to any traffic sign category and since the combinations between traffic signs that can be attached to a single pole are practically unbounded, their recognition cannot be robustly performed during the traffic sign classification stage. Instead, we approached this problem during the traffic sign validation stage where we propose an algorithm to divide the candidate region into parts that correspond to each individual traffic sign. Since the outline of the overlapped traffic signs is only partially occluded, the identification of the complete boundaries of the traffic signs’ rims can be obtained by identifying the linear and circular features contained in the candidate regions using the Hough transform. However, as indicated before, since the size of the circular traffic signs is not known in advance, we devised a more flexible multi-stage approach which involves the identification of the inner sections of the traffic signs. In our approach we used the information that the inner parts of the traffic signs are painted in bright colors to maximize the chromatic contrast with the outline (rim) of the signs. The traffic signs that are employed to regulate the Irish and UK roads have their inner parts painted in white and the text inside the inner regions is painted in black. The approach to identify the traffic signs in the presence of overlap is shown in Fig. 4. The inversion of color segmentation image provides us with
the inner parts of traffic signs. As shown in Fig. 3, the shapes of the inner parts are similar to the shapes of the traffics signs that include them, and most importantly the inner parts of the overlapped traffic signs are disjoint. Thus, the identification of the inner parts of the traffic signs allows us to identify the region of interest (or the minimum bounding rectangle (MBR)) for each traffic signs contained in the candidate region. To achieve this, we need to calculate the coordinates of the bounding boxes for all inner parts that were identified using (5) and the MBR for each traffic sign is determined by enlarging the MBR calculated for the corresponding traffic sign’s inner part with respect to the thickness of the traffic sign’s rim. The identification of MBRs for overlapped traffic signs is illustrated in Fig. 3(b-d). Once the MBRs have been determined for all traffic signs present in the input image, the last component of the TSR system deals with the classification of the traffic signs.
V. TRAFFIC SIGN CLASSIFICATION
A. Traffic sign categories Our experiments have focused on the recognition of four
categories of Irish and UK traffic signs [13,14], namely prohibitory, mandatory, warning and stop & yield. Fig. 5 illustrates the traffic signs analyzed in this paper and they are categorized in distinct classes with respect to color and shape as shown in Table II. In this study we have not addressed the identification/recognition of route confirmation traffic signs since these signs are not standardized and they are not used to regulate the traffic.
Fig. 5. Four categories of traffic signs evaluated in our paper.
TABLE II
CATEGORIZATION OF THE TRAFFIC SIGNS WITH RESPECT TO COLOR AND SHAPE Color Shape Category Red Octagonal Stop Red Triangular, pointing downward Yield Red Triangular, pointing upward Warning Red Circular Prohibitory Blue Circular Mandatory
Fig. 4. The method to detect overlapped traffic signs.
Color segmentation
Inverse of color segmentation image
Shape and size validation
Input image
Image pre-processing
111

B. SVM Classification After the validation of the traffic sign candidate regions is
finalized, the pictograms encompassed by the candidate regions’ MBRs are re-scaled to 31×31 to generate scale invariant image attributes, where the feature vector has been obtained by scanning the pictogram in a raster scan mode. Since the signs can be roughly categorized based on color we have employed two SVM classifiers, one for red signs and another one for blue traffic signs. We have adopted this classification strategy to increase the classification accuracy as the number of classes that are trained for each classifier when using this approach is reduced.
Fig. 6. Pictograms for a 30km/h speed limit sign used for SVM training. (a) Grayscale pictograms. (b) Histogram equalized grayscale pictograms. (c) Binary pictograms.
Fig. 7. Examples detailing the traffic sign classification (the candidate traffic signs regions are marked with rectangles and the classification results are shown on the top left side of the image).
A distinct problem that we addressed during the development of the proposed traffic sign classification strategy was related to the construction of the training set and the type of input data that can be used for training and testing purposes. As the traffic signs are located outdoor, the pictogram information determined from the region of interest (MBR) of each candidate region is affected by illumination and
viewpoint changes that are caused by the improper orientation of the traffic signs with respect to the optical axis of the camera. To reduce the problems generated by these changes, for each class of traffic signs (red and blue categories) we constructed a training set that consists of 30 pictograms that include illumination and viewpoint changes. Another important issue was related to the identification of the input data that returns optimal classification results. Thus, in our study we evaluated the classification accuracy for three types of input data: grayscale pictograms, histogram equalized grayscale pictograms and binary pictograms. Fig. 6 presents samples that are included in the training set for each type of input data and Fig. 7 illustrates examples of the results returned by the classification process.
VI. EXPERIMENTAL RESULTS In our experiments we have analyzed 650 images and 5
sequences of traffic video data (1600 frames). The speed of the vehicle was adjusted according to road conditions and was always within legal limits. The image resolution in the video sequences is 448x336. The images and video sequences used in our experiments have been acquired in diverse environment conditions, as indicated in Table III, and they allowed us to conduct a comprehensive performance evaluation for our traffic sign recognition system. Since the proposed system consists of distinct computational components, the performance evaluation has been carried out for color segmentation, sign validation and overall classification accuracy. Detailed experimental results that are obtained for various weather conditions, image quality, presence of occlusion and state of the traffic signs are reported in Tables III and IV. The accuracies of the color segmentation and traffic sign validation reported in Table III were calculated as the ratio between the number of correctly segmented/validated traffic signs and the total number of traffic signs present in the image and video sequences. In Table IV the classification accuracy has been determined as the ratio between the number of correctly classified traffic signs and the total number of validated traffic signs. The results reported in Tables III and IV are provided to indicate the performances obtained by each individual component of the proposed TSR system to avoid the problems related to error propagation.
TABLE III
ACCURACY OF THE COLOR SEGMENTATION AND VALIDATION OF THE TRAFFIC SIGN CANDIDATE REGIONS
Conditions Color segmentation
Validation of candidate regions
Clustered signs 95.6% 90% Bad lighting 99.1% 99.1%
Blurred Signs 80.9% 76.1% Damaged Signs 87.2% 84.6% High Lighting 98.9% 93.8%
At Night 91.6% 91.7% Occluded Signs 84.6% 65.6% Rotated Signs 90.5% 88.6%
Snow 90.0% 86.6% Normal 100% 100%
Average 91.8% 87.6%
112

TABLE IV ACCURACY OF THE TRAFFIC SIGN CLASSIFICATION USING DIFFERENT INPUT
ATTRIBUTES (C-SVM WITH LINEAR KERNELS) Input Attributes Classification accuracy
Grayscale pictograms 95.9% Histogram equalized grayscale pictograms 98.67%
Binary pictograms 99.2%
The last experiments evaluate the performance of the entire (whole) TSR system (overall TSR accuracy), which is given by the total number of correctly classified traffic signs and the total number of traffic signs present in the image and video data. Table V presents comparative overall classification results obtained by our and two representative TSR systems. To provide more results about the performance of our TSR system, in addition to TSR accuracy we also indicate the false positives rate (FPR). The overall classification results shown in Table V indicate that our TSR algorithm is more accurate than the TSR methods detailed in [5] and [15].
TABLE V
OVERALL ACCURACY: OUR ALGORITHM AND OTHER PUBLISHED TSR WORKS
TSR Method Overall TSR Accuracy
False positive rate (FPR)
Fleyeh [5] 82.3% - Ruta et al [15] 85.3% -
Our work 86.7% 1.2%
In our implementation we have used the C-SVM classifier [12] and best classification results were obtained when linear kernels were used to map the feature space and the parameter C = 1.0. As indicated in Section V.B three types of pictograms were used as input for C-SVM classifiers and the experiments show that the best results (see Table IV) were obtained for binary traffic sign pictograms. These results were expected as the pictogram binarization process removes to a great extent the undesired effects that are generated by changes in illumination. In line with the increased performance, the use of binary pictograms proved opportune for practical reasons as it allows real-time operation. The entire TSR algorithm has been implemented in C++ using OpenCV [12] and the mean average time required to process one image (448×336) is 0.125s when the algorithm was executed on a dual-core 2.2 GHz computer.
VII. CONCLUSIONS This paper detailed the development of a new approach for
traffic sign recognition which involves a three-stage process: color segmentation, validation of the traffic sign candidate regions with respect to color and shape information and SVM traffic sign classification. In this investigation a special focus was placed on the evaluation of the proposed traffic sign recognition system using challenging video data captured from a moving vehicle where of interest was the identification of the optimal input patterns that maximize the accuracy of the traffic sign classification process. The proposed system obtained 86.7% overall TSR classification accuracy when it was applied to identify four categories of traffic signs. In our future studies we will focus on the implementation of robust traffic sign
tracking algorithms that will be used to enhance the confidence of the traffic sign recognition in video data and on the extension of the proposed system to handle the recognition of a larger set of traffic signs and on the automatic identification of the traffic lights.
REFERENCES [1] H. Fleyeh, “Traffic sign recognition by fuzzy sets”, IEEE Intelligent
Vehicles Symposium, University of Technology Eindhoven, The Netherlands, June 4-6, 2008.
[2] S. Maldonado-Bascón, S. Lafuente-Arroyo, P. Gil-Jiménez, H. Gómez-Moreno and F. López-Ferreras, “Road-sign detection and recognition based on Support Vector Machines”, IEEE Trans. on Intelligent Transportation Systems, vol. 8, no. 2, pp. 264- 278, 2007.
[3] H. Fleyeh, “Shadow and highlight invariant colour segmentation algorithm for traffic signs”, IEEE Conference on Cybernetics and Intelligent Systems, Bangkok, Thailand, June 2006.
[4] S. Maldonado-Bascón, J. Acevedo-Rodríguez, A. Fernández-Caballero, and F. López-Ferreras, “An optimization on pictogram identification for the road-sign recognition task using SVMs”, Computer Vision and Image Understanding, vol. 114, no. 3, pp. 373-383, 2009.
[5] H. Fleyeh, “Traffic and road sign recognition”, Dalarna University, Sweden, 2008.
[6] P. Rosin, “Measuring shape: Ellipticity, rectangularity, and triangularity”, Machine Vision and Applications, vol. 14, no. 3, pp. 172-184, 2003.
[7] H. Gómez-Moreno, S. Maldonado-Bascón, P. Gil-Jiménez, and S. Lafuente-Arroyo, “Goal evaluation of segmentation algorithms for traffic sign recognition”, IEEE Trans. on Intelligent Transportation Systems, vol. 11, no. 4, pp. 917-930, 2010.
[8] A. Escalera, L.E. Moreno, M.A. Salichs, and J. Armingol, “Road traffic sign detection and classification”, IEEE Trans. on Industrial Electronics, vol. 44, no. 6, pp. 848-859, 1997.
[9] F. Chang, C.J. Chen, and C.J. Lu, “A linear-time component-labelling algorithm using contour tracing technique”, Computer Vision and Image Understanding, vol. 93, no. 2, pp. 206-220, 2004.
[10] M. Meuter, C. Nunn, S. Gormer, S. Muller-Schneiders, and A. Kummert, “A decision fusion and reasoning module for a traffic sign recognition system”, IEEE Trans. on Intelligent Transportation Systems, vol. 12, no. 4, pp. 1126-1134, 2011.
[11] T. Le, S. Tran, S. Mita, and T.D. Nguyen, “Real-time traffic sign detection using color and shape-based features", 2nd Asian Conference on Intelligent Information and Database Systems, LNAI 5991, Hue, Vietnam, 2010.
[12] G. Bradski and A. Kaehler, Learning OpenCV: Computer Vision with the OpenCV Library, First Edition, O’Reilly Media, 2008
[13] Department of Transport, Ireland, “Traffic Signs Manual”, 2010. [14] Department of Transport, UK, “Traffic Signs Manual”, 2004. [15] A. Ruta, Y. Li, and X. Liu, “Real-time traffic sign recognition from
video by class-specific discriminative features”, Pattern Recognition, vol. 43, no. 1, pp. 416-430, 2010.
113
Copyright © 2022 FDOKUMEN