A Review of Automated Methods for Detection of Myocardial ...
35
A Review of Automated Methods for Detection of Myocardial Ischemia and Infarction using Electrocardiogram and Electronic Health Records Sardar Ansari ∗ , Member, IEEE, Negar Farzaneh, Student Member, IEEE, Marlena Duda, Kelsey Horan, Hedvig B. Andersson, Zachary D. Goldberger, Brahmajee K. Nallamothu ∗ , and Kayvan Najarian ∗ , Senior Member, IEEE Abstract—There is a growing body of research focusing on automatic detection of ischemia and myocardial infarction (MI) using computer algorithms. In clinical settings, ischemia and MI are diagnosed using ECG recordings as well as medical context including patient symptoms, medical history and risk factors, information that is often stored in the electronic health records. The ECG signal is inspected to identify changes in the morphology such as ST-segment deviation and T wave changes. Some of the proposed methods compute similar features automatically while others use non-conventional features such as wavelet coefficients. This paper provides an overview of the methods that have been proposed in this area, focusing on their historical evolution, the publicly available datasets that they have used to evaluate their performance and the details of their algorithms for ECG and EHR analysis. The validation strategies that have been used to evaluate the performance of the proposed methods are also presented. Finally, the paper provides recommendations for future research to address the shortcomings of the currently existing methods and practical considerations to make the proposed technical solutions applicable in clinical practice. Index Terms—Myocardial infarction, Myocardial ischemia, ST- segment deviation, ECG waveform analysis, Automated detection. I. I NTRODUCTION S. Ansari is with the Department of Emergency Medicine, University of Michigan, Ann Arbor, MI, 48109 USA. e-mail: [email protected]. N. Farzaneh is with the Department of Computational Medicine and Bioinformatics, University of Michigan, Ann Arbor, MI, 48109 USA. e-mail: [email protected]. M. Duda is with the Department of Computational Medicine and Bioin- formatics, University of Michigan, Ann Arbor, MI, 48109 USA. e-mail: [email protected]. K. Horan is with the Department of Computer Science, City College of New York, New York, NY, 10031 USA. e-mail: [email protected]. H. B. Andersson is with the Department of Cardiology, The Heart Centre, Rigshospitalet, Copenhagen University Hospital, Copenhagen, Denmark and the Department of Internal Medicine, University of Michigan, Ann Arbor, MI, 48109 USA. e-mail: [email protected]. Z. D. Goldberger is with the Department of Medicine, Division of Cardiol- ogy, University of Washington School of Medicine, Seattle, WA, 98195 USA. e-mail: [email protected]. B. K. Nallamothu is with the Department of Internal Medicine, University of Michigan, Ann Arbor, MI, 48109 USA. e-mail: [email protected]. K. Najarian is with the Department of Computational Medicine and Bioinformatics, the Department of Emergency Medicine and the Electrical Engineering and Computer Science Department, University of Michigan, Ann Arbor, MI, 48109 USA. e-mail: [email protected]. ∗ Author is a member of the Michigan Center for Integrative Research in Critical Care (MCIRCC), University of Michigan, Ann Arbor, MI, 48109 USA. I SCHEMIC heart disease (IHD) is the leading cause of death worldwide, responsible for more than 8 million deaths globally every year [1]. Ischemic heart disease occurs because of insufficient oxygen supply to the heart (ischemia). The most common reason for this is atherosclerosis, resulting in narrowing of the coronary arteries and restricted blood supply. If persistent, ischemia will lead to cell death and permanent damage to the heart muscle causing a myocardial infarction (MI), commonly known as a heart attack [2]. The 12-lead electrocardiogram is the primary screening tool for myocardial ischemia and MI. ECG signs suggestive of ischemia and MI are myriad, and include ST-elevation and depression, T wave abnormalities, the development of patho- logical Q waves and at times new conduction disturbances. The specific ECG leads showing these changes correspond to the area and size of myocardium affected by ischemia, which in turn is dependent on the localization of the coronary artery occlusion (Table I). The ECG changes also reflect the duration of the ischemic event. ST-elevation in ECG leads ascribed to a certain localization are often, but not always, accompanied by reciprocal ST-depression in other ECG leads. In general, anteriorly or laterally localized ST-elevation causes reciprocal inferior ST-depression and vice versa. Any permanent damage of the heart tissue is reflected by elevated blood levels of the cardiac biomarker troponin, a heart muscle protein released to the blood when there is myocardial cell death. Elevated levels of troponin can be detected in a blood sample and is required for the diagnosis of MI [2]. MI is further classified into various subtypes depending on ECG characteristics, localization (anterior, anteroseptal, lateral, in- ferior or posterior), and the underlying cause and clinical presentation (MI type 1-5) [2]. If there is ischemia without progression to MI, troponin levels will be normal. Patients with IHD typically present with chest pain and shortness of breath. In chronic IHD, symptoms develop gradually with progressive narrowing of the coronary arteries over time. In contrast, acute coronary syndrome (ACS) is characterized by acute onset of symptoms due to a sudden occlusion of a coronary artery. Diagnosis and treatment strategy of patients suspected of ACS is summarized in Figure 1. In patients presenting with ACS, time to treatment is critical. Depending on ECG changes and troponin levels, ACS is subdivided into three groups; ST- elevation MI (STEMI), non-ST-elevation MI (NSTEMI), and unstable angina pectoris (UAP). STEMI is the most severe 'LJLWDO 2EMHFW ,GHQWL¿HU 5%0( ,((( 7UDQVODWLRQV DQG FRQWHQW PLQLQJ DUH SHUPLWWHG IRU DFDGHPLF UHVHDUFK RQO\ 3HUVRQDO XVH LV DOVR SHUPLWWHG EXW UHSXEOLFDWLRQUHGLVWULEXWLRQ UHTXLUHV ,((( SHUPLVVLRQ 6HH KWWSZZZLHHHRUJSXEOLFDWLRQV VWDQGDUGVSXEOLFDWLRQVULJKWVLQGH[KWPO IRU PRUH LQIRUPDWLRQ
-
Upload
khangminh22 -
Category
Documents
-
view
0 -
download
0
Transcript of A Review of Automated Methods for Detection of Myocardial ...
A Review of Automated Methods for Detection ofMyocardial Ischemia and Infarction using
Electrocardiogram and Electronic Health RecordsSardar Ansari∗, Member, IEEE, Negar Farzaneh, Student Member, IEEE,
Marlena Duda, Kelsey Horan, Hedvig B. Andersson,
Zachary D. Goldberger, Brahmajee K. Nallamothu∗, and Kayvan Najarian∗, Senior Member, IEEE
Abstract—There is a growing body of research focusing onautomatic detection of ischemia and myocardial infarction (MI)using computer algorithms. In clinical settings, ischemia andMI are diagnosed using ECG recordings as well as medicalcontext including patient symptoms, medical history and riskfactors, information that is often stored in the electronic healthrecords. The ECG signal is inspected to identify changes inthe morphology such as ST-segment deviation and T wavechanges. Some of the proposed methods compute similar featuresautomatically while others use non-conventional features suchas wavelet coefficients. This paper provides an overview of themethods that have been proposed in this area, focusing ontheir historical evolution, the publicly available datasets thatthey have used to evaluate their performance and the detailsof their algorithms for ECG and EHR analysis. The validationstrategies that have been used to evaluate the performance of theproposed methods are also presented. Finally, the paper providesrecommendations for future research to address the shortcomingsof the currently existing methods and practical considerationsto make the proposed technical solutions applicable in clinicalpractice.
Index Terms—Myocardial infarction, Myocardial ischemia, ST-segment deviation, ECG waveform analysis, Automated detection.
I. INTRODUCTION
S. Ansari is with the Department of Emergency Medicine, University ofMichigan, Ann Arbor, MI, 48109 USA. e-mail: [email protected].
N. Farzaneh is with the Department of Computational Medicine andBioinformatics, University of Michigan, Ann Arbor, MI, 48109 USA. e-mail:[email protected].
M. Duda is with the Department of Computational Medicine and Bioin-formatics, University of Michigan, Ann Arbor, MI, 48109 USA. e-mail:[email protected].
K. Horan is with the Department of Computer Science, City College of NewYork, New York, NY, 10031 USA. e-mail: [email protected].
H. B. Andersson is with the Department of Cardiology, The Heart Centre,Rigshospitalet, Copenhagen University Hospital, Copenhagen, Denmark andthe Department of Internal Medicine, University of Michigan, Ann Arbor, MI,48109 USA. e-mail: [email protected].
Z. D. Goldberger is with the Department of Medicine, Division of Cardiol-ogy, University of Washington School of Medicine, Seattle, WA, 98195 USA.e-mail: [email protected].
B. K. Nallamothu is with the Department of Internal Medicine, Universityof Michigan, Ann Arbor, MI, 48109 USA. e-mail: [email protected].
K. Najarian is with the Department of Computational Medicine andBioinformatics, the Department of Emergency Medicine and the ElectricalEngineering and Computer Science Department, University of Michigan, AnnArbor, MI, 48109 USA. e-mail: [email protected].
∗Author is a member of the Michigan Center for Integrative Research inCritical Care (MCIRCC), University of Michigan, Ann Arbor, MI, 48109USA.
ISCHEMIC heart disease (IHD) is the leading cause of death
worldwide, responsible for more than 8 million deaths
globally every year [1]. Ischemic heart disease occurs because
of insufficient oxygen supply to the heart (ischemia). The
most common reason for this is atherosclerosis, resulting in
narrowing of the coronary arteries and restricted blood supply.
If persistent, ischemia will lead to cell death and permanent
damage to the heart muscle causing a myocardial infarction
(MI), commonly known as a heart attack [2].
The 12-lead electrocardiogram is the primary screening tool
for myocardial ischemia and MI. ECG signs suggestive of
ischemia and MI are myriad, and include ST-elevation and
depression, T wave abnormalities, the development of patho-
logical Q waves and at times new conduction disturbances.
The specific ECG leads showing these changes correspond to
the area and size of myocardium affected by ischemia, which
in turn is dependent on the localization of the coronary artery
occlusion (Table I). The ECG changes also reflect the duration
of the ischemic event. ST-elevation in ECG leads ascribed to
a certain localization are often, but not always, accompanied
by reciprocal ST-depression in other ECG leads. In general,
anteriorly or laterally localized ST-elevation causes reciprocal
inferior ST-depression and vice versa.
Any permanent damage of the heart tissue is reflected by
elevated blood levels of the cardiac biomarker troponin, a heart
muscle protein released to the blood when there is myocardial
cell death. Elevated levels of troponin can be detected in a
blood sample and is required for the diagnosis of MI [2]. MI
is further classified into various subtypes depending on ECG
characteristics, localization (anterior, anteroseptal, lateral, in-
ferior or posterior), and the underlying cause and clinical
presentation (MI type 1-5) [2]. If there is ischemia without
progression to MI, troponin levels will be normal. Patients with
IHD typically present with chest pain and shortness of breath.
In chronic IHD, symptoms develop gradually with progressive
narrowing of the coronary arteries over time. In contrast, acute
coronary syndrome (ACS) is characterized by acute onset of
symptoms due to a sudden occlusion of a coronary artery.
Diagnosis and treatment strategy of patients suspected of
ACS is summarized in Figure 1. In patients presenting with
ACS, time to treatment is critical. Depending on ECG changes
and troponin levels, ACS is subdivided into three groups; ST-
elevation MI (STEMI), non-ST-elevation MI (NSTEMI), and
unstable angina pectoris (UAP). STEMI is the most severe
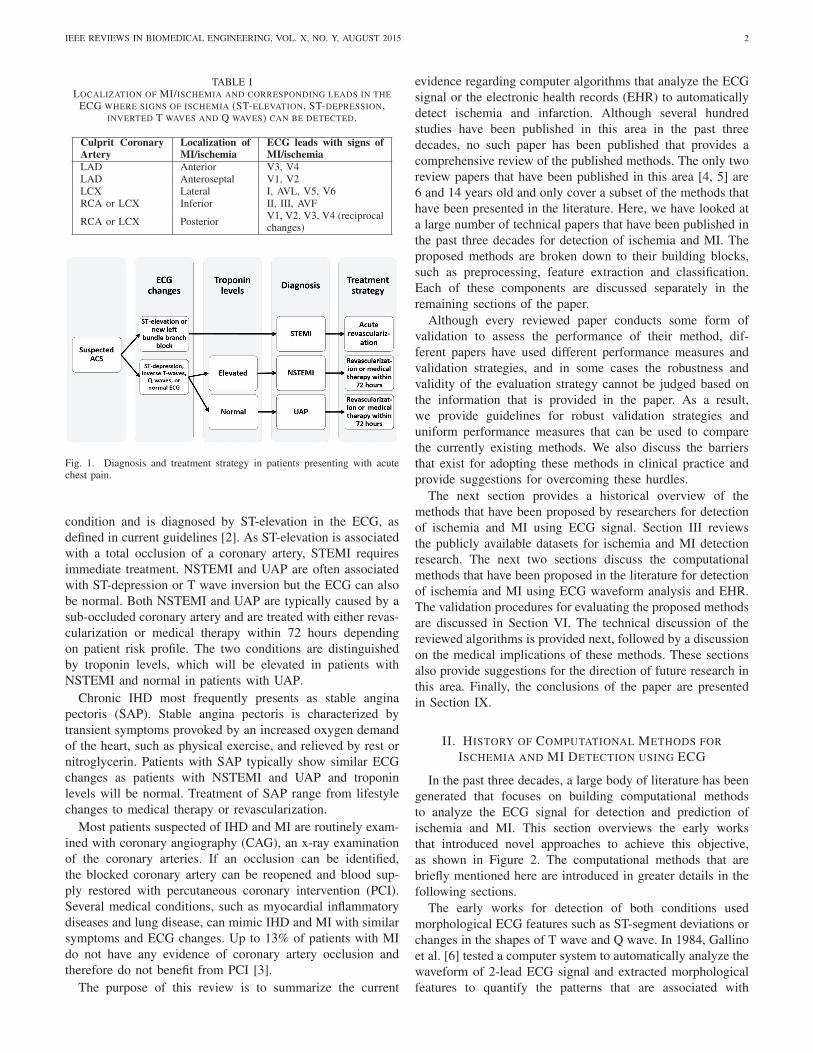
IEEE REVIEWS IN BIOMEDICAL ENGINEERING, VOL. X, NO. Y, AUGUST 2015 2
TABLE ILOCALIZATION OF MI/ISCHEMIA AND CORRESPONDING LEADS IN THE
ECG WHERE SIGNS OF ISCHEMIA (ST-ELEVATION, ST-DEPRESSION,INVERTED T WAVES AND Q WAVES) CAN BE DETECTED.
Culprit CoronaryArtery
Localization ofMI/ischemia
ECG leads with signs ofMI/ischemia
LAD Anterior V3, V4LAD Anteroseptal V1, V2LCX Lateral I, AVL, V5, V6RCA or LCX Inferior II, III, AVF
RCA or LCX PosteriorV1, V2, V3, V4 (reciprocalchanges)
Fig. 1. Diagnosis and treatment strategy in patients presenting with acutechest pain.
condition and is diagnosed by ST-elevation in the ECG, as
defined in current guidelines [2]. As ST-elevation is associated
with a total occlusion of a coronary artery, STEMI requires
immediate treatment. NSTEMI and UAP are often associated
with ST-depression or T wave inversion but the ECG can also
be normal. Both NSTEMI and UAP are typically caused by a
sub-occluded coronary artery and are treated with either revas-
cularization or medical therapy within 72 hours depending
on patient risk profile. The two conditions are distinguished
by troponin levels, which will be elevated in patients with
NSTEMI and normal in patients with UAP.
Chronic IHD most frequently presents as stable angina
pectoris (SAP). Stable angina pectoris is characterized by
transient symptoms provoked by an increased oxygen demand
of the heart, such as physical exercise, and relieved by rest or
nitroglycerin. Patients with SAP typically show similar ECG
changes as patients with NSTEMI and UAP and troponin
levels will be normal. Treatment of SAP range from lifestyle
changes to medical therapy or revascularization.
Most patients suspected of IHD and MI are routinely exam-
ined with coronary angiography (CAG), an x-ray examination
of the coronary arteries. If an occlusion can be identified,
the blocked coronary artery can be reopened and blood sup-
ply restored with percutaneous coronary intervention (PCI).
Several medical conditions, such as myocardial inflammatory
diseases and lung disease, can mimic IHD and MI with similar
symptoms and ECG changes. Up to 13% of patients with MI
do not have any evidence of coronary artery occlusion and
therefore do not benefit from PCI [3].
The purpose of this review is to summarize the current
evidence regarding computer algorithms that analyze the ECG
signal or the electronic health records (EHR) to automatically
detect ischemia and infarction. Although several hundred
studies have been published in this area in the past three
decades, no such paper has been published that provides a
comprehensive review of the published methods. The only two
review papers that have been published in this area [4, 5] are
6 and 14 years old and only cover a subset of the methods that
have been presented in the literature. Here, we have looked at
a large number of technical papers that have been published in
the past three decades for detection of ischemia and MI. The
proposed methods are broken down to their building blocks,
such as preprocessing, feature extraction and classification.
Each of these components are discussed separately in the
remaining sections of the paper.
Although every reviewed paper conducts some form of
validation to assess the performance of their method, dif-
ferent papers have used different performance measures and
validation strategies, and in some cases the robustness and
validity of the evaluation strategy cannot be judged based on
the information that is provided in the paper. As a result,
we provide guidelines for robust validation strategies and
uniform performance measures that can be used to compare
the currently existing methods. We also discuss the barriers
that exist for adopting these methods in clinical practice and
provide suggestions for overcoming these hurdles.
The next section provides a historical overview of the
methods that have been proposed by researchers for detection
of ischemia and MI using ECG signal. Section III reviews
the publicly available datasets for ischemia and MI detection
research. The next two sections discuss the computational
methods that have been proposed in the literature for detection
of ischemia and MI using ECG waveform analysis and EHR.
The validation procedures for evaluating the proposed methods
are discussed in Section VI. The technical discussion of the
reviewed algorithms is provided next, followed by a discussion
on the medical implications of these methods. These sections
also provide suggestions for the direction of future research in
this area. Finally, the conclusions of the paper are presented
in Section IX.
II. HISTORY OF COMPUTATIONAL METHODS FOR
ISCHEMIA AND MI DETECTION USING ECG
In the past three decades, a large body of literature has been
generated that focuses on building computational methods
to analyze the ECG signal for detection and prediction of
ischemia and MI. This section overviews the early works
that introduced novel approaches to achieve this objective,
as shown in Figure 2. The computational methods that are
briefly mentioned here are introduced in greater details in the
following sections.
The early works for detection of both conditions used
morphological ECG features such as ST-segment deviations or
changes in the shapes of T wave and Q wave. In 1984, Gallino
et al. [6] tested a computer system to automatically analyze the
waveform of 2-lead ECG signal and extracted morphological
features to quantify the patterns that are associated with
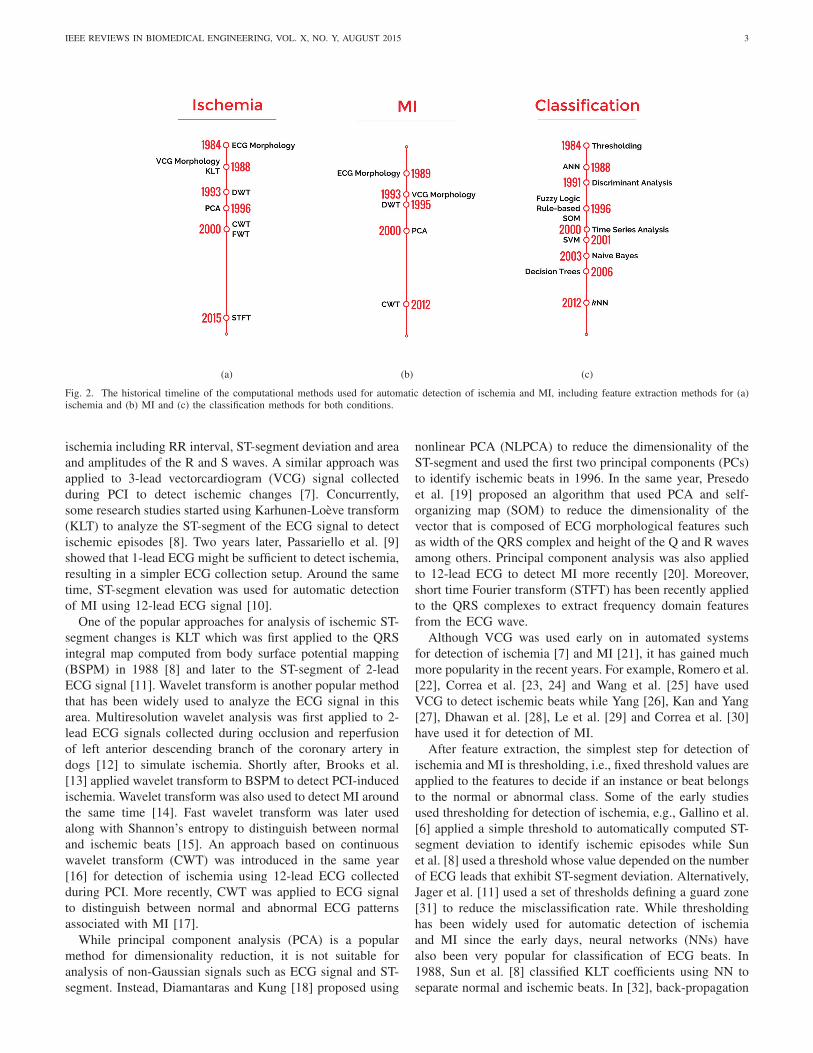
IEEE REVIEWS IN BIOMEDICAL ENGINEERING, VOL. X, NO. Y, AUGUST 2015 3
(a) (b) (c)
Fig. 2. The historical timeline of the computational methods used for automatic detection of ischemia and MI, including feature extraction methods for (a)ischemia and (b) MI and (c) the classification methods for both conditions.
ischemia including RR interval, ST-segment deviation and area
and amplitudes of the R and S waves. A similar approach was
applied to 3-lead vectorcardiogram (VCG) signal collected
during PCI to detect ischemic changes [7]. Concurrently,
some research studies started using Karhunen-Loeve transform
(KLT) to analyze the ST-segment of the ECG signal to detect
ischemic episodes [8]. Two years later, Passariello et al. [9]
showed that 1-lead ECG might be sufficient to detect ischemia,
resulting in a simpler ECG collection setup. Around the same
time, ST-segment elevation was used for automatic detection
of MI using 12-lead ECG signal [10].
One of the popular approaches for analysis of ischemic ST-
segment changes is KLT which was first applied to the QRS
integral map computed from body surface potential mapping
(BSPM) in 1988 [8] and later to the ST-segment of 2-lead
ECG signal [11]. Wavelet transform is another popular method
that has been widely used to analyze the ECG signal in this
area. Multiresolution wavelet analysis was first applied to 2-
lead ECG signals collected during occlusion and reperfusion
of left anterior descending branch of the coronary artery in
dogs [12] to simulate ischemia. Shortly after, Brooks et al.
[13] applied wavelet transform to BSPM to detect PCI-induced
ischemia. Wavelet transform was also used to detect MI around
the same time [14]. Fast wavelet transform was later used
along with Shannon’s entropy to distinguish between normal
and ischemic beats [15]. An approach based on continuous
wavelet transform (CWT) was introduced in the same year
[16] for detection of ischemia using 12-lead ECG collected
during PCI. More recently, CWT was applied to ECG signal
to distinguish between normal and abnormal ECG patterns
associated with MI [17].
While principal component analysis (PCA) is a popular
method for dimensionality reduction, it is not suitable for
analysis of non-Gaussian signals such as ECG signal and ST-
segment. Instead, Diamantaras and Kung [18] proposed using
nonlinear PCA (NLPCA) to reduce the dimensionality of the
ST-segment and used the first two principal components (PCs)
to identify ischemic beats in 1996. In the same year, Presedo
et al. [19] proposed an algorithm that used PCA and self-
organizing map (SOM) to reduce the dimensionality of the
vector that is composed of ECG morphological features such
as width of the QRS complex and height of the Q and R waves
among others. Principal component analysis was also applied
to 12-lead ECG to detect MI more recently [20]. Moreover,
short time Fourier transform (STFT) has been recently applied
to the QRS complexes to extract frequency domain features
from the ECG wave.
Although VCG was used early on in automated systems
for detection of ischemia [7] and MI [21], it has gained much
more popularity in the recent years. For example, Romero et al.
[22], Correa et al. [23, 24] and Wang et al. [25] have used
VCG to detect ischemic beats while Yang [26], Kan and Yang
[27], Dhawan et al. [28], Le et al. [29] and Correa et al. [30]
have used it for detection of MI.
After feature extraction, the simplest step for detection of
ischemia and MI is thresholding, i.e., fixed threshold values are
applied to the features to decide if an instance or beat belongs
to the normal or abnormal class. Some of the early studies
used thresholding for detection of ischemia, e.g., Gallino et al.
[6] applied a simple threshold to automatically computed ST-
segment deviation to identify ischemic episodes while Sun
et al. [8] used a threshold whose value depended on the number
of ECG leads that exhibit ST-segment deviation. Alternatively,
Jager et al. [11] used a set of thresholds defining a guard zone
[31] to reduce the misclassification rate. While thresholding
has been widely used for automatic detection of ischemia
and MI since the early days, neural networks (NNs) have
also been very popular for classification of ECG beats. In
1988, Sun et al. [8] classified KLT coefficients using NN to
separate normal and ischemic beats. In [32], back-propagation

IEEE REVIEWS IN BIOMEDICAL ENGINEERING, VOL. X, NO. Y, AUGUST 2015 4
was used to train a NN with the raw ECG signal as input
(after normalization) that classified ischemic and normal 1-
lead ECGs.
Discriminant analysis was also among the classification
methods that were used early on for detection of ischemia
and MI [33]. It was applied to morphological features that
were extracted from 120-lead ECG including the amplitude
and duration of different waves in the signal for detection of
MI. In 1996, a fuzzy implementation of a knowledge-based
expert system was proposed to identify ischemic episodes [34].
The system applied expert rules to morphological features such
as the amplitude of ST-segment deviation and T wave. In the
same year, a hybrid fuzzy multilayer perceptron model was
applied to morphological features computed from QRS and Q
and T segments to detect MI [35]. A few years later, Garcıa
et al. [36] used root mean square (RMS) difference series
to model changes in the ST-segment level followed by an
exponential averager. The algorithm applied a threshold to the
filtered and smoothed difference time series to detect changes
that are associated with ischemia.
With the rising popularity of support vector machines
(SVMs), several studies employed this classification algorithm
to distinguish between normal and ischemic or MI beats.
Principal component analysis was used in 2001 to reduce the
dimensionality of the ST-segment and the PCs were fed to
a combination of SOM and SVM to classify ischemic beats
[37]. Two years later, a naive Bayes classifier was used to
classify ischemic ST-segment changes using features that were
computed using reconstructed phase space (RPS) and Gaussian
mixture model (GMM) [38]. Decision trees (DTs) were used in
2006 to distinguish between normal and ischemic beats based
on the values of ECG morphological features such as the ST-
segment changes and slope. More recently, k-nearest neighbor
(k-NN) was used for classification of ischemic beats. In [39],
the authors applied fuzzy rough sets to wavelet coefficients for
reduction of dimensionality of the data and the reduced space
was classified using k-NN.
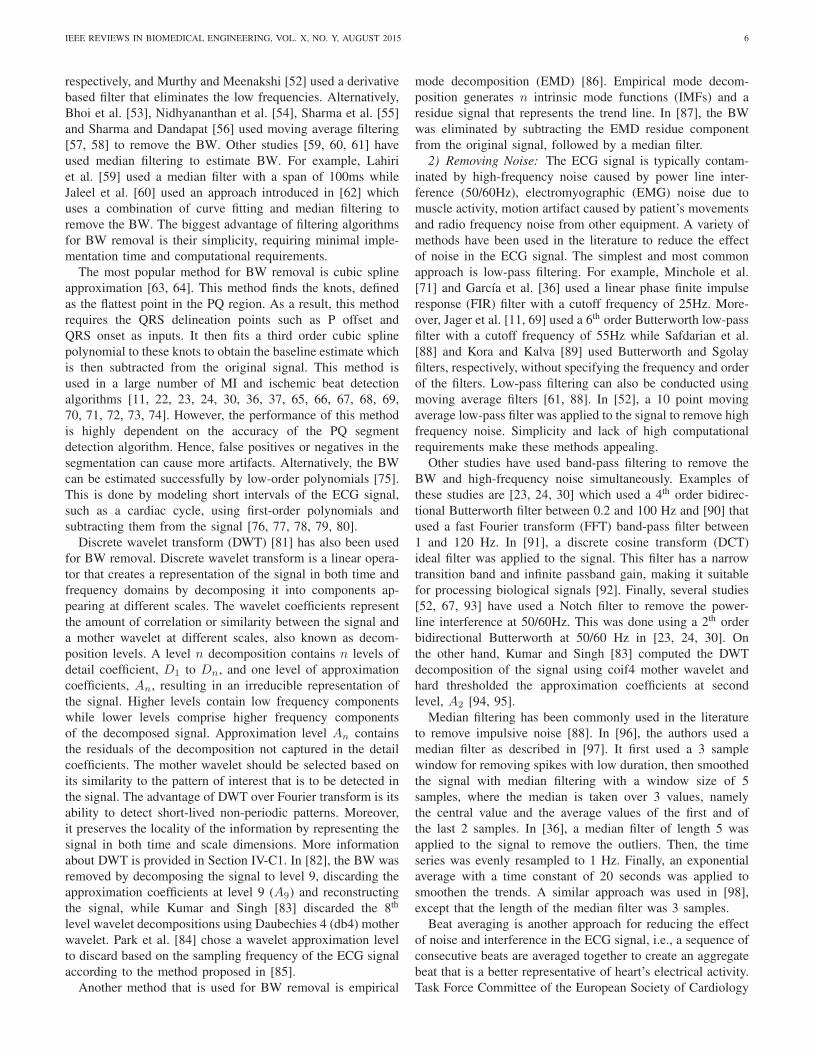
III. DATASETS
Majority of the studies involving computational methods
for automatic diagnosis of ischemia and MI use publicly
available datasets that contain ECG waveforms to evaluate the
performance of their methods. All three major datasets that are
used in this area, The Physikalisch-Technische Bundesanstalt
(PTB), The European ST-T (EST) and The Long-Term ST
(LTST) datasets, are available through Physionet data reposi-
tory [40]. The details of each dataset are described below and
summarized in Table II.
• The Physikalisch-Technische Bundesanstalt Diagnos-tic ECG Dataset [41]. This dataset is comprised of 549
ECG records, obtained from 290 healthy volunteers and
patients with various heart diseases. Among the diseases
represented in the dataset are MI, cardiomyopathy/heart
failure, bundle branch block (BBB), dysrhythmia, mycar-
dial hypertrophy, valvularheart disease, and myocarditis.
The dataset includes 209 males and 81 females, with an
average age of 57.2 years. The dataset has 148 records
annotated for MI. The 15-lead ECG signals (standard 12-
lead + 3 Frank leads) were sampled at 1 kHz, with some
records available in up to 10 kHz on special request.
The header files contain a detailed clinical summary
for each record including age, gender, diagnosis, and
if applicable, data on medical history, medication and
interventions, coronary artery pathology, ventriculogra-
phy, echocardiography, and hemodynamics. The records
were collected at the Department of Cardiology of the
University Clinic Benjamin Franklin (Berlin, Germany),
and the digitized ECG signals were provided by National
Metrology Institute of Germany.
Strengths: includes 12 standard and 3 Frank leads and
each lead is measured at a higher resolution compared
to the EST and LTST datasets.
Limitations: the sample size is small, limiting the
generalizability of the results that are obtained using
this dataset. Moreover, the definition of MI has changed
since this dataset was made available.
• European ST-T Dataset [42]. This dataset is intended
to assist with the evaluation of ischemia detection algo-
rithms and provide a common dataset on which to report
detection accuracy metrics and benchmarks. The two hour
ECG recordings were selected to be representative of
a multitude of cardiac abnormalities, all representing in
ST-segment and T wave changes. The dataset consists
of 70 males and 8 females, aged 30-84 years. Each
of the patients was diagnosed or suspected of myocar-
dial ischemia; the dataset contains 367 episodes of ST-
segment changes and 401 episodes of T wave changes.
Each record contains two most revealing ambulatory
ECG leads, sampled at 250 Hz and annotated by two
cardiologists beat-by-beat for both ST-segment and T
wave placement and changes along with signal quality,
beat types, etc. Each record is provided with information
on age, sex, medications, clinical findings, summary of
pathology and electrolyte imbalance. The development
of the full dataset was coordinated by the Institute of
Clinical Physiology of the National Research Council
(Pisa, Italy), and the Thoraxcenter of Erasmus University
(Rotterdam, Netherlands).
Strengths: the dataset includes beat by beat annotations
and the data is aggregated from multiple cohorts of
patients.
Limitations: The dataset only includes 2 leads that better
represented ST-T changes at the time of measurement.
Therefore, a variety of two-channel ECGs are recorded
which are not consistent among records. Moreover, this
dataset was found to contain non-ischemic ST-segment
changes that were caused by postural changes or slow
drift of the ST-segment deviation level [44], leading to
false positives. In addition, as this dataset was originally
collected to be used for detection of ST-segment and
T wave morphology changes, the dataset may contain
ischemic beats which are not accompanied with ST-
T changes, leading to false negatives. Furthermore, the
sample size is small, limiting the generalizability of the
IEEE REVIEWS IN BIOMEDICAL ENGINEERING, VOL. X, NO. Y, AUGUST 2015 5
TABLE IITHE LIST OF PUBLICLY AVAILABLE DATASETS FOR ISCHEMIA AND MI RESEARCH.
Dataset, Type, Year Subjects/Records Group Distribution Leads Beat-by-beat annotations
PTB [41], Infarction, 1995 290/549148 (MI), 52 (Normal), 68(non-MI/non-Normal) subjects
12 + 3 Frank None
EST [42], Ischemia, 1989-1992 79/90 367 (ST), 401 (T) episodes 2 (various)ST-segment and T wave morphol-ogy, rhythm, signal quality, etc.
LTST [43], Ischemia, 1995-2002 80/861155 (ischemic), 335 (non-ischemic) ST episodes
2-3 (various)ST-segment deviation, beat seg-mentation, etc.
results that are obtained using this dataset. Also, the
length of recordings is relatively short (2 hours) which
limits the use of computational methods that analyze the
signals over a longer period of time. Finally, the definition
of ischemia has changed since this dataset was made
available.
• LTST Dataset [43]. This dataset is intended to provide
long term ST-segment changes for both ischemic and
non-ischemic episodes. Mixtures of ECG ST-segment
anomalies can be found throughout the 86 21-24 hour
recordings. The dataset is fully annotated by multiple
experts using SEMIA, a software for annotation. Each
record contains a clinical summary including age, sex,
the Holter report on symptoms during recording, final di-
agnosis, previous coronary angioplasty or coronary artery
bypass grafting (CABG), current medications, previous
clinical investigations, and if applicable, potential factors
that could affect ST-T morphology. Annotations include
various ECG points and levels, as well as ischemic
ST episodes. Records in the dataset are contributed by
multiple institutions including University of Ljubljana
(Ljubljana, Slovenia), University Medical Center (Ljubl-
jana, Slovenia), CNR Institute for Clinical Physiology
at University of Firenze (Firenze, Italy), Massachusetts
Institute of Technology (Cambridge, MA, USA), and
the Beth Israel Deaconess Medical Center (Boston, MA,
USA).
Strengths: ischemic and non-ischemic ST-segment events
are annotated and distinguished over long periods of time.
The dataset covers a variety of real world conditions.
Moreover, it has been aggregated from multiple cohorts
of patients.
Limitations: similar to the EST dataset, the best 2-3
revealing ECG leads were recorded for each patient;
therefore, a variety of lead combinations exist in the
dataset which are not consistent among subjects. More-
over, the non-ST-segment deviated ischemic beats are not
annotated in this dataset. Furthermore, the sample size
is small limiting the generalizability of the results that
are obtained using this dataset. Finally, the definition
of ischemia has changed since this dataset was made
available.
IV. DETECTION OF ISCHEMIA AND MI USING ECG
WAVEFORM ANALYSIS
ECG signal is the most widely available signal in medical
settings and it can be used for initial diagnosis of patients with
symptoms associated with ischemia or MI. There has been a
growing number of studies that use the ECG waveform to auto-
matically detect these conditions. These methods are generally
composed of four steps, preprocessing, ECG wave quantifica-
tion, feature extraction and classification. The preprocessing
step is responsible for cleaning the ECG signal from noise and
artifacts. It is often followed by wave quantification through
ECG segmentation to find the characteristic points and waves
in the signal. Next, the signals are processed to extract a set
of features that quantify the patterns that exist in the ECG
signal including morphological features such as ST-segment
deviation and T wave amplitude as well as frequency and
wavelet based features among others. The extracted features
are then fed into a classification algorithm to make a diagnosis
for the input ECG signal. The classification can be as simple as
thresholding the features or as complex as SVM and artificial
neural network (ANN) algorithms. In some cases, the classifi-
cation step is preceded by a feature selection or reduction step
where a large set of features is reduced to a smaller one either
by selecting a subset of them that are more correlated with the
ischemia or MI outcome or by projecting the features into a
lower dimensional space that better represents the information
with a smaller number of variables. In some studies, the
classification step is followed by a postprocessing step that
is often responsible for combining the output of the classifier
for individual beats to form ischemic or MI episodes.
The details of each of these steps are outlined in the
following sections.
A. Preprocessing
The process of analyzing the ECG signal to detect signs
of MI and ischemic beats often starts with preprocessing
the signal. This includes baseline wander (BW) removal,
noise removal and beat averaging, among others. Different
preprocessing steps and the proposed approaches in the MI
and ischemia literature to address them are detailed below.
1) Removing baseline wander: BW is a low-frequency (0-
0.5Hz) interference in the ECG signal caused by respiration,
body movement and changes in electrode impedance. The
presence of BW can complicate the analysis of the ECG
waveform. Hence, it is crucial to remove BW before any
further processing of ECG signal is undertaken.
The simplest approach for BW removal is high-pass filter-
ing. For example, the Butterworth filter was used in [45, 46]
(cutoff=0.5Hz) and [47] (cutoff=0.67Hz) for removing BW,
while Garcıa et al. [48] used a 3rd order Butterworth filter
whose cutoff frequency depends on the heart rate (HR) [49].
Moreover, Schmidt et al. [50] and Hadjem et al. [51] used
high-pass filtering with cutoff frequencies of 0.3 and 0.5Hz,
IEEE REVIEWS IN BIOMEDICAL ENGINEERING, VOL. X, NO. Y, AUGUST 2015 6
respectively, and Murthy and Meenakshi [52] used a derivative
based filter that eliminates the low frequencies. Alternatively,
Bhoi et al. [53], Nidhyananthan et al. [54], Sharma et al. [55]
and Sharma and Dandapat [56] used moving average filtering
[57, 58] to remove the BW. Other studies [59, 60, 61] have
used median filtering to estimate BW. For example, Lahiri
et al. [59] used a median filter with a span of 100ms while
Jaleel et al. [60] used an approach introduced in [62] which
uses a combination of curve fitting and median filtering to
remove the BW. The biggest advantage of filtering algorithms
for BW removal is their simplicity, requiring minimal imple-
mentation time and computational requirements.
The most popular method for BW removal is cubic spline
approximation [63, 64]. This method finds the knots, defined
as the flattest point in the PQ region. As a result, this method
requires the QRS delineation points such as P offset and
QRS onset as inputs. It then fits a third order cubic spline
polynomial to these knots to obtain the baseline estimate which
is then subtracted from the original signal. This method is
used in a large number of MI and ischemic beat detection
algorithms [11, 22, 23, 24, 30, 36, 37, 65, 66, 67, 68, 69,
70, 71, 72, 73, 74]. However, the performance of this method
is highly dependent on the accuracy of the PQ segment
detection algorithm. Hence, false positives or negatives in the
segmentation can cause more artifacts. Alternatively, the BW
can be estimated successfully by low-order polynomials [75].
This is done by modeling short intervals of the ECG signal,
such as a cardiac cycle, using first-order polynomials and
subtracting them from the signal [76, 77, 78, 79, 80].
Discrete wavelet transform (DWT) [81] has also been used
for BW removal. Discrete wavelet transform is a linear opera-
tor that creates a representation of the signal in both time and
frequency domains by decomposing it into components ap-
pearing at different scales. The wavelet coefficients represent
the amount of correlation or similarity between the signal and
a mother wavelet at different scales, also known as decom-
position levels. A level n decomposition contains n levels of
detail coefficient, D1 to Dn, and one level of approximation
coefficients, An, resulting in an irreducible representation of
the signal. Higher levels contain low frequency components
while lower levels comprise higher frequency components
of the decomposed signal. Approximation level An contains
the residuals of the decomposition not captured in the detail
coefficients. The mother wavelet should be selected based on
its similarity to the pattern of interest that is to be detected in
the signal. The advantage of DWT over Fourier transform is its
ability to detect short-lived non-periodic patterns. Moreover,
it preserves the locality of the information by representing the
signal in both time and scale dimensions. More information
about DWT is provided in Section IV-C1. In [82], the BW was
removed by decomposing the signal to level 9, discarding the
approximation coefficients at level 9 (A9) and reconstructing
the signal, while Kumar and Singh [83] discarded the 8th
level wavelet decompositions using Daubechies 4 (db4) mother
wavelet. Park et al. [84] chose a wavelet approximation level
to discard based on the sampling frequency of the ECG signal
according to the method proposed in [85].
Another method that is used for BW removal is empirical
mode decomposition (EMD) [86]. Empirical mode decom-
position generates n intrinsic mode functions (IMFs) and a
residue signal that represents the trend line. In [87], the BW
was eliminated by subtracting the EMD residue component
from the original signal, followed by a median filter.
2) Removing Noise: The ECG signal is typically contam-
inated by high-frequency noise caused by power line inter-
ference (50/60Hz), electromyographic (EMG) noise due to
muscle activity, motion artifact caused by patient’s movements
and radio frequency noise from other equipment. A variety of
methods have been used in the literature to reduce the effect
of noise in the ECG signal. The simplest and most common
approach is low-pass filtering. For example, Minchole et al.
[71] and Garcıa et al. [36] used a linear phase finite impulse
response (FIR) filter with a cutoff frequency of 25Hz. More-
over, Jager et al. [11, 69] used a 6th order Butterworth low-pass
filter with a cutoff frequency of 55Hz while Safdarian et al.
[88] and Kora and Kalva [89] used Butterworth and Sgolay
filters, respectively, without specifying the frequency and order
of the filters. Low-pass filtering can also be conducted using
moving average filters [61, 88]. In [52], a 10 point moving
average low-pass filter was applied to the signal to remove high
frequency noise. Simplicity and lack of high computational
requirements make these methods appealing.
Other studies have used band-pass filtering to remove the
BW and high-frequency noise simultaneously. Examples of
these studies are [23, 24, 30] which used a 4th order bidirec-
tional Butterworth filter between 0.2 and 100 Hz and [90] that
used a fast Fourier transform (FFT) band-pass filter between
1 and 120 Hz. In [91], a discrete cosine transform (DCT)
ideal filter was applied to the signal. This filter has a narrow
transition band and infinite passband gain, making it suitable
for processing biological signals [92]. Finally, several studies
[52, 67, 93] have used a Notch filter to remove the power-
line interference at 50/60Hz. This was done using a 2th order
bidirectional Butterworth at 50/60 Hz in [23, 24, 30]. On
the other hand, Kumar and Singh [83] computed the DWT
decomposition of the signal using coif4 mother wavelet and
hard thresholded the approximation coefficients at second
level, A2 [94, 95].
Median filtering has been commonly used in the literature
to remove impulsive noise [88]. In [96], the authors used a
median filter as described in [97]. It first used a 3 sample
window for removing spikes with low duration, then smoothed
the signal with median filtering with a window size of 5
samples, where the median is taken over 3 values, namely
the central value and the average values of the first and of
the last 2 samples. In [36], a median filter of length 5 was
applied to the signal to remove the outliers. Then, the time
series was evenly resampled to 1 Hz. Finally, an exponential
average with a time constant of 20 seconds was applied to
smoothen the trends. A similar approach was used in [98],
except that the length of the median filter was 3 samples.
Beat averaging is another approach for reducing the effect
of noise and interference in the ECG signal, i.e., a sequence of
consecutive beats are averaged together to create an aggregate
beat that is a better representative of heart’s electrical activity.
Task Force Committee of the European Society of Cardiology
IEEE REVIEWS IN BIOMEDICAL ENGINEERING, VOL. X, NO. Y, AUGUST 2015 7
(ESC), the American Heart Association (AHA), and the Amer-
ican College of Cardiology (ACC) provided the guidelines for
beat averaging in 1991 [99, 100]. The guidelines indicated that
the method should first exclude time varying signals, such as
ectopic or premature complexes, from the averaging process by
comparing each beat against a previously established template
(cross-correlation of at least 98% is required). The beats also
need to be aligned according to a fiducial point, such as the
R wave. Lastly, the system should average 50-300 beats for
denoising. These guidelines were used in [101] to remove the
high-frequency noise. A similar approach has been used in
several other studies [67, 93]. For example, Jager et al. [11]
and Jaleel et al. [60] averaged 15 and 5 consecutive ECG
beats, respectively. Furthermore, Garcıa et al. [66] used an
exponential moving average filter to denoise the ECG beats
as described in [102]. In [90], the noise from VCG signals,
described in later sections, was removed by normalizing the
beats to the same length and averaging them. A software
[103] for beat averaging that determines the high-frequency
noise content of each beat and excludes a beat from the
average if the noise level is above a threshold was used in
[74]. Although the old guidelines suggested the use of beat
averaging, the Guidelines for Management of Patients With
Ventricular Arrhythmias and the Prevention of Sudden Cardiac
Death published by AHA, ACC and ESC in 2006 and Scien-
tific Statement on Noninvasive Risk Stratification Techniques
for Identifying Patients at Risk for Sudden Cardiac Death
published by AHA, ACC and Heart Rhythm Society (HRS)
in 2008 casted doubt on the usefulness of beat averaging.
They concluded that high negative predictive value (NPV)
of signal averaged ECG (SAECG) makes it a useful tool for
identifying patients with a history of MI that have a low risk
of sudden cardiac death (SCD). However, the effectiveness of
this method for identifying high risk patients is not adequately
supported by evidence. Despite its absence from medical
practice, beat averaging remains a popular method for noise
reduction in research studies related to automatic analysis of
ECG signal.
A group of studies identify noisy beats and exclude them
from the analysis. An exponentially updated threshold for
signal to noise ratio (SNR) to discard noisy beats was used
in [36, 48]. They also excluded consecutive beats whose
isoelectric levels differ by more than a threshold. The latter
criteria was also used in [37, 71]. In [98], the abnormal
beats and their neighboring beats were discarded when the
difference between the PQ level and the mean PQ level was
larger than 0.6mV. In [69], noisy beats were detected using
an algorithm proposed in [104] which thresholds the peak-to-
peak amplitude of the ECG beat. In [23, 24, 30], the authors
excluded the noisy beats whose RMS noise level, measured
within a 40ms window located at two thirds of the RR interval,
is larger than 0.04mV. Moreover, a single-layer perceptron
was used in [70] to classify beats into sinus rhythm and non-
sinus rhythm groups and the latter group was excluded from
the analysis. This method was initially proposed in [105]. In
addition to discarding noisy beats, some studies [22, 69, 72]
also excluded abnormal beats from the analysis as identified
by Moody and Mark [106].
Another popular method for denoising the ECG signal uses
wavelet transform. In [55, 56], the noise in the ECG signal
was removed by computing the relative energies of wavelet
subbands and estimates of noise variance, as explained in
[107, 108]. Banerjee et al. [109] suggested the use of DWT
with db6 mother wavelet and elimination of D1 and D2
coefficient levels to remove the high frequency noise. This
method has been employed in [17, 82, 110, 111, 112, 113].
In addition to DWT filtering, Gupta and Kundu [110] also
used a 4th order low-pass Butterworth filter with a cutoff
frequency of 90 Hz prior to DWT filtering. Moreover, they
aligned the ECG beats, applied PCA and reconstructed the
signal using the first PC which provided maximum variance
in the eigenvectors. Alternatively, the coif4 mother wavelet
was used by Liu et al. [114] for denoising the ECG signal. In
[115], the authors used db4 mother wavelet and thresholded
the detail coefficients D1-D4. The high-frequency noise was
removed in [83] using a soft threshold that was computed
by estimating the noise level in the 1st level approximate
coefficients. They also eliminated the 50 Hz power-line inter-
ference by 2nd level decomposition using coif5 mother wavelet
and hard thresholding. Jayachandran et al. [116] incorporated
wavelet shrinkage via soft thresholding as described in [117].
Moreover, a noise reduction algorithm for ECG signals using
undecimated wavelet transform (UWT), a form of DWT that
has a better balance between smoothness and accuracy, along
with a shrinkage operation was introduced in [118]. This
method was used in [51] with a db6 mother wavelet and
four decomposition levels. Furthermore, Bezerianos et al. [73]
applied wavelet transform and analyzed the evolution of the
coefficient maxima across scales. The singularities of the
signal create wavelet maxima with different properties from
those of the induced noise. A neural network was trained to
distinguish between the wavelet maxima of the signal from
those of the noise. This method is described in [119].
Axis shift, defined as changes in the electrical axis of the
heart as a result of patient’s postural changes, causes sudden
and significant changes in the ST level and can lead to false
positives. Axis shift was detected in [11] by searching for step
changes in the feature vectors. A step change is characterized
by an interval of significant change in the ST level between
two intervals during which ST level is relatively constant.
3) Removing Ectopic Beats: Ectopic beats are premature
heartbeats that lead to an irregular heart rhythm. The most
common types of ectopic beats are premature ventricular
contractions (PVC) and premature atrial contractions (PAC).
Ectopic beats have a distinctly different pattern than normal
beats. Hence, their presence can complicate the analysis of the
ECG signal. As a result, some studies have tried to identify
and remove ectopic beats prior to the analysis. For example,
Jaleel et al. [60] used a QRS subtraction method [120, 121]
that subtracts a template beat (e.g. the median beat from
the previous five beats) from the current beat and uses the
area under the residual signal to detect ectopic beats. Correa
et al. [23, 24, 30] used a template (visually low-noise normal
beat) and multiscale cross-correlation to align the beats, as
proposed in [122]. Beats with a correlation level of < 95%were considered ectopic and eliminated from the analysis.
IEEE REVIEWS IN BIOMEDICAL ENGINEERING, VOL. X, NO. Y, AUGUST 2015 8
B. ECG Wave Quantification
In most studies that were reviewed, ECG characteristic
features such as the QRS complex, T wave and isoelectric
line were identified before feature selection. A multitude of
algorithms have been introduced in the literature to achieve
this goal. A review of these methods is presented below.
1) ECG Delineation: Electrocardiogram delineation is a
fundamental step in characterization of the ECG wave. There
is a large number of algorithms proposed in the literature
for ECG delineation. Pan and Tompkins [123, 124, 125] is
a popular method for detection of QRS complexes. After
band-pass filtering, this algorithm differentiates, squares and
integrates the ECG signal and applies a set of rules to the
resulting signal to detect the QRS complexes. This algorithm
has been widely used in MI and ischemic beat detection
[24, 46, 52, 54, 55, 56, 76, 77, 78, 79, 80, 91, 112, 113, 126,
127, 128, 129]. Another method that has been used for QRS
detection by many researchers [11, 22, 36, 65, 66, 69, 71] is
the ARISTOTLE detector [106] which operates on two ECG
leads simultaneously. This method uses a digital matched filter
and dynamic threshold adjustment along with a look-back
procedure that is designed to reduce false negatives. It also
differentiates between normal beats and arrhythmias. Electro-
cardiogram signal in [70] was modeled using parabolic inter-
polation when the first derivative exceeded a fixed threshold
as described in [130]. The peak of the parabola was assumed
to estimate the R wave. Silipo and Marchesi [131] and Taddei
et al. [96] used a QRS detector which operates based on the
analysis of spatial velocity, defined as linear combination of
signal differences from two ECG leads, or one lead when the
other one was found too noisy [132]. QRS complexes were
detected in [48] using decision rules, according to a multistage
process [133], that are applied to the envelope of the ECG
signal. The algorithm in [134], implemented in Physionet’s
WFDB toolbox [40, 135] (the wqrs routine), was used in [38].
This method converts the ECG signal to a curve length signal
and applies adaptive thresholding to the onset and duration of
the QRS complex. The curve length signal is generated using a
transform employing a nonlinear scaling factor to enhance the
QRS complex and to suppress unwanted noise. An algorithm
based on the Hilbert transform of the first derivative of the
ECG beat and peak detection was presented in [136, 137]
which has a higher detection accuracy due to increased ratio
of the R peak amplitude to the T wave. This algorithm was
used in [67] for QRS detection; a similar approach was used
in [138]. In [139], the authors proposed a two-layer learning
vector quantization neural network with the samples of the
raw ECG signal as inputs. This method was used in [32] to
detect the QRS complexes. Furthermore, Bhoi et al. [53] used
thresholding and filtering to detect the R peaks and searched
for inflection points before and after the R peak within a
window to find the S and Q waves, as described in [140].
Wavelet transform has also been used for ECG delineation.
D4 and D5 wavelet coefficients were used in [17, 83, 111] to
identify the QRS complexes as described in [109]. The ECG
signal in [141] was decomposed using DWT and a multi-
resolution approach along with thresholding was used for
detection of R peaks. This is done using localized frequency
domain features in D3-D5 detail coefficients. The Q and
S waves were detected by differentiation and slope criteria
based search. This algorithm, used in [22, 23, 30, 65, 72],
also detects the QRS onset and offset points and the T wave
peak. Moreover, Remya et al. [82] used a combination of
D5 and D6 detail coefficients and an adaptive threshold to
find the QRS complex. The algorithm searches a window
around the R peak to find the Q and S waves. Park et al.
[84] decomposed the ECG signal using db8 mother wavelet.
After removing the BW, a pulse score was computed for
each wavelet detail coefficient level to determine the wavelet
scale for protruding shape of ECG. The QRS complexes
were detected when the largest drop in the pulse scores for
consecutive scales were observed. In [30], CWT and Haar
mother wavelet were used to decompose the ECG signal and
a threshold was applied to the time-scale representation of the
signal to detect the QRS complexes as described in [142]. In
[110], the authors thresholded the combination of D2 and D3
wavelet coefficients using db6 mother wavelet to find the QRS
peaks. They also searched within a window relative to the QRS
peak and examine the signal slope to find the T wave. In [115],
Pan and Tompkins [123, 124, 125] algorithm was applied to
the wavelet reconstruction of the ECG signal from the D2-D5
coefficients with db4 as the mother wavelet and the detected
peaks that were less than 250ms apart were combined.
Detection of T wave is also essential for diagnosis of MI and
ischemic beats. Hence, several methods have been proposed
in the reviewed literature for T wave detection. In [70], a
parabolic interpolation over a large segment of the ECG signal
was used after low-pass filtering the signal with a cutoff
frequency of 15 Hz to find the peak of the T wave. Some
studies [76, 77, 79, 80] conducted a search for the maximum
ECG amplitude in a 200ms window staring from the onset of
the T wave which was assumed to be at J80 + 0.0375*RR
(J80 is the sample located 80ms after the J point and RR
is the interval between the consecutive R waves.) Gupta and
Kundu [110] examined the absolute slope of the ECG wave
in a window from 600ms after the R wave to the end of the
beat to find the T wave. In [143], the T wave was found using
the Q wave and the QT length estimated using a formula that
depends on HR and the gender of the patient.
Full delineation of the ECG beats, proposed in [144],
was used by Andreao et al. [98]. This algorithm uses hid-
den Markov model (HMM) to analyze the ECG waveform
with wavelet coefficient features (using Mexican Hat mother
wavelet) as inputs. It trained four HMMs (3 states each) for
the QRS complex, two HMMs (2 states each) for the PQ and
ST-segments, two HMMs (3 states each) for the P wave, two
HMMs (6 states each) for the T wave and one HMM (3 states)
for the isoelectric line. Alternatively, Chang et al. [145] used
four HMM models each representing one ECG lead. Each
HMM model was composed of six states corresponding to
the isoelectric line and each of the five ECG waves (P, Q, R,
S and T) to delineate each ECG beat. In [146], the modulus
maxima-minima pair at the lowest wavelet coefficient scale
with quadratic spline mother wavelet and a fixed threshold
were used to detect the R peak. Then a neighborhood around
IEEE REVIEWS IN BIOMEDICAL ENGINEERING, VOL. X, NO. Y, AUGUST 2015 9
the detected point was searched in the higher wavelet levels
to verify the existence of the R peak. Moreover, the Q and
S waves as well as the onset and offset of the QRS complex
were detected using the low scale wavelet coefficients. On the
other hand, the T and P waves were detected using the 4th
level coefficients of the wavelet decomposition.
Garcıa et al. [66] used an algorithm proposed in [147, 148]
which detects the QRS complexes using another conventional
detector. It then found the zero crossings in the differentiated
ECG signal after low-pass filtering to identify the P and T
waves. In [60], the authors used a full delineation algorithm
based on the first and second derivatives of the ECG signal
and adaptive thresholding, and exploited temporal coherence
along a single lead and spatial coherence across the 12 leads to
detect the Q, R, S and J along with boundaries and peaks of the
P and T waves, as well as the ST-segment and the isoelectric
line [149]. Vila et al. [143] applied an adaptive threshold to
the signal after linear filtering to enhance the QRS complexes
and attenuate the rest of the ECG components according to
the method in [150]. Then, they used a Hanning filter to
detect the width of the QRS complex and a grammar-based
algorithm that characterizes the height and width of each of the
waves that make up the QRS complex [151]. The method in
[152], which decomposes the ECG signal into subbands with
uniform frequency bandwidths using a filter bank, was used in
[50]. Features were extracted from different subbands of each
lead and a heuristic was used to detect the QRS complexes.
Moreover, UWT was used in [51] with a bi-orthogonal mother
wavelet at 8th level decomposition and the zero-crossings were
found in the detail coefficients. This method was applied to
all available leads of the ECG signal.
Lastly, detection of the J point plays a crucial role in esti-
mating the ST deviation. Most studies [67, 76, 77, 78, 79, 80]
searched for the J point in a 100ms window starting from 20ms
after the R wave to find a 20ms segments with signal slope less
than or equal 2.5 μVms−1 (as opposed to 5 μVms−1 that was
originally proposed by Duskalov et al. [153]). In addtion, Starc
and Schlegel [154] assumed the J point to be the first point of
inflection in the S wave’s upstroke. In [155], the location of
the J point was detected using UWT decomposition at level 1
with db4 mother wavelet as the point that corresponds to the
peak after the S wave.
While a large number of methods have been introduced
for delineation of the ECG waves, the accuracy of these
methods for characterization of MI and ischemic beats has
not been sufficiently studied. Specifically, the morphology of
the MI and ischemic beats differ from those of normal sinus
rhythm, potentially complicating the wave delineation. As a
result, independent comparative studies are needed to evaluate
the performance of the discussed methods. A disadvantage
for majority of the reviewed methods is the use of a single
lead for QRS detection and wave delineation. As a result,
the information available in other leads is discarded. More
sophisticated methods that take into account the information
from all the available signals can improve the accuracy of
wave delineation [156].
2) Detection of Isoelectric Line: The ST-segment level is
often measured against the isoelectric level in MI and ischemia
detection algorithms. The isoelectric level is defined as the
average amplitude of the ECG signal during the period of
electrical inactivity between the offset of T wave and the
onset of P wave. Several methods have been used to find the
isoelectric level in the MI and ischemia detection literature.
For example, Duskalov et al. [153] searched a window from
100ms to 40ms prior to the R wave to find an interval of 20ms
with signal slope ≤ 5μVms−1 (2.5μVms−1 in some studies)
and used the mean value of this interval as the isoelectric
level. This algorithm has been used in several studies including
[67, 76, 77, 78, 79, 80]. Alternatively, Badilini et al. [70]
searched a 90ms window prior to the R wave to find the point
where the first derivative of the ECG signal and the absolute
product between the signal and its derivative are minimum.
Likewise, Maglaveras et al. [127] and Stamkopoulos et al.
[32, 129] found the region in an 80ms window prior to the R
wave where the first derivative of the signal became equal
to zero for at least 10ms or the flattest 20ms segment of
the window. Jager et al. [104] proposed a backwards search
starting from the fiducial point found by the ARISTOTLE
algorithm [106] for up to 30ms to find a sample with a slope
of zero or a change in the derivative sign. The last sample
(fiducial point minus 30ms) was selected if such a point did
not exist. The algorithm then searched an 80ms window prior
to this point to find the flattest 16ms segment and used the
mean amplitude of this segment as an approximation for the
isoelectric level. This algorithm was used by Jager et al. [11].
Finally, [155] identified the isoelectric line using UWT with
db4 mother wavelet. It used a 3rd level decomposition to find
the most stable zero crossings between the P and T waves and
averaged the values for beats to estimate the isoelectric line.
C. Feature Extraction
Once the ECG signal has been preprocessed and segmented,
various methodologies are used to extract informative features
that will allow for downstream detection of MI or ischemia.
Feature extraction methods range from simple morphological
features calculated directly from ECG signal, to metrics based
on complex transformations and decompositions of the sig-
nal. Here, we will discuss feature extraction techniques that
have been applied for the detection of myocardial ischemia
and infarction separately. Majority of the reviewed literature
which applied signal processing techniques to the ECG signal
did not utilize other contextual information such as patient
demographics, symptoms, medical history, etc. This could
be considered a major weakness for these methods. The
exceptions are [76, 77, 80, 126] which used the patient age as
a feature for classification.
1) Myocardial Ischemia: A large number of methods for
feature extraction from the ECG signal have been proposed
for detection of ischemia. A summary of these methods is
presented in this section.
ECG morphological features. The simplest and most intuitive
method of extracting meaningful information for the detection
of ischemic beats is to calculate features from the ECG signal
directly. A large number of these features are widely used
by physicians in the clinic to diagnose the ischemic beats, as
IEEE REVIEWS IN BIOMEDICAL ENGINEERING, VOL. X, NO. Y, AUGUST 2015 10
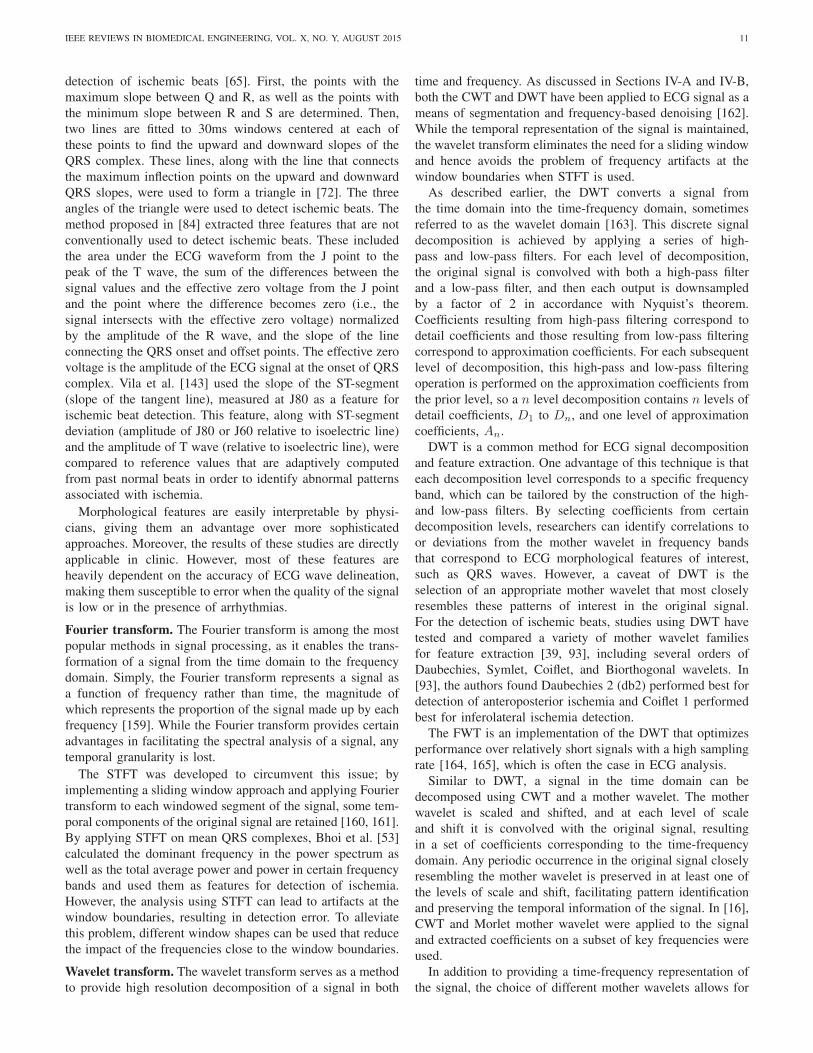
(a) (b)
Fig. 3. Depiction of different morphological features that different studieshave extracted from the ECG waveform. Majority of the reviewed studies useJ80 as the reference for ST-segment measurements. This is inconsistent withthe medical guidelines which suggest that ST-segment elevation should bemeasured at the J point.
outlined in Section I. The most widely used morphological
features are depicted in Figure 3. The computation of these
features depend on the delineation of key ECG characteristic
points prior to feature extraction, such as the QRS complex,
the J point and the isoelectric line, as described in Section
IV-B. ST-segment deviation has commonly been measured at
J80 or J60 in the literature, which are found by advancing 80
or 60ms from the J point, respectively. Deviation is computed
by subtracting the amplitude of the isoelectric line from the
J80 amplitude if HR is below 120bpm and J60 amplitude
otherwise [67, 76, 77, 79, 80, 96, 98, 126]. While this method
is widely used by researchers, there is little evidence showing
that ST-segment elevation measured at J60 or J80 (relative to
the amplitude of the isoelectric line) is associated with acute
STEMI. In fact, Third Universal Definition of MyocardialInfarction [2] published by ESC, ACC Foundation, AHA
and World Health Organization (WHO) in 2012 as well as
Recommendations for the Standardization and Interpretationof the Electrocardiogram–Part VI: Acute Ischemia/Infarctionpublished by AHA, ACC Foundation and HRS in 2009 sug-
gested that the ST-segment elevation should be measured at J
point for diagnosis of ischemia and MI. Moreover, a survey of
63 Senior House Officers and Specialist Registrars from three
large teaching hospitals in Manchester, England, indicated that
34.3% and 29.7% of ST-segment elevation measurements were
made at J point and J40, respectively, while only 23.3% of the
measurements were made after J40 [157]. As a result, a greater
amount of attention should be paid to the measurement of ST-
segment elevation in automated systems and the location at
which it is measured should be further studied.
In some studies, ST deviation has been compared to a
reference value specific to each patient. This reference value
can be computed from a period at the beginning of the ECG
waveform in long-term continuous ECG collections or from an
ECG reading captured during a prior clinic visit if available.
A major limitation of these methods is that the baseline ECG
signal is often not available to compute the reference value.
Specifically, the collection of the ECG signal might start after
the onset of the condition in emergency situations.
The detection methods in [146, 155] used the amplitude of
the ECG signal between the J point and the onset of the T
wave as the ST-segment, then used the deviation from the
isoelectric line as a feature. When two ECG channels are
available, the ST-segment values can be plotted in a two-
dimensional x-y plane. The method proposed in [96] divided
this plane into three sections using two concentric circles.
The inner and outer circles contain normal and ST elevated
beats, respectively. This method detected ischemic ST-segment
deviation based on the amount of time a single ST-segment
lied outside of the inner circle. The method presented in
[83] measured ST-segment deviation by an alternative method,
utilizing the isoelectric energy function (IEEF), a function
that gives higher weights to points in the ST-segment whose
amplitude is farther away from the isoelectric line. The method
then applied a simple threshold to the output of the IEEF
function to discriminate between normal and ischemic beats.
The method used in [32, 127] compared the ST-segment of
the ECG waveform, found using a 160ms window starting
from 60ms after the R wave (R + 40ms if HR>100bpm), to a
normal template that was computed by averaging the first ten
normal beats. This computed difference was directly fed into
a classification model that detected ischemic beats. Likewise,
Minchole et al. [71] and Garcıa et al. [36] compared a section
of the ECG beat that is representative of the ST-segment to
a template that was found by averaging several normal beats
and computed the RMS difference as a measure of ST-segment
deviation. One study [158] proposed the use of vessel-specific
leads by recording 120-lead ECG during induced episodes of
acute ischemia. Ischemia was induced by elective balloon-
inflation PCI of the three main coronary arteries, left anterior
descending artery (LAD), right coronary artery (RCA), and
left circumflex coronary artery (LCx). The location of the
lead with maximum ST-segment deviation during occlusion
of each artery was determined. Lastly, three vessel-specific
bipolar leads for LAD, LCx, and RCA were generated using
a transformation from the standard 12-lead ECG to the leads
that were found to have the maximum ST-segment deviation.
Unlike the conventional methods that utilize information from
individual leads to determine presence and localization of
ischemia, this method derives new ECG leads that better
represent each type of ischemia.
The ST-segment slope, defined as the slope of the line
connecting the J point and J80 (or J60 if HR>120) has also
been used for detection of ischemic beats (see Figure 3)
[67, 76, 77, 79, 80, 126]. Another commonly used morpho-
logical feature for ischemia detection is the amplitude of the
T wave, defined as the positive or negative (inverted T wave)
peak of the T wave from the isoelectric line. The amount of
change in the amplitude of the T wave has been used as a
feature in several studies [76, 77, 79, 80, 126, 146]. Some of
these studies also used the ST-segment area, computed as the
area between ECG signal and the isoelectric line from the J
point to J80 (or J60 if HR>120) [80, 126]. Moreover, the QT
interval has been used for detection of ischemic beats [126],
computed as the distance between the onset of the Q wave
and the offset of the T wave. In [52], the raw ECG signal in a
600ms (150 samples) window, which roughly corresponds to
the RT segment, was fed to a classification model as features.
QRS upward and downward slopes have also been used for
IEEE REVIEWS IN BIOMEDICAL ENGINEERING, VOL. X, NO. Y, AUGUST 2015 11
detection of ischemic beats [65]. First, the points with the
maximum slope between Q and R, as well as the points with
the minimum slope between R and S are determined. Then,
two lines are fitted to 30ms windows centered at each of
these points to find the upward and downward slopes of the
QRS complex. These lines, along with the line that connects
the maximum inflection points on the upward and downward
QRS slopes, were used to form a triangle in [72]. The three
angles of the triangle were used to detect ischemic beats. The
method proposed in [84] extracted three features that are not
conventionally used to detect ischemic beats. These included
the area under the ECG waveform from the J point to the
peak of the T wave, the sum of the differences between the
signal values and the effective zero voltage from the J point
and the point where the difference becomes zero (i.e., the
signal intersects with the effective zero voltage) normalized
by the amplitude of the R wave, and the slope of the line
connecting the QRS onset and offset points. The effective zero
voltage is the amplitude of the ECG signal at the onset of QRS
complex. Vila et al. [143] used the slope of the ST-segment
(slope of the tangent line), measured at J80 as a feature for
ischemic beat detection. This feature, along with ST-segment
deviation (amplitude of J80 or J60 relative to isoelectric line)
and the amplitude of T wave (relative to isoelectric line), were
compared to reference values that are adaptively computed
from past normal beats in order to identify abnormal patterns
associated with ischemia.
Morphological features are easily interpretable by physi-
cians, giving them an advantage over more sophisticated
approaches. Moreover, the results of these studies are directly
applicable in clinic. However, most of these features are
heavily dependent on the accuracy of ECG wave delineation,
making them susceptible to error when the quality of the signal
is low or in the presence of arrhythmias.
Fourier transform. The Fourier transform is among the most
popular methods in signal processing, as it enables the trans-
formation of a signal from the time domain to the frequency
domain. Simply, the Fourier transform represents a signal as
a function of frequency rather than time, the magnitude of
which represents the proportion of the signal made up by each
frequency [159]. While the Fourier transform provides certain
advantages in facilitating the spectral analysis of a signal, any
temporal granularity is lost.
The STFT was developed to circumvent this issue; by
implementing a sliding window approach and applying Fourier
transform to each windowed segment of the signal, some tem-
poral components of the original signal are retained [160, 161].
By applying STFT on mean QRS complexes, Bhoi et al. [53]
calculated the dominant frequency in the power spectrum as
well as the total average power and power in certain frequency
bands and used them as features for detection of ischemia.
However, the analysis using STFT can lead to artifacts at the
window boundaries, resulting in detection error. To alleviate
this problem, different window shapes can be used that reduce
the impact of the frequencies close to the window boundaries.
Wavelet transform. The wavelet transform serves as a method
to provide high resolution decomposition of a signal in both
time and frequency. As discussed in Sections IV-A and IV-B,
both the CWT and DWT have been applied to ECG signal as a
means of segmentation and frequency-based denoising [162].
While the temporal representation of the signal is maintained,
the wavelet transform eliminates the need for a sliding window
and hence avoids the problem of frequency artifacts at the
window boundaries when STFT is used.
As described earlier, the DWT converts a signal from
the time domain into the time-frequency domain, sometimes
referred to as the wavelet domain [163]. This discrete signal
decomposition is achieved by applying a series of high-
pass and low-pass filters. For each level of decomposition,
the original signal is convolved with both a high-pass filter
and a low-pass filter, and then each output is downsampled
by a factor of 2 in accordance with Nyquist’s theorem.
Coefficients resulting from high-pass filtering correspond to
detail coefficients and those resulting from low-pass filtering
correspond to approximation coefficients. For each subsequent
level of decomposition, this high-pass and low-pass filtering
operation is performed on the approximation coefficients from
the prior level, so a n level decomposition contains n levels of
detail coefficients, D1 to Dn, and one level of approximation
coefficients, An.
DWT is a common method for ECG signal decomposition
and feature extraction. One advantage of this technique is that
each decomposition level corresponds to a specific frequency
band, which can be tailored by the construction of the high-
and low-pass filters. By selecting coefficients from certain
decomposition levels, researchers can identify correlations to
or deviations from the mother wavelet in frequency bands
that correspond to ECG morphological features of interest,
such as QRS waves. However, a caveat of DWT is the
selection of an appropriate mother wavelet that most closely
resembles these patterns of interest in the original signal.
For the detection of ischemic beats, studies using DWT have
tested and compared a variety of mother wavelet families
for feature extraction [39, 93], including several orders of
Daubechies, Symlet, Coiflet, and Biorthogonal wavelets. In
[93], the authors found Daubechies 2 (db2) performed best for
detection of anteroposterior ischemia and Coiflet 1 performed
best for inferolateral ischemia detection.
The FWT is an implementation of the DWT that optimizes
performance over relatively short signals with a high sampling
rate [164, 165], which is often the case in ECG analysis.
Similar to DWT, a signal in the time domain can be
decomposed using CWT and a mother wavelet. The mother
wavelet is scaled and shifted, and at each level of scale
and shift it is convolved with the original signal, resulting
in a set of coefficients corresponding to the time-frequency
domain. Any periodic occurrence in the original signal closely
resembling the mother wavelet is preserved in at least one of
the levels of scale and shift, facilitating pattern identification
and preserving the temporal information of the signal. In [16],
CWT and Morlet mother wavelet were applied to the signal
and extracted coefficients on a subset of key frequencies were
used.
In addition to providing a time-frequency representation of
the signal, the choice of different mother wavelets allows for
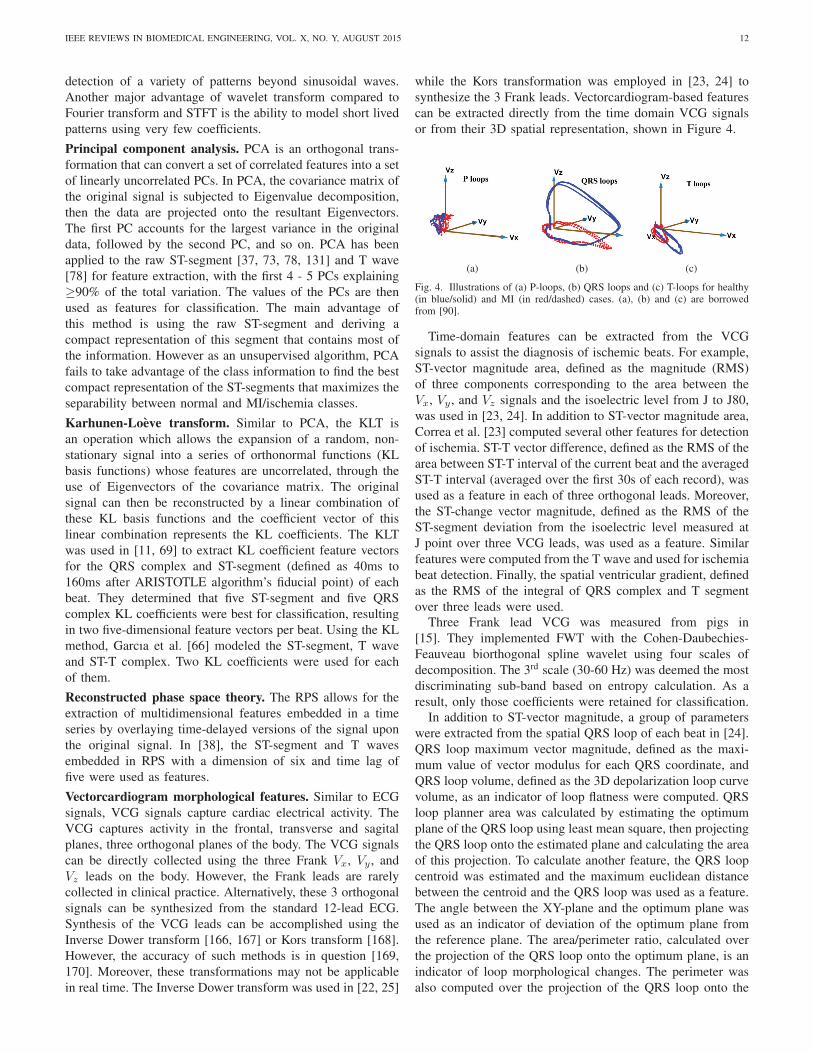
IEEE REVIEWS IN BIOMEDICAL ENGINEERING, VOL. X, NO. Y, AUGUST 2015 12
detection of a variety of patterns beyond sinusoidal waves.
Another major advantage of wavelet transform compared to
Fourier transform and STFT is the ability to model short lived
patterns using very few coefficients.
Principal component analysis. PCA is an orthogonal trans-
formation that can convert a set of correlated features into a set
of linearly uncorrelated PCs. In PCA, the covariance matrix of
the original signal is subjected to Eigenvalue decomposition,
then the data are projected onto the resultant Eigenvectors.
The first PC accounts for the largest variance in the original
data, followed by the second PC, and so on. PCA has been
applied to the raw ST-segment [37, 73, 78, 131] and T wave
[78] for feature extraction, with the first 4 - 5 PCs explaining
≥90% of the total variation. The values of the PCs are then
used as features for classification. The main advantage of
this method is using the raw ST-segment and deriving a
compact representation of this segment that contains most of
the information. However as an unsupervised algorithm, PCA
fails to take advantage of the class information to find the best
compact representation of the ST-segments that maximizes the
separability between normal and MI/ischemia classes.
Karhunen-Loeve transform. Similar to PCA, the KLT is
an operation which allows the expansion of a random, non-
stationary signal into a series of orthonormal functions (KL
basis functions) whose features are uncorrelated, through the
use of Eigenvectors of the covariance matrix. The original
signal can then be reconstructed by a linear combination of
these KL basis functions and the coefficient vector of this
linear combination represents the KL coefficients. The KLT
was used in [11, 69] to extract KL coefficient feature vectors
for the QRS complex and ST-segment (defined as 40ms to
160ms after ARISTOTLE algorithm’s fiducial point) of each
beat. They determined that five ST-segment and five QRS
complex KL coefficients were best for classification, resulting
in two five-dimensional feature vectors per beat. Using the KL
method, Garcıa et al. [66] modeled the ST-segment, T wave
and ST-T complex. Two KL coefficients were used for each
of them.
Reconstructed phase space theory. The RPS allows for the
extraction of multidimensional features embedded in a time
series by overlaying time-delayed versions of the signal upon
the original signal. In [38], the ST-segment and T waves
embedded in RPS with a dimension of six and time lag of
five were used as features.
Vectorcardiogram morphological features. Similar to ECG
signals, VCG signals capture cardiac electrical activity. The
VCG captures activity in the frontal, transverse and sagital
planes, three orthogonal planes of the body. The VCG signals
can be directly collected using the three Frank Vx, Vy , and
Vz leads on the body. However, the Frank leads are rarely
collected in clinical practice. Alternatively, these 3 orthogonal
signals can be synthesized from the standard 12-lead ECG.
Synthesis of the VCG leads can be accomplished using the
Inverse Dower transform [166, 167] or Kors transform [168].
However, the accuracy of such methods is in question [169,
170]. Moreover, these transformations may not be applicable
in real time. The Inverse Dower transform was used in [22, 25]
while the Kors transformation was employed in [23, 24] to
synthesize the 3 Frank leads. Vectorcardiogram-based features
can be extracted directly from the time domain VCG signals
or from their 3D spatial representation, shown in Figure 4.
(a) (b) (c)
Fig. 4. Illustrations of (a) P-loops, (b) QRS loops and (c) T-loops for healthy(in blue/solid) and MI (in red/dashed) cases. (a), (b) and (c) are borrowedfrom [90].
Time-domain features can be extracted from the VCG
signals to assist the diagnosis of ischemic beats. For example,
ST-vector magnitude area, defined as the magnitude (RMS)
of three components corresponding to the area between the
Vx, Vy , and Vz signals and the isoelectric level from J to J80,
was used in [23, 24]. In addition to ST-vector magnitude area,
Correa et al. [23] computed several other features for detection
of ischemia. ST-T vector difference, defined as the RMS of the
area between ST-T interval of the current beat and the averaged
ST-T interval (averaged over the first 30s of each record), was
used as a feature in each of three orthogonal leads. Moreover,
the ST-change vector magnitude, defined as the RMS of the
ST-segment deviation from the isoelectric level measured at
J point over three VCG leads, was used as a feature. Similar
features were computed from the T wave and used for ischemia
beat detection. Finally, the spatial ventricular gradient, defined
as the RMS of the integral of QRS complex and T segment
over three leads were used.Three Frank lead VCG was measured from pigs in
[15]. They implemented FWT with the Cohen-Daubechies-
Feauveau biorthogonal spline wavelet using four scales of
decomposition. The 3rd scale (30-60 Hz) was deemed the most
discriminating sub-band based on entropy calculation. As a
result, only those coefficients were retained for classification.In addition to ST-vector magnitude, a group of parameters
were extracted from the spatial QRS loop of each beat in [24].
QRS loop maximum vector magnitude, defined as the maxi-
mum value of vector modulus for each QRS coordinate, and
QRS loop volume, defined as the 3D depolarization loop curve
volume, as an indicator of loop flatness were computed. QRS
loop planner area was calculated by estimating the optimum
plane of the QRS loop using least mean square, then projecting
the QRS loop onto the estimated plane and calculating the area
of this projection. To calculate another feature, the QRS loop
centroid was estimated and the maximum euclidean distance
between the centroid and the QRS loop was used as a feature.
The angle between the XY-plane and the optimum plane was
used as an indicator of deviation of the optimum plane from
the reference plane. The area/perimeter ratio, calculated over
the projection of the QRS loop onto the optimum plane, is an
indicator of loop morphological changes. The perimeter was
also computed over the projection of the QRS loop onto the
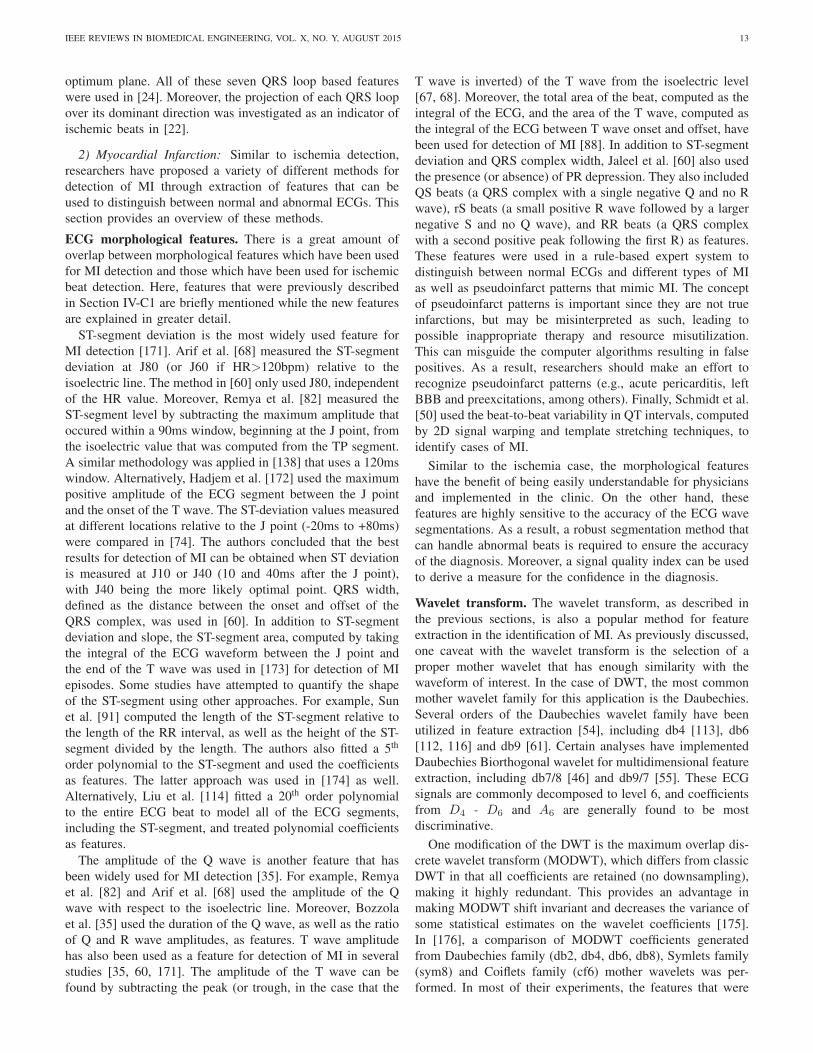
IEEE REVIEWS IN BIOMEDICAL ENGINEERING, VOL. X, NO. Y, AUGUST 2015 13
optimum plane. All of these seven QRS loop based features
were used in [24]. Moreover, the projection of each QRS loop
over its dominant direction was investigated as an indicator of
ischemic beats in [22].
2) Myocardial Infarction: Similar to ischemia detection,
researchers have proposed a variety of different methods for
detection of MI through extraction of features that can be
used to distinguish between normal and abnormal ECGs. This
section provides an overview of these methods.
ECG morphological features. There is a great amount of
overlap between morphological features which have been used
for MI detection and those which have been used for ischemic
beat detection. Here, features that were previously described
in Section IV-C1 are briefly mentioned while the new features
are explained in greater detail.
ST-segment deviation is the most widely used feature for
MI detection [171]. Arif et al. [68] measured the ST-segment
deviation at J80 (or J60 if HR>120bpm) relative to the
isoelectric line. The method in [60] only used J80, independent
of the HR value. Moreover, Remya et al. [82] measured the
ST-segment level by subtracting the maximum amplitude that
occured within a 90ms window, beginning at the J point, from
the isoelectric value that was computed from the TP segment.
A similar methodology was applied in [138] that uses a 120ms
window. Alternatively, Hadjem et al. [172] used the maximum
positive amplitude of the ECG segment between the J point
and the onset of the T wave. The ST-deviation values measured
at different locations relative to the J point (-20ms to +80ms)
were compared in [74]. The authors concluded that the best
results for detection of MI can be obtained when ST deviation
is measured at J10 or J40 (10 and 40ms after the J point),
with J40 being the more likely optimal point. QRS width,
defined as the distance between the onset and offset of the
QRS complex, was used in [60]. In addition to ST-segment
deviation and slope, the ST-segment area, computed by taking
the integral of the ECG waveform between the J point and
the end of the T wave was used in [173] for detection of MI
episodes. Some studies have attempted to quantify the shape
of the ST-segment using other approaches. For example, Sun
et al. [91] computed the length of the ST-segment relative to
the length of the RR interval, as well as the height of the ST-
segment divided by the length. The authors also fitted a 5th
order polynomial to the ST-segment and used the coefficients
as features. The latter approach was used in [174] as well.
Alternatively, Liu et al. [114] fitted a 20th order polynomial
to the entire ECG beat to model all of the ECG segments,
including the ST-segment, and treated polynomial coefficients
as features.
The amplitude of the Q wave is another feature that has
been widely used for MI detection [35]. For example, Remya
et al. [82] and Arif et al. [68] used the amplitude of the Q
wave with respect to the isoelectric line. Moreover, Bozzola
et al. [35] used the duration of the Q wave, as well as the ratio
of Q and R wave amplitudes, as features. T wave amplitude
has also been used as a feature for detection of MI in several
studies [35, 60, 171]. The amplitude of the T wave can be
found by subtracting the peak (or trough, in the case that the
T wave is inverted) of the T wave from the isoelectric level
[67, 68]. Moreover, the total area of the beat, computed as the
integral of the ECG, and the area of the T wave, computed as
the integral of the ECG between T wave onset and offset, have
been used for detection of MI [88]. In addition to ST-segment
deviation and QRS complex width, Jaleel et al. [60] also used
the presence (or absence) of PR depression. They also included
QS beats (a QRS complex with a single negative Q and no R
wave), rS beats (a small positive R wave followed by a larger
negative S and no Q wave), and RR beats (a QRS complex
with a second positive peak following the first R) as features.
These features were used in a rule-based expert system to
distinguish between normal ECGs and different types of MI
as well as pseudoinfarct patterns that mimic MI. The concept
of pseudoinfarct patterns is important since they are not true
infarctions, but may be misinterpreted as such, leading to
possible inappropriate therapy and resource misutilization.
This can misguide the computer algorithms resulting in false
positives. As a result, researchers should make an effort to
recognize pseudoinfarct patterns (e.g., acute pericarditis, left
BBB and preexcitations, among others). Finally, Schmidt et al.
[50] used the beat-to-beat variability in QT intervals, computed
by 2D signal warping and template stretching techniques, to
identify cases of MI.
Similar to the ischemia case, the morphological features
have the benefit of being easily understandable for physicians
and implemented in the clinic. On the other hand, these
features are highly sensitive to the accuracy of the ECG wave
segmentations. As a result, a robust segmentation method that
can handle abnormal beats is required to ensure the accuracy
of the diagnosis. Moreover, a signal quality index can be used
to derive a measure for the confidence in the diagnosis.
Wavelet transform. The wavelet transform, as described in
the previous sections, is also a popular method for feature
extraction in the identification of MI. As previously discussed,
one caveat with the wavelet transform is the selection of a
proper mother wavelet that has enough similarity with the
waveform of interest. In the case of DWT, the most common
mother wavelet family for this application is the Daubechies.
Several orders of the Daubechies wavelet family have been
utilized in feature extraction [54], including db4 [113], db6
[112, 116] and db9 [61]. Certain analyses have implemented
Daubechies Biorthogonal wavelet for multidimensional feature
extraction, including db7/8 [46] and db9/7 [55]. These ECG
signals are commonly decomposed to level 6, and coefficients
from D4 - D6 and A6 are generally found to be most
discriminative.
One modification of the DWT is the maximum overlap dis-
crete wavelet transform (MODWT), which differs from classic
DWT in that all coefficients are retained (no downsampling),
making it highly redundant. This provides an advantage in
making MODWT shift invariant and decreases the variance of
some statistical estimates on the wavelet coefficients [175].
In [176], a comparison of MODWT coefficients generated
from Daubechies family (db2, db4, db6, db8), Symlets family
(sym8) and Coiflets family (cf6) mother wavelets was per-
formed. In most of their experiments, the features that were
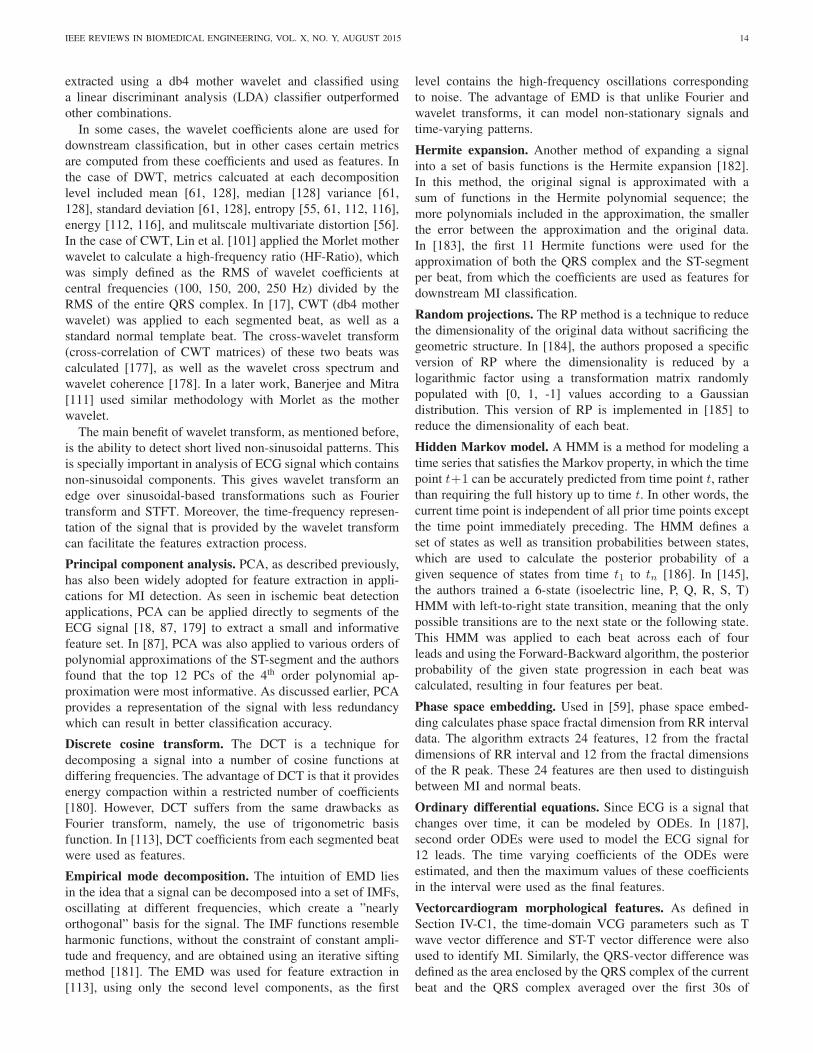
IEEE REVIEWS IN BIOMEDICAL ENGINEERING, VOL. X, NO. Y, AUGUST 2015 14
extracted using a db4 mother wavelet and classified using
a linear discriminant analysis (LDA) classifier outperformed
other combinations.
In some cases, the wavelet coefficients alone are used for
downstream classification, but in other cases certain metrics
are computed from these coefficients and used as features. In
the case of DWT, metrics calcuated at each decomposition
level included mean [61, 128], median [128] variance [61,
128], standard deviation [61, 128], entropy [55, 61, 112, 116],
energy [112, 116], and mulitscale multivariate distortion [56].
In the case of CWT, Lin et al. [101] applied the Morlet mother
wavelet to calculate a high-frequency ratio (HF-Ratio), which
was simply defined as the RMS of wavelet coefficients at
central frequencies (100, 150, 200, 250 Hz) divided by the
RMS of the entire QRS complex. In [17], CWT (db4 mother
wavelet) was applied to each segmented beat, as well as a
standard normal template beat. The cross-wavelet transform
(cross-correlation of CWT matrices) of these two beats was
calculated [177], as well as the wavelet cross spectrum and
wavelet coherence [178]. In a later work, Banerjee and Mitra
[111] used similar methodology with Morlet as the mother
wavelet.
The main benefit of wavelet transform, as mentioned before,
is the ability to detect short lived non-sinusoidal patterns. This
is specially important in analysis of ECG signal which contains
non-sinusoidal components. This gives wavelet transform an
edge over sinusoidal-based transformations such as Fourier
transform and STFT. Moreover, the time-frequency represen-
tation of the signal that is provided by the wavelet transform
can facilitate the features extraction process.
Principal component analysis. PCA, as described previously,
has also been widely adopted for feature extraction in appli-
cations for MI detection. As seen in ischemic beat detection
applications, PCA can be applied directly to segments of the
ECG signal [18, 87, 179] to extract a small and informative
feature set. In [87], PCA was also applied to various orders of
polynomial approximations of the ST-segment and the authors
found that the top 12 PCs of the 4th order polynomial ap-
proximation were most informative. As discussed earlier, PCA
provides a representation of the signal with less redundancy
which can result in better classification accuracy.
Discrete cosine transform. The DCT is a technique for
decomposing a signal into a number of cosine functions at
differing frequencies. The advantage of DCT is that it provides
energy compaction within a restricted number of coefficients
[180]. However, DCT suffers from the same drawbacks as
Fourier transform, namely, the use of trigonometric basis
function. In [113], DCT coefficients from each segmented beat
were used as features.
Empirical mode decomposition. The intuition of EMD lies
in the idea that a signal can be decomposed into a set of IMFs,
oscillating at different frequencies, which create a ”nearly
orthogonal” basis for the signal. The IMF functions resemble
harmonic functions, without the constraint of constant ampli-
tude and frequency, and are obtained using an iterative sifting
method [181]. The EMD was used for feature extraction in
[113], using only the second level components, as the first
level contains the high-frequency oscillations corresponding
to noise. The advantage of EMD is that unlike Fourier and
wavelet transforms, it can model non-stationary signals and
time-varying patterns.
Hermite expansion. Another method of expanding a signal
into a set of basis functions is the Hermite expansion [182].
In this method, the original signal is approximated with a
sum of functions in the Hermite polynomial sequence; the
more polynomials included in the approximation, the smaller
the error between the approximation and the original data.
In [183], the first 11 Hermite functions were used for the
approximation of both the QRS complex and the ST-segment
per beat, from which the coefficients are used as features for
downstream MI classification.
Random projections. The RP method is a technique to reduce
the dimensionality of the original data without sacrificing the
geometric structure. In [184], the authors proposed a specific
version of RP where the dimensionality is reduced by a
logarithmic factor using a transformation matrix randomly
populated with [0, 1, -1] values according to a Gaussian
distribution. This version of RP is implemented in [185] to
reduce the dimensionality of each beat.
Hidden Markov model. A HMM is a method for modeling a
time series that satisfies the Markov property, in which the time
point t+1 can be accurately predicted from time point t, rather
than requiring the full history up to time t. In other words, the
current time point is independent of all prior time points except
the time point immediately preceding. The HMM defines a
set of states as well as transition probabilities between states,
which are used to calculate the posterior probability of a
given sequence of states from time t1 to tn [186]. In [145],
the authors trained a 6-state (isoelectric line, P, Q, R, S, T)
HMM with left-to-right state transition, meaning that the only
possible transitions are to the next state or the following state.
This HMM was applied to each beat across each of four
leads and using the Forward-Backward algorithm, the posterior
probability of the given state progression in each beat was
calculated, resulting in four features per beat.
Phase space embedding. Used in [59], phase space embed-
ding calculates phase space fractal dimension from RR interval
data. The algorithm extracts 24 features, 12 from the fractal
dimensions of RR interval and 12 from the fractal dimensions
of the R peak. These 24 features are then used to distinguish
between MI and normal beats.
Ordinary differential equations. Since ECG is a signal that
changes over time, it can be modeled by ODEs. In [187],
second order ODEs were used to model the ECG signal for
12 leads. The time varying coefficients of the ODEs were
estimated, and then the maximum values of these coefficients
in the interval were used as the final features.
Vectorcardiogram morphological features. As defined in
Section IV-C1, the time-domain VCG parameters such as T
wave vector difference and ST-T vector difference were also
used to identify MI. Similarly, the QRS-vector difference was
defined as the area enclosed by the QRS complex of the current
beat and the QRS complex averaged over the first 30s of
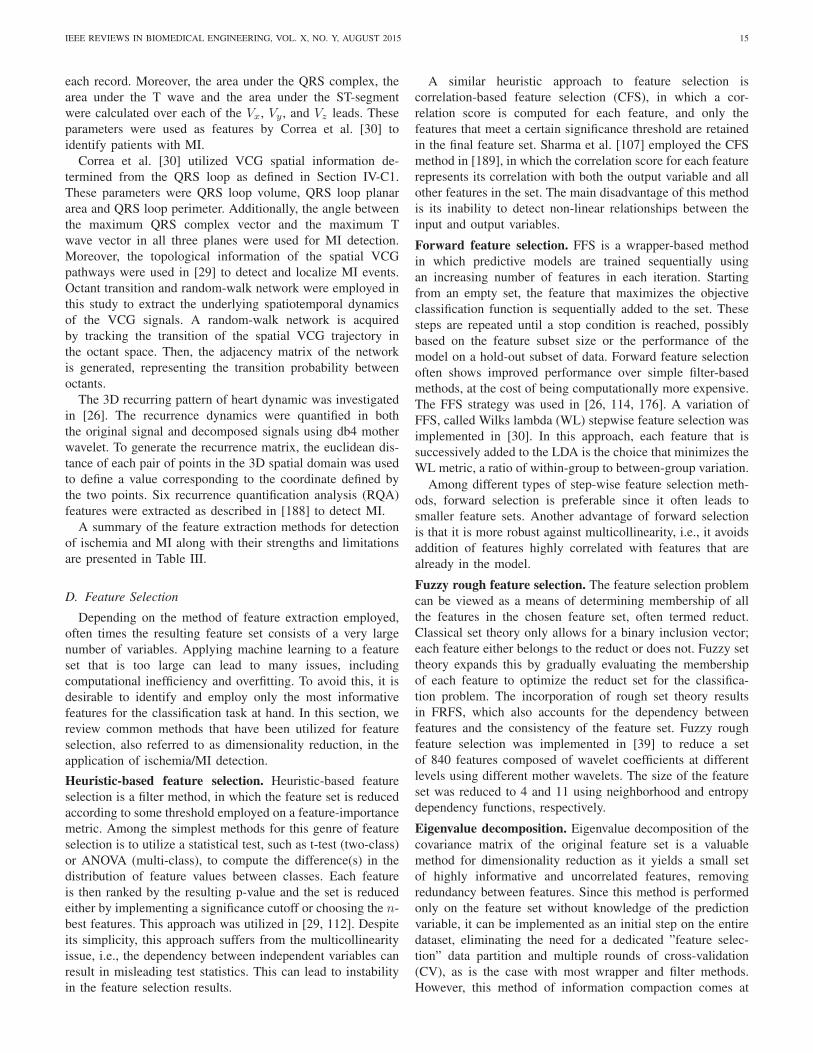
IEEE REVIEWS IN BIOMEDICAL ENGINEERING, VOL. X, NO. Y, AUGUST 2015 15
each record. Moreover, the area under the QRS complex, the
area under the T wave and the area under the ST-segment
were calculated over each of the Vx, Vy , and Vz leads. These
parameters were used as features by Correa et al. [30] to
identify patients with MI.
Correa et al. [30] utilized VCG spatial information de-
termined from the QRS loop as defined in Section IV-C1.
These parameters were QRS loop volume, QRS loop planar
area and QRS loop perimeter. Additionally, the angle between
the maximum QRS complex vector and the maximum T
wave vector in all three planes were used for MI detection.
Moreover, the topological information of the spatial VCG
pathways were used in [29] to detect and localize MI events.
Octant transition and random-walk network were employed in
this study to extract the underlying spatiotemporal dynamics
of the VCG signals. A random-walk network is acquired
by tracking the transition of the spatial VCG trajectory in
the octant space. Then, the adjacency matrix of the network
is generated, representing the transition probability between
octants.
The 3D recurring pattern of heart dynamic was investigated
in [26]. The recurrence dynamics were quantified in both
the original signal and decomposed signals using db4 mother
wavelet. To generate the recurrence matrix, the euclidean dis-
tance of each pair of points in the 3D spatial domain was used
to define a value corresponding to the coordinate defined by
the two points. Six recurrence quantification analysis (RQA)
features were extracted as described in [188] to detect MI.
A summary of the feature extraction methods for detection
of ischemia and MI along with their strengths and limitations
are presented in Table III.
D. Feature Selection
Depending on the method of feature extraction employed,
often times the resulting feature set consists of a very large
number of variables. Applying machine learning to a feature
set that is too large can lead to many issues, including
computational inefficiency and overfitting. To avoid this, it is
desirable to identify and employ only the most informative
features for the classification task at hand. In this section, we
review common methods that have been utilized for feature
selection, also referred to as dimensionality reduction, in the
application of ischemia/MI detection.
Heuristic-based feature selection. Heuristic-based feature
selection is a filter method, in which the feature set is reduced
according to some threshold employed on a feature-importance
metric. Among the simplest methods for this genre of feature
selection is to utilize a statistical test, such as t-test (two-class)
or ANOVA (multi-class), to compute the difference(s) in the
distribution of feature values between classes. Each feature
is then ranked by the resulting p-value and the set is reduced
either by implementing a significance cutoff or choosing the n-
best features. This approach was utilized in [29, 112]. Despite
its simplicity, this approach suffers from the multicollinearity
issue, i.e., the dependency between independent variables can
result in misleading test statistics. This can lead to instability
in the feature selection results.
A similar heuristic approach to feature selection is
correlation-based feature selection (CFS), in which a cor-
relation score is computed for each feature, and only the
features that meet a certain significance threshold are retained
in the final feature set. Sharma et al. [107] employed the CFS
method in [189], in which the correlation score for each feature
represents its correlation with both the output variable and all
other features in the set. The main disadvantage of this method
is its inability to detect non-linear relationships between the
input and output variables.
Forward feature selection. FFS is a wrapper-based method
in which predictive models are trained sequentially using
an increasing number of features in each iteration. Starting
from an empty set, the feature that maximizes the objective
classification function is sequentially added to the set. These
steps are repeated until a stop condition is reached, possibly
based on the feature subset size or the performance of the
model on a hold-out subset of data. Forward feature selection
often shows improved performance over simple filter-based
methods, at the cost of being computationally more expensive.
The FFS strategy was used in [26, 114, 176]. A variation of
FFS, called Wilks lambda (WL) stepwise feature selection was
implemented in [30]. In this approach, each feature that is
successively added to the LDA is the choice that minimizes the
WL metric, a ratio of within-group to between-group variation.
Among different types of step-wise feature selection meth-
ods, forward selection is preferable since it often leads to
smaller feature sets. Another advantage of forward selection
is that it is more robust against multicollinearity, i.e., it avoids
addition of features highly correlated with features that are
already in the model.
Fuzzy rough feature selection. The feature selection problem
can be viewed as a means of determining membership of all
the features in the chosen feature set, often termed reduct.
Classical set theory only allows for a binary inclusion vector;
each feature either belongs to the reduct or does not. Fuzzy set
theory expands this by gradually evaluating the membership
of each feature to optimize the reduct set for the classifica-
tion problem. The incorporation of rough set theory results
in FRFS, which also accounts for the dependency between
features and the consistency of the feature set. Fuzzy rough
feature selection was implemented in [39] to reduce a set
of 840 features composed of wavelet coefficients at different
levels using different mother wavelets. The size of the feature
set was reduced to 4 and 11 using neighborhood and entropy
dependency functions, respectively.
Eigenvalue decomposition. Eigenvalue decomposition of the
covariance matrix of the original feature set is a valuable
method for dimensionality reduction as it yields a small set
of highly informative and uncorrelated features, removing
redundancy between features. Since this method is performed
only on the feature set without knowledge of the prediction
variable, it can be implemented as an initial step on the entire
dataset, eliminating the need for a dedicated ”feature selec-
tion” data partition and multiple rounds of cross-validation
(CV), as is the case with most wrapper and filter methods.
However, this method of information compaction comes at
IEEE REVIEWS IN BIOMEDICAL ENGINEERING, VOL. X, NO. Y, AUGUST 2015 16
TABLE IIISUMMARY OF THE POPULAR FEATURE EXTRACTION METHODS FOR DETECTION OF MI AND ISCHEMIA AND THEIR STRENGTHS AND LIMITATIONS.
Feature type Strengths Limitations
Morphological• Easy to interpret• Directly applicable in the clinic
• Accuracy highly depends on the performance of ECGsegmentation algorithm
STFT• Easy to understand and use• Computationally efficient• Preserves the temporal granularity
• Uses sinusoidal basis functions, making it unsuitable formodeling non-periodic non-trigonometric patterns
• Discontinuity at the beginning and end of the window canresult in artifacts
• It uses the same window length for all frequencies
Wavelettransform
• Does not require a sliding window• Maintains both time and frequency dimensions• Can use a variety of mother wavelets modeling different patterns• Is suitable for modeling short lived non-trigonometric patterns
• Inaccurate around the ends of the signal due to boundaryeffects
• More difficult to understand and implement
PCA and KLT• Creates a compact representation of the data with less redundancy
between the variables• Computationally efficient and easy to implement
• Fails to use the class information• The new variables are difficult to interpret
VCG• Provides a more compact representation of the electrical activity of
the heart using orthogonal leads• The representation can be easily visualized and is more intuitive
• Frank leads are not commonly measured in the clinic• The synthesis methods have low accuracy
the cost of feature interpretability, as each feature in the
reduced feature set represents a linear combination of all
features in the original set. Eigenvalue decomposition methods
include PCA and singular value decomposition (SVD), which
is similar to PCA but omits the initial step of mean-centering.
Another method that involves Eigenspace projection of data
is the locality preserving projection (LPP) [190]. This method
differs from PCA and SVD in that it first aims to preserve
the local structure of the data, rather than focusing on the
projection with the maximum variance. Feature selection by
PCA [54, 55, 61], SVD [46], and LPP [113] have been utilized
for ischemia and MI detection.
Evolutionary optimization algorithms. At the most basic
level, feature selection boils down to an optimization prob-
lem: minimizing the number of features while simultaneously
maximizing the performance of the model. Many optimization
algorithms take inspiration from principles of natural phenom-
ena, and are widely used for the purposes of feature reduction.
In genetic algorithm (GA) [191], a randomly initialized
set of solutions is subjected to various principles of genetic
evolution, including mutation, crossover and reproduction.
This evolution of solutions is continued until a pre-defined
fitness function reaches a certain threshold. As implemented
in [28, 114], the feature set was represented as a binary feature
inclusion indicator vector which was mutated and evolved until
the classification error fell below some cutoff.
Two other optimization algorithms which have been inspired
by principles of nature are the particle swarm and bat algo-
rithms [192]. In the particle swarm optimization algorithm,
a set (swarm) of solutions (particles) are shifted within their
search space to optimize both the position of each particle
and the layout of the swarm. This algorithm is based on the
biological principle of swarm intelligence, seen in flocks of
birds or schools of fish. The bat algorithm [193] was inspired
by echolocation exhibited by microbats, in which the rate of
pulse emission increases and the loudness decreases as the
bat gets closer to its prey. In the bat algorithm, both the
pulse emission rate and the loudness of each bat is used for
optimization. These iterative processes are again repeated until
the fitness function meets a predefined cutoff. Both particle
swarm optimization [114] and bat algorithm [89] have been
utilized in the selection of ECG features.
Feature weighting approaches. Many machine learning clas-
sification algorithms have intrinsic methods of feature selec-
tion, where only features with non-zero weights, or weights
above a certain threshold value, are used for the final classifica-
tion task. Some of the most commonly used machine learning
algorithms for this feature selection method are Random Forest
and Lasso; however, this technique is not limited to these
algorithms only. In [194], a multi-layer Perceptron (MLP)
(described in detail in Section IV-E) was trained and then
pruned, eliminating nodes with edge weights falling beneath a
certain cutoff and thereby removing features that are irrelevant
to the final classification task.
E. Classification
For MI and ischemia detection systems, a decision or clas-
sification algorithm is implemented to determine whether the
features extracted from the ECG are decisive for or indicative
of the severe cardiac event. Many of the presented classifica-
tion techniques are implemented as binary classification, i.e.
the algorithm determines if a feature vector describes a normal
or MI/ischemic ECG segment.
Classification algorithms can formalize clinical guidelines
for MI and ischemia diagnosis using ECG signal. These
guidelines regarding the morphological features of the ECG
signal have been formalized and applied for beat classification
[76, 79]. Additionally, clinical definitions were mapped to
16 formal algorithmic rules, to classify ECG samples into 9
classes including normal, pericarditis and STEMI [60]. Expert
knowledge has also been modeled with fuzzy logic in [34],
where the authors constructed a linguistic filter with persis-
tence and separation criterions to detect ST and T episodes.
An alternative rule-based construction is given in [80], where
six association rules, applied to ECG signal features including
ST-segment deviation, slope and area, are determined during
training and used for classification according to a classifica-
IEEE REVIEWS IN BIOMEDICAL ENGINEERING, VOL. X, NO. Y, AUGUST 2015 17
tion based on predictive association rules (CPAR) algorithm
presented in [195].
One of the simplest classification methods implemented for
MI and ischemia detection is thresholding. Following feature
extraction from an ECG sample, a simple threshold is applied
on either a single feature or a linear combination of features.
Upon new input, the threshold determines the classification of
the data; values above the threshold are classified differently
than values below the threshold. Despite its simplicity, thresh-
olding can not generate sophisticated models with non-linear
decision boundaries.
Thresholding was conducted for ECG classification in
[66, 69, 83, 101, 111]. In the two class scenario, this tech-
nique uses a constant or adaptive value for the threshold to
classify an ECG segment into normal and abnormal classes.
Thresholding of morphological features has been used to
classify MI and ischemia where the threshold is applied to
ST-segment amplitude and time [96], ST-segment elevation
[138] or ST-segment deviation and duration [98]. Moreover,
the features of Q depth and ST-segment elevation for each
lead were used for thresholding [82], as well as a dissimilarity
factor on QRS complex and T wave [110]. Thresholding
on distortion of covariance matrices between adjacent beats
has been used to determine MI and ischemia as well [56].
Additionally, Jager et al. [11] implemented a thresholding
technique that determines a guard zone as proposed in [31],
i.e. an indeterminate area which requires further classification.
Samples above or below the guard zone are considered normal
or abnormal while samples within the guard zone are subject
to further adaptive thresholds to determine which class the
sample belongs to.
The ST-segment amplitudes or deviations can be analyzed
as time series for classification of MI and ischemic beats. This
was done by analyzing the RMS difference series generated
from the ST-segment deviations and using the results for detec-
tion of ischemia in [36]. This method was later combined with
an algorithm to detect body position changes to improve the
accuracy [71]. Moreover, the log-likelihood of the ST-segment
deviation belonging to the abnormal class, computed using
the probability density function of the ST-segment deviations,
was used along with hypothesis testing in a wireless system
to detect MI non-invasively [172]. Alternatively, Badilini et al.
[70] defined an ischemic episode as a period of 20 seconds
that contains non-noisy beats with significantly depressed
ST-segments compared to normal and used this criteria for
ischemic episode detection.
Decision trees are a popular algorithm for classification in
medical applications. Each node of the tree represents a binary
decision which works to separate data by class; each node
partitions the dataset based on the value of a particular feature.
To classify a new sample, the input feature vector propagates
down the tree taking the path determined by the rules of
each node along that path. The input sample is then assigned
the class of the terminating leaf node. The DT classification
model is advantageous because the rules of each node are
explicitly represented and yield a model that can be interpreted
by physicians. Moreover, the decision rules in DT nodes create
a cellular decision ’surface’, allowing for creation of complex
models. While this is an advantage for a classification model,
it also makes the algorithm prone to overfitting.
The DT algorithm was used in [51] to classify abnormal ST-
segments and T waves using 18 ECG morphological features.
They used an implementation of the DT called random under
sampling that is designed to handle unbalanced class sizes
[196]. A multi-class DT was used to classify ECG samples into
three classes (ischemic, arrhythmia and healthy) that employed
frequency domain features computed by short time Fourier
transform [53]. Additionally, Exarchos et al. [126] used a C4.5
DT algorithm [197] to find classification rules, which were
transformed into a fuzzy model and then parameterized with
Healed Topographical Multilevel Single Linkage algorithm
[198] for ECG classification. Decision trees have also been
applied to 161 features computed from VCG octants for MI
classification and localization [29]. The DT was implemented
using the classification and regression tree (CART) algorithm
in this study.
The k-NN algorithm is a classification method based on the
proximity of an input data point to labeled training data points,
parameterized by choice of k and a distance metric. Feature
vectors are viewed as points in a multidimensional feature
space. To classify a new sample, the algorithm determines the
k nearest labeled training points to the input feature vector, and
assigns the majority class to the input vector. The description
of k-NN found in [199] has been used in [39, 112, 113] with
k = 5. The implementation found in [55] also classifies the
signals using a k-NN classifier with k = 5 that is applied to six
PCA features, reduced from 24 wavelet features. Additionally,
the Arif-Fayyaz prunning method [200] was applied to the
training data to reduce the number of required samples in the
k-NN model by 93% for ECG classification [68]. Although k-
NN is computationally efficient, it can easily lead to overfitting
when there is dependency between observations, as illustrated
in Section VI.
The SVM classification algorithm is a supervised learning
method which performs classification on data points in a
high dimensional feature space. The algorithm determines a
maximal-margin separating hyperplane, or set of hyperplanes,
which partition the feature space such that data points be-
longing to each class appear in a distinct partition. These
hyperplanes are constructed to maximize the width of the
margin resulting in the largest separation between the classes
while minimizing the misclassification rate. To classify a new
data point, the input sample is given the class of all data points
in that partition. The SVM algorithm can perform classification
on linearly separable data points as well as non-linear classi-
fication using a mathematical tool called the kernel trick. The
kernel embeds all feature vectors into a higher dimensional
feature space, where classes are linearly separable; hence, a
linear SVM model can be used to classify the data points.
The SVM algorithm uses maximum-margin hyperplanes to
make classification robust against noise and outliers. The
algorithm also provides a balance between accuracy and model
complexity by implementing regularization.
Support vector machines have been widely used in a multi-
tude of medical applications. Likewise, several studies have
used SVM for detection of ischemia and MI with linear
IEEE REVIEWS IN BIOMEDICAL ENGINEERING, VOL. X, NO. Y, AUGUST 2015 18
[54, 55, 84, 115], radial basis function (RBF) [28, 55, 67, 87,
128, 155, 201], polynomial [46] and exponential chi-squared
[46] kernel functions. Support vector machines have also been
used for multiclass MI classification, applied to features that
are extracted using ODEs to represent morphology of the ECG
signal. This method classifies the signals into five classes
of heart conditions, MI, cardiomyopathy/heart failure, BBB,
dysrhythmia and myocardial hypertrophy/valvular heart dis-
ease/myocarditis/miscellaneous combined [187]. Multi-class
SVM classification was also used in [55] for localization of
six types of MI (anterior, anterolateral, anteroseptal, inferior,
inferolateral, and inferoposterolateral).
Another popular method for classification in biomedical
applications is NN. It is composed of a network of neurons
implemented to approximate an unknown function from a
data vector to the appropriate class. The model is dependent
upon the number of neurons and the connections between
the neurons, i.e. the network structure, as well as the the
neuron parameters and training algorithm. The interconnected
nodes are hierarchically organized into layers. The input layer
distributes the feature vector of a sample amongst the neurons
in the subsequent layer. Each neuron in the NN computes a
weighted sum of the inputs, determined by the neuron weights,
and outputs a nonlinear function of that weighted sum. The
neurons in one layer distribute their outputs to the neurons
in the subsequent layer. Following the application of all
other layers, the output layer calculates the final classification.
During training the network learns the weights for each con-
nection to minimize a chosen loss function, which is applied
after classification. The weight calculation can be formulated
as an optimization problem, which is solved using one of
various algorithms. A common choice of training algorithm
is backpropagation, which uses a form of gradient descent.
The backpropagation algorithm computes the derivative of the
error with respect to each weight and determines a direction
and amount of change for weights in the network to minimize
error. Additional training algorithms include GAs and particle
swarm algorithm, but all methods addressed in this paper
utilized a variation of gradient descent. After several iterations
of the weight optimization procedure, the model is finalized
and all of the weights have been learned. The NN has many
alternative variations: recurrent neural network (RNN) takes
the form of a cyclic network, an RBF-NN uses the RBF func-
tion as the non-linear unit, a Levenberg Marquardt NN uses a
training algorithm based on Levenberg Marquardt optimization
that is very efficient. A probabilistic neural network (PNN)
first normalizes samples then determines class probabilities
and classifies based on the maximum probability. The MLP
is a popular NN in which each layer is fully connected, i.e.
each neuron in one layer is connected to every neuron in the
subsequent layer.
A basic back-propagation NN was used in [59, 78, 93, 131].
Alternatively, feed-forward NN with adaptive training back-
propagation was used in [32, 52, 127], which adjusts the
learning rate during training. Moreover, Stamkopoulos et al.
[129] used an RBF-NN in whiche the size of the second layer
was determined by NLPCA feature space (number of PCs).
A Levenberg Marquardt NN [202], designed to minimize the
sum of squared errors, was used in [89]. Bayesian NN, a clas-
sification algorithm constructed from a number of independent
NNs with different degrees of certainty, were used in [203]. In
this work the number of hidden nodes was determined using
3-fold CV.
A neuro-fuzzy system is a NN in which the neuron param-
eters for internal layers are fuzzy IF-THEN rules, as opposed
to weights. The evaluation of these IF-THEN rules does not
require completely true or completely false evaluations, but
allows for partial-truth and partial-falsehood. One advantage
of a neuro-fuzzy system lies in the fact that the rules applied at
each neuron can be framed in terms of clinically interpretable
IF-THEN rules. The neuro-fuzzy system in [171] was initial-
ized by encoding clinical expert knowledge as IF-THEN rules.
It then proceeded to find the best set of parameters for the
neuro-Fuzzy model. The MLP approach used in [35] translates
the network into linguistic rules for easier interpretation.
Alternatively, Bogdanova et al. [185] used an adaptive neuro-
fuzzy classifier with linguistic hedges [204] which was trained
by the more efficient scaled conjugate gradient (SCG) NN
method.
The SOM algorithm is an unsupervised NN, which clusters
the training data. As an unsupervised NN, training takes the
form of competitive learning as opposed to backpropagation.
Just as a supervised NN, each neuron is parameterized by a
set of weights, i.e. a weight vector. Alternatively, the weight
vectors in the SOM are compared to the input vector and
the most similar neuron, as determined by some similarity
measure, outputs 1 while all other neurons output 0. All weight
vectors are updated according to this similarity measure.
The supervised network self-organizing map (sNetSOM)
algorithm adapts the SOM algorithm to reduce error on
boundary data points. Instances, or subspaces, that are mixed
by classes and are therefore more difficult to classify using
the traditional SOM setup are given as input to a supervised
learning algorithm. This can be seen as using the SOM model
for easy to classify data points and a local expert for difficult
to classify data points. Localization and classification of MI
was done with a hierarchical supervised SOM in [27, 90].
The SOM algorithm presented in [205] was extended in [37],
where the local experts were an SVM. This same sNetSOM
was extended in [73], with local experts as MLP.
The Naive Bayes classifier uses the training samples to
construct a class probability distribution. Upon new samples,
the sample is classified as the class with the highest posterior
probability of the sample belonging to the class. The Niave
Bayes classifier was used in [38, 88, 174]. Alternatively, the
GMM algorithm assumes that all data comes from a prob-
ability distribution that is the ”mixture” of multiple gaussian
distributions and predicts which class an input sample belongs
to. The GMM was used in [145], with 6 distributions of MI
and 6 distributions of normal.
The multiple instance learning (MIL) classification algo-
rithm constructs labeled bags, i.e. the classifier consists of
sets of unlabeled instances. In terms of ECG classification,
the ECG record and heartbeats correspond to the bag and
unlabeled instances, respectively. The MIL algorithm imple-
mented in [91] predicts whether an unseen ECG contains MI.
IEEE REVIEWS IN BIOMEDICAL ENGINEERING, VOL. X, NO. Y, AUGUST 2015 19
The sparse representation-based classification (SRC) method,
which sparsely represents biomedical signals as a linear com-
bination of basis elements, was used in [67] where features
extracted from the dataset were used to represent new instances
for MI detection. The multi-criteria decision analysis (MCDA)
algorithm attempted to create decisions, i.e. classifications,
based on multiple criteria that are conflicting. The MCDA
algorithm, as described in [206, 207], was used in [77], along
with GA.
The LDA algorithm creates functions that are linear com-
binations of different features in order to classify data. These
independent discriminant functions are created to maximize
the differences between output on different classes. As de-
scribed in [208], discriminant analysis has been used for ECG
classification in [176]. Moreover, LDA has been used for
classification of MI and ischemia in [23, 24, 26, 30].
Many authors have conducted studies that compare various
classification algorithms. Neural network was compared to
SVM in [128] and the authors concluded that SVM achieves a
higher accuracy. On the other hand, ANN outperformed k-NN
and SVM with linear, polynomial and RBF kernels in [52].
Moreover, a comparison was conducted between SVM and
kernel density estimation (KDE) in [84], resulting in slightly
higher accuracy for SVM although KDE required much lower
computational power for model parameter selection. A simple
adaptive thresholding approach was compared to ANN in [82]
and the former was concluded to have a better performance.
Furthermore, Silipo and Marchesi [131] compared simple
thresholding, static NN, recurrent NN and knowledge learning
network (KLN). They concluded that recurrent NN does not
achieve a significantly better accuracy and static NN, when
combined with PCA, outperforms the other three methods. In
another comparative study, probabilistic NN was compared to
k-NN, MLP and Naive Bayes [88]. The results indicated that
Naive Bayes achieves the highest performance for detection of
MI while probabilistic NN have the best accuracy for localiza-
tion of MI. Support vector machine and SRC were compared
in [67] and the two methods achieved similar accuracies but
SRC had a higher sensitivity compared to SVM. Likewise, k-
nearest neighbor and a Bayes-based classifier achieved similar
accuracies when they were compared in [39].
Four different classifiers were compared in [114], the J-48 as
described in [209], K-star as described in [210], Random Tree
as described in [211] and Naive Bayes as described in [212].
Their results showed that J-48 has the highest performance
when ST-segment based features are used while K-star is
superior when the coefficients of a polynomial fit to the ECG
beats are used as features. In [80], rule-based association clas-
sification [195] was shown to have a slightly higher accuracy
when compared to classification based on associations [213],
multiple-class association rules [214], and the apriori-total
from partial classification [215]. Moreover, the authors used
two different discretization methods for continuous features:
equal depth binning as described in [216] and CT-disk as
described in [217].
The reported results in the comparative studies do not
generally point towards a certain direction and sometimes have
contradicting conclusions. As a result, more comprehensive
studies are needed to compare both feature extraction and
classification methods and identify the ones with higher per-
formance.
F. Postprocessing
Several studies conducted a postprocessing step after per-
forming classification. The most common postprocessing step
is to use the determined classifications for individual beats to
form ischemic/MI episodes. Taddei et al. [42, 218] defined the
ST-segment episodes as a ≥30s window of a signal in which
the absolute value of the deviation was ≥0.1mV. To find the
beginning of the episode, one needs to move backwards from
the beginning of the window (first point where the absolute
ST-segment deviation became ≥0.1mV) until a beat for which
the absolute ST-segment deviation is ≤0.05mV is found, such
that the absolute ST-segment deviation is ≤0.1mV throughout
the preceding 30s window. The end of the episode is found
similarly. The methods presented in [69, 98, 155] used this
criteria to find ischemic episodes, while Jager et al. [69] and
Andreao et al. [98] also merged detected episodes that occur
closer than 30s and 120s to each other, respectively. Jager
et al. [11] also used the same criteria, along with a guard
zone, such that any sample above the upper boundary of the
guard zone was marked as abnormal and any sample below
the lower boundary of the guard zone was marked as normal,
as described in [31].
Adaptive thresholding was used in [36] to identify ischemic
beats. Ischemic eipsodes were considered to be 45s sections of
the ECG signal containing ischemic beats and episodes closer
than 2 minutes were merged. Windows that contained at least
75% ischemic beats were declared as ischemic windows in
[76, 78, 79]. They also merged ischemic windows with short
(≤20 or ≤30s) gaps between them to determine ischemic
episodes. Additionally, the effect of misclassified beats can
be reduced by relabeling the beats. The method proposed in
[32] corrected classification labels if a group of ten consec-
utive beats had unstable labels with frequent changes. This
correction was made based on the classification of the beats in
the previous group of ten beats. After classification correction,
periods of the signal longer than 15s with abnormal beats were
marked as ischemic episodes. Alternatively, Maglaveras et al.
[127] processed groups of ten beats and assigned all of them
to the majority class of the group. Then, the method searched
for periods of ≥30 ischemic beats and declared these periods
as ischemic episodes.
Vila et al. [143] applied a median filter to the ST-segment
deviation and T wave amplitude time series to eliminate noisy
measurements, followed by a linguistic filter to find significant
deviations from normal periods, coupled with a persistence
criterion to identify MI episodes that are at least 30s long.
Finally, Abdelazez et al. [219] used a finite state machine with
several thresholds applied to ST-segment deviation in order to
define state transitions. The current state of the machine at any
given time determined whether MI is diagnosed or not.
Additional studies conduct postprocessing to detect false
alarms (incorrectly classified ischemic or STEMI beats or
episodes). For example, Quesnel et al. [47] computed a signal
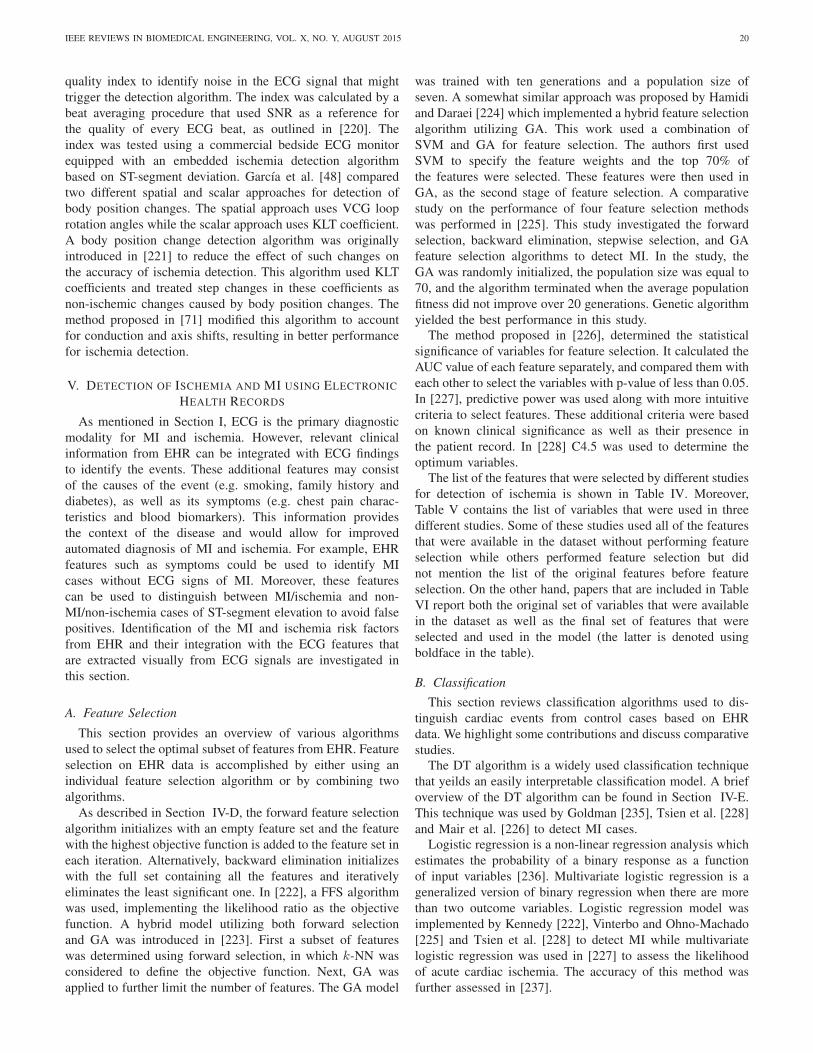
IEEE REVIEWS IN BIOMEDICAL ENGINEERING, VOL. X, NO. Y, AUGUST 2015 20
quality index to identify noise in the ECG signal that might
trigger the detection algorithm. The index was calculated by a
beat averaging procedure that used SNR as a reference for
the quality of every ECG beat, as outlined in [220]. The
index was tested using a commercial bedside ECG monitor
equipped with an embedded ischemia detection algorithm
based on ST-segment deviation. Garcıa et al. [48] compared
two different spatial and scalar approaches for detection of
body position changes. The spatial approach uses VCG loop
rotation angles while the scalar approach uses KLT coefficient.
A body position change detection algorithm was originally
introduced in [221] to reduce the effect of such changes on
the accuracy of ischemia detection. This algorithm used KLT
coefficients and treated step changes in these coefficients as
non-ischemic changes caused by body position changes. The
method proposed in [71] modified this algorithm to account
for conduction and axis shifts, resulting in better performance
for ischemia detection.
V. DETECTION OF ISCHEMIA AND MI USING ELECTRONIC
HEALTH RECORDS
As mentioned in Section I, ECG is the primary diagnostic
modality for MI and ischemia. However, relevant clinical
information from EHR can be integrated with ECG findings
to identify the events. These additional features may consist
of the causes of the event (e.g. smoking, family history and
diabetes), as well as its symptoms (e.g. chest pain charac-
teristics and blood biomarkers). This information provides
the context of the disease and would allow for improved
automated diagnosis of MI and ischemia. For example, EHR
features such as symptoms could be used to identify MI
cases without ECG signs of MI. Moreover, these features
can be used to distinguish between MI/ischemia and non-
MI/non-ischemia cases of ST-segment elevation to avoid false
positives. Identification of the MI and ischemia risk factors
from EHR and their integration with the ECG features that
are extracted visually from ECG signals are investigated in
this section.
A. Feature Selection
This section provides an overview of various algorithms
used to select the optimal subset of features from EHR. Feature
selection on EHR data is accomplished by either using an
individual feature selection algorithm or by combining two
algorithms.
As described in Section IV-D, the forward feature selection
algorithm initializes with an empty feature set and the feature
with the highest objective function is added to the feature set in
each iteration. Alternatively, backward elimination initializes
with the full set containing all the features and iteratively
eliminates the least significant one. In [222], a FFS algorithm
was used, implementing the likelihood ratio as the objective
function. A hybrid model utilizing both forward selection
and GA was introduced in [223]. First a subset of features
was determined using forward selection, in which k-NN was
considered to define the objective function. Next, GA was
applied to further limit the number of features. The GA model
was trained with ten generations and a population size of
seven. A somewhat similar approach was proposed by Hamidi
and Daraei [224] which implemented a hybrid feature selection
algorithm utilizing GA. This work used a combination of
SVM and GA for feature selection. The authors first used
SVM to specify the feature weights and the top 70% of
the features were selected. These features were then used in
GA, as the second stage of feature selection. A comparative
study on the performance of four feature selection methods
was performed in [225]. This study investigated the forward
selection, backward elimination, stepwise selection, and GA
feature selection algorithms to detect MI. In the study, the
GA was randomly initialized, the population size was equal to
70, and the algorithm terminated when the average population
fitness did not improve over 20 generations. Genetic algorithm
yielded the best performance in this study.The method proposed in [226], determined the statistical
significance of variables for feature selection. It calculated the
AUC value of each feature separately, and compared them with
each other to select the variables with p-value of less than 0.05.
In [227], predictive power was used along with more intuitive
criteria to select features. These additional criteria were based
on known clinical significance as well as their presence in
the patient record. In [228] C4.5 was used to determine the
optimum variables.The list of the features that were selected by different studies
for detection of ischemia is shown in Table IV. Moreover,
Table V contains the list of variables that were used in three
different studies. Some of these studies used all of the features
that were available in the dataset without performing feature
selection while others performed feature selection but did
not mention the list of the original features before feature
selection. On the other hand, papers that are included in Table
VI report both the original set of variables that were available
in the dataset as well as the final set of features that were
selected and used in the model (the latter is denoted using
boldface in the table).
B. ClassificationThis section reviews classification algorithms used to dis-
tinguish cardiac events from control cases based on EHR
data. We highlight some contributions and discuss comparative
studies.The DT algorithm is a widely used classification technique
that yeilds an easily interpretable classification model. A brief
overview of the DT algorithm can be found in Section IV-E.
This technique was used by Goldman [235], Tsien et al. [228]
and Mair et al. [226] to detect MI cases.Logistic regression is a non-linear regression analysis which
estimates the probability of a binary response as a function
of input variables [236]. Multivariate logistic regression is a
generalized version of binary regression when there are more
than two outcome variables. Logistic regression model was
implemented by Kennedy [222], Vinterbo and Ohno-Machado
[225] and Tsien et al. [228] to detect MI while multivariate
logistic regression was used in [227] to assess the likelihood
of acute cardiac ischemia. The accuracy of this method was
further assessed in [237].
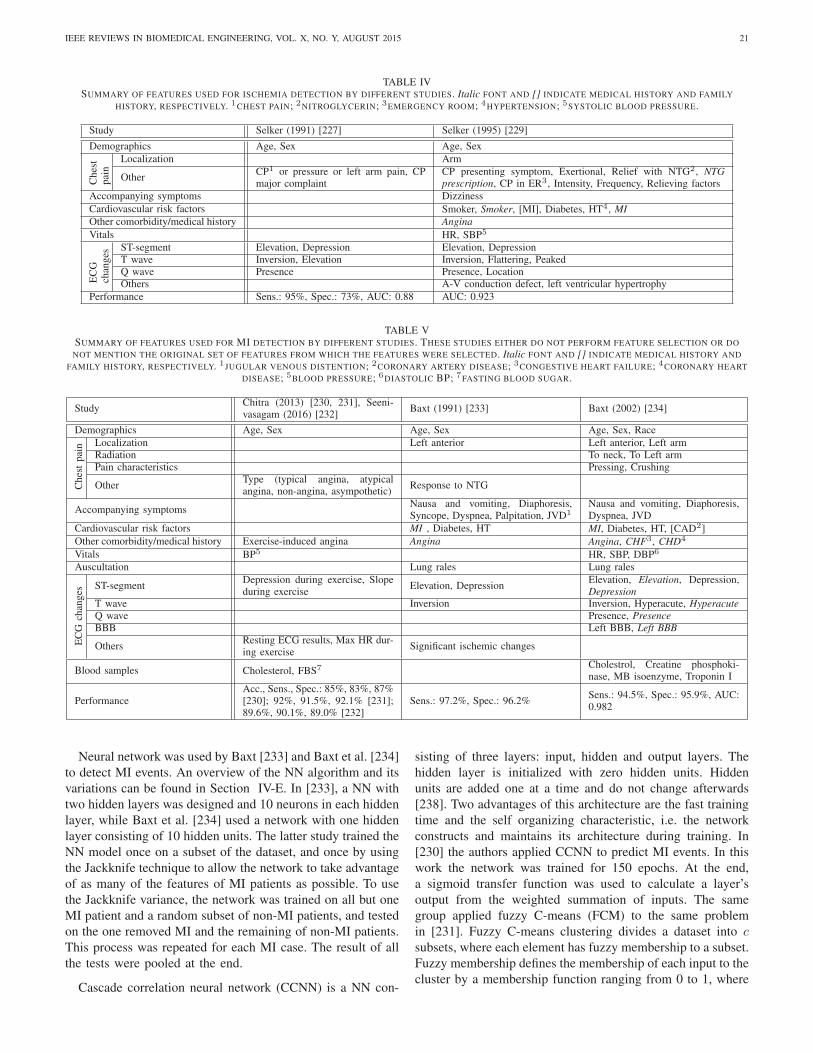
IEEE REVIEWS IN BIOMEDICAL ENGINEERING, VOL. X, NO. Y, AUGUST 2015 21
TABLE IVSUMMARY OF FEATURES USED FOR ISCHEMIA DETECTION BY DIFFERENT STUDIES. Italic FONT AND [] INDICATE MEDICAL HISTORY AND FAMILY
HISTORY, RESPECTIVELY. 1CHEST PAIN; 2NITROGLYCERIN; 3EMERGENCY ROOM; 4HYPERTENSION; 5SYSTOLIC BLOOD PRESSURE.
Study Selker (1991) [227] Selker (1995) [229]
Demographics Age, Sex Age, Sex
Ch
est
pai
n
Localization Arm
OtherCP1 or pressure or left arm pain, CPmajor complaint
CP presenting symptom, Exertional, Relief with NTG2, NTGprescription, CP in ER3, Intensity, Frequency, Relieving factors
Accompanying symptoms Dizziness
Cardiovascular risk factors Smoker, Smoker, [MI], Diabetes, HT4, MIOther comorbidity/medical history AnginaVitals HR, SBP5
EC
Gch
ang
es
ST-segment Elevation, Depression Elevation, DepressionT wave Inversion, Elevation Inversion, Flattering, PeakedQ wave Presence Presence, LocationOthers A-V conduction defect, left ventricular hypertrophy
Performance Sens.: 95%, Spec.: 73%, AUC: 0.88 AUC: 0.923
TABLE VSUMMARY OF FEATURES USED FOR MI DETECTION BY DIFFERENT STUDIES. THESE STUDIES EITHER DO NOT PERFORM FEATURE SELECTION OR DO
NOT MENTION THE ORIGINAL SET OF FEATURES FROM WHICH THE FEATURES WERE SELECTED. Italic FONT AND [] INDICATE MEDICAL HISTORY AND
FAMILY HISTORY, RESPECTIVELY. 1JUGULAR VENOUS DISTENTION; 2CORONARY ARTERY DISEASE; 3CONGESTIVE HEART FAILURE; 4CORONARY HEART
DISEASE; 5BLOOD PRESSURE; 6DIASTOLIC BP; 7FASTING BLOOD SUGAR.
StudyChitra (2013) [230, 231], Seeni-vasagam (2016) [232]
Baxt (1991) [233] Baxt (2002) [234]
Demographics Age, Sex Age, Sex Age, Sex, Race
Ch
est
pai
n Localization Left anterior Left anterior, Left armRadiation To neck, To Left armPain characteristics Pressing, Crushing
OtherType (typical angina, atypicalangina, non-angina, asympothetic)
Response to NTG
Accompanying symptomsNausa and vomiting, Diaphoresis,Syncope, Dyspnea, Palpitation, JVD1
Nausa and vomiting, Diaphoresis,Dyspnea, JVD
Cardiovascular risk factors MI , Diabetes, HT MI, Diabetes, HT, [CAD2]
Other comorbidity/medical history Exercise-induced angina Angina Angina, CHF3, CHD4
Vitals BP5 HR, SBP, DBP6
Auscultation Lung rales Lung rales
EC
Gch
ang
es
ST-segmentDepression during exercise, Slopeduring exercise
Elevation, DepressionElevation, Elevation, Depression,Depression
T wave Inversion Inversion, Hyperacute, HyperacuteQ wave Presence, PresenceBBB Left BBB, Left BBB
OthersResting ECG results, Max HR dur-ing exercise
Significant ischemic changes
Blood samples Cholesterol, FBS7 Cholestrol, Creatine phosphoki-nase, MB isoenzyme, Troponin I
PerformanceAcc., Sens., Spec.: 85%, 83%, 87%[230]; 92%, 91.5%, 92.1% [231];89.6%, 90.1%, 89.0% [232]
Sens.: 97.2%, Spec.: 96.2%Sens.: 94.5%, Spec.: 95.9%, AUC:0.982
Neural network was used by Baxt [233] and Baxt et al. [234]
to detect MI events. An overview of the NN algorithm and its
variations can be found in Section IV-E. In [233], a NN with
two hidden layers was designed and 10 neurons in each hidden
layer, while Baxt et al. [234] used a network with one hidden
layer consisting of 10 hidden units. The latter study trained the
NN model once on a subset of the dataset, and once by using
the Jackknife technique to allow the network to take advantage
of as many of the features of MI patients as possible. To use
the Jackknife variance, the network was trained on all but one
MI patient and a random subset of non-MI patients, and tested
on the one removed MI and the remaining of non-MI patients.
This process was repeated for each MI case. The result of all
the tests were pooled at the end.
Cascade correlation neural network (CCNN) is a NN con-
sisting of three layers: input, hidden and output layers. The
hidden layer is initialized with zero hidden units. Hidden
units are added one at a time and do not change afterwards
[238]. Two advantages of this architecture are the fast training
time and the self organizing characteristic, i.e. the network
constructs and maintains its architecture during training. In
[230] the authors applied CCNN to predict MI events. In this
work the network was trained for 150 epochs. At the end,
a sigmoid transfer function was used to calculate a layer’s
output from the weighted summation of inputs. The same
group applied fuzzy C-means (FCM) to the same problem
in [231]. Fuzzy C-means clustering divides a dataset into csubsets, where each element has fuzzy membership to a subset.
Fuzzy membership defines the membership of each input to the
cluster by a membership function ranging from 0 to 1, where
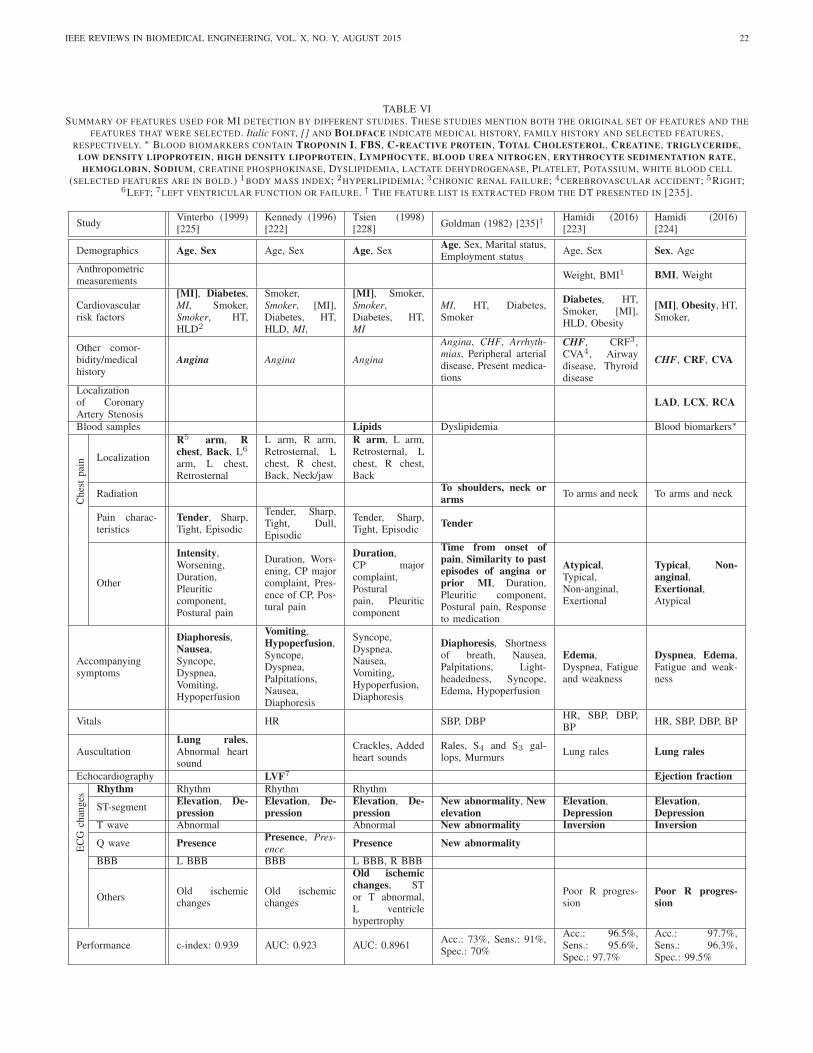
IEEE REVIEWS IN BIOMEDICAL ENGINEERING, VOL. X, NO. Y, AUGUST 2015 22
TABLE VISUMMARY OF FEATURES USED FOR MI DETECTION BY DIFFERENT STUDIES. THESE STUDIES MENTION BOTH THE ORIGINAL SET OF FEATURES AND THE
FEATURES THAT WERE SELECTED. Italic FONT, [] AND BOLDFACE INDICATE MEDICAL HISTORY, FAMILY HISTORY AND SELECTED FEATURES,RESPECTIVELY. ∗ BLOOD BIOMARKERS CONTAIN TROPONIN I, FBS, C-REACTIVE PROTEIN, TOTAL CHOLESTEROL, CREATINE, TRIGLYCERIDE,
LOW DENSITY LIPOPROTEIN, HIGH DENSITY LIPOPROTEIN, LYMPHOCYTE, BLOOD UREA NITROGEN, ERYTHROCYTE SEDIMENTATION RATE,HEMOGLOBIN, SODIUM, CREATINE PHOSPHOKINASE, DYSLIPIDEMIA, LACTATE DEHYDROGENASE, PLATELET, POTASSIUM, WHITE BLOOD CELL
(SELECTED FEATURES ARE IN BOLD.) 1BODY MASS INDEX; 2HYPERLIPIDEMIA; 3CHRONIC RENAL FAILURE; 4CEREBROVASCULAR ACCIDENT; 5RIGHT;6LEFT; 7LEFT VENTRICULAR FUNCTION OR FAILURE. † THE FEATURE LIST IS EXTRACTED FROM THE DT PRESENTED IN [235].
StudyVinterbo (1999)[225]
Kennedy (1996)[222]
Tsien (1998)[228]
Goldman (1982) [235]† Hamidi (2016)[223]
Hamidi (2016)[224]
Demographics Age, Sex Age, Sex Age, SexAge, Sex, Marital status,Employment status
Age, Sex Sex, Age
Anthropometricmeasurements
Weight, BMI1 BMI, Weight
Cardiovascularrisk factors
[MI], Diabetes,MI, Smoker,Smoker, HT,HLD2
Smoker,Smoker, [MI],Diabetes, HT,HLD, MI,
[MI], Smoker,Smoker,Diabetes, HT,MI
MI, HT, Diabetes,Smoker
Diabetes, HT,Smoker, [MI],HLD, Obesity
[MI], Obesity, HT,Smoker,
Other comor-bidity/medicalhistory
Angina Angina Angina
Angina, CHF, Arrhyth-mias, Peripheral arterialdisease, Present medica-tions
CHF, CRF3,CVA4, Airwaydisease, Thyroiddisease
CHF, CRF, CVA
Localizationof CoronaryArtery Stenosis
LAD, LCX, RCA
Blood samples Lipids Dyslipidemia Blood biomarkers∗
Ch
est
pai
n Localization
R5 arm, Rchest, Back, L6
arm, L chest,Retrosternal
L arm, R arm,Retrosternal, Lchest, R chest,Back, Neck/jaw
R arm, L arm,Retrosternal, Lchest, R chest,Back
RadiationTo shoulders, neck orarms To arms and neck To arms and neck
Pain charac-teristics
Tender, Sharp,Tight, Episodic
Tender, Sharp,Tight, Dull,Episodic
Tender, Sharp,Tight, Episodic
Tender
Other
Intensity,Worsening,Duration,Pleuriticcomponent,Postural pain
Duration, Wors-ening, CP majorcomplaint, Pres-ence of CP, Pos-tural pain
Duration,CP majorcomplaint,Posturalpain, Pleuriticcomponent
Time from onset ofpain, Similarity to pastepisodes of angina orprior MI, Duration,Pleuritic component,Postural pain, Responseto medication
Atypical,Typical,Non-anginal,Exertional
Typical, Non-anginal,Exertional,Atypical
Accompanyingsymptoms
Diaphoresis,Nausea,Syncope,Dyspnea,Vomiting,Hypoperfusion
Vomiting,Hypoperfusion,Syncope,Dyspnea,Palpitations,Nausea,Diaphoresis
Syncope,Dyspnea,Nausea,Vomiting,Hypoperfusion,Diaphoresis
Diaphoresis, Shortnessof breath, Nausea,Palpitations, Light-headedness, Syncope,Edema, Hypoperfusion
Edema,Dyspnea, Fatigueand weakness
Dyspnea, Edema,Fatigue and weak-ness
Vitals HR SBP, DBPHR, SBP, DBP,BP
HR, SBP, DBP, BP
AuscultationLung rales,Abnormal heartsound
Crackles, Addedheart sounds
Rales, S4 and S3 gal-lops, Murmurs
Lung rales Lung rales
Echocardiography LVF7 Ejection fraction
EC
Gch
ang
es
Rhythm Rhythm Rhythm Rhythm
ST-segmentElevation, De-pression
Elevation, De-pression
Elevation, De-pression
New abnormality, Newelevation
Elevation,Depression
Elevation,Depression
T wave Abnormal Abnormal New abnormality Inversion Inversion
Q wave Presence Presence, Pres-ence Presence New abnormality
BBB L BBB BBB L BBB, R BBB
OthersOld ischemicchanges
Old ischemicchanges
Old ischemicchanges, STor T abnormal,L ventriclehypertrophy
Poor R progres-sion
Poor R progres-sion
Performance c-index: 0.939 AUC: 0.923 AUC: 0.8961Acc.: 73%, Sens.: 91%,Spec.: 70%
Acc.: 96.5%,Sens.: 95.6%,Spec.: 97.7%
Acc.: 97.7%,Sens.: 96.3%,Spec.: 99.5%

IEEE REVIEWS IN BIOMEDICAL ENGINEERING, VOL. X, NO. Y, AUGUST 2015 23
the degree of membership scales with the function output
[239]. Chitra and Seenivasagam [231] mapped the output to
three clusters (c = 3). The first and second clusters belong to
MI and normal cases, respectively, and the third cluster cor-
responds to patients that belong to neither of them. In a more
recent paper [232], the same research group compared the
performance of three classifiers including CCNN, feed forward
neural network (FFNN), and SVM with RBF kernel function.
The training for the CCNN model terminated when either the
RMS error was less than 0.1 or the algorithm had performed
500 epochs. A sigmoid activation function was implemented
to determine the output. Feed forward neural network models
were designed in 3 ways. First, a basic FFNN was designed
with one hidden layer and six neurons. The hidden layer
utilized a sigmoid activation function. The training parameters
including learning rate, momentum constant and terminating
condition were similar to those used to train CCNN. The
second FFNN was optimized using GA. This NN had one
hidden layer to which neurons with sigmoid activation function
were optimally added. The third FFNN was optimized using
particle swarm optimization (PSO) method. Similarly, it had
one hidden layer. The cognition learning rate and the social
learning rate were initially set to 2. The whole process stopped
when the generation reached 200 or the minimum fitness was
achieved. Several of these studies [230, 231, 232] used the
Heart Disease dataset from UCI (University of California,
Irvine) Center for Machine Learning and Intelligent Systems
repository to train their model. They considered the existence
of any major vessels with over 50 percent narrowing as an
indicator of MI and used it as an output in their classification
models. This is a major limitation for these studies.
Another comparison for classification methods aimed at
predicting acute cardiac ischemia in emergency department
patients can be found in [229]. The authors compared logistic
regression, ID3 DT, and two NN structures. The first NN
contained one hidden layer and the second NN contained
two hidden layers. Among these models, the NN with one
hidden layer yielded the best performance. Moreover, in order
to determine the possibility of one model type capturing in-
formation that was missed by another model type, the authors
used the outputs from each model type as additional inputs to
the other two model types, resulting in hybrid models.
Two comparative studies were done by the same research
group in [223, 224] to detect MI. In [223], Naive Bayes,
AdaBoost, J48 and simpleCART were used. J48 is an open
source Java implementation of the C4.5 DT algorithm and
AdaBoost [240] combines multiple weak learners by summing
the probabilistic predictions to construct an accurate model.
SimpleCART and J48 achieved the highest accuracies in this
study. The second study [224] compared REPTree, Random
Forest [241], Bayesian Network [242], SVM, MLP, k-NN,
sequential minimal optimization (SMO) and Naive Bayes
models to classify MI cases. REPTree builds various DTs at
different iterations using regression tree logic, then the best
tree is selected as the representative [243]. A Bayesian network
is a type of statistical model that has a set of nodes as random
variables which are conditionally dependent. The correlation
between nodes defines the conditional probability function,
TABLE VII
Prediction+ - Total
Trut
h + TP FN PT
- FP TN NT
Total PP NP T
(a) The structure of a confusion matrix.Prediction
+ - Total
Trut
h + 9 1 10- 100 900 1000
Total 109 901 1010
(b) An example for the confution matrixof a problem with unbalanced classes.
which can be used to determine the joint probability distribu-
tion of a set of observables based on the evidences provided
[244]. Sequential minimal optimization is a method to train
SVM which breaks down the large quadratic optimization
problem into series of smaller optimization problems which
are solved analytically [245]. The paper concluded that MLP
and SMO have the best accuracy. Although these two studies
were done on the dataset of same patients, Hamidi and Daraei
[224] benefited from the use of 19 additional input variables
including Troponin I, C-reactive protein, Lymphocyte, and
LAD information. Therefore, the result of these studies cannot
be compared.
One major drawback of the models using EHR is that some
of the incorporated features might not be available at the time
of admission. Therefore, there need to be an exhaustive study
to evaluate the performance of these models in face of missing
data.
VI. VALIDATION
Given the abundance of the proposed methods for detection
of ischemic beats and MI, it is essential to validate these
methods and compare them to find the ones that are more
effective. As a result, it is crucial to use robust validation
techniques and uniform performance metrics to create results
that are generalizable and reproducible. Unfortunately, this has
not been the dominant trend in the ischemia and MI detection
literature. Some of the deficiencies of the validation strategies
in the literature are outlined in this section. First, there is a lack
of uniformity in the performance measures that are used for
evaluation. Majority of the studies use sensitivity and speci-
ficity which are common measures of performance in technical
fields. Sensitivity and specificity are defined as TPTP+FN = TP
PT
and TNTN+FP = TN
NT, respectively. TP , TN , FP , FN , PT
and NT are the number of true positives, true negatives, false
positives, false negatives and the total number of positive
and negative instances, respectively. While sensitivity and
specificity are widely-used performance measures, they do not
reflect the burden that false alarms put on medical personnel
when prevalence of the positive cases (disease, condition, etc.)
is low, i.e., the classes are not balanced. For example, assume
that the condition of interest has a prevalence rate of 1% (1:100
incidence ratio). Let the dataset contain 10 positive and 1000
negative cases and the classification outcomes distributed as
IEEE REVIEWS IN BIOMEDICAL ENGINEERING, VOL. X, NO. Y, AUGUST 2015 24
shown in Table VIIb. This results in sensitivity and specificity
of 90%. However, there are 109 positive calls and only 9
of them are true positives. Hence, majority of alarms would
be false, putting a huge burden on the medical providers by
directing time and resources towards patients that have normal
ECGs. As a result, physicians use other performance metrics,
namely positive predictive value (PPV) and negative predictive
value (NPV), defined as TPTP+FP and TN
TN+FN , respectively.
It is noteworthy that the denominators are the total predictedpositive and negative cases; therefore, an increase in the false
positives or the false negatives would directly reduce the values
of PPV or NPV. For example, the PPV and NPV for the
example in Table VIIb are 8.25% and 99.89%, respectively.
The low PPV can be attributed to the high rate of false alarms,
making PPV and NPV more proper performance measures
to assess medical diagnosis tools. In fact, these measures
are widely used in medical publications to report the results.
Hence, we recommend that authors of technical papers adopt
the same measures to assess their methods. Alternatively,
authors can use a combination of precision (=PPV) and recall
(=sensitivity) to report their results and compute F1-score
instead of accuracy when classes are not balanced. More
importantly, it is crucial that researchers report the confusion
matrix for their results, as shown in Table VIIb. This would
allow readers to compute a variety of different performance
metrics from the matrix including PPV and NPV as well as
sensitivity and specificity. For problems with multiple classes,
the confusion matrix can be expanded to have one column and
row per class. Other useful performance measures are receiver
operating characteristic (ROC) and precision-recall curves and
their area under the curve (AUC). Area under the curve for the
ROC is more robust than sensitivity, specificity and accuracy
when the classes are balanced as it encompasses all of these
three measures. On the other hand, AUC for the precision-
recall curve is more suitable in the presence of class imbalance.
Also, AUCs are not dependent on the internal threshold of the
classifier, making them more objective performance metrics.
The performance of the classification models often heavily
depends on the balance of the dataset, i.e., an unbalanced
dataset in which one class has many more instances than
the other class can result in low classification performance.
There are several methods to alleviate this problem including
sampling from the larger class, replicating instances from the
smaller class or assigning weights to the instances based on
their class size. However, the class imbalance also impacts
the calculated performance level for a model. For example,
sensitivity and specificity of 95% and 85%, respectively, lead
to an accuracy of 90% in a balanced dataset with 1:1 class
ratio. While the sensitivity and specificity remain unchanged,
the same classification model will have an accuracy of 85.9%
if the size of the negative class increases by a 10:1 ratio.
Likewise, PPV and NPV values are heavily impacted by class
imbalance. As a result, it is essential that the testing data has
a class ratio that is representative of the true incidence rate for
the event/disease/condition of interest in the target population.
Validation strategy is a very crucial element for ensuring
that the results are robust and generalizable. Additional atten-
tion should be paid to model validation in signal processing
applications where several instances can be generated from the
waveforms of a single patient. In machine learning, the data
is often stored in a matrix where rows correspond to instances
(a.k.a. records, observations) and columns correspond to fea-
tures (a.k.a. variables, predictors). Signal processing methods
are often applied to small portions of the waveforms and
features are extracted from each portion, e.g., the signal can
be processed beat by beat or in short sliding windows that
are typically a few seconds or minutes long. As a result, each
patient can potentially be represented by multiple rows in the
dataset. All validation methods rely on separating the dataset
into training and testing (and sometimes validation) subsets,
i.e., the data is trained on the training subset and tested on
the testing subset which should be unavailable to the method
that is being validated during the training process. A crucial
assumption in all validation methods is the independence of
the testing instances from the training ones [246]. Hence, when
several rows are generated from the same patient, extra caution
should be exercised to ensure that the rows belonging to one
patient are not divided between the training and testing subsets,
violating the independence assumption. In other words, the
rows that belong to the same patient should all fall either
into the training subset or the testing subset. We refer to this
approach as subject-wise validation.
The violation of the independence assumption can invalidate
the reported results since it can result in a model that memo-rizes the data as opposed to learning the patterns in the data. In
theory, the experimenter can achieve any desired performance
level by oversampling the data if the independence assumption
is violated. To demonstrate this phenomenon, an example is
presented in Appendix A. Despite the importance of subject-
wise validation, majority of the reviewed literature, with a few
exceptions, either used a non-subject-wise approach or did
not provide enough information regarding the details of their
validation method, making it difficult to judge the validity of
their results.
The validation results for a small subset of the reviewed
studies are presented in Tables VIII and IX. We have only
included papers where the authors have explicitly or implicitly
stated that they have used subject or episode-wise validation.
The best performance for ischemia detection is achieved in
[24] where VCG signals are analyzed to extract the ST-vector
magnitude and spatial QRS loop for each beat. The extracted
features were classified using LDA. Unlike other methods in
Table VIII, Correa et al. [24] used the normal subjects from the
PTB dataset which contains the Frank leads while the ischemia
patients were from the STAFFIII dataset [247] for which the
VCG leads were synthesized using Kors transform. Among the
studies that used the EST dataset, Vila et al. [143] and Jager
et al. [69] obtained the best overall performances. While Vila
et al. [143] used morphological features such as height and
width of the QRS waves, amplitude of the ST-segment, ST
slope and amplitude of T wave, Jager et al. [69] used KLT to
extract feature vectors for QRS complex and ST-segment. The
best performances for MI detection were obtained by Weng
et al. [87] and Padhy and Dandapat [46]. The former applies
PCA to the the concatenated ST-segments from 12 leads of
ECG as well as their polynomial approximations. On the
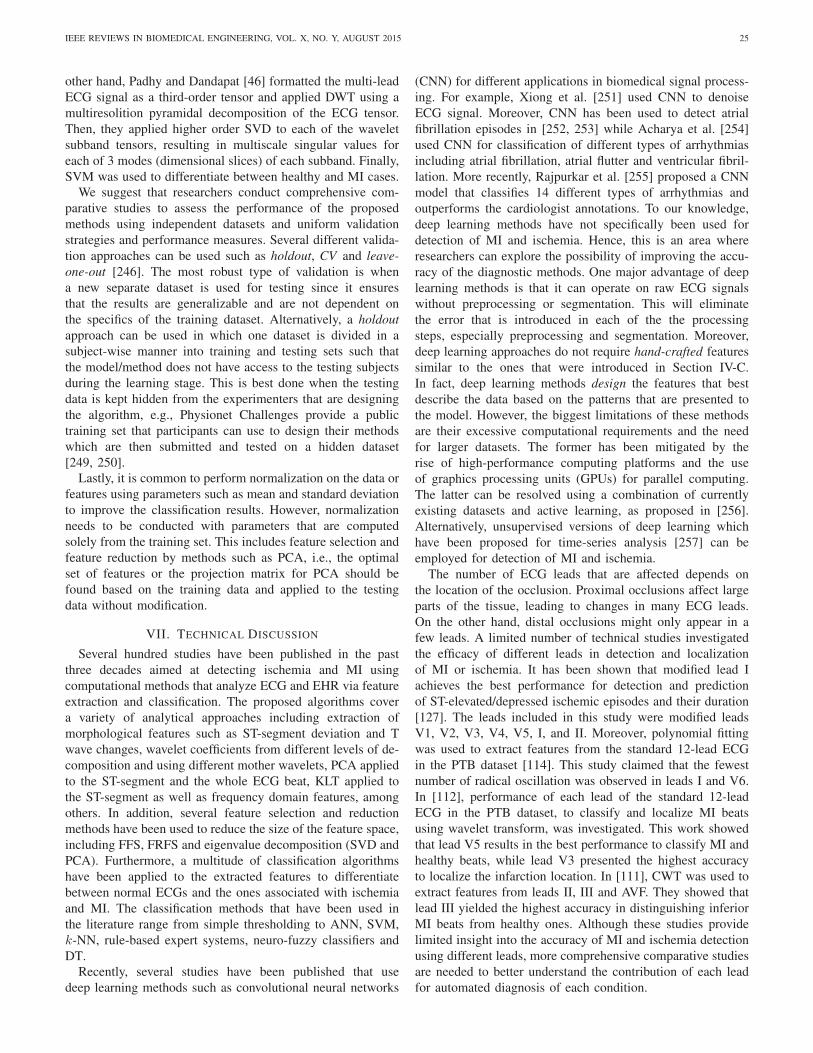
IEEE REVIEWS IN BIOMEDICAL ENGINEERING, VOL. X, NO. Y, AUGUST 2015 25
other hand, Padhy and Dandapat [46] formatted the multi-lead
ECG signal as a third-order tensor and applied DWT using a
multiresolition pyramidal decomposition of the ECG tensor.
Then, they applied higher order SVD to each of the wavelet
subband tensors, resulting in multiscale singular values for
each of 3 modes (dimensional slices) of each subband. Finally,
SVM was used to differentiate between healthy and MI cases.We suggest that researchers conduct comprehensive com-
parative studies to assess the performance of the proposed
methods using independent datasets and uniform validation
strategies and performance measures. Several different valida-
tion approaches can be used such as holdout, CV and leave-one-out [246]. The most robust type of validation is when
a new separate dataset is used for testing since it ensures
that the results are generalizable and are not dependent on
the specifics of the training dataset. Alternatively, a holdoutapproach can be used in which one dataset is divided in a
subject-wise manner into training and testing sets such that
the model/method does not have access to the testing subjects
during the learning stage. This is best done when the testing
data is kept hidden from the experimenters that are designing
the algorithm, e.g., Physionet Challenges provide a public
training set that participants can use to design their methods
which are then submitted and tested on a hidden dataset
[249, 250].Lastly, it is common to perform normalization on the data or
features using parameters such as mean and standard deviation
to improve the classification results. However, normalization
needs to be conducted with parameters that are computed
solely from the training set. This includes feature selection and
feature reduction by methods such as PCA, i.e., the optimal
set of features or the projection matrix for PCA should be
found based on the training data and applied to the testing
data without modification.
VII. TECHNICAL DISCUSSION
Several hundred studies have been published in the past
three decades aimed at detecting ischemia and MI using
computational methods that analyze ECG and EHR via feature
extraction and classification. The proposed algorithms cover
a variety of analytical approaches including extraction of
morphological features such as ST-segment deviation and T
wave changes, wavelet coefficients from different levels of de-
composition and using different mother wavelets, PCA applied
to the ST-segment and the whole ECG beat, KLT applied to
the ST-segment as well as frequency domain features, among
others. In addition, several feature selection and reduction
methods have been used to reduce the size of the feature space,
including FFS, FRFS and eigenvalue decomposition (SVD and
PCA). Furthermore, a multitude of classification algorithms
have been applied to the extracted features to differentiate
between normal ECGs and the ones associated with ischemia
and MI. The classification methods that have been used in
the literature range from simple thresholding to ANN, SVM,
k-NN, rule-based expert systems, neuro-fuzzy classifiers and
DT.Recently, several studies have been published that use
deep learning methods such as convolutional neural networks
(CNN) for different applications in biomedical signal process-
ing. For example, Xiong et al. [251] used CNN to denoise
ECG signal. Moreover, CNN has been used to detect atrial
fibrillation episodes in [252, 253] while Acharya et al. [254]
used CNN for classification of different types of arrhythmias
including atrial fibrillation, atrial flutter and ventricular fibril-
lation. More recently, Rajpurkar et al. [255] proposed a CNN
model that classifies 14 different types of arrhythmias and
outperforms the cardiologist annotations. To our knowledge,
deep learning methods have not specifically been used for
detection of MI and ischemia. Hence, this is an area where
researchers can explore the possibility of improving the accu-
racy of the diagnostic methods. One major advantage of deep
learning methods is that it can operate on raw ECG signals
without preprocessing or segmentation. This will eliminate
the error that is introduced in each of the the processing
steps, especially preprocessing and segmentation. Moreover,
deep learning approaches do not require hand-crafted features
similar to the ones that were introduced in Section IV-C.
In fact, deep learning methods design the features that best
describe the data based on the patterns that are presented to
the model. However, the biggest limitations of these methods
are their excessive computational requirements and the need
for larger datasets. The former has been mitigated by the
rise of high-performance computing platforms and the use
of graphics processing units (GPUs) for parallel computing.
The latter can be resolved using a combination of currently
existing datasets and active learning, as proposed in [256].
Alternatively, unsupervised versions of deep learning which
have been proposed for time-series analysis [257] can be
employed for detection of MI and ischemia.
The number of ECG leads that are affected depends on
the location of the occlusion. Proximal occlusions affect large
parts of the tissue, leading to changes in many ECG leads.
On the other hand, distal occlusions might only appear in a
few leads. A limited number of technical studies investigated
the efficacy of different leads in detection and localization
of MI or ischemia. It has been shown that modified lead I
achieves the best performance for detection and prediction
of ST-elevated/depressed ischemic episodes and their duration
[127]. The leads included in this study were modified leads
V1, V2, V3, V4, V5, I, and II. Moreover, polynomial fitting
was used to extract features from the standard 12-lead ECG
in the PTB dataset [114]. This study claimed that the fewest
number of radical oscillation was observed in leads I and V6.
In [112], performance of each lead of the standard 12-lead
ECG in the PTB dataset, to classify and localize MI beats
using wavelet transform, was investigated. This work showed
that lead V5 results in the best performance to classify MI and
healthy beats, while lead V3 presented the highest accuracy
to localize the infarction location. In [111], CWT was used to
extract features from leads II, III and AVF. They showed that
lead III yielded the highest accuracy in distinguishing inferior
MI beats from healthy ones. Although these studies provide
limited insight into the accuracy of MI and ischemia detection
using different leads, more comprehensive comparative studies
are needed to better understand the contribution of each lead
for automated diagnosis of each condition.
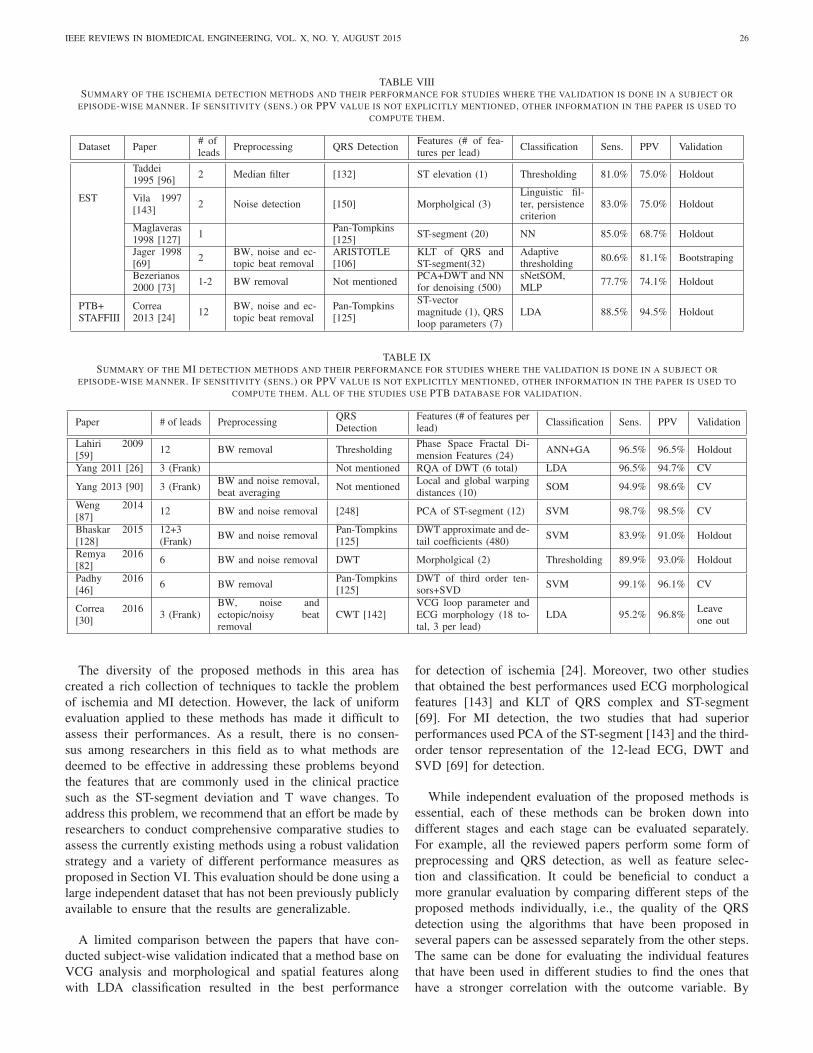
IEEE REVIEWS IN BIOMEDICAL ENGINEERING, VOL. X, NO. Y, AUGUST 2015 26
TABLE VIIISUMMARY OF THE ISCHEMIA DETECTION METHODS AND THEIR PERFORMANCE FOR STUDIES WHERE THE VALIDATION IS DONE IN A SUBJECT OR
EPISODE-WISE MANNER. IF SENSITIVITY (SENS.) OR PPV VALUE IS NOT EXPLICITLY MENTIONED, OTHER INFORMATION IN THE PAPER IS USED TO
COMPUTE THEM.
Dataset Paper# ofleads
Preprocessing QRS DetectionFeatures (# of fea-tures per lead)
Classification Sens. PPV Validation
EST
Taddei1995 [96]
2 Median filter [132] ST elevation (1) Thresholding 81.0% 75.0% Holdout
Vila 1997[143]
2 Noise detection [150] Morpholgical (3)Linguistic fil-ter, persistencecriterion
83.0% 75.0% Holdout
Maglaveras1998 [127]
1Pan-Tompkins[125]
ST-segment (20) NN 85.0% 68.7% Holdout
Jager 1998[69]
2BW, noise and ec-topic beat removal
ARISTOTLE[106]
KLT of QRS andST-segment(32)
Adaptivethresholding
80.6% 81.1% Bootstraping
Bezerianos2000 [73]
1-2 BW removal Not mentionedPCA+DWT and NNfor denoising (500)
sNetSOM,MLP
77.7% 74.1% Holdout
PTB+STAFFIII
Correa2013 [24]
12BW, noise and ec-topic beat removal
Pan-Tompkins[125]
ST-vectormagnitude (1), QRSloop parameters (7)
LDA 88.5% 94.5% Holdout
TABLE IXSUMMARY OF THE MI DETECTION METHODS AND THEIR PERFORMANCE FOR STUDIES WHERE THE VALIDATION IS DONE IN A SUBJECT OR
EPISODE-WISE MANNER. IF SENSITIVITY (SENS.) OR PPV VALUE IS NOT EXPLICITLY MENTIONED, OTHER INFORMATION IN THE PAPER IS USED TO
COMPUTE THEM. ALL OF THE STUDIES USE PTB DATABASE FOR VALIDATION.
Paper # of leads PreprocessingQRSDetection
Features (# of features perlead)
Classification Sens. PPV Validation
Lahiri 2009[59]
12 BW removal ThresholdingPhase Space Fractal Di-mension Features (24)
ANN+GA 96.5% 96.5% Holdout
Yang 2011 [26] 3 (Frank) Not mentioned RQA of DWT (6 total) LDA 96.5% 94.7% CV
Yang 2013 [90] 3 (Frank)BW and noise removal,beat averaging
Not mentionedLocal and global warpingdistances (10)
SOM 94.9% 98.6% CV
Weng 2014[87]
12 BW and noise removal [248] PCA of ST-segment (12) SVM 98.7% 98.5% CV
Bhaskar 2015[128]
12+3(Frank)
BW and noise removalPan-Tompkins[125]
DWT approximate and de-tail coefficients (480)
SVM 83.9% 91.0% Holdout
Remya 2016[82]
6 BW and noise removal DWT Morpholgical (2) Thresholding 89.9% 93.0% Holdout
Padhy 2016[46]
6 BW removalPan-Tompkins[125]
DWT of third order ten-sors+SVD
SVM 99.1% 96.1% CV
Correa 2016[30]
3 (Frank)BW, noise andectopic/noisy beatremoval
CWT [142]VCG loop parameter andECG morphology (18 to-tal, 3 per lead)
LDA 95.2% 96.8%Leaveone out
The diversity of the proposed methods in this area has
created a rich collection of techniques to tackle the problem
of ischemia and MI detection. However, the lack of uniform
evaluation applied to these methods has made it difficult to
assess their performances. As a result, there is no consen-
sus among researchers in this field as to what methods are
deemed to be effective in addressing these problems beyond
the features that are commonly used in the clinical practice
such as the ST-segment deviation and T wave changes. To
address this problem, we recommend that an effort be made by
researchers to conduct comprehensive comparative studies to
assess the currently existing methods using a robust validation
strategy and a variety of different performance measures as
proposed in Section VI. This evaluation should be done using a
large independent dataset that has not been previously publicly
available to ensure that the results are generalizable.
A limited comparison between the papers that have con-
ducted subject-wise validation indicated that a method base on
VCG analysis and morphological and spatial features along
with LDA classification resulted in the best performance
for detection of ischemia [24]. Moreover, two other studies
that obtained the best performances used ECG morphological
features [143] and KLT of QRS complex and ST-segment
[69]. For MI detection, the two studies that had superior
performances used PCA of the ST-segment [143] and the third-
order tensor representation of the 12-lead ECG, DWT and
SVD [69] for detection.
While independent evaluation of the proposed methods is
essential, each of these methods can be broken down into
different stages and each stage can be evaluated separately.
For example, all the reviewed papers perform some form of
preprocessing and QRS detection, as well as feature selec-
tion and classification. It could be beneficial to conduct a
more granular evaluation by comparing different steps of the
proposed methods individually, i.e., the quality of the QRS
detection using the algorithms that have been proposed in
several papers can be assessed separately from the other steps.
The same can be done for evaluating the individual features
that have been used in different studies to find the ones that
have a stronger correlation with the outcome variable. By
IEEE REVIEWS IN BIOMEDICAL ENGINEERING, VOL. X, NO. Y, AUGUST 2015 27
evaluating each step of the algorithm independently, a super-algorithm can be formed using the best-performing approach
in each step. This could be a way to consolidate several
decades of research into one algorithm that can outperform
its predecessors.
While majority of the studies have used the ECG signal to
detect ischemia and MI, a smaller group has investigated the
potential of using VCG signal in this application. Given that
VCG recordings are not available in most medical settings, the
use of VCG as a practical tool in this area should be justified.
This can be done by conducting rigorous studies to compare
the performance of ECG- and VCG-based methods to show
that the latter has the potential to outperform the traditional
methods of ischemia and MI detection.
VIII. MEDICAL PERSPECTIVE
In the past three decades, there has been a growing number
of studies that have proposed a variety of computational
methods to detect ischemia and MI. However, the proposed
methods suffer from several limitations and shortcomings that
have resulted in low to no adoption of such methods in clinical
practice. This section summarizes some of these limitations
and provides recommendations for researches to address them.
Majority of the reviewed papers use three different datasets
for evaluating their performance, one for MI and two for
ischemia, as outlined in Section III. Although the waveforms
for each patient are relatively long in these datasets, the
numbers of patients are small relative to what is typically used
for evaluation in medical studies. Moreover, the fact that a
large majority of the proposed methods are tested on the same
dataset greatly limits the generalizability and reproducibility of
the reported results. In addition, the data in all of these datasets
have been collected, annotated and labeled about two decades
ago. The definitions of ischemia and MI have changed several
times since then (e.g., the introduction of troponin); hence,
the labels cannot be considered reliable anymore according to
the current definitions. As a result, there is a great need for
new datasets that are collected using more modern acquisition
devices and labeled using the recent guidelines for diagnosis
of ischemia and MI. Given the technological advances in
continuous acquisition and storage of medical waveforms in
the past two decades, it is possible today to generate datasets
with larger number of patients and records. The increase in the
size would ensure that the dataset better represents the various
types of ischemia and MI and properly reflects the variability
among the patients and their ECG patterns. Such datasets
should include 12-lead ECG signals as well as patient EHR
information for both ischemia and MI cases, in accordance
with the common clinical practice. Furthermore, the ratio of
the class sizes should be representative of the prevalence of
these conditions in the target population to avoid over- or
underestimation of PPV, NPV and the rate of false alarms.
A large portion of the reviewed papers measure ST-segment
deviation and use it as a feature in some shape or form. The
ST-segment deviation has often been measured at J80 (or J60)
relative to the amplitude of the isoelectric line in the reviewed
papers. However, this approach for measuring the ST-segment
deviation is inconsistent with the medical practice and the
published guidelines by medical organizations such as AHA,
ESC, ACC and HRS for diagnosis of ischemia and MI, as
discussed in Section IV-C1. On the other hand, the ST-segment
deviation should be measured at the J point according the
aforementioned guidelines. Moreover, a study that surveyed
cardiologists found that majority of their ST-segment measure-
ments were done between J point and J40. Consequently, the
association between the ST-segment measurements between J
point and J80 and the ischemia and/or MI outcomes should be
further studied using large independent datasets. Furthermore,
the use of SAECG to improve the accuracy of the diagnosis is
not supported by evidence and the recent medical guidelines
have concluded that using this technique for detection of
ischemia and MI is not advisable except for low-risk patients.
Although beat averaging has been used in several studies to
remove noise, the usefulness of applying this technique and its
effects on sensitivity and specificity of the detection algorithms
should be further studied.
The number of leads that are used in the majority of the
reviewed literature is dictated by the dataset that they have
used to evaluate their method. Majority of ischemia detection
algorithms use 2-3 ECG leads (the number of leads available
in the EST and LTST datasets) while majority of MI detection
papers use 12 leads (the number of leads available in the PTB
dataset). Given that ischemia is often diagnosed and monitored
using 12-lead ECG in the clinical practice, it is difficult
to assess the findings of the published studies in relation
to the common medical practices used by physicians. To
demonstrate that the performance of the proposed approaches
for ischemia detection is comparable to the medical practice,
comprehensive studies should be carried out to compare the
effectiveness of the detection algorithms with different number
of leads. If a small number of leads prove to be sufficient for
detection of ischemia, it opens the door for further studies
on ECG signals that are measured using more contemporary
devices such as ECG patches and smart phones and watches
that collect single-lead ECG. This might result in improved
monitoring for patients with low-risk of ischemia given the
accessibility of such devices.
The new ECG monitoring devices that have become avail-
able in recent years, such as ECG patches and smart phones,
make the continuous in-home monitoring of ECG possible.
This potentially allows for out-of-hospital monitoring of pa-
tients at risk of heart disease to capture transient and silent
cases of MI and ischemia. However, there are several limi-
tations associated with these devices. First, these ECG mon-
itoring devices only capture one lead, typically representing
one of the precordial leads. Depending on the location of the
ischemia and MI, the event might not be captured by that
certain lead. Also, a medical diagnosis of MI requires ECG
changes in at least two leads. Although several patches can
be worn simultaneously to capture multi-lead ECG, this limits
the detection capability of these patches for MI and ischemia.
Second, ECG patches are usually replaced daily by the patient.
Inaccurate placement of the electrodes can result in inaccurate
signal measurements which can complicate interpretation of
ECG changes. This problem can potentially be addressed using
IEEE REVIEWS IN BIOMEDICAL ENGINEERING, VOL. X, NO. Y, AUGUST 2015 28
markers on the patients body that indicate the exact location of
electrode placements. Third, the impact of noise, movements
and posture changes on the ECG signal can also complicate
acquiring a reliable baseline for the signal. This is another
limitation of ECG patches in this area; however, researchers
might be able to use accelerometer, gyroscope and other types
of sensors to measure movement and posture changes and
correct the ECG signal based on the context in which the
signal is collected. Given these issues, the usefulness of these
new ECG monitoring devices for diagnosing ischemia and MI
is currently limited.
Another major limitation of the published literature in this
area is the lack of transparency in the proposed methods, i.e.,
the reported accuracy for each method reflects the performance
of the preprocessing, extracted features and classification al-
gorithm, among others, altogether. Hence, the significance of
each individual feature cannot be judged based on the reported
results. This is inconsistent with the general approach towards
feature assessment in medical publications where rigorous
statistical analysis is conducted to demonstrate the statistical
significance or insignificance of a variable for detection of
a particular condition or event. This is a major barrier for
adoption of the proposed feature sets in clinical settings since it
is not possible to pinpoint what part of the algorithm and which
features in particular are responsible for the improvement in
the accuracy. Although the overall performance of a model
is the most important factor that determines its usefulness, a
feature-by-feature assessment allows for secondary analyses
that might reveal the underlying causes of a disease and its
manifestations and might assist medical researchers to find
more effective treatments. As a result, we recommend that
the researchers conduct an in-depth analysis of the statistical
significance for different features that they use in their method
similar to what is typically done in medical publications.
Additionally, it would be beneficial to compare the output of
the proposed algorithms to the ones generated by conventional
digital ECG recorders that are used in the clinic to show that
the proposed methods can achieve significantly better accuracy
levels compared to the tools that are currently available to
physicians.
Finally, a critically important shortcoming of the majority of
the reviewed studies that conduct ECG analysis is ignoring the
patient context. None of the methods used any demographics
information besides patient’s age. Moreover, medical history
of the patient, symptoms such as chest pain and vital signs
were not used in any of the studies. Incorporating this infor-
mation in the diagnostic models can potentially have a large
impact on their performance given that the association between
some of these features and the presence or absence of ischemia
and MI is well understood.
IX. CONCLUSIONS
The main aim of this paper was to provide an overview of
the computational methods that have used ECG signal and
EHR information to detect ischemia and MI. The general
approach in all of the reviewed papers that analyze the ECG
signal consists of preprocessing, ECG wave characterization,
feature extraction and classification while some of the methods
also perform feature selection and/or postprocessing. Alterna-
tively, the algorithms that use EHR information are typically
composed of feature selection and classification. The exami-
nation of the validation techniques that are used to evaluate
the performance of these methods revealed that there is a need
for comparative studies that use a uniform set of performance
measures, consistent with the ones used in medical studies,
and a robust validation strategy guaranteeing that the results
are generalizable. Moreover, there is a growing need for new
datasets that contain a large number of patients with labels that
are generated using recent medical guidelines for diagnosis
of ischemia and MI. Finally, the extracted features should be
assessed in the context of clinical factors before they can be
adopted by physicians in clinical practice.
APPENDIX A
AN EXAMPLE OF DATA memorization CAUSED BY
NON-SUBJECT-WISE VALIDATION
To demonstrate the effect of memorization, a simple prob-
lem with four patients and two features was simulated. The
feature values were generated randomly using Gaussian distri-
butions with means and standard deviations that were chosen
manually. The Gaussian distributions were placed 15 minutes
apart and then interpolated to have 1 sample per minute.
Finally, 0.2% Gaussian noise was added to the signals and
the resulting feature values are shown in Figures 5a and 5b.
A contiguous period of 30 minutes with a random starting
point, independent from the feature values, was assigned to the
positive class for each subject. The features are plotted against
each other in Figure 5c confirming the absence of any pattern
separating the positive and negative classes. Consequently, any
validation algorithm should result in a <50% classification
accuracy. k-nearest neighbor classifiers with different values
of k were trained to demonstrate the failure of the validation
method when the independence assumption is violated. In
subject-wise validation, a leave-one-out strategy was used
while the non-subject-wise validation used 4-folds cross-
validation, dividing the data into four parts for testing and
training irrespective of the subjects that the instances were
generated from. The learning and evaluation was conducted for
k = 1..10 and the data was oversampled by interpolation. The
results for subject-wise and non-subject-wise validations are
shown in Figure 5d. While the subject-wise validation results
hover around 50%, the non-subject-wise results approach
100%, regardless of the value of k, as the oversampling rate
increases. This is due to the fact that oversampling increases
the number of points in the neighborhood around a data point.
If the training and testing data are not separated based on the
subjects, some of these data points would fall into the training
subset while the others fall into the testing subset. As a result,
the k-NN model memorizes the location of the points and the
class that they belong to as opposed to learning a separating
hyperplane that classifies the data.
ACKNOWLEDGMENT
The authors would like to thank Dr. Kevin Ward and Dr.
Hamid Ghanbari for their invaluable input and expertise.

IEEE REVIEWS IN BIOMEDICAL ENGINEERING, VOL. X, NO. Y, AUGUST 2015 29
(a) (b)
(c) (d)
Fig. 5. The simulation of an example with randomly generated features andlabels that are generated randomly and independent from the feature values.The example demonstrates that using non-subject-wise validation can lead tooverestimation of accuracies.
REFERENCES
[1] World Health Organization, “Global health estimates: Deaths by cause,age, sex and country, 2000-2015,” Geneva, WHO, 2016.
[2] K. Thygesen, J. S. Alpert, A. S. Jaffe, M. L. Simoons, B. R.Chaitman, H. D. White, and the Writing Group on behalf of theJoint ESC/ACCF/AHA/WHF Task Force for the Universal Definitionof Myocardial Infarction, “Third universal definition of myocardialinfarction,” Circulation, vol. 126, no. 16, pp. 2020–2035, Oct. 2012.
[3] S. Agewall, J. F. Beltrame, H. R. Reynolds, A. Niessner, G. Rosano,A. L. Caforio, R. De Caterina, M. Zimarino, M. Roffi, K. Kjeldsenet al., “ESC working group position paper on myocardial infarc-tion with non-obstructive coronary arteries,” European Heart Journal,vol. 38, no. 3, pp. 143–153, 2016.
[4] A. K. Manocha and M. Singh, “An overview of ischemia detection tech-niques,” International Journal of Scientific & Engineering Research,vol. 2, no. 11, pp. 1–6, 2011.
[5] C. Papaloukas, D. I. Fotiadis, A. Likas, and L. K. Michalis, “Automatedmethods for ischemia detection in long duration ECGs,” Cardiovascu-lar Reviews and Reports, vol. 24, no. 6, pp. 313–319, 2003.
[6] A. Gallino, S. Chierchia, G. Smith, M. Croom, M. Morgan, C. March-esi, and A. Maseri, “Computer system for analysis of ST segmentchanges on 24 hour Holter monitor tapes: Comparison with otheravailable systems,” Journal of the American College of Cardiology,vol. 4, no. 2, pp. 245–252, 1984.
[7] J. Oates, B. Cellar, L. Bernstein, B. P. Bailey, and S. B. Freedman,“Real-time detection of ischemic ECG changes using quasi-orthogonalleads and artificial intelligence,” in Computers in Cardiology, 1988.Proceedings. IEEE, 1988, pp. 89–92.
[8] G. Sun, C. W. Thomas, J. Liebman, Y. Rudy, Y. Reich, D. Stilli, andE. Macchi, “Classification of normal and ischemia from BSPM byneural network approach,” in Engineering in Medicine and BiologySociety, 1988. Proceedings of the Annual International Conference ofthe IEEE. IEEE, 1988, pp. 1504–1505.
[9] G. Passariello, F. Mora, E. De La Cruz, J. Gotoc, and B. Cerreult,“Real-time detection and quantification of ischemic ECG changes,” inEngineering in Medicine and Biology Society, 1990., Proceedings ofthe Twelfth Annual International Conference of the IEEE. IEEE, 1990,pp. 809–810.
[10] M. W. Krucoff, M. A. Croll, L. P. Pendley, D. L. Burdette, J. Pope,D. Hutchinson, J. Stone, R. Weber, and R. Califf, “Continuouscomputer-assisted electrocardiographic monitoring in patients withacute myocardial infarction: early experience,” in Computers in Car-diology 1989, Proceedings. IEEE, 1989, pp. 197–200.
[11] F. Jager, R. Mark, G. Moody, and S. Divjak, “Analysis of transient STsegment changes during ambulatory monitoring using the Karhunen-Loeave transform,” in Computers in Cardiology 1992, Proceedings of,IEEE. IEEE Comput. Soc. Press, 1992, pp. 691–694.
[12] N. Thakor, B. Gramatikov, and M. Mita, “Multiresolution wavelet
analysis of ECG during ischemia and reperfusion,” in Computers inCardiology 1993, Proceedings. IEEE, 1993, pp. 895–898.
[13] D. Brooks, H. On, R. MacLeod, and H. Krim, “Analysis of changesin body surface potentials during PTCA-induced ischemia using thetemporal wavelet transform,” in Computers in Cardiology 1994. IEEE,1994, pp. 329–332.
[14] G. Sierra, T. Fetsch, L. Reinhardt, A. Martinez-Rubio, K. Balkenhoff,M. Borggrefe, and G. Breithardt, “Multiresolution decomposition of thesignal averaged ECG in patients with myocardial infarction comparedto a control group,” in Engineering in Medicine and Biology Society,1995., IEEE 17th Annual Conference, vol. 2. IEEE, 1995, pp. 1057–1058.
[15] D. Lemire, C. Pharand, J.-C. Rajaonah, B. Dube, and A.-R. LeBlanc,“Wavelet time entropy, T wave morphology and myocardial ischemia,”IEEE Transactions on Biomedical Engineering, vol. 47, no. 7, pp. 967–970, 2000.
[16] B. Gramatikov, J. Brinker, S. Yi-chun, and N. V. Thakor, “Waveletanalysis and time-frequency distributions of the body surface ECGbefore and after angioplasty,” Computer Methods and Programs inBiomedicine, vol. 62, no. 2, pp. 87–98, Apr. 2000.
[17] S. Banerjee and M. Mitra, “Cross wavelet transform based analysis ofelectrocardiogram signals,” International Journal of Electrical, Elec-tronics and Computer Engineering, vol. 1, no. 2, pp. 88–92, 2012.
[18] K. I. Diamantaras and S. Y. Kung, Principal component neural net-works: theory and applications. John Wiley & Sons, Inc., 1996.
[19] J. Presedo, E. Fernandez, J. Vila, and S. Barro, “Cycles of ECG param-eter evolution during ischemic episodes,” in Computers in Cardiology,1996. IEEE, 1996, pp. 489–492.
[20] M. Arif, I. A. Malagore, and F. A. Afsar, “Automatic detection andlocalization of myocardial infarction using back propagation neuralnetworks,” in Bioinformatics and Biomedical Engineering (iCBBE),2010 4th International Conference on. IEEE, 2010, pp. 1–4.
[21] B. Heden, L. Edenbrandt, W. Haisty, and O. Pahlm, “Neural networksfor ECG diagnosis of inferior myocardial infarction,” in Computers inCardiology 1993, Proceedings. IEEE, 1993, pp. 345–347.
[22] D. Romero, M. Ringborn, P. Laguna, O. Pahlm, and E. Pueyo, “Depo-larization changes during acute myocardial ischemia by evaluation ofQRS slopes: Standard lead and vectorial approach,” IEEE Transactionson Biomedical Engineering, vol. 58, no. 1, pp. 110–120, Jan. 2011.
[23] R. Correa, P. D. Arini, L. S. Correa, M. Valentinuzzi, and E. Laciar,“Novel technique for ST-T interval characterization in patients withacute myocardial ischemia,” Computers in Biology and Medicine,vol. 50, pp. 49–55, 2014.
[24] R. Correa, P. D. Arini, M. E. Valentinuzzi, and E. Laciar, “Novel setof vectorcardiographic parameters for the identification of ischemicpatients,” Medical Engineering & Physics, vol. 35, no. 1, pp. 16–22,2013.
[25] C. Wang, X. Dong, S. Ou, W. Wang, J. Hu, and F. Yang, “A newmethod for early detection of myocardial ischemia: cardiodynamics-gram (CDG),” Science China Information Sciences, vol. 59, no. 1, pp.1–11, 2016.
[26] H. Yang, “Multiscale recurrence quantification analysis of spatialcardiac vectorcardiogram signals,” IEEE Transactions on BiomedicalEngineering, vol. 58, no. 2, pp. 339–347, feb 2011.
[27] C. Kan and H. Yang, “Dynamic spatiotemporal warping for thedetection and location of myocardial infarctions,” in 2012 IEEE Inter-national Conference on Automation Science and Engineering (CASE),Aug. 2012, pp. 1046–1051.
[28] A. Dhawan, B. Wenzel, S. George, I. Gussak, B. Bojovic, andD. Panescu, “Detection of acute myocardial infarction from serial ECGusing multilayer support vector machine,” in Engineering in Medicineand Biology Society (EMBC), 2012 Annual International Conferenceof the IEEE. IEEE, 2012, pp. 2704–2707.
[29] T. Q. Le, S. T. S. Bukkapatnam, B. A. Benjamin, B. A. Wilkins, andR. Komanduri, “Topology and random-walk network representationof cardiac dynamics for localization of myocardial infarction,” IEEETransactions on Biomedical Engineering, vol. 60, no. 8, pp. 2325–2331, Aug. 2013.
[30] R. Correa, P. D. Arini, L. S. Correa, M. Valentinuzzi, E. Laciar, andothers, “Identification of patients with myocardial infarction,” Methodsof Information in Medicine, vol. 55, no. 3, pp. 242–249, 2016.
[31] S. Banks, Signal Processing: Image Processing and Pattern Recogni-tion, ser. Discovering Historic Scotland. Prentice Hall, 1990.
[32] T. Stamkopoulos, M. Strintzis, C. Pappas, and N. Maglaveras, “One-lead ischemia detection using a new backpropagation algorithm andthe European ST-T database,” in Computers in Cardiology 1992,Proceedings of, IEEE. IEEE Comput. Soc. Press, 1992, pp. 663–
IEEE REVIEWS IN BIOMEDICAL ENGINEERING, VOL. X, NO. Y, AUGUST 2015 30
666.[33] F. Kornreich, T. Montague, and P. Rautaharju, “Discriminant analysis
of body surface potential maps for classification of non-Q waveinfarction,” in Computers in Cardiology 1991, Proceedings. IEEE,1991, pp. 61–64.
[34] J. Presedo, J. Vila, S. Barro, F. Palacios, R. Ruiz, A. Taddei, andM. Emdin, “Fuzzy modelling of the expert’s knowledge in ECG-basedischaemia detection,” Fuzzy Sets and Systems, vol. 77, no. 1, pp. 63–75,jan 1996.
[35] P. Bozzola, G. Bortolan, C. Combi, F. Pinciroli, and C. Brohet,“A hybrid neuro-fuzzy system for ECG classification of myocardialinfarction,” in Computers in Cardiology, 1996. IEEE, 1996, pp. 241–244.
[36] J. Garcıa, L. Sornmo, S. Olmos, and P. Laguna, “Automatic detectionof ST-T complex changes on the ECG using filtered RMS differenceseries: application to ambulatory ischemia monitoring,” IEEE Transac-tions on Biomedical Engineering, vol. 47, no. 9, pp. 1195–1201, 2000.
[37] S. Papadimitriou, S. Mavroudi, L. Vladutu, and A. Bezerianos, “Is-chemia detection with a self-organizing map supplemented by super-vised learning,” IEEE Transactions on Neural Networks, vol. 12, no. 3,pp. 503–515, 2001.
[38] M. W. Zimmerman, R. J. Povinelli, M. T. Johnson, and K. M. Ropella,“A reconstructed phase space approach for distinguishing ischemicfrom non-ischemic ST changes using Holter ECG data,” in Computersin Cardiology, 2003, Sep. 2003, pp. 243–246.
[39] D. A. Orrego, M. A. Becerra, and E. Delgado-Trejos, “Dimensionalityreduction based on fuzzy rough sets oriented to ischemia detection,”in 2012 Annual International Conference of the IEEE Engineering inMedicine and Biology Society, Aug. 2012, pp. 5282–5285.
[40] A. L. Goldberger, L. A. Amaral, L. Glass, J. M. Hausdorff, P. C.Ivanov, R. G. Mark, J. E. Mietus, G. B. Moody, C.-K. Peng, and H. E.Stanley, “Physiobank, physiotoolkit, and physionet,” Circulation, vol.101, no. 23, pp. e215–e220, 2000.
[41] R. Bousseljot, D. Kreiseler, and A. Schnabel, “Nutzung der EKG-Signaldatenbank CARDIODAT der PTB uber das Internet,” Biomedi-zinische Technik/Biomedical Engineering, vol. 40, no. s1, pp. 317–318,1995.
[42] A. Taddei, G. Distante, M. Emdin, P. Pisani, G. Moody, C. Zeelen-berg, and C. Marchesi, “The European ST-T database: standard forevaluating systems for the analysis of ST-T changes in ambulatoryelectrocardiography,” European Heart Journal, vol. 13, no. 9, pp. 1164–1172, 1992.
[43] F. Jager, A. Taddei, G. B. Moody, M. Emdin, G. Antolic, R. Dorn,A. Smrdel, C. Marchesi, and R. G. Mark, “Long-term ST database: Areference for the development and evaluation of automated ischaemiadetectors and for the study of the dynamics of myocardial ischaemia,”Medical & Biological Engineering & Computing, vol. 41, no. 2, pp.172–182, Mar. 2003.
[44] F. Jager, G. B. Moody, B. Pavlic, I. Blazina, I. Zupic, and R. G.Mark, “Characterization of temporal patterns of transient ischemic STchange episodes during ambulatory ECG monitoring,” in Computers inCardiology, 1996. IEEE, 1996, pp. 681–684.
[45] S. Padhy, L. Sharma, and S. Dandapat, “Multilead ECG data com-pression using SVD in multiresolution domain,” Biomedical SignalProcessing and Control, vol. 23, pp. 10–18, 2016.
[46] S. Padhy and S. Dandapat, “Third-order tensor based analysis ofmultilead ECG for classification of myocardial infarction,” BiomedicalSignal Processing and Control, vol. 31, pp. 71–78, Jan. 2017.
[47] P. X. Quesnel, A. D. C. Chan, and H. Yang, “Signal quality andfalse myocardial ischemia alarms in ambulatory electrocardiograms,”in 2014 IEEE International Symposium on Medical Measurements andApplications (MeMeA), Jun. 2014, pp. 1–5.
[48] J. Garcıa, M. Astrom, J. Mendive, P. Laguna, and L. Sornmo, “ECG-based detection of body position changes in ischemia monitoring,”IEEE Transactions on Biomedical Engineering, vol. 50, no. 6, pp. 677–685, 2003.
[49] L. Sornmo, “Time-varying filtering for removal of baseline wanderin exercise ECGs,” in Computers in Cardiology 1991, Proceedings.IEEE, 1991, pp. 145–148.
[50] M. Schmidt, M. Baumert, A. Porta, H. Malberg, and S. Zaunseder,“Two-dimensional warping for one-dimensional signals–conceptualframework and application to ECG processing,” IEEE Transactions onSignal Processing, vol. 62, no. 21, pp. 5577–5588, Nov. 2014.
[51] M. Hadjem, F. Naıt-Abdesselam, and A. Khokhar, “ST-segment andT-wave anomalies prediction in an ECG data using RUSBoost,” in2016 IEEE 18th International Conference on e-Health Networking,Applications and Services (Healthcom), Sep. 2016, pp. 1–6.
[52] H. N. Murthy and M. Meenakshi, “ANN, SVM and KNN classifiers forprognosis of cardiac ischemia-a comparison,” Bonfring InternationalJournal of Research in Communication Engineering, vol. 5, no. 2, p. 7,2015.
[53] A. K. Bhoi, K. S. Sherpa, and B. Khandelwal, “Classification probabil-ity analysis for arrhythmia and ischemia using frequency domain fea-tures of QRS complex,” International Journal Bioautomation, vol. 19,no. 4, 2015.
[54] S. S. Nidhyananthan, S. Saranya, and R. S. S. Kumari, “Myocardialinfarction detection and heart patient identity verification,” in 2016International Conference on Wireless Communications, Signal Process-ing and Networking (WiSPNET), Mar. 2016, pp. 1107–1111.
[55] L. N. Sharma, R. K. Tripathy, and S. Dandapat, “Multiscale energyand eigenspace approach to detection and localization of myocardialinfarction,” IEEE Transactions on Biomedical Engineering, vol. 62,no. 7, pp. 1827–1837, Jul. 2015.
[56] L. N. Sharma and S. Dandapat, “Detecting myocardial infarction bymultivariate multiscale covariance analysis of multilead electrocardio-grams,” in Proceedings of the International Congress on Informationand Communication Technology, S. C. Satapathy, Y. C. Bhatt, A. Joshi,and D. K. Mishra, Eds. Singapore: Springer Singapore, 2016, vol. 439,pp. 169–179.
[57] M. Kaur, B. Singh et al., “Comparison of different approaches forremoval of baseline wander from ECG signal,” in Proceedings ofthe International Conference & Workshop on Emerging Trends inTechnology. ACM, 2011, pp. 1290–1294.
[58] R. M. Rangayyan and N. P. Reddy, “Biomedical signal analysis: a case-study approach,” Annals of Biomedical Engineering, vol. 30, no. 7, pp.983–983, 2002.
[59] T. Lahiri, U. Kumar, H. Mishra, S. Sarkar, and A. D. Roy, “Analysisof ECG signal by chaos principle to help automatic diagnosis ofmyocardial infarction,” Journal of Scientific and Industrial Research(JSIR), vol. 68, no. 10, pp. 866–870, 2009.
[60] A. Jaleel, R. Tafreshi, and L. Tafreshi, “An expert system for differentialdiagnosis of myocardial infarction,” Journal of Dynamic Systems,Measurement, and Control, vol. 138, no. 11, p. 111012, Aug. 2016.
[61] H. Pereira and N. Daimiwal, “Analysis of features for myocardialinfarction and healthy patients based on wavelet,” in 2016 Conferenceon Advances in Signal Processing (CASP), Jun. 2016, pp. 164–169.
[62] V. Chouhan and S. S. Mehta, “Total removal of baseline drift fromECG signal,” in Computing: Theory and Applications, 2007. ICCTA’07.International Conference on. IEEE, 2007, pp. 512–515.
[63] C. Meyer and H. Keiser, “Electrocardiogram baseline noise estimationand removal using cubic splines and state-space computation tech-niques,” Computers and Biomedical Research, vol. 10, no. 5, pp. 459–470, 1977.
[64] F. Badilini, A. J. Moss, and E. L. Titlebaum, “Cubic spline baselineestimation in ambulatory ECG recordings for the measurement ofST segment displacements,” in Engineering in Medicine and BiologySociety, 1991. Vol. 13: 1991., Proceedings of the Annual InternationalConference of the IEEE. IEEE, 1991, pp. 584–585.
[65] E. Pueyo, L. Sornmo, and P. Laguna, “QRS slopes for detectionand characterization of myocardial ischemia,” IEEE Transactions onBiomedical Engineering, vol. 55, no. 2, pp. 468–477, feb 2008.
[66] J. Garcıa, P. Lander, L. Sornmo, S. Olmos, G. Wagner, and P. Laguna,“Comparative study of local and Karhunen–Loeve-based STT indexesin recordings from human subjects with induced myocardial ischemia,”Computers and Biomedical Research, vol. 31, no. 4, pp. 271–292, 1998.
[67] Y.-L. Tseng, K.-S. Lin, and F.-S. Jaw, “Comparison of support-vectormachine and sparse representation using a modified rule-based methodfor automated myocardial ischemia detection,” Computational andMathematical Methods in Medicine, vol. 2016, pp. 1–8, 2016.
[68] M. Arif, I. A. Malagore, and F. A. Afsar, “Detection and localizationof myocardial infarction using k-nearest neighbor classifier,” Journalof Medical Systems, vol. 36, pp. 279–289, 2012.
[69] F. Jager, G. B. Moody, and R. G. Mark, “Detection of transient STsegment episodes during ambulatory ECG monitoring,” Computers andBiomedical Research, vol. 31, no. 5, pp. 305–322, 1998.
[70] F. Badilini, M. Merri, J. Benhorin, and A. Moss, “Beat-to-beat quan-tification and analysis of ST displacement from Holter ECGs: a newapproach to ischemia detection,” in Computers in Cardiology 1992,Proceedings of. IEEE, 1992, pp. 179–182.
[71] A. Minchole, B. Skarp, F. Jager, and P. Laguna, “Evaluation of a rootmean squared based ischemia detector on the long-term ST databasewith body position change cancellation,” in Computers in Cardiology,2005, sep 2005, pp. 853–856.
[72] D. Romero, J. P. Martınez, P. Laguna, and E. Pueyo, “Ischemia
IEEE REVIEWS IN BIOMEDICAL ENGINEERING, VOL. X, NO. Y, AUGUST 2015 31
detection from morphological QRS angle changes,” PhysiologicalMeasurement, vol. 37, no. 7, p. 1004, 2016.
[73] A. Bezerianos, L. Vladutu, and S. Papadimitriou, “Hierarchical statespace partitioning with a network self-organising map for the recogni-tion of ST-T segment changes,” Medical and Biological Engineeringand Computing, vol. 38, no. 4, pp. 406–415, Jul. 2000.
[74] S. Man, C. C. t. Haar, A. C. Maan, M. J. Schalij, and C. A. Swenne,“The dependence of the STEMI classification on the position ofST-deviation measurement instant relative to the J point,” in 2015Computing in Cardiology Conference (CinC), Sep. 2015, pp. 837–840.
[75] P. J. Brockwell and R. A. Davis, Time Series: Theory and Methods,ser. Springer Series in Statistics. New York, NY: Springer New York,1991.
[76] C. Papaloukas, D. I. Fotiadis, A. P. Liavas, A. Likas, and L. K.Michalis, “A knowledge-based technique for automated detection ofischaemic episodes in long duration electrocardiograms,” Medical &Biological Engineering & Computing, vol. 39, no. 1, pp. 105–112,2001.
[77] Y. Goletsis, C. Papaloukas, D. I. Fotiadis, A. Likas, and L. K. Michalis,“Automated ischemic beat classification using genetic algorithms andmulticriteria decision analysis,” IEEE Transactions on BiomedicalEngineering, vol. 51, no. 10, pp. 1717–1725, 2004.
[78] C. Papaloukas, D. I. Fotiadis, A. Likas, and L. K. Michalis, “An is-chemia detection method based on artificial neural networks,” ArtificialIntelligence in Medicine, vol. 24, no. 2, pp. 167–178, 2002.
[79] C. Papaloukas, D. I. Fotiadis, A. Likas, C. S. Stroumbis, and L. K.Michalis, “Use of a novel rule-based expert system in the detection ofchanges in the ST segment and the T wave in long duration ECGs,”Journal of Electrocardiology, vol. 35, no. 1, pp. 27–34, 2002.
[80] T. P. Exarchos, C. Papaloukas, D. I. Fotiadis, and L. K. Michalis, “Anassociation rule mining-based methodology for automated detection ofischemic ECG beats,” IEEE Transactions on Biomedical Engineering,vol. 53, no. 8, pp. 1531–1540, 2006.
[81] A. N. Akansu and R. A. Haddad, Multiresolution signal decomposition:transforms, subbands, and wavelets. Academic Press, 2001.
[82] R. Remya, K. Indiradevi, and K. A. Babu, “Classification of myocardialinfarction using multi resolution wavelet analysis of ECG,” ProcediaTechnology, vol. 24, pp. 949–956, 2016.
[83] A. Kumar and M. Singh, “Ischemia detection using Isoelectric EnergyFunction,” Computers in Biology and Medicine, vol. 68, pp. 76–83,Jan. 2016.
[84] J. Park, W. Pedrycz, and M. Jeon, “Ischemia episode detection in ECGusing kernel density estimation, support vector machine and featureselection,” Biomedical Engineering Online, vol. 11, no. 1, p. 1, 2012.
[85] B. Arvinti, D. Toader, M. Costache, and A. Isar, “Electrocardiogrambaseline wander removal using stationary wavelet approximations,” inOptimization of Electrical and Electronic Equipment (OPTIM), 201012th International Conference on. IEEE, 2010, pp. 890–895.
[86] M. Blanco-Velasco, B. Weng, and K. E. Barner, “ECG signal denoisingand baseline wander correction based on the empirical mode decompo-sition,” Computers in Biology and Medicine, vol. 38, no. 1, pp. 1–13,2008.
[87] J. T.-Y. Weng, J.-J. Lin, Y.-C. Chen, and P.-C. Chang, “Myocardialinfarction classification by morphological feature extraction from big12-lead ECG data,” in Trends and Applications in Knowledge Discoveryand Data Mining, W.-C. Peng, H. Wang, J. Bailey, V. S. Tseng, T. B.Ho, Z.-H. Zhou, and A. L. Chen, Eds. Cham: Springer InternationalPublishing, 2014, vol. 8643, pp. 689–699.
[88] N. Safdarian, N. J. Dabanloo, and G. Attarodi, “A new pattern recog-nition method for detection and localization of myocardial infarctionusing T-wave integral and total integral as extracted features from onecycle of ECG signal,” Scientific Research Publishing, vol. 7, p. 818,2014.
[89] P. Kora and S. R. Kalva, “Improved Bat algorithm for the detection ofmyocardial infarction,” SpringerPlus, vol. 4, no. 1, Dec. 2015.
[90] H. Yang, C. Kan, G. Liu, and Y. Chen, “Spatiotemporal differentiationof myocardial infarctions,” IEEE Transactions on Automation Scienceand Engineering, vol. 10, no. 4, pp. 938–947, oct 2013.
[91] L. Sun, Y. Lu, K. Yang, and S. Li, “ECG analysis using multiple in-stance learning for myocardial infarction detection,” IEEE Transactionson Biomedical Engineering, vol. 59, no. 12, pp. 3348–3356, Dec. 2012.
[92] H. S. Shin, C. Lee, and M. Lee, “Ideal filtering approach on dct domainfor biomedical signals: index blocked dct filtering method (ib-dctfm),”Journal of Medical Systems, vol. 34, no. 4, pp. 741–753, 2010.
[93] J. I. Pelaez, J. M. Dona, J. Fornari, and G. Serra, “Ischemia classifi-cation via ECG using MLP neural networks,” International Journal ofComputational Intelligence Systems, vol. 7, no. 2, pp. 344–352, 2014.
[94] A. Kumar and M. Singh, “Optimal selection of wavelet function anddecomposition level for removal of ECG signal artifacts,” Journal ofMedical Imaging and Health Informatics, vol. 5, no. 1, pp. 138–146,2015.
[95] M. B. Mol, S. Prabavathy, B. P. Shan, and J. Mohanalin, “A robust ’rulebased denoising scheme’ using wavelets,” Journal of Medical Imagingand Health Informatics, vol. 4, no. 4, pp. 457–468, 2014.
[96] A. Taddei, G. Costantino, R. Silipo, M. Emdin, and C. Marchesi, “Asystem for the detection of ischemic episodes in ambulatory ECG,” inComputers in Cardiology 1995. IEEE, 1995, pp. 705–708.
[97] P. Heinonen and Y. Neuvo, “FIR-median hybrid filters,” IEEE Trans-actions on Acoustics, Speech, and Signal Processing, vol. 35, no. 6,pp. 832–838, 1987.
[98] R. V. Andreao, B. Dorizzi, J. Boudy, and J. C. M. Mota, “ST-segmentanalysis using hidden Markov Model beat segmentation: application toischemia detection,” in Computers in Cardiology, 2004. IEEE, 2004,pp. 381–384.
[99] G. Breithardt, M. E. Cain, N. El-Sherif, N. C. Flowers, V. Hombach,M. Janse, M. B. Simson, and G. Steinbeck, “Standards for analysisof ventricular late potentials using high-resolution or signal-averagedelectrocardiography: a statement by a task force committee of theEuropean Society of Cardiology, the American Heart Association, andthe American College of Cardiology,” Journal of the American Collegeof Cardiology, vol. 17, no. 5, pp. 999–1006, 1991.
[100] M. E. Cain, J. L. Anderson, M. F. Arnsdorf, J. W. Mason, M. M.Scheinman, A. L. Waldo et al., “Signal-averaged electrocardiography,”Journal of the American College of Cardiology, vol. 27, no. 1, pp.238–249, 1996.
[101] C. C. Lin, W. Hu, and Y. W. Lin, “A wavelet-based high-frequencyanalysis of fragmented QRS complexes in patients with myocardialinfarction,” in 2015 Computing in Cardiology Conference (CinC), Sep.2015, pp. 565–568.
[102] O. Pahlm and L. Sornmo, “Data processing of exercise ECG’s,” IEEETransactions on Biomedical Engineering, no. 2, pp. 158–165, 1987.
[103] H. Draisma, C. Swenne, H. Van de Vooren, A. Maan, B. H. Van Huys-duynen, E. Van der Wall, and M. Schalij, “LEADS: an interactiveresearch oriented ECG/VCG analysis system,” in Computers in Cardi-ology, 2005. IEEE, 2005, pp. 515–518.
[104] F. Jager, R. Mark, and G. Moody, “Analysis of transient ST segmentchanges during ambulatory monitoring,” in Computers in Cardiology1991, Proceedings. IEEE, 1991, pp. 453–456.
[105] F. Badilini, A. M. Tekalp, and A. J. Moss, “A single-layer perceptronto discriminate non-sinus beats in ambulatory ECG recordings,” inEngineering in Medicine and Biology Society, 1992 14th AnnualInternational Conference of the IEEE, vol. 2. IEEE, 1992, pp. 521–522.
[106] G. B. Moody and R. G. Mark, “Development and evaluation of a 2-leadECG analysis program,” Computers in Cardiology, vol. 9, pp. 39–44,1982.
[107] L. Sharma, S. Dandapat, and A. Mahanta, “Multiscale wavelet energiesand relative energy based denoising of ECG signal,” in CommunicationControl and Computing Technologies (ICCCCT), 2010 IEEE Interna-tional Conference on. IEEE, 2010, pp. 491–495.
[108] ——, “Kurtosis-based noise estimation and multiscale energy to de-noise ECG signal,” Signal, Image and Video Processing, vol. 7, no. 2,pp. 235–245, 2013.
[109] S. Banerjee, R. Gupta, and M. Mitra, “Delineation of ECG char-acteristic features using multiresolution wavelet analysis method,”Measurement, vol. 45, no. 3, pp. 474–487, 2012.
[110] R. Gupta and P. Kundu, “Dissimilarity factor based classification ofinferior myocardial infarction ECG,” in Control, Measurement andInstrumentation (CMI), 2016 IEEE First International Conference on.IEEE, Jan. 2016, pp. 229–233.
[111] S. Banerjee and M. Mitra, “Application of cross wavelet transformfor ECG pattern analysis and classification,” IEEE Transactions onInstrumentation and Measurement, vol. 63, no. 2, pp. 326–333, Feb.2014.
[112] U. R. Acharya, H. Fujita, V. K. Sudarshan, S. L. Oh, M. Adam, J. E.Koh, J. H. Tan, D. N. Ghista, R. J. Martis, C. K. Chua, C. K. Poo,and R. S. Tan, “Automated detection and localization of myocardialinfarction using electrocardiogram: a comparative study of differentleads,” Knowledge-Based Systems, vol. 99, pp. 146–156, May 2016.
[113] U. R. Acharya, H. Fujita, M. Adam, O. S. Lih, V. K. Sudarshan, T. J.Hong, J. E. Koh, Y. Hagiwara, C. K. Chua, C. K. Poo, and T. R.San, “Automated characterization and classification of coronary arterydisease and myocardial infarction by decomposition of ECG signals:A comparative study,” Information Sciences, vol. 377, pp. 17–29, Jan.

IEEE REVIEWS IN BIOMEDICAL ENGINEERING, VOL. X, NO. Y, AUGUST 2015 32
2017.[114] B. Liu, J. Liu, G. Wang, K. Huang, F. Li, Y. Zheng, Y. Luo, and
F. Zhou, “A novel electrocardiogram parameterization algorithm and itsapplication in myocardial infarction detection,” Computers in Biologyand Medicine, vol. 61, pp. 178–184, 2015.
[115] C. A. Bustamante, S. I. Duque, A. Orozco-Duque, and J. Bustamante,“ECG delineation and ischemic ST-segment detection based in wavelettransform and support vector machines,” in Health Care Exchanges(PAHCE), 2013 Pan American. IEEE, 2013, pp. 1–7.
[116] E. S. Jayachandran, P. Joseph K., and R. Acharya U., “Analysis ofmyocardial infarction using discrete wavelet transform,” Journal ofMedical Systems, vol. 34, no. 6, pp. 985–992, Dec. 2010.
[117] B. N. Singh and A. K. Tiwari, “Optimal selection of wavelet basisfunction applied to ECG signal denoising,” Digital Signal Processing,vol. 16, no. 3, pp. 275–287, 2006.
[118] V. N. P. Raj and T. Venkateswarlu, “ECG signal denoising usingundecimated wavelet transform,” in Electronics Computer Technology(ICECT), 2011 3rd International Conference on, vol. 3. IEEE, 2011,pp. 94–98.
[119] S. Papadimitriou, D. Gatzounas, V. Papadopoulos, V. Tzigounis, andA. Bezerianos, “Denoising of the fetal heart rate signal with non-linearfiltering of the wavelet transform maxima,” International Journal ofMedical Informatics, vol. 44, no. 3, pp. 177–192, 1997.
[120] D. Shah, T. Yamane, K.-J. Choi, and M. Haissaguerre, “QRS subtrac-tion and the ECG analysis of atrial ectopics,” Annals of NoninvasiveElectrocardiology, vol. 9, no. 4, pp. 389–398, 2004.
[121] J. Salinet Jr, J. P. Madeiro, P. C. Cortez, P. J. Stafford, G. A. Ng,and F. S. Schlindwein, “Analysis of QRS-T subtraction in unipolaratrial fibrillation electrograms,” Medical & Biological Engineering &Computing, vol. 51, no. 12, pp. 1381–1391, 2013.
[122] E. Laciar, R. Jane, and D. H. Brooks, “Improved alignment method fornoisy high-resolution ECG and Holter records using multiscale cross-correlation,” IEEE Transactions on Biomedical Engineering, vol. 50,no. 3, pp. 344–353, 2003.
[123] W. J. Tompkins, “Biomedical digital signal processing,” EditorialPrentice Hall, 1993.
[124] P. S. Hamilton and W. J. Tompkins, “Quantitative investigation ofQRS detection rules using the MIT/BIH arrhythmia database,” IEEETransactions on Biomedical Engineering, no. 12, pp. 1157–1165, 1986.
[125] J. Pan and W. J. Tompkins, “A real-time QRS detection algorithm,”IEEE Transactions on Biomedical Engineering, no. 3, pp. 230–236,1985.
[126] T. P. Exarchos, M. G. Tsipouras, C. P. Exarchos, C. Papaloukas,D. I. Fotiadis, and L. K. Michalis, “A methodology for the automatedcreation of fuzzy expert systems for ischaemic and arrhythmic beatclassification based on a set of rules obtained by a decision tree,”Artificial Intelligence in Medicine, vol. 40, no. 3, pp. 187–200, jul2007.
[127] N. Maglaveras, T. Stamkopoulos, C. Pappas, and M. G. Strintzis,“An adaptive backpropagation neural network for real-time ischemiaepisodes detection: development and performance analysis using theEuropean ST-T database,” IEEE Transactions on Biomedical Engineer-ing, vol. 45, no. 7, pp. 805–813, Jul. 1998.
[128] N. A. Bhaskar, “Performance analysis of support vector machineand neural networks in detection of myocardial infarction,” ProcediaComputer Science, vol. 46, pp. 20–30, 2015.
[129] T. Stamkopoulos, K. Diamantaras, N. Maglaveras, and M. Strintzis,“ECG analysis using nonlinear PCA neural networks for ischemiadetection,” IEEE Transactions on Signal Processing, vol. 46, no. 11,pp. 3058–3067, 1998.
[130] M. Merri, D. C. Farden, J. G. Mottley, and E. L. Titlebaum, “Samplingfrequency of the electrocardiogram for spectral analysis of the heart ratevariability,” IEEE Transactions on Biomedical Engineering, vol. 37,no. 1, pp. 99–106, 1990.
[131] R. Silipo and C. Marchesi, “Artificial neural networks for automaticECG analysis,” IEEE Transactions on Signal Processing, vol. 46, no. 5,pp. 1417–1425, May 1998.
[132] R. Silipo, A. Taddei, and C. Marchesi, “Continuous monitoring anddetection of ST-T changes in ischemic patients,” in Computers inCardiology 1994. IEEE, 1994, pp. 225–228.
[133] L. Sornmo, O. Paklm, and M.-e. Nygards, “Adaptive QRS detection: Astudy of performance,” IEEE Transactions on Biomedical Engineering,no. 6, pp. 392–401, 1985.
[134] W. Zong, G. Moody, and D. Jiang, “A robust open-source algorithmto detect onset and duration of QRS complexes,” in Computers inCardiology, 2003. IEEE, 2003, pp. 737–740.
[135] I. Silva and G. B. Moody, “An open-source toolbox for analysing and
processing physionet databases in matlab and octave,” Journal of OpenResearch Software, vol. 2, no. 1, 2014.
[136] D. Benitez, P. Gaydecki, A. Zaidi, and A. Fitzpatrick, “The use of theHilbert transform in ECG signal analysis,” Computers in Biology andMedicine, vol. 31, no. 5, pp. 399–406, 2001.
[137] N. M. Arzeno, Z.-D. Deng, and C.-S. Poon, “Analysis of first-derivativebased QRS detection algorithms,” IEEE Transactions on BiomedicalEngineering, vol. 55, no. 2, pp. 478–484, 2008.
[138] M. Rad, S. Ghuchani, K. Bahaadinbeigy, and M. Khalilzadeh, “Realtime recognition of heart attack in a smart phone,” Acta InformaticaMedica, vol. 23, no. 3, pp. 151–154, 2015.
[139] M. Strintzis, G. Stalidis, X. Magnisalis, and N. Maglaveras, “Useof neural networks for electrocardiogram (ECG) feature extractionrecognition and classification,” Neural Network World, vol. 3, no. 4,pp. 313–328, 1992.
[140] Y.-C. Yeh and W.-J. Wang, “QRS complexes detection for ECG signal:The Difference Operation Method,” Computer Methods and Programsin Biomedicine, vol. 91, no. 3, pp. 245–254, 2008.
[141] J. P. Martınez, R. Almeida, S. Olmos, A. P. Rocha, and P. Laguna, “Awavelet-based ECG delineator: evaluation on standard databases,” IEEETransactions on Biomedical Engineering, vol. 51, no. 4, pp. 570–581,2004.
[142] A. Gutierrez, M. Lara, and P. Hernandez, “A QRS detector based onhaar wavelet, evaluation with MIT-BIH arrhythmia and European ST-Tdatabases,” Computacion y Sistemas, vol. 8, pp. 293–302, 2005.
[143] J. Vila, J. Presedo, M. Delgado, S. Barro, R. Ruiz, and F. Palacios,“SUTIL: Intelligent ischemia monitoring system,” International Jour-nal of Medical Informatics, vol. 47, no. 3, pp. 193–214, dec 1997.
[144] R. Andreao, B. Dorizzi, J. Boudy, and J. Mota, “Online beat segmenta-tion and classification through hidden Markov models,” Proc. IFMBE,vol. 5, 2004.
[145] P.-C. Chang, J.-J. Lin, J.-C. Hsieh, and J. Weng, “Myocardial infarctionclassification with multi-lead ECG using hidden Markov models andGaussian mixture models,” Applied Soft Computing, vol. 12, no. 10,pp. 3165–3175, 2012.
[146] P. Ranjith, P. Baby, and P. Joseph, “ECG analysis using wavelettransform, application to myocardial ischemia detection,” ITBM-RBM,vol. 24, pp. 44–47, 2003.
[147] P. Laguna, R. Jane, and P. Caminal, “Automatic detection of waveboundaries in multilead ECG signals: Validation with the CSEdatabase,” Computers and Biomedical Research, vol. 27, no. 1, pp.45–60, 1994.
[148] R. Jane, A. Blasi, J. Garcıa, and P. Laguna, “Evaluation of an automaticthreshold based detector of waveform limits in holter ECG with the QTdatabase,” in Computers in Cardiology 1997. IEEE, 1997, pp. 295–298.
[149] R. Tafreshi, A. Jaleel, J. Lim, and L. Tafreshi, “Automated analysis ofECG waveforms with atypical QRS complex morphologies,” Biomed-ical Signal Processing and Control, vol. 10, pp. 41–49, 2014.
[150] O. Pahlm and L. Sornmo, “Software QRS detection in ambulatorymonitoring–a review,” Medical and Biological Engineering and Com-puting, vol. 22, no. 4, pp. 289–297, 1984.
[151] J. Vila, J. Presedo, A. Bugarın, S. Barro, R. Ruiz, and F. Palacios,“Application of synctactic processing to ECG analysis,” in 12th Inter-national Congress on Medical Informatics, MIE-94, 1994, pp. 579–584.
[152] V. X. Afonso, W. J. Tompkins, T. Q. Nguyen, and S. Luo, “ECGbeat detection using filter banks,” IEEE Transactions on BiomedicalEngineering, vol. 46, no. 2, pp. 192–202, 1999.
[153] I. Duskalov, I. A. Dotsinsky, and I. I. Christov, “Developments in ECGacquisition, preprocessing, parameter measurement, and recording,”IEEE Engineering in Medicine and Biology Magazine, vol. 17, no. 2,pp. 50–58, 1998.
[154] V. Starc and T. T. Schlegel, “Change in angular velocity at the end ofthe QRS loop aids the electrocardiographic detection of acute inferiormyocardial infarction,” in 2015 Computing in Cardiology Conference(CinC), Sep. 2015, pp. 601–604.
[155] S. C. Bulusu, M. Faezipour, V. Ng, M. Nourani, L. S. Tamil, andS. Banerjee, “Transient ST-segment episode detection for ECG beatclassification,” in Life Science Systems and Applications Workshop(LiSSA), 2011 IEEE/NIH. IEEE, 2011, pp. 121–124.
[156] S. Ansari, A. Belle, H. Ghanbari, M. Salamango, and K. Najarian,“Suppression of false arrhythmia alarms in the ICU: a machine learningapproach,” Physiological Measurement, vol. 37, no. 8, p. 1186, 2016.
[157] S. Carley, R. Gamon, P. Driscoll, G. Brown, and P. Wallman, “What’sthe point of ST elevation?” Emergency Medicine Journal, vol. 19, no. 2,pp. 126–128, 2002.
[158] J. J. Wang, O. Pahlm, G. S. Wagner, J. W. Warren, B. M. Horacek,
IEEE REVIEWS IN BIOMEDICAL ENGINEERING, VOL. X, NO. Y, AUGUST 2015 33
and J. L. Sapp, “Validation of the vessel-specific leads (VSLs) foracute ischemia detection on a dataset with non-ischemic ST-segmentdeviation,” in 2015 Computing in Cardiology Conference (CinC), Sep.2015, pp. 849–852.
[159] R. N. Bracewell and R. N. Bracewell, The Fourier transform and itsapplications. Mcgraw-Hill New York, 1986, vol. 31999.
[160] S. Gade and K. Gram-Hansen, “The analysis of nonstationary signals,”SV Sound and Vibration, vol. 31, no. 1, pp. 40–46, 1997.
[161] O. Rioul and M. Vetterli, “Wavelets and signal processing,” IEEESignal Processing Magazine, vol. 8, no. 4, pp. 14–38, 1991.
[162] P. S. Addison, “Wavelet transforms and the ECG: a review,” Physio-logical Measurement, vol. 26, no. 5, p. R155, 2005.
[163] I. Daubechies, “The wavelet transform, time-frequency localization andsignal analysis,” IEEE Transactions on Information Theory, vol. 36,no. 5, pp. 961–1005, 1990.
[164] S. G. Mallat, “A theory for multiresolution signal decomposition: thewavelet representation,” IEEE Transactions on Pattern Analysis andMachine Intelligence, vol. 11, no. 7, pp. 674–693, 1989.
[165] I. Daubechies, Ten lectures on wavelets. Siam, 1992.[166] G. E. Dower and H. B. Machado, “XYZ data interpreted by a 12-
lead computer program using the derived electrocardiogram,” Journalof Electrocardiology, vol. 12, no. 3, pp. 249–261, 1979.
[167] L. Edenbrandt and O. Pahlm, “Vectorcardiogram synthesized from a12-lead ECG: superiority of the inverse Dower matrix,” Journal ofElectrocardiology, vol. 21, no. 4, pp. 361–367, 1988.
[168] J. Kors, G. Van Herpen, A. Sittig, and J. Van Bemmel, “Reconstructionof the Frank vectorcardiogram from standard electrocardiographicleads: diagnostic comparison of different methods,” European HeartJournal, vol. 11, no. 12, pp. 1083–1092, 1990.
[169] M. Guillem, A. Sahakian, and S. Swiryn, “Derivation of orthogonalleads from the 12-lead ECG. accuracy of a single transform for thederivation of atrial and ventricular waves,” in Computers in Cardiology,2006. IEEE, 2006, pp. 249–252.
[170] S. Man, A. M. Algra, C. A. Schreurs, C. J. W. Borleffs, R. W. Scherp-tong, L. van Erven, E. E. van der Wall, S. C. Cannegieter, M. J. Schalij,and C. A. Swenne, “Influence of the vectorcardiogram synthesis matrixon the power of the electrocardiogram-derived spatial QRS-T angle topredict arrhythmias in patients with ischemic heart disease and systolicleft ventricular dysfunction,” Journal of Electrocardiology, vol. 44,no. 4, pp. 410–415, 2011.
[171] H. Lu, K. Ong, and P. Chia, “An automated ECG classification systembased on a neuro-fuzzy system,” in Computers in Cardiology 2000.IEEE, 2000, pp. 387–390.
[172] M. Hadjem, O. Salem, F. N. Abdesselam, and A. Mehaoua, “Earlydetection of myocardial infarction using WBAN,” in e-Health Net-working, Applications & Services (Healthcom), 2013 IEEE 15th In-ternational Conference on. IEEE, 2013, pp. 135–139.
[173] L. O. Resende, E. S. Resende, and A. O. Andrade, “Assessment of theST segment deviation area as a potential physiological marker of theacute myocardial infarction,” in 2012 Annual International Conferenceof the IEEE Engineering in Medicine and Biology Society, Aug. 2012,pp. 669–672.
[174] M. Devika, C. Gopakumar, R. Aneesh, and G. R. Nayar, “Myocardialinfarction detection using hybrid BSS method,” in CommunicationSystems and Networks (ComNet), International Conference on. IEEE,2016, pp. 167–172.
[175] D. B. Percival and A. T. Walden, Wavelet methods for time seriesanalysis. Cambridge University Press, 2006, vol. 4.
[176] E. A. Maharaj and A. M. Alonso, “Discriminant analysis of multi-variate time series: Application to diagnosis based on ECG signals,”Computational Statistics & Data Analysis, vol. 70, pp. 67–87, 2014.
[177] C. Torrence and G. P. Compo, “A practical guide to wavelet analysis,”Bulletin of the American Meteorological Society, vol. 79, no. 1, pp.61–78, 1998.
[178] C. Torrence and P. J. Webster, “Interdecadal changes in the ENSO–monsoon system,” Journal of Climate, vol. 12, no. 8, pp. 2679–2690,1999.
[179] M. A. Kramer, “Nonlinear principal component analysis using autoas-sociative neural networks,” AiChE Journal, vol. 37, no. 2, pp. 233–243,1991.
[180] N. Ahmed, T. Natarajan, and K. R. Rao, “Discrete cosine transform,”IEEE Transactions on Computers, vol. 100, no. 1, pp. 90–93, 1974.
[181] N. E. Huang, Z. Shen, S. R. Long, M. C. Wu, H. H. Shih, Q. Zheng,N.-C. Yen, C. C. Tung, and H. H. Liu, “The empirical mode decompo-sition and the Hilbert spectrum for nonlinear and non-stationary timeseries analysis,” in Proceedings of the Royal Society of London A:Mathematical, Physical and Engineering Sciences, vol. 454, no. 1971.
The Royal Society, 1998, pp. 903–995.[182] L. Sornmo, P. O. Borjesson, M.-E. Nygards, and O. Pahlm, “A method
for evaluation of QRS shape features using a mathematical model forthe ECG,” IEEE Transactions on Biomedical Engineering, no. 10, pp.713–717, 1981.
[183] H. Haraldsson, L. Edenbrandt, and M. Ohlsson, “Detecting acutemyocardial infarction in the 12-lead ECG using Hermite expansionsand neural networks,” Artificial Intelligence in Medicine, vol. 32, no. 2,pp. 127–136, 2004.
[184] D. Achlioptas, “Database-friendly random projections: Johnson-Lindenstrauss with binary coins,” Journal of Computer and SystemSciences, vol. 66, no. 4, pp. 671–687, 2003.
[185] I. Bogdanova, F. Rincon, and D. Atienza, “A multi-lead ECG classifica-tion based on random projection features,” in 2012 IEEE InternationalConference on Acoustics, Speech and Signal Processing (ICASSP), mar2012, pp. 625–628.
[186] L. Rabiner and B. Juang, “An introduction to hidden Markov models,”IEEE ASSP Magazine, vol. 3, no. 1, pp. 4–16, 1986.
[187] G. Zewdie and M. Xiong, “Fully automated myocardial infarctionclassification using ordinary differential equations,” arXiv PreprintarXiv:1410.6984, 2014.
[188] N. Marwan, N. Wessel, U. Meyerfeldt, A. Schirdewan, and J. Kurths,“Recurrence-plot-based measures of complexity and their applicationto heart-rate-variability data,” Physical Review E, vol. 66, no. 2, p.026702, 2002.
[189] C.-J. Huang, D.-X. Yang, and Y.-T. Chuang, “Application of wrapperapproach and composite classifier to the stock trend prediction,” ExpertSystems with Applications, vol. 34, no. 4, pp. 2870–2878, 2008.
[190] X. He and P. Niyogi, “Locality preserving projections,” in Advancesin Neural Information Processing Systems, 2004, pp. 153–160.
[191] W. Siedlecki and J. Sklansky, “A note on genetic algorithms for large-scale feature selection,” Pattern Recognition Letters, vol. 10, no. 5, pp.335–347, 1989.
[192] I. C. Trelea, “The particle swarm optimization algorithm: convergenceanalysis and parameter selection,” Information Processing Letters,vol. 85, no. 6, pp. 317–325, 2003.
[193] X.-S. Yang, “Bat algorithm for multi-objective optimisation,” Interna-tional Journal of Bio-Inspired Computation, vol. 3, no. 5, pp. 267–274,2011.
[194] G. Bortolan and I. Christov, “Myocardial infarction and ischemiacharacterization from T-loop morphology in VCG,” in Computers inCardiology 2001. IEEE, 2001, pp. 633–636.
[195] X. Yin and J. Han, “CPAR: Classification based on predictive associa-tion rules,” in Proceedings of the 2003 Siam International Conferenceon Data Mining. SIAM, 2003, pp. 331–335.
[196] C. Seiffert, T. M. Khoshgoftaar, J. Van Hulse, and A. Napolitano,“RUSBoost: A hybrid approach to alleviating class imbalance,” IEEETransactions on Systems, Man, and Cybernetics-Part A: Systems andHumans, vol. 40, no. 1, pp. 185–197, 2010.
[197] J. R. Quinlan, C4.5: programs for machine learning. Elsevier, 2014.[198] F. Theos, I. Lagaris, and D. Papageorgiou, “PANMIN: sequential and
parallel global optimization procedures with a variety of options for thelocal search strategy,” Computer Physics Communications, vol. 159,no. 1, pp. 63–69, 2004.
[199] R. O. Duda, P. E. Hart, and D. G. Stork, Pattern classification. JohnWiley & Sons, 2012.
[200] M. Arif, M. U. Akram, and F. A. Afsar, “Arrhythmia beat classificationusing pruned fuzzy k-nearest neighbor classifier,” in Soft Computingand Pattern Recognition, 2009. SOCPAR’09. International ConferenceOf. IEEE, 2009, pp. 37–42.
[201] M. W. Zimmerman and R. J. Povinelli, “On improving the classificationof myocardial ischemia using Holter ECG data,” in Computers inCardiology, 2004. IEEE, 2004, pp. 377–380.
[202] S. Sapna, A. Tamilarasi, and M. P. Kumar, “Backpropagation learningalgorithm based on Levenberg Marquardt Algorithm,” Comp Sci InformTechnol (CS and IT), vol. 2, pp. 393–398, 2012.
[203] H. Haraldsson, L. Edenbrandt, and M. Ohlsson, “Detecting acutemyocardial infarction in the 12-lead ECG using Hermite expansionsand neural networks,” Artificial Intelligence in Medicine, vol. 32, no. 2,pp. 127–136, 2004.
[204] B. Cetisli, “Development of an adaptive neuro-fuzzy classifier usinglinguistic hedges: Part 1,” Expert Systems with Applications, vol. 37,no. 8, pp. 6093–6101, 2010.
[205] T. Kohonen, “The self-organizing map,” Neurocomputing, vol. 21,no. 1, pp. 1–6, 1998.
[206] B. Roy, Multicriteria Methodology for Decision Aiding, ser. NonconvexOptimization and Its Applications. Springer US, 1996.
IEEE REVIEWS IN BIOMEDICAL ENGINEERING, VOL. X, NO. Y, AUGUST 2015 34
[207] P. Vincke, Multicriteria decision-aid. John Wiley & Sons, 1992.[208] R. H. Shumway, “Time-frequency clustering and discriminant analy-
sis,” Statistics & Probability Letters, vol. 63, no. 3, pp. 307–314, 2003.[209] S. L. Salzberg, “C4.5: Programs for machine learning by J. Ross
Quinlan. Morgan Kaufmann Publishers, Inc., 1993,” Machine Learning,vol. 16, no. 3, pp. 235–240, 1994.
[210] J. G. Cleary, L. E. Trigg et al., “K*: An instance-based learner usingan entropic distance measure,” in Proceedings of the 12th InternationalConference on Machine Learning, vol. 5, 1995, pp. 108–114.
[211] T. G. Dietterich, “An experimental comparison of three methodsfor constructing ensembles of decision trees: bagging, boosting, andrandomization,” Machine Learning, vol. 40, no. 2, pp. 139–157, 2000.
[212] G. H. John and P. Langley, “Estimating continuous distributions inBayesian classifiers,” in Proceedings of the Eleventh Conference onUncertainty in Artificial Intelligence. Morgan Kaufmann PublishersInc., 1995, pp. 338–345.
[213] B. L. W. H. Y. Ma and B. Liu, “Integrating classification and associa-tion rule mining,” in Proceedings of the 4th, 1998.
[214] W. Li, J. Han, and J. Pei, “CMAR: Accurate and efficient classificationbased on multiple class-association rules,” in Data Mining, 2001. ICDM2001, Proceedings IEEE International Conference on. IEEE, 2001,pp. 369–376.
[215] F. Coenen, “The LUCS-KDD group, department of computer science,the university of liverpool, uk,” 2004.
[216] J. Catlett, “On changing continuous attributes into ordered discreteattributes,” in European Working Session on Learning. Springer, 1991,pp. 164–178.
[217] L. Breiman, J. Friedman, C. J. Stone, and R. A. Olshen, Classificationand regression trees. CRC Press, 1984.
[218] A. Taddei, A. Benassi, A. Biagini, M. Bongiorni, C. Contini, G. Dis-tante, L. Landucci, M. Mazzei, P. Pisani, N. Roggero et al., “ST-Tchange analysis in ECG ambulatory monitoring: a European standardfor performance evaluation,” Computers in Cardiology, vol. 14, pp.63–68, 1987.
[219] M. Abdelazez, P. Quesnel, A. Chan, and H. Yang, “Signal qualityanalysis of ambulatory electrocardiograms to gate false myocardialischemia alarms,” IEEE Transactions on Biomedical Engineering,vol. PP, no. 99, pp. 1–1, 2016.
[220] P. X. Quesnel, A. D. C. Chan, and H. Yang, “Real-time biosignal qual-ity analysis of ambulatory ECG for detection of myocardial ischemia,”in 2013 IEEE International Symposium on Medical Measurements andApplications (MeMeA). IEEE, May 2013, pp. 1–5.
[221] J. Garcıa, M. Astrom, J. Mendive, P. Laguna, and L. Sornmo, “ECG-based detection of body position changes in ischemia monitoring,”IEEE Transactions on Biomedical Engineering, vol. 50, no. 6, pp. 677–685, 2003.
[222] R. L. Kennedy, “Early diagnosis of acute myocardial infarction usingclinical and electrocardiographic data at presentation: derivation andevaluation of logistic regression models.” European Heart Journal,1996.
[223] H. Hamidi and A. Daraie, “A new hybrid method for improving theperformance of myocardial infarction prediction,” Journal of Commu-nity Health Research, vol. 5, pp. 5–6, 2016.
[224] H. Hamidi and A. Daraei, “Analysis and evaluation of techniques formyocardial infarction based on genetic algorithm and weight by SVM,”Information Systems & Telecommunication, p. 85, 2016.
[225] S. Vinterbo and L. Ohno-Machado, “A genetic algorithm to selectvariables in logistic regression: example in the domain of myocardialinfarction.” Proceedings of the AMIA Symposium, pp. 984–988, 1999.
[226] J. Mair, B. Puschendorf, J. Smidt, P. Lechleitner, and F. Dienstl, “Adecision tree for the early diagnosis of acute myocardial infarction innontraumatic chest pain patients at hospital admission,” Chest, vol. 108,no. 6, pp. 1502–1509, Dec. 1995.
[227] H. P. Selker, J. L. Griffith, and R. B. D’Agostino, “A tool for judgingcoronary care unit admission appropriateness, valid for both real-timeand retrospective use: a time-insensitive predictive instrument (TIPI)for acute cardiac ischemia: a multicenter study,” Medical Care, pp.610–627, 1991.
[228] C. L. Tsien, H. S. F. Fraser, W. J. Long, and R. L. Kennedy,“Using classification tree and logistic regression methods to diagnosemyocardial infarction,” Medinfo ’98 - 9th World Congress on MedicalInformatics, Pts 1 and 2, vol. 52, pp. 493–497, 1998.
[229] H. Selker, “A comparison of performance of mathematical predic-tive methods for medical diagnosis: identifying acute cardiac is-chemia among emergency department patients,” Journal of Investiga-tive Medicine, 1995.
[230] R. Chitra and V. Seenivasagam, “Heart attack prediction system using
cascaded neural network,” in Proceedings of the International Confer-ence on Applied Mathematics and Theoretical Computer Science-2013,2013, p. 223.
[231] ——, “Heart attack prediction system using Fuzzy C Means classifier,”IOSR Journal of Computer Engineering, vol. 14, pp. 23–31, 2013.
[232] V. Seenivasagam and R. Chitra, “Myocardial infarction detection usingintelligent algorithms,” Neural Network World, vol. 26, no. 1, pp. 91–110, 2016.
[233] W. Baxt, “Use of an artificial neural network for the diagnosis ofmyocardial infarction.” Annals of Internal Medicine, 1991.
[234] W. G. Baxt, F. S. Shofer, F. D. Sites, and J. E. Hollander, “A neuralcomputational aid to the diagnosis of acute myocardial infarction,”Annals of Emergency Medicine, vol. 39, no. 4, pp. 366–373, 2002.
[235] L. Goldman, “A computer-derived protocol to aid in the diagnosis ofemergency room patients with acute chest pain,” New England Journalof Medicine, no. 307, pp. 588–596, 1982.
[236] D. W. Hosmer Jr, S. Lemeshow, and R. X. Sturdivant, Applied logisticregression. John Wiley & Sons, 2013, vol. 398.
[237] C. B. Cairns, J. T. Niemann, H. P. Selker, and M. M. Laks, “Comput-erized version of the time-insensitive predictive instrument,” Journalof Electrocardiology, vol. 24, pp. 46–49, jan 1991.
[238] S. E. Fahlman and C. Lebiere, “The cascade-correlation learningarchitecture,” in Advances in Neural Information Processing Systems,1990, pp. 524–532.
[239] J. C. Bezdek, R. Ehrlich, and W. Full, “FCM: The fuzzy c-meansclustering algorithm,” Computers & Geosciences, vol. 10, no. 2-3, pp.191–203, 1984.
[240] Y. Freund and R. E. Schapire, “A desicion-theoretic generalizationof on-line learning and an application to boosting,” in EuropeanConference on Computational Learning Theory. Springer, 1995, pp.23–37.
[241] M. Pal, “Random forest classifier for remote sensing classification,”International Journal of Remote Sensing, vol. 26, no. 1, pp. 217–222,2005.
[242] Y. Wang and J. Vassileva, “Bayesian network-based trust model,” inWeb Intelligence, 2003. WI 2003. Proceedings. IEEE/WIC InternationalConference on. IEEE, 2003, pp. 372–378.
[243] S. Kalmegh, “Analysis of WEKA data mining algorithm REPTree,Simple CART and RandomTree for classification of indian news,” In-ternational Journal of Innovative Science, Engineering and Technology,vol. 2, no. 2, pp. 438–46, 2015.
[244] N. Friedman, D. Geiger, and M. Goldszmidt, “Bayesian networkclassifiers,” Machine Learning, vol. 29, no. 2-3, pp. 131–163, 1997.
[245] J. Platt, “Sequential minimal optimization: A fast algorithm for trainingsupport vector machines,” Microsoft Research Lab - Redmond, Tech.Rep., 1998.
[246] R. Kohavi et al., “A study of cross-validation and bootstrap for accuracyestimation and model selection,” in Ijcai, vol. 14, no. 2. Stanford, CA,1995, pp. 1137–1145.
[247] J. Pettersson, E. Carro, L. Edenbrandt, C. Maynard, O. Pahlm, M. Ring-born, L. Sornmo, S. G. Warren, and G. S. Wagner, “Spatial, individual,and temporal variation of the high-frequency QRS amplitudes in the12 standard electrocardiographic leads,” American Heart Journal, vol.139, no. 2, pp. 352–358, 2000.
[248] M. Chawla, H. Verma, and V. Kumar, “RETRACTED: A new statisticalPCA–ICA algorithm for location of R-peaks in ECG,” InternationalJournal of Cardiology, vol. 129, no. 1, pp. 146–148, 2008.
[249] G. B. Moody and F. Jager, “Distinguishing ischemic from non-ischemicST changes: the Physionet/Computers in Cardiology Challenge 2003,”in Computers in Cardiology, 2003, Sep. 2003, pp. 235–237.
[250] F. Dawoud, G. S. Wagner, G. Moody, and B. M. Horacek, “Usinginverse electrocardiography to image myocardial infarction-reflectingon the 2007 PhysioNet/Computers in Cardiology Challenge,” Journalof Electrocardiology, vol. 41, no. 6, pp. 630–635, 2008.
[251] P. Xiong, H. Wang, M. Liu, S. Zhou, Z. Hou, and X. Liu, “ECG signalenhancement based on improved denoising auto-encoder,” EngineeringApplications of Artificial Intelligence, vol. 52, pp. 194–202, 2016.
[252] B. Pourbabaee, M. J. Roshtkhari, and K. Khorasani, “Deep convolutionneural networks and learning ECG features for screening paroxysmalatrial fibrillatio patients,” IEEE Transactions on Systems, Man, andCybernetics: Systems, 2017.
[253] C. Yuan, Y. Yan, L. Zhou, J. Bai, and L. Wang, “Automated atrialfibrillation detection based on deep learning network,” in Informationand Automation (ICIA), 2016 IEEE International Conference on.IEEE, 2016, pp. 1159–1164.
[254] U. R. Acharya, H. Fujita, O. S. Lih, Y. Hagiwara, J. H. Tan, andM. Adam, “Automated detection of arrhythmias using different inter-
IEEE REVIEWS IN BIOMEDICAL ENGINEERING, VOL. X, NO. Y, AUGUST 2015 35
vals of tachycardia ECG segments with convolutional neural network,”Information Sciences, vol. 405, pp. 81–90, 2017.
[255] P. Rajpurkar, A. Y. Hannun, M. Haghpanahi, C. Bourn, and A. Y.Ng, “Cardiologist-level arrhythmia detection with convolutional neuralnetworks,” Arxiv Preprint Arxiv:1707.01836, 2017.
[256] M. M. Al Rahhal, Y. Bazi, H. AlHichri, N. Alajlan, F. Melgani,and R. R. Yager, “Deep learning approach for active classification ofelectrocardiogram signals,” Information Sciences, vol. 345, pp. 340–354, 2016.
[257] M. Langkvist, L. Karlsson, and A. Loutfi, “A review of unsupervisedfeature learning and deep learning for time-series modeling,” PatternRecognition Letters, vol. 42, pp. 11–24, 2014.
Sardar Ansari is a research fellow in the Universityof Michigan Department of Emergency Medicineand a member of Michigan Center for IntegrativeResearch in Clinical Care (MCIRCC). He earned hisPh.D. in Computer Science and his M.S. degree inStatistics at Virginia Commonwealth University in2013. He received his bachelors degree in SoftwareEngineering from University of Tehran, Electricaland Computer Engineering Department in 2008,and his M.S. in Computer Science from VCU in2010. His research interests are medical signal and
image processing, machine learning, data mining and development of medicaldevices as well as non-linear and discrete optimization and queuing theory.
Negar Farzaneh is a PhD candidate in the De-partment of Computational Medicine and Bioinfor-matics at the University of Michigan–Ann Arbor.She earned her B.E. in biomedical engineering fromAmirkair University of Technology, Tehran, Iran,in 2011. She is currently working on projects thatinvolve image processing and machine learning tech-niques to develop a computer-assisted clinical deci-sion support system for traumatic injury in KayvanNajarian’s laboratory.
Marlena Duda completed her Bachelors of Sciencein Biology at Northeastern University in Boston,MA. She worked as a research assistant and dataanalyst at the Wall Lab from 2011 to 2016, at bothHarvard Medical School and Stanford University.She is currently pursuing a PhD in ComputationalMedicine and Bioinformatics at the University ofMichigan. Her research focuses on machine learningapproaches to improve diagnosis of various psychi-atric and neurological disorders.
Kelsey Horan is a Ph.D. student in ComputerScience at The Graduate Center, the City Universityof New York, under the advisement of ProfessorDelaram Kahrobaei. Kelsey received her undergrad-uate degree in Mathematics from Rutgers University.She worked as a visiting researcher at the Univer-sity of Michigan–Ann Arbor in Kayvan Najarian’slab, on research projects including studying cardiacevent detection algorithms. Kelsey’s other researchinterests include computational medicine, machinelearning and cryptography.
Hedvig B. Andersson graduated from the Universityof Copenhagen in 2011. She is a physician and Ph.D.student at the Heart Centre, Copenhagen UniversityHospital Rigshospitalet, Copenhagen, Denmark/TheUniversity of Copenhagen, Copenhagen, Denmarkand is currently a visiting research scholar at theUniversity of Michigan, Ann Arbor, MI, USA. Shehas clinical experience within the field of cardiology,emergency medicine and family medicine. Her mainresearch interest is acute cardiovascular diseases,with focus on ischemic heart disease.
Zachary D. Goldberger is an electrocardiographerand Associate Professor of Medicine in the Divi-sion of Cardiology at Harborview Medical Cen-ter/University of Washington School of Medicine.He serves as an Associate Program Director forthe cardiology fellowship, and as director of theElectrocardiography/Arrhythmia Monitoring Labo-ratory at Harborview Medical Center. He has servedon Writing Committees for several clinical prac-tice guidelines through the ACC, AHA, and HeartRhythm Society. He has received numerous citations
for both research and his role as an educator.
Brahmajee K. Nallamothu is an interventionalcardiologist and cardiovascular outcomes researcherat the University of Michigan in Ann Arbor. Heis a nationally-recognized investigator whose workfocuses on improving the delivery specialized car-diovascular procedures, particularly primary PCI inST-elevation myocardial infarction. Dr. Nallamothuhas made important contributions using hospital- andpopulation-level approaches to examine strategiesfor optimizing door-to-balloon times and the use ofreperfusion therapies in STEMI systems of care. He
was a member of the Steering and Research & Publications committees of theAmerican College of Cardiologys D2B Alliance. He also has worked closelywith the American Heart Associations Mission: Lifeline program.
Kayvan Najarian is an Associate Professor in thedepartments of Computational Medicine and Bioin-formatics, and Emergency Medicine at the Univer-sity of Michigan. He also serves as the directorof the Michigan Center for Integrative Researchin Critical Care’s Biosignal-Image and Computa-tional (BIC) Core program. Dr. Najarian received hisPh.D. in Electrical and Computer Engineering fromUniversity of British Columbia, Canada, M.Sc inBiomedical Engineering from Amirkabir University,Iran, and B.Sc. in Electrical Engineering from Sharif
University, Iran. The focus of Dr. Kayvan Najarian’s research is on the designof signal/image processing and machine learning methods to create computer-assisted clinical decision support systems that improve patient care. Dr.Najarian serves as the Editor-in-Chief of a journal in the field of BiomedicalEngineering as well as the Associate Editor of two journals in the field ofbiomedical informatics. He is also a member of many editorial boards andhas served as a guest editor of special issues for several journals.