A PTAL approach to measuring changes in bus service accessibility
14
A PTAL approach to measuring changes in bus service accessibility Belinda M. Wu * , Julian P. Hine Transport and Road Assessment Centre, School of Built Environment, University of Ulster at Jordanstown, Shore Road, Newtonabbey BT37 0QB, UK Received 1 February 2003; revised 1 June 2003; accepted 1 July 2003 Abstract Accessible transport systems are essential to ensure equal opportunities for all people in society. The need for information about transport disadvantage is now a key policy requirement and previous studies have highlighted the need for tools to assess the impact of interventions on the bus network and the accessibility of the system. Geographical Information System (GIS) and ACCMAP enable the analysis of transport disadvantage and accessibility. This paper provides an analysis of the Citybus Network in Northern Ireland and assesses the spatial impact of a hypothetical network change on populations residing within the Citybus network area. q 2003 Elsevier Ltd. All rights reserved. Keywords: Bus service; Public transport accessibility levels; Equivalent doorstep frequency 1. Introduction In future accessibility will be given more weight in land use and transport decisions (ODPM, 2003). Bus service provision and the proximity of public transport networks are important for sections of the population who are more likely to experience exclusion from goods, services and employ- ment (Hine and Mitchell, 2001a, 2003; Diaz et al., 2000). Accessibility planning is a key area of transport policy. Indeed improved access to bus services is a key cornerstone of integrated transport strategy. The importance of access to public transport in order to access local goods and services has been identified by several studies (DETR, 1998; DETR, 2000; Hine and Mitchell, 2001b; General Consumer Council for Northern Ireland, 2001; ODPM, 2003). The consequences of poor access to public transport, which due to its very nature impacts disproportionately on those with low incomes, the elderly and women, results in a lack of ability to access education, jobs, health facilities and hospitals (Hine and Mitchell, 2001a,b, 2003). In Belfast car ownership has increased rapidly, and has as a result produced a gap in terms of access to opportunities between those with and without access to private transport. According to the 2001 census 43% of households in Belfast do not own a car (NISRA, 2003). The new Regional Transportation Strategy (RTS) has given a sharper focus on the need for public transport investment to meet the needs of the socially excluded (DRD, 2002; Cooper et al., 2001). In Northern Ireland the sectarian divide is a dimension to the planning of transport systems that needs to be considered (Smyth, 2000). Each community, whether Protestant or Catholic, exhibits distinctive social and political attributes, values and preferences (Douglas et al., 1982). It often means that for the delivery of public transport services, different services have to be operated for different sections of the community. Members of either community generally do not wish to be seen using a public transport service that takes them through other community areas for reasons of safety and fear of attack, either real or perceived (Smyth, 2000; Murtagh, 1994). In this paper we have, using the PTAL approach explored this dimension of public transport policy. This paper firstly provides a description of the Belfast area served by the Citybus network, and secondly the impact of hypothetical network changes on accessibility (scen- arios). The paper also looks at the impact of these changes on different age and religious groupings as measured by the PTALs approach. These scenarios are: Option 1—current situation; Option 2—a redeployment of buses to underpin the development of a metro/overground style network, with no off peak services; Option 3—consists of metro/over- gound network as in Option 2 plus a secondary network and 0967-070X/$ - see front matter q 2003 Elsevier Ltd. All rights reserved. doi:10.1016/S0967-070X(03)00053-2 Transport Policy 10 (2003) 307–320 www.elsevier.com/locate/tranpol * Corresponding author. Tel.: þ 44-2890-366-892. E-mail address: [email protected] (B.M. Wu).
Transcript of A PTAL approach to measuring changes in bus service accessibility
A PTAL approach to measuring changes in bus service accessibility
Belinda M. Wu*, Julian P. Hine
Transport and Road Assessment Centre, School of Built Environment, University of Ulster at Jordanstown, Shore Road, Newtonabbey BT37 0QB, UK
Received 1 February 2003; revised 1 June 2003; accepted 1 July 2003
Abstract
Accessible transport systems are essential to ensure equal opportunities for all people in society. The need for information about transport
disadvantage is now a key policy requirement and previous studies have highlighted the need for tools to assess the impact of interventions on
the bus network and the accessibility of the system. Geographical Information System (GIS) and ACCMAP enable the analysis of transport
disadvantage and accessibility. This paper provides an analysis of the Citybus Network in Northern Ireland and assesses the spatial impact of
a hypothetical network change on populations residing within the Citybus network area.
q 2003 Elsevier Ltd. All rights reserved.
Keywords: Bus service; Public transport accessibility levels; Equivalent doorstep frequency
1. Introduction
In future accessibility will be given more weight in land
use and transport decisions (ODPM, 2003). Bus service
provision and the proximity of public transport networks are
important for sections of the population who are more likely
to experience exclusion from goods, services and employ-
ment (Hine and Mitchell, 2001a, 2003; Diaz et al., 2000).
Accessibility planning is a key area of transport policy.
Indeed improved access to bus services is a key cornerstone
of integrated transport strategy. The importance of access to
public transport in order to access local goods and services
has been identified by several studies (DETR, 1998; DETR,
2000; Hine and Mitchell, 2001b; General Consumer
Council for Northern Ireland, 2001; ODPM, 2003). The
consequences of poor access to public transport, which due
to its very nature impacts disproportionately on those with
low incomes, the elderly and women, results in a lack of
ability to access education, jobs, health facilities and
hospitals (Hine and Mitchell, 2001a,b, 2003).
In Belfast car ownership has increased rapidly, and has
as a result produced a gap in terms of access to
opportunities between those with and without access to
private transport. According to the 2001 census 43% of
households in Belfast do not own a car (NISRA, 2003).
The new Regional Transportation Strategy (RTS) has given
a sharper focus on the need for public transport investment
to meet the needs of the socially excluded (DRD, 2002;
Cooper et al., 2001).
In Northern Ireland the sectarian divide is a dimension to
the planning of transport systems that needs to be
considered (Smyth, 2000). Each community, whether
Protestant or Catholic, exhibits distinctive social and
political attributes, values and preferences (Douglas et al.,
1982). It often means that for the delivery of public transport
services, different services have to be operated for different
sections of the community. Members of either community
generally do not wish to be seen using a public transport
service that takes them through other community areas for
reasons of safety and fear of attack, either real or perceived
(Smyth, 2000; Murtagh, 1994). In this paper we have, using
the PTAL approach explored this dimension of public
transport policy.
This paper firstly provides a description of the Belfast
area served by the Citybus network, and secondly the impact
of hypothetical network changes on accessibility (scen-
arios). The paper also looks at the impact of these changes
on different age and religious groupings as measured by the
PTALs approach. These scenarios are: Option 1—current
situation; Option 2—a redeployment of buses to underpin
the development of a metro/overground style network, with
no off peak services; Option 3—consists of metro/over-
gound network as in Option 2 plus a secondary network and
0967-070X/$ - see front matter q 2003 Elsevier Ltd. All rights reserved.
doi:10.1016/S0967-070X(03)00053-2
Transport Policy 10 (2003) 307–320
www.elsevier.com/locate/tranpol
* Corresponding author. Tel.: þ44-2890-366-892.
E-mail address: [email protected] (B.M. Wu).
off-peak services; Option 4—metro/overground network
plus comprehensive secondary network operated through
out the day.
2. GIS and accessibility planning
This study reviews available census data and network
data with the aid of GIS and ACCMAP technology. The
approach adopted includes
† Use of Noble Index of Deprivation to assess levels of
deprivation within the Citybus network spatially.
† Use of GIS and ACCMAP to spatially assess changes in
levels of public transport accessibility, as networks
change.
2.1. Noble index of deprivation
Measures of Deprivation in Northern Ireland study is
carried out by Social Disadvantage Research Centre of
University of Oxford in 2000. It sets out the methodology for
combining the indicators into Domain Deprivation Measures
and for combining the domains into an overall ward level
Multiple Deprivation Measure (MDM). The Noble Index of
Multiple Deprivation used in this study is based on the 1991
Census, and provides insight into the geographical distri-
bution of different forms of deprivation and disadvantage.
The domains of deprivation refer to different types of
deprivation or ways in which deprivation can be experienced.
The measures consist of seven separate types of deprivation
(Social Disadvantage Research Centre, 2001)
† Income domain
† Employment domain
† Health and disability domain
† Education domain
† Geographical access to services domain1
† Social environment domain
† Housing domain
2.2. GIS and ACCMAP
GIS is renowned for its ability to visualise, analyse and
model geographical data. It enables the application of
quantitative geographical methods within a digital environ-
ment. A GIS map can combine many layers of information
that are associated with a linked database. In this study, data
sets are displayed in a range of innovative ways (3-D, Grid,
thematic maps, etc.) to facilitate data interpretation.
Another major activity that complements GIS analysis is
the use and development of network models using
ACCMAP. This journey access and travel time mapping
package measures accessibility to and from any point based
on travel costs through highway and public transport
networks (Citilabs). ACCMAP also provides an accessibility
mapping overlay on any background map to allow the impact
of network changes on the transport system to be clearly
shown. ACCMAP is also a useful tool in the development of
network models. The software also facilitates the production
of Public Transport Accessibility Levels (PTAL) indices for
different public transport service time periods.
2.3. PTALs
The objective in assessing public transport accessibility
is primarily to enable comparisons to be made between
† The relative accessibility which exists at different
locations within the city, and
† The relative effects on such accessibility of introducing
different schedules or levels of service.
Data sets of public transport stop locations, route
delineations and service schedule frequency have to be
populated for the public transport network database to
generate the PTAL indices. Depending on local environ-
mental factors, the input parameters for PTAL generation
can be altered. System defaults were utilized in this paper,
although ‘origin’ and ‘maximum walk distance’ parameters
were selected to meet our own analytical objectives—
namely 250 m (equidistant) and 400 m, respectively.
Public transport accessibility is influenced by the
aggregate availability/quality of public transport services
within a reasonable walking distance, therefore:
Access time ¼ walking time þ average waiting time
¼ walking time þ k þ scheduled waiting time
Where k is a ‘reliability’ factor relating to the reliability of
the service, which may be derived from observed survey
data for each service at any time of day. If services are
operating to schedule then k ¼ 1; however, in the absence of
up-to-date and accurate survey data it has been agreed with
London Transport that k ¼ 0:75 for underground, rail and
tram services and k ¼ 2 for bus services (Citilabs). The
default settings for the reliability factor and weightings for
walking time and the waiting time are used in this study as
advised by the ACCMAP manual.
For each selected route the scheduled waiting time
(SWT) is calculated. This is estimated as half the headway
(i.e. the interval between services,) so SWT ¼ 0.5*
(60/Frequency), hence
Average waiting time ¼ k þ 30=scheduled frequency per hour
Then the Equivalent Doorstep Frequency (EDF) can be
calculated for each route as follows
EDF ¼30
access time
1 Here the access to services does not include public transport services. It
refers to the public services such as post offices and health services.
B.M. Wu, J.P. Hine / Transport Policy 10 (2003) 307–320308
The aggregate EDF (or the Accessibility Index) for each
location can then be obtained by a summation of all the
individual EDFs within the walking distance (London
Borough of Hammersmith and Fulham, 2000). Having
derived Accessibility Indices for a range of locations
(origins), the indices were then grouped (and spatially
mapped) into six value ranges, and then defined in terms of
Accessibility Levels (i.e. spanning a range of Accessibility
Indices, Table 1).
PTALs are a highly detailed measure of the accessibility
of any origin point to the public transport network, taking
into account the walk access time and service availability.
The method is particularly suited to local area studies in
urban situations and it reflects
† The walking time from the origin point to the public
transport access points.
† The reliability of the service modes available.
† The number of services available within the catchment.
† The level of service at the public transport access
points—i.e. average waiting time.
Level of access to public transport services is therefore a
function of the degree to which social exclusion processes
are experienced. PTALs as indicators are of particular
importance in revealing the impact of network changes on
travel patterns for those groups who rely on bus provision.
PTAL analysis has been increasingly used throughout the
UK since the original methodology was developed and
thoroughly tested by London Borough of Hammersmith and
Fulham (1992) and Hardcastle and Cleve (1995) for
example. The main strength of the approach is that it is
easy to understand. Unlike traditional modelling
approaches, PTALs provide a direct visualization of data
using the coloured contour map in which patterns of
provision are clearly shown. PTALs can provide useful
indicators to facilitate strategic planning. For example, in
assessing whether a change of services is acceptable,
proposals can be considered in the light of such factors as
PTALs to evaluate potential changes that could hinder
social inclusion objectives. PTALs can also be used to
identify areas where public transport accessibility is high.
While providing a useful indicator of local accessibility
and comparative studies, this approach does assume that
access to the public transport network provides access to
reasonably well integrated rail and bus services within the
urban context and consequently a range of final destinations.
This is a reasonable assumption to make for a city such as
Belfast, a city with a reasonably comprehensive public
transport network. However, in rural areas the method may
not be applicable where there may only be a limited number
of routes with poor connections and interchange facilities.
Other criticisms of the method are that it does not consider
aspects of travel time such as speed of service, congestion,
crowding, stopping/express services and ease of
interchange.
3. The Citybus network
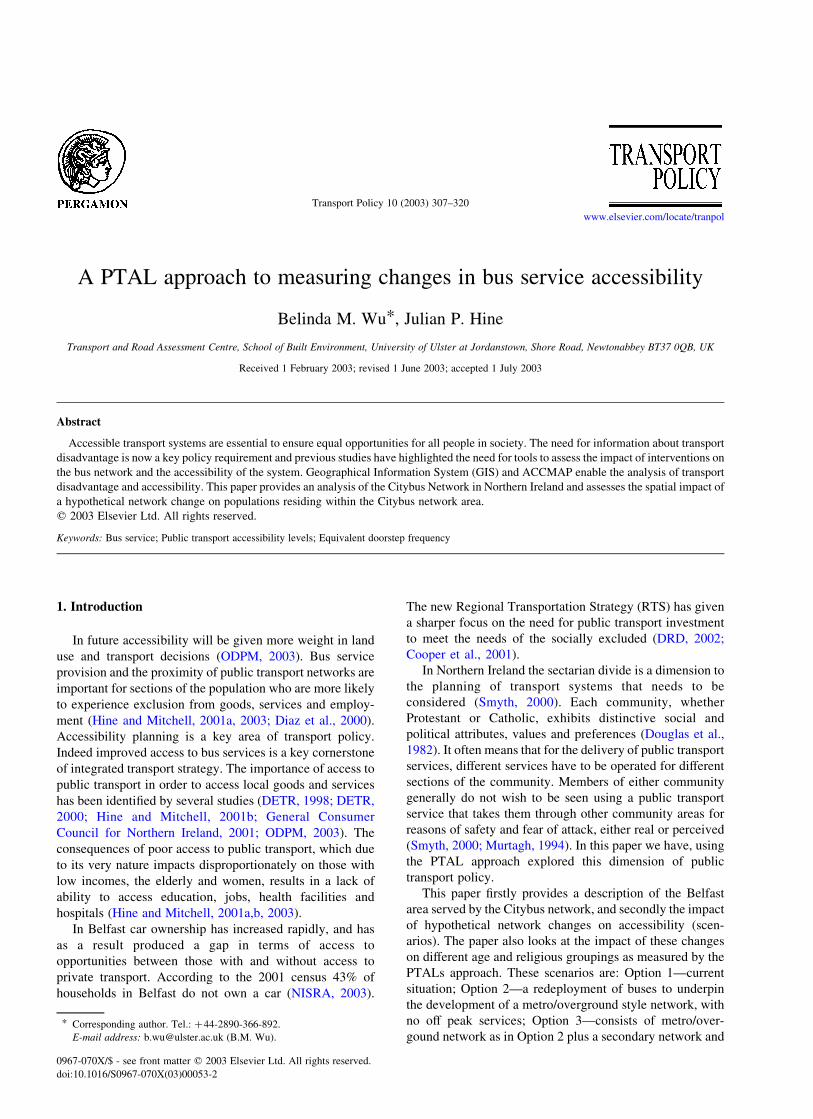
Citybus, Northern Ireland Railways and Ulsterbus are
the three operating subsidiaries of Northern Ireland
Transport Holding Company (NITHC). NITHC and
operate bus and rail public transport services under the
group name Translink. Citybus was formed in 1973 from
the Belfast Corporation Transport undertaking and it
operates approximately 60 routes in Belfast. It maintains
a fleet of over 250 buses to provide services from 04:00
in the morning till 24:00, and provides additional peak
hour journeys during the Morning Peak and Evening Peak
for passengers who are going to or leaving school/work
(Fig. 1).
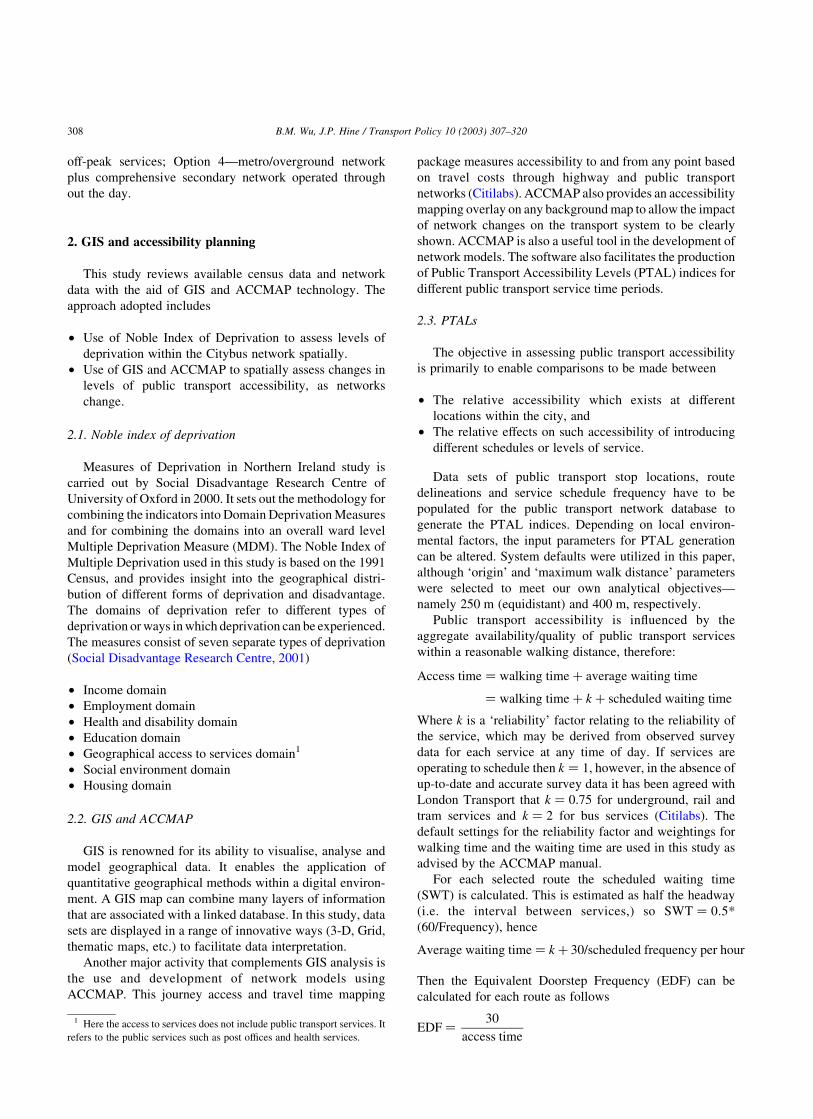
The Citybus service area is divided into five sectors,
these are
† The Inner Zone serving the City Centre area,
† Sector 1 serving northwest areas such as Springmartin,
Glencairn, Ligoniel, Silverstream, Carrs Glen, Oldpark
and Downview,
† Sector 2 serving southwest areas such as Falls Park, Turf
Lodge, Glencolin, Lenadoon, Ladybrook, Malone, Erin-
vale, Balmoral, Stranmillis, Ormeau, Annadale and Four
Winds,
† Sector 3 serving southeast areas such as Creagagh,
Gilnahirk, Mann’s Corner, Braniel and Stormont, and
† Newtownabbey Sector serving Networnabbey areas
such as Greencastle, Hydepark, Ballyhenry, Mossley,
Carnmoney and Ballyduff (Fig. 2).
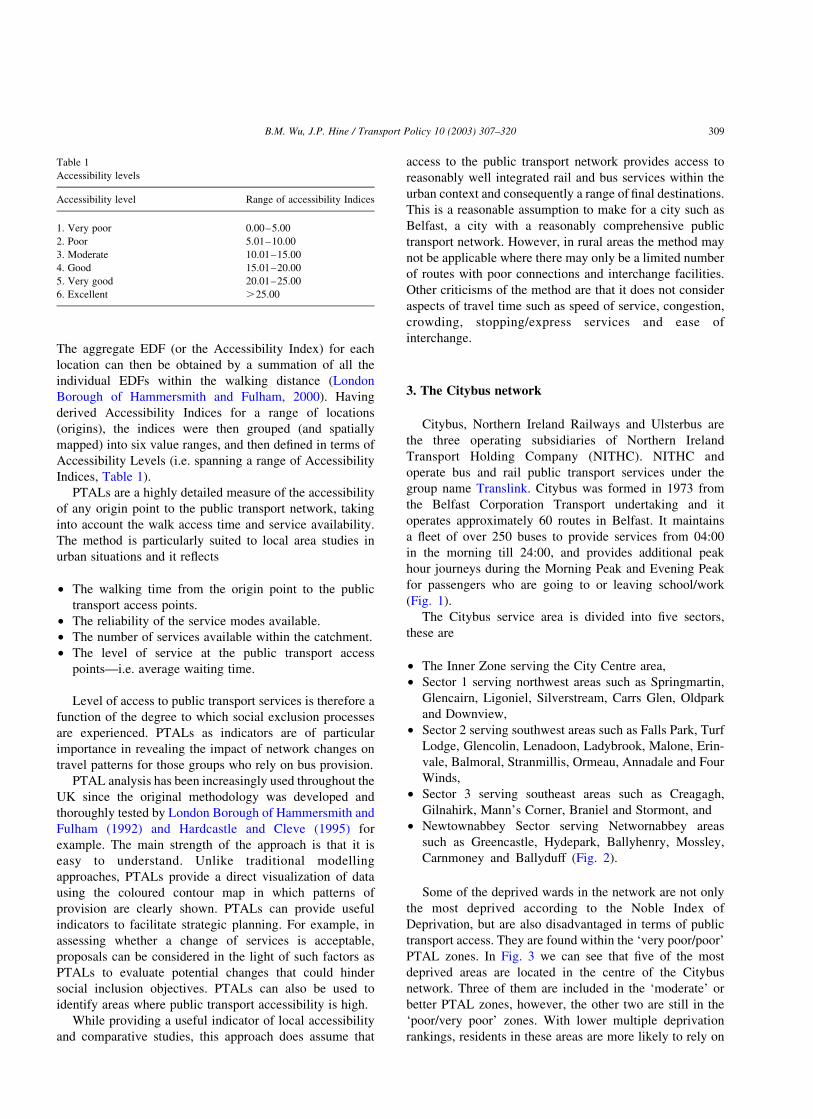
Some of the deprived wards in the network are not only
the most deprived according to the Noble Index of
Deprivation, but are also disadvantaged in terms of public
transport access. They are found within the ‘very poor/poor’
PTAL zones. In Fig. 3 we can see that five of the most
deprived areas are located in the centre of the Citybus
network. Three of them are included in the ‘moderate’ or
better PTAL zones, however, the other two are still in the
‘poor/very poor’ zones. With lower multiple deprivation
rankings, residents in these areas are more likely to rely on
Table 1
Accessibility levels
Accessibility level Range of accessibility Indices
1. Very poor 0.00–5.00
2. Poor 5.01–10.00
3. Moderate 10.01–15.00
4. Good 15.01–20.00
5. Very good 20.01–25.00
6. Excellent .25.00
B.M. Wu, J.P. Hine / Transport Policy 10 (2003) 307–320 309
public transport services. Hence, Citybus is of particular
importance to these people.
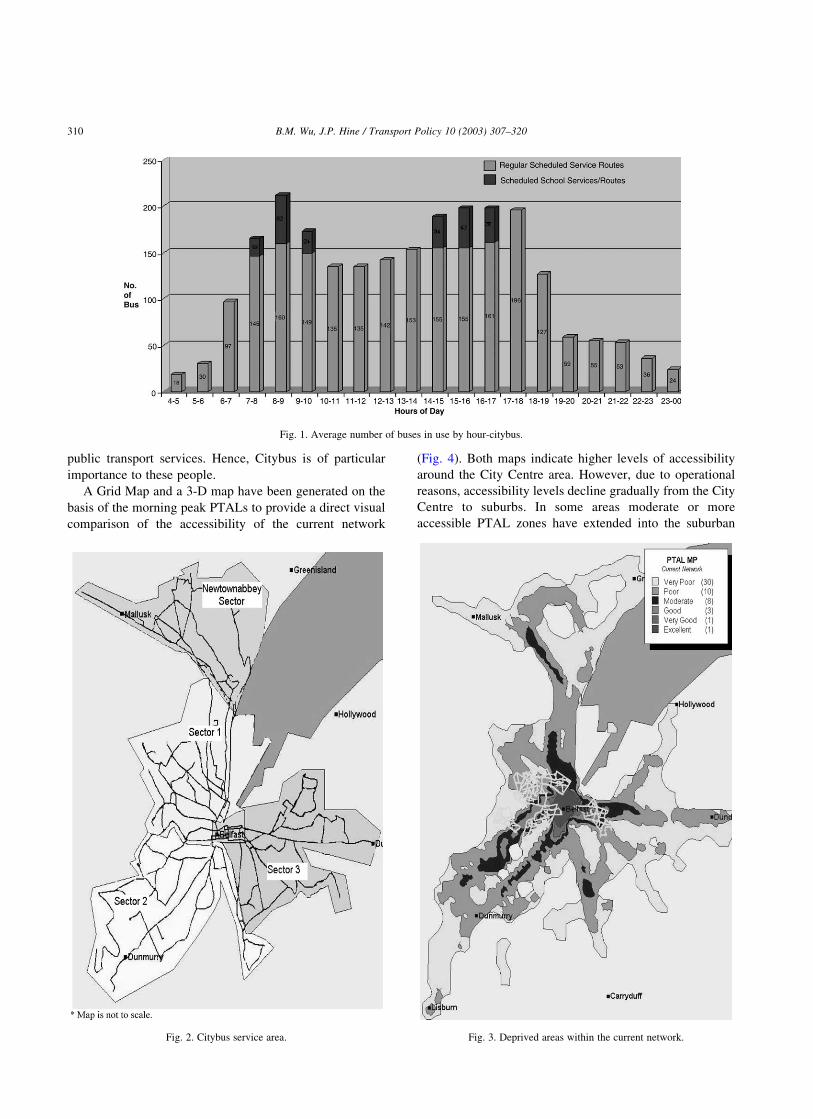
A Grid Map and a 3-D map have been generated on the
basis of the morning peak PTALs to provide a direct visual
comparison of the accessibility of the current network
(Fig. 4). Both maps indicate higher levels of accessibility
around the City Centre area. However, due to operational
reasons, accessibility levels decline gradually from the City
Centre to suburbs. In some areas moderate or more
accessible PTAL zones have extended into the suburban
Fig. 1. Average number of buses in use by hour-citybus.
Fig. 2. Citybus service area. Fig. 3. Deprived areas within the current network.
B.M. Wu, J.P. Hine / Transport Policy 10 (2003) 307–320310
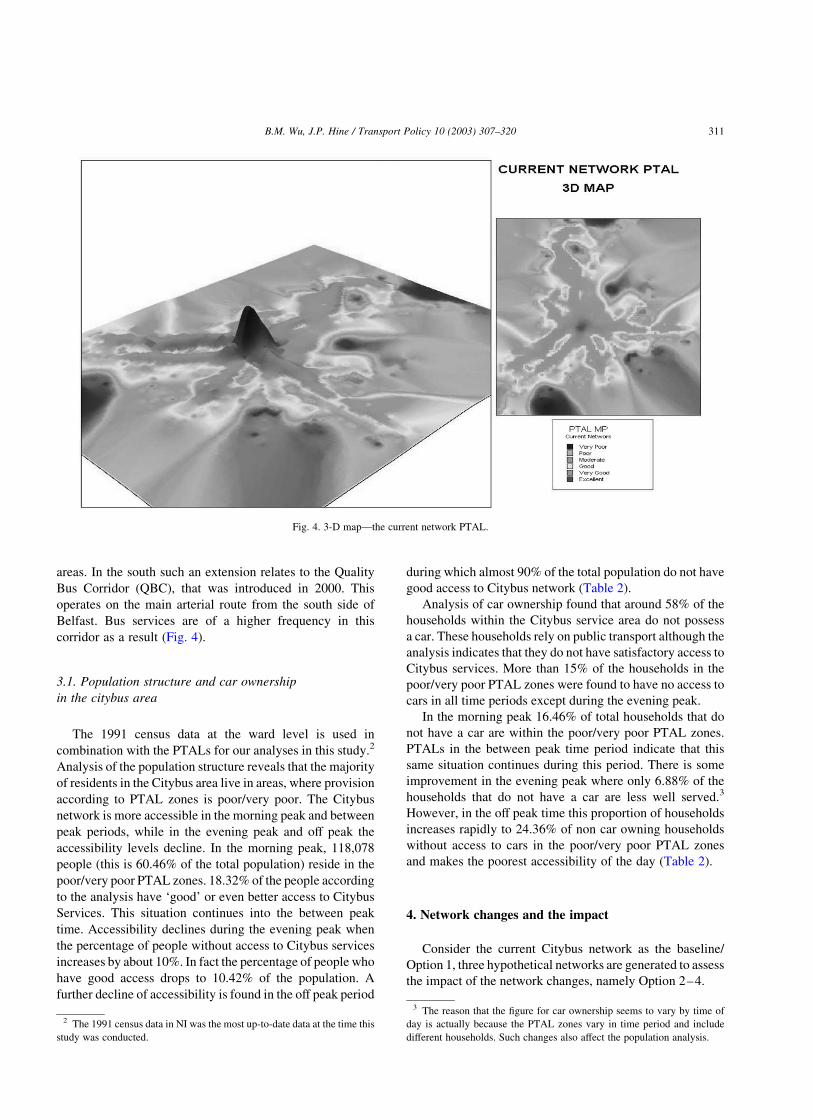
areas. In the south such an extension relates to the Quality
Bus Corridor (QBC), that was introduced in 2000. This
operates on the main arterial route from the south side of
Belfast. Bus services are of a higher frequency in this
corridor as a result (Fig. 4).
3.1. Population structure and car ownership
in the citybus area
The 1991 census data at the ward level is used in
combination with the PTALs for our analyses in this study.2
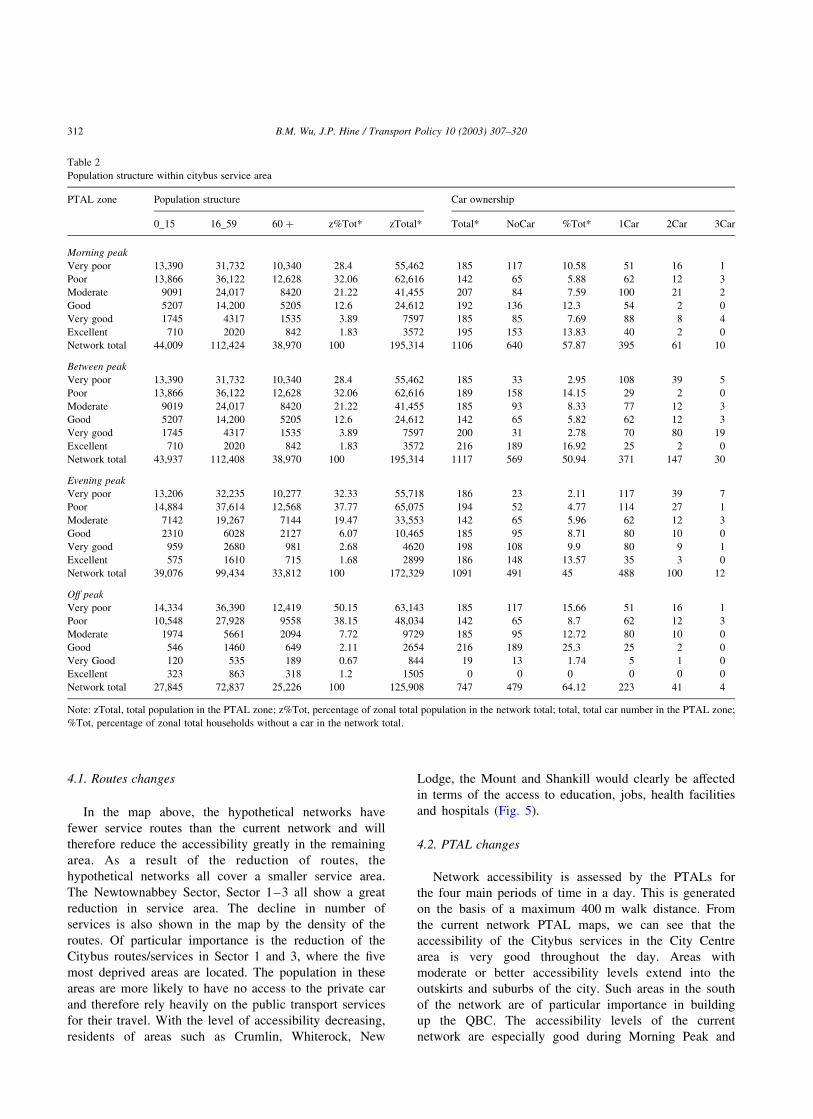
Analysis of the population structure reveals that the majority
of residents in the Citybus area live in areas, where provision
according to PTAL zones is poor/very poor. The Citybus
network is more accessible in the morning peak and between
peak periods, while in the evening peak and off peak the
accessibility levels decline. In the morning peak, 118,078
people (this is 60.46% of the total population) reside in the
poor/very poor PTAL zones. 18.32% of the people according
to the analysis have ‘good’ or even better access to Citybus
Services. This situation continues into the between peak
time. Accessibility declines during the evening peak when
the percentage of people without access to Citybus services
increases by about 10%. In fact the percentage of people who
have good access drops to 10.42% of the population. A
further decline of accessibility is found in the off peak period
during which almost 90% of the total population do not have
good access to Citybus network (Table 2).
Analysis of car ownership found that around 58% of the
households within the Citybus service area do not possess
a car. These households rely on public transport although the
analysis indicates that they do not have satisfactory access to
Citybus services. More than 15% of the households in the
poor/very poor PTAL zones were found to have no access to
cars in all time periods except during the evening peak.
In the morning peak 16.46% of total households that do
not have a car are within the poor/very poor PTAL zones.
PTALs in the between peak time period indicate that this
same situation continues during this period. There is some
improvement in the evening peak where only 6.88% of the
households that do not have a car are less well served.3
However, in the off peak time this proportion of households
increases rapidly to 24.36% of non car owning households
without access to cars in the poor/very poor PTAL zones
and makes the poorest accessibility of the day (Table 2).
4. Network changes and the impact
Consider the current Citybus network as the baseline/
Option 1, three hypothetical networks are generated to assess
the impact of the network changes, namely Option 2–4.
Fig. 4. 3-D map—the current network PTAL.
2 The 1991 census data in NI was the most up-to-date data at the time this
study was conducted.
3 The reason that the figure for car ownership seems to vary by time of
day is actually because the PTAL zones vary in time period and include
different households. Such changes also affect the population analysis.
B.M. Wu, J.P. Hine / Transport Policy 10 (2003) 307–320 311
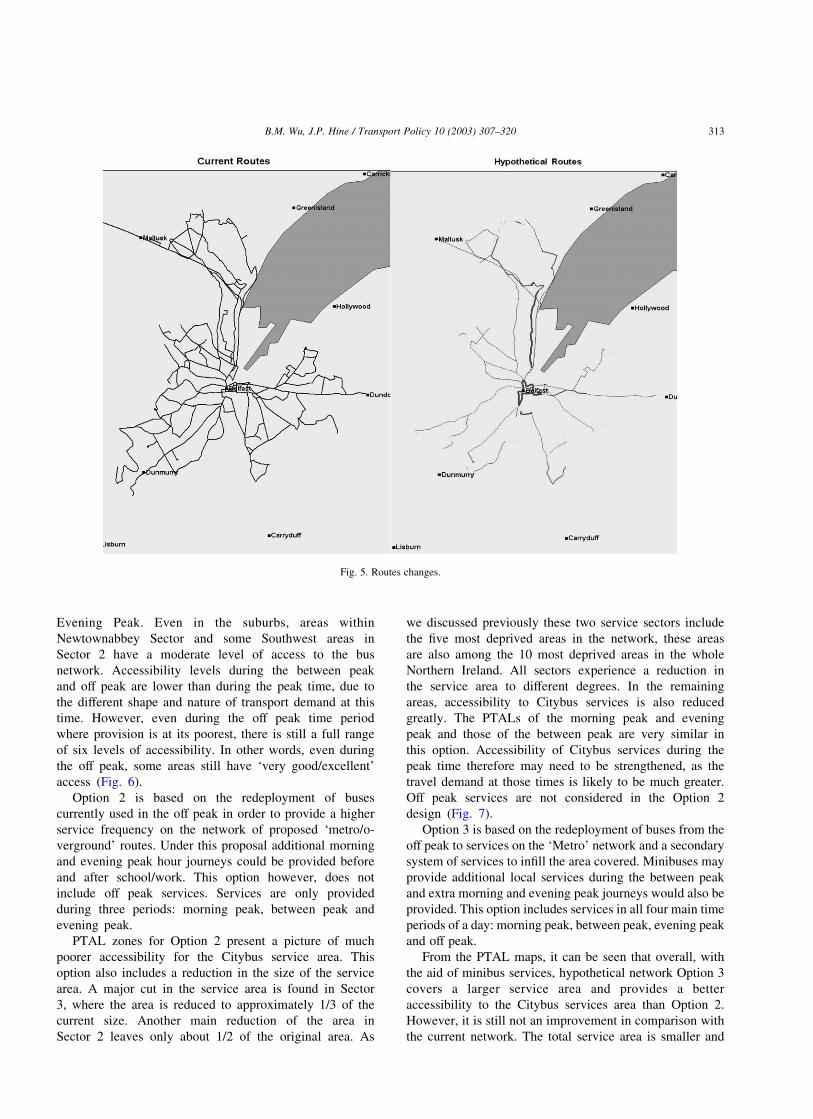
4.1. Routes changes
In the map above, the hypothetical networks have
fewer service routes than the current network and will
therefore reduce the accessibility greatly in the remaining
area. As a result of the reduction of routes, the
hypothetical networks all cover a smaller service area.
The Newtownabbey Sector, Sector 1–3 all show a great
reduction in service area. The decline in number of
services is also shown in the map by the density of the
routes. Of particular importance is the reduction of the
Citybus routes/services in Sector 1 and 3, where the five
most deprived areas are located. The population in these
areas are more likely to have no access to the private car
and therefore rely heavily on the public transport services
for their travel. With the level of accessibility decreasing,
residents of areas such as Crumlin, Whiterock, New
Lodge, the Mount and Shankill would clearly be affected
in terms of the access to education, jobs, health facilities
and hospitals (Fig. 5).
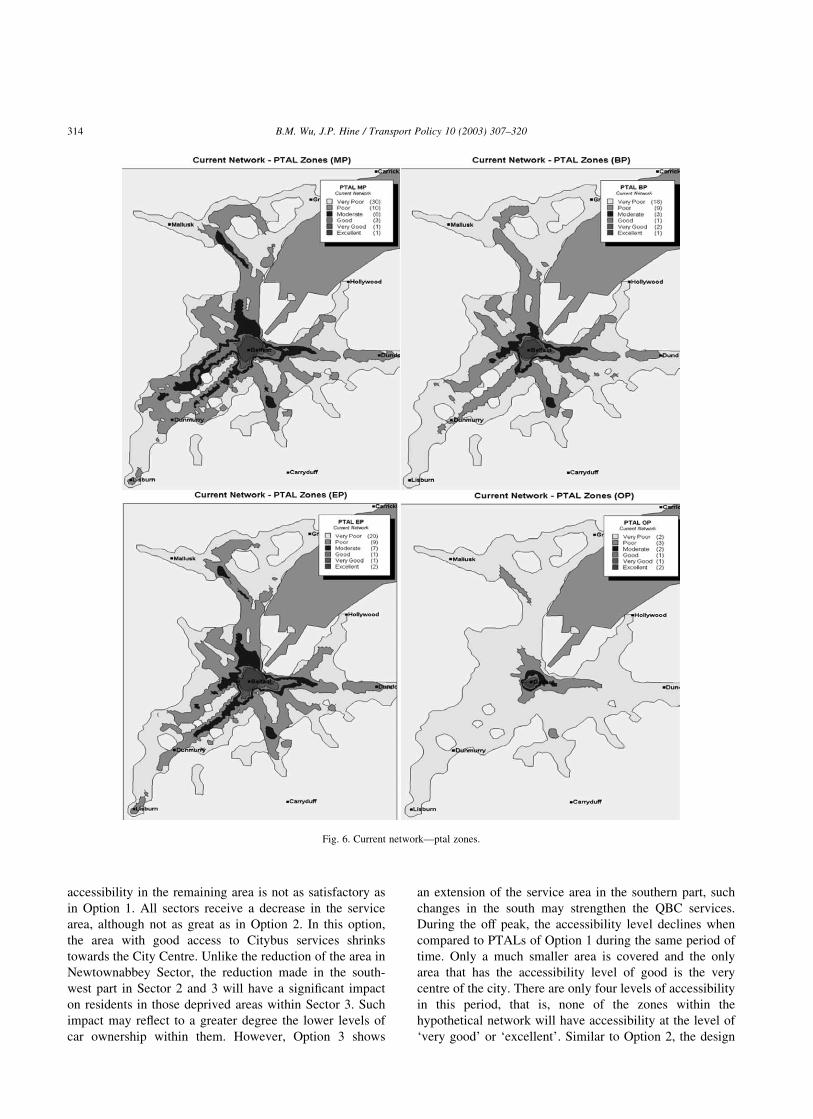
4.2. PTAL changes
Network accessibility is assessed by the PTALs for
the four main periods of time in a day. This is generated
on the basis of a maximum 400 m walk distance. From
the current network PTAL maps, we can see that the
accessibility of the Citybus services in the City Centre
area is very good throughout the day. Areas with
moderate or better accessibility levels extend into the
outskirts and suburbs of the city. Such areas in the south
of the network are of particular importance in building
up the QBC. The accessibility levels of the current
network are especially good during Morning Peak and
Table 2
Population structure within citybus service area
PTAL zone Population structure Car ownership
0_15 16_59 60 þ z%Tot* zTotal* Total* NoCar %Tot* 1Car 2Car 3Car
Morning peak
Very poor 13,390 31,732 10,340 28.4 55,462 185 117 10.58 51 16 1
Poor 13,866 36,122 12,628 32.06 62,616 142 65 5.88 62 12 3
Moderate 9091 24,017 8420 21.22 41,455 207 84 7.59 100 21 2
Good 5207 14,200 5205 12.6 24,612 192 136 12.3 54 2 0
Very good 1745 4317 1535 3.89 7597 185 85 7.69 88 8 4
Excellent 710 2020 842 1.83 3572 195 153 13.83 40 2 0
Network total 44,009 112,424 38,970 100 195,314 1106 640 57.87 395 61 10
Between peak
Very poor 13,390 31,732 10,340 28.4 55,462 185 33 2.95 108 39 5
Poor 13,866 36,122 12,628 32.06 62,616 189 158 14.15 29 2 0
Moderate 9019 24,017 8420 21.22 41,455 185 93 8.33 77 12 3
Good 5207 14,200 5205 12.6 24,612 142 65 5.82 62 12 3
Very good 1745 4317 1535 3.89 7597 200 31 2.78 70 80 19
Excellent 710 2020 842 1.83 3572 216 189 16.92 25 2 0
Network total 43,937 112,408 38,970 100 195,314 1117 569 50.94 371 147 30
Evening peak
Very poor 13,206 32,235 10,277 32.33 55,718 186 23 2.11 117 39 7
Poor 14,884 37,614 12,568 37.77 65,075 194 52 4.77 114 27 1
Moderate 7142 19,267 7144 19.47 33,553 142 65 5.96 62 12 3
Good 2310 6028 2127 6.07 10,465 185 95 8.71 80 10 0
Very good 959 2680 981 2.68 4620 198 108 9.9 80 9 1
Excellent 575 1610 715 1.68 2899 186 148 13.57 35 3 0
Network total 39,076 99,434 33,812 100 172,329 1091 491 45 488 100 12
Off peak
Very poor 14,334 36,390 12,419 50.15 63,143 185 117 15.66 51 16 1
Poor 10,548 27,928 9558 38.15 48,034 142 65 8.7 62 12 3
Moderate 1974 5661 2094 7.72 9729 185 95 12.72 80 10 0
Good 546 1460 649 2.11 2654 216 189 25.3 25 2 0
Very Good 120 535 189 0.67 844 19 13 1.74 5 1 0
Excellent 323 863 318 1.2 1505 0 0 0 0 0 0
Network total 27,845 72,837 25,226 100 125,908 747 479 64.12 223 41 4
Note: zTotal, total population in the PTAL zone; z%Tot, percentage of zonal total population in the network total; total, total car number in the PTAL zone;
%Tot, percentage of zonal total households without a car in the network total.
B.M. Wu, J.P. Hine / Transport Policy 10 (2003) 307–320312
Evening Peak. Even in the suburbs, areas within
Newtownabbey Sector and some Southwest areas in
Sector 2 have a moderate level of access to the bus
network. Accessibility levels during the between peak
and off peak are lower than during the peak time, due to
the different shape and nature of transport demand at this
time. However, even during the off peak time period
where provision is at its poorest, there is still a full range
of six levels of accessibility. In other words, even during
the off peak, some areas still have ‘very good/excellent’
access (Fig. 6).
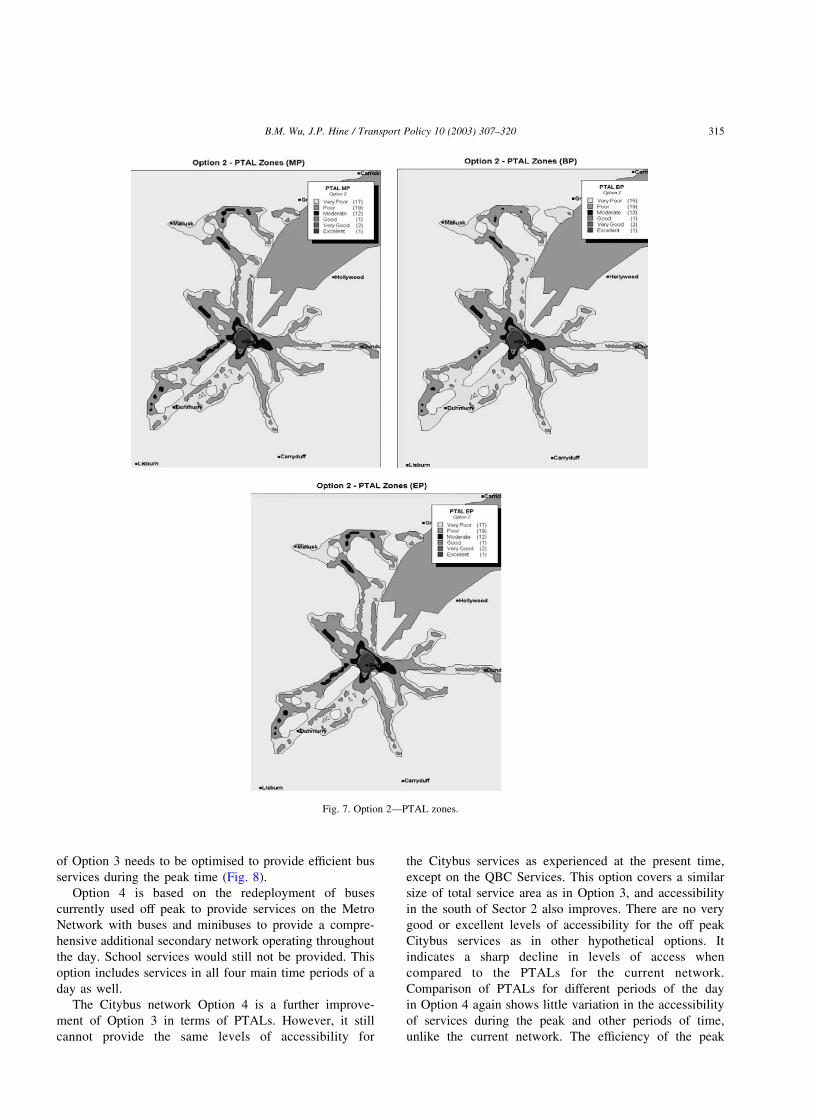
Option 2 is based on the redeployment of buses
currently used in the off peak in order to provide a higher
service frequency on the network of proposed ‘metro/o-
verground’ routes. Under this proposal additional morning
and evening peak hour journeys could be provided before
and after school/work. This option however, does not
include off peak services. Services are only provided
during three periods: morning peak, between peak and
evening peak.
PTAL zones for Option 2 present a picture of much
poorer accessibility for the Citybus service area. This
option also includes a reduction in the size of the service
area. A major cut in the service area is found in Sector
3, where the area is reduced to approximately 1/3 of the
current size. Another main reduction of the area in
Sector 2 leaves only about 1/2 of the original area. As
we discussed previously these two service sectors include
the five most deprived areas in the network, these areas
are also among the 10 most deprived areas in the whole
Northern Ireland. All sectors experience a reduction in
the service area to different degrees. In the remaining
areas, accessibility to Citybus services is also reduced
greatly. The PTALs of the morning peak and evening
peak and those of the between peak are very similar in
this option. Accessibility of Citybus services during the
peak time therefore may need to be strengthened, as the
travel demand at those times is likely to be much greater.
Off peak services are not considered in the Option 2
design (Fig. 7).
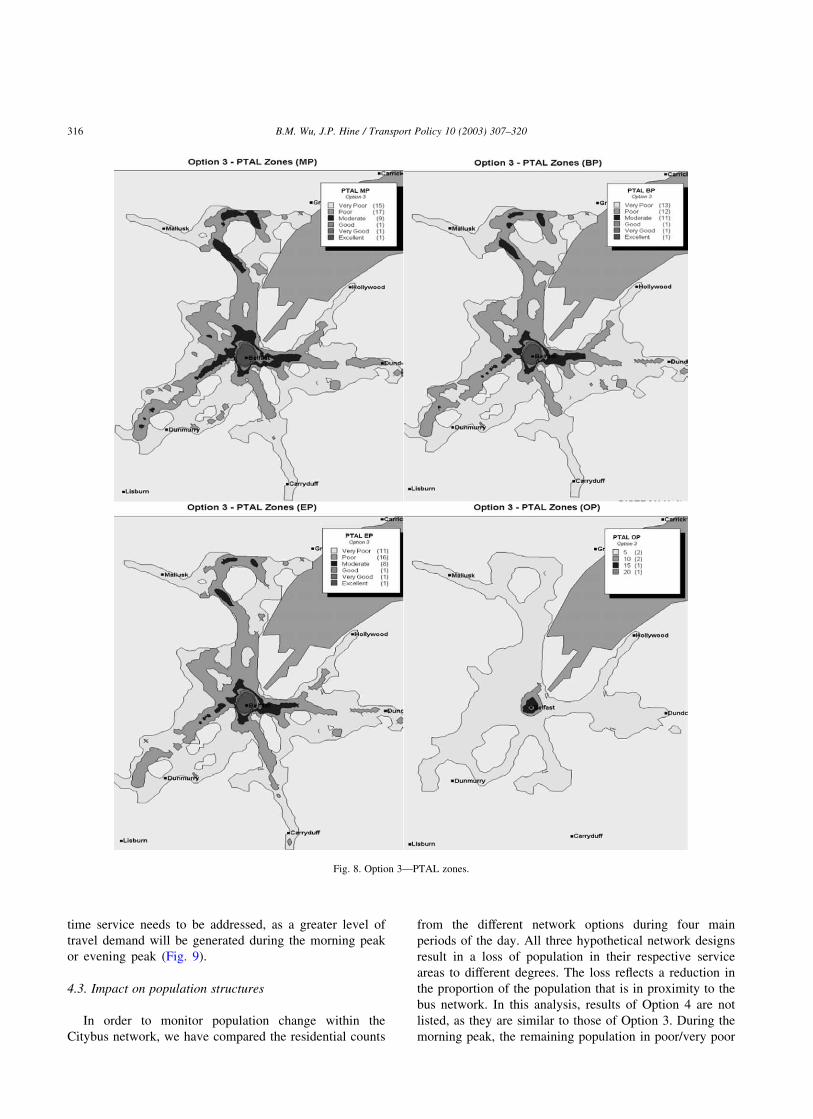
Option 3 is based on the redeployment of buses from the
off peak to services on the ‘Metro’ network and a secondary
system of services to infill the area covered. Minibuses may
provide additional local services during the between peak
and extra morning and evening peak journeys would also be
provided. This option includes services in all four main time
periods of a day: morning peak, between peak, evening peak
and off peak.
From the PTAL maps, it can be seen that overall, with
the aid of minibus services, hypothetical network Option 3
covers a larger service area and provides a better
accessibility to the Citybus services area than Option 2.
However, it is still not an improvement in comparison with
the current network. The total service area is smaller and
Fig. 5. Routes changes.
B.M. Wu, J.P. Hine / Transport Policy 10 (2003) 307–320 313
accessibility in the remaining area is not as satisfactory as
in Option 1. All sectors receive a decrease in the service
area, although not as great as in Option 2. In this option,
the area with good access to Citybus services shrinks
towards the City Centre. Unlike the reduction of the area in
Newtownabbey Sector, the reduction made in the south-
west part in Sector 2 and 3 will have a significant impact
on residents in those deprived areas within Sector 3. Such
impact may reflect to a greater degree the lower levels of
car ownership within them. However, Option 3 shows
an extension of the service area in the southern part, such
changes in the south may strengthen the QBC services.
During the off peak, the accessibility level declines when
compared to PTALs of Option 1 during the same period of
time. Only a much smaller area is covered and the only
area that has the accessibility level of good is the very
centre of the city. There are only four levels of accessibility
in this period, that is, none of the zones within the
hypothetical network will have accessibility at the level of
‘very good’ or ‘excellent’. Similar to Option 2, the design
Fig. 6. Current network—ptal zones.
B.M. Wu, J.P. Hine / Transport Policy 10 (2003) 307–320314
of Option 3 needs to be optimised to provide efficient bus
services during the peak time (Fig. 8).
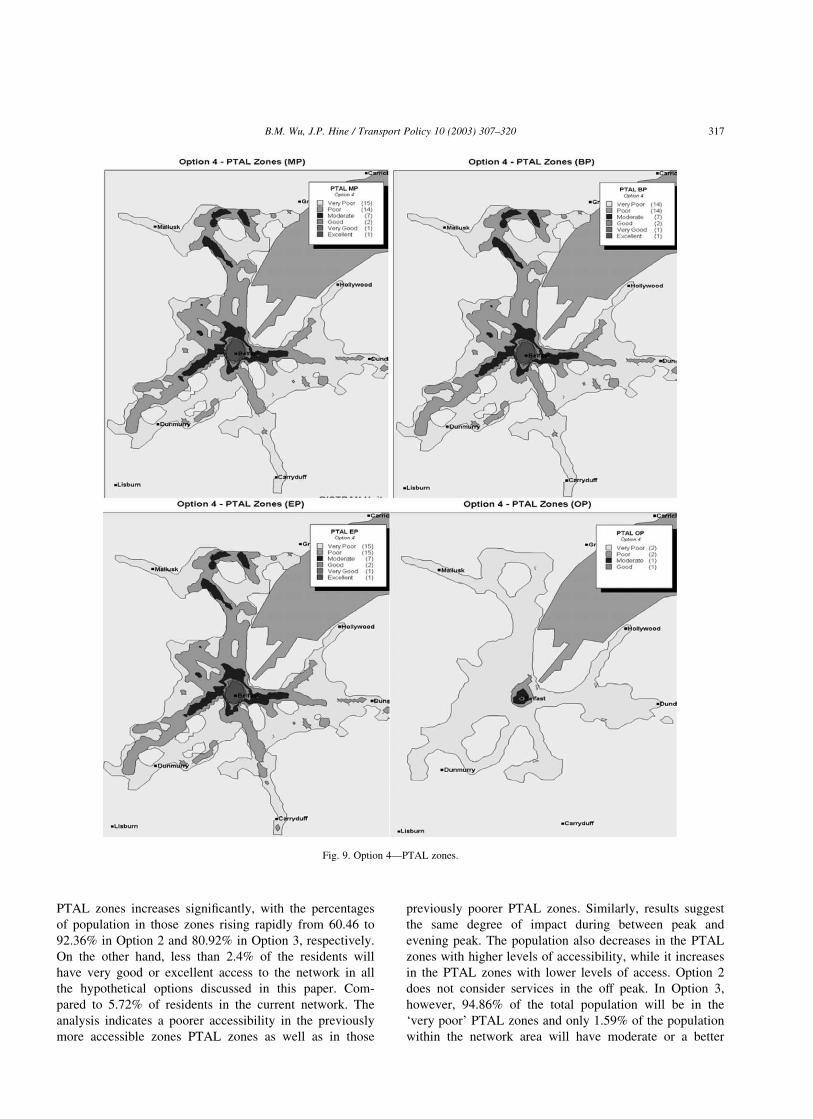
Option 4 is based on the redeployment of buses
currently used off peak to provide services on the Metro
Network with buses and minibuses to provide a compre-
hensive additional secondary network operating throughout
the day. School services would still not be provided. This
option includes services in all four main time periods of a
day as well.
The Citybus network Option 4 is a further improve-
ment of Option 3 in terms of PTALs. However, it still
cannot provide the same levels of accessibility for
the Citybus services as experienced at the present time,
except on the QBC Services. This option covers a similar
size of total service area as in Option 3, and accessibility
in the south of Sector 2 also improves. There are no very
good or excellent levels of accessibility for the off peak
Citybus services as in other hypothetical options. It
indicates a sharp decline in levels of access when
compared to the PTALs for the current network.
Comparison of PTALs for different periods of the day
in Option 4 again shows little variation in the accessibility
of services during the peak and other periods of time,
unlike the current network. The efficiency of the peak
Fig. 7. Option 2—PTAL zones.
B.M. Wu, J.P. Hine / Transport Policy 10 (2003) 307–320 315
time service needs to be addressed, as a greater level of
travel demand will be generated during the morning peak
or evening peak (Fig. 9).
4.3. Impact on population structures
In order to monitor population change within the
Citybus network, we have compared the residential counts
from the different network options during four main
periods of the day. All three hypothetical network designs
result in a loss of population in their respective service
areas to different degrees. The loss reflects a reduction in
the proportion of the population that is in proximity to the
bus network. In this analysis, results of Option 4 are not
listed, as they are similar to those of Option 3. During the
morning peak, the remaining population in poor/very poor
Fig. 8. Option 3—PTAL zones.
B.M. Wu, J.P. Hine / Transport Policy 10 (2003) 307–320316
PTAL zones increases significantly, with the percentages
of population in those zones rising rapidly from 60.46 to
92.36% in Option 2 and 80.92% in Option 3, respectively.
On the other hand, less than 2.4% of the residents will
have very good or excellent access to the network in all
the hypothetical options discussed in this paper. Com-
pared to 5.72% of residents in the current network. The
analysis indicates a poorer accessibility in the previously
more accessible zones PTAL zones as well as in those
previously poorer PTAL zones. Similarly, results suggest
the same degree of impact during between peak and
evening peak. The population also decreases in the PTAL
zones with higher levels of accessibility, while it increases
in the PTAL zones with lower levels of access. Option 2
does not consider services in the off peak. In Option 3,
however, 94.86% of the total population will be in the
‘very poor’ PTAL zones and only 1.59% of the population
within the network area will have moderate or a better
Fig. 9. Option 4—PTAL zones.
B.M. Wu, J.P. Hine / Transport Policy 10 (2003) 307–320 317
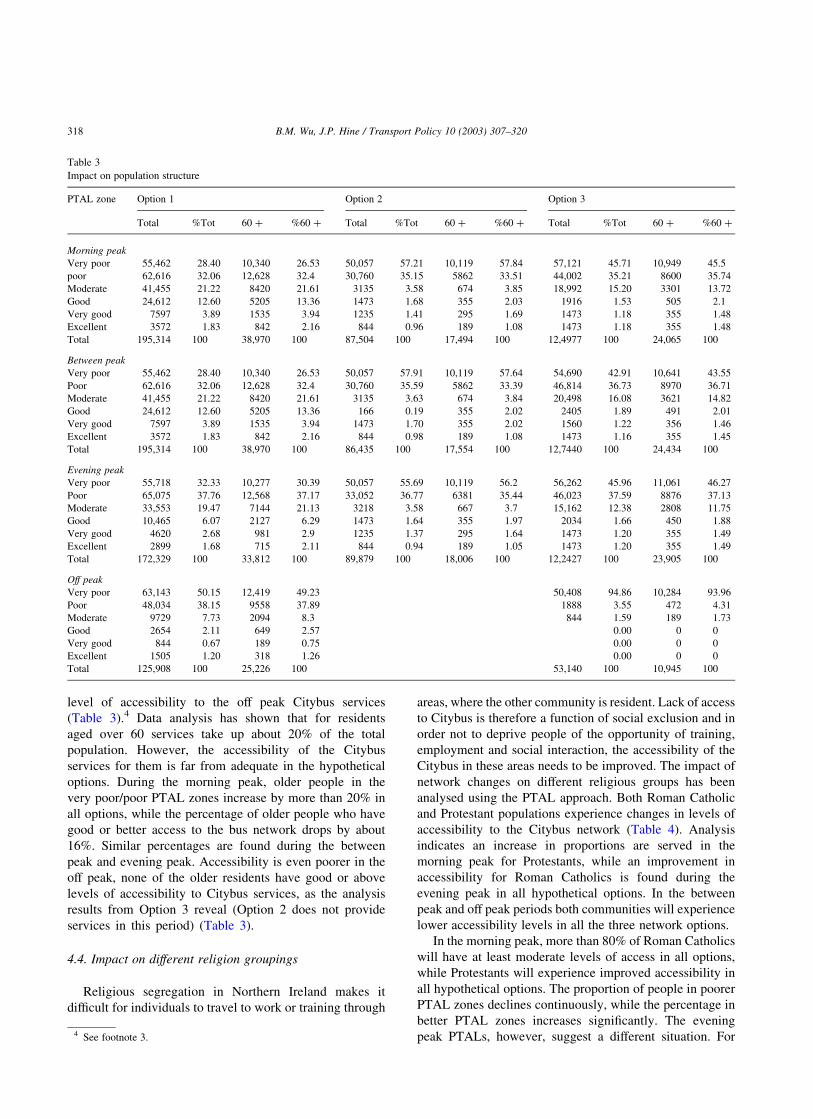
level of accessibility to the off peak Citybus services
(Table 3).4 Data analysis has shown that for residents
aged over 60 services take up about 20% of the total
population. However, the accessibility of the Citybus
services for them is far from adequate in the hypothetical
options. During the morning peak, older people in the
very poor/poor PTAL zones increase by more than 20% in
all options, while the percentage of older people who have
good or better access to the bus network drops by about
16%. Similar percentages are found during the between
peak and evening peak. Accessibility is even poorer in the
off peak, none of the older residents have good or above
levels of accessibility to Citybus services, as the analysis
results from Option 3 reveal (Option 2 does not provide
services in this period) (Table 3).
4.4. Impact on different religion groupings
Religious segregation in Northern Ireland makes it
difficult for individuals to travel to work or training through
areas, where the other community is resident. Lack of access
to Citybus is therefore a function of social exclusion and in
order not to deprive people of the opportunity of training,
employment and social interaction, the accessibility of the
Citybus in these areas needs to be improved. The impact of
network changes on different religious groups has been
analysed using the PTAL approach. Both Roman Catholic
and Protestant populations experience changes in levels of
accessibility to the Citybus network (Table 4). Analysis
indicates an increase in proportions are served in the
morning peak for Protestants, while an improvement in
accessibility for Roman Catholics is found during the
evening peak in all hypothetical options. In the between
peak and off peak periods both communities will experience
lower accessibility levels in all the three network options.
In the morning peak, more than 80% of Roman Catholics
will have at least moderate levels of access in all options,
while Protestants will experience improved accessibility in
all hypothetical options. The proportion of people in poorer
PTAL zones declines continuously, while the percentage in
better PTAL zones increases significantly. The evening
peak PTALs, however, suggest a different situation. For
Table 3
Impact on population structure
PTAL zone Option 1 Option 2 Option 3
Total %Tot 60 þ %60 þ Total %Tot 60 þ %60 þ Total %Tot 60 þ %60 þ
Morning peak
Very poor 55,462 28.40 10,340 26.53 50,057 57.21 10,119 57.84 57,121 45.71 10,949 45.5
poor 62,616 32.06 12,628 32.4 30,760 35.15 5862 33.51 44,002 35.21 8600 35.74
Moderate 41,455 21.22 8420 21.61 3135 3.58 674 3.85 18,992 15.20 3301 13.72
Good 24,612 12.60 5205 13.36 1473 1.68 355 2.03 1916 1.53 505 2.1
Very good 7597 3.89 1535 3.94 1235 1.41 295 1.69 1473 1.18 355 1.48
Excellent 3572 1.83 842 2.16 844 0.96 189 1.08 1473 1.18 355 1.48
Total 195,314 100 38,970 100 87,504 100 17,494 100 12,4977 100 24,065 100
Between peak
Very poor 55,462 28.40 10,340 26.53 50,057 57.91 10,119 57.64 54,690 42.91 10,641 43.55
Poor 62,616 32.06 12,628 32.4 30,760 35.59 5862 33.39 46,814 36.73 8970 36.71
Moderate 41,455 21.22 8420 21.61 3135 3.63 674 3.84 20,498 16.08 3621 14.82
Good 24,612 12.60 5205 13.36 166 0.19 355 2.02 2405 1.89 491 2.01
Very good 7597 3.89 1535 3.94 1473 1.70 355 2.02 1560 1.22 356 1.46
Excellent 3572 1.83 842 2.16 844 0.98 189 1.08 1473 1.16 355 1.45
Total 195,314 100 38,970 100 86,435 100 17,554 100 12,7440 100 24,434 100
Evening peak
Very poor 55,718 32.33 10,277 30.39 50,057 55.69 10,119 56.2 56,262 45.96 11,061 46.27
Poor 65,075 37.76 12,568 37.17 33,052 36.77 6381 35.44 46,023 37.59 8876 37.13
Moderate 33,553 19.47 7144 21.13 3218 3.58 667 3.7 15,162 12.38 2808 11.75
Good 10,465 6.07 2127 6.29 1473 1.64 355 1.97 2034 1.66 450 1.88
Very good 4620 2.68 981 2.9 1235 1.37 295 1.64 1473 1.20 355 1.49
Excellent 2899 1.68 715 2.11 844 0.94 189 1.05 1473 1.20 355 1.49
Total 172,329 100 33,812 100 89,879 100 18,006 100 12,2427 100 23,905 100
Off peak
Very poor 63,143 50.15 12,419 49.23 50,408 94.86 10,284 93.96
Poor 48,034 38.15 9558 37.89 1888 3.55 472 4.31
Moderate 9729 7.73 2094 8.3 844 1.59 189 1.73
Good 2654 2.11 649 2.57 0.00 0 0
Very good 844 0.67 189 0.75 0.00 0 0
Excellent 1505 1.20 318 1.26 0.00 0 0
Total 125,908 100 25,226 100 53,140 100 10,945 100
4 See footnote 3.
B.M. Wu, J.P. Hine / Transport Policy 10 (2003) 307–320318
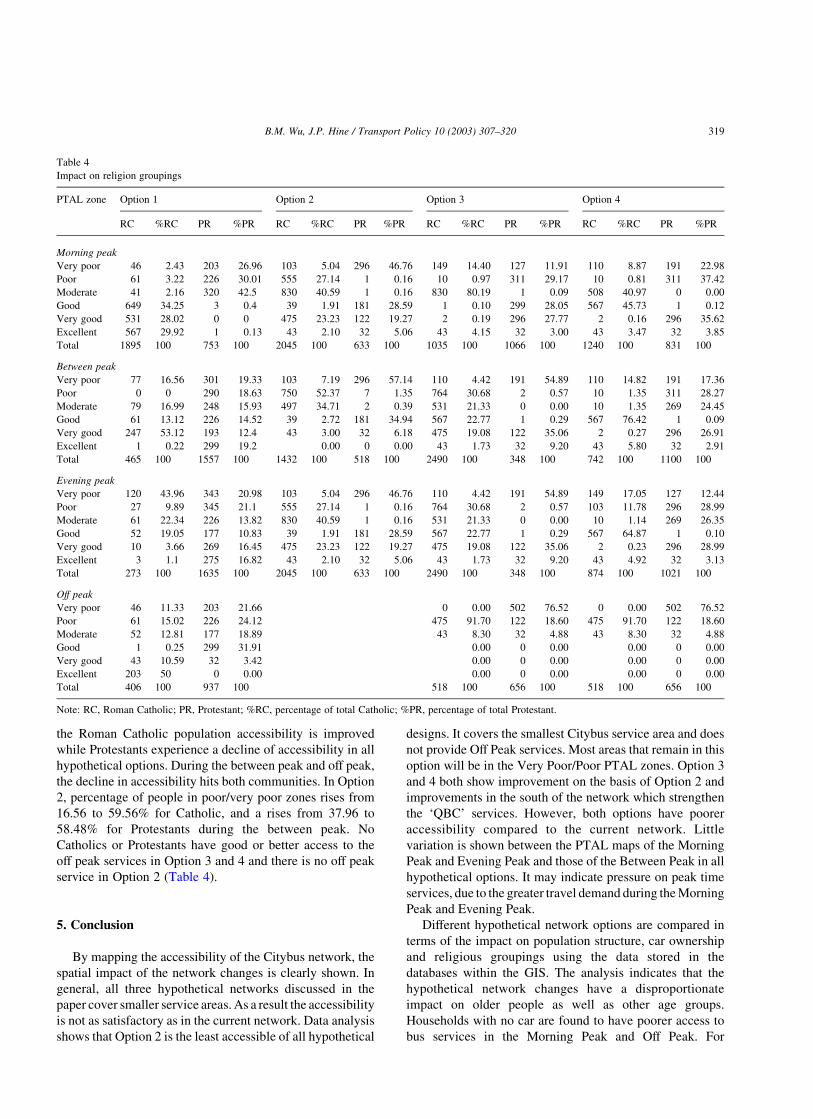
the Roman Catholic population accessibility is improved
while Protestants experience a decline of accessibility in all
hypothetical options. During the between peak and off peak,
the decline in accessibility hits both communities. In Option
2, percentage of people in poor/very poor zones rises from
16.56 to 59.56% for Catholic, and a rises from 37.96 to
58.48% for Protestants during the between peak. No
Catholics or Protestants have good or better access to the
off peak services in Option 3 and 4 and there is no off peak
service in Option 2 (Table 4).
5. Conclusion
By mapping the accessibility of the Citybus network, the
spatial impact of the network changes is clearly shown. In
general, all three hypothetical networks discussed in the
paper cover smaller service areas. As a result the accessibility
is not as satisfactory as in the current network. Data analysis
shows that Option 2 is the least accessible of all hypothetical
designs. It covers the smallest Citybus service area and does
not provide Off Peak services. Most areas that remain in this
option will be in the Very Poor/Poor PTAL zones. Option 3
and 4 both show improvement on the basis of Option 2 and
improvements in the south of the network which strengthen
the ‘QBC’ services. However, both options have poorer
accessibility compared to the current network. Little
variation is shown between the PTAL maps of the Morning
Peak and Evening Peak and those of the Between Peak in all
hypothetical options. It may indicate pressure on peak time
services, due to the greater travel demand during the Morning
Peak and Evening Peak.
Different hypothetical network options are compared in
terms of the impact on population structure, car ownership
and religious groupings using the data stored in the
databases within the GIS. The analysis indicates that the
hypothetical network changes have a disproportionate
impact on older people as well as other age groups.
Households with no car are found to have poorer access to
bus services in the Morning Peak and Off Peak. For
Table 4
Impact on religion groupings
PTAL zone Option 1 Option 2 Option 3 Option 4
RC %RC PR %PR RC %RC PR %PR RC %RC PR %PR RC %RC PR %PR
Morning peak
Very poor 46 2.43 203 26.96 103 5.04 296 46.76 149 14.40 127 11.91 110 8.87 191 22.98
Poor 61 3.22 226 30.01 555 27.14 1 0.16 10 0.97 311 29.17 10 0.81 311 37.42
Moderate 41 2.16 320 42.5 830 40.59 1 0.16 830 80.19 1 0.09 508 40.97 0 0.00
Good 649 34.25 3 0.4 39 1.91 181 28.59 1 0.10 299 28.05 567 45.73 1 0.12
Very good 531 28.02 0 0 475 23.23 122 19.27 2 0.19 296 27.77 2 0.16 296 35.62
Excellent 567 29.92 1 0.13 43 2.10 32 5.06 43 4.15 32 3.00 43 3.47 32 3.85
Total 1895 100 753 100 2045 100 633 100 1035 100 1066 100 1240 100 831 100
Between peak
Very poor 77 16.56 301 19.33 103 7.19 296 57.14 110 4.42 191 54.89 110 14.82 191 17.36
Poor 0 0 290 18.63 750 52.37 7 1.35 764 30.68 2 0.57 10 1.35 311 28.27
Moderate 79 16.99 248 15.93 497 34.71 2 0.39 531 21.33 0 0.00 10 1.35 269 24.45
Good 61 13.12 226 14.52 39 2.72 181 34.94 567 22.77 1 0.29 567 76.42 1 0.09
Very good 247 53.12 193 12.4 43 3.00 32 6.18 475 19.08 122 35.06 2 0.27 296 26.91
Excellent 1 0.22 299 19.2 0.00 0 0.00 43 1.73 32 9.20 43 5.80 32 2.91
Total 465 100 1557 100 1432 100 518 100 2490 100 348 100 742 100 1100 100
Evening peak
Very poor 120 43.96 343 20.98 103 5.04 296 46.76 110 4.42 191 54.89 149 17.05 127 12.44
Poor 27 9.89 345 21.1 555 27.14 1 0.16 764 30.68 2 0.57 103 11.78 296 28.99
Moderate 61 22.34 226 13.82 830 40.59 1 0.16 531 21.33 0 0.00 10 1.14 269 26.35
Good 52 19.05 177 10.83 39 1.91 181 28.59 567 22.77 1 0.29 567 64.87 1 0.10
Very good 10 3.66 269 16.45 475 23.23 122 19.27 475 19.08 122 35.06 2 0.23 296 28.99
Excellent 3 1.1 275 16.82 43 2.10 32 5.06 43 1.73 32 9.20 43 4.92 32 3.13
Total 273 100 1635 100 2045 100 633 100 2490 100 348 100 874 100 1021 100
Off peak
Very poor 46 11.33 203 21.66 0 0.00 502 76.52 0 0.00 502 76.52
Poor 61 15.02 226 24.12 475 91.70 122 18.60 475 91.70 122 18.60
Moderate 52 12.81 177 18.89 43 8.30 32 4.88 43 8.30 32 4.88
Good 1 0.25 299 31.91 0.00 0 0.00 0.00 0 0.00
Very good 43 10.59 32 3.42 0.00 0 0.00 0.00 0 0.00
Excellent 203 50 0 0.00 0.00 0 0.00 0.00 0 0.00
Total 406 100 937 100 518 100 656 100 518 100 656 100
Note: RC, Roman Catholic; PR, Protestant; %RC, percentage of total Catholic; %PR, percentage of total Protestant.
B.M. Wu, J.P. Hine / Transport Policy 10 (2003) 307–320 319
the Protestant community, Option 2–4 mean that they are
increasingly well served in the morning peak, while an
improvement for Roman Catholics is found during the
evening peak in all hypothetical options. In the between
peak and off peak both communities are hit by lower
accessibility levels in all hypothetical network options.
Previous studies have highlighted the need for tools to
assess the impact of interventions on the bus network and the
accessibility of the system. Using Geographic Information
Systems and ACCMAP, the analysis of transport disadvantage
and accessibility is possible. This paper provides an analysis of
the Citybus network in Northern Ireland and assesses the
spatial impact of hypothetical network changes on populations
residing within the Citybus network area. Within the GIS
environment, data sets are displayed in a range of innovative
ways (3-D, Grid and other thematic maps) to facilitate data
interpretation. The use of ACCMAP allows the development
of network models and it also facilitates the strategic analysis
of existing and proposed public transport services through the
production of PTALs in different time periods.
References
Citilabs. ACCMAP Manual.
Cooper, J., Ryley, T., Smyth, A., 2001. Contemporary lifestyles and the
implications for sustainable development policy: lessons from the UK’s
most car dependent city, Belfast. Cities 18 (2), 103–113.
DETR (Department of Environment Transport and The Regions), 1998.
A New Deal for Transport: Better for Everyone, The Government’s
White Paper on the Future of Transport, DETR, London.
DETR (Department of Environment, Transport and The Regions), 2000.
Social Exclusion and The Provision and Availability of Public
Transport, London,.
Diaz, O., Palomas, G., Jamet, C., Caiafa, M., Camara, P., Boeckt, T., 2000.
Social exclusion and public transport: aspects of accessibility and
mobility in bus systems environment, urban transportation and
environment, Proceedings of the International Conference CODATU
IX, Mexico City, 11–14 April, pp. 695–700.
Douglas, J., Neville, H., Boal, F. W., 1982. The Northern Ireland problem.
In: Boal, F.W., Douglas, J. (Eds.), Integration and Division, Academic
Press, London.
DRD (Department for Regional Development), 2002. Regional Transport
Strategy for Northern Ireland 2002–2012, DRDNI, Belfast.
General Consumer Council for Northern Ireland, 2001. The Price of
Being Poor, Belfast, Available at: www.gccni.org.uk/filestore/
document_uploads/transport_trap.pdf.
Hardcastle, D., Cleve, I., 1995. Accessibility modelling using GIS,
Proceedings of Seminar N, European Transport Forum, University of
Warwick, England, September 11–15, pp. 27–35.
Hine, J., Mitchell, F., (2001), The Role of Transport in Social Exclusion in
Urban Scotland, Scottish Executive, Central Research Unit.
Hine, J., Mitchell, F., 2001. Better for everyone? Travel experiences and
transport exclusion. In: ed Imrie, R., (Ed.), Urban Studies, Special Issue
on The Barrier Free City: Possibilities and Prospects, vol. 38., pp.
319–322.
Hine, J., Mitchell, F., 2003. Transport Disadvantage and Social Exclusion,
Ashgate Publishing, Aldershot.
London Borough of Hammersmith and Fulham, June 2000. UDP Review:
Revised Hypothetic Alterations, London.
Murtagh, B., 1994. Ethnic Space and Challenge to Urban Planning. A Study
of Belfast’s Peace Lines, Centre for Policy Research/Centre for
Research on Policy and Management, Research Paper 7.
NISRA, 2003. Population Census Data 2001.
Office of Deputy Prime Minister, 2003. Making the Connections. Final
Report on Transport and Social Exclusion, Social Exclusion Unit.
Smyth, A., 2000. The Implication of Segregation for Transport within
Northern Ireland, Community Relations Council for Northern Ireland.
Social Disadvantage Research Centre, 2001. Measures of Deprivation in
Northern Ireland, Department of Social Policy and Social work,
University of Oxford.
Translink, available at: www.translink.co.uk
B.M. Wu, J.P. Hine / Transport Policy 10 (2003) 307–320320