A Prioritized Access Point Algorithm for 802.11b Networks in a Lossy Environment
13
JOURNAL OF COMPUTING, VOLUME 2, ISSUE 5, MAY 2010, ISSN 2151-9617 HTTPS://SITES.GOOGLE.COM/SITE/JOURNALOFCOMPUTING/ WWW.JOURNALOFCOMPUTING.ORG 53 A Prioritized Access Point Algorithm for 802.11b Networks in a Lossy Environment A. N. Omara, Sherine M. Abd El-Kader, Hussein S. Eissa, S. El-Ramly Abstract— In recent years, WLAN technology has been gaining popularity around the world with its sub standard 802.11b receiving major deployments in many indoor and outdoor environments. In this article we investigate the performance of IEEE 802.11b infrastructure networks in the lossless and lossy environments by means of a simulation study. Also, this study shows how the FIFO discipline of the 802.11b MAC affects on the global performance when at least one channel is under the influence of the bursty errors. Furthermore, this paper proposes a channel aware backoff algorithm for the Access Point (AP) to prioritize its transmissions and to accelerate the transmissions in the poor radio channels to enhance the performance of the real time applications. The final results of this simulation study showed that the proposed algorithm is able to enhance the throughput and the delay in lossy environment by an average of 49% and 83% respectively. Keywords—802.11b networks, lossy environment, binary exponential backoff, voice traffic, mean opinion score. —————————— —————————— 1 INTRODUCTION ne of the most critical factors driving the efficiency of the 802.11b networks still remains the ability to over- come the obstacles imposed by the wireless channel. The fairly unpredictable capacity of the links leads to unrelia- ble frame delivery time; hence it dramatically hampers the network performance, especially with regard to real- time applications such as voice. Beside the performance anomaly of 802.11b networks described in [1] [2] and the channel capture effect [3], the Head‐Of‐Line (HOL) blocking is very important issue that appears in the lossy environments when the packets addressed to different destinations are queued in FIFO discipline in the MAC layer of the AP. When the HOL packet of MAC suffers from channel errors then the MAC tries to retransmit the packet until it get a response from the recipient or drops the packet if the retransmissions reach to a predefined limit called the retry limit. Those retransmissions of the HOL packet defer the transmis‐ sions of the other packet in the same queue regardless of their channel quality. This issue degrades the system throughput whatever the used transport layer protocol (TCP or UDP). This paper discusses the HOL blocking issue and its effect on the quality of the voice traffic. Also, it proposes a new backoff algorithm that prioritizes the AP in the lossy environment to alleviate this issue. The rest of the paper is organized as follows. Section 2 defines the 802.11b MAC layer, section 3 discuses the main issues of the 802.11b networks in lossy environment, section 4 presents some efforts performed by researchers that interested in the problem, section 5 discusses the proposed algorithm, section 6 describes in details the im‐ plemented scenarios with their obtained results. Finally, section 7 concludes the paper. This paper discusses the HOL blocking issue and its effect on the quality of the voice traffic. Also, it proposes a new backoff algorithm that prioritizes the AP in the lossy environment to alleviate this issue. The rest of the paper is organized as follows. Section 2 defines the 802.11b MAC layer, section 3 discuses the main issues of the 802.11b networks in lossy environment, section 4 presents some efforts performed by researchers that interested in the problem, section 5 discusses the proposed algorithm, section 6 describes in details the im‐ plemented scenarios with their obtained results. Finally, section 7 concludes the paper. 2 PERFORMANCE OF 802.11B MAC In the IEEE 802.11b [4], the main mechanism to access the medium is the DCF (Distributed Coordination Function), which is a random access scheme based on the CSMA/CA (Carrier Sense Multiple Access with Collision Avoidance) protocol with Binary Exponential Backoff (BEB) algo‐ rithm. The DCF describes two access techniques for pack‐ et transmission: the basic access mechanism and the RTS/CTS mechanism. In the basic access mechanism, when a WS has a new packet to transmit, it selects a ran‐ dom backoff (in slots) randomly between 0 and CW‐1, where CW is the Contention Window. Then, the WS gene‐ rates a backoff counter, and monitors the channel. The backoff counter of the WS is decremented by 1 if the ———————————————— A. N. Omara is with the Department of Computers and Systems, Electron- ics Research Institute, Egypt. Sherine M. Abd El-Kader is with the Department of Computers and Sys- tems, Electronics Research Institute, Egypt. Hussein S. Eissa is with the Department of Computers and Systems, Elec‐ tronics Research Institute, Egypt. S. El‐Ramly is with the Department of Electronics and Communications, Engineering Faculty, Ain Shams University, Egypt. O
-
Upload
independent -
Category
Documents
-
view
3 -
download
0
Transcript of A Prioritized Access Point Algorithm for 802.11b Networks in a Lossy Environment
JOURNAL OF COMPUTING, VOLUME 2, ISSUE 5, MAY 2010, ISSN 2151-9617 HTTPS://SITES.GOOGLE.COM/SITE/JOURNALOFCOMPUTING/ WWW.JOURNALOFCOMPUTING.ORG 53
A Prioritized Access Point Algorithm for 802.11b Networks in a Lossy Environment
A. N. Omara, Sherine M. Abd El-Kader, Hussein S. Eissa, S. El-Ramly
Abstract— In recent years, WLAN technology has been gaining popularity around the world with its sub standard 802.11b receiving major deployments in many indoor and outdoor environments. In this article we investigate the performance of IEEE 802.11b infrastructure networks in the lossless and lossy environments by means of a simulation study. Also, this study shows how the FIFO discipline of the 802.11b MAC affects on the global performance when at least one channel is under the influence of the bursty errors. Furthermore, this paper proposes a channel aware backoff algorithm for the Access Point (AP) to prioritize its transmissions and to accelerate the transmissions in the poor radio channels to enhance the performance of the real time applications. The final results of this simulation study showed that the proposed algorithm is able to enhance the throughput and the delay in lossy environment by an average of 49% and 83% respectively.
Keywords—802.11b networks, lossy environment, binary exponential backoff, voice traffic, mean opinion score.
—————————— ——————————
1 INTRODUCTION
ne of the most critical factors driving the efficiency of the 802.11b networks still remains the ability to over-
come the obstacles imposed by the wireless channel. The fairly unpredictable capacity of the links leads to unrelia-ble frame delivery time; hence it dramatically hampers the network performance, especially with regard to real-time applications such as voice.
Beside the performance anomaly of 802.11b networks
described in [1] [2] and the channel capture effect [3], the
Head‐Of‐Line (HOL) blocking is very important issue
that appears in the lossy environments when the packets
addressed to different destinations are queued in FIFO
discipline in the MAC layer of the AP. When the HOL
packet of MAC suffers from channel errors then the MAC
tries to retransmit the packet until it get a response from
the recipient or drops the packet if the retransmissions
reach to a predefined limit called the retry limit. Those
retransmissions of the HOL packet defer the transmis‐
sions of the other packet in the same queue regardless of
their channel quality. This issue degrades the system
throughput whatever the used transport layer protocol
(TCP or UDP).
This paper discusses the HOL blocking issue and its
effect on the quality of the voice traffic. Also, it proposes a
new backoff algorithm that prioritizes the AP in the lossy
environment to alleviate this issue.
The rest of the paper is organized as follows. Section 2
defines the 802.11b MAC layer, section 3 discuses the
main issues of the 802.11b networks in lossy environment,
section 4 presents some efforts performed by researchers
that interested in the problem, section 5 discusses the
proposed algorithm, section 6 describes in details the im‐
plemented scenarios with their obtained results. Finally,
section 7 concludes the paper.
2 PERFORMANCE OF 802.11B MAC
In the IEEE 802.11b [4], the main mechanism to access the
medium is the DCF (Distributed Coordination Function),
which is a random access scheme based on the CSMA/CA
(Carrier Sense Multiple Access with Collision Avoidance)
protocol with Binary Exponential Backoff (BEB) algo‐
rithm. The DCF describes two access techniques for pack‐
et transmission: the basic access mechanism and the
RTS/CTS mechanism. In the basic access mechanism,
when a WS has a new packet to transmit, it selects a ran‐
dom backoff (in slots) randomly between 0 and CW‐1,
where CW is the Contention Window. Then, the WS gene‐
rates a backoff counter, and monitors the channel. The
backoff counter of the WS is decremented by 1 if the
————————————————
A. N. Omara is with the Department of Computers and Systems, Electron-ics Research Institute, Egypt.
Sherine M. Abd El-Kader is with the Department of Computers and Sys-tems, Electronics Research Institute, Egypt.
Hussein S. Eissa is with the Department of Computers and Systems, Elec‐tronics Research Institute, Egypt.
S. El‐Ramly is with the Department of Electronics and Communications, Engineering Faculty, Ain Shams University, Egypt.
O
JOURNAL OF COMPUTING, VOLUME 2, ISSUE 5, MAY 2010, ISSN 2151-9617 HTTPS://SITES.GOOGLE.COM/SITE/JOURNALOFCOMPUTING/ WWW.JOURNALOFCOMPUTING.ORG 54
channel is idle for a pre‐defined slot time, and frozen oth‐
erwise. In the latter case, when the channel is idle for an
interval of time that exceeds the DIFS (Distributed Inter‐
Frame Space) after the channel busy period, the WS re‐
sumes the decrement of the backoff counter for every idle
slot. When the backoff counter of the WS becomes 0, the
packet of the WS is transmitted. After the transmission, if
the WS experiences a collision, it generates a random
backoff counter for an additional deferral time before the
next retransmission. This collision avoidance feature of
the protocol intends to minimize collisions during conten‐
tion among multiple WSs.
The RTS/CTS mechanism involves the transmission of
the RTS (Request‐To‐Send) and CTS (Clear‐To‐Send) con‐
trol frames prior to the transmission of the data packet. A
successful exchange of RTS and CTS frames attempts to
reserve the channel for the time duration needed to
transmit the packet under consideration. The rules for the
transmission of an RTS frame are the same as those for a
packet under the basic access scheme. Hence, the analysis
of the basic access mechanism is the same as that of the
RTS/CTS mechanism except that the packet transmission
times are different in both mechanisms. The RTS/CTS
mechanism is more effective than basic access mechanism
in case of large packets. It also solves the hidden node
problem to a certain extent.
3 PERFORMANCE OF FIFO DISCIPLINE IN A LOSSY
ENVIRONMENT
The main issues of any wireless technology are related to
the nature of the wireless medium. Unlike the wired me‐
dium, the wireless medium is open, and all of the signals
travelled through the atmosphere are subjected to all sorts
of environmental and external factors. This includes
storms and the number of walls, ceilings that the signal
must pass through.
The lossy channel is that channel whose quality is time
varying and may distort the signals travelled through. In
802.11b networks, it is sufficient to have a single lossy
channel to produce dramatic performance degradation
not only on the lossy channels but also on the lossless
channels. In 802.11b networks, the lossy environment
raises different issues such as the Performance Anomaly
[1] [2], the channel capture effect [3] and the head of line
blocking. This paper focuses on the effect of the last issue
on the performance of the 802.11b networks.
Many works addressed the HOL blocking issue such
as [5]. The author in this paper introduced a simple for‐
mula that obtains the expected time (iT ) needed to send a
packet toiWS . Assuming that ( ) is the time length of
the idle slot in the 802.11b protocol, (Ts) is the time re‐
quired for a successful packet transmission, and (Tf) is the
time wasted for an unsuccessful transmission, which
could be caused by either a packet collision or channel
errors. The average value of the iT could be expressed as
shown in equation (1).
i i i i i i i
w 1 w 1 2w 1T 1 p Ts p 1 p Tf Ts
2 2 2
m
mi i i i
w 1 2w 1 2 w 1... p 1 p ... mTf Ts
2 2 2
m
m 1i i i
w 1 2 w 1 2 w 1p ... (m 1)T f T s
2 2 2
(1)
Where:
m : is the retry limit.
w : is the minimum contention window.
ip : is the probability of unsuccessful transmission to the
WS i.
Note that, (Ts) and (Tf) are determined by the 802.11b
specifications of data rates, PHY header, MAC header,
ACK, DCF Inter‐Frame Space (DIFS), Short Inter‐Frame
Space (SIFS), and the length of the payload [6].
Let us consider a system completely managed via the
basic access mechanism. Let (H) be the packet headers
including MAC and physical layer headers, (Pi) be the
fixed size of all the packets destined to WSi and ( ) be
the propagation delay, then iTs and iTf could be ex‐
pressed as shown in equation (2) and (3).
i iTs H P SIFS ACK DIFS (2)
i iTf H P DIFS (3)
Note that, equation (1) assumes that each WS makes
all its retransmissions consecutively; i.e. without any in‐
terruption of another transmissions. But this contradicts
the fact that all WSs contend the medium and have the
same chance to access it; i.e. the WS may wait and froze
its backoff counter if there is another transmission from
another WS .So, the formula of the iT is considered the
minimum time needed by a WS to send a packet not the
maximum time.
Equation (1) represents a simple proof for the HOL
blocking when the iT is the time spent by the AP to send
a packet to the destination i, then it could be noted that
the AP spend more time in transmitting any packet in
poor channels (high ip ) and this time depends on the
number of retransmissions and the contention window
length.
4 RELATED WORKS
One of the first papers that address the problem of HOL
blocking in wireless networks is [7]. It proposes a sche‐
duling algorithm called Channel State Dependent Packet
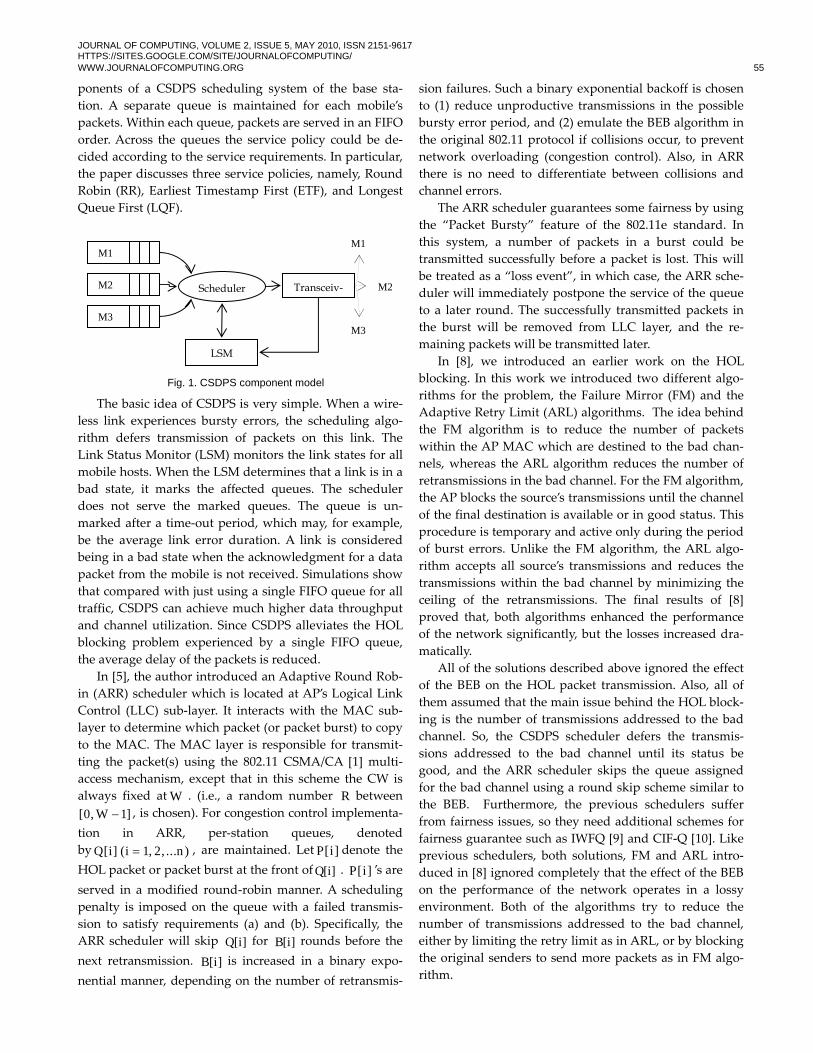
Scheduling (CSDPS). Figure (1) presents the major com‐
JOURNAL OF COMPUTING, VOLUME 2, ISSUE 5, MAY 2010, ISSN 2151-9617 HTTPS://SITES.GOOGLE.COM/SITE/JOURNALOFCOMPUTING/ WWW.JOURNALOFCOMPUTING.ORG 55
ponents of a CSDPS scheduling system of the base sta‐
tion. A separate queue is maintained for each mobile’s
packets. Within each queue, packets are served in an FIFO
order. Across the queues the service policy could be de‐
cided according to the service requirements. In particular,
the paper discusses three service policies, namely, Round
Robin (RR), Earliest Timestamp First (ETF), and Longest
Queue First (LQF).
The basic idea of CSDPS is very simple. When a wire‐
less link experiences bursty errors, the scheduling algo‐
rithm defers transmission of packets on this link. The
Link Status Monitor (LSM) monitors the link states for all
mobile hosts. When the LSM determines that a link is in a
bad state, it marks the affected queues. The scheduler
does not serve the marked queues. The queue is un‐
marked after a time‐out period, which may, for example,
be the average link error duration. A link is considered
being in a bad state when the acknowledgment for a data
packet from the mobile is not received. Simulations show
that compared with just using a single FIFO queue for all
traffic, CSDPS can achieve much higher data throughput
and channel utilization. Since CSDPS alleviates the HOL
blocking problem experienced by a single FIFO queue,
the average delay of the packets is reduced.
In [5], the author introduced an Adaptive Round Rob‐
in (ARR) scheduler which is located at AP’s Logical Link
Control (LLC) sub‐layer. It interacts with the MAC sub‐
layer to determine which packet (or packet burst) to copy
to the MAC. The MAC layer is responsible for transmit‐
ting the packet(s) using the 802.11 CSMA/CA [1] multi‐
access mechanism, except that in this scheme the CW is
always fixed at W . (i.e., a random number R between
[0, W 1] , is chosen). For congestion control implementa‐
tion in ARR, per‐station queues, denoted
byQ[i] (i 1, 2, ...n ) , are maintained. Let P[i] denote the
HOL packet or packet burst at the front ofQ[i] . P[i] ’s are
served in a modified round‐robin manner. A scheduling
penalty is imposed on the queue with a failed transmis‐
sion to satisfy requirements (a) and (b). Specifically, the
ARR scheduler will skip Q[i] for B[i] rounds before the
next retransmission. B[i] is increased in a binary expo‐
nential manner, depending on the number of retransmis‐
sion failures. Such a binary exponential backoff is chosen
to (1) reduce unproductive transmissions in the possible
bursty error period, and (2) emulate the BEB algorithm in
the original 802.11 protocol if collisions occur, to prevent
network overloading (congestion control). Also, in ARR
there is no need to differentiate between collisions and
channel errors.
The ARR scheduler guarantees some fairness by using
the “Packet Bursty” feature of the 802.11e standard. In
this system, a number of packets in a burst could be
transmitted successfully before a packet is lost. This will
be treated as a “loss event”, in which case, the ARR sche‐
duler will immediately postpone the service of the queue
to a later round. The successfully transmitted packets in
the burst will be removed from LLC layer, and the re‐
maining packets will be transmitted later.
In [8], we introduced an earlier work on the HOL
blocking. In this work we introduced two different algo‐
rithms for the problem, the Failure Mirror (FM) and the
Adaptive Retry Limit (ARL) algorithms. The idea behind
the FM algorithm is to reduce the number of packets
within the AP MAC which are destined to the bad chan‐
nels, whereas the ARL algorithm reduces the number of
retransmissions in the bad channel. For the FM algorithm,
the AP blocks the source’s transmissions until the channel
of the final destination is available or in good status. This
procedure is temporary and active only during the period
of burst errors. Unlike the FM algorithm, the ARL algo‐
rithm accepts all source’s transmissions and reduces the
transmissions within the bad channel by minimizing the
ceiling of the retransmissions. The final results of [8]
proved that, both algorithms enhanced the performance
of the network significantly, but the losses increased dra‐
matically.
All of the solutions described above ignored the effect
of the BEB on the HOL packet transmission. Also, all of
them assumed that the main issue behind the HOL block‐
ing is the number of transmissions addressed to the bad
channel. So, the CSDPS scheduler defers the transmis‐
sions addressed to the bad channel until its status be
good, and the ARR scheduler skips the queue assigned
for the bad channel using a round skip scheme similar to
the BEB. Furthermore, the previous schedulers suffer
from fairness issues, so they need additional schemes for
fairness guarantee such as IWFQ [9] and CIF‐Q [10]. Like
previous schedulers, both solutions, FM and ARL intro‐
duced in [8] ignored completely that the effect of the BEB
on the performance of the network operates in a lossy
environment. Both of the algorithms try to reduce the
number of transmissions addressed to the bad channel,
either by limiting the retry limit as in ARL, or by blocking
the original senders to send more packets as in FM algo‐
rithm.
Fig. 1. CSDPS component model
Scheduler
M1
M2
M3
LSM
Transceiv-
M1
M2
M3
JOURNAL OF COMPUTING, VOLUME 2, ISSUE 5, MAY 2010, ISSN 2151-9617 HTTPS://SITES.GOOGLE.COM/SITE/JOURNALOFCOMPUTING/ WWW.JOURNALOFCOMPUTING.ORG 56
5 THE PRIORITIZED ACCESS POINT ALGORITHM
Unlike the algorithms discussed in section 4, the pro‐
posed algorithm considers the effect of the BEB on the
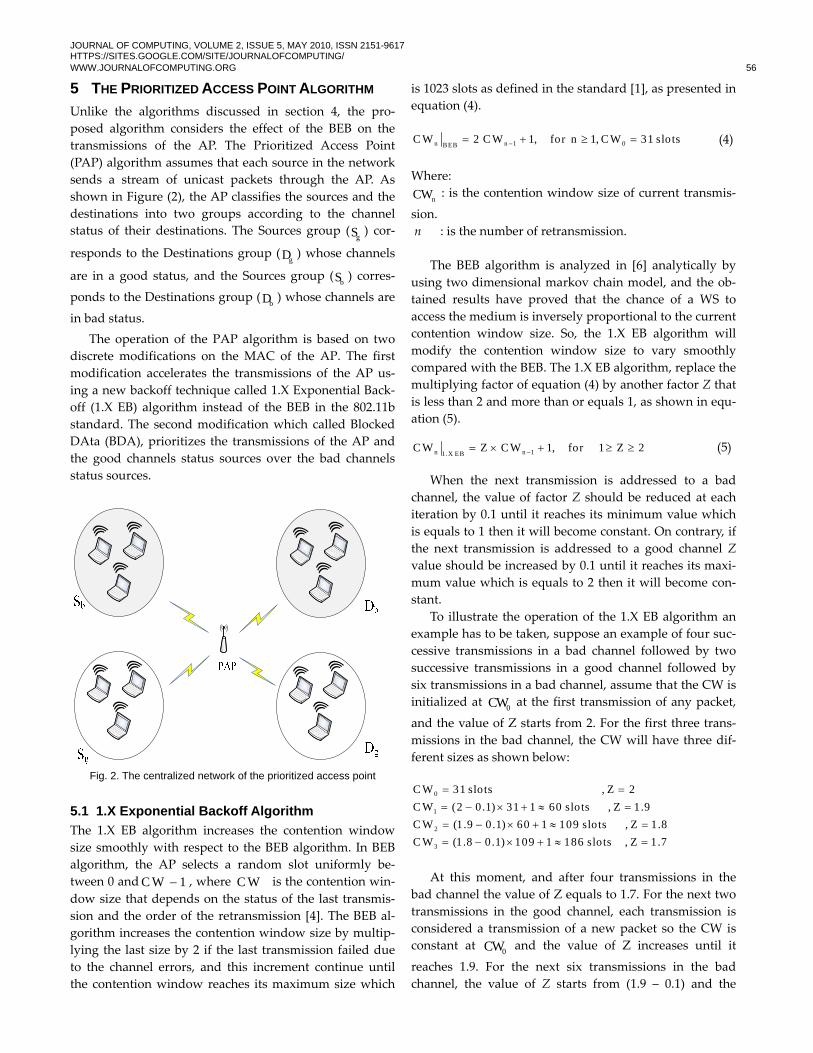
transmissions of the AP. The Prioritized Access Point
(PAP) algorithm assumes that each source in the network
sends a stream of unicast packets through the AP. As
shown in Figure (2), the AP classifies the sources and the
destinations into two groups according to the channel
status of their destinations. The Sources group (gS ) cor‐
responds to the Destinations group (gD ) whose channels
are in a good status, and the Sources group (bS ) corres‐
ponds to the Destinations group (bD ) whose channels are
in bad status.
The operation of the PAP algorithm is based on two
discrete modifications on the MAC of the AP. The first
modification accelerates the transmissions of the AP us‐
ing a new backoff technique called 1.X Exponential Back‐
off (1.X EB) algorithm instead of the BEB in the 802.11b
standard. The second modification which called Blocked
DAta (BDA), prioritizes the transmissions of the AP and
the good channels status sources over the bad channels
status sources.
Fig. 2. The centralized network of the prioritized access point
5.1 1.X Exponential Backoff Algorithm
The 1.X EB algorithm increases the contention window
size smoothly with respect to the BEB algorithm. In BEB
algorithm, the AP selects a random slot uniformly be‐
tween 0 andC W 1 , where C W is the contention win‐
dow size that depends on the status of the last transmis‐
sion and the order of the retransmission [4]. The BEB al‐
gorithm increases the contention window size by multip‐
lying the last size by 2 if the last transmission failed due
to the channel errors, and this increment continue until
the contention window reaches its maximum size which
is 1023 slots as defined in the standard [1], as presented in
equation (4).
n n 1 0BEBC W 2 C W 1, for n 1, C W 31 slots (4)
Where:
nCW : is the contention window size of current transmis‐
sion.
n : is the number of retransmission.
The BEB algorithm is analyzed in [6] analytically by
using two dimensional markov chain model, and the ob‐
tained results have proved that the chance of a WS to
access the medium is inversely proportional to the current
contention window size. So, the 1.X EB algorithm will
modify the contention window size to vary smoothly
compared with the BEB. The 1.X EB algorithm, replace the
multiplying factor of equation (4) by another factor Z that
is less than 2 and more than or equals 1, as shown in equ‐
ation (5).
n n 11.X EBC W Z C W 1, for 1 Z 2 (5)
When the next transmission is addressed to a bad
channel, the value of factor Z should be reduced at each
iteration by 0.1 until it reaches its minimum value which
is equals to 1 then it will become constant. On contrary, if
the next transmission is addressed to a good channel Z
value should be increased by 0.1 until it reaches its maxi‐
mum value which is equals to 2 then it will become con‐
stant.
To illustrate the operation of the 1.X EB algorithm an
example has to be taken, suppose an example of four suc‐
cessive transmissions in a bad channel followed by two
successive transmissions in a good channel followed by
six transmissions in a bad channel, assume that the CW is
initialized at 0CW at the first transmission of any packet,
and the value of Z starts from 2. For the first three trans‐
missions in the bad channel, the CW will have three dif‐
ferent sizes as shown below:
0
1
2
3
C W 31 slots , Z 2
C W (2 0.1) 31 1 60 slots , Z 1.9
C W (1.9 0.1) 60 1 109 slots , Z 1.8
C W (1.8 0.1) 109 1 186 slots , Z 1.7
At this moment, and after four transmissions in the
bad channel the value of Z equals to 1.7. For the next two
transmissions in the good channel, each transmission is
considered a transmission of a new packet so the CW is
constant at 0CW and the value of Z increases until it
reaches 1.9. For the next six transmissions in the bad
channel, the value of Z starts from (1.9 – 0.1) and the
JOURNAL OF COMPUTING, VOLUME 2, ISSUE 5, MAY 2010, ISSN 2151-9617 HTTPS://SITES.GOOGLE.COM/SITE/JOURNALOFCOMPUTING/ WWW.JOURNALOFCOMPUTING.ORG 57
C W will have six different sizes as shown below:
0
1
2
3
4
5
C W 31 slots , Z 1.8
C W (1.8 0.1) 31 1 54 slots , Z 1.7
C W (1.7 0.1) 54 1 87 slots , Z 1.6
C W (1.6 0.1) 87 1 132 slots , Z 1.5
C W (1.5 0.1) 132 1 186 slots , Z 1.4
C W (1.4 0.1) 186 1 243 slots , Z 1.3
A question may come to mind, why the value of Z isnʹt
fixed and equals to 1 to minimize the CW size for ever
and give the AP more chance to access the medium? The
answer to this question was in [14], the author proved
analytically that the collision probability is inversely pro‐
portional to the size of the CW. So, this paper recom‐
mends utilizing a higher contention window after a suc‐
cessful transmission instead of resetting it to0CW . But,
this recommendation may be used by the terminals not
by the AP, because the higher contention window reduces
the transmission probability that may raise the HOL
blocking problem within the AP. So, the 1.X EB algorithm
proves that the contention window must increase after
the failed transmissions to reduce the collision probability
and the algorithm also clarifies that this increment must
vary smoothly to keep the chance of the AP to access the
medium.
5.2 Blocked Data Algorithm
The main idea of BDA algorithm is to prioritize the
transmissions of the access point and the good channels
status sources over the bad channels status sources. So, to
achieve this technique the AP should acknowledged all of
the frames sent from the gS sources without exception,
and blocked any data frame (the AP will not acknowledge
them) sent by the bS sources temporarily. It should be
noted that the AP will block the transmissions of any
member belongs to the bS group until the AP sends a new
frame to any destination or the number of successive
blocked frames for the bS member is less than the retry
limit by one. The maximum number of successive blocked
frames must be less than the retry limit by on to prevent
the source from dropping the frame. Those imposed
losses at the bS sources triggers the BEB at their MAC
layers (as discussed in section 5.1). Also, those successive
retransmissions reduce the transmission probability of
them and grant the chance of medium access to the AP
and the gS sources according to the analysis of the BEB
discussed in [6] and [14].
It should be noted that the BDA algorithm differs from
the FM algorithm described in [8]. In the FM algorithm,
the AP doesn’t consider the number of successive blocked
data frames that may increase the dropping rate at the bS
sources when the successive blocked frames is greater
than the retry limit of the MAC. While the BDA algo‐
rithm, adapts the successive blocked frames (as described
in section 5.2) such that they don’t increase the retry limit
of MAC.
6 SIMULATION STUDY
The simulations are done by using the OPNET 14.0 mod‐
eler network simulator. All of the simulation scenarios
concentrate on the performance of the 802.11b MAC in
lossless and lossy environments. Also, they concerned
with the QoS of the voice traffic in the same environ‐
ments. So, this study selects a common voice encoder to
be applied which is G.726 with encoding rate of 32kbps.
Note that, the speech activity is selected to be 80% and the
Framing Interval (FI) will be variable in our simulation
studies. Also, the voice sessions will be one way, i.e. the
voice session has one source and one destination.
For the topology of the simulated 802.11b network, it
has been chosen to be Basic Service Set (BSS) that uses a
central coordinator which is an AP. Also, this simulation
study is concerned with the basic DCF mode only, which
uses DATA‐ACK handshaking only.
In addition to the foregoing, both short and long re‐
transmission limits are initially assigned to be equals to 7
and 4 respectively as they are the default of the standard.
On the other side, due to the header effects of fragmenta‐
tion on the whole performance of the BSS network, the
value of Fragmentation Threshold is set to (NONE). Also,
all the MAC buffers are assumed to have infinite buffers
to avoid any losses due to the limited buffers.
In respect of the geographical size of the network, it
has been set to 100 x 100 meters. Therefore, all senders
and receivers are within the transmission range of each
other and not more than one transmission can take place
at a time, and the total bandwidth is divided between the
competing transmissions. Note that, the transmission
range of the 802.11b protocol is approximately 100 m.
For the physical layer, all fixed nodes are equipped
with an IEEE 802.11b PHY operating at frequency 2.4
GHz with a transmission power of 1mW and the physical
data rate was selected to be 11 Mbps with High‐Rate Di‐
rect Sequence Spread Spectrum technology (HR‐DSSS).
Finally, the metrics that have been studied are:
The throughput: which refer to the total number of
bits received successfully at the MAC of the destina‐
tion in a period of time.
The delay: it measures the elapsed time from the
packet that is queued in the buffer of the source until
it is successfully received at the destination. So, it
will include the queuing delay and the propagation
delay. Note that the voice quality is acceptable for
end to end delay less than 150 ms and for some ap‐

JOURNAL OF COMPUTING, VOLUME 2, ISSUE 5, MAY 2010, ISSN 2151-9617 HTTPS://SITES.GOOGLE.COM/SITE/JOURNALOFCOMPUTING/ WWW.JOURNALOFCOMPUTING.ORG 58
plications the voice quality is acceptable for delay
less than 400 ms [11].
The packet loss: it measures the total number of dis‐
carded packets in a period of time. Note that the
voice quality is acceptable for loss ratio below 5%
[12].
The Mean Opinion Score (MOS): it provides a numeri‐
cal measure of the quality of human speech at the
destination end of the circuit. The scheme uses sub‐
jective tests (opinionated scores) that are mathemati‐
cally averaged to obtain a quantitative indicator of
the system performance. Now, the MOS value can be
measured using objective methods. Note that, the
MOS value ranges from 1 (worst) to 5 (best) and the
quality of voice is acceptable if the MOS values are
above 3.6 [13].
6.1 Simulation Scenarios
Our simulationʹs study are divided into two groups of
scenarios, the primary goal of the first group is to eva‐
luate the performance of the contention access mechan‐
ism of the DCF protocol in lossless environment, and to
determine the voice capacity according to the maximum
achievable throughput and the acceptable values for the
predefined metrics. In this group of scenarios, the voice
sessions are varying from 1 to 30 sessions and the FI of
G.726 is set to 0.02, 0.04 sec respectively.
The second group is divided into two subsets of sce‐
narios. The first subset, studies the impact of the lossy
environment on the performance of the contention access
scheme. In this subset, the offered load is set to high load
which is equal to 75% from the maximum load and to a
medium load which is equal to 50% from the maximum
load respectively. Note that, the expression of “maximum
load” means the maximum load that can be offered with‐
out affecting the voice quality. In these scenarios, the
voice session is considered failed session if the destination
channel suffers from a Frame Loss Ratio (FLR) of 50% or
70% and the FLR is assumed to be constant during the
simulation run. While the second subset of scenarios, stu‐
dies the impact of the PAP algorithm on the performance
of the DCF access scheme. All of the simulations are run
for 600 seconds and each scenario is repeated for ten
times to precise the average values of the scenario.
6.2 Simulation Scenarios
This section discusses and analyzes the final results of the
simulation scenarios described in section (6.1). 6.2.1 Performance of 802.11b in Lossless
Environment
Figure (3), shows the average throughput achieved
under varying one way G.726 sessions that transmitting
symmetric voice frames. For both values of FI, it could be
seen that the throughput increases linearly with the num‐
ber of voice sessions until it reaches its maximum value
then the network is overloaded and the throughput re‐
duces somewhat linearly. For FI equals to 0.02 sec, the
throughput is gradually increased from 39 kbps to 550
kbps then it decreases gradually, but for FI equals to 0.04
sec, it is increased gradually from 33 kbps to 864 kbps.
From the shape of the graph, it could be noticed that the
network is saturated for the number of voice sessions
greater than 14 sessions with FI equals to 0.02 sec, while
in case of FI equals to 0.04 sec, the network is saturated
for number of voice sessions greater than 26 sessions.
Fig. 3. Avg. throughput in lossless environment
Figure (4) demonstrates the average end‐to‐end delay
of 802.11b in lossless environment. For FI equals to 0.02
sec, from the figure it should be notice that the average
end to end delay increases somewhat linearly by on aver‐
age 28 ms per voice session till the network is saturated
then it increases rapidly, while for FI equals to 0.04 sec,
the average end to end delay increases linearly by on av‐
erage 36 ms per voice session till the network is saturated
then it increases rapidly also. From the figure also it could
be seen that, the average delay is less than the acceptable
level (i.e., 150 ms) as long as the number of sessions is less
than 13 and 25 sessions for FI equals to 0.02 and 0.04 sec
respectively.
Fig. 4. Avg. end-to-end delay in lossless environment

JOURNAL OF COMPUTING, VOLUME 2, ISSUE 5, MAY 2010, ISSN 2151-9617 HTTPS://SITES.GOOGLE.COM/SITE/JOURNALOFCOMPUTING/ WWW.JOURNALOFCOMPUTING.ORG 59
For average packet loss, as illustrated in figure (5), no
packet loss in the lossless environment till the number of
voice sessions exceed the level of saturation. It should be
noted that, although the packet loss is equal zero the col‐
lisions are found and increase until the successive re‐
transmissions exceed the retry limit of the MAC then the losses appear.
Fig. 5. Avg. packet loss in lossless environment
Figure (6) illustrates the simulated average MOS values.
For FI equals to 0.02 sec, the MOS values are always
above 3.6 till the number of sessions reach 13 sessions.
While for FI equals to 0.04 sec, the MOS values are above
the same level till the number of sessions reach 24 ses‐
sions. For MOS values greater than 3.6, the quality of
voice call is considered acceptable, so the value of 3.6 is
very important to determine the maximum load or the
voice capacity of the 802.11b network. So, from the figure
it could be concluded that for FI equals to 0.02 sec, the
voice capacity is equal to 13 voice sessions, while for FI
equals to 0.04 sec, the voice capacity is equal to 24 one
way voice sessions.
Fig. 6. Avg. MOS values in lossless environment
6.2.2 Performance of 802.11b in Lossy
Environment
This section demonstrates the simulation results for the
lossy environment before and after applying the PAP al‐
gorithm. Initially, the scenario is applied for two different
offered loads which are 75% and 50% from the maximum
load that refer to high and medium load respectively.
From the first scenarios set, for FI equals to 0.02 sec,
the high load refers to 10 voice sessions, and the medium
load refers to 7 voice sessions. While for FI equals to 0.04
sec, the high load refers to 18 voice sessions, and the me‐
dium load refers to 13 voice sessions. 6.2.2.1 High Load Scenarios
Figures (7), (8), (9) and (10) shows the simulated average
throughput, delay, losses and MOS respectively for the
high loads with FI equals to 0.02 sec.
Figure (7) shows the average throughput of the
802.11b in lossy environment. The average throughput is
approximately equal to 387 kbps until the number of bad
sessions equal to 3 sessions with 50% FLR then it de‐
grades somewhat linearly by on average 27 kbps per
failed session. While for 70% FLR, the average through‐
put is approximately equal to 387 kbps until the number
of bad sessions exceed 1 session then it degrades linearly
by on average of 34 kbps per failed session. For the PAP
algorithm, it is clear that the average throughput of the
PAP algorithm is improved significantly by on average of
29%, 96% for 50% and 70% FLR respectively. Also, it could
be seen that the throughput reaches its maximum value
when the number of bad sessions reach 7 sessions with
50% FLR, and 3 sessions with 70% FLR.
Fig. 7. Avg. throughput (High Load, FI = 0.02 sec)
The average end to end delay results are illustrated in
figure (8). Form the figure, it is clear that the 802.11b de‐
lay is below the acceptable level as long as the number of
failed sessions is less than or equal 3 sessions with 50%
FLR. While for 70% FLR, it was sufficient for 1 bad ses‐
sion to increase the delay dramatically and exceed the
acceptable level. For the PAP algorithm, it could be seen
that the average delay is improved significantly by on
average 88%, 73% for 50% and 70% FLR respectively. Al‐
so, for 50% FLR, it is clear that the delay is below the ac‐
ceptable level in case of the number of failed sessions is
less than or equal 7 sessions. While for 70% FLR, the de‐
lay is below the acceptable level in case of the number of
JOURNAL OF COMPUTING, VOLUME 2, ISSUE 5, MAY 2010, ISSN 2151-9617 HTTPS://SITES.GOOGLE.COM/SITE/JOURNALOFCOMPUTING/ WWW.JOURNALOFCOMPUTING.ORG 60
failed sessions is less than or equal 3 sessions.
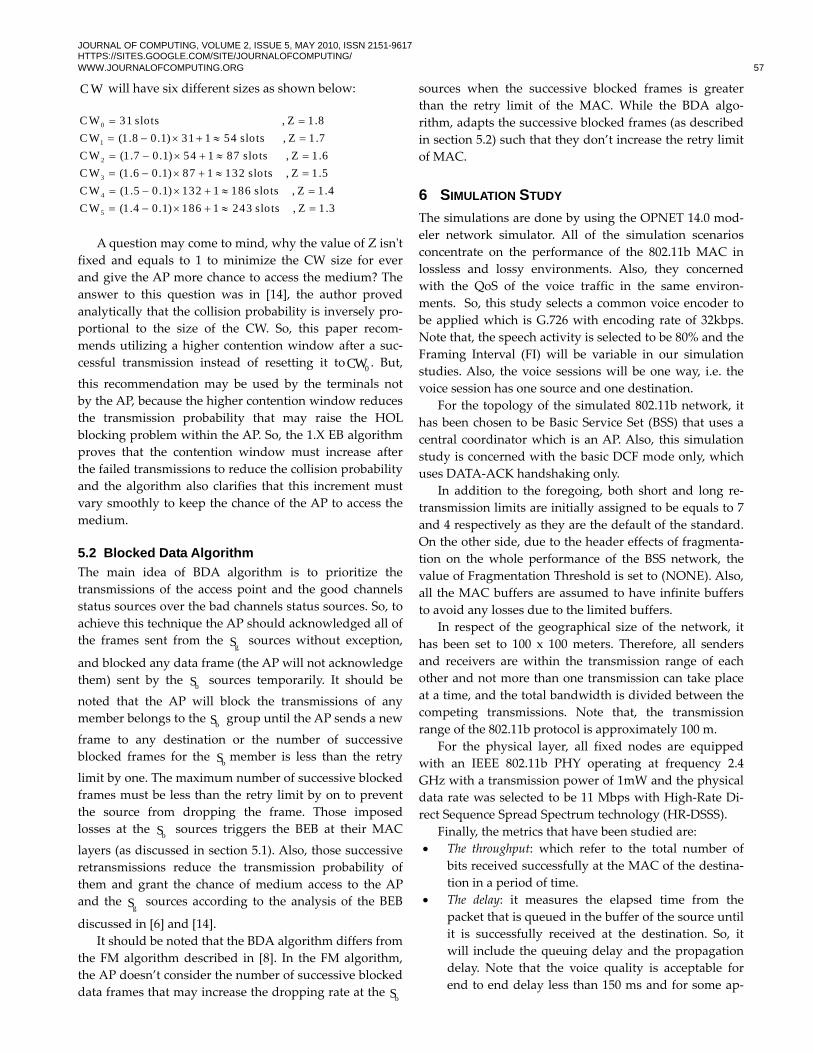
Fig. 8. Avg. end-to-end delay (High Load, FI = 0.02 sec)
Figure (9) shows the packet loss results for both of the
802.11b and the PAP algorithms. For the 802.11b results, it
could be noticed that the loss increases rapidly for few
number of bad sessions then it increases smoothly for
large number of bad sessions; i.e. the increasing rate is not
linearly and the amount of packet loss per session de‐
creases when the number of bad sessions increase. This
phenomenon appears due to the HOL blocking that
blocks all accumulated packets for long time and post‐
pone their transmissions which increase the delay and
reduce the losses. If we assumed that the increasing rate is
linear, it could be seen that the losses increase by on aver‐
age 0.2 kbps per failed session with 50% FLR, while for
70% FLR, the losses increase by on average 0.7 kbps.
While in PAP algorithm, it could be seen that the losses
increased dramatically by on average 48%, 136% for 50%
and 70% FLR respectively. Also, it could be seen that the
PAP algorithm increase the average losses per failed ses‐
sion to be 0.3 kbps for 50% FLR, and 2 kbps for 70% FLR.
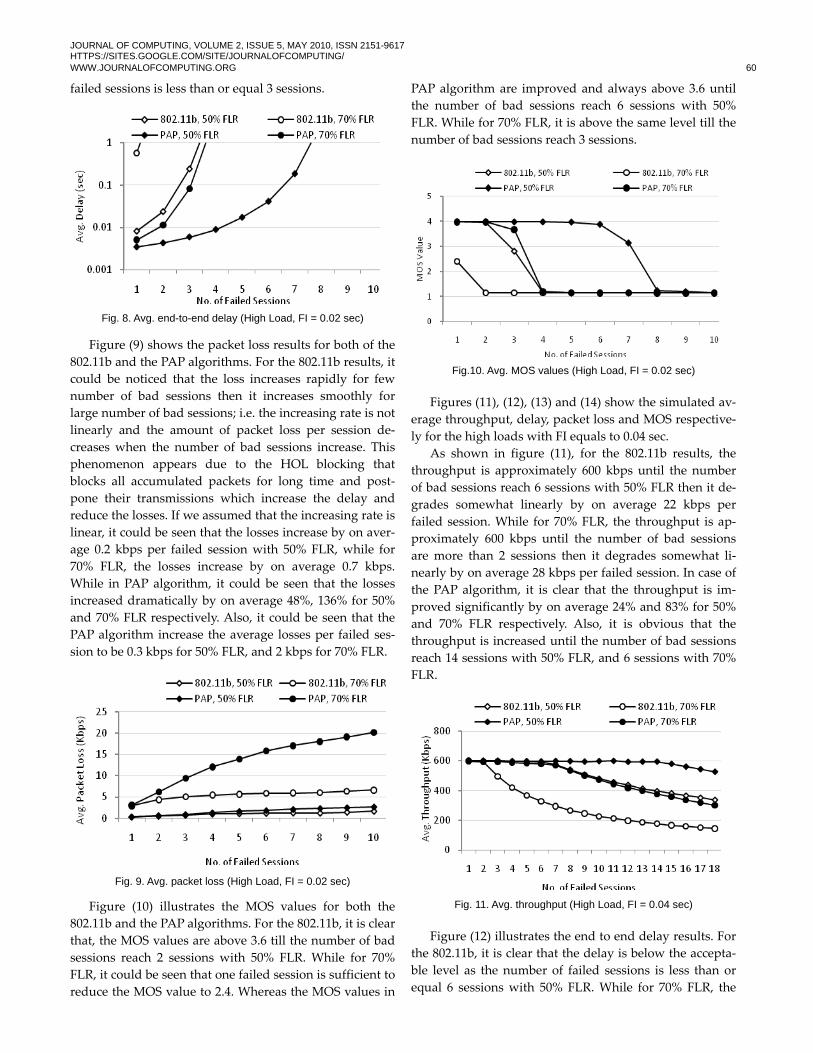
Fig. 9. Avg. packet loss (High Load, FI = 0.02 sec)
Figure (10) illustrates the MOS values for both the
802.11b and the PAP algorithms. For the 802.11b, it is clear
that, the MOS values are above 3.6 till the number of bad
sessions reach 2 sessions with 50% FLR. While for 70%
FLR, it could be seen that one failed session is sufficient to
reduce the MOS value to 2.4. Whereas the MOS values in
PAP algorithm are improved and always above 3.6 until
the number of bad sessions reach 6 sessions with 50%
FLR. While for 70% FLR, it is above the same level till the
number of bad sessions reach 3 sessions.
Fig.10. Avg. MOS values (High Load, FI = 0.02 sec)
Figures (11), (12), (13) and (14) show the simulated av‐
erage throughput, delay, packet loss and MOS respective‐
ly for the high loads with FI equals to 0.04 sec.
As shown in figure (11), for the 802.11b results, the
throughput is approximately 600 kbps until the number
of bad sessions reach 6 sessions with 50% FLR then it de‐
grades somewhat linearly by on average 22 kbps per
failed session. While for 70% FLR, the throughput is ap‐
proximately 600 kbps until the number of bad sessions
are more than 2 sessions then it degrades somewhat li‐
nearly by on average 28 kbps per failed session. In case of
the PAP algorithm, it is clear that the throughput is im‐
proved significantly by on average 24% and 83% for 50%
and 70% FLR respectively. Also, it is obvious that the
throughput is increased until the number of bad sessions
reach 14 sessions with 50% FLR, and 6 sessions with 70%
FLR.
Fig. 11. Avg. throughput (High Load, FI = 0.04 sec)
Figure (12) illustrates the end to end delay results. For
the 802.11b, it is clear that the delay is below the accepta‐
ble level as the number of failed sessions is less than or
equal 6 sessions with 50% FLR. While for 70% FLR, the
JOURNAL OF COMPUTING, VOLUME 2, ISSUE 5, MAY 2010, ISSN 2151-9617 HTTPS://SITES.GOOGLE.COM/SITE/JOURNALOFCOMPUTING/ WWW.JOURNALOFCOMPUTING.ORG 61
delay is below the acceptable level as long as the number
of bad sessions don’t exceed one session. Whereas the
average delay is improved significantly by on average
85% and 73% for 50% and 70% FLR respectively in case of
the PAP algorithm. Also, for 50% FLR, it is obvious that
the delay is below the acceptable level as the number of
failed sessions is less than or equal 13 sessions. While for
70% FLR, the delay is below the acceptable level as long
as the number of failed sessions is less than or equal 6
sessions.
Fig. 12. Avg. end-to-end delay (High Load, FI = 0.04 sec)
The packet loss results for the 802.11b and PAP algo‐
rithms are presented in figure (13). For the 802.11b re‐
sults, it should be noted that the packet loss increases by
on average 0.12 kbps per failed session with 50% FLR,
while for 70% FLR, the losses increase by on average 0.54
kbps. In case of the PAP algorithm, the losses increased
dramatically by on average 70% and 148% for 50% and
70% FLR respectively. Also, it could be seen that the PAP
algorithm increases the average losses per failed session
to be 0.3 kbps for 50% FLR, and 2 kbps for 70% FLR.
Fig. 13. Avg. packet loss (High Load, FI = 0.04 sec)
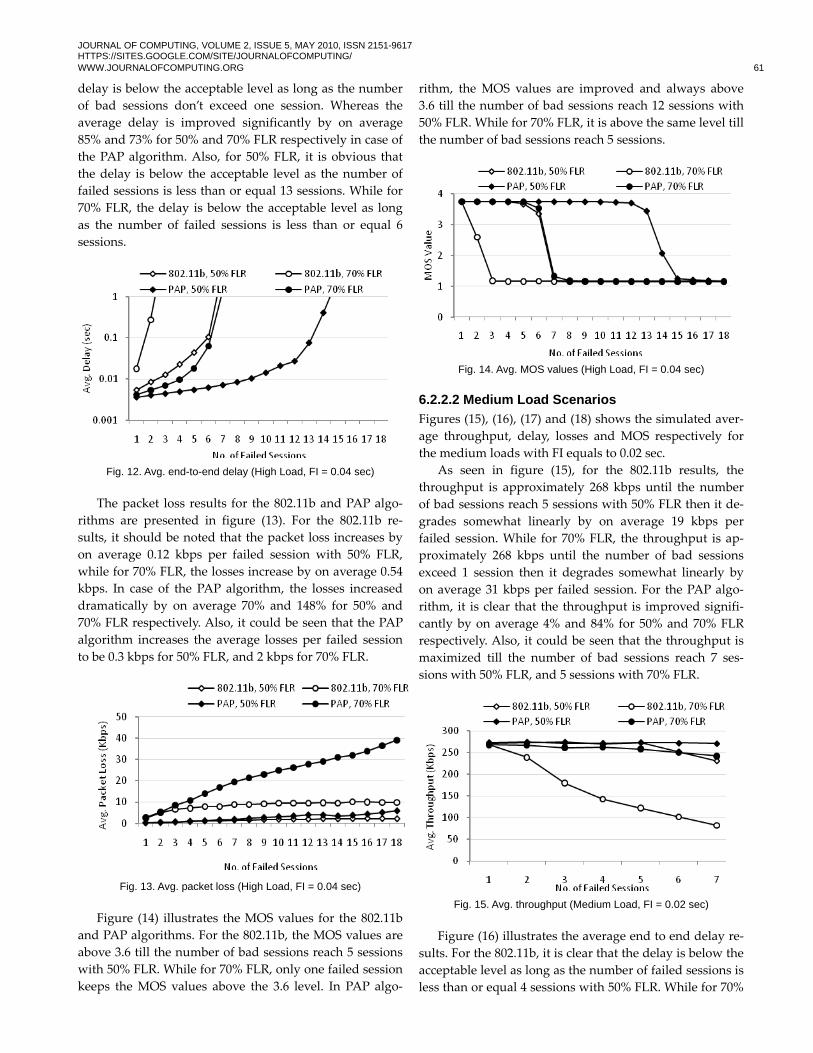
Figure (14) illustrates the MOS values for the 802.11b
and PAP algorithms. For the 802.11b, the MOS values are
above 3.6 till the number of bad sessions reach 5 sessions
with 50% FLR. While for 70% FLR, only one failed session
keeps the MOS values above the 3.6 level. In PAP algo‐
rithm, the MOS values are improved and always above
3.6 till the number of bad sessions reach 12 sessions with
50% FLR. While for 70% FLR, it is above the same level till
the number of bad sessions reach 5 sessions.
Fig. 14. Avg. MOS values (High Load, FI = 0.04 sec)
6.2.2.2 Medium Load Scenarios
Figures (15), (16), (17) and (18) shows the simulated aver‐
age throughput, delay, losses and MOS respectively for
the medium loads with FI equals to 0.02 sec.
As seen in figure (15), for the 802.11b results, the
throughput is approximately 268 kbps until the number
of bad sessions reach 5 sessions with 50% FLR then it de‐
grades somewhat linearly by on average 19 kbps per
failed session. While for 70% FLR, the throughput is ap‐
proximately 268 kbps until the number of bad sessions
exceed 1 session then it degrades somewhat linearly by
on average 31 kbps per failed session. For the PAP algo‐
rithm, it is clear that the throughput is improved signifi‐
cantly by on average 4% and 84% for 50% and 70% FLR
respectively. Also, it could be seen that the throughput is
maximized till the number of bad sessions reach 7 ses‐
sions with 50% FLR, and 5 sessions with 70% FLR.
Fig. 15. Avg. throughput (Medium Load, FI = 0.02 sec)
Figure (16) illustrates the average end to end delay re‐
sults. For the 802.11b, it is clear that the delay is below the
acceptable level as long as the number of failed sessions is
less than or equal 4 sessions with 50% FLR. While for 70%

JOURNAL OF COMPUTING, VOLUME 2, ISSUE 5, MAY 2010, ISSN 2151-9617 HTTPS://SITES.GOOGLE.COM/SITE/JOURNALOFCOMPUTING/ WWW.JOURNALOFCOMPUTING.ORG 62
FLR, the delay is below the acceptable level as long as the
number of bad sessions don’t exceed one session. For the
PAP algorithm, it could be seen that the delay is im‐
proved significantly by on average 82% and 97% for 50%
and 70% FLR respectively. Also, for 50% FLR, it is clear
that the delay is below the acceptable level as long as the
number of failed sessions is less than or equal 7 sessions.
While for 70% FLR, the delay is below the acceptable level
(150 ms) as long as the number of failed sessions is less
than or equal 5 sessions.
Fig. 16. Avg. end-to-end delay (Medium Load, FI = 0.02 sec)
Figure (17) shows the packet loss results for the
802.11b and PAP algorithm. For the 802.11b results, it
could be noticed that the losses increase by on average 0.2
kbps per failed session with 50% FLR, while for 70% FLR,
the losses increase by on average 1 kbps. Whereas in PAP
algorithm, it could be seen that the losses increased dra‐
matically by on average 15% and 94% for 50% and 70%
FLR respectively. Also, it could be seen that the PAP algo‐
rithm increases the average losses per failed session to be
0.3 kbps for 50% FLR, and 3 kbps for 70% FLR.
Fig. 17. Avg. packet loss (Medium Load, FI = 0.02 sec)
Figure (18) illustrates the MOS values for the 802.11b
and PAP algorithms. For the 802.11b, it is clear that the
MOS values are above 3.6 till the number of bad sessions
reach 4 sessions with 50% FLR. While for 70% FLR, it
could be noticed that only one failed session keeps the
MOS above the 3.6 level. While for the PAP algorithm, it
could be seen that the MOS values are improved and al‐
ways above 3.6 till the number of bad sessions reach 7
sessions with 50% FLR. While for 70% FLR, it is above the
same level till the number of bad sessions reach 5 ses‐
sions.
Fig. 18. Avg. MOS values (Medium Load, FI = 0.02 sec)
Figures (19), (20), (21) and (22) shows the simulated
average throughput, delay, losses and MOS respectively
for the medium loads with FI equals to 0.04 sec.
As shown in figure (19), for the 802.11b results, the
throughput is approximately 433 kbps until the number
of bad sessions reach 10 sessions with 50% FLR then it
degrades somewhat linearly by on average 23 kbps per
failed session. While for 70% FLR, the throughput is ap‐
proximately 268 kbps until the number of bad sessions
exceeds 3 sessions then it degrades somewhat linearly by
on average 28 kbps per failed session. For the PAP algo‐
rithm, it is clear that the throughput is improved signifi‐
cantly by on average 3% and 66% for 50% and 70% FLR
respectively. Also, could be noticed that the throughput is
increased till the number of bad sessions reach 13 sessions
with 50% FLR, and 10 sessions with 70% FLR.
Fig. 19. Avg. throughput (Medium Load, FI = 0.04 sec)
Figure (20) illustrates the average end to end delay re‐
sults. For the 802.11b, it is clear that the delay is below the
acceptable level (150 ms) in case of the number of failed
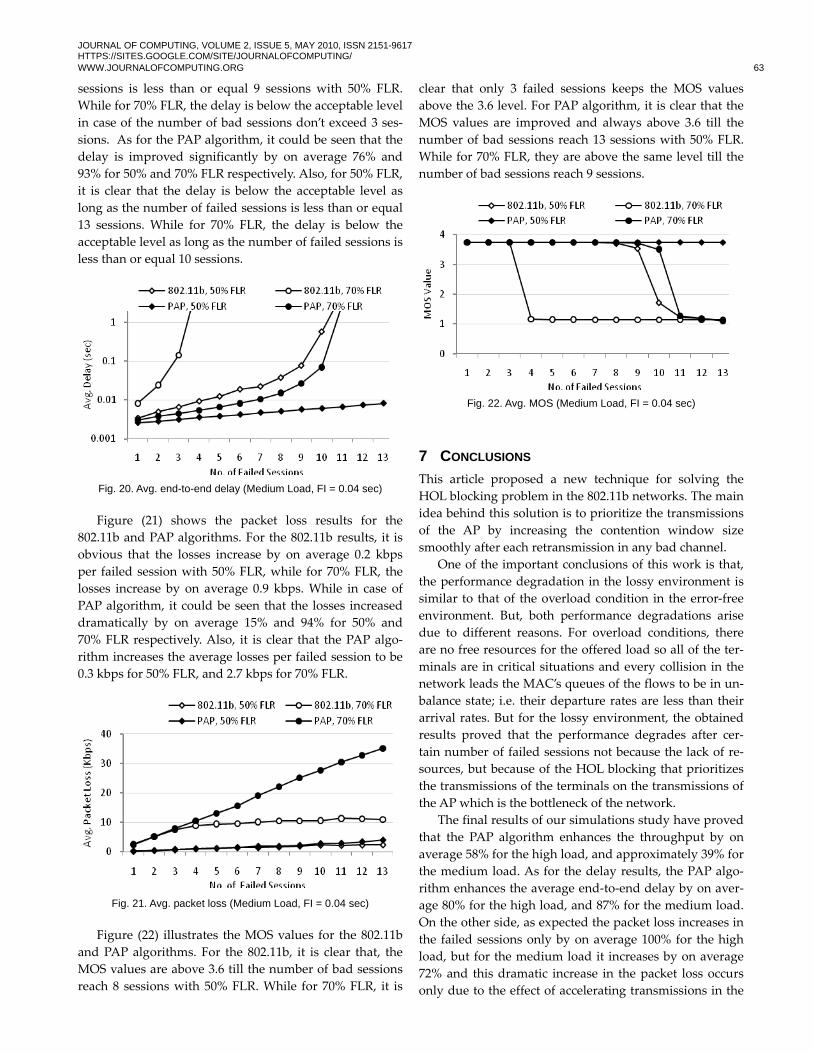
JOURNAL OF COMPUTING, VOLUME 2, ISSUE 5, MAY 2010, ISSN 2151-9617 HTTPS://SITES.GOOGLE.COM/SITE/JOURNALOFCOMPUTING/ WWW.JOURNALOFCOMPUTING.ORG 63
sessions is less than or equal 9 sessions with 50% FLR.
While for 70% FLR, the delay is below the acceptable level
in case of the number of bad sessions don’t exceed 3 ses‐
sions. As for the PAP algorithm, it could be seen that the
delay is improved significantly by on average 76% and
93% for 50% and 70% FLR respectively. Also, for 50% FLR,
it is clear that the delay is below the acceptable level as
long as the number of failed sessions is less than or equal
13 sessions. While for 70% FLR, the delay is below the
acceptable level as long as the number of failed sessions is
less than or equal 10 sessions.
Fig. 20. Avg. end-to-end delay (Medium Load, FI = 0.04 sec)
Figure (21) shows the packet loss results for the
802.11b and PAP algorithms. For the 802.11b results, it is
obvious that the losses increase by on average 0.2 kbps
per failed session with 50% FLR, while for 70% FLR, the
losses increase by on average 0.9 kbps. While in case of
PAP algorithm, it could be seen that the losses increased
dramatically by on average 15% and 94% for 50% and
70% FLR respectively. Also, it is clear that the PAP algo‐
rithm increases the average losses per failed session to be
0.3 kbps for 50% FLR, and 2.7 kbps for 70% FLR.
Fig. 21. Avg. packet loss (Medium Load, FI = 0.04 sec)
Figure (22) illustrates the MOS values for the 802.11b
and PAP algorithms. For the 802.11b, it is clear that, the
MOS values are above 3.6 till the number of bad sessions
reach 8 sessions with 50% FLR. While for 70% FLR, it is
clear that only 3 failed sessions keeps the MOS values
above the 3.6 level. For PAP algorithm, it is clear that the
MOS values are improved and always above 3.6 till the
number of bad sessions reach 13 sessions with 50% FLR.
While for 70% FLR, they are above the same level till the
number of bad sessions reach 9 sessions.
Fig. 22. Avg. MOS (Medium Load, FI = 0.04 sec)
7 CONCLUSIONS
This article proposed a new technique for solving the
HOL blocking problem in the 802.11b networks. The main
idea behind this solution is to prioritize the transmissions
of the AP by increasing the contention window size
smoothly after each retransmission in any bad channel.
One of the important conclusions of this work is that,
the performance degradation in the lossy environment is
similar to that of the overload condition in the error‐free
environment. But, both performance degradations arise
due to different reasons. For overload conditions, there
are no free resources for the offered load so all of the ter‐
minals are in critical situations and every collision in the
network leads the MAC’s queues of the flows to be in un‐
balance state; i.e. their departure rates are less than their
arrival rates. But for the lossy environment, the obtained
results proved that the performance degrades after cer‐
tain number of failed sessions not because the lack of re‐
sources, but because of the HOL blocking that prioritizes
the transmissions of the terminals on the transmissions of
the AP which is the bottleneck of the network.
The final results of our simulations study have proved
that the PAP algorithm enhances the throughput by on
average 58% for the high load, and approximately 39% for
the medium load. As for the delay results, the PAP algo‐
rithm enhances the average end‐to‐end delay by on aver‐
age 80% for the high load, and 87% for the medium load.
On the other side, as expected the packet loss increases in
the failed sessions only by on average 100% for the high
load, but for the medium load it increases by on average
72% and this dramatic increase in the packet loss occurs
only due to the effect of accelerating transmissions in the

JOURNAL OF COMPUTING, VOLUME 2, ISSUE 5, MAY 2010, ISSN 2151-9617 HTTPS://SITES.GOOGLE.COM/SITE/JOURNALOFCOMPUTING/ WWW.JOURNALOFCOMPUTING.ORG 64
failed sessions. Finally, the MOS values are increased sig‐
nificantly by on average 79% for the high load, and 97%
for the medium load, and these increases in the MOS val‐
ues prove that the AP is capable of serving more failed
sessions without affecting the quality of the good ses‐
sions.
In the future, it is necessary to enhance the PAP algo‐
rithm to guarantee the time and service fairness between
the good and failed sessions that could not be achieved in
the FIFO discipline. Also, it is necessary to apply this al‐
gorithm on different types of traffics to prove its effec‐
tiveness.
REFERENCES [1] M. Heusse, F. Rousseau, G. Berger‐Sabbatel, A. Duda, “Per‐
formance Anomaly of 802.11b,” Proc. Of IEEE Infocom 2003,
San Francisco, April 2003.
[2] Liqiang Zhang, Yu‐Jen Cheng, and Xiaobo Zhou, “Rate Ava‐
lanche: Effects on the Performance of Multi‐rate 802.11 Wire‐
less Networks,” Journal of Simulation Modeling Practice
and Theory, Elsevier, Vol. 17, No. 3, pp. 487‐503, March 2009.
[3] H.L. Vu, T. Sakurai, “Collision probability in saturated ieee
802.11 networks,” in: Proceedings Australian Telecommuni‐
cation Networks & Applications Conference (ATNAC), De‐
cember, 2006.
[4] IEEE 802.11, “Wireless LAN Medium Access Control (MAC)
and Physical Layer (PHY) Specification,” 1997.
[5] L. Jiang and S. C. Liew, “An Adaptive Round Robin Schedu‐
ler for HOL Blocking Problem in WLANs,” IEEE Wireless
Communications and Network Conference , Vol. 2, 13‐17
March 2005, pp. 1219‐ 1224.
[6] G. Bianchi, “Performance analysis of the IEEE 802.11 distri‐
buted coordination function,” IEEE J. Select. Areas Commu‐
nication, Vol. 18, Issue 3, Mar 2000, pp. 535 – 547.
[7] P. Bhagwat, P. Bhattacharya, A. Krishna, S. Tripathi, “En‐
hancing throughput over wireless LANs using channel state
dependent packet scheduling ,” INFOCOM ʹ96. Fifteenth
Annual Joint Conference of the IEEE Computer Societies,
Vol.3 , 24‐28 Mar 1996 , pp. 1133‐1140 .
[8] A. N. Omara, S. M. Abd El‐kader, H. S. Eissa, S. Elramly,
“Enhancig the Wi‐Fi Performance within the Error‐Prone
Channels,” The Mediterranean Journal of Computers and
Networks, Volume 5, No. 2, April 2009
[9] S. Lu and V. Bharghavan, “Fair scheduling in wireless packet
networks,” IEEE/ACM Trans. Networking, Vol. 7, no. 4,
1999, pp. 473–489.
[10] T. S. Eugene Ng, I. Stoica, and H. Zhang, “Packet fair
queueing algorithms for wireless networks with location‐
dependent errors,” in Proc. INFOCOM98, Vol. 2, Mar. 1998,
pp.1103–1111.
[11] Malathi Veeraraghavan, Nabeel Cocker, and Tim Moors,
“Support of voice services in IEEE 802.11 wireless LANs,” In
proceedings of IEEE INFOCOM 2001, 2001.
[12] A. Muezerie, I. Nikolaidis, P. Gburzynski, “Buffer Space
Tradeoffs for VoIP QoS in Deflection Networks,” 2005 Inter‐
national Symposium on Performance Evaluation of Comput‐
er and Telecommunication Systems (SPECTS 2005), Phila‐
delphia, USA, 24‐28 July 2005, pp. 381‐390.
[13] A. Trad and al. “Capacity Evaluation of VoIP in IEEE
802.11e WLAN Environment,ʺ In IEEE CCNC 2006.
[14] P. Chatzimisios, et al., “A simple and effective backoff
scheme for the IEEE 802.11 MAC protocol,” Proceedings of
CITSA 2005, Orlando, FL, USA, July 2005.
BIOGRAPHIES Ahmed Naguib Omara received the B.S. degree in electronics and communications from Shoubra Faculty of Engineering, Zagazig Uni-versity, in 2003. His research interests include performance evalua-tion of 802.11 MAC protocol, wireless ad hoc networks, and quality of service. He is a Research Assistant at computers & systems dept., Electronics Research Institute since 2004. Sherine Abd El-Kader has her M.Sc., and Ph.D. degrees from the electronics & communications dept. & computers dept., faculty of engineering, Cairo University, at 1998, and 2003, respectively. Dr. Abd El-kader is an Associate Prof., at computers & systems dept., Electronics Research Institute (ERI). She is supervising three Ph.D students, and 5 M.Sc. Students. Dr. Abd El-kader had published more than 15 papers in computer networking area. She is working in many computer networking hot topics such as; Wi-MAX, Wi-Fi, IP Mobility, Active Queue Management, QoS, Wireless sensors Net-works, Ad-Hoc Networking, real-time traffics, Bluetooth, and IPv6. She is an Associate Prof., at Faculty of Engineering, Akhbar El Yom Academy from 2007 till now. Also she is a technical reviewer for many international journals. She is heading the Internet and Net-working unit at ERI since 2003. Dr. Abd El-kader is supervising many Graduation Projects from 2006 still now. Finally, Dr. Abd El-kader is the main researcher at two US-EG joint funded projects with Univer-sity of California at Irvine, CA, USA. Hussein Eissa had his B.Sc. and M.Sc. degrees from electronics & communications dept., faculty of engineering, Cairo University at 1993 and 1996. Dr. Eissa had his Ph.D degree from electronics & communications dept., faculty of engineering, Cairo University in cooperation with electrical engineering dept., university of Pennsyl-vania, Philadelphia, USA at 2000. Dr. Eissa had an international certificate in business & management from IESES business school, university of Navarra, Spain at 2004. Dr. Eissa is an associate prof. at computers & systems dept., Electronics Research Institute. R. Eissa had published 22 papers in the computer networking area. Dr. Eissa is the director of the R&D sector for the Egyptian IPv6 task force (E-IPv6 TF) since 2004. Dr. Eissa is the director of Information System dept. at ministry of communications & information technolo-gy. Salwa Hussein Abdelfattah Elramly is now Professor Emeritus with the Electronics & Communications Engineering Department, Faculty of Engineering, Ain Shams University. She is specialized in Communications Engineering& Signal Processing. Dr. Salwa had her BSc. (1967), MSc. (1972) from the Faculty of Engineering, Ain Shams University, and her PhD from Nancy University, France
JOURNAL OF COMPUTING, VOLUME 2, ISSUE 5, MAY 2010, ISSN 2151-9617 HTTPS://SITES.GOOGLE.COM/SITE/JOURNALOFCOMPUTING/ WWW.JOURNALOFCOMPUTING.ORG 65
(1976). She worked as a demonstrator, assistant Professor, Asso-ciate Professor, then as a Professor with the Electronics & Commu-nications Engineering Department since1989. She worked as a Di-rector of the Microelectronics Research Unit (attached to Ain Shams Engineering Consultancy Center) for four years, and then was nomi-nated the Head of the Electronics & Communications Engineering Department (2004-2006). Dr. Salwa is an IEEE Senior Member and is the IEEE (Egypt section) Signal Processing Chapter Chair. She is the Secretary of the Permanent Committee for nominating Profes-sors (Universities Supreme Council), the leader of the Communi-cations Group in the Space Program (with the National Agency for Remote Sensing NARSS) and Secretary General of the Egyptian Society Of Language Engineering ISOLE). Dr Salwa supervised many PhD & MSc thesis and has many publications in Journals and conferences. She is also a member in many committees and share in the steering and technical committees of scientific conferences. Dr. Elramly current research areas are speech coders for mobile communications, smart antennas for location position, multimedia and video conferencing, ciphering, direct delivery of Internet services to users by low earth orbit satellite, multi-user detection in CDMA, GPS for network planning, performance evaluation of CDMA 2000, radars, frequency planning for mobile communications, environmen-tal effects of microwaves emitted from mobile base stations, network management in third generation mobile communications, voice over IP networks, space-time coding, digital video broadcasting for mobile TV, software defined radio, and language engineering.