Health insurance benefit packages prioritized by low-income clients in India: Three criteria to...
13
Electronic copy available at: http://ssrn.com/abstract=1016681 Social Science & Medicine 64 (2007) 884–896 Health insurance benefit packages prioritized by low-income clients in India: Three criteria to estimate effectiveness of choice $ David Mark Dror a, , Ruth Koren b , Alexander Ost c , Erika Binnendijk d , Sukumar Vellakkal e , Marion Danis f a Erasmus University Rotterdam, Institute for Health Policy & Management, rte de Frontenex 39B, 1207 Geneva, Switzerland b Tel Aviv University Medical School, Tel Aviv, Israel c University of Cologne, Cologne, Germany d Erasmus University Rotterdam, Institute for Health Policy & Management, The Netherlands e Institute for Social and Economic Change, Bangalore, India f National Institutes of Health, Bethesda, MD, USA Available online 4 December 2006 Abstract We applied a decision tool for rationing choices, with a predetermined budget of about US$11 per household per year, to identify priorities of poor people regarding health insurance benefits in India in late 2005. A total of 302 individuals, organized in 24 groups, participated from a number of villages and neighborhoods of towns in Karnataka and Maharashtra. Many individuals were illiterate, innumerate and without insurance experience. Involving clients in insurance package design is based on an implied assumption that people can make judicious rationing decisions. Judiciousness was assessed by examining the association between the frequency of choosing a package and its perceived effectiveness. Perceived effectiveness was evaluated by comparing respondents’ choices to the costs registered in 2049 illness episodes among a comparable cohort, using three criteria: ‘reimbursement’ (reimbursement regardless of the absolute level of expenditure), ‘fairness’ (higher reimbursement rate for higher expenses) and ‘catastrophic coverage’ (insurance for catastrophic exposure). The most frequently chosen packages scored highly on all three criteria; thus, rationing choices were confirmed as judicious. Fully 88.4% of the respondents selected at least three of the following benefits: outpatient, inpatient, drugs and tests, with a clear preference to cover high aggregate costs regardless of their probability. The results ARTICLE IN PRESS www.elsevier.com/locate/socscimed 0277-9536/$ - see front matter r 2006 Published by Elsevier Ltd. doi:10.1016/j.socscimed.2006.10.032 $ This CHAT experiment was jointly implemented by the project ‘Strengthening Micro Health Insurance Units for the Poor in India’ and the National Institutes of Health of the US Public Health Service (NIH). The European Commission within the EU–India Economic Cross-Cultural Programme funded the project. The household survey was partly funded by the Deutsche Gesellschaft fu¨r Technische Zusammenarbeit (GTZ India). NIH funded the development of CHAT materials, and personnel training and facilitation of the exercise. Logistical support was provided by the Birla Institute for Management Technology, Greater Noida (India). Persons who contributed include: D. Garand, S. Khare, A. Joshi, N. Badwe, A. Rao, F. Hay and K. Shailabh, Dr. Sudarshan, and the leaders and residents of the villages that participated. O. Koren provided research assistance in data mining. R. Radermacher, and O. van Putten Rademaker provided essential logistical support. The opinions expressed are those of the authors, and do not reflect positions of the institutions they are associated with. Corresponding author. Tel.: +41 78 790 6789; fax: +41 22 788 2288. E-mail addresses: [email protected] (D.M. Dror), [email protected] (R. Koren), [email protected] (A. Ost), [email protected] (E. Binnendijk), [email protected] (S. Vellakkal), [email protected] (M. Danis).
-
Upload
microinsuranceacademy -
Category
Documents
-
view
1 -
download
0
Transcript of Health insurance benefit packages prioritized by low-income clients in India: Three criteria to...
ARTICLE IN PRESS
0277-9536/$ - se
doi:10.1016/j.so
$This CHAT
and the Nation
Cross-Cultural
Zusammenarbe
Logistical supp
include: D. Gar
villages that par
essential logisti
associated with�CorrespondE-mail add
erikabinnendijk
Social Science & Medicine 64 (2007) 884–896
www.elsevier.com/locate/socscimed
Health insurance benefit packages prioritizedby low-income clients in India: Three criteria
to estimate effectiveness of choice$
David Mark Drora,�, Ruth Korenb, Alexander Ostc, Erika Binnendijkd,Sukumar Vellakkale, Marion Danisf
aErasmus University Rotterdam, Institute for Health Policy & Management, rte de Frontenex 39B, 1207 Geneva, SwitzerlandbTel Aviv University Medical School, Tel Aviv, Israel
cUniversity of Cologne, Cologne, GermanydErasmus University Rotterdam, Institute for Health Policy & Management, The Netherlands
eInstitute for Social and Economic Change, Bangalore, IndiafNational Institutes of Health, Bethesda, MD, USA
Available online 4 December 2006
Abstract
We applied a decision tool for rationing choices, with a predetermined budget of about US$11 per household per year,
to identify priorities of poor people regarding health insurance benefits in India in late 2005. A total of 302 individuals,
organized in 24 groups, participated from a number of villages and neighborhoods of towns in Karnataka and
Maharashtra. Many individuals were illiterate, innumerate and without insurance experience. Involving clients in
insurance package design is based on an implied assumption that people can make judicious rationing decisions.
Judiciousness was assessed by examining the association between the frequency of choosing a package and its perceived
effectiveness. Perceived effectiveness was evaluated by comparing respondents’ choices to the costs registered in 2049 illness
episodes among a comparable cohort, using three criteria: ‘reimbursement’ (reimbursement regardless of the absolute level
of expenditure), ‘fairness’ (higher reimbursement rate for higher expenses) and ‘catastrophic coverage’ (insurance for
catastrophic exposure). The most frequently chosen packages scored highly on all three criteria; thus, rationing choices
were confirmed as judicious. Fully 88.4% of the respondents selected at least three of the following benefits: outpatient,
inpatient, drugs and tests, with a clear preference to cover high aggregate costs regardless of their probability. The results
Electronic copy available at: http://ssrn.com/abstract=1016681
e front matter r 2006 Published by Elsevier Ltd.
cscimed.2006.10.032
experiment was jointly implemented by the project ‘Strengthening Micro Health Insurance Units for the Poor in India’
al Institutes of Health of the US Public Health Service (NIH). The European Commission within the EU–India Economic
Programme funded the project. The household survey was partly funded by the Deutsche Gesellschaft fur Technische
it (GTZ India). NIH funded the development of CHAT materials, and personnel training and facilitation of the exercise.
ort was provided by the Birla Institute for Management Technology, Greater Noida (India). Persons who contributed
and, S. Khare, A. Joshi, N. Badwe, A. Rao, F. Hay and K. Shailabh, Dr. Sudarshan, and the leaders and residents of the
ticipated. O. Koren provided research assistance in data mining. R. Radermacher, and O. van Putten Rademaker provided
cal support. The opinions expressed are those of the authors, and do not reflect positions of the institutions they are
.
ing author. Tel.: +41 78 790 6789; fax: +41 22 788 2288.
resses: [email protected] (D.M. Dror), [email protected] (R. Koren), [email protected] (A. Ost),
@gmail.com (E. Binnendijk), [email protected] (S. Vellakkal), [email protected] (M. Danis).
ARTICLE IN PRESSD.M. Dror et al. / Social Science & Medicine 64 (2007) 884–896 885
show that involving prospective clients in benefit package design can be done without compromising the judiciousness of
rationing choices, even with people who have low education, low-income and no previous experience in similar exercises.
r 2006 Published by Elsevier Ltd.
Keywords: India; Benefit package design; Low-income population; Rationing choices; Access to healthcare; Health insurance
Introduction
The purpose of this article is to draw policyinsights from the analysis of choices made byprospective clients among the poor in India onbenefit-package composition for health insurance.
Many authors agree that if the poor are to acceptinsurance, it must respond to their needs(Ahuja & Jutting, 2004; Gumber, 2002; Leftley,2005; Radwan, 2005). However, these authorsadvocate that the industry design different insur-ance products for the poor, but do not refer toperceived priorities of the clients themselves. Theliterature on consumer-driven healthcare has so fardealt mainly with the situation in rich countries.Coast (2001) investigated whether citizens want tomake rationing decisions in healthcare in thecontext of universal coverage in the UK. Herfindings suggest inter alia that the potential distressthat denying care may cause increases citizens’desire to be directly involved in such decisions.Following this logic, poor population segments inlow-income countries, who can at best buy onlyseverely rationed health insurance packages, wouldpresumably be exposed to high potential distressdue to limited access to healthcare, and wouldtherefore wish to be involved in rationing decisions.In developing countries, there is a general shortageof information and data about the preferences ofhouseholds (Asfaw, 2003). Specifically, there is verylittle literature on the preferences of prospectiveclients of health insurance who personify simulta-neously low-income, low-education, low-numeracyand low- or no experience with insurance. The fewstudies we were able to identify concluded that‘groups of low-income uninsured individuals [in theUSA] are able to identify acceptable benefitpackages that are comparable in cost but differ inbenefit design from managed care contracts offeredto many US employees’ (Danis, Biddle, & Goold,2002); that clients’ satisfaction with benefit-packagedesign in a community-based health insurancescheme in West Africa contributed to a higherwillingness to enroll (De Allegri, Sanon, Bridges, &Sauerborn, 2006); and that in the same area, there
Electronic copy available at: http:
were strong preferences for inclusion of high-costhealth services such as operation, essential drugsand consultation fees in the benefit package (Dong,Mugisha, Gbangou, Kouyate, & Sauerborn, 2004).Finally, one study, carried out in India on asomewhat related topic, suggested that most house-holds would prefer a comprehensive benefit packageover partial coverage (Mathiyazhagan, 1998). How-ever, this falls short of evidence-based reporting ofthe preferences of such population segments inIndia. Thus, our article offers new information onthe expressed priorities of households that wereasked to compose the health insurance package oftheir choice.
In India today, out-of-pocket spending by house-holds for healthcare represents about 73% of totalhealth expenditure (WHO, 2006); another estimateputs that rate at more than 80% (Devadasan,Ranson, Van Damme, Acharya, & Criel, 2005).This high rate exposes many households to un-expected and unaffordable healthcare costs forwhich insurance can be an attractive and cheaperalternative (Ray, Pandav, Anand, Kapoor, &Dwivedi, 2002). However, at present only about3% of India’s population, mostly in the formalsector, benefit from some form of health insuranceand the role of grassroots community-basedschemes is prominent in the informal economyrelative to the alternatives offered by the publicsector or by commercial insurers (Devadasan et al.,2005; Tabor, 2005).
Furthermore, community-based health insuranceschemes in India cover a partial benefit package thatreflects the assumption that premiums are the mainsource of financing. If the poor are to pay forinsurance, the package must be attractive in tworegards: it must meet clients’ perceived needs and beaffordable to them (Radwan, 2005; Wiesmann &Jutting, 2000). Since affiliation to grassroots schemesis voluntary, and considering that willingness to joinsuch schemes may increase when prospective clientsare satisfied with the benefit package and identifywith it (De Allegri et al., 2006; Fleck, 1994; Schone &Cooper, 2001), it is important to develop a tool toassess prospective clients’ priorities.
//ssrn.com/abstract=1016681
ARTICLE IN PRESS
Table 1
Sticker cost of benefits
Benefit types Coverage level
Basic Medium High
Drugs (D) 18 18+12 18+12+12
Outpatient medicine (OP) 11 11+6 11+6+10
Hospitalization (IP) 10 10+6 10+6+8
Tests (T) 8 8+5 8+5+5
Dental care (DEN) 7 7+4 7+4+5
Medical equipment (ME) 5 5+3 5+3+3
Preventive care (P) 1 1+1 1+1+1
Maternity (M) 1 1+1
Indirect costs (IC) 1 1+1
Mental health care (MH) 1 1+1
D.M. Dror et al. / Social Science & Medicine 64 (2007) 884–896886
The novelty of the experiment described in thisarticle is that it divulges information on therationing choices of low-income, low-educationpopulation segments in India who were given theopportunity to compose an affordable benefitpackage.
Methods
Study design
The ‘Choosing Healthplans All Together’(CHAT) experiment described here is based on amodified version of an original CHAT tool devel-oped and tested in the USA (Danis et al., 2002;Danis, Biddle, & Goold, 2004; Goold, Biddle,Klipp, Hall, & Danis, 2005; Keefe & Goold,2004). Around 302 individuals organized in 24groups participated in the exercise. The exercisewas carried out in November–December 2005, inKarnataka and Maharashtra. Selection of thevillages or neighborhoods of towns where theinterviews were conducted was purposive, basedon contacts the research group established througha household survey conducted earlier in 2005.Participation in the groups was voluntary, anddepended on availability of persons at the day andtime of assembly rather than on sampling techni-ques. In reality, most people in the locations wantedto participate. The material was translated intoseveral local languages; local facilitators weretrained to read out instructions and provideexplanations so that illiterate persons could never-theless participate. We saw no evidence thatilliterate persons were less intelligent or less capableof making choices once they were given help toovercome the objective limitation of illiteracy.
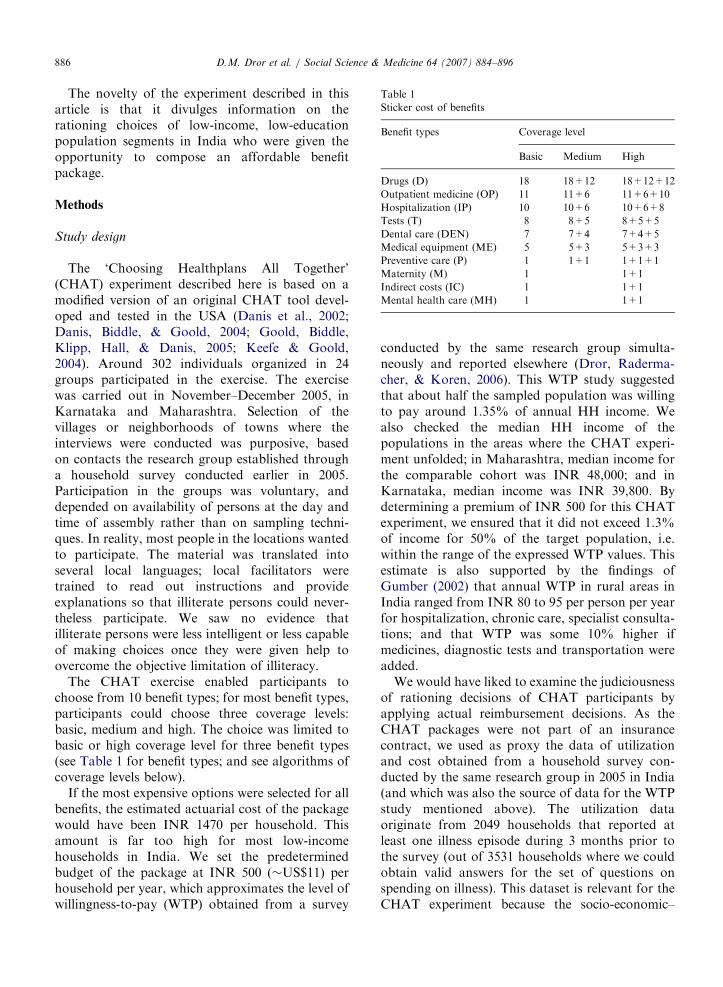
The CHAT exercise enabled participants tochoose from 10 benefit types; for most benefit types,participants could choose three coverage levels:basic, medium and high. The choice was limited tobasic or high coverage level for three benefit types(see Table 1 for benefit types; and see algorithms ofcoverage levels below).
If the most expensive options were selected for allbenefits, the estimated actuarial cost of the packagewould have been INR 1470 per household. Thisamount is far too high for most low-incomehouseholds in India. We set the predeterminedbudget of the package at INR 500 (�US$11) perhousehold per year, which approximates the level ofwillingness-to-pay (WTP) obtained from a survey
conducted by the same research group simulta-neously and reported elsewhere (Dror, Raderma-cher, & Koren, 2006). This WTP study suggestedthat about half the sampled population was willingto pay around 1.35% of annual HH income. Wealso checked the median HH income of thepopulations in the areas where the CHAT experi-ment unfolded; in Maharashtra, median income forthe comparable cohort was INR 48,000; and inKarnataka, median income was INR 39,800. Bydetermining a premium of INR 500 for this CHATexperiment, we ensured that it did not exceed 1.3%of income for 50% of the target population, i.e.within the range of the expressed WTP values. Thisestimate is also supported by the findings ofGumber (2002) that annual WTP in rural areas inIndia ranged from INR 80 to 95 per person per yearfor hospitalization, chronic care, specialist consulta-tions; and that WTP was some 10% higher ifmedicines, diagnostic tests and transportation wereadded.
We would have liked to examine the judiciousnessof rationing decisions of CHAT participants byapplying actual reimbursement decisions. As theCHAT packages were not part of an insurancecontract, we used as proxy the data of utilizationand cost obtained from a household survey con-ducted by the same research group in 2005 in India(and which was also the source of data for the WTPstudy mentioned above). The utilization dataoriginate from 2049 households that reported atleast one illness episode during 3 months prior tothe survey (out of 3531 households where we couldobtain valid answers for the set of questions onspending on illness). This dataset is relevant for theCHAT experiment because the socio-economic–

ARTICLE IN PRESSD.M. Dror et al. / Social Science & Medicine 64 (2007) 884–896 887
demographic characteristics of the cohorts werecomparable. We applied the CHAT business rulesto this proxy.
Algorithms for the calculation of coverage levels
Basic level of coverage: covers 50% of all costs;50% is paid out-of-pocket
Medium level of coverage: benefit increases as thebill increases, according to the following formula:
a.
bill under median cost: insurance pays 50% ofbill,b.
bill between median and 70th percentile: insur-ance paysðMedian=2Þ þ ðbill�median � 0:9Þ.
c.
bill higher than 70th percentile: insurance pays:ðMedian=2Þ þ ðp70�medianÞ � 0:9
þ ðbill� p70Þ � 0:95.
High level of coverage: 100% of all costs; zeroout-of-pocket payment.
We did not expect the participants to understandthese complex algorithms, and explained the re-imbursement rules using easy-to-understand exam-ples. For instance, the explanation forhospitalization was as follows: ‘Basic level: Insur-ance pays half your bill. Medium level: You pay halfthe cost of low amounts, but as your bill increasesyour insurance payments increase even more. Forexample, when your bill is INR 1000 you pay INR500, but when the bill is INR 10,000 you pay onlyINR 1275. High level: Insurance pays your entirebill’.
Definitions of what is included under the various
benefit types
The cost of drugs (D) includes only prescribedallopathic drugs but excludes the cost of traditional(homeopathic or ayurvedic) drugs and unprescribeddrugs.
The cost of outpatient care (OP) includespayments for consultations with a general practi-tioner, pediatrician and with specialists, but ex-cludes consultations with traditional practitioners.
Inpatient care (IP) costs reflect all out-of-pocketcosts that are required during periods of IP,including surgery in hospital (note: antenatal &
postnatal care & confinement for delivery arecategorized as maternity benefits, not IP).
The cost of diagnostic tests (T) includes lab testsand medical imaging.
The cost of dental care (Den) includes all caregiven by a dentist.
The cost of medical equipment (ME) includes eyeglasses, hearing aids, wheelchairs, crutches andambulance.
The cost of preventive care (P) includes preventiveservices for household members older than 1 year.
The cost of maternity (M) includes mother’s carebefore, during and after delivery in hospital, andchild’s care until 1 year; also includes familyplanning.
The cost of indirect costs (IC) covers INR 50 orINR 100 (for basic or high levels of coverage,respectively) per day of hospitalization (compensat-ing wage loss and transportation of patient and caregiver). IC also covers the cost of continuing thehealth insurance coverage if the HH head died or ispermanently disabled (3 months coverage at basiclevel and 6 months’ extension at high level).
The cost of mental health (MH) covers treatmentfor mental illnesses, alcohol or drug abuse.
Actuarial estimates of costs
The incidence and distribution of unit costs ofhospitalizations, consultations, diagnostic tests andpurchase of prescribed drugs was estimated based onthe HH survey, and adjusted as necessary by anactuary with field experience in India. The incidenceand distribution of unit costs of P, Den, mental care,ME and M was estimated by the same actuary. Theestimated incidence of IC was established by theactuary. The adjustments made to the data were basedon actuarial experience with various insurance schemesin India and other countries considering the overallnational household expenditures for health in India.
The actuarial calculations that determine the costof the benefits were expressed in monetary terms,which were converted to stickers. Respondentsreceived a budget of 50 stickers (each sticker reflectedthe value of INR 10). The ‘sticker values’ of eachbenefit type and each level of coverage that wasavailable in this experiment are shown in Table 1.
The choices that clients could make
The version of the CHAT exercise consisted oftwo rounds. In the first round, each participant
ARTICLE IN PRESSD.M. Dror et al. / Social Science & Medicine 64 (2007) 884–896888
composed a benefit package that met his/her andher/his families’ priorities separately, by selectingbenefit types and the level of coverage (basic,medium or high). Players indicated their choicesby gluing stickers on circles drawn on a board. Inthe second round of the game, the whole group(group sizes ranged from 10 to 17 respondents)composed a benefit package that reflected the choiceof the entire group; at this stage, group discussionscontinued until a consensus had been reached.During the discussions, the facilitator mediated theprocess to ensure that preferences of all participantswere considered. In cases when facilitators notedattempts of certain respondents to dominate thediscussion, they intervened and requested thoseindividuals to respect the feeling of others. Theopinions of all participants on the fairness of theprocess were solicited through an exit questionnaire;72% strongly agreed and 27% agreed with thestatement: ‘the way the group reached its decisionwas equally fair to each member of the group’.More details on the group dynamics and partici-pants’ satisfaction with the process are providedelsewhere (Danis et al., 2006).
The process of choice offered in the CHATexercise obliged respondents to make a yes–nochoice first; if respondents did not choose aparticular benefit, the outcome was termed ‘noth-ing’. For every benefit chosen, participants had toselect the basic level of benefits first, and addstickers for the choice of a higher level of coveragethereafter.
At the end of round one, players picked health
event cards that contain a scenario/story of an illnessepisode and what it costs. Participants could thenestimate what they would have received from theinsurance according to the coverage level theyselected (basic, medium or high) if they hadexperienced the same scenario. The validation ofchoices against a concrete scenario was read outaloud and thus enabled participants to assess theirchoices, or change them in the next round.
Data
The choices noted by players on the CHATboards were uploaded to an electronic file. Thedataset retained the identification of each group ofplayers, as well as a separate record of replies inround one and in round two. The structure of therecord ensured confidentiality, as replies were nottraceable back to any specific respondent.
Analysis
Statistical analysis of the data was performed byusing SPSS statistical software.
Findings
Choices made by participants
The choices of respondents (the number of repliesand percent of total population that selected thebenefit types, as well as levels of service) arerecorded in Table 2.
The number of positive replies (including basic,medium or high levels) is significantly higher (w2
test) than the negative ones (who preferred exclud-ing that benefit), for all benefits except Den andME. We observe more choices at the basic level(1626), followed by high level (5 2 1) and fewestchoices of medium level of coverage (49). If benefittypes are ranked according to the frequency ofpositive replies, the ranking is as follows: M (100%positive replies); drugs (92.7%); IC (90.4%); tests(83.8%); IP (82.1%); P (77.8%); OP (56.6%); MH(56.0%); ME (45.7%); and Den (42.1% positivereplies).
Major benefits
The facilitators who observed the entire experi-ment reported that most respondents started theselection process by choosing two, three or four ofthe following: D, OP, IP and T. Non-access to thesefour benefits can spell disaster in case of illness, andpaying for this access out-of-pocket could signifi-cantly deplete household finances because theyrepresent the highest aggregate expenses. The highcost of these services was also reflected in the highsticker cost (shown in Table 1). They were thusdenoted here as ‘major benefits’.
In Table 3 we show the combinations of majorbenefits that respondents selected in this CHATexperiment. The cost of the combination includingall four major benefits at basic level of coverage was47 stickers of the available 50. This leaves very fewstickers for other benefit. Participants were thusconfronted with the question whether to select allfour major benefits at basic level or to forego one ormore of the ‘major four’ in order to buy highercoverage levels for the remaining major benefitsand/or include minor benefits in their package.Participants chose only eight combinations that

ARTICLE IN PRESS
Table 3
Packages chosen
Choicea No. of groups No. of individuals % of all
individuals
Sticker cost (%) Stickers left for
minor benefits
1 OP(b)+IP(b)+T(b)+D(b) 6 81 26.8 47 3
2 IP(b)+T(b)+D(b) 8 96 31.8 36 14
3 OP(b)+T(b)+D(b) 3 42 13.9 37 13
4 OP(b)+IP(b)+D(b) 3 36 11.9 39 11
5 OP(b)+IP(b)+T(b) 1 12 4.0 29 21
6 IP(m)+D(b) 1 13 4.3 34 16
7 T(m)+D(b) 1 12 4.0 31 19
8 IP(h)+T(h) 1 10 3.3 42 8
aOP ¼ outpatient; IP ¼ inpatient; T ¼ tests; D ¼ drugs; (b) ¼ basic; (m) ¼ medium; (h) ¼ high.
Table 2
Choices of the participants
Type of benefits Nothing Basic Medium High
Replies % of total Replies % of total Replies % of total Replies % of total
Drugs (D) 22 7.28 280 92.72 0 0.00 0 0.00
Out patient medicine (OP) 131 43.38 171 56.62 0 0.00 0 0.00
Hospitalization (IP) 54 17.88 225 74.50 13 4.30 10 3.31
Tests (T) 49 16.23 231 76.49 12 3.97 10 3.31
Dental care (DEN) 175 57.95 115 38.08 12 3.97 0 0.00
Medical equipment (ME) 164 54.30 138 45.70 0 0.00 0 0.00
Preventive care (P) 67 22.19 105 34.77 12 3.97 118 39.07
Maternity (M) 0 0.00 144 47.68 0 0.00 158 52.32
Indirect costs (IC) 29 9.60 130 43.05 0 0.00 143 47.35
Mental health care (MH) 133 44.04 87 28.81 0 0.00 82 27.15
Totals 824 1626 49 521
D.M. Dror et al. / Social Science & Medicine 64 (2007) 884–896 889
include one or more of the four major benefits,described in Table 3. Many other permutations weretheoretically possible.
The data in Table 3 show that 88.4% of theparticipants chose a package that includes at leastthree of the ‘major benefits’ and all choices are atthe basic level of coverage. The remaining 11.6% ofthe participants chose only two of the majorbenefits, but at coverage levels that were sometimeshigher than basic.
Criteria to determine the perceived effectiveness of
benefit packages
The entire proposition of involving clients inbenefit-package design is based on an impliedassumption that a group of people acting as acohesive social unit can relate, better than any
outsider, needs and priorities to the location-specificconditions, prevalent activities and level of re-sources (Dror & Jacquier, 1999). It also impliesthat people are capable of judicious rationingdecisions. We propose that a positive associationbetween the frequency of a choice of a package andits perceived effectiveness would signify a ‘judiciousrationing decision’.
We define the following criteria as the quantita-tive expressions of the ‘perceived effectiveness of abenefit package’:
(1)
The reimbursement criterion: suggests that in-sured wish to be reimbursed some part of everybill, regardless of whether the absolute level ofexpenditure is low or high. This attribute isimportant for people who perceive insurance asuseless when there is no reimbursement in case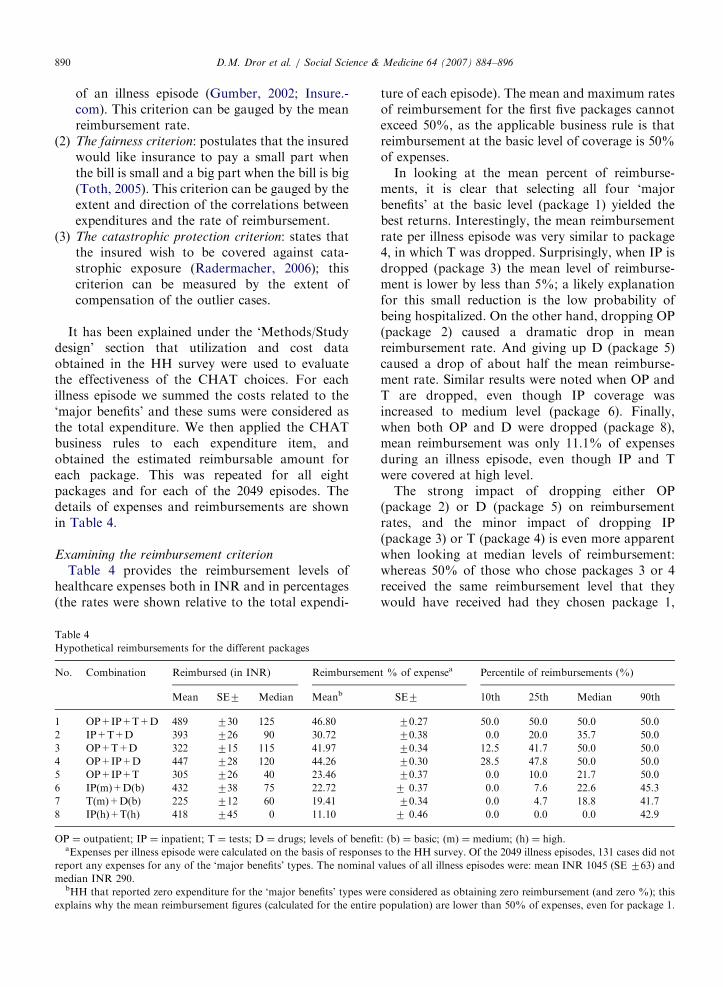
ARTICLE IN PRESS
Tab
Hyp
No.
1
2
3
4
5
6
7
8
OPaE
repo
medbH
expl
D.M. Dror et al. / Social Science & Medicine 64 (2007) 884–896890
of an illness episode (Gumber, 2002; Insure.-com). This criterion can be gauged by the meanreimbursement rate.
(2)
The fairness criterion: postulates that the insuredwould like insurance to pay a small part whenthe bill is small and a big part when the bill is big(Toth, 2005). This criterion can be gauged by theextent and direction of the correlations betweenexpenditures and the rate of reimbursement.(3)
The catastrophic protection criterion: states thatthe insured wish to be covered against cata-strophic exposure (Radermacher, 2006); thiscriterion can be measured by the extent ofcompensation of the outlier cases.It has been explained under the ‘Methods/Studydesign’ section that utilization and cost dataobtained in the HH survey were used to evaluatethe effectiveness of the CHAT choices. For eachillness episode we summed the costs related to the‘major benefits’ and these sums were considered asthe total expenditure. We then applied the CHATbusiness rules to each expenditure item, andobtained the estimated reimbursable amount foreach package. This was repeated for all eightpackages and for each of the 2049 episodes. Thedetails of expenses and reimbursements are shownin Table 4.
Examining the reimbursement criterion
Table 4 provides the reimbursement levels ofhealthcare expenses both in INR and in percentages(the rates were shown relative to the total expendi-
le 4
othetical reimbursements for the different packages
Combination Reimbursed (in INR) Reimbursemen
Mean SE7 Median Meanb
OP+IP+T+D 489 730 125 46.80
IP+T+D 393 726 90 30.72
OP+T+D 322 715 115 41.97
OP+IP+D 447 728 120 44.26
OP+IP+T 305 726 40 23.46
IP(m)+D(b) 432 738 75 22.72
T(m)+D(b) 225 712 60 19.41
IP(h)+T(h) 418 745 0 11.10
¼ outpatient; IP ¼ inpatient; T ¼ tests; D ¼ drugs; levels of benefi
xpenses per illness episode were calculated on the basis of response
rt any expenses for any of the ‘major benefits’ types. The nominal
ian INR 290.
H that reported zero expenditure for the ‘major benefits’ types we
ains why the mean reimbursement figures (calculated for the entire
ture of each episode). The mean and maximum ratesof reimbursement for the first five packages cannotexceed 50%, as the applicable business rule is thatreimbursement at the basic level of coverage is 50%of expenses.
In looking at the mean percent of reimburse-ments, it is clear that selecting all four ‘majorbenefits’ at the basic level (package 1) yielded thebest returns. Interestingly, the mean reimbursementrate per illness episode was very similar to package4, in which T was dropped. Surprisingly, when IP isdropped (package 3) the mean level of reimburse-ment is lower by less than 5%; a likely explanationfor this small reduction is the low probability ofbeing hospitalized. On the other hand, dropping OP(package 2) caused a dramatic drop in meanreimbursement rate. And giving up D (package 5)caused a drop of about half the mean reimburse-ment rate. Similar results were noted when OP andT are dropped, even though IP coverage wasincreased to medium level (package 6). Finally,when both OP and D were dropped (package 8),mean reimbursement was only 11.1% of expensesduring an illness episode, even though IP and Twere covered at high level.
The strong impact of dropping either OP(package 2) or D (package 5) on reimbursementrates, and the minor impact of dropping IP(package 3) or T (package 4) is even more apparentwhen looking at median levels of reimbursement:whereas 50% of those who chose packages 3 or 4received the same reimbursement level that theywould have received had they chosen package 1,
t % of expensea Percentile of reimbursements (%)
SE7 10th 25th Median 90th
70.27 50.0 50.0 50.0 50.0
70.38 0.0 20.0 35.7 50.0
70.34 12.5 41.7 50.0 50.0
70.30 28.5 47.8 50.0 50.0
70.37 0.0 10.0 21.7 50.0
7 0.37 0.0 7.6 22.6 45.3
70.34 0.0 4.7 18.8 41.7
7 0.46 0.0 0.0 0.0 42.9
t: (b) ¼ basic; (m) ¼ medium; (h) ¼ high.
s to the HH survey. Of the 2049 illness episodes, 131 cases did not
values of all illness episodes were: mean INR 1045 (SE 763) and
re considered as obtaining zero reimbursement (and zero %); this
population) are lower than 50% of expenses, even for package 1.
ARTICLE IN PRESS
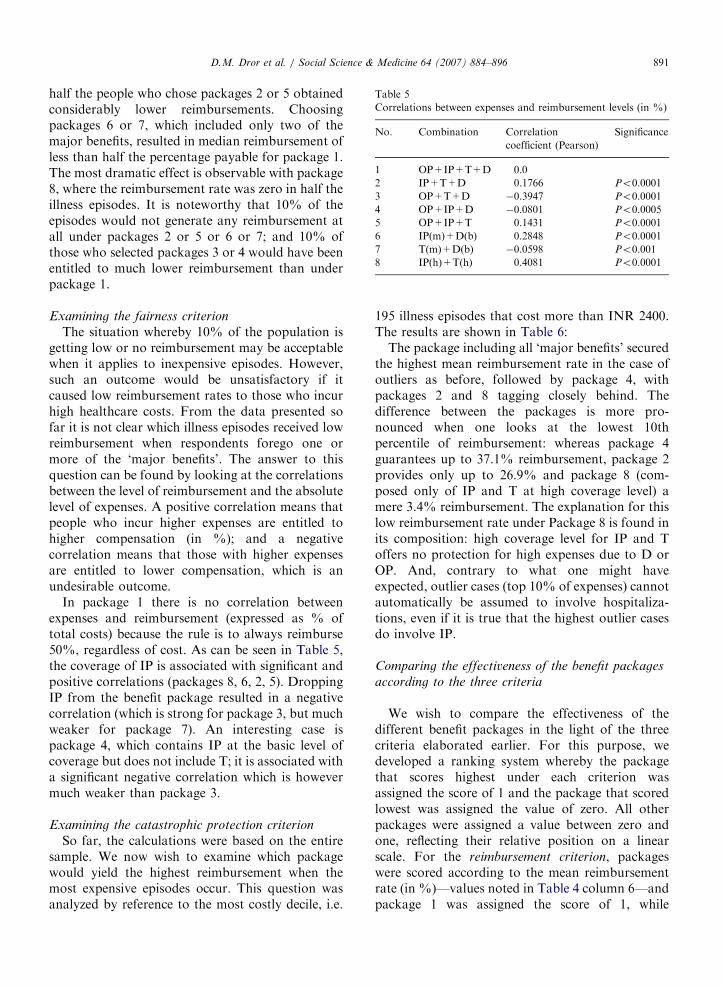
Table 5
Correlations between expenses and reimbursement levels (in %)
No. Combination Correlation
coefficient (Pearson)
Significance
1 OP+IP+T+D 0.0
2 IP+T+D 0.1766 Po0.0001
3 OP+T+D �0.3947 Po0.0001
4 OP+IP+D �0.0801 Po0.0005
5 OP+IP+T 0.1431 Po0.0001
6 IP(m)+D(b) 0.2848 Po0.0001
7 T(m)+D(b) �0.0598 Po0.001
8 IP(h)+T(h) 0.4081 Po0.0001
D.M. Dror et al. / Social Science & Medicine 64 (2007) 884–896 891
half the people who chose packages 2 or 5 obtainedconsiderably lower reimbursements. Choosingpackages 6 or 7, which included only two of themajor benefits, resulted in median reimbursement ofless than half the percentage payable for package 1.The most dramatic effect is observable with package8, where the reimbursement rate was zero in half theillness episodes. It is noteworthy that 10% of theepisodes would not generate any reimbursement atall under packages 2 or 5 or 6 or 7; and 10% ofthose who selected packages 3 or 4 would have beenentitled to much lower reimbursement than underpackage 1.
Examining the fairness criterion
The situation whereby 10% of the population isgetting low or no reimbursement may be acceptablewhen it applies to inexpensive episodes. However,such an outcome would be unsatisfactory if itcaused low reimbursement rates to those who incurhigh healthcare costs. From the data presented sofar it is not clear which illness episodes received lowreimbursement when respondents forego one ormore of the ‘major benefits’. The answer to thisquestion can be found by looking at the correlationsbetween the level of reimbursement and the absolutelevel of expenses. A positive correlation means thatpeople who incur higher expenses are entitled tohigher compensation (in %); and a negativecorrelation means that those with higher expensesare entitled to lower compensation, which is anundesirable outcome.
In package 1 there is no correlation betweenexpenses and reimbursement (expressed as % oftotal costs) because the rule is to always reimburse50%, regardless of cost. As can be seen in Table 5,the coverage of IP is associated with significant andpositive correlations (packages 8, 6, 2, 5). DroppingIP from the benefit package resulted in a negativecorrelation (which is strong for package 3, but muchweaker for package 7). An interesting case ispackage 4, which contains IP at the basic level ofcoverage but does not include T; it is associated witha significant negative correlation which is howevermuch weaker than package 3.
Examining the catastrophic protection criterion
So far, the calculations were based on the entiresample. We now wish to examine which packagewould yield the highest reimbursement when themost expensive episodes occur. This question wasanalyzed by reference to the most costly decile, i.e.
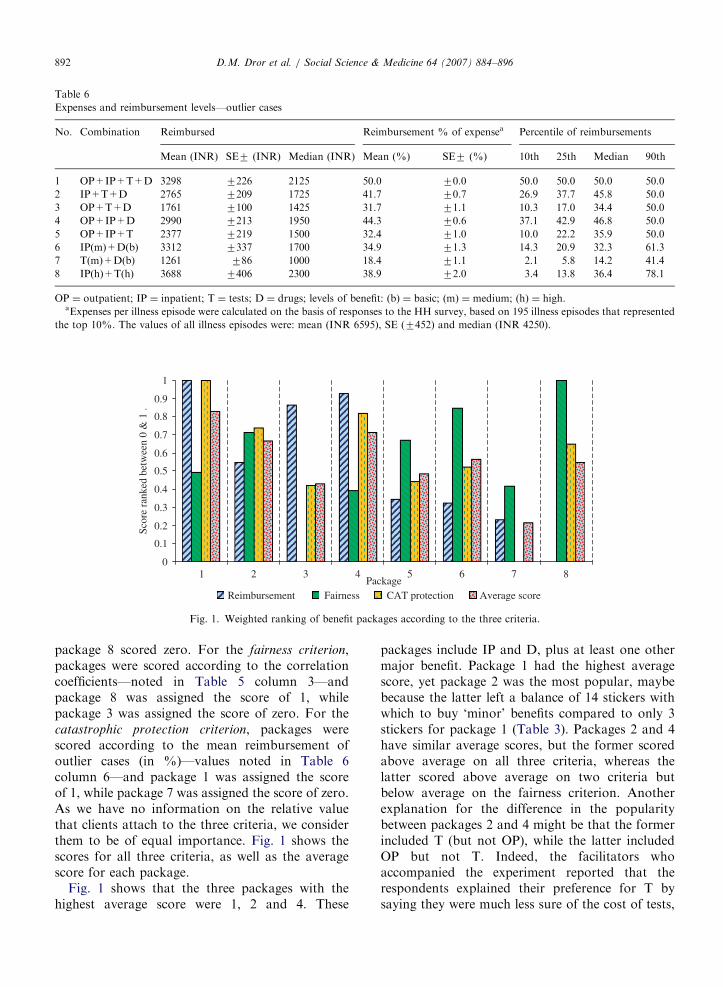
195 illness episodes that cost more than INR 2400.The results are shown in Table 6:
The package including all ‘major benefits’ securedthe highest mean reimbursement rate in the case ofoutliers as before, followed by package 4, withpackages 2 and 8 tagging closely behind. Thedifference between the packages is more pro-nounced when one looks at the lowest 10thpercentile of reimbursement: whereas package 4guarantees up to 37.1% reimbursement, package 2provides only up to 26.9% and package 8 (com-posed only of IP and T at high coverage level) amere 3.4% reimbursement. The explanation for thislow reimbursement rate under Package 8 is found inits composition: high coverage level for IP and Toffers no protection for high expenses due to D orOP. And, contrary to what one might haveexpected, outlier cases (top 10% of expenses) cannotautomatically be assumed to involve hospitaliza-tions, even if it is true that the highest outlier casesdo involve IP.
Comparing the effectiveness of the benefit packages
according to the three criteria
We wish to compare the effectiveness of thedifferent benefit packages in the light of the threecriteria elaborated earlier. For this purpose, wedeveloped a ranking system whereby the packagethat scores highest under each criterion wasassigned the score of 1 and the package that scoredlowest was assigned the value of zero. All otherpackages were assigned a value between zero andone, reflecting their relative position on a linearscale. For the reimbursement criterion, packageswere scored according to the mean reimbursementrate (in %)—values noted in Table 4 column 6—andpackage 1 was assigned the score of 1, while
ARTICLE IN PRESS
Table 6
Expenses and reimbursement levels—outlier cases
No. Combination Reimbursed Reimbursement % of expensea Percentile of reimbursements
Mean (INR) SE7 (INR) Median (INR) Mean (%) SE7 (%) 10th 25th Median 90th
1 OP+IP+T+D 3298 7226 2125 50.0 70.0 50.0 50.0 50.0 50.0
2 IP+T+D 2765 7209 1725 41.7 70.7 26.9 37.7 45.8 50.0
3 OP+T+D 1761 7100 1425 31.7 71.1 10.3 17.0 34.4 50.0
4 OP+IP+D 2990 7213 1950 44.3 70.6 37.1 42.9 46.8 50.0
5 OP+IP+T 2377 7219 1500 32.4 71.0 10.0 22.2 35.9 50.0
6 IP(m)+D(b) 3312 7337 1700 34.9 71.3 14.3 20.9 32.3 61.3
7 T(m)+D(b) 1261 786 1000 18.4 71.1 2.1 5.8 14.2 41.4
8 IP(h)+T(h) 3688 7406 2300 38.9 72.0 3.4 13.8 36.4 78.1
OP ¼ outpatient; IP ¼ inpatient; T ¼ tests; D ¼ drugs; levels of benefit: (b) ¼ basic; (m) ¼ medium; (h) ¼ high.aExpenses per illness episode were calculated on the basis of responses to the HH survey, based on 195 illness episodes that represented
the top 10%. The values of all illness episodes were: mean (INR 6595), SE (7452) and median (INR 4250).
0
0.1
0.2
0.3
0.4
0.5
0.6
0.7
0.8
0.9
1
1Package
Scor
e ra
nked
bet
wee
n 0
& 1
.
Reimbursement Fairness CAT protection Average score
2 3 4 5 6 7 8
Fig. 1. Weighted ranking of benefit packages according to the three criteria.
D.M. Dror et al. / Social Science & Medicine 64 (2007) 884–896892
package 8 scored zero. For the fairness criterion,packages were scored according to the correlationcoefficients—noted in Table 5 column 3—andpackage 8 was assigned the score of 1, whilepackage 3 was assigned the score of zero. For thecatastrophic protection criterion, packages werescored according to the mean reimbursement ofoutlier cases (in %)—values noted in Table 6column 6—and package 1 was assigned the scoreof 1, while package 7 was assigned the score of zero.As we have no information on the relative valuethat clients attach to the three criteria, we considerthem to be of equal importance. Fig. 1 shows thescores for all three criteria, as well as the averagescore for each package.
Fig. 1 shows that the three packages with thehighest average score were 1, 2 and 4. These
packages include IP and D, plus at least one othermajor benefit. Package 1 had the highest averagescore, yet package 2 was the most popular, maybebecause the latter left a balance of 14 stickers withwhich to buy ‘minor’ benefits compared to only 3stickers for package 1 (Table 3). Packages 2 and 4have similar average scores, but the former scoredabove average on all three criteria, whereas thelatter scored above average on two criteria butbelow average on the fairness criterion. Anotherexplanation for the difference in the popularitybetween packages 2 and 4 might be that the formerincluded T (but not OP), while the latter includedOP but not T. Indeed, the facilitators whoaccompanied the experiment reported that therespondents explained their preference for T bysaying they were much less sure of the cost of tests,
ARTICLE IN PRESSD.M. Dror et al. / Social Science & Medicine 64 (2007) 884–896 893
some of which could be very expensive, but knewthe expected costs of OP.
Packages 3 and5 also include three of the fourmajor benefits, but unlike packages 2 and 4, did notinclude one of the critical components: IP or D.They scored below average. Packages 6, 7 and 8 arecomposed of only two major benefits, whichprevented them from scoring high (except on thefairness criterion); these packages were selected byonly one group each.
In summary, the analysis shown in Fig. 1 helpsdistill an important insight on the effective compo-sition of the benefit packages: IP and D have ahigher significance than the other major benefits.And a composition of three major benefits thatincludes these two and that scores well on all threecriteria is the most interesting for the clients.
Minor benefits
The balance of the sticker-budget after the majorbenefits are chosen determines the choices of minorbenefits. The balance of sticker-budget and thenumber of possible combinations to select minorbenefits are shown in Table 7 for each of thepackages. The large gap between the number ofpossible combinations and the number of thecombinations actually chosen indicates a coherentset of priorities rather than random distribution ofchoices.
It should be noted that two of the minor benefits(ME and Den) are more costly than the other fourwhich offer basic coverage with one sticker and highcoverage with 2 or 3 stickers only (Table 1). Thisprice difference has an impact on the possiblechoices. For instance, respondents with a balance ofless than five stickers must buy the cheap minorbenefits. And respondents who have more than nine
Table 7
The number of possible combinations and the number actually chosen
Package Stickers left for
minors
1 OP(b)+IP(b)+T(b)+D(b) 3
2 IP(b)+T(b)+D(b) 14
3 OP(b)+T(b)+D(b) 13
4 OP(b)+IP(b)+D(b) 11
5 OP(b)+IP(b)+T(b) 21
6 IP(m)+D(b) 16
7 T(m)+D(b) 19
8 IP(h)+T(h) 8
stickers must buy at least one of the costly minorbenefits, because the cost of buying all the cheapminor benefits at the high level is exactly ninestickers.
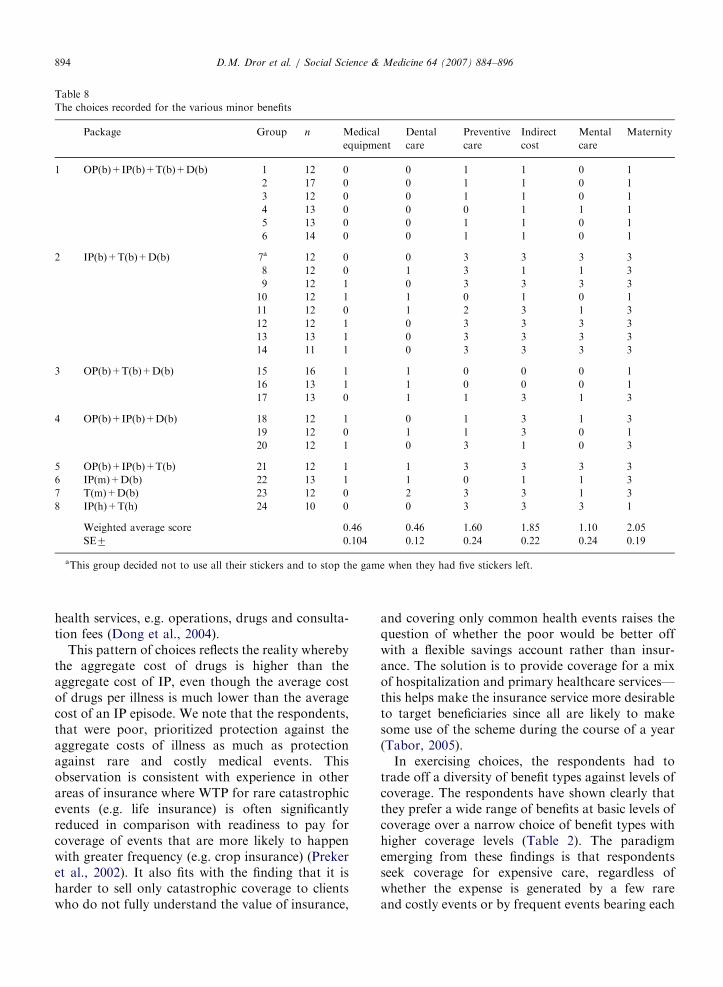
Table 8 presents the choices of minor benefits thatwere recorded during the experiment. The choicesare represented here as scores, where ‘0’ means thatthe benefit was not chosen, and ‘1’, ‘2’ and ‘3’ thatthe benefit was chosen at the basic, medium andhigh level of coverage, respectively.
The average scores shown at the bottom of Table8 are weighted according to the number ofrespondents in each of the 24 groups. As can beseen, in the choice between the two costly minorbenefits (Den and ME) the score was the same forboth. And in the choice of the less costly minorbenefits, groups consistently favored M, followed byIC, followed by P, and mental care came last.
Discussion and conclusions
The main finding of this study is that rural, poor,predominantly illiterate and innumerate groups inIndia, many of whom have little experience withhealth insurance, have been able to compose benefitpackages for health insurance with a limited budgetof INR 500 (�US$11) per household per year.
The study shows that about 88% of respondentschose at least three out of four benefits that aredirectly related to vital care in case of illness andwhich also cost the most: D, IP, OP and T (denotedhere as ‘major benefits’). 92.7% of the respondentschose to cover D, and 82.1% chose IP. 70.5% of therespondents chose benefit packages that includedboth IP and D (Table 3). Interestingly, these choicesecho findings from Africa that people clearlypreferred a benefit package that included high-cost
Possible
combinations
Combinations
chosen
No. of groups
17 3 6
52 4 8
48 2 3
55 3 3
53 1 1
48 1 1
53 1 1
21 1 1
ARTICLE IN PRESS
Table 8
The choices recorded for the various minor benefits
Package Group n Medical
equipment
Dental
care
Preventive
care
Indirect
cost
Mental
care
Maternity
1 OP(b)+IP(b)+T(b)+D(b) 1 12 0 0 1 1 0 1
2 17 0 0 1 1 0 1
3 12 0 0 1 1 0 1
4 13 0 0 0 1 1 1
5 13 0 0 1 1 0 1
6 14 0 0 1 1 0 1
2 IP(b)+T(b)+D(b) 7a 12 0 0 3 3 3 3
8 12 0 1 3 1 1 3
9 12 1 0 3 3 3 3
10 12 1 1 0 1 0 1
11 12 0 1 2 3 1 3
12 12 1 0 3 3 3 3
13 13 1 0 3 3 3 3
14 11 1 0 3 3 3 3
3 OP(b)+T(b)+D(b) 15 16 1 1 0 0 0 1
16 13 1 1 0 0 0 1
17 13 0 1 1 3 1 3
4 OP(b)+IP(b)+D(b) 18 12 1 0 1 3 1 3
19 12 0 1 1 3 0 1
20 12 1 0 3 1 0 3
5 OP(b)+IP(b)+T(b) 21 12 1 1 3 3 3 3
6 IP(m)+D(b) 22 13 1 1 0 1 1 3
7 T(m)+D(b) 23 12 0 2 3 3 1 3
8 IP(h)+T(h) 24 10 0 0 3 3 3 1
Weighted average score 0.46 0.46 1.60 1.85 1.10 2.05
SE7 0.104 0.12 0.24 0.22 0.24 0.19
aThis group decided not to use all their stickers and to stop the game when they had five stickers left.
D.M. Dror et al. / Social Science & Medicine 64 (2007) 884–896894
health services, e.g. operations, drugs and consulta-tion fees (Dong et al., 2004).
This pattern of choices reflects the reality wherebythe aggregate cost of drugs is higher than theaggregate cost of IP, even though the average costof drugs per illness is much lower than the averagecost of an IP episode. We note that the respondents,that were poor, prioritized protection against theaggregate costs of illness as much as protectionagainst rare and costly medical events. Thisobservation is consistent with experience in otherareas of insurance where WTP for rare catastrophicevents (e.g. life insurance) is often significantlyreduced in comparison with readiness to pay forcoverage of events that are more likely to happenwith greater frequency (e.g. crop insurance) (Prekeret al., 2002). It also fits with the finding that it isharder to sell only catastrophic coverage to clientswho do not fully understand the value of insurance,
and covering only common health events raises thequestion of whether the poor would be better offwith a flexible savings account rather than insur-ance. The solution is to provide coverage for a mixof hospitalization and primary healthcare services—this helps make the insurance service more desirableto target beneficiaries since all are likely to makesome use of the scheme during the course of a year(Tabor, 2005).
In exercising choices, the respondents had totrade off a diversity of benefit types against levels ofcoverage. The respondents have shown clearly thatthey prefer a wide range of benefits at basic levels ofcoverage over a narrow choice of benefit types withhigher coverage levels (Table 2). The paradigmemerging from these findings is that respondentsseek coverage for expensive care, regardless ofwhether the expense is generated by a few rareand costly events or by frequent events bearing each
ARTICLE IN PRESSD.M. Dror et al. / Social Science & Medicine 64 (2007) 884–896 895
a moderate cost. This pattern of choice suggests thathealth insurance covering only low-probability-&-high-cost care would probably not be attractive tothis target population. On the other hand, benefitpackages that also include high-probability-&-low-cost care would find takers.
As this benefit-package composition challengesthe prevailing thought that health insurance canbe operated for low-probability-&-high-cost carebut less so for high-probability-&-low-cost care(Churchill, Liber, McCord, & Roth, 2003; Mor-duch, 2006), we examined the judiciousness of thechoices people make.
The literature on public involvement in healthcarepriority setting cites a range of methods to elicitpeople’s preferences regarding rationing prioritieswithin a fixed budget (Coast, 2001; Mullen, 1999;Ryan et al., 2001). However, we have been unable tofind reports using quantitative methods to examinethe judiciousness of choices made, let alone in arelevant context. Hence, the exercise of simulatingthe impact of different rationing choices on HHexpenditure for healthcare, and the criteria weformulated to evaluate different choices, are novelto the best of our knowledge.
We juxtaposed the choices respondents madewith costs related to actual illness episodes that wereregistered within a comparable cohort among poorpeople in India. Three criteria were employed forthe assessment of the results: the ‘reimbursement
criterion’ (which is based on the assumption thatrespondents will reject insurance when costs thatthey associate with the insurance are not reim-bursed, regardless of the absolute level); the ‘fairness
criterion’ (the underlying assumption of which isthat people prefer a higher share of reimbursementwhen higher costs are incurred, even when costs arenot catastrophically high); and the ‘catastrophic
protection criterion’ (which is based on the conceptthat insurance should provide adequate protectionagainst catastrophes).
The results confirm that the packages chosenmost frequently satisfied all three criteria. IncludingIP contributed most to protection against cata-strophic costs and to fairness, and including drugswas critical for the reimbursement criterion.
The analysis also showed that respondents werewilling to trade off optimal coverage of majorbenefits (package 1) in return for coverage ofminor benefits. The choice of minor benefits inlieu of major benefits reflects a wish to improvequality of life (by including ME) and prevent
situations of severe morbidity (by including P).This trade off also reflects the ability of therespondents to address their long-term needsas well as the needs of entire communities,rather than the needs of people with acute illnessesonly.
However, one should recall that contributoryhealth insurance schemes depend on a broad-basedwillingness to affiliate, which is presumably asso-ciated with clients’ satisfaction with the compositionof the benefit package. Hence, there would be astrong case for considering the choices of prospec-tive clients as a basis for benefit-package design.And this experiment provides encouraging proofthat the CHAT method offers a workable way toelicit respondents’ choices effectively.
The CHAT decision tool imposes the rule thatrespondents must choose benefits until they exhausta predetermined sticker budget; respondents canneither buy additional stickers nor forego stickers inexchange for a premium reduction. Nor canrespondents negotiate the prices of the benefits inthe setting of the game. This double inflexibilitycould bias the choices of benefits when respondentsare left with a small number of stickers that theymust ‘get rid of’. The bias occurs when respondentsselect benefits they do not really prioritize becausethis is their only option to dispose of the residualstickers (‘the residual sticker bias’). For instance,77.8% of the respondents chose P, but wouldas many have made the same choice if P had costmore than 1 to 3 stickers, or if they could haveobtained a premium reduction in lieu of the residualstickers?
In conclusion, the results of this analysis demon-strate that respondents can participate actively inthe design of their health insurance packages; thatthey make judicious choices even at their presentlevel of literacy and numeracy; and that the CHATexercise provides a means to identify clients’perceived priorities. Therefore, it seems an attractivetool for engaging potential clients in the launch ofvoluntary health insurance. This tool opens upoptions for policy makers in resource-poor coun-tries wishing to encourage the successful implemen-tation of contributory health insurance among low-income populations by supporting benefits that theclients prioritize through a subsidy of medium coverat the cost of basic cover. Such policy choice wouldhave the added advantage that it does not dampenthe willingness to affiliate and to pay, and limits thesubsidy to those who commit their own resources in
ARTICLE IN PRESSD.M. Dror et al. / Social Science & Medicine 64 (2007) 884–896896
improving their access to healthcare through healthinsurance.
References
Ahuja, R., & Jutting, J. (2004). Are the poor too poor to demand
health insurance?. New Delhi: Indian Council for Research on
International Economic Relations.
Asfaw, A. (2003). Cost of illness, demand for medical care, and
the prospect of community health insurance schemes in the
rural areas of Ethiopia. Development Economics and Policy,
p. 131.
Churchill, C., Liber, D., McCord, M., & Roth, J. (2003). Making
insurance work for microfinance institutions: A technical guide
to developing and delivering microinsurance. Geneva: Interna-
tional Labour Organization.
Coast, J. (2001). Citizens, their agents and health care rationing:
An exploratory study using qualitative methods. Health
Economics, 10(2), 159–174.
Danis, M., Biddle, A. K., & Goold, S. D. (2002). Insurance
benefit preferences of the low-income uninsured. Journal of
General Internal Medicine, 17(2), 125–133.
Danis, M., Biddle, A. K., & Goold, S. D. (2004).
Enrollees choose priorities for Medicare. Gerontologist,
44(1), 58–67.
Danis, M., Binnendijk, E., Ost, A., Vellakkal, S., Koren, R., & Dror,
D.M. (2006). Eliciting the health insurance benefit choices of low-
income populations in India with the CHAT exercise. Health
Services Management Research, submitted for publication.
De Allegri, M., Sanon, M., Bridges, J., & Sauerborn, R. (2006).
Understanding consumers’ preferences and decision to enroll
in community-based health insurance in rural West Africa.
Health Policy, 76(1), 58–71.
Devadasan, N., Ranson, K., Van Damme, W., Acharya, A., &
Criel, B. (2005). The landscape of community health
insurance in India: An overview based on 10 case studies.
Health Policy.
Dong, H., Mugisha, F., Gbangou, A., Kouyate, B., & Sauerborn,
R. (2004). The feasibility of community-based health insur-
ance in Burkina Faso. Health Policy, 69(1), 45–53.
Dror, DM., & Jacquier, C. (1999). Micro-insurance: Extending
health insurance to the excluded. International Social Security
Review, 52(1), 71–97.
Dror, D. M., Radermacher, R., & Koren, R. (2006). Willingness to
pay for health insurance among rural and poor persons: Field
evidence from seven micro health insurance units in India.
Health Policy, in press, doi:10.1016/j.healthpol.2006.07.011.
Fleck, L. M. (1994). Just caring: Health reform and health
care rationing. Journal of Medicine and Philosophy, 19(5),
435–443.
Goold, S. D., Biddle, A. K., Klipp, G., Hall, C. N., & Danis, M.
(2005). Choosing healthplans all together: A deliberative
exercise for allocating limited health care resources. Journal of
Health Politics Policy and Law, 30(4), 563–601.
Gumber, A. (2002). Health insurance for the informal sector:
Problems and prospects. New Delhi: Indian Council for
Research on International Economic Relations.
Insure.com. The 2004 national homeowners insurance study.
Browsed 21 May 2006 /http://info.insure.com/home/jdpo-
wer1101.htmlS.
Keefe, C. W., & Goold, S. D. (2004). Designing health plan
benefits: A simulation exercise. Medical Education, 38(11),
1196.
Leftley, R. (2005). Technical assistance for the promotion of
micro insurance—The experience of opportunity interna-
tional. Good and bad practices in microinsurance. CGAP
Working Group on Microinsurance.
Mathiyazhagan, K. (1998). Willingness to pay for rural health
insurance through community participation in India. Inter-
national Journal of Health Planning and Management, 13(1),
47–67.
Morduch, J. (2006). Micro-insurance: The next revolution? In
Banerjee, A., Benabou, R., & Mookherjee, D. (Eds.), Under-
standing Poverty (chapter 22). Oxford: University Press, April
2006, ISBN: 9780195305203.
Mullen, P. M. (1999). Public involvement in health care priority
setting: An overview of methods for eliciting values. Health
Expect, 2(4), 222–234.
Preker, A. S., Carrin, G., Dror, D., Jakab, M., Hsiao, W., &
Arhin-Tenkorang, D. (2002). Effectiveness of community
health financing in meeting the cost of illness. Bulletin of the
World Health Organization, 80(2), 143–150.
Radermacher, R. (2006). Health insurance for the poor—
Examples from India. Unpublished monograph.
Radwan, I. (2005). India: Private health services for the poor, a
policy note. Washington, DC: World Bank.
Ray, T. K., Pandav, C. S., Anand, K., Kapoor, S. K., & Dwivedi,
S. N. (2002). Out-of-pocket expenditure on healthcare in a
north Indian village. National Medical Journal of India, 15(5),
257–260.
Ryan, M., Scott, D. A., Reeves, C., Bate, A., van Teijlingen, E.
R., Russell, E. M., et al. (2001). Eliciting public preferences
for healthcare: A systematic review of techniques. Health
Technology Assessment, 5(5), 1–186.
Schone, B. S., & Cooper, P. F. (2001). Assessing the impact of
health plan choice. Health Affairs (Millwood), 20(1),
267–275.
Tabor, S. R. (2005). Community-based health insurance and social
protection policy, Social Protection Discussion Paper Series.
Washington, DC: WorldBank.
Toth, W. (2005). Satisfaction is job one. Insurance & Technology
(July 2005), Browsed 21 May 2006 /http://www.insurance
tech.com/news/showArticle.jhtml?articleID=166402239S.
WHO. (2006). The World Health Report 2006: Working together
for health. Geneva World Health Organization.
Wiesmann, D., & Jutting, J. (2000). The emerging movement of
Community Based Health Insurance in Sub-Saharan Africa:
Experiences and lessons learned. Afrika Spectrum, 35(2),
193–210.