A photoelectrochemical investigation of conversion coatings on Mg substrates
18
A photoelectrochemical investigation of conversion coatings on Mg substrates L. Anicai 1 , R. Masi, M. Santamaria * , F. Di Quarto Dipartimento di Ingegneria Chimica dei Processi e dei Materiali, Universita ` di Palermo, Viale delle Scienze, 90128 Palermo, Italy Available online 25 August 2005 Abstract The structure, morphology and composition of conversion coatings grown in stannate bath on pure Mg were studied using potential–time, polarization curves, X-ray diffraction, scanning electron microscopy and photocurrent spectroscopy. The coating is manly constituted by crys- talline magnesium–tin hydroxide, whose morphology and distribution depends on the conver- sion bath composition and temperature. The photoelectrochemical investigation allowed to estimate the band gap value of MgSn(OH) 6 and flat band potential. A sketch of the metal/pas- sive film/electrolyte junction formed during conversion on the metal substrate is reported to account for the overall photoelectrochemical behaviour. Ó 2005 Elsevier Ltd. All rights reserved. Keywords: Conversion coating; Mg; Mixed hydroxide; Photocurrent spectroscopy 1. Introduction Light metals-based metallic materials are widely used in various fields of electrical engineering, electronics, aeronautics and automotive industries. Depending on the 0010-938X/$ - see front matter Ó 2005 Elsevier Ltd. All rights reserved. doi:10.1016/j.corsci.2005.05.033 * Corresponding author. Tel.: +39 091 6567287; fax: +39 091 6567280. E-mail address: [email protected] (M. Santamaria). 1 Permanent address: Department of Environmental Protection and Technological Development, Petromservice SA, str.Gral Budisteanu 11 bis, Bucharest, Romania. Corrosion Science 47 (2005) 2883–2900 www.elsevier.com/locate/corsci
-
Upload
independent -
Category
Documents
-
view
1 -
download
0
Transcript of A photoelectrochemical investigation of conversion coatings on Mg substrates

Corrosion Science 47 (2005) 2883–2900
www.elsevier.com/locate/corsci
A photoelectrochemical investigationof conversion coatings on Mg substrates
L. Anicai 1, R. Masi, M. Santamaria *, F. Di Quarto
Dipartimento di Ingegneria Chimica dei Processi e dei Materiali, Universita di Palermo,
Viale delle Scienze, 90128 Palermo, Italy
Available online 25 August 2005
Abstract
The structure, morphology and composition of conversion coatings grown in stannate bathon pure Mg were studied using potential–time, polarization curves, X-ray diffraction, scanningelectron microscopy and photocurrent spectroscopy. The coating is manly constituted by crys-talline magnesium–tin hydroxide, whose morphology and distribution depends on the conver-sion bath composition and temperature. The photoelectrochemical investigation allowed toestimate the band gap value of MgSn(OH)6 and flat band potential. A sketch of the metal/pas-sive film/electrolyte junction formed during conversion on the metal substrate is reported toaccount for the overall photoelectrochemical behaviour.� 2005 Elsevier Ltd. All rights reserved.
Keywords: Conversion coating; Mg; Mixed hydroxide; Photocurrent spectroscopy
1. Introduction
Light metals-based metallic materials are widely used in various fields of electricalengineering, electronics, aeronautics and automotive industries. Depending on the
0010-938X/$ - see front matter � 2005 Elsevier Ltd. All rights reserved.doi:10.1016/j.corsci.2005.05.033
* Corresponding author. Tel.: +39 091 6567287; fax: +39 091 6567280.E-mail address: [email protected] (M. Santamaria).
1 Permanent address: Department of Environmental Protection and Technological Development,Petromservice SA, str.Gral Budisteanu 11 bis, Bucharest, Romania.

2884 L. Anicai et al. / Corrosion Science 47 (2005) 2883–2900
applied surface treatments, various coating types may be formed having differentapplications as (a) coating layers with decorative–anticorrosive properties; (b) adher-ent pre-treatment layers for successive finishing; (c) in composite materials withspecial functional characteristics.
In the case of Mg and its alloys, potential advantages due to interesting propertiessuch as low density, high thermal conductivity, good workability, easy recycling andbio-compatibility, are counteracted by their poor corrosion and wear resistance.Moreover, the high chemical reactivity of Mg and its alloys, if exposed to aqueoussolutions or humid atmosphere, with formation of a poorly protective surface layerhas detrimental effect on further processing of such alloys [1–4].
Previous investigations [3,5–8] have shown that the electrochemical behaviour ofMg electrodes is strongly dependent on the electrolyte involved as well as on its pHvalue. Thus, according to their characteristic effect, electrolytes may act as (i) strongpassivators (e.g. fluorides, chromates); (ii) moderate passivators (e.g. hydroxides,carbonates, borates, phosphates); (iii) moderate corrosion stimulators (e.g. sul-phates, nitrates) or (iv) strong pitting agents (e.g. chlorides, bromides).
Coating procedures in the case of Mg and Mg alloys involves chemical/electro-chemical conversion to produce a superficial layer of substrate metal oxides, chro-mates, phosphates or other compounds that are chemically bonded to the surface.These coatings are usually applied to impart corrosion protection and a good paintbase properties to the metal. Among the conversion treatments the most used arethose based on CrO3 or chromate solutions which however has proved to have aharmful effect on the environment and human health, so that, the development ofless toxic processes becomes a necessity.
One ‘‘clean’’ candidate for substitution of chromate-based solutions is representedby stannate-based chemical conversion bath allowing the formation of a surfacelayer with protective characteristics [1,9–11]. According to [11] the formation of a2–3 lm adherent layer of MgSnO3 Æ 3H2O is occurring in alkaline stannate solutionused for at least 20 min at a relatively high temperature (around 82 �C). The film wasfound to be developed by a nucleation and growth process through an initial cor-rosion film existing on the substrate. Huo et al. [10] suggested the formation ofMgSnO3 Æ H2O during chemical conversion in stannate solution for 60 min at90 �C. The layer exhibited a porous structure that provided some advantage foradsorption during sensitization treatment prior to a second step involving electrolessnickel plating.
According to this previous work, stannate-based chemical conversion bathsrepresent a potential environmental friendly treatment both for Mg and its alloys,offering some advantages for anticorrosion treatment. In spite of these aspects, thereare just few reported data regarding the composition, structure, morphology anddevelopment of the coating on Mg metal.
In this paper, we present experimental results pertaining to the physico-chemicalcharacterization of stannate-based chemical conversion layers grown on Mg sub-strates, carried out by ex situ SEM and XRD techniques and in situ electrochemicaland photoelectrochemical techniques.

L. Anicai et al. / Corrosion Science 47 (2005) 2883–2900 2885
2. Experimental
In order to perform experiments, 99.9% pure magnesium working electrodes havebeen used, as metallic foils (125–150 lm thickness) or rods (7 mm diameter), pro-vided from Goodfellow. Mg foil electrodes have been covered with lacomit stoppingoff, or in the case of rod electrodes embedded in a Teflon cylinder and sealed withepoxy resin (Torr Seal Varian Ass.), leaving under investigation in solution exposure(after chemical conversion treatment) a constant geometrical area. Before immersionin chemical conversion electrolyte, electrode surfaces have been subjected to mechan-ical polishing with 600 and 1200 emery paper, followed by washing with acetone inan ultrasonic bath for 5 min. A pickling step was applied, using 250 ml l�1 HF solu-tion (40% HF) for 30 s at room temperature, followed by rinsing with distilled waterand drying.
To form chemical conversion layers, alkaline stannate solutions have been pre-pared, whose compositions and operating parameters are given in Table 1.
The development of the conversion coating has been followed by recording theopen circuit potential–time response, involving a Zahner 6 IMe potentiostat, againsta saturated calomel reference electrode (SCE). Gravimetric experiments have beenperformed to evaluate the mass weight, on a minimum of three specimens for eachvariant.
The morphology of the coatings after stannate treatments has been examined byscanning electron microscopy (SEM) using a Philips ESEM microscope equippedwith energy dispersive X-ray (EDX) analysis facilities. The structure of the coatingshas been determined by X-ray diffraction (XRD), using CuKa radiation.
To get more qualitative and quantitative information on the electronic propertiesof conversion coatings and the structure of metal/passive film/electrolyte interface,photocurrent spectroscopy (PCS) technique has been used. A three electrode cell,equipped with flat quartz windows, was used for PCS investigation. The mono-chromatic light in a quite large range of wavelengths, between 200 and 800 nm,
Table 1Composition and operation conditions for stannate-based chemical conversion treatments on Mgelectrode
No. Composition g l�1 Operation conditions
1 NaOH 9.95 T = 82 ± 5 �CK2SnO3 Æ 3H2O 49.87 t = 30–60 minNaC2H3O2 Æ 3H2O 9.95 Stationary conditionsNa4P2O7 49.87pH = 11.5–12.0
2 NaOH 10 T = 90 ± 5 �CK2SnO3 Æ 3H2O 50 t = 60 minNaC2H3O2 Æ 3H2O 10 Moderate stirringpH = 11.5–12.0
2886 L. Anicai et al. / Corrosion Science 47 (2005) 2883–2900
is provided through a lamp–UV/VIS–monochromator–mechanical chopper systemcoupled to a lock in amplifier (EG&G 7206). The chopping frequency was 13 Hz.Data have been acquired through an analog/digital interface to a desk computerand corrected for the quantum emission of the light source (lamp and monochroma-tor). Thus, on the y-axis of photocurrent spectra, a photocurrent yield in arbitraryunits is reported.
3. Results and discussion
3.1. Gravimetric, morphological and XRD study
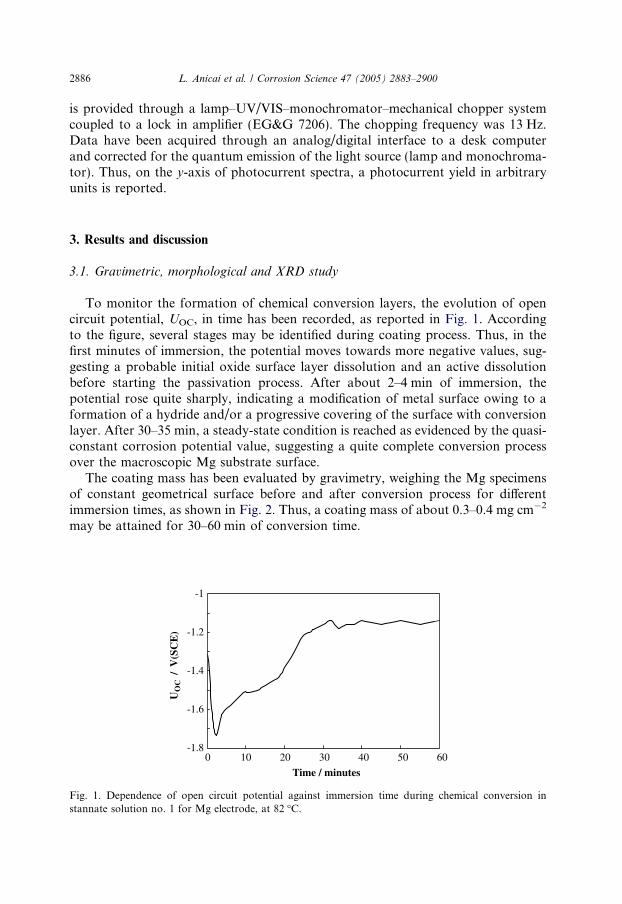
To monitor the formation of chemical conversion layers, the evolution of opencircuit potential, UOC, in time has been recorded, as reported in Fig. 1. Accordingto the figure, several stages may be identified during coating process. Thus, in thefirst minutes of immersion, the potential moves towards more negative values, sug-gesting a probable initial oxide surface layer dissolution and an active dissolutionbefore starting the passivation process. After about 2–4 min of immersion, thepotential rose quite sharply, indicating a modification of metal surface owing to aformation of a hydride and/or a progressive covering of the surface with conversionlayer. After 30–35 min, a steady-state condition is reached as evidenced by the quasi-constant corrosion potential value, suggesting a quite complete conversion processover the macroscopic Mg substrate surface.
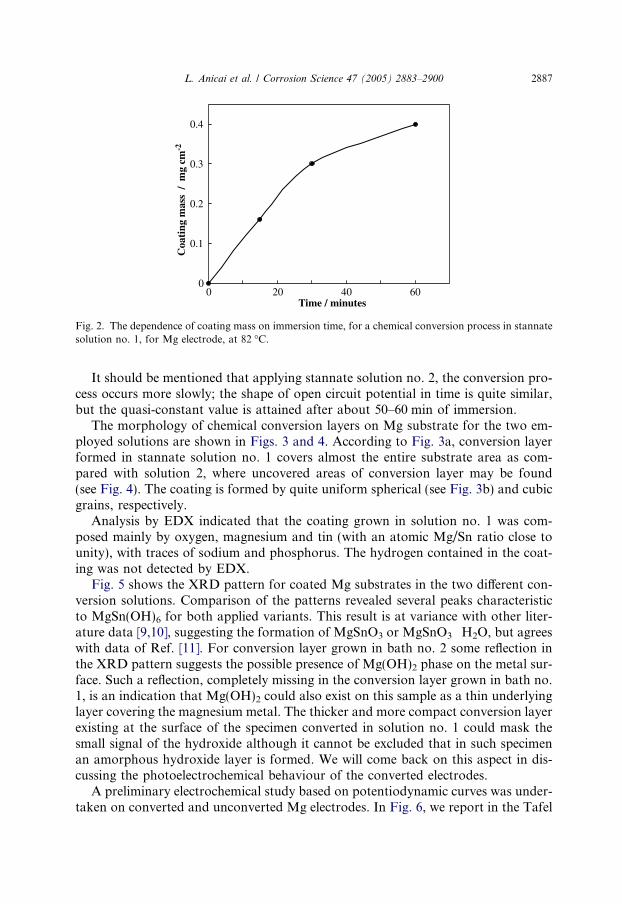
The coating mass has been evaluated by gravimetry, weighing the Mg specimensof constant geometrical surface before and after conversion process for differentimmersion times, as shown in Fig. 2. Thus, a coating mass of about 0.3–0.4 mg cm�2
may be attained for 30–60 min of conversion time.
UO
C /
V(S
CE
)
-1.8
-1.6
-1.4
-1.2
-1
0 10 20 30 40 50 60
Time / minutes
Fig. 1. Dependence of open circuit potential against immersion time during chemical conversion instannate solution no. 1 for Mg electrode, at 82 �C.
Coa
ting
mas
s /
mg
cm-2
0
0.1
0.2
0.3
0.4
0 20 40 60Time / minutes
Fig. 2. The dependence of coating mass on immersion time, for a chemical conversion process in stannatesolution no. 1, for Mg electrode, at 82 �C.
L. Anicai et al. / Corrosion Science 47 (2005) 2883–2900 2887
It should be mentioned that applying stannate solution no. 2, the conversion pro-cess occurs more slowly; the shape of open circuit potential in time is quite similar,but the quasi-constant value is attained after about 50–60 min of immersion.
The morphology of chemical conversion layers on Mg substrate for the two em-ployed solutions are shown in Figs. 3 and 4. According to Fig. 3a, conversion layerformed in stannate solution no. 1 covers almost the entire substrate area as com-pared with solution 2, where uncovered areas of conversion layer may be found(see Fig. 4). The coating is formed by quite uniform spherical (see Fig. 3b) and cubicgrains, respectively.
Analysis by EDX indicated that the coating grown in solution no. 1 was com-posed mainly by oxygen, magnesium and tin (with an atomic Mg/Sn ratio close tounity), with traces of sodium and phosphorus. The hydrogen contained in the coat-ing was not detected by EDX.
Fig. 5 shows the XRD pattern for coated Mg substrates in the two different con-version solutions. Comparison of the patterns revealed several peaks characteristicto MgSn(OH)6 for both applied variants. This result is at variance with other liter-ature data [9,10], suggesting the formation of MgSnO3 or MgSnO3 Æ H2O, but agreeswith data of Ref. [11]. For conversion layer grown in bath no. 2 some reflection inthe XRD pattern suggests the possible presence of Mg(OH)2 phase on the metal sur-face. Such a reflection, completely missing in the conversion layer grown in bath no.1, is an indication that Mg(OH)2 could also exist on this sample as a thin underlyinglayer covering the magnesium metal. The thicker and more compact conversion layerexisting at the surface of the specimen converted in solution no. 1 could mask thesmall signal of the hydroxide although it cannot be excluded that in such specimenan amorphous hydroxide layer is formed. We will come back on this aspect in dis-cussing the photoelectrochemical behaviour of the converted electrodes.
A preliminary electrochemical study based on potentiodynamic curves was under-taken on converted and unconverted Mg electrodes. In Fig. 6, we report in the Tafel

Fig. 3. SEM images showing the coating morphology of stannate-based conversion involving solutionno. 1 for 30 min at 82 �C at different magnitudes.
2888 L. Anicai et al. / Corrosion Science 47 (2005) 2883–2900
plane the polarization curves recorded at 1 mV s�1 in 0.1 M NaOH at room temper-ature for Mg (a) after mechanical treatment, (b) after 30 min in 0.1 M NaOH at82 �C and (c) after 30 min in solution no. 1 at 82 �C. In the absence of conversionlayer, a cathodic Tafel line which accounts for the possible hydrogen evolution onoxidized Mg surface was recorded. The Tafel slopes for this cathodic process are140 and 160 mV per current decade for electrode (a) and (b), respectively. Thisbehaviour differs from that observed for the converted sample showing in a largerange of cathodic potential values an almost constant current, typical of an electro-chemical process under limiting current control.
A strongly different behaviour has been shown in the anodic branch. In fact, forMg electrode as well as for Mg after immersion in hot NaOH for UE > UOC an ano-dic current due the oxidation of magnesium to Mg(OH)2 process has been detected,the lower value being measured for the second sample, whose surface is presumably

Fig. 4. SEM image showing the coating morphology of stannate-based conversion involving solutionno. 2 for 60 min at 90 �C.
L. Anicai et al. / Corrosion Science 47 (2005) 2883–2900 2889
covered by the hydroxide before immersion in the polarizing electrolyte. In the caseof converted sample, a very pronounced anodic peak is observed, sometimes fol-lowed by a second smaller anodic peak at higher potential before reaching a stea-dy-state current density. The analysis of the polarizing curves of Fig. 6 clearlyindicates that the differences in electrochemical behaviour of the electrodes mustbe attributed to the presence of stannate species in the electrolyte, derived fromthe selective dissolution of Sn(IV) of the conversion layer as SnO2�
3 ions, due thelow stability of Sn(OH)4 in alkaline environment [12]. According to Pourbaix, stan-nate ions may be reduced to bistannite ions. The rate of this process may be con-trolled by the diffusion of the stannate ions produced by the dissolution of theconversion layer, concentrated in the cavities between the spheres constituting thedeposit. For polarizing voltage slightly higher than the corrosion potential HSnO�
2
ions can be re-oxidized in the anodic branch, even if we cannot exclude that the mea-sured anodic current is also due to the oxidation of magnesium from the uncoatedareas. The second smaller anodic peak at higher potential can be attributed to theoxidation of adsorbed HSnO�
2 ions.It is important to stress that the red–ox reactions occurring during the polariza-
tion seem to interest only the surface of the conversion layer, since no appreciabledifferences in the morphology and structure of the film have been evidenced bySEM and XRD analysis after the polarization.
3.2. Photoelectrochemical study
To get more information on the electronic structure and, indirectly, on the chem-ical composition of chemical conversion layer grown in stannate solution, sev-eral photoelectrochemical experiments have been performed by recording the

Fig. 5. XRD patterns of Mg electrode coated by chemical conversion layer involving: (a) solution no. 1(30 min, 82 �C) and (b) solution no. 2 (60 min, 90 �C). Identification according to cards nos. 7-239 and9-27 of JCPDS—International Centre for Diffraction Data. A: MgSn(OH)6; B: Mg; C: Mg(OH)2.
2890 L. Anicai et al. / Corrosion Science 47 (2005) 2883–2900
photocurrent spectra (Iph–k), at different constant electrode potentials, as well as theIph vs UE plots (photocharacteristics) at a fixed wavelength.
Taking into account the previous results, pertaining to the morphology of theconversion layer, it can be considered that a chemical conversion process of30 min in solution no. 1 and at least 60 min in solution no. 2 allows the formation

-1.8
-1.6
-1.4
-1.2
-1
-0.8
-0.6
-0.4
-0.2
1.E-10 1.E-09 1.E-08 1.E-07 1.E-06 1.E-05 1.E-04 1.E-03 1.E-02
Current density / A cm-2
UE
/ V
(SC
E)
Mg
Conversionlayer
Mg after 30 min in 0.1 M NaOH 82˚C
Fig. 6. Polarization curves recorded at 1 mV s�1 in 0.1 M NaOH at room temperature for (a) Mg aftermechanical cleaning, (b) Mg after mechanical cleaning and 30 min in 0.1 M NaOH at 82 �C and (c) afterconversion in solution no. 1 (30 min at 82 �C).
L. Anicai et al. / Corrosion Science 47 (2005) 2883–2900 2891
of a relatively uniform coating on Mg metal. In both cases, the presence ofMgSn(OH)6 has been revealed, by XRD analysis, in the conversion layer whilstthe possible presence of Mg(OH)2, underlying the coatings grown in both solutions,was left unsolved. Photoelectrochemical investigation was performed on both layerssoon after the end of conversion process as well as after ageing in laboratory atmo-sphere at room temperature after variable elapsed times. All investigations werecarried in 0.1 M NaOH solution at pH value near to that of the formation bath(pH = 12).
Figs. 7 and 8 show photocurrent spectra, corrected for the efficiency of the lamp–monochromator system, for Mg electrode coated by conversion layer using solutionno. 1 and 2, respectively, polarized at open circuit potential UOC = �1.15 V/SCE.UOC was almost the same for samples prepared in both solutions and quite wellreproducible for every initial treatment and usually ranging around �1.1 ± 0.1V/SCE, in very good agreement with the values estimated from the polarizationcurves (see Fig. 6).
The optical band gap value was derived according to the equation:
ðIphhmÞ ¼ constðhm � Eoptg Þn ð1Þ
where n = 2 by assuming indirect optical transitions [13–15]. According to Eq. (1),the extrapolation to zero of the plot (Iphhm)
0.5 vs hm allows to get the Eoptg value which
was quite near for both samples and equal to 3.00 ± 0.1 eV (see inset of Figs. 7 and8). The photocurrent is cathodic on the whole range of wavelengths at this potential,as evidenced by the phase of the photocurrent signal in chopped light lock-in experi-ments as well as by looking to the change of the total current in switching on–off thelight impinging on the electrode surface.
As for the photocurrent spectra we like to stress that, at UOC, fresh specimen con-verted in solution no. 1 displayed higher value of photocurrent with respect to the

0
10
20
30
40
50
60
200 250 300 350 400 450 500
Wavelength / nm
Pho
tocu
rren
t yi
eld
/ a.u
.
h
0
4
8
12
16
2.5 3 3.5 4 4.5 5
(Ih
)0.5 /a
.u.
/eV
Fig. 8. Photocurrent spectrum corrected for the photon emission of the light source recorded for chemicalconversion layer on Mg (60 min in solution no. 2 at 90 �C after mechanical treatment and pickling) at�1.15 V/SCE in 0.1 M NaOH. Inset: determination of the optical band gap by assuming indirect opticaltransitions.
0
50
100
150
200
250
300
200 250 300 350 400 450 500
Pho
tocu
rren
t yi
eld
/ a.u
.
(Ih
)0.5/a
.u.
h /eV
0
10
20
30
40
2.5 3 3.5 4 4.5 5
Wavelength / nm
Fig. 7. Photocurrent spectrum corrected for the photon emission of the light source recorded for chemicalconversion layer on Mg (30 min in solution no. 1 at 82 �C after mechanical treatment and pickling) at�1.15 V/SCE in 0.1 M NaOH. Inset: determination of the optical band gap by assuming indirect opticaltransitions.
2892 L. Anicai et al. / Corrosion Science 47 (2005) 2883–2900
sample converted in solution no. 2. Regardless of conversion solution usually a tail-ing at longer wavelengths was observed at UOC. Slightly higher Eg values wererecorded, obviously, in the presence of a short tailing (compare Figs. 7 and 8).
The photocurrent spectra recorded at various potentials (both cathodic and ano-dic with respect to UOC) exhibited also a significant absorption in the region of lowenergies (long tail). In the case of cathodic photocurrent, the possible onset of aninternal electron photoemission process (from the metallic substrate to the conduc-tion band of coating layers) must be taken into account, whilst in the presence of

L. Anicai et al. / Corrosion Science 47 (2005) 2883–2900 2893
very thin insulating high band gap material also an external electron photoemissionprocess becomes possible.
In the case of external photoemission processes (tunnelling of electrons throughthe film to the solution), the threshold energy can be determined according to theso-called 5/2 power law:
Iph / ðhm � hm0 � eUEÞ5=2 ð2Þwhere UE is the applied potential against a reference electrode and hm0 is the photo-electric threshold at UE = 0. According to this law, a linear dependence on electrodepotential, with a slope of 1 eV/V [13–15], is expected for the external photoemissionthreshold. Such a linear dependence was not observed so that this type of processescan be excluded as a source of the tailing.
In the hypothesis of internal photoemission, the Fowler law is assumed to hold:
Iph ¼ const ðhm � EthÞ2 ð3Þwhere Eth is the internal photoemission threshold energy, which can be obtainedfrom I0.5ph vs hm plots [13–15]. According to this in Fig. 9, we report the photocurrentspectrum at UE = �1.05 V/SCE in the tail region and the Fowler plot (see inset) for asample converted in solution no. 1 for 30 min. An energy threshold value of 1.60 eVcan be estimated according to Eq. (3). By polarizing the electrode at different poten-tials, but in a range where cathodic photocurrent was recorded at any wavelength,internal photoemission threshold values of about 1.65 ± 0.1 eV were determinedregardless of conversion solution and time of immersion. This value is much lowerthan that obtained in the case of non-converted Mg electrodes, immersed in NaOHsolution at 82 �C for different immersion times and under similar cathodic polariza-tion [16], showing an internal photoemission threshold of about 2.3 ± 0.1 eV. Such alarge difference in the threshold values suggests that the photocurrent action
0
1
2
3
4
5
6
7
400 450 500 550 600 650 700 750
Pho
tocu
rren
t yi
eld
/ a.
u.
h /eV
0
0.5
1
1.5
2
2.5
3
1.5 2 2.5 3 3.5
Wavelength / nm
(Ih
)0.5 /a
.u.
Fig. 9. Photocurrent spectrum corrected for the photon emission of the light source recorded for chemicalconversion layer on Mg (30 min in solution no. 1 at 82 �C after mechanical treatment and pickling) atUE = �1.05 V/SCE in 0.1 M NaOH. Inset: determination of the threshold energy according to Fowlerlaw.

2894 L. Anicai et al. / Corrosion Science 47 (2005) 2883–2900
spectrum of Fig. 9 could be due to an internal electron photoemission process fromthe metallic substrate to the conduction band of MgSn(OH)6 conversion layerhaving insulating-like properties. The possible presence of a very thin (<3–4 nm)Mg(OH)2 layer, underlying the mixed hydroxide, should be still compatible with aprocess of internal electron photoemission from Mg metal to the conduction bandof MgSn(OH)6. We will come back shortly to this point in the following.
To verify the effect of light and applied potential on the photoelectrochemicalproperties of the conversion layer, photocurrent spectra at various values of UE havebeen recorded starting from the corrosion potential. By polarizing the electrode atpotential more cathodic than UOC, usually a slightly decrease of the Eopt
g valuewas observed owing to the increase of photocurrent tailing attributed to the presenceof an internal electron photoemission process (see above). By increasing the electrodepotential in the anodic direction different behaviour could be observed for differentelectrodes showing almost similar corrosion potential and initial Eopt
g value.When the applied potential moves from UOC towards the anodic direction, the
intensity of the photocurrent initially diminishes at any wavelength. Starting frompotentials equal or slightly more anodic than �0.5 V/SCE, a sudden change of thephotocurrent phase angle against wavelength is noticed, corresponding to the onsetof an anodic photocurrent in the region of high energies. From the long wavelengthsregion, where a still cathodic photocurrent is measured (see Fig. 10), an almost con-stant cathodic photoemission threshold at around 1.65 ± 0.1 eV is derived.
By increasing the polarizing voltage in the positive direction, a potential value isreached where the entire photocurrent spectrum becomes anodic. When thisoccurred two band gap values at high and lower photon energy were derived. Thispotential value changes very much (about 1 V) depending less from the details ofthe electrode preparation and more from its electrochemical history. According tothis although the Eopt
g value derived from high-energy region was always accessible atnot too high anodic potentials (UE P �0.1 V/SCE), the low-energy gap was notalways accessible until very anodic potentials (UE P 1.0 V/SCE) were reached.
Pho
tocu
rren
t / n
A
0
0.5
1
1.5
2
2.5
3
200 250 300 350 400 450 500-160
-140
-120
-100
-80
-60
-40
-20
0
20
Phase angle / ˚
Wavelength / nm
Fig. 10. Raw photocurrent spectrum and phase angle for chemical conversion layer on Mg (30 min insolution no. 1 at 82 �C after mechanical treatment and pickling) at UE = 0.0 V/SCE in 0.1 M NaOH.

L. Anicai et al. / Corrosion Science 47 (2005) 2883–2900 2895
When this occurred the two band gap values, although not well reproducible, did notdiffer too much from those derived in Fig. 12.
In Fig. 11, we report the raw photocurrent spectra for a Mg electrode coated witha conversion layer formed for 30 min in solution no. 1, at three different potentialsand after about 12 h of ageing in air at room temperature. When the applied poten-tial moves towards anodic direction the intensity of photocurrent spectrum dimin-ishes and at about �0.1 V/SCE it becomes anodic (see also Fig. 12) at anywavelength, whilst no cathodic photocurrent tailing at longer wavelengths (seeFig. 10) is now observed.
From cathodic photocurrent spectra of Fig. 11, at UE = �1.40 V/SCE and�1.05 V/SCE, an almost constant Eopt
g value around 2.90 ± 0.1 eV was derived forindirect optical transitions, whilst at more anodic potentials (UE = �0.1 V/SCE),where only anodic photocurrent was recorded, the spectra displayed differentfeatures. This is clearly evidenced in Fig. 12 where the photocurrent spectrum at�0.1 V/SCE, corrected for lamp emission, is reported. As shown in the inset, the(Iphhm)
0.5 vs hm plot exhibits now two extrapolation regions. From the region of highenergies an optical band gap of about 4.22 eV was determined whilst a secondextrapolation, at lower photon energy, gives an Eopt
g value around 3.15 eV (see insetin Fig. 12). Almost identical band gap values were also measured at higher anodicelectrode potential (UE = +0.1 V/SCE). The value of band gap obtained from theextrapolation of the high-energy region is very close to that reported for anodicallygrown Mg(OH)2 [14]. As for the second extrapolation, at lower photon energy(Eopt
g ¼ 3.15 eV), such a value appears very close to that obtained from cathodic pho-tocurrent spectra recorded at very cathodic potentials (see Figs. 7 and 8) and attri-buted to the presence of MgSn(OH)6 phase.
According to these experimental results it may be suggested that, in this rangeof potentials, the photocurrent at high photon energy is mainly due to optical
0
10
20
30
40
50
60
200 250 300 350 400 450 500
-1.4 V/SCE-1.1 V/SCE-0.1 V/SCE
Wavelength / nm
Pho
tocu
rren
t / n
A
Fig. 11. Photocurrent spectra, not corrected for photon efficiency recorded in 0.1 M NaOH for Mgelectrode coated with conversion layer formed in solution no. 1 for 30 min at 82 �C and aged in air for 12 hat room temperature, polarized at various potentials.

0
5
10
15
20
25
2.5 3.5 4.5 5.5
0
20
40
60
80
100
120
200 250 300 350 400 450 500
Pho
tocu
rren
t yi
eld
/ a.u
.
(I
h)0.
5/a
.u.
h /eV
Wavelength / nm
Fig. 12. Photocurrent spectrum corrected for the photon emission of the light source recorded forchemical conversion layer on Mg (30 min in solution no. 1 at 82 �C after mechanical treatment andpickling, aged in air for 12 h at room temperature) at �0.1 V/SCE in 0.1 M NaOH. Inset: determination ofthe optical band gap assuming indirect optical transitions.
2896 L. Anicai et al. / Corrosion Science 47 (2005) 2883–2900
transitions from the valence band to the conduction band of a magnesium hydroxidelayer having a band gap of 4.25 ± 0.1 eV.
The attribution of a lower energy gap to the presence of insulating MgSn(OH)6compound, initially suggested on the basis of XRD data, is further supported bythe photoelectrochemical behaviour of Fig. 12. In fact, the almost equal optical bandgap values derived from the anodic and cathodic photocurrent spectra, as well as thevalue of the internal electron photoemission threshold, roughly equal to half the esti-mated band gap value of mixed hydroxide, strongly support the hypothesis of forma-tion of an insulating layer on the surface of magnesium electrode after immersion instannate solution.
Analogous findings have been reported in the literature [17] for insulating passivefilms on bismuth thinner than the stannate conversion layer. However, very low val-ues (6103 cm�1) of light absorption coefficient for under-band gap photon energiesare common and could account for the presence of electron photoemission at thesubstrate/mixed hydroxide interface.
In order to have further information on the photoelectrochemical properties ofconversion layers, we recorded photocurrent vs applied potential, by irradiatingthe electrodes at various constant wavelengths, starting from the UOC and changingthe potential in anodic direction at a sweep rate of 5 mV s�1. In Fig. 13, we report thephotocurrent vs potential curves at three different wavelengths showing a very asym-metrical behaviour with larger cathodic photocurrent values and much smaller,almost constant, anodic photocurrent especially at longer wavelengths. The valuesof the inversion photocurrent potential, Vinv, shown in Table 2 are relatively scat-tered but a value close to �0.54 V/SCE or a more cathodic one is a reasonableestimate of such a parameter.
After experiments of Fig. 13, the measured corrosion potential of the electrode wasslightly nobler (UOC = �1.04 V/SCE), the photocurrent values at any wavelengths

Voltage / V(SCE)
Pho
tocu
rren
t / n
A
0
10
20
30
40
-1.2 -0.9 -0.6 -0.3 0 0.3 0.6
350 nm300 nm250 nm
Fig. 13. Photocurrent vs potential for Mg electrode coated by chemical conversion layer formed insolution no. 1 for 30 min at 82 �C recorded in 0.1 M NaOH by irradiating the electrode at differentwavelengths (vscan = 5 mV s�1).
Table 2Inversion potential, Vinv obtained from Iph–UE curves, relating to Mg electrode coated by chemicalconversion layer grown in solution no. 1 (30 min at 82 �C), recorded by irradiating the electrode atdifferent wavelengths in 0.1 M NaOH
k, nm Vinv, V/SCE
250 �0.57300 �0.54350 �0.73
L. Anicai et al. / Corrosion Science 47 (2005) 2883–2900 2897
were sensibly smaller whilst the value of the indirect optical band gap measured atthe new UOC remained almost unchanged (Eopt
g ¼ 3.00 eV).Analogous experiments on a pure Mg electrode, immersed for 30 min in a solu-
tion at pH = 12.5, showed very different behaviour. In fact, a much more anodicinversion photocurrent potential (Vinv P �0.24 V/SCE) and almost symmetricalanodic and cathodic photocurrent branches (see Fig. 14) were observed. A more de-tailed analysis of the photoelectrochemical behaviour of passivated Mg electrodeswill be presented in a future paper.
In order to understand the photocurrent behaviour on the anodic side of thephotocharacteristics displayed in Fig. 13 different hypotheses can be suggested: (a)the presence of a thin Mg(OH)2 layer underlying the mixed magnesium–tin hydrox-ide; (b) slow kinetics of photo-holes transfer at the mixed hydroxide/electrolyte inter-face. According to point (a), a large offset (about 1 eV) in the conduction band of theheterojunction Mg(OH)2/MgSn(OH)6 can be assumed by considering the difference

Voltage / V(SCE)
Pho
tocu
rren
t / n
A
0
5
10
15
-1 -0.5 0 0.5 1 1.5
Fig. 14. Photocurrent vs potential Mg electrode after 30 min in 0.1 M NaOH at 82 �C, recorded byirradiating the electrode at 250 nm (vscan = 5 mV s�1).
2898 L. Anicai et al. / Corrosion Science 47 (2005) 2883–2900
in the band gap values of the two phases (see Fig. 15). This would originate a largerecombination, at the Mg(OH)2/MgSn(OH)6 inner interface, of thermalized photo-carriers under anodic polarization. However, the thickness of Mg(OH)2 layer shouldbe not too high in order to make possible the tunnelling of photo-emitted electronsunder cathodic polarization.
In the hypothesis (b), the MgSn(OH)6 phase is electrically connected to the under-lying metal surface but a strong recombination process is now occurring at the mixedhydroxide/electrolyte interface owing to a very slow kinetics of reaction between thephotogenerated hole and the reduced species in solution or at the surface layer. If we
Fig. 15. Schematic diagram of substrate/Mg(OH)2/MgSn(OH)6/electrolyte interface.

L. Anicai et al. / Corrosion Science 47 (2005) 2883–2900 2899
assume that anodic photocurrent is related to the photo-oxidation of the water mole-cules the small energy distance, if any (see Fig. 15) between EV and redox level ofH2O/O2 couple in solution should favour the strong recombination at this interface.The kinetics of the oxygen evolution reaction as well as of layer oxidation areexpected to be quite slow. Further investigations on these aspects are necessarybefore reaching a final conclusion.
In discussing the photoelectrochemical results, we have tacitly assumed that theoptical band gap values measured on the Mg electrode after chemical conversionin stannate bath pertain to Mg(OH)2 (Eg = 4.25 eV) and to MgSn(OH)6, whichare both well-known crystalline hydroxides [18]. Although such an identificationhas been made indirectly on the basis of XRD patterns and/or thermodynamic con-sideration we would like to mention that as for the identification of mixed hydroxideMgSn(OH)6, the possibility exists for use of PCS for an ‘‘in situ’’ identification ofsuch mixed hydroxide.
In previous works [14,19], we have proposed a correlation between the band gapof hydroxide and the difference of electronegativity between cation and anionconstituents according to the following equation:
Eg ¼ AðvM � vOHÞ2 þ B ðeVÞ ð4Þ
where A = 1.21 and B = 0.90 for s,p-metal hydroxides, vM nd vOH are respectivelythe Pauling electronegativity parameter of the metallic cation and of the anion. Byassuming for OH� a value of vOH = 2.85, obtained by the arithmetic average be-tween the value of hydrogen (2.2) and that of oxygen (3.5) in the Pauling scale, it hasbeen shown that it is possible to correlate a number of optical band gap values ofhydroxide of s,p-metal (as well as of d-metal hydroxides by using different A andB values) according to Eq. (4).
By following a procedure, analogous to that followed for mixed oxides [14], it ispossible to extend the previous correlation to mixed hydroxides if we introduce inEq. (4) an average cationic electronegativity parameter. This last parameter has beendefined as:
vav ¼ xAvA þ xBvB ð5Þwhere xA and xB represent the atomic fraction of metals A and B in the mixedhydroxide, while vA and vB are the respective electronegativity parameter. Accordingto Eq. (5), an average cationic value vav = 1.5 is obtained for MgSn(OH)6 com-pound, while by using Eq. (4) a band gap value equal to 3.1 eV is obtained forMgSn(OH)6. This result is in very good agreement with the values of band gapreported in Figs. 7, 8 and 10 and it lends further support to the interpretation ofPCS data previously described.
4. Conclusions
It has been shown by using both in situ and ex situ methods that a conversionlayer of mixed magnesium and tin hydroxides is formed on magnesium metal by

2900 L. Anicai et al. / Corrosion Science 47 (2005) 2883–2900
immersion in aqueous stannate baths at high temperature. The morphology andkinetics of growth of the layer change with changing the bath composition.
The PCS study suggests the formation of an insulating mixed hydroxide coveringthe surface of magnesium hydroxide. By using a previously proposed correlation, thevalue of measured band gap at very cathodic potentials, as well as at more anodicones but at lower photon energies, agrees with the hypothesis of formation of amixed MgSn(OH)6 hydroxide.
Although further studies are necessary before reaching a final acceptance of theproposed correlation for s,p metal hydroxides and to extend it to the case of d metalhydroxide, it is evident that the functional dependence of the band gap values fromthe difference of electronegativity of the film constituents is a general one. Moreover,the results previously described and recent results on Co hydroxide passive film [20]seem to confirm that as a general rule the hydroxide phases display a smaller bandgap than their anhydrous counterpart within some limits previously described [21].
The successful use of an average electronegativity parameter also in the case ofmixed hydroxides allows the use of PCS as a quantitative in situ technique for thecharacterisation of very thin passive films also in the presence of hydroxidesformation.
References
[1] J.E. Gray, B. Luan, J. Alloys Comp. 336 (2002) 88.[2] G. Song, D. St. John, Corros. Sci. 46 (2004) 1381.[3] E. Gulbrandsen, Electrochim. Acta 37 (1992) 1403.[4] R. Linstrom, L.-G. Johansson, G.E. Thompson, P. Skeldon, J.E. Svensson, Corr. Sci. 46 (2004) 1141.[5] G. Song, A. Atrens, D. St. John, J. Nairn, Y. Li, Corros. Sci. 39 (1997) 855.[6] G. Song, A. Atrens, D. St. John, X. Wu, J. Nairn, Corros. Sci. 39 (1997) 1981.[7] E. Gulbrandsen, J. Tafto, A. Olsen, Corros. Sci. 34 (1993) 1423.[8] G. Baril, N. Pebere, Corros. Sci. 43 (2001) 471.[9] M.A. Gonzales-Nunez, C.A. Nunez-Lopez, P. Skeldon, G.E. Thompson, H. Karimzadeh, P. Lyon,
T.E. Wilks, Corr. Sci. 37 (1995) 1763.[10] H. Huo, Y. Li, F. Wang, Corros. Sci. 46 (2004) 1467.[11] M.A. Gonzales-Nunez, P. Skeldon, G.E. Thompson, H. Karimzadeh, Corrosion 55 (1999) 1136.[12] M. Pourbaix, Atlas of Electrochemical Equilibria in Aqueous Solutions, Pergamon Press, Oxford,
1966.[13] F. Di Quarto, S. Piazza, C. Sunseri, Curr. Topics Electrochem. 3 (1994) 357.[14] F. Di Quarto, C. Sunseri, S. Piazza, M. Santamaria, in: H.S. Nalwa (Ed.), Handbook of Thin Films,
vol. 2, Academic Press, San Diego, 2002, p. 373.[15] U. Stimming, Electrochim. Acta 31 (1986) 415.[16] R. Masi, L. Anicai, M. Santamaria, F. Di Quarto, in preparation.[17] L.M. Castillo, L.M. Peter, J. Electroanal. Chem. Interf. Electrochem. 146 (1983) 377.[18] F.S. Galasso, in: Structure and Properties of Inorganic Solids, Pergamon press, Oxford, 1970, p. 132,
and 168.[19] F. Di Quarto, M.C. Romano, M. Santamaria, S. Piazza, C. Sunseri, Russ. J. Electrochem. 36 (2000)
1203.[20] M. Santamaria, E. Adragna, F. Di Quarto, Electrochem. Solid-State Lett. 8 (2005) B12.[21] F. Di Quarto, M. Santamaria, C. Sunseri, in: P. Marcus, F. Mansfeld (Eds.), Analytical methods for
Corrosion Science and Engineering, Taylor and Francis Group, Boca Raton, 2006, p. 697 (Chapter18).