Aesthetic Coatings for Concrete Bridge Components
251
AESTHETIC COATINGS FOR CONCRETE BRIDGE COMPONENTS Al Ghorbanpoor (Prof.) Habib Tabatabai (Assoc. Prof.) Brent Kriha (Grad. Student) Department of Civil & Environmental Engineering University of Wisconsin-Milwaukee WisDOT ID no. 0092-13-05 December 2016
-
Upload
khangminh22 -
Category
Documents
-
view
3 -
download
0
Transcript of Aesthetic Coatings for Concrete Bridge Components
AESTHETIC COATINGS FOR CONCRETE
BRIDGE COMPONENTS
Al Ghorbanpoor (Prof.)
Habib Tabatabai (Assoc. Prof.)
Brent Kriha (Grad. Student)
Department of Civil & Environmental EngineeringUniversity of Wisconsin-Milwaukee
WisDOT ID no. 0092-13-05
December 2016
ii
Technical Report Documentation Page 1. Report No.
0092-13-052. Government Accession No 3. Recipient’s Catalog No
4. Title and Subtitle
Aesthetic Coatings for Concrete Bridge Components5. Report Date
December 20166. Performing Organization Code
7. Authors
Al Ghorbanpoor, Habib Tabatabai, and Brent R. Kriha8. Performing Organization Report No.
9. Performing Organization Name and Address
Department of Civil & Environmental Engineering
University of Wisconsin-Milwaukee
3200 N. Cramer Street
Milwaukee, WI 53211
10. Work Unit No. (TRAIS)
11. Contract or Grant No.
0092-13-05
12. Sponsoring Agency Name and Address
Wisconsin Department of Transportation
Wisconsin Highway Research Program (WHRP)
4802 Sheboygan Ave. Rm 104
Madison, WI 53707
13. Type of Report and Period Covered
August 1, 2013 – May 31, 2016
14. Sponsoring Agency Code
15. Supplementary Notes
Research was funded by the Wisconsin DOT and FHWA through the WHRP Program.
Wisconsin DOT Contact: Mr. William Dreher: (608) 266-8489
16. Abstract
The performance of aesthetic coating systems for concrete bridge applications was studied. Ten coating systems
were selected and subjected to a battery of tests, including accelerated weathering, outdoor weathering, chloride
ion penetration, and mechanical tests to assess their performance characteristics. Consideration was also given
to surface preparation and application procedures, but common practices were determined to be adequate. The
coatings evaluated consisted of acrylic, acrylic-siloxane, epoxy, and polyurethane materials. Aesthetically, the
acrylic based systems exhibited the highest performance. However, these systems provided limited additional
protection to the concrete substrate. The best overall performance was achieved by an acrylic-siloxane hybrid
system utilizing varying proportions for the base and top coats. In this system, a primarily siloxane base coat
provided improved chloride ion resistance, while a principally acrylic top coat produced superior aesthetics.
17. Key Words
Coating systems, aesthetic coatings, acrylic, acrylic-
siloxane, epoxy, polyurethane, accelerated weathering,
gloss retention, color retention, adhesion, surface
preparation, chloride ion penetration, outdoor exposure.
18. Distribution Statement
No restriction. This document is available to the public
through the National Technical Information Service
5285 Port Royal Road
Springfield VA 22161
18. Security Classif.(of this report)
Unclassified19. Security Classif. (of this page)
Unclassified20. No. of Pages
23221. Price
i
Disclaimer
This research was funded through the Wisconsin Highway Research Program by the Wisconsin
Department of Transportation and the Federal Highway Administration under Project No. 0092-13-05. The
contents of this report reflect the views of the authors who are responsible for the facts and the accuracy of the
data presented herein. The contents do not necessarily reflect the official views of the Wisconsin Department of
Transportation or the Federal Highway Administration at the time of publication.
This document is disseminated under the sponsorship of the Department of Transportation in the interest
of information exchange. The United States Government assumes no liability for its contents or use thereof.
This report does not constitute a standard, specification, or regulation.
The United States Government does not endorse products or manufacturers. Trade and manufacturer
names appear in this report only because they are considered essential to the object of the document.

WISCONSIN HIGHWAY RESEARCH PROGRAM
PROJECT NO. 0092-13-05
AESTHETIC COATINGS FOR CONCRETE BRIDGE COMPONENTS
DRAFT FINAL REPORT
By:
Al Ghorbanpoor
Habib Tabatabai
Brent R. Kriha
Department of Civil & Environmental Engineering
University of Wisconsin-Milwaukee
SUBMITTED TO
THE WISCONSIN DEPARTMENT OF TRANSPORTATION
December 2016
Acknowledgements
The authors wish to acknowledge the following individuals who contributed as employees of the
Wisconsin Department of Transportation or as members of this project’s oversight committee: Mr. William
Dreher, Mr. Travis McDaniel, Mr. David Kiekbusch, Mr. David Nelson, Mr. William Oliva, Mr. Michael
Williams, and Mr. John Bolka. Additionally, the authors would like to recognize the WisDOT regional offices,
various state DOTs, manufacturers, and contractors who participated in the questionnaire and provided
necessary information on the surface preparation, application, and selection of coating systems.
Acknowledgement is also extended to Tony Holzinger (Carboline), Steve Smyczek (PPG), Brad
Dahlgren (Sherwin Williams), and Don Kopidlansky (TK Products), who as representatives of various coating
manufacturers, supplied the selected coating systems and offered assistance during the early stages of this
project.
The authors would also like to thank Rahim Reshadi, Brian Mullens, Brian Schafer, and Juan Zaragoza
from the University of Wisconsin-Milwaukee for their assistance with this project.

i
Executive Summary
This report serves as a synopsis of a study conducted to evaluate the durability and aesthetic
performance of coating systems for utilization in concrete bridge applications. The principle objectives of this
study were: 1) Identify aesthetic coating systems appropriate for concrete bridge applications; 2) Evaluate the
performance of the selected systems through a laboratory testing regimen; 3) Develop guidelines for coating
selection, surface preparation, and application.
A series of site visits to various bridges throughout the State of Wisconsin provided insight into the
performance of common coating systems and allowed problematic structural details to be identified. To aid in
the selection of appropriate coating systems, questionnaires were distributed to coating manufacturers, bridge
contractors, and various DOT offices to identify high performing coating systems and best practices for surface
preparation and application. These efforts supplemented a literature review investigating recent publications
related to formulation, selection, surface preparation, application, and performance evaluation of coating
materials.
Based on this preliminary work, ten coating systems were selected and an evaluation program was
developed. The selected coating systems utilized acrylic, acrylic-siloxane, epoxy, and polyurethane binder
materials. These coating systems were applied to concrete substrates and subjected to a battery of testing that
included UV/Prohesion and Xenon accelerated weathering exposures, an 18 month outdoor exposure, chloride
ion penetration evaluations, and various coating performance evaluations.
The utilized surface preparation and application procedures achieved adequate adhesion for all coating
systems evaluated. The majority of systems exhibited pull-off adhesion strengths in excess of the tensile
strength of the concrete substrate, while a select number of coatings experienced a combination of cohesion and
substrate failure.
Based on the results of the accelerated and outdoor weathering exposures, acrylic coatings exhibited the
best long term aesthetic performance. However, this coating material provided limited additional chloride
resistance to the concrete substrate without utilizing a substantial film thickness. The epoxy systems, on the
ii
contrary, nearly eliminated the penetration of chloride but lacked aesthetic durability. The best overall
performance was achieved by an acrylic-siloxane hybrid system which utilized a predominantly siloxane base
coat and an acrylic top coat. This combination obtained improved chloride resistance from the siloxane while
still maintaining superior aesthetic durability characteristics with an acrylic top coat.
iii
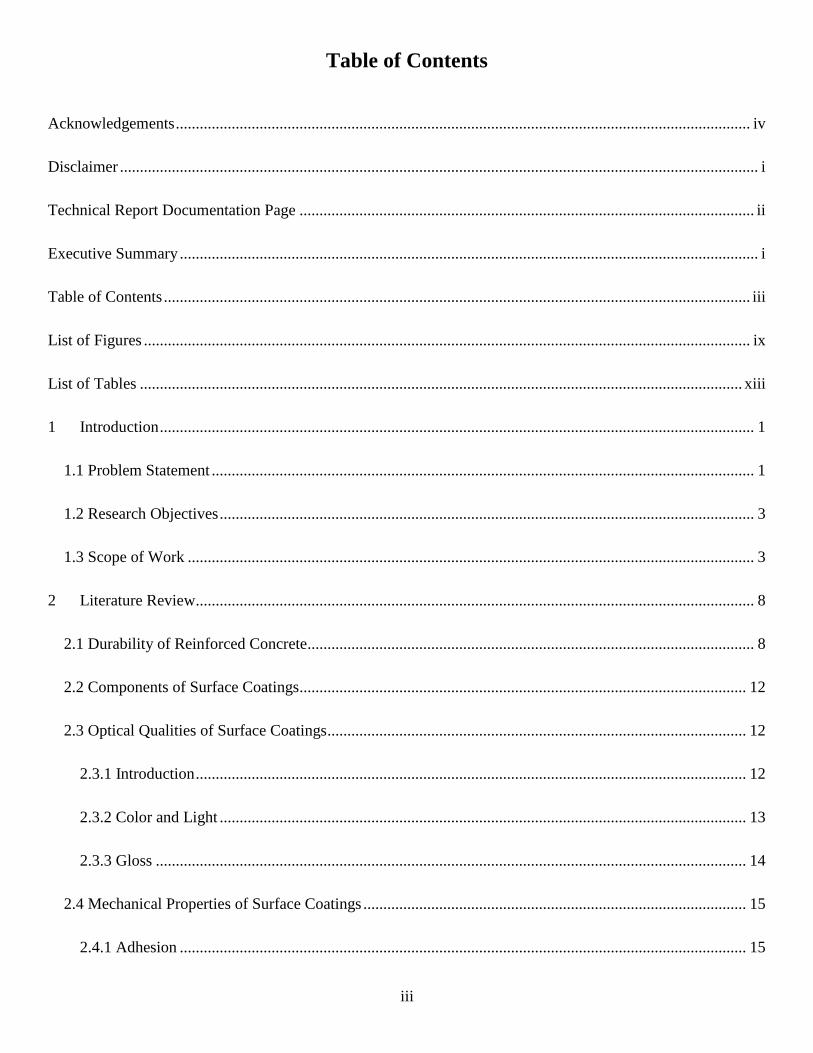
Table of Contents
Acknowledgements ................................................................................................................................................ iv
Disclaimer ................................................................................................................................................................ i
Technical Report Documentation Page .................................................................................................................. ii
Executive Summary ................................................................................................................................................. i
Table of Contents ................................................................................................................................................... iii
List of Figures ........................................................................................................................................................ ix
List of Tables ....................................................................................................................................................... xiii
1 Introduction ..................................................................................................................................................... 1
1.1 Problem Statement ........................................................................................................................................ 1
1.2 Research Objectives ...................................................................................................................................... 3
1.3 Scope of Work .............................................................................................................................................. 3
2 Literature Review............................................................................................................................................ 8
2.1 Durability of Reinforced Concrete................................................................................................................ 8
2.2 Components of Surface Coatings................................................................................................................ 12
2.3 Optical Qualities of Surface Coatings ......................................................................................................... 12
2.3.1 Introduction .......................................................................................................................................... 12
2.3.2 Color and Light .................................................................................................................................... 13
2.3.3 Gloss .................................................................................................................................................... 14
2.4 Mechanical Properties of Surface Coatings ................................................................................................ 15
2.4.1 Adhesion .............................................................................................................................................. 15
iv
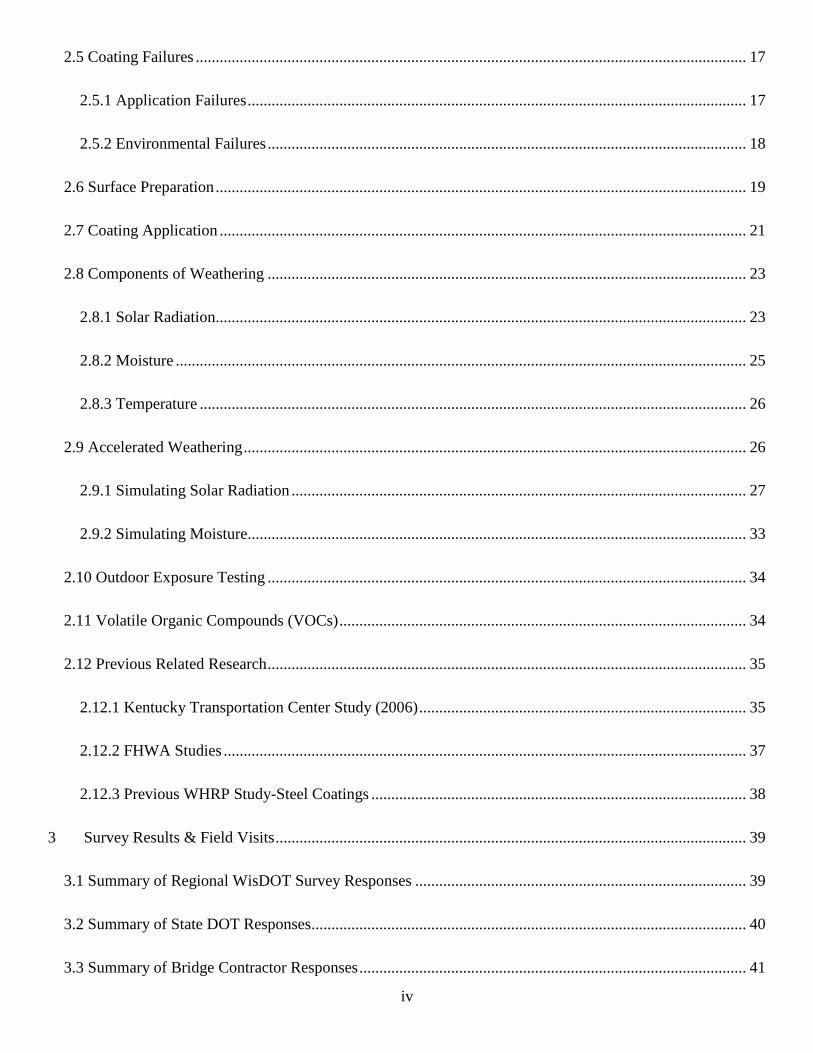
2.5 Coating Failures .......................................................................................................................................... 17
2.5.1 Application Failures ............................................................................................................................. 17
2.5.2 Environmental Failures ........................................................................................................................ 18
2.6 Surface Preparation ..................................................................................................................................... 19
2.7 Coating Application .................................................................................................................................... 21
2.8 Components of Weathering ........................................................................................................................ 23
2.8.1 Solar Radiation..................................................................................................................................... 23
2.8.2 Moisture ............................................................................................................................................... 25
2.8.3 Temperature ......................................................................................................................................... 26
2.9 Accelerated Weathering .............................................................................................................................. 26
2.9.1 Simulating Solar Radiation .................................................................................................................. 27
2.9.2 Simulating Moisture............................................................................................................................. 33
2.10 Outdoor Exposure Testing ........................................................................................................................ 34
2.11 Volatile Organic Compounds (VOCs) ...................................................................................................... 34
2.12 Previous Related Research ........................................................................................................................ 35
2.12.1 Kentucky Transportation Center Study (2006) .................................................................................. 35
2.12.2 FHWA Studies ................................................................................................................................... 37
2.12.3 Previous WHRP Study-Steel Coatings .............................................................................................. 38
3 Survey Results & Field Visits ...................................................................................................................... 39
3.1 Summary of Regional WisDOT Survey Responses ................................................................................... 39
3.2 Summary of State DOT Responses............................................................................................................. 40
3.3 Summary of Bridge Contractor Responses ................................................................................................. 41
v
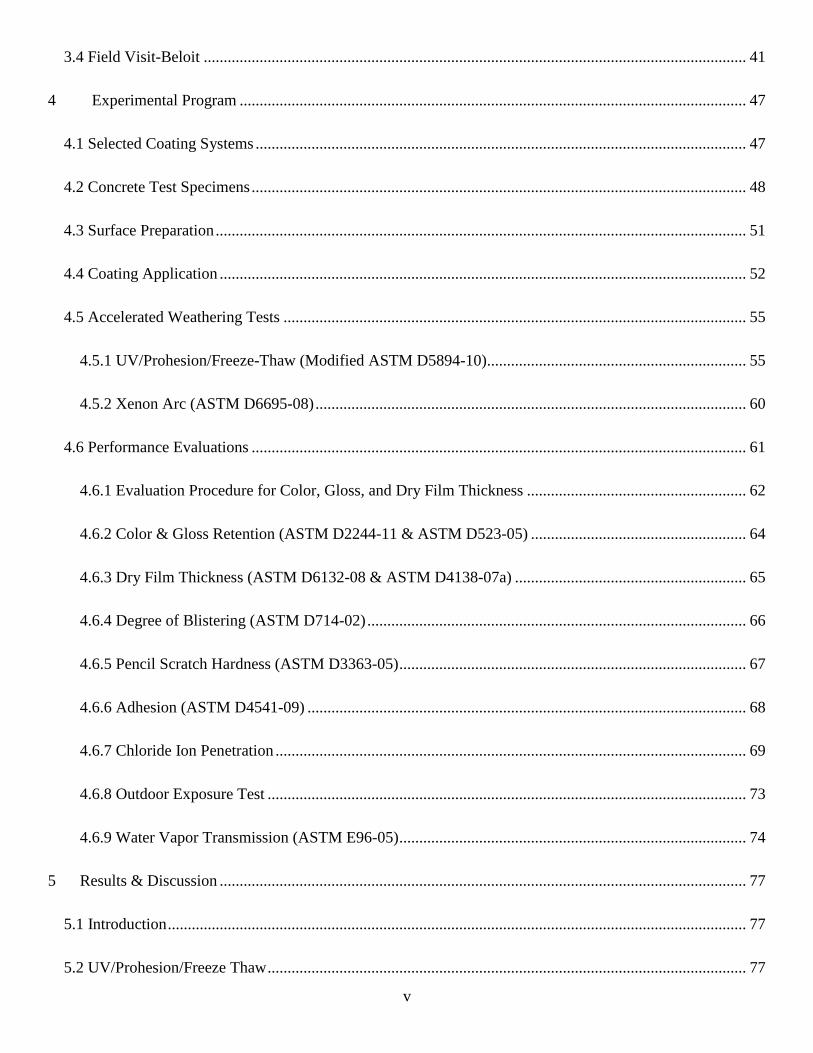
3.4 Field Visit-Beloit ........................................................................................................................................ 41
4 Experimental Program ............................................................................................................................... 47
4.1 Selected Coating Systems ........................................................................................................................... 47
4.2 Concrete Test Specimens ............................................................................................................................ 48
4.3 Surface Preparation ..................................................................................................................................... 51
4.4 Coating Application .................................................................................................................................... 52
4.5 Accelerated Weathering Tests .................................................................................................................... 55
4.5.1 UV/Prohesion/Freeze-Thaw (Modified ASTM D5894-10)................................................................. 55
4.5.2 Xenon Arc (ASTM D6695-08) ............................................................................................................ 60
4.6 Performance Evaluations ............................................................................................................................ 61
4.6.1 Evaluation Procedure for Color, Gloss, and Dry Film Thickness ....................................................... 62
4.6.2 Color & Gloss Retention (ASTM D2244-11 & ASTM D523-05) ...................................................... 64
4.6.3 Dry Film Thickness (ASTM D6132-08 & ASTM D4138-07a) .......................................................... 65
4.6.4 Degree of Blistering (ASTM D714-02) ............................................................................................... 66
4.6.5 Pencil Scratch Hardness (ASTM D3363-05) ....................................................................................... 67
4.6.6 Adhesion (ASTM D4541-09) .............................................................................................................. 68
4.6.7 Chloride Ion Penetration ...................................................................................................................... 69
4.6.8 Outdoor Exposure Test ........................................................................................................................ 73
4.6.9 Water Vapor Transmission (ASTM E96-05) ....................................................................................... 74
5 Results & Discussion .................................................................................................................................... 77
5.1 Introduction ................................................................................................................................................. 77
5.2 UV/Prohesion/Freeze Thaw ........................................................................................................................ 77
vi
5.2.1 Color Retention .................................................................................................................................... 77
5.2.2 Gloss Retention .................................................................................................................................... 84
5.2.3 Coating Defects .................................................................................................................................... 85
5.2.4 Adhesion .............................................................................................................................................. 86
5.2.5 Pencil Scratch Hardness ....................................................................................................................... 88
5.2.6 Degree of Blistering ............................................................................................................................. 90
5.3 Xenon Arc ................................................................................................................................................... 90
5.3.1 Color Retention .................................................................................................................................... 90
5.3.2 Gloss Retention .................................................................................................................................... 97
5.4 Outdoor Exposure Results .......................................................................................................................... 98
5.4.1 Color Retention .................................................................................................................................... 99
5.4.2 Gloss Retention .................................................................................................................................. 103
5.5 Weathering Exposure Comparison ........................................................................................................... 104
5.5.1 Color Retention .................................................................................................................................. 104
5.5.2 Gloss Retention .................................................................................................................................. 109
5.6 Performance Testing Results .................................................................................................................... 110
5.6.1 Chloride Ion Penetration Results ....................................................................................................... 111
5.6.2 Water Vapor Transmission Results ................................................................................................... 113
5.7 Coating Rankings ...................................................................................................................................... 115
5.8 Anticipated Service Life ........................................................................................................................... 117
6 Conclusions, Recommendations, and Future Work .................................................................................... 119
6.1 Conclusions ............................................................................................................................................... 119
vii
6.2 Recommendations ..................................................................................................................................... 121
6.3 Future Work .............................................................................................................................................. 122
References ........................................................................................................................................................... 123
Appendix A: Relevant ASTM and AASHTO Test Standards ............................................................................ 126
Appendix B-Summary of WisDOT Regional Surveys ....................................................................................... 129
Appendix C - Summary of State DOT Survey ................................................................................................... 132
Appendix D - Summary of Wisconsin Bridge Contractor Survey ..................................................................... 142
Appendix E – Technical Background of Coating Materials ............................................................................... 145
E.1 Components of Surface Coatings ............................................................................................................. 145
E.1.1 Binders ............................................................................................................................................... 145
E.1.2 Solvents ............................................................................................................................................. 146
E.1.3 Pigments ............................................................................................................................................ 147
E.1.4 Additives............................................................................................................................................ 149
E.2 Method of Dispersion ............................................................................................................................... 150
E.3 Typical Concrete Coating Materials ......................................................................................................... 151
E.3.1 Acrylic Polymers ............................................................................................................................... 151
E.3.2 Epoxy Resins ..................................................................................................................................... 154
E.3.3 Polyurethanes .................................................................................................................................... 156
E.3.4 Silanes, Siloxanes and Silicone Resins ............................................................................................. 165
Appendix F - UV/Prohesion/Freeze-Thaw Sample Photographs ....................................................................... 169
Appendix G - Xenon Arc Sample Photographs .................................................................................................. 189
Appendix H – Pull-off Adhesion Test Photographs ........................................................................................... 204
viii
Appendix I – Outdoor Exposure Photographs .................................................................................................... 214
Appendix J – Outdoor Exposure Climate Data................................................................................................... 224
Appendix K – Updated Comprehensive Special Provisions ............................................................................... 226
Appendix L – Performance Based Protocol........................................................................................................ 230
ix
List of Figures
Figure 1-1:Examples of coating failures; (A) Peeling on Jefferson Bridge parapets, (B) rust bleeding/staining on
Sauk City Bridge parapet, and (C) Color fading on Baraboo Bridge. .................................................................... 2
Figure 2-1: Spectrum of light produced by an open-flame carbon arc compared to summer sunlight. ............... 29
Figure 2-2: Full spectral power distribution of a daylight filtered xenon light source. ........................................ 30
Figure 2-3: UV spectral power distribution of a daylight filtered xenon light source. ......................................... 31
Figure 3-1: Prepared and coated form lined concrete surfaces. ............................................................................ 42
Figure 3-2: Discontinuities in coating film caused by surface voids. ................................................................... 43
Figure 3-3: Loss of coating film on horizontal surface and the immediately adjacent vertical surface of a
parapet. .................................................................................................................................................................. 44
Figure 3-4: Examples of rust staining; (A) Exposed reinforcement on form lined surface, (B) Surrounding
structural identification plaque, (C) Cracking near anchoring of steel guardrail. ................................................ 45
Figure 3-5: Examples of spalled concrete on the Portland Avenue Bridge (Beloit, WI). .................................... 45
Figure 3-6: Voids left in concrete surface to accommodate form ties. ................................................................. 46
Figure 4-1: Typical concrete sample formwork. ................................................................................................... 49
Figure 4-2: Typical reinforcement of the chloride ion and outdoor exposure test specimens. ............................. 50
Figure 4-3: Concrete specimen before and after sack rubbing surface treatment. ................................................ 52
Figure 4-4: Equipment used for coating application [19]. .................................................................................... 53
Figure 4-5: Wet film gage used during coating application. ................................................................................ 54
Figure 4-6: Sample curing conditions following coating application. .................................................................. 55
Figure 4-7: UV chamber sample rotation procedure. ........................................................................................... 57
Figure 4-8: Salt fog chamber sample rotation procedure. ..................................................................................... 57
Figure 4-9: UV/Condensation accelerated weathering chamber. ......................................................................... 58
Figure 4-10: Cyclic salt fog corrosion testing chamber. ....................................................................................... 59
Figure 4-11: Salt fog chamber initial calibration pH and volume of solution. ..................................................... 60
x
Figure 4-12: Xenon arc sample rotation procedure. ............................................................................................. 61
Figure 4-13: Xenon Arc test chamber, with an uninsulated black panel for temperature measurement. ............. 61
Figure 4-14: Evaluation points for UV/Prohesion, Xenon arc, and outdoor weathering samples. ....................... 63
Figure 4-15: Spectrophotometer used for color and gloss evaluations. ................................................................ 64
Figure 4-16: Ultrasonic coating thickness gage used to determine dry film thickness. ....................................... 66
Figure 4-17: Pencil hardness tester. ...................................................................................................................... 68
Figure 4-18: Manual pull-off adhesion tester. ...................................................................................................... 68
Figure 4-19: Chloride ion penetration solution pooling conditions. ..................................................................... 70
Figure 4-20: AASHTO T-260 evaluation procedure. ........................................................................................... 72
Figure 4-21: Outdoor weathering exposure rack and saline solution application procedure. .............................. 74
Figure 4-22: Adjustable film casting knife (Left) and a prepared permeability dish with test specimen (Right). 75
Figure 4-23: Environmental chamber (Right) and scale (Left) used for the evaluations of water vapor
transmission. ......................................................................................................................................................... 76
Figure 5-1: UV/Prohesion mean ΔE*ab values throughout exposure period with 95% confidence intervals. ..... 78
Figure 5-2: UV/Prohesion mean ΔL* values throughout xposure period with 95% confidence intervals. .......... 80
Figure 5-3 UV/Prohesion mean Δa* values throughout exposure period with 95% confidence intervals. .......... 82
Figure 5-4: UV/Prohesion mean Δb* values throughout exposure period with 95% confidence intervals. ........ 83
Figure 5-5: Percent change in gloss (%ΔG) throughout the UV/Prohesion accelerated weathering exposure. ... 84
Figure 5-6: Coating defects developed throughout UV/Prohesion exposure for each coating system. ............... 86
Figure 5-7: Average adhesion strengths before and after weathering exposure. .................................................. 87
Figure 5-8: Average pencil scratch hardness values of each system with and without weathering exposure. ..... 89
Figure 5-9: Average ΔEab* values of each coating system throughout xenon arc exposure. ............................... 92
Figure 5-10: Mean values of ΔL* for each system throughout xenon arc exposure. ........................................... 94
Figure 5-11: Mean values of Δa* of each coating system throughout xenon arc exposure. ................................ 95
Figure 5-12: Mean values of Δb* of each coating system throughout xenon arc exposure. ................................ 96
Figure 5-13: Percent change in gloss (%ΔG) throughout xenon arc exposure. .................................................... 97
xi
Figure 5-14: Average ΔEab* values of each coating system throughout outdoor exposure. .............................. 100
Figure 5-15: Average ΔL* values of each coating system throughout outdoor exposure. ................................. 101
Figure 5-16: Average Δa* values of each coating system throughout outdoor exposure................................... 102
Figure 5-17: Average Δb* values of each coating system throughout outdoor exposure. ................................. 103
Figure 5-18: Percent change in gloss (%ΔG) throughout outdoor exposure. ..................................................... 104
Figure 5-19: Maximum recorded ΔE*ab from each weathering exposure by coating system. .......................... 105
Figure 5-20: Maximum recorded ΔL* from each weathering exposure by coating system. .............................. 107
Figure 5-21: Maximum recorded Δa* from each weathering exposure by coating system. .............................. 108
Figure 5-22: Maximum recorded Δb* from each weathering exposure by coating system. .............................. 109
Figure 5-23: Maximum recorded %ΔG from each weathering exposure by coating system. ............................ 110
Figure 5-24: Average chloride ion concentration by depth following 90 day continuous ponding of 3% Cl-
solution. ............................................................................................................................................................... 111
Figure 5-25: Average system water vapor transmission rates over the 168 hour test period with 95% confidence
interval. ............................................................................................................................................................... 114
Figure 5-26: Comparison of average water vapor transmission rates to average sample film thickness. .......... 115
Figure 5-27: Aggregate coating system scores, broken down by category score. .............................................. 116
Figure E-1: General Chemical Structure of Acrylic Polymers. .......................................................................... 152
Figure E-2: General Chemical Structure of Styrene Acrylic Polymers. ............................................................. 152
Figure E-3: Di-isocyanate reaction with polyol to form polyurethane and their respective chemical structures
[4]. ....................................................................................................................................................................... 157
Figure E-4: Di-isocyanate reactions with amine and water to form polyurea and their respective chemical
structures [4]. ...................................................................................................................................................... 157
Figure E-5: Reaction and resulting chemical structure of reactive polyurethane prepolymer [4]. ..................... 158
Figure E-6: Adduct formation reaction and chemical structures [4]. ................................................................. 159
Figure E-7: Trimer and dimer chemical structures [4]. ...................................................................................... 160
xii
Figure E-8: Basic silicon units characterized by functionality monofunctional (M), difunctional (D),
trifunctional (T), and quadrifunctional (Q) [4]. .................................................................................................. 165
Figure J-1: Cumulative precipitation during the duration of the outdoor weathering exposure, based on
measurements from NOAA station in Shorewood, WI. ..................................................................................... 224
Figure J-2: Average monthly high and low temperature during the outdoor exposure evaluation, based on
measurements from NOAA station in Shorewood, WI. ..................................................................................... 224
Figure J-3: Average monthly high and low relative humidity during the outdoor exposure evaluation, based on
measurement from NOAA station in Shorewood, WI. ....................................................................................... 225
xiii
List of Tables
Table 4-1: Characteristics of the selected concrete coating systems. ................................................................... 48
Table E-1: Classification of various generic binders commonly used in paint formulations. ............................ 146
Table E-2: Isocyanate effects on polyurethane properties {4}. .......................................................................... 157
Table E-3: Polyol effects on polyurethane properties [4]. .................................................................................. 160
1
1 Introduction
In recent years, a variety of coating materials have been used during, or subsequent to,
the construction of highway bridges to augment aesthetic appeal and durability of the structure.
This stems from a contemporary emphasis on the aesthetics of structures and has led to
substantial financial investment to achieve the desired appeal. Though employed chiefly for
aesthetic enhancement, current coating materials typically claim to provide sufficient protection
against the hostile environmental conditions to which highway bridge components are commonly
subjected. Such conditions include exposure to ultraviolet solar radiation, moisture ingress,
severe thermal cycles, exposure to corrosive chemicals, and man-made damage, among others.
Effective long term performance of coating materials may be achieved if sufficient
consideration is given to a variety of influencing factors. These factors include material
characteristics, geometrical details, surface preparation, application method, and exposure
conditions. Unsatisfactory coating performance is a result of one or more of these factors not
being considered or implemented properly. Extensive research has been conducted on the
performance of coatings for bridge structures under a variety of service conditions. The general
consensus from this research supports the notion that if the proper material selection for a
specific application is paired with the correct surface preparation and application procedures, a
long-term satisfactory coating performance could result.
1.1 Problem Statement
The utilization of coating materials to enhance the aesthetic appeal and durability of
concrete bridge structures requires a significant initial investment and significant future
maintenance investment. As such, reasonable performance over the relatively long service life
of such structures is anticipated. Regrettably, some coating materials have been inept in meeting
2
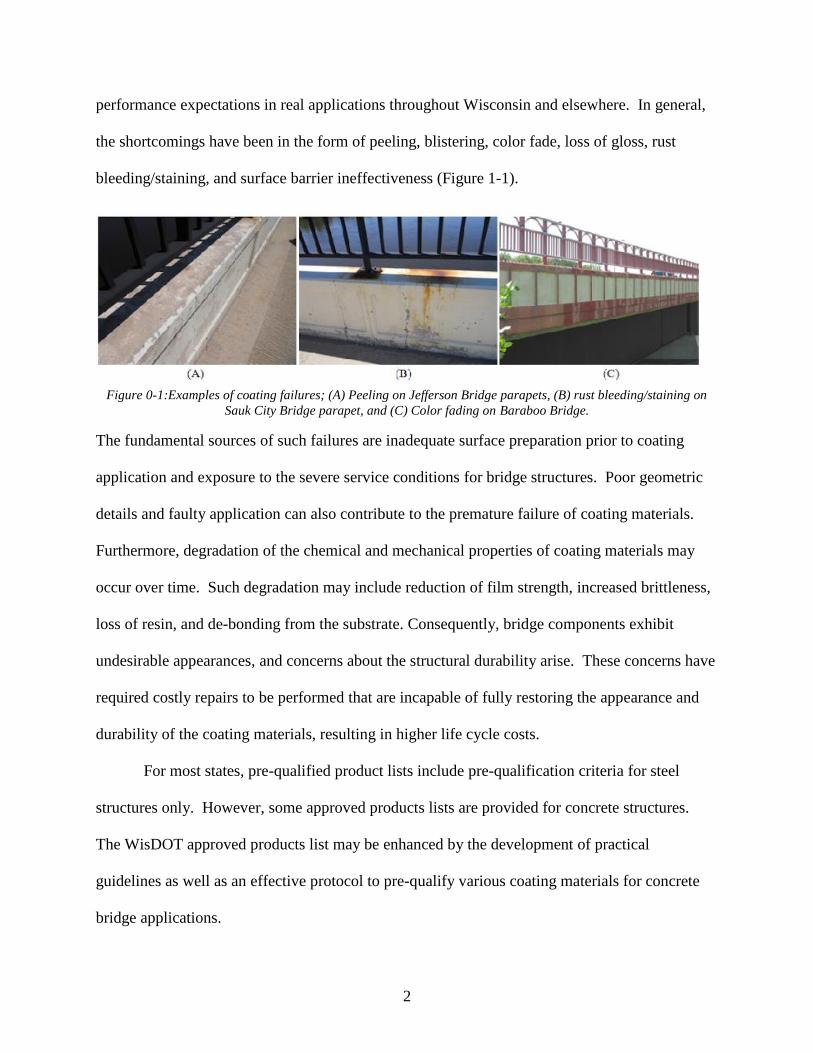
performance expectations in real applications throughout Wisconsin and elsewhere. In general,
the shortcomings have been in the form of peeling, blistering, color fade, loss of gloss, rust
bleeding/staining, and surface barrier ineffectiveness (Figure 1-1).
Figure 0-1:Examples of coating failures; (A) Peeling on Jefferson Bridge parapets, (B) rust bleeding/staining on
Sauk City Bridge parapet, and (C) Color fading on Baraboo Bridge.
The fundamental sources of such failures are inadequate surface preparation prior to coating
application and exposure to the severe service conditions for bridge structures. Poor geometric
details and faulty application can also contribute to the premature failure of coating materials.
Furthermore, degradation of the chemical and mechanical properties of coating materials may
occur over time. Such degradation may include reduction of film strength, increased brittleness,
loss of resin, and de-bonding from the substrate. Consequently, bridge components exhibit
undesirable appearances, and concerns about the structural durability arise. These concerns have
required costly repairs to be performed that are incapable of fully restoring the appearance and
durability of the coating materials, resulting in higher life cycle costs.
For most states, pre-qualified product lists include pre-qualification criteria for steel
structures only. However, some approved products lists are provided for concrete structures.
The WisDOT approved products list may be enhanced by the development of practical
guidelines as well as an effective protocol to pre-qualify various coating materials for concrete
bridge applications.
3
1.2 Research Objectives
The objectives of this study were to:
● Review and understand the application and performance evaluation of concrete
coating materials for new applications as related to Wisconsin bridge components.
● Identify appropriate coating materials that can enhance the aesthetics and
protection of concrete bridge components over a long period of service.
● Conduct appropriate laboratory and field evaluations to verify aesthetic retention
and protection properties of the selected coating materials over a long service life.
● Develop a guideline for cost-effective aesthetic appeal and durability.
● Make recommendations for the implementation of the results of this study.
1.3 Scope of Work
The objectives of this study were achieved through the completion of the following tasks,
categorized into two phases.
Phase 1: Literature Review, User Survey, and Interim Report
Literature Review
A comprehensive review of available literature concerning standards, guidelines,
materials, surface preparation, application, structural details, and long term durability and
aesthetic performance on various coating materials for concrete bridges or similar applications
was conducted. The primary sources of information relevant to this study included the available
standards and test data from the Protective Coatings Committee (PCC) of the National
Transportation Products Evaluation Program (NTPEP), publications from the Paint and
Corrosion Laboratory of the Federal Highway Administration, the 2006 study performed at the
University of Kentucky Transportation Center, as well as ASTM and AASHTO standards.
4
Supplementary to these primary sources, were materials obtained and reviewed from online
sources and technical databases, such as the Journal of Protective Coatings and Linings (JPCL)
and the Journal of Architectural Coatings (JAC).
User Survey
A formal survey was conducted to document the current concrete coating practices
(material selection, surface preparation, and coating application), performance, and experiences
of the WisDOT regional offices, the Departments of Transportation from other states,
particularly those with environmental conditions similar to Wisconsin (AASHTO Region 3-Mid-
America), as well as bridge contractors. The survey included inquiries pertaining to the types of
coating materials used for new concrete applications, existing standards, performance records,
minimum acceptance criteria, pre-qualified materials lists, environmental exposure conditions,
surface preparation, types and causes of failures, aesthetic performance, and coating durability.
As part of a previous WHRP research study, a user survey was carried out early in 2011
regarding the use and performance of coating materials for both steel and concrete highway
applications [1]. The survey was conducted by contacting coating manufacturers, consultants,
contractors, and state and regional DOT officials. That survey yielded useful information
regarding the performance of specific coating materials used under different environmental
service conditions. The user survey conducted as part of this study was designed to enhance the
results of the past survey and to promote an improved response rate from the participants. This
was done by several means. First, questions with improved clarity were developed to eliminate
interpretation issues observed in the initial survey. Secondly, questions were formatted to
correlate with those obtaining the highest response rates in the previous study. Lastly, the
5
surveys for the regional offices were distributed through WisDOT to promote a higher response
rate.
Interim Report
For the conclusion of Phase 1, an interim report, including a revised work plan and
summarizing the findings of the literature review and user survey, was submitted to the Project
Oversight Committee (POC). Subsequent to the interim report, the research team met with the
POC to present the findings of the Phase 1 study and discuss the details of the updated testing
program. A 30 day period was provided for the POC to review, suggest changes, and approve
the work plan prior to the commencement of Phase 2 of the study. The details of the final work
plan are presented in Section 4 of this report.
Phase 2: Testing and Material Evaluation, Recommendations, and Deliverables
Testing and Material Evaluation
A vast number of ASTM and AASHTO test standards address the performance
evaluation of coating materials on various substrates. These are listed in Appendix A. A subset
of such standards that are pertinent to the objectives of this study were selected to guide the
required coating performance evaluation. Despite some standards being specified for steel
materials, reliable results for concrete applications can be achieved with certain modifications -
an approach that was also adopted by the PCC of NTPEP. The standard test methods that were
implemented in this study include ASTM E96, ASTM D2244, ASTM D523, ASTM D3363,
ASTM D4541, ASTM D5894, ASTM D6695 and AASHTO T259. The details of these test
procedures and methods are discussed in Section 4 of this report. The standards used for
experimental testing of the ten selected concrete coating systems can be categorized into two
groups: material evaluations and environmental exposure procedures.
6
The standards used for material evaluations characterize specific coating attributes, which
contribute to satisfactory long-term durability and aesthetic performance. Such characteristics
include color and gloss retention, adhesion, water vapor transmission, and pencil scratch
hardness. These evaluations served as the basis for performance comparison of the concrete
coating systems included in this study.
Environmental exposure procedures include standards for conducting laboratory
weathering tests and outdoor weathering exposures. The laboratory weathering methods
specifically selected for this study include a modified version of the UV/Prohesion procedure
outlined in ASTM D5894, the xenon arc exposure as presented in ASTM D6695, and the
AASHTO T259 method of determining resistance of concrete to chloride ion penetration. These
procedures were selected to simulate the exposure conditions to which typical coating materials
are subjected during the service life of highway bridge structures. To correlate the results from
these laboratory weathering procedures to natural weathering conditions, samples from each
coating system were also subjected to a period of outdoor exposure testing.
Recommendations
Based on the findings of this study and the review of the existing WisDOT provisions,
the research team developed special provisions for concrete coatings applied to Wisconsin
bridges. The new provisions included all relevant aspects of material selection, surface
preparation, application, measurement and cost for a selected number of coating materials. In
addition, updates to the current WisDOT approved products list based on the performance of
coating systems in this study are proposed. Based on the results of this study, performance-
based protocols are proposed to aid WisDOT and coating manufacturers add new products to the
approved products list. Lastly, recommendations for the future research needs related to a more

7
cost-effective use of coating materials in highway applications are presented. The details of the
aforementioned are presented in Section 6 of this report.
8
2 Literature Review
2.1 Durability of Reinforced Concrete
A concrete structure that performs its intended function for the duration of its design life
with minimal maintenance is considered durable. In Wisconsin, the minimum design life of a
concrete bridge structure is 75 years [2]. The durability of concrete structures can be improved
through the application of surface coatings if the proper coating system is applied appropriately.
Concrete coatings can provide resistance to chemical attack and protection against reinforcement
corrosion while also improving aesthetics. Coated concrete surfaces also reduce maintenance by
granting waterproofing, improved cleanability, and dust reduction.
The primary modes of concrete deterioration are alkali-silica reaction, leaching, thermal
and moisture changes, carbonation, chloride induced corrosion, sulphate attack, and cracking.
Each of these modes of deterioration can be reduced through the application of the proper
concrete surface coating.
Alkali-silica Reaction (ASR)
Concrete can deteriorate by an alkali-silica reaction (ASR) in the presence of moisture if
reactive aggregates are present. Certain aggregates used in concrete contain a form of silica
which reacts with the sodium and potassium hydroxides released from the cement to form an
alkali silicate gel. This gel develops expansive forces that cause deterioration of concrete; cracks
appear and a soft viscous gel oozes out, which turns whitish and hardens once exposed to air.
Three conditions must be present for ACR to occur, a high alkali level in the cement (more than
0.6%), reactive constituents in the aggregates, and moisture. The absence of any one of these
factors prohibits ASR from occurring [3]. Therefore, the application of a waterproof coating on
concrete can prevent deterioration by ASR.

9
Leaching
Another form of deterioration of concrete caused by the presence of moisture is leaching.
Extensive quantities of water entering through concrete pores can cause lime in the concrete to
leach out and redeposit on the surface as calcite, which forms following a chemical reaction.
Consequently, leaching causes a loss of concrete strength. Additionally, seepage accompanied
by freeze-thaw cycles can produce spalling, chipping, and exfoliation of concrete surfaces.
Thus, leaching may be prevented via the application of a waterproof protective coating.
Thermal and Moisture Changes
Concrete experiences changes in temperatures and moisture content when exposed to sun
and rain. These changes in moisture and temperature produce movement, which when prevented
or restrained within a structure develop stresses. Cyclic stressing produced by these changes can
cause concrete deterioration. Again, in this instance, concrete deterioration can be reduced using
waterproofing coatings, but may also be diminished by the use of coatings with heat reflectivity.
Chloride Induced Corrosion
While embedded in hydrating concrete, steel reacts with oxygen to form a thin layer of
insoluble ferrous oxide (passivity layer) on its surface. The ferrous oxide adheres strongly to the
underlying steel and protects it from corrosion as long as the alkalinity of the surrounding
concrete remains high (pH>11) [4]. However, chloride ions, from contaminated concrete mix
constituents and de-icing chemicals, react with ferrous oxide to form ferrous chloride. This
complex dissolves in the concrete pore solution eliminating the protective passivity layer,
allowing corrosion to ensue. Once initiated, the presence of oxygen and moisture are pivotal to
the continuation of the corrosion process. Concrete with a relative humidity between 70 and 80
10
percent is most susceptible to corrosion of reinforcement steel [5]. The presence of moisture or
oxygen is limited when the internal relative humidity of concrete falls above or below this range.
Corrosion of steel reinforcement has two detrimental effects on the durability of concrete
structures. First, the product of corrosion (i.e. rust) occupies a volume several times larger than
the original steel creating expansive stresses in concrete that can cause cracking, spalling, or
delamination. Secondly, as corrosion progresses, the effective cross-sectional area of steel is
reduced, resulting in a reduction in the load carrying capacity of the system. Concrete coatings
act as a barrier to the ingress of chloride and may aid in limiting the presence of moisture, thus
providing protection from chloride-induced corrosion.
Carbonation
Carbonation is the result of alkaline materials in concrete reacting with atmospheric
carbon dioxide to form carbonates. Gaseous carbon dioxide does not directly react with solid
lime, but both constituents must be present within a moisture film for reaction to occur.
Therefore, the rate of carbonation is greatly dependent on the level of moisture present, and
occurs most rapidly in a humidity range of 50%-80%. Below this range, no moisture film is
present on the pore surface inhibiting the formation of carbonates. When in excess of 80%
humidity, dissolved carbon dioxide must diffuse through fully saturated pores to reach concrete
beyond the carbonation front before additional reactions occur.
The consequence of carbonation is a reduction in the alkalinity of concrete, eventually
dropping below the level of passivity for steel reinforcement, allowing corrosion to initiate.
Carbonation can be prevented by the application of anti-carbonation coatings. These surface
treatments have low permeability to carbon dioxide and are typically applied with dry film
thicknesses in excess of 7 mils to form a defect free film on rough concrete surfaces.
11
Sulphate Attack
The chemical attack of sulphates produces another form of concrete deterioration. These
chemicals are typically present in the soil or ground water, but may also be in the aggregates.
Sulphate reacts with calcium hydroxides and calcium aluminates of hydrated cement to form
calcium sulphate and calcium sulphoaluminate compounds [4]; the reactants occupy a smaller
volume than the resulting compounds leading to the development of tensile stresses within the
concrete. The rate and severity of sulphate attack is dependent on the type and concentration of
sulphates, the continuity of sulphate supply, as well as the permeability and presence of cracks in
the concrete. The supply of sulphate to the concrete can be reduced or eliminated by coating
application, therefore preventing concrete deterioration due to sulphate attack.
Cracking
Cracks form in concrete from a variety of effects including chemical attack, corrosion of
reinforcement, shrinkage, inadequate structural support, differential movements, dynamic
loadings, and moisture/temperature changes. Cracks in the surface of concrete make it more
susceptible to other forms of degradation, especially freeze-thaw effects. There are two
classifications of cracks, active and inactive. Further movement is not expected from inactive
cracks so repairs can be conducted using mortar pastes or epoxy injection. For active cracks
however, any repair must allow for further potential movement. Typically, an elastomeric
acrylic coating with crack-bridging capacity (see Section 2.2) is used to repair this type of crack
[4]. Though typically used for maintenance applications, elastomeric coatings can be applied to
a new structure to preserve film continuity after minor cracking occurs.
12
2.2 Components of Surface Coatings
Protective coatings are composed of several different components categorized into two
phases, continuous and discontinuous. The continuous phase, or vehicle, consists of the binder
and the solvent. These components provide protection of the coated surface and determine the
means of application. The discontinuous phase consists of the primary pigment and extenders.
This phase develops the desired aesthetic qualities, but also plays a role in weatherability and
corrosion resistance. Supplementary to the fundamental components, additives can be included
to enhanced desired properties and mitigate defects. A discussion of the basic function of each
of these fundamental components, common materials used in their formulation, and the
relationships between the components are discussed in Appendix E.
2.3 Optical Qualities of Surface Coatings
2.3.1 Introduction
A key attribute of a surface coating is the nearly limitless capacity to modify the
appearance of a substrate. Paints have been used in the building industry for both the
ornamentation and camouflage of structures. Paint's ability to be manipulated to yield surface
finishes ranging from flat to high gloss, with diverse opacity, a variety of textures, and a vast
range of color effects allows for assorted aesthetic appearance. Whether used to emphasize
certain architectural elements or to give the appearance of natural stone concrete, surface
coatings are pivotal to the overall aesthetics of a structure.
This section will discuss the important appearance qualities, specifically color, gloss, and
opacity, and the specification and control of these qualities.
13
2.3.2 Color and Light
Aesthetically, the color retention properties of a coating system are paramount.
Variations in the appearance parameters of color (particularly hue, lightness, and chroma) can
cause a drastic change in the perception of a structure.
In a coating film, hundreds of interfaces exist between binder and pigment materials.
When light is cast upon the surface, refraction occurs at each of these interfaces returning light to
the eyes of the observer. A similar phenomenon will allow two incompatible transparent resins
to appear white or cloudy, as the refraction that occurs between particles returns white light to
the observer.
Variations in color seen by the observer are the result of specific wavelengths of light
being absorbed by the pigments in the coating system. The wavelengths that remain are returned
to the eye of the observer to give the appearance of a specific color. The resulting color is
dominated by the primary transmitted wavelengths that determine its basic hue. This hue will be
modified by undertones of other wavelengths to produce an individual shade. White is the
observed color if no wavelengths are absorbed and black is the color observed in a total absence
of light.
In order to achieve colors which are not found in the spectrum (e.g. grey and brown) it is
important to understand the rules governing the mixture of colors, specifically those related to
pigments. The properties of color mixing pigments vary drastically from the color mixing of
light. Since two pigments mixed together both absorb light, such mixing is known as subtractive
mixing. The color observed will be the result of the wavelengths of light that are not absorbed
by any of the mixed components. If two complementary colors are combined, the result will be
grey rather than white, which would be expected from additive mixing. This is because when

14
mixed together, the complementary colors do not reflect enough light energy. Light and dark
shades are achieved by adjusting the amount of light energy reflected by the mixture of
pigments.
Adopted by the “Commission Internationale de I’Eclairage” (CIE) in 1976, the CIELAB
Uniform Colour Space is a mathematical representation of color within a three dimensional
rectangular coordinate system. The location of the color within this space is defined by three
opponent axes L*, a*, and b* representing the range of lightness (Black=0 and White=100), red
to green (Green = -a and Red = +a), and blue to yellow (Blue=-b and Yellow=+b) respectively.
2.3.3 Gloss
Gloss is the ability of a surface to reflect more light in directions close to the spectator
than in others. The uniformity of the coating surface will determine the final level of gloss. The
amount of gloss of a particular coating will be principally determined by the ratio of binder and
pigment utilized in its formulation. As the proportion of binder material increases, the surface of
the film will produce a more regular reflection, and thus a higher gloss finish. Conversely, with
a low proportion of binder, grains of pigments will be left exposed, roughening the surface that
results in a matte finish. In addition to the ratio between binder and pigment, the gloss of a
coating film is influenced by the ratio of the refraction indexes of both constituents.
It has been shown that the performance and appearance of coatings are affected by the
properties that control surface sheen. Since matte finished coatings have less binder, they are
more susceptible to mechanical damage than the high gloss alternative. The smooth surfaces of
high gloss paints also make them less susceptible to staining. However, despite their high
resistance to mechanical damage, high gloss paints show imperfections more prevalently and
15
cannot be repaired locally without a notable variation in gloss. It is this characteristic that makes
matte finish desirable.
2.4 Mechanical Properties of Surface Coatings
2.4.1 Adhesion
Regardless of the desirable performance properties a coating may possess, it will be
ineffective without adequate adhesion. Unless the coating remains on the substrate, its resistance
to weather, chemicals, scratches, impact, or stress are irrelevant. Consequently, understanding
adhesion of polymeric coatings is important, as all coatings must adhere to the substrate to
provide the desired protection or aesthetic appeal.
Adhesion of coatings is a complex phenomenon composed of both physical effects and
chemical reactions at the interface of the substrate. Though the true mechanism by which
adhesion occurs in not fully understood, several theories have been proposed, including
mechanical attachment, chemical bonding, and paint diffusion. Depending on the type of coating
material, as well as the chemistry and physics of the substrate surface, a combination or a single
one of these mechanisms may be involved.
A mechanical bond is formed when the coating spreads and solidifies in pores, holes,
crevices, and voids in the substrate surface. In this case, the coating acts as a mechanical anchor.
Instrumental analyses have suggested that a coating can penetrate into complex tunnel shaped
undercuts and cracks to develop this mechanical bond.
Surface roughness improves the adhesion of a coating. The bonding surface area can be
increased by five times by sand blasting the surface. However, due to other factors, the adhesion
will not increase in the same proportion. The advantage of surface roughness is only realized if
16
the coating completely penetrates into all surface irregularities. If such penetration is not
achieved, less coating-to-interface contact exists than the corresponding geometric area, leaving
voids between the coating and the substrate. This results in trapped air bubbles in the voids,
which will allow moisture accumulation resulting in an eventual loss of adhesion.
The formation of chemical bonds across the interface is achievable with some coating
materials, and such bonding is expected to be the strongest and the most durable. To occur, it is
necessary for tightly bound mutually reactive chemical groups to be present on both the substrate
surface and in the coating. Organo-silanes are one such coating material, which is commonly
used to promote the adhesion of resins to minerals in a concrete substrate.
Adhesion by coating diffusion occurs when two phases of coating and polymeric
substrate achieve molecular contact by wetting and segments of the macromolecules diffuse
across the interface. Depending on the material properties and curing conditions, different levels
of migration will occur. Such bonding cannot be achieved by dissimilar polymers because of
their long-chain nature and low diffusion coefficients.
There are two methods commonly used to evaluate the adhesion of coating systems: the
cross-cut test (ASTM D-3359) and pull-off methods (ASTM D-5179). The cross-cut test relies
on a qualitative visual evaluation to rate the level of adhesion, rather than a quantitative measure
used in pull-off methods. The pull-off method has been standardized internationally. This
method is affected by the thickness and solvent retention of the coating film. As the coating film
thickness increases, the breaking strength is reduced. There are several less common methods
for testing the adhesion of a coating including: indentation debonding, impact tests, and
delamination tests (knife cutting method, peel test, and blister method). These methods are used
to measure the resistance to various failures; impact tests are used to determine the stone-chip
17
resistance of a coating, and delamination tests are used to measure the resistance to peeling
forces that attack the bond between the paint film and substrate.
2.5 Coating Failures
Coating or bond failures may occur from inadequate surface preparation, improper
application, atmospheric effects, structural defects in the film, stresses, or corrosion acting
independently or in combination. This section will discuss the different types of coating failures
and the causes that contribute to their development.
2.5.1 Application Failures
Several problems can stem from the improper preparation and application of coatings to
the surface of the substrate. These failures include cracking, checking, alligatoring, peeling,
flaking, delamination, lifting, wrinkling, edge failures, and pinholing.
Cracking, checking, and alligatoring develop as the coating film ages. The resulting
shrinkage within the film causes these types of defects. Alligatoring is a film rupture
which typically occurs when a hard, brittle film is applied over a more flexible film.
Peeling and flaking are the result of poor adhesion, and delamination is used to refer to
peeling or flaking which occurs between coats.
Lifting is the result of the solvent of a succeeding coat softening the previous film too
swiftly.
Wrinkling occurs when the surface of the coating dries more rapidly than the remainder
of the film.
Edges of coated components are more susceptible to coating failures as these areas have
the thinnest coating thickness due to surface tension during the curing process.
18
Pinholes are tiny irregularities in the coating film that expose the substrate. These
irregularities are caused by improper atomization of the paint spray or segregation of the
resin within the coating.
Blistering of the coating film can be caused by a variety of factors, but those stemming
from the application and preparation include:
o Inadequate solvent release during application and curing of the film.
o Moisture vapor condensing at a point of low adhesion after passing through the
film.
o Poor surface preparation.
o Poor coating adhesion to the substrate or previous coat.
2.5.2 Environmental Failures
Atmospheric factors contributing to the degradation of a coating include UV light,
temperature, oxygen, ozone, wind, and pollution. The predominant types of failures resulted by
these factors include:
Chalking - occurs when a coating film is subjected to UV light, oxygen, and chemicals
that degrade the coating and produce a fine powder on the surface of the paint film.
Color fading or color change - may be caused by chalk on the surface or by colored
pigment breakdown, which can be caused by UV light or chemical reaction.
Blistering - can be caused by several different effects. Due to environmental effects, they
are commonly caused by chemical or solvent attack. If the film is not resistant to a
specific attack, apparent disintegration of the film will occur.
Erosion of the coating - will occur if the utilized coating material does not have sufficient
resistance to wind and driven rain leading to the eventual loss of film.
19
2.6 Surface Preparation
Surface treatments are designed to provide protection in a variety of environments, and
therefore, the choice and application of surface treatment vary considerably based on location.
In terms of surface preparation, concrete is not different than other conventional
substrates. The application surface must be clean, free of grease, flaking paint, efflorescence,
fungal growth, corrosion products, release agents, curing membranes, and be in a good state of
repair.
Typically, signs of degradation, reinforcement corrosion, spalling, mechanical damage,
etc., are apparent from general surface appearance. The extent of the damage and best means of
remediation must be assessed before the final surface preparation can be selected.
Specific surface preparation must be used for a given application, as each concrete
surface has its own discrete set of issues. Suggested methods of cleaning include wire brushing
(small areas), high-pressure water blast (if suitable drainage exists), wet/dry vacuum abrasive
blasting, mechanical impact, and mechanical abrasion.
The aforementioned mechanical surface treatments are extremely effective for removing
deeply implanted contamination, but are often too aggressive and result in micro-cracking of the
surface while causing a once smooth concrete surface to become deeply textured. This does not
leave a suitable surface for coating application without the expense of skimming the surface.
The washing techniques also pose concerns, as the use of an improper detergent may only spread
containments or if the detergent is not fully removed during the washing process it may itself
interfere with the application of a surface treatment.
Grit-blasting techniques are growing in popularity as an effective method of removing
surface grime and lightly penetrated contaminants. Due to its impact on the environment and

20
possible health and safety issues, dry blasting has become less favorable. The risks inherent to
grit-blasting are reduced to an acceptable level through wet or vacuum dry-blasting, though the
disposal of grit-rich water is still problematic.
Blow-holes (or bug-holes) are not visibly apparent initially, as they are often covered by
a thin film of cement paste prior to cleaning, the cleaning process will often remove this film
leaving the surface badly pitted. Furthermore, freshly cast concrete will inevitably exhibit
shutter marks, fins, grout runs, and protrusions. If a thin film finishing system is utilized, which
is the most common, these surface defects make it impossible to achieve a pinhole-free finish.
Under these circumstances, successful coating application will only be achieved if these defects
are re-profiled using a scrape-coat or by the application of a fairing coat.
These defects stem from a reduced cement content and increased water/cement ratio in
the concrete cover zone. The result is a more porous, thus lower density concrete, near the
surface than is present within the core of the structural element. This variation in concrete
quality is the direct result of concrete compaction, which drives excess air and moisture in the
mix to the periphery of the member. Since traditional formwork materials are impermeable, the
migration of air and moisture within the mix ceases at the formwork interfaces. This entrapped
air and moisture leads to the formation of blow-holes and other surface defects, and leaves the
surface of concrete more susceptible to carbonation, chloride penetration, freeze-thaw, and
abrasion. These shortcomings can however be minimized by the implementation of controlled
permeability formwork, which allows the excess air and moisture to pass through the
concrete/formwork interface, thus improving the overall quality of concrete in the cover zone.
This can lead to a reduction in the application cost of a surface treatment as the necessity for a
fairing coat could be minimized or eliminated.
21
A final consideration for the surface preparation of concrete is the presence of moisture.
This is critical as most surface coating will not be able to withstand water pressure from inside
the concrete. This issue is also another drawback to the use of high pressure water blasting for
cleaning, as sufficient drying time must be provided to insure appropriate application conditions.
There are several methods for testing the moisture presence in concrete prior to the application of
surface coatings, and such evaluations are recommended in areas where poor drying conditions
exist.
2.7 Coating Application
There are three main methods of application commonly available for concrete surface
treatments. These include spray, brushing, and rolling applications. The choice of application
method will be dependent on many factors, such as the environment, surface area to be coated,
accessibility and finish. The majority of coating systems can be applied by any of these
methods.
Spray application is the preferred method for structures with large surface areas and/or
where a smooth finish is desired. There are two types of systems commonly utilized for the
spray application of surface coatings, air assisted (conventional) and airless.
Conventional spray systems introduce jets of compressed air to a stream of paint at the
nozzle, breaking the stream into tiny droplets that are carried to the surface of the substrate by
the air current. High potential for paint losses has been found to reach levels as high as 30-40%
[4]. The paint losses result from bounce-back and overspray as the paint is mixed with large
amounts of air. The application of paint at corners and crevices is difficult with conventional
spray systems as severe blowback will result.
22
Airless spray units utilize a plunger pump to pressurize the paint, which then passes
through a high pressure hose to the nozzle where it is atomized and propelled to the application
surface by the pressure release. This method of application is more efficient than the
conventional spray method and therefore is preferred by most contractors. The draw backs to
this type of system include high initial equipment costs, the danger of high pressures, and the
inability to adjust fan patterns.
Both of these systems atomize the paint prior to application, which with solvent based
products become an environmental concern. This shortcoming is being overcome in the coating
industry with an increased use of water-based or high solid paints. While such emissions can be
further reduced by utilizing roller application, such application is very labor intensive on large
surface areas. Spray systems, when used correctly, allow for the most uniform application of
coating systems, minimal coating defects, and greatest control of film thickness.
Brushing is an effective and simple method of paint application, particularly for primers,
as it allows paint to be worked into pores and surface irregularities. However, because the
process is slow, it is used primarily for small surface areas, surfaces with complex
configurations, or where access limits the use of spray applications. Another advantage of
brushing is the ability to apply a thick film in only a single coat, though uniformity of the coating
layer is difficult with this application method, especially for rapidly drying paints.
The final common form of application, rolling, is advantageous for large, flat areas that
do not required the smoothness and uniformity of spray applied systems, or in interior areas
where overspray poses cleaning and masking issues. The primary downfall to this application
method is the inability to penetrate pores, cracks, and other surface irregularities, and is therefore
not recommended for the application of primers. Furthermore, roller application causes air to
23
mix with the paint leaving points where moisture can penetrate the cured film. Because of these
pitfalls, roller application is best suited for the application of top coats over a primer that has
been applied by another method.
2.8 Components of Weathering
When polymeric coatings are subjected to environmental exposures, the primary factors
causing degradation are thermal, mechanical, radiant, and chemical compositions. Living
organisms such as mildew can also degrade polymers.
2.8.1 Solar Radiation
The most harmful component in outdoor applications is exposure to ultraviolet (UV)
radiation. Such radiations may cause fading, cracking, chalking, and embrittlement. After
prolonged exposure to direct sunlight, most polymers exhibit lower overall mechanical
performance and appearance alterations.
Sunlight consists of radiation from the visible, ultraviolet (UV), and infrared regions of the
electromagnetic spectrum [6]. The various regions of the electromagnetic spectrum are shown in
Figure 2-1. The radiation from the UV light region, wavelengths ranging from 100 to 400 nm,
has been determined to be the most damaging to polymeric materials. The UV region makes up
a small portion of sunlight, just 5% to 7%, due to the filtering effects of the atmosphere [7]. This
region is divided into three categories: UV-A (315 to 400 nm), UV-B (280 to 315 nm), and UV-
C (100 to 280 nm). The energetic short wavelength UV-C is the most damaging region, but
these wavelengths are entirely filtered out by ozone in the upper levels of the atmosphere.
Therefore, for terrestrial exposure conditions, the UV-B region is the most damaging to coatings.
The energy levels of radiation in this region are sufficient to break carbon-nitrogen, carbon-
24
carbon, nitrogen-hydrogen, carbon-oxygen, and carbon-hydrogen bonds of the polymeric portion
of coatings. The less energetic UV-A radiation lacks sufficient energy to break certain bonds,
most notably carbon-hydrogen.
Since UV light is filtered by air masses, pollution, and cloud cover, the amount and spectrum
of natural UV exposure is variable. In the winter months, when the sun is lower in the sky,
sunlight is filtered through a greater air mass. This causes two significant differences between
sunlight exposures in the summer and winter seasons. In the winter, most of the damaging short
wave UV light is filtered out resulting in lower intensities (8 to 1 at 320 nm) and the solar cut off
shifts from approximately 295 nm to roughly 310 nm. This will lead to very little degradation
during the winter in polymers that have a light sensitivity to only UV light under 320 nm.
The ability of a polymer to withstand weathering varies by type and within grades of an
individual resin. Additives with UV absorption properties are implemented in many grades of
resins to improve weatherability. However, with comparable additives, resins grades with a
higher molecular weight will generally be more durable than the lower molecular weight grades.
Furthermore, certain types of pigments will also weather better than others, creating variations in
weatherability based on color.
Erosion is an example of degradation caused by solar radiation. In this process, the
coating surface layers degrade by the breaking of chemical bonds that causes chalking, fading,
and loss of gloss. Through the degradation of the outer layer of polymeric binder, pigments are
exposed. Without protection from the binder, pigments become more susceptible to fading and
erosion, leading to changes in color and/or appearance.
25
2.8.2 Moisture
The significance of moisture in the degradation of paint is often overlooked based on the
assumption that structures are only subjected to moisture by rain, splashing, or immersion.
Time-of-wetness studies conducted outside in various locations in the United States and Canada
exhibited a moisture presence approximately 30% of the time, an average of nearly 8 hours a day
[8]. Water in a natural environment is caused by rain, melting snow and ice, or dew (high
relative humidity). Several types of degradation may be initiated when water present on the
surface is absorbed by or passes through the coating.
One type of degradation is the formation of an osmotic cell, which is caused by fluid
passing through the coating and interacting with a water-soluble material. An example of this
occurs when concrete with a high salt content is coated. Once water ponds on the surface of the
coating, the difference in solution concentration on either side of a semi-permeable membrane
(coating) causes a spontaneous flow of liquid which is known as osmosis. The flow of liquid
through the membrane creates hydrostatic pressure causing blistering and delaminating of the
coating.
Another process, which affects most coatings, is the cyclic absorption and desorption of
water. Permeation of liquid into the coating may cause swelling in certain materials, and when
the liquid evaporates, the loss of moisture in turn causes the coating to shrink. Recurring stages
of permeation and evaporation of liquid thus induces cyclical stressing of the system. Additional
stressing of the coating system can occur if inner layer coating materials are at different points in
the cycle relative to the top surface. These cyclic moisture changes can lead to surface stress
cracking, as well as cracking and peeling of the entire coating system.
26
2.8.3 Temperature
The third component of weathering is temperature. Temperature can directly cause
coating degradation, but also accelerates the weathering effects of light and moisture. Past
experience with coating testing has indicated that degradation of coatings occurs more rapidly at
elevated temperatures.
Direct degradation of coating materials is caused by expansion and contraction stresses
produced by temperature variations. Expansion and contraction of the substrate itself can
magnify the thermal stresses experienced by the coating. This type of temperature degradation
may lead to cracking, peeling, checking, or loss of adhesion.
The temperature of the coating when exposed to moisture can change the moisture
effects. Specifically, erosion of the paint surface may result from thermal shock, which may be
caused by rain striking a warm coating surface initiating an evaporation process, which quickly
cools the surface. The degradation effects of moisture that has passed through or been absorbed
by the coating can also be intensified by temperature. When subjected to temperatures below
freezing, the absorbed or passed water expands, which may produce stresses in both the coating
and porous substrates. Since concrete has low tensile strength, it is susceptible to the effects of
freeze-thaw cycles and may spall if moisture is allowed to pass through the surface coating.
2.9 Accelerated Weathering
Accelerated weathering tests allow the performance characteristics of multiple coating
systems to be studied comparatively under controlled exposure conditions. It should be noted
that no accelerated weathering test can fully duplicate the true exposure environment to which a
bridge is subjected. However, if performed properly, accelerated weathering tests can yield
27
results which aid in the selection and application of coating systems in a reduced time in
comparison to real exposure tests.
Accelerated weathering involves the use of laboratory equipment to imitate the coating
degradation that occurs during actual outdoor exposure [9, 10, 11]. Artificial weathering is most
often referred to as accelerated weathering because at least one of the components of weathering,
mainly light, heat, and moisture, are either intensified or in longer duration than encountered in
outdoor exposure. This heightened exposure condition causes coatings to weather or degrade
more rapidly. In an effort to accelerate the effects of natural weathering, laboratory conditions
may, however, be unduly aggressive and generate results that are not always attained during
natural weathering. This section focuses on how the different components of weathering are
simulated and intensified in weathering apparatuses, as well as the different accelerated testing
methods available.
2.9.1 Simulating Solar Radiation
To simulate the effects of solar radiation in artificial weathering devices, a variety of light
sources have been used. These sources include filtered and unfiltered mercury arcs, open-flame
and enclosed carbon arcs, xenon arcs, and fluorescent lamps. However, when the results of
natural weathering were compared to the results obtained from early accelerated weathering
devices, light sources were modified to achieve results that correlate better to natural weathering.
As a result, the majority of current test specifications require the use of open-flame carbon arcs,
xenon arcs, or fluorescent lamps as these light sources more closely simulate the degrading UV
light range of sunlight [7]. Recent advances in artificial weathering have led to the use of high
efficiency metal halide lamps as light sources. As part of the testing process, each light source
provides both benefits and detriments.
28
2.9.1.1 Light Sources
While some light sources are much more common for current accelerated weathering
testing, it is important to understand the characteristics of those light sources prevalent in historic
tests. Four of the most commonly used light sources will be discussed briefly in this section.
2.9.1.1.1. Carbon Arc
An open flame carbon arc, or sunshine carbon arc, light source consists of copper-coated
electrodes and a central core of rare earth that operates in a free flow of air rather than within a
borosilicate globe, as is the case with enclosed carbon arc light sources.
The light source is surrounded by an array of borosilicate glass panels that filter portions
of the lower wavelength light from the spectrum. The spectrum of the open-flame carbon arc is
similar to sunlight in the region between 310 and 370 nm. However, there is a spectral disparity
between 370 and 450 nm where large bands are observed. The weakness of the open-flame
carbon arc is the emission between 260 and 310 nm, which includes a portion of UV-C radiation,
a poor spectral distribution correlation with sunlight in the visible spectrum, and the maintenance
needs. Carbon arc equipment typically requires daily rod replacement and filter cleaning, and
the filters must be replaced periodically because their transmission characteristics change with
exposure to UV radiation. Despite reports of good correlation with outdoor exposures for certain
materials, the use of open-flame carbon arcs in artificial weathering has been widely depreciated
due to their poor simulation of the spectral distribution of natural sunlight.
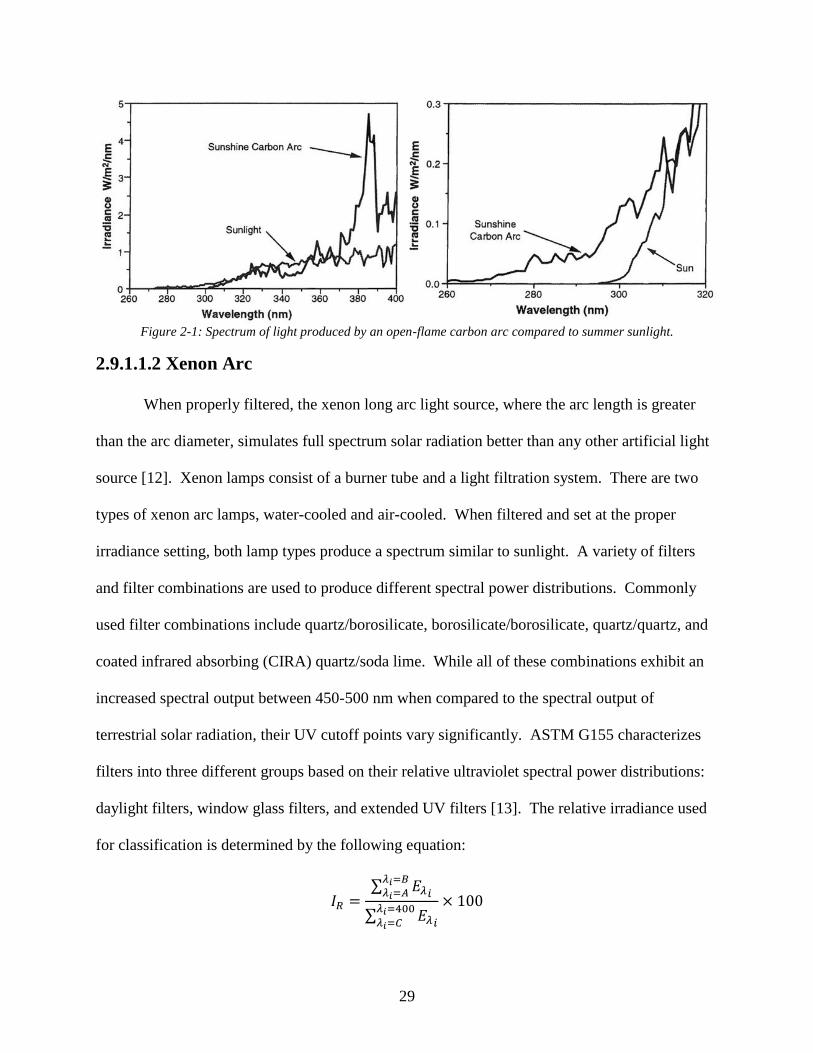
29
Figure 2-1: Spectrum of light produced by an open-flame carbon arc compared to summer sunlight.
2.9.1.1.2 Xenon Arc
When properly filtered, the xenon long arc light source, where the arc length is greater
than the arc diameter, simulates full spectrum solar radiation better than any other artificial light
source [12]. Xenon lamps consist of a burner tube and a light filtration system. There are two
types of xenon arc lamps, water-cooled and air-cooled. When filtered and set at the proper
irradiance setting, both lamp types produce a spectrum similar to sunlight. A variety of filters
and filter combinations are used to produce different spectral power distributions. Commonly
used filter combinations include quartz/borosilicate, borosilicate/borosilicate, quartz/quartz, and
coated infrared absorbing (CIRA) quartz/soda lime. While all of these combinations exhibit an
increased spectral output between 450-500 nm when compared to the spectral output of
terrestrial solar radiation, their UV cutoff points vary significantly. ASTM G155 characterizes
filters into three different groups based on their relative ultraviolet spectral power distributions:
daylight filters, window glass filters, and extended UV filters [13]. The relative irradiance used
for classification is determined by the following equation:
𝐼𝑅 =∑ 𝐸𝜆𝑖
𝜆𝑖=𝐵𝜆𝑖=𝐴
∑ 𝐸𝜆𝑖
𝜆𝑖=400
𝜆𝑖=𝐶
× 100
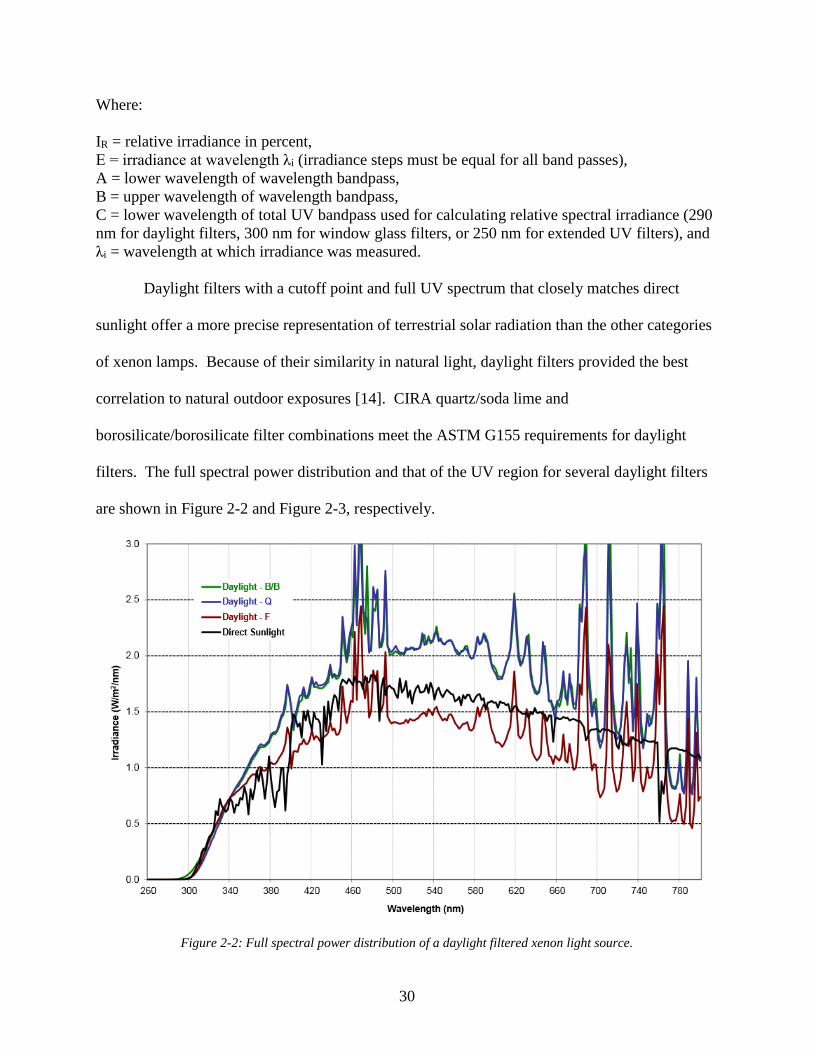
30
Where:
IR = relative irradiance in percent,
E = irradiance at wavelength λi (irradiance steps must be equal for all band passes),
A = lower wavelength of wavelength bandpass,
B = upper wavelength of wavelength bandpass,
C = lower wavelength of total UV bandpass used for calculating relative spectral irradiance (290
nm for daylight filters, 300 nm for window glass filters, or 250 nm for extended UV filters), and
λi = wavelength at which irradiance was measured.
Daylight filters with a cutoff point and full UV spectrum that closely matches direct
sunlight offer a more precise representation of terrestrial solar radiation than the other categories
of xenon lamps. Because of their similarity in natural light, daylight filters provided the best
correlation to natural outdoor exposures [14]. CIRA quartz/soda lime and
borosilicate/borosilicate filter combinations meet the ASTM G155 requirements for daylight
filters. The full spectral power distribution and that of the UV region for several daylight filters
are shown in Figure 2-2 and Figure 2-3, respectively.
Figure 2-2: Full spectral power distribution of a daylight filtered xenon light source.
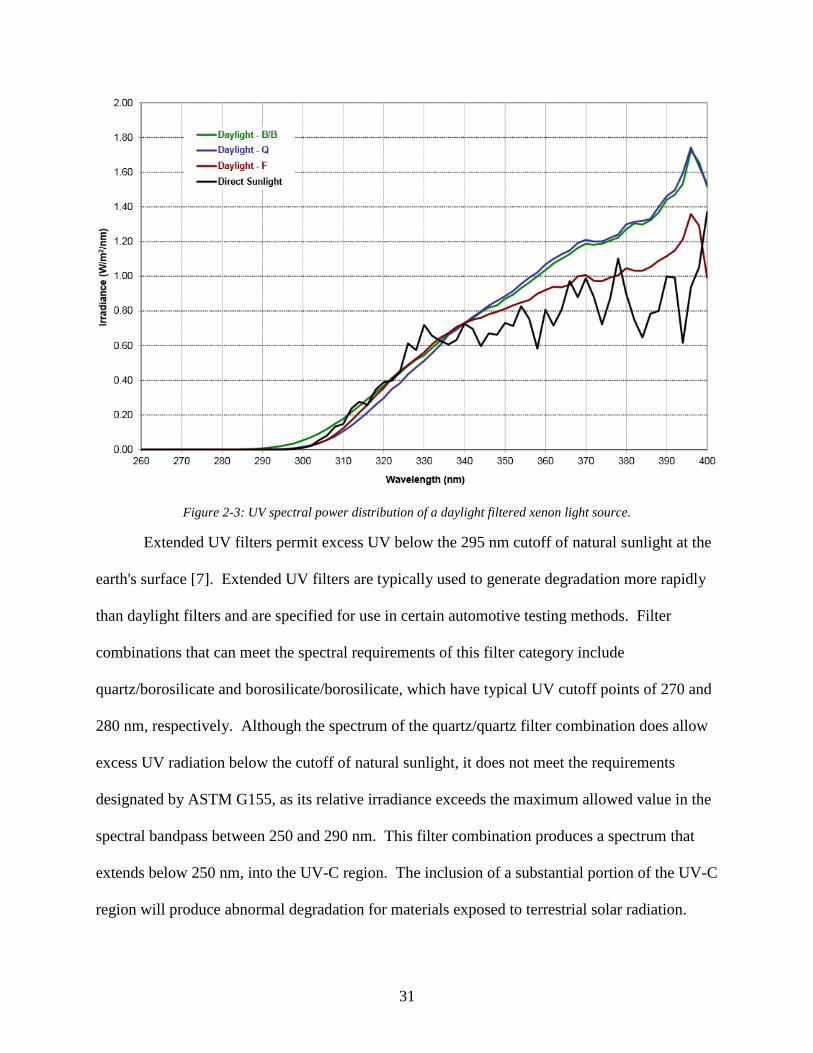
31
Figure 2-3: UV spectral power distribution of a daylight filtered xenon light source.
Extended UV filters permit excess UV below the 295 nm cutoff of natural sunlight at the
earth's surface [7]. Extended UV filters are typically used to generate degradation more rapidly
than daylight filters and are specified for use in certain automotive testing methods. Filter
combinations that can meet the spectral requirements of this filter category include
quartz/borosilicate and borosilicate/borosilicate, which have typical UV cutoff points of 270 and
280 nm, respectively. Although the spectrum of the quartz/quartz filter combination does allow
excess UV radiation below the cutoff of natural sunlight, it does not meet the requirements
designated by ASTM G155, as its relative irradiance exceeds the maximum allowed value in the
spectral bandpass between 250 and 290 nm. This filter combination produces a spectrum that
extends below 250 nm, into the UV-C region. The inclusion of a substantial portion of the UV-C
region will produce abnormal degradation for materials exposed to terrestrial solar radiation.
32
Therefore, this type of filter combination is most commonly used to produce extraterrestrial
exposure conditions for testing materials intended for use in aerospace applications.
2.9.1.1.3 Fluorescent UV
Unlike the xenon arc, fluorescent UV light sources were not developed to simulate the
entire spectrum of sunlight, but rather only the damaging UV region. A variety of such lamps
are available to simulate various exposure conditions. The two most commonly utilized for
accelerated weathering exposures are the UVA-340 and UVB-313. The UVA-340 lamp
produces the best simulation of the short wavelength region (295 nm to 365 nm) of sunlight, but
provides minimal exposure of wavelengths in excess of 390 nm. Alternatively, the UVB-313
provides a substantially higher UV exposure leading to more rapid degradation and faster test
results.
Historically, UVB lamps were more commonly used as they allowed for materials to be
evaluated more rapidly. However, in some situations the higher output of these bulbs resulted in
degradation that did not match that observed in real applications. Because of this variation, a
shift has been made to UVA lamps as the degradation observed through their use often correlates
better to field applications. Despite the degradation process taking longer with UVA lamps, it is
still accelerated in comparison to outdoor weathering. The degradation produced by these
fluorescent bulbs may vary significantly from natural weathering due to the lack of long
wavelength radiation. Furthermore, due to the lack of emissions in the visible spectrum, coatings
of different colors will not experience much variation in surface temperature, which will occur
with exposure to natural light.
Advances in instrumentation have allowed the irradiance of fluorescent bulbs to be
operated at higher intensities. This allows for more accelerated degradation rates without
33
sacrificing the correlation of the spectrum. However, the drawback of such use is that the bulbs
must be monitored to evaluate bulb aging and decay in irradiance output.
2.9.1.1.4 Metal Halide
A recent advance in artificial weathering is the use of metal halide lamps. These lamps
do not produce a continuous spectrum, but rather utilize an abundance of spectrum lines over a
wide spectral range. While such lamps are capable of producing a spectrum somewhat similar to
sunlight, they also require filters, devices to stabilize irradiance, and electronic power supplies to
achieve this correlation. Although these lamps can reproduce the relative energy over a given
range, they are not known to be good overall simulators of sunlight. Furthermore, each lamp
varies in output, requiring each lamp to be measured to determine its suitability. Because of
these factors, metal halide lamps have not seen widespread use in accelerated weathering
evaluations.
2.9.2 Simulating Moisture
In artificial testing, moisture can be simulated by water spray, condensation, fog, or
immersion. The process and speed of degradation is influenced by the permeability of the
coating and the contact time required to initiate water penetration. Acceleration of the
weathering process is achieved by increasing the frequency of wet/dry cycles or increasing the
time of exposure. Because accelerated weathering devices run autonomously, the eight hour
average wetness found in natural weathering can be met or exceeded while running specimens
through several wet/dry cycles. Prolonging the period of moisture exposure may cause
approximately the same coating degradation as the stresses caused by wet/dry cycling [7].
34
2.10 Outdoor Exposure Testing
An outdoor exposure evaluation should be performed to verify the results of the
accelerated laboratory testing. A prolonged outdoor exposure subjects coatings to conditions
that cannot be fully replicated in the laboratory setting. The outdoor environment exposes
coatings to true temperature fluctuations and a full spectrum of light, with the addition of site-
specific factors including chemical intrusion (from both air and moisture), driven precipitation,
snow accumulation, wind, and humidity.
2.11 Volatile Organic Compounds (VOCs)
There are increasing concerns about the health and safety and environmental
consequences caused by the emission of volatile organic compounds (VOCs) in the construction
industry, as it is a major consumer of surface coating products.
Health and safety concerns stem from the flammability, storage, and transportation of
solvent-based coatings, and the protection of individuals working with or in the vicinity of
coating systems. These occupational health and safety problems can be accommodated by
training and the adoption of best practice procedures.
The level of VOC emissions that solvents from surface coatings make to the atmosphere
are the focus of the environmental concerns. VOCs react with other pollutants in the atmosphere
to create ozone, which, at ground level, causes photochemical smog. Smog has been implicated
in crop and tree damage, as well as having adverse effects on individuals with respiratory
illnesses.
Solvents contributed an estimated 40% of VOC emissions caused by human actions,
which comprise 70% of the total VOC emissions to the atmosphere [4]. The primary sources of
VOC emissions are from the manufacture and application of surface coatings, and from the
35
commercial cleaning of metals and fabrics. Recently legislation, both nationally and
internationally, focused on the reduction of VOC emissions, have pressured the industry into the
implementation of low-VOC technologies in most areas [15].
The vast majority of VOC emissions from surface coatings are due to the solvent
component used, though a minor contribution is made from the drying reactions of some binders.
Pigmentary materials and extenders do not contribute to VOC emissions. The release of VOCs
is also produced by the use of solvent based cleaning of equipment and surface following
application. The level of emissions by a particular coating system can be estimated based on the
average density of the coating and the solvent content. Strides have been made to the production
and implementation of high solid content solvent and water based coating systems to help reduce
the coating industry’s contribution to VOC emissions.
2.12 Previous Related Research
2.12.1 Kentucky Transportation Center Study (2006)
Palle and Hopwood conducted the most relevant study on the performance of coatings for
structural concrete at the University of Kentucky Transportation Center [16]. This study focused
on maintenance concrete coatings and implemented a variety of standard test methods and a field
test to establish the minimum failure criteria for nine different coating systems. The coating
materials were evaluated for adhesion, water vapor transmission rate, resistance to chloride
penetration, and color variation due to weathering.
Laboratory Testing
In this study, Durock® cement board substituted concrete to make panels for accelerated
weathering testing. The cement board panels were prepared for coating application with a coal-
36
slag abrasive sweep blast. Then, by spray application, the coating systems were applied to only
one surface of the panels.
Cleary, the use of Durock® cement board instead of concrete panels may have influenced
the results of this test. Though similar in composition to concrete, cement board utilizes a high
portion of cementitious materials (>40 WT%), lightweight aggregates, silica, and a proprietary
blend of mineral-based materials [17]. The resulting material has approximately half the density
and is significantly more permeable than typical structural concretes [17]. In addition, the use of
prefabricated panels, that were not exposed to form release chemicals, eliminates one of the
primary causes of coating failure.
Furthermore, excess moisture is always present following cement hydration, and
ultimately evaporates through the exposed surfaces of concrete. Therefore, the coatings on
certain bridge components, parapets in particular, must allow the passage of water vapor. By
only coating a single side of the test specimens, excess moisture may egress through the back
and sides of the panel, potentially improving coating performance.
Though a variety of performance tests were conducted, no evaluation of the freeze-thaw
performance was carried out in this study. This neglects a key weathering effect, which can
cause both thermal and mechanical stresses in the coating and degrade the concrete substrate.
Field Evaluations
For the field study, each experimental coating system was applied to two panels along the
barrier wall of KY 676 implementing both pressure washing and abrasive sweep blasting for
surface preparation. The bridge selected was over 20 years old with a largely deteriorated
masonry coating and some defects present in the barrier concrete. Baseline chloride
37
concentrations were determined at depths of 1/2" and 1" near the base and crown of the barrier
wall prior to coating application.
Coatings were evaluated nine months after application. Satisfactory performance was
reported with adequate adhesion to both vertical and horizontal surfaces. However, damage
attributed to rock hits was noted near the base of the barrier wall. Additional chloride samples
were evaluated fourteen months after coating application, showing negligible increases from the
baseline values. Despite adequate adhesion observed from both surface preparation methods
when utilized in a maintenance application, additional contaminates present on new concrete
components may result in performance differences.
2.12.2 FHWA Studies
As part of an evaluation of one-coat systems for steel bridge applications, the Federal
Highway Administration (FHWA) conducted two separate accelerated weathering exposures.
One such test was conducted with an ocean front exposure. The other was conducted at the
Turner-Fairbank Highway Research Center (TFHRC). At both locations, the sample sets were
placed on an inclined wooden frame with a southern exposure. Specifically at the TFHRC, two
sample sets were evaluated; one set was subjected only to natural weathering, and the second set
was subjected to a 15 percent sodium chloride solution. In addition to the outdoor exposure
evaluations, a UV/Prohesion/Freeze accelerated weathering test was conducted. A variety of
performance characteristics of the coatings were evaluated including dry film thickness, color,
gloss, pencil scratch hardness, and adhesion [18].
The inclusion of the sodium chloride solution into the outdoor weathering evaluation
would be effective for accelerating the degradation of the coating systems, or simulating deicing
chemicals.

38
2.12.3 Previous WHRP Study-Steel Coatings
Recently, a similar study was conducted at the University of Wisconsin-Milwaukee to
evaluate the performance of aesthetic coatings for steel bridge applications. As part of this
evaluation, steel coating samples were subjected to both UV/Prohesion/Freeze and Xenon arc
accelerated weathering exposures. Evaluations of such samples were conducted weekly during
these exposure tests, and in several instances the changes observed over such a short timeframe
were insignificant. This suggests that evaluations of the test specimens could be conducted at a
greater interval without sacrificing the clarity of the results.
Despite the inclusion of two separate accelerated weathering tests to address different
factors affecting the degradation of coating materials, no outdoor exposure evaluation was
conducted as part of this study. The lack of such a test prevents any correlation between the
results of the accelerated weathering tests with those from true in-field applications.
39
3 Survey Results & Field Visits
As part of Phase 1 of this project, three questionnaires were developed and distributed to
the WisDOT regional offices, various state Departments of Transportation, and major Wisconsin
bridge contractors. Scrutiny of the responses provided insight into the coating practices,
materials, and performance prevalent in highway bridge applications. The complete
questionnaires and responses are presented in Appendixes B, C and D.
3.1 Summary of Regional WisDOT Survey Responses
A majority of the WisDOT regional offices responded to the survey, but only two
identified specific coating products used for recent concrete bridge applications. However,
considerable information was provided pertaining to the implementation of anti-graffiti coating
products. These products have been excluded from new projects due to prior ineffectiveness
paired with extensive expenses associated with both initial application and cleaning. The
common practice for dealing with graffiti is simply recoating the area; some regions use color
matched coatings while others just reapply the original coating to the affected areas.
The most prevalent coating failures reported for concrete applications were peeling and
color fading. The identified problem areas for these coating failures include the top surface of
parapets, wing walls with direct exposure, and the edges adjacent to uncoated surfaces.
Conversely, improved coating system performance was noted for surfaces where form liners
were implemented. Likewise, allowing a 28 day concrete curing period prior to coating
application was also reported to enhance the performance of concrete coating systems, but may
force coating application on projects to be delayed over winter.
40
3.2 Summary of State DOT Responses
The majority of the approved products reported by the various state DOTs surveyed were
100% acrylic or acrylic-silicone hybrid coatings. Michigan's approved products are primarily
crack bridging elastomeric waterborne coatings; Iowa and Nebraska had similar approved
products, consisting of acrylic emulsions and acrylic-silicone hybrid stains. Contrary to the other
responses, South Dakota's approved products were all prefabricated waterproof polyethylene
membranes.
An assortment of surface preparation techniques was specified. In Iowa, it is common
practice to delay coating application for at least two winter seasons to allow weak surface
concrete to spall through freeze-thaw exposure; this delay also permits the breakdown of surface
contaminates via UV exposure. Despite this practice, recent surface preparation has consisted of
a combined sand and water blast to ensure proper surface profile and openness. However, the
performance characteristics of coatings applied to surfaces prepared by this method is unknown,
as none of the projects utilizing this technique are old enough to justify the evaluation of coating
failures. In addition, prior to coating application, the pH and moisture content of the concrete
surfaces must be evaluated in accordance with ASTM D4262 and ASTM E1907, respectively.
Michigan requires abrasive blasting of all concrete surfaces prior to coating application, while
the remaining states require preparation in accordance with manufacturer recommendations.
Iowa was the only state to list specific requirements for coating application. This
included a two coat minimum and for each additional coat to be applied perpendicular to the
former. All states allowed spray and roller application, and with the exception of Michigan,
brush application as well.
41
Similar to the reports from the WisDOT regional offices, the primary modes of failure
experienced in other states were peeling and color fading. Suggested attributes contributing to
the loss of adhesion consists of poor removal of curing compounds, damage to the substrate
caused by freeze-thaw, the presence of moisture, and over-finishing of concrete surfaces.
3.3 Summary of Bridge Contractor Responses
The survey of Wisconsin bridge contractors yielded only one response, but the provided
information was beneficial. All the coating products used on recent concrete bridge projects
were acrylic based materials and have allegedly performed well on multiple highway structures.
Concrete surfaces are typically sack rubbed finished and water blasted in preparation for coating
application, and form release agents are removed by pressure washing of the contaminated
surfaces. Steel formwork produces the smoothest surface finish, which if not prepared properly
could lead to adverse coating adhesion issues.
3.4 Field Visit-Beloit
A field visit to a pair of bridges in Beloit, WI allowed for the observation of the coating
application process and the evaluation of a previously coated bridge structure.
The coating application process was observed during the expansion of the Henry Avenue
Bridge (B-53-0001). During the visit, coatings were applied to concrete surfaces that were cast-
in-place using steel formwork and an architectural form liner. Both surfaces were prepared for
coating application by a minimum 3,000 psi water blast. Spray application methods were
typically used on the surfaces cast against steel formwork, but in certain locations roller
application was more feasible. To achieve the desired appearance, form lined surfaces were
coated using both spray and brush application. Figure 3-1 depicts the form lined surface
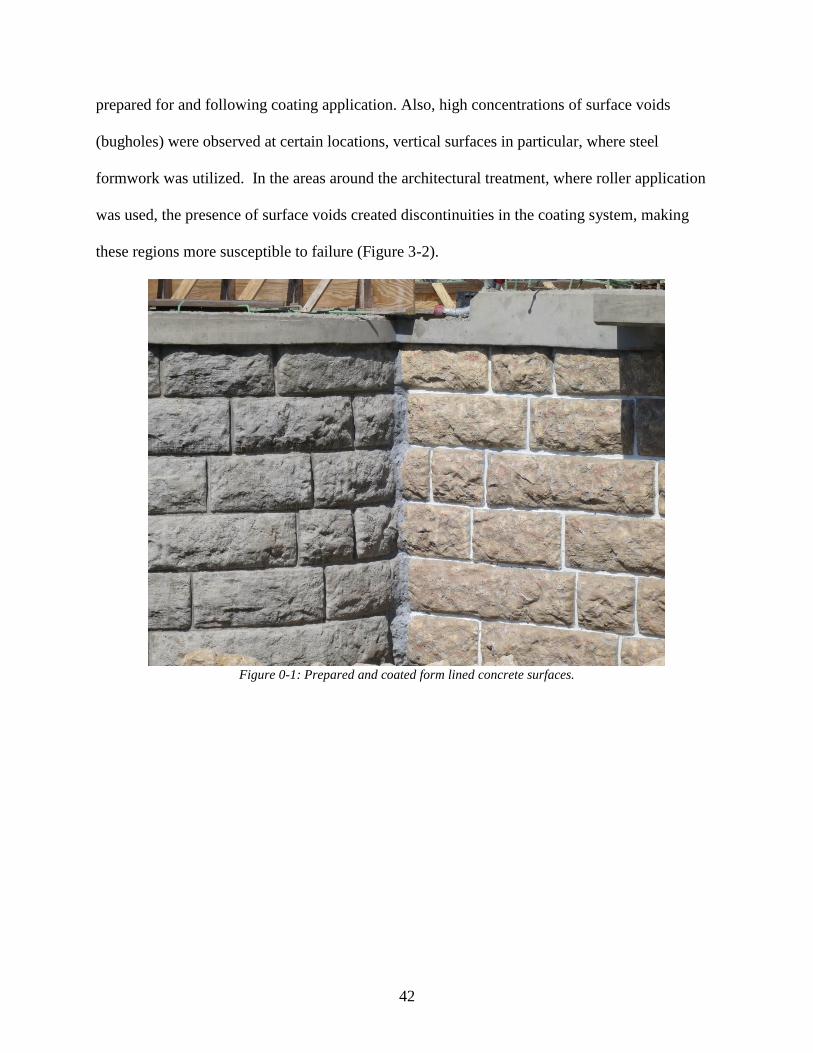
42
prepared for and following coating application. Also, high concentrations of surface voids
(bugholes) were observed at certain locations, vertical surfaces in particular, where steel
formwork was utilized. In the areas around the architectural treatment, where roller application
was used, the presence of surface voids created discontinuities in the coating system, making
these regions more susceptible to failure (Figure 3-2).
Figure 0-1: Prepared and coated form lined concrete surfaces.
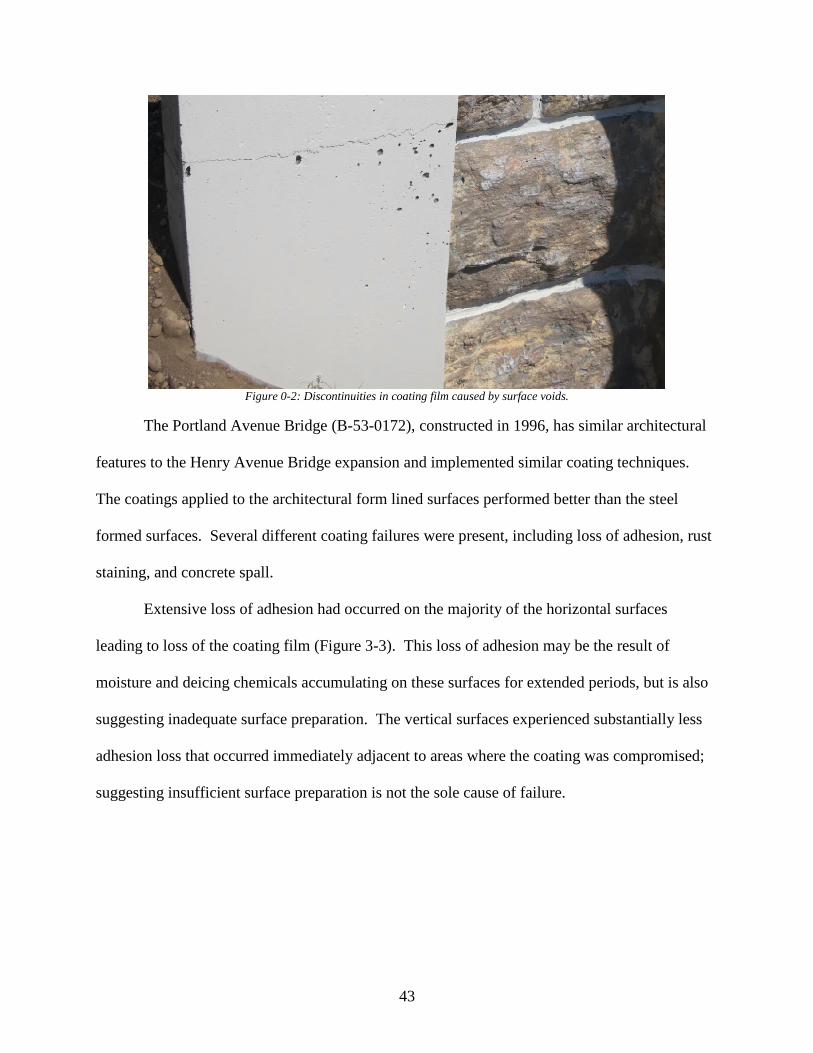
43
Figure 0-2: Discontinuities in coating film caused by surface voids.
The Portland Avenue Bridge (B-53-0172), constructed in 1996, has similar architectural
features to the Henry Avenue Bridge expansion and implemented similar coating techniques.
The coatings applied to the architectural form lined surfaces performed better than the steel
formed surfaces. Several different coating failures were present, including loss of adhesion, rust
staining, and concrete spall.
Extensive loss of adhesion had occurred on the majority of the horizontal surfaces
leading to loss of the coating film (Figure 3-3). This loss of adhesion may be the result of
moisture and deicing chemicals accumulating on these surfaces for extended periods, but is also
suggesting inadequate surface preparation. The vertical surfaces experienced substantially less
adhesion loss that occurred immediately adjacent to areas where the coating was compromised;
suggesting insufficient surface preparation is not the sole cause of failure.
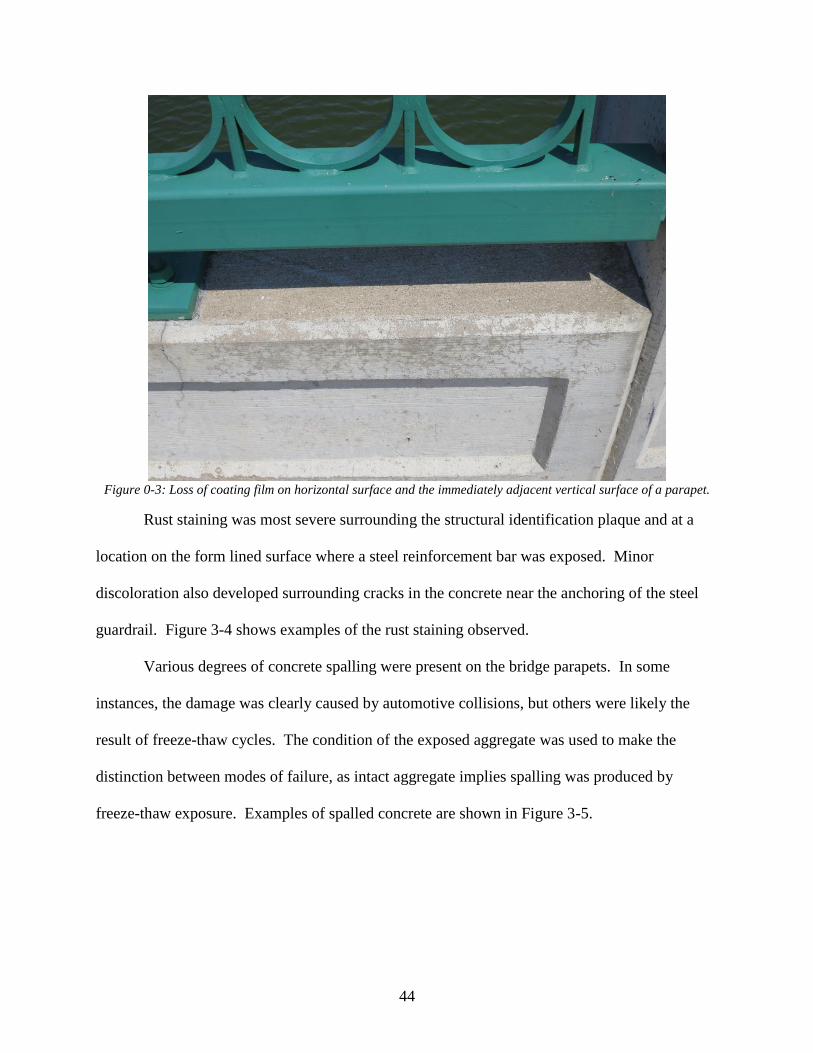
44
Figure 0-3: Loss of coating film on horizontal surface and the immediately adjacent vertical surface of a parapet.
Rust staining was most severe surrounding the structural identification plaque and at a
location on the form lined surface where a steel reinforcement bar was exposed. Minor
discoloration also developed surrounding cracks in the concrete near the anchoring of the steel
guardrail. Figure 3-4 shows examples of the rust staining observed.
Various degrees of concrete spalling were present on the bridge parapets. In some
instances, the damage was clearly caused by automotive collisions, but others were likely the
result of freeze-thaw cycles. The condition of the exposed aggregate was used to make the
distinction between modes of failure, as intact aggregate implies spalling was produced by
freeze-thaw exposure. Examples of spalled concrete are shown in Figure 3-5.
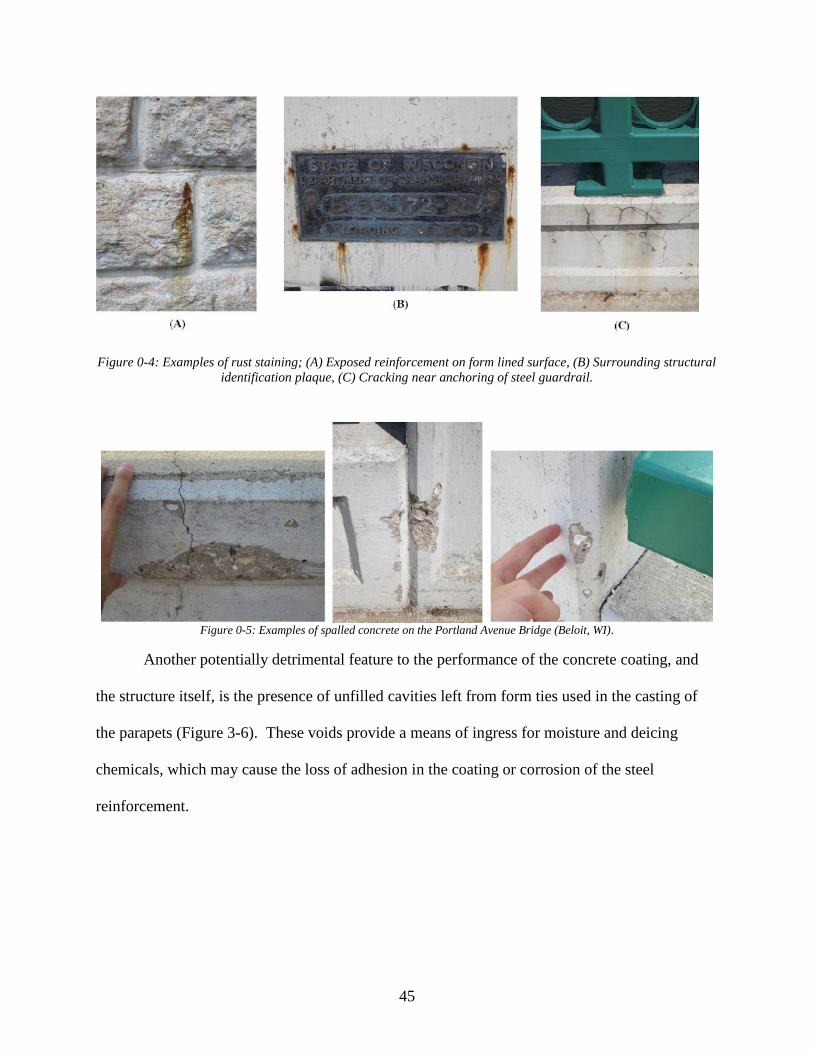
45
Figure 0-4: Examples of rust staining; (A) Exposed reinforcement on form lined surface, (B) Surrounding structural
identification plaque, (C) Cracking near anchoring of steel guardrail.
Figure 0-5: Examples of spalled concrete on the Portland Avenue Bridge (Beloit, WI).
Another potentially detrimental feature to the performance of the concrete coating, and
the structure itself, is the presence of unfilled cavities left from form ties used in the casting of
the parapets (Figure 3-6). These voids provide a means of ingress for moisture and deicing
chemicals, which may cause the loss of adhesion in the coating or corrosion of the steel
reinforcement.
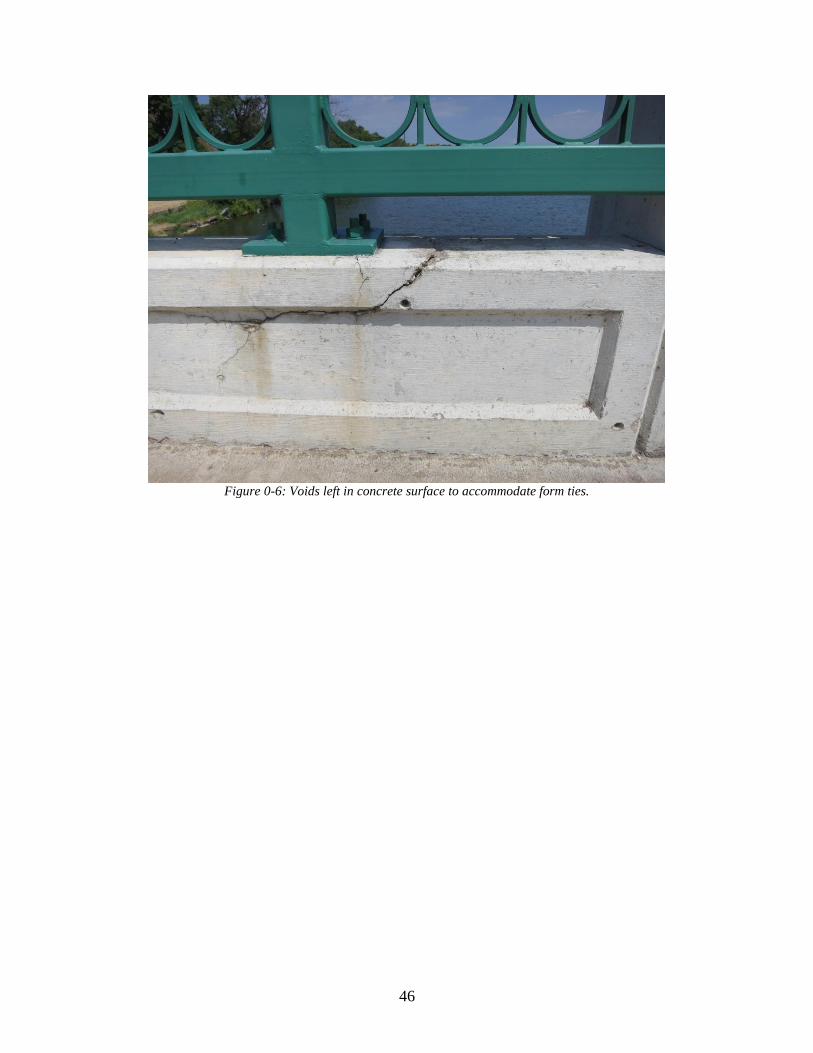
46
Figure 0-6: Voids left in concrete surface to accommodate form ties.
47
4 Experimental Program
4.1 Selected Coating Systems
The available budget, resources, and the capacity of the UWM laboratory testing
equipment limited the number of coating systems to ten, the number of test panels per system to
three, and the number of colors (pigments) to one (Brown; FC #102191) in this study. Coating
systems were selected to produce a diverse sampling of materials and system types. Based on
survey responses and manufacturer recommendations, acrylic, acrylic hybrid, epoxy, and
polyurethane coating materials were included in the experimental program. The selected
systems were categorized into four different types: one-coat, homogeneous two-coat,
heterogeneous two-coat, and stains. The characteristics of each coating system are shown in
Table 0-1.
1 http://www.federalstandardcolor.com/
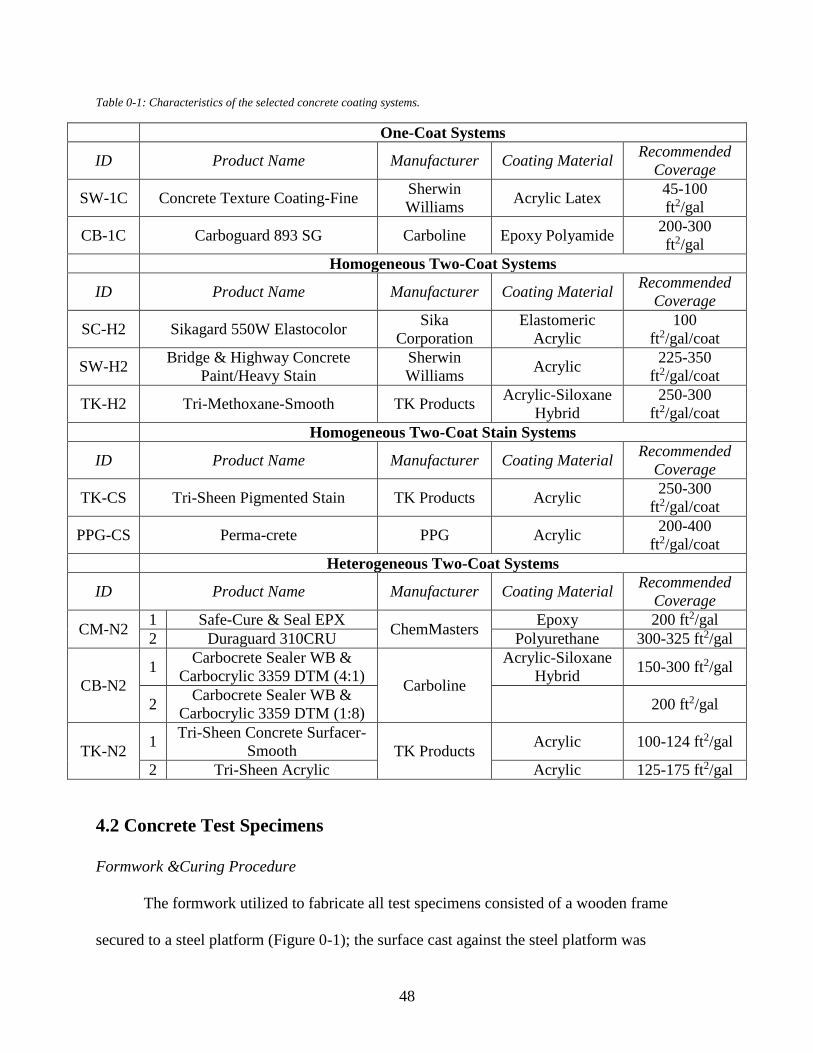
48
Table 0-1: Characteristics of the selected concrete coating systems.
One-Coat Systems
ID Product Name Manufacturer Coating Material Recommended
Coverage
SW-1C Concrete Texture Coating-Fine Sherwin
Williams Acrylic Latex
45-100
ft2/gal
CB-1C Carboguard 893 SG Carboline Epoxy Polyamide 200-300
ft2/gal
Homogeneous Two-Coat Systems
ID Product Name Manufacturer Coating Material Recommended
Coverage
SC-H2 Sikagard 550W Elastocolor Sika
Corporation
Elastomeric
Acrylic
100
ft2/gal/coat
SW-H2 Bridge & Highway Concrete
Paint/Heavy Stain
Sherwin
Williams Acrylic
225-350
ft2/gal/coat
TK-H2 Tri-Methoxane-Smooth TK Products Acrylic-Siloxane
Hybrid
250-300
ft2/gal/coat
Homogeneous Two-Coat Stain Systems
ID Product Name Manufacturer Coating Material Recommended
Coverage
TK-CS Tri-Sheen Pigmented Stain TK Products Acrylic 250-300
ft2/gal/coat
PPG-CS Perma-crete PPG Acrylic 200-400
ft2/gal/coat
Heterogeneous Two-Coat Systems
ID Product Name Manufacturer Coating Material Recommended
Coverage
CM-N2 1 Safe-Cure & Seal EPX
ChemMasters Epoxy 200 ft2/gal
2 Duraguard 310CRU Polyurethane 300-325 ft2/gal
CB-N2
1 Carbocrete Sealer WB &
Carbocrylic 3359 DTM (4:1) Carboline
Acrylic-Siloxane
Hybrid 150-300 ft2/gal
2 Carbocrete Sealer WB &
Carbocrylic 3359 DTM (1:8)
200 ft2/gal
TK-N2 1
Tri-Sheen Concrete Surfacer-
Smooth TK Products Acrylic 100-124 ft2/gal
2 Tri-Sheen Acrylic Acrylic 125-175 ft2/gal
4.2 Concrete Test Specimens
Formwork &Curing Procedure
The formwork utilized to fabricate all test specimens consisted of a wooden frame
secured to a steel platform (Figure 0-1); the surface cast against the steel platform was
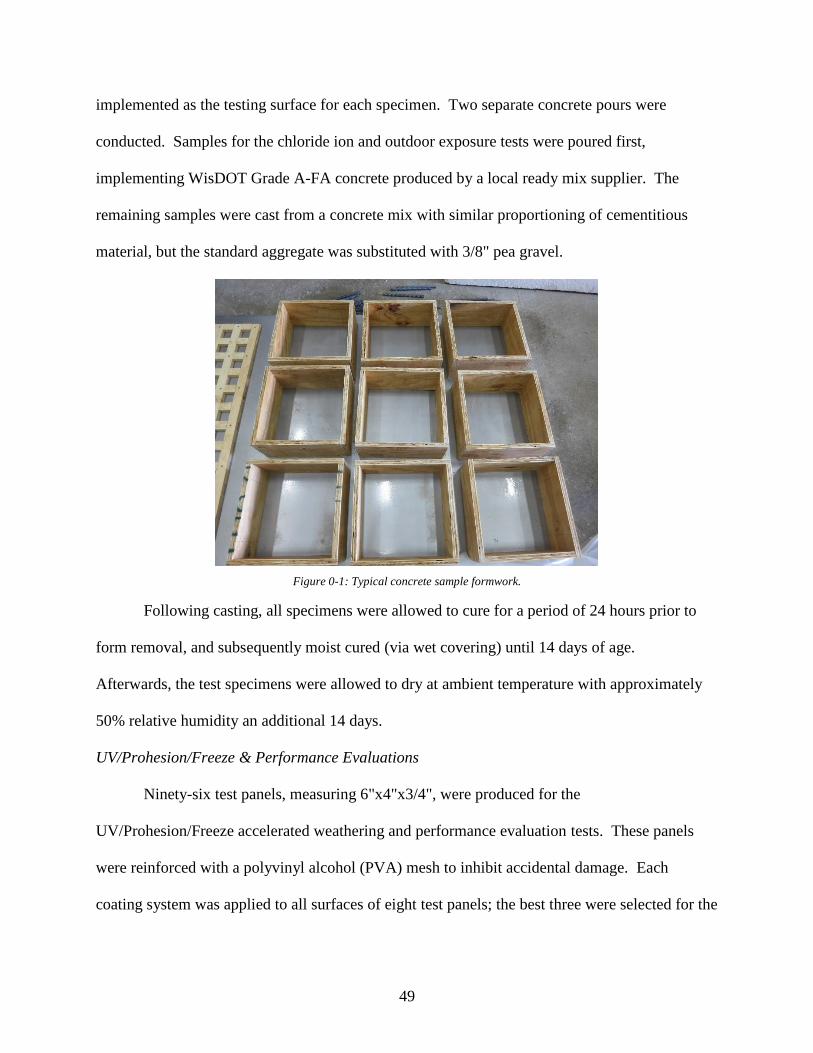
49
implemented as the testing surface for each specimen. Two separate concrete pours were
conducted. Samples for the chloride ion and outdoor exposure tests were poured first,
implementing WisDOT Grade A-FA concrete produced by a local ready mix supplier. The
remaining samples were cast from a concrete mix with similar proportioning of cementitious
material, but the standard aggregate was substituted with 3/8" pea gravel.
Figure 0-1: Typical concrete sample formwork.
Following casting, all specimens were allowed to cure for a period of 24 hours prior to
form removal, and subsequently moist cured (via wet covering) until 14 days of age.
Afterwards, the test specimens were allowed to dry at ambient temperature with approximately
50% relative humidity an additional 14 days.
UV/Prohesion/Freeze & Performance Evaluations
Ninety-six test panels, measuring 6"x4"x3/4", were produced for the
UV/Prohesion/Freeze accelerated weathering and performance evaluation tests. These panels
were reinforced with a polyvinyl alcohol (PVA) mesh to inhibit accidental damage. Each
coating system was applied to all surfaces of eight test panels; the best three were selected for the
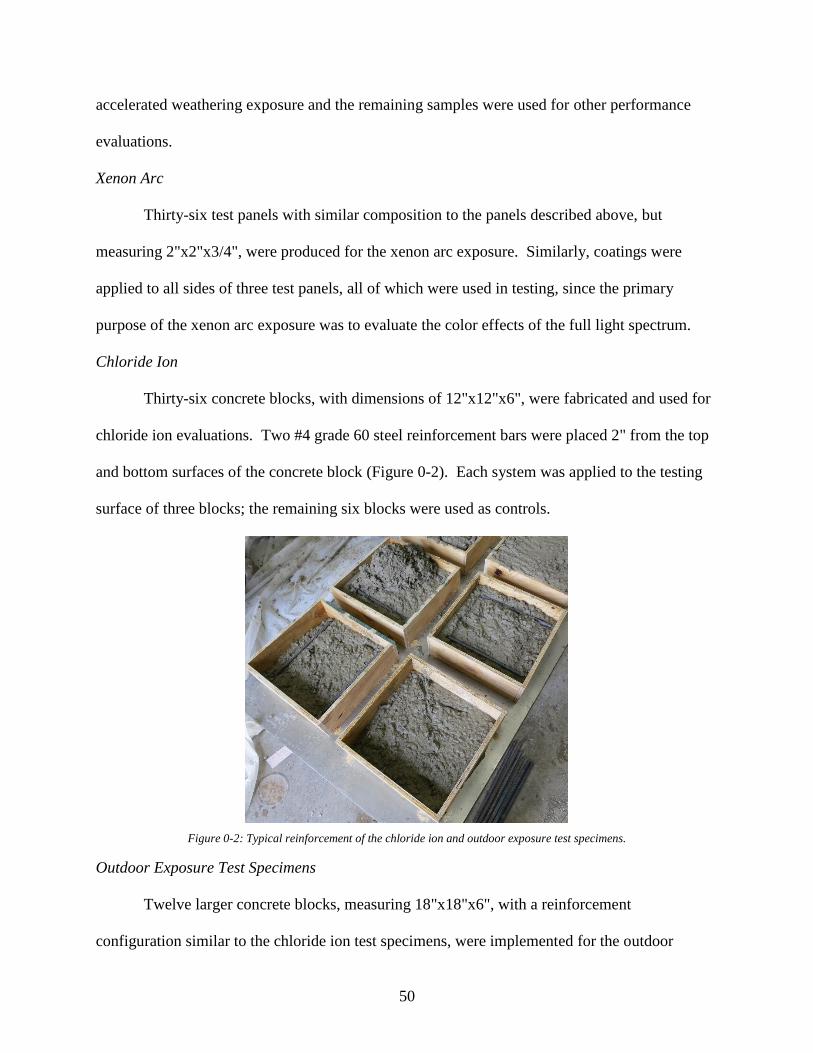
50
accelerated weathering exposure and the remaining samples were used for other performance
evaluations.
Xenon Arc
Thirty-six test panels with similar composition to the panels described above, but
measuring 2"x2"x3/4", were produced for the xenon arc exposure. Similarly, coatings were
applied to all sides of three test panels, all of which were used in testing, since the primary
purpose of the xenon arc exposure was to evaluate the color effects of the full light spectrum.
Chloride Ion
Thirty-six concrete blocks, with dimensions of 12"x12"x6", were fabricated and used for
chloride ion evaluations. Two #4 grade 60 steel reinforcement bars were placed 2" from the top
and bottom surfaces of the concrete block (Figure 0-2). Each system was applied to the testing
surface of three blocks; the remaining six blocks were used as controls.
Figure 0-2: Typical reinforcement of the chloride ion and outdoor exposure test specimens.
Outdoor Exposure Test Specimens
Twelve larger concrete blocks, measuring 18"x18"x6", with a reinforcement
configuration similar to the chloride ion test specimens, were implemented for the outdoor
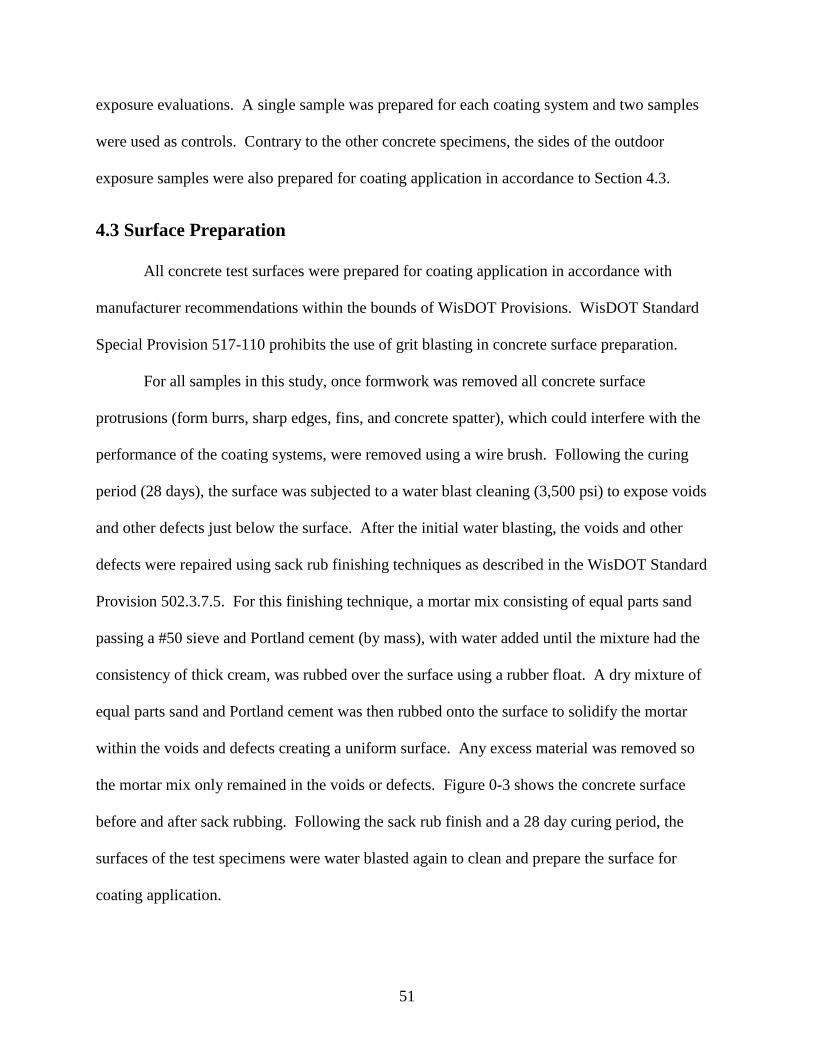
51
exposure evaluations. A single sample was prepared for each coating system and two samples
were used as controls. Contrary to the other concrete specimens, the sides of the outdoor
exposure samples were also prepared for coating application in accordance to Section 4.3.
4.3 Surface Preparation
All concrete test surfaces were prepared for coating application in accordance with
manufacturer recommendations within the bounds of WisDOT Provisions. WisDOT Standard
Special Provision 517-110 prohibits the use of grit blasting in concrete surface preparation.
For all samples in this study, once formwork was removed all concrete surface
protrusions (form burrs, sharp edges, fins, and concrete spatter), which could interfere with the
performance of the coating systems, were removed using a wire brush. Following the curing
period (28 days), the surface was subjected to a water blast cleaning (3,500 psi) to expose voids
and other defects just below the surface. After the initial water blasting, the voids and other
defects were repaired using sack rub finishing techniques as described in the WisDOT Standard
Provision 502.3.7.5. For this finishing technique, a mortar mix consisting of equal parts sand
passing a #50 sieve and Portland cement (by mass), with water added until the mixture had the
consistency of thick cream, was rubbed over the surface using a rubber float. A dry mixture of
equal parts sand and Portland cement was then rubbed onto the surface to solidify the mortar
within the voids and defects creating a uniform surface. Any excess material was removed so
the mortar mix only remained in the voids or defects. Figure 0-3 shows the concrete surface
before and after sack rubbing. Following the sack rub finish and a 28 day curing period, the
surfaces of the test specimens were water blasted again to clean and prepare the surface for
coating application.
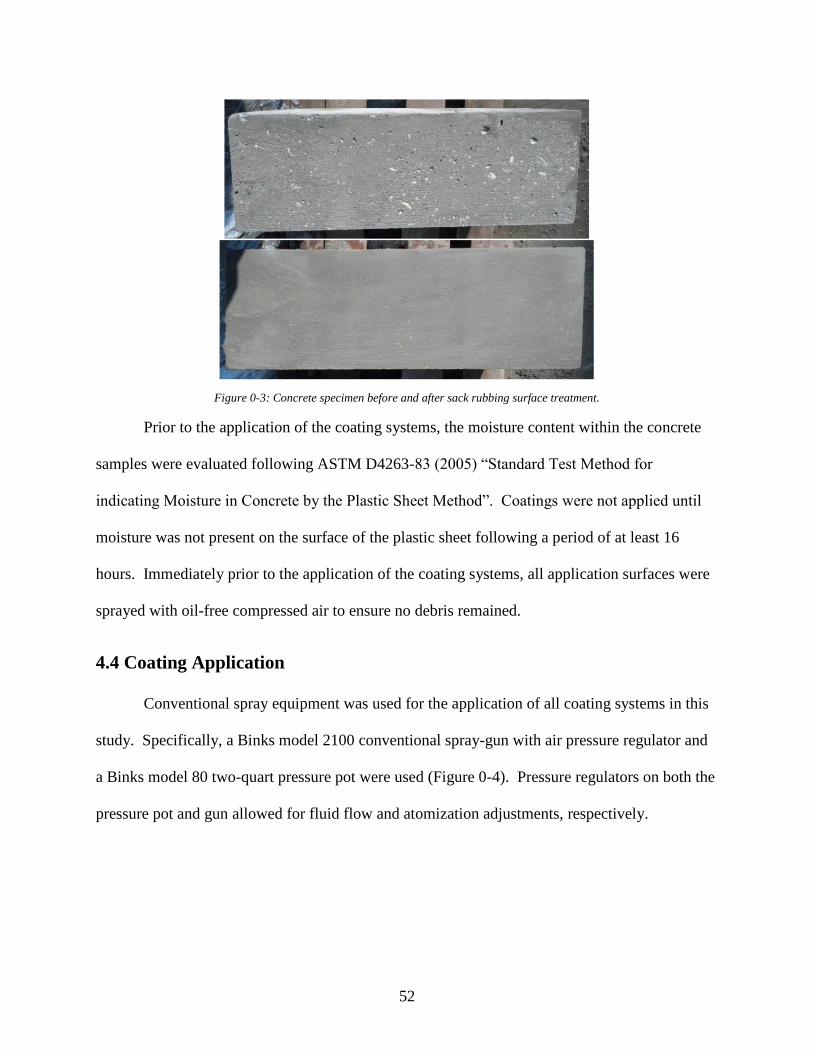
52
Figure 0-3: Concrete specimen before and after sack rubbing surface treatment.
Prior to the application of the coating systems, the moisture content within the concrete
samples were evaluated following ASTM D4263-83 (2005) “Standard Test Method for
indicating Moisture in Concrete by the Plastic Sheet Method”. Coatings were not applied until
moisture was not present on the surface of the plastic sheet following a period of at least 16
hours. Immediately prior to the application of the coating systems, all application surfaces were
sprayed with oil-free compressed air to ensure no debris remained.
4.4 Coating Application
Conventional spray equipment was used for the application of all coating systems in this
study. Specifically, a Binks model 2100 conventional spray-gun with air pressure regulator and
a Binks model 80 two-quart pressure pot were used (Figure 0-4). Pressure regulators on both the
pressure pot and gun allowed for fluid flow and atomization adjustments, respectively.
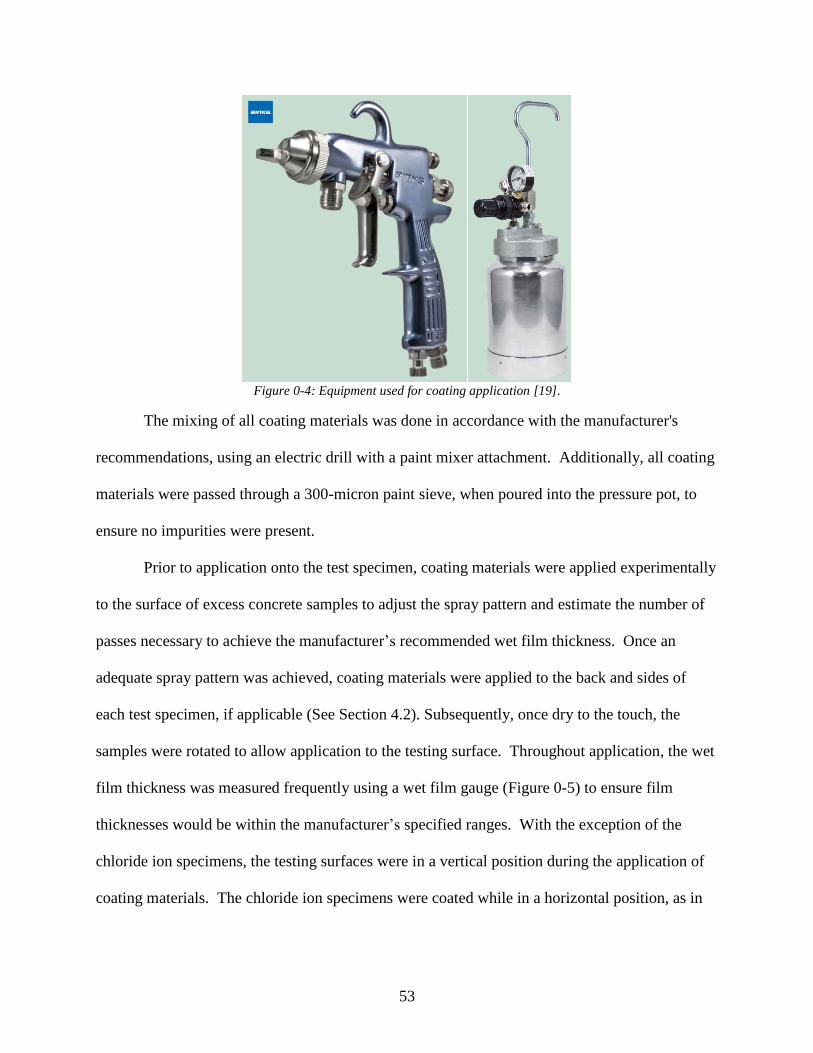
53
Figure 0-4: Equipment used for coating application [19].
The mixing of all coating materials was done in accordance with the manufacturer's
recommendations, using an electric drill with a paint mixer attachment. Additionally, all coating
materials were passed through a 300-micron paint sieve, when poured into the pressure pot, to
ensure no impurities were present.
Prior to application onto the test specimen, coating materials were applied experimentally
to the surface of excess concrete samples to adjust the spray pattern and estimate the number of
passes necessary to achieve the manufacturer’s recommended wet film thickness. Once an
adequate spray pattern was achieved, coating materials were applied to the back and sides of
each test specimen, if applicable (See Section 4.2). Subsequently, once dry to the touch, the
samples were rotated to allow application to the testing surface. Throughout application, the wet
film thickness was measured frequently using a wet film gauge (Figure 0-5) to ensure film
thicknesses would be within the manufacturer’s specified ranges. With the exception of the
chloride ion specimens, the testing surfaces were in a vertical position during the application of
coating materials. The chloride ion specimens were coated while in a horizontal position, as in
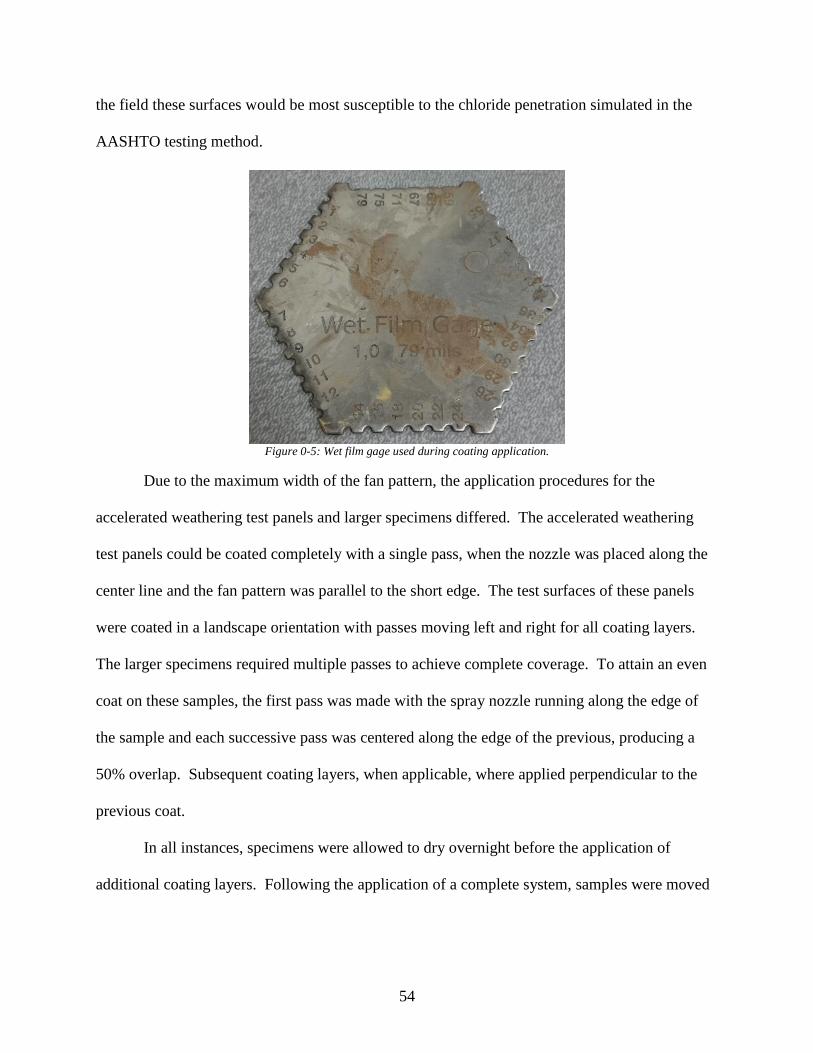
54
the field these surfaces would be most susceptible to the chloride penetration simulated in the
AASHTO testing method.
Figure 0-5: Wet film gage used during coating application.
Due to the maximum width of the fan pattern, the application procedures for the
accelerated weathering test panels and larger specimens differed. The accelerated weathering
test panels could be coated completely with a single pass, when the nozzle was placed along the
center line and the fan pattern was parallel to the short edge. The test surfaces of these panels
were coated in a landscape orientation with passes moving left and right for all coating layers.
The larger specimens required multiple passes to achieve complete coverage. To attain an even
coat on these samples, the first pass was made with the spray nozzle running along the edge of
the sample and each successive pass was centered along the edge of the previous, producing a
50% overlap. Subsequent coating layers, when applicable, where applied perpendicular to the
previous coat.
In all instances, specimens were allowed to dry overnight before the application of
additional coating layers. Following the application of a complete system, samples were moved
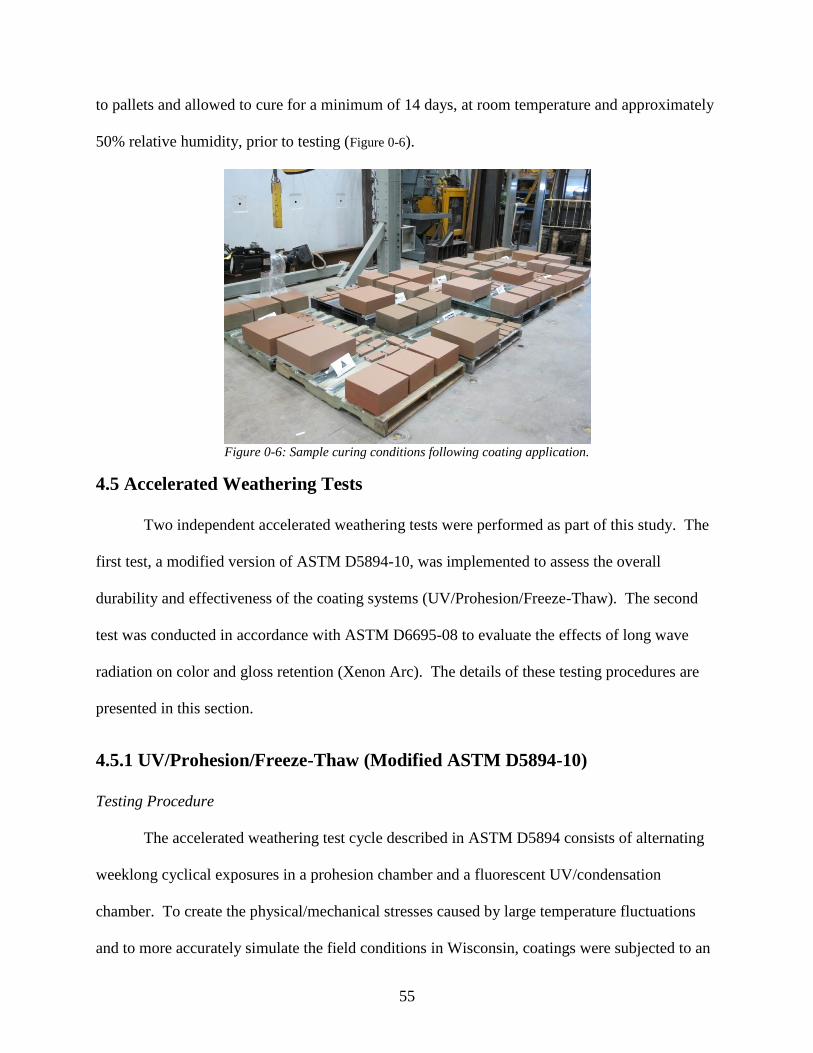
55
to pallets and allowed to cure for a minimum of 14 days, at room temperature and approximately
50% relative humidity, prior to testing (Figure 0-6).
Figure 0-6: Sample curing conditions following coating application.
4.5 Accelerated Weathering Tests
Two independent accelerated weathering tests were performed as part of this study. The
first test, a modified version of ASTM D5894-10, was implemented to assess the overall
durability and effectiveness of the coating systems (UV/Prohesion/Freeze-Thaw). The second
test was conducted in accordance with ASTM D6695-08 to evaluate the effects of long wave
radiation on color and gloss retention (Xenon Arc). The details of these testing procedures are
presented in this section.
4.5.1 UV/Prohesion/Freeze-Thaw (Modified ASTM D5894-10)
Testing Procedure
The accelerated weathering test cycle described in ASTM D5894 consists of alternating
weeklong cyclical exposures in a prohesion chamber and a fluorescent UV/condensation
chamber. To create the physical/mechanical stresses caused by large temperature fluctuations
and to more accurately simulate the field conditions in Wisconsin, coatings were subjected to an

56
additional 24 hour freezing period following each weeklong exposure period. The addition of a
freeze cycle into the ASTM D5894 procedure has been shown in previous research to provide a
better representation of field conditions.
With the additional 24-hour freeze periods, a complete exposure cycle lasted 16 days
(384 hours).The details of each exposure cycle are shown below:
UV/Prohesion/Freeze-Thaw Cycle: 384 hours
1. Florescent UV/condensation:168 hours (7 days)
● Repetitious 8-hour cycles
▪ 4 hour UVA-340nm light exposure
❖ Irradiance: 0.89 W/m2·nm
❖ Temperature: 60°C
▪ 4 hour condensation
❖ Temperature:50°C
2. Freeze: 24 hours
● Temperature: -23°C
3. Prohesion(salt fog/dry): 168 hours (7 days)
● Repetitious 2-hour cycles
▪ 1 hour salt fog
❖ Temperature: Ambient
❖ Salt Solution: 0.35% ammonium sulfate and 0.05% sodium chloride
(by mass)
▪ 1 hour dry-off
❖ Temperature: 35°C
4. Freeze:24 hours
● Temperature: -23°C
Following the completion of every third cycle, the samples were removed, for a period of
24 hours, to be evaluated for color retention, gloss retention, and dry film thickness.
Sample Rotation
To minimize the variation in degradation caused by exposure condition variations within
both the UV/condensation and the prohesion chambers, test panel positions were rotated
following each testing cycle.
The rotation procedure within the UV/condensation chamber consisted of shifting each
panel holder one position to the left following each cycle of exposure. In addition, the test panels
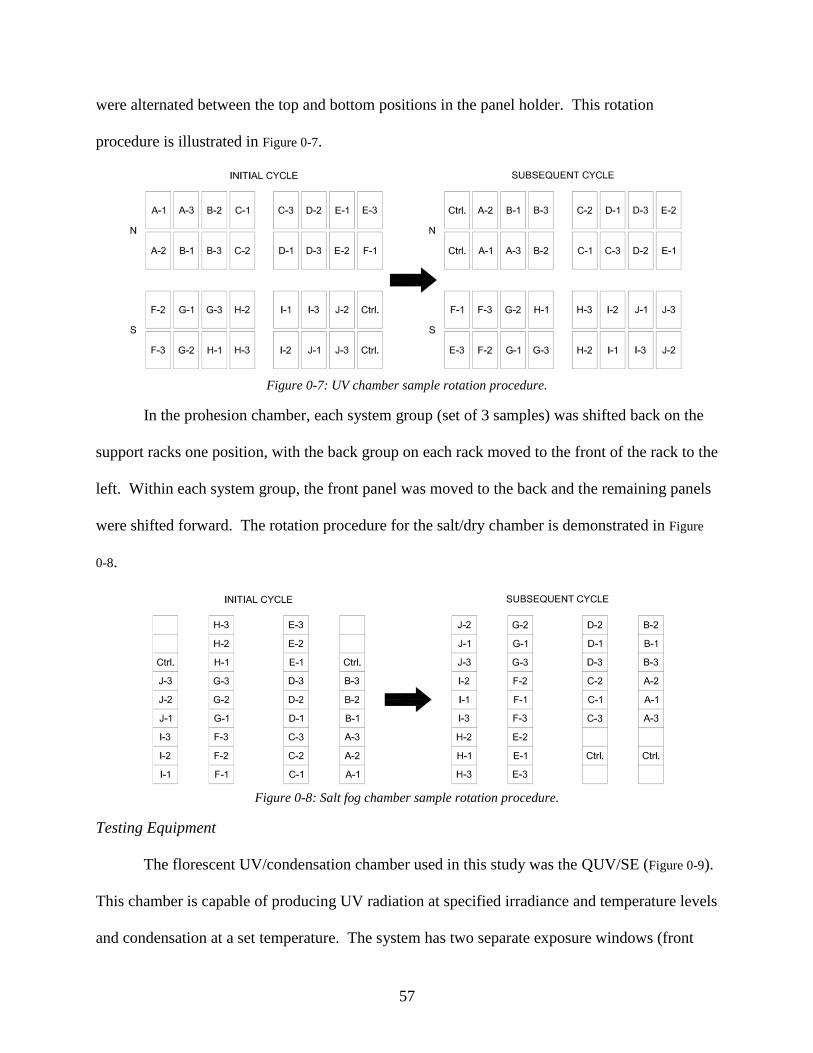
57
were alternated between the top and bottom positions in the panel holder. This rotation
procedure is illustrated in Figure 0-7.
Figure 0-7: UV chamber sample rotation procedure.
In the prohesion chamber, each system group (set of 3 samples) was shifted back on the
support racks one position, with the back group on each rack moved to the front of the rack to the
left. Within each system group, the front panel was moved to the back and the remaining panels
were shifted forward. The rotation procedure for the salt/dry chamber is demonstrated in Figure
0-8.
Figure 0-8: Salt fog chamber sample rotation procedure.
Testing Equipment
The florescent UV/condensation chamber used in this study was the QUV/SE (Figure 0-9).
This chamber is capable of producing UV radiation at specified irradiance and temperature levels
and condensation at a set temperature. The system has two separate exposure windows (front
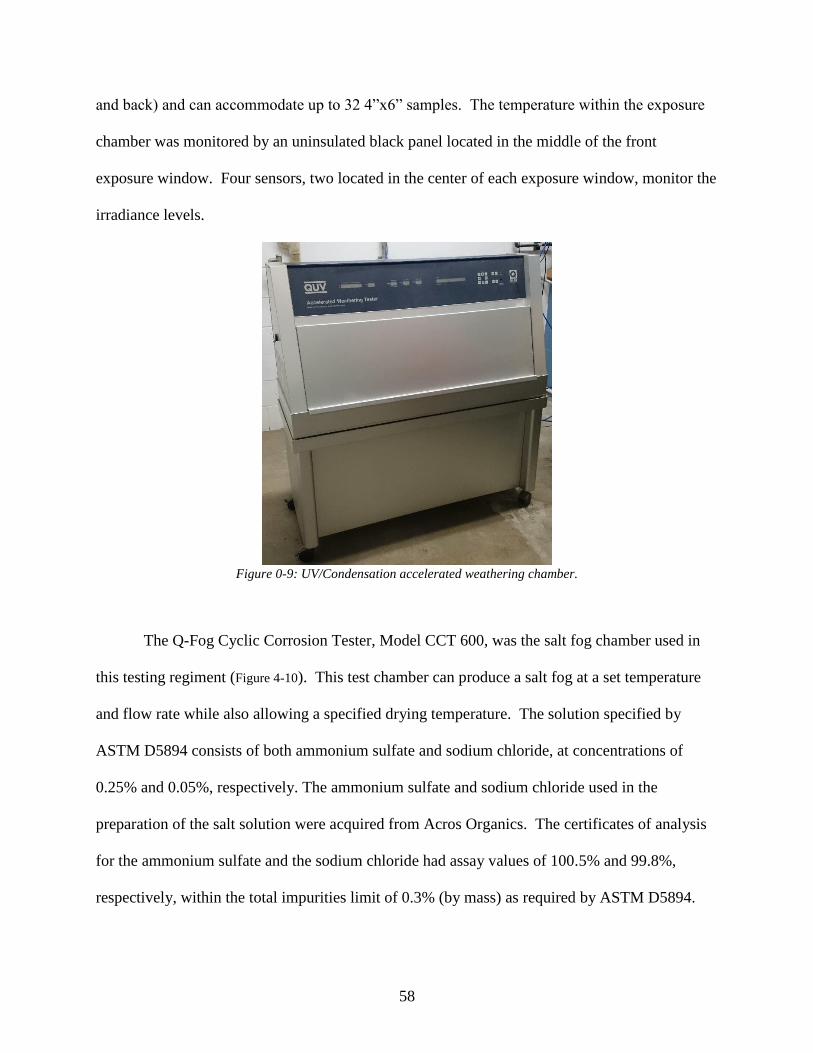
58
and back) and can accommodate up to 32 4”x6” samples. The temperature within the exposure
chamber was monitored by an uninsulated black panel located in the middle of the front
exposure window. Four sensors, two located in the center of each exposure window, monitor the
irradiance levels.
Figure 0-9: UV/Condensation accelerated weathering chamber.
The Q-Fog Cyclic Corrosion Tester, Model CCT 600, was the salt fog chamber used in
this testing regiment (Figure 4-10). This test chamber can produce a salt fog at a set temperature
and flow rate while also allowing a specified drying temperature. The solution specified by
ASTM D5894 consists of both ammonium sulfate and sodium chloride, at concentrations of
0.25% and 0.05%, respectively. The ammonium sulfate and sodium chloride used in the
preparation of the salt solution were acquired from Acros Organics. The certificates of analysis
for the ammonium sulfate and the sodium chloride had assay values of 100.5% and 99.8%,
respectively, within the total impurities limit of 0.3% (by mass) as required by ASTM D5894.
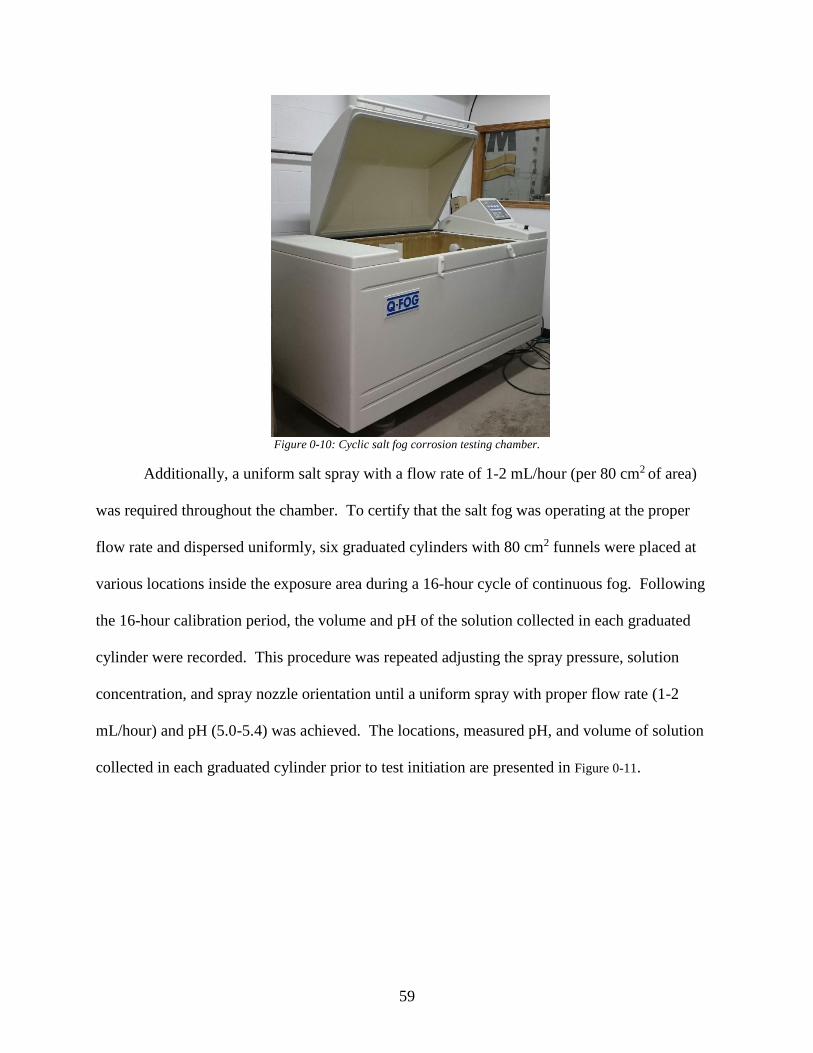
59
Figure 0-10: Cyclic salt fog corrosion testing chamber.
Additionally, a uniform salt spray with a flow rate of 1-2 mL/hour (per 80 cm2 of area)
was required throughout the chamber. To certify that the salt fog was operating at the proper
flow rate and dispersed uniformly, six graduated cylinders with 80 cm2 funnels were placed at
various locations inside the exposure area during a 16-hour cycle of continuous fog. Following
the 16-hour calibration period, the volume and pH of the solution collected in each graduated
cylinder were recorded. This procedure was repeated adjusting the spray pressure, solution
concentration, and spray nozzle orientation until a uniform spray with proper flow rate (1-2
mL/hour) and pH (5.0-5.4) was achieved. The locations, measured pH, and volume of solution
collected in each graduated cylinder prior to test initiation are presented in Figure 0-11.
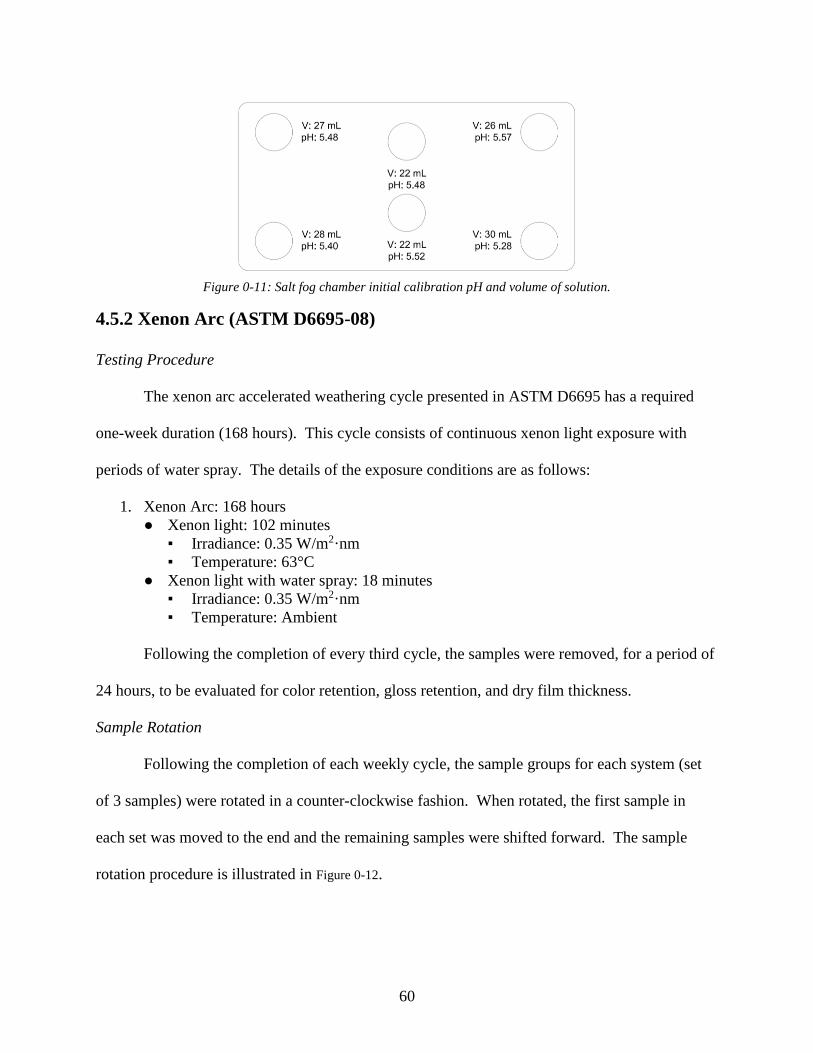
60
Figure 0-11: Salt fog chamber initial calibration pH and volume of solution.
4.5.2 Xenon Arc (ASTM D6695-08)
Testing Procedure
The xenon arc accelerated weathering cycle presented in ASTM D6695 has a required
one-week duration (168 hours). This cycle consists of continuous xenon light exposure with
periods of water spray. The details of the exposure conditions are as follows:
1. Xenon Arc: 168 hours
● Xenon light: 102 minutes
▪ Irradiance: 0.35 W/m2·nm
▪ Temperature: 63°C
● Xenon light with water spray: 18 minutes
▪ Irradiance: 0.35 W/m2·nm
▪ Temperature: Ambient
Following the completion of every third cycle, the samples were removed, for a period of
24 hours, to be evaluated for color retention, gloss retention, and dry film thickness.
Sample Rotation
Following the completion of each weekly cycle, the sample groups for each system (set
of 3 samples) were rotated in a counter-clockwise fashion. When rotated, the first sample in
each set was moved to the end and the remaining samples were shifted forward. The sample
rotation procedure is illustrated in Figure 0-12.
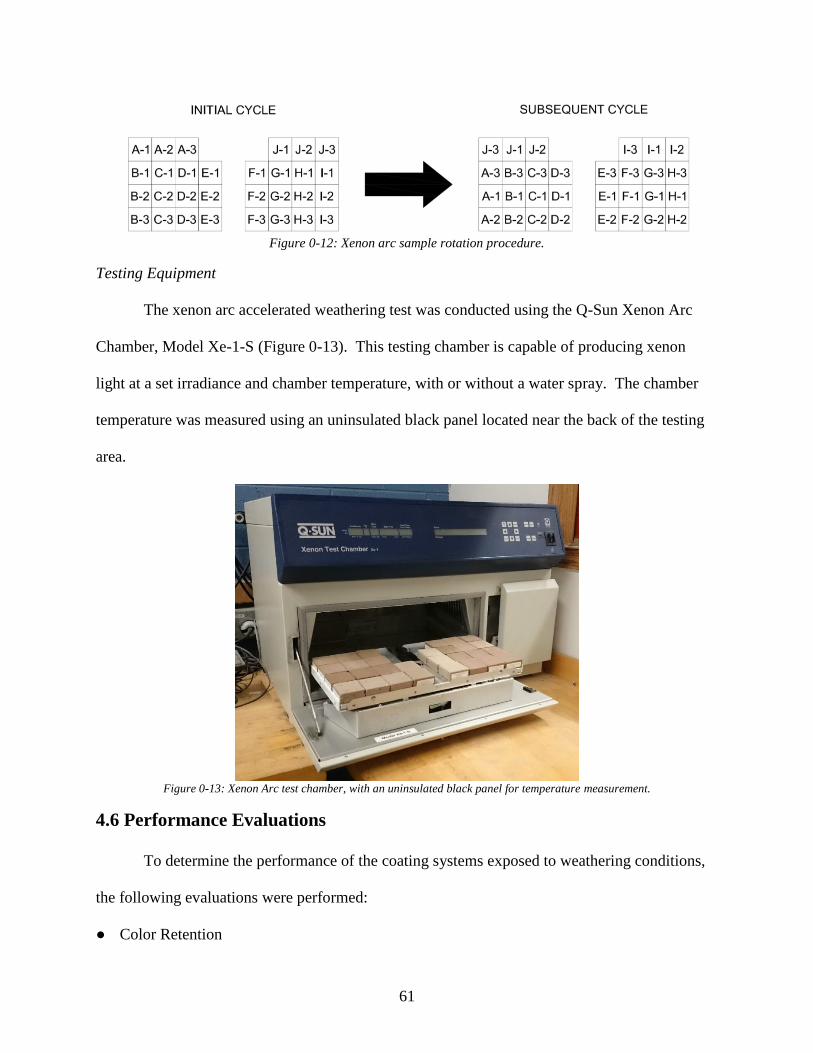
61
Figure 0-12: Xenon arc sample rotation procedure.
Testing Equipment
The xenon arc accelerated weathering test was conducted using the Q-Sun Xenon Arc
Chamber, Model Xe-1-S (Figure 0-13). This testing chamber is capable of producing xenon
light at a set irradiance and chamber temperature, with or without a water spray. The chamber
temperature was measured using an uninsulated black panel located near the back of the testing
area.
Figure 0-13: Xenon Arc test chamber, with an uninsulated black panel for temperature measurement.
4.6 Performance Evaluations
To determine the performance of the coating systems exposed to weathering conditions,
the following evaluations were performed:
● Color Retention
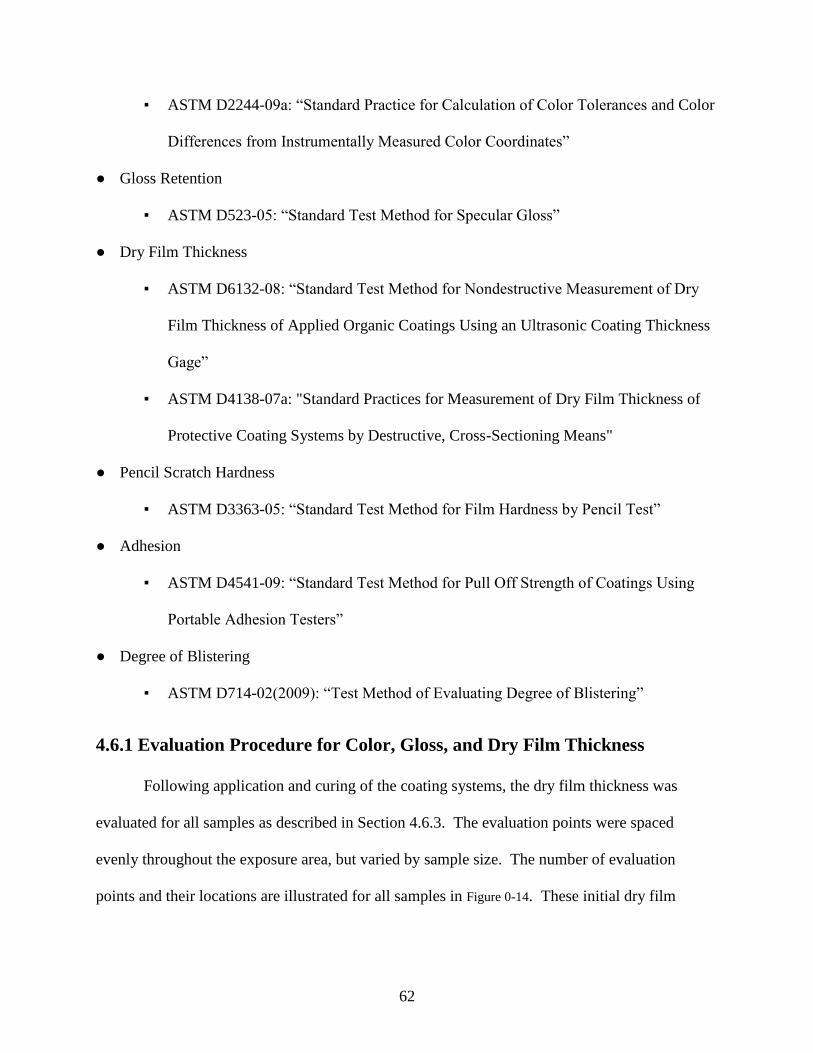
62
▪ ASTM D2244-09a: “Standard Practice for Calculation of Color Tolerances and Color
Differences from Instrumentally Measured Color Coordinates”
● Gloss Retention
▪ ASTM D523-05: “Standard Test Method for Specular Gloss”
● Dry Film Thickness
▪ ASTM D6132-08: “Standard Test Method for Nondestructive Measurement of Dry
Film Thickness of Applied Organic Coatings Using an Ultrasonic Coating Thickness
Gage”
▪ ASTM D4138-07a: "Standard Practices for Measurement of Dry Film Thickness of
Protective Coating Systems by Destructive, Cross-Sectioning Means"
● Pencil Scratch Hardness
▪ ASTM D3363-05: “Standard Test Method for Film Hardness by Pencil Test”
● Adhesion
▪ ASTM D4541-09: “Standard Test Method for Pull Off Strength of Coatings Using
Portable Adhesion Testers”
● Degree of Blistering
▪ ASTM D714-02(2009): “Test Method of Evaluating Degree of Blistering”
4.6.1 Evaluation Procedure for Color, Gloss, and Dry Film Thickness
Following application and curing of the coating systems, the dry film thickness was
evaluated for all samples as described in Section 4.6.3. The evaluation points were spaced
evenly throughout the exposure area, but varied by sample size. The number of evaluation
points and their locations are illustrated for all samples in Figure 0-14. These initial dry film
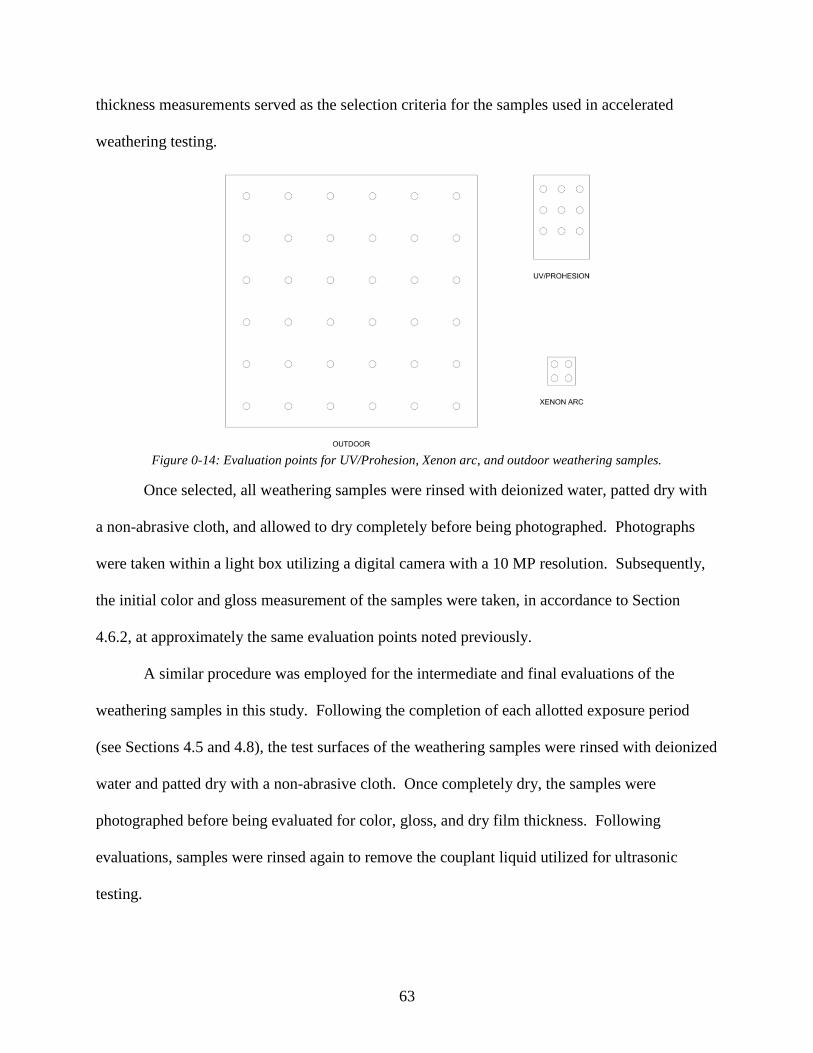
63
thickness measurements served as the selection criteria for the samples used in accelerated
weathering testing.
Figure 0-14: Evaluation points for UV/Prohesion, Xenon arc, and outdoor weathering samples.
Once selected, all weathering samples were rinsed with deionized water, patted dry with
a non-abrasive cloth, and allowed to dry completely before being photographed. Photographs
were taken within a light box utilizing a digital camera with a 10 MP resolution. Subsequently,
the initial color and gloss measurement of the samples were taken, in accordance to Section
4.6.2, at approximately the same evaluation points noted previously.
A similar procedure was employed for the intermediate and final evaluations of the
weathering samples in this study. Following the completion of each allotted exposure period
(see Sections 4.5 and 4.8), the test surfaces of the weathering samples were rinsed with deionized
water and patted dry with a non-abrasive cloth. Once completely dry, the samples were
photographed before being evaluated for color, gloss, and dry film thickness. Following
evaluations, samples were rinsed again to remove the couplant liquid utilized for ultrasonic
testing.
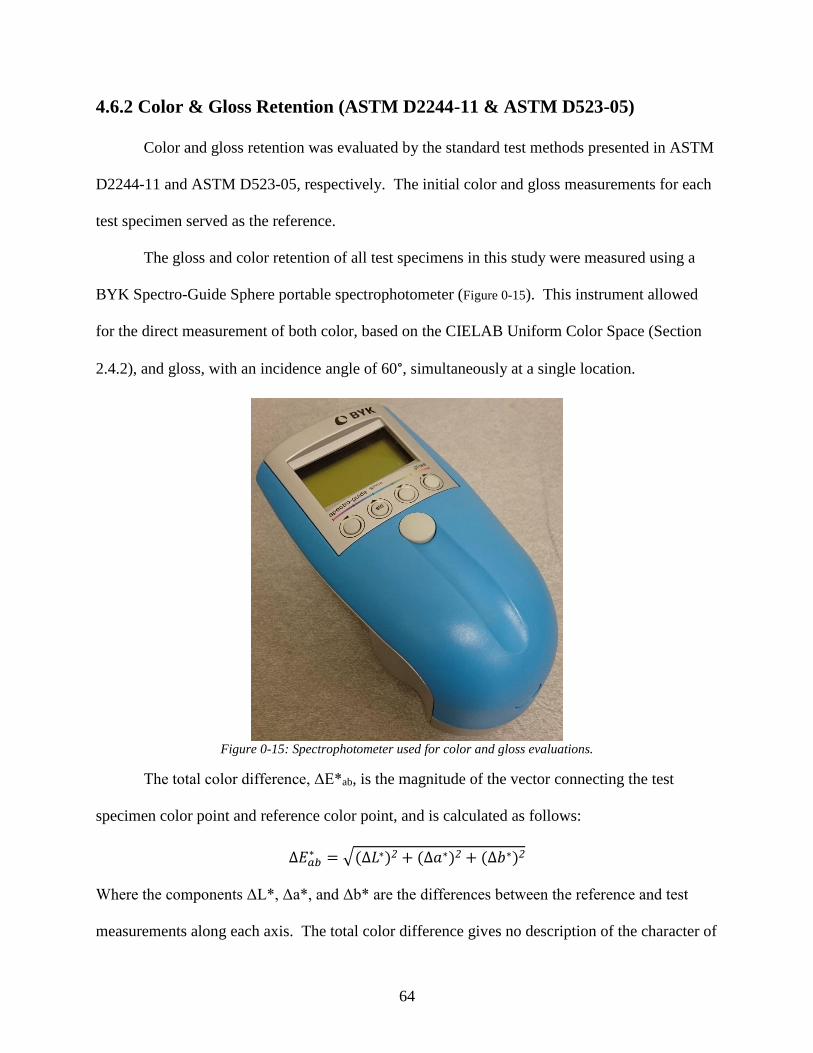
64
4.6.2 Color & Gloss Retention (ASTM D2244-11 & ASTM D523-05)
Color and gloss retention was evaluated by the standard test methods presented in ASTM
D2244-11 and ASTM D523-05, respectively. The initial color and gloss measurements for each
test specimen served as the reference.
The gloss and color retention of all test specimens in this study were measured using a
BYK Spectro-Guide Sphere portable spectrophotometer (Figure 0-15). This instrument allowed
for the direct measurement of both color, based on the CIELAB Uniform Color Space (Section
2.4.2), and gloss, with an incidence angle of 60°, simultaneously at a single location.
Figure 0-15: Spectrophotometer used for color and gloss evaluations.
The total color difference, ΔE*ab, is the magnitude of the vector connecting the test
specimen color point and reference color point, and is calculated as follows:
∆𝐸𝑎𝑏∗ = √(∆𝐿∗)2 + (∆𝑎∗)2 + (∆𝑏∗)2
Where the components ΔL*, Δa*, and Δb* are the differences between the reference and test
measurements along each axis. The total color difference gives no description of the character of
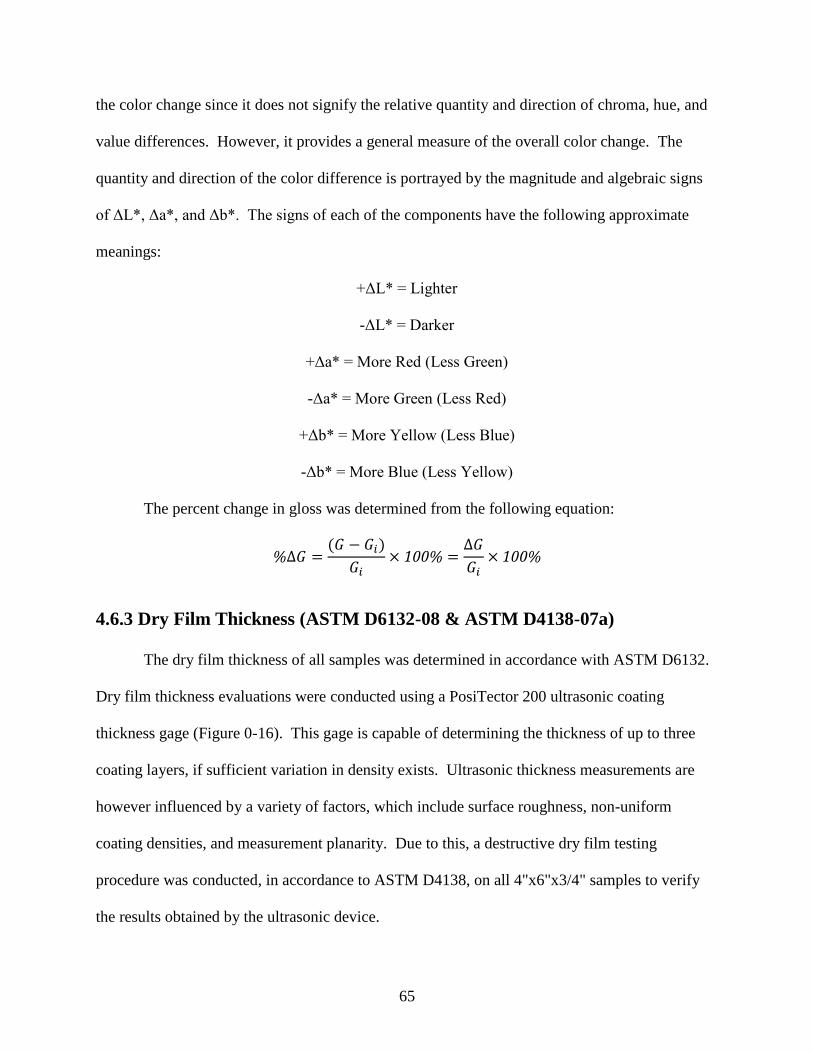
65
the color change since it does not signify the relative quantity and direction of chroma, hue, and
value differences. However, it provides a general measure of the overall color change. The
quantity and direction of the color difference is portrayed by the magnitude and algebraic signs
of ΔL*, Δa*, and Δb*. The signs of each of the components have the following approximate
meanings:
+ΔL* = Lighter
-ΔL* = Darker
+Δa* = More Red (Less Green)
-Δa* = More Green (Less Red)
+Δb* = More Yellow (Less Blue)
-Δb* = More Blue (Less Yellow)
The percent change in gloss was determined from the following equation:
%∆𝐺 =(𝐺 − 𝐺𝑖)
𝐺𝑖× 100% =
∆𝐺
𝐺𝑖× 100%
4.6.3 Dry Film Thickness (ASTM D6132-08 & ASTM D4138-07a)
The dry film thickness of all samples was determined in accordance with ASTM D6132.
Dry film thickness evaluations were conducted using a PosiTector 200 ultrasonic coating
thickness gage (Figure 0-16). This gage is capable of determining the thickness of up to three
coating layers, if sufficient variation in density exists. Ultrasonic thickness measurements are
however influenced by a variety of factors, which include surface roughness, non-uniform
coating densities, and measurement planarity. Due to this, a destructive dry film testing
procedure was conducted, in accordance to ASTM D4138, on all 4"x6"x3/4" samples to verify
the results obtained by the ultrasonic device.
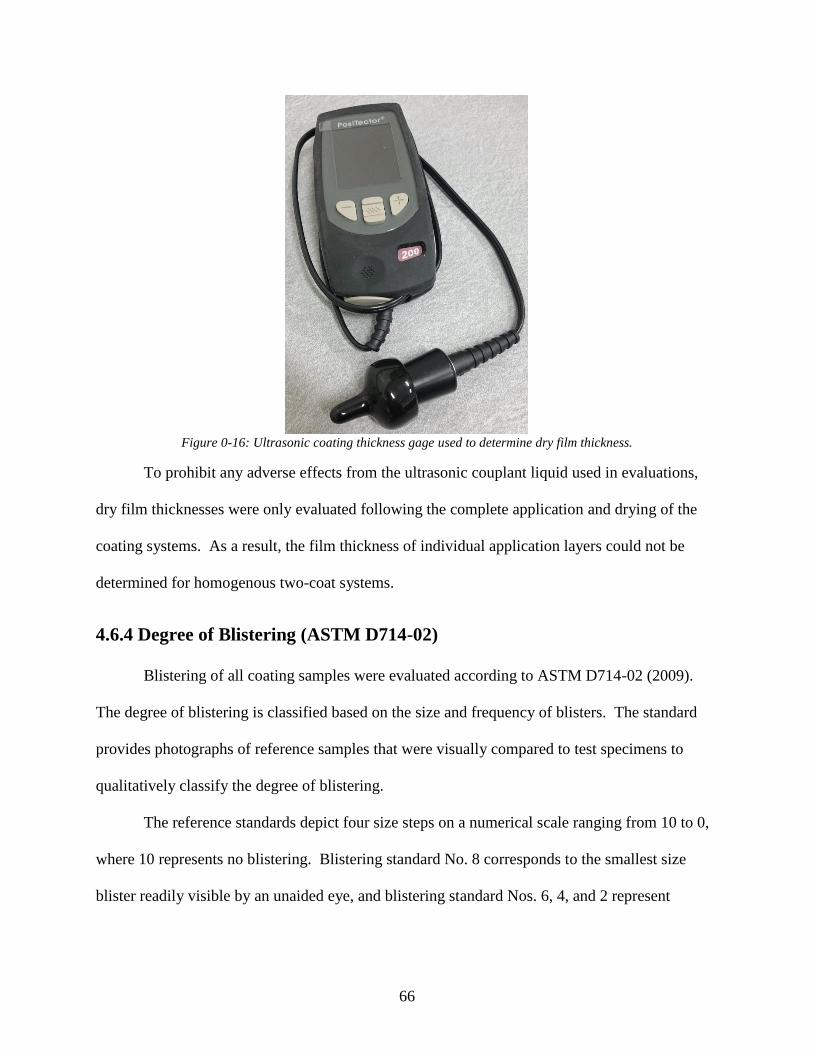
66
Figure 0-16: Ultrasonic coating thickness gage used to determine dry film thickness.
To prohibit any adverse effects from the ultrasonic couplant liquid used in evaluations,
dry film thicknesses were only evaluated following the complete application and drying of the
coating systems. As a result, the film thickness of individual application layers could not be
determined for homogenous two-coat systems.
4.6.4 Degree of Blistering (ASTM D714-02)
Blistering of all coating samples were evaluated according to ASTM D714-02 (2009).
The degree of blistering is classified based on the size and frequency of blisters. The standard
provides photographs of reference samples that were visually compared to test specimens to
qualitatively classify the degree of blistering.
The reference standards depict four size steps on a numerical scale ranging from 10 to 0,
where 10 represents no blistering. Blistering standard No. 8 corresponds to the smallest size
blister readily visible by an unaided eye, and blistering standard Nos. 6, 4, and 2 represent
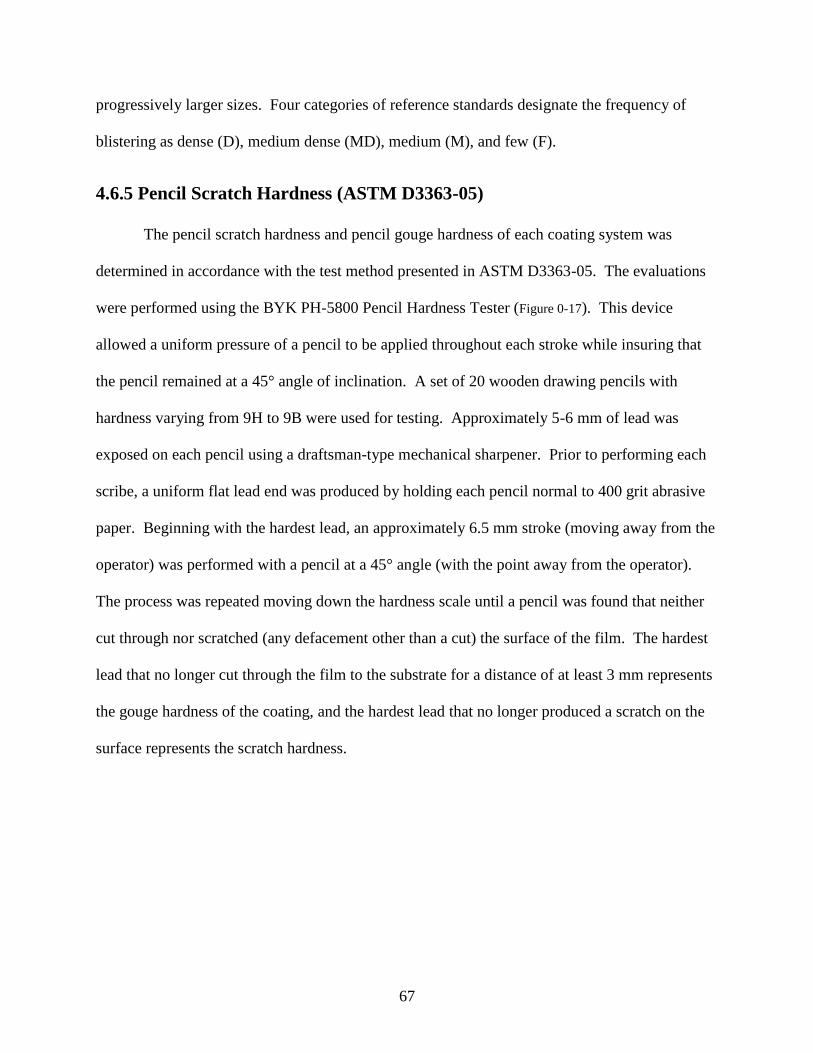
67
progressively larger sizes. Four categories of reference standards designate the frequency of
blistering as dense (D), medium dense (MD), medium (M), and few (F).
4.6.5 Pencil Scratch Hardness (ASTM D3363-05)
The pencil scratch hardness and pencil gouge hardness of each coating system was
determined in accordance with the test method presented in ASTM D3363-05. The evaluations
were performed using the BYK PH-5800 Pencil Hardness Tester (Figure 0-17). This device
allowed a uniform pressure of a pencil to be applied throughout each stroke while insuring that
the pencil remained at a 45° angle of inclination. A set of 20 wooden drawing pencils with
hardness varying from 9H to 9B were used for testing. Approximately 5-6 mm of lead was
exposed on each pencil using a draftsman-type mechanical sharpener. Prior to performing each
scribe, a uniform flat lead end was produced by holding each pencil normal to 400 grit abrasive
paper. Beginning with the hardest lead, an approximately 6.5 mm stroke (moving away from the
operator) was performed with a pencil at a 45° angle (with the point away from the operator).
The process was repeated moving down the hardness scale until a pencil was found that neither
cut through nor scratched (any defacement other than a cut) the surface of the film. The hardest
lead that no longer cut through the film to the substrate for a distance of at least 3 mm represents
the gouge hardness of the coating, and the hardest lead that no longer produced a scratch on the
surface represents the scratch hardness.
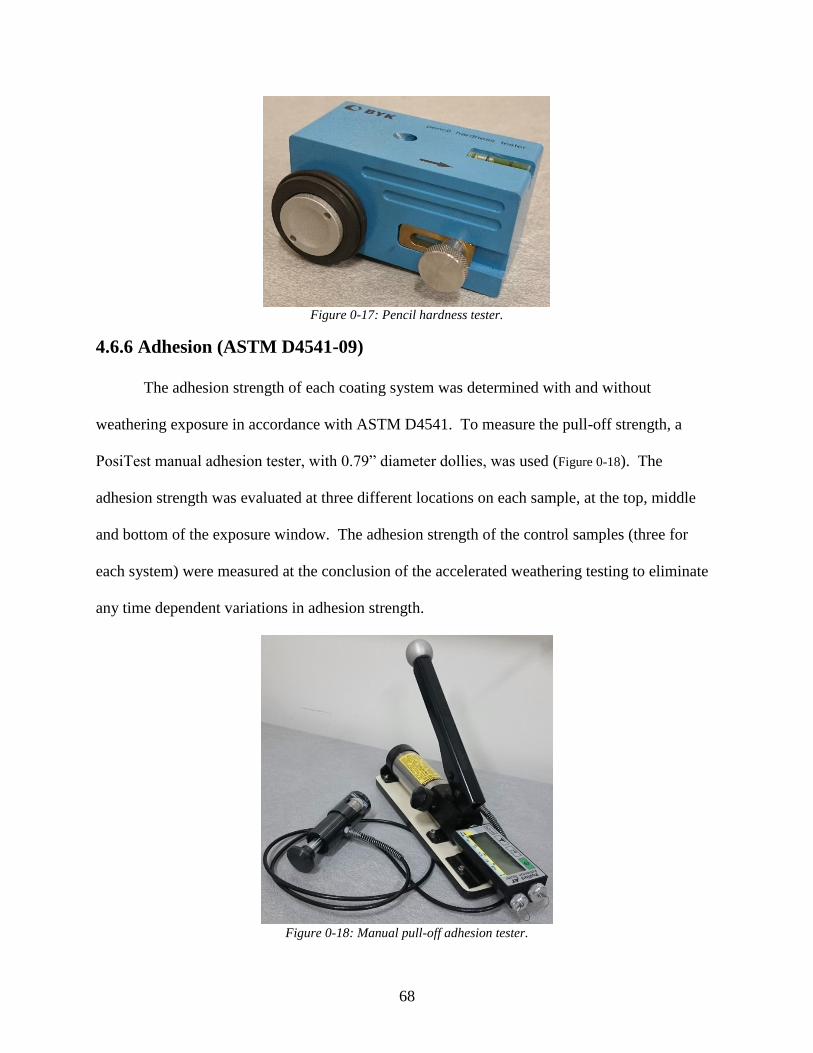
68
Figure 0-17: Pencil hardness tester.
4.6.6 Adhesion (ASTM D4541-09)
The adhesion strength of each coating system was determined with and without
weathering exposure in accordance with ASTM D4541. To measure the pull-off strength, a
PosiTest manual adhesion tester, with 0.79” diameter dollies, was used (Figure 0-18). The
adhesion strength was evaluated at three different locations on each sample, at the top, middle
and bottom of the exposure window. The adhesion strength of the control samples (three for
each system) were measured at the conclusion of the accelerated weathering testing to eliminate
any time dependent variations in adhesion strength.
Figure 0-18: Manual pull-off adhesion tester.
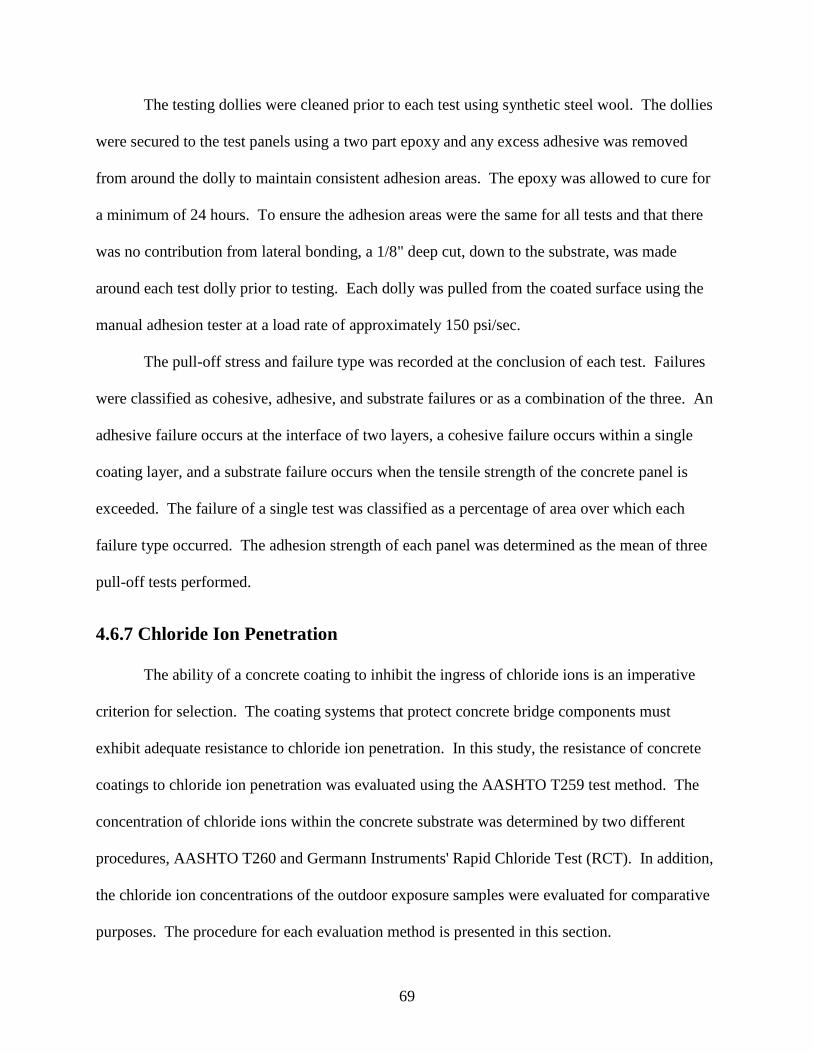
69
The testing dollies were cleaned prior to each test using synthetic steel wool. The dollies
were secured to the test panels using a two part epoxy and any excess adhesive was removed
from around the dolly to maintain consistent adhesion areas. The epoxy was allowed to cure for
a minimum of 24 hours. To ensure the adhesion areas were the same for all tests and that there
was no contribution from lateral bonding, a 1/8" deep cut, down to the substrate, was made
around each test dolly prior to testing. Each dolly was pulled from the coated surface using the
manual adhesion tester at a load rate of approximately 150 psi/sec.
The pull-off stress and failure type was recorded at the conclusion of each test. Failures
were classified as cohesive, adhesive, and substrate failures or as a combination of the three. An
adhesive failure occurs at the interface of two layers, a cohesive failure occurs within a single
coating layer, and a substrate failure occurs when the tensile strength of the concrete panel is
exceeded. The failure of a single test was classified as a percentage of area over which each
failure type occurred. The adhesion strength of each panel was determined as the mean of three
pull-off tests performed.
4.6.7 Chloride Ion Penetration
The ability of a concrete coating to inhibit the ingress of chloride ions is an imperative
criterion for selection. The coating systems that protect concrete bridge components must
exhibit adequate resistance to chloride ion penetration. In this study, the resistance of concrete
coatings to chloride ion penetration was evaluated using the AASHTO T259 test method. The
concentration of chloride ions within the concrete substrate was determined by two different
procedures, AASHTO T260 and Germann Instruments' Rapid Chloride Test (RCT). In addition,
the chloride ion concentrations of the outdoor exposure samples were evaluated for comparative
purposes. The procedure for each evaluation method is presented in this section.
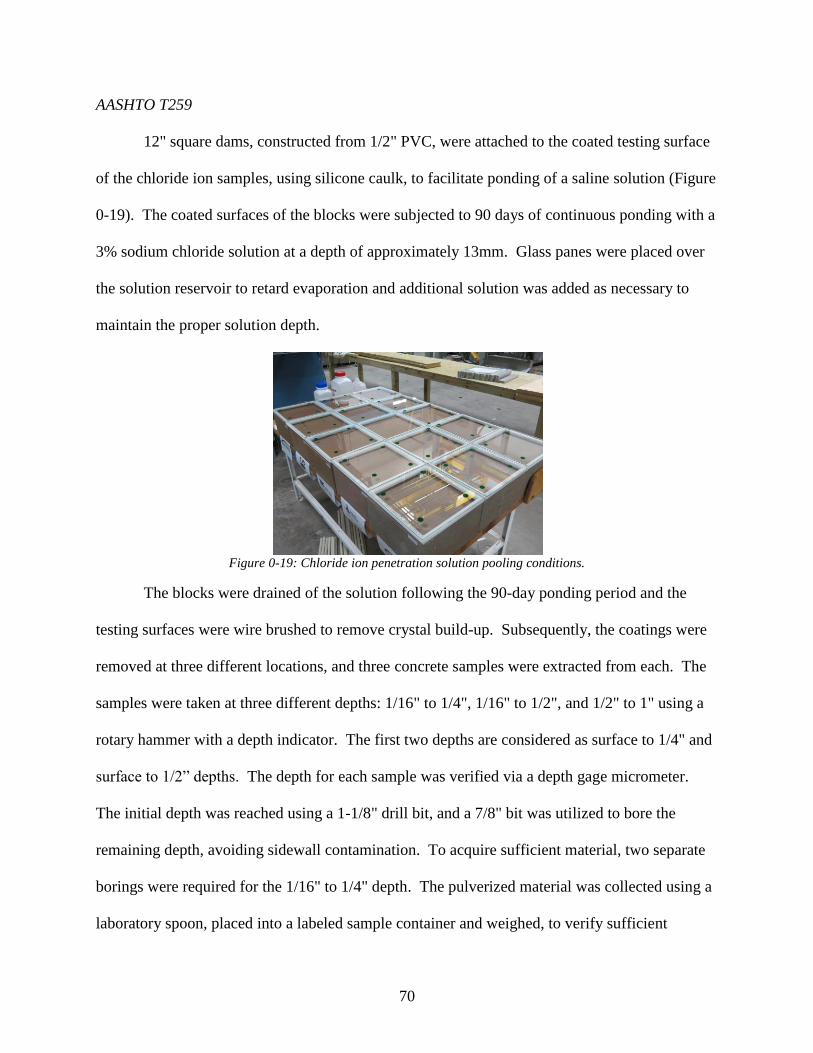
70
AASHTO T259
12" square dams, constructed from 1/2" PVC, were attached to the coated testing surface
of the chloride ion samples, using silicone caulk, to facilitate ponding of a saline solution (Figure
0-19). The coated surfaces of the blocks were subjected to 90 days of continuous ponding with a
3% sodium chloride solution at a depth of approximately 13mm. Glass panes were placed over
the solution reservoir to retard evaporation and additional solution was added as necessary to
maintain the proper solution depth.
Figure 0-19: Chloride ion penetration solution pooling conditions.
The blocks were drained of the solution following the 90-day ponding period and the
testing surfaces were wire brushed to remove crystal build-up. Subsequently, the coatings were
removed at three different locations, and three concrete samples were extracted from each. The
samples were taken at three different depths: 1/16" to 1/4", 1/16" to 1/2", and 1/2" to 1" using a
rotary hammer with a depth indicator. The first two depths are considered as surface to 1/4" and
surface to 1/2” depths. The depth for each sample was verified via a depth gage micrometer.
The initial depth was reached using a 1-1/8" drill bit, and a 7/8" bit was utilized to bore the
remaining depth, avoiding sidewall contamination. To acquire sufficient material, two separate
borings were required for the 1/16" to 1/4" depth. The pulverized material was collected using a
laboratory spoon, placed into a labeled sample container and weighed, to verify sufficient
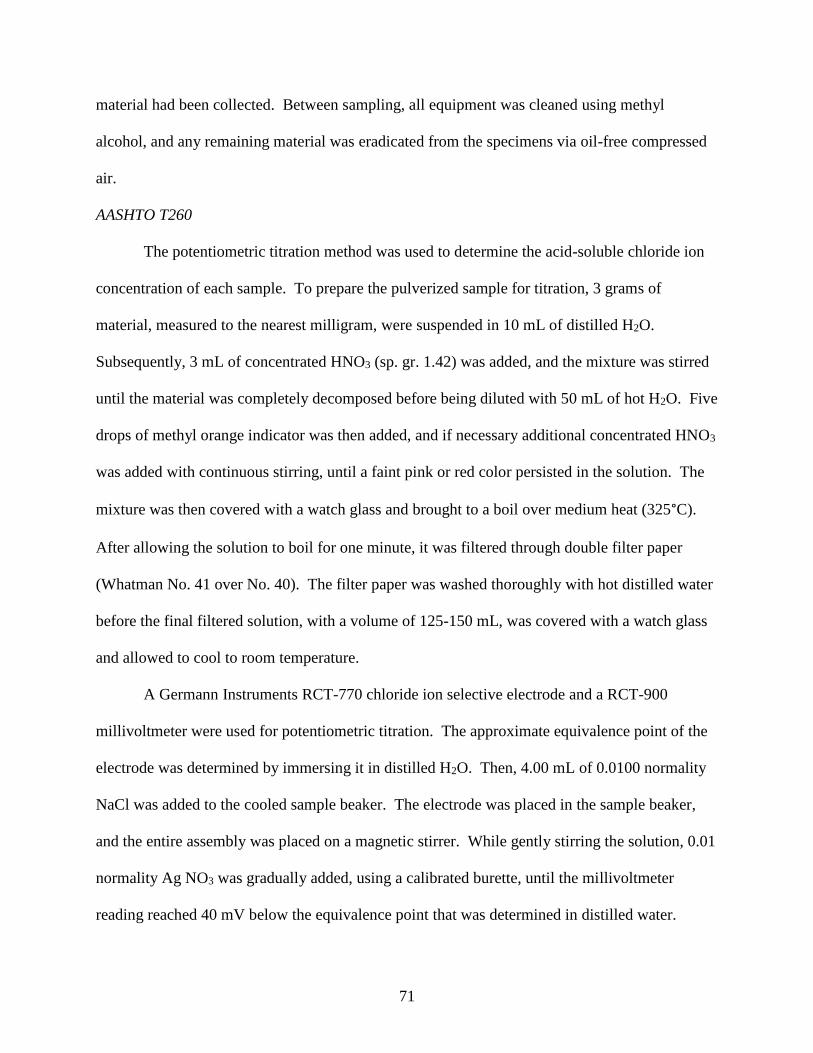
71
material had been collected. Between sampling, all equipment was cleaned using methyl
alcohol, and any remaining material was eradicated from the specimens via oil-free compressed
air.
AASHTO T260
The potentiometric titration method was used to determine the acid-soluble chloride ion
concentration of each sample. To prepare the pulverized sample for titration, 3 grams of
material, measured to the nearest milligram, were suspended in 10 mL of distilled H2O.
Subsequently, 3 mL of concentrated HNO3 (sp. gr. 1.42) was added, and the mixture was stirred
until the material was completely decomposed before being diluted with 50 mL of hot H2O. Five
drops of methyl orange indicator was then added, and if necessary additional concentrated HNO3
was added with continuous stirring, until a faint pink or red color persisted in the solution. The
mixture was then covered with a watch glass and brought to a boil over medium heat (325°C).
After allowing the solution to boil for one minute, it was filtered through double filter paper
(Whatman No. 41 over No. 40). The filter paper was washed thoroughly with hot distilled water
before the final filtered solution, with a volume of 125-150 mL, was covered with a watch glass
and allowed to cool to room temperature.
A Germann Instruments RCT-770 chloride ion selective electrode and a RCT-900
millivoltmeter were used for potentiometric titration. The approximate equivalence point of the
electrode was determined by immersing it in distilled H2O. Then, 4.00 mL of 0.0100 normality
NaCl was added to the cooled sample beaker. The electrode was placed in the sample beaker,
and the entire assembly was placed on a magnetic stirrer. While gently stirring the solution, 0.01
normality Ag NO3 was gradually added, using a calibrated burette, until the millivoltmeter
reading reached 40 mV below the equivalence point that was determined in distilled water.
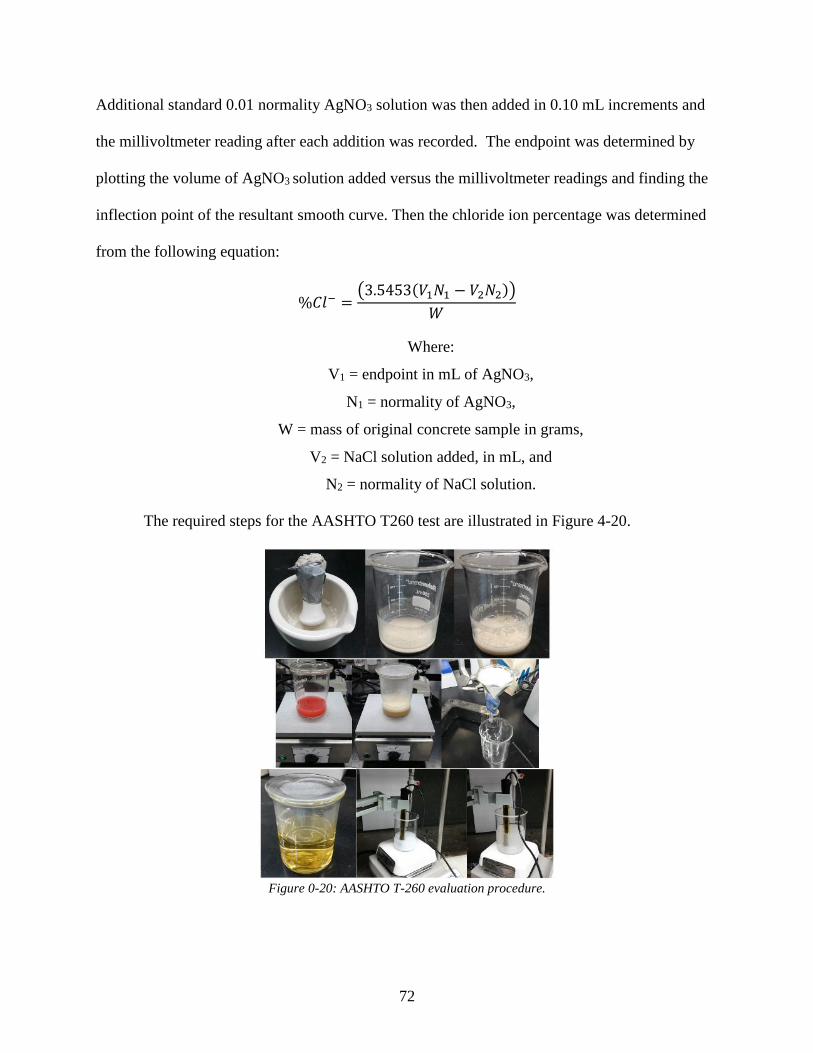
72
Additional standard 0.01 normality AgNO3 solution was then added in 0.10 mL increments and
the millivoltmeter reading after each addition was recorded. The endpoint was determined by
plotting the volume of AgNO3 solution added versus the millivoltmeter readings and finding the
inflection point of the resultant smooth curve. Then the chloride ion percentage was determined
from the following equation:
%𝐶𝑙− =(3.5453(𝑉1𝑁1 − 𝑉2𝑁2))
𝑊
Where:
V1 = endpoint in mL of AgNO3,
N1 = normality of AgNO3,
W = mass of original concrete sample in grams,
V2 = NaCl solution added, in mL, and
N2 = normality of NaCl solution.
The required steps for the AASHTO T260 test are illustrated in Figure 4-20.
Figure 0-20: AASHTO T-260 evaluation procedure.
73
Rapid Chloride Test (RCT)
The results from the potentiometric titration method of AASHTO T260 were compared to
the results determined using the Germann Instruments Rapid Chloride Test (RCT). To determine
the chloride ion concentration via RCT, a 1.5 gram sample was weighed on a precision balance
(0.001 g) and poured into a testing vial containing 10 ml of extraction liquid. The vials were
then allowed to stand over-night to permit 100% extraction of the acid soluble chlorides. Prior to
testing each solution, the electrode was cleaned with distilled water and patted dry. The
electrode was then placed into the test vial and the solution was gently stirred until the reading
on the electrometer stabilized. The reading, in mV, was recorded and converted to chloride
content, in percent of concrete weight, using the provided calibration curve computer software.
The calibration curve is determined by measuring the potential when the ion selective electrode
is immersed in four calibration liquids each with a different known concentration of chloride
ions: 0.005%, 0.020%, 0.050%, and 0.500%.
4.6.8 Outdoor Exposure Test
Eleven chloride ion samples (one for each system and a control) were placed on a
wooden testing rack with a 30 degree inclination (Figure 0-21). The testing rack was located
outside the University of Wisconsin-Milwaukee’s University Services and Research Building
(USRB) with an unobstructed southern exposure. The samples were exposed for an 18-month
period with a 15% sodium chloride solution applied to the surface once daily five days a week.
Approximately 150 ml of solution was applied to the testing surface of each sample manually
using a compression sprayer with a fan nozzle (Figure 0-21). Following a snowfall, the surface
of the samples was cleared using a non-abrasive cloth prior to the application of the solution.
74
The samples were photographed and evaluated for dry film thickness, color retention, and gloss
retention following every six months of exposure.
Climate data was recorded throughout the exposure period and was obtained from the
Milwaukee/Sullivan National Weather Service Office. The data recorded includes high, low,
and average air temperature; high, low, and average relative humidity; average cloud cover; and
daily precipitation. In addition to this climate data, the time of sodium chloride solution
application was also record.
Figure 0-21: Outdoor weathering exposure rack and saline solution application procedure.
4.6.9 Water Vapor Transmission (ASTM E96-05)
The transmission of water vapor through each coating system was evaluated in
accordance to ASTM E96-05. Free film samples were necessary to evaluate water vapor
transmission rates of the selected coating systems. Each coating was applied to glass panels or
release paper using an adjustable film casting knife (Figure 0-22) to form strips of continuous
films with approximately the same thickness as when applied to concrete. The films were
allowed to cure for two weeks at room temperature and approximately 50% relative humidity
before being removed, as solid films, from the casting surfaces. The films were then cut into 3”
diameter circles to accommodate the opening of the permeability dish (Figure 0-22).

75
Figure 0-22: Adjustable film casting knife (Left) and a prepared permeability dish with test specimen (Right).
Three dishes for each system were prepared by filling the reservoir with distilled water
and then sealing the dish with films, leaving a 3/4” gap between the water and the film. The
prepared samples were subsequently placed within an environmental chamber (Figure 0-23) and
maintained at a temperature and relative humidity of 23±1°C and 50±2%, respectively. The
weight of the test dishes were measured every 24 hours over a 7 day period using an electronic
scale with an accuracy of 0.0001 grams (Figure 0-23). Due to the size of the environmental
chamber, the samples were removed from the chamber and measured in ambient conditions.
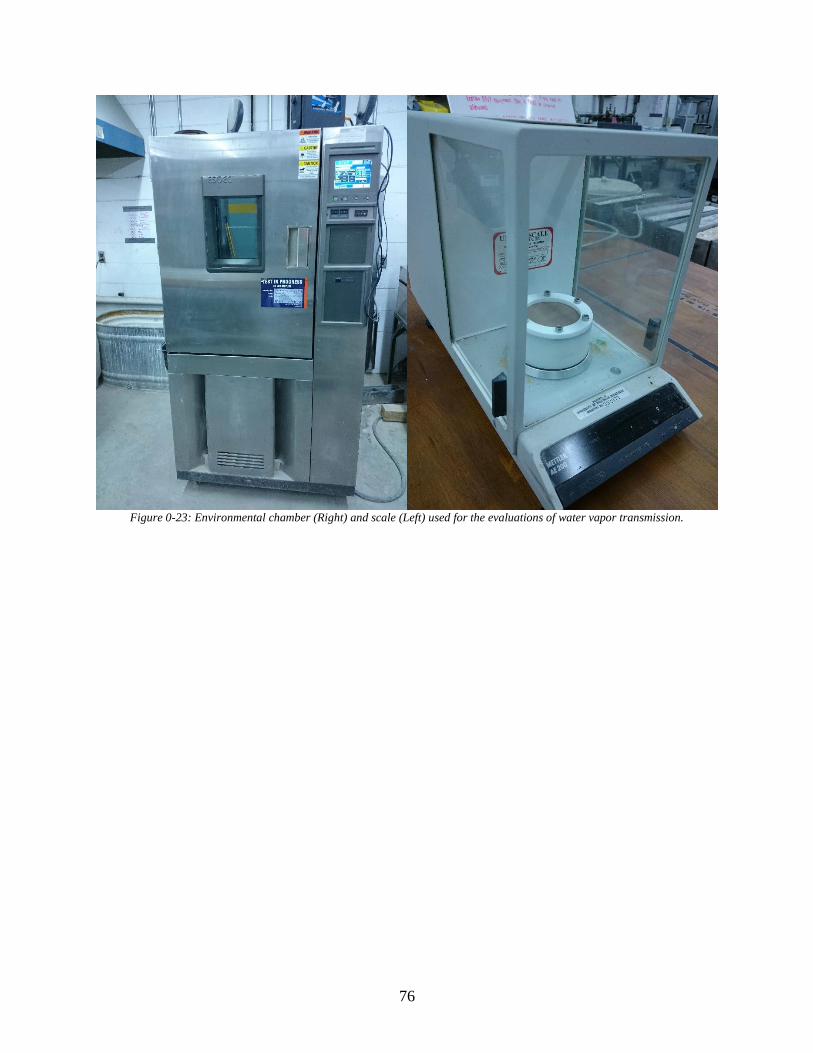
76
Figure 0-23: Environmental chamber (Right) and scale (Left) used for the evaluations of water vapor transmission.
77
5 Results & Discussion
5.1 Introduction
This section presents the findings of all tests conducted as part of this study. In addition
to the experimental results, a discussion comparing the results of this study to those from other
relevant studies. Based on the findings, a performance hierarchy is developed to rank the coating
systems evaluated in this study.
5.2 UV/Prohesion/Freeze Thaw
The test specimens subjected to the UV/Prohesion/Freeze Thaw accelerated weathering
exposure were evaluated for both aesthetics and durability. The aesthetic performance was
evaluated based on the color and gloss measurements recorded throughout the exposure period,
and durability was evaluated based on the dry film thickness measurements, the number of
coating defects, coating adhesion, and the pencil scratch hardness of the selected systems.
5.2.1 Color Retention
To characterize the effect of accelerated weathering exposure on color, the color indexing
values (L*, a*, b* under the CIELAB model) were compared to the initial values of each
respective sample. From these measurements, four comparison criterions were calculated. Three
of the criterions, ΔL*, Δa*, and Δb*, represent the difference between the current and initial
color indexing values. These values indicate both the magnitude and direction of changes from
white-to-black, red-to-green, and blue-to-yellow, respectively. The fourth criterion, ΔE*ab,
represents the total color change and is calculated as the root mean square of all the color
indexing values. The comparison of coating performance based on ΔE*ab values alone is
inadequate as certain color variations may be more acceptable aesthetically.
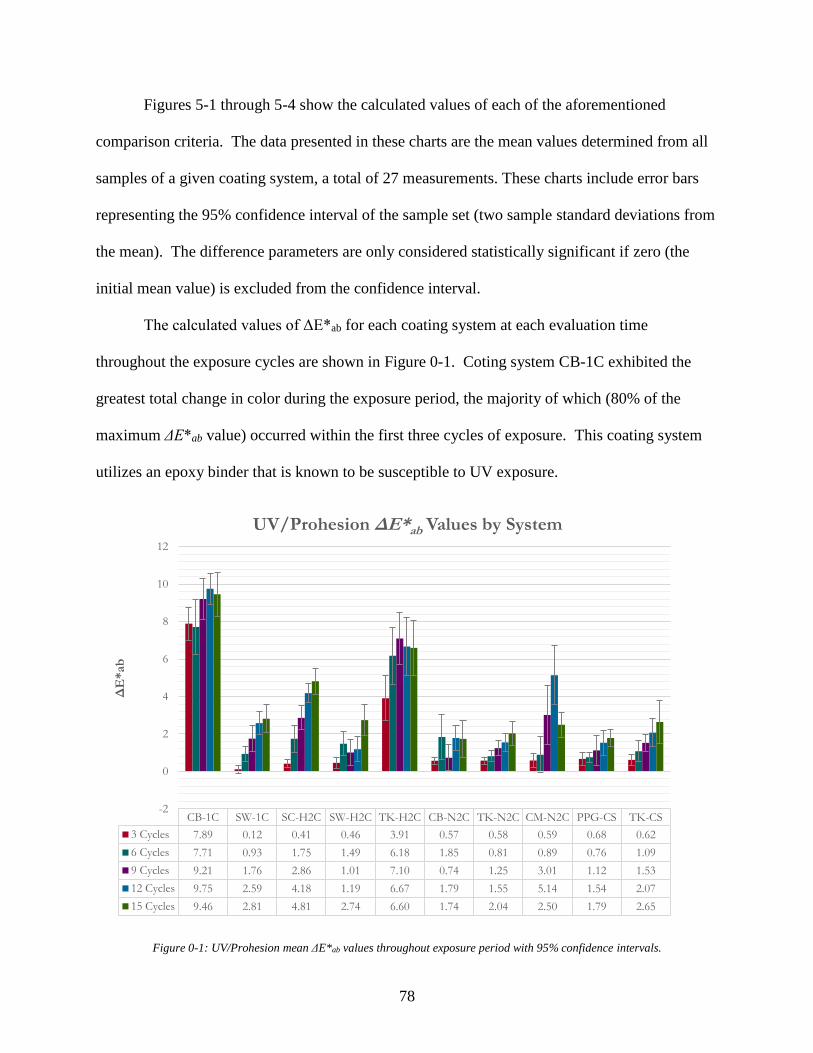
78
Figures 5-1 through 5-4 show the calculated values of each of the aforementioned
comparison criteria. The data presented in these charts are the mean values determined from all
samples of a given coating system, a total of 27 measurements. These charts include error bars
representing the 95% confidence interval of the sample set (two sample standard deviations from
the mean). The difference parameters are only considered statistically significant if zero (the
initial mean value) is excluded from the confidence interval.
The calculated values of ΔE*ab for each coating system at each evaluation time
throughout the exposure cycles are shown in Figure 0-1. Coting system CB-1C exhibited the
greatest total change in color during the exposure period, the majority of which (80% of the
maximum ΔE*ab value) occurred within the first three cycles of exposure. This coating system
utilizes an epoxy binder that is known to be susceptible to UV exposure.
Figure 0-1: UV/Prohesion mean ΔE*ab values throughout exposure period with 95% confidence intervals.
CB-1C SW-1C SC-H2C SW-H2C TK-H2C CB-N2C TK-N2C CM-N2C PPG-CS TK-CS
3 Cycles 7.89 0.12 0.41 0.46 3.91 0.57 0.58 0.59 0.68 0.62
6 Cycles 7.71 0.93 1.75 1.49 6.18 1.85 0.81 0.89 0.76 1.09
9 Cycles 9.21 1.76 2.86 1.01 7.10 0.74 1.25 3.01 1.12 1.53
12 Cycles 9.75 2.59 4.18 1.19 6.67 1.79 1.55 5.14 1.54 2.07
15 Cycles 9.46 2.81 4.81 2.74 6.60 1.74 2.04 2.50 1.79 2.65
-2
0
2
4
6
8
10
12
ΔE
*ab
UV/Prohesion ΔE*ab Values by System
79
TK-H2C showed the second largest total color change, peaking after the ninth cycle of
exposure. This acrylic-siloxane hybrid system began developing coating discontinuities in the
later stages of the testing period. This loss of coating material may account for the slight
regression in the mean ΔE*ab values calculated at the latter stages. However, despite these
defects, the mean ΔE*ab values remained within the 95% confidence interval during the last nine
cycles of the test. Conversly, the other acrylic-siloxane hybrid coating system included in this
study, CB-N2, experienced the smallest peak ΔE*ab value when subjected to the UV/Prohesion
exposure conditions.
The lone system with a polyurethane top coat, CM-N2, showed a peak mean ΔE*ab of
5.14. The measurements for this system were highly variable following the ninth and twelfth
cycles of exposure, and a significant regression in the mean ΔE*ab value of the system was
observed in the final measurements.
With the exception of SC-H2, the remaining systems exhibited similar peak ΔE*ab values.
These systems utilized an acrylic binder, and therefore similar color retention properties were
anticipated. The acrylic system with the poorest weathering performance in this accelerated
weathering test was the only elastomeric acrylic system included in the evaluation.
Figure 0-2 depicts the lightness (white-to-black) variation in color throughout the
UV/Prohesion exposure. In this figure, positive values of ΔL* characterize lightening of the
coating in relation to the initial mean value and thus conversely, a negative value signifies
darkening of the coating. Comparing the magnitude of the ΔL* values to those of ΔEab*, it is
observed that the lightness component of color change (ΔL*) is the dominate component for the
majority of the evaluated coating systems, with SW-H2 being the only exception.
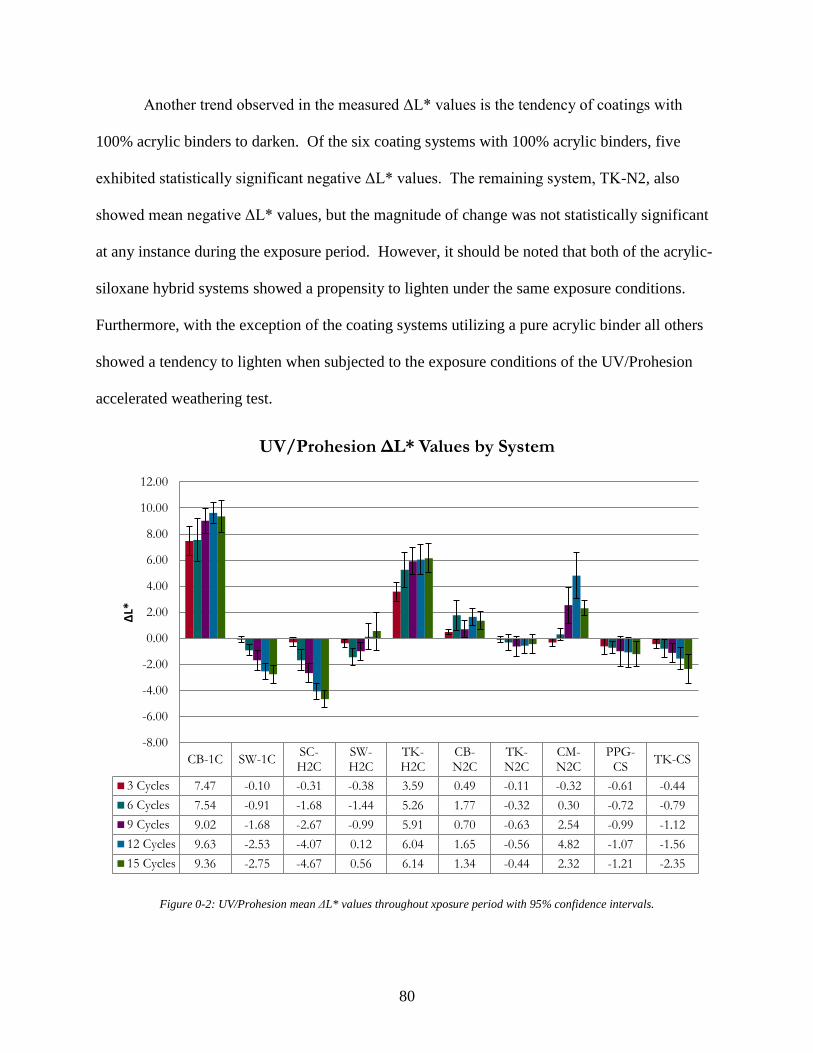
80
Another trend observed in the measured ΔL* values is the tendency of coatings with
100% acrylic binders to darken. Of the six coating systems with 100% acrylic binders, five
exhibited statistically significant negative ΔL* values. The remaining system, TK-N2, also
showed mean negative ΔL* values, but the magnitude of change was not statistically significant
at any instance during the exposure period. However, it should be noted that both of the acrylic-
siloxane hybrid systems showed a propensity to lighten under the same exposure conditions.
Furthermore, with the exception of the coating systems utilizing a pure acrylic binder all others
showed a tendency to lighten when subjected to the exposure conditions of the UV/Prohesion
accelerated weathering test.
Figure 0-2: UV/Prohesion mean ΔL* values throughout xposure period with 95% confidence intervals.
CB-1C SW-1CSC-H2C
SW-H2C
TK-H2C
CB-N2C
TK-N2C
CM-N2C
PPG-CS
TK-CS
3 Cycles 7.47 -0.10 -0.31 -0.38 3.59 0.49 -0.11 -0.32 -0.61 -0.44
6 Cycles 7.54 -0.91 -1.68 -1.44 5.26 1.77 -0.32 0.30 -0.72 -0.79
9 Cycles 9.02 -1.68 -2.67 -0.99 5.91 0.70 -0.63 2.54 -0.99 -1.12
12 Cycles 9.63 -2.53 -4.07 0.12 6.04 1.65 -0.56 4.82 -1.07 -1.56
15 Cycles 9.36 -2.75 -4.67 0.56 6.14 1.34 -0.44 2.32 -1.21 -2.35
-8.00
-6.00
-4.00
-2.00
0.00
2.00
4.00
6.00
8.00
10.00
12.00
ΔL*
UV/Prohesion ΔL* Values by System
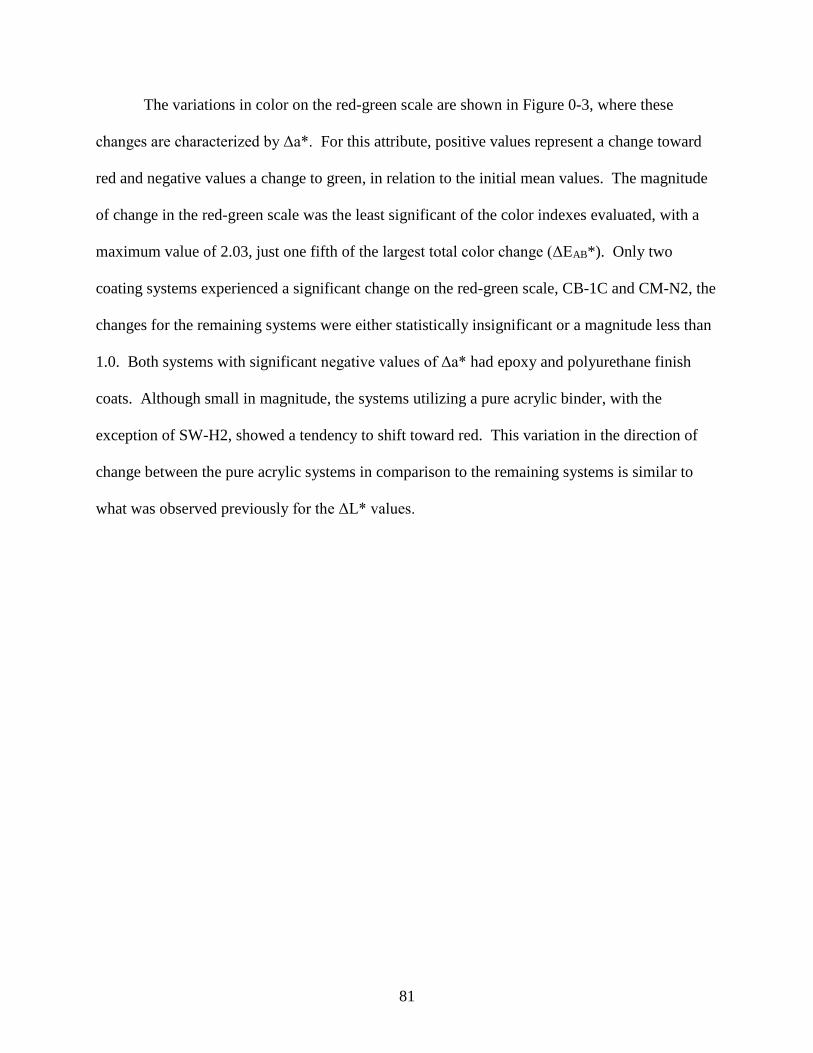
81
The variations in color on the red-green scale are shown in Figure 0-3, where these
changes are characterized by Δa*. For this attribute, positive values represent a change toward
red and negative values a change to green, in relation to the initial mean values. The magnitude
of change in the red-green scale was the least significant of the color indexes evaluated, with a
maximum value of 2.03, just one fifth of the largest total color change (ΔEAB*). Only two
coating systems experienced a significant change on the red-green scale, CB-1C and CM-N2, the
changes for the remaining systems were either statistically insignificant or a magnitude less than
1.0. Both systems with significant negative values of Δa* had epoxy and polyurethane finish
coats. Although small in magnitude, the systems utilizing a pure acrylic binder, with the
exception of SW-H2, showed a tendency to shift toward red. This variation in the direction of
change between the pure acrylic systems in comparison to the remaining systems is similar to
what was observed previously for the ΔL* values.
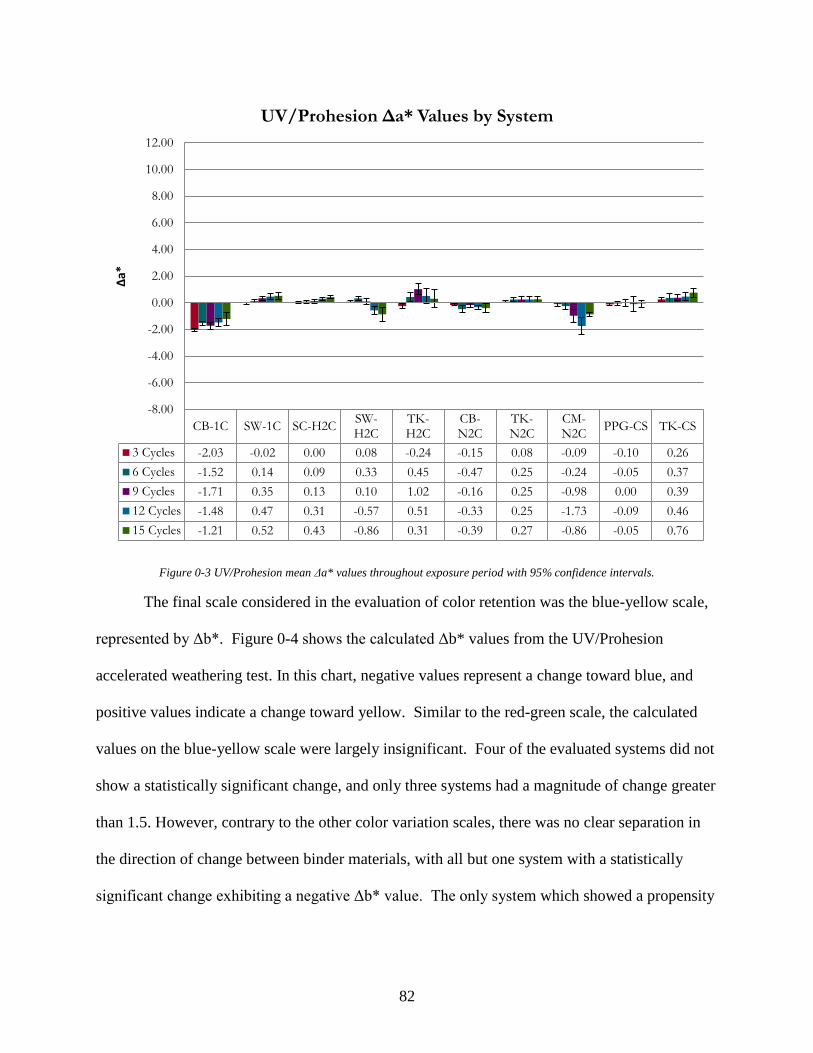
82
Figure 0-3 UV/Prohesion mean Δa* values throughout exposure period with 95% confidence intervals.
The final scale considered in the evaluation of color retention was the blue-yellow scale,
represented by Δb*. Figure 0-4 shows the calculated Δb* values from the UV/Prohesion
accelerated weathering test. In this chart, negative values represent a change toward blue, and
positive values indicate a change toward yellow. Similar to the red-green scale, the calculated
values on the blue-yellow scale were largely insignificant. Four of the evaluated systems did not
show a statistically significant change, and only three systems had a magnitude of change greater
than 1.5. However, contrary to the other color variation scales, there was no clear separation in
the direction of change between binder materials, with all but one system with a statistically
significant change exhibiting a negative Δb* value. The only system which showed a propensity
CB-1C SW-1C SC-H2CSW-H2C
TK-H2C
CB-N2C
TK-N2C
CM-N2C
PPG-CS TK-CS
3 Cycles -2.03 -0.02 0.00 0.08 -0.24 -0.15 0.08 -0.09 -0.10 0.26
6 Cycles -1.52 0.14 0.09 0.33 0.45 -0.47 0.25 -0.24 -0.05 0.37
9 Cycles -1.71 0.35 0.13 0.10 1.02 -0.16 0.25 -0.98 0.00 0.39
12 Cycles -1.48 0.47 0.31 -0.57 0.51 -0.33 0.25 -1.73 -0.09 0.46
15 Cycles -1.21 0.52 0.43 -0.86 0.31 -0.39 0.27 -0.86 -0.05 0.76
-8.00
-6.00
-4.00
-2.00
0.00
2.00
4.00
6.00
8.00
10.00
12.00
Δa*
UV/Prohesion Δa* Values by System

83
to change toward yellow was TK-H2, which also showed the largest magnitude of change on this
scale.
Figure 0-4: UV/Prohesion mean Δb* values throughout exposure period with 95% confidence intervals.
Evaluation of the color retention performance of a coating system is difficult to
characterize based on color space measurements alone, as perception of color changes can vary
between individuals and certain changes may be more acceptable aesthetically. Recognizing
this, the measured color space values were compared to photographs of the weathering samples
taken throughout the exposure period to verify consistency between the perceived and measured
changes. The photos for each exposure type are included in appendixes E-G of this report.
CB-1C SW-1C SC-H2CSW-H2C
TK-H2C
CB-N2C
TK-N2C
CM-N2C
PPG-CS TK-CS
3 Cycles -1.49 0.02 -0.23 -0.23 1.54 -0.25 -0.56 -0.45 -0.23 -0.31
6 Cycles 0.12 0.14 -0.48 0.10 3.18 -0.22 -0.66 -0.80 -0.21 -0.62
9 Cycles -0.58 0.36 -1.03 -0.05 3.76 -0.15 -1.03 -1.28 -0.42 -0.93
12 Cycles -0.19 0.21 -0.92 -1.00 2.76 -0.57 -1.39 -0.28 -1.00 -1.25
15 Cycles 0.41 0.22 -1.10 -2.47 2.33 -1.02 -1.96 -0.05 -1.24 -0.92
-8.00
-6.00
-4.00
-2.00
0.00
2.00
4.00
6.00
8.00
10.00
12.00
Δb*
UV/Prohesion Δb* Values by Coating System
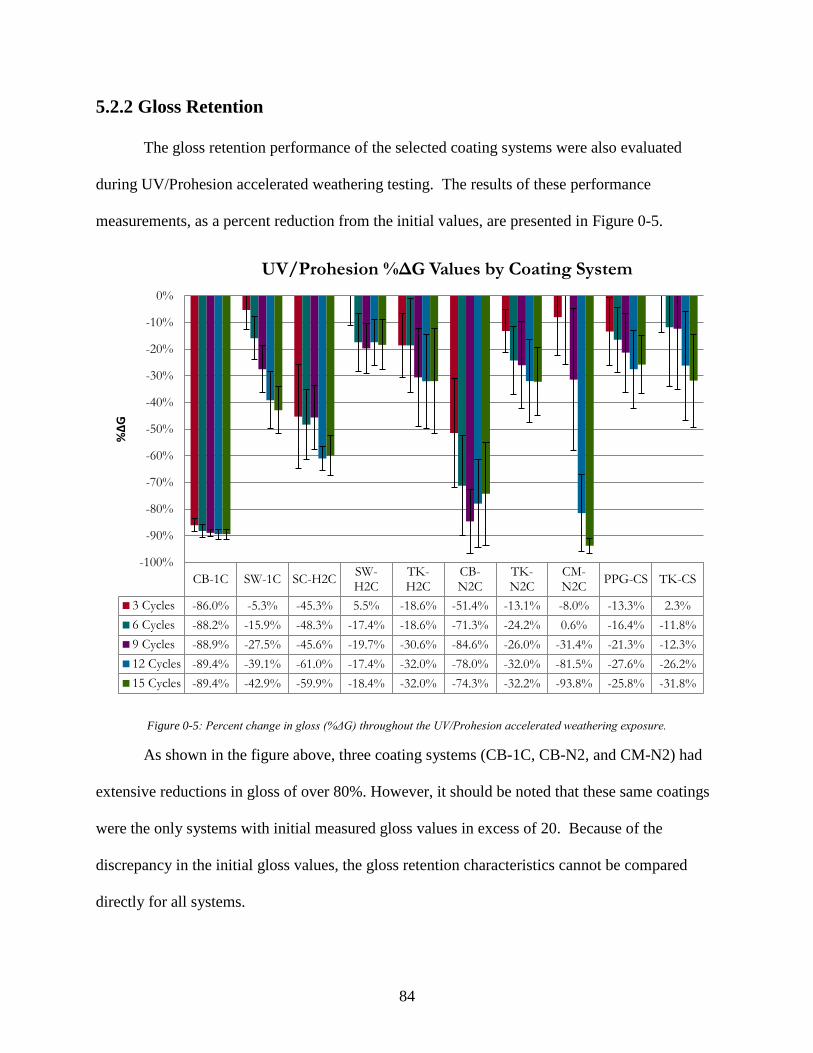
84
5.2.2 Gloss Retention
The gloss retention performance of the selected coating systems were also evaluated
during UV/Prohesion accelerated weathering testing. The results of these performance
measurements, as a percent reduction from the initial values, are presented in Figure 0-5.
Figure 0-5: Percent change in gloss (%ΔG) throughout the UV/Prohesion accelerated weathering exposure.
As shown in the figure above, three coating systems (CB-1C, CB-N2, and CM-N2) had
extensive reductions in gloss of over 80%. However, it should be noted that these same coatings
were the only systems with initial measured gloss values in excess of 20. Because of the
discrepancy in the initial gloss values, the gloss retention characteristics cannot be compared
directly for all systems.
CB-1C SW-1C SC-H2CSW-H2C
TK-H2C
CB-N2C
TK-N2C
CM-N2C
PPG-CS TK-CS
3 Cycles -86.0% -5.3% -45.3% 5.5% -18.6% -51.4% -13.1% -8.0% -13.3% 2.3%
6 Cycles -88.2% -15.9% -48.3% -17.4% -18.6% -71.3% -24.2% 0.6% -16.4% -11.8%
9 Cycles -88.9% -27.5% -45.6% -19.7% -30.6% -84.6% -26.0% -31.4% -21.3% -12.3%
12 Cycles -89.4% -39.1% -61.0% -17.4% -32.0% -78.0% -32.0% -81.5% -27.6% -26.2%
15 Cycles -89.4% -42.9% -59.9% -18.4% -32.0% -74.3% -32.2% -93.8% -25.8% -31.8%
-100%
-90%
-80%
-70%
-60%
-50%
-40%
-30%
-20%
-10%
0%
%ΔG
UV/Prohesion %ΔG Values by Coating System
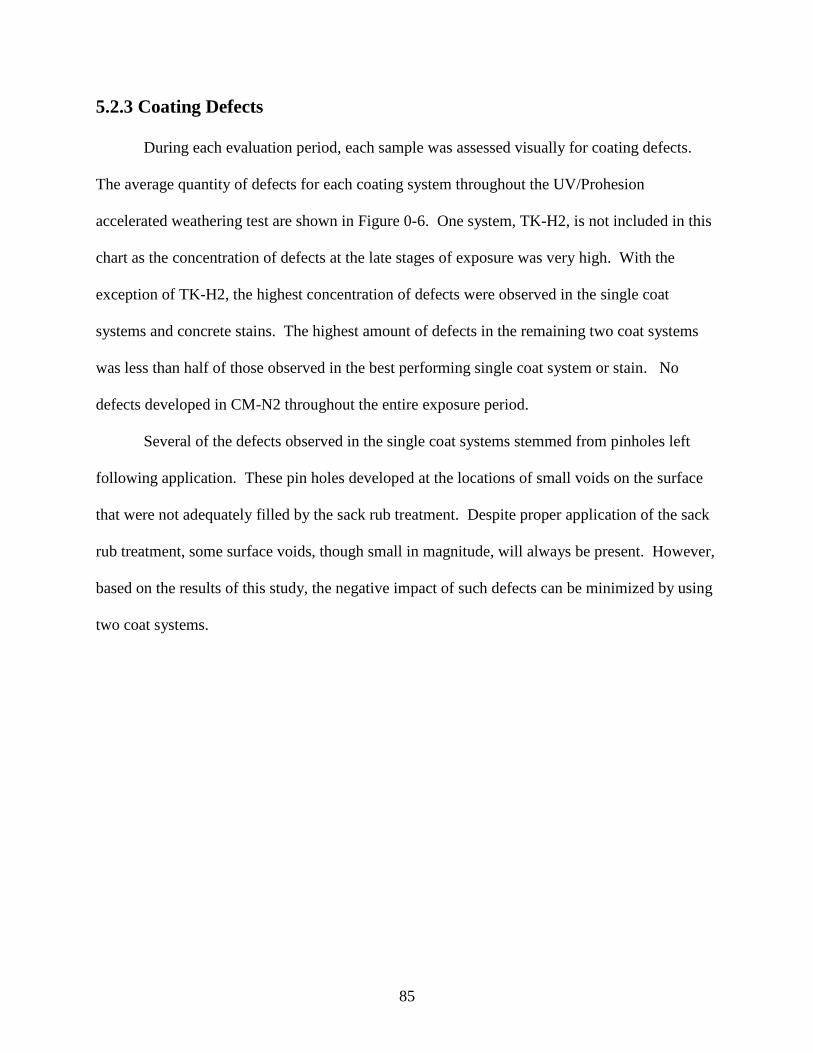
85
5.2.3 Coating Defects
During each evaluation period, each sample was assessed visually for coating defects.
The average quantity of defects for each coating system throughout the UV/Prohesion
accelerated weathering test are shown in Figure 0-6. One system, TK-H2, is not included in this
chart as the concentration of defects at the late stages of exposure was very high. With the
exception of TK-H2, the highest concentration of defects were observed in the single coat
systems and concrete stains. The highest amount of defects in the remaining two coat systems
was less than half of those observed in the best performing single coat system or stain. No
defects developed in CM-N2 throughout the entire exposure period.
Several of the defects observed in the single coat systems stemmed from pinholes left
following application. These pin holes developed at the locations of small voids on the surface
that were not adequately filled by the sack rub treatment. Despite proper application of the sack
rub treatment, some surface voids, though small in magnitude, will always be present. However,
based on the results of this study, the negative impact of such defects can be minimized by using
two coat systems.
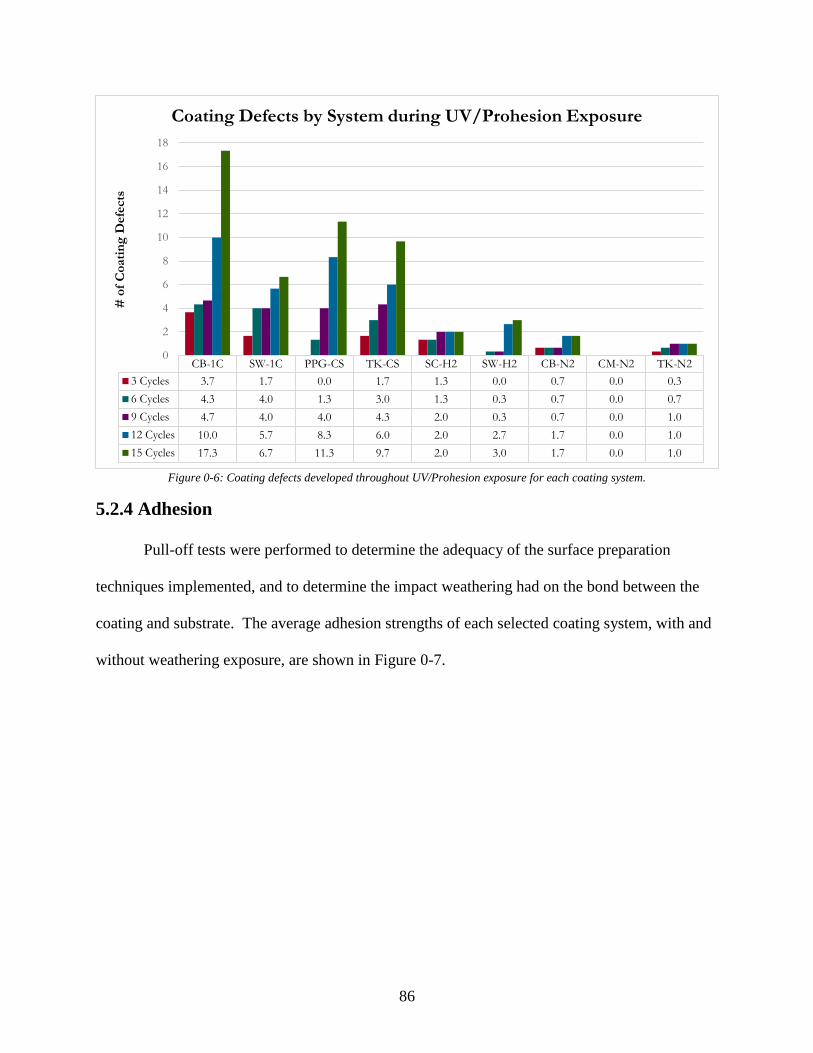
86
Figure 0-6: Coating defects developed throughout UV/Prohesion exposure for each coating system.
5.2.4 Adhesion
Pull-off tests were performed to determine the adequacy of the surface preparation
techniques implemented, and to determine the impact weathering had on the bond between the
coating and substrate. The average adhesion strengths of each selected coating system, with and
without weathering exposure, are shown in Figure 0-7.
CB-1C SW-1C PPG-CS TK-CS SC-H2 SW-H2 CB-N2 CM-N2 TK-N2
3 Cycles 3.7 1.7 0.0 1.7 1.3 0.0 0.7 0.0 0.3
6 Cycles 4.3 4.0 1.3 3.0 1.3 0.3 0.7 0.0 0.7
9 Cycles 4.7 4.0 4.0 4.3 2.0 0.3 0.7 0.0 1.0
12 Cycles 10.0 5.7 8.3 6.0 2.0 2.7 1.7 0.0 1.0
15 Cycles 17.3 6.7 11.3 9.7 2.0 3.0 1.7 0.0 1.0
0
2
4
6
8
10
12
14
16
18
# o
f C
oati
ng
Defe
cts
Coating Defects by System during UV/Prohesion Exposure
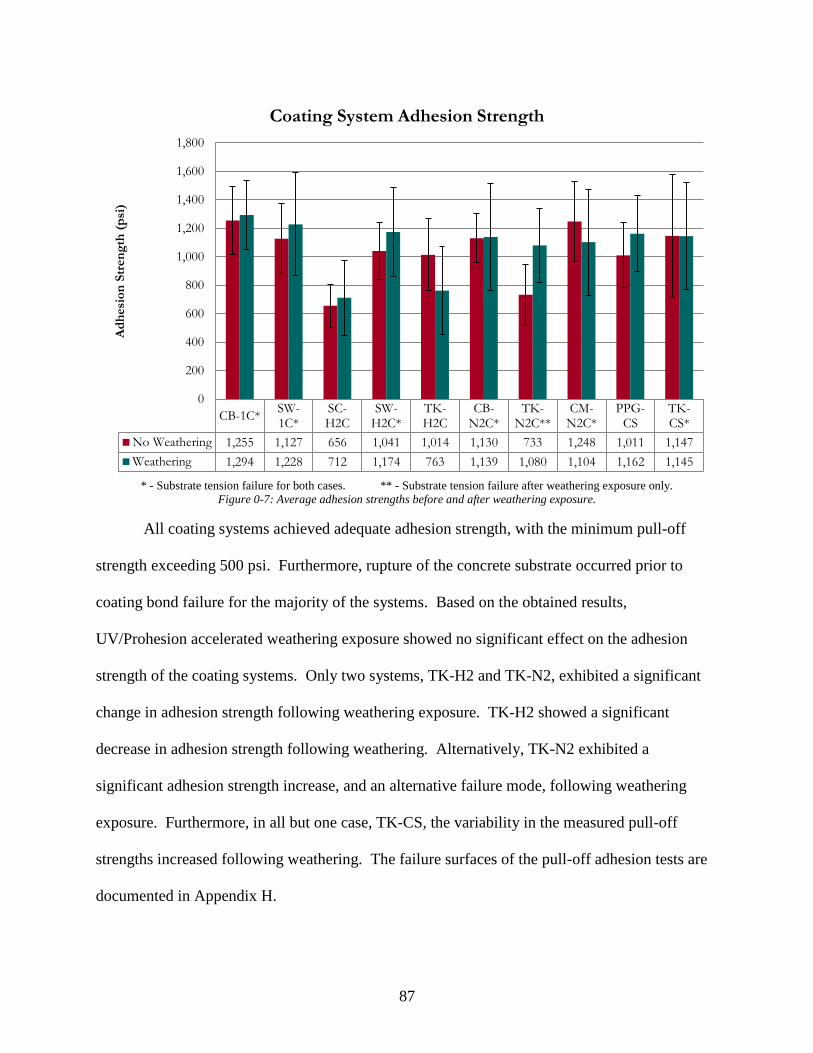
87
* - Substrate tension failure for both cases. ** - Substrate tension failure after weathering exposure only.
Figure 0-7: Average adhesion strengths before and after weathering exposure.
All coating systems achieved adequate adhesion strength, with the minimum pull-off
strength exceeding 500 psi. Furthermore, rupture of the concrete substrate occurred prior to
coating bond failure for the majority of the systems. Based on the obtained results,
UV/Prohesion accelerated weathering exposure showed no significant effect on the adhesion
strength of the coating systems. Only two systems, TK-H2 and TK-N2, exhibited a significant
change in adhesion strength following weathering exposure. TK-H2 showed a significant
decrease in adhesion strength following weathering. Alternatively, TK-N2 exhibited a
significant adhesion strength increase, and an alternative failure mode, following weathering
exposure. Furthermore, in all but one case, TK-CS, the variability in the measured pull-off
strengths increased following weathering. The failure surfaces of the pull-off adhesion tests are
documented in Appendix H.
CB-1C*SW-1C*
SC-H2C
SW-H2C*
TK-H2C
CB-N2C*
TK-N2C**
CM-N2C*
PPG-CS
TK-CS*
No Weathering 1,255 1,127 656 1,041 1,014 1,130 733 1,248 1,011 1,147
Weathering 1,294 1,228 712 1,174 763 1,139 1,080 1,104 1,162 1,145
0
200
400
600
800
1,000
1,200
1,400
1,600
1,800
Ad
hesi
on
Str
en
gth
(p
si)
Coating System Adhesion Strength
88
In previous steel coatings studies [1], weathering exposure was shown to have a negative
effect on adhesion strength. However, the effect was less pronounced when the initial pull-off
strength was below 1,000 psi. In a similar evaluation on concrete coatings systems, the effect of
weathering was sporadic, but the magnitudes of the adhesion strengths were similar. Of seven
systems for which initial and final values were reported, four showed a decrease in the average
adhesion strength while the remaining three systems showed opposing results. However, these
results were obtained from standard concrete cylinder halves subjected to 5,000 hours of
continuous salt fog exposure, rather than cast surfaces subjected to combined UV, Prohesion, and
freeze-thaw weathering effects. The reason a similar trend to that observed in steel coatings is
not present for concrete coatings is the differences in the mechanical properties of the substrate.
The lower tensile strength of concrete, as the substrate, places an upper bound on the bond
strength that can be measured by this test method.
5.2.5 Pencil Scratch Hardness
The pencil scratch hardness of the selected coatings systems was evaluated to
characterize abrasion resistance. Similar to the evaluation of adhesion strength, pencil scratch
hardness was assessed on two sample sets, with and without weathering exposure. Overall, the
results showed that pencil scratch hardness was not significantly influenced by weathering
exposure. Of the ten systems tested, only two showed variations greater than two pencil
hardness grades between the sample sets; however, these systems showed opposite tendencies
(Figure 0-8). CB-N2 showed the greatest weathering effect, softening by four pencil hardness
grades after subjection to accelerated weathering. Conversely, the second largest variation was
observed for SW-1C, which hardened by three grades when exposed to accelerated weathering
conditions. For the remaining systems, the largest magnitude of variation was approximately

89
one hardness grade, which is within the allowable of the testing method, and therefore
signifies no significant change. Overall, the change in hardness of the evaluated systems was
divided, with half the systems showing a slight increase in hardness while the other half showed
a slight softening. However, the average magnitude of change for the softened coating systems
was approximately 40% higher than that of the hardened systems.
Figure 0-8: Average pencil scratch hardness values of each system with and without weathering exposure.
The results of this test are consistent to those obtained in a previous study on steel
coatings [1], where it was concluded that accelerated weathering exposure had no significant
effect on the pencil scratch hardness of the coating systems. It should be noted however, that
only a select number of coatings in this evaluation utilize similar materials to those in the
previous study.
6B
5B
4B
3B
2B
B
HB
F
H
2H
3H
4H
5H
6H
CB-1C SW-1C SC-H2C SW-H2C TK-H2C CB-N2C TK-N2C CM-N2C PPG-CS TK-CS
Pen
cil
Scra
tch
Hard
ness
Coating System Scratch Hardness
No Weathering Weathering
90
5.2.6 Degree of Blistering
Only one sample showed any signs of blistering during testing. However, this blistering
occurred during the initial UV exposure, during which the chamber temperature exceeded the set
point significantly. This event also caused several coating systems to soften and adhere to the
testing brackets. It should be noted that this problem occurred primarily in the water based
systems. Following the conclusion of the test, several blisters were broken to determine the
cause of their formation. Once broken, it was observed that the blisters formed within a single
coating layer suggesting temperature was the primary factor in their formation, rather than poor
substrate bonding or improper surface preparation. This observation was reinforced as no new
blister developed during the remainder of the test cycle. Photos of the aforementioned test
specimen can be found in Appendix F.
5.3 Xenon Arc
A second accelerated weathering experiment using xenon arc exposure was conducted to
evaluate the effects of full spectrum sunlight on color and gloss retention. The samples of this
accelerated weathering exposure condition were subjected to only light and moisture limiting any
combined effects produced in the UV/Prohesion accelerated weathering procedure. The
correlation between the average color and gloss retention values of the two types of accelerated
weathering methods will be discussed later in this report.
5.3.1 Color Retention
Based on the average root mean square values of color change, ΔEab*, the coating
systems were classified into three discrete groups: ΔEab* ≥ 5; 4.5 ≥ ΔEab* ≥ 3.5; ΔEab* ≤ 2.5.
The results of this test are summarized in Figure 0-9.
91
The coating systems showing the largest magnitude of change were CB-1C, SW-H2, TK-
H2, and CM-N2, with TK-H2 showing the most overall change in color. While CB-1C and TK-
H2 showed a steady change in color throughout the exposure period, the other two systems
experienced a significant increase in color change in the later cycles of exposure. SW-H2
showed no significant change through six cycles of exposure, but increased at a rate of two units
per evaluation cycle for the remainder of the exposure period. CM-N2 experienced a similar
increase in color change, but at a much higher magnitude. This system had the 4th lowest
aggregate change in color following the completion of the 9th cycle of exposure, but by the end
of the exposure period had undergone the second highest total change in color. The top coat
binder materials of the coatings that experienced the largest color changes (in order of peak
values) were: acrylic-siloxane hybrid (TK-H2); polyurethane (CM-N2); epoxy polyamide (CB-
1C), and acrylic (SW-H2).
The group exhibiting a moderate change in color consisted of two systems, TK-N2 and
TK-CS. The rate of change was similar for both systems, with the highest rate occurring after
initial exposure and slowly decreasing in magnitude throughout the duration of testing. The
measured color changes between the final evaluations were smaller than the error of the
measurement device. The top coats of these systems were both 100% acrylic. The similar
performance trend for the two systems is reasonable as both utilize a similar binder material and
are produced by the same manufacturer.
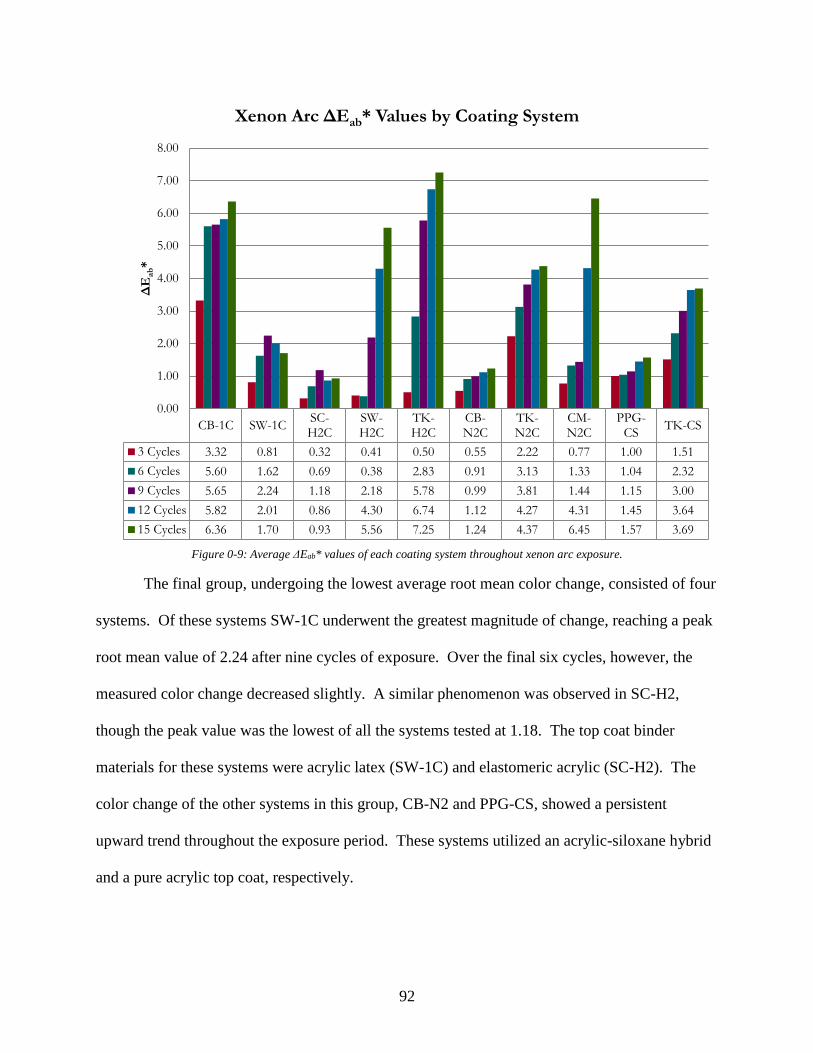
92
Figure 0-9: Average ΔEab* values of each coating system throughout xenon arc exposure.
The final group, undergoing the lowest average root mean color change, consisted of four
systems. Of these systems SW-1C underwent the greatest magnitude of change, reaching a peak
root mean value of 2.24 after nine cycles of exposure. Over the final six cycles, however, the
measured color change decreased slightly. A similar phenomenon was observed in SC-H2,
though the peak value was the lowest of all the systems tested at 1.18. The top coat binder
materials for these systems were acrylic latex (SW-1C) and elastomeric acrylic (SC-H2). The
color change of the other systems in this group, CB-N2 and PPG-CS, showed a persistent
upward trend throughout the exposure period. These systems utilized an acrylic-siloxane hybrid
and a pure acrylic top coat, respectively.
CB-1C SW-1CSC-H2C
SW-H2C
TK-H2C
CB-N2C
TK-N2C
CM-N2C
PPG-CS
TK-CS
3 Cycles 3.32 0.81 0.32 0.41 0.50 0.55 2.22 0.77 1.00 1.51
6 Cycles 5.60 1.62 0.69 0.38 2.83 0.91 3.13 1.33 1.04 2.32
9 Cycles 5.65 2.24 1.18 2.18 5.78 0.99 3.81 1.44 1.15 3.00
12 Cycles 5.82 2.01 0.86 4.30 6.74 1.12 4.27 4.31 1.45 3.64
15 Cycles 6.36 1.70 0.93 5.56 7.25 1.24 4.37 6.45 1.57 3.69
0.00
1.00
2.00
3.00
4.00
5.00
6.00
7.00
8.00Δ
Eab*
Xenon Arc ΔEab* Values by Coating System
93
Based on the results, pure acrylic binders showed the best color retention characteristics
accounting for five of the six lowest overall changes in color. The performance of the acrylic-
siloxane hybrid systems appear to be inconsistent, with the two such systems representing the
highest and second lowest total color changes. However, the hybrid system that showed the least
aggregate color change utilized a mixture of a pure acrylic coating and siloxane sealer. The base
coat consisted primarily of siloxane (4:1), but the top coat was largely acrylic (8:1). Thus, since
the top coat binder of this system was also primarily acrylic, performance characteristics similar
to the pure acrylic systems was anticipated. Finally, both the polyurethane (CM-N2) and epoxy
(CB-1C) top coat systems showed high variability in color, experiencing the second and third
most change, respectively.
The observed mean variations in color of the xenon arc samples on the light-dark scale
(L*) are summarized in Figure 0-10. When the magnitude of the values of ΔL* is compared
with the root mean square color change (ΔE*ab), it is observed that the variations in the light-
dark scale is the governing attribute for the majority of the coating systems. The only coating
systems where the dominate change did not occur on the light-dark scale were TK-N2, PPG-CS,
and TK-CS.
The coating systems utilizing a primarily acrylic top coat showed a tendency to darken
when subjected to the xenon arc exposure, with five of the seven such coatings darkening
throughout the exposure period. Only one acrylic based system, SW-H2, showed a significant
lightening of color when subjected to xenon arc exposure.
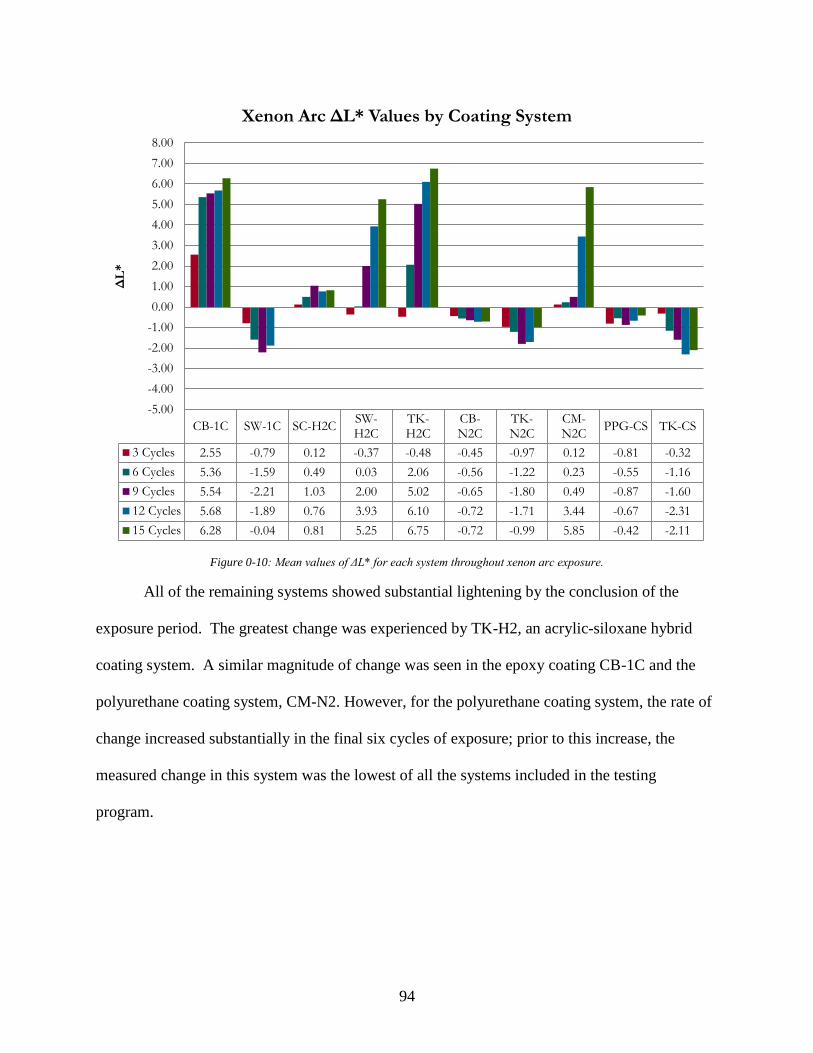
94
Figure 0-10: Mean values of ΔL* for each system throughout xenon arc exposure.
All of the remaining systems showed substantial lightening by the conclusion of the
exposure period. The greatest change was experienced by TK-H2, an acrylic-siloxane hybrid
coating system. A similar magnitude of change was seen in the epoxy coating CB-1C and the
polyurethane coating system, CM-N2. However, for the polyurethane coating system, the rate of
change increased substantially in the final six cycles of exposure; prior to this increase, the
measured change in this system was the lowest of all the systems included in the testing
program.
CB-1C SW-1C SC-H2CSW-H2C
TK-H2C
CB-N2C
TK-N2C
CM-N2C
PPG-CS TK-CS
3 Cycles 2.55 -0.79 0.12 -0.37 -0.48 -0.45 -0.97 0.12 -0.81 -0.32
6 Cycles 5.36 -1.59 0.49 0.03 2.06 -0.56 -1.22 0.23 -0.55 -1.16
9 Cycles 5.54 -2.21 1.03 2.00 5.02 -0.65 -1.80 0.49 -0.87 -1.60
12 Cycles 5.68 -1.89 0.76 3.93 6.10 -0.72 -1.71 3.44 -0.67 -2.31
15 Cycles 6.28 -0.04 0.81 5.25 6.75 -0.72 -0.99 5.85 -0.42 -2.11
-5.00
-4.00
-3.00
-2.00
-1.00
0.00
1.00
2.00
3.00
4.00
5.00
6.00
7.00
8.00
ΔL
*Xenon Arc ΔL* Values by Coating System
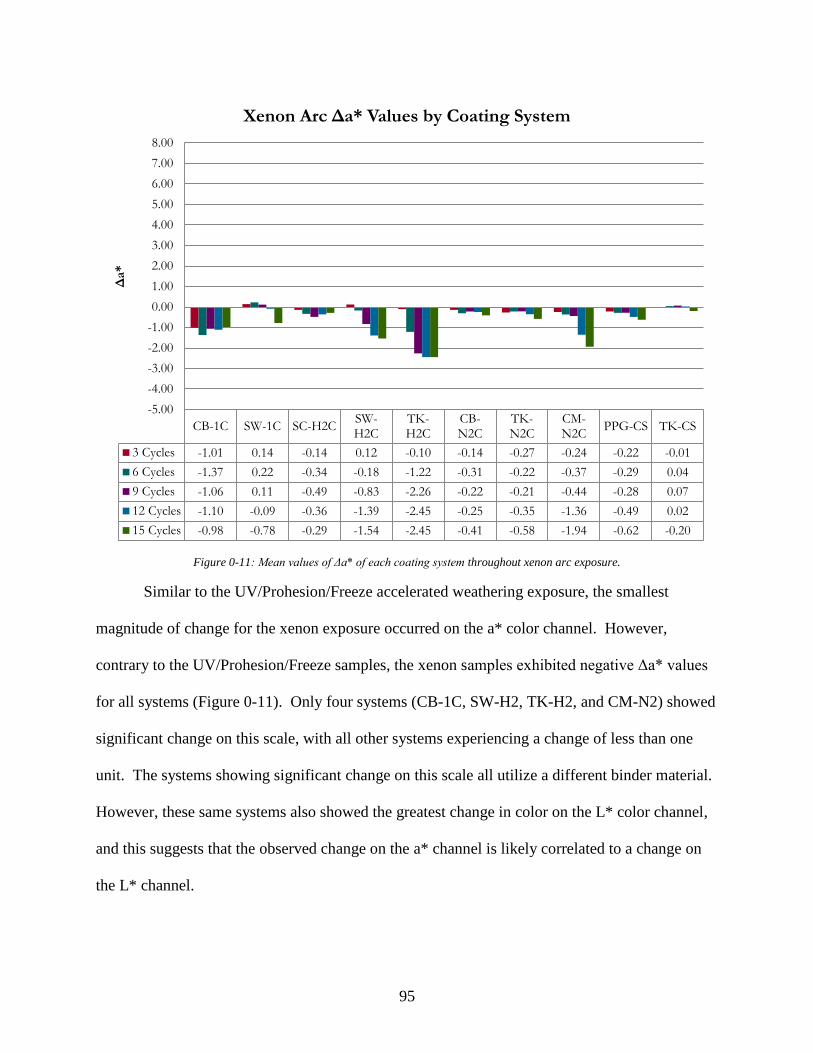
95
Figure 0-11: Mean values of Δa* of each coating system throughout xenon arc exposure.
Similar to the UV/Prohesion/Freeze accelerated weathering exposure, the smallest
magnitude of change for the xenon exposure occurred on the a* color channel. However,
contrary to the UV/Prohesion/Freeze samples, the xenon samples exhibited negative Δa* values
for all systems (Figure 0-11). Only four systems (CB-1C, SW-H2, TK-H2, and CM-N2) showed
significant change on this scale, with all other systems experiencing a change of less than one
unit. The systems showing significant change on this scale all utilize a different binder material.
However, these same systems also showed the greatest change in color on the L* color channel,
and this suggests that the observed change on the a* channel is likely correlated to a change on
the L* channel.
CB-1C SW-1C SC-H2CSW-H2C
TK-H2C
CB-N2C
TK-N2C
CM-N2C
PPG-CS TK-CS
3 Cycles -1.01 0.14 -0.14 0.12 -0.10 -0.14 -0.27 -0.24 -0.22 -0.01
6 Cycles -1.37 0.22 -0.34 -0.18 -1.22 -0.31 -0.22 -0.37 -0.29 0.04
9 Cycles -1.06 0.11 -0.49 -0.83 -2.26 -0.22 -0.21 -0.44 -0.28 0.07
12 Cycles -1.10 -0.09 -0.36 -1.39 -2.45 -0.25 -0.35 -1.36 -0.49 0.02
15 Cycles -0.98 -0.78 -0.29 -1.54 -2.45 -0.41 -0.58 -1.94 -0.62 -0.20
-5.00
-4.00
-3.00
-2.00
-1.00
0.00
1.00
2.00
3.00
4.00
5.00
6.00
7.00
8.00
Δa*
Xenon Arc Δa* Values by Coating System
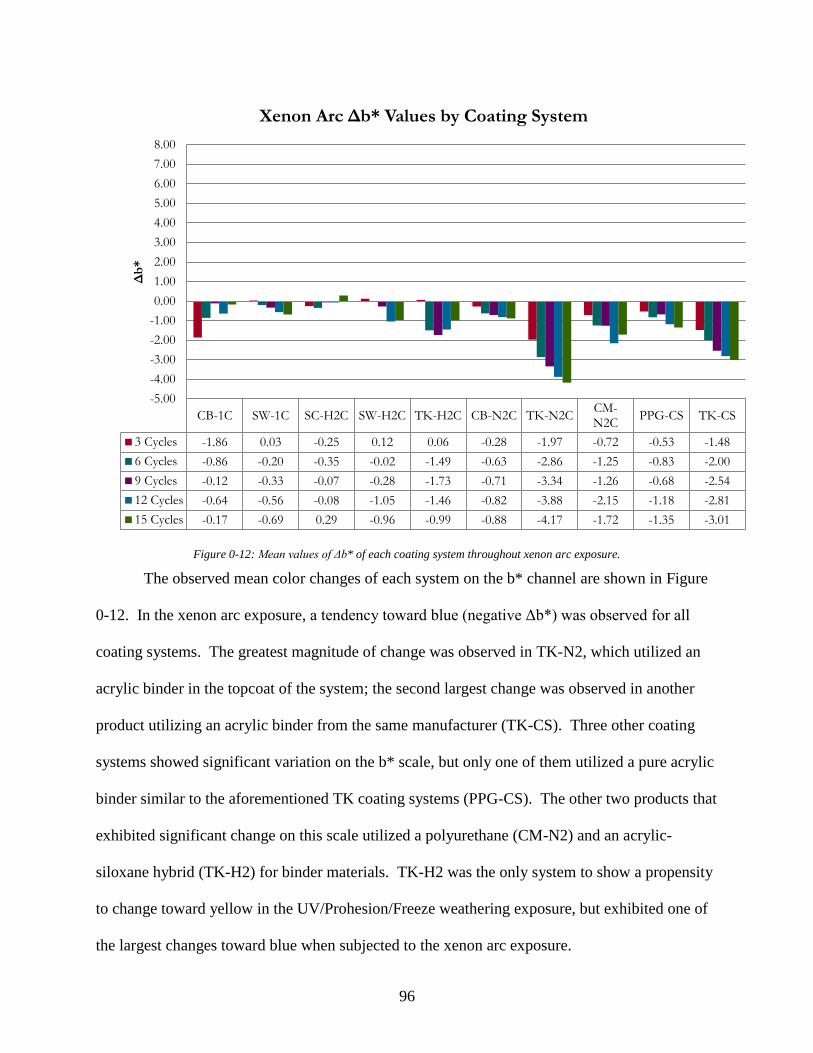
96
Figure 0-12: Mean values of Δb* of each coating system throughout xenon arc exposure.
The observed mean color changes of each system on the b* channel are shown in Figure
0-12. In the xenon arc exposure, a tendency toward blue (negative Δb*) was observed for all
coating systems. The greatest magnitude of change was observed in TK-N2, which utilized an
acrylic binder in the topcoat of the system; the second largest change was observed in another
product utilizing an acrylic binder from the same manufacturer (TK-CS). Three other coating
systems showed significant variation on the b* scale, but only one of them utilized a pure acrylic
binder similar to the aforementioned TK coating systems (PPG-CS). The other two products that
exhibited significant change on this scale utilized a polyurethane (CM-N2) and an acrylic-
siloxane hybrid (TK-H2) for binder materials. TK-H2 was the only system to show a propensity
to change toward yellow in the UV/Prohesion/Freeze weathering exposure, but exhibited one of
the largest changes toward blue when subjected to the xenon arc exposure.
CB-1C SW-1C SC-H2C SW-H2C TK-H2C CB-N2C TK-N2CCM-N2C
PPG-CS TK-CS
3 Cycles -1.86 0.03 -0.25 0.12 0.06 -0.28 -1.97 -0.72 -0.53 -1.48
6 Cycles -0.86 -0.20 -0.35 -0.02 -1.49 -0.63 -2.86 -1.25 -0.83 -2.00
9 Cycles -0.12 -0.33 -0.07 -0.28 -1.73 -0.71 -3.34 -1.26 -0.68 -2.54
12 Cycles -0.64 -0.56 -0.08 -1.05 -1.46 -0.82 -3.88 -2.15 -1.18 -2.81
15 Cycles -0.17 -0.69 0.29 -0.96 -0.99 -0.88 -4.17 -1.72 -1.35 -3.01
-5.00
-4.00
-3.00
-2.00
-1.00
0.00
1.00
2.00
3.00
4.00
5.00
6.00
7.00
8.00Δ
b*
Xenon Arc Δb* Values by Coating System
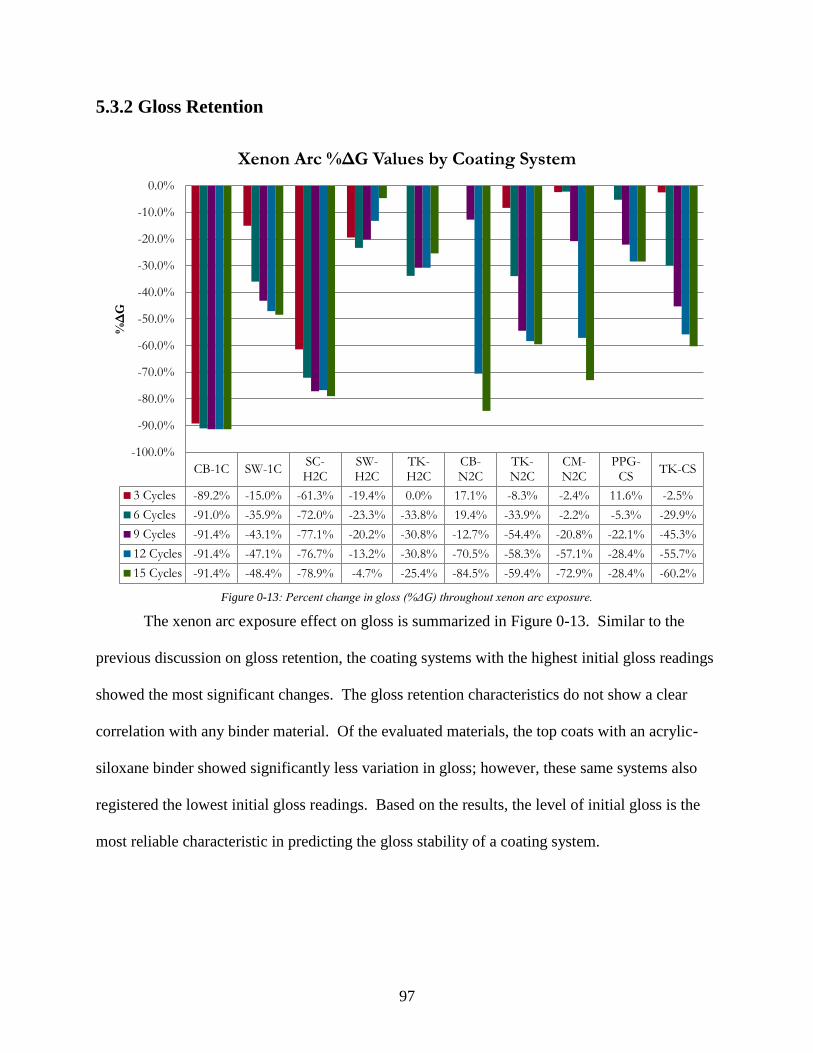
97
5.3.2 Gloss Retention
Figure 0-13: Percent change in gloss (%ΔG) throughout xenon arc exposure.
The xenon arc exposure effect on gloss is summarized in Figure 0-13. Similar to the
previous discussion on gloss retention, the coating systems with the highest initial gloss readings
showed the most significant changes. The gloss retention characteristics do not show a clear
correlation with any binder material. Of the evaluated materials, the top coats with an acrylic-
siloxane binder showed significantly less variation in gloss; however, these same systems also
registered the lowest initial gloss readings. Based on the results, the level of initial gloss is the
most reliable characteristic in predicting the gloss stability of a coating system.
CB-1C SW-1CSC-H2C
SW-H2C
TK-H2C
CB-N2C
TK-N2C
CM-N2C
PPG-CS
TK-CS
3 Cycles -89.2% -15.0% -61.3% -19.4% 0.0% 17.1% -8.3% -2.4% 11.6% -2.5%
6 Cycles -91.0% -35.9% -72.0% -23.3% -33.8% 19.4% -33.9% -2.2% -5.3% -29.9%
9 Cycles -91.4% -43.1% -77.1% -20.2% -30.8% -12.7% -54.4% -20.8% -22.1% -45.3%
12 Cycles -91.4% -47.1% -76.7% -13.2% -30.8% -70.5% -58.3% -57.1% -28.4% -55.7%
15 Cycles -91.4% -48.4% -78.9% -4.7% -25.4% -84.5% -59.4% -72.9% -28.4% -60.2%
-100.0%
-90.0%
-80.0%
-70.0%
-60.0%
-50.0%
-40.0%
-30.0%
-20.0%
-10.0%
0.0%
%Δ
G
Xenon Arc %ΔG Values by Coating System
98
5.4 Outdoor Exposure Results
To correlate the accelerated weathering results with that of field exposure conditions, an
outdoor exposure evaluation was conducted on large scale samples. These samples were
subjected to a 30° southern exposure and a once daily spray, five days a week, with a 15%
sodium chloride solution. The exposure period was conducted for an 18-month period (January
2014 – July 2015), and coating evaluations were conducted following every six months of
exposure; the results are summarized and discussed below. Photographs of the samples
following each coating evaluation are included in Appendix I, and a summary of the weather
conditions during the exposure period is included in Appendix J.
99
5.4.1 Color Retention
Several systems showed a substantial change in color following only 18 months of
outdoor exposure. The average total color change for the outdoor exposure samples are shown in
Figure 0-14. Similar to both accelerated weathering tests, CB-1C and TK-H2 exhibited the
greatest change in color over the course of the outdoor exposure period. However, the observed
color changes in the remaining systems correlate better to the xenon arc exposure than the
UV/Prohesion/Freeze. This was the anticipated result as the xenon arc exposure test was
developed to closely match the true light spectrum produced by sunlight.
Overall, only five systems showed a total root mean color change in excess of 2.00 after
18 months of continuous outdoor exposure. All these systems, with the exception of CM-N2,
exhibited the highest low cycle changes during the xenon arc exposure test. Despite having a
small low cycle change in the xenon arc exposure, at the later stages CM-N2 showed a
substantial change, and a significant change during the outdoor exposure evaluations was
expected.
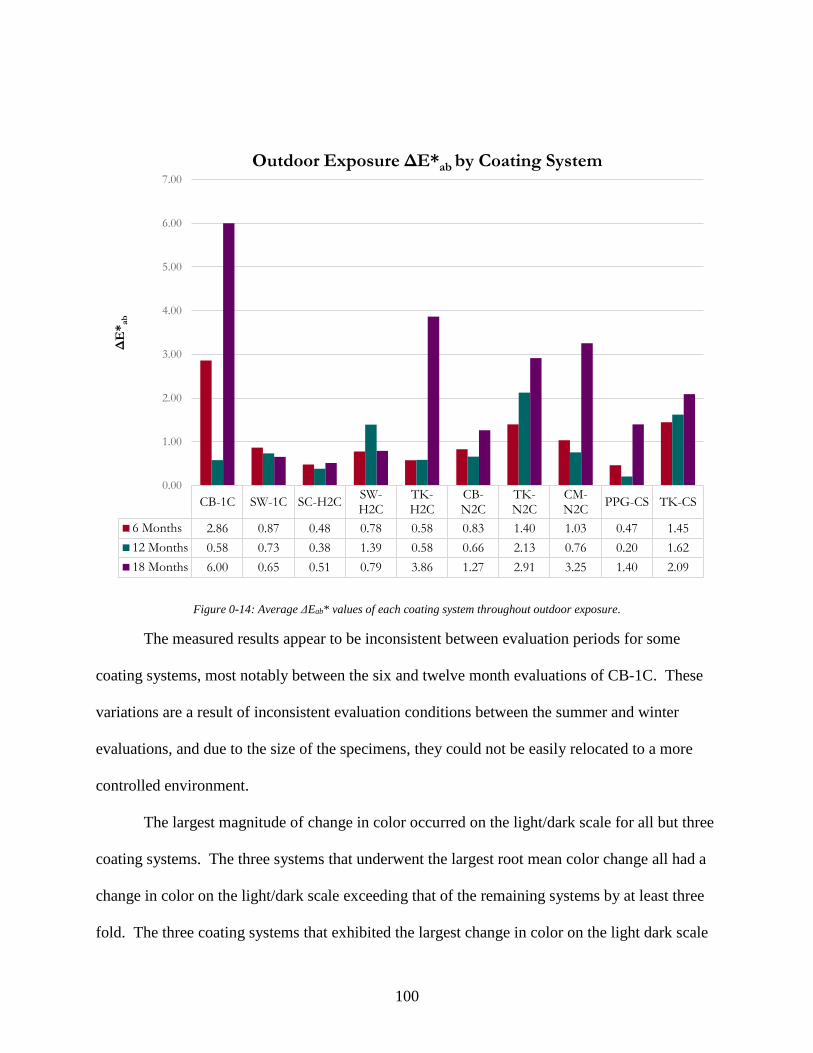
100
Figure 0-14: Average ΔEab* values of each coating system throughout outdoor exposure.
The measured results appear to be inconsistent between evaluation periods for some
coating systems, most notably between the six and twelve month evaluations of CB-1C. These
variations are a result of inconsistent evaluation conditions between the summer and winter
evaluations, and due to the size of the specimens, they could not be easily relocated to a more
controlled environment.
The largest magnitude of change in color occurred on the light/dark scale for all but three
coating systems. The three systems that underwent the largest root mean color change all had a
change in color on the light/dark scale exceeding that of the remaining systems by at least three
fold. The three coating systems that exhibited the largest change in color on the light dark scale
CB-1C SW-1C SC-H2CSW-H2C
TK-H2C
CB-N2C
TK-N2C
CM-N2C
PPG-CS TK-CS
6 Months 2.86 0.87 0.48 0.78 0.58 0.83 1.40 1.03 0.47 1.45
12 Months 0.58 0.73 0.38 1.39 0.58 0.66 2.13 0.76 0.20 1.62
18 Months 6.00 0.65 0.51 0.79 3.86 1.27 2.91 3.25 1.40 2.09
0.00
1.00
2.00
3.00
4.00
5.00
6.00
7.00
ΔE
*ab
Outdoor Exposure ΔE*ab by Coating System
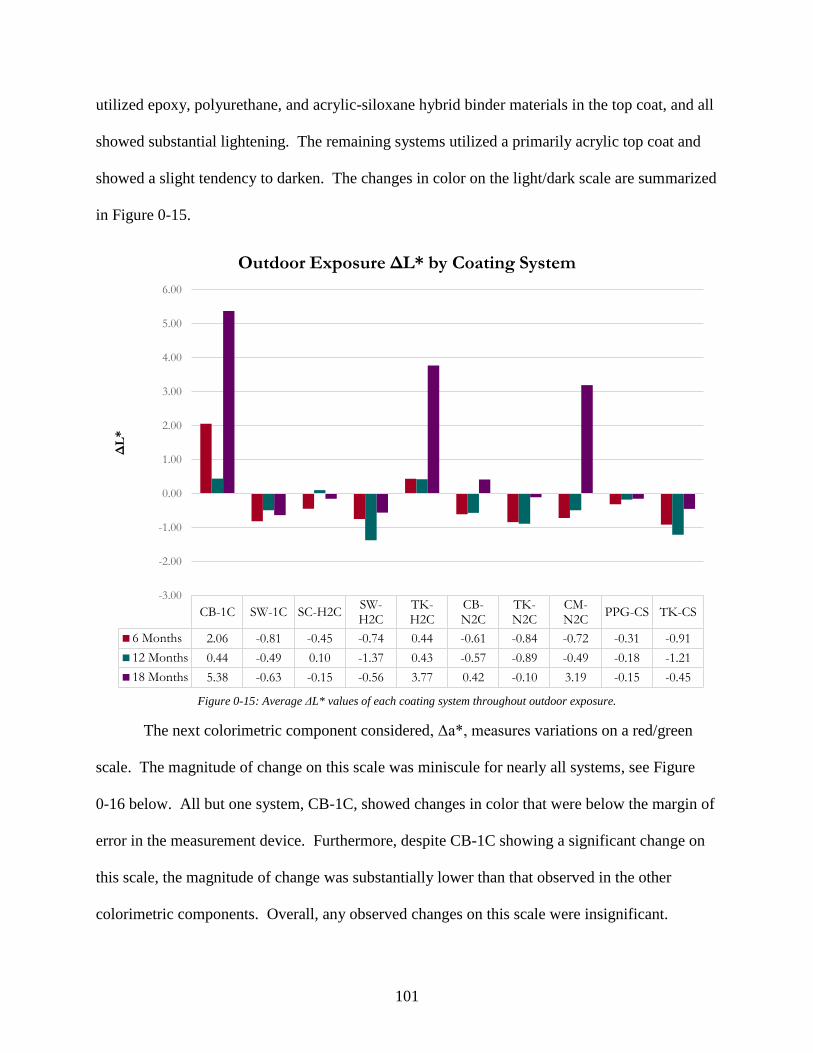
101
utilized epoxy, polyurethane, and acrylic-siloxane hybrid binder materials in the top coat, and all
showed substantial lightening. The remaining systems utilized a primarily acrylic top coat and
showed a slight tendency to darken. The changes in color on the light/dark scale are summarized
in Figure 0-15.
Figure 0-15: Average ΔL* values of each coating system throughout outdoor exposure.
The next colorimetric component considered, Δa*, measures variations on a red/green
scale. The magnitude of change on this scale was miniscule for nearly all systems, see Figure
0-16 below. All but one system, CB-1C, showed changes in color that were below the margin of
error in the measurement device. Furthermore, despite CB-1C showing a significant change on
this scale, the magnitude of change was substantially lower than that observed in the other
colorimetric components. Overall, any observed changes on this scale were insignificant.
CB-1C SW-1C SC-H2CSW-H2C
TK-H2C
CB-N2C
TK-N2C
CM-N2C
PPG-CS TK-CS
6 Months 2.06 -0.81 -0.45 -0.74 0.44 -0.61 -0.84 -0.72 -0.31 -0.91
12 Months 0.44 -0.49 0.10 -1.37 0.43 -0.57 -0.89 -0.49 -0.18 -1.21
18 Months 5.38 -0.63 -0.15 -0.56 3.77 0.42 -0.10 3.19 -0.15 -0.45
-3.00
-2.00
-1.00
0.00
1.00
2.00
3.00
4.00
5.00
6.00
ΔL
*
Outdoor Exposure ΔL* by Coating System
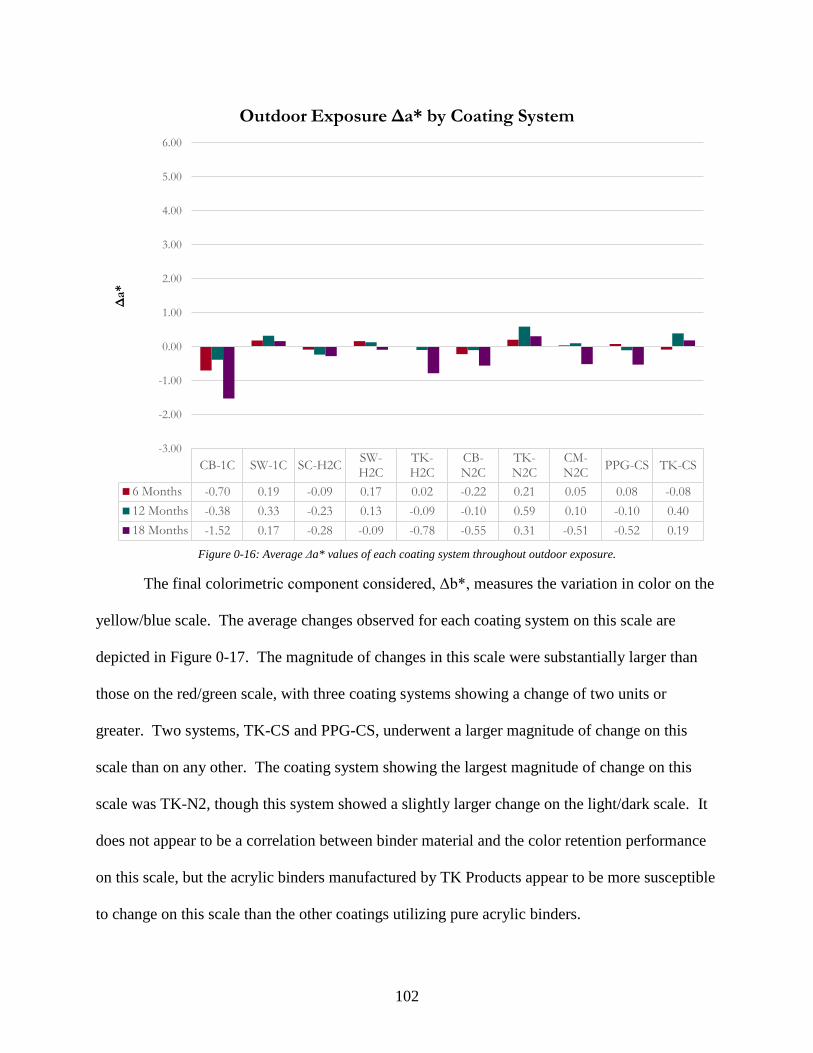
102
Figure 0-16: Average Δa* values of each coating system throughout outdoor exposure.
The final colorimetric component considered, Δb*, measures the variation in color on the
yellow/blue scale. The average changes observed for each coating system on this scale are
depicted in Figure 0-17. The magnitude of changes in this scale were substantially larger than
those on the red/green scale, with three coating systems showing a change of two units or
greater. Two systems, TK-CS and PPG-CS, underwent a larger magnitude of change on this
scale than on any other. The coating system showing the largest magnitude of change on this
scale was TK-N2, though this system showed a slightly larger change on the light/dark scale. It
does not appear to be a correlation between binder material and the color retention performance
on this scale, but the acrylic binders manufactured by TK Products appear to be more susceptible
to change on this scale than the other coatings utilizing pure acrylic binders.
CB-1C SW-1C SC-H2CSW-H2C
TK-H2C
CB-N2C
TK-N2C
CM-N2C
PPG-CS TK-CS
6 Months -0.70 0.19 -0.09 0.17 0.02 -0.22 0.21 0.05 0.08 -0.08
12 Months -0.38 0.33 -0.23 0.13 -0.09 -0.10 0.59 0.10 -0.10 0.40
18 Months -1.52 0.17 -0.28 -0.09 -0.78 -0.55 0.31 -0.51 -0.52 0.19
-3.00
-2.00
-1.00
0.00
1.00
2.00
3.00
4.00
5.00
6.00
Δa*
Outdoor Exposure Δa* by Coating System
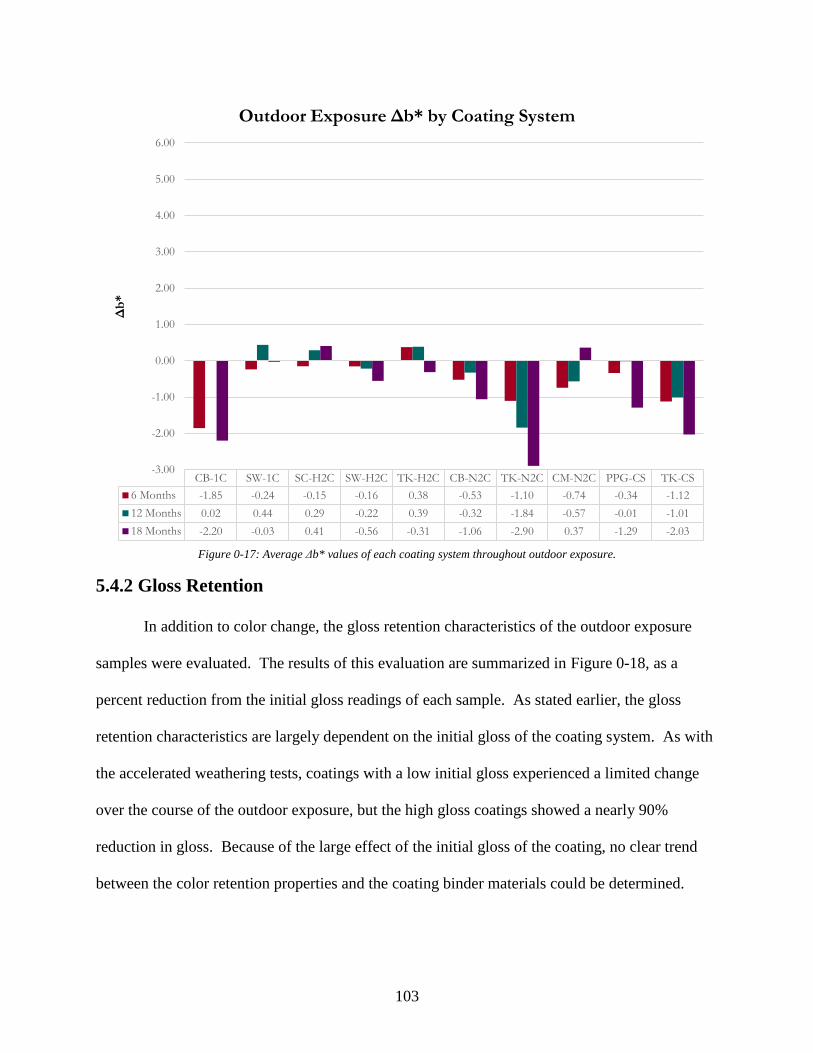
103
Figure 0-17: Average Δb* values of each coating system throughout outdoor exposure.
5.4.2 Gloss Retention
In addition to color change, the gloss retention characteristics of the outdoor exposure
samples were evaluated. The results of this evaluation are summarized in Figure 0-18, as a
percent reduction from the initial gloss readings of each sample. As stated earlier, the gloss
retention characteristics are largely dependent on the initial gloss of the coating system. As with
the accelerated weathering tests, coatings with a low initial gloss experienced a limited change
over the course of the outdoor exposure, but the high gloss coatings showed a nearly 90%
reduction in gloss. Because of the large effect of the initial gloss of the coating, no clear trend
between the color retention properties and the coating binder materials could be determined.
CB-1C SW-1C SC-H2C SW-H2C TK-H2C CB-N2C TK-N2C CM-N2C PPG-CS TK-CS
6 Months -1.85 -0.24 -0.15 -0.16 0.38 -0.53 -1.10 -0.74 -0.34 -1.12
12 Months 0.02 0.44 0.29 -0.22 0.39 -0.32 -1.84 -0.57 -0.01 -1.01
18 Months -2.20 -0.03 0.41 -0.56 -0.31 -1.06 -2.90 0.37 -1.29 -2.03
-3.00
-2.00
-1.00
0.00
1.00
2.00
3.00
4.00
5.00
6.00
Δb
*Outdoor Exposure Δb* by Coating System
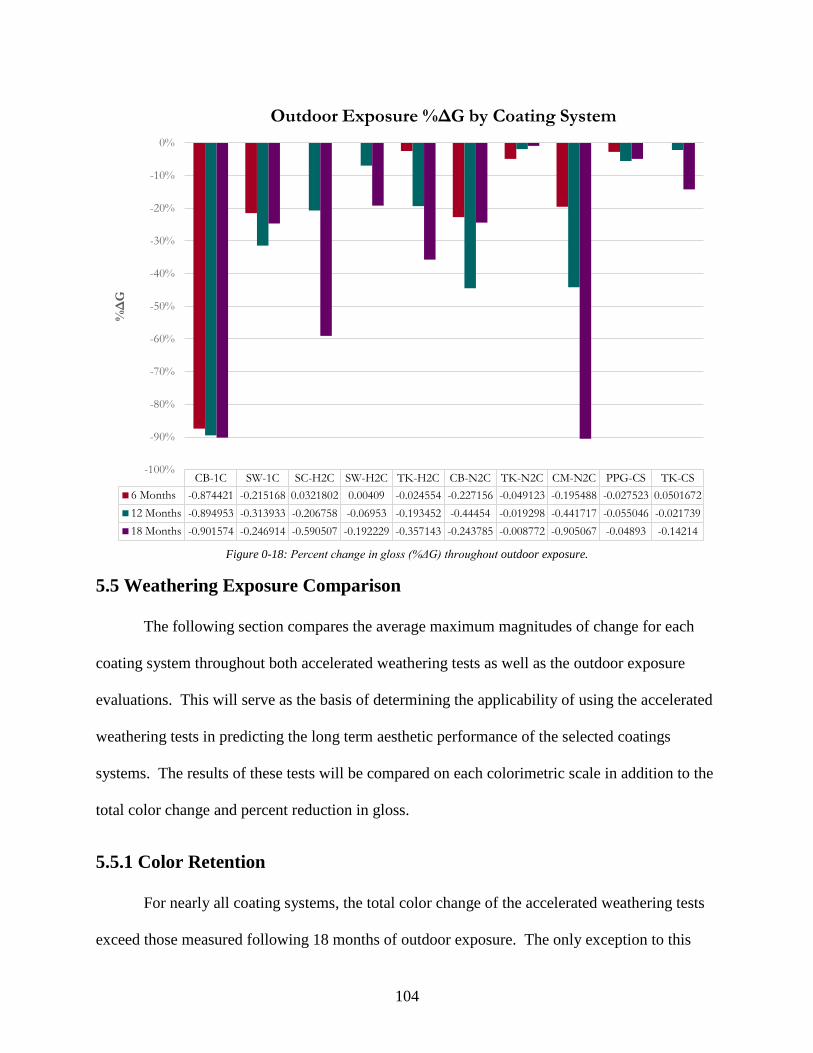
104
Figure 0-18: Percent change in gloss (%ΔG) throughout outdoor exposure.
5.5 Weathering Exposure Comparison
The following section compares the average maximum magnitudes of change for each
coating system throughout both accelerated weathering tests as well as the outdoor exposure
evaluations. This will serve as the basis of determining the applicability of using the accelerated
weathering tests in predicting the long term aesthetic performance of the selected coatings
systems. The results of these tests will be compared on each colorimetric scale in addition to the
total color change and percent reduction in gloss.
5.5.1 Color Retention
For nearly all coating systems, the total color change of the accelerated weathering tests
exceed those measured following 18 months of outdoor exposure. The only exception to this
CB-1C SW-1C SC-H2C SW-H2C TK-H2C CB-N2C TK-N2C CM-N2C PPG-CS TK-CS
6 Months -0.874421 -0.215168 0.0321802 0.00409 -0.024554 -0.227156 -0.049123 -0.195488 -0.027523 0.0501672
12 Months -0.894953 -0.313933 -0.206758 -0.06953 -0.193452 -0.44454 -0.019298 -0.441717 -0.055046 -0.021739
18 Months -0.901574 -0.246914 -0.590507 -0.192229 -0.357143 -0.243785 -0.008772 -0.905067 -0.04893 -0.14214
-100%
-90%
-80%
-70%
-60%
-50%
-40%
-30%
-20%
-10%
0%
%Δ
GOutdoor Exposure %ΔG by Coating System
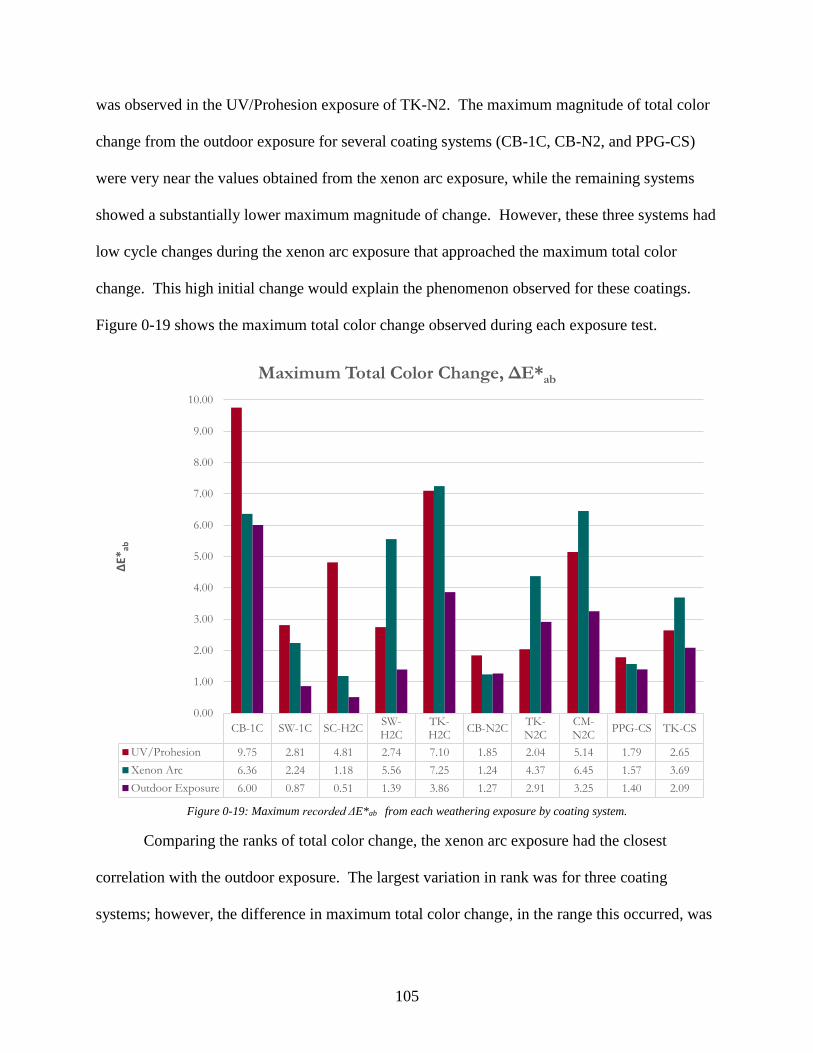
105
was observed in the UV/Prohesion exposure of TK-N2. The maximum magnitude of total color
change from the outdoor exposure for several coating systems (CB-1C, CB-N2, and PPG-CS)
were very near the values obtained from the xenon arc exposure, while the remaining systems
showed a substantially lower maximum magnitude of change. However, these three systems had
low cycle changes during the xenon arc exposure that approached the maximum total color
change. This high initial change would explain the phenomenon observed for these coatings.
Figure 0-19 shows the maximum total color change observed during each exposure test.
Figure 0-19: Maximum recorded ΔE*ab from each weathering exposure by coating system.
Comparing the ranks of total color change, the xenon arc exposure had the closest
correlation with the outdoor exposure. The largest variation in rank was for three coating
systems; however, the difference in maximum total color change, in the range this occurred, was
CB-1C SW-1C SC-H2CSW-H2C
TK-H2C
CB-N2CTK-N2C
CM-N2C
PPG-CS TK-CS
UV/Prohesion 9.75 2.81 4.81 2.74 7.10 1.85 2.04 5.14 1.79 2.65
Xenon Arc 6.36 2.24 1.18 5.56 7.25 1.24 4.37 6.45 1.57 3.69
Outdoor Exposure 6.00 0.87 0.51 1.39 3.86 1.27 2.91 3.25 1.40 2.09
0.00
1.00
2.00
3.00
4.00
5.00
6.00
7.00
8.00
9.00
10.00
ΔE*
ab
Maximum Total Color Change, ΔE*ab
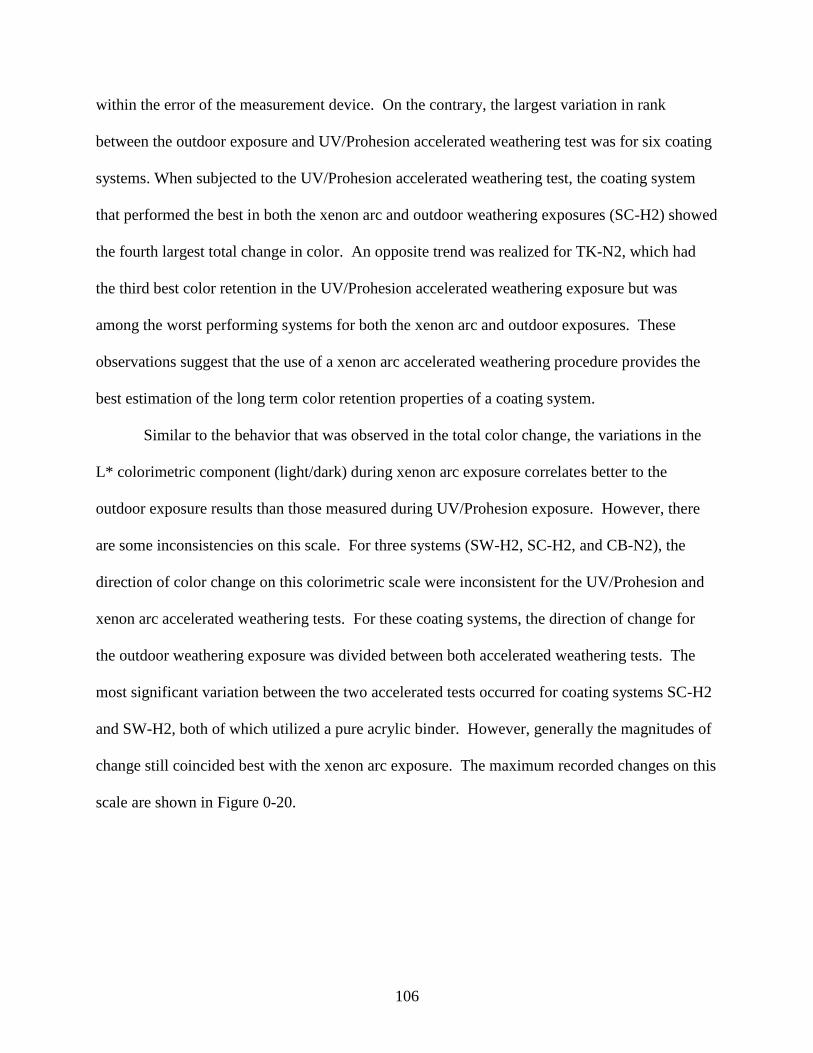
106
within the error of the measurement device. On the contrary, the largest variation in rank
between the outdoor exposure and UV/Prohesion accelerated weathering test was for six coating
systems. When subjected to the UV/Prohesion accelerated weathering test, the coating system
that performed the best in both the xenon arc and outdoor weathering exposures (SC-H2) showed
the fourth largest total change in color. An opposite trend was realized for TK-N2, which had
the third best color retention in the UV/Prohesion accelerated weathering exposure but was
among the worst performing systems for both the xenon arc and outdoor exposures. These
observations suggest that the use of a xenon arc accelerated weathering procedure provides the
best estimation of the long term color retention properties of a coating system.
Similar to the behavior that was observed in the total color change, the variations in the
L* colorimetric component (light/dark) during xenon arc exposure correlates better to the
outdoor exposure results than those measured during UV/Prohesion exposure. However, there
are some inconsistencies on this scale. For three systems (SW-H2, SC-H2, and CB-N2), the
direction of color change on this colorimetric scale were inconsistent for the UV/Prohesion and
xenon arc accelerated weathering tests. For these coating systems, the direction of change for
the outdoor weathering exposure was divided between both accelerated weathering tests. The
most significant variation between the two accelerated tests occurred for coating systems SC-H2
and SW-H2, both of which utilized a pure acrylic binder. However, generally the magnitudes of
change still coincided best with the xenon arc exposure. The maximum recorded changes on this
scale are shown in Figure 0-20.
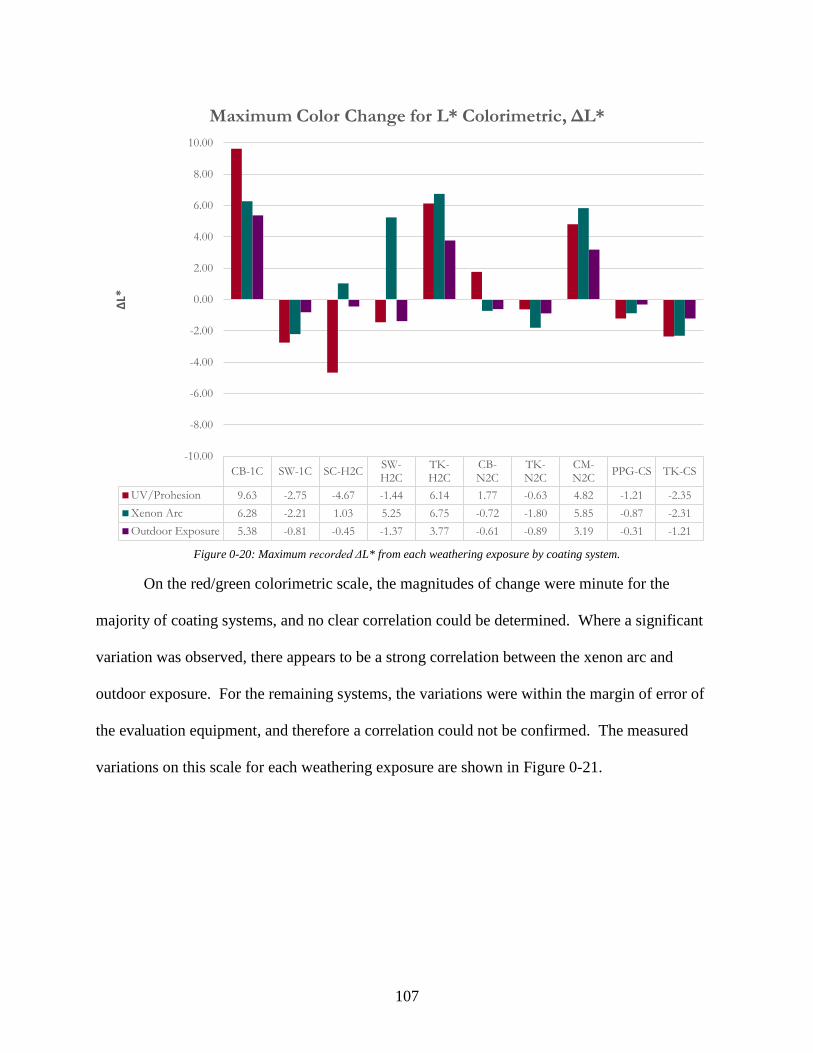
107
Figure 0-20: Maximum recorded ΔL* from each weathering exposure by coating system.
On the red/green colorimetric scale, the magnitudes of change were minute for the
majority of coating systems, and no clear correlation could be determined. Where a significant
variation was observed, there appears to be a strong correlation between the xenon arc and
outdoor exposure. For the remaining systems, the variations were within the margin of error of
the evaluation equipment, and therefore a correlation could not be confirmed. The measured
variations on this scale for each weathering exposure are shown in Figure 0-21.
CB-1C SW-1C SC-H2CSW-H2C
TK-H2C
CB-N2C
TK-N2C
CM-N2C
PPG-CS TK-CS
UV/Prohesion 9.63 -2.75 -4.67 -1.44 6.14 1.77 -0.63 4.82 -1.21 -2.35
Xenon Arc 6.28 -2.21 1.03 5.25 6.75 -0.72 -1.80 5.85 -0.87 -2.31
Outdoor Exposure 5.38 -0.81 -0.45 -1.37 3.77 -0.61 -0.89 3.19 -0.31 -1.21
-10.00
-8.00
-6.00
-4.00
-2.00
0.00
2.00
4.00
6.00
8.00
10.00
ΔL*
Maximum Color Change for L* Colorimetric, ΔL*
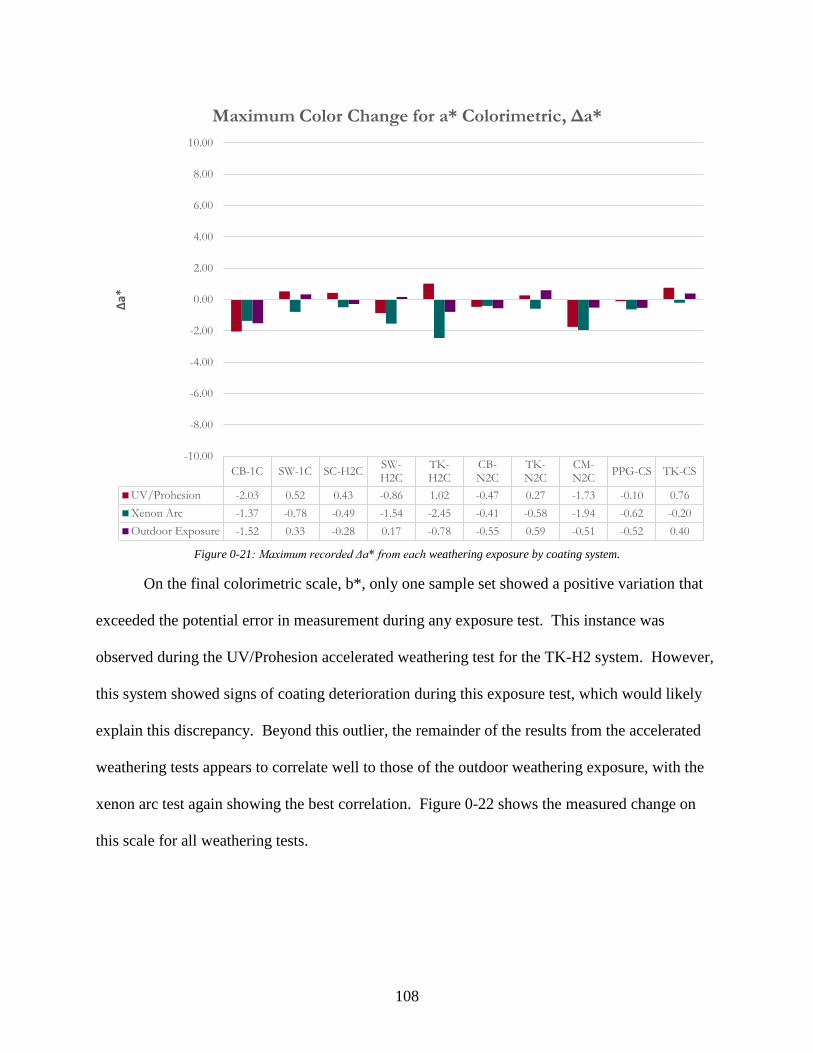
108
Figure 0-21: Maximum recorded Δa* from each weathering exposure by coating system.
On the final colorimetric scale, b*, only one sample set showed a positive variation that
exceeded the potential error in measurement during any exposure test. This instance was
observed during the UV/Prohesion accelerated weathering test for the TK-H2 system. However,
this system showed signs of coating deterioration during this exposure test, which would likely
explain this discrepancy. Beyond this outlier, the remainder of the results from the accelerated
weathering tests appears to correlate well to those of the outdoor weathering exposure, with the
xenon arc test again showing the best correlation. Figure 0-22 shows the measured change on
this scale for all weathering tests.
CB-1C SW-1C SC-H2CSW-H2C
TK-H2C
CB-N2C
TK-N2C
CM-N2C
PPG-CS TK-CS
UV/Prohesion -2.03 0.52 0.43 -0.86 1.02 -0.47 0.27 -1.73 -0.10 0.76
Xenon Arc -1.37 -0.78 -0.49 -1.54 -2.45 -0.41 -0.58 -1.94 -0.62 -0.20
Outdoor Exposure -1.52 0.33 -0.28 0.17 -0.78 -0.55 0.59 -0.51 -0.52 0.40
-10.00
-8.00
-6.00
-4.00
-2.00
0.00
2.00
4.00
6.00
8.00
10.00
Δa*
Maximum Color Change for a* Colorimetric, Δa*
109
Figure 0-22: Maximum recorded Δb* from each weathering exposure by coating system.
5.5.2 Gloss Retention
The gloss retention properties measured during the outdoor weathering exposure were
most closely replicated by the UV/Prohesion accelerated weathering test, though the relationship
was not consistent for all the coating systems. However, for the majority of the systems
evaluated, the maximum change in gloss was nearly equal for both the outdoor exposure and
UV/Prohesion samples. The samples subjected to xenon arc exposure exhibited maximum
changes in gloss that meet or exceeded those of the UV/Prohesion test in all but one instance.
This break in the trend occurred for the CM-N2 samples, which showed the greatest reduction in
gloss during the supplementary exposures. It is the variations observed in this system which
suggest that the UV/Prohesion exposure better predicts the gloss retention characteristics of the
CB-1C SW-1C SC-H2CSW-H2C
TK-H2C
CB-N2C
TK-N2C
CM-N2C
PPG-CS TK-CS
UV/Prohesion -1.49 0.36 -1.10 -2.47 3.76 -1.02 -1.96 -1.28 -1.24 -1.25
Xenon Arc -1.86 -0.69 -0.35 -1.05 -1.73 -0.88 -4.17 -2.15 -1.35 -3.01
Outdoor Exposure -2.20 0.44 0.41 -0.56 0.39 -1.06 -2.90 -0.74 -1.29 -2.03
-10.00
-8.00
-6.00
-4.00
-2.00
0.00
2.00
4.00
6.00
8.00
10.00
Δb*
Maximum Color Change for b* Colorimetric, Δb*
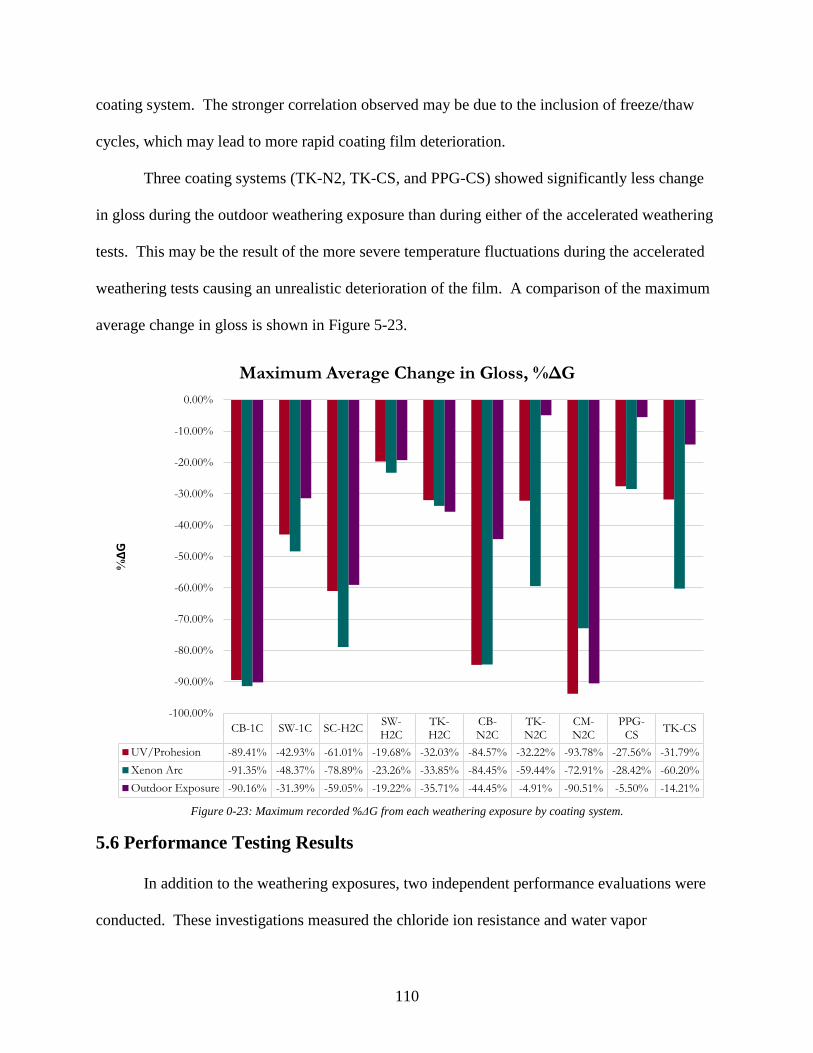
110
coating system. The stronger correlation observed may be due to the inclusion of freeze/thaw
cycles, which may lead to more rapid coating film deterioration.
Three coating systems (TK-N2, TK-CS, and PPG-CS) showed significantly less change
in gloss during the outdoor weathering exposure than during either of the accelerated weathering
tests. This may be the result of the more severe temperature fluctuations during the accelerated
weathering tests causing an unrealistic deterioration of the film. A comparison of the maximum
average change in gloss is shown in Figure 5-23.
Figure 0-23: Maximum recorded %ΔG from each weathering exposure by coating system.
5.6 Performance Testing Results
In addition to the weathering exposures, two independent performance evaluations were
conducted. These investigations measured the chloride ion resistance and water vapor
CB-1C SW-1C SC-H2CSW-H2C
TK-H2C
CB-N2C
TK-N2C
CM-N2C
PPG-CS
TK-CS
UV/Prohesion -89.41% -42.93% -61.01% -19.68% -32.03% -84.57% -32.22% -93.78% -27.56% -31.79%
Xenon Arc -91.35% -48.37% -78.89% -23.26% -33.85% -84.45% -59.44% -72.91% -28.42% -60.20%
Outdoor Exposure -90.16% -31.39% -59.05% -19.22% -35.71% -44.45% -4.91% -90.51% -5.50% -14.21%
-100.00%
-90.00%
-80.00%
-70.00%
-60.00%
-50.00%
-40.00%
-30.00%
-20.00%
-10.00%
0.00%
%ΔG
Maximum Average Change in Gloss, %ΔG
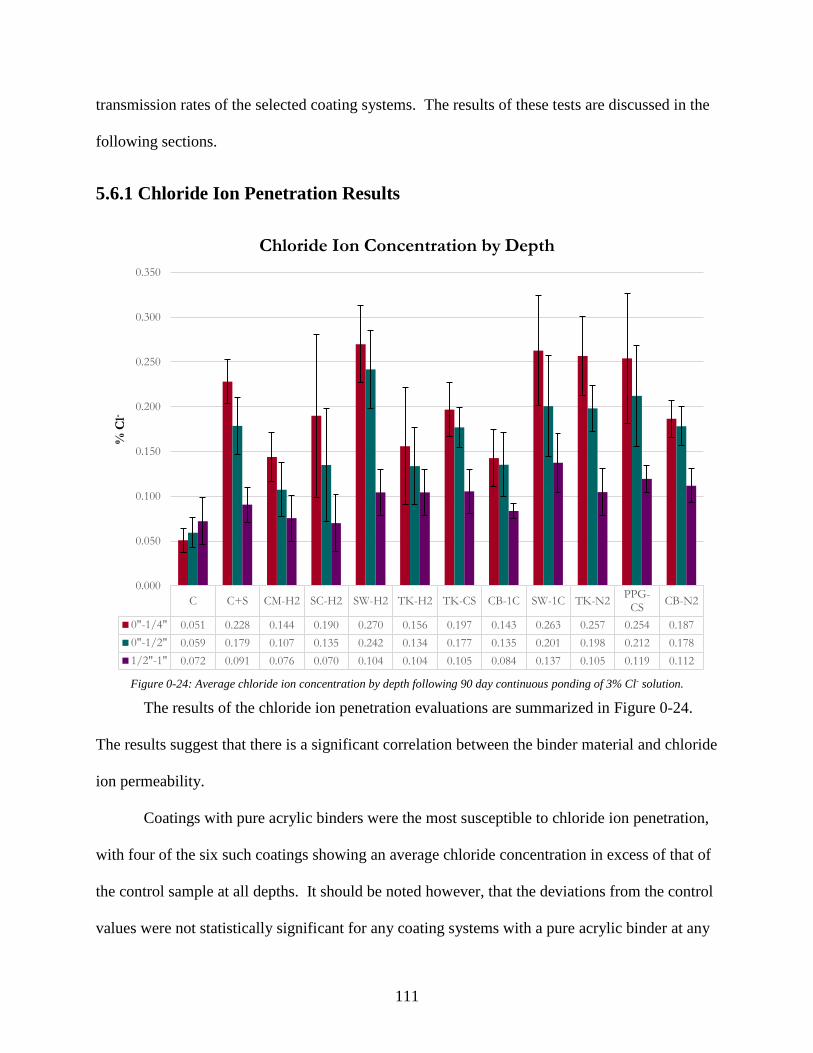
111
transmission rates of the selected coating systems. The results of these tests are discussed in the
following sections.
5.6.1 Chloride Ion Penetration Results
Figure 0-24: Average chloride ion concentration by depth following 90 day continuous ponding of 3% Cl- solution.
The results of the chloride ion penetration evaluations are summarized in Figure 0-24.
The results suggest that there is a significant correlation between the binder material and chloride
ion permeability.
Coatings with pure acrylic binders were the most susceptible to chloride ion penetration,
with four of the six such coatings showing an average chloride concentration in excess of that of
the control sample at all depths. It should be noted however, that the deviations from the control
values were not statistically significant for any coating systems with a pure acrylic binder at any
C C+S CM-H2 SC-H2 SW-H2 TK-H2 TK-CS CB-1C SW-1C TK-N2PPG-
CSCB-N2
0"-1/4" 0.051 0.228 0.144 0.190 0.270 0.156 0.197 0.143 0.263 0.257 0.254 0.187
0"-1/2" 0.059 0.179 0.107 0.135 0.242 0.134 0.177 0.135 0.201 0.198 0.212 0.178
1/2"-1" 0.072 0.091 0.076 0.070 0.104 0.104 0.105 0.084 0.137 0.105 0.119 0.112
0.000
0.050
0.100
0.150
0.200
0.250
0.300
0.350
% C
l-
Chloride Ion Concentration by Depth
112
evaluation depth. These findings suggest that coatings utilizing an acrylic binder provide limited
resistance to chloride ions.
Similarly, the acrylic-siloxane hybrid systems showed no statistically significant
deviation from the control values. However, these systems had an average chloride
concentration below the 95% confidence interval of the control sample, and showed a significant
change in comparison to a pair of the pure acrylic systems. As mentioned earlier, the
concentration of siloxane is substantially different in the top coats of the two hybrid systems
tested. Considering this, it is observed that the average chloride concentration is considerably
lower, though not statistically significant, in the system with a higher concentration of siloxane
in the top coat. These observations suggest that the inclusion of siloxane in the formulation of
the binder improves the chloride resistance of an acrylic coating system.
The final two coating systems evaluated as part of this study exhibited similar resistance
to chloride ion penetration, and both utilized an epoxy base coat. Both systems showed a
statistically significant lower concentration of chloride ions than the control sample at the
shallowest depth. However, a lower statistically significant value was only observed in the
coating system that utilized a polyurethane top coat. These chloride ions concentrations varied,
with statistical significance, from the majority of the acrylic systems, but not from the acrylic-
siloxane hybrid systems. These findings suggest coatings with epoxy binders provide a
significant improvement to chloride ion resistance. The results also suggest polyurethane may
improve the chloride ion resistance further, though this conclusion is based on the performance
of only one coating system.
The measured values of chloride ions concentration in the control samples reinforce the
validity of these results. No coating system exhibited a chloride ion concentration at any depth
113
that was greater, with statistical significance, than the control sample subjected to the same
continuous ponding. Furthermore, the chloride ions concentrations in all ponded samples at the
two shallowest depths exceeded, with statistical significance, the values from the unexposed
control sample. There were, however, two coating samples that had chloride concentrations at
the greatest depth that exhibited an increase, with statistical significance, over that of the
unexposed control sample. In general, the chloride ions concentrations only showed significant
change at the shallowest depths, which is consistent with previous research.
5.6.2 Water Vapor Transmission Results
Coating systems were also evaluated for their water vapor transmission rates. The
average measured transmission rates over the one week (168 hour) continuous exposure period
are shown in Figure 0-25, with error bars representing the 95% confidence intervals for each
coating system. A free film for this testing procedure could not be successfully prepared for one
system, CB-1C, due to its brittle behavior following curing. Therefore, the results of this test are
limited to only nine coating systems.
Due to limitations on the number of available testing apparatuses, the coating systems
had to be evaluated in two separate groups. The first group consisted of 15 samples from five
coating systems (3 samples per system) utilizing pure acrylic binders (PPG-CS, SW-1C, SW-H2,
SC-H2, and TK-N2); the remaining systems were evaluated separately. In order to correlate the
results of the two separate exposures, samples from two systems evaluated in the initial round of
testing were also included in the second set of test specimens. The results obtained from the
samples included in both exposures were compared and the results from the second round of
testing were normalized to allow comparison between the two exposures. This was achievable
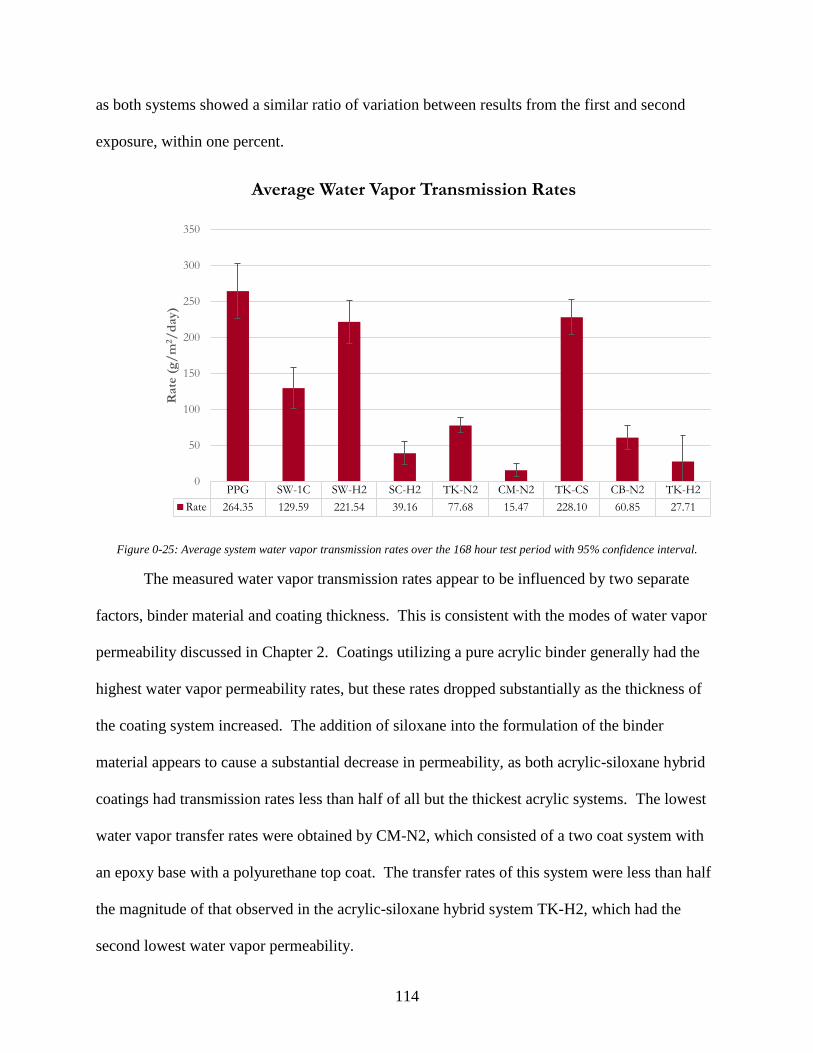
114
as both systems showed a similar ratio of variation between results from the first and second
exposure, within one percent.
Figure 0-25: Average system water vapor transmission rates over the 168 hour test period with 95% confidence interval.
The measured water vapor transmission rates appear to be influenced by two separate
factors, binder material and coating thickness. This is consistent with the modes of water vapor
permeability discussed in Chapter 2. Coatings utilizing a pure acrylic binder generally had the
highest water vapor permeability rates, but these rates dropped substantially as the thickness of
the coating system increased. The addition of siloxane into the formulation of the binder
material appears to cause a substantial decrease in permeability, as both acrylic-siloxane hybrid
coatings had transmission rates less than half of all but the thickest acrylic systems. The lowest
water vapor transfer rates were obtained by CM-N2, which consisted of a two coat system with
an epoxy base with a polyurethane top coat. The transfer rates of this system were less than half
the magnitude of that observed in the acrylic-siloxane hybrid system TK-H2, which had the
second lowest water vapor permeability.
PPG SW-1C SW-H2 SC-H2 TK-N2 CM-N2 TK-CS CB-N2 TK-H2
Rate 264.35 129.59 221.54 39.16 77.68 15.47 228.10 60.85 27.71
0
50
100
150
200
250
300
350
Rate
(g
/m
2/
day)
Average Water Vapor Transmission Rates
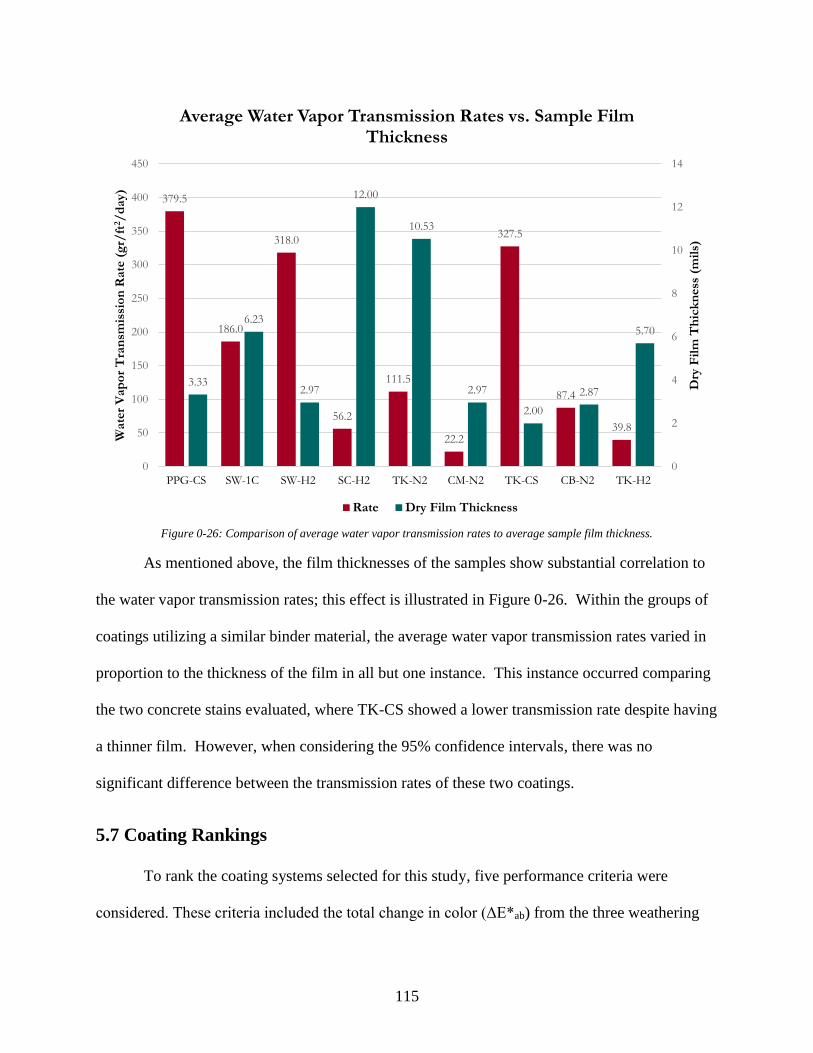
115
Figure 0-26: Comparison of average water vapor transmission rates to average sample film thickness.
As mentioned above, the film thicknesses of the samples show substantial correlation to
the water vapor transmission rates; this effect is illustrated in Figure 0-26. Within the groups of
coatings utilizing a similar binder material, the average water vapor transmission rates varied in
proportion to the thickness of the film in all but one instance. This instance occurred comparing
the two concrete stains evaluated, where TK-CS showed a lower transmission rate despite having
a thinner film. However, when considering the 95% confidence intervals, there was no
significant difference between the transmission rates of these two coatings.
5.7 Coating Rankings
To rank the coating systems selected for this study, five performance criteria were
considered. These criteria included the total change in color (ΔE*ab) from the three weathering
379.5
186.0
318.0
56.2
111.5
22.2
327.5
87.4
39.8
3.33
6.23
2.97
12.00
10.53
2.97
2.00
2.87
5.70
0
2
4
6
8
10
12
14
0
50
100
150
200
250
300
350
400
450
PPG-CS SW-1C SW-H2 SC-H2 TK-N2 CM-N2 TK-CS CB-N2 TK-H2
Dry
Fil
m T
hic
kn
ess
(m
ils)
Wate
r V
ap
or
Tra
nsm
issi
on
Rate
(g
r/ft
2/
day)
Average Water Vapor Transmission Rates vs. Sample Film Thickness
Rate Dry Film Thickness
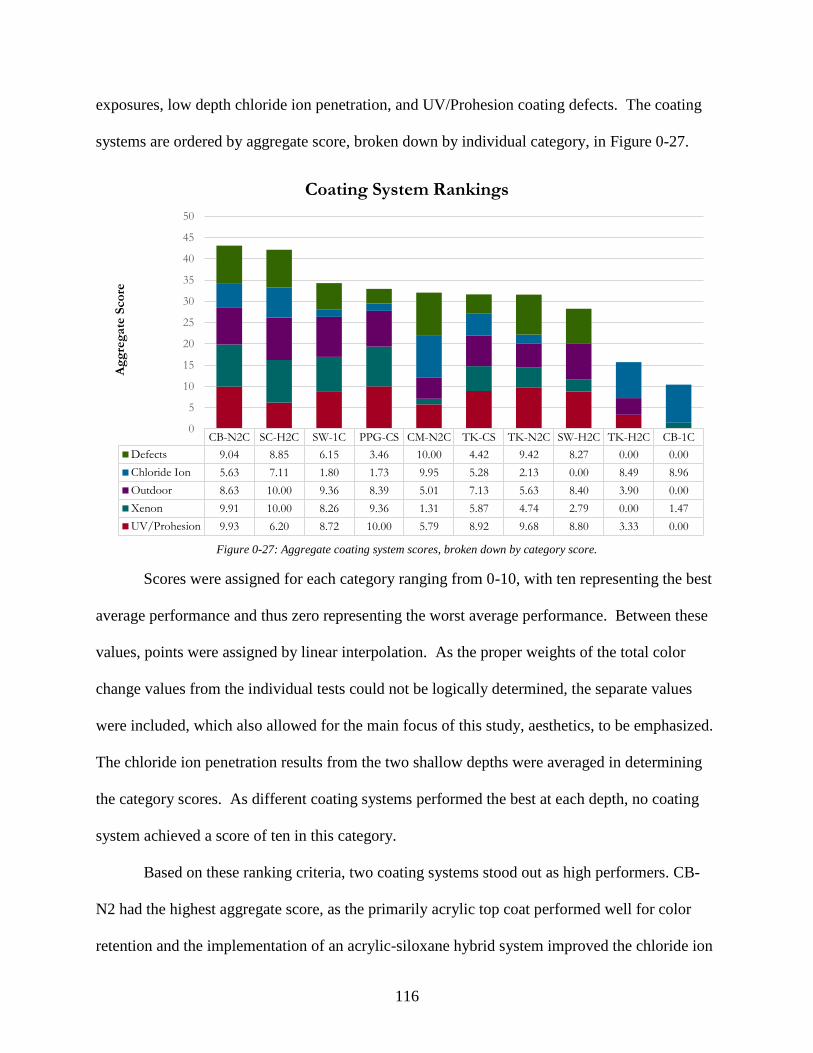
116
exposures, low depth chloride ion penetration, and UV/Prohesion coating defects. The coating
systems are ordered by aggregate score, broken down by individual category, in Figure 0-27.
Figure 0-27: Aggregate coating system scores, broken down by category score.
Scores were assigned for each category ranging from 0-10, with ten representing the best
average performance and thus zero representing the worst average performance. Between these
values, points were assigned by linear interpolation. As the proper weights of the total color
change values from the individual tests could not be logically determined, the separate values
were included, which also allowed for the main focus of this study, aesthetics, to be emphasized.
The chloride ion penetration results from the two shallow depths were averaged in determining
the category scores. As different coating systems performed the best at each depth, no coating
system achieved a score of ten in this category.
Based on these ranking criteria, two coating systems stood out as high performers. CB-
N2 had the highest aggregate score, as the primarily acrylic top coat performed well for color
retention and the implementation of an acrylic-siloxane hybrid system improved the chloride ion
CB-N2C SC-H2C SW-1C PPG-CS CM-N2C TK-CS TK-N2C SW-H2C TK-H2C CB-1C
Defects 9.04 8.85 6.15 3.46 10.00 4.42 9.42 8.27 0.00 0.00
Chloride Ion 5.63 7.11 1.80 1.73 9.95 5.28 2.13 0.00 8.49 8.96
Outdoor 8.63 10.00 9.36 8.39 5.01 7.13 5.63 8.40 3.90 0.00
Xenon 9.91 10.00 8.26 9.36 1.31 5.87 4.74 2.79 0.00 1.47
UV/Prohesion 9.93 6.20 8.72 10.00 5.79 8.92 9.68 8.80 3.33 0.00
0
5
10
15
20
25
30
35
40
45
50
Ag
gre
gate
Sco
re
Coating System Rankings
117
resistance over the other pure acrylic systems. SC-H2 had only a slightly lower aggregate score.
This pure acrylic system had the best color retention properties in both the outdoor and xenon arc
exposures, and due to the overall thickness of the system, highest among the systems tested, the
chloride ion resistance was substantially higher than the other acrylic systems.
The next tier of coatings consisted of a majority, six, coating systems with similar
aggregate scores. Five of these systems utilized a pure acrylic binder, and the final coating in
this group was a two coat system utilizing an epoxy base coat and polyurethane top coat. The
acrylic systems had superior color retention qualities, but were significantly more susceptible to
chloride ions than the remaining coatings in this study. Conversely, the epoxy/polyurethane
coating system had the best chloride ion performance, but was more susceptible to color change.
However, one coating system in this group, TK-CS, exhibited average performance in all
categories evaluated.
The final two coating systems consistently had the worst color retention properties, and
as a result had a significantly lower aggregate score. Both these systems, CB-1C and TK-H2,
showed a good resilience to chloride ion penetration but were also susceptible to coating defects.
Overall these coatings exhibited the poorest performance.
5.8 Anticipated Service Life
The accepted service life of a protective coating system is influenced by both the
exposure environment and the performance requirements, in addition to the coating’s inherent
materials properties. Naturally, coatings used in more aggressive environments will have a
shorter life span. When relying on a coating system for both protection of the substrate and
lightfastness, the service life estimation must be based on considering a balanced level of
performance for both requirements. Generally, the service life of protective coating systems is
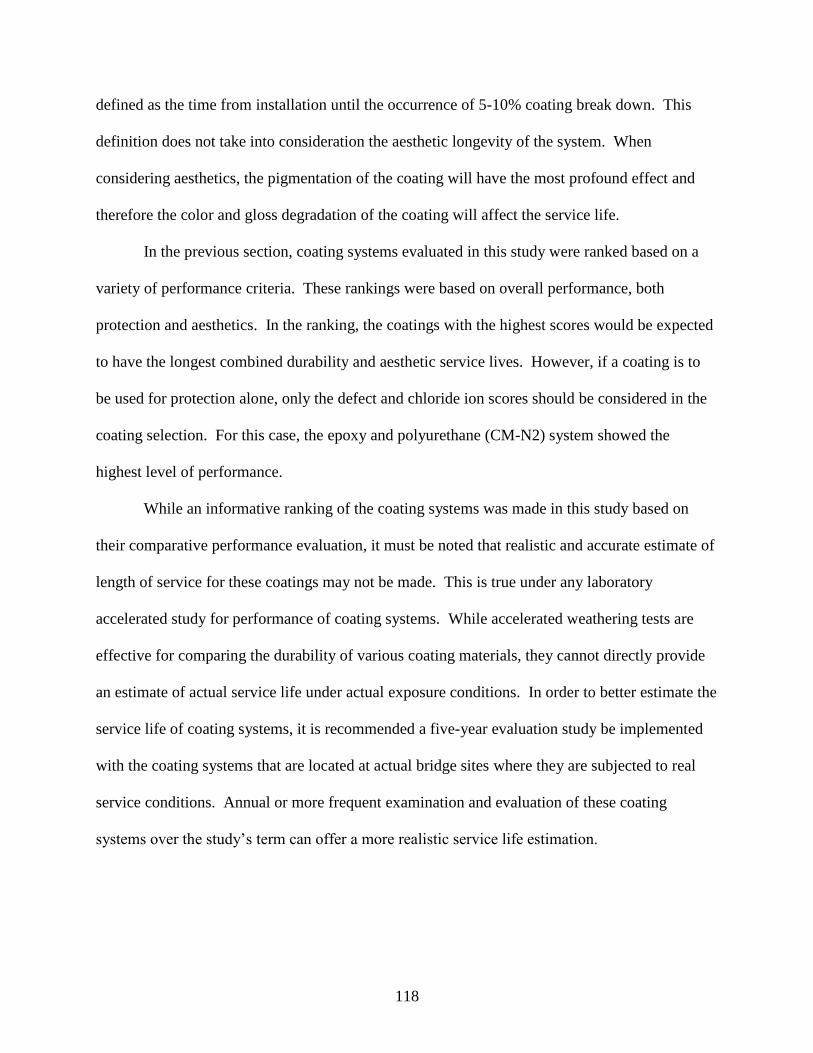
118
defined as the time from installation until the occurrence of 5-10% coating break down. This
definition does not take into consideration the aesthetic longevity of the system. When
considering aesthetics, the pigmentation of the coating will have the most profound effect and
therefore the color and gloss degradation of the coating will affect the service life.
In the previous section, coating systems evaluated in this study were ranked based on a
variety of performance criteria. These rankings were based on overall performance, both
protection and aesthetics. In the ranking, the coatings with the highest scores would be expected
to have the longest combined durability and aesthetic service lives. However, if a coating is to
be used for protection alone, only the defect and chloride ion scores should be considered in the
coating selection. For this case, the epoxy and polyurethane (CM-N2) system showed the
highest level of performance.
While an informative ranking of the coating systems was made in this study based on
their comparative performance evaluation, it must be noted that realistic and accurate estimate of
length of service for these coatings may not be made. This is true under any laboratory
accelerated study for performance of coating systems. While accelerated weathering tests are
effective for comparing the durability of various coating materials, they cannot directly provide
an estimate of actual service life under actual exposure conditions. In order to better estimate the
service life of coating systems, it is recommended a five-year evaluation study be implemented
with the coating systems that are located at actual bridge sites where they are subjected to real
service conditions. Annual or more frequent examination and evaluation of these coating
systems over the study’s term can offer a more realistic service life estimation.
119
6 Conclusions, Recommendations, and Future Work
6.1 Conclusions
Based on the results from two accelerated weathering tests and an 18-month outdoor
exposure test, the pure acrylic binder systems selected for this study showed the best overall
color retention characteristics. However, this class of coating system also was the least resistant
to chloride ion penetration and had the highest water vapor transmission rates, unless a
substantial film thickness was utilized. Furthermore, for this binder material, coating defects
were much more prevalent in coating systems that utilized only a single coating application.
This was the consequence of minute voids in the surface of the concrete that were not adequately
filled by the sack rub treatment or were revealed following surface preparation. The application
of the second coat prevents the formation of a complete void to the substrate.
The addition of siloxane to the binder material in the acrylic-siloxane hybrid systems
improved the chloride resistance of the system while reducing the color retention performance.
As these systems typically utilized a much thinner film, they were more susceptible to coating
defects, specifically at sharp corners where the surface tension during film curing causes reduced
film thickness. However, one hybrid system, CB-N2 was an exception to these trends. This
system used a primarily siloxane (4:1) base coat and a primarily acrylic (8:1) top coat. The
combination improved the chloride ion resistance of the system with minimal effect on the color
retention properties. Overall, this coating system showed the highest overall performance.
The final class of coatings selected for this study utilized epoxy binders. This binder
material showed the greatest chloride resistance, but was the most prone to color change. When
only applied in a single coat there was a high propensity for defects. However, the two coat
system in this category, though utilizing a polyurethane top coat, exhibited no defects during any
120
exposure. When exposed, this type of coating showed the worst color retention properties but
these characteristics were improved when a polyurethane top coat was utilized, with negligible
impact on chloride resistance.
Based on the observations of this study, both xenon arc and UV/Prohesion accelerated
weathering exposures are viable for predicting the long term performance of coating systems.
However, the overall performance of a coating cannot be determined from a single accelerated
weathering exposure. The color retention properties observed in the xenon arc exposure showed
a much better correlation to those observed in the outdoor weathering test. Yet, this exposure
test did not accurately represent the potential for defects in the coating system. A similar
tendency for defects, in comparison to the outdoor weathering exposure, was however observed
during the UV/Prohesion weathering test. Therefore, to most accurately predict the long term
performance both tests should be conducted, but if only a single test is to be utilized, the
UV/Prohesion will more accurately predict the overall durability of the system while still giving
some insight into the color retention properties.
The rankings provided in this report attribute significant weight to the color retention
properties, as the focus of this study was on the long term aesthetic properties of coatings for
bridge applications. However, as a variety of exposure conditions exist throughout such
structures, coatings should not be selected solely based on the ranks provided. Depending on the
in-situ exposure conditions, coatings that ranked low in this study may be the best option, and the
strengths and weakness of each coating system determined in this study should be considered
during selection.
121
6.2 Recommendations
Based on the observations of this study, it is recommended that a minimum of two coats
be used for all concrete coating systems, as the single coat systems evaluated in this study
showed a significantly greater susceptibility to coating defects. These defects were the result of
small surface irregularities that still exist following sack rub finishing and proper surface
preparation.
From the results of this study, pure acrylic coatings showed the best long term aesthetic
performance, but provided very little resistance to chloride ions. Though, if used in combination
with concrete with a high chloride resistance, these systems may still be the best option for long
term aesthetic performance. However, the added cost of a high performance concrete throughout
the structure would likely be prohibitive in many instances. It is therefore recommended that an
acrylic-siloxane hybrid system with a primarily acrylic top coat be utilized for future concrete
bridge applications on components exposed to sunlight, as this type of system showed the best
overall performance. Though it is common practice to coat only visible surfaces, in highly
corrosive areas with limited sun exposure epoxy/polyurethane coatings would be the best option.
An additional common phenomenon that was confirmed during this study was the
susceptibility of coatings to deterioration near sharp edges. This is the results of a reduced film
thickness along the edge caused by surface tension developed during the curing process. It is
recommended that an effort be made to minimize the presence of sharp edges throughout the
structure or additional coating material be provided along such edges, either through an
additional coat or greater application thickness.
Based on the measured adhesion values from this study, surface preparation by 3,000 psi
water blast is sufficient. There were no observed adhesion failures at the interface between
122
coating and substrate for any system in this study, with nearly all systems achieving a pull off
strength which exceeded the tensile strength of concrete. The primary disadvantage of the water
blast preparation method is the introduction of moisture into the substrate prior to coating
application. If this moisture is not allowed to dissipate adequately prior to coating application, it
can have detrimental effects on the performance of the coating system. It is recommended that
the moisture within the substrate be evaluated in accordance with ASTM D4263 prior to coating
application.
6.3 Future Work
This investigation was limited by the required scope of work and available resources. By
striving to include a broad range of coating systems, the results for each class of coating system
are based on a limited sample size and of only a single color. It would be beneficial to evaluate
the performance of additional coating systems and colors, selected based on the findings of this
study. An evaluation of additional coating systems would produce a larger database for
comparison of the performance of coating types, and verify the color retention performance
when different colors (pigments) are used in the study. Different coating colors have proven to
be more susceptible to color change in a recent study on steel coating systems. However, for
concrete applications, different binder materials are utilized so the trends observed for steel
coatings may not necessarily be applicable to these systems.
Although an outdoor weathering exposure was conducted as part of this study, this cannot
be a realistic substitute for an actual or in-situ conditions of a bridge structure. It is
recommended that high performing coating systems from this study and future new systems be
evaluated under real in-situ conditions for a period of at least five years.
123
References
[1] A. Ghorbanpoor, H. Tabatabai and Z. Leppie, "Aesthetic Coatings For Steel Bridge
Components," WHRP, 2013.
[2] Wisconsin Department of Transportation, "WisDOT Bridge Manual," WisDOT, 2012.
[3] S. K. Roy, K. B. Poh and D. O. Northwood, "Identifying the alkali reactivity of concrete
aggregates - Tests on autoclaved concrete samples," in ACI International Conference on
High Performance Concrete: Design and Materials and Recent Advances in Concrete
Technology, Kuala Lumpur, Malaysia, 1997.
[4] R. Bassi and S. K. Roy, Handbook of Coatings for Concrete, Scotland, UK: Whittles
Publishing, 2002.
[5] A. M. Neville, Properties of Concrete, Harlow, UK: Pearson Education Limited, 1996.
[6] P. J. Brennan and C. Fedor, "Sunlight, UV, and Accelerated Weathering," The Q-Panel
Company, Clevelenad, OH, 1987.
[7] J. V. Koleske, Paint and Coating Testing Manual, West Conshohocken, PA: ASTM
International, 2012.
[8] D. Grossman, "Know Your Enemy: The Weather," Vinyl Technology, vol. 3, no. 1, pp. 12-
19, 1981.
[9] K. S. E. Z. G. Kampf, "Studies in Accelerated Weathering. Part 1. Determination of the
Activation Spectrum of Photodegradation in Polymers," Progress in Organic Coatings, vol.
19, pp. 67-69, 1991.
[10] A. Sommer, E. Zirngieble, L. Kahl and M. Schonfelder, "Studies in Accelerated
124
Weathering. Part II. Ultrafast Weathering - A NEw Method for Evaluating the Weather
Resistane of Polymers," Progress in Organic Coatings, vol. 19, pp. 79-87, 1991.
[11] R. M. Fischer, W. D. Ketola and W. P. Morrey, "Inherent Variability in Accelerated
Weathering Devices," Progress in Organic Coatings, vol. 19, pp. 165-179, 1991.
[12] Atlas Material Testing Solutions, "Weathering Test Methods: Natural Weathering," Atlas
Material Testing Solutions.
[13] ASTM International, G155 - 13 Standard Practice for Operating Xenon ARc Light
Apparatus for Exposure of Non-Metallic Materials, ASTM International, 2013.
[14] Q-Lab Corporation, Technical Bulletin LX-5060, Q-Lab Corporation, 2014.
[15] N. Passant, "Source Inventrories and Control Strategies for VOCs," in Volatile Organic
Copounds in the Atmosphere, Royal Society of Chemistry, 1995, pp. 51-64.
[16] S. Palle and T. Hopwood, "Coatings, Sealants, and Fillers to Address Bridge Concrete
Deterioraion and Aesthetics - Phase I," Kentucky Transportation Center - Univeristy of
Kentucky, Lexington, Kentucky, 2006.
[17] DUROCK Cement Board Next Gen Material Safety Data Sheet, Chicago, IL: United States
Gypsum Corporation, 2014.
[18] Federal Highway Administration, "Federal Highway Administration Research and
Technology," US Department of Transportation, 23 4 2012. [Online]. Available:
https://www.fhwa.dot.gov/publications/research/infrastructure/bridge/11046/002.cfm.
[Accessed 2013].
[19] B. Gurney, "Finishing Technologies," 2012. [Online]. Available: http://www.finishing-
technologies.com/.
125
[20] N. Wheat, "Evolution of Inorganic/Organic Hybrid Systems for the Protective Coatings
Industry," Journal of Protective Coatings and Linings (JPCL), no. August, 2005.
[21] R. Lambourne and T. A. Strivens, Paint and Surface Coatings Theory and Practice,
Cambridge, UK: Woodhead Publishing Limited, 1999.
[22] G. Turner, Introduction to Paint Chemistry and Principles of Paint Technology, London,
UK: St Edmundsbury Press Ltd., 1988.
[23] D. Lick, "Durability and Design," Master Painters Institute, 25 February 2014. [Online].
Available: http://www.durabilityanddesign.com/news/. [Accessed 2014].
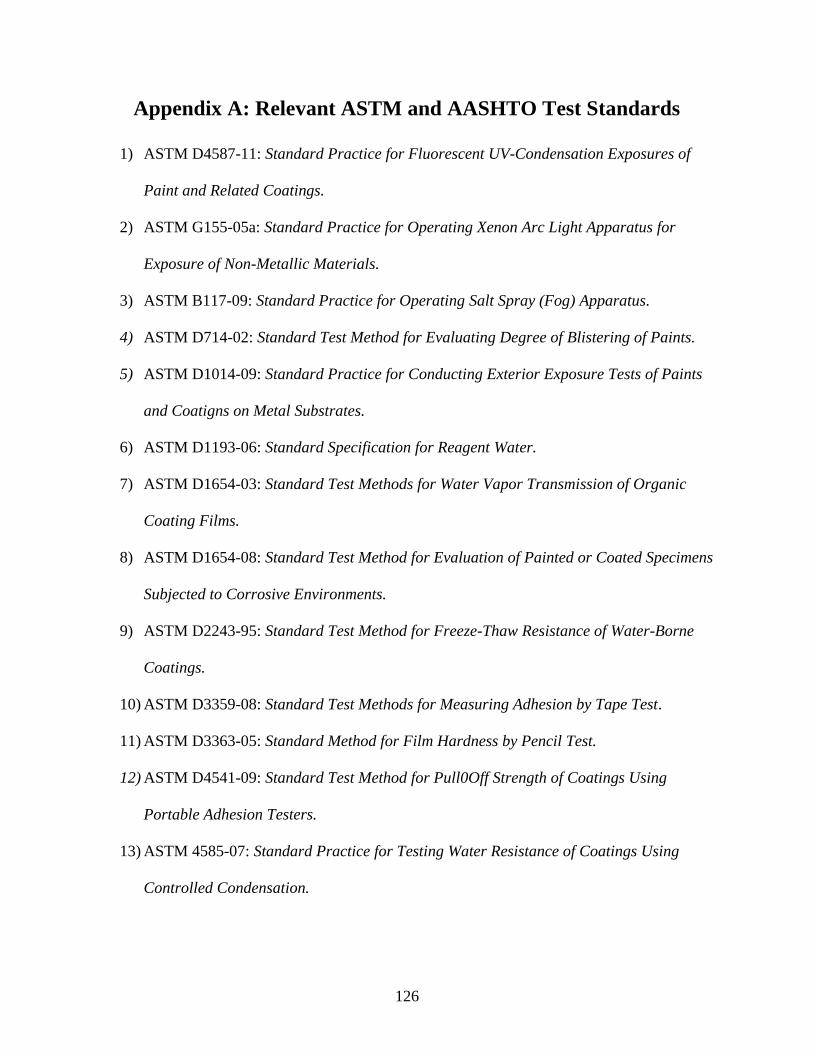
126
Appendix A: Relevant ASTM and AASHTO Test Standards
1) ASTM D4587-11: Standard Practice for Fluorescent UV-Condensation Exposures of
Paint and Related Coatings.
2) ASTM G155-05a: Standard Practice for Operating Xenon Arc Light Apparatus for
Exposure of Non-Metallic Materials.
3) ASTM B117-09: Standard Practice for Operating Salt Spray (Fog) Apparatus.
4) ASTM D714-02: Standard Test Method for Evaluating Degree of Blistering of Paints.
5) ASTM D1014-09: Standard Practice for Conducting Exterior Exposure Tests of Paints
and Coatigns on Metal Substrates.
6) ASTM D1193-06: Standard Specification for Reagent Water.
7) ASTM D1654-03: Standard Test Methods for Water Vapor Transmission of Organic
Coating Films.
8) ASTM D1654-08: Standard Test Method for Evaluation of Painted or Coated Specimens
Subjected to Corrosive Environments.
9) ASTM D2243-95: Standard Test Method for Freeze-Thaw Resistance of Water-Borne
Coatings.
10) ASTM D3359-08: Standard Test Methods for Measuring Adhesion by Tape Test.
11) ASTM D3363-05: Standard Method for Film Hardness by Pencil Test.
12) ASTM D4541-09: Standard Test Method for Pull0Off Strength of Coatings Using
Portable Adhesion Testers.
13) ASTM 4585-07: Standard Practice for Testing Water Resistance of Coatings Using
Controlled Condensation.
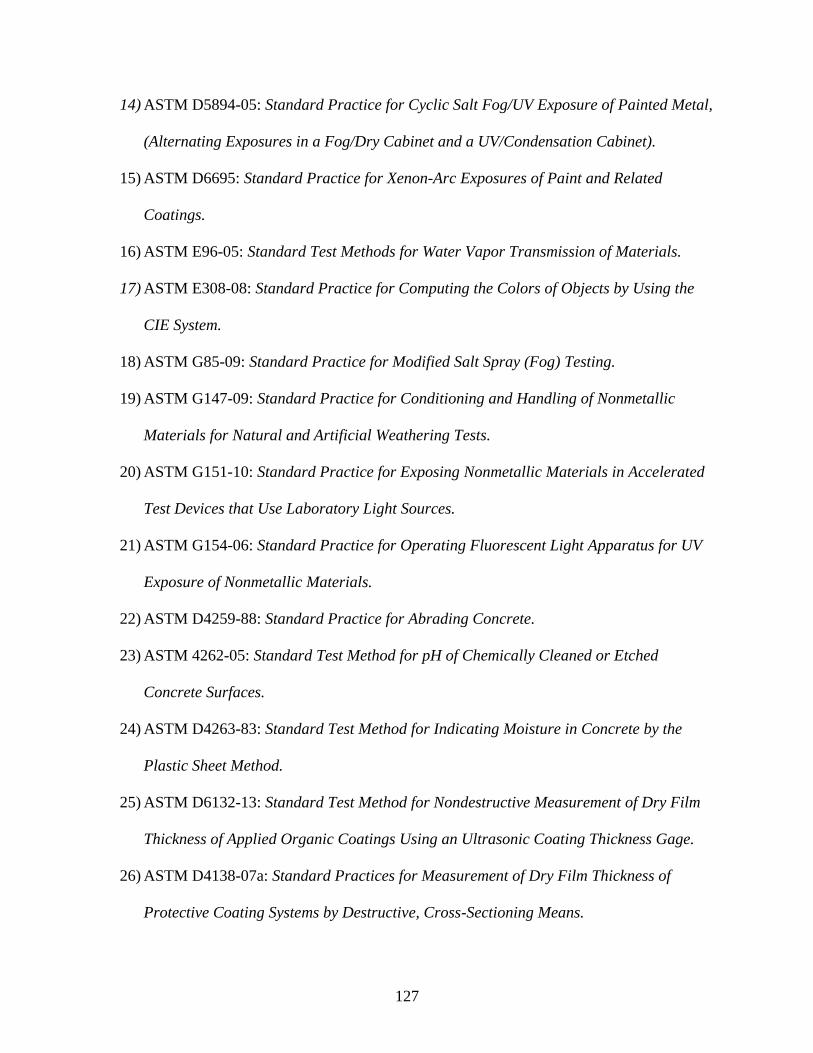
127
14) ASTM D5894-05: Standard Practice for Cyclic Salt Fog/UV Exposure of Painted Metal,
(Alternating Exposures in a Fog/Dry Cabinet and a UV/Condensation Cabinet).
15) ASTM D6695: Standard Practice for Xenon-Arc Exposures of Paint and Related
Coatings.
16) ASTM E96-05: Standard Test Methods for Water Vapor Transmission of Materials.
17) ASTM E308-08: Standard Practice for Computing the Colors of Objects by Using the
CIE System.
18) ASTM G85-09: Standard Practice for Modified Salt Spray (Fog) Testing.
19) ASTM G147-09: Standard Practice for Conditioning and Handling of Nonmetallic
Materials for Natural and Artificial Weathering Tests.
20) ASTM G151-10: Standard Practice for Exposing Nonmetallic Materials in Accelerated
Test Devices that Use Laboratory Light Sources.
21) ASTM G154-06: Standard Practice for Operating Fluorescent Light Apparatus for UV
Exposure of Nonmetallic Materials.
22) ASTM D4259-88: Standard Practice for Abrading Concrete.
23) ASTM 4262-05: Standard Test Method for pH of Chemically Cleaned or Etched
Concrete Surfaces.
24) ASTM D4263-83: Standard Test Method for Indicating Moisture in Concrete by the
Plastic Sheet Method.
25) ASTM D6132-13: Standard Test Method for Nondestructive Measurement of Dry Film
Thickness of Applied Organic Coatings Using an Ultrasonic Coating Thickness Gage.
26) ASTM D4138-07a: Standard Practices for Measurement of Dry Film Thickness of
Protective Coating Systems by Destructive, Cross-Sectioning Means.
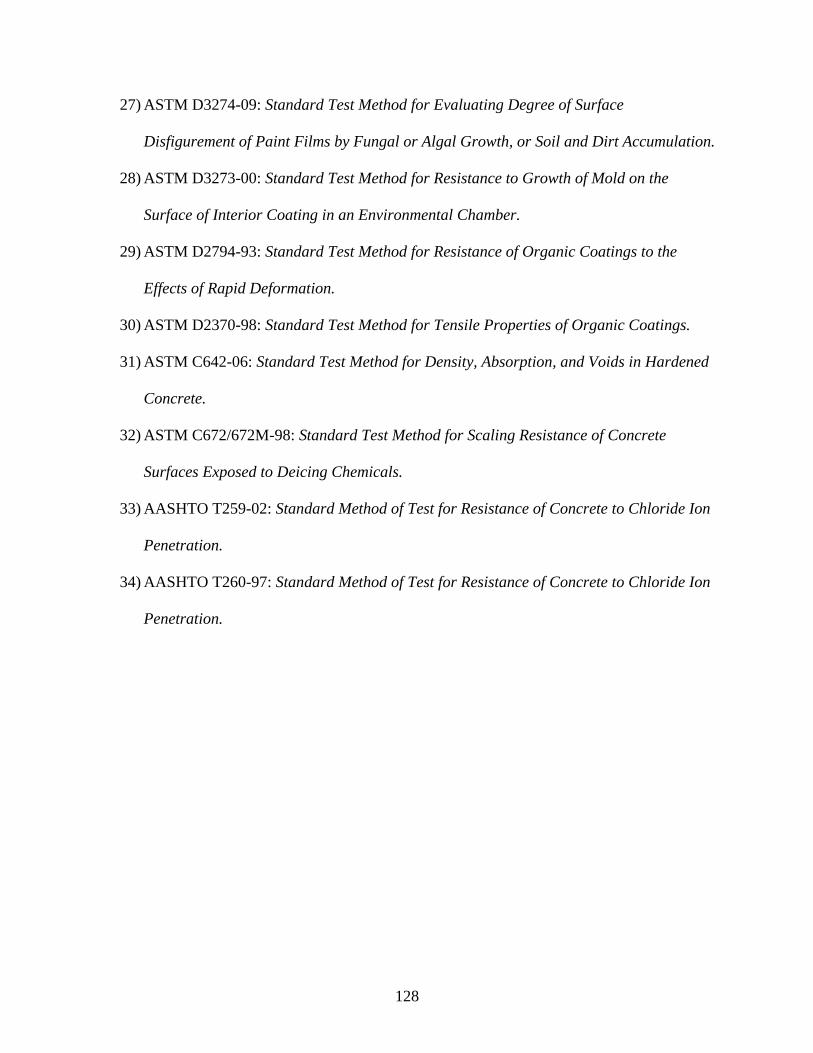
128
27) ASTM D3274-09: Standard Test Method for Evaluating Degree of Surface
Disfigurement of Paint Films by Fungal or Algal Growth, or Soil and Dirt Accumulation.
28) ASTM D3273-00: Standard Test Method for Resistance to Growth of Mold on the
Surface of Interior Coating in an Environmental Chamber.
29) ASTM D2794-93: Standard Test Method for Resistance of Organic Coatings to the
Effects of Rapid Deformation.
30) ASTM D2370-98: Standard Test Method for Tensile Properties of Organic Coatings.
31) ASTM C642-06: Standard Test Method for Density, Absorption, and Voids in Hardened
Concrete.
32) ASTM C672/672M-98: Standard Test Method for Scaling Resistance of Concrete
Surfaces Exposed to Deicing Chemicals.
33) AASHTO T259-02: Standard Method of Test for Resistance of Concrete to Chloride Ion
Penetration.
34) AASHTO T260-97: Standard Method of Test for Resistance of Concrete to Chloride Ion
Penetration.
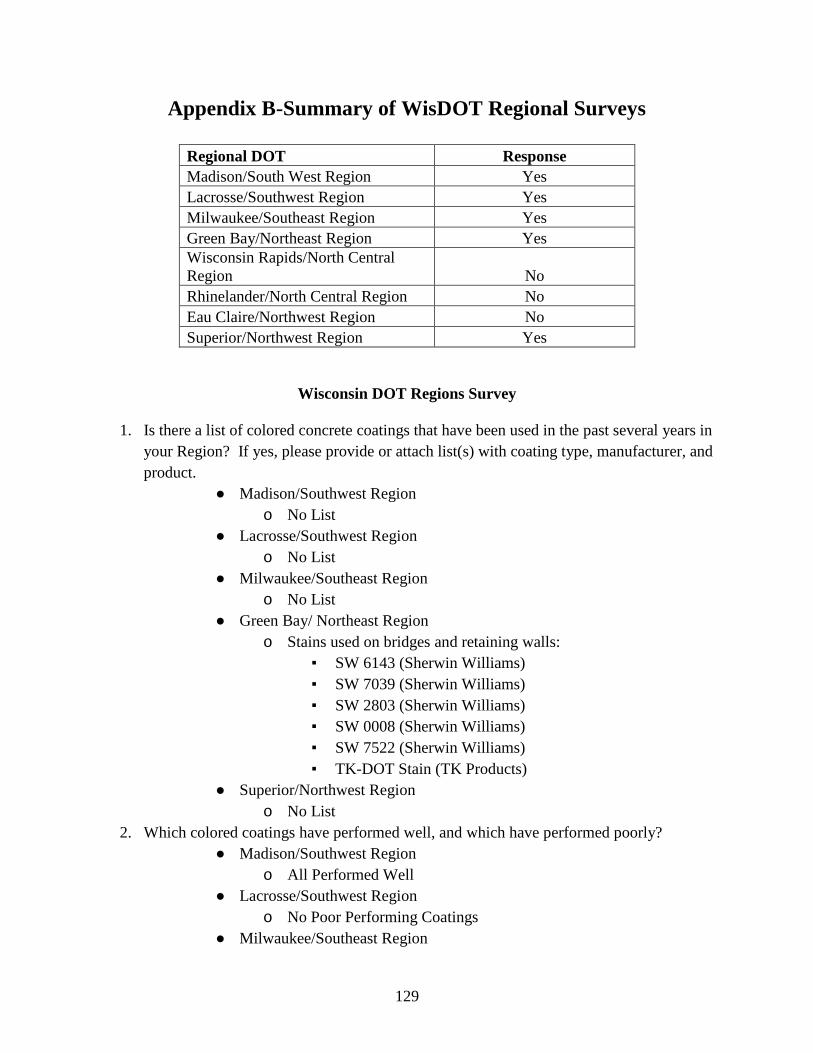
129
Appendix B-Summary of WisDOT Regional Surveys
Regional DOT Response
Madison/South West Region Yes
Lacrosse/Southwest Region Yes
Milwaukee/Southeast Region Yes
Green Bay/Northeast Region Yes
Wisconsin Rapids/North Central
Region No
Rhinelander/North Central Region No
Eau Claire/Northwest Region No
Superior/Northwest Region Yes
Wisconsin DOT Regions Survey
1. Is there a list of colored concrete coatings that have been used in the past several years in
your Region? If yes, please provide or attach list(s) with coating type, manufacturer, and
product.
● Madison/Southwest Region
o No List
● Lacrosse/Southwest Region
o No List
● Milwaukee/Southeast Region
o No List
● Green Bay/ Northeast Region
o Stains used on bridges and retaining walls:
▪ SW 6143 (Sherwin Williams)
▪ SW 7039 (Sherwin Williams)
▪ SW 2803 (Sherwin Williams)
▪ SW 0008 (Sherwin Williams)
▪ SW 7522 (Sherwin Williams)
▪ TK-DOT Stain (TK Products)
● Superior/Northwest Region
o No List
2. Which colored coatings have performed well, and which have performed poorly?
● Madison/Southwest Region
o All Performed Well
● Lacrosse/Southwest Region
o No Poor Performing Coatings
● Milwaukee/Southeast Region
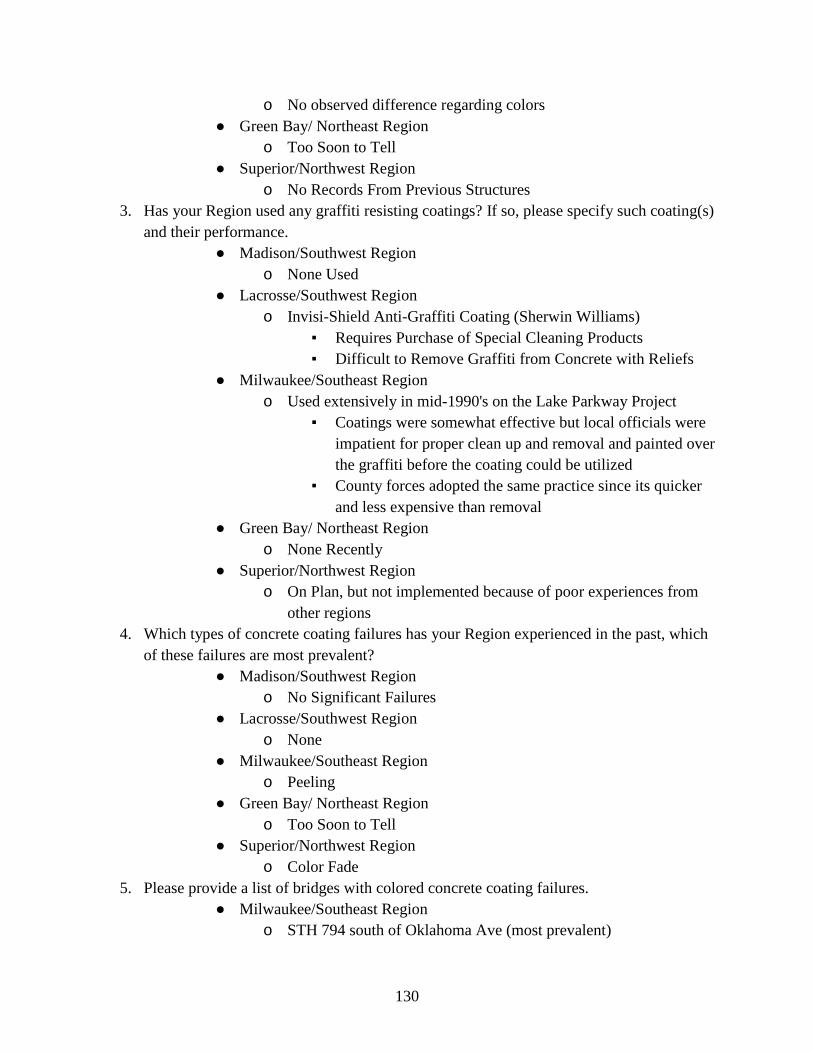
130
o No observed difference regarding colors
● Green Bay/ Northeast Region
o Too Soon to Tell
● Superior/Northwest Region
o No Records From Previous Structures
3. Has your Region used any graffiti resisting coatings? If so, please specify such coating(s)
and their performance.
● Madison/Southwest Region
o None Used
● Lacrosse/Southwest Region
o Invisi-Shield Anti-Graffiti Coating (Sherwin Williams)
▪ Requires Purchase of Special Cleaning Products
▪ Difficult to Remove Graffiti from Concrete with Reliefs
● Milwaukee/Southeast Region
o Used extensively in mid-1990's on the Lake Parkway Project
▪ Coatings were somewhat effective but local officials were
impatient for proper clean up and removal and painted over
the graffiti before the coating could be utilized
▪ County forces adopted the same practice since its quicker
and less expensive than removal
● Green Bay/ Northeast Region
o None Recently
● Superior/Northwest Region
o On Plan, but not implemented because of poor experiences from
other regions
4. Which types of concrete coating failures has your Region experienced in the past, which
of these failures are most prevalent?
● Madison/Southwest Region
o No Significant Failures
● Lacrosse/Southwest Region
o None
● Milwaukee/Southeast Region
o Peeling
● Green Bay/ Northeast Region
o Too Soon to Tell
● Superior/Northwest Region
o Color Fade
5. Please provide a list of bridges with colored concrete coating failures.
● Milwaukee/Southeast Region
o STH 794 south of Oklahoma Ave (most prevalent)

131
o Marquette interchange on outside faces of bridge parapets (spots)
● Green Bay/ Northeast Region
o None at this time
● Superior/Northwest Region
o B-07-0055 STH 35 over St. Croix River, Burnett Co. Built 2007
o B-65-0049 STH 77 over Namekagon River, Washburn Co. Built
2005
6. Are there specific structural details or areas of bridges which experience more colored
coating failures? If yes, please specify (e.g. smooth surfaces, southern exposure, etc.).
● Milwaukee/Southeast Region
o Top of barrier or parapet
o Along edges (adjacent to uncoated surfaces)
● Green Bay/ Northeast Region
o Not Enough History
● Superior/Northwest Region
o Wings with Direct Exposure
7. Do concrete surfaces produced using different form materials affect the performance of
colored concrete coatings? If so, which form types produce the best performance?
● Milwaukee/Southeast Region
o Surfaces where liners for stone faced walls were used seem to be
holding up very well
● Green Bay/ Northeast Region
o Not Enough History
8. Please list any additional information or comments that may aid to this study.
● Madison/Southwest Region
o Biggest improvement to concrete coatings has been 28 day curing
prior to application.
▪ This forces many projects to delay over winter to allow
staining.
● Lacrosse/Southwest Region
o Best results from high solids volume stains (Sherwin Williams
DOT Bridge and Concrete Sealer with Pigment & TK DOT Stain)
o Graffiti recoated with another coat of color matched stain
● Superior/Northwest Region
o Due to budgetary restrictions coatings are not touched up
o If graffiti is an issue, the area is painted over, without color match.
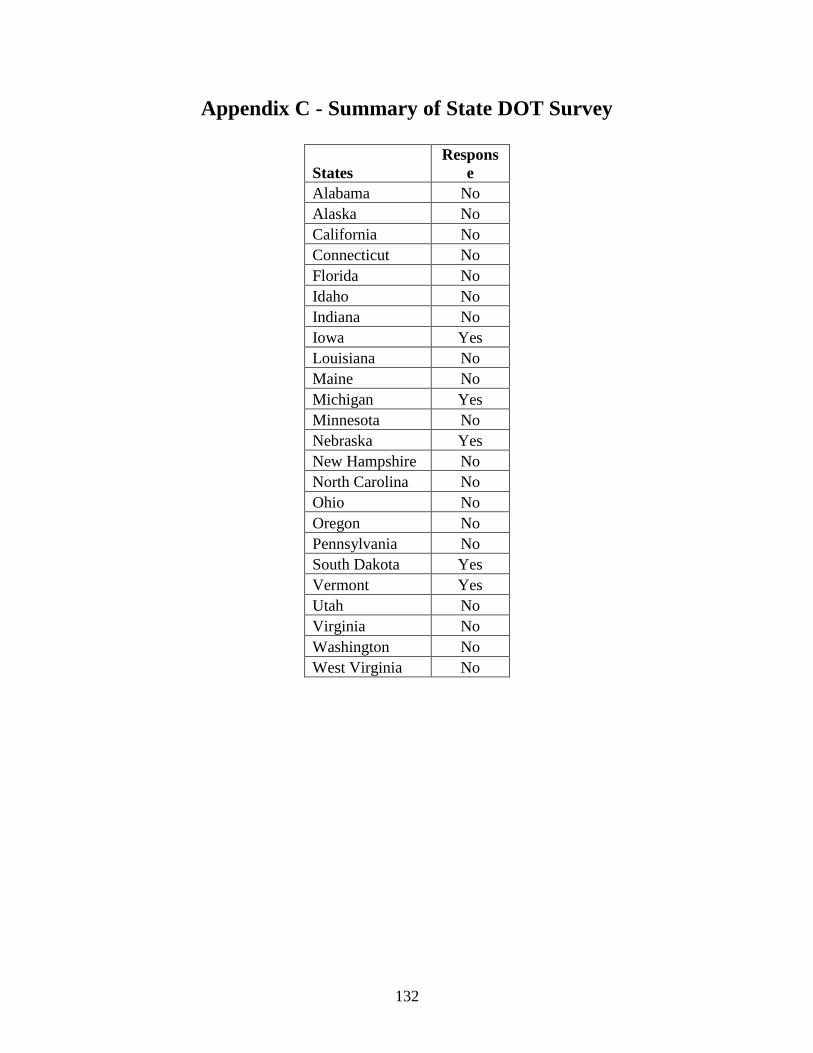
132
Appendix C - Summary of State DOT Survey
States
Respons
e
Alabama No
Alaska No
California No
Connecticut No
Florida No
Idaho No
Indiana No
Iowa Yes
Louisiana No
Maine No
Michigan Yes
Minnesota No
Nebraska Yes
New Hampshire No
North Carolina No
Ohio No
Oregon No
Pennsylvania No
South Dakota Yes
Vermont Yes
Utah No
Virginia No
Washington No
West Virginia No
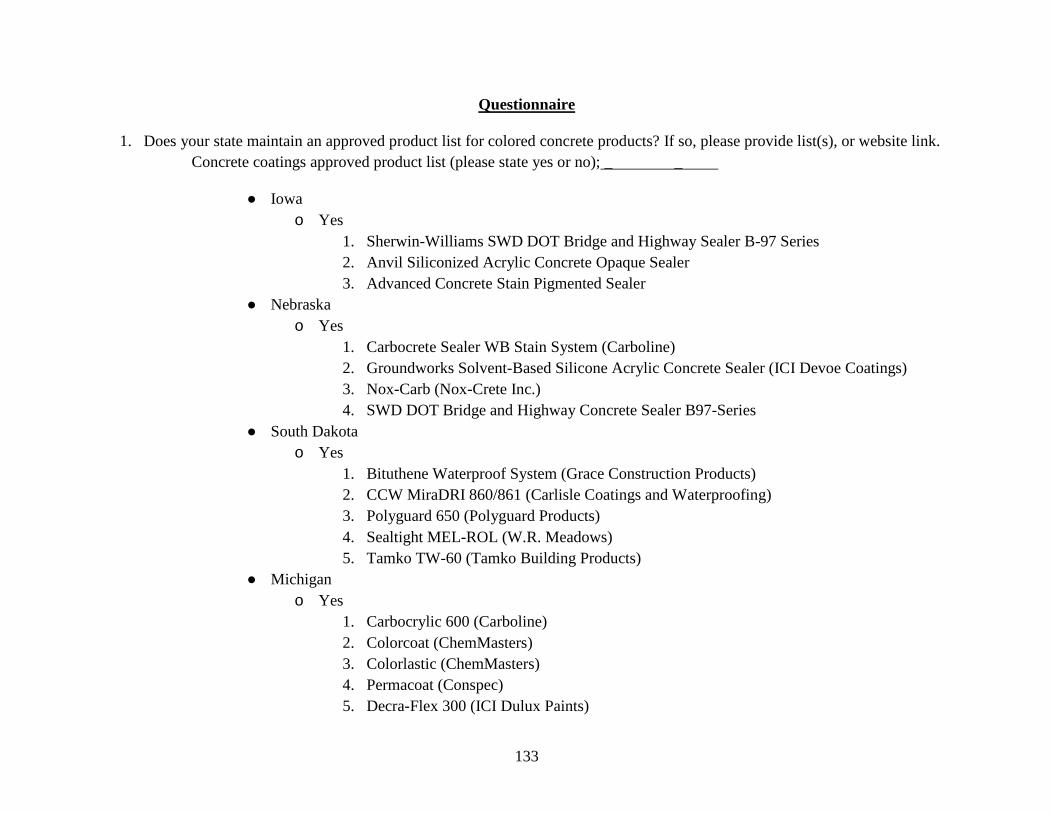
133
Questionnaire
1. Does your state maintain an approved product list for colored concrete products? If so, please provide list(s), or website link.
Concrete coatings approved product list (please state yes or no); _ _
● Iowa
o Yes
1. Sherwin-Williams SWD DOT Bridge and Highway Sealer B-97 Series
2. Anvil Siliconized Acrylic Concrete Opaque Sealer
3. Advanced Concrete Stain Pigmented Sealer
● Nebraska
o Yes
1. Carbocrete Sealer WB Stain System (Carboline)
2. Groundworks Solvent-Based Silicone Acrylic Concrete Sealer (ICI Devoe Coatings)
3. Nox-Carb (Nox-Crete Inc.)
4. SWD DOT Bridge and Highway Concrete Sealer B97-Series
● South Dakota
o Yes
1. Bituthene Waterproof System (Grace Construction Products)
2. CCW MiraDRI 860/861 (Carlisle Coatings and Waterproofing)
3. Polyguard 650 (Polyguard Products)
4. Sealtight MEL-ROL (W.R. Meadows)
5. Tamko TW-60 (Tamko Building Products)
● Michigan
o Yes
1. Carbocrylic 600 (Carboline)
2. Colorcoat (ChemMasters)
3. Colorlastic (ChemMasters)
4. Permacoat (Conspec)
5. Decra-Flex 300 (ICI Dulux Paints)
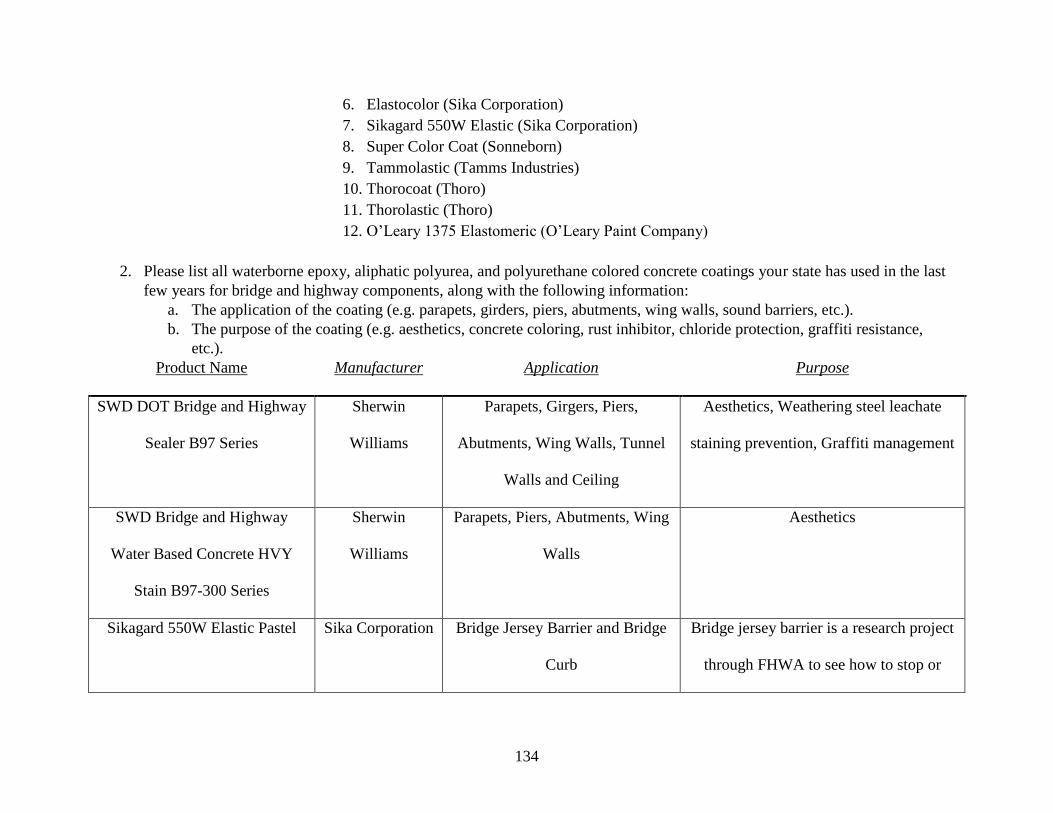
134
6. Elastocolor (Sika Corporation)
7. Sikagard 550W Elastic (Sika Corporation)
8. Super Color Coat (Sonneborn)
9. Tammolastic (Tamms Industries)
10. Thorocoat (Thoro)
11. Thorolastic (Thoro)
12. O’Leary 1375 Elastomeric (O’Leary Paint Company)
2. Please list all waterborne epoxy, aliphatic polyurea, and polyurethane colored concrete coatings your state has used in the last
few years for bridge and highway components, along with the following information:
a. The application of the coating (e.g. parapets, girders, piers, abutments, wing walls, sound barriers, etc.).
b. The purpose of the coating (e.g. aesthetics, concrete coloring, rust inhibitor, chloride protection, graffiti resistance,
etc.).
Product Name Manufacturer Application Purpose
SWD DOT Bridge and Highway
Sealer B97 Series
Sherwin
Williams
Parapets, Girgers, Piers,
Abutments, Wing Walls, Tunnel
Walls and Ceiling
Aesthetics, Weathering steel leachate
staining prevention, Graffiti management
SWD Bridge and Highway
Water Based Concrete HVY
Stain B97-300 Series
Sherwin
Williams
Parapets, Piers, Abutments, Wing
Walls
Aesthetics
Sikagard 550W Elastic Pastel Sika Corporation Bridge Jersey Barrier and Bridge
Curb
Bridge jersey barrier is a research project
through FHWA to see how to stop or
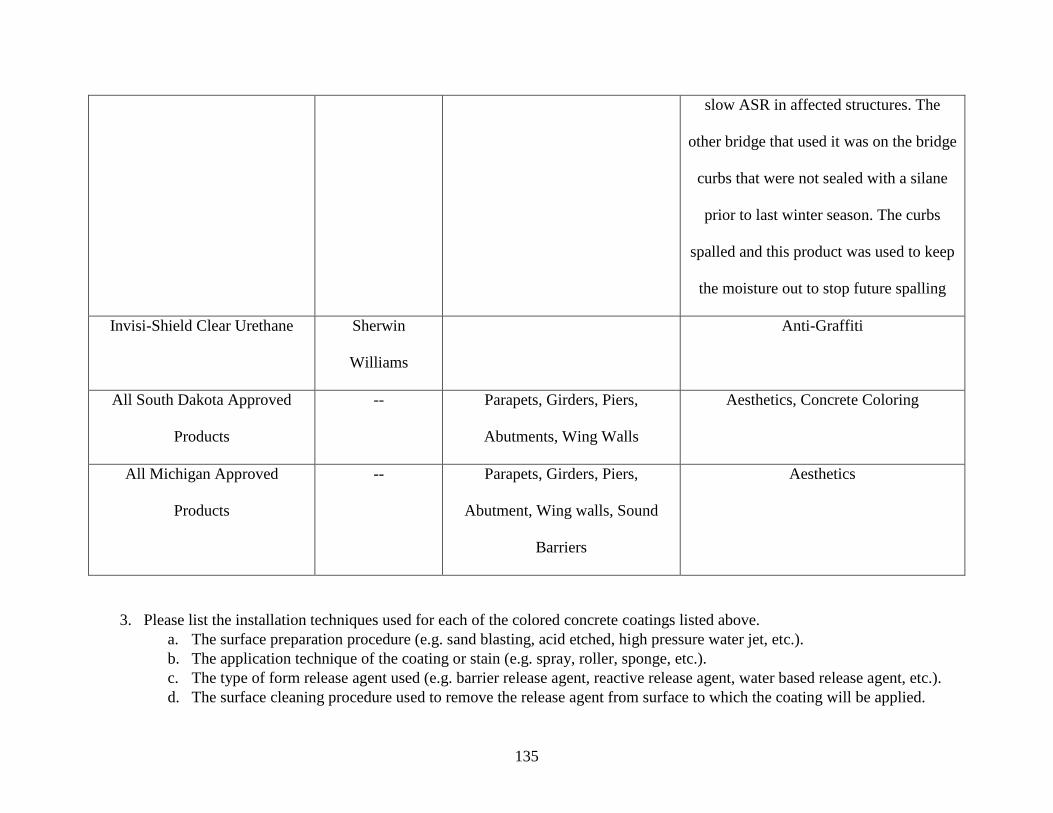
135
slow ASR in affected structures. The
other bridge that used it was on the bridge
curbs that were not sealed with a silane
prior to last winter season. The curbs
spalled and this product was used to keep
the moisture out to stop future spalling
Invisi-Shield Clear Urethane Sherwin
Williams
Anti-Graffiti
All South Dakota Approved
Products
-- Parapets, Girders, Piers,
Abutments, Wing Walls
Aesthetics, Concrete Coloring
All Michigan Approved
Products
-- Parapets, Girders, Piers,
Abutment, Wing walls, Sound
Barriers
Aesthetics
3. Please list the installation techniques used for each of the colored concrete coatings listed above.
a. The surface preparation procedure (e.g. sand blasting, acid etched, high pressure water jet, etc.).
b. The application technique of the coating or stain (e.g. spray, roller, sponge, etc.).
c. The type of form release agent used (e.g. barrier release agent, reactive release agent, water based release agent, etc.).
d. The surface cleaning procedure used to remove the release agent from surface to which the coating will be applied.
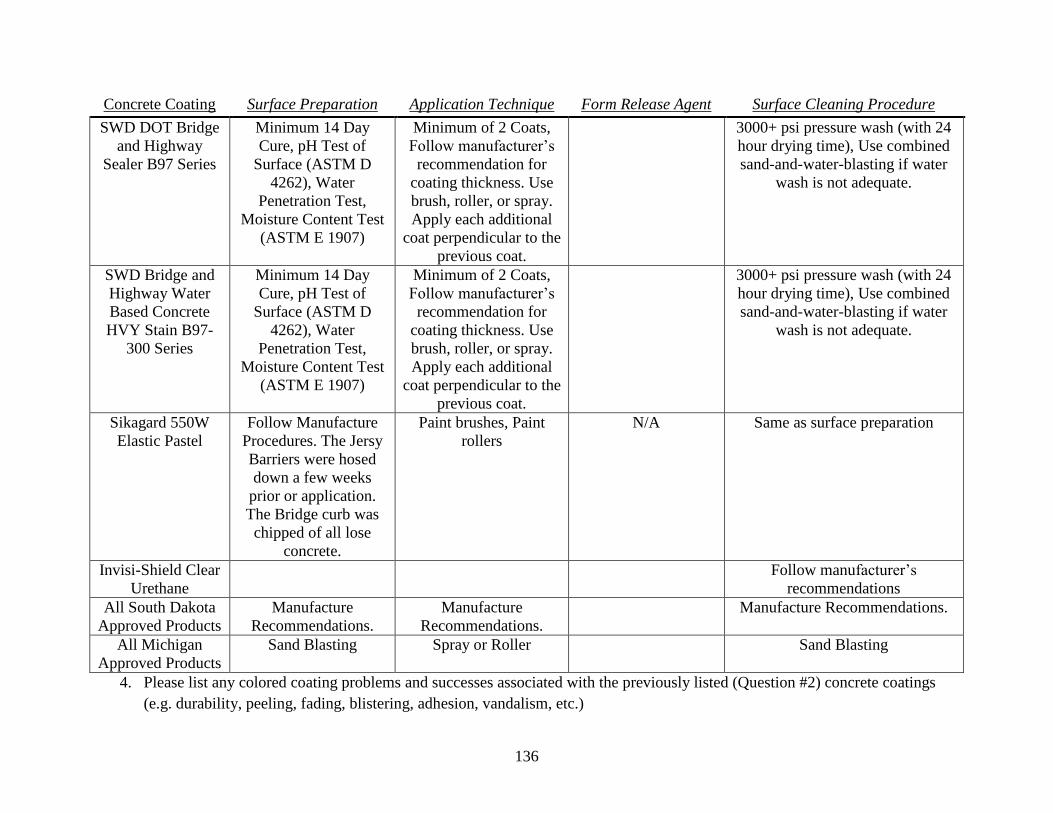
136
Concrete Coating Surface Preparation Application Technique Form Release Agent Surface Cleaning Procedure
SWD DOT Bridge
and Highway
Sealer B97 Series
Minimum 14 Day
Cure, pH Test of
Surface (ASTM D
4262), Water
Penetration Test,
Moisture Content Test
(ASTM E 1907)
Minimum of 2 Coats,
Follow manufacturer’s
recommendation for
coating thickness. Use
brush, roller, or spray.
Apply each additional
coat perpendicular to the
previous coat.
3000+ psi pressure wash (with 24
hour drying time), Use combined
sand-and-water-blasting if water
wash is not adequate.
SWD Bridge and
Highway Water
Based Concrete
HVY Stain B97-
300 Series
Minimum 14 Day
Cure, pH Test of
Surface (ASTM D
4262), Water
Penetration Test,
Moisture Content Test
(ASTM E 1907)
Minimum of 2 Coats,
Follow manufacturer’s
recommendation for
coating thickness. Use
brush, roller, or spray.
Apply each additional
coat perpendicular to the
previous coat.
3000+ psi pressure wash (with 24
hour drying time), Use combined
sand-and-water-blasting if water
wash is not adequate.
Sikagard 550W
Elastic Pastel
Follow Manufacture
Procedures. The Jersy
Barriers were hosed
down a few weeks
prior or application.
The Bridge curb was
chipped of all lose
concrete.
Paint brushes, Paint
rollers
N/A Same as surface preparation
Invisi-Shield Clear
Urethane
Follow manufacturer’s
recommendations
All South Dakota
Approved Products
Manufacture
Recommendations.
Manufacture
Recommendations.
Manufacture Recommendations.
All Michigan
Approved Products
Sand Blasting Spray or Roller Sand Blasting
4. Please list any colored coating problems and successes associated with the previously listed (Question #2) concrete coatings
(e.g. durability, peeling, fading, blistering, adhesion, vandalism, etc.)
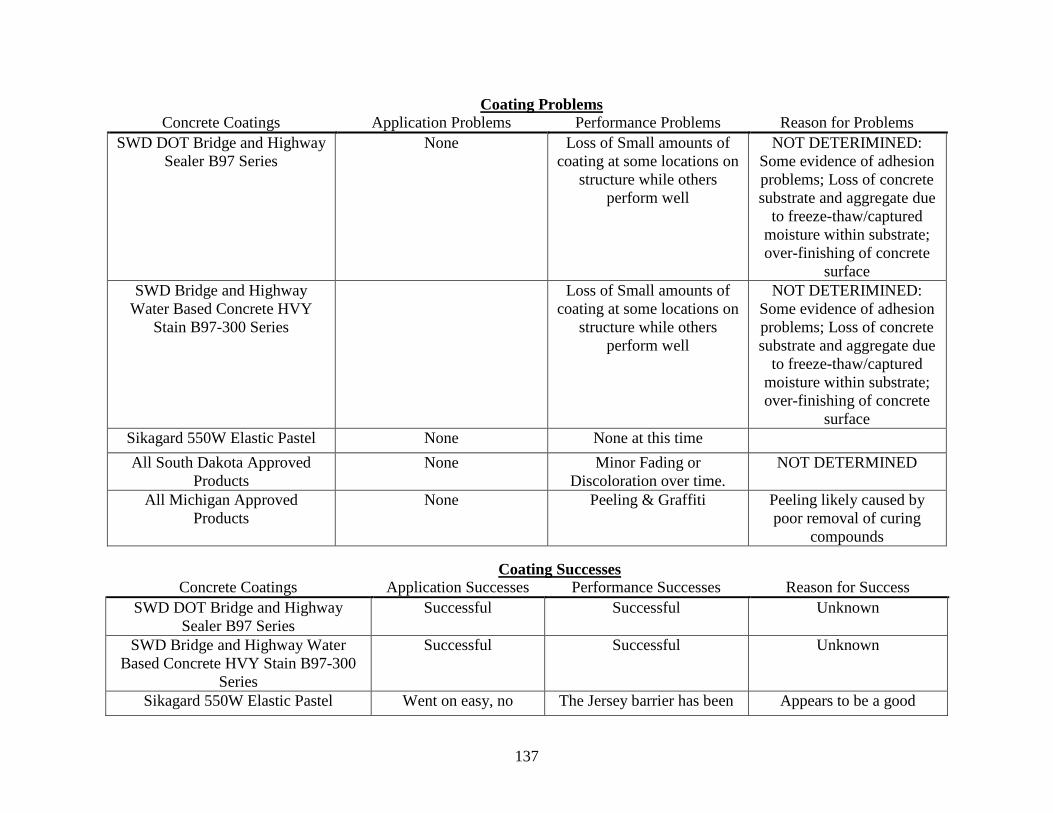
137
Coating Problems
Concrete Coatings Application Problems Performance Problems Reason for Problems
SWD DOT Bridge and Highway
Sealer B97 Series
None Loss of Small amounts of
coating at some locations on
structure while others
perform well
NOT DETERIMINED:
Some evidence of adhesion
problems; Loss of concrete
substrate and aggregate due
to freeze-thaw/captured
moisture within substrate;
over-finishing of concrete
surface
SWD Bridge and Highway
Water Based Concrete HVY
Stain B97-300 Series
Loss of Small amounts of
coating at some locations on
structure while others
perform well
NOT DETERIMINED:
Some evidence of adhesion
problems; Loss of concrete
substrate and aggregate due
to freeze-thaw/captured
moisture within substrate;
over-finishing of concrete
surface
Sikagard 550W Elastic Pastel None None at this time
All South Dakota Approved
Products
None Minor Fading or
Discoloration over time.
NOT DETERMINED
All Michigan Approved
Products
None Peeling & Graffiti Peeling likely caused by
poor removal of curing
compounds
Coating Successes
Concrete Coatings Application Successes Performance Successes Reason for Success
SWD DOT Bridge and Highway
Sealer B97 Series
Successful Successful Unknown
SWD Bridge and Highway Water
Based Concrete HVY Stain B97-300
Series
Successful Successful Unknown
Sikagard 550W Elastic Pastel Went on easy, no The Jersey barrier has been Appears to be a good
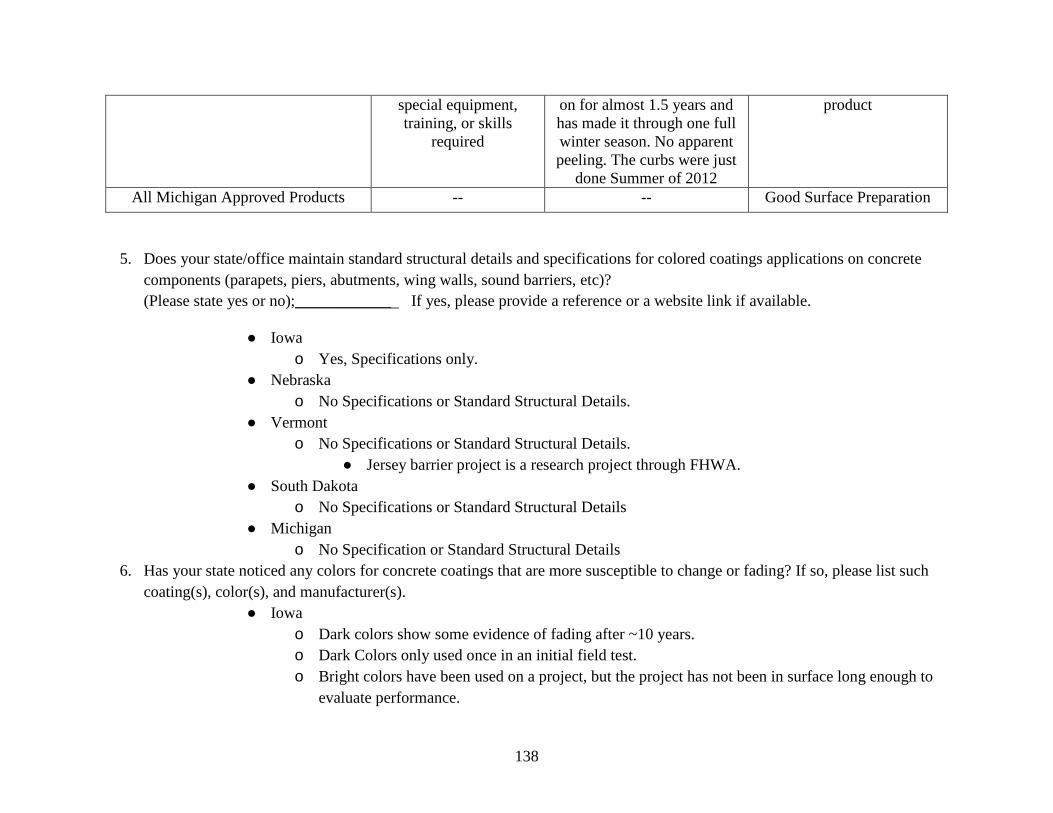
138
special equipment,
training, or skills
required
on for almost 1.5 years and
has made it through one full
winter season. No apparent
peeling. The curbs were just
done Summer of 2012
product
All Michigan Approved Products -- -- Good Surface Preparation
5. Does your state/office maintain standard structural details and specifications for colored coatings applications on concrete
components (parapets, piers, abutments, wing walls, sound barriers, etc)?
(Please state yes or no);____________ If yes, please provide a reference or a website link if available.
● Iowa
o Yes, Specifications only.
● Nebraska
o No Specifications or Standard Structural Details.
● Vermont
o No Specifications or Standard Structural Details.
● Jersey barrier project is a research project through FHWA.
● South Dakota
o No Specifications or Standard Structural Details
● Michigan
o No Specification or Standard Structural Details
6. Has your state noticed any colors for concrete coatings that are more susceptible to change or fading? If so, please list such
coating(s), color(s), and manufacturer(s).
● Iowa
o Dark colors show some evidence of fading after ~10 years.
o Dark Colors only used once in an initial field test.
o Bright colors have been used on a project, but the project has not been in surface long enough to
evaluate performance.

139
● Nebraska
o Darker pigments are generally more susceptible to fading, but no issues with fading has been
experienced.
● Vermont
o No significant fading difference
● South Dakota
o Darker Colors show more fading
● Michigan
o Darker Colors tend to fade.
7. Do concrete surfaces produced using different form materials affect the performance of colored concrete coatings? If so, which
form types produce the best performance?
● Iowa
o Unknown: No evidence that form face material has any effect on adhesion potential or surface
efficacy.
o Due to cost concerns cast-in-place forming methods are not used unless physical features prevent
slip-forming.
8. Does your state maintain any evaluation program for colored concrete coatings? If so, please specify below or provide a web
link if available.
● Iowa
o No Program
● Nebraska
o No Program
● Vermont
o No Program
● South Dakota
o No Program
● Michigan
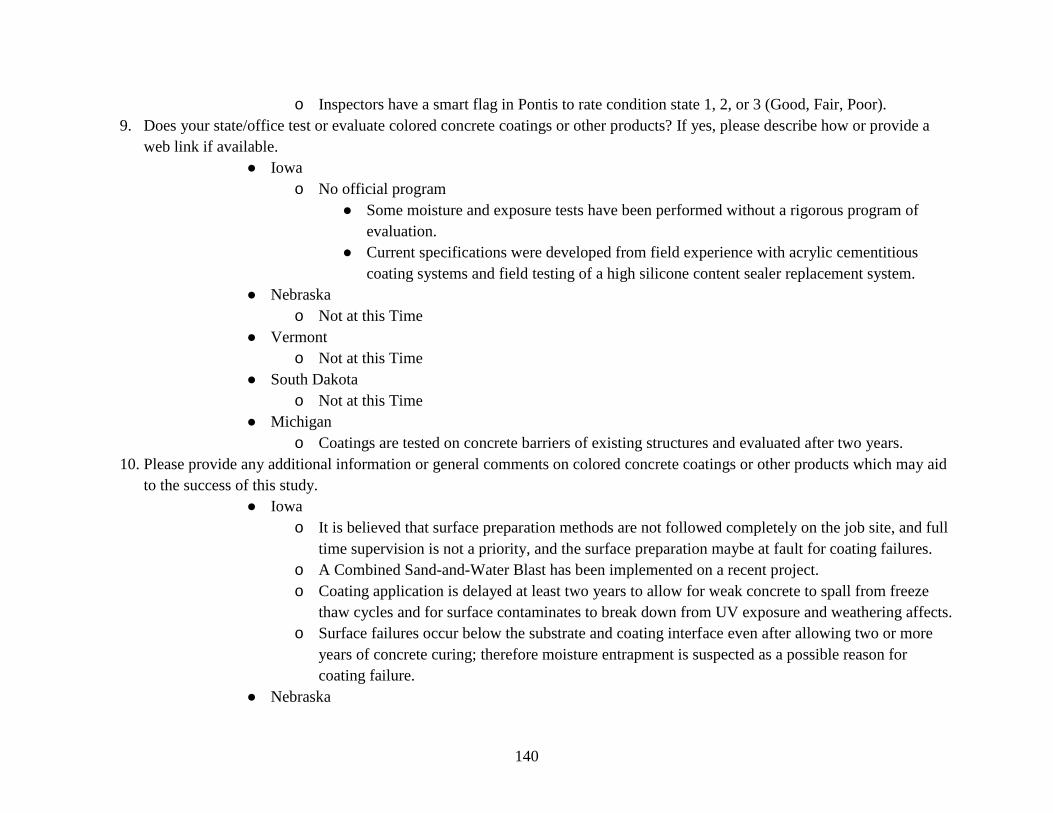
140
o Inspectors have a smart flag in Pontis to rate condition state 1, 2, or 3 (Good, Fair, Poor).
9. Does your state/office test or evaluate colored concrete coatings or other products? If yes, please describe how or provide a
web link if available.
● Iowa
o No official program
● Some moisture and exposure tests have been performed without a rigorous program of
evaluation.
● Current specifications were developed from field experience with acrylic cementitious
coating systems and field testing of a high silicone content sealer replacement system.
● Nebraska
o Not at this Time
● Vermont
o Not at this Time
● South Dakota
o Not at this Time
● Michigan
o Coatings are tested on concrete barriers of existing structures and evaluated after two years.
10. Please provide any additional information or general comments on colored concrete coatings or other products which may aid
to the success of this study.
● Iowa
o It is believed that surface preparation methods are not followed completely on the job site, and full
time supervision is not a priority, and the surface preparation maybe at fault for coating failures.
o A Combined Sand-and-Water Blast has been implemented on a recent project.
o Coating application is delayed at least two years to allow for weak concrete to spall from freeze
thaw cycles and for surface contaminates to break down from UV exposure and weathering affects.
o Surface failures occur below the substrate and coating interface even after allowing two or more
years of concrete curing; therefore moisture entrapment is suspected as a possible reason for
coating failure.
● Nebraska

141
o Have had success with siloxane/acrylic type coatings.
● Vermont
o Sikagard 550W Elastic Pastel has performed well in two applications, more formal testing
procedures would be beneficial.
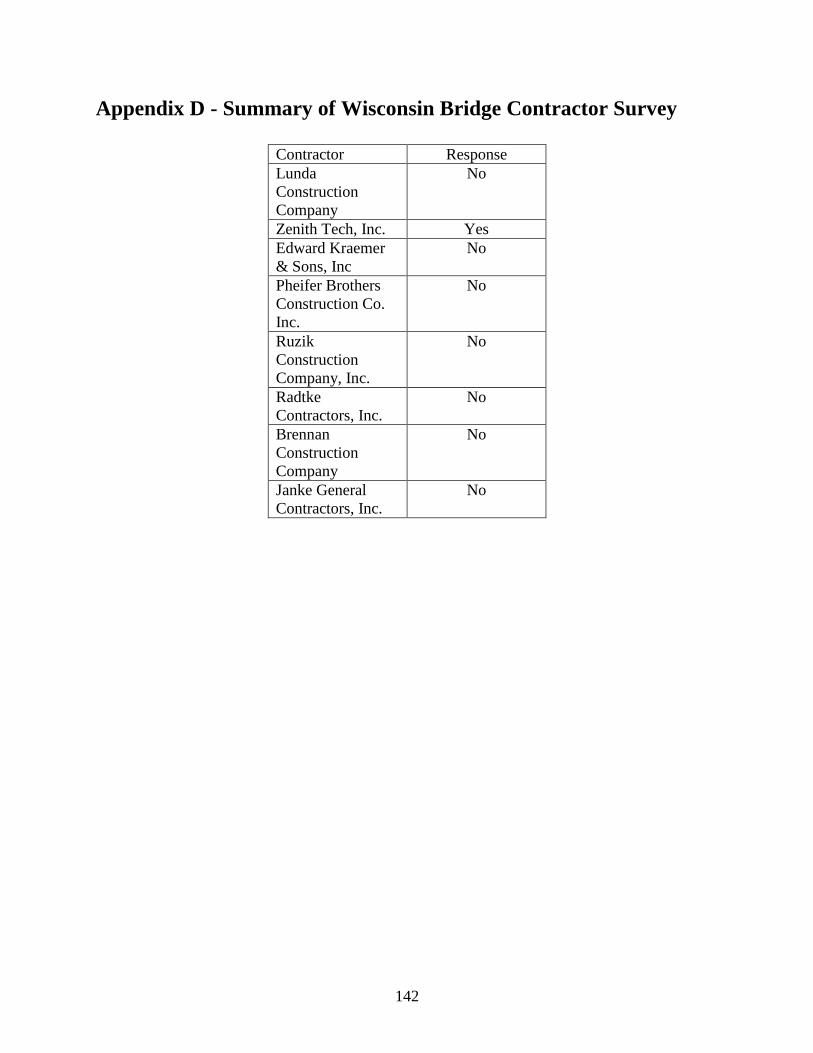
142
Appendix D - Summary of Wisconsin Bridge Contractor Survey
Contractor Response
Lunda
Construction
Company
No
Zenith Tech, Inc. Yes
Edward Kraemer
& Sons, Inc
No
Pheifer Brothers
Construction Co.
Inc.
No
Ruzik
Construction
Company, Inc.
No
Radtke
Contractors, Inc.
No
Brennan
Construction
Company
No
Janke General
Contractors, Inc.
No
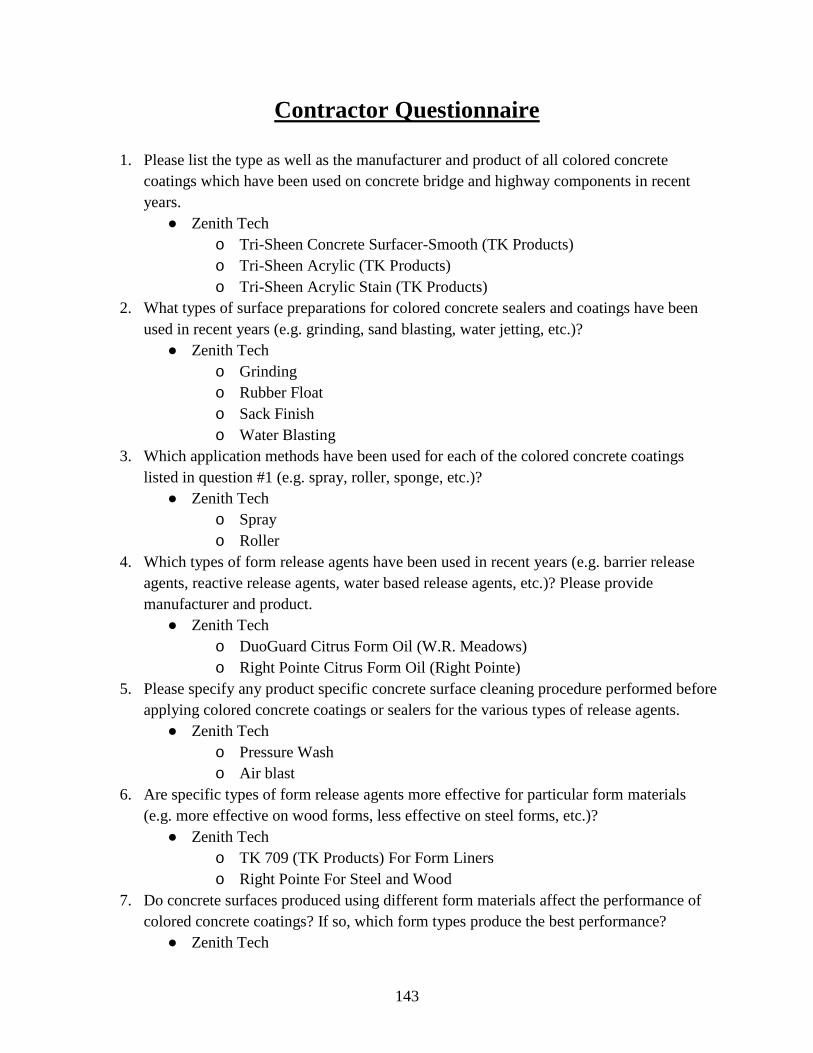
143
Contractor Questionnaire
1. Please list the type as well as the manufacturer and product of all colored concrete
coatings which have been used on concrete bridge and highway components in recent
years.
● Zenith Tech
o Tri-Sheen Concrete Surfacer-Smooth (TK Products)
o Tri-Sheen Acrylic (TK Products)
o Tri-Sheen Acrylic Stain (TK Products)
2. What types of surface preparations for colored concrete sealers and coatings have been
used in recent years (e.g. grinding, sand blasting, water jetting, etc.)?
● Zenith Tech
o Grinding
o Rubber Float
o Sack Finish
o Water Blasting
3. Which application methods have been used for each of the colored concrete coatings
listed in question #1 (e.g. spray, roller, sponge, etc.)?
● Zenith Tech
o Spray
o Roller
4. Which types of form release agents have been used in recent years (e.g. barrier release
agents, reactive release agents, water based release agents, etc.)? Please provide
manufacturer and product.
● Zenith Tech
o DuoGuard Citrus Form Oil (W.R. Meadows)
o Right Pointe Citrus Form Oil (Right Pointe)
5. Please specify any product specific concrete surface cleaning procedure performed before
applying colored concrete coatings or sealers for the various types of release agents.
● Zenith Tech
o Pressure Wash
o Air blast
6. Are specific types of form release agents more effective for particular form materials
(e.g. more effective on wood forms, less effective on steel forms, etc.)?
● Zenith Tech
o TK 709 (TK Products) For Form Liners
o Right Pointe For Steel and Wood
7. Do concrete surfaces produced using different form materials affect the performance of
colored concrete coatings? If so, which form types produce the best performance?
● Zenith Tech
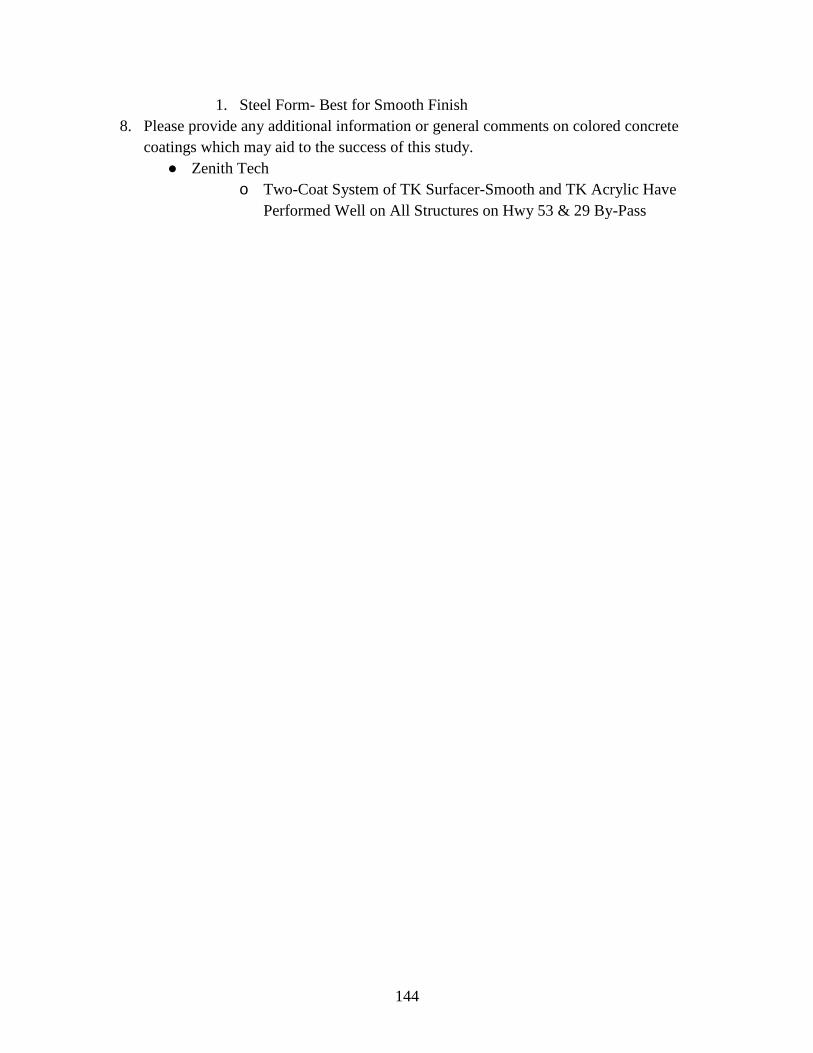
144
1. Steel Form- Best for Smooth Finish
8. Please provide any additional information or general comments on colored concrete
coatings which may aid to the success of this study.
● Zenith Tech
o Two-Coat System of TK Surfacer-Smooth and TK Acrylic Have
Performed Well on All Structures on Hwy 53 & 29 By-Pass

145
Appendix E – Technical Background of Coating Materials
E.1 Components of Surface Coatings
E.1.1 Binders
The binder or resin is the film-forming component of the paint formulation; without it, continuous
coatings would not be possible [4]. The permeability, chemical resistance, and ultraviolet resistance of a
coating are determined primarily by the density and composition of the binder. Because of this influence on the
performance characteristics, coatings are usually defined by the type of binder or resin. An assortment of
binders is used in paints, and can be subdivided into two categories: convertible and non-convertible (Table 2-
1).
The former consists of polymer-precursors which, following application to the substrate, undergo
reactions (polymerization) to form a solid film. Binders in this class consist of relatively low molecular weight
materials that react to form large cross-linked molecules. Three different reaction mechanisms are commonly
implemented in the development of convertible coatings: oxidation, chemical curing, and moisture curing.
Because the chemical state of the coating is altered once reaction takes place, fully cured convertible coatings
cannot be redissolved into the original carrier solvent.
Non-convertible binders consist of high molecular weight polymers dispersed or dissolved in a medium
that evaporates after coating application, leaving a continuous film on the surface of the substrate. The long
chain polymers typically used in this type of binder can interlock to form continuous films without chemical
reaction. However, because no chemical changes occur, non-convertible binders can be redissolved in
appropriate solvents. This characteristic has advantages and disadvantages, the primary advantage being an
indefinite overcoating period with good intercoat adhesion since solvents in the freshly applied coat will
penetrate into the underlying paint film. Another advantage of this type of binder is the wide range of
application temperatures that will produce a film with the same properties, as only variation in the solvent
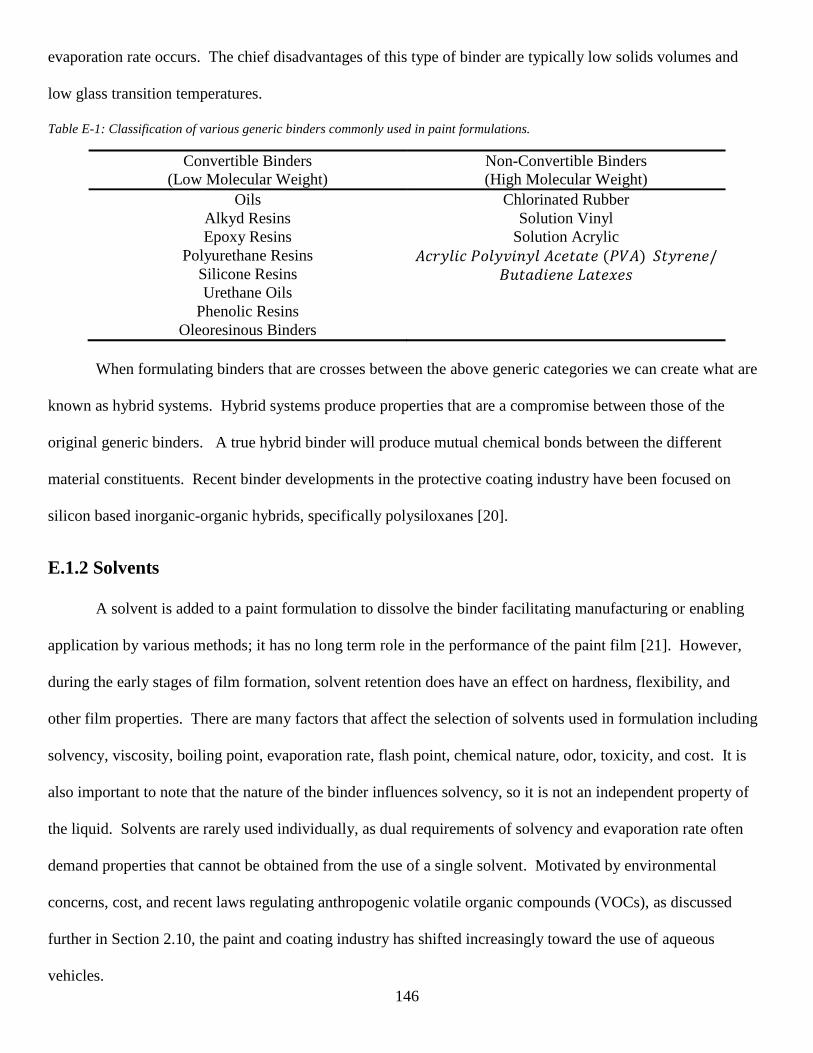
146
evaporation rate occurs. The chief disadvantages of this type of binder are typically low solids volumes and
low glass transition temperatures.
Table E-1: Classification of various generic binders commonly used in paint formulations.
Convertible Binders
(Low Molecular Weight)
Non-Convertible Binders
(High Molecular Weight)
Oils Chlorinated Rubber
Alkyd Resins Solution Vinyl
Epoxy Resins Solution Acrylic
Polyurethane Resins 𝐴𝑐𝑟𝑦𝑙𝑖𝑐 𝑃𝑜𝑙𝑦𝑣𝑖𝑛𝑦𝑙 𝐴𝑐𝑒𝑡𝑎𝑡𝑒 (𝑃𝑉𝐴) 𝑆𝑡𝑦𝑟𝑒𝑛𝑒/𝐵𝑢𝑡𝑎𝑑𝑖𝑒𝑛𝑒 𝐿𝑎𝑡𝑒𝑥𝑒𝑠 Silicone Resins
Urethane Oils
Phenolic Resins
Oleoresinous Binders
When formulating binders that are crosses between the above generic categories we can create what are
known as hybrid systems. Hybrid systems produce properties that are a compromise between those of the
original generic binders. A true hybrid binder will produce mutual chemical bonds between the different
material constituents. Recent binder developments in the protective coating industry have been focused on
silicon based inorganic-organic hybrids, specifically polysiloxanes [20].
E.1.2 Solvents
A solvent is added to a paint formulation to dissolve the binder facilitating manufacturing or enabling
application by various methods; it has no long term role in the performance of the paint film [21]. However,
during the early stages of film formation, solvent retention does have an effect on hardness, flexibility, and
other film properties. There are many factors that affect the selection of solvents used in formulation including
solvency, viscosity, boiling point, evaporation rate, flash point, chemical nature, odor, toxicity, and cost. It is
also important to note that the nature of the binder influences solvency, so it is not an independent property of
the liquid. Solvents are rarely used individually, as dual requirements of solvency and evaporation rate often
demand properties that cannot be obtained from the use of a single solvent. Motivated by environmental
concerns, cost, and recent laws regulating anthropogenic volatile organic compounds (VOCs), as discussed
further in Section 2.10, the paint and coating industry has shifted increasingly toward the use of aqueous
vehicles.
147
Though the term solvent specifically refers to liquids that dissolve other substances, its use in the
coating industry frequently includes liquids that do not. Accordingly, it should more properly be labelled as
diluents. In paint formulations, diluents are used to adjust the viscosity to facilitate the same processes as
solvents, and in some cases, one liquid can serve as a true solvent for some components and a diluent for the
binder. This is the case for water in latex (emulsion) paints. Solvents that are added to dilute paint during
application are referred to as thinners.
In surface coatings, all solvents, thinners, and diluents, are low molecular weight organic compounds,
with the exception of water. The organic compounds are classified into two types, hydrocarbons and
oxygenated compounds.
E.1.3 Pigments
The inclusion of pigments serve two purposes, improved aesthetic appeal and improved corrosion
protection. Pigments are particulate solids that are dispersed into the binder or film former to bestow certain
characteristics. Pigments are categorized into two principle groups, namely primary pigments and extenders.
Primary pigments are distinguished from extenders in that they contribute to one or more of the principle
functions: color, opacification, and anti-corrosive properties. The extenders, although important, generally do
not contribute to these properties to a major extent. The function of the extender is primarily related to
reductions in cost, but they can contribute less obvious properties to a paint, for instance enhanced opacity,
surface sheen control, and ease of sanding.
E.3.1 Primary Pigments
The majority of primary pigments are crystalline and the characteristics of the pigment are affected by
the crystal form. The agglomeration or packing of a pigment within the paint binder or matrix is affected by the
size and shape of its particles. The particle size also affects the gloss of the final film, wetting by the binder,
and settlement of the pigment during storage. Another important property of the pigment is density, affecting
both settling and the volume of pigment for a given weight addition. The critical attributes of a primary
pigment are tinting strength, lightfastness, hiding power, and particle geometry.
148
Tinting strength is a measure of the quantity of colored pigment required to achieve a similar hue to a
standard pigment. This measurement was developed as the majority of paints contain initial, typically white,
pigments that are later tinted to the desired color by the introduction of colored pigments. If a substantial
amount of colored pigment is required to produce the desired shade, the tinting strength of the coating will be
classified as poor.
Lightfastness is a measure of the propensity of a coating film to maintain its initial color when exposed
to ultra-violet radiation. Such radiation is sufficiently energetic to break down chemical bonds, which in turn
affects the coatings ability to absorbed light in the visible spectrum, causing the initial color to fade, darken, or
change shade. Pigments with superior lightfastness are capable of absorbing ultraviolet light without
breakdown of the chemical structure, protecting the binder and dissipating the energy as heat.
Hiding power measures how effectively a coating film can conceal the colors beneath. Ideally the
amount of paint necessary to expunge the existing color should not exceed the thickness necessary to provide
adequate protection and achieve a pleasing appearance. To obliterate the color beneath, the pigments used must
prohibit light from passing through the film to the underlying color and back to the eye of the observer. The
pigments achieve this by absorbing and scattering light. The hiding power of a pigment is quantified as the area
that can be covered per mass of pigment (e.g. ft2/lb or m2/kg) when applied so that it will just hide any previous
color. Hiding power will depend on the wavelengths and amount of light the pigment will absorb, the
pigment’s refractive index, and also the particle geometry.
To maximize the scattering of light at interfaces, the particle diameter of the pigment should be
approximately equal to the wavelength of the light in the particle. The optimum particle size is generalized to
one half of the wavelength of light in air. Below this size, scattering power is lost; above it, the number of
interfaces per unit weight of pigment declines. No specific pigment contains particles of uniform size, but
consists of a mixture of sizes with an average diameter. The size of the particle is connected to surface area and
oil absorption of the pigment. There is an inverse relationship between particle size and surface area. Oil
absorption is a method utilized to indicate the surface area of a particular pigment, and is quantified as the
149
minimum weight of raw linseed oil required to completely wet (replace air molecules on the particle surface) a
specific weight of pigment.
The shape of the pigment particles are also important and can exist in a variety of forms; spherical,
cubic, nodular (irregular rounded shape), acicular (rod or needle-like), or lamellar (plate-like). The shape of the
particles will affect pigment packing, and thus influence hiding power. Acicular particles can reinforce coating
films or may tend to poke through the surface reducing gloss, making this particle shape particularly useful as a
base coat. Lamellar particle forms have a tendency to overlap one another; making it more difficult for
moisture to penetrate the film.
E.3.2 Extenders
Extenders or fillers are primarily used to increase the volume of a coating through the incorporation of
low-cost materials. However, these materials can also impact the abrasion resistance and permeability of a
coating system in addition to the cost savings. Common extender materials include chalk, wood dust, talc, and
mica. Talc and mica both help reduce the permeability through the film due to their plate-like particles forcing
water and oxygen to follow a longer path through the binder.
E.1.4 Additives
Formulation of coating materials often includes trace amounts of additives that have a profound
influence on the final properties. Such additives are commonly used to affect viscosity, surface/interfacial
tension, gloss, or chemical reaction.
Resinous thickeners and silica are both commonly used to manipulate the viscosity of a coating system.
The inclusion of these materials in formulation introduces a non-Newtonian viscosity to the final product. This
characteristic is beneficial as it allows for easy application under shearing action (brush or spray gun) while
generating an increase in viscosity once the liquid coating is still on the surface being coated. The introduction
of fine particle silica results in a pseudo-plastic effect, as the result of surface forces and large surface area. A
similar effect is believed to be produced by the inclusion of resinous thickeners via surface forces developed by
attractions among polar groups or among polar portions of large resin molecules [22].
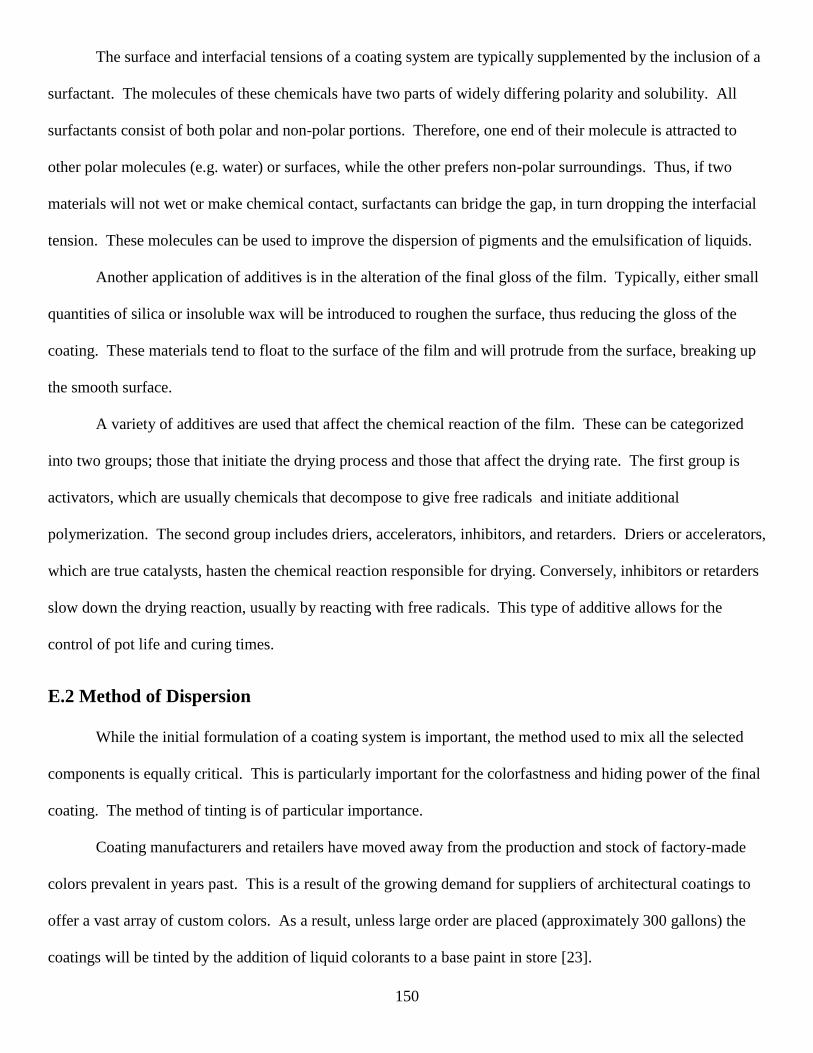
150
The surface and interfacial tensions of a coating system are typically supplemented by the inclusion of a
surfactant. The molecules of these chemicals have two parts of widely differing polarity and solubility. All
surfactants consist of both polar and non-polar portions. Therefore, one end of their molecule is attracted to
other polar molecules (e.g. water) or surfaces, while the other prefers non-polar surroundings. Thus, if two
materials will not wet or make chemical contact, surfactants can bridge the gap, in turn dropping the interfacial
tension. These molecules can be used to improve the dispersion of pigments and the emulsification of liquids.
Another application of additives is in the alteration of the final gloss of the film. Typically, either small
quantities of silica or insoluble wax will be introduced to roughen the surface, thus reducing the gloss of the
coating. These materials tend to float to the surface of the film and will protrude from the surface, breaking up
the smooth surface.
A variety of additives are used that affect the chemical reaction of the film. These can be categorized
into two groups; those that initiate the drying process and those that affect the drying rate. The first group is
activators, which are usually chemicals that decompose to give free radicals and initiate additional
polymerization. The second group includes driers, accelerators, inhibitors, and retarders. Driers or accelerators,
which are true catalysts, hasten the chemical reaction responsible for drying. Conversely, inhibitors or retarders
slow down the drying reaction, usually by reacting with free radicals. This type of additive allows for the
control of pot life and curing times.
E.2 Method of Dispersion
While the initial formulation of a coating system is important, the method used to mix all the selected
components is equally critical. This is particularly important for the colorfastness and hiding power of the final
coating. The method of tinting is of particular importance.
Coating manufacturers and retailers have moved away from the production and stock of factory-made
colors prevalent in years past. This is a result of the growing demand for suppliers of architectural coatings to
offer a vast array of custom colors. As a result, unless large order are placed (approximately 300 gallons) the
coatings will be tinted by the addition of liquid colorants to a base paint in store [23].
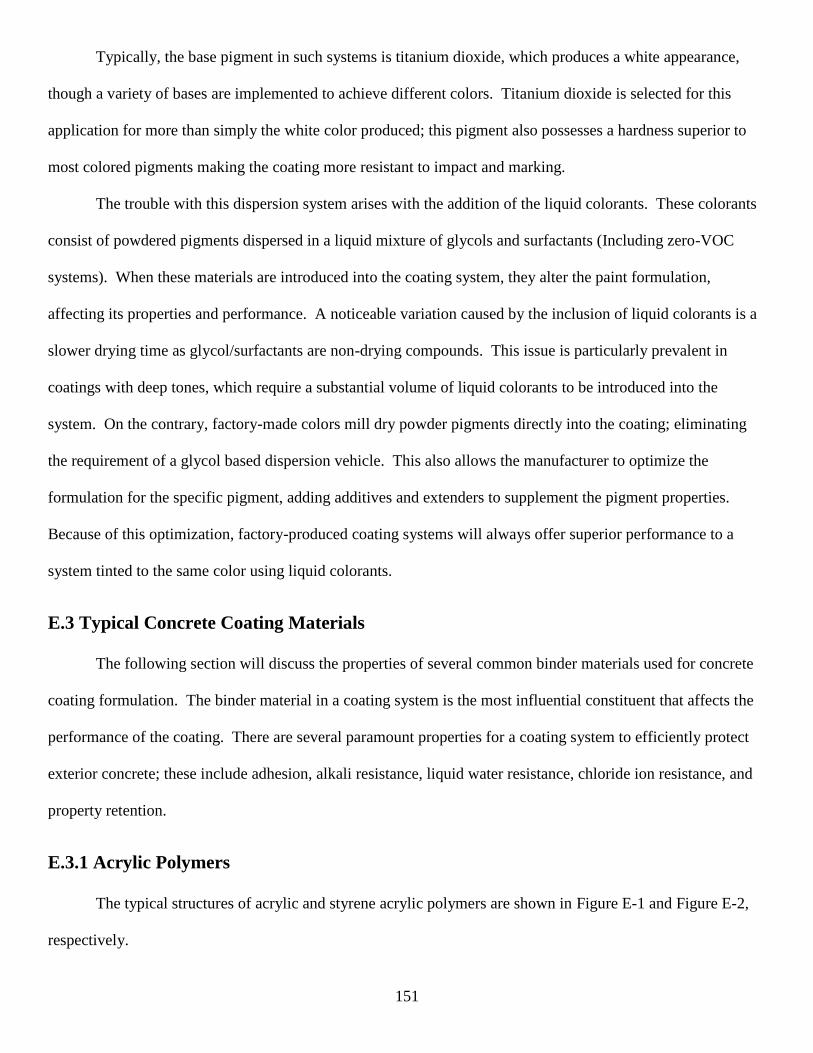
151
Typically, the base pigment in such systems is titanium dioxide, which produces a white appearance,
though a variety of bases are implemented to achieve different colors. Titanium dioxide is selected for this
application for more than simply the white color produced; this pigment also possesses a hardness superior to
most colored pigments making the coating more resistant to impact and marking.
The trouble with this dispersion system arises with the addition of the liquid colorants. These colorants
consist of powdered pigments dispersed in a liquid mixture of glycols and surfactants (Including zero-VOC
systems). When these materials are introduced into the coating system, they alter the paint formulation,
affecting its properties and performance. A noticeable variation caused by the inclusion of liquid colorants is a
slower drying time as glycol/surfactants are non-drying compounds. This issue is particularly prevalent in
coatings with deep tones, which require a substantial volume of liquid colorants to be introduced into the
system. On the contrary, factory-made colors mill dry powder pigments directly into the coating; eliminating
the requirement of a glycol based dispersion vehicle. This also allows the manufacturer to optimize the
formulation for the specific pigment, adding additives and extenders to supplement the pigment properties.
Because of this optimization, factory-produced coating systems will always offer superior performance to a
system tinted to the same color using liquid colorants.
E.3 Typical Concrete Coating Materials
The following section will discuss the properties of several common binder materials used for concrete
coating formulation. The binder material in a coating system is the most influential constituent that affects the
performance of the coating. There are several paramount properties for a coating system to efficiently protect
exterior concrete; these include adhesion, alkali resistance, liquid water resistance, chloride ion resistance, and
property retention.
E.3.1 Acrylic Polymers
The typical structures of acrylic and styrene acrylic polymers are shown in Figure E-1 and Figure E-2,
respectively.
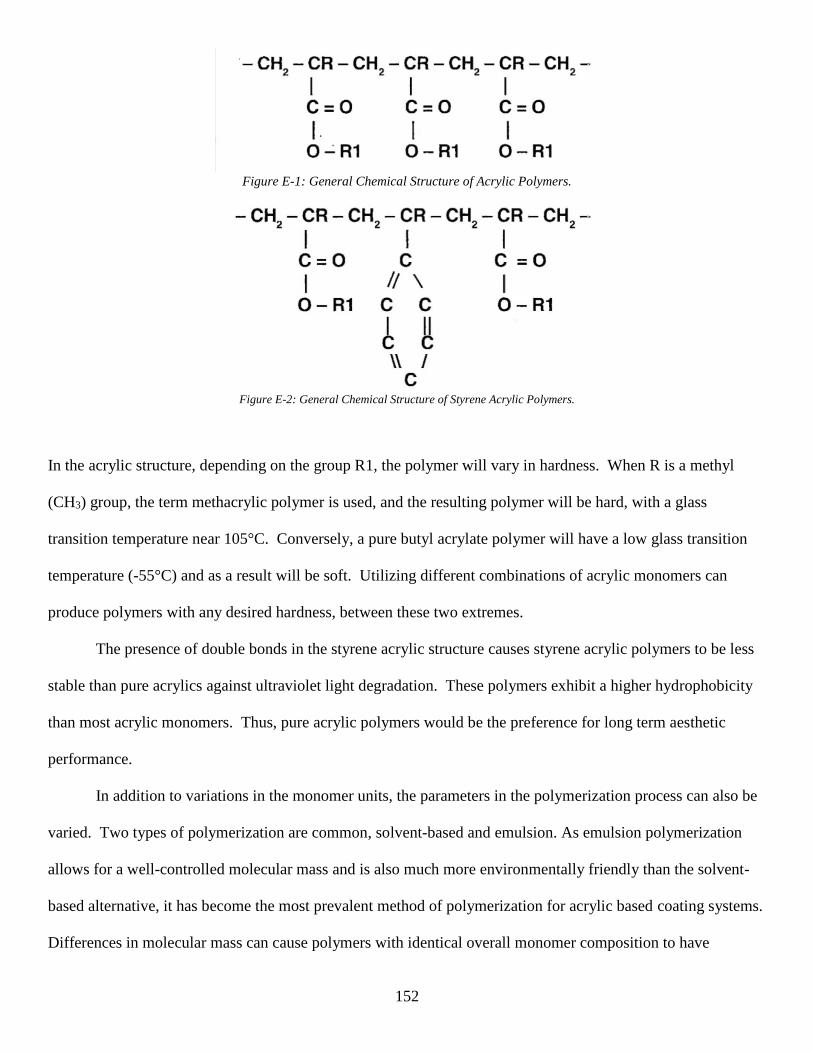
152
Figure E-1: General Chemical Structure of Acrylic Polymers.
Figure E-2: General Chemical Structure of Styrene Acrylic Polymers.
In the acrylic structure, depending on the group R1, the polymer will vary in hardness. When R is a methyl
(CH3) group, the term methacrylic polymer is used, and the resulting polymer will be hard, with a glass
transition temperature near 105°C. Conversely, a pure butyl acrylate polymer will have a low glass transition
temperature (-55°C) and as a result will be soft. Utilizing different combinations of acrylic monomers can
produce polymers with any desired hardness, between these two extremes.
The presence of double bonds in the styrene acrylic structure causes styrene acrylic polymers to be less
stable than pure acrylics against ultraviolet light degradation. These polymers exhibit a higher hydrophobicity
than most acrylic monomers. Thus, pure acrylic polymers would be the preference for long term aesthetic
performance.
In addition to variations in the monomer units, the parameters in the polymerization process can also be
varied. Two types of polymerization are common, solvent-based and emulsion. As emulsion polymerization
allows for a well-controlled molecular mass and is also much more environmentally friendly than the solvent-
based alternative, it has become the most prevalent method of polymerization for acrylic based coating systems.
Differences in molecular mass can cause polymers with identical overall monomer composition to have
153
drastically different performance characteristics. Polymers with a very high molecular mass (order of 106 or
greater) are favorable for durability and toughness, whereas those with a low molecular mass (order of 104) are
used for the development of adhesives.
It has been observed that harder acrylic polymers provided a better barrier against carbon dioxide.
However, harder polymers may not have sufficient flexibility at low temperatures, and cracks may develop due
to thermal movements of the concrete substrate. Traditionally, softer acrylic polymers had poor “dirt pick-up”
resistance, but advances in polymer technology have produced soft polymers with good “dirt pick-up”
resistance through cross linking of the surface when subjected to daylight.
Acrylic polymers have a strong resistance to mild alkalis, but generally should not be applied directly to
fresh concrete. For consistent long term performance, the concrete should be allowed to cure for at least 28
days prior to the application of the coating, the exception being curing membranes that are applied to freshly
cast concrete to slow the rate of water evaporation. These membranes can serve as the base coat of the aesthetic
coating system.
Acrylic polymers exhibit good adhesion properties, even to old concrete, but are not designed to
reinforce spalling concrete. Therefore, unsound concrete must be power washed to remove loose material and
resurfacing may be required prior to coating application. Solvent-based acrylic polymers are capable of
achieving the deepest penetration into the substrate, followed by ultrafine emulsion polymers, with conventional
emulsion polymers yielding the least substrate penetration.
A favorable balance of water vapor permeability and carbon dioxide diffusion resistance is exhibited by
pure acrylic emulsion polymers. When applied to dimensionally stable concrete structures, acrylic paint will
provide adequate protection against carbonization, but carbonization will no longer be retarded if cracks
develop in the coating and substrate. However, some acrylic polymers are specifically formulated to bridge
cracks in the substrate and maintain carbon dioxide protection. The crack width that can be bridged is
proportional to the thickness of the film, and thus such coating systems typically are applied at significantly
higher thicknesses than those not specifically designed to bridge cracks.

154
With proper application and formulation, acrylic emulsion based coatings can also provide structural
concrete with protection from the ingress of chloride ions, that can deteriorate the reinforcing steel. However,
with improper application (specifically if the primer is not used) certain acrylic paints have been shown to have
a resistance to chloride ingress worse than that of unprotected concrete. This is the result of the coating acting
as a selective permeable membrane, allowing chloride ions to pass through into the concrete but not allowing
them to diffuse back through the acrylic film.
E.3.2 Epoxy Resins
Epoxy resins have a long history of implementation for the protection of concrete structures, and
continuous advancements have been made to adapt to changes in environmental regulations and performance
requirements. Generally, epoxy coatings are considered synonymous with structural longevity and high
performance construction, with much higher prevalence in areas with strong regulations and high performance
specifications throughout the world.
Epoxy resins contain one or more reactive epoxy groups. The most commercially important epoxy resins
are the result of the condensation of epichlorohydrin and bisphenol-A (and/or bisphenol-F). The resulting
glycidyl ethers vary in molecular mass depending on the equivalents of epichlorohydrin and bisphenol used in
the condensation reaction. Liquid epoxy resins with relatively low molecular weights (approximately 380) are
available from this reaction, which are implemented free of solvents. Although more commonly used to protect
steel structures for marine and heavy duty applications, higher condensate resins of molecular mass 760 or
higher are advantageous in the coatings industry.
Additional to the aforementioned resinous materials, another class of epoxy functional material is
extremely useful in the protection of concrete—reactive diluents. These diluents are implemented to modify the
above epoxy resins to produce systems with appropriate viscosities for in-situ conditions. Such materials are
formed through the condensation reaction of epichlorohydrin with alcohols and glycols. The most commonly
used reactive diluents are alkyl glycidyl ether and hexaediol diglycidyl ether. Both of these materials help to
reduce the viscosity of the epoxy resin, which helps to improve the wetting of pigments and fillers. The
155
primary epoxy resin used in civil engineering applications is a mixed bisphenol-A/bisphenol-B resin modified
with an alkyl glycidyl ether.
Numerous reactions can occur within an epoxy functional group, typically consisting of an additional
co-reactant to the epoxy group with concomitant hydroxyl group formation, without any elimination of by-
products. For cold cure surface protection of concrete, the principal reactions are those involving the addition
of amines and mercapatans to low viscosity liquid resins. To optimize the properties of the polymer produced
from amine reactions, two conditions must be met:
1:1 reaction of epoxy groups with active hydrogen to form a polymer
The addition reaction should be able to approach 100% conversion
The active hydrogen will continue to react with the epoxy group at a given ambient temperature until the
glass transition temperature of the developing polymer reaches, or exceeds, that temperature. At this instant, the
mobility within the polymer network becomes negligible, halting polymerization. For unmodified amines, this
point occurs at a relatively low conversion of active hydrogen, resulting in a polymer with a low cross-link
density and a high content of free amine and epoxy groups. With the exception of polyaminoamides and
Mannich bases, which have internal plasticization allowing the reaction to proceed, the utilized amines will
need to be modified to achieve higher conversion rates. When modified, amines are capable of high conversion
rate reactions at temperatures as low as 40 F°, but the rate of reaction becomes slothful. In cold curing
conditions, the amine-epoxy reaction rate must be increased by implementing highly reactive, basic amines;
tertiary amines; or certain organic acids.
The main issues with epoxy systems on site are caused by the effects of water and/or carbon dioxide on the
curing polymer. These effects lead to surface defects on curing films, lower chemical resistance and
mechanical strength, and/or poor wet surface adhesion. These defects are caused by an irreversible reaction
between water and carbon dioxide in the form of carbonic acid with the amine species. Such reactions are faster
than the desired amine-epoxy reaction, especially at low temperatures and when the amine is very basic. The
simplest effect of this side-reaction is the consumption of reactive amine, leading to a non-equivalence, and thus
the incomplete curing of the polymer.
156
The flexibility of coating systems is pivotal to protecting concrete, where movement and cracking is
expected in the substrate. Maintaining coating integrity over a limited range of movement is necessary, but
excessive flexibility may mask structural defects and excessive movement. In order to achieve adequate
flexibly in epoxy systems, specific curing agents must be implemented. These flexible curing agents produce a
coating with lower chemical resistance than a standard epoxy system. Thus, in applications where high
chemical resistance is required, a multi-layer system is typically implemented with a flexible epoxy base coat
protected by a standard epoxy top coat.
As mentioned in the discussion of flexibility, the curing agent will determine the chemical resistance of a
particular epoxy resin-curing agent combination. In general, more reactive basic amines and their derivatives
will provide lower chemical resistance against acids, while slow reacting amines have a tendency for poor
solvent resistance.
Great strides have been made in epoxy technology, curing agents in particular, since first conception, and in
turn the breadth of suitable applications of this polymer binder. Epoxy systems, when properly formulated and
applied, provide concrete structures with long lasting protection while reducing the frequency of maintenance.
E.3.3 Polyurethanes
Polyurethanes are the most versatile class of polymers. They are used in a variety of forms and in many
different market sectors. The exceptional ability of polyurethanes to be manipulated both chemically and
mechanically, allowing for an almost infinite variety of properties and the use of many different manufacturing
techniques, sets them apart from other polymers. This section will focus on the forms of polyurethanes
typically used for coating applications and the chemistry behind their formulation will be discussed.
A discussion on polyurethanes would not be complete without discussing, in at least some detail, the
chemistry of the many available varieties. This understanding will lead to a more informed choice of product to
fit any application. The aforementioned variety of properties means that there is much to be discussed on this
subject.
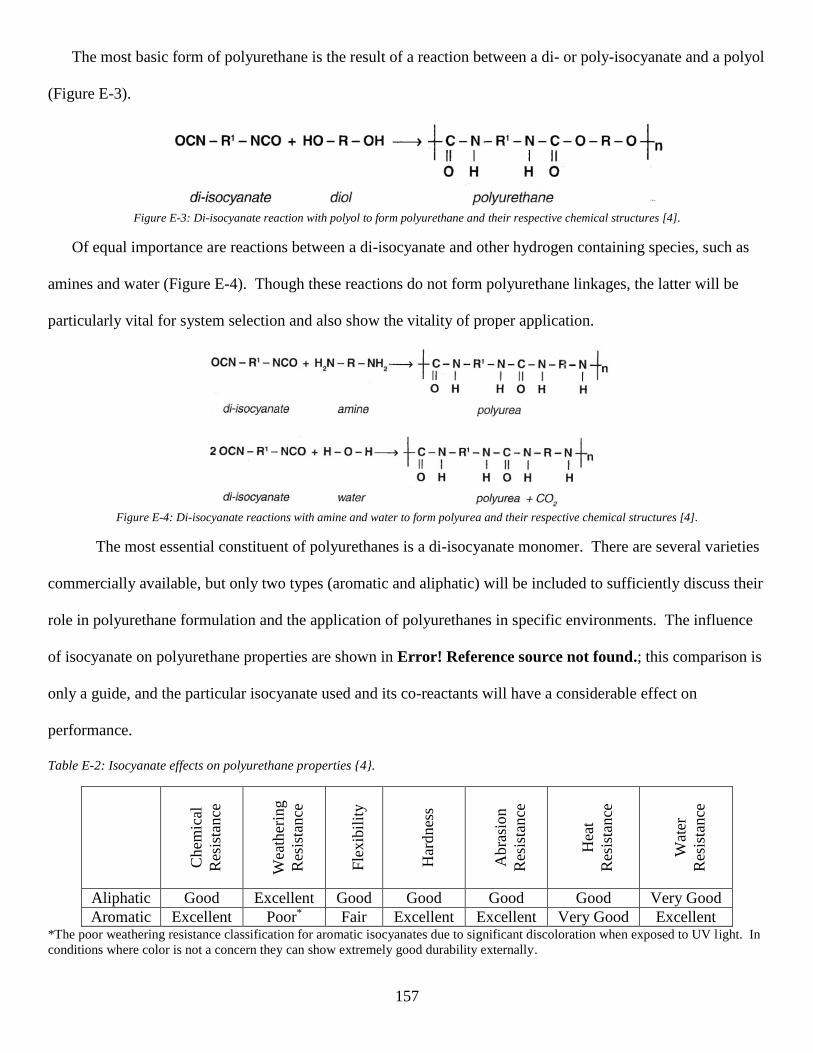
157
The most basic form of polyurethane is the result of a reaction between a di- or poly-isocyanate and a polyol
(Figure E-3).
Figure E-3: Di-isocyanate reaction with polyol to form polyurethane and their respective chemical structures [4].
Of equal importance are reactions between a di-isocyanate and other hydrogen containing species, such as
amines and water (Figure E-4). Though these reactions do not form polyurethane linkages, the latter will be
particularly vital for system selection and also show the vitality of proper application.
Figure E-4: Di-isocyanate reactions with amine and water to form polyurea and their respective chemical structures [4].
The most essential constituent of polyurethanes is a di-isocyanate monomer. There are several varieties
commercially available, but only two types (aromatic and aliphatic) will be included to sufficiently discuss their
role in polyurethane formulation and the application of polyurethanes in specific environments. The influence
of isocyanate on polyurethane properties are shown in Error! Reference source not found.; this comparison is
only a guide, and the particular isocyanate used and its co-reactants will have a considerable effect on
performance.
Table E-2: Isocyanate effects on polyurethane properties {4}.
Chem
ical
Res
ista
nce
Wea
ther
ing
Res
ista
nce
Fle
xib
ilit
y
Har
dnes
s
Abra
sion
Res
ista
nce
Hea
t
Res
ista
nce
Wat
er
Res
ista
nce
Aliphatic Good Excellent Good Good Good Good Very Good
Aromatic Excellent Poor* Fair Excellent Excellent Very Good Excellent *The poor weathering resistance classification for aromatic isocyanates due to significant discoloration when exposed to UV light. In
conditions where color is not a concern they can show extremely good durability externally.
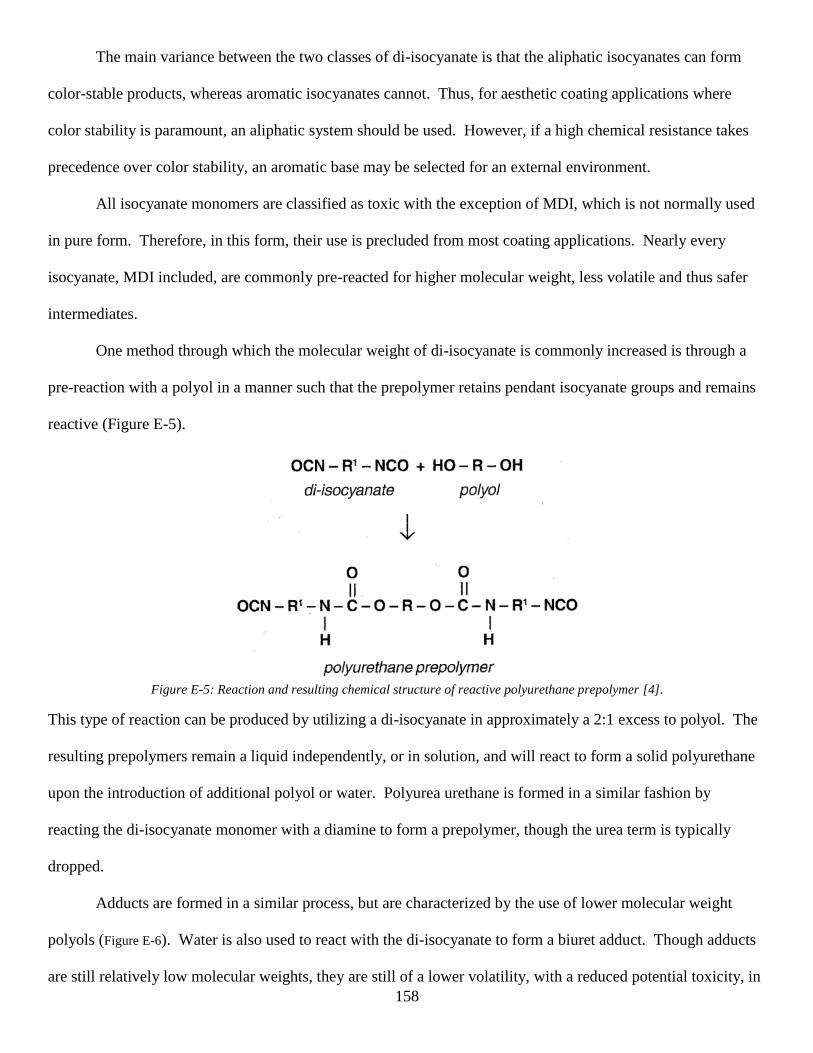
158
The main variance between the two classes of di-isocyanate is that the aliphatic isocyanates can form
color-stable products, whereas aromatic isocyanates cannot. Thus, for aesthetic coating applications where
color stability is paramount, an aliphatic system should be used. However, if a high chemical resistance takes
precedence over color stability, an aromatic base may be selected for an external environment.
All isocyanate monomers are classified as toxic with the exception of MDI, which is not normally used
in pure form. Therefore, in this form, their use is precluded from most coating applications. Nearly every
isocyanate, MDI included, are commonly pre-reacted for higher molecular weight, less volatile and thus safer
intermediates.
One method through which the molecular weight of di-isocyanate is commonly increased is through a
pre-reaction with a polyol in a manner such that the prepolymer retains pendant isocyanate groups and remains
reactive (Figure E-5).
Figure E-5: Reaction and resulting chemical structure of reactive polyurethane prepolymer [4].
This type of reaction can be produced by utilizing a di-isocyanate in approximately a 2:1 excess to polyol. The
resulting prepolymers remain a liquid independently, or in solution, and will react to form a solid polyurethane
upon the introduction of additional polyol or water. Polyurea urethane is formed in a similar fashion by
reacting the di-isocyanate monomer with a diamine to form a prepolymer, though the urea term is typically
dropped.
Adducts are formed in a similar process, but are characterized by the use of lower molecular weight
polyols (Figure E-6). Water is also used to react with the di-isocyanate to form a biuret adduct. Though adducts
are still relatively low molecular weights, they are still of a lower volatility, with a reduced potential toxicity, in
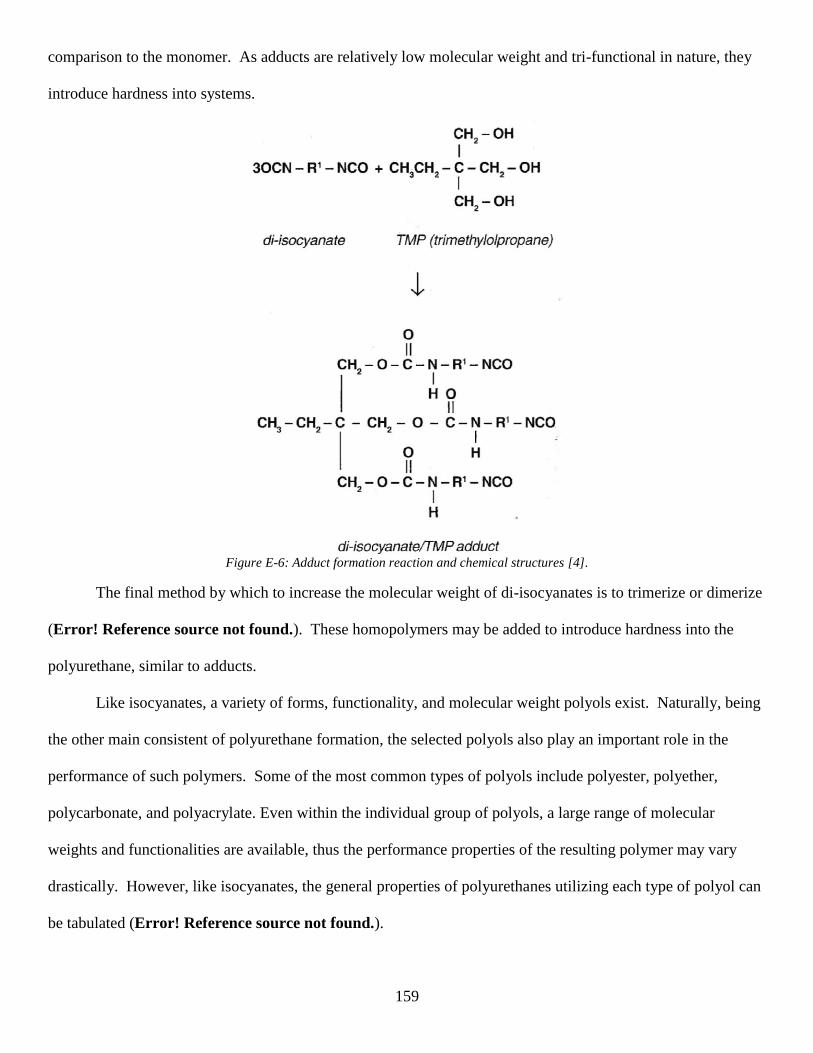
159
comparison to the monomer. As adducts are relatively low molecular weight and tri-functional in nature, they
introduce hardness into systems.
Figure E-6: Adduct formation reaction and chemical structures [4].
The final method by which to increase the molecular weight of di-isocyanates is to trimerize or dimerize
(Error! Reference source not found.). These homopolymers may be added to introduce hardness into the
polyurethane, similar to adducts.
Like isocyanates, a variety of forms, functionality, and molecular weight polyols exist. Naturally, being
the other main consistent of polyurethane formation, the selected polyols also play an important role in the
performance of such polymers. Some of the most common types of polyols include polyester, polyether,
polycarbonate, and polyacrylate. Even within the individual group of polyols, a large range of molecular
weights and functionalities are available, thus the performance properties of the resulting polymer may vary
drastically. However, like isocyanates, the general properties of polyurethanes utilizing each type of polyol can
be tabulated (Error! Reference source not found.).
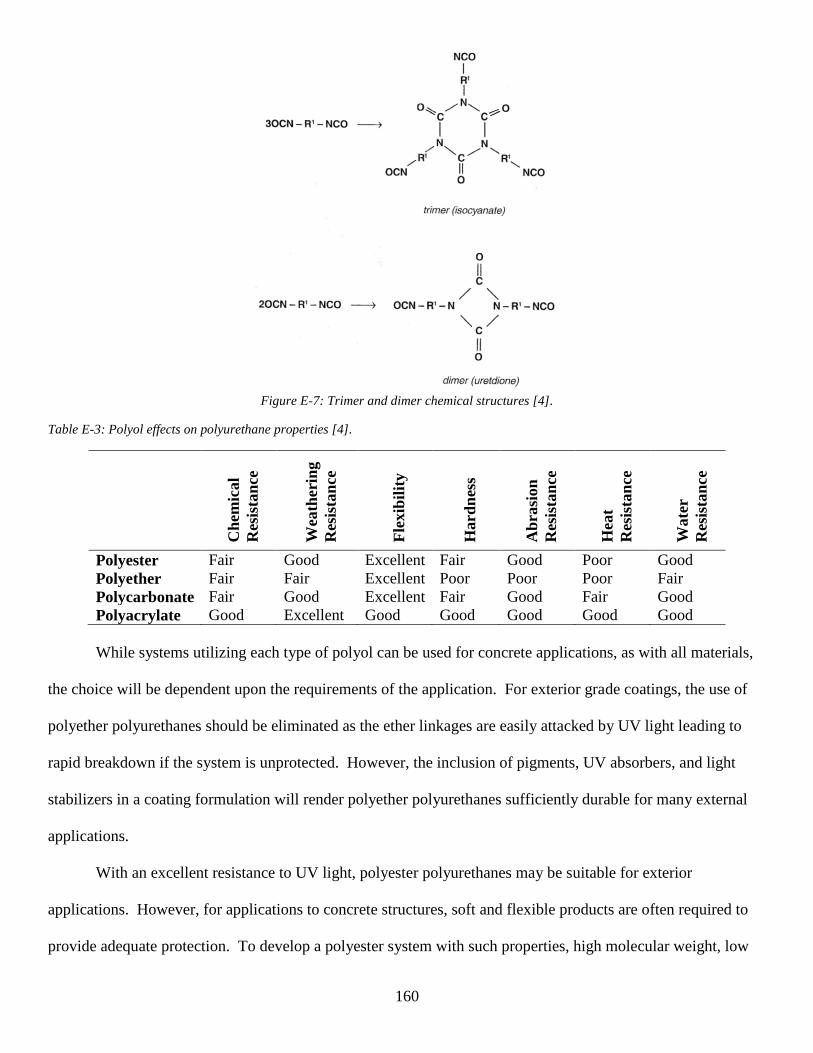
160
Figure E-7: Trimer and dimer chemical structures [4].
Table E-3: Polyol effects on polyurethane properties [4].
Ch
emic
al
Res
ista
nce
Wea
ther
ing
Res
ista
nce
Fle
xib
ilit
y
Hard
nes
s
Ab
rasi
on
Res
ista
nce
Hea
t
Res
ista
nce
Wate
r
Res
ista
nce
Polyester Fair Good Excellent Fair Good Poor Good
Polyether Fair Fair Excellent Poor Poor Poor Fair
Polycarbonate Fair Good Excellent Fair Good Fair Good
Polyacrylate Good Excellent Good Good Good Good Good
While systems utilizing each type of polyol can be used for concrete applications, as with all materials,
the choice will be dependent upon the requirements of the application. For exterior grade coatings, the use of
polyether polyurethanes should be eliminated as the ether linkages are easily attacked by UV light leading to
rapid breakdown if the system is unprotected. However, the inclusion of pigments, UV absorbers, and light
stabilizers in a coating formulation will render polyether polyurethanes sufficiently durable for many external
applications.
With an excellent resistance to UV light, polyester polyurethanes may be suitable for exterior
applications. However, for applications to concrete structures, soft and flexible products are often required to
provide adequate protection. To develop a polyester system with such properties, high molecular weight, low
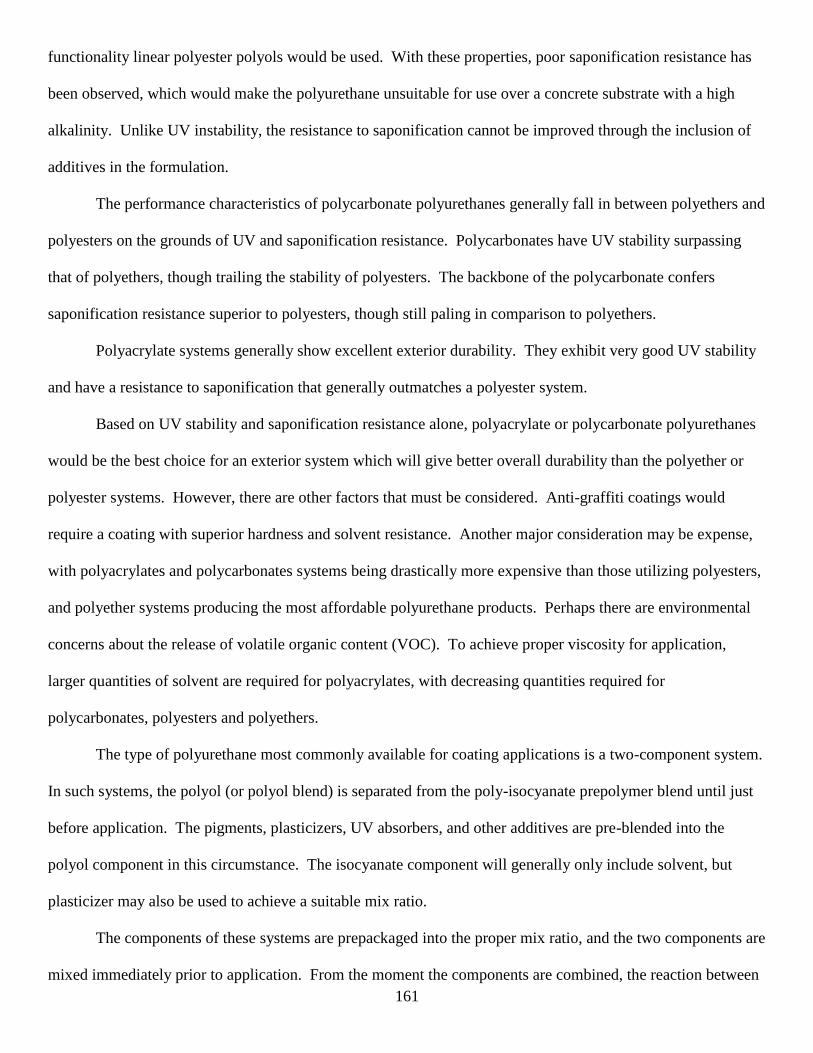
161
functionality linear polyester polyols would be used. With these properties, poor saponification resistance has
been observed, which would make the polyurethane unsuitable for use over a concrete substrate with a high
alkalinity. Unlike UV instability, the resistance to saponification cannot be improved through the inclusion of
additives in the formulation.
The performance characteristics of polycarbonate polyurethanes generally fall in between polyethers and
polyesters on the grounds of UV and saponification resistance. Polycarbonates have UV stability surpassing
that of polyethers, though trailing the stability of polyesters. The backbone of the polycarbonate confers
saponification resistance superior to polyesters, though still paling in comparison to polyethers.
Polyacrylate systems generally show excellent exterior durability. They exhibit very good UV stability
and have a resistance to saponification that generally outmatches a polyester system.
Based on UV stability and saponification resistance alone, polyacrylate or polycarbonate polyurethanes
would be the best choice for an exterior system which will give better overall durability than the polyether or
polyester systems. However, there are other factors that must be considered. Anti-graffiti coatings would
require a coating with superior hardness and solvent resistance. Another major consideration may be expense,
with polyacrylates and polycarbonates systems being drastically more expensive than those utilizing polyesters,
and polyether systems producing the most affordable polyurethane products. Perhaps there are environmental
concerns about the release of volatile organic content (VOC). To achieve proper viscosity for application,
larger quantities of solvent are required for polyacrylates, with decreasing quantities required for
polycarbonates, polyesters and polyethers.
The type of polyurethane most commonly available for coating applications is a two-component system.
In such systems, the polyol (or polyol blend) is separated from the poly-isocyanate prepolymer blend until just
before application. The pigments, plasticizers, UV absorbers, and other additives are pre-blended into the
polyol component in this circumstance. The isocyanate component will generally only include solvent, but
plasticizer may also be used to achieve a suitable mix ratio.
The components of these systems are prepackaged into the proper mix ratio, and the two components are
mixed immediately prior to application. From the moment the components are combined, the reaction between
162
polyol and poly-isocyanate will proceed, leading to increased viscosity, limited pot life, and eventual
gelatinization. The same reaction proceeds following application to the substrate. Therefore the main reaction
is:
Polyol + Poly-isocyanate prepolymer Polyurethane
However, the other components included in the formulation will inevitably contain some water. As
previously discussed, water will also react with the poly-isocyanate in a competing reaction if the components
are not pre-dried. This condition is compounded upon application to the substrate as the isocyanate can now
also react with moisture in both the atmosphere and substrate. The presence of moisture allows the following
reaction to proceed:
Poly-isocyanate prepolymer + H2O Polyurethane + CO2
As the reaction proceeds on the substrate, the viscosity of the system will increase, causing the
molecular mobility of the system to reduce. This will inhibit contact between the isocyanate groups and
hydroxyl groups, slowing the reaction. The extent of the reaction between these two groups is also dependent
on the atmospheric conditions during application, predominately humidity. The higher the level of atmospheric
moisture, the greater the proportion of isocyanate that will react with water. This dependence on atmospheric
and substrate conditions will result in variability in both performance and appearance of the polyurethane
coating. Applications in high humidity will reduce cross-linking between the polyol and poly-isocyanate, thus
altering the mechanical properties and weathering capabilities. As the contribution of the isocyanate reaction
with water increases, down-glossing of the finished film may occur and, in extreme cases, bubbles and pinholes
will form from the release of carbon dioxide gas.
The side reaction from the two-component system mentioned earlier can be utilized to fully cross-link
poly-isocyanates to form a solid film; this type of polyurethane system is known as moisture cured. Systems of
this type are more difficult to manufacture, as they often require the pre-drying of any additives to prevent the
isocyanate reaction with water and subsequent CO2 release and viscosity increase. The advantage of this type
of system is the ability to be packaged as a single component system, which only requires application to the
substrate.
163
While moisture cure systems can still be formulated with a wide variety of property profiles depending
upon the choice of raw materials, there are several limitations, most notably their moisture sensitivity. The
curing and quality of this type of polyurethane system is deeply dependent upon atmospheric humidity during
application. If relative humidity during application exceeds 80%, the film formation will occur too rapidly to
allow for the release of the generated CO2, trapping the gas in the film. Conversely, if the relative humidity is
low (less than 45%) during application, the curing time will be slow, and if humidity is low enough, the rate of
curing will be unacceptably slow. Furthermore, due to the release of gas during curing, the maximum film
build of the system is limited. Though formulation will affect the achievable build, too high of a build will
assuredly result in the formation of bubbles as the CO2 is unable to discharge through the forming film.
The convenience of a single pack system can however be obtained without a drastic dependence on
application conditions. The solution to this is the inclusion of a latent hardener to produce a moisture triggered
system. These systems utilize a latent hardener that reacts with atmospheric moisture. The resulting activated
hardener will subsequently react with the poly-isocyanate. Oxazolidines are typically used as latent hardeners
in this type of polyurethane system, with bis-oxazolidines being the most common.
As the moisture triggered systems still contain poly-isocyanate, the potential of direct reaction with
atmospheric moisture remains. However, when the reaction rates are considered, such a reaction is most likely
insignificant. The first reaction between the oxazolidine and water proceeds quickly to form a hydroxyl and a
functional amine, but is reversible. However, the reaction between the subsequently formed amine and
isocyanate, allowing the formation of urea to link, is very fast, thus the initial reaction quickly moves towards
completion. The reaction rates of poly-isocyanate with water and the newly formed hydroxyl groups have a
similar rate, but as a significant portion of the isocyanate has reacted with the formed amine, less isocyanate is
available to react with water regardless of application conditions. Due to the nature of these reactions, moisture
triggered systems will experience excellent curing with relative humidity in excess of 30%; such systems are
even capable of curing underwater as the formation of CO2 gas is retarded via the amine-isocyanate reaction.
Another advantage of moisture triggered systems is a significant reduction in the solvent requirement as
oxazolidines are low viscosity species. Systems of this type are available with as little as 5% solvent by weight.
164
Though bis-oxazolidines are most common, ester and carbonate linked oxazolidines are also available with even
lower viscosities and can reduce the amount of VOC even further.
Oxazolidines can react with isocyanates themselves and therefore, to produce stable products, only less
reactive isocyanates may be used in combination with oxazolidines. Aromatic systems are generally not stable
with oxazolidine, therefore all moisture triggered polyurethane systems available on the market are aliphatic in
nature and suitable for exterior applications, provided they are otherwise formulated correctly.
Stemming from the moisture triggered polyurethane systems is yet another form that utilizes polyamines
in place of polyol. These polyurea systems are becoming increasingly common two-component systems.
However, as mentioned earlier the reactions between amines and isocyanates proceed extremely rapidly, with
gel times less than a few seconds. With such a rapid reaction speed, these systems cannot be premixed, but
must be applied using specialized plural component spray equipment. Despite the demands of application,
these systems are growing in popularity for concrete applications due to their rapid curing times even under
severe conditions.
The aforementioned polyurethane systems were all solvent based, but with growing awareness of
environmental impacts, water-based systems are becoming more prevalent, and they also allow for a simplified
cleaning procedure. While the properties of these systems are slightly more limited than their solvent-based
counterparts, a wide range of properties are still achievable when utilizing polyurethane dispersion systems
(PUDs). As with solvent-based systems, the first stage is the formation of a prepolymer, at which point many of
the finished product properties are introduced. The bulk of commercially available PUDs are aliphatic
isocyanate based, as they are less reactive with water during production, but aromatic systems are also
available. PUDs are manufactured in a similar fashion to other water-based dispersion/emulsion coatings.
However, often solvents required for formulation prior to dispersion are still present, but there are a growing
number of solvent-free PUDs becoming available. As with all water-based systems, there are more severe
application limitations. However, with proper application conditions, excellent performance properties can be
achieved. Currently these water-based polyurethane systems have a limited market share as other water-borne
emulsion systems, acrylics specifically, tend to be more cost efficient.
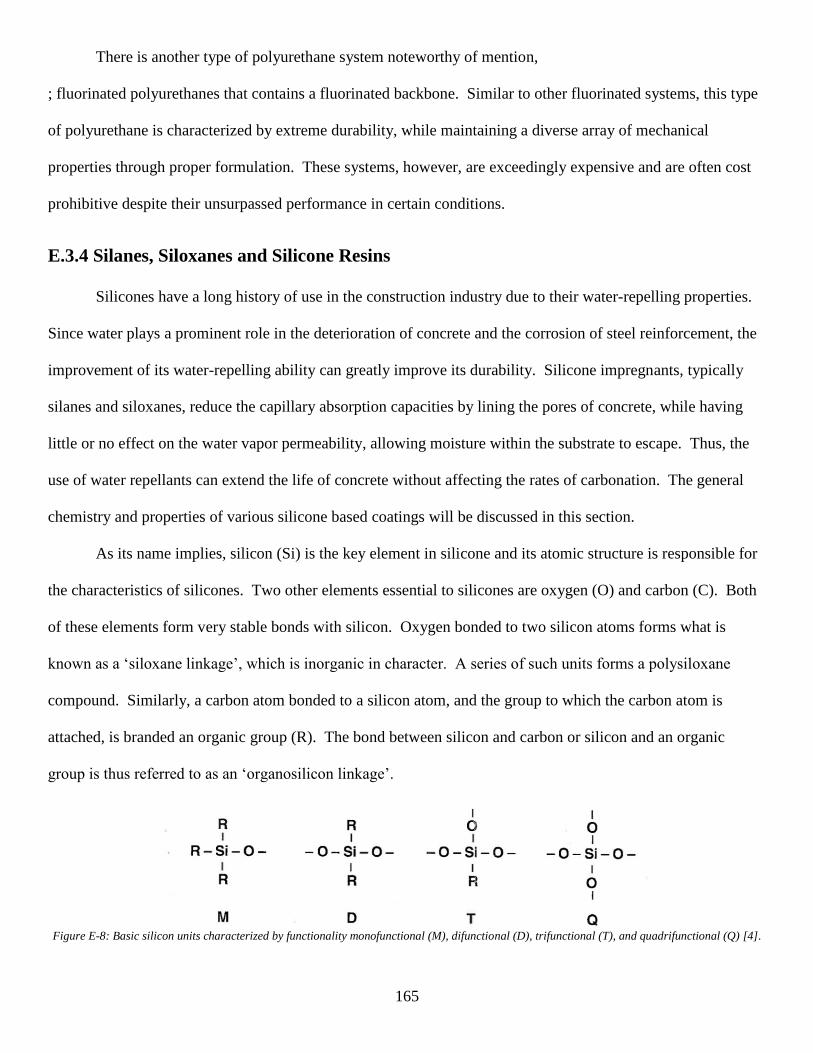
165
There is another type of polyurethane system noteworthy of mention,
; fluorinated polyurethanes that contains a fluorinated backbone. Similar to other fluorinated systems, this type
of polyurethane is characterized by extreme durability, while maintaining a diverse array of mechanical
properties through proper formulation. These systems, however, are exceedingly expensive and are often cost
prohibitive despite their unsurpassed performance in certain conditions.
E.3.4 Silanes, Siloxanes and Silicone Resins
Silicones have a long history of use in the construction industry due to their water-repelling properties.
Since water plays a prominent role in the deterioration of concrete and the corrosion of steel reinforcement, the
improvement of its water-repelling ability can greatly improve its durability. Silicone impregnants, typically
silanes and siloxanes, reduce the capillary absorption capacities by lining the pores of concrete, while having
little or no effect on the water vapor permeability, allowing moisture within the substrate to escape. Thus, the
use of water repellants can extend the life of concrete without affecting the rates of carbonation. The general
chemistry and properties of various silicone based coatings will be discussed in this section.
As its name implies, silicon (Si) is the key element in silicone and its atomic structure is responsible for
the characteristics of silicones. Two other elements essential to silicones are oxygen (O) and carbon (C). Both
of these elements form very stable bonds with silicon. Oxygen bonded to two silicon atoms forms what is
known as a ‘siloxane linkage’, which is inorganic in character. A series of such units forms a polysiloxane
compound. Similarly, a carbon atom bonded to a silicon atom, and the group to which the carbon atom is
attached, is branded an organic group (R). The bond between silicon and carbon or silicon and an organic
group is thus referred to as an ‘organosilicon linkage’.
Figure E-8: Basic silicon units characterized by functionality monofunctional (M), difunctional (D), trifunctional (T), and quadrifunctional (Q) [4].
166
The silicone units, shown in Figure E-8, are distinguished by their functionality. Four basic silicon units
exist: monofunctional (M), difunctional (D), trifunctional (T), and quadrifunctional (Q). The three basic types of
silicone; silicone fluid, silicone rubber, silicone resin, and their derivatives, are composed of these units. In
order to be classified as a silicone, silicon atoms, oxygen atoms and organic groups must be present, therefore
only the M, D, and T structures are strictly a silicone. The organic groups in these units, which are usually
hydrophobic, are inert and cannot take part in any cross-linking reactions. As the M unit is only
monofunctional, it can only form the last link in a polymer chain. With two oxygen atoms, the D unit is
difunctional, allowing for the formation of chains and rings. The T unit is the only strictly silicone capable of
forming three-dimensional cross-linked structures, as it is trifunctional. The Q unit, which does not contain any
organosilicon linkages, is also capable of forming three-dimensional cross-linked units. This unit is the basis
for quartz, sand and all organic and inorganic silicates, but is often introduced into silicone as a cross-linking
agent.
The term ‘silane’ in the building industry denotes alkyltrialkoxysilane. This molecule, which is the
simplest silicon T unit, consists of one alkyl side group and three alcohol side groups attached via the oxygen
atom of the hydroxyl group. Silanes are classified according to their attached side groups (methoxysilane has a
methanol side group; methylsilane has a methyl side group, etc.). Silanes are typically transparent, low-
viscosity fluids which incorporate various amounts of bound alcohol. Butylrietoxysilane and
octylriethoxysilane, typically used for water-repellent impregnation of concrete, incorporate 63% and 50%
ethanol by weight, respectively. This bound alcohol is released during the cross-linking reaction on the mineral
substrate that forms a silicone resin network.
With longer side chains, alkylsilanes are more alkali resistant than methylsilanes, and therefore suitable
for the water-repellent treatment of reinforced concrete. Their low viscosity aids the silane in penetrating the
treated substrate. However, they are disadvantageous due to the quantity of bound alcohol and their volatility,
which results in high losses during application. Because of this, alkoxysilanes are typically not diluted before
use. Another disadvantage stems from their monomeric nature, which means there is an extremely long
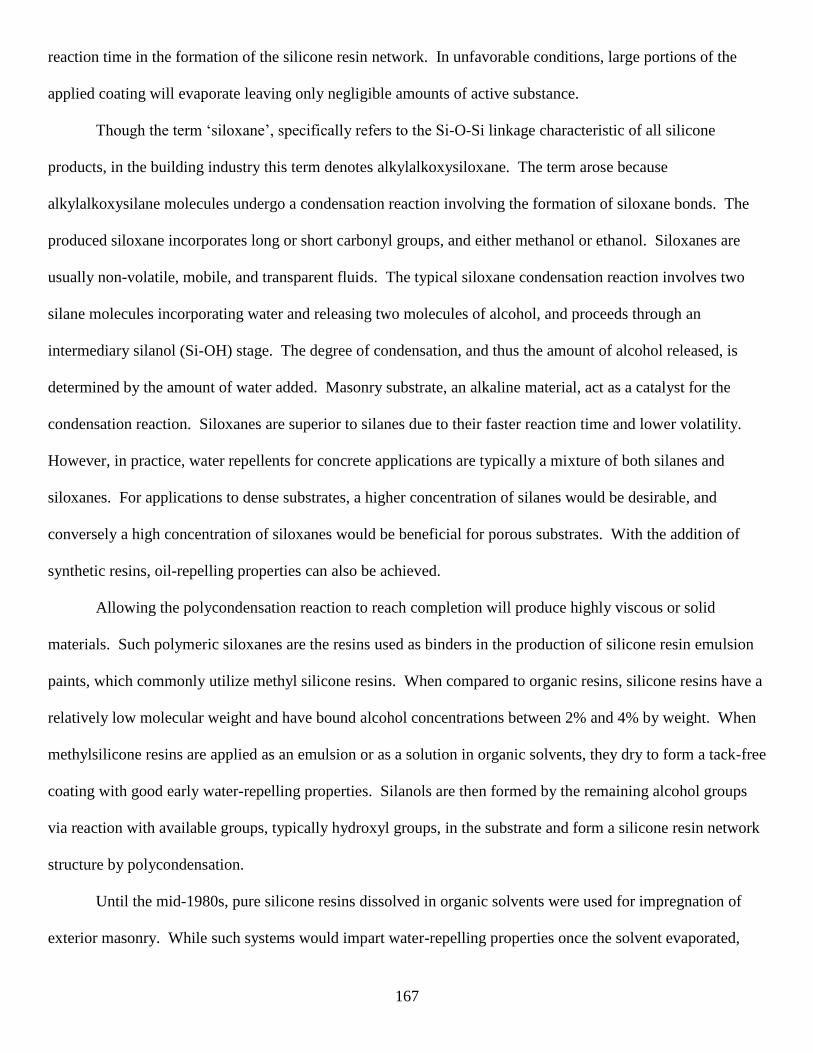
167
reaction time in the formation of the silicone resin network. In unfavorable conditions, large portions of the
applied coating will evaporate leaving only negligible amounts of active substance.
Though the term ‘siloxane’, specifically refers to the Si-O-Si linkage characteristic of all silicone
products, in the building industry this term denotes alkylalkoxysiloxane. The term arose because
alkylalkoxysilane molecules undergo a condensation reaction involving the formation of siloxane bonds. The
produced siloxane incorporates long or short carbonyl groups, and either methanol or ethanol. Siloxanes are
usually non-volatile, mobile, and transparent fluids. The typical siloxane condensation reaction involves two
silane molecules incorporating water and releasing two molecules of alcohol, and proceeds through an
intermediary silanol (Si-OH) stage. The degree of condensation, and thus the amount of alcohol released, is
determined by the amount of water added. Masonry substrate, an alkaline material, act as a catalyst for the
condensation reaction. Siloxanes are superior to silanes due to their faster reaction time and lower volatility.
However, in practice, water repellents for concrete applications are typically a mixture of both silanes and
siloxanes. For applications to dense substrates, a higher concentration of silanes would be desirable, and
conversely a high concentration of siloxanes would be beneficial for porous substrates. With the addition of
synthetic resins, oil-repelling properties can also be achieved.
Allowing the polycondensation reaction to reach completion will produce highly viscous or solid
materials. Such polymeric siloxanes are the resins used as binders in the production of silicone resin emulsion
paints, which commonly utilize methyl silicone resins. When compared to organic resins, silicone resins have a
relatively low molecular weight and have bound alcohol concentrations between 2% and 4% by weight. When
methylsilicone resins are applied as an emulsion or as a solution in organic solvents, they dry to form a tack-free
coating with good early water-repelling properties. Silanols are then formed by the remaining alcohol groups
via reaction with available groups, typically hydroxyl groups, in the substrate and form a silicone resin network
structure by polycondensation.
Until the mid-1980s, pure silicone resins dissolved in organic solvents were used for impregnation of
exterior masonry. While such systems would impart water-repelling properties once the solvent evaporated,
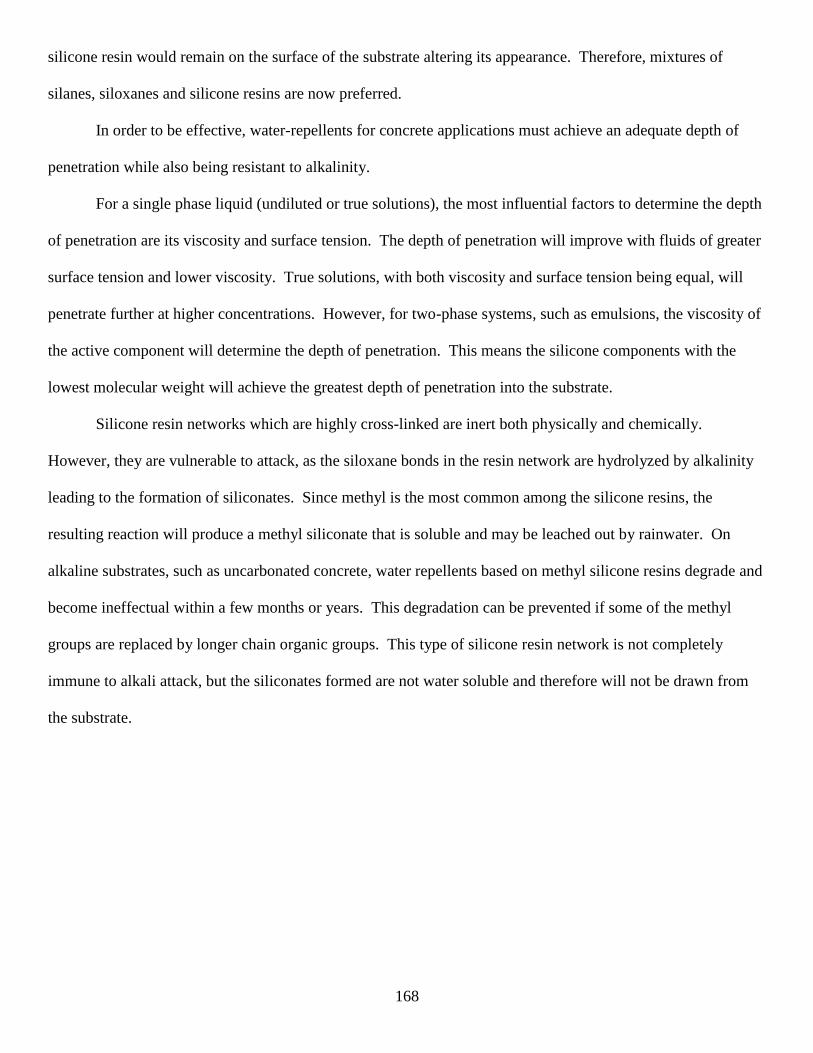
168
silicone resin would remain on the surface of the substrate altering its appearance. Therefore, mixtures of
silanes, siloxanes and silicone resins are now preferred.
In order to be effective, water-repellents for concrete applications must achieve an adequate depth of
penetration while also being resistant to alkalinity.
For a single phase liquid (undiluted or true solutions), the most influential factors to determine the depth
of penetration are its viscosity and surface tension. The depth of penetration will improve with fluids of greater
surface tension and lower viscosity. True solutions, with both viscosity and surface tension being equal, will
penetrate further at higher concentrations. However, for two-phase systems, such as emulsions, the viscosity of
the active component will determine the depth of penetration. This means the silicone components with the
lowest molecular weight will achieve the greatest depth of penetration into the substrate.
Silicone resin networks which are highly cross-linked are inert both physically and chemically.
However, they are vulnerable to attack, as the siloxane bonds in the resin network are hydrolyzed by alkalinity
leading to the formation of siliconates. Since methyl is the most common among the silicone resins, the
resulting reaction will produce a methyl siliconate that is soluble and may be leached out by rainwater. On
alkaline substrates, such as uncarbonated concrete, water repellents based on methyl silicone resins degrade and
become ineffectual within a few months or years. This degradation can be prevented if some of the methyl
groups are replaced by longer chain organic groups. This type of silicone resin network is not completely
immune to alkali attack, but the siliconates formed are not water soluble and therefore will not be drawn from
the substrate.
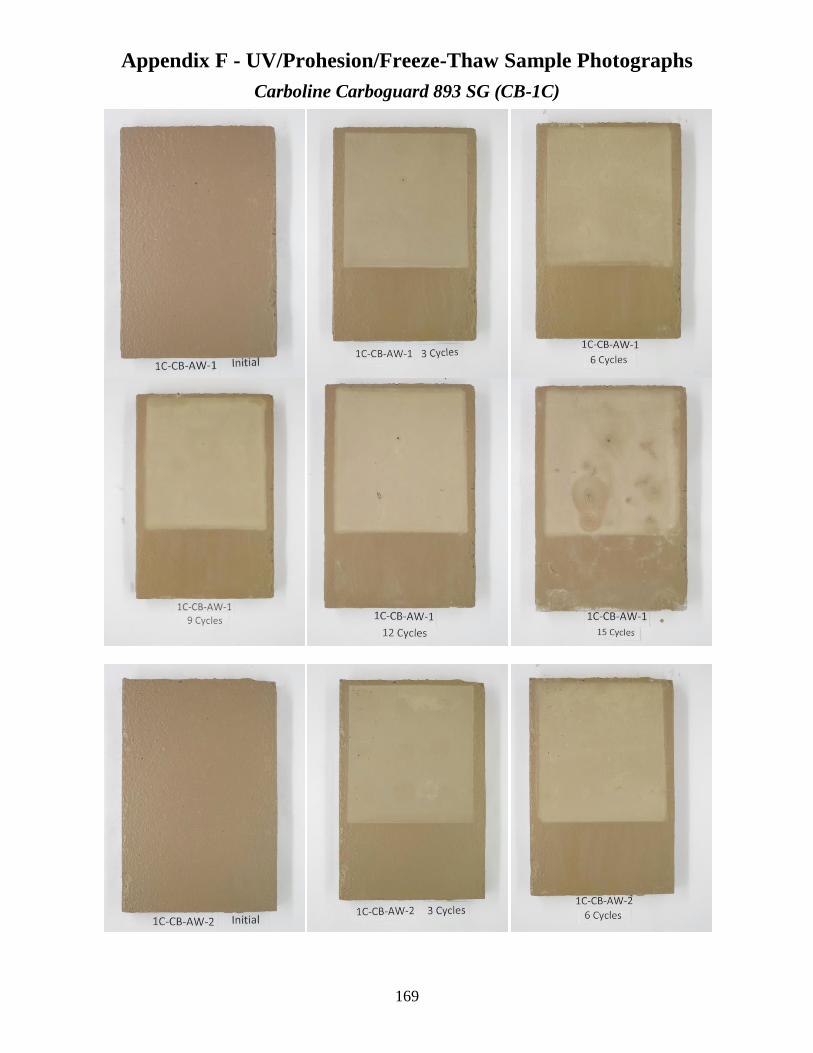
169
Appendix F - UV/Prohesion/Freeze-Thaw Sample Photographs
Carboline Carboguard 893 SG (CB-1C)
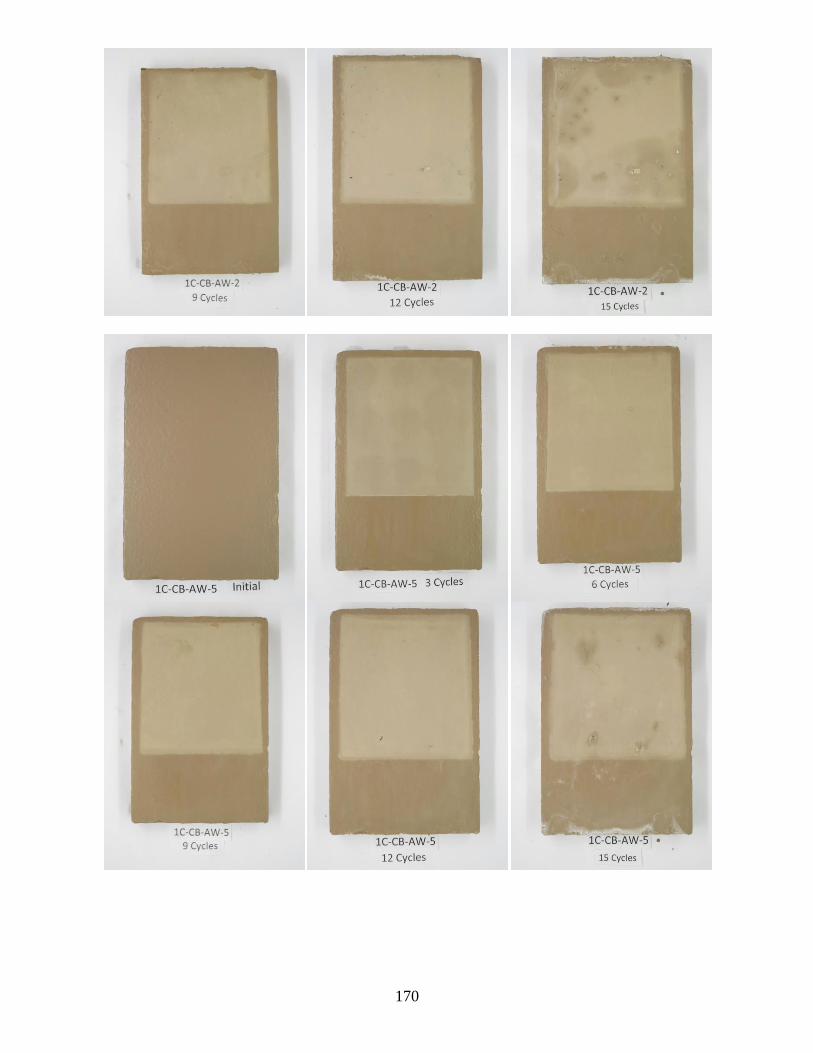
170
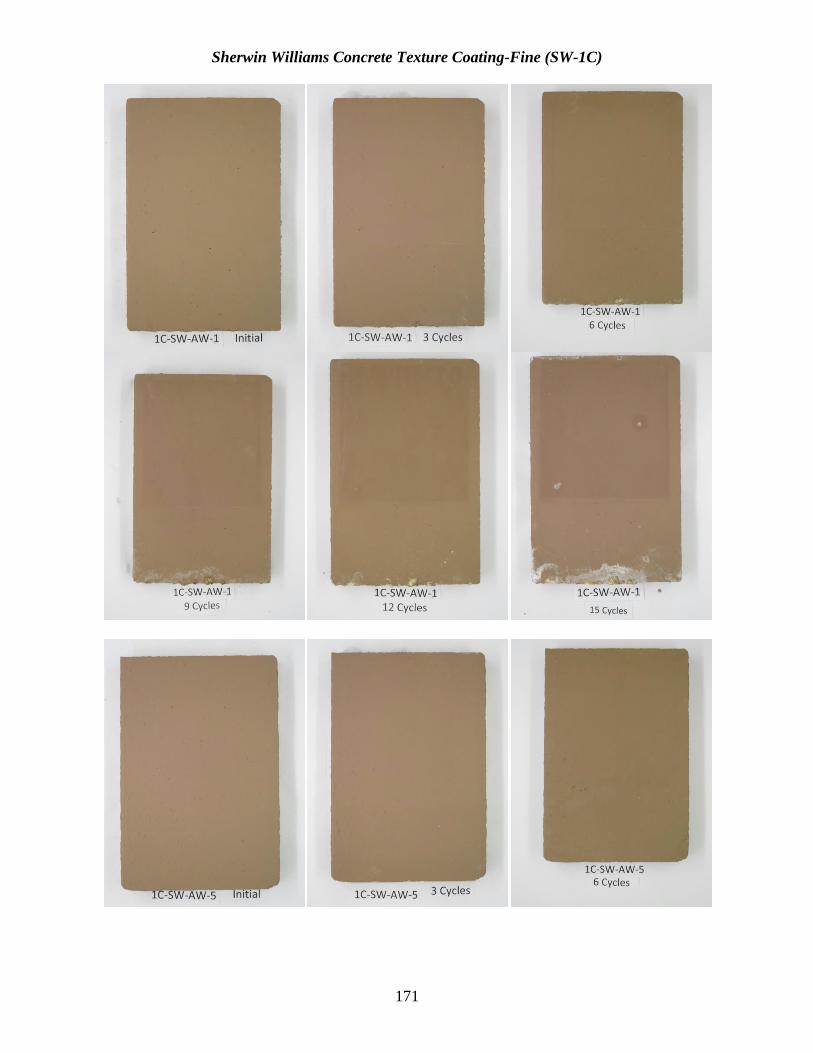
171
Sherwin Williams Concrete Texture Coating-Fine (SW-1C)
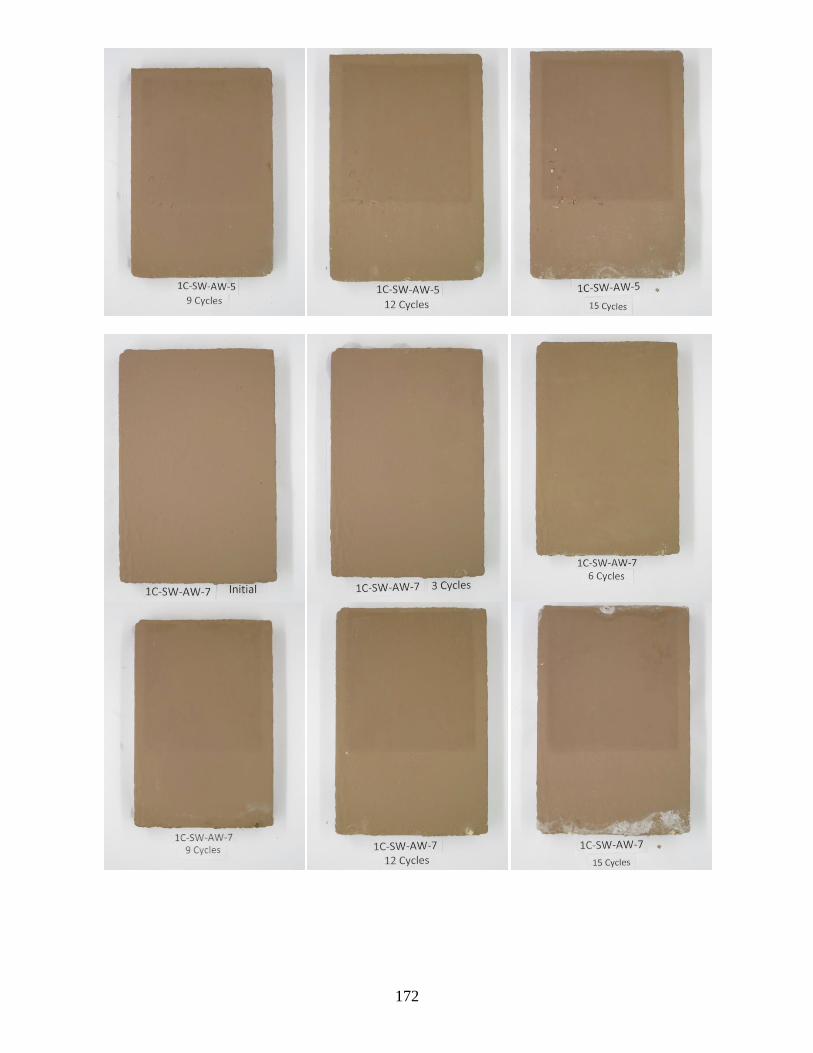
172
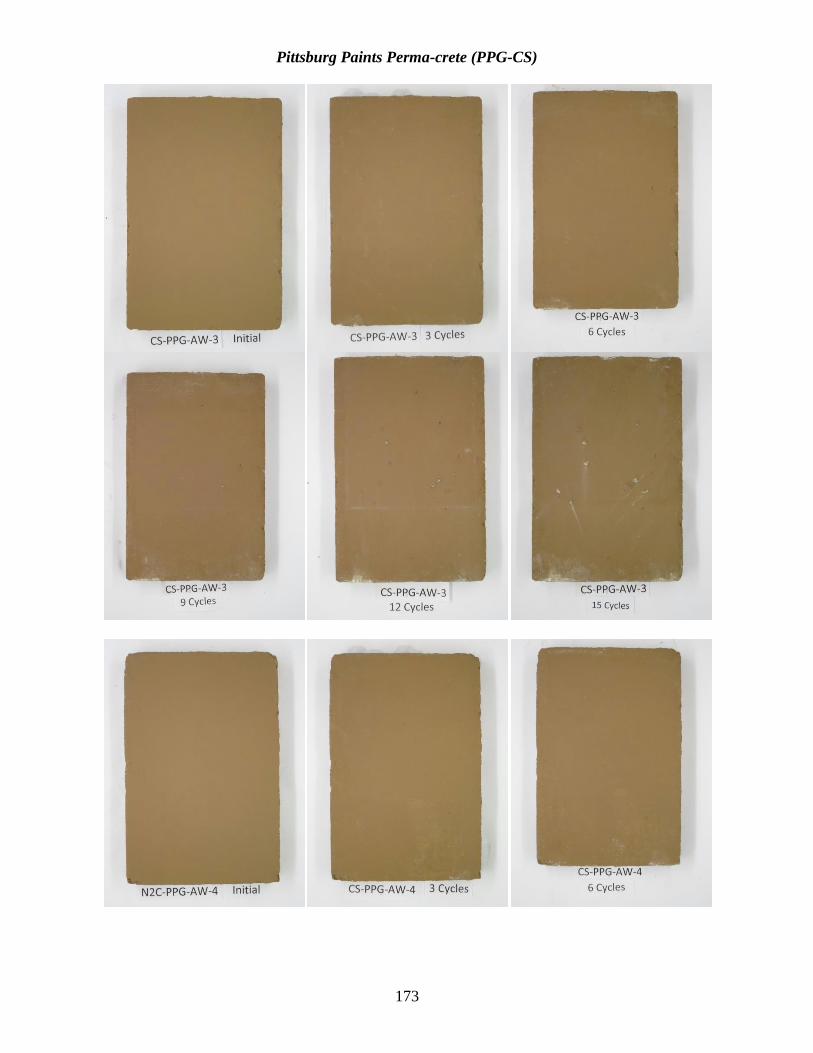
173
Pittsburg Paints Perma-crete (PPG-CS)
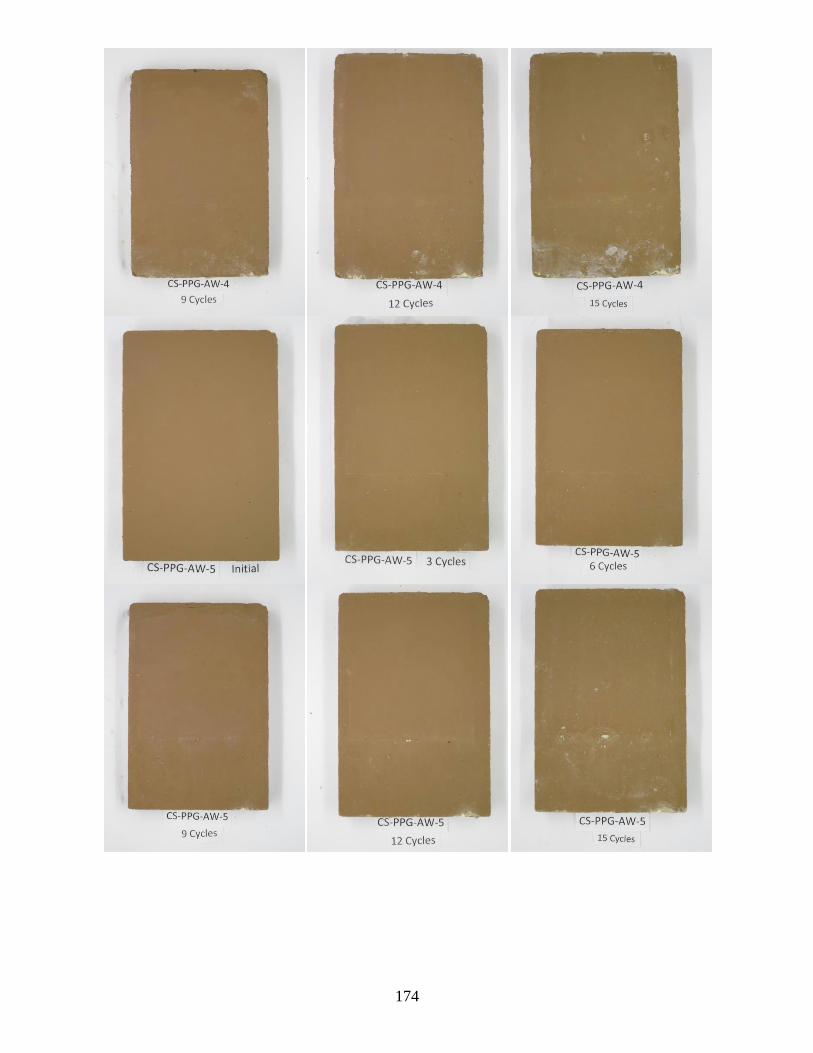
174
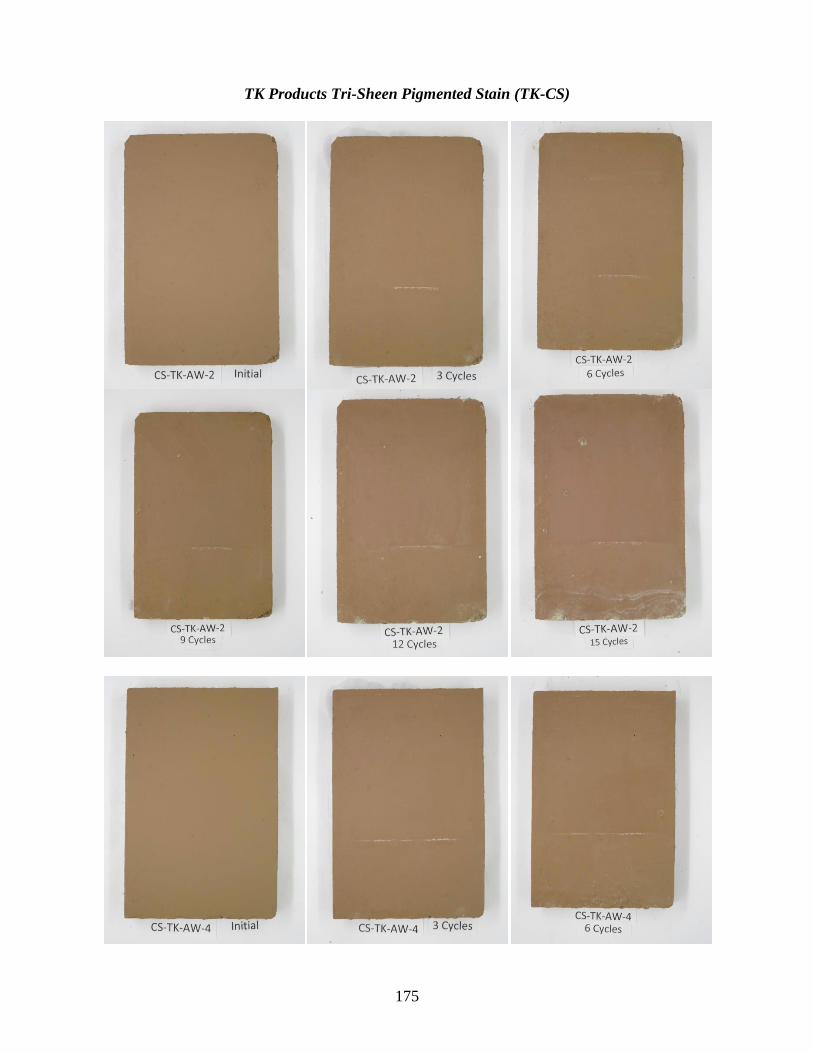
175
TK Products Tri-Sheen Pigmented Stain (TK-CS)
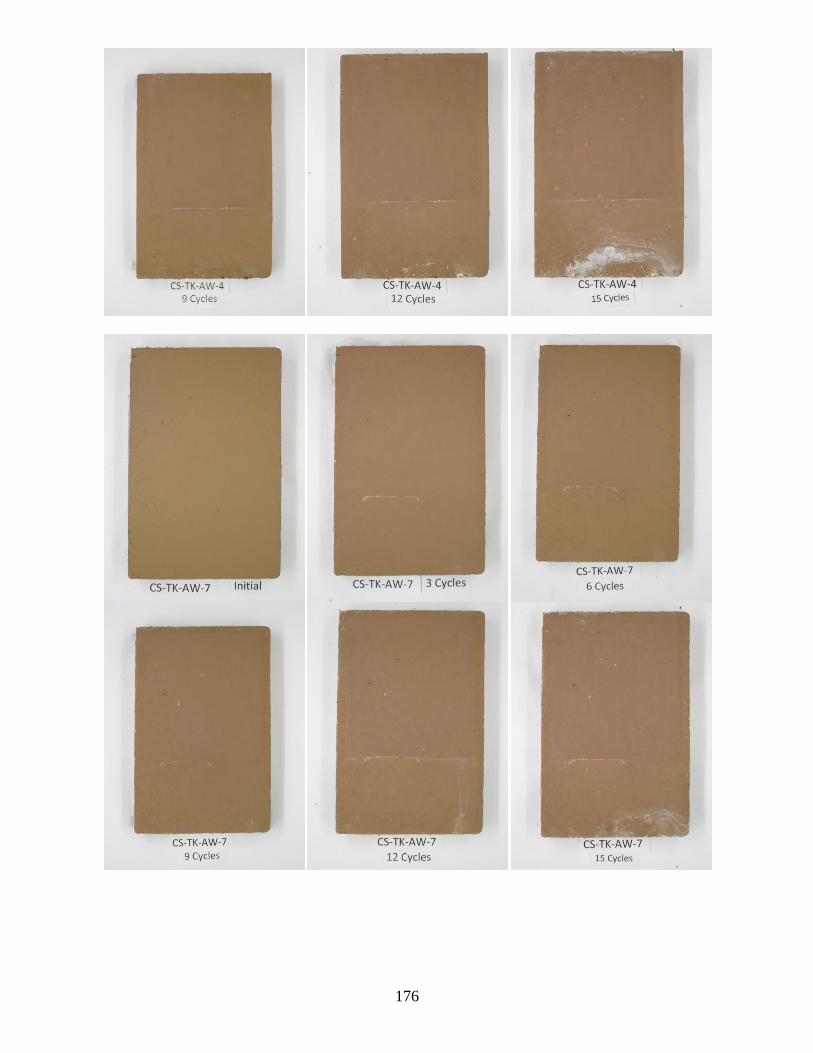
176
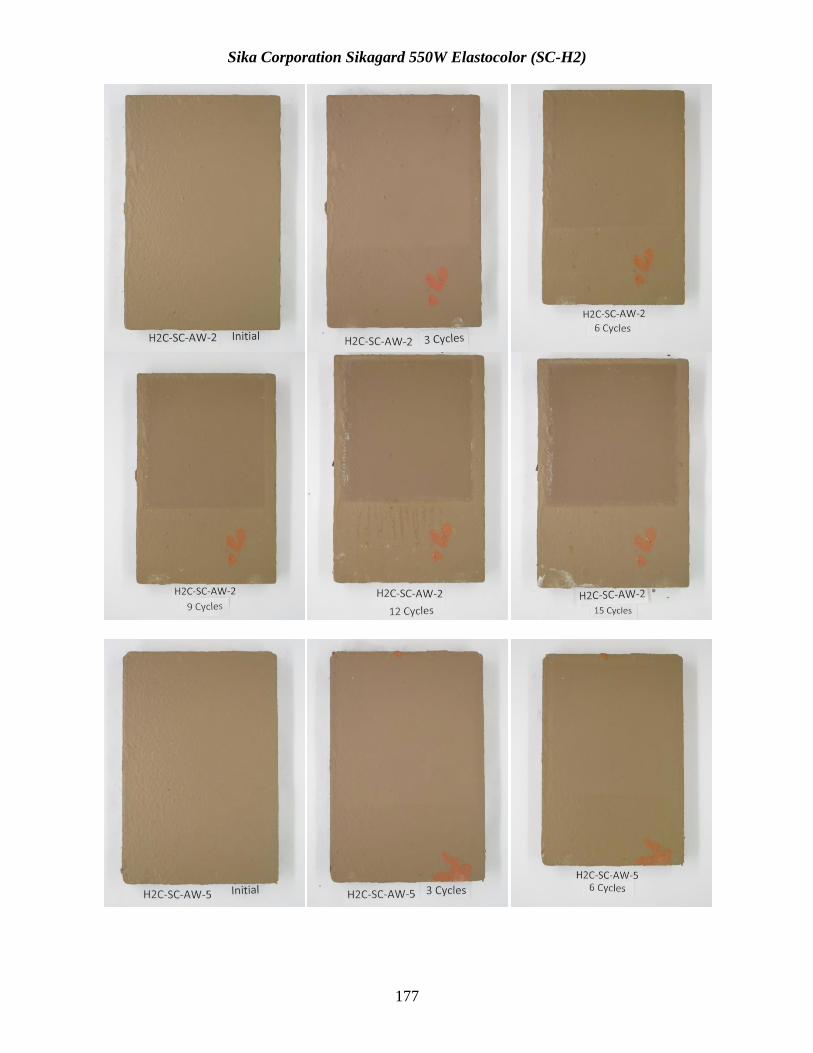
177
Sika Corporation Sikagard 550W Elastocolor (SC-H2)
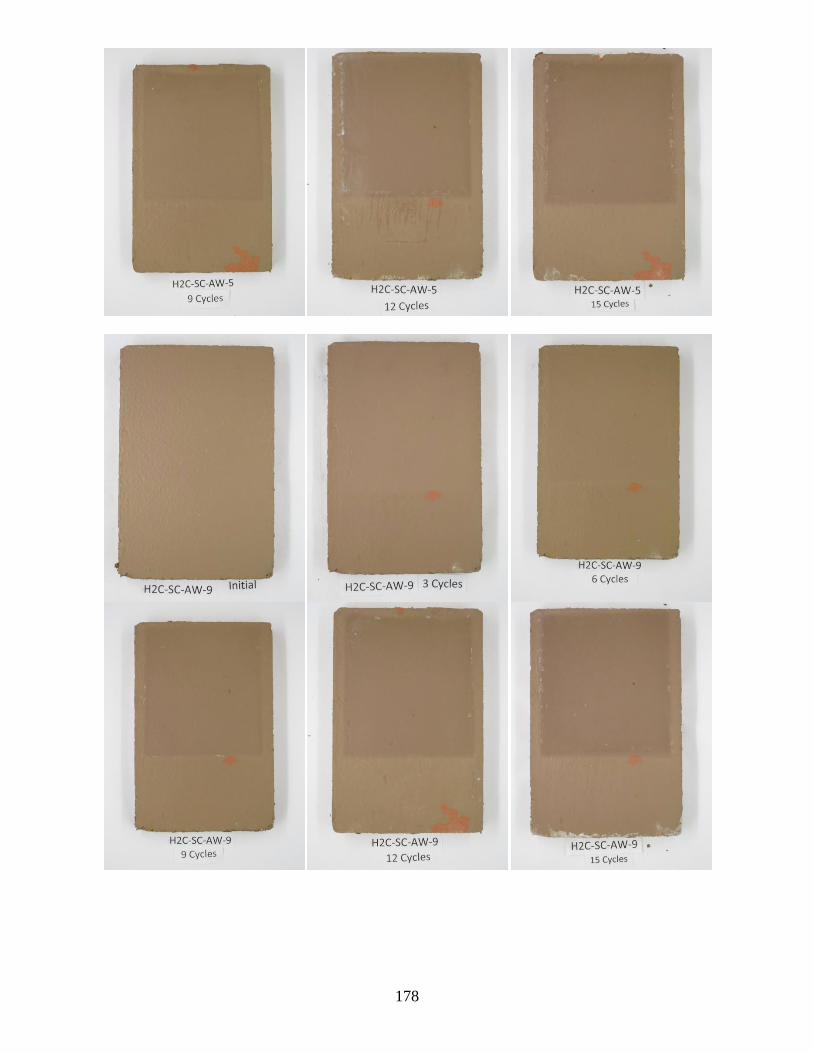
178
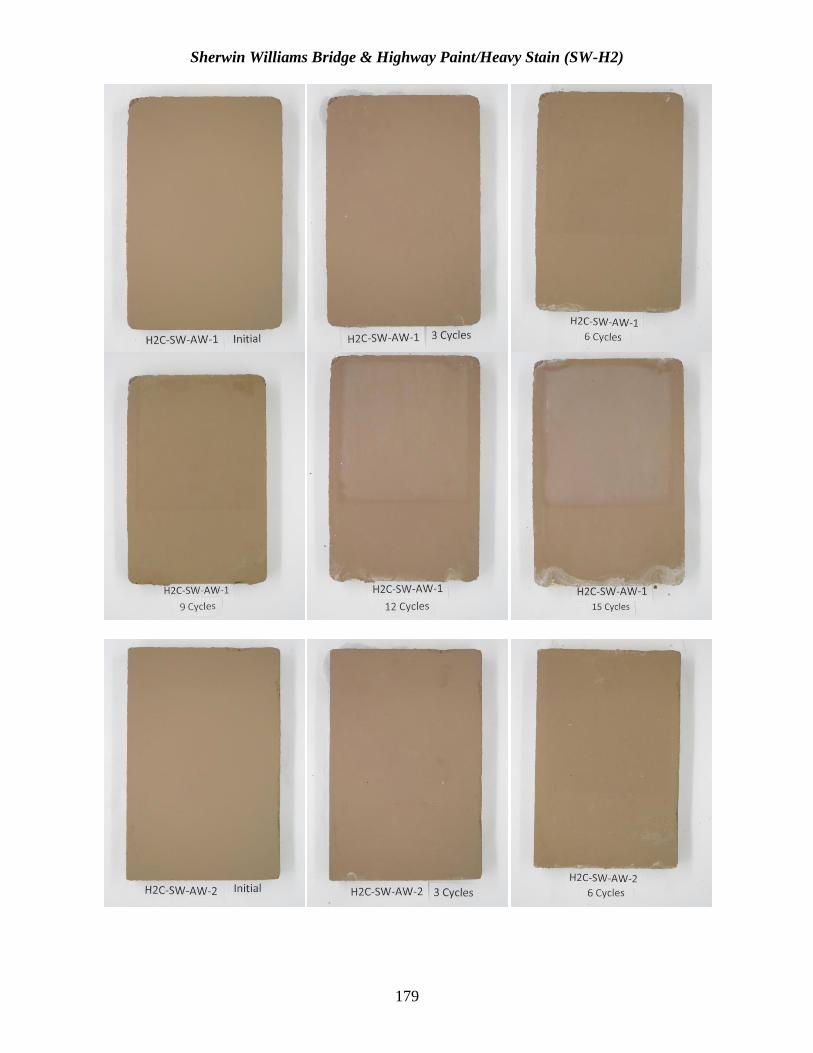
179
Sherwin Williams Bridge & Highway Paint/Heavy Stain (SW-H2)
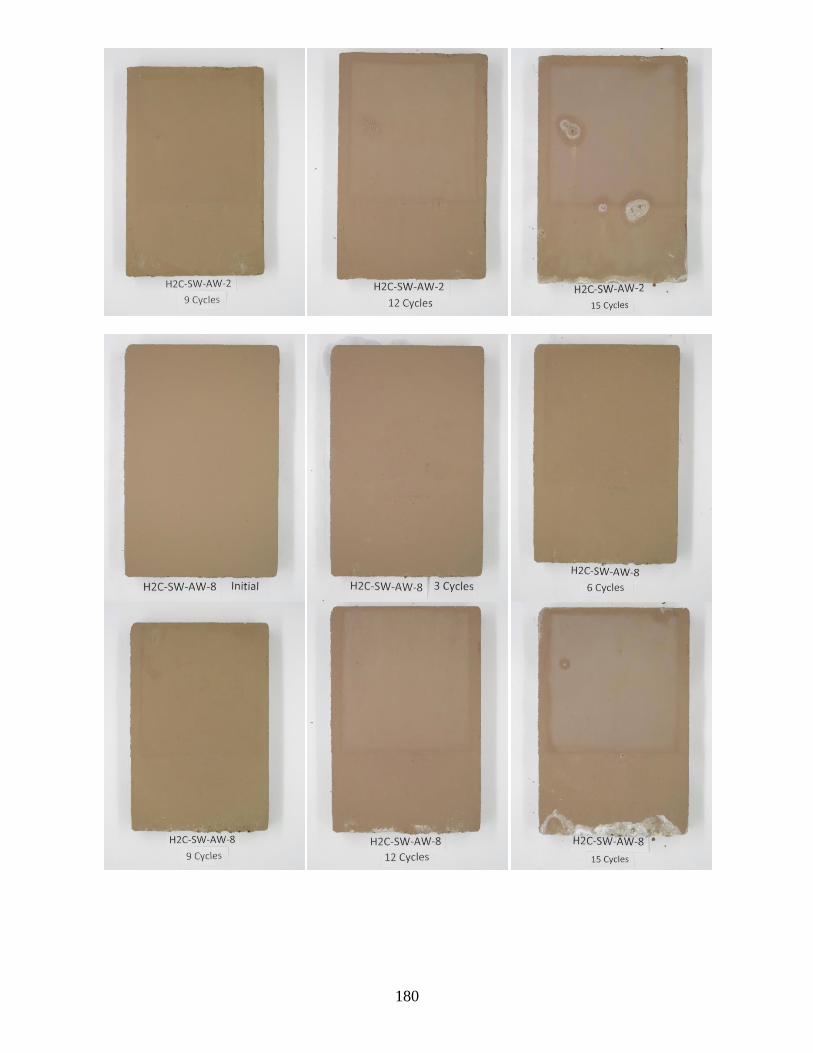
180
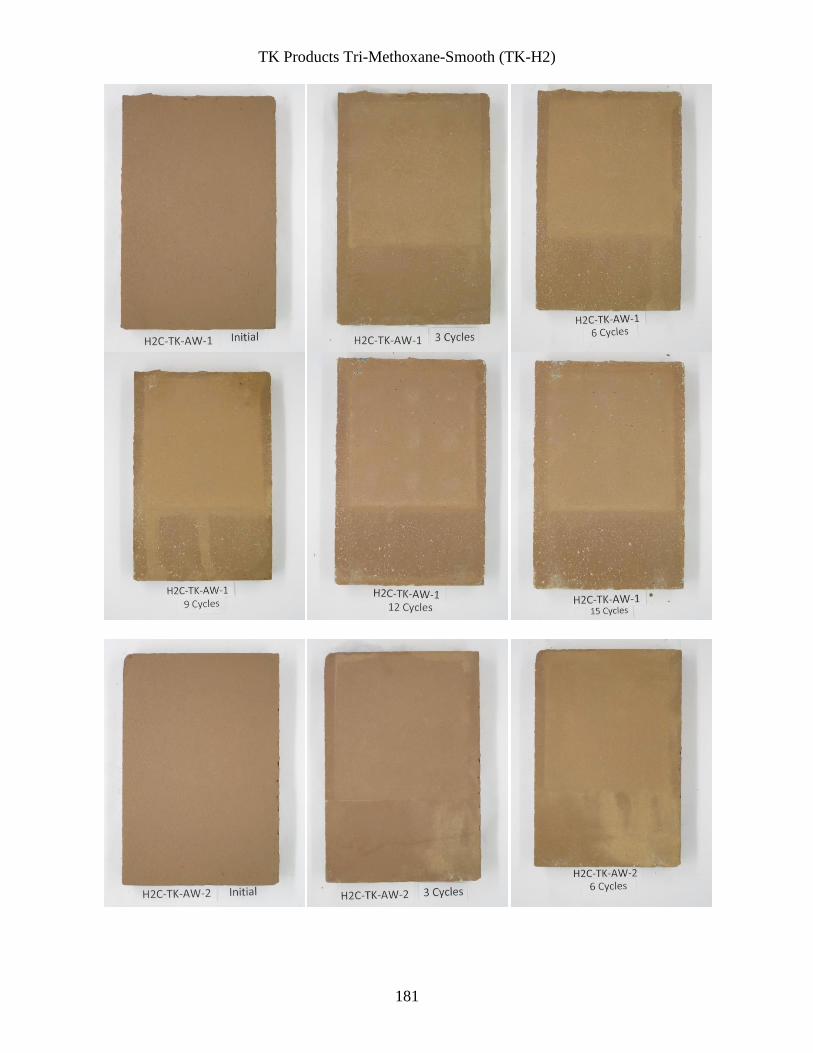
181
TK Products Tri-Methoxane-Smooth (TK-H2)
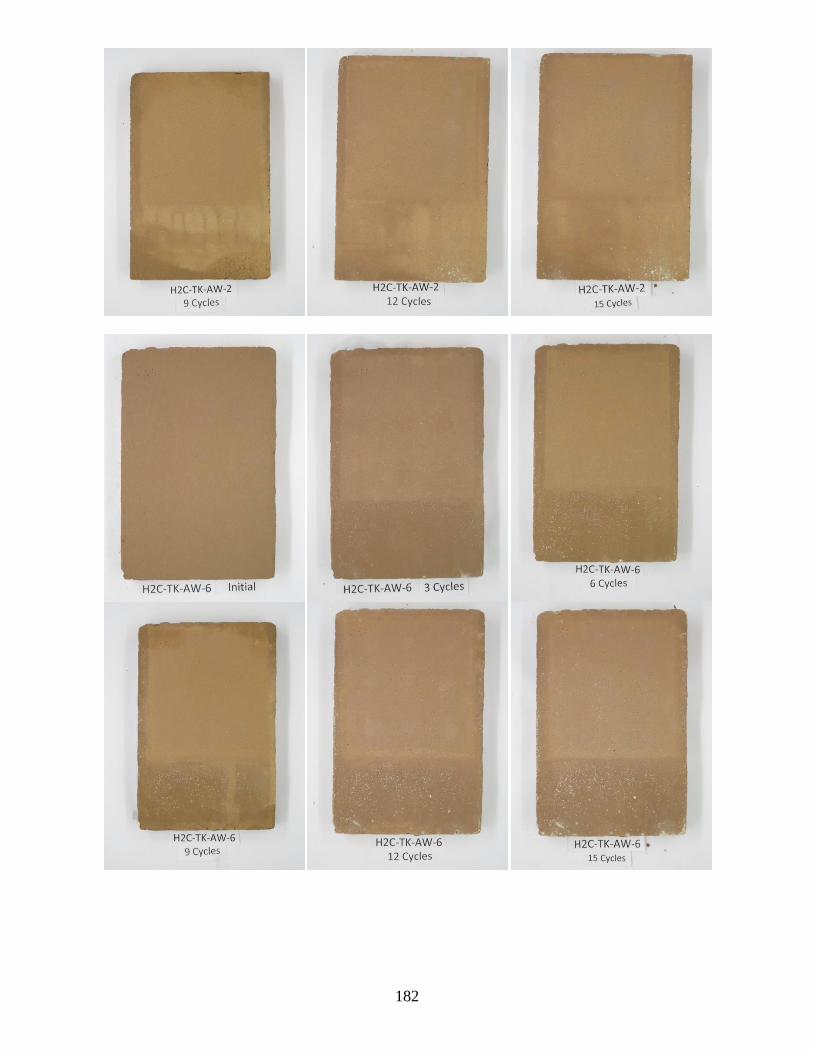
182
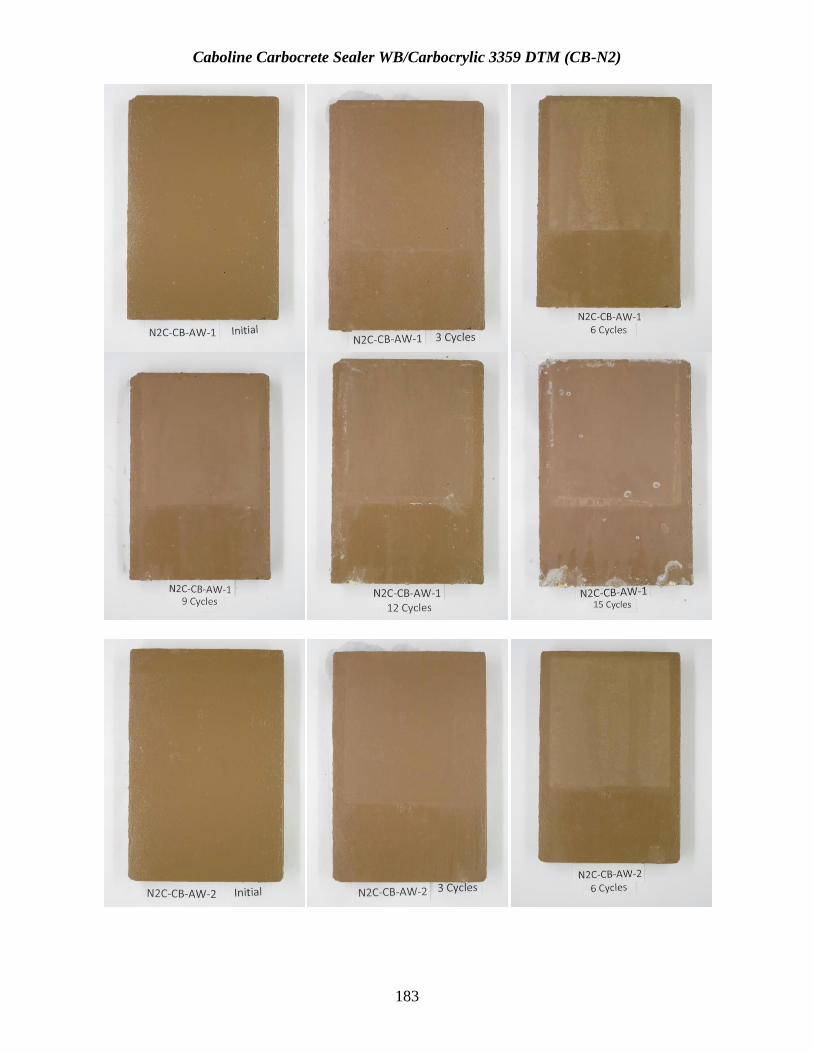
183
Caboline Carbocrete Sealer WB/Carbocrylic 3359 DTM (CB-N2)
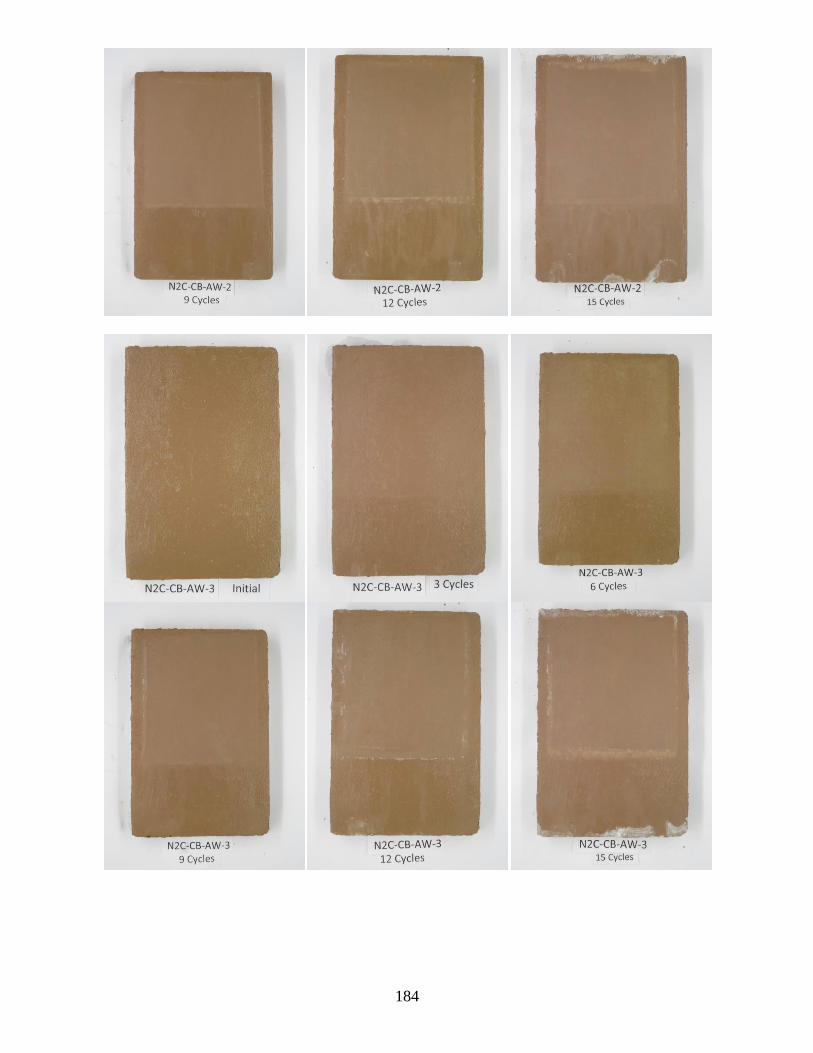
184
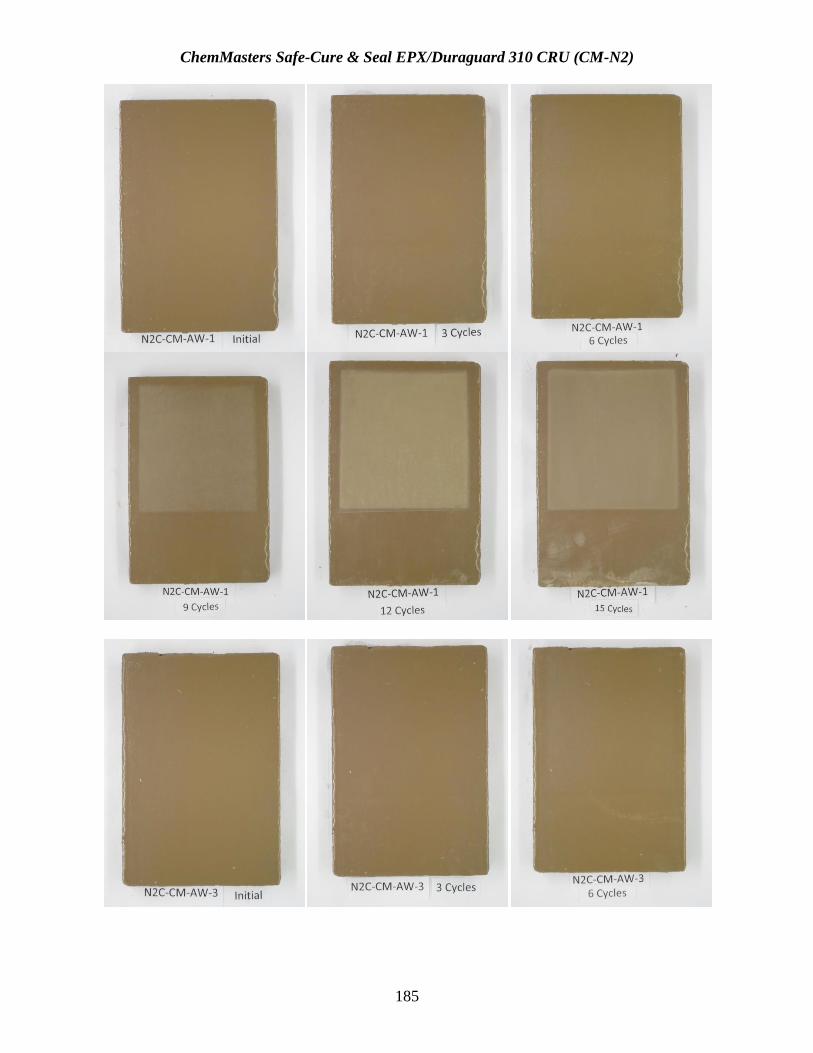
185
ChemMasters Safe-Cure & Seal EPX/Duraguard 310 CRU (CM-N2)
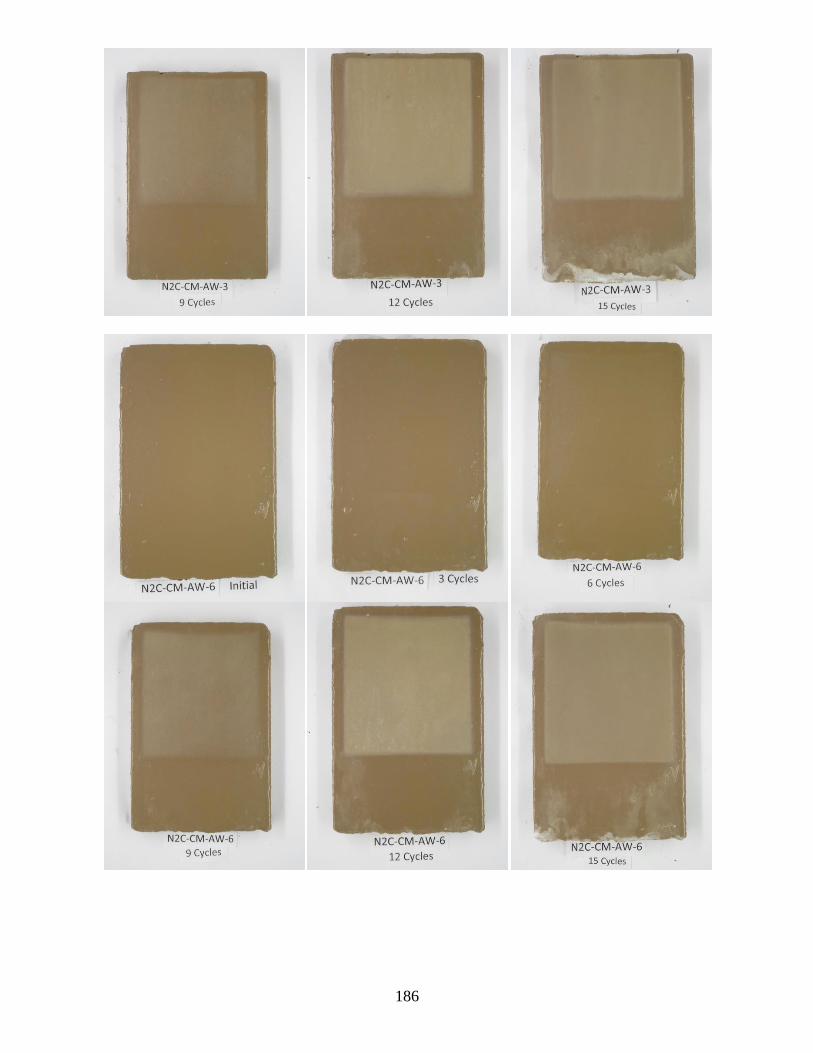
186
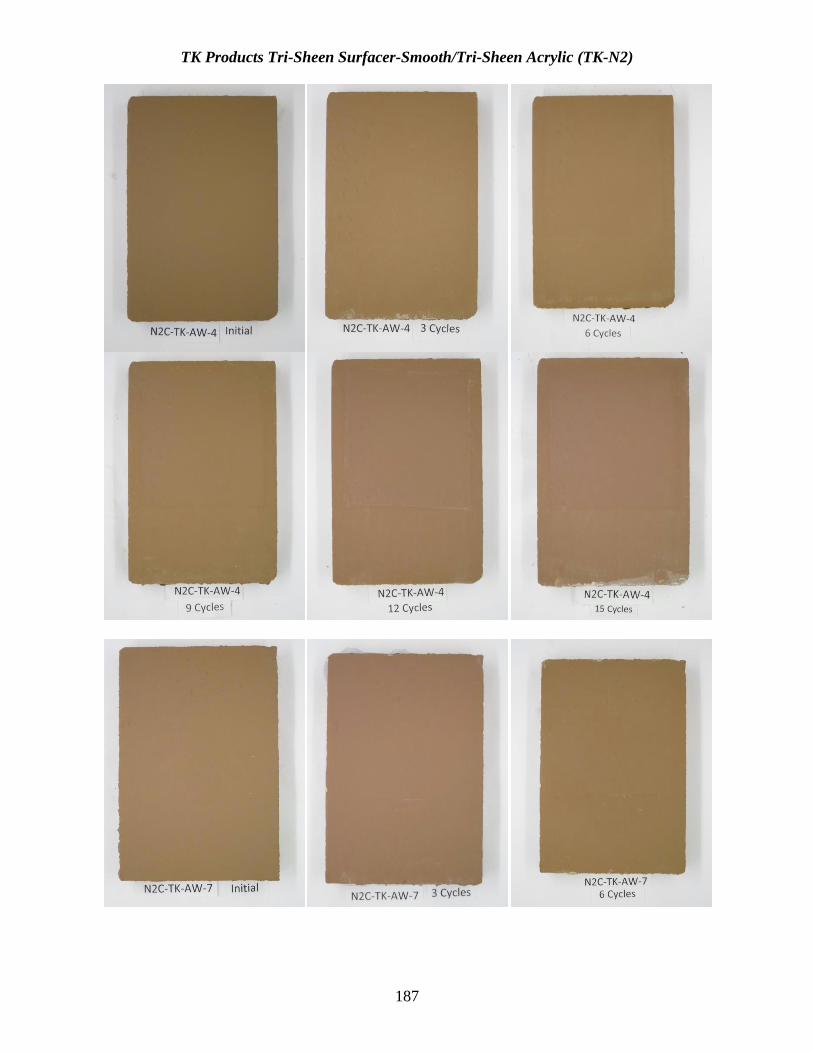
187
TK Products Tri-Sheen Surfacer-Smooth/Tri-Sheen Acrylic (TK-N2)
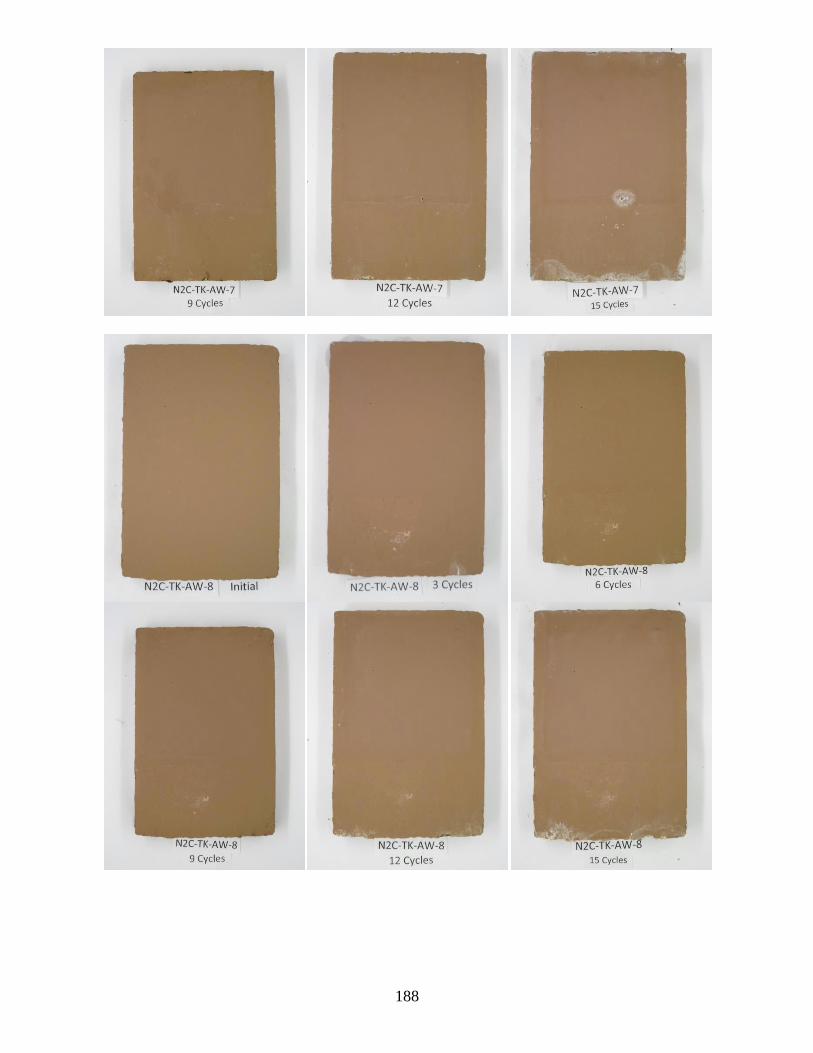
188
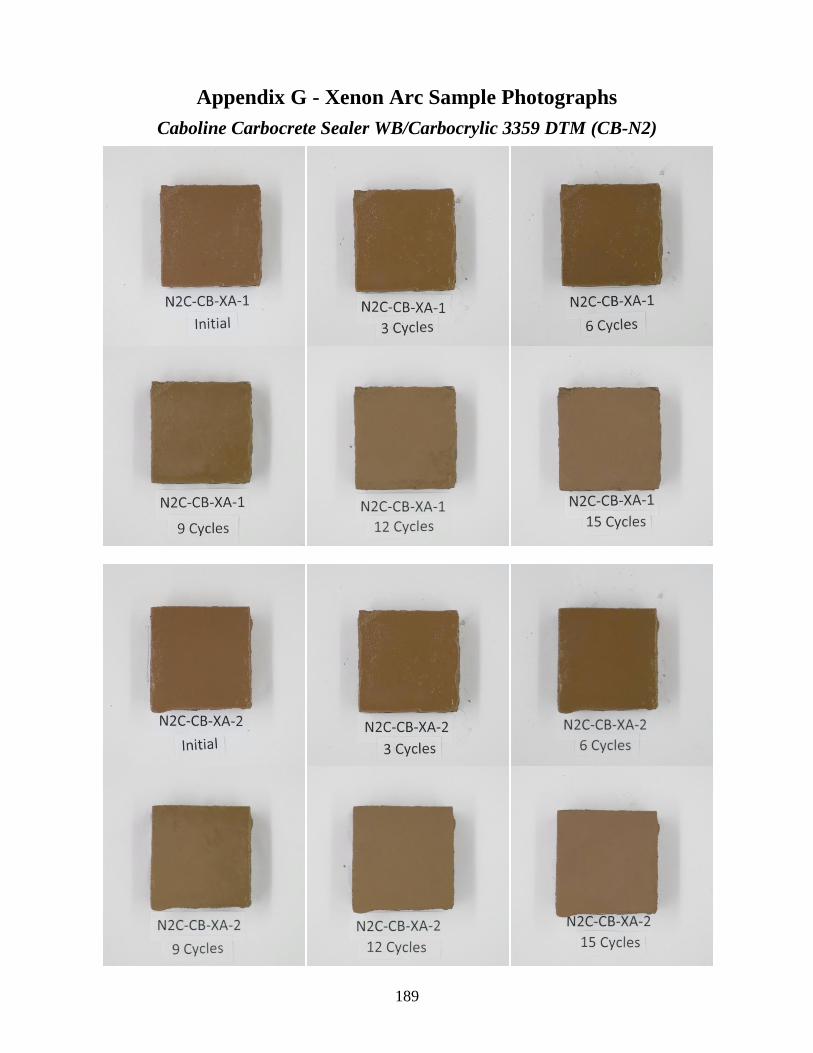
189
Appendix G - Xenon Arc Sample Photographs
Caboline Carbocrete Sealer WB/Carbocrylic 3359 DTM (CB-N2)
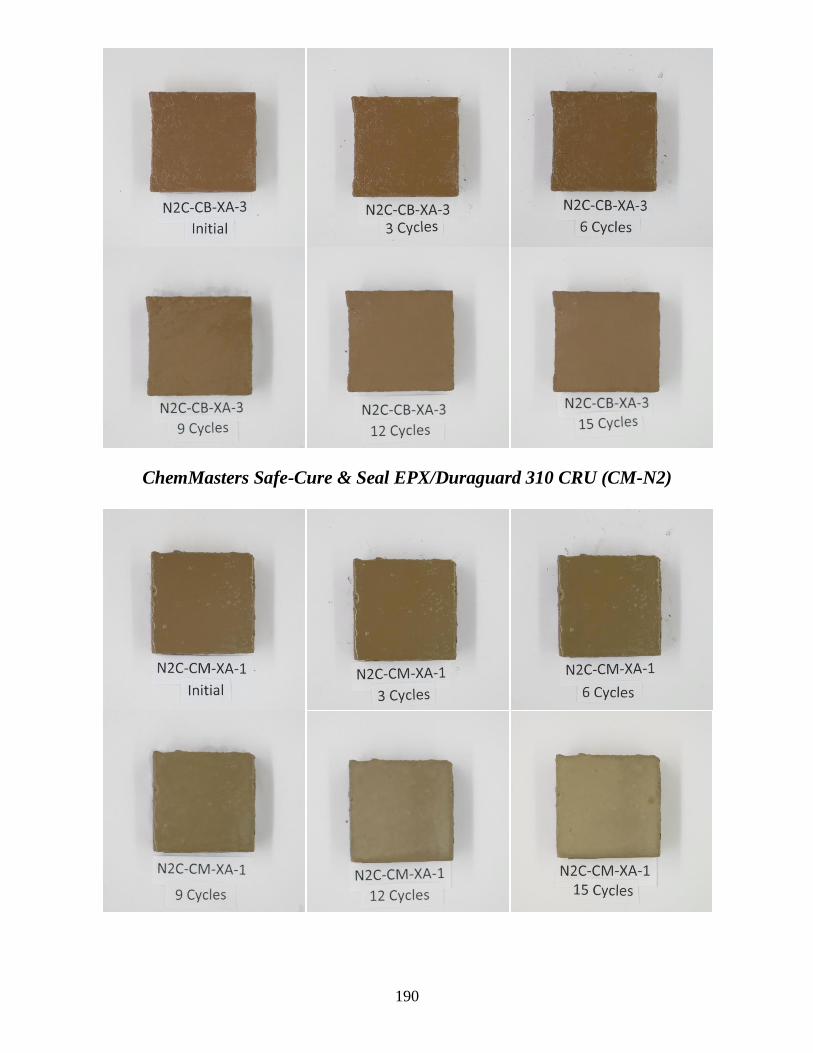
190
ChemMasters Safe-Cure & Seal EPX/Duraguard 310 CRU (CM-N2)
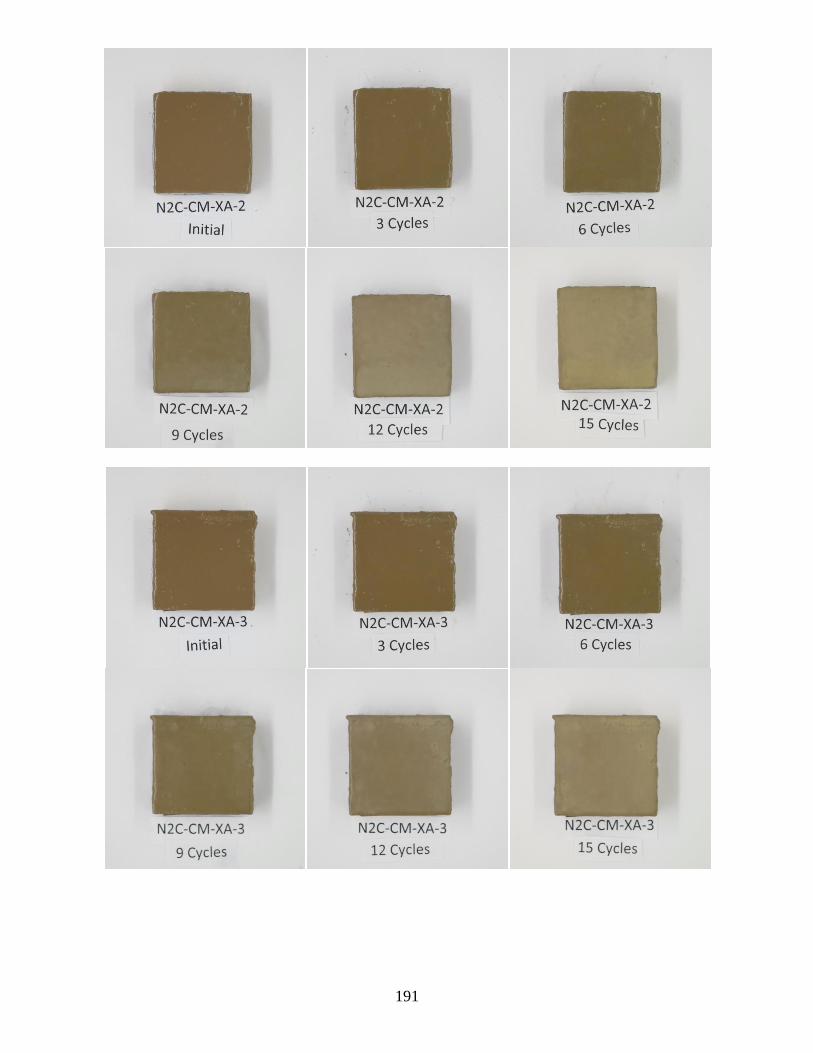
191
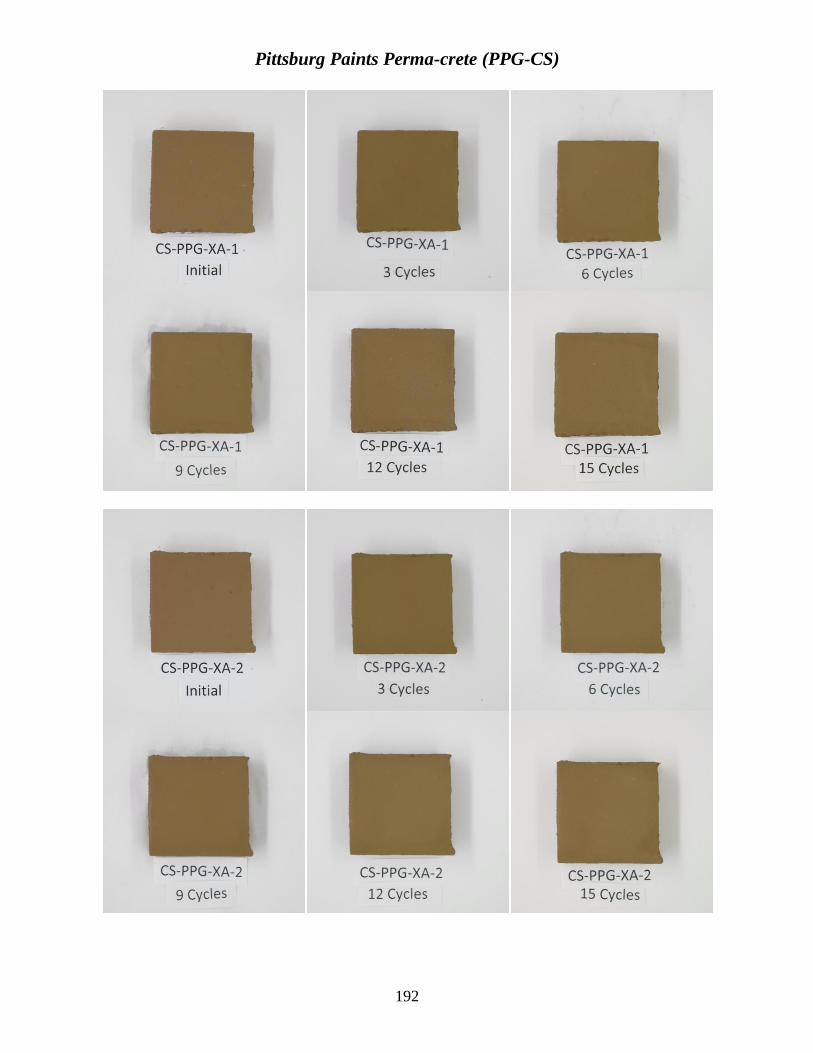
192
Pittsburg Paints Perma-crete (PPG-CS)
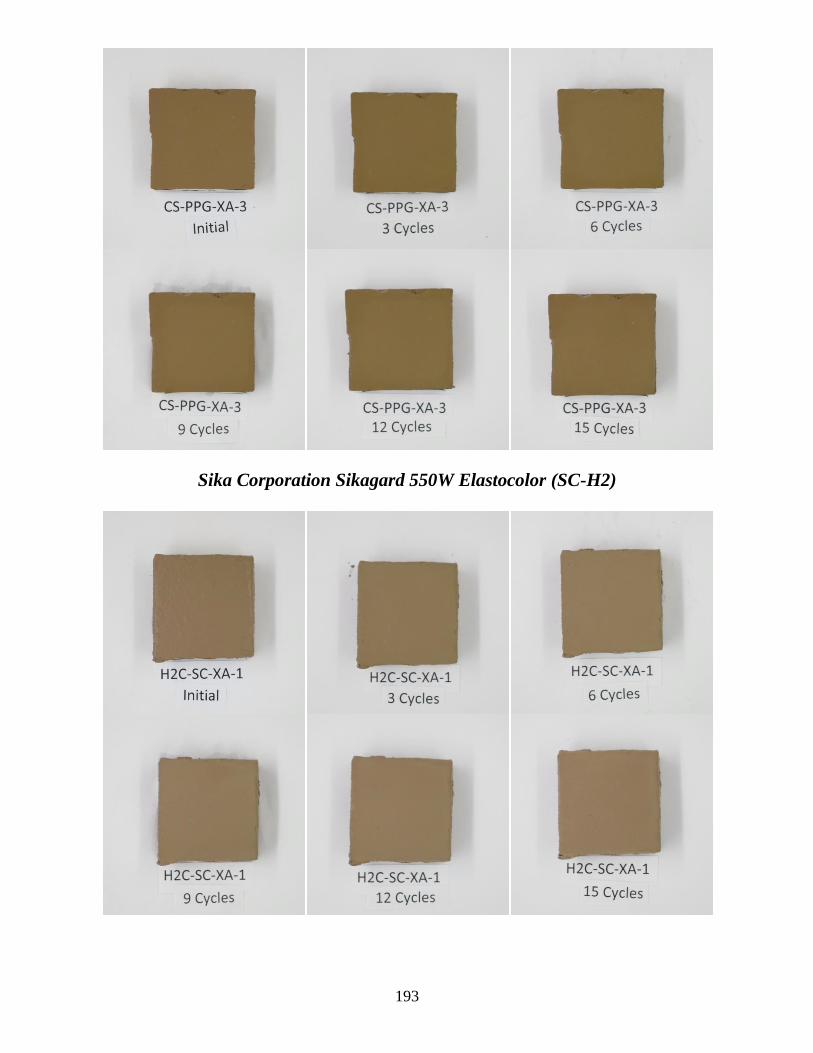
193
Sika Corporation Sikagard 550W Elastocolor (SC-H2)
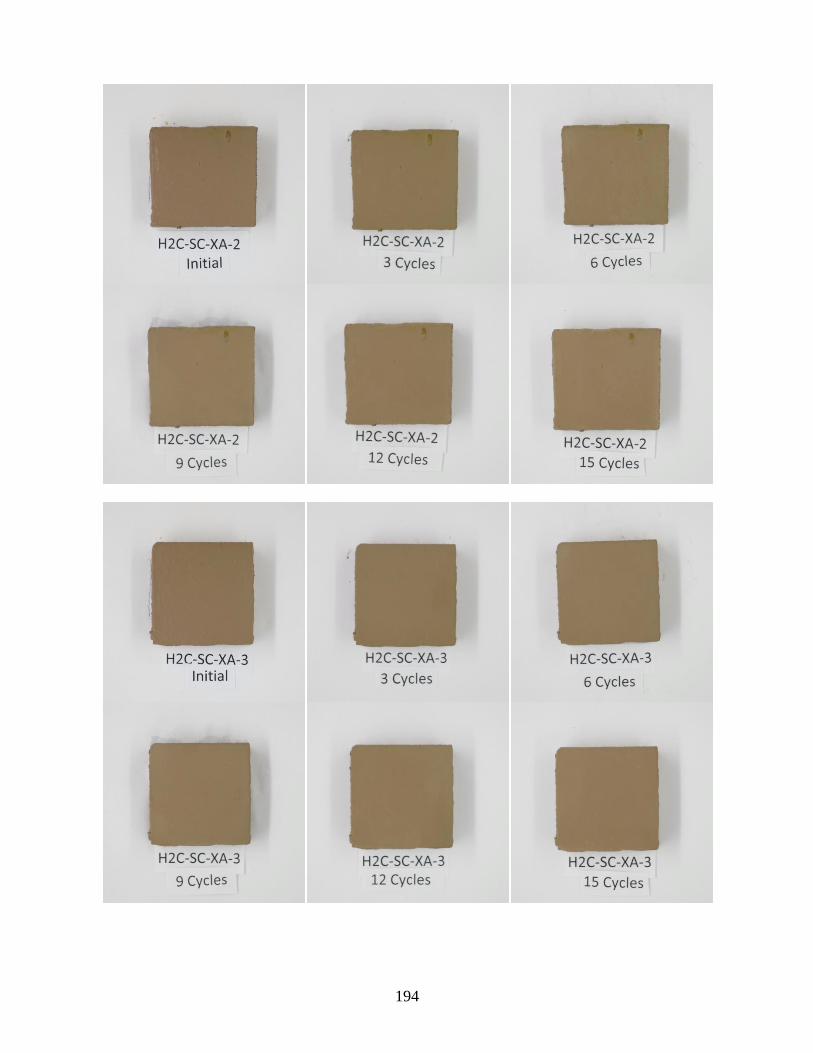
194
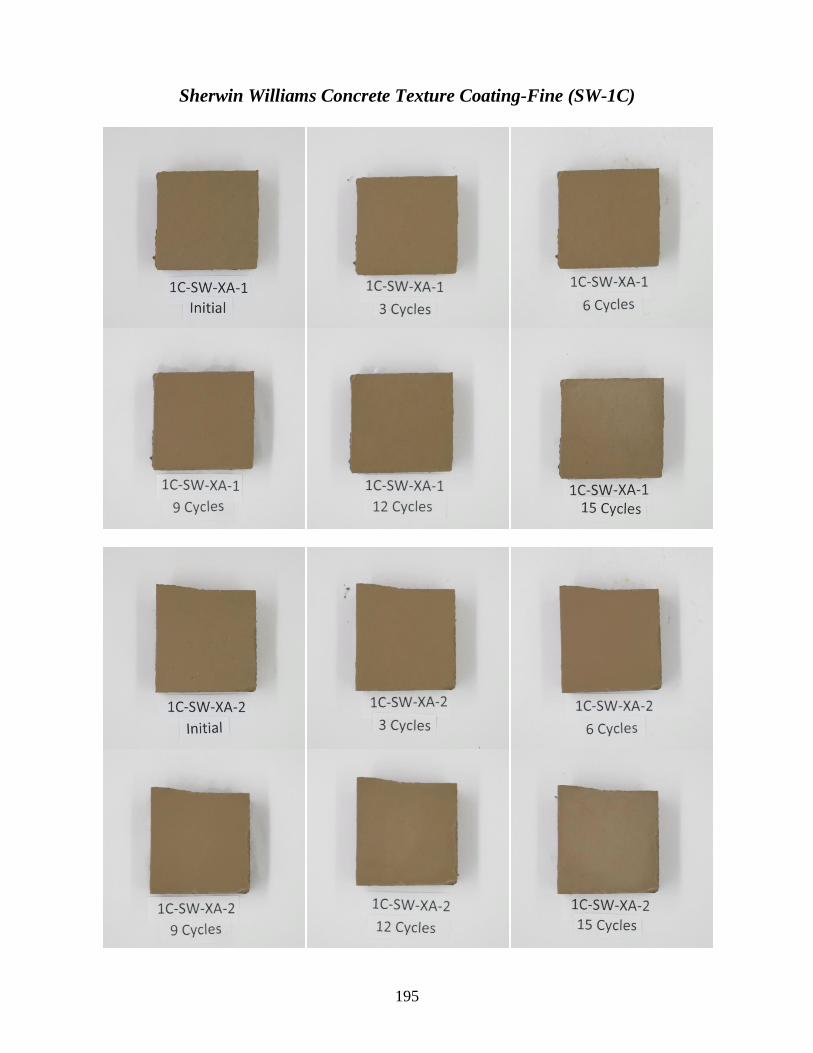
195
Sherwin Williams Concrete Texture Coating-Fine (SW-1C)
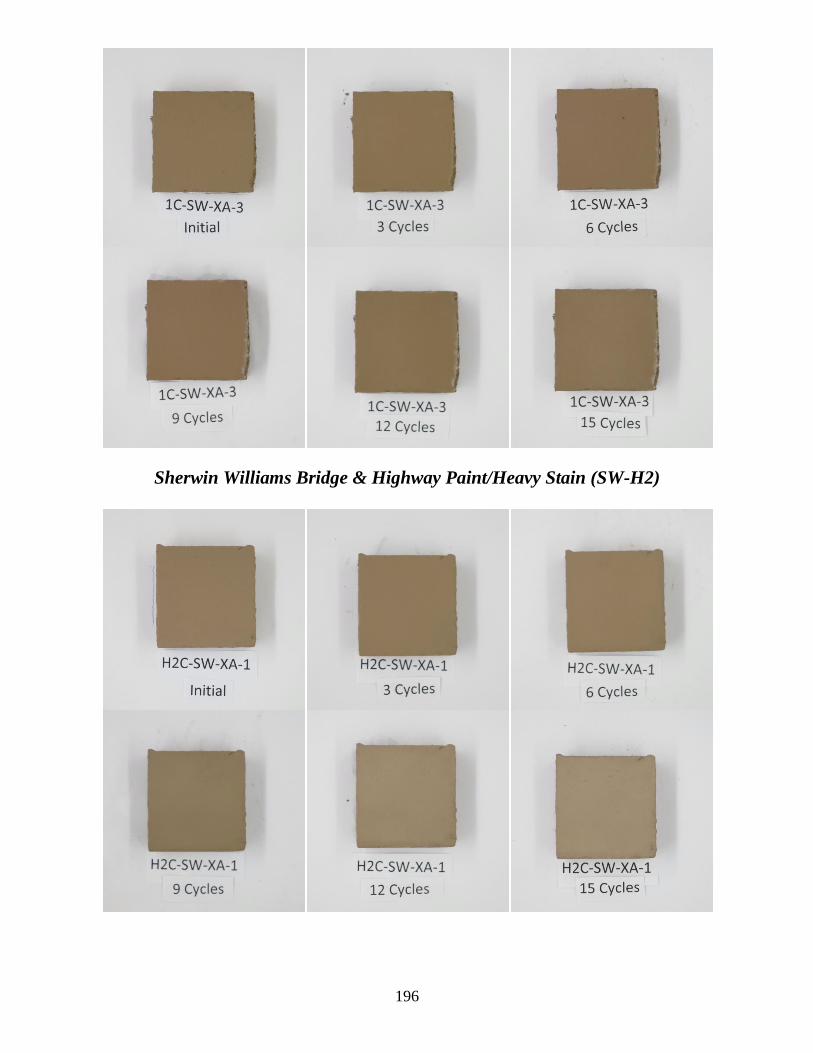
196
Sherwin Williams Bridge & Highway Paint/Heavy Stain (SW-H2)

197
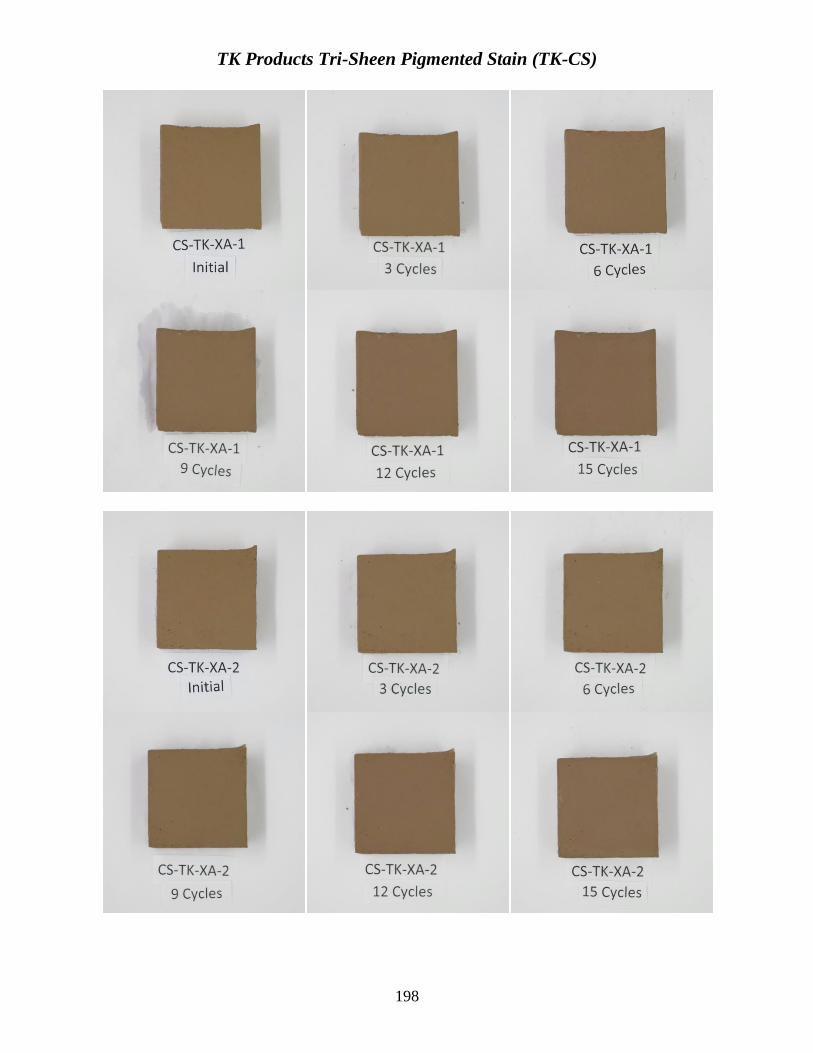
198
TK Products Tri-Sheen Pigmented Stain (TK-CS)
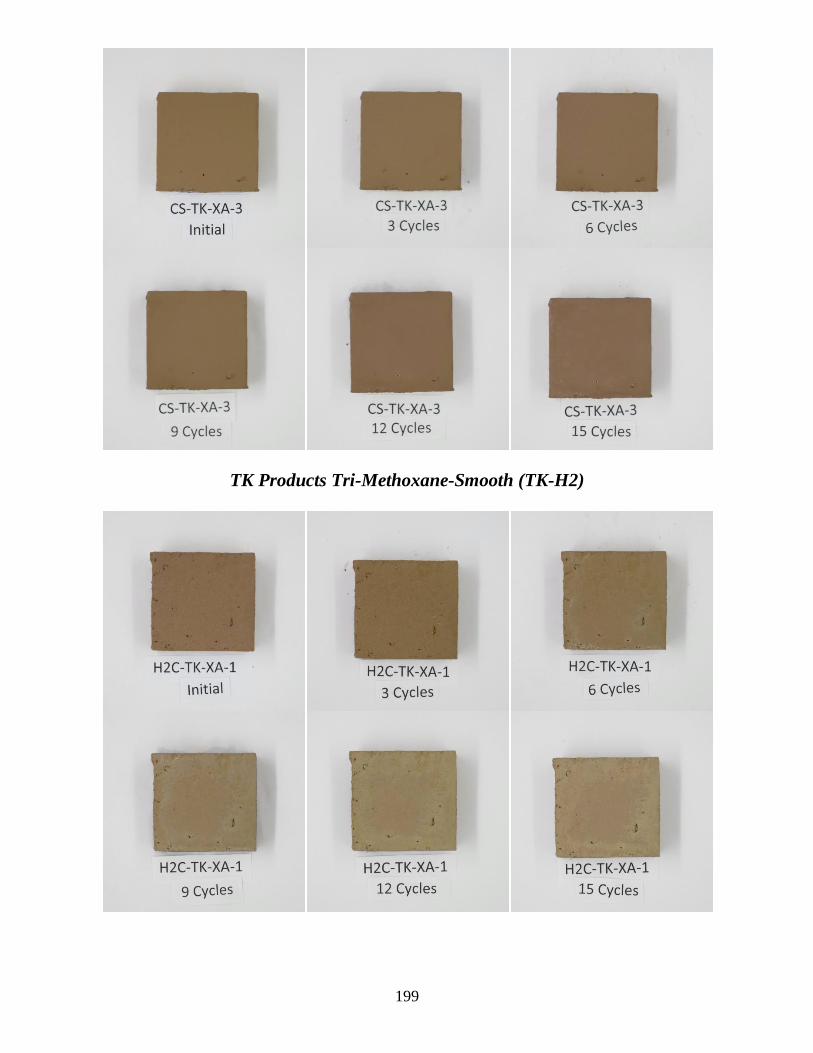
199
TK Products Tri-Methoxane-Smooth (TK-H2)
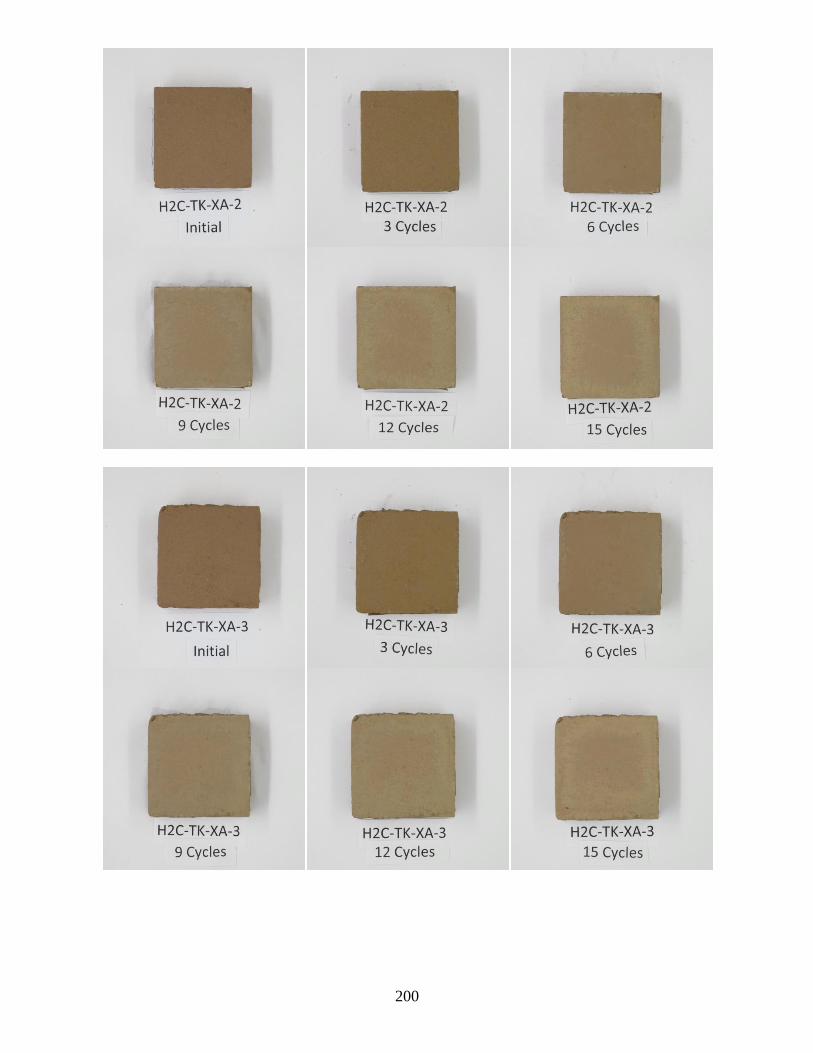
200
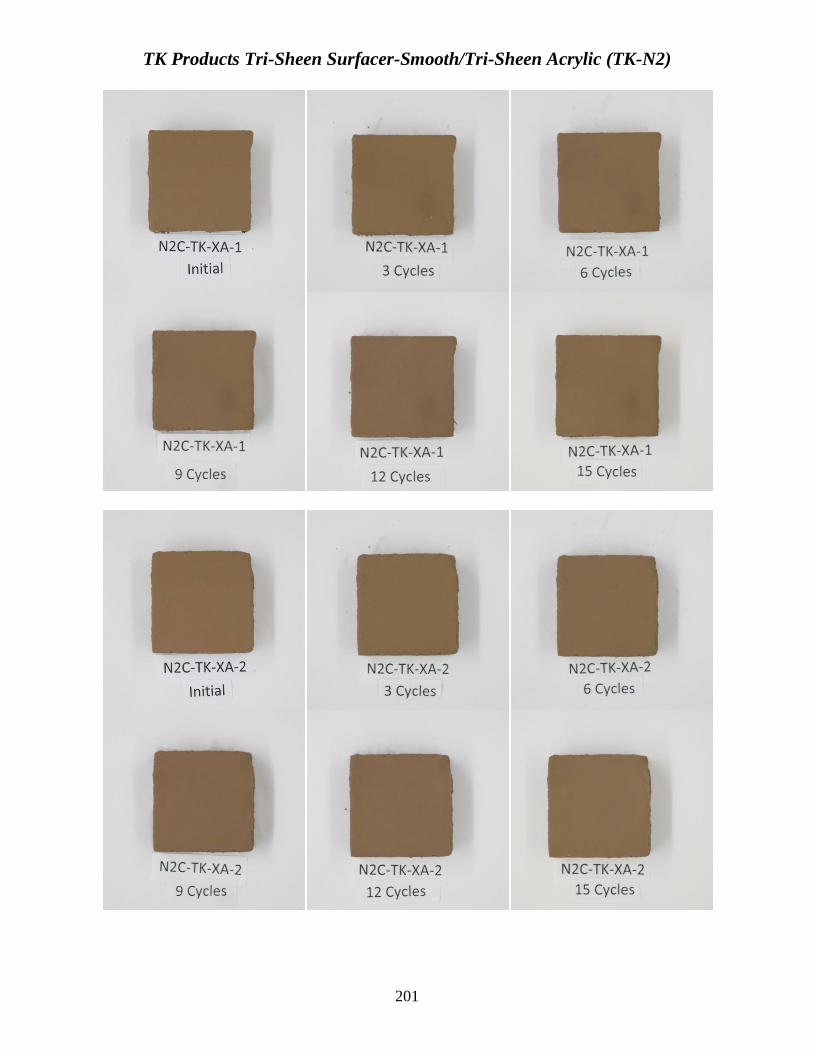
201
TK Products Tri-Sheen Surfacer-Smooth/Tri-Sheen Acrylic (TK-N2)
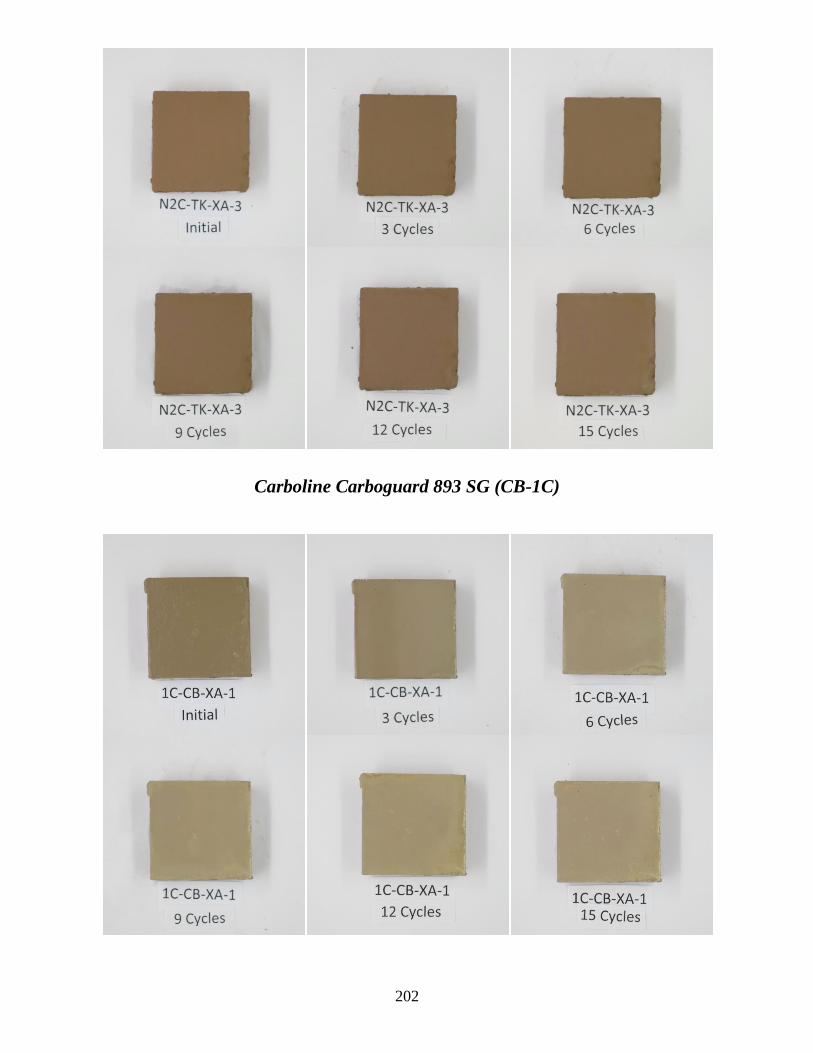
202
Carboline Carboguard 893 SG (CB-1C)
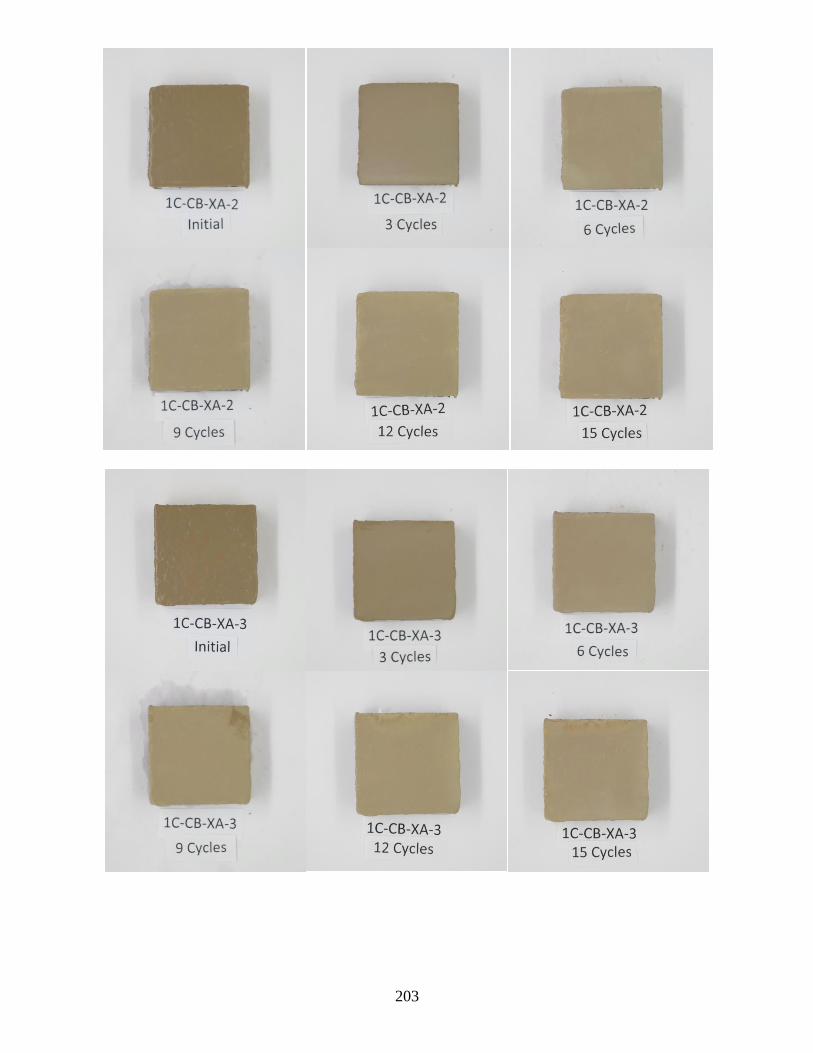
203
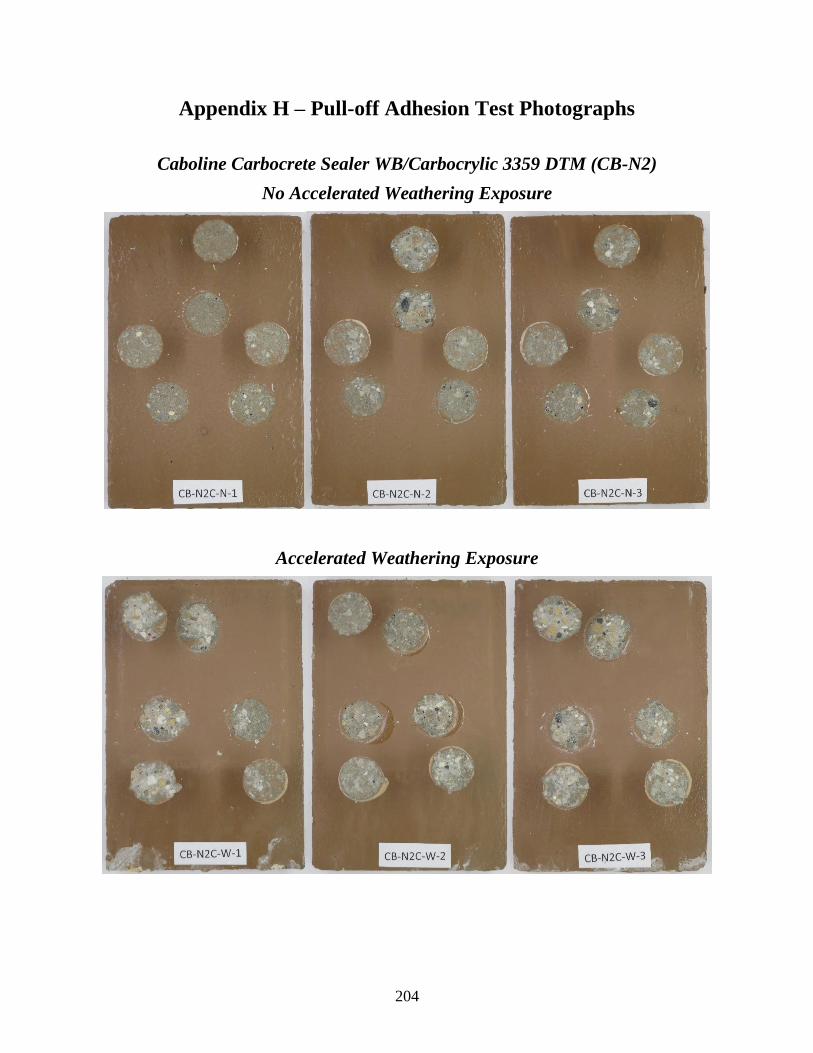
204
Appendix H – Pull-off Adhesion Test Photographs
Caboline Carbocrete Sealer WB/Carbocrylic 3359 DTM (CB-N2)
No Accelerated Weathering Exposure
Accelerated Weathering Exposure
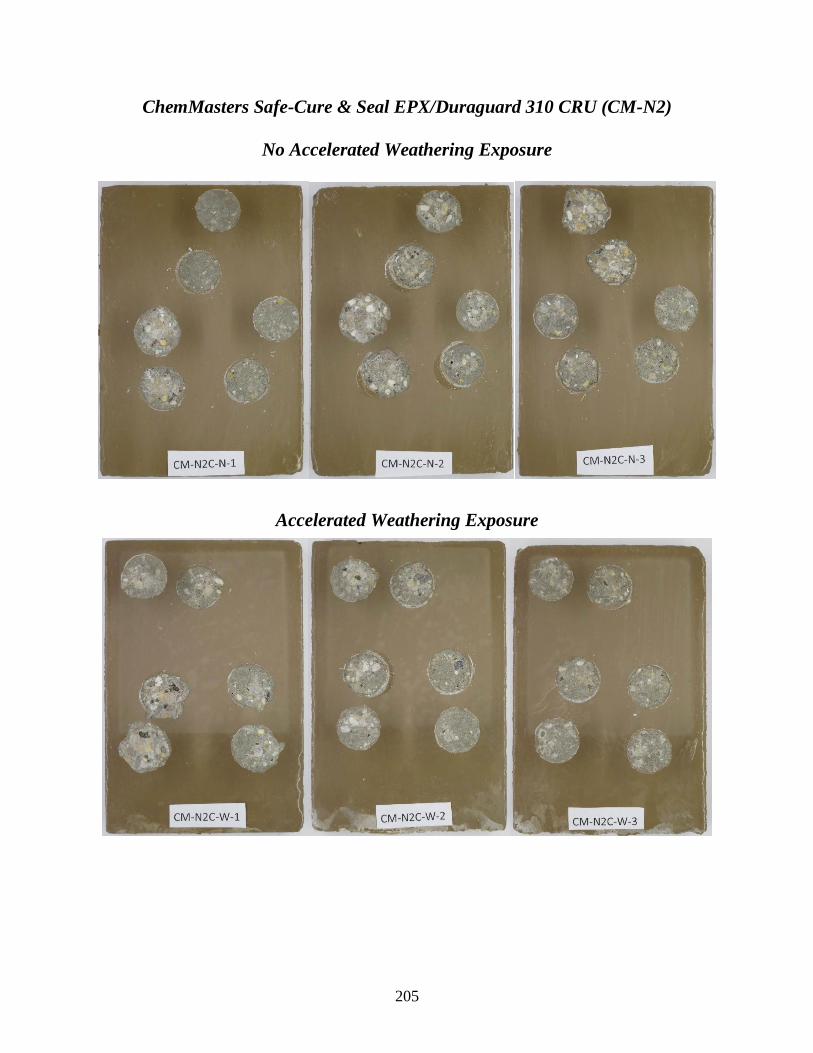
205
ChemMasters Safe-Cure & Seal EPX/Duraguard 310 CRU (CM-N2)
No Accelerated Weathering Exposure
Accelerated Weathering Exposure
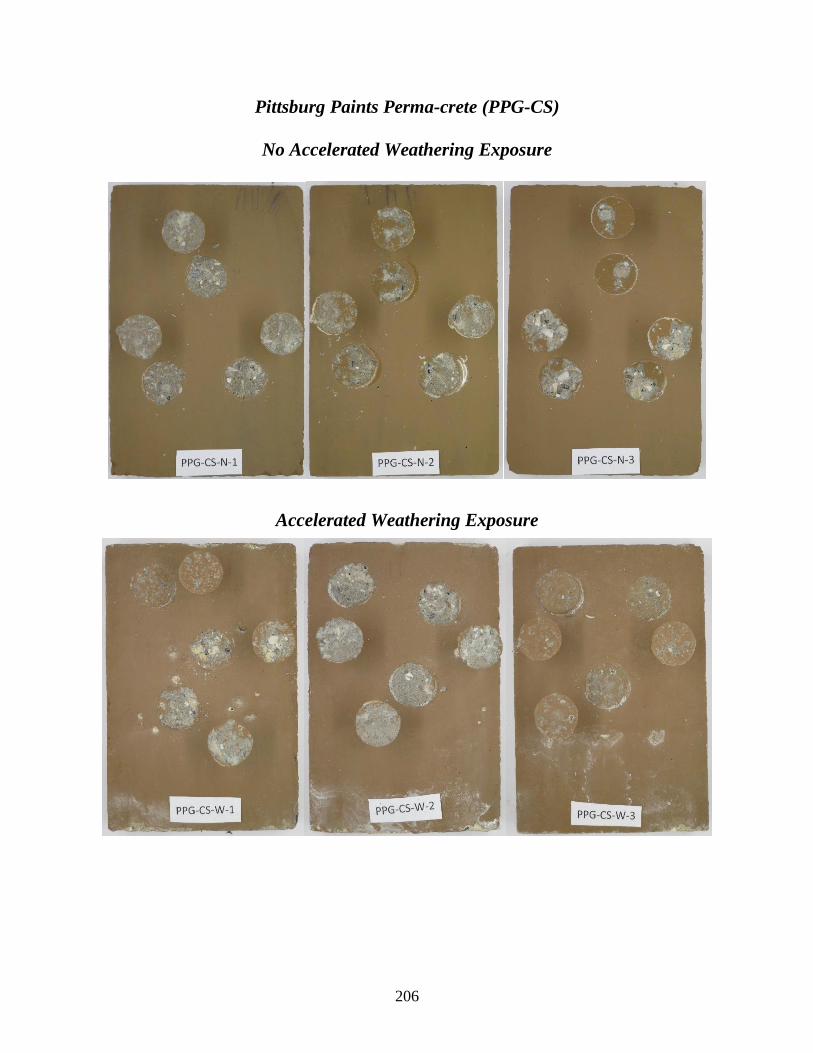
206
Pittsburg Paints Perma-crete (PPG-CS)
No Accelerated Weathering Exposure
Accelerated Weathering Exposure

207
Sika Corporation Sikagard 550W Elastocolor (SC-H2)
No Accelerated Weathering Exposure
Accelerated Weathering Exposure
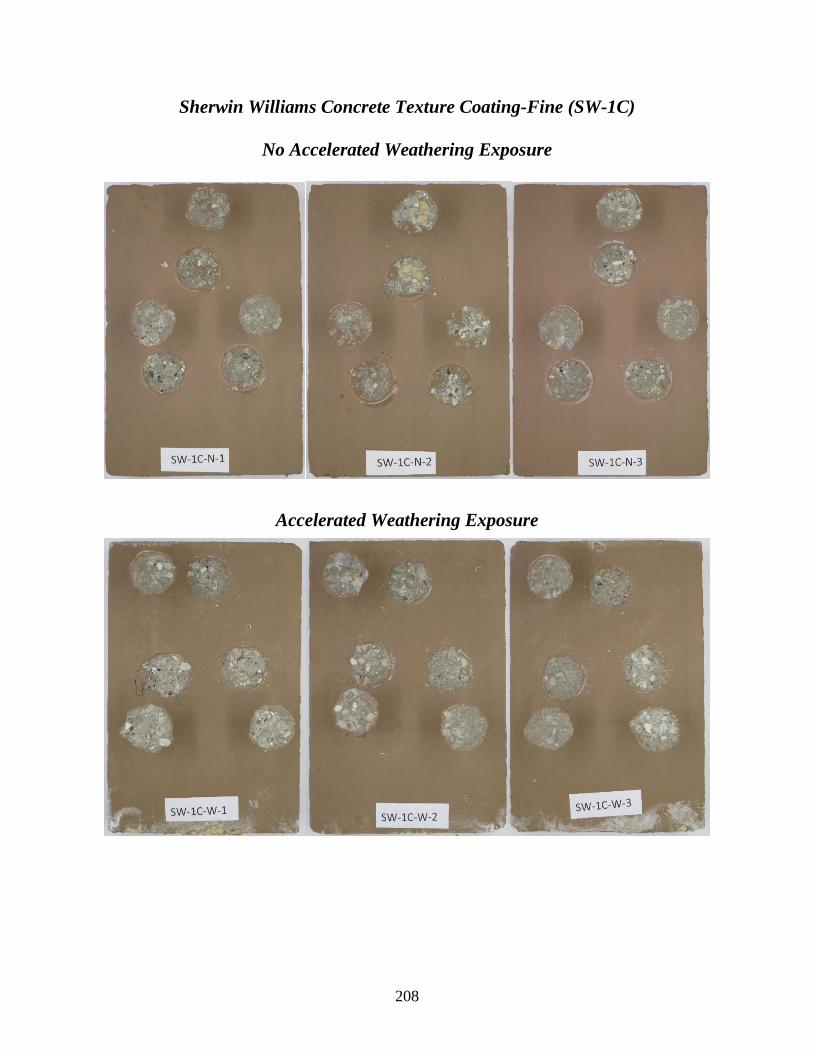
208
Sherwin Williams Concrete Texture Coating-Fine (SW-1C)
No Accelerated Weathering Exposure
Accelerated Weathering Exposure
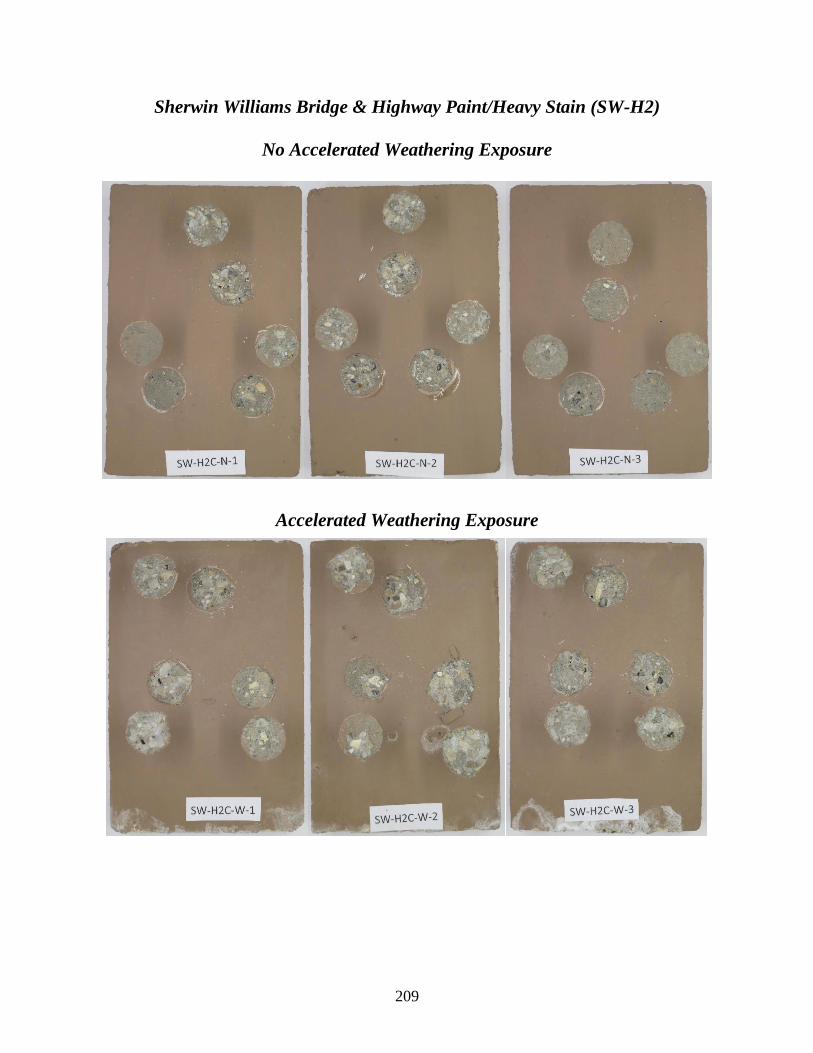
209
Sherwin Williams Bridge & Highway Paint/Heavy Stain (SW-H2)
No Accelerated Weathering Exposure
Accelerated Weathering Exposure
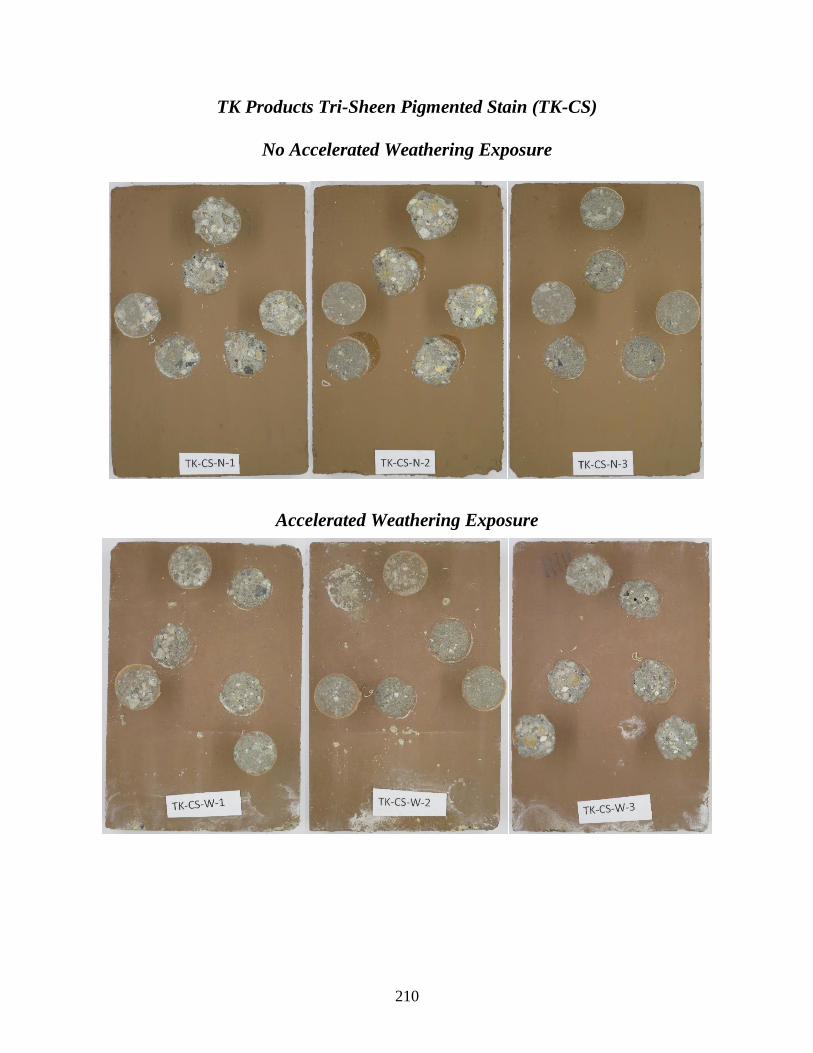
210
TK Products Tri-Sheen Pigmented Stain (TK-CS)
No Accelerated Weathering Exposure
Accelerated Weathering Exposure
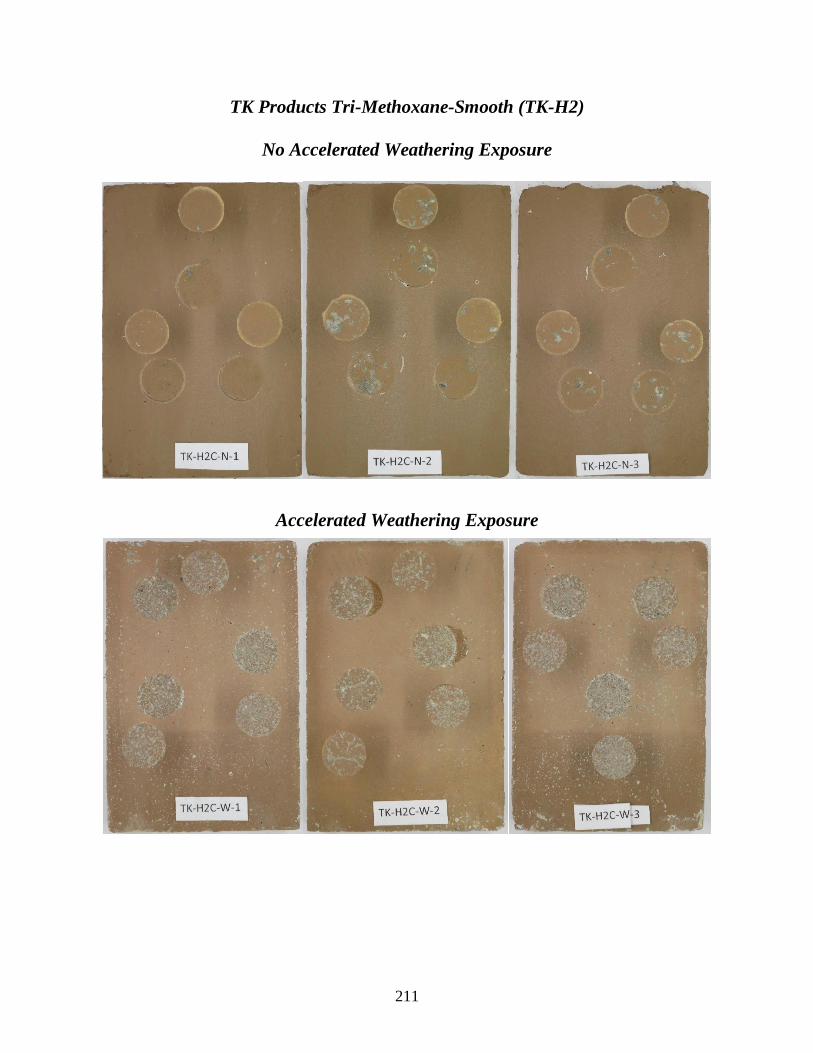
211
TK Products Tri-Methoxane-Smooth (TK-H2)
No Accelerated Weathering Exposure
Accelerated Weathering Exposure
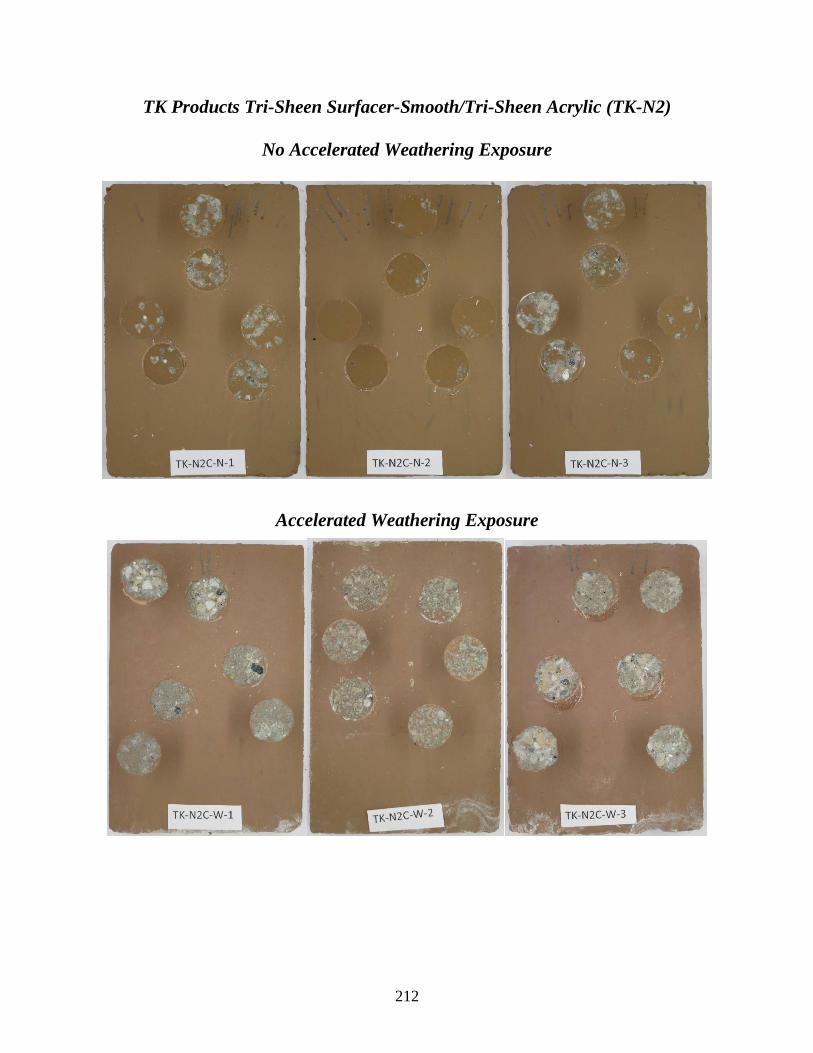
212
TK Products Tri-Sheen Surfacer-Smooth/Tri-Sheen Acrylic (TK-N2)
No Accelerated Weathering Exposure
Accelerated Weathering Exposure
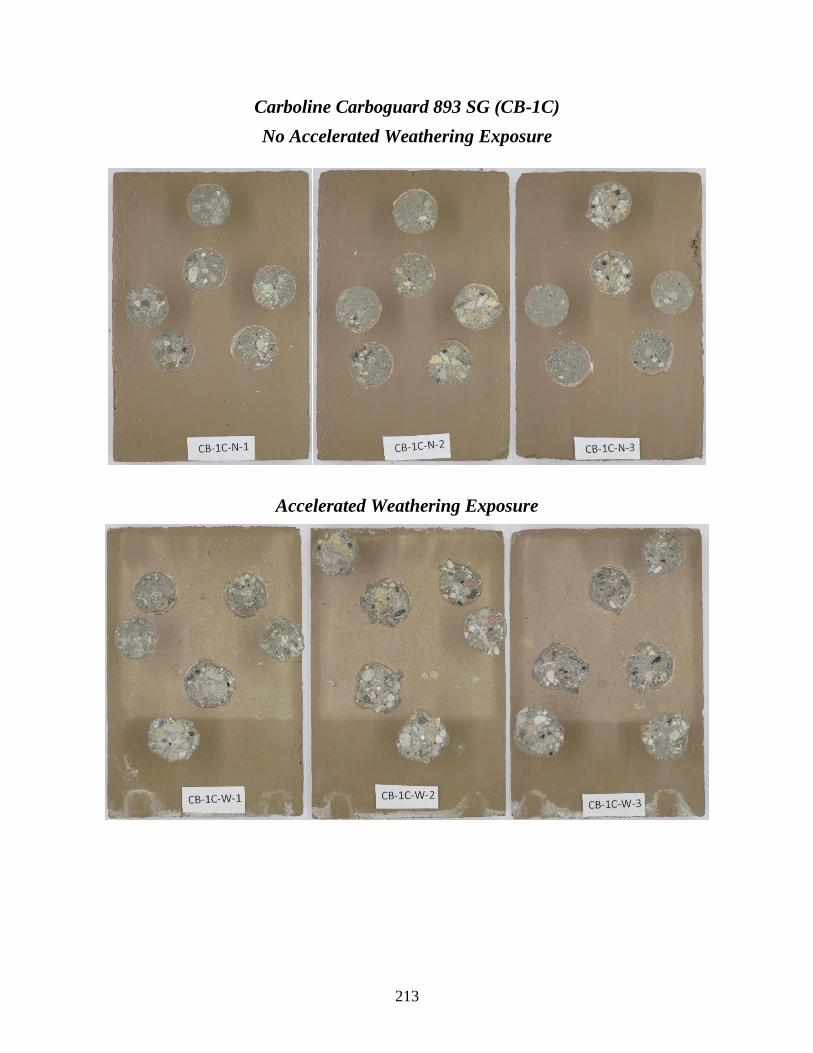
213
Carboline Carboguard 893 SG (CB-1C)
No Accelerated Weathering Exposure
Accelerated Weathering Exposure
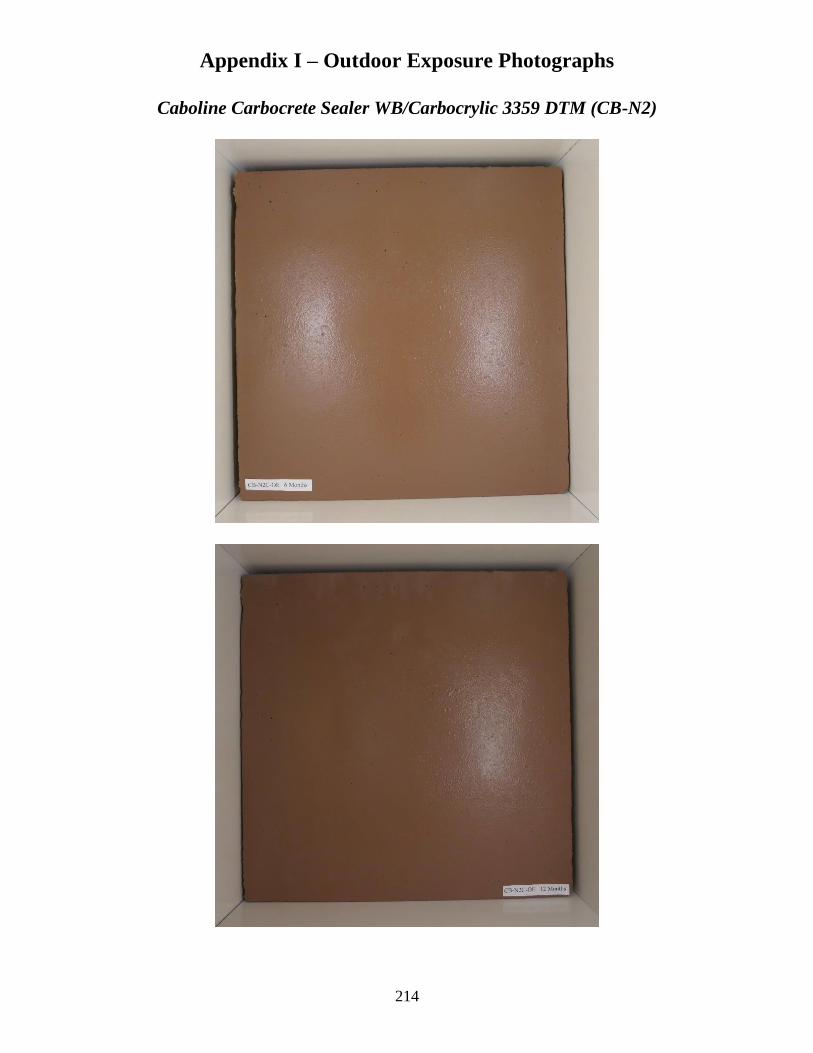
214
Appendix I – Outdoor Exposure Photographs
Caboline Carbocrete Sealer WB/Carbocrylic 3359 DTM (CB-N2)
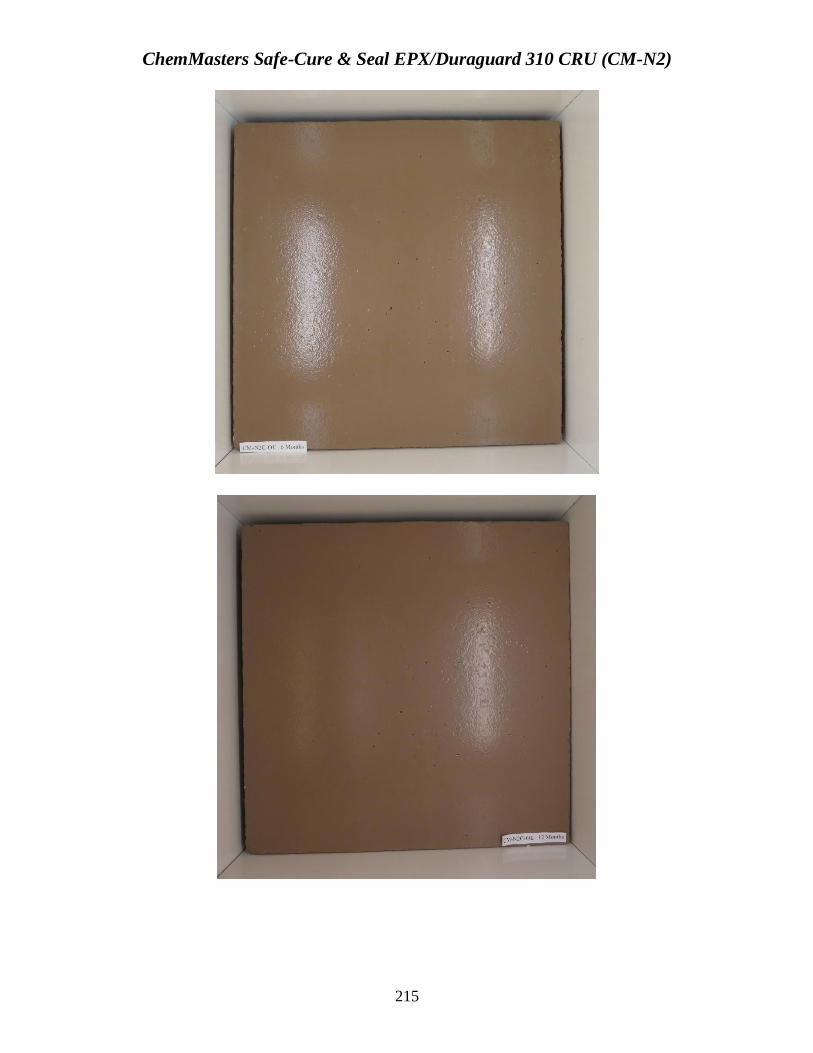
215
ChemMasters Safe-Cure & Seal EPX/Duraguard 310 CRU (CM-N2)
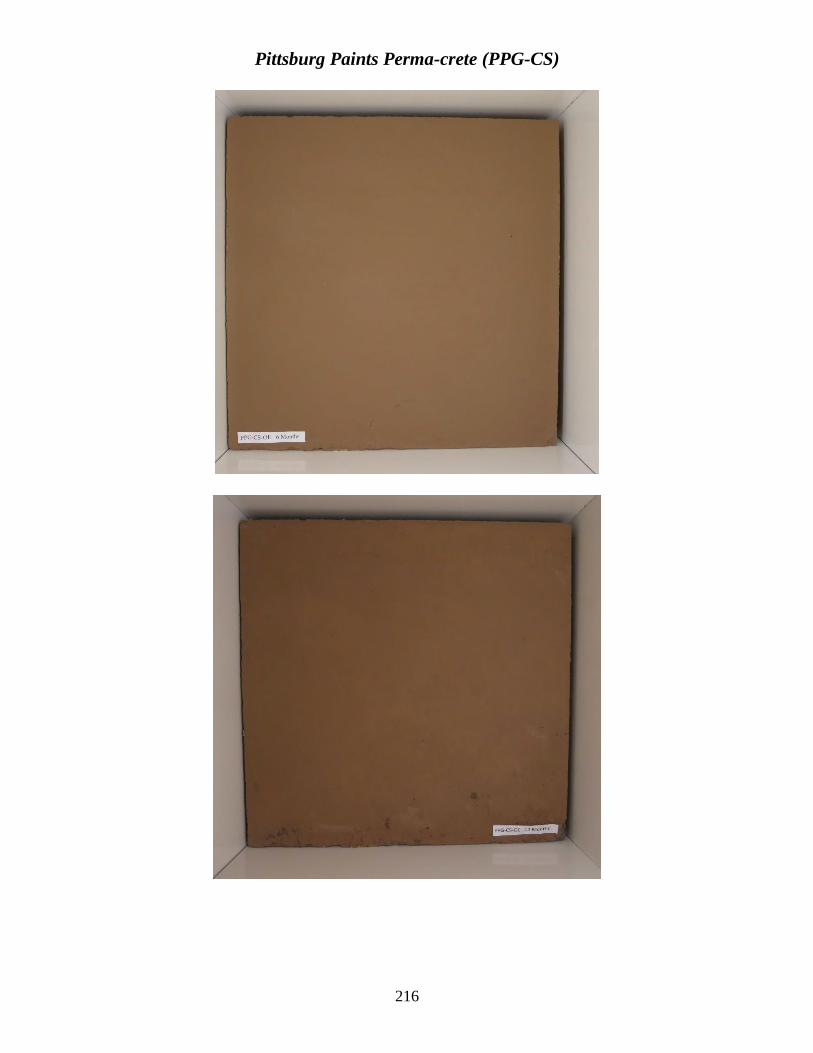
216
Pittsburg Paints Perma-crete (PPG-CS)

217
Sika Corporation Sikagard 550W Elastocolor (SC-H2)

218
Sherwin Williams Concrete Texture Coating-Fine (SW-1C)

219
Sherwin Williams Bridge & Highway Paint/Heavy Stain (SW-H2)
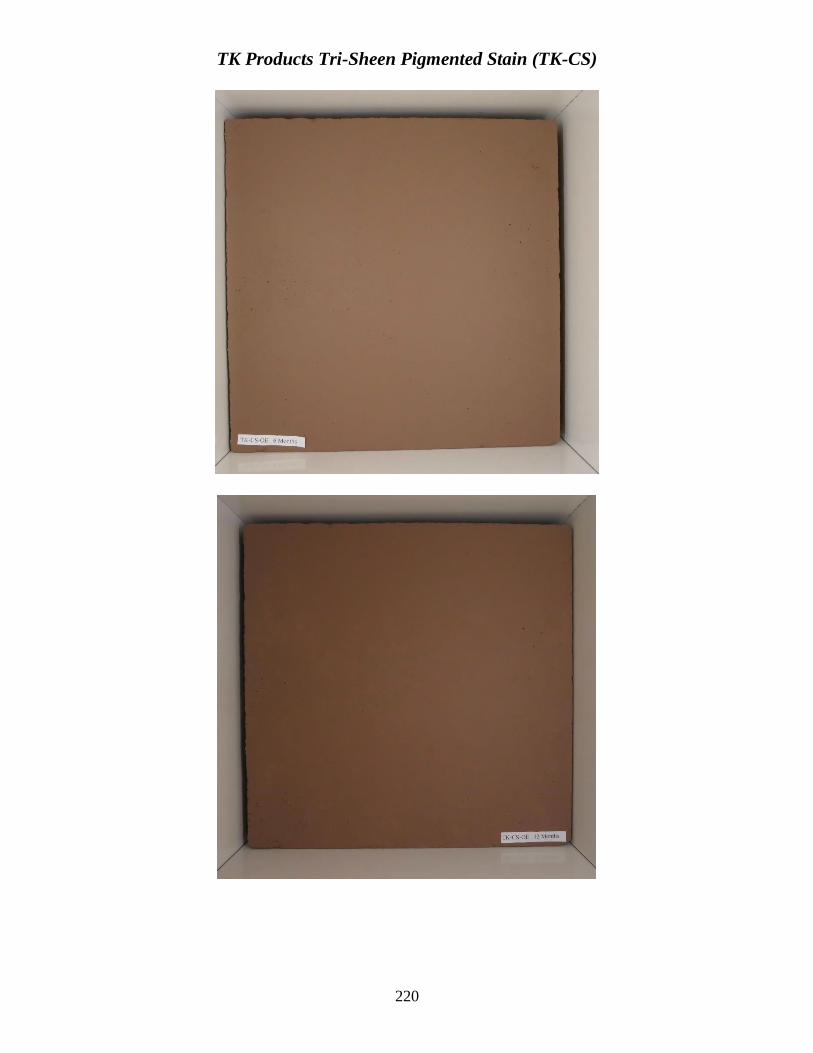
220
TK Products Tri-Sheen Pigmented Stain (TK-CS)
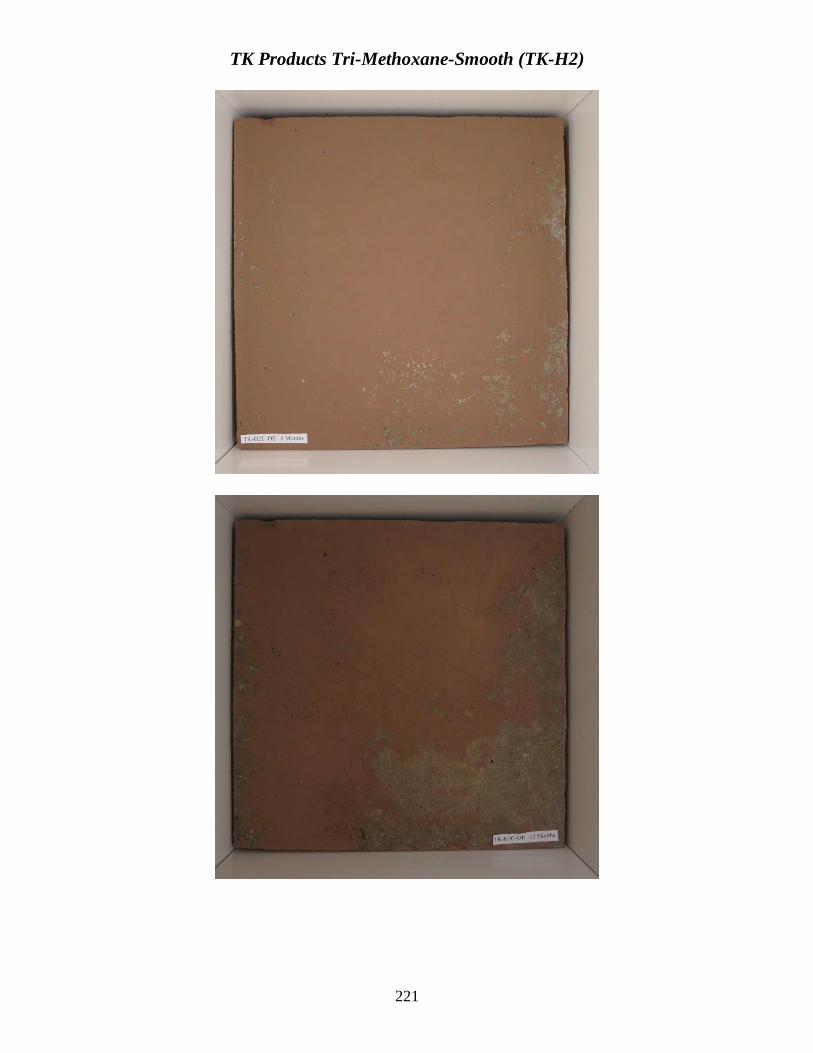
221
TK Products Tri-Methoxane-Smooth (TK-H2)
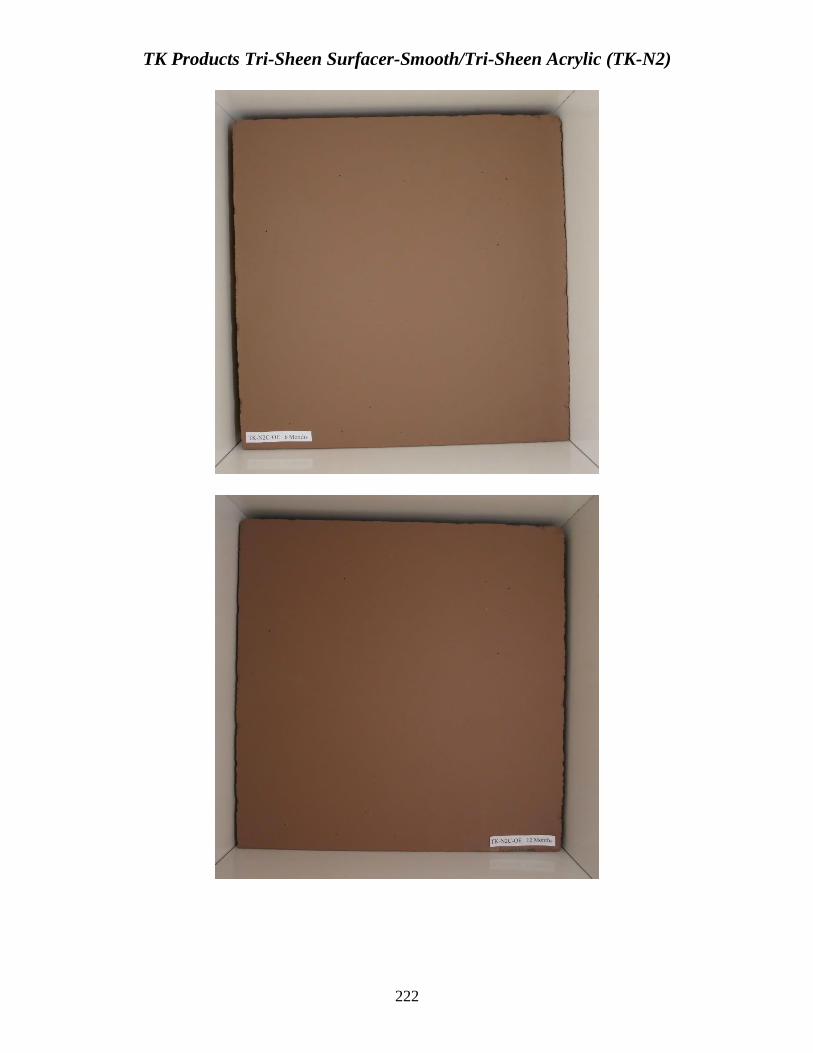
222
TK Products Tri-Sheen Surfacer-Smooth/Tri-Sheen Acrylic (TK-N2)
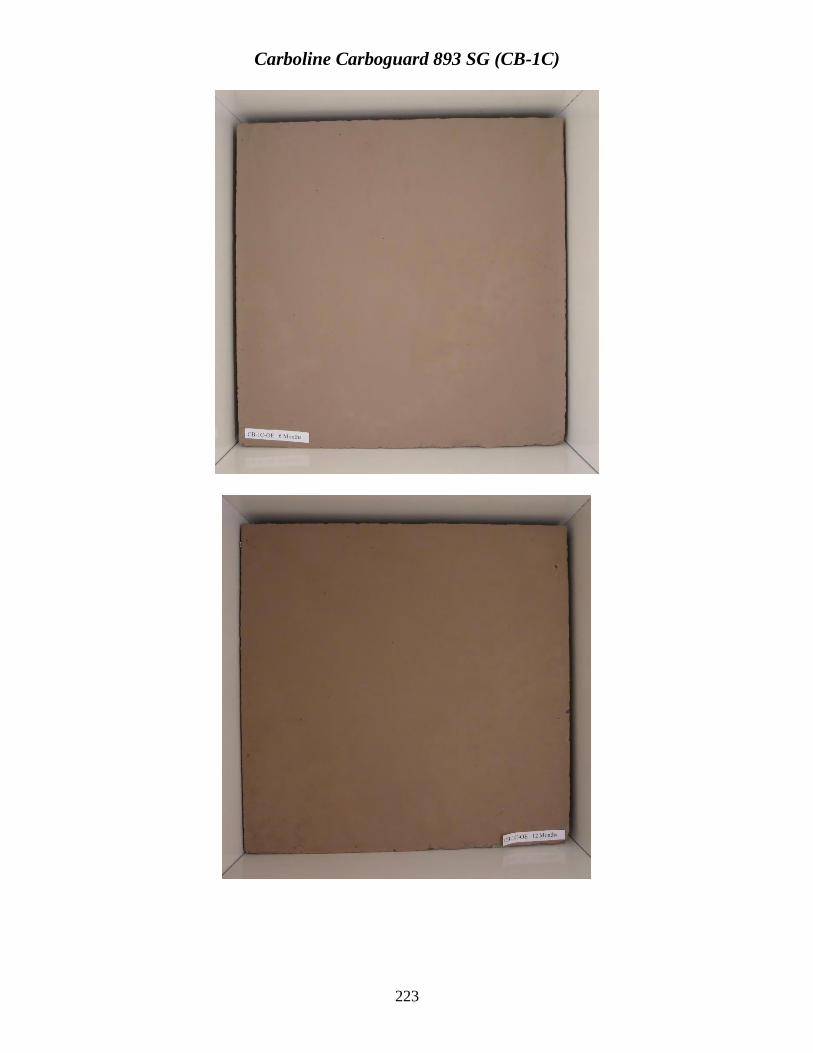
223
Carboline Carboguard 893 SG (CB-1C)
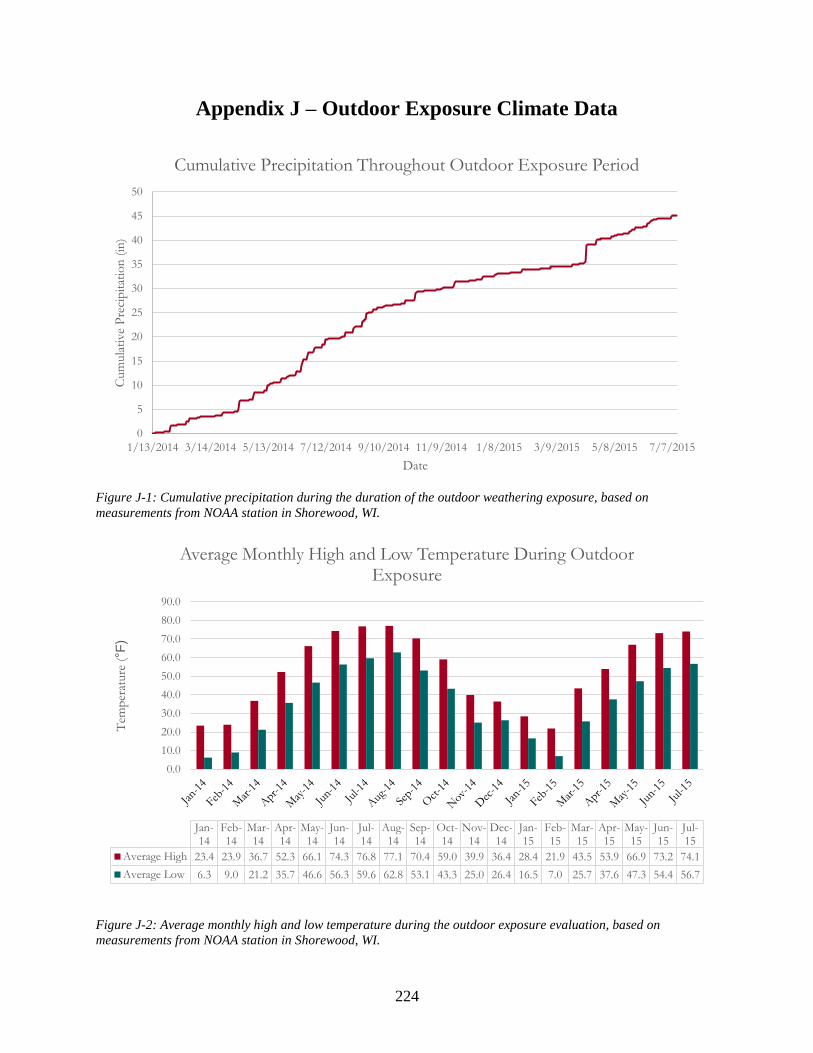
224
Appendix J – Outdoor Exposure Climate Data
Figure J-1: Cumulative precipitation during the duration of the outdoor weathering exposure, based on
measurements from NOAA station in Shorewood, WI.
Figure J-2: Average monthly high and low temperature during the outdoor exposure evaluation, based on
measurements from NOAA station in Shorewood, WI.
0
5
10
15
20
25
30
35
40
45
50
1/13/2014 3/14/2014 5/13/2014 7/12/2014 9/10/2014 11/9/2014 1/8/2015 3/9/2015 5/8/2015 7/7/2015
Cum
ula
tive
Pre
cip
itat
ion
(in
)
Date
Cumulative Precipitation Throughout Outdoor Exposure Period
0.0
10.0
20.0
30.0
40.0
50.0
60.0
70.0
80.0
90.0
Tem
per
ature
(°F
)
Jan-14
Feb-14
Mar-14
Apr-14
May-14
Jun-14
Jul-14
Aug-14
Sep-14
Oct-14
Nov-14
Dec-14
Jan-15
Feb-15
Mar-15
Apr-15
May-15
Jun-15
Jul-15
Average High 23.4 23.9 36.7 52.3 66.1 74.3 76.8 77.1 70.4 59.0 39.9 36.4 28.4 21.9 43.5 53.9 66.9 73.2 74.1
Average Low 6.3 9.0 21.2 35.7 46.6 56.3 59.6 62.8 53.1 43.3 25.0 26.4 16.5 7.0 25.7 37.6 47.3 54.4 56.7
Average Monthly High and Low Temperature During Outdoor Exposure
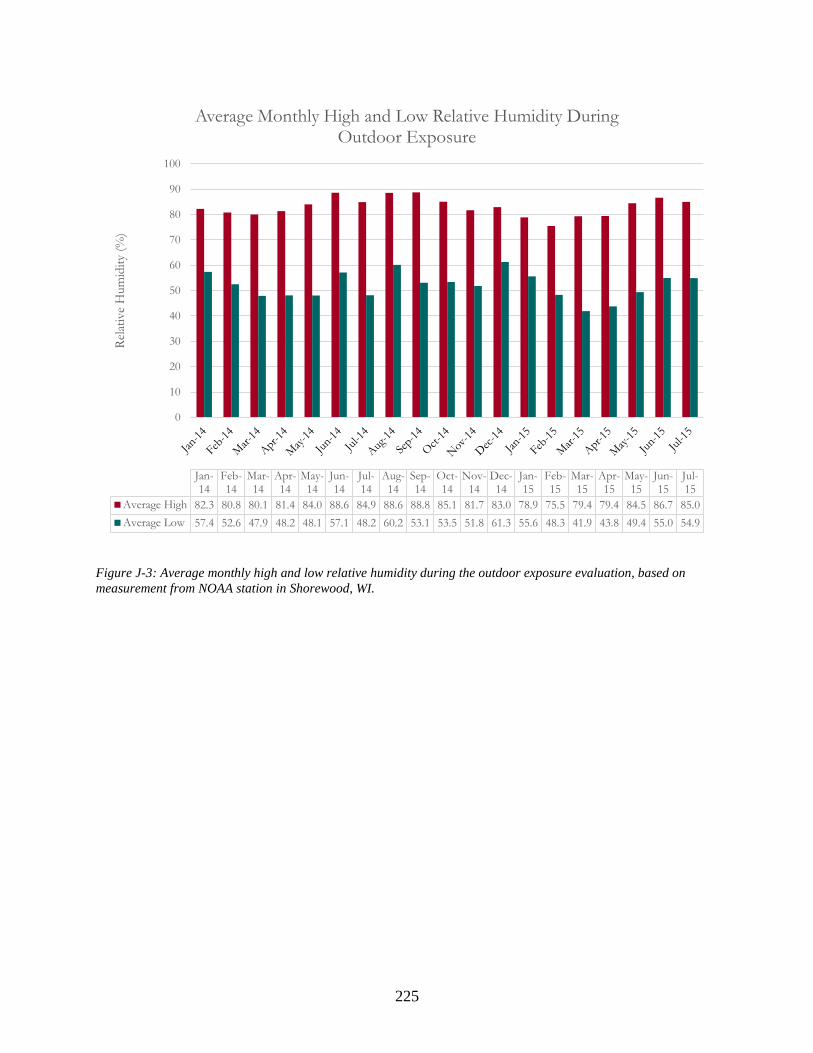
225
Figure J-3: Average monthly high and low relative humidity during the outdoor exposure evaluation, based on
measurement from NOAA station in Shorewood, WI.
0
10
20
30
40
50
60
70
80
90
100
Rel
ativ
e H
um
idit
y (%
)
Jan-14
Feb-14
Mar-14
Apr-14
May-14
Jun-14
Jul-14
Aug-14
Sep-14
Oct-14
Nov-14
Dec-14
Jan-15
Feb-15
Mar-15
Apr-15
May-15
Jun-15
Jul-15
Average High 82.3 80.8 80.1 81.4 84.0 88.6 84.9 88.6 88.8 85.1 81.7 83.0 78.9 75.5 79.4 79.4 84.5 86.7 85.0
Average Low 57.4 52.6 47.9 48.2 48.1 57.1 48.2 60.2 53.1 53.5 51.8 61.3 55.6 48.3 41.9 43.8 49.4 55.0 54.9
Average Monthly High and Low Relative Humidity During Outdoor Exposure
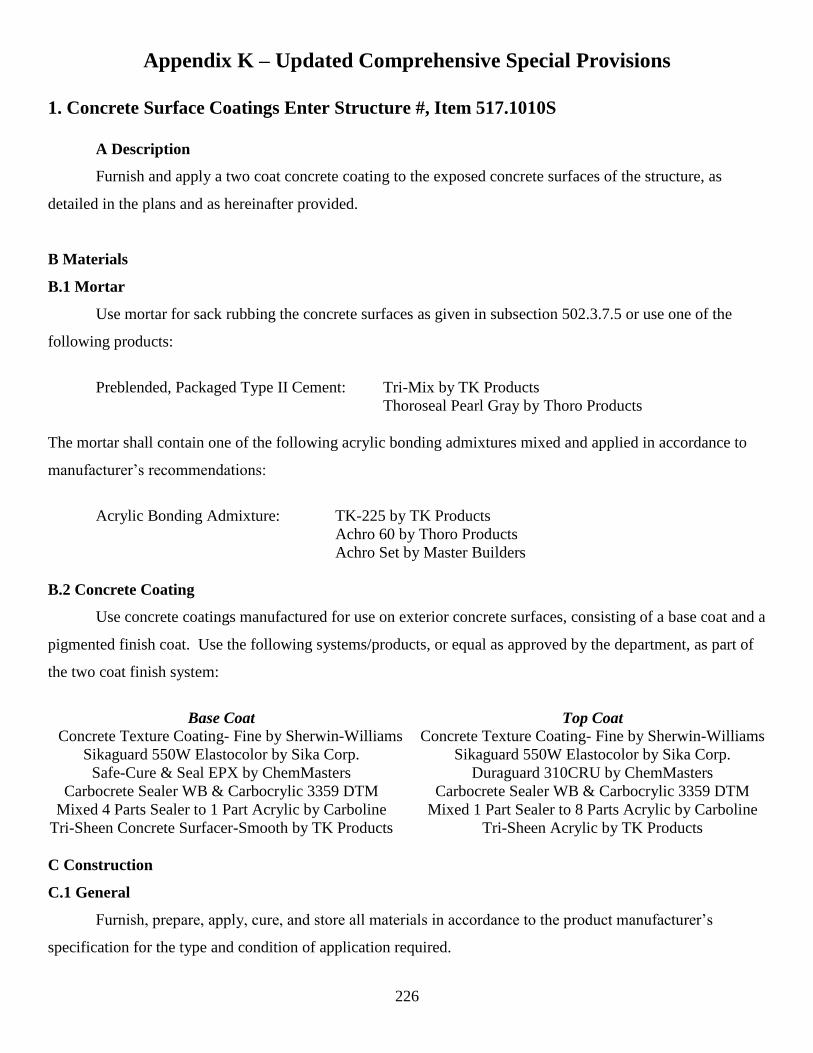
226
Appendix K – Updated Comprehensive Special Provisions
1. Concrete Surface Coatings Enter Structure #, Item 517.1010S
A Description
Furnish and apply a two coat concrete coating to the exposed concrete surfaces of the structure, as
detailed in the plans and as hereinafter provided.
B Materials
B.1 Mortar
Use mortar for sack rubbing the concrete surfaces as given in subsection 502.3.7.5 or use one of the
following products:
Preblended, Packaged Type II Cement: Tri-Mix by TK Products
Thoroseal Pearl Gray by Thoro Products
The mortar shall contain one of the following acrylic bonding admixtures mixed and applied in accordance to
manufacturer’s recommendations:
Acrylic Bonding Admixture: TK-225 by TK Products
Achro 60 by Thoro Products
Achro Set by Master Builders
B.2 Concrete Coating
Use concrete coatings manufactured for use on exterior concrete surfaces, consisting of a base coat and a
pigmented finish coat. Use the following systems/products, or equal as approved by the department, as part of
the two coat finish system:
Base Coat
Concrete Texture Coating- Fine by Sherwin-Williams
Sikaguard 550W Elastocolor by Sika Corp.
Safe-Cure & Seal EPX by ChemMasters
Carbocrete Sealer WB & Carbocrylic 3359 DTM
Mixed 4 Parts Sealer to 1 Part Acrylic by Carboline
Tri-Sheen Concrete Surfacer-Smooth by TK Products
Top Coat
Concrete Texture Coating- Fine by Sherwin-Williams
Sikaguard 550W Elastocolor by Sika Corp.
Duraguard 310CRU by ChemMasters
Carbocrete Sealer WB & Carbocrylic 3359 DTM
Mixed 1 Part Sealer to 8 Parts Acrylic by Carboline
Tri-Sheen Acrylic by TK Products
C Construction
C.1 General
Furnish, prepare, apply, cure, and store all materials in accordance to the product manufacturer’s
specification for the type and condition of application required.
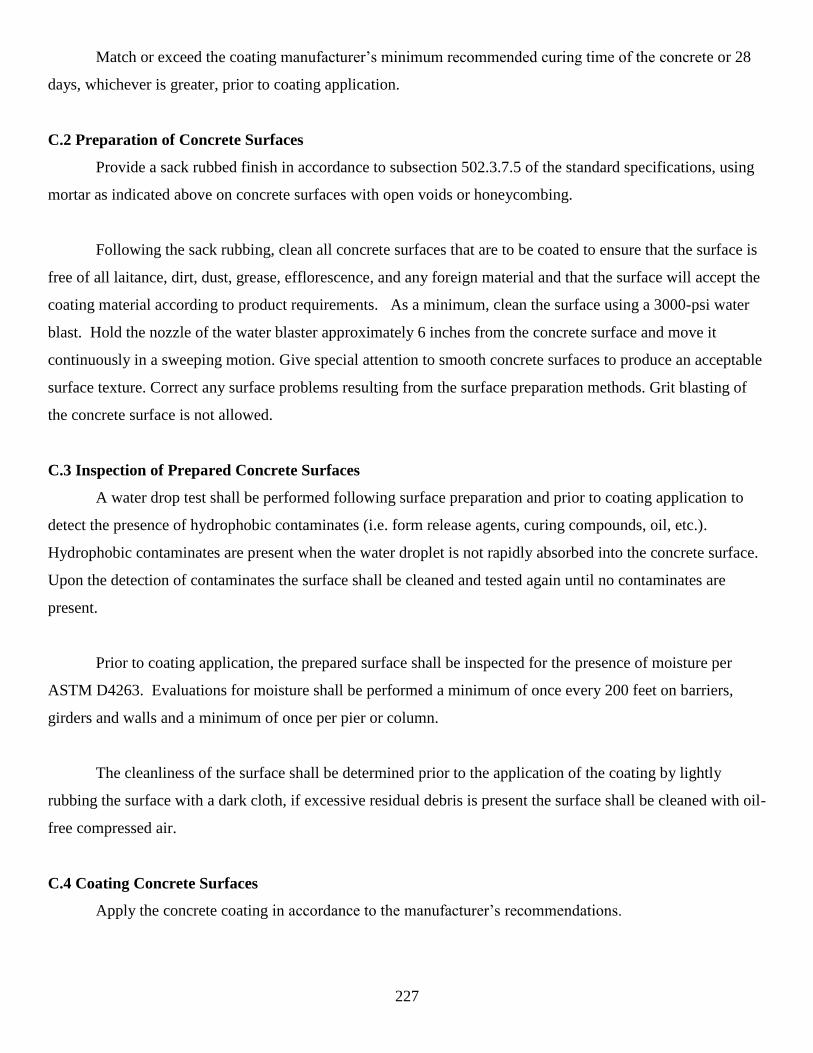
227
Match or exceed the coating manufacturer’s minimum recommended curing time of the concrete or 28
days, whichever is greater, prior to coating application.
C.2 Preparation of Concrete Surfaces
Provide a sack rubbed finish in accordance to subsection 502.3.7.5 of the standard specifications, using
mortar as indicated above on concrete surfaces with open voids or honeycombing.
Following the sack rubbing, clean all concrete surfaces that are to be coated to ensure that the surface is
free of all laitance, dirt, dust, grease, efflorescence, and any foreign material and that the surface will accept the
coating material according to product requirements. As a minimum, clean the surface using a 3000-psi water
blast. Hold the nozzle of the water blaster approximately 6 inches from the concrete surface and move it
continuously in a sweeping motion. Give special attention to smooth concrete surfaces to produce an acceptable
surface texture. Correct any surface problems resulting from the surface preparation methods. Grit blasting of
the concrete surface is not allowed.
C.3 Inspection of Prepared Concrete Surfaces
A water drop test shall be performed following surface preparation and prior to coating application to
detect the presence of hydrophobic contaminates (i.e. form release agents, curing compounds, oil, etc.).
Hydrophobic contaminates are present when the water droplet is not rapidly absorbed into the concrete surface.
Upon the detection of contaminates the surface shall be cleaned and tested again until no contaminates are
present.
Prior to coating application, the prepared surface shall be inspected for the presence of moisture per
ASTM D4263. Evaluations for moisture shall be performed a minimum of once every 200 feet on barriers,
girders and walls and a minimum of once per pier or column.
The cleanliness of the surface shall be determined prior to the application of the coating by lightly
rubbing the surface with a dark cloth, if excessive residual debris is present the surface shall be cleaned with oil-
free compressed air.
C.4 Coating Concrete Surfaces
Apply the concrete coating in accordance to the manufacturer’s recommendations.
228
Apply the concrete coating when the temperature of the concrete surface is 45° F or higher, or as given
by the manufacturer.
The color of the coating shall be as given on the plan. Tint the base coat to match the finish coat; the two
coats shall be compatible with each other.
Do not begin coating the structure until earthwork operations are completed to a point where this work
can begin without receiving damage. Where this work is adjacent to exposed soil or pavement areas, provide
temporary covering protection from overspray or splatter.
C.5 Test Areas
Prior to applying the coating to the structure, apply the coating to sample panels measuring a minimum
of 48-inches x 48-inches and constructed to demonstrate workmanship in the use of the form liner specified on
the structure if applicable. Match or exceed the coating manufacturer’s minimum recommended curing time of
the concrete or 28 days, whichever is greater, prior to coating application. Prepare the concrete surfaces of the
sample panels and apply coating using same materials and in the same manner as proposed for the structure,
including coating of the joints between the stones produced by the form liner if applicable. Do not apply coating
to the structure until the department approves the test panels.
C. 6 Surfaces to be Coated
Apply concrete coating to the surfaces in accordance to the plan.
D Measurement
The department will measure Concrete Coating (Structure) in area by the square foot of surface,
acceptably prepared and coated.
E Payment
The department will pay for measured quantities as the contract unit price under the following bid item:
ITEM NUMBER DESCRIPTION UNIT
517.1010.S Concrete Coating Enter Structure # SF

229
Payment is full compensation for furnishing and applying the two coat system; for preparing the
concrete surface; for preparing the sample panels; and for furnishing all labor, tools, equipment, and incidentals
to complete the contract work.
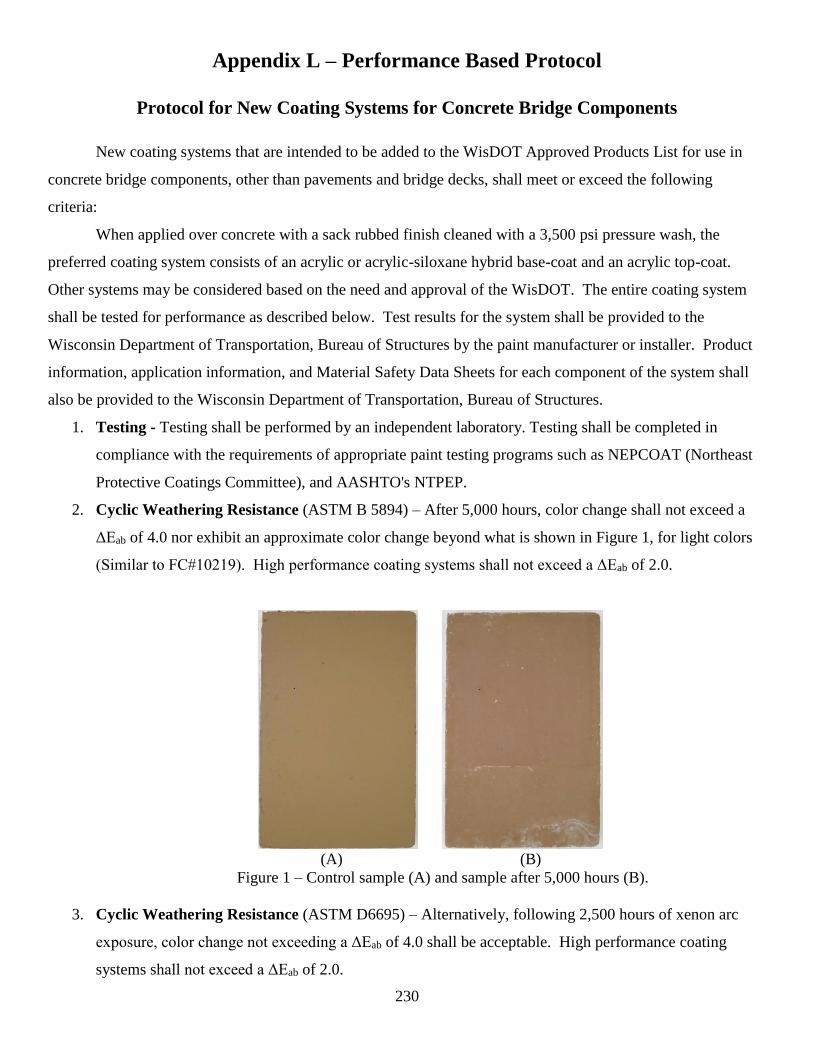
230
Appendix L – Performance Based Protocol
Protocol for New Coating Systems for Concrete Bridge Components
New coating systems that are intended to be added to the WisDOT Approved Products List for use in
concrete bridge components, other than pavements and bridge decks, shall meet or exceed the following
criteria:
When applied over concrete with a sack rubbed finish cleaned with a 3,500 psi pressure wash, the
preferred coating system consists of an acrylic or acrylic-siloxane hybrid base-coat and an acrylic top-coat.
Other systems may be considered based on the need and approval of the WisDOT. The entire coating system
shall be tested for performance as described below. Test results for the system shall be provided to the
Wisconsin Department of Transportation, Bureau of Structures by the paint manufacturer or installer. Product
information, application information, and Material Safety Data Sheets for each component of the system shall
also be provided to the Wisconsin Department of Transportation, Bureau of Structures.
1. Testing - Testing shall be performed by an independent laboratory. Testing shall be completed in
compliance with the requirements of appropriate paint testing programs such as NEPCOAT (Northeast
Protective Coatings Committee), and AASHTO's NTPEP.
2. Cyclic Weathering Resistance (ASTM B 5894) – After 5,000 hours, color change shall not exceed a
ΔEab of 4.0 nor exhibit an approximate color change beyond what is shown in Figure 1, for light colors
(Similar to FC#10219). High performance coating systems shall not exceed a ΔEab of 2.0.
(A) (B)
Figure 1 – Control sample (A) and sample after 5,000 hours (B).
3. Cyclic Weathering Resistance (ASTM D6695) – Alternatively, following 2,500 hours of xenon arc
exposure, color change not exceeding a ΔEab of 4.0 shall be acceptable. High performance coating
systems shall not exceed a ΔEab of 2.0.
231
4. Chloride Ion Penetration (AASHTO T-259 & T-260) – The concentration of chloride ions at a depth
of ½” shall not exceed 0.175% following a 90 day continuous ponding of a 15% chloride solution. High
performance coatings should not exceed a concentration of 0.135% at the same ½” depth.
5. Coating Product Identification - The coating product name and formulation shall be the same on the
coating system tested, the literature on file with the Bureau of Structures, the literature on file with the
project engineer, and the containers of the components on the job site.
232
Wisconsin Highway Research Program
University of Wisconsin – Madison
1415 Engineering Drive
Madison, WI 53706
http://wisdotresearch.wi.gov/whrp