A study on toxic organic emissions from batch combustion of styrene
Upload
independentCategory
view
2download
0
A Partial Phase Diagram for a Mixture of Polystyrene with a Low Molecular Weight
Styrene-Dimethylsiloxane Block Copolymer
BAOYU WANG and SONJA KRAUSE, Department of Chemistry, Rensselaer Polytechnic Institute, Troy, New York 12180
Synopsis
Differential Scanning calorimetry (Dsc) was used to examine the miscibility of polystyrene (PS), mol. wt. lo', with a phase-separated s t y r e n e - d i m e t h y l e (S-DMS) diblock copolymer, M,, = 3800,s wt% S. Mixtures whose S content varied from 4 to 96 wt% PS were examined at a 10 K min-' heating rate following a 200 K min-' cooling rate from temperatures varying from 403 to 573 K. At some compositions, two glass transition temperatures, Tgs, corresponding to PS transitions were observed, at others only a single Tg was observed. When it was assumed that the 200 K min-' cooling rate correaponded to quenching from the starting temperature, and when the heat capacity changes at the S glass trausitions were used to calculate the percentage of S repeat units undergoing each glass transition, it was possible to calculate an approximate partial phase diagram for this mixture. At 96 wtS PS, there was evidence for a small amount of mixed S phase, possibly block copolymer micelles, in equilibrium with PS; from about 60 to 90 wt% PS, the S repeat units from the block copolymer appeared to be completely mixed with the PS. At lower wt% PS, unmixed block copolymer was in equilibrium with block copolymer whose S segments were mixed with the PS. The phase diagram appeared to vary only slightly with temperature.
INTRODUCTION For many years, the miscibility of homopolymers into the chemically
identical microphases in block copolymers having a block which is chemically identical to the homopolymer was considered in a rather simple fashion. It was assumed that some of these systems would be miscible and that others would be immiscible. For example, Inoue et al.,' in a study using light and electron microecopy of mixtures of styrene-isoprene diblock copolymers (S-I) with polystyrene (PS) or polyisoprene (PI), found that the homopolymers appeared to be miscible with the chemically identical domains of the block copolymer when the homopolymer had a molecular weight equal to or less than that of the block comprising that domain. When the molecular weight of the homopolymer exceeded that of the chemically identical block, no mixing seemed to occur, and the homopolymer formed large, separate phases. Toy et al.,2 also using electron micmsmpy, found that polybutadiene (PB) mixed into the butadiene microphases of styrene-butadiene-styrene (S-B-S) triblock copolymers when its molecular weight was much less than that of the B block, and formed separate phases when its molecular weight was much higher. Hashimot0 et al.,3 in an elegant small-angle x-ray scattering (SAXS) study of mixtures of S-I diblock copolymers with PS and PI, both with molecular weight considerably smaller than the chemically identical blocks, studied the changes in microphase size and separation as homopolymer was added and
Journal of Polymer Science: Part B: Polymer Physics, Vol. 26,2237-2246 (1988) Q 1988 John Wiley & Sons, Inc. CCC 0098-1273/88/112237-10$04.00
2238 WANG AND KRAUSE
completely solubilized into the microphases. A little later, Lu et al.,4 in this laboratory, found somewhat different results using refractive index-tempera- ture (n-T) measurements on mixtures of PS with styrene-dimethylsiloxane (S-DMS) diblock copolymers. A single glass transition temperature 7'' was found in the temperature range corresponding to the S phase transitions in all mixtures studied; this Tg was quite sharp and corresponded to a mixture of the S microphases from the block copolymer with the added PS whether the molecular weight of the added PS was larger or smaller than that of the S block in the S-DMS block copolymer. In one case, an approximately 50 wt% mixture of S microphase and PS was observed in which the ratio of PS molecular weight to S block molecular weight exceeded 20:l.
More recent work on homopolymer-block copolymer mixtures has recog- nized the existence of complex phase diagrams for these mixtures. Solubility often exists only over limited composition ranges. Rameau et d.,5 for example, examined cloud point curves of mixtures of oligomeric samples of PS, PB and S-B diblock copolymer; upper critical solution temperatures (UCSTs) were obtained in all mixtures observed. Roe and Zin' combined SAXS with cloud point measurements to obtain the first complete phase diagrams of block copolymer-homopolymer mixtures. They studied two mixtures, each contain- ing an S-B diblock copolymer with S block molecular weight 7600 and B block molecular weight 20,000. One mixture contained PS, molecular weight 2400, whereas the other contained PB, molecular weight 26,000. Both phase dia- grams were complex, ending with an UCST. Different kinds of mixing exist in different parts of the phase diagrams. When the block copolymer was itself (micr0)phase separated, any thermodynamic phase* containing this block copolymer was called a mesophase. When the block copolymer was not microphase separated, any thermodynamic phase containing this block copoly- mer was called a liquid phase. Two liquid phases, two mesophases, or a liquid phase and a mesophase could be and were in equilibrium with each other in different areas of the phase diagrams. Relatively simple phase relationships in block copolymer-homopolymer mixtura have been examined theoretically by Leibler,8 while Noolandi and coworker^^-^^ predicted complex phase diagrams of the sort found by Roe and Zin.' The predictions by Noolandi and co- w o r k e r ~ ~ - ' ~ are for lamellar microphases in the mesophases, whereas the data of Roe and Zin' were for a block copolymer with spherical inclusions of S in a B matrix.
No one seems to have examined, either theoretically or experimentally, a mixture of block copolymer and homopolymer in which the homopolymer had a molecular weight one to two orders of magnitude greater than that of the chemically identical block in the block copolymer. We have been able to study such a mixture using differential scanning calorimetry (DSC) by choosing a block copolymer with an S block molecular weight so low that the glass transition temperature Tg of the microphase made up of that block was 48 K lower than that of the high molecular weight PS with which the block copolymer was mixed.
*The fact that thermodynamic phases must contain complete molecules and cannot simply consist of microphases containing only one of the blocks of a block copolymer has been discussed in Ref. 7.
PARTIAL PHASE DIAGRAM 2239
EXPERIMENTAL
Samples
The PS used in this work was an anionically polymerized standard sample purchased from the ARRO Chemical Co., Joliet, Ill., with molecular weight lo5 and ratio of weight-average molecular weight to number-average molecu- lar weight, MJM, I 1.1. The diblock copolymer used in this work was called 1-24 in one previous p~blication'~ and DI-1 in another;14 its M , = 4100 f 300, M, = 3800 f 300, 86 wt% S. This sample therefore had an S block with M, = 3300 and a DMS block with M, = 500.
Blend Preparation
Blends were cast as thin films from 5% (w/v) solutions in toluene onto aluminum weighing dishes, and the solvent was allowed to evaporate at room temperature for about 24 h. Subsequent drying was under reduced pressure in a vacuum oven for 5 days at 318 K and then for 2 days at 335 K.
Differential Scanning Calorimetry
All measurements were performed on a Perkin-Elmer DSC-4 interfaced with an Ithaca Intersystem microcomputer using software from Laboratory Microsystems Inc. (Troy, N.Y.). Since most of the data on S microphases and mixtures discussed in this paper were obtained above 210 K, nitrogen could usually be used as the purge gas. At lower temperatures, helium was used as purge gas, and liquid nitrogen was used as coolant. Polymer samples weighing 15-20 mg were placed in flat aluminum DSC pans. Calibration of this instrument has been d d b e d previ~usly.'~.'~ The samples and mixtures were cooled at two different rates, 10 and 200 K min-', from various annealing temperatures which are noted in the tables, and all of the data were collected during reheating at 10 K min-' from 210 to 405 K; an occasional run started at 113 K. Samples were held at their annealing temperatures for 30 min. Glass transition temperatures were obtained from heat capacity C, versus tempera- ture T plots; the Tg was the temperature at which the experimental C, versus T curve crossed a point halfway between the extrapolated rubbery and glassy baselines. The width of the glass transition ATg was the difference between the temperatures at which the tangent to the C, versus T curve at Tg intersected the glassy baseline and the rubbery baseline. The heat capacity change at the glass transition AC, was the vertical distance between the extrapolated glawy baseline and the rubbery baseline at Tg. These parameters have been shown graphically in Figure 1 of Ref. 13; the reasons for choosing the above definition of AT, were discussed in Ref. 13.
RESULTS AND DISCUSSION The DMS microphase Tg was not detectable even in the pure block
copolymer. Nevertheless, there is much evidence that this sample is micro- phase separated: that is, that it exists as a mesophase at mom temperature. The pure diblock copolymer had a Tg = 326 K, comparable to t h e of S microphasea in block copolymers with similar S block molecular weights.13

2240 WANG AND KRAUSE
2-50-
2.00 &! z? r m 0, I 2 1.50 'c
L In
1 .oo
275 300 325 350 375 4
Temperature (K)
0
Fig. 1. Specific heat versus temperature after 10 K min-' cooling from 403 K. (1) Pure diblock copolymer, (2) blend B3, (3) blend B2, and (4) pure PS. The ordinate corresponds to curve 1. The rest of the curves have been shifted progressively downward by 0.15 J g-' K- l .
Depending on the choice of glassy baseline on the C, versus T plot, the AC, of this microphase was 0.30 or 0.32 J g-' K-', close to the average value for PS, 0.29 J g-' K-'.I3 If the DMS blocks were mixed into the S microphases, the expected Tg of the mixed phase would be 285 K using the Fox equation,16 and the AC, should have been 0.362 J g-' K-', assuming that the DMS micro- phases retain their normal AC, = 0.50 J g-' K-' '*,17 up to 285 K. In addition, we have studied the Tgs of both microphases in a diblock copolymer containing a DMS block with M, = lo00 and an S block with M, = 5800. That block copolymer had definitely separated into mi~rophases.'~
Figure 1 shows the C, versus T curves of the pure block copolymer, the pure homopolymer, and two of the blends, B2 and B3, identified in Table I after the 10 K min-' cooling rate. These two blends exhibited two Tgs each, one identical to that of the block copolymer, and the other somewhat lower than that of the homopolymer. The Tg of the homopolymer was 374 K, ATg = 6.5 K, and AC, = 0.29 J K-' g-'. Thus, it appears that these two blends contain two different S phases, one identical within experimental error to that in the pure block copolymer and the other consisting of the homopolymer mixed with S repeat units from some of the block copolymer molecules. Some blends, notably B1 and B6, had only a single Tg, intermediate between that of the S microphase in the pure block copolymer and that of the PS. Presumably, there was complete mixing of the PS into the microphases in these blends.
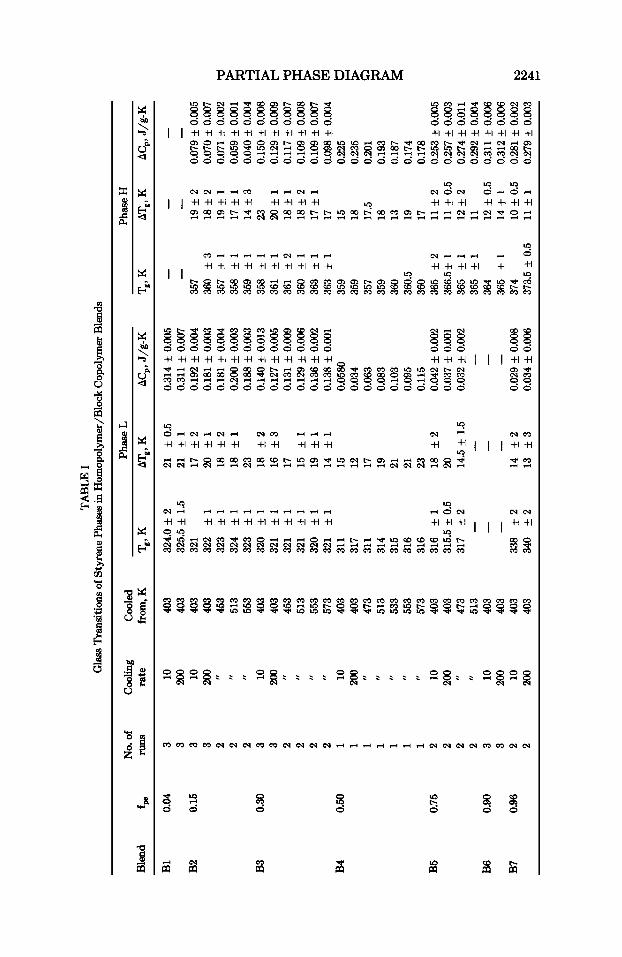
Table I identifies the blends and shows some of the data obtained using DSC. Phase L refers to the phase with the lower Tg, phase H refers to the
TA
BL
E I
Gla
ss T
rans
ition
s of S
tyre
ne P
hase
s in
Hom
opol
ymer
/Blo
ck C
opol
ymer
Ble
nds
Phas
e L
Phas
e H
No.
of
cooling
Coo
led
Ble
nd
f P
run8
rate
fr
om, K
T
g, K
A
Tg, K
AC
p, J
/gK
T
g, K
A
Tg, K
AC
,,, J/
g-K
B3
0.30
B4
0.50
B1
0.04
3 3 B2
0.15
3 3 2 2 2 3 3 2 2 2 2 1 1 1 1 1 1 1 B5
0.75
2 2 2 2 B6
0.90
3 3 B7
0.96
2 2
10
200 10
200
,I ,I ,, 10
200
,I ,, I, 10
200
,I I, ,, ,, ,# 10
200
,# ,, 10
200 10
200
403
403
403
403
453
513
553
403
403
453
513
553
573
403
403
473
513
533
553
573
403
403
473
513
403
403
403
403
324.0 f 2
325.5 f 1.5
321
322
f 1
323
f 1
324
f 1
323
f 1
320
f 1
321
f 1
321
f 1
321
f 1
320
f 1
321
f 1
311
317
311
314
315
316
316
316
f 1
315.5 f 0.5
317
f 2
-
-
-
338
f2
340
f2
21 f 0.5
21 +1
17 f2
20 f1
18 f2
18 &1
23
18 f2
16 f3
17
15 f1
19 *1
14 f1
15
12
17
19
21
21
23
18 f2
20
14.5 *
1.5
-
-
-
14 f2
13 f3
0.314 f 0.005
0.311
f 0.007
0.192 f 0.004
0.181 f 0.003
0.181 * 0.
004
0.200 f 0.003
0.188 f 0.003
0.140 f 0.013
0.127 f 0.005
0.131 * 0.
009
0.129 * 0.
006
0.136 f 0.002
0.138 f 0.001
0.0580
0.034
0.063
0.083
0.103
0.095
0.115
0.042 f 0.002
0.037 f 0.001
0.032 f 0.002
-
-
-
0.029 f 0.008
0.034 f 0
.006
-
-
-
-
357
19 f 2
360
f3
18 f 2
357
+ 1
19 f
1
358
f1
17 f 1
359 f 1
14 f 3
358
*1
23
361
f 1
20 f 1
361
f 2
18 f 1
360
f1
18 f 2
363
f 1
17 f 1
363 f 1
17
359
15
359
18
357
17.5
359
18
360
13
360.5
19
360
17
365 f 2
11 f 2
366.5f 1
11
f 0.5
365
f1
12 f 2
365 f 1
11
364
12 f
0.5
365
+ 1
14 f
1
374
10 f 0.5
373.5 f 0.5
11 f
1
-
-
0.079 f 0.005
0.070 f 0.007
0.071
f 0.002
0.059 f 0.001
0.040
f 0.004
0.150 f 0.008
0.129
f 0.009
$ 0.109 f 0.008
0.109 * 0.
007
0.225
0.235
0.201
0.193
5 0 z?
0.187
0.174
5: 0.178
0.253 f 0.005
0.257 f 0.003
0.274 f 0.011
0.292 f 0.004
0.311 f 0
.006
0.312 f 0
.006
0.281 f 0.002
N
0.279
0.003
2242 WANG AND KRAUSE
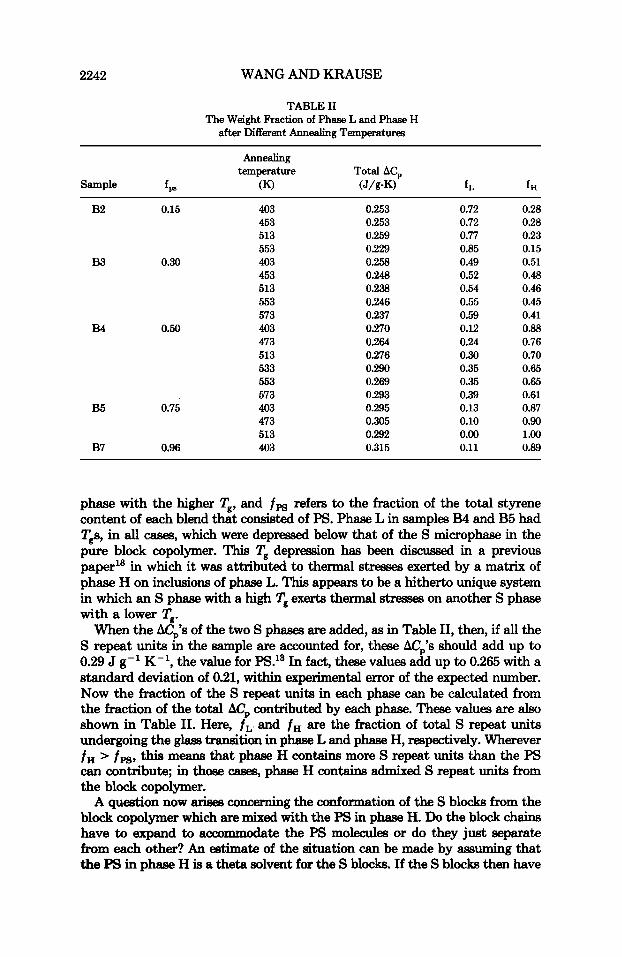
TABLE I1 The Weight Fraction of Phase L and Phase H
after Different Annealing Temperatures
Annealing temperature Total ACp
Sample f P (K) (J/g-K) f L f H
B2 0.15 403 453 513 553
B3 0.30 403 453 513 553 573
B4 0.50 403 473 513 533 553 573
B5 0.75 403 473 513
B7 0.96 403
0.253 0.253 0.259 0.229 0.258 0.248 0.238 0.246 0.237 0.270 0.264 0.276 0.290 0.269 0.293 0.295 0.305 0.292 0.315
0.72 0.72 0.77 0.85 0.49 0.52 0.54 0.55 0.59 0.12 0.24 0.30 0.35 0.35 0.39 0.13 0.10 0.00 0.11
0.28 0.28 0.23 0.15 0.51 0.48 0.46 0.45 0.41 0.88 0.76 0.70 0.65 0.65 0.61 0.87 0.90 1 .oo 0.89
phase with the higher Tg, and f P S refers to the fraction of the total styrene content of each blend that consisted of PS. Phase L in samples B4 and B5 had Tgs, in all cases, which were depressed below that of the S microphase in the pure block copolymer. This T' depression has been discussed in a previous paper'' in which it was attributed to thermal stresses exerted by a matrix of phase H on inclusions of phase L. This appears to be a hitherto unique system in which an S phase with a high Tg exerts thermal stresses on another S phase with a lower Tg.
When the ACp's of the two S phases are added, as in Table 11, then, if all the S repeat units in the sample are accounted for, these ACp's should add up to 0.29 J g-' K-', the value for PS.13 In fact, these values add up to 0.265 with a standard deviation of 0.21, within experimental error of the expected number. Now the fraction of the S repeat units in each phase can be calculated from the fraction of the total AC, contributed by each phase. These values are also shown in Table 11. Here, f L and f H are the fraction of total S repeat units undergoing the glass transition in phase L and phase H, respectively. Wherever f H > f p g , this means that phase H contains more S repeat units than the PS can contribute, in those cases, phase H contains admixed S repeat units from the block copolymer.
A question now arises concerning the conformation of the S blocks from the block copolymer which are mixed with the PS in phase H. Do the block chains have to expand to accommodate the PS molecules or do they just separate from each other? An estimate of the situation can be made by assuming that the PS in phase H is a theta solvent for the S blocks. If the S blocks then have
PARTIAL PHASE DIAGRAM 2243
1.75 *
Y yz
1.50- m
V Y- V
.- 1.25-
1 . . . . 1 . . . . 1 . . . . 1 . . . . 1 . . . . 1 275 300 325 350 375 400
Temperature (K) Temperature (K)
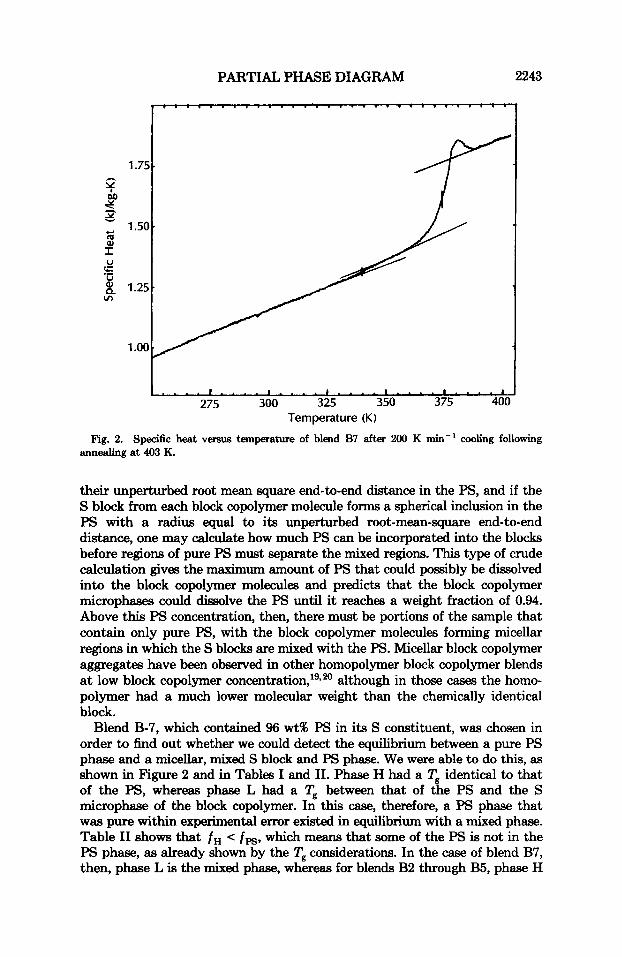
Fig. 2. Specific heat versus temperature of blend B7 after 200 K mix-' cooling following annealing at 403 K.
their unperturbed root mean square end-to-end distance in the PS, and if the S block from each block copolymer molecule forms a spherical inclusion in the PS with a radius equal to its unperturbed root-mean-square end-to-end distance, one may calculate how much PS can be incorporated into the blocks before regions of pure PS must separate the mixed regions. This type of crude calculation gives the maximum amount of PS that could possibly be dissolved into the block copolymer molecules and predicts that the block copolymer microphases could dissolve the PS until it reaches a weight fraction of 0.94. Above this PS concentration, then, there must be portions of the sample that contain only pure PS, with the block copolymer molecules forming micellar regions in which the S blocks are mixed with the PS. Micellar block copolymer aggregates have been observed in other homopolymer block copolymer blends at low block copolymer concent ra t i~n , '~~~~ although in those cases the homo- polymer had a much lower molecular weight than the chemically identical block.
Blend B-7, which contained 96 wt% PS in its S constituent, was chosen in order to find out whether we could detect the equilibrium between a pure PS phase and a micellar, mixed S block and PS phase. We were able to do this, as shown in Figure 2 and in Tables I and 11. Phase H had a Tg identical to that of the PS, whereas phase L had a Tg between that of the PS and the S microphase of the block copolymer. In this case, therefore, a PS phase that was pure within experimental error existed in equilibrium with a mixed phase. Table I1 shows that f H < f p g , which means that some of the PS is not in the PS phase, as already shown by the Tg considerations. In the case of blend B7, then, phase L is the mixed phase, whereas for blends B2 through B5, phase H
2244 WANG AND KRAUSE
2.001
e yz $
g 1.00
p 1.50
c,
I U 'c
Q v)
.-
PS/S Block Weight Ratio 1:l .SO.
f . . . . l , . . . l . . . . 1 . . . . 1 . . . .
275 300 325 350 375 4 Temperature (K)
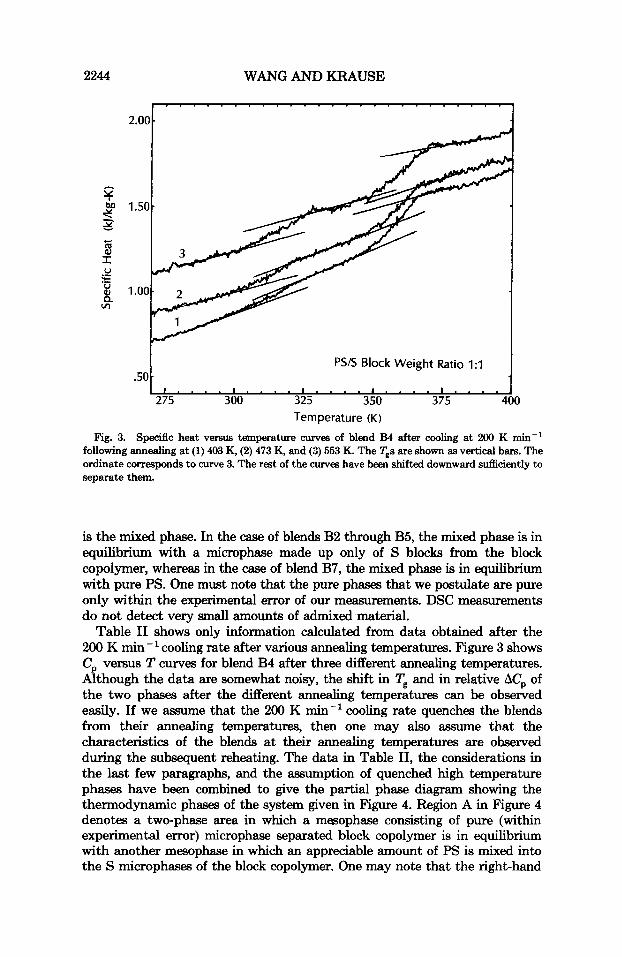
Fig. 3. Specific heat versus temperature auves of blend EM after cooling at 200 K min-' following annealing at (1) 403 K, (2) 473 K, and (2) 553 K. The Tgs are shown as vertical bars. The ordinate corresponds to curve 3. The rest of the curves have been shifted downward sufficiently to separate them.
is the mixed phase. In the case of blends B2 through B5, the mixed phase is in equilibrium with a microphase made up only of S blocks from the block copolymer, whereas in the case of blend B7, the mixed phase is in equilibrium with pure PS. One must note that the pure phases that we postulate are pure only within the experimental error of our measurements. DSC measurements do not detect very small amounts of admixed material.
Table I1 shows only information calculated from data obtained after the 200 K min-' cooling rate after various annealing temperatures. Figure 3 shows C, versus T curves for blend B4 after three different annealing temperatures. Although the data are somewhat noisy, the shift in Tg and in relative AC, of the two phases after the different annealing temperatures can be observed easily. If we assume that the 200 K min-' cooling rate quenches the blends from their annealing temperatures, then one may also assume that the characteristics of the blends at their annealing temperatures are observed during the subsequent reheating. The data in Table 11, the considerations in the last few paragraphs, and the assumption of quenched high temperature phases have been combined to give the partial phase diagram showing the thermodynamic phases of the system given in Figure 4. Region A in Figure 4 denotes a two-phase area in which a mesophase consisting of pure (within experimental error) microphase separated block copolymer is in equilibrium with another mesophase in which an appreciable amount of PS is mixed into the S microphases of the block copolymer. One may note that the right-hand
PARTIAL PHASE DIAGRAM
GOO
0
550'!
500. I--'
450
400"
2245
R E G I O N C T W O PHASE
b
11
R E G I O N A T W O PHASE
0
I I I I
A. *
REGION B I
ONE PHASE: I
A V O 4 I
0.0 0.2 0.4 0.6 0.8 1.0 r
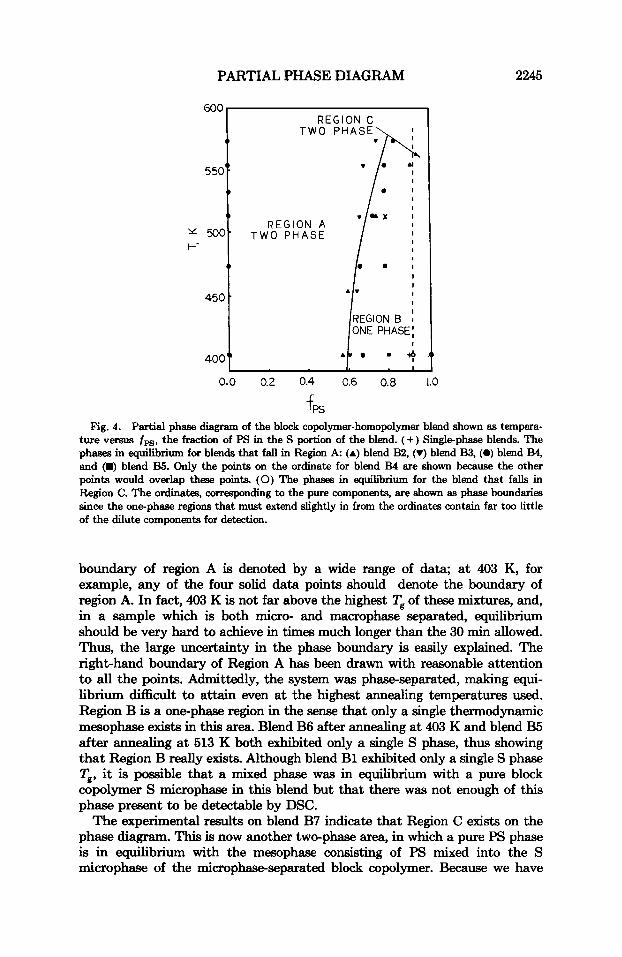
tPs Fig. 4. Partial phase diagram of the block copolymer-homopolymer blend shown as tempera-
ture versus f p g , the fraction of PS in the S portion of the blend. (+) Single-phase blends. The phases in equilibrium for blends that fall in Region A: (A) blend B2, (r) blend B3, (0) blend B4, and (m) blend B5. Only the points on the ordinate for blend B4 are shown because the other points would overlap these points. (0) The phases in equilibrium for the blend that falls in Region C. The ordinata, corresponding to the pure components, are shown as phase boundaries since the one-phaae regions that must extend slightly in from the ordinates contain far too little of the dilute components for detection.
boundary of region A is denoted by a wide range of data, at 403 K, for example, any of the four solid data points should denote the boundary of region A. In fact, 403 K is not far above the highest Tg of these mixtures, and, in a sample which is both micro- and macrophase separated, equilibrium should be very hard to achieve in times much longer than the 30 min allowed. Thus, the large uncertainty in the phase boundary is easily explained. The right-hand boundary of Region A has been drawn with reasonable attention to all the points. Admittedly, the system was phase-separated, making equi- librium difficult to attain even at the highest annealing temperatures used. Region B is a one-phase region in the sense that only a single thermodynamic mesophase exists in this area. Blend B6 after annealing at 403 K and blend B5 after annealing at 513 K both exhibited only a single S phase, thus showing that Region B really exists. Although blend B1 exhibited only a single S phase Tg, it is possible that a mixed phase was in equilibrium with a pure block copolymer S microphase in this blend but that there was not enough of this phase present to be detectable by DSC.
The experimental results on blend B7 indicate that Region C exists on the phase diagram. This is now another two-phase area, in which a pure PS phase is in equilibrium with the mesophase consisting of PS mixed into the S microphase of the microphase-separated block copolymer. Because we have
2246 WANG AND KRAUSE
only one point on the left hand boundary of Region C, we have shown this boundary as a dotted line.
Despite the problems in reaching equilibrium with these blends, we have been able to show that a thermodynamic phase diagram exists and that high molecular PS may be appreciably soluble in the S microphases of an S-DMS block copolymer in which the S block molecular weight is only about 3.5% of that of the PS but that this solubility only occurs at relatively high F'S contents in the blends.
We thank C. I. Chung, Department of Materials Engineering, for the use of the Perkin-Elmer DSC-4, and we thank the National Science Foundation, Polymers Program, for partial support of this work through grant No. DMR81-06107.
References 1. T. Inoue, T. Soen, T. Hashimoto, and H. Kawai, Macromolecules, 3,87 (1970).
3. H. Hashimoto, M. Fujimura, T. Hashitnoto, and H. Kawai, M m m k c u l e s , 14,844 (1981). 4. Z.-H. Lu, S. Kra- and M. Iskandar, Macromolecule, 15,367 (1982). 5. A. Rameau, Jt-P. Lingelser, and Y. Gallot, Makromol. Chm., Rapid Commun., 3, 413
2. L. TOY, M. Niinomi, and M. Shm, J. M a ~ r o m ~ l . Sci.-Phys., B11,281 (1975).
(1982). 6. R.-J. Roe and W.-C. Zin, Ma~r~m~lecUles , 17,189 (1984). 7. S. K r a q Macrornokuks, 10,870 (1977). 8. L. Leibler, Makromol. Chem. Rapid Commun., 2,393 (1981). 9. K. M. Hong and J. Noolandi, Macrondecules, 16,1083 (1983).
10. M. D. Whitmore and J. Noolandi, Macromolecules, 18,2486 (1985). 11. J. Noolandi, Ber. Bunsenges. Phys. Chem., 89,1147 (1985). 12. M. D. Whitmore and J. Noolandi, Polym. Commun., 2s, 267 (1985). 13. S. Krause, M. Iskandar, and M. Iqbal, Macromolecules, 15,105 (1982). 14. B. Wang and S. Krause, M ~ m l e c u & s , 20,2201 (1987). 15. A. T. Granger, B. Wang, and S. Krawe, Ado. C h . Ser., 211,127 (1986). 16. T. G Fox, Bull. Am. Phys. Soc., 2, 123 (1956). 17. Y. K. Godovskii, V. Y. Levin, G. L. Slonimskii, A. A. Zhdanov, and K. A. Andrianov,
18. S. Kram and B. Wang, J. Polym. Sci., Polym. Phys. Ed., 24, 35 (1986). 19. J. Selb, P. Marie, A. Rameau, R. Duplexsix, and Y. Gallot, Polym. Bull., 10, 444 (1983). 20. D. Rigby and R.-J. Roe, Macromolecu&s, 17,1778 (1984).
Vysokoml. Soedin., All, 2444 (1969); pdym. Sci. USSR, 11,2778 (1969).
Received January 14,1987 Accepted August 26,1987
Copyright © 2022 FDOKUMEN