A Novel Performance Evaluation Methodology for Single-Target Trackers
18
JOURNAL OF L A T E X CLASS FILES, VOL. VV, NO. NN, MONTH YYYY 1 A Novel Performance Evaluation Methodology for Single-Target Trackers Matej Kristan, Member, IEEE, Jiri Matas, Aleˇ s Leonardis, Member, IEEE, Tom ´ aˇ s Voj´ ıˇ r, Roman Pflugfelder, Gustavo Fern´ andez, Georg Nebehay, Fatih Porikli and Luka ˇ Cehovin Abstract—This paper addresses the problem of single-target tracker performance evaluation. We consider the performance measures, the dataset and the evaluation system to be the most important components of tracker evaluation and propose requirements for each of them. The requirements are the basis of a new evaluation methodology that aims at a simple and easily interpretable tracker comparison. The ranking-based methodology addresses tracker equivalence in terms of statistical significance and practical differences. A fully-annotated dataset with per-frame annotations with several visual attributes is introduced. The diversity of its visual properties is maximized in a novel way by clustering a large number of videos according to their visual attributes. This makes it the most sophistically constructed and annotated dataset to date. A multi-platform evaluation system allowing easy integration of third-party trackers is presented as well. The proposed evaluation methodology was tested on the VOT2014 challenge on the new dataset and 38 trackers, making it the largest benchmark to date. Most of the tested trackers are indeed state-of-the-art since they outperform the standard baselines, resulting in a highly-challenging benchmark. An exhaustive analysis of the dataset from the perspective of tracking difficulty is carried out. To facilitate tracker comparison a new performance visualization technique is proposed. Index Terms—Performance analysis, single-target tracking, model-free tracking, tracker evaluation methodology, tracker evaluation datasets, tracker evaluation system ✦ 1 I NTRODUCTION Visual tracking is a rapidly evolving field that has been increasingly attracting attention of the vision community. It offers many scientific challenges and it emerges in other computer vision problems such as motion anal- ysis, event detection and activity recognition. A steady increase of hardware performance and its price reduction have opened a vast application potential for tracking algorithms including surveillance systems, transport, sports analytics, medical imaging, mobile robotics, film post-production and human-computer interfaces. The activity in the field is reflected in abundance of new tracking algorithms presented in journals and at conferences summarized in the many survey pa- pers, e.g., [1], [2], [3], [4], [5], [6], [7]. However, the boom in tracker proposals has not been accompanied by standardization of the methodology for their objective comparison. One of the most influential performance analysis ef- forts for object tracking is PETS (Performance Evalua- tion of Tracking and Surveillance) [8]. The first PETS workshop took place in 2000 aiming at evaluation of • M. Kristan and L. ˇ Cehovin are with the Faculty of Computer and Information Science, University of Ljubljana, Slovenia. E-mail: see http://www.vicos.si/People/Matejk • R. Pflugfelder, G. Nebehay and G. Fern´ andez are with Austrian Institute of Technology, Austria • J. Matas and T. Voj´ ıˇ r are with Czech Technical University in Prague, Czech Republic • A. Leonardis is with CNCR University of Birmingham, United Kingdom • F. Porikli is with NICTA and Australian National University, Australia visual tracking algorithms for surveillance applications. Its focus gradually shifted to high-level event interpre- tation algorithms. Other frameworks and datasets have been presented since, but these focused on evaluation of surveillance systems and event detection, e.g., CAVIAR 1 , i-LIDS 2 , ETISEO 3 , change detection [9], sports analytics (e.g., CVBASE 4 ), or specialized on tracking specific ob- jects like faces, e.g., FERET [10], [11]. Recently, several publications have been published in the broad area of model-free visual object tracking evaluation, eg., [12], [13], [14], [15], [16], [17], [18], [19]. There are several important subfields in visual track- ing, ranging from multi-camera, multi-target [12], [20], to single-target [15], [16], [17], [18], [19] trackers. These subfields are quite diverse, without a unified evaluation methodology and specific methodologies have to be tailored to each subfield. In this paper, single-camera, single-target, model-free, causal trackers, applied to short-term tracking are con- sidered. The model-free property means that the only su- pervised training example is provided by the bounding box in the first frame. The short-term tracking means that the tracker does not perform re-detection after the target is lost. Drifting off the target is considered a failure. The causality means that the tracker does not use any future frames to infer the object position in the current frame. The tracker output is specified by a rotated bounding box. 1. http://homepages.inf.ed.ac.uk/rbf/CAVIARDATA1 2. http://www.homeoffice.gov.uk/science-research/hosdb/i-lids 3. http://www-sop.inria.fr/orion/ETISEO 4. http://vision.fe.uni-lj.si/cvbase06/ arXiv:1503.01313v1 [cs.CV] 4 Mar 2015
Transcript of A Novel Performance Evaluation Methodology for Single-Target Trackers

JOURNAL OF LATEX CLASS FILES, VOL. VV, NO. NN, MONTH YYYY 1
A Novel Performance Evaluation Methodologyfor Single-Target Trackers
Matej Kristan, Member, IEEE, Jiri Matas, Ales Leonardis, Member, IEEE, Tomas Vojır, Roman Pflugfelder,Gustavo Fernandez, Georg Nebehay, Fatih Porikli and Luka Cehovin
Abstract—This paper addresses the problem of single-target tracker performance evaluation. We consider the performance measures,the dataset and the evaluation system to be the most important components of tracker evaluation and propose requirements foreach of them. The requirements are the basis of a new evaluation methodology that aims at a simple and easily interpretabletracker comparison. The ranking-based methodology addresses tracker equivalence in terms of statistical significance and practicaldifferences. A fully-annotated dataset with per-frame annotations with several visual attributes is introduced. The diversity of its visualproperties is maximized in a novel way by clustering a large number of videos according to their visual attributes. This makes it themost sophistically constructed and annotated dataset to date. A multi-platform evaluation system allowing easy integration of third-partytrackers is presented as well. The proposed evaluation methodology was tested on the VOT2014 challenge on the new dataset and38 trackers, making it the largest benchmark to date. Most of the tested trackers are indeed state-of-the-art since they outperform thestandard baselines, resulting in a highly-challenging benchmark. An exhaustive analysis of the dataset from the perspective of trackingdifficulty is carried out. To facilitate tracker comparison a new performance visualization technique is proposed.
Index Terms—Performance analysis, single-target tracking, model-free tracking, tracker evaluation methodology, tracker evaluationdatasets, tracker evaluation system
F
1 INTRODUCTION
Visual tracking is a rapidly evolving field that has beenincreasingly attracting attention of the vision community.It offers many scientific challenges and it emerges inother computer vision problems such as motion anal-ysis, event detection and activity recognition. A steadyincrease of hardware performance and its price reductionhave opened a vast application potential for trackingalgorithms including surveillance systems, transport,sports analytics, medical imaging, mobile robotics, filmpost-production and human-computer interfaces.
The activity in the field is reflected in abundanceof new tracking algorithms presented in journals andat conferences summarized in the many survey pa-pers, e.g., [1], [2], [3], [4], [5], [6], [7]. However, theboom in tracker proposals has not been accompanied bystandardization of the methodology for their objectivecomparison.
One of the most influential performance analysis ef-forts for object tracking is PETS (Performance Evalua-tion of Tracking and Surveillance) [8]. The first PETSworkshop took place in 2000 aiming at evaluation of
• M. Kristan and L. Cehovin are with the Faculty of Computer andInformation Science, University of Ljubljana, Slovenia.E-mail: see http://www.vicos.si/People/Matejk
• R. Pflugfelder, G. Nebehay and G. Fernandez are with Austrian Instituteof Technology, Austria
• J. Matas and T. Vojır are with Czech Technical University in Prague,Czech Republic
• A. Leonardis is with CNCR University of Birmingham, United Kingdom• F. Porikli is with NICTA and Australian National University, Australia
visual tracking algorithms for surveillance applications.Its focus gradually shifted to high-level event interpre-tation algorithms. Other frameworks and datasets havebeen presented since, but these focused on evaluation ofsurveillance systems and event detection, e.g., CAVIAR1,i-LIDS 2, ETISEO3, change detection [9], sports analytics(e.g., CVBASE4), or specialized on tracking specific ob-jects like faces, e.g., FERET [10], [11]. Recently, severalpublications have been published in the broad area ofmodel-free visual object tracking evaluation, eg., [12],[13], [14], [15], [16], [17], [18], [19].
There are several important subfields in visual track-ing, ranging from multi-camera, multi-target [12], [20],to single-target [15], [16], [17], [18], [19] trackers. Thesesubfields are quite diverse, without a unified evaluationmethodology and specific methodologies have to betailored to each subfield.
In this paper, single-camera, single-target, model-free,causal trackers, applied to short-term tracking are con-sidered. The model-free property means that the only su-pervised training example is provided by the boundingbox in the first frame. The short-term tracking means thatthe tracker does not perform re-detection after the targetis lost. Drifting off the target is considered a failure. Thecausality means that the tracker does not use any futureframes to infer the object position in the current frame.The tracker output is specified by a rotated boundingbox.
1. http://homepages.inf.ed.ac.uk/rbf/CAVIARDATA12. http://www.homeoffice.gov.uk/science-research/hosdb/i-lids3. http://www-sop.inria.fr/orion/ETISEO4. http://vision.fe.uni-lj.si/cvbase06/
arX
iv:1
503.
0131
3v1
[cs
.CV
] 4
Mar
201
5
JOURNAL OF LATEX CLASS FILES, VOL. VV, NO. NN, MONTH YYYY 2
1.1 Requirements for tracker evaluation
The evaluation of new tracking algorithms depends onthree essential components: (1) performance evaluationmeasures, (2) a dataset and (3) an evaluation system. Inthe following, the requirements for these components arestated.
Performance measures. A wealth of performance mea-sures have been proposed for single-object tracker eval-uation, but there is no consensus on which measureshould be preferred. Ideally, measures should clearlyreflect different aspects of tracking. Apart from merelyranking, we also need to determine cases when two ormore trackers are performing equally well. We requirethe following: The measures should allow an easy inter-pretation and should support tracker comparison with awell-defined tracker equivalence.
Datasets. The dataset should allow evaluation oftrackers under diverse conditions like occlusion, clutterand illumination changes. One approach is to construct avery large dataset, but this does not guarantee diversityin visual attributes and it significantly slows down theprocess of evaluation. A better approach is to annotateeach sequence with the visual attributes occurring in thatsequence and perform clustering to reduce the size ofthe dataset, while keeping it diverse. Annotation is alsoimportant for per-attribute tracker analysis. A commonapproach is to annotate a sequence globally with an at-tribute if that attribute occurs anywhere in the sequence.The trackers can then be compared only on the sequencescorresponding to a particular attribute. However, visualphenomena do not usually last throughout the entiresequence. For example, an occlusion might occur at theend of a sequence, while a tracker might fail due to someother effects occurring at the beginning of the sequence.In this case, the failure would be falsely attributed to theocclusion. A per-frame dataset labeling is thus requiredto facilitate a more precise analysis. This motivates thefollowing requirements: (1) The dataset should be di-verse in visual attributes. (2) Per-frame annotation ofvisual attributes is required.
Evaluation systems. For a rigorous evaluation, anevaluation system that performs the same experimenton different trackers using the same dataset is required.A wide-spread practice is to initialize the tracker in thefirst frame and let it run until the end of a sequence.However, the tracker might fail right at the beginningof the sequence due to some visual degradation, effec-tively meaning that the system utilized only the firstfew frames for evaluation of this tracker. Thus thefirst requirement for the system is that it fully usesthe data. This means that once the tracker fails, thesystem has to detect the failure and reinitialize thetracker. Therefore, a certain level of interaction, that goesbeyond simple running until the end of the sequence,is required. Furthermore, the evaluation system has toalso account for the fact that the trackers are typicallycoded in various programming languages and often
platform-dependent. This motivates the following set ofrequirements the evaluation system should meet: (1) Fulluse of the dataset. (2) Allow interaction with the tracker.(3) Support for multiple platforms. (4) Easy integrationwith trackers.
1.2 Our contributions
In this paper we present the following four contribu-tions: the first contribution is a novel tracker evalu-ation methodology based on two simple, easy inter-pretable, performance measures. A significant noveltyof the proposed methodology is the use and first ofits kind analysis of reinitializations at tracking failures.Reinitialization-based measures are compared theoreti-cally and experimentally to standard counterparts thatdo not apply reinitialization. We propose a first of itskind tracker ranking methodology that addresses theconcept of tracker equivalence and takes into accountstatistical significance as well as practical difference intracking accuracy. A new visualization of ranks is pro-posed as well to aid comparative analysis.
The second contribution is a new dataset and eval-uation system. The dataset is constructed by a novelvideo clustering approach based on visual properties.The dataset is fully annotated, all the sequences arelabeled per-frame with visual attributes to facilitate in-depth analysis. The benefits of per-frame attribute an-notation are analyzed theoretically and experimentally.The proposed evaluation system enjoys multi-platformcompatibility and offers easy integration with trackers.The system has been tested in a large-scale distributedexperiment on the VOT2013 and VOT2014 challenges.
The third contribution is a detailed comparative anal-ysis of 38 trackers using the proposed methodology,making it the largest benchmark to date.
The forth contribution is a novel analysis of the se-quences in the dataset from the perspective of trackingsuccess.
Preliminary versions of some parts of this paper havebeen previously published (during the period 2013-2014)in three workshop papers [21], [19], [22].
The remainder of the paper is structured as follows:In Section 2 the most related work is reviewed anddiscussed. The new tracker evaluation methodology ispresented and theoretically analyzed in Section 3, whilethe new dataset selection approach, the evaluation sys-tem and the results of the experimental analysis are pre-sented in Section 4. Conclusions are drawn in Section 5.
2 RELATED WORK
2.1 Performance measures
A wealth of performance measures have been proposedfor single-object tracker evaluation. These range frombasic measures like center error [23], region overlap [24],tracking length [25], failure rate [26], [27], F-score [13],[16], pixel-based precision [13], to more sophisticated

JOURNAL OF LATEX CLASS FILES, VOL. VV, NO. NN, MONTH YYYY 3
measures, such as CoTPS [28] [29], which combine sev-eral measures. A nice property of the combined mea-sures is that they provide a single score to rank the track-ers. A downside is that they offer little insight into thetracker performance which limits their interpretability.All measures strongly depend on the experimental setupwithin which they are computed. For example, someevaluation protocols, like Wu et al. [15] and Smeulderset al., [16] initialize the trackers at the beginning of thesequence and let them run until the end. Measures com-puted in such a setup are inappropriate for short-termtracking evaluation, since the trackers are not expectedto perform re-detection. The values of performance mea-sures thus become irrelevant after the point of trackingfailure. Including the frames past the point of failurein the computation of a global performance measureintroduces significant distortions since failures closer tothe beginning of the sequence are significantly morepenalized than failures occurring later in the sequence.
While some authors choose several basic measures tocompare their trackers, a recent study [30], [31] haveshown that many measures are correlated and do notreflect diverse aspects of tracking performance. In thisrespect, choosing a large number of measures may infact again bias results toward some particular aspectsof tracking performance. Smeulders et al. [16] proposeusing two measures: an F-score calculated at the Pascalregion overlap criterion (threshold 0.5)[32] and a centererror. Note that the F-score based measure was origi-nally designed for object detection. The threshold 0.5is also rather high and there is no clear justification ofwhy exactly this threshold should be used to comparetrackers [15]. Since the center error becomes arbitraryhigh once the tracker fails, Wu et al. [15] propose tomeasure the percentage of frames in which the centerdistance is within some prescribed threshold. However,this threshold significantly depends on the object size,which makes this particular measure quite brittle. Anormalized center error measured during successfultracks may be used to alleviate the object size problem,however, the results in [16] show that the trackers do notdiffer significantly under this measure which makes itless appropriate for tracker comparison. As an additionalmeasure, [15] propose an area under a ROC-like plotof thresholded overlaps. Recently, [30] have shown thatthis is equivalent to the average region overlap measurecomputed from all frames of sequences. In fact, based onan extensive analysis of performance measures, Cehovinet al. [31] argue that the region overlap is superior tothe center error.
While it is important to study and evaluate the trackerperformance separately in terms of several less corre-lated performance measures, it is sometimes requiredto rank trackers in a single rank list. In this case aconvenient strategy is to combine these measures intorank averaging, similarly to what was done in the changedetection challenge [9]. In rank averaging, competingalgorithms are ranked with respect to several perfor-
mance measures and their ranks are averaged. This sim-ulates competition of trackers with respect to differentperformance measures and assumes equal importanceof all measures. The fact that trackers are ranked alongeach measure induces normalization of measures to acommon scale prior to averaging.
2.1.1 Visual performance evaluationSeveral authors propose to visually compare track-ing performance via performance summarization plots.These plots show the percentage of frames for whichthe estimated object location is within some thresholddistance of the ground truth. Most notable are precisionplots [6], [33], [15], which measure the object locationaccuracy in terms of center error. Alternatively, successplots [14], [15] use the region overlap instead. Salti etal., [14] implicitly account for variable threshold depen-dency by plotting the percentage of correctly trackedframes with respect to the mean region overlap withinthese frames. Cehovin et al. [30], [31] propose a similarvisualization, but they apply a single, zero, threshold onthe overlap. A tracker is thus represented as a singlepoint in this 2D space, rather than a curve, which allowseasier comparison. A drawback of performance plots isthat they typically become cluttered when comparingseveral trackers on several sequences in the same plot.To address this, Smeulders et al. [16] calculate a per-formance measure per sequence for a tracker and orderthese values from highest to lowest, thus obtaining a so-called survival curve. The performance of several track-ers is then compared on the entire dataset by visualizingtheir survival curves.
2.2 DatasetsIt is a common practice to compare trackers on manypublicly-available sequences, which have became a de-facto standard in evaluation of new trackers. However,many of these sequences lack a standard ground truth la-beling, which makes comparison of algorithms difficult.To sidestep this issue, Wu et al. [34] have proposed aprotocol for stochastic tracker evaluation on a selecteddataset that does not require ground truth labels. Asimilar approach was adapted by [35] to evaluate track-ing algorithms on long sequences. Datasets with variousvisual phenomena equally represented are not usuallyused. In fact, many popular sequences are conceptuallysimilar, which makes the results biased toward someparticular types of the phenomena. To address this issue,Wu et al. [15] annotated each sequence with severalvisual attributes and report tracker performance with re-spect to each attribute separately. However, a per-frameannotation is not provided and not all sequences are incolor, which makes results skewed with proportions ofcolor and gray sequences. Recently, Smeulders et al. [16],have presented a very large dataset called ‘AmsterdamLibrary of Ordinary Videos’ (ALOV). The dataset is com-posed of over three hundred sequences collected from
JOURNAL OF LATEX CLASS FILES, VOL. VV, NO. NN, MONTH YYYY 4
published datasets and additional YouTube videos. Thesequences are assigned to one of thirteen classes of diffi-culty [36] and, with the exception of ten long sequences,are kept short to increase the diversity. The sequencesare not annotated per-frame with visual attributes, somesequences contain cuts and ambiguously defined targetssuch as fireworks which makes the dataset inappropriatefor short-term tracking evaluation.
2.3 Evaluation systemsThe most notable and general evaluation systems areODViS [37], VIVID [38], ViPER [39]. The former twofocus on the design of surveillance systems, while thelatter is a set of utilities/scripts for annotation and com-putation of different types of performance measures. Therecently proposed ViCamPEv [13] toolkit is dedicatedto testing a pre-determined set of OpenCV-based basictrackers. None of these systems support interaction withthe tracker, which limits their applicability. Collecting theresults from the existing publications is an alternative forbenchmarking trackers. Pang et al. [17] have proposeda page-rank-like approach to data-mine the publishedresults and compile unbiased ranked performance lists.However, as the authors state in their paper, the pro-posed protocol is not appropriate for creating ranksof the recently published trackers due to the lack ofsufficiently many publications that would compare thesetrackers.
3 VISUAL OBJECT TRACKER EVALUATION
The proposed methodology assumes that the evaluationsystem and the dataset fulfill the requirements stated inSection 1.1, i.e., (i) the dataset is per-frame annotated byvisual attributes and the object positions are denoted bypossibly rotated bounding boxes, (ii) trackers are run oneach sequence of the dataset. Once the tracker drifts offthe target, the system detects a tracking failure and re-initializes the tracker. All trackers are run multiple timesto account for their possibly stochastic nature.
3.1 Evaluation methodologyBased on the recent analysis of widely-used performancemeasures [30], [31] two weakly-correlated and easilyinterpretable measures were chosen: (i) accuracy and(ii) robustness. The accuracy at time-step t measureshow well the bounding box ATt predicted by the trackeroverlaps with the ground truth bounding box AGt and isdefined as the intersection-over-union
φt =AGt ∩ATtAGt ∪ATt
. (1)
The robustness is the number of times the tracker failed,i.e., drifted from the target, and had to be reinitialized.A re-initialization is triggered when the overlap (Eq. 1)drops to zero.
The re-initialization of trackers might introduce a biasinto the performance measures. If a tracker fails at a
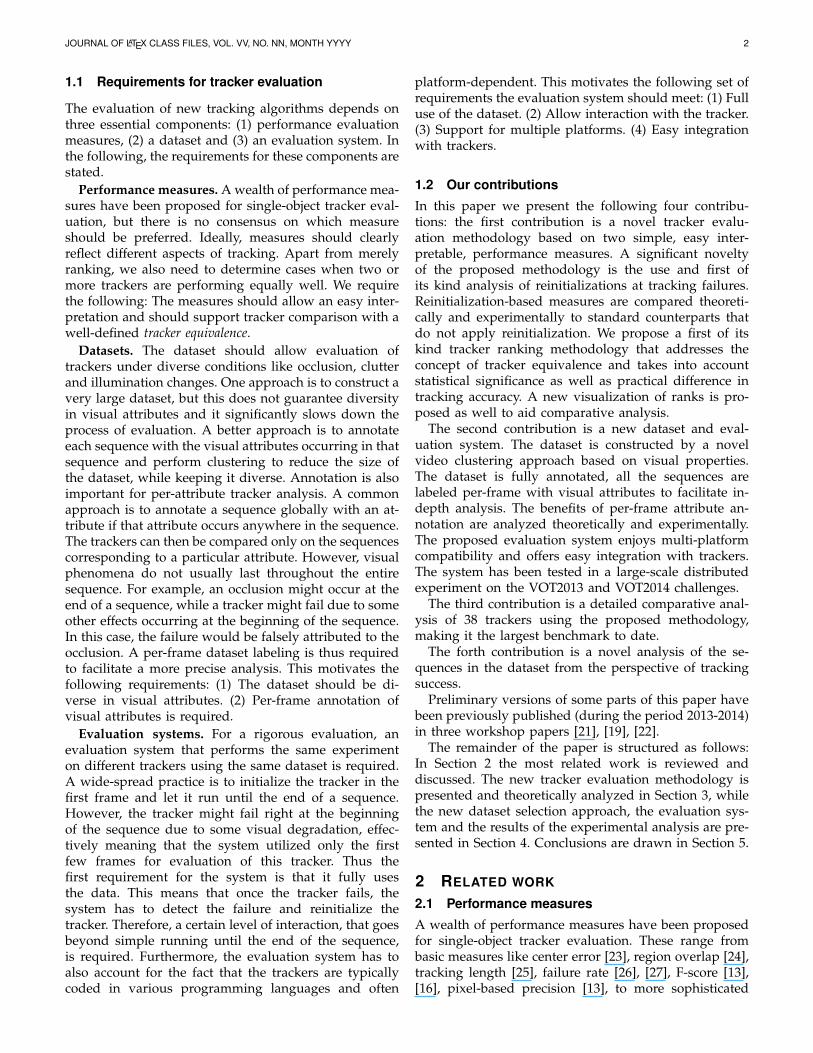
Fig. 1. Overlaps after re-initialization averaged over alarge number of trackers and many re-initializations.
particular frame it will likely fail again immediately afterre-initialization. To reduce this bias, the tracker is re-initialized five frames after the failure. This number wasdetermined experimentally on a separate dataset. In thecase of a full occlusion, the tracker is initialized on thefirst frame in which the object is not fully occluded. Asimilar bias occurs in the accuracy measure. The overlapsin the frames right after the initialization are biasedtowards higher values over several frames and it takes afew frames of the burn-in period to reduce the bias. In apreliminary study we have determined by a large-scaleexperiment that the burn-in period is approximately tenframes (Figure 1). This means that we label the framesin the burn-in period as invalid and do not use them incomputation of the accuracy.
A tracker is run on each sequence Nrep times whichallows dealing with the potential variance of its perfor-mance. In particular, let Φt(i, k) denote the accuracy ofi-th tracker at frame t at experiment repetition k. Theper-frame accuracy is obtained by taking the averageover these, i.e., Φt(i) = 1
Nrep
∑Nrep
k=1 Φt(i, k). The averageaccuracy of the i-th tracker, ρA(i), over some set of Nvalid
valid frames is then calculated as the average of per-frame accuracies
ρA(i) =1
Nvalid
∑Nvalid
j=1Φj(i). (2)
In contrast to accuracy measurements, a single mea-sure of robustness per experiment repetition is obtained.Let F (i, k) be the number of times the i-th tracker failedin the experiment repetition k over a set of frames. Theaverage robustness of the i-th tracker is then
ρR(i) =1
Nrep
Nrep∑k=1
F (i, k). (3)
The overall performance on the dataset can be es-timated as the weighted average of the per-sequenceperformance measures, with weights proportional tothe lengths of the sequences. Note that this is equiv-alent to concatenating the sequence of per-frame over-laps/failures from the entire dataset into a single super-sequence and calculating the two averages in (2) and(3). Similarly, per-visual-attribute performance can beevaluated for a specific attribute by collecting all theframes labelled as that attribute into an attribute super-sequence and calculating (2) and (3).
JOURNAL OF LATEX CLASS FILES, VOL. VV, NO. NN, MONTH YYYY 5
For fair a comparison, we propose a ranking-basedmethodology akin to [40], [9] but we introduce the con-cept of equally-ranked trackers. For each tracker, a groupof so-called equivalent trackers containing trackers per-forming indistinguishably is determined. The correctedrank of the tracker is then calculated as the mean ofthe ranks in the group of equivalent trackers. Note thatthe concept of equivalent trackers is not transitive, andshould not be mistaken for the standard equivalencerelation. For example, consider trackers T1, T2 and T3. Itmay happen that a tracker T2 performs indistinguishablyfrom T1 and T3, but this does not necessarily meanthat T1 performs equally well as both, T2 and T3. Theequality of trackers should therefore be established foreach tracker separately. Two types of tests for estab-lishing performance equivalence are considered in thefollowing.
3.1.1 Tests of statistical differencesA per-frame accuracy is available for each tracker. Oneway to gauge equivalence in this case is to apply apaired test to determine whether the difference in ac-curacies is statistically significant. When the differencesare distributed normally, the Student’s t-test, which isoften used in the aeronautic tracking research [41], is theappropriate choice. However, in a preliminary study wehave applied Anderson-Darling tests of normality [42]and have observed that the accuracies in frames arenot always distributed normally, which might renderthe t-test inappropriate. As an alternative, the WilcoxonSigned-Rank test as in [43] is applied.
In case of robustness, several measurements of thenumber of tracker failures over the entire sequence indifferent runs is obtained. However, these cannot bepaired, and the Wilcoxon Rank-Sum (also known asMann-Whitney U-test) [43] is used instead to test thedifference in the average number of failures.
3.1.2 Tests of practical differencesNote that statistical difference does not necessarily implya practical difference [44], which is particularly im-portant in equivalency tests for accuracy. The practicaldifference is a level of difference in accuracy that isconsidered negligibly small. This level can come fromthe noise in annotation, the fact that multiple groundtruth annotations of bounding boxes might be equallyvalid, or simply from the fact that very small differencesin tracking accuracy are negligible from a practical pointof view. Therefore, a pair of trackers is considered toperform equally well in accuracy if their difference inperformance is not statistically significant or if it failsthe practical difference test.
In terms of practical difference, a pair of trackers i andj is said to perform differently if the difference of theiraverages is greater than a predefined threshold γ, i.e.,|ρA(i)− ρA(j)| > γ, or, by defining a difference at framet, dt(i, j) = φt(i)−φt(j), expanding the sums and pullingthe threshold into the summation, 1
T |∑Tt=1 dt(i, j)/γ| >
1. Since the frames in super-sequence come from mul-tiple sequences, the thresholds γ may vary over theframes. A pair of trackers therefore passes the test forpractical difference in accuracy if the following relationholds
1
T|∑T
t=1dt(i, j)/γt| > 1, (4)
where γt is the practical difference threshold correspond-ing to t-th frame.
3.1.3 Visualization of resultsResults can be visualized by the accuracy-robustnessplots proposed by [30] in which a tracker is presentedas a point in terms of accuracy and robustness. Theaccuracy is defined as in (2), while the robustness isconverted into a probability of tracker failing after Sframes, thus scaling robustness into range between zeroand one. Since we have extended the methodologyof [30] to rankings, we also extend the visualization. Inparticular, the rank results can be displayed using theaccuracy-robustness (AR) rank plots. Since each trackeris presented in terms of its rank with respect to robust-ness and accuracy, we can plot it as a single point on thecorresponding 2D AR-rank plot. Trackers that performwell relative to the others are positioned in the top-rightpart of the plot, while the, relatively speaking, poorly-performing trackers occupy the bottom-left part.
3.2 Theoretical comparison to related worksThe most related works to the performance evaluationmethodology presented in this paper are the method-ologies presented by Wu et al. [15] and Smeulders etal. [16]. In principle, all methodologies use global aver-ages based on overlaps of tracker bounding boxes andground truth. The main difference between [15] and [16]is that [15] computes average-overlap-based measure(like our approach), while the [16] computes an F-scoreat 0.5 overlap. For short-term tracking, the tracker isnot required to re-detect the target after losing it. Thismeans that the tracker is not required to report the targetloss and the F-score from [16] reduces to precision, i.e.,the ratio of frames in which the overlap with groundtruth is grater than 0.5. Applying such a high thresholdreduces the strength of the performance measure. Forexample, consider a pair of trackers, tracker A and B:tracker A performs at 0.47 overlap, whereas tracker Bperforms at 0.1 overlap and none of the trackers everdrifts off the target. The F-score at overlap 0.5 is zero forboth trackers, meaning that the measure cannot discernthe performance among the trackers since their overlapis below 0.5. Furthermore, the measure would inducea large distinction between trackers A (F-score 0) anda tracker that performs at overlap 0.5 (F-score 1) eventhough the difference between both is only 0.03 overlap.
There are three notable differences between ourmethodology and [15], [16]. The first difference is thatour methodology detects tracking failure and applies

JOURNAL OF LATEX CLASS FILES, VOL. VV, NO. NN, MONTH YYYY 6
re-initializations, while the [15] and [16] do not re-initialize, nor detect a failure. The methodology from [15]relies on compensating for this drawback by increasingthe number of sequences to 50 and recently [16] pro-posed using over 300 sequences. The second differenceis that our methodology is based on per-frame visual-attribute annotation for per-visual attribute performanceevaluation. On the other hand, the [15], [16] globallyannotate a sequence with all the appearing tributes.Per-visual attribute performance is then computed byusing all frames of the sequences globally annotatedby a particular attribute. The last difference relates tothe ability to state that one tracker performs better thananother. While all three methodologies produce ranks,only our methodology accounts for the practical as wellas statistical difference and takes into account the noisein ground truth annotation to gauge equivalence oftrackers.
The aim of the methodologies is to estimate the trackeroverall or per-visual attribute performance and ranktrackers according to this estimate. In this respect, themethodologies can be thought of as state estimators inwhich the hidden state is the tracker true performance(e.g., expected overlap). Thus, methodologies can bestudied from perspective of bias and variance of stateestimators. In the following we apply this view to furtheranalyze the properties of estimators in terms of applyingre-initialization as well as per-frame visual attributeannotation.
3.2.1 The importance of re-initializationTo establish some theoretical results on performanceevaluation with or without applying re-initializations,the following thought experiment will be considered.Assume a tracker is tested on a set of N sequences, eachNs frames long. Sequence j contains a critical point at theframe αjNs, where a tracker fails with probability p, i.e.,drifts and remains off the target for the remaining partof the sequence. During a successful period of tracking,the per-frame overlaps are sampled from a distributionwith mean µA and variance σ2
A. After the failure, theoverlaps fall to zero, i.e., they are sampled from adistribution with µb = 0 and σ2
A = 0. A critical point canoccur anywhere in the sequence with equal probability,meaning that these points are distributed uniformly ina sequence, i.e., αj ∼ U(0, 1). A tracker is run oneach sequence and a set of N per-sequence averageoverlaps {Mj}j=1:N is calculated. The final performanceis reported as the average over the sequences, i.e., anoverall average overlap M = 1
N
∑j=1:N Mj . The aim of
the estimator (evaluation methodology) is to recover thehidden average performance µA. In the following wewill study the expected value and the variance of theoutput M depending on whether tracker is re-initializedat failure (WIR) or the failure is ignored (NOR).
The NOR-based methodologies ([15], [16]) do notdetect the failures and the overlaps after the failureaffect the estimate of the true overlap µA. Alternatively,
the WIR-based methodology (our approach) detects afailure, skips ∆ frames and re-initializes the tracker. Itcan be shown that the expected value 〈MNOR〉 and thevariance var(MNOR) of the overall overlap MNOR esti-mated without re-initialization on the theoretical track-ing experiment are
〈MNOR〉 = µA(1− p
2), (5)
var(MNOR) =(2− p)σ2
A
2NNs+p(4− 3p)µ2
A
12N, (6)
while the expected values and variance for the overalloverlap estimated by WIR, i.e., MWIR, are
〈MWIR〉 = µA, (7)
var(MWIR) = σ2A
Ns −∆(1− p)NNs(Ns −∆)
≤ var(MNOR). (8)
The following observations can be deduced from theequations (5-8). The NOR estimator is biased increas-ingly with the probability of failing at a critical point.If critical points always cause failure, i.e., p = 1, then theoverall average estimated by the NOR is half the trueoverlap. On the other hand, the WIR estimator is unbi-ased, recovers the true hidden overlap, and the meandoes not depend on the critical points. The varianceof the NOR estimator depends both on the variance ofoverlaps during successful track as well as the hiddenoverlap µA. This results in a large variance for trackersthat track at high overlap and fail at critical points.On the other hand, the variance of the WIR does notshow this effect and is always lower than for NOR, i.e.,var(MWIR) ≤ var(MNOR).
The asymptotic properties of the estimators are visu-alized in Figure 2 w.r.t. the number of test sequences Nfor parameters µA = 0.63, σA = 0.4, Ns = 150, p = 0.5,∆ = 15. Note that the WIR estimator is indeed asymptot-ically unbiased, while the NOR is biased toward a loweroverlap values. Furthermore, the variance of the WIRis significantly smaller than that of NOR and decreasesfaster than for WIR, which is primarily due to the secondterm in var(MNOR) (5), i.e., lack of re-initializations inNOR. A practical implication is that the methodologieslike [15], [16] require many more sequences than ourmethodology to produce similarly small variance of theestimate and their estimate will always be much morebiased than ours when failures occur.
3.2.2 The importance of per-frame annotationTo study the impact of visual property annotation strate-gies, we will assume running a tracker on a dataset inwhich N sequences contain a particular attribute, e.g.,illumination change. The aim is to estimate tracking per-formance on this visual attribute. A tracker is thus run oneach of N sequences, recovering the set of per-sequenceoverlaps {Mj}j=1:N , and the average of these is reportedas an overall performance, i.e., M = 1
N
∑j=1:N Mj . For
ease of exposition assume that each sequence containsNA frames with illumination change and the remaining

JOURNAL OF LATEX CLASS FILES, VOL. VV, NO. NN, MONTH YYYY 7
5 10 15 20 25 30 35 40 45 50 55 600.2
0.25
0.3
0.35
0.4
0.45
0.5
0.55
0.6
0.65
N
overlap
Estimator with reinitialization
Estimator without reinitialization
Fig. 2. Effects of re-initialization in performance esti-mators. The expected values and standard deviationsof the estimators are shown in solid and dashed lines,respectively.
NB = ηNA frames contain the other attributes. Thusthe per-frame overlaps during the NA frames can bedescribed as samples from a distribution with mean µA
and variance σ2A, while the per-frame overlaps in the
remaining NB frames are governed by a distributionwith mean µB and variance σ2
B . For clarity of analysiswe will assume that there are no critical points in anysequence, i.e., a tracker never fails during tracking, andthat the variances σ2
A and σ2B are equal.
A global visual property annotation strategy (GLA)(e.g., [15], [16]) calculates overall per-visual propertyperformance MGLA using all the frames in sequencesthat contain at least one frame with the consideredvisual property. Alternatively, the per-frame annotationstrategy (PFA) (our approach) considers only framesannotated with a particular visual attribute to estimatethe performance MPFA. Note, however, that some framesmay be incorrectly annotated. From the perspective ofbias in state estimation, the most critical frames are thosethat are incorrectly annotated as the considered attribute.Assume therefore, that in each sequence, a set of βNA
are added as false annotations to the correctly annotatedNA frames. With these definitions, it is easy to show thatthe mean and variance of the MGLA estimator are
〈MGLA〉 =1
1 + ηµA +
η
1 + ηµB , (9)
var(MGLA) =1
NNA(1 + η)σ2A, (10)
while the mean and variance for the and MPFA estimatorare,
〈MPFA〉 =1
1 + βµA +
β
1 + βµB , (11)
var(MPFA) =1
NNA(1 + β)σ2A. (12)
According to equations (9,12) both estimators are bi-ased, but the bias in MGLA is much greater than the biasin MPFA. For example, assuming sequence lengths NS =150, with NA = 50 properly labelled frames and five
frames per sequence mislabelled, results in η = 2 andβ = 0.1. This means that MGLA is biased with 0.67µB ,while the bias of MPFA is only 0.09µB . In fact, sincetypical sequences contain only small subsets of frameswith particular visual attribute, (9) shows that the MGLA
estimator actually reflects performance that is dominatedby the other visual attributes, thus significantly skewingthe per-visual attribute performance evaluation. Notethat the variance of the MGLA is lower than that ofMPFA by a constant 1+β
1+η since it applies more frames.Nevertheless, the variances of both estimators decreaselinearly with factor NNA. A practical implication ofthese results is that per-frame annotation of moderately-sized dataset (our approach), even with a reasonablenumber of mislabelled frames, provides a much betterestimate of true per-visual attribute performance than aper-sequence labelled large dataset (methodologies usedin [15], [16]).
4 EXPERIMENTAL EVALUATION
4.1 VOT2014 challenge
The tracker comparison methodology from Section 3was applied to a large-scale experiment, organized asa Visual Object Tracking challenge5 (VOT2014). An an-notated dataset (Section 4.2) was constructed and anevaluation system implemented in Matlab/Octave tofulfill the multi-platform, multi-programming languagecompatibility requirement from Section 1.1. A minimalAPI is defined to integrate a tracker with the systemregardless of the programming language used to imple-ment the tracker. The reader is referred to the evaluationkit document [19] for further details. Researchers wereinvited to participate by downloading the evaluation kit,to integrate it into their tracker and to run it locallyon their machines. The evaluation kit downloaded theVOT2014 dataset and performed a set of pre-definedexperiments (Section 4.1.1). To ensure a fair analysis,the authors were instructed to select a single set ofparameters for all experiments. This way, the authors ofthe trackers themselves were responsible for setting theproper parameters and removing possible errors fromthe tracker implementations. The raw results from theevaluation system were then submitted to the VOT2014homepage, along with a short description of the trackersand optionally with the binaries or source code to allowthe VOT2014 committee further verification of their re-sults.
4.1.1 Experiments
The VOT2014 challenge includes the following two ex-periments:
• Experiment 1 (baseline) runs a tracker on all se-quences in the VOT2014 dataset by initializing it onthe ground truth bounding boxes.
5. http://www.votchallenge.net/
JOURNAL OF LATEX CLASS FILES, VOL. VV, NO. NN, MONTH YYYY 8
• Experiment 2 (bounding box perturbation) performsExperiment 1 with noisy bounding boxes. The noiseaffected the position and size by drawing pertur-bations uniformly from the ±10% interval of theground truth bounding box size and the rotation bydrawing uniformly from the ±0.1 radian range.
All the experiments were automatically performed bythe evaluation kit6. A tracker was run on each sequence15 times to obtain a better statistic on its performance.
4.1.2 Tested trackers
In total 38 trackers were considered in the challenge,most of which had been published in recent years andrepresent the state-of-the-art. These included 33 originalsubmissions and 5 baseline highly-cited trackers thatwere contributed by the VOT committee. We referencethe unpublished trackers by the VOT2014 challengereport [22]. For the interested reader a more detaileddescription of each tracker can be found in the sup-plementary material and a condensed summary of thetrackers is available in Table 2.
Several trackers explicitly decomposed the targetinto parts. These ranged from key-point-based trackersCMT [45], IIVTv2 [22], Matrioska [46] and its derivativeMatFlow (a combination of Matrioska and FoT [47])to general part-based trackers LT-FLO [48], PT+ (animprovement of the Pixeltrack tracking algorithm [49]),LGT [50], OGT [51], DGT [52], ABS [22], while threetrackers applied flock-of-trackers approaches FoT [47],BDF ([53]) and FRT [54]. Several approaches wereapplying global generative visual models for targetlocalization: a channel blurring approach EDFT [55]and its derivative qwsEDFT [56] (an improvement ofboth trackers DFT [57] and EDFT [55]), GMM-basedVTDMG (an extension of [58]), scale-adaptive meanshift eASMS (an extension of ASMS [59]), color andtexture-based ACAT (a combination of Colour AttributesTracker (CAT) [60] and CSK tracker [61]), NCC basedtracker with motion model IMPNCC (an improve-ment of the NCC tracker [62]), two color-based par-ticle filters SIR-PF (a combination of particle filter, abackground model as in [63] and information com-ing from colour space YCbCr) and IPRT (an improve-ment of colour-based particle filter [64], [65] usingparticle re-propagation), a compressive tracker CT [66]and intensitiy-template-based pca tracker IVT [23]. Twotrackers applied fusion of flock-of-trackers and meanshift, HMM-TxD [22] and DynMS (which is a MeanShift tracker [67] with an isotropic kernel bootstrappedby a flock-of-features (FoF) tracker). Many trackers werebased on discriminative models, i.e., boosting-based par-ticle filter MCT [68], multiple-instance-learning-basedtracker MIL [33], detection-based FSDT [22] while sev-eral applied regression-based techniques, i.e., varia-tions of online structured SVM, Struck [69], aStruck (a
6. https://github.com/vicoslab/vot-toolkit
combination of optical-flow-based tracker and the dis-criminative tracker Struck [69]), TStruck (a CUDA-based implementation of the Struck tracker [69]),PLT13 [21] and PLT14 (an improved version of PLT13
tracker), kernelized-correlation-filter-based KCF [70],kernelized-least-squares-based ACT [60] and discrimina-tive correlation-based DSST [71] and SAMF [72].
4.2 The VOT2014 Dataset
A usual approach to creating a diverse dataset is col-lecting all sequences from existing datasets. But a largedataset does not necessarily mean being rich in visualproperties. In fact, many sequences may be visually simi-lar and would not contribute to the diversity while theywould significantly slow down the evaluation process.We have therefore applied an approach that leads to adataset that includes various visual phenomena whilecontaining a small number of sequences.
The dataset was prepared as follows. The initialpool included 394 sequences, including sequences usedby various authors in the tracking community, theVOT2013 benchmark [21], the recently published ALOVdataset [16], the Online Object Tracking Benchmark [15]and additional, so far unpublished, sequences. The setwas manually filtered by removing sequences shorterthan 200 frames, grayscale sequences, sequences contain-ing poorly defined targets (e.g., fireworks) and sequencescontaining cuts. The following global intensity (it) andspatial (sp) attributes were automatically computed foreach of the 193 remaining sequences:
1) Illumination change is defined as the average of theabsolute differences between the object intensity inthe first and remaining frames (it).
2) Object size change is the sum of averaged local sizechanges, where the local size change at frame tis defined as the average of absolute differencesbetween the bounding box area in frame t and pastfifteen frames (sp).
3) Object motion is the average of absolute differencesbetween ground truth center positions in consecu-tive frames (sp).
4) Clutter is the average of per-frame distances be-tween two histograms: one extracted from withinthe ground truth bounding box and one from anenlarged area (by factor 1.5) outside of the bound-ing box (it).
5) Camera motion is defined as the average of trans-lation vector lengths estimated by key-point-basedRANSAC between consecutive frames (sp).
6) Blur was measured by the Bayes-spectral-entropycamera focus measure [73] (it).
7) Aspect-ratio change is defined as the average of per-frame aspect ratio changes. The aspect ratio changeat frame t is calculated as the ratio of the boundingbox width and height in frame t divided by theratio of the bounding box width and height in thefirst frame (sp);
JOURNAL OF LATEX CLASS FILES, VOL. VV, NO. NN, MONTH YYYY 9
8) Object color change defined as the change of theaverage hue value inside the bounding box (it);
9) Deformation is calculated by dividing the imagesinto 8 × 8 grid of cells and computing the sumof squared differences of averaged pixel intensityover the cells in current and first frame (it).
10) Scene complexity represents the level of randomness(entropy) in the frames and it was calculated ase =
∑255i=0 bi log bi, where bi is the number of pixels
with value equal to i (it).In this way each sequence was represented as a 10-dimensional feature vector. Sequences were clustered inan unsupervised way using affinity propagation [74] into12 clusters7. From these, 25 sequences were manuallyselected such that the various visual phenomena like,occlusion, were still represented well within the selec-tion.
The selected objects in each sequence are manually an-notated by bounding boxes. For most sequences, the au-thors provide axis-aligned bounding boxes placed overthe target. For most frames, the axis-aligned boundingboxes approximated the target well with large percent-age of pixels within the bounding box (at least > 60%)belonging to the target. Some sequences contained elon-gated, rotating or deforming targets and these were re-annotated by rotated bounding boxes. After inspectingall the bounding box annotations, sequences with mis-placed original annotations were re-annotated.
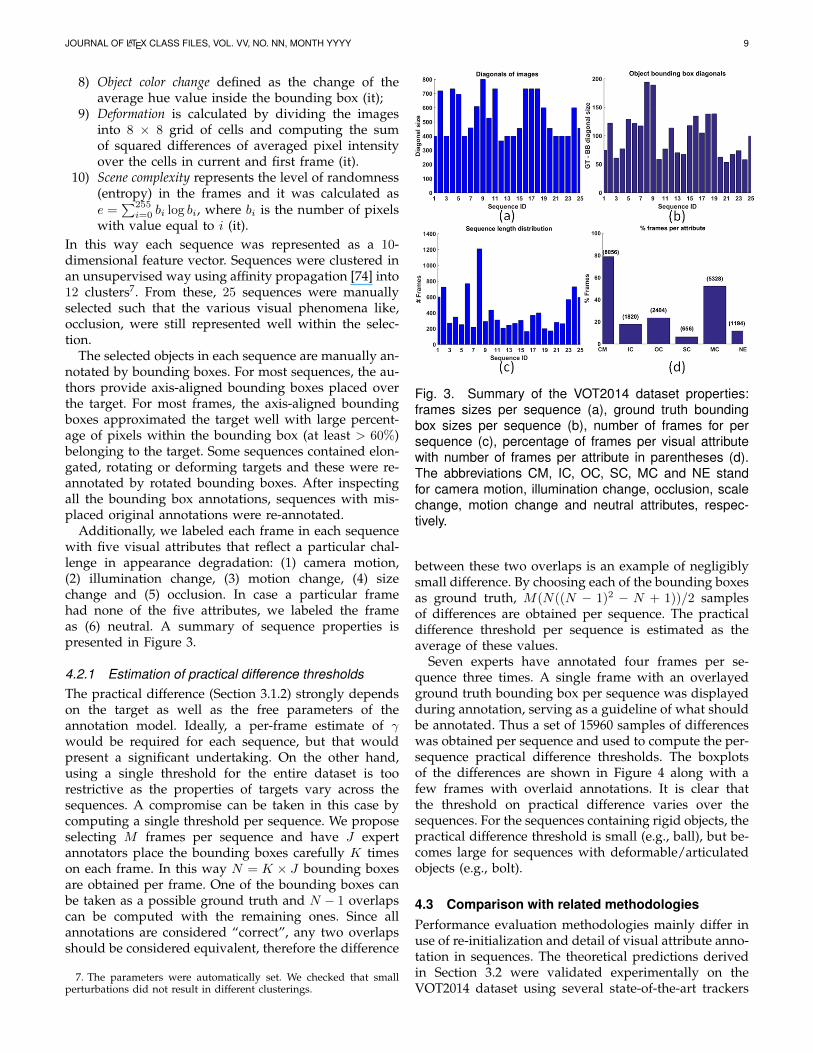
Additionally, we labeled each frame in each sequencewith five visual attributes that reflect a particular chal-lenge in appearance degradation: (1) camera motion,(2) illumination change, (3) motion change, (4) sizechange and (5) occlusion. In case a particular framehad none of the five attributes, we labeled the frameas (6) neutral. A summary of sequence properties ispresented in Figure 3.
4.2.1 Estimation of practical difference thresholdsThe practical difference (Section 3.1.2) strongly dependson the target as well as the free parameters of theannotation model. Ideally, a per-frame estimate of γwould be required for each sequence, but that wouldpresent a significant undertaking. On the other hand,using a single threshold for the entire dataset is toorestrictive as the properties of targets vary across thesequences. A compromise can be taken in this case bycomputing a single threshold per sequence. We proposeselecting M frames per sequence and have J expertannotators place the bounding boxes carefully K timeson each frame. In this way N = K × J bounding boxesare obtained per frame. One of the bounding boxes canbe taken as a possible ground truth and N − 1 overlapscan be computed with the remaining ones. Since allannotations are considered “correct”, any two overlapsshould be considered equivalent, therefore the difference
7. The parameters were automatically set. We checked that smallperturbations did not result in different clusterings.
Fig. 3. Summary of the VOT2014 dataset properties:frames sizes per sequence (a), ground truth boundingbox sizes per sequence (b), number of frames for persequence (c), percentage of frames per visual attributewith number of frames per attribute in parentheses (d).The abbreviations CM, IC, OC, SC, MC and NE standfor camera motion, illumination change, occlusion, scalechange, motion change and neutral attributes, respec-tively.
between these two overlaps is an example of negligiblysmall difference. By choosing each of the bounding boxesas ground truth, M(N((N − 1)2 − N + 1))/2 samplesof differences are obtained per sequence. The practicaldifference threshold per sequence is estimated as theaverage of these values.
Seven experts have annotated four frames per se-quence three times. A single frame with an overlayedground truth bounding box per sequence was displayedduring annotation, serving as a guideline of what shouldbe annotated. Thus a set of 15960 samples of differenceswas obtained per sequence and used to compute the per-sequence practical difference thresholds. The boxplotsof the differences are shown in Figure 4 along with afew frames with overlaid annotations. It is clear thatthe threshold on practical difference varies over thesequences. For the sequences containing rigid objects, thepractical difference threshold is small (e.g., ball), but be-comes large for sequences with deformable/articulatedobjects (e.g., bolt).
4.3 Comparison with related methodologiesPerformance evaluation methodologies mainly differ inuse of re-initialization and detail of visual attribute anno-tation in sequences. The theoretical predictions derivedin Section 3.2 were validated experimentally on theVOT2014 dataset using several state-of-the-art trackers

JOURNAL OF LATEX CLASS FILES, VOL. VV, NO. NN, MONTH YYYY 10
0
0.1
0.2
0.3
0.4
0.5
ball
basketball
bicycle
bolt
car
david
diving
drunk
fernando
fish1
fish2
gymnastics
hand1
hand2
jogging
motocross
polarbear
skating
sphere
sunshade
surfing
torus
trellis
tunnel
woman
Ball
David Bolt
Car Hand1
Basketball
Fig. 4. Examples of the diversity of bounding boxannotations for different images (top) and box plots of per-sequence distribution of ground truth overlaps.
STRUCK [69], DSST [71], SAMF ([72]) and KCF [70] andtwo trackers commonly used as baselines, CT [66] andFRT [54].
4.3.1 Effects of re-initializationThe theoretical comparison of estimators (Section 3.2.1)that apply re-initialization, (MWIR), and those that donot, MNOR, was evaluated experimentally. Each trackerwas run on all sequences in the VOT2014 dataset oncewith re-intializations and once without. A set of Ksequences was randomly sampled and average overlapwas computed on this set for each estimator. The processwas repeated thousand times to estimate the mean andvariance. Table 1 shows results for varying K. Due tosampling with replacement, sequences were repeatedacross some sets, which means that the variance wasunderestimated. Nevertheless, the trends are as pre-dicted by the theoretical model. The means of MNOR areconsistently lower than for MWIR, which is especiallyevident for trackers that fail frequently, e.g., FRT andCT. Moreover, the variance of MNOR is consistentlyhigher than for MWIR across all trackers. The Wilcoxonpaired tests showed that both types of differences arestatistically significant at p < 0.01.
4.3.2 Importance of per-frame annotationThe properties of estimators that apply per-frame visualattribute annotation, MGLA, and the estimators that ap-ply only per-sequence annotation, MPFA, were estimatedusing a similar experiment as in previous section. Forfair comparison, re-initialization was applied in all ex-periments. The results for K = 24 sequences are visu-alized in Figure 5 and confirm the predictions from ourtheoretical model. The variance of per-attribute MGLA
is generally slightly smaller than MPFA since MGLA
uses more frames in estimation, of which many might
TABLE 1Performance of estimators with re-initialization, Y(WIR),
and without re-initialization, N(NOR) indicated in thecolumn denoted by R. Average overlap is shown for eachtracker and the standard deviation is shown in brackets.
K R DSST KCF SAMF CT FRT Struck
5 N 0.49(.14) 0.49(.15) 0.50(.14) 0.23(.09) 0.24(.09) 0.35(.11)Y 0.63(.09) 0.64(.08) 0.63(.08) 0.43(.07) 0.49(.06) 0.52(.08)
10 N 0.50(.10) 0.49(.10) 0.51(.10) 0.24(.06) 0.24(.06) 0.36(.08)Y 0.63(.06) 0.64(.06) 0.63(.06) 0.43(.05) 0.48(.04) 0.52(.06)
15 N 0.50(.08) 0.49(.08) 0.51(.08) 0.24(.05) 0.25(.05) 0.36(.06)Y 0.63(.05) 0.64(.05) 0.63(.05) 0.43(.04) 0.49(.04) 0.52(.05)
20 N 0.50(.07) 0.50(.07) 0.52(.07) 0.24(.04) 0.24(.04) 0.36(.06)Y 0.63(.04) 0.64(.04) 0.63(.04) 0.43(.03) 0.49(.03) 0.52(.04)
24 N 0.50(.06) 0.50(.07) 0.52(.06) 0.24(.04) 0.24(.04) 0.36(.05)Y 0.63(.04) 0.64(.04) 0.63(.04) 0.43(.03) 0.49(.03) 0.52(.04)
not contain the attribute in question, making the MGLA
estimator strongly biased toward the global mean. Thisbias is also reflected in the dispersion of per-attributevalues around their global mean, which is greater forMPFA than for MGLA. This means that the MGLA ismuch weaker at making predictions regarding per-visualattribute performance evaluation. For example, considerthe trackers DSST, KCF and SAMF. These are highlysimilar trackers by design, which is reflected in thetrends of per-attribute values in Figure 5. Nevertheless,the MGLA cannot distinguish performance with respectto attributes motion change, scale change and occlusion,while the performance difference is clear from MPFA. AWilcoxon paired test on pairs with varying K = 15 : 24showed that the variance of MPFA is lower than thatof MGLA at level p < 0.01 and an F-test on dispersionshowed a difference at significance p < 0.05.
4.4 Application to tracker analysis on VOT2014The results of the baseline and bounding box perturbationexperiments described in Section 4.1.1 are visualizedin Figure 6 and summarized in Table 2. The AR-rankplots in Figure 6 are obtained by ranking trackers withrespect to each sequence and averaging the ranking lists.In Table 2, these results are denoted as per-sequencenormalization.
The top-performing trackers in robustness consideringboth the baseline and noise experiments are PLT13,PLT14, MatFlow and DGT. PLT13 and PLT14 are trackersthat apply holistic models. Both trackers are extensionsof the Struck [69] tracker which uses a structured SVMon grayscale patches to learn a regression from intensityto center of object displacement. In contrast to Struck, thePLT13 and PLT14 also apply histogram backprojection asfeature selection strategy in the SVM training. The PLT13
is the winner of the VOT2013 challenge [21] which doesnot adapt the target size, while the PLT14 is an extensionof PLT13 that adapts the size as well. Interestingly, thePLT14 does improve in accuracy compared to PLT13, ata cost of slightly decreased robustness. The MatFlow andDGT are part-based trackers. The MatFlow tracker is anextension of Matrioska [46] which applies a ORB/SURFkeypoints and robust voting and matching techniques.
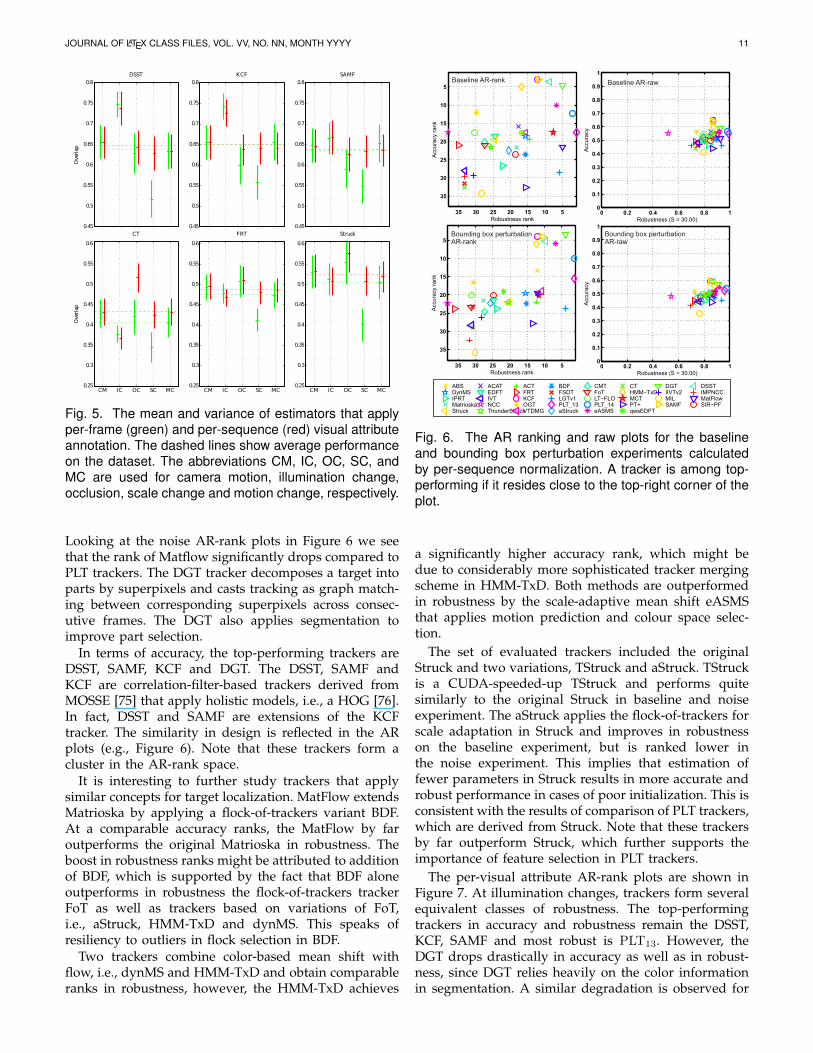
JOURNAL OF LATEX CLASS FILES, VOL. VV, NO. NN, MONTH YYYY 11
SAMF
Overlap
CM IC OC SC MC0.45
0.5
0.55
0.6
0.65
0.7
0.75
0.8KCF
Overlap
CM IC OC SC MC0.45
0.5
0.55
0.6
0.65
0.7
0.75
0.8DSST
Overlap
CM IC OC SC MC0.45
0.5
0.55
0.6
0.65
0.7
0.75
0.8
Struck
Overlap
CM IC OC SC MC0.25
0.3
0.35
0.4
0.45
0.5
0.55
0.6
FRT
Overlap
CM IC OC SC MC0.25
0.3
0.35
0.4
0.45
0.5
0.55
0.6
CT
Overlap
CM IC OC SC MC0.25
0.3
0.35
0.4
0.45
0.5
0.55
0.6
Fig. 5. The mean and variance of estimators that applyper-frame (green) and per-sequence (red) visual attributeannotation. The dashed lines show average performanceon the dataset. The abbreviations CM, IC, OC, SC, andMC are used for camera motion, illumination change,occlusion, scale change and motion change, respectively.
Looking at the noise AR-rank plots in Figure 6 we seethat the rank of Matflow significantly drops compared toPLT trackers. The DGT tracker decomposes a target intoparts by superpixels and casts tracking as graph match-ing between corresponding superpixels across consec-utive frames. The DGT also applies segmentation toimprove part selection.
In terms of accuracy, the top-performing trackers areDSST, SAMF, KCF and DGT. The DSST, SAMF andKCF are correlation-filter-based trackers derived fromMOSSE [75] that apply holistic models, i.e., a HOG [76].In fact, DSST and SAMF are extensions of the KCFtracker. The similarity in design is reflected in the ARplots (e.g., Figure 6). Note that these trackers form acluster in the AR-rank space.
It is interesting to further study trackers that applysimilar concepts for target localization. MatFlow extendsMatrioska by applying a flock-of-trackers variant BDF.At a comparable accuracy ranks, the MatFlow by faroutperforms the original Matrioska in robustness. Theboost in robustness ranks might be attributed to additionof BDF, which is supported by the fact that BDF aloneoutperforms in robustness the flock-of-trackers trackerFoT as well as trackers based on variations of FoT,i.e., aStruck, HMM-TxD and dynMS. This speaks ofresiliency to outliers in flock selection in BDF.
Two trackers combine color-based mean shift withflow, i.e., dynMS and HMM-TxD and obtain comparableranks in robustness, however, the HMM-TxD achieves
ABS ACAT ACT BDF CMT CT DGT DSSTDynMS EDFT FRT FSDT FoT HMM−TxD IIVTv2 IMPNCCIPRT IVT KCF LGTv1 LT−FLO MCT MIL MatFlowMatrioska NCC OGT PLT_13 PLT_14 PT+ SAMF SIR−PFStruck ThunderStruckVTDMG aStruck eASMS qwsEDFT
0 0.2 0.4 0.6 0.8 10
0.1
0.2
0.3
0.4
0.5
0.6
0.7
0.8
0.9
1
Robustness (S = 30.00)
Accu
racy
5101520253035
5
10
15
20
25
30
35
Robustness rank
Accu
racy
ran
k
Baseline AR-rank Baseline AR-raw
0 0.2 0.4 0.6 0.8 10
0.1
0.2
0.3
0.4
0.5
0.6
0.7
0.8
0.9
1
Robustness (S = 30.00)
Accu
racy
5101520253035
5
10
15
20
25
30
35
Robustness rank
Acc
ura
cy r
an
k
Bounding box perturbation AR-rank
Bounding box perturbation AR-raw
Fig. 6. The AR ranking and raw plots for the baselineand bounding box perturbation experiments calculatedby per-sequence normalization. A tracker is among top-performing if it resides close to the top-right corner of theplot.
a significantly higher accuracy rank, which might bedue to considerably more sophisticated tracker mergingscheme in HMM-TxD. Both methods are outperformedin robustness by the scale-adaptive mean shift eASMSthat applies motion prediction and colour space selec-tion.
The set of evaluated trackers included the originalStruck and two variations, TStruck and aStruck. TStruckis a CUDA-speeded-up TStruck and performs quitesimilarly to the original Struck in baseline and noiseexperiment. The aStruck applies the flock-of-trackers forscale adaptation in Struck and improves in robustnesson the baseline experiment, but is ranked lower inthe noise experiment. This implies that estimation offewer parameters in Struck results in more accurate androbust performance in cases of poor initialization. This isconsistent with the results of comparison of PLT trackers,which are derived from Struck. Note that these trackersby far outperform Struck, which further supports theimportance of feature selection in PLT trackers.
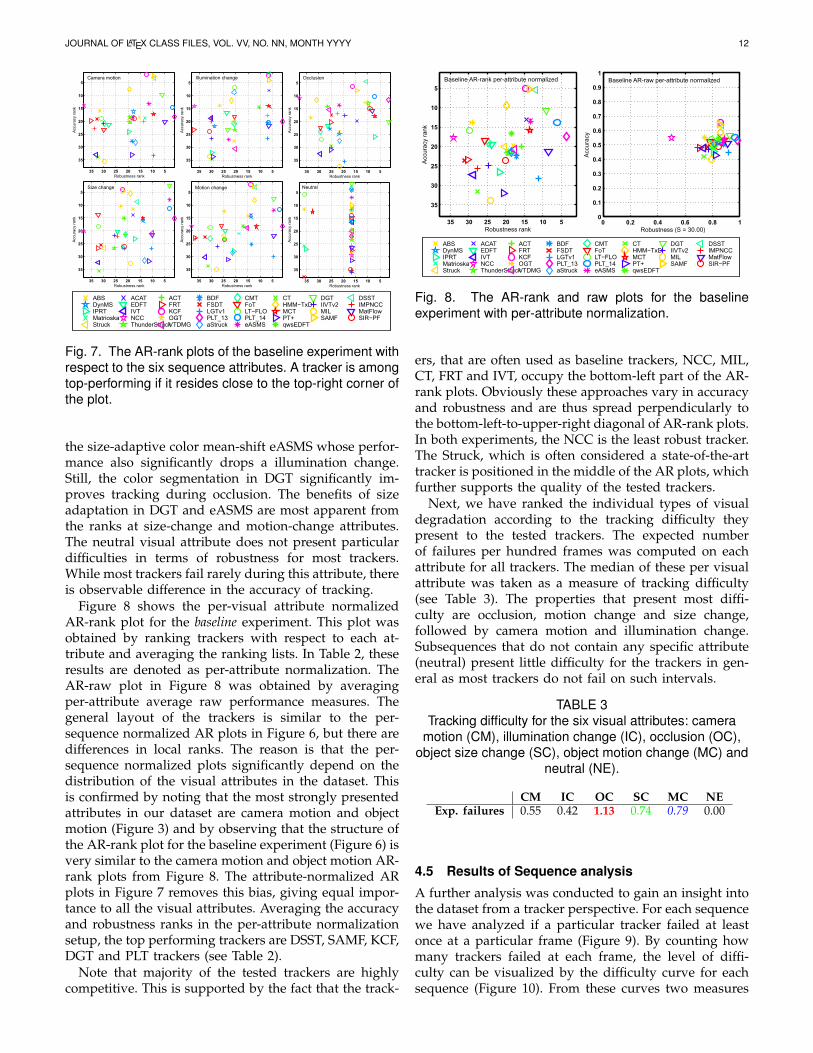
The per-visual attribute AR-rank plots are shown inFigure 7. At illumination changes, trackers form severalequivalent classes of robustness. The top-performingtrackers in accuracy and robustness remain the DSST,KCF, SAMF and most robust is PLT13. However, theDGT drops drastically in accuracy as well as in robust-ness, since DGT relies heavily on the color informationin segmentation. A similar degradation is observed for
JOURNAL OF LATEX CLASS FILES, VOL. VV, NO. NN, MONTH YYYY 12
ABS ACAT ACT BDF CMT CT DGT DSSTDynMS EDFT FRT FSDT FoT HMM−TxD IIVTv2 IMPNCCIPRT IVT KCF LGTv1 LT−FLO MCT MIL MatFlowMatrioska NCC OGT PLT_13 PLT_14 PT+ SAMF SIR−PFStruck ThunderStruckVTDMG aStruck eASMS qwsEDFT
5101520253035
5
10
15
20
25
30
35
Robustness rank
Accura
cy r
ank
Camera motion
5101520253035
5
10
15
20
25
30
35
Robustness rank
Acc
ura
cy r
ank
Size change
5101520253035
5
10
15
20
25
30
35
Robustness rank
Acc
ura
cy r
ank
Motion change
5101520253035
5
10
15
20
25
30
35
Robustness rankA
ccura
cy r
ank
Neutral
5101520253035
5
10
15
20
25
30
35
Robustness rank
Accura
cy r
ank
Illumination change
5101520253035
5
10
15
20
25
30
35
Robustness rank
Accura
cy r
ank
Occlusion
Fig. 7. The AR-rank plots of the baseline experiment withrespect to the six sequence attributes. A tracker is amongtop-performing if it resides close to the top-right corner ofthe plot.
the size-adaptive color mean-shift eASMS whose perfor-mance also significantly drops a illumination change.Still, the color segmentation in DGT significantly im-proves tracking during occlusion. The benefits of sizeadaptation in DGT and eASMS are most apparent fromthe ranks at size-change and motion-change attributes.The neutral visual attribute does not present particulardifficulties in terms of robustness for most trackers.While most trackers fail rarely during this attribute, thereis observable difference in the accuracy of tracking.
Figure 8 shows the per-visual attribute normalizedAR-rank plot for the baseline experiment. This plot wasobtained by ranking trackers with respect to each at-tribute and averaging the ranking lists. In Table 2, theseresults are denoted as per-attribute normalization. TheAR-raw plot in Figure 8 was obtained by averagingper-attribute average raw performance measures. Thegeneral layout of the trackers is similar to the per-sequence normalized AR plots in Figure 6, but there aredifferences in local ranks. The reason is that the per-sequence normalized plots significantly depend on thedistribution of the visual attributes in the dataset. Thisis confirmed by noting that the most strongly presentedattributes in our dataset are camera motion and objectmotion (Figure 3) and by observing that the structure ofthe AR-rank plot for the baseline experiment (Figure 6) isvery similar to the camera motion and object motion AR-rank plots from Figure 8. The attribute-normalized ARplots in Figure 7 removes this bias, giving equal impor-tance to all the visual attributes. Averaging the accuracyand robustness ranks in the per-attribute normalizationsetup, the top performing trackers are DSST, SAMF, KCF,DGT and PLT trackers (see Table 2).
Note that majority of the tested trackers are highlycompetitive. This is supported by the fact that the track-
0 0.2 0.4 0.6 0.8 10
0.1
0.2
0.3
0.4
0.5
0.6
0.7
0.8
0.9
1
Robustness (S = 30.00)
Accu
racy
5101520253035
5
10
15
20
25
30
35
Robustness rank
Accu
racy
ra
nk
ABS ACAT ACT BDF CMT CT DGT DSSTDynMS EDFT FRT FSDT FoT HMM−TxD IIVTv2 IMPNCCIPRT IVT KCF LGTv1 LT−FLO MCT MIL MatFlowMatrioska NCC OGT PLT_13 PLT_14 PT+ SAMF SIR−PFStruck ThunderStruckVTDMG aStruck eASMS qwsEDFT
Baseline AR-rank per-attribute normalized Baseline AR-raw per-attribute normalized
Fig. 8. The AR-rank and raw plots for the baselineexperiment with per-attribute normalization.
ers, that are often used as baseline trackers, NCC, MIL,CT, FRT and IVT, occupy the bottom-left part of the AR-rank plots. Obviously these approaches vary in accuracyand robustness and are thus spread perpendicularly tothe bottom-left-to-upper-right diagonal of AR-rank plots.In both experiments, the NCC is the least robust tracker.The Struck, which is often considered a state-of-the-arttracker is positioned in the middle of the AR plots, whichfurther supports the quality of the tested trackers.
Next, we have ranked the individual types of visualdegradation according to the tracking difficulty theypresent to the tested trackers. The expected numberof failures per hundred frames was computed on eachattribute for all trackers. The median of these per visualattribute was taken as a measure of tracking difficulty(see Table 3). The properties that present most diffi-culty are occlusion, motion change and size change,followed by camera motion and illumination change.Subsequences that do not contain any specific attribute(neutral) present little difficulty for the trackers in gen-eral as most trackers do not fail on such intervals.
TABLE 3Tracking difficulty for the six visual attributes: camera
motion (CM), illumination change (IC), occlusion (OC),object size change (SC), object motion change (MC) and
neutral (NE).
CM IC OC SC MC NEExp. failures 0.55 0.42 1.13 0.74 0.79 0.00
4.5 Results of Sequence analysis
A further analysis was conducted to gain an insight intothe dataset from a tracker perspective. For each sequencewe have analyzed if a particular tracker failed at leastonce at a particular frame (Figure 9). By counting howmany trackers failed at each frame, the level of diffi-culty can be visualized by the difficulty curve for eachsequence (Figure 10). From these curves two measures

JOURNAL OF LATEX CLASS FILES, VOL. VV, NO. NN, MONTH YYYY 13
TABLE 2Ranking results of the baseline and bounding box perturbation experiments with per-sequence normalization of theranks and the baseline experiment with per-attribute normalization. The per-accuracy and per-robustness averagedranks are denoted by A and R, respectively. The top, second and third lowest average ranks are shown in red, blue
and green respectively. The last four columns denote tracker properties which are split into: localization(stochastic/deterministic, i.e., S/D); model type (holistic/part-based, i.e., H/P); visual model representation
(generative/discriminative, i.e., G/D); scale adaptation (yes/no, i.e., Y/N).
Experiment Baseline Region perturbation Baseline PropertiesNormalization per sequence per sequence per attributeRanking measure A R Avg. A R Avg. A R Avg. Loc. Model Repr. ScaleDSST [71] 3.67 8.86 6.26 5.25 9.78 7.51 5.41 11.93 8.67 D H D YSAMF [72] 3.00 11.91 7.45 4.00 10.70 7.35 5.30 13.55 9.43 D P D YKCF [70] 3.00 12.33 7.67 4.00 12.08 8.04 5.05 14.60 9.82 D H D NDGT [52] 4.62 5.00 4.81 3.50 4.00 3.75 10.76 9.13 9.95 D P G YPLT14 [22] 12.29 2.00 7.15 10.00 1.50 5.75 13.88 6.19 10.03 D H D YPLT13 [21] 17.50 1.00 9.25 15.55 1.50 8.52 17.54 3.67 10.60 D H D NeASMS [59] 10.00 6.80 8.40 6.00 6.83 6.42 13.48 13.33 13.40 D H G YACAT [22] 16.00 17.62 16.81 19.54 12.08 15.81 12.99 14.49 13.74 D H G YHMM-TxD [22] 5.00 16.80 10.90 6.00 12.36 9.18 9.43 19.94 14.69 D P G YMCT [68] 17.50 7.67 12.58 20.07 11.70 15.89 15.88 13.52 14.70 S H G YMatFlow [22] 21.54 5.00 13.27 19.54 12.08 15.81 21.25 8.49 14.87 D P G NqwsEDFT [56] 17.50 16.92 17.21 19.00 21.75 20.38 16.65 18.53 17.59 D H G NACT [60] 19.42 14.62 17.02 22.00 12.33 17.17 20.08 15.91 18.00 D H D NABS [22] 17.50 16.92 17.21 13.45 12.08 12.76 19.72 17.88 18.80 D H G YVTDMG [22] 17.50 15.69 16.60 19.00 11.00 15.00 20.77 17.70 19.24 D H G NLGT [50] 28.63 5.75 17.19 23.81 4.00 13.91 28.12 11.22 19.67 S P G YBDF [53] 23.50 15.69 19.60 22.29 15.36 18.82 22.42 17.12 19.77 D P G NaStruck [22] 22.50 20.45 21.48 22.29 25.73 24.01 21.41 18.40 19.90 D P D NDynMS [22] 18.54 15.69 17.12 19.54 15.58 17.56 21.54 18.75 20.14 S H G YStruck [69] 19.58 24.60 22.09 22.00 20.44 21.22 20.11 20.29 20.20 D H D NMatrioska [46] 21.54 18.40 19.97 21.50 27.62 24.56 21.15 19.86 20.50 D P G NTStruck [69] 21.54 25.64 23.59 22.00 20.44 21.22 21.71 19.35 20.53 D H D NOGT [51] 12.06 29.78 20.92 16.50 30.58 23.54 13.76 29.15 21.45 S H G NEDFT [55] 18.54 24.43 21.49 21.50 24.80 23.15 19.43 23.80 21.61 D H G NCMT [45] 20.17 27.44 23.81 24.72 27.30 26.01 18.93 24.61 21.77 D P G YSIR-PF [22] 23.50 18.57 21.04 20.07 24.80 22.44 23.62 20.09 21.86 S H G NFoT [47] 21.00 27.44 24.22 23.32 31.20 27.26 18.48 25.70 22.09 D P G YLT-FLO [48] 17.50 30.50 24.00 20.07 31.20 25.64 15.98 29.84 22.91 S P G YIPRT [22] 26.67 22.33 24.50 23.81 23.89 23.85 26.68 21.68 24.18 S H G NIIVTv2 [22] 29.35 30.67 30.01 26.18 28.17 27.17 24.79 24.79 24.79 D P G YNCC [62] 17.50 38.00 27.75 22.29 38.00 30.14 17.74 34.25 26.00 D H G NPT+ [22] 32.64 15.69 24.16 27.84 13.56 20.70 32.05 20.68 26.37 D P G YIMPNCC [22] 29.73 33.25 31.49 32.42 31.71 32.07 25.56 27.66 26.61 D H G YFRT [54] 21.00 35.00 28.00 23.81 36.00 29.91 23.38 30.38 26.88 D P G NFSDT [22] 31.50 33.40 32.45 23.32 30.73 27.02 23.55 31.17 27.36 D H D YIVT [23] 28.05 33.14 30.60 28.35 31.20 29.77 27.23 28.92 28.07 D H G YMIL [33] 34.25 28.38 31.31 35.75 30.10 32.92 33.95 24.22 29.09 D H D NCT [66] 32.64 33.14 32.89 29.00 30.88 29.94 31.51 27.79 29.65 D H D N
of sequence difficulty are derived: area and max. The areais a sum of frame-wise values from the difficulty curvenormalized by the number of frames, while the max isthe maximum on this curve. The former indicates theaverage level of difficulty of a sequence, and the latterreflects the difficulty of the most difficult part in thesequence. Table 4 summarizes the area and max valuesfor all sequences. A high value of the area suggests thatsuch sequence is challenging in a considerable numberof frames. For example, the area for the david sequenceis smaller than the area for the woman sequence, whichsuggests that david sequence is less challenging that thewoman sequence. A large max indicates the presence ofdifficult frames. For example, a significant peak in thewoman sequence (frame 566) suggests that this sequencecontains a subsequence around this frame which ischallenging to most of the trackers. In case of drunk
sequence, the corresponding max value is 3 (see Table 4),thus almost all trackers successfully track the target.
Using the area measure the sequences were labeled bythe following four levels of difficulty: Hard (area greaterthan 3.00), intermediate (area between 3.00 and 2.00),intermediate/easy (area between 1.00 and 1.00) andeasy (area less than 1.00) (see Table 4). These levelswere defined by manually clustering the areas into fourclear clusters. Surprisingly, the david sequence (Figure 10)shows a small area in this study, although the sequenceis usually considered in the community to be challeng-ing and it is commonly referred in the literature. Oneexplanation might be that the trackers are over-fittedto this sequence since it is so often used in evaluationand development. An alternative explanation might bethat the sequence is actually not very challenging fortracking, but appears to be to a human observer. The

JOURNAL OF LATEX CLASS FILES, VOL. VV, NO. NN, MONTH YYYY 14
Fig. 9. The scatter plot for the woman sequence showsthe failures for each tracker w.r.t. frame number.
Sequence area max frame difficultymotocross 5.92 19 39 hardhand2 5.65 24 167 harddiving 4.85 15 195 hardfish2 4.59 16 35 hardbolt 4.14 17 17 hardhand1 3.23 15 51 hardfish1 2.94 16 39 intermfernando 2.78 19 292 intermgymnastics 2.59 19 97 intermtorus 2.26 9 146 intermskating 2.12 9 312 intermtrellis 1.58 10 391 interm./easybasketball 1.43 11 668 interm./easytunnel 1.27 6 493 interm./easysunshade 1.24 12 114 interm./easyjogging 1.12 28 77 interm./easywoman 1.05 19 566 interm./easybicycle 0.75 8 176 easydavid 0.60 4 200 easyball 0.47 7 189 easysphere 0.41 3 33 easycar 0.25 7 170 easydrunk 0.11 3 248 easysurfing 0.04 1 178 easypolarbear 0.00 0 1 easy
TABLE 4Sequence difficulty from tracking perspective. The table
shows for each sequence the average number ofper-frame failed trackers (area), the frame (frame) wheremaximum number (max) of trackers simultaneously failed
and the difficulty level (difficulty).
popularity would then be explained by the fact that it isappealing to demonstrate good tracking performance ona sequence that appears difficult, even though it mightnot be. The analysis also shows that the motocross, hand2,diving, fish2, bolt and hand1 are the most challengingsequences. Most of the difficulties in these sequencesarise from changes in camera and object motion aswell as from rapid changes in object size. For example,motocross is hard because all three aforementioned nui-sances occur simultaneously while the hand2 sequence
Fig. 10. Difficulty curves for the bicycle, bolt, david, andwoman sequences.
shows challenging pose variations of the person’s hand.The diving sequence shows significant changes in objectsize, in bolt sequence both motions camera and objectoccur simultaneously, while the fish2 sequence showschallenging pose variations of the object.
Easy to intermediate sequences might remain valuablefor tracker comparison as these sequences still concealchallenges in particular frames. These sequences areidentified by considering max in Table 4. For example,almost all trackers fail at frame 77 of the jogging se-quence. A closer look at this frame and previous framesshows a complete occlusion of the object. Similarly, thewoman sequence at frame 566 (Figure 10) contains camerazooming which makes 19 out of 38 trackers fail. Thebicycle sequence also shows a peak in the difficulty curveat frame 176 (Figure 10). In this part of the sequence,an object is occluded, which is immediately followedby a shadow cast over the target. A significant peak isalso present in the bolt sequence (Figure 10) at frame 17.Many trackers fail here. A closer look at the frame andits neighbouring frames shows significant object motionbetween frames as a cause of failures.
5 CONCLUSION
In this paper a novel tracker performance evaluationmethodology was presented. Requirements for the per-formance measures, the dataset and the evaluation sys-tem are defined and a new evaluation methodologyis proposed which aims at simple, easily interpretable,tracker comparison. The proposed methodology is thefirst of its kind to account for the tracker equivalenceby considering statistical significance and practical dif-ferences. A new dataset and a cross-platform-compatibleevaluation system were presented. The dataset consistsof 25 color sequences, which are per-frame annotatedby visual attributes and rotated boxes. Effects of re-initialization and per-frame annotation are studied the-oretically and the theoretical predictions are verified
JOURNAL OF LATEX CLASS FILES, VOL. VV, NO. NN, MONTH YYYY 15
with experiments. The novel performance evaluationwas applied to comparison of 38 trackers, making it thelargest benchmark to date. Using the benchmark, thedataset was analyzed from perspective of per-sequenceand per-visual-attribute tracking difficulty.
The results of an exhaustive analysis show that track-ers tend to specialize either for robustness or accuracy.None of the trackers consistently outperformed the oth-ers by all measures at all sequence attributes. The top-performing trackers include trackers with holistic as wellas part-based visual models. There is some evidence thatrobustness is achieved by discriminative learning wherevariants of structured SVM, e.g. PLT, seem promising.Variants of segmentation appear to play a beneficial rolein tracking with noisy initializations. This is evident infavorable performance of trackers DGT and PLTs in thenoise experiment. But relying strongly on segmentationreduces performance when color significantly changeswhich is seen in significant deterioration of the DGTon illumination change. Estimation of few parameterslikely increases tracking robustness at reduced accuracy.Attribute-wise analysis shows that motion predictionsignificantly improves performance during dynamic tar-get motion. Results show that evaluating trackers bypooling results from sequences largely depends in thetypes of attributes that dominate the dataset. A per-visual-attribute analysis and attribute normalization infinal ranking is thus beneficial to remove this bias. Mostof the tested trackers outperform standard baselines andperform favorably to common state-of-the-art such asStruck, making the benchmark quite challenging.
The per-attribute analysis of the new dataset showedthat the visual attributes that are most challenging totrackers are occlusion, motion change and size change.Sequence-wise analysis showed that some sequencesare challenging on average, other sequences are verychallenging at particular frames, and some of them arewell tackled by all the trackers. An interesting find isthat one particular sequence (David), which is usuallyassumed challenging in the tracking community, seemsnot to be according to the presented analysis, as trackersrarely fail on this sequence.
While establishing standard datasets and evaluationmethodology tends to result in significant short-termadvances in the field, it can also have negative effects,leading to empoversihed specter of approaches that getput forward in the long run [77]. Evaluation is oftenreduced to a single performance score, which mightlead to degradation in research. The primary goal ofauthors, i.e. coming up with new tracking concepts,shifts to increasing a single performance score, and thisis further enforced by pre-occupied reviewers that mayfind appealing to base their decision on this singlescore as well. We would like to explicitly warn againstthis. In practical experiments we are in fact comparingperformance of various implementations rather thanconcepts. Implementations sometimes contain tweaksthat improve performance, while often being left out
from the original papers in interest of purity of thetheory. While we believe that it is difficult to overfit atracker to a visually diverse dataset, tuning parametersmay very likely contribute to higher ranks. Because ofthis unavoidable dependence on implementation andeffort spent in adjusting the parameters, care has tobe taken when deciding for or against a new trackerbased on performance scores. One approach might be toapply comparative evaluation to position a new trackingapproach against a set of standard baseline implemen-tations using a single ranking experiment, use detailedanalysis with respect to different visual attributes andput further focus on the theory.
Our future work will focus on revising and care-fully enriching the dataset, continually improving thetracker evaluation methodology and, through furtherorganization of the VOT challenges, pushing towards astandardised tracker comparison.
ACKNOWLEDGMENTSThis work was supported in part by the following re-search programs and projects: Slovenian research agencyresearch programs and projects P2-0095, P2-0214, J2-4284, J2-3607, the EU project EPiCS (grant agreementno 257906), the CTU Project SGS13/142/OHK3/2T/13and by The Czech Science Foundation Project GACRP103/12/G084.
REFERENCES[1] D. M. Gavrila, “The visual analysis of human movement: A
survey,” Comp. Vis. Image Understanding, vol. 73, no. 1, pp. 82–98, 1999.
[2] T. B. Moeslund and E. Granum, “A survey of computer vision-based human motion capture,” Comp. Vis. Image Understanding,vol. 81, no. 3, pp. 231–268, March 2001.
[3] P. Gabriel, J. Verly, J. Piater, and A. Genon, “The state of the artin multiple object tracking under occlusion in video sequences,”in Proc. Advanced Concepts for Intelligent Vision Systems, 2003, pp.166–173.
[4] W. Hu, T. Tan, L. Wang, and S. Maybank, “A survey on visualsurveillance of object motion and behaviors,” IEEE Trans. Systems,Man and Cybernetics, C, vol. 34, no. 30, pp. 334–352, 2004.
[5] T. B. Moeslund, A. Hilton, and V. Kruger, “A survey of advancesin vision-based human motion capture and analysis,” Comp. Vis.Image Understanding, vol. 103, no. 2-3, pp. 90–126, November 2006.
[6] A. Yilmaz and M. Shah, “Object tracking: A survey,” Journal ACMComputing Surveys, vol. 38, no. 4, 2006.
[7] X. Li, W. Hu, C. Shen, Z. Zhang, A. R. Dick, and A. Van den Hen-gel, “A survey of appearance models in visual object tracking,”arXiv:1303.4803 [cs.CV], 2013.
[8] D. P. Young and J. M. Ferryman, “PETS Metrics: On-line perfor-mance evaluation service,” in ICCCN ’05 Proceedings of the 14thInternational Conference on Computer Communications and Networks,2005, pp. 317–324.
[9] N. Goyette, P. M. Jodoin, F. Porikli, J. Konrad, and P. Ish-war, “Changedetection.net: A new change detection benchmarkdataset.” in CVPR Workshops. IEEE, 2012, pp. 1–8.
[10] P. J. Phillips, H. Moon, S. A. Rizvi, and P. J. Rauss, “The feretevaluation methodology for face-recognition algorithms,” IEEETrans. Pattern Anal. Mach. Intell., vol. 22, no. 10, pp. 1090–1104,2000.
[11] R. Kasturi, D. B. Goldgof, P. Soundararajan, V. Manohar, J. S.Garofolo, R. Bowers, M. Boonstra, V. N. Korzhova, and J. Zhang,“Framework for performance evaluation of face, text, and vehicledetection and tracking in video: Data, metrics, and protocol,”IEEE Trans. Pattern Anal. Mach. Intell., vol. 31, no. 2, pp. 319–336,2009.
JOURNAL OF LATEX CLASS FILES, VOL. VV, NO. NN, MONTH YYYY 16
[12] K. Bernardin and R. Stiefelhagen, “Evaluating multiple objecttracking performance: The clear mot metrics,” EURASIP Journalon Image and Video Processing, Special Issue on Video Tracking inComplex Scenes for Surveillance Applications, vol. 2008, 2008.
[13] B. Karasulu and S. Korukoglu, “A software for performanceevaluation and comparison of people detection and trackingmethods in video processing,” Multimedia Tools and Applications,vol. 55, no. 3, pp. 677–723, 2011.
[14] S. Salti, A. Cavallaro, and L. Di Stefano, “Adaptive appearancemodeling for video tracking: Survey and evaluation,” IEEE Trans.Image Proc., vol. 21, no. 10, pp. 4334 – 4348, 2012.
[15] Y. Wu, J. Lim, and M. H. Yang, “Online object tracking: Abenchmark,” in Comp. Vis. Patt. Recognition, 2013.
[16] A. W. M. Smeulders, D. M. Chu, R. Cucchiara, S. Calderara,A. Dehghan, and M. Shah, “Visual Tracking: an ExperimentalSurvey,” IEEE Trans. Pattern Anal. Mach. Intell., 2013.
[17] Y. Pang and H. Ling, “Finding the best from the second bests –inhibiting subjective bias in evaluation of visual tracking algo-rithms,” in Int. Conf. Computer Vision, 2013.
[18] M. Kristan and L. Cehovin, Visual Object Tracking Challenge(VOT2013) Evaluation Kit, Visual Object Tracking Challenge, 2013.
[19] M. Kristan, R. Pflugfelder, A. Leonardis, J. Matas, F. Porikli,L. Cehovin, G. Nebehay, G. Fernandez, and T. Vojir, “The vot2013challenge: overview and additional results,” in Computer VisionWinter Workshop, 2014.
[20] F. Fleuret, J. Berclaz, R. Lengagne, and P. Fua, “Multi-CameraPeople Tracking with a Probabilistic Occupancy Map,” IEEETransactions on Pattern Analysis and Machine Intelligence, vol. 30,no. 2, pp. 267–282, February 2008.
[21] M. Kristan, R. Pflugfelder, A. Leonardis, J. Matas, F. Porikli,L. Cehovin, G. Nebehay, G. Fernandez, T. Vojir, A. Gatt, A. Kha-jenezhad, A. Salahledin, A. Soltani-Farani, A. Zarezade, A. Pet-rosino, A. Milton, B. Bozorgtabar, B. Li, C. S. Chan, C. Heng,D. Ward, D. Kearney, D. Monekosso, H. C. Karaimer, H. R. Rabiee,J. Zhu, J. Gao, J. Xiao, J. Zhang, J. Xing, K. Huang, K. Lebeda,L. Cao, M. E. Maresca, M. K. Lim, M. E. Helw, M. Felsberg,P. Remagnino, R. Bowden, R. Goecke, R. Stolkin, S. Y. Lim,S. Maher, S. Poullot, S. Wong, S. Satoh, W. Chen, W. Hu, X. Zhang,Y. Li, and Z. Niu, “The Visual Object Tracking VOT2013 challengeresults,” in ICCV Workshops, 2013, pp. 98–111.
[22] M. Kristan, R. Pflugfelder, A. Leonardis, J. Matas, L. Cehovin,G. Nebehay, T. Vojir, G. Fernandez, A. Lukezic, A. Dimitriev,A. Petrosino, A. Saffari, B. Li, B. Han, C. Heng, C. Garcia,D. Pangersic, G. Hager, F. Shahbaz Khan, F. Oven, H. Possegger,H. Bischof, H. Nam, J. Zhu, J. Li, J. Y. Choi, J.-W. Choi, J. a.Henriques, J. Van de Weijer, J. Batista, K. Lebeda, K. Ofjall, K. M.Yi, L. Qin, L. Wen, M. E. Maresca, M. Danelljan, M. Felsberg, M.-M. Cheng, P. Torr, Q. Huang, R. Bowden, S. Hare, S. YueYing Lim,S. Hong, S. Liao, S. Hadfield, S. Li, S. Duffner, S. Golodetz,T. Mauthner, V. Vineet, W. Lin, Y. Li, Y. Qi, Z. Lei, and Z. Niu, “TheVisual Object Tracking VOT2014 challenge results,” in ECCV2014Workshops, Workshop on visual object tracking challenge, 2014, pp.98–111.
[23] D. A. Ross, J. Lim, R. S. Lin, and M. H. Yang, “Incrementallearning for robust visual tracking.” Int. J. Comput. Vision, vol. 77,no. 1-3, pp. 125–141, 2008.
[24] H. Li, C. Shen, and Q. Shi, “Real-time visual tracking usingcompressive sensing.” in Comp. Vis. Patt. Recognition. IEEE, 2011,pp. 1305–1312.
[25] J. Kwon and K. M. Lee, “Tracking of a non-rigid object via patch-based dynamic appearance modeling and adaptive basin hoppingmonte carlo sampling.” in Comp. Vis. Patt. Recognition. IEEE, 2009,pp. 1208–1215.
[26] M. Kristan, J. Pers, M. Perse, and S. Kovacic, “Closed-world track-ing of multiple interacting targets for indoor-sports applications,”Comput. Vision Image Understanding, vol. 113, no. 5, pp. 598–611,May 2009.
[27] M. Kristan, S. Kovacic, A. Leonardis, and J. Pers, “A two-stagedynamic model for visual tracking.” IEEE Transactions on Systems,Man, and Cybernetics, Part B, vol. 40, no. 6, pp. 1505–1520, 2010.
[28] T. Nawaz and A. Cavallaro, “A protocol for evaluating videotrackers under real-world conditions.” IEEE Trans. Image Proc.,vol. 22, no. 4, pp. 1354–1361, 2013.
[29] P. Carvalho, J. S. Cardoso, and L. Corte-Real, “Filling the gapin quality assessment of video object tracking,” Image and VisionComputing, vol. 30, no. 9, pp. 630–640, 2012.
[30] L. Cehovin, M. Kristan, and A. Leonardis, “Is my new trackerreally better than yours?” in IEEE WACV2014, 2014.
[31] L. Cehovin, A. Leonardis, and M. Kristan, “Visual object trackingperformance measures revisited,” arXiv:1502.05803 [cs.CV], 2015.
[32] M. Everingham, L. Eslami, S. M. A.and Van Gool, C. K. I.Williams, J. Winn, and A. Zisserman, “The pascal visual objectclasses challenge - a retrospective,” Int. J. Comput. Vision, 2014.
[33] B. Babenko, M. H. Yang, and S. Belongie, “Robust object trackingwith online multiple instance learning.” IEEE Trans. Pattern Anal.Mach. Intell., vol. 33, no. 8, pp. 1619–1632, 2011.
[34] H. Wu, A. C. Sankaranarayanan, and R. Chellappa, “Onlineempirical evaluation of tracking algorithms.” IEEE Trans. PatternAnal. Mach. Intell., vol. 32, no. 8, pp. 1443–1458, 2010.
[35] J. SanMiguel, A. Cavallaro, and J. Martınez, “Adaptive on-lineperformance evaluation of video trackers,” IEEE Trans. ImageProc., vol. 21, no. 5, pp. 2812–2823, 2012.
[36] D. M. Chu and A. W. M. Smeulders, “Thirteen hard cases in visualtracking,” in IEEE International Conference on Advanced Video andSignal Based Surveillance, 2010.
[37] C. Jaynes, S. Webb, R. Steele, and Q. Xiong, “An open develop-ment environment for evaluation of video surveillance systems,”in PETS, 2002.
[38] R. Collins, X. Zhou, and S. K. Teh, “An open source trackingtestbed and evaluation web site,” in Perf. Eval. Track. and Surveil-lance, 2005.
[39] D. Doermann and D. Mihalcik, “Tools and techniques for videoperformance evaluation,” in Proc. Int. Conf. Pattern Recognition,2000, pp. 167–170.
[40] M. Everingham, L. Van Gool, C. K. I. Williams, J. Winn, andA. Zisserman, “The pascal visual object classes (voc) challenge,”Int. J. Comput. Vision, vol. 88, no. 2, pp. 303–338, Jun. 2010.
[41] Y. Bar-Shalom, X. R. Li, and T. Kirubarajan, Estimation withApplications to Tracking and Navigation. John Wiley & Sons, Inc.,2001, ch. 11, pp. 438–440.
[42] T. W. Anderson and D. A. Darling, “Asymptotic theory of certain‘goodness of fit’ criteria based on stochastic processes,” The Annalsof Mathematical Statistics, vol. 23, no. 2, pp. 193–212, 1952.
[43] J. Demsar, “Statistical comparisons of classifiers over multipledatasets,” Journal of Machine Learning Research, vol. 7, pp. 1–30,2006.
[44] ——, “On the appropriateness of statistical tests in machinelearning,” in Workshop on Evaluation Methods for Machine LearningICML, 2008.
[45] G. Nebehay and R. Pflugfelder, “Consensus-based matching andtracking of keypoints for object tracking,” in Winter Conference onApplications of Computer Vision. IEEE, Mar. 2014.
[46] M. E. Maresca and A. Petrosino, “Matrioska: A multi-level ap-proach to fast tracking by learning,” in Proc. Int. Conf. ImageAnalysis and Processing, 2013, pp. 419–428.
[47] T. Vojir and J. Matas, “Robustifying the flock of trackers,” in Comp.Vis. Winter Workshop. IEEE, 2011, pp. 91–97.
[48] K. Lebeda, R. Bowden, and J. Matas, “Long-term tracking throughfailure cases,” in Vis. Obj. Track. Challenge VOT2013, In conjunctionwith ICCV2013, 2013.
[49] S. Duffner and C. Garcia, “Pixeltrack: a fast adaptive algorithmfor tracking non-rigid objects,” in Proceedings of the InternationalConference on Computer Vision (ICCV), 2013, pp. 2480–2487.
[50] L. Cehovin, M. Kristan, and A. Leonardis, “Robust Visual Track-ing using an Adaptive Coupled-layer Visual Model,” IEEE Trans.Pattern Anal. Mach. Intell., vol. 35, no. 4, pp. 941–953, Apr. 2013.
[51] H. Nam, S. Hong, and B. Han, “Online graph-based tracking,” inTo appear in 2014 European Conference on Computer Vision ECCV,2014.
[52] Z. Cai, L. Wen, Z. Lei, N. Vasconcelos, and S. Li, “Robustdeformable and occluded object tracking with dynamic graph,”IEEE Transactions on Image Processing, vol. 23, no. 12, pp. 5497–5509, 2014.
[53] M. Maresca and A. Petrosino, “Clustering local motion estimatesfor robust and efficient object tracking,” in Proceedings of theWorkshop on Visual Object Tracking Challenge, European Conferenceon Computer Vision (ECCV), 2014.
[54] A. Adam, E. Rivlin, and I. Shimshoni, “Robust Fragments-basedTracking using the Integral Histogram,” in CVPR, vol. 1. IEEEComputer Society, Jun. 2006, pp. 798–805.
[55] M. Felsberg, “Enhanced distribution field tracking using channel

JOURNAL OF LATEX CLASS FILES, VOL. VV, NO. NN, MONTH YYYY 17
representations,” in Vis. Obj. Track. Challenge VOT2013, In conjunc-tion with ICCV2013, 2013.
[56] K. Ofjall and M. Felsberg, “Weighted update and comparison forchannel-based distribution field tracking,” in Proceedings of theWorkshop on Visual Object Tracking Challenge, European Conferenceon Computer Vision (ECCV), 2014.
[57] L. Sevilla-Lara and E. G. Learned-Miller, “Distribution fields fortracking,” in Comp. Vis. Patt. Recognition. IEEE, 2012, pp. 1910–1917.
[58] K. M. Yi, H. Jeong, S. W. Kim, and J. Y. Choi, “Visual tracking withdual modeling,” in Proceedings of the 27th Conference on Image andVision Computing New Zealand, IVCNZ 12, 2012, pp. 25–30.
[59] T. Vojir, J. Noskova, and J. Matas, “Robust scale-adaptive mean-shift for tracking,” Pattern Recognition Letters, 2014.
[60] M. Danelljan, F. S. Khan, M. Felsberg, and J. Van de Weijer,“Adaptive color attributes for real-time visual tracking,” in 2014Conference on Computer Vision and Pattern Recognition CVPR, 2014.
[61] F. Henriques, R. Caseiro, P. Martins, and J. Batista, “Exploitingthe circulant structure of tracking-by-detection with kernels,” in2012 European Conference on Computer Vision ECCV, 2012.
[62] K. Briechle and U. D. Hanebeck, “Template matching using fastnormalized cross correlation,” in Aerospace/Defense Sensing, Sim-ulation, and Controls, International Society for Optics and Photonics,2001, pp. 95–102.
[63] D. Comaniciu, V. Ramesh, and P. Meer, “Kernel-based objecttracking,” IEEE Trans. Pattern Anal. Mach. Intell., vol. 25, no. 5,pp. 564–577, 2003.
[64] K. Nummiaro, E. Koller-Meier, and L. Van Gool, “Color featuresfor tracking non-rigid objects,” Chinese J. Automation, vol. 29, no. 3,pp. 345–355, May 2003.
[65] P. Perez, C. Hue, J. Vermaak, and M. Gangnet, “Color-basedprobabilistic tracking,” in Proc. European Conf. Computer Vision,vol. 1, 2002, pp. 661–675.
[66] K. Zhang, L. Zhang, and M. H. Yang, “Real-time compressivetracking,” in Proc. European Conf. Computer Vision, ser. LectureNotes in Computer Science. Springer, 2012, pp. 864–877.
[67] D. Comaniciu and P. Meer, “Mean shift: A robust approachtoward feature space analysis,” IEEE Trans. Pattern Anal. Mach.Intell., vol. 24, no. 5, pp. 603–619, 2002.
[68] S. Duffner and C. Garcia, “Exploiting contextual motion cues forvisual object tracking,” in Proceedings of the Workshop on VisualObject Tracking Challenge, European Conference on Computer Vision(ECCV), 2014, pp. 1–12.
[69] S. Hare, A. Saffari, and P. H. S. Torr, “Struck: Structured out-put tracking with kernels,” in Int. Conf. Computer Vision, D. N.Metaxas, L. Quan, A. Sanfeliu, and L. J. V. Gool, Eds. IEEE,2011, pp. 263–270.
[70] J. F. Henriques, R. Caseiro, P. Martins, and J. Batista, “High-speedtracking with kernelized correlation filters,” IEEE Trans. PatternAnal. Mach. Intell., vol. 1, no. 3, pp. 125–141, 2014.
[71] M. Danelljan, G. Hager, F. S. Khan, and M. Felsberg, “Accuratescale estimation for robust visual tracking,” in Proceedings of theBritish Machine Vision Conference BMVC, 2014.
[72] L. Yang and Z. Jianke, “A scale adaptive kernel correlation filtertracker with feature integration,” in Proceedings of the Workshop onVisual Object Tracking Challenge, European Conference on ComputerVision (ECCV), 2014.
[73] M. Kristan, J. Pers, M. Perse, and S. Kovacic, “Bayes spectralentropy-based measure of camera focus,” in Computer VisionWinter Workshop, February 2005, pp. 155–164.
[74] B. J. Frey and D. Dueck, “Clustering by passing messages betweendata points,” Science, vol. 315, pp. 972–976, 2007.
[75] D. S. Bolme, J. R. Beveridge, B. A. Draper, and Y. M. Lui, “Visualobject tracking using adaptive correlation filters,” in Comp. Vis.Patt. Recognition, 2010.
[76] N. Dalal and B. Triggs, “Histograms of oriented gradients forhuman detection,” in Comp. Vis. Patt. Recognition, vol. 1, June 2005,pp. 886–893.
[77] A. Torralba and A. A. Efros, “Unbiased look at dataset bias,” inComp. Vis. Patt. Recognition. IEEE, 2011, pp. 1521–1528.
Matej Kristan received a Ph.D from the Facultyof Electrical Engineering, University of Ljubljanain 2008. He is an Assistant Professor at theViCoS Laboratory at the Faculty of Computerand Information Science and at the Faculty ofElectrical Engineering, University of Ljubljana.His research interests include probabilistic meth-ods for computer vision with focus on visualtracking, dynamic models, online learning, ob-ject detection and vision for mobile robotics.
Jiri Matas is a Professor at the Center for Ma-chine Perception, Faculty of Electrical Engineer-ing at the Czech Technical University in Prague,Czech Republic. He is author or co-author ofmore than 250 papers in the area of ComputerVision and Machine Learning. His research in-terests include object recognition, image re-trieval, tracking, sequential pattern recognition,invariant feature detection and Hough Transformand RANSAC-type optimization.
Ales Leonardis is a Professor at the Schoolof Computer Science, University of Birminghamand co-Director of the Centre for ComputationalNeuroscience and Cognitive Robotics. He is aprofessor at the FCIS, University of Ljubljanaand adjunct professor at the FCS, TU-Graz. Hisresearch interests include robust and adaptivemethods for computer vision, object and scenerecognition and categorization, statistical visuallearning, 3D object modeling, and biologicallymotivated vision.
Tomas Vojır received a Master degree at theCenter for Machine Perception, Faculty of Elec-trical Engineering at the Czech Technical Univer-sity in Prague in 2010 and is currently pursuinghis PhD at the same faculty. His research inter-ests are computer vision with focus in real-timevisual object tracking.
Roman Pflugfelder received his Ph.D. degreeat the Institute of Computer Graphics at GrazUniversity of Technology in 2008. Currently, DrPflugfelder is scientist and project leader at theAustrian Institute of Technology. His researchinterests lie in object tracking and camera auto-calibration for video surveillance.
Gustavo Fernandez is scientist at the Videoand Security Technology Group, Austrian Insti-tute of Technology. He obtained his master de-gree from the University of Buenos Aires (Ar-gentina) in 2000 and his PhD from Graz Uni-versity of Technology (Austria) in 2004. Since2005 he is at the Austrian Institute of Technologydoing research in the area of Computer Vision.His research interests are both theory and appli-cations of object detection, object tracking andcognitive systems.
JOURNAL OF LATEX CLASS FILES, VOL. VV, NO. NN, MONTH YYYY 18
Georg Nebehay received his Master Degree inComputer Science in 2011 from Vienna Univer-sity of Technoogy, Austria. He is currently PhDstudent at the Austrian Institute of Technology.His research interests are tracking and videosurveillance.
Fatih Porikli is a Professor at the AustralianNational University in Canberra. Previously, Pro-fessor Porikli was a Distinguished ResearchScientist at Mitsubishi Electric Research Labs(MERL). He received his PhD degree, with spe-cialization in video object segmentation, fromNYU Poly, USA. He has authored more than 100publications and invented more than 60 patents.His work covers areas including computer vision,machine learning, video surveillance, multime-dia processing among others.
Luka Cehovin received his Dipl.ing. and M.Sc.degree at the Faculty of Computer Science andInformatics, University of Ljubljana, Slovenia in2007 and 2010, respectively. Currently he isworking at the Visual Cognitive Systems Labo-ratory, Faculty of Computer Science and Infor-matics, University of Ljubljana, Slovenia as anassistant and a researcher. His research inter-ests include computer vision, HCI, distributedintelligence and web-mobile technologies.