A nonlinear two-dimensional model of blood flow in an overlapping arterial stenosis subjected to...
16
Pergamon Mathl. Comput. Modelling Vol. 24, No. 1, pp. 43-58, 1996 Copyright@1996 Elsevier Science Ltd Printed in Great Britain. All rights reserved SO8957177(96)00079-9 08957177/96 $15.00 + 0.00 A Nonlinear Two-Dimensional Model of Blood Flow in an Overlapping Arterial Stenosis Subjected to Body Acceleration S. CHAKRAVARTY AND P. K. MANDAL Department of Mathematics, Visva-Bharati University Santiniketan 731 235, India (Received February 1994; revised and accepted August 1995) Abstract-This paper presents a theoretical study on the nonlinear behaviour of blood flow over a single cardiac cycle through an arterial segment having an overlapping stenosis when it is subjected to whole body acceleration. An improved shape of the time-variant stenosis in the realm of the formation of the arterial narrowing caused by atheroma is constructed mathematically in order to update resemblance to the in-wawo situation. The artery has been treated ss an elastic (moving wall) cylindrical tube containing a Newtonian fluid representing the flowing blood. The nonlinear terms appearing in the Navier-Stokes equations governing blood flow are accounted for. The unsteady flow mechanism in the stenosed artery subject to pulsatile pressure gradient arising from the normal functioning of the heart and the body szceleration is presented mathematically. The present analytical treatment bears the potential to calculate the axial and the radial velocity profiles with low computational complexity by exploiting the appropriate boundary conditions. A thorough quantitative analysis is performed through numerical computations of the desired quantities. Results are presented graphically at the end of the paper. They yield an estimate of the effects of the body acceleration, the pressure gradient, the vessel wall deformability and the severity of the stenosis on the unsteady flow characteristics of blood. Some important conclusions are drawn that sufficiently substantiate the applicability of the present model. Keywords-Nonlinear, Overlapping stenosis, Body acceleration, Single cardiac cycle, Atheroma. 1. INTRODUCTION In the recent past, several theoretical and experimental investigations pertaining to blood flow through arteries under stenotic conditions have been carried out, with a variety of considerations in the realm of arterial biomechanics. Although the root cause for the initiation of a stenosis in the arterial lumen is not completely clear, it is quite apparent that the presence of a stenosis can lead to serious circulatory disorders. The arterial constriction hampers the normal movement of blood, and the transport of blood to the region beyond such constriction is reduced consid- erably. In order to have a complete understanding of the development of the stenosis from the physiological point of view one needs to be fully conversant with the haemodynamic behaviour of the streaming blood together with the mechanical properties of the vascular wall material under physiological conditions. In general, the transport of blood in the circulatory system depends The authors are grateful to the Council of Scientific and Industrial hearch for providing financial assistance during the present work. The authors do appreciate the help and cooperation from Mr. Sunu, Engineer of Physics Department (Visva- Bharati). 43
-
Upload
independent -
Category
Documents
-
view
1 -
download
0
Transcript of A nonlinear two-dimensional model of blood flow in an overlapping arterial stenosis subjected to...

Pergamon Mathl. Comput. Modelling Vol. 24, No. 1, pp. 43-58, 1996
Copyright@1996 Elsevier Science Ltd Printed in Great Britain. All rights reserved
SO8957177(96)00079-9 08957177/96 $15.00 + 0.00
A Nonlinear Two-Dimensional Model of Blood Flow in an
Overlapping Arterial Stenosis Subjected to Body Acceleration
S. CHAKRAVARTY AND P. K. MANDAL Department of Mathematics, Visva-Bharati University
Santiniketan 731 235, India
(Received February 1994; revised and accepted August 1995)
Abstract-This paper presents a theoretical study on the nonlinear behaviour of blood flow over a single cardiac cycle through an arterial segment having an overlapping stenosis when it is subjected to whole body acceleration. An improved shape of the time-variant stenosis in the realm of the formation of the arterial narrowing caused by atheroma is constructed mathematically in order to update resemblance to the in-wawo situation. The artery has been treated ss an elastic (moving wall) cylindrical tube containing a Newtonian fluid representing the flowing blood. The nonlinear terms appearing in the Navier-Stokes equations governing blood flow are accounted for. The unsteady flow mechanism in the stenosed artery subject to pulsatile pressure gradient arising from the normal functioning of the heart and the body szceleration is presented mathematically. The present analytical treatment bears the potential to calculate the axial and the radial velocity profiles with low computational complexity by exploiting the appropriate boundary conditions. A thorough quantitative analysis is performed through numerical computations of the desired quantities. Results are presented graphically at the end of the paper. They yield an estimate of the effects of the body acceleration, the pressure gradient, the vessel wall deformability and the severity of the stenosis on the unsteady flow characteristics of blood. Some important conclusions are drawn that sufficiently substantiate the applicability of the present model.
Keywords-Nonlinear, Overlapping stenosis, Body acceleration, Single cardiac cycle, Atheroma.
1. INTRODUCTION
In the recent past, several theoretical and experimental investigations pertaining to blood flow
through arteries under stenotic conditions have been carried out, with a variety of considerations
in the realm of arterial biomechanics. Although the root cause for the initiation of a stenosis in
the arterial lumen is not completely clear, it is quite apparent that the presence of a stenosis can
lead to serious circulatory disorders. The arterial constriction hampers the normal movement
of blood, and the transport of blood to the region beyond such constriction is reduced consid-
erably. In order to have a complete understanding of the development of the stenosis from the
physiological point of view one needs to be fully conversant with the haemodynamic behaviour of
the streaming blood together with the mechanical properties of the vascular wall material under
physiological conditions. In general, the transport of blood in the circulatory system depends
The authors are grateful to the Council of Scientific and Industrial hearch for providing financial assistance during the present work. The authors do appreciate the help and cooperation from Mr. Sunu, Engineer of Physics Department (Visva- Bharati).
43

44 S. CHAKFLWARTY AND P. K. MANDAL
entirely on the pumping action of the heart producing a pressure gradient throughout the arterial
system. However, it is not uncommon that humans experience rather large whole body acceler- ations. Such situations arise while riding in a vehicle or while flying in a spacecraft. External
accelerations of considerable amplitudes imparted to the human body can cause serious problems
in the cardiovascular system leading to the impairment of certain physiological functions.
To understand the effects of a single mild stenosis present in the arterial lumen, a good number
of studies (cf. [l-S]) on the blood flow through stenosed arteries have been performed. All these
studies were made with the assumption that the flowing blood is Newtonian and the geometry of
the stenosis is a smooth cosine function. Blood exhibits a non-Newtonian behaviour at low shear
rates in tubes of smaller diameters, but at high shear rates, commonly found in larger arteries
(above 1 mm in diameter), blood behaves like a Newtonian fluid as reported by Taylor [7]. In most
of the recent literature about stenotic flow in either a rigid tube or a flexible artery, the stenotic
geometry has been regarded as time-independent. Such a consideration may suit well for a rigid
vessel but for a flexible vessel wall, the stenosis cannot remain static. Moreover, the problem
becomes more acute in the presence of an overlapping stenosis in the arterial lumen instead of
having a single (mild) stenosis as considered by aforesaid researchers. A consistent mathematical
model for the unsteady flow of blood through an overlapping arterial stenosis was put forward
first by the present authors [8] in which the streaming blood was treated as a viscoelastic fluid
and the flow was considered only in the axial direction.
Moreover, most of the earlier investigations related to blood flow were based on the use of the
linearized Navier-Stokes equations. This may suit well for explaining some aspects of haemody-
namic flow in smaller arteries but for larger arteries, consideration of the nonlinear terms in the
Navier-Stokes equations governing the flow of blood becomes indispensable. These terms may be
disregarded in a one-dimensional blood flow hypothesis but they are not at all negligible for two-
dimensional flow in larger arteries which are known to have large dynamic storage effects. The
nonlinear velocity profiles of the pulsatile flow of blood through the descending aorta have been
investigated by Ling and Atabek [9] and Imaeda and Goodman [lo] by considering the artery as
a uniformly tapered thick cylindrical tube of isotropic and incompressible material. Nonlinear
mathematical models, in particular, allow a much better evaluation of the mean flow and the
mean pressure drop than the linear models as pointed out by O’Rourke and Milnor [ll] and
Fry [12], from their experimental observations. Furthermore, the studies mentioned above have
totally disregarded any effect of the whole body accelerations, and hence, attention has only been
centered on the flow characteristics of blood under normal functioning of the heart. But when
the constricted arteries are subjected to body accelerations, the problem becomes complicated
from the physiological point of view and certainly deserves attention for simulation. Considerable
efforts to study whole body accelerations on human subjects have already been made through a
number of experiments performed by Hiatt et al. [13], Verdouw et al. [14], Arntzenius et al. [15],
and Burton et al. [16]. An attempt is made in the present theoretical investigation to evaluate some of the important
characteristics of the nonlinear blood flow past an overlapping arterial stenosis constrained with
the pulsatile pressure gradient and a single cycle of body acceleration. This study considers the
arterial segment to be an elastic cylindrical tube and blood flowing through it to be Newtonian.
Attention is paid to the effects of wall motion on local fluid mechanics but not on the stresses and strains in the arterial wall, although in the general problem such as this they are of great
concern. The time-variant geometry of the overlapping stenosis has been accounted for in order to improve resemblance to the in tivo situation. The body acceleration expressible in terms of unit step functions is such that it builds up from zero to a maximum value at a uniform rate,
remains constant there for some time and thereafter drops down to zero at a uniform rate. The cylindrical coordinate system has been taken for analytical formulation. The present theory
includes an original expression of axial and radial velocity profiles which are expressed as a power series of the radial coordinate. The accuracy of the approximation can easily be improved just

A Nonliiear Two-Dimensional Model 45
by increasing the number of terms of the series. A thorough quantitative analysis is performed through a large scale numerical computation of the desired quantities presented graphically at the end of the paper with a complete discussion in order to address the question whether the body acceleration, the pressure gradient, the time-variant stenosis and the movement of the vessel wall bear the potential to influence si~~cantly the nonlinear flow characteristics of blood in the vicinity of an overlapping stenosis developed in an artery.
2. FORMULATION OF THE PROBLEM
The stenosed arterial segment under consideration is modelled as a thin elastic cylindrical tube containing an incompre~ible Newtonian &rid representing blood. Let (r, 8, .z) be the coordinates of a material point in the cylindrical polar coordinates system where the z-axis is taken along the axis of the artery while T, 0 are taken along the radial and the circumferential directions, respectively. The geometry of the time-variant overlapping stenosis (cf. Figure 1) is described mathematically as
i
plojl-~{32 z S( R(z,=
- dfzg - $z - d)2zg + (z - d)%J - i(z - d)“}] , a d~z~d+;zrJ, (l)
i 41(% otherwise,
where R(z,t) denotes the radius of the arterial segment in the stenotic region, a the constant radius of the artery in the nonstenotic region, and 3Zc/2 the length of the stenosis. Here, T, the critical height of the stenosis, such that the ratio rm/a << 1, appears at two specific locations, i.e., z = d f lo/2 and z = d + 1 0. The height of the stenosis at a distance of d + 32014 from the
origin is (3/4)7,. The time dependent function al(t) is given by
Q(t) = 1 + 3 coswt - I),
in which w represents the angular frequency and T designates the time parameter. In the present simulation the generic time t is assumed to be small (one cardiac period) in comp~ison with T, else the amplitude of the motion of the wall will be too large. Also, the relative height of the stenosis varies constantly with time. The arterial segment under consideration is taken to be of finite length L. One can also explore the possibility of having a rigid stenosed artery which can be derived from (1) and (2) d irectly as noted in the Appendix.
AZ. w.<*.<.----V Ul-.s_._._. ---- _-m-s . ..--h..-,, Y_
n zI__--_- .--_-._.““---. -----~-.- L ----. -----_I. ,--- ---. ____.-_____--__-_.$.
Figure 1. The geometry of the overlapping stenosis in an artery.
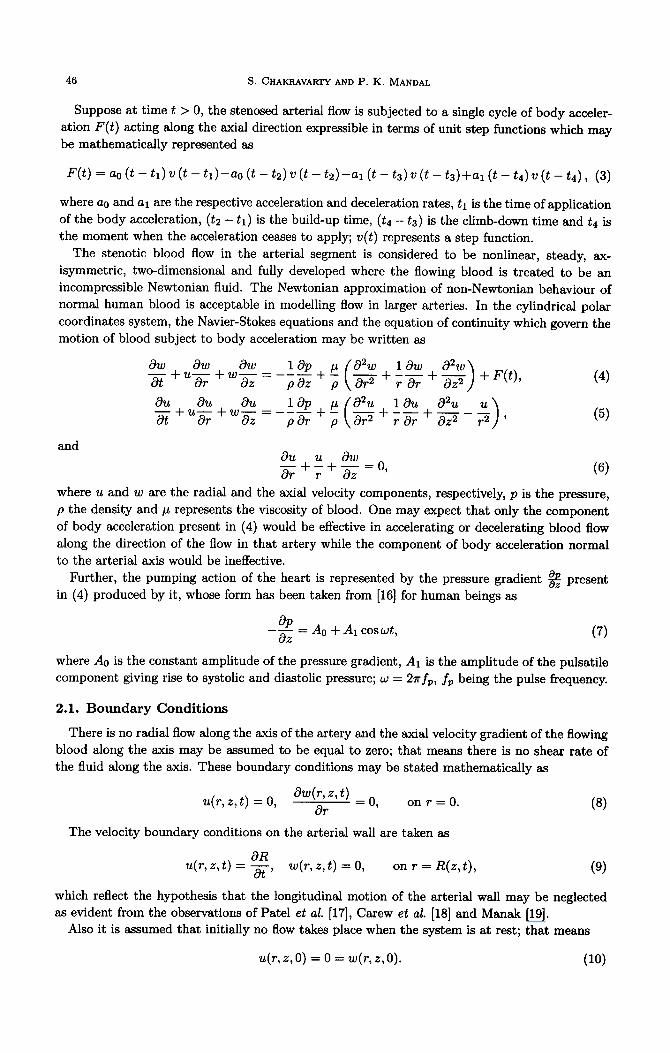
46 S. CHAKRAVARTYAND P. K. MANDAL
Suppose at time t > 0, the stenosed arterial flow is subjected to a single cycle of body acceler-
ation F(t) acting along the axial direction expressible in terms of unit step functions which may
be mathematically represented as
F(t) = a0 (t - t1) 21 (t - tl)-ao (t - tz) 2, (t - ta)-al (t - t3) 21 (t - t3)+al (t - t4) 2) (t - t4) ) (3)
where ac and al are the respective acceleration and deceleration rates, tl is the time of application
of the body acceleration, (tz - tl) is the build-up time, (t4 - t3) is the climb-down time and t4 is
the moment when the acceleration ceases to apply; v(t) represents a step function.
The stenotic blood flow in the arterial segment is considered to be nonlinear, steady, ax-
isymmetric, two-dimensional and fully developed where the flowing blood is treated to be an
incompressible Newtonian fluid. The Newtonian approximation of non-Newtonian behaviour of
normal human blood is acceptable in modelling flow in larger arteries. In the cylindrical polar
coordinates system, the Navier-Stokes equations and the equation of continuity which govern the
motion of blood subject to body acceleration may be written as
dW -.-f”$+“~=-lap p a2w Paz +p ( 1 aw d2W
dr2+;ar+ a9 - +JTt), >
6h.L at+ug+wg=_lap P al-
+‘I “‘“+;g+?& ) ( p dr2 > and
E+;+$o, (6) where u and w are the radial and the axial velocity components, respectively, p is the pressure,
p the density and p represents the viscosity of blood. One may expect that only the component
of body acceleration present in (4) would be effective in accelerating or decelerating blood flow
along the direction of the flow in that artery while the component of body acceleration normal
to the arterial axis would be ineffective.
Further, the pumping action of the heart is represented by the pressure gradient $$ present
in (4) produced by it, whose form has been taken from [16] for human beings as
-$ = A0 + Al coswt,
where Ao is the constant amplitude of the pressure gradient, Al is the amplitude of the pulsatile
component giving rise to systolic and diastolic pressure; w = 27rfp, fr, being the pulse frequency.
2.1. Boundary Conditions
There is no radial flow along the axis of the artery and the axial velocity gradient of the flowing
blood along the axis may be assumed to be equal to zero; that means there is no shear rate of the fluid along the axis. These boundary conditions may be stated mathematically as
U(T, z, t) = 0, awcr, 2, t> = o
ar ’ on r = 0.
The velocity boundary conditions on the arterial wall are taken as
u(T,Z,t) = g, W(T, 2, t) = 0, on r = R(z, t), (9)
which reflect the hypothesis that the longitudinal motion of the arterial wall may be neglected
as evident from the observations of Pate1 et al. [17], Carew et al. [18] and Manak [19]. Also it is assumed that initially no flow takes place when the system is at rest; that means
u(r, Z, 0) = 0 = w(r, Z, 0). (10)

A Nonlinear Two-Dimensional Model 47
3. METHOD OF SOLUTION
Usually in a problem involving coupling of the fluid mechanics with the vessel wall mechanics,
R(z, t) would not be given but instead, could be computed as a part of the solution of the coupled
problem. Here R(z,t) is known explicitly, and hence, we focus our attention on haemodynamic
factors only. We introduce a radial coordinate transformation, given by
t = &)’ (11)
which has the effect of immobilising the arterial wall in the transformed coordinate <.
Using this transformation, the equations of motion (4)-(6) g overning blood flow together with
the prescribed conditions (8)-(10) take the following form:
with
and
u(5,z7 0) = 0 = w(5, z, O),
where u = u(<, z, t) and w = w(<, z, t).
Multiplying (14) by (R and integrating with respect to [, one finds
Using the boundary conditions (16) in (18) one arrives at the following relation:
in which f(E) represents an arbitrary function satisfying
s 1
5f(O& = 1. 0
(12)
(13)
(14)
(15)
(16)
(17)
(18)
(19)
(20)
Making use of the approximate equivalence of integrals and integrands, one gets from (19)
(21)
Further, the function f(t) must satisfy the condition f(1) = 0 since g = 0 on 6 = 1. Let us express f(c) by a power series of < truncated to finite order as
f(t) = 2 & (t2k - 1) 3 (22) k=l

48 S. CHAKFLWARTY AND P. K. MANDAL
which satisfies the condition f(1) = 0 and the coefficient Ak can be directly obtained by making
use of (20) as
(23)
Replacing f(t) by this power series, the equation (21) becomes
(24)
The expression of radial velocity component can thus be obtained from (18) with the use of (24)
as
2L(E, 2, r) =
The axial velocity component may be given by the following polynomial form:
N
W(<, z,t> = zak(&t) (tzk - 1) 7
k=l
satisfying the above-mentioned boundary conditions.
Incorporating (26) into (25) one gets
(25)
(26)
(27)
We introduce (24), (26), and (27) into (12) so that the latter reduces to
~~(<%-_1,-“1” N k=l
R N dt c (pl,k + <2Nsl,k) tzk + $-1 + ; 5 (fi,k + tzNS2d tzk k=l k=l
which may be written in a more compact form as
N
tzN 2 skc2" + &kEZk - g 2 + = 0, P-9 k=l
- 3 2 k2ak,$2k-2 + ;g - F(t) = 0, (28) k=l
where
Sk = ;s,,k - ;$g&,k, k=1,2,3 ,..., N, (30)
1 b’R &&---P&k
N dt - -$k + l)‘ak+l, k=1,2,3 ,..., N, (31)
with QN+r = 0, while S&k, R&k, Sl,k, Rr,k and Tl have got their expressions included in the Appendix. The above relation (29) has to be satisfied for any .$, and hence, all the coefficients of
various powers of c may be assumed to be zero, so that we have
+-+,-;z+F(t)-;Tl=O, (32)
pk =o, k=1,2,3 ,..., N, (33)
A Nonlinear Two-Dimensional Model
and
& =O, k=1,2,3 ,..., N.
In order to avoid the terms containing c power 2N and above, we need to disregard Sk (k =
1,2,3, . . . , N) and Pk for k = N only from (29). Thus, a system of (2N+ 1) equations represented
by (32)-(34) is reduced to the following system of N equations comprising of (32) and (33)
excepting (PN = 0) involving N state variables ok (k = 1,2,3,. . . , N), given by
ask
dt= ;+$pl,k - -$,k + +(k + 1)2%+1, k=1,2,3 ,..., N-l, (35)
8CrN N-1 dak -=- --
at c k=l
at -$o, + $2 + $1 - F(t). (36)
Introducing (35) into (36) one gets
N
p2,$ - ;;g Ncp,,, - -+ c k2ak + ;TI + ;$ - F(t). (37) k=l k=l
The equations (35) and (37) represent a dynamic system with state variables ok. Once they
are solved for (Yk (k = 1,2,3, . . . , N) with the use of initial conditions that ok = 0 at t = 0
for all k together with the pressure gradient and the body acceleration as prescribed in (7)
and (3), respectively, the velocity components of the streaming blood can be determined from
(26) and (27). Although the equation (13) does not come into play explicitly in the aforesaid
analysis, the present solution is found to satisfy it, in the sense that the error involved in it is
within the required tolerance.
After having obtained the velocity components of blood, one can determine the volumetric flow
rate (Q), the resistive impedance (X) and the wall shear stress (7-rz) from the following relations:
J R(G)
Q = 21r 0
rwdr =-?r~2(z,t)~ak(r,t)&, k=l
(3%
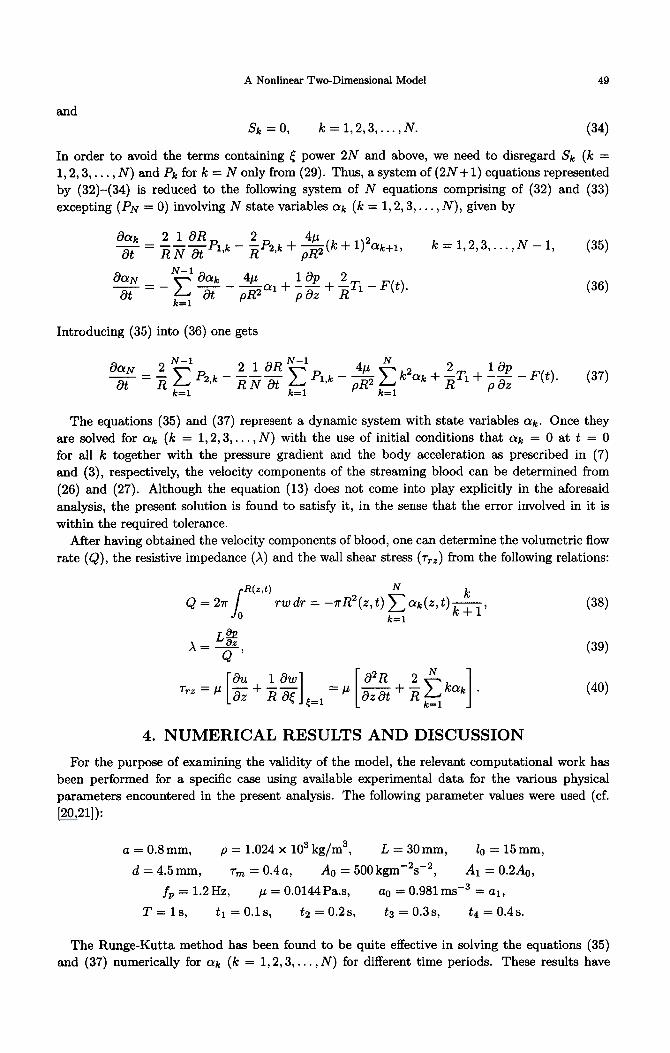
4. NUMERICAL RESULTS AND DISCUSSION
For the purpose of examining the validity of the model, the relevant computational work has
been performed for a specific case using available experimental data for the various physical
parameters encountered in the present analysis. The following parameter values were used (cf.
[20,21]):
a = 0.8 mm, p = 1.024 x lo3 kg/m3, L=30mm, lo = 15mm,
d = 4.5 mm, rm = 0.4 a, A0 = 500 kgmB2sm2, A1 = 0.2Ao,
fp = 1.2Hz, p = 0.0144 Pa.s, a0 = 0.981 msm3 = al,
T=ls, t1 = 0.1s t2 = 0.2s t3 = 0.3s, t4 = 0.4s.
The Runge-Kutta method has been found to be quite effective in solving the equations (35) and (37) numerically for (Yk (k = 1,2,3, . . . , N) for different time periods. These results have
50
0.6
0.2
S. CHAKRAVARTY AND P. K. MANDAL -~~--~~~-..__...______
./ .____.._ _T.---‘-‘-- ..r_-. . _._._ ..,. _.._ --.,--_ ._.._.. r...-_.‘_-_’
0 5 10 15 20 25 : z (mm)
I
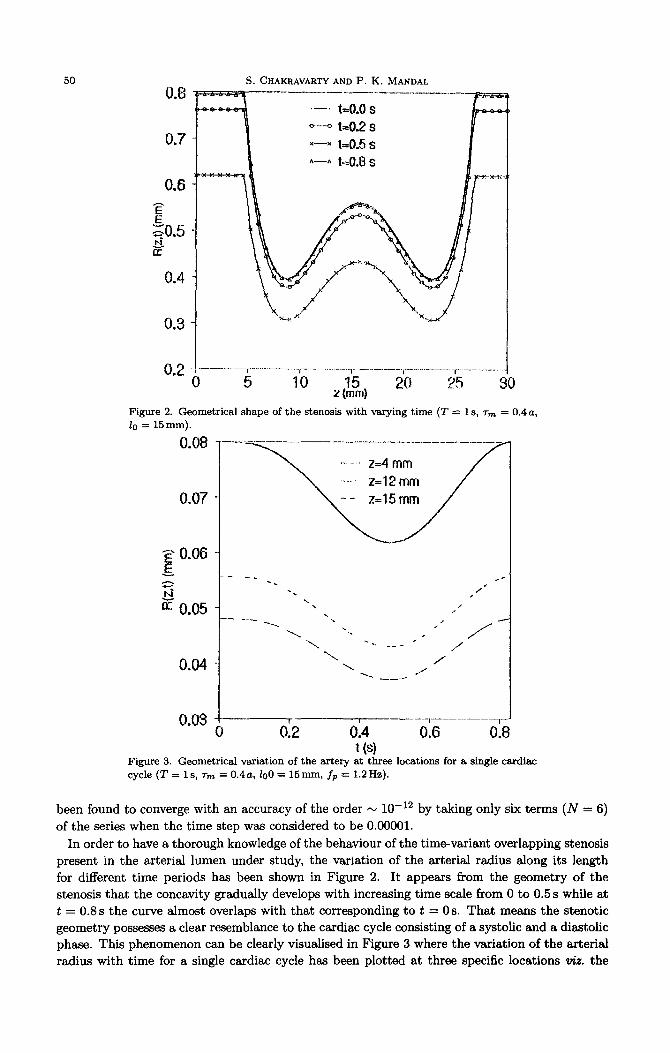
Figure 2. Geometrical shape of the stenosis with varying time (T = 1 s, TV = 0.4 a, lo = 15 mm).
0.08
jj~ 0.06 !E z
fz 0.05
0.04
0.03 -I I I _~~~_~~~~~~~~~~_ 0 52 0.4 0.6 0.8
Figure 3. Geometrical variation of the artery at three locations for a single cardisc
cycle (T = 1 s, 7m = 0.4a, lo0 = 15nm-1, fp = 1.2Hz).
been found to converge with an accuracy of the order N lo-r2 by taking only six terms (N = 6)
of the series when the time step was considered to be 0.00001.
In order to have a thorough knowledge of the behaviour of the time-variant overlapping stenosis
present in the arterial lumen under study, the variation of the arterial radius along its length
for different time periods has been shown in Figure 2. It appears from the geometry of the
stenosis that the concavity gradually develops with increasing time scale from 0 to 0.5 s while at
t = 0.8 s the curve almost overlaps with that corresponding to t = 0 s. That means the stenotic
geometry possesses a clear resemblance to the cardiac cycle consisting of a systolic and a diastolic
phase. This phenomenon can be clearly visualised in Figure 3 where the variation of the arterial
radius with time for a single cardiac cycle has been plotted at three specific locations tiz. the

A Nonlinear Two-Dimensional Model 51
nonconstricted site (z = 4mm), the constricted site (z = 12 mm) and the overlapping region
(z = 15mm). At all the sites, the respective arterial radii remain same for both the onset (t = 0)
of the systolic phase and the offset (t = 0.83s) of the diastolic phase in a single pulse cycle.
6
5
4
P 13 z
2
1
.-’ wilhF(l) o--o without F(1) x----x normal atlfxy
0 +-----------~--- --__--____.-.-.--T.‘-.__.~
0 0.2 0.4 0.6 0.3 1 F
Figure 4. Axial velocity profile of the sten&d artery at t = 0.25s (z = 12mm, 7m = 0.4 a).
0
-0.2
5? E
=-0.4
-0.6
.-. with F(t) o-----o wilhoul F(t) x---x normal artery
t_----___..i--____.---__.-r---__-___-__r.____-______,_____ ___./
0 0.2 0.4 t 0.6 0.8 1 Figure 5. Radial velocity profile of the stenosed artery at t = 0.25s (.z = 12mm, 7m = 0.4a).
Figure 4 illustrates the results for the axial velocity profile of the streaming blood at a specific location of z = 12 mm in the constricted region of the artery at an instant of t = 0.25 s consisting
of four different curves with distinguishable marks. All the curves are found to be decreasing from their maxima at the axis as one moves away from it and finally drop to zero on the wall
surface. One may note that the decreasing rate of the axial velocity appears to be higher in the case of a normal artery than that for constricted arteries with or without the presence of
52 S. CHAKRAVARTY AND P. K. MANDAL
body acceleration. The flow velocity enhances in the absence of stenosis and the deviation of the results as observed from the first and the third curves (from the top) clearly estimates the effects
of the overlapping stenosis on the axial velocity profile. Also, the presence of body acceleration
causes the velocity of blood to increase appreciably, and thus, its effect on the flow velocity can
be quantified through the numerical comparison between the bottom two curves. The vessel wall
deformability also bears the potential to contribute significantly to the flow behaviour in the
presence of stenosis, as evident from the results of the present figure.
Unlike the nature of the axial flow velocity, the results of the radial velocity component varying
radially presented in Figure 5 are found to be negative except for the rigid vessel wall where they
appear to increase from zero velocity on the axis followed by a slight decrease towards the wall
surface. Here, the presence of external body acceleration does not affect much the radial flow
velocity as observed from two overlapping curves of the present figure, but the effect of the
overlapping stenosis on it is considerably pronounced. Hence, presence of stenosis and rigidity of
the wall clearly affect the radial velocity of the flow.
2.5
2
$5
2 3
1
05
------
‘-. 1zo.15 s
- t-o.25 s x-----x 1=0.25 s (F(l)=O.O)
_~_~______~_~__~._~~~~.~~__~~.'~.~~.~.~‘~~~~
0 5 10 15 20 2.5 30 z (mm)
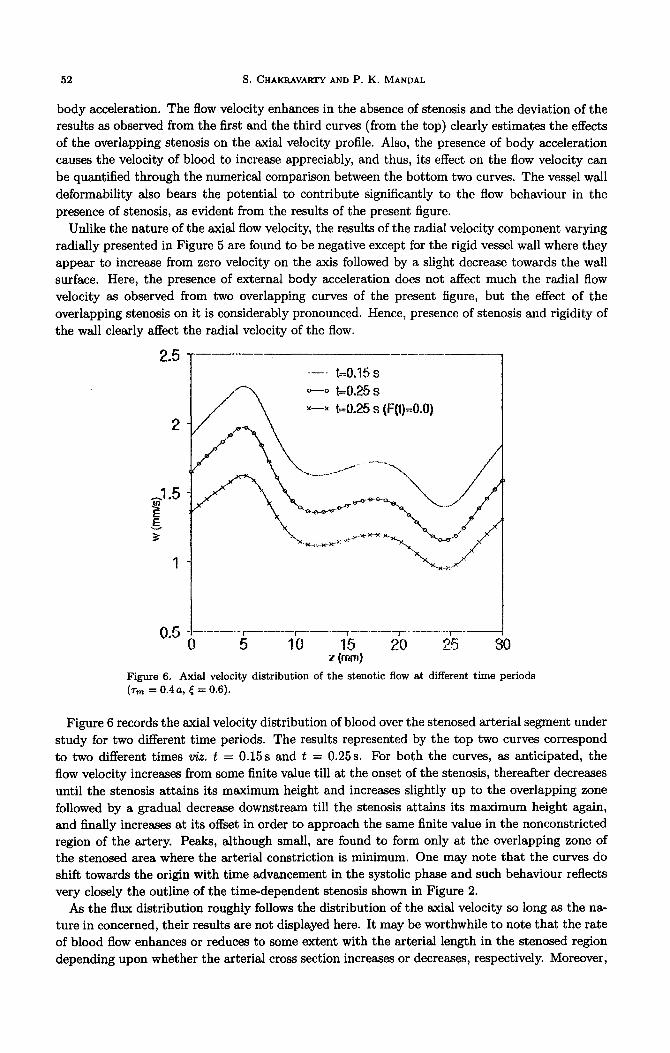
Figure 6. Axial velocity distribution of the stenotic flow at different time periods (TV = 0.4a, < = 0.6).
Figure 6 records the axial velocity distribution of blood over the stenosed arterial segment under
study for two different time periods. The results represented by the top two curves correspond
to two different times viz. t = 0.15s and t = 0.25s. For both the curves, as anticipated, the
flow velocity increases from some finite value till at the onset of the stenosis, thereafter decreases
until the stenosis attains its maximum height and increases slightly up to the overlapping zone
followed by a gradual decrease downstream till the stenosis attains its maximum height again,
and finally increases at its offset in order to approach the same finite value in the nonconstricted region of the artery. Peaks, although small, are found to form only at the overlapping zone of the stenosed area where the arterial constriction is minimum. One may note that the curves do
shift towards the origin with time advancement in the systolic phase and such behaviour reflects very closely the outline of the time-dependent stenosis shown in Figure 2.
As the flux distribution roughly follows the distribution of the axial velocity so long as the na-
ture in concerned, their results are not displayed here. It may be worthwhile to note that the rate of blood flow enhances or reduces to some extent with the arterial length in the stenosed region
depending upon whether the arterial cross section increases or decreases, respectively. Moreover,
A Nonlinear Two-Dimensional Model 53
the flow rate has also been found to be inversely proportional to the resistive impedances arising
out of the stenotic flow under physiological conditions.
0.25 _.--..- I
.-----__
0.1
‘-. 1=0.15 s o---o 1=025 s x--.--x 1=0.25 s (F(t)=O_O)
0.05 _f7__‘__._,_.. - “__. ---.-.
10 15 20 25 : 2 (rilm)
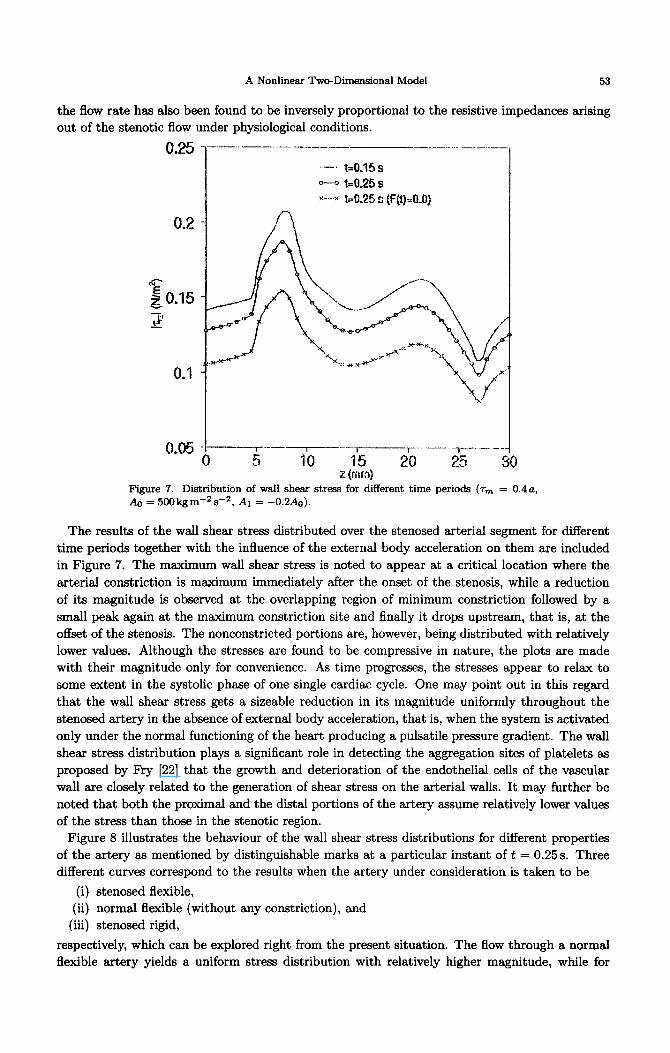
Figure 7. Distribution of wall shear stress for different time periods (TV = 0.4a, & = 500kgm-2s-2, A1 = -0.2Ao).
The results of the wall shear stress distributed over the stenosed arterial segment for different
time periods together with the influence of the external body acceleration on them are included
in Figure 7. The maximum wall shear stress is noted to appear at a critical location where the
arterial constriction is maximum immediately after the onset of the stenosis, while a reduction
of its magnitude is observed at the overlapping region of minimum constriction followed by a
small peak again at the maximum constriction site and finally it drops upstream, that is, at the offset of the stenosis. The nonconstricted portions are, however, being distributed with relatively
lower values. Although the stresses are found to be compressive in nature, the plots are made with their magnitude only for convenience. As time progresses, the stresses appear to relax to
some extent in the systolic phase of one single cardiac cycle. One may point out in this regard
that the wall shear stress gets a sizeable reduction in its magnitude uniformly throughout the
stenosed artery in the absence of external body acceleration, that is, when the system is activated
only under the normal functioning of the heart producing a pulsatile pressure gradient. The wall
shear stress distribution plays a significant role in detecting the aggregation sites of platelets as
proposed by Fry [22] that the growth and deterioration of the endothelial cells of the vascular
wall are closely related to the generation of shear stress on the arterial walls. It may further be
noted that both the proximal and the distal portions of the artery assume relatively lower values
of the stress than those in the stenotic region. Figure 8 illustrates the behaviour of the wall shear stress distributions for different properties
of the artery as mentioned by distinguishable marks at a particular instant of t = 0.25s. Three different curves correspond to the results when the artery under consideration is taken to be
(i) stenosed flexible,
(ii) normal flexible (without any constriction), and
(iii) &nosed rigid,
respectively, which can be explored right from the present situation. The flow through a normal flexible artery yields a uniform stress distribution with relatively higher magnitude, while for

54 S. CHAKFLAVARTYAND P.K. MANDAL
--- stenosed ilexible artery o- .-Q normal ilexible artery x--x s&nosed rigid artery
O."b_- 10 1 15 I 20 ,-------I--- 25 --- : z (mm)
Figure 8. Distribution of wall shear stress for different shape of the artery at t = 0.25 s (Tm = 0.4 a).
all other arteries an almost similar trend is observed in their respective distributions differing
in magnitudes only. The maximum wall shear stress appears to enhance more downstream at a
critical location where the arterial constrictions assume maximum stenosed artery than for the
flexible stenosed artery. It may be of some importance to note that the stresses are found to be
compressive for all the types of the artery, although their plots are made by taking their absolute
values only.
4*1()lp.__-__-___-_--__-_--__._- ____. ..-_
__.__-__.j--.._.__._iF--.._~~_.. . ..___._.~~..._._._._~~__ . . . . . .
J - 3
z (mm) 3
Figure 9. Effect of the severity of the stenosis on the resistive impedance at t = 0.25s.
The resistive impedances are greatly influenced by the severity of the stenosis as observed from
the results of Figure 9 plotted for the same instant of time. The severity of the stenosis can be
A Nonlinear Two-Dimensional Model 55
visualised by increasing the height of the stenosis. One finds that the resistive impedances are largely enhanced even for a slight increment of the height of the stenosis. If the severity of the stenosis is increased from 20% to 40% there is an enhancement of the maximum impedance value by nearly 340%. Moreover, the peak resistances occur at two specific locations where the arterial constrictions are maximum of which the maximum impedance experienced by the streaming blood towards the upstream is noted more for severe stenosis than for a mild one. The present results agree qualitatively well with those of Srivastava [23] who studied the behaviour of the couple stress fluid representing blood under stenotic condition as a function of difference in the geometry of the stenosis, disregarding the arterial wall flexibility. As his results were displayed in a dimensionless form, they could not be reproduced directly in the present figure, and hence, no quantitative comparison to or validation of the results of our study could be made. Hence, one may conclude that if constriction grows then resistance grows fast, with or without vascular
wall deformability.
0.2
0.18
0.16
0.12
0.1 _--- -_ r_- ‘-)--T--_T_____
5 IO 15 20 25 z(mmI
3
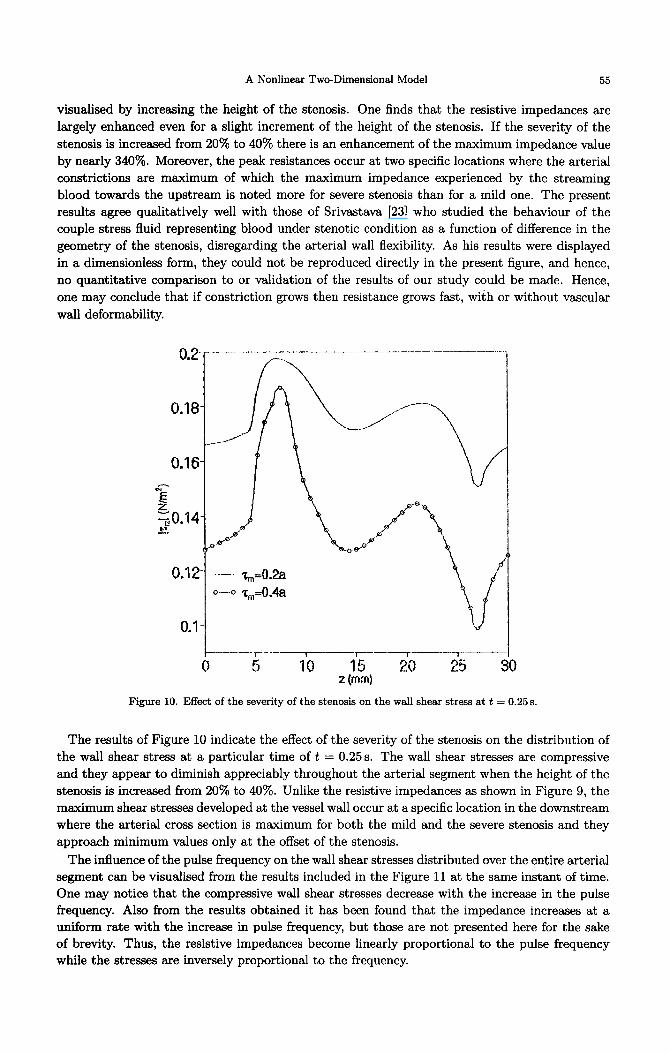
Figure 10. Effect of the severity of the stenosis on the wall shear stress at t = 0.25s.
The results of Figure 10 indicate the effect of the severity of the stenosis on the distribution of the wall shear stress at a particular time of t = 0.25s. The wall shear stresses are compressive and they appear to diminish appreciably throughout the arterial segment when the height of the stenosis is increased from 20% to 40%. Unlike the resistive impedances as shown in Figure 9, the maximum shear stresses developed at the vessel wall occur at a specific location in the downstream where the arterial cross section is maximum for both the mild and the severe stenosis and they approach minimum values only at the offset of the stenosis.
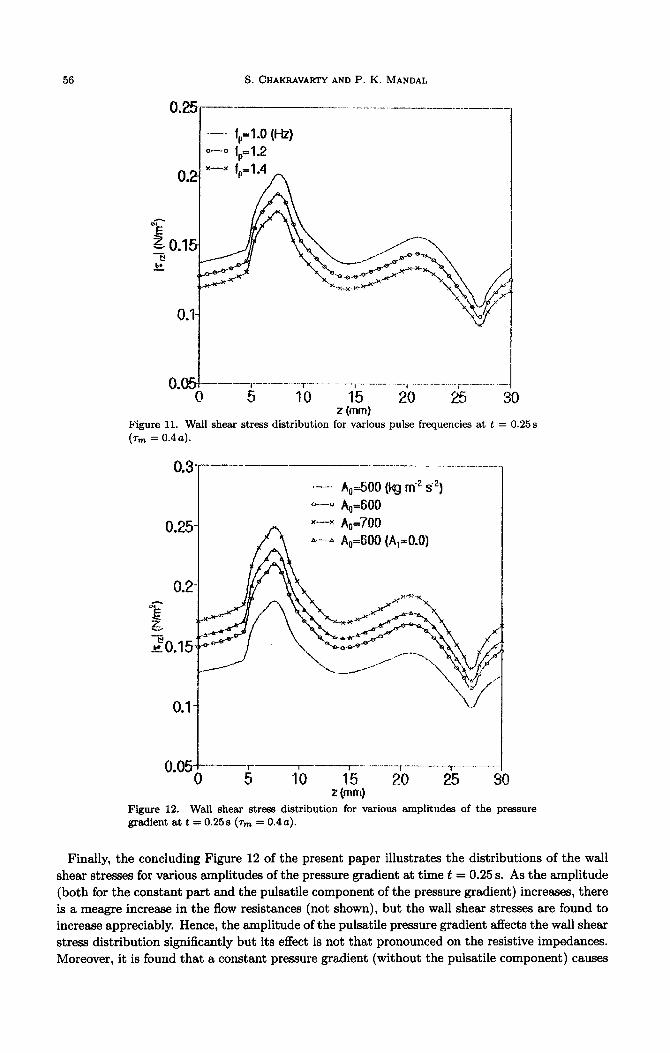
The influence of the pulse frequency on the wall shear stresses distributed over the entire arterial segment can be visualised from the results included in the Figure 11 at the same instant of time. One may notice that the compressive wall shear stresses decrease with the increase in the pulse frequency. Also from the results obtained it has been found that the impedance increases at a uniform rate with the increase in pulse frequency, but those are not presented here for the sake of brevity. Thus, the resistive impedances become linearly proportional to the pulse frequency while the stresses are inversely proportional to the frequency.
56 S. CHAKRAVARTYAND P. K. MANDAL
..__.,_ _ ._.. -..-._.“r-_... - -..j . __ .._... --(._ ._._ - ._.... i__._..-_. __
0 5 10 15 20 a 30 x (mm]
Figure 11. Wall shear stress distribution for various pulse frequencies at t = 0.25s
(% = 0.4a).
0.3~--- ____.______
.-’ A,=500 (kg m‘” de) o---O A,=600
A----h A,=600 (A,=O.O)
Figure 12. Wall shear stress distribution for various amplitudes of the pressure gradient at t = 0.25s (T,,, = 0.4~~).
Finally, the concluding Figure 12 of the present paper illustrates the distributions of the wall
shear stresses for various amplitudes of the pressure gradient at time t = 0.25 s. As the amplitude (both for the constant part and the pulsatile component of the pressure gradient) increases, there
is a meagre increase in the flow resistances (not shown), but the wall shear stresses are found to increase appreciably. Hence, the amplitude of the pulsatile pressure gradient affects the wall shear stress distribution significantly but its effect is not that pronounced on the resistive impedances.
Moreover, it is found that a constant pressure gradient (without the pulsatile component) causes

A Nonlinear Twc+Dimensional Model 57
an increase in the resistive impedances by a little and in the wall shear stresses by a sizeable
amount.
5. CONCLUDING REMARKS
A nonlinear mathematical model of two-dimensional unsteady blood flow in a stenosed artery
has been developed. The stenosis has been given a time-variant overlapping shape in better
accordance with physical reality. Special attention has been focussed on the body acceleration
acting along the axial direction which influences most of the flow charecteristics under the stenotic
conditions. The flow mechanism has been made governed by pulsatile pressure gradient. The
influence-according to the present model when using realistic parameter values of the body
acceleration, the pressure gradient, the pulse frequency and the severity of the stenosis on the flow velocity, the resistive impedances and the wall shear stresses-is investigated.
The salient observations of this study are listed below:
(1)
(2) (3)
(4
(5)
(6)
(7)
(3)
(9)
(10)
The axial flow velocity increases in the presence of body acceleration and decreases in the
presence of stenosis.
Presence of stenosis and rigidity of the vessel wall clearly affect the radial velocity.
Like the axial flow velocity, the flow rate also diminishes and increases depending upon
whether the arterial constriction assumes maximum or minimum, respectively.
The flow rate becomes inversely proportional to the resistive impedance.
The geometry of the present overlapping stenosis has got a remarkable influence on the
flow characteristics of blood in in wivo condition.
The different properties of the artery under consideration greatly influence the resistive
impedances and the wall shear stresses.
The severity of the stenosis affects both the resistive impedances and the wall shear stresses
significantly.
The resistive impedances become linearly proportional to the pulse frequency while the
stresses are inversely proportional to it.
The increasing amplitude of the pressure gradient causes an increase of the wall shear
stresses more than the resistive impedances.
The present results substantiate the importance of the consideration of such an improved
flexible arterial stenosis in studying the flow phenomenon one step closer to the real situ-
ation.
APPENDIX
One can express the following mathematical function from (1) and (2) in order to assume the geometry of the stenosis es rigid:
1 _ 327, -
W I al,4 E(Z - d)l$ - E(Z - d)2@j + (2 - d)%) - i(Z - d)4} )
-= a diz<d+;lo,
I 17 otherwise.
The quantities Sr,k, Pr,k, Sz,k, Pz,k and 2’1 involved in (29)-(31) have their expressions given
by
N N+k-j Sl,k = c aN+k-j,
j=k
j
k-l Nk
Pl,k = c &aj - c _;ak, N1
j=1 Ic - 3 j=13 with PIJ = - c ;a~,
j=l

58 S. CHAKRAVARTY AND P. K. MANDAL
N
‘2vk = C QN+k-j@j, j=k
k-l
P2,k = c aj@k-j - 5 (aj@k + akpj) 7
and
where
j=l j=l
dRlk+l t3R ok = z~k - Kak> k=l,2,3 ,..., N.
REFERENCES
1. D.F. Young, Effects of a time dependent stenosis on flow through a tube, J. Engng. Ind. ‘Duns. ASME 90, 248-254 (1968).
2. D.F. Young, Fluid mechanics of arterial stenosis, J. Biomech. Engng. Bans. ASME 101, 157-175 (1979). 3. J.H. Forrester and D.F. Young, Flow through a converging-diverging tube and its implications in occlusive
vascular disease, J. Biomech. 3, 297-316 (1970). 4. J.S. Lee and Y.C. Fung, Flow in locally constricted tubes at low Reynolds numbers, J. Appl. Mech. %ns.
ASME Ser. E37, 9-16 (1970). 5. D.F. Young and F.Y. Tsai, Flow characteristics in models of arterial stenosisI. Steady flow, J. Biomech.
6, 395411 (1973). 6. J.C. Misra and S. Chakravarty, Flow in arteries in presence of stenosis, J. Biomech. 19, 907-918 (1986). 7. M.G. Taylor, The influence of anomalous viscosity of blood upon its oscillatory flow, Phys. Med. Biol. 3,
273-290 (1959). 8. S. Chakravarty and P.K. Mandal, Mathematical modelling of blood flow through an overlapping arterial
stenosis, Mathl. Comput. Modelling 19 (1) 59-70 (1994). 9. S.C. Ling and H.B. Atabek, A nonlinear analysis of pulsatile blood flow in arteries, J. Fluid Mech. 55,
492-512 (1972). 10. K. Imaeda and F.O. Goodman, Analysis of nonlinear pulsatile blood flow in arteries, J. Biomech. 13,
1007-1022 (1980). 11. M.F. O’Rourke and W.R.. Milnor, Relation between differential pressure and flow in the pulmonary artery
of the dog, Cardiouasc. Res. 5, 558-565 (1971). 12. D.L. Fry, Measurement of pulsatile blood flow by the computed pressure gradient technique, IRE Duns.
Med. Electron. ME6, 259-264 (1959). 13. E.P. Hiatt, J.P. Meechan and T.V. Galambos, Reports on human acceleration, Publication 901, NAS-NRC,
Washington, DC, (1974). 14. P.D. Verdouw, A. Noordergraff, A.C. Arnteenius and P.H. Huisman, Relative movement between subject
and support in body acceleration applied synchronously with the heartbeat (BASH), Biblphy. Cardiol. 31, 57-62 (1973).
15. AC. Arntzenius, J.D. Laird, A. Noordergrd, P.D. Verdouw and P.H. Huisman, Body acceleration synchro- nous with the heartbeat, Biolphy. Cardiol. 29, l-5 (1972).
16. A.C. Burton, Introductory Text, Physiology and Biophysics of the Circulation, Year Book Medical Publisher, Chicago, (1966).
17. D.J. Patel, J.C. Greenfield and D.L. Fry, In vivo pressure-length-radius relationship of certain blood vessels in man and dog, In Pulsatile Blood Flow, (Edited by E.O. Attinger), McGraw-Hill, New York, (1964).
18. T.E. Carew, R.N. Baishnav and D.J. Patel, Compressibility of the arterial wall, Circul. Res. 23, 61-68 (1968).
19. J.J. Manak, The two-dimensional in uitru passive stress-strain elasticity relationship for the steer thoracic sorta blood vessel tissue, J. Biomech. 13, 637-646 (1980).
20. D.A. McDonald, Blood flow in arteries, Edwanl (1974). 21. W.R. Milnor, Hemodynamics, Williams and Williams, Baltimore, MD, (1982). 22. D.L. Fry, Acute vascular endothelial changes associated with increased blood velocity gradient, Circulation
Res. 22, 165-197 (1968). 23. L.M. Srivastava, Flow of couple stress through stenotic blood vessels, J. Biomech. 18, 479-485 (1985).