
Leveraging the QorIQ Data Path Acceleration Architecture ...
Upload
khangminh22Category
view
1download
0
LUDWIG-MAXIMILIANS-UNIVERSITÄT MÜNCHEN
Department “Institut für Informatik”Lehr- und Forschungseinheit Medieninformatik
Prof. Dr. Heinrich Hußmann
Diplomarbeit
Acceleration-Based Gesture Recognition for Conductingwith Hidden Markov Models
Dominik [email protected]
Bearbeitungszeitraum: 21.03.2007 bis 22.10.2007Betreuer: Prof. Asim Smailagic, Ph. D.
Prof. Daniel P. Siewiorek, Ph. D.Verantw. Hochschullehrer: Prof. Bernd Brügge, Ph. D.Co-Referat: Prof. Dr. Heinrich Hußmann

Abstract
This thesis focuses on developing new means of input for an existent system allowing users withany skill to conduct a virtual orchestra in realtime. As a first step, several user studies with musicalconductors were performed to learn more about the interaction between conductor and orchestra.
The eWatch, a wearable computing and sensing platform, is selected as input device. It is wornlike a regular wrist watch and transmits acceleration data via Bluetooth to the host computer.
Hidden Markov models are chosen to perform the gesture recognition task. While realizinga reliable and continuous gesture recognition, the proposed system is able to successfully rejectnon-meaningful hand movements, applying a threshold model. The system makes use of a discretehidden Markov model in conjunction with a modified version of the Viterbi algorithm, which isspecifically adopted for continuous gesture recognition.
By performing common conducting gestures, the user is able to indicate the measure. Inaddition, he or she can influence the orchestra’s tempo and volume by varying the gestures inspeed and size. The evaluation of the proposed approach with different users yields a detectionratio of more than 94% and a reliability of more than 90% with an average latency around 90 msfor the user-dependent recognition.
While focusing on the application domain of conducting, the proposed recognition approachis versatility applicable to arbitrary user interfaces benefiting from gesture input. Using a machinelearning approach, new gestures can easily be trained.

Ich erkläre hiermit, dass ich die vorliegende Arbeit selbstständig angefertigt, alle Zitate als solchekenntlich gemacht sowie alle benutzten Quellen und Hilfsmittel angegeben habe.
München, October 22, 2007
. . . . . . . . . . . . . . . . . . . . . . . . . . . . . . . . . . . . . . . . .

Preface
This thesis has been submitted as Diplomarbeit (diploma thesis) to the department of computer sci-ence, school of media informatics, of the Ludwig-Maximilians-Universität in München, Germany.While it was supervised by Prof. Bernd Brügge, Ph. D. of the Technische Universität München, Idid the underlying research at the Institute for Complex Engineered Systems (ICES) at CarnegieMellon University in Pittsburgh, PA, USA under the supervision of Prof. Asim Smailagic, Ph. D.and Prof. Daniel P. Siewiorek, Ph. D.
The input device used, namely the eWatch, has also been developed at ICES, who kindlyprovided me with an exemplar to work with. In the course of doing research for this thesis, thedirection with respect to recognition methods and requirements was under constant change, eitherdue to approaches that did not perform as expected, or due to new ideas that came up in themeantime. There is no written assignment of task.
As a by-product of the research done in the context of this thesis, a poster was submitted andaccepted for the 11th IEEE International Symposium on Wearable Computers. A copy of thisposter may be found in the appendix.

Contents
1 Introduction 11.1 The Pinocchio System . . . . . . . . . . . . . . . . . . . . . . . . . . . . . . . 11.2 Motivation and Challenges . . . . . . . . . . . . . . . . . . . . . . . . . . . . . 21.3 Principle Methods . . . . . . . . . . . . . . . . . . . . . . . . . . . . . . . . . . 21.4 Structure of this Thesis . . . . . . . . . . . . . . . . . . . . . . . . . . . . . . . 2
2 Related Work 52.1 Pattern Recognition with Hidden Markov Models . . . . . . . . . . . . . . . . . 52.2 History of Conducting Systems . . . . . . . . . . . . . . . . . . . . . . . . . . . 6
2.2.1 Buchla Lightning . . . . . . . . . . . . . . . . . . . . . . . . . . . . . . 62.2.2 Mathews et. al. (1970 – 1997) . . . . . . . . . . . . . . . . . . . . . . . 92.2.3 Buxton et. al. (1980) . . . . . . . . . . . . . . . . . . . . . . . . . . . . 102.2.4 Keane et. al. (1989 – 1991) . . . . . . . . . . . . . . . . . . . . . . . . 112.2.5 Morita, Sawada et. al. (1989 – 1997) . . . . . . . . . . . . . . . . . . . 112.2.6 Bertini et. al. (1992) . . . . . . . . . . . . . . . . . . . . . . . . . . . . 122.2.7 Bien et. al. (1992) . . . . . . . . . . . . . . . . . . . . . . . . . . . . . 132.2.8 Lee (M.), Brecht, Garnett et. al. (1992 – 2001) . . . . . . . . . . . . . . 132.2.9 Tobey et. al. (1995 – 1996) . . . . . . . . . . . . . . . . . . . . . . . . . 142.2.10 Marrin et. al. (1996 – 2000) . . . . . . . . . . . . . . . . . . . . . . . . 142.2.11 Borchers, Lee (E.) et. al. (1997 – 2006) . . . . . . . . . . . . . . . . . . 152.2.12 Ilmonen et. al. (1997 – 1999) . . . . . . . . . . . . . . . . . . . . . . . 172.2.13 Usa et. al. (1998) . . . . . . . . . . . . . . . . . . . . . . . . . . . . . . 172.2.14 Bianchi et. al. (2000) . . . . . . . . . . . . . . . . . . . . . . . . . . . . 182.2.15 Segen et. al. (2000) . . . . . . . . . . . . . . . . . . . . . . . . . . . . . 182.2.16 Kolesnik et. al. (2004) . . . . . . . . . . . . . . . . . . . . . . . . . . . 182.2.17 Murphy et. al. (2004) . . . . . . . . . . . . . . . . . . . . . . . . . . . . 182.2.18 Schertenleib et. al. (2004) . . . . . . . . . . . . . . . . . . . . . . . . . 192.2.19 Dillon et. al. (2006) . . . . . . . . . . . . . . . . . . . . . . . . . . . . 192.2.20 Studies . . . . . . . . . . . . . . . . . . . . . . . . . . . . . . . . . . . 192.2.21 Comparison . . . . . . . . . . . . . . . . . . . . . . . . . . . . . . . . . 202.2.22 Discussion . . . . . . . . . . . . . . . . . . . . . . . . . . . . . . . . . 25
3 Preceding Studies 273.1 Conducting Gestures . . . . . . . . . . . . . . . . . . . . . . . . . . . . . . . . 273.2 Initial User Studies . . . . . . . . . . . . . . . . . . . . . . . . . . . . . . . . . 28
4 Design Decisions 314.1 Requirements Elicitation . . . . . . . . . . . . . . . . . . . . . . . . . . . . . . 314.2 Recognition Method Decision . . . . . . . . . . . . . . . . . . . . . . . . . . . 324.3 Hardware Decisions . . . . . . . . . . . . . . . . . . . . . . . . . . . . . . . . . 334.4 Software Decisions . . . . . . . . . . . . . . . . . . . . . . . . . . . . . . . . . 36
5 Conducting Gesture Recognition 395.1 Choice of Machine Learning Approach . . . . . . . . . . . . . . . . . . . . . . 39
5.1.1 Artificial Neural Networks . . . . . . . . . . . . . . . . . . . . . . . . . 395.1.2 Hidden Markov Models . . . . . . . . . . . . . . . . . . . . . . . . . . 39
5.2 Gesture Classification . . . . . . . . . . . . . . . . . . . . . . . . . . . . . . . . 425.2.1 Preceding Considerations . . . . . . . . . . . . . . . . . . . . . . . . . . 425.2.2 Hidden Markov Model Parameters and Feature Extraction . . . . . . . . 445.2.3 Non-Meaningful Gesture Rejection . . . . . . . . . . . . . . . . . . . . 49
I

5.3 Gesture Spotting . . . . . . . . . . . . . . . . . . . . . . . . . . . . . . . . . . 505.3.1 Integrated Gesture Recognizer . . . . . . . . . . . . . . . . . . . . . . . 505.3.2 Single Beat Detection . . . . . . . . . . . . . . . . . . . . . . . . . . . 53
5.4 Gesture Interpretation . . . . . . . . . . . . . . . . . . . . . . . . . . . . . . . . 545.4.1 Tempo . . . . . . . . . . . . . . . . . . . . . . . . . . . . . . . . . . . 545.4.2 Volume . . . . . . . . . . . . . . . . . . . . . . . . . . . . . . . . . . . 54
6 Implementation 576.1 Testbed . . . . . . . . . . . . . . . . . . . . . . . . . . . . . . . . . . . . . . . 586.2 Recognition Algorithms . . . . . . . . . . . . . . . . . . . . . . . . . . . . . . . 596.3 eWatch Module . . . . . . . . . . . . . . . . . . . . . . . . . . . . . . . . . . . 616.4 Test Data Preparation Tools . . . . . . . . . . . . . . . . . . . . . . . . . . . . . 616.5 Evaluation Environment . . . . . . . . . . . . . . . . . . . . . . . . . . . . . . 646.6 Recognition Subsystem . . . . . . . . . . . . . . . . . . . . . . . . . . . . . . . 65
6.6.1 Gesture Input Device Subsystem . . . . . . . . . . . . . . . . . . . . . . 666.6.2 Filter Subsystem . . . . . . . . . . . . . . . . . . . . . . . . . . . . . . 676.6.3 Recognizer Subsystem . . . . . . . . . . . . . . . . . . . . . . . . . . . 67
7 Evaluation 697.1 Method . . . . . . . . . . . . . . . . . . . . . . . . . . . . . . . . . . . . . . . 697.2 Results . . . . . . . . . . . . . . . . . . . . . . . . . . . . . . . . . . . . . . . . 72
7.2.1 Number of States . . . . . . . . . . . . . . . . . . . . . . . . . . . . . . 727.2.2 Number of Labels . . . . . . . . . . . . . . . . . . . . . . . . . . . . . 747.2.3 Cutoff Threshold . . . . . . . . . . . . . . . . . . . . . . . . . . . . . . 767.2.4 Smoothing . . . . . . . . . . . . . . . . . . . . . . . . . . . . . . . . . 78
7.3 Discussion . . . . . . . . . . . . . . . . . . . . . . . . . . . . . . . . . . . . . . 78
8 Conclusions 818.1 Strengths . . . . . . . . . . . . . . . . . . . . . . . . . . . . . . . . . . . . . . 818.2 Limitations . . . . . . . . . . . . . . . . . . . . . . . . . . . . . . . . . . . . . 82
9 Future Work 839.1 Input Device . . . . . . . . . . . . . . . . . . . . . . . . . . . . . . . . . . . . . 839.2 Gesture Recognition . . . . . . . . . . . . . . . . . . . . . . . . . . . . . . . . 839.3 Evaluation . . . . . . . . . . . . . . . . . . . . . . . . . . . . . . . . . . . . . . 849.4 Pinocchio . . . . . . . . . . . . . . . . . . . . . . . . . . . . . . . . . . . . . . 849.5 Outlook . . . . . . . . . . . . . . . . . . . . . . . . . . . . . . . . . . . . . . . 85
10 Acknowledgments 87
11 Appendix 89
II

1 INTRODUCTION
1 Introduction
When using a virtual orchestra system on the computer—with musicians that look and soundquite real—it does not seem to make a lot of sense to interact with it using traditional input de-vices. Telling the violist to play a little louder by turning the mouse’s scroll wheel might beefficient—but is far from the way you would communicate with a real instrumentalist; and makingthe musicians play faster by hitting the “+” key on the keyboard a couple of times is certainly un-derstood by the orchestra application—but again, this is not the way a conductor tells the orchestrato increase the tempo. The interaction between the user in the role of a conductor and the orches-tra simulated in the computer would be much more realistic if the same means of communicationwhich are used in the real world could be used instead, namely conducting gestures. This virtualorchestra is an example for a computer application which benefits from providing alternative waysof communicating with the user, from offering new and more natural means of interaction, makingit easier—and certainly much more fun in this case—to use the application.
This thesis presents the theoretical background, implementation, and evaluation of a gesture-based input device for an existent virtual orchestra system. A wearable computer platform resem-bling an ordinary wrist watch and equipped with several sensors is used to capture accelerationdata, and a machine learning approach is then applied to recognize conducting gestures. The userof the system takes over the conductor’s role and can control the orchestra’s tempo and volume bymeans of common conducting gestures and by varying execution speed and size. In the followingsection, I shall introduce the existent orchestra system to be provided with a gesture input device.
1.1 The Pinocchio System
Pinocchio1 [Brügge et al., 2007] is a virtual orchestra system originally targeted at children to en-hance their interest in classical music in a playful manner. It is being developed at the TechnischeUniversität München in cooperation with the Bavarian Radio Symphony Orchestra.
Pinocchio features a virtual concert hall populated by musicians which are represented usingsynchronized audio and video playbacks. As a key difference to other existent systems the user hasthe freedom to configure the musicians’ setup: Each musician can be selected and positioned freelyin 3D space and can be addressed individually. Thus, it is possible to select certain instrumentsand to realize a virtual walk-through experience featuring a realistic 3D audio representation.
In the current version, the user can control the system with a baton whose movements arecaptured by a camera. Conducting gestures are recognized in order to control tempo and volume ofthe virtual orchestra. The audio and video footage used in the system has been acquired recordingindividual musicians of the Bavarian Radio Symphony Orchestra separately to increase the realismof the virtual orchestra. Currently, recordings of four musicians (two violin players, one violist,and one cellist) playing Mozart’s Quartet in C for Strings, “Dissonant” (KV465) are available.
Pinocchio started in 2004 as a first prototype of a conducting system and was called Marris.It was able to track the baton and to perform 3D audio mixing. In 2005, the project was renamedinto Virtual Symphony Orchestra (VSO) and real musicians were recorded. It was also possibleto position them freely in 3D space. VSO was running on a cluster of six iMacs. VSO++ wasintroduced in 2006, realizing several optimizations that enabled the conducting system to run on asingle machine.
First experiments with alternative input devices have been conducted. Lachenmaier[Lachenmaier, 2006] added a conducting learning module to VSO++, applying artificial neuralnetworks (ANN) to optical gesture recognition. Bierbaum [Bierbaum, 2007] realized a reengi-neering project optimizing poorly performing parts in order to make Pinocchio capable of han-dling more complex scores and larger virtual orchestras on a single machine. Besides the work
1The name Pinocchio was inspired by a gaze—or nose—recognition experiment. It is an abbreviation for“Probability-based INference Of Composition and Conducting beHaviors in Interactive Orchestras”.
1

1.2 Motivation and Challenges 1 INTRODUCTION
presented in this thesis, Pinocchio is expanded to support a head-up display which presents thescore to the conductor in realtime [Fenzl, 2007].
1.2 Motivation and Challenges
The motivation behind this research is to enable the user to interact with a system in a natural way,i.e. in a way he or she would interact intuitively, considering the system’s application domain. Inthe case of Pinocchio, I shall develop an input device which is able to recognize hand gesturesbased on acceleration data, i.e. I am focusing on the application domain of musical conducting.The input device will be able to recognize and interpret conducting gestures—which are fairlycomplex and have a defined meaning—to control a virtual orchestra.
Choosing this specific application domain, however, does not limit the recognition method assuch to conducting gestures. Since a general machine learning approach is applied, arbitrary handgestures can be trained. That is, the hand gesture recognition approach to be developed in thecontext of this thesis may be applied to other application areas that benefit from a gestural input.
The work presented here covers several areas of computer science, thus posing challenges atdifferent levels: First, in the context of human-computer interaction, adequate gestures have tobe defined and a suitable hardware device has to be found and adopted. Second, a recognitionalgorithm has to be developed and evaluated. Third, the algorithm has to be implemented andembedded into an existent software architecture.
While accelerometers enable small an light devices, they only deliver relative information onmotion and provide noisy data—making it more difficult to build a reliable gesture recognitionsystem. The acceleration data thus needs to be preprocessed adequately. Since the user is likelyto move the hand randomly during times he or she is not performing an intentional gesture, therecognition system must be able to discard non-meaningful movements without influencing therecognition rate of intentional gestures. In the following section, I shall give a brief introductionof the methods applied in order to realize a conducting gesture recognition system.
1.3 Principle Methods
The choice of input device fell onto the eWatch—a wearable computing and sensor platform devel-oped at the Institute for Complex Engineered Systems at Carnegie Mellon University in Pittsburgh,PA, USA. The device is worn as like regular wrist watch and transmits raw acceleration data ofthe user’s arm movements via Bluetooth to the host system.
After doing a literature research, covering existent orchestra systems on the one hand as wellas more general gesture recognition approaches on the other hand, I chose discrete hidden Markovmodels (HMM) for recognizing conducting gestures. This approach requires several steps in orderto preprocess the raw acceleration data, which have to be carefully chosen.
In order to evaluate the proposed gesture recognition approach, I collected several hours ofgesture data performed by different users. Three different conducting gestures, representing dif-ferent measures, were performed by the users to test the system’s recognition performance.
1.4 Structure of this Thesis
The remainder of this thesis is structured as follows:Chapter 2 provides an overview of related work. I shall discuss the application of hidden
Markov models (HMM) to pattern recognition tasks before presenting the history of computer-based conducting and orchestra systems. This chapter enables the reader to gain an understandingof pattern recognition application areas and see Pinocchio in the context of similar systems.
In chapter 3 I shall introduce the application domain of musical conducting with a focus onconducting gestures. Additionally, this chapter contains a description of two user studies per-
2

1 INTRODUCTION 1.4 Structure of this Thesis
formed with conductors, and discusses their implications with respect to the development of anew user interface for conducting gestures.
After performing a requirement elicitation at the beginning of chapter 4, I shall explain the de-cisions I made regarding the general gesture recognition method as well as hardware and software.This chapter defines the foundation for the system to be developed.
Based on this foundation, I shall describe my approach for conducting gesture recognitionin chapter 5. After motivating my choice for HMM, I shall discuss the different modules of thegesture recognizer to be realized in the context of this thesis. This chapter makes the readerfamiliar with the theoretical background the subsequent implementation is based on.
Chapter 6 describes the implementation of the conducting gesture recognizer as well as theintegration into Pinocchio. Additionally, I shall introduce software tools I developed for the ac-quisition of user test data and the evaluation of the recognition performance.
In chapter 7, I shall evaluate the system’s performance with regard to detection ratio andreliability. The presented evaluation is based on gesture data acquired from different users. Ishall conclude this chapter with a discussion of the results’ implications.
Chapter 8 summarizes strengths and limitations of the gesture recognition approach developedin the course of this thesis while chapter 9 shows an outlook on future work, regarding further im-provements of the input device, the gesture recognition approach, as well as a general perspectiveon using and combining sensors in human computer interaction.
3

1.4 Structure of this Thesis 1 INTRODUCTION
4

2 RELATED WORK
2 Related Work
In this chapter, I shall review related work that applies hidden Markov models (HMM) to differentpattern recognition tasks—such as hand gesture, hand writing, or activity recognition, to name afew. Since this thesis focuses on the recognition of musical conducting gestures in the context ofa virtual orchestra, I shall present prior work related to the application domain of computer-basedconducting and orchestra systems separately in section 2.2, independent from the input modalitiesused.
2.1 Pattern Recognition with Hidden Markov Models
As motivated in section 5.1, I am applying HMM to the recognition of conducting gestures. Inthis section, I shall present an overview of prior systems and studies, applying HMM to a varietyof pattern recognition tasks, while focusing on hand gestures as a general class of conductinggestures. In this review, I am classifying the presented systems by two categories, namely
• recognition type, i.e. which class of patterns does the system recognize, and
• sensor type, i.e. which sensors are used and where are they positioned.
Table 2.1 shows the occurrences represented in the reviewed systems.
Category OccurrencesRecognition type Hand writing
2D shapesHand gesturesBody gesturesHuman activities
Sensor type MouseCameraAccelerometersMicrophoneData gloveElectro-magnetic position sensor
Table 2.1: Classification categories of HMM-based recognition system
The approach proposed by [He and Kundu, 1991] is able to classify 2D-shapes.[Starner et al., 1994] recognize cursive hand-writing, using discrete HMM. [Yamato et al., 1992]use an image-based approach for human action recognition; the presented system is able to recog-nize six different human actions, namely different tennis moves.
A variety of systems recognizes hand gestures, either using cameras (stationary orhat-mounted, i.e. wearable), data gloves and electro-magnetic position sensors, or ac-celerometers (body-worn or device-embedded). Some systems are able to recognize con-tinuous gestures while others are restricted to the recognition of isolated gestures only.[Starner and Pentland, 1995, Starner et al., 1997, Brashear et al., 2003] present sign language rec-ognizers, using either cameras, or a combination of camera and accelerometers. Several systemsare designed for the recognition of various hand gesture commands—reaching from controllingTV sets or cell phones to steering robots—such as [Yang and Xu, 1994, Morguet and Lang, 1998,Rigoll et al., 1998, Iba et al., 1999, Mäntylä et al., 2000, Pylvänäinen, 2005, Kela et al., 2006].[Campbell et al., 1996] propose a system that is able to recognize T’ai Chi gestures, using a stereocamera setup.
5

2.2 History of Conducting Systems 2 RELATED WORK
[Lukowicz et al., 2003, Minnen et al., 2005] focus on the recognition of human activities forthe realization of context-aware applications. Both are using accelerometers and microphonesin order to accomplish this task. Further activity recognition approaches are presented by[Krause et al., 2005, Krause et al., 2003]. These approaches do not apply HMM, but they are us-ing the eWatch, respectively a predecessor of the eWatch, as input device, which is also used inorder to realize conducting gesture recognition in the context of this thesis (compare section 4.3).In the following section, I shall explain how conducting and virtual orchestra systems developed.
2.2 History of Conducting Systems
Over the last 35 years2, a multiplicity of systems have emerged around the topic of conducting acomputer–or the computer following a conductor. Aiming at different goals, different approacheshave been developed. Nevertheless, some ideas remain the same across many of the conductingsystems.
This section consists of a structured overview of existent computer-based conducting systems3
and the approaches they apply. This survey puts an emphasis on the gesture recognition part of thesystems.
Section 2.2.1 starts with a brief description of an often used input device called the BuchlaLightning. All the systems that have been considered are also briefly described in short paragraphswhich are categorized by their respective authors and ordered by their publish date. Two articlesthat do not include a detailed system description and mainly deal with studying the relationshipbetween conductor and orchestra are presented in chapter 2.2.20. Chapter 2.2.21 closes this sectionwith a comparison of the presented systems.
In addition, figure 2.1 shows a timeline which emphasizes the temporal sequence and illus-trates dependencies among the systems. Table 2.2 summarizes relevant innovations and technolo-gies together with their first appearance in a conducting system. A comparison of more generalframeworks like EyesWeb or Max/MSP that are used in some of the presented conducting systemscan be found in [Grüll, 2005].
2.2.1 Buchla Lightning
Before the introduction of the actual conducting systems, it is useful to have a look at a com-mercially available input device as it is used by many of the presented systems. In his review ofthe Buchla Lightning II which is used by several conducting systems, [Rich, 1996] discusses itsfeatures and capabilities. While the basic concepts remain the same, the version II adds internalsound, improved wands, and new software features.
Two hand held wands with an infrared emitter and a trigger button, resembling “high-techdrumsticks”, are used as control devices. Detectors track position and trajectory of each wandin 2D space. The system can operate at two different ranges: At up to 2.4m and at up to 4.8 m,impacting the possible operation time.
Space is divided in four times two zones. Each zone can be used to define different behaviors.In general, MIDI events are assigned to hand gestures, but the system comes with a powerfulsoftware offering its own, object-oriented programming language. Therefore it is possible to definecomplex interactions.
Although Rich emphasizes the system’s capabilities to be used as an instrument, they alsomention the already included conduct program. The user can program conducting patterns byassigning a wand motion (that is, up, down, left, or right strikes) to each beat. The program
2Considering Mathews’ Conductor Program mentioned in 1970 [Mathews and Moore, 1970] as first conductingsystem (compare 2.2.2).
3Although a considerable effort has been put into researching the history of computer-based conducting systems,the presented list might not be exhaustive.
6

2 RELATED WORK 2.2 History of Conducting Systems
Innovation System Author (see chapter) Year
Conducting application GROOVE/Conductor Program Mathews (2.2.2) 1970
Stick interface Sequential Drum Mathews (2.2.2) 1979
Baton interface∗ MIDI Baton Keane et. al. (2.2.4 1989
Image-based recognition Computer Music System that Fol-lows a Human Conductor
Morita et. al. (2.2.5) 1989
Fuzzy logic On-line Analysis of Music Conduc-tor’s Two-Dimensional Motion
Bien et. al. (2.2.7) 1992
Artificial neural networks Adaptive Conductor Follower Lee, M. et. al. (2.2.8) 1992
Acceleration-based recognition Gesture Analysis Using 3D Acceler-ation Sensor for Music Control
Sawada et. al. (2.2.5) 1995
3D sound Virtual Orchestra Performance Ilmonen et. al. (2.2.12) 1997
HMM, recognition of common con-ducting gestures
A Multi-Modal Conducting Simula-tor
Usa et. al. (2.2.13) 1998
Animated, virtual musicians Conductor Following with ArtificialNeural Networks
Ilmonen et. al. (2.2.12) 1999
Unmodified baton for image-basedrecognition, left hand
Visual Interface for Conducting Vir-tual Orchestra
Segen et. al. (2.2.15) 2000
Real orchestra recordings Personal Orchestra Borchers et. al. 2.2.11) 2001
Recognition of expressive gestures Recognition, Analysis and Perfor-mance with Expressive ConductingGestures
Kolesnik et. al. (2.2.16) 2004
Variable orchestra configuration Conducting a Virtual Orchestra Schertenleib et. al. (2.2.18) 2004
Table 2.2: Innovations and their first appearance in conducting systems∗Although [Mathews, 1989] presented the Mechanical Baton, it resembles more a drumstick from the descriptionsavailable.
7

2.2 History of Conducting Systems 2 RELATED WORK
1976
1972
1974
1978
1982
1986
1990
1994
1998
2002
1970
1980
1984
1988
1992
1996
2004
2000
2006
1976
1972
1974
1978
1982
1986
1990
1994
1998
2002
1970
1980
1984
1988
1992
1996
2004
2000
2006
Mat
hew
s et
. al.
Bu
xto
n e
t. al
.K
ean
e et
. al.
Mar
rin
et.
al.
Bo
rch
ers,
Lee
(E.)
et. a
l.
Mo
rita
, Saw
ada
et. a
l.
Tob
ey e
t. al
.
Usa
et.
al.B
ian
chi e
t. al
.
Ko
lesn
ik e
t. al
.
Seg
en e
t. al
.
Ilmo
nen
et.
al.
Mu
rph
y et
. al.
Dill
on
et.
al.
Sch
erte
nle
ib e
t. al
.
Bie
n e
t. al
.
Ber
tin
i et.
al.
Vis
ua
l In
terf
ace
V
isu
al I
nte
rfa
ce
for
Co
nd
uct
ing
...
for
Co
nd
uct
ing
...
GR
OO
VE
GR
OO
VE
Seq
uen
tia
l Dru
mSe
qu
enti
al D
rum
Mic
roco
mp
ute
r-B
ase
dM
icro
com
pu
ter-
Ba
sed
Co
nd
uct
ing
Sys
tem
Co
nd
uct
ing
Sys
tem
Co
nd
uct
or
Pro
gra
mC
on
du
cto
r P
rog
ram
Mec
ha
nic
al B
ato
nM
ech
an
ica
l Ba
ton
Ra
dio
Dru
m/ B
ato
nR
ad
io D
rum
/ Ba
ton
MID
I Ba
ton
MID
I Ba
ton
Dig
ita
l Ba
ton
Dig
ita
l Ba
ton
Co
nd
uct
or‘
s Ja
cket
Co
nd
uct
or‘
s Ja
cket
Vir
tua
l V
irtu
al
Orc
hes
tra
...O
rch
estr
a...
Co
nd
uct
ing
a V
irtu
al O
rch
estr
aC
on
du
ctin
g a
Vir
tua
l Orc
hes
tra
Vir
tua
l Orc
hes
tra
: V
irtu
al O
rch
estr
a:
An
Imm
ersi
ve...
An
Imm
ersi
ve...
Co
nd
uct
ing
Au
dio
File
s vi
a ..
.C
on
du
ctin
g A
ud
io F
iles
via
...
Live
Inte
rpre
tati
on
...Li
ve In
terp
reta
tio
n...
Vir
tua
l Co
nd
uct
ing
Vir
tua
l Co
nd
uct
ing
Pra
ctic
e En
viro
nm
ent
Pra
ctic
e En
viro
nm
ent
(Ad
ap
tive
) (A
da
pti
ve)
Co
nd
uct
or
Follo
wer
Co
nd
uct
or
Follo
wer
Vir
tua
l En
sem
ble
Vir
tua
l En
sem
ble
Lig
ht B
ato
nLi
gh
t Ba
ton
Vir
tua
l Orc
hes
tra
Per
form
an
ceV
irtu
al O
rch
estr
a P
erfo
rma
nce
A M
ult
i-M
od
al C
on
du
ctin
g S
imu
lato
rA
Mu
lti-
Mo
da
l Co
nd
uct
ing
Sim
ula
tor
Co
nd
uct
or
Follo
win
g w
ith
Art
ific
ial N
NC
on
du
cto
r Fo
llow
ing
wit
h A
rtif
icia
l NN
Pers
on
al O
rch
estr
aPe
rso
na
l Orc
hes
tra R
eco
gn
itio
n, A
na
lysi
s R
eco
gn
itio
n, A
na
lysi
s a
nd
Per
form
an
ce ..
.a
nd
Per
form
an
ce ..
.
You
’re
The
Co
nd
uct
or
You
’re
The
Co
nd
uct
or
con
ga
/Ma
estr
o!/
iSym
ph
on
yco
ng
a/M
aes
tro
!/iS
ymp
ho
ny
Ense
mb
le M
emb
er...
Ense
mb
le M
emb
er...
Extr
act
ion
of
Extr
act
ion
of
Co
nd
uct
ing
Ges
ture
s...
Co
nd
uct
ing
Ges
ture
s...
Co
mp
ute
r M
usi
c Sy
stem
tha
t C
om
pu
ter
Mu
sic
Syst
em th
at
Follo
ws
a H
um
an
Co
nd
uct
or
Follo
ws
a H
um
an
Co
nd
uct
or
Ges
ture
An
aly
sis
Usi
ng
G
estu
re A
na
lysi
s U
sin
g
3D A
ccel
era
tio
n S
enso
r...
3D A
ccel
era
tio
n S
enso
r...
On
-lin
e A
na
lysi
s o
f O
n-l
ine
An
aly
sis
of
Mu
sic
Co
nd
uct
or’
s...
Mu
sic
Co
nd
uct
or’
s...
Lee
(M.),
Bre
cht,
Gar
net
t et
. al.
Figure 2.1: Timeline of conducting systems
8

2 RELATED WORK 2.2 History of Conducting Systems
derives tempo and generates MIDI clocks. Rich notes that the conduct program works best withsimple up and down strikes. It seems to be difficult, though, to conduct more complex pattern likepatterns used by orchestral conductors due to low recognition accuracy.
2.2.2 Mathews et. al. (1970 – 1997)
GROOVE and Conductor Program
Although [Mathews and Moore, 1970] presented a general purpose system for “creating, storing,reproducing, and editing functions of time”, GROOVE has only been used for sound synthesis—with an application called the Conductor Program. The system reads stored samples from mem-ory, combines these samples with realtime input from the user, and computes output samples forcontrol. Four knobs, a 3D joystick, and a keyboard are used as input devices.
The Conductor Program introduces a new view on the interaction with musical systems: Math-ews notes that “the desired relation between the performer and the computer is not that betweenthe player and his instrument, but rather that between the conductor and the orchestra.” Thus, thescore is stored in the computer while the user influences the way it is played back—making theConductor Program probably the first conducting system.
Some more details about the Conductor Program were presented by Mathews in 1976[Mathews, 1976]. He emphasizes again that the supported functions are typically those whichare done by a conductor. Possible areas of application are playing new musical compositions,serving as an accompaniment device, and “active listening”, an application that allows the user tobe an active participant in the performance of a piece of music by conducting and interpreting it[Boulanger et al., 1990].
The Conductor Program consists of three modes: Entering the score, rehearsal—that is ad-justing the manner of playing—and performance. In performance mode, all voices play together.Overall dynamics and balance of individual voices can be controlled by using the joystick. Thereare two different ways to control the tempo: Either the performer uses the knob or he or she canexercise control by beating on a key—an interaction already resembling the one of input devicesused later.
Sequential Drum
Presented in 1979, the Sequential Drum [Mathews, 1979, Mathews and Abbott, 1980] is the firstof three attempts by Mathews to create a mechanical baton [Boulanger et al., 1990]. It is made ofa rectangular surface that can be struck either by hand or by a drumstick. The system’s output con-sists of a trigger whenever the surface was hit, along with information about the strike’s strength(measured by microphones), and the strike’s x and y position (determined from grounding wires).
Although the presented application controlling a synthesizer is able to follow the user’s tempoinducted by his or her beats and to adjust the loudness according to the strikes’ strength, theSequential Drum was rather intended to be a new way of playing “intelligent instruments”; theterm “conducting” as such was not thought of in this context.
Mechanical Baton (Daton)
In 1989, [Mathews, 1989] started using the Conductor Program in conjunction with a MechanicalBaton (or Daton), the successor of the Sequential Drum. It consists of a 14 inch square plateequipped with a strain gauge in each of the four corners. When the plate is struck with a relativelysoft drumstick, the beat’s position and strength are computed using the four electrical impulsesgenerated by the strain gauges. This information is used to control the tempo. As can be seen fromthis setup, the Daton cannot produce continuous values. Therefore, the system uses a joystick andknobs as additional input devices to adjust volume and loudness, for example.
9

2.2 History of Conducting Systems 2 RELATED WORK
In this system, the performer is a conductor of an orchestra rather than a player of an instru-ment. In this context, Mathews also notes that “the program simulates a number of the functionsof an orchestra following the baton of a conductor”. Like in an orchestra, the user does not haveinfluence on the pitch; Mathews gave the task of pitch selection to the computer.
Besides containing information about pitches and durations of notes, the score also containsinformation about expected strokes which is used to control the tempo. According to Matthews,“each Daton stroke after the first stroke sets the tempo that will be used until the next stroke”. If astroke occurs before the next beat mark in the score, the system will jump to this position. If thecomputer arrives at the beat first, it halts and waits for the next stroke. This tempo control makesthe system follow the conductor very closely, a behavior which was preferred by users who triedthe program.
Mathews proposes two potential usage scenarios. The system could be used as an accompani-ment of soloists (as a cheaper alternative) or as an interactive record where the music appreciator“would purchase a computer score and conduct his own interpretation of the piece” rather thanjust listening to recorded music4.
Radio Drum
While looking quite similar at a first glance, the Radio Drum, Boie89, also introduced in 1989, usesa different technology and is more powerful than the Mechanical Baton. It relies on the principle ofcapacitance sensing of electromagnetic waves. The surface is equipped with an array of receivingantennas which receive signals sent by transmitting antennas built into the drum sticks.
In contrast to the Mechanical Baton, an arbitrary number of drumsticks can be used as longas they operate at different frequencies. Furthermore, the Radio Drum continuously measures thesticks’ positions in three dimensions. While the accuracy of the x and y axis is about one percent oftheir maximal value when the stick is close to the surface, it decreases non-linearly with increasingz distance.
Creating two virtual surfaces the Radio Drum also works as a trigger. This mode was appliedwhen the Radio Drum was used as an input device for the Conductor Program [Mathews, 1976].Although this program takes continuous values as inputs, too, [Boie et al., 1989] does not mentionusing the Radio Drum in this way. In the related article, the device is seen as a controller for music,rather than a tool to actually conduct.
Radio Baton
In 1991, [Mathews, 1991] noted that it is possible to have different configurations of the RadioDrum; such a configuration is not being presented, though. The Radio Drum [Boie et al., 1989] isa special version of the Radio Baton with receivers located in a three-dimensional volume.
Interestingly, [Boulanger and Mathews, 1997] uses the term Radio Baton for the same devicewhich was previously called Radio Drum. It has one square antenna and two batons. Besides thealready discussed Conductor Program a second mode for improvisation is presented. The batonsends triggers and x, y, and z coordinates, when requested, to an application which is supposedto interpret this information. While the Radio Baton only delivers control information, Boulangernotes that “the user is expected to program their own improvisation algorithms”.
2.2.3 Buxton et. al. (1980)
A Microcomputer-Based Conducting System
Similar to Mathews’ Conductor Program [Mathews, 1976],[Buxton et al., 1980] built a systemthat enables controlling a digital sound synthesizer. They explicitly named it a conducting system.
4Mathews called this idea “active listening”, too [Boulanger et al., 1990].
10

2 RELATED WORK 2.2 History of Conducting Systems
Nevertheless, it is important to have a closer look at its capabilities with regard to user interactionin order to understand what is meant by conducting in this context.
The user interface of the presented system consists of a CRT screen, a keyboard for text input,a tablet, and a slider box. It allows the user to adjust eight different parameters (tempo and ampli-tude, among others), affecting the way stored scores are played back. This adjustment is done byusing the controls available in the on screen textual user interface, resembling standard controlspresent in nowadays graphical user interfaces. They are “spatially distributed on the screen inmuch the same manner that knobs and dials are distributed on a mixing console.” Buxton et. al.mention different techniques for changing values. The user can for example type numbers or usea dragging technique, i.e. moving the cursor to adjust values.
Although the proposed input techniques are advanced considering the year of publication,the system seems to be more a playback tool for synthesized music scores than a conductingapplication: It allows the user to affect the way music is played back in detail but the requiredinteractions are not the same as an orchestra conductor uses to communicate with musicians.[Mathews, 1976] in contrast mentioned tapping a key in order to control the playback tempo inhis system - which comes closer to conducting gestures than adjusting numerical values using akeyboard or a graphic tablet.
The system is a conducting system if conducting refers to influencing parameters in realtimewhile playing back scores. But it is not a conducting system if conducting means interacting withthe system in a way that resembles the interaction between a real conductor and an orchestra. Itwould not be possible for example to simultaneously conduct live performers and the sequencer,using this system.
2.2.4 Keane et. al. (1989 – 1991)
The MIDI Baton and Successors
[Keane and Gross, 1989] introduced the MIDI Baton system in 1989 to simultaneously conductlive performers and a MIDI sequencer. Shaped like a tube, the device resembles a regular batonwith a metal weight inside. During acceleration, this weight is forced against the tube’s side and aelectrical signal is produced. An interface connected via a wire takes care of removing noise andproviding the signal to a synchronizer which in turn anticipates the tempo and advances the MIDIsequencer. The timing relationship can be adjusted to conduct either behind or ahead of the beat.Start and stop can be controlled using a foot pedal.
Due to its inherent design, the MIDI Baton is only able to provide discrete values thatare used for tempo but not for volume control. In a succeeding version [Keane et al., 1990,Keane and Wood, 1991] of the MIDI Baton, a wireless transmitter was introduced eliminatingthe need for a wired connection between the baton and the MIDI unit. Moreover, switches for startand stop were moved from the foot pedal to the transmitter.
2.2.5 Morita, Sawada et. al. (1989 – 1997)
Computer Music System that Follows a Human Conductor
In 1989, [Morita et al., 1989] presented a system that realizes “an improvisational performance inrealtime”. It is the first conducting system to be based on visual recognition of the conductor’sbaton. A CCD camera in conjunction with feature extraction hardware is used to track eitherthe baton augmented with a white marker or the conductor’s hand wearing a white glove. Aconventional PC is then used to recognize the conducting gestures.
Tempo, strength, start, and stop are detected and sent to MIDI control units. To determinethe tempo, vertical turning points of the baton are analyzed. The strength is extracted from thepath’s length. Although Morita et. al. claim to use a “knowledge database of conducting” there is
11

2.2 History of Conducting Systems 2 RELATED WORK
no further discussion on this topic. They apply an adaptive tempo adjustment by inserting a delaybetween conducting gestures and music playback in order to make the system sound “more naturalin human ears”.
The system can be used as a stand-alone application to enjoy conducting but is also intendedto be used together with real musicians or as accompaniment for plays or operas.
Beginning in 1990, [Morita et al., 1990, Morita et al., 1991] extended the system describedabove by a data glove worn on the left hand which is used to capture additional expressions ac-cording to the grammar of conducting. The authors try to reproduce the process a human musiciangoes through while playing an instrument in an orchestra.
The “musical performance expression” (MPX) is introduced as a formalism that captures the“artistic essence” of performance. In contrast to basic music information like pitch or durationof notes, MPX describes parameters such as “crescendo” or “ritardando” and consists of severalcomponents.
The user is able to input his or her evaluation of the system’s interpretation enabling the systemto adapt to a user’s gestures and preferences. Morita et. al. intend their system to be used as anensemble member together with human musicians or as an automated accompaniment.
Gesture Analysis Using 3D Acceleration Sensor for Music Control
In 1995, [Sawada et al., 1995], developed a “new musical performance system” that uses 3D ac-celerometers for gesture recognition which are fixed to the back of the right hand. In this version,the system has two modes of control: Performance control allows the user to direct performanceadvancements and timbral control is used for mapping kinetic to sound parameters. While notmany details on the hardware and its usability are provided, applied algorithms are describedmore extensively.
[Sawada and Hashimoto, 1997] provide a more in-depth description of a later version of thesame system in 1997—however, not covering the timbral control part, which is of lower interestin the conducting context. The presented system is supposed to “enable anyone to play music”. Ituses two different approaches for gesture recognition:
On the one hand, maxima in the acceleration data are detected for tempo and volume control.Tempo prediction is applied to improve the system’s response. On the other hand, the systemis able to learn arbitrary gesture commands using a recognition based on the distance betweenfeature vectors. Therefore, several kinetic parameters are extracted out of the acceleration data.Using these features, an evaluation value is calculated for each gesture that has been trained before.If the minimum over all evaluation values is below a certain threshold, a gesture is recognized.The start of a gesture is detected by comparing the current acceleration values to the fluctuationsobserved before.
Sawada and Hashimoto report an accuracy of 100% for the gesture recognition if training datacome from the same user and or accuracy of 90% otherwise. It takes between 0.5 s and 1.0 s inorder to detect a gesture. The length of expected gestures has to be known beforehand. No furtherdiscussion is being held on the integration of the two proposed recognition approaches.
2.2.6 Bertini et. al. (1992)
Light Baton
[Bertini and Carosi, 1992] built a system to effectively synchronize live musicians with electronicsynthesis systems in 1992. Similar to [Morita et al., 1989] they also use a visual approach. Thebaton is augmented with a bright LED on its tip. A CCD camera with an image acquisition boardcaptures images at 25 Hz. The coordinates of the baton are then extracted and used for gesturerecognition. Identifying times of minima and maxima of the vertical coordinate is used for the
12

2 RELATED WORK 2.2 History of Conducting Systems
extraction of features like amplitude and duration. The next beat point is predicted by the systemand tempo changes are applied smoothly, resembling the response of a real orchestra.
Although [Bertini and Carosi, 1992] mention a prior study leading to findings that indicatethat, while the x-axis of the baton’s trajectory is relevant for recognizing the downbeats, the y-axis identifies the order number of movements, this information does not seem to be used in thepresented system.
2.2.7 Bien et. al. (1992)
On-line Analysis of Music Conductor’s Two-Dimensional Motion
In 1992, [Bien and Kim, 1992] also used a visual approach to detect the conductor’s gestures. Aspecial purpose hardware takes care of extracting the baton’s trajectory at a rate of 15 Hz (referredto as “high-speed”). This information is transferred to a PC which analyzes the gestures. Noaugmentation for the baton seems to be needed in order to detect its tip.
Motivated by a higher tolerance to noise, a fuzzy logic approach is applied to detect turningpoints of the baton movement rather than looking at direction change features directly. The systemis able to detect the first beat of a measure and derive tempo as well as dynamics by applying simplerules. In addition, it detects static points (“fermata”). Music playback is realized by a 12 channelsound card. Bien and Kim do not mention any attempt to smooth the tempo adjustments in orderto make it behave more like a real orchestra.
2.2.8 Lee (M.), Brecht, Garnett et. al. (1992 – 2001)
Adaptive Conductor Follower
[Lee et al., 1992b] use a Buchla Lightning and a Mattel Power Glove as input hardware for theirartificial musician, or conductor follower. They are the first to apply artificial neural networks(ANN) to conducting gesture recognition. Their architecture consists of classification and param-eter estimation modules—both using separate preprocessors and ANN. The system is supposed torecognize tempo, volume, and “other performance parameters”. Unfortunately, not much detailon the implementation is provided. Also, the role of the Power Glove is not discussed.
The authors mention that they use baton movement in one dimension to derive the impliedtempo, which is calculated from time points within a beat to achieve a faster responds time and tobe able to vary tempo within a beat. ANN are used to approximate the tempo. It is noted that anadjustment for each conductor is recommended because of the wide variation in gestures.
Later in 1992 [Lee et al., 1992a], a slightly different version of the system is reported. Insteadof the Buchla Lightning, Mathews’ Radio Baton [Mathews, 1991] is used as input device. Thesoftware architecture remains the same, focusing on simultaneous classification and parameterestimation. In this version of the system, the data glove is used as a mode controller. Two differenthand gestures can be recognized, one for volume and one for tempo, while the baton’s velocity ismapped to either one of the parameters.
Conductor Follower
In enhancing the system proposed by [Lee et al., 1992b, Brecht and Garnett, 1995] introduced dif-ferent models for tempo recognition and prediction in 1995. While the algorithm originally usedsuffered from not being able to change the tempo rapidly enough, a refined version maps morepoints along the beat’s curve in order to enable more frequent updates. Another proposed modeluses ANN which output the probability of the next beat happening as well as the according beatsubdivision. Although claiming that this system is the first to use “standard conducting gestures”,no further details are provided on this topic.
13

2.2 History of Conducting Systems 2 RELATED WORK
Virtual Conducting Practice Environment
In 1999, taking a different approach compared to the previously discussed systems,[Garnett et al., 1999] pursued an educational intention. Their Virtual Conducting Practice En-vironment is clearly targeted at conducting students, thus it offers graphical and auditory feedbackin order to improve a student’s learning curve. It uses the Buchla Lightning system. Besides anapproach to detect different articulation styles, no information about the actual process of gesturerecognition is presented.
Virtual Ensemble
In 2001, [Garnett et al., 2001] capture position and orientation information of both the user’s handsand his or her head, using three wireless magnetic sensors with six degrees of freedom each. Theproposed systems aims at being used in conductor training and as a conductor-based performanceinstrument. Only preliminary recognition methods are presented. Two beat types can be recog-nized with an accuracy of 85% applying a hybrid approach consisting of a segmentation step andan ANN for classification. Neither tempo nor dynamics recognition is discussed.
2.2.9 Tobey et. al. (1995 – 1996)
The Ensemble Member and the Conducted Computer
In 1995, [Tobey, 1995] presented a conductor-following system created by a professional conduc-tor aiming at the synchronization of live performers and synthesizers as well as conductor training.A Buchla Lightning is used as input device for this MIDI-based system. Tempo is tracked alongthe continual shape of the baton’s path using information from lower and upper turning points aswell as hints coming from the acceleration in between. Tobey calls this approach “rubato con-trol”. The system also provides a training module which can be used to make adjustments to anindividual conductor’s style.
Extraction of Conducting Gestures in 3D Space
In 1996, [Tobey and Fujinaga, 1996] extended the previously presented system by adding anotherBuchla Lightning to the setup in order to be able to track the conductor’s gesture in three di-mensions. The additionally available z-axis is used to track movements away and towards theconductor’s body which was found to be another important dimension in the communication withthe orchestra.
In addition to tempo control, this revised version of the conducting system also provides con-trol over dynamics, beat pattern and style, accentuation, and timbral balances. Besides the use ina hybrid computer-human ensemble, Tobey mentions that this system can also be used as a virtualorchestra.
2.2.10 Marrin et. al. (1996 – 2000)
Digital Baton
Marrin’s [Marrin, 1997, Marrin and Paradiso, 1997] motivation for building the Digital Baton wasto create a new instrument for the performance of computer music. On the one hand, it is intendedto be used as an instrument for musical control to do both, execute individual notes and providehigher-level control for conducting. On the other hand, it is supposed to be used to performmouse-pointing and clicking actions.
14
2 RELATED WORK 2.2 History of Conducting Systems
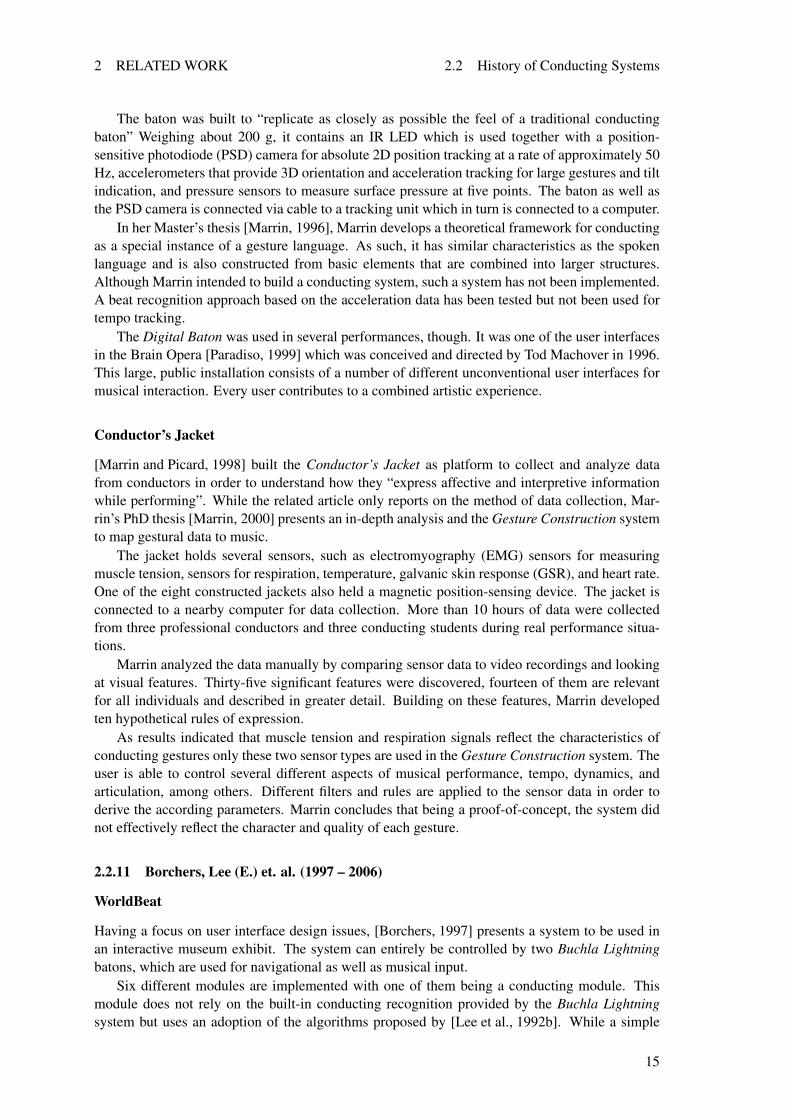
The baton was built to “replicate as closely as possible the feel of a traditional conductingbaton” Weighing about 200 g, it contains an IR LED which is used together with a position-sensitive photodiode (PSD) camera for absolute 2D position tracking at a rate of approximately 50Hz, accelerometers that provide 3D orientation and acceleration tracking for large gestures and tiltindication, and pressure sensors to measure surface pressure at five points. The baton as well asthe PSD camera is connected via cable to a tracking unit which in turn is connected to a computer.
In her Master’s thesis [Marrin, 1996], Marrin develops a theoretical framework for conductingas a special instance of a gesture language. As such, it has similar characteristics as the spokenlanguage and is also constructed from basic elements that are combined into larger structures.Although Marrin intended to build a conducting system, such a system has not been implemented.A beat recognition approach based on the acceleration data has been tested but not been used fortempo tracking.
The Digital Baton was used in several performances, though. It was one of the user interfacesin the Brain Opera [Paradiso, 1999] which was conceived and directed by Tod Machover in 1996.This large, public installation consists of a number of different unconventional user interfaces formusical interaction. Every user contributes to a combined artistic experience.
Conductor’s Jacket
[Marrin and Picard, 1998] built the Conductor’s Jacket as platform to collect and analyze datafrom conductors in order to understand how they “express affective and interpretive informationwhile performing”. While the related article only reports on the method of data collection, Mar-rin’s PhD thesis [Marrin, 2000] presents an in-depth analysis and the Gesture Construction systemto map gestural data to music.
The jacket holds several sensors, such as electromyography (EMG) sensors for measuringmuscle tension, sensors for respiration, temperature, galvanic skin response (GSR), and heart rate.One of the eight constructed jackets also held a magnetic position-sensing device. The jacket isconnected to a nearby computer for data collection. More than 10 hours of data were collectedfrom three professional conductors and three conducting students during real performance situa-tions.
Marrin analyzed the data manually by comparing sensor data to video recordings and lookingat visual features. Thirty-five significant features were discovered, fourteen of them are relevantfor all individuals and described in greater detail. Building on these features, Marrin developedten hypothetical rules of expression.
As results indicated that muscle tension and respiration signals reflect the characteristics ofconducting gestures only these two sensor types are used in the Gesture Construction system. Theuser is able to control several different aspects of musical performance, tempo, dynamics, andarticulation, among others. Different filters and rules are applied to the sensor data in order toderive the according parameters. Marrin concludes that being a proof-of-concept, the system didnot effectively reflect the character and quality of each gesture.
2.2.11 Borchers, Lee (E.) et. al. (1997 – 2006)
WorldBeat
Having a focus on user interface design issues, [Borchers, 1997] presents a system to be used inan interactive museum exhibit. The system can entirely be controlled by two Buchla Lightningbatons, which are used for navigational as well as musical input.
Six different modules are implemented with one of them being a conducting module. Thismodule does not rely on the built-in conducting recognition provided by the Buchla Lightningsystem but uses an adoption of the algorithms proposed by [Lee et al., 1992b]. While a simple
15

2.2 History of Conducting Systems 2 RELATED WORK
downbeat turning point detection is used for tempo control, the gesture size is mapped to playbackvolume. No further tempo prediction or adaptation is applied.
Personal Orchestra
In 2001, [Borchers et al., 2001, Borchers et al., 2002, Borchers et al., 2004] presented the firstconducting system that uses pre-recorded audio rather than synthesized music. The PersonalOrchestra enables the user to control tempo, dynamics, and instrument emphasis with a BuchlaLightning II baton. Examining the first derivate of the y coordinate, downward turning points arerecognized by detecting changes in sign. No details on dynamics or instrument emphasis recog-nition are provided. The authors propose an algorithm that allows the music to catch up when theconductor changes tempo. The system has successfully been used as a museum exhibit.
You’re The Conductor
Similar to Personal Orchestra, You’re The Conductor [Lee et al., 2004] is an exhibit on display ina museum. Targeted at children, it uses a different interaction style and a different, more robusttechnical implementation. Instead of a Buchla Lightning baton, a custom designed baton madefrom an aluminum tube with an LED at the tip is used. A PSD camera picks up the emitted lightand tracks the baton’s trajectory.
The recognition process is fairly simple: Gesture speed is mapped to tempo and gesture sizeto volume; no beat synchronization takes place. Instead of the pre-stretched audio in PersonalOrchestra, You’re The Conductor is capable of realtime audio stretching.
conga Framework and Maestro!/iSymphony
After Personal Orchestra and You’re The Conductor, [Lee et al., 2006a, Grüll, 2005] presentedtheir latest system called Maestro!—or iSymphony—[Lee et al., 2006c] in 2005. It is also installedas a part of a museum exhibit. A Buchla Lightning II is used as an input device. Aiming atbuilding a system that does not need training but at the same time recognizes a variety of gesturesthe authors propose conga, a framework for conducting gesture analysis.
conga is realized as an acyclic graph consisting of linked nodes. Nodes can be either featuredetector or data manipulation nodes. In its current implementation, three different gestures can berecognized. A gesture profile selector chooses the best match. From the description provided, itseems to be rather difficult to build a profile for a more complex gesture like the four-beat pattern.The authors report a recognition rate of more then 90% and a latency of up to 675 ms for thefour-beat pattern.
Toward a Framework for Interactive Systems to Conduct Digital Audio and Video Streams
In this work, [Lee et al., 2006b] combine two of their systems taking the gesture recognition partfrom Personal Orchestra and the audio and video rendering engine from You’re the Conductor.As already discussed in [Lee and Borchers, 2005], a semantic time framework based on beatsand notes in case of musical applications is introduced. It allows non-uniform spacing betweentime units and is able to represent the possibly non-linear relation between real and semantic time.Therefore, operations that change the data’s time base become possible without losing informationabout the semantic time.
16

2 RELATED WORK 2.2 History of Conducting Systems
2.2.12 Ilmonen et. al. (1997 – 1999)
Virtual Orchestra Performance
In 1997, [Takala, 1997] presented a conducting system that features an orchestra of animated vir-tual musicians. These rule-based agents adjust their tempo as well as other aspects of performanceaccording to the conductor who wears the data gloves. Gesture recognition is performed usingANN. The system uses 3D sound.
Conductor Following with Artificial Neural Networks
Two years later in 1999, [Ilmonen and Takala, 1999, Ilmonen, 1999] used a data suite containingseveral magnetic motion trackers with six degrees of freedom each to acquire data for conductinggesture recognition. Applying different ANN and heuristic rules using a priori knowledge aboutthe score, the system can detect tempo, dynamics, and articulation. No evaluation concerning therecognition accuracy has been provided. It is noted that the ANN should be trained anew for eachconductor.
In 2000, [Ilmonen and Jalkanen, 2000] exchanged the above used magnetic tracker for ac-celerometers in order to build a lower priced system to be used in a public exhibition. A wiredtube was equipped with two orthogonally mounted accelerometers.
Two inherent problems of accelerometers used for position tracking are discussed: Drift androtation. In order to overcome those, the authors applied a digital signaling processing approachusing several low- and high-pass filters. Although it is stated that the results are not comparable tothose of magnetic trackers, they were sufficiently satisfying for this application.
2.2.13 Usa et. al. (1998)
A Multi-Modal Conducting Simulator
Building on the model of recognition by actual orchestra musicians, [Usa and Mochida, 1998a,Usa and Mochida, 1998b] presented a conductor follower system that can be used for trainingpurposes. It uses 2D accelerometers attached to a baton at a sampling frequency of 100 Hz andHMM together with fuzzy production rules for gesture recognition. Supporting common conduct-ing gestures as described by Rudolf, the user can control various parameters of the performancelike tempo, dynamics, and articulation, among others.
The applied recognition process tries to imitate the way a real musician interprets conductinggestures. It consists of several agents, one of them integrating a HMM that is used to derive theorder number of a beat within a measure. Acceleration data are filtered and quantified into 32labels before used as input for the HMM. Thus, a discrete HMM is utilized. The start of a gestureis determined by detecting local peaks in the acceleration data.
Several other rule-based approaches are applied to detect further parameters, such as dynamicsor articulation. In combination with fuzzy production rules that take into account the score andcompute probabilities of the next beat occurring, an accuracy of 99.74% is reported if the systemis used by the same person who also trained the HMM. The accuracy drops to 98.95% for otherusers.
In order to realize a more realistic simulation, Usa and Mochida insert a delay between therecognized beats and music playback as a linear function of tempo. The amount of delay to beintroduced was determined in an experiment with Japanese conductors. In a later version, Usa andMochida added eye tracking and breath-sensing to the system.
17
2.2 History of Conducting Systems 2 RELATED WORK
2.2.14 Bianchi et. al. (2000)
Virtual Orchestra: Technical and Creative Issues
The virtual orchestra system presented by [Bianchi and Campbell, 2000] is intended to be used inprofessional opera and theater productions as an alternative to the live orchestra. The fairly largesystem is therefore installed in the pit. It is able to use up to 32 audio channels and follows theconductor’s tempo. No details on the recognition algorithms are discussed.
2.2.15 Segen et. al. (2000)
Visual Interface for Conducting Virtual Orchestra
In 2000, [Segen et al., 2000] presented a conducting system which relies on image processingfor gesture recognition. Using two cameras, 3D trajectories of the baton as well as of the lefthand are reconstructed. The user can control tempo and dynamics using common conductinggestures. While the hand is used for volume control only, the baton controls both, volume andtempo. Volume control by the baton controls the overall volume per measure while the handcontrols overall volume per beat (using different levels of elevation) and volume per orchestrasection (using a special volume gesture).
Recognition is based on analyzing position data and applying rules. In addition to the auditoryoutput, a virtual dance ensemble consisting of 3D human models is synchronized to the user’sinput. No information about the system’s accuracy is provided.
2.2.16 Kolesnik et. al. (2004)
Recognition, Analysis and Performance with Expressive Conducting Gestures
In 2004, [Kolesnik, 2004, Kolesnik and Wanderley, ] used two USB cameras to track the user’sleft and right hand, wearing colored gloves. While the system recognizes indicative, continuousgestures for the right hand, it recognizes expressive, isolated gestures for the left hand.
Discrete HMM are used in the recognition process running in parallel with a “gesture analy-sis system” that performs a beat amplitude and transition points extraction based on extrema ofabsolute positional values. Using this information about temporal segmentation in addition to theprobabilities output by the HMM, continuous gestures can be identified. The system is able toidentify isolated gestures with an accuracy of 97.2% and continuous gestures with an accuracy of94.6%.
2.2.17 Murphy et. al. (2004)
Conducting Audio Files via Computer Vision
[Murphy et al., 2004] presented a conducting system that uses one to two cameras in order to tracka regular baton. Beats are extracted automatically from audio files to enable mapping between theconductor’s beat and beats in the recorded file. Although it is noted that the system uses commonconducting gestures, only the tempo can be influenced and no insights into gesture recognitionalgorithms are given.
Live Interpretation of Conductors’ Beat Patterns
Building on the baton tracking system presented above, the author proposes a mathematical modelfor following and interpreting a conductor’s gestures [Murphy, 2004]. Moreover, he notes that itis usually known what beat pattern is going to be issued and that the importance lies in how the
18

2 RELATED WORK 2.2 History of Conducting Systems
conductor executes it. The proposed model determines the meaningful deviation from a neutralexecution of a beat pattern.
A beat template represented by a continuous close parametric curve built from the user’s exe-cution of the beat pattern is used in the recognition process that keeps track of where the baton isin relation to the whole pattern. No results about the accuracy of this approaches are presented.
2.2.18 Schertenleib et. al. (2004)
Conducting a Virtual Orchestra
In 2004, [Schertenleib et al., 2004] presented a virtual reality system that is targeted at music am-ateurs providing an “entertaining multimedia experience”. The presented work does not intend toadvance existing conducting interfaces but tries rather to offer an immersive experience conductinga virtual orchestra.
It is the first system that allows the user to modify the orchestra’s layout and to select anarbitrary viewing. While the virtual musicians are presented on a large projection screen, the maininput interface is a PDA with an attached magnetic tracker. Simple conducting gestures controlthe orchestra’s tempo and volume using the gestures’ frequency and amplitude respectively.
2.2.19 Dillon et. al. (2006)
Virtual Orchestra: An Immersive Computer Game for Fun and Education
[Dillon et al., 2006] present their virtual orchestra system on the one hand as a “fun computergame” that introduces children to music and on the other hand as a “conducting training tool”.Using a commercial air gyro mouse, conducting gestures are detected by recognizing sequencesof “impulses”, that is, fast changes in direction. The user is able to control tempo, dynamics, andarticulation.
Besides the MIDI audio output, the system is also able to display virtual musicians. Dillonet. al. implemented a scoring system to evaluate a user’s performance based on a comparisonbetween conducted tempo respectively dynamics and those written in the score. Different levelsof difficulty are selectable and the virtual audience shows reactions according to how the userperforms.
The authors note that is it possible to build a standalone version of the virtual orchestra that isable to run on a standard PC. No evaluation on recognition accuracy or details about the mentionedtraining part are presented.
2.2.20 Studies
Improving Orchestral Conducting Systems in Public Spaces: Examining the TemporalCharacteristics and Conceptual Models of Conducting Gestures
In 2005, [Lee et al., 2005] investigated the temporal characteristics of conducting gestures withregard to beat placement comparing conductors to non-conductors. Determining parameters thatmakes it possible to clearly distinguish between these two user group allows for building an adap-tive conducting system.
Twenty-three users took part in the study. They were instructed to conduct a fixed orchestralrecording using a simple up-down-motion, being aware that they can not influence the perfor-mance. No automatic recognition was used. Beats in the audio track as well as lower turningpoints in conducting gestures were annotated manually.
The findings show that conductors lead by an average of 152 ms compared to non-conductorswho lead by an average of 47 ms. Also, non-conductors vary their beat-placement 50% more thanconductors. In contrast, non-conductors do not make more beat errors than conductors. Additional
19

2.2 History of Conducting Systems 2 RELATED WORK
observations showed that non-conductors often follow the musical rhythm rather than the actualbeat. Moreover, as “spiral of death” was observed: In response to a slowdown in music the userslows down the gestures which in turn slows down the music even more. The authors assumedthat these findings also apply to an active system which still has to be investigated.
Modeling the Tempo Coupling between an Ensemble and the Conductor
In 2006, [Baird and Izmirli, 2001] analyzed the tempo coupling between conductor and ensemble,that is, the measure indicating “how closely the tempo of the ensemble corresponds to the tempoof the conductor”, especially during changing tempos when a difference can be observed.
A position sensor attached to the conductor’s baton or index finger is used to gather data fromlive performances. After creating a compact representation of the coupling, results are generalizedand a model is built which is used in a performance system to simulate different levels of ensembleresponsiveness.
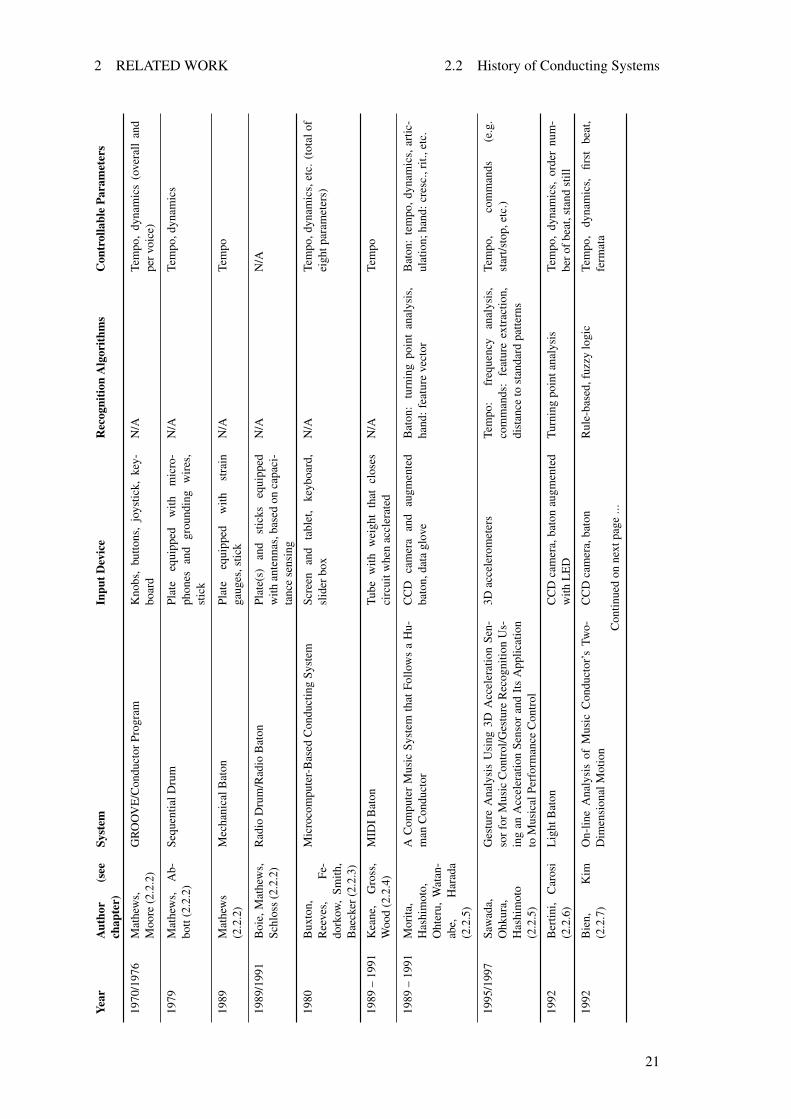
2.2.21 Comparison
Table 2.3 provides a compact comparison of the presented computer-based conducting systemswith focus on the input and gesture recognition part. Since there are many systems with differentproperties, the table’s categories are kept quite general in order to make it possible to fit the sys-tems’ characteristics into one single table for easier comparison. Further details can be found inthe corresponding chapters of this section. Only properties that are described in the related articlesare considered.
The systems are ordered in the same way as in the beginning of this section. Those by thesame group of authors are presented consecutively. The following categories are used:
System contains either the name of the system or the title of the corresponding paper if thesystem does not have a clear name. If a system introduces only minor changes compared to anearlier system, it is listed in the same row.
Input device lists the input devices (and their functional principle, if custom-made) that areavailable in the corresponding system to enable the user to conduct.
Recognition algorithms categorizes the techniques that are used to detect the user’s intention,i. e., algorithms that are applied to translate raw data coming from the input devices into controldata used to influence parameters of music playback. Turning point analysis refers to techniquesthat use position, velocity, or acceleration data in order to determine the point in time where thebaton changes its direction, indicating either a down- or an up-beat. Systems that follow a rule-based approach apply rules that combine different facts in order to derive the conductor’s intention.When a system uses frequency and amplitude analysis it does not map beats but simply correlatesgesture speed and size to tempo and volume, for example.
Controllable parameters lists the musical parameters that can be influenced by the user throughconducting. Only parameters that are mentioned in the corresponding articles to be actually usedin the systems are listed.
20
2 RELATED WORK 2.2 History of Conducting Systems
Year
Aut
hor
(see
chap
ter)
Syst
emIn
putD
evic
eR
ecog
nitio
nA
lgor
ithm
sC
ontr
olla
ble
Para
met
ers
1970
/197
6M
athe
ws,
Moo
re(2
.2.2
)G
RO
OV
E/C
ondu
ctor
Prog
ram
Kno
bs,
butto
ns,
joys
tick,
key-
boar
dN
/ATe
mpo
,dy
nam
ics
(ove
rall
and
perv
oice
)
1979
Mat
hew
s,A
b-bo
tt(2
.2.2
)Se
quen
tialD
rum
Plat
eeq
uipp
edw
ithm
icro
-ph
ones
and
grou
ndin
gw
ires
,st
ick
N/A
Tem
po,d
ynam
ics
1989
Mat
hew
s(2
.2.2
)M
echa
nica
lBat
onPl
ate
equi
pped
with
stra
inga
uges
,stic
kN
/ATe
mpo
1989
/199
1B
oie,
Mat
hew
s,Sc
hlos
s(2
.2.2
)R
adio
Dru
m/R
adio
Bat
onPl
ate(
s)an
dst
icks
equi
pped
with
ante
nnas
,bas
edon
capa
ci-
tanc
ese
nsin
g
N/A
N/A
1980
Bux
ton,
Ree
ves,
Fe-
dork
ow,
Smith
,B
aeck
er(2
.2.3
)
Mic
roco
mpu
ter-
Bas
edC
ondu
ctin
gSy
stem
Scre
enan
dta
blet
,ke
yboa
rd,
slid
erbo
xN
/ATe
mpo
,dyn
amic
s,et
c.(t
otal
ofei
ghtp
aram
eter
s)
1989
–19
91K
eane
,G
ross
,W
ood
(2.2
.4)
MID
IBat
onTu
bew
ithw
eigh
tth
atcl
oses
circ
uitw
hen
accl
erat
edN
/ATe
mpo
1989
–19
91M
orita
,H
ashi
mot
o,O
hter
u,W
atan
-ab
e,H
arad
a(2
.2.5
)
AC
ompu
ter
Mus
icSy
stem
that
Follo
ws
aH
u-m
anC
ondu
ctor
CC
Dca
mer
aan
dau
gmen
ted
bato
n,da
tagl
ove
Bat
on:
turn
ing
poin
tan
alys
is,
hand
:fea
ture
vect
orB
aton
:te
mpo
,dyn
amic
s,ar
tic-
ulat
ion;
hand
:cre
sc.,
rit.,
etc.
1995
/199
7Sa
wad
a,O
hkur
a,H
ashi
mot
o(2
.2.5
)
Ges
ture
Ana
lysi
sU
sing
3DA
ccel
erat
ion
Sen-
sorf
orM
usic
Con
trol
/Ges
ture
Rec
ogni
tion
Us-
ing
anA
ccel
erat
ion
Sens
oran
dIt
sA
pplic
atio
nto
Mus
ical
Perf
orm
ance
Con
trol
3Dac
cele
rom
eter
sTe
mpo
:fr
eque
ncy
anal
ysis
,co
mm
ands
:fe
atur
eex
trac
tion,
dist
ance
tost
anda
rdpa
ttern
s
Tem
po,
com
man
ds(e
.g.
star
t/sto
p,et
c.)
1992
Ber
tini,
Car
osi
(2.2
.6)
Lig
htB
aton
CC
Dca
mer
a,ba
ton
augm
ente
dw
ithL
ED
Turn
ing
poin
tana
lysi
sTe
mpo
,dy
nam
ics,
orde
rnu
m-
bero
fbea
t,st
and
still
1992
Bie
n,K
im(2
.2.7
)O
n-lin
eA
naly
sis
ofM
usic
Con
duct
or’s
Two-
Dim
ensi
onal
Mot
ion
CC
Dca
mer
a,ba
ton
Rul
e-ba
sed,
fuzz
ylo
gic
Tem
po,
dyna
mic
s,fir
stbe
at,
ferm
ata
Con
tinue
don
next
page
...
21

2.2 History of Conducting Systems 2 RELATED WORK
Year
Aut
hor
(see
chap
ter)
Syst
emIn
putD
evic
eR
ecog
nitio
nA
lgor
ithm
sC
ontr
olla
ble
Para
met
ers
1992
/199
5L
ee(M
.),G
ar-
nett,
Wes
sel,
Bre
cht,
Gar
nett
(2.2
.8)
Ada
ptiv
eC
ondu
ctor
Follo
wer
/Con
duct
orFo
l-lo
wer
Buc
hla
Lig
htni
ng(l
ater
Rad
ioB
aton
),M
atte
lPow
erG
love
Neu
raln
etw
orks
Tem
po,
dyna
mic
s,m
isc.
per-
form
ance
para
met
ers
1999
Gar
nett,
Mal
var-
Rui
z,St
oltz
fus
(2.2
.8)
Vir
tual
Con
duct
ing
Prac
tice
Env
iron
men
tB
uchl
aL
ight
ning
N/A
Tem
po,d
ynam
ics,
artic
ulat
ion
2001
Gar
nett,
Jon-
nala
gadd
a,E
lezo
vic,
John
-so
n,Sm
all
(2.2
.8)
Tech
nolo
gica
lAdv
ance
sfo
rC
ondu
ctin
ga
Vir-
tual
Ens
embl
eT
hree
body
-wor
n6D
OF
mag
-ne
ticm
otio
ntr
acke
rsSe
gmen
tatio
n,ne
ural
netw
orks
Bea
ttyp
es
1995
Tobe
y(2
.2.9
)T
heE
nsem
ble
Mem
ber
and
the
Con
duct
edC
ompu
ter
Buc
hla
Lig
htni
ngTu
rnin
gpo
inta
naly
sis
Tem
po
1996
Tobe
y,Fu
ji-na
gaE
xtra
ctio
nof
Con
duct
ing
Ges
ture
sin
3DSp
ace
Two
Buc
hla
Lig
htni
ngN
/ATe
mpo
,dyn
amic
s,be
atpa
ttern
,be
atst
yle,
timbr
alba
lanc
e
1997
Mar
rin,
Par-
adis
oD
igita
lBat
on(2
.2.1
0)B
aton
with
acce
lero
met
ers,
pres
sure
sens
ors,
IRL
ED
and
PSD
cam
era
N/A
N/A
1998
/200
0M
arri
n,Pi
card
(2.2
.10)
Con
duct
or’s
Jack
etD
ata
suite
with
EM
G,
resp
ira-
tion,
tem
pera
ture
,G
SR,
hear
tra
te,a
ndm
agne
ticpo
sitio
nse
n-so
rs
Tem
po,
dyna
mic
s,ar
ticul
atio
n,m
isc.
perf
orm
ance
para
met
ers
1997
Bor
cher
s(2
.2.1
1)W
orld
Bea
tTw
oB
uchl
aL
ight
ning
Turn
ing
poin
tana
lysi
sTe
mpo
,dyn
amic
s
2001
–20
04B
orch
ers,
Lee
(E.),
Sam
-m
inge
r,M
user
,M
ühlh
äuse
r(2
.2.1
1)
Pers
onal
Orc
hest
raB
uchl
aL
ight
ning
Turn
ing
poin
tana
lysi
sTe
mpo
,dy
nam
ics,
inst
rum
ent
emph
asis
Con
tinue
don
next
page
...
22

2 RELATED WORK 2.2 History of Conducting Systems
Year
Aut
hor
(see
chap
ter)
Syst
emIn
putD
evic
eR
ecog
nitio
nA
lgor
ithm
sC
ontr
olla
ble
Para
met
ers
2004
Lee
(E.),
Mar
-ri
n,B
orch
ers
(2.2
.11)
You
’re
The
Con
duct
orPS
Dca
mer
a,ba
ton
with
IRL
ED
Freq
uenc
yan
dam
plitu
dean
al-
ysis
Tem
po,d
ynam
ics
2006
Lee
(E.),
Grü
ll,K
iel,
Bor
cher
s,D
eden
bach
,K
arre
r,W
olf
(2.2
.11)
cong
a/M
aest
ro!/
iSym
phon
yB
uchl
aL
igth
ning
Rul
e-ba
segr
aph
appr
oach
Tem
po,
dyna
mic
s,in
stru
men
tem
phas
is
1997
Taka
la(2
.2.1
2)V
irtu
alO
rche
stra
Perf
orm
ance
Dat
agl
oves
Neu
raln
etw
orks
Tem
po,m
isc.
perf
orm
ance
pa-
ram
eter
s
1999
/200
0Il
mon
en,
Taka
la,
Jalk
a-ne
n(2
.2.1
2)
Con
duct
orFo
llow
ing
With
Art
ifici
alN
eura
lN
etw
orks
Dat
asu
itew
ith6D
OF
mag
netic
mot
ion
trac
kers
Neu
raln
etw
orks
,heu
rist
icru
les
Tem
po,d
ynam
ics,
nuan
cing
1998
Moc
hida
,U
sa(2
.2.1
3)A
Mul
ti-M
odal
Con
duct
ing
Sim
ulat
orB
aton
with
2Dac
cele
rom
eter
sH
MM
,fuz
zyru
les
Tem
po,
dyna
mic
s,ar
ticul
atio
nst
art/s
top,
ferm
ata
2000
Bia
nchi
,Cam
p-be
ll(2
.2.1
4)V
irtu
alO
rche
stra
N/A
N/A
N/A
2000
Sege
n,G
luck
-m
an,
Kum
ar(2
.2.1
5)
Vis
ualI
nter
face
forC
ondu
ctin
gV
irtu
alO
rche
s-tr
aTw
oca
mer
as,
bato
nan
dha
ndtr
acki
ngTu
rnin
gpo
int
anal
ysis
,ru
le-
base
dTe
mpo
,dyn
amic
s,be
atph
ase
2004
Kol
esni
k,W
an-
derl
ey(2
.2.1
6)R
ecog
nitio
n,A
naly
sis
and
Perf
orm
ance
with
Exp
ress
ive
Con
duct
ing
Ges
ture
sC
amer
as(t
rack
ing
both
hand
s)H
MM
Tem
po,e
xpre
ssiv
eco
ntro
l
2004
Mur
phy,
An-
ders
en,
Jens
en(2
.2.1
7)
Con
duct
ing
Aud
ioFi
les
via
Com
pute
rVis
ion
One
ortw
oca
mer
as,b
aton
N/A
Tem
po
2004
Mur
phy
(2.2
.17)
Liv
eIn
terp
reta
tion
ofC
ondu
ctor
s’B
eat
Pat-
tern
sO
neor
two
cam
eras
,bat
onM
athe
mat
ical
mod
elN
/A
2006
Sche
rten
leib
,G
utie
rrez
,V
exo,
Tha
l-m
ann
(2.2
.18)
Con
duct
ing
aV
irtu
alO
rche
stra
Mag
netic
trac
ker
atta
ched
toPD
AFr
eque
ncy
and
ampl
itude
anal
-ys
isTe
mpo
,dyn
amic
s
Con
tinue
don
next
page
...
23
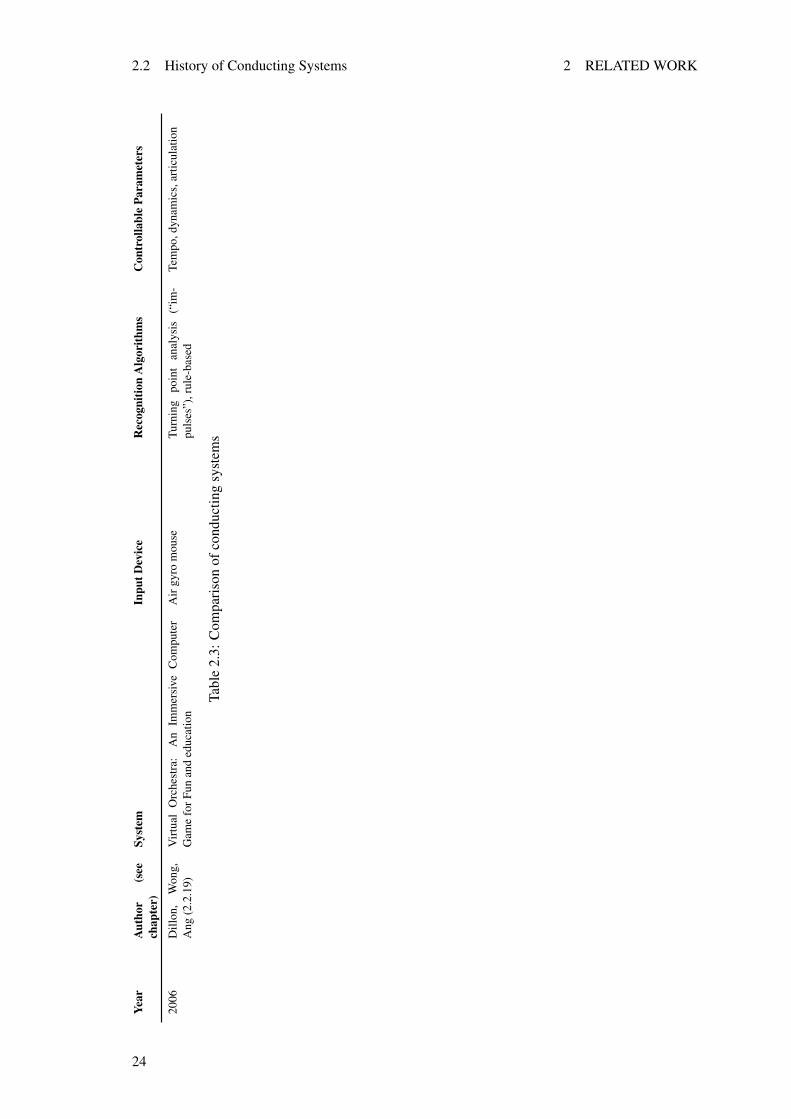
2.2 History of Conducting Systems 2 RELATED WORK
Year
Aut
hor
(see
chap
ter)
Syst
emIn
putD
evic
eR
ecog
nitio
nA
lgor
ithm
sC
ontr
olla
ble
Para
met
ers
2006
Dill
on,
Won
g,A
ng(2
.2.1
9)V
irtu
alO
rche
stra
:A
nIm
mer
sive
Com
pute
rG
ame
forF
unan
ded
ucat
ion
Air
gyro
mou
seTu
rnin
gpo
int
anal
ysis
(“im
-pu
lses
”),r
ule-
base
dTe
mpo
,dyn
amic
s,ar
ticul
atio
n
Tabl
e2.
3:C
ompa
riso
nof
cond
uctin
gsy
stem
s
24

2 RELATED WORK 2.2 History of Conducting Systems
2.2.22 Discussion
Due to their great variety in a number of characteristics, it would be quite difficult to compare thepresented systems in general. In fact, it seems to be more beneficial to focus on the respectiveinput devices and recognition techniques used, since this is the emphasis of the present thesis aswell.
Several types of sensors have been used for conducting gesture recognition: Cameras in con-junction with more or less augmented batons, muscle tension, heart rate, respiration, and galvanicskin response sensors, data gloves, magnetic motion trackers, and accelerometers. For the actualrecognition, most of the systems rely on only one of those sensor classes. Although [Marrin, 2000]used a combination of several sensor types to conduct a user study, only two of them were used inher recognition system. As can easily be seen from table 2.3, the majority of systems use a visualapproach to capture the conductor’s movements; almost half of them chose the Buchla Lightingas input device. Accelerometers are only part of three of the adopted input devices. Several otherapproaches were taken, ranging from magnetic tracking over custom-built approaches (especiallyin the early years) to combinations of a multiplicity of different sensors.
A second important choice, that has to be made when designing a computer-based conductingsystem, is which recognition technique to use (including feature extraction and representation).Together with the input device, this decision defines the system’s limits in terms of possible varietyof recognizable gestures, and thus the number of controllable parameters as well as the achievablerecognition accuracy.
Most of the presented system use a rule-based approach, often analyzing the turning points ofthe baton’s trajectory in order to recognize beats. While one approach develops a fairly compli-cated mathematical model [Murphy, 2004], another system incorporates a recognition process thatuses a graph structure with nodes for data manipulation and feature detection [Lee et al., 2006a].Four of the systems make use of ANN, two of HMM.
In this context, it is important to have the intended application in mind. Several of the presentedsystems are intended to be used in museum exhibits where a single user only has a very limitedtime to get familiar and interact with the system. In such a case, it does not make sense to providea large number of controllable parameters, for example. Others put an emphasis on conductortraining applications. In this area, it might be desirable to support a larger set of conductinggestures. Some of the systems are designed for playing along with human musicians. Here, it isimportant to reliably support at least a basic set of parameters that allow the system to follow theconductor. Another application area can be found in the entertainment category.
It is interesting to note that the output capabilities changed over the years as well. Beginningwith systems that controlled a synthesizer, the MIDI standard is used in the majority of the systems.A more realistic performance was achieved by systems that used prerecorded audio which wasstretched according to tempo. In addition, several approaches for visual output were presented,ranging from virtual, animated characters to professional recordings of real symphony orchestras.
In this chapter, I presented an overview of approaches that apply HMM to pattern recognitiontasks on the one hand, and the history of computer-based conducting and orchestra systems onthe other hand. In the course of the document, I shall refer to the prior worked mentioned inthis chapter in the course of the document, where applicable. In the next chapter, I shall give anintroduction to the application domain of conducting and describe initial user studies which wereperformed in the context of this thesis.
25

2.2 History of Conducting Systems 2 RELATED WORK
26

3 PRECEDING STUDIES
3 Preceding Studies
After presenting an overview of related work in the previous chapter, I shall briefly introducethe application domain of conducting—with a focus on conducting gestures—at the beginningof this chapter. In section 3.2, I shall describe two initial user studies with conductors and theirimplications for the gesture recognition approach to be developed.
3.1 Conducting Gestures
The following comments are mainly based on [Rudolf, 1950], who claims to be the first publisherof a textbook on conducting techniques. When interacting with an orchestra, the conductor takesthe role of a musical leader; he is part musician and part actor. The task of directing an orchestrais complex, since many musical details have to be communicated.
A conductor uses his gestures in order to convey his intention to the orchestra. Besides indi-cating tempo, much more information may be included in conducting gestures, such as dynamicsor articulation—information that is required to achieve an artistic result. Usually, the right hand isused for time beating, while the left hand performs expressive gestures.
[Rudolf, 1950] drastically emphasizes the importance of a good baton technique by statingthat “a conductor who fractured his left arm would still be able to exercise complete control of hisgroup, provided that he had a good baton technique.” He notes that an orchestra can be directedwithout a baton as well—it is the technique of performing gestures that is relevant. However, abaton makes it easier for musicians to follow the conductor which is especially important for largeensembles with a considerable distance between musicians and conductor.
In the grammar of conducting, there are different gestures defined for the indication of differenttypes of measures, e.g. 2-beat or 3-beat measures. These gestures can be performed at varyingspeed in order to communicate tempo, and at varying size in order to communicate dynamics.Moreover, the gestures may vary in style in order to communicate articulation.
2
1
(a) 2-beat
3
1 2
(b) 3-beat
4
12 3
(c) 4-beat
Figure 3.1: Light-staccato conducting gestures [Rudolf, 1950]
Figure 3.1 contains three diagrams which illustrate how light-staccato conducting gesturesfor 2-, 3-, and 4-beat measures are supposed to be performed. These diagram depict the baton’smovement in a plane, i.e. contain information in which order up, down, left, and right movementshave to be performed. Squares indicate short halts in the movement, the numbers denote beatswithin a measure.
For the remainder of this thesis, I chose light-staccato over alternative articulations, such asnon-espressivo or legato, since the according gestures are relatively easy to learn and perform andcontain the same information with regard to time beating. I shall focus on developing an approachwhich recognizes conducting gestures of three different measures, performed in light-staccato,and which is able to extract conveyed information about tempo and dynamics. Pinocchio in its
27

3.2 Initial User Studies 3 PRECEDING STUDIES
current version is able to process this information and influence the virtual orchestra’s performanceaccordingly. Since [Rudolf, 1950] indicates that conducting gestures can be performed with orwithout baton, I decided not to use a baton for the evaluation presented in this thesis for practicalreasons.
An evaluation on how the usage of a baton affects the data captured by the accelerometers,and thus the recognition performance, is left to future research (compare chapter 9). Additionally,different styles of articulation may be added in the future by means of simply training the recogni-tion module accordingly. Future work may also include an extension that enables the recognitionof additional expressive features.
3.2 Initial User Studies
Daniel Meyer At the beginning of this research project, I was given the opportunity to per-form a first user study with conductor Daniel Meyer5 during a rehearsal of the Pittsburgh YouthSymphony Orchestra. Figure 3.2 shows a picture of him wearing the eWatch.
The intention of this study is twofold: First, I am interested in the interaction between aconductor and his orchestra, especially with respect to timing. Second, I am interested in theeWatch’s suitability as an input device to capture conducting gestures. That is, I am investigating ifthe acceleration data provided by the eWatch contains sufficiently enough information for gesturerecognition on the one hand, and if the user is comfortable wearing the eWatch while conductingon the other hand.
Figure 3.2: Conductor Daniel Meyer wearing the eWatch during a rehearsal
During the rehearsal, I recorded Daniel Meyer using a Panasonic DVC-30 digital camcorderwhile he was wearing the eWatch. Additionally, I positioned a microphone (connected to the cam-corder) close to the conductor’s platform in order to capture the same audio information observedby the conductor at the same time. Using this recording setup, I captured video paired with au-dio footage as well as acceleration and light data. The synchronization of the resulting two datasources, which is a required processing step to be able to annotate acceleration data by analyzingimage sequences, is described in detail in section 6.4.
I selected a two minute long section from Brahm’s Symphony No. 3 in F major, Allegro forfurther analysis. That is, I manually annotated the conducting gesture’s lower turning points—indicating beats—in the acceleration data with the help of the simultaneously recorded video.Since a reliable audio beat extraction tool is not available, I implemented a tool in MATLAB whichallows to play a digital music file and tap along the beat by hitting a key repeatedly. The recordedbeat times are then adjusted to match the actual music beats using an audio editor. Comparing
5Daniel Meyer is resident conductor of the Pittsburgh Symphony Orchestra and the music director of the PittsburghYouth Symphony Orchestra [Meyer, 2007].
28

3 PRECEDING STUDIES 3.2 Initial User Studies
conducting to music beats, it turns out that the conductor is ahead by 272 ms on average in theselected piece.
Furthermore, the results show that the eWatch’s acceleration data can be used to identify con-ducting beats manually. Its suitability for automatic beat identification—or more general for con-ducting gesture recognition—is discussed in section 4.3. During the rehearsal, Daniel Meyer waswearing the eWatch for approximately three hours with intermissions. He stated that he was awareof wearing the eWatch while conducting. However, he was able to perform conducting gestures asusual. These results affirm that the eWatch is a suitable input device for a virtual orchestra system.
This user study’s results were integrated into a poster which was accepted for the 11th Interna-tional Symposium on Wearable Computers [Schmidt et al., 2007]. The according paper is shownin figures 11.2 and 11.3; the poster presented at the conference’s poster session is shown in figure11.4 in the appendix.
Walter Morales Analyzing the previous recording with Daniel Meyer, which was taken dur-ing a live orchestra rehearsal, I realized that there is more information conveyed in conductinggestures—thus making the gestures very complex—than can be recognized and interpreted in afirst approach of building a conducting gesture recognizer. Therefore, I chose to use a more con-trolled environment in this second user study by restricting the types of gestures to be performedwith regard to measure, tempo, and articulation.
For this user study, I asked conductor Walter Morales6 to perform different conducting ges-tures following a metronome on the one hand, and selected pieces of classical music of differentmeasures on the other hand. This user study’s goal is to learn more about how conducting gesturesare performed; watching a conductor doing so gives much more insight than referring to a textbook only. A description of the recording setup may be found in section 6.4.
In this user study, the conductor was wearing the eWatch differently in order to collect datathat better capture a conducting gesture’s features (compare section 4.3). Additionally, he per-formed the same gestures with and without baton for later analysis of potential differences (com-pare section 9.3). The video footage’s analysis was a valuable help in understanding the nature ofconducting gestures. While, at the beginning, the gestures performed by Walter Morales seemedto be very complex and even not accurate for the untrained eye, a frame by frame analysis revealedthat the beat placement matched with the metronome’s ticks, in fact. Figure 3.3 shows an imagesequence of Walter Morales performing a 2-beat conducting gesture.
In this chapter, I explained how conducting gestures are performed and which information maybe communicated during conducting. Moreover, I presented results of two user studies with con-ductors performed in different environments. These studies affirmed the eWatch’s suitability asinput device for a virtual orchestra system. In the next chapter, I shall introduce design decisionsmade with regard to the realization of this project.
6Walter Morales is the music director of the Edgewood Symphony Orchestra as well as the music director andconductor for the Carnegie Mellon Contemporary Ensemble. He is also the assistant director of orchestral studies atCarnegie Mellon University and assistant conductor for the Carnegie Mellon Philharmonic [Morales, 2007].
29

3.2 Initial User Studies 3 PRECEDING STUDIES
Figure 3.3: Conductor Walter Morales performing a 2-beat conducting gesture
30

4 DESIGN DECISIONS
4 Design Decisions
Based on a requirement elicitation at the beginning of this chapter, I shall explain the decisionsI made regarding the gesture recognition method as well as hardware and software to be used inthe realization of the gesture recognition module. Furthermore, I shall show the reasoning that ledto these decisions, as a consequence of the requirements on the one hand, and the components’availability on the other hand.
Due to the fairly comprehensive nature of integrating a gesture recognition module into anexisting software system—potentially requiring a complex approach—there are multiple decisionsteps at different levels to be taken. Figure 4.1 depicts the different decision steps that led to thesedecisions and illustrates how they depend on each other.
Hardware
Software
RecognitionMethod
Decision Step
determines
Requirements- functional- non-functional
Figure 4.1: Decision steps
Deciding on a recognition method, specific hardware components, and software tools definesthe resulting system’s capabilities as well as its limitations, which I shall also discuss in the fol-lowing sections. The remainder of this chapter starts with a requirements elicitation, identifyingfunctional and non-functional requirements, and continues with a discussion about recognitionmethod, hardware, and software choices.
4.1 Requirements Elicitation
For a clear definition of the requirements relevant to the context of this thesis, one has to differ-entiate between the requirements for the Pinocchio system in general and the requirements for theconducting gesture recognition part (the subject of this thesis) in particular. I shall not cover anelicitation of requirements for the Pinocchio system in general; this has already been discussedand can be found in [Bierbaum, 2007] and [Fenzl, 2007].
In fact, I shall focus on those requirements which are relevant for the decisions to be maderegarding the gesture recognition subsystem in the remainder of this section. Following the termi-nology described in [Brügge and Dutoit, 2003], I shall stick to the distinction between functionaland non-functional requirements to provide a more structured compilation of requirements.
I identified the functional requirements listed in table 4.1, which “describe the in-teractions between the system and its environment independent of its implementation”[Brügge and Dutoit, 2003, page 125]. To simplify matters, the term “system” is meant to referto “gesture recognition subsystem” in the following tables.
Table 4.2 lists the identified nonfunctional requirements, which “describe aspects of the systemthat are not directly related to the functional behavior of the system” [Brügge and Dutoit, 2003,page 126]:
31

4.2 Recognition Method Decision 4 DESIGN DECISIONS
Functional Requirement DescriptionGesture identification The system must be able to find and classify common con-
ducting gestures (compare [Rudolf, 1950]) which are con-tinuously performed by the user with his or her arm andhand. This requirement is twofold: The system needs tosegment the continuous user input on the one hand, and torecognize the type of gesture that has been performed on theother hand.
User-independent recognition The system must be able to recognize conducting gesturesfrom different users at a given time without changing thesystem’s implementation.
Extensible recognition approach The chosen recognition approach must be extensible, that is,it must be possible to setup the system in a way that enablesit to recognize arbitrary gestures performed with the user’sarm and hand without changing the system’s implementa-tion. One must be able to add a conducting gesture for adifferent measure easily, for example.
Gesture interpretation In addition to the identification of gestures, the system mustbe able to interpret the gestures it identified. In the contextof conducting gestures this means that (at least) the intendedtempo and volume as conveyed in the gestures need to beextracted by the system.
Table 4.1: Functional requirements of the gesture recognition subsystem
4.2 Recognition Method Decision
Before a final decision on either the hardware or the software to be used is possible, after reviewingthe requirements introduced in the previous section, there is one more step in the chain of decisionsto be tackled. Decisions have to be made on
1. what class of input device will be used and on
2. what type of recognition algorithm will be applied (this decision is closely related to theprevious one since the recognition algorithm depends on the data provided by the inputdevice).
It is necessary to make these decisions at this point in order to choose the appropriate hardware,and later the software. As presented in section 2.2.21, previous conducting systems were using abroad variety of different input devices (ranging from knobs and drum sticks via cameras and datagloves to other type of sensors) and a few different recognition approaches (rule-based recognitionand machine learning approaches).
Class of Input Device Reviewing the requirements defined in section 4.1 and bearing in mindthe onsite availability of the eWatch device (for details see 4.3), I chose to use an input device in-corporating accelerometers for the following reasons. Accelerometers can easily be positioned tocapture the motion of the user’s arm and hand, as well as meeting the gesture recognition require-ment defined above. Furthermore, they are able to provide data at higher frequencies comparedto visual approaches incorporating regular cameras thus ensuring not to discard higher frequencyparts of the user’s motion. At the same time they meet the responsiveness requirement as identi-fied above. With a closer look at the usability requirement defined above it becomes apparent that
32

4 DESIGN DECISIONS 4.3 Hardware Decisions
Non-Functional Requirement DescriptionAvailability The system and its components must be able to provide the
gesture recognition service to its host system (Pinocchio) aslong as this runs.
Usability The input device to be used by the system must not limitthe user’s execution of motions while conducting, nor mustit restrict the user’s operating range, that is the user must beable to chose his or her position to conduct freely while in thesame room with the computer running Pinocchio, regardlessof his or her orientation towards this computer.
Reliability The processing chain consisting of the input device, therecognition module, and the connection to Pinocchio as wellas the interaction between these components need to workproperly and create reproducible results.
Robustness The system must be able to differentiate between meaningfulgestures, that is gestures relevant for conducting, and arbi-trary movements.
Responsiveness Conducting is a time-critical process (compare[Schmidt et al., 2007, Lee et al., 2005]). Therefore, thesystem must have a response time between zero and twentymilliseconds in order to provide sufficiently fast feedback tothe user.
Interface The system has to be seamlessly integrated into the exist-ing Pinocchio virtual orchestra system. It must be accessiblethrough Pinocchio’s graphical user interface and it must beable to control tempo and volume of the piece of music be-ing played.
Table 4.2: Non-functional requirements of the gesture recognition subsystem
accelerometers are an excellent choice to build an input device which does not rely on the line ofsight and—because of the relatively small amount of data being generated—is able to transfer itssensor data over the air.
Type of Recognition Algorithm For choosing a recognition algorithm, all of the functionalrequirements defined above have to be considered. I chose to use a machine learning approachbecause such approaches have been successfully applied in similar systems before and becausethey are able to handle the recognition of sequences in related areas dealing with time series data(such as speech or handwriting recognition) at the same time. Machine learning approaches seemto be more suitable to recognize gestures coming from different users. Additionally, since they arebeing trained, it seems fairly simple to teach new gestures.
4.3 Hardware Decisions
This section illustrates the decision process for the hardware to be used in this project, guided bythe requirements elicitation and recognition method decision discussed above.
33

4.3 Hardware Decisions 4 DESIGN DECISIONS
Computer Platform The choice of the hardware platform which is to run the actual virtual or-chestra system is predetermined by the interface requirement listed in table 4.2: Pinocchio hasbeen implemented for the Apple Macintosh computer platform and is still under constant devel-opment to improve its capabilities. Since this thesis presents an extension to Pinocchio enhancingits input capabilities, I shall use the same platform for the final implementation of the gestureinput subsystem. For a discussion of resulting limitations which result from this choice, refer toparagraph 4.4.
Input Device This thesis’ goal is to explore new methods for gesture recognition, applyingmachine learning techniques to acceleration data. Conducting gestures for controlling a virtualorchestra are used as an example application area. Due to the nature of conducting gestures, theaccelerometers to be used have to be positioned as close as possible to the hand executing thegestures (as mentioned under the functional requirement of gesture identification).
Elaborating further on the previously non-functional requirement of usability, the followingadditional requirements regarding the acceleration sensors can be identified. It is necessary thatthey are
• comfortable to wear (they must be light enough not to interfere with the gesture execution),
• that they are easy to put on and easy to remove (the user must be able to accomplish thesetasks without help in a reasonable amount of time, not taking longer than putting on a watchfor example),
• and that they can easily communicate with the host application (not limiting the user’s rangeof action as they would with a wired connection for example).
In late 2006, Nintendo introduced its new gaming console Wii featuring the Wiimote, an ad-vanced input device housing accelerometers among others. It communicates with its host sys-tem using the Bluetooth standard, making it possible to be used with different systems as well7.[Ailive, 2006] offers a commercial software package that allows to train and recognize gaminggestures, using a machine learning approach; further details are not given. The Wiimote’s housingresembles a regular TV or stereo remote control. This design might be suitable for a variety ofgames, but it is not appropriate for a conducting gesture input device. A conductor often uses abaton [Rudolf, 1950]—which is not possible if the input device itself has to be held at the sametime. Even if the conductor is not using a baton, holding a remote control would severely limit themovements of the hand.
The eWatch (see figure 4.2) is a “wearable sensing, notification, and computing plat-form built into a wrist watch form factor” that houses several sensors [Smailagic et al., 2005,Maurer et al., 2006]. Besides accelerometers it features built-in light, audio, and temperature sen-sors. It incorporates a software controlled CPU and internal flash memory for persistent datastorage. Without the battery the eWatch weighs 85 g. Additionally, it is capable of visual, audio,and tactile feedback and provides a Bluetooth communication module. Unfortunately, the currentversion of the eWatch provides acceleration data in two dimensions only. It is planned to provide3D acceleration data in upcoming revisions.
After a close look at the requirements defined above the eWatch turns out to be well suited. Itis worn like a normal wrist watch and just as easy to put on. In addition, it is fairly lightweightand can provide wireless communication as well.
The relevant difference for this conducting gesture recognition application between the eWatchand the Wiimote is clearly the form factor. Wearing a watch is much more unobtrusive than holding
7Kimura Hiroaki developed DarwiinRemote which is a framework that allows to read the Wiimote’s sensors underMac OS X [Darwiin, 2007]. This framework has been used to conduct experiments integrating the Wii as an inputdevice for Pinocchio.
34

4 DESIGN DECISIONS 4.3 Hardware Decisions
(a) with housing (b) without housing
Figure 4.2: Top view of eWatch
a remote control and therefore better suited to capture motion while conducting. Additionally,the eWatch is more powerful since it offers on-board computing power which can potentially beused to recognize gestures online on the eWatch itself rather than transmitting raw accelerationdata and performing the recognition on the host system. The eWatch is currently being used toautomatically classify locations frequently visited by the user. Using it for gesture recognition is anew application area. Besides the advantages mentioned above, the eWatch was readily availablefor this project and knowledge transfer was easy to realize on site.
On the downside, this specific placement of the eWatch on the user’s wrist also posts severallimitations to the kind of motion that is detectable. Clearly, motions of the fingers (which arealso part of a complex conducting gesture) can not be detected using this setup. Furthermore,acceleration data coming from a motion of the hand alone might contain less information thana motion that incorporates the whole arm and thus causes a higher acceleration of the wrist. Asalready mentioned above, another limitation of the current version of the eWatch is the restrictionto 2D accelerometers.
On the one hand, these accelerometers are mounted in a way that enables them to captureaccelerations in the plane of the eWatch. On the other hand, the majority of the informationconveyed in conducting gestures is traditionally contained in the plane parallel to the user’s face[Rudolf, 1950]. In consequence, if the user wears the eWatch as it is supposed to be worn (i.e. likea regular watch on the wrist), the plane of conducting gestures in front of the user unfortunatelyis not completely covered; the eWatch captures movements to the right or to the left (which isdesired) as well movements toward and away from the user’s body (rather than up and downmovements).
A decision on how to deal with this shortcoming requires the identification of potential solu-tions first. I identified the following three potential solutions:
1. Using a single eWatch worn like a regular wrist watch. This setup limits motion capturingto right/left and forward/backward movements.
2. Using two eWatches worn as depicted in figure 4.3 (a). This setup not only allows capturingmovements in the conducting gesture plane but also enables the use of three-dimensionaldata.
3. Using a single eWatch worn perpendicularly as depicted in figure 4.3 (b). The secondeWatch in this picture serves the single purpose of holding the first eWatch in the shownposition; it does not capture acceleration data. This setup captures movements in the con-ducting gestures’ plane.
Unfortunately, solution one and two were not feasible because for the following reasons. Whenthe eWatch was worn like a regular wrist watch as described in solution 1, the resulting data did
35

4.4 Software Decisions 4 DESIGN DECISIONS
(a) configuration one (b) configuration two
Figure 4.3: Wearing two eWatches
not contain enough information to discriminate between different conducting gestures because ofthe reasons explained above.
Using two eWatches as described in solution 2 seemed to work very well at first glance. Sev-eral test runs I conducted with data collected using this setup showed quite promising resultsregarding detection ratio and reliability of gesture recognition. Nevertheless, when going fromoffline testing to online testing, it became apparent that it is not an easy matter to synchronizethe two eWatches in realtime. Since the recognition process relies on the accurate alignment ofthe acceleration data’s different dimensions synchronization is crucial. The eWatches do not sendinformation that could be used for synchronization, such as time stamps. Considering the timethat would have been necessary to first change the eWatches firmware and second come up witha reliable synchronization approach, I opted for solution three. A disadvantage of this solution isthat because to the looseness of the mounting, a certain amount of noise is introduced, dependingon how firmly the eWatch is strapped to the user’s wrist.
Table 4.3 summarizes the hardware choices discussed in this section.
System Part Hardware ComponentComputer platform for Pinocchio Apple Macintosh
Input device eWatch
Table 4.3: Summary of hardware components to be used
4.4 Software Decisions
The last decisions to be made are the ones regarding the software to be used in the system. In theremainder of this section, I shall introduce these software decisions.
Target Application As mentioned above (compare paragraph 4.3), Pinocchio is an already exis-tent system. It has been implemented using the Objective-C programming language designed forthe Mac OS X operating system thus determining an interface requirement (compare table 4.2).Therefore, I shall also use Objective-C in order to realize the integration of the gesture recognitionsubsystem. This choice limits the usage of Pinocchio to the Apple Macintosh computer platform.
Research Environment Nevertheless, keeping in mind the research character of this thesis (withits uncertainties at the beginning and in the course of the project) it did not seem feasible to startthe implementation in the above mentioned programming language right away. Combining the
36

4 DESIGN DECISIONS 4.4 Software Decisions
eWatch (being a research device and not a commercial product which means a less stable behavior)with a machine learning recognition approach (compare section 5.1) that has rarely been used (ifat all) for this specific combination of input device, sensor types, and target application requires aconsiderable amount of trial and error evaluating different approaches.
At the beginning of this project it was not yet clear which of the numerous, often vague ideas ofwhat would be feasible would work out in the end. Additionally, many new ideas were generatedduring this iterative process. A more flexible and powerful solution than what the programminglanguage mentioned above offers became necessary. Therefore, I chose MATLAB in order toimplement, evaluate, and compare different types and iterations of algorithms. MATLAB offersflexible and powerful tools to accomplish these tasks. It is relatively easy to create prototypes ofalgorithms and to deal with test data. Furthermore, MATLAB offers excellent plotting capabilitiesin order to visualize recognition and evaluation results.
Application Software ToolInput device communication Java
Data processing and gesture recognition MATLAB (generates C libraries)
System integration Objective-C
Table 4.4: Summary of software tools to be used
MATLAB itself runs on several computer platforms, such as Microsoft Windows and MacOS X, among others [MatlabRequirements, 2007]. It is capable of generating C libraries fromMATLAB functions for the platform it is running on. Additionally, the integration of Java classesis fairly straightforward and well documented. Since Objective-C’s JavaBridge [Apple, 2007] alsoprovides a seamless integration of Java, I chose to implement the software component responsiblefor the Bluetooth communication with the eWatch in Java. This approach offers the advantage thatthe communication part of the code only has to be developed and tested once, and can subsequentlybe used in the research environment with MATLAB as well as in Pinocchio itself. A summary ofsoftware tools to be applied can be found in table 4.4.
In this chapter, I discussed the necessary steps of the decisions to be taken, including definingrequirements, the choice of recognition method, and decisions regarding hardware and softwareto be used. In the next chapter I shall explain the design and implementation of the actual gesturerecognition method.
37

4.4 Software Decisions 4 DESIGN DECISIONS
38

5 CONDUCTING GESTURE RECOGNITION
5 Conducting Gesture Recognition
After deciding on using a machine learning approach to recognize conducting gestures in the pre-vious chapter, I shall describe the actual conducting gesture recognition method in this chapter. Insection 5.1, I start with a discussion of the reasons for choosing hidden Markov models (HMM). Insections 5.2 through 5.3, I explain my approach to classify conducting gestures and the realizationof a continuous gesture recognizer. I shall finish this chapter with a description of how gesturesare eventually interpreted in order to derive gather information, such as tempo or volume.
5.1 Choice of Machine Learning Approach
In the following, I shall describe the reasons that led to the choice of HMM as the machine learningapproach to be used. First, I introduce artificial neural networks (ANN) and discuss their potentialapplication to gesture recognition. Second, I explain the concept of HMM and my decision to usethem for recognizing conducting gestures.
5.1.1 Artificial Neural Networks
Artificial neural networks have been used in a few of the conducting systems pre-sented in chapter 2. These systems either used a visual approach and a data glove[Lee et al., 1992b, Takala, 1997] or magnetic motion trackers with six degrees of freedom[Ilmonen and Takala, 1999, Garnett et al., 2001]. Accelerometers have not yet been successfullyused in conjunction with ANN for the recognition of conducting gestures. Nevertheless, I choseANN as a first machine learning approach to evaluate because I already had prior experience inthis field. Additionally, I conducted several preliminary gesture recognition experiments usingANN together with the eWatch during my first contact with the Pinocchio project.
The initial user study I conducted when I began working on this thesis yielded about one anda half hours of conducting gesture data (compare section 3.2). Using parts of these data, togetherwith some additional gesture data I collected myself, I started to evaluate the usage of ANN to rec-ognize gestures with Netlab, a MATLAB toolbox “designed to provide the central tools necessaryfor the simulation of theoretically well founded neural network algorithms” [Netlab, 2007].
Different topologies may be used for ANN: While feed-forward ANN are based on an acyclicgraph—thus allowing to travel the signal one way only—recurrent ANN contain feedback loops(compare [Mitchell, 1997]). In the following, I shall evaluate the usage of feed-forward ANN.Recurrent ANN may be considered in future evaluations.
I conducted numerous experiments with different parameters and model settings, such as vary-ing numbers of hidden neurons, different preprocessing methods for acceleration data, and severalthresholds designed to prevent multiple recognition of the same gesture. However, I was notable to get sufficiently satisfying results to justify a further investigation in this direction. Therecognition rate was less than 50% for any of the tested settings. Especially for the recognitionof gestures in a continuous data stream, i.e. the gesture spotting, ANN seem to be unsuitablesince they are not able to automatically detect gesture boundaries [Yang and Xu, 1994]. I testeda sliding window approach, which feeds input data covered by the window to the artificial neuralnetwork and then moves the windows forward. This approach was not able to reliably identifygestures. [Lee and Kim, 1999] indicates that ANN are more effective for the recognition of staticthan dynamic patterns.
5.1.2 Hidden Markov Models
Moving forward, I evaluated the second machine learning approach that has been usedin prior conducting systems, namely HMM [Usa and Mochida, 1998b, Kolesnik, 2004].
39

5.1 Choice of Machine Learning Approach 5 CONDUCTING GESTURE RECOGNITION
[Rabiner and Juang, 1986, page 5] defines an HMM as a “doubly stochastical process with an un-derlying stochastic process that is not observable (it is hidden), but can only be observed throughanother set of stochastic processes that produce the sequence of observed symbols.” HMM areable to characterize sequences of observations produced by real-world processes and to representa signal model—they thus make it possible to build prediction or recognition systems.
Application Areas HMM have been widely used for speech recognition [Huang et al., 1990].According to [Bishop, 2006, page 610], other application areas for HMM can be found in bioinfor-matics, shape classification, handwriting recognition, and gesture recognition. Section 2.1 presentsseveral example applications of HMM.
Elements An HMM consists of several elements which I shall introduce in the following: Thereare a finite number of hidden states N within which “the signal possesses some measurable, dis-tinctive properties” [Rabiner and Juang, 1986, page 7]. These states are connected by edges rep-resenting transitions. A transition probability is assigned to each of these edges (including self-transitions), or, put differently, each state has a transition probability distribution. Therefore, thetransition probability between states depends on the current state only (commonly referred to asMarkov property). The states and transitions trained for recognizing a pattern represent its subpat-terns and their sequential order [Lee and Kim, 1999]. When an HMM was trained to recognize agesture for example, states and transitions represent subgestures.
Each state also has an observation probability distribution which determines the distribution ofobservation symbols. In addition, an initial state distribution determines the state where the pro-cess starts in. An HMM λ is thus determined by its initial, state transition, and observation symbolprobability distribution; λ = (A,B,π). Figure 5.1 shows an HMM with states Q = {q1,q2,q3},transition probabilities ai j and observation symbol probability distributions b j which in turn de-termine output symbols vk. Table 5.1 provides a formal model notation for a discrete observationHMM after [Rabiner and Juang, 1986], summarizing an HMM’s elements as discussed above.
The HMM discussed so far produce discrete output symbols. There are also HMM produc-ing observations of continuous vectors; the observation symbol probability distribution can bemodeled by Gaussian M-component mixture densities, for example.
T = length of observation sequence
N = number of states
M = number of observation symbols
Q = {q1,q2, . . . ,qN}, states
V = {v1,v2, . . . ,vN}, discrete set of possible symbol observations
A ={
ai j}
,ai j = Pr(q j at t +1|qi at t), state transition probability distribution
B ={
b j (k)}
,b j (k) = Pr(vk at t|q j at t), observation symbol probability distribution instate j
π = {πi} ,πi = Pr(qi at t = 1), initial state distribution
Table 5.1: Formal model notation for a discrete observation HMM [Rabiner and Juang, 1986]
Topologies HMM can have different types of topologies, depending on how transition probabil-ities ai j are chosen. Figure 5.1 shows an ergodic HMM, i.e., any state can be reached from anyother state; all state transition probabilities ai j are larger than zero. It is possible to restrict statetransitions by setting selected transitions probabilities to zero.
40

5 CONDUCTING GESTURE RECOGNITION 5.1 Choice of Machine Learning Approach
q1
a11 a
21
a12
a31a23 a
32a13
a22
a33
q2
vk
vk
b1
b2
b3
vk
q3
Figure 5.1: Ergodic hidden Markov model with three states
In order to realize a left-to-right, or forward chaining, HMM, which only allows state tran-sitions from lower to higher numbered states (i.e. j ≥ i for a state transition from qi to q j), alltransition probabilities ai j with i > j have to be set to zero. This results in an upper triangularstate transition matrix. Furthermore, it is possible to limit the maximum number of states that canbe skipped by setting further state transition probabilities to zero. The initial state distribution forleft-to-right HMM is chosen so that π1 = 1 and πi = 0,1 < i ≤ N. Left-to-right HMM impose atemporal order; observations in lower numbered states occur before observations in higher numberstates.
Dynamic Behavior In the following, the dynamic behavior of an HMM creating observationsequences is illustrated: After determining the initial state, at each clock time t, an observationsymbol is produced according to the observation probability distribution of the current state. Then,the transition probability distribution of the current state is used to determine the next state whichin turn determines the next observation probability distribution, and so on.
Basic Problems To apply HMM to an actual recognition task, three basic problems have tobe solved according to [Rabiner and Juang, 1986]8. First, the HMM needs to be trained. Thatis, for a given observation sequence O, I want to adjust the model parameters λ = (A,B,π) tomaximize Pr(O|λ ). Second, given an observation sequence O and the model λ = (A,B,π), Iwant to compute probability Pr(O|λ ) of this observation sequence. Third, given an observationsequence O, I want to compute the most likely state sequence that produces this sequence, given amodel λ = (A,B,π).
There exist well-established algorithms to solve each of the three problems. The Baum-Welch algorithm solves the problem of determining model parameters λ = (A,B,π) while theForward-Backward algorithm computes the probability of an observation sequence for a givenmodel. In order to determine a model’s most likely state sequence for an observation se-quence, the Viterbi algorithm is applied. Although it would be beyond the scope of this the-sis to describe all of these algorithms in detail—a comprehensive description can be found in[Rabiner and Juang, 1986, Rabiner, 1989]; I shall furthermore discuss and propose a modificationto the Viterbi algorithm realizing a continuous recognizer in section 5.3.
8I shall list the three HMM problems in a different order than the one introduced by [Rabiner and Juang, 1986] fora better illustration of the application to the gesture recognition discussed in this thesis.
41

5.2 Gesture Classification 5 CONDUCTING GESTURE RECOGNITION
Realization Having the HMM toolbox for MATLAB [HMMToolbox, 2007] at hand, I con-ducted some initial evaluations which are described in section 6.1. Since the obtained resultswere quite promising, I chose HMM as machine learning approach to be used in this project.
5.2 Gesture Classification
The goal of the conducting gesture recognition subsystem to be developed in the context of thisthesis is to identify conducting gestures in a continuous data stream. In order to identify a gesture,its boundaries within the input data have to be extracted first, i.e., the input data stream has tobe segmented. This step is also called gesture spotting [Morguet and Lang, 1998]. After it hasbecome apparent where a gesture starts and where it ends, the next task is to classify this gestureto determine its type.
HMM are able to combine these two subtasks and solve the problem of gesture identificationin an integrated approach; HMM “can automatically absorb a range of model boundary infor-mation for continuous gesture recognition” [Yang and Xu, 1994]. Nevertheless, it makes sensefirst to have a look a the gesture classification as such, since the implementation of a continuousrecognizer, that is able to segment and to classify, is more complicated. I chose to explain theclassification before the segmentation approach, because classifying gestures, without a segmen-tation solution in place, works quite well, while the reverse constellation is difficult to realize usingHMM.
This section describes how HMM are used to classify isolated gestures. It starts with severalpreceding considerations regarding the input signal at hand. A description of the HMM parametersI chose for the conducting gesture classification follows. In this context, I shall explain necessarysteps to preprocess and extract features out of the raw acceleration data, so that the data can beused with the HMM. This section concludes with a description of the approach I took to rejectnon-meaningful gestures, i.e. random or non-gesture movements of the hand.
5.2.1 Preceding Considerations
As mentioned in the introduction, I shall describe the necessary steps to realize conducting gestureclassification using HMM. This means that the data to classify gestures in, is not a continuousstream of acceleration data, but consists of already segmented pieces of acceleration data. Thequestion is whether there is a gesture contained in a segment and if so, what gesture it is.
After deciding for HMM, there remain several decisions regarding the model itself left. Sinceit is often not obvious which parameter settings make sense for the application discussed in thisthesis, I relied on both, related work and experiments (compare section 6.1), to guide my decisions.
Before these decisions can be made, it is essential to look at the characteristic of the inputsignal to model. In this application, the eWatch provides an input signal consisting of accelerationsamples in two dimensions, i.e., a feature vector consists of one sample for x and one for y accel-eration per time step t. These samples take integer values from −128 through 127, depending onthe strength of acceleration. A combined sample consisting of acceleration values for x and y attime t thus represents the acceleration’s direction in the plane in front of the user (see 4.3 for adiscussion of the eWatch’s orientation). The eWatch is able to provide sensor data at controllablesampling intervals up to 100 kHz [Maurer et al., 2006]. The first step is to find a suitable samplingfrequency for recognizing conducting gestures.
Sampling Frequency As sampling frequency I chose 100 Hz, which is sufficient to capturemotions at a frequency of up to 50 Hz, according to the Nyquist-Shannon sampling theorem.Figures 5.2 through 5.4 contain plots of acceleration data recorded with the eWatch at a samplingfrequency of 100 Hz. Plots on the left hand side, labeled with (a), show x and y accelerationseries over time for repeated conducting gesture performances, while plots on the right hand side,
42

5 CONDUCTING GESTURE RECOGNITION 5.2 Gesture Classification
0 100 200 300 400 500 600-60
-40
-20
0
20
40
60
Time [ms × 10]
Acce
lera
tion
xyLast beat of measure
(a) 5 repetitions
-60 -40 -20 0 20 40 60-60
-40
-20
0
20
40
60
Acceleration x
Acce
lera
tion
y
(b) 1 repetition
Figure 5.2: Plot of user A performing 2-beat conducting gestures
0 100 200 300 400 500 600-60
-40
-20
0
20
40
60
Time [ms × 10]
Acce
lera
tion
xyLast beat of measure
(a) 3 repetitions
-60 -40 -20 0 20 40 60-60
-40
-20
0
20
40
60
Acceleration x
Acce
lera
tion
y
(b) 1 repetition
Figure 5.3: Plot of user A performing 3-beat conducting gestures
0 100 200 300 400 500-60
-40
-20
0
20
40
60
Time [ms × 10]
Acce
lera
tion
xyLast beat of measure
(a) 2 repetitions
-60 -40 -20 0 20 40 60-60
-40
-20
0
20
40
60
Acceleration x
Acce
lera
tion
y
(b) 1 repetition
Figure 5.4: Plot of user A performing 4-beat conducting gestures
43

5.2 Gesture Classification 5 CONDUCTING GESTURE RECOGNITION
labeled with (b), show x and y acceleration of a single gesture performance. Examining the plotsmanually, different gestures are clearly distinguishable—suggesting the possibility of a successfulautomatic gesture detection.
Looking at related literature covering the field of human activity recognition with body-wornaccelerometers, I found the following sampling frequencies to be used (for a summary of selectedsystems refer to table 5.2):
[Lukowicz et al., 2003] used a sampling frequency of approximately 93 Hz to recognize wood-shop activities; [Minnen et al., 2005] used a sampling frequency of 100 Hz for the recognition ofhuman activities in context-aware computing. For the recognition of control gestures for videogames [Keir et al., 2006] used a sampling frequency of 60 Hz. [Chambers et al., 2002] recognizedcomplex human gestures in sports at a sampling frequency of 96 Hz. [Mäntyjärvi et al., 2004] im-plemented a DVD player control based on gestures using a sampling frequency of 46 Hz. Althoughnot body-worn, [Kallio et al., 2003] applied accelerometers at a sampling frequency of 50 Hz tothe recognition of gesture for interaction with mobile devices (also housing the accelerometers).
System Application Area Sensor Type Frequency [Hz]
[Morita et al., 1991] Conducting gesture recognition CCD camera 30
[Bien and Kim, 1992] Conducting gesture recognition CCD camera 15
[Bertini and Carosi, 1992] Conducting gesture recognition CCD camera 25
[Sawada and Hashimoto, 1997] Conducting gesture recognition Accelerometers 25
[Usa and Mochida, 1998a] Conducting gesture recognition Accelerometers 100
[Chambers et al., 2002] Sport gesture recognition Accelerometers 96
[Lukowicz et al., 2003] Workshop activity recognition Accelerometers 93
[Mäntyjärvi et al., 2004] DVD player control gesture recognition Accelerometers 46
[Minnen et al., 2005] Activity recognition Accelerometers 100
[Keir et al., 2006] Video game control gesture recognition Accelerometers 60
Table 5.2: Comparison of sample frequencies for selected human activity recognition systems
Conducting gesture systems using a visual approach, such as the ones described in[Morita et al., 1991, Bertini and Carosi, 1992], are limited to the frame rate that the visual sen-sor provides. In the case of regular cameras, the frame rate is 25 Hz for the PAL standard andapproximately 29.97 Hz for the NTSC standard. [Bien and Kim, 1992] only processes the incom-ing images at a rate of 15 Hz, though.
For the recognition of conducting gestures with accelerometers,[Sawada and Hashimoto, 1997] used a sampling frequency of only 25 Hz, while[Usa and Mochida, 1998a, page 278/279] state that “the lower limit of the sampling fre-quency to recognize a conducting gesture is about 100 Hz”, and thus uses a sampling frequency of100 Hz in the according conducting system. This statement, together with the fact that neither ofthe approaches described above was using a sampling frequency higher than 100 Hz, confirmedmy decision to use a sampling frequency of 100 Hz in this project.
5.2.2 Hidden Markov Model Parameters and Feature Extraction
After carefully examining the available input signal, I shall determine suitable HMM parametersand feature extraction methods in the following. To realize isolated, i.e. non-continuous, recog-nition of gestures (as described in this section) a respective HMM λg is built and trained for eachgesture that is supposed to be recognized by the system9. A segment of input data—the observation
9Continuous recognition of gestures requires a more integrated approach and is described in section 5.3.
44
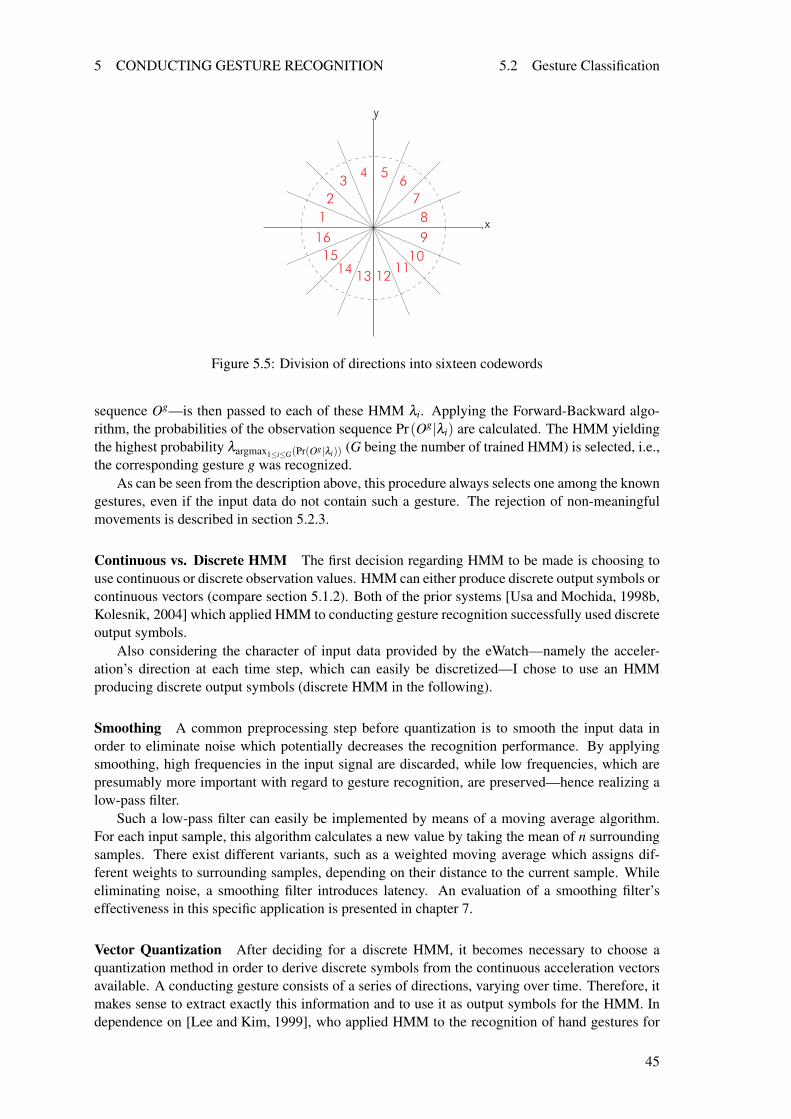
5 CONDUCTING GESTURE RECOGNITION 5.2 Gesture Classification
x
y
1234 5
6789
1011
1213141516
Figure 5.5: Division of directions into sixteen codewords
sequence Og—is then passed to each of these HMM λi. Applying the Forward-Backward algo-rithm, the probabilities of the observation sequence Pr(Og|λi) are calculated. The HMM yieldingthe highest probability λargmax1≤i≤G(Pr(Og|λi)) (G being the number of trained HMM) is selected, i.e.,the corresponding gesture g was recognized.
As can be seen from the description above, this procedure always selects one among the knowngestures, even if the input data do not contain such a gesture. The rejection of non-meaningfulmovements is described in section 5.2.3.
Continuous vs. Discrete HMM The first decision regarding HMM to be made is choosing touse continuous or discrete observation values. HMM can either produce discrete output symbols orcontinuous vectors (compare section 5.1.2). Both of the prior systems [Usa and Mochida, 1998b,Kolesnik, 2004] which applied HMM to conducting gesture recognition successfully used discreteoutput symbols.
Also considering the character of input data provided by the eWatch—namely the acceler-ation’s direction at each time step, which can easily be discretized—I chose to use an HMMproducing discrete output symbols (discrete HMM in the following).
Smoothing A common preprocessing step before quantization is to smooth the input data inorder to eliminate noise which potentially decreases the recognition performance. By applyingsmoothing, high frequencies in the input signal are discarded, while low frequencies, which arepresumably more important with regard to gesture recognition, are preserved—hence realizing alow-pass filter.
Such a low-pass filter can easily be implemented by means of a moving average algorithm.For each input sample, this algorithm calculates a new value by taking the mean of n surroundingsamples. There exist different variants, such as a weighted moving average which assigns dif-ferent weights to surrounding samples, depending on their distance to the current sample. Whileeliminating noise, a smoothing filter introduces latency. An evaluation of a smoothing filter’seffectiveness in this specific application is presented in chapter 7.
Vector Quantization After deciding for a discrete HMM, it becomes necessary to choose aquantization method in order to derive discrete symbols from the continuous acceleration vectorsavailable. A conducting gesture consists of a series of directions, varying over time. Therefore, itmakes sense to extract exactly this information and to use it as output symbols for the HMM. Independence on [Lee and Kim, 1999], who applied HMM to the recognition of hand gestures for
45

5.2 Gesture Classification 5 CONDUCTING GESTURE RECOGNITION
browsing PowerPoint using a camera-based approach, I shall use a vector quantization approachthat converts continuous, two-dimensional feature vectors of acceleration into a finite number ofdirections, more generally referred to as labels or codewords. Figure 5.5 depicts the division of di-rections into sixteen codewords. The number of labels to be used in this application is empiricallydetermined in chapter 7.
Vector quantization assigns a directional codeword to every feature vector in the following way:At time step t, the directional feature vector at is determined by using values xt and yt of the two-dimensional acceleration data (compare figure 5.6). This approach requires the calibration of inputdata as discussed in the following section. at is then normalized using equation 1 (if not zero).
at =(
xt
yt
), at =
(xt
yt
)at =
at
‖at‖,‖at‖> 0 (1)
Equation
cosα =at · et
‖at‖ · ‖et‖= at · et = xt ,‖at‖> 0 (2)
shows that cosα = xt , xt being the x acceleration value after normalization. To assign a directionalcodeword it is not necessary to compute α itself. Note that xt only covers a semicircle (that issegments one through eight in figure 5.5). In order to cover the whole circle, i.e. all possibledirections, I also have to take yt—or yt since the sign does not change with normalization—intoaccount. In the following equation, n stands for the number of desired codewords (sixteen in figure5.6); n must be even.
cwt =
round
(xt ·
n2−1
2 +n2−1
2 +1)
, yt ≥ 0∧‖at‖> 0
round(
xt ·n2−1
2 +n2−1
2 +1)
+ n2 , yt < 0∧‖at‖> 0
round( n
2−12 +1
), ‖at‖= 0
(3)
Multiplying and rounding realizes the assignment to a codeword cw1 . . .cw n2
for yt ≥ 0 as shownin equation 3. Using the case differentiation, I assign directions cw n
2 +1 . . .cwn to feature vectorsthat lie in the other semicircle, i.e. yr < 0. If ‖at‖= 0, i.e. xt = 0∧ yt = 0, I assign the directionalcodeword determined by round
( n2−1
2 +1)
. In order to minimize the influence of low-amplitudenoise, the vector quantization algorithm allows the specification of a cutoff threshold thc. If ‖at‖>thc, at is set to
(00
). An evaluation of this cutoff threshold is presented in section 7.2.3.
Even if there is no motion at all, acceleration values are not always zero due to gravity anddepending on the eWatch’s orientation. Since the extraction of directional codewords as describedhere relies on non-shifted acceleration values for x and y, the acceleration data have to be calibratedfirst, in order to produce meaningful codewords (figure 5.6 shows already calibrated accelerationdata). The calibration method is responsible for eliminating the gravity’s effect, while maintainingthe signal’s characteristics at the same time (compare [Keir et al., 2006]). Because of its complex-ity, I shall describe the calibration method separately in the following section.
46

5 CONDUCTING GESTURE RECOGNITION 5.2 Gesture Classification
�
Time
Acceleration
t
y
x
yt
xt
y
1
α
1
êx
ât
-1
-1x
Figure 5.6: Illustration of vector quantization approach
It is also possible to use a vector quantization algorithm that automatically clusters the featurevectors, rather than using fixed classes of directions. Nevertheless, I chose to use the direction ex-traction method because it fits the nature of hand gestures well and can be implemented efficiently.Besides the described method of label extraction in the signal’s time domain, a feature extractionin the frequency domain is possible, too. An analysis in the frequency domain requires a signaltransformation, using a sliding window approach. I decided for the vector quantization method inthe time domain as described above because, first, one of the requirements defined in section 4.1is a fast response, and second, a sliding window introduces a certain latency.
Data Calibration Effective calibration is crucial to the vector quantization method introducedabove. The algorithm I propose for calibration works as depicted in listing 1. It uses a buffer ofsize n to calculate a running average, which is then subtracted from the current data sample (line4). Note that the buffer is filled with already calibrated data (line 5). input_data is an array ofone-dimensional acceleration data, that is, the calibration has to be executed for each dimensionseparately. The average is not just computed by taking the buffer’s mean value but, as shown inline 6, an adapt_factor< 0 is used to adjust the value slowly.
Listing 1: Calibration algorithm
1 avg = 0 ;2 b u f f e r (1 : n ) = 0 ;3 f o r i = 1 : l e n g t h ( i n p u t _ d a t a )4 c a l i b r a t e d _ d a t a ( i ) = i n p u t _ d a t a − avg ;5 s t o r e _ i n _ b u f f e r ( c a l i b r a t e d _ d a t a ( i ) ) ;6 avg = avg + a d a p t _ f a c t o r ∗ mean ( b u f f e r ) ;7 end
To show the approach’s effectiveness I recorded acceleration data from the eWatch while itwas turned from lying with the LCD screen facing up, to the side with one button facing up, tothe back side facing up, and then to the side with two buttons facing up. Figure 5.7 shows the
47

5.2 Gesture Classification 5 CONDUCTING GESTURE RECOGNITION
4000 6000 8000 10000
-50
0
50Ac
cele
ratio
n
Time [ms × 10]
(a) original signal
4000 6000 8000 10000
-50
0
50
Acce
lera
tion
Time [ms × 10]
(b) after calibration
Figure 5.7: Normalization effect of calibration algorithm
2.142 2.144 2.146 2.148x 10⁴
-150
-100
-50
0
50
100
150
Time [ms × 10]
Acce
lera
tion
(a) original signal
2.142 2.144 2.146 2.148x 10⁴
-150
-100
-50
0
50
100
150
Acce
lera
tion
Time [ms × 10]
(b) after calibration
Figure 5.8: Preserving effect of calibration algorithm
resulting data’s plot before (a) and after (b) calibration10. As can be seen from the plots, thecalibration algorithm efficiently shifts the acceleration data.
Moreover, it also preserves the signal’s characteristic. The eWatch, lying on a surface, wasquickly moved to the right. Figure 5.8 shows the resulting acceleration data before (a) and after(b) calibration. As can be seen from the plots, the signal’s characteristics did not change aftercalibration; the motion is still clearly recognizable.
HMM Topology Another decision to be made is what topological configuration to apply. Thatis, one has to decide whether it is more suitable to use an ergodic, i.e. fully connected, or aleft-to-right HMM. [Kolesnik, 2004] and [Usa and Mochida, 1998b] used a left-to-right model forconducting gesture recognition. This makes sense for the following reason:
As explained in section 5.1.2, a left-to-right HMM imposes a temporal order. Lower states ac-count for observations that occur before those in higher states. Thus, this HMM topology matchesthe nature of a (conducting) gesture, which is a temporal sequence of directional movements hav-ing a starting and an ending point. Movements at the beginning of the gesture obviously happenbefore those in the end of the gesture. This temporal characteristic can be represented by a left-to-right HMM in a suitable way.
10An adapt_factor of 0.03 was used.
48

5 CONDUCTING GESTURE RECOGNITION 5.2 Gesture Classification
Number of HMM States While there exist well-established training algorithms to op-timize an HMM’s probability distributions (compare section 5.1.2), the number of statesis often selected manually [Yamato et al., 1992, Min et al., 1997, Usa and Mochida, 1998b,Lee and Kim, 1999] using a priori knowledge about the complexity of the information to be mod-eled [Huang et al., 1990, Pylvänäinen, 2005]. In the context of this thesis, this means that, thelonger a conducting gesture lasts, the more states are required to adequately represent it using anHMM; “more states can distinguish more different characteristics” [He and Kundu, 1991].
Since it is not apparent what number of states is suitable for recognizing conducting ges-tures from two-dimensional acceleration data using a discrete HMM, I used cross validation[Wilson and Bobick, 1999, Günter and Bunke, 2003] to empirically determine an optimum num-ber of states. This evaluation procedure is described in detail in section 7.2.1. As assumed, a statesetting assigning more states to longer, i.e. more complex, gestures yielded better recognitionresults than a state setting assigning the same number of states to all gestures.
5.2.3 Non-Meaningful Gesture Rejection
As mentioned in the introduction to section 5.2.2, the approach described so far always selects agesture, even if the provided input data did not contain one. This behavior is due to selecting themaximum probability of the input sequence being produced by one of the trained HMM.
Garbage Model One approach commonly used to reject non-gesture hand movements is theconcept of a garbage or filler model [Lee and Kim, 1999]. An additional HMM is trained whichis supposed to recognize non-meaningful gestures, i.e. yield the highest probability of all usedHMM if the input data do not contain a gesture. Of course, this garbage HMM also has to betrained. It is not apparent, however, what training data are suitable in the context of this project.I evaluated the usage of both, random movements and noise recorded when the eWatch was heldstill, as training data (compare [Rigoll et al., 1998]). Neither of the two training data classes wereable to successfully reject non-meaningful gestures, though.
Threshold Model A simple solution to the rejection is the introduction of a threshold value: Ifthe maximum probability is smaller than the threshold value, the system would return the resultthat no gesture was recognized. Unfortunately, such a simple thresholding often does not work(compare [Lee and Kim, 1999]). It is for example not apparent how to select a suitable thresholdvalue.
During the evaluation of the threshold approach, I tested using the smallest probabilityPrming = min
(Pr(OTg |λg
))that was output by the Forward-Backward algorithm when being ap-
plied to the training sequences OTg used to train model λg representing gesture g, as proposedby [Hofmann et al., 1998]. That is, I used the same observation sequences OTg as input to theForward-Backward algorithm which I also used above to train the according HMM λg (by meansof the Baum-Welch algorithm). This approach was not able to successfully reject non-meaningfulgestures; it constantly misclassified gestures as garbage and vice versa. Additionally, the usage ofan arbitrarily selected “quality factor” to be multiplied with the determined threshold in order tocompensate for unsatisfactory performance, as described in [Hofmann et al., 1998], indicates thata simple threshold is not a generally applicable approach.
[Lee and Kim, 1999] propose the usage of a threshold model which computes an adaptivethreshold to be used in the decision on whether the input data represent a gesture. The proposedthreshold model λT , described as “a weak model for all trained gestures”, yields a lower proba-bility for a given gesture g than the appropriate HMM λg, if the input data contained gesture g.Therefore, it can be used as an adaptive threshold. That is, if an HMM λg corresponding to agesture g yields a lower probability than the threshold model λT for a given observation sequenceO, O did not contain any meaningful gesture.
49

5.3 Gesture Spotting 5 CONDUCTING GESTURE RECOGNITION
The threshold model has the same number of states as all gesture HMM combined; it is as-sembled by copying the states from the (already trained) gesture HMM λi as follows: All states,i.e. their observation symbol probability distributions and their self-transition probabilities, staythe same, but all state transition probability distributions are discarded. Instead, every state getsconnected with every other state, using transition probabilities of
ai j =1−ai j
N−1, for all j, i 6= j (4)
—resulting in an ergodic model. An initial and final state is added which connects to respectively isreachable from all inner states. The integration of the threshold model into a continuous recognizeris described the next section.
5.3 Gesture Spotting
After solving the task of classifying different gestures as described in the previous section, the nextstep is to implement a recognizer which is able to identify gestures from a continuous data stream.In addition to the classification, such a recognizer needs to segment its input data, i.e. it needs tofind the gesture’s starting and end point. This procedure is also referred to as gesture spotting (inthe style of word spotting in speech recognition, the first application area of HMM).
It is possible to realize the input segmentation as a separate module, i.e. independent fromthe HMM classifier. [Hofmann et al., 1998] follow such an approach. They separate gesturesfrom each other by means of a preprocessing method which thresholding to the input data’svelocity profile. [Kang et al., 2004] follow a similar approach. They identify possible seg-mentation points which have an “abnormal velocity” or other special characteristics that distin-guish them from regular samples. Again, the gesture spotting is realized as a separate module.[Morguet and Lang, 1999] compare the two approaches and report that using a single-stage HMMyields better performance than using a separate segmentation module.
5.3.1 Integrated Gesture Recognizer
Compound Model To realize the recognition of conducting gestures in this thesis, I decided infavor of an integrated approach, similar to the one proposed in [Lee and Kim, 1999]. Figure 5.9shows a compound gesture recognizer for three different conducting gestures (2-beat, 3-beat, and4-beat as depicted in figure 3.1 on page 27), including a threshold model as described in section5.2.3. In this example, the number of states per HMM is eight, twelve, and sixteen, respectively.This constellation thus results in a threshold model consisting of thirty six states. The submodelsrepresenting the gestures use a left-to-right topology which allows to skip at most one state.
Additionally, an initial state with transitions to each HMM’s first state is introduced and thesingle model’s last states are connected to its initial state. The single models and their probabilitydistributions are not touched any further. I shall discuss the meaning of event and final states asdepicted in figure 5.9 in section 5.3.2.
As can be seen from this description, combining the individual gesture models with the thresh-old model results in a new HMM. That is, it is possible to apply the well-established Viterbi algo-rithm for finding an optimal state sequence to this new HMM. In the following, I shall illustratehow gestures can be spotted and classified using the proposed model. For this, I modified theViterbi algorithm in a way that allows handling of continuous input data as well as integratedspotting and classifying of potentially contained gestures.
The Viterbi Algorithm Before describing the modifications, I shall outline the Viterbi algo-rithm’s basic functionality first (for further details compare [Rabiner, 1989]). Table 5.1 on page40 defines the elements of an HMM used in the following description.
50

5 CONDUCTING GESTURE RECOGNITION 5.3 Gesture Spotting
1
2 3 4 5 6 7 8 9
10 11 12 13 14 15 16 17 18 19 20 21
22 23 24
38 74
25 26 27 28 29 30 31 32 33 34 35 36 37
...
2/4
3/4
4/4
Threshold
r
Regularstate
i
Initialstate
e
Eventstate
f
Finalstate
Transition
Figure 5.9: Compound HMM for three conducting gestures
The Viterbi algorithm finds the single best state sequence, Q = {q1,q2 . . .qT}, for a givenobservation sequence O = {O1,O2 . . .OT} and an HMM λ . At each point in time t, the highestprobability for each state j is calculated, taking into account the first t observation symbols. Iintroduce
δt ( j) =[
max1≤i≤N
δt−1 (i)ai j
]·b j (Ot) , 2≤ t ≤ T
1≤ j ≤ N (5)
which thus contains the probability of the most likely single path that leads to state j at time t,given the observations symbols O1,O2 . . .Ot . In order to retrieve the state sequence that led to thisstate, I introduce the array
ψt ( j) = argmax1≤i≤N
[δt−1 (i)ai j] , 2≤ t ≤ T
1≤ j ≤ N (6)
keeps track of the argument that maximized equation 5. Using backtracking, the state sequencecan be uncovered. The variables are initialized with
δ1 ( j) = π jb j (O1) , 1≤ j ≤ N (7)
ψ1 ( j) = 0. (8)
The algorithm terminates as follows:
P∗ = max1≤i≤N
[δT (i)] (9)
q∗T = argmax1≤i≤N
[δT (i)] . (10)
P∗ determines the probability for the most likely state q∗T . The Viterbi algorithm produces a Trellis,the nodes are represented by states qi which are connected by transitions ai j. When implement-ing the algorithm it is necessary to introduce a scaling technique in order to avoid mathematicalunderflow (for further details refer to [Rabiner, 1989]).
51
5.3 Gesture Spotting 5 CONDUCTING GESTURE RECOGNITION
Modification The algorithm described so far determines the most likely state sequence for agiven observation sequence O of known length T . In order to realize a gesture recognizer for con-tinuous input data, as it is the intention of this thesis, the algorithm has to be extended. First, someconsiderations have to be given the problem of input sequences of arbitrary length—because, aslong as the system runs, there are input data coming from the eWatch. Second, the modified algo-rithm has to output when a gesture was detected, which one was detected, and when it started—events have to be generated. In the following, I shall describe the approach I used to tackle theseproblems.
In order to identify a gesture within the input data, I shall make use of the property of statesand transitions representing subpatterns of a gesture (compare section 5.1.2). Also taking intoconsideration the left-to-right topology applied here, it is apparent that the end of a gesture isindicated by being in the last state of the according HMM when the Viterbi algorithm is applied.These states are labeled final states in the compound model (see figure 5.9). While constructingthe compound model, references to these states are stored along with the model for later usageduring recognition.
During the recognition process, equation 5 is executed at each time step. In addition, equation10 is used to determine the currently most likely state (here, T refers to the last sample of inputdata so far). If the detected state q∗T is one of the final states, we know that the currently mostlikely path of states goes through the according submodel; due to the left-to-right topology thereis no other possible path to reach a submodel’s final state. That is, it is likely that the input datacontained the gesture the corresponding submodel was trained for.
Since the final state represents a part of the gesture as well, i.e. it has an observation probabilitysymbol distribution, it is not appropriate to instantly report on the detection of a gesture once itsfinal state has been reached. I determined the number of time steps to wait and stay in a final state,before reporting on a gesture event, by using the training data which contain beat annotations. Bymeans of applying the recognition algorithm to the training data, it is easily possible to calculatethe mean of time steps during which a particular model remained in the final state, before the beat,i.e. the end of the gesture, occurred.
Once a gesture was detected, i.e. the gesture’s end point as well as the type of gesture wasidentified, the gesture’s starting point can be determined by using ψt ( j) to track back the path ofstates. Finally, values stored so far for δt ( j) and ψt ( j) can be discarded, and the algorithm startsanew. If we ended up in the threshold’s final state, we can also discard previously stored valuesδt ( j) and ψt ( j) and restart the algorithm—without reporting on a gesture event.
Considering the computational costs required during the recognition process, the modifiedViterbi algorithm is more efficient compared to the usage of a simple classification approach, i.e.computing the input sequences’ probabilities for every single HMM separately and comparingthem afterwards (as described in section 5.2.2). Using the modified Viterbi algorithm, equations5 and 6 have to be evaluated once for every input data sample. A simple classification approach,however, requires a sliding window in order to realize continuous recognition. That is, the recogni-tion algorithm used to calculate the probability of an observation sequence covered by the slidingwindow has to be applied for every single HMM at each time step, involving as many steps as theinput sequence contains each time—resulting in a higher number of required calculations com-pared to the modified Viterbi algorithm. Regarding memory complexity however, the modifiedViterbi algorithm is more demanding than a simple classification approach, since it keeps track ofprobabilities for each state and time step. Additionally, the number of states being involved at agiven time is larger because the modified Viterbi algorithm uses a compound HMM.
An evaluation of the modified Viterbi algorithm using example conducting gesture data can befound in section 7.2.
52

5 CONDUCTING GESTURE RECOGNITION 5.3 Gesture Spotting
5.3.2 Single Beat Detection
The approach proposed above is able to recognize conducting gestures as a whole. As figure 3.1depicts, a conducting gesture contains several beats. The number of beats depends on the type ofmeasure which is represented by the according gesture.
If single beats contained in a conducting gestures can be detected, a closer coupling of userinput and music playback would be possible, because more points of reference in time wouldexist. Additionally, it would be possible not only to control tempo and volume, but to synchronizemeasures in conducting and playback.
Separate Training I tested two approaches to realize this feature. First, I trained a separateHMM for each beat of a gesture. Taking the example of three conducting gestures (2-beat, 3-beat,and 4-beat), nine models were trained. After training, I connected the models representing thesame measure, resulting in three HMM, very similar to those that the training with whole gesturesyielded. However, states that correspond to single beats are known (namely the states where aconnection was inserted). Applying this knowledge, the modified Viterbi algorithm is able toreport on single beat occurrences. Yet, it is not apparent how to chose transition probabilitiesfor the connection of single beat models, or if it makes sense to possibly insert more connectionbetween states11. In addition, one has to decide in advance how many states are assigned for therepresentation of a single beat.
Single Beat Derivation Taking these shortcomings into consideration, I followed a differentapproach: Instead of training models for single beats, I stuck to training models for measures as awhole, as initially described. In order to determine what states correspond to the occurrences of abeat, I applied the same technique already introduced in section 5.3.1 (for determining the numberof time steps to wait before reporting on a gesture event). That is, training data which contain beatannotations is used to identify those states that correspond to a single beat. This information isstored together with the average number of time steps the model remains in the states for utilizationin the modified Viterbi algorithm.
Modification The Viterbi algorithm was modified to reset after a gesture is detected. This be-havior is not suitable after detecting a single beat, though. If the algorithm was reset in such a case,it would not be possible to detect later beats, or the end of a gesture. Therefore, I introduced theprinciple of event states as shown in figure 5.9. Event states are states that trigger the recognizer toreport on a detected event—either a single beat or the end of a gesture. Final states are thus eventstates, too. However, only final states account for the algorithm to reset.
The state diagram depicted in figure 11.1 on page 89 illustrates the operating principle of themodified Viterbi algorithm. dur refers to the number of time steps an event state has been visited,i.e. the duration this state was the most likely state for. The number of time steps to remain in anevent state before reporting is referred to by stateOffset. minDur refers to the minimum numberof time steps that are required to trigger an event in case an event state is left, i.e. a different statebecame more likely, before stateOffset is reached. It is also determined by analyzing training data.
Since Pinocchio, in the version available when this thesis was written, does not support theprocessing and synchronization of beat information, the detection of single beats is not integratedin the implementation described in chapter 6. It went beyond the scope of this thesis to integratesuch a mechanism into Pinocchio.
11For example, it might be beneficial to connect the last state of the model representing the first beat of a 2-beatgesture with the first states of the models representing the second beat of a 3-beat and 4-beat gesture. Since the first beatis very similar for all three types of conducting gestures, this modification might increase the recognition performance.
53

5.4 Gesture Interpretation 5 CONDUCTING GESTURE RECOGNITION
5.4 Gesture Interpretation
The method described above is able to find and classify conducting gestures. The next step is tointerpret recognized gestures. That is, tempo and volume have to be extracted as musical controlinformation to be sent to the host system.
5.4.1 Tempo
The tempo of conducting gestures is determined by their execution speed. Extracting the tempois a fairly straightforward task to accomplish, having the gesture recognition in place. When agesture is recognized, its type defining the number of contained beats b, as well as its duration isknown (due to the extraction of starting and end points ts respectively te). In addition, the samplingfrequency F and thus the length of a time step t is known.
tempog =b
te−tsF·60 (11)
calculates the number of beats per minute (bpm) of gesture g. For example, if a 3-beat gesturewith a duration of 250 samples was detected at a sampling frequency of 100 samples
s , equation 11would yield a tempo of
tempogex =3 beats
250 samples100 samples
s
·60 = 72beatsmin
.
Before the tempo is send to the host system, a simple moving average filter is used to smooththe result and compensate for small spotting errors. [Borchers et al., 2004] use a more complexapproach for adjusting the orchestra’s tempo: They let the orchestra play faster after the conductorsped up in order to get in phase again. As can be seen from their method, a tighter couplingbetween the conductor’s and the orchestra’s tempo is used. Such a synchronization requires theactual orchestra system to be able to receive information about single beats as well as their positionwithin a measure. Pinocchio in its current version does not support this feature (compare section5.3.2).
5.4.2 Volume
The volume information conveyed in conducting gestures is determined by the gesture size. Toextract a gesture’s size, i.e. the length of the path that the user’s hand covered while executing thegesture (compare [Morita et al., 1989]), acceleration data a1,a2 · · ·aT collected for the duration Tof the gesture is used.
Summing up acceleration twice yields the length of the path which is used together with thepreviously extracted tempo and the number of beats contained in the recognized gesture to ap-proximate the intended volume.
volumeg = G ·T
∑i=1
∣∣∣∣∣ i
∑j=1
∥∥a j∥∥∣∣∣∣∣ (12)
In addition, a conducting gesture specific factor G is applied, since the path lengths is also de-pendent on a gesture’s shape. A simple moving average filter is applied to smooth the extractedvolume values.
54

5 CONDUCTING GESTURE RECOGNITION 5.4 Gesture Interpretation
In this chapter, I motivated my choice for HMM as machine learning approach to be used for therecognition of conducting gestures in this project. After a short introduction to HMM, I describedand illustrated how HMM can be applied to the task of conducting gesture classification, includinga discussion of input signal characteristics, choice of HMM properties, preprocessing and vectorquantization methods, and methods to reject non-meaningful gestures.
Pinocchio
Smoothing Calibration
Gesture Recognizer
eWatch
VectorQuantization
GestureInterpretation
GestureRecognition
Spotting
Classification
raw
accel.
tempo
volume
singlesingle
beatsbeats
smooth.
accel.
calib.
accel.
codewords
gestures
garbage
Figure 5.10: Gesture recognizer
Once I explained how gestures can be classified, I discussed the problem of gesture segmenta-tion, alternatively gesture spotting, and how it can be tackled in an integrated recognition approach.This included the modification of the Viterbi algorithm for continuous input data and gesture eventgeneration. Furthermore, I introduced methods to realize a subgesture recognition of single beats.
Finally, I explained the methods applied to interpret gestures, i.e. to extract tempo and volumeto be used for musical control. In the following chapter, I shall describe the implementation of themodules introduces so far, summarized in figure 5.10. Chapter 7 will cover an evaluation of themethods proposed so far, utilizing recorded gesture data from different users.
55

5.4 Gesture Interpretation 5 CONDUCTING GESTURE RECOGNITION
56

6 IMPLEMENTATION
6 Implementation
In the previous chapter, I explained methods and approaches for a conducting gesture recognitionmodule, including data calibration and feature extraction, gesture spotting and classification, aswell as gesture interpretation. This chapter describes the implementation of the module and re-quired tools in several steps. I shall introduce a testbed for gesture recognition in section 6.1 whichI used to guide my implementation of the recognition algorithms described in section 6.2. Afterexplaining the eWatch communication module in section 6.3, I shall describe tools for data col-lection and evaluation in sections 6.4 and 6.5. This chapter concludes with integrating the gesturerecognizer into Pinocchio.
Reading through previously presented descriptions, it might appear that design choices and pa-rameter decisions were fairly straightforward. In reality, they involved several iteration steps oftest implementations and evaluation. This is due to the fact that the gesture recognizer is builtfrom scratch; no prior implementation to build on was available. Furthermore, not only the recog-nition algorithms have to be implemented, but it is also necessary to develop modules and tools toverify design and parameter choices in a controlled environment, to reliably retrieve data from theeWatch, and to collect, analyze, and annotate large amount of training data for evaluation.
eWatch Module[Java]
Testbed[Matlab]
Recognition Algorithms[Matlab]
Evaluation Environment[Matlab]
Test Data Preparation Tools[Matlab]
Recognition Subsystem[Objective-C]
providesdata
providesdata
uses uses
communicates
integrates
uses
uses
uses data(manual transfer)
Pinocchio
Figure 6.1: Implementation components
Figure 6.1 depicts the components discussed in this chapter, as well as the implementationlanguages used for realization. The eWatch module (compare section 6.3) provides an interface tocommunicate with the eWatch device over Bluetooth. Both, the evaluation environment (comparesection 6.5) and the recognition subsystem (which integrates gesture recognition into Pinocchio,compare section 6.6), access the eWatch module to retrieve acceleration data. The recognitionalgorithms (compare section 6.2) are also accessed by both of the modules mentioned above—aswell as by the testbed (compare section 6.1), which was used for a first evaluation of the algo-rithms. In addition to accessing the eWatch module, evaluation data are prepared manually to be
57

6.1 Testbed 6 IMPLEMENTATION
used in the evaluation environment, i.e. data are recorded on the eWatch, transferred, and anno-tated using the test data preparation tools (compare section 6.4).
6.1 Testbed
I decided to implement a separate testbed for recognizing gestures using HMM12 for the followingreasons:
• Elimination of uncertainties. The tasks of using the eWatch as input device and of prepro-cessing raw acceleration data already impose several uncertainties which may potentiallyaffect the recognition process. This makes it thus infeasible to initially evaluate the usageof HMM in such an environment, because the increased number of error sources may leadto an unpredictable behavior.
• Ease of test data generation. The acquisition and preparation of conducting gesture test datausing the eWatch is not an easy matter and consumes a considerable amount of time; referto section 6.4 for a description of the data recording and analysis process.
I designed the testbed to accept mouse gestures as input and to recognize figures from “1”to “9”. Since mouse input data are easier to acquire and since they also contain less noise thanacceleration data coming from the eWatch, uncertainties concerning steps happening before theactual recognition process with HMM can be reduced. Moreover, it is easier to collect sample dataas the majority of computers is equipped with a mouse which can easily be accessed.
The implementation is done in MATLAB, allowing me to get familiar with the Hidden MarkovModel toolbox [HMMToolbox, 2007] which implements basic HMM algorithms. The testbed isdesigned to classify isolated gestures. It is not capable of recognizing gestures in a continuousinput stream, i.e. it is not capable of performing gesture spotting. To indicate gesture boundaries,the user has to hold down a mouse button while executing a gesture.
(a) graphical user interface
αp1
p2
(b) quantization
Figure 6.2: Mouse gesture recognition testbed
To make the testbed more usable for a first evaluation of HMM, I implemented a simple graph-ical user interface which allows the training and recognition of mouse gestures13, shown in figure6.2 (a).
The input data used for training and recognition is quantized in a similar way as described foracceleration data in the previous chapter (compare section 5.2.2). However, instead of extracting
12The testbed was inspired in parts by [Starner et al., 1994, Yang and Xu, 1994] who implemented a handwritingrecognizer, and by [Kolesnik, 2004] who implemented a symbol recognition as a testbed for a conducting gesturerecognition system.
13Using the training module, it is of course possible to train other gestures in addition to the figures from “1” to “9”mentioned above
58

6 IMPLEMENTATION 6.2 Recognition Algorithms
directions of acceleration, positional directions of the mouse path are used. That is, the angle α
of a connecting line between two sampling points p1, p2 is used to generate codewords (comparefigure 6.2 (b)).
In training mode, the user selects the gesture to be trained and then repeats the gesture foran arbitrary number of times. After training all gestures, the resulting HMM can be saved forlater usage and the system is switched to recognition mode. When the user draws a figure, thetestbed passes the quantized gesture data to each of the trained HMM, which in turn calculate theprobability of the input sequence produced by the according model, using the Forward-Backwardalgorithm (an example of resulting probability values can be seen in the bar chart in figure 6.2 (a)).The resulting probabilities are compared, and the gesture corresponding to the HMM that yieldedthe largest probability is selected as the gesture that was recognized.
Using this testbed, I also evaluated the implementation of the threshold model (compare sec-tion 5.2.3) which showed promising results; the testbed now refused gestures that were not similarto one of the trained figures—while still recognizing them. Before the introduction of the thresh-old model, the testbed always recognized—or rather selected—one of the trained gestures forsure. The testbed is also able to reliably recognize gestures drawn at different speeds or in differ-ent sizes. Furthermore, I tested the user-independence of the HMM gesture recognition approachby recognizing gestures from a different user than the one who provided the training data. Again,the promising results confirmed my choice of model. Several other options, such as the usage ofcontinuous HMM, a window approach for continuous recognition, or the generation of gesturesusing HMM, were tested in addition, but did not perform well enough to find their way into theactual implementation of the conducting gesture algorithms.
I did not conduct any formal evaluations using this testbed; this was not the intention of imple-menting it. In fact, I rather see the testbed as a sort of playground that enabled me to get familiarwith the properties and peculiarities of gesture recognition with HMM—without having to dealwith the difficulties that arise from hard-to-acquire and noisy input data. It was indeed an invalu-able tool for collecting experiences regarding this project’s realization. In the next section, I shalldescribe issues related to the actual implementation of the conducting gesture recognizer.
6.2 Recognition Algorithms
As motivated in section 4.4, I chose MATLAB for the implementation of the required algorithmsto recognize gestures; MATLAB offers a flexible and powerful environment for the efficient eval-uation of different approaches. Moreover, it was easy to deal with gesture test data, i.e. to managedifferent test sets and according annotations; test data acquisition and annotation is described indetail in section 6.4.
I followed the decisions introduced in sections 5.2 respectively 5.3 in implementing the gesturerecognition algorithms. Since the underlying principles already have been described above, I shallfocus on implementation specific issues in this section.
The recognition algorithms are split into different modules responsible for data processingand gesture analysis, as depicted in figure 5.10 on page 55. These modules are realized as either asingle MATLAB function or, if appropriate due to increased complexity, as a collection of MAT-LAB functions. The algorithms implemented here are used by the evaluation environment and bythe recognition subsystem (and were used by the testbed during the initial stage of the realizationprocess).
Since there is only one single implementation of the recognition algorithms, testing has do bedone only once. That is, after I implemented and tested the recognition algorithms using the evalu-ation environment, I did not have to implement and test them again for the usage in the recognitionsubsystem, i.e. for the integration into Pinocchio. It was easier to perform testing and verificationin the evaluation environment than it would have been in Pinocchio directly. MATLAB, which is
59

6.2 Recognition Algorithms 6 IMPLEMENTATION
used in implementing the evaluation environment as well, also allows the visualization of interme-diate steps, which enables potential errors to be quickly identified and eliminated.
Pinocchio is implemented in Objective-C (compare section 4.4). Therefore, the recognitionsubsystem being responsible for the integration into Pinocchio uses the same implementation lan-guage. In order to be able to use the recognition algorithms written in MATLAB from within therecognition subsystem, they have to be converted so that they are accessible from an Objective-Capplication: MATLAB comes with a compiler [MatlabCompiler, 2007] which generates functionlibraries in C or C++. If MATLAB is not installed on the target machine where Pinocchio is de-ployed, the MATLAB Component Runtime (MCR) must be installed in order to be able to use thelibraries generated by MATLAB.
After making Objective-C aware of the libraries’ location, MATLAB functions can easily beaccessed after they have been compiled using the MATLAB compiler. It is possible to pass param-eters to and retrieve results from MATLAB functions without any difficulties. I implemented thefollowing modules, sometimes consisting of several algorithms, for gesture recognition in MAT-LAB: Smoothing, calibration, and vector quantization (compare section 5.2.2), modified Viterbialgorithm for gesture spotting and classification (compare section 5.3.1), and—realized as part ofthe Viterbi module—gesture interpretation (compare section 5.4).
The first versions of the recognition modules which I implemented were only able to handleoffline recognition, because that is the way how I first approached the problem, in order to keepthings simple at the beginning. That is, the algorithms expected the whole sequence of input datato be present at the time of execution. Apparently, it is impossible to have the whole input sequenceat hand during an online, i.e. realtime, recognition. In fact, input samples are available at a certainfrequency one after another only, and an output is expected at each of these steps. Therefore, I hadto modify the recognition algorithms to be able to handle realtime recognition.
Doing so is straightforward for algorithms that are not stateful, like the vector quantization;the output of this algorithm is dependent on the current sample only. In contrast, the calibrationalgorithm, the Viterbi algorithm, and the gesture interpretation algorithms require informationto be stored over several time steps. The calibration algorithm for example needs to keep trackof a running average. Therefore, I extended all stateful algorithms to return variables, that aresupposed to be kept over several time steps, as output on the one hand, and to also accept these statevariables as input on the other hand. The host application, i.e. either the evaluation environmentor the recognition subsystem in this case, buffers state variables which are returned by functionsimplementing the algorithms, and passes them as parameters in the subsequent function call. Indoing so, the current state of an algorithm is saved by the host application.
This approach allows for a flexible linking of different algorithms at the level of the host ap-plication. That is, the algorithms can be executed independently, and their results can be usedas input in turn. Therefore, this approach is suitable for the utilization in the recognition subsys-tem, written in Objective-C. The recognition subsystem’s architecture, depicting the integrationapproach amongst others, is described in section 6.6.
Besides the algorithms applied for recognition, there are also algorithms required for themodel’s training. Using the Baum-Welch algorithm, an HMM can be trained for a certain ges-ture, for example (compare section 5.1.2). After having trained every gesture that is supposed tobe recognized by the system, a threshold model has to be built, and the single HMM have to beintegrated into a compound HMM (compare sections 5.2.3 and 5.3.1). I implemented all requiredalgorithms in MATLAB, respectively used algorithms by Netlab where a suitable implementationwas available. Currently, these algorithms are used in the evaluation environment only. That is,they are used to evaluate different types of training configurations. A training module integratedinto the recognition subsystem, i.e. a training module which is accessible by the end user in Pinoc-chio to train new gestures, is an option to increase the system’s usability but does not improve theactual task of gesture recognition (compare chapter 9).
As can be seen from this section, all core algorithms, i.e. algorithms that deal with the recog-
60

6 IMPLEMENTATION 6.3 eWatch Module
nition of gestures and the necessary preprocessing as well as training steps, are implemented inMATLAB. Algorithms that are required during the realtime recognition are made accessible to therecognition subsystem for integration into Pinocchio by means of using C libraries exported fromMATLAB.
6.3 eWatch Module
The eWatch module is responsible for communicating with the eWatch. As it is implemented inJava (this decision is motivated in section 4.4), it can be used in both, in the evaluation environ-ment, as well as the integration of the gesture recognition subsystem into Pinocchio.
Since the eWatch is a Bluetooth device providing a serial port, the communication is realizedusing virtual COM ports14, which are available as soon as the eWatch has been successfully pairedwith the computer. Sending data to and retrieving data from the eWatch is then possible by meansof standard Java input and output streams. The eWatch accepts simple text commands with pa-rameters. After the sensors are set up with regard to sensor types and sampling frequency to beused, and the data capturing is started, the eWatch continuously sends acceleration data. On thecomputer side, the eWatch module waits for incoming data and parses them as soon as they arrive.Parsed data are stored in a circular buffer.
The client application—either the evaluation environment or the recognition subsystem in thecontext of this project—queries the eWatch module in regular intervals; the content of the circularbuffer mentioned above is then returned and the buffer is emptied. This approach bears the dis-advantage of requiring an additional thread in the client application. However, it decouples theeWatch module from its client, making it possible to be used in different types of applications,which even might be implemented in different languages, as it is the case here. Additionally, theeWatch module can easily be replaced by a communication module supporting different input de-vices. The potentially resulting decrease in performance when using this approach is tolerable fora prototype implementation which is under steady change, thus requiring a flexible structure. Amore efficient way of implementation may be considered for a productive system.
In order to be able to test applications without having the eWatch at hand, I implemented afunction that allows the eWatch module to read acceleration data from a file instead from the actualdevice. The data source, which can be selected at runtime, does not affect the client application;the eWatch module behaves identically, independent from its data source.
6.4 Test Data Preparation Tools
Before it is possible to evaluate any algorithm or parameter setting, test data have to be capturedand particularly prepared. After recording gesture data of a user performing conducting gestures,it is necessary to annotate them, i.e. to identify those points of time that correlate to the eventof a beat or a gesture. Only after these annotations have been made, it is possible to extract datasegments representing single gestures for training. The annotations are also essential in order toevaluate a recognizer’s detection ratio and reliability, by comparing detected events to expected(or rather annotated) events.
The more training data available, the more useful an evaluation becomes, because more vari-ations are represented. Therefore, it is desirable to collect as much training data as possible withregards to the time being at disposal. In the remainder of this section, I shall describe several meth-ods for annotating test data, which depend on the circumstances the data were recorded under, andtherefore vary in the tools required.
14While the port identifiers for serial ports over Bluetooth vary from operating system to operating system (“COMX”for Windows, “/dev/tty.X” for Mac OS, e.g.), the method of accessing the device stays the same.
61

6.4 Test Data Preparation Tools 6 IMPLEMENTATION
Video Annotation The first gesture data that I annotated were recorded for the initial user studydescribed in section 3.2. The intention of this study is to learn more about the interaction betweena conductor and his orchestra on the one hand, and to verify that the eWatch is a suitable tool forcapturing gesture data on the other hand. During a rehearsal, conductor Daniel Meyer was wearingthe eWatch while I recorded him using a Panasonic DVC-30 digital camcorder.
Analysis
eWatch
Conductor
Orchestra
GestureAnalysis
CamcorderBeat
Analysis
Comparison
Synchronization
Data Collection
A/VBeats
Acc/L
L
Acc
V
V
A
Turning points
Acc: AccelerationL: LightA: AudioV: Video
Figure 6.3: Data collection setup
As mentioned in the introduction to this section, the goal of test data preparation is to iden-tify acceleration samples that correspond to conducting beats, since these samples represent ges-ture boundaries which the system is supposed to identify. Figure 6.3 depicts the recording setupused during data capturing. The principle idea of annotating gesture data with the help of videorecordings is to go through the recorded video footage, and find those frames that correspond to aconducting beat. These frames are clearly identifiable by manually expecting image by image. Inorder to double the resolution in time, I used a simple AviSynth script [AviSynth, 2007] to sepa-rate whole frames into fields; one frame consists of two fields as long as the video is recorded ininterlaced mode.
Since the eWatch and the digital camcorder are separate devices, means of synchronizationhave to be found. Otherwise, it would not be possible to correlate video images to accelerationsamples. Synchronization serves two purposes: First, it initially aligns video and acceleration data.Second, it accommodates for clock drift. The synchronization approach I chose for this recordingis described in the following.
500 100 150 200
Ligh
t int
ensi
ty
Time [ms × 10]
(a) Light sensor data from eWatch (b) Image sequence from video
Figure 6.4: Synchronization using LED flashes
I am using a LED emitting bright flashes of approximately 50 ms in duration that are clearlyrecognizable in both, the digital camcorder’s video track and the eWatch’s light sensor data (com-pare figure 6.4). LED flashes are recorded at the beginning of the rehearsal and in its end. I amaligning eWatch and camcorder data and match their lengths manually. Since light and acceler-ation data from the eWatch, and video and audio from the camcorder, are already synchronizedrespectively, synchronizing light data and video results in a synchronization of acceleration data
62

6 IMPLEMENTATION 6.4 Test Data Preparation Tools
and video. The actual annotations are entered manually: After identifying a conducting beat, Isimply calculated the corresponding eWatch data sample (sample frequencies are known and datasources were aligned before) and stored their indices manually using a MATLAB matrix. In thenext section, I shall describe how audio recordings may be used to realize an annotation methodthat requires fewer manual steps.
Audio Annotation For the second user data acquisition, which is introduced in section 3.2, Iasked conductor Walter Morales to perform conducting gestures in a controlled studio environ-ment, following a metronome and selected pieces of classical music. I used the same setup ofrecording devices as described in the previous section, namely the eWatch and a Panasonic DVC-30 digital camcorder. The LED flash synchronization is used as well. In contrast to the previousdata collection, I am using a different approach for data annotation—at least for those gesturesthat were recorded following the metronome. The camcorder’s audio track contains the distinc-tive sound of the metronome’s ticks, which is easy to isolate automatically by analyzing the audiosignal’s amplitude. The gestures were recorded in a sound studio, thus making the metronome theonly significant source of sound.
Figure 6.5: Beat annotation tool
In order to be able to annotate gesture data quickly while minimizing errors (which are likely tohappen due to the annotation task’s monotony), I implemented a tool to make annotating gesturedata easier and more efficient in terms of required time. The tool’s graphical user interface isshown in figure 6.5. It allows to inspect a video file frame by frame. Once the user identifieda gesture beat, he or she tells the system to insert an annotation for this frame, which is thenautomatically stored.
If the “snap to audio” feature is activated, a window of length n15 surrounding the currentlyselected frame in the recording’s audio track is scanned for a metronome tick. If the system isable to identify a tick, the annotation is aligned with it. The “snap to audio” feature makes theannotation of data easier, since the user is not required to exactly specify a conducting beat’sposition. In fact, it is sufficient to roughly point to a conducting beat.
In this section, I described how to extend the previously introduced, video-based annotationmethod by means of using metronome ticks which are audible in the recording’s audio track. Thismethod provides a more efficient and accurate way of annotating conducting gesture data, but it islimited to recordings with an identifiable beat pattern in the according audio track. In the following
15The window size n is chosen to be shorter than twice the length of a beat in order to prevent the system fromselecting a metronome tick belonging to one of the surrounding beats.
63

6.5 Evaluation Environment 6 IMPLEMENTATION
section, I shall introduce a method to collect large numbers of gesture data, without the necessityfor manual annotation.
Automated Annotation In order to evaluate the algorithms used for recognizing conductinggestures, I had to collect large numbers of gesture test data, preferably covering different users,measures, tempos, and sizes. Acquiring data using the approaches described so far would havetaken too long with respect to time limits that apply for realizing this thesis. Therefore, I chose adifferent approach for collecting gesture data which I shall describe in the following.
I asked users to perform conducting gestures following a metronome, similar to the user studydescribed in the previous section. However, I only used the eWatch’s accelerometers to recorddata for approximately two minutes per setting; I did not make any audio or video recordings.Knowing how a beat’s acceleration data plot looks from previous data collections, I was able toclearly identify the start of the first as well as the last beat performed in a recording session. Sincethe user was following the metronome with a fixed tempo, it is trivial to insert intermediate beatannotations.
That is, in order to annotate two minutes worth of continuous gesture data, the only steps tobe performed are identifying the first and last beat and specifying tempo and measure used duringrecording (in order to be able to calculate distances between single beats). This approach is appar-ently limited to the annotation of repeatedly performed gestures of the same type. Moreover, theannotation’s accuracy depends on the user’s timing while performing the gestures. Nevertheless,taking into account the time saving potential, I chose this automated approach in order to collectgesture data for evaluating the recognition algorithms.
Using this method, I collected seventy-two data sets of two minutes each, or almost two and ahalf hours of pure gesture data, covering four users, three beat types, five tempos, and three differ-ent gesture sizes. Due to time limitations, I did not collect data for every possible combination ofthe variables mentioned above. In fact, I focused on several settings in order to evaluate differentaspects of the recognition system systematically, as described in chapter 7.
In all three of the approaches described in this chapter, I transferred data manually from theeWatch, rather than using the eWatch module described in section 6.3, which is targeted at beingused in realtime recognition tasks. Unfortunately, there was no tool available to easily transferdata from the eWatch to an arbitrary computer. Therefore, we implemented an eWatch readerapplication in Java16 (using the same communication classes as the eWatch module) to transferdata stored in the eWatch’s flash memory to the computer. The reader application is currentlybeing used in several other projects applying the eWatch at Carnegie Mellon University.
6.5 Evaluation Environment
The evaluation environment is also implemented in MATLAB. It uses the recognition algorithmsdescribed in section 6.2 and applies them either to live data coming from the eWatch directly, orit uses an offline evaluation with prerecorded data of known content (which have been collectedusing the approach described in section 6.4) as described in chapter 7. While the recognition ofonline data is fairly straightforward, the offline evaluation of potentially large data sets, with amultiplicity of different settings to be tested, requires more implementational efforts which I shalldescribe in the following.
After test data are prepared using the tools described in the previous section, the evaluationenvironment allows to specify parameter values of the gesture recognizer’s calibration, vectorquantization, and gesture recognition components to be tested (compare chapter 5 and figure 5.10on page 55 in particular). It performs a cross-validation on each of the settings specified. In doing
16While I was responsible for implementing the communication part of the eWatch reader, Brian French, a graduatestudent at Carnegie Mellon’s electrical and computer engineering department, implemented the data decoding.
64

6 IMPLEMENTATION 6.6 Recognition Subsystem
so, it assures that data loss due to errors in algorithms to be tested or due to external interruptions,such as power outages, is minimized by saving intermediary results to the hard drive.
As described in [Bishop, 2006, page 32], an S-fold cross-validation is performed by partition-ing the available data into S groups. S−1 groups are used to train a model which is then evaluatedon the remaining group. This procedure is repeated S times and the performance scores of thesingle runs are averaged. In the context of this project, I used a two-minute test recording set asone group. Please note that the gesture recognizer requires a test recording for each gesture that issupposed to be recognized.
To better illustrate the procedure of cross-validation, I shall give an example in the follow-ing. In order to evaluate the effect of using different number of labels during vector quantization(for a description of the applied vector quantization approach refer to section 5.2.2) on the user-dependent recognition at a certain tempo and gesture size, all available training sets matching theselected user, tempo, and gesture size are selected as input for the cross-validation.
In order to keep the procedure simple, the evaluation environment requires that all gestures tobe recognized are represented by the same number of data sets. That is, if there are five recordingsof user X performing a 2-beat gesture at 90 bpm, there must also be five recordings each of userX performing a 3- and 4-beat gesture at 90 bpm. In every step of cross-validation for a fixednumber of labels (which is the variable to be evaluated in this example), a data set for 2-, 3-, and4-beat each is chosen and held out; all remaining sets are used for training the recognition model.The three sets previously held out are then used to evaluate the recognition performance. Thisprocedure is repeated five times (in this example) and the final evaluation result is calculated bytaking the average over the results of the single test runs. The whole cross-validation procedure isthen repeated for each number of quantization labels to be evaluated (compare section 7.1).
The evaluation environment allows the user to specify which test data sets to be used, andwhich parameter values to be tested. It then performs the cross-validation in a batch mode. Sincea file is generated for each evaluation setting, it is easy to use multiple computers to perform thetesting in parallel. All results presented in chapter 7 have been produced using the evaluationenvironment described here.
6.6 Recognition Subsystem
(a) main screen (b) settings screen
Figure 6.6: Graphical user interface of recognition subsystem
In the final section of this chapter, I shall describe the implementation of the recognition sub-system which is realized in Objective-C. The recognition subsystem connects the conducting ges-ture recognition algorithms with the eWatch module and integrates them into Pinocchio, enablingthe user to control the virtual orchestra’s tempo and volume by means of common conducting ges-
65

6.6 Recognition Subsystem 6 IMPLEMENTATION
tures. Moreover, I followed a flexible approach while designing the recognition subsystem whichallows for later replacement of single components. For example, the recognition algorithms cur-rently implemented in MATLAB may be replaced by more efficient Objective-C implementationswithout requiring major changes. Additionally, it is possible to realize modules in order to supportother input devices than the eWatch.
+ stop() : void+ start() : void+ initWithType(type : int) : id
GestureInputDeviceController
GestureRecognizerSubsystem
1
1
+ initWithType(type : int) : id
GestureRecognizerFacade
FilterSubsystem
1 1
+ reset() : void+ filter(data : NSMutableArray) : NSMutableArray+ initWithStrategy(strategy : int) : id
FilterFacade
GestureInputDeviceSubsystem
1
1
+ stop() : void+ start() : void+ initialize(type : int, port : NSString) : void+ getStatus() : int+ getBuffer() : NSMutableArray
GestureInputDeviceFacade
Figure 6.7: Class diagram of subsystems and controller
The recognition subsystem itself is split into three further subsystems (for the sake of sim-plicity referred to as subsystems in the course of this section) as shown in figure 6.7, namely intogesture input device, filter, and gesture recognizer subsystem. Each of the three subsystems con-tains a facade class, providing a simplified interface to the respective subsystem to be accessed bythe GestureInputDeviceController, which controls the subsystems and acts as an access point forthe host application, Pinocchio in this case, in turn. Figure 6.6 shows the recognition subsystem’sgraphical user interface, integrated into Pinocchio. It allows the user to select the port the eWatchis connected to and to adjust several recognition settings.
6.6.1 Gesture Input Device Subsystem
Being responsible for communicating with the input device, the gesture input device subsystem(shown in figure 6.8) is potentially able to handle different types of input devices. Currently, onlythe EWatchJavaAdaptor, which uses the Objective-C’s JavaBridge to access the eWatch module(compare chapter 6.3), and its according factory classes are realized. Future versions of this sub-system may contain implementations for a native eWatch module written in Objective-C, or amodule to access a Wiimote controller. Basic operations to be supported by all input devices arestart and stop, to begin and end receiving input data, as well as a function to retrieve buffered inputdata.
66

6 IMPLEMENTATION 6.6 Recognition Subsystem
6.6.2 Filter Subsystem
+ stop() : void+ start() : void+ initialize(type : int, port : NSString) : void+ getStatus() : int+ getBuffer() : NSMutableArray
GestureInputDeviceFacade
+ createGestureInputDevice(port : NSString) : GestureInputDevice
<<interface>>GestureInputDeviceFactory
+ stop() : void+ start() : void+ getStatus() : int+ getBuffer() : NSMutableArray+ initWithImplementor(implementor : GestureInputDeviceImplementor) : id
GestureInputDevice
+ stop() : void+ start() : void+ setBufferSize(size : int) : void+ getBuffer() : NSMutableArray
<<interface>>GestureInputDeviceImplementor
EWatchJavaFactoryEWatchNativeFactoryWiiFactory
11
1
1
+ initWithPort(port : NSString) : id
EWatchJavaAdaptor EWatchNativeImplementor WiiImplementor
eWatch Module
<<creates>>
<<creates>>
<<creates>>
Figure 6.8: Class diagram of gesture input device subsystem
The filter subsystem (shown in figure 6.9) is responsible for preprocessing input data providedby the gesture input device subsystem. It is centered around the Filter interface which definestwo methods, one for actually filtering data and one for resetting the filter. Currently, only theMatlabFilterAdaptor is implemented which accesses MATLAB functions exported as C libraries(compare section 6.2). Native filter implementations in Objectiv-C may be realized in the futureto improve efficiency for a non-prototype system. An instance of a subclass of the FilterStrat-egy interface defines filters and their order to be used. MatlabFilterStrategy for example passesincoming data first to the smoothing, then to the calibration, and then to the vector quantizationfunction.
6.6.3 Recognizer Subsystem
The gesture recognizer subsystem (shown in figure 6.9) handles input data which have been pre-processed by the filter subsystem before in order to recognize gestures. When a gesture is rec-ognized, notifications are sent to Pinocchio which in turn adjusts tempo and volume accordingly.Currently, the MatlabViterbiAdaptor is the only implementation of the GestureRecognizer inter-face; it accesses the Viterbi algorithm implemented as MATLAB function using an exported Clibrary.
Both, the filter as well as the gesture recognizer subsystem, make use of the MatlabLi-braryProxy class which realizes a singleton pattern to make sure that the MATLAB ComponentRuntime is only initialized once, and that it is terminated when the host application itself ter-minates. In addition, GestureInputDeviceSettings holds several global settings for the filters andalgorithms used in the two subsystems.
67

6.6 Recognition Subsystem 6 IMPLEMENTATION
+ reset() : void+ filter(data : NSMutableArray) : NSMutableArray
<<interface>>FilterStrategy
NativeFilterStrategy MatlabFilterStrategy
+ reset() : void+ filter(data : NSMutableArray) : NSMutableArray+ initWithStrategy(strategy : int) : id
FilterFacade
11
+ reset() : void+ filter(data : NSMutableArray) : NSMutableArray
<<interface>>Filter
1..*
1
NativeSmoothFilter
NativeNormalizeFilterNativeQuantizeFilter
+ initWithFilterType(type : int) : id
MatlabFilterAdaptor
MatlabLibraryProxy
+ initWithType(type : int) : id
GestureRecognizerFacade
+ reset() : void+ process(data : NSMutableArray) : NSMutableArray
<<interface>>GestureRecognizer
+ isValidGesture() : boolean+ getVolume() : double+ getTime() : int+ getTempo() : double+ getGestureIndex() : int+ getEventState() : int+ getDesc() : NSString+ getBeatIndex() : int+ initWithValues(... : int) : void
GestureEvent
1
1MatlabViterbiAdaptorNativeRecognizer
GestureInputDeviceSettings
Figure 6.9: Class diagram of filter and recognizer subsystems
In this chapter, I discussed the implementation of modules and algorithms that have been intro-duced in the previous chapter. Before actually dealing with gesture data coming from the eWatch,I implemented a testbed using mouse gestures to evaluate initial versions of the recognition al-gorithms. The implementations of the eWatch module, responsible for communicating with theeWatch, and the recognition algorithms, realizing the core functionality of recognizing gestures,are both used by the evaluation environment as well as the recognition subsystem. While the recog-nition subsystem is implemented in Objective-C and responsible for the integration into Pinocchio,the evaluation environment is implemented in MATLAB and able to use prerecorded gesture testdata to perform cross-validations in order to optimize parameters settings. Results of such anevaluations are described in the following chapter.
68

7 EVALUATION
7 Evaluation
In this chapter, I shall provide an evaluation of the gesture recognition system developed andmotivate decisions with regard to preprocessing and recognition algorithm settings, as introducedin chapter 5. These decisions are based on empirical evaluations. As described above, I used theevaluation environment introduced in the previous chapter to collect gesture data from differentusers performing different gestures. After describing basic conditions and methods in section 7.1,I shall motivate the evaluations performed and present their results in section 7.2. In section 7.3, Ishall conclude this chapter with a discussion of implications and limitations that appeared duringthis evaluation.
7.1 Method
Evaluation Results Structure Due to the high number of test data recordings and parametervalues that can vary, the evaluation environment uses a hierarchical data structure to store testresults. Before introducing this structure, I shall define several terms that will be used in thefollowing discussion:
• Test data recording: A two minute acceleration data recording containing data for one singlegesture which was repeatedly performed by the same user at a fixed tempo. Additionally, atest data recording contains beat annotations inserted as described in section 6.4.
• Test data recording set: Set of g test data recordings, g being the number of gestures thesystem is able to recognize, i.e. three in all examples presented so far, namely 2-, 3-, and4-beat gestures. A test data recording set contains exactly one test data recording for eachgesture.
• Setting: Set of parameter values that potentially influence the recognition performance. Forexample, the number of states to be used in the HMM is one of the recognizer’s parameters.
• Setting set: Set of settings, usually with the values of one single parameter varying17 fromsetting element to setting element. For example, the first element of the setting set may havea value of ten for the number of HMM states, the second may have a value of eleven, and soon.
Figure 7.1 depicts the hierarchy of different tests performed during an evaluation. I shallintroduce the different test levels in the following paragraphs:
• Parameter evaluation: The goal of a parameter evaluation is to find optimal values for aparameter with respect to recognition performance and the test data available. A parame-ter evaluation consists of k test suites, which all use the same setting set but different testdata recording sets. For example, The first test suite may use test data for training andrecognition coming from the same user (user-dependent test), while the second test suitemay use test data for training coming from a different user than the test data for recognition(user-independent test).
• Test suite: A test suite is defined for a setting set containing l settings and multiple testdata recording sets. The evaluation environment allows the user to specify which of the testdata recording sets to be used for training and which for recognition. The number of testdata recording sets assigned for recognition, m, determines the number of test runs one levelbelow. Note that it is possible to assign a single test data recording set to both, training and
17Varying more than one parameter from setting to setting makes it difficult to identify the source for a potentialchange in recognition performance.
69

7.1 Method 7 EVALUATION
recognition. In such a case, a cross-validation is performed. The evaluation environmentgoes through all elements contained in the specified setting set and performs a setting testfor each of them.
• Setting test: A fixed setting is used in a setting test. The evaluation environment performsa test run for every test data recording set assigned for recognition one level above, i.e. itperforms m test runs. Note that test data used for recognition is never used for trainingduring the same test.
• Single test: A single test is performed for a single test data recording, i.e. test data containingthe performance of one gesture. The setting to be used is determined by the according settingtest.
ParameterEvaluation
...TestSuite 1
TestSuite k
... ...
...
SettingTest 1
TestRun 1
SingleTest 1
SingleTest 2
SingleTest 3
TestRun m
SingleTest 1
SingleTest 2
SingleTest 3
SettingTest l
...
Figure 7.1: Evaluation results structure
Test Data Recordings In contrast to the initial two user studies with orchestra conductors, I amusing test data collected from four different users for evaluating the gesture recognizer. All theusers are graduate students of electrical or computer engineering between the age of twenty-fourand twenty-six. This choice is due to the rather limited availability of conductors for user studies.One of the four users who contributed to the test data is female, three are male. Neither of themhas a background knowledge in musical conducting. As discussed in section 1.1, Pinocchio istargeted at children without prior conducting knowledge as well.
Before recording gesture data, the users were shown how to perform the requested conductinggestures. After practicing for approximately one minute per gesture to be performed, data wererecorded. As described in section 6.4, conducting gestures are performed following a metronomewhich is set to a fixed tempo per recording session. One recording session lasts for two minutes
70

7 EVALUATION 7.1 Method
and consists of repeated and continuous performances of a specific conducting gesture. Usingrecordings longer than that results in a decrease of the user’s concentration, hence in a loweraccuracy of beat placement (compare 8.2).
All test data recordings contain regions with random hand movement, namely at the beginningand at the end of each recording, i.e. when the user prepares to start and before the recording isstopped. These regions are about twenty seconds in length per recording on an average and posea challenge to the recognizer’s threshold model. As can be seen from the results described below,the gesture recognizer is able to successfully reject random movements.
Seventy-two sets of test data were collected in total, resulting in approximately 144 min ofgesture data. These sets cover conducting gestures for three different measures—2-, 3-, and 4-beat—and tempos of 50, 70, 90, 110, and 130 bpm. Due to the mere number of different possiblesettings and their according value domains, it is impossible to evaluate all possible combinationsof settings. Thus, I had to focus on a selection of settings that appeared to be beneficial to test,i.e. that seemed to be of high relevance to the decisions to be made. Moreover, the order of testedparameters is important, since after a specific parameter value is found to produce good results, itwill be used in subsequent test runs for the evaluation of different parameters. I chose the presentedorder with respect to importance of parameters as reported in the literature, and also stepped backfor several settings in order to test different combinations.
Metrics The recognition process has four possible outcomes. Either a gesture is recognizedcorrectly—further discussed below—, it was deleted (the recognizer did ignore the gesture), it gotsubstituted (the recognizer detected a gesture but misclassified it), or it was inserted (the recognizerdetected a gesture where there was none). In the course of the evaluations presented in this chapterI shall use the following metrics in order to evaluate the recognition performance with regard tovarying settings.
• Detection ratio = # of correctly recognized gestures# of input gestures
• Reliability = # of correctly recognized gestures# of input gestures + # of insertion errors
• Latency = mean of offsets of correctly recognized gestures
As can be seen from these definitions, the detection ratio provides the number of correctlyrecognized gesture in relation to the number of expected input gestures. However, this metricalone is not sufficient, since it does not reflect the number of inserted gestures, i.e. the numberof false positives produced by the recognizer. Therefore, the reliability is used in addition to thedetection ratio.
The decision weather a recognized gesture was recognized correctly is dependent on two con-ditions. First, it must be recognized at the correct point in time; this condition is related to thegesture segmentation or spotting problem discussed in section 5.3. Second, it must be classifiedcorrectly, as discussed in section 5.2. While it is straightforward to verify conformance with thesecond condition, it is necessary to introduce a threshold in order to be able to verify conformancewith the first condition. Given a sampling rate of 100 Hz and the fact that a human conductor isnot able to accurately perform conducting beats at a resolution of 10 ms, I defined a time windowaround the expected event of an input gesture; as long as a (correctly classified) gesture is spottedwithin this window, it is considered to be correctly recognized. A window size of 100 samplescentered around the current sample is used in all tests presented in this chapter, resulting in amaximum allowed displacement of 500 ms. However, the average latency in most of the results ismany times slower.
The third metric introduced above, latency, is thus the mean of absolute offsets of correctlyrecognized gestures. That is, if a gesture is recognized correctly, with respect to the two conditions
71

7.2 Results 7 EVALUATION
discussed above, the absolute value of displacement between the recognized gesture event and theexpected gesture event contributes to the average latency. Recognition performance in generalrefers to a combination of these three metrics: the higher the detection ratio and the reliability are,and the lower latency is, the better is the recognition performance.
Whenever a mean value for one of these three metrics with respect to a specific setting isgiven, it has been calculated in the following way (compare figure 7.1): Results for single testsare averaged for each test run. Results for test runs are averaged for each setting test, in turn. Itis apparent that it does not make sense to average over setting tests since the whole point of thisevaluation is to find out which setting is best suited. If more than one test suite is used during aparameter evaluation however, setting tests are averaged across test suites in order to determineoptimal values independent from test data used, using a weighted average according to the numberof test data recording sets used for recognition. For example, results from setting test one of testsuite one are combined with results from setting test one of test suite two, and so on.
Looking at the standard deviation at different levels of the evaluation hierarchy yields cluesabout different aspects with regard to the recognition and the test data used. A high standarddeviation of single tests in the bottom level for an individual test run is an indication that therecognition performance varies a lot for different gestures, e.g. the system may be better in rec-ognizing a 2-beat gesture than a 3-beat gesture. A high standard deviation at the level of test runsis an indication that the test data used yields varying results, e.g. one test data recording sets per-forms better than another set, using the same setting. Finally, the standard deviation’s meaning forsetting tests across test suites depends on the choice of test data for individual test suites. For ex-ample, if test suite one tests user-dependent recognition while test suite two tests user-independentrecognition, a high standard deviation is an indication that a setting does not perform equally wellfor different training/recognition constellations.
7.2 Results
In this section, I shall present a selection of evaluation results that are particularly relevant todesign decisions made for the gesture recognizer. Since it is not always obvious at the beginningwhat parameter values to test, and how to design a parameter evaluation, I conducted additionalevaluations besides those presented in this section; they either lead to one of the tests presentedhere, or turned out not to be relevant for the decisions to be made.
Varying numbers of test sets are used for evaluating different parameter settings. This is dueto the unequal availability of test data with certain characteristics for different users; it is alwaysnoted how many data sets were used for a test suite.
7.2.1 Number of States
The choice of an adequate number of states to be used in order to represent a gesture in an HMMis not apparent. Therefore, I tested various different state settings, keeping in mind that differenttest data characteristics, with respect to user and tempo, may behave differently. The goal is tofind a state setting which is equally suitable for any of the characteristics represented in the testdata.
I tested state settings with an equal number of states for each gesture to be recognized on theone hand, and state settings with the number of states corresponding to the gesture’s length on theother hand. In the presented plots, the first 56 values along the x axis, i.e. 1≤ x≤ 56, correspond toequally distributed number of states, starting at allocating 5 states to each HMM and ending withallocating 60 states to each HMM. For 56 < x ≤ 72, a different number of states is assigned foreach gesture. That is, i states are assigned to the HMM representing a 2-beat conducting gesture,2i states are used for a 3-beat, and 3i for a 4-beat conducting gestures, with 5≤ i≤ 20. Table 7.1summarizes the state setting used.
72
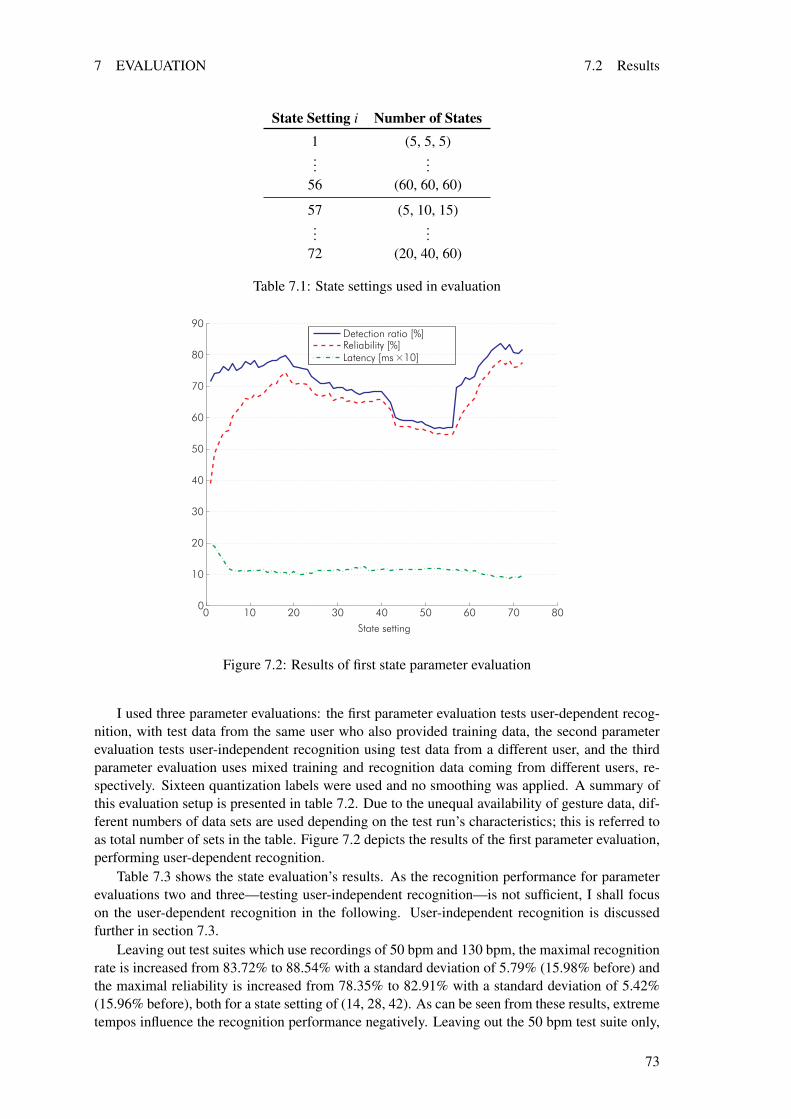
7 EVALUATION 7.2 Results
State Setting i Number of States1 (5, 5, 5)...
...56 (60, 60, 60)
57 (5, 10, 15)...
...72 (20, 40, 60)
Table 7.1: State settings used in evaluation
0 10 20 30 40 50 60 70 800
10
20
30
40
50
60
70
80
90
State setting
Detection ratio [%]Reliability [%]Latency [ms × 10]
Figure 7.2: Results of first state parameter evaluation
I used three parameter evaluations: the first parameter evaluation tests user-dependent recog-nition, with test data from the same user who also provided training data, the second parameterevaluation tests user-independent recognition using test data from a different user, and the thirdparameter evaluation uses mixed training and recognition data coming from different users, re-spectively. Sixteen quantization labels were used and no smoothing was applied. A summary ofthis evaluation setup is presented in table 7.2. Due to the unequal availability of gesture data, dif-ferent numbers of data sets are used depending on the test run’s characteristics; this is referred toas total number of sets in the table. Figure 7.2 depicts the results of the first parameter evaluation,performing user-dependent recognition.
Table 7.3 shows the state evaluation’s results. As the recognition performance for parameterevaluations two and three—testing user-independent recognition—is not sufficient, I shall focuson the user-dependent recognition in the following. User-independent recognition is discussedfurther in section 7.3.
Leaving out test suites which use recordings of 50 bpm and 130 bpm, the maximal recognitionrate is increased from 83.72% to 88.54% with a standard deviation of 5.79% (15.98% before) andthe maximal reliability is increased from 78.35% to 82.91% with a standard deviation of 5.42%(15.96% before), both for a state setting of (14, 28, 42). As can be seen from these results, extremetempos influence the recognition performance negatively. Leaving out the 50 bpm test suite only,
73

7.2 Results 7 EVALUATION
ParameterEvaluation #
Test Suite # Training Data Recognition Data
from at tempo∗[bpm]
from at tempo∗[bpm]
1 1 User A 90 (3) User A 50 (1)2 70 (2)3 90 (3)4 110 (2)5 130 (1)6 70 (1) 50 (1)7 90 (1) 70 (1)8 110(1) 90 (1)9 110 (1)10 130 (1)
2 1 User A 90 (3) User B 90 (2)2 User C 90 (2)3 User D 90 (2)
3 1 User A-D 90 (4) User A-D 90 (4)2
Table 7.2: State evaluation setup∗ total number of sets specified in brackets
the recognition performance increases further (maximal recognition rate: 88.87% with a standarddeviation of 5.04%; maximal reliability: 83.40% with a standard deviation of 5.03%). Theseresults suggest that accelerations caused by conducting gestures at a tempo of 50 bpm are too lowin order to enable a reliable recognition using the method presented here. I shall discuss this issuefurther in section 7.3.
A value of 13.14% (15.75%) as average over all standard deviations of the detection ratio (reli-ability) at the single tests level18—indicating how the recognition performance varies for differentconducting gestures—suggests that certain conducting gestures are recognized better than others.Figure 7.3 shows the first parameter evaluation’s result (leaving out 50 bpm test data recordingsets) split by conducting gesture. As can be seen from these plots, the 3-beat gesture performsworse than the 2-beat or 4-beat gesture. The 4-beat gesture is recognized better for a greatervariety of state settings.
The best recognition performance for the user-dependent evaluation was achieved when as-signing 14 states to the HMM representing a 2-beat gesture, 28 states to the HMM representinga 3-beat gesture, and 48 states to the HMM representing a 4-beat gesture. This result does notguarantee that such a state setting still yields the best recognition performance if other parametervalues are changed. However, since it is not feasible to test all possible combinations of parametervalues, I shall use this state setting in the further evaluation.
7.2.2 Number of Labels
In the evaluation so far, I used sixteen labels for vector quantization (compare section 5.2.2). Testsconducted earlier in the gesture recognizer’s development phase suggested that using fewer thansixteen labels essentially decreases recognition performance. Using more labels increases memoryand computational costs, since the HMM handles more observation symbols, resulting in larger
18The presented values were determined in the first parameter evaluation, leaving out 50 bpm test data recording sets.
74

7 EVALUATION 7.2 Results
0 10 20 30 40 50 60 70 800
10
20
30
40
50
60
70
80
90
100
State setting
Detection ratio [%]Reliability [%]Latency [ms × 10]
(a) 2-beat
0 10 20 30 40 50 60 70 800
10
20
30
40
50
60
70
80
90
100
State setting
Detection ratio [%]Reliability [%]Latency [ms × 10]
(b) 3-beat
0 10 20 30 40 50 60 70 800
10
20
30
40
50
60
70
80
90
100
State setting
Detection ratio [%]Reliability [%]Latency [ms × 10]
(c) 4-beat
Figure 7.3: Results of first state parameter evaluation, partitioned by conducting gesture
75

7.2 Results 7 EVALUATION
ParameterEvaluation #
Max. RecognitionRate [%]
Max. Reliability [%] Recognition Data[ms]
1 83.72 (15.98) 78.35 (15.96) 90.7 (39.2)for (14, 28, 42) states for (14, 28, 42) states for (14, 28, 42) states
2 53.94 (9.13) 37.38 (3.25) ∗∗
for (9, 9, 9) states∗ for (13, 13, 13) states∗
3 71.90 (2.64) 60.22 (0.77) ∗∗
for (5, 5, 5) states∗ for (14, 28, 42) states∗
Table 7.3: State evaluation results∗ Considering the high fluctuation in recognition performance and the low number of states (num-bers this low did not yield suitable result in the first parameter evaluation, which showed a morestable behavior in general) these results are likely to be random; i.e. recognition does not work forthese settings and test data selection.∗∗ Not specified because of insufficient recognition performance.
matrices for representing the HMM. In addition, it is likely that more training data are needed thanbefore.
In order to find out if increasing the number of labels also increases the recognition perfor-mance, I performed a parameter evaluation using two test suites for user-dependent recognition,as well as a parameter evaluation using two test suites for user-independent recognition, both timestesting sixteen versus thirty-two quantization labels. While detection ratio and reliability stayedconstant for the user-dependent evaluation, detection ratio decreased by 7.55 percentage pointsand reliability by 5.5 percentage points for the user-independent evaluation. Therefore, I shall usesixteen quantization labels in the further evaluation.
7.2.3 Cutoff Threshold
ParameterEvaluation #
Test Suite # Training Data Recognition Data
from at tempo∗[bpm]
from at tempo∗[bpm]
1 1 User A 90 (3) User A 90 (1)2 110 (2)
2 1 User A 90 (3) User B 90 (2)2 User C 90 (2)
Table 7.4: Cutoff threshold evaluation setup∗ total number of sets specified in brackets
The vector quantization algorithm (compare section 5.2.2) allows to specify a cutoff thresholdthc. That is, if the acceleration vector’s norm is smaller than thc it is set to zero in order to minimizeperturbation due to noise. Table 7.4 gives a summary of the evaluation setup used to analyze thecutoff threshold’s influence on recognition performance. Again, two parameter evaluations aredefined—one user-dependent and one user-independent—to evaluate values 0≤ thc ≤ 30.
As can be seen from the evaluation’s results in figure 7.4, the user-dependent recognition per-formance is not particularly affected by threshold values up to approximately 18; values greater
76

7 EVALUATION 7.2 Results
0 5 10 15 20 25 30 350
10
20
30
40
50
60
70
80
90
100
Cutoff threshold
Detection ratio [%]Reliability [%]Latency [ms × 10]
(a) user-dependent
0 5 10 15 20 25 30 350
10
20
30
40
50
60
70
80
90
100
Cutoff threshold
Detection ratio [%]Reliability [%]Latency [ms × 10]
(b) user-independent
Figure 7.4: Results of cutoff threshold evaluation
than 18 result in a rapid drop of recognition performance, though. The best recognition perfor-mance is achieved for thc = 15 with a detection ratio of 88.99% and a reliability of 84.04%. How-ever, the user-independent recognition performance is clearly affected by lower cutoff thresholds;it increases steadily for threshold values up to approximately 20.
Since a cutoff threshold value of thc = 15 does not hurt the user-dependent recognition per-formance while at the same time increasing the user-independent recognition performance, I shalluse this threshold value in the further evaluation.
Additionally, I was interested in how the cutoff threshold affects the recognition of slowly per-formed conducting gestures, which yielded a fairly disappointing recognition performance before.Therefore, I also evaluated the cutoff threshold with a user-dependent test suite, using training dataat 70, 90, and 110 bpm and recognition data at 50 bpm. As can be seen from the results shownin figure 7.5, increasing the cutoff threshold also increases the recognition performance, up to acertain threshold value. This finding confirmed my decision to use a value of thc = 15.
0 5 10 15 20 25 30 350
10
20
30
40
50
60
70
80
90
100
Cutoff threshold
Detection ratio [%]Reliability [%]Latency [ms × 10]
Figure 7.5: Results of cutoff threshold evaluation for 50 bpm recognition
77

7.3 Discussion 7 EVALUATION
ParameterEvaluation #
Test Suite # Training Data Recognition Data
from at tempo∗[bpm]
from at tempo∗[bpm]
1 1 User A 90 (3) User A 90 (3)2 70 (1) 110 (1)
90 (1)110 (1)
2 1 User A 90 (3) User B 90 (2)
Table 7.5: Smoothing evaluation setup∗ total number of sets specified in brackets
7.2.4 Smoothing
The last parameter I tested in the context of this evaluation is smoothing (compare 5.2.2), using amoving average algorithm with window size n; table 7.5 shows the training and recognition dataused. I tested window sizes of 0≤ n≤ 50.
Figure 7.6 depicts the results of this parameter evaluation. As can be seen from the plot,smoothing does not have a great effect on user-dependent recognition performance up to values ofn = 28. For greater values, the recognition performance drops. The results of the user-independentevaluation show more fluctuation; the recognition performance seems to be slightly higher forvalues of 11≤ n≤ 25.
It is interesting to notice that the latency is not particularly affected by smoothing; even for val-ues of n = 20—introducing a latency of 200 ms—there is almost no change in the resulting latency.This behavior may be explained with the test data’s periodic nature. Since test data recordings con-tain continuously performed conducting gestures, and since smoothing is also applied to test databefore training, it becomes apparent that not the actual gestures are trained anymore, but a shiftedversion of them. Thus, gestures are in fact recognized with a very low latency—since the recog-nizer was trained on shifted data. This approach becomes problematic if the shifting introduceddue to smoothing becomes too large, or if isolated gestures are supposed to be recognized.
Since smoothing does not improve recognition performance, and since it introduces latencywhich may cause problems for isolated gesture recognition, it is not used in this conducting gesturerecognition system.
7.3 Discussion
Table 7.6 summarizes the parameter values chosen for the conducting gesture recognizer based onthe evaluations’ results presented in the previous section. As already stated earlier, the order I usedto evaluate the different parameters potentially influenced this result; choosing a certain parameterfor subsequent evaluations alters their basic conditions. However, since it is not feasible to testany possible combination of parameter values, I chose the parameter’s order by the magnitude oftheir potential impact, guided by the reviewed literature
Furthermore, due to limitations in time and availability of test subjects, I was not able to use thesame number of test data recordings during all of the evaluation steps. However, when analyzingresults of similar test sets, it turns out that their recognition performance is similar as well. Anevaluation using 130 bpm data for recognition yields almost the same results compared to using110 bpm data for recognition, for example. Therefore I am confident that the results presented aresuitable for the recognition system proposed.
78

7 EVALUATION 7.3 Discussion
0 10 20 30 40 50 600
10
20
30
40
50
60
70
80
90
100
Window size
Detection ratio [%]Reliability [%]Latency [ms × 10]
(a) user-dependent
0 10 20 30 40 50 600
10
20
30
40
50
60
70
80
90
100
Window size
Detection ratio [%]Reliability [%]Latency [ms × 10]
(b) user-independent
Figure 7.6: Results of smoothing evaluation
Parameter ValueNumber of states (14, 28, 42)
Number of labels 16
Cutoff value 15
Smoothing None
Table 7.6: Summary of decisions made based on evaluation
The maximal detection rate achieved for user-dependent recognition applying the chosen pa-rameter values is 94.56%, the maximal reliability is 90.07%, and the mean latency is 91.14 ms(compare figure 7.6). For a further discussions on approaches to improve the recognition perfor-mance, using beat prediction for example, refer to chapter 9. In the following, I shall discussseveral limitations of the conducting system that became apparent during the evaluation.
User-Independence As can be seen from the evaluation results presented in this chapter, theuser-independent recognition performance is not satisfactory: detection rates lie around 50% whilethe reliability is even lower.
It is expected that the recognition using gesture data from a user who did not contribute tothe data that were used to train the recognizer’s HMM performs worse than the recognition usinggesture data from the same user. However, since the achieved recognition performs seems to beexceptionally slow, I analyzed the test data recordings and compared data coming from differentusers.
As can be seen from figure 7.7, it seems that the level of noise varies strongly among differentusers. A possible reason for this shortcoming may be found in the way the eWatch is currentlyworn, namely using a second eWatch to enable an upright position of the first eWatch responsiblefor data collection (compare section 4.3). This way of mounting is less stiff and makes the eWatchjiggle more—depending on how firm the wrist band is tight to the user’s wrist. Since differentusers have different preferences with regard to how firm they close the wrist band, the eWatchjiggles with varying strength, thus resulting in a different noise profile.
The integration of a 3D accelerometers into the eWatch is currently in progress and is expectedto be completed by the end of 2007. A 3D accelerometer would not only enable the recognition of
79

7.3 Discussion 7 EVALUATION
5450 5500 5550 5600 5650
-50
-40
-30
-20
-10
0
10
20
30
40
Time [ms × 10]
Acce
lera
tion
xy
(a) user A
800 850 900 950 1000
-30
-20
-10
0
10
20
30
Time [ms × 10]
Acce
lera
tion
xy
(b) user C
Figure 7.7: Different levels of noise in acceleration data of a 4-beat conducting gesture at 90 bpm
more gesture variations due to the additional dimension, but would also solve the mounting prob-lem mentioned above, potentially resulting in a better user-independent recognition performance.
Tempo While the recognition of conducting gestures at high tempos up to 130 bpm did notaffect the recognition performance, slow conducting gestures at 50 bpm were not recognized wellby the system (compare section 7.2.1), potentially due to the acceleration’s low amplitude. Sincethe introduction of a cutoff threshold, i.e. the reduction of noise for low acceleration amplitudes,helped to improve the recognition performance—the detection ratio increased by 48.01 percentagepoints (compare figure 7.5)—a reduction of noise, coming along with wearing the eWatch as it issupposed to be worn as discussed in the previous section, is likely to improve the recognitionperformance for slow conducting gestures.
Additional Gestures The proposed system is currently limited to the recognition of three dif-ferent conducting gestures. This is sufficient for a large variety of different pieces of classicalmusic, especially since tempo and volume are extracted as well. While it is straightforward to in-clude additional gestures by means of simply training them, a higher number of gestures increasesthe number of states which in turn increases the number of computational steps required for per-forming the recognition. Moreover, confusion between different gestures becomes more likely,depending on the gesture’s similarity.
In this chapter, I introduced a method for the systematic evaluation of the conducting recognitionsystem using test recordings from several users. After defining the evaluations to be performedI presented the results and concluded with a discussion of the system’s limitations. In the nextchapter, I shall give a summary of the ideas and contributions of this thesis.
80

8 CONCLUSIONS
8 Conclusions
In this chapter, I shall summarize the work presented so far and discuss strengths as well as limita-tions of the proposed gesture recognition approach, while comparing the achieved results to priorsystems.
In this thesis, I described the development of a gesture-base input device, focusing on musi-cal conducting gestures as example application. The eWatch, a wearable sensor platform with awrist-watch form factor, transmits acceleration data in two dimension at a sampling frequency of100 Hz via Bluetooth to the host computer, running the recognition system which is embeddedinto Pinocchio, a virtual symphony orchestra. By using the eWatch as an input device, the systemis able to continuously recognize different conducting gestures, representing different measures,and extract the conveyed information about tempo and volume to control the virtual orchestra.
The gesture recognition system consists of several modules for preprocessing the raw accel-eration data received from the eWatch. After calibrating, i.e. eliminating the gravity’s effect, thedata are quantized into labels, using the acceleration’s direction. The task of gesture recogni-tion consists of two subtasks, namely gesture spotting and gesture classification. In the proposedapproach, a discrete hidden Markov model (HMM) is used to perform gesture recognition in asingle stage. After training models for the gestures to be recognized separately, these single mod-els are integrated into a combined model. A threshold model—responsible for rejecting randommovement—is added to the combined model as well.
The combined model is a regular hidden Markov model in turn that allows the application ofstandard algorithms. In order realize a continuous recognition of gestures, the Viterbi algorithmis adopted to handle continuous data streams as input. After a gesture is recognized, its conveyedtempo and volume information is extracted and sent to the host system which adjusts the virtualorchestra’s performance accordingly.
8.1 Strengths
In discussing this approach’s strengths, I shall stick to the functional and non-functional require-ments defined above in section 4.1. The approach as presented is able to find and classify commonconducting gestures (as described by [Rudolf, 1950]) which are continuously performed by theuser with his or her arm. The recognized gestures are interpreted, i.e. tempo and volume areextracted. Moreover, it is possible to recognize arbitrary gestures by means of providing accord-ing training data. Although the system is capable of recognizing gestures performed by differentusers, the respective user has to provide training data first in order to enable a reliable recognition.
The eWatch is worn around the wrist, a common, socially accepted place. It uses accelerome-ters to capture the user’s gestures. In contrast to vision-based approaches, accelerometers do notrely on special requirements with respect to lighting conditions. To compensate this shortcomingof camera-based systems, a special baton is often used that either holds a light emitter or is aug-mented with a color marker. Accelerometers do not necessarily have to be built into the baton ascan be seen from the system described in this thesis. Therefore, the user is free to chose any batonhe or she likes or is accustomed to19.
Due to their small size, accelerometers can be used in an unobtrusive way. While vision-basedsystems may be even less obtrusive, accelerometers do not restrict the user’s range of action. Usingcameras, the user has to stay withing the viewing frustum which is much smaller than the area awireless transmitter for acceleration data can cover. Furthermore, accelerometers—as well as theother modules used to build the eWatch—are low cost components.
Using a threshold model to reject non-meaningful gestures, the recognition system presentedhere is fairly robust; it reaches a reliability of more than 90% and a recognition rate of more than
19[Rudolf, 1950] indicates that a conductor choses his or her baton thoroughly with respect to several properties.
81
8.2 Limitations 8 CONCLUSIONS
94% for user-dependent recognition, with an average latency of around 90 ms (not meeting thedefined responsiveness requirement, compare section 8.2).
In the following, I shall compare these results to those achieved by prior conducting systemsfor user-dependent conducting gesture recognition. While reporting on an accuracy of 100%,the system proposed by [Sawada et al., 1995] has a latency of 500 ms – 1000 ms at the sametime. [Usa and Mochida, 1998b] achieve an accuracy of 99.74%, using score information and beatprediction in addition to HMM, however. Although the approach presented by [Kolesnik, 2004]recognizes gestures with an accuracy of 92.2%, he states that this solution is not feasible forrealtime. [Garnett et al., 2001] achieve an accuracy of 85% and [Grüll, 2005, Lee et al., 2006a] anaccuracy of more than 90%, the latter with a latency of up to 675 ms, however.
Meeting the interface requirement defined above, the gesture recognition module is integratedinto Pinocchio enabling the user to conduct the virtual orchestra in realtime and providing a graph-ical user interface for adjusting recognition parameters. No formal evaluation on availability orreliability was conducted. However, the eWatch has been used in two user studies, more thantwo hours of additional gesture data were collected, and the Pinocchio system with the embeddedgesture recognition module was tested without issues—regarding availability or reliability—tobecome apparent. The eWatch’ battery lasts for several hours under the conditions used here.
8.2 Limitations
Besides of the strengths discussed in the previous section, there are several limitations to be men-tioned as well. Due to the fact that the eWatch houses 2D accelerometers only, the recognitionsystem is not able to detect gestures that mainly use the third dimension. Conducting gestures mayalso include movements of the fingers to convey certain information. Since the eWatch is wornaround the wrist, this information is not captured. In addition, the eWatch’s loose mounting—asa result of the workaround discussed in section 4.3—accounts for an increased amount of noise,which is a potential cause for the insufficient user-independent recognition performance (comparesection 7.3). Moreover, recognition performance decreases with tempo. At 50 bpm, the detectionrate drops to approximately 70% with a reliabiliy of around 62%.
The system’s evaluation was limited to the usage of three gestures. While arbitrary gesturescan be trained, not every gesture is equally well suited for recognition. In addition, gestures mustbe sufficiently different in order to be distinguishable. The accuracy of beat annotations for thecollected user data relies on the user’s performance. If a user does not follow the metronome’s tickaccurately, the resulting annotations will not match the gestures represented in the accelerationdata.
Although the system is able to perform gesture recognition in realtime using a MacBookequipped with a 2.16 GHz Intel Core 2 Duo processor and 1 GB of RAM, the lowest possiblelatency—determined in offline evaluation—is around 90 ms on an average.
This chapter provided a summary of the presented approach with regard to strengths and limita-tions. In the next chapter, I shall pick up some of those limitations and discuss potential improve-ments in future work.
82

9 FUTURE WORK
9 Future Work
In this chapter, I shall outline potential directions of future research, beginning with several ideasclosely related to the approaches and implementation presented here and concluding with a moregeneral outlook on using sensors for human computer interaction in a multimodal environment.
9.1 Input Device
The eWatch’s limitation of featuring only 2D accelerometers required a workaround, which wasidentified as a potential cause for the decrease in user-independent compared to user-dependentrecognition performance (compare section 8.2). A new version of the eWatch—currently underdevelopment at Carnegie Mellon University and Intel Research—will be equipped with 3D ac-celerometers. Using the third dimension enables the system to capture more information aboutthe performed gestures. Variations between gestures, that were not recognizable using two-dimensional acceleration data only, may be detected in the future—allowing for a greater varietyof gestures that can be recognized.
Besides accelerometers, the eWatch also features light, audio, and temperature sensors whichare currently not used in the recognition process (the light sensor is used for synchronizationonly). Incorporating these sensors into the recognition process might result in features that help toincrease the recognition performance.
Although users were able to wear the eWatch during conducting for an extensive amountof time (compare section 3.2), its usability would improve with a reduction in size and weight.Several of the eWatch’s components are not used during gesture recognition, such as the LCD orthe CPU. By removing these components, a smaller and lighter input device can be realized.
Using the eWatch’s processing power to recognize gestures onboard is another possible di-rection of future research—keeping the CPU as a component in this case is necessary. Such animplementation would result in a lower amount of data to be transferred to the host computer, butwould result in a shorter battery life due to the increased computation at the same time. However,having a gesture recognizer on the eWatch enables new areas of applications, since the eWatch caninterpret gestures and send according commands independently.
9.2 Gesture Recognition
Prediction Although a recognition rate of 94.56% and a reliability of 90.07% was achieved foruser-dependent recognition, further improvement is desirable (when conducting for two minutesusing a 2-beat gesture at 90 bpm, there are still about five gestures not recognized correctly onan average). Besides of improving the machine learning approach itself, the use of predictionmethods is subject to further investigation. Applying a tempo prediction, the expected time of thenext beat may be used as an additional clue, since the tempo is not likely to vary rapidly. Severalother orchestra systems are using such a technique (compare section 2.2).
Additionally, context information with regard to the piece of music being conducted may beused. [Starner et al., 1994, Starner and Pentland, 1995] use a grammar when recognizing cursivehandwriting and American Sign Language to guide the recognition process, for example. A similarmechanism, i.e. applying information contained in the musical score, may be incorporated infuture versions.
Single Beat Detection The detection of single beats, as described in section 5.3.2, shows promis-ing results. Further development and evaluation is required, however, in order to realize a reliablerecognition at the level of single beats. In addition, Pinocchio needs to be adopted in order tosupport the synchronization between the conductor’s beats and the beats in the music.
83

9.3 Evaluation 9 FUTURE WORK
Training Currently, training the recognizer, i.e. enabling it to recognize certain gestures, is donemanually using the evaluation environment implemented in MATLAB. The file containing theresulting hidden Markov model is then loaded by the gesture recognition module in Pinocchio.Further implementations may contain a training module which is accessible through a graphicaluser interface in order to enable the training of new gestures by the end user. Such a modulewould prompt the user to perform a certain conducting gesture following the ticks of a metronome.Additionally, it could provide feedback on the quality of the gesture with regard to its suitabilityfor the gesture recognizer.
In order to reduce the required amount of training data, noise can be added artificially to gener-ate more training data sets. [Kela et al., 2006] use such an approach and report on an improvementof the recognition results for the presented gesture recognition system. Further information on theapplicability of noise for increasing detectability can be found in [Kay, 2000].
Performance In order to maintain a high flexibility during the development and evaluation ofthe gesture recognition approach presented in this thesis, the system is implemented in MATLABand integrated into Pinocchio by means of adopters. Results show that the system is capableof performing realtime gesture recognition with the virtual orchestra running on a Apple Mac-Book equipped with a 2.16 GHz Intel Core 2 Duo processor and 1 GB of RAM. However, are-implementation of the recognition algorithms in Objective-C will reduce the recognizer’s com-putational overhead.
In addition, the eWatch’s firmware may be adopted to communicate more efficiently and savebandwidth. For debugging purposes, there is currently more data transmitted than just raw accel-eration information.
9.3 Evaluation
User Study In this section, I shall discuss how the evaluation method may be improved in futurework. Using a larger number of different users, who are performing gestures in a larger variety, islikely to result in a more representative result for the user-independent recognition performance.Due to time limitations, I was not able to use gesture data recorded with conductor Walter Moralesin evaluating the system’s recognition performance. Future research may use these data to analyzehow the gesture recognition system performs when a professional musician conducts a piece ofmusic.
Baton In the course of this thesis, gesture data for evaluation was collected from users who werenot using a baton. As stated before, Walter Morales performed gestures with and without baton inthe according user study. These data may be used to analyze differences and potential impacts onthe recognition system. It is of interest if the acceleration profile produced by performing gesturesthe one or the other way is similar enough to allow a recognition when only one of the modes isused for training.
9.4 Pinocchio
In its current version, Pinocchio offers two conducting modes: The previously implementedcamera-based baton recognition and the conducting gesture recognition using the eWatch whichis topic of this thesis. However, these two modules are working independently. One goal of futurework may include the integration of these two modules in order to compensate for module-specificshortcomings and increase the recognition performance. [Brashear et al., 2003] report on a per-formance increase in sign language recognition, using a hat-mounted camera in conjunction withaccelerometers.
84

9 FUTURE WORK 9.5 Outlook
Moreover, such a sensor fusion approach may include further input devices, thus providingPinocchio with a truly multimodal user interface. A gaze detection may be used to apply conduct-ing gestures only to selected parts of the orchestra, addressing a specific group of musicians, forexample.
9.5 Outlook
The virtual orchestra conducting system Pinocchio, with its potentially multimodal input capabil-ities, is an example for a system with complex user interaction. Applying the experience gainedin the course of this research project, a general framework can be thought of which supports mul-tiple input devices incorporating different types of sensors for a variety of interaction modalities.Using such a sensor fusion approach, the system is able to compensate for shortcomings that asingle input device may have. Possible applications include an intelligent house, or a smart cardashboard. The combination of different input sources, capturing different aspects of the user’sdirect and indirect communication, may help the system to react more appropriately to the user’sintention.
85

9.5 Outlook 9 FUTURE WORK
86

10 ACKNOWLEDGMENTS
10 Acknowledgments
Letting the past seven months I was working on this thesis passing my mind, I realize that a lot ofpeople helped me and contributed in different ways. In this last chapter, I would like to take theopportunity to thank them for their support.
In doing so, I would like to thank my advisors in Germany and the US, Prof. Bernd Brügge,Prof. Asim Smailagic, and Prof. Daniel P. Siewiorek, for giving me the opportunity, motiva-tion, and freedom to work on this project, and Prof. Heinrich Hußmann for taking over the co-supervision. In addition, I would like to thank Prof. Roger B. Dannenberg, Daniel Meyer, andWalter Morales for their great support in conducting the user studies.
Furthermore, I would like to thank all my family and friends for their support, encouragement,and patience. For valuable advice, proofreading, and conducting, I would especially like to thankJoseph Bradley, Lucia Castellanos, Sophie Crass, Wolfgang Crass, Linda Estevez, Brian French,Stanislav Funiak, Max Heinig, Andreas Krause, Uwe Maurer, and Marko Skocibušic.
87

10 ACKNOWLEDGMENTS
88

11 APPENDIX
11 Appendix
even
t sta
te d
etec
ted
/last
Eve
ntS
tate
=cur
rent
Sta
te;d
ur=0
[cur
rent
Sta
te is
no
final
sta
te]
non-
even
t sta
te d
etec
ted
non-
even
t sta
te d
etec
ted
Eve
nt D
etec
ted
/ent
rydu
r++
[cur
rent
Sta
te !=
last
Eve
ntS
tate
]/la
stE
vent
Sta
te=c
urre
ntS
tate
; dur
=0
[cur
rent
Sta
te !=
last
Eve
ntS
tate
]/la
stE
vent
Sta
te=c
urre
ntS
tate
; dur
=0
[cur
rent
Sta
te is
fina
l sta
te]
/rese
t()
dur >
= m
inD
ur/re
portE
vent
()
even
t sta
te d
etec
ted
/last
Eve
ntS
tate
=cur
rent
Sta
te;d
ur=0
[cur
rent
Sta
te is
no
final
sta
te]
[cur
rent
Sta
te is
fina
l sta
te]
/rese
t()
non-
even
t sta
te d
etec
ted
dur <
min
Durno
n-ev
ent s
tate
det
ecte
d
[cur
rent
Sta
te =
= la
stE
vent
Sta
te]
even
t sta
te d
etec
ted
Eve
nt R
epor
ted
Non
-Eve
nt D
etec
ted
[dur
< s
tate
Offs
et]
Rea
dy
[dur
>=
stat
eOffs
et]
/repo
rtEve
nt()
even
t sta
te d
etec
ted
[cur
rent
Sta
te =
= la
stE
vent
Sta
te]
Figure 11.1: State diagram for modified Viterbi algorithm
89

11 APPENDIX
Learning an Orchestra Conductor’s TechniqueUsing a Wearable Sensor Platform
Dominik SchmidtLudwig-Maximilians-Universitat
Roger B. DannenbergCarnegie Mellon University
Asim SmailagicCarnegie Mellon University
Daniel P. SiewiorekCarnegie Mellon University
Bernd BruggeTechnische Universitat Munchen
Abstract
Our study focuses on finding new input devices for asystem allowing users with any skill to configure andconduct a virtual orchestra in real-time. As a first step,we conducted a user study to learn more about the inter-action between a conductor’s gestures and the orches-tra’s reaction.
During an orchestra rehearsal session, we ob-served a conductor’s timing and gestures using theeWatch, a wrist-worn wearable computer and sensorplatform. The gestures are analyzed and compared tothe music of the orchestra.
1. Introduction
Pinocchio [2] is a system that allows users with anyskill to configure and conduct a virtual orchestra in real-time, using audio and video material based on profes-sional recording sessions with the Bavarian Radio Sym-phony Orchestra. In its current stage, Pinocchio recog-nizes common conducting gestures using a video-basedapproach that applies neural networks in order to con-trol tempo and dynamics. We decided to use the eWatch[8] as an additional input device for acceleration basedgesture recognition. Built into a wrist watch form fac-tor, it is an unobtrusive wearable sensing and computingplatform that does not constrain the conductor’s move-ments.
2. Related Work
Mathews created the first computer system with aconducting interface using the Mechanical Baton (Da-ton) [7]. Lee et. al. [5] applied neural networks torecognize gestures captured by an optical tracking sys-tem. Accelerometers and Hidden Markov Models forconducting gesture recognition were used by Usa andMochida [9]. The Media Computing Group at RWTHAachen University developed different versions of theirvirtual orchestra [3]. Marrin [6] developed a Conduc-tor’s Jacket that records physiological and motion infor-mation about conductors. Baird and Irmirli [1] used aposition sensor to track conducting gestures during liveperformances. Lee et. al. [4] conducted experimentsin a controlled environment with a passive system. Incontrast to systems that rely on visual approaches, theeWatch does not require any additional setup, works un-der different light conditions, and allows the conductorto move around freely. Furthermore, the eWatch is us-ing low cost components and has the capability of exe-cuting recognition tasks locally. The conductor has theadvantage of using his or her familiar baton.
3. Data Collection and Analysis
We asked conductor Daniel Meyer to wear theeWatch on his right wrist during a rehearsal. In par-allel, we recorded him using a Panasonic DVC-30 dig-ital camcorder providing video at 59.94 Hz and audio
Figure 11.2: Paper as accepted for IEEE ISWC 2007, page 1 of 2
90

11 APPENDIX
at 48 kHz. The eWatch recorded light and accelera-tion data at 100 Hz. A LED emitting bright flashesthat are clearly recognizable in the video track and inthe light sensor data is used to synchronize eWatch andcamcorder, thus accommodating for clock drift. Fig-ure 1 depicts the system diagram with recording setupand analysis part.
Figure 1. System diagram
A two minute long section from Brahm’s Sym-phony No. 3 in F major, Allegro is selected for fur-ther analysis. Annotation of lower turning points in theconducting gestures (indicating the start of a measure)is done manually by observing the recorded video on afield-by-field basis. In Figure 2, velocity data of the xaxis extracted from the eWatch’s acceleration sensors isshown together with the annotations. The beat patternis clearly recognizable.
Figure 2. Velocity and gesture annotations
As a reliable audio beat extraction tool is not avail-able, we marked beats manually by first tapping alongwith the music and later applying fine adjustment us-ing an audio editor. Similar to the results presented byLee et. al. [4] we found that the conductor conductsahead of the beat, showing that these results also applyto a setting where the conductor can influence the per-formance. At a tempo of 72 bpm in the selected piecethe conductor was ahead by 272 ms on average.
4. Conclusion and Future Work
The results obtained in this study affirm that theeWatch is a suitable and unobtrusive input device forthis virtual orchestra system. Our goal is to build anuser-independent and accurate recognition module thatallows for the detection of arbitrary conducting ges-tures. The eWatch can be used as alternative or exten-
sion to already existent input capabilities. We are evalu-ating the use of Hidden Markov Models for the recogni-tion of continuous gestures based on acceleration data.We wish to thank conductor Daniel Meyer for allowingus to record conducting gestures during a rehearsal.
5. Acknowledgment
This material is based upon work supported by theNational Science Foundation under Grant No. EEEC-540865 and Grant No. 0205266, the Defence Ad-vanced Project Agency (DARPA) under Contract No.NBCHD030010, Pennsylvania Infrastructure Technol-ogy Alliance (PITA) — a collaboration among Com-monwealth of Pennsylvania, Carnegie Mellon andLehigh University, and a grant from Intel Corporation.
References
[1] B. Baird and O. Izmirli. Modeling the tempo couplingbetween an ensemble and the conductor. In Proceedingsof the International Computer Music Conference, pages163–166, 2001.
[2] B. Bruegge, C. Teschner, P. Lachenmaier, E. Fenzl,D. Schmidt, and S. Bierbaum. Pinocchio: Conductinga virtual symphony orchestra. In Proceedings of the In-ternational Conference of Advances in Computer Enter-tainment Technology, 2007.
[3] E. Lee, H. Kiel, S. Dedenbach, I. Grull, T. Karrer,M. Wolf, and J. Borchers. In CHI ’06: CHI ’06 ExtendedAbstracts on Human Factors in Computing Systems.
[4] E. Lee, M. Wolf, and J. Borchers. Improving orchestralconducting systems in public spaces: examining the tem-poral characteristics and conceptual models of conductinggestures. In CHI ’05: Proceedings of the SIGCHI Con-ference on Human Factors in Computing Systems, pages731–740, 2005.
[5] M. Lee, G. Garnett, and D. Wessel. An adaptive conduc-tor follower. In Proceedings of the International Com-puter Music Conference, pages 454–455, 1992.
[6] T. Marrin and R. Picard. The ”Conductor’s Jacket”: Adevice for recording expressive musical gestures. In Pro-ceedings of the International Computer Music Confer-ence, pages 215–219, 1998.
[7] M. V. Mathews. The Conductor Program and MechanicalBaton, pages 263–281. 1989.
[8] U. Maurer, A. Rowe, A. Smailagic, and D. P. Siewiorek.eWatch: A wearable sensor and notification platform. InWearable and Implantable Body Sensor Networks, 2006.BSN 2006., 2006.
[9] S. Usa and Y. Mochida. A multi-modal conducting simu-lator. In Proceedings of the International Computer Mu-sic Conference, pages 25–32, 1998.
Figure 11.3: Paper as accepted for IEEE ISWC 2007, page 2 of 2
91

11 APPENDIX
Figure 11.4: Poster as presented at IEEE ISWC 2007 in Boston, MA, USA on 10/11/2007
92

11 APPENDIX
Wrist sensor lets you conduct a virtual orchestra
Step aside maestro. Would-be conductors now have a system that allows them to change the tempo and dynamics of a virtual orchestra with the wave of a hand. "Instead of just sitting there listening to a CD you could actually be influen-cing the performance," says Dominik Schmidt of the Ludwig Maximilian Universi-ty in Munich, Germany.
A year ago, his collaborator Bernd Brügge at the Technical University of Munich used audio and video recordings of a performance by the Bavarian Radio Sym-phony Orchestra to create a virtual orchestra. This 3D model of the real orchest-ra could be made to play faster, slower, louder or softer in real time.
He also created software that analyses video footage of someone waving a baton, detecting specific movements and making changes to the tempo or dyna-mics of the virtual orchestra accordingly. However, the software had problems pi-cking out the baton in certain lighting conditions.
Now Schmidt has created an upgrade that should work under any lighting. In-stead of a baton, he equips the would-be conductor with an eWatch, a computer the size and shape of a large wristwatch that contains accelerometers and tilt sensors. The eWatch records the user's hand movements and sends them to a computer via Bluetooth. Software then translates the actions into dynamics and tempo commands, and feeds them to Brügge's virtual orchestra.
In the future, users could control the different groups of instruments via a camera that monitors gaze.
Appeared in the New Scientist Magazine, issue 2625, on October 18th, 2007.
Figure 11.5: Press coverage of poster presented at IEEE ISWC 2007
93

11 APPENDIX
94

Content of Attached CD
CD 1
• Document: LATEX source files, figures, PDF version of this document
• Gesture Data: eWatch recordings of conducting gestures from test users
• Pictures: Daniel Meyer wearing the eWatch, screenshots
• References: PDF version of papers cited (if available)
CD 2
• Matlab: scripts and functions, including implementations of recognition algorithms
• Pinocchio: Pinocchio system, including recognition subsystem
CD 3
• Daniel Meyer: video (recompressed) and eWatch data from user study
CD 4
• Walter Morales: video (recompressed) and eWatch data from user study
95

List of Tables
2.1 Classification categories of HMM-based recognition system . . . . . . . . . . . 52.2 Innovations and their first appearance in conducting systems . . . . . . . . . . . 72.3 Comparison of conducting systems . . . . . . . . . . . . . . . . . . . . . . . . . 244.1 Functional requirements of the gesture recognition subsystem . . . . . . . . . . . 324.2 Non-functional requirements of the gesture recognition subsystem . . . . . . . . 334.3 Summary of hardware components to be used . . . . . . . . . . . . . . . . . . . 364.4 Summary of software tools to be used . . . . . . . . . . . . . . . . . . . . . . . 375.1 Formal model notation for a discrete observation HMM [Rabiner and Juang, 1986] 405.2 Comparison of sample frequencies for selected human activity recognition systems 447.1 State settings used in evaluation . . . . . . . . . . . . . . . . . . . . . . . . . . 737.2 State evaluation setup . . . . . . . . . . . . . . . . . . . . . . . . . . . . . . . . 747.3 State evaluation results . . . . . . . . . . . . . . . . . . . . . . . . . . . . . . . 767.4 Cutoff threshold evaluation setup . . . . . . . . . . . . . . . . . . . . . . . . . . 767.5 Smoothing evaluation setup . . . . . . . . . . . . . . . . . . . . . . . . . . . . . 787.6 Summary of decisions made based on evaluation . . . . . . . . . . . . . . . . . 79
96
List of Figures
2.1 Timeline of conducting systems . . . . . . . . . . . . . . . . . . . . . . . . . . 83.1 Light-staccato conducting gestures [Rudolf, 1950] . . . . . . . . . . . . . . . . . 273.2 Conductor Daniel Meyer wearing the eWatch during a rehearsal . . . . . . . . . 283.3 Conductor Walter Morales performing a 2-beat conducting gesture . . . . . . . . 304.1 Decision steps . . . . . . . . . . . . . . . . . . . . . . . . . . . . . . . . . . . 314.2 Top view of eWatch . . . . . . . . . . . . . . . . . . . . . . . . . . . . . . . . . 354.3 Wearing two eWatches . . . . . . . . . . . . . . . . . . . . . . . . . . . . . . . 365.1 Ergodic hidden Markov model with three states . . . . . . . . . . . . . . . . . . 415.2 Plot of user A performing 2-beat conducting gestures . . . . . . . . . . . . . . . 435.3 Plot of user A performing 3-beat conducting gestures . . . . . . . . . . . . . . . 435.4 Plot of user A performing 4-beat conducting gestures . . . . . . . . . . . . . . . 435.5 Division of directions into sixteen codewords . . . . . . . . . . . . . . . . . . . 455.6 Illustration of vector quantization approach . . . . . . . . . . . . . . . . . . . . 475.7 Normalization effect of calibration algorithm . . . . . . . . . . . . . . . . . . . 485.8 Preserving effect of calibration algorithm . . . . . . . . . . . . . . . . . . . . . 485.9 Compound HMM for three conducting gestures . . . . . . . . . . . . . . . . . . 515.10 Gesture recognizer . . . . . . . . . . . . . . . . . . . . . . . . . . . . . . . . . 556.1 Implementation components . . . . . . . . . . . . . . . . . . . . . . . . . . . . 576.2 Mouse gesture recognition testbed . . . . . . . . . . . . . . . . . . . . . . . . . 586.3 Data collection setup . . . . . . . . . . . . . . . . . . . . . . . . . . . . . . . . 626.4 Synchronization using LED flashes . . . . . . . . . . . . . . . . . . . . . . . . . 626.5 Beat annotation tool . . . . . . . . . . . . . . . . . . . . . . . . . . . . . . . . . 636.6 Graphical user interface of recognition subsystem . . . . . . . . . . . . . . . . . 656.7 Class diagram of subsystems and controller . . . . . . . . . . . . . . . . . . . . 666.8 Class diagram of gesture input device subsystem . . . . . . . . . . . . . . . . . 676.9 Class diagram of filter and recognizer subsystems . . . . . . . . . . . . . . . . . 687.1 Evaluation results structure . . . . . . . . . . . . . . . . . . . . . . . . . . . . . 707.2 Results of first state parameter evaluation . . . . . . . . . . . . . . . . . . . . . 737.3 Results of first state parameter evaluation, partitioned by conducting gesture . . . 757.4 Results of cutoff threshold evaluation . . . . . . . . . . . . . . . . . . . . . . . 777.5 Results of cutoff threshold evaluation for 50 bpm recognition . . . . . . . . . . . 777.6 Results of smoothing evaluation . . . . . . . . . . . . . . . . . . . . . . . . . . 797.7 Different levels of noise in acceleration data of a 4-beat conducting gesture at 90 bpm 8011.1 State diagram for modified Viterbi algorithm . . . . . . . . . . . . . . . . . . . . 8911.2 Paper as accepted for IEEE ISWC 2007, page 1 of 2 . . . . . . . . . . . . . . . . 9011.3 Paper as accepted for IEEE ISWC 2007, page 2 of 2 . . . . . . . . . . . . . . . . 9111.4 Poster as presented at IEEE ISWC 2007 in Boston, MA, USA on 10/11/2007 . . 9211.5 Press coverage of poster presented at IEEE ISWC 2007 . . . . . . . . . . . . . . 93
97

98

References
[Ailive, 2006] Ailive (2006). LiveMove white paper. Technical report.
[Apple, 2007] Apple (2007). http://developer.apple.com/documentation/cocoa/conceptual/legacy/javabridge/javabridge.html, last checked on 10/03/2007.
[AviSynth, 2007] AviSynth (2007). http://avisynth.org, last checked on 10/16/2007.
[Baird and Izmirli, 2001] Baird, B. and Izmirli, O. (2001). Modeling the tempo coupling betweenan ensemble and the conductor. In Proceedings of the International Computer Music Confer-ence, pages 163–166.
[Bertini and Carosi, 1992] Bertini, G. and Carosi, P. (1992). Light baton: A system for conductingcomputer music performance. In Proceedings of the International Computer Music Conference,pages 73–76.
[Bianchi and Campbell, 2000] Bianchi, F. W. and Campbell, R. H. (2000). The virtual orchestra:Technical and creative issues. Journal of Sound and Vibration, 232(1):275–279.
[Bien and Kim, 1992] Bien, Z. and Kim, J. S. (1992). On-line analysis of music conductor’s two-dimensional motion. In IEEE International Conference on Fuzzy Systems, pages 1047–1053.
[Bierbaum, 2007] Bierbaum, S. (2007). Investigation of multimodal interaction between a con-ductor and a virtual interactive orchestra. Master’s thesis, Technische Universität München.
[Bishop, 2006] Bishop, C. M. (2006). Pattern Recognition and Machine Learning. Springer-Verlag New York, Inc., Secaucus, NJ, USA.
[Boie et al., 1989] Boie, B., Mathews, M. V., and Schloss, A. (1989). The radio drum as a syn-thesizer controller. In Proceedings of the International Computer Music Conference, pages42–45.
[Borchers et al., 2004] Borchers, J., Lee, E., Samminger, W., and Mühlhäuser, M. (2004). Per-sonal orchestra: a real-time audio/video system for interactive conducting. Multimedia Systems,9(5):458–465.
[Borchers et al., 2001] Borchers, J., Samminger, W., and Muser, M. (2001). Conducting a realisticelectronic orchestra. In Proceedings of the 14th annual ACM symposium on User interfacesoftware and technology, pages 161–162.
[Borchers, 1997] Borchers, J. O. (1997). Worldbeat: Designing a baton-based interface for aninteractive music exhibit. In CHI ’97: Proceedings of the SIGCHI conference on Human factorsin computing systems, pages 131–138.
[Borchers et al., 2002] Borchers, J. O., Samminger, W., and Mühlhäuser, M. (2002). Engineer-ing a realistic real-time conducting system for the audio/video rendering of a real orchestra.In Proceedings. Fourth International Symposium on Multimedia Software Engineering, pages352–362.
[Boulanger and Mathews, 1997] Boulanger, R. and Mathews, M. V. (1997). The 1997 radio batonand improvisation modes. In Proceedings of the International Computer Music Conference,pages 395–398.
[Boulanger et al., 1990] Boulanger, R., Mathews, M. V., Vercoe, B., and Dannenberg, R. (1990).Conducting the midi orchestra, part 1: Interviews with Max Mathews, Barry Vercoe, and RogerDannenberg. Computer Music Journal, 14(2):34–46.
99

[Brashear et al., 2003] Brashear, H., Starner, T., Lukowicz, P., and Junker, H. (2003). Usingmultiple sensors for mobile sign language recognition. pages 45–52.
[Brecht and Garnett, 1995] Brecht, B. and Garnett, G. E. (1995). Conductor follower. In Pro-ceedings of the International Computer Music Conference, pages 185–186.
[Brügge and Dutoit, 2003] Brügge, B. and Dutoit, A. H. (2003). Object-Oriented Software Engi-neering Using UML, Patterns, and Java. Prentice Hall, Englewood Cliffs, NJ, second edition.
[Brügge et al., 2007] Brügge, B., Teschner, C., Lachenmaier, P., Fenzl, E., Schmidt, D., and Bier-baum, S. (2007). Pinocchio: conducting a virtual symphony orchestra. In ACE ’07: Proceed-ings of the international conference on Advances in computer entertainment technology, pages294–295, New York, NY, USA. ACM Press.
[Buxton et al., 1980] Buxton, W., Reeves, W., Fedorkow, G., Smith, K. C., and Baecker, R.(1980). A microcomputer-based conducting system. Computer Music Journal, 4(1):8–21.
[Campbell et al., 1996] Campbell, L. W., Becker, D. A., Azarbayejani, A., Bobick, A. F., andPentland, A. (1996). Invariant features for 3-d gesture recognition. In Automatic Face andGesture Recognition, 1996., Proceedings of the Second International Conference on, pages157–162.
[Chambers et al., 2002] Chambers, G. S., Venkatesh, S., West, G. A. W., and Bui, H. H. (2002).Hierarchical recognition of intentional human gestures for sports video annotation. volume 2,pages 1082–1085 vol.2.
[Darwiin, 2007] Darwiin (2007). http://sourceforge.net/projects/darwiin-remote/, last checked on10/19/2007.
[Dillon et al., 2006] Dillon, R., Wong, G., and Ang, R. (2006). Virtual orchestra: An immersivecomputer game for fun and education. In CyberGames ’06: Proceedings of the 2006 interna-tional conference on Game research and development, pages 215–218.
[Fenzl, 2007] Fenzl, E. (2007). Methods for multimodal input for the interaction with distributedsystems using a virtual orchestra. Master’s thesis, Technische Universität München.
[Garnett et al., 2001] Garnett, G. E., Jonnalagadda, M., Elezovic, Johnson, T., and Small, K.(2001). Technological advances for conducting a virtual ensemble. In Proceedings of theInternational Computer Music Conference, pages 167–169.
[Garnett et al., 1999] Garnett, G. E., Malvar-Ruiz, F., and Stoltzfus, F. (1999). Virtual conductingpractice environment. In Proceedings of the International Computer Music Conference, pages371–374.
[Grüll, 2005] Grüll, I. (2005). conga: A conducting gesture analysis framework. Master’s thesis,Universität Ulm.
[Günter and Bunke, 2003] Günter, S. and Bunke, H. (2003). Optimizing the number of states,training iterations and gaussians in an hmm-based handwritten word recognizer. In Docu-ment Analysis and Recognition, 2003. Proceedings. Seventh International Conference on, pages472–476 vol.1.
[He and Kundu, 1991] He, Y. and Kundu, A. (1991). 2-d shape classification using hidden markovmodel. IEEE Trans. Pattern Anal. Mach. Intell., 13(11):1172–1184.
[HMMToolbox, 2007] HMMToolbox (2007). http://www.cs.ubc.ca/ murphyk/software/hm-m/hmm.html, last checked on 10/04/2007.
100
[Hofmann et al., 1998] Hofmann, F. G., Heyer, P., and Hommel, G. (1998). Velocity Profile BasedRecognition of Dynamic Gestures with Discrete Hidden Markov Models.
[Huang et al., 1990] Huang, X., Ariki, Y., and Jack, M. (1990). Hidden Markov Models forSpeech Recognition. Columbia University Press, New York, NY, USA.
[Iba et al., 1999] Iba, S., Weghe, J. M. V., Paredis, C. J. J., and Khosla, P. K. (1999). An ar-chitecture for gesture-based control of mobile robots. In Intelligent Robots and Systems, 1999.IROS ’99. Proceedings. 1999 IEEE/RSJ International Conference on, volume 2, pages 851–857vol.2.
[Ilmonen, 1999] Ilmonen, T. (1999). Tracking conductor of an orchestra using artificial neuralnetworks. Master’s thesis, Helsinki University of Technology.
[Ilmonen and Jalkanen, 2000] Ilmonen, T. and Jalkanen, J. (2000). Accelerometer-based motiontracking for orchestra conductor following. In Proceedings of 6th Eurographics Workshop,pages 187–196.
[Ilmonen and Takala, 1999] Ilmonen, T. and Takala, T. (1999). Conductor following with artificialneural networks. In Proceedings of the International Computer Music Conference, pages 367–370.
[Kallio et al., 2003] Kallio, S., Kela, J., and Mantyjarvi, J. (2003). Online gesture recognitionsystem for mobile interaction. volume 3, pages 2070–2076 vol.3.
[Kang et al., 2004] Kang, H., Lee, C. W., and Jung, K. (2004). Recognition-based gesture spottingin video games. Pattern Recogn. Lett., 25(15):1701–1714.
[Kay, 2000] Kay, S. (2000). Can detectability be improved by adding noise? Signal ProcessingLetters, IEEE, 7(1):8–10.
[Keane and Gross, 1989] Keane, D. and Gross, P. (1989). The midi baton. In Proceedings of theInternational Computer Music Conference, pages 151–154.
[Keane et al., 1990] Keane, D., Smecca, G., and Wood, K. (1990). The midi baton ii. In Proceed-ings of the International Computer Music Conference, page Supplements.
[Keane and Wood, 1991] Keane, D. and Wood, K. (1991). The midi baton iii. In Proceedings ofthe International Computer Music Conference, pages 541–544.
[Keir et al., 2006] Keir, P., Payne, J., Elgoyhen, J., Horner, M., Naef, M., and Anderson, P. (2006).Gesture-recognition with non-referenced tracking. pages 151–158.
[Kela et al., 2006] Kela, J., Korpipää, P., Mäntyjärvi, J., Kallio, S., Savino, G., Jozzo, L., andMarca, D. (2006). Accelerometer-based gesture control for a design environment. PersonalUbiquitous Comput., 10(5):285–299.
[Kolesnik, 2004] Kolesnik, P. (2004). Conducting gesture recognition, analysis and performancesystem. Master’s thesis, McGill University, Montreal.
[Kolesnik and Wanderley, ] Kolesnik, P. and Wanderley, M. Recognition, analysis and perfor-mance with expressive conducting gestures.
[Krause et al., 2005] Krause, A., Ihmig, M., Rankin, E., Leong, D., Gupta, S., Siewiorek, D.,Smailagic, A., Deisher, M., and Sengupta, U. (2005). Trading off prediction accuracy andpower consumption for context-aware wearable computing. pages 20–26.
101

[Krause et al., 2003] Krause, A., Siewiorek, D. P., Smailagic, A., and Farringdon, J. (2003). Un-supervised, dynamic identification of physiological and activity context in wearable computing.pages 88–97.
[Lachenmaier, 2006] Lachenmaier, P. (2006). Entwurf und Implementierung eines Dirigierlern-systems für Kinder.
[Lee and Borchers, 2005] Lee, E. and Borchers, J. (2005). The role of time in engineering com-puter music systems. In Proceedings of the 2005 conference on New interfaces for musicalexpression, pages 204–207.
[Lee et al., 2006a] Lee, E., Grüll, U., Kiel, H., and Borchers, J. (2006a). conga: A framework foradaptive conducting gesture analysis. In Proceedings of the 2006 conference on New interfacesfor musical expression, pages 260–265.
[Lee et al., 2006b] Lee, E., Karrer, T., and Borchers, J. (2006b). Toward a framework for interac-tive systems to conduct digital audio and video streams. Computer Music Journal, 30(1):21–36.
[Lee et al., 2006c] Lee, E., Kiel, H., Dedenbach, S., Grüll, Karrer, T., Wolf, M., and Borchers,J. (2006c). isymphony: An adaptive interactive orchestral conducting system for digital audioand video streams. In CHI ’06 extended abstracts on Human factors in computing systems,pages 259–262.
[Lee et al., 2004] Lee, E., Marrin, T., and Borchers, J. (2004). You’re the conductor: A realisticinteractive conducting system for children. In Proceedings of the 2004 conference on Newinterfaces for musical expression, pages 68–73.
[Lee et al., 2005] Lee, E., Wolf, M., and Borchers, J. (2005). Improving orchestral conductingsystems in public spaces: Examining the temporal characteristics and conceptual models ofconducting gestures. In Proceedings of the SIGCHI conference on Human factors in computingsystems, pages 731–740.
[Lee and Kim, 1999] Lee, H.-K. and Kim, J. H. (1999). An hmm-based threshold model approachfor gesture recognition. Pattern Analysis and Machine Intelligence, IEEE Transactions on,21(10):961–973.
[Lee et al., 1992a] Lee, M., Freed, A., and Wessel, D. (1992a). Neural networks for simultaneousclassification and parameter estimation in musical instrument control. In Proceedings of SPIE,volume 1706, pages 244–255.
[Lee et al., 1992b] Lee, M., Garnett, G., and Wessel, D. (1992b). An adaptive conductor follower.In Proceedings of the International Computer Music Conference, pages 454–455.
[Lukowicz et al., 2003] Lukowicz, P., Ward, J., Junker, H., Stager, M., Troster, G., Atrash, A.,and Starner, T. (2003). Recognizing workshop activity using body worn microphones andaccelerometers.
[Mäntyjärvi et al., 2004] Mäntyjärvi, J., Kela, J., Korpipää;, P., and Kallio, S. (2004). Enablingfast and effortless customisation in accelerometer based gesture interaction. In MUM ’04:Proceedings of the 3rd international conference on Mobile and ubiquitous multimedia, pages25–31, New York, NY, USA. ACM Press.
[Mäntylä et al., 2000] Mäntylä, V. M., Mäntyjärvi, J., Seppänen, T., and Tuulari, E. (2000). Handgesture recognition of a mobile device user. volume 1, pages 281–284 vol.1.
102
[Marrin, 1996] Marrin, T. (1996). Toward an understanding of musical gesture: Mapping expres-sive intention with the digital baton. Master’s thesis, Massachusetts Institute of Technology.
[Marrin, 1997] Marrin, T. (1997). Possibilities for the digital baton as a general-purpose gesturalinterface. In CHI ’97 extended abstracts on Human factors in computing systems, pages 311–312.
[Marrin, 2000] Marrin, T. (2000). Inside the “Conductor’s Jacket”: Analysis, Interpretation andMusical Synthesis of Expressive Gesture. PhD thesis, Massachusetts Institute of Technology.
[Marrin and Paradiso, 1997] Marrin, T. and Paradiso, J. (1997). The digital baton: a versatileperformance instrument. In Proceedings of the International Computer Music Conference,pages 313–316.
[Marrin and Picard, 1998] Marrin, T. and Picard, R. (1998). The “conductor’s jacket”: A devicefor recording expressive musical gestures. In Proceedings of the International Computer MusicConference, pages 215–219.
[Mathews, 1976] Mathews, M. V. (1976). The conductor program. In Proceedings of the Inter-national Computer Music Conference.
[Mathews, 1979] Mathews, M. V. (1979). Sequential drum. The Journal of the Acoustical Societyof America, 66:42+.
[Mathews, 1989] Mathews, M. V. (1989). The Conductor Program and Mechanical Baton, pages263–281. MIT Press.
[Mathews, 1991] Mathews, M. V. (1991). The radio baton and conductor program, or: Pitch, themost important and least expressive part of music. Computer Music Journal, 15(4):37–46.
[Mathews and Abbott, 1980] Mathews, M. V. and Abbott, C. (1980). The sequential drum. Com-puter Music Journal, 4(4):45–59.
[Mathews and Moore, 1970] Mathews, M. V. and Moore, F. R. (1970). GROOVE - a program tocompose, store, and edit functions of time. Communications of the ACM, 13(12):715–721.
[MatlabCompiler, 2007] MatlabCompiler (2007). http://www.mathworks.com/access/helpdesk/help/toolbox/compiler/, last checked on 10/15/2007.
[MatlabRequirements, 2007] MatlabRequirements (2007). http://www.mathworks.com/products/matlab/requirements.html, last checked on 10/03/2007.
[Maurer et al., 2006] Maurer, U., Rowe, A., Smailagic, A., and Siewiorek, D. P. (2006). eWatch:A wearable sensor and notification platform. pages 4 pp.+.
[Meyer, 2007] Meyer (2007). http://www.pittsburghyouthsymphony.org/bio_danmeyer.html, lastchecked on 10/16/2007.
[Min et al., 1997] Min, B.-W., Yoon, H.-S., Soh, J., Yang, Y.-M., and Ejima, T. (1997). Handgesture recognition using hidden markov models. In Systems, Man, and Cybernetics, 1997.’Computational Cybernetics and Simulation’., 1997 IEEE International Conference on, vol-ume 5, pages 4232–4235 vol.5.
[Minnen et al., 2005] Minnen, D., Starner, T., Ward, J. A., Lukowicz, P., and Troster, G. (2005).Recognizing and discovering human actions from on-body sensor data. pages 1545–1548.
103

[Mitchell, 1997] Mitchell, T. M. (1997). Machine Learning. McGraw-Hill Science/Engineering/-Math.
[Morales, 2007] Morales (2007). http://www.edgewoodsymphony.org/about/director, lastchecked on 10/16/2007.
[Morguet and Lang, 1998] Morguet, P. and Lang, M. (1998). Spotting dynamic hand gestures invideo image sequences using hidden markov models. In Image Processing, 1998. ICIP 98.Proceedings. 1998 International Conference on, pages 193–197 vol.3.
[Morguet and Lang, 1999] Morguet, P. and Lang, M. (1999). Comparison of approaches to con-tinuous hand gesture recognition for a visual dialog system.
[Morita et al., 1991] Morita, H., Hashimoto, S., and Ohteru, S. (1991). A computer music systemthat follows a human conductor. Computer, 24(7):44–53.
[Morita et al., 1989] Morita, H., Ohteru, S., and Hashimoto, S. (1989). Computer music sys-tem which follows a human conductor. In Proceedings of the International Computer MusicConference, pages 207–210.
[Morita et al., 1990] Morita, H., Watanabe, H., and Harada, T. (1990). Knowledge informationprocessing in conducting computer music performer. In Proceedings of the International Com-puter Music Conference, pages 332–334.
[Murphy, 2004] Murphy, D. (2004). Live interpretation of conductors’ beat patterns. In Pro-ceedings of the 13th Danish Conference on Pattern Recognition and Image Analysis, pages111–120.
[Murphy et al., 2004] Murphy, D., Andersen, T. H., and Jensen, K. (2004). Conducting AudioFiles via Computer Vision, pages 529–540. Springer Berlin / Heidelberg.
[Netlab, 2007] Netlab (2007). http://www.ncrg.aston.ac.uk/netlab/, last checked on 10/04/2007.
[Paradiso, 1999] Paradiso, J. A. (1999). The brain opera technology: New instruments andgestural sensors for musical interaction and performance. Journal of New Music Research,28(2):130–149.
[Pylvänäinen, 2005] Pylvänäinen, T. (2005). Accelerometer Based Gesture Recognition UsingContinuous HMMs.
[Rabiner and Juang, 1986] Rabiner, L. and Juang, B. (1986). An introduction to hidden markovmodels. ASSP Magazine, IEEE [see also IEEE Signal Processing Magazine], 3(1):4–16.
[Rabiner, 1989] Rabiner, L. R. (1989). A tutorial on hidden markov models and selected applica-tions in speech recognition. Proceedings of the IEEE, 77(2):257–286.
[Rich, 1996] Rich, R. (1996). Buchla lightning ii. Electronic Musician, 12(8):118–122.
[Rigoll et al., 1998] Rigoll, G., Kosmala, A., and Eickeler, S. (1998). High performance real-timegesture recognition using hidden markov models. pages 69+.
[Rudolf, 1950] Rudolf, M. (1950). The Grammar of Conducting - A Practical Study of ModernBaton Technique. G. Schirmer, New York.
[Sawada and Hashimoto, 1997] Sawada, H. and Hashimoto, S. (1997). Gesture recognition usingan acceleration sensor and its application to musical performance control. Electronics andCommunications in Japan, Part III, 80(5):9–17.
104

[Sawada et al., 1995] Sawada, H., Ohkura, S., and Hashimoto, S. (1995). Gesture analysis using3d acceleration sensor for music control. In Proceedings of the International Computer MusicConference, pages 257–260.
[Schertenleib et al., 2004] Schertenleib, S., Gutierrez, M., Vexo, F., and Thalmann, D. (2004).Conducting a virtual orchestra. IEEE Multimedia, 11(3):40–49.
[Schmidt et al., 2007] Schmidt, D., Dannenberg, R. B., Smailagic, A., Siewiorek, D. P., andBrügge, B. (2007). Learning an orchestra conductor’s technique using a wearable sensor plat-form. In Wearable Computers, 2007 11th IEEE International Symposium on, pages 113–114.
[Segen et al., 2000] Segen, J., Gluckman, J., and Kumar, S. (2000). Visual interface for conduct-ing virtual orchestra. In Proceedings of the 15th International Conference on Pattern Recogni-tion, pages 276–279.
[Smailagic et al., 2005] Smailagic, A., Siewiorek, D. P., Maurer, U., Rowe, A., and Tang, K. P.(2005). eWatch: Context sensitive system design case study. pages 98–103.
[Starner et al., 1997] Starner, Weaver, J., and Pentland, A. (1997). A wearable computing basedamerican sign language recognizer.
[Starner et al., 1994] Starner, T., Makhoul, J., Schwartz, R., and Chou, G. (1994). On-line cursivehandwriting recognition using speech recognition methods. In Acoustics, Speech, and Sig-nal Processing, 1994. ICASSP-94., 1994 IEEE International Conference on, volume v, pagesV/125–V/128 vol.5.
[Starner and Pentland, 1995] Starner, T. and Pentland, A. (1995). Real-time american sign lan-guage recognition from video using hidden markov models. In SCV95.
[Takala, 1997] Takala, T. (1997). Virtual orchestra performance. In SIGGRAPH ’97: ACM SIG-GRAPH 97 Visual Proceedings: The art and interdisciplinary programs of SIGGRAPH ’97,pages 81–81.
[Tobey, 1995] Tobey, F. (1995). The ensemble member and the conducted computer. In Proceed-ings of the International Computer Music Conference, pages 529–530.
[Tobey and Fujinaga, 1996] Tobey, F. and Fujinaga (1996). Extraction of conducting gestures in3d space. In Proceedings of the International Computer Music Conference, pages 305–307.
[Usa and Mochida, 1998a] Usa, S. and Mochida, Y. (1998a). A conducting recognition system onthe model of musicians’ process. Journal of the Acoustical Society of Japan, pages 275–287.
[Usa and Mochida, 1998b] Usa, S. and Mochida, Y. (1998b). A multi-modal conducting simula-tor. In Proceedings of the International Computer Music Conference, pages 25–32.
[Wilson and Bobick, 1999] Wilson, A. D. and Bobick, A. F. (1999). Parametric hidden markovmodels for gesture recognition. Pattern Analysis and Machine Intelligence, IEEE Transactionson, 21(9):884–900.
[Yamato et al., 1992] Yamato, J., Ohya, J., and Ishii, K. (1992). Recognizing human action intime-sequential images using hidden markov model. In Computer Vision and Pattern Recogni-tion, 1992. Proceedings CVPR ’92., 1992 IEEE Computer Society Conference on, pages 379–385.
[Yang and Xu, 1994] Yang, J. and Xu, Y. (1994). Hidden Markov Model for Gesture Recognition.
105
Copyright © 2022 FDOKUMEN


![[ITA] Acceleration methods for PageRank](https://static.fdokumen.com/doc/165x107/6321641780403fa2920cb95c/ita-acceleration-methods-for-pagerank.jpg)