A new indicator to assess the credibility of the EMS
25
EUROPEAN ELSEVIER European Economic Review 41 (1997) 1511-1535 A new indicator to assess the credibility EMS Marta Gbmez-Puig a, Jo& G. Montalvo a7b, * of the a Uniuersitat Pompeu Fabra, c/ Trias Fargas 2% 27, 132, 08005 Barcelona, Spain b IVIE, Valencia, Spain Received 15 February 1995;revised 15 July 1996 Abstract This paper proposes a new credibility indicator for tbe EMS based on the realignment expectations calculated using the inferred probabilities derived from the estimation of a Markov-switching regimes model. This indicator avoids most of the problems presented by the so-called ‘drift adjusted method’ and, in particular, it accounts, in a natural manner, for ‘ex-ante’ expectations instead of using ‘ex-post’ realignment times in order to deal with the jumps in the exchange rates. The periods of high probability of realignment match very closely the crisis of the EMS. JEL classijication: C22; F31; F33 Keywords: Credibility; Target zones; Markov switching model 1. Introduction The European Monetary System (EMS) was initially thought of as an agree- ment to reduce the variability of exchange rates for a Europe in transition to economic integration. The Exchange Rate Mechanism (ERM) is the basic instru- ment to obtain such stability. The ERM imposes on the economic authorities the obligation to intervene whenever the exchange rate of their currencies gets close to the edges of the bands. * Correspondingauthor. Tel.: (+ 34) 3-5422682;fax: (+ 34) 3-5421746;e-mail: [email protected]. 0014-2921/97/$17.00 0 1997 Elsevier Science B.V. All rights reserved. PIZ SOOl4-2921(96)00043-8
-
Upload
independent -
Category
Documents
-
view
0 -
download
0
Transcript of A new indicator to assess the credibility of the EMS
EUROPEAN
ELSEVIER European Economic Review 41 (1997) 1511-1535
A new indicator to assess the credibility EMS
Marta Gbmez-Puig a, Jo& G. Montalvo a7b, *
of the
a Uniuersitat Pompeu Fabra, c/ Trias Fargas 2% 27, 132, 08005 Barcelona, Spain b IVIE, Valencia, Spain
Received 15 February 1995; revised 15 July 1996
Abstract
This paper proposes a new credibility indicator for tbe EMS based on the realignment expectations calculated using the inferred probabilities derived from the estimation of a Markov-switching regimes model. This indicator avoids most of the problems presented by the so-called ‘drift adjusted method’ and, in particular, it accounts, in a natural manner, for ‘ex-ante’ expectations instead of using ‘ex-post’ realignment times in order to deal with the jumps in the exchange rates. The periods of high probability of realignment match very closely the crisis of the EMS.
JEL classijication: C22; F31; F33
Keywords: Credibility; Target zones; Markov switching model
1. Introduction
The European Monetary System (EMS) was initially thought of as an agree- ment to reduce the variability of exchange rates for a Europe in transition to economic integration. The Exchange Rate Mechanism (ERM) is the basic instru-
ment to obtain such stability. The ERM imposes on the economic authorities the obligation to intervene whenever the exchange rate of their currencies gets close to the edges of the bands.
* Corresponding author. Tel.: (+ 34) 3-5422682; fax: (+ 34) 3-5421746; e-mail: [email protected].
0014-2921/97/$17.00 0 1997 Elsevier Science B.V. All rights reserved.
PIZ SOOl4-2921(96)00043-8

1512 A4. GdmepPuig, J.G. MontaEuo/ European Economic Review 41 (1997) ~511-1535
However, the ERM recognizes explicitly the possibility of realignment when
central banks interventions are not enough to keep currencies within the bands.
Therefore, the target zone approach to exchange rates modelling, originated in Krugman (1991), is not completely satisfactory for the EMS case. The Krugman
model has two crucial assumptions. First, the exchange rate target zone is perfectly credible. Second, the target zone is defended with ‘marginal’ interventions only.
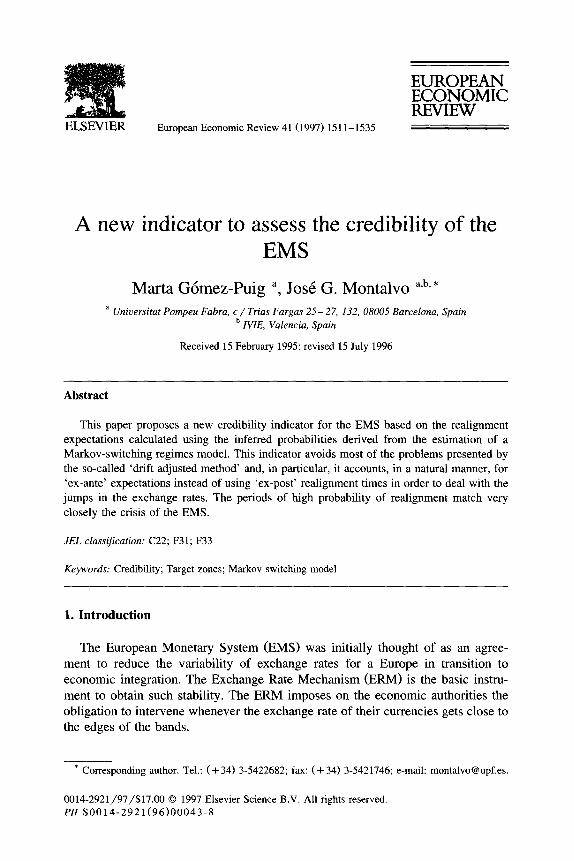
1 .l SPANISH PESETAID. MARK
100
90 -
M. Go’mez-Puig, J.G. Montaluo/European Economic Review 41 (1997) 1511-1535 1513
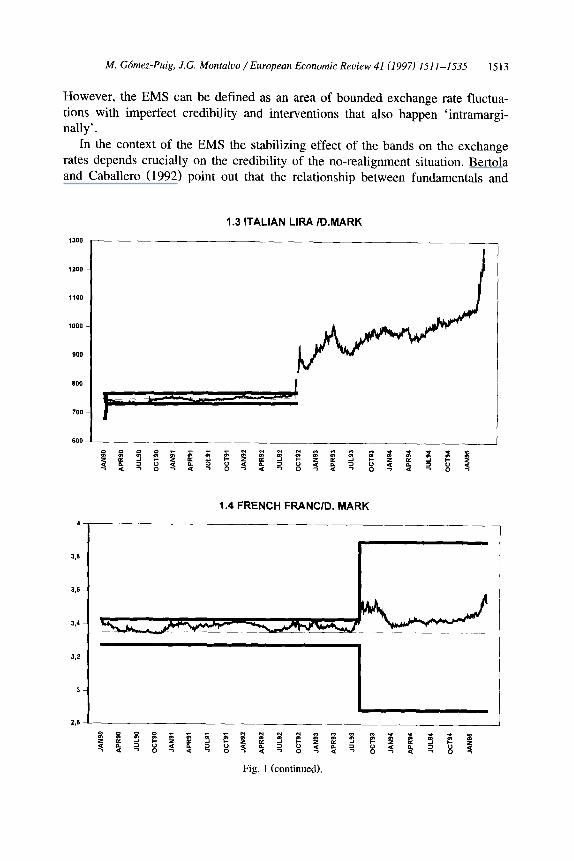
However, the EMS can be defined as an area of bounded exchange rate fluctua- tions with imperfect credibility and interventions that also happen ‘intramargi- nally' .
In the context of the EMS the stabilizing effect of the bands on the exchange rates depends crucially on the credibility of the no-realignment situation. Bertola and Caballero (1992) point out that the relationship between fundamentals and
1.3 ITALIAN LIRA /D.MARK
1.4 FRENCH FRANC/D. MARK
1514 M. Ghez-Puig, J.G. Montaluo/European Economic Reuiew 41 (1997) 1511-1535
exchange rates predicted by Krugman (1991) is reversed when there is high risk of realignment. The likelihood of target zone predictions hinges on the probability of realignment perceived by agents.
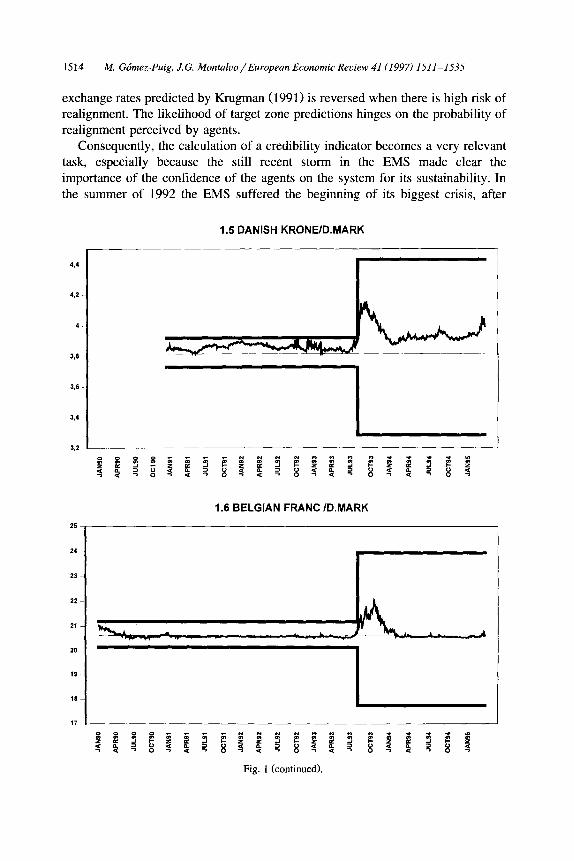
Consequently, the calculation of a credibility indicator becomes a very relevant task, especially because the still recent storm in the EMS made clear the importance of the confidence of the agents on the system for its sustainability. In
the summer of 1992 the EMS suffered the beginning of its biggest crisis, after
1.5 DANISH KRONE/D.MARK
hf. Gbmez-Puig, J.G. Montaluo/European Economic Review 41 (1997) 1511-1535 1515
more than five years of no realignments of parities. The crisis led to several
devaluations (the Spanish Peseta, the Irish Punt and the Portuguese Escudo) and the exit of the Pound Sterling and the Italian Lira. The crisis led also to a reform of the ERM which implied the increase in the bands defined around the bilateral central rates (see Fig. 1).
The objective of this paper is to obtain a rigorous indicator of target zone credibility. In particular, the construction of this indicator takes into account the fact that exchange rates in the EMS are subject to changes of regime at uncertain moments. Traders at exchange markets assign some probability to the event of change of regime and the interaction of these defines the evolution of exchange rates. For these reasons we adopt the methodology proposed by Hamilton (1989) and some extensions of his approach in order to deal with the exchange rates
evolution in the EMS. The remainder of this paper is organized as follows. Section 2 revises the
literature on credibility indicators and its empirical implementation. Section 3 presents a brief description of the econometric methods used in this paper. The
applications of that econometric methodology to the EMS appear in Section 4. Section 5 concludes.
2. Target zone credibility indicators
Most of the literature on the credibility of the EMS takes the uncovered interest parity condition as its starting point. Under the uncovered interest parity (UIP)
assumption, the interest rate differential between two homogeneous assets nomi- nated in different currencies should be equal to the expected rate of depreciation of one currency relative to the other, during the time interval corresponding to the maturity of those assets. The UIP is recognized as a reasonable approximation to foreign exchange markets when risk premium is small. ’
We can write the uncovered interest parity condition as
where i: is the domestic interest rate at time t for assets of maturity T, iI*’ is the foreign interest rate at time t for assets of the same default risk and the same maturity T, E, denotes expectations conditional upon information available at time t, s, denotes the logarithm of the spot rate (measured in units of domestic currency
per foreign currency).
I Svensson (1992) argues that for reasonable levels of risk aversion there is no significant risk
premium in a target zone. Ayuso and Restoy (1992) obtain a small estimation for the risk premium
component due to the fact that risk can be easily diversified in the EMS.

1516 M. Gdmez-Puig, J.G. Montaluo/ European Economic Review 41 (1997) 1511-1535
The seminal work of Bertola and Svensson (1993) proposes to decompose the expected rate of exchange rate change as the sum of the expected change in the deviation of the spot with respect to the central parity, or depreciation within the band and the expected change in the central parity:
E,A~,+./~~E,A~,+./~+E,Ac,+./~ (2)
where s, is the logarithm of the spot rate, ct is the logarithm of the central parity and x, = s, - c,. Therefore, using Eqs. (1) and (2) we can write the expected rate
of realignment as
EtAc,+,= (i;- i:T)r- EfAXf+7. (3)
Consequently, when there is no risk premium, the difference between the interest rate differential of two homogeneous assets nominated in different curren- cies and the rate of depreciation within the band can be identified as the expected rate of realignment in the central parity.
Most of the credibility indicators proposed in the literature on target zones are based on Eq. (3). A popular approach to assess the credibility of the EMS relies on estimating the expected rate of depreciation within the band using regression
techniques and leads to the so called drift-adjustment method. Using this method- ology, the interest rate differential is adjusted by the drift of expected exchange rate within the band in order to obtain the expected rate of realignment. 2
However, estimating the expected rate of depreciation within the band is not an easy task given that it usually jumps at realignments. In order to deal with this
problem Svensson (1993) and Rose and Svensson (1995) decompose E, Ax,,, into two elements:
E, A&+ 7 =P:E,(A~,+.IR) + (1 +)E,(Ax,+.lNR) (4)
where p: is the probability of a change of regime during the period from time t to time t + T, R is the event ‘realignment’ and NR is the event ‘no realignment’.
Following this strategy the expected rate of devaluation/revaluation, g:, can be written as
Pp:[E,(Ax,+.lR) -E,(A~,+.INR)]/T+E,Ac,+./~. (5)
This expression can be also rewritten as the product of the frequency of realign-
ment by the expected conditional devaluation size: 3
g:W[E,(Ac,+,lR) +E,(Ax,+.lR) -E,(Ax,+.lNR)]/7. (6)
In order to obtain the estimates of the series x, conditional on the no realignment event, Svensson (1993) eliminates from the sample the 65 observa-
* Rose and Svensson (1994, 1995), Svensson (1993) and Lindberg et al. (1993).
3 Edin and Vredin (1993) obtain the probability of realignment using limited dependent variable
models.
M. Gbmez-Puig, J.G. Montaluo/European Economic Review 41 (1997) 1511-1535 1517
tions corresponding to the three months before a realignment took place, given that
he uses r = 3 months. However, even when the realignment observations are excluded from the sample, the possibility of a future realignment makes the sample movement of x, conditional on both realignment and no-realignment probabilities. 4 Furthermore, the reduction in the number of observations implied
by this strategy leads to a loss of information.
3. Econometric methods
This section covers the econometric methods proposed for the estimation of the model. The procedures described in this section try to overcome some of the problems found in the literature on target zone credibility.
The ‘peso problem’ is the first question to address in order to estimate the expected rate of change of central parities. When there is realignment risk, the sample distribution of the series x, may not be an accurate description of the true distribution of the error term. The sample represents a mixture distribution while
the underlying distribution has, in fact, two regimes: a stormy state and a stable state. Given that the regime is unobserved, inferences obtained using the mixture
distribution without an appropriate mechanism to estimate the regime will be clearly biased. If agents expect the devaluation of a currency, the subjective distribution of probability of the exchange rate within the band will incorporate the probability of that event in the mean and the variance, even if the realignment does not happen. Under these circumstances, a single normal distribution is not a good choice for the sample distribution.
In addition, the usual estimation procedure for the exchange rate within the band relies on the ‘ex-post’ knowledge of the realignment dates which will lead to conditional distribution different to the ‘ex-ante’ distribution. 5
Therefore, we need an estimation procedure that allows us to deal with the
mixture distribution generated by two possible situations: realignment and no realignment. Furthermore, the probability that the exchange rate at time t comes from one of the distributions might depend on the past values of the exchange rate. At the same time, this method should estimate jointly the jump and the probability of it and provide a credibility indicator based on information known at time t. For these reasons it seems plausible to use the Hamilton (1989, 1994) model for changes in regimes. 6 This procedure is adequate when there are dramatic breaks
4 Chen and Giovannini (1993), even though their realignment expectations indicator is ‘ex-post’. 5 Malz (1996) describes a procedure to estimate the ‘ex-ante’ probability of realignment derived
from futures and options on exchange rates.
’ In an effort somewhat related to the work presented in this paper, Bekaert and Gray (1996)
estimate, using maximum-likelihood, the conditional distribution of exchange rates taken explicitly into
account the probability of a jump to the information available at that point in time.
1518 M. Gbmez-Puig, J.G. Montaluo/European Economic Review 41 (1997) 1511-1535
in a time series like, for instance, devaluations or realignments, and will allow us to obtain a EMS credibility indicator which will be associated with the probability
of a change in regime. Very recently, Ruge-Murcia (1995) used Hamilton’s model to evaluate the credibility of stabilization policy in Israel during the 1980s. He
measures the credibility of a stabilization plan as the agent’s inferred probability that the joint observation of inflation, the nominal interest rate and government spending were generated by a reformed public expenditure regime.
3.1, The switching regimes model
Assume there are two possible states or regimes: one regime of attacks against some currencies (stormy state) and high variance, associated to low credibility and another regime of stability associated with high credibility. The regime is unob- served and the process switches between states following a discrete-time two-state
Markov chain. Suppose that exchange traders do not observe the current regime and make inferences based on the observed exchange rate. Define the unobserved
regimes as s, = 1 and s, = 2. The observed change in the exchange rate is supposed to follow an autoregressive process, where the mean and the variance in each period depend on the state of the economy. An AR(l) example of this kind of processes could be represented as
Y~-P~=~(Y,-~-I-L,)+E~’ l C-N(O,Q
~t-/+=e(~t-r-~2)+e2, l 2NN(O’oz2).
In general, we can represent an AR(q) regime switching model as
Yt - P,t = %( Yt- 1 - CL,,_,) + UYP, - Ps,J + ...
+ q Yt-q - &_,> + Uf, P-1
where u, = o-$,E,, E, N N(0, 1) i.i.d. and the 0’s are such that the process is stationary. ’
Suppose that s, is a discrete-valued random variable. The Markov property and the fact that there are only two states, s, = 1 and s, = 2, describe the process as a two-state Markov chain. The matrix of transition probabilities can be written as
p = Pll P21
[ I P12 P22
where
Pkl = ‘( st=kls,_, =I,s,_~=~,. ..)=P(s,=kls,_,=1) (10)
and
PI1 + PI2 = P21 + P22 = 1. (11)
’ Without loss of generality the mean and the variance could be parametrized as
/-$,=P,+P2&~ a,r=Yl+Y2%. (8)

M. Gchez-Puig, J.G. Montaluo/ European Economic Review 41 (1997) 1511-1535 1519
The unconditional probabilities, or ergodic probabilities, can be calculated as
7T=P?r (12) where P is the matrix of transition probabilities and 7~ is a vector that contains the
unconditional probabilities:
P(s,= 1)
7r= P(st=2) [ I (13)
The objective consists in estimating the parameters of the model summarized in
the vector 8=(~,,1*.~, Or, 8, ,... , f$,, P,~, pz2, (TV, a,>. Hamilton (1989) proposes the maximum-likelihood estimation of these parameters. The conditional log-like-
lihood function is
lnP(y,,Y,_,,...,Y,lY,-,,Y,-,,...,Y,)
T
= Cln P(y,lY,-1, Yf--2~...~ Yo) (14)
where
p(~,~~~:,)= i i . . . i P(Ytdt,S,- IT... &&&) s,=os,_,=o s,_,=o
(15)
We can find the maximum of this function using numerical techniques. The probability of each observation conditional on its past can be calculated using a
nonlinear filter and an initial value for 8. ’ The estimation procedure entails the evaluation of the filter for different values of 8 until reaching the maximum likelihood.
In order to analyze the probability assigned to each state, this procedure also delivers the inferred or filtered probabilities of being in state s, conditional on the information available at that time:
q&lY,, Yl-l**,*? YO),
This is the indicator we will use in Section 4 to measure credibility.
(16)
3.2. A Markov switching ARCH model
Many studies on exchange rates are centered on exchange risk and, for this reason, they suggest very elaborate models for the variance of the process. Most of them are transformations of the basic ARCH model.
* Hamilton (1989, 1994) explain the algorithm used to obtain the conditional probabilities at each
stage.
1520 M. Gbnez-Puig, J.G. Montaluo/ European Economic Review 41 (1997) 1511-1535
The model presented in the last subsection could be extended to the case of a switching ARCH process. Several authors have argued that changes in regime could induce the misleading conclusion of not being able to reject the existence of an unit root in the level of the series. In the same way, the false high persistence of ARCH models may be caused by structural changes in ARCH process. Hamilton
and Susmel (1994) have proposed a modification to the usual ARCH model that allows changes in regime, combining the idea of autoregressive conditional
heteroskedasticity and the Markov-switching model (SWARCH). A SWARCH model with two states, a disturbance following an ARCH(l) and a second order autoregressive for yt, SWARCH(2,2, l), can be written as
Y*=~,+~,Y,-,+S,Y,-,+u,,
u, = d,,5,> St= 132, i--
5, = h*E,,
where et could be specified as a standard normal or a t-distribution. 9
(17)
4. Application to the EMS
This section presents the application of the econometric methods discussed above to the case of the currencies in the EMS. In particular, we analyze the probability of regime changes in different periods of time for the currencies in the
EMS. In related independent work, Engel and Hakkio (1994) have applied a version
of the Markov-switching model to the EMS. They try to improve the jump-diffu- sion model (Ball and Roma, 1993) by using a version of Hamilton (1989) where the probability of switching from one state to another depends on the position of the exchange rate within the EMS. Their primary objective is to obtain a procedure for finding outliers. The estimation leads to the implication that near the edges of the bands realignments are more likely the quicker is the movement to them. lo
The objective of this paper is different from Engel and Hakkio (1994). We use the Markov-switching model to construct an indicator of credibility. Engel and Hakkio (1994) only analyze the French Franc and the Italian Lira. We want to cover more currencies, comparing the evolution of the ones that decided to stay in the system with the evolution of the currencies that exited it. In addition, we
9 Cai (1994) presents an alternative parametrization of the switching ARCH model.
lo Chen and Giovannini (1993) and Werner (1995) address also the issue of the relationship between
the expected rate of realignment and the distance from the central parity.
M. Gbmez-Puig, J.G. Montalvo/ European Economic Review 41 (1997) 1511-1535 1521
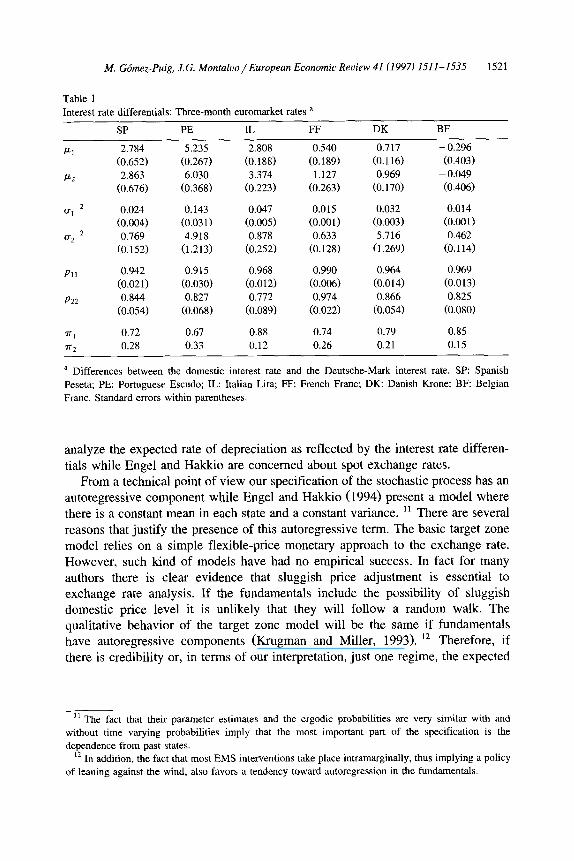
Table 1
Interest rate differentials: Three-month euromarket rates a
SP PE IL FF DK BF
CL1 2.784 5.235 2.808 0.540 0.717 - 0.296
(0.652) (0.267) CO.1881 (0.189) (0.116) (0.403) I*2 2.863 6.030 3.374 1.127 0.969 - 0.049
(0.676) (0.368) (0.223) (0.263) (0.170) (0.406)
@I z 0.024 0.143 0.047 0.015 0.032 0.014
CO.0041 (0.03 11 (0.0051 (0.001) (0.003) (0.001) o2 2 0.769 4.918 0.878 0.633 5.716 0.462
(0.152) Cl.2131 (0.252) CO.1281 (1.269) (0.114)
Pi1 0.942 0.915 0.968 0.990 0.964 0.969
(0.021) (0.030) Co.0121 (0.006) (0.014) CO.0131 P22 0.844 0.827 0.772 0.974 0.866 0.825
(0.054) (0.068) CO.0891 (0.022) CO.0541 (0.080)
VI 0.72 0.67 0.88 0.74 0.79 0.85 m2 0.28 0.33 0.12 0.26 0.21 0.15
a Differences between the domestic interest rate and the Deutsche-Mark interest rate. SP: Spanish
Peseta; PE: Portuguese Escudo; IL: Italian Lira; FF: French Franc: DK: Danish Krone; BF: Belgian
Franc. Standard errors within parentheses.
analyze the expected rate of depreciation as reflected by the interest rate differen- tials while Engel and Hakkio are concerned about spot exchange rates.
From a technical point of view our specification of the stochastic process has an autoregressive component while Engel and Hakkio (1994) present a model where there is a constant mean in each state and a constant variance. ‘r There are several
reasons that justify the presence of this autoregressive term. The basic target zone model relies on a simple flexible-price monetary approach to the exchange rate. However, such kind of models have had no empirical success. In fact for many authors there is clear evidence that sluggish price adjustment is essential to exchange rate analysis. If the fundamentals include the possibility of sluggish domestic price level it is unlikely that they will follow a random walk. The qualitative behavior of the target zone model will be the same if fundamentals have autoregressive components (Krugman and Miller, 1993). l2 Therefore, if there is credibility or, in terms of our interpretation, just one regime, the expected
7 The fact that their parameter estimates and the ergodic probabilities are very similar with and
without time varying probabilities imply that the most important part of the specification is the
dependence from past states.
” In addition, the fact that most EMS interventions take place intramarginally, thus implying a policy of leaning against the wind, also favors a tendency toward autoregression in the fundamentals.
1522 M. Gdmez-Puig, J.G. Montaluo/ European Economic Reuiew 41 (1997) 1511-1535
2.1 SPANISH PESETAID. MARK
11
10
9
8
7
6
5
4
3
* B I f f %
f < B s ? “““Eg$j”$L?;g”” s 0 -I 5 5 2 -I 8 $ 9 2 k $ 4 2 8 z 7 5 $ g 5 _)
2.2 PORT. ESCUDOID. MARK
1
ff~E$I~~f~i~19SE~~~&I
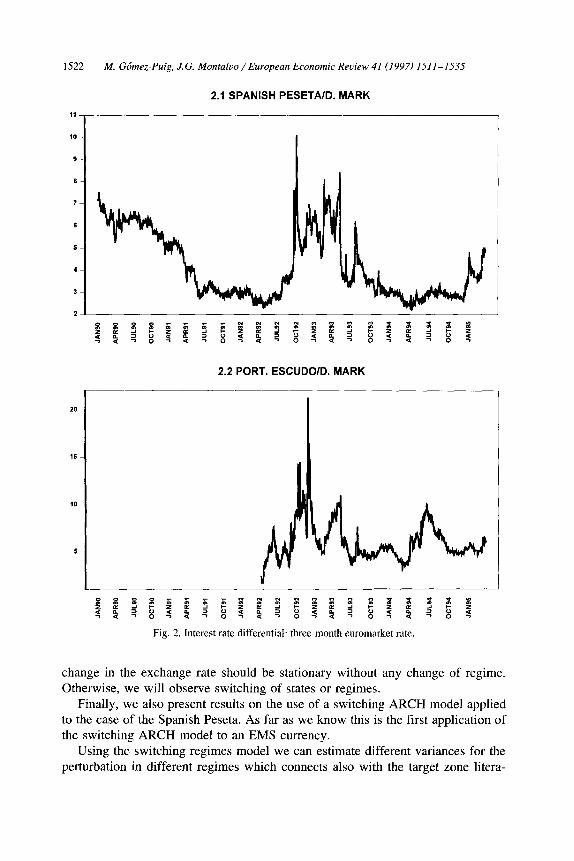
Fig. 2. Interest rate differential: three-month euromarket rate.
change in the exchange rate should be stationary without any change of regime. Otherwise, we will observe switching of states or regimes.
Finally, we also present results on the use of a switching ARCH model applied to the case of the Spanish Peseta. As far as we know this is the first application of the switching ARCH model to an EMS currency.
Using the switching regimes model we can estimate different variances for the perturbation in different regimes which connects also with the target zone litera-

AP
R99
JULI
O
lxx9
9
JAN
91
AP
R91
J”I.9
1
OC
T9l
9 JA
N92
gs
AP
RIZ
t-
2
r Ju
l.92
5.
E
OC
TS
Z
g
JAN
95
v
AP
R93
J”L
93
OC
T93
JAN
94
AP
R94
J”L
94
ocT
94
JAN
95
JAN
99
APR
99
JUL
99
OC
T99
JAN
91
AP
RS
I
J”t.
91
JAN
92
AP
R92
JU.9
2
lxx9
2
JAN
93
AP
R93
JUi.9
3
OC
TS
J
JAN
94
AP
R94
JUL
SII
OC
T94
JAN
95

1524 M. Ghnez-Puig, J.G. Montaluo/European Economic Review 4I(I997) 1511-1535
2.5 DANISH KRONEID. MARK
their respective means and variances. A period of scarce credibility is character- ized as a very volatile situation with a high probability of change in the mean of the process.
The analysis of the expected rate of depreciation is the base of our credibility indicator. For the reasons presented in Section 2, this paper does not pursue the ‘theoretical’ decomposition present in most of the literature but it uses an

JAN
9ll
AP
RS
O
I
J”L9
0
OC
T90
JAN
91
AP
R91
J”L9
1
OC
T91
JAN
92
I A
PR
92
JAN
93
1526 M. Go’mez-Puig, J.G. Montaluo/European Economic Review 41 (1997) 1511-1535
I
i
3.3 ITALIAN LIRAID. MARK
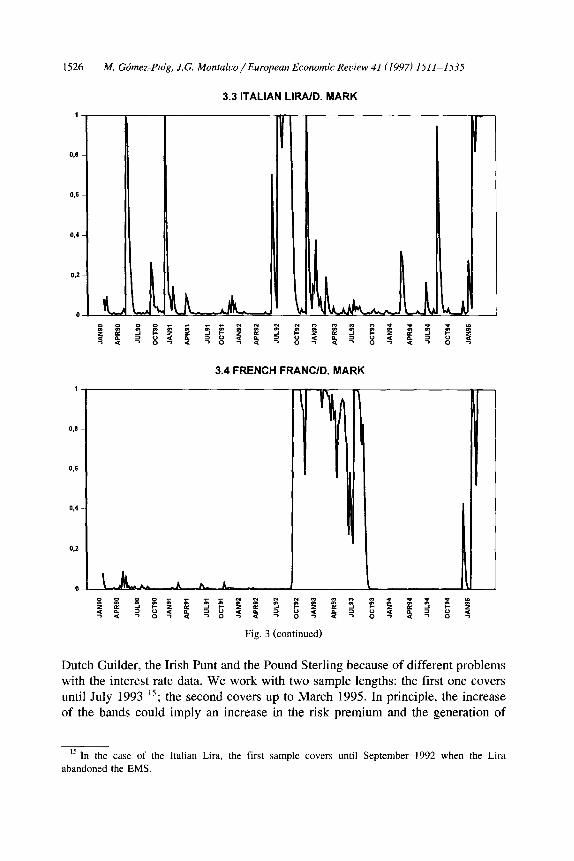
Dutch Guilder, the Irish Punt and the Pound Sterling because of different problems with the interest rate data. We work with two sample lengths: the first one covers until July 1993 15; the second covers up to March 1995. In principle, the increase of the bands could imply an increase in the risk premium and the generation of
I5 In the case of the Italian Lira, the first sample covers until September 1992 when the Lira
abandoned the EMS.
JAN
90
AP
RS
O
JUL
SO
OC
TS
O
JAN
91
AP
RS
I
JUL
Sl
OC
TS
I
JAN
92
crl
C.
gs
hP
RS
2 w
77
s
JUL
92
2.
2 0C
T92
8 v
JAN
93
AP
RS
J
JUL
93
OC
T93
JAN
94
AP
RS
I
JUL
94
OC
T94
JAN
95
JAN
90
AP
RS
O
JUL
SO
OC
TS
O
JhN
91
AP
RS
I
JUL
SI
OC
TS
I
JAN
92
AP
R92
JUL
92
JAN
33
AP
R93
JUL
93
OC
T93
JAN
94
At’
R94
JUL
94
JAN
96
1528 M. Gbmez-Puig, J.G. Montalvo/European Economic Reuiew 41 (1997) 1511-1535
4.1 SPANISH PESETAID. MARK
1
0.6
4.2 PORT. ESCUDOID. MARK
xsi 8XSZ ZE;;;$P $p 23 et s?; t B
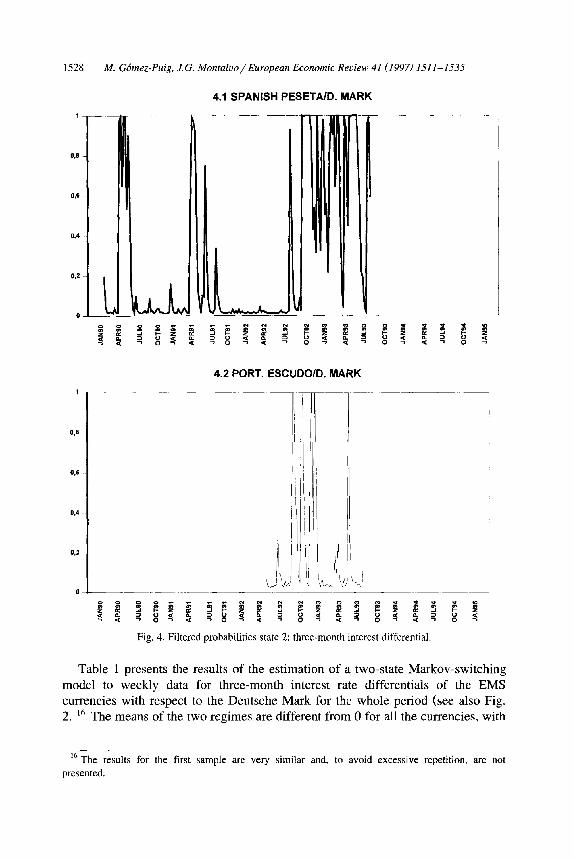
fi 5 i ii 3 z z g ; f : 8 q $ 2 8 4 z i i 2 Fig. 4. Filtered probabilities state 2: three-month interest differential.
Table 1 presents the results of the estimation of a two-state Markov-switching model to weekly data for three-month interest rate differentials of the EMS currencies with respect to the Deutsche Mark for the whole period (see also Fig. 2. I6 The means of the two regimes are different from 0 for all the currencies, with
I6 The results for the first sample are very similar and, to avoid excessive repetition, are not
presented.
JAN
90
AP
R99
J”L9
0
OC
T90
JAN
91
*PR
91
J”L9
1
ocnl
11
JAN
92
?Q
P
FtP
R92
;;‘ s
J”L9
2
c.
2 O
CT
92
Et
v JA
N93
AP
R93
J”L9
3
ocT
93
JAN
94
AP
R94
J”L9
4
OC
T94
AP
R91
JAN
92
AP
R92
JAN
93
AP
R93
JUL
93
JAN
94
AP
R94
JUL
9.4
OC
T94
JAN
95

1530 M. Ghez-Puig, J.G. Mont&o/European Economic Reuiew 41 (1997) 1511-1535
1
006
0.4
0,s
4.5 DANISH KRONEID. MARK
high for all currencies. There is also a lot of persistency of the states, as measured by the conditional probabilities pI1 and pZ2, especially of state 1.
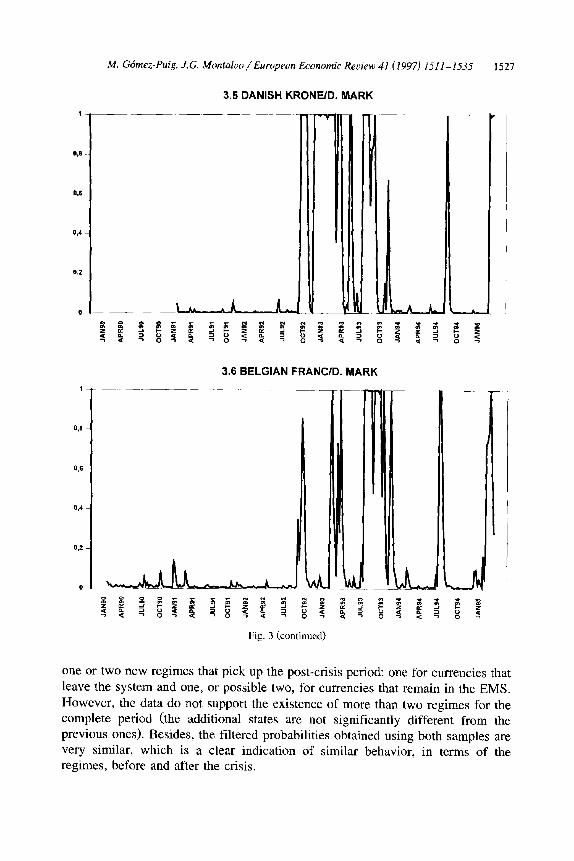
The graphs in Fig. 3 present the inferred probabilities obtained by the applica- tion of the filter described in Section 3.1. Therefore, they represent the probabili- ties, perceived by the agents, of being in the high volatility state conditional on the past information about the interest rate differential. The graphs in Fig. 3 show that

M. Gbmez-Puig, J.G. Montalvo/European Economic Review 41 (1997) 1511-1535 1531
in July 1992, more than one month before the beginning of the storm, the Spanish
Peseta, the Portuguese Escudo and the Italian Lira already showed a very high probability of state 2. These three currencies were precisely the ones that suffered a realignment. For the other currencies the increase of the probability of state 2 is contemporaneous to the crisis. This leads to think that the common component of credibility of the EMS argued by Rose and Svensson (1994) is an important factor.
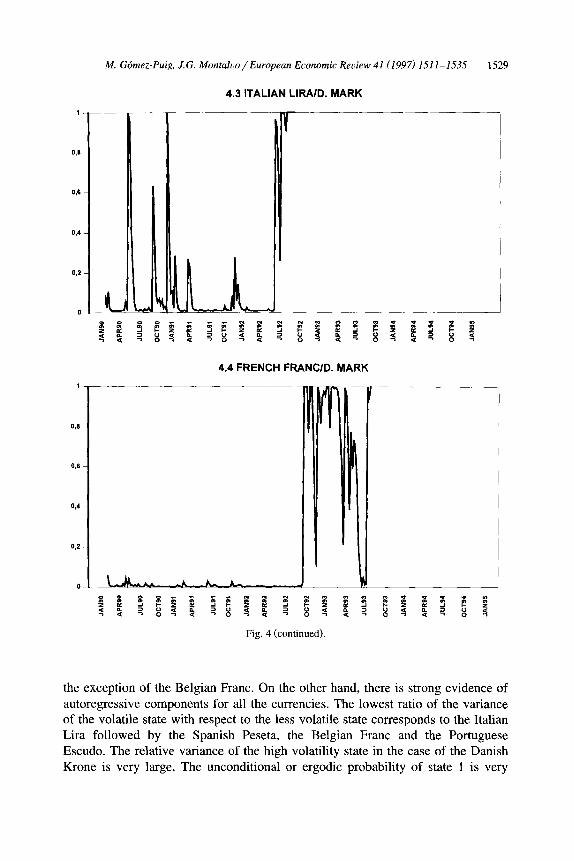
The graphs in Fig. 4 show the same indicator but using only the shorter sample
that covers only until 1993. These graphs show a very similar pattern to the one observed for the filtered probabilities derived using the whole sample. An interest-
ing feature of these graphs is the quick jump in the probability of a change of state that happened previously to the actual realignment. This feature contrasts with the results obtained by using other credibility indicators that, in general, depict a smooth movement of the probability of realignment over time. At the same time it is consistent with some of the findings in Rose and Svensson (1994). These authors report that it is very difficult to find a reasonable level of correlation between macroeconomic variables and realignment expectations. In fact, they recognize that credibility moves “frequently reacting to economic non-events and not moving consistently in response to events which would appear to be relevant from the theoretical viewpoint’ ’ . Our indicator seems to capture the sudden change in expectations that gives rise to a self-fulfilling attack with a quick change in the
probability of realignment, which in ‘theory’ will not decrease at least there is a reaction in the form of a realignment or an increase in the bands of fluctuation.
Table 2
SWARCH (2,2,1): Spanish Peseta a
Long Short
4
0.73 0.79
(0.06) (0.14) 0.24 0.18
(0.06) (0.13)
0.67
(0.18)
0.33
(0.14)
0.74
(0.20)
0.36
(0.17)
0.035
~0.009)
0.03 1
(0.01)
0.96 0.96 0.86 0.9 1
0.78 0.72 0.22 0.28
a Long: sample ending in March of 1995. Short: sample ending in July of 1993. Three-month interest
rate differentials of the Spanish Peseta with respect to the Deutsche Mark. Standard errors in
parentheses.
1532 M. Gdmez-Puig, J.G. Montalvo/European Economic Review 41 (1997) 1511-1535
In this way, the probability of state 2 decreases for the Italian Lira, once it
leaves the EMS, in September 1992, returning to the level it was before the beginning of the crisis. However, for the rest of the currencies, the probability of the volatile state remains high for many periods, in spite of the different EMS realignments (see the graphs of Fig. 1). In fact, the probability of state 2 does not decrease until the period starting in August 1993, with the increase in the bands.
After that date, there are, finally, many periods with high probability of the stable state, similar to what happened before the beginning of the storm. Nevertheless, the above-mentioned increase in the credibility is only transitorily. At the end of
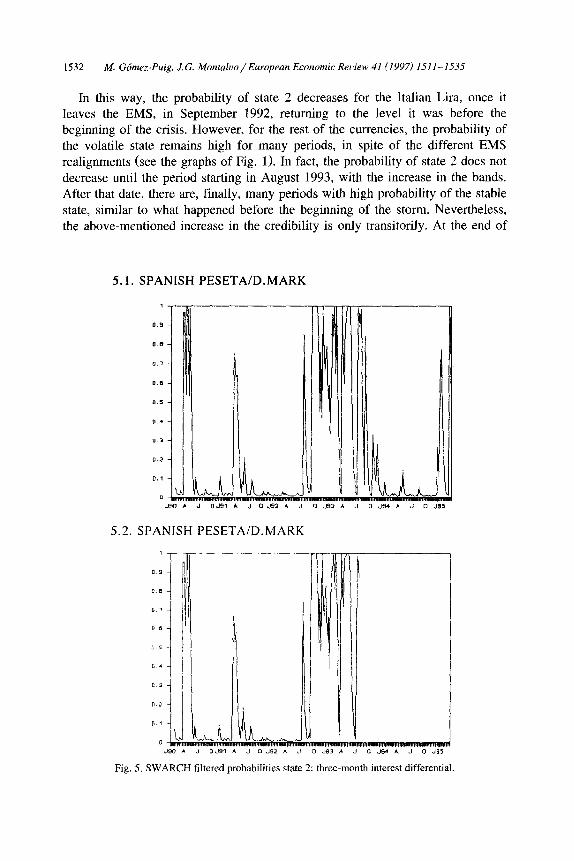
5.1. SPANISH PESETA/D.MARK
5.2. SPANISH PESETA/D.MARK
Fig. 5. SWARCH filtered probabilities state 2: three-month interest differential.
M. Gbmez-Puig, J.G. Montaluo/ European Economic Review 41 (1997) 1511-1535 1533
the sample period (January-March 19951, matching the last EMS storm, all the
currencies began to show an increase in the probability of the high volatility state. In fact, even the Italian Lira, out of the EMS discipline, shows a similar pattern of the probability of state 2. These new findings seem to point out that neither the existence of the bands ‘per se’, nor its widening, preserve currencies from speculative attacks. In addition, the correlation between the pattern shown by the Italian Lira probabilities and the probabilities of the rest of the currencies leads to think that the stilized fact described by Rose and Svensson (1994) as the common nature of EMS credibility may extend also to some currencies outside the System.
Table 2 shows the results of estimating the switching ARCH model to the case of the three-month interest rate differentials of the Spanish Peseta with respect to the Deutsche Mark for the two samples considered. The parameter estimates are
very similar for both samples as shown by the table. In addition, the probability of the high volatility state follows very closely the results found without the ARCH
component, as graphs 1 (long sample) and 2 (short sample) of Fig. 5 show. Besides minor differences, both graphs look essentially the same.
5. Conclusions
This paper presents an indicator of the credibility of the EMS based on an
econometric methodology different from that most widely used in the target zone literature, the so called ‘drift-adjustment’ method. In particular, the indicator of credibility we have obtained hinges on the inferred probabilities derived from the
estimation of a Markov-switching model applied to the expected rate of deprecia- tion of the EMS currencies. In this way, we avoid the main problem presented by the ‘drift-adjustment’ method, which lies in the difficulty of estimating the
expected rate of currency depreciation within the bands. Our results show that the inferred probability of state 2 has a very informative
content in terms of the credibility of the EMS. More than one month ahead of the realignment of September 1992, the probability of state 2 already jumped in the case of the Spanish Peseta, the Italian Lira and the Portuguese Escudo. Except for the Italian Lira, that left the EMS during the crisis of 1992, the probability of this stormy state remained high for many periods. In fact, for most of the currencies, it
does not decrease until the period starting August 1993, with the increase in the bands. Therefore, for the post-1993 period, our indicator shows that most of the currencies improved their credibility, at least transitorily. With no exception, the
currencies analyzed show a probability of state 2 close to 1 at the end of the period (January-March 19951, h’ h w ic coincides with a new storm in the EMS. Finally, it is also interesting to note that for the Italian Lira, out of the System since the crisis of 1992, the inferred probability of state 2 has also increased during the final months of the sample, like for the rest of the currencies.
1534 M. Gbmez-Puig, J.G. Mont&o/European Economic Review 41 (1997) 1511-1535
Acknowledgements
This paper is based upon work supported by the DGICYT under grant number PB93-0388. We thank the referee and participants in seminars at the IGIER, the Meetings of the European Economic Association in Prague, Universitat Pompeu Fabra and the Conference on Forecasting Financial Markets for comments on previous versions of the paper, which circulated under the title: ‘Bands Width, Credibility and Exchange Risk: Lessons from the EMS Experience’. We would
also like to thank Analistas Financieros Internacionales, S.A. who have kindly provided the data used in the empirical part of it.
References
Ayuso, J. and F. Restoy, 1992, Eficiencia y primas de riesgo en 10s mercados de cambio, Working
paper no. 9225 (Banco de Espaiia, Madrid).
Ball, C.A. and A. Roma, 1993, A jump diffusion model for the European Monetary System, Journal of
International Money and Finance 12.
Bekaert, G. and F. Gray, 1996, Target zones and exchange rates: An empirical investigation, Working
paper no. 5445 (NBER, Cambridge, MA).
Bertola, G. and R. Caballero, 1992, Target zones and realignments, The American Economic Review
82, no. 3.
Bertola, G. and L.E.O. Svensson, 1993, Stochastic devaluation risk and the empirical fit of target zone
models, Review of Economic Studies 60.
Cai, J., 1994, A Markov model of switching-regime ARCH, Journal of Business and Economic
Statistics 12, no. 3.
Chen, Z. and A. Giovannini, 1993, The determinant of realignments expectations under the EMS:
Some empirical regularities, Discussion paper no. 398 (Center for International Policy Research,
London).
Edin, P.-A. and A. Vredin, 1993, Devaluation risk in target zones: Evidence from the Nordic countries,
The Economic Journal 103.
Engel, E. and C.S. Hakkio, 1994, The distribution of exchange rates in the EMS, Working paper no.
4834 (National Bureau of Economic Research, Cambridge, MA).
Hamilton, J.D., 1989, A new approach to the economic analysis of nonstationary time series and the
business cycle, Econometrica 57, no. 2.
Hamilton, J.D.., 1994, Time series analysis (Princeton University Press, Princeton, NJ).
Hamilton, J.D. and ?. Susmel, 1994, Autoregressive conditional heteroskedasticity and changes in
regime, Journal of Econometrics 64. Krugman, P., 1991, Target zones and exchange rate dynamics, Quarterly Journal of Economics 106,
no. 3.
Krugman, P. and M. Miller, 1993, Why have a target zone?, Carnegie-Rochester Conference Series on
Public Policy 38.
Lindberg, H., L. Svensson and P. Soderlind, 1993, Devaluation expectations: The Swedish krona 1985-92, The Economic Journal 103.
Malz, A., 1996, Using option prices to estimate realignment probabilities in the EMS: The case of the
Sterling-Mark, Journal of International Money and Finance, forthcoming.
Ruge-Murcia, F., 1995, Credibility and changes in policy regime, Journal of Political Economy 103.

M. Gckez-Puig, J.G. Mont&o/European Economic Review 41 (1997) 151 I-1535 1535
Rose, A. and L. Svensson, 1994, European exchange rate credibility before the fall, European
Economic Review 38.
Rose, A. and L. Svensson, 1995, Expected and predicted realignments: The FF/DM exchange rate
during the EMS, 1979-1993, Scandinavian Journal of Economics 97, no. 2.
Svensson, L.E.O., 1992, The foreign exchange risk premium in a target zone with devaluation risk,
Journal of International Economics 33.
Svensson, L.E.O., 1993, Assessing target zone credibility: Mean reversion and devaluation expectations
in the ERM, 1979-1992, European Economic Review 37.
Werner, A.M., 1995, Exchange rate target zones, realignments and the interest rate differential: Theory
and evidence, Journal of International Economics 39.