International Journal of Multidisciplinary Educational Research
Upload
khangminh22Category
view
2download
0
MOVING-ON FROM A RURAL PARISH:
A Multidisciplinary Longitudinal Study of Population Trends and Migration in an area of the English-Welsh
Borderland
David Maund, BA; M.Phil. (Leicester) Department of Applied Sciences, Geography and Archaeology
University of Worcester.
A thesis submitted in partial fulfilment of the University's requirements
for the Degree of Doctor of Philosophy
February 2008
Coventry University in association with
the University of Worcester.

Moving – ON FROM A RURAL PARISH: A Multidisciplinary Longitudinal Study of Population Trends and Migration in an area of the English-Welsh
Borderland
CONTENTS
Abstract i Acknowledgements ii List of Figures iii List of Tables vi
Chapter 1 Introduction
1
Chapter 2 Migration through Time and Space
6
Chapter 3 Sources and Methods
22
Chapter 4 Place: The Geographical Context
42
Chapter 5 The Cultural Context and Ways of Life
67
Chapter 6 Demographic Context 1801-2001
107
Chapter 7
Migrating Families: Neighbourhood of Little Hereford, 1871-1881
139
Chapter 8 The Decision to Move
194
Chapter 9 There and Back – How Far Was It?
248
Chapter 10 Outcomes and Prospects
309
References
317
ii

ABSTRACT
This study is about migration and aims to analyse the complexities which underlie the movement of people in time and space. There are three major interdependent elements essential to such a study – data, a context and longitudinal time scale. The study commences with a discussion of various approaches which have been taken by scholars to the study of migration, drawing particular attention to the behavioural or decision making perspective. This is followed by an assessment of relevant data sources, including census enumerators’ books, parish registers and oral accounts. This piece of research has been structured to use these sources for an analysis of a study area in the middle English /Welsh Borderland, concentrating on the neighbourhood of the parish of Little Hereford. The salient geographical characteristics of the area and family structure are highlighted in Chapter 4, before an examination is made of its culture, ways of life and changing demographic profile in Chapters 5 and 6. The remainder of the study homes in on the details of migration, first looking at the pattern of movement in the decade 1871 to 1881 and then charting the movements of three core families (Bennett, Rowbury and Maund), with a particular focus on the last of these. It is these three families which give the longitudinal dimension to the study. An assessment of the role of place in migration decisions is attempted but even at this micro scale of analysis it proves difficult to get really close to the decisions made over a long time period.
i
ACKNOWLEDGEMENTS
This study is dedicated to the memory of Frederick Godwin Maund, 1917 - 2002, my brother Fred, 19 years older than me and who, perhaps unknowingly, started it all more than 60 years ago with his stories of Bircher Common and living in the caravan. But I am also indebted to my sister Brenda Middlecott, currently 94 years young; my brother Ken, 1915 - 2006 and cousin Bill, 1913 – 2000. Polly Rubery, Chris Davies and Gary Maund provided essential family history data for the analysis and the expertise of Polly was also important in filling in some gaps in my own family tree. I am immensely grateful to them all. The contents of the maps and diagrams are entirely mine but the presentation is due to Graham Hill of the University of Worcester. I could not have managed without him and his very rapid response to all my demands. Martin Ingram generously offered time in setting up spreadsheets which enabled the analysis in Chapter 7. He was also always available when the PC developed a mind of its own. My neighbour, John Barker, volunteered his considerable skills as a proof reader, beyond the call of duty. The Record Offices, particularly those in Shrewsbury and in Hereford, were an essential resource and their staff so very obliging, face to face and on the telephone, when I asked for small details I had omitted to record. The same is true of Robin Hill of the Hereford Reference Library who has great patience and wonderful knowledge of the collection he so carefully manages. The staff of the library at the University of Worcester saved me innumerable journeys from the western fringe of the Borderland. My Director of Studies is Dr David Storey and I can not thank him enough for his quick and willing responses to my drafts and queries, his subtle and careful guidance and his humour and support. I’ve known Emeritus Professor Gareth Lewis for 40 years and, in retirement, he’s read my drafts, driven down the motorways to meet with me, willingly shared his expertise and shown great interest and support. I could not have asked for two better or more complementary supervisors than these. My wife of course has done the final, vital, proof read but she has also been willing to sit in Record Offices and shown great indulgence – and she’s done just that for a life time. But, finally, I must mention our daughter, Dr Karen Maund, whose occasional quizzical scepticism has been a joy whilst our son, Matthew, has looked on with amused tolerance at such eccentricity. David Maund. Pembridge. 2008.
ii

LIST OF FIGURES
Figure 2.1 Approaches within Migration 17
Figure 3.1 Sequence through the Investigation 25
Figure 3.2 Detail of a CEB 30
Figure 3.3 Family and Household 32
Figure 4.1 Western Cultural Provinces 45
Figure 4.2 The Welsh Borderland 47
Figure 4.3 The Mid Borderland 48
Figure 4.4 The Prime Parish - Little Hereford 50
Figure 4.5 Little Hereford and its Neighbourhood 51
Figure 4.6 The Parishes in the Neighbourhood of Little Hereford 1871 62
Figure 5.1 The Mid Borderland 70
Figure 5.2 Little Hereford and Basin of River Teme 72
Figure 5.3 Tenbury and Bewdley Railway 87
Figure 5.4 Railways of Little Hereford Locality c 1870 88
Figure 5.5 New House Farm – Little Hereford 94
Figure 6.1 Population Transition 109
Figure 6.2 Population Trends in England and Wales 1801 – 2001 112
Figure 6.3 Population Trends in Birmingham 114
Figure 6.4 Birmingham: Population Growth and Boundary Change 115
Figure 6.5 The Expansion of Birmingham 116
Figure 6.6 Trends in County Population Totals, 1801-2001 119
Figure 6.7 Population Trends in County Towns, 1801-2001 122
Figure 6.8 Population Trends in Market Towns 126
Figure 6.9 Population Trends in the Neighbourhood of Little Hereford 128
Figure 6.10 Key Events in Context, Little Hereford 1750-1991 129
Figure 6.11 Parishes of the Neighbourhood of Little Hereford 131
Figure 6.12 Population Trends in the Parishes of the Neighbourhood 132
Figure 6.13 Summary of Population Trends, Category of Parish 134
iii

Figure 7.1 Schematic Family Cycle 143
Figure 7.2 Notional Family Cycle 143
Figure 7.3 Accessibility in the Neighbourhood of Little Hereford: Late 19th Century
153
Figure 7.4 Characteristics of Out-Migrating Families: Neighbourhood of Little Hereford 1871-1881
156
Figure 7.5 Life Cycle: Head of Household of Out-Migrating Families, Neighbourhood of Little Hereford 1871
160
Figure 7.6 Family Structure: Out Migrating Families, Neighbourhood of Little Hereford, 1871.
163
Figure 7.7 Family Cycle –Out Migrating Families 165
Figure 7.8 Origins of Marriage Partners 169
Figure 7.9 Occupations of Head of Households 172
Figure 7.10 Distances Moved by Out Migrating families 176
Figure 7.11 Destination of Families of Out Migrants 180
Figure 8.1 Parish of Little Hereford – Location of Core Families 201
Figure 8.2 Bedlam Row, 1846 202
Figure 8.3 A Bedlam Row Cottage 203
Figure 8.4 Notice to Quit 205
Figure 8.5 Migration Routes of Core Families to 19th Century 211
Figure 8.6 Bennett Family Tree (1) 216
Figure 8.7 Bennett Family Tree (2) 217
Figure 8.8 Bennett Family Tree (3) 218
Figure 8.9 Bennett: Migration Path 219
Figure 8.10 The Family of John Rowbury (2) 228
Figure 8.11 Migration Path of Rowbury Family 229
Figure 8.12 Migration Path of Maund Family 235
Figure 8.13.1 The Bennetts 244
Figure 8.13.2 The Rowburys 244
Figure 8.13.3 The Maunds 245
Figure 9.1 Time of Decision (Kirk 1963 p369) 250
Figure 9.2 The Position of Magene 254
iv

Figure 9.3 The Maund Territory (Shepherd 1979 p2) 255
Figure 9.4 Distribution of Maund Names 1 256
Figure 9.5 Distribution of Maund Names 2 258
Figure 9.6 Distribution of Maund Names 3 259
Figure 9.7 The Maund Country 1800-1850 260
Figure 9.8 High Street, Harborne 266
Figure 9.9 Bircher Common 269
Figure 9.10 Extract, Admissions Register, Cock Gate School, 1924 271
Figure 9.11 Letter from Fred Maund 11th Nov 1996 273
Figure 9.12 The Caravan 273
Figure 9.13 “A Better House” 276
v

LIST OF TABLES
Table 2.1 Changes in Migration Studies 1980s to 1990s 10
Table 2.2 Recent Ideas in Migration Studies 11
Table 2.3 Life Course Transitions 19
Table 3.1 Framework for achieving Aims 24
Table 4.1 Core Families of Little Hereford Parish 57
Table 4.2 Little Hereford: Place of Birth Heads of Household and Spouses 1851
59
Table 4.3 Birth Place Distances from Little Hereford Parish 60
Table 4.4 Birth Place Gradient 61
Table 5.1 Little Hereford – Land Use 1846 79
Table 5.2 Kimbolton - Land Use 1840 79
Table 5.3 Crop Proportions on single Farm 79
Table 5.4 Animals on a single Farm 80
Table 5.5 Little Hereford- Field Size 81
Table 5.6 Little Hereford - Farm Size 81
Table 5.7 Types of Farm Worker in Little Hereford 1851 95
Table 5.8 Types of Farm Worker in Little Hereford 1901 96
Table 5.9 Living-In Contrasts in Little Hereford 1851 and 1901 101
Table 5.10 Changing Trade Skills and Occupations 102
Table 5.11 Change in Skilled Jobs in Little Hereford 111851 and 1901 104
Table 6.1 Rate of Population Change-England and Wales 112
Table 6.2 Comparative Rates of Population Change 117
Table 6.3 Period Population Change – Counties 120
Table 6.4 County Population Change by Decade 121
Table 6.5 Population Changes, County Towns 122
Table 6.6 Percentage Population growth, County Towns 1951-2001 123
Table 6.7 Distances of Market Towns 125
Table 6.8 Rates of Population Change Counties and Market Towns 127
vi

Table 6.9 Absolute Population Change Neighbourhood of Little Hereford
130
Table 6.10 Comparative Parish Population Trends 137
Table 7.1 Schedule of Characteristics of Migrating Families 145
Table 7.2 Population and Household Change 1871-81 149
Table 7.3 Families Moving Out 1871-81 150
Table 7.4 Access Index 152
Table 7.5 Accessibility 152
Table 7.6 Household Turnover 1871-1881 154
Table 7.7 Characteristics of Out Migrating Families 157
Table 7.8 Numbers in Household 158
Table 7.9 Age of Heads of Household 159
Table 7.10 Out Migrants by Life Cycle 162
Table 7.11 Structure of Out Migrating Families 164
Table 7.12 Family Cycle, Out Migrating Families 167
Table 7.13 Origin of Marriage Partners 170
Table 7.14 Occupations: Head of Household 173
Table 7.15 Distances Moved by Families Out Migrating Families 175
Table 7.16 Categories of Distance Moved 177
Table 7.17 Movement of Labouring Families 178
Table 7.18 Families Moving Long Distance 181
Table 7.19 Destination of Migrating families 182
Table 7.20 Occupational Change: 1851 –1901 184
Table 7.21 In and Out Migration 1871-81: Little Hereford 185
Table 7.22 Location in 1881 of those born in Little Hereford 186
Table 7.23 Little Hereford Incomers 1871 –1881 187
Table 7.24 Distribution of Individual Leavers 1871 – 1881 188
Table 7.25 Summary of Families leaving Little Hereford 190
Table 8.1 Core Families of Little Hereford 198
Table 8.2 The Early Moves of the three Core Families in Context 209
Table 8.3 The Bennetts: Generation by Generation. 212
Table 8.4 The Bennett Branch. 215
vii

Table 8.5 Rowbury Family Generation by Generation 222
Table 8.6 John Rowbury Senior: Life Cycle 224
Table 8.7 The Rowbury Branch 225
Table 8.8 Maund Family Generation by Generation 231
Table 8.9 The Maund Branch 233
Table 8.10 The Life Path of Thomas Maund 238
Table 8.11 Location of Descendents of Thomas Maund 239
Table 9.1 The Relationships of People mentioned in Chapter 9 252
Table 9.2 Socio-Economic Phases of 20th Century 262
Table 9.3 The Moves of Fred Maund 285
Table 9.4 Life Course Transitions of Fred Maund 286
Table 9.5 The Moves of Ken Maund 287
Table 9.6 Life Course Transitions of Ken Maund 289
Table 9.7 The Moves of Bob Maund 290
Table 9.8 Life Course Transitions of Bob Maund 292
Table 9.9 The Moves of Brenda Maund 295
Table 9.10 Life Course Transitions of Brenda Maund 297
Table 9.11 The Moves of David Maund 298
Table 9.12 The Life Course Transitions of David Maund 300
Table 9.13 Maund Family: Individual Motives for First Migration to Herefordshire
306
viii

Chapter 1 Introduction
Migration, or the movement of people from one residential location to another has,
over time, not only increased in volume and diversity but has also involved steadily
lengthening distances. With industrialisation and urbanisation, and the emergence of
a world economy and globalisation, migration has exploded at all geographical scales.
These trends form the overarching background to this study which involves the
migration of individuals and families through time and reflects changes in economy
and society in Britain both regionally and locally.
Essentially this study is concerned with migration through time and space involving
one small rural area with its own cultural distinctiveness and a time dimension of
more than a century and a half. Its broad aim is to determine the nature and form of
individual and family migration since the 1870s and to gain an understanding of the
processes involved from the viewpoint of the migrants, and, in particular, the role of
culture and place. By focussing on one small rural area, the neighbourhood of Little
Hereford, a parish in the heart of the Welsh Borderland, and the utilisation census data
from the Census Enumerators Books to develop a residence history analysis
supplemented by family histories it is hoped that this research will contribute to our
understanding of migration through time as well as the way that individuals and
families responded to a changing economy and society.
Until recent decades much of the geographical research on migration was based on
deriving patterns largely from census based data (Lewis 1982; Boyle et al 1998). The
use of such data enable detailed examination of general trends but is much less
suitable for investigating detailed causal processes. This study seeks to contribute to a
growing body of research which has focussed on process, albeit largely contemporary,
and does so by adopting a time-space perspective. By deriving suitable data from
family histories, which in this instance are available in detail from 1841 and in lesser
detail from as far back as 1540 for one family, a longitudinal approach can be
developed whereby the migrations may be seen in operation over a long time scale.
1

The explanation of large scale migration patterns and trends has, frequently, relied
upon their association with equally large scale socio-economic changes. Thus, the 19th
century depopulation of the countryside has been ascribed to technical advances and
consequent restructuring of economic activity producing increased concentration in
urban areas. Such large scale changes cannot easily explain individual cases and it is
in this context that the focus of this study rests. It seeks explanation, certainly in the
context of national changes but, particularly through individual decisions and the
influences which play upon those decisions. Part of this influence is, according to
Pooley and Turnbull (1998 p97), local culture because “Attachment to Place is likely
to be an important part of cultural identity.”
Essentially then this research has two broad aims:
1. to identify the paths and character of individual family migrations based upon
the neighbourhood of Little Hereford since the 19th century, and, 2. to elucidate the nature and significance of local culture and place in the
decision-making of migratory families at different stages of their lives. To effect these aims the research was divided into four principal parts each of which
has its own specific objective.
(a) Research by local historians has identified long term residents, usually in
families, which are associated with particular territories (Hey 1976; Metson 1993).
These have been termed ‘core families’ and it has been argued that the territory they
occupy can be viewed as a distinctive rural neighbourhood. Such a neighbourhood in
turn is embedded within a cultural region which families identify with and in turn
develop their own values and attitudes. According to Mabogunje (1972) such cultural
identities can help families to remain within the rural neighbourhood for a long time,
hence the concept of core families, as well as attracting family members to return later
in their life cycle. On the other hand, in certain contexts these identities can be
overridden by the social and economic attractions of other places, particularly cities.
So, in order to begin to identify the role of culture and place in the migratory
decisions of families over time it is necessary first
2
to identify the nature of the rural neighbourhood in question and in particular the changing characteristics of its culture over the period of the study.
(b) Over the past two centuries Little Hereford and its region, the Welsh
Borderland, will have experienced considerable restructuring of its population. It is
well documented that the 19th century witnessed great changes in the socio-economic
structure of England and Wales which was clearly evident in the countryside. The
resultant population change involved national, regional and local changes including
differential trends between town and country (Redford 1925; Saville 1957). It was
towards the end of the 19th century that the core families exemplified in this study
began to move away from their rural neighbourhood. The relative depopulation of the
countryside in which the core families were to be found raises the question as to what
this meant for the behaviour of the families living there. This can be examined, at
least for a short period, using the data from the Census Enumerators’ Books (CEBs)
for each of the parishes in the rural neighbourhood in question between 1871 and
1881, the point of absolute population decline in many parts of the countryside. In
order to gain an insight into the nature of this population change and the migratory
flows involved it will be necessary
to determine the population trends from the early 19th century onwards as well as the detailed migration flows at the end of the 19th century.
( c ) Inevitably since the mid 19th century, at the family scale, individuals will have
been directly or indirectly influenced by the wider social and economic changes
experienced by the countryside. From family history records it is possible to witness
how complete nuclear families and individual members have reacted to socio-
economic change and have quite often pursued different migratory paths. Core
families are particularly interesting since generally members maintain strong ties with
their rural neighbourhood. So, in the context of wider migratory movements, the third
objective will be
to identify the migratory paths of core families since the early 19th century and their changing attachment to their rural neighbourhood. (d) The residential sifting and sorting of individual families over time will involve
a number of causal factors. To determine the residential decision making process and
3

the influences involved in deciding whether to move or not is, of course, extremely
difficult because of the complexity of unravelling individual and family responses
(Seavers 1999). In this study it is even more difficult because of a dearth of suitable
historical documentary sources. However, in this research, such difficulty has partly
been overcome by the construction, for one family, of detailed and specific
information using oral histories and other documentary sources overtime of family
members in the form of a family biography. By using these data it will be possible to
explore:
the extent to which culture and place influenced the residential decision making of individual family members over time.
The general structure of this thesis follows the normal convention. Chapter 2
provides an overview of the literature which has a direct bearing upon the
investigation. Because the focus is upon migration process and its particular
relationship to place by no means all of this literature is geographical. The methods
and sources and in particular the use of family and oral histories is explained in
Chapter 3. Here the necessity of employing a range of methodological approaches is
argued.
The local historian’s view of neighbourhood area or locality is complemented by the
idea of a cultural region within which the neighbourhood is embedded. Therefore, in
Chapter 4, the idea of neighbourhood is explored in relation to Little Hereford and a
territory identified and delimited as a unit from which family migratory behaviour
may be examined. In Chapter 5 the identification and description of a broader
cultural region within which interrelated but distinctive ways of life may be found is
attempted. Thus, at least notionally, a mosaic of localities embedded within a region
can be envisaged.
Chapter 6 provides a detailed analysis of population change at differing scales,
national, regional and local showing the changing relationship between countryside
and town since the early 19th century. This provides a context for the movement of
individual family members which is analysed in the succeeding three chapters. The
first, Chapter 7, provides a detailed analysis of family migration between 1871 and
4
1881 in Little Hereford and its neighbourhood at a time when depopulation of the
countryside was at its zenith. Chapter 8 traces the migrations of members of three
core families from their entry to the neighbourhood onwards and highlights the
different paths adopted. Using one family as a case study, Chapter 9, investigates the
decision making of its members by means of interviews, a diary and writings of the
individuals involved. The researcher is also a member of this family, though some
half a generation younger and, therefore, able to offer reflection and different
experiences (Rose 1997).
The distinctiveness and contribution of this study, within the context of the migration
process, comes from its longitudinal time scale of some 400 years made possible by
the use of data from family genealogy, a series of detailed individual testimonies from
members of a single family and an investigation conducted by a member of that
family. It is intended that the outcome of the investigation should be a contribution to
the overall understanding of migration. However it cannot be claimed that the
movements of one family reveal laws or even generalisations about migration process
rather it is intended to give some insights. Such insights, when taken together with
others, may result in some more sustainable generalisations. Thus “macro generalities
should be founded on individuals, identities, and the micro level, rather than people
treated as a mass” ( Peet 1998 p151).
5

Chapter 2 Migration through Time and Space
2.1 Introduction With the explosion of migration at all geographical scales over the past two centuries
it has inevitably become of major concern, thus justifying Goldstein’s (1976 p424)
observation that, “whereas the study of fertility dominated demographic research in
the past several decades, migration may well have become the next important branch
of demography in the last quarter of the twentieth century.” In order to enhance an
understanding of these expanding migratory flows, Zelinsky (1971) has linked them
to the process of modernization in such a way that different types of migration could
be seen as being characteristic of different stages of development. His model
highlights two significant transformations in the redistribution of population since
1850: firstly, during the late nineteenth century the concentration of population, or
urbanisation, consequent upon the advance of industrialisation, into a limited number
of areas, and secondly, during more recent decades, a rather different and what some
have regarded as unexpected trend, whereby “a number of major centres of
population concentration in the industrial nations began to experience a decline in the
in-movement of population from the more remote and peripheral regions of those
nations. This decline has continued …… and in many places has gone as far as to
create a net flow of population out of the major conurbations back into the peripheral
and predominately (sic) rural regions” (Vining and Kontuly 1978 p49).
Within such migratory trends there has been a corresponding increase in the desire
and necessity to identify and explain these movements because, according to Claeson
and Egero (1972 p1), “a knowledge of population movement, representing as it does
both cause and effect of societal processes, remains of fundamental importance to a
complete understanding of social change, economic development and political
organisation”.
The realisation of the importance of migration in any understanding of human
organisation is reflected in the extensive and detailed literature that is available (for an
overview see for example, Willis 1974; White and Woods 1980; Lewis 1982; Ogden
1990; Boyle, Halfacree and Robinson 1996; Cohen 1996; Guinness 2002). The
6

genesis for much of the study of migration lies in Ravenstein’s (1885; 1889) seminal
studies. Despite these early beginnings Lewis (1982) has claimed that there was a
dearth of substantial migration studies until the 1950s; after that date there was a
massive growth of interest in the field, possibly reflecting the emergence of several
distinctive social science disciplines as well as sub-fields within historical studies.
The purpose of this chapter, therefore, is to identify those elements of the literature
which reflect the particular needs of this study, its aims and research thinking and,
subsequently, the implications for the methodology and data sources. Any review of
migration literature will quickly reveal that there are a number of false or inadequate
conceptions concerning the nature of migration, and these have led to unsatisfactory
definitions of the phenomenon (Boyle and Halfacree 1998). Much of the resultant
confusion is due partly to the fact that each discipline has viewed migration from its
own particular perspective and partly to the variability of the data sources available
for study (Lewis 1982). Put simply, “the essential defining feature is that migration
occurs where a permanent change of residence has occurred” (Pryce 2000 p66).
According to the national census permanence is defined as residence in a defined area
for at least one year (ONS 2001). However, for the purpose of this research a slightly
wider perspective has been adopted: “….migration is the changing of the abode
permanently, or when temporarily, for an appreciable duration …….. It is used
symbolically in the transition from one surrounding to another in the course of human
life” (Weinberg 1961 pp265-6).
The long history of interest in migration studies, as revealed in the literature, shows a
number of notable shifts in emphasis and these are examined, albeit briefly, here in
order to show the points of departure for this study. A shift towards a more process
orientation, which is the focus for this study, is a notable feature in the literature. Here
the approach taken is to view migration as a series of continuous events over time in
contrast to migration pattern which is seen as the product of those events at a moment
in time. In other words a snap shot by contrast to a moving picture. Such a distinction
may be useful for purposes of exposition and classification (Pryce 2000). In this
interpretation the two are inextricably linked and intimately interrelated because
ultimately the distinction is a false one since the two can be reconciled at the point of
decision (Burrell 2003). However, an emphasis upon process brings with it certain
7

attributes and characteristics which have significant antecedents in the literature.
These include developments in approach, in the type and use of data, macro/micro
relationship, life cycle/life course, and place and culture.
2.2 From Pattern to Process Inevitably any review of migration literature must begin with Ravenstein’s (1876;
1885;1889) analysis of late nineteenth century migration in Britain and Western
Europe. By means of place of birth statistics, Ravenstein was able to identify
different flows of migration between places and regions and he assumed an economic
cause for the patterns he observed. From these observations Ravenstein enunciated
his now famous ‘Laws of Migration’ which have been used as the starting point for
innumerable contemporary studies. Indeed several of the ‘Laws’ are still valid today,
as is pointed out in two major reviews (Grigg 1977; Pooley and Turnbull 1998).
Ravenstein’s work in the late 19th century was essentially about pattern and was
prompted by the national growth of population at the time accompanied by the
significant growth in the population of towns and the depopulation of the countryside
(Chapter 6). Thus people were assumed to leave the countryside because less labour
was required as farming became mechanised and, on the other hand, moved to towns
because of the concentration of industry requiring labour (Saville 1957; Lawton
1967). Thus both pattern and explanation were about change in the macro structure
with human migratory behaviour determined by forces beyond individual control.
There was little recognition of individual agency. The situation in the neighbourhood
of Little Hereford at this time will be examined in Chapter 7 using a similar positivist
approach and quantitative methodology.
Redford (1926) was able to confirm Ravenstein’s findings on the prevalence of short
distance migration using census data. However, he also used Poor Law data for the
early 19th century and was able to show how the Laws of Settlement interrupted the
free operation of the labour market. Under these laws, persons who were unemployed
were liable to be sent back to the parish which held their settlement, irrespective of
where it was or whether there was employment there (Snell 1985). Such evidence
therefore begins to divide migrating populations on both economic and social class
8
dimensions and begins a shift in the attempt to explain pattern away from purely
deterministic ones.
Despite this, people continued to be viewed as the passive receivers of migratory
forces beyond their power to control rather than as people in control of the decisions.
A shift to a more behavioural approach attempted to overcome this and several
reasons were advanced to explain patterns (Cohen 1996; Brettell and Hollifield 2000).
At its most crude was the notion of the supposed attraction of the town at least
offering the possibility of individual choice of town. There was also the notion that
people left from economically depressed areas, areas of unemployment, to seek work
in areas of labour shortage (Knowles 1995). But it was also observed, by some, that
similar areas may have different migration patterns thus raising the matter of human
decision (Baines 1985). There was also the problem of ascribing generalised, macro
level, explanation to micro level situations, for which the term ‘ecological fallacy’
was coined by Robinson (1950).
2.3 A Behavioural Perspective The economic historian Baines (1985) in a quite exhaustive account of emigration,
exposed the problem with economic determinism when he showed that, despite some
coincidence with fluctuations in the business cycle, people emigrating to the Americas
in the second part of the 19th century did not do so from uniformly similar
environments. His tentative explanation of this was that migrant sources tended to be
where there was good feedback home from the early migrants that gave knowledge
and security to those who followed as part of a chain migration. This is a similar
knowledge feedback conclusion to that proposed by Mabogunje (1970). This clearly
introduces the element of human agency and decision making. Potentially this is an
example of tension between structural forces determining migration and individual
family factors. This form of explanation removes the over concentration on
economically deterministic reasoning and places the decision firmly within human
processes of decision-making (Fotheringham 2000).
A framework for viewing human agency, not exclusive to migration studies, had been
offered by Kirk (1963). He suggested that each person constructed their own reality
9

by perceiving their environment, physical and cultural, through a filter of values and
attitudes. In this manner decision was placed firmly within particular value systems.
Such a construct allows for the effect of structural forces but the response to them is a
matter of human decision rather than an inevitable, pre-determined one. This was a
very important insight for the study of migration process.
White and Van der Knaap (1985)
Champion and Fielding (1992)
Assumptions:
Approach: Scale: Descriptors: Questions raised:
Search for general theory as explanation; economic, rational man, supply led, forecasting as purpose. Positivist, quantitative, behavioural. Macro and regional level with aggregated data. Life cycle; age; socio-economic and environmental conditions. Does way of life reflect where you live? Complex motives for migration? What is the role of individual preference?
Issue based, empirical e.g. housing market, unemployment. Model building as bridge to theory construction. Continued need for monitoring of macro trends, migration as a dynamic and multifaceted process. Behavioural, individual assessment of cost/ benefit, rediscovery of place Sub regional, but advocacy of move to micro level and individual level. Importance of social changes; life course; families; housing tenure; education; sensitivity to distance; migration as a cultural event. What is the micro reaction to macro trends? How do we ‘measure’ love of the new or place identity? The role of local culture?
Table 2.1 Changes in Migration Studies 1980s to 1990s
Briefly, a number of other studies have advanced the concept of the behavioural
environment in the study of migration. Thus Wolpert (1965) proposed that the
decision to migrate was taken according to the value placed on residence and its
environment, what he called place utility. According to Golledge et al. (1981)
decisions are a function of learning, cognition, perception and attitude formation, not
unlike the views of Kirk (1963). Such a perspective became the basis of much
migration research during the late 1970s through to the early 1990s.
10

The particular emphasis tended to be individual migration and often this involved
movements within cities (Clark and Moore 1980; Preston 1987) and moves into and
out of the countryside (Champion 1989). Much effort went into the gaining an
understanding of the process of residential decision making and the components
involved including knowledge, attitude and image. (Brown and Moore 1970;
Cadwallader 1989). As summarised in Table 2.1 there had, by the beginning of the
1990s, been a distinct shift in the geographical analysis of migration from pattern to
that of process, or as some would say from positivism towards behaviouralism
(Golledge 1980; Courgeau 1995; Walmsley and Lewis 1998).
Pooley and Turnbull; Migration and Mobility in Britain since the 18th Century (1998)
Pryce, W.T.R., A Migration Typology and some Topics for the Research Agenda (2000)
• Migration decisions are embedded in
culture • Events in one place and time are affected
by events in another place and time. • Need for research using individual
biographies and life paths. • Culture and social change is a necessary
component of migration. • Regional and cultural identity is of
increasing importance. • Work on the individual needs to be set in
the wider process. • Choice/Constraint provides a suitable
framework. • Structuration Theory offers the best
approach.
• Some of the most effective studies are
small scale because processes can be examined impossible at the aggregated scale.
• Studies need to be related to the wider context.
• Need to look at individual histories and motivations.
• Career ladders may be a useful study. • Need to look at the role of individuals in
the decision process. • Individual perceptions of migration
destinations necessary. • Migration trajectories may be a useful
technique.
Table 2.2 Recent Ideas in Migration Studies.
The voluminous literature on behavioural approaches to the migration process has in
turn led to a realisation that geographers and social scientists need to be more
sensitive to the factors involved rather than simply asking the questions ‘why?’,
‘where?’ and ‘what?’. So over the past decade or so a much wider perspective has
been adopted in the analysis of the migration process as summarised in Table 2.2.
Broadly, it may be said that of these recent developments in migration studies three
are of particular significance for this small scale study. First, the greater emphasis
placed upon the individual decision maker led to the realisation that cultural factors
11

and their territorial context had important formative influences upon the individual
(Holloway and Hubbard 2001; Johnston and Sidaway 2004). A number of studies had
advocated exploration of the role of culture in the study of migration (White and
Jackson 1995) by arguing that local cultures form the background from which
individuals migrate. So, for example in relation to the decision to migrate, Champion
and Fielding (1992) maintain that cultural norms are an essential element in the
decision to migrate whilst Pooley and Turnbull (1998) assert the importance of the
social and economic context. A second trend has identified the household as a more
sensitive unit of analysis, not only because of its implications for social change but
also, because of the changing nature of the family (Coleman and Salt 1992). Thus the
notion of a typical nuclear family has, through the 20th century, undergone re
examination (Drake 1994; Elman 1998; Goode 2003). For example, the relationship
between total households and total population has undergone a change. Families tend
to be smaller, there are more of them, including single person households (Haskey
1996). These changes are a function of change in the total society as divorce and
cohabitation become more prominent features. “Recent decades has seen major
changes in the structure of families in most western countries. In most countries,
both the number of single, never married people and of the divorced as a percentage
of the adult population has risen, and the proportion of those who are married has
fallen.” (Campbell and Ormerod 1998 p2).
So it has become evident that a more significant unit of analysis in the contemporary
world is the household and its constituent members. Thirdly, somewhat surprisingly,
the time element has been largely neglected in migration studies despite the fact that
time, as well as space, is implicit in all forms of spatial interaction. The greater
emphasis upon a behavioural approach has led to the realisation of the significance of
a longitudinal or ‘through-time’ approach to migration. Essentially this has led to
two themes: first, the frequency of moves by individuals during their life history, or
specific time-periods; and second, the susceptibility of individuals or households to
migration through their life history (Fielding 1989; Lewis and Sherwood 2000). Each
of these three contemporary trends in the study of migration are nowhere better
illustrated than in the recently completed theses by Seavers (1999), Glasser (2002)
and Burrell (2003).
12

2.4 Place and Culture A growing number of researchers have attempted to determine the significance of
place and culture in the decision to change residence (Burrell 2003). Fielding (1992)
claimed that the rediscovery of the importance of place and the bonds between people
and place pointed to the relationship between culture and migration. Although an
intuitively attractive concept there is a very real problem with the definition of culture
and even greater difficulty with attempting to use it as an implementable research
tool. Thus, “Culture is the property of individuals and groups and arises from the
sharing of practices and the intersubjective negotiation of meanings and refers to
deeply felt values and to all those things that are taken for granted in our relations
with others” (Fielding 1992, p202).
These ideas firmly place the explanation of migration into the sphere of human
agency and the influences of culture and place upon decision also raised the question
of the relationship between human agency and structural process. There are a number
of relevant contributions in this context. For example, local historians have long been
interested in the relationship between local studies and the broader historical context
(Hoskins 1966; Phythian-Adams 1993; Hey 1999). However, it was Structuration
Theory, developed by Giddens (1984) which attempted to provide some insight into
the structure-agency problem. Briefly and simply this maintained that macro
processes were received in cultural regions (termed Locales) according to the filters
and values of that culture and that the same force may have different outcomes in
different places or at different times. Further, it proposed, changes in the locality at
the micro level may filter back to the macro and effect change there. There is thus
two-way interaction, a release from determinism and inevitability and a justification
for a place-centred approach. It seems therefore that the shifts in thinking have
identified context as a critical element in individual migration behaviour. Such a
realisation leads inevitably to a focus on individual decision and, by implication, a
shift from quantitative methodology towards a more qualitative one involving
judgement in a particular context.
So far the argument has maintained that the decision to migrate is firmly based with
the individual, either person or family. Even when some structural imperative beyond
their control exists there are still elements of personal decision remaining (Lawson
13

1999; Burrell 2003). Further, the argument runs, the decision is conditioned by the
attitudes and values of the individual which are formulated in consequence of them
learning a set of cultural values and mores and that this culture is related to a place or
area which has both a spatial and a time dimension. In other words, as Blauw (1985
p105) maintained, “Ways of life depend on where you live”. Clearly though, people,
areas or regions do not exist in isolation and so the question arises as to the nature of
the relationship which exists between the macro and micro scales, that is between
structure and agency?
The discussion so far has shown something of a convergence in thinking between
geographers, local historians and sociologists about the concept of place and its
inevitable relationship to culture. There is an inextricable and interdependent
relationship between place, culture and way of life. The literature yields some
powerful support for this claim, for example, “Quality of life relates to the
rediscovery of the importance of Place and the importance of bonds between people
and Place.” (Champion and Fielding 1992 p217) and “Locales are settings within
which people learn how to act as human agents; their interpretations of their
compositional categories are learned in particular places.” (Johnston 1997 p238),
“Locales provide the settings within which interactions are organised.” (Johnston
1997 p238) and “Locality is the space within which the larger part of most citizen’s
daily working and consuming lives is lived. We become what we are because of
where we are”. (Johnston 1997 p243).
This revival of interest in the role of place and culture in the migration process has
according to Burrell (2003) raised four fundamental questions:
1. What components of place identity and culture influence the decision to
migrate?
2. How does place identity and culture both encourage and discourage the act of
migration?
3. How does migration itself initiate cultural change?
4. How does individual and family place attachment and value system change
over a life-time and trigger the decision to migrate?
14

Some of these issues have been analysed by Burrell (2003) in a detailed and
painstaking analysis of three small migrant communities – the Poles, Italians and
Greek Cypriots in Leicester. By means of a series of oral histories and in-depth
interviews Burrell (2003) highlights how place identity is still a strong element in the
migrants’ everyday life but is not sufficient to encourage them to return to their
homeland. This she attributes to a shift over generations in the value system of parts
of the community due to their experiences of their day to day activities. The study
also highlights the tensions felt between collective ideals and personal autonomy, and
argues that the flexibility of collective constructs allows each respondent to
experience migration, place of origin and place of destination, as well as community,
individually.
2.5 New Household Formation and Decision-Making A major factor in determining mobility is the changing threshold of residential
dissatisfaction that accompanies changes in the family life cycle. From the formation
to the dissolution of the cycle critical events can be identified which increase or
decrease the propensity to migrate, for example, marriage, birth of child, last child
leaving home or retirement (Schurer 1991). Despite initial evidence demonstrating
the significance of the life cycle in the migration process, later writers have indicated
that life changes are never perfectly correlated with mobility levels, particularly those
involving changing career patterns, income or social status (Lewis 1982). Probably
the most significant reason for a need to revise the family life cycle has been the
diversification of family and non-family structures over recent decades. These new
household formations, such as single parent households, young and old single adult
households or two earners in a dual-headed household, have led Stapledon (1980) to
suggest an expanded life cycle model, emphasising that a variety of households now
exist and that these tend to fluctuate in time and space. Within a rural context, for
example, Lewis and Sherwood (1994) found that in shire England divorce,
widowhood and the onset of adulthood were significant stimulants to migration, in
particular moves from the countryside to the cities, or at least to the local town.
According to Seavers (1999) essentially four questions arise from these changes;
1. How do household formations influence residential mobility?
15

2. How do the transitions from one household formation to another initiate
migration?
3. Do different household formations locate in different localities?
4. How do different household formations decide to migrate?
Seavers (1999) has also suggested that, as a result of greater female participation in
the labour market, the balance of power within the residential decision making
process has begun to shift away from the employed male (Bonney and Love 1991).
For example, Seavers’ (1999) findings in a study in lowland England during the
1990s supports the view that the presence of two earners within a dual-headed
household “potentially both increases and narrows residential location options whilst
also increasing the influence of the female in the residential location options,
significantly, the more equal the spouses income the more equal their influence in the
process” (Fegnani 1993 p176).
Further, Seavers (1999) identified the respective roles played by each of the partners
at different stages of the decision-making process; for example, it was shown that the
female dominated decision was evident in several parts of the process, in particular
the choice to move into or within the countryside (Mulder and Wagner 1993). From
this growing literature on the nature of household decision-making it is apparent that
the distinction often made between male dominated power to make important but
infrequent decisions (‘orchestration power’), and more female oriented power to
make time-consuming but less important decisions (‘implementation power’) needs to
be reassessed (Katz and Monk 1993; Van Haan 2003).
2.6 Life Courses and Residential History Analysis According to Glasser (2002 p7) most studies of migration “thus far have adopted
what can be termed a cross-sectional approach; that is that the focus is upon the same
place at two different points in time, but in general does not involve the same
people.”
The prospect of a longitudinal study is provided by the use of family biographies.
Using family history data offers the potential to exploit advantages not available
through the cross sectional approach (Hagerstrand 1982; Hobscraft and Murphy 1986;
16

Bailey 1989). The use of family biographies has been advocated (Hagerstrand 1982;
Halfacree and Boyle 1993; Gutting 1996; Ni Laoire 2000) as a means of tracking the
movement of both individuals and families but may offer only the time scale of one
generation. For example, Pooley and Turnbull (1998) used data from family histories
which yielded a time scale back to the 18th century. However they aggregated the
resultant data and so maintained a positivist approach with a largely quantitative
methodology. An alternative, adopted here, is to use family histories and their family
trees back to the 16th century and over up to eleven generations (Chapters 8 and 9)
thus enabling a significant time scale to a longitudinal approach (Courgeau and
Lelievre 1992). The advantage of this over a cross sectional approach is summarised
Figure 2.1.
Cross-Sectional Longitudinal
Family Life-cycle Lifecourse
Age/Stage related Transitions
Figure 2.1 Approaches within Migration (After Glasser 2002 p8)
Shyrock and Larmen (1965) suggest that the advantages of the longitudinal approach
are that it:
1. Shows the migration development over a lifetime. 2. May identify types of area of residence. 3. Indicates circular or return migration. 4. Reveals proportion spending entire lives in one locality. 5. Shows frequency of moves made.
Together with the use of family trees developed by family historians, such
perspectives open the possibility of extending the reach of a study beyond a single
17

lifetime, indeed for as long as the family tree may be extended. This also offers the
possibility for the construction of context for each generation and the changes which
follow. This study proposes to do this using three families.
The cross-sectional approach used the idea of family life cycle as an important
framework for analysis to explain migration (Warnes 1992; Grundy 1992). This idea
of age related migration was explored by Thomas (1938) in her investigation of
interstate moves in late 19th and early 20th century USA. The concept applied well to
large populations of data but has disadvantages in that it suggests an inevitable, even
immutable, sequence of moves associated with stage in the family life cycle. It takes
little account of individual differences and is therefore of little use in individual cases
such as envisaged by this study. The more flexible life course idea proposed under the
longitudinal approach is more likely to yield insight into detailed process and this is
particularly so when allied to the related notion of a transition (Bryman 1987). Both
Grundy (1992) and Warnes (1992), whilst discussing life cycle, see the way forward
through the pursuit of life course approaches. This had been discussed some ten years
earlier by Hareven (1982) who saw it as having the advantage of accounting for
constant change rather than stage change and emphasising the importance of the
context in which such changes took place.
The disadvantages have been pointed out by Warnes (1992) who went on to explore
the utility of a life course approach as an alternative framework in relation to
migration (Table 2.3). The life course approach is not time specific and that implies
that not all individuals or social groups follow the same sequence. Warnes (1992)
suggests that rather than the inevitable stages of the life cycle there may be a series of
what he calls life course transitions. It is not clear though from the list of transitions
which he presents (Table 2.3) whether he sees these as definitive or merely
illustrative. A distinctive feature of the life course is the idea of ‘Transitions’ by
contrast to the life cycles ‘stages’.
18

Table 2.3 Life Course Transitions (Warnes 1992 p182)
These may occur at any time and are not necessarily age related. They might
therefore be viewed as turning points or ‘time of decision’ to use a phrase coined by
Kirk (1963). An important characteristic of the life course is that it necessarily
accounts for what has gone before and therefore gives a context for action (Cohen
1984). Such an idea is very important to the analysis of migration decisions of the
families investigated in Chapters 8 and 9. In Harris’s (1987) terms an individual’s life
course is the intersection of historical time and personal time. To this might well be
added geographical space as will be developed in Chapters 4 and 5 of this study.
In her study of migration through time Glasser (2002) adopts a Residence History
Analysis together with the concept of life course as a central idea to the analysis
(Pryor 1979). The nature of a life course perspective has been succinctly summarised
by Hareven and Adams (1982 p6) as the “the interrelationship between individuals
and collective family behaviour as they constantly change over peoples lives in the
context of historical conditions. The life course approach is concerned with the
movement of individuals over their own lives and through historical time with the
relationship of family members to each other as they travel through personal and
historical time.”
19

From a migration viewpoint this approach raises three questions:
1. What are the circumstances of the household at the time of the migration?
2. What is the position of a particular migration within the life and migration
history of the household?
3. What are the possible influence of previous migratory experiences upon the
present, and likely future moves?
There is clear utility in the use of the concept of life course in the analysis of
migration process. It does, though, demand an examination of the context in which a
life takes its course and upon the contextual factors which influence its transitions.
Such a conclusion brings the discussion back to culture and place but also, by
implication, to structuration theory the relationship between individual action and
structural processes (Giddens 1984).
2.7 Conclusion This brief and selective review of an enormous literature has revealed a number of
factors and ideas of direct relevance to this investigation. In doing so it has shown not
only points of departure but potential for a distinctive contribution to be made.
Clearly with any developing field there will, over time, be changes and shifts of
emphasis. Some of these may be due to fashion but more importantly they are to do
with meeting the challenge of newly identified issues in society. Alternatively they
may be due to a particular line of enquiry being exhausted for the moment. But
developments are certainly not exclusively linear and several different ones may
coexist, indeed different paradigms may be pursued contemporaneously either as a
matter of differing belief systems or because they address different problems
(Halfacree and Boyle 1993; Skeldon 1995).
What might be called first order shifts such as:
Positive/Behavioural, Ethnographical Approaches Objective/Subjective Pattern/ Process Macro/Micro Scale Quantitative/Qualitative Methodologies Aggregated/Individualised Data Agency/Structure
20

can all be found in the literature but they hide lesser order but very significant factors
which in combination may offer distinctive ways forward. Thus in the context of an
investigation of migration process the following would appear to be of major
importance for this project.
Longitudinal approach using biographical data. Individual data and life course Family unit as decision-making locus Context involving culture, place and time
This necessarily brief review does not pre-empt the use of and reference to, other
literature. Indeed this will be necessary as the enquiry proceeds. In the next Chapter
methods and sources are discussed in the course of which the ideas presented above
are developed further to the point of implementation and a strategy identified to carry
the investigation forward.
21

Chapter 3 Sources and Methods
3.1 Introduction Place, and the ways of life associated with it, constitutes a dimension of major
importance to the explanation of migration decisions. The place, in this instance, is an
area of the Mid Borderland but wholly in England and to the east of the boundary
between England and Wales and is therefore referred to throughout the study as the
Mid Borderland. This territory is identified in Chapters 4 and 5. Before proceeding,
however, it is necessary to discuss the sources and methods employed in the enquiry
and these constitute the subject matter of this chapter.
Some sources, and indeed methods, are not necessarily familiar ones. For example,
some of the data for this small scale, longitudinal study come from the records of
family historians and the sources for these and the manner of their application for
analysis need to be discussed in some detail. First, however, it is necessary, briefly, to
explain the approaches and methodologies within which the sources and methods
supporting this enquiry are embedded. This will be followed by a brief outline of the
structure and sequencing of the project in order to provide a context for the discussion
of sources and methods.
Some have recently argued that the nature of enquiry into migration demands both a
multi approach and a multi methodology. For example, “researchers have, ….
recently, combined a wider range of approaches – quantitative, behavioural,
ethnographic – in explicitly multi-method approaches to migration research” (Pooley
and Turnbull 1998 p21). These imply necessarily small scale enquiries, albeit within a
broader context, and “these approaches highlight a key methodological issue in
migration research: namely, the significance of small-scale, micro-level studies in the
context of large-scale macro investigations” (Pryce 2000 p66).
The study adopts a broadly behavioural approach which is implemented, particularly
in Chapter 7, through a quantitative methodology utilising information derived from
population census and related sources. Small scale research based upon three
22

23
families, and ultimately a single family, brings different methodological requirements
and, especially in Chapter 9, an ethnographic methodology is employed. The methods
which serve the approach and methodologies are explained below and expanded upon
in later chapters where appropriate. They are chosen as fit for the purpose of
pursuing the aims and objectives outlined in Chapter 1.
Table 3.1 provides a conceptual framework for the enquiry and makes explicit the
interrelationships between the objectives as expressed in Chapter 1 (columns) and the
approaches, methodologies, sources and concepts (rows). More explicitly, row 1
outlines the broad sequence of the analysis (given in greater detail in Figure 3.1) with
the associated approach and methodology in row 2. Rows 3 and 4 are the subject
matter of this chapter (developed below) and row 5 shows something of the
conceptual underpinnings revealed in the literature (discussed in Chapter 2). The
columns show how each of these relates to the main analytical content. In order to
make this conceptual approach more explicit from the point of view of methods and
sources, Table 3.1 can be read in conjunction with Figure 3.1 which indicates the
sequence of the investigation.
The scale of the enquiry and data used has clear implications for the sources and
methods. The remainder of this chapter will focus upon methods and sources
although, as indicated above, more detail will also be included, where appropriate in
particular chapters, as the analysis proceeds.
3.2 Sequence followed by the Investigation The purpose of this section is to offer a broad outline of the path followed by the
investigation. The major phases and concepts of this multidisciplinary research are
identified in sequence. It is emphasised that this sequence relates to the substantive
analysis detailed in Chapter 4 to 9 (Figure 3.1).

1
CONTENT
1 IDENTIFICATION: RURAL
NEIGHBOURHOOD
2 CULTURE AND WAYS
OF LIFE
2 a POPULATION
TRENDS
2 b FAMILY MIGRATION
PATTERN
3 MOVEMENT
CORE FAMILIES
4 INDIVIDUAL
DECISION & MOTIVE
2
APPROACH
METHODOLOGY
Behavioural; Regional. Quantitative
Behavioural Secondary source search
Positivist. Quantitative.
Behavioural Quantitative
Behavioural Genealogical
Ethnographic Participant Observation
3
METHODS
1.Identification of concepts. 2.Identification of criteria to delimit NA. 3.Plot Place of Birth. 4.Identify Parishes in Neighbourhood of Little Hereford.
Search of published sources against criteria derived from literature.
Aggregation and manipulation by Excel of census data to graph trends at three scales from 1801 -1991
Identification of Migrating families by comparison of 1871 and 81 CEBs for 17 parishes. • Locate Families • Classify Families. • Presentation by table
and graph using Excel.
Identification and plot of location of families according to detail of Family Tree.
Taped Interviews, Informal discussion, Site visits, Diary for 1934, Biography, Checking/triangulation
4
SOURCES
Census Enumerators Book for Little Hereford 1871.
Secondary source material from Books, Articles, Pamphlets, Tithe Apportionment.
Census, General and County Reports 1801 –1991.
CEBs for 17 Parishes 1871 and 1881. CD Rom from 1881 Census of UK.
Family Trees constructed from Parish Registers, IGI, CEBs, Certificates.
Generation of Siblings, Cousin. 1934 Diary,
5
CONCEPTS
Neighbourhood Area.
Core Family.
Region/Place.
• Economic
Features • Social relations • Political
Structure
Trend; Differentiation Urbanisation Counterurbanisation
Family Description.
• Distance • Life Cycle • Social Class • Family Structure • Structure/Agency
Nuclear Family. Migration Path Longitudinal, intermittent Structure/Agency
Motive, Place, Decision, Transition Acculturation Life Course. Longitudinal Structure/Agency
Table 3.1 Framework for achieving Aim of Gaining Insight into Migration Process and Decision
24

Figure 3.1 Sequence through the Investigation.
1.PRIME PARISH
The Prime Parish is identified, from family memory, as Little Hereford where in 19th century the Maund family and two other core families for which data were available, were resident. These data are derived from Parish Registers, Enumerators books and Parish reconstruction for the period 1841 to 1891.
2. NEIGHBOURHOOD AREA
The expression Neighbourhood Area is one used by local historians to describe a locality, more extensive than a parish but less than a region. It is intended to convey a neighbourhood with some social coherence. Such a neighbourhood is identified around Little Hereford and delimited by the use of place of birth data recorded in the 1871 census enumerators’ book. This revealed 17 enumeration districts (though 20 parishes) and formed the territory from which the migrating families were identified (Chapter 4).
3. CONTEXT
The spatial and socio economic context is essential to decision making. Secondary sources as well as calculations from tithe assessments and CEBs are used to examine socio economic change and continuity in the context of the Mid Borderland (Chapter 5). Ideas from the work of Griffiths and Johnson (1991) are used as a framework to collect data. Subsequently census data are used to examine population trends at national, regional and local level over the period of the study (Chapter 6).
4. MIGRATING FAMILIES
Comparison of the enumerators’ books for 1871 and 1881 identified the families that migrated in that time from the neighbourhood of Little Hereford. These are recorded against a schedule devised to show the characteristics of the families which moved. Subsequently these data were processed to show patterns using techniques available through Microsoft Excel. The new location of the families was determined by means of the 1881 census on CD Rom and presented in tables and charts (Chapter 7).
25

5. MIGRATION PATTERNS These data of migrating families establish patterns such as family structure, life cycle and proximity of marriage partners and enables a description, shown in tabular, graph and map form. This enables an analysis of their major characteristics and determines the extent to which there is a pattern (Chapter 7).
6. THREE CORE FAMILIES The CEBs from 1841 to 1891 for Little Hereford show that 7 families out of a variable total of about 80 families in the parish were there for the entire period. This was used as a definition of core family. For three of these rigorous family history work had been conducted and therefore genealogies established here. For one family the surviving third generation members were subsequently interviewed to determine their movements over the last 80 years. Unlike other sources these data yield information on every move made rather that that which is simply officially recorded (Chapter 8 and 9).
7. MIGRATION DECISION The family trees enable a plot of the migration paths of each family. This is of course incomplete because of reliance on the recording of vital events. Later, through a form of participant observation (although the researcher is a member of the family), taped interviews and lifetime experiences a more complete record of the members of the Maund family is made together with their motivations and decisions.
One of the distinctive features of this investigation is the use of data from family
history sources and this is explained below in some detail especially the use of parish
records and various elements of the census. But before turning to the sources there
will first be discussion of scale and its implications for the enquiry and the resultant
data issues.
26

3.3 Scale and Data If the underlying decision process of migrants is to be more clearly understood then
this can not readily be achieved through large scale studies nor, of course, from
aggregated data. According to Courgeau and Lelievre (1992 p2) “as long as
demographers use statistics such as those published in registration records or
population registers, they have no way of dealing with the two basic problems; the
analysis of the interactions between demographic phenomena and the heterogeneity in
human groups.” The data for many migration studies have come in aggregated form
from the decennial census and frequently used place of birth statistics but they have
also used data from sources such as the National Health Service Central Register
(NHSCR). There are many such studies describing general population changes both
in the past and present, for example, Lawton (1968, 1973; Owen and Green 1992).
None of these studies provide detail of individual moves which would enable the
study of motivation and decision. So there have for some time been calls for the use
of alternative data sources such as personal biographies (Hagerstrand 1982; Pooley
and Turnbull 1998; Pryce 2000) or indeed diaries and other personal accounts (Hey
1975; Parton 1980).
However, it must be emphasised that all of this is not new since over fifty years ago
Saville (1957) in his classic study of rural depopulation in England and Wales
maintained that the starting point for migration studies should be small communities
i.e. parishes of less than 500 population. He maintained that migration generally
started with the smaller places and it was only by means of local studies that a clear
understanding of the reasons to migrate could be achieved. Where census data are
used this of necessity produces a form of cross sectional study (Glasser 2002 p7) since
the data are only available at ten year intervals. Individual biographies could possibly
allow for a lifetime study, depending on the source, and therefore the possibility for
longitudinal study. It is in this regard that family histories may well have a role as
data sources. But two forms of scale issue arise with personal biographies, firstly, how
many biographies should there be in a study and, secondly, over what time period are
they spread? Pooley and Turnbull (1998) made extensive use of records of family
historians which enabled them to study migration from 1750 with 16,091 life histories
sourced from 80 Family History Societies in England, Scotland and Wales. The
27
quantity of data enabled aggregation which formed the basis for their analysis.
However, from the perspective of this study, its major advantage was that it enabled a
longitudinal study and this important feature will be returned to in more detail below.
There is not an extensive literature on family history although Hey (1996) provides an
overview. Apart from local publications, Society magazines and practical guides, for
example, Pelling (1995), the major works are limited (Camp 1978; Wagner 1983;
Sanders 1989; Pryce 1994). The methods and sources used by family historians will
be returned to in detail below. For this study the use of family histories raises two
issues, it enables detail and a long time scale over which to examine migration
process. The use of individualised data may yield insights into process but it removes
the possibility of generalisation from the findings. It is in this form of analysis that an
ethnographic methodology is required and methods involving participant observation
(Cloke et al. 2004). Such an approach is not new and perhaps owes something to the
work of Sauer (1956), of his “being there” attitude. Subsequent studies by Ley (1974)
into living in a black inner city area in the USA, Western (1981) into life in an inner
city neighbourhood in South Africa and Rowles (1978) study of the lives and
geographical experiences of older people have all used a methodology of immersing
themselves in the lives of their subjects. But this immersion is almost invariably for a
finite period. In this study the researcher, as a member of one of the families
concerned, has the distinction of a lifetime of participation. This is discussed in detail
in Chapter 4 and again in Chapters 8 and 9. Finally, the need to set all such enquiries
in a more general context is essential if the study is to recognise the possible influence
of macro processes since individual cases do not operate in a vacuum. This is
discussed further in Chapter 5. There will now follow a detailed discussion of the
sources and methods to be used in the investigation as summarised in Table 3.1.
3.4 The Census The decennial census provides two broad types of source for this study (Higgs 1989).
Firstly, there are the gross data of population totals presented in the County reports
each ten years from 1801. These data are used as the basis for the investigation of
population trends for England and Wales, the Mid Borderland, the neighbourhood of
Little Hereford and selected towns discussed in Chapter 6. This is intended to provide
28

a context for the study of migration as the changes in the distribution of population are
described and analysed. Notable in this context is 1881 the time of absolute decline in
the populations of Herefordshire and Shropshire and this point provides the period for
the study of migrating families from the defined neighbourhood of Little Hereford
between 1871 and 1881 (Chapter 7). There are though a number of other features of
the census at this scale that need to be noted.
The period from 1801 nearly defines, but not quite, the longitudinal scale of this
enquiry. Data on family trees extends dates back before the first census in 1801 and so
for demographic trends during the 18th century this research relies upon the
formidable reconstruction of national totals calculated by Wrigley and Schofield
(1981). There were boundary changes at a variety of levels over the period from 1801
to the present. In this time parishes were created or amalgamated or incorporated into
urban areas. The definition of the county of Worcestershire changed and at the other
end of the scale the parish of Burford was divided into three separate parishes.
Additionally there were some changes in enumeration districts vis a vis civil parishes.
The manner of dealing with these issues is pursued in the chapters in which they are
relevant but where possible the integrity of the initial unit is maintained by
aggregation. It is also the case that the published units of population are not always
those that would be ideal for spatial study.
Another important source within the census is the Census Enumerators’ Books
(CEBs). The first useful one of these is for 1841. They show the detail of each
household at each census and are available for each census year up to 100 years of the
present1. The Church of Latter Day Saints (Mormons) has codified the Books of the
1881census on CD Rom which also includes a search mechanism. This is quite
critical for this enquiry especially in Chapter 7 where it is used first of all to identify
migrating families from the neighbourhood of Little Hereford and then to locate their
whereabouts in 1881.
CEBs are a major source for family historians too because they record details
additional to place and date of the vital events. But they too have their problems, for
1 At the time of the calculations for this enquiry the most recent available were those for 1891.
29
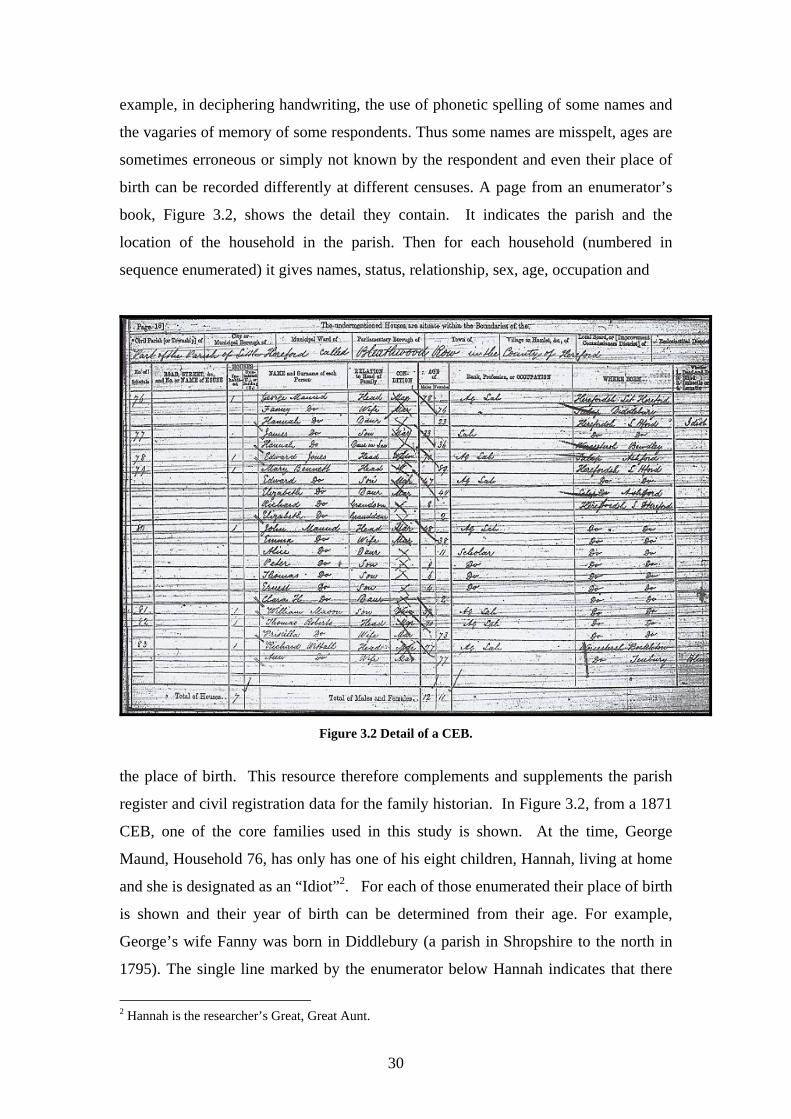
example, in deciphering handwriting, the use of phonetic spelling of some names and
the vagaries of memory of some respondents. Thus some names are misspelt, ages are
sometimes erroneous or simply not known by the respondent and even their place of
birth can be recorded differently at different censuses. A page from an enumerator’s
book, Figure 3.2, shows the detail they contain. It indicates the parish and the
location of the household in the parish. Then for each household (numbered in
sequence enumerated) it gives names, status, relationship, sex, age, occupation and
Figure 3.2 Detail of a CEB.
the place of birth. This resource therefore complements and supplements the parish
register and civil registration data for the family historian. In Figure 3.2, from a 1871
CEB, one of the core families used in this study is shown. At the time, George
Maund, Household 76, has only has one of his eight children, Hannah, living at home
and she is designated as an “Idiot”2. For each of those enumerated their place of birth
is shown and their year of birth can be determined from their age. For example,
George’s wife Fanny was born in Diddlebury (a parish in Shropshire to the north in
1795). The single line marked by the enumerator below Hannah indicates that there
2 Hannah is the researcher’s Great, Great Aunt.
30

was another family living in the same household. It is George and Fanny’s son James
and his wife, also named Hannah. This Hannah was born in Bewdley and this raises
the question of how and where both James and his father came to meet their wives. A
family historian would search for the marriage place and date. In the case of
household numbered 80, the family of John Maund, son of George, the birthplace of
his wife, Emma, is given as Little Hereford but more detailed research using the web-
site ancestry.com has revealed this to be incorrect. She was actually born in Ross
where her family had moved from Hereford sometime in the late 1820s. This serves to
illustrate some of the errors that do occur and the problems that can come by a too
ready acceptance of the data contained in the CEBs. But despite this it is still a vital
source for this enquiry and also for family historians generally.
For this study enumerators’ books were a help in building family trees but also, in
Chapter 7, for identifying migrating families from the parishes of the Little Hereford
area and then locating their new residences. Comparing the enumerators’ books for
each parish concerned and then using the search mechanism contained in the 1881 CD
Rom provided a means for locating each family. Thus the leavers from each parish in
the neighbourhood of Little Hereford after 1871 were identified and their residence in
1881 located. This is briefly explained in Chapter 7. Once a family that had moved
had been identified by comparing the 1871 and 1881 CEBs it can, in many cases, have
its location identified. The search mechanism depends on:
A surname, first name or both. A year of birth (which can be calculated from age) A County and/or Parish of birth.
This seems very simple but in practice it is not so because, as indicated above,
information is not always accurately represented for a whole range of reasons. Never
the less the method proved to have a more than 70% success rate in locating a family.
Families are easier to trace than individuals since any member of a family may be
used. Those that are not traced will have died, emigrated, not been enumerated or so
badly enumerated that they cannot be detected. It is a very helpful though imperfect
procedure.
The tracing of the migrating families between 1871 and 1881 as described is, in
practice, an extremely cumbersome method. The procedures for processing these data
31

on moving families relied upon a search for pattern involving a classification of
family characteristics devised from the headings of the CEBs and explained fully in
Chapter 7. There was also the pattern of movement from calculations of distance,
direction and place. The patterns produced by statistical manipulation using Excel
formed the basis for the analysis of the characteristics of the families that moved.
The CEB data has other uses and one particularly relevant to this study is parish
reconstruction. The data are collected in Households as can be seen in Figure 3.3 and
each is numbered but their precise location is not always clear and is especially
difficult to locate when a dwelling may have been demolished subsequently. But
from such data, and some work in the field, it is possible to do a parish reconstruction
for any census year and indeed a longitudinal one from 1841 and this was done for
Little Hereford3. In such a way it is possible to build a profile of each residence over
the time period and to identify the length of time that a household remains in a parish
and often how long they remain at a particular location. Thus the core families of
Little Hereford were identified.
Figure 3.3 Family and Household.
3 For a different project conducted in the 1990s.
32

In Figure 3.3 the household of James Arnett is shown. His is one of the core families
of the parish although not used in the later analysis here (Chapter 8) and he heads his
nuclear family but also the household that contains a number of farm workers as does
the household of Elizabeth Giles at No 46. This serves to illustrate that a family may
constitute a household but that a household may be made up of more than a family. It
is important for this study that there be no confusion over terms. When the migration
of families is considered in Chapter 7 it is the nuclear family, whose members would
be a cohabiting couple and their progeny, that is the focus. Families appear to be a
more sophisticated measure of social change than individuals since family type seems
to reflect the changes taking place in the broader society.
Clearly the sources of parish register, civil registration and CEBs form a source that
provides the framework data for a family tree, but there are gaps in between the dates
they provide and also potential gaps between the locations given at any time. Thus
there may be movement which these sources do not record. Therefore, the data are
incomplete but yet provide a reasonably detailed picture of the past.
3.5 Family History Family history data are, at least potentially, an important source at this scale of
analysis. Pooley and Turnbull (1998) had used family history data but they aggregated
them to arrive at macro patterns. By contrast this investigation uses data at the scale of
the individual nuclear family as will be made explicit in Chapters 8 and 9. Because
the use of family history data is unusual, if not unique for this type of enquiry, it needs
further discussion in order to make clear its various components as well as its
weaknesses and strengths.
The last thirty years has seen a huge growth in interest in family history as more
people have pursued their family trees. Record Offices all over the country have
become hives of activity as the resources they contain have become increasingly
widely used, family history societies have been founded and even a Chair in Family
and Local History established at the University of Sheffield. The result is a major
network of Record Offices, Family History Societies and a developing literature. The
33

increasing popularity of this field is recognised in programmes on network television
which show celebrity search for ancestors.
There are a number of simple and basic guides in existence, for example, Pelling,
(1980) provided detailed advice on the available sources for the construction of family
trees. There are also a number of periodicals such as the monthly ‘Family History’
and ‘Family Tree’ magazines to mention but two. In addition there is a whole range of
local, limited circulation, publications, the product of investigations by local history
societies and even individuals. More recently there has been development of data
available on the Word Wide Web, for example, there is access to census reports, even
enumerators books and the subscription web-site, Ancestry.Com, provides a search
mechanism of available documentation.
Despite this quite significant output there is, as yet, little documentation of a
substantive and longitudinal nature detailing actual family histories and the
methodology of their construction. An exception is the work of Camp (1978) who, as
Director of Research at the Society of Genealogists, not only produced an
authoritative study on sources for genealogy but also traced their historical context
and significance. Similarly Sanders (1989) study of his family history from the mid
17th century is meticulously researched and set in its appropriate historical context.
Interestingly, there are also books which have been developed around particular
people or families not so much as genealogies and family trees but rather focussing
upon a person or set of circumstances. Examples of these include that written by
Ashby (1961) about her remarkable father, Joseph. This is written, despite their
relationship, in an academic style and shows the impact and influence of this low born
and illegitimate son of a housemaid who grew to have major influence in the rural
communities and local politics of south Warwickshire. In the act of writing this book
a whole set of features relating to ways of life in the late 19th century Warwickshire
countryside is revealed. But it is a snapshot of a time and place not a history of a
family. Another possible source is a diary; probably one of the most detailed being
Kilvert’s diary which is an account of life in a rural parish in the Welsh Borderland
during the late 19th century from the viewpoint of a parish priest (Kilvert 1987).
34

A further example, but of a rather different nature, is the account by Lorna Sage
(2001) of the life of her eccentric father and the quite dysfunctional family in which
she was brought up. In doing so she tells much of ways of life in post war England
and of the movements of families at that time. The field of family history is, therefore,
a quite diffuse one that stretches on the one hand from what are essentially instruction
manuals to biographies and personal accounts on the other.
Much of what is called family history is in fact genealogy and the quality of the
research is extremely variable. Except for common sources and certain presentational
software packages a common methodology is only slowly evolving and certainly the
concept of evidence is applied variably. The product, in these circumstances, can only
be of doubtful provenance and variable in quality and accuracy. By no means all
family histories insist upon the rigour of documentary evidence to support their
findings. Practitioners vary from those with a mild and passing interest to those who
have spent a lifetime and have developed a huge knowledge base. The link with local
history is frequently tenuous. But despite this, if used with caution and
circumspection, family histories still have enormous potential as a data source in the
study of migration.
In this study data from three families are used. They all lived in the parish of Little
Hereford, in the Mid Borderland, from the late 18th century and into the 20th century.
These are the families referred to as core families (Chapter 4) and they will be traced
throughout the period for which the genealogical data exist (Chapter 8). It is the
availability of these data which defines the time period of this study as a longitudinal
one. The concept of a core family is also part of the basis for defining the locality or
neighbourhood of Little Hereford. The coincidence of the availability of data from
three families, the Rowburys, the Maunds and the Bennetts, resident over the same
time period in Little Hereford, is the key to the definition of the spatial as well as time
scale for this project. This theme will be increasingly apparent as the investigation
progresses and is explored in some detail in Chapters 4 and 6.
Four individuals were responsible for the collection of these data for the three
families. Christopher Davies has, (from a curiosity about his origins), traced his direct
family, the Bennetts, from the neighbourhood of Little Hereford to North Wales and
35

eventually to Bristol with some references to off-shoots in south and southwest Wales.
This is a relatively narrowly focussed tree but admirably performs the function
demanded of it in this study, as will be seen in Chapter 8. The Rowbury family tree,
on the other hand, has a rather different origin and motivation. Polly Rubery, whose
central interest lies in the name and its variants, has provided these data. She is a
highly skilled and knowledgeable genealogist with a vast database of this name. She
maintains that it derives from “Rough Hill” which is located very close to the territory
from which Maund takes its name to the east of the River Lugg in north Herefordshire
between Leominster and Hereford (Chapter 9). So the origin and meaning of
surnames is also a source of interest for genealogists and local historians. Similarly
the Maund family data too owe something to the origin of the name that derives from
the Celtic, Magene (Gelling, 1984; Coplestone-Crow 1989). It is what Hey (1997)
has termed a locative name, that is one derived from a place. Such names therefore
give a clue to family historians tracing their family tree backwards which is the
normal practice. This route was followed by the current researcher in an earlier
investigation. Such a route starts with the living and their memories and only later to
documents as will be shown below. For those trees relating to the family before they
moved to Little Hereford, about 1783, the study rests on the work of Gary Maund who
in the course of investigating his own direct branch obtained data from which he was
able to construct the tree relevant to this study.
3.6 Parish Registers The basic data for the construction of a family tree, baptisms, marriages and burials,
are contained, from 1538, in Parish Registers. These data vitally indicate the date and
parish of the event. In the case of baptisms they give the names of the parents, and for
marriages the names of the couple and that of their fathers. Data contained in parish
registers are subject to a variety of flaws, not least that some have been lost or
destroyed particularly those from the Civil War period. They are subject to the
vagaries of spelling and some have been damaged in a variety of ways and it has even
to be concluded that some events were simply not recorded by the incumbent. There is
also, sometimes, an issue with clarity and the decoding of handwriting. For the Maund
family, the Brimfield register is fragmentary up to the mid 17th century but virtually
complete in Little Hereford from the time of their arrival there about 1783. The
36

Bennetts simply have not been located before the mid 18th century but the Rowburys
offer a complete trace from the 16th century.
Due to the work of individuals, family history societies and the Mormons many
registers have now been transcribed and are available in Record Offices and also on
the Internet. Much has been done and published on a County basis by Mormons and
recorded in an alphabetical index, the International Genealogical Index (IGI). This
removes some problems presented by raw parish registers but it is still subject to
errors in transcription and indeed omission and is not entirely reliable although it does
make searching very much easier. The IGI has developed in a major way in recent
times with the availability of subscription web-sites which contain data from a variety
of sources, including overseas, and also search engines which take much of the labour
away from the search.
From 1837 there was a requirement to register vital events through the civil authority
and copies of certificates can be obtained through the Public Record Office. It was
through this means that the birthplace of Thomas E. Maund (see Chapters 8 and 9)
was traced and provided a link in the chain of migratory movement of that family. In
summary registration provides dates and place of vital events together with some
family relationships. Apart from the errors noted its main disadvantage for migration
studies is that it is episodic and gives no account of movement between events. It is
though a form of individual record, which for micro study is a significant advance
upon the aggregated census data.
3.7 Oral Sources There are of course a whole range of other sources that are used by family historians -
wills, gravestone inscriptions, Poor Law Records, diaries and a whole variety of less
systematic sources. One very important source though is oral evidence of the people
who actually had the experiences of moving and the decisions which underlay them
(Humphries 1984; Perks 1992; Perks and Thomson 1998). Within a rural context a
classic study using oral evidence is Blythe’s (1972) account of life in a remote Suffolk
village in the 1960s.
37

In fact the origins of this project lie in what can only be called oral evidence. Within
the Maund family there were stories told of journeys from Birmingham to
Herefordshire, specifically Bircher Common, of living in a caravan, roaming the vast
common, attending Cock Gate School and of the great pleasure of visiting and living
in north Herefordshire and experiencing its ways of life. Then there were the people,
Emma, Uncle Dave, Bill, Hazel and Jack. This became almost like folklore. This,
and the curiosity aroused by living in an area where places were prefixed Maund
(Chapter 9) eventually, many years later, led to this enquiry. Just sufficient
information to begin the project came with the clue that Little Hereford was part of
the story and thus the essential location from which this enquiry grew.
An oral enquiry into the migration of a family inevitably deals with the time scale of
living memory and the testimony of those who actually took the decisions and
activated the processes (Moss and Goldstein 1979). Those used here are the living
members of a branch of the Maund family whose personal experience stretches back
to the early 1920s complemented by stories told for a generation or two before that.
The researcher is, unusually, a part of this family so although the source is clear the
methods used and the form of evidence they produce needs some consideration (Rose
1997).
By relying for part of this research (Chapters 8 and 9) on oral testimony essentially an
ethnographic approach was adopted (Cook and Crang 1995; Findlay and Li 1997). In
particular a form of participant observation (Hoggart et al 2002; Cloke et al, 2004).
The ethnographic approach and a methodology involving participant observation is
not new (Dey 1993). Indeed there is a long and honourable history both in geography
and other social sciences (Cook and Crang 1995; Cloke et al. 2004). Each study is
different, and does not provide a framework since each gives differing perspectives.
Limb and Dwyer (2001) argue that the position of the researcher may be different or
the length of the participation only a short period and the ethical issues controversial,
there may even be a purpose of social action. In such differing circumstances the
research design needs to have both a clear framework and structure. An important
aspect of the framework here comes from the idea of a longitudinal study using
individual family biographies allied to the life course transitions that arise. All of this
is placed not merely in the family context but also the broader local and national one.
38

This framework and the focus in retrieving data upon transitions, formative
experiences and the unfolding events in time and space offered essential structure but
there remains the issue of the insider who is also recorder and researcher. In accounts
of participant observation as a methodology stress is placed upon the need for
reflexivity on the part of the researcher (Rose 1997; Cloke et al 2004). In addition to
the usual reflection upon events and processes there is also the need to triangulate
events, reports and assessment among the siblings, a form of constant checking and
verification (Denzin 1989). In a somewhat similar context Robina Mohammad (2001
p104) remarked, “experiential ‘sameness’ is used to prove moral authority to an
account on the basis that this sameness endows the researcher with greater
understanding of the researched’s reality.” Similarly, twenty years earlier,
Hagerstrand (1982 p326) had remarked that, “ the insider …is involved in the network
of meanings that bind … together and… he might even be able to trace to the roots of
the projects back to their finer details”.
Also Burrell, (2003) in her study of the lives of Polish migrants to Leicester quotes
Portelli (1981 p99), “the unique and precious element which oral sources force upon
the historian and which no other sources possess in equal measure is the speakers
subjectivity.” All these quotations not only emphasise the problem with oral histories
but also their advantages when used with care and sensitivity.
There are ethical considerations about the extent to which the observed were aware of
and in agreement with the observation. For example, Parr (2001 p160)) has a
particular view of the morality issues in her work. In part she appears to justify her
method because it, “…was necessary if I was to make contact with people ……. who
avoided other medical and voluntary institutional geographies.” In a sense this
suggests that the method is justified because there is no other way and this is difficult
to reconcile with an ethical position.
In the case of this research issues of this type did not arise and the participants knew,
at the more formal stage of the investigation, what it was about and were willing
collaborators. Those being observed were of the immediate family of the observer
and thus there is no question of going native since the observer was already a native!
Use of observations or unconscious participation made over possibly the 60 previous
39
years is a matter for the researcher to reflect upon before putting forward insights. A
major strength in this case is that the participation was not for a known restricted
period but for a lifetime. This brings with it some issues which need to be resolved.
In particular there may be a possibility of a taken for granted culture which may
involve unstated assumption among the participants. Although in a very different
context Fuller (1999 p223) considered this issue and concludes that “We are different
people in different circumstances, we have different identities or roles in different
spaces.” For the purposes of this study this research method is about reporting and
reflecting upon actions from the position of an insider in order to gain an insight into
the process of migration. These matters are pursued further in the context of where
they arise in Chapters 8 and 9.
3.8 Other Sources The identification of the cultural context and ways of life in the Mid Borderland
outlined in Chapter 5 come from a wide range of sources. Inevitably selection was a
problem but guidance was provided by Johnston and Sidaway’s (2004) suggestion
that a framework for determining local cultures and ways of life should focus on
local economy, local society and local political structures. These criteria follow
closely those suggested by others (Champion and Fielding 1992; Warnes 1992) and
were used in this study to cull the appropriate information from different sources.
The sources used include the Tithe Surveys, agricultural returns, the census for its
data on occupations and Ordnance Survey maps at different scales. A significant local
source was the Transactions of the Woolhope Club, based in Herefordshire, which
has been in publication since 1852. The articles it contains are all based on original
research in the Mid Borderland and cover a large range of disciplines and topics.
A unique source which provided much local information during the 19th century was
publication of the letters of Anna Maria Fay who in 1850 came to live in Richards
Castle for one year (Fay 1923). Whilst in Richards Castle Fay wrote regularly to her
family in the USA. These published letters are a quite splendid reflection on the
countryside habits and manners in the mid 19th century. It is used appropriately in
Chapter 5 which seeks to identify ways of life in the local countryside. Although
40

written from the point of view of the landowning and privileged classes it offers
important insights into social and cultural activities and also relationships between the
classes.
Information from these sources together with some calculations made from the Tithe
Assessment Survey of 1846 and occupations from CEBs, are used as the basis for the
analysis of ways of life in the Mid Borderland in the 19th century.
3.9 Summary and Conclusions This chapter has focussed, in the main, upon issues arising from the sources and the
methods used to carry forward this enquiry and attempted to show their coherence
through a framework of enquiry in which they are located (Table 3.1). Much of the
data collection was notably time consuming, for example, the retrieval of data from
CEBs in the Record Offices, the search for families which had migrated, the analysis
and checking of family trees and the plotting and checking of migration routes.
Some of this was due to the wide range and disparate nature of the material and its
widely dispersed nature.
Eventually the product of this retrieval process is, where possible, stored on
spreadsheets as a preliminary to presentation in tabular, graphical and map form.
Other data of a non quantifiable form are stored on audio tape and CD representing
the interviews with the respondents largely represented in Chapter 9.
It is important to indicate that some of the data sources, even the CEBs, are to an
extent problematic. This is reinforced in the context of their use in appropriate
sections of the analysis. In other areas there are the vagaries of memory and selected
perception to be, if not overcome, minimised. They will be highlighted in the text.
This is possibly in the nature of a micro study down to the individual level, where the
errors can not be ‘hidden’ or evened out by aggregation.
At the core of this study is the investigation of the relationship between place and
migration. In the next chapter the identification of the places involved is undertaken.
41
Chapter 4 Place: The Geographical Context
4.1 Introduction It has long been established that studies of migration which seek explanation in
terms of human reaction to a series of remorseless forces can only give at best a
partial answer (Lewis, 1982). As discussed in Chapter 2 this shift away from such a
deterministic mode of explanation to a more behavioural and structural one has
raised the issue of the significance of place in the migration process (Walmsley and
Lewis, 1988). Increasingly several authorities have argued that place influences
values, attitudes and behaviours (Peet 1998; Holloway and Hubbard 2002; Johnston
and Sidaway 2004) since according to Blauw (1985 p106) “ways of life depend on
where you live”.
Throughout this study the notion of a place-based culture is an important theme
and, in particular, its role in the process of migration over time. Immediately this
raises the question of how to identify the nature and form of place and its culture
and ways of life. As a prelude to the investigation this chapter discusses the
concept of place identity and its character within the case study area whilst its
culture and ways of life are outlined in the succeeding chapter.
In a longitudinal study of migration covering in excess of 200 years it is to be
expected that there will be a range of places and locations involved. The focal point
of the study is the parish of Little Hereford in Herefordshire, and Shropshire in the
heart of the Mid Borderland. The specific purpose of this chapter is to identify the
parish which gave rise to the study and also its surrounding neighbourhood together
with its setting in the Mid Borderland. It is this parish locality or neighbourhood
from which the analysis of migrating families at the end of the 19th century is
undertaken (Chapter 7). The Borderland setting for this is the key to the subsequent
assessment of the influence of the ways of life upon individual family migration
(Chapters 8 and 9). There are thus two different scales of territory to be
determined in this Chapter, a region, which might be termed the Mid Borderland
and the locality of a Borderland Parish. However, the chapter begins by
42

considering the nature and location of the case study parish, Little Hereford, within
its regional and local setting.
4.2 The Mid Borderland Little Hereford is a rural parish set in a remote area of the countryside in the Mid
Borderland. Because of the significance of the regional setting and the debate about
how such an area might be identified this analysis deals with this before moving to
the more precise identification of the locality of Little Hereford.
A number of subjects including geography, local history and family history are
interested in the identification of areas as the setting for regional description and
local studies. Inevitably there are particular issues involved in this because what is
sought is not a unique area unrelated to its surroundings but rather in the words of
Johnston and Sidaway (2002 p234) “a regional mosaic … reflecting the
interpretation of local contexts by the actors involved”.
The image here is one of several localities contributing to a region. An interesting
conceptual framework for the identification of such areas has been suggested by the
sociologist, Giddens (1984), in his development of structuration theory which
addressed the problem of the relationship between macro and micro or structure and
agency. His view was that changes in macro structure produced a response at the
local level but interpreted differently in different places. He further maintained that
changes brought about locally would feed back to the macro structure and produce a
response there. Therefore, a two way interactive system was produced. The
‘places’ which formed the micro part of this interaction he referred to as “Locales”.
“It is usually possible to designate locales in terms of their physical properties,
either as features of the material world or, more commonly, as combinations of
those features and artifacts” (Giddens 1984 p118). Unfortunately, this gives little
assistance to identify a specific place.
However local historians, have made significant contributions to the identification
issue (Phythian-Adams 1993; Hey 1996). Hey (1996 p282), quoting Marshall,
claimed that “whatever criteria one uses, a “region” …… can scarcely be seen as a
43
fixed and static entity. It is, to say the least, a mass of overlapping and sometimes
conflicting or interlocking economic and social relationships.” The implication
would seem to be that regions are neither fixed nor homogeneous but rather they are
a balance of elements which for the moment creates the whole. Presumably an
imbalance provoked either internally or externally would produce change. A region
may therefore be a form of an open system. For the historian of the countryside,
Rackham (1986 p1), humans are the powerful agents of change, “…there are
instances where men have made different landscapes out of apparently similar
natural environments, or the same landscape out of different environments”. This
view suggests two features, firstly that there is a long and evolving history but also
secondly the importance of human control; in other words a region is not
determined by physical factors alone. These ideas are not new and certainly the
concept of sequent occupance has a long history in the writings of cultural
geographers (Whittlesey 1929; Meinig 1979). Phythian-Adams (1993 p6) would
concur with the importance of historical continuity since he has suggested that “…
it is difficult to envisage a better surrogate for changing local social structure as a
whole than the spatial geography of social relations” By this he is emphasising the
importance of the residential pattern thrown up by each successive generation.
Later he writes of , “ a socially definable district … with an intensity of economic,
cultural and kinship links between the places concerned” (Phythian-Adams 1993
p6).
In a contribution on the geographical distribution of surnames, Hey (1997)
introduced the concept of ‘Country’ to describe the territory occupied by
predominant surnames and added that “these ‘Countries’ were moulded partly by
topography, partly by the nature of the work, by building materials, by
characteristics of speech, and by ways of thinking and believing” (Hey, 1997,
p.xix).
From this comes the image of a territory built up by successive changes over time
and manifested both in the landscape, including artefacts, values and ways of life of
the people. However, this is not the end of the matter for in seeking an adequate
philosophical and methodological basis for their subject local historians have
claimed that local study needs to be placed in its broader context (Short 1992).
44
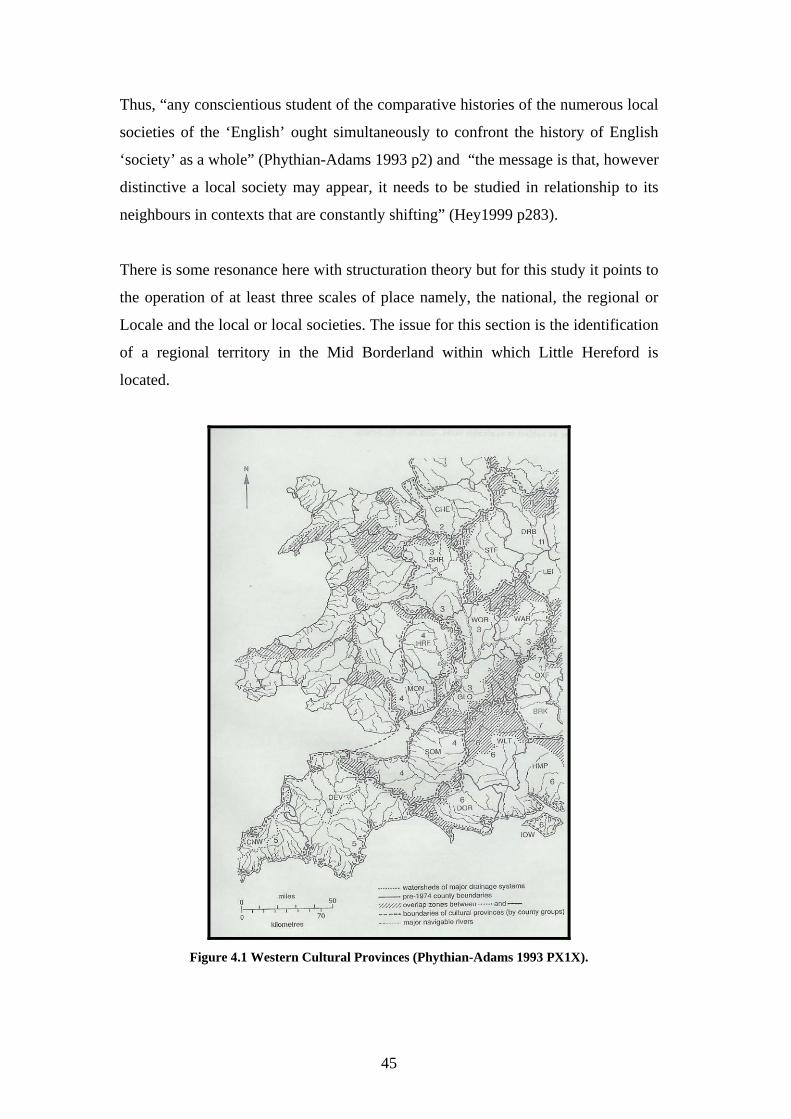
Thus, “any conscientious student of the comparative histories of the numerous local
societies of the ‘English’ ought simultaneously to confront the history of English
‘society’ as a whole” (Phythian-Adams 1993 p2) and “the message is that, however
distinctive a local society may appear, it needs to be studied in relationship to its
neighbours in contexts that are constantly shifting” (Hey1999 p283).
There is some resonance here with structuration theory but for this study it points to
the operation of at least three scales of place namely, the national, the regional or
Locale and the local or local societies. The issue for this section is the identification
of a regional territory in the Mid Borderland within which Little Hereford is
located.
Figure 4.1 Western Cultural Provinces (Phythian-Adams 1993 PX1X).
45

Phythian-Adams (1993) proposed a nation divided into a series of ‘Cultural
Provinces’ based upon the great river basins defined by their watersheds and
therefore suggestive of a degree of physical determination. In the context of the
Borderland he offers Herefordshire and Monmouthshire as a province and
Shropshire and Worcestershire as another but with the county boundary between
Herefordshire and Shropshire being an ‘Overlap Zone’ (Fig. 4.1).
This structure cuts across the territory under consideration here and is not entirely
helpful in the designation of a region in which Little Hereford would be located.
However there are two other sources which take the discussion forward. Firstly,
Thomas’s (1957) analysis of the political development of Wales and, more
specifically,,, the geographical character of the Middle Welsh Borderland and,
secondly, Sylvester’s (1969) extensive and detailed consideration of the Welsh
Borderland in its entirety. Briefly, Thomas (1957) considers the Borderland in
terms of both its cultural divide and a national boundary as evidenced by the
existence of several dykes including, of course, that of Offa (Fig. 4.2). He quotes
Fox (1940) for whom Offa’s Dyke is “a boundary defined by treaty and agreement
between the men of the hills and the men of the lowlands” (Thomas 1957 p186).
Sylvester’s (1969) view broadly concurs with this divide and emphasises how the
area to the east of it has been subjected to various overlays of cultural influence
over time. Thus she refers to the Borderland as a hybrid zone. In this she tended to
agree with Rackham (1986 p1) “regions are of great antiquity, for county and parish
boundaries determined a thousand years ago completely ignore them.” There is,
according to Sylvester (1969), a continuity produced by a form of acculturation
which develops this hybridisation as the Borderland adapted to each successive
influence. She does, however, discuss the Borderland in detail on a county basis
and thus ignores the strictures of Rackham. This is largely forced upon her by the
manner in which her sources are available county by county. However, within each
county she does identify sub regions which contrast with neighbouring ones but
which have some degree of internal integrity and cohesion. Thus, she identifies the
southern hill country of Shropshire which is very similar to what she describes as
central and eastern Herefordshire. These two territories when put together form a
part of the Borderland shown in Figure 4.2 and enlarged in Figure 4.3.
46

Figure 4.2 The Welsh Borderland (J.G.Thomas 1957 p184)
For the purposes of this study this area is defined as the Region, Cultural Province
or Locale which forms the study area. It can not be, despite the search by
Phythian-Adams (1993 p9), an “ unambiguously defined area”. The cultural
characteristics of this region will be examined in detail in Chapter 5.
47

Figure 4.3 The Mid Borderland.
For the moment this study area is designated as one with identifiable ways of life
which will inform the analysis of migrating families. It stretches west to east
broadly from Offa’s Dyke to the Severn and north to south from Shrewsbury to
Hereford. The fact that it is not entirely arbitrary is helpful because it fulfils two
conditions. Firstly it is designed for the purpose of this study, another study may
have a different region and, secondly, it is intended to merge with its adjacent areas
rather than contrast with them. It is essentially that area of rolling hilly country with
river valleys which extends into England from mid Wales and identified by both
Sylvester (1969) and Thomas (1957). It is certainly intended to be spatially greater
48

than any one local society. In Figure 4.3 Little Hereford is shown as LH, roughly
in the middle of the territory.
This region is the broader setting for Little Hereford but the parish also has a more
local area in which it is set. It is to this local scale that the analysis of geographical
context now turns.
4.3 Little Hereford and its Location The parish of Little Hereford is in northern Herefordshire at the point where the
county meets two other counties. Thus the north western and north eastern
boundary of this triangular shaped parish are formed with Shropshire and part of the
southern boundary, at the eastern end, is with Worcestershire. This latter boundary
is effectively made by the eastward flowing River Teme (Figures 4.4 and 4.5). The
Prime Parish is therefore a form of intrusion into two other counties which raises
the issue of the relationship between areas of study and administrative units.
Data are collected for administrative units and even with family history, as Chapter
3 has shown, much of the documentation is collected in such units. Even though
Little Hereford is a single parish it has relationships with its surrounding area, a
parish boundary even a county boundary, does not prevent interaction particularly
with its immediate neighbourhood and this is explored later below.
From Figure 4.4 it can be seen that the Parish consists of three areas. The western
part is Middleton, in the 19th century an area of relatively large tenant farms. The
scattering of dwellings along the main west to east route, which includes the
Church, was known as the Village and the area to the north of it, but east of
Middleton, was called Bleathwood, part of which had been Common land. There is
no village as such, which is typical of an area that probably never had an open field
system but rather an area of hamlets.
49

Figure 4.4 The Prime Parish - Little Hereford
Easton Court, the seat of the Lord of the Manor, is to the east of the Parish. From
the River Teme in the south the land rises northward from about 60 metres to over
100 metres around central Bleathwood, thereafter it slopes away again to the north
and east towards the Ledwyche Brook. Generally the parish is an area of good rich
farmland.
Figure 4.5 shows the location of Little Hereford in relation to its immediate
surroundings. It can be seen that it is broadly equidistant between three market
towns, Ludlow, Tenbury Wells and Leominster. These towns are, in the days of
modern transport, very close together and at a maximum 12 miles apart means that
50

even in earlier times people and animals could walk to a town, there and back, in a
day. They were effectively market towns serving a farming community.
Figure 4.5 Little Hereford and its Neighbourhood.
Another feature to be noted is that Little Hereford lies on the big bend of the River
Teme where it changes from southward flowing to eastward. Figure 4.5 shows the
significance of this in terms of route ways. Thus little Hereford has access to the
major north south route down the Mid Borderland and also to the main route to the
east, to Bewdley, Worcester and therefore access to the Severn and beyond. It is
remote but not isolated.
Parishes are not single social entities, they are a part of an interacting social and
economic locality; the parish boundary or even the county one does not cut them off
51

from their neighbours. How such an interactive area might be determined is an
important question for the spatial context, at the smallest scale, for this study.
4.4 The Neighbourhood and Core Families The local historian has a central interest in the question of definition of local and the
related concepts of Core Family and Neighbourhood Area. This merits examination
in the context of this study of nineteenth century migration. These two concepts
have been mainly used in studies of local histories of the late medieval and early
modern period, a time of relatively slow population change (Hey, 1974; Mitson,
1993). The late nineteenth century on the other hand was a period of massive
population and technological change and concomitant change to institutions, which
affected the countryside. It is interesting to consider whether conceptual
frameworks developed for an earlier age continue to have efficacy during a period
of rapid change.
The concepts are interdependent because, according to local historians,
neighbourhood area relies upon core family for its identification. For the local
historian a core family is taken to be one that resides in a locality for a long period
of time and has social interactions within that locality which defines it as a
neighbourhood area. There are immediate and obvious problems with this. How
long is a long time and what is the extent of the locality and the nature of the
interactions within it? A whole range of studies gives us some insight into these
questions.
Some studies have used these concepts, incidental to the main theme of the work,
and appear to take their meaning for granted. For example, Kathleen Ashby (1961)
in her study of the remarkable life of her father, Joseph Ashby of Tysoe, observed
that it was very unusual for a family to stay in that part of rural south Warwickshire,
during the second half of the 19th century, for more than three generations. She also
claimed that her grandmother, Elizabeth, never went outside her own District. So,
arising from a quite different agenda, a number of ideas can be identified. Firstly,
there is the suggestion that three generations, perhaps a hundred years, was the
maximum length of residence in one district. Might this be a definition of core
52

family? However, it was not clear whether members of the family travelled outside
their own district and what, most importantly, constituted a district?
In his classic study of the Shropshire rural community of Myddle, Hey (1974)
identified core families by means of the family trees of farmers who worked the
land from the late sixteenth to early eighteenth centuries. This length of residence
is not inconsistent with the more casual observation of Ashby (1961) although the
period is slightly more than 100 years. Hey (1974) however added that these stable
families become related through marriage during this period and so gave a sense of
permanence to the community. It is important to register that those identified as
core families represented only one social class, tenant farmers, and not labourers,
despite the latter representing half the population by 1650. This under
representation of the lower classes in local histories is a point made forcibly by
Hoskins (1966) some years earlier and also has some relevance for this study
(Chapter 8).
Even the stable families had regular movement between groups of parishes and
marriage partners were drawn from about a ten-mile radius (Perry 1968). In this
context the families which are core are status defined as well as being time defined
and the interactions which result from marriage or blood, take place over a group of
parishes. Is this then a neighbourhood area? It should be noted that the countryside
had, during this period, basically three status groups, Gentry, Farmers and
Labourers (Hobsbawm and Rude, 1969). Of course these were neither distinct nor
discrete categories. There were variations in wealth within each class and some
labourers had small plots of land whilst some farmers sold their labour from time to
time. In addition there were skilled men who, although they identified with
labourers, may have owned some land and farmed it. There was also a sprinkling of
professional people, clerics, teachers, and land agents. The Gentry appear to have
operated across a much wider territory, county wide or even nationally rather than
the neighbourhood area. The point is that those families designated as core were
most often from a class of people likely to be recorded or had left wills. The poor
left nothing behind them. According to Hobsbawm and Rude (1969 p41) “… they
left nothing identifiable behind them, for the marvellous surface of the British
landscape, the work of their ploughs, spades and shears and the beasts they looked
53

after, bears no signature or mark such as the masons left on cathedrals.” So could
labourers too form core families? The problem with any attempt to answer this
question is that a great deal of work on migration by historians and local historians
before the advent of the census and particularly that of 1851, is heavily dependent
upon sources which were unsystematic For example, the research on Myddle was
dependent upon the availability of the contemporary writings of Richard Gough
(1834) published 140 years after it was undertaken (Hey 1974). In these
circumstances it is difficult to be sure that any conclusions about core families do
not simply reflect the available material.
Of course marriage between local people was not just restricted to core families; the
majority married someone from the locality. There are some interesting
observations relevant to this discussion, but not strictly concerned with core
families, made by Perry (1968) in a study of marriage distances in Dorset. He
offered the notion of each person having a territory for interaction, a personal or
community region. He observed that the upper classes selected partners from a
wider area and if by this he meant the gentry, then the observation fits with that of
Hobsbawm and Rude (1969). In contrast to Hey (1974) Perry maintained that it
was the workers whose behaviour defined territory. However it must be borne in
mind that Perry (1968) was researching the period 1837 to 1937 and using a much
more comprehensive and systematic data source than was available to Hey, namely
the civil records, which were instituted in 1837. Some labourers too stayed in an
area for long periods of time and interacted across a territory that could be seen as a
neighbourhood area. Perry (1968) maintained that from the 1880s the rural
situation changed rapidly and coincided with complete literacy in adults implying
that written contact could now be maintained. The ‘territory’ expanded as workers
were freed from walking as a means of communication. It is certainly likely that up
to this point the economy of rural areas, particularly the pastoral areas of the west
with its need for regular, daily labour was one that was entirely consistent with the
development of a neighbourhood area. This travel issue also related to the spacing
of market towns as touched upon above.
The two concepts of core family and neighbourhood area appear to be used, quite
centrally, by local historians as part of a framework for viewing and defining a
54

locality. Interestingly some studies have directly employed the concepts of core
family and neighbourhood area as a means for analysis. For example, Mitson
(1993) acknowledged the richness of the work that had been done on single parishes
and that had recognised the core family and neighbourhood area as a major
characteristic and she wished to apply these ideas further into the wider community.
Using an area in west Nottinghamshire between Nottingham and the Derbyshire
border she attempted to show a sense of belonging, which went beyond the family
and the parish into the wider area, which she identified as the neighbourhood area.
Such an area was defined as “an entity comprising a group of parishes” (Mitson
1993 p 24) which were highly interconnected. In so doing Mitson (1993) refined
the concept of the core family into that of a dynastic family, a term borrowed from
Everitt (1982), and defined as a “stable group of core families resident over several
generations in the same parish or, more significantly over a group of contiguous
parishes”. (Mitson, 1993, p25).
However, despite the detail involved in this study the distinction made between a
core and dynastic family still remains rather unclear. Perhaps Mitson, (1993)
intended that dynastic families had more than one branch and exercised some
degree of power and influence over their neighbourhood, but this was never stated.
She even claimed that the presence of such families is “the delimiting factor in the
perpetuation of quite precisely defined neighbourhood area” (Mitson 1993 p 25).
From such a claim Mitson proceeded to arbitrarily define her study area within
which three neighbourhood areas fit exactly. The families that she identified had
been in their neighbourhoods for at least 130 years. There then follows a
description, using a variety of criteria derived from Hearth Taxes and Wills which
aimed at showing the distinctiveness and discreteness of each neighbourhood area.
But, given the flawed nature of the definitions, the conclusions seem somewhat
tautological and inevitable. In consequence it must be concluded that
neighbourhood area is an attractive but loose concept lacking a definition useful for
practical application.
55

4.5 The Neighbourhood of Little Hereford An essential precondition for this study is to define and delimit an area or locality
around Little Hereford which has an interactive relationship with that parish and
which will be the territory from which migrating families can be identified and
located (Chapter 7). Defining such an area would need to fulfil certain
requirements:
• Reflect the behaviour of local people
• Have some cohesion or internal integrity
• Be faithful to the context of the area
• Be capable of replication in similar areas
• Be simple to construct and apply
• Yield sufficient data
The successful application of these criteria offers the possibility of delimiting a
locality or neighbourhood area. For the 19th century the most comprehensive
available data source is the Census Enumerators’ Books (CEBs). For the period
1841 – 1901 in Little Hereford the occupants at each dwelling at successive
decennial censuses were identified. This involved plotting, dwelling by dwelling,
the occupants at each decennial census. This produced about an 80% success rate
because some dwellings, even with the aid of fieldwork, could not be identified.
The Tithe Assessment schedule was particularly helpful in this task because it was
produced in 1846, at an intercensal point and showed changes not available by a ten
year interval. By this method seven families were identified as having been present
in the Parish throughout the period 1841 - 1901. This is a minimum of sixty years
or about two generations but provisionally they were designated as core families. Of
these, in 1901, four were labourers and three farmers.
It needs to be indicated that this exercise does not necessarily take account of
changes in name through marriage and, therefore, the seven families are a minimum
number. For example, Richard Hill, a sawyer, lived at Bradley Cottage in 1841.
He took on a live-in worker, William Rowbury who married his daughter Sarah and
by 1891 was head of household there. So in a sense a core family married into a
56
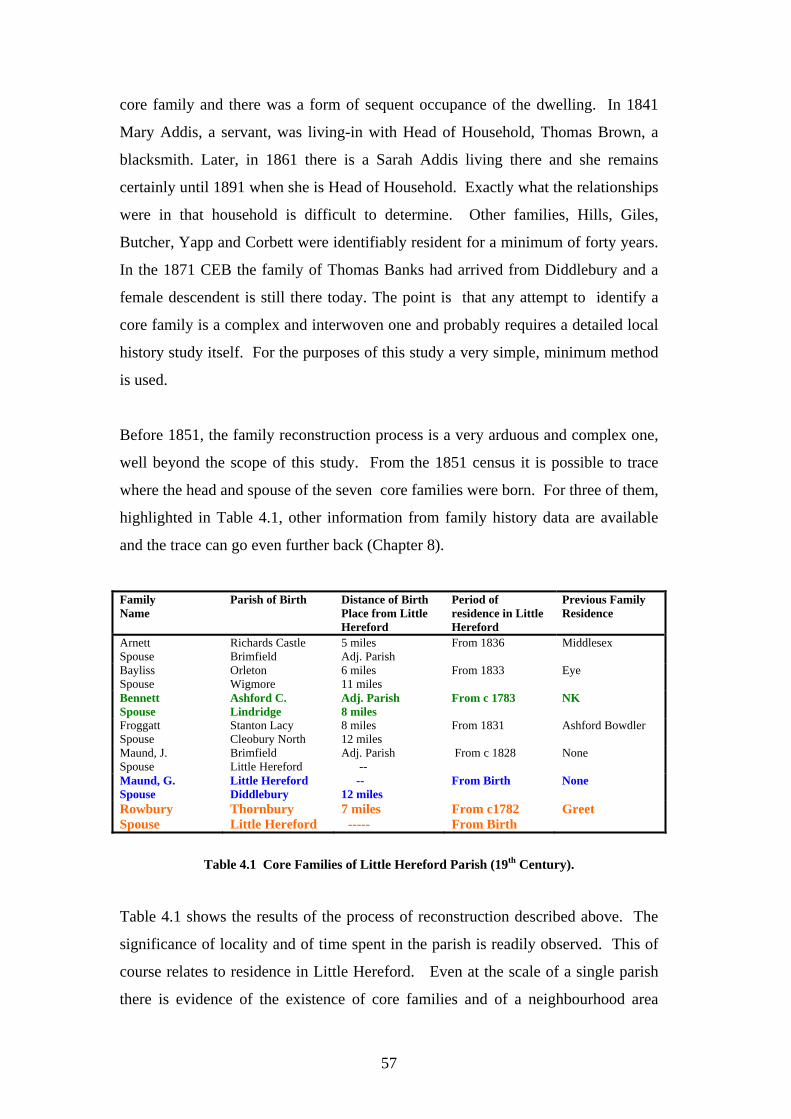
core family and there was a form of sequent occupance of the dwelling. In 1841
Mary Addis, a servant, was living-in with Head of Household, Thomas Brown, a
blacksmith. Later, in 1861 there is a Sarah Addis living there and she remains
certainly until 1891 when she is Head of Household. Exactly what the relationships
were in that household is difficult to determine. Other families, Hills, Giles,
Butcher, Yapp and Corbett were identifiably resident for a minimum of forty years.
In the 1871 CEB the family of Thomas Banks had arrived from Diddlebury and a
female descendent is still there today. The point is that any attempt to identify a
core family is a complex and interwoven one and probably requires a detailed local
history study itself. For the purposes of this study a very simple, minimum method
is used.
Before 1851, the family reconstruction process is a very arduous and complex one,
well beyond the scope of this study. From the 1851 census it is possible to trace
where the head and spouse of the seven core families were born. For three of them,
highlighted in Table 4.1, other information from family history data are available
and the trace can go even further back (Chapter 8).
Family Name
Parish of Birth Distance of Birth Place from Little Hereford
Period of residence in Little Hereford
Previous Family Residence
Arnett Spouse
Richards Castle Brimfield
5 miles Adj. Parish
From 1836 Middlesex
Bayliss Spouse
Orleton Wigmore
6 miles 11 miles
From 1833 Eye
Bennett Spouse
Ashford C. Lindridge
Adj. Parish 8 miles
From c 1783
NK
Froggatt Spouse
Stanton Lacy Cleobury North
8 miles 12 miles
From 1831 Ashford Bowdler
Maund, J. Spouse
Brimfield Little Hereford
Adj. Parish --
From c 1828 None
Maund, G. Spouse
Little Hereford Diddlebury
-- 12 miles
From Birth None
Rowbury Spouse
Thornbury Little Hereford
7 miles -----
From c1782 From Birth
Greet
Table 4.1 Core Families of Little Hereford Parish (19th Century).
Table 4.1 shows the results of the process of reconstruction described above. The
significance of locality and of time spent in the parish is readily observed. This of
course relates to residence in Little Hereford. Even at the scale of a single parish
there is evidence of the existence of core families and of a neighbourhood area
57

determined by their origin and previous residence. Thus no one is born more than
12 miles from Little Hereford, including the marriage partners.
These data were derived solely from information contained in the 1851 census
which gives place of birth in contrast to that in 1841. The period of residence in
Little Hereford is in some cases calculated from the date and place of birth of the
children and, therefore, cannot be precise. It should also be noted that all of these
families are plotted through the male line. To do the same through the female line
is much more complex because of the possible change of surname involved. If this
is unknown it makes searches very difficult and can have a knock on effect through
the generations.
On the basis of Table 4.1 there is a clear relationship to the ideas of core families
and neighbourhood area although the evidence does not demonstrate relationships
between the families. From other information it is known that both the Rowbury
family and the family of John Maund were related to the Roberts, who were long
time residents of Little Hereford. It is also known from family trees to be used later
in the study (Chapter 8) that the parents of George Maund arrived in Little Hereford
about 1783 from the neighbouring parish of Brimfield. Thus no one source
contains all evidence.
All of the families originated from within the locality and some moved within it.
Only one family, Arnett, moved a major distance but they were born in the locality,
moved to Middlesex and then returned. The Arnetts, Froggatts and Baylises were
farmers and all tenants of the Lord of the Manor. The other four families were
essentially labourers, although the Rowburys later became craftsmen and small
landowners. At the time of writing none of the families is still living in Little
Hereford. Over time even core families are essentially temporary.
Clearly there is evidence for the existence of core families in Little Hereford during
the 19th century and for them occupying a locality. In an effort to define the locality
more precisely, and to be more inclusive or comprehensive than the earlier writings,
the place of birth in 1851 of all heads of household and spouses was calculated.
1851 was chosen because this was the first census to record these data but also
58

because it was well before the total population of Herefordshire and Shropshire
began to decline.
From Table 4.2 it can be seen that there is a distance decay feature rather than a
discrete territory something not noted by Mitson (1993) who used clear boundaries.
The shape of the gradient away from Little Hereford is interesting (Table 4.2).
There is almost a plateau of about ten miles diameter within which about 72% of
heads of household and 72% of spouses were born, then a quite rapid fall-away
with a very small proportion from beyond 20 miles. The neighbourhood area is not
a discrete territory but a continuum which falls away gently at first from Little
Hereford and then steeply from about six miles.
Distance from LH Head of Household
Spouse/Next of Kin
Little Hereford 35% 30% Up to 5 miles distant 28% 31% 6 to 10 miles distant 9% 11% 11 to 15 miles distant 10% 10% 16 to 20 miles distant 5% 2% Over 20 miles 9% 6% Not Known 5% 10%
Table 4.2 Little Hereford:
Place of Birth, Heads of Household and Spouses 1851.
These findings are not inconsistent with those of Perry (1968 p124). He conducted a
study of marriage distances in rural Dorset and found that between 1837 and 1886
in excess of 80% of marriage partners came from within six miles of the parish
concerned. These two calculations are not exactly comparable because Perry used
data drawn from Marriage Registers. Never the less there is confirmation of an area,
around a parish, where there is intensive social interaction. After 1886, according
to Perry (1968) this spatial relationship, whilst not breaking down, extends to
greater distances.
So far the analysis has shown that the concepts of core family and neighbourhood
area have utility, and that place of birth of heads of household and their spouses
also support the idea of an area of intense social interaction. The benefit of this
latter is that it involves all heads of household and, therefore, removes the problem
of a territory defined solely by higher status people. Place of birth seems to be an
59

effective index of social interaction in the context of the territorial mobility patterns
of the day such as journey to work and journey to market.
The place of birth of all inhabitants is given in the CEB. Having established the
core families from the point of their earliest inclusion in the CEB a date nearer to
the date of the analysis in Chapter 7 was adopted to define the neighbourhood area.
Data for all inhabitants of Little Hereford were plotted from the 1871 CEB. This
census was used because it comes in the ten years just prior to the point at which an
absolute loss of population in the Mid Borderland was observed. This means that
every resident, including children, not merely those that are core or even married,
has an opportunity to contribute to the definition of neighbourhood area. In this
way, for example, those living-in in households and contributors to the area of
social interaction would be included and this may delimit the neighbourhood area
more precisely and might be used to provide a comparison with data from 1851
(Table 4.3).
Born within
Number Cumulative No.
% Cumulative
Little Hereford 161 161 40 1 Mile 14 175 44 2 Miles 27 202 51 3 Miles 31 233 59 4 Miles 20 253 64 5 Miles 13 266 67 6 Miles 10 276 70 7 Miles 1 277 70
Table 4.3 Birth Place Distance of Little Hereford Parish Residents 1871.
The results of this calculation for the locality are given in Table 4.3. The distances
refer to any parishes through which lines drawn from the centre of Little Hereford
pass. Any person born in a parish through which such a distance line goes is
ascribed that distance from Little Hereford.
It can immediately be seen that this neighbourhood area is broadly similar to that
for 1851. The 70% of all inhabitants born either in or within six miles of Little
Hereford demonstrates the area of intensive social interaction. More broadly the
distance decay feature indicates that although this area is identifiable it also merges
60

with other neighbourhoods at the fringe. Beyond this area of social activity the
gradient falls away steeply.
This Table 4.4 extends the area of data and can, despite the different basis of the
calculation, be compared with that for Head of Household and Spouse in Table 4.2.
% - Cumulative Distance from Little Hereford 40% born in Little Hereford 67% within 5 miles 82% within 10 miles 84% within 15 miles 91% Over 20 miles
Table 4.4 Birth Place Gradient 1871
Although two thirds of the population is born within five miles of Little Hereford at
the other end of the continuum only 9% were born more than 15 miles away and,
although not included in the Tables, only 12 people were born more than 100 miles
away. This gives the broader context for identifying a credible neighbourhood area.
So what is the extent of the neighbourhood area? It is clearly not a distinct entity
and some judgement has to be made as to its extent. Too much precision would be
inappropriate and spurious because the distances measured are only approximations
not measurements to the precise spot at which each person was born. Parishes vary
in area and shape so it is quite conceivable that some people might actually be born
further away than the measurement given.
From Tables 4.3 and 4.4 the boundary of the neighbourhood can be identified as
those parishes within five miles of the centre of Little Hereford. This was a
compact area and at the point at which the cumulative total begins to grow more
slowly, it is a break in slope in the distance decay function. Clearly this is a distance
that could be comfortably walked there and back in a day. This is particularly
important given that all of the population is included in the calculation rather than
only those who had access to other means of travel. It reflects one essential aspect
of everyone’s behaviour, the place where they were born. However there are some
61

qualifications to be made before arriving at a final definition of a neighbourhood
area.
It seems important that the parishes identified by this means be contiguous with no
territorial breaks and in this instance this is the case. Clearly not all of the parishes
were the same shape or size and the method would be more accurate were it
possible to define the area based on the location of the actual household in which
the individual was born. The census was collected on an enumeration district basis,
which was almost always the parish, and was not sufficiently accurate to identify
easily the location of a number households.
Figure 4.6 The Parishes of the Neighbourhood of Little Hereford 1871.
62

Even when this was attempted by intensive fieldwork in Little Hereford it failed to
locate a number of the dwellings. Some had been demolished and for some others
the census description was too general.
What this method has given is a series of parishes around Little Hereford in every
direction, a total of 20 parishes and one market town within a 5-mile boundary.
Three parishes to the east and north east of Little Hereford, Hope Bagott, Nash and
Boraston had no one born there and resident in Little Hereford and so these were
omitted. A total of 17 parishes and one market town within the 5-mile boundary
were identified as the neighbourhood area or locality and shown in Figure 4.6. The
position of the parishes identified in this manner in relation to their immediate
surroundings has been indicated previously in Figure 4.5. They occupy an area of
about 64 square miles and a total parish population in 1881 of 7,994 in addition to
the market town of 2,090. This is the area to be used as the base for analysis from
which some families migrated after 1871. It is more comprehensively delimited
than those suggested by local historians and, for this study, is the area from which
the pattern of migrating families after 1871 will be studied (Chapter 7).
Although to some extent data are determined arbitrarily by parish boundary, it is
interesting to note that there are three counties involved and their boundaries do not
appear to influence the identification of the locality at all, in fact they cut right
through the neighbourhood. It is as though these boundaries did not exist. The
conclusion is that, at least at this scale, boundaries did not influence social
interaction. So there is now a locality defined which represents the territory around
an individual parish from which it drew the majority of its population and over
which they interacted. It was also an informal unit rather than an administrative
one. For the purposes of this study the neighbourhood or locality of Little Hereford
was:
That contiguous territory around the Prime Parish from which it drew the majority of its residents at a moment in time. This territory showed diminishing interaction away from the prime parish, at first gently sloping and then sharply falling away. This change in slope was the delimiting factor of the Locality.
63

Clearly this is not a generalisation, the last word on defining neighbourhood areas
during the 19th century; it merely takes some of the earlier work a little further and
serves the purpose of defining a small scale area for this investigation that is not
completely arbitrary. To take this a little further it is possible to suggest that in the
gradient away from the prime parish there is an inner neighbourhood area, here
delimited at five miles, and an outer neighbourhood area of between five and seven
miles. This would be consistent with the idea of an area of immediate interaction
and one of less frequent interaction. Thus in the 19th century five miles might be an
acceptable maximum daily journey to work by foot wheras seven miles might be a
weekly visit to a market town or perhaps a visit home by those living-in.
This procedure has established an area that fulfils the criteria established at the
outset of the analysis. It reflects the behaviour of people in the context of time and
place; it is relatively easy to calculate and is certainly replicable in any area. There
is also almost certainly some coherence within the area so defined ( Chapters 5 and
7). It is the area where the majority of people who live there were born and find
their marriage partners. It is what might be called a locality, “the space within
which the larger part of most citizens daily working and consuming lives is lived ”
(Johnston 1997 p243). It can never be a completely discrete and unique area; it must
inevitably merge with others.
The neighbourhood so defined yields, even in an area of low population, sufficient
data from which to draw valid conclusions without losing the detail required by a
small-scale enquiry. Finally, it has to be noted, that a neighbourhood area in the 19th
century may be very different in extent from a neighbourhood area in the 21st
century when working, consuming and social lives are conducted more easily
across space. It takes perhaps, an hour to walk five miles, perhaps fifteen minutes
on a bicycle and five minutes by car. Therefore, developments in transport
technology may affect the dimensions of a neighbourhood area or locality.
4.6 Conclusion This chapter has identified areas at two different scales: A region and a locality. In
doing this it has used ideas from local historians. However, these ideas of cultural
64

province, neighbourhood area and core family have been adapted to fit the purposes
of this study. The great significance of this is to use the idea of “we become what
we are because of where we are” (Johnston 1997 p243) in order to investigate its
significance to the pattern and process of migration. No where is it suggested that
the places delimited here are static and unchanging, indeed the very notion of a
gradual merging with surrounding areas is an important aspect of this study. In a
longitudinal study involving more than two hundred years change is to be expected.
The locality of Little Hereford is that which existed towards the end of 19th century
but the region of the Mid Borderland may have more longevity as suggested by its
historical antecedents. Change here may be more concerned with adaptations to the
ways of life over time than its external boundaries.
This study will now proceed on the basis of an identified Prime Parish, Little
Hereford, a locality here called the Neighbourhood of Little Hereford and a Region
here designated as the Study Area. The cultural context of these areas is discussed
in the next Chapter.
65

Chapter 5 The Cultural Context and Ways of Life
5.1 Introduction The realisation of the inadequacies of deterministic explanations of human behaviour
or, as Cloke et al (2004 p308) put it, “people are not rocks”, resulted in an extensive
exploration of the role of culture in migration studies (Gordon 1992; Fielding, 1992;
Halfacree and Boyle 1993; White and Jackson 1995; Pooley and Turnbull, 1998;
Johnston 1997; Johnston and Sidaway 2004). When the notion of culture becomes
identified with place as outlined in the previous chapter it appears as a powerful idea
for analysis. However, this immediately attractive concept is not without its
difficulties especially in definition and application and may therefore be
problematical. The purpose of this chapter is to explore the concept of culture and its
application to the activities and behaviours in the region under study. This is
consistent with one of the aims of the study and the objective, expressed in Chapter 1,
to identify the nature and culture of the rural neighbourhood of the Mid Borderland.
According to Dorothy Sylvester (1969) the Welsh Borderland was historically a
cultural hybrid. She justified this by a detailed analysis of the cultural overlays of
successive occupiers of the region using in particular one of their cultural artefacts
namely settlement type and form. As indicated earlier Phythian-Adams (1993), on the
other hand, defined the concept of a region by means of physical boundaries and then
looked at the cultural artefacts. Both stress the importance of the time dimension in
the adaptation and acculturation process and this is clearly important in a longitudinal
study. As noted previously sources for this type of investigation are fragmented and of
variable provenance but the attempt will be made to bring some coherence to them by
identifying at least a general framework for their analysis.
The structure of the chapter is to firstly examine various interpretations of culture and
then to proceed to identify, in an historical time scale, such elements and activities of
the Mid Borderland which might contribute to a description of its culture. Finally, in
the light of this exercise there will be a discussion of practical ways forward for the
enquiry and how culture may best be interpreted for the purposes of this enquiry.
66

5.2. Defining Culture Culture is very difficult to define in a way that makes it useful in a research
investigation of migration, as is indicated by the selection of definitions given below.
“Culture is that complex whole which includes knowledge, art, morals, customs and any other capabilities and habits acquired by man as a member of society” (Chinoy 1964 p20 quoting Taylor 1871) “The totality of what is learned by individuals as members of a society” (Chinoy 1964 p20)
“… a collective memory store from which individuals or groups could choose different combinations of available beliefs or ways of doing” (Hey 1996 p365)
“An interconnected pattern of widely observed ways of believing, communicating and doing that is informally transmitted from generation to generation” (Phythian-Adams 1996 p364)
“…groups of people who adopt similar ways of life and whose everyday lives are given shape through cultural artefacts and rituals they create and exchange” (Holloway and Hubbard 2001 p146)
With such a range of abstractions it is difficult to see how they might be
operationalised for the purposes of research. Moreover no mention is made of the
significance of place or the distinctive ways of life and sense of belonging that is also
involved. However, other studies have produced less abstract and indeed more
comprehensive views, for example Pooley and Turnbull (1998) introduced the
important reference to place, quoted in the previous chapter of this study, indicating
the significance of place identity and culture. This view is supported by Burrell (2003)
who pointed to the real and emotional ties that the migrants she interviewed still had
to their homeland. The introduction of the notion of attachment suggests some
personalised and emotional tie to a place.
These views were reinforced by Johnston, (1997 p249), “regions are places where
people learn culture and contribute to its continuation.” It seems that place and ways
of life are inseparable and therefore there is some irresistible relationship between
culture, place and ways of life.
67

From the discussion of definition and interpretation of culture it seems clear that the
concept of culture is a highly complex one. For the purpose of this study it is seen as
an amalgam of values, beliefs, attitudes, behaviours and practices inextricably linked
to place. Further, these attributes evolve continuously over time and therefore the
culture is subject to change over both time and space. In the Borderland there is
tangible evidence for this in the artefacts of previous generations for example,
settlement form (Sylvester 1969) and field systems (Shepherd 1979). There appears
to be much support for the position that people’s decision to migrate is related to
individual and cultural factors rather than determined by some outside impulsion.
Burrell (2003 p27) using Chamberlain (1997) put the position quite clearly, “the
motive for migration may have had as much to do with the maintenance of the family
and its livelihoods, with the enhancement of status and experience within a culture
which prized migration per se and historically perceived it as a statement of
independence, as to do with individual economic self advancement.” The question
then arises of how to proceed with an analysis of the Borderland as a context for this
study.
There has been much discussion of place, locale and locality possibly resulting from
the extreme difficulty with the concept of culture. For example, Johnston (1997) and
Johnston and Sidaway (2004) review the arguments involved in the development of
thinking around these concepts and their relationship to region. They conclude that a
practical application is offered in the study made by Griffiths and Johnston (1991). In
this study of the 1984 miners strike they offer a three component framework as a
means of describing and analysing place. This framework was briefly referred to in
the previous chapter as using categories related to the locality namely, local
economic, social and political structures. Although these are very broad categories
they do at the very least suggest a way forward. Hoggart et al (2002) point to the
importance of an explicit structure because, although, they maintain that research can
only be an interpretation, a framework and structure allows for checking. These
structures certainly offer the potential for this and provide a framework for the
retrieval of data from the variety of sources available, in other words, a form of
structure for data selection. With the addition of a time scale this structure provides
an opportunity to examine the major features and characteristics of the Mid
Borderland in an historical time scale thus showing the evolution of the social,
68
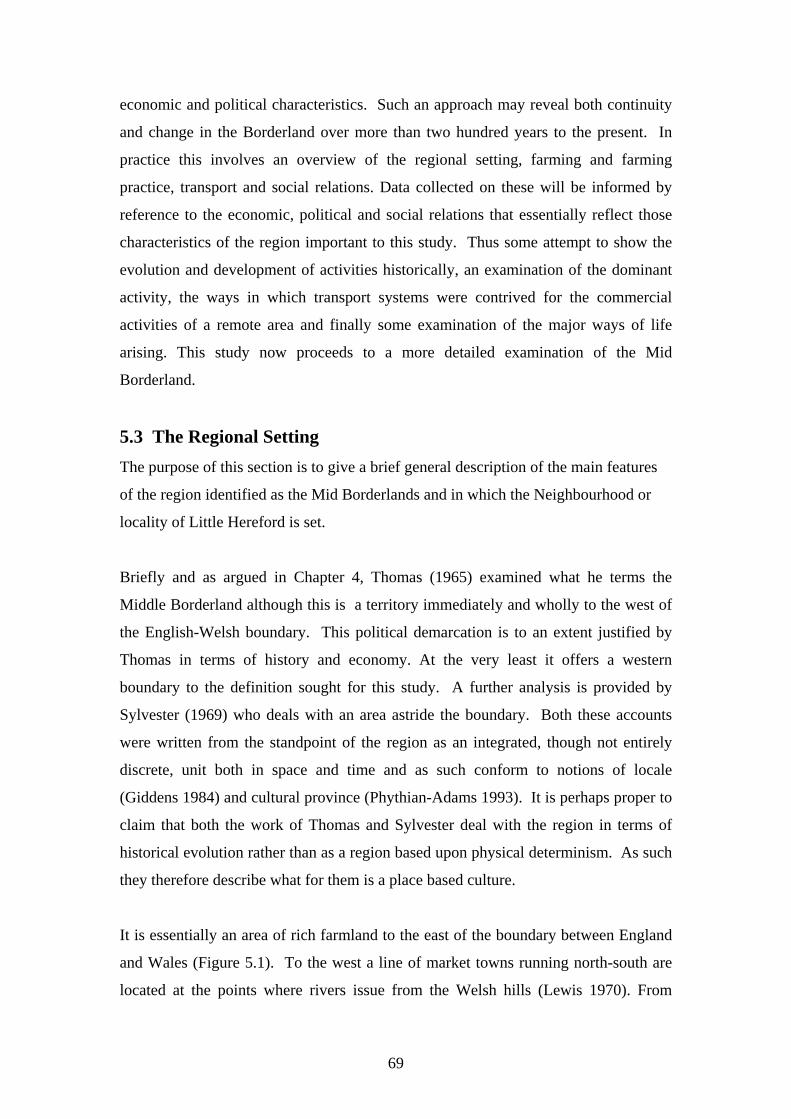
economic and political characteristics. Such an approach may reveal both continuity
and change in the Borderland over more than two hundred years to the present. In
practice this involves an overview of the regional setting, farming and farming
practice, transport and social relations. Data collected on these will be informed by
reference to the economic, political and social relations that essentially reflect those
characteristics of the region important to this study. Thus some attempt to show the
evolution and development of activities historically, an examination of the dominant
activity, the ways in which transport systems were contrived for the commercial
activities of a remote area and finally some examination of the major ways of life
arising. This study now proceeds to a more detailed examination of the Mid
Borderland.
5.3 The Regional Setting The purpose of this section is to give a brief general description of the main features
of the region identified as the Mid Borderlands and in which the Neighbourhood or
locality of Little Hereford is set.
Briefly and as argued in Chapter 4, Thomas (1965) examined what he terms the
Middle Borderland although this is a territory immediately and wholly to the west of
the English-Welsh boundary. This political demarcation is to an extent justified by
Thomas in terms of history and economy. At the very least it offers a western
boundary to the definition sought for this study. A further analysis is provided by
Sylvester (1969) who deals with an area astride the boundary. Both these accounts
were written from the standpoint of the region as an integrated, though not entirely
discrete, unit both in space and time and as such conform to notions of locale
(Giddens 1984) and cultural province (Phythian-Adams 1993). It is perhaps proper to
claim that both the work of Thomas and Sylvester deal with the region in terms of
historical evolution rather than as a region based upon physical determinism. As such
they therefore describe what for them is a place based culture.
It is essentially an area of rich farmland to the east of the boundary between England
and Wales (Figure 5.1). To the west a line of market towns running north-south are
located at the points where rivers issue from the Welsh hills (Lewis 1970). From
69

Welshpool in the north to Hay-on-Wye in the south may be the effective western edge
of the region. Both in the past and in the present these towns serviced the different
agricultural regimes to their east and west. East of the western towns is yet another
line of towns running north south from Shrewsbury through Church Stretton, Craven
Arms, Ludlow and Leominster to Hereford. These too are important agricultural
markets but are also linked by the major north-south route down the Borderland.
Figure 5.1 The Mid Borderland.
The rivers flowing east from this area eventually flow south to join the Severn.
Especially significant for the locality of Little Hereford are the rivers Teme, Lugg and
Wye. Finally, at the extreme east is the line of the River Severn and the towns along
it that formed an important means of transportation for agricultural produce. Of
particular significance are Bewdley, Stourport-on-Severn and Worcester. Routes from
these provided access not only to Birmingham and the Black Country but also down
stream to Gloucester, Bristol and London by water. From Leominster and Hereford
70

routes south down the Lugg and the Wye led to South Wales and Bristol via
Chepstow.
These market towns and river ports form, over a long period of time, an essential
network for the economy of the area (Lewis 1973). The closely spaced market towns
were essential points of exchange, each servicing its own neighbourhood but also
connected with others so that livestock from the hills of Wales could be sold at market
to those seeking to fatten them in the lowlands. Thence the products could be moved
to the Severn for transfer to the wider market. So there was a coherence, an
interconnected system which served the agricultural activities of the region.
Importantly, the Mid Borderland was remote but not inaccessible. This is an important
theme, one which may be noted as an enduring characteristic.
The great arc of the River Severn is important in this system and effectively provides
the northern and eastern edge to the region. But it is also the collection point for a
number of other but smaller river systems. Thus the Teme rises in mid Wales flows
east to Ludlow and then south and finally east forming the southern boundary of Little
Hereford and then on to join the Severn at Worcester. This river basin of the Teme is
effectively in the centre of the region and important for the neighbourhood of Little
Hereford (Figure 5.2).
Little Hereford, the Prime Parish, is in the centre of its neighbourhood area between
the market towns of Ludlow in the north and Tenbury to the east. Ludlow is about
four and a half miles away in a direct line and Tenbury about three. Six miles away to
the south is Leominster. The distance between markets was conditioned by the need to
have access to them. With transportation difficulties there was a need to be able to get
to them and back on foot in a day frequently driving livestock on the hoof. So,
although the towns may be ten to twelve miles apart, no intervening location was
more than five to six miles from a town. This feature is more readily seen on the more
localised Figure 4.10 in Chapter 4. On this map also the routes out of the region and
the towns they connect to are indicated. The location of these can be seen on Figure
5.1. The neighbourhood marked on Figure 4.5 and again on Figure 5.1 is almost
entirely in the basin of the middle Teme. On its north eastern edge is Clee Hill and
Bringwood Chase on the north-western, both with different economic histories and,
therefore, exceptions to the generally rich farm land of the remainder of the area as is
71

indicated later.
Figure 5.2 Little Hereford and Basin of River Teme
South of this is the River Wye which, rising in mid Wales, flows east to Hereford and
then south to the Severn at Chepstow. On the way it collects the Arrow near
Leominster and the Lugg and Frome at Hereford. These minor river systems not only
provide wide valleys and meadowland but also, essential route ways for the
commercial agricultural products and linkages between the market towns before the
coming of the modern transport systems.
72

In many ways the Mid Borderland fits Rackham’s (1986) description of Ancient
Countryside with its hamlets, very few nucleated villages but small market towns,
isolated farms, roads not straight and sometimes sunken, small woods with open fields
largely abolished before 1700. It is doubtful whether there was ever an open field
system here and such enclosure that took place did so in 15th and 16th centuries (Tate
1978; West and West 1985; Hey 1997). Later at the end of 18th century there was
some enclosure of the commons (Moir 1990). Much of this enclosure was undertaken
at the behest of the Lord of the Manor in particular parishes.
In arguing for a hybrid form of the culture in the Borderland Sylvester (1969 p166)
shows that distinctions in settlement structure are determined by what she refers to as
the Parish Line which does not follow an English/Welsh distinction but cuts across
that line. Thus for the Mid Borderlands region the line between single and multi
township parishes cuts through south Shropshire. Most of the region in the 19th
century was designated as an area of single township parishes. She also notes that
where there were nucleated villages these tended to be in west Herefordshire whereas
the east and north east was typified by dispersed settlement. The move to greater
nucleation is in fact a mid 20th century phenomenon when planning authorities
designated key villages in the face of rising demand for housing (Maund, 1976).
Much of the discussion among historians of the countryside about settlement form
rests on interpretations of the presence or otherwise of an open field system and the
nature of the control of the community (Short 1982). In an attempt to classify
different forms of settlement Mills (1980) developed a classification based on
attitudes towards the implementation of the poor law. In doing so he proposed ‘open
villages’ where the control of the Lord of the Manor was weak and ‘closed villages’
where incomers were prevented from settling by the Lord. This typology was
developed for areas of eastern England where much of the farming was arable and
there was a very strongly developed open field system and does not appear to be an
useful concept to describe the countryside of the Mid Borderland. It would appear that
the nature of the demand for labour was different from that of the pastoral west
(Hobsbawm and Rude 1969; Snell 1985) and had significant implications for the type
of settlement. However, whatever the form of the settlement, they appear to be
73

determined by the needs and activities of each region which may well have developed
its own response to changes.
The description of the countryside in the Mid Borderland is taken further by the words
of Daniel Defoe (1971) on his early 18th century travels when he came up the Teme
valley and must therefore have passed through, or close by, Little Hereford. “I
observe they are a diligent and laborious people, chiefly addicted to husbandry, and
they boast, perhaps not without reason, that they have the finest wool, and the best
hops and richest cider in all Britain .......... great quantities of this cider are sent to
London, even by land carriage, though so very remote, which is evidence for the
goodness of it, beyond contradiction. .... but ‘tis certain, that not any of our southern
counties ... comes up to the fertility of this county” (Defoe 1971 p 372).
This quotation raises a number of points. It was clearly a rich agricultural area
engaged in mixed farming with both animals and cash crops of a significantly
commercial variety. It was able to trade over distances even in Defoe’s time when
travel and transport were by no means easy. Further Defoe testifies to its remoteness,
so the goods must have been much in demand. It seems clear from this that
remoteness was not necessarily a barrier to access.
A more contemporary view of the countryside over a hundred years later, in 1850,
was that by the American, Anna Maria Fay writing home about her journey from
Shrewsbury south to Richards Castle in the neighbourhood of Little Hereford. “For
twenty miles we drove through what appeared to us Paradise. Parks on all sides with
sheep and cattle grazing under magnificent oaks, mountains in the distance tinted
under a glorious rising sun with shades of purple, cottages sometimes in the
foreground, sometimes on hillsides, in valleys, built of stone with pointed thatched
roofs and the fronts and sides covered with ivy or flowering vines” (Fay 2002 p66).
This brief description of the region is not merely the platform or setting for this study
it is an essential aspect of the character of the area. The region was pre-eminently a
farming area and most of the economic activities supported farming or those engaged
in it. There was a small amount of other workings including coal, iron and quarrying
in Bringwood Chase and Clee Hill but this was not typical of the region. In terms of
74

the landscape of an area divided by rivers the Victoria County History (1989) has
described south Shropshire as a series of ‘Pays’ whilst Dodd (1979) identified a series
of similar sub regions in Herefordshire in the 19th century based on minor differences
in agricultural regime.
5.4 Farming and Farming Practise One of the purposes of this section is to consider the view of Phythian-Adams (1993)
that ‘Cultural Provinces’ display not only continuity but also change, and that of
Giddens (1982) on the relationship between macro and micro structures and their role
in producing a distinctive culture of place. The Mid Borderland has a remarkable
history of adaptability in the face of external and national forces and therefore
adaptability will be a strong and enduring theme.
The early 14th century in Herefordshire was a period of famine and disasters which, in
1349, gave way to the Black Death (Hopkinson 1983). There followed a national and
local decline in population, (Chapter 6), perhaps by more than a third of the national
total (Hey 1997). Thus land became cheap and labour in short supply. One answer to
this in Herefordshire was a consolidation of holdings through piecemeal enclosure.
Another response in the Borderland as a whole was for less labour intensive practises,
and so sheep rearing took hold as the major economic activity. It was during this
period, the late 14th and early 15th century, that the yeoman farmer began to appear
(Hopkinson 1983). Over the next two centuries the region developed a widespread
trade in wool, even into Europe, and the market towns boomed (West and West
1985). Reeves (c1970) in a study of the history of Leominster and district quotes an
unknown source ( p120)
“Where lives the man on Britain’s furthest shore To whom did never sound the name of Lemster ore? That with the silk worm’s thread for fineness doth compare”
This “ore” he maintains, came from the fleece of the famous Ryland sheep, developed
around Leominster, and much of its success was due, up to the mid 16th century, to
the work of the Priory monks. Leominster became a major late medieval and early
English market. But over a period of time the quality of the wool declined with
75
changing habits for feeding sheep. The region adapted through the development of
beef cattle breeding to take the place of wool (Reeves c1970). This illustrates a
continuous process of adaptation, a process rather than an event and the change was
slow and piecemeal, there was both continuity and change.
According to Reeves (c1970) the tradition for cattle breeding began in about the 17th
century and some maintain that the Scudamore family of Holme Lacy, long term
aristocratic farmers, were responsible for this when the then Lord introduced Flemish
cattle in about 1660 (Reeves c1970). Lord Scudamore too was responsible for the red
streak apple and, by 1639, was sending cider to London, noted a hundred years later
by Defoe (1971). So the challenge to wool which came from the continent was met by
turning to beef cattle.
A particular characteristic of the Mid Borderland was the influence of pioneers and
innovators perhaps not nationally famous but none-the-less very important locally as
leaders of change. For example, the Tomkins family from just north of Hereford were
another family to progress by careful selective breeding of cattle. From this
beginning the famous Hereford breed was established and with it a tradition of herd
improvement and selective breeding, and in 1846 the first edition of the famous
Hereford Herd Book Society was published. This breeding practise and success was
not localised for it influenced the cattle areas of the world. The practise of improving
the Hereford breed continued into the second half of the 20th century when
competition from other foreign breeds and beef products saw a decline. However it
must not be overlooked that there was a close association between beef and arable
because of the need for fodder and with it rotations and the maintenance of soil
fertility. So wheat became an important crop not only for cattle fodder and subsistence
but also for export. Of course this long tradition of commercial farming in the Mid
Borderland required well worked transport systems and this will be returned to later.
By the mid 17th century the region was an area of mixed farming and, it is reasonable
to suppose, able to respond more rapidly to changing markets than the more
monocultural eastern England. This possibly stemmed from its history and attitudes
and perhaps the hybrid nature of its culture. There were also a continuous set of
innovations, experimentation and technological developments that enabled changing
76

conditions to be met. Improvements in manuring and the introduction of clover and
turnips into the rotation were all achieved here. For example, as early as 1689 Ann
Cooke of Richards Castle was growing five acres of winter corn and 18 acres of
spring crops including two acres of turnips (VCH 1989 p147). By 1650 hops had
been introduced into the Teme valley and John Smith of Burford had 20,000 poles as
well as apples and cider (VCR 1989). But the emphasis still remained on livestock
and much of the crops were grown as fodder in support of this. The local towns were
the markets and essential to the activity of the area (Lewis 1975). Animals were
transported on the hoof until the coming of the railways, but buyers at specialist fairs
that were established came from as far afield as Berkshire and Kent (Reeves 1970).
Perhaps part of the Mid Borderland’s adaptability was due to external contacts for,
despite its remoteness, there was much contact with the outside world and, therefore,
exchange of knowledge and ideas, and not merely by the better off. Apart from fairs,
drovers out of Wales traversed the area en route to the markets of London although
the major tracks went south of the neighbourhood area, crossing the Wye at Hereford
or north through Shrewsbury (Bouser 1970). There was a ford across the Teme at
Ashford Carbonel, a neighbouring parish to Little Hereford, and through here herds of
cattle were driven on their way to Bewdley (Ray 1998). But the system of markets
and fairs will have brought much contact. Factors from as far afield as Berkshire and
Kent came regularly to the region. One of the functions of the region was cattle
fattening as well as cattle breeding. Cattle came from the west to the local markets
and were bought by local farmers for fattening for resale to buyers who came from the
populated Midlands or London (VCR 1989). This was one of the major farming
activities and provided a demand for labour and much of it all year round.
The 19th century is particularly important for this study as a context for the
investigation of migrating families. It has now been established that the region of the
Mid Borderland was by the 19th century a rich one for agriculture and capable of
sustaining a variety of farming regimes which continued well into the 20th century
and the next. The success of farming regimes and production may be, in some senses,
subject to physical conditions so a bad harvest can be the product of poor weather as
at the end of the Napoleonic Wars and then again during the early 1870s. But physical
conditions are better regarded as permissive rather than deterministic. Farmers can
77

respond to the market although changing agricultural regimes takes some time.
Clearly there are different time scales: selective breeding may take a hundred years; to
change from arable to pastoral, say, five years; to cultivate a different crop, one year.
Building up a herd takes time too as does growing a new crop, so there are lags in
response to the market and these have to be managed. In such circumstances the
simple laws of supply and demand have to be amended for agriculture to take account
of the time delay hence the Cobweb Theorem (Lipsey 1963). Despite the difficulties,
by the very nature of its mixed regime, the region was well placed to respond to
changed demand. From the late 20th century the demand for milk has fallen away,
beef is now highly specialised but potatoes, farm shops, leisure pursuits and fruit are
now all part of the farming regime as the region adapts yet again by diversifying.
All these adaptations were the results of decisions made by farmers in consequence of
their interests and how they perceived the conditions of the day. Some were
innovators like the Tomkins family and others improvers like John Arkwright (to be
discussed later). It appears that some changed because of their individualistic and
pro-active outlook, some simply as a response to national circumstance. Not all
responded successfully and indeed some may not have responded at all. But in total
these decisions were all part of the characteristics and traditions of the area to which
different people had different reactions. Commercial success in farming is frequently
an individual response rather than a corporate one and this is illustrated in Chapter 9.
Individualistic responses are a characteristic of the region as some of the above
illustrates. In 19th century agriculture there was a series of national phases and in
terms of farming they formed four distinct periods:
1. To 1812 - Boom in prices, poor harvests and the poor suffered. 2. 1815-51 - Depression, rioting, Swing Riots, New Poor Law, Reform Act, Tithe Commutation Act, repeal of Corn Laws. 3. 1852-74 -Boom, High Farming, land draining. 4. From 1874 -Depression, competition, depopulation of the countryside.
One result of the 1836 Tithe Commutation Act was a survey that enables the
reconstruction of the land use of the time and thus some judgment can be made of the
farming regime. In Little Hereford this survey was conducted in 1846 and the data
when aggregated from each of the field totals offers the following summary of land
use in the parish (Table 5.1). Most of the land within the parish was in use and Table
78

5.1 illustrates that a total of 53% of the land was down to grass. It was a very active
agricultural area, even before the boom that came after 1850.
Land Use % Meadow 17 Pasture 38 Arable 42 Hops 3 Orchard 10 Wood etc 0.4 Rough 0.4
Table 5.1 Little Hereford – Land Use 1846.
Grass was necessary for hay as fuel for horses which were used on the farms and thus
for transporting produce and also to feed other livestock over wintering.
In Kimbolton, to the south of Little Hereford, the tithe apportionment was completed
six years earlier in 1840 (James 2001). As can be seen from Table 5.2 orchards were
Land Use % Meadow/Pasture 53 Arable 37 Woodland 2.5 Hops 1.6
Table 5.2 Kimbolton - Land Use 1840
not recorded for Kimbolton, although they must have existed but, this aside, the land
use pattern was similar to that in Little Hereford. The making of cider was an
important aspect of farming because its provision was an essential part of the
labourer’s employment terms. It is likely that orchards were included in pasture
because it had this dual use. This pattern of agriculture derived from the tithe data
confirms the suggestion by Phillips (1979) that after 1870 the proportion of grassland
actually increased. Such a finding was entirely consistent with the changing fortunes
in agriculture as farms went out of wheat in the face of cheaper grain from overseas.
Crop Arable Wheat Barley Oats Turnips Beans Ley Fallow Acres 40 14 3 2 4 4 6 7
Table 5.3 Crop Proportions on single Farm , late 19th century (Dodd 1979).
79

In a very interesting survey Dodd (1979) used data from a range of sources relating to
the second half of 19th century, to produce land and crop surveys for different parts of
Herefordshire. For the Little Hereford neighbourhood he showed the crop proportions
on an 81-acre farm (Table 5.3). The 40 acres not down to crops was clearly down to
grass but a picture was also given of the range of crops produced. In addition there
was also an orchard and a small hop yard. It was a typical mixed holding with apples
for cider, hops for brewing, wheat as a cash crop and the remainder as fodder. As
shown in Table 5.4 there were only a few animals on this farm.
Cattle 3 Store 2 Calves 2 Milch Sheep 4, 2 year (Wintered) 19 Ewes 12 Lambs Horses 3 Pigs 1 Poultry
Table 5.4 Animals on a single Farm, late 19th century (Dodd 1979)
So this particular farmer’s income would come from wheat (although some was fed to
animals), lambs, beef and some from the orchard and hops. Although the milch cows,
pigs and poultry and to some extent the apples were largely for subsistence they were
also reared for small scale commercial purposes. The animals for sale were taken to
market on the hoof and other products such as eggs, poultry and butter would be
driven to the appropriate town on market day, probably in a pony and trap. Certainly
as late as the 1920s this was still happening, for example, from Yarpole, adjacent to
the neighbourhood of Little Hereford, to Leominster on a Friday (Chapter 8).
The animal husbandry on this farm illustrated was labour intensive and required work
all year round hence the differing regime from the arable east referred to previously.
The animals would be indoors during the winter and have to be fed daily with hay and
roots and this demanded daily labour. An acre of ploughing would take a day, in the
course of which the ploughman would walk about eight miles. The acreage under
crops was seasonal and probably additional casual labour would be required at
harvest. Some of the activity was aimed at subsistence, the pig, two Milch cows and
the poultry. Until the coming of mechanisation, after 1870, much of the work would
have been hand labour and this persisted in some areas up to the Second World War.
Certainly the early machinery was all horse drawn (Hill & Stamper 1993).
80
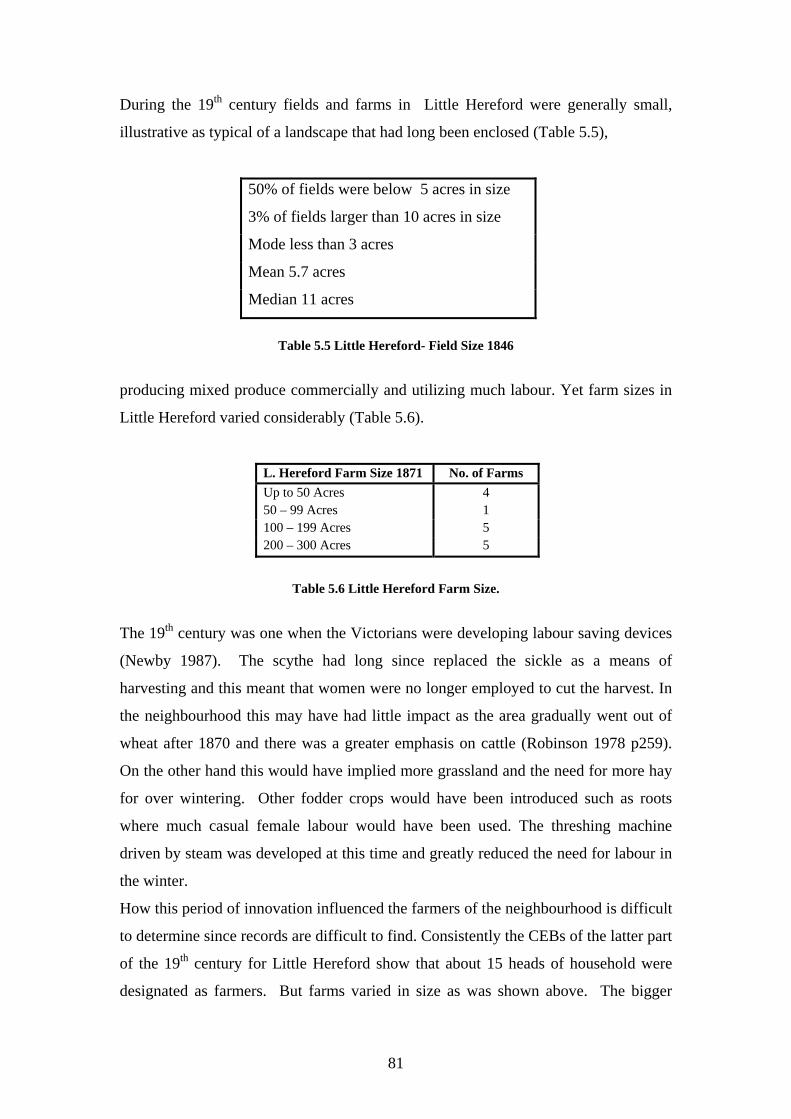
During the 19th century fields and farms in Little Hereford were generally small,
illustrative as typical of a landscape that had long been enclosed (Table 5.5),
50% of fields were below 5 acres in size
3% of fields larger than 10 acres in size
Mode less than 3 acres
Mean 5.7 acres
Median 11 acres
Table 5.5 Little Hereford- Field Size 1846
producing mixed produce commercially and utilizing much labour. Yet farm sizes in
Little Hereford varied considerably (Table 5.6).
L. Hereford Farm Size 1871 No. of Farms Up to 50 Acres 4 50 – 99 Acres 1 100 – 199 Acres 5 200 – 300 Acres 5
Table 5.6 Little Hereford Farm Size.
The 19th century was one when the Victorians were developing labour saving devices
(Newby 1987). The scythe had long since replaced the sickle as a means of
harvesting and this meant that women were no longer employed to cut the harvest. In
the neighbourhood this may have had little impact as the area gradually went out of
wheat after 1870 and there was a greater emphasis on cattle (Robinson 1978 p259).
On the other hand this would have implied more grassland and the need for more hay
for over wintering. Other fodder crops would have been introduced such as roots
where much casual female labour would have been used. The threshing machine
driven by steam was developed at this time and greatly reduced the need for labour in
the winter.
How this period of innovation influenced the farmers of the neighbourhood is difficult
to determine since records are difficult to find. Consistently the CEBs of the latter part
of the 19th century for Little Hereford show that about 15 heads of household were
designated as farmers. But farms varied in size as was shown above. The bigger
81
farmers lived in large houses and employed much labour, both on the land and as
domestic servants. For example, the widow Elizabeth Giles had 260 acres and
employed four men, three women and a boy and additionally five men living-in. They
were generally family farms and employed their sons, but not exclusively so.
Younger sons moved on at marriage to other farms in the neighbourhood area and
established themselves as independent. But the farmers themselves moved. By 1901
only three of the farmers present in Little Hereford in 1841, all with farms over 100
acres, were still there and one of these, the Baylises, had moved to a very much
smaller farm. This was, of course, in the midst of the depression which did not lift
until the Great War gave a much needed impetus. Some farms disappeared from the
census, which suggests that when a farmer moved the land was redistributed to
existing farmers by the landowner. Generally, but not exclusively, it was the smaller
farmer who moved in the period 1841 to 1901, which might support the notion that
farmers moved to better themselves (Saville 1957).
Rees (1994 p289) reviewing farming from the mid 19th century in Herefordshire
describes a system of high farming, land drainage and changing landownership. The
peak price years for farmland were in the early 1870s; prices were less than a half of
this by the end of the century. In the face of this slump estates frequently adjusted
rents to keep tenants in business. But, he goes on, as farming slumped everywhere it
was less severe in Herefordshire because of the mixed farming regimes. Hand in
hand with these changes went a decline in population in the countryside. For sixty
years after 1870 natural increase in the County was 53,000 but over the same period
there were 65,000 out migrants (Grundy 1986 p448).
Thus the Mid Borderland had been and remained a major commercial farming area
during the 19th century. Dodd (1979) in his account of farming in Herefordshire
during the 19th century testified to the quality of the produce and the pre-eminence of
wheat, much more of which was produced than the population could consume. He
too quotes Defoe but shows how the cultivation of hops and fruit had expanded but
wheat was still the major crop and capable of yields of 30 bushels to the acre. This
was maintained by a big programme of land drainage, very necessary in these heavy
soils and initiated by provisions in the Act of 1848 that repealed the Corn Laws to
give aid to this process. At the same time new pipes took over from the older system
82

of putting small tree cuttings into a trench.
It is difficult to assess the relationship between local farming and national trends
(Howkins 1991). At the very broadest level the region was clearly subject to macro
forces, thus the broad farming trends shown above applied but the real question is
how did the region respond? The answer given here is that it adapted positively
because of its mixed farming regime which enabled a quicker response than a
monocultural system such as that in the east and south of England. On the other hand,
there were local men who were pioneers and affected the national system, thus the
Hereford breed of beef cattle had an international impact and continued to do so up to
the 1960s. The area was a great wheat growing one at the time of the Napoleonic
wars. All through this time period the price of Herefordshire wheat remained below
the national average price. Parker (1979 p 44) maintains that this lower price was the
consequence of the large quantities produced. This, he continues, was in part due to
the successful production and national demand which led to the bringing into
production of more marginal land and the enclosure of commons such as Bleathwood
in Little Hereford in 1799. One very intriguing factor, he suggested, was the
willingness of farmers to sell wheat to their labourers at well below the market price,
thus suppressing the average price. If this was true it reflected upon the labourer
relations in the area and may explain why there were so few cases of criminal
disruption in the area. This is returned to later.
There are a number of distinctive features about the economy of the Mid Borderlands
that would suggest a regional response to changing conditions. Firstly, there was the
great adaptability of the farming regimes over time and this was not simply due to the
advantage of physical conditions. Advantage needed to be identified and exploited
and this could only be achieved through the decisions of people. This is seen not
merely in the simple change of regime but also in the care taken with selective
breeding, the introduction of new features into the rotation and later draining the land.
Much of this was due to the drive and energy from new money such as that of the
Arkwrights and the Clives (See 5.6). Secondly there was the condition of labour that,
although poorly paid and housed, was more frequently in work and fared relatively
better when wages slumped than their contemporaries in the east and south of
England (Redford 1926; Snell 1985; Mingay 1986). There was no evidence of
83

significant labour disputes (Hobsbawm and Rude 1969). Finally there was the
persistence of trade despite remoteness. Mass transport systems came late to the area,
perhaps reflecting its remoteness but also the relative scarcity of venture capital
(Beddoes and Smith 1995). A region is bound together by its social relationships.
Despite being late with many technical developments the Borderland adapted to
national change and changed its farming regimes successfully but it also contributed
through the enterprise of some of the farmers to the national and even international
developments. This characteristic of enterprise continued into the 21st century. For
example, in 1911 only 8% of farmers owned their land, by 1922 this had risen to 18%
and by 1941 to 30% (Hill and Stamper 1993 p12). In part this was due to the demise
of the great landowners as they sold off farms cheaply to tenants, in order to pay off
debt.
In the Mid Borderland there were undoubtedly phases of adaptation and development.
From the close of the feudal system there was the sheep and wool phase which saw
the establishment of the market towns and the transport routes. From the 17th century
came the great era of beef cattle but supported by hops and fruit, particularly apples.
Alongside this was a very significant trade in wheat (Parker 1981). All through this
time national population growth was surging (Wrigley and Schofield 1981). With the
onset of the depression after 1870 the region turned to dairying to satisfy demand
especially from the rapidly growing Birmingham and the Black Country area (Wise
1950). Collection stations were set up throughout the region and milk was transported
rapidly by a developing transport system. Thus through the depression in farming and
up to the Second World War the region maintained an important farming role in the
national economy. In the 1920s a new cash crop, sugar beet, was introduced and this
gave an impetus in the midst of depression which was further enhanced by the onset
of the Second World War (VCR 1989). This resulted in the bringing into cultivation
of marginal land to aid the drive for home grown produce. After the war this
continued as the Mid Borderland population grew and the start of the population
turnaround could be noted. This prosperity lasted through into the 1980s when a
succession of events and government policy produced a significant move to
diversification and changing regimes (Evans et al 2001). Thus, beef, wheat, milk and
hops declined and niche markets for specialised products developed. There are also
signs, perhaps for the first time, of a move to extensive farming of potatoes and soft
84
fruit. Some of the developments are highly inventive and individualised. For
example, the conversion of a potato farm into crisp production on a national scale at
Dilwyn, some twelve miles west of Little Hereford and the setting up of direct selling
to the door of milk and milk products in Cleobury Mortimer, eight miles to the north
east. These are individual responses to identified need in the face of the decline of
more traditional products.
5.5 Transport Factors Such commercial orientation of farming gave rise to the need for transport and
communications systems. This was particularly the case in an area so remote from
large centres of population and over an undulating and heavy terrain that rapidly
became waterlogged in wet conditions.
According to Rackham (1986) there had been a well-developed system of routes in
Britain from the earliest pre-industrial age. This would appear to have been also true
in the Mid Borderland. Without it the trade which undoubtedly existed would not
have been possible, thus the conclusion must be that the Borderland was relatively
remote but not inaccessible. Briefly there was a well-developed Roman system of
main and feeder routes. As referred to earlier, there were routes north/south along the
Borderland and connecting the main markets and on to South Wales. West/east routes
coming out of Wales headed to the Midlands and also to London via the ports of the
Severn and its Estuary. The west to east routes followed the line of the rivers in the
main. For those going to the south the important link was down the Lugg to the Wye
and into the Severn at Chepstow. The neighbourhood of Little Hereford sits
conveniently where the main north/south route meets the west/ east one down the
Teme initially and then the Rea to Bewdley on the Severn (Figure 4.10).
People used these routes from earliest times but produce and products were not
always farm ones. For example, iron was brought from Bewdley to Bringwood in the
19th century (Figure 4.5) where there was timber for charcoal to work the iron. This
was effected by pack horse and horse and cart despite the fact that at times the route
was impassable because of water logging. Bewdley was important because it was a
river port on the Severn although later it was a crossing en route to the Black Country
85

and Birmingham. It was a nearer and less hilly route to the Severn than the one to
Worcester that was only used when the Bewdley route was impassable. Animals were
driven on the hoof and other products carried by horse or oxen drawn vehicles.
Rivers were very important, not just because they provided a lower land route but
because they were themselves a system for transport. In the region the main river
route was either down the Lugg from Leominster and into the Wye and thence either
to Bristol or to south Wales. This was particularly important for transporting the bulk
goods like wheat downstream and coal back upstream. Alternatively there was the
route down the Teme and Rea east to the Severn either at Bewdley or Worcester.
There is no record of the Teme being used for navigation; it was probably too shallow
and unreliable. This is not to say that the Lugg was entirely satisfactory for
navigation, it too was liable to flood and drought so the regime was variable in the
extreme. None the less from the late 17th century on there was significant interest in
making the Lugg and Wye more navigable (Brian 1994). After 1695 various Acts
were presented to Parliament to buy up mills along the rivers, to raise bridges and
build locks. This is testament to the demand for Herefordshire food from London and
elsewhere and the urgent need to get it there efficiently. Undoubtedly produce from
the region was moved in this way but better land routes were needed too, either to
feed the water routes or as connections in their own right. In 1728 an Act was passed
to construct the toll road from Leominster to Brimfield. There then followed in 1751
the Ludlow to Woofferton and Little Hereford toll. Toll houses were built to collect
the tolls but these had a remarkably short life. The toll house at Brimfield was sold in
1869 for £40, the one at Little Hereford in 1873 for £45, whilst at Woofferton the toll
house fetched only £35 in 1878. By this time though there was a railway network
(Tonkin 1994).
Towards the end of the 18th century interest grew in building a canal through Little
Hereford and to connect Leominster to Bewdley, but it never completed its length.
The canal era came late to the region and was overtaken by the development of the
railway. The first railway in the area was that from Shrewsbury to Hereford, opened
in 1852, which effectively connected the area to south Wales and to Liverpool. It was
another nine years before the west/east line was opened in 1861. This connected with
the north-south route at Woofferton Junction and proceeded to Little Hereford where
86
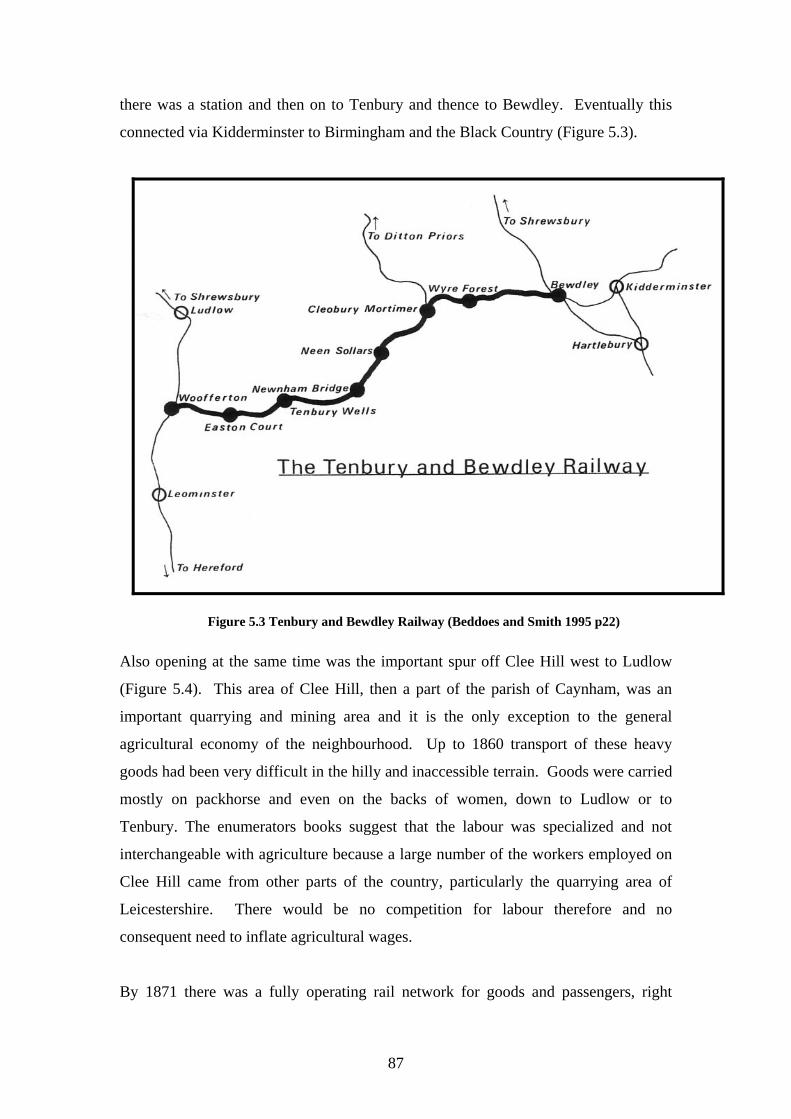
there was a station and then on to Tenbury and thence to Bewdley. Eventually this
connected via Kidderminster to Birmingham and the Black Country (Figure 5.3).
Figure 5.3 Tenbury and Bewdley Railway (Beddoes and Smith 1995 p22)
Also opening at the same time was the important spur off Clee Hill west to Ludlow
(Figure 5.4). This area of Clee Hill, then a part of the parish of Caynham, was an
important quarrying and mining area and it is the only exception to the general
agricultural economy of the neighbourhood. Up to 1860 transport of these heavy
goods had been very difficult in the hilly and inaccessible terrain. Goods were carried
mostly on packhorse and even on the backs of women, down to Ludlow or to
Tenbury. The enumerators books suggest that the labour was specialized and not
interchangeable with agriculture because a large number of the workers employed on
Clee Hill came from other parts of the country, particularly the quarrying area of
Leicestershire. There would be no competition for labour therefore and no
consequent need to inflate agricultural wages.
By 1871 there was a fully operating rail network for goods and passengers, right
87

through the neighbourhood and connecting to all parts of the country. The rail system
needed a feeder system to get goods to and from its access points. This was a system
of carriers but in the enumerators books they do not appear as occupations. This was
because most of them were women who were not Heads of Households. It is
maintained that, at this time, a parish with a population of 450 could sustain four
carriers (Paul 1994 p582), yet in the neighbourhood of Little Hereford not a single
carrier is registered by the census enumerator.
Figure 5.4 Railway of Little Hereford Locality c1870.
The rail network was funded, like the canal system before it, by private investors
working through limited companies. By the last third of the 19th century the region,
88

and with it the neighbourhood, was a prosperous farming area with a large trade in
agricultural produce and, though remote, well connected to all other parts of the
country. The prosperity though was invested in very few people. The gradual
evolution of the transport system driven by the needs of the modifying farming
system illustrates the slow but continuous adaptation of the area to the demands of the
market.
Despite its individuality and enterprise the Mid Borderland had to have leadership and
governance and the farming systems had to be organised and, in a region of farms, it
came from the landowners and the farmers. In the 19th century the whole system,
nationally, of who governed was in transition and its local circumstances are to be
investigated next.
5.6 The Society 5.6.1 Landowners and Farmers
In the 19th century power and influence, based on wealth and title, lay with the
landowner and the landed (Newby 1977) since 7,000 people owned half the land in
Britain and Ireland (Bateman 1971). These were arranged in a hierarchy at the centre
of which were 2,800 Great Landowners that included 400 Peers of the Realm. They
wielded the power in Parliament and at County level. But tenant farmers whose rents
funded the life style of the landowner did the farming in the main. Only 15% of the
land nationally was actually farmed by owner-occupiers. But changes to this structure
took place throughout the century and it came from two directions. In the first place
many landowners over-reached themselves and found themselves in financial
difficulties that were passed on to their heirs. Secondly there was the rise of a
different class of wealthy people, those who had gained wealth from commerce, trade
and industry and who felt detached from power by the control still exercised by the
landed in Parliament. The Great Reform Act of 1832 changed the franchise and
gradually over the century the membership of the legislature and of the great houses
changed. Some who moved in were interested in agriculture and agricultural
innovation and others were not (Mingay 1986; Newby 1987).
For example, just south of the neighbourhood of Little Hereford the textile magnate,
89

Richard Arkwright, bought the Hampton Court estate at Bodenham for his son,
Richard. Previously this 6,000-acre estate had been, for generations, in the hands of
the aristocratic Viscount Conningby who sold it in 1808 for £220,000 (Fitton 1989).
Eventually it came into the hands of Arkwright’s grandson John who, in addition to
becoming a Member of Parliament, proceeded to farm the estate on modern and
innovatory lines. In the 1880s he won several prizes at the Smithfield show for the
quality of his beasts (Reeve c1970).
The County became attractive to ‘new’ money looking to invest and enhance their
status. Little Hereford provided an excellent example. Here the estate was in the
hands of the Dansey family until 1841. They were a very old established family who
had owned and lived on the estate at Brinsop Court just north of Hereford until 1723.
At this point it was sold for £4,000 to pay off debts and the family moved to their
other land at Easton Court, Little Hereford. This the family had acquired by marriage
from the Delemere family in the 16th century. In 1841 they sold again, because of
debt, to the Baileys, iron masters and coal owners in South Wales.
The Danseys did little in the parish but they did rebuild the Court1 and enclosed the
103 acres Bleathwood Common in 1799 (Tate 1978). This was at a time when the
price of wheat was very high. Significantly the houses of Bedlam Row on the edge of
the Common were left untouched (Chapter 8). The pattern of tenant farms remained
under the Baileys who also appear to have been benefactors. They founded the school
in the 1840s and contributed to the funding of the railway. The Baileys did this rather
cleverly by providing the metal rails in return for shares in the Company (Beddoes
and Smith 1995). The estate in 1876 was worth £25,000 per year (Bateman 1971).
A similar pattern emerged in Bockleton (Figure 4.6) when Mrs Arabella Prescott,
widow of a wealthy London banker, bought the Court . This was 5,000 acres worth
£3,000 a year in 1876 (Bateman 1876). In nearby Richards Castle the Salwey family,
in 1851, appeared to be in difficulty according to Anna Maria Fay, an American
whose family had leased Moor Park, the Salwey family seat, “The Salways (sic) are
of Saxon origin and were settled ……in the County of Staffordshire at a period
1 Cheaply and poorly according to a personal account from then owner in 1998.
90

antecedent to the Conquest……… and have been resident at Richards Castle for
several generations. …… They have always held honourable positions in their day.
The present proprietor is John Salway. Who, from extravagance, finds it necessary to
economise” (Fay 2002 p10). In 1881 Alfred Salwey and his small household were
living in the lodge. In 1876 the estate was 3,064 acres, valued at £3,136 but yielding
less than £3,000 a year (Bateman 1876).
Much expense could be incurred through the social life of the landowning families.
Fay (2002) describes a quite hectic round of entertaining, visits for sumptuous lunches
and dinners and sometimes balls. There was much devotion to country sports, hunting
with hounds, shooting of game birds and indeed horse racing. There was a local
round of events and church going was described rather more as a social than a
spiritual experience. The clergy too were part of the social scene of this upper
stratum; they entertained, rode and went hunting. In addition to this local round of
events there were also trips to the county town, Shrewsbury, and even to London. A
large number of servants, both indoor and outdoor, supported these activities and
lived-in.
One characteristic which emerges from an examination of census enumerators books
is that by far the largest proportion of servants in the great houses came from outside
the neighbourhood and even outside the region. Very little employment was given to
local people and this would have distanced the landowner even more from them. On
census day in 1871 there were 22 persons in the Bailey household at Easton Court,
Little Hereford. Of these, seven were family members and one was a visitor, the
Vicar of Burford. The fourteen servants had a range of jobs from butler to kitchen
maid and none of them was from the parish or even the neighbourhood. The butler
came from Suffolk and the valet from Fife.
Fay (2002) has given some flavour of the relationships in the 1850s between the well
to do and the villagers in an account of a trip from Richards Castle to Orleton. She
writes: “You should see us receive the salutations of the cottagers – the gracious bow
we give to the elders, and the smile we bestow upon the little ones. Indeed I do not
flatter myself, I am sure, when I say that no lady of the Manor could find fault with
the style in which I confer these favours. … Willie confirms me in this opinion, and
91
compliments (sic) me upon the smile I give the boys when they pull their forelocks
and the little girls as they curtsey” (Fay 2002 p59).
Such were the manners of the day and the attitudes towards the ordinary people who
provided the labour to create the wealth. It points to the distance that must have
existed between the classes, not just social distance but distance in experience. Even
those appointed for their spiritual needs lived an entirely different life style. In other
words during the 19th century there were differences within the local society (Newby
1979).
However, relationships within the upper classes were not always cordial. In the early
19th century Richard Dansey of Easton Court fathered a number of illegitimate
children with women from Little Hereford. Their Baptisms are recorded in the Parish
Register where the Incumbent takes the unprecedented step of naming the father.
Thus, for example, “Richard, Base son of Ann Maund by Richard Dansey, Lord of
the Manor, 10 Jan, 1801” (Parish Register HCRO). Clearly the relationships between
Church and Manor were strained. There had been a dispute when a previous Dansey
refused to pay some dues to the Parish that was ultimately settled by a deal over a
piece of land for housing the poor. This is important in a later analysis of core
families (Chapter 8).
It would clearly be a stereotype to argue that there were particular ways of life
relating to a particular class of person. Within the broad category different landowners
had different ways of life. Thus the cattle breeder, benefactor and MP John Arkwright
had a different way of life from the impoverished John Salwey. But the old order of
landowner was being replaced and many of the new order were investors of wealth
created from trade and industry. They were migrants, investing, incomers looking for
a way of life but also mobile; benefactors but not necessarily committed to an area as
a core family. Such a family was the Baileys who were in Little Hereford from 1841
until 1909. The Danseys, on the other hand, had a long-term stake in the area, they
were long term landed, but because of unwise living had to move. The major point is
that the class of landowner was in the late 19th century changing and this change
meant mobility.
The farmers were a heterogeneous group. They were mostly tenants renting from the
92
landowners; in fact 86% of the land in Herefordshire was rented in the period 1870 to
1900 (Robinson 1978 p259). However, the definition of a farmer was varied (Newby
1977). Some were little more than labourers, working a few acres and supplementing
their income by other work and, at the other extreme, were tenants with large
acreages, maybe 300 to 400 acres, employing up to twenty labourers as well as
domestic staff. In many ways the latter lived like the landed. It was from this class
that the parish was governed. They formed the ‘Vestry’ that ran the affairs of the
Parish, the roads, the relief of the poor and were elected by each other to these offices.
They, with the Vicar in the chair, also set the Parish rate. They had their nominated
pews in church, behind the big house of course, but generally arranged in a hierarchy
of esteem. On the other hand the smaller farmers led a life more like that of the
labourer, they worked the land and worked along side their labourers, some of them
may indeed have started off as labourers (Newby 1977).
There is however a question about the mobility of these farmers. In 1722 in Little
Hereford a Schedule of Kneeling was drawn up (H.C.R.O. AB24/3). In this the
Dansey family had the front pew and their servants immediately behind; perhaps
another social barrier to separate them from their tenants. Thereafter, came the
farmers. But none of these farming families were present in Little Hereford at the time
of the first available enumerators book in 1841. There had been a complete
changeover of farms in this 110 year period. Later in the period 1841 to 1901 only
three farming families were ever present in the parish in the same farms. The others
all moved, so there was migration of tenants maybe to better themselves as other
property became available or perhaps from sell-off by impecunious landowners.
Figure 5.5 illustrates what it meant in 1871 to be a large tenant farmer. New House
was one of the bigger farms with 260 acres employing four men, three women and, a
boy. In addition there were five men living-in and two women. Two of the farmers
sons also worked on the farm, a total of 16 employed on the land. The social gap
between such a farmer and the one with about 15 acres seems clear. But, in an area of
small farms, the ways of life of those who worked them was very similar to those who
worked for them. There is evidence given above that farmers were not as static as
might be imagined, only three of them in Little Hereford were core families.
93

Figure 5.5 New House Farm – Little Hereford
Many worked like labourers and alongside labourers. Although they subsisted
largely on the farm produce they were also commercial and had wide commercial
contacts from the markets, fairs, merchants and factors. They were businessmen.
They had relationships up and down the social hierarchy and, most importantly, they
brought their children up to work the land and to a way of life.
Locally the landed controlled the rents of their tenants and, therefore, to an extent the
livelihood of the farmers. Nationally they could influence the legislature through
their social networks which were on a national scale or directly if they were members
of the Commons or Lords. At the County level they controlled the by-laws and
frequently the administration of justice or at least the law. But their membership and
therefore their interests were changing as a new group of very rich emerged. By the
nature of their position they had a very distinctive way of life (Newby 1987).
Farmers controlled the parish and they could hire and fire. They wanted to keep
wages down; education was not valued because it took away cheap casual labour.
This must have been a major influence upon the migratory habits of the poor.
94

Farmers were vulnerable not only to rents but to national, even international,
movements in farm prices and also to the vicissitudes of the weather. They were also,
in part, at the mercy of their relative location in the country. London had dominated
the market for agricultural produce until the national market was fully established
with the development of the rail network after 1850 (Newby 1987).
5.6.2 The Farm Workers
There may be something of a stereotype attaching to the 19th century farm worker; the
inarticulate cloddish person may not reflect the actuality. Snell (1985) asserts that
there is evidence to the contrary in sensitive and emotional letters sent back home
from abroad. But it is true that before 1870 there was very little opportunity for
education.
Even among those that might be called the ordinary people on the land there were
different groups (Hobsbawm and Rude 1969). There were labourers but also
waggoners and stockmen, dairymen and drainers who, because of their greater level
of skill and specialisation, were higher in the social structure. According to the CEBs
from 1851 there was some evidence of this in Little Hereford although there is no
certainty about its accuracy or consistency. Table 5.7 is an attempt to show those
variations of farm worker that are recorded. It is very difficult to judge what credence
can be placed on the accuracy of this and the term labourer may hide unstated
specialisms. It is surely true that labourer carried with it important farming skills.
Little Hereford Labourers ‘51
No. Outworkers
No. Living-In
Labourers 45 16 Farm Servants 4 Waggoner 5 Stable Boy 1 Drainer 4 Totals 49 26
Table 5.7 Types of Farm Worker in Little Hereford 1851 It was not merely a specialist skill however. There was also the matter of adapting to
new ways of farming which came about in the later 19th century. For example, the
use of machinery like the steam plough or the steam driven threshing machine that
95

became widespread from the 1840s (Hill and Stamper 1993). By 1901 there were still
different categories of worker that almost certainly carried with them differing status
and wage (Table 5.8). They also now predominantly lived off the farm whereas in
1851 those who worked with animals tended to live-in.
Little Hereford Labourers 1901
No. Outworkers
No. Living-In
Labourers 28 Farm Servants 2 3 Cattlemen 7 Carters 3 Horse boy 2 Bailiff 2 1 Waggoner 9 1 Totals 53 5
Table 5.8 Types of Farm Worker in Little Hereford, 1901.
The move away from home was an important aspect of the migration process. Young
men left home when they were old enough to work, and lived-in on the farm where
they were employed, generally on a yearly contract. So, for example, in 1881,
Thomas Maund of Bleathwood in Little Hereford, aged 15, lived-in on a farm in
neighbouring Greet. Young farm workers were referred to as ‘farm servants’ until
such time as they received adult wages. There were variations from place to place
and time to time in the age at which this was granted; anything from 18 to 21 years.
According to Snell (1985) children joined the workforce and left home earlier in the
east than in the west. In 1860 the average age of leaving home in
Herefordshire/Worcestershire/Monmouthshire was 14.1 but in Hertfordshire it was
13.8. Snell also revealed a further contrast in the level of winter unemployment
among agricultural workers in the arable east which compared very poorly to that of
the west where there was more regular labour demand. This difference was attributed
to the fact that livestock need tending all year round and in all weather conditions.
In wages too there were differences between east and west. Prior to the boom years
after 1850, nationally, there was a wage peak in 1833. At this time an agricultural
worker in Herefordshire received 8/6 per week by contrast with the 11/4 in
Hertfordshire. Wages then fell so that by 1850 the Herefordshire labourer had 8/5 per
96

week whilst the Hertfordshire labourer had 9/-. Snell’s (1985) point is that when the
hard times came Herefordshire labourers received the highest proportion of the 1833
rate and they were to an extent cushioned by the nature of the farming regime. This is
further evidence that despite being poor the Borderland’s farm workers were better off
than those in the south and east.
Dodd, (1979) whilst generally confirming the wage levels calculated by Snell (1985),
was also able to show how wages varied and fluctuated with farming fortunes. In
1853 wages in Herefordshire were 9/- in June but by December it had risen to 11/-.
This seems surprising since there were more hours of daylight in June and hay to
make; on the other hand, the animals had to be fed by hand in December since they
were over wintering inside.
Aside from wages living conditions were also poor in other ways. Accommodation
was cramped and damp which, according to Dodd (1979), contributed to the trend to
migrate although he does not give any evidence for such an assertion. In fact this may
be a case of 19th century living conditions seen through 20th century values. It was
certainly the case though that the system of tied cottages made the labourer more
vulnerable, if he left his job he also had to leave his accommodation and he could
only take a job if some accommodation was provided with it. Housing supply was
certainly an issue in rural migration during the 19th century and this is returned to in
Chapters 7 and 8. For example, in the areas of eastern England the supply of housing
in estate villages was controlled by the landowner and so created a system of closed
villages (Mills 1980). In this way newcomers were prevented from settling and had to
move to those villages which were less restrictive, often termed open. There is no
evidence that this system existed in the Mid Borderland which adds to the impression
of the region’s distinctiveness.
Labourers had little power, not even the power of their labour (Hobsbawm and Rude
1969). They worked for low wages, lived in a tied cottage and faced the workhouse if
they were injured or old. But times were changing for the labourer too; at the end of
the 19th century there was less demand for agricultural labour but there was also the
prospect of organised labour. For example the VCH (Shropshire Vol 14 1989) tells of
an 1871 meeting of the North Herefordshire and South Shropshire Agricultural
97

Labourers Mutual Improvement Society attended by about 300 people. At this time
wages were 9/- per week with an extra 1/- for Sunday work but ‘perks’ accounted for
maybe as much as 3/- to 4/- per week.
Until the 1870 Education Act children frequently left school, if they went at all, by the
age of 9 years. They had to pay for what schooling they had in any case.
Significantly, the 1870 Education Act took some children out of the employment
market at a time when demand for labour was declining, as is frequently the case with
changes in school leaving ages. Truancy for illegal work still continued (Boynton
1990) and another Act was introduced in 1873 to attempt to regulate children’s
employment in agriculture. Perry (1968 p126) maintained that there were other
benefits from the introduction of schooling. It extended social contacts since the
school was often shared by several parishes and thereby promoted social change by
extending the sphere of social contact of working people. For example, Phyllis Ray
(1998 p36) has shown how children from Ashford Carbonel walked the two miles to
Little Hereford after the school opened there in 1843 which continued until Ashford’s
own school opened in 1872. The ability to read and write also had a similar effect in
that it enabled people to maintain contact. This idea of change and with it social
change was important at the end of the 19th century (Newby 1987; Howkins 1991).
5.7 An Interpretation of Change and Social Coherence in the 19th
Century The whole sphere of social relationships is difficult to identify and describe. To an
extent the hierarchical arrangement of society determined these relationships. There
was certainly a significant gulf between the landed and the labourers. Nationally, in
the first part of the 19th Century there was widespread fear of the influence of the
French Revolution on the part of the ruling classes. At this time discontent in parts of
England was rife. The poor were poverty stricken as the price of bread rose with the
grain shortages produced by poor harvests and continental blockade and as the old
Poor Law proved inadequate to meet their needs despite the Speenhamland
modifications (Chambers and Mingay 1966; Hobsbawm and Rude 1969; Mingay
1976). Landowners were discontented because of poor agricultural returns as were
the developing middle class of merchants and industrialists because of their distance
98

from control of political power. In eastern England the effects of the Parliamentary
Enclosure and of high food prices pushed discontent to the verge of insurrection.
There were riots and rick burnings. The authorities were stretched to the limit and
became the focus of the discontented. In these circumstances the elected village
constables were no match for angry rioters and frequently the militia had to be called
in. This discontent was not only in rural areas but also in the newer industrial areas of
the northwest as witnessed by the Peterloo massacre in 1819.
The authorities acted swiftly to quell the uprising and to punish those involved. Often
transportation ensued. This turbulence and unrest, together with the memory of the
French Revolution, had its effect and brought about the legislative changes of the
1830s. These were reluctant moves by a government and a Parliament that did not
represent the people. The House of Lords were mainly large landowners and
aristocrats. The Commons were merely landowners. The Reform Act restructured the
parliamentary constituencies and enlarged the franchise. It was enough to appease the
hitherto unrepresented middle classes but not to satisfy them. The Poor Law
Amendment Act was in the end a fudged attempt to relieve the problem, not so much
of poverty, but rather the strain on ratepayers who were responsible for the poor. The
most significant feature was the establishment of Poor Law Unions to build and run
the new Workhouses. The Municipal Reform Act extended the franchise to all
ratepayers and the Police Act gave permission for the establishment of police forces
(Evans, 1983).
What of the response in the Borderland region? In 1841 nearly 40% of the population
was associated with agriculture but it was detached by reason of its remoteness from
other agricultural populations in the east and south of the country. During the
discontent at this time in Wiltshire, 339 men and women were transported to New
South Wales and 162 from Berkshire. But in Herefordshire only one was transported
and that for a threatening letter sent to a large farmer. No threshing machines were
broken but in nearby Gloucestershire 28 were damaged and there were two cases of
arson (Hobsbawm and Rude 1969). This suggests that either the Herefordshire
labourer was much more acquiescent or that relationships with employers were more
confident. For example, when the price of flour was high farmers sold it cheaply to
their workers (Reeve c1970; Phillips 1981; Snell 1985) which suggests sympathetic
99

relationships between the labourer and the farmer. Farms were small and the farmer
and his family worked alongside the labourers in the fields and with the animals.
Some labourers also lived-in with the family and work was all year round since there
were daily needs for animals to be tended especially in winter when outdoor work was
impossible.
Circumstances were undoubtedly changing and living-in seems to be a key item for
interpretation of migration processes and indeed for social change in the Borderland.
Snell, (1985) records that in 1851 Herefordshire had 18.7% of its agricultural work
force living-in whilst Hertfordshire had 7.9%. He maintains that there was at least a
30-year time lag between agricultural regions of the east and south and those of the
west, evidence for the distinctiveness of the Borderland.
A move from home to live-in with a employer was usually the first step that a young
person made to move on from home. It was driven by a cultural norm with an
expedient rationale. Firstly, in an era of large families, there was no more room at
home and the young moved on. For example, John and Emma Maund had 10
children between 1856 and 1880 in their one up and one down cottage on the edge of
Bleathwood Common in Little Hereford (Chapter 8). The young had to leave home
too because they needed to work to survive in a low wage economy. The critical
financial time for a labourer was between the age of about 30 and 45. At this time
there were likely to be maximum dependent children to support (Chapter 7). So the
demise of living-in either produced or, more likely, was a symptom of social change
(Howkins 1991). Snell’s (1985) evidence on living-in supports the notion that there
was greater social cohesion between labourer and farmer in the Borderland than
elsewhere. The pattern of living-in in Little Hereford for the second part of the 19th
Century is interesting. Table 5.9 shows the contrast between 1851 and 1901, the
period in which an absolute decline in population occurred. It is displayed in this way
for two reasons. Firstly to be consistent with the notion that change is a slow
continuous process and, secondly, because, with small populations, the change may
not be seen over a shorter period. The one chosen here starts at the beginning of the
period of prosperity and runs some thirty years into the period of depression.
100
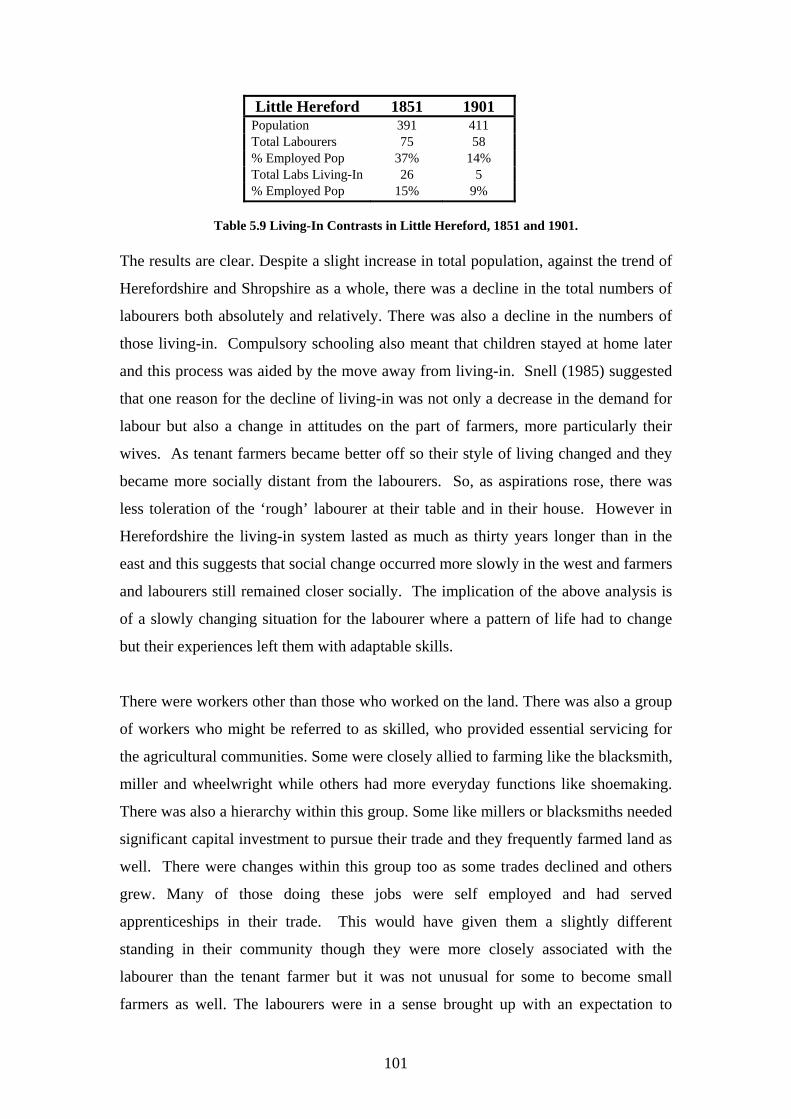
Little Hereford 1851 1901 Population 391 411 Total Labourers 75 58 % Employed Pop 37% 14% Total Labs Living-In 26 5 % Employed Pop 15% 9%
Table 5.9 Living-In Contrasts in Little Hereford, 1851 and 1901.
The results are clear. Despite a slight increase in total population, against the trend of
Herefordshire and Shropshire as a whole, there was a decline in the total numbers of
labourers both absolutely and relatively. There was also a decline in the numbers of
those living-in. Compulsory schooling also meant that children stayed at home later
and this process was aided by the move away from living-in. Snell (1985) suggested
that one reason for the decline of living-in was not only a decrease in the demand for
labour but also a change in attitudes on the part of farmers, more particularly their
wives. As tenant farmers became better off so their style of living changed and they
became more socially distant from the labourers. So, as aspirations rose, there was
less toleration of the ‘rough’ labourer at their table and in their house. However in
Herefordshire the living-in system lasted as much as thirty years longer than in the
east and this suggests that social change occurred more slowly in the west and farmers
and labourers still remained closer socially. The implication of the above analysis is
of a slowly changing situation for the labourer where a pattern of life had to change
but their experiences left them with adaptable skills.
There were workers other than those who worked on the land. There was also a group
of workers who might be referred to as skilled, who provided essential servicing for
the agricultural communities. Some were closely allied to farming like the blacksmith,
miller and wheelwright while others had more everyday functions like shoemaking.
There was also a hierarchy within this group. Some like millers or blacksmiths needed
significant capital investment to pursue their trade and they frequently farmed land as
well. There were changes within this group too as some trades declined and others
grew. Many of those doing these jobs were self employed and had served
apprenticeships in their trade. This would have given them a slightly different
standing in their community though they were more closely associated with the
labourer than the tenant farmer but it was not unusual for some to become small
farmers as well. The labourers were in a sense brought up with an expectation to
101

move. They left home, sometimes as early as 9 years old. When they married they
went to where there was accommodation and they moved again perhaps several times
into tied cottages. Daughters went into service and sometimes moved a long way for
work; if they were unemployed they sometimes returned home to help out.
1851 1901
Shoemaker 7 - Dressmaker 5 1 Blacksmith 4 2 Carpenter 3 2 Sawyer 3 - Gamekeeper 2 1 Seamstress 2 1 Gardener 2 4 Saddler 1 - Mason 1 - Wheelwright 1 1 Tailor 1 - Bricklayer - 1
Table 5.10 Changing Trade Skills and Occupations Numbers Employed in Little Hereford 1851 and 1901.
The consequence of change was that employment structure changed also and Table
5.10 showing numbers in skilled trades gives an indication of this. Some occupations
ceased to exist in the parish, possibly as a consequence of the function migrating to
the town and most notable in this context is the demise of the village shoemaker. In
1851 twelve different trades were represented in the parish, by contrast, in 1901, there
were only eight. So, there was gradual change in the type, range and location of
skilled jobs. This change in the range of skills on offer within the parish was a
significant element of both economic and social change.
Table 5.11 gives another perspective on structural change. The numbers in skilled
and specialist jobs located in Little Hereford diminished over the fifty years whereas
domestics held their place and living-in declined a little. Domestics, mainly women,
maintained their position in the occupational structure of the parish between 1851 and
1901 but the skilled workers declined absolutely and proportionately. There was both
102

Little Hereford 1851 1901
Nos. Domestics 42 36 % Employed Population
24 24
Nos. Living-In 33 29 % Living-In 19 19 Nos. Skilled 32 13 % Employed Population
18 9
Nos. Living-In 0 0 % Living-In 0 0
Table 5.11 Change in Skilled Jobs in Little Hereford 1851 and 1901
structural change, as some skills become increasingly redundant and also locational
change. Skilled functions moved as well as those employed in them, and relocated in
the town. This would imply an inevitable change in the social structure of the
community as economic functions migrated and centralised.
The gradual shift of some of these skilled occupations to the town was assisted by the
development of cheap rail transport. Tenbury was only minutes away by train from
Little Hereford. However, it was also part of a much more widespread pattern as
functions began to concentrate in the town. This implies significant change in ways
of life over a period which also saw change in population totals and distribution
(Chapter 6). Such small and gradual changes over a fifty-year time span may well
have been accompanied by change in habits and customs as the socio-economic
structure of the parish changed.
As well as those in employment it is also necessary to consider, albeit briefly, the
position of the poor and destitute who came under the Poor Law provisions.
According to the CEBs for 1871 and 1881 in the 17 parishes which make up the
neighbourhood of Little Hereford only 12 received outdoor relief in their own homes
or that of a relative. But the poor were also provided for by the Union Workhouse
and the Alms Houses. In 1881 the provision in Leominster, Ludlow and Tenbury
amounted to 193 inmates. Of these only 53, or 27%, had been born in the
Neighbourhood. All this suggests movement and that there was no substantial
poverty although there may well have been poor people. Of course the Workhouse
was more a safety net for the very young and the old.
103

5.8 Summary and Conclusions This analysis has attempted to show the nature of the society, largely during the 19th
century, in the Mid Borderland. Clearly there was persistence and change but it was
slow and maintained a continuity as adaptation took place in the region. Such
adaptation must also have brought with it social changes which influenced the ways
of life of the people which might be seen as an attribute of the culture of the place.
From the mid 19th century onwards there was structural change at the macro level as
industrialisation and urbanisation took place and this was inevitably reflected in the
countryside (Saville 1957).
The picture described in this chapter is of a rich agricultural area with a long tradition
of commercial farming and with much commercial interaction across its territory. It
was consistently able to adapt its regime when faced with different circumstances. But
change was also provoked internally by local enterprise as in the establishment of the
Hereford cattle breed. The challenge towards the end of the 19th Century came from
foreign imports driven by the technological changes brought about by the industrial
revolution accompanied by unprecedented population growth and redistribution
(Chapter 6). This was the period of urbanisation when the countryside lost population
relative to the town (Mingay 1986; Newby 1987).
It seems fairly clear from the above analysis that the character of this remote area was,
in the last part of the 19th century, changing. This change locally was slow and it may
have been that those experiencing it were only gradually aware of it. The different
social groupings that made up the region each had differing, but interrelated, roles that
slowly changed with circumstance, both national and local. There was a slow change
not only in the demand for labour on the land but also in what was required of this
labour so those who stayed had to adapt. It was a tribute to the flexibility of the
labour force that it was able to do this as mechanisation took place and new and
different products were needed. Changes was not merely about numbers, which were
relatively small, but rather about manners and social relationships. There were
changes in the behaviour of the families as a result of the demise of the system of
living-in and the advent of primary education for all.
104

While it would be unwise to speak of a distinctive regional culture, this is not to say
that there is no distinctiveness about the Mid Borderland. On the contrary the greater
focus on place using the framework offered by Griffith and Johnston (1991) has
yielded a number of features which may be seen as characteristic of the region. Thus
it is physically remote but because of the nature of its economic products is not
inaccessible and, indeed, there is evidence of a persistent attempt to maintain contacts
by adapting transportation systems. This theme of adaptability is to be found as a
general feature, economically and socially. Clearly an attribute of adaptability is
flexibility and this is true for the agricultural workforce as different practises were
adopted at different times. These attributes of adaptability and flexibility give a form
of social cushion in times of change and thus the changes may be imperceptible in the
time scale.
Some of these changes were adaptations to structural and national changes and some
as the result of local developments and initiatives especially within the farming
community. There is evidence here of inventiveness, innovation and pioneering
initiatives. However there has frequently been a time lag in adapting to change and
this in part is due to remoteness but also to the different nature of a mixed and
pastoral farming regime.
What does seem apparent though is that there is continuity among the changes which
took place over a long time scale. This continuity extended also to differing, though
overlapping, ways of life associated with the major economic function of farming.
Such interrelationships though slowly changing with circumstances show a degree of
social stability which is yet another aspect of the regional unity.
These features or characteristics seem to be evidence for the distinctiveness of the
Mid Borderland Region and to provide an essential context for the analysis of
migratory behaviour of families (Chapter 7). Beyond this is the question of the extent
to which these regional characteristics and ways of life lead to an attachment to place
and what part this may play in the migration process? The concept of culture remains
a difficult one but place and culture may well be inextricably bound together although
not easily demonstrated. Because of this the concept of culture is not rejected rather
105

there is a change of focus to give place a more central role in the investigation. If the
approach is from the perspective of the place then perhaps a greater insight into
culture can be achieved. As Pooley and Turnbull (1998 p7) have observed
“attachment to place is likely to be an important part of cultural identity.” Thus
culture is pursued through place rather than place through culture particularly in
Chapters 8 and 9.
The social and structural changes taking place, particularly during the 19th century and
into the 20th were associated also with demographic changes. These changes produced
differential trends from place to place and were a factor to be considered when
examining migration process. These trends too provide an essential context for a
study of migration and the enquiry will examine these in the next chapter.
106

Chapter 6 Demographic Context 1801 – 2001
6.1 Introduction The previous chapter examined the changes in culture and ways of life in the Mid
borderland over the past 200 years. Demographic changes are a response to changes
in the economy and society which in turn create further socio-economic changes.
Demographic change provides a context in which the movement of people, both
individual and families, takes place. The purpose of this chapter therefore is to
examine changes in population and its redistribution at several geographical scales
during the 19th and 20th centuries as a background to the detailed analysis of the
migration of individuals and families considered in Chapters 7, 8 and 9.
Population data on a systematic basis only became available from 1801 with the
institution of the national census but aspects of this study predate this so efforts will
be made to examine some of the data that does exist for the period prior to 1801. The
analysis is conducted at four levels; the macro level in the form of England and
Wales; the regional described as the Mid Borderland; the locality or neighbourhood of
Little Hereford; and the individual parishes which make up that neighbourhood. It
should be stressed that this is an analysis of trends in population over time. It is not
itself a direct demographic study of birth rates, death rates and marriage rates but
these will be referred to where appropriate to the analysis.
There are three macro population trends which particularly inform this analysis;
firstly the population transition from about 1750, secondly the point at which
population in the countryside began to decline during the second half of the 19th
century and, thirdly, the population turnaround from the 1980s onward when
population appeared to return to the countryside from the towns (Saville 1957; Cross
1990). The period of this study also encompasses two major national periods of social
change with implications for population redistribution and migration, namely a
process of urbanisation and then later a process of counterurbanisation. The period of
urbanisation was associated with concentration of economic activity and consequent
growth of towns and thus is important for this study. Included in this is an
107

examination of trends in Birmingham, the provincial capital for the Mid Borderland.
The magnitude of change may be demonstrated when in 1851 half the national
population lived in places designated as urban but by 1951 this had increased to over
80% (Jackson 1998). This was part of a socio-economic and structural change which
manifested itself generally in the countryside by a 20% decline in male agricultural
workers between 1861 and 1881 (Saville 1957).
Over the past two centuries differential changes in population trends between the
scales suggests a redistribution of population and it is this redistribution which is of
interest to a study of migration. Redistribution brought with it boundary changes as
some areas grew and others declined. There are therefore some issues with the data
caused by this feature, in particular there are issues of comparability not merely
between different scales but also within the same place at different times. For
example, the area designated in Chapter 4 as the neighbourhood or locality of Little
Hereford has 17 parishes located in three counties. Simple aggregation can give
population totals for this area but to maintain comparability the units in 1801 have
been used throughout. It is very difficult to calculate data for the Mid Borderland as a
whole and therefore data from the three counties which in part occupy this area will
be used. As the analysis progresses differences in the population trends of
Herefordshire and Shropshire on the one hand and Worcestershire on the other
diverge and this highlights the problem of identifying a region which does not
conveniently correspond with data collection units. Issues arising from this, and the
changes in boundaries which take place over the two hundred years, are addressed at
the relevant points in the text.
6.2 England and Wales The trends in the population of England and Wales provide the macro context within
which families moved throughout the period of the study and serve as an illustration
of its longitudinal nature. This chapter relies for its data largely upon the decennial
national census. Before 1801 there was no national census and estimates of the
population total were very difficult to calculate. The monumental work of Wrigley
and Schofield (1981) resulted in a reconstruction of population totals and trends
108

before 1801 using information from a sample of parish registers and based on
calculations using the 1871 census as a datum line (Figure 6.1).
The major population change known as the population transition took place towards
the end of the 18th century and, since this coincided with moves into Little Hereford
by the core families (Chapter 8), it is worthy of detailed discussion here. This
Demographic Transition was a period which started around the mid 18th century when
population grew markedly (Figure 6.1). The changes associated with this were
profound and had consequences for the whole of England and Wales (Kitch 1992).
Figure 6.1 Population Transition (Wrigley and Schofield 1981 p207).
6.2.1 Outset of Urbanisation – up to 1850s
The most noteworthy feature was the change in the rate of growth of population after
about 1750, there had been other periods of population growth but this one was
unprecedented both in terms of its rate and also its sustainability. Estimates made by
Wrigley and Schofield (1981) suggested that the population of England grew, during
that century, by some 3.6 million, from 5 million in 1700 to 8.6 million in 1800, a
growth of 71%. As outlined in the previous chapter the Mid Borderland was capable
109

of increased agricultural production and exhibited significant adaptability including
switching regimes in response to demand. The expansion in trade links also meant
important contact with the world outside the Borderland and, therefore, knowledge of
other places that may be significant for migration process.
There was, in the 18th century, the beginning of a national market although this was
not to be completely realised until a railway network was established in the mid 19th
century (Saville 1957). Despite this the demands of a growing population in London
required large quantities of food and all parts of the country contributed (Barker
1967). In 1650 it is estimated that London had about 7% of national population but
by 1750 it had 11% (Wrigley 1967). Further, it was thought that a high proportion of
the population visited London at some time in their lives, thus creating conditions for
changing national attitudes and social change (Clark 1987).
Earlier population growths had always come up against the problem of the provision
of a surplus to support the additional population. This time there was take-off into
self-sustained growth, a period now known as the Industrial Revolution. Arguments
have always taken place as to the reasons for the population growth (Deane 1965) and
these have been debated extensively (Hinde 2003) but here it is sufficient to say that it
is now thought that a change in the average age at marriage of women resulted in
longer exposure to child bearing and therefore an increased birth rate (Pollock 1998).
Clarkson (1982) maintained that nuptiality had a key influence on fertility and
ascribed this to increased real incomes consequent upon improved economic
conditions. It may also be the case that this change was associated with the decline of
living-in (Snell 1985) and, therefore, lowered the age at marriage and the earlier
setting up of new households. But this was a cultural change that clearly did not
happen everywhere at the same time. The implications of this for the Mid Borderland
were discussed in Chapter 5 where it was argued that living-in persisted much later
than elsewhere, but differing farming regimes and customs bring with them
differential application of structural change as localities adapt.
This population increase came about in the period before the establishment of a
national means of mass transportation. In the Borderland cattle were driven on the
hoof out of Wales across the region to London; ox drawn carts and wagons took other
110
goods to navigable watercourses. From the region they went west to Stourport and
Bewdley or south to Chepstow. The growth of population during the demographic
transition, and specifically and earlier in London, provided an engine for change.
Thus the Demographic Transition was not a single dimension change it was part of a
complex and complicated interrelated set of changes that altered forever the course of
the whole nation not merely the pattern of living in the countryside. “ England was
radically transformed from a rural, agrarian country into the first Nation to be
reshaped by the Industrial Revolution” (Wrigley and Schofield 1981 p402).
It was a period of complex interrelationships between population growth,
industrialisation and concentration of population into urban and metropolitan areas.
What is certain is that output grew as did incomes and there was a change in the
relationship between town and countryside. Agricultural employment declined but
productivity increased; it was what has come to be known as the agricultural
revolution. An important question arising from these structural changes is to what
extent did migration from the countryside contribute to urban concentration? This is a
question to be examined in Chapter 7.
6.2.2 From Urbanisation to Counterurbanisation
In England and Wales population continued to grow throughout the 19th century and
by the time of the analysis of family migration from the neighbourhood of Little
Hereford between 1871 and 1881 (Chapter 7) growth in England and Wales as a
whole had been taking place for over 100 years. Population rose throughout the period
but the rate slowed progressively and after the 1950s it was significantly slower.
Figure 6.2 shows this slow down in overall growth from the turn of the century until
about 1971 when it slowed even more. These changes are shown even more clearly
by the proportional change at fifty year intervals in Table 6.1. Although there is clear
absolute growth for each of the 50-year periods during the 19th and 20th centuries
there are changes in rates of growth. Just as with the demographic transition these
changes had their roots in socio-economic factors, the increased spread of the desire
111

Population - England & Wales
0
10
20
30
40
50
60
1801
1811
1821
1831
1841
1851
1861
1871
1881
1891
1901
1911
1921
1931
1941
1951
1961
1971
1981
1991
2001
Mill
ions
Figure 6.2 Population Trends in England and Wales 1801 – 2001
to limit families, changes in family structure and the desire for enhanced standards of
living and consequent changes in life style and, of course, changes in the roles of the
sexes.
Period Change, Actual Change % 1801-1851 9 million 101% 1851-1901 14.6 million 82% 1901-1951 11.2 million 34% 1951-1991 6.1 million 14%
Table 6.1 Rate of Population Change-England and Wales
The quite marked decline in rate of growth after 1901 and accelerating decline after
1951 is well illustrated in Table 6.1 but these data at the macro level give no
indication of regional variation or social change. Indeed Lawton (1990) has shown
that rural population peaked at 9.1 million in 1861 and continued to a low of 7.3
million prior to the second world war. There are problems of course in defining rural
but following Bowley (1914) who used Rural Districts with a population density of
under 0.3 persons per acre, in 1801 65.2% of the population of England and Wales
lived in rural areas wheras by 1851 this had dropped to 49% and by 1937 to17.6%.
Thus there are not only hidden variations in the crude data but also major differences
112

between urban and rural trends. According to Lawton (1967) the major areas of
population loss were in a belt from east Anglia to the south west and also Wales and
the Pennines. Out migration was seen as the principle reason for this population
decline and this was described as the drift to the towns (Saville 1957). This macro
level trend was not the only feature for both Perry (1969) and Lewis (1979) noted a
tendency, in the late 19th century, for inter parish population movement within about a
ten mile radius of origin. Such a movement is confirmed by Pooley and Turnbull
(1998).
The major movement to towns was explained by Saville (1957 p131) as “the result of
the concentration of economic activities in the rapidly growing towns and the
successful competition of the urban factories with the rural craftsmen and rural
industries”. However, these population trends were more complex than this, Saville
(1957) noted that population loss beyond the expanding urban area was not as great as
elsewhere in the countryside. Pahl (1965) noted the expansion into the countryside of
Hertfordshire of urban dwellers and this was confirmed by Maund (1976) in north
Herefordshire and Lewis (1979). There was thus a counter movement to urbanisation,
the turnaround.
This movement, very obvious from the 1970s, but present in smaller numbers before
this, was socially selective for whilst the young continued to move to the towns the
early movers to the countryside were older families, generally middle class and
frequently retired (Maund 1976). Nationally the turnaround appears to have had a
number of phases. From the end of the Second World War until the 1960s population
redistribution in England was from north to south as old industries declined and the
southeast boomed. Thereafter and into the 1970s, movement was out from the major
conurbations, the very ones that had grown a hundred years previously. The general
figures in Figure 6.2 and Table 6.1 can not show these trends. People moved from the
metropolitan centre, particularly after 1980 (Lewis 2000) and one of these was the
regional centre of the Mid Borderland, Birmingham.
6.2.3 Urban Growth: Birmingham
During the late 19th and early 20th centuries urban areas in England and Wales grew
rapidly to create a series of major cities and conurbations (Robson 1973). As detailed
113

in the previous section, this growth has attenuated during recent decades with the
onset of counterurbanisation but the nature and form of these large urban areas
remains largely unchanged. In terms of urban growth London clearly has primacy
over the whole of England and Wales but it must not be overlooked that every region
has its own major urban influence. In the case of the Mid Borderland it was, and still
is, Birmingham that is the pre-eminent influence. It was, and still is, the regional
centre extending from the Welsh Border to north Staffordshire, Leicester and to the
edge of the Cotswolds (Wise 1950). In view of the significance of Birmingham for
the economy and society of the Mid Borderland and, in particular, for the migration of
people during the late 19th and 20th centuries a brief examination of its growth in
population follows.
Population - Birmingham
0
200,000
400,000
600,000
800,000
1,000,000
1,200,000
1801
1811
1821
1831
1841
1851
1861
1871
1881
1891
1901
1911
1921
1931
1941
1951
1961
1971
1981
1991
2001
Figure 6.3 Population Trends in Birmingham.
From Figure 6.3 it can be seen that the population change experienced by
Birmingham between 1801 and 1991 was to a certain extent similar to that of England
and Wales as a whole. Thus, Birmingham’s population growth in the 19th century
was fairly steady which contrasted to the national surge of the population transition.
The surge in the population of Birmingham began later and accelerated from the
beginning of the 20th century. The population of Birmingham peaked in the 1950s and
thereafter declined. There were a number of relevant factors behind these trends. The
114

growth of industry in Birmingham and the Black Country was supported by the rapid
development of transport systems, initially canals from 1772 and then rail from 1837.
The system of canals connected the area to the Severn which was the principle
transport artery at the time. The Birmingham to Worcester canal opened in 1815 thus
Figure 6.4 Birmingham: Population Growth and Boundary Change (Redrawn from Wise 1950
p208)
tying Worcester into the industrial region. This did not happen west of the Severn
until 50 years later. These systems came much earlier than they did to the Mid
Borderland or to the Teme valley (Chapter 5). Never the less they assisted the
bringing in of agricultural produce from the west via Worcester, Bewdley and
Stourport.
As Birmingham’s population grew and spread out the boundary of the city was
extended on several occasions (Figure 6.4). According to Wise (1950) there was a
major extension of the city’s boundaries in the period 1891 to 1910 which coincides
115

with the great surge in population shown in Figure 6.3. This was the period of
suburbanisation when great areas of new housing were constructed as evidenced, for
example, by the increased growth of Sutton Coldfield and Solihull. Of particular
relevance to this study is the southward spread of the city.
Figure 6.5 The expansion of Birmingham (Redrawn from Wise 1950 p215)
116

For example, the south west of the city was undeveloped and in this area a detached
village in 1890, Kings Norton, subsequently became swept up in the suburbanisation
process and taken into the city (Figure 6.5).
This is significant as the place to which Thomas Maund moved his family in about
1889 (Chapter 8). This is simply acknowledged here but will be developed fully in
Chapter 8 and again in Chapter 9. The Austin Motor Works factory at Longbridge
began to develop around the turn of the century and there was a major extension from
1914, first as part of the war effort and then as the mass production of motor vehicles
took off.
In the inter war period the city population grew by nearly 17% but the centre and
middle suburbs decreased by 22% (Wise 1950 p228). At the same time the outer
suburbs grew by 90%. This is important in terms of movement of the Maund family
to be discussed in Chapter 9.
Place 1801-51 1851-01 1901-51 1951-91 England & Wales 9 million- 101% 14.6 million – 82% 11.2 million – 34% 6.1 million – 14% Birmingham 171,816-– 282% 289,566 – 124% 590,481– 113% -151,644- -14% Herefordshire 27,053 - 31% -2940 - -3% 14,610 – 13% 33,822 – 27% Salop 60,092 - 36% 10,443 – 5% 5,019 - 21% 113,676 – 39% Worcestershire 130,485 - 89% 211,412 – 76% 34,508 – 7% -14,831 - -3%
Table 6.2 Comparative Rates of Population Change
Table 6.2 illustrates the high growth rate of the Metropolitan area after 1851
compared with the national pattern. It also illustrates the late 20th century fall in the
population of Birmingham, when the turnaround is particularly noticeable after 1950
as the counterurbanisation process was revealed but with continued population rise
nationally (Cross 1990).
Having examined the trends in population in England and Wales over the past two
centuries, and also that of Birmingham, the provincial capital of the Borderland, it is
now necessary to consider the demographic changes experienced by the broad region
within which the case study area is located.
117

6.3 Regional: The Three Counties The Mid Borderland region was delimited in Chapter 4, as that between the Welsh
Massif in the West and the River Severn in the East and between Shrewsbury in the
North and Hereford in the South. This definition presents a significant data problem
because the region as defined is not an administrative unit, indeed by its very nature
its boundaries are porous and changing. The prime parish of Little Hereford lies at
the point where the three counties of Worcester, Hereford and Shropshire meet and
the 17 parishes of its neighbourhood are not equally distributed among them as shown
below:
Worcestershire (2): Bockleton, Tenbury. Shropshire (7): Ashford Bowdler, Ashford Carbonel, Burford, Caynham, Greet, Ludford, Richards Castle (part). Herefordshire (8): Richards Castle (part), Orleton, Brimfield, Little Hereford, Middleton-on the-Hill, Laysters, Pudlestone, Eye.
Thus the majority of the territory is administratively in Herefordshire or Shropshire
and there would therefore be a case for using data solely from these two counties to
represent the Mid Borderland. The problem of regional definition and compatible data
collection units is clearly pointed up by this example. As a means of proceeding the
three counties population trends are examined together in order to consider their
characteristics and perhaps begin to, at least partially, resolve the problem.
In his major work on rural depopulation Saville (1957) noted that the first absolute
decline in rural population occurred in Wiltshire and Montgomery in 1851 whilst in
Herefordshire and Shropshire absolute decline was delayed until 1881. From Figure
6.6 it can be seen that over the period 1801 to 2001 all three counties experienced an
overall increase in their total populations. Throughout the period Worcestershire
always had the largest population, which fluctuated in certain decades, whilst
Herefordshire and Shropshire with their smaller totals, experienced a steadier and
slower growth. Yet the rate of population growth in all the three counties in the early
19th century was much lower than that of England and Wales as a whole. A
significant feature of the trends identified in Figure 6.6 suggests that the demography
of Worcestershire from 1801 to 2001 was quite different to that of Herefordshire and
Shropshire (Lawton 1968).
118

Population - Counties
0
100,000
200,000
300,000
400,000
500,000
600,000
1801
1811
1821
1831
1841
1851
1861
1871
1881
1891
1901
1911
1921
1931
1941
1951
1961
1971
1981
1991
2001
Herefordshire Shropshire Worcestershire
Figure 6.6 Trends in County Population Totals, 1801-2001
The most startling difference was the steep increase in population from 1841 until the
turn of the century (Figure 6.6; Table 6.2). Much of this was due to the growth of the
urban and industrial areas within its boundaries, for example, these included the
southern parts of Birmingham and parts of the Black Country. In other words,
Worcestershire, rather than being a largely rural area is a county of great contrasts
with significant urban development.
According to Grundy’s (1987) detailed study, the loss of population in Herefordshire
after 1871 was overwhelmingly through migration; she asserts that between 1871 and
1931 natural increase in the county totalled 57,000 but 67,000 were lost through
migration. Grundy (1987) cogently argued that this depopulation was engendered by
a decline in agriculture under pressure from foreign imports and the attraction of
better wages and living conditions. In the case of Herefordshire the major destination
of the migrants was Birmingham and the Black Country but a substantial number also
went overseas (Erickson 1994). It could be argued however, that too much can be
made of rural depopulation since in the case of Herefordshire the number lost was as
little as 10,000 over a sixty year period, less than 170 per year for a whole county
(Grundy 1987). Even here of course, though overwhelmingly based on out migration,
it must be emphasised that it was a net figure and even in periods of depopulation
there was still an inflow of people (Lewis 2000; Pooley and Turnbull 1998).
119

By the 1990s much of rural Britain began to experience an upturn in population, a
feature which is often referred to as counterurbanisation or the rural turnround (Cross
1990; Lewis 2000). In the case of the Mid Borderland it would appear that
counterurbanisation was not quite as widespread in its occurrence as might be
expected from the national picture (Chapman 1996; Lewis 2000). From Figure 6.6
and Table 6.2 it seems that the population of both Herefordshire and Shropshire had
grown significantly between 1951 and 1991 whilst, surprisingly, that of
Worcestershire had actually fallen by 3%. Such a difference is difficult to explain for
a number of reasons; for example, Lewis (2000) has argued that the rural turnaround
occurred in different places at different times and was certainly underway in some
areas as early as the 1950s; secondly, because of the use of net data both
depopulation and counterurbanisation could coexist; thirdly the effect of boundary
changes resulted in distortions in the overall totals such as the enlargement of the
boundaries of Birmingham, Dudley and Kidderminster as a result of suburbanisation.
Tables 6.3 and 6.4 focus in more detail on the so called turnaround period. What is
evident from these tables is that since 1951 the overall population growth was much
higher in Shropshire and Herefordshire and only after 1991, though markedly
attenuated, did Worcestershire’s growth rate mirror that of the other two counties.
Period Worcestershire Shropshire Herefordshire 1951 - 2001 4% 52% 37% 1971 - 2001 29% 31% 26% 1991 - 2001 7% 9% 9%
Table 6.3 Period Population Changes.
Some of the difficulties in interpreting the differential trends was unravelled by Boyle
et al (1996) in a ward level analysis of census data for 1990-91. This revealed that
there were marked local variations within Worcestershire in terms of the movement of
people. It would appear that counterurbanisation was rife in north west
Worcestershire largely due to out migration from the West Midlands conurbation
whilst other rural parts of the county grew quite sharply at the expense of some of the
surrounding towns. Clearly at this scale planning authority decisions played a role;
120

1951-61 1961-71 1971-81 1981-91
Herefordshire 4k - 3% 8k - 6% 9k - 6% 13k - 9%
Shropshire 7k - 2% 40k - 13% 39k - 12% 27k - 7%
Worcestershire -31k - - 6% -71k - -14% 63k - 15% 24k - 5%
Table 6.4 County Population Change by Decade
for example, the designation of growth villages in the 1970s within four miles of
Hereford played a significant part in explaining the population growth in part of
Herefordshire (Maund 1976). Yet, the growth in west Herefordshire was much more
diffuse since it involved not only commuters but also retired and rural retreaters.
(Lindgren 2003; Stockdale 2006).
Essentially, over the past two centuries the three counties considered here underwent
a considerable degree of population change and redistribution. Not all of it mirrored
national trends and each county, to a certain extent, had a different demographic
experience at different times. What is evident from this examination is that the towns
within the Mid Borderland played a significant role in these demographic changes. It
is now opportune to consider the nature of the changes they experienced.
6.3.2 The County Towns
The largest significant urban centres in the Mid Borderland are the three County
towns: Hereford, Shrewsbury and Worcester. Although roughly in the centres of their
respective counties these are actually at the periphery of the region of the Mid
Borderland as defined earlier. It has been shown that the population trends of the
county of Worcestershire were different from those of the other two counties,
sufficient to suggest that it was largely a different region. It might follow from this
that its county town, connected so readily to Birmingham and standing on the great
early route way of the Severn would be similarly different from the other county
towns. Figure 6.7 illustrates the population trends in Hereford, Shrewsbury and
Worcester between 1801 and 2001. None of these county towns reached a population
of 100,000 during this period and demographically they were dwarfed by
Birmingham, where population exceeded 1 million in 1981.
121
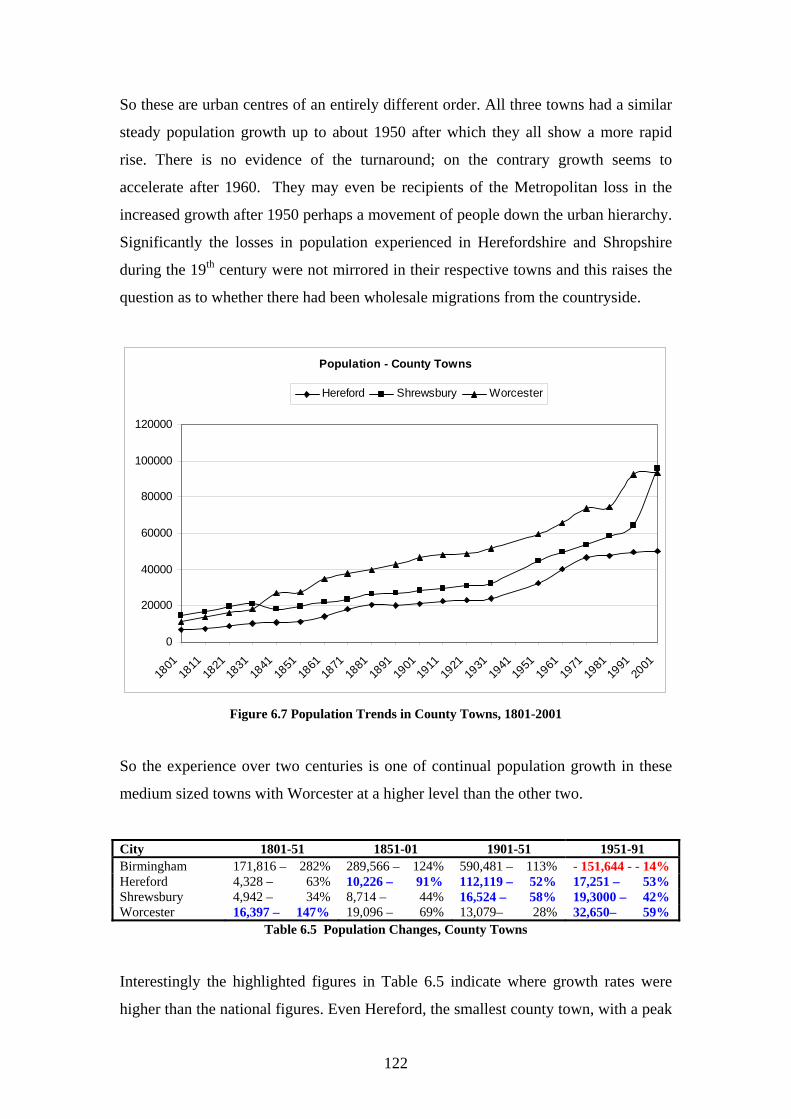
So these are urban centres of an entirely different order. All three towns had a similar
steady population growth up to about 1950 after which they all show a more rapid
rise. There is no evidence of the turnaround; on the contrary growth seems to
accelerate after 1960. They may even be recipients of the Metropolitan loss in the
increased growth after 1950 perhaps a movement of people down the urban hierarchy.
Significantly the losses in population experienced in Herefordshire and Shropshire
during the 19th century were not mirrored in their respective towns and this raises the
question as to whether there had been wholesale migrations from the countryside.
Population - County Towns
0
20000
40000
60000
80000
100000
120000
1801
1811
1821
1831
1841
1851
1861
1871
1881
1891
1901
1911
1921
1931
1941
1951
1961
1971
1981
1991
2001
Hereford Shrewsbury Worcester
Figure 6.7 Population Trends in County Towns, 1801-2001
So the experience over two centuries is one of continual population growth in these
medium sized towns with Worcester at a higher level than the other two.
City 1801-51 1851-01 1901-51 1951-91 Birmingham 171,816 – 282% 289,566 – 124% 590,481 – 113% - 151,644 - - 14% Hereford 4,328 – 63% 10,226 – 91% 112,119 – 52% 17,251 – 53% Shrewsbury 4,942 – 34% 8,714 – 44% 16,524 – 58% 19,3000 – 42% Worcester 16,397 – 147% 19,096 – 69% 13,079– 28% 32,650– 59%
Table 6.5 Population Changes, County Towns
Interestingly the highlighted figures in Table 6.5 indicate where growth rates were
higher than the national figures. Even Hereford, the smallest county town, with a peak
122

of just under 50,000 in 1991, has generally higher rates of growth than England and
Wales as a whole. The contrast with Birmingham was clear both in scale and
magnitude of change. Hereford in the latter part of the 19th century had a very
significant growth of 91% at a time when the countryside was losing population.
However, Worcester does show features which lend it some distinction from the other
two. This is not as marked as the differences between the counties but sufficient to
suggest that Worcestershire and its county town are different and reinforces the notion
that it belongs to a different region. There is scope here for further investigation of
these features of county towns and the processes underpinning them since it does not
appear to have been explored in the literature.
In an attempt to gain more insight into the trends among the three counties for the last
half of the 20th century, broadly the period of the population turnaround, the data are
used to show change for each period of the census (Table 6.6). From this exercise a
number of features emerge. Firstly, there was similar proportionate growth among the
three county towns over fifty years - just over a third in each case. But in absolute
terms the bigger the city the bigger the growth. Yet the growth of Hereford from
1951 to 1971 was significantly greater than for the other two county towns is
particularly noteworthy. The reasons are difficult to determine and would need
detailed local investigation but it may be to do with the establishment of a major
Hereford Shrewsbury Worcester 1951-2001 35% 33% 36% 1951-1961 24% 10% 10% 1961-1971 15% 8% 12% 1971-1981 3% 9% 2% 1981-1991 4% 10% 11% 1991-2001 1% 5% 12%
Table 6.6 Percentage Population Growth, County Towns, 1951-2001
engineering enterprise in Hereford which may also relate to the changes in nearby
villages as identified by Maund (1976).
123
6.3.3 The Market Towns
Historically market towns were an essential aspect of the economic system of the
Welsh Borderland (Thomas 1965) since they formed an interrelated system of
markets. These were stable over many years with only slight changes in the
hierarchy (Lewis 1973). They were the very hubs of commercial farming almost to
the end of the 20th century when some markets closed or were relocated. Lewis (1973)
has shown that these towns had been in existence for several centuries, even in the
time of the Norman conquest of Wales. In a longitudinal study of urban central places
he identified twenty one towns between the Cambrian watershed and the north-south
line linking Shrewsbury and Hereford. His region, as defined, does not go east of this
line but the Mid Borderland defined in Chapter 5 extends to the line of the River
Severn. In this eastern area there are seven such towns, Bridgenorth, Stourport,
Bewdley, Worcester, Much Wenlock, Cleobury Mortimer and Tenbury Wells. Of
these the first four are on the river and also performed the function of ports for
carrying agricultural produce (Chapter 5). The last three are genuine market towns
similar to those studied by Lewis (1973). It was shown by Maund (1969) in a study
of central places in Herefordshire that there was a distinct regularity in the spatial
arrangement of these towns such that no place was more than about six miles from a
market, a convenient distance over which to drive animals on the hoof to market
before the advent of mechanised transport (Chapters 4 and 6). The local market was
therefore essential and for Little Hereford there were three roughly the same distance
apart. These were the market towns of Tenbury, Leominster and Ludlow and towns
which served, perhaps different parts of the neighbourhood of Little Hereford. Strictly
only Tenbury is included in the neighbourhood of Little Hereford (Chapter 4).
Ludlow lies at the northern fringe and Leominster is about two miles south west on
the southern fringe.
In 1801 Tenbury, Ludlow and Leominster were small towns (less than 4,000
population) and all of them had tracts of countryside with farms within their
boundaries. The county towns may have hosted the specialised livestock markets and
fairs but the week by week trading in butter, eggs, cheese and cider, all produced on
the farm in addition to the livestock and field crops passed through the market towns.
From the mid 19th century the skilled trades such as shoemaking and dressmaking
124
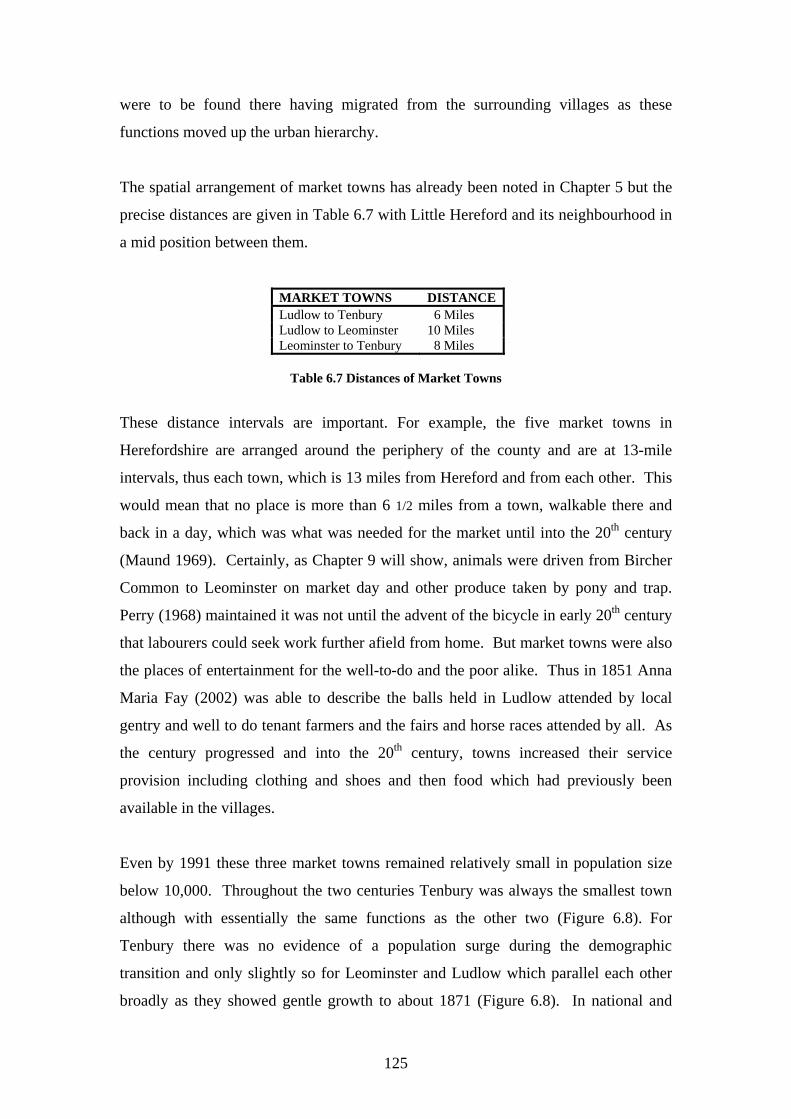
were to be found there having migrated from the surrounding villages as these
functions moved up the urban hierarchy.
The spatial arrangement of market towns has already been noted in Chapter 5 but the
precise distances are given in Table 6.7 with Little Hereford and its neighbourhood in
a mid position between them.
MARKET TOWNS DISTANCE Ludlow to Tenbury 6 Miles Ludlow to Leominster 10 Miles Leominster to Tenbury 8 Miles
Table 6.7 Distances of Market Towns
These distance intervals are important. For example, the five market towns in
Herefordshire are arranged around the periphery of the county and are at 13-mile
intervals, thus each town, which is 13 miles from Hereford and from each other. This
would mean that no place is more than 6 1/2 miles from a town, walkable there and
back in a day, which was what was needed for the market until into the 20th century
(Maund 1969). Certainly, as Chapter 9 will show, animals were driven from Bircher
Common to Leominster on market day and other produce taken by pony and trap.
Perry (1968) maintained it was not until the advent of the bicycle in early 20th century
that labourers could seek work further afield from home. But market towns were also
the places of entertainment for the well-to-do and the poor alike. Thus in 1851 Anna
Maria Fay (2002) was able to describe the balls held in Ludlow attended by local
gentry and well to do tenant farmers and the fairs and horse races attended by all. As
the century progressed and into the 20th century, towns increased their service
provision including clothing and shoes and then food which had previously been
available in the villages.
Even by 1991 these three market towns remained relatively small in population size
below 10,000. Throughout the two centuries Tenbury was always the smallest town
although with essentially the same functions as the other two (Figure 6.8). For
Tenbury there was no evidence of a population surge during the demographic
transition and only slightly so for Leominster and Ludlow which parallel each other
broadly as they showed gentle growth to about 1871 (Figure 6.8). In national and
125

urban terms this implies a relative loss in population. The decline from the late 19th
century and into the early 20th century is an echo of the decline in county population
and is important for analysis of migrating families in the next and subsequent
chapters.
Population - Neighbourhood Area Towns
0
2000
4000
6000
8000
10000
12000
1801
1811
1821
1831
1841
1851
1861
1871
1881
1891
1901
1911
1921
1931
1941
1951
1961
1971
1981
1991
2001
Tenbury Leominster Ludlow
Figure 6.8 Population Trends in Market Towns
It seems to be an important conclusion that market towns appear to be part of their
immediate context, they behave as part of the countryside in which they are
embedded. Some of the 19th century trends in population may be explained in terms of
the integration rather than distinctiveness of town and country, especially in an area
remote from large cities.
Figure 6.8 indicates that between 1911 and 1931 there is some recovery from the late
19th century slump in population and then quite sharp growth from 1971 in the cases
of Leominster and Ludlow. This feature could well be part of the turnaround
(Champion 1989; Cross 1990). Tenbury does not experience the mid to late 19th
century slump and in fact it grows by 16%. This may be as a consequence of the
development of the railway from the 1860s and attempts to develop Tenbury as a
Victorian Spa town. This illustrates the potential of local factors to influence trends as
well as the more macro ones.
126

The trends are seen more clearly in Table 6.8 which shows change both at county and
market town level and in which negative changes are highlighted.
Place 1801 - 1851 1851 - 1901 1901 - 1951 1951 – 1991 Herefordshire 27,053 - 31% -2940 - -3% 14,610 – 13% 33,822 – 27% Salop 60,092 - 36% 10,443 – 5% 5,019 - 21% 113,676 – 39% Worcestershire 130,485 - 89% 211,412 – 76% 34,508 – 7% -14,831 - -3% Leominster 1,248 - 31% -628 - -12% 1,704 - 37% 3,638 - 58% Ludlow 794 - 20% -139 - -0.3% 1,904 - 42% 2,555 - 40% Tenbury 245 - 16% 294 - 16% -162 - -8% 747 - 39%
Table 6.8 Rates of Population Change in Three Counties and the Market Towns-1801-1991.
Here it can be seen that Herefordshire, Leominster and Ludlow all lost population in
the latter part of 19th century. The population turnaround may be illustrated by the
final column in Table 6.9. This shows significant population gains over the forty-year
period from 1951 for all but Worcestershire. Even in absolute terms the gains are
quite significant for a low base population. It should be noted that this was after the
return of the core family of Maunds to Herefordshire (Chapter 9).
6.4 The Neighbourhood of Little Hereford 6.4.1 The Neighbourhood
Bearing in mind the trends in population identified in the three counties and their
respective county and market towns it is now opportune to examine the demographic
shifts within the case study neighbourhood. For the purpose of initial analysis
population data was aggregated for the 17 defined parishes and summarised in Figure
6.9. In turn these population trends can be considered within the socio-economic
changes experienced by the neighbourhood of Little Hereford (Figure 6.10). This
figure shows the population trends over two hundred years in the aggregated
neighbourhood parishes along side certain key events, nationally and locally. Thus
the movement of the core families to be discussed and analysed in Chapters 8 and 9 is
shown. Additionally some of the detail from the description of the Borderland in the
previous chapter is repeated in the context of the population trend. This figure can be
used as a point of reference to a number of events to be discussed in later chapters.
Three significant features stand out from Figure 6.9. Firstly there was a quite sharp
growth in population at the beginning of the period, reflecting the demographic
127

transition to 1811; after that there was a slight decline followed by a rise which
evened itself out to 1851.
Population - Neighbourhood Area
0
1000
2000
3000
4000
5000
6000
7000
8000
9000
10000
1801
1811
1821
1831
1841
1851
1861
1871
1881
1891
1901
1911
1921
1931
1941
1951
1961
1971
1981
1991
2001
Figure 6.9 Population Trends in the Neighbourhood of Little Hereford.
This change may have been sufficiently slight and so variable between the 17 parishes
as to be scarcely detectable over a generation of inhabitants. Anna Marie Fay (Fay
2002), staying in Richards Castle in the mid 19th century, makes no mention of it in
her letters home. It was an imperceptible phase. In terms of the national pattern the
period from about 1850 was one of high demand for agricultural products before the
era of importation from the ‘new’ colonies. What does appear to be the case is that, in
contrast to Herefordshire and Shropshire as a whole, 1881 was not a point of absolute
loss for the neighbourhood of Little Hereford.
In terms of the trends in rural areas generally there was no great decline but rather a
period of gentle decline from late 19th century onwards (Saville 1857). This came to
an end around 1971 to be followed by a significant growth coinciding with the
decline seen in the figures for Birmingham. In detail the high point for total
population was 8,647 in 1831 and the low point 6,287 in 1971, a decline of 27% but
128

Before the 1801census local and regional population is difficult to calculate. But, after Black Death population slumped and agriculture became less labour intensive & the wool trade grew with the Ryland sheep. Local markets established and trade with London expanded. As population grew increasing amounts of wheat and beef were produced, The Hereford breed emerges. Later hops in the Teme valley in addition to apples. Surge in wheat production as result of Napoleonic wars. Period of Demographic Transition. Maund family enter LH. Bennett Family enter LH. Bleathwood Common enclosed. Rowbury Family enter LH. Despite innovation farming was still labour intensive and living-in continued as the first move from home. This continued to end century because of need to care for animals. Repeal of Corn Laws facilitated land drainage & enabled increase in wheat production. Tenbury to Bewdley railway completed & linked locality to Severn, Birmingham and Black Country which were growing significantly. Gave impetus to market towns. Absolute decline in population of Shropshire and Herefordshire. Study of Migrating families Chapter 7. Thomas Maund leaves for Birmingham fringe. Population in slow decline and farming suffers from overseas competition but area adapts to milk production to supply Midland conurbation using now rapid transport system. Family of Thomas E. Maund begin the return to Herefordshire. Farming recovers with War and its aftermath. Milk production very important. Diversification into fruit and eggs. Noticeable increases in population at key villages, many retired and middle class. Period of Demographic Turnaround. Major challenges to farming with EU policy and globalisation. Response in large scale fruit, holidays, farm shops, golf courses, organic food. Change in itinerant labour.
Figure 6.10 Key Events in Context, Little Hereford 1750-1991.
129

over a period of 140 years. Put in another way the loss was 2,360 over 140 years or
less than an average of 17 persons per year in 17 parishes! This is not massive
population loss, it is a gentle decline and this seems to be a very important conclusion
in a relatively remote area of about 80 square miles. This point can be illustrated
further when the data for absolute change are broken down by fifty-year intervals
(Table 6.9).
Period Change, Numbers Change % 1801-1851 1,607 23.2 1851-1901 - 964 - 11.3 1901-1951 - 1,164 - 15.4 1951-1991 1,954 20.1
Table 6.9 Absolute Population Change in the Neighbourhood of Little Hereford 1801-1991
In the period to 1851 population grew in the parishes of the neighbourhood. From
1851, the trend was one of stagnation and decline despite it being a period of
agricultural prosperity and success and the development of the transport system with
the coming of the railway (figure 6.10). For a century the locality declined in
population and in fact it was only after 1971 that there was renewed growth, perhaps
coincident with the period of the population turnaround, a growth rate of 28%
between 1971 and 1991.
However, it is evidence that even within the 17 parishes considered together there
were differences in their demographies since 1801 which are of significance in any
understanding of local family moves. A brief examination of population changes over
the last two centuries in these parishes will now be undertaken.
6.4.2 The Parishes
The 17 parishes which make up the neighbourhood of Little Hereford are shown in
Figure 6.11 and for the sake of comparability and consistency, the boundaries in 1881
have been retained throughout the study.
The population trends between 1801 and 1991 in the neighbourhood parishes are
shown in Figure 6.12 and with the exception of Caynham and Burford the pattern is
far from clear. Caynham, in 1881, is not only the largest unit by far but its population
130

trends are erratic. In 1871 –81 it was one enumeration district occupying, in part, the
western flanks of the Clee Hill. At this time this was a coal mining and quarrying
area employing relatively large numbers of people many of whom were relative
newcomers from similar quarrying areas particularly the Mount Sorrel district of
Figure 6.11 Parishes of the Neighbourhood of Little Hereford
Leicestershire (Chapter 5). The remainder of the parish had a similar landscape and
farming regime as the neighbourhood generally. Burford, which is immediately
adjacent to Tenbury, was for all practical purposes, in the late 19th century, a
functioning part of Tenbury; the railway station called Tenbury was actually in
Burford with all the activities associated with it including a hotel and cattle market.
131

Saville (1957) observed that during the 19th century smaller communities tended to
experience depopulation first and this appeared to still be the case in the mid 20th
century when Maund (1976) observed a category of parishes which had suffered
depopulation. Not only were these small but they were the least accessible.
Population - Trends in Neighbourhood Parishes
0
500
1000
1500
2000
2500
3000
1801
1811
1821
1831
1841
1851
1861
1871
1881
1891
1901
1911
1921
1931
1941
1951
1961
1971
1981
1991
2001
Ashford Bowdler Ashford Carbonel BrimfieldBurford Bockleton CainhamEye Greet KimboltonLittle Hereford Laysters LudfordMiddleton on the Hill Orleton PudlestoneRichards Castle
Figure 6.12 Population Trends in the Parishes of the Neighbourhood.
Based on this the population trends of the neighbourhood of Little Hereford were
examined by parish population total in 1881 modified by spatial proximity. For this
exercise, which is intended to clarify the trends obscure in Figure 6.12, Caynham is
omitted because of its clearly different nature and Tenbury because of its urban
functions. Figure 6.13 shows the population trends of the remaining parishes in a form
intended to enable visual comparisons.
132

For the parishes in category (1) all had been small over the entire 200 year period
with less than 350 population. The decline in the late 19th century was most marked
in Laysters and Pudlestone, adjacent parishes (Figure 6.11). The latter parish though
is the only one to show what might be evidence of the population turnaround.
misleading without other evidence.
Population Trends
050
100150
200250
300350
400
1801
1811
1821
1831
1841
1851
1861
1871
1881
1891
1901
1911
1921
1931
1941
1951
1961
1971
1981
1991
2001
Ashford Bowdler Greet Laysters Pudlestone
Category 1
0
200
400
600
800
1000
1801
1811
1821
1831
1841
1851
1861
1871
1881
1891
1901
1911
1921
1931
1941
1951
1961
1971
1981
1991
2001
Richards Castle Ludford Middleton on the Hill Ashford Carbonel
Category 2
133
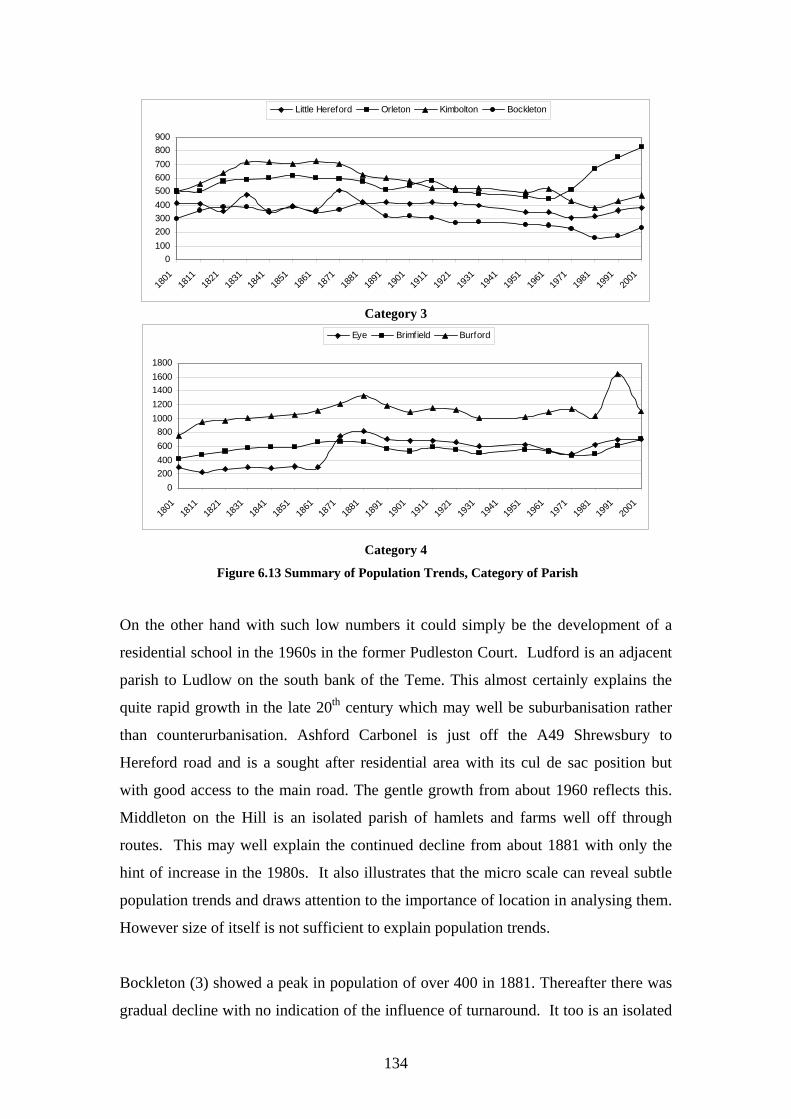
0100200300400500600700800900
1801
1811
1821
1831
1841
1851
1861
1871
1881
1891
1901
1911
1921
1931
1941
1951
1961
1971
1981
1991
2001
Little Hereford Orleton Kimbolton Bockleton
Category 3
0200400600800
10001200140016001800
1801
1811
1821
1831
1841
1851
1861
1871
1881
1891
1901
1911
1921
1931
1941
1951
1961
1971
1981
1991
2001
Eye Brimfield Burford
Category 4
Figure 6.13 Summary of Population Trends, Category of Parish
On the other hand with such low numbers it could simply be the development of a
residential school in the 1960s in the former Pudleston Court. Ludford is an adjacent
parish to Ludlow on the south bank of the Teme. This almost certainly explains the
quite rapid growth in the late 20th century which may well be suburbanisation rather
than counterurbanisation. Ashford Carbonel is just off the A49 Shrewsbury to
Hereford road and is a sought after residential area with its cul de sac position but
with good access to the main road. The gentle growth from about 1960 reflects this.
Middleton on the Hill is an isolated parish of hamlets and farms well off through
routes. This may well explain the continued decline from about 1881 with only the
hint of increase in the 1980s. It also illustrates that the micro scale can reveal subtle
population trends and draws attention to the importance of location in analysing them.
However size of itself is not sufficient to explain population trends.
Bockleton (3) showed a peak in population of over 400 in 1881. Thereafter there was
gradual decline with no indication of the influence of turnaround. It too is an isolated
134

parish similar to Middleton on the Hill. No main road goes through it and there has
never been a railway, in fact it is not a place that people go through, they have to go to
it. The major feature is the strong growth of Orleton from the 1960s. This was a
period of major building as part of the Development Plan of Herefordshire (H.C.C.
1960). The precise locations were not specified in the Plan but in practice were
located where existing infrastructure reduced costs. In this manner a form of access
criterion existed. Orleton was designated as a key village and the infrastructure
developed to accommodate major house building. Thus the population rose from 445
in 1961 to 754 in 1991. In an area of small parishes this is major growth. The largest
parish of all in the 19th century, Kimbolton, shows a decline from the peak in 1861;
there is some recent late 20th century growth but this is slight. The prime parish of
Little Hereford shows unexplained peaks in 1841 and again in 1881 but these are on a
base of less than 500 total. The 1841 surge may have been associated with the move
into the parish of the Bailey family and their household. A similar surge in the 1870s
may have been to do with the coming of the railway. There was a plateau from 1881
to 1931 followed by gentle decline and what appears as the beginnings of recovery in
the 1980s.
The final graph, (4), shows the trends in the three largest parishes in 1881. This has a
slightly different scale from the previous ones with an interval of 200 people.
However, despite this it does show the trends which are quite distinctive. Brimfield is
the best connected parish. In 1881 it had the main Shrewsbury to Hereford road, the
main road east to Bewdley, Kidderminster and Birmingham and an important rail
junction where the north south lines met the east west line. Despite these favourable
conditions the trends appears as stable with very few fluctuations or noticeable
changes in trend. There is a dip from 1881 and a slight rise from the 1970s.
Eye was another parish where some residential development was promoted from the
1960s and this shows in the trend. It is Burford which shows the most marked
features. The rising trend from about 1871 was almost certainly to do with the
increased activity brought about by the Tenbury railway station and cattle market.
The decline afterwards follows the familiar trend of loss from the countryside but the
most marked feature is the sharp rise from 1981. This is a period of major house
building but whether this is suburbanisation as Tenbury grew or counterurbanisation
135
as people moved to the area from other towns is difficult to tell without further, more
detailed investigation.
A number of points emerge from this analysis of the individual parishes of the
neighbourhood. Firstly, 1881 is by no means the point of absolute decline in
population unlike the general trend for the two counties. There is some evidence for
the turnaround but more so in the larger parishes but, to what extent this is to do with
the strategy of the planning authorities is not entirely clear without further
investigation. There is some evidence to confirm a relationship between population
trend and both size and access but there was no dramatic fall in population in this
area of countryside. Any fall was gentle and over a span of about fifty years.
These parishes of the neighbourhood area do show some features in common but the
impression is that the area is by no means homogeneous. Of course when the area was
delimited in Chapter 4 no claim was made for homogeneity rather it was an area of
parishes with an interactive relationship with the prime parish of Little Hereford. It
seems clear that even at the level of the locality there are differences to be identified
and thus different places respond differently to macro trends.
Table 6.10 highlights some of the key trends in the parishes and also for the
neighbourhood as a whole. Generally the neighbourhood follows what might be seen
as an expected pattern. There is a rise in the early 19th century, at the latter part of the
population transition but during a time of comparative farming depression. The
trends in the parishes however did not by any means fit this overall trend. This is
interesting because the neighbourhood as designated in Chapter 4 was one of social
and economic interaction but was not necessarily a homogeneous one. It may be that
population trends need to be seen over such an area for a general but none the less
local pattern. Viewed in this manner the area is a form of self regulating unit. Little
Hereford, the prime parish is in no way typical of its neighbourhood, nor indeed need
it be if a neighbourhood is in some form of counteracting balance.
136

Place 1801-51 1851-01 1901-51 1951-91 Pop 1881 Ashford Bowdler 23% -8% -10% -37% 95 Greet 2% 182% -4% -16% 97 Laysters 14% -6% -14% -29% 238 Pudleston 18% -33% -18% 29% 287 Ashford Carbonel 61% -5% -23% -17% 290 R.Castle 29% 1% 37% -4% 312 Ludford 24% -4% -3% 31% 365 Middleton-o-Hill 30% -32% -9% -10% 392 Bockleton 29% -17% -19% -33% 416 Little Hereford -6% 5% 14% -3% 421 Orleton 22% -17% -15% 61% 575 Kimbolton 29% -18% -13% -13% 622 Brimfield 40% -11% 6% 11% 663 Eye 4% 121% -8% -2% 815 Caynham 16% -42% -21% 38% 1165 Burford 40% 3% -6% 60% 1335 Neighbourhood LH 23% -11% -11% 20% 8088
Table 6.10 Comparative Parish Population Trends
The failure to grow at all in the first part of the 19th century may be to do with the
unpopularity of the Dansey family (see Chapters 5 and 7). It was also the period in
which Bleathwood Common was enclosed. Only detailed local investigation would
reveal the factors underlying this time. The positive trend in the second half of the
century may reflect the drainage of land in the Middleton area, the coming of the
railway with a station located there and the influence of the Bailey family. The
negative trends for the hundred year period after 1851 follows the pattern emerging of
slow gradual decline in population totals already noted. Although the proportions
between parishes are variable from minus 42% in Caynham to plus 61% in Orleton.
The general 20% growth in the neighbourhood after 1951 reflects the turnaround but a
number of parishes did not experience this. Generally therefore the data confirm that
even at the local level there are internal differences.
6.5 Summary and Conclusion
From the above analysis it is possible to draw out a number of features that are of
significance in an analysis of migration. The Mid Borderland and the provincial
capital, Birmingham, appear to be part of an interacting system. In part this seems to
be driven by the provincial capital in that it grew faster than any other city and than
England and Wales as a whole. Having said that other cities grew faster than the
countryside. In the countryside there was population decline from the 19th century
onwards but it was a slow process. Interestingly the market towns tended to behave
137

similarly to that of the countryside they served; they appeared to be more countrified
than urban. The countryside and the provincial capital appeared to have an inverse
relationship; thus in the late 20th century, there was population loss in the large cities
and gains in the countryside including the market towns. This though was not always
such a simple pattern in the Mid Borderland as originally designated because the
county, as a data collection unit, often masked important internal differences since
demographically Worcestershire often behaves more like Birmingham. Significantly,
even at the local scale, the parishes of the neighbourhood of Little Hereford were not
demographically homogeneous over the period 1801-2001; at certain times they react
differently to national trends.
This chapter, like the previous one, has been constructed with a view to discovering
whether, by analysing population trends, there is a case for claiming some
distinctiveness for the Borderland region and in particular the neighbourhood of Little
Hereford. The summary of findings suggests that this may well be the case. But there
is also the matter of providing context for the migration study which is to follow.
However, it is important to acknowledge that the trends noted in this chapter were all
part of a broader set of processes of significant structural change involving
urbanisation and modernisation but which had different responses and consequences
in different areas.
There is a major difficulty in relating population change, shown by net data, to
migration. It can not be stated from this analysis whether decline was due to changes
in the vital rates, from migration or some interaction of the two. The major loss from
depopulation proposed by Grundy (1985) could be construed differently. The
evidence here is for gentle, slow loss. Of course that does not mean no change
because these forms of data hide any incoming and outgoing movement since they
merely record the balance. There does appear to be a form of unity in the
neighbourhood of Little Hereford but there are also contrasts between parishes in
population trends.
In an attempt to examine more closely these trends the study now moves to a direct
focus upon migrating families from the neighbourhood of Little Hereford and the
patterns and processes which they bring about.
138

Chapter 7 Migrating Families:
Neighbourhood of Little Hereford, 1871 – 1881
7.1 Introduction In the previous chapter it was revealed that in 1881 the Mid Borderland experienced
an absolute decline in population for the first time after the 18th century demographic
transition. However, it was also revealed that within the region, for example in the
neighbourhood of Little Hereford, there was still a growth, although attenuated, in
population whilst several of its parishes were beginning to lose individuals and
families. Despite these variations it would appear that something was happening in
the decade 1871 to 1881 and it would appear to be the beginning of a long period of
rural depopulation (Saville 1957). Clearly this demographic turmoil, or turning point,
deserves a more detailed investigation particularly as a context for the movements of
individuals and families analysed in the succeeding chapters (Nicholas and Shergold
1987). From this two questions arise, firstly, what role did migration play in these
trends and, secondly, what was the form and pattern of any migration flows at the
point of absolute decline?
In order to seek answers to these questions the focus will be upon families rather than
individuals. Individuals leave home as part of the life cycle, as described in chapter 5,
and there has been much research on this and their gender differences during the 19th
century which has been so effectively summarised by Pooley and Turnbull (1998).
However, the focus in this study is upon the family not only because of its role as a
decision making unit in the migration process but also because the relationships
between different branches of the same family bring some coherence to an area (Hey
1976). The introduction of the notion of a core family strengthens this because it
implies a presence over a long period and, therefore, stability. Such stability would
also assist in the development of the value systems and culture, giving it identity and
sustainability. It is this which gave rise to the identification of the concept of a
neighbourhood area or locality. Thus, there are three intimately interrelated factors,
the family, the neighbourhood and the region with the family as an essential building
139

block. If this were to begin to change as a result of the movement of hitherto core
family movement then this might be seen as an indicator of structural change.
It has already been shown (Chapter 6) that the slow decline in population experienced
in the neighbourhood of Little Hereford during the second half of the 19th century
continued well into the 20th century. In other words there had been no sudden
emptying of the countryside but rather an imperceptible decline. But what was the
role of migration in this slow population process? Part of the function of this chapter
is to offer some assessment of this decline. More specifically the chapter identifies the
pattern of family movement from and within the neighbourhood and in doing so
identifies the characteristics of the families that moved (Darroch 1981).
The sequence of this chapter will be firstly to specify the methods used, then to look
at the patterns of the moving families and identify their characteristics and finally to
examine in more detail the movement associated with the prime parish, Little
Hereford. This latter phase of the analysis provides the platform for the identification
of the migration histories of the parish’s core families and in particular their
movement after 1881.
7.2 Sources and Methods In this section the sources and methods employed, as previously outlined in Chapter
3, are developed in more detail. The approach is generally behavioural since the
purpose is to identify migration patterns. The neighbourhood concerned though
relatively small in scale, involved 17 parishes which occupied less than 80 square
miles. This neighbourhood as defined in Chapter 4 contained 18 parishes but because
one of these, Whitton, was included for electoral enumeration purposes in the parish
of Burford, there were actually 17 units. Additionally the parish of Tenbury
contained the market town of Tenbury Wells and a surrounding area of three
substantial hamlets. In order not to confuse the analysis with functions that were
essentially to do with this town the census data for the town itself have been omitted.
This entailed judging from the addresses in the CEBs whether a household was in the
town or the surrounding rural district. Inevitably there will be some inaccuracies
incurred by this procedure but on balance it was judged better to tolerate these rather
140
than omit in excess of 800 rural dwellers and, therefore, potential migrants. Ludford
too raises a similar issue. Although it was a discrete parish in 1871, part of it was
effectively within the town of Ludlow. Here because of the smaller numbers
involved, Ludford was included in its entirety within the analysis.
There are several phases to this aspect of the investigation which, together with their
associated methods, lead to the identification of the family migration patterns.
Broadly they involved the comparison of the 1871 CEBs for the seventeen units
(hereafter referred to as the parishes) of the locality with those of 1881 CEBs. It needs
to be emphasised that because of difficulties with data retrieval the focus will be upon
families which leave their 1871 residence. It is not possible to identify the 1871
residence location of those who move in and they are not included in this aspect of the
analysis. However, the parish of Little Hereford is of particular importance to this
study as the 19th century location of the core families to be examined in Chapter 8. It
is therefore the Prime Parish and the point from which its neighbourhood is measured
and delimited (Chapter 4). The last section of this chapter will examine, by a form of
parish reconstruction, both out and in movement of families.
The CEBs for each of the parishes were printed from the CD Rom containing the
1881 National Census (Church of Jesus Christ of Latter Day Saints 1999). These
were then compared with those for 1871 stored in the appropriate County Record
Office on microfiche or micro film. A parish of 500 population would take about 5
hours of sustained intensive work and each parish, or more accurately enumeration
district, would need to be coded at a single sitting because of the need for familiarity
with the data. Thus the largest parish, Caynham, took well over 6 hours. Families
which were on the 1871 record but not the 1881 were deemed, at this stage, to have
moved out of the parish. The details of the entire household in 1871 were recorded
from the CEB for later use.
The next phase relied upon the search mechanism within the CD Rom of the 1881
census. Using this search mechanism the location of families which had moved after
1871 could be traced. Unfortunately it is not possible to identify the previous
residence of newcomers in 1881 and so the data collected refers only to leavers and
their location in 1881. The search rests firstly upon the family name but also the place
141

of birth and the age from which the year of birth can be determined. From these the
location of the family in 1881 can normally be identified. There are problems which
can arise though, for example, the Head of Household may have died in which case
the search depends upon other members of the family. Here too there are potential
difficulties because the children may have left home and the wife remarried. In these
circumstances, sometimes, a widow who had remarried may be identified from the
first name, place of birth and age statistic and the same too with married daughters.
The more difficult problems emerge where the census enumerator has not, for
whatever reason, recorded accurate information and, therefore, the search mechanism
has incorrect data upon which to work. Finally, though families may have died out in
the intervening ten years their age in 1871 may present reasonable grounds for
assuming that they were deceased and that younger people may have emigrated.
Despite these shortcomings, over three quarters (77%) of 1871 families were traced in
1881. The search mechanism in the CD Rom is therefore a very powerful research
tool for this type of investigation.
The details recorded in the census for the family and household in 1871 were noted
and, therefore, the characteristics of the family before they moved formed the basis
for the analysis. In this way even families which were not traced are included on the
grounds that, in whatever circumstances, they had left the parish and, therefore,
changed its composition. Before describing the next phase which was to identify and
record characteristics of the families it is important to define family and household. In
the CEBs a household is all those resident in a dwelling. For the purpose of this study
a family is taken to be that of the nuclear family, whilst a household includes both a
family but also co-residents such as relatives, lodgers and those living-in.
Of course, the household is essentially a short-lived feature and would be unlikely by
the nature of its interrelationships and structure to migrate as a unit. The family too is
a temporary and changing feature but, because of the nature of the interdependence
between its members, may well migrate as a unit. The family though is not a unit of
singular and uniform structure. Several different family structures may be identified
both in the past and present. One way of arriving at a workable classification of the
19th century family might be to view the family as a feature with a definite life cycle
which changed over time in rather the same way as an individual (Figure 7.1).
142
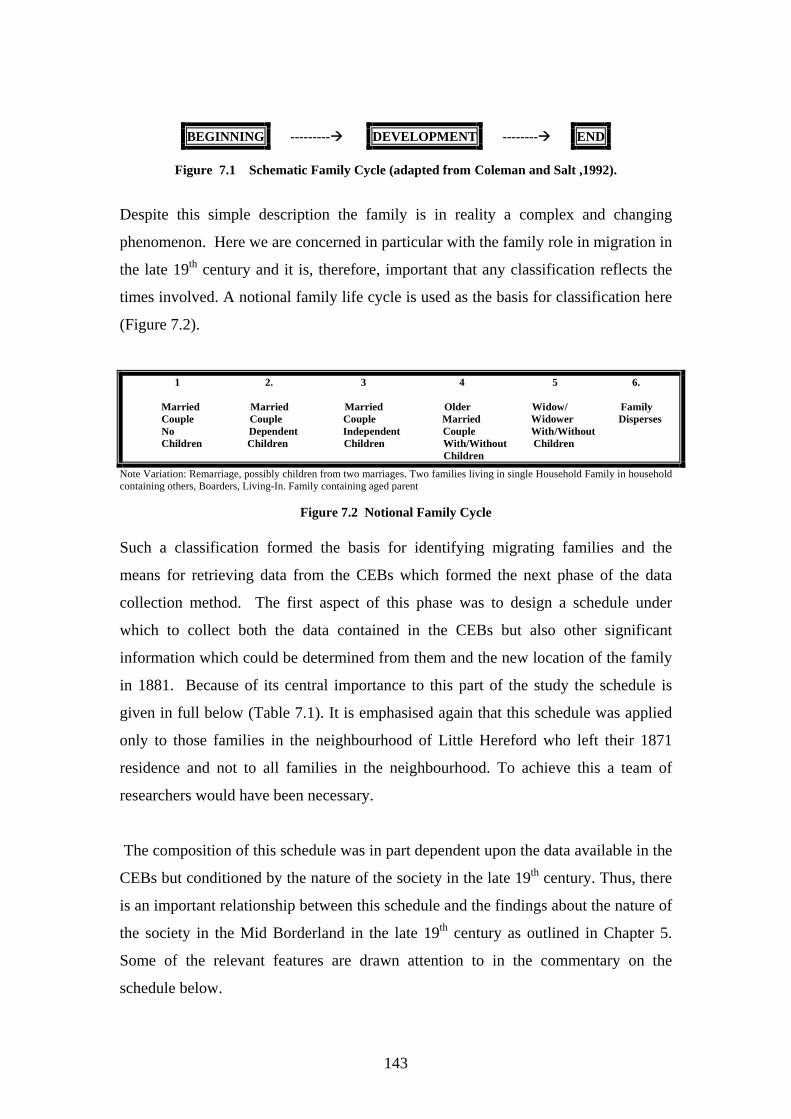
BEGINNING --------- DEVELOPMENT -------- END
Figure 7.1 Schematic Family Cycle (adapted from Coleman and Salt ,1992).
Despite this simple description the family is in reality a complex and changing
phenomenon. Here we are concerned in particular with the family role in migration in
the late 19th century and it is, therefore, important that any classification reflects the
times involved. A notional family life cycle is used as the basis for classification here
(Figure 7.2).
1 2. 3 4 5 6. Married Married Married Older Widow/ Family Couple Couple Couple Married Widower Disperses No Dependent Independent Couple With/Without Children Children Children With/Without Children Children
Note Variation: Remarriage, possibly children from two marriages. Two families living in single Household Family in household containing others, Boarders, Living-In. Family containing aged parent
Figure 7.2 Notional Family Cycle
Such a classification formed the basis for identifying migrating families and the
means for retrieving data from the CEBs which formed the next phase of the data
collection method. The first aspect of this phase was to design a schedule under
which to collect both the data contained in the CEBs but also other significant
information which could be determined from them and the new location of the family
in 1881. Because of its central importance to this part of the study the schedule is
given in full below (Table 7.1). It is emphasised again that this schedule was applied
only to those families in the neighbourhood of Little Hereford who left their 1871
residence and not to all families in the neighbourhood. To achieve this a team of
researchers would have been necessary.
The composition of this schedule was in part dependent upon the data available in the
CEBs but conditioned by the nature of the society in the late 19th century. Thus, there
is an important relationship between this schedule and the findings about the nature of
the society in the Mid Borderland in the late 19th century as outlined in Chapter 5.
Some of the relevant features are drawn attention to in the commentary on the
schedule below.
143
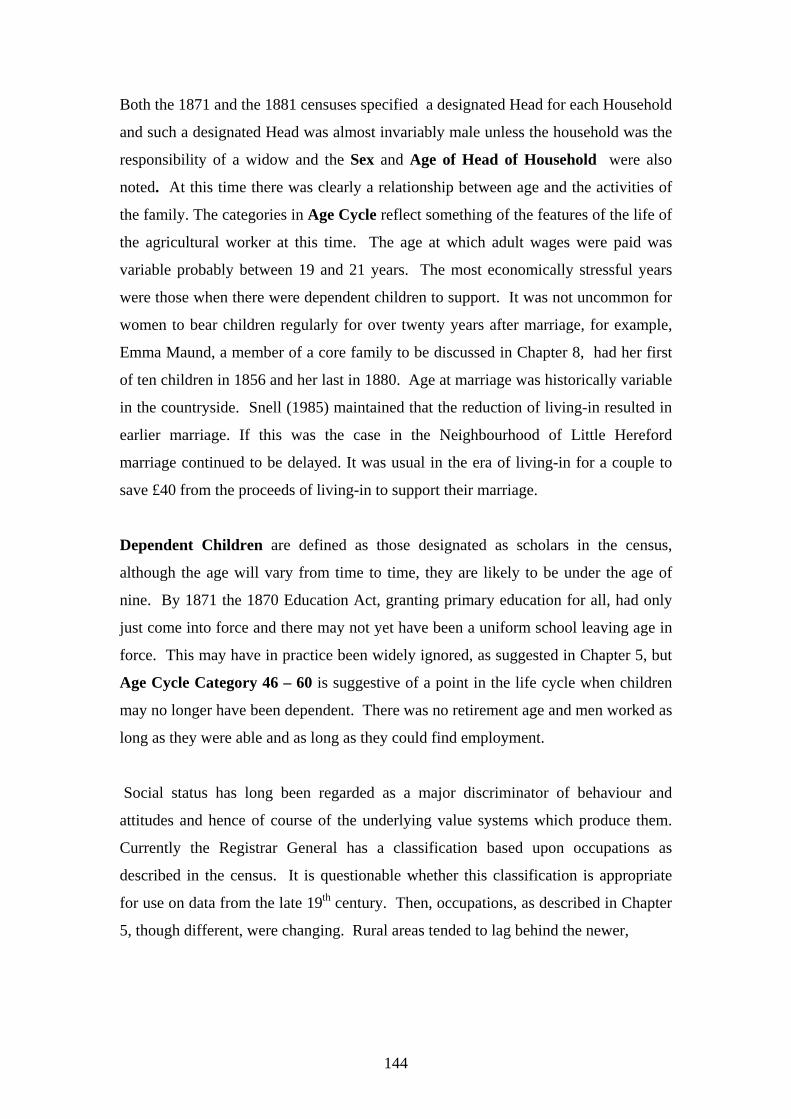
Both the 1871 and the 1881 censuses specified a designated Head for each Household
and such a designated Head was almost invariably male unless the household was the
responsibility of a widow and the Sex and Age of Head of Household were also
noted. At this time there was clearly a relationship between age and the activities of
the family. The categories in Age Cycle reflect something of the features of the life of
the agricultural worker at this time. The age at which adult wages were paid was
variable probably between 19 and 21 years. The most economically stressful years
were those when there were dependent children to support. It was not uncommon for
women to bear children regularly for over twenty years after marriage, for example,
Emma Maund, a member of a core family to be discussed in Chapter 8, had her first
of ten children in 1856 and her last in 1880. Age at marriage was historically variable
in the countryside. Snell (1985) maintained that the reduction of living-in resulted in
earlier marriage. If this was the case in the Neighbourhood of Little Hereford
marriage continued to be delayed. It was usual in the era of living-in for a couple to
save £40 from the proceeds of living-in to support their marriage.
Dependent Children are defined as those designated as scholars in the census,
although the age will vary from time to time, they are likely to be under the age of
nine. By 1871 the 1870 Education Act, granting primary education for all, had only
just come into force and there may not yet have been a uniform school leaving age in
force. This may have in practice been widely ignored, as suggested in Chapter 5, but
Age Cycle Category 46 – 60 is suggestive of a point in the life cycle when children
may no longer have been dependent. There was no retirement age and men worked as
long as they were able and as long as they could find employment.
Social status has long been regarded as a major discriminator of behaviour and
attitudes and hence of course of the underlying value systems which produce them.
Currently the Registrar General has a classification based upon occupations as
described in the census. It is questionable whether this classification is appropriate
for use on data from the late 19th century. Then, occupations, as described in Chapter
5, though different, were changing. Rural areas tended to lag behind the newer,
144

Table 7. 1 Schedule of Characteristics of Migrating Families - Definitions and Coding Analysis sheet used to retrieve data from CEBs. Bold letters refer solely to Excel spreadsheet columns.
B. Family Structure
1. Young, childless, married couple (Head of Household under 45)
2. Married couple with dependent children 3. Married couple with dependent and
independent children 4. Married couple with independent
children 5. Widow/widower with children 6. Older married couple (H.o.HH over 46) 7. Widow/widower – no children 8. Single person with household
C. Number in Household
D. Household Characteristic 1. Nuclear Family
2. Living-in 3. Living-in (relatives) 4. Living-in (others, e.g. boarders)
E. Sex, Head Household 1. Male 2. Female
F. Age, Head Household
G. Age Cycle, Head Household 1. 20 – 30 Years 2. 31 – 45 Years 3. 46 – 60 Years
4. Over 60 Years
H. Occupation Head of Household
I. Occupation Category, Head of Household 1. Farmer 2. Labourer 3. Skilled Person 4. Domestic 5. Others (specify)
J. Numbers of Children in Household
L. Categories of Children 1. Infant and Scholar, as shown by
Enumerator 2. Young working i.e. c9 to 19 3. Over 19
(These ages are defined from consideration of school leaving ages and ages at which adult wages were paid.)
P. Distance Moved
Q. Distance Category
1. Up to 7 miles 2. 8 - 15 miles 3. 16 – 20 miles 4. 21 – 30 miles 5. Over 31 miles 6. Not Known
145

R. Direction Moved (From lines drawn NE – SW & NW – SE through Parish from which the migration takes place.)
1. North 2. South 3. East 4. West 5. Not Known
S. Rural/Urban Destination
1. Rural 2. Industrial Village 3. Market Town 4. County Town 5. Industrial Town 6. Regional centre
7. Not Known
U. Previous Moves
1. Head of Household 2. Spouse 3. Both 4. Neither
V. Birth Proximity of Couple
1. Both, Neighbourhood Area 2. One, Neighbourhood Area 3. Neither, Neighbourhood Area 4. Both, proximate but away from NA 5. Both, apart but away 6. Not Known
W. Outcome
1. Family Moved 2. Family Dispersed 3. Family Reconstituted 4. Not Known
growing urban ones in a variety of ways although here too the old systems were on
the verge of change. But the suggestion made here is that in rural north Herefordshire
in 1871-81, change was even slower. In the countryside, as argued in Chapter 5, there
were essentially three classes, Landowners, Farmers and Labourers with the caution
that there were overlaps and differences. Despite this a simple classification suggests
itself although tradesmen or craftsmen were also an important element. In the earlier
parts of the 19th century cordwainers, tailors, carpenters and blacksmiths were familiar
occupations in most rural areas. This is applied with caution because gradually the
socio-economic systems were changing partly as the result of the development of new
transport systems and the increasing concentration of some crafts in towns (see
Chapter 5).
There was also technological change, for example the coming of the railways (1863 in
Little Hereford), which brought new trades, like platelayer, with them. The late 19th
century was also the beginning of the end of the village blacksmith as hay gave way
to steam. From these considerations an Employment Index was constructed
146

(Occupation and Occupation Category of Head of Household) which, whilst
reflecting the conditions of the day, had sufficient data in each category to be
meaningful. Therefore, the category of agricultural labourers was not subdivided for
this reason but also because the sub categories did not always appear to be
consistently recorded in the CEBs. Landowners, Clerics and School Teachers formed
such a small element that they were consigned to category ‘Others’ although their
exact status was maintained on the database.
Migration implies a permanent change of residence as defined in Chapter 2. Place of
Birth statistics are useful but they only show where someone was born and do not
show how many moves have been made to the current residence. An indicator of this
might be the birth place of children and this is used in Chapter 8. Here such an
indicator does not yield uniform data because some families do not have children or
they have left home. Because this issue cannot be entirely resolved this section of the
analysis shows the location of families only in 1881 and it is acknowledged that there
may have been moves in the previous ten years. The distance between the recorded
1871 location and the recorded 1881 one is used (Distance Moved and Distance
Category) and also the nature and direction of the new residence. (Direction
Moved). The nature of the new residence should go some way towards providing an
answer to the question of whether there was direct movement to towns.
(Rural/Urban Destination). For the indices involving Distance the straight-line
distance from the centre of the leaving parish to the centre of the receiving parish was
measured. This may result in some marginal underestimation of distance but it has
the benefit of being a uniform method. In an attempt to break down these crude
distance figures they were divided into categories. The basis for these categories
requires some clarification. The area up to seven miles is designated as the
neighbourhood of the individual parish. In Chapter 4 the neighbourhood or locality
was defined and delimited around the Prime Parish of Little Hereford. The figures
actually showed an interactive neighbourhood at some five miles from the centre of
Little Hereford but there was also an area beyond this which was related but not
necessarily reciprocally. There was therefore an inner Neighbourhood and a form of
outer Neighbourhood. The inner neighbourhood seems perfectly manageable for the
purposes of daily interaction on the basis of a maximum of four to five miles to work.
Beyond these, distances would be too great for those travelling on foot though
147

journeys to market and occasional visits home would still be practical for up to seven
miles or so. It is assumed that for local migration that a similar outer neighbourhood
would be appropriate. The remaining distance categories reflect the rate of fall off in
place of birth locations.
Direction was measured by lines drawn from North East to South West and North
West to South East intersecting in the centre of the Prime Parish. Thus four quadrants
were produced labelled as the cardinal points of the compass. The expectation might
be that families would move at least towards the areas of urban concentration given
the growth in population of cities and especially the Birmingham conurbation
(Chapter 6). In order to examine the nature of the location to which families moved
these were classified into a number of categories. These were intended to depict a
number of different possible locations for migrating families, including a division in
types of urban centres.
The data in the CEBs enabled the testing of one of the definitions of neighbourhood,
namely as the area from which marriage partners were drawn (Hey 1974). Birth
Proximity may give some indication of the degree to which people in the countryside
remained ‘local’. Finally, given the proposition that families had a life cycle there is
the issue of what happened to the moving family. The outcome of this may suggest
differing motivations to move (Outcome).
The next phase was to encode the data for each migrating family and record it in an
Excel spreadsheet, family by family and parish by parish. By the conclusion of this
phase, there were 17 parishes with variations from 9 families leaving from Ashford
Bowdler to 69 families leaving from the defined Tenbury Rural (TenRur). Each of
these appeared on separate Excel spreadsheets with appropriate data from the
schedule. In addition to the coding, each family was named on the data base as well
as the name of their 1881 location and their precise employment. Not all these data
were used subsequently but they did provide a detailed record of each individual
family despite its use in more aggregated form later. The encoded data were then
aggregated into a single data base summarising the characteristics of the families
which could then be manipulated statistically to produce tables and graphs. It is these
148

data which are presented as the product of this part of the research and the basis of the
analysis which follows.
7.3 Population Change in the Neighbourhood 1871-1881 The data in Table 7.2 were obtained entirely from the 1871 and 1881 census returns.
Parish Population Households
'71 ‘81 + - +% -% ‘71 ‘81 + - +% -%A.Bowdler 93 95 2 2 27 18 9 33A.Carbonell 341 293 48 14 72 70 2 3 Bockleton 304 220 84 28 53 51 2 4 Brimfield 673 633 40 6 163 148 15 9 Burford 672 432 240 36 73 89 16 22 Caynham 819 1170 351 42 197 228 31 16 Eye 302 704 402 133 63 162 99 157 Greet 188 97 91 48 33 17 16 48Kimbolton 704 622 82 12 163 124 77 47Laysters 279 238 41 17 60 56 2 7 Little Hereford 400 421 21 5 87 89 2 5 Ludford 390 461 71 18 58 98 40 70 M.o.H 382 392 10 3 80 68 12 15Orleton 591 574 17 3 136 122 14 10Pudleston 292 287 5 2 87 61 26 30R.Castle 433 765 332 130 87 155 68 78 Tenrural 782 843 61 8 135 169 34 25
Total 7645 8247 602 8 1574 1684 110 7 Mean 449.7 485 92.6 99 Median 390 427 80 89 Range 197-
27 228-17
Table 7.2: Population and Household Change, 1871-81:
Parishes of Neighbourhood of Little Hereford.
They are gross data for individuals and also for households which is the basis on
which the census data were collected and recorded. These data for households should
not be confused with those for families presented later. The most obvious feature is
the variability of population change between the parishes over the ten year period
both in terms of individuals and households. In Burford there was a loss in population
but a gain in households. Why this should be is a matter of conjecture; for example, it
may be that in 1871 there were still temporary residents associated with the newly
constructed railway and cattle market and by 1881 households serving these functions
149

were established. The growth in Eye too was notable and this may well be to do with
the railway which runs north-south through the parish and its position adjacent to
Leominster in the south and the then important railway junction of Woofferton to the
north.
The data shown in Table 7.2 are important because, as indicated in Chapter 6, despite
the general trend for the Mid Borderland to lose population in the late 19th century,
the population of the neighbourhood actually increased by 602 (8%) over the period
1871 to 1881. These findings do not support the notion of a mass movement from the
countryside, at least as represented at the scale of the neighbourhood. Despite growth
overall in both population and households there were, as noted, significant variations
between parishes over the period to 1881.
Table 7.3 Families Moving Out 1871-81
Parish Total Families % Families moving out
A.Bowdler 9 33 A.Carbonell 27 38 Bockleton 35 66 Brimfield 46 28 Burford 30 41 Caynham 66 34 Eye 30 48 Greet 22 67 Kimbolton 57 35 Laysters 26 43 Little Hereford 21 24 Ludford 29 50 M.o.H 41 51 Orleton 49 36 Pudleston 37 43 R.Castle 39 45 Tenrural 69 51 Total 633 40 Mean 37.235 Median 35 Mode 30 Range 66 - 9
Parishes of Neighbourhood of Little Hereford
The most simple and basic data, derived from the calculations above and relating to
families moving from the neighbourhood are summarised Table 7.3. What stands out
immediately is that all parishes had families leave over the ten-year period. This
150

amounted to a total of 633 families, 40% of the total families in the neighbourhood in
1871. Each parish lost at least a quarter of their 1871 total families. It needs to be
stressed that this is a gross figure and it represents only the total families leaving and,
of course, this does not mean that because a family left a parish that they also left the
neighbourhood.. The net figure, in the form of Households, is shown in Table 7.2 and
varied between 157% increase in Eye to a 48% decrease in households in Greet.
These data also give a clear idea of both the magnitude of family migration in this part
of the Mid Borderland in the late 19th century and the variation between parishes. In
summary it seems clear that between 1871 and 1881 a high proportion of families
moved out of the individual parishes. The smallest parishes appeared to lose the
greater proportion of families and the larger ones the lowest. But the reasons for these
patterns are difficult to explain. For example, there is no instantly apparent spatial
patterning to the distribution of parishes within the neighbourhood either in terms of
clustering, or relationship to any other location such as proximity or otherwise to the
market towns.
In Table 7.3 the parishes of Greet and Bockleton are highlighted in red since they are
the two parishes with the greatest proportion of families moving out. On the other
hand, Little Hereford, Brimfield and Ashford Bowdler are shown in blue as having
the least proportion of families moving. A possible interpretation might be that at a
time when travel for ordinary people was difficult this may have made the residents of
Greete and Bockleton comparatively remote with fewer opportunities for work,
housing and marriage. Burford and Brimfield (in red) on the other hand are well
served by communications. Brimfield is possibly the best-connected parish in the
neighbourhood since it is at the point where the River Teme makes a right angle turn
to the east. Here the north – south route along the Marches meets an east – west route
from mid Wales to the Midlands; a natural thoroughfare (Chapter 6). There may
therefore be an access component to the patterning.
It has been shown by Maund and Lewis (1975) and Maund (1976) in a case study of
46 parishes in North Herefordshire that population change could be differentiated on
the basis of access. Briefly, a simple access index was devised using a very simple
scoring system of accessibility involving proximity to routes, both road and rail and
also the presence of a railway station (Table 7.4).
151
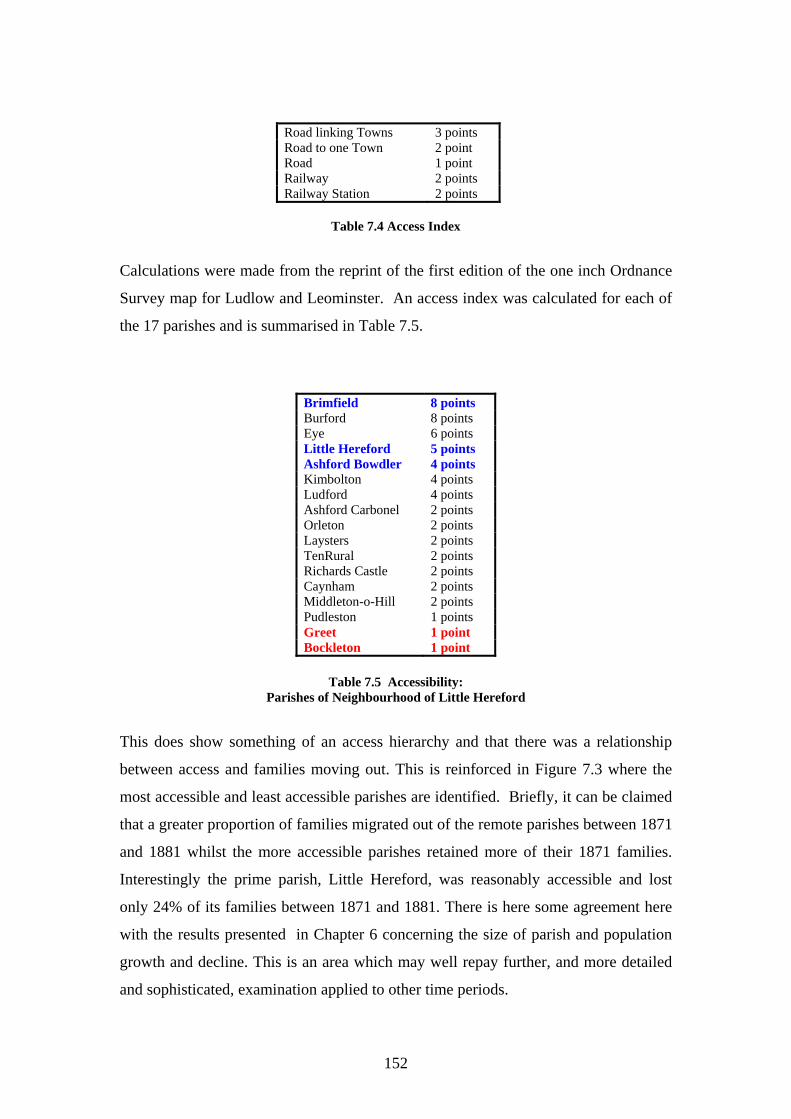
Road linking Towns 3 points Road to one Town 2 point Road 1 point Railway 2 points Railway Station 2 points
Table 7.4 Access Index
Calculations were made from the reprint of the first edition of the one inch Ordnance
Survey map for Ludlow and Leominster. An access index was calculated for each of
the 17 parishes and is summarised in Table 7.5.
Brimfield 8 points Burford 8 points Eye 6 points Little Hereford 5 points Ashford Bowdler 4 points Kimbolton 4 points Ludford 4 points Ashford Carbonel 2 points Orleton 2 points Laysters 2 points TenRural 2 points Richards Castle 2 points Caynham 2 points Middleton-o-Hill 2 points Pudleston 1 points Greet 1 point Bockleton 1 point
Table 7.5 Accessibility: Parishes of Neighbourhood of Little Hereford
This does show something of an access hierarchy and that there was a relationship
between access and families moving out. This is reinforced in Figure 7.3 where the
most accessible and least accessible parishes are identified. Briefly, it can be claimed
that a greater proportion of families migrated out of the remote parishes between 1871
and 1881 whilst the more accessible parishes retained more of their 1871 families.
Interestingly the prime parish, Little Hereford, was reasonably accessible and lost
only 24% of its families between 1871 and 1881. There is here some agreement here
with the results presented in Chapter 6 concerning the size of parish and population
growth and decline. This is an area which may well repay further, and more detailed
and sophisticated, examination applied to other time periods.
152

Figure 7.3 Accessibility in the Neighbourhood of Little Hereford, late 19th century.
7.4 New Households 1881 Unfortunately, it is not possible to identify from the 1881 CEBs the inward flow of
families into each of the parishes. However, what can be determined is the number of
new households which may have moved as a unit, or family formations within the
parishes themselves. Table 7.6 summarises the degree of household turnover between
153

1871 and 1881 in the parishes of the Little Hereford neighbourhood. In Table 7.6
Column 1 derives from the original research described in Section 7.2 the remainder
Parish 1.
Families Leaving
2. New
Families
3. Gains/Losses
4. Turnover (Absolute)
5. Turnover % 1881
A.Bowdler 9 0 -9 9 50 A.Carbonel 27 25 -2 52 74 Bockleton 35 33 -2 68 133 Brimfield 46 31 -15 77 44 Burford 30 46 16 76 85 Caynham 66 97 31 163 71 Eye 30 129 99 159 98 Greete 22 6 -16 28 164 Kimbolton 57 18 -39 76 49 Laysters 26 42 -4 48 85 Little Hereford 21 23 2 44 49 Ludford 29 69 40 98 100 M.o.H. 41 29 -12 70 102 Orleton 49 35 -14 84 68 Pudlestone 37 11 -26 48 78 R.Castle 39 41 2 80 51 TenRural 69 103 34 172 101 Neighbourhood
of Little Hereford
633
743
110
1376
81
Table 7.6 Household Turnover 1871-81: Neighbourhood of Little Hereford.
are taken from the censuses of 1871 and 1881 and arithmetically calculated from
those data. The most striking feature of this table is that despite considerable losses of
families there was also a high proportion of new families within each of the parishes.
The absolute negative changes are highlighted in red in Table 7.6 and this varies from
a loss of 39 families in Kimbolton to a gain of 99 families in Eye. There is therefore
no uniformity between the parishes. Overall however, there is compensation among
the parishes because the neighbourhood shows a gain 110 new households. It needs to
be emphasised that these figures do not necessarily denote households moving in,
they are merely new households, some of which, may have been created from existing
people in the parish.
Columns 4 and 5 give data on turnover of families in each parish, both in absolute
numbers of families and also as a proportion of families present at the 1881 census. In
absolute terms the greatest turnover was in Tenbury Rural, Caynham and Eye but
these were in parishes with relatively large populations (Table 7.2). On the other
154

hand other parishes, with large populations, did not experience quite such a degree of
turnover in particular Brimfield, Burford and Kimbolton. The explanation for these
features are more difficult to explain. There is some correspondence with the access
index (Table 7.5) but this is by no means a complete. The most marked feature from
these calculation is the degree of turnover which existed in these late 19th century
parishes. They were by no means stable populations and this has implications for
social change and for the role of core families (Chapter 8). It is certainly a
characteristic of this part of the Mid Borderland at this time.
7.5 The Structural Characteristics of Families Moving-On Having identified those families that left their parish of residence between 1871 and
1881 their principal characteristics can be determined. However, there is one caution
about this analysis since would be wrong to assume that family structure remained
stable over a long period even during the latter part of the 19th century (Coleman and
Salt 1992; Pooley and Turnbull 1998). This aspect of the investigation is a snapshot
within the longer longitudinal scale of this study and is based in the conditions in the
neighbourhood of Little Hereford at the outset of the decade 1871 – 1881. It needs to
be noted that, in the various tables illustrating the findings, the data for the numbers of
families leaving each of the parishes between 1871 and 1881 are repeated. This is to
allow some base for the interpretation of the data for each parish on each index.
7.5.1 Household Type
It has been well established in the literature that, during the middle of the 19th century,
the majority of families were made up of nuclear families and at least one other
person living-in (Wrigley and Schofield 1982). For example, Anderson (1990) has
calculated that in 1851, 44% of households contained at least one person living-in.
Therefore, rather surprisingly, in the neighbourhood of Little Hereford between 1871
and 1881 as much as 59% of those households that moved were nuclear family only
(Figure 7.4; Table 7.7). None the less 40% of neighbourhood families which moved
did so with others living-in. For the majority, nuclear families, when the household
moved they were either nuclear at that point or other members of the household either
remained at the original residence or moved elsewhere. It must be emphasised
however, that there was significant variation between the different parishes Table 7.7.
155

Nuclear family Living in Living in (relatives) Living in (other)
Figure 7.4 Characteristics Out-Migrating Families: Neighbourhood of Little Hereford, 1871-1881
Nuclear families varied from at one extreme Burford (83%), Orleton (81%) and Little
Hereford (71%) to Ashford Bowdler (33%) and Pudlestone (41%) although it is clear
that the majority of parishes clustered around the neighbourhood mean of 59%. It is
possibly surprising that relatives was not the greatest group of those living-in and only
amounted to 9% whereas 30% of other families had servants or other workers. Here
too though there were significant variations between the parishes.
Although variation between the parishes appears to be something of a theme the
explanation of the variation is very difficult to determine even when contrasting
parishes are identified. Whether parishes show any common pattern among the
various indices is a matter for further examination as the analysis develops.
156

Parish Total No. 1. Nuclear Family 2. Living-in
3.Living-in (relatives)
4.Living-in (other)
Families Total % Total % Total % Total %
A.Bowdler 9 3 33% 4 44% 2 22% 0 0% A.Carbonell 27 15 56% 4 15% 3 11% 0 0% Bockleton 35 22 63% 9 26% 4 11% 0 0% Brimfield 46 24 52% 13 28% 9 20% 0 0% Burford 30 25 83% 4 13% 0 0% 0 0% Caynham 66 36 55% 26 39% 4 6% 0 0% Eye 30 18 60% 8 27% 4 13% 0 0% Greete 22 12 55% 9 41% 1 5% 0 0% Kimbolton 57 31 54% 21 37% 5 9% 0 0% Laysters 26 16 62% 7 27% 1 4% 2 8% L. Hereford 21 15 71% 2 10% 3 14% 1 5% Ludford 29 15 52% 10 34% 3 10% 1 3% M.o.H 41 21 51% 16 39% 4 10% 0 0% Orleton 48 39 81% 9 19% 0 0% 0 0% Pudlestone 37 15 41% 14 38% 6 16% 2 5% R.Castle 39 21 54% 17 44% 1 3% 0 0%
Tenrural 69 45 65% 18 26% 6 9% 0 0%
Total 632 373 59% 191 30% 56 9% 6 1%
Mean 37.1765
Median 35
Mode 30
Range 9-69
Table 7. 7 Characteristics Out Migrating Families: Neighbourhood of Little Hereford. 1871-1881
7.5.2 Household Size
Of course not all the individuals that make up the households will have migrated but it
does imply that the migration of the family changed the circumstances of all those
who lived in the household. Table 7.8 shows a simple count of the totals in each
moving household for each parish. The column for families is retained to indicate the
volume of moving families from each parish but the calculation is based on the total
moving households containing families. These have been processed statistically to
arrive at a variety of forms of average size of household. The range in household size
varied from one person in several parishes to twenty-two in Eye. The mean was
slightly less than five persons per household for the neighbourhood and this is quite
close to the means for each parishes. The median too is around the same figure but
the most frequently occurring, the mode, is 4. These figures were collected in 1871
and therefore can not be taken as completely accurate because they contain
157

individuals living-in who may not have moved with the family and they almost
certainly contained individuals who were not born when the data were collected.
Parish Total Total Mean Median Mode Range Families Indivs
A.Bowdler 9 47 5.2 5 5 2 – 8 A.Carbonell 27 152 5.6 5 5 1 – 18 Bockleton 35 195 5.6 5 4 2 - 13 Brimfield 46 209 4.5 4 4 1 – 9 Burford 30 118 4.1 4 3 1 – 8 Caynham 66 325 4.9 5 5 2 – 11 Eye 30 155 5.2 5 2 1 – 22 Greete 22 120 5.5 5.5 4 2 – 10 Kimbolton 57 265 4.6 4 4 1 – 13 Laysters 26 143 5.5 5.5 7 2 – 10 Lithfd 21 91 4.3 4 2 2 –10 Ludford 29 139 4.8 4 2 2 – 15 M.o.H 41 190 4.6 5 4 1 – 10 Orleton 48 172 3.6 3 2 1 – 8 Pudlestone 37 155 4.2 4 3 2 - 8 R.Castle 39 182 4.7 5 6 1 – 9
Tenrural 69 344 5.0 4 3 1 - 13
N'hood Area 632 3002 4.8 5 4 1 - 22
Table 7.8 Numbers in Households Out Migrating Families Neighbourhood of Little Hereford, 1871
Nationally, during the 19th century, mean household size had declined. According to
Anderson (1990) it had not exceeded five persons since the 18th century. In 1851 it
was 4.7 persons per household and in 1901 it was 4.4 . He noted though that these
average sizes varied with the age of the household and, thus, a young household had a
greater size than an older one. The data in Table 7.8 may lead one to speculate that
the size of moving households also varied spatially between parishes; for example, it
was as low as 4.2 persons in Pudleston and as high as 5.6 in Ashford Carbonel and
Bockleton. What the reasons are however, for these spatial variations in size of
moving families is a matter of conjecture. This will be returned to at the conclusion
of this analysis of family characteristics.
7.5.3 Age of Head of Household
There is much evidence to indicate a relationship between age and migration
behaviour, in particular, that age acts as a constraint on migration. For example,
Pooley and Turnbull (1998) found that there was a distinct decline in migratory levels
158
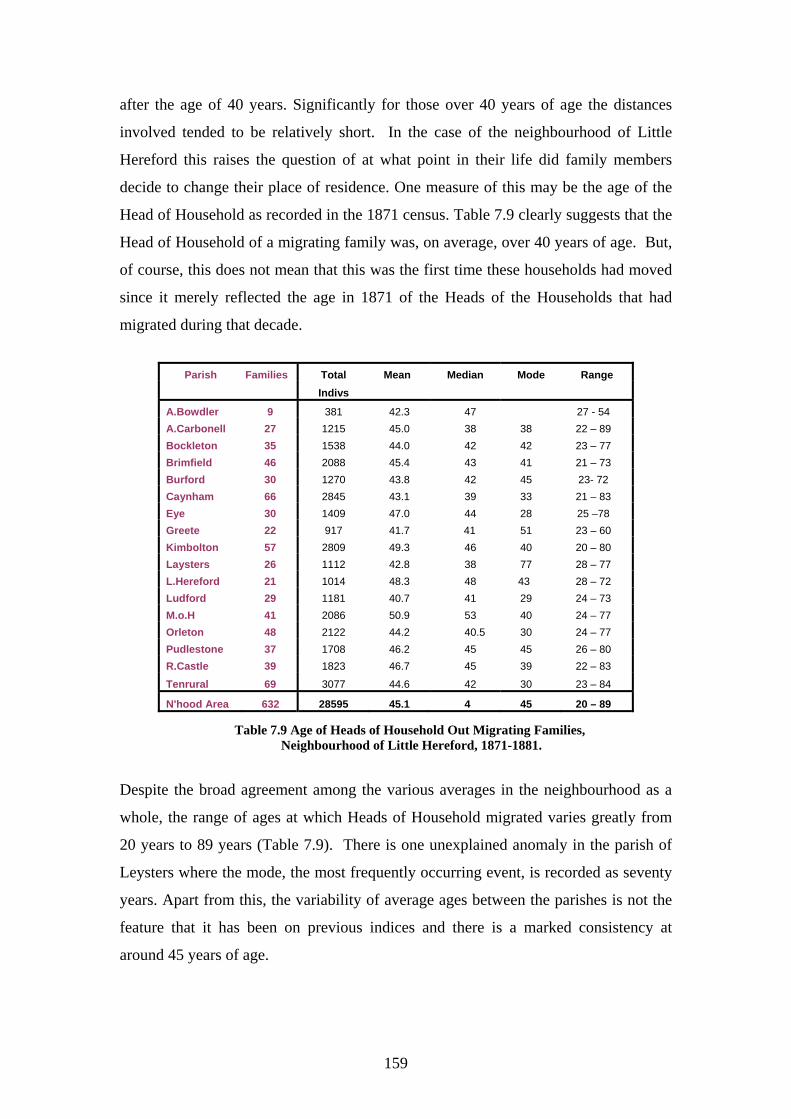
after the age of 40 years. Significantly for those over 40 years of age the distances
involved tended to be relatively short. In the case of the neighbourhood of Little
Hereford this raises the question of at what point in their life did family members
decide to change their place of residence. One measure of this may be the age of the
Head of Household as recorded in the 1871 census. Table 7.9 clearly suggests that the
Head of Household of a migrating family was, on average, over 40 years of age. But,
of course, this does not mean that this was the first time these households had moved
since it merely reflected the age in 1871 of the Heads of the Households that had
migrated during that decade.
Parish Families Total Mean Median Mode Range
Indivs
A.Bowdler 9 381 42.3 47 27 - 54 A.Carbonell 27 1215 45.0 38 38 22 – 89 Bockleton 35 1538 44.0 42 42 23 – 77 Brimfield 46 2088 45.4 43 41 21 – 73 Burford 30 1270 43.8 42 45 23- 72 Caynham 66 2845 43.1 39 33 21 – 83 Eye 30 1409 47.0 44 28 25 –78 Greete 22 917 41.7 41 51 23 – 60 Kimbolton 57 2809 49.3 46 40 20 – 80 Laysters 26 1112 42.8 38 77 28 – 77 L.Hereford 21 1014 48.3 48 43 28 – 72 Ludford 29 1181 40.7 41 29 24 – 73 M.o.H 41 2086 50.9 53 40 24 – 77 Orleton 48 2122 44.2 40.5 30 24 – 77 Pudlestone 37 1708 46.2 45 45 26 – 80 R.Castle 39 1823 46.7 45 39 22 – 83
Tenrural 69 3077 44.6 42 30 23 – 84
N'hood Area 632 28595 45.1 4 45 20 – 89
Table 7.9 Age of Heads of Household Out Migrating Families, Neighbourhood of Little Hereford, 1871-1881.
Despite the broad agreement among the various averages in the neighbourhood as a
whole, the range of ages at which Heads of Household migrated varies greatly from
20 years to 89 years (Table 7.9). There is one unexplained anomaly in the parish of
Leysters where the mode, the most frequently occurring event, is recorded as seventy
years. Apart from this, the variability of average ages between the parishes is not the
feature that it has been on previous indices and there is a marked consistency at
around 45 years of age.
159

A possible way of interpreting the relationship between age and the propensity to
migrate is to view age within the context of the life cycle phase of the household (Lee
1966; Grundy 1992; Warnes 1992). Following Grundy’s (1992) categorisation of a
life cycle, for the needs of this study, phases were designed to reflect the features of
the life of the agricultural worker.
20-30 Yrs 31-45 Yrs 46-60 Yrs Over 60
Figure 7.5 Life Cycle: Head of Household of Out Migrating Families, Neighbourhood of Little
Hereford 1871
Figure 7.5 illustrates the pattern of life cycle moves in the neighbourhood as a whole.
The first category 20 – 30 years reflects those years immediately after the point when
full adult wages were paid and the period during which marriage was entered. As
quoted earlier, Snell (1985) maintained that a reduction of living-in resulted, in
England and Wales, in earlier marriages but, generally, age at marriage was
historically variable in the countryside. It was normally at the point when the couple
had £40 from the proceeds of living-in (Snell 1985) and usually, this would be around
30 years of age. During the second half of the 19th century the most economically
stressful years were those when there were most dependent children to support,
generally between 30 and 45 years of age. This cannot be an exact category because
the point at which children were born depends to an extent on the age at marriage. It
was not uncommon for women to bear children regularly for over twenty years after
160

marriage. On the other hand the 46 – 60 years category in Figure 7.5 is suggestive of
a phase in the life cycle when children may no longer be dependent and were leaving
home for work. During the 19th century there was no retirement age and men worked
as long as they were able and as long as they could find employment.
The overall pattern however, does not point to a particular cycle when migration took
place. The largest single category is 31 to 45 years, the most economically stressed
years but there was significant movement during the three other cycles too suggesting
that generally, life cycle was not a particularly sensitive discriminator and that people
moved throughout the life cycles.
In Table 7.10 the data for cycle movers are given for each parish and although the
general data for the whole of the neighbourhood were used to construct Figure 7.5 it
can immediately be seen that there is significant variation between the parishes for
each phase of the life cycle. Thus, for example, one person in the 20 to 30 years phase
moved in Little Hereford wheras in Caynham 16 moved. Admittedly there are
differences in the sizes of parishes but even proportionately this represented 24% in
Caynham and only 5% in Little Hereford. Because this is the age group where
marriages are likely to occur and when people finally left home there may be housing
factors at work here. In this regard, Little Hereford may be an exceptional case and
this will be returned to in Chapter 8. This variability extends to other age categories
too even in category 31 to 45 years where the largest numbers of movers are recorded.
Here there is a range from 22% in Ashford Bowdler and Ashford Carbonel to 65% in
Laysters. A speculation would be that this variation was to do with availability of
work. It seems clear that there is variation both between categories and within
categories (Table 7.10).
An examination of the individual parishes reveals significant variations showing that
the neighbourhood was not homogeneous in the age at which families moved and
suggesting that, at the scale of the individual parish, life cycle may not be so useful an
analytical framework as several authorities have claimed.
161

Parish Total No.
1. 20-30 yrs %
2. 31-45 yrs %
3. 46-60 yrs %
4. Over 61
yrs % Families
A.Bowdler 9 2 22 2 22 5 56 0 0 A.Carbonell 27 6 22 6 22 4 15 6 22 Bockleton 35 6 17 16 46 7 20 6 17 Brimfield 46 9 20 19 41 10 22 8 17 Burford 30 5 17 14 47 5 17 5 17 Caynham 66 16 24 22 33 15 23 13 20 Eye 30 8 27 9 30 5 17 8 27 Greete 22 3 14 10 45 9 41 0 0 Kimbolton 57 6 11 18 32 17 30 15 26 Laysters 26 3 12 17 65 2 8 4 15 L. Hereford 21 1 5 9 43 7 33 4 19 Ludford 29 10 34 9 31 7 24 3 M.o.H 41 6 15 11 27 11 27 13 32 Orleton 48 10 21 10 21 10 21 8 17 Pudlestone 37 7 19 14 38 8 22 8 22 R.Castle 39 7 18 14 36 10 26 8 21 Tenrural 69 9 13 34 49 17 25 1 1
Total 632 114 18 234 37 149 24% 110 17 Mean 37.1765 Median 35 Mode 30 Range 9-69
Table 7.10 Out Migrants by Life Cycle: Neighbourhood of Little Hereford, 1871.
From Table 7.10 and Figure 7.5 it can be seen that despite differences in the
circumstances of households at various ages, the age related migration was nowhere
as clear-cut in the neighbourhood of Little Hereford. Certainly households where the
Head was aged between 31 and 45 years were the most mobile though those aged
between 46 and 60 years also moved, notably in Ashford Bowdler, Little Hereford
and Kimbolton.
7.5.4 Family Structure
A number of studies have used what might be termed the characteristics of migrants.
For example, Pooley and Turnbull (1998 p63) examine their sample by such criteria
as age, marital status, position in the family and occupation. By contrast this study
used a notion, closely related to life cycle, namely family structure. There seems little
on this in relation to migration in the literature despite the known changing
characteristics of the family over time (Coleman and Salt 1992). In Figures 7.1 and
7.2 the notion of a family life cycle was proposed, a similar idea to that of the age life
162

cycle. Thus there would be a pattern from the establishment of a family at marriage
to its dispersal with the death of parents and the formation of other families by their
children. For the purpose of this investigation the different structures of a family,
admittedly related to life cycle, are identified through the research in order to
determine the relationship between structure and migration. Clearly this can only be a
static classification reflecting the society of the late 19th century countryside and can
take no account of changes taking place in the 20th century (Coleman and Salt 1992
p227).
Young Married plus dependent childrenplus dependent/independent children plus independent childrenWidow/er and dependent children Older Married coupleWidow/er Single
Figure 7.6 Family Structure: Out Migrating Families, Neighbourhood of Little Hereford, 1871.
(See also Table 7.1)
In this section the 633 migrating families in the neighborhood of Little Hereford are
classified by family structure in order to yield the pattern of families migrating. In
Figure 7.6 the seven categories relate to the discussion of family structure in Section
7.2 and identified in Table 7.1. Here in Figure 7.6 the proportions of each of these
categories migrating are shown. The biggest single, and quite dominant category of
family movers is that with dependent children which, to an extent, accords with those
in the life cycle category 30-45 years. Precisely what role the children played in this
process can not be known but in a society dependent on tied cottages accommodation
163

must have been significant. This would certainly be important for young couples
starting out on married life. But the evidence seems to. suggest that people moved
throughout the family cycle
Parish Total No. 1 % 2 % 3 % 4 % 5 % 6 % 7 % 8 %
Families
A.Bowdler 9 0 0 4 44 2 22 0 0 1 11 2 22 0 0 0 0
A.Carbonell 27 2 7 11 41 5 19 0 0 3 11 0 0 1 4 5 19
Bockleton 35 2 6 19 54 4 11 5 14 2 6 3 9 0 0 0 0
Brimfield 46 3 7 23 50 3 7 2 4 3 7 6 13 1 2 5 11
Burford 30 1 3 15 50 1 3 2 7 5 17 3 10 1 3 1 3
Caynham 66 6 9 33 50 7 11 6 9 4 6 6 9 0 0 4 6
Eye 30 6 20 11 37 1 3 3 10 5 17 1 3 1 3 2 7
Greete 22 1 5 12 55 2 9 3 14 0 0 2 9 0 0 2 9
Kimbolton 57 4 7 19 33 8 14 3 5 11 19 3 5 4 7 5 9
Laysters 26 2 8 12 46 5 19 1 4 3 12 2 8 0 0 1 4
L.Hereford 21 2 10 7 33 3 14 0 0 2 10 2 10 2 10 3 14
Ludford 29 2 7 11 38 3 10 4 14 3 10 4 14 0 0 2 7
M.o.H 41 1 2 13 32 7 17 3 7 6 15 5 12 3 7 3 7
Orleton 48 4 8 20 42 2 4 3 6 3 6 10 21 0 0 6 13
Pudlestone 37 6 16 12 32 2 5 3 8 3 8 3 8 2 5 6 16
R.Castle 39 3 8 11 28 4 10 5 13 8 21 2 5 1 3 5 13
Tenrural 69 10 14 33 48 15 22 0 0 3 4 5 7 1 1 2 3
Total 632 55 9% 266 42% 74 12% 43 7% 65 10% 59 9% 17 3% 52 8% Mean 37.1765
Median 35
Mode 30
Range 9-69
Table 7.11 Structure of Out Migrating Family, Neighbourhood of Little Hereford, 1871.
In Table 7.11 the numbers 1 – 8 in the first row refer to the different family structures
discussed earlier. As revealed by Figure 7.6 the biggest single family type among the
migrating families in 1871, was the married couple with young children in fact 266 or
42% of the 632 families. Significantly, this figure broadly conforms with the average
for England and Wales as a whole (Anderson 1990).
The detail of the individual parishes in Table 7.11 appears to show little significant
variability between parishes. Because the variability is between categories this
suggests that the pattern shown in Figure 7.6 is indeed a general one. The largest
group of families moving was that with a married couple with dependent children.
164

7.5.5 Family Cycle
A closely related notion to that of family structure is that of family cycle. The use of
this concept may enables a more flexible and less predetermined analysis (Warnes
1992). Any one family is a temporary phenomenon which goes through a cycle
similar to that of an individual. In relation to migration this cycle can be depicted as:
(1) Family formation – the creation of a new household; (2) Family moved – where
the parent(s) and children move as a unit; (3) Family Dispersed – beginning of the
break-up of the family by the departure of some or all of the children, and (4) Family
reconstituted – where a parent moves to live with one of the children. However,
because data are not available for family formation only the latter three are included
in this analysis.
Family Moved Family Dispersed Family Reconsructed Not Known
Figure 7.7 Family Cycle of Out Migrating Families, Neighbourhood of Little Hereford, 1871.
Data on three of these categories of families that had moved were collected in 1881
and are represented in Figure 7.7 where it can be seen that the majority of families
(52%) moved intact between 1871 and 1881 and, therefore, clearly represented the
maintenance of the nuclear family. On the other hand, the ‘Family Dispersed’
occurred when, for example, the children had left home to live-in or set up separate
establishments and where one or both of the marriage partners had died. This is the
165

nuclear family at the end of the cycle. It does though raise the question as to whether
this is truly family migration although the dispersed members of the family can be
located. If there was one spouse living, even though living-in with relatives, this was
taken here to be the ultimate phase in family migration. Family Dispersed made up
12% of the identified migrating families. Reconstituted families were taken to be
those who remarry after the death of the spouse or an elder sibling caring for the
family in a new household and there were 13% of these at a time when it was not
uncommon for one spouse to die early.
Even though most families moved intact and set up a new household in a new
residence, the fact that a quarter of the moving households changed their structure by
1881 is a significant feature. Bearing in mind that the changes could have taken place
after the date of migration there is a strong likelihood that the migration was initiated
by changes in the structure of the family or even the move itself initiated changes in
the family structure. (Wrigley and Schofield 1981). Possibly this evidence suggests
the beginning of the decline of the nuclear family as a migratory unit and the growing
significance of the changing family structure, so prevalent in the present day, in the
migration process ( Coleman and Salt 1992).
In Table 7.12 the detail of the parishes for family cycle is given. It should be borne in
mind that family numbers in this table are based on those successfully discovered in
1881. Column 4, (NK) are those which remained untraced and which amount to
some 20% of the total. Just over half of those that moved were families with children.
So, only slightly over half the families moved as a unit which suggested that the move
of the other half of the families was provoked by the phase in their life cycle. There
are variations between the parishes. Thus, in Leysters, over three quarters of those
families which moved did so as a unit whereas from Little Hereford and Orleton only
36% moved as a unit. For the other two categories the numbers are so small as to
make a pattern difficult to detect.
Even if this index is taken together with the life cycle there is no clear pattern
revealed nor do these data indicate how life cycle, family cycle and migration
interacted. The data sets are not sufficiently large to refine the classes further but
166

Parish Total No.
1 Family. Moved
2. Family
Dispersed.
3. Family
Reconstit’ 4.
NK Families % % % %
A.Bowdler 9 4 44 4 44 0 0 1 11 A.Carbonell 27 13 48 4 15 3 11 7 26 Bockleton 35 24 69 8 23 0 0 3 9 Brimfield 46 24 52 0 0 8 17 14 30 Burford 30 12 40 0 0 14 47 3 10 Caynham 66 43 65 0 0 11 17 12 18 Eye 30 20 67 5 17 0 0 5 17 Greete 22 10 45 0 0 6 27 6 27 Kimbolton 57 24 42 12 21 5 9 16 28 Laysters 26 20 77 4 15 0 0 0 0 L. Hereford 21 8 38 5 24 2 10 6 29 Ludford 29 17 59 3 10 3 10 6 21 M.o.H 41 18 44 12 29 4 10 7 17 Orleton 48 18 38 1 2 11 23 18 38 Pudlestone 37 17 46 2 5 9 24 9 24 R.Castle 39 18 46 10 26 2 5 9 23 Tenrural 69 38 55 8 12 7 10 5 7
Total 632 328 52 78 12 85 13 127 20 Mean 37.1765
Median 35
Mode 30
Range 9-69
Table 7.12 Family Cycle of Out Migrating Families, Neighbourhood of Little Hereford, 1871
there is no overwhelmingly common pattern. In fact people migrated at all points in
the life cycle between 1871 and 1881. Movement in the late 19th century countryside
was a complex matter and the framework provided by family structure and family life
cycle, certainly at this scale, does not appear to provide either an explanation or a
convincing pattern. This will be returned to later in the discussion.
7.5.6 Marriage Partners
Another feature that may have had a bearing on migration habits was the origin of the
marriage partners of those families which moved out. In Chapter 4 reference was
made to the work of Hey (1976) who maintained that one of the defining
characteristics of a neighbourhood was the area from which marriage partners are
drawn. Such a feature might be seen as part of family structure since, if it were the
case that significant numbers married from within the neighborhood, then there would
be implications for community relationships and coherence but it would also add to
167

the evidence about the utility of the neighbourhood as a research aid. It has to be
noted that, in an era of travel difficulty, it might be expected that marriage partners
generally came from the same locality. The data were derived from the place of birth
statistics in the 1871 census. Table 7.13 and Figure 7.8 seem to indicate that location
of marriage partners alone may not be adequate to define a neighborhood or locality.
In only 21% of families do both partners come from the same neighbourhood. But
these data are derived only from families who migrated and this may indicate that
families that migrated usually had less ties to the area and therefore a greater tendency
to migrate and the families that do not migrate have a greater proportion of local
marriage partners.
Perry (1968) analysed mobility in rural Dorset in the century after 1837 using data
from marriage registers. He observed that each parish had a territory, similar to Hey’s
(1976) neighbourhood area as used in this investigation. Unlike Hey, he specifically
targeted what he called the working classes in 27 parishes. In a complex analysis he
showed that the more isolated the parish the more intra parish marriages took place in
the period before 1886. After this point the intra parish marriages declined sharply.
The data for the neighbourhood as presented suggests that, if Perry’s findings hold
true here, then the Neighbourhood of Little Hereford may well be experiencing a
changing pattern in 1881. This would tend to support both Hey (1976) and Mitson
(1993) who claim the significance of core families. This may be important indicating
a greater propensity to migrate among those who have experienced migration.
But 25% of families had one partner from the neighbourhood. In 46% of cases at
least one partner was born in the area. On the other hand 26% had neither partner
from the Neighbourhood and a further 17% were born not only outside the
Neighbourhood but at some distance away from each other.
168

Both born in NA One born in NA Neither from NA Both different NA Not known
Figure 7.8 Origins of Marriage Partners of Out Migrating Families, Neighbourhood of Little
Hereford 1871 The importance of the neighbourhood for at least one of the partners is clear but it is
also further evidence of the amount of movement in the countryside of the late 19th
century. Perhaps travel was not so difficult as some times thought.
In Table 7.13 the detail for each of the parishes is given and there is some measure of
variability at this scale. For example, only 10% of marriages in Burford were from
the neighbourhood whereas the figure in Little Hereford was 48%. At the other
extreme, where neither partner came from the neighbourhood there were only 10% in
this category in Little Hereford. So, not only were a significant proportion of
marriage partners from the neighbourhood moving, there were also a very small
proportion of those not married in the neighbourhood leaving. This is a situation
difficult to explain. A small number (11%) were partners from the same
neighbourhood but a different one from that of Little Hereford. Burford which had a
small number from the same neighbourhood also had a large number, 40% where
neither was from the neighbourhood.
169
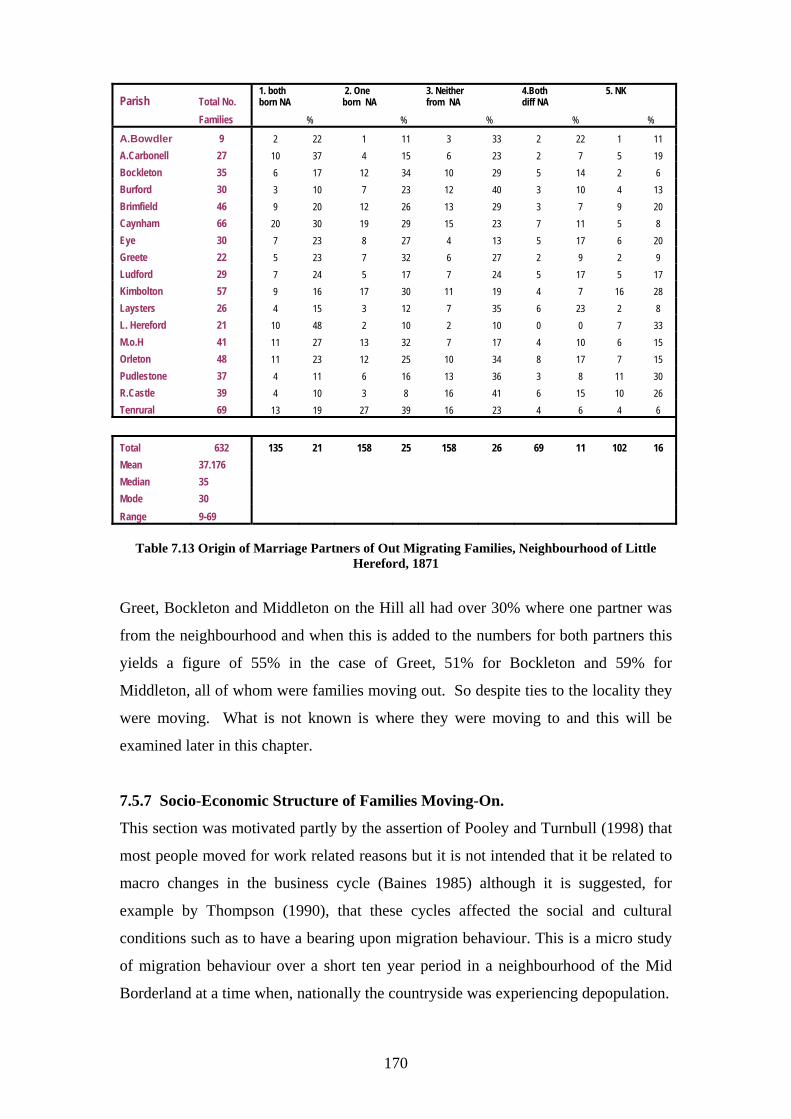
Parish Total No. 1. both born NA
2. One born NA
3. Neither from NA
4.Both diff NA
5. NK
Families % % % % %
A.Bowdler 9 2 22 1 11 3 33 2 22 1 11 A.Carbonell 27 10 37 4 15 6 23 2 7 5 19 Bockleton 35 6 17 12 34 10 29 5 14 2 6 Burford 30 3 10 7 23 12 40 3 10 4 13 Brimfield 46 9 20 12 26 13 29 3 7 9 20 Caynham 66 20 30 19 29 15 23 7 11 5 8 Eye 30 7 23 8 27 4 13 5 17 6 20 Greete 22 5 23 7 32 6 27 2 9 2 9 Ludford 29 7 24 5 17 7 24 5 17 5 17 Kimbolton 57 9 16 17 30 11 19 4 7 16 28 Laysters 26 4 15 3 12 7 35 6 23 2 8 L. Hereford 21 10 48 2 10 2 10 0 0 7 33 M.o.H 41 11 27 13 32 7 17 4 10 6 15 Orleton 48 11 23 12 25 10 34 8 17 7 15 Pudlestone 37 4 11 6 16 13 36 3 8 11 30 R.Castle 39 4 10 3 8 16 41 6 15 10 26 Tenrural 69 13 19 27 39 16 23 4 6 4 6
Total 632 135 21 158 25 158 26 69 11 102 16 Mean 37.176 Median 35 Mode 30
Range 9-69
Table 7.13 Origin of Marriage Partners of Out Migrating Families, Neighbourhood of Little Hereford, 1871
Greet, Bockleton and Middleton on the Hill all had over 30% where one partner was
from the neighbourhood and when this is added to the numbers for both partners this
yields a figure of 55% in the case of Greet, 51% for Bockleton and 59% for
Middleton, all of whom were families moving out. So despite ties to the locality they
were moving. What is not known is where they were moving to and this will be
examined later in this chapter.
7.5.7 Socio-Economic Structure of Families Moving-On.
This section was motivated partly by the assertion of Pooley and Turnbull (1998) that
most people moved for work related reasons but it is not intended that it be related to
macro changes in the business cycle (Baines 1985) although it is suggested, for
example by Thompson (1990), that these cycles affected the social and cultural
conditions such as to have a bearing upon migration behaviour. This is a micro study
of migration behaviour over a short ten year period in a neighbourhood of the Mid
Borderland at a time when, nationally the countryside was experiencing depopulation.
170
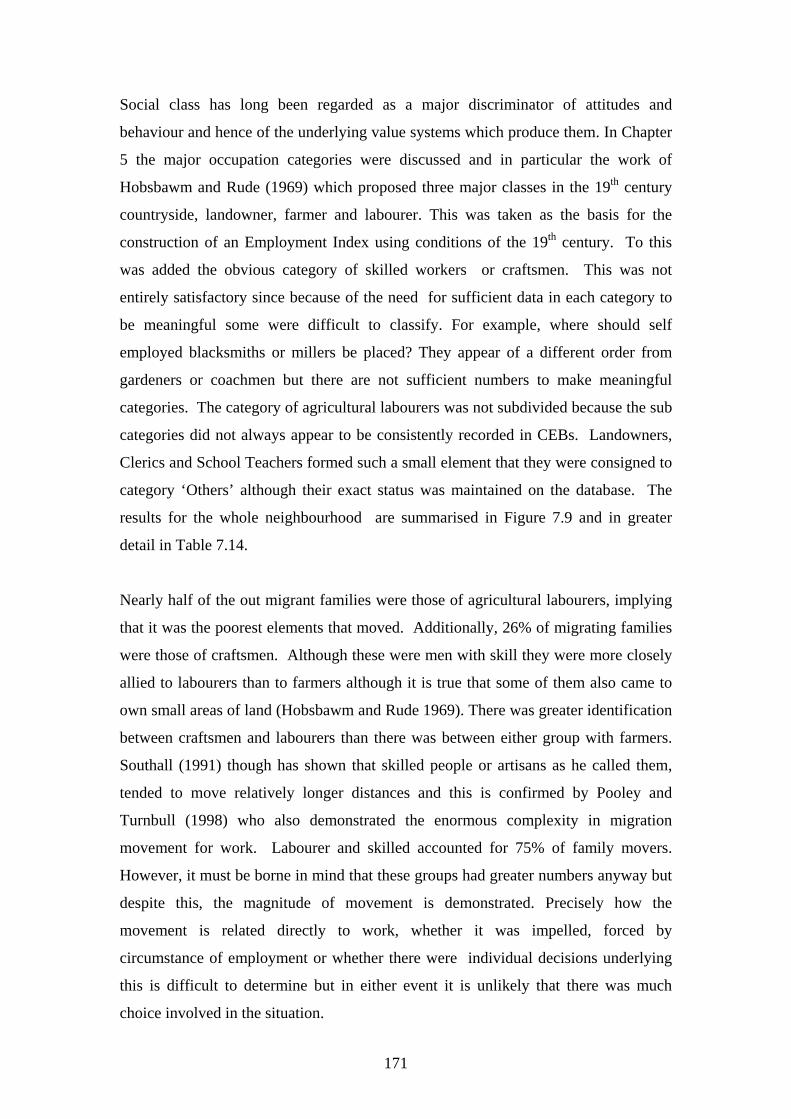
Social class has long been regarded as a major discriminator of attitudes and
behaviour and hence of the underlying value systems which produce them. In Chapter
5 the major occupation categories were discussed and in particular the work of
Hobsbawm and Rude (1969) which proposed three major classes in the 19th century
countryside, landowner, farmer and labourer. This was taken as the basis for the
construction of an Employment Index using conditions of the 19th century. To this
was added the obvious category of skilled workers or craftsmen. This was not
entirely satisfactory since because of the need for sufficient data in each category to
be meaningful some were difficult to classify. For example, where should self
employed blacksmiths or millers be placed? They appear of a different order from
gardeners or coachmen but there are not sufficient numbers to make meaningful
categories. The category of agricultural labourers was not subdivided because the sub
categories did not always appear to be consistently recorded in CEBs. Landowners,
Clerics and School Teachers formed such a small element that they were consigned to
category ‘Others’ although their exact status was maintained on the database. The
results for the whole neighbourhood are summarised in Figure 7.9 and in greater
detail in Table 7.14.
Nearly half of the out migrant families were those of agricultural labourers, implying
that it was the poorest elements that moved. Additionally, 26% of migrating families
were those of craftsmen. Although these were men with skill they were more closely
allied to labourers than to farmers although it is true that some of them also came to
own small areas of land (Hobsbawm and Rude 1969). There was greater identification
between craftsmen and labourers than there was between either group with farmers.
Southall (1991) though has shown that skilled people or artisans as he called them,
tended to move relatively longer distances and this is confirmed by Pooley and
Turnbull (1998) who also demonstrated the enormous complexity in migration
movement for work. Labourer and skilled accounted for 75% of family movers.
However, it must be borne in mind that these groups had greater numbers anyway but
despite this, the magnitude of movement is demonstrated. Precisely how the
movement is related directly to work, whether it was impelled, forced by
circumstance of employment or whether there were individual decisions underlying
this is difficult to determine but in either event it is unlikely that there was much
choice involved in the situation.
171

Farmers Labourers Skilled Domestic Other
Figure 7.9 Occupations of Head of Households of Out Migrants, Neighbourhood of Little Hereford, 1871
There is no evidence that there was movement to ‘better’ themselves for, although
there was social mobility, it took place largely among individuals rather than families.
None for example moved to become farmers. Where there was a change of occupation
it was invariably from one form of labouring to another. Clearly the system of tied
cottages had a role to play but because of the lack of records it is difficult to
determine the extent of this process. However, the very small number of domestics
identified in the analysis merely reflected the fact that women were infrequently
Heads of Household. It may be that particular skills moved to the town for example,
shoemaking and tailoring. Yet, nearly one fifth of the movement was of farmers but
the system of tenancy may have encouraged this by offering opportunities to better
themselves with advantageous rents, more and land and the chance to accrue capital
with which to buy their own farms. This is an area that would reward further detailed
investigation at the level of the individual farmer1.
1 For example David Maund, ‘Mon’ who figures in Chapters 8 and 9 moved 4 times between about 1918 and 1938, each time for a bigger and better farm.
172
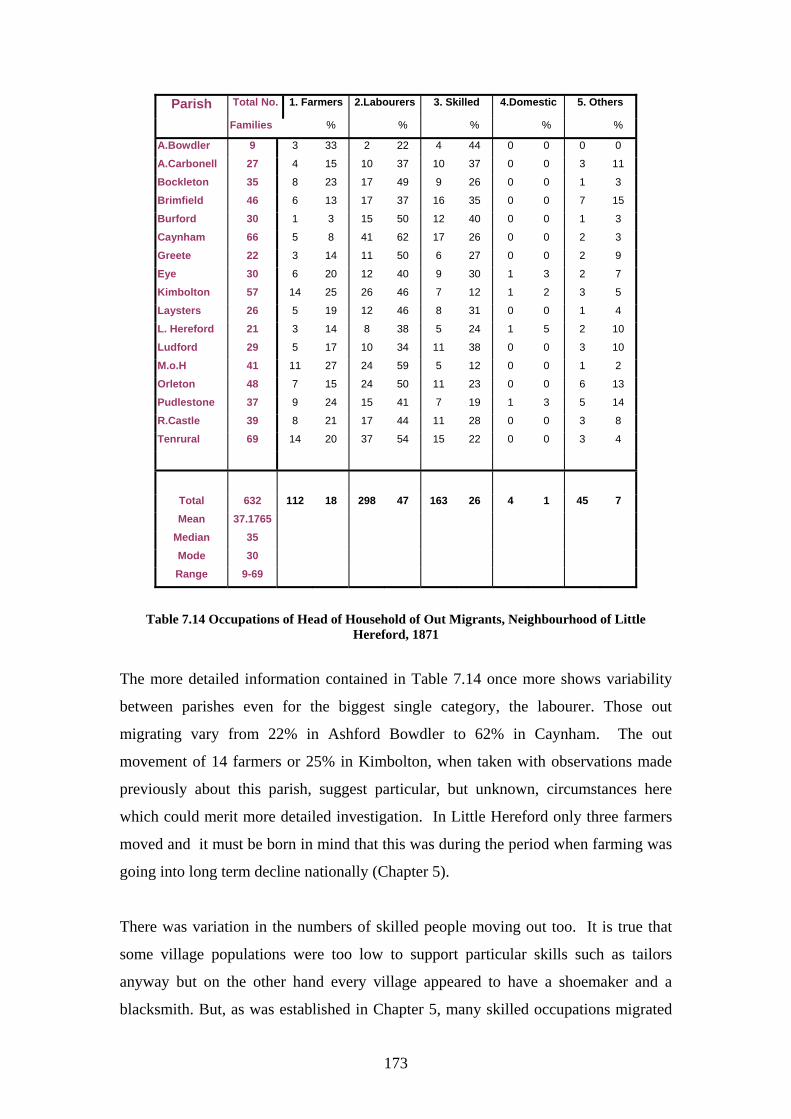
Parish Total No. 1. Farmers 2.Labourers 3. Skilled 4.Domestic 5. Others
Families % % % % %
A.Bowdler 9 3 33 2 22 4 44 0 0 0 0
A.Carbonell 27 4 15 10 37 10 37 0 0 3 11
Bockleton 35 8 23 17 49 9 26 0 0 1 3
Brimfield 46 6 13 17 37 16 35 0 0 7 15
Burford 30 1 3 15 50 12 40 0 0 1 3
Caynham 66 5 8 41 62 17 26 0 0 2 3
Greete 22 3 14 11 50 6 27 0 0 2 9
Eye 30 6 20 12 40 9 30 1 3 2 7
Kimbolton 57 14 25 26 46 7 12 1 2 3 5
Laysters 26 5 19 12 46 8 31 0 0 1 4
L. Hereford 21 3 14 8 38 5 24 1 5 2 10
Ludford 29 5 17 10 34 11 38 0 0 3 10
M.o.H 41 11 27 24 59 5 12 0 0 1 2
Orleton 48 7 15 24 50 11 23 0 0 6 13
Pudlestone 37 9 24 15 41 7 19 1 3 5 14
R.Castle 39 8 21 17 44 11 28 0 0 3 8
Tenrural 69 14 20 37 54 15 22 0 0 3 4
Total 632 112 18 298 47 163 26 4 1 45 7 Mean 37.1765
Median 35 Mode 30 Range 9-69
Table 7.14 Occupations of Head of Household of Out Migrants, Neighbourhood of Little Hereford, 1871
The more detailed information contained in Table 7.14 once more shows variability
between parishes even for the biggest single category, the labourer. Those out
migrating vary from 22% in Ashford Bowdler to 62% in Caynham. The out
movement of 14 farmers or 25% in Kimbolton, when taken with observations made
previously about this parish, suggest particular, but unknown, circumstances here
which could merit more detailed investigation. In Little Hereford only three farmers
moved and it must be born in mind that this was during the period when farming was
going into long term decline nationally (Chapter 5).
There was variation in the numbers of skilled people moving out too. It is true that
some village populations were too low to support particular skills such as tailors
anyway but on the other hand every village appeared to have a shoemaker and a
blacksmith. But, as was established in Chapter 5, many skilled occupations migrated
173

from the villages to the town in the late 19th century. Brimfield, at an important rail
junction (Chapter 5) has 16 households of skilled workers move out. A speculation
could be here that the establishing of this important rail junction had attracted skilled
occupations which, when the work was done, subsequently migrated. However, the
important feature for this investigation is the continued observation of variability as
the scale of the enquiry reduces.
7.6 The Spatial Patterns of Families Moving-On The literature from the time of Ravenstein (1876; 1885; 1889) has claimed that
migration over time has a number of distinct spatial features including a tendency for
migrants to move only short distances, and urbanward, in a step-like fashion in the
direction of a large city (Lewis 1982). In order to determine the validity of these
claims in the late 19th century neighbourhood of Little Hereford, calculations were
made of the distance between the 1871 residence and the one in 1881 of each of the
migrating families as well as the places involved. The resultant data has been
summarised in Table 7.15.
7.6.1 Distance Moved
Because of the difficulty in determining the precise location of a family within a
parish, distances used here are those between the centre of the leaving parish and the
receiving one. This may have produced some marginal underestimation, or indeed
over estimation, of distance but it has the benefit of being a uniform method. The
results in Table 7.15 show quite significant variation both between parishes and also
between the different forms of average. Thus the mean distance moved is over 17
miles but between parishes it varies from about 5 miles for Little Hereford to about 32
miles for Richards Castle. Almost every parish had at least one family that moved
over a hundred miles and there is one of 250 miles. The smallest movement was
generally one or two miles. So there was significant variation in movement. The
median and mode calculations though are revealing. They suggest that whilst there
was a large range between short and long distances the dominant form of migration
was over short distances, thus confirming long held knowledge about distances
moved.
174
Parish Total Total Mean Median Mode Range Families Miles
A.Bowdler 9 250 31.3 13.5 3 1 – 120 A.Carbonell 27 326 16.3 6 3 2 – 90 Bockleton 35 436 13.6 5 5 2 – 120 Brimfield 46 518 16.2 7.5 2 2 – 108 Burford 30 269 10.3 3.5 1 1 – 44 Caynham 66 980 18.1 5 3 2 – 250 Eye 30 682 27.3 12 2 1 – 135 Greete 22 158 9.9 5 2 1 – 66 Kimbolton 57 463 11.9 5 2 1 – 150 Laysters 26 485 22.1 13.5 1 1 – 150 L. Hereford 21 71 5.1 2 2 1 – 24 Ludford 29 414 18.0 6 4 1 – 120 M.o.H 41 278 9.3 5 5 1 – 35 Orleton 48 561 18.7 7 2 2 – 100 Pudlestone 37 737 25.4 6 5 2 – 150 R.Castle 39 965 32.2 16 3 2 – 150 Tenrural 69 784 14.8 5 3 2 – 120
N’hood Area 632 8377 17.7 6 2 1 - 250
Table 7.15 Distances Moved by Out Migrating Families Parishes of Neighbourhood of Little Hereford 1881
Thus the overall median or mid point is 6 miles whilst the most frequently occurring
distance is only 2 miles for the neighbourhood as a whole. Indeed no parish has a
mode greater than 5 miles. Such calculations tend to counteract the distortions
wrought by extremes and to reinforce the notion of a neighbourhood as an area of
immediate interaction.
In order to provide some meaning to these crude distances Figure 7.10 and Table 7.15
categorise them based upon the dimensions of the concept of neighbourhood. The
area up to seven miles was designated as the neighbourhood of each parish. This is
consistent with calculations made earlier that noted an inner and, at a distance of 7
miles, an outer neighbourhood area. It is this which forms the first category of
movement and the remaining distance categories reflect the rate of fall off in places of
birth locations (See Chapter 4). It was assumed that each parish has its own
neighbourhood or locality similarly arranged to that of the prime parish of Little
Hereford and that the distances involved are the same as for the prime parish.
Therefore a system of interlocking neighbourhood areas is envisaged.
175

Distance moved
0
50
100
150
200
250
300
Up to 8 8 to 15 16 to 20 21 to 30 Over 30
Distance (miles)
Num
bers
Figure 7.10 Distances Moved by Out Migrating Families
Parishes of Little Hereford Neighbourhood 1881
From Figure 7.10 44% of migrating families had moved within 7 miles of their
leaving parish, that is, within the broader neighbourhood. In effect, the migration was
truly localised with over 50% moving less than 15 miles.
However these figures were in all probability an underestimation of the real situation
because 144 families in the neighbourhood could not be traced2 and the calculations
were based on the total that moved not just those which could be traced. In other
words all the evidence indicated that much family migration was within the
neighbourhood. Further, in Table 7.16 there is a dominance of short distance
movement. The distance decay feature, as the proportions decline from 44% at seven
miles to 12% at over 30 miles, is clearly evident. However, there is also variability
between parishes underlying this general observation.
2 There is a whole range of possible reasons for this. Although some may have emigrated it is likely that a number of transcription errors producing untraceable spelling is the major reason. There are also inconsistencies in the recording of P.o.B and age data. Allied to this are the problems of literacy and the phonetic spelling of local accents.
176

Parish To
tal f
amili
es
Up
to 7
mile
s
% 8 –
15 m
iles
% 16 –
20
mile
s
% 21 –
30
mile
s
% Ove
r 30
mile
s
% Not
Kno
wn
% Ashford Bowdler 9 4 44 0 0 0 0 2 22 2 22 1 11 Ashford Carbonel 27 12 44 4 15 1 4 0 0 3 11 7 26 Bockleton 35 23 66 4 11 1 3 1 3 3 9 3 9 Brimfield 46 16 35 5 11 3 7 2 4 6 13 14 30 Burford 30 17 57 2 7 3 10 1 3 3 10 3 10 Caynham 66 36 55 6 9 0 0 7 11 5 8 12 18 Greete 22 12 55 1 5 0 0 2 9 1 5 6 27 Eye 30 10 33 5 17 2 7 1 3 7 23 5 17 Kimbolton 57 24 42 7 12 5 9 1 2 2 4 18 32 Laysters 26 7 27 5 19 4 15 0 0 6 23 0 0 L. Hereford 21 11 52 2 10 0 0 1 5 0 0 7 33 Ludford 29 12 41 3 10 0 0 2 7 6 21 6 21 M.o.H 41 19 46 5 12 1 2 3 7 2 5 11 27 Orleton 48 15 31 8 17 1 2 1 2 5 10 18 38 Pudleston 37 16 43 2 5 2 5 1 3 8 22 8 22 Richards Castle 39 14 36 0 0 4 10 3 8 9 23 9 23 Tenbury Rural 69 31 45 7 10 5 7 0 0 6 9 16 23
Total 632 279 44 66 10 32 5 28 4 74 12 144 23 Mean 37.17 Median 35 Mode 30 Range 9-69
Table 7.16 Categories of Distance Moved by Out Migrants, Parishes of Neighbourhood of Little Hereford, 1881
Thus, although the distance decay feature is clear for each of the parishes its
magnitude is variable. For example, in Laysters 27% moved within seven miles
compared with 66% for Bockleton. The greatest proportion moving over 30 miles is
23% in both Eye and Laysters. In total 74 families moved more than 30 miles. On
this index there is both clear pattern but also a degree of variability.
Unfortunately the analysis tells us little about the distances moved by different
categories of families. As was revealed in the previous section, the largest group of
migrating families in the neighbourhood between 1871 and 1881 was that of
labourers. Therefore in order to investigate whether they had a distinctive spatial
pattern they were separated and analysed separately (Table 7.17). It has often been
claimed that the nature of a farm labourer’s employment and their dependency upon
177

tied cottages for accommodation made their migrations even more localised than the
rest of the population during the 19th century (Newby 1977). Further it might be
expected that any decision to move would be pre-empted by termination of contract
rather than a rational, thought out decision from a range of options. In such
circumstances there might have been rather more constraint than choice involved in
the process. Indeed it might be that labourers expected to move and it may have been
what they had to do. This is returned to in Chapter 8 when a more individualised
analysis is undertaken.
Table 7.17, perhaps surprisingly, does not indicate that the migratory behaviour of
labouring families varied greatly from the generality of families, although labourers
constituted 42% of moving families. It was true that the mean distance moved was
Parish Total Families
Total Lab Families
Not traced
Mean Distance Moved
No. Over 30 miles
A.Bowdler 9 1 0 1.0 0 A.Carbonell 27 9 1 16.2 1 Bockleton 35 17 2 6.0 0 Brimfield 46 17 4 9.7 1 Burford 30 16 1 7.4 0 Caynham 66 19 1 11.5 1 Eye 30 12 2 22.6 2 Greete 22 11 3 11.2 1 Kimbolton 57 25 5 6.5 0 Laysters 26 14 1 15.0 2 L.Hereford 21 8 1 3.4 0 Ludford 29 10 3 4.4 0 M.o.H 41 24 4 16.0 0 Orleton 48 23 4 12.3 2
Pudlestone 37 15 4 21.2 2 R.Castle 39 12 2 12.5 1
Tenrural 69 35
5 7.2 1
N’hood Area 632 268
43 9.0 14
Table 7.17 Movement of Labouring Families,
Parishes of Little Hereford neighbourhood, 1881 further than the extended neighbourhood at 9 miles and less than the mean distance
for the general movement. There were also families who moved out of the Mid
Borderland. In some parishes the mean figure is low. So, although there was a
tendency for labouring families to move shorter distances than other families, only
178

2% moved more than 30 miles, there was still a deal of variability which suggests that
the migratory habits of labourers are rather more complex and varied than might have
been thought.
There was also the possibility that there was a dynamic within very localised
communities that explained variability. If there was a cultural factor in the decision to
move then its effects did not distinguish between social classes and occupations. From
the evidence it was apparent that during the second half of the 19th century the
movement of labourers was not determined entirely by their employment since it was
so similar to that of the rest of the migrating families.
The investigation of direction moved was inconclusive with similar proportions
moving in different directions. Therefore the analysis is omitted here as being
inappropriate. Indeed, since the majority of movement was local, this may be an
expected outcome.
7.6.2 Destination of Families Moving-On
The enormous growth of medium and large towns and the shift in occupations to the
industrial area might indicate, despite the evidence that the majority of moves were
local, that some families, albeit a minority, moved to urban areas. To what extent this
was true for the families of the neighbourhood of Little Hereford was analysed
directly through the data derived from the 632 families. The 1881 location of each of
the traced families was categorised according to a simple classification of places
(Figure 7.11 and Table 7.18) . These places are intended to represent a number of
different possible locations for migrating families, including a division into types of
urban centres and are derived completely empirically from the list of places noted on
the spreadsheet of results. It should also be noted that Rural implies a similar parish
to those in the neighbourhood whilst Industrial Village was one where the main
activity is industrial or extractive such as the villages of Clee or Pensax. Similarly,
Kidderminster is an example of an Industrial Town.
Significantly there was no evidence of mass movement from the neighbourhood of
Little Hereford to the industrial areas by families between 1871 and 1881 (Figure
7.11 and Table 7.18).
179

Destination of moving families
0
100
200
300
400
500
600
Rural Village IndustrialVillage
Market Town County Town IndustrialTown
RegionalCentre
Settlement Type
Num
ber
of fa
mili
es
Figure 7.11 Destination of Families Out Migrating, Parishes of Little Hereford Neighbourhood, 1881
For example, those families that left for industrial villages, industrial towns and the
Regional Centre, Birmingham, amounted to only 6% of the moving families and of
course this does not mean that they all necessarily took up industrial occupations. In
fact the biggest single group went to other rural locations (55%), and this again
confirms the localised nature of the migration between 1871 and 1881. This provides
some support for Pooley and Turnbull’s (1998) conclusion that after moves within the
same settlement, “…removal to another settlement in the same size category was the
next most frequent occurrence”.
Of greater significance as destinations, for migrating families between 1871 and 1881
for the residents of the neighbourhood of Little Hereford, were the market and county
towns (Table 7.18). 14% of movers went to the market towns of Tenbury, Ludlow
and Leominster which were the most significant destinations in contrast to the three
county towns which were of little attraction. The majority of movement was clearly
within the countryside especially when market towns are allied to rural areas.
180

Finally, it must be said that these localised and rural movements between 1871 and
1881 should be seen in the perspective that over the same period 40 families moved
long distances and/or to large industrial towns (Table 7.18). This is not a great number
Destination Numbers of Families
Birmingham & Black Country 21
London 5
South Wales 5
Over 100 Miles 9
Table 7.18 Families from the Neighbourhood of Little Hereford
Moving Long Distances
but it does serve to illustrate that families behave individualistically ; their decisions
may be conditioned to an extent by external factors but in the end they are made by
individuals.
Some of the truth of the realisation of individual decisions may explain the variability
between parishes (Table 7.19). In Ashford Bowdler, admittedly from a low base
population, 77% of out migrating families went to towns of various orders. On the
other hand from Ashford Carbonel, the immediately adjacent village, only 4% went to
the town. Only from Ashford Bowdler and Leysters did any significant proportions
go to county towns. The fact that no more than a total of three families, from any one
village, went to industrial towns does not support the view of an exodus in that
direction. Richards Castle has the smallest proportion moving to a similar rural area,
(31%) but the highest proportion (33%) went to a market town. Thus, this index also
demonstrates variability and this feature is the most marked throughout the analysis in
this section.
181

Parish To
tal N
o. F
amili
es
1. R
ural
%
2. In
dust
rial V
illag
e
%
3. M
arke
t Tow
n
%
4. C
ount
y To
wn
%
5. In
dust
rial T
own
%
6. R
egio
nal C
entr
e
%
Ashford Bowdler 9 1 11 0 0 4 44 2 22 1 11 0 0 Ashford Carbonel 27 16 59 0 0 4 15 0 0 0 0 0 0
Bockleton 35 26 74 0 0 3 9 0 0 3 9 0 0
Brimfield 46 20 43 1 2 8 17 0 0 3 7 0 0
Burford 30 17 57 0 0 5 17 2 7 1 3 1 3
Caynham 66 41 62 3 5 6 9 1 2 3 5 0 0
Eye 30 20 67 2 7 2 7 1 3 0 0 0 0
Greete 22 12 55 0 0 3 14 0 0 1 5 0 0
Kimbolton 57 31 54 0 0 6 11 0 0 0 0 2 4
Laysters 26 14 54 1 4 2 8 5 19 0 0 0 0
L. Hereford 21 10 48 0 0 4 19 0 0 0 0 0 0
Ludford 29 18 62 0 0 2 7 1 3 2 7 0 0
M.o.H 41 26 63 1 2 3 7 0 0 0 0 0 0
Orleton 48 26 54 2 4 2 4 0 0 0 0 0 0
Pudlestone 37 15 41 0 0 8 22 3 8 2 5 1 3 Richards Castle 39 12 31 1 3 13 33 0 0 2 5 2 5
Tenbury Rural 69 44 64 2 3 3 4 0 0 2 3 0 0
Total 632 349 55 13 2 78 12 15 2 20 3 6 1 Mean 37.1765
Median 35
Mode 30
Range 9-69
Table 7.19 Destination of Out Migrating Families, Neighbourhood Parish, Little Hereford, 1981.
7.7 Summary and Implications of the Characteristics of Out Migrating Families
In the context of a small scale enquiry covering 17 rural parishes it should not,
perhaps, be expected that the patterns revealed would necessarily be strong and
marked and that is the case. However, some patterns have reinforced those from
previous research, for example, migration was over short distances. On the other
hand there were some surprising findings. The gross numbers of families moving was
very considerable. There was no very significant movement to towns between 1871
and 1881. In contrast generally the Mid Borderland was experiencing an absolute
182

decline in population at this time. This leads to the strong possibility that the
neighbourhood was a distinctive area. Thus, there is some factor related to scale
operating in this instance. The locality does not entirely reflect the region.
The variability in the behaviour patterns between villages, noted on most indices,
suggests yet another difference related to the scale of the enquiry. At the scale of the
individual village, behaviour can not be explained by general causes such as
industrialisation since there are marked differences in behaviour between villages.
Although there is some suggestion, as noted, of the relationship to village population
size and accessibility this is by no means clear cut. Clearly there are other factors at
work not revealed at the scale of enquiry pursued to this point. Therefore in order to
begin to clarify this point a brief study will be made of the characteristics of the
behaviour in the Prime Parish of Little Hereford.
7.8 The Case of Little Hereford Before beginning this final section of this chapter it is important to set the context for
this aspect of the enquiry. Little Hereford is the Prime Parish because it is the parish
in which the core families, which provide data for the analysis in Chapters 8 and 9,
resided during the 19th century. For this reason it became the place from which its
neighbourhood area was calculated (Chapter 4). Secondly, the data on which the
previous analysis was based was those for the families within the neighbourhood who
left their parish of residence after 1871. It did not include those who moved in for the
reasons argued above. This section will include an examination in so far as is
possible of arrivals and stayers as well as leavers and not only of families but
individuals also. In other words it is a more comprehensive examination of a single
parish than was possible for the other parishes by reason of the difficulty of
generating and processing the very large quantity of data that that would have
involved. It is an enquiry, a case study, at a smaller scale and therefore offering more
detailed data.
Saville (1957) maintained that the depopulation of the countryside was associated
with a decline in numbers working on the land. Between 1861 and 1881 there was a
decline nationally in the agricultural workforce of 20%. But in Little Hereford,
183

between 1851 and 1901, the population actually increased by 5%, from 391 in 1851 to
411 in 1901, whilst agricultural labourers went from 44% of the employed population
in 1851 to 48% in 1891. At the same time the number of farmers increased from 11%
to 13% (Table 7.20).
Occupation No. 1851 % No. 1901 %
Farmer 19 11 21 13 Labourer 78 44 77 48 Skilled 35 20 20 13 Domestic 40 23 24 15 White Collar 5 3 10 6 Shop Worker 0 0 7 4 (Living-In Labs) (16) (3) (6) (4)
Table 7.20 Occupational Change in Little Hereford: 1851 –1901
Though the statistics reveal only marginal changes they do confirm the continued
vibrancy of Little Hereford’s agricultural economy during the second half of the 19th
century, a further illustration of the distinctive economy (Chapters 5 and 6) and its
relative isolation from the effects of industrialisation and urbanisation.
Access to appropriate data is a major problem for migration studies. For the second
half of the 19th century the release of CEBs showing data collected at the individual
level and classified in households gives some opportunity for both parish
reconstruction and the potential for individual and whole family moves to be tracked.
Using these data the occupants of each dwelling can be identified for each census year
and a whole enumeration district reconstructed from 1851 up to 1901. Thus over the
period 1841 – 1901 the incomers, stayers and leavers can be identified and recorded
for any area. In this manner an entire district or any part of it can be reconstructed
over this sixty-year period residence by residence.
One benefit of this approach is that it uses gross data and, therefore, all movement
may be detected. A problem is that with the exception of 1881 it is very difficult to
trace those who have left and to identify where those who come in have come from.
With few exceptions the occupants of each dwelling at each census year is known.
These data form the source for this section. In Little Hereford the trend of total
population in the parish from 1801 to 1871 had been one of a gentle rise but thereafter
to 1911 it levelled out. All this whilst England and Wales and urban areas were
184

growing at a fast rate (Chapter 6). So, if Little Hereford is typical of the remote
countryside as a whole, then it was stagnating and relatively declining.
7.8.1 The Movers
The total movement for the period 1871 to 1881 is given in Figure 7.21. The apparent
confusion between Households and Families simply reflects the manner in which the
data were collected3 and does not detract from their value. Firstly, there was
considerable movement of people over the ten-year period both in and out of the
parish and this reinforces Ravenstein’s (1885) position on streams and counter
streams of migration.
1871 Movers 1881Pop Total 400 421 H’hold Total 85 87 Leavers, Individual. 109 Leavers, Families 21 Incomers, Individual. 34 Incomers, Families 33
Table 7.21 In and Out Migration 1871-81: Parish of Little Hereford
Despite there being significantly more individual leavers (109) than individual
incomers (34) over the period the total population grew rather than declined. The
increased number of families may have compensated for this in 1881 though
differential births and deaths may have also played a part. Significantly these data do
show the extent of gross movement even though the net change was only a gain of
two households but the gross movement, both in and out, was 143 individuals and 54
families. What this turnover meant in terms of community cohesion can only be
speculated upon but it may well reinforce the importance of the role of core families
in providing stability to the local community.
In addition it was possible to locate the 1881 residence of all those living in the UK
who had been born in Little Hereford. This calculation was achieved using the search
mechanism in the 1881 census as explained previously.
3 The census enumerators books classify by household but the precise location of them is not always identifiable. The reconstruction was done on the basis of families in 1995.
185

Distance from Little Hereford %
Up to 5 Miles 26 6 – 10 Miles 8 11 – 15 Miles 5 16 – 20 Miles 3 Over 20 Miles 16 Remained in Little Hereford 40
Table 7.22 Location in 1881 of those born in Parish of Little Hereford
Table 7.22 shows the distance from the parish that the movers had gone. In 1881 there
were 391 people living in the UK who had been born in Little Hereford. Of these 157
(40%) were still living in the parish so more had left than remained. Table 7.21
shows the distance the remaining 234, or 60% of those born in the parish, had moved.
This suggests that leavers either went a short distance of less than 5 miles, roughly the
neighbourhood area, or they went a significant distance of over 20 miles. Of course,
these data do not take account of those who had left the country entirely as emigrants.
The characteristics of the movers or precisely what sort of location they went to was
not revealed. There may also be differences between the characteristics of individual
movers and family movers. For an individual to migrate is a normal matter since
people leave home, to release space in a crowded household, to gain employment or
to get married. People live in households and they usually live in a nuclear family
but for a whole family to move is a matter affecting all in the household.
7.8.2 Incomers
Comparison of the CEBs for 1871 and 1881 yielded information on individual and
family movers and provided the data summarised in Table 7.23. Not surprisingly the
major difference between individual movers and family movers was their age;
individuals were overwhelmingly young, and they were inclined to move over a
longer distance and 85% were either labourers or domestics. Incomers, both
individuals and families, tended to have moved from another rural area. A significant
minority had moved from small market towns but, as noted in Chapter 6, since these
towns tended to behave similarly to the countryside the distinction may not be a real
one. The figure of 12% incoming farming families confirms the view that there was
mobility among tenant farmers.
186

INCOMERS 1871 - 1881 Individuals Families
Number 34 33 Mean Age 26.2 41 (Head of HH) Employment
Labourer 50% 55% Skilled 21% 27% Farmer - 12% Professional - 6% Domestic 35% - Distance Moved Neighbourhood Area 38% 36% Up to 20 Miles 32% 45% Over 20 Miles 24% 15% Previous Residence Rural 62% 67% Urban 21% 30% N/K 18% 3% Mean HH Size 4.6 persons Range 2 – 13 persons
Table 7.23 Incomers 1871 –1881, Parish of Little Hereford
There is though a problem with these data on in-migration because they were based
on place of birth information and this may be misleading since there may have been
several moves since birth. For families with young children it was possible to have
slightly more confidence since the place of birth of the youngest child may give a
reasonable expectation of where the family last lived. Indeed for families with several
children it is possible to track the family movements. Not all families have children at
home though so some of the data were not entirely reliable and consistent but none
the less probably give the best estimate of the movement of people.
7.8.3 Leavers
For an analysis of the leavers, both individuals and families that left Little Hereford
between 1871 and 1881 were identified. Determination of their precise location in
1881 was possible due to the search mechanism built into the CD Rom version by the
Mormons. However, it was difficult to tell precisely, in the ten-year interval, when
the movement actually took place, and how often movement took place during the
intercensal period. The same reservations about this form of tracking apply here as
with incomers.
187

After 1871, 119 left Little Hereford as individuals.4 The location in 1881 of 63 of
these was traced and it is likely that at least a further 10 were deceased by 1881. This
leaves 46 or 39% unaccounted for, a very high proportion. It is difficult to know why
but it is almost certainly to do with difficulties with the census material. Some people
will have died, some will, for whatever reason, not have been enumerated, some will
have married and where there was a change of surname it is very difficult to trace
them unless they have an uncommon first name. Some, of course, will have left the
country because the late 19th century was a time of high emigration (Baines 1985).
There is always the problem of incorrect or ambiguous information having been
recorded and, of course, the perennial issue of deciphering the handwriting. Finally, it
is the case that families are easier to trace than individuals, because the numbers of
people in a family provide more clues and, therefore, the success rate in tracing them
is rather better.
LEAVERS 1871-1881 Rural Urban Total
Neighbourhood Area 29% 11% 40% Up to 20 Miles 19% 14% 33% Over 20 Miles 5% 22% 27% Total 52% 48%
Table 7.24 Distribution of Individual Leavers,
Parish of Little Hereford, 1871 - 1881
Table 7.24 shows the location and distance moved of those individuals who were
traceable. Consistent with previous findings the largest group, 40%, moved within the
Neighbourhood so, perhaps slightly surprisingly in view of previous evidence, only
52% of leavers remained in this rural area whilst 48% went to a town. Those who
travelled farthest tended to go to towns. The mean age in1871 of those leavers who
could be traced was young, 21 years. In turn 21% of individual leavers formed new
households, 33% joined different households but 34% remained unidentified. This
detail of individuals migration confirms much that is already known about movement
in the countryside during the late 19th and early 20th centuries (Saville 1957; Pooley
and Turnbull 1998).
4 It should be noted that in addition there were also 113 persons contained in migrating families so in the ten-year period 232, out of a total 1871 population of 400, moved.
188

In order to illustrate at the micro scale the complexity of the migration process during
the 19th century some examples of individuals, identified in the census, from Little
Hereford will now be briefly discussed.
There are different types of household that movers may join. Some join households
headed by one of their children, as is the case of Mary Bloom, aged 71 in 1871, but in
1881 lived with her son in adjacent Ashford Carbonel. Some lived in as employees
because this system still prevailed in the area. So, Henry Hill, aged 8 in 1871 by
1881 was living-in at Leysters and Thomas Maund, 16 in 1881, was in Greete.
Distinct from living-in was lodging and Joseph Maund, a groom, was a lodger in far
away County Durham. The young wage earner from a labouring family had to leave
home because of cramped conditions in a situation where the workers still had large
families. For example, Thomas Maund was one of ten children born in a one up and
one down dwelling (See Chapter 8). There was however, a slightly different pattern to
female living-in probably due to the fact they were mainly employed as domestics.
For example, Catherine Brown, a daughter of a blacksmith and 22 years of age, was a
cook in Hampstead and Elizabeth and Mary Rowbury were servants at a boarding
school in Sale. Interestingly eleven of the 14 women domestics moved to a town
whereas only 6 of 14 males went to towns.
7.8.3 Families leaving after 1871
Table 7.24 is an edited extract from the Excel data base described in Section 7.2.
This shows some of the data which went towards the calculations of the
characteristics of moving families in Table 7.2. There are clearly omissions of some
data and classifications and those shown are particularly suitable for the detailed
descriptions attempted here. Thus two columns not included in the analysis earlier are
those relating to the precise occupation of the Head of Household and the precise
location in 1881. The ‘previous moves’ column is speculative since it was based
upon the birthplace of children recorded in the census of 1871. These data not only
yield more detailed information but also illustrate some of the difficulties with using
the 1881 census so, for example, the final row contains a Sarah Goldmark who in
1871 was the 37 year old widowed school teacher living with her 14 year old son,
Arthur J. Despite the distinctive name neither of them could be traced in 1881.
189

Table 7.25 Summary of Families leaving Little Hereford, 1871-1881
There are three possibilities; they had emigrated, they had not been enumerated or
they had both died. The latter is possible because the next year, 1872, there was an
outbreak of diphtheria in the parish and several young children died.
William Bayliss was a son of Thomas Bayliss, a tenant farmer and one of the core
families to be discussed in Chapter 8. He had become a carpenter and appears to have
returned to his birthplace in Brimfield to marry and his son was born there. But in the
CEB the birthplace is given as Wyson. Only someone who knew the area would
know that Wyson is part of Brimfield.
Charles Child, a farm labourer, was born along with his wife in Middleton on the Hill,
a neighbouring parish. His eldest son was born in Leominster and his next three
children in Bromley, given in the CEB as Herefordshire, in fact it was Shropshire near
to Bridgenorth. The youngest child was 10 months when the 1871 census was taken
and she had been born in Little Hereford. The youngest son was 4 and born in
Family
Occupation, Head of Household
Age, Head of Household
Number in Household
Number of Dependent Children
Distance Moved Location
Previous Moves
Mary Bloom Lau 71 4 0 2 Ash. Carb. 1
Ed Cadmore Lab 48 2 0 3 Whitton 3
Wm Moss Lab 44 8 6 2 Tenbury 1
J.Johnson Lab 43 3 1 8 H.Child 2
C.Corbett Lab 51 6 4 nk NK 4
Rich Faulkener Lab 28 6 1 6 Milsom 3
Sav Bradford Lab 55 4 0 1 Upton 3
Thos Pritchard Wheelwr 64 6 4 2 Tenbury 3
John Jones Farmer 72 6 0 nk NK nk
Thos Jones Farmer 43 3 1 12 Diddlebury 3
Wm Hotchkiss Gardener 40 2 0 4 Ludlow 2
Chas Child Waggoner 38 6 2 2 M.o.H 3
Wm Bayliss Carp 50 4 2 1 Burford 3
Rich Millichap Lab 30 6 4 2 Tenbury 3
John Griffiths Gkeeper 50 10 3 24 Condover 3
Martha Maund Lab 51 2 0 2 Ash. Carb. 4
R.Price nk 42 2 0 nk NK 1
Froggatt Farmer 31 2 0 nk NK 1
Geo Hackett L.Agent 58 5 0 nk NK 3
E.Stephens nk 68 2 0 nk NK 1
Goldmark Teacher 37 2 1 nk NK 1
190

Bromley so between 1867 and 1871 they had moved to Little Hereford. By 1881 they
were in Middleton on the Hill, returning to their birthplace. There is clearly a
migration story in this family which is far more than a number in a census. But it is
by this type of examination that the data in the ‘previous moves’ column of Figure
7.25 has been obtained.
John Griffiths was a 50 year old game keeper in 1871. He could not be traced.
Eventually, via the names and ages of his sons, his wife was found and it became
clear that John had died and that his wife had remarried and in 1881 was living in
Condover which is about six miles south of Shrewsbury. Much more difficult was the
case of John Jones, aged 72 years, a tenant farmer of 196 acres and, therefore, quite
well to do. In 1871 he had a household of six none of whom was related to him. By
1881 he would have been 82. Moreover his birth place was simply recorded as
Herefordshire. Alas he proved impossible to trace and, therefore, had to be assumed
deceased.
7.9 Summary and Conclusion The neighbourhood of Little Hereford is not seen as a microcosm or sample of the
countryside: it is an area defined by the interactions of the people of Little Hereford.
None the less there is no reason to suppose that the findings are unique or that they
are substantially different from what might be found generally in the Mid Borderland.
This is based upon the view that each parish had a neighbourhood and that a mosaic
of these made up a region.
It is certainly clear that a high proportion of families moved in the neighbourhood of
Little Hereford in the latter part of the 19th century. But among these and despite the
absolute loss of population in the two counties there is no evidence to support a major
move from the countryside and certainly not to the town. It is now known that towns
grew much more from natural increase (Wrigley and Schofield,1981) than from
migration and the relationship of migration to transport development is uncertain,
especially the railways since they were used to carry goods in the main and it was
later, around the turn of the century, before the cheap trains made an impact in terms
of passenger movement (Reeves c1970).
191

There is certainly evidence in support of Saville (1957) who maintained that gross
movement was very much greater than net movement and this is supported from both
the Little Hereford study and the analysis of the migrating families. There does
appear to be a relationship with parish size and migration where large parishes lost
proportionately fewer migrants but may be compensated for by in-migration as the
Little Hereford study tended to show. Significantly much of the movement was short
distance and was to places that were similar to the ones that were left. This has
implications for the maintenance of local culture. This seems consistent with some of
the evidence in Chapter 5 about the culture in the Mid Borderland and generally that
if there was change then it was slow. It is tempting to conclude that family migration
did not contribute significantly to population loss in the countryside
The short distance movement supports a similar finding by Ravenstein but it does
seem also to conform to the type of rural circulation described by Pooley and Turnbull
(1998). They found that many moves were over short distances; indeed more than
50% of them were less than 10 kilometres. This is roughly an extended
Neighbourhood in the terms used here and the largest single group moved less than 1
kilometre. This is entirely consistent with the findings outlined above. The repeated
evidence for the distance moved seems compelling. Because of the size of their
database Pooley and Turnbull (1998) were able to distinguish these distance data on
age and occupation criteria. So, for example, the age group 40 to 59 moved shorter
distances and farmers moved further than farm workers. Interestingly these too had a
higher mean than the mode showing a similar variability to those found in this study.
It also suggests that movement within a five-mile radius may lend some further
substance to the notion of a locality around each parish. The neighbourhood may be
quite a dominant social feature for the meeting of three counties and their boundaries
appear to have no significance at all in family migration.
People moving within or near to the locality may suggest the power or at least
influence of place upon decisions It does raise the point as to whether this very short
distance move is migration at all. Perhaps migration could be defined as more than a
mere change of residence but rather as one out of an area, out of the cultural space, to
a different way of life. This would raise a different set of questions and sharply
focuses on decision, motivation and knowledge similar to those raised by Baines
192

(1985) in his study of emigration. It also raises questions about core families for it
appears perfectly possible for a core family to move residence but not way of life or
social contacts. Thus a core family could be one associated with the particular
Neighbourhood rather than a single parish.
This enquiry is more specific than that of Pooley and Turnbull (1998) and in
consequence the findings are much less clear cut. Even where there appears to be a
pattern to migrating families there are many which do not follow that pattern
suggesting a different dynamic at work which may be lost in larger scale enquiries.
More generally it can be seen that a whole range of people migrated, from labourers
to land agents and of a variety of ages.
The above brief commentary gives some insight into the detail which attaches to
migration of individual families. It can not be known what motivation existed or why
certain places were chosen, if indeed they were chosen. What contacts were there?
What information was held? These questions may only be addressed through an
enquiry at a different scale and this will be the substance of the next two chapters.
193

Chapter 8
The Decision to Move 8.1 Introduction In the previous chapter it was established that the pattern of movement in the
Neighbourhood of Little Hereford was far from clear in 1881. Although these
movements took place in the context of national population trends (Chapter 6) and
significant associated social change, this was not obvious at this local scale. Saville
(1957) had assumed major economic forces, of both a push and a pull form, for the
depopulation of the countryside during the second half of the 19th century. On the
one hand, he saw the pull of major urban centres with their demand for labour,
generated by the developing industries and, on the other, the general dissatisfaction
with conditions in the countryside both in terms of income and housing. These macro
urban-industrial factors can only provide the context within which decisions are
made; there must be other processes at work at an individual level providing a motive
for the movements which were made. To apply general causes to particular events or
circumstances is to commit the ecological fallacy (Robinson 1950; Walmsley and
Lewis 1997). Because of the difficulty in offering explanation for the findings in
Chapter 7 the investigation now moves quite specifically, in this chapter and the
succeeding one, to an examination of the influences bearing upon individual family
decision.
So far a number of propositions have been raised which are important in informing
the remainder of this enquiry.
1. Within a region particular ways of life emerge from the interaction
between agency and structure. 2. Inhabitants of such an area may develop a personal, emotional,
identification and attachment to that place and its ways of life. 3. Only at the micro level, even individual level, can the processes of
migration decision-making be identified.
The purpose of this chapter is to trace the movement of three families, resident in
Little Hereford in 19th century, from their earliest record to the present. This is a
longitudinal analysis to give a view of longer term movement. The first section is
devoted to a more detailed exposition of the approach and this will be followed by an
194

account of the three core families from which the source material for the later analysis
arises.
8.2 Sources and Methods The general approach, methods and sources for this chapter were discussed in Chapter
3 (See Figure 3.4) and the sequencing of it is indicated in Figure 3.5. The major
sources are the family trees of three core families. The sources for the construction of
family trees have been discussed elsewhere in this study but it is important to make a
distinction between genealogy which can produce a family tree from these sources
and family history which is a much broader concept. Unfortunately these two
concepts, in common use, appear to be used interchangeably but true family history is
the interface between genealogy and local history. A family tree is constructed from
the basic data of birth, marriage and death together with the recorded names of
parents, employment and place and date at which the event took place (Pelling 1995).
Family history on the other hand, will give not only the historical context in which the
event took place but also detail about the personal lives of those involved (Camp
1996). This chapter, following three families, is essentially based in genealogy but set
against the background of the Mid Borderland as described in Chapter 5 and its main
population trends (Chapter 6). Some of the historical context of Little Hereford in 19th
century will be included where appropriate.
Using these data to trace the location and movement of three families for the entirety
of their record constitutes a form of longitudinal study of migration. There have been
calls for such an approach notably from Champion and Fielding (1992) and Grundy
(1992). Later Pryce (2000) linked this call to the suggestion of the use of life histories
and biographical information. This call was not new for it had been made earlier by
Hagerstrand (1982). Pooley and Turnbull (1998) exploited the potential of what they
termed family history in their large scale study of migration since the 18th century.
The data they used, from family history societies, amounted to over 16,000
individuals and the statistical manipulation resulted in a contribution to the
understanding of changing regional patterns of migration at an aggregated level.
Inevitably in such a study there was a significant loss of individual and local detail
and an absence of evidence on decision and the process of migration. Therefore, this
195

chapter differs markedly from the study of Pooley and Turnbull (1998) in that the
focus is upon the individual migrant families and their decision-making context over
time. However the notion of a longitudinal study used here needs a degree of
qualification. The data from the three families do not constitute a continuous flow,
rather they are points in time when an event took place for which there is a record of
location and time.
There are very few studies which employ a longitudinal approach to individual data
despite its undoubted advantages in a study of migration process and decision making
(Lewis 1982, Glasser 2002). Shyrock and Larnmon (1965) offered five advantages
stemming from such an approach, namely; study of development over time,
identification of different areas moved to, identification of the extent of circular and
return migration, identification of the proportion who stay and the study of frequency
of moves by individuals. Clearly, these advantages are generalisations and based
upon the assumption of an aggregated rather than individualised study.
Longitudinal studies do offer an opportunity to develop an important additional
concept to the understanding of migration, namely life cycle. Thus Rossi (1955)
suggested reasons for mobility; formation of a new household, mortality, household
dissolution and work. Something of this idea was utilised in the previous chapter
where the notion of a family cycle was introduced in an attempt to identify pattern.
The results there were not altogether clear since a majority of families movements did
not conform to a simple life cycle pattern. However, this has to been seen against a
longitudinal scale of only ten years and a relatively small data base. More recently
Boyle et al. (1998) used the idea to identify phases of movement which they maintain
have remained stable over time, namely, high mobility after birth, a trough between 3
and 13 years, peak movement between 17 and 30 years followed by declining
movement to the mid 50s. Once again such conclusions imply the use of data at the
macro level. Warnes (1992) on the other hand urged that life cycle be replaced by
studies of life courses arguing that life cycle was static and tended to predetermine
outcomes. Life course on the other hand offered the opportunity to study individuals
rather than attempt to classify them. After all it may well be the case that several
families move to similar places at similar times and at similar points in the family
cycle but underlying this may be very different decision processes, choices and
196

constraints. This seems an approach well suited to the purposes of a longitudinal
micro study but requiring quite focussed data. It is one used extensively in the next
chapter and introduced where data permits here.
A recent investigation by Glasser (2002) adopted a longitudinal approach allied to the
concept of life course rather than life cycle and offered a quite extensive review of the
available literature and pointed to the paucity of data for such approaches. This
chapter utilises the concepts of longitudinal, life cycle and, to a lesser extent, life
course as a framework. Within this framework the use of the three families attempts
to redress the problem of the paucity of data. Clearly this is subject to the
qualifications and reservations expressed above but never the less is attempted as a
possible way forward in the understanding of migration process.
Data from three families, all resident in Little Hereford in 19th century, are used to
plot their movements from the point at which data are available, and certainly from
the end of the 18th century, to the present. Each of these data sources arose from the
different motivations of the compilers and therefore involved different perspectives.
This does not inhibit their use in any way although there are disadvantages of this
form of longitudinal approach. It is certainly the case that the linear progression is
intermittent, that is, each location is dependent upon a recordable event such as place
of birth. If moves are made between events then their precise moment can not be
determined and it is possible for more than one move to be made which was not
recorded and therefore unknown. It is only when there is direct evidence in the form
of individual testimony that this disadvantage can be overcome. Of course, with only
documentary sources available, the reasons behind a particular move can only be
speculated upon but the pattern of movement made by the three families can be
compared with each other and also with known patterns of movement. Fielding (1992
p201) proposed that, “moving is a statement of an individuals view and values”. This
chapter offers some test of this proposition, here the type of evidence available may
be too fragmentary but in Chapter 9 it will be an essential consideration.
197

8.3 Core Families From the discussion in Chapter 4 it can be seen that there is no clearly agreed
definition of a core family but any definition certainly involves length of residence
over at least three generations. In Little Hereford, from 1841 to 1901, seven families
were identified that were present throughout the entire 60-year period of the available
CEBs. Of these there were three well-worked family trees available which provided
an indication of the location of these families both before and after these dates and
these were used for the analysis that follows. This was the work of Polly Rubery in
her One Name Study of the Rowburys; Chris Davies’s research into his immediate
family of Bennetts and Gary Maund who contributed to the Maund family tree.
Core families may not have stayed as long as many have thought, for example, it is
perhaps significant that families that appeared in the Little Hereford Church Kneeling
Register of 1722 had all left the Parish by the census of 1841 (H.C.R.O. AB24/3).
Even core families therefore appear to be essentially temporary but on a longer time
scale. But, of course, they may have stayed within the neighbourhood. Table 8.1
summarises basic information about the seven Little Hereford core families.
Family Arrival LH Previous Residence Place of Birth of Marriage Partners
Froggett C1831 Ashford Bowdler Stanton Lacy/Cleobury Mortimer
Bayliss C1833 Eye Orleton /Wigmore
Arnett C1835 Middlesex Richards Castle/Brimfield
Maund, J. C1828 Family formed Brimfield/Little Hereford
Maund, W. C1783 Brimfield Brimfield/Brimfield
Rowbury C1809 Family formed Thornbury/Little Hereford
Bennett C1786 Ashford Carbonel N/K
Table 8.1 Core Families of Little Hereford.
A number of points arise from Table 8.1 which reinforces the findings in Chapter 7.
With the exception of the Arnetts, movement was local, indeed within the inner
parishes of the Neighbourhood. But even the Arnetts, who moved from Middlesex,
originated locally. The places of birth were either in the neighbourhood or close to
the extended neighbourhood. This reinforces the idea that core families were more
identified as locality specific rather than parish specific. The origins of Gregory
198

Bennett and his wife, who moved to Little Hereford from Ashford Carbonel, remain
unknown and illustrate a gap in family genealogical data. Another problem is the
uncertainty of arrival dates that have to be estimated from the date and place of birth
of children and, in the case of John Maund and John Rowbury, from the marriage date
although both may have been resident in the parish at the time.
Of the seven core families the shortest period of residence was the sixty-six years of
the Arnetts. Three of the families were farmers, tenants of the Lord of the Manor.
The first of these farmers to arrive were the Froggetts, around 1831, from the adjacent
parish of Ashford Bowdler although the married couple had been born in Stanton
Lacy and Cleobury Mortimer (just beyond the neighbourhood). They took up
residence at a farm, large for the area at 280 acres, Upper House, Middleton. A few
years later Thomas Bayliss arrived at the 160-acre Middleton Farm from nearby Eye.
Thomas was born in Orleton, in the neighbourhood, and his wife in Wigmore adjacent
and to the west of the neighbourhood. Finally, the Arnetts arrived in about 1835,
surprisingly from Middlesex although they had been born in Richards Castle and
Brimfield respectively. They took up Temple Farm of 110 acres. All three families
came at a time when national farming conditions were difficult and, locally, before
the drainage of the heavy soils of the Middleton district of the parish had began, and a
few years before the sale of Easton Court estate to the Baileys.
The other core families were all labourers or of labouring origin. These families
were the Bennetts, the Rowburys and the two families of Maunds. For the family of
John and Mary Maund there are no extensive family trees available save some
knowledge that the next generation moved west to Leintwardine and that some of
their ancestors now live in Texas, U.S.A. For the other three families there is
extensive but not entirely directly comparable information.
The three families to be investigated in detail were chosen solely because the data
from their family history are available. Much of family history tends to follow the
male line and, because of this, some of the story of core families may be lost. For
example, John Maund of Brimfield, in 1828 married Mary Roberts of Little Hereford
and the Roberts family had been long time resident there, certainly since the late 18th
century. Elizabeth Rowbury too was a Roberts and she was born in Little Hereford in
199

1782 and was probably the Aunt of Mary Maund. As well as illustrating the problem
of the use of the male line in defining core families this also shows the complexity of
core families and indicates something of the power of the interrelationships and
kinship networks that existed at the time. So, in terms of social cohesion and the
development of ways of life and culture, it may be that labouring classes had an
influence in addition to that of the few powerful dynastic families which are better
recorded. Certainly there was movement but it was local and may not have affected
cohesion; indeed it could have been an element which bound the locality together.
This is an area which may well repay investigation even to modern times. Housing
availability may have been a key element in migration since labourers in particular
were dependent upon the availability of accommodation (Chapter 5). It may have
determined, to an extent, the date of marriage and, almost certainly, the jobs that were
taken frequently depended upon the availability of tied cottages (Laslett1968; Mingay
1976).
All three families examined here, and that of John and Mary Maund, lived in the
same row of houses and these, unusually, were not tied. This is discussed in some
detail because of its possible significance as a factor in the decision to stay or migrate.
To re-emphasise, no other labouring family stayed in Little Hereford for as much as
three generations and it therefore seems reasonable to consider the characteristics of
this location as a factor in the migration process.
8.3.1 Bedlam – A Privileged Location?
The location of Bedlam Row is labelled in Figure 8.1. Until 1800 it was on the edge
of the then Bleathwood Common and the farms of the three core farming families are
shown in red to the west of Bedlam Row. Bedlam Row was a rectangular shaped
piece of land of little less than two acres and designated as “Poor Land” in the 1846
Tithe Survey. Moir (1990) maintained that it housed squatters’ cottages but the truth
is rather more complex. It was land given in 1748 by the then Lord of the Manor,
William Dansey, “ to the Minister, Church Warden and Overseer , in order for the
parishioners to erect houses upon for the use of the Poor of the aforesaid parish, or to
make use of as they think proper” ( H.C.R.O., OS 367).
200

Figure 8.1 Parish of Little Hereford – Location of Core Families
This was not quite the act of benevolence that it appears for in fact it was a deal by
Dansey to exchange land controlled by the Vestry for what was to be Bedlam Row.
The name Bedlam came from a charity set up by an unknown donor for the relief of
the poor. The Little Hereford Manor had come into the hands of the Dansey family in
the late 16th century through marriage into the Delamere family (H.C.R.O. A95/18).
They came permanently to Little Hereford when they sold their main estate, Brinsop
Court, just to the north of Hereford for £4,000 in order to pay off debts in 1743.
Dansey sponsored the Bill to enclose Bleathwood Common (H.C.R.O AB 24/3) that
went ahead despite appeals in 1799. This of course was at a time of high wheat prices
associated with the Napoleonic Wars. In 1799 the price of Herefordshire wheat
reached 98% of the national price (Parker 1979). Dansey also embarked on the
layout of the Park and the building of Easton Court. By 1841 they had sold the entire
201

Manor to Sir Richard Bailey, a family of South Wales iron masters, and moved to a
smaller property some six miles away.
This brief reference to the Danseys is given for two reasons. Firstly, it illustrates the
point made in Chapter 5 about the demise of some of the older landed families and the
take over by the new ‘moneys’ of commerce and industry. This was to have an effect,
eventually, on the inhabitants of the Poor Land. Secondly, the maintenance of
Figure 8.2 Bedlam Row (from 1846 Tithe Map)
the Bedlam Row houses, up to sixteen at one point, for the Poor Land may well have
acted as a draw for some families to move to Bedlam Row. It may therefore be an
explanation for the occurrence of Core Families of labourers located here but nowhere
else in the parish.
Figure 8.2 is an enlargement of a part of the Tithe Map and shows the immediate
location and layout of Bedlam Row (H.C.R.O., OS 367). It can be seen that the Row was
originally on the northern edge of the Common; hence Moir’s (1990) assumption of
squatters’ cottages. Immediately to the west were five small plots or gardens that went
with the houses. Such plots would be a significant advantage in terms of the standard
202
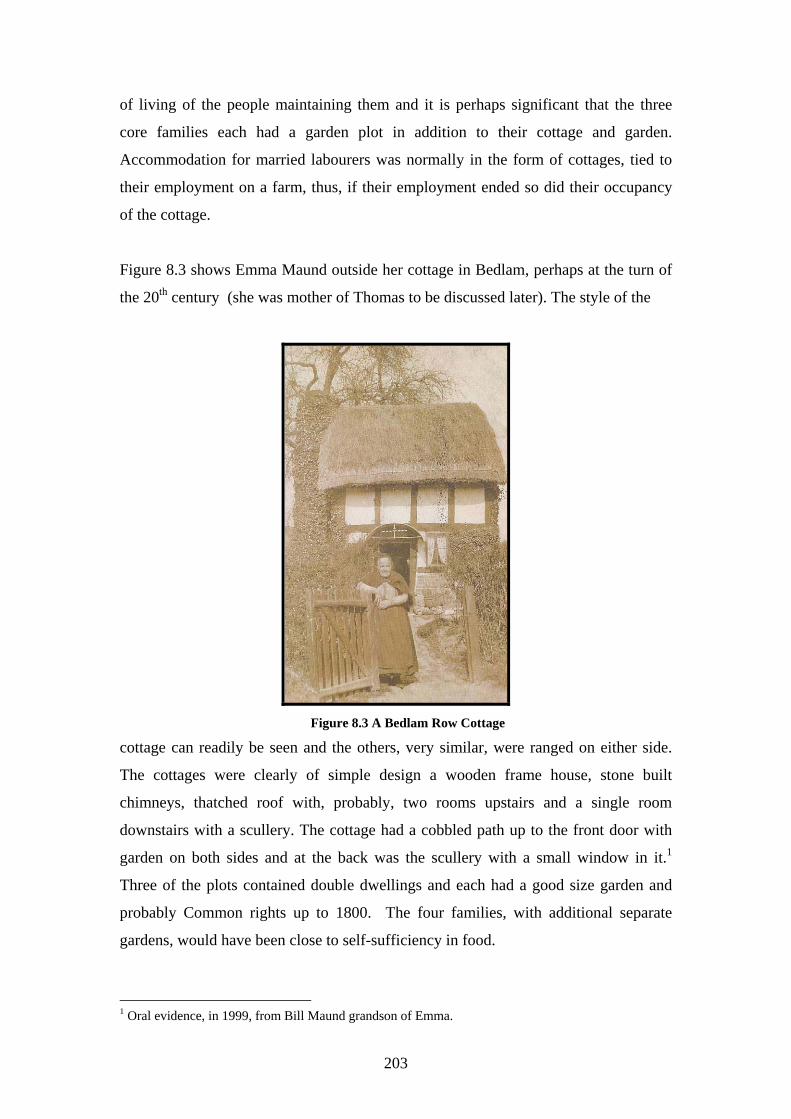
of living of the people maintaining them and it is perhaps significant that the three
core families each had a garden plot in addition to their cottage and garden.
Accommodation for married labourers was normally in the form of cottages, tied to
their employment on a farm, thus, if their employment ended so did their occupancy
of the cottage.
Figure 8.3 shows Emma Maund outside her cottage in Bedlam, perhaps at the turn of
the 20th century (she was mother of Thomas to be discussed later). The style of the
Figure 8.3 A Bedlam Row Cottage
cottage can readily be seen and the others, very similar, were ranged on either side.
The cottages were clearly of simple design a wooden frame house, stone built
chimneys, thatched roof with, probably, two rooms upstairs and a single room
downstairs with a scullery. The cottage had a cobbled path up to the front door with
garden on both sides and at the back was the scullery with a small window in it.1
Three of the plots contained double dwellings and each had a good size garden and
probably Common rights up to 1800. The four families, with additional separate
gardens, would have been close to self-sufficiency in food.
1 Oral evidence, in 1999, from Bill Maund grandson of Emma.
203

Housing policy is an important factor in the range of factors that interact with the
migration decision. The late 19th century was a major period of economic
restructuring not unlike, in some respects, the late 20th century. For example, Munro
(1992) has pointed out that the housing system is a key barrier to the mobility of
labour. However, Forest and Murie (1992) have argued that the influence of housing
on migration can be overemphasised, it being normally of secondary importance,
certainly in the late 20th century which may imply a decision with more choice than
constraint. Comparisons between the late 19th century and the late 20th century can be
taken too far as Green (1992 p105) has pointed out, “… migration is a dynamic
process which changes through time as it responds to evolving economic, social and
political environments in which it occurs.”
But the inhabitants of Bedlam Row were embedded in the culture and ways of life of
their place and time. To make judgements about their attitudes and behaviour based
in a value system of a different place and time would be misleading and probably
erroneous. At best it can be said that to have the opportunity to live in secure
accommodation, however poor, was itself a major advantage not to be given up
lightly. Moreover there was also the opportunity for succeeding generations to
occupy the same property something that otherwise only ownership might bring.
This arrangement of houses for the Poor came to an end in 1876 when Sir Joseph
Bailey of Easton Court bought the entire row of houses from the Bedlam Charity for
£152 as well as all of the legal costs. The sum was then invested and to be used in
support of the Poor where the Poor Law arrangement would not otherwise help.
There was protest from some occupiers of the properties, “from not having paid rent
appear to hold an opinion of their own right to continue possession” (H.C.R.O. T19
33). There was a court case, inspired by the residents, it was lost and so they had no
alternative but to pay rent for the first time. This was to be 6d per year and 5/- per
year for garden rent. Thus, the entire basis upon which the residents occupied Bedlam
was changed as illustrated in Figure 8.4. The symbolism of the legalistic language is
clear and carried with it all the rights of the landlord leading to an entirely different
set of circumstances for the residents. They were no longer in a significantly better
position than any other tenant and this after 100 years or more of ‘free’ occupancy.
204

Figure 8.4 Bedlam Row: Notice to Quit
The foregoing has given some of the direct circumstances of the residents of Bedlam
Row. They enjoyed a degree of independence and they were not subservient; John
Watts threw his notice to quit at the feet of the bailiff who served it (H.C.R.O., T19 33).
It also provides some evidence of social cohesion and interrelationship in that they
acted together in protest. Perhaps residence in such property bred confidence and a
form of mini culture. Precisely what influence this had upon decisions to move or
stay though can only be speculative. It may be reasonable though to suppose that the
changed terms of the housing contract would have an influence upon the decision to
stay or not, certainly for the next generation of the core families. To what extent such
change was related to the changed circumstances of the tenancy and to what extent it
was related to other, broader, societal changes is impossible to determine but it is
illustrative of the very complex factors surrounding the decision to migrate. The next
section of this analysis will look in some detail at the movements of each of the three
core families.
205

8.4 The Movements of the Core Families 8.4.1 Introduction
Because of the detailed genealogy of the core families it is possible to trace each of
them before they came to Little Hereford and indeed, in the case of the Rowburys
they have been traced back to 1550. Thus there is a long time scale to the study of the
movement of these families. They were all local families too so there is a case to state
that they were core families of the locality for up to 400 years. This differs from the
core families identified by local historians, (Hey 1974; Metson 1993) who tended to
be better off families for whom written records existed. By contrast, this study using
family history data, shows a localisation of poorer people, labourers. If this
localisation is taken together with evidence for a rural circulation (Pooley and
Turnbull 1998) then it may well be that the poorer people had a bigger impact on the
locality, an understated and unheralded culture and ways of life hitherto unconsidered.
Certainly, in Little Hereford it appears that there was a localisation of poor people
who were involved in short distance moves in families and it was not until the 20th
century that these core families moved significantly away from their area of origin.
Genealogical trees are complex and not always easy to interpret. They show, where
this has been possible to trace, place of birth, marriage and death and the migration
paths described below are based on these data. If, in each generation, as a family
disperses each branch were to be followed then it would very rapidly become so
complex as to be unmanageable. Therefore only one branch of a family will be
followed.
It is important at this point to make clear some of the decisions which have been made
with regard to the use of the family trees of the three core families and the manner in
which the resultant data have been presented. Firstly, the trees were constructed by
different people at different times for different purposes. The Bennett tree was
devised by a member of that family from curiosity about his origins and relates only
to the very narrow branch of the family to which he belongs. The Rowburys, on the
other hand, are a part of a vast data collection about all who bear that name and
conducted by a person with great knowledge and skill of family genealogy. Finally,
the work on the Maunds, particularly in the 19th and 20th centuries, was conducted by
206

the researcher as a project to satisfy family curiosity surrounding stories which had
been handed down. Thus, although there are major similarities in the structure of the
trees there are also differences in the amount of information they contain, particularly
in regard to their breadth at any one generation. The Rowburys have great breadth
and so the paths of all those from Little Hereford in the 19th century are known but
this is not the case with either the Bennetts or the Maunds. However, because of oral
evidence the knowledge of the branch of the Maunds in the 20th century is virtually
complete. This raises at least two issues, the question of definition of core family and
also of comparability. For the former, residence of at least part of the family in Little
Hereford from before the CEB of 1841 and present in that of 1901 is taken as the
definition. This amounts to a minimum of three generations although this does not
necessarily include the branch tracked. For example, as will be shown, Thomas
Maund left Little Hereford around 1889 and Joseph Bennett as early as 1850 but their
families remained. Clearly this is an issue arising from family dispersal for even core
families disperse.
The great complexity of family trees and their interpretation for purpose of migration
studies gives rise to some difficulty of comparability, particularly with presentation of
data. For the purposes of this study the decision of which branch to follow was, in the
case of the Bennetts, pre-empted by the availability of data and for the Rowburys by
that branch which had survived to the present. For the Maunds, because of the focus
in the next chapter, Chapter 9, the whole of the family of Thomas E. Maund was
followed throughout the 20th century. In these circumstances presentation poses some
problems with regard to sequencing and chronology but more particularly with the
use of life cycle as a framework. A difficulty is to find a balance between clarity of
description and repetition and here, in the interests of clarity the decision was taken to
tolerate a degree of overlap. So, similar diagrams were constructed, for each family,
but which contained a degree of overlap in order to manage the data necessary for the
analysis. These diagrams are explained as part of the analysis.
Each family is examined in turn and, in so far as it is possible, the same procedures
are adopted for each. First, the analysis begins with an overview of the time scale and
historical context of all three families up to the end of the 19th century. This arises
from the detail provided in Chapters 5 and 6. Thereafter, for each family the study
207

begins with a discrete generation by generation analysis to give some indication of the
significance of life cycle effects. This is followed by an examination of the directly
longitudinal features of each branch from each generation through to the present and
using the data already identified and described. Much of the detail of this longitudinal
description relies upon diagrammatic representation in order to reduce the complexity
and hopefully, enhance understanding.
8.4.2 The Core Families in Context
Table 8.2 attempts to show the three core families in the context of their location and
time and the conditions, both macro and micro, within which they lived. The location
and approximate time of movement of each family up to the end of the 19th century is
shown. Such a Table serves to illustrate problems with the use of family trees for
migration studies. As has already been indicated the time of migration was taken
from place of birth of children and, although frequently a good guide, it is none the
less imprecise and in the case of a couple without children only very approximate.
This Table is intended to give some indication of the location of the families in
relation to the demographic and historical events detailed in Chapters 5 and 6. Two
main points emerge from this. Firstly, for the two families where data go back to the
16th and 17th centuries there appears to be very little movement in that time, although
Clark (1987) maintains that in the early 17th century three quarters of rural population
moved at least once in their lifetime.
There were at least five generations of Rowburys in Thornbury extending well in
excess of two hundred years, apparently stemming from a single couple who were
married in 1575. However, since Richard Rowbury was born in 1550 it is reasonable
to suppose they were there before that date. The branch of the Maunds too go back as
far as the Parish Register in Brimfield will allow i.e. 1654. There were Maunds in that
parish before that date but they cannot be connected to the branch discussed here
because the record is so fragmented. In the Borderlands there were Maunds as far
back as records go, certainly to 1540 (chapter 9). In Brimfield this family too goes
back for at least five generations in that parish so they may be viewed as a core
family of the Region as well as the locality.
208

TIME LINE
GENERAL CONDITIONS
LOCATION of CORE FAMILIES
1550 1558 Accession Eliz I 1642 Civil War C1743 Danseys arrive. 1776American Independence 1800 Enclosure Bleathwood Common 1819 PeterlooMassacre 1830s 1841 Baileys Arrive 1848 Repeal, Corn Laws 1876 1901 Death Victoria
Significant population growth, stimulates agriculture and growth of Town Markets produces rural – urban exchange. Population 3 million in 1561 becomes 5 million in 1641. Very little vagrancy in Herefordshire. Commercial agriculture, high prices, wages low, soaring rents Slow down population. Growth, Towns decline, Plague loses virulence. Move across Atlantic, Late marriage controls population. Increased agricultural production. New farming methods, manuring, generous parish relief in Herefordshire and little male migration from Herefordshire. Low agricultural prices Turnpike system Slow rise in population Demographic Transition Poor Harvests, High prices, Swing Riots, little in Herefordshire. Bleathwood Common enclosed. Reform Acts, Franchise, Poor Law, Tithe Commutation High population growth, Urbanisation. High farming, land drainage. Bedlam Row sold Poor Harvests, emigration.
THORNBURY 1550 Richard Rowbury, BRIMFIELD C1650 Richard Maund ASHFORD CARBONEL 1783 Richard Bennett 1792 John Rowbury (1) in GREETE LITTLE HEREFORD C1783 Wm and Hannah Maund enter C1786 Bennetts enter C1809 John Rowbury (2) C1850 Joseph Bennett to Leintwardine C1889 Thomas Maund leaves LH
Table 8.2 The Early Moves of the Three Core Families in Context, 1550-1901.
209

The 17th and 18th centuries was a period of successful farming with increased
commercialisation and prosperity (Reeve 1970). It was also a period of steadily, but
not rapidly, growing population as the countryside recovered from the 14th century
Black Death. In the bad times the Poor Law was generous. So, generally, the need to
move was less obvious. Although there was movement nationally Clark (1987)
emphasised the dangers of suggesting macro level explanation for local events and
pointed to the regional variations that existed. He noted that, even in the 17th century,
six out of ten males had moved but a lesser proportion of them in the west. Most was
short distance, less than 10 miles. However, there was less movement in the 100 years
between 1650 and 1750 and there was a slight drop in population. Marriage was
delayed and the system of living-in was in full swing. Vagrancy in Herefordshire was
minimal being only 16 in the period 1598 to 1664 compared with over 300 for some
counties (Slack, 1987 p187). The evidence of Defoe (1971) quoted previously
suggests, in 1725, a vigorous and prosperous area of commercial farming suggesting
that amicable relationships and successful farming were conditions for developing a
relatively stable society in the Mid Borderland.
The second feature of note in Table 8.2 is that the three core families had only
migrated a short distance to Little Hereford. They had merely crossed the parish
boundary although the Rowburys had had a previous move from Thornbury. In fact,
the Rowburys came from just outside the extended neighbourhood of Little Hereford.
It is tempting to think that they came because of the availability of housing in Bedlam
Row. They all arrived around the turn of the 19th century, the Maunds about 1783,
John Rowbury joined Elizabeth Roberts in 1809, but her family was already there and
had been from at least 1782. The last to arrive was Richard Bennett but precisely
when is unknown, although he married Mary Uncles in Little Hereford in 1804.
Figure 8.5 shows the spatial dimension of the early migration to Little Hereford. The
inner circle denotes the neighbourhood, defined earlier, and the remnant of the outer
circle is the enhanced neighbourhood at seven miles. Certainly this early movement
210

Figure 8.5 Migration Routes of Core Families to 19th Century
of the families tends to confirm the definition of the neighbourhood made in Chapter
4. The analysis now turns to the detail of the movement of each core family. It has to
be acknowledged that the three trees are not strictly parallel because they do not all
begin at the same time.
8.4.3 The Bennetts
The data for the Bennett family go back to the 18th century and, as will be seen later,
are not so informative about early movement as that of the Rowburys and the
Maunds. However, the successive generations displayed in Table 8.3 illustrates the
essence of the existing data. Such life cycle factors that can be gained from the first
211

generation headed by Gregory showed that he married at the age of 32 and remained
in his home parish for six more years. He had three children in Ashford Carbonel (not
shown), one of whom died. He moved to Bedlam Row in the neighbouring parish
where he had nine more children and remained there for the rest of his life. Whether
he moved around in his earlier life can not be detected from the family tree but there
is the clear suggestion that this branch of the Bennetts had eleven children over a long
time scale, was localised and the head of the family married comparatively late to a
woman twelve years his junior.
The next generation remained in the locality but moved three times. Richard also
married young, at twenty two years, to a woman two years older who came from a
parish just outside the neighbourhood of Little Hereford to the east. Richard moved
from Ashford Carbonel to marry in Little Hereford where he remained for two years
having no children there. His first child was born when he was 24 and living in the
adjacent parish of Burford. He returned to Little Hereford ten years later at the age of
thirty four with four children where he lived for another forty one years. This is a
different pattern from the life cycle of his father since the events occurred at a
younger age, but the attraction of Little Hereford was clear and perhaps supports the
notion that Bedlam Row was important as a factor in migration.
Generation Date 1748 …….. 38 yrs…….. 1786 …….. 48 Yrs……..1833
1 Place Ashford Carbonel Little Hereford Gregory Age 32 yrs 38 yrs 85 yrs
Event m. 1780 Moved Deceased Generation Date 1783…22 yrs…1805..2 yrs..1807..10 yrs..1817….41 yrs….1858
2 Place Ashford Carbonel L.H. Burford L.H. Richard Age 22 yrs 22 yrs 23 yrs 33 yrs 75 yrs
Event m.1805 Moved (1) Moved (2) Moved (3) Deceased
Generation Date 1820…… 37 yrs……. 1857…5 yrs…1862….. 21 yrs….. 1883 3 Place Little Hereford Leintwardine L.H. Ashford Carbonel
Joseph Age 32 yrs 37 yrs 42 yrs 63 yrs Event Married (1) Married (2) Moved Deceased
212

Generation Date 1872…. 32 yrs…. 1904.… c 12 yrs…. 1916….. C 36 yrs…..1952 4 Place Ashford Carbonel Weston Rhyn Selattyn
Mary Jane Age 32 yrs c 44 yrs 80 yrs Event Married/Moved (1) Moved (2) Deceased Generation Date 1916…22 yrs…1938 ..4yrs..1942 ..6yrs. .1950/1952..… 48yrs….. 2004
5 Place Selattyn Oundle Oswestry Shrewsbury Market Drayton Birmingham Colwyn Bay
Enid Age 22 yrs 26 yrs 34-36 yrs 88 yrs Event Moved(1) Moved (2) Moves(3+) Deceased
Generation Date 1950..2 yrs ..1952……. 17 yrs ……. 1969 ……….. .. 1978…..to date 6 Place Shrewsbury etc Market Drayton Hitchen Bristol
Christopher Age 2 yrs 19 yrs 28 yrs Event Moves by Mother Education Move Work
Table 8.3 The Bennett Family: Generation by Generation
The third generation shows yet a different pattern. Joseph married later at age thirty
two years in Little Hereford but this marriage lasted only two years when his wife
died. He appeared to remarry almost immediately, in 1857, in Leintwardine the
parish of his new wife. They lived in Little Hereford where the first two children
were born. Joseph was forty two when the family moved to Ashford Carbonel, the
birthplace of his father and grandfather, a type of return migration. Here he had five
more children. The last of these was Mary Jane who was born when Joseph was fifty
two years of age and his wife forty five. Joseph died in 1883 at a time of significant
change. His life had straddled the period of high farming and into the period of
competition, the coming of the railway and the beginning of population loss.
The fourth generation of Bennetts is represented by the seventh and last child of
Joseph, a daughter, Mary Jane known as ‘Polly’, and so the life cycle moves here
through the female line. Polly was thirty two years old when she married John Lloyd
in Ashford Carbonel. He was from Denbighshire and how they came to meet is
unknown but their first child was born in the year of their marriage in Weston Rhyn,
about 25 miles north west of Shrewsbury. They had six children over a twelve year
period and in about 1916 they had moved to Selattyn, about two miles south of
Weston Rhyn. They both died in Selattyn in the early 1950s. Their lifetime had cut
213

across the great urbanisation movement of the late 19th and early 20th centuries but it
appeared not to have changed their lives. Polly exchanged one rural environment for
another. Their last child was Enid, born in Selattyn in 1916 and it is through her that
the branch continued.
According to her son, Christopher Davies, Enid worked in hotels as a young person,
and so this evidence does not entirely rely on family trees and in consequence there is
more evidence available than for previous generations. At the age of twenty two,
Enid was working in Oundle and four years later, in 1942, was in Oswestry nearer to
home. This confirms other findings about the longer distance moves made by single
females in the early part of their working lives (Pooley and Turnbull 1998). Although
Enid married during the Second World War this marriage broke up but in 1950 she
had an illegitimate son, Christopher, in Shrewsbury at the age of 34 years. In an
effort to support her son and also find accommodation she moved first to Birmingham
and then to Colwyn Bay before settling in Market Drayton in 1952. Market Drayton is
a market town some 25 miles north east of Shrewsbury so Enid was returning
essentially to the same region, though not neighbourhood, as her parents. There is
evidence too that her older sister and brother-in-law had also lived there and
Christopher completed his schooling in Market Drayton and Enid remained there until
she died in Telford Hospital in 2004, aged 78. In 1969 Christopher at the age of
nineteen went into higher education and moved to Hitchen in Hertfordshire. He
married in 1975 and three years later moved to work in Bristol at the age of 28. He
remains in Bristol.
The evidence of the relationship between migration and family life cycle as presented
in the previous chapter is not strong. In Chapter 7 the conclusion was that families
moved when the head of household was between thirty and sixty years of age and that
the movement was mainly local. The description above simply bears out criticisms of
family life cycle models as being too inflexible (Warnes 1992). Of course the data
here, certainly before the 20th century, show nothing of the pre marriage movements.
Thereafter there is some relationship to the time of marriage but there was also
movements when there are young children. This at least is consistent with previous
findings where it was shown that the majority of families moving were nuclear with
young children.
214

During the 20th century other factors, for example, movement after marriage to a
partners home area and, thereafter, the establishment as another core family in an
alternative location. There is also the movement of a single woman and later a single
parent and finally the introduction of movement for education. It may be that the
most potent factor is that of scale where the life cycle concept fails to offer
understanding both at the meso level and certainly at the micro level. It may be a
concept best suited to macro analyses with large data sets aimed at general
understanding of pattern.
Thus far the analysis of the migratory behaviour of the Bennetts has been episodic
based upon generations, it now looks at the spatial movement from a longitudinal
perspective. This inevitably involves a degree of repetition since the same family is
under investigation but this time with movement as the main focus.
In Table 8.4 the chronology of the moves of the Bennett family is indicated together
with the dates of birth and death of the head of household.
BENNETT FAMILY Unlike the Maunds and Rowburys who were core families from at least the 18th century nothing is known of the Bennett family before the birth of Gregory in1748 in Ashford Carbonel. He died in LH and his fourth child John was born there in 1786. The line goes through first son Richard, below.
Richard & Mary Richard was born in Ashford Carbonel and went to Burford C1783 1856 by 1807 where 4 children were born, then to LH between 1816 and 1820 where his fifth child Joseph was born. Subsequently 2 others were born there. Richard died in LH in 1858.
.
Joseph & Elizabeth They were married in Leintwardine where Elizabeth was 1820 1883 born. Their first 2 children born in LH. Then 5 more in Ashford Carbonel from 1862. The last, Mary Jane, in 1872 through whom the line now goes. Others of the family remained in Bedlam Row and were still there in 1901.
215

. Mary Jane (Polly) & John Lloyd The line now passes through the female line. 1872 1952 ‘Polly’ married and moved to the Wrexham area She had 6 children variously at Weston Rhyn, . Shrewsbury and Telford where in1916 Enid was born. .
Enid Although Enid married during the war there were no 1916 2004 children but after a marriage break up she had a son, Christopher, in 1950. Enid prior to this had moved between the Borders, Birmingham and Oundle working. After the birth they settled in Market Drayton.
Christopher Davies & Wendy Christopher moved to Hitchen where he married 1950 in 1975. Then to Bristol where in 1984 the first of 2 children were born. They currently live there.
Table 8.4 The Bennett Branch
The early family tree, Figure 8.6, shows something of the problem of using such data.
Certainly Gregory and Mary Bennett died in Little Hereford in Bedlam Row. This
information will have been obtained from the Burial Register but when did they arrive
there? Their first three children were born in Ashford Carbonel but the fourth, John,
in Little Hereford, so somewhere between the birth of Margaret in 1785 and John in
1786 they arrived in Little Hereford. There were three other children born later than
1796 not shown here. In total, they had 12 children born between 1781 and 1804.
Figure 8.6 Bennett Family Tree (1)
216

This size of family was not unusual for the late 18th, early 19th century and they will
not all have lived at home simultaneously as discussed in Chapter 5.
Richard Bennett, son of Gregory and Mary, shown in Figure 8.7, although born in
Ashford Carbonel raised his children and died in Little Hereford. One of his seven
children, born in Little Hereford between 1807 and 1826, was Joseph Bennett who
also had seven children between 1858 and 1872 ( Figure 8.8).
Figure 8.7 Bennett Family Tree (2)
These fragments of family tree show this line of descent but also show from the
birthplace of Joseph’s children the uncertainty of when this branch moved from Little
Hereford back to Ashford Carbonel.
Certainly Jane and Bill were born in Little Hereford (Figure 8.7) and from other
sources it is known that Lizzie was born in Ashford Carbonel in 1862. The family
moved sometime between the birth of Bill, 1859, and Lizzie 1862. The line followed
for this study is through Polly, born in Ashford Carbonel in 1872 (Figure 8.8). She
was a direct ancestor of Chris Davies, the source of these data, and she died in 1952 in
North Wales. This of course is only one branch of the descendents of Gregory and
generally they remained in the neighbourhood. Three died outside the area, Lizzie in
Weston Rhyn near the northwest Shropshire border with Wales, George in Llandeilo
and Jim in Pontypridd.
217

Figure 8.8 Bennett Family Tree(3)
Lizzie was ten years older than Polly but they both died in the same locality, Lizzie in
1938 and Polly in1952. There may well be family reasons why they both lived in this
locality, in north Shropshire, so far from their place of origin presumably quite close
to the neighbourhood from which John Lloyd came. Certainly their first and last
children, John and Enid, were born there.
This level of detail has been given to illustrate the dispersal of families and also the
immense complexity of family trees and the difficulties with using them as a device
for tracking movement. Thus far in the analysis Polly is the fourth generation from
Gregory. She married John Lloyd of Denbighshire in Ashford Carbonel in 1904.
How she came to meet him is not known. They had six children all born in north
Shropshire as far as the information is able to go,
The migration path of the branch followed is a complex one and an attempt to show
this is given in Figure 8.9 . This is an adaptation of an idea by Knowles (1995) and is
intended to show the migration path and to illustrate both the time and spatial
dimension of the movements of the core families. This takes the form of a graph with
place on the vertical axis and time on the horizontal axis. Thus the vertical axis shows
a variety of locations each and increasing distance from the Prime Parish, Little
Hereford. The neighbourhood area (NA) is shown followed by an area immediately
adjacent to it. The study area is the Region of the Mid Borderland.
218

Figure 8.9 The Migration Path of the Bennett Family
219
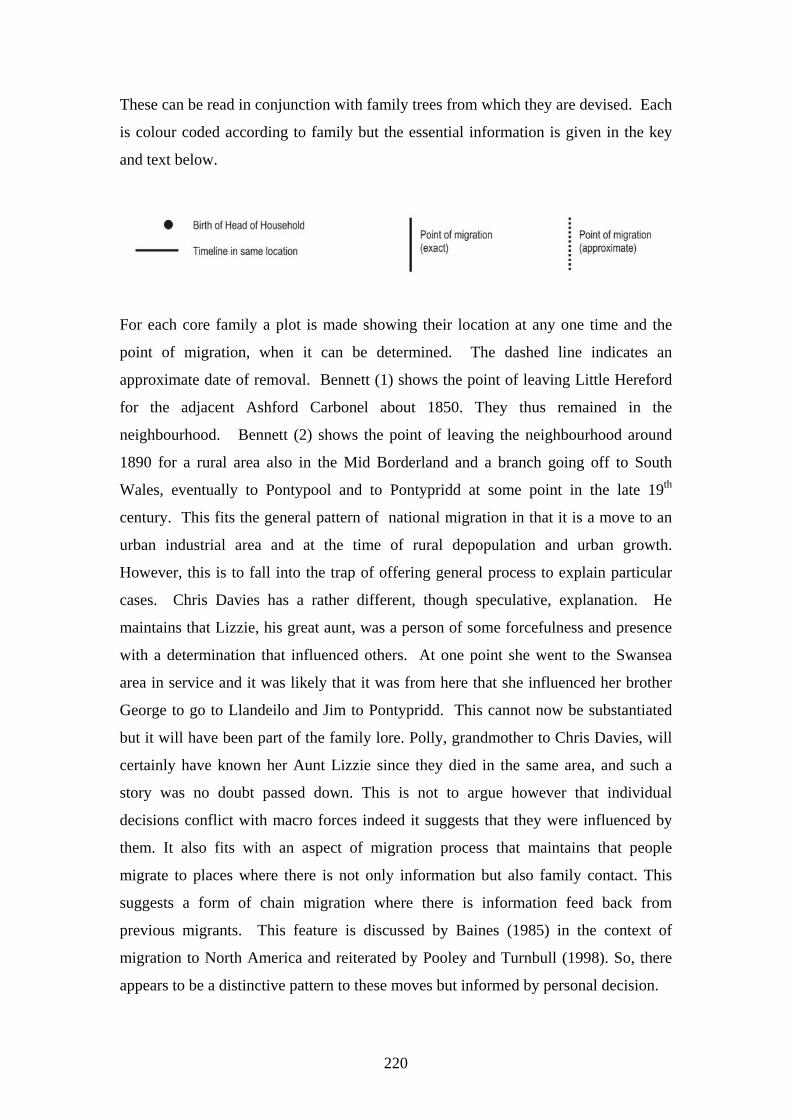
These can be read in conjunction with family trees from which they are devised. Each
is colour coded according to family but the essential information is given in the key
and text below.
For each core family a plot is made showing their location at any one time and the
point of migration, when it can be determined. The dashed line indicates an
approximate date of removal. Bennett (1) shows the point of leaving Little Hereford
for the adjacent Ashford Carbonel about 1850. They thus remained in the
neighbourhood. Bennett (2) shows the point of leaving the neighbourhood around
1890 for a rural area also in the Mid Borderland and a branch going off to South
Wales, eventually to Pontypool and to Pontypridd at some point in the late 19th
century. This fits the general pattern of national migration in that it is a move to an
urban industrial area and at the time of rural depopulation and urban growth.
However, this is to fall into the trap of offering general process to explain particular
cases. Chris Davies has a rather different, though speculative, explanation. He
maintains that Lizzie, his great aunt, was a person of some forcefulness and presence
with a determination that influenced others. At one point she went to the Swansea
area in service and it was likely that it was from here that she influenced her brother
George to go to Llandeilo and Jim to Pontypridd. This cannot now be substantiated
but it will have been part of the family lore. Polly, grandmother to Chris Davies, will
certainly have known her Aunt Lizzie since they died in the same area, and such a
story was no doubt passed down. This is not to argue however that individual
decisions conflict with macro forces indeed it suggests that they were influenced by
them. It also fits with an aspect of migration process that maintains that people
migrate to places where there is not only information but also family contact. This
suggests a form of chain migration where there is information feed back from
previous migrants. This feature is discussed by Baines (1985) in the context of
migration to North America and reiterated by Pooley and Turnbull (1998). So, there
appears to be a distinctive pattern to these moves but informed by personal decision.
220

Moves to form a new household and for work fit one of the categories of migration
identified by Rossi (1955). These though are generalised reasons and little can be
seen of the individual decision in terms of either choice or constraint.
For Enid Lloyd, as a single parent family, needed to support her son and this would
certainly have informed her choices. In their work on classification of families used in
this study as the basis for the data retrieval schedule in Chapter 7, Coleman and Salt
(1992) make the point about the changing nature of the family unit. The life course of
the single parent, Enid Lloyd, illustrates the consequences for spatial patterns that
such changes may bring. But in terms of the general pattern of movement her return
to the region has to be noted and indeed the earlier return of her ancestors to the home
parish of Ashford Carbonel and the possible influence of family contact. There were
moves to urban locations for work and a settled period in a market town. A move to a
major urban location does not occur till 1979. Above all they were clearly a core
family in relation to the Region. However the migration characteristics shown by this
family are returned to later as part of the summary of the movements of core families.
8.4.3 The Rowburys
In order to bring the movement of the Rowbury family up to the present the branch to
be traced needed careful selection because so many branches died out without issue.
There is also the matter of the need to simplify a highly complex and detailed family
tree. The data comes from Polly Rubery who collects data on all who bear the name
Rowbury or its derivatives. It is a major one name study which now bears only
marginal relationship to her own family. The motives for collection then are different
from a desire to seek ones immediate origins.
The origins of the name is of some interest for according to Polly Rubery’s discussion
with Margaret Gelling it derives from the Celtic, ‘Rough Hill’2 and is related to the
farm, Rowbury Court, which is in the parish of Bodenham (Chapter 5). The interest is
furthered by the fact that this area is in the territory of Maund (from the Celtic
‘Magene’) to be discussed later in connection with the Maund family (chapter 9). The
two names therefore, according to this reasoning, derive from the same locality to the 2 Report of conversation held between Margaret Gelling and Polly Rubery. Some of the problems with place name evidence are discussed in Chapter 9.
221

south of the neighbourhood of Little Hereford. How they came to be ascribed to
people as surnames is another issue which is discussed later but it does indicate that
ancient names of places also have a role in the investigation of migration.
The Rowbury family, as indicated earlier, have been traced back to Thornbury,
immediately outside the extended neighbourhood (Figure 8.2) in 1550. Because of the
availability of such early records the Rowburys have thirteen generations whose
movements can be traced, a period of about 450 years (Table 8.5). A similar
procedure to that of the Bennetts is now followed with, first, an examination of the
thirteen generations. Unlike the family trees of the Bennetts and the Maunds, the
level of detail in the Rowbury tree diminishes in the last two generations (Table 8.5).
Here there is no first hand oral evidence available and reliance is placed entirely upon
the data provided. This is perhaps another variable to be considered when using
family trees as research data.
Generation Date c1550…… 5 Generations… at least 230 yrs…………………….. c1791 1 - 5 Place Thornbury
Age Event One branch in 3rd Gen Bockleton c1615; One branch 4th Gen to Tenbury c1650
Generation Date 1759….. …. ……1791…………….. .1813……1819………….1826 6 Place Thornbury Greet Burford LH
John Age 25 yrs 67 yrs Event m1784 Moved(1) Moved(2) Moved(3) D’ceased
Generation Date 1787………1791………1809…………………. . …..……………1837 7 Place Thornbury Greet Little Hereford
John Age 21 yrs 50 yrs Event m1809 Moved 7 Children Deceased
Generation Date 1826…………………………………………………………………1899 8 Place Little Hereford
Edward Age 25 yrs 73 yrs Event m 1851 7 Children Deceased
222

Generation Date 1866…………………….1890…………………………..1935?……1942 9 Place Little Hereford Tenbury Ludlow
James Age 23 yrs Moved(1) 76 yrs Event m1889 6 Children Deceased Generation Date 1890……………….1913….1915……………………. ?
10 Place Tenbury Cleo Mort. Aston RD
Ada Age 23 yrs 25 yrs Event b.son m1915
Generation Date 1913…………………………..1940………………………….1970 11 Place Cleobury Mortimer Kidderminster
Stanley Age 27 yrs 57 yrs Event M1940 Deceased
Generation Date 1945…………………………………………………….to date 12 Place Kidderminster
Margaret Age 24 yrs Event Son born 1969 Generation Date 1969……………………………………1992………….to date
13 Place Kidderminster Stewart Age 23 yrs
Event m1992
Table 8.5 The Rowbury Family Generation by Generation
The Rowburys were resident in Thornbury, on the edge of the neighbourhood of Little
Hereford, for at least 230 years from 1540 and probably longer (Figure 8.5).
Anything that can be said about their residence there can only be conjecture from
known national circumstance but it was certainly an era of low migration. Two
branches of Rowburys moved during this period but only short distance to Bockleton
in about 1616 and the other to Tenbury around 1660. Both of these are in the
neighbourhood of Thornbury.
The Bockleton movement seems to have been permanent because second generation
William married a woman from Bockleton and their three children were born there.
The Tenbury move was temporary for one child in the third generation was born there
before the family returned to have six more children in Thornbury. This is
effectively rural circulation within a neighbourhood.
223

Sixth generation, John and Mary, were married in Tenbury and had three children in
Thornbury before they moved some seven miles to Greete, in about 1791, a parish
adjacent to Little Hereford. At the time of the move the three children were young:
aged six, three and two years. In Greete six more children were born, the last in 1806
when John was 47 years old.
There was no clear record after this date but other sources from Polly Rubery’s
documented evidence indicated that John moved around 1813, to Burford, adjacent to
Greete and then in 1819 to Little Hereford, possibly to live in Bedlam Row with the
family of his son, John. He died in Bedlam Row in 1826 aged 67 years. This profile
suggests an interesting life cycle.
Age Date Event Location Children’s Ages
1759 Birth Thornbury
25 1784 Marriage Thornbury
26 1785 Birth Thornbury Died
28 1787 Birth Thornbury
30 1789 Birth Thornbury 2;
33 1792 Birth Greete 5;3
35 1794 Birth Greete 7;5;2
39 1798 Birth Greete 11;9;6;4
41 1800 Birth Greete 13;11;8;6;2
44 1803 Birth Greete 16;14;12;9;5
47 1806 Birth Greete 19;17;15;12;8. Died.
54 1813 Moved Burford 26;24;22;19;15
60 1819 Moved L. Hereford 32;30;28;25;21
67 1826 Death L.Hereford 39;37;35;32;28
Table 8.6 Life Cycle: John Rowbury Senior
Table 8.6 together with the colour coding is an attempt to show the life cycle utilising
information about way of life detailed in Chapter 5 ands also the structure of the
schedule used in Chapter 7. Thus for John and Mary Rowbury there was a short
period after marriage where both partners may have been working and, therefore, the
family income was relatively good; at this point John was a young man in his mid
thirties. This was followed by the birth of five children over the next seven years and,
since one of these died, leaving four dependent children in the household. The family
224

remained in Thornbury until after the birth of the third child. By the birth of the
fourth child they had moved to Greete, but by now two of the children were more than
nine years old and may well have been living-in on a farm. If these assumptions are
correct then it would mean that about three children were at home at any one time.
The period between about 1790 and 1806 may well have been the period of greatest
financial stress. Just one move was made at this period. The move to Burford in about
1813 was probably at a time when all the children had left home but why this move
was undertaken can only be imagined. However, the move to Little Hereford about
1819 may well have been to do with age and infirmity because John moved to live
with his eldest son John who was now married and living in Bedlam Row.
John Rowbury (Generation 7) moved with his parents to Greet before he was five
(Table 8.5). How long he stayed there is not known; he would have been eleven in
1798 and almost certainly would have left home by then. Sometime between then and
1809 he met and married Elizabeth Roberts of Bedlam Row, Little Hereford. Of
course Greete and Little Hereford were adjacent parishes so such a meeting was
perhaps inevitable. Elizabeth’s family had almost certainly been resident in Bedlam
since the cottages were erected in the second half of the 18th century and, according to
the 1846 Tithe Survey, she and John occupied the cottage at the extreme western end
of the row nearest to the detached gardens. They had eight children there although
John died aged 50 in 1837 four years before the 1841 CEB. It is from these children
that the family disperses and almost dies out. The line from the eldest son, William
moves to Uttoxeter and dies out there in 1896. The sequence of the line followed in
shown in Table 8.7.
ROWBURY FAMILY The Rowburys have been traced from c1550 in Thornbury, just beyond the extended Neighbourhood to the south east. There were at least 6 generations there. John was born here in 1759 and married in 1784.
John & Mary John and Mary had 3 children whilst still in Thornbury. 1759 ?? One of these was John in 1787. By 1792 they were in Greete immediately east of LH where 6 more children were born
225

. John & Elizabeth John married Elizabeth Roberts whose family were 1787 1837 already in LH probably in Bedlam Row. They had 8 children there. William married and brought up a family in LH. His line dies out in next generation but it reaches Uttoxeter. Richard too has children and his line is currently in Leicestershire. Youngest son Edward marries Ann Mound and has 6 children in LH. Edward & Ann Edward became a stone mason and was responsible for the 1826 1899 building of two houses in LH one of which he lived in. Only James of the 6 children had offspring. James & Mary James was a successful carpenter and wheelwright who 1866 1942 lived in a ‘good’ house in LH. He had 6 children and the line through Vincent died out in Ludlow. Ada continues the line. Ada Ada marries in 1915 but 2 years before she gave birth to 1890 an illegitimate son, Stanley. This was in Cleobury Mortimer. Ada’s marriage produces no children. Stanley & Alice Stanley marries Alice in Kidderminster when he is 27. His 1913 1970 2 children are born there and he is buried there too. 1941 Bernard Bernard only has step children, born in Bromsgrove. 1945 Margaret Margaret has 3 illegitimate children born in Kidderminster. Two of them marry and have children born in Bromsgrove Stourbridge.
Table 8.7 The Rowbury Branch
The line through John dies in Ludlow in 1896; that of Hannah in 1842 in Little
Hereford; Richard had two wives which produced three further generations one of
which died out in Leicestershire in 1879 and the other two in Ludlow in 1895. It was
226

the last child of John and Elizabeth, Edward, who carried the line forward to the
present (Figure 8.10).
The generation (8) (Table 8.5) produced by John and Elizabeth is interesting, not so
much because of life cycle, but because of a break in the way of life despite the
poverty of their parents. In 1851 Elizabeth was still living in Bedlam Row but on
parish relief. In 1841 she was 60 years old and a widow of four years living in
Bedlam Row with a daughter and youngest son Edward. Her life had been a familiar
one up to this point. Married at the age of 27 and five years older than her husband,
she had eight children and was then widowed. She stayed in Bedlam until after 1851
but in 1861 she lived with Edward, her youngest son, who was a mason and lived in
Stoke Row. Interestingly, two of the four houses in this row were built by Edward.
Thus, the son of a labourer becomes a skilled craftsman and a property owner
illustrating that even in the quite strict social-economic hierarchy of the day some
upward social mobility was possible and with a rather different way of life. The life
cycle is changed by a change in way of life. Edward had six children, two of whom
became skilled men and property owners. One of these was James, the youngest, and
it is he, out of nineteen in that generation, who is the only one to carry the line
forward (Generation 9).
The level of information about Generations 11, 12 and 13 is not so great as for some
of the previous ones but they are the generations which move to urban areas. It is
from this point that a family which had inhabited the neighbourhood for 10
generations over 450 years begins to move significantly away. What they do and how
they came to make the moves is obscure. These generations descend from Ada
(Generation 10). Her father, James (Generation 9), had six children between 1890
and 1898 two of whom died at birth or shortly afterwards. One other child, Vincent,
married and had three children for whom there is no record after 1950. Ada was
James oldest child, born 1890, and she had an illegitimate son, Stanley, in 1913 who
continued the line (Generation 11). It is from Ada that the family line begins to move
away from the neighbourhood of Little Hereford which they had inhabited for at least
ten generations (Table 8.5).
227

Something of the complexity of this tree is shown in Figure 8.10. This shows,
Edward (Generation 8), the last child of John junior and Elizabeth to have had six
children and it is from the last of these, James, that the line through Ada continues. As
Figure 8.10 The Family of John Rowbury (2)
Figure 8.10 indicates Ada’s son Stanley was born out of wedlock in Cleobury
Mortimer in 1913. He married in Kidderminster in 1940 and died there in 1970. It is
not known when he moved to Kidderminster but it was sometime between 1913 and
1940. His two children were born in Kidderminster as were three of his grandchildren,
three others were born in nearby Bromsgrove and two great grandchildren in
Stourbridge. So, a family which came from Thornbury in the 16th century, moved in
stages to Greete, to Little Hereford, to Cleobury Mortimer, Kidderminster,
228

Figure 8.11 Migration Path of the Rowbury Family
229

Bromsgrove and Stourbridge. In the process all other lines died out and the name
Rowbury was lost. But this family did not move far from the Region in contrast to the
Bennetts. These latter generations show moves up the urban hierarchy. Stanley was
born in a small market town and then moved to the larger industrial town of
Kidderminster, itself a part of the Black Country conurbation. Thus, in contrast to the
Bennetts, evidence of moves to the town came earlier among the Rowburys.
The moves are illustrated in Figure 8.11. The upper graph shows the moves from
adjacent neighbourhood (Thornbury) to Greete but the precise date is unknown so an
approximation was indicated by means of the dotted line. The large dots indicate the
birth of the head of household because the study is centred on nuclear family
migration. The two parallel lines to the right of the graph indicate both the family that
remained in Little Hereford and the one that left to carry the family forward. On the
lower graph the family moved away from the Neighbourhood to an adjacent urban
area (Cleobury Mortimer) and then to an urban area still in the region
(Kidderminster). It should perhaps be mentioned that the Rowbury family appear to
fulfil the pattern of a move from the countryside to the town and in their case from a
small town to larger industrial town in a step like sequence and broadly in the
direction of the regional centre.
What is not known is the motives and imperatives which underpin these movements.
Pooley and Turnbull (1998 p98) maintain that most moves were made to similar
places and movement up or down the hierarchy was the exception. Equally there is
evidence both with the Bennetts and the Rowburys of the urbanisation process but
none of counterurbanisation. This analysis, although showing some conformity with
macro forces at the micro level still lacks the detail that might develop the
understanding of migration; it can show the movement and the approximate time but
not the process that underpins it. It also, like the Bennett family, shows only the
movement of one branch of the family.
8.4.5 The Maunds
The third family to be investigated is the Maunds. For this family there is some direct
oral evidence available which helps to explain some of the 20th century movement,
and, therefore, a greater level of detail exists, much of which is used in the next
230

Chapter. Here, for the most part, a similar approach to that of the other two families
is followed. In terms of life cycle one of the more interesting ones is that of Thomas
Maund and this will be examined at the appropriate point in the sequence.
Generation Date C1640…… 4 Generations… at least 140 yrs…………………….. c1783 1 - 4 Place Brimfield
Age Event
Generation Date 1757….. …. ……1783…………………………….. . . ………….1838 5 Place Brimfield Little Hereford
William Age 22 yrs 26 years 81 yrs Event m1779 Moved1783 Deceased
Generation Date 1802………………………………………………………………..18?? 6 Place Little Hereford
George Age 21 yrs Event 8 Children Deceased
Generation Date 1827………………………………………………………………1902 7 Place Little Hereford
John Age 28 yrs 73 yrs Event m 1855 10 Children Deceased
Generation Date 1865………………1887………………………………...c1906….1954 8 Place L.Hereford A.Carb Kings Norton many moves across Borderland. Settled B’ham
Thomas Age 22 yrs 41 yrs 89 yrs Event Birth m.1887 Move (1)1889 x many 9 Children D’ceased
Generation Date 1890……………1911…….…………1931……1945……………..1966 9 Place Kings Norton Harborne B.Green Herefordshire
Thomas E. Age Born 21 yrs 41 yrs 56 yrs 76 yrs Event Many moves across Borderland married 5 children Move Died
Generation Date 1913/1915/1917/1919/……….1936 10 Place Birmingham return to Herefordshire see Ch 9.
Brenda/Ken/Fred/Bob/David Age Event
231

Generation Date 1940…………………………………………………….to date 11 Place Various See Chapter 9 Age
Event Generation Date From c 1962………….to date
12 Place Widespread Age
Event
Table 8.8 The Maund Family Generation by Generation
Table 8.8 follows broadly the same pattern as for the other two families but for the
later generations the detail is omitted and dealt with differently later in this section.
This is because this form of diagram is unsuited to the amount of detail available from
oral and biographical sources. However it can be seen that the first record of the
family is in Brimfield an adjacent parish to Little Hereford (Generation 1-4). About
1783 William and Hannah Maund (Generation 5) moved to Bedlam Row from
Brimfield with their three children and five more were to be born in Bedlam, the last
of whom was George in 1802. Previous to William and Hannah there were at least
four generations of this family of Maunds resident in Brimfield. Before the original
family of Richard, born in 1654, the records are fragmentary and assumed to be
destroyed during or in the aftermath of the Civil War.
It is not known precisely where the Maund family lived in Brimfield or why they
moved to Little Hereford. The distance from Brimfield is slight, perhaps a mile.
What contacts there were which led them to Bedlam can not be known, Bleathwood
Common was seventeen years away from enclosure so it could not have been a
demand for labour. It is conceivable that they built their own house and they certainly
had an additional detached garden, an extremely valuable asset. The sequence of the
generations is shown in Tables 8.8 and 8.9 but their youngest child George took over
the house and is recorded as the Head of Household in the CEB for 1841, married to
Fanny and with five children, including John then aged 13. George’s mother,
Hannah, had died the previous year and father William in 1838. Fanny came from
Diddlebury about 10 miles to the north. George was a drainer so he may well have
met her in the course of his work. In all George and Fanny had eight children and the
232

eldest son, John, appears to have inherited the house. John Maund married Emma
Gwynn in 1855 and they had ten children in total, all in the cottage in Bedlam Row.
Emma recorded all their births in the family bible3. In Figure 8.3 it is Emma at the
gate of their cottage. John, also a drainer, died in 1902 from pneumonia and Emma in
1917 aged 88. She was the last of this family to live in Little Hereford.
MAUND FAMILY At least five generations of the family in Brimfield which C1640 is adjacent to LH and to the southwest. Precisely where they lived in the parish is unknown. . William & Hannah Married in Brimfield, had 3 children there. Moved c1783 C1757 1838 to Bedlam Row. Here they had 5 more children, including George in 1802. George & Fanny George became a drainer and that may be how he met Fanny 1802 C1870 who was from Diddlebury about 10 miles to the north. . They lived in Bedlam Row all their lives and had 8 children. The oldest boy was John who as a young person lived-in in the Parish. John & Emma Emma came from Ross but worked in 1851 in Tenbury 1827 1902 district. Married 1855 and lived entirely in Bedlam Row. 10 children including Thomas, in 1865, and the last in 1880, David, ‘Mon’. Emma died in 1917 the last Maund in Bedlam Row. Thomas & Jane Thomas worked locally at first, married Jane in Ashford 1865 1954 Carbonel in 1885. Went to Kings Norton where Thomas E. born. Traversed Borderland to Birmingham until finally settling in Birmingham c1908. 3 Now in the possession of the grandchildren of their youngest son, David Gwynn Maund.
233

Thomas E. & Hephzibah Married 1912, lived in High St., Harborne. 4 children 1890 1966 born here. Moved c1932 to Bartley Green where last child born. In 1938 Fred instigated move to Herefordshire. 1913 Brenda & Graham First move to Herefordshire in 1946 then again in 1990. 1915 Ken & Beryl 2006 Move to Worcester 1940, Herefordshire 1950 and 1985. 1917 Fred & Kathleen 2002 Move to Herefordshire 1938. 1919 Bob & Mary 1989 Move to Herefordshire 1942. 1936 David & Irene First move to Herefordshire 1938 then 1999.
Table 8.9 The Maund Branch
Of the children of John and Emma (Generation 7) the eldest, William, a labourer,
went to nearby Leysters, in the neighbourhood of Little Hereford and about two miles
away. Alice stayed at home for a long time and Peter moved to nearby Bockleton.
Ernest and Frederick went to the USA, possibly in the 1890s, and were part of the
great emigration described by Baines (1985) and covered in Chapter 5. (They are not
in the list of Ellis Island landings so the family legend of them jumping ship in San
Francisco may bear some truth. Louisa died in her teens, Clara married and went to
Willenhall in Staffordshire and Rosa also married and went to Ludlow. The presence
of Clara in Willenhall may explain one of the later moves of Thomas.
The last child, David, known as ‘Mon’, was born in 1880. He is very important in the
later migration of the family of his brother Thomas (Generation 8) and this is part of
the substance of Chapter 9. He was a man of enterprise and adventure. He lied about
his age to go to the Boer War and after it was over he went to the US and met up with
his brothers. He did well as a cowboy and breaker of horses, sent for his fiancée,
Louise, and married her in Boston. His first child, Hazel, was born there and he
intended to stay in the USA. Contact was maintained with his mother via letter and as
she grew old and alone in the cottage in Bedlam it put more and more pressure on her
youngest son to come home and sometime after 1909 he did so and bought a farm at
Bircher Common just outside the neighbourhood.4
4 Oral evidence from Bill Maund, elder son of David, on audio tape 1995.
234

Figure 8.12 The Migration Path of the Maund Family
235

These circumstances had important repercussions for the family of Thomas Ernest, his
nephew, which will be taken up in the next chapter.
The third son of John and Emma was Thomas born in 1865 (Generation 8). It is his
migration path that makes the extraordinary pattern in Figure 8.12. Although this
figure shows something of the moves that traverse between the Borderland and the
Greater Birmingham area they are more easily demonstrated in Table 8.10. On the
face of it this does seem a quite extraordinary traversing of the West Midlands and
Borderland. Between about 1890 and 1901 the family appears to move three times
eastward and twice westward so the permanent move took over 10 years. This will be
returned to below. In some ways this is similar to the moves of the Bennetts but in
that instance the moves came sixty years later and were made by a person on her own,
for work. A more settled existence came when the child was born and of age to attend
school. Fifty years previously no such inhibition appears to influence the family of
Thomas Maund.
Thomas Maund started work as a farm labourer. He is identified in the 1881 CEB as
living-in on a farm in neighbouring Greet. He would almost certainly have left school
in Little Hereford at the age of nine, the then school leaving age at around 1874.
Evidence in Chapter 5 has suggested that education was not valued highly in this area
at this time so attendance may well have been spasmodic with time out for casual
farm work. Under these circumstances it is doubtful whether more than the most
basic rudiments of literacy and numeracy were mastered. He signed the marriage
certificate with a cross as did his bride, Jane Deakin. They were married in Ashford
Carbonel where their first child, Alice, was born in 1887. Thomas specialised in some
of the skills of the farm worker, he became a horseman and later deployed these rural
skills in an urban environment as a coachman. This suggests a degree of ambition,
enterprise and adaptability.
Why he moved, around 1889, to Kings Norton is unknown but subsequent moves may
in part be explained by his temperament. He was a man prone to anger and with a
quick temper who treated his wife and children selfishly. More over he was wont to
leave his job if he disagreed with his employer. According to some of his
grandchildren he would down tools and go, leaving wife and children behind.
236

If this is plausible for the time when coachmen and grooms were in demand up to and
beyond the turn of the century then why did the family go where they did?
Llanbadarn is in the then Radnorshire about six miles west of the Shropshire border.
On the border is the village of Beguildy, birthplace of Jane Deakin his wife. In the
circumstances described above this may have been the place Jane went to with her
two children, Alice and Thomas Ernest, when the family left Kings Norton around
1891. From here Thomas got a job as a groom, a lowering of status, but with it went
accommodation at Breezy Corner. This is speculative and inferential, but as with
much family history, it is the best that can be contrived in the absence of documentary
or oral evidence. It may though illustrate a feature of migration studies, the
importance of relatives and contacts in the process of migration.
The precise date of Thomas’s move to Knowle, or whether there were intervening
moves, is not known, nor indeed the reason why they went there. Knowle and Kings
Norton are a maximum of eight miles apart; it was certainly a return to a familiar area.
What is certain is that Thomas Ernest, by his own testimony, went to school in
Knowle.
In 1899 Frederick was born in Aston Munslow in Shropshire some twelve miles north
of Little Hereford. It is also adjacent to Diddlebury where the 14-year-old Jane
Deakin had lived with her Family in 1881 and where her father was a shepherd.
Perhaps made homeless by another walkout she returned home to have her fifth child.
The move to Willenhall in Staffordshire may have been because the sister of Thomas
had married and was living there.
One further factor needs to be added to this argument about motives and influences
upon the migration process. By 1910 Thomas, the horseman, was an insurance agent
probably a door-to-door collector of weekly contributions. The age of the horse and
carriage was over; hay had given way to oil. Of course there was no longer tied
accommodation so normal rented accommodation had to be found. This was in
Harborne near the centre of Birmingham. In the Great War Thomas served in
237

France, where he met, by coincidence, his son Thomas Ernest also serving there5.
Thomas was a driver,6 the rural skills had become redundant. The technological
changes as well as the depression in agriculture had caught up with Thomas at some
point in his early 40s. There was one further family move to a rented house, also in
Harborne, near to his son Thomas E, who paid the rent for him7. He became an
arranger of newspaper deliveries and his unmarried daughters supported the
household.
There may be a number of reasons for the pattern of migration of Thomas’s family
(Figure 8.12). Table 8.10 attempts through colour coding some indication of a life
cycle from the early days in the neighbourhood, through the criss crossing of the
Borders for about fifteen years with a young family.
DATE EVENT LOCATION SOURCE OCCUPATION
1865 Birth Bedlam Row Parish Register Son, Drainer 1881 Living-In Greete CEB Farm Servant 1887 Marriage Ashford Carbonel Marriage Cert 1888 Birth Alice Ashford Carbonel Birth Cert Coachman 1890 Birth Thomas E. Kings Norton Birth Cert Coachman 1891 Llanbadarn
Fynydd CEB Groom
1894 Birth Harold Knowle, Warks St Caths House Coachman 1896 Birth Maggie Knowle, Warks St. Caths House Coachman 1899 Birth Frederick Aston Munslow,
Salop Calculation, CEB
1901 Willenhall, Staffs CEB Coachman 1902 Birth ‘Jack’ Willenhall, Staffs St. Caths House Coachman 1905 Birth Annie Harborne,
Birmingham St. Caths House
1907 Birth Florence Harborne Birmingham
St Caths House
1910 Birth Pauline Harborne Birmingham
Birth Cert Insurance Agent
1920’s Change address Harborne Birmingham
Oral Newspaper delivery
1936 Death Jane Harborne Birmingham
Oral
1954 Death Bearwood Birmingham
Oral
Table 8.10 The Life Path of Thomas Maund
5 Testimony of Thomas Ernest. 6 From a family photograph. 7 Testimony of his grandchildren.
238

He settled in Harborne around 1905 and although he lived in two different houses
they were essentially in the same community. He lived there until age forced him to
live with his daughter three miles away.
The moves of the next two generations of the Maund family (Generations 9 and 10)
are the subject of the detailed analysis in Chapter 9. Here for the sake of
completeness and comparability a brief description of these moves is made. As Table
8.10 shows Thomas E was born in 1890 and was part of the moves of Thomas in his
early years. At 19 years old, Thomas Ernest went to Brussels to work as a waiter
having taught himself the rudiments of French from a book8. He married around 1911
and went to work in Paris. On arrival home his first four children were born in
Birmingham and he served in France during the Great War. They moved once within
Birmingham in 1932 and then, in 1938, the first of the family returned to
Herefordshire. Others followed at intervals as the family split up into separate
marriages and families. The move to Birmingham lasted less than two generations
and the return came before the population turnaround of the late 20th century.
Thomas Maund had nine children between 1888 and 1910, and if Thomas is counted
as first generation urban migrant his descendents have spread, at the fifth generation,
across a broad area. Table 8.11 gives an indication of this spread. The fifth generation
is now so widespread that there is little interconnection or even knowledge between
them and so the family of Thomas Maund is effectively dispersed.
Generation 8
Thomas Maund
Generation 9 Thomas E.
Maund
Generation 10The
Researcher
Generation 11 Generation 12
Generation 13
5 Birmingham 2 Birmingham 2 Herefordshire* 7 Herefordshire 8 Herefordshire Herefordshire 1 Birkenhead 1 Birkenhead 2 Herefordshire 3 Berks/Wilts 3 Berks/ Wilts Berks/ Wilts 1 Herefordshire 3 Herefordshire 1 Berks/Wilts 1 Birkenhead 2 Durham 2 California 2 California 1 Birkenhead 1 Cambridge 2 Aberdeen Aberdeen 2 Devon 4 Devon 3 Somerset Somerset 1 South Africa 1 Somerset 2 London 1 France 1 Cumbria Cumbria 1 Hull 1 Glasgow 1 Portugal 1 Tanzania Sweden 1 France * Deceased
Table 8.11 Location of Descendents of Thomas Maund
8 Direct communication with his youngest son. Even aged 65, in retirement, he could speak French sufficiently well to act as interpreter for a group of French tourists.
239

This is an illustration of the issue surrounding the classification of families referred to
briefly in Chapter 7. But a core of the family remains in Herefordshire. The
investigation now turns to an attempt to draw together some of the features and issues
arrived at through the above analysis of individual family migration.
8.4.6 Summary of the Movements of Core Families
This study is fundamentally focussed on the process of migration but in the course of
the investigation in this chapter there are some other important features that will be
addressed before drawing out the implications for the process of migration.
The concept of neighbourhood or locality was seen as important in defining an area of
study that was not solely dictated by arbitrary boundaries. But, in the course of the
investigation, the neighbourhood, as defined in Chapter 4, also appears to be
increasingly important in relation to countryside migration, at least in the 19th century.
Thus it has been shown to be an area within which much migration takes place and
also much important social contact, especially as a source of marriage partners (See
Figures 8.7; 8.9; 8.11). Because of its territorial restriction marriage leads to a number
of inter family relations that must have had significance for social relationships and
cultural development and cohesion. There appears to be some evidence to support the
notion of an inner neighbourhood of quite intense interaction set in an outer
neighbourhood of lesser but none the less significant interaction. This of course
applies particularly to the countryside of the 19th century and no claims are made for
large urban areas or other times.
There was frequent movement in the 19th century countryside as Chapter 7 has shown
and there is further evidence here that even members of so called core families also
moved. Prior to the 19th century there was some evidence though of more stable
migratory behaviour as illustrated by the two core families that go back to 16th and
17th centuries. If the evidence from the Little Hereford Register of Kneeling and the
1841 census can be accepted there does appear to have been a quickening of the
migratory turnover between the mid 18th and the mid 19th centuries. The latter part of
the 19th century was the time at which the three core labouring families appeared in
Little Hereford.
240

The concept of core family is important to this study. This concept is ill defined in
the literature but the evidence presented here suggests a residence in the same place of
at least three generations. Significantly the three core families used here are all from
labouring stock and all living in the same locality in similar dwellings with the same
tenure. They preceded the three core farming families in the parish although the area
of origin of the marriage partners was similarly within the extended neighbourhood.
Why these three labouring families should stay for such a long time, longer than any
other labouring family, is an interesting question. It is even more interesting when it
is noted that other labouring families moved on in this era of rural circulation (Pooley
and Turnbull 1998). The answer must lie in the type of tenure that attached to the
dwellings they occupied at Bedlam Row and that within about twenty-five years of a
change in tenure they had all left. Clearly this provides support for the argument that
accommodation and its type are an important factor in the decision to migrate.
There must have been quite a community built up among the residents of Bedlam
Row and possibly the three houses on the other side of the lane. Firstly, there were
others who stayed in the Row for lengthy periods of time such as the Passeys and the
Cookes; secondly, they were all local people who were born in the locality or close to
it, and, thirdly, they were interrelated, at least two households were married into the
Roberts family who also had lived in Bedlam Row. Also, as mentioned earlier there
was in 1876 the legal challenge by the residents to the change in ownership of the
land whilst in the great diphtheria outbreak of 1870 Emma Maund was in attendance
at the death of the young Bennett son9. All point to a high degree of interrelationship
and interdependence amongst the residents who lived in accommodation independent
of their employers. Finally, as has been pointed out earlier, there was a degree of
subsistence available from the large gardens and the detached gardens in Bedlam
Row; a small community within the broader community with some of its own values
and ways of life and a degree of social cohesion based on shared experiences and
interests.
Paradoxically, it would appear that, the poor of Bedlam Row were privileged
compared with other labourers in the parish but, even they, as core families were 9 From research undertaken by Chris Davies.
241

essentially temporary on any long time scale. Of course various individual members
moved away in every generation and this has been demonstrated above, but
eventually the family ceased to reside in the parish. This is because the family moved
or dispersed. There seems to be a good case to identify a core family with the
neighbourhood area which appears to define the locality; in other words they occupy
and define a territory. But in this case they are poor families unlike those analysed by
Hey (1976).
The core family had important implications for the territory and its social cohesion
and culture. If families stay in an area over several generations and at the same time
marry into other similar families then it suggests a development of coherence and
similarity of value contributing to the distinctiveness of culture. This could be
particularly powerful where the movement is typically short distance. It would imply
an importance to the influence of quite apparently low status people with little
manifest power but significant latent influence. Whether this has a positive or
negative effect on the area is a value judgement. It was certainly a factor in continuity
but whether it assisted change is another question. When influential people migrate
they may well influence others to do so also. There is some minor evidence for this as
possibly in the case of the Bennett family’s move to South Wales and the move of
some Maunds to the USA and the moves of Thomas Maund between the Borderland
and the Birmingham area. In other words, the role of significant ‘others’ may be
important in the process of migration.
In Chapter 3 the essential distinction was made between the concepts of pattern and
process. It was argued that the search for process required a quite different
methodological approach from that used to identify pattern. This chapter has
identified and described the migration paths of three core families. This is still,
largely, a pattern but it is also a spatial sequence, a spatial manifestation of a process.
The longitudinal approach adopted has to an extent illustrated the factors identified by
Shyrock and Larnmon (1965) in showing the different areas the families moved to,
the extent of circular and return migration and frequency of movement. The paths of
the three families representing the core families are shown partially schematically in
Figure 8.13. This is shown in order to give the impression of the longitudinal
242

movement and also to show that three families that originated in a single row of
houses all went very separate ways. It needs to be emphasised however that these
moves are constructed from intermittent data rather than from continuous information.
Figure 8.13 illustrates, of course, pattern rather than process but the very differences
illustrated suggests different processes at work in similar families. The decisions
made were based upon individual circumstance rather than some external, irresistible
imperative albeit in the context of macro circumstances. Thus, for example, Polly
Bennett moved as a result of her marriage to a man from Selattyn on the Shropshire-
Welsh border. How she met him or why she moved rather than him is not known but
they would provide the answer to her migration path. Even the reason that first took
Thomas Maund to Kings Norton is not known although the reasons for his return can
be tentatively explained. However it has to be said that Thomas moved towards
Birmingham at a time of rural depopulation and urbanisation and his career shows a
move from rural skills to urban occupations.
The attempt to use the life cycle approach has not yielded consistent results so,
although the formation of a household can be shown and also the death of the head of
household, these do not consistently result in movement and it is not at all certain
which moves are provoked by the need for work. This suggests that the life cycle
approach is not appropriate at least at this scale; in other words it is more suited to
aggregated data.
There are some similarities in the migration paths shown in Figures 8.13 but there are
also differences. Thus two families move east and one north then south. The
association with the national population trends is not clear either. It is true that in the
pre 20th century there is evidence of rural migration and eventually a move to urban
areas but these are not clear cut moves suggesting the influence of individual factors
rather than general ones. The family though does seem to be a consistent factor in
influencing decisions and this is examined further in the next chapter. There were
others originating in the families who went in other directions and over different
243

Figure 8.13.1 The Bennetts
This figure shows the moves of the
branch of the family from C1750 to
2000. The later moves are off the map as
a move was made first to Hitchen and
later to Bristol. The northwest, southeast
moves in the 20th century were made by a
single woman and then a single parent
family. These do not represent any of the
established and generalised patterns of
movement and thus reflect more the
circumstances of the individuals
concerned. It is though a family which
has dispersed.
Figure 8.13.2 The Rowburys
This shows the branch of the Rowburys
followed here from C1550 to the present.
This is now the only branch still surviving.
Although some of the extinct branches went
beyond the study area, to Uttoxeter and
Leicestershire, this one has remained within
the study area.
It follows a pattern of rural to rural town to
industrial town and therefore reflects more
the ‘typical’ migration profile. It is not
known though what decisions underlie these
movements. The family has been in the sub
Birmingham fringe for over 50 years now. Is
it a new form of core family?
244
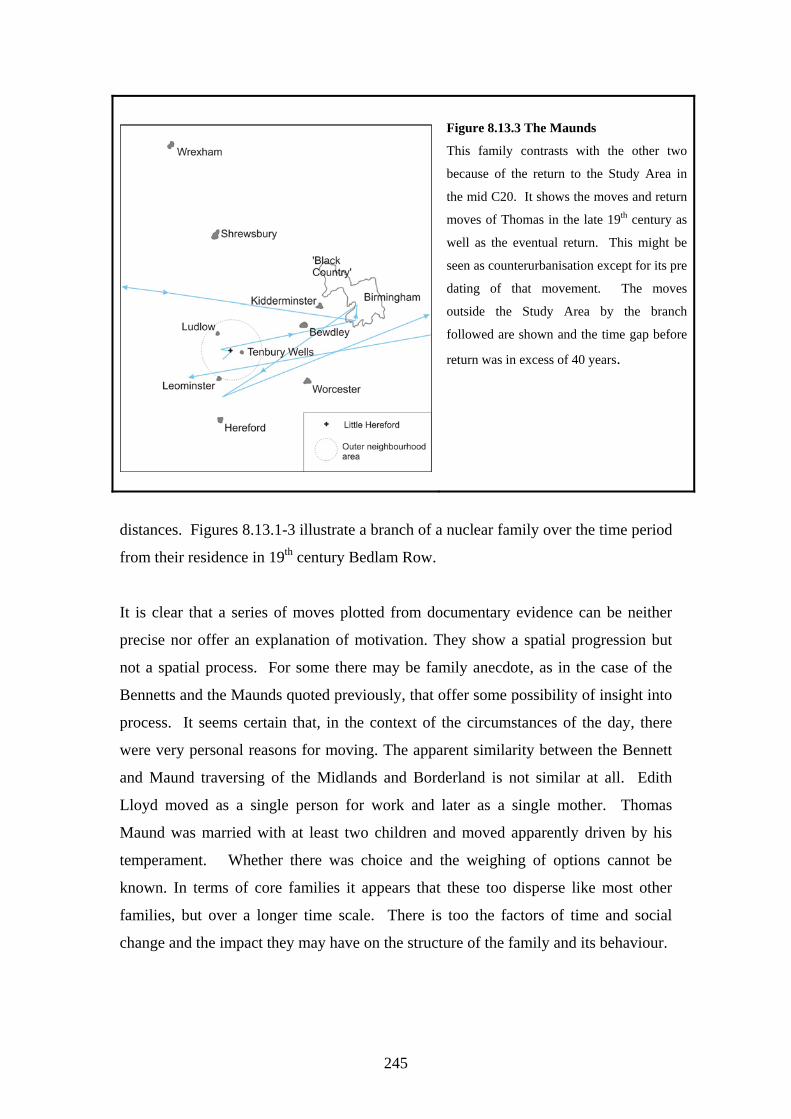
Figure 8.13.3 The Maunds
This family contrasts with the other two
because of the return to the Study Area in
the mid C20. It shows the moves and return
moves of Thomas in the late 19th century as
well as the eventual return. This might be
seen as counterurbanisation except for its pre
dating of that movement. The moves
outside the Study Area by the branch
followed are shown and the time gap before
return was in excess of 40 years.
distances. Figures 8.13.1-3 illustrate a branch of a nuclear family over the time period
from their residence in 19th century Bedlam Row.
It is clear that a series of moves plotted from documentary evidence can be neither
precise nor offer an explanation of motivation. They show a spatial progression but
not a spatial process. For some there may be family anecdote, as in the case of the
Bennetts and the Maunds quoted previously, that offer some possibility of insight into
process. It seems certain that, in the context of the circumstances of the day, there
were very personal reasons for moving. The apparent similarity between the Bennett
and Maund traversing of the Midlands and Borderland is not similar at all. Edith
Lloyd moved as a single person for work and later as a single mother. Thomas
Maund was married with at least two children and moved apparently driven by his
temperament. Whether there was choice and the weighing of options cannot be
known. In terms of core families it appears that these too disperse like most other
families, but over a longer time scale. There is too the factors of time and social
change and the impact they may have on the structure of the family and its behaviour.
245

8.5 Conclusions In the course of the analysis in this chapter a number of well known features of
migratory behaviour have been identified. These features in the main stem from
macro studies of the migratory behaviour of large populations. It is therefore not
surprising that in a micro study such as this some of these macro features can be
identified. These include short distance movement, chain migration, the influence of
significant others, and the significance of work and accommodation. But these
features do not apply in all generations or to all families and the influence of life cycle
factors are not instantly observable in all families. This would suggest, at least at the
micro level, that there are other factors at work in the decision and motivation to
move. In some ways this conclusion is reinforced by the attempt to use the life cycle
as an explanation for migration. This has proved at best to be inconclusive at this
scale. Such a device is tried and tested on large populations but here, apart from two
exceptions, it fails to offer much insight. The criticism of the life cycle approach as a
static, inflexible and constraining device is certainly justified (Warnes 1992; Glasser
2002).
There have been calls for the use of individual biographies (Pryce, 2000) as a method
of gaining insight into individual migratory behaviour and this chapter has made a
limited attempt at this. Such a method requires a longitudinal approach but although
this chapter has revealed spatial progression over time the events used to describe it
are precisely that, events. In a sense the progression is an assumed line, spatial and
temporal, between these events and, therefore, possibly not a true longitudinal study.
For example, from the birth of Stanley Rowbury to his marriage in Kidderminster
there is no continuity. Was that the only move he made? The public record is
insufficient to provide an answer and certainly incapable of yielding insight into
decision except by recourse to general reasons.
Despite these issues it has been revealed that there needs to be a convergence
between some form of life cycle approach and the data which yield a greater level of
detail to enable insight into the space-time progression. Such a convergence may be
possible through an examination of the notion of life course and the use of oral
246

testimony from those who actually moved. This is explored and presented in the next
chapter.
This chapter has shown a way forward for this enquiry, but a number of other insights
have been gained as a consequence of the analysis. It can be seen that movement is
not always completely coincident with the great macro changes in population trend
and socio-economic structure, there are time lags. Such an observation is entirely
consistent with the more general findings of the previous chapter where the analysis
of migration coincided with the point of absolute loss of population in the Borderland
at the height of the period of urban growth and industrial change. What may appear
as general trends exhibit great variability at the local level.
The spatial dispersion of families has been demonstrated despite the emphasis upon
the nuclear family but this has to be reconciled with the undoubted importance of
place. It certainly seems to be the case that the concept of a neighbourhood is more
than a mere territory; it is an area of social and economic interaction which carries
with it a degree of meaning for those who inhabit it. The core families certainly offer
substance to this idea.
Although this chapter has revealed more about migratory patterns it has also shown
that the separation of pattern and process is arbitrary and false. Underlying every
pattern there is a process. Pattern may be seen as a moment in time in an on-going
process. This chapter has provided a link between the, admittedly not entirely clear,
pattern of chapter 7 and the concentration on process and decision in the next chapter.
247

Chapter 9 There and Back – How Far Was It?
9.1 Introduction In Chapter 7 the general migration characteristics of the locality of Little Hereford in
the late 19th century were demonstrated. The migration pattern was by no means clear
and factors other than general economic ones had been operating. The subsequent
examination of the life paths of the three core families showed that over at least a two
hundred year time scale there were differences even between similar families
suggesting that migration had resulted from individual family circumstance and
decision. The purpose of this chapter is, at an even more reduced scale, to examine
the decisions and influences behind a single family movement. Thus, the scale of the
enquiry has been reduced successively from the meso to the micro and now to what
may be termed the mini-micro in order to focus more sharply upon the processes of
individual migration decision making over time. In other words, it focuses on one of
the aims expressed in Chapter 1, “to elucidate the nature and significance of local
culture and place in the decision making of migrating families at different stages of
their lives.”
Recent reviews have urged that such investigation is necessary if further progress is to
be made with the understanding of migration processes. The evidence here comes
from the testimony of individuals of a single family (Pooley 2000) of which the
researcher is a member of that family (Hagerstrand 1982). Such an undertaking
requires a difference in approach to a more ethnographic one employing a form of
participant observation and personal interviews (Chapter 3).
Before embarking upon the analysis of the 20th century family migrations something
of the historical background to the name Maund will be given. This dimension of
family history adds to the discussion of core families through the exploration of the
relationship between place and family names. It also emphasises the longitudinal
nature of the migration process and sets a context. Thus there are three main sections
to the investigation in this chapter; firstly, a discussion of methodology including
sources and methods; next an examination of the origins and significance of the name
248

Maund and finally an analysis of the 20th century movement of one branch of the
family and the decision making processes involved.
9.2 Methods and Sources The examination of the history of the name Maund was developed from secondary
sources and in the first instance related to the interpretation of place names. The study
of their distribution from 16th century relies upon data originally recorded in parish
registers.
The substance of the examination of process relies upon an approach that could be
termed ethnographic which “involves the ethnographer in participating overtly or
covertly in peoples daily lives for an extended period of time” (Hoggart et al. 2002
p256). The essential data for the analysis of migration process come from the life
paths of the children of Thomas E. Maund, shown in Chapter 8 as generation 10
(Table 8.9). In the context of this project the researcher, David Maund, as a member
of the researched family is a distinctive feature and, therefore, is in the position of life
long participant and observer This is a contrast to the more normal participant
observation mode where the observer stays with the observed for a finite period and
always knows that there is a point at which they will leave. “Interpersonal knowing is
predicated upon a deepening friendship between participant and researcher, a
relationship which takes time to establish and in which otherwise hidden or
suppressed aspects of personal understanding become knowable” (Ley 1978 p355).
In these very unusual circumstances the need to behave reflexively is paramount
where interpretations of behaviour and actions are made. In a sense the very act of
conducting structured research is itself a form of reflection. As the youngest in the
family the researcher has a powerful and privileged position. This allowed the
relationship to be that of protected young person among adults and the bond that
developed was based upon this foundation of support, mutual regard, trust and
empathy.
To explore the process more formally the notion of residential histories and life
course was employed in contrast to the more static life cycle framework used in the
249
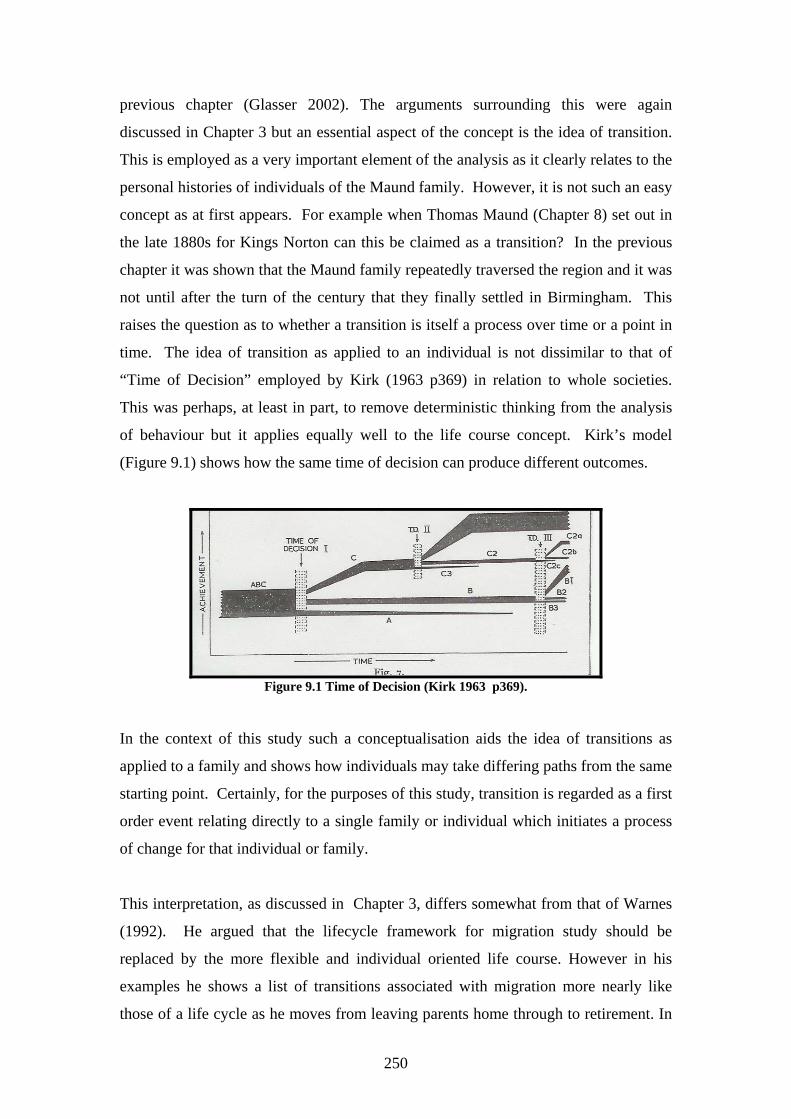
previous chapter (Glasser 2002). The arguments surrounding this were again
discussed in Chapter 3 but an essential aspect of the concept is the idea of transition.
This is employed as a very important element of the analysis as it clearly relates to the
personal histories of individuals of the Maund family. However, it is not such an easy
concept as at first appears. For example when Thomas Maund (Chapter 8) set out in
the late 1880s for Kings Norton can this be claimed as a transition? In the previous
chapter it was shown that the Maund family repeatedly traversed the region and it was
not until after the turn of the century that they finally settled in Birmingham. This
raises the question as to whether a transition is itself a process over time or a point in
time. The idea of transition as applied to an individual is not dissimilar to that of
“Time of Decision” employed by Kirk (1963 p369) in relation to whole societies.
This was perhaps, at least in part, to remove deterministic thinking from the analysis
of behaviour but it applies equally well to the life course concept. Kirk’s model
(Figure 9.1) shows how the same time of decision can produce different outcomes.
Figure 9.1 Time of Decision (Kirk 1963 p369).
In the context of this study such a conceptualisation aids the idea of transitions as
applied to a family and shows how individuals may take differing paths from the same
starting point. Certainly, for the purposes of this study, transition is regarded as a first
order event relating directly to a single family or individual which initiates a process
of change for that individual or family.
This interpretation, as discussed in Chapter 3, differs somewhat from that of Warnes
(1992). He argued that the lifecycle framework for migration study should be
replaced by the more flexible and individual oriented life course. However in his
examples he shows a list of transitions associated with migration more nearly like
those of a life cycle as he moves from leaving parents home through to retirement. In
250
this study a different perspective is taken where, after a change in direction or
behaviour, the reasons behind the decision are sought. This may well be an
illustration of the difference between research aimed at generalisation and pattern and
that concerned with process and individual response.
The researcher is very definitely an “insider” and as such able to recall, contribute and
interpret events and feelings over at least a sixty-five year time span. Coupled with
this was the great confidence that existed between the researcher and his siblings
which enabled easy and open dialogue over even the most sensitive areas. At one
point each of the three surviving siblings said during a semi formal interview and
quite independently, “Now, I’ve never told anyone this…” Because of the age gap the
researcher did not share the earlier experiences of his siblings although he was
generally aware of them from family conversations and reminiscences. At the formal
stage of the research the siblings became the sources and a family history was
constructed over about a four-year period with constant reference to the memories of
the three living siblings (Bob had died in 1989). Part of this was semi formal taped
interviews, firstly, with the three living siblings, then on an excursion to the place in
Birmingham where they were brought up and finally with Bill Maund (cousin of the
researcher) about the farm at Bircher.
Clearly these discussions were informed by the researcher’s memories which
provided background to the type of questions asked. These discussions provided an
opportunity for the memories to be cross checked and triangulated and there was for
some time continuous discussion and checking of perceptions. The dialogue during
the early days of this project was one of almost continuous, checking and cross
checking different interpretations and memories with siblings all in their eighties but
also with Roger Maund the grandson of David Maund (see below, ‘Uncle Dave’) and
the granddaughter of Thomas senior, Margaret Hayes.
In order to identify more clearly the family members involved and their relationships
both to each other and to the analysis which follows a summary is produced in Table
9.1.
251

GENERATION
7
John and Emma Maund of Bedlam Row Little Hereford (See Table 8.9). Parents of Thomas and ‘Uncle Dave’
GENERATION
8
Thomas born in Bedlam row 1864, Grandfather to Generation 10. Older brother of David Gwynn (Uncle Dave or ‘Mon’) significant because of his residence at Yew Tree Farm, Bircher Common
GENERATION
9
THOMAS ERNEST, born 1890 in Kings Norton, eldest son of Thomas, husband to Hephzibah (nee Jones) produced the 5 children who are the subjects in the investigation.
GENERATION 10
BRENDA (1913-); KEN (1915-2006); FRED(1917-2002); BOB (1919-1989); DAVID (1936-) the Researcher. Children of Thomas E. and Hephzibah.
OTHERS Bill, Hazel, ‘Jack’ children of Uncle Dave. Margaret Hayes, cousin to generation 10 and granddaughter of Thomas. Roger Maund, grandson of Uncle Dave. Aunt, wife of Uncle Dave. Dickie, illegitimate son to Hazel. Auntie ‘Cissie’, sister of mother, Hephzibah Maund. Graham Danks, first husband to Brenda. ‘Bumper’ Bill Williams, later husband to Hazel. Gary Maund, provider of data on Brimfield Maunds, not known to be related.
Table 9.1 The Relationships of People mentioned in Chapter 9.
There was also some documentary evidence, particularly the diary of Fred Maund for
the year 1934. Diaries are potentially very useful not only in gaining insight into local
cultures and ways of life, for example, Kilvert’s account of life in the Borderland
during the 19th century (Kilvert 1987) and thus, Hey’s (1975) use of the diaries of
Richard Gough (1834) which provided the basis for the formulation of ideas on core
families. Unfortunately Fred’s diary is not so extensive as these two but it is complete
for 1934 and gives insight into the life of the Maund family in the context of
Birmingham. In later life Fred wrote poems about his life and interests which were
collected together in an unpublished form.
There was also available a memoir written in the form of a book by Ken Maund
(1999) which offers some information about the history of the family and, in
particular, values and interests. Of course this source has only limited potential and
does not bear comparison with autobiographies and biographies such as those of
Ashby (1961), Sanders (1989) and Sage (2000).
The accounts of family members of their early experiences and subsequent
movements is intended to give insights into in the context of place. Much of the
dialogue with the siblings was around their perception of place on their movements.
252
“Young experiences taught us much, Quiet woodlands, murmuring stream, natures touch, That diminished memory of foul factory and smoke, And grime and rush for rail and bus” (Fred Maund c1997).
The structure of this phase of the investigation is as a narrative, based on the
interviews with each respondent, but structured around the notion of life course and
transition. The spatial biography of each of the children will be given in turn with an
interpretation of their decisions against an outline of their experiences. This is not
dissimilar to an account given by Hagerstrand (1982) but it does not pursue the
graphical representation he uses because of the much more individualised focus of
this study.
9.3 Historical Context of Maund The name Maund appears to come from the Celtic, Magene (Gelling 1984).1 This is
to be found in the place names of an area covering six parishes to the east of the River
Lugg in North Herefordshire (Figure 9.2.), which formed a territory, possibly a
Celtic/Welsh unit. Today the area includes the parishes of Bodenham, Marden,
Withington, Sutton, Preston Wynne and Felton. Working on the findings from the
interpretation of Celtic place names Coplestone-Crow (1989) traced the evolution of
the name from the Celtic to its English version, thus, Magana c675; Magane 1179;
Mawen 1303; Maune 1373.
Shepherd (1979), from a 1725 map surveying the Conningsby estate (later to be
owned by John Arkwright referred to in Chapter 5.) and the excavation report of
Sutton Walls (Kenyon 1954), reconstructed the territory following field patterns and
boundaries to demonstrate the command of the territory from Sutton Walls from the
time of the establishment of the Iron Age Fort there in 1st century B.C. (Kenyon 1954)
(Figure 9.3).
1 From her book and private communication by letter.
253

Figure 9.2 The Position of Magene
Hey (1997) in his classification of family names typifies those that stem from
particular places as ‘Locative’ and maintained that Maund is one such name.2 How
such a name became designated to a family is a matter of some speculation but
probably arose from attempts to distinguish between those of similar Christian name,
thus John from Maund becomes John Maund. Certainly the name was well
established as a surname by the mid 16th century.
2 Private communication by letter.
254

Figure 9.3 The Maund Territory (Shepherd 1979 P2).
It should be pointed out that this very brief account of the origin of a name and in the
context of the Borderland is itself speculative. The use of Celtic place names as
evidence, on their own, is insecure since there is debate and uncertainty over
translation. In this case, to ascribe Magene to a definite territory would need further
documentary support but it is at least a tenable position to adopt. The occurrence of
elements of the same name in a relatively defined area is suggestive of this. The
reconstruction adopted by Shepherd (1979) is a well known and reliable method of
research and the use of place names as surnames is a well known occurrence.3
How the name Maund arrived first in Brimfield and then in Little Hereford is not
known although Hey (1997) maintained that locative names almost invariably stem
from a single couple so, on this basis, all Maunds are related though this is open to
dispute without supporting evidence (Redmonds 1973). Of course, such evidence
might be forthcoming by means of DNA analysis particularly that of the Y-
chromosome (Sykes 2001).
3 From extensive discussion with the Medieval Historian and 11th Century Wales and Borderland specialist, Dr K.L.Maund.
255

For an earlier project the earliest parish registers, in the form of the IGI were used to
identify all entries named Maund and were plotted to reveal a spatial distribution as
shown in Figures 9.4 – 9.6. A fifty year interval was used to yield sufficient numbers
to differentiate the places and then mapped by proportional circles as shown. The last
part of the 19th century was not plotted because the decline in church attendance and
the popularity of direct Civil Registration resulted in reduced use of baptism as a route
to registration and, therefore, the results could be a significant under estimate of the
real numbers.
The3 product of this earlier research is shown in Figure 9.4 where Sutton Walls and
Maund Bryan are shown as an indication of the place of origin of the Maund name.
Interestingly there were no Maund surnames in the registers of the six
Figure 9.4 Distribution of Maund Names 1.
parishes which made up Magene until one occurs in Bodenham in the 1880s. During
the late 16th and early 17th century maps, the names were clearly to be found in the
Teme basin and during the late 16th century none occurred in Herefordshire. The
surname was well established by 1540. Before the 15th century records that can be
found relating to Maunds all contained ‘de’ indicating ‘of’ Maund rather than a
256

surname. Thus, in 1247 Mathew de Mauntz, Lord of Humbere, granted a land and
buildings to his Steward. (H.C.R.O). These were people of some significant social
position but the Maunds that form this enquiry were of a much more humble origin
and, therefore, left no record.
By the mid 17th century, however, the distribution had begun to change. For the first
time there were Maunds in Brimfield at the elbow of the Teme and also in Richards
Castle, south of Ludlow. But two occurrences persist from 16th century; one south
west of Shrewsbury and the other east of Tenbury. The occurrence of the Maunds
near Shrewsbury was in the parish of Worthen but the name disappeared from the
register by 1700. There may be an explanation for this. In 1571 the Lord of the
Manor, Edward, Lord Stafford was in debt to Richard Powell an opulent mercer of
Shrewsbury. Unable to pay he offered land with the words, “You are welcome, if
you like, to take yonder morass in exchange” (Unascribed, SRO 6000/6432). The
offer was taken up and Powell drained the land and improved it. He also built
Worthen Hall, and died in 1626. It is perfectly plausible to imagine that such works
over a period of time resulted in movement of people into the parish. It was indeed,
according to Hey (1976), a period of woodland clearance and settlement renewal in
Shropshire. At this time there were only about three generations of Maunds in
Worthen and they seemed to disappear from the records as quickly as they arrived.
During the second half of the 17th century the Maunds were diminishing in number in
Worthen and by the early 18th century had disappeared completely (Figure 9.5). The
connection between the development of Worthen and the movement of the Maunds
cannot, of course, be demonstrated. However some plausibility is offered by Gary
Maund who has provided some genealogical data for this investigation. He is
currently pursuing a possible connection between his family in Brimfield in the 18th
century and the Worthen Maunds. Such a discussion gives an insight into the very
tentative nature of genealogical investigation but also the possible relationship to local
history. It also shows how easy it might be to place too much reliance on tenuous
evidence.
257

Figure 9.5 Distribution of Maund Names 2.
Interestingly the high concentration of surnames within a particular area has been
referred to by Hey (1997) as “Country”. So the high incidence of the Maund name in
the basin of the Teme might well be regarded as Maund Country. It is another form
of territory, within the region but including the neighbourhood of Little Hereford.
What the relationship between the three might be is difficult to say but it is suggestive
of the role of core families engendering the social and cultural cohesion of interrelated
territories. This would be especially true if those with the same name were related by
blood and becomes even more coherent when those brought into the name by
marriage are considered.
Of course such a territory both persists and changes over time. By the late 17th
century there was a movement of the Maund name both south and east (Figure 9.5).
Indeed by the early 18th century there was a definite concentration around and south
of Ludlow and then east along the Teme, in Brimfield, Leysters and Tenbury itself.
This concentration around the elbow of the Teme became even more pronounced in
the late 18th century and into the early 19th century with a scattering of small outliers
(Figure 9.6). This shift was also coincident with the extended neighbourhood of Little
Hereford although it did not become a major concentration itself until the early 19th
258

century (Figure 9.6). This was the time of course when the Maund family moved
from Brimfield to Little Hereford as described in the previous chapter. The
concentration of Maunds near the great bend in the Teme was coincident with the
population transition of the late 18th century and also is at the entrance to one of the
few good west to east routes in the area and at the point where agricultural products
were in great demand from the growing urban areas to the east.
These changes in the distribution of the Maund name suggests migration and was
probably an illustration of rural circulation which over time shifts the area of
concentration. There was a movement east which raises the question as to whether
Thomas Maund and others moved, step like over time rather than directly to the
metropolitan area of Birmingham.
Figure 9.6 Distribution of Maund Names 3.
As indicated earlier, because of the increase in civil registration, data from parish
registers after 1850 are not sufficiently reliable to identify the incidence of surnames
within an area. Irrespective of this an analysis of the family names on the registers
between 1800 and 1850 did show some evidence of a growing shift eastwards and to
urban centres particularly Birmingham and Worcester (figure 9.7). In this figure the
259

Maund names in the registers between 1800 and 1850 are recorded and plotted on the
schematic map, Figure 9.7. Thus, following the key for Figure 9.6, the largest
concentrations are in Worcester and Birmingham. Thus, if there was a movement it
was a slow and gradual one over a long period of time.
Figure 9.7 The Maund Country: Schematic Representation 1800-1850.
Finally, it might be observed that if small numbers moved towards urban areas in the
early 19th century, at a time of population growth in the Borderland, it may have been
the unidentified beginning to the rural depopulation process which had its roots
further back in time. This is only clearly observable in the late 19th century from
national gross population trends. Yet at the same time, as Chapter 7 has shown, the
neighbourhood of Little Hereford continued to grow, albeit slowly. Perhaps two
diverging processes may be present simultaneously and only when one begins to
dominate is it a trend.
This section has developed further the idea of core families and the places they were
associated with and in doing so has added to the longitudinal nature of the enquiry.
Perhaps more importantly it has attempted to give a context for the analysis of the 20th
century movement of a single family. It also shows the essential interrelationship
between local history, family history and genealogy and suggests some of the
difficulties involved in identifying evidence. There is a further important question
raised by the patterns demonstrated. If feelings about place are an important factor in
260

migration is there some form of cultural memory which draws people back to that
place? This is probably an unanswerable question certainly from the evidence that
can be produced here but unanswerable questions should not be dismissed. This will
be returned to later.
The analysis now moves to an examination of the life paths of the members of a
single Maund family. The basis for this was laid in the move of Thomas Maund, the
eighth generation, ultimately to Birmingham at the turn of the century and outlined in
the previous chapter. As discussed above the approach, methodology and methods
are rather different in that it uses personal accounts from individual family members.
9.4 The Life Course and Migration Decisions of the Maund Family In this final phase of the study the enquiry focuses upon the migration decisions of the
families of the children of Thomas E. Maund during the 20th century.
9.4.1 Introduction
This section is presented broadly as a chronological narrative placed within the local
and national socio-economic conditions of the time. In particular, and arising from
these contexts, transitions will be identified which affected the course of the lives of
the Maunds.
Essential to the analysis in this chapter is the idea that distinctive ways of life develop
in particular places and this underpins the argument about personal identity and the
role of culture in migration decision-making as discussed in Chapter 5. The accounts
of family members of their early experiences and subsequent movements is intended
to give insights into process and this in the context of the concept of place as
identified by neighbourhood area and core family. Much of the dialogue with the
siblings was informed by the idea of the influence of place on their movements and
motivations and the source of these motivations.
9.4.2 The Socio-economic Context
261

Phases National and Local Conditions Life Course of the Maunds
1913-1940 Inter war period
Nationally this was a period of difficult economic conditions but despite the decline of ‘old’ industry Birmingham and the west midlands had a developing economy based in the mass production of motor vehicles and their engineering suppliers. The large scale unemployment was not reflected in Birmingham and area and there were significant opportunities for employment. Those of the working class experiencing Grammar School education found developing white collar work. In Herefordshire farming stagnated and there was much subsistence farming from small farms although trade continued with the developing urban area. Sugar beet was introduced as an important new crop. Birmingham continued to expand at the fringes, suburbanisation.
Brought up in Birmingham though the contact with Herefordshire was established. Boys attended Grammar school and obtained white collar jobs with training. Thomas E. in constant employment in this period. Move out of Harborne to the outer suburbs from early 1930s.
1940 to 1960 War gave impetus to economy especially agriculture. This presented opportunities for initiative in this field. Farming prospered until towards the end of the period with further competition from overseas, advances in real incomes and growth of consumer society and consumer lead booms. Great growth in consumer goods like TV’s, fridges, washing machines lead to demand and the growth of credit as a means of living. More owner occupiers and increased demand for quality. “You’ve never had it so good” Farming boomed at first, especially milk production but then fell back and the trend moved to larger farms and agri-businesses.
The Maunds took advantage of the farming conditions and moved away from Birmingham to transform their lives in the country. To an extent they diverged.
1960 to 1980’s Continued consumer boom but further decline in industry beginnings of significant challenge to agriculture from cheaper overseas products. European Union and subsidies distorts market. Diversification but significant population return to countryside.
Maunds in mid to late career. Eventually all but David back in Herefordshire and still involved with ‘country’ interests even in retirement. Later their children establish families, only one to do with agriculture.
Late 1980’s to Date
Need for diversification in farming very marked, unresolved problems of agricultural production but dramatic decline in milk production and crises with BSE and Foot and Mouth.
Death of Bob, late 80s. All settle in Herefordshire and continued interest through sporadic involvement in farming.
Table 9.2 Socio-Economic Phases of 20th Century. (Adapted from Wise 1950; Evans et al 2001)
This section of the study extends from the birth of the young Maunds over the period
1913 to the present. During that time in addition to changes in population trends
detailed in Chapter 6 there were also considerable socio-economic changes both
locally and nationally. It is certainly not the contention that these circumstances
262

determined the lives and decision of the family but they certainly provided the context
in which decisions were made (Table 9.2). For the purpose of analysis the period is
divided into three long periods of time, namely growing up to about 1940; the War
years and immediate aftermath to the mid 1950s, and a period in mid career of the
Maund family leading to retirement in the mid 1980s. These are not entirely arbitrary
categories since they represent phases in the lives of the Maund family during the 20th
century as well as indicators of changing socio-economic conditions in England and
Wales.
9.4.2 Cultural Context and Influences
According to Champion and Fielding (1992) the cultural background within which an
individual is embedded is an essential consideration when examining the migration
process. Here in the case of the Maund family this will be considered under two
broad headings: parental and environmental.
Parental
For this part of the study the focus is upon the five children of Thomas E Maund and
his wife Hephzibah. Thomas E was 9th generation in the Maund family (Table 8.8)
and the first to be born away from Herefordshire, in Kings Norton in 1890. His
migration path was traced in the previous Chapter along with that of his father,
Thomas (Table 9.1). What follows here are selective items chosen to make up a
profile of family influences but they were achieved after reflection and consultation
with family members in order to show the early influences, particularly the clash of
values, upon the children that may go some way to explain some of their subsequent
decisions. It is offered here to give insight into motivation.
One of the major conduits for the transmission of culture and the developments of
attitudes and values is the family itself. Thomas E. Maund’s early life was spent
moving backwards and forwards from the Birmingham area to the Borderland
(Chapter 8). He was born in Kings Norton in 1890 and died in Bredenbury,
Herefordshire, in 1966 aged 76 years. He spent much of his school years in Knowle,
Warwickshire, and despite his disrupted life he was allowed to leave a year early at 13
because he had reached the required academic standards. His early adult life was
spent in Birmingham where, apart from a spell with an aircraft company, he was a
263

waiter. This brought him into contact with a range of people, life styles and vicarious
experiences that informed the rest of his life. He was an enquiring man and an
adventurous man with a great capacity for learning. Aged 19 years he taught himself
the rudiments of French and went to Brussels to work as a waiter. By his own
account, dismounting from the train in Brussels, he wondered at the strange accents,
“French is not spoken like people from Birmingham”.4 He married around 1911 and
the couple went to Paris where he worked as a waiter in the city centre. In 1955, aged
65 and on a trip to Dublin, he was still sufficiently proficient in French to act as
interpreter for a group going round the Guinness Brewery. He went to the US and
Canada for a year in 1921 financed out the £1,200 proceeds from a treble on the
November Handicap; he also lost his job for betting on the premises. In 1939 he was
taken on by the Ministry of Aircraft Production as an Aeronautical Inspector and led a
department of 26 engineering graduates.
He was a man of many interests with a great reverence for learning, for example, he
read the entirety of Gibbon’s ‘Decline and Fall of the Roman Empire’, took evening
classes at Reading University in his 50s and passed the first year maths course there.
He had interests that lasted years and then moved on to others, breeding greyhounds,
making radio sets, golf and beekeeping. Thomas had strong but unselfconscious views
about his place in society, he believed in class and breeding but was not personally
diminished by it. He could converse with anyone, was highly sociable and skilled and
entirely without personal ambition or interest in material possessions.
He did though come from what could be said to be a working class family with
experience and attitudes of service and some of his attitudes might be traced back to
this. His father, as shown earlier, had been a farm worker, a groom, a coachman and
then latterly an insurance collector and a distributor of newspapers. His mother, the
daughter of a shepherd had been a domestic servant. They always lived in rented
accommodation and never aspired to own their own house, perhaps never believing it
was possible. His eldest sister was also a domestic servant and three other sisters
worked on the line at Cadbury’s chocolate factory. Two brothers went to the US and
4 Recounted to the researcher, his youngest son, David, possibly in 1950s.
264

prospered, another became a chef and travelled the world. In other words, a family of
service and adventure but without social ambition.
Thomas married, by contrast, Hephzibah Jones, the last child of a small shopkeeper
and newsagent brought up in Wallheath on the rural fringe of the Black Country.
Hers was a narrow non-conformist upbringing, she sang contralto in the Chapel Choir
and was taught to play the piano. Her siblings, all older, were all worldly and
successful; one sister managed a large hotel in Blackpool, another married a stock
broker, two brothers owned butchers shops and in the 1930s her mother owned a car.
Hephzibah’s family thought she had married beneath her status. She had narrow
attitudes and standards, was critical of people and had scarcely any social skills but
had an abiding love of the countryside.
This volatile clash of attitudes and values, of aspiration and ways of life, produced a
daughter and four sons, all born in Birmingham between 1913 and 1936. Hephzibah
was ambitious for, and fiercely protective of, her children and asserted the superiority
particularly of her sons, and had strong views on behaviour and public presentation.
She was thrifty and careful - she had to be because of Thomas E’s attitudes of
profligacy and live for the moment.
Environment (1)
The first four children were brought up in cramped, rented accommodation above a
shop in the High Street of an inner Birmingham suburb (Figure 9.8). This suburb was
in marked contrast to the rural conditions of Bedlam Row (Figure 8.3). They were
different worlds separated by about 40 miles and incalculable cultural difference. In
Little Hereford men went to work in the fields on foot, they grew a good deal of their
own food in their gardens and children walked to school to be taught by teachers with
quite different sets of values, they worked on the land when they were needed and
visited the town infrequently and they walked everywhere. There was no electricity,
no gas and no water closets. When they left school they worked on the land or were
apprenticed to a skilled man – or they left for the town.
265

Figure 9.8 High Street, Harborne (Clarke 1994)
In Birmingham work in the restaurant or factory, the Austin or Cadbury’s, was
accessed by public transport. School was regularly attended, there were only a few
gardens and food came from shops and milk from a churn brought to the door. Major
shopping was regularly accessible, whilst in Herefordshire it was probably only once
per week.
The first child, Brenda, left school aged 14 years in 1927 and trained as a
comptometer operator and then worked in the Water Department of Birmingham City
Council. The three boys passed the ‘scholarship’ and went to an elite boys grammar
school. They left school at 16 years of age and went into white-collar jobs, two at the
Austin Longbridge factory and one in the Treasurer’s Department of Birmingham
City Council. They were socially upwardly mobile. They married respectively a
typist and a telephonist who both went to grammar schools and a comptometer
operator who went to a private school. This was against a background of a developing
economy in Birmingham and, in the 1930s, a developing opportunity for those from
266

the working classes who used a grammar school education as a means of social and
economic improvement.
The Environment (2)
Fred was born in 1917 with a cleft pallet. His father, Thomas E., paid 200 guineas for
him to have a pioneering operation to correct this. Thomas E. was financially very
well off indeed, to secure his job as a waiter in the exclusive Exchange Restaurant,
Birmingham, he had to pay a premium of £5 per week to be allowed to work there.
The operation was a great success but Fred remained sickly. So, in 1923, in order to
help his recovery Thomas E. had a caravan built and towed by horse to Bircher
Common, Herefordshire, to Yew Tree farm owned by his uncle David Maund,
(‘Uncle Dave’ or ‘Mon’). The family took up residence there at Easter 1923 to stay
for the duration of the summer whilst Thomas E remained at work in Birmingham.
The children enrolled at the local school along with their second cousins Hazel, Bill
and Jack. They went back to Birmingham in September but the experiences of the
previous five months stayed with them for life. They returned the following year for
the summer. This was, it later transpired, the first step in the eventually permanent
return of the family to Herefordshire.
Although it was only a temporary migration at this stage it shows some of the known
features of migration. For example, the visit to an area before the decision to migrate
permanently. In more detail it indicates some of the essential phases in the process of
migration.
• Motive or trigger to migrate – the perceived health need of Fred. • Enabling resource to move – the income of Thomas E. • A destination to move to – the facility and location provided by ‘Uncle Dave’.
These points are not suggested as an inevitable sequence; the knowledge of a
destination may become the motive to move. This is a not unfamiliar feature of
migration over a long period of time. For example, Baines (1985) noted the role of
knowledge as an essential ingredient in the 19th century emigrations to the USA,
267

whilst Pryce (2000, p69) has referred to it as a ‘Migration Feedback Loop’. However,
recent research has shown the very great complexity in the decision to migrate
particularly between marriage partners (Seavers 1999). In the case of the young
Maunds the temporary move to Bircher Common began a process of, at least partial,
acculturation. This process of assimilating and adapting to the rural culture or at least
admiration for its way of life possibly provided an additional stimulus to move to
Herefordshire more permanently.
As indicated previously the notion of life course has to an extent superseded the life
cycle as a means of describing migration process. Here the view is taken that life
course relates to the sequence through life of an individual or family which may or
may not show similarity to others but which is marked by turning points or transitions
some of which may relate to migration. Indeed it may be perfectly possible to go
through a transition without recognising it rather like the time of decision alluded to
by Kirk (1963). A transition too is here regarded as more of a process than an event.
Thus, the visit to Bircher by the Maunds in 1923 may be viewed as a transition point
but in reality it may be seen more as the beginning of a process. The acquaintance
with Bircher was, in terms of life course, an important transition for the whole family.
Different individuals responded to this in slightly different ways but for the whole
family it was an essential point in a process. It transformed the life course of the
entire family.
It also seems clear, although there is no direct evidence, that there must have been
previous contact between the Birmingham Maunds and the Herefordshire Maunds. It
seems safe to assume that when Emma Maund died in Little Hereford in 1917 that
Thomas would have attended the funeral perhaps accompanied by his son Thomas E.
In fact Thomas E., when passing Little Hereford church, referred to it as the place
where his grandmother was buried. Uncle Dave would have been at the funeral too so
some communication would have been established. After the Great War Thomas E.
had a powerful motorbike (1000cc Ariel, OH 6973) and may well have visited Bircher
to set up the siting of the caravan. So another phase of the process was established:
• Prior contact with Destination • Identification with ways of life as a stage to Acculturation.
268

Bircher Common is immediately adjacent to the neighbourhood of Little Hereford, to
the west in the parish of Yarpole, which is on the western edge of Richards Castle and
Orleton. Figure 9.9 gives an indication of the layout of the 345-acre common, one of
the largest in Herefordshire. Yew Tree Farm is at the south-eastern edge with Cock
Gate School due south. To the west is the Iron Age fort of Croft Ambrey and Croft
Castle whilst Bircher Hall is to the southeast. The common itself lies on the south
facing flanks of an east-west ridge and rises to 280 metres. There is woodland
towards the summit and the rest is grass, fern and gorse. The holdings on its southern
and eastern edge had grazing rights so there were sheep and semi wild horses.
Figure 9.9 Bircher Common
As noted in Chapter 8 Uncle Dave returned from the USA in May 1912, just avoiding
being a passenger on the Titanic. He bought Yew Tree Farm for £800. This farm was
269

only 40 acres5 but crucially it had grazing rights on the Common. For the
Birmingham Maunds it was an entirely new world, quite different from that
experienced in central Birmingham in the 1920s. At this time the regime on the farm
was not unlike that described by Dodd (1979). It was a small mixed farm but
supporting much more than its acreage due to the grazing rights. The Common was
used for sheep that were commercially reared for the market in Leominster. The
ponies were caught by Uncle Dave using his American saddle and a lasso and then
broken to be sold in South Wales as pit ponies. Milk and butter were sold at the door,
both full cream and skim, the skim derived from separating the cream that was used
for the churning of the butter. This was made by Aunt who sang “Keep the Home
Fires Burning” as she churned. All this provided income. Each member of the
family, adult or child, worked the farm, and each had a specialised role. Bill was the
sheepman and his brother Jack the horseman; this from an early age for it was both
work and leisure, a way of life. Aunt looked after the house, the poultry and
essentially the farm accounts. In fact it would be true to say that life did not consist of
a separation between home, work and leisure, it was all one – a genuine way of life.
“Flower” the horse provided the means of cultivating the land and the crops included
beet, mangolds, swedes and potatoes. Additionally oats, beans and wheat were grown
similarly for fodder. Of course apples were grown for cider. So it was essentially a
pastoral farm but with significant arable support. On Fridays, those not at school,
went to market in Leominster. The pony and trap carried butter, eggs and sometimes
chicks and other fowl. Animals to be sold, sheep or cattle or calves, were driven the
six miles on the hoof. The pony and trap was left for the day at the Golden Lion for a
small fee. The farm was self-supporting in many ways, certainly for most foods, but
any other necessary items were bought on the weekly trip to Leominster because it
was also an opportunity for some leisure to be looked forward to.
There were no public services on Bircher Common until the 1950s. Water was
carried in buckets using a yoke and oil lamps or candles provided light. In the winter
evenings the family gathered together around the kitchen table and read or played
5 The material in this section is drawn from recorded conversations with Bill Maund son of Uncle Dave, Roger his grandson and with Ken, Fred, Brenda, sons and daughter of Thomas E.
270

cards or did sewing repairs, all by the light of a single candle. They lived in a
desperately frugal manner.
The children of Uncle Dave, and the contrast in their way of life, had a profound
influence upon the young Maunds which remained with them for ever. For example,
they caught and trapped animals and birds, some of which they tamed and kept in
homemade cages and runs. They rode the horses on the Common, but never with a
saddle for fear of being caught in a stirrup as Uncle Dave had seen many times in
America. It was a complete contrast to the way of life of the Birmingham Maunds.
They walked across the Common to the village school and because of the nature of
the activities and way of life they developed a bond that remained with them for life.
Bill was the leading figure in this, he was a skilled and intelligent man whom the
others admired and saw as a model. He passed the ‘Scholarship’ as did his sister
Hazel, but neither of them took up their places. They felt that extended school could
do little to support or enhance their way of life. This fits entirely with the view
expressed in Chapter 5 that part of the culture was an undervaluing of the potential of
education.
271

Figure 9.10 Extract, Admissions Register, Cock Gate School, 1924 (H.C.R.O. J17/4 )
Figure 9.10 shows an extract from the Admissions Register of Cock Gate School.
The four young Maunds are shown entered there with Robert starting at the school for
the first time. The previous year, 1923, he was too young to go when the others
started there. The lower part of the extract shows the leaving of the school date for
the return to Birmingham for the Autumn of 1924. A previous page in the Register
shows the admission of the three Maund Cousins, Hazel Gwynn, William David, and
John Wilfred, ‘Jack’.
Something of the way the young Maunds lived in their caravan is given in an extract
from a letter sent to the researcher by his brother, Fred, together with the drawing
below it (Figures 9.11 and 9.12). In the extract something of the feeling for the place
comes through. This extract makes clear the preference for this experience on Bircher
Common rather than the one in the City.
To the Birmingham Maunds it may have seemed like a rural idyll and certainly it
remained in their memory as such for the rest of their lives. They were
impressionably young, in the company of their mother who was in many ways ‘rural’
and with a new and exciting peer group; they were also there in the summer.
272

“The caravan was parked in an orchard some 200 yards behind the farm house. On the far side or rear were two bunk beds. Under the rear of the caravan and attached to was a large wooden box the full width, with a hinged lid. Mother used to keep utensils in it, a sort of locker. This could have been about 1925. At the time we lived in Harborne in a small house behind and over a shop. It consisted of a small living room and what we called scullery, with two small bedrooms and an attic. So we were glad to go to the caravan. Life in the caravan was obviously primitive, no flush toilet. All water carried from the farm and therefore rationed. Springs and streams were reasonably clean, fertilisers were not used extensively then, so we drank from these sources”
Figure 9.11 Letter from Fred Maund 11th Nov 1996.
Figure 9.12 The caravan. A sketch made by Fred in November 1996 when he was 79 years old.
273

They enjoyed freedom to roam, the excitement of the farm and its regime, the
company of cousins with whom they identified and with whom they forged a lasting
bond, the affection and admiration for Uncle Dave. Above all it was a life style and
way of life and witnessed in exciting and unusual circumstances.
In Chapter 5 the importance of culture in the decision to migrate or at least the ways
of life associated with it was emphasised. A culture may contain a variety of
interdependent ways of life and the one played out here was both similar and greatly
different from that of the agricultural labourer. This was another reality to the
situation. The Maunds of Bircher were independent farmers who owned their farm;
therefore the farming decisions were theirs. It was, despite the vestiges of
subsistence, a commercial enterprise designed to make money so it was another
aspect of the culture of the area. The 1920s and 1930s was a period of depression in
farming but for those with the insight, as always, there was money to be made. Uncle
Dave was a travelled man, his wife was from the neighbouring village and was a hard
working business woman. The way of life, though attractive, was geared to the
business of farming. Uncle Dave made three other moves by 1939, to farms each one
better than the last, in Newton, Preston Wynn and finally Sutton, all within 12 miles
of Bircher. In 1939 he bought, for £3,000, the 87 acre farm, Amberley in the parish of
Sutton St Nicholas between Hereford and Leominster, in the territory of Maund.
The experiences on Bircher Common in the early 1920s made a formative and lasting
impression upon the young Birmingham Maunds such as to give direction to the rest
of their lives. This, by their own testimony, was an essential component in their
decisions to migrate.
The argument above leads to the conclusion that an aspect of the migration process is
an image of the desired way of life in the receiving area.
• Perceived way of life is important in the decision to migrate. • The properties of the receiving area are important in the decision to
migrate. • There may be a personal fulfilment/ambition component in the
decision to migrate.
274

• Ambition led migration requires energy and drive.
This though is not the whole of the matter. There may be an impression of the
receiving way of life but in practice this has to mesh with what is brought by the
migrant. Thus the attitudes and values previously learned have to mesh with those of
the receiving community. This part of the process is an essential consideration for
acculturation which is an aspect of the success of the migration process. Previous
experience is not expunged by the new one, they both have to be brought together into
some form of relationship and different people will do so in different ways. In this
manner there is no deterministic, inevitable outcome to the process.
The contention here is that the Maunds, in addition to the Bircher experiences,
brought something from their parents, for example, their mother’s desire for material
improvement and something from their urban experiences of a grammar school
education and early beginnings in white-collar jobs. All this informed their later
movements and judgements.
• An aspect of the decision to migrate is the previous life experiences of the potential migrant.
• For successful migration there needs to be an accommodation between the incoming migrant and the receiving community.
The remainder of this chapter traces the migration paths of each of the Maund
children together with their stated motives for each move.
9.4.3 The Inter-War Period: The Early Migrations
This section examines the first moves made by the Maund family all within the inter
war period and then as they married and the family dispersed. Much of the analysis is
based on the personal evidence of those concerned.6 Much of this evidence is in the
form of recorded conversations, both one to one and also together, on Bircher
Common and in Harborne. It is not a formal interview situation because this would
have been inappropriate but it rested around the need to understand the answers to
three fundamental questions. Where? When? Why? This methodology, a form of
participant observation, is a familiar one (Hoggart et al 2002; Cloke et al 2004).
6 The exception is Bob who predeceased this study, so much will be based on evidence from his elder daughter and the researcher.
275

“It was a better House” The Maunds made one move within Birmingham. In 1932 they moved further out of
the City to a three bed roomed, semi-detached rented property with a bathroom, in the
rural-urban fringe, with a very large garden. This was part of the suburbanisation
process then affecting large urban areas as they continued to expand (Wise 1950).
Bartley Green was on the edge of the then built up area and there was a farm at the
end of the lane where a chicken could be bought for 2/6. Contrast Figure 9.13 with
Figure 9.6, they were three miles apart but ages in terms of standards of living. The
decision to move was taken by Mother with the active urging and support of her
children. She took the initiative and found the house and moved. It was much more
like the location of her childhood. And, of course at least three of the children were
earning. Fred said,
“Well, it was a better house wasn’t it?” Brenda said,
“We were older by then and could put pressure on” This suggests that Thomas E. merely acceded. This was not a move conditioned by
some predetermined life cycle stage but more initiated by the children to meet their
life style aspirations. It was a transition.
Figure 9.13 “A Better House”
276

In the 1920s and 1930s unlike their counterparts in the countryside, a grammar school
education was seen as an opportunity to improve life chances. The young Maunds
had this opportunity and seized upon it. By 1932 Brenda and Ken were working in
white-collar jobs with prospects and Fred was about to join them. Their mother had
aspirations from her childhood experiences.
There was much in the conversations and references to the extreme dislike that
Mother and the children had for the Harborne accommodation. They certainly felt
disadvantaged by it and resentful that they lived in such circumstances when the
income existed for better accommodation. By 1932 all but Bob were earning and
could contribute to the support of the household so, it looked as though the move was
made irrespective of the views of Thomas E.; he was not part of this decision for there
was no thought on his part for this type of material improvement.
The circumstances may reveal another aspect of the migration process and in some
way relate to previous notions discussed in Chapter 7 about the possible significance
of accommodation in the process.
• Improving accommodation and environment may be a factor in the process of migration decision.
“Nearly a Poultry Farm”
In January 1934 Fred started a diary that he filled for the whole year with remarkable
consistency. All but December is complete for that year. He had his 17th birthday
during that year and the diary tells of his work, some happenings in the family, and
gives an insight into the continued interest in rural affairs as learned in Herefordshire.
It would be possible to do a form of content analysis upon the diary but this section
takes a more open approach to illustrate themes to do with the desire for a country
way of life. Thomas E. worked on the assembly line at the Austin Motor Company
and the three older children had white-collar jobs. Although they had what might be
called urban employment they maintained a rural interest. In the diary three
significant themes emerge: considerable discussion concerning contacts with
Herefordshire, the emergence of interest in horticulture, and the development of
277

commercial interests. In many ways these were quite different interests to those of
their father, Thomas E., and the other children of Thomas Maund (Generation 9).
The family had a large garden and an allotment that was supplemented by two other
allotments in the course of the year. In addition to growing produce for the house
there was also the production of eggs and the rearing of poultry.
“Mother is thinking about putting wire netting round the allotment and keeping fowl (White Leghorns), sitting broody hens and rearing chicks” (Friday Jan 5th.)
Then the next month he records,
“I got home and hurried my dinner, had a wash and went to Harborne. I then went to the Bank where I got 15/- out. Afterwards I went to Collins & Wells, the ironmongers, and asked the price of the wire netting. They said 17/- for a roll fifty yards long by five feet high and two-inch mesh. I thought that was too much and went to Whistles where I got it for 15/6. It was British made and guaranteed. I also bought a nice little galvanised bucket, 6d.” (Friday 2nd February).
There are many references to the fowls, each day the number of eggs they layed and
also to their sale, plucked and dressed. In March he goes to the Bull Ring,
“I walked round about five times & finally bought 8 white Aylesbury ducklings for just under 6/-. The fellow wanted 8/- for them but I knocked him down to that price.” (Friday 23rd June).
Even these brief extracts show money saved for future use and the interest in best
prices and bargains, a business approach to a hobby.
There are also references to the cultivated plants and the involvement of the other
members of the family. With the exception of Thomas E., they all joined in.
“Ken has got the broad bean and peas and tomato seeds from Northfield and we all dug the garden in the afternoon” (Saturday 11th February)
278

There are also many references to the planting, watering and finally harvesting of
these crops. Prices are frequently quoted also. It is a mine of information about the
family interest in growing and rearing things and to buying and reading the weekly
“Small Holder” and the collecting of a number of editions to qualify for their
encyclopaedia.
There are many references to visits to the local farm,
“I stopped in, in the morning, and went to Davies’s in the afternoon. I milked a cow.” (Sunday 6th May)
But Fred, however, turns down an opportunity to work on the farm.
“… went up to Davies’s farm and Mrs Lucas asked me, or rather told me, that I could have a job there but I would rather stick to the one that I have as I can save more money” (Wednesday 2nd May)
He was constantly visiting this farm and buying items from them such as straw but the
interest here is his desire to save money, gained from his Mother and her thrift but
also suggesting some future aim or ambition, which was addressed later.
“I often wish I was far away from Austin in the country some where. I have this feeling lots of times. The noise and chatter of factory people doesn’t suit me” (Wednesday 13th June).
This reinforces the idea of delayed gratification for some later achievement. The next
day some of this dream is expressed when he records,
“I sold a cockerel at work, 1 to Mr Bentley and 1 to Mr Amphlett, that is six orders for cockerels so far. I have only 8. I have 21 chickens and chicks and hens etc amount to 44 head of stock. Nearly a poultry farm”. (Thursday 14th June).
Certainly all this was driven by interest but it was not a mere hobby, it was also
commercial. There was an attempt to make money from the enterprises and there was
an intellectual component, a desire to learn, in the reading of appropriate literature.
The emotional attachment to the countryside is best summed up in two late entries,
279

“Read Lorna Doone or rather a few pages out of the book. It describes the country on Exmoor marvellously. Also farm life is described” (Thurs 1st November).
and then a few days later,
“I took the book Lorna Doone to work with me and read it during the dinner hour. The scenes are on Exmoor far out in the country round about the year 1680. I hope to save up and have a farm sometime far out, as Shakespeare (sic) says ‘Far from the madding crowd’” (Monday 5th November).
So, the ambition is stated clearly.
In the diary there is also evidence of continued contact with Yew Tree Farm in
Herefordshire and this some 10 years after the last summer stay in the caravan in
1924. Thus,
“I wrote to Jack and Bill today” (Tuesday 28th February).
“I had a letter from Jack at the farm yesterday and mother had one from Aunt. Flower is dead, a bit of bad luck. I wrote to him and Bill and then after that I wrote a bit in my diary.” (Wednesday 28th March).
“We had a letter from the farm. Aunt sat 48 eggs and got 9 chicks” (Saturday 5th May). “They may come from the farm on Sunday” (Friday 13th July). “Bill, Jack, Aunt, Uncle, Hazel, Dickie and Bumper came in a four seater Standard. I moved the fowl run onto the grass. What a job it was too. Jack has grown a bit and Dickie. I think I shall go for my holidays.” (Sunday 22nd July). “I was thinking, a fortnight today ahead I hope to be at the farm” (Tuesday 24th July).
In fact Fred did not visit the farm but rather went to stay with his Auntie Cissie in
Rhyl. Here he had a good time with her children and the excitement of the
entertainments, the fair ground and the cinema. These interests, urban based, contrast
with his countryside interests, a duality he maintained throughout his life. At this time
280

despite his desire to be in Herefordshire, he went to the seaside instead. But on the
other hand members of the family did go to Herefordshire.
“Mother is going to the Farm on Saturday” (Wednesday 29th August). “Winkle(Ken) is bad having felt sick all last night and today. However, if all goes well Bobbie and he will cycle to the farm tomorrow for a week, while mother goes on the Midland Red.” (Friday 31st August). “Mother and Bob and Ken went to the farm this morning for a week” (Saturday 1st September).
So there are persistent themes in the diary relating to growing and rearing things,
about the ultimate commercial nature of this and a willingness to learn more. The
continued contact with the farm and the friendship and bond between them is also a
feature. Of course this is a partial selection of the diary, there are many references to
work at the Austin factory, to attending evening classes, the activities of the
household and to some world events. But what emerges from the selection are two
further features of the migration process;
• As an aspect of the migration process the significance of the concept of way of life.
• Continuous contact with the reception area is important in the migration process.
Whether these interests and experiences can be seen to constitute a real understanding
and appreciation of the rural way of life is difficult to determine. It could equally be
that it was an idealised view based as it was on two exciting summers spent with a
peer group away from a drab home environment. On the other hand, it emphasised
that the Maund boys were all immensely proud, not so much of their grammar school
education but that they had been to King Edward VI Grammar School, Five Ways.
They spoke of it, could recite the register of names of their class and wore the Old
Boys tie. These were important formative experiences which assisted their lives later.
281
9.4.4 The Moves away from Birmingham.
In the terminology of Coleman and Salt (1992) the family of Thomas E. dispersed,
effectively from 1938, when the move back to Herefordshire began. It was on the
initiative of Fred with the active encouragement, support and participation of Mother
which resulted in finding a cottage for rent. He moved there with his mother and two
year old brother, David, (present author and born in 1936) and maternal grandmother,
Xantepe Jones. For the moment the other members of the family stayed in
Birmingham and, over the next four years married, and as will be shown below,
moved to Herefordshire as individual families. This came at the second phase of the
socio-economic context which came as the war created a resurgence in farming and
brought it out of the stagnation which it had suffered since the 1870s (Table 9.1).
Although this move to Herefordshire was important in the lives of the family it could
be argued that it was a continuation of a phase initiated by the transition of the early
1920s and preparatory to the next transition. It was more than a change of location
but not yet a transition.
There is no doubt that Fred was the leader and catalyst for the moves. In 1932 he left
school early and after a short period at the Technical College responded to an advert
in the “Farmers Weekly” and went as a live-in farm worker to a farm in Sussex. The
whole tone of his 1934 diary, written after his return, strongly suggests that it was he
and his mother who were responsible, in the main, for the cultivation of the garden,
the allotments and the production and sale of poultry and eggs. The others were
interested followers. Thomas E. never took part in these activities nor did he ever
initiate a move of house. But wherever he was he found things to interest him and
they always had an intellectual component.
Another characteristic of the migration process suggests itself from the role of Fred.
• Leadership or initiative taking is an important aspect of the migration
process.
The first move was to a cottage on a common, by coincidence, Maund Cottage on
Maund Common in the hamlet of Maund Bryan. The origin and significance of this
name has been described in detail above. Because of the significance of Fred in
282
leading the family migration his moves are charted first in what follows. The data
used comes from recorded conversations in 1998 that predate the structure of this
project. They were recorded at this point because of the age and health of the
respondents. The sequences are accurate but the dates not always entirely precise.
Bob had predeceased this work and, therefore, his sequence of moves comes from his
children and the researcher.
The moves are shown in the form of a chart together with some commentary. For
example, Table 9.3 a colour-coded chart that plots these moves. The brown shows
countryside locations and the green locations in Market Towns. Immediately a
number of patterns can be identified.
For example, the vast majority of the moves were within the countryside and there
was only one short period away from Herefordshire, more specifically from North
Herefordshire. But there were other important features. For the years up to the mid
1950s Fred pursued his ambition to be a farmer. To achieve this he gradually built up
his resources. At the rented Lion Inn during the War he farmed 15 acres, mostly dairy
farming, as well as running the Inn. In three years he made £1,000, which provided
the capital for his first farm in Carmarthenshire.
He left Herefordshire for Wales in 1946,
“… because farms were cheap there, I paid £1,200 for Pantygweinth and then £6,000 for Blaencynlleth which was better land”
This move to a farm may be called a transition in the life course of Fred, it was the
culmination of a set of endeavours all aimed at owning a farm. In the act of doing this
he changed his entire life style. He was by then married and had three children but
these events were not so significant as the change to the ownership of a farm.
The move to Wales was a means to an end, the return to Herefordshire to buy a farm.
He achieved this ambition in 1950 when he bought a farm in Herefordshire, aged 33
years. He acquired two farms in quick succession. But this was the end of his
seeking the way of life of the farmer. Thereafter making of money in a less long term
manner and the ownership of property became Fred’s goal. To an extent material
283
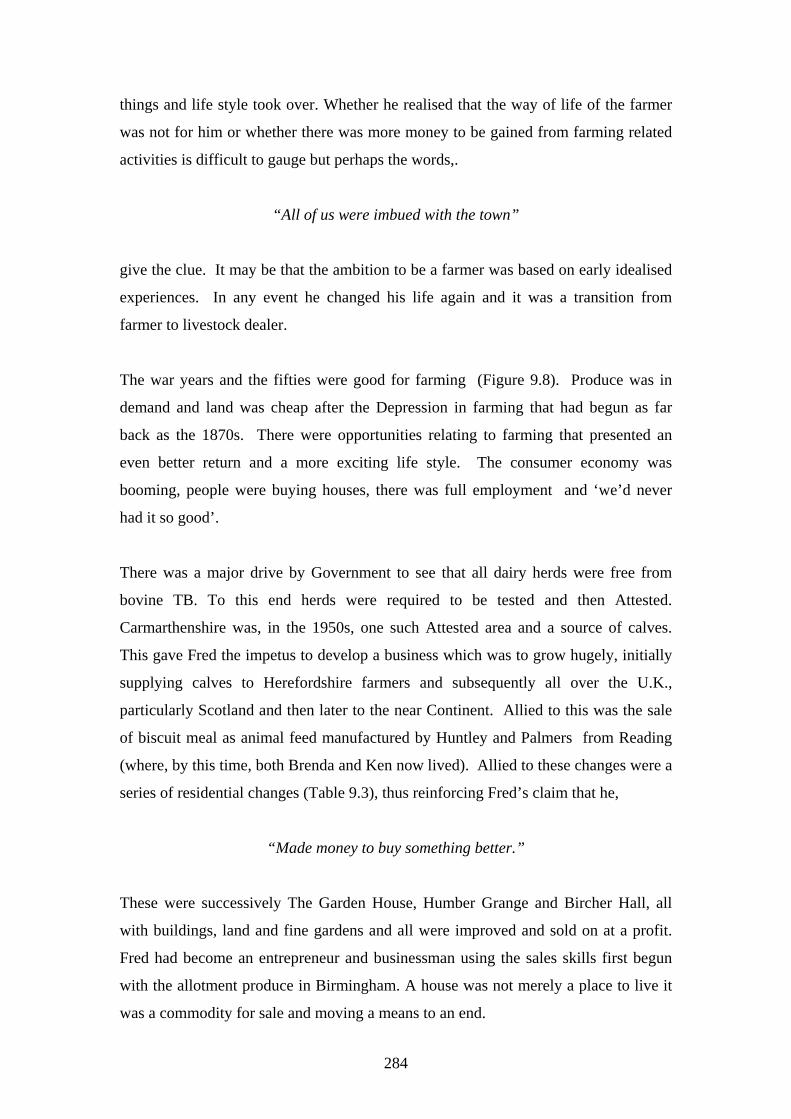
things and life style took over. Whether he realised that the way of life of the farmer
was not for him or whether there was more money to be gained from farming related
activities is difficult to gauge but perhaps the words,.
“All of us were imbued with the town”
give the clue. It may be that the ambition to be a farmer was based on early idealised
experiences. In any event he changed his life again and it was a transition from
farmer to livestock dealer.
The war years and the fifties were good for farming (Figure 9.8). Produce was in
demand and land was cheap after the Depression in farming that had begun as far
back as the 1870s. There were opportunities relating to farming that presented an
even better return and a more exciting life style. The consumer economy was
booming, people were buying houses, there was full employment and ‘we’d never
had it so good’.
There was a major drive by Government to see that all dairy herds were free from
bovine TB. To this end herds were required to be tested and then Attested.
Carmarthenshire was, in the 1950s, one such Attested area and a source of calves.
This gave Fred the impetus to develop a business which was to grow hugely, initially
supplying calves to Herefordshire farmers and subsequently all over the U.K.,
particularly Scotland and then later to the near Continent. Allied to this was the sale
of biscuit meal as animal feed manufactured by Huntley and Palmers from Reading
(where, by this time, both Brenda and Ken now lived). Allied to these changes were a
series of residential changes (Table 9.3), thus reinforcing Fred’s claim that he,
“Made money to buy something better.”
These were successively The Garden House, Humber Grange and Bircher Hall, all
with buildings, land and fine gardens and all were improved and sold on at a profit.
Fred had become an entrepreneur and businessman using the sales skills first begun
with the allotment produce in Birmingham. A house was not merely a place to live it
was a commodity for sale and moving a means to an end.
284

• In favourable circumstances migration can be used to generate a
livelihood.
Date Location Herefordshire Location elsewhere Employment
1938 1940 1941 1942 1943 1946 1948 1950 1954 1956 1958 1961 1966 1972 1975 1978 1979 1981 1996 2000
Bodenham - Maund Cottage ,, - Moor Croft ,, -Pigeon Hse Cott Ullingwick – Wood Hill Amley – Lion Inn Nine Wells Farm – Marden Middlewood Farm – Clifford Yarkhill Garden House - Shobden Humber Grange Bircher Hall Falcons Roost – Newton Kingsley House – Dinmore Light House – Leominster Old Hall – Hatfield Livestock Centre – Stoke Prior Leominster Wigmore
Pantygweinth – Carms Blaencynlleth – Carms
R.O. Factory Lorry Driver & Small Holder Publican & Small Farmer Dairy Farmer ,, ,, Dairy farmer ,, ,, Calf Dealer & Smallholder Calf Dealer & Land Owner Calf Dealer Calf Dealer Calf Dealer & Land owner Calf & Car Dealer Renting Flats Dealer Dealer, livestock, cars, rented property, land. Retired Retired –Died 2002.
Table 9.3 The Moves of Fred Maund.
Thus, for example, Humber Grange was bought for £3k and sold for £9k. Bircher
Hall was bought with 15 acres for £10k and sold for £12.5k. Some of the land was
sold separately for £10k so in total the deal amounted to £22.5k.
The sixties began a new era in the economy which gathered pace into the seventies
when even the newer industries came under pressure from overseas competition.
Historically the 1970s began to see farming under pressure again and there was
inflation in property prices and land. Fred took advantage of this, but always lived in
285
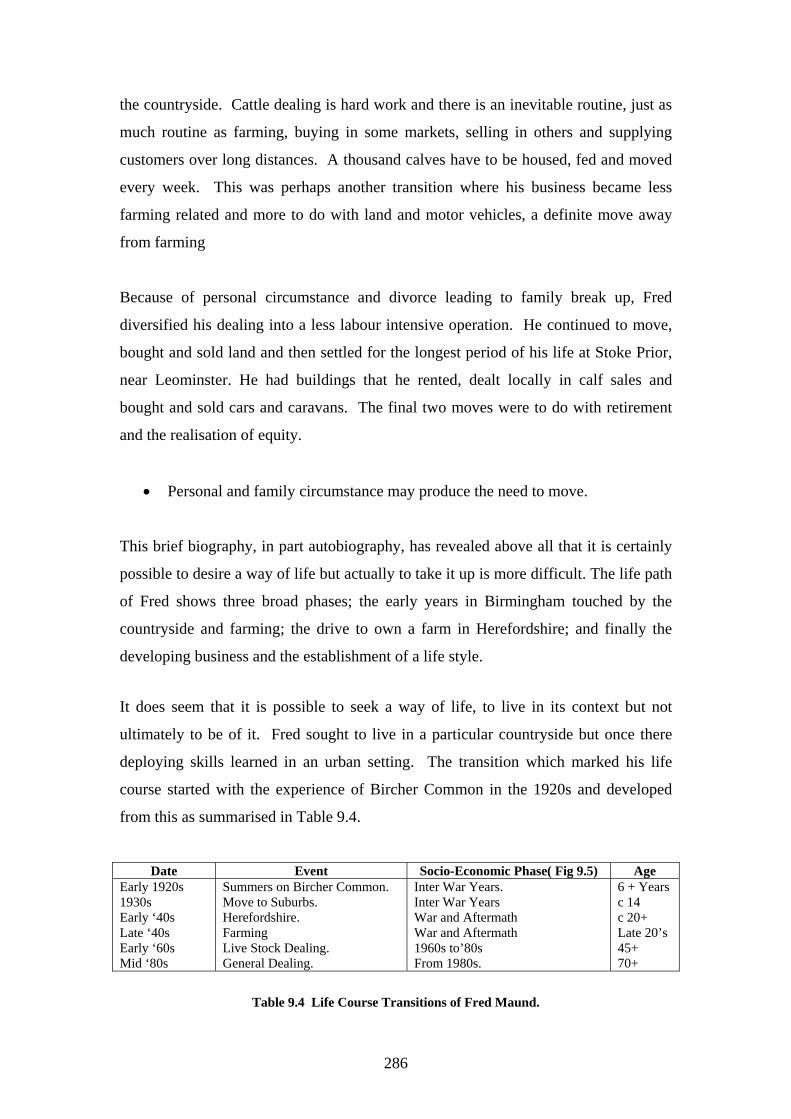
the countryside. Cattle dealing is hard work and there is an inevitable routine, just as
much routine as farming, buying in some markets, selling in others and supplying
customers over long distances. A thousand calves have to be housed, fed and moved
every week. This was perhaps another transition where his business became less
farming related and more to do with land and motor vehicles, a definite move away
from farming
Because of personal circumstance and divorce leading to family break up, Fred
diversified his dealing into a less labour intensive operation. He continued to move,
bought and sold land and then settled for the longest period of his life at Stoke Prior,
near Leominster. He had buildings that he rented, dealt locally in calf sales and
bought and sold cars and caravans. The final two moves were to do with retirement
and the realisation of equity.
• Personal and family circumstance may produce the need to move.
This brief biography, in part autobiography, has revealed above all that it is certainly
possible to desire a way of life but actually to take it up is more difficult. The life path
of Fred shows three broad phases; the early years in Birmingham touched by the
countryside and farming; the drive to own a farm in Herefordshire; and finally the
developing business and the establishment of a life style.
It does seem that it is possible to seek a way of life, to live in its context but not
ultimately to be of it. Fred sought to live in a particular countryside but once there
deploying skills learned in an urban setting. The transition which marked his life
course started with the experience of Bircher Common in the 1920s and developed
from this as summarised in Table 9.4.
Date Event Socio-Economic Phase( Fig 9.5) Age
Early 1920s 1930s Early ‘40s Late ‘40s Early ‘60s Mid ‘80s
Summers on Bircher Common. Move to Suburbs. Herefordshire. Farming Live Stock Dealing. General Dealing.
Inter War Years. Inter War Years War and Aftermath War and Aftermath 1960s to’80s From 1980s.
6 + Years c 14 c 20+ Late 20’s 45+ 70+
Table 9.4 Life Course Transitions of Fred Maund.
286

Elder brother Ken had similar early life experiences to that of Fred, initially clerical
work after school before eventually at the Austin Motor Company as a progress
chaser which by the outbreak of the Second World War put him in a senior position
on the night shift at £6 per week. But, significantly, he lived in Herefordshire briefly
in 1938,
“I was fed up with Austin, with all the noise, and the country life beckoned”
But then a series of events took him back to Birmingham, imminent marriage and the
threat of war. This time he went to the part of Austin now designated for the war
effort, Aeroparts, which was a reserved occupation.
In 1939 he succeeded in obtaining the tenancy of a County Council Small Holding on
the outskirts of Worcester. He did this by persuading the Council Committee of his
experience of farming on Bircher Common. The rent was 9/6 per week and the ‘in-
going’ £50. It came about from his initiative to place an advert in the Worcester
Journal. Throughout the war he cultivated the holding as a market garden, selling the
produce to shops and the remainder on the market. Date Location Herefordshire Location elsewhere Employment
1939 1947 1948 1949 1950 1952 1960 1966 1972 1974 1996 2004
Star Pit Farm Herefordshire Thornbury Pudleston Leominster
Dines Green - Worcester Clynfelin - Carms Blaenavon - Carms Tally - Carms Reading – Emmer Green Reading - Caversham Berkshire – Pangborne Wiltshire
Min of Aircraft Prod/ Smallholder Dairy Farmer ,, ,, ,, ,, ,, ,, Company Sec./Small Holder Company Director CD/ Small Farmer Small Farmer Jewellery Dealer Retired Retired to children
Table 9.5 The Moves of Ken Maund.
At the same time he worked at Aeroparts. It was a time of war and shortages and,
therefore, a good time for growing and selling produce.
287

At the end of the war he gave up his job and worked full time on his plot and sold
through a shop, rented in the town. Eventually this became two shops when he went
into partnership with a returning army officer. In 1947 he sold the good will on the
smallholding for £2,500 and moved to Wales.
Table 9.5 shows the moves made by Ken which is again colour coded similarly to that
for Fred but with the addition of a rural/urban fringe in green and town in red.
There are clear differences with the chart of Fred but also distinct similarities, the
farms in Wales to increase equity rather than to farm and the desire for a farm in
Herefordshire which was achieved in 1950. He also had the drive to succeed by
making money. Of his period in Wales Ken says,
“I made a mistake with Clynfelin, I paid £1,700 for 80 acres and moved there in the May only to find that I could have got a 200 acre farm for £1,200. So I sold it for a profit and moved on the next September”
Fred’s influence is apparent here as he was already in Wales at this time so in a sense
Ken followed him and received information from him. It was a time when outsiders
were beginning to move to this area, a number of Polish war veterans came and the
price of farms rose. The Maund brothers were in at the beginning before the prices
began to rise significantly and so reaped the rewards.
• Some migration is a stepping-stone to later migration.
The move back to Herefordshire was short lived. An offer came through from his
immediate boss at Aeroparts to join a new venture in the 1950s Hire Purchase boom.
A Company had been established in Reading and he was invited to be Company
Secretary at a starting salary of £1,000 per annum. This was an opportunity to set his
family up which farming on the scale he had achieved could never do. He moved to
the Oxfordshire fringe of Reading, to a smallholding with greenhouses.
• The role of significant others is important in the migration process.
288

The later move into the town was to a large house capable of accommodating, more
comfortably, his three teen age daughters. The success of the business meant he could
once more follow his interests. He bought a small farm on the outskirts of Reading
and farmed it as well as being a Company Director and chairman of the Commercial
Bankers Association.
Thus, both brothers could see an opportunity and were capable of taking a risk to
pursue it. This and their interest in the countryside and in farming explains many of
their moves.
• The identification of opportunity and willingness to take risks is a
factor in migration.
The return to Herefordshire was facilitated by retirement where in quick succession he
bought two smallholdings, staying in the last one for 22 years, part of which was
spent dealing in jewellery (which he bought in the Jewellery Quarter of Birmingham)
with jewellers up and down the Borderland. It was the longest stay anywhere. The
move into Leominster was because the work on the smallholding became too much –
he was 81 years old. From here he went daily to Bircher Common to walk. In 2004,
aged 89, he moved, with great reluctance, to Wiltshire to be close to his daughters. He
died there in 2006 and his ashes were scattered, at his request, on Bircher Common.
Clearly there are parallels to the lifecourse of Fred - the achievement of an ambition
to farm and a subsequent change in direction. As indicated in Table 9.6
Date Event Socio-economic phase Age
Early 1920s 1930s Early ‘40s Late ‘40s Early ‘50s Mid ‘70s 2004 2006
Summers on Bircher Common. Move to Suburbs. Worcester Market Garden Farming Company Secretary/Director Retired, Jewellery Move Wiltshire Died
Inter War Years Inter war years War and Aftermath War and Aftermath. Aftermath ; 60s /70s From ‘80s From ‘80s
C8 C16 C25 C30 C37 C60 89 91
Table 9.6 Life Course Transitions of Ken Maund.
Ken also experienced a series of distinct transitions, some different from those of
Fred but the broad pattern is not dissimilar with the same broad influences producing
289
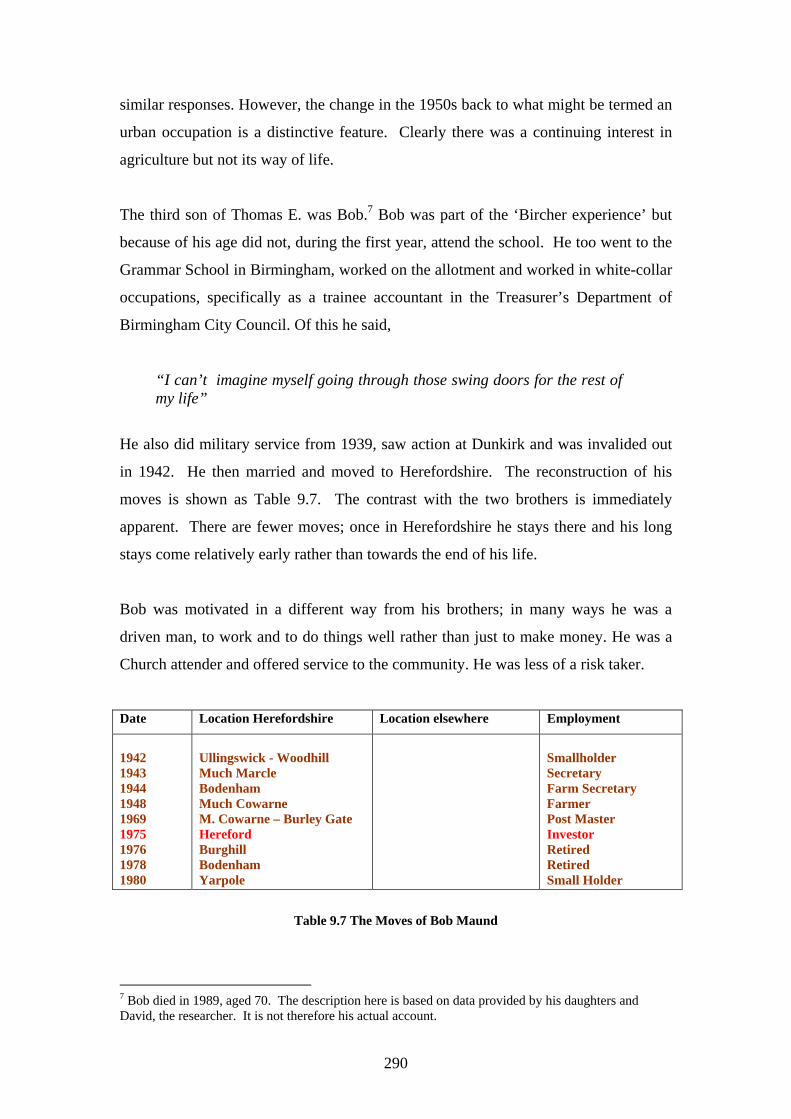
similar responses. However, the change in the 1950s back to what might be termed an
urban occupation is a distinctive feature. Clearly there was a continuing interest in
agriculture but not its way of life.
The third son of Thomas E. was Bob.7 Bob was part of the ‘Bircher experience’ but
because of his age did not, during the first year, attend the school. He too went to the
Grammar School in Birmingham, worked on the allotment and worked in white-collar
occupations, specifically as a trainee accountant in the Treasurer’s Department of
Birmingham City Council. Of this he said,
“I can’t imagine myself going through those swing doors for the rest of my life”
He also did military service from 1939, saw action at Dunkirk and was invalided out
in 1942. He then married and moved to Herefordshire. The reconstruction of his
moves is shown as Table 9.7. The contrast with the two brothers is immediately
apparent. There are fewer moves; once in Herefordshire he stays there and his long
stays come relatively early rather than towards the end of his life.
Bob was motivated in a different way from his brothers; in many ways he was a
driven man, to work and to do things well rather than just to make money. He was a
Church attender and offered service to the community. He was less of a risk taker.
Date Location Herefordshire Location elsewhere Employment
1942 1943 1944 1948 1969 1975 1976 1978 1980
Ullingswick - Woodhill Much Marcle Bodenham Much Cowarne M. Cowarne – Burley Gate Hereford Burghill Bodenham Yarpole
Smallholder Secretary Farm Secretary Farmer Post Master Investor Retired Retired Small Holder
Table 9.7 The Moves of Bob Maund
7 Bob died in 1989, aged 70. The description here is based on data provided by his daughters and David, the researcher. It is not therefore his actual account.
290

His memories of Bircher were not as powerful or as compelling as they were for his
brothers, his attachment to the sons of Uncle Dave not as strong, he was possibly too
young for them to be his peer group. Bob, by contrast with his brothers, did not have
an obvious nostalgia for his youth but he did have a commitment to a community of
which he wished to be a part.
He came to Herefordshire because of Fred and his mother and the need to recuperate
after his war experience. Fred found him and his new bride a place to live, but he was
not ready for farming. He moved to Much Marcle in eastern Herefordshire where he
worked in the offices of the Weston Cider Company, so his skills learned in an urban
area served well in a rural environment. There was a bungalow that went with the
job.
Herefordshire is an area of large landowners as well as small farms. One such was
Captain Norman Edwards who had five farms that he ran through farm bailiffs in each
case. Such an enterprise requires organisation and a bureaucracy and Bob became
Secretary to the estate and moved to a tied house in Bodenham, Maund Court. The
estate office was in nearby Preston Wynn at the main farm, Rosemaund. When
Norman Edwards died prematurely Bob went to work for his father Major Edwards
who also had farms. He remained also as accountant to Norman Edwards’ widow.
In 1948 he moved to Panks Bridge Farm, in Much Cowarne, first of all as tenant and
then as owner, sold to him as sitting tenant by his then employer, Major Edwards. He
had been interested in farming, just like his brothers but his early experience was not
successful. Working as a farm secretary and mixing with the farm bailiffs was a
learning experience so when the opportunity arose to become a farmer he seized it.
Once more the influence of contacts and significant others is important in moving-on.
Bob farmed at Panks Bridge Farm successfully until 1969. During the 1960s farming
was under pressure, because the government was encouraging the amalgamation of
farms in order to achieve economies of scale, the Common Market was well
established, and farm labour was difficult to hire. Dairy farming is a 365-day
commitment and Bob was driven to work continually and for long hours. He
successfully diversified into beef, soft fruit and eggs. The next move was precipitated
291

by ill health; he had a heart attack and on medical advice gave up the heavy work of
the farm. So, he bought the village post office at Burley Gate in the same parish and
built it up from a very small village shop to a local mini market with grocery and
paper rounds. It was sheer chance that the post office became available when he
needed it but the development was down to his business skills, imagination and
relentless drive.
The next move was because the business had grown and was too much for him to
handle, so he looked for somewhere to invest his money and bought a large property
in Hereford that was divided into flats. He lived there for a while, taking rents but
moved to a new bungalow in a village near Hereford. Whilst here he maintained the
Hereford property and gradually sold off each apartment as a separate entity.
The next investment was in an old cottage in Bodenham, again part of the Maund
territory, where he was well known having lived there before, where he had friends,
sang in the choir and felt part of the community. He improved the property
significantly and then bought again this time in Yarpole, in the parish of Bircher
Common. This last property was also a smallholding so he reared and fattened
bullocks. At the same time he worked providing bookkeeping and accountancy
services for his nephew (son of Fred) and then to a local garage and car sales
business.
Date Event Socio-economic phase Age
Early 1920s 1930s Early ‘40s Late ‘40s Early ‘70s
Summers on Bircher Common. Move to Suburbs. Herefordshire, Farm Sec. Farming Property, part time clerical
Inter War Years Inter war years War and Aftermath War and Aftermath. 70s
C8 C16 C23 C30
C50+
Table 9.8 The Life Course Transitions of Bob Maund
It was only in the last fifteen years of his life that Bob moved frequently and this, like
his brothers, was for investment purposes. This was forced on him by his health
rather than an early drive to increase equity. His moves were short distance and he
remained in touch with his community, the friends, the ‘local’ and the choir in which
292

he sang for thirty years. In his farming days he served on the Rural District Council,
took part in and organised events and supported the local professional football team.
In 1953, being one of the few villagers to own a television (there was no mains
electricity then) he invited those who wished to come and view the Coronation on his
12” set. He had a sense of community and a commitment to its people. As
summarised in Table 9.8 the transitions of Bob’s life course were more localised than
those of Fred and Ken but yet were equally driven and distinctive.
It could be argued that the remaining two children of Thomas E. had slightly different
experiences and life chances, Brenda born in 1913, because she was the eldest and a
female and David because he was the youngest and over half a generation after the
other four. Brenda said of the experience of going to Bircher Common,
“Going to Bircher Common and to school there ruined my education.”
Then later she observed, speaking of the 1920s and 1930s,
“Where there were children of both sexes in those times the boys were sent to the Grammar school but not the girls.”
So there was sex discrimination,
“But we just got on with it, took it for granted”
Brenda did not go to the Grammar School but instead went to a comptometer school
when she was 14 years old and worked in the Water Department of Birmingham City
Council. Here she was one of the better paid at 25/- per week, better than the typists
and, as she commented,
“A lot of the girls were from well to do families.”
In terms of the society of the day she, like her brothers, was enjoying a form of
upward social mobility indicating aspiration and probably explaining the pressure to
293

move from Harborne to Bartley Green to a better house. But it was different for a
woman. In a sense the work they got, however prestigious, was to service functions
organised by men. Never-the-less certain jobs represented, for some, upward social
mobility, they could join the lower middle classes, mostly through their expertise.
• Upward social mobility may be a factor in the migration process
One other factor needs to be noted. It was frequently the case that the work needs of
the husband dictated much of the family movement, so if the husband’s job moved
then so did the family. It would therefore be expected that Brenda’s husband
(Graham), whom she married in 1938, would have determined the moves of the
family. Graham was a Birmingham man who had been well educated and, pushed by
his parents, became a skilful and well qualified pianist. He too worked originally in
the Water Department; he was popular, humorous and took part in the social life,
tennis parties, concerts and holidays abroad. He was not though, unlike the Maunds,
an initiative taker; he was reactive rather than proactive. Graham imagined himself
serving in the Council House until retirement. In the case of Brenda it was she, from
the 1940s, who held the ‘orchestration power’ (Seavers 1999).
Table 9.9 shows the moves that the family made. One item not shown is the
temporary move made by Brenda in 1940. Because of a difficulty she had had in
carrying a pregnancy to full term, on the advice of her Doctor, she joined the Land
Army. She did her three months training at Nantwich in Cheshire and went to work
on a farm in Herefordshire, near to Ross-on-Wye. She was here for about two years
and fully contributed to the work on the farm, living-in. This was not the case with all
her contemporaries,
“A lot of the girls couldn’t cope on the farms, especially with the cows.”
It would appear that the experience at Bircher had only partly ruined her education.
In early 1943 she was pregnant and went to live temporarily with her mother and
youngest brother at Maund Cottage in Bodenham. She was required by the Doctor to
rest throughout the last seven months of her pregnancy. David was 7 years old and
his mother 50. Brenda and David were to form a very strong bond.
294
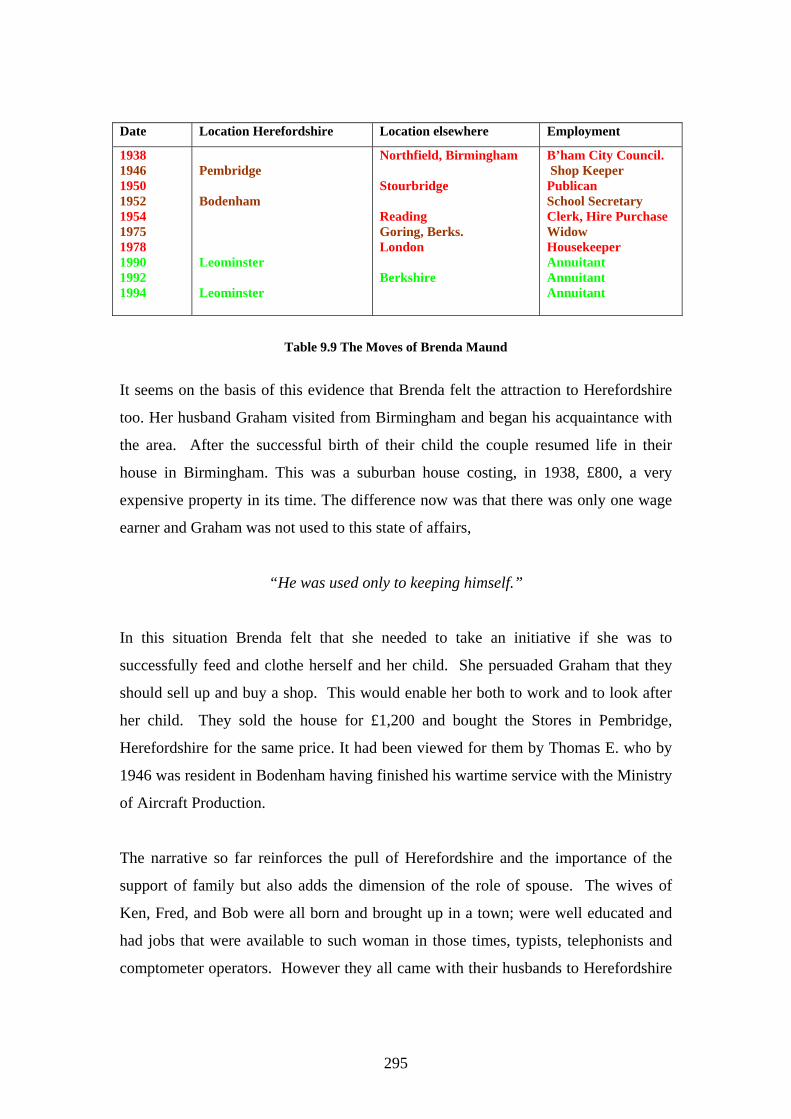
Date Location Herefordshire Location elsewhere Employment
1938 1946 1950 1952 1954 1975 1978 1990 1992 1994
Pembridge Bodenham Leominster Leominster
Northfield, Birmingham Stourbridge Reading Goring, Berks. London Berkshire
B’ham City Council. Shop Keeper Publican School Secretary Clerk, Hire Purchase Widow Housekeeper Annuitant Annuitant Annuitant
Table 9.9 The Moves of Brenda Maund
It seems on the basis of this evidence that Brenda felt the attraction to Herefordshire
too. Her husband Graham visited from Birmingham and began his acquaintance with
the area. After the successful birth of their child the couple resumed life in their
house in Birmingham. This was a suburban house costing, in 1938, £800, a very
expensive property in its time. The difference now was that there was only one wage
earner and Graham was not used to this state of affairs,
“He was used only to keeping himself.”
In this situation Brenda felt that she needed to take an initiative if she was to
successfully feed and clothe herself and her child. She persuaded Graham that they
should sell up and buy a shop. This would enable her both to work and to look after
her child. They sold the house for £1,200 and bought the Stores in Pembridge,
Herefordshire for the same price. It had been viewed for them by Thomas E. who by
1946 was resident in Bodenham having finished his wartime service with the Ministry
of Aircraft Production.
The narrative so far reinforces the pull of Herefordshire and the importance of the
support of family but also adds the dimension of the role of spouse. The wives of
Ken, Fred, and Bob were all born and brought up in a town; were well educated and
had jobs that were available to such woman in those times, typists, telephonists and
comptometer operators. However they all came with their husbands to Herefordshire
295

to take part in a life that was completely alien to them. In the case of Brenda it was
the other way round and the new life was alien to Graham. So,
• The role of spouse is important in successful family migration.
Seavers (1999) has shown quite powerfully the significance of this either
positively or negatively in contemporary family migration.
Unfortunately, Graham did not adapt.
“He didn’t like the shop so I sold it and then we had no where to go so I had to do something”
The family moved to Stourbridge to a rented public house and the tenancy of the pub
was taken from the couple that bought the shop. It was a chance affair and not a
conscious decision to go to Stourbridge.
• The location for some migrations can be based on chance factors.
Once more this was an unsuccessful venture and the family returned to Herefordshire,
to Bodenham and a rented cottage found by Brenda. She said of her husband:
“All he wanted was to be looked after, I was the man and he was the woman.”
Graham took a job as clerical assistant in a school and later with a firm of builders
and Brenda with a branch of Aeroparts in Hereford. By this time Ken was well
established in his new role with the developing Hire Purchase Company in Reading.
This was expanding rapidly with the consumer boom from the mid fifties. Graham
was offered the position of heading up the section of the firm to deal with failed
agreements and Brenda as a comptometer operator. Accommodation was provided in
an apartment in the large Victorian house that was the offices of the Company. This
reinforces the point that,
296

• Family connections facilitate the process of migration
In 1975 Graham died and Brenda, in rented accommodation, had little or no income
so went to live with her daughter in Goring-on-Thames.
At the time of her marriage in 1938, Brenda had formed a friendship with a similar
couple and remained close friends from then on. Through this couple Brenda went as
housekeeper to a widower in London. She married him and when he died used the
funds he carefully left for her use to return to Herefordshire and she moved to
Leominster in 1990. She returned to Berkshire in 1992 when she became ill and went
into sheltered accommodation. When she recovered a little the pull of Herefordshire
exerted itself again and she returned to the same street in Leominster where she had
previously resided. The new house proved uncomfortable and inconvenient for her so
she moved over the road to a larger house. Finance was no longer an issue.
• Contacts can be an important factor in the migration process. • Some moves can be made for convenience.
In 2002, aged 89, she moved again, this time to a large bungalow because she could
no longer manage stairs. It is an excellent, large, bungalow but her complaint was:
“I don’t have a view, I can’t see the countryside”
Date Event Socio-economic phase Age
Early 1920’s 1930’s 1947 1978 1990
Summers on Bircher Common. Move to Suburbs. Move to Herefordshire Move to London Back to Herefordshire
Inter War Years Inter war years War and Aftermath ‘60’s to ‘80s. Post ‘80s
C8 C16 C34 C65 C80
Table 9.10 Life Course Transitions of Brenda Maund.
This was to Brenda an unsatisfactory life course which took a number of twists and
turns as she sought to find a satisfactory way of life for herself. The key turns are
shown by the transitions in Table 9.10.
297

David was the youngest of the children of Thomas E. He was born in Birmingham in
1936 and moved to Herefordshire in 1938 where he spent his school years. He did
not have the Bircher experience nor did he have the peer group of siblings to grow up
with. Moreover in the wartime Thomas E. was away so he was brought up largely
alone with his mother in Maund Cottage. He did not know the family in Birmingham,
the grandparents, uncles, aunts and cousins as well as neighbours. His siblings were
adults and married but formed a huge support group and from them he learned the
stories of their childhood in Birmingham but also on the farm at Bircher. By contrast
he had no desire to farm, he turned down the offer from Bob to work the farm and
from Ken to go to Reading and join the new Company. He stayed on at school and,
influenced by his sister with views about security and a pension, trained as a teacher.
The moves are shown in Table 9.11 and the coding blue is for another category,
Suburban Village.
Date Location Herefordshire Location elsewhere Employment
1956 1959 1960 1969 1974 1999
Pembridge
Coventry Reading Coventry Nottinghamshire Leicestershire
School Teacher ,, ,, ,, ,, HE Lecturer Education Adviser Retired
Table 9.11 The Moves of David Maund.
The move to Coventry was for no other reason than the availability of work. In 1956
the explosion in education, particularly secondary schools, had not yet begun and
there was no work in Herefordshire the place of choice. The home area carried with it
an attraction but not the farming way of life. There were certain criteria employed in
the search for work. Large metropolitan areas were excluded from consideration but
anywhere in the Midlands within range of Herefordshire were considered.
The move to Reading, after marriage, was entirely due to the availability of
accommodation that was offered there by Brenda. The move back to Coventry, one
year later, was due to the apparent impossibility of ever buying a house in the Reading
area and being passed over for promotion. In the early 1960s two significant national
trends occurred. There was great house price inflation, especially in southeast
298
England, but additionally there was a major shortage of teachers and great demand in
expanding towns such as Coventry. Two further factors facilitated the move back to
Coventry. Firstly, there was the record that David and his wife had gained as teachers
with the Authority and then there was the policy of the City Council to build and to
offer for sale on 100% mortgages houses for what were called key personnel. So, as
touched upon in Chapter 8,
• Availability of housing is a factor in the migration process. • Housing policy can be used to attract migrants.
The move to Nottingham in 1969 was in order to achieve a particular ambition, to
teach in Higher Education and to train teachers. There were three options available at
the time, in Newcastle, in Eastbourne and in Nottingham. This time most areas of the
country, outside London, would have been acceptable.
• Migration can be triggered by ambition and perceived job satisfaction.
In some senses this is not unlike the move of the brothers to Herefordshire for a
perceived way of life. Rather like the move of Ken to Reading it was not related to
place but it was of the same order of ambition. Sometimes perceptions do not work
out and the move does not produce satisfaction, rather like the first move of Brenda to
Herefordshire and then to Stourbridge. But additionally the teacher-training boom
had begun to decline and there was danger of oversupply, therefore, opportunities for
promotion had dried up as colleges began to close.
• A mixture of motives and circumstances can trigger migration. • Other forms of ambition may supersede the attraction of place.
The second return to Coventry was facilitated by qualifications and experience but
also previous reputation there. The employment was with the Coventry Local
Education Authority but the residence was in Lutterworth. This was determined by
the needs and wishes of David’s daughter, Karen. It was thought undesirable for her
to attend a school in an Education Authority where David had some influence and
interest. Beyond Coventry the nearest Authority was that of Warwickshire but during
the 1970s it still maintained a selective system of secondary education and also single
299

sex schools, both of which were considered undesirable by the family. An alternative
with reasonable access to Coventry was Leicestershire which had the perceived
advantage of a respected comprehensive system of secondary education. Effectively
then the possible choice of residence was Hinckley or Lutterworth and since the latter
had suitable and affordable housing David and his family moved there in 1974.
• Educational needs of children and ideology may determine the place of migration.
• Where there is choice precise location of migrants may be determined by availability and taste in housing.
The last move, delayed after retirement by seven years, was the always-intended
return to Herefordshire. It was delayed because of the unwillingness on the part of
David’s wife, Irene, to relinquish the contacts and ties that she had built up in the area
and her concern about establishing similar ones in a new area. This was resolved
partly by the relocation of their son and his family to Herefordshire and by
reassurances about the maintenance of friendships, interests and contacts with the
Leicestershire area. It was a negotiated move.
• Where there are family and community considerations moves may have to be negotiated within the family.
As illustrated in Table 9.12 the transitions in David’s life course are very different
from those of the siblings.
Date Event Socio-economic phase Age
1938 1954 1966-69 1992 1999
Family move to Herefordshire. Education Career.. Undergraduate Education Retirement - research Back to Herefordshire
War and aftermath Aftermath to 1960s ‘60s to ‘80s Late ‘80s onward ,, ‘90s ,,
2 18 30 56 62
Table 9.12 The Life Course Transitions of David Maund.
9.5 Commentary The interpretation of the moves of the Maund Family during the 20th century has
produced a number of insights into the migration process. This has been facilitated by
300

the use of the concept of life course and the associated use of transition has proved an
invaluable framework for the analysis. It has indeed given form to the content and
enabled comparability between the decisions of the members of the family. The life
course idea has reinforced the essential longitudinal nature of the enquiry and the
concept of transition emphasised the major turning points in the life course. Clearly
this is a different interpretation of this framework from that which was offered by, for
example, Warnes (1992) but it is fit for the purpose of this study. The insights into
migration process are highlighted in the text and will be brought together in the
Summary below. The purpose of this Section is to draw out certain features,
implications and indeed speculations arising from the analysis.
The most regularly occurring feature, emphasised by all respondents, was the pull of
Herefordshire. There was a most marked sense of place amongst all the family
members. The influence of the early experiences on Bircher Common condition most
of the moves. In fact, the only one not apparently dominated by this was Thomas E.
himself. Even David had the idea of Herefordshire implanted in him from an early
age and eventually returned there despite not having the same early experiences. It is
not merely place but its association with particular relationships and ways of life
which really made up its attraction. To what extent this also relates to the origin of
the name and the territory of Maund can only be a matter for speculation and is
certainly beyond the scope of this study.
The pull of place was consistently held at one level but it was also, at times, in
conflict with the desire for personal success and fulfilment which could not be
achieved in Herefordshire. These conditions appeared to have been brought about by
a number of factors, the home influences upon ambition, the reinforcement of the peer
group of which the family was a part and the early and formative experience in
Herefordshire. These factors displayed themselves in different ways in different
members of the family such that the direction of their life courses were different.
After the point of family dispersal the transitions were at different times and with
some times different motivations. Always though these transitions are made against a
background of particular circumstance within a national trend or framework.
301
This raises a number of interesting features. Interestingly, the beginnings of the move
to Herefordshire in 1938 began before the conventionally agreed point of the
counterurbanisation phase in contemporary national population trends. Of course,
Pahl (1965) and Lewis (2002) have argued that this trend started significantly before
it became statistically noticeable in the 1970s. This reinforces the view that each
move has its own origins and individual motivation but together they become a trend
or tendency. Thus the macro trend is the product of many different individual, micro,
decisions.
The gradual move east of the Maund Country noted in the earlier part of this chapter
may too be an illustration of the beginnings of another trend, in this case the
movement in the direction of dominant urban areas. If this were the case then, at least
for this branch of the Maunds, Thomas’s move in the late 19th century was at the point
when the countryside of the Borderland showed an absolute loss of population.
Further, in the case of this Thomas, he used skills developed in a rural environment
and adapted for urban living. He became a coachman. It was only when these skills
became redundant with the increased popularity of the motor car that he was forced to
change to an unrelated form of employment and became an insurance collector.
In all the Maunds spent only about a generation and a half in Birmingham, less than
40 years. On his return to the countryside Bob used ‘urban’ skills as an entrée to the
world of agriculture. This appears to have been quite an effective mechanism for the
ultimate development of a farming way of life. Bob was the most successful in
developing this way of life and only severe ill health forced him to abandon it. Ken
and Fred on the other hand spent a relatively small amount of time as farmers. Ken
seized opportunities created by the war to embark upon an agricultural career but
within ten years, and the ownership of three farms in succession, he had abandoned it.
Similarly Fred lasted only about ten years as a farmer and in that time owned four
farms. So despite the apparent desire for a farming way of life the reality proved
unsatisfactory. But the pull of Herefordshire remained. Brenda too felt this though
she never showed an interest in farming apart from her spell in the Land Army. So it
is the attraction of place which is the common element in the Maund’s migratory
behaviour rather than farming as a way of life.
302

There are further interesting implications for the role of macro processes in the
development of these migratory histories. Undoubtedly, by the 1940s when all
members of the family were in Herefordshire, conditions that had prevailed in the
1920s had changed and these changes continued through the 1950s and 1960s.
Firstly, farming was not the same in the 1950s and 1960s as it had been in the 1920s
when it was largely depressed and was largely subsistence with an element of
commercialism. During the ‘50s and ‘60s farming began to become an agribusiness
with the complete removal of subsistence resulting in a different way of life. The
early buying of farms by the Maund brothers took place before land prices began to
rise and in particular dairy farming had the advantage of yielding a regular monthly
income on a rising market of demand. In turn the sale of farms took place against a
background of accelerating rising land prices and high food prices.
The move out of farming by Ken and Fred was again consistent with more general
economic processes, for example, the need for Attested cattle and the consumer boom
which led to the rise of purchase by credit. Then there was the inflationary rise in
property prices that could be used as a source of income and consequently drive
migration. Bob adapted in a different way, initially he changed his farming practise
from dairying to beef and soft fruits, and stayed in farming until ill health forced him
to move. So the Maunds adapted, perhaps because of their urban experiences, they
were imbued with the town and in the country but were not entirely of the country.
David was brought up in the country but left it and became part of an urban-based
culture with widely dispersed networks. His career sat astride national movements in
education. He benefited by entering it just as the education system was expanding
and developing, later he was frustrated by the contraction in teacher training colleges
in the 1970s. But migration was a necessary concomitant of upward mobility. These
themes could be developed further but it is important to stress that although the family
benefited from macro changes they did not actually plan for it but by their action
contributed to those changes. They saw opportunities and took the necessary risks.
It seems fairly clear that there are different routes to the same ambition and at least
part of these routes will be determined by individual decision within a national
framework. To what extent this is consciously undertaken by the individual is
difficult to determine but in the process certain features were clearly apparent. Among
303

the members of the Maund family the pull of Herefordshire was felt by all, as was the
drive and will to do well in some way or another. All, except David, felt the attraction
of agriculture, of growing plants and rearing animals. Within this framework their life
paths were determined by their own decisions and within the context of wider socio-
economic changes.
How should the distance travelled in Maund migration be measured? In terms of the
spatial and temporal distance they returned fifty years after the family migrated to
broadly the same area, very different from the one left fifty years earlier. It was 40
miles and a cultural gulf mediated by temporary contact in the 1920s. This gulf cannot
be measured but it was part of the process.
9.6 Summary and Conclusions
The previous section looked at some of the broader implications of the analysis. This
section lists the insights which have been identified during the analysis. These are the
product of the aim to investigate the migration process. They are not intended to be
generalisations but some insights from the behaviour of one family and based in the
assumption that generalisations and tendencies are made up from individual decision
based in individual values and circumstance. These insights are drawn from those
highlighted in the text and presented in groupings or categories but they are not
intended to be discrete. From the analysis it should be clear that they are an
interrelated set of conditions.
Necessary Conditions
• A motive or trigger to migrate. • An enabling resource to move • A destination to move to • Prior contact with a destination • Leadership or initiative taking was an important aspect of the migration.
Motivation
• There may be a personal fulfilment/ambition component in the decision to migrate.
• Ambition led migration required energy and drive. • Migration was triggered by perceived job satisfaction. • An aspect of the decision to migrate was the previous life experiences of the
potential migrant.
304

• Improving accommodation and environment may be a factor in the process of migration decision.
• Availability of housing was a factor in the migration process. • Personal and family circumstance may have produced the need to move.
• Educational needs of children and ideology could determine the place to migrate to.
• The role of significant ‘others’ is important in the migration process. • The decision to migrate often involved a mixture of motives and particular
circumstances. Qualities for successful Migration
• A sustained interest in a particular way of life, Farming in the case of the Maund family was a significant aspect of the migration process.
• Continuous contact with the reception area is important in the migration process.
• In favourable circumstances migration could be used as a means of improving a family’s livelihood.
• The identification of opportunity and willingness to take risks is a factor in migration.
• The role of spouse was important in any successful family migration. • Family connections could facilitate the process of migration
Acculturation
• A perceived way of life was important in the decision to migrate. • The character of the receiving area was important in the decision to migrate. • For a successful change of residence there was a need for an accommodation
between the incoming migrant and the receiving community. • Housing policy was used as a means to attract migrants.
Other Features
• Often one move would be a stepping-stone to later migrations. • Some moves were made for convenience. • Where there was choice, the location of migrants may be determined by
availability and taste in housing. • Where there were family and community considerations moves had to be
negotiated within the family.
The list of insights categorised above does not itself represent a process of migration.
Derived as they were from the decisions and moves of the family of Thomas E. they
offer, tentatively, an opportunity to carry the analysis further, to the level of the
individual family and to explore similarities and differences between them.
305

In Table 9.13 the insights are shown in the first column and in the succeeding
columns the position of each family on each insight is indicated. Thus, for example,
housing policy was not a factor behind the move of any of the families to
Herefordshire. The Table refers to the decision to make the initial move, as an adult,
for a permanent residence in Herefordshire. It does not cover any other move or
return. Where characteristics arise from A subsequent move they may not have an
indicator in that row.
CHARACTERISTICS BRENDA KEN FRED BOB DAVID HM TEM
Necessary Conditions
Motive • • • • • • Enabling resource • • • •Destination • • • • • •Prior Contact • • • • • • •Leadership/Initiative • • •
Motivation Personal fulfilment/Ambition
• • • • •
Job Satisfaction Previous Life Experiences • • • • • • Improved Accommodation. Housing Availability • Personal circumstances • Significant ‘Others’ • • • • • • •
Qualities, successful migration
Interest in Way of Life • • • • Contact with receiving area • • • • • • •Improved Livelihood Risk taking • • Role of Spouse • • Family connections • • • • • • •
Acculturation Perceived way of Life • • • Character of receiving area • • • • • • Accommodate to receiving area
• • •
Housing Policy Other Features
Stepping Stone Convenience •Housing taste Family negotiation • • • •
Year of Arrival 1946 1950 1938 1942 1999 1938 1945 Age at Arrival 33 Years 35
Years 21
Years 23
Years 63
Years 46
Years 55
Years Break in Residence • • •
Table 9.13 Maund Family: Individual Motives for First Migration to Herefordshire.
306
In these circumstances the decision was made when the family of Thomas E had
dispersed or was dispersing into separate families and therefore responsible for their
own individual family decisions. Generation 10 and also Thomas E. and Hephzibah
are shown in the Table.
The dates of the first move vary from 1938 for Fred and Hephzibah to 1999 for David
(he was not involved in the decision to move in 1938). In these circumstances the
ages also vary considerably from Fred at 21 years to David at 63 years. It needs to be
emphasised that each member of the family attested to attachment to place being the
main factor behind their decision to move to Herefordshire. The variable ages
suggests that other factors overrode this attachment but that these applied differently
to different family members. Certainly the leadership of Fred (and of Hephzibah
initially) would mean that others followed later because of intervening considerations.
For example, in the case of David lack of suitable employment opportunities
ameliorated the effectiveness of attachment and for Ken his desire to be a successful
businessman.
Comparison of the columns shows both similarities and differences but most marked
is the power of prior contact; significant ‘others’; contact with receiving area and
family contact in the process of decision making at whatever point in the life course.
Interestingly, as the previous analysis has shown, each of these was interrelated rather
that discrete factors. On the other hand only for Brenda and David did the role of the
spouse play a significant part and in each case that role was different.
The considerations raised by the data in Table 9.13 take the analysis down to the level
of the individual and their particular characteristics and raise, albeit tentatively, the
possibility that ultimately migration decision rests upon quite personal factors within
an individual and their particular circumstance.
The insights do not necessarily all apply to all migrants but they were evident among
the members of the Maund family. However, it should be emphasised that they are
merely a list of attributes identified from the migration decisions of one family. The
question therefore arises that if these are attributes then what is the essence of the
migration process? It does seem, from this analysis, that central to the process is the
307

concept of transition and in the context of life course this appears to be a passage of
time rather than a point in time. It is argued that the transition is a process of value
and attitude formation which leads to a decision. This does not necessarily involve all
individuals and families and, rather like Kirk’s (1963) suggestion in relation to
societies, some individuals may not perceive a need for action. An example might be
Thomas Maund who, when his skills became redundant in the early 20th century,
essentially relied upon his family to support him. He did not anticipate such a
situation but even if he had he probably lacked personal resources to overcome it.
On the other hand, there were those who were pro-active such as Fred Maund who
saw the need for attested cattle and took action in advance. Certainly the interaction
between national and local conditions, the macro and micro was perceived differently
by individual members of the family. For example, the national conditions of war and
local conditions of the availability of land led Ken Maund to take employment with
the Ministry of Aircraft Production and also obtain a market garden in advance of the
demand for fruit and vegetables.
There appear from this to be three broad elements in the transition, the national, the
local and the individual and central to this is the individual. In the early part of this
chapter an attempt was made to describe the influences which played upon the young
Maund family, the influences which made them the personalities and characters which
they were. Thus the early experience in Birmingham may have conditioned their
positive response to Herefordshire. In other words the pull of place is determined to
an extent by previous experience. But, critically, it has been shown that each
individual makes their own, conscious or unconscious, assessment of these
experiences and follows their own unique life course. It does seem clear that there is a
sequential link between transitions and that one transition leads to another albeit with
the possibility for retrieving dormant pre-transition experiences such as Ken Maund’s
change from farming to commerce. Whether the argument can be stretched to claim
that experiences over several generations also has an influential effect is much more
problematical and certainly can not be demonstrated although, the recurrence of the
name Maund in relation to place is a tantalising coincidence.
308

Chapter 10 Outcomes and Prospects
The broad aim of this study was to identify the paths and character of individual
family migration since the 1870s and to explore the role of culture and place in the
decision making of those families. The approaches and methods were chosen as
appropriate for a micro study based on individual families and as such it was intended
to produce insights rather than generalisations. This final chapter summarises the
findings and then offers some general considerations related to the approach taken. It
also addresses the insights gained into migration decisions and the role of place.
These insights pertain to individual perceptions of structural processes, formative
experiences and the role of significant others, sense of place, and personal
characteristics. In the course of this some observations about ways forward are
proposed.
The study identified the prime parish of Little Hereford and its attendant
neighbourhood area in the late 19th century. This Mid Borderland area was a relatively
rich agricultural area characterised by commercial farming and considerable social
and economic interaction. It was an area of change and adaptation to broader trends,
though this change may have been slow and imperceptible. While there is evidence of
inventiveness and innovation, there was also a degree of social stability and
continuity. Nevertheless, broader structural changes (associated with industrialisation,
urbanisation and agricultural change) in the late 19th and early 20th centuries were
accompanied by demographic change which displayed considerable spatial variation.
Within the neighbourhood area there was substantial population movement across the
age and social ranges. There is no evidence of an overwhelming migration to towns
and cities. Indeed, there was considerable short distance movement that seems to
suggest a form of rural circulation within what might be seen as the same cultural
space. Three core families, those who have resided in the same place for a long period
of time, were identified. The Bennett, Rowbury and Maund families had been resident
in Little Hereford over at least three generations and an investigation of the
movements of family members reveals that short distance movements, chain
migration, the influence of family connections and work and accommodation
requirements were identifiable elements in the migration process. While movement
309

might be seen within the context of broader structural changes, these do not of
themselves operate in a deterministic manner. Such changes are perceived differently
by different people. Oral evidence from one core family provides deeper insights into
decision making and suggests a range of conditions, motivations and circumstances
influences the decision to move and plays a role in the success (or otherwise) of a
move. The available evidence further suggests that life course transitions play a key
role in migration decision making.
Reflecting more broadly on the research, there are a number of assumptions
underlying the analysis of migration decision. Human action is a result of human
decision and does not solely result from inexorable forces outside individual control.
Related to this is the observation that each person creates their own reality rather than
there being an objective reality to be discovered. Accordingly, it follows that
decisions are made in the light of the manner in which each person or group perceives
their circumstances or their behavioural environment. This follows directly from the
work of William Kirk (1951;1963) which sought to give a non-deterministic approach
to explanation in human geography (See also Chapter 9, Figure 9.1). Immediately
juxtaposed to this is the closely related idea that decisions to move take place in the
context of macro processes which may influence and guide, but not determine entirely
these decisions. This tension between agency and structure is not, therefore, seen as a
dichotomous pairing but rather a continuum where influence upon any particular
decision may vary, from person to person, along the scale. Finally, it has to be
emphasised that the behavioural environment or the manner in which people see their
circumstance is a function of their values, attitudes and, importantly, their
experiences. These assumptions inform the analysis conducted at different, but
interrelated, scales in Chapters 7, 8 and 9.
The different scales of analysis introduce a challenge to the interpretation of the
balance between structure and agency. In Chapter 7, migrating families from the
neighbourhood of Little Hereford, some 17 parishes, were examined. At this meso
scale a positivist methodology was used aimed at identifying patterns among
migrating families. It was assumed that the patterns revealed would relate to known
structural processes of rural depopulation, industrialisation and urbanisation in the late
19th century countryside. In the event such evidence was not forthcoming, there was
310

little evidence of depopulation, occupational change and certainly no significant
moves to the town. Such findings not only reinforce the distinctiveness of the
neighbourhood of Little Hereford but suggest the likelihood that there were other
factors behind the decision to move. Whilst, in the absence of direct evidence, it is
impossible to identify precisely the process of individual agency and its relationship
to structural factors it is possible to make some headway through the behavioural
approach. For example, an understanding of the context involving ways of life
exhibiting elements of both continuity and change associated with farming, social
relationships and technological developments is essential (Chapters 5 and 6). This
gives at least the opportunity for inferences to be drawn from known behaviours.
Thus, for example, the minimal movement to the town and short distance moves
suggest a rural circulation. This is consistent with the assumption of an essential role
for human agency and could be explored further through some use of the historians
concept of empathy defined as “the capacity to understand another persons behaviour
on the basis of one’s own experience and behaviour and on the basis of information
about the others situation” (Blythe et al 1976 p119). This suggests the potential
importance of participant observation as a means of shedding light on the factors
influencing migration decisions (Chapters 3 and 9).
The study of the three migrating families revealed familiar, but different, migration
paths and provides many examples of the tension between structure and agency
(Chapter 8). For example, the move of Mary Bennett, upon marriage, is interesting.
Why did she go to Weston Rhyn, her husband’s home area, rather than him moving to
Ashford Carbonel? Is this linked to issues of gender, work or accommodation or some
combination of these? The answers are unlikely ever to be known but there is the
suggestion of choice and decision here implying human agency. Elsewhere, Thomas
Maund’s move to Birmingham, at the time of rural depopulation and urbanisation
displays several false starts. The interruptions appear to have been the result of
human agency but the overall permanent move the result of structural process. There
are other examples, indeed some from direct testimony such as Ken Maund’s use of
the war to initiate not only a change of occupation but also of life style and life course
(Chapter 9). The precise moves resulted from his decisions, but they were facilitated
by war and later the onset of a national credit boom. Even though the Maunds moved
in different ways and due to individually different decisions (Table 9.13) most of their
311

moves appeared to coincide with national patterns such as those produced by
urbanisation, counterurbanisation and the war. There is an inevitable interrelationship
between structure and agency such that even individual family movements can be
seen to have some relationship with broader trends (Chapter 8).
It should be clear that no one subject area embraces all of the ideas, concepts and
knowledge which contribute to an understanding of migration decision. This is a
multidisciplinary study which offers opportunities to identify and use concepts from
other disciplines, for example, local history. The local historians notion of core family
has been particularly helpful since it is directly related to place and can therefore be
used for investigating social stability and change in the 19th century countryside.
Critically, it also leads to an examination of attachment to place in the migration
decision process. In consequence this enquiry has shown practical advances in the
implementation of the concepts of core family and neighbourhood area. These
interrelated concepts are at the heart of the definition of territory in the 19th century
countryside. The family historians’ use of family trees provides data, though it can
not claim to be anything other than partially applied through the male line. It is
important in the identification of core families and equally important for the tracking
of their migration paths. The interrelationships of these concepts and skills have been
of major importance for this study and especially to the definition of place or locality
(Chapter 4). The complexities involved in endeavouring to define the concept of
culture (Chapter 5) and, hence in relating it directly to place, suggest that an
exploration of ways of life in a neighbourhood area and a consideration of attachment
to place displayed by members of core families may be more fruitful ways to cast
light on migration decisions (Chapter 9).
Over a ten year period at the end of the 19th century the neighbourhood of Little
Hereford displays particular migration patterns. For example, 40% of all the families
resident in the neighbourhood had moved and the majority of the movements were
over short distances. Not surprisingly, therefore, unlike much of the countryside
during the late 19th century, Little Hereford neighbourhood did not lose population
and even when depopulation did set in at the turn of the century it was relatively
insignificant. The migration experience of the neighbourhood area thus exhibits a
degree of distinctiveness relative to broader national trends. Given the nature of these
312

movements, core families, those resident in the neighbourhood for at least three
generations, were probably instrumental in maintaining community social cohesion.
This was possibly an element contributing to a form of place distinctiveness and is an
area for further investigation. There seems little doubt that place played an important
role in the migratory behaviour of at least some families right up to the present.
However the role of the more specific neighbourhood in contemporary times is an
open question which deserves some consideration as does its relationship to
neighbourhood areas of the past.
It is not only the definition of neighbourhood area and the identification of its
characteristics which formed part of the objectives of this study but, centrally, the role
of place in the migration process. It was clear that the attraction of north
Herefordshire dominated the movements of a generation of the Maund family.
However, the nature and origin of that attraction and identification with place was
more difficult to determine. It was shown that the difficulties associated with
operationalising the concept of culture meant it was not especially useful in this
context. Instead attention was paid to the ways in which individuals may identify with
the attributes and experiences of a place. It would seem that social networks within
place are rather more important than the physical characteristics of that place. If this is
the case then, for the Maunds, migration decisions appeared to be connected with
early experiences of a farming way of life and the influences of significant role
models within the family. However, for some members of family, once a farming way
of life had been attained, other factors seemed to determine subsequent migration
behaviour. These later factors of course may well have been also due to different
early experiences and even to individual personal characteristics, indeed two of the
family never had farming aspirations. Overall, this points to the complexity of human
experience.
Although place had a central role in the migratory decisions of the Maund family it
may not have the same centrality for other families. There is no evidence from this
analysis that place held the same attraction for the other two core families, the
Bennetts and the Rowburys. Indeed, until the research into respective family histories
was undertaken in the late 1990s and at the outset of the work, contemporary
members of these two families had no idea that their family had previously lived in
313

Little Hereford or indeed in Herefordshire. However, it needs to be borne in mind
that the information used to reconstruct the movements of members of the three
families is derived from different sources designed for different purposes and it is not
strictly comparable. Despite this, attachment to place is an idea which deserves further
examination in order to cast light on why it seems more important for some than
others.
The different methodologies employed in this study were devised for the purpose of
investigating the different objectives of this study. The core data for the research
relied upon those derived from family history, essentially genealogy but more
specifically family trees. Family history does not have the conceptual framework to
be a true discipline, it is rather a field of knowledge and skills which generates data
and is used here for the study of aspects of migration. The need for detailed and
individualised data has for some time been an issue for migration studies and data
generated by family historians were seen as at least a partial solution to this problem.
While the information for the three core families is derived from different sources, the
availability of family trees for all of them and personal biographies for one of them
opened up a route for a genuine longitudinal study over many generations. The
opportunity therefore existed for an identification and analysis of the factors
governing personal decisions in a long time frame and of a nature not available solely
from documentary sources. This significantly extended the approach to migration
research into increasingly detailed studies of motivation and decision and suggested
opportunities for future work, for example, a monitored longitudinal study. Such
studies may well require a team approach and contributions from a range of subject
disciplines. In an increasingly globalised world this could make a major contribution
to an understanding of migration issues currently emerging and provide advice and
guidance on policy issues.
There is an essential interrelationship between time, in the form of a longitudinal
study; of life course, in the form of individual migration biographies and the concept
of transition as a decision point in a life course. These three factors offer a framework
within which to study migration and it has been shown to be powerful in the
development of an understanding of the migratory decisions of the Maund family and
of course could be applied to other, perhaps contrasting, family migrations.
314

Additionally such a framework may offer a rationale for those pursuing their family
history since currently many such studies concentrate only on genealogy and therefore
lack a structure and are only of interest to the family concerned.
The use of oral sources potentially overcomes the problems of intermittent data
(Chapter 9). For this a form of participant observation was the method used. The
great strength of this method is that it enables the construction of a complete life
course or courses, the identification of transitions and vitally casts light on the reasons
for any moves made. Investigation of attachment to place requires and investigation
of emotional rather than cognitive issues. This though relies upon the openness and
veracity of the respondent and the insight of the researcher. Such a method is open to
mistrust and manipulation by the respondent and the offering of answers which may
be untrue or simply those which it is thought were desired. Participant observation
appears to be a generic term covering different forms devised for particular
circumstances and the period of participation appears to vary in extent and contact
time. In the case of this research the researcher, as a member of the family, was able
to interpret the responses based on more than sixty years ‘insider’ experience. The
strengths and weaknesses of this method and also the unique position of the
researcher here are discussed extensively in Chapter 3. The essential elements are the
life time scale of the participation and the confidence generated as the youngest in the
family which enables strong empathetic relationships. It yielded data and insights
which could not have been available through any other method, indeed data which
could be matched to contemporary structural processes. Such a situation might be
considered to suffer from shared values and lack objectivity. While there are potential
limitations in the approach, it yields important insights which would have been
impossible to reveal otherwise. In these circumstances it does require reflection and
constant cross referencing with other sources but the method is aimed at revealing the
subjective views of those concerned.
The research has, consistent with its purpose, gained some insight into the migration
process. It has demonstrated clearly the immense complexity of individual motivation
and suggested that the process of migration is still only partially understood, and at
the most detailed level may, to an extent, lie in the individual psyche. However, such
a position would deny the possibility of there ever being an overall understanding
315

from which to describe and explain the migration analysed here. From an
interpretation of the various insights gained in the course of this enquiry there do
appear to be four major factors involved;
1.Individual perception of structural processes; 2. The formative experiences and the role of significant others; 3. The sense of place; 4. Individual and personal characteristics.
Each of these four factors interacts with the others and the varying interactions
between them would condition the nature of the migration decisions.
In conclusion it would seem from this research that the tendency among certain
authorities in the literature to argue for a greater emphasis to be placed upon the role
of culture, at the expense of structural processes, in explaining migratory behaviour is
a little misplaced. The relationship between culture and place remains unresolved. On
the other hand attachment to place may be an idea which would benefit from further
detailed research, particularly among core families in rural areas. The evidence from
this study suggests the need for greater awareness of the role of place in the migratory
process and adds weight to Smith’s (2002 p16) view that “everyman has a map in his
heart of his own country and the heart will never allow you to forget this map.”
316

REFERENCES
Anderson, M., (1990) The Social Implications of Demographic Change, in, Thompson, F.M.L., The Cambridge Social History of Britain, Vol 2, C.U.P., Cambridge, 1-70. Ashby, M.K., (1961) Joseph Ashby of Tysoe, C.U.P., Cambridge. Bailey, A.J. (1989) Getting on your bike: what difference does a migration history make? Tijdschrift voor Economische en Sociale Geografie, 80, 312 –17. Baines, D., (1985) Migration in a Mature Economy, C.U.P., Cambridge. Barker, T., (1967) London and the Great Leap Forward, The Listener, June 29, 845-847. Bateman, (1876) The Great Landowners of Britain and Ireland, Harrison, London. Bayne, A.M., (1996) Emigration to Australia in the 1950s, in Faulkener, L., and Finnegan, R., (Eds), Project Reports in Family and Community History, CD ROM (CDR0057), Open University, Milton Keynes. Beddoes, K. and Smith, W.H., (1995) The Tenbury and Bewdley Railway, Wild Swan Press, Didcott. Berry, B.J.L., (1976) The Counterurbanisation Process: Urban America since 1970, Urban Affairs Review,11, 17-30. Blauw, W., (1985) Intra Urban Migration and Changing Social Contacts, in White, P.E. and Van der Knaap, B., (Eds), Contemporary Studies of Migration, Norwich, 105-114. Blythe, W.A.L., Cooper, K., Derricott, R., Elliott, G., Sumner, H., Waplington, A., (1976), Place Time and Society 8-13, Collins, Bristol, 119. Bodley, J.H., (1994), Cultural Anthropology: Tribes, States and the Global System, McGraw Hill, New York. Bonney, N., and Love, J., (1991) Gender and migration: geographical mobility and the wife’s sacrifice, Sociological Review, 39, 335-48. Bonser, K.J., (1970) The Drovers, Macmillan, London. Bowen, E.G., (Ed.), (1957) Wales, University of Wales Press, Cardiff. Bowley, A.L., (1914) Rural population in England and Wales: a study of the changes of density, occupations and ages, Journal of Royal Statistical Society, 97, 597-645. Boyle, P., (1995) Rural in-migration in England and Wales 1980-81, Journal of Rural Studies, 11, 65-78.
317

Boyle, P., Flowerdew, R., Shen, J., (1996) Modelling Inter Ward Migration in Hereford and Worcester: The Importance of Housing Growth and Tenure, Regional Studies, 32, 113-132. Boyle, P., and Halfacree, K., (1998) Migration into Rural Areas, Wiley, London. Boyle, P., Halfacree, K., and Robinson, V., (1998) Exploring Migration, Prentice Hall, London. Boynton, J., (1990) Three Times Table, Self Published, Upton. Brettell, C.B. and Hollifield, J.F. (Eds) (2000), Migration Theory: Talking Across Disciplines, Routledge, London. Brian, A., (1994), As to the Lugg, T.W.N.F.C., XLVIII, 37-42. British Census and National Index, 1881, (1998), The Church of Jesus Christ of Latter-day Saints, CD Rom. Brown, L.A., and Moore, E.G., (1970) The Intra-Urban Migration Process, Geografiska Annaler, Series 52 B, 1-13. Bryman, A., (Ed), (1987) Rethinking the Life Cycle, Macmillan, Basingstoke. Burrell, K., (2003) Moving Lives, unpublished Ph.D. Thesis, University of Leicester. Buttimer, A., (1969) Social Space in Interdisciplinary Perspective, Geographical Review, 59, 417-426. Cadwallader, M., A (1989) Conceptual framework for analysing Migration Behaviour in the Developed World, Progress in Human Geography, 13, 4, 494-511. Camp, A., (1978) Everyone has Roots, Star Books, London. Camp, A., (1996) Family History, in Hey, D., The Oxford Companion to Local and Family History, O.U.P., London 168-174. Campbell, M., and Ormerod, P., (1998) The Evolution of Family Structures in a Social Context, London. Carter, H., and Davies, W.K.D., (Eds), (1970) Urban Essays, Longman, London. Chamberlain, M., (1997) Narratives of Exile and Return, St Martins Press, London. Chambers J.D., and Mingay, G.E., (1966) Agricultural Revolution 1750 – 1880, Batsford, London. Champion, A.G., (Ed) (1989) Counterurbanisation: The Changing Pace and Nature of Population Deconcentration, Arnold, London.
318

Champion T., and Fielding, T., (Eds) (1992) Migration Processes and Patterns, Belhaven, London. Chinoy, E., (1964) Society, Random House, New York. Clark, P., (1979) Migration in England during the late 17th Century and early 18th Century, Past and Present 83, 57-90. Clark, W.A.W. and Moore, E.G., (1980) Population Mobility and Residential Change, N.W. University Press, Washington. Clark, P. and Souden, D., (Eds.), (1987) Migration and Society in Early Modern England, Hutchinson, London. Clarke, R., (1994) Old Harborne, Tempus, Stroud. Clarkson, L.A., (5.2.82) History will never be the same again, Times Higher Education Supplement, 97. Cloke, P., Cook, I., Goodwin, M., Painter, J., Philo, C., (2004) Practising Human Geography, Sage, London. Cohen, G., (1987) Social Change and the Life Course, Tavistock, London. Coleman, D. and Salt, J., (1992) The British Population: Patterns, Trends and Processes, O.U.P., Oxford. Cooke, (1989) quoted in; Johnston R.J., (1997) Geography and Geographers, Hodder Arnold, London, 243. Cook, I. and Crang, M., (1995) Doing Ethnographies, Catmog, 58, Norwich. Concise Oxford Dictionary, (1995) 9th Edition Courgeau, D. and Lelievre,E., (1992) Event History Analysis in Demography, Clarendon, Oxford. Coplestone-Crow, B., (1989) Herefordshire Place Names, B.A.R, British Series 214. Cross, D.F.W., (1990) Counterurbanisation in England and Wales, Avebury, Aldershot. Darrock, H. C., (1981) Migrants in the nineteenth century: fugitives or families in motion? Journal of Family History 6, 257-77. Deane, P., (1965) The First Industrial Revolution, C.U.P., Cambridge. Defoe, D., (1971) A Tour through the whole Island of Great Britain, Penguin, London.
319

Denzin, N.K., (1989) Interpretive Biography, Sage, London. Dey, I., (1993) Qualitative Data Analysis: A User Friendly Guide to Social Scientists, Routledge, London. Dodd, J.P., (1979) Herefordshire Agriculture in the Mid-Nineteenth Century, T.W.N.F.C., 203. Douglas J.W.B., (1964) The Home and the School, Penguin, London,. Drake, M., (Ed) (1994), Time, family and community: perspectives on family and Community History, Blackwell, Oxford. Elman, C., (1998), Intergenerational household structure and economic change at the turn of the twentieth century, Journal of Family History, 23, 417-40. Elrington, C.R., (Ed), (1989) Victoria County History, Vol IV, Oxford,. Erickson, C., (1990) Emigration from the British Isles to the USA in 1841, Population Studies, 347-67. Erickson, C., (1994) Leaving England: Essays on British Emigration in the Nineteenth Century, Cornell University Press, Cornell. Everitt, A.M., (1982) Transformation and Tradition: Aspects of the Victorian Countryside, University of East Anglia, Norwich. Everitt, A.M., (1985) Landscape and Community in England, Hambledon Press, London. Evans, E.J., (1983) Forging of the Modern State, Longman, London. Evans, N.J., Handley, T., Lovelace, D., (2001) The Herefordshire Farming Study, Centre for Rural Research, University of Worcester. Fay, A.M., (2002) Victorian Days in England, Dog Rose Press, Ludlow. Fielding, A.J., (1989) Inter-Regional Migration and Social Change, Trans.I.B.G., 14, 1, 24-36. Fielding, T., (1992) Migration and Culture, in Champion T. and Fielding, T., Migration Processes and Patterns, Longman, London, 201-212. Findlay, A.M. and Li, F.L.N (1997) An autobiographical approach to understanding migration: the case of Hong Kong emigrants, Area, 29, 34-44. Fitton, R.S., (1989) The Arkwrights – Spinners of Fortune, Manchester University Press, Manchester.
320

Floud, R. and McCloskey, D., (1994) An Economic History of Britain since 1700, C.U.P., Cambridge. Flowerdew, R., (1992) Labour Market Operation and Geographical Mobility, in Champion, T., and Fielding, T., (Eds) Migration Processes and Patterns, Belhaven, London, 135-147. Forest, R. and Murie, A., (1992) Housing as a Barrier to the Geographical Mobility of Labour, in Champion, T., and Fielding, T., (Eds) Migration Processes and Patterns, Belhaven, London, 77 – 101. Fotheringham, A.S., Champion, T., Wymer, C., and Coombe, M., (2000), Measuring destination attractivity: a migration example, International Journal of Population Geography, 6, 391-421. Fox, Sir Cyril, (1940) The Boundary Line of Cymru, Proceedings of the British Academy, XXVI, 275-301. Fuller, D., (1999) Part of the action, or ‘going native’? Learning to cope with the ‘politics of integration’, Area, 31, 3, 221-227. Gelling, M., (1984) Signposts to the Past, Dent, London. Giddens, A., (1984) The Constitution of Society: Outline of the Theory of Structuration, C.U.P., Cambridge. Glasser, M, (2002) Migration Through Time: A Residence History Analysis of a Rural Population., Unpublished Ph. D. Thesis, University of Leicester. Golledge, R.A., (1980), A behavioural view of mobility and migration research, Professional Geographer, 31, 14-21. Golledge, R.G., (1981) Misconceptions, misinterpretations and misrepresentations of behavioural approaches to human geography, Environment and Planning, 13, 1325-44. Golledge, R.G., Brown, L.A., Williams, F., (1972) Behavioural approaches in geography, Australian Geographer, 12, 59-79. Goode, W.J., (2003) Family changes over the long term: a sociological commentary, Journal of Family History, 28, 15-30. Gordon, I., (1992) Modelling Approaches to Migration and the Labour Market, in Champion, T., and Fielding, T., (Eds), Migration Processes and Patterns, Belhaven, London, 119-134. Gough, R., (1834) Antiquityes and Memoryes of the parish of Myddle (1700) and Observations concerning the Seates in Myddle and the Familyes to which They Belong. (1701-2), Penguin, London.
321

Government Statistics, (2001) www.statistics.gov.uk/census Glossary, Definitions. Green, A., (1992) Changing Labour Processes and Internal Migration., in Champion, T. and Fielding, T., (Eds), Migration Processes and Patterns, Belhaven, London, 105-118. Gregson, G., (1986) On duality and dualism, Progress in Human Geography, 10, 184-205. Griffiths, M.J., and Johnston, R.J., (1991) What’s in a place? An approach to the concept of place as illustrated by the British National Union of Mine Workers strike, 1984-1985, Antipode, 23, 185-213. Grigg, D., (1967) Regions, Models and Classes, in Chorley, R.J. and Haggett, P., Integrated Models in Geography, Arnold, London, 461-509. Grigg, D.B., (1977) E.G.Ravenstein and the “Laws of Migration”, Journal of Historical Geography. 3.1. 41-54. Grundy, E., (1992) The Household Dimension in Migration Research, in Champion, T. and Fielding, T., (Eds), Migration Processes and Patterns, Belhaven, London, 165-174. Grundy, J.E., Population Movements in 19th Century Herefordshire, TWNFC, Vol. XLV, 488. Guinness, P., (2002) Migration, Hodder Murray, London. Gutting, D. (1996) Narrative identity and residential history, Area, 28, 482-90. Hagerstrand, T., (1982) Diorama, path and project, T.V.S.G., 73, 323-339. Haggett, P., (1965) Locational Analysis in Human Geography, Arnold, London. Halfacree, K., and Boyle, P.J., (1993) The challenge facing migration research: the case for a biographical approach, Progress in Human Geography, 17 333-348. Hareven, T., (1982) Transitions: The Family and the Life Course in Historical Perspective, Academic Press, New York. Harris, C., (1987) The Individual and Society, in Bryman, A., (Ed), Rethinking the Life Cycle, 17-29, Macmillan, Basingstoke, 17-29. Harris, J., (1993) Private Lives, Public Spirit: Britain 1870 – 1914, Penguin, London. Haskey, J., (1996) Population Review, families and households in Great Britain, Population Trends, 85, 7-24. Harvey, D., (1969) Explanation in Geography, Arnold, London.
322

H.C.R.O. AB24/3 Extract from the Register of Kneeling and Exempt Jurisdiction of Little Hereford and Ashford Carbonel and agreed by the inhabitants at a Parish Meeting, March 26, 1722. H.C. R.O., OS 367 H.C.R.O., T19 33 File of papers on the Bedlam Charity. Herefordshire County Council, (1960) County Development Plan. Hey, D., (1974) An English Rural Community, Myddle under the Tudors and Stuarts, Leicester University Press, Leicester. Hey, D., (1996) The Oxford Companion to Local and Family History, Oxford University Press, Oxford. Hey, D., (1997) The Local History of Family Names, Local Historian, 27, 4, i-xx. Higgs, E., (1989) Making Sense of the Census: The Manuscript Returns of England and Wales, 1801-1901, H.M.S.O., London. Hill, R., and Stamper, P., (1993) The Working Countryside 1862-1945, Swan Hill, Shrewsbury. Hinde, A., (2003) England’s Population, Arnold, London. Hobcraft, J. and Murphy, M., (1986) Demographic event history analysis; a selective review, Population Index, 52, 3-27. Hobsbawm, E.J. and Rude, G., (1969), Captain Swing, Penguin, London. Hoggart, K., Lees, L., and Davies, A., (2002) Researching Human Geography, Arnold, London. Holloway, L., and Hubbard, P., (2001) People and Place, Prentice Hall, Harlow. Hopkinson, J., (1983) Little Cowarne, A Herefordshire Village, Orphans Press, Leominster. Hoskins, W.G., (1966) English Local History – The Past and the Future, An Inaugural Lecture, University of Leicester. Howkins, A., (1991) Reshaping Rural England: A Social History, Routledge, London. Humphries, S., (1984) The Handbook of Oral History; Recording Life Stories, Allan and Unwin, London. Jackson, S., (1998) Britain’s Population: Demographic Issues in Contemporary Society, Routledge, London.
323

James, Y., (Ed), (2001) Kimbolton with Hamnish, Orphans Press, Leominster,. Johnston, R.J., (1997) Geography and Geographers, Hodder Arnold, London. Johnston, R.J., and Sidaway, J., (2004) Geography and Geographers, Hodder Arnold, London. Joshi, H.E.,(Ed), (1989) The Changing Population of Britain, Blackwell, Oxford. Katz, C. and Monk, J. (Eds) (1993), Full Circles: Geography of Women over the Life Course, Routledge, London. Kenyon, K.M., (1954) Excavations at Sutton Walls, Herefordshire, 1948-55, Archaeological Journal, 110, 1-87. Kilvert, R.F., (1987) Diary of Francis Kilvert 1870-79, University of Wales, Cardiff. Kirk, W., (1951) Historical Geography and the concept of the Behavioural Environment, Indian Geographical Journal, Silver Jubilee Vol., 152-160. Kirk, W., (1963) Problems of Geography, Geography, 48, 357-371. Kitch, M., (1992) ‘Population movement and migration in pre-industrial rural England, in Short, B., (Ed) The English Rural Community: Image and Analysis, C.U.P., Cambridge, 62-84. Knowles, A.K., (1995) Immigration Trajectories through the Rural-Industrial Transition in Wales and the United States, 1795-1850, AAAG, 85(2), 246-266. Laslett, P., (1965) The World We have Lost, Methuen, London. Lawson, V.A., (1999), Questions of migration and belonging: Understandings of migration under neoliberalism in Ecuador, International Journal of Population Geography, 5, 261-76. Lawton, R., (1967) Rural depopulation in nineteenth century England, in Steel, R.W. and Lawton, R., (Eds), Liverpool Essays in Geography: A Jubilee Collection, Longman, London, 227-55. Lawton, R., (1968) Population Change in England and Wales in the late C19, Trans IBG,, 55-74. Lawton, R., Regional Population Trends, (1977) in, Hobcraft, J, and Rees, P.(Eds), Regional Demographic Development, Croom Helm, London, 29-70. Lawton, R., Rural Depopulation in 19th Century England, (1973) in Mills, D., English Rural Communities, Macmillan, London, 195-219. Lee, E., A Theory of Migration, (1966) Demography 3, 47-57.
324

Lewis, C.R., (1970) The Central Place Pattern of Mid-Wales and the Middle Welsh Borderland, 228-68, in Carter, H. and Davies, W.K.D., (Eds), Urban Essays, Longman, London, 228-268. Lewis, C.R., (1975) The analysis of Changes in Urban Status: A Case Study in Mid-Wales and the Middle Welsh Borderland, Trans IBG, 64, 49-65,. Lewis, G.J., (1979) Rural Communities – A Social Geography, Longman, London. Lewis, G.J., (1979) Mobility, Location and Demographic Change: The Case of North Cardiganshire, 1851-71, Welsh History Review, Vol 9, 290-304. Lewis, G.J., (1982) Human Migration, Croom Helm, London. Lewis, G.J., (2000) Changing Places in a Rural World, Geography, 85(2), 157-165. Lewis, G.J., (2002) Unpublished MS. Lewis, G.J. and Maund, D.J., (1976) The Urbanisation of the Countryside, Geografiska Annaler, Vol 58, 17-27. Ley, D., (1978) ‘Review of Prisoners of Space? by Graham Rowles’ Economic Geography, 54, 355-6. Ley, D., (1982) Rediscovering Mans Place, Trans I.B.G. 7, 248-53,. Limb, M. and Dwyer, C., Eds, (2001) Qualitative Methodologies for Geographers, Edward Arnold, London. Lindgren, U., (2003) Who is the counter-urban mover? Evidence from the Swedish urban system, International Journal of Population Geography, 9, 399-418. Lipsey, R.G., (1966) An Introduction to Positive Economics, Weiderfield and Nicholson, London. Lord, E., (1993) Communities of common interest: social landscape of South-East Surrey, 1750-1850, in Phythian-Adams, C. (Ed.), Societies, Cultures and Kinship, Leicester U.P., London,131-199. Ludlow and Leominster, 1” Ordnance Survey Reprint, David & Charles, 1970. Mabogunje, A.L., (1970) Systems Approach to a Theory of Rural-Urban Migration, Geographical Analysis, 2, 1-18. Maslow, A., (1970) Motivation and Personality, 2nd Edition, Harper Collins, New York,. Maund, D.J., (1969) Shopping Centres in Herefordshire, unpublished BA Dissertation, University of Leicester,
325

Maund, D.J., (1976) The Urbanisation of the Countryside, Unpublished M.Phil Thesis, University of Leicester. Maund, D.J., Ellis, B., Pountney, G., Scrivener, T., Ward, C., (1985) Topic Work, Guidelines for Planning, Coventry Local Education Authority, Coventry. Maund, Fred, ‘A Little of Heaven, a Little of Hell’, Page 9 in, Unpublished, A Selection of Poems. Maund, Ken, (1999) Country Memories of an Octogenarian, Private Publication, Leominster. Meinig, D.W., (1979) The Interpretation of Ordinary Landscapes, Oxford University Press, New York. Mills, D.R., (1980) Lord and Peasant in 19th Century Britain, Croom Helm, London. Mingay, G.E., (1976) Rural Life in Victorian England, Heinemann, London. Mitson, A., (1993), The Significance of Kinship Networks in the seventeenth Century, in, Phythian-Adams, C., (Ed.), Societies, Cultures and Kinship, Leicester U.P., London, 24 –76. Moir, J., (1990) A World unto Themselves? Squatter Settlements in Herefordshire 1780 - 1880, Unpublished Ph.D. Thesis, University of Leicester. Moss, L. and Goldstein, S. (Eds) (1979) The Recall Method in Social Surveys, University of London Institute of Education, London. Mulder, C.H. and Wagner, M. (1993) ‘Migration and marriage in the life course: a method of studying synchronised events’, European Journal of Population, 9, 55-76. Munro, M., (1992) Housing Market Restructuring: Consequences for Migration, in Champion, T., and Fielding, T., (Eds) Migration Processes and Patterns, Belhaven, London, 41 – 54. Newby, H., (1977) The Deferential Worker, Penguin, London. Newby, H., (1987) Country Life: A Social History of Rural England, Weiderfield and Nicholson, London. Nicholas, S., and Shergold, R., (1987) ‘Internal migration in England, 1818 –39, Journal of Historical Geography, 13, 155-68. Ni Laoire, C. (2000) Conceptualising Irish Youth Migration; A Biographical Approach, International Journal of Population Geography, 6, 229-43. Ogden, P., (1990) Migration and Geographical Change, C.U.P., Cambridge.
326

Owen, D. and Green A., (1992) Migration Trends and Patterns, in Champion, T., and Fielding, T., (Eds), Belhaven, London, Migration Processes and Patterns , 17-38. Pahl, R.E., (1965) Urbs in Rure, LSE Geographical Paper No. 2. Parker, W.K., (1979) Wheat Supply and Prices in Herefordshire 1793-1815, T.W.N.F.C., Vol 63, 41-53. Parr, H., 2001) Feeling, Reading and Making Bodies in Space, Geographical Review, 91, 158-1. Parton, A.G., (1980) The Travels of Joseph Smith, Well Sinker, North Staffordshire Journal of Field Studies, 20, 33-40. Paul, E.D., (1994) Herefordshire Carriers in 1890, T.W.N.F.C., XLVIII, 582. Peet, R., (1998) Modern Geographical Thought, Blackwell, Oxford. Pelling, G., (1995) Beginning Your Family History, Federation of Family History Societies, Oxford. Perks, R., (1992) Oral History: Talking about the Past, Historical Association, London. Perks, R. and Thomson, A. (Eds) (1998) The Oral History Reader, Routledge, London. Perry, P.J., (1968) Working Class isolation and Mobility in Rural Dorset, 1837-1936, Trans I.B.G., 121-141. Phythian-Adams, C., (Ed.), (1993) Societies, Cultures and Kinship, Leicester University Press, London. Phillips, A.D.M., (1979/81) Agricultural Land Use and the Herefordshire Tithe Surveys, Circa 1840, T.W.N.F.C., Vol. XLIII, 54-61. Pollock, L.A., (1998) Rethinking patriarchy and family in seventeenth century England, Journal of Family History, 23, 3-27. Pooley, C., (2003) Mobility in the Twentieth Century; Substituting Commuting for Migration, in Gilbert, D., Matless, D., and Short, B., (Eds), Geographies of British Mobility, Blackwell, Oxford, 80 – 96. Portelli, A., (1981) “The peculiarities of oral history”, History Workshop, 12, 67-91. Pooley, C., and Turnbull, J., (1998) Migration and Mobility in Britain Since the 18th Century, U.C.L. Press, London, Preston, S., (1987) Demography, Blackwell, London.
327
Pryor, R., (1979) Residence History Analysis, Australian National University, Canberra. Pryce W.T.R., (1994) From Family History to Community History, C.U.P., Cambridge. Pryce, W.T.R.,(2002) A Migration Typology and Some Topics for the Research Agenda, Family and Community History, 3/1, 65-80. Rackham, O., (1986) The History of the Countryside, Phoenix, London. Ravenstein, E.G., (1876) Census of the British Isles, Geographical Magazine, 3, 173-7. Ravenstein, E.G., (1885)The Laws of Migration, Journal of the Statistical Society, 48, 167-227. Ravenstein, E.G., (1889) The Laws of Migration Journal of the Statistical Society, 52, 214-301. Ray, P. M., (1998) Ashford Carbonel – A Brief History, Ludlow Historical Research Group. Redford, A., (1926), Labour Migration in England, 1800 – 1850, Manchester University Press, Manchester. Redmonds, G., (1973) Yorkshire West Riding, Philimore, London,. Rees, G., (1994) Changes in Herefordshire during the Woolhope Years, TWNFC, XLIV, 289 Reeves, N.C., (c1970) The Town in the Marches, Orphans P.P., Leominster. Robinson, G.M., (1978) Agricultural Depression.1870 – 1900, T.W.N.F.C., XLII, 259. Robinson, W., (1950) Ecological correlations and the behaviour of individuals, American Sociological Review 15, 351-357. Robson, B.T., (1973) Urban Growth: An Approach, Methuen, London. Rose, G. (1997), Situating Knowledges: positionality, reflexivities and other tactics, Progress in Human Geography, 21, 305-20. Rowles, G.D., (1978) Prisoners of Space? Exploring the Geographical Experience of Older People, West View Press, Boulder. Rowley, T., (1972) The Shropshire Landscape, The Making of the English Landscape, Penguin, London.
328

Sage, L., (2000) Bad Blood, Fourth Estate, London. Sanders, P., (1989) The Simple Annals, Alan Sutton, Gloucester. Saville, J., (1957) Rural Depopulation in England and Wales, Routledge and Keegan Paul, London. Sauer, C. O., (1956) The Education of a Geographer, AAAG, 46, 287-99. Sayer, A., (1984) Method in Social Science, Harper Collins, London. Schurer, K., (1991), The role of the family in the process of migration, in Pooley, C.G., and Whyte, I.D., (Eds), Migrants, Emigrants and Immigrants: A Social History of Migration, Routledge, London, 106-42. Seavers, J.D., (1999) Residential Search and Joint Decision-Making in a Rural Environment, Unpublished Ph. D. Thesis, University of Leicester. Sheppard, J.A., (1979) The Origins and Evolution of Field and Settlement Patterns in the Herefordshire Manor of Marden, Occasional Paper 15, University of London. Short, B., (Ed) (1992) The English Rural Community; Image and Analysis, Cambridge University Press, Cambridge. Shyrock, H.S., and Larmen, E.A., (1965) Some Longitudinal Data on Internal Migration, Demography 2, 579-92. Skeldon, R. (1995) The challenge facing migration research: a case for greater awareness, Progress in Human Geography, 19, 91-6. Slack, P., (1987) Vagrants and Vagrancy in England 1598 – 1664, in, Clark, P., and Souden, D., (Eds.), Migration and Society in Early Modern England, Hutchinson, London, Chapter 2. Smith, A.M., (2002) The No. 1 Ladies’ Detective Agency, Abacus, New York, 16. Snell, K.D.M., (1985) Annals of the Labouring Poor, C.U.P., Cambridge. Southall, H., (1991) The Tramping Artisan Revisits, Economic History Review, 44, 272-291. Speare, A., Goldstein, S., Frey, W., (1974) Residential Mobility, Migration and Metropolitan Change, Ballinger, Cambridge, Mass. Stillwell, J., (1985) Mobility between Metropolitan and non-Metropolitan Regions of the U.K., in, White, P.E. and Van der Knaap, B., Contemporary Studies of Migration, Geo Books, Norwich, 7-25. .
329

Stockdale, A., (2006) The role of retirement migration in the repopulation of rural areas, Population, Space and Place, 12, 1-13. Sullivan, H.S., (1953) The Interpersonal Theory of Psychiatry, Norton Press, New York. Sykes, B., (2001) The Seven Daughters of Eve, Corgi, London. Sylvester, D., (1969) The Rural Landscape of the Welsh Borderland, Macmillan, London. Tate, W.E., (1978) A Domesday of English Enclosure Acts and Awards, University of Reading, London. Thomas, J. G., (1965) The Middle Borderlands, in Bowen, E.G., (Ed), Wales a Physical, Historical and Human Geography, Methuen, London, 461-485. Thomas, D.S., (1938) Research Memorandum on Migration Differentials, Social Science Research Council, New York. Thompson, F.M.L., (ed) (1990) The Cambridge Social History of Britain, C.U.P., Cambridge. Tonkin, M., (1994) Herefordshire toll houses – then and now, T.W.N.F.C., XLVIII, 398. Unwin, T., (1992), The Place of Geography, Prentice Hall, London. Van Haan, M., (2003), Job access at labour market entry and occupational achievement in the life course, International Journal of Population Geography, 9, 389-98. Victoria County History, (1989) Shropshire, Vol 14, , London. Vining , D.R., and Kontuly, T.M., (1978) Population dispersal from major Metropolitan Regions, International Regional Science Review, 3, 49-73. Wagner, A.R., (1983) English Genealogy, Clarendon Press, London. Walmsley, A., and Lewis, G.J., (1998) People and Environment, London. Warnes, T., (1992) Migration and the Life Course, in Champion, T. and Fielding, T., (Eds) Migration Processes and Patterns, Belhaven, London, 175-187. Weinberg, A., (1961) Migration and Belonging, Martinus Nijhoff, The Hague. West, J. and West, M., (1985) A History of Herefordshire, Philimore, London. Western, J., (1981) Outcast Cape Town, Harper Collins, Minneapolis.
330

White, P.E., and Van der Knaap, B., (1985) Contemporary Studies of Migration, Geo Books, Norwich. . White, P., and Woods, R., (Eds), (1980) The Geographical Impact of Migration, Longman, London. White, P., and Jackson, P., (1995), (Re)theorising population geography, International Journal of Population Geography, 1, 111-24. Whittlesey, D., (1929), Sequent Occupance, AAAG, Vol X1X, 72-78. Williams, R., (1982) Culture and Society, Penguin, London. Willis, K., (1974) Problems in Migration Analysis, Saxon House, Farnborough. Winchester, H.P.M., (1985) Origins Characteristics of Migrants in Isere, France, in White, P.E., & Van der Knaap, B., Contemporary Studies of Migration, Geo Books, Norwich, 45-54. Wise, M.J., (Ed), (1950) Birmingham and its Regional Setting, British Association, Birmingham. Wolpert, J., (1965) Behavioural Aspects of the Decision to Migrate, Papers and Proceedings of the Regional Science Association, 15, 159-69. Wrigley, E.A., (1967) London and the Great Leap Forward, The Listener, July 6, 4-6. Wrigley, E.A., and Schofield, R.S., (1981) The Population History of England 1541 – 1871, C.U.P., London. www.statistics.gov.uk Census Bicentenary, Count Me In, Census 2001. Zelinsky, W., (1971) The Hypothesis of the Mobility Transition, Geographical Review 61, 219-49. ABREVIATIONS T.W.N.F.C. Transactions of the Woolhope Naturalists Field Club. Trans I.B.G. Transactions of the Institute of British Geographers. T.V.S.G. Tijdschrift voor Econ. En Soc. Geografie. A.A.A.G. Annals of the Association of American Geographers
331
Copyright © 2022 FDOKUMEN