A Multidisciplinary Academic Journal - IUBAT Review
79
IUBAT Review A Multidisciplinary Academic Journal Volume 1, Number 3, November 2018 International University of Business Agriculture and Technology A review of Up-flow Anaerobic Sludge Blanket (UASB) Bioreactor for Sewage Treatment ISSN Print: 1029-6778 ISSN Online: 2520-0895
-
Upload
khangminh22 -
Category
Documents
-
view
0 -
download
0
Transcript of A Multidisciplinary Academic Journal - IUBAT Review
IUBAT ReviewA Multidisciplinary Academic Journal
Volume 1, Number 3, November 2018
International University of Business Agriculture and Technology
A review of Up-flow Anaerobic Sludge Blanket (UASB) Bioreactor for Sewage Treatment
ISSN Print: 1029-6778
ISSN Online: 2520-0895
Editorial Office, International University of Business Agriculture and Technology (IUBAT)4 Embankment Drive Road, Sector 10, Uttara Model Town, Dhaka 1230, BangladeshTel: (+88) 55091801, 55091802,55091803, 55091804, 55091805E-mail: [email protected]
EDITORIAL BOARD MEMBERS
Professor Dr. Abul Khair, Dept.of Chemistry, IUBAT
Professor Dr. Karen Lund, Canadian Nurse Teaching Specialist,
HRH Project in Bangladesh
Dept. of Psychology, IUBAT
Professor Dr. AZA Saifullah, Dept. of Mechanical Engineering, IUBAT
Professor Dr. Md. Abdul Haque, Dept. Computer Science and Engineering, IUBAT
Dr. Utpal Kanti Das, Associate Professor, Dept. Computer Science and Engineering, IUBAT
Dr. Md. Momtazur Rahman, Associate Professor, Dept. English Language, IUBAT
Dr. Farzana Sultana, Assistant Professor, College of Agricultural Science, IUBAT
Dr. Biswajit Saha, Associate Professor, Dept. of Electrical and Electronic Engineering, IUBAT
Prof Khaja Sultanul Aziz, IUBAT
ADVISORY BOARD
Chief Advisor:
Professor Selina Nargis
Advisors:
Dr. Rezaul Karim, University of Technology, Sydney, Australia
Dr. Najmul Ahsan Kolimullah, V. C,Begum Rokeya University, Bangladesh.
Dr. John Richards, Professor, Simon Fraser University, Canada
Professor Alex Berland, University of British Columbia, Canada
Dr. Venkata Subramanian
Dr. Venkat & associate, India
Dr. Koji Matsuoka, Professor, Kobe University, Japan
Dr. Mizanur Rahman, Professor, Nanzan University, Japan
Dr. Robert Hodgson, Professor, University of Exeter, UK
Dr. Gulam Kibria, Professor, Delaware State University, USA
Editor:
Dr. Md. Monirul Islam, Dean and Professor, College of Engineering and Technology, IUBAT
Associate Editors:
Dr. Md. Mahbubur Rahman, Associate
Professor, Department of Physics, IUBAT
Mozaffar Alam Chowdhury, Assistant Professor, College of Business
Administration, IUBAT
EDITORS
Front cover photo: Ashley Wheaton/flickr
www.iubatreview.twoinc.ca

IUBAT ReviewA Multidisciplinary Academic Journal
Volume 1, Number 3, November 2018
Editor
Prof. Md. Monirul Islam, PhD

Editors’ Note
The IUBAT Review is a multidisciplinary academic journal that the editors intend to publish annually. The office of the Journal is located at the International University of Business Agriculture and Technology, the first non-government university in Bangladesh. It was founded in 1991 as a not-for-profit institution. The university’s mission is to develop human resources through quality education.
IUBAT Review is peer-reviewed. The editors accept submissions from authors in Bangladesh and elsewhere. The articles should generally analyze current issues relevant to management, social sciences, engineering, agriculture, science and technology.
For submission guidelines, contact the editor at [email protected].

IUBAT ReviewA Multidisciplinary Academic JournalVolume 1, Number 3, November 2018
Review Paper on: UASB Bioreactor for Sewage Treatment
by Samiha Binte Shohid, Rowshan Mamtaz and M.Shohidullah Miah .....6
Depiction and Analysis of a Split P-shaped Microstrip Patch Antennafor S, C, X and Ku-band Applications
by Md. Jubaer Alam ...................................................................................25
Vulnerability Analysis for Sustainable Development against Flood Hazardand Relief Distribution: A Case Study of 2017 Flood of Bangladesh
by Monirul Islam, Mahfuzur Rahman, Xiaoying Li and Nahidul Islam .....38
Are we faithful to the Concept plus Practice of Interdiciplinarity
by Iván G. Somlai.........................................................................................48
The Accord and Alliance: Lessons learned after five years of remediation
by Kirk Hepburn .........................................................................................57
Sustainable Supply Chain Management Practices and Challenges ofAgri-business in Bangladesh
by Zahir Rayhan Salim.................................................................................68

6 IUBAT Review, A Multidisciplinary Academic Journal, Volume 1, Number 3
IUBAT ReviewA Multidisciplinary Academic Journal
Samiha Binte Shohid, Rowshan Mamtaz and M.Shohidullah Miah. 2018. “Review Paper on: UASB Bioreactor for Sewage Treatment.” IUBAT Review 1 (3): 6-24. iubat.edu/journal
ABSTRACT: The Up-flow Anaerobic Sludge Blanket (UASB) is a low cost and high rate of treatment process that can produce more bio-energy benefits in terms of biogas production. The UASB treatment process cannot completely remove the organic matter and pathogenic microorganisms. Therefore, a post-treatment process is required for UASB effluent before discharge to the environment to be reused and recycled for agricultural irrigation. The post-treatment of UASB effluent may be an aerobic process, such as a Final Polishing Ponds Unit system (FPU); Trickling Filters (TF); Rotating Biological Contactor (RBC); Bio-Filter (BF); Sand Filter; Sequence Batch Reactor (SBR) and Down-flow Hanging Sponge System (DHS). Alternatively, the post-treatment of UASB effluent may be an anaerobic process such as Anaerobic Bio-film Fluidized Bed reactor; Anaerobic Sludge Thickening and Digestion Process; Anaerobic Hybrid Reactor (AHR); Anaerobic Filter Process (AF) and Dissolved Air Flotation system which are not performed well for the treatment of sewage. Among the systems for treating UASB effluent, Down-flow Hanging Sponge System (DHS) is the best combination process. It reduces significantly the organic load and pathogenic microorganisms. It produces less excess sludge and a final effluent with higher level of dissolved oxygen.KEYWORDS: Sewage; UASB Bioreactor; Post-treatment; Anaerobic Vs. Aerobic Digestion; Standard Effluent
Review Paper on: UASB Bioreactor for Sewage
TreatmentSamiha Binte Shohid1,* Rowshan Mamtaz1 M.Shohidullah Miah2
1 Department of Civil and Environmental Engineering, Bangladesh University of Engineering and Technology, (BUET), Dhaka, Bangladesh
2 College of Agricultural sciences, IUBAT—International University of Business Agriculture and Technology, Dhaka,Bangladesh.
*Corresponding author: E-mail: [email protected]

IUBAT Review, A Multidisciplinary Academic Journal, Volume 1, Number 3 7
INTRODUCTION
Sewage is wastewater, primarily generated from toilets. It is easily biodegradable organic waste with solids and microorganisms that settle easily. The settled materials are referred to as sludge. Before it can be discharged to the environment, the high oxygen-demanding waste, suspended solids, ammonia, phosphates and a high load of pathogenic microorganisms (Coliform group) must be removed by an advanced sewage treatment process. Most urban areas in developing countries are facing severe deterioration of aquatic environment, due mainly to direct discharge of municipal sewage, which in turn is due to a lack of low-cost treatment technologies. Karn& Harada (2001) reported that rivers in urban areas of Nepal, India and Bangladesh are severely polluted due to direct discharge of urban waste and wastewater. Initially, the main drawback of anaerobic treatment was that the hydraulic retention time (HRT) treatment process required a long retention time. Today, the UASB system is widely used in mesophilic temperature conditions with shorter retention times. Relative to HRT, UASB systems are more
reliable and simpler for high-rate anaerobic processing of sewage (Seghezzo et al., 1998; Van Haandel and Lettinga 1994). Sewage treatment using a UASB reactor generates effluent containing a high count of fecal microorganisms. It is not ready for direct discharge to the environment (Sperling et al., 2000; Augusto et al., 2000; Goncalves et al., 1999). It is necessary to undertake post-UASB treatment of the effluent. This review paper critically analyzes the efficiency of low-cost treatment systems for UASB effluent in the context of developing countries.
Significance of Combined Process for Sewage Treatment
Microorganisms play a key role in biological wastewater treatment processes. Basically, bacteria metabolize the organic matter, as shown in Figure 1. Under aerobic condition, oxygen is used as an electron acceptor during the degradation of organic matter. Under anaerobic conditions, in the absence of oxygen, organic matter is oxidized with inorganic electron acceptors such as nitrate
Figure 1: Biodegradation mechanisms of organic matter under aerobic and anaerobic process
CO2 H2O
O2
Aerobic
Anaerobic
(CaHbOc)n
CO2
N2
CO2CH4 CO2
CO2
H2SSO4NO3

8 IUBAT Review, A Multidisciplinary Academic Journal, Volume 1, Number 3
(denitrification), sulphate (sulphate reduction), carbon dioxide (methanogensis).
Under both anaerobic and aerobic processes, bacteria have a beneficial effect in minimizing the organic load and pathogenic microorganisms in UASB effluent (Torres and Foresti, 2001; Augusto et al., 2000).
Characteristics of Raw Sewage
The major components of raw sewage in some selected developing countries are shown in Table1. The composition of sewage is similar in these countries. The volume of raw sewage generation in different countries differs from place to place due to climatic conditions and economic aspects. The raw sewage composition in developing countries is low-strength, which is suitable for anaerobic digestion. The suspended solids (300-600 mg/l), CODt (210-740 mg/l) are suitable for anaerobic treatment (Henze et al., 2000).
Table 1: The characteristics of raw sewage in selected developing and high-income countries
Country Temp pHCOD mg/l
BOD mg/l
TSS mg/l
NH4-N mg/l
F.Coli. MPN/100ml
Ref.
Bangladesh 20-30 7.0 -- 200 200 -- 2.5 x 10⁵ 1
Brazil 24-26 7.6 727 368 429 34 4 x 10⁷ 2
Colombia 24-27 7.2 267 95 215 17 --- 3
Egypt 17 --- 527 -- --- 49 8.5 x 10⁶ 4
India 25.68 7.1 256 150 223 22 7.3 x 10⁶ 5
Indonesia 22-29 --- 230 100 159 --- 1.4 x 10⁶ 6
Nepal -- -- 798 360 220 41 8 x 10⁷ 7
Palestine -- -- 1586 --- 736 80 -- 8
Netherlands 20 --- 528 --- ---- 48 ---- 9
Spain -- 7.8 693 360 226 20 --- 10
Therefore, depending on the characteristics of the raw sewage, anaerobic treatment is required for treatment for remaining high concentrations of COD, BOD, nutrients and pathogens (Mahmoud et al., 2004).
Conventional Processes for Sewage Treatment
Most developing countries do not undertake any sewage treatment for sewage; some follow traditional methods, such as stabilization ponds for municipal sewage (de Sousa et al., 2001; Melo et al., 2000). Raw sewage remains in the ponds for many days for auto bio-degradation processes to operate. Van Der Steen et al., (1999) reported that sewage treatment in a stabilization pond is low-cost but has some disadvantages:
• Extensive land area is required
• Spreads a noxious odor and affects air pollution

IUBAT Review, A Multidisciplinary Academic Journal, Volume 1, Number 3 9
• Creates a potential breeding field for mosquitoes.
An alternative to stabilization ponds is the septic tank process. It is simple; it is the oldest digestion process.
Concept on UASB Treatment Process
UASB is an anaerobic granular sludge bed technology. It is a special kind of reactor with “High Rate” anaerobic treatment of wastewater. The UASB treatment system was developed by a research group in the Netherlands in the 1970s (Lettinga and Vinken 1980). UASB reactors have operated successfully at lab-scale, pilot-scale and full-scale sewage treatment plant (Monroy et al., 2000). The
application of UASB systems has increased for sewage treatment in developing countries in tropical and subtropical regions, such as Brazil, Colombia, China, India, and Mexico (Ciftci and Oztiirk 1995). The UASB reactor achieves higher methanogenic activity under mesophilic temperatures.
The UASB reactor is not only extensively used for sewage treatment but also for various types of wastewater treatment (Kato et al., 2003). The UASB system is a bottom-feeding mode reactor. The sludge is in contact directly with raw waste water and substrate-microorganisms (Lettinga et al.,1993). The schematic diagram of the UASB process is shown in Figure 2. The sludge contained at the bottom and dense sludge do not require
Figure 2: Schematic Diagram of the UASB Process

10 IUBAT Review, A Multidisciplinary Academic Journal, Volume 1, Number 3
to washout even more high dense flocculated sludge enhanced for good treatment system at high organic loading rate (Kato et al., 2003). The benefits of the UASB process are the following:
• It has a high-rate anaerobic treatment potential
• UASB bio reactors perform well under mesophilic conditions
• UASB reactors can treat high organic strength waste water
• It is a relatively simple low operational cost technology
• It has high organic removal efficiency
• It potentially can generate a benefit through bio-gas capture
• Sludge production is much less than under aerobic treatment systems
Post-Treatment of UASB Effluent
There are many systems combining UASB and either aerobic or anaerobic post-UASB effluent treatment systems.
Combination of UASB and Aerobic Systems
• UASB/FPU/SP (Final polishing ponds / Stabilizing ponds)
• UASB/TF (Trickling filters) process
• UASB/RBC (Rotating biological contractor) system
• UASB/BF (Aerated Bio-filter)
• UASB/SF (Sand filter)
• UASB/SBR (Sequencing Batch reactor) process
• UASB/FFB (Fluidized & fixed-bed reactors
• UASB/DHS (Down-flow hanging sponge) system
Combination of UASB and Anaerobic systems
• UASB/ASTD (Anaerobic sludge thickening and digestion) process
• UASB/ABFBR (Anaerobic bio-film fluidized bed reactor)
• UASB/AH (Anaerobic hybrid) process
• UASB/AF (Anaerobic filter) process
• UASB/UASB-digester system
• UASB/EGSB (Expanded granular sludge bed reactor)
• UASB/DAF (Dissolved-Air Flotation) process
Post-treatment of UASB Effluent Using a Final Polishing Pond Unit (UASB/FPU) System
Final polishing ponds are more effective in warmer than in colder climates due to algal growth (Cavalcanti et. al., 2001). The photosynthetic activity accelerates the pH and dissolved oxygen, which reduces bacterial pathogens (Curtis et al., 1992). The bi-sulfide ions present in the UASB effluent are oxidized in the FPU ponds, which reduces bad odors. A flowchart for the post-treatment of UASB effluent with a FPU unit is shown in Figure 3.
Problems arise with post-treatment of UASB effluent in a FPU system. The final effluent from FPU does not fulfill the effluent quality standards due to a high fecal coliform

IUBAT Review, A Multidisciplinary Academic Journal, Volume 1, Number 3 11
LAURA ELIZABETH POHL PHOTO VIA FLICKR
Figure 3: Post-treatment of UASB Effluent Under FPU System (Cavalcanti et. al., 2001).
(105.8 MPN/100 ml) presence even when the HRT of a FPU system is maintained at 24 hours. The post-treatment of UASB effluent by the DHS filtration technique is more suitable than the FPU system (Okubo et al., 2005).
Post-Treatment UASB Effluent Using Trickling Filter Process (UASB/TF)
In the trickling filter process, microorganisms form a microbial film on the surface of the filter medium. The trickling filter is a packed-bed,
fixed film reactor where beds materials are used in a circular tank is shown in Figure 4. The bed materials are different sizes of stones, but recently stones are being replaced by plastic materials. The influent sprays over the packed materials by using mechanically rotated distributor arms.
This process creates some problems, such as excess sludge and bio-film of microbial growth. Due to the higher abundance of microorganisms in the trickling filter, it showed good performance for removing the pollution parameters (Augusto et al., 2000). But the

12 IUBAT Review, A Multidisciplinary Academic Journal, Volume 1, Number 3
Figure 4: UASB process with Trickling Filter Process (TF)
presence of pathogenic microorganisms in the final effluent was more, which is a major drawback for this TF process. There are numerous trickling filter processes which have been developed in developing countries for treating the sewage.
Post-Treatment of UASB Effluent by Using Rotating Biological Contractor (UASB/RBC)
The RBC process is designed with circulation process. The packing matters are used to grow more microorganisms in the RBC bio-reactor. The most common type of RBC is made up
circular shaped high-density plastic packing materials. It should be usually less than 10 meters in length. The circulation of RBC is maintained by electric motor (Castillo et al., 1999). The attached biomass can take oxygen due to rotation and can grow more biomass on the film. The attached bacterial biomass helps to treat the wastewater under the biological process. Two-stage RBCs were used for the post-treatment of UASB effluent. Most of the COD is removed at the first stage RBC, and in the second stage RBC the nitrification process occurs (Tawfik et al., 2002). But there was

IUBAT Review, A Multidisciplinary Academic Journal, Volume 1, Number 3 13
a major drawback, the RBC was frequently blocked due to suspended materials and excessive growth of bacterial biomass. The schematic diagram of RBC process is shown in Figure 5.
Post Treatment of UASB Effluent by Using Submerged Aerated Bio-filter (UASB/BF)
Rocher et al., (2012) studied an Aerated Bio-filter (BF) process. The BF is totally submerged, comprising polystyrene spheres with 3 mm diameter, 1200 m2/m3 specific surface and 0.5 m height. The air was injected in the BF
bottom. The combined treatment capacity of UASB and BF was tested at various HRTs. The granule was also formed at the BF system. The UASB/BF combined system can be considered as a viable alternative post-treatment of UASB effluent, but the presence of pathogenic microorganisms of fecal coliform in the BF effluent was much more than the acceptable level. This is a disadvantage of the UASB/BF system. UASB reactor and post-treatment of UASB effluent in submerged aerated bio-filter (BF) were operated by Newman et al., (2005), as shown in Figure 6.
Figure 5: Schematic diagram of UASB process and Rotating Biological Contractor

14 IUBAT Review, A Multidisciplinary Academic Journal, Volume 1, Number 3
Post-Treatment of UASB Effluent by Using Down-Flow Sand Filter Process (UASB/DSF)
The preliminary post-treatment of UASB effluent by using Down-flow Sand Filter (DSF) was invested by Ghangrekar and Kahalekar (2003). The total volume of sand filter reactor was 2.3 L with HRT 2.5 h at in India. According to their observations, they concluded that the properly operated UASB reactor and post-treatment of UASB effluent by using sand filtration combination could meet the effluent standard for disposal to the environment. The cost analysis of UASB and DSF has also showed the economic aspects.
Post-Treatment of UASB Effluent by Using Sequence Batch Reactor (UASB/SBR)
Sousa and Foresti (1996) were the first to investigate the post-treatment of UASB effluent by using SBR system. SBR refers to the wastewater under cyclic and aerated system. Torres and Foresti (2001) studied domestic sewage using UASB and aerobic sequencing batch reactor (SBR) system. Under their study the UASB system was operated under a constant HRT (6h) while the SBR cycle duration was 24, 12, 6 and 4 h with corresponding aeration time. Significant reduction of COD, TSS,
Figure 6: Schematic diagram of post treatment of UASB effluent in submerged aerated bio-filter (BF)

IUBAT Review, A Multidisciplinary Academic Journal, Volume 1, Number 3 15
TKN and phosphate was achieved. Aparna Dutta and Sudipta Sarkar (2015) also studied a UASB/SBR combined system for sewage treatment. Under this combined system, UASB/SBR did not satisfy the reduction of pathogenic microorganism and effluent standard quality. The schematic design of SBR is shown in Figure 7.
Post-Treatment of UASB Effluent by Using Down-flow Hanging Sponge System (UASB/DHS)
The novel UASB/DHS system was developed for the post-treatment systems of UASB effluent
in Japan (Uemura et al., 2002; Tanduker et al., 2003. and Okubo et al., 2005). Under this combined process, the nitrogen level was removed from UASB effluent through the nitrification and de-nitrification process under DHS system (Tanduker et al., 2003). The UASB/DHS combined system has successfully been operated as a simple low-cost technology suitable for sewage treatment in developing countries (Machdaret al., 1997). Relative to other systems, the DHS system also produced less excess sludge and does not require external aeration. The DHS effluent contains less fecal coliform (<104 MPN/100 ml). The UASB/DHS
Figure 7: Schematic diagram of post treatment of UASB effluent in Sequence Batch Reactor (SBR)

16 IUBAT Review, A Multidisciplinary Academic Journal, Volume 1, Number 3
combined system has economic advantages in irrigation purposes because it requires minimum chlorination (Okubo et al., 2005). A schematic diagram of UASB/DHS system, as operated in India for the post-treatment UASB effluent, is shown in Figure 8.
Post-Treatment of UASB Effluent by Using UASB Digester (UASB/ASTD)
The UASB digester is mainly placed for re-digestion of daily washed sludge from UASB system. This system operated two UASB processes -- first time UASB at 15℃ and for second time UASB at 35℃ in Netherlands (Mahmoud et al., 2004). The re-circulated washed sludge from the UASB effluent contributed to an additional 20% methane
production in the UASB digester system. The sludge production is very low, contains little water and is stabilized. In this system, the focus is mainly on sludge digestion and reduction of excess sludge volume produced by the UASB system. The schematic diagram of the UASB-digester process is shown in Figure 9.
Post-Treatment of UASB Effluent by Using Expanded Granular Sludge Bed (EGSB) Bio-reactor
The EGSB reactor using flocculent sludge was evaluated for the post-treatment of effluent from a UASB reactor treating domestic sewage. Kato et al. (2003) investigated a pilot-scale 157.5 L capacity EGSB reactor for 331 days. Seed granular sludge was needed to start up
Figure 8: Schematic diagram of post treatment of UASB effluent in Down Flow Hanging Sponge System (DHS)

IUBAT Review, A Multidisciplinary Academic Journal, Volume 1, Number 3 17
the EGSB reactor. The EGSB system uses high flow velocity in a tall reactor. The low-strength soluble wastewater (less than 1-2 g COD/l) is good for EGSB system. The EGSB system was also developed in Netherlands, by Lettinga in 1970s. Based on granular sludge the EGSB reactor was operated by applying of high-flow liquid velocity. The combination of UASB/EGSB showed good treatment efficiency. The granular sludge showed that the smaller size granule sludge had more methanogenic activity than the larger size granules (Reback et al., 1997). The small sludge granules can also improve the filtration and entrapment
mechanisms for removal of CODs. The combination of UASB/EGSB system is shown in Figure10.
Post-Treatment of UASB Effluent by Using Anaerobic Hybrid Reactor (UASB/AH)
Elmitwalli et al., (1999) studied the post-treatment of UASB effluent with three reactors -- one is UASB and two are AH reactors with small sludge granules with an average diameter of 0.73 m at low temperature (13℃). The experiment took place in Netherlands. The AH reactors were placed vertically with
Figure 9: Schematic diagram of post treatment of UASB effluent in UASB Digester

18 IUBAT Review, A Multidisciplinary Academic Journal, Volume 1, Number 3
polyurethane foam sheet and the HRT was 8 h. The removal and degradation of colloidal particle from sewage appear to be limited in UASB reactors at low temperature (Mergaert et al., 1992). In the UASB/AH reactors, used the smaller size granules were used to obtain higher degradation effect and recover more
Figure 10: Schematic diagram of post treatment of UASB effluent in EGSB
COD. The polyurethane foam (PF) appeared as an excellent colonization matrix for filtration. The results with the combination system of UASB/AH performed significantly for the post-treatment of UASB effluent. A disadvantage of the reactor is the need to back wash the reactor. The combination of UASB/AH system is shown in Figure 11.

IUBAT Review, A Multidisciplinary Academic Journal, Volume 1, Number 3 19
required low land area, has a simple operation technique, uses locally available materials with low prices (sponge materials are cheap and universally available). It is a low-cost technology and the DHS effluent fulfilled the standard effluent quality with minimum chlorination. Therefore, the DHS effluent could be useable for irrigation purpose, which may significantly affect the economic aspects of developing countries. Comparison of effluent characteristics of post-treated UASB effluent is shown in Table 2.
Figure 11: UASB reactor and post-treatment of UASB effluent in the Anaerobic Hybrid Reactor (AH)
Discussion
The post-UASB technology discussed is more acceptable for many reasons, such as lower capital cost, less land area required, simple operation techniques, more reliable, locally available reactor materials, longevity of the reactor and the fulfillment of the standard effluent quality. Among the post-treatment technologies, the DHS system could be considered as the best reactor for post-treatment of UASB effluent, because it

20 IUBAT Review, A Multidisciplinary Academic Journal, Volume 1, Number 3
Conclusions
Sewage contributes directly to environmental pollution. The UASB treatment process can provide bio-energy from sewage treatment. In this review paper, various post-treatment processes of UASB effluent have been analyzed for their ability to fulfil the quality standards of UASB effluent in developing countries. The combination of UASB and DHS system is more convenient and economic than others,
Table 2: Effluent Characteristics of Post-treated UASB Effluent by Using Various types of Bio-Reactors
Primary treatment
Post-treatment reactors
pHCOD
(mg/lBOD
(mg/l)SS
(mg/l)F.Coli.
MPN/100mlReferences
UASB FPU/SP 7.3 145
88-11241
32-6474
52-120105.8
1.1 x 10⁶
Okubo et al., (2005) Cavalcanti et al., (2001)
UASB Trickling Filter (TF) -- 60-120 >67 >30 Not DoneChernicharo & Nascimento (2001)
UASBRotating Biological Contractor (RBC)
--- 61-76 … … 6.5 x 10⁵ Tawfik et al., (2002)
UASBSubmerged Aerated Biofilter (BF)
--- 49 19.0 10 Not DoneGoncalves et al., (1998)
UASBSequencing Batch Reactor (SBR)
7.4 94 --- 26.0 Not DoneTorres &Foresti et al., (2001)
UASBFluidized and Fixed-bed reactor (FFB)
--- 45 30 --- Not DoneColliviganarelli et al., (1991)
UASBDown-flow Hanging Sponge System
7.9 33 5 10 104 Okubo et al., (2005)
UASBExpanded Granular Sludge Bed (EGSB)
-- 87 --- 32 Not DoneKato et al., (2003)
UASBAnaerobic Hybrid (AH) reactor
--- 67 --- ---- ----Elmithwalliet al., (1999)
UASBAnaerobic filter (AF) process
--- 60-79 31-34 9-21 Not DoneChernicharo& Machado (1998)
UASB UASB-digester 7.4 460 ND ----- Not DoneMahmoud et al., (2004)
UASBDissolved air flotation (DAF)
5.1-7.6
50 ----- 8 Not DonePenetraet al., (1999)
because UASB and DHS systems produce less excess sludge and the final effluent has a higher level of dissolved oxygen (DO) and less fecal coliform (<104/100 ml). This system satisfied the WHO standard. Therefore, the DHS effluent can be reused in irrigated fields and aquaculture industry with minimum chlorination, which simultaneously reduces environmental pollution and significantly contributes to economic development.

IUBAT Review, A Multidisciplinary Academic Journal, Volume 1, Number 3 21
References
Agrawal, L.K., Y.Ohashi,E. Mochida, H.Okui, Y.Ueki, H.Harada and A.Ohashi 1997. Treatment of raw sewage in a temperate climate using a UASB reactor and the hanging sponge cubes process, Water Sci. Technol,p.433-440.
Amin, A.F.M.S., S.A.J.Shamsuddin and M.M.Alam 1998.Optimization of sewage treatment process at Pagla. 24thWEDC conference, Sanitation and water for all, Islamabad, Pakistan, p. 129-132.
Alaerts, G.J., S.Veenstra,M. Bentvelsen, and L.A.VanDuijl1990. Feasibility of anaerobic sewage treatment in sanitation strategies in developing countries, International Institute for Hydraulic and Environmental Engineering, IHE Report series 20, Delft, The Netherlands,.
Augusto, C., L.Chernicharo,M.C.P.Nascimento 2000. A new configuration of trickling filter applied to the post-treatment of effluents from UASB reactors, VI Latin-American workshop and Seminar on Anaerobic digestion, 5-9 November, Brazil.
Aparna Dutta and Sudipta Sarkar 2015. Sequencing Batch Reactor for Waste Water Treatment: Recent Advance, Springer, Vol. 1, Issue3, PP 177-190; https://link.springer.com/article/10.1007/s40726-015-0016-y
Amin AFMS, Shamsuddin SAJ & Alam MM 1999. Optimisation of sewage treatment process at Pagla. 24th WEDC conference, Sanitation and water for all, Islamabad, Pakistan, 129-132p.
Alaerts GJ, Veenstra S, Bentvelsen M & van Duijl LA 1990. Feasibility of anaerobic sewage treatment in sanitation strategies in developing countries, International Institute for Hydraulic and Environmental Engineering.
IHE Report series 20, Delft, The Netherlands. Augusto C, Chernicharo L, Nascimento MCP 2000. A new configuration of trickling filter applied to the post-treatment of effluents from UASB reactors. VI Latin-American workshop and Seminar on Anaerobic digestion, 5-9 November, Brazil.
Bogte, J.J., A.M.Breure, van J.G. Andel, and G.Lettinga 1993. Anaerobic treatment of domestic wastewater in small scale UASB reactor, Water Sci.Technol. p. 75-82.
Castillo, A., F.Cecchi, and J.Mata-alvaren1997. A combined anaerobic-aerobic system to treat domestic sewage in coastal areas, Water Res. p. 3057-3063.
Cavalcanti,P.F.F., van A.Haandel, and G. Lettinga2001. Polishing ponds for post-treatment of digested sewage part 1: flow-through ponds, Water Sci. Technol. p. 237-245.
Ciftci C &Oztiirk I 1995. Nine years of full-scale anaerobic-aerobic treatment experiences with fermentation industry effluents. Water. Sci. Technol. 32(12): 131-139.
Cavalcanti PFF, van Haandel A &Lettinga G 2001. Polishing ponds for post-treatment of digested sewage part 1: flow-through ponds. Water Sci. Technol. 44 (4): 237-245
Collivignarelli, C., G.Urbini,A.Farneti,A.Bassetti, and U.Barbaresi,. 1991. Economic removal of organic and nutrient substances from municipal wastewater with full-scale UASB fluidized and fixed-bed reactors, Water Sci. and Technol,p. 90-95.

22 IUBAT Review, A Multidisciplinary Academic Journal, Volume 1, Number 3
Crine, M., M.Schlitz,and L.Vandevenne,1990. Evaluation of the performance of random plastic media in aerobic trickling filters,Wat. Sci. Tech.,p.227-238.
Dixo, N.G.H., M.P.Gambrill,P.F.C.Catunda, and van A.C.Haandel, 1995. Removal of pathogenic organisms from the effluent of an up-flow anaerobic digestion using waste stabilization ponds, Water Sci. Technol. p. 275-284.
De Sousa, J.T., and E. Foresti, 1996. Domestic sewage treatment in an upflow anaerobic sludge blanket-sequencing batch reactor system, Water Sci. Technol.,p. 73-84.
Elmitwalli, T.A., M.H.Zandvoort,G.Zeeman,H. Bruning,andG.Lettinga 1999. Low temperature of domestic sewage in upflow anaerobic sludge blanket and anaerobic hybrid reactors,Wat.Sci. Tech.p.177-185.
Elmitwalli,T., 2000. Anaerobic treatment of domestic sewage at low temperature, Ph.D. thesis, Department of Environmental Technology, Wageningen University, The Netherlands.
El-Gohary, F., and F.Nasr,1999. Cost-effective pre-treatment of wastewater, Water Sci. Technol.p. 97-103.
Goncalves, R.F., V.L.de Araujo, and C.A.L.Chernicharo,1998. Association of a UASB reactor and a submerged aerated biofilter for domestic sewage treatment, Water Sci. Technol.p. 189-195.
Goncalves, R.F., V.Araujo,S.B.Vancleide,1999.Combining upflow anaerobic sludge blanket (UASB) reactors and submerged aerated bio-filter for secondary domestic wastewater treatment, Water Sci. Technol. p. 71-79.
Grin, P.C., R.E.Roersms, and G.Lettinga,1985. Anaerobic treatment of raw sewage in UASB reactors at temperatures from 9-20℃, In: Proceedings of the Seminar/Workshop Anaerobic Treatment of Sewage, Amherst,p. 109-124.
Goncalves RF, Araujo V, Vancleide SB 1999. Combining upflow anaerobic sludge blanket (UASB) reactors and submerged aerated biofilter for secondary domestic wastewater treatment. Water Sci. Technol. 40 (8): 71-79.
Ghangrekar MM & UJ Kahalekar 2003. Performance and cost efficacy of two-stage anaerobic sewage treatment J. of Institute of Engineers (India)-EN: (84):16-22p.
Kato, M.T., S.Rebac,andG.Lettinga,1999. Anaerobic treatment of low strength brewery wastewater in expanded granular sludge bed reactor, Appl.Bioch. Biotech, ,p. 15-32.
Kato, M.T., L.Florencio, and R.F.M. Arantes,2003. Post-treatment of UASB effluent in an expanded granular sludge bed reactor type using flocculent studge, Water Sci. Technol.,p.279-284.
Kato MT, Florencio L & Arantes RFM 2003. Post-treatment of UASB effluent in an expanded granular sludge bed reactor type using flocculent studge. Water Sci. Technol. 48 (6): 279-284
Karn, S. K. andH. Harada,2001. Surface water pollution in three urbanTerritories of Nepal, India and Bangladesh, Env. Manag.,p. 483-496.
Lettinga, G., andJ.N.Vinken,1980. Feasibility of the Upflow anaerobic sludge blanket (UASB) process for the treatment of low strength wastes, 35th Purdue Industrial waste Conference Proceedings. 625-634.

IUBAT Review, A Multidisciplinary Academic Journal, Volume 1, Number 3 23
Lettinga, G., A.De Man,A.R.M.VanderLast,W.Wiegant,van K.Knippenberg, J.Frijns,and Van J.C.L.Buuren,1993,. Anaerobic treatment of domestic sewage and wastewater, Water Sci. Technol. p.67-73.
Lettinga G &Vinken JN 1980. Feasibility of the upflow anaerobic sludge blanket (UASB) process for the treatment of low strength wastes. 35th Purdue Industrial waste Conference Proceedings 625-634
Mahmoud N, Zeeman G, Gijzen H &Lettinga G 2004. Anaerobic sewage treatment in a one-stage UASB reactor and a combined UASB-digester system. Water Res. 38 (9): 2004.
Machdar, I., H.Harada,A.Ohashi,Y.Sekiguchi,H.Okui,&K.Ueki,, 1997. A novel and cost-effective sewage treatment system consisting of UASB pre-treatment and aerobic post-treatment units for developing countries, Water.Sci. Technol. p.189-197.
Machdar, I., Y.Sekiguchi,H.Sumino,A.Ohashi,andH.Harada,2000. Combination of a UASB reactor and a curtain type DHS (downflow hanging sponge) reactor as a cost-effective sewage treatment system for developing countries, Water. Sci. Technol.,
Mergaert, K., B.Vanderhaegen,andW.Verstraete,1992. Application and trends of pre-treatment of municipal wastewater, Water Res.p.1025-1033.
Mohmoud,N.,N.M.Amarneh,R.Al-Sayed,G.Zeeman,H.Gijzen, and G.Lettinga,2003. Sewage characterization as a tool for the application of anaerobic treatment in Palestine, Environmental Pollution,p.115-122.
Mahmoud, N., G.Zeeman,H.Gijzen, and G.Lettinga, . 2004. Anaerobic sewage treatment in a one-stage UASB reactor and a combined UASB-digester system, Water Res.
Monroy S, Graciela F, Monica M. Leticia M &Herve M 2000. Anaerobic digestion for wastewater treatment in Mexico: state of the technology. Water Res. 34 (6): 1803-1816
Newman, J.; Occiano, V.; Appleton, R.; Melcer, H.; Seval, S.; Parker, D.; Langworthy, A.; Wong, P. 2005. Confirming BAF Performance for Treatment of CEPT Effluent on a Space Constrained Site. Proceedings of WEFTEC’05., Washington, D.C.
Okubo T, Onodera T, Miah MS, Uemura S, Ohashi A & Harada H (2005). Performance of DHS-Biotower for UASB post-treatment unit at Karnal sewage treatment plant, Hariana, India.The 4th International Symposium on Global Renaissance by Green Energy Elmitwalli T 2000. Anaerobic treatment of domestic sewage at low temperature. Ph.D. thesis, Department of Environmental Technology, Wageningen University, The Netherlands.
Pearson, H. W., D.D.Mara,S.W.Mills and D.J.Smallman1987. Physico-chemical parameters influencing faecal bacterial survival in waste stabilization ponds, Wat. Sci. Technol.,p.145-152.
Revolution, Proceedings 21 century COE on 24-25 January 2005, Nagaoka University of Technology, Nagaoka, Japan Poster no. B4: 106

24 IUBAT Review, A Multidisciplinary Academic Journal, Volume 1, Number 3
Rocher, V.; Paffoni, C.; Goncalves, A.; Guerin, S.; Azimi, S.; Gasperi, J.; Moilleron, R.; Pauss, A. 2012. Municipal Wastewater Treatment by Biofiltration: Comparisons of Various Treatment Layouts. Part 1: Assessment of Carbon and Nitrogen Removal. Water Science and Technology 65, 1705-1712.
Seghezzo, L. G.Zeeman,VanJ.B.Lier,H.V.M.Hamelers,andG. Lettinga,1998. A review: The anaerobic treatment of sewage in UASB and EGSB reactors. BioresourceTechnol.,p. 175-190.
Sperling, MV, Freire VH, Chernicharo CAD 2000. Performance evaluation of UASB-activated sludge system treating municipal wastewater. 1st World water Congress of the international water association (IWA)3-7 July. Paris.
Sperling, M.V., V.H.Freire,C.A.D.Chernicharo, 2000.Performance evaluation ofUASB-activated sludge system treating municipal wastewater, 1st World water Congress of the international water association (IWA)3-7 July, Paris.,
Thomas,P., D.Curtis,M.Duncan,andS.Salomaoa,1992. Influence of pH, oxygen and humic substances on ability of sunlight to damage fecal coliforms in waste stabilization pond water, Appl. and Environ,Microbiol,p. 1335-1343.
Torres,P. and E.Foresti,2001. Domestic sewage treatment in a pilot system composed of UASB and SBR reactors, Eater Sci. Technol.,p.247-253.
Torres P & Foresti E 2001. Domestic sewage treatment in a pilot system composed of UASB and SBR reactors. Eater Sci. Technol. 44(4): 247-253.
Tawfik A, Klapwijk B, El-Gohary F &Lettinga G 2002. Treatment of anaerobically pre-treated domestic sewage by a rotating biological contactor. Water Res. 36: 147-155.
Thomas P, Curtis D, Duncan M &Salomaoa S 1992. Influence of pH, oxygen and humic substances on ability of sunlight to damage fecal coliforms in waste stabilization pond water. Appl. and Environ. Microbiol 58 (4): 1335-1343
Uemura, S.,K.Takahashi,A.Takaishi, I.Machdar,A.Ohashi,andH.Harada,2002. Removal of indigenous coliphages and fecal coliform by a novel sewage treatment system consisting of UASB and DHS units, Water Sci. Technol., p. 303-309.
Van Haandel, A.C., and G.Lettinga,1994. Anaerobic sewage treatment: A practical guide for regions with a hot climate, John Wiley and Sons, Chichester, England.
Van Der Steen,P., A. Brenner,J.Van Buuren,andOron, Gideon 1999. Post-treatment of UASB reactor effluent in an integrated duckweed and stabilization pond system, Water. Res., p. 615-620.
WHO Global water supply and sanitation assessment 2000 report, Geneva: World Health Organizat

IUBAT Review, A Multidisciplinary Academic Journal, Volume 1, Number 3 25
IUBAT ReviewA Multidisciplinary Academic Journal
Md. Jubaer Alam. 2016. “Depiction and Analysis of a Split P-shaped Microstrip Patch Antenna for S, C, X, and Ku-band Applications.” IUBAT Review 1 (3): 25-37. iubat.edu/journal
Depiction and Analysis of a Split P-shaped Microstrip Patch
Antenna for S, C, X, and
Ku-band ApplicationsMd. Jubaer Alam1,*
1Department of Electrical and Electronic Engineering, IUBAT—International University of Business Agriculture and Technology, Dhaka, Bangladesh
*corresponding author Email: [email protected]
ABSTRACT: In this paper, a split P-shaped multiband microstrip patch antenna is designed and its measurement results in terms of different parameters are given. This patch antenna is designed to sup-port models with resonances at 3.48 GHz, 5.85 GHz, 9.4 GHz, 12.91 GHz, 15.93 GHz and 19.06 GHz. FR-4 (lossy) is used as a substrate to design the recommended antenna which has a firm dimension of 18×20 mm2. This antenna operates at S, C, X, and Ku band with moderate bandwidth because of its design and feedline. This mixed quadrilateral shaped multiband antenna has directivity gain of 2.61dBi, 5.78dBi, 3.04dBi, 0.97dBi, 3.42dBi and 7.47dBi at resonating frequencies and is suitable for a modern communication system. The proposed split multiband antenna results are obtained in terms of Return Loss, Voltage Standing Wave ratio, Gain and Radiation Pattern which have admissible values of return loss less than -10 dB, Efficiency more than 80% at each resonant frequency and Gain more than 5 dB. A suitable radiation pattern and an emerging gain make the recommended antenna suitable for the use in a modern communication system.
KEYWORDS: Multiband; Microstrip Antenna; Split gap; Modern communication;

26 IUBAT Review, A Multidisciplinary Academic Journal, Volume 1, Number 3
Introduction
Given the recent advance of modern modes of communication, there is need for antennas that are small in size, compact in shape, and low cost and that can provide good output characteristics over a large frequency range. In early 1970s, the microstrip patch antenna (MPA) was introduced and it has initiated a revolution in antenna design. Designing optimal MPAs has attracted the attention of researchers attempting to reduce further the size of the antenna. Microstrip antennas cover much of the wireless system, such as Bluetooth, Wi-Fi, WLAN, WiMAX applications.MPAs are known as low profile antennas. They are used in planar and nonplanar surfaces. They are being used widely because they are simple and inexpensive to fabricate. MPAs have a frequency range above 100 MHz [1]. They are fabricated on a dielectric substrate. The advantage of this conformable structure is the ability to integrate the antenna into vari-ous telecommunication systems. Designing an optimum MPA requires experimentation with different designs: the splits, gaps and spaces among the element determine the resonant frequency of the antenna. The most important decision is the choice of spacing. Gaps and spaces play a vital role in the MPA. They de-termine the resonance at different frequencies. So these splits and gaps need to channelize perfectly. But tuning the MPA in a particular position may make the structure complex. A coupling problem occurs with the reduc-tion of the structure. Sometimes, increased spacing creates the possibility of uncertain convexity in the substrate [2-9]. A handful of researchers has worked to design better patch
antennas keeping in mind the goal of smaller size and better operation in several discrete frequencies. In spite of complexities regarding the design of multiband antennas, researchers have discussed the schematic composition of MPAs that have operating frequencies in more than one band.A lot of research has been done on the layout of MPAs. A double G-shaped planar multiband antenna of 40×30mm2 has been designed for WLAN, WiMAX, and HIPERLAN2 [10]. A 50×50 mm2 slot ring antenna integrated with capacitive patch has been proposed, which is able to function at frequencies related to WLAN and WiMAX applications [11]. Coplanar Wave-guide (CPW)-fed slotted patch antennas of 23×30 mm2 designed to operate in 2.4–2.63, 3.23–3.8 and 5.15–5.98GHz bands [12], and 25×25mm2 to cover 2.14–2.85, 3.29–4.08, and 5.02–6.09GHz bands [13] have been de-veloped. The two-U slot-shaped patch antenna of 40×50mm2 with three resonant frequencies of 2.7, 3.3 and 5.3GHz has been implemented to cover tri-band wireless system [14]. Alam et al. worked on this microstrip antenna in recent past. They proposed a combined dou-ble H-shaped microstrip antenna for X-band operation [15] and a split quadrilateral shaped antenna for C, X, Ku, and K-band (multiband) applications [16]. The gain of the H-shaped antenna was more than 5 dB, but it covered only X-band, whereas the split quadrilateral antenna covered multiband with gain around 3 dB. The main concern of the researchers on the above-mentioned proposals and designs was to design multiband antennas with minimum concession to either higher fabrication cost or larger effective electrical area. The parameters of concern are steady radiation performance,

IUBAT Review, A Multidisciplinary Academic Journal, Volume 1, Number 3 27
gain or efficiency. There remains scope for researchers to build low profile MPAs with better gain, radiation patterns, and efficiency.On the basis of the background study, a low profile, multifunctional, small sized MPA is proposed in this paper with highly tolerable FR-4 material as the substrate. The slit P-shaped multiband patch antenna has an area of 18×20mm2. After fabrication, this patch has been compared with other similar antennas on different performance criteria. This slit quad-rilateral shaped MPA that produces multiple bands resonating at 6.3GHz, 7.2GHz, 7.5GHz, 8.7GHz, 12.8GHz, 17GHz and 21.3GHz with excellent return loss. The frequencies accessi-ble with the proposed antenna cover C, X, Ku and K bands, which have many applications in wireless communications such as GSM (Global System for Mobile communications), DCS (Distributed control system), CDMA (Code-division multiple access), PCS (Personal Communications Service).In this paper, the background has been ex-plained in section I. Section II explains the
design of the antenna. Section III is based on results and discussion of different parameters like VSWR, directivity, surface current etc. And finally, section IV provides a conclusion.
Methodology
The geometry and layout of the proposed split P-shaped MPA are highlighted in Figure 1. Table 1 shows the summary. This antenna consists of three layers: a patch, substrate and ground. All measurements are in mm scale. In this antenna, FR-4 (lossy) is used as a dielectric substrate. This substrate has a thickness of 1.6 mm and a relative dielectric constant (εr) of 4.4 and loss tangent tan δ=0.02. The dimensions of the substrate are 18×20×1.67 mm3. Copper annealed is used as the patch and ground material. When there is a little change in the feed line, there is a remarkable change in resonances. It is the shape of the antenna that makes it possible to resonate at different frequency ranges.
Figure 1: The geometry of the proposed MPA
(a) Front view of the prototype (b) Front view of the design

28 IUBAT Review, A Multidisciplinary Academic Journal, Volume 1, Number 3
Figure 2: Prototype of the MPA
(a) Front view (b) Back view
Figure 2 illustrates the prototype of the MPA. Here, the Length of the antenna L is 11mm and width of the antenna Wg is 15mm. All antenna parameters are tabulated in Table 1 and the antenna was simulated with commer-cially available Finite Integration Technique (FIT) based on Computer Simulation Technol-ogy (CST) microwave studio software.
Results and Discussions
The performance of this split Quadrilateral shaped antenna is determined by CST soft-ware. The simulation has been done with ASUS
Table 1: Antenna Parameters
Parameter Optimum value (mm) Parameter Optimum value (mm)
L 20 W1 1.5
W 18 W2 1
L1 14 W3 0.5
L2 16 R 5
L3 2 r 2.5
L4 0.38
A556U series. The Central Processing Unit is Intel Core i5-6200U, RAM- 8GB, HDD- 1TB. It took about 293 seconds for each simulation. The Satimo Starlab anechoic chamber was used for measuring different parameters.The analysis is made on VSWR, Frequency, Di-rectivity, Measured gain, Radiation on surface current, E and H field radiation pattern, with a frequency range of 1 to 20 GHz. This antenna shows resonance in four different bands. The analysis is illustrated below with figures.Voltage standing wave ratio (VSWR) is used to measure the imperfections of the transmission line. It measures the ratio of the amplitudes of the maximum standing wave. In the case of a

IUBAT Review, A Multidisciplinary Academic Journal, Volume 1, Number 3 29
transmission system, this VSWR represents the efficiency of transferring RF power into the load via a transmission line from the power source. The implementation of the VSWR of the mentioned MPA in Figure 3 represents the measured impedance bandwidth of the antenna within the range of 1 to 20GHz for VSWR ≤ 2. Both simulated and measured re-sults have a decent match. The inconsistency between the results of simulated and measured are predominantly due to deceptions in the process of fabrication. However, the inconsist-ency may be occurring due to the use of the connector during the measurement. But in the case of simulation, the microstrip feeding cable is not considered. In spite of these, the mentioned miniaturized MPA shows resonance at multiple bands.On the other hand, reflection coefficient (S11) does similar activities like VSWR. It signifies the relationship between input and output ports in an electrical system. It represents the quality of the impedance match between the source and the measured load. And for any antenna, the value of (S11) is taken in account when it is less than -10dB.
The antenna has four resonant frequencies at four different bands and these resonant frequen-cies appeared in the range of 3 to 20 GHz. At resonant frequencies, return losses are quite similar. They fluctuate within a range of -10.7 dB to -22.24 dB. These resonant frequencies along with their corresponding bands and return losses are tabulated below.Table 2 describes the return loss at different resonant frequencies. The bandwidth is quite impressive at those resonances. The fundamen-tal resonance of the antenna is at 3.48GHz and its bandwidth is 53MHz. On the other hand, the highest resonant frequency is 19.06GHz and the bandwidth is 1890MHz. There, corresponding return losses are -22.24dB and -19.41dB.Figure 4 describes the input impedance of the proposed MPA. It is evident from Figure 3 that the VSWR is much higher than 2 at lower frequencies and returns loss follows the same. Besides, at higher frequencies the -10dB band-width is much wider. This may occur due to the impedance mismatch over lower frequen-cies. As the input impedance of an electrical network is the quantity of restriction to current flow both static and dynamic in the electrical
Figure 3: Simulated and measured VSWR of the antenna

30 IUBAT Review, A Multidisciplinary Academic Journal, Volume 1, Number 3
source, impedance matching is pretty impor-
tant. From input impedance curve in Figure
4, it is observed hat the impedance fluctuates
extensively in the frequency range of 0-20GHz.
From 0 to 4GHz, reactance is quite high and
has a peak value of around 2000Ω. Apart from
that, the impedance remains close to 50Ω. A
ground plane effect is there to create the input
impedance mismatch to 50Ω.
The main concern of an antenna is its di-rectivity or radiation pattern. It explains the direction of a particular antenna at which the radiation is directed. It is measured by the ratio of two radiation intensities; one is in the particular direction and the other is the overall direction. Figures 5 and 6 show the radiation pattern of the antenna at resonant frequencies in E and H plane. The figures are shown from the relevant pattern from φ= 0 and φ= 90.̊ For
Figure 4: Simulated input impedance of the MPA
TABLE 2: Return loss and bandwidth of the proposed MPA
Resonant Frequency (GHz) Band covered Return loss (dB) Bandwidth (MHz)
3.48 S -22.24 53
ce5.85 C -16.21 221
9.4 X -15.673 969
12.91 Ku -14.30 1135
15.93 Ku -14.29 1133
19.06 K -19.41 1890
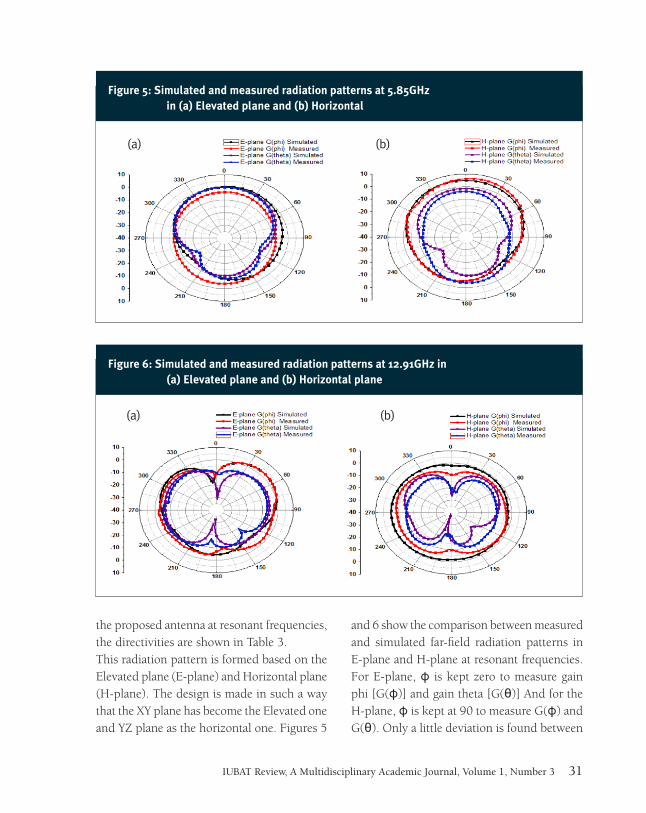
IUBAT Review, A Multidisciplinary Academic Journal, Volume 1, Number 3 31
Figure 5: Simulated and measured radiation patterns at 5.85GHz in (a) Elevated plane and (b) Horizontal
(a) (b)
Figure 6: Simulated and measured radiation patterns at 12.91GHz in (a) Elevated plane and (b) Horizontal plane
(a) (b)
the proposed antenna at resonant frequencies, the directivities are shown in Table 3.This radiation pattern is formed based on the Elevated plane (E-plane) and Horizontal plane (H-plane). The design is made in such a way that the XY plane has become the Elevated one and YZ plane as the horizontal one. Figures 5
and 6 show the comparison between measured and simulated far-field radiation patterns in E-plane and H-plane at resonant frequencies. For E-plane, φ is kept zero to measure gain phi [G(φ)] and gain theta [G(θ)] And for the H-plane, φ is kept at 90 to measure G(φ) and G(θ). Only a little deviation is found between

32 IUBAT Review, A Multidisciplinary Academic Journal, Volume 1, Number 3
the measured results and the simulated results. This may happen because of the cable loss which is the connector between controller and antenna. Apart from that, the results are quite impressi,ve and over the resonating frequen-cies, the radiation patterns are quite steady. In the case of G(φ) radiation for both E and H plane are essentially symmetric. But in the case of G(θ), the patterns are quite similar at the operating frequencies.Figure 7 and 8 represent the 3D radiation patterns at 5.85GHz and 12.91GHz. The study is made on “xy”, “yz” and “zx” planes to compare the radiation. Two different resonant frequencies are taken to observe the activity in two different bands. As expected, these phase
patterns have a helical profile with a 2π phase
change in one turn. Therefore, the proposed
antenna adequately radiates a circularly polar-
ized electromagnetic wave [18]. It is seen from
the Figure 7 and 8 is the main lobe directions
are 0 ̊and main lobe magnitudes are 5.79dBi and
7.15dBi respectively for 5.85GHz and 12.91GHz
Table 3 describes the value of the directivity at
different resonating points in E and H plane re-
spectively. In the case of the E-plane, the highest
directivity is found at 19.06GHz. On the other
hand, for H plane, the highest value is also at
19.06GHz. Even the radiation patterns are also
impressive at these resonant frequencies.
Figure 7: Simulated 3D radiation pattern at 5.85GHz in (a) xy, (b) yz and (c) zx plane
(a) (b) (c)
Figure 8: Simulated 3D radiation pattern at 12.91GHz in (a) xy, (b) yz and (c) zx plane
(a) (b) (c)

IUBAT Review, A Multidisciplinary Academic Journal, Volume 1, Number 3 33
In metallic antennas, the surface current is an actual electric current that is induced by an applied electromagnetic field. The electric field pushes charges around. Figure 9 illustrates the
Figure 9: Surface Currents distribution of the antenna simulated at (a), (b), (c) and (d)GHz
(a)3.48GHz (b)5.85GHz
(c)9.4GHz (d)12.91GHz
TABLE 3: Directivity of E and H plane at operating frequencies.
Resonant Frequencies (GHz) Directivity in E-plane (dBi) Directivity in H-plane (dBi)
3.48 2.61 1.1
5.85 5.78 5.78
9.4 3.04 3.77
12.91 0.97 5.95
15.93 3.42 4.0
19.06 7.47 7.37
result of simulation of the current distribution of the proposed MPA for (a) 3.48 GHz, (b) 5.85 GHz, (c) 9.4 GHz and (d) 12.91 GHz.

34 IUBAT Review, A Multidisciplinary Academic Journal, Volume 1, Number 3
with the higher frequencies, the current has to
cover curvier paths than a straight one in lower
frequencies. This is because of skin effect.
Due to it, at higher frequencies, current flows
through the surface of a conductor instead of
its fundamental part. Hence, in the case of both
the upper and lower band, excitation is quite
strong in the entire parts of the MPA.
Figure 10: Comparison between Simulated and Measured gain of the MPA
It is visible from the figure that the feedline is carrying more current. The generated electric field has been found at this point [17]. It is also observed that the current distribution of the lower frequencies is more balanced than the higher or upper ones. In upper bands, the created electric field near the slot is quite legitimate. In lower frequencies, the current is distributed almost all over the patch. But
Figure 11: Comparison between Simulated and Measured efficiency of the MPA

IUBAT Review, A Multidisciplinary Academic Journal, Volume 1, Number 3 35
Antenna gain is a term that explains the amount of transmitted power in the direction of an isotropic source. It is the measurement of an antenna’s ability to provide a direction to the radio frequency energy in a distinct pattern. This gain is measured by Satimo StarLab near-field measurement system. Figure 10 illustrates the gain of the MPA within 1 to 18 GHz. There is a negligible deviation between measured and simulated curve. And it is visible that the gain crosses the 5dBi line at 13.5 GHz. The highest gain is found between 19 and 20GHz where the value is almost 6dBi, but that is not included in the figure as the measurement could be made only up to 18GHz.The efficiency of the patch is also done by Satimo StarLab near-field measurement sys-tem. Figure 11 illustrates the efficiency of the patch within range of 1 to 18 GHz. The highest efficiency is recorded at 81.35% with an average of 70%. In this figure, both meas-ured and simulated efficiencies are compared within 18GHz as the Satimo StarLab near-field
measurement system cannot measure more than 18GHz. The efficiency is not that high because the patch is designed for the high loss FR-4 dielectric substrate. Due to this reason, both efficiency and gain are deteriorated. The gain and efficiency of the proposed MPA can be upgraded by using expensive microwave substrate rather than low-cost FR-4.The comparison of the proposed MPA with existing antennas based area and application are shown in Table 4. Though the related an-tennas are made of identical materials, there are definite resonant frequencies at different bands because of the various shapes of the antennas. After analyzing the detailed performance char-acteristics, the mentioned antennas are bigger in shape, cramped in bandwidth and cover fewer bands comparing to the proposed split quadrilateral shaped MPA.
TABLE 4: Performance comparison between proposed antenna and some existing antennas.
AntennaDimension Area (mm2)
Covered Bands Bandwidth (MHz) Application
[9] 20×20 S and C 360, 440, 1550 WiMax, C-Band
[10] 40× 30 L, S and C 140, 270, 675WLAN, Blue-tooth,
WiMAX, HIPERLAN2
[12] 23×30 S and C 290, 290, 700 WiFi/WiMax, C-Band
[13] 25×25 S and C 300, 500, 700 WiMax/ WLAN
[14] 40×50 S and C 180, 150, 170 Tri-band Wireless
Proposed 18×20 C, X, K and Ku358, 537, 445,
1553, 1036, 2182WLAN, C-Band, Satellite
Communication

36 IUBAT Review, A Multidisciplinary Academic Journal, Volume 1, Number 3
Conclusions
In this paper, a small split P-shaped multiband microstrip patch antenna is proposed for the modern communication system, especially for wireless communication. For this antenna, the resonant frequencies are obtained in S, C X and Ku bands with satisfactory gain. Moreover, the directivity and gains are quite impressive. The perimeter of the designed MPA is quite small and compact for an antenna that gets resonant frequencies with four different bands. Despite using the FR-4 substrate, the antenna is only 1.67 mm thick. This design works well in wire-less systems like WiFi, WLAN, WiMAX, etc.
References
Prasad K 2011 Antenna & Wave propagation (Satya Prakashan).
Fertas K, Kimouche H, Challal M, Aksas H, Aksas R and Azrar A,”Design and Optimization of a CPW-Fed Tri-band patch Antenna Using Genetic Algorithms”, ACES- Appl. Comput. Electromagn. Soc. J., Vol. 30, No. 9, 754-759, 2015.
Mathur V, Gupta M, Zhang Y P, Pan S, Kawase D, Sakakibara K, Seo K, Kikuma N, Hirayama H, Latif S I, Shafai L, Shafai C, Langston W L, Jackson D R, Bhadouria A S, Kumar M, Sung Y J, Kim Y-S, MacPhie R H, Song L, Fang Q, Fu S and Wu Q ,”Design of microstrip antennas fed by four-microstrip-port waveguide transition with slot radiators”, IEEE Trans. Antennas Propag., Vol. 55, No. 10, 2769–2773, 2015.
M.N. Shakib, M.T. Islam, and N. Misran, “Stacked patch antenna with folded patch feed for ultra-wideband applications”, IET-Microw Antennas Propag., Vol. 4, No. 10, 1456–1461, 2010 .
Behdad N and Sarabandi K, “Dual-band reconfigurable antenna with a very wide tunability range”, IEEE Trans. Antennas Propag.,Vol. 54, No. 2, 409–416, 2006.
M.M. Islam, M.T. Islam, and M.R.I. Faruque, “Design of an UWB Patch Antenna for Dual-Frequency Operations”, Res J Appl Sci Eng Technol., Vol. 7, No. 2, 822–825, 2014.
H. A. Majid and M. A. Rahim, “Frequency Reconfigurable Microstrip Patch-Slot Antenna with Directional Radiation Pattern,” Prog. Electromagn. Res., Vol. 144, No., 319–328, 2013.
Islam M M, Islam M T and Faruque M R I,”Dual-band operation of a microstrip patch antenna on a Droid 5870 substrate for Ku- and K-bands”, Sci. World J., Vol.2013, Article id. 378420, 2013.
Ahsan M R, Islam M T and Ullah M H,”A New Low-Profile Inverted A-Shaped Patch Antenna for Multiband Operations”, Wire. Pers. Commun., Vol. 81, No. 2, 519–529, 2015.
Dadgarpour A, Abbosh A and Jolani F,”Planar multiband antenna for compact mobile transceivers”, IEEE Antennas Wirel. Propag. Lett., Vol. 10, 651–654, 2011.
Sim C Y D, Cai F R and Hsieh Y P,”Multiband slot-ring antenna with single and dual-capacitive coupled patch for wireless local area network/worldwide interoperability for microwave access operation”, IET Microwaves, Antennas & Propag., Vol. 5, No. 15, 1830–1835, 2011.

IUBAT Review, A Multidisciplinary Academic Journal, Volume 1, Number 3 37
Wang P, Wen G-J, Huang Y-J and Sun Y-H,”Compact CPW-fed planar monopole antenna with distinct triple bands for WiFi/WiMAX applications” Electron. Lett. Vol. 48, No. 7, 357, 2012.
Liu H W, Ku C H and Yang C F,”Novel CPW-fed planar monopole antenna for WiMAX/WLAN applications” IEEE Antennas Wirel. Propag. Lett.,Vol. 9, 240–243, 2010.
AbuTarboush H F, Nilavalan R, Budimir D and Al-Raweshidy H S,”Double U-slots patch antenna for tri-band wireless systems” Int. J. RF Micro. Comput. Eng., Vol. 20’ No. 3, 279–285, 2010
Alam M J, Faruque M R I, Hossain M I, Islam M T and Abdullah S, “ A Combined Double H-shaped Microstrip Patch Antenna for X-Band operation” Int. Conf. Elec. Comput. and Comm. Eng., (ECCE), February, 2017
Alam M J, Faruque M R I and Islam M T”Split quadrilateral multiband microstrip patch antenna design for modern communication system” Microwave Opt. Technol. Lett., Vol. 59, No. 7, 1530–1538, 2017.
Hossain M J, Faruque M R I and Islam M T,”Design of a Patch Antenna for Ultra wide band applications” Microwave Opt. Technol. Lett., Vol. 58, No. 9, 2152–2156, 2016.
M. Barbuto, F. Trotta, F. Bilotti, and A. Toscano, “Circular polarized patch antenna generating orbital angular momentum,” Prog. Electromagn. Res., Vol. 148, 23–30, 2014.

38 IUBAT Review, A Multidisciplinary Academic Journal, Volume 1, Number 3
Vulnerability Analysis for Sustainable Development against Flood Hazard and Relief Distribution:
A Case Study of 2017 Flood of Bangladesh
IUBAT ReviewA Multidisciplinary Academic Journal
Monirul Islam, Mahfuzur Rahman, Xiaoying Li and Nahidul Islam. 2018. “Vunerablility Analysis for Sustainable Development against Flood Hazard and Relief Distribution: A Case Study of 2017 for Bangladesh.” IUBAT Review 1 (3): 38-47. iubat.edu/journal
ABSTRACT: Floods are one of the most destructive natural hazards. Bangladesh and its neighbors in India and Myanmar are highly vulnerable to flood hazards. This study addressed a methodology to assess the relationship between flood hazard vulnerability and relief distribution based on the flood hazard event of 2017 of Bangladesh, using Geographical Information System (GIS). Flood vulnerability maps were developed through a vulnerability score, calculated on the basis of the interactive effect of observed vulnerabilities. Then, flood vulnerability ranks were determined using the ranking matrix of three-dimensional multiplication modes by the interactive effect of three vulnerability maps: flood-affected people, flood-affected infrastructure, and flood-affected crop land. The resulting map revealed the de-gree of vulnerability of districts to flood hazard events. The analyses exhibit that 49.9% of districts (31 districts out of 64) were to some extent vulnerable to a flood hazard event. Moreover, the GIS technique was used to identify the correlation of flood vulnerability (for people, infrastructure, and crop land) and relief distribution in terms of rice, cash, and dry food. The correlation was determined by overlaying relief distribution data on developed vulnerability maps. The correlation matrix between flood-affected crops land map and relief distribution (cash in BDT) showed the highest congruence (78.85%). Finally, flood vulnerability maps for administrative districts provide relevant information about mitigation techniques and countermeasures against flood damages.Keywords: Flood, Geographical Information System (GIS), Hazard, Relief, Vulnerability
1 IUBAT – International University of Business Agriculture and Technology, Dhaka, Bangladesh
2 Hohai University, Nanjing, Jiangsu
3 PhD Research Fellow, Institute of Mountain Hazards and Environment, Chinese Academy of Sciences, Chengdu, Sichuan, P.R.China
*Corresponding author E-mail: [email protected]
Monirul Islam1,*, Mahfuzur Rahman1,3, Xiaoying Li2, Nahidul Islam1
IUBAT Review, A Multidisciplinary Academic Journal, Volume 1, Number 3 39
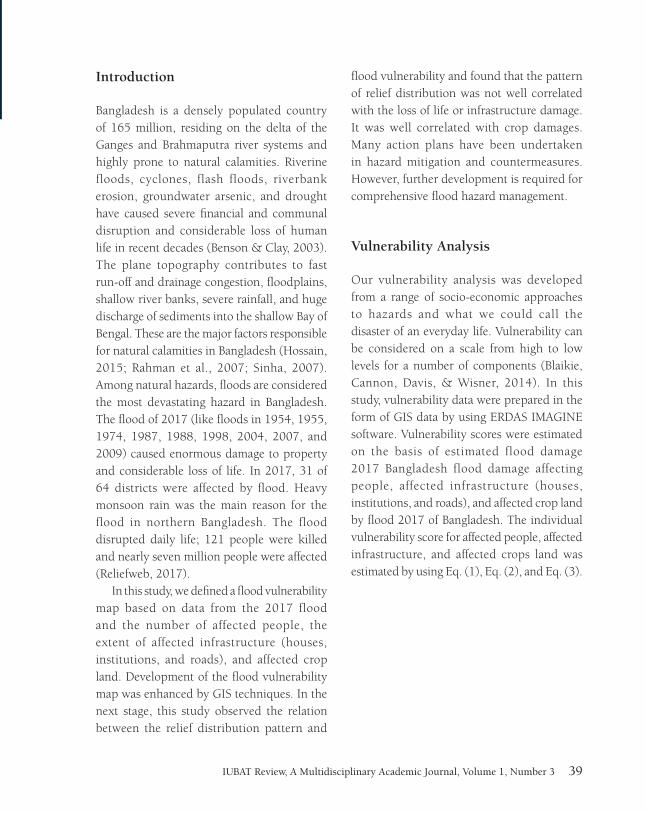
Introduction
Bangladesh is a densely populated country of 165 million, residing on the delta of the Ganges and Brahmaputra river systems and highly prone to natural calamities. Riverine floods, cyclones, flash floods, riverbank erosion, groundwater arsenic, and drought have caused severe financial and communal disruption and considerable loss of human life in recent decades (Benson & Clay, 2003). The plane topography contributes to fast run-off and drainage congestion, floodplains, shallow river banks, severe rainfall, and huge discharge of sediments into the shallow Bay of Bengal. These are the major factors responsible for natural calamities in Bangladesh (Hossain, 2015; Rahman et al., 2007; Sinha, 2007). Among natural hazards, floods are considered the most devastating hazard in Bangladesh. The flood of 2017 (like floods in 1954, 1955, 1974, 1987, 1988, 1998, 2004, 2007, and 2009) caused enormous damage to property and considerable loss of life. In 2017, 31 of 64 districts were affected by flood. Heavy monsoon rain was the main reason for the flood in northern Bangladesh. The flood disrupted daily life; 121 people were killed and nearly seven million people were affected (Reliefweb, 2017).
In this study, we defined a flood vulnerability map based on data from the 2017 flood and the number of affected people, the extent of affected infrastructure (houses, institutions, and roads), and affected crop land. Development of the flood vulnerability map was enhanced by GIS techniques. In the next stage, this study observed the relation between the relief distribution pattern and
flood vulnerability and found that the pattern of relief distribution was not well correlated with the loss of life or infrastructure damage. It was well correlated with crop damages. Many action plans have been undertaken in hazard mitigation and countermeasures. However, further development is required for comprehensive flood hazard management.
Vulnerability Analysis
Our vulnerability analysis was developed from a range of socio-economic approaches to hazards and what we could call the disaster of an everyday life. Vulnerability can be considered on a scale from high to low levels for a number of components (Blaikie, Cannon, Davis, & Wisner, 2014). In this study, vulnerability data were prepared in the form of GIS data by using ERDAS IMAGINE software. Vulnerability scores were estimated on the basis of estimated flood damage 2017 Bangladesh flood damage affecting people, affected infrastructure (houses, institutions, and roads), and affected crop land by flood 2017 of Bangladesh. The individual vulnerability score for affected people, affected infrastructure, and affected crops land was estimated by using Eq. (1), Eq. (2), and Eq. (3).

40 IUBAT Review, A Multidisciplinary Academic Journal, Volume 1, Number 3
The calculated scores for flood vulnerability on the basis of affected people, affected infrastructure, and affected crops land for 31 districts of Bangladesh are shown in Table 1. Vulnerability points for each district were calculated on the basis of linear interpolation of weighted score from 0 to 100. The vulnerability points 0 and 100 corresponding to the lowest weighted score and highest weighted score. Vulnerability ranks for flood affected people were fixed by the corresponding value of the vulnerability point 0 to 10 corresponded to vulnerability rank 1, 10 to 55 for 2 and 55 to 100 for 3; for flood affected infrastructure vulnerability points were fixed by the corresponding value of 0 to 10 corresponded to vulnerability rank 1, 10 to 50 for 2 and 50 to 100 for 3; for affected crop land vulnerability points were fixed by the corresponding value of 0 to 10 corresponded to vulnerability rank 1, 10 to 40 for 2 and 40 to 100 for 3 which is shown in Table 1. Using the vulnerability rank from
1-3 for 31 districts, three vulnerability maps for affected people, affected infrastructure, and affected crops land were developed. Finally, the combined vulnerability map was developed by considering the interactive effect of these three maps. The new proposed vulnerability map was categorized by considering vulnerability rank from 1 to 27 using multiplication mode of three-dimensional matrix (3×3×3), suggested by Islam and Sado (2000) which is shown in Figure 1. The combined vulnerability ranks were obtained 1, 2, 3, 4, 6, 8, 9, 12, 18, and 27. But in the combined vulnerability map, vulnerability rank 3, 9, and 27 did not show the pixel value. Analyzing the vulnerability map, it was found that rank 1 covered 11.55% of the country, rank 2 covered 18.80%, rank 4 covered 2.48%, rank 6 covered 2.85%, rank 8 covered 2.70%, rank 12 covered 3.81%, and rank 18 covered 7.71%, respectively against the flood hazard event. Kurigram, Dinajpur, Naogaon, and Jamalpur exhibit the highest vulnerability index for flood hazard.
=
=
=
2)(Road+3)ion(Instituit+5)(House =Score Weighted1.5
0.5)road affected (Partially+1)road affected(Fully Road Affected
1.5
0.5)ninstitutio affected (Partially+1)ninstitutio affected(Fully nInstitutio Affected
1.5
0.5)house damaged (Partially+1)house damaged(Fully House Affected
=
10)death of (No +1)People Affected ( =Score Weighted1.5
0.5)people affectedPartially (+1) people affected(Fully People Affected Flood
1.5
0.5)land crops affected (Partially+1)land crops affected(Fully =Land Crops Affected
(1)
(2)
(3)

IUBAT Review, A Multidisciplinary Academic Journal, Volume 1, Number 3 41
Table 1: Vulnerability score for affected people, infrastructure and crops land of 31 administrative districts of Bangladesh
Sl. No.
District
Affected People Affected Infrastructure Affected Crop Land
Weighted Score
Point RankWeighted
ScorePoint Rank
Land (Hec.)
Point Rank
1 Panchagar 60406.67 17.34 2 0 0 1 417.33 1.03 1
2 Thakurgaon 38410 11.03 2 5000 2.16 1 4886.67 12.10 2
3 Nilphamari 39194.67 11.25 2 0 0 1 12683.33 31.40 2
4 Lalmonirhat 15809 4.54 1 20202.81 8.74 1 10466.67 25.91 2
5 Kurigram 170564 48.97 2 231228 100 3 16677 41.29 3
6 Rangpur 30 0.01 1 110 0.05 1 12938.33 32.03 2
7 Dinajpur 261374.67 75.04 3 98831.67 42.74 2 40390 100 3
8 Gaibandha 177505.33 50.96 2 190415.70 82.35 3 8312.33 20.58 2
9 Joypurhat 12303.33 3.53 1 4761.33 2.06 1 7553.33 18.70 2
10 Naogaon 150825 43.30 2 182075 78.74 3 24161.67 59.82 3
11 Bogra 45405.67 13.04 2 177.45 0.08 1 3506.67 8.68 1
12 Natore 88490.67 25.40 2 142 0.06 1 400 0.99 1
13 Serajgonj 137890.33 39.59 2 75637.33 32.71 2 5978.33 14.80 2
14 Jessore 39474.67 11.33 2 16821.33 7.27 1 2555.33 6.33 1
15 Rajbari 47647.67 13.68 2 1905.67 0.82 1 1141.33 2.83 1
16 Faridpur 18083.33 5.19 1 1422 0.61 1 193.67 0.48 1
17 Shariatpur 0 0 1 8 0 1 0 0 1
18 Madaripur 9753.33 2.80 1 0 0 1 7 0.02 1
19 Sherpur 1646.67 0.47 1 0 0 1 1196.67 2.96 1
20 Jamalpur 348334 100 3 35451.33 15.33 2 16262.33 40.26 3
21 Mymenshing 275276.67 79.03 3 34136.33 14.76 2 3700.33 9.16 1
22 Netrokona 41346.67 11.87 2 4190 1.81 1 3855.67 9.55 1
23 Sunamgonj 31270 8.98 1 24526.67 10.61 2 3491.67 8.64 1
24 Sylhet 44580 12.80 2 6819.67 2.95 1 2554.67 6.32 1
25 Moulvibazar 2914 0.84 1 0 0 1 195 0.48 1
26 Tangail 147586 42.37 2 131287.30 56.78 3 6144.33 15.21 2

42 IUBAT Review, A Multidisciplinary Academic Journal, Volume 1, Number 3
Table 1 continued
Sl. No.
District
Affected People Affected Infrastructure Affected Crop Land
Weighted Score
Point RankWeighted
ScorePoint Rank
Land (Hec.)
Point Rank
27 Manikgonj 61000 17.51 2 89091.33 38.53 2 5674 14.05 2
28 Dhaka 12503.33 3.59 1 276.67 0.12 1 20.37 0.05 1
29 Bramanbaria 138 0.04 1 140.33 0.06 1 671.33 1.66 1
30 Comilla 48844.67 14.02 2 1127.33 0.49 1 1058.67 2.62 1
31 Rangamati 10666.67 3.06 1 3266.67 1.41 1 790 1.96 1
Figure 1: Vulnerability map for administrative districts of Bangladesh

IUBAT Review, A Multidisciplinary Academic Journal, Volume 1, Number 3 43
Analysis of Vulnerability and Relief Distribution
Floods are the most frequent among all natural hazards in the country and are a seri-ous obstacle to development of Bangladesh. Moderate monsoon flooding deposits silt, which is essential to maintenance of crop land productivity. Severe and prolonged flooding, such as occurred in 2017, is a different matter. The people of 31 districts of Bangladesh were seriously affected. In this study, we construct a correlation matrix between the flood hazard vulnerability map and three relief distribu-tion maps, using the two-dimensional matrix multiplication mode (Islam & Sado, 2000). In each of nine correlation matrices, the diagonal elements exhibit the desired relation between flood vulnerability and relief distribution – the
more severely affected districts in terms of vulnerability realizes the most generous flood relief, the moderately vulnerability districts receive moderate flood relief, and the least affected districts receive the least generous. If there was 100% congruence among the vul-nerability and relief rankings, then the matrix cells in Figures 2-4 representing either over- or under-distribution of relief would be zero. However, in none of the matrices illustrated in Figures 2-4 is it the case that the off-diagonal cells are all zero. The correlations show the deviation in the marginal distribution of relief among the affected people, infrastructure, and crops land compared with relief distribution map developed through the analysis of the relief packages; rice (MT), cash (BDT), and dry food (Packet) which is shown in Table 2.
Table 2: Distributed Relief in the context of flood 2017 of Bangladesh.
Sl. No.
DistrictRice (Metric Ton) Cash (BDT) Dry Food (Packet)
Allocated Distributed Allocated Distributed Allocated Distributed
1 Panchagar 650 445 2000000 1095000 2000 1950
2 Thakurgaon 750 305 1700000 1350000 2000 1760
3 Nilphamari 850 525 2000000 1750000 2000 2000
4 Lalmonirhat 1050 866 2800000 1795000 2000 2000
5 Kurigram 2000 1861 8000000 695000 6000 6000
6 Rangpur 1300 288 4200000 499000 0 0
7 Dinajpur 2195 1595 8600000 6250000 7000 5000
8 Gaibandha 1400 1136 4300000 3310000 2000 2000
9 Joypurhat 75 55 150000 80000 0 0

44 IUBAT Review, A Multidisciplinary Academic Journal, Volume 1, Number 3
Table 2 continued
Sl. No.
DistrictRice (Metric Ton) Cash (BDT) Dry Food (Packet)
Allocated Distributed Allocated Distributed Allocated Distributed
10 Naogaon 700 552 2400000 1825000 2000 2000
11 Bogra 550 524 1300000 10450000 2000 2000
12 Natore 150 90 600000 200000 0 0
13 Serajgonj 1200 716 3700000 1741000 2000 2000
14 Jessore 200 101 700000 185000 0 0
15 Rajbari 500 384 1650000 893000 0 0
16 Faridpur 550 185 1600000 540000 0 0
17 Shariatpur 400 21.76 1300000 104000 0 0
18 Madaripur 300 50 1400000 315000 0 0
19 Sherpur 300 34 1600000 430000 0 0
20 Jamalpur 1800 1668 4700000 3625000 2000 2000
21 Mymenshing 400 64 1500000 989500 0 0
22 Netrokona 500 80 2400000 375000 0 0
23 Sunamgonj 600 234 2300000 390000 2000 2000
24 Sylhet 300 267 1200000 500000 0 0
25 Moulvibazar 300 240 1500000 680000 0 0
26 Tangail 400 230 1600000 1250000 0 0
27 Manikgonj 500 372 1900000 1450000 2000 2000
28 Dhaka 250 119 400000 183000 0 0
29 Bramanbaria 130 46 600000 50000 0 0
30 Comilla 143 40 380000 21000 0 0
31 Rangamati 200 75 1400000 582000 1000 1000

IUBAT Review, A Multidisciplinary Academic Journal, Volume 1, Number 3 45
Matrices in Figures 2-4 show correlations between generosity of relief distribution via three sources (rice in Figure 2, cash in Figure 3, dry food in Figure 4) and three measures of
Figure 2: Correlation Matrix
Lower
Lower Lower
Lower
Figure 3: Correlation Matrix
Lower Lower
flood hazard vulnerability (flood-affected people, flood-affected infrastructure, flood-affected crop land).
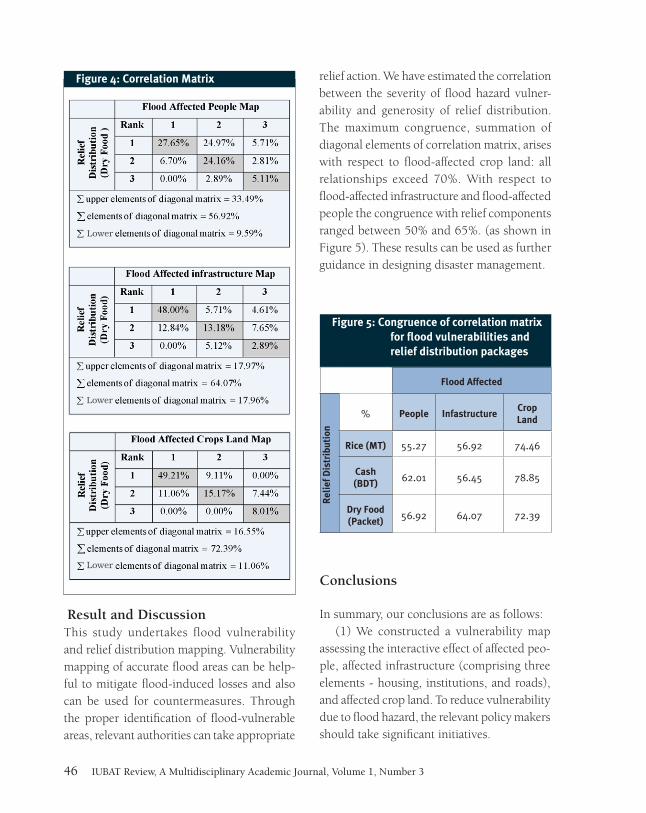
46 IUBAT Review, A Multidisciplinary Academic Journal, Volume 1, Number 3
Result and DiscussionThis study undertakes flood vulnerability and relief distribution mapping. Vulnerability mapping of accurate flood areas can be help-ful to mitigate flood-induced losses and also can be used for countermeasures. Through the proper identification of flood-vulnerable areas, relevant authorities can take appropriate
Figure 5: Congruence of correlation matrix for flood vulnerabilities and relief distribution packages
Flood Affected
% People InfastructureCrop Land
Rice (MT) 55.27 56.92 74.46
Cash (BDT) 62.01 56.45 78.85
Dry Food (Packet) 56.92 64.07 72.39
Rel
ief D
istr
ibut
ion
Figure 4: Correlation Matrix
Lower
Lower
Lower
relief action. We have estimated the correlation between the severity of flood hazard vulner-ability and generosity of relief distribution. The maximum congruence, summation of diagonal elements of correlation matrix, arises with respect to flood-affected crop land: all relationships exceed 70%. With respect to flood-affected infrastructure and flood-affected people the congruence with relief components ranged between 50% and 65%. (as shown in Figure 5). These results can be used as further guidance in designing disaster management.
Conclusions
In summary, our conclusions are as follows:(1) We constructed a vulnerability map
assessing the interactive effect of affected peo-ple, affected infrastructure (comprising three elements - housing, institutions, and roads), and affected crop land. To reduce vulnerability due to flood hazard, the relevant policy makers should take significant initiatives.

IUBAT Review, A Multidisciplinary Academic Journal, Volume 1, Number 3 47
(2) We also constructed three relief distribu-tion maps, constructed in terms of categories of relief. We assessed the correlation between vulnerability severity rankings and relief distribution maps. Policy-makers should be more concerned about distributing relief in a manner that provides most relief to the most affected districts.
References
Benson, C., & Clay, E. (2003). Economic and financial impacts of natural disasters: an assessment of their effects and options for mitigation: synthesis report. Overseas Development Institute, London.
Blaikie, P., Cannon, T., Davis, I., & Wisner, B. (2014). At risk: natural hazards, people’s vulnerability and disasters: Routledge.
Hossain, S. (2015). Local level flood forecasting system using mathematical model incorporating WRF model predicted rainfall.
Islam, M. M., & Sado, K. (2000). Development of flood hazard maps of Bangladesh using NOAA-AVHRR images with GIS. Hydrological Sciences Journal, 45(3), 337-355.
Rahman, A. A., Alam, M., Alam, S. S., Uzzaman, M. R., Rashid, M., & Rabbani, G. (2007). Risks, vulnerability and adaptation in Bangladesh. Human Development Report, 8.
Reliefweb. (2017). Bangladesh: Flood Situation -August 22, 2017. Retrieved September, 2017, from https://reliefweb.int/report/bangladesh/bangladesh-flood-situation-August-22-2017
Sinha, D. K. (2007). Natural disaster reduction: South East Asian realities, risk perception and global strategies: Anthem Press.

48 IUBAT Review, A Multidisciplinary Academic Journal, Volume 1, Number 3
IUBAT ReviewA Multidisciplinary Academic Journal
Are We Faithful to the Concept plus Practice of
Interdisciplinarity?
Iván G. Somlai. 2018. “Are We Faithful to the Concept plus Practice of Interdisciplinary?” IUBAT Review 1 (3): 48-56. iubat.edu/journal
ABSTRACT: The preponderance of projects and conflict situations that, at times, reach unexpected complexity may be mitigated by engaging in collaborative and collective conceptualisation, planning and implementation of improvements. One of the most effective ways to ensure proper design and execution of needed work is that a collective of various specialists, likely to be involved at some stage of a project’s lifetime, think and work through ideas presented by one another. History shows that useful insights often arise from orthogonal specialists collaborating in civil society, government and industry. Academe has a potent role in research and development of solutions for complexities in all domains, and should set the example for seeking interdisciplinary solutions.KEYWORDS: Collaboration, Interdisciplinarity, Conflict mitigation
Iván G. Somlai1,*
1 Centre for Asia Pacific Initiatives, University of Victoria, Canada.Director – ETHNOBUREAUCRATICA.Managing Editor - International Journal of Social ForestryEditorial Board - Pakistan Journal of Peace and Conflict Studies*Corresponding author Email: [email protected]

IUBAT Review, A Multidisciplinary Academic Journal, Volume 1, Number 3 49
Introduction
Until the mid-1990s, I did not pay much at tent ion to the di fference between interprofessionalism, transdisciplinarity, cross-disciplinarity, multidisciplinarity and interdisciplinarity. Many academics, as well as field practitioners, used these – and other similar – terms interchangeably. However, after years of field work around the world, my experience has convinced me that there has to be a more refined definition, at least for field and academic purposes, of the various ideas embodied by these terms. Being able to discern differences can clarify and improve project planning and implementation in any sector.
Over the past century, there has been an increase in collaborative science (Wuchty, Jones, & Uzzi, 2007), an unavoidable overlapping of disciplinary boundaries (Braun & Schubert, 2003; Porter & Rafols, 2009), and an “ongoing specialization in which new scientific specialties and disciplines continuously proliferate” (Stichweh, 1992). These trends have created the need to better understand and learn from other disciplines (Weingart, 2000).
Fundamentally, “...different disciplines have different ways of thinking about and dealing with unknowns and there is no core literature that brings these understandings together (Australian National University, 2018).
Definitions of Interdisciplinarity
Amongst many versions, these two are sufficient to adequately understand the scope and intent of interdisciplinarity.
• “Interdisciplinary research....is a mode of research by teams or individuals that integrates information, data, techniques, tools, perspectives, concepts, and/or theories from two or more disciplines or bodies of specialized knowledge to advance fundamental understanding or to solve problems whose solutions are beyond the scope of a single discipline or area of research practice”. (NAS 2004)
• “...research that integrates the multiple disciplines to effectively form a new unified body of work” (Kostoff, 2002).
Background
The loosening of monodisciplinary approaches began sometime around the mid-twentieth century. Through sporadic initiatives, aca-demics and field workers came gradually to understand the benefits of combining diverse perspectives, through blending specialized disciplinary language and facilitating cross-cultural boundary integration (Evans, 2016).
With time, it became clear that interdis-ciplinary collaboration in groups spawned combinations of open criticism, collabora-tion, improved problem solving and increased co-authorship.
Society is affected by disparate and at times nuanced subsystems – such as housing, educa-tion, economy, health, sanitation, politics, se-curity, law, transportation, general governance and so on. Normally, experts in each of these subsystems work within their own paradigm. Difficulties may be encountered when one subsystem frustrates us and, as we attempt to deal with it, we discover that it overlaps with another subsystem and requires vertical and

50 IUBAT Review, A Multidisciplinary Academic Journal, Volume 1, Number 3
horizontal bureaucratic connections to get answers and remedies.
A mundane example from municipal management (some readers are expected to be very familiar with this): the road in front of one’s house is dug up for repairs to the water line; while the repair is in progress, the road is impassable by motorized vehicles and dangerous for children. After a few weeks of work, the road is filled in only to be once again dug up for installation of new power cables. This process is repeated for telephone and sewerage improvements and the inconvenience may continue for months. With each improvement being independently planned and uncoordinated with others, the inhabitants face tremendous hardship. Viewed simplistically, this is a coordination issue (which in itself can be difficult to resolve!), but in essence, cooperative decision-making requires at least some understanding of the expertise, modus operandi, constraints and rationalisation processes of the various subsystems involved. By dia loguing with other experts, we can be alerted to “preliminary verification of their implications and consequences” (Gasser, 1982) and—hopefully—improve our planning.
When members of large teams in development or government engineering projects (e.g. land zoning new neighbourhoods and housing; confirming location of new highways and roads; repair or upgrading of municipal infrastructures; elaboration of a national health insurance scheme for all; large irrigation schemes) focus on their own areas of expertise, any problems that arise are normally handled by “mono-specialist” teams on their own. However, when “mono-specialist” teams
make adjustments without consideration of impacts on other specialities, this creates tension, confusion, delay and often results in sub-standard solutions. A
“dialectical analysis may improve an interdisciplinary team’s understanding of differences and tensions” (Durfee et al., 2004).
IUBAT mentions “interdisciplinary” in some of its programmes, and presumably the purpose of the IUBAT Review, a “Multidisciplinary Academic Journal”, is to invite articles from any and all disciplines. That is justifiable. However, how much more interesting it might be if the Review sought synergies among the disciplines present on campus by having them work together on issues that, at first glance, seem to require only mono-specialization. The Review could motivate such work and facilitate the write-up of such collaboration, so that IUBAT graduates appreciate the advantages of creating and enhancing shared mental models! Such an initiative could energize both students and faculty, and put the institution in the forefront of interdisciplinary research and application.
Previously, in my work in conflict environments, I concluded that “the multiplicity of sectors affected and the complexity of finding durable resolutions.... favour.... an interdisciplinary approach” (Somlai 2010). Simply put, it is impossible to comprehend the contextual complexities of conflict, nor of social or infrastructural development issues and their enhancement processes in peaceful areas, from the perspective of any one single discipline specialist.

IUBAT Review, A Multidisciplinary Academic Journal, Volume 1, Number 3 51
Interdisciplinary initiatives
Numerous academics and field workers have recognized the advantages in seeking inputs from disciplines not normally associated with their own. I emphasize, again, that this does not mean taking issues to disparate experts separately, but rather assembling a collective of various experts. Here are some examples.
HOROLOGY: In this case, I quote from Maruyama (1989):
The first wristwatch using a quartz electronic resonant circuit….was designed by Seiko, and (it) defeated Swiss watches in time keeping accuracy in a 1967 Swiss competition. Prior to miniaturization, the first quartz clock was so big that it had to be transported on a pick-up truck. Seiko achieved miniaturization by several methods (from different disciplines). One involved cutting quartz into a zigzag, thereby compressing into a small space the length needed for the desired resonant frequency. By letting quartz experts who did not know how to cut quartz work together with jewelry makers, Seiko was able to put quartz into wrist watches.
TRANSPORTATION: Another example from Maruyama (idem) is a solution, devised in the 1950s, to derailing problems of high-speed trains. The use of aircraft technology enabled engineers to eliminate spontaneous resonant vibrations. This facilitated creation of the Japanese bullet train in the 1960s.
SOCIAL FORESTRY: In 1993, central authorities requested that the provincial university of East Kalimantan, Indonesia, develop some mitigation strategies to counter severe friction between extractive industries (timber, coal,
palm oil) and adjacent communities. This friction often led to violence. Working with host colleagues at Mulawarman University, initial research made it evident that the extractive sector required diverse knowledge. It was not a case of getting timber harvesting experts together with community leaders, or company executives having coffee with higher level government officers or some outside conflict consultant personally visiting company and community sites. The inter-connection of issues to many distinct specialities made it obvious that any resolution required collaboration of overlapping sector specialities: forestry, agroforestry, timber management and harvesting, hydrology, irrigation, education, dendrology, anthropology, law, gender relations, project management, economics, finance, and others. Our next conviction was that such specialists needed to work as a collective, not as independent experts.
In our ensuing conceptualisation and later establishment of a Centre for Social Forestry in 1997, we embarked on a holistic approach. The solution for mitigating emerging conflicts lay not in having various specialists look at a particular problem within their respective offices and claiming that we had a “transdisciplinary” or “multidisciplinary” team. Rather, all issues would be collectively analysed so that an “interdisciplinary team” could multiply its creativity and response alternatives. Based on that foresight, this Centre continues to this day!
ORGANIZED CRIME: Various scientific research specialties are needed in the study and control of organized crime. Organized crime encompasses such diverse phenomena as illegal markets, quasi-governmental criminal

52 IUBAT Review, A Multidisciplinary Academic Journal, Volume 1, Number 3
structures, corporate and state crime. The study of organized crime has attracted scholars representing criminology, sociology, anthropology, economics, psychology, neurobiology history, law, forensics and political science (von Lampe, 2006).
HEALTH: Patient autonomy has become an ethical issue, especially in Western society (e.g. euthanasia, antibiotic use, blood transfusions, pain alleviation, life support, religious obligations and restrictions). Such issues often result in competing decisions because of misunderstandings. Reaching solutions includes culturally appropriate interdisciplinary team deliberation, including doctors of various specialties, nurses, patients, religious leaders, social workers and family members amongst others.
BEHAVIOURISM: Behavioral realists have an interdisciplinary bent. They merge research programs and theoretical orientations, as exemplified by hybrid proposals for a “biopsy-chosociology” (Gove, 1995), “evolutionary sociology” (Maryanski, 1998), “biosociology” (Ellis, 1996), “cognitive sociology” (DiMag-gio, 2002) or even neurosociology (Smith and Stevens, 1996).
FOREST FIRE MANAGEMENT: As climate change increases the area scorched and frequency of forest fires around the world, including in Bangladesh (Ghatak, 2016), it has become evident that firefighting teams responding with limited physical resources is insufficient. Holistic approaches for prevention and response require the interdisciplinary team efforts of foresters, agroforesters, fire ecologists, fire behaviouralists, cartographic analysts, ap-
propriate equipment manufacturers and repair persons, rural extension workers, bureaucrats efficient in planning and coordinating, hous-ing and livelihood experts, health specialists, communication experts, security and conflict-resolution resource staff and so on.
Recommendations
The remedy in all the above cases requires non-exclusive or what I term “interdisciplinary” approaches. Specialists in different scientific disciplines and applied sectors ought not to be involved independently of each other; rather, these discrete scientists and sectoral workers should collectively discuss, analyse and propose solutions. Quite often someone from a discipline seemingly marginal to the problems at hand provides surprising and useful solutions (Somlai 2017)!
Integrative communication
To paraphrase my favourite interdisciplinarian, Magoroh Maruyama, consider, for example, a problem in a remote Bangladesh village regarding irrigation service expansion and delivery. A social organizer would communicate with villagers in a familiar vernacular. Speaking with male committee members would further necessitate one type of communication, whereas with more reclusive women another style and vocabulary. Such consideration is essential so as to develop an accurate understanding among all involved. Back at her or his office, the social organizer would use another form of communication with

IUBAT Review, A Multidisciplinary Academic Journal, Volume 1, Number 3 53
colleagues. Thereafter, in conversation with the government Public Health and Irrigation Departments, the social organizer might employ a bureaucratic language, and with a water systems technical expert a technical jargon. Reporting to and discussing with implementing partners (executing agency and donors) might require yet another language.
Different communication paradigms can, at times, be incommensurable (Maruyama, 1974) if the ideas of one cannot be fully stated in the vocabulary of the other.
There is a need in complex work amongst experts from several disciplines to understand and communicate in different languages. Difficulties in interdisciplinary groups lie not so much in the fact that the communicating parties use different vocabularies or languages to talk about the same thing, but rather that they use different structures of reasoning (Maruyama, ibidem). These strutures arise because of differing backgrounds, perceptions, experiences, world views and aspirations (Somlai, 2007).
Further complicating collaborative behaviour are internal bureaucratic and broader societal forces. These include departmental management and interests; sectoral support for, and interest in, particular programmes; influence of elites inside and outside the institution, and self-interest. Even if all the preceding are aligned, the quality, qualifications and actual proficiency of staff may be a complication.
Diversity of skills on a team is beneficial in decision-making, as it brings greater resources to problem-solving and leads to a more complete analysis of an issue. However, different personal and professional backgrounds may lead to
differences in how team members interpret information and to multiple representations of a problem. In turn, this may lead to delays in decision making (Akyol, 2017) hence interdisciplinary collaboration may prevent quick solutions.
Communicative abilities, along with the need for interdisciplinary clarifications are essential. Consider, for example, that the term “desertification” evokes a different meaning for practitioners in climatology, soil science, meteorology, hydrology, geography, political science, economics and anthropology (Durfee et al, 2004). Contemplate, as well, why in a society with a common language and culture there still exists the need for lawyers and management consultants! Even in a society with a common language and shared culture the meaning of a word may differ among people, especially if the word is in a technical field.
Conclusion
Efforts to sustain mono-disciplinary expertise is often fraught with opportunity for error by disregarding stakeholders from other disciplines who could make a vital contribution to understanding of the whole. Each interested stakeholder can probably add – without imposing – a unique ingredient; no single contribution is adequate by itself. The holistic approach makes the difference; yet this process of engagement does not “hold all the promise of a miracle cure” (Althusser, 1990).
Genuine creativity can be attained either by interactions of ideas in one person’s mind or by interactions among many persons. “Many

54 IUBAT Review, A Multidisciplinary Academic Journal, Volume 1, Number 3
… inventions in Japan are devised by groups,” concludes Maruyama (1989).
The judicious use of intercultural / interdisciplinary teams (whether from the same country or not) is an imperative organizational tool to better understand and improve functioning within specific contexts (Somlai, 2011).
I do not propose that henceforth all planning and execution of projects and curricula should be done in a standing collective of different disciplines. I do strongly suggest that, at a minimum, known advances and learning within particular disciplines taught on campus be proactively shared via seminars. It would then be up to those in other disciplines to digest and extract ideas that could be extrapolated to their own discipline. Critical problems, as they arise, should be sounded out among several departments. Faculty fortunate to have had the opportunity to work in another country ought to infuse their respective curricula with relevant insights from abroad. Sundry other cross-departmental collaborations could be devised to promote interdisciplinarity with the aim of generating new knowledge.
IUBAT has an opportunity – a challenge! – to enhance its interdisciplinary nature with the actual practice of more effective interdisciplinary processes.
Acknowledgements
My respect for the work of Magoroh Maruyama in particular has, over several decades, given me confidence in efforts to apply interdisciplinary initiatives. In this regard, I also acknowledge
that the seminal conceptualization and implementation of the Centre for Social Forestry in Indonesia has been an effective model of interdisciplinarity. This is thanks to the synthesis of intertwined disciplines by Pak Riyanto, Rachmad Hernadi, Simon Devung, Mustofa Agung Sardjono, Ndan Imang, Tia Setiawati, Ketut Gunawan, Paulus Matius, Rujehan, Fadjar Pambudhi, Ary Yasir Philipus, Martinus Nanang and Apriadi D. Gani.
References
Akyol A. (2017). The Conversation, Greater skills diversity on boards might actually be worse for business 13-December. Retrieved December 8, 2017 from https://theconversation.com/greater-skills-diversity-on-boards-might-actually-be-worse-for-business-88079?utm_medium=email&utm_campaign=Latest%20from%20The%20Conversation%20for%20December%2014%202017&utm_content=Latest%20from%20The%20Conversation%20for%20December%2014%202017+CID_65523f80a44a0aaaba49fdb3a39853da&utm_source=campaign_monitor_ca&utm_term=Greater%20skills%20diversity%20on%20boards%20might%20actually%20be%20worse%20for%20business.
Althusser, L. (1990) Philosophy and the Spontaneous Philosophy of the Scientists & Other Essays [Part 2] VERSO London - New York. p.78 Retrieved April 3, 2017 from http://www.marx2mao.com/Other/PSPS90ii.html

IUBAT Review, A Multidisciplinary Academic Journal, Volume 1, Number 3 55
Australian National University (2018). Disciplinary perspectives on unknowns. Retrieved from http://i2s.anu.edu.au/resources/disciplinary-perspectives-unknowns April 4.
Dimaggio, P. (2002). “Why Cognitive (and Cultural) Sociology needs Cognitive psychology“. In: Cerulo, K. A. (Ed.). Culture in Mind: Toward a Sociology of Culture and Cognition. New York: Routledge, 274–281.
Durfee, LJ, Mills, JI, Emmi, PC, Forster, CB (2004). “The Chicken or the Egg: Does Interdisciplinary Collaboration Enhance Systems Model-Building or Does Systems Model-Building Enhance Interdisciplinary Collaborations?”
Ellis, L. (1996). “A Discipline in Peril: Sociology’s Future Hinges on Curing Its Biophobia”. The American Sociologist 27:21–41. In Lizardo, O. Formalism, Behavioral Realism and the Interdisciplinary Challenge in Sociological Theory Journal for the Theory of Social Behaviour 39:1 0021–8308 Oxford and Malden, MA USA 2009.
Kostoff, RN (2002). “Overcoming Specialization”, BioScience 52(10) 937-941
Evans, ED. (2016). “Measuring Interdisciplinarity Using Text”. Stanford University, Socius: Sociological Research for a Dynamic World Volume 2: 1–18
Gasser, G. (1982) Interdisciplinarity: a concept still unclear p.292 UNESCO Prospects Vol. XII, No. 3 1982
Ghatak, A. (2016) ‘Cartel of the powerful’ sets Sundarbans on fire to gain control of forests, say locals. May 6. Retrieved April 3, 2018 from https://bdnews24.com/bangladesh/2016/05/06/cartel-of-the-powerful-sets-sundarbans-on-fire-to-gain-control-of-forests-say-locals
Gove, WR. (1995). “Is Sociology the Integrative Discipline in the Study of Human Behavior?” Social Forces 73:4 1197–1206.
Maruyama, M. (1974). “Paradigmatology and its Application to Cross-Disciplinary, Cross-Professional and Cross-Cultural Communication”. Dialectica, 28, 135-196.
___________(1989). “Successful Business Management in Different Cultures: Two Ways to Attain High Quality”, 1-October. IFSR Newsletter No. 4 (24).
___________(2004) Peripheral Vision, Polyocular Vision or Subunderstanding? Organization Studies 25(3): 467–480. ISSN 0170–8406. Copyright © 2004. SAGE Publications (London, Thousand Oaks, CA & New Delhi)
Maryanski, AR. (1998). “Evolutionary Sociology”. Advances in Human Ecology 7:1–56. In Lizardo, O. Formalism, Behavioral Realism and the Interdisciplinary Challenge in Sociological Theory Journal for the Theory of Social Behaviour 39:1 0021–8308 Oxford and Malden, MA USA.
National Academy of Sciences (NAS). (2004). “Facilitating Interdisciplinary Research” Committee on Facilitating Interdisciplinary Research, National Academy of Sciences, National Academy of Engineering, Institute of Medicine. Washington DC ISBN: 0-309-54727-X, 332 pages.
Porter, A. L. & Rafols, I. (2009). Is science becoming more interdisciplinary? Measuring and mapping six research fields over time. Scientometrics, 81, 719‐745.
Smith, TS. & Stevens, GT. (1996). “Emergence, Self-Organization, and Social Interaction: Arousal-Dependent Structure in Social Systems”. Sociological Theory Vol. 14, No. 2, 14:131–153.

56 IUBAT Review, A Multidisciplinary Academic Journal, Volume 1, Number 3
Somlai, IG. (2007). “Web in the Shadows/Chaayaamaa Maakuraako Jaalo: Anatomy of stakeholder influences in an insurgency”. In Lawoti, M. (ed.) “Contentious Politics and Democratization in Nepal”; Delhi: Sage,
__________(2010). “The Advantages of Links with Weak Peripheral Groups in Environments of Conflict”; chapter in Conflict Resolution Research in South Asia; Department of International Relations, University of Karachi.
__________(2011). “Proposal development for Royal Roads University, China Conflict Segment”. December 9.
__________(2017). Personal correspondence with Dr. Sadmir Karović, Criminologist, Bosnia and Herzegovina, December 7.
Stichweh, R. (1992). The Sociology of Scientific Disciplines: On the Genesis and Stability of the Disciplinary Structure of Modern Science. Science in Context, 5, 3‐15.
von Lampe, K. (2006). “The Interdisciplinary Dimensions of the Study of Organized Crime”. Trends in Organized Crime 9(3) 77-95.
Wuchty, S., Jones, B. F., & Uzzi, B. (2007). The Increasing Dominance of Teams in Production of Knowledge. Science, 316, 1036‐1039.

IUBAT Review, A Multidisciplinary Academic Journal, Volume 1, Number 3 57
IUBAT ReviewA Multidisciplinary Academic Journal
Kirk Hepburn. 2018.“The Accord and Alliance: Lessons learned after five years of remediation” IUBAT Review 1 (3): 57-67. iubat.edu/journal
ABSTRACT: In response to the tragic Rana Plaza building collapse in 2013, major western clothing brands launched two initiatives: Bangladesh Accord on Fire and Building Safety (Accord) and Alliance for Bangladesh Worker Safety {Alliance). The initiatives sought to remediate the many violations of global electrical, fire, and structural standards among Bangladeshi ready-made garment (RMG) factories supplying these major brands. The agreements between the two initiatives and the government of Bangladesh ended in June, 2018. While meaningful progress was made in the remediation of electrical and fire deficiencies, inspection data from the Accord (up to late 2016) showed at that time that about half of identified structural problems remained unsolved, with a large portion of structural repairs over two years past their deadlines. The pace of remediation for these repairs was much slower than expected. As the Alliance has ended its intensive remediation work and the Accord seeks to begin a three-year extension, this article provides an update and suggests several lessons to be applied in the future.KEYWORDS: corporate social responsibility; labour rights; Bangladesh; apparel; governance; occupational safety
The Accord and Alliance: Lessons learned after five years
of remediationKirk Hepburn1,2,*
1 BA in Sociocultural Anthropology,
2 Brigham Young University, Provo, Utah.
Master of Public Policy, Simon Fraser University, Burnaby, British Columbia.
*Corresponding author: E-mail: [email protected]

58 IUBAT Review, A Multidisciplinary Academic Journal, Volume 1, Number 3
INTRODUCTION
On April 24, 2013, Rana Plaza, a building in Savar that housed factories producing clothes for western retailers, collapsed. Initial reports pegged the death toll at less than one hundred (Manik and Yardley 2013), but a full accounting documented 1,139 dead and about 2,500 injured. The Rana Plaza collapse is the worst textile factory disaster in history in terms of fatalities (Bhattacharjee 2016). An engineering inspection the day before had identified structural flaws and misplaced generators in the building, yet factory owners urged their employees to return to work despite these concerns. Later that year, the government brought formal murder charges against Sohel Rana, owner of the building, and 40 others (Manik and Najar 2015).
The Government of Bangladesh, factory representatives, and workers’ rights advocates adopted the National Tripartite Plan of Action on Fire Safety and Structural Integrity in the Garment Sector of Bangladesh (also called the National Initiative) in response to the tragedy. This set new standards for factory safety and added resources to the responsible government department.
Western retailers also responded to the Rana Plaza event. A set of largely European clothiers signed The Bangladesh Accord on Fire and Building Safety (the Accord), while another set of North American companies joined the alternative Alliance for Bangladesh Worker Safety (the Alliance). Both initiatives were five-year, binding plans to provide higher-quality building safety inspections for factories with close ties to the brand signatories
of either initiative. This update focuses on the performance of these brand-led initiatives.
The Accord and the Alliance were ground-breaking efforts in improving worker safety throughout a supply chain, and policy makers will need to know, moving forward, to what extent efforts such as these substantively improve working conditions in contexts of weak governance.
As the first multi-stakeholder corporate responsibility effort, the Accord and Alliance provide a vital learning experience. This paper builds off, and provides an update to, research done for a Master’s thesis (Hepburn 2017) that analysed the extent of progress the Accord made in correcting workplace hazards by the fall of 2016. I analysed the entire set of factory inspection reports the Accord had made public by late 2016.
As of late July, 2018, the future of industry-wide workplace safety is in question (Safi 2018; Mirdha 2018; Mathews 2018; Star Business Report 2018b, 2018a; Tribune Desk 2018; Accord 2018b). The Alliance is willing to work in conjunction with the government; the Accord hopes to extend its mandate for another three years. Whether the government will agree to the Accord’s request or assume full responsibility as of 2018 is not clear at time of writing (August 2018). Whatever the short-term outcome in Bangladesh, this post-Rana Plaza model for corporate social responsibility is being implemented in other jurisdictions, notably Vietnam and India (Hasib 2018). This paper therefore assesses the Accord’s and Alliance’s contributions, shortcomings, and barriers and the most important lessons of relevance to other jurisdictions.

IUBAT Review, A Multidisciplinary Academic Journal, Volume 1, Number 3 59
History of Bangladeshi Ready-made Garment Industry Regulation
Before the Rana Plaza incident, the Bangladeshi government’s inspection regime was marked by corruption, a lack of vigilance, and underfunding (Clifford and Greenhouse 2013; Rahim and Alam 2013; Richards 2013; Zafarullah and Rahman 2008). Lax factory regulation, which enabled factory owners to avoid building maintenance costs, was a major feature of the low-cost Bangladesh garment sector and its successful expansion. Furthermore, anti-union laws enabled factory owners to set unduly low wages. The close association between elected politicians and factory owners, who are often one and the same, assured the persistence of this environment (Financial Post 2013). It remains to be seen whether the shock of the Rana Plaza collapse, the creation of the National Initiative, and the intervention of the Accord and Alliance will substantively and sustainably change the regulatory environment.
The Accord identified over 125,000 violations of global safety standards among the large-volume exporting factories subject to inspections, and in May of 2015 it deemed all of the approximately 1,500 factories it had inspected to be “high risk” (Loewen 2015). This is powerful evidence of government and employer negligence, as well as the ineffectiveness of retailers’ previous corporate social responsibility (CSR) attempts. Reports of corruption surround the building and inspection of Rana Plaza itself (Al-Mahmood 2013).
Moving forward, the government’s chief interest will be in protecting the industry’s low-cost structure in the global market while
also making the case that image-conscious companies can source from Bangladesh without fearing tragedies in their supply chains. Balancing these interests requires extensive changes to the status quo ante.
Accord Performance by Fall 2016
According to the Accord, Alliance, and National Initiative, factories are required to submit to fire, structural, and electrical inspections. Factories then agree to a corrective action plan (CAP), which is binding. Because the Alliance and National Initiative did not provide the same level of public information about remediation completion (at the factory level), only the Accord’s results were analyzed.
The Accord’s CAPs include narratives about remediations needed, any updates since the CAP was first issued, follow-up inspections that had taken place, timelines, and some factory information. Each CAP is composed of individual standards violations, each with its own remediation plan, deadline, and follow-up commentary (Accord 2016). As of mid-October, 2016, 1,601 CAPs existed, of which very few had been designated “completed” and even fewer had been marked “on track”. The overwhelming majority were “behind schedule”.
I downloaded the publicly available CAPs and analysed which standards remained unmet well after the final deadline. The length of each remediation’s “delinquency” (the number of days the remediation was behind schedule) was calculated by subtracting the most recent inspection date from the final deadline date, which yielded a delinquency measured in days. Exploratory analyses were undertaken

60 IUBAT Review, A Multidisciplinary Academic Journal, Volume 1, Number 3
to determine correlates of such delinquency and to assess the overall status and rate of remediations.
The Accord’s 1,601 CAPs contained 125,860 individual inspection observations and their respective remediations. Since the Accord’s inception the factories had corrected 62,634 (50.6%) of the observed problems; factories had claimed that another 18,284 (14.7%) had been corrected but needed Accord verification, and 43,779 (34.8%) remained uncorrected.
Figure 3 shows the total number of remediations corrected, pending verification, or incomplete (i.e. “In Progress”), disaggregated by type of remediation and by factory tier (where data exist). Tiers 1 and 2 factories are those in which the purchase order volume is much higher than tier 3, so the Accord places certain additional requirements on them.
The distributions of progress between tiers were quite similar. Although the business relationship between brands and the factories in tiers 1 and 2 entailed much greater purchase volume than tier 3 factories, both sets of factories had completed their remediations to a similar extent. Figure 1 shows that substantial progress had been made, especially in terms of fire and electrical issues. From this alone we can conclude that the Accord had a meaningful impact on worker safety.
The Accord’s inspectors assigned deadlines to remediations, to which factory owners agreed. For remediations where progress was slow, these deadlines were often subject to an update to permit more time. This was done for nearly all remediations. Many remediations, though, had by fall 2016 long passed both the original and updated deadline, and were delinquent. There is a strong relationship between the overall type of remediation required and whether it is behind schedule. Figure 2 demonstrates the strength of this relationship.
Figure 1: Remediation progress status, by factory tier and type of remediation, fall 2016
Figure 2: Corrective action progress status, by corrective action type, fall 2016

IUBAT Review, A Multidisciplinary Academic Journal, Volume 1, Number 3 61
A large proportion of the remediations remained “in progress” in 2016, well past their updated deadlines. Nearly half of the structural and a third of the fire remediations were past their deadlines. This was a strong indication that remediation was not proceeding as quickly as hoped, and that structural remediations were the most likely to pass their deadline uncompleted.
Adding the element of time demonstrates another important difference among the three types. Figure 3 shows the remediations divided across a number of dimensions: the date of the remediation’s final deadline, its type, its progress status, and whether it was assigned in the original inspection or a later one.
As shown, electrical remediations with deadlines before 2016 were nearly all implemented by late 2016, while those with more recent deadlines show a greater tendency to be delinquent. This suggests that
electrical problems were being solved, slowly but successfully. Almost all the remediations assigned in follow-up inspections were electrical, and these remediations fell behind schedule in a pattern like those assigned in the original inspection. The fact that electrical problems were identified so frequently in follow-up inspections suggests that many new electrical problems arose. Electrical safety may be the most difficult element to maintain moving forward.
Most of the fire remediations had deadlines in 2016. Those with deadlines before 2016, like their electrical counterparts, had nearly all been completed by late 2016.
About half of the structural remediations whose deadlines were in 2014 had not been reported as satisfactorily completed by 2016, two years past-due. The bulk of structural deadlines were in the year 2016, and more than half of these remediations were also
Figure 3 Remediation progress by deadline, type, and inspection (original vs. later)
Note: data collection date indicated by vertical rule

62 IUBAT Review, A Multidisciplinary Academic Journal, Volume 1, Number 3
unfinished. If the remediations due in 2016 follow the pattern of those due in 2014, I expect many to remain incomplete through 2022. The remediations given deadlines in 2016 were assigned their deadlines in the same inspections as those remediations due in 2014, which suggested that these longer-term remediations were expected to be costly, time-consuming, and capital-intensive. If so, then many of these remediations would not occur. even by 2022, given the rate of remediation seen in 2016.
Based on this analysis, I projected that electrical and fire remediation could be near complete by the initiatives’ sunset in June 2018. Indeed, by April 1, 2018, 92.9% and 82.1% of original electrical and fire remediations respectively have been reported or verified as completed (Bangladesh Accord Secretariat 2018). This was a significant stride toward providing safer working conditions for factory workers. And 72.3% of the original structural remediations – and 59.0% of nearly 1,500 new ones – have been corrected (though not necessarily verified). This is a large improvement over fall 2016 results, yet this still falls short of the goal.
If the Accord continues its activities to 2021, we may see near-complete remediation across the board. I drew data reported in the Accord’s quarterly updates on remediation completion.1 Using these historical numbers of complete and incomplete remediations,
1 The Accord’s quarterly updates show a decline in the number of confirmed structural remediations from 8,892 in April 2017 to 8,510 in July 2017, whereas the bar charts based on these numbers show an increase. The decline is presumably an error, and I changed 8,510 to 9,510, roughly what the bar charts show.
linear models were calculated on the number of total prescribed remediations and the number of remediations completed. Projecting each model into the future and calculating the projected proportion of completed remediations yielded the following projections.
Nearly all structural remediations required were prescribed at the original inspection, whereas many new electrical and some new fire remediations were prescribed in subsequent inspections. The rate of structural remediation hastened after fall 2016, while the rate of electrical remediations slowed in 2017 as more and more new problems were identified. Assuming these historical rates hold steady, these projections predict complete remediation by 2021.
My naïve projections based purely on past performance may be overly optimistic. The final structural remediations may be the costliest, so the rate of remediation could slow dramatically over the final ten to twenty percent of structural remediations. The Accord engineers’ vigilance may wax and wane unpredictably, leading perhaps to gluts of new remediations and significantly slowing statistical progress. In other words, past performance does not necessarily indicate future performance.
My thesis research showed that lack of financing arrangements was a strong predictor for the length of remediation delays, and structural remediations tend to be the costliest of the three remediation categories. This does not come as a surprise, given previous research on the topic; a sharp difference exists between the cost of remediation for factories that require extensive structural retrofitting and those that do not (ILO and IFC 2016). This

IUBAT Review, A Multidisciplinary Academic Journal, Volume 1, Number 3 63
reinforces the need for immense investment in factory improvements on the part of western signatories and governments.
While financial arrangements between signatories and factories remain private, some additional funding became available since my thesis. The Accord Remediation Fund announced that it had helped remediate five participating factories for $514,000 USD (Accord 2018a). Foreign governments and international bodies such as IFC and ILO have contributed some assistance, but most funding is believed to come through agreements between factories and signatory brands. The confidential nature of these investments makes assessment of the Accord and Alliance difficult, but progress has taken place.
When addressing numerous issues across an industry and in a context of weak governance,
factory safety remediation takes significantly more time than imagined in a context of a stronger regulatory environment. That said, the Accord’s factories are substantially safer now than before Rana Plaza’s collapse – due to pressure and financing from governments, signatory brands, and inspectors. Whether factories are brought entirely in-line with global standards depends on decisions regarding the Accord and Alliance after their sunset date of June 2018.
The Current Situation
The expiration of their agreements with the government in June 2018 was preceded by acknowledgment by both the Accord and Alliance complete remediation would not
(% of remediations verified to have been corrected)
Figure 4: Actual and projected remediation progress as a proportion of total remediations

64 IUBAT Review, A Multidisciplinary Academic Journal, Volume 1, Number 3
occur by the deadline. Accord signatories and leadership were concerned about the preparedness of the new national regulator, the Remediation Coordination Cell (RCC). The RCC – backed by the ILO and the governments of Bangladesh, the UK, the Netherlands, and Canada – had only recently been staffed and trained. Fears around losing valuable progress therefore prompted a desire to continue the Accord. The Accord began collecting signatures for Accord 2018, a three-year extension to the initial Accord. The Alliance decided not to extend in as intensive a manner, though it is in talks around establishing a transitional “safety monitoring organization” with the government and BGMEA.
If approved by the government, the Accord 2018 would add several new features. First, safety committees and training would be established at all factories, not only those in tiers 1 and 2. The training and complaints protocol would cover workers’ association rights, though guarantees for these rights would not be bolstered. Severance payments would be provided to workers impacted by factory closures and relocations. The scope would expand to include home textiles and fabric and knit accessories. The agreement would transition to the RCC as soon as the joint Transition Monitoring Committee determines that the RCC is prepared to assume responsibility for upholding an appropriate level of scrutiny.
This Accord’s extension has been plagued by legal and political backlash. Industry leaders in Bangladesh have criticized it as overreach by powerful transnational corporations (Mathews 2018; Star Business Report 2018a). In a dispute between the Accord and a factory, the High
Court ruled that the Accord failed to properly consult the government regarding an extension and stayed the Accord 2018’s implementation (Staff Correspondent 2018a; Tribune Desk 2018). This stay was delayed until December 2018, and cabinet members have expressed reluctance in granting an extension because they feel the RCC is fully prepared to bear the responsibility for the entire sector (Star Business Report 2018b; Staff Correspondent 2018b). Commerce minister Tofail Ahmed on Tuesday said that Accord and Alliance were no longer required for Bangladesh readymade garment sector and the time frame of the platforms would not be extended anymore beyond December this year. The Accord re-leased a statement, backed by the ILO and signatory brands, insisting that the RCC is not yet prepared, and committing the Accord to support the RCC’s preparation if an extension is granted. The statement carries the threat that Accord signatory brands may reduce orders from Bangladesh (Accord 2018b).
Lessons learned
The Accord and Alliance were novel solutions to an old problem: how to produce in a context of low costs and weak governance without unconscionable lapses in safety? Instead of pursuing individual firm corporate social responsibility programs, the major brands decided to assume collective responsibility for factory safety regulation, a responsibility that, in most countries, would be a responsibility of the domestic government. The brands agreed to regulate jointly, creating two organizations independent of the Bangladesh government,

IUBAT Review, A Multidisciplinary Academic Journal, Volume 1, Number 3 65
and bound themselves to condition their or-ders on decisions made by the Accord and Al-liance. As shown by the Accord’s remediation progress, the approach has succeeded some-what, though certainly not entirely. There are significant lessons to take from the experience.
First, while corporations committed to remediation, the source of financing to realize the required remediations were not made clear from the beginning. A future application of this approach should include greater transpar-ency and prior commitments around who will pay for the remediation and how. Lack of firm financing turned out to be a major source of the delays experienced by the Accord.
Second, the original timeframe for the Accord was far too tight. An industry whose factories were in as dire a state as Bangladesh’s factories in 2013 requires more than five years of inspection and remediation work to meet acceptable standards. Stakeholders realized that ongoing remediation of the sector re-quires strong regulatory institutions (such as the RCC will hopefully become) and a strong check to factory owners’ power (such as a healthy and robust labour movement could provide). In the absence of strong govern-ment regulatory institutions and a robust labour movement, the sector may be “reme-diated” only to return to its pre-2013 status. Therefore, a longer timeframe and built-in protections for workers’ association rights are merited in future Accord-like arrangements.
Third, arrangements such as the Accord lack democratic legitimacy. By not returning full responsibility for the sector’s safety to the national regulator, safety responsibility remains largely in the hands of transnational corporations and labour unions. Others have
found this to be unsatisfactory, despite the progress it has engendered (Scheper 2017). Bangladeshi workers should be able to look to their own governments, factory owners, and unions for protection, not organizations headquartered in North America and Europe, which are chiefly accountable to investors and consumers. One way for future Accord-like arrangements to address this problem is to build in supports for the domestic institutions from the very beginning. This should include a staged handoff several years after the period of intensive remediation, during which time explicit financial and other supports are given to domestic labour and inspection institutions.
In conclusion … If t ransnat ional corporations truly wish to take responsibility for the risks associated with low cost supply chains in countries with weak governance, Accord-like arrangements show great promise. By applying these three lessons to future Accord-like arrangements, major corporations and the ILO can contribute to the improvement in governance quality of developing countries.
References
Accord. 2016. “Inspection Reports.” The Bangladesh Accord Foundation. 2016. http://bangladeshaccord.org/inspection-reports/.
———. 2018a. “Accord Remediation Fund Provides Financial Support to Five RMG Factories.” The Bangladesh Accord (blog). May 15, 2018. http://bangladeshaccord.org/2018/05/accord-remediation-fund-provides-financial-support-five-rmg-factories/.

66 IUBAT Review, A Multidisciplinary Academic Journal, Volume 1, Number 3
———. 2018b. “Accord Statement on 4th High Level Meeting of the Bangladesh Sustainability Compact.” The Bangladesh Accord (blog). July 27, 2018. http://bangladeshaccord.org/2018/07/accord-statement-4th-high-level-meeting-bangladesh-sustainability-compact/.
Al-Mahmood, Syed Zain. 2013. “Nexus of Politics, Corruption Doomed Rana Plaza.” Dhaka Tribune, April 27, 2013. http://archive.dhakatribune.com/politics/2013/apr/26/nexus-politics-corruption-doomed-rana-plaza.
Bangladesh Accord Secretariat. 2018. “Quarterly Aggregate Report - on Remediation Progress at RMG Factories Covered by the Accord.” The Bangladesh Accord Foundation. http://bangladeshaccord.org/wp-content/uploads/Accord_Quarterly_Aggregate_Report_April_2018.pdf.
Bhattacharjee, Shikha Silliman. 2016. “Precarious Work in the H&M Global Value Chain.” Workers Voices from the Global Supply Chain. Asia Floor Wage Alliance (AFWA). http://asia.floorwage.org/workersvoices/reports/precarious-work-in-the-h-m-global-value-chain.
Clifford, Stephanie, and Steven Greenhouse. 2013. “Fast and Flawed Inspections of Factories Abroad.” New York Times, September 2, 2013.
Financial Post. 2013. “Bangladesh: How Factory Owners Keep Wages Low, Get Away with Lax Safety | Financial Post.” Financial Post, May 3, 2013. https://financialpost.com/news/retail-marketing/how-textile-kings-weave-a-hold-on-bangladesh-as-retailers-reap-the-rewards.
Hasib, Nurul Islam. 2018. “Buyers Taking Bangladesh’s Factory Safety Model to Vietnam, India: Alliance Member.” Bdnews24.Com, July 23, 2018. https://bdnews24.com/business/2018/07/23/buyers-taking-bangladeshs-factory-safety-model-to-vietnam-india-alliance-member.
Hepburn, Kirk Joseph. 2017. “Running out of Thread: Securing Bangladeshi Ready-Made Garment Factory Safety given the Looming Cut-off for the Accord and the Alliance.” Master’s Thesis, Burnaby, BC: Simon Fraser University. http://summit.sfu.ca/item/17254.
ILO, and IFC. 2016. “Remediation Financing in Bangladesh’s Ready Made Garment Sector.” Overview. International Labour Organization / International Finance Corporation. http://www.ilo.org/wcmsp5/groups/public/---asia/---ro-bangkok/---ilo-dhaka/documents/publication/wcms_492345.pdf.
Loewen, Brad. 2015. “Conclusions From Initial Inspections on Risk Status of Factories,” May 12, 2015. http://bangladeshaccord.org/wp-content/uploads/Accord-CSI-letter-on-risk-status-inspected-factories-May-2015.pdf.
Manik, Julfikar Ali, and Nida Najar. 2015. “Bangladesh Police Charge 41 With Murder Over Rana Plaza Collapse.” The New York Times, June 1, 2015. http://www.nytimes.com/2015/06/02/world/asia/bangladesh-rana-plaza-murder-charges.html.
Manik, Julfikar Ali, and Jim Yardley. 2013. “Scores Dead in Bangladesh Building Collapse.” The New York Times, April 24, 2013. http://www.nytimes.com/2013/04/25/world/asia/bangladesh-building-collapse.html.

IUBAT Review, A Multidisciplinary Academic Journal, Volume 1, Number 3 67
Mathews, Brett. 2018. “Bangladesh Wants Accord and Alliance out by December.” Apparel Insider (blog). July 20, 2018. https://apparelinsider.com/bangladesh-wants-accord-alliance-december/.
Mirdha, Refayet Ullah. 2018. “Accord’s Extension Now More Difficult.” The Daily Star, April 10, 2018. https://www.thedailystar.net/business/accords-extension-now-more-difficult-1560520.
Rahim, Mia Mahmudur, and Shawkat Alam. 2013. “Convergence of Corporate Social Responsibility and Corporate Governance in Weak Economies: The Case of Bangladesh.” Journal of Business Ethics 121 (4): 607–20. https://doi.org/10.1007/s10551-013-1699-x.
Richards, John. 2013. “Diplomacy, Trade and Aid: Searching for ‘Synergies.’” C.D. Howe Institute. http://site.ebrary.com/id/10830749.
Safi, Michael. 2018. “Brands Including Ikea Shun New Safety Accord after Rana Plaza Disaster.” The Guardian, June 6, 2018, sec. World news. http://www.theguardian.com/world/2018/jun/06/rana-plaza-disaster-bangladesh-brands-ikea-new-safety-accord.
Scheper, Christian. 2017. “Labour Networks under Supply Chain Capitalism: The Politics of the Bangladesh Accord: Debate: Labour Networks under Supply Chain Capitalism.” Development and Change 48 (5): 1069–88. https://doi.org/10.1111/dech.12328.
Staff Correspondent. 2018a. “Govt Extends RMG Factory Remediation Deadline to Dec.” New Age | The Outspoken Daily, June 22, 2018. http://www.newagebd.net/article/44157/govt-extends-rmg-factory-remediation-deadline-to-dec.
———. 2018b. “Accord, Alliance to Leave Bangladesh after Dec 7: Tofail.” New Age | The Outspoken Daily, July 30, 2018. http://www.newagebd.net/article/46266/accord-alliance-to-leave-bangladesh-after-dec-7-tofail.
Star Business Report. 2018a. “Two Temporary Bodies to Ease Accord, Alliance Departure.” The Daily Star, April 22, 2018, sec. Star Business Report. https://www.thedailystar.net/business/two-temporary-bodies-ease-accord-alliance-departure-1565992.
———. 2018b. “No More Extension for Accord, Alliance.” The Daily Star, July 18, 2018. https://www.thedailystar.net/business/no-more-extension-accord-alliance-1607203.
Tribune Desk. 2018. “High Court Extends Accord’s Inspection Period for 6 More Months.” Dhaka Tribune, May 31, 2018. http://www.dhakatribune.com/bangladesh/court/2018/06/01/high-court-extends-accord-s-inspection-period-for-6-more-months.
Zafarullah, Habib, and Redwanur Rahman. 2008. “The Impaired State: Assessing State Capacity and Governance in Bangladesh.” International Journal of Public Sector Management 21 (7): 739–52. https://doi.org/10.1108/09513550810904541.

68 IUBAT Review, A Multidisciplinary Academic Journal, Volume 1, Number 3
Sustainable SupplyChain Management Practices and
Challenges of Agri-business in Bangladesh
Zahir Rayhan Salim1,* Abu Syef Md Tusar1
1 Faculty, College of Business Administration, IUBAT- International University of Business Agriculture and Technology, Dhaka, Bangladesh.
ABSTRACT: Supply Chain Management (SCM) concerns management of the total flow of a distribution channel from supplier to end consumer. It is a set of activities that promotes an effective management of supplier partnerships, meeting customer demands, movement of goods and information sharing throughout the supply network of an industry. The fundamental difference between food supply chains and other chains is the continuous and significant changes in the quality of agro-food products throughout the sup-ply chain network. SCM activities (like service, delivery, and information)pose major difficulties in the agro-food sector. Furthermore, competitiveness in supply chains has been a key issue for organizations and mapping the competitiveness of an organization helps to form a sound basis for sustainable busi-ness development. Agro-food industries have to deal with government rules, customer and stakeholders’ interests, seasonality, supply spikes, long supply lead time and perishability. Strategically, rather than competing within low-cost market segments, many agro-food producers are following a differentiation strategy that targets niche market segments like organic foods. Studies have identified that stakeholders such as consumers, retailers, suppliers and regulators are the influential force driving firms to balance environmental aspects of their business with financial performance. The agri-business and sustainable challenges are observed using graphical representation through survey.KEY WORD: Supply chain management, agro-food sector, information, organic foods, sustainable.
IUBAT ReviewA Multidisciplinary Academic Journal
Zahir Rayhan Salim. 2018.“The Accord and Alliance: Lessons learned after five years of remediation” IUBAT Review 1 (3): 68-77. iubat.edu/journal

IUBAT Review, A Multidisciplinary Academic Journal, Volume 1, Number 3 69
INTRODUCTION
Bangladesh is a developing country with a large population and a small land area. This large population depends on the domestic agri-business sector for the needs of everyday life. Agri-business plays an indispensable role in the world’s economy. More than 10 percent of GDP comes from agri-business (Bangladesh Bureau of Statistics, 2017-2018). Agri-business products have three specific characteristics that make sustainability more complicated than in most sectors: seasonality, supply spikes, and perishability. Planning is required for seasonal products as consumption takes place throughout the year. Hence, most agricultural products have long supply lead times. Process-ing agricultural products, including packing, storing and transporting, requires handling that minimizes perishability. If it is not properly managed, substantial product value can be lost.
This paper assesses considerations of sustainability in the context of agri-business. According to Corbett and Kleindorfer(2003), sustainability in agri-business is the critical next step in agri-business management.
Literature Review
Cunningham (2003) scrutinized 123 peer-reviewed journal articles published during 1987-2000 in seven commercial databases on the theme of agri-business supply management and explored the possibility of conducting additional studies on all agri-business supply chain processes. Vasileiou and Morris (2006) conducted descriptive research based on primary data collected through exploratory interviews of 240 potato cultivators, 17 potato
merchants, and 4 potato retailers. They ana-lyzed the data using nonparametric statistical tools. Results show that all respondents in the supply chain were immensely concerned about sustaining their respective businesses and gaining comparative advantage. Market, social and environmental factors have great bearing on these ventures. According to Drumwrigh (1994), firms should not focus solely on maximizing profit but should also embrace their social responsibilities. Many researchers have defined social SCM as SCM focusing on maintaining environmental, economic, and social stability for long-term sustainable growth (Ahi and Searcy 2013; Beske et al. 2014;Carter and Rogers 2008; Dubey et al. 2016; Silvestre2015). Seuring and Muller (2008) define SCM as the management of material, information, and capital flows, as well as the cooperation among firms along the supply chain, while adopting goals from all three dimensions of sustainable development. The World Commission on Environment and Development (1987) considers sustainability as economic practices that meet needs of the present without compromising the ability of future generations to meet their needs.
To distinguish green SCM, Ahi and Searcy (2013) identify 22 definitions for green SCM and 12 for social SCM. They conclude that the latter is the extension of the former. Dubey et al. (2016) make an in-depth analysis of the definitions of social SCM based on a literature review and divide it into two broad categories: social SCM as a management philosophy and social SCM as a set of management processes. Srivastava (2007) reckons that an organization must manage not only short-term financial results but also the risk factors resulting from

70 IUBAT Review, A Multidisciplinary Academic Journal, Volume 1, Number 3
its products, environmental waste, and safety of workers and public. Ahi and Searcy (2013) consider that green and lean practices are two important pillars of sustainable business devel-opment. They expand business sustainability characteristics into an integrated perspective, including not only the environmental, social and economic focus but also resilience in terms of stakeholders and volunteers.
Current Challenges facing Agri-business in Bangladesh
The scope of agri-business spans many sub-sectors within agriculture and agro-based pro-cessing industries and services. Agri-business has developed over the years, but it still lags behind its potential (Dev and Zaman, 2007). Bangladesh’s large population is dependent on the success of this sector. During a conference organized by the Bangladesh Agricultural and Research Council (BARC) in 2008, The Daily Star (Shaikh 2008) identified some of the challenges:
• Increasing population to feed.
• Loss of agricultural land (annual loss of 10000 hectares of productive agriculture land due to roads, housing, and other de-velopment projects).
• Erosion of river banks.
• Lack of technology creating a “yield gap’ (the difference between actual and potential production).
During the last two decades, the focus for optimizing operations has moved from a spe-cific facility or organization to the entire supply chain. By optimizing along the entire sequence
of that chain, firms can realize the greatest value at the lowest possible cost (Handfield and Nichols 1999). According to Prokesch and Steven (2010), most organizations focus on the nature of their relationships, and in supply chains. 90% of these relationships are still not stable, because there is very little trust and little ability of firms to innovate together. In case of a big manufacturer or retailer, it can exercise upstream pressure, so the cost to the large firm can be reduced. They also mentioned key challenge areas:
• Understand the larger system
• Learn to work with the people with whom you did not work before, and
• Define how you perceive sustainability.
Figure 1 shows that
• Agro-business firms source directly from farmers’ associations and small medium enterprises (SME).
• SME suppliers source directly from middle-men in wholesale market, and from indi-vidual farmers.
Understanding importance of sustainability in supply Chain
Sustainability has become a key priority in the design and operation of supply chains in the 21st century. A focus on sustainability allows a supply chain to better serve more environ-mentally conscious expectations while often improving supply chain performance. The focus of sustainability has increased as large countries like China, India and Indonesia have developed. Economic and technological factors

IUBAT Review, A Multidisciplinary Academic Journal, Volume 1, Number 3 71
are improving global living standards in a way that no one had imagined 40 years ago, and it is clear that, if supply chains do not become more sustainable, then it will be difficult to manage the world’s resources.
Objective of the study
This study endeavored to explore the construct of SCM practices and sustainability in the agri-business sector in Bangladesh. The objective of the study are as follows:
• To comprehend and articulate the contem-porary practices of the supply chain in the agri-business sector of Bangladesh.
• To investigate the relationship between the sustainable supply chain and organizational performance.
• To exhibit the relationship between a sus-tainable supply chain and social, economic and environmental sustainability.
• To frame the challenges in adopting an optimum sustainable supply chain in the agricultural sector of Bangladesh.
Methodology
This study has used both primary and second-ary data. Ten leading agri-business firms were selected for the study. The primary data have been collected from discussions with 150 interviewees in different agri-business firms. Interviewees are classified by job title and their job functions (corporate executive, purchas-ing, manufacturing/production, distribution/logistic, SCM, transportation of Bangladesh agri-business products). The study also utilizes secondary industry-related data collected from the website, reputed journals, relevant books, magazines and other documents. The collected data were analyzed statistically with SPSSV19 software. The associated outcomes are exhib-ited through graphical representation as well as the numerical outputs.
Figure 1: Framework of Agri-business in Bangladesh

72 IUBAT Review, A Multidisciplinary Academic Journal, Volume 1, Number 3
Data Interpretation
Do supply chain practices have a positive relation with sustainability?
Are sustainable supply chain management prac-tices related to economic sustainability?
Yes
No
Figure 2
70% of respondents believe that there is a positive relationship between supply chain practices and sustainability
Are sustainable supply chain management prac-tices positively related with social sustainability?
Yes
No
Figure 3
More than 60% of respondents identified sustainable supply practices as important for social and economic sustainability.
30%
70%
37%
63%
Figure 4
Yes
No
33%
67%
Are sustainable supply chain management practices positively related with environmental sustainability?
Figure 5
Opinions on whether sustainable supply chain management improves environmental sustainability are fairly evenly divided.
Yes
No
53%47%

IUBAT Review, A Multidisciplinary Academic Journal, Volume 1, Number 3 73
Can sustainable supply chain management over-come the challenge of supply chain integrity, flex-ibility and responsiveness?
Which sustainability performance issues most concern your company?
a. Lack of interest among stakeholders (employees and clients)
b. Regulatory Compliance
c. No way to measure impact
d. Current economic relatives, the need to run lean
e. Managing the life cycle and cumulative envi-ronmental impacts
Figure 6
Yes
No
20%
80%
80% of respondents agreed with the statement.
How confident are you in understanding the sus-tainability performance of your suppliers?
Figure 7
Extremely confident
19%
28%53%Do not know
Very confident
Most firms understand their suppliers’ performance.
a. 35%
b. 23%c. 17%
e.13%
d. 12%
Figure 8
The most common response identified a lack of interest from stakeholders; the second response focused on regulatory compliance.

74 IUBAT Review, A Multidisciplinary Academic Journal, Volume 1, Number 3
What hinders sustainability innovation in your Supply Chain?
a. Uncertain
b. Return on investment (ROI)
c. Insufficient Supplier Understanding
d. Limited Resources
was prepared and a thorough survey was conducted on the subject. The results led to some interesting observations. For instance, in parallel to raising concern about sustainability around the world, people involved with agri-business in Bangladesh have become aware about the concept and prospects of Sustainable Development. As evidence, more than 70% of the participants believe that their current sup-ply chain practices have a positive relation with sustainability. Moreover,80% of the respond-ents also agreed that sustainable supply chain management practices could solve problems of integrity, flexibility and responsiveness.
Interestingly, even though the majority of respondents believe that sustainable supply chain management practices have a positive relation with social and economic sustain-ability, more than half of participants believe that sustainable practices have no direct in-teraction with environmental sustainability. This finding exhibits the gap in the proper conceptual realization of sustainability among the participants. In other words, this calls for knowledge promotional activities. The majority of respondents believe that the lack of interest of employees and clients, as well as the gap in knowledge among suppliers, may retard adoption of sustainable SCM. As a consequence, in the future, an attempt should be made to investigate the reasons behind this knowledge gap.
Figure 9
a.17%d. 14%
c. 40% b. 29%
It seems that suppliers have less un-derstanding about innovative ideas about sustainability.
Discussion and suggestions
In this era of globalization, the increase in reckless production and consumption results in environmental degradation, economic crisis and social disorder. Sustainability has become a serious concern for many business sectors. So, as a major contributor to economic development of Bangladesh, the agricultural sector cannot avoid the call for sustainable development. As a response to this call, this research has attempted to realize the prospect and challenges in infusing the concepts of sustainability within the agricultural supply chain of Bangladesh. A set of questionnaires

IUBAT Review, A Multidisciplinary Academic Journal, Volume 1, Number 3 75
References
Ahi, P., & Searcy, C. (2013). A comparative literature analysis of definitions for green and sustainable supply chain management. Journal of Cleaner Production, 52(4), 329-341.
Azevedo, S.G., Carvalho, H., Duarte, S.,& Cruz-Machado, V., (2012a). Influence of greenand lean upstream supply chain management practices on business sustainability. IEEE Trans. Eng. Manag., 59 (4), 753e-765.
Beske, P. (2012). Dynamic capabilities and sustainable supply chain management. International Journal of Physical Distribution & Logistics Management, 42(2), 372-387.
Carter, C. R., & Rogers, D. S. (2008). A framework of sustainable supply chain management: Moving toward new theory. International Journal of Physical Distribution & Logistics Management, 38(5), 360-387.
Corbett, C.J., &Kleindorfer, P.R.(2003). Environmental management and operations management: Introduction to the third special issue. Production and Operations Management, 12(3), 287-289.
Cunningham, D.C. (2001). The distribution and extent of agrifood chain management research in the public domain. Supply Chain Management: An InternationalJournal, 6, 212-215.https://doi.org/10.1108/EUM0000000006040
Deb, U., & Zaman, Z.U. (2007). Agri-business in Bangladesh: Current situation and challenges, Trading Up, Verma, S. (Editor), April-June.
Drumwright, M. E. (1994). Socially responsible organizational buying: Environmental concern as a noneconomic buying criterion, Journal of marketing, 58(3), 1-19
Dubey, R., Gunasekaran, A., Childe, S. J., Papadopoulos, T., &Wamba, S. F. (2016). World class sustainable supply chain management: Critical review and further research directions. International Journal of Logistics Management.https://doi/10.1016/j.jclepro.2017.06.093
Handfield, R.B., & Nichols, E.L.(1999). Introduction to supply chain management. Upper Saddle River, New Zealand:Prentice Hall.
Shaikh, M. A .Q. (November15, 2008). Bangladesh agriculture: Challenges ahead. The Daily Star. Retrieved from http://www.thedailystar.net/news-detail-63295 accessed on 02/02/2018
https://thefinancialexpress.com.bd/economy/bangladesh/bbs-data-show-gdp-growth-728pc-per-capita-income-1610-1510667356
http://bbs.portal.gov.bd accessed on 10/09/2018
Islam, T. S. &Sarker, M. A. R. (2003). A study of livestock and poultry population and production in north-western Bangladesh. Bangladesh Journal of Political Economy, 18(1), June.
Khan, A. R. & Hossain, M. (1989). The strategy of development in Bangladesh. London:Macmillan.
Prokesch, S. (October, 2010). The Sustainable supply chain. Harvard, United States of America: Harvard business Review. Retrieved from https://hbr.org/2010/10/the-sustainable-supply-chain
Seuring, S., & Müller, M. (2008). From a literature review to a conceptual framework for sustainable supply chain management. Journal of Cleaner Production, 16(15), 1699-1710.

76 IUBAT Review, A Multidisciplinary Academic Journal, Volume 1, Number 3
Silvestre, B. S. (2014). A hard nut to crack! : Implementing supply chain sustainability in an emerging economy. Journal of Cleaner Production, 96, 171-181.
Srivastava, S.K., (2007). Green supply chain management: A state of the art literature review. International Journal Management Review, 9(1), 53-80.
Vasileiou, K. and Morris, J. (2006). The Sustainability of the supply chain for fresh potatoes in Britain. Supply Chain Management: An International Journal, 11, 317-327. https://doi.org/10.1108/13598540610671761
World commission of Environment and Development (WCED). (1987). Our common future. Oxford,New York : Oxford University Press

APPENDIX
Research questionnaire
Supply Chain practices has a positive relation with sustainability. Yes No
Sustainable Supply Chain Management practices is positively related with social sustainability. Yes No
Sustainable Supply Chain Management practices is related to Economic Sustainability. Yes No
Sustainable Supply Chain Management practices positively related with Environmental Sustainability.
Yes No
Sustainable Supply Chain Management can overcome the challenge of supply chain integrity, flexibility and responsiveness.
Yes No
How confident are that you understand the sustainability performance of your Suppliers. Extremely Confident Very Confidently Do not know
Which sustainability performance issues most concern your company? Lack of interest stakeholders (Employees and Clients) Regulatory Compliance No way to measure impact Current economic relatives, the need to run lean Managing the life cycle and cumulative environmental impacts
What hinders sustainability innovation in your Supply Chain? Uncertain ROI Insufficient Supplier Understanding Limited Resources

About IUBAT
International University of Business Agriculture and Technology (IUBAT University) is a government approved non-profit independent institution and its fundamental objective is human resource development through appropriate teaching, training and guidance as well as creation of knowledge conducive to socio economic development of developing societies in general and that of Bangladesh in particular. This objective is being attained through offering courses and curricula relating to various aspects of knowledge as well as providing opportunities for individuals to acquire skills and relevant experience in the chosen field of specialization, research, consultancy and training through specialized Centers.
IUBAT University is approved by the Government of Bangladesh as a degree granting institution under the Non-Government University Act of 1992. IUBAT University curriculums have been approved by the University Grants Commission (UGC) of Bangladesh and vetted by cooperating universities abroad. The Bangladesh Public Service Commission accepts its academic standards.
IUBAT University operates as an international institution having linkages with 74 universities and institutions located in industrially developed and developing countries. The university is a member of Association of Commonwealth Universities, extending its recognition to all 34 Commonwealth countries including those in SAARC region. IUBAT University is also a member of a number of international scholarly bodies including Association of SAARC Universities, Those linkages with universities and networks enables IUBAT University to conduct international programs within the country and conduct programs internationally.
IUBAT University has more than180 Faculties (Professor, Associate Professor, Assistant Professor and Lecturer) in Different Disciplines/Programs. It has 80 officers (Registrar, Deputy Registrar, Assistant Registrar, Project Director, Deputy Director, Administrative officer, Accounts officer etc.) and 20 Staffs who represent different Department. As mentioned earlier, IUBAT University is organized into colleges, departments and centers for academic as well as service activities. There are nine specialized centers which carry out applied research, offer diplomas, certificate courses and professional consultancy services to clients as well as support to academic programs of IUBAT University colleges and departments.

IUBAT—International University of Business Agriculture and Technology
www.iubat.edu