Multidisciplinary Journal of Educational Research - HIPATIA ...
138
Multidisciplinary Journal of Educational Research Adinkra Mathematics: A study of ethnocomputing in Ghana - William Babbitt, Michael Lachney, Enoch Bulley & Ron Eglash …….………….110 Developing Cooperative Learning Through Tasks in Content and Language Integrated Learning - María del Carmen Ramos Ordóñez & Víctor Pavón Vázquez …………..……………………………….…………...136 “Since Feeling is First”: Exploring the Affective Dimension of Teacher Licensure Exams - Emery Petchauer, Kira J. Baker-Doyle, Lynnette Mawhinney & Brian Ciarkowski ………………….………………………...167 Understanding Universal Vouchers and Urban Public Schools in Santiago de Chile: Educational Administrators’ Responses to Choice - Jaime Portales & Julian Vasquez Heilig ….………………….…………....196 Cómo triunfan los niños: determinación, curiosidad y el poder del carácter- Teresa Morlà ………………….…………….…............................240 Volume 5, Number 2 Hipatia Press www.hipatiapress.com h
-
Upload
khangminh22 -
Category
Documents
-
view
0 -
download
0
Transcript of Multidisciplinary Journal of Educational Research - HIPATIA ...

Multidisciplinary Journal
of Educational Research
Adinkra Mathematics: A study of ethnocomputing in Ghana - William Babbitt, Michael Lachney, Enoch Bulley & Ron Eglash …….………….110
Developing Cooperative Learning Through Tasks in Content and Language Integrated Learning - María del Carmen Ramos Ordóñez & Víctor Pavón Vázquez …………..……………………………….…………...136
“Since Feeling is First”: Exploring the Affective Dimension of Teacher
Licensure Exams - Emery Petchauer, Kira J. Baker-Doyle, Lynnette Mawhinney & Brian Ciarkowski ………………….………………………...167
Understanding Universal Vouchers and Urban Public Schools in Santiago de Chile: Educational Administrators’ Responses to Choice - Jaime Portales & Julian Vasquez Heilig ….………………….…………....196 Cómo triunfan los niños: determinación, curiosidad y el poder del carácter- Teresa Morlà ………………….…………….…............................240
Volume 5, Number 2
Hipatia Press www.hipatiapress.com
h

Instructions for authors, subscriptions and further details:
http://remie.hipatiapress.com Adinkra Mathematics: A Study of Ethnocomputing in Ghana
William Babbitt1, Michael Lachney1, Enoch Bulley2, Ron Eglash1 1) Rensselaer Polytechnic Institute. United States 2) Ayeduase Junior High School. Ghana Date of publication: June 15th, 2015 Edition period: June 2015 – October 2015
To cite this article: Babbitt, W., Lachney, M., Bulley, E., & Eglash, R. (2015). Adinkra Mathematics: A study of ethnocomputing in Ghana. Multidisciplinary Journal of Educational Research, 5(2), 110-135. doi:10.17583/remie.2015.1399
To link this article: http://doi.org/10.17583/remie.2015.1399
PLEASE SCROLL DOWN FOR ARTICLE
The terms and conditions of use are related to the Open Journal System and
to Creative Commons Attribution License (CCAL).

REMIE – Multidisciplinary Journal of Educational Research Vol. 5 No. 2 June 2015 pp. 110-135
2015 Hipatia Press ISSN: 2014-2862 DOI: 10.17583/remie.2015.1399
Adinkra Mathematics: A study of Ethnocomputing in Ghana1 William Babbitt RPI
Michael Lachney RPI
Enoch Bulley Ayeduase Jr High School
Ron Eglash RPI
Abstract
This paper details the development and evaluation of software that allows middle school students to explore the mathematical aspects of Ghanaian Adinkra symbols. We tested the effectiveness of this simulation in a Ghanaian junior high school by conducting a randomized quasi-experiment. We begin this paper by framing culturally responsive math education within the interventionist tradition of ethnomathematics. We draw this tradition together with an empirical exploration of the mathematics embedded in Adinkra symbols. We follow this with a methodological explanation for how we translated the mathematical significance of Adinkra into the design of our software, “Culturally Situated Design Tools.” Finally,
we describe the quasi-experimental evaluation of the software using a randomized assignment of students in control and intervention groups in Ghana. We found statistically significant improvement for students using the culture-based software in comparison to similar software with no cultural content.
Keywords: indigenous knowledge, ethnomathematics, Ghana, culturally responsive education, Adinkra symbols

REMIE – Multidisciplinary Journal of Educational Research Vol. 5 No. 2 June 2015 pp. 110-135
2015 Hipatia Press ISSN: 2014-2862 DOI: 10.17583/remie.2015.1399
Matemáticas Adinkra: Un Estudio de Etnocomputación en Ghana1 William Babbitt RPI
Michael Lachney RPI
Enoch Bulley Ayeduase Jr High School
Ron Eglash RPI
Resumen
Este artículo detalla el desarrollo y la evaluación de un software que permite a estudiantes de secundaria explorar los aspectos matemáticos de los símbolos Adinkra de Ghana. Se puso a prueba su eficacia en una escuela secundaria de Ghana mediante la realización de un casi-experimento aleatorizado. El artículo comienza enmarcando la educación matemática culturalmente responsable en la tradición intervencionista de las etnomatemáticas. Se combina esta tradición con una exploración empírica de las matemáticas presentes en los símbolos Adinkra. A continuación se explica cómo traducir el significado matemático de Adinkra en el diseño del software “Culturally Situated Design Tools”. Por último, se describe la evaluación cuasi-experimental del software usando una asignación aleatoria de estudiantes en grupos de control y grupos de intervención en Ghana. Se encuentra una mejoría estadísticamente significativa en los estudiantes que utilizan el software basado en la cultura, en comparación con un software similar sin contenido cultural.
Palabras clave: conocimiento indígena, etnomatemática, Ghana, educación culturalmente sensible, símbolos Adinkra

112 Babbitt, Lachney, Bulley & Eglash – Adinkra Mathematics
his paper describes our research on the development and evaluation of computer simulations for culture-based math education in Ghana. These simulations belong to a suite of web applets,
“Culturally Situated Design Tools” (CSDTs), which bring together
ethnomathematics research with the “sandbox” approach of open-ended design software (Eglash et al., 2006). The CSDT we focus on for this project is “Adinkra Computing,” which allows students to simulate the
geometric forms and algorithmic composition of a textile stamping tradition in Ghana. We will briefly review the research on ethnomathematics in culturally responsive education. We then describe the empirical foundation for Adinkra Computing, the design of the software, and the testing of the software in a quasi-experimental evaluation that compares the mathematical performance of control and intervention groups of Ghanaian junior high school students.
A 2004 report by Ghana’s Ministry of Education concluded that when
compared internationally, Ghanaian junior high school students’ math
scores lag significantly behind other nations in algebra, geometry, and measurement (Anamuah-Mensah, Mereku & Asabere-Ameyaw, 2004). There are likely multiple causes for this lower performance. Research suggests that underpaid teachers and the lack of access to basic educational materials place students at a disadvantage (Osei, 2006). Economic issues such as currency depreciation and price inflation heighten these factors. While addressing these structural issues is beyond the reach of pedagogy, there are other factors, which can ameliorate these effects within the classroom. Ghanaians may be poor in monetary wealth, but they are rich in cultural capital. Thus there have been recent attempts by parents, teachers, administrators, and policy makers to improve Ghanaian education through the use of culturally relevant local resources (Dei, 2004). We hypothesize that ethnomathematics (Ascher, 1994; Ascher & D'Ambrosio, 1994) and its sister discipline of ethnocomputing (Eglash et al. 2006) are areas of research that can help Ghanaian educators in their efforts to utilize culturally responsive education as a means to improve student mathematics achievement.
T
REMIE – Multidisciplinary Journal of Educational Research, 5(2) 113
Research on Ethnomathematics as Intervention in Education The ethnomathematics literature has no lack of visionary statements on what its advantages might be. In some cases, the motivation comes from the concept of “cultural relevance” to a specific population. Jama (1999) for example draws out normative connections between indigenous mathematics and science of the Somali culture in the Horn of Africa region and local school curriculum. He suggests that ethnomathematics can be used as a “special language” to help students see themselves as historical and
political actors through deep engagement in their own cultures’
mathematical heritage. In other cases, ethnomathematics is framed more broadly as a way to challenge curricular Eurocentrism (Anderson, 1990; Frankenstein & Powell, 1994; Gerdes, 1985). The latter stresses the use of ethnomathematics not in terms of a specialized fit to a particular population, but rather as a way to enable students’ understanding of math as an
empowering tool in the repertoire of humanitarian practices. As a research program present within and outside school walls, ethnomathematics challenges classic notions of math education while also revealing power dynamics about who is represented and hidden within curricula.
Zaslavsky (1994) describes her early ethnomathematics research as motivated by the fact that African mathematics did not appear in US library catalogs, nor did she find any information on the topic when she contacted the Secretariat in Ghana. This is not a casual happenstance. Western “exceptionalism” has a pervasive hold on its math and science as the only
accurate way to explain reality (Elliott, 2009; Harding, 2008). This has profound influence on non-Western education. Indigenous math and science continues to be marginalized in Ghanaian and other African curricula (Ahia & Fredua-Kwarteng, 2012), despite persuasive arguments that its inclusion may help with problems of enrollment, engagement, and performance (Ezeife, 2003).
In the US context, these arguments have found empirical support in the work of the Alaskan Native Knowledge Network. Lipka et al. (2005) for example developed a set of culture-based lessons for native Alaskan students, which combine discovery or inquiry learning pedagogy with contexts that emphasize native Alaskan traditional knowledge. Their work
114 Babbitt, Lachney, Bulley & Eglash – Adinkra Mathematics
shows statistically significant improvement in pre/post test scores for the intervention group in comparison to their control group (Kisker et al., 2012). Similar quantitative evidence for the efficacy of this approach has been used among students of many racial backgrounds--not only Native American but African American and Latino as well. In some of this research, the pedagogy is known as “ethnocomputing”: the use of
simulations to allow students to explore indigenous and vernacular knowledge spanning both mathematical topics as well as computational thinking (Eglash & Bennett, 2009). For example, in one study, African fractals were introduced in an ethnically diverse high school computing class in New York City: this intervention group showed statistically significant improvement on pre/post comparisons relative to a control group which received similar instruction without any cultural connections (Eglash et al., 2011). Despite this evidence for efficacy, there has been little serious adoption in most curricula (Khan, 2011); even when cultural connections are introduced, the overwhelming tendency is to only superficially represent indigenous knowledge (D'Ambrosio, 2010a).
While the “culture” side of ethnomathematics can vary widely--including topics from vernacular culture such as graffiti, working class skills such as carpet laying, and even investigations of cultural influences in professional mathematics--indigenous math plays a special role, as it directly contradicts the pernicious myths of genetic determinism. When students are convinced that there is a “math gene” enjoyed by Asian and
white students but denied to students of African or other indigenous heritage, it becomes a self-fulfilling prophecy (Steele et al., 2002). Indigenous ethnomath or ethnocomputing directly contradicts that myth. Similarly, the colonial legacy introduces a myth of cultural determinism: Fordham (1991) and Ogbu (1998) document the ways in which African American students perceive a forced choice between black identity and high scholastic achievement. Fryer and Torelli (2010) found statistical evidence supporting the contention that high-achieving African American students are often accused of “acting white” by their peers. This means that
culturally responsive educational interventions should always be conscious of the difficulties some students face when reconciling their own identities

REMIE – Multidisciplinary Journal of Educational Research, 5(2) 115
with those identities offered-up by teachers and curricula in mathematics and computer classrooms (Cobb & Hodge, 2002).
Finally, we note that there is a mimetic resonance between these historical modes of epistemological domination and pedagogical styles of authoritarian learning. Just as rote memorization is often justified to satisfy the ends of testing at the expense of learning that students find meaningful, lasting colonial legacies form a “neocolonial” context that justifies a putative universal form of knowledge at the expense of the flourishing of cultural traditions. Thus, the potential for indigenous knowledge to have meaningful influence on student performance is not merely a matter of test scores, since institutional bodies that aim to meet the demands of a workforce employed by global financial forces, environmentally destructive industries, and increasingly deadly militaries all directly or indirectly create the content for those standardized tests. It is no surprise that indigenous knowledge systems appear to be ill suited for the mathematical and computational knowledge base of these enterprises. Nonetheless, it is our hypothesis--supported by statistically significant empirical studies--that schools can have their cake and eat it too: that incorporating indigenous knowledge systems into a math and computing curriculum can both raise student scores on tests that are influenced by these institutions, and simultaneously help to impart the cultural, ecological and ethical knowledge (Eglash & Garvey, 2014) that will offer solutions to these harmful global forces.
A significant amount of research demonstrates that for education to have lasting impacts on students’ knowledge, they must be able to interact emotionally and critically with content that is culturally relevant to their communities and identities (Gutstein, 2006; Roth & Barton, 2004; Nasir, 2002). Here we offer evidence, based on our Ghanaian case study, that research in ethnocomputing offers the opportunity to design such curricula that better motivates students’ academic engagement. Simultaneously, we
suggest that the inclusion of indigenous knowledge in classroom activities can offer a way to support indigenous traditions that foster sustainable relations between the natural and social worlds. We see this work as part of larger ethnomathematics and ethnocomputing projects that fight against political and epistemological inequalities through, “restoring cultural
116 Babbitt, Lachney, Bulley & Eglash – Adinkra Mathematics
dignity and offer[ing] the intellectual tools for the exercise of citizenship”
(D’Ambrosio, 2010b).
Ghanaian Adinkra Symbols Adinkra symbols can be primarily observed today in Ghanaian textiles. The Akan peoples of Ghana adopted Adinkra textiles around the year 1800, yet the origins of the craft remain uncertain (Willis, 1998). Many of their geometric forms exist in older archaeological artifacts, across a wider geographic range. In the case of the textiles, these were originally used in the funerary arts with each symbol communicating a particular idea to the departed loved one. Contemporary uses of Adinkra symbols have expanded well beyond the funerary arts. Traditional Adinkra artisans in Ntonso, Ghana still carve symbols from the calabash gourd, make their own ink, and stamp various types and styles of cloth; primarily for tourists that visit their shops. A drive through nearby Kumasi reveals Adinkra symbols on garden walls, the columns of Internet cafes, and molded into the backs of plastic chairs. In the 21st century, Adinkra has become a global phenomenon. In the United States, Adinkra symbols adorn everything from t-shirts and jewelry to braiding salons.
During 2010-2014 we engaged in ongoing ethnographic research on the mathematical and computational significance of Ghanaian Adinkra symbols. This research included teaching interventions in Ghanaian junior high schools. The foundation of this work is based on Eglash’s (1999) research that documents Ghanaian pre-colonial knowledge of logarithmic curves in symbolic representations of organic growth. Western mathematicians have long recognized logarithmic curves as a defining characteristic of organic growth. Darcy Thompson’s 1917 classic, On Growth and Form, was one of the first works to provide a formal analysis. Today specific examples such as the Fibonacci sequence in plant spirals have become a math textbook staple, while more complex theories for the ubiquity of power laws in biological morphogenesis are the subject of significant research programs (eg West, Brown, & Enquist, 1997). While we do not want to attribute understandings that are not actually present, there is solid evidence that pre-colonial Ghanaian designers consciously
REMIE – Multidisciplinary Journal of Educational Research, 5(2) 117
employed logarithmic scaling--in particular the log spiral--as a visual model for the underlying geometric forms common to living organisms. Adinkra symbols do not just mimic organic growth; they are a means of representing a hybrid knowledge form at the intersections of biological, mathematical, and social concepts.
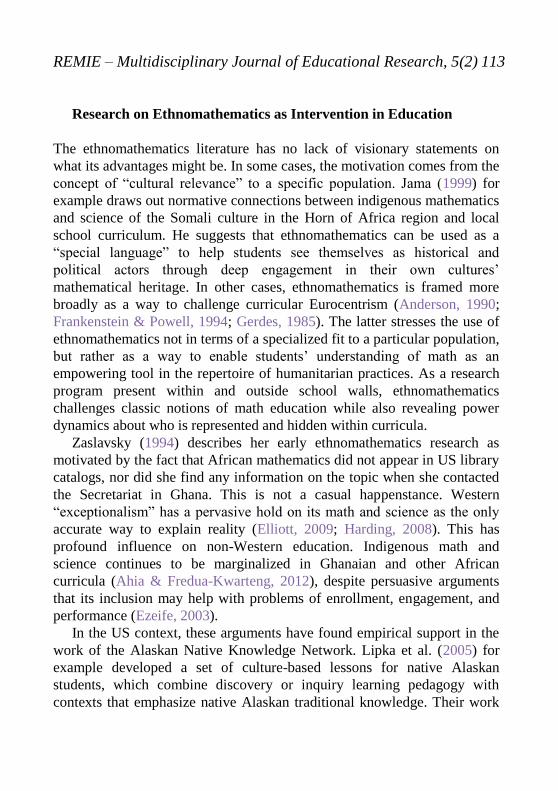
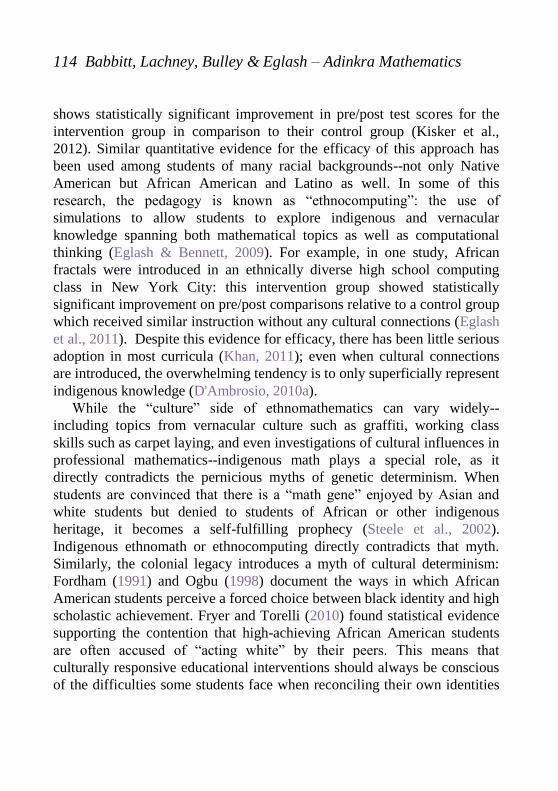
In the pre-colonial Ghanaian context, the logarithmic curves found in Adinkra designs are consistently associated with biological structures. Examples (Figure 1-3) include the ram’s horn, chicken’s foot, and curve of
a long-necked bird. Each symbol represents a colloquial saying connected to cultural and ethical values. For example, Dwennimen, the ram’s horns, is
associated with the saying “it is the heart, and not the horns that leads a ram
to bully.” In a science classroom this saying can be interpreted by teachers
and students through a biological lens that strongly relates natural and social worlds: it is not genetics (the horns you were born with), but rather your efforts (from your heart) that matter.
Figure 1. Dwennimen: ram’s horns.
Figure 2. Akoko nan: chicken’s foot.
118 Babbitt, Lachney, Bulley & Eglash – Adinkra Mathematics
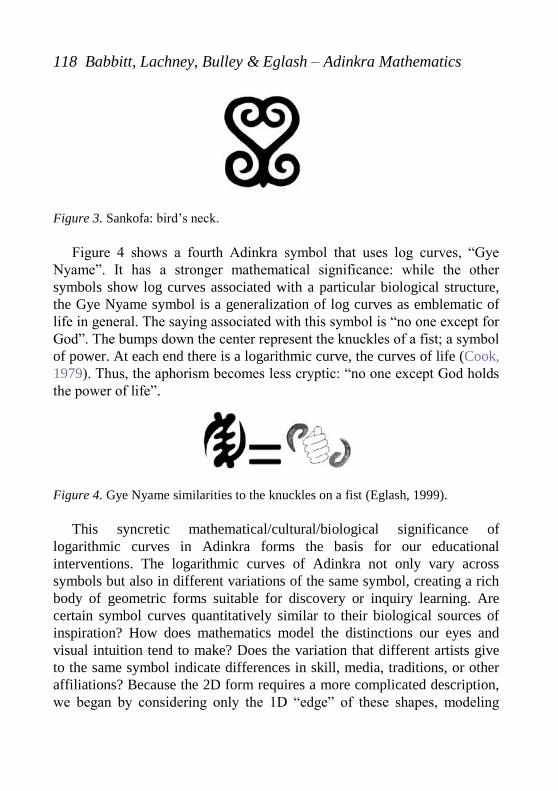
Figure 3. Sankofa: bird’s neck.
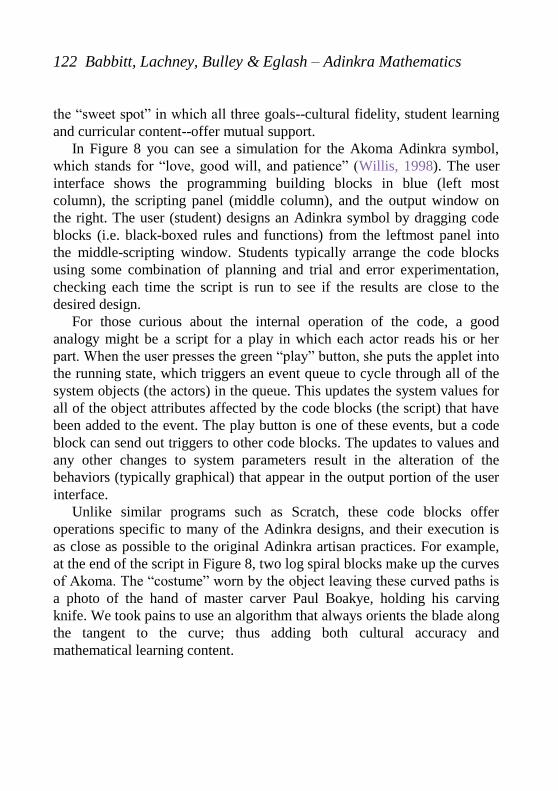
Figure 4 shows a fourth Adinkra symbol that uses log curves, “Gye
Nyame”. It has a stronger mathematical significance: while the other
symbols show log curves associated with a particular biological structure, the Gye Nyame symbol is a generalization of log curves as emblematic of life in general. The saying associated with this symbol is “no one except for
God”. The bumps down the center represent the knuckles of a fist; a symbol
of power. At each end there is a logarithmic curve, the curves of life (Cook, 1979). Thus, the aphorism becomes less cryptic: “no one except God holds
the power of life”.
Figure 4. Gye Nyame similarities to the knuckles on a fist (Eglash, 1999).
This syncretic mathematical/cultural/biological significance of logarithmic curves in Adinkra forms the basis for our educational interventions. The logarithmic curves of Adinkra not only vary across symbols but also in different variations of the same symbol, creating a rich body of geometric forms suitable for discovery or inquiry learning. Are certain symbol curves quantitatively similar to their biological sources of inspiration? How does mathematics model the distinctions our eyes and visual intuition tend to make? Does the variation that different artists give to the same symbol indicate differences in skill, media, traditions, or other affiliations? Because the 2D form requires a more complicated description, we began by considering only the 1D “edge” of these shapes, modeling

REMIE – Multidisciplinary Journal of Educational Research, 5(2) 119
them as the arc of a logarithmic spiral. Thus we could focus on two parameters: the angle “sweep” of the log spiral arc, and a constant C that
determines the overall shape (from the equation in polar coordinates: Radius = CTheta). We referred to the constant “C” as the amount of “coilness” (either tightly or loosely) in the curve, in our work with the
Ghanaian junior high school students. For example, consider the Adinkra symbol Sankofa, which means, “you can always return to your roots”
(hence the bird looking backwards). In Figure 5, we can see that the logarithmic spiral makes up the curve of the Sankofa’s neck. Variations to
the design of Sankofa result from the changes in the exponential parameter or coilness of the neck. Figure 6 has a smaller exponential parameter than Figure 7, which results in the more closed, tightly coiled spiral. Figure 7 has a larger exponential parameter resulting in a more open, loosely coiled spiral. As we describe in the next section, this mathematical insight was designed into the log spiral “block” of Adinkra Computing CSnap software
as the value “C”.
Figure 5. Logarithmic spiral overlaid on top of Sankofa.
Figure 6. Sankofa with tight curvature.

120 Babbitt, Lachney, Bulley & Eglash – Adinkra Mathematics
Figure 7. Sankofa with loose curvature.
Adding the mathematical significance of Gye Nyame, Sankofa, and
other Adinkra symbols to Ghanaian educational contexts could create a valuable alternative to dominant curricular models, which simultaneously claim to be non-cultural abstract universals, and at the same time make clearly Western references (Pythagorean Theorem, Archimedean spiral, etc.). Paulo Freire (2000) argues that the decontextualization of education from learners’ concrete experiences is alienating. While the Ghanaian
national curriculum has made an admirable effort to include Adinkra and other local cultural resources in its humanities curriculum, Freire’s critique
is still applicable in the case of math and science in Ghanaian schools. The study of Ghanaian culture could be incorporated in schools starting
in the lower primary levels where students are taught how to identify and draw geometric shapes. Pupils could draw some of the easiest traditional symbols, such as the Akoma (heart shape), in addition to other basic shapes already in the curriculum. This would make it easy for students to view their heritage as having contemporary significance rather than merely a holdover from earlier times. However, this cultural background is more often taught as part of the Ghanaian language subject in junior high schools; there is no connection to the study of math, science and technology. Despite the clear presence of mathematical concepts such as geometric transformations, the Cartesian plane and basic computations employed by artisans in the making of the Adinkra symbols, none of these resources are fused into the teaching of math and science in the classroom. Most of the

REMIE – Multidisciplinary Journal of Educational Research, 5(2) 121
examples and illustrations given to students are purely abstract theories, with any concrete illustrations taken from the most generic examples.
One issue that challenges the fusion of culture into math, science and technology education is the fact that each of the ten regions in Ghana has differences in their cultural practices and values. In effect, there are different contents for the Ghanaian language curriculum and syllabus depending on the region a student finds him or herself. For instance, while a student in the Northern Region may be learning about mud architecture, those in Upper West region might be learning about the Xylophone as part of their cultural heritage. This is another reason why Adinkra is particularly appropriate; the symbols have taken on a status as part of the Ghana national culture shared by all regions, and even internationally as symbolic of African heritage.
Culturally Situated Design Tools
The suite of Culturally Situated Design Tools2 offers a variety of user interfaces and cultural contexts that aim to help teachers and students make deep connections between math, science, computing, and social knowledge. The Adinkra Computing user interface shown in Figure 8 is a programmable CSDT that allows users to configure blocks of code that script various mathematical operations. The design of each CSDT begins with fieldwork. In the case of Adinkra Computing, we interviewed and observed the practices of Adinkra ink makers, carvers, stampers, and other cultural experts. This data helped us to understand the underlying mathematical aspects of Adinkra from an indigenous perspective, rather than simply impose the meaning from an outsider’s view.
3 During the design process, software developers who aim to translate the
embedded math of Adinkra artisans into the code, graphical user interface, and user-experience, work to reinterpret this data. Some compromise is always necessary, as the ways in which artistic practices embody mathematical or computational thinking may not be optimal for either student use or pedagogical clarity; the final interface is an attempt to find
122 Babbitt, Lachney, Bulley & Eglash – Adinkra Mathematics
the “sweet spot” in which all three goals--cultural fidelity, student learning and curricular content--offer mutual support.
In Figure 8 you can see a simulation for the Akoma Adinkra symbol, which stands for “love, good will, and patience” (Willis, 1998). The user interface shows the programming building blocks in blue (left most column), the scripting panel (middle column), and the output window on the right. The user (student) designs an Adinkra symbol by dragging code blocks (i.e. black-boxed rules and functions) from the leftmost panel into the middle-scripting window. Students typically arrange the code blocks using some combination of planning and trial and error experimentation, checking each time the script is run to see if the results are close to the desired design.
For those curious about the internal operation of the code, a good analogy might be a script for a play in which each actor reads his or her part. When the user presses the green “play” button, she puts the applet into
the running state, which triggers an event queue to cycle through all of the system objects (the actors) in the queue. This updates the system values for all of the object attributes affected by the code blocks (the script) that have been added to the event. The play button is one of these events, but a code block can send out triggers to other code blocks. The updates to values and any other changes to system parameters result in the alteration of the behaviors (typically graphical) that appear in the output portion of the user interface.
Unlike similar programs such as Scratch, these code blocks offer operations specific to many of the Adinkra designs, and their execution is as close as possible to the original Adinkra artisan practices. For example, at the end of the script in Figure 8, two log spiral blocks make up the curves of Akoma. The “costume” worn by the object leaving these curved paths is
a photo of the hand of master carver Paul Boakye, holding his carving knife. We took pains to use an algorithm that always orients the blade along the tangent to the curve; thus adding both cultural accuracy and mathematical learning content.

REMIE – Multidisciplinary Journal of Educational Research, 5(2) 123
Figure 8. CSnap interface with the Akoma script.
When the system encounters the “log spiral” block in the scripting
panel, it will take the value entered by the user in the text fields for the values of “C” (coilness), starting angle, ending angle, size, pen growth, and
clockwise, executing those parameters of the curve in relationship to the original pen size, point in direction, and so on. Each of these values in the log spiral block is specific to the practices of Adinkra artisans. Yet, these ethnomathematics infused blocks must work smoothly and consistently with the rest of the system; otherwise we risk a profusion of special purpose blocks and imply that indigenous knowledge is in some sense an inverse of universal knowledge, only applicable to its own narrow context. Just as we want to encourage students to feel that they do not need to give up their cultural identity to become scientists or mathematicians, the coding blocks themselves must also simultaneously embody the local and the universal.
Evaluation
The Adinkra Computing CSDT was tested in a “quasi-experimental evaluation” (Cook, Campbell, & Day, 1979) using control and intervention groups in a junior high school in Ghana. We refer to this as a “quasi-experiment” because as stated in the education evaluation literature, unlike
a laboratory setting, researchers in a classroom cannot control every variable. Within those constraints the crucial variables were controlled: all students were from the same school, the same grades (a combination of 7th and 8th), with the lessons taught by the same teachers. To prevent unconscious bias, we assigned our student participants to either the control group or an experimental group using a random number table. We had two

124 Babbitt, Lachney, Bulley & Eglash – Adinkra Mathematics
groups of 10, with an attrition of 10% in the intervention group resulting in only 9 students.
We taught the mathematics of logarithmic spirals to the students in both groups using a similar format of lecture, followed by reinforcement of concepts taught with simulation software. We developed the control group lesson using a freely available website that details the mathematics of logarithmic spirals, followed by a GeoGebra based logarithmic spiral applet to reinforce the mathematics lesson based on the website. In addition, the control group lesson also included a teacher led guided practice using the GeoGebra software, as well as a group practice where students collaborated on a learning project. This allowed us to avoid confusion by having both groups use software and receive verbal lessons; the non-cultural software of GeoGebra served as the control for that pedagogical context.
The intervention lesson included the same mathematical concepts as those used with the control group; however, each of the concepts were motivated and taught using an Adinkra symbol. For example, in a review of the Cartesian plane (Figure 9), we used the “Kronti Ne Akwamu” (Figure 10), the symbol for “the dual nature of life and democratic decision making
in the State of Ghana” (Willis, 1998). The symbol enabled a comparison between the positive and negative combinations across quadrants and the importance of disagreement (-x, y and x, -y) in democratic decision-making. This enabled us to expose the embedded mathematical structures present in the symbol to the students.
Figure 9. The Cartesian plane.

REMIE – Multidisciplinary Journal of Educational Research, 5(2) 125
Figure 10. Kronti Ne Akwamu Adinkra symbol.
The intervention group lesson used the Adinkra Computing CSDT to reinforce the mathematics lesson based on the Adinkra symbols. Like the control group, the experimental group also included a teacher led guided practice and a group collaboration project.
The control group intervention occurred prior to the experimental group intervention. Both interventions began with a pretest and ended with a posttest that measured the students’ knowledge of the topics covered in the
lesson. The control group received two days of instruction using the lecture and GeoGebra software simulation. The experimental group received three days of instruction using lecture and Adinkra Computing in CSnap. The extra day in the experimental group intervention was included for students to explore the cultural significance of Adinkra.4 Instruction time on the math of logarithmic spirals was equal in both groups.
The pretest and posttests formed the independent samples for a t-test. The results showed a significant advantage for the scores for the Adinkra computing based lesson (M = 45.22, SD = 18.67) in comparison to the GeoGebra computing based lesson (M = 13.87, SD = 15.93); the difference was statistically significant at the .001 confidence level.
Discussion
The successful use of Adinkra symbols to support mathematics learning in this study can serve as encouragement to Ghanaian parents and teachers, as they seek to include local resources in math, science, and computing curricula. Adopting local resources to use in lesson plans that disrupt “traditional” methods of education can be a daunting task. Often the highest

126 Babbitt, Lachney, Bulley & Eglash – Adinkra Mathematics
barriers to overcome are those put in place by institutions, such as the Ministry of Education. These barriers usually come in the form of prescribed lesson plans, which are designed to yield specific student outcomes on standardized tests. Given these conditions we have considered two avenues for moving forward with integrating Adinkra in Ghanaian math, science, and computing curricula: 1) school communities and educators lobby the Ministry of Education to include Adinkra in curricula; 2) teachers who have the time and interest develop Adinkra lessons that meet curricular standards, to use in their own classrooms and share with others.
Both of these avenues require that the math, science, and computing aspects of Adinkra be popularized among community members and educators. One possible way to popularize lessons like Adinkra Computing is through forming relationships with Parent-Teacher Associations (PTAs). In our collaborations with Ghanaian schools, we have found that PTA members can act as a bridge between communities and educators. It is our goal that this study be used to support future documents written for PTA audiences, which explain how Adinkra can be used in classrooms across primary and secondary school curricula while also enhancing student performance.
Although we believe that the use of the Adinkra Computing CSDT to reinforce the learning in the intervention group was a success, we realize that there are limitations in this particular quasi-experiment. One possible limitation is that our sample size is small with only 19 student’s total (10
students for the control group and 9 in the intervention group). This number however, was as large as possible, given the constraints placed on us by the number of computers available for student use. We wanted to make sure that each student had access to their own machine to limit the potential effects of students having to share equipment. The students used all available computing equipment in the classroom, including all teacher-machines. This is a limitation of the study and its possible relevance to further classroom implementation, since it is more common for students in Ghana to work on computers in groups as opposed to individually.
One of the most exciting anecdotal outcomes of the experiment was the reaction of students in the intervention group. While control group students

REMIE – Multidisciplinary Journal of Educational Research, 5(2) 127
freely left the classroom not long after the lesson ended, the intervention group students were ready to reclaim their computers and form small groups at the front of the room to continue working with the Adinkra Computing software. This is not unique to Ghana; similar outcomes have been observed in the US for African American, Latino and Native American students; a promising sign for this approach.
Conclusion
This study has shown how ethnomathematics research can be used to develop ethnocomputing interventions in classrooms. The ethnocomputing activity, Adinkra Computing engaged students’ interest and increased
mathematical performance between pretests and posttests. In future research we hope to examine the role that heritage variation might play in these results. In this case, we carried out the testing in the Akan cultural region; thus, many of the students would likely have been of Akan extraction. While Adinkra symbols have taken on a national identity in Ghana, and even pan-African symbolism globally, there is still a sense of its close identification with Akan cultural heritage. Thus, we may see different results elsewhere in Ghana. We have seen a great deal of variation with CSDTs in the US, with some African American students expressing more interest in Native American design tools and vice-versa (Babbitt, Lyles & Eglash, 2012). Data on Adinkra Computing across the different regions of Ghana will provide further understanding about how the math, science, and computing aspects of Adinkra symbols may be interpreted similarly or differently based on the geographical location and cultural context of implementation.
Notes 1. This research was made possible by NSF grant DGE-0947980 and conducted under IRB #998.
2. http://www.csdt.rpi.edu
128 Babbitt, Lachney, Bulley & Eglash – Adinkra Mathematics
3. It should be noted that this process is always partial: some of the traditional knowledge was lost in the colonial era, and even in the original context the deeper indigenous conceptions are often “networked” across a variety of practices—healers, farmers, artisans, and others as well as non-human elements of the ecosystems in which they were embedded.
4. During our ethnographic research, we found that while many of the JHS students we worked with were aware of the most culturally popular Adinkra symbols, they were not familiar with the history or current production practices that surround Adinkra. This makes our ongoing work on Adinkra math and computing with junior high school students in control and intervention groups, as well as the surrounding region, of critical importance for both cultural and ethical reasons.
References
Ahia, F., & Fredua-Kwarteng, E. (2012). Gazing Mathematics and Science Education in Ghana. In A. Asabere-Ameyaw, G. J. Sefa Dei, K. Raheem, & J. Anamuah-Mensah (Eds.), Contemporary Issues in African Sciences and Science Education (pp. 103-125). Rotterdam: Sense Publishers.
Anamuah-Mensah, J., Mereku, D., & Asabere-Ameyaw, A. (2004). Ghanaian junior secondary school students’ achievement in
mathematics and science: Results from Ghana’s participation in the
2003 Trends in International Mathematics and Science Study. Accra: Ministry of Education Youth and Sports.
Anderson, S. (1990). Worldmath curriculum: Fighting Eurocentrism in mathematics. Journal of Negro Education, 348-359.
Ascher, M. (1994). Ethnomathematics: A Multicultural View of Mathematical Ideas. Boca Raton, FL: CRC Press.
Ascher, M., & D'Ambrosio, U. (1994). Ethnomathematics: A dialogue. For the Learning of Mathematics, 14(2), 36-43.
Babbitt, B., Lyles, D., & Eglash, R. (2012). From Ethnomathematics to Ethnocomputing. In S. Mukhopadhyay & W.-M. Roth (Eds.), Alternative Forms of Knowing (in) Mathematics (pp. 205-219). Rotterdam: Sense Publishers.
Cobb, P., & Hodge, L. L. (2002). A relational perspective on issues of cultural diversity and equity as they play out in the mathematics
REMIE – Multidisciplinary Journal of Educational Research, 5(2) 129
classroom. Mathematical thinking and learning, 4(2-3), 249-284. doi:10.1207/S15327833MTL04023_7
Cook, T. A. (1979). The curves of life: being an account of spiral formations and their application to growth in nature, to science, and to art: with special reference to the manuscripts of Leonardo da Vinci. New York, NY: Dover Publications.
Cook, T. D., Campbell, D. T., & Day, A. (1979). Quasi-experimentation: Design & analysis issues for field settings. Boston, MA: Houghton Mifflin.
D'Ambrosio, U. (2010a). Ethnomathematics: A response to the changing role of mathematics in society. Philosophy of Mathematics Education, 25. Retrieved from http://people.exeter.ac.uk/PErnest/pome25/index.html
D’Ambrosio, U. (2010b). From Ea, through Pythagoras, to Avatar: Different settings for mathematics. Paper presented at the Proceeding of the 34th conference of the international group for the psychology of mathematics education.
Dei, G. J. S. (2004). Schooling and education in Africa: The case of Ghana: Africa World Press.
Eglash, R. (1999). African Fractals: Modern Computing and Indigenous Design. Piscataway, NJ: Rutgers University Press.
Eglash, R., & Bennett, A. (2009). Teaching with Hidden Capital: Agency in Children’ s Computational Explorations of Cornrow Hairstyles.
Environments, 19(1), 58-73. Retrieved from http://www.colorado.edu/journals/cye
Eglash, R., Bennett, A., O Donnell, C., Jennings, S., & Cintorino, M. (2006). Culturally situated design tools: Ethnocomputing from field site to classroom. American Anthropologist, 108, 347. doi:10.1525/aa.2006.108.2.347
Eglash, R., & Garvey, C. (2014). Basins of Attraction for Generative Justice. In S. Banerjee, S. S. Ercetin, & A. Tekin (Eds.), Chaos Theory in Politics (pp. 75-88). Netherlands: Springer.
Eglash, R., Krishnamoorthy, M., Sanchez, J., & Woodbridge, A. (2011). Fractal simulations of African design in pre-college computing

130 Babbitt, Lachney, Bulley & Eglash – Adinkra Mathematics
education. ACM Transactions on Computing Education (TOCE), 11, 17. doi:10.1145/2037276.2037281
Elliott, F. (2009). Science, Metaphoric Meaning, and Indigenous Knowledge. Alberta Journal of Educational Research, 55(3), 284-297.
Ezeife, A. N. (2003). Using the environment in mathematics and science teaching: An African and aboriginal perspective. International Review of Education, 49(3-4), 319-342. doi:10.1023/A:1025307404154
Fordham, S. (1991). Peer-proofing academic competition among black adolescents: "Acting white" black American style. In C. E. Sleeter (Ed.), Empowerment through multicultural education (pp. 69-93). Albany, NY: State University of New York Press.
Frankenstein, M., & Powell, A. B. (1994). Toward liberatory mathematics: Paulo Freire’s epistemology and ethnomathematics. In C. Lankshear
& P. McLaren (Eds.), Politics of liberation: Paths from Freire (pp. 74-99). London, UK: Routledge.
Freire, P. (2000). Pedagogy of the oppressed. New York, NY: Bloomsbury Publishing.
Fryer Jr, R. G., & Torelli, P. (2010). An empirical analysis of acting white. Journal of Public Economics, 94(5), 380-396. doi:10.1016/j.jpubeco.2009.10.011
Gerdes, P. (1985). Conditions and strategies for emancipatory mathematics education in undeveloped countries. For the Learning of Mathematics, 5(1), 15-20.
Gutstein, E. (2006). Reading and writing the world with mathematics: Toward a pedagogy for social justice. New York, NY: Routledge.
Harding, S. G. (2008). Sciences from below: Feminisms, postcolonialities, and modernities. Durham, NC: Duke University Press.
Jama, J. M. (1999). The role of ethnomathematics in mathematics education cases from the horn of Africa. ZDM, 31(3), 92-95. doi:10.1007/BF02652730
Khan, S. (2011). Ethnomathematics as Mythopoetic Curriculum. For the Learning of Mathematics, 31(3), 14-18.
Lipka, J., Hogan, M. P., Webster, J. P., Yanez, E., Adams, B., Clark, S., & Lacy, D. (2005). Math in a cultural context: Two case studies of a

REMIE – Multidisciplinary Journal of Educational Research, 5(2) 131
successful culturally based math project. Anthropology & Education Quarterly, 36(4), 367-385. doi:10.1525/aeq.2005.36.4.367
Nasir, N. i. S. (2002). Identity, goals, and learning: Mathematics in cultural practice. Mathematical thinking and learning, 4(2-3), 213-247. doi:10.1207/S15327833MTL04023_6
Ogbu, J. U., & Simons, H. D. (1998). Voluntary and involuntary minorities: a cultural-ecological theory of school performance with some implications for education. Anthropology & Education Quarterly, 29(2), 155-188. doi:10.1207/S15327833MTL04023_6
Osei, G. M. (2006). Teachers in Ghana: issues of training, remuneration and effectiveness. International Journal of Educational Development, 26(1), 38-51. doi:10.1016/j.ijedudev.2005.07.015
Roth, W.-M., & Barton, A. C. (2004). Rethinking scientific literacy. New York, NY: Routledge Falmer.
Steele, C. M., Spencer, S. J., & Aronson, J. (2002). Contending with group image: The psychology of stereotype and social identity threat. Advances in experimental social psychology, 34, 379-440. doi:10.1016/S0065-2601(02)80009-0
West, G. B., Brown, J. H., & Enquist, B. J. (1997). A general model for the origin of allometric scaling laws in biology. Science, 276(5309), 122-126. PMID:9082983
Willis, W. B. (1998). The Adinkra dictionary: A visual primer on the language of Adinkra. Washington, DC: Pyramid Complex.
Zaslavsky, C. (1994). 'Africa Counts' and ethnomathematics. For the Learning of Mathematics, 14(2), 3-8.

132 Babbitt, Lachney, Bulley & Eglash – Adinkra Mathematics
William Babbitt is a recent graduate of the Multidisciplinary Sciences program at Rensselaer Polytechnic Institute in Troy, NY, USA.
Michael Lachney is a Ph.D. Candidate at Rensselaer Polytechnic Institute in Troy, NY, USA.
Enoch Bulley is an ICT teacher at the Ayeduase Junior High School in Kumasi Ghana.
Ron Eglash is Professor in the Science and Technology Studies Department at Rensselaer Polytechnic Institute in Troy, NY, USA.
Contact Address: William Babbitt. Rensselaer Polytechnic Institute 110 8th St, Troy, NY 12180, United States. Email: [email protected]

REMIE – Multidisciplinary Journal of Educational Research, 5(2) 133
Appendix A
Pre/Post Test
1) Define the following terms in your own words. You may draw images to help you explain.
a) Exponential Growth
b) Exponential Parameter
c) Tangent Vector
d) Angle
e) Degree
f) Cartesian Plane
2) Describe how you would create the following figure using math or computing.
3) Name three examples of logarithmic spirals in nature.
a)
b)
c)

134 Babbitt, Lachney, Bulley & Eglash – Adinkra Mathematics
4) Look at spirals a, b, and c below. Put the spirals in order from the smallest to the largest exponential parameters. 1 being the smallest and 3 being the largest.
1. _______ 2. ________ 3. ________
a. b. c.
5) Describe the shape below mathematically.
6) Give three examples of logarithmic spirals in everyday life.
a)
b)
c)

REMIE – Multidisciplinary Journal of Educational Research, 5(2) 135
7) Look at shapes a and b, which shape is found more in nature? Circle the answer below.
8) Draw two circles that intersect from the tangent vectors below.

Instructions for authors, subscriptions and further details:
http://remie.hipatiapress.com Developing Cooperative Learning Through Tasks in Content and
Language Integrated Learning
María del Carmen Ramos Ordóñez, Víctor Pavón Vázquez1
1) Department of English and German Philology, University of Cordoba, Spain.
Date of publication: June 15th, 2015 Edition period: June 2015 – October 2015
To cite this article: Ramos, M. C., & Pavón, V. (2015). Developing cooperative learning through tasks in Content and Language Integrated Learning. Multidisciplinary Journal of Educational Research, 5(2), 136-166.doi:10.17583/remie.2015.1429
To link this article: http://doi.org/10.17583/remie.2015.1429 PLEASE SCROLL DOWN FOR ARTICLE
The terms and conditions of use are related to the Open Journal System and
to Creative Commons Attribution License (CC-BY).
REMIE – Multidisciplinary Journal of Educational Research, Vol. 5, No. 2 June 2015 pp. 136-166
2015 Hipatia Press
ISSN: 2014-2862 DOI: 10.17583/remie.2015.1429
Developing Cooperative Learning through Tasks in Content and Language Integrated Learning María del Carmen Ramos Ordóñez Víctor Pavón Vázquez University of Cordoba University of Cordoba
Abstract
This article presents the results of a study on teachers’ perceptions regarding
specific work with tasks in the CLIL (Content and Language Integrated Learning) classroom, a context where academic content and a foreign language are learnt simultaneously. A questionnaire consisting of closed and open questions was administered to 25 teachers working in a school participating in an innovative project based on the implementation of tasks used as an instrument to promote cooperative learning. Following an interdisciplinary approach, the teachers worked in collaboration to design tasks that were organised and linked around a common topic. These crosscurricular themes were selected in the different subjects with the objective of making students work towards a common final goal through several developmental stages. The results of the study show that the teachers are concerned about the methodological difficulties that the use of tasks entail, about their own ability to cope with them, and about the problems that they encounter to collaborate. However, the teachers also value the benefits of this strategy in terms of achievement of learning objectives, and display a high degree of motivation to continue working with this model.
Keywords: bilingual education, CLIL, language learning, cooperative learning, task-based learning.
REMIE – Multidisciplinary Journal of Educational Research, Vol. 5 No. 1 February 2015 pp. 136-166
2015 Hipatia Press ISSN: 2014-2862 DOI: 10.17583/remie.2015.1429
Desarrollo de Aprendizaje Cooperativo a través del Uso de Tareas en Aprendizaje Integrado de Lengua y Contenido María del Carmen Ramos Ordóñez Víctor Pavón Vázquez University of Cordoba University of Cordoba Resumen
En este artículo se presentan los resultados de un estudio sobre las percepciones de los profesores con respecto al trabajo con tareas en un contexto de enseñanza AICLE (Aprendizaje Integrado de Lengua y Contenido), en el que los contenidos académicos y la lengua extranjera se aprenden de forma simultánea. 25 profesores participantes en un proyecto basado en la utilización de tareas como medio para fomentar el trabajo cooperativo completaron un cuestionario compuesto por preguntas cerradas y abiertas. De acuerdo con un enfoque interdisciplinar, los profesores trabajaron de forma conjunta para diseñar tareas organizadas y conectadas alrededor de un eje temático común. El objetivo era que los alumnos, a partir de elementos temáticos conectados entre las distintas asignaturas, trabajaran a lo largo de distintas fases para conseguir crear un producto final. Los resultados de este estudio muestran que el profesorado es consciente de las dificultades metodológicas que entraña el trabajo con tareas, de sus propias limitaciones para afrontarlo y de los problemas que en general supone establecer un modelo de colaboración entre ellos. Sin embargo, el profesorado también valora los beneficios de este tipo de trabajo aporta para la consecución de los objetivos de aprendizaje, además de mostrar un alto nivel de motivación para continuar trabajando de esta manera. Palabras clave: bilingüismo educativo, AICLE, aprendizaje de lenguas, aprendizaje cooperativo, aprendizaje por tareas.
138 Ramos & Pavón – Developing Cooperative Learning & CLIL
n the last two decades there has been an interest in implementing innovative educational methods particularly related to the teaching of content subjects in a foreign language (Eurydice, 2006, p. 8). Since the 1990s, “European programmes, educational legislative
actions and other initiatives have resulted in various forms of curricular change as a result of integrating languages with content fields” (Marsh, 2013, p. 5), favouring the introduction of Content and Language Integrated Learning (CLIL) programmes as an approach to promote “innovative
classroom pedagogies also in content subjects” (Dalton-Puffer, Llinares, Lorenzo & Nikula, 2014, p. 215). CLIL is a teaching approach based on the learning of different curricular content areas through a foreign language: “CLIL is a dual-focused educational approach in which an additional language is used for the learning and teaching of content and language mastery to pre-defined levels” (Coyle, Hood and Marsh, 2010, p. 1). CLIL makes available opportunities for interaction “that are not typical in traditional foreign language teaching” (Dalton-Puffer, Nikula & Smit, 2010, p. 279) and endorses the design of tasks with the objective of “engaging
students’ participation and interaction” (Escobar and Sánchez, 2008, p. 68). The Andalusian Regional Government in Spain designed a linguistic policy following the principles defined in the Common European Framework of Reference for Languages (Council of Europe, 2001), and in 2005 launched the Plan to Promote Plurilingualism (Consejería de Educación, 2005). The objective was to achieve plurilingual and pluricultural skills, sequencing the contents of each stage of schooling and adapting assessment criteria to those established in the CEFRL, and fostering the development of oral and written skills within meaningful tasks and projects (Segovia et al. 2010, p. 155). In line with these recommendations, the school (Manuel Siurot, in La Roda de Andalucía) decided to implement a CLIL programme based on specific work with tasks, through which the students could learn curricular content and acquire command of the foreign language. The idea behind this proposal was that connecting subjects through the elaboration of tasks could beseem cooperative learning and, as a result, help develop interaction and facilitate the learning of content. In this study, we analyse the shortcomings of the implementation of tasks and cooperative learning in a CLIL context through the opinions of the teachers involved in the project. The objective is to identify the difficulties of this methodological strategy, and evaluate how teachers appreciate its implementation by reflecting on their own
I

REMIE – Multidisciplinary Journal of Educational Research, 5(2) 139
competences, problems encountered, and attainment of learning objectives, coordination measures, and motivation.
Cooperative Learning
Cooperative learning advocates a type of instruction where students work together in small groups to achieve a common goal. Sometimes cooperation is used as a synonym of collaboration; however, they are not exactly the same. While cooperative learning can be defined as “working together to
accomplish shared goals” (Smith, 1995, p. 1), collaborative learning is “a method that implies working in a group of two or more to achieve a common goal, while respecting each individual’s contribution to the whole”
(McInnerney and Roberts, 2004, p. 205). In other words, cooperation can be achieved if all participants do their parts separately and bring their results to the rest of the group, while collaboration entails direct interaction among the students in the group “to produce a product and involves processes such as negotiations, discussions, and acceptance of the opinions of other group mates” (Kozar, 2010, p. 17).
Nevertheless, the line separating these two concepts is not so clear in practice and cooperative learning may also include the development of social skills, group reflection and interrelated work (Dillenbourg, Baker, Blaye & O’Malley, 1996; Kagan, 1985; Roberts and MacInnerney, 2007; Roschelle and Teasley, 1995). Cooperative learning has become increasingly popular with benefits that include boosting students’ interest, improving critical thinking, and the opportunity to practice both productive and receptive skills in a natural context (Casal, 2008). In a CLIL or language-learning context, the array of benefits extends beyond increased language learning to include increased self-esteem and tolerance of diverse points of view (Johnson and Johnson, 1989; Kagan, 1995; McCafferty, Jacobs & Iddings, 2006; Slavin, 1995). Although cooperative learning has numerous variations, Johnson and Johnson (1989) indicate five features of a successful cooperative learning activity: (1) students learn that their success depends upon working together interdependently; (2) students are individually accountable while achieving group goals; (3) students support and assist one another’s success through
face-to-face interactions; (4) students develop social skills by cooperating and working together effectively; and (5) students as a group have the

140 Ramos & Pavón – Developing Cooperative Learning & CLIL
opportunity to reflect on the effectiveness of working together. When these principles are realised, cooperative learning creates a rich environment for students to learn language and simultaneously develop their capacities for communication and problem solving.
It has to be noted that the claim that cooperative learning differs from collaborative learning is based on the idea that the teacher adapts tasks and goals to the characteristics of the students in cooperative learning, whereas in collaborative learning the students negotiate with the teacher the mechanisms to achieve tasks’ objectives (McWhaw, Schnackenberg, Schlater & Abrami, 2003). In our view, both of them demand active involvement in the realization of tasks and are considered different facets of the same process. The general principles of cooperative learning establish the need for specific work with students in pairs and small groups (Long and Porter, 1985; Pica, Lincoln-Porter, Paninos & Linell, 1996) so that they can help each other in the construction of meaning by using the language (Gillies, 2007). Cooperative learning can also be an impaired tool to prevent one specific danger typical of CLIL contexts, the potential drawbacks deriving from leaning too much towards receptive skills (listening and reading), therefore compromising the acquisition of productive skills (speaking and writing). As de Graaf, Koopman, Anikina and Westhoff (2007) and Casal (2008) point out, cooperative learning may in fact be a powerful strategy to counteract the negative effects of overusing receptive works in the CLIL classroom, because it proposes the use of the language not only to understand, but also to communicate and discuss by manipulating the content matter.
Learning through Tasks in Content and Language Integrated Learning
It is stated in Chapter 2 of the Common European Framework of Reference for Languages (Council of Europe, 2001) that the methodological approach based on action through tasks is the most effective one for the development of communicative competences that are needed by individuals. Willis (1996, p. 23) defines a task as an activity in which the language is used for a communicative purpose “to accomplish an outcome”. Skehan (1998) observes that tasks are activities in which meaning is primary, there is a communicative problem to solve, there is a situation comparable to real-world activities, the stress is on communicative code and not on the linguistic form, task completion is a priority, and they are assessed in terms of an

REMIE – Multidisciplinary Journal of Educational Research, 5(2) 141
identifiable outcome. The most common characteristic of working with task-based learning is the focus on authentic use of language for meaningful purposes (Willis & Willis, 1996, 2007).
The focus on the elaboration of tasks brings about notable benefits to the learning of English as a foreign language and is particularly relevant in CLIL because of the emphasis on “problem-solving” (Navés & Muñoz, 2000, p. 2), even though the conditions may not be ideal: “task-based learning can favour participation and interaction in a CLIL context where students have low linguistic proficiency” (Pavón, Prieto and Ávila, 2015, p. 85). In fact, the relationship between task-based learning and CLIL can be defined as “symbiotic” (Meyer, 2010, p.19) due to the use of authentic and meaningful content. In the context of this study, communicative tasks are a pivotal strategy in CLIL, in that they really promote cooperative learning: “A lot of what goes on in the CLIL classroom involves practical application of knowledge through problem solving tasks and cooperative learning” (Pavón and Ellison, 2013, p. 71). Working with tasks provides a richer learning experience as it entails working through different subjects in a more realistic way: "Students learn knowledge and elements of the core curriculum, but also apply what they know to solve authentic problems and produce results that matter” (Markham, 2011, p.38). Also, students have a more active role in their own learning and in the learning of the rest of their classmates: “the
students not only learn from their teachers but also from the other students” (Pastor, 2011, p.112). The objective is to attain linguistic or communicative competence as the result of the fusion between formal (linguistic) and instrumental (communicative) knowledge, two dimensions that have to be constructed in an interrelated way: “The key to successful learning is to find ways of weaving together formal and instrumental knowledge” (Estaire and Zanon, 1994, p. 77).
In order to weigh the efficiency of models, methodologies and strategies in CLIL, it is essential, together with the analysis of the structure of tasks and of interaction, to take an insight into “the students’ perceptions and teachers’
mind-sets” (Bonnet, 2012, p. 87). With regard to the analysis of the beliefs that teachers possess of their own performance, it has to be said that knowledge of this area definitely contributes to sketch the ideal conditions for the application of any given teaching methodology. The way they have been taught and their implicit theories about teaching are by far the most

142 Ramos & Pavón – Developing Cooperative Learning & CLIL
influential factors determining their pedagogy, and the same can be said when investigating their role in CLIL: “When it comes to bilingual teachers,
their personal baggage, knowledge and concept of bilingualism is of vital importance” (Pena & Porto, 2007, p. 153). This means that investigating the personal experience of the CLIL teacher and the fashion they adopt to shape teaching brings about a fine understanding of their role in the teaching process (Meyer, 2010, p. 13). Reflection on their own practice will play a part in their own professional development (Guazzieri, 2008, p. 78), this way contributing to develop a finer version of the methodology used. Teachers’
own perception of their work is a deciding factor for the success of CLIL, as teachers are responsible to provide adequate support by scaffolding students’ negotiation of meaning (Bonnet, 2012, p.182), and scaffolding is necessary to provide the appropriate support to structure and accomplish tasks (Meyer 2010, p. 15).
Research Design
Objectives and Research Questions The main objective of this study is to analyse the perceptions of teachers involved in bilingual education about the use of cooperative learning and tasks, and if working in this way may bring about more involvement by students in the learning process. The independent variables are cooperative learning and tasks, which represent the phenomena that we are going to analyse in order to determine the effects and changes that they produce in the studied context. The dependent variables are the students’ participation and involvement in the learning process and the teachers’ reflections as they
represent the means that measure these changes. The research questions posited in this study are the following:
1) Do teachers feel confident when working with cooperative learning and tasks? 2) What are the difficulties of adopting cooperative learning strategies and tasks with Primary Education students? 3) Are tasks and cooperative learning an effective way to promote students’ involvement and to achieve the learning goals? 4) Is coordination between teachers a key factor for the promotion of cooperative learning?

REMIE – Multidisciplinary Journal of Educational Research, 5(2) 143
5) Are teachers motivated for the introduction of cooperative learning and tasks in their teaching and learning practices?
Characteristics, Context and Participants Since the general objective of this study is to determine if the use of cooperative learning and tasks bring about more involvement of the students in the learning process, this research can be considered applied and practical at the same time, according to the classification of research in second language acquisition determined by Seliger and Shohamy (1989) in three categories: basic or theoretical, applied and practical. It is applied because we are trying to test if, according to teachers, the use of cooperative learning during the implementation of tasks has a positive influence on students’
performance in the classroom. It is practical because in the course of the research, teachers have incorporated tasks in their actual practices in order to promote cooperative learning strategies.
This study was carried out during the academic year 2012/13 in the school Manuel Siurot, a Pre-school and Primary School in La Roda de Andalucía, Seville. Most of the students come from families of a medium to low socioeconomic level, though the entire social stratification is present, since this is the only pre-school and primary school in the town. In all the classes there are students of ethnic minorities from Romania and Morocco, and a small representation of South American nationalities. A total 25 teachers participated in the study, from the areas of English, Music, Physical Education, Science, Religion, Language and Speech Therapy, and Therapeutic Pedagogy. Data Collection: Instruments and Procedure Table 1 Instruments
Classification of instruments Semi-structured questionnaires Teachers’ questionnaire Record reviews Colabor@ Platform

144 Ramos & Pavón – Developing Cooperative Learning & CLIL
In this research, an eclectic approach with quantitative and qualitative methods has been used in an attempt to provide an accurate description of the area of research. Semi-structured questionnaires included several dimensions with a narrow range of possible answers and items with open questions. The reason for including open questions was to find specific characteristics of the phenomena as teachers perceived them. It was important to include both quantitative and qualitative data because the subjective data gathered from qualitative research helps to explain and describe elements from reality that are difficult to quantify:
We see most value in investigations that combine objective and subjective elements, that quantify only what can be usefully quantified, and that utilise qualitative data collection and analysis procedures wherever they are appropriate. (Allwright and Bailey, 1991, p. 67).
The researcher administered the teachers’ questionnaire at the end of the
academic year 2012-13, a time of the year where they could be more relaxed once classes with students had finished and they did not have to correct tests, prepare classes, attend to parents and write up school documents and on-line reports. One of the concerns about using questionnaires was that there could be a low rate of return. In this research, despite the fact that questionnaires were given to the teachers at the end of the year, the return rate was of a 92.59%.
The second instrument for data collection was the Colabor@ Platform, a digital collaborative tool created by the Andalusian educational authorities to keep a record of the information and documents that are shared by teachers participating in educational projects. For the purpose of this research, the relevant data were the opinions, impressions and experiences of the teachers once they had been trained in the understanding and implementation of cooperative learning strategies in their classes. These data were collected in the last task of the training project, where teachers were asked to reflect on the general benefits and difficulties that using tasks entails. The researcher has used these data to triangulate with the opinions stated by teachers in the questionnaires.

REMIE – Multidisciplinary Journal of Educational Research, 5(2) 145
Data Analysis and Discussion
The data is classified and presented in five dimensions: teachers’ confidence
and competences; difficulties of working with tasks; the connection between cooperative learning, tasks and learning goals; the role of coordination of teachers in the design and implementation of tasks; and motivation on the part of teachers to work with tasks. The findings are presented and analysed quantitatively and qualitatively using the data provided by the two different instruments. The results that can be analysed quantitatively are depicted graphically, either in tables or in bar diagrams. Qualitative analysis is illustrated by quotations from teachers. In order to identify the teachers, they are represented with a ‘T’ followed by a number. Teachers’ Confidence In the questionnaire that was administered to the teachers, they were asked in questions 1 and 2 if they felt qualified to teach through tasks and if they had ever worked in this way. The results were that 88.23% answered that they did not feel qualified and only 11.76 answered they were. The argument for all the teachers who answered negatively and who thought that they did not feel confident and had doubts about how to work through tasks, not only in the planning phase but also in their implementation, was that they were not qualified for that type of teaching. On the other hand, it is interesting to note that the teachers who stated they were confident were teachers who had previously worked in pre-school levels:
T2. We could say that in pre-school education we work through tasks since the centres of interesting which we work encompass all areas. The only difference is that we don’t present a final product. T3. It has not been very difficult for me, since in pre-school education we work from in a collaborative way. The first didactic units were done quite a long time ago for the first cycle and it helped me to understand the concept of task.

146 Ramos & Pavón – Developing Cooperative Learning & CLIL
Obviously, teachers who had received specific training in cooperative learning and use of tasks, and who had worked in a similar way in the past, also felt reasonably comfortable:
T5. I didn’t feel a hundred per cent secure, but designing tasks in cycle
meetings and with my colleagues, the training that we have received along these two last years, and the fact that we progressively assimilate tasks in our daily work, all this, has helped me not to feel lost and to put them into practice with success. T23. This last year I have more confidence. Though I have a lot to learn and improve I have clear ideas.
All in all, teachers concur that it is necessary to have more training to feel
confident enough:
T8. I had many doubts, lack of training and even lack of conviction. However, I think I have overcome that phase and now I feel the opposite side. I feel the need to improve in this type of work. T17. Since in the last year we worked through tasks, this year I have felt more comfortable but I don’t feel trained enough.
The stability of the teaching staff is considered essential, as for most of them this methodology is new and they had not experienced the training and implementation of tasks in the previous academic year:
T13. It was my first year in the school and I didn’t feel qualified
because I have never worked like this before … and furthermore, there
was lack of information on the part of the teachers that had already worked in the school. T23. Sincerely, the first year I didn’t feel qualified to put into practice
tasks since that was the first time I worked as a teacher. Difficulties Teachers were asked about the greatest difficulties that they faced when teaching through tasks (question 3). In line with the opinions in the previous
REMIE – Multidisciplinary Journal of Educational Research, 5(2) 147
section, teachers agree that training, and also commitment on their part, are essential to help them gain confidence in their daily practice:
T8. I didn’t feel qualified but my own desire to improve and the wish
to innovate and to know new methodologies have made me feel very comfortable accomplishing tasks.
Teachers also state that having an unstable staff implies the need for
continuous training to support new teachers, and this affects coordination negatively. Although teachers have some slots in their schedules to coordinate with the rest of the teachers, they think that this is not enough:
T14. The problem would be solved if the staff in the school were permanent.
Teachers consider that they need plenty of time to develop the activities that they design and that it is very complicated if the students are young. To overcome this it is very important that teachers design activities suitable for the students’ age and also teach them how to work cooperatively in order to make projects:
T14. Lack of time to get adapted to the rhythm of the class, a situation which worsens when there is no cohesion in the group. T19. It’s difficult to implement with young students because they are not autonomous.
In pre-school education, it is very common to ask parents to work with
their children at home and even to participate in the school activities. Sometimes families collaborate with the school in storytelling activities or to help the teachers with some projects, but in primary education the situation is different. There is a great change in the way students work as in primary education they usually sit individually or in pairs, whereas in pre-school students sit in groups to work cooperatively in the projects that they are involved in. When students in primary education are arranged in teams to work cooperatively within tasks, some families do not support this initiative:
148 Ramos & Pavón – Developing Cooperative Learning & CLIL
T11. The family doesn’t support group work because of personal
reasons, and this makes our task even more difficult than it is.
Other problems are generated by the great diversity of students, which brings about two important considerations: firstly, the degree of participation and engagement in the group activities; and secondly, the adaptation of the design of the tasks and goals to the diversity of students:
T13. Most students work in the right way, but some of them delegate responsibilities to the others and they don’t get involved. T10. Most students progress favourably though there are cases where even being good students don’t get the results they should for their level.
This last quotation points out something crucial, that this is a
methodology that requires more time both for the teachers and for the students. Students need to be comfortable connecting ideas and contents from different subjects. Also, diversity is a reality. There are students with different levels in every single class. We might find students who require curricular adaptation and they are following a programme of reinforcement to overcome their learning difficulties, either because they have learning difficulties, they have been incorporated late into the Spanish educative system, they suffer from behavioural problems or syndromes such as attention deficit disorder, with or without hyperactivity, autism, Asperger’s
syndrome, etc. With this variety of students, teachers have to design the activities sensibly and with great sensitivity to student needs so that they may be able to participate within groups. Cooperative work can be a powerful aid for these students since working with other students may help them achieve success. However, this is not always possible:
T24. I encounter difficulties if we don’t take into account the diversity
of students: level of difficulty, means of presenting the contents, adaptation to different characteristics, interests and abilities of each student. It requires perseverance, dedication and effort on the part of all the teachers involved.

REMIE – Multidisciplinary Journal of Educational Research, 5(2) 149
T22. Each student is unique and for that reason needs an individualized programme. T25. Cooperative learning needs to be adapted to the student’s
characteristics and needs, and this is not always possible.
Another issue is the alteration of the classroom dynamics. The fact is that working in small groups implies a great change. Students have to follow some rules. They need to organise themselves and follow guidelines. Often noise increases in the class, and sometimes this may cause lack of concentration in some students:
T18. What I don’t like is the noisy atmosphere that group-work produces. T8. We are afraid to change because we lose our leading role in the class. However, I think that with this system our role acquires another dimension. All those shortcomings and difficulties can become our ally and create an ideal atmosphere in our classes.
Therefore, it is evident that students need to be instructed to work in
teams in order for the teaching-learning process to be successful. It is necessary to group the students in cooperative teams to implement tasks, and this requires a lot of preparation. First, compatibility among students is necessary. They need to know each other, to know what their classmates’
skills are, their weak and their strong points, and to know how to organise themselves within the group to accomplish the tasks successfully. In order to achieve that cohesion and to strengthen the relationship among students, teachers need to start the school year doing a study of their social relationships and put into practice classroom dynamics:
T15. It is essential to have a class of students that allow you to do this type of activity. The biggest difficulty is in the cohesion of the group.
Finally, teachers were asked in questions 4 and 6 if they were able to
achieve the goals in all the tasks, and if not, to identify the reasons. Only 33.4% of the teachers answered that they could carry out the task, and 66.6%
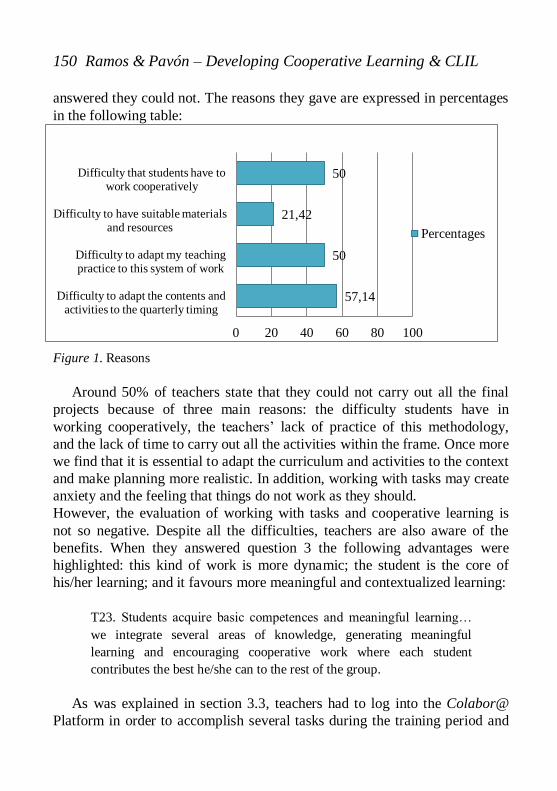
150 Ramos & Pavón – Developing Cooperative Learning & CLIL
answered they could not. The reasons they gave are expressed in percentages in the following table:
Figure 1. Reasons
Around 50% of teachers state that they could not carry out all the final projects because of three main reasons: the difficulty students have in working cooperatively, the teachers’ lack of practice of this methodology, and the lack of time to carry out all the activities within the frame. Once more we find that it is essential to adapt the curriculum and activities to the context and make planning more realistic. In addition, working with tasks may create anxiety and the feeling that things do not work as they should. However, the evaluation of working with tasks and cooperative learning is not so negative. Despite all the difficulties, teachers are also aware of the benefits. When they answered question 3 the following advantages were highlighted: this kind of work is more dynamic; the student is the core of his/her learning; and it favours more meaningful and contextualized learning:
T23. Students acquire basic competences and meaningful learning…
we integrate several areas of knowledge, generating meaningful learning and encouraging cooperative work where each student contributes the best he/she can to the rest of the group.
As was explained in section 3.3, teachers had to log into the Colabor@
Platform in order to accomplish several tasks during the training period and
57,14
50
21,42
50
0 20 40 60 80 100
Difficulty to adapt the contents and activities to the quarterly timing
Difficulty to adapt my teaching practice to this system of work
Difficulty to have suitable materials and resources
Difficulty that students have to work cooperatively
Percentages

REMIE – Multidisciplinary Journal of Educational Research, 5(2) 151
to reflect and share ideas with all the teachers that were participating in the training programme. These tasks were also used to assess the development of the training activity. During the fulfilment of these different tasks, teachers commented appreciatively on their own work in relation to the implementation of tasks and cooperative learning with their students. A summary of the answers of all the teachers is shown in the following table:
Table 2 Teachers’ opinions in Colabor@ Platform
Teachers’ opinions about the Difficulties and Benefits of Cooperative Learning
Difficulties Benefits Some students “delegate” their work
to their mates and they do not get involved in teamwork or they prefer to do the tasks individually without sharing their results.
It is important to make the families aware of the importance of cooperative work. Some of them think that “team work” is a loss of
time. There are many doubts at the
beginning of implementing cooperative learning, which suggests that specific training is needed.
Sometimes, there is not enough time to coordinate with other teachers.
Students need to talk about their tasks, they ask many questions, they make noise, and sometimes there is an apparent disorder in the class. Teachers have to assume and accept this with normality.
Students feel more confident in their answers and their self-esteem rises.
Autonomy and motivation are reinforced.
It is strengthened that students improve their own results but also the results of his/her teammates.
Shared responsibility and students’ relationship are
favoured by promoting respect towards the others.
It favours oral expression, turn-taking, and general communication in class.
Students have an active role in their learning process.
It favours activities where “inclusion” is possible, though with certain difficulties,
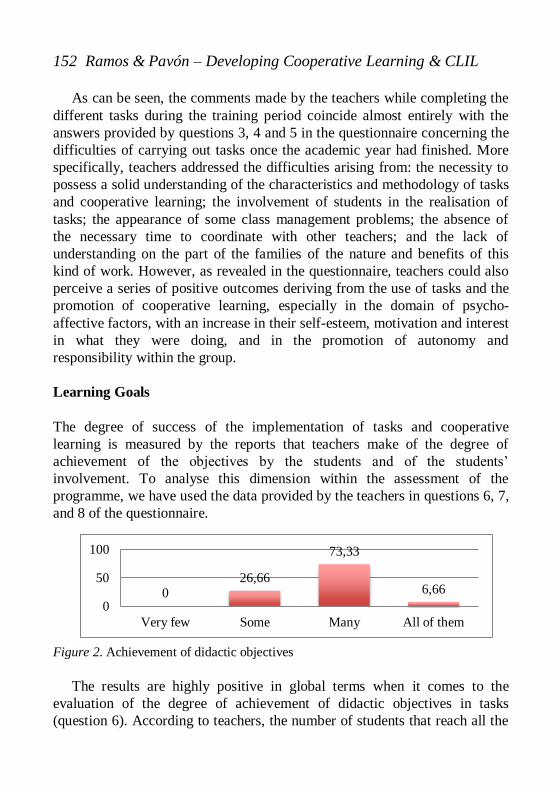
152 Ramos & Pavón – Developing Cooperative Learning & CLIL
As can be seen, the comments made by the teachers while completing the different tasks during the training period coincide almost entirely with the answers provided by questions 3, 4 and 5 in the questionnaire concerning the difficulties of carrying out tasks once the academic year had finished. More specifically, teachers addressed the difficulties arising from: the necessity to possess a solid understanding of the characteristics and methodology of tasks and cooperative learning; the involvement of students in the realisation of tasks; the appearance of some class management problems; the absence of the necessary time to coordinate with other teachers; and the lack of understanding on the part of the families of the nature and benefits of this kind of work. However, as revealed in the questionnaire, teachers could also perceive a series of positive outcomes deriving from the use of tasks and the promotion of cooperative learning, especially in the domain of psycho-affective factors, with an increase in their self-esteem, motivation and interest in what they were doing, and in the promotion of autonomy and responsibility within the group.
Learning Goals The degree of success of the implementation of tasks and cooperative learning is measured by the reports that teachers make of the degree of achievement of the objectives by the students and of the students’
involvement. To analyse this dimension within the assessment of the programme, we have used the data provided by the teachers in questions 6, 7, and 8 of the questionnaire. Figure 2. Achievement of didactic objectives
The results are highly positive in global terms when it comes to the evaluation of the degree of achievement of didactic objectives in tasks (question 6). According to teachers, the number of students that reach all the
0 26,66
73,33
6,66 0
50
100
Very few Some Many All of them
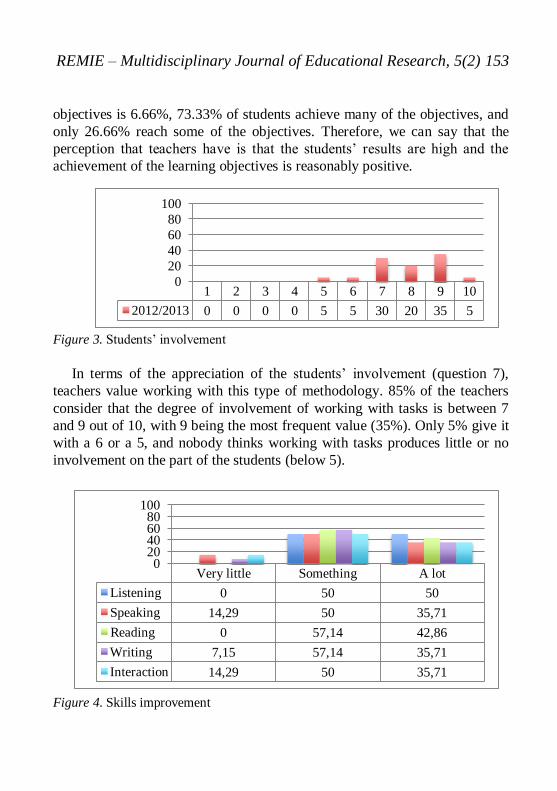
REMIE – Multidisciplinary Journal of Educational Research, 5(2) 153
objectives is 6.66%, 73.33% of students achieve many of the objectives, and only 26.66% reach some of the objectives. Therefore, we can say that the perception that teachers have is that the students’ results are high and the
achievement of the learning objectives is reasonably positive.
Figure 3. Students’ involvement
In terms of the appreciation of the students’ involvement (question 7), teachers value working with this type of methodology. 85% of the teachers consider that the degree of involvement of working with tasks is between 7 and 9 out of 10, with 9 being the most frequent value (35%). Only 5% give it with a 6 or a 5, and nobody thinks working with tasks produces little or no involvement on the part of the students (below 5).
Figure 4. Skills improvement
1 2 3 4 5 6 7 8 9 10
2012/2013 0 0 0 0 5 5 30 20 35 5
0 20 40 60 80
100
Very little Something A lot
Listening 0 50 50
Speaking 14,29 50 35,71
Reading 0 57,14 42,86
Writing 7,15 57,14 35,71
Interaction 14,29 50 35,71
0 20 40 60 80
100

154 Ramos & Pavón – Developing Cooperative Learning & CLIL
With regard to the analysis of the skills that teachers perceive that are being promoted with the use of tasks (question 8), again the evaluation is positive since all the linguistic skills, including interaction, improve significantly (“a lot”) for more than two thirds of the teachers. The perception
then is that the majority of the teachers believe that all the linguistic skills improve with the use of tasks. In fact the total number of teachers state that listening and reading always improve, and only a minority think that speaking (14.29%), writing (7.15%) and interaction (14.29%) improve very little. Coordination Teachers had already identified (in question 4) the need for coordination as one of the difficulties for the implementation of cooperative learning, and in questions 9 and 10 were specifically requested to give their opinions on the existence of coordination between teachers and on the types of coordination established.
Figure 5. Teacher’s coordination
Figure 6. Possibility to coordinate
82.23
17,77
0 20 40 60 80 100
Yes
No
28,57 71,42
52,38 9,52
0 20 40 60 80 100
e-mail Afternoon
Coordination slot Between lessons
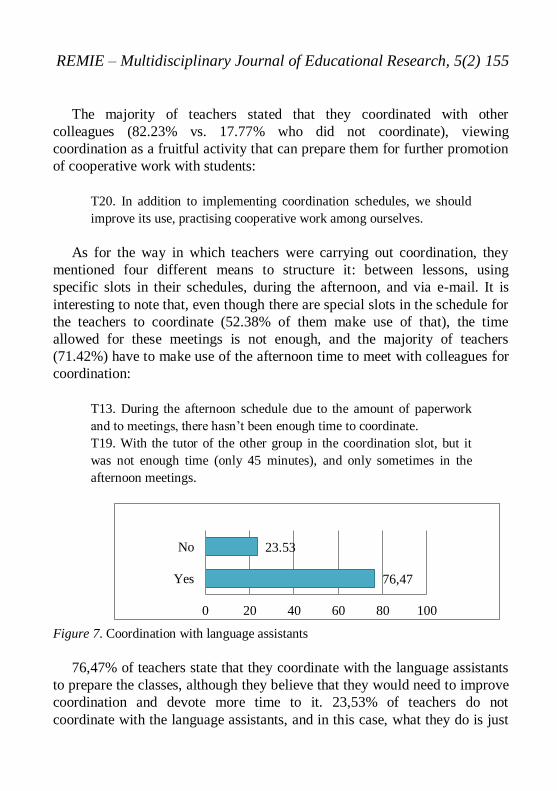
REMIE – Multidisciplinary Journal of Educational Research, 5(2) 155
The majority of teachers stated that they coordinated with other colleagues (82.23% vs. 17.77% who did not coordinate), viewing coordination as a fruitful activity that can prepare them for further promotion of cooperative work with students:
T20. In addition to implementing coordination schedules, we should improve its use, practising cooperative work among ourselves.
As for the way in which teachers were carrying out coordination, they
mentioned four different means to structure it: between lessons, using specific slots in their schedules, during the afternoon, and via e-mail. It is interesting to note that, even though there are special slots in the schedule for the teachers to coordinate (52.38% of them make use of that), the time allowed for these meetings is not enough, and the majority of teachers (71.42%) have to make use of the afternoon time to meet with colleagues for coordination:
T13. During the afternoon schedule due to the amount of paperwork and to meetings, there hasn’t been enough time to coordinate. T19. With the tutor of the other group in the coordination slot, but it was not enough time (only 45 minutes), and only sometimes in the afternoon meetings.
Figure 7. Coordination with language assistants
76,47% of teachers state that they coordinate with the language assistants
to prepare the classes, although they believe that they would need to improve coordination and devote more time to it. 23,53% of teachers do not coordinate with the language assistants, and in this case, what they do is just
76,47
23.53
0 20 40 60 80 100
Yes
No

156 Ramos & Pavón – Developing Cooperative Learning & CLIL
follow the activities of the textbooks without previous planning. When there is coordination between the teacher and the language assistant, sometimes the language assistant follows the activities that are programmed in the books, whereas in other classes they bring their own ideas (mainly games to practise oral skills) taking into account the contents that students are learning at that moment. Following one or another’s lesson planning, depends on the freedom that the teacher gives the language assistant to innovate and do what they consider best:
T11. We explained to her how we worked and sometimes she prepared worksheets or games related to the topic. T15. I planned the lessons and the language assistant did what I told her.
They coordinate in breaks or in the class when they change from one
lesson to another and some of them use e-mails, but they do not have a specific slot in their schedules to coordinate with the language assistants:
T13. I think it is necessary to establish sessions for bilingual coordination with the language assistant in the schedule so as to encourage such coordination. T19. Not much. It was limited to short periods of time in the breaks or when she came to class and I explained then what I wanted her to do for the next lesson.
As we see, there is not a specific time devoted to coordination with the
language assistants and this implies that they are not properly used because if content teachers had more time to work cooperatively and collaboratively with the language assistants, they could design activities carefully which might be different to the ones that are traditionally included in the textbooks and encourage more enriched learning activities for students. Motivation Teachers expressed their level of motivation towards this project and their opinion about the continuity of it in question 11:

REMIE – Multidisciplinary Journal of Educational Research, 5(2) 157
T8. I’m convinced of its efficiency and of the clear improvement that we’ll have with our students. T9. I think it is positive to work through projects and that teachers should improve in the implementation of them.
Despite the difficulties previously analysed, almost all the teachers in the
school were positively motivated though to different degrees, depending on the difficulties or problems that they had in their particular classes:
T13. Students are more autonomous and the time to correct activities is reduced, therefore it is possible to better attend to students with learning difficulties. T18. My students have fewer behavioural problems than in the previous year.
The global perception is that the majority believed that it would be
positive to continue with the implementation of tasks:
T7. My highest motivation is to continue with the practice of this type of methodological project, with great enthusiasm, since students like it a lot. It’s a playful way to teach and learn and I hope to experiment with new ideas.
Only one teacher gave a completely negative opinion towards this project,
an opinion that should be carefully analysed:
T14. A lot of work to get poor results. The administration doesn’t pay
for our effort. We leave aside key contents for future learning (calculus, memorization, study techniques, grammar). Nowadays, everything is based on social issues, groups, etc., nullifying individuality. Everything is politics.
It has to be highlighted that this is an opinion of a teacher of a class of
students with many special educational needs, where there was no cohesion among the group, and there were students who had behavioural problems. In addition, we can identify in those words that there is a misunderstanding of
158 Ramos & Pavón – Developing Cooperative Learning & CLIL
what a task is. Working through tasks does not mean that students are not going to study calculus, study techniques or grammar. All of them are, and must be included, in the didactic planning of tasks. The purpose of tasks is to look for the connection between different areas to teach students in a meaningful way. Working in cooperative groups does not mean neglecting individual tasks, as both coexist within the dynamics of the classroom.
Conclusion
This study examines the teachers’ perceptions on cooperative learning and tasks. First of all, this research confirms the assumption that using tasks is a suitable strategy to promote cooperative learning in a CLIL context (Coonan, 2012; Dalton-Puffer et al., 2010). At the same time, the findings of this study reveal that tasks may be an ideal condition for the integration of content and languages since the students’ degree of engagement increases (Berton, 2008; Guazzieri, 2008), and they promote meaningful learning connected with students’ interests and motivation (Heras and Lasagabaster, 2015; Poisel, 2012).
More particularly, the findings with respect to the research questions formulated are that some teachers may not feel confident when working with cooperative learning and tasks, not only due to the complexity of the enterprise, but mainly because of the lack of experience with the implementation of a pedagogical approach that is new and unknown to many of them. Teachers stated that specific training on these areas is required, and also that the stability of staff is a key factor in helping structure collaboration and cooperation between teachers. Secondly, teachers described a number of difficulties that could seriously harm the work with tasks and the promotion of cooperative learning: again, stability of staff; the increase of time that these strategies demand; the difficulty to engage students and to foment group cohesion with very different class dynamics; the lack of cooperation from families; and more importantly, the great diversity of factors related to students. But at the same time, they could notice some benefits, such as the move to learner-centred teaching, the move towards more meaningful and contextualised learning, and the increase in students’ motivation, interest and self-esteem. Thirdly, tasks and cooperative learning seem to effectively endorse the achievement of learning goals and the promotion of the students’
involvement, as the majority of teachers reported that students were able to
REMIE – Multidisciplinary Journal of Educational Research, 5(2) 159
attain the learning objectives, and that there was a significant improvement in the language skills. Fourthly, the majority of teachers understand the potential and the necessity to coordinate with other teachers and with the language assistants when working with tasks, although they identified the short time devoted to gathering together as a hindrance that impairs agreed planning of activities which can seriously hamper coordination. Finally, teachers seem to be truly motivated towards the introduction of cooperative learning and tasks in their teaching and learning practices, and, despite all the difficulties, they see them as powerful pedagogical tools that can enrich the students’ learning process and the teachers’ own professional development.
A first general pedagogical conclusion is that, in the case of cooperative learning, teachers have to facilitate group cohesion through group dynamics (Dörnyei, 1997), so that they can organise their classes into groups or teams. It is when teams are formed, when students have to assume different roles within the team so that they engage in a process of cooperative learning. A second major conclusion is that cooperative interaction processes within the classroom are essential, but those processes cannot be isolated. They have to be developed within a parallel, transversal system of common pedagogical guidelines for the whole school (Pérez-Cañado, 2014). It should not be an isolated initiative of one teacher, but on the contrary, all teachers in the school should incorporate the same pedagogical guidelines in their classes (Pavón, Ávila, Espejo & Gallego, 2014). Therefore, cooperative work has to extend beyond the limits of the classroom to the whole educational community. Teachers have to cooperate and collaborate in all the phases of the teaching learning process, which consists of cycles of analysis of the situation, design of curricular programmes, implementation of those programmes, evaluation, and design of new strategies of didactic intervention. If teachers engage in this cooperative cycle, the results will be successful and they will be able to achieve their objectives.
Finally, it has to be noted that this is an investigation with natural groups and for that reason there are variables such as students’ sex, age and
particular characteristics that are difficult to control. As a consequence, it might be possible that in another school context the results are different. Concerning possible lines of future research, an experimental approach could be used to test how strategies of cooperative learning contribute to the development of each one of the five linguistic skills, for example. Also,

160 Ramos & Pavón – Developing Cooperative Learning & CLIL
similar studies could be complemented with class observation, and with the analysis of how to integrate students with specific needs, a controversial issue that would require a deeper level of analysis.
Acknowledgments
The authors wish to express their sincerest gratitude to the teachers of the Pre-school and Primary School “Manuel Siurot” (La Roda de Andalucía,
Sevilla, Spain) for their willingness to participate in this study.
References
Allwright, R., & Bailey. K.M. (1991). Focus on the Language Classroom.
Cambridge: Cambridge University Press. Berton, G. (2008). Tasks, Learning Activities and Oral Production Skills in
CLIL Classrooms. In M. Coonan (Ed.), CLIL e l’Appredimento delle
Lingue. Le Sfide del Nuovo Ambiente di Apprendimento (pp. 143-151). Venezia: University Ca’ Foscari, Venezia.
Bonnet, A. (2012). Language, Content and Interaction: How to Make CLIL Classroom Work. In D. Marsh, O. Meyer (Eds.), Quality Interfaces: Examining Evidence & Exploring Solutions in CLIL (pp. 172-189). Eichstätt: Eichstätt Academic Press.
Casal, S. (2008). Cooperative Learning in CLIL Contexts: Ways to Improve Students’ Competences in the Foreign Language Classroom. Paper presented in the IAIE Conference Cooperative Learning in Multicultural Societies: Critical Reflections. Turin. Retrieved from http://soniacasal.wordpress.com/2008/10/18/cooperative-learning-in-clil-contexts-ways-to-improve-students-competences-in-the-foreign-language-classroom/
Consejería de Educación de la Junta de Andalucía (2005). Plan de Fomento del Plurilingüismo [Plan to Promote Plurilingualism]. Seville: Junta de Andalucía. Retrieved from http://www.juntadeandalucia.es/averroes/plurilinguismo/
Coonan, C. M. (2012). Affect and Motivation in CLIL. In D. Marsh and O. Meyer (Eds.), Quality Interfaces: Examining Evidence & Exploring Solutions in CLIL (pp. 52-659). Eichstätt: Eichstätt Academic Press.
REMIE – Multidisciplinary Journal of Educational Research, 5(2) 161
Council of Europe. (2001). Common European Framework of Reference for Languages: Learning, Teaching, and Assessment. Cambridge: Cambridge University Press.
Coyle, D., Hood, P., & Marsh, D. (2010). CLIL Content and Language Learning. Cambridge: Cambridge University Press.
Dalton-Puffer, D., Nikula, T., & Smit, U. (2010). Language Use and Language Learning in CLIL: Current Findings and Contentious Issues. In C. Dalton-Puffer, T. Nikula & U. Smit (Eds.), Language Use and Language Learning in CLIL (pp. 279-291). Amsterdan: John Benjamins.
Dalton-Puffer, C., Llinares, A., Lorenzo, F., & Nikula, T. (2014). You Can Stand Under My Umbrella: Immersion, CLIL and Bilingual Education. A Response to Cenoz, Genesee and Gorter (2013). Applied Linguistics, 35(2), 213-218. doi:10.1093/applin/amu010
Dillenbourg, P., Baker, M., Blaye, A., & O’Malley, C. (1996). The Evolution of Research on Collaborative Learning. In E. Spada & P. Reiman (Eds.), Learning in Humans and Machine: Towards an Interdisciplinary Learning Science (pp. 189–211). Oxford: Elsevier.
Dörnyei, Z. (1997). Psychological Processes in Cooperative Language Learning: Group Dynamics and Motivation. The Modern Language Journal, 81(4), 482-493. doi:10.1111/j.1540-4781.1997.tb05515.x
Escobar, C., & Sánchez, A. (2009). Language Learning Through Tasks in a Content and Language Learning (CLIL) Science Classroom. Porta Linguarum, 11, 65-83.
Estaire, S., & Zanon, J. (1994). Planning Classwork: a Task-based Approach. England: Heinemann.
Eurydice. (2006). Content and Language Learning (CLIL) at School in Europe. Brussels: European Commission.
Gillies, R. (2007). Cooperative Learning: Integrating Theory and Practice. Los Angeles, CA: Sage.
de Graaf, R., Koopman, G.J., Anikina, Y. & Westhoff, G. (2007). An Observation Tool for Effective L2 Pedagogy in Content and Language Integrated Learning (CLIL). The International Journal of Bilingual Education and Bilingualism, 10(5), 603–624.
Guazzieri, A.V. (2008). Oral Interaction in CLIL Student-led Cooperative Group Work. In C.M. Coonan (Ed.), CLIL e l’Appredimento delle
162 Ramos & Pavón – Developing Cooperative Learning & CLIL
Lingue. Le Sfide del Nuovo Ambiente di Apprendimento (pp. 79-1039. Venezia: University Ca’ Foscari, Venezia.
Heras, A., & Lasagabaster, D. (2015). The Impact of CLIL on Affective Factors and Vocabulary Learning. Language Teaching Research, 19(1), 70-88. doi:10.1177/1362168814541736
Johnson, D. W., & Johnson, R.T. (1989). Cooperation and competition: Theory and research. Edina, MN: Interaction Book Co.
Kagan, S. (1985). Cooperative Learning. Resources for Teachers. Riverside, CA: University of California.
Kagan, S. (1995). We Can talk: Cooperative Learning in the Elementary ESL Classroom. Washington, DC: ERIC Clearinghouse on Languages and Linguistics.
Kozar, O. (2010). Towards Better Group Work: Seeing the Difference between Cooperation and Collaboration. English Teaching Forum, 2, 16-23.
Long, M., & Porter, P. (1985). Group Work, Interlanguage Talk, and Second Language Acquisition. TESOL Quarterly, 19, 207-28. doi:10.2307/3586827
Markham, T. (2011). Project Based Learning. Teacher Librarian, 39(2), 38-42.
McCafferty, S. G., Jacobs, G. M., & Iddings, A. C. (2006). Cooperative Learning and Second Language Teaching. Cambridge: Cambridge University Press.
McInnerney, J. M., & Roberts, T. S. (2004). Collaborative or Cooperative Learning? In T.S. Roberts (Ed.), Online Collaborative Learning: Theory and Practice (pp. 203-14). Hershey, PA: Information Science Publishing.
McWhaw, K., Schnackenberg, H., Schlater, J., & Abrami P. C. (2003). From Cooperation to Collaboration: Helping Students Become Collaborative Learners”. In R. Gillies, A. Ashman, (Eds.), The Social and Intellectual Outcomes of Learning in Groups (pp. 69-86). London: Routledge Falmer.
Marsh, D. (2013). The CLIL Trajectory: Educational Innovation for the 21th Century iGeneration. Córdoba: University of Cordoba Academic Press.
Meyer, O. (2010). Towards Quality-CLIL: Successful Planning and Teaching Strategies. Puls, 33, 11-29.

REMIE – Multidisciplinary Journal of Educational Research, 5(2) 163
Navés, T., & Muñoz, C. (2000). Usar las lenguas para aprender y aprender a usar las lenguas extranjeras. Una introducción al AICLE para madres, padres y jóvenes. In D. Marsh & G. Langé (Eds.), Using Languages to Learn and Learning to Use Language (pp. 1-16). Jyväskylá: UniCOM, University of Jyväskylä on behalf of TIE-CLIL. Part 3.
Pastor, M. R. (2011). CLIL and Cooperative Learning. Encuentro, 20, 109-118.
Pavón, V., & Ellison, M. (2013). Examining Teacher Roles and Competences in Content and Language Learning (CLIL). Linguarum Arena, 4, 65-78.
Pavón, V., Ávila, F. J., Espejo, R., & Gallego, A. (2014). Strategic and Organisational Decisions in Planning CLIL: a Study on the Collaboration Between Content and Language Teachers. International Journal of Bilingual Education and. Bilingualism, advance access. doi:10.1080/13670050.2014.909774
Pavón, V., Prieto, M., & Ávila, J. (2015). Perceptions of Teachers and Students of the Promotion of Interaction and Cooperative Learning Through Task-based Activities in CLIL. Porta Linguarum, 23, 75-91.
Pena, C., & Porto, M.D. (2007). Teacher Beliefs in a CLIL Education Project. Porta Linguarum, 10, 151-161.
Pérez-Cañado, M. L. (2014). Teacher Training Needs for Bilingual Education: In-service Teacher Perceptions, International Journal of Bilingual Education and Bilingualism, advance access. doi:10.1080/13670050.2014.980778
Pica, T., Lincoln-Porter, F., Paninos, D., & Linell, J. (1996). Language Learners Interaction: How Does it Address the Input, Output, and Feed-back Needs of L2 Learners. TESOL Quaterly, 30(1), 59 – 84. doi:10.2307/3587607
Poisel, E. (2012). Competence Development Through Task-based Learning. In D. Marsh & O. Meyer (Eds.), Quality Interfaces: Examining Evidence & Exploring Solutions in CLIL (pp. 251-263). Eichstätt: Eichstätt Academic Press.
Roberts, T. S., & McInnerney, J. M. (2007). Seven Problems of Online Group Learning (and Their Solutions). Educational Technology & Society, 10(4), 257-268.

164 Ramos & Pavón – Developing Cooperative Learning & CLIL
Roschelle, J., & Teasley, S. (1995). The Construction of Shared Knowledge in Collaborative Problem Solving. In C.E. O´Malley (Ed.), Computer supported collaborative learning (pp. 69-67). Heidelberg: Springer-Verlag.
Segovia, I., Lupiáñez, J. L., Molina, M., González, F., Miñán, A., & Real, I. (2010). The Conception and Role of Interdisciplinarity in the Spanish Education System. Issues in Integrative Studies, 28, 138-69.
Seliger, H. W., & Shohamy, E. (1989). Second Language Research Methods. Oxford: Oxford University Press.
Skehan, P. (1998). Task-based Instruction. Cambridge: Cambridge University Press.
Slavin, R. E. (1995). Cooperative Learning: Theory, Research, and Practice. 2nd ed. Boston: Allyn and Bacon.
Smith, K. A. (1995). Cooperative Learning: Effective Teamwork for Engineering Classrooms. Paper presented at the annual ASEE/IEEE Frontiers in Education Conference, Atlanta. Retrieved from http://fie-conference.org/fie95/2b5/2b54/2b54.htm
Willis, J. (1996). A Theoretical Framework for Task-Based Learning. Harlow: Longman.
Willis, J., & Willis, D. (1996). Challenge and Change in Language Teaching. Oxford: Heinemann.
Willis, J., & Willis, D. (2007). Doing Task-based Teaching. Oxford: Oxford University Press.
María del Carmen Ramos Ordóñez is a Primary education teacher at the Manuel Siurot Primary School and a doctorate student at the University of Cordoba. Víctor Pavón Vázquez is Senior Lecturer and Coordinator of the Bilingual Programme at the University of Cordoba. Contact Address: Víctor Pavón Vázquez. Department of English and German Philology. Faculty of Humanities. University of Córdoba. Plaza del Cardenal Salazar, 3, 14071, Córdoba, Spain. Email: [email protected]
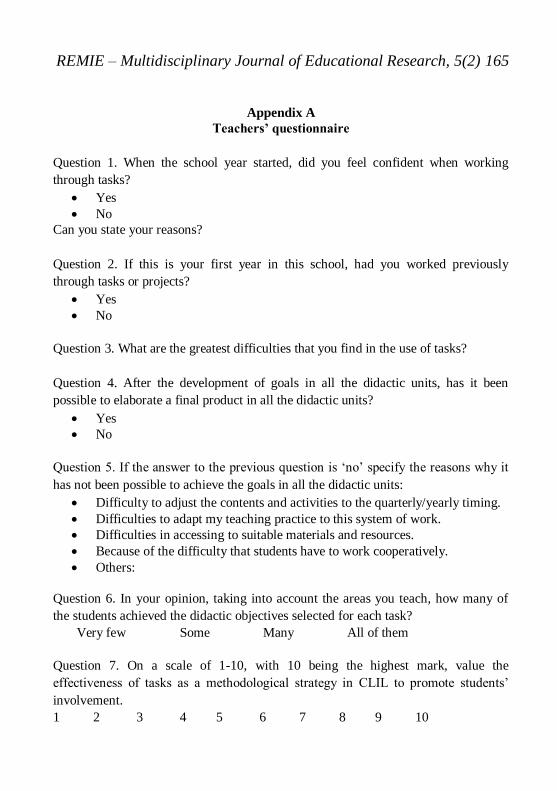
REMIE – Multidisciplinary Journal of Educational Research, 5(2) 165
Appendix A Teachers’ questionnaire
Question 1. When the school year started, did you feel confident when working through tasks?
Yes No
Can you state your reasons? Question 2. If this is your first year in this school, had you worked previously through tasks or projects?
Yes No
Question 3. What are the greatest difficulties that you find in the use of tasks? Question 4. After the development of goals in all the didactic units, has it been possible to elaborate a final product in all the didactic units?
Yes No
Question 5. If the answer to the previous question is ‘no’ specify the reasons why it
has not been possible to achieve the goals in all the didactic units: Difficulty to adjust the contents and activities to the quarterly/yearly timing. Difficulties to adapt my teaching practice to this system of work. Difficulties in accessing to suitable materials and resources. Because of the difficulty that students have to work cooperatively. Others:
Question 6. In your opinion, taking into account the areas you teach, how many of the students achieved the didactic objectives selected for each task? Very few Some Many All of them Question 7. On a scale of 1-10, with 10 being the highest mark, value the effectiveness of tasks as a methodological strategy in CLIL to promote students’
involvement. 1 2 3 4 5 6 7 8 9 10
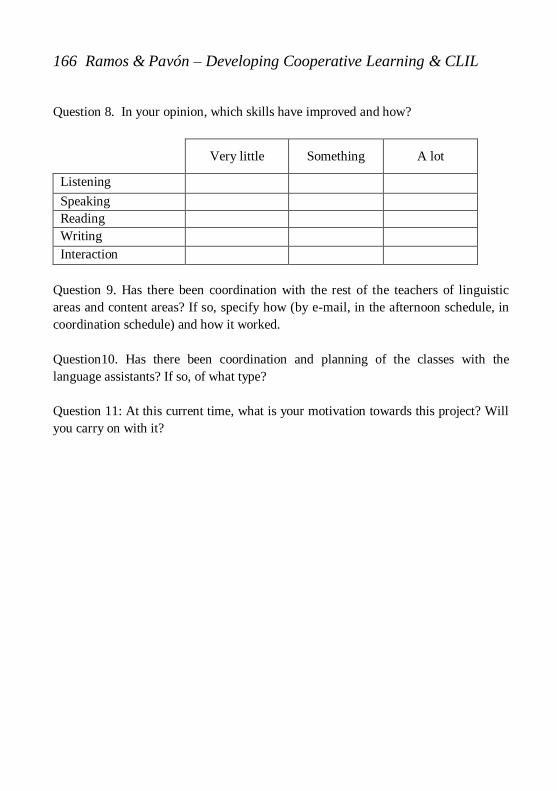
166 Ramos & Pavón – Developing Cooperative Learning & CLIL
Question 8. In your opinion, which skills have improved and how?
Very little Something A lot
Listening
Speaking Reading Writing Interaction
Question 9. Has there been coordination with the rest of the teachers of linguistic areas and content areas? If so, specify how (by e-mail, in the afternoon schedule, in coordination schedule) and how it worked. Question10. Has there been coordination and planning of the classes with the language assistants? If so, of what type? Question 11: At this current time, what is your motivation towards this project? Will you carry on with it?
Instructions for authors, subscriptions and further details:
http://remie.hipatiapress.com “Since Feeling is First”: Exploring the Affective Dimension of
Teacher Licensure Exams Emery Petchauer1, Kira J. Baker-Doyle2, Lynnette Mawhinney3, Brian Ciarkowski4 1) Oakland University. United States 2) Arcadia University. United States 3) The College of New Jersey. United States 4) Bloomfield Hills School District. United States Date of publication: June 15th, 2015 Edition period: June 2015 – October 2015
To cite this article: Petchauer, E., Baker-Doyle, K. J., Mawhinney, L., & CIarkowski, B. (2015). “Since Feeling is First”: Exploring the Affective
Dimension of Teacher Licensure Exams. Multidisciplinary Journal of Educational Research, 5(2), 167-195. doi:10.17583/remie.2015.1495 To link this article: http://doi.org/10.17583/remie.2015.1495
PLEASE SCROLL DOWN FOR ARTICLE
The terms and conditions of use are related to the Open Journal System and
to Creative Commons Attribution License (CC-BY).

REMIE – Multidisciplinary Journal of Educational Research Vol. 5 No. 2 June 2015 pp. 167-195
2015 Hipatia Press ISSN: 2014-2862 DOI: 10.17583/remie.2015.1495
“Since Feeling is First”: Exploring the Affective Dimension of Teacher Licensure Exams Emery Petchauer Oakland University
Kira J. Baker-Doyle Arcadia University
Lynnette Mawhinney The College of New Jersey
Brian Ciarkowski Bloomfield Hills School District
Abstract
Teacher licensure exams directly shape the racial demographics of the teaching profession. This is particularly the case for “basic skills” exams that are program
entrance requirements in the United States and expanding into other countries. This qualitative study explored an important yet overlooked dimension of these exams for test takers: emotional and affective states. Specifically, we were interested in the affective dimension of the test-taking event. Our findings reveal a number of positive and negative affective states that both African American and White preservice teachers experience during the exam and the processes of appraisal that produce these states. Our findings also highlight the importance of preparation activities prior to the exam to help alleviate negative affective states during the exam.
Keywords: licensure, certification, testing, race, affect, emotion, teacher education
REMIE – Multidisciplinary Journal of Educational Research Vol. 5 No. 2 June 2015 pp. 167-195
2015 Hipatia Press ISSN: 2014-2862 DOI: 10.17583/remie.2015.1495
“Porque Sentir es lo Primero”: Explorando la Dimensión Afectiva de los Exámenes de Licencia para Profesorado Emery Petchauer Oakland University
Kira J. Baker-Doyle Arcadia University
Lynnette Mawhinney The College of New Jersey
Brian Ciarkowski Bloomfield Hills School District
Resumen
Los exámenes de licencia para profesorado dan forma de manera directa a la demografía racial de la profesión docente. Éste es particularmente el caso de los exámenes de "habilidades básicas", que son requisitos de ingreso al programa en Estados Unidos y que están expandiéndose a otros países. Este estudio cualitativo exploró una dimensión importante pero poco explorada por los examinadores: los estados emocionales y afectivos. En concreto, nos interesamos por la dimensión afectiva del evento de realización de la prueba. Nuestros resultados revelan una serie de estados afectivos positivos y negativos experimentados tanto por los futuros profesores afroamericanos y blancos durante el examen, así como los procesos de evaluación que producen estos estados. Nuestros resultados también ponen de relieve la importancia de las actividades de preparación antes del examen para ayudar a aliviar los estados afectivos negativos durante el examen.
Palabras clave: licencia, certificación, pruebas, raza, afecto, emoción, formación de profesorado
REMIE –Multidisciplinary Journal of Educational Research, 5(2) 169
since feeling is first
who pays any attention to the syntax of things
-e.e. Cummings
tandardized examinations are integral components of education systems around the world. Data from these exams are used for a variety of purposes, including ranking countries internationally against one another to deciding which schools get funded or
closed down in the United States; for individual students, standardized examinations are frequently the gatekeepers to tertiary education and other selective educational opportunities (Ravitch, 2014). The gatekeeping function of high-stakes, standardized exams are particularly evident in the preparation of teachers. In test-heavy countries like the United States, standardized tests are both entrance and exit requirements for most teacher education programs (Petchauer, 2012; Wang, Coleman, Coley, & Phelps, 2003) and thus have a tremendous influence on who is permitted to enter the professional pipeline and eventually become a teacher.
In light of this gatekeeping function, licensure exams have been closely studied with regard to their influence on the teacher workforce, with particular attention to racial and ethnic diversity. Large-scale statistics indicate significant pass rates gaps between People of Color and Whites (Angrist & Guryan, 2007; Nettles et al., 2011). Consequently, these exams have functioned to reduce the racial and ethnic diversity of the teaching profession in the United States. In response, researchers have explored preservice teachers’ perspectives on the exam and preparation (Baker-Doyle & Petchauer, in press; Bennett, McWhorter, & Kuykendall, 2006; Graham, 2013) and their social psychological experiences while taking it (Graham, 2013; Petchauer, 2013; 2014; in press) in order to probe deeper than the large-scale statistics on pass rates.
In this article, we explore an unexamined dimension of the licensure exam experience: emotional and affective states. We do so through interview data collected from 40 pre-service teachers in the United States
S
170 Petchauer et al – Since feeling is first
over the course of 3 years, as part of a larger study on this topic. Our findings reveal a number of positive and negative affective states that both African American and White preservice teachers experience during the exam and the processes of appraisal that produce these states. Our findings also highlight the importance of preparation activities prior to the exam to help alleviate negative affective states during the exam.
Background Literature
Anxieties about paper-and-pencil teacher tests and their specific effects on the racial demographics of the profession date back to the 1980s. Many of these concerns were in response to the “testing for competencies”
movement of this era and unfolded in a special issue of the Journal of Teacher Education (1984) as well as other venues (Gifford, 1985; Smith, Miller, & Joy, 1988). Although scholars were most concerned with content area exams and their position as exit criteria for programs, scholars also warned of what might come next: entrance exams to teacher education programs (George, 1985).
Now, basic skills or professional readiness exams developed by third-party private companies are standard tools in the United States for determining whether a prospective teacher can enter an education program (Petchauer, 2012). However, this approach is relatively unique to the United States. Aside from England, the majority of countries in Europe and Asia do not use private, standardized tests to determine teacher education candidacy. Most gatekeeping measures elsewhere are developed and determined by the accrediting institutions (Wang et al., 2003). Thus, in the United States, the role of private companies, questions regarding the fairness and validity of standardized testing schemes, and high stakes aspects of the exams have led to much criticism.
Educational Testing Services (ETS) and Pearson are the two main testing companies that create licensure exams in the United States. Research by ETS illustrates the profound effect that licensure exams have on the racial composition of the teaching profession. Nettles et al. (2011) compared the first-time pass rate of over 77,000 Black and White preservice teachers between 2005 and 2009 on the Praxis basic skills exam

REMIE –Multidisciplinary Journal of Educational Research, 5(2) 171
and found that African American test takers are roughly half as likely to pass the exams on their first attempt compared to their White counterparts. Angrist and Guryan (2007) reported that licensure exams also disproportionately reduce the percentages of Latino/a teachers in the United States.
Scholars have responded to these results in different ways. Gitomer, Brown, and Bonett (2011) found that test takers who struggle on basic skills exams are unlikely to pass subsequent content area exams. Consequently, they concluded that basic skills exams are useful tools to screen out underprepared prospective teachers. Other scholars have challenged the relevance these exams have to measures of teacher quality. Using different approximations of teacher quality, multiple studies have concluded that there is little relationship between basic skills exam scores and teacher quality (Angrist & Guryan, 2008; Goodman, Arbona, & de Raminez, 2008; Memory, Coleman, & Watkins, 2003). In some instances, the predictive validity of licensure exams also varies depending upon racial group (Goldhaber & Hansen, 2010).
In order to probe deeper than these large-scale statistics, scholars have started exploring test takers’ experiences with and perspectives on the
exam, mainly through social psychological frameworks. Studies have found that some African American and Latino/a preservice teachers perceive and experience stereotype threat (Steele & Aronson, 1995) on the exam in coordination with difficulties on the exam, and that they do not believe the exams to be accurate measurements of their abilities (Bennett et al., 2006; Graham, 2013). Petchauer (2013, 2014) explored African American test takers’ experiences with the exam but expanded upon previous work in
theory and design. Reframing the licensure exam as a test event (a guiding concept we give further attention to in the next section), these studies have focused on how test takers experience the comprehensive “event” of the
exam with attention to how it may become a racialized experience. This work has used identity contingencies and situational cues (Steele, Spencer, & Aronson, 2002) to identify what it is in the test event that signals judgments, treatments, or stereotypes to test takers. The findings indicated that the licensure exam can become a racialized experience through interactions with proctors and other test takers that signal negative ideas

172 Petchauer et al – Since feeling is first
about Black test takers’ intelligence, test taking abilities, and character
(Petchauer, 2014). This work also found that specific methods of test administration, such as a race demographic survey prior to the test, can make the test a racialized experience when some test takers are aware of the larger racialized discourse about standardized tests and African Americans (Petchauer, 2013). In this study, we move away from these social psychological lenses and toward affective and emotional experiences with licensure exams.
Theoretical Framework: Toward the Affective
Building upon prior research in this area, we first drew upon Petchauer (2014) to conceptualize teacher licensure exams as a test event.
A testing event includes interactions with proctors, site administrators, and other test takers before and during exams, but like the proverbial “big race” for a runner, it includes a nexus of cognitive and affective
processes beyond the specific skills the test is designed to measure. (p. 127) Petchauer points to processes such as self-regulation (Molden & Dweck,
2006), attribution and causation (Weiner, 1986), appraisal of abilities (Bandura, 1986), tacit theories of intelligence (Dweck, 2006), and various identity threats (Steele, 2010) as components of a test event. Most globally, this framework directed us to look beyond score differences and test takers’
beliefs about the exam and instead look to understand how they experienced the test event.
We were concerned most specifically with the affective dimension of the experience, given the many ways that affective states shape and interact with cognitive processes (see Blanchette & Richards, 2009). Consequently, we drew from some key distinctions and ideas in the field of affective psychology to guide our theoretical framework. We use the term affect as an umbrella category for states that are most often distinguished along a positive-negative binary (Gross & Thompson, 2007; see also Scherer, 1984). These states are stress responses, emotions, moods, and other impulses. Emotions and moods are particularly important to our study, and we use Bower and Forgas’ (2000) framework to distinguished between
REMIE –Multidisciplinary Journal of Educational Research, 5(2) 173
emotions and moods in the following way. An emotion has the property of a reaction; it has “an identifiable cause—a stimulus or antecedent thought, it is usually a spasmodic, intense experience of short duration, and the person is typically well aware of it” (p. 88). For example, one might
consider a student who begins a licensure exam and, seeing its difficult content, suddenly feels anxiety. A mood, however, generally lasts longer and is subtle, among other features (Bower & Forgas, 2000). Here, one might consider a student traveling to the test center to take her licensure exam and feeling calm.
But what counts as an emotion or affective state? Lazarus (1993) argued that we can identify “roughly” fifteen different emotions that can be
classified along a negative-positive division. The negative ones include anger, fright, anxiety, guilt, shame, sadness, envy, jealousy, and disgust. The positive ones include happiness, pride, relief, and love. Lazarus added that emotions such as hope, compassion, and gratitude can also be put in this list. These lists, of course, should not be considered exhaustive, and we should not hold onto the exact terms too tightly. Ekman (1992) helps loosen this grip through the notion of emotion families, highlighting that a particular emotion such as happiness can exist as a similar affective state with variations, intensities, and differences. It might be said that a certain emotion family such as anger has a variety of anger expressions (see Ekman & Friesen, 1978). This helpful division between positive and negative emotions (and affective states more broadly) gave us a useful binary division for data analysis, which we discuss in the following section.
Fredrickson’s (1998) broaden-and-build theory outlines one of the many approaches to understanding how emotions and affective states shape cognitive processes that are important to licensure exams. The central hypothesis of the theory is that “positive emotions broaden the scope of
attention, cognition, and action, widening the array of percepts, thoughts, and actions presently in mind” (Fredrickson & Branigan, 2005; p. 315). This hypothesis stands upon a large body of empirical work that has found positive affect makes people more likely to see the interconnections and relatedness between ideas, elaborate on them, think creatively, access memory, and more (see Isen, 2000). Affect can also be an information source “infused” into a person’s cognition, thus influencing learning,

174 Petchauer et al – Since feeling is first
attention, memory, and other processes (Forgas, 1995). Predictably, negative emotions can have converse effects, narrowing the range of available reactions and options in one’s mind (Fredrickson & Branigan, 2005; p. 315).
With emotions, there is another essential component of the process to consider: appraisal. Roseman and Smith (2001) pinpoint that “emotions are
elicited by evaluations (appraisals) of events and situations” (p. 3). That is,
emotions and affective states to not thrust themselves upon people devoid of context, nor do environments (such as a testing environment) impose emotions upon test takers. Rather, it is how people interpret events with respect to their goals, motives, and beliefs that cause emotions (see Scherer, Schorr & Johnstone, 2001). Returning to the anxious student in the example above: the experience of anxiety is not without context. Upon beginning the exam, he appraises the difficulty of it against his beliefs about his capabilities and his goal to pass the exam in order to become a teacher. Conversely, consider another student taking the exam next to him. She opens the same exam and experiences the emotion of relief because the content seems within her skill range. Her appraisal process leads to a different emotional experience. Both affective states (anxiety and relief) involve goals, motives, and beliefs about their professional need to pass the exam and their abilities to do so.
Overall, these theoretical components directed us to make a division between positive and negative affective states with regards to participants’
experiences in the test event, which we illustrate in the following section. We also paid attention where appropriate to the appraisal processes that led to test takers’ emotional and affective states in order to understand what
brings them about during the test event.
Methods
Participants in this study were 40 preservice teachers attending two institutions in the Northeastern United States. One of these institutions was “Douglass College,” a public institution with a majority African American
enrollment of approximately 2,400 students. The other was “Park University,” a satellite campus of a large, public university with a majority

REMIE –Multidisciplinary Journal of Educational Research, 5(2) 175
White enrollment of approximately 3,000 students. We use pseudonyms for all names throughout this article. Table 1 presents relevant demographic information about our sample. Throughout this article, we use the terms White to refer to participants with European backgrounds and alternate between Black and African American for participants of color because they identified with both terms. Table 1 Participant demographics
Gender 8 Male
32 Female
Race/Ethnicity 31 Black
8 White
1 Latino/a
School 9 Park University
31 Douglass College
Age 38 Age 18-24
1 Age 25-39
1 Age 40+
Participants at both institutions had to pass the basic skills exam before
being admitted into the teacher education major. However, exam preparation was largely centralized at Douglass College and decentralized at Park University. Douglass provided a voluntary preparation “cohort” workshop
that students attended in varying degrees. The cohort was a weekly 75-minute preparation workshop where participants learned about the test

176 Petchauer et al – Since feeling is first
format, worked on sample problems, and strategized about taking the exam. Serving as vicarious models of success, students who had already passed the exam also gave advice and encouragement to students attending the preparation cohort. As a small teacher education program of roughly 50 students, the institution also provided transportation for students to a testing center in order to take the exam. Park University, with a teacher education program of about 70 students, provided no formal support systems for students. The university provided general information about the exam, such as how to register, but students were expected to prepare for it on their own if necessary, which some did. We make note of these different preparation opportunities across institutions and their roles in our findings below.
Data Collection Following previous work on this topic (e.g., Bennett et al., 2006; Graham, 2013; Petchauer, 2014), we selected focus group interviews as our primary tool to understand how participants experienced the test event. We selected a focus group approach since there were many collective experiences associated with the exam across both institutions. These collective experiences included sharing relevant information, preparation and study, waiting together before and after the exam at the test site, and sharing challenges, successes, and advice. Although the test event itself was an individual experience, many of the experiences surrounding it were collective.
We conducted 12 focus group interviews (lasting between 60 and 75 minutes) within a two-week window after participants had taken their Praxis basic skills licensure exam. Students took the exam in both paper-based and computerized formats at a variety of different test centers. Among the questions in these interviews (see Appendix), two question/activities were most critical to our focus on emotion and affective states:
1. What words come to mind when you hear the word “Praxis”? 2. What words describe how you felt while actually taking Praxis?
Following the protocol in Petchauer (2014), we printed each of these questions separately on poster-size posts-its. We read and explained the questions to participants, and then gave them markers to write their

REMIE –Multidisciplinary Journal of Educational Research, 5(2) 177
responses on the post-its. After reassembling the group, we then used the words and phrases on these post-its as starting points to discuss their experiences with the licensure exam. All interviews were recorded and transcribed verbatim, resulting in 193 pages of single-spaced text. Data Analysis We organized the data in Dedoose, a mixed methods platform for data analysis. Data analysis began with two researchers independently, inductively analyzing one transcript from each of the three groups to create an initial list of codes. Following the theoretical framework, these coders paid attention to the feeling and affect words that students listed and the meanings they attached to them through discussion. As a form of check coding (Miles & Huberman, 1994), they then compared results from this initial coding procedure to clarify concepts and make modifications to the coding schema before using this framework to code all data.
After clarification and modifications, the two researchers then applied these coding procedures to the entire corpus of data. They also wrote analytical memos throughout this process, which we refer to below. This process resulted in 91% reliability agreement between the two analysts. We then discussed discrepancies between the coding decisions and came to agreement about each of them. This process satisfied our standard of coder reliability and triangulation for this stage of data analysis.
In order to move toward some more general yet grounded dimensions of the testing experience, we then merged a number of these codes into macro-codes. Guided by our theoretical framework, we called these positive affective states and negative affective states. We also developed a code of mustering up confidence through writing reflective memos. These were instances in which students discussed a positive affective state but by trying to create it during the test event (i.e., muster it up). We saw this as a form of regulation, which is an important cognitive function (Roseman & Smith, 2001), but separate from experiencing a positive affective state. Consequently, we ensured that data in this code did not overlap with data coded as positive affective states. Table 1 illustrates this code-merge process as well as the number of datum in each code, parenthetically noted.

178 Petchauer et al – Since feeling is first
Table 2 Coding process Initial codes Resultant macro-codes Stress, pressure, nervousness (28);
annoyed (3); fear/scary (8); mad/angry (3); upset (2); uncomfortable (9)
Negative affective states (53)
Calm & comfortable (11); confident (15); relief (12); not stressing (2); excited (2); success (1)
Positive affective states (43)
Confidence (4); maintain positive outlook (18); keep goal in mind (4)
Mustering up confidence (26)
Findings
We organize the findings below by three main sections. The first two of these sections deals with positive affective states and negative affective states. Within each of these two sections, we share data to illustrate these affective states and how they are brought about in the test event. The third section focuses on instances in which participants attempted to produce affective states or when they reported disaffected states. Through the findings section we put in italics the words and phrases that students wrote on the discussion scrolls as entry points to discuss their affective experience of the test event, and we maintain any punctuation marks or symbols they added as well. Given the gaps in passing along the lines of race, we also note each speaker’s race/ethnic identification to give a picture of how
distributed these affective states are across race.

REMIE –Multidisciplinary Journal of Educational Research, 5(2) 179
Positive Affective States Interview data suggest a variety of different reasons behind positive affective states among test takers. One of these reasons was seeing material on the exam and appraising that it was within their skill range. This process was oftentimes in light of what students had studied while preparing for the exam. Brandy, a White student at Park University, noted this while discussing why she felt relief: “I was relieved when I found out the test was pretty similar to what I already took and passed. So I tried to stay focused and breathe [laughs]. And then it was over.”
African American test takers also demonstrated this too, as noted by Tamara at Douglass College, who was up-front about her struggles taking the math portion of the exam yet still felt confident at times during it.
I said confident. Even though I didn’t study as hard as I could have,
the stuff that I did study, it came to me during the test. So that kind of piqued my, “Oh, I know one or two things.” So that was good.
Similarly, some students experienced positive affective states not because of an appraised relationship between test material and skills but simply because they had prepared. Justin, an African American student at Douglass, unpacked this: “I was relaxed because I felt like I was prepared, like I studied. My moms, she’s a teacher, so she had this big book I used.”
There were also reasons beyond appraisals of test content, skills, and
preparation that accounted for positive moods and emotions. Some students felt relieved, excited, and happy simply because they were taking the exam that had been talked about and built-up so much by their classmates. At Douglass, Shana and Erin (who are Black and White, respectively) connected this reason to a set of words and phrases they put on the scroll that signaled a positive affective state at different points in the day.
Shana: It’s over!!! Because I was happy that it was over. Stress-free. Yay! This was during the bus ride [to the exam] because it was the
180 Petchauer et al – Since feeling is first
day of the Praxis so I was ready to take the test. Yay! It’s the day of
the test. Erin: At peace because I don’t have to worry about this anymore. I’m taking it now.
One other reason behind positive emotions dealt with the testing center
and the perceived competence of the proctors. Patricia, an African American student at Park University, noted the receptiveness of the proctor at the computerized testing center.
Patricia: I felt positive. I felt welcomed at the computer center where I was at. He explained everything to me. He was really, um, he knew his stuff, you know? He knew his job….He just gave me good
directions. That made me feel welcomed. When I got ready for the next section, he was like, “Do you want to take a break?” You
know, “Do you have to use the bathroom?”….he just knew his stuff. Although these details about the professionalism and consciousness of
the test administrator may seem mundane compared to other data, we saw them as important because some of the identity threats participants experienced through ambiguous or confrontational interactions with proctors in other stages of this study (Petchauer, 2014).
As noted in the Methods section, Douglass College provided a voluntary
preparation workshop for their students that met each semester, though enrolling in the seminar was optional. Some of the positive affective states and appraisals for students at Douglass College were based upon their experiences participating in the workshops. Chrissie, a Black student at Douglass, made some of the benefits clear in the following excerpt.
Chrissie: After the cohort I was really confident….I was excited to
take Praxis so that I could just take it and just get done and over with it and I know what to expect….But just going to the cohort, I just felt so relieved. I’m like, “Wow.” I just really had to sit there and
think, “I know all the techniques, why am I so worried?”
REMIE –Multidisciplinary Journal of Educational Research, 5(2) 181
For Chrissie, the cohort gave her a set of strategies to analyze questions for different parts of the test and identify different question types. She was even “excited.” Additionally, there were benefits related to the simple act of
preparation, as outlined by Bernice, an African American participant at Douglass.
Bernice: Once I got onto the bus I was relieved because everybody was there and just said to myself, “Relax, focus. You went to Praxis cohort, so you prepared, there’s nothing to worry about.” But at the
end I was still nervous because it’s like “Oh my god, it’s a test,” but
I was determined, you know, “I got to do this.” In this instance, it was not any specific, test-related preparation from the
cohort that helped Bernice to experience a positive affective state. Rather, in the moment when she started feeling nervous, she could remind herself that she prepared and self-regulate accordingly.
Negative Affective States Participants experienced negative emotions and affective states for a variety of reasons. Brandy, a White participant at Park University, pointed out a number of different reasons in one concise response.
Brandy: Yeah, I was nervous because it’s been a long time since I
took a standardized test. And I didn’t know how accurate it really
was – if I took the pre-test – how it really stood up to the real test. And I also knew I was going to be a junior this year, so I knew that I HAD to pass this test. And I’m also on a limited budget, so I didn’t
want to have to take it more than once. And then I wanted to, you know – it was over an hour’s drive [to the test center] so I couldn’t
review right before it. So, I guess those are some of the things I was nervous about.
Brandy’s overview of why she was nervous pinpoints five reasons: 1)
unfamiliarity with the format, 2) uncertainty about the alignment between practice test and the actual exam, 3) a pressing need to pass the test for admission into her program and upper-division courses, 4) the financial cost

182 Petchauer et al – Since feeling is first
of (re)taking the test, and 5) limited study time immediately prior to the test. Recalling the role of appraisals in affective states – particularly in context with a person’s goals, motives, and beliefs – there were some key appraisals happening in Brandy’s narration stemming from her goal to become a teacher and beliefs about her abilities with respect to the uncertain test content. These reasons for her nervousness and appraisals were also evident among other participants.
While Brandy spoke about negative affective states surrounding the test
event, other students experienced these states due to the physical dimensions of the testing space and the strict procedures of test administration, such as proctors assigning test takers to seats so that they could not cheat. Jamie, a bi-racial student at Douglass who identifies as both Black and Puerto Rican, spoke to this.
Jamie: I feel as though it’s an uncomfortable situation. It’s one thing
being at school taking it, but then you get there and then they place you where they want you put. So if I find a seat I’m comfortable in,
don’t get too comfortable because they might change you to another
seat by the window, and it’s cold outside, or it’s too hot in the
classroom. So it could be a little uncomfortable. Other students echoed this feeling as well by connecting it to other test
takers in the room waiting to take the exam. Stephanie and Pamela, both White students at Park University, spoke to this point.
Pamela: When we got in there, we – I don’t know if we HAD to – but everyone was silent. Stephanie: Everyone was so nervous. Pamela: I’m not sure if we would have gotten in trouble if we
talked, but no one did. And we just sat there and waited. The physical aspects of the room and procedures organized by proctors
were notable to other test takers in a similar way. Both Lamar and Cameron – in separate interviews, institutions, and test sites – likened the experience to prison.

REMIE –Multidisciplinary Journal of Educational Research, 5(2) 183
Cameron: I feel like it was structured like a prison because there was so much order and everything and the whole time, like, the lady that I had was actually pretty rude. And she was like, the whole time she was just saying like, “You have to be quiet, you have to be quiet.” And you go in and raise your hand and there’s just so much
order and everything. And it just – even in the room, like how neat everything was. And I feel like that made it more stressful. And I know it has to be like that, but that didn’t help the stress when it’s a
high-pressure situation. ______ Lamar: I felt like I was in prison [others agree]. On time out in one of those rooms, which is a very uncomfortable environment. Amade: Or ISS, in school suspension. Lamar: Wooden tables and chairs. I can’t think of the word. Amade: Restricted? Lamar: Yeah, restricted.
Test rooms and prisons are very different from one another. Yet, we
found their mutual selection of the word prison startling not only because of its strong connotative meaning but also because this reference came from different test sites, administrations of the exam, and groups of proctors. Yet, the common experience led them to name it as prison.
Other negative affective states that test takers experienced resided at different level than those discussed so far. These were negative affective states such as nervousness and anxiety that did not appear to be rooted in a clear appraisal or event. We called these “front end” affective states because
participants described them as a more-or-less static disposition toward the exam. Keyon, an African American student at Douglass College, illustrated this most clearly.
Keyon: I just get real intimidated with tests. Like when I sit down to take a test, I feel like the test is thinking, “I own you!”
[Laughter]. That’s how I look at it, “You’re gonna listen to me.
Walk the way I tell you to walk!” That’s how I feel. It’s bad that I
feel that way.
184 Petchauer et al – Since feeling is first
Ruby, also African American and at Douglass College, demonstrated this front-end state while explaining why she put nervous on the scroll: “Well, nervous. I always get nervous with tests. I’m always scared that I’m gonna
not be ready.” Front-end, static negative affective states typically lacked in-depth
explanations and reasons. As in these examples, participants described them succinctly without connecting them to any appraisal of test content or salient quality of the environment. In looking at who was more likely to experience front-end negative affective states, we found that generally it was students who either did not have the opportunity for structured preparation activity or did not take advantage of them.
Participating in structured preparation activities seemed to push students
through negative affective states prior to the actual test event. The following exchange between the Petchauer and Douglass students illustrates this process and their thinking.
Petchauer: I’m interested that so far, nobody put up there anxious or anxiety. Often times when I ask this question, a couple people put anxious….So did you all experience any of those things? Erin: That happened prior to the – that happened like during the cohort, prior to Praxis. So by the time we took the Praxis, we were all anxioused-out. Can’t feel anything. Bernice: Yeah, just get it done. Erin: During the time we were taking the cohort, everybody was saying, “That’s hard, you’re going to have to take it. It’s a hard
test, it’s impossible to pass.” Like that whole period. Petchauer: So when you finally took it – Erin: – It was like, “Okay, I just have to do this. There’s no
escaping this.” Petchauer: Would the rest of you agree? Bernice: Yeah. Petchauer: [To Bernice] What made you not feel that extreme anxiousness? Bernice: I guess just having the cohort, coming in and studying. Wayland: [over Bernice] It was the biggest help out of all.
REMIE –Multidisciplinary Journal of Educational Research, 5(2) 185
Bernice: Yeah, and having somebody that actually passed it talk to you about it.
As this exchange illustrates, it appears that the cohort helped push the
students through their anxiety (particularly for Erin) in the midst of other classmates sharing negative experiences with the test. Students who had already passed the exam also came to the cohort to give advice to attendees, and that vicarious model of success seemed to help as well. Disaffected States and Mustering-Up Confidence While some test takers experienced positive affective states for various reasons, others reported positive affective states of a different sort. These instances at first resembled positive affective states due to the words students used during the interview exercises, but these states were of a different nature upon closer examination. Aisha demonstrated one of these cases. In different parts of her focus group interview, she described her state during the exam as calm and chill. Toward the end of the interview, it became clear the roots of this otherwise positive affective state were much different from other test takers. She spoke about “psyching myself out the
night before.” Petchauer: How was that? Aisha: ‘Cause I was taking the practice ones, I was like getting on
the writing like a 16 out of 38. I was like, “Gosh!” ‘Cause of stuff
like that. Petchauer: So the next morning, why weren’t you sort of nervous? Aisha: ‘Cause I figured I can’t change it once I do it, so there’s no
point. Through this exchange, it became clear that Aisha was calm and chill
during the test event but not because she felt prepared, as other students had reported. Rather, the failure experiences while attempting to prepare the evening before left her with little sense of control about her performance on the exam. Her feeling of calmness in this case seems to be derived from a disaffected state. This disaffected state was different from the negative
186 Petchauer et al – Since feeling is first
affective states, such as nervousness, that some other test takers felt in the midst of unpreparedness.
Some other test takers reported positive affective states, but these were because they tired to produce these states themselves, or as we coded the data, muster them up. Some of these instances involved test takers trying to feel confidence in the midst of uncertainty or nervousness because they knew these negative states would not associate with success. Jasmine shared one specific instance of trying to make herself feel confidence in the midst of nervousness, a negative affective state. She spoke about her state while first starting to take the exam.
I put nervous because everything was riding on it, and I just kept telling myself as I sat there looking at it – not focusing on the test – I’m just saying “you can do it, you can do it, you’re gonna pass,
you’re gonna pass.”
As we discussed in the previous section, nervousness is a negative affective state that some participants experienced, such as Jasmine in this instance. Her nervousness was rooted in the high-stakes nature of the exam. Recognizing her state, she attempted to coach herself into feeling confident, which is different than actually feeling a sense of confidence, for example, from appraising test content to be easy with respect to one’s abilities.
Autumn and Arica reported positive affective states as well but not because they actually experienced them during the test event. Rather, they knew that it would be to their advantage if they were actually to experience these positive affective states.
Autumn: I [put] confident and focused because I know that sometimes when I go into tests, I have to be confident in myself knowing that I know this stuff. So there’s no reason why I shouldn’t be able to
answer the questions accordingly. Arica: And I think brave because you have to feel a certain way when you are taking a test – like know that you can do it. Have faith and believe that you could be able to pass it and you probably will.
In these instances, Autumn and Arica demonstrate an understanding of
the benefits of positive affective states like confidence. However, their

REMIE –Multidisciplinary Journal of Educational Research, 5(2) 187
descriptions lack evidence that they experienced any of these states due to their appraisal of test content and their skills, or some other factor. Their responses point more to the ideal affective states that some test takers desire to have during the exam, rather than what they actually experienced.
Discussion
The results of this study both extend and challenge prior research on this topic. Bennett et al. (2006) found that African American and Latino/a test takers who took advantage of preparation opportunities were less likely to see bias and other barriers in the exam. Our results align with this finding in that, generally, students who took part in preparation activities experienced fewer negative affective states and more positive affective states during the test event. These affective states were not only because students learned skills to use on the exam. Going through preparation activities gave students a resource to lean upon when they experienced nervous or another negative affective state. Additionally, preparation activities gave students opportunities to work through front-end negative affective states before they stepped into the real test event.
In previous stages of our research, we found that some African American test takers experienced stereotype threats and identity contingencies during the test event, primarily through interactions with proctors (Petchauer, 2013, 2014). These kinds of identity threats often produce negative affective states as well (see Steele, 2010). In the findings of this study, we did not find evidence that negative affective states for African American participants were due to similarly racialized experiences in the test event. Instead, these negative affective states for African American (and White) participants were related to self-appraisals about abilities with respect to test difficulty, aspects of the test environment, and the high-pressure nature of the exam. As with the findings of Graham (2013), our results identify that there is an array of experiences during licensure exams for African American test takers, and some of these experiences overlap with those of White test takers.
With regard to Black and White test takers, the results also add texture to the large-scale quantitative studies on race and licensure exams (Gitomer et

188 Petchauer et al – Since feeling is first
al., 2011; Nettles et al., 2011). As helpful as these are, they have a tendency to reinforce existing, overly-simplistic ideas about race and standardized test achievement. The positive and negative affective states among participants were not limited to a specific racial classification. Our results suggest that across racial categories, students have both positive and negative experiences with licensure exams. The reasons for positive and negative experiences can be filtered through the subjective and personal lens of race (Petchauer, 2013, 2014), but the affective experiences are not limited by race.
Our results also highlight valuable points pertaining to our theoretical point of entry. This is especially the case with appraisals and their role alongside affective states. To recall, people appraise events and situations in context with their goals, motives and beliefs; these appraisals then elicit emotions (Roseman & Smith, 2001; Scherer et al., 2001). We saw evidence in our data that preparation activities leading up to Praxis factored into the appraisal process. Practice test and other study activities for exams are usually thought to be valuable because of the knowledge and skills that students can gain from them. This is true. However, it the mere act of preparing can give test takers an experiential resource to draw upon as they appraise events, thus increasing the likelihood that the appraisal (or reappraisal) will result in positive and not negative affective response. It can also push them through more static, negative affective states before they take the exam and have to perform.
Herein lies an important connection to self-efficacy theory (Bandura, 1997), which has been recommended as a relevant dimension of the licensure exam experience (Petchauer, 2012, in press). Physiological and affective states are one source of information from which people develop beliefs about their capabilities in specific domains and tasks (Bandura, 1997). One person might interpret the feeling of nervousness as a sign that she is not prepared for the exam. Another might interpret that same feeling as an indicator that she is excited and ready to perform well. It stands to reason that taking advantage of preparation opportunities before the exam can make students more likely to appraise some physiological and affective states during the actual test event in a manner that has a positive result. One exception to this positive outcome, however, is preparation that gives
REMIE –Multidisciplinary Journal of Educational Research, 5(2) 189
students an initial, significant experience of failure, such as taking a 40-question practice test and getting many questions wrong. Direct experience is consistently a more powerful information source of self-efficacy compared to physiological and affective states (Usher & Pajares, 2008), so reckless preparation may undermine the overall goal of producing positive affective states during the exam.
Implications and Conclusions
The findings of our study hold implications for both practice and future research. For practice, our study underscores the importance of teacher education programs organizing deliberate and structured licensure exam supports for students and centralizing this process. Our sense is that most institutions, as was the case at Park University, leave students to navigate this process alone. Given how our findings pointed to the preparation cohort at Douglass College, we recommend that teacher education programs consider the benefits of preparing their students for licensure exams. These benefits are academic (familiarization with test content and format) but also affective (pushing through nervousness). We encourage teacher education programs to consider the affective benefits of licensure exam supports as well as the academic ones, particularly through ways that are parallel to the requisite curriculum and thus would not add financial burden to students. Given how exam success directly impacts the racial and ethnic diversity of groups admitted into teacher education programs, these efforts ultimately can help increase the diversity of programs and the profession.
For future research, we encourage scholars to give further attention to the affective dimensions of the test event and what might promote more positive affective orientations toward the exam and positive affective states during the test event. Annoyance, nervousness, and other negative emotions are understandable affective stances toward high-stakes exams that cost students money. However, the psychological literature that grounds this study suggests that there are benefits related to performance that follow from positive affective states. Understanding what pushes preservice teachers toward a positive affective exam orientation (e.g., excited rather than nervous) will likely put them in a better position to perform to their

190 Petchauer et al – Since feeling is first
capabilities. Similarly, understanding how students affectively regulate themselves during the test event can have equally positive outcomes.
We also encourage inquiry that is guided by the notion of a test event and its different dimensions. Between views of the licensure exam as an unnecessary obstacle (Bennett et al., 2006) or a useful signal (Gitomer et al., 2011), the test event directs researchers first and foremost to test takers in the social and psychological context of the exam and its numerous layers. Additionally, it pushes scholars to explore much more than test content and questions but the intertwined cognitive and affective mechanisms that play into performance. Licensure exams are a (if not the) critical step of professional matriculation for preservice teachers, and the exams directly shape the racial demographics of the profession as well. This status requires scholars to use a robust heuristic to understand it.
References
Angrist, J. D., & Guryan, J. (2008). Does teacher testing raise teacher quality? Evidence from state certification requirements. Economics of Education Review, 27, 483-503. doi:10.1016/j.econedurev.2007.03.002
Baker-Doyle, K., & Petchauer, E. (in press). Rumor has it: Investigating teacher licensure exam networks. Teacher Education Quarterly.
Bandura, A. (1997). Self-efficacy: The exercise of self control. New York: W. H. Freeman and Company.
Bennett, C. I., McWhorter, L. M., & Kuykendall, J. A. (2006). Will I ever teach? Latino and African American students’ perceptions on
PRAXIS I. American Educational Research Journal, 43, 531-575. doi:10.3102/00028312043003531
Blanchette, I., & Richards, A. (2009). The influence of affect on higher level cognition: A review of research on interpretation, judgment, decision making and reasoning. Cognition and Emotion, 24(4), 561-595. doi:10.1080/02699930903132496
Bower, G. H., & Forgas, J. P. (2000). Affect, memory, and social cognition. In E. Eich, J. F. Kihlstorm, G. H. Bower, J. P. Forgas, & P. M

REMIE –Multidisciplinary Journal of Educational Research, 5(2) 191
Niedenthal (Eds.) Cognition and emotion (pp. 87-168). New York: Oxford University Press.
Dweck, C. S. (2006). Mindset. New York: Random House. Ekman, P. (1992). An argument for basic emotions. Cognition and emotion,
6, 169-200. doi:10.1080/02699939208411068 Ekman, P., & Friensen, W. V. (1978). Facial action coding system: A
teachnique for the measurement of facial movement. Palo Alto, CA: Consulting Psychologist Press.
Forgas, J. P. (1995). Mood and judgment: The Affect Infusion Model (AIM). Psychological Bulletin, 177, 39-66. doi:10.1037/00332909.117.1.39
Fredrickson, B. L., & Branigan, C. (2005). Positive emotions broaden the scope of attention and thought-action repertoires. Cognition and emotion, 19(3), 313-332. doi:10.1080/02699930441000238
Fredrickson, B. L. (1998). What good are positive emotions? Review of general psychology, 2(3), 300-319. doi:10.1037/1089-2680.2.3.300
George, P. (1985). Teacher testing and the historically Black college. Journal of Teacher Education, 36, 54-57. doi:10.1177/002248718503600609
Gifford, B. R. (1985). Teacher competency testing and its effects on minorities: Reflection and recommendations. In E. E. Freeman (Ed.) Educational standards, testing, and access: Proceedings of the 1984 ETS Forth-Fifth Invitational Conference. Princeton, NJ: Educational Testing Service.
Gitomer, D. H., Brown, T. L., & Bonett, J. (2011). Useful signal or unnecessary obstacle? The role of basic skills test in teacher preparation. Journal of Teacher Education, 62(5), 431-445. doi:10.1177/0022487111412785
Goldhaber, D., & Hansen, M. (2010). Race, gender, and teacher testing: How informative a tool is teacher licensure testing? American Educational Research Journal, 47, 218-251. doi:10.3102/0002831209348970
Goodman, G., Arbona, C., & de Ramirez, R. D. (2008). High-stakes, minimum-competency exams: How competent are they for
192 Petchauer et al – Since feeling is first
evaluating teacher competence? Journal of Teacher Education, 59, 24-39. doi:10.1177/0022487107309972
Graham, A. (2013). Black teachers education candidates’ performance on
PRAXIS I: What test results do not tell us. The Negro Education Review, 64, 9-36.
Gross, J. J., & Thompson, R. A. (2007). Conceptual foundations for the field. In J. J. Gross (Ed.), Handbook of emotion regulation (pp. 3-24). New York: Guilford Press.
Isen, A. M. (2000). Positive affect and decision making. In M. Lewis, & J. M. Haviland-Jones (Eds.), Handbook of emotions (2nd ed., pp. 75-94). Hillsdale, NJ: Erlbaum.
Journal of Teacher Education (1984). Testing for Competency [special issue], 35(2).
Lazarus, R. S. (1993). From psychological stress to the emotions: A history of changing outlooks. Annual Review of Psychology, 44(1), 1-21. doi:10.1146/annurev.ps.44.020193.000245
Memory, D. M., C. J. Coleman, & Watkins. S. D. (2003). Possible tradeoffs in raising basic skills cutoff scores for teacher licensure: A study with implications for participation of African Americans in teaching. Journal of Teacher Education 54, 217-227. doi:10.1177/0022487103251746
Miles, M. B., & Huberman, M. A. (1994). Qualitative data analysis, 2nd ed. Thousand Oakes, CA: Sage Publications.
Molden, D. C., & Dweck, C. S. (2006). Finding “meaning” in psychology:
A lay theories approach to self-regulation, social perception, and social development. American Psychologist, 61, 192-203. doi:10.1037/0003-066X.61.3.192
Nettles, M. T., Scatton, L. H., Steinberg, J. H., & Tyler, L. L. (2011). Performance and passing rate differences of African American and White prospective teachers on Praxis examinations. ETS Research Report 11-08. Retrieved August 13, 2011 from http://www.ets.org/Media/Research/pdf/RR-11-08.pdf
Petchauer, E. (2012). Teacher licensure exams and Black teacher candidates: Toward new theory and promising practice. Journal of Negro Education, 81(3), 252-267.
REMIE –Multidisciplinary Journal of Educational Research, 5(2) 193
Petchauer, E. (2013). Passing as white: Race, shame, and success in teacher licensure testing events for Black preservice teachers. Race, Ethnicity, and Education. [Online version] doi:10.1080/13613324.2013.792796
Petchauer, E. (2014). “Slaying ghosts in the room”: Identity contingencies,
teacher licensure testing events, and African American preservice teachers. Teachers College Record, 116(7), 1-40.
Petchauer, E. (in press). Shall we overcome? Self-efficacy, teacher licensure exams, and African American preservice teachers. The New Educator.
Ravitch, D. (2014). Reign of error: The hoax of the privitization movement and the dangers to America’s public schools. New York: Knof.
Roseman, I. J., & Smith, C. A. (2001). Appraisal theory: Overview, assumptions, varieties, controversies. In K. R. Scherer, A. Schorr, & T. Johnstone (Eds.) Appraisal process in emotion: Theory, methods, research (pp. 3-19). New York: Oxford University Press.
Scherer, K. R. (1984). On the nature and function of emotion: A component process approach. In K. R. Scherer & P. Ekman (Eds.) Approaches to emotion (pp. 293-317). Hillsdale, NJ: Lawrence Erlbaum Associates.
Scherer, K. R., Schorr, A., & Johnstone, T. (Eds.) (2001). Appraisal process in emotion: Theory, methods, research. New York: Oxford University Press.
Smith, G. P., Miller, M. C., & Joy, J. (1988). A case study of the impact of performance-based testing on the supply of minority teachers. Journal of Teacher Education, 39, 45-53. doi:10.1177/002248718803900409
Steele, C. M. (2010). Whistling Vivaldi: How stereotypes affect us and what we can do. New York: Norton.
Steele, C. M., & Aronson, J. (1995). Stereotype threat and the intellectual test performance of African Americans. Journal of Personality and Social Psychology, 69, 797-811. doi:10.1037/0022-3514.69.5.797
Steele, C. M., Spencer, S. J., & Aronson, J. (2002). Contending with group image: The psychology of stereotype and social identity threat. In M. P. Zanna (Ed.), Advances in experimental social psychology (Vol. 34, pp. 379-440). San Diego, CA: Academic Press.

194 Petchauer et al – Since feeling is first
Usher, E. L., & Pajares, F. (2008). Sources of self-efficacy in school: Critical review of the literature and future directions. Review of Educational Research, 78, 751-796. doi:10.3102/0034654308321456
Wang, A. H., Coleman, A. B., Coley, R. J., & Phelps, R. P. (2003). Preparing Teachers around the World. Policy Information Report. Princeton: Educational Testing Service Policy Information Center.
Weiner, B. (1986). An attributional theory of emotion and motivation. New York: Springer-Verlag.
Emery Petchauer is an Assistant professor of Urban Education at Oakland University.
Kira J. Baker-Doyle is an Assistant professor at Arcadia University School of Education.
Lynnette Mawhinney is an Associate professor of Urban Education at The College of New Jersey.
Brian Ciarkowski is a Spanish Teacher at Bloomfield Hills High School.
Contact Address: Emery Petchauer. Oakland University 470C Pawley Hall, Rochester, Michigan, 48309 USA Email: [email protected]

REMIE –Multidisciplinary Journal of Educational Research, 5(2) 195
Appendix A Interview questions
1. What are your general feelings about standardized tests? (Probe: what standardized tests have you taken?) 2. Before you took Praxis, how did you predict your performance would be? (i.e., how did you think you would do?). (Probes: On the whole thing? On individual tests?) 3. Scroll exercise 1: What words come to mind when you hear the word “Praxis?”
(This question printed on a scroll size post-it, and students write their responses in marker. Discussing response as a group.) 4. Scroll exercise 2: What words describe how you felt while actually taking Praxis? (Can include before, during, and after the test or at any point during the day). (Same instructions as question 3 above.) 5. At what points during the day were you most uncomfortable (i.e., anxious, nervous, etc.)? At what point were you most confortable (i.e., calm, relaxed, etc.)? 6. Where there any instances when your mood, mindset, or feelings quickly changed? For example, you were feeling or thinking one way, and then something made you feel or think a different way. 7. What do you think about standardized test taking abilities? Do you think some people are naturally good test takers, or can people work hard and become good test takers? 8. Are there any other parts of the Praxis test that you want to bring up or that you think we should talk about? (Open ended portion of interview)
Instructions for authors, subscriptions and further details:
http://remie.hipatiapress.com Understanding Universal Vouchers at Urban Public School Districts in Santiago de Chile: Educational Administrators’
Responses to Choice Jaime Portales1, Julian Vasquez Heilig2 1) Ministry of Education of Chile. Chile 2) California State Sacramento. United States Date of publication: June 15th, 2015 Edition period: June 2015 – October 2015
To cite this article: Portales, J., & Vasquez Heilig, J. (2015). Understanding Universal Vouchers at Urban Public School Districts in Santiago de Chile: Educational Administrators’ Responses to Choice. Multidisciplinary Journal of Educational Research, 5(2), 196-239. doi:10.17583/remie.2015.1461 To link this article: http://doi.org/10.17583/remie.2015.1461
PLEASE SCROLL DOWN FOR ARTICLE
The terms and conditions of use are related to the Open Journal System and
to Creative Commons Attribution License (CC-BY).

REMIE – Multidisciplinary Journal of Educational Research Vol. 5 No. 2 June 2015 pp. 196-239
2015 Hipatia Press ISSN: 2014-2862 DOI: 10.17583/remie.2015.1461
Understanding Universal Vouchers at Urban Public School Districts in Santiago de Chile: Educational Administrators’ Responses to Choice
Jaime Portales Ministry of Education. Chile
Julian Vasquez Heilig California State Sacramento
Abstract
In this study we examine how school leaders in urban districts have responded to the Chilean universal school voucher system. We conducted interviews with public district school officials and principals in Santiago, Chile. We found that school leaders in the wealthy public schools have confronted the market policy by implementing similar cream-skimming measures as private-voucher schools. In comparison, the poorer public-municipal schools are not able to select their students. The respondents in our study elucidated that parent and student choice is limited because specific family and student characteristics (i.e. SES background, test scores), as well as the family/student residence within the city (in a relatively wealthy or poor section of the city) influence the spectrum of opportunities a student will have and the school he/she will enter. As a result, the voucher system introduces educational opportunities for students who have the capital (pecuniary and non-pecuniary) to enable a move from one public school to another within an area, from a public school to private-voucher school within an area, from one district to another, or from a public school within an area to a private school within another district.
Keywords: vouchers, school choice, social justice, poverty, school leaders.

REMIE – Multidisciplinary Journal of Educational Research Vol. 5 No. 2 June 2015 pp. 196-239
2015 Hipatia Press ISSN: 2014-2862 DOI: 10.17583/remie.2015.1461
Entendiendo el Sistema de Vouchers en los Distritos Públicos Urbanos de Santiago de Chile: Respuestas de los Administradores Educacionales al Mercado Educativo
Jaime Portales Ministerio de Educación. Chile
Julian Vasquez Heilig California State Sacramento
Resumen
En este estudio examinamos cómo han respondido los líderes escolares de distritos urbanos al sistema de vouchers universales en Chile. Hemos hecho entrevistas con funcionarios y directores de escuelas públicas en Santiago, Chile. Vemos que los líderes escolares en las escuelas públicas ricas han afrontado la política de mercado con la aplicación de medidas de cream-skimming similares a las de las escuelas privadas. En comparación, las escuelas públicas municipales más pobres no pueden seleccionar a sus estudiantes. Los participantes apuntan a que la elección de padres y estudiantes es limitada porque las características específicas de la familia/estudiante (e.g. nivel socioeconómico, resultados de exámenes), así como la residencia de la familia/estudiante en la ciudad (en un área relativamente rica o pobre) influyen en las oportunidades de un estudiante y en la escuela a la que accederá. Como resultado, el sistema de vouchers genera oportunidades educativas para aquellos estudiantes que tienen el capital (material e inmaterial) que les posibilita un movimiento de una escuela pública a otra en su misma área, de una escuela pública a una escuela privada en su misma área, de un distrito a otro, o de una escuela pública en un distrito a una escuela privada en otro distrito.
Palabras clave: vouchers, elección de escuela, justicia social, pobreza, líderes escolares.

198 Portales & Vasquez Heilig –Understanding Universal Vouchers
he push to extend voucher programs rests on the primary assumption that the programs will spur competition between public and private schools, make them more responsive to families and
students, increase student achievement, and improve effectiveness (Chubb & Moe, 1990; Friedman, 1962; Gallego, 2002, 2004; Peterson, 2009; Sapelli & Vial, 2002). In addition, some researchers (e.g. Ladner & Brouillette, 2000) have pointed out that vouchers will prompt inter-district competition and competition between districts and private schools, as well as create an education market that will improve student success.
Evidence from the Chilean voucher implementation proves instructive for voucher debates in the U.S. and elsewhere due to its immense scale and scope. The system has grown steadily, increasing its enrollment throughout the years to a point where about 93% of all students are now included in the voucher system, with the roughly 7% of remaining students attending private-paid independent schools that do not receive vouchers. Overall, the voucher system has generated an expansion of student enrollment within the private school sector since its creation in 1981 under dictatorial supervision. Since 1990, the voucher system has continued unabated under democratic governments. Particularly, private-voucher enrollment increased from 33% in 1990 to 48% in 2007 in both primary and secondary schools (Larrañaga, Peirano & Falck, 2009a). By 2014, private voucher enrollment has risen to 55% in Chile (Ministry of Education: Research and Statistics Department, 2015).
In parallel, there was an expansion in the number of private-voucher schools from 2,425 in 1990 to 3,343 in 2007 at both primary and secondary levels, especially within urban areas and in cities with more than 100,000 inhabitants (Larrañaga, Peirano & Falck, 2009a). By 2014, this number had increased to 6135 schools (Ministry of Education: Research and Statistics Department, 2015). As a result, vouchers resulted in steep enrollment declines for public schools since first being implemented, and from 1990 onward. In particular, the public schools experienced a decrease in their student enrollment from 59% in 1990 to 45% in 2007. In 2014, public schools represented 36% of student enrollment at the national level (Ministry of Education: Research and Statistics Department, 20151).
T

REMIE –Multidisciplinary Journal of Educational Research, 5(2) 199
In addition, despite the population growth in Chile of about 4 million, the overall number of public schools decreased from 6,000 in 1990 to 5,572 in 2007— mainly at the primary level and within urban areas (Larrañaga, Peirano & Falck, 2009a). In 2014, this number corresponded to 5331 public schools (Ministry of Education: Research and Statistics Department, 2015).
The voucher system, therefore, spurred intense market competition for students amongst Chilean schools, and thus, provides a useful “test case”
for the potential impact of large-scale voucher systems in the U.S. and elsewhere. A number of researchers in the U.S. have, in fact, examined the effects of vouchers on schools over time in Chile and found that such systems have led to few improvements in achievement and increased stratification between schools (Auguste & Valenzuela, 2004; Gauri, 1998; Hsieh & Urquiola, 2004, 2006; McEwan & Carnoy, 2000).
However, there is a shortage of studies to date that examine how voucher systems, either in Chile or the U.S., affect schools and school districts and how school leaders and officials respond to them. Voucher programs are intended to have similar competitive effects on school districts as upon individual schools, spurring competitive market pressures at both levels (Ladner & Brouillette, 2000). As a result, studying the local/district level could provide policymakers in Chile and the U.S. with needed insight into the responses of district and school leaders to voucher programs— a level of analysis that is rarely attended to in debates about market-based school reform.
Main Purpose and Research Questions of this Study In general, studies of voucher effects in Chile have been analyzed either at the national (aggregate) or school (disaggregate) levels, and only a few consider how vouchers affect districts (see, for example, Auguste & Valenzuela, 2004). To date, most voucher studies have focused on a quantitative analyses of the effects of vouchers on student achievement (Bellei, 2009; Bravo, Contreras & Sanhueza, 1999; Gallego, 2002, 2004; McEwan & Carnoy, 2000; Mizala & Romaguera, 2000, 2003; Portales & Vasquez Heilig, 2014; Sapelli & Vial, 2002), between- and within-school stratification and segregation (Elacqua, 2006; Gauri, 1998; Parry, 1996;
200 Portales & Vasquez Heilig –Understanding Universal Vouchers
Valenzuela, Bellei & De los Rios, 2006), or on a combination of both (Auguste & Valenzuela, 2004; Hsieh & Urquiola, 2004, 2006). However, fewer have used the local/municipal level as the unit of analysis (Hsieh & Urquiola, 2004, 2006; Larrañaga, Peirano & Falck, 2009b; Raczynski & Salinas, 2009; Salinas & Raczynski, 2009), and none have qualitatively examined district leaders’ responses to vouchers.
A small number of researchers point out that vouchers have a significant impact on districts in Chile, and even less indicate that vouchers affect different types of districts in distinct ways. For example, when analyzing student enrollment gains and losses over time among public schools at different localities, existing studies (Hsieh & Urquiola, 2004, 2006) show that the flight of students from public to private schools, and between public schools, has not been homogenous across districts. Some local public school systems lost more students than others under vouchers, and some local public school systems gained enrollment because better-off students (of middle-income backgrounds or higher ability) enrolled in their schools.
What currently remains unknown are the specific competitive pressures that district leaders perceive they are facing under vouchers and the resulting organizational and strategic responses they have implemented. Few analyses exist in Chile and elsewhere on the impact of vouchers at the local/municipal level or on how district leaders have responded to market pressures. Thus, the main purpose of this paper is to qualitatively study how Chilean school leaders in urban districts have responded to market pressures under the Chilean school voucher system. Particularly, we analyze and compare the measures undertaken by public school district officials and public school principals at the local level in Santiago de Chile, the Chilean capital city, to retain or attract students to their public schools, as well as to explain why they have either succeeded or failed in achieving this goal in the midst of universal vouchers.
In sum, this study asks the following overarching research questions: 1. How have public district leaders operating schools in Chile and
particularly in Santiago been affected by, and how have they responded to, the pressures of competition for students in the context of extended vouchers?

REMIE –Multidisciplinary Journal of Educational Research, 5(2) 201
1.1 Were public school leaders in Santiago able to attract and maintain students over time responding to the competitive market pressures of vouchers? Or did they lose students?
1.2 What strategies are school leaders employing for attracting and retaining students?
1.3 How do district contexts help explain some of the enrollment gains/losses observed across districts and in different areas or sections of the city?
Market-Based Theory: District Vouchers and School Leader Responses Understanding the impact of vouchers on public school enrollment and how district and school leaders respond to market pressures is a critical issue in Chile because the flight of students from public to private schools has surpassed a national-level tipping point, wherein the number of students attending private-voucher schools is now greater than the number of students attending public schools within the country (Ministry of Education: Research and Statistics Department, 2015).
Additionally, while prior research examined the effects of vouchers on schools in Chile in terms of student achievement or stratification, none have qualitatively examined how local/district administrators have responded to the competition for students. It is clear that public districts play a central role in the functioning of schools in Chile, and “competition” under the voucher
system is theorized to affect not only schools, but also districts and how they function. Thus, a district-level perspective on analyzing school leaders’
responses to vouchers— their strategies and arrangements—is important for three main reasons. First, local districts are important for Chilean public schools because they receive funding from the central government, and, in turn, make funding allocations. Individual schools have little power in deciding issues such as funding and other resource allocation, school closures or consolidations, and the contracting or relocation of teachers within a district. Even in their most decentralized version, when local districts delegate expenditures and contracting decisions to individual schools, they continue to be legally responsible. Thus, the ability of public schools to “compete” with private-voucher schools is significantly shaped by
202 Portales & Vasquez Heilig –Understanding Universal Vouchers
the local government and by the district-level policies and organizational practices implemented.
Second, administrators in local districts have the power to decide many strategic issues that affect school-level enrollment. Administrators are in charge of making investment decisions such as physical plant improvements and transportation ameliorations, and have the responsibility for planning the development of local public schools, both in the mid and long terms. Previous literature suggests that these matters are relevant for attracting enrollment (Gewirtz, Ball & Bowe, 1995; Wylie, 1994, 1995, 1997).
Lastly, districts, through local education offices, help to build and market the reputations of public schools that influence their enrollment paths (Gewirtz, Ball & Bowe, 1995; Lubienski, Gulosino & Weitzel, 2009). When choosing a public school, people not only care about the school’s reputation,
but also about the reputation of the administrating district and the neighborhoods where they are located (Gewirtz, Ball & Bowe, 1995). We consider how local schools’ historical reputations and marketing, public and
private, impact educational options for the few at the expense of the many. Thusly, we seek to understand how the universal Chilean voucher system
elicits responses from public district officials and school leaders in Santiago, Chile, the capital and largest voucher market in the country. We interviewed school leaders from public districts to understand the market context within which they operate, seeking to understand whether within-sector heterogeneity is an important consideration in the midst of universal vouchers.
Methods
Qualitative methods were employed to analyze how public school officials and public school principals have sought to attract and retain students to their schools at two municipal districts in Santiago de Chile. Santiago was chosen due to its status as the national capital city and due to the fact that it is the largest voucher market in Chile. Specifically, we conducted interviews in Spanish with public school officials and public school principals working at two municipal district education offices in Santiago (Las Parcelas and San Antonio2), each located in very different sections or areas of the city.

REMIE –Multidisciplinary Journal of Educational Research, 5(2) 203
Overall, 14 interviews with public school district leaders and officials and public school principals were conducted— seven from each municipal district (see Appendix: Table 8 for more details). Interviewees were recommended by and made available to the research team by the Education Directors (ED) from each municipal district. All interviewees recommended by the EDs agreed to share their thoughts and experiences with us. Interviews lasted between 60 and 90 minutes and took place at the corresponding school or district central office. The interviews were audio recorded for transcription.
The interviews corresponded to semi-structured or part-structured conversations (Hartas, 2010). We developed a list of relevant themes and questions to ask to respondents, while at the same time allowing for new themes and topics to emerge during the meeting. Main topics included: Perception and judgment of public school enrollment gains or losses within the district under vouchers; Consideration of potential factors affecting public school enrollment in the area; Strategies used for attracting and retaining students to public schools, and reasons for using them; Analysis of strengths and weaknesses of strategies employed; Challenges at the district levels for increasing/maintaining enrollment; Supports needed from central government or the district itself to ensure adequate levels of enrollment (see Appendix: Table 7 for more details).
The audio-recorded interviews were transcribed by a graduate student and were then analyzed using the constant comparative method (Patton, 1990). Charmaz (2005) suggested that the flexibility of qualitative comparative analysis empowers researchers to move beyond surface observations, and to delve deeper into phenomena of interest with informants as they arise during the research process. Respondent passages were initially coded by the transcribing graduate student, and could receive multiple codes. We then coded phrases that had meaning in relation to the main topics and purposes of the study.
To triangulate the coding, the faculty members of the research team examined the coding for concurrence. Disagreement was rare due the overlap of the multiple coding strategies. Axial relationships were considered for the development of emerging themes from passages that received singular and multiple codes. The axial relationships were developed

204 Portales & Vasquez Heilig –Understanding Universal Vouchers
to identify consistent emerging themes within the phrase coding. This process was described by Lincoln and Guba (1986) as the "saturation of categories" or the "emergence of regularities," and by Moustakas (1994) as “essence description” (see Appendix: Table 11 for more details). After the
coding process was complete, thematic summaries were written to create the descriptions of participants’ motives and circumstances. These summaries
are presented in the Qualitative Findings section. The matrix of major themes and issues resulted in the identification of
five main themes: 1) District and District Corporation main characteristics; 2) Factors associated with public school enrollment change in the area; 3) Reasons for preferring public or private-voucher schools in the area; 4) Strategies for attracting and retaining students to local public schools; and 5) District position and status within the city. Each of these themes was described and analyzed with the purpose of contrasting and comparing the specific situations that emerged in each of the localities. All these topics and themes helped to build an understanding of district level response to vouchers and private school competition in Santiago de Chile.
For synthesis, informant counts by category were conducted to understand the representativeness of the dominant codes generated in the field interviews. To check the authenticity of the work and to provide the researchers with background and contextual information, qualitative data were compared with field notes, archival materials provided by schools and local media reports in Chile. Also, to moderate the validity threats of description and researcher bias, a graduate student and two faculty members conducted member checks by examining field interviews, reviewing the data, helping to develop the emerging themes and participating in group sessions throughout the research process from transcription to the completed manuscript. Selection of Sample Taking into account the quantitative findings of Portales and Vasquez-Heilig (2014) and how Chilean municipal districts distributed in terms of public school enrollment gains or losses between 2000 and 2009 (see Appendix: Tables 1 and 2), two typologies of extreme to moderate cases of public

REMIE –Multidisciplinary Journal of Educational Research, 5(2) 205
school enrollment change at the local/district level were built, one for the national level (see Appendix: Tables 3 and 5) and another for the Santiago Metro Area (see Appendix: Tables 4 and 6). Each of these typologies is compounded of four categories (‘big loser’, ‘moderate loser’, ‘slight loser’
and ‘retainer’) that are useful for analyzing and comparing local public districts across the country and/or within the Santiago Metro Region.3
We recognized that pure categories are rarely consistent year to year, and that a combination of contiguous quartiles is more representative and accurate. Considering the Santiago Metro Region classification, the first district chosen for analysis was Las Parcelas, which represents a combination of the ‘retainer’ and ‘slight loser’ categories. The second
district selected is San Antonio, which represents a combination of the ‘big
loser’ and ‘moderate loser’ categories. Districts were chosen from a pool of
local/municipal options and were invited to participate in the study. Both districts immediately accepted our invitation to be a part of this research.
The primary criteria for selecting these districts was the degree of public school enrollment change each district had during the period analyzed, thereby choosing two communities within the city of Santiago that have very different levels of public school enrollment change between 2000 and 2009. Las Parcelas has been able to retain— and only slightly lose— enrollment over time (-10.1%, see Appendix: Graph 3 for more details), thereby falling into the “retainer” category of the typology. San Antonio has hugely decreased its enrollment during the period analyzed (-43.7%, see Appendix: Graph 4 for more details) thereby falling into the “big loser” category of the
typology. In addition to the primary criteria, we chose these two districts in
Santiago based on their differing socioeconomic profiles, characteristics and location within the city. Las Parcelas is an urban district located in Northeastern Santiago, the most affluent section of the city. The area has a small percentage of low-income population (4.3%), makes district expenditures on education personnel wages and related fixed costs that do not surpass the total voucher received from the central government (representing 95.7% of the voucher), obtains student achievement results for local public schools above the 75th quartile of 237 points (obtaining 277 points) and has a moderate private voucher penetration of 33.3%. Finally,
206 Portales & Vasquez Heilig –Understanding Universal Vouchers
student achievement results for public schools in Las Parcelas (277 points on average) surpass private-voucher average results in the area (256 points). (For more details, see Appendix: Table 9)
In comparison, San Antonio is an urban district located in Northwestern Santiago, one of the lowest income sections of the city. The area has a medium to high percentage of low-income population (11.6%), makes district expenditures on education personnel wages and related fixed costs that surpass the total voucher received from the central government (118.2%), obtains student achievement results for local public schools below the 25th quartile of 220 points (obtaining 216 points) and has a moderate private voucher penetration of 20%. Finally, student achievement results for public schools in San Antonio (216 points on average) are below private-voucher average results in the area (261 points). (For more details, see Appendix: Table 10).
By choosing these cases we were able to compare how administrators in districts with different SES demographics, mean student achievement results for local public schools, education funds, resources available and locations within the city, but with similar overall population changes, elicit very different organizational responses and strategies for attracting and retaining students to their public schools, and obtain very different enrollment outcomes as a result.4
Findings
Las Parcelas’ Administrative Responses to Vouchers What has Las Parcelas District done in response to competition for students under vouchers? Considering the specific educational context the area confronts, the specific factors that influence its public school enrollment changes over time and the position it occupies within the city, Las Parcelas has responded in particular ways to the task of attracting and retaining students to local public schools. Main characteristics of Las Parcelas´ public school district. One of the main characteristics of Las Parcelas is that it has a decentralized system for
REMIE –Multidisciplinary Journal of Educational Research, 5(2) 207
administrating schools. This implies that many decisions such as the elaboration of the annual budget, expenditures choices and the contracting of teachers are a school level, rather than a district level, responsibility. However, school expenditures accountability and teaching and learning support services remain at the district office. The respondents explained that the decentralization change started in 2000 and gave school principals and their staff the opportunity to manage more independently. In general, public schools in Chile usually depend on budget and expenditures, and on contracting decisions made at the district level. As a result, Las Parcelas represents a novel district within the educational system.
Managerial innovation at Las Parcelas implied various changes for the Municipal District Corporation5 in the area that occurred between 2000 and 2004. First, principals and school staff in the district were trained on managerial and administrative issues and were empowered for making decisions. Second, the district office personnel was reduced and accommodated. Since new District Corporation functions were mainly related to expenditures, supervision and accountability, a small group of accountants were kept and other professionals were discarded. Teaching and learning support services were handed over to an external organization that took responsibility for helping schools with curricular and pedagogical issues. Consequently, the District Corporation Education Director held all responsibility for district curricular issues and was the liaison for outside contractors.
Overall, changes empowered public school principals and their staff to make the bulk of educational decisions. According to respondents, the positive side of the transformation was that it gave more discretionary power and managerial flexibility to school principals and their staff, thereby making the system more efficient and less bureaucratic. However, modifications also implied less coordination between schools and greater isolation of school staff when doing their work. A Las Parcelas principal responded, “Decentralization implied greater school isolation. Sometimes, the predominant model in the district is that each school has to resolve issues on its own.”
Decentralization did not imply a complete reduction of the district office power over schools, but its redefinition. Las Parcelas District Corporation
208 Portales & Vasquez Heilig –Understanding Universal Vouchers
continues to have the power to contract— hire, fire or relocate— public school principals, has assumed stricter school expenditure supervision procedures, and has implemented new academic accountability devices by which schools are periodically measured on math and language student achievement. These district tests are seen as a key element in the new district education structure and function as key inputs for both schools and the district office.
Another mechanism that ensures district power over schools is the implementation of a system of rewards. Las Parcelas District Corporation devolved decision-making power to local public schools; however, it continues to oversee their actions and demand they create specific annual goals in both financial and academic areas. Each school defines these goals at the beginning of each academic year, and if they comply with them by the end of the year, the school staff receives a financial incentive from the District Corporation in addition to their regular wage.
Overall, and despite decentralization to the school level, all these mechanisms guarantee a relevant role for the district office. As one public school principal from the area indicated:
By implementing decentralization, our schools obtained more freedom. However, the District Corporation continuously oversees the pedagogical and expenditure administration we do, and when we need advice or support they give it to us. (Public school principal, Las Parcelas)
Factors Associated with Las Parcelas’ Public School Enrollment Retention and Stability In Las Parcelas, the low percentage of low-income population (4.3%), the sufficiency of the voucher received from the central government for paying education personnel wages and the average student achievement results for local public schools that are above the 75th quartile of the city’s public
school achievement distribution attracts students. As demonstrated by Portales and Vasquez Heilig (2014), these local/district factors intermingle to minimize public school enrollment losses (-10.1%) despite the moderate private-voucher penetration in the area (33%). Considered alone, this

REMIE –Multidisciplinary Journal of Educational Research, 5(2) 209
penetration level should be considered a risk factor associated with moderate to high public school enrollment losses in the area; however, the ideal profile of the community has mitigated public school enrollment losses.
According to public school officials and public school principals interviewed, Las Parcelas is attractive to students due to several factors. First, local public schools have a respected tradition and have built prestige based on the previous generations having studied there. Second, in the last decade they obtained excellent student achievement and academic results— above public and private-voucher schools in general and comparable to private-paid schools in the area. Third, most local public schools have an excellent infrastructure and have recently made large investments in classroom technology. Finally, the district is located in the northeastern section of Santiago, the wealthiest section of the city, and is near the city center.
Considering these general trends and characteristics, most public schools at Las Parcelas have more applicants than spaces available. As a result, most schools in Las Parcelas are able to select their students by applying admission tests, requesting students’ academic records and interviewing
their parents. Following these procedures, they choose their desired candidates from the pool of applicants.6 This overall mechanism strengthens the local public schools reputation in that, by ensuring that only certain students with specific socioeconomic and/or ability backgrounds enter and/or remain studying in the district, the district reputation is ensured. Gewirtz, Ball and Bowe (1995) came across similar findings when analyzing the effects of school choice policies in England. In that case, district reputation is also linked with student intake and/or the ability to attract better able students.
The student application process is highly selective at the secondary level. Here, admission tests, reviews of students’ academic records and parent
interviews openly occur every year. Some secondary public schools in the area not only select students from a pool of applicants, but also demand students to academically perform above a certain level to remain in the school. If students do not perform above certain benchmarks, they are either not promoted from one level to the next, or they are removed from the school. Of note, these additional requirements are not implemented in all

210 Portales & Vasquez Heilig –Understanding Universal Vouchers
secondary schools within the district, as some of them do not require a level of performance as a condition to stay enrolled.
The above description illustrates the heterogeneity that exists between public schools at Las Parcelas. Some schools are more demanding and selective than others, and consequently, some schools tend to obtain better academic results than others. As some respondents point out, these differences occasionally produce rivalries between schools, particularly at the secondary level. Las Parcelas District Corporation demands that all schools meet similar benchmarks, but not all schools use the same selection and promotion criteria. A Las Parcelas public secondary principal stated,
There are secondary schools at Las Parcelas where students are expelled if they do not academically perform above a certain level. We do not discriminate that way, but others do. That is unfair competition within the district.
Despite the differential admission policies implemented by school leaders
across the district, the stellar academic performance of public schools in the area, combined with their historical prestige, benefits all schools belonging to the district.
If you see the trajectory of average student achievement results for local public schools at Las Parcelas you will see an ascending annual trajectory of performance, and I think that ascending trajectory helps attracting students to the district. (Public school principal, Las Parcelas)
This tradition and stamp of approval for good results are sources of
‘capital’ for such schools that have accumulated over time. It is precisely
that ‘accumulated capital,’ in the education market of the city, coupled with the higher level of wealth within the district, which favors public schools in the area. The selectivity of Las Parcelas schools based on test scores and other factors also helps to explain their high-levels of student retention and attraction capacity despite private-voucher penetration and competition. A Las Parcelas central district official stated,

REMIE –Multidisciplinary Journal of Educational Research, 5(2) 211
We are a valuable educational option for many families living both within and outside the district. We provide good education as a district, and that gives us power of attraction.
Is important to note that the market structure may change in incoming
years, since various law and education policy changes have occurred in the country since 2014. One of these changes refer to the fact that all public and private-voucher schools (including all secondary level schools) will no longer be allowed to choose student applicants based on socioeconomic backgrounds and/or academic records beginning in 2016. How these modifications will change Las Parcelas’ retention and attraction capacity and
its student’s intake is an important open question for future research.
Las Parcelas’ strategies for attracting and retaining students. According to respondents, the main strategies Las Parcelas District Corporation has implemented for attracting and retaining students to local public schools are related to the student achievement results they have obtained during the past decade, and the decentralization changes that were implemented which has given greater decision-making power to school level actors— such as selective admissions. A Las Parcelas principal stated, “Due
to good academic results and good school management parents feel that Las Parcelas public schools have a plus as compared to other districts.”
Via selectivity and its neighborhood composition, La Parcelas is ensured an adequate level of student applications and retention each year without the need to focus on aggressive advertisement. However, school leaders in the district still undertake a variety of recruiting efforts. Respondents identified various marketing mechanisms. First, each year public school principals visit other public schools in the district for promotional purposes. For secondary school principals this promotion consists of visiting primary schools in the area and talking directly to parents. In comparison, primary school principals visit public day care centers in the area and deliver promotional flyers.
Another recruiting mechanism that is utilized by Las Parcelas is public school alliances. Many of the secondary public schools have created networks of collaboration with primary public schools in the area for sharing teaching and learning initiatives and supporting each other. Such alliances also have the stated purpose to attract student applications. Other recruiting

212 Portales & Vasquez Heilig –Understanding Universal Vouchers
efforts utilized by Las Parcelas for the promotion of its schools are the door-to-door placement of flyers and the display of promotional canvas on local avenues and streets. The Las Parcelas District Corporation Education Director related that this marketing effort tries to reinforce the interest in the district by “advertising the good academic results obtained by our local
public schools.” San Antonio’s Administrative Responses to Vouchers
How have school leaders in the San Antonio District responded to competition for students under vouchers? We first consider the specific economic and educational contexts the area confronts, the specific factors that influence its public school enrollment changes over time and the position it occupies within the city. We then discuss how school leaders in San Antonio have responded to the task of attracting and retaining students to local public schools.
Main characteristics of San Antonio’s public school district. One
of the main characteristics of the San Antonio community is the presence of the district’s action for public schools through multiple means, including
support systems for teaching and learning. These district level actions and interventions in local public schools are part of a deep organizational change that began occurring at the district office in 2007-2008. First, the transformation focused on the elaboration of a school curriculum that identified the main cognitive and attitudinal characteristics that the district wanted to develop in their public school students. This process resulted in the creation of two new departments: Academics and Pedagogy and Human Development.
The purpose of the Academics and Pedagogy department was to give educational planning and pedagogical support to public school teachers through regular supervision, classroom observations and by implementing meetings for the sharing of knowledge and experiences. These instances, which are coordinated by the District Corporation and implemented with the help of outside contractors, allow schools to plan, implement and jointly evaluate their teaching and learning initiatives.
REMIE –Multidisciplinary Journal of Educational Research, 5(2) 213
The purpose of the Human Development department was to promote citizenship values among school level actors and to encourage and strengthen parents and students participation and organization. These purposes involve systematic and permanent work with parents and student organizations, promoting their involvement in school issues and decision-making.
According to respondents, these organizational changes strengthened the district’s capacity to coordinate and support schools and to increase parents
and students commitment with schooling. In addition, the new school curriculum provided school level actors a common language for sharing experiences, and a common core of abilities and values to focus on when educating students. As one San Antonio public school principal proffered,
The new district school curriculum has allowed local public education at San Antonio to have certain common characteristics, and to develop a common stamp and character on local public school students.
Despite the changes, several problems persist in San Antonio such as a chronic budgetary deficit, teacher absenteeism and bullying between students. These difficulties relate to district, school, family and/or neighborhood characteristics that promoted public school enrollment losses (-43.7%) over the past decade.
Factors associated with San Antonio’s public school enrollment
losses. In San Antonio, the relatively high percentage of low-income population for the city (11.6%), the necessity of funds and resources for paying education personnel wages and related fixed costs that surpasses the total voucher received from the central government (representing 118.2% of the voucher), and the average student achievement results for local public schools that are below the 25th quartile of the city’s public school
achievement distribution, constitute relevant factors that are associated with public school enrollment losses in the area. As demonstrated by Portales and Vasquez Heilig (2014), these local/district factors intermingle together to raise public school enrollment losses to a high percentage (-43.7%) despite the fact that only a moderate private-voucher penetration (20%) occurred in the area between 2000 and 2009.

214 Portales & Vasquez Heilig –Understanding Universal Vouchers
Various public school officials and public school principals interviewed at San Antonio say that the expansion of the private-voucher sector in the area has been “brutal” and that public schools were crippled as a result.
What is also clear is that some advantaged students (i.e. those with high test scores, ability to pay beyond voucher) had access to other private and public districts in Santiago. Respondents suggested that parents and students think private-voucher and wealthier public districts tend to be better because they have newer infrastructure and better outward appearance, students seem to have better behavior, and because they can choose the students who enroll or remain at the school. In comparison, local public schools at San Antonio have few resources to model an image, have not been able to invest in their building appearance and have been unable to re-craft the negative perception of their image across the city.
Additionally, public schools in San Antonio have the obligation to receive all students that apply, and only can select them if applicants surpass the number of spaces available. A San Antonio public school principal proffered,
Private-voucher schools can always choose the students that get enrolled, and easily expel those students that cause them problems. We cannot do that. We cannot refuse the enrollment of a student or expel him/her. That occurs only under very specific conditions… As
public schools, we have the obligation to receive all students. According to respondents, there are additional factors that contribute to
increasing the probability of public school enrollment losses at San Antonio. First, the perception of many families that public education in the area suffers from student behavioral problems has contributed to the flight of enrollment. As some respondents indicated, one of the greater problems of public schools at San Antonio relates to student discipline issues such as absenteeism and bullying.
Second, a perception of teachers’ lack of commitment to teaching and relatively high levels of teacher absenteeism has contributed to student flight. This absenteeism is facilitated by a teacher statute that protects public school teachers from being removed or dismissed from their positions without cause. Such regulations are not applicable to private-voucher schools.

REMIE –Multidisciplinary Journal of Educational Research, 5(2) 215
The teacher statute protects public school teachers and pays them full wage under sickness or administrative leave. In comparison, private-voucher teachers do not have those same benefits; they get pay if they have sickness leave but only up to a certain limit. (Public school principal, San Antonio)
Adding to this unfortunate context for public education, structural financing problems are in play in San Antonio. A public school official indicated,
Since we receive the voucher from the central government according to the total public school enrollment and student attendance we have, year by year we end up receiving less and less contributions and resources The problem is that each year we have to cover similar operational and fixed costs, and we increasingly have to attend a more vulnerable population of students. (District Corporation General Director, San Antonio)
Despite this situation, the San Antonio district adjusted its personnel and
promoted the voluntary retirement of teachers; however, these measures were insufficient for solving the budgetary problem.
Considering these general trends and characteristics, most local public schools in San Antonio operated in a disadvantaged position in the market that was hard to overcome; different district, school, family and/or neighborhood characteristics have intermingled to configure a ‘big loser’
scenario. The final result was public school enrollment losses, private-voucher enrollment gains and student flight to wealthier public districts.
San Antonio’s strategies for attracting and retaining students.
Despite these weaknesses, San Antonio’s school leaders believe that they
have some comparative advantages over private-voucher schools in the area. They have sought to develop, strengthen and promote competitive advantages such as the development of a local curriculum created through participatory means and the delivery of systematic support services to students in need within the district.

216 Portales & Vasquez Heilig –Understanding Universal Vouchers
Additionally, beginning in 2007-2008, San Antonio implemented a set of strategies with the purpose of developing and strengthening the district’s
capacity to better communicate its benefits to the public. The schools leaders sought to attract and retain students for local public schools and to increase student attendance and performance. The district also sought to hire innovative public school principals at various school sites. The arrival of these new principals triggered more organizational changes at the school level such as the improvement of school climate and the relationships between students between teachers and students. By improving principal and assistant principals’ leadership positions, empowering teachers and auxiliary
personnel on disciplinary issues, and developing an agreed manual for “good
relationships” at each school site, the hope is that student attraction and retention problem will be ameliorated.
Finally, district capacity was strengthened by developing and implementing multiple extracurricular activities for public school students in the area, including sports and cultural activities, and through the establishment of an agreement with a public university in Santiago that provides access to high-achieving secondary school students studying in the district to concurrently attend university preparatory courses. The agreement allows for students in good standing to later enroll in the partner university when graduating from high school. According to various respondents, private-voucher competitors in the area do not currently offer these opportunities. A San Antonio academic coordinator stated,
Our students have various opportunities private-vouchers students do not have. For example, we have an agreement with a public university in Santiago and currently 20 students are attending university preparatory courses in there.
All these measures were advertised through multiple promotional activities at different public sites across the locality. They reveal the existence of a common district strategy and a concerted effort by San Antonio to confront the loss of public school enrollment in order to actively compete with private-voucher and wealthy public schools in Santiago. According to local and national media, marketing and promotional efforts have apparently produced a positive effect on San Antonio’s public school

REMIE –Multidisciplinary Journal of Educational Research, 5(2) 217
enrollment— which increased for 2013-14 and approximately matched 2009-10 numbers (Muñoz, 2015).
Discussion: Winners and Losers in Santiago’s Stratified Educational Market
Responses from district and schools leaders from Las Parcelas and San Antonio suggest that the success of public schools in an educational market like Santiago is the result of the prestige of the district, economic conditions of the community, management decisions and student outcomes. Each of these factors represents capital in a voucherized education market. These local/district characteristics create different educational positions and status for each of the public districts in this study. On the one hand, the historical prestige, school management style and good academic results of Las Parcelas public schools contribute to create an advantaged, recognized and valuable status for the area. On the other hand, the relatively low student achievement results and various economic and organizational problems of San Antonio public schools contribute to create a perpetually disadvantaged competitive status for the area.
Conclusions Based on the interviews performed in this study, local public school enrollment losses and private school enrollment gains occurred due to a combination of circumstances. Important factors influencing public school enrollment losses and private school gains include the different public images and perceptions each sector has within the country and within the city of Santiago. According to respondents, private schools and wealthy public schools are now perceived as higher in quality and as more desirable than the poorer public schools and districts. This occurs because private schools are able to select which students they enroll, charge additional fees to parents, have newer infrastructure and because they are able to select students based on achievement and behavior. Oversubscribed wealthy public schools are able to mimic many of the student selection practices and investments available to private schools. Further, respondents suggested that
218 Portales & Vasquez Heilig –Understanding Universal Vouchers
wealthy public schools and districts are able to compete for students with private schools in general when school leaders are able to use similar competitive procedures or mechanisms. Las Parcelas represents this behavioral response. In comparison, the poorer public districts, such as San Antonio, are not able to select their students based on achievement or other characteristics, do not charge additional fees to parents, are less able to invest in outward building appearances and cannot reject students with behavioral problems.
In sum, the respondents in this study conveyed that unequal competition between and within public and private schools helps explain public school enrollment losses and private school enrollment gains. School choice supporters posit that the introduction of vouchers will improve the educational opportunities of disadvantaged students (Sugarman, 1999), as well as contribute to their social integration with middle and upper class students. However, under a universal voucher system like the one developed in Chile, a social justice argument appears to fail. In fact, in practice, a universal market system appears to enhance stratification relative to economic conditions in a community, student test scores and behavior. In essence, test scores and good behavior become non-pecuniary capital in the market.
The public Chilean districts studied in this research underscore what previous studies have already underscored quantitatively— that urban stratification and segregation in Chile continues to operate and is escalated by the universal voucher system (Bellei, 2009; Carnoy, 1998; Gauri, 1998; McEwan & Carnoy, 2000; Parry, 1996; Portales & Vasquez Heilig, 2014; Valenzuela, Bellei & De los Rios, 2006). As demonstrated in this study, the Chilean voucher system generates cream-skimming responses within the public school system benefiting select families and students. In particular, parental choice coupled with specific policy arrangements— student selection procedures and/or the charging of additional fees to parents— tend to benefit better-off students or families (only those that demonstrate greater abilities or are able to pay), while disadvantaging students of lower-abilities or lower SES students with low-test scores.
How does this occur within Santiago and its Metro Region? In general, it can be said that the voucher system in the city introduces new educational

REMIE –Multidisciplinary Journal of Educational Research, 5(2) 219
opportunities for students who have the capital (pecuniary and non-pecuniary) to enable a move from one public school to another within an area, from a public school to private-voucher school within an area, from one district to another, or from a public school within an area to a private-voucher school within another district. The respondents in our study further elucidated that parent and student choice is limited because specific family and students characteristics (i.e. SES background, test scores), as well as the family/student residence within the city (in a relatively wealthy or in a relatively poor section of the city) influence the spectrum of opportunities a student will have and the school he/she will finally enter.
Concerning the public school districts considered in this study, the students that enroll at Las Parcelas, if selected, enter a district that offers them not only the credit of previous good mean student achievement results, but also a solid educational system based on rigorous admissions processes and a management style where each public school takes direct responsibility for educating students. In comparison, students attending San Antonio enter a district that not only has a history of exiguous academic results, but also where no rigorous admissions policies exist and where structural and organizational difficulties are magnified in the midst of reforms. These characteristics coupled with the fact that each district is located in a specific section of the city (Northeastern vs. Northwestern Santiago) determine quite different educational opportunities for public school students enrolled in each area. In addition, these attributes determine quite different student access. Where Las Parcelas District mainly provides access to more academically qualified students (students with high test scores who are typically from the middle and upper classes), San Antonio provides access to all students, regardless of their ability levels.
Notably, Chile has recognized the inequity for low-SES students as a problem in their market-based approach system and, in 2008, passed the Preferential Subvention Law (PSL), changing the apportionment of the voucher. Prior to the PSL, the voucher amount was the same for all students. The new law created a larger voucher for high-poverty students. The data in this study are focused on the period prior to the passage of the PSL; therefore, future research is necessary to understand if the newly allotted voucher amounts are enough for the schools (suppliers) to take an interest in
220 Portales & Vasquez Heilig –Understanding Universal Vouchers
the low-SES students (disadvantaged consumers in the market). Thus, a question for future research is whether the newly allotted voucher apportionment is enough to balance the market in favor of low-SES students, particularly for those living in mid- high and high poverty areas and with low standardized test scores, determining whether the PSL has changed the existing pattern of attraction and retention. Finally, the effects of the most recent changes to the law (passed in the 2014 legislation period) and their impacts on parental school choice, student enrollment trends and the capacity of public school districts to retain and attract students to their campuses will need to be considered in future research.
Should a nation focus on competition or equity? Does it matter that a universal voucher system privileges some students over others based on the capital that they bring to the school? Considering the responses of district and school leaders in Chile, policymakers should weigh whether educational reform that has winners and losers tied to financial advantage in a market is the best approach for addressing inequities in education. Notably, Finland has had larger gains over the past two decades and ranks higher in the Trends in International Mathematics and Science Study (TIMSS) than both Chile and the United States. The Finnish attribute this rise to a focus on equity and have pointed out that their international standing on a variety of metrics has, over the past two decades, improved more than neighboring and comparable Sweden, using an education reform approach grounded in market-based choice (Sahlberg, 2011). Thus, an important question for the field and for U.S. educational policymakers is whether the Chilean market-based approach or a Finnish equity-based approach is more appropriate to foment equity and excellence in schools. Additionally, U.S policymakers should consider that unregulated vouchers have been deemed problematic in the Chilean context by the public and policymakers alike. Current educational reform approaches are requiring stronger regulations over public and private-voucher schools to limit further stratification and limits on equity and access that had been further entrenched after decades of privatization.
REMIE –Multidisciplinary Journal of Educational Research, 5(2) 221
Notes
1. In 2014, about 7% of Chilean students attended private-paid independent schools that do not receive vouchers. 2. These names correspond to pseudonyms of real municipal districts analyzed. Denominations have been changed for confidentiality purposes. 3. Portales and Vasquez Heilig (2014) focused on the factors associated with public school enrollment changes between 2000 and 2009 in Chile. Findings from this paper show, for example, that the reduction of birth rate and the decline in children´s population are not associated with changes in student enrollment for the 2000-2009 period. 4. We considered the fact that Las Parcelas and San Antonio both experienced general population decreases as a control (See Tables 9 and 10). If Las Parcelas had a population increase and San Antonio a decrease, then the likely critique would be that that our data could be attributed to changing demographics. By choosing two areas with overall population decreases, the oversubscribed schools in Las Parcelas and student population loss in San Antonio likely cannot be attributed solely to population fluctuations. 5. Chile has two types of municipal or district education offices: Municipal Education Departments and Municipal or District Corporations. The first ones directly depend on the major of the municipality, the latter is administered in a more independent and flexible manner. 6. Some respondents indicated that selection even unofficially occurs at the primary level where it has been legally prohibited since 2009.
References Auguste, S., & Valenzuela, J. P. (2004). Do students benefit from school
competition? The Chilean experience. PhD dissertation, University of Michigan: Ann Arbor, MI.
Bellei, C. (2009). The public-private controversy in Chile. In Chakrabarti, R. & Peterson. P. (eds.), School choice international, exploring public-private partnerships (pp.165- 192). Cambridge, MA: The MIT Press.
Bravo, D., Contreras, D., & Sanhueza, C. (1999). Rendimiento educacional, desigualdad y brecha de desempeño público/privado: Chile 1982’
1997. Departamento de Economía, Universidad de Chile. Carnoy, M. (1998). National Voucher Plans in Chile and Sweden: Did
Privatization Reforms Make for Better Education? Comparative Education Review, 42(3), 309-337.
Charmaz, K. (2005). Grounded theory in the 21st century: A qualitative method for advancing social justice research. In N. K. Denzin & Y. S.

222 Portales & Vasquez Heilig –Understanding Universal Vouchers
Lincoln (Eds.), Handbook of qualitative research (3rd ed., pp. 507-535). Thousand Oaks, CA: Sage.
Chubb, J. E., & Moe, T. M. (1990). Politics, markets, and America’s
schools. Washington DC: The Brookings Institution. Elacqua, G. (2006). Enrollment practices in response to vouchers: Evidence
from Chile. Working paper. Santiago de Chile: Universidad Adolfo Ibañez.
Friedman, M. (1962). Capitalism and freedom. Chicago, IL: Chicago University Press.
Gallego, F. (2002). Competencia y resultados educativos: Teoría y evidencia para Chile. Working paper N 150: Central Bank of Chile.
Gallego, F. (2004). School choice, incentives, and academic outcomes: Evidence for Chile. Working paper: Massachusetts Institute of Technology.
Gauri, V. (1998). School choice in Chile: Two decades of educational reform. Pittsburgh, PA: Pittsburgh University Press.
Gewirtz, S., Ball, S., & Bowe, R. (1995). Markets, choice and equity in education. Philadelphia, PA: Open University Press.
Hartas, D. (2010). Educational research and inquiry: qualitative and quantitative approaches. New York, NY: Continuum International Publishing Group.
Hsieh, C., & Urquiola, M. (2004). When schools compete, how do they compete? An assessment of Chile's nationwide school voucher program. Working Paper No. 10008. Cambridge, MA: National Bureau of Economic Research.
Hsieh, C., & Urquiola, M. (2006). The effects of generalized school choice on achievement and stratification: Evidence from Chile’s voucher
program. Journal of Public Economics, 90, 1477-1503. doi:10.1016/j.jpubeco.2005.11.002
Ladner, M., & Brouillette, M. (2000). The impact of limited school choice on public school districts. Midland, MI: Mackinac Center for Public Policy.
Larrañaga, O., Peirano, C., & Falck, D. (2009a). Una mirada al interior del sector district. In Marcel M. / Raczynski D. (eds.) La asignatura

REMIE –Multidisciplinary Journal of Educational Research, 5(2) 223
pendiente: Claves para la revalidación de la educación pública de gestión local en Chile. Santiago de Chile: Uqbar Editores.
Larrañaga, O., Peirano, C., & Falck, D. (2009b). La gestión de la educación district y si efecto en los resultados de enseñanza. In Marcel M. / Raczynski D. (eds.) La asignatura pendiente: Claves para la revalidación de la educación pública de gestión local en Chile. Santiago de Chile: Uqbar Editores.
Lincoln, Y., & Guba, E. (1986). But is it rigorous? Trustworthiness and authenticity in naturalistic evaluation. In D.D. Williams (Ed.), Naturalistic evaluation (pp. 73-84), New Directions for Program Evaluation. San Francisco, CA: Jossey-Bass.
Lubienski, C., Gulosino, C., & Weitzel, P. (2009). School choice and competitive incentives: Mapping the distribution of educational opportunities across local education markets. American Journal of Education, 115(4), 601- 647.
McEwan, P. J., & Carnoy, M. (2000). The effectiveness and efficiency of private schools in Chile's voucher system. Educational Evaluation and Policy Analysis, 22(3), 213- 239. doi: 10.3102/01623737022003213
Ministry of Education: Research and Statistics Department (2015) National Education Statistics [Data files]. Retrieved from http://centroestudios.mineduc.cl/index.php?t=96&i=2&cc=2036&tm=2
Mizala, A., & Romaguera, P. (2000). School performance and choice: The Chilean experience. Journal of Human Resources, 35(2), 392-417.
Mizala, A., & Romaguera, P. (2003). Equity and educational performance. Working Paper No. 136. Centro de Ecomomía Aplicada, Universidad de Chile.
Moustakas, C. (1994). Phenomenological research methods. Thousand Oaks, CA: Sage Publications.
Muñoz, D. (2015, February 22) La educación municipal sale a buscar alumnos. La Tercera. Retrieved from http://diario.latercera.com/2015/02/22/01/contenido/pais/31-184100-9-la-educacion-municipal-sale-a-buscar-alumnos.shtml

224 Portales & Vasquez Heilig –Understanding Universal Vouchers
Parry, T. R. (1996). Will pursuit of higher quality sacrifice equal opportunity in education? An analysis of the education voucher system in Santiago. Social Science Quarterly, 77(4), 821-841.
Patton, M. Q. (1990). Qualitative evaluation and research methods (2nd ed.). Newbury Park, CA: Sage.
Peterson, P. (2009). Chapter 14: Voucher impacts, differences between public and private schools. In M. Berends, M. G. Springer, D.Ballou, & H. J.Walberg (eds.), Handbook of research on school choice (pp. 249-265). New York, NY: Routledge.
Portales, J. & Vasquez Heilig, J. (2014) Understanding How Universal Vouchers Have Impacted Urban School Districts’ Enrollment in
Chile. Education Policy Analysis Archives, 22(72). doi:10.14507/epaa.v22n72.2014
Raczynski, D., & Salinas, D. (2009). Prioridades, actores y procesos en la gestión district de educación. In M. Marcel & D. Raczynski (eds.), La Asignatura Pendiente: Claves para la revalidación de la educación pública de gestión local en Chile. Santiago: Uqbar Editores.
Sahlberg, P. (2011). Finnish lessons. What can the world learn from educational change in Finland? New York: Teachers College Press.
Salinas, D., & Raczynski, D. (2009). ¿Cómo se hace realmente gestión educativa Municipal? In M. Marcel & D. Raczynski (eds.), La Asignatura Pendiente: Claves para la revalidación de la educación pública de gestión local en Chile. Santiago: Uqbar Editores.
Sapelli, C., & Vial, B. (2002). The performance of private and public schools in the Chilean education system. Cuadernos de Economía, 39(118), 423- 454.
Sugarman, S. (1999). School choice and public funding. In S. Sugarman & F. Kemerer (Eds.) School choice and social controversy: Politics, policy and law (pp ). Washington DC: Brookings Institution.
Valenzuela, J. P., Bellei, C., & De los Ríos, D. (2006). Evolución de la Segregación Socioeconómica de los Estudiantes Chilenos y su relación con el Financiamiento Compartido. FONIDE: Ministerio de Educación de Chile.
Wylie, C. (1994). Self managing schools in New Zealand: the fifth year. Wellington: New Zealand Council for Educational Research.

REMIE –Multidisciplinary Journal of Educational Research, 5(2) 225
Wylie, C. (1995). Contrary currents: the application of the public sector reform framework in education. New Zealand Journal of Educational Studies, 20(2), 149- 164.
Wylie, C. (1997). Self managing schools seven years on: What we have learnt? Wellington, New Zealand: New Zealand Council for Educational Research.
Jaime Portales is Ph.D. in Education Policy from the University of Texas at Austin. He currently works as an educational policy advisor at the Ministry of Education of Chile.
Julian Vasquez Heilig is Ph.D. in Education Administration and Policy Analysis from Stanford University and Professor of Educational Leadership and Policy Studies at California State Sacramento.
Contact Address: Jaime Portales. Alameda 1371, Piso 5. Santiago de Chile, Chile. Email: [email protected]
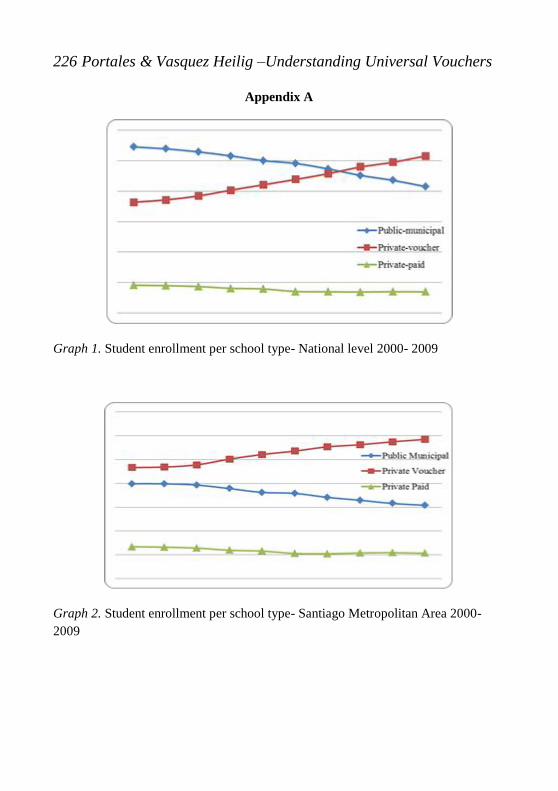
226 Portales & Vasquez Heilig –Understanding Universal Vouchers
Appendix A
Graph 1. Student enrollment per school type- National level 2000- 2009
Graph 2. Student enrollment per school type- Santiago Metropolitan Area 2000- 2009

REMIE –Multidisciplinary Journal of Educational Research, 5(2) 227
Graph 3. Student enrollment per school type (%) - Las Parcelas District 2000- 2009
Graph 4. Student enrollment per school type (%) - San Antonio District 2000- 2009
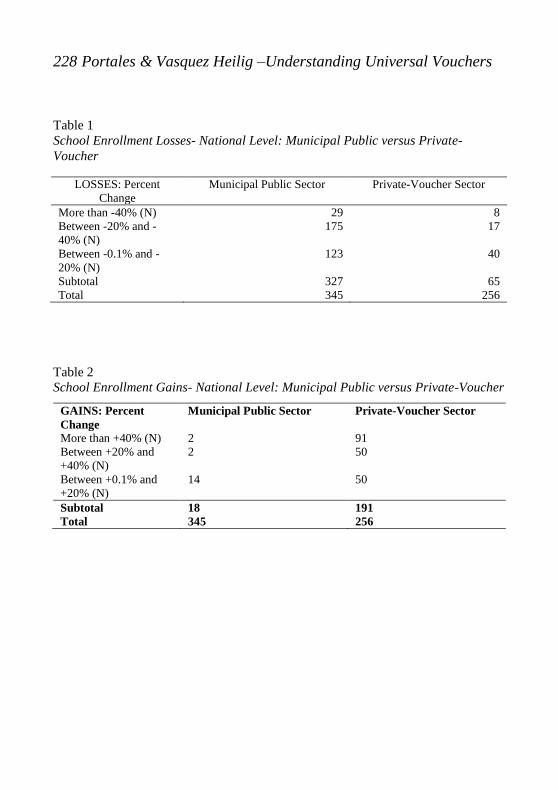
228 Portales & Vasquez Heilig –Understanding Universal Vouchers
Table 1 School Enrollment Losses- National Level: Municipal Public versus Private- Voucher
LOSSES: Percent Change
Municipal Public Sector Private-Voucher Sector
More than -40% (N) 29 8 Between -20% and -40% (N)
175 17
Between -0.1% and -20% (N)
123 40
Subtotal 327 65 Total 345 256
Table 2 School Enrollment Gains- National Level: Municipal Public versus Private-Voucher
GAINS: Percent Change
Municipal Public Sector Private-Voucher Sector
More than +40% (N) 2 91 Between +20% and +40% (N)
2 50
Between +0.1% and +20% (N)
14 50
Subtotal 18 191 Total 345 256

REMIE –Multidisciplinary Journal of Educational Research, 5(2) 229
Table 3 Quartile Distributions of Dependent and Significant Independent Variables of Interest- National level
Quartiles National
level
Public School Enrollment
Change 2000- 2009
(DV)
Poverty Index
CASEN Survey
2009 (IV)
Total District Expenditures on Education
Personnel Expenses over Total Voucher received 2009
(IV)
SIMCE Language
Math Public 2006- 2008
(IV)
Percent Change of Private-voucher Schools
2000- 2009 (IV)
25th -30.55 9.5 100.27 225.26 .01 50th -22.75 15.1 114.10 234.10 20.71 75th -13.51 21.3 131.41 243.15 66.66 N 345 335 335 339 256
Table 4 Quartile Distributions of Dependent and Significant Independent Variables of Interest- Santiago Metropolitan Area
Quartiles Santiago
Metropolitan Area
Public School
Enrollment Change
2000- 2009 (DV)
Poverty Index
CASEN Survey
2009 (IV)
Total District Expenditures on Education
Personnel Expenses over Total Voucher received 2009
(IV)
SIMCE Language
Math Public 2006- 2008
(IV)
Percent Change of Private-voucher Schools
2000- 2009 (IV)
25th -35.97 7.4 118.23 220.33 6.25 50th -25.29 9.4 133.09 226.46 33.33 75th -16.72 13.3 155.40 237.41 88.47 N 52 52 51 52 48
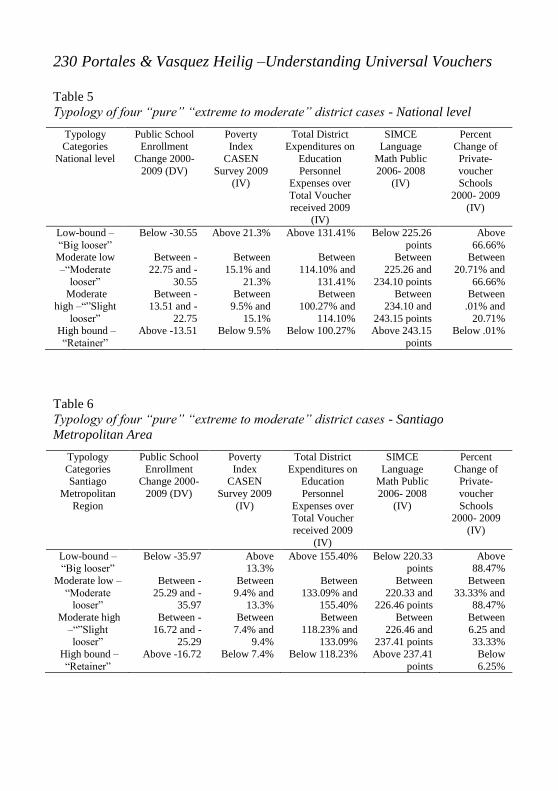
230 Portales & Vasquez Heilig –Understanding Universal Vouchers
Table 5 Typology of four “pure” “extreme to moderate” district cases - National level
Typology Categories
National level
Public School Enrollment
Change 2000- 2009 (DV)
Poverty Index
CASEN Survey 2009
(IV)
Total District Expenditures on
Education Personnel
Expenses over Total Voucher received 2009
(IV)
SIMCE Language
Math Public 2006- 2008
(IV)
Percent Change of Private-voucher Schools
2000- 2009 (IV)
Low-bound –“Big looser”
Below -30.55 Above 21.3% Above 131.41% Below 225.26 points
Above 66.66%
Moderate low –“Moderate
looser”
Between -22.75 and -
30.55
Between 15.1% and
21.3%
Between 114.10% and
131.41%
Between 225.26 and
234.10 points
Between 20.71% and
66.66% Moderate
high –“”Slight
looser”
Between -13.51 and -
22.75
Between 9.5% and
15.1%
Between 100.27% and
114.10%
Between 234.10 and
243.15 points
Between .01% and
20.71% High bound –
“Retainer” Above -13.51 Below 9.5% Below 100.27% Above 243.15
points Below .01%
Table 6 Typology of four “pure” “extreme to moderate” district cases - Santiago Metropolitan Area
Typology Categories Santiago
Metropolitan Region
Public School Enrollment
Change 2000- 2009 (DV)
Poverty Index
CASEN Survey 2009
(IV)
Total District Expenditures on
Education Personnel
Expenses over Total Voucher received 2009
(IV)
SIMCE Language
Math Public 2006- 2008
(IV)
Percent Change of Private-voucher Schools
2000- 2009 (IV)
Low-bound –“Big looser”
Below -35.97 Above 13.3%
Above 155.40% Below 220.33 points
Above 88.47%
Moderate low –“Moderate
looser”
Between -25.29 and -
35.97
Between 9.4% and
13.3%
Between 133.09% and
155.40%
Between 220.33 and
226.46 points
Between 33.33% and
88.47% Moderate high
–“”Slight looser”
Between -16.72 and -
25.29
Between 7.4% and
9.4%
Between 118.23% and
133.09%
Between 226.46 and
237.41 points
Between 6.25 and 33.33%
High bound –“Retainer”
Above -16.72 Below 7.4% Below 118.23% Above 237.41 points
Below 6.25%

REMIE –Multidisciplinary Journal of Educational Research, 5(2) 231
Table 7 Main topics & questions for the qualitative section of the study
Main Topics for Interviews
- Perception and judgment of the public school enrollment issue within the district. - Consideration of potential factors affecting public school enrollment in the area. - Strategies used for attracting/retaining students to public schools, and reasons for
using them. - Analysis of strengths and weaknesses of strategies employed. - Challenges at the district and school levels for increasing/maintaining
enrollment. - Supports needed from central government/the Ministry of Education/the mayor
of the district to ensure adequate levels of enrollment Questions for interviews with public school officials
- What is your perception about the student enrollment of public schools within the district? Has it increase, decrease or maintained during the last decade? Why has this occurred?
- What factors/issues you think explain this decrease, increase or maintenance over time? What are the most important factors that explain this situation? Why?
- Have the district education office in the district designed and implemented any strategies for attracting/retaining students in the last years? Which have been these strategies?
- What have been the purposes of designing and implementing these strategies? Which have been the pursued outcomes?
- Have strategies implemented been successful? Have pursued outcomes been reached? Why or why not? What can be done better for aiming desired results?
- What are the main challenges of the district education office you work in? Is student enrollment a challenge? Why? How would you deal with these challenges?
- Would the district education office need some external supports for pursuing its goals, particularly its enrollment ones? What kinds of supports? From whom?
- What could the central government do to help districts operate local public schools, and to attract/retain students? What could the Ministry of Education and the mayor of the district do to help districts operate local public schools and to attract/retain students?
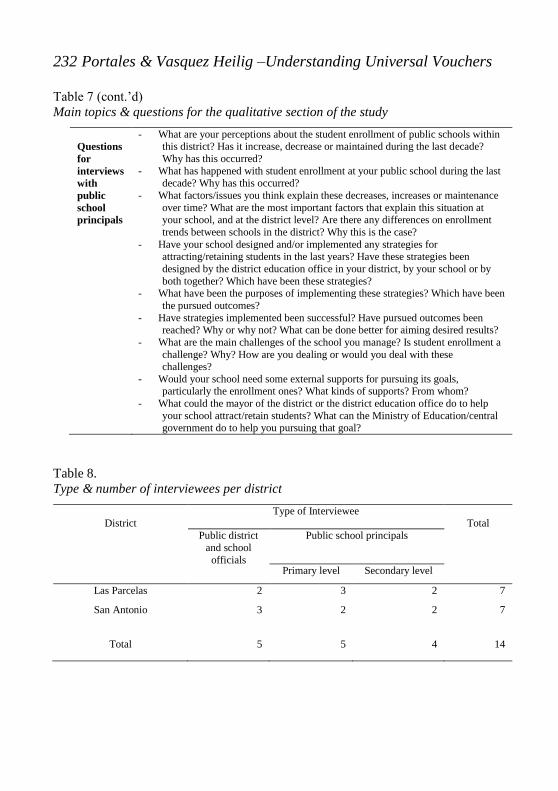
232 Portales & Vasquez Heilig –Understanding Universal Vouchers
Table 7 (cont.’d) Main topics & questions for the qualitative section of the study
Questions for interviews with public school principals
- What are your perceptions about the student enrollment of public schools within this district? Has it increase, decrease or maintained during the last decade? Why has this occurred?
- What has happened with student enrollment at your public school during the last decade? Why has this occurred?
- What factors/issues you think explain these decreases, increases or maintenance over time? What are the most important factors that explain this situation at your school, and at the district level? Are there any differences on enrollment trends between schools in the district? Why this is the case?
- Have your school designed and/or implemented any strategies for attracting/retaining students in the last years? Have these strategies been designed by the district education office in your district, by your school or by both together? Which have been these strategies?
- What have been the purposes of implementing these strategies? Which have been the pursued outcomes?
- Have strategies implemented been successful? Have pursued outcomes been reached? Why or why not? What can be done better for aiming desired results?
- What are the main challenges of the school you manage? Is student enrollment a challenge? Why? How are you dealing or would you deal with these challenges?
- Would your school need some external supports for pursuing its goals, particularly the enrollment ones? What kinds of supports? From whom?
- What could the mayor of the district or the district education office do to help your school attract/retain students? What can the Ministry of Education/central government do to help you pursuing that goal?
Table 8. Type & number of interviewees per district
District
Type of Interviewee Total
Public district and school
officials
Public school principals
Primary level Secondary level
Las Parcelas 2 3 2 7
San Antonio 3 2 2 7
Total 5 5 4 14

REMIE –Multidisciplinary Journal of Educational Research, 5(2) 233
Table 9 Las Parcelas District profile
Geographic and Demographic Information
Total District Population 2009 2001
149205
175393
Total District Population % Change 2000/2009 -14.93 District Surface kms2 (2011) 16.9
Population Density per km2 (2011) 8720.71 Percent of Urban Population (2009) 100 Percent of Rural Population (2009) 0
Poverty Index % (CASEN Survey 2009) 4.3 Poor Percent (CASEN Survey 2009) 3.93
Indigent Percent (CASEN Survey 2009) .89 Student Vulnerability Index % (IVE SINAE 2009) 63.6
Educational Information
School Enrollment Total Percent
2009 2000 (N) 2009 (N) % Change 2000/2009
Public 33.47 12042 10826 -10.10 Private-voucher 37.93 11473 12270 + 6.95
Private-paid 28.60 12969 9252 -28.66 Total Student
Population 100.00 36484 32384 -11.34
Average Student Achievement Results 4th and 10th Grades
(SIMCE 2006- 2008)
Number of Schools 2000 2009 % Change 2000/2009
Public 277.38 Public 15 17 + 13.33 Private-voucher 256.67 Private-voucher 15 20 + 33.33
Private-paid 287.93 Private-paid 33 24 - 27.27 Student Achievement
Results (SIMCE) Grade Level
2006 2007 2008 Average 2006/2008
Public 4th Grade 259.45 244.00 264.45 255.97 10th Grade 297.64 - 299.93 298.79
Private-voucher 4th Grade 252.81 262.67 265.82 260.43 10th Grade 247.69 - 258.14 252.92
Private-paid 4th Grade 281.52 287.63 289.70 286.29 10th Grade 293.97 - 285.20 289.58

234 Portales & Vasquez Heilig –Understanding Universal Vouchers
Table 9 (cont.’d) Las Parcelas District profile
Total District Revenue and Expenditures (2009) Total District Revenue 19405148
Total District Revenue Per Capita 130.1 Total District Expenditures 20444388
District Education Revenue and Expenditures (2009) Total District Education Revenue 10099216
Revenue Contributions from MINEDUC (Voucher) 7794407 Revenue Contributions MINEDUC % from Total District Education Revenue 77.18
Revenue Contributions from District 560941 District Contributions % to Education from Total District Revenue 2.89
Revenue Contributions District % from Total District Education Revenue 5.55 Total District Expenditures on Public Education 10311065
Total District Expenditures on Public Education Per Student 952.44 Total District Expenditures on District Education Personnel 7460863
Total Expenditures on District Education Personnel Wages and related fixed costs over Total Voucher received
95.72
Total District Expenditures on Teachers 4918200 Teachers Expenditures Percent from Total District Education Personnel Expenditures 65.92
Teacher Expenditures Percent from Total District Education Expenditures 47.70 Operations Expenditures on Public Education 1478015
Operations Expenditures Percent from Total District Education Expenditures 15.55 Investments on Public Education -
Investments Percent from Total District Education Expenditures -
Table 10 San Antonio District profile
Geographic and Demographic Information Total District Population 2009 2001
94744 117395 Total District Population % Change 2000/2009 - 19.29
District Surface kms2 (2011) 6.7 Population Density per km2 (2011) 13.934.93 Percent of Urban Population (2009) 100 Percent of Rural Population (2009) 0
Poverty Index % (CASEN Survey 2009) 11.6 Poor Percent (CASEN Survey 2009) 7.77
Indigent Percent (CASEN Survey 2009) 3.80 Student Vulnerability Index % (IVE SINAE 2009) 73
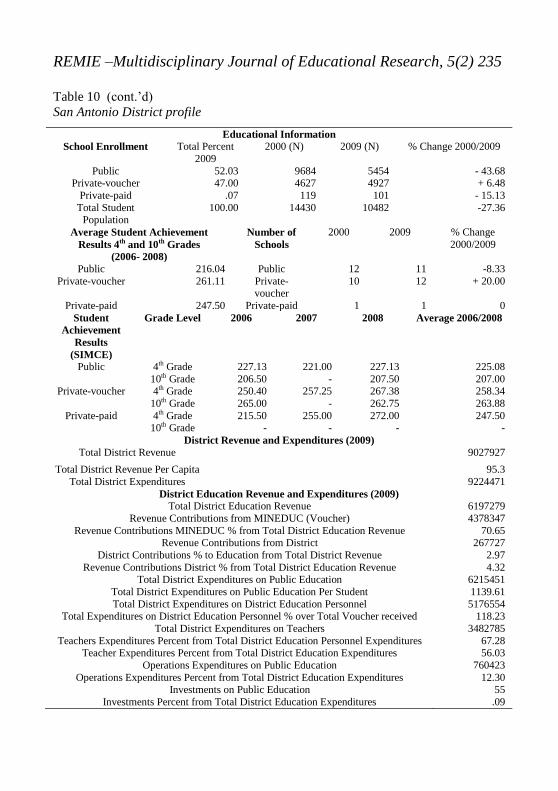
REMIE –Multidisciplinary Journal of Educational Research, 5(2) 235
Table 10 (cont.’d) San Antonio District profile
Educational Information School Enrollment Total Percent
2009 2000 (N) 2009 (N) % Change 2000/2009
Public 52.03 9684 5454 - 43.68 Private-voucher 47.00 4627 4927 + 6.48
Private-paid .07 119 101 - 15.13 Total Student
Population 100.00 14430 10482 -27.36
Average Student Achievement Results 4th and 10th Grades
(2006- 2008)
Number of Schools
2000 2009 % Change 2000/2009
Public 216.04 Public 12 11 -8.33 Private-voucher 261.11 Private-
voucher 10 12 + 20.00
Private-paid 247.50 Private-paid 1 1 0 Student
Achievement Results
(SIMCE)
Grade Level 2006 2007 2008 Average 2006/2008
Public 4th Grade 227.13 221.00 227.13 225.08 10th Grade 206.50 - 207.50 207.00
Private-voucher 4th Grade 250.40 257.25 267.38 258.34 10th Grade 265.00 - 262.75 263.88
Private-paid 4th Grade 215.50 255.00 272.00 247.50 10th Grade - - - -
District Revenue and Expenditures (2009) Total District Revenue 9027927
Total District Revenue Per Capita 95.3 Total District Expenditures 9224471
District Education Revenue and Expenditures (2009) Total District Education Revenue 6197279
Revenue Contributions from MINEDUC (Voucher) 4378347 Revenue Contributions MINEDUC % from Total District Education Revenue 70.65
Revenue Contributions from District 267727 District Contributions % to Education from Total District Revenue 2.97
Revenue Contributions District % from Total District Education Revenue 4.32 Total District Expenditures on Public Education 6215451
Total District Expenditures on Public Education Per Student 1139.61 Total District Expenditures on District Education Personnel 5176554
Total Expenditures on District Education Personnel % over Total Voucher received 118.23 Total District Expenditures on Teachers 3482785
Teachers Expenditures Percent from Total District Education Personnel Expenditures 67.28 Teacher Expenditures Percent from Total District Education Expenditures 56.03
Operations Expenditures on Public Education 760423 Operations Expenditures Percent from Total District Education Expenditures 12.30
Investments on Public Education 55 Investments Percent from Total District Education Expenditures .09

236 Portales & Vasquez Heilig –Understanding Universal Vouchers
Table 11 Matrix of mayor themes and issues emerged from interviews
Main Themes Main Issues on each theme District and District Corporation main characteristics
Las Parcelas
- Has only slightly lose public school enrollment (-10.10%) between 2000 and 2009.
- Located in Northeastern Santiago –the most affluent section of the city.
- Has low poverty level (4.3%). - Good student achievement results for public schools (277 points on
average) that surpass private-voucher average results in the area (256 points).
- Has experienced an expansion of 33% of private-voucher schools. - Has a decentralized system for administrating schools since 2000.
Many decisions are a school level responsibility rather than a district level one.
- Decentralization did not imply a complete reduction of the district office power over schools, but its redefinition.
- Local public schools tend to select their students by applying admission tests, requesting students’ academic records, and
interviewing their parents. - Currently (2011), the district is under a big crisis –of schools
shutdown and students on strike- following a national student movement that spread throughout the country claiming for a better
public education.
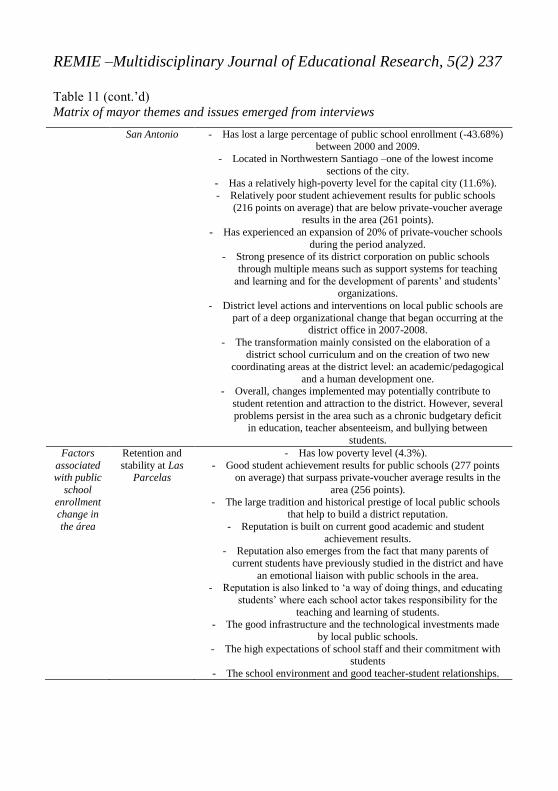
REMIE –Multidisciplinary Journal of Educational Research, 5(2) 237
Table 11 (cont.’d) Matrix of mayor themes and issues emerged from interviews
San Antonio - Has lost a large percentage of public school enrollment (-43.68%) between 2000 and 2009.
- Located in Northwestern Santiago –one of the lowest income sections of the city.
- Has a relatively high-poverty level for the capital city (11.6%). - Relatively poor student achievement results for public schools
(216 points on average) that are below private-voucher average results in the area (261 points).
- Has experienced an expansion of 20% of private-voucher schools during the period analyzed.
- Strong presence of its district corporation on public schools through multiple means such as support systems for teaching
and learning and for the development of parents’ and students’ organizations.
- District level actions and interventions on local public schools are part of a deep organizational change that began occurring at the
district office in 2007-2008. - The transformation mainly consisted on the elaboration of a
district school curriculum and on the creation of two new coordinating areas at the district level: an academic/pedagogical
and a human development one. - Overall, changes implemented may potentially contribute to
student retention and attraction to the district. However, several problems persist in the area such as a chronic budgetary deficit
in education, teacher absenteeism, and bullying between students.
Factors associated with public
school enrollment change in the área
Retention and stability at Las
Parcelas
- Has low poverty level (4.3%). - Good student achievement results for public schools (277 points
on average) that surpass private-voucher average results in the area (256 points).
- The large tradition and historical prestige of local public schools that help to build a district reputation.
- Reputation is built on current good academic and student achievement results.
- Reputation also emerges from the fact that many parents of current students have previously studied in the district and have
an emotional liaison with public schools in the area. - Reputation is also linked to ‘a way of doing things, and educating
students’ where each school actor takes responsibility for the
teaching and learning of students. - The good infrastructure and the technological investments made
by local public schools. - The high expectations of school staff and their commitment with
students - The school environment and good teacher-student relationships.
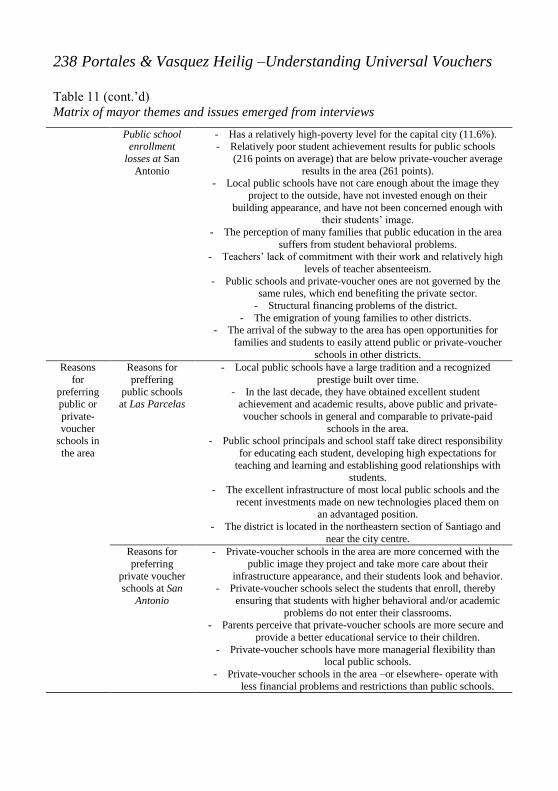
238 Portales & Vasquez Heilig –Understanding Universal Vouchers
Table 11 (cont.’d) Matrix of mayor themes and issues emerged from interviews
Public school enrollment
losses at San Antonio
- Has a relatively high-poverty level for the capital city (11.6%). - Relatively poor student achievement results for public schools
(216 points on average) that are below private-voucher average results in the area (261 points).
- Local public schools have not care enough about the image they project to the outside, have not invested enough on their
building appearance, and have not been concerned enough with their students’ image.
- The perception of many families that public education in the area suffers from student behavioral problems.
- Teachers’ lack of commitment with their work and relatively high
levels of teacher absenteeism. - Public schools and private-voucher ones are not governed by the
same rules, which end benefiting the private sector. - Structural financing problems of the district.
- The emigration of young families to other districts. - The arrival of the subway to the area has open opportunities for
families and students to easily attend public or private-voucher schools in other districts.
Reasons for
preferring public or private-voucher
schools in the area
Reasons for preffering
public schools at Las Parcelas
- Local public schools have a large tradition and a recognized prestige built over time.
- In the last decade, they have obtained excellent student achievement and academic results, above public and private-voucher schools in general and comparable to private-paid
schools in the area. - Public school principals and school staff take direct responsibility
for educating each student, developing high expectations for teaching and learning and establishing good relationships with
students. - The excellent infrastructure of most local public schools and the
recent investments made on new technologies placed them on an advantaged position.
- The district is located in the northeastern section of Santiago and near the city centre.
Reasons for preferring
private voucher schools at San
Antonio
- Private-voucher schools in the area are more concerned with the public image they project and take more care about their
infrastructure appearance, and their students look and behavior. - Private-voucher schools select the students that enroll, thereby
ensuring that students with higher behavioral and/or academic problems do not enter their classrooms.
- Parents perceive that private-voucher schools are more secure and provide a better educational service to their children.
- Private-voucher schools have more managerial flexibility than local public schools.
- Private-voucher schools in the area –or elsewhere- operate with less financial problems and restrictions than public schools.
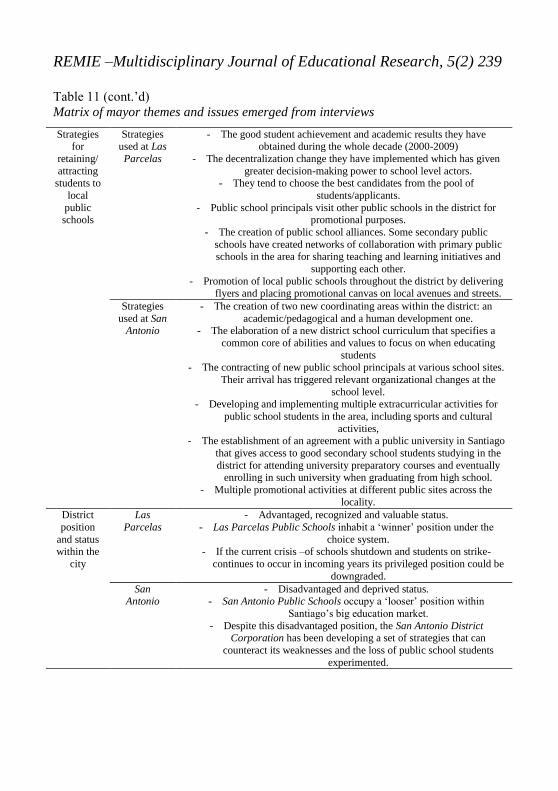
REMIE –Multidisciplinary Journal of Educational Research, 5(2) 239
Table 11 (cont.’d) Matrix of mayor themes and issues emerged from interviews
Strategies for
retaining/ attracting
students to local
public schools
Strategies used at Las Parcelas
- The good student achievement and academic results they have obtained during the whole decade (2000-2009)
- The decentralization change they have implemented which has given greater decision-making power to school level actors.
- They tend to choose the best candidates from the pool of students/applicants.
- Public school principals visit other public schools in the district for promotional purposes.
- The creation of public school alliances. Some secondary public schools have created networks of collaboration with primary public schools in the area for sharing teaching and learning initiatives and
supporting each other. - Promotion of local public schools throughout the district by delivering
flyers and placing promotional canvas on local avenues and streets. Strategies
used at San Antonio
- The creation of two new coordinating areas within the district: an academic/pedagogical and a human development one.
- The elaboration of a new district school curriculum that specifies a common core of abilities and values to focus on when educating
students - The contracting of new public school principals at various school sites.
Their arrival has triggered relevant organizational changes at the school level.
- Developing and implementing multiple extracurricular activities for public school students in the area, including sports and cultural
activities, - The establishment of an agreement with a public university in Santiago
that gives access to good secondary school students studying in the district for attending university preparatory courses and eventually
enrolling in such university when graduating from high school. - Multiple promotional activities at different public sites across the
locality. District position
and status within the
city
Las Parcelas
- Advantaged, recognized and valuable status. - Las Parcelas Public Schools inhabit a ‘winner’ position under the
choice system. - If the current crisis –of schools shutdown and students on strike-
continues to occur in incoming years its privileged position could be downgraded.
San Antonio
- Disadvantaged and deprived status. - San Antonio Public Schools occupy a ‘looser’ position within
Santiago’s big education market. - Despite this disadvantaged position, the San Antonio District
Corporation has been developing a set of strategies that can counteract its weaknesses and the loss of public school students
experimented.

Instructions for authors, subscriptions and further details:
http://remie.hipatiapress.com Cómo triunfan los niños: determinación, curiosidad y el poder del carácter. Teresa Morlà1 1) Universidad de Barcelona. España Fecha de publicación: Junio 15th, 2015 Período de Edición: Junio 2015 – Agosto 2015
To cite this article: Morlà, T. (2015). Cómo triunfan los niños: determinación, curiosidad y el poder del carácter [Review del libro]. Multidisciplinary Journal of Educational Research, 5(2), 240-241. doi:10.17583/remie.2015.1492 To link this article: http://doi.org/10.17583/remie.2015.1492
PLEASE SCROLL DOWN FOR ARTICLE
The terms and conditions of use are related to the Open Journal System and
to Creative Commons Attribution License (CC-BY).

240 Morlà – Cómo triunfan los niños [Book Review]
2015 Hipatia Press ISSN: 2014-2862 DOI: 10.17583/remie.2015.1492
Review Tough, P. (2014). Cómo triunfan los niños: determinación, curiosidad y el poder del carácter. Madrid: Palabra. ISBN: 978-84-9061-089-3 El fracaso educativo, sobre todo entre el alumnado más desfavorecido, sigue siendo un problema sin resolver, según Tough el motivo es que se ha buscado la solución en lugares equivocados. En este sentido, Paul Tough, en Cómo triunfan los niños: determinación, curiosidad y el poder del carácter, nos presenta nuevos caminos para superar la desigualdad educativa y social. El autor defiende que es importante centrarse, nuevamente, en tres pilares: la relación padres e hijos, el desarrollo de las habilidades humanas y la formación del carácter, con el fin de analizar los motivos del triunfo o fracaso educativo.
El libro desarrolla la importancia de las cualidades de carácter; expone que son tanto o más importantes que el aprendizaje académico o cognitivo, esta afirmación se sustenta por los estudios de James Heckman, Premio Nobel de economía. Heckman defiende que los y las estudiantes con éxito no se predicen por su coeficiente intelectual, sino por las habilidades no cognitivas. Estas habilidades que Tough denomina cualidades de carácter hacen referencia a la perseverancia, la curiosidad, la meticulosidad, la resolución y la autoconfianza, todas ellas habilidades maleables que se pueden enseñar, aprender y mejorar (también en edad adulta).
La argumentación del libro se sustenta por diferentes campos de estudio, como es la neurociencia, psicología y educación hecho que sirve para comprender la globalidad de la problemática y apuntar aspectos entorno al éxito educativo basado en argumentaciones científicas. Fruto de estas investigaciones insisten en la importancia del entorno de los niños y niñas. Se demuestra que el éxito educativo no se facilita por el estatus económico de las familias, sino por la gestión de los sentimientos que se producen en la vida familiar, conocido como apego correcto. Ante esta realidad, Tough centra su atención en aquellos que crecen en ambientes traumáticos y

REMIE – Multidisciplinary Journal of Educational Research, 5(2)241
estresantes, ya que hay estudios previos que han concluido que hay una relación directa entre los traumas vividos y el consumo de drogas, enfermedades (por ejemplo cardíacas), problemas de escolarización, entre otros. Mediante casos concretos de jugadores y jugadoras de ajedrez demuestra que con esfuerzo se alcanza el éxito. De la misma manera, cuando antes se adquieren las habilidades de carácter más posibilidades de éxito. En este sentido, el entorno familiar tiene una gran responsabilidad pero también el entorno educativo y es aquí donde el profesorado adquiere un papel protagonista. Defiende que para potenciar el éxito es importante tener unas altas expectativas hacia el alumnado, independientemente de su procedencia. Asimismo, se afirma que si se mejora el contexto se aumenta el éxito futuro. En el último capítulo: un camino mejor, expone otra premisa para garantizar el éxito: saber superar el fracaso. Tough expone que es importante dejar que los niños y niñas fracasen, que se equivoquen, pero a su vez siempre se sientan apoyados por su entorno para que este fracaso sirva de aprendizaje para la próxima vez escoger el camino exitoso.
De manera magistral se entrelazan relatos personales con investigaciones neurocientíficas, métodos educativos y experiencias docentes, implicando y responsabilizando así toda la comunidad educativa con su lenguaje directo. El autor se muestra optimista en la capacidad de transformación de la educación. El libro nos da la máxima de que no hay una herramienta de lucha contra la pobreza que podemos ofrecer a los jóvenes desfavorecidos que sea más valiosa que las fortalezas de carácter. En definitiva, rompe con la creencia del destino social, y concreta que si se analiza el contexto y se detecta el error se puede modificar la trayectoria vital. Sin embargo, las políticas educativas juegan un papel transcendental y expone que tienen que centrar su punto de mira en aquel alumnado más desfavorecido con el fin de reducir los efectos traumáticos y estrés vividos en ambientes de pobreza. Este libro ofrece una defensa para garantizar a todo el alumnado las mismas posibilidades educativas y opciones para alcanzar el éxito, y según Tough esto es posible a partir de las fortalezas del carácter.
Teresa Morlà i Folch, Universidad de Barcelona [email protected]