
International Journal of Multidisciplinary Educational Research
328
Volume 3, Issue 3(4), March 2014 International Journal of Multidisciplinary Educational Research Published by Sucharitha Publications Visakhapatnam – 530 017 Andhra Pradesh – India Email: [email protected] website : www.ijmer.in
-
Upload
khangminh22 -
Category
Documents
-
view
0 -
download
0
Transcript of International Journal of Multidisciplinary Educational Research

Volume 3, Issue 3(4), March 2014International Journal of
Multidisciplinary Educational Research
Published bySucharitha PublicationsVisakhapatnam – 530 017Andhra Pradesh – IndiaEmail: [email protected] : www.ijmer.in


Editorial BoardEditor-in-ChiefDr. Victor Babu KoppulaFacultyDepartment of PhilosophyAndhra University – Visakhapatnam -530 003Andhra Pradesh – India
EDITORIAL BOARD MEMBERS
Prof. S.Mahendra DevVice ChancellorIndira Gandhi Institute of Development ResearchMumbai
Prof.Y.C. SimhadriDirectorInstitute of Constitutional and ParlimentaryStudies, New Delhi & Formerly Vice Chancellor ofBenaras Hindu University, Andhra UniversityNagarjuna University, Patna University
Prof. (Dr.) Sohan Raj TaterFormer Vice ChancellorSinghania University , Rajasthan
Prof.K.Sreerama MurtyDepartment of EconomicsAndhra University - Visakhapatnam
Prof. K.R.RajaniDepartment of PhilosophyAndhra University – Visakhapatnam
Prof. A.B.S.V.RangaraoDepartment of Social WorkAndhra University – Visakhapatnam
Prof.S.Prasanna SreeDepartment of EnglishAndhra University – Visakhapatnam
Prof. P.SivunnaiduDepartment of HistoryAndhra University – Visakhapatnam
Prof. P.D.Satya PaulDepartment of AnthropologyAndhra University – Visakhapatnam
Prof. Josef HÖCHTLDepartment of Political EconomyUniversity of Vienna, Vienna &Ex. Member of the Austrian Parliament, Austria
Prof. Alexander ChumakovChair of Philosophy DepartmentRussian Philosophical Society Moscow, Russia
Prof. Fidel Gutierrez VivancoFounder and PresidentEscuela Virtual de Asesoría FilosóficaLima Peru
Prof. Igor KondrashinThe Member of The Russian Philosophical SocietyThe Russian Humanist Society and Expert of theUNESCO, Moscow, Russia
Dr. Zoran VujisiæRectorSt. Gregory Nazianzen Orthodox InstituteUniversidad Rural de Guatemala, GT,U.S.A Swami MaheshwaranandaFounder and PresidentShree Vishwa Deep GurukulSwami Maheshwarananda Ashram Education &Research CenterRajasthan, India
Dr. Momin Mohamed NaserDepartment of GeographyInstitute of Arab Research and StudiesCairo University, Egypt
I KETUT DONDERDepasar State Institute of Hindu DharmaIndonesia

© Editor-in-Chief , IJMERTypeset and Printed in India
www.ijmer.in
IJMER, Journal of Multidisciplinary Educational Research, concentrates on criticaland creative research in multidisciplinary traditions. This journal seeks to promoteoriginal research and cultivate a fruitful dialogue between old and new thought.
Prof. Roger WiemersProfessor of EducationLipscomb University, Nashville, USA
Prof. G.VeerrajuDepartment of PhilosophyAndhra UniversityVisakhapatnam
Prof.G.SubhakarDepartment of EducationAndhra University, Visakhapatnam
Dr.B.S.N.MurthyDepartment of Mechanical EngineeringGITAM University –Visakhapatnam
N.Suryanarayana (Dhanam)Department of PhilosophyAndhra University,Visakhapatnam
Dr.Ch.Prema KumarDepartment of PhilosophyAndhra University,Visakhapatnam
Dr. E.Ashok KumarDepartment of EducationNorth- Eastern Hill University, Shillong
Dr.K.ChaitanyaPostdoctoral Research FellowDepartment of ChemistryNanjing University of Science and TechnologyPeople’s Republic of China
Dr.Merina IslamDepartment of PhilosophyCachar College, Assam
Dr R DhanujaPSG College of Arts & ScienceCoimbatore
Dr. Bipasha SinhaS. S. Jalan Girls’ CollegeUniversity of CalcuttaCalcutta
Dr. K. John BabuDepartment of Journalism & Mass CommCentral University of Kashmir, Kashmir
Dr. H.N. VidyaGovernement Arts CollegeHassan, Karnataka
Dr.Ton Quang CuongDean of Faculty of Teacher EducationUniversity of Education, VNU, Hanoi
Prof. Chanakya KumarUniversity of PunePUNE

Volume 3 Issue 3(4) March 2014
C O N T E N T S
1. Impact of Teaching Practice Program upon thePersonality Development of B.Ed., Trainees
Nalamotu Venkateswarlu
2. The Impact of Training & Development Activities onExecutives at Visakhapatnam Steel Plant (RINL)
G.Henry James and K. Hari Hara Raju
3. Internet Marketing N.Prasanna Kumar
4. Impact of Global Economic Crisis on Indian Economy:An Analysis
P.Satya Vara Prasad
5. Work Extrinsic and Intrinsic Motivation among NursesD. Ravi Shanker and D. Renuka Rani
6. A Study of Risk Factors on The Family Life AmongOvertime Apparel Women Workers in Mysore City- ASouthern Interior Part of Karnataka
N. Vadiraja and N.N. Rajgopal
7. A Comparative Study of Super Luminescent Diode(SLED) and Vertical-Cavity Surface-Emitting Laser(VCSEL) as a Source for Fiber Optic Gyroscope
Namita Das, Kaushik Chandra Deva Sarmaand Apurba Kumar Raibaruah
8. Current Scenario of Global Human ResourceDevelopment
U.Chakravarthy and T.Subbarayudu
9. Issues Relating to Teachers’ Stay at their Work Places– An Analytical Study
H. Subhrahmanyam
10. Main Causes and Types: AnxietyChaman Lal Banga
1
9
32
41
52
69
81
84
91
101

11. Partial Information Security in Distributed BrokeringSystem
A.Uma Maheswari,R.Selvasudhan andK. Vigneshkumar
12. Health Insurance Market Scenario in India– AnOverview
N.Ratna Kishor
13. The Digital Divide: A Global PredicamentR.Purushothaman
14. A Study of Social Skills among School Children withSpecial Reference to their Gender
Nishi Tyagi and Yukti Saraswat
15. Consciousness and its Place in the Scientific view ofthe World
Sarat Chandra Bibhar
16. Support Vector Machine and Its ApplicationArti Khajone,Nidhi Desai and Nikesh Patel
17. Bio Gas as A Cheapest Clean Alternative Energy SourceGlobally Creating Awareness among Agricultural People
Gourav Dureja and Neeraj Kumar
18. Digital Technology in Information Users of HigherEducation in Kanchipuram Districts
K. Viji , R.Valarmady and K.Nithyanandam
19. Range Adjustment Using Received Signal Strength inWireless Sensor Networks
Jegadeesan.S, PrasannaVenkatesan.G.K.D,Sandhiya.G and Saranya.K
20. RTI in Corruption Driven SystemGian Singh
21. Kushana Inscriptions and History: A New PerspectivePallavi Prasad
116
136
148
162
174
183
196
208
218
231
244

22. Enhancing A Weighted Query and Secure Multi-Keyword Ranked Search Over Encrypted Data Set inCloud
S.Dharani,S.Shanthi and K.Ganesan
23. Suicide as Narrative Strategy in Twentieth CenturyWomen’s Fiction: Doris Lessing’s The Grass is Singing
Sajja. Divya
24. Enhancing the Quality and Accessibility of HigherEducation Through the Use of ICT
Pasupuleti Paparao
25. Body Hydration Status and Psycho-Physiological Profileof College Level Basketball Players (18-22 Years)
Avneet Kaur Oberoi and Priti Rishi Lal
26. Etiology of Elevated Anthropometric Parameters inYoung Adults
Luxita Sharma and Mahavir Singh
27. The Global HR ManagerU.Chakravarthy
256
271
280
292
302
314

Dr. K.VICTOR BABU ISSN: 2277-7881; Impact Factor -2.735
Editor-in-ChiefINTERNATIONAL JOURNAL OF MULTIDISCIPLINARY EDUCATIONAL
RESEARCH
Visakhapatnam -530 003, Andhra Pradesh – India, www.ijmer.in
Editorial ……..Provoking fresh thinking is certainly becoming the prime purpose of
International Journal of Multidisciplinary Educational Research (IJMER). The
new world era we have entered with enormous contradictions is demanding a
unique understanding to face challenges. IJMER’s contents are overwhelmingly
contributor, distinctive and are creating the right balance for its readers with its
varied knowledge.
We are happy to inform you that IJMER got the high Impact Factor
2.735, Index Copernicus Value 5.16 and IJMER is listed and indexed in 34
popular indexed organizations in the world. This academic achievement of
IJMER is only author’s contribution in the past issues. I hope this journey of IJMER
more benefit to future academic world.
The current issue deals with Teaching Practice programme, Global
economic crisis, Global Human resource development, Digital Divde, RTI
Corruption driven system Gloabl HR Managar and etc. These applied topics are a
fund of knowledge for their utilization.
In the present issue, we have taken up details of multidisciplinary issues
discussed in academic circles. There are well written articles covering a wide range
of issues that are thought provoking as well as significant in the contemporary
research world.
My thanks to the Members of the Editorial Board, to the readers, and in
particular I sincerely recognize the efforts of the subscribers of articles. The journal
thus receives its recognition from the rich contribution of assorted research papers
presented by the experienced scholars and the implied commitment is generating
the vision envisaged and that is spreading knowledge. I am happy to note that the
readers are benefited.
My personal thanks to one and all.
(Dr.Victor Babu Koppula)

INTERNATIONAL JOURNAL OF MULTIDISCIPLINARY EDUCATIONAL RESEARCHISSN : 2277-7881; IMPACT FACTOR - 2.735; IC VALUE:5.16VOLUME 3, ISSUE 3(4), MARCH 2014
1
IMPACT OF TEACHING PRACTICE PROGRAM UPON THEPERSONALITY DEVELOPMENT OF B.ED., TRAINEES
Dr. Nalamotu VenkateswarluPrincipal
PDRV College of Education, HarurDharmapuri District, Tamil Nadu
INTRODUCTION
The relationship between psychology and education has been a very
close and cordial one. Each has profited by the data and principles of the
other. The first practical applications of psychology of systematic type were
made in the field of education, where today many of the individual and
group methods of the laboratory are employed under the heading
“experimental pedagogy”. Indeed, both methods of teaching and content
of the curriculum have been altered in accordance in to progress made in
psychology which is not a completed process and hence this attempt.
Education is a dynamic force in the life of every individual,
influencing physical, mental, emotional and social development.
Educational psychology is the application of some general principles of
psychology to the growth of education and teaching. Personality develops
in certain direction. Personality is a product of action and their reaction.
Teaching practice is a generalized plan for teaching which included
structured designed learner behavior in terms of global of instruction and
outline of planned tactics necessary to implement the practice.
NEED AND SIGNIFICANCE OF THE STUDY
Psychology of personality is of recent growth. Personality is the
completed jigsaw puzzles as the whole individual is to be studied as whole.
As we come to know a person, either younger or older than ourselves, we
INTERNATIONAL JOURNAL OF MULTIDISCIPLINARY EDUCATIONAL RESEARCHISSN : 2277-7881; IMPACT FACTOR - 2.735; IC VALUE:5.16VOLUME 3, ISSUE 3(4), MARCH 2014
2
begin to recognize individual from all other people. As we observable a
particular person over a period of time, we notice how his temperament,
interests and attitudes are developing and how his behavior and personality
tends to make a more or less consistent direction. Philosophers are of the
view that the personality is ideal of perfection or self-realization or the
internal self.
The need of the study is to find out the effect of teaching practice
which is a compulsory training program for 40days of B.Ed., trainees upon
their personality development which is researched before and after the
scheduled teaching practice with micro and macro skills, aids and subject
knowledge in various schools during the course.
OBJECTIVES OF THE STUDY
1. To develop values, attitudes, awareness consistent with sustainable
development in education.
2. To develop knowledge and skills in teaching practice of B.Ed., trainees.
3. To appreciate the commonality of needs, rights, values and psychology
bind B.Ed., trainee with teaching practice program.
4. To increase the personality development of future teachers.
5. To link the personality development to educational reforms.
HYPOTHESES OF THE STUDY
1. There is no significant difference in the level of personality development
of rural B.Ed., trainees before and after their teaching practice program.
2. There is no significant difference in the level of personality development
of unmarried B.Ed., trainees before and after their teaching practice
program.

INTERNATIONAL JOURNAL OF MULTIDISCIPLINARY EDUCATIONAL RESEARCHISSN : 2277-7881; IMPACT FACTOR - 2.735; IC VALUE:5.16VOLUME 3, ISSUE 3(4), MARCH 2014
3
3. There is no significant difference in the level of personality development
of B.Ed., science graduate trainees before and after their teaching
practice program.
4. There is no significant difference in the level of personality development
of B.Ed., most backward community trainees before and after their
teaching practice program.
METHODOLOGY
In the present study, explorative research method was employed.
The investigator used the Eyesnck’s Personality Inventory Questionnaire.
The tool was administered to the sample selected before and after the
teaching practice period and collected data from the respondents. The data
thus collected were put in to a appropriate statistical analyzed like mean,
standard deviation and level of significance.
SAMPLE OF THE STUDY
The group sampling was used for this study. A total of 200 B.Ed.,
trainees for the variable from three self-financing B.Ed., colleges in PDRV
Educational Institutions, Harur, Dharmapuri District of Tamil Nadu were
selected as a sample.
TOOLS OF THE STUDY
The investigator was used Eysenck’s personality inventory
questionnaire. Prof.Eysenck’s Personality Inventory questionnaire has
30 items selected from 57 based on single point scale. The responses are
capable of measuring personality against the items given in the personality
inventory questionnaire. The opinions positively oriented responses are
given as “yes” and assigned scores are given +1 and the negatively oriented
responses are given as “No” and assigned scores are given -1. The net

INTERNATIONAL JOURNAL OF MULTIDISCIPLINARY EDUCATIONAL RESEARCHISSN : 2277-7881; IMPACT FACTOR - 2.735; IC VALUE:5.16VOLUME 3, ISSUE 3(4), MARCH 2014
4
opinions cores are considered as the basis for calculation. In the light of
these scoring key, credits are given to responses of the scores obtained.
DATA ANALLYSIS
HYPOTHESIS 1
There is no significant difference in the level of personality
development of rural B.Ed., trainees before and after their teaching practice
program
Table – 1: Showing the significant difference in the mean scoresof personality development level pre and post-teaching practiceprogram of B.Ed., rural trainees.
It is found that t value 2.43 is significant at 0.05 levels. Since the calculated
is greater than the table value and hence null hypothesis is rejected. Hence,
it is concluded that the level of personality development of B.Ed., rural
trainees after their teaching practice program significantly from the
personality development of their pre teaching practice program.
HYPOTHESIS 2
There is no significant difference in the level of personality
development of B.Ed., unmarried trainees before and after their teaching
practice program.

INTERNATIONAL JOURNAL OF MULTIDISCIPLINARY EDUCATIONAL RESEARCHISSN : 2277-7881; IMPACT FACTOR - 2.735; IC VALUE:5.16VOLUME 3, ISSUE 3(4), MARCH 2014
5
Table – 2: Showing the significant difference in the mean scores
of personality development level pre and post-teaching practice
program of B.Ed., unmarried trainees.
It is found that t value 2.44 is significantly at 0.05 levels. Since the
calculated value is greater than the table value and hence null hypothesis
is rejected. Hence, it is concluded that the level of personality of B.Ed.,
unmarried trainees after their teaching practice program significantly from
the personality development of their pre-teaching practice program.
HYPOTHESIS 3
There is no significant difference in the level of personality
development of B.Ed., science graduate trainees before and after their
teaching practice program.
Table – 3: Showing the significant difference in the mean scores
of personality development level pre and post-teaching practice
program of B.Ed., science graduate trainees.

INTERNATIONAL JOURNAL OF MULTIDISCIPLINARY EDUCATIONAL RESEARCHISSN : 2277-7881; IMPACT FACTOR - 2.735; IC VALUE:5.16VOLUME 3, ISSUE 3(4), MARCH 2014
6
It is found that t value 2.06 is significantly at 0.05 levels. Since the
calculated value is greater than the table value and hence null hypothesis
is rejected. Hence, it is concluded that the level of personality of B.Ed.,
science graduate trainees after their teaching practice program significantly
from the personality development of their pre-teaching practice program.
HYPOTHESIS 4
There is no significant difference in the level of personality
development of B.Ed., most backward community trainees before and after
their teaching practice program.
Table – 3: Showing the significant difference in the mean scores
of personality development level pre and post-teaching practice
program of B.Ed., most backward community trainees.
It is found that t value 2.39 is significantly at 0.05 levels. Since the
calculated value is greater than the table value and hence null hypothesis
is rejected. Hence, it is concluded that the level of personality of B.Ed.,
most backward community trainees after their teaching practice program
significantly from the personality development of their pre-teaching practice
program.
FINDINGS
The findings from this research reveals that the level of personality
development of B.Ed., trainees increases significantly after the teaching

INTERNATIONAL JOURNAL OF MULTIDISCIPLINARY EDUCATIONAL RESEARCHISSN : 2277-7881; IMPACT FACTOR - 2.735; IC VALUE:5.16VOLUME 3, ISSUE 3(4), MARCH 2014
7
program compared to personality development level of trainees before
teaching practice program.
IMPLICATIONS OF THE STUDY
A student with a positive or high personality has high self-esteem.
High personality develops self-confidence and poor personality hinders
initial school adjustment and academic progress also. Trainees with high
concept tend to accept their failure as well as limitations. They are better
achievers. They are more determined to achieve their goals. They do not
suffer from inferiority complex. They are free from mental sickness and
work rigorously and express their ideas and beliefs to others with confidence
and conviction. They have the ability to impress others. They are rational
in their approach. Development of personality takes place due to the
influence of biological and situational factors. Biological or heredity factors
in personality are difficult to study through there are few studies to
determine unique individual attributes. The way they are treated in culture,
determines the personality fatteners. This condition applies for the training
teachers also.
CONCLUSION
In general, the activities, objectives and events that we see
potentially enhancing or threatening the personality and what command
our attention and exert the most significant influence on our development.
And since the aspects of the environment in teaching with which one person
is self involved may be quite from those which seems important to another,
we can see how the development of the personality, contributes to
differentiate psychological behavior. Since, the B.Ed., trainees were exposed
to the real teaching field and environment during their teaching practice ,
where they have adjusted and adapted for the environment and hence

INTERNATIONAL JOURNAL OF MULTIDISCIPLINARY EDUCATIONAL RESEARCHISSN : 2277-7881; IMPACT FACTOR - 2.735; IC VALUE:5.16VOLUME 3, ISSUE 3(4), MARCH 2014
8
obtained positively increased personality development which will reflect
upon their performance or profession.
The way the teacher behaves and interacts with students can
influence the children’s way of living. Thus, the teachers are the harbingers
of knowledge and can mould the students according to the needs and
requirements of the society which ultimately reflects the personality of
the student to bring out more awareness in the education of the sustainable
development in the prcess of structuring and planning education for the
development in the B.Ed., curriculum through various research practices
across the globe. The teaching practice program has to be viewed in order
to cater the future of teacher education. Professional development and
cognitive psychology focus towards total personality development which
ensures the teacher education.
References
1. J.C.Aggarwal, Basic Ideas in Educational Psychology, Shipra Publication,
Vikas Marg, Shakapur, Delhi, 2006, p-100-102.
2. F.U. John Paul & Sarath Manickaraj, Psychological Profile of
Undergraduates and Post Graduates, Journal of Psychological Researches,
the Madras Psychology Society, Vol-50, January 2006.
3. B.N.Panda, Advanced Educational Psychology, Discovery Publishing
House, New Delhi. P. 239.
4. Romesh Verma, Psychology og Teachers, Models Approach for Twenty-
first Century, Anmol Publications Pvt. Ltd. New Delhi. P-140-141.
5. A.Subramonia Pilla, Impact of Practicing Schools on Quality Teaching
Practice of Teacher Trainnes, Journal of Indian Education, Volume XXIX,
Number 2, August 2004, p-107.

INTERNATIONAL JOURNAL OF MULTIDISCIPLINARY EDUCATIONAL RESEARCHISSN : 2277-7881; IMPACT FACTOR - 2.735; IC VALUE:5.16VOLUME 3, ISSUE 3(4), MARCH 2014
9
THE IMPACT OF TRAINING & DEVELOPMENT ACTIVITIESON EXECUTIVES AT VISAKHAPATNAM STEEL PLANT (RINL)
G.Henry JamesAssociate Professor
Department of Management StudiesPydah College of Engineering &
Technology, Visakhapatnam
Dr. K. Hari Hara RajuPost-Doctoral Fellow
Department of Commerce &Management Studies
Andhra University, Visakhapatnam
Introduction
Learning from experience is not enough, people have to be trained
to manage the challenges posed by changing business environment Training
and development of employees in an organization is important due to its
favorable consequences of improved performance at work, change in
attitude, etc. The development of high potential personnel through
continuous training and retraining is seen as a core element in the
development of the successful organization. Training not only works wonder
for the country and organization but also is important to every facet of
growth and development of any individual. A change in various junctures
of a person’s career requires training.
The steel is critical in infrastructure development and infrastructure
is the backbone of our country’s economy. In response to the challenges
posed in the steel industry, Visakhapatnam Steel Plant has envisaged to
increase the plant capacity to 6.5 Mt per year of hot metal and 6.3 Mt per
year liquid steel with corresponding increase in the production capacities
of all its upstream and downstream units keeping in view to achieve
optimum utilization of available resources like land etc., and the anticipated
upturn in global and domestic steel demand. Therefore, there is a need of
expansion process which requires skilled and competent hands. Training

INTERNATIONAL JOURNAL OF MULTIDISCIPLINARY EDUCATIONAL RESEARCHISSN : 2277-7881; IMPACT FACTOR - 2.735; IC VALUE:5.16VOLUME 3, ISSUE 3(4), MARCH 2014
10
and development is the means to prepare this fleet of competent people
among operative and managerial staff.
Training and development of human resource management is the
pivot around which all the techniques of growth process revolve. On the
one hand, promoting employment is an accepted national goal and on the
other finding suitable and trained manpower is a basic necessity for running
economic enterprises. It has been rightly said that skills are the single
most important factors in development.
Need and significance
Therefore, training is very significant for managers as they need
skills to handle situations of high responsibility, training is essential for
the growth of country, organization and its people. Hence, the importance
given by the Visakhapatnam Steel Plant (RINL) management for training
and development and the necessity of highly skilled managerial personnel,
inspired the researcher to conduct a study on the impact of training and
development programmes in Visakhapatnam Steel Plant which is one of
the major steel producing plant in India.
For the view the above discussions, the present study in
Visakhapatnam Steel Plant aims at finding how far the training and
development programs increased the efficiency of the organization. After
an initial study of the organization the study focused on critical analysis
of training programs conducted for the executives by the Visakhapatnam
Steel Plant, to examine its policy and practices in training and development
programs and its impact on managerial efficiency, effectiveness and
organization development with the following objectives.

INTERNATIONAL JOURNAL OF MULTIDISCIPLINARY EDUCATIONAL RESEARCHISSN : 2277-7881; IMPACT FACTOR - 2.735; IC VALUE:5.16VOLUME 3, ISSUE 3(4), MARCH 2014
11
Objectives
1. To critically analyze the training programs conducted for the
executives by the Visakhapatnam Steel Plant
2. To examine the policy and practices on training of executives in
Visakhapatnam Steel Plant
3. To research out data on training and development programmes
of Visakhapatnam Steel Plant and how the training and
development practices has helped in development of the
organiastion.
4. To evaluate its impact on managerial efficiency and effectiveness.
5. To find out the effectiveness of the training imparted to the
executives on their job
Research questions
Keeping in view of the above objectives, an attempt has been made
to find out the answers for the following questions.
1. Are opportunities available for growth and development of
executives?
2. Are the opportunities for development open to all and what is
the Criteria for sponsoring a executives for training?
3. Do the training programs attended by executives are related to
their job needs?
4. Are the training and development activities sufficient for the
development of executives?
5. Do the rules and regulations of organization play a
complementary role for transfer of training?

INTERNATIONAL JOURNAL OF MULTIDISCIPLINARY EDUCATIONAL RESEARCHISSN : 2277-7881; IMPACT FACTOR - 2.735; IC VALUE:5.16VOLUME 3, ISSUE 3(4), MARCH 2014
12
6. What is the overall impact of training on the organization?
7. Is the organization benefited from the training and development
program?
Hypotheses
This study intends to provide insight into the important dimensions
of training and development activities. An attempt is made to find out the
effect of these activities on the efficiency and effectiveness of the executives.
Therefore, in particular, the study aims at processing the data to test the
following hypotheses.
H1: There is no significant difference between Male and Female employees
on the impact of Training & development on executive RINL.
H2: Age of the employees as a factor which determining the impact of
training and development an executive of RINL.
H3: There is no significant difference between married and unmarried
employees in their opinion towards the impact of training and
development on the executive of RINL.
H4: There is no significant difference among different education level
employees towards the impact of training and development on the
executives of RINL.
H5: The job experience is one of the factors to which indicate the impact of
training and development on the executives of RINL.
H6: The opinion of the employees towards the impact of training and
development on the executives of RINL did not based on this income
levels.
INTERNATIONAL JOURNAL OF MULTIDISCIPLINARY EDUCATIONAL RESEARCHISSN : 2277-7881; IMPACT FACTOR - 2.735; IC VALUE:5.16VOLUME 3, ISSUE 3(4), MARCH 2014
13
Methodology
The drastic development of Visakhapatnam Steel Plant (RINL) and
its growth and achievements in industrial sector made the researcher to
observe these changes from outside and desired to study the organizing its
functions and means for development, he selected for the study, and the
variables for the study are training awareness, work objectives, use of
training, features of training, components of training, training process,
training criteria, training outcomes and evaluation. Ranking method was
also used for qualitative analysis.
Instrumentation (Tool)
The researcher has personally involved in the investigation by
visiting different departments of the selected organization and collected
the necessary data and information through a pre-designed questionnaire,
which is standardized by Critical Ratio Analysis Method for establishing
the validity and reliability of the instrument.
Sample of the study (Data)
After designing the questionnaire the researcher personally visited
the study unit and administered the questionnaire with a sample of 540
employees by random sampling method. The investigator has covered
executives working in the selected organization both male and female
categories with different education levels and experience status.
Variables in the study
The study has considered both independent and dependent variables
in the investigation, where, the socio-demographic characters of the sample
respondents (executives) are observed as independent variables and the
dimensions of the impact of training and development are observed as

INTERNATIONAL JOURNAL OF MULTIDISCIPLINARY EDUCATIONAL RESEARCHISSN : 2277-7881; IMPACT FACTOR - 2.735; IC VALUE:5.16VOLUME 3, ISSUE 3(4), MARCH 2014
14
dependent variables. The dependent variables were studied in order to
study the opinion of the executives on the training and development
activities practiced in the human resource management of VSP organization
and find out the influence of independent variables on the dependent
variables.
Statistical techniques for analysis
The measurement of impact of training and development activities
in human resource management at Visakhapatnam Steel Plant carried
out with a statistical tool SPSS (Statistical Package for Social Sciences).
The collected data through questionnaires indicate the impact of training
and development on executives was statistically tested with t-test and f-
test (ANOVA) techniques to test the hypothesis and analyze the impact of
training and development activities on executives of VSP.
Analysis and discussion of data
After collecting the data of response from the executives working
in Visakhapatnam Steel Plant on the impact of training and development
activities in the organization, the investigator has framed some hypothesis
to test the data with suitable statistical treatment. The following tables
analyses the testing results of the hypothesis.

INTERNATIONAL JOURNAL OF MULTIDISCIPLINARY EDUCATIONAL RESEARCHISSN : 2277-7881; IMPACT FACTOR - 2.735; IC VALUE:5.16VOLUME 3, ISSUE 3(4), MARCH 2014
15
The above table analyses the significance difference between Male
and Female employees in Visakhapatnam Steel Plant towards dimensions
of training in the industry. Regarding training, the average performance
of the Female employees (59.85) shows little higher than the Male employees
(58.62) and the respective standard deviations are 3.706 and 4.257. The
calculated t-value 1.436 found not significant.
Towards views of executives about objectives and work in the
organization, the average performance of the Male employees was 21.31
and Female employees was 21.23, and the respective standard deviations
are 1.873 and 1.177. The tested t-value 0.222 and found no significant
level. In the views of individuals on training, the average performance of
female executives (76.46) found significantly higher than male executives
(73.41) and the standard deviations are 8.491 and 3.979. Therefore, the
observed t-value is 3.538 found significant at 0.01 level.
Regarding the features of existing training methods, the average
performance of female executives was 46.19 and male executives was 45.05,
and the respective standard deviations are 2.953 and 1.711. Hence, the
tested t-value 3.172 indicates 0.01 level significant. According to the
response of sample towards components of training, the average
performance of female was 20.73 and male was 20.08 and the standard
deviations are 1.041 and 0.809. The tested t-value is 3.922 shows significant
at 0.01 level.
Towards training process, the mean performance of female
executives (46.46) shows significantly higher than male executives (43.97),
and the respective standard deviations are 1.726 and 1.640. Therefore, the
calculated t-value 7.534 found significant at 0.01 level. Regarding training

INTERNATIONAL JOURNAL OF MULTIDISCIPLINARY EDUCATIONAL RESEARCHISSN : 2277-7881; IMPACT FACTOR - 2.735; IC VALUE:5.16VOLUME 3, ISSUE 3(4), MARCH 2014
16
criteria, the average performance of male executives (30.87) found little
higher than female executives (30.65), and the respectively standard
deviations are 1.034 and 0.892. Hence, the derived t-value 1.063 indicates
no significant level.
The above analysis and discussion indicates that the female
employees are more satisfied in training, individual views on training,
features of existing training methods, components of training, and training
process in the organization. Whereas, the male executives are dominating
in their satisfaction levels in views about objectives and work, training
criteria. Except training, the female satisfaction level in remaining
dimensions found significantly higher than male executives. Therefore,
this shows that the female executives are satisfying more than male
executives towards dimensions of training and development in the
organization. Hence, the null-hypothesis is rejected.

INTERNATIONAL JOURNAL OF MULTIDISCIPLINARY EDUCATIONAL RESEARCHISSN : 2277-7881; IMPACT FACTOR - 2.735; IC VALUE:5.16VOLUME 3, ISSUE 3(4), MARCH 2014
17
The above table explains the opinion difference among different
age group employees in Visakhapatnam Steel Plant. Regarding training,
the average performance of 36-45 years age group executives was 58.76,
above 45 years age group executives was 58.73 and 26-35 years executives
was 58.37, and the standard deviations are 4.127, 2.337 and 3.890
respectively. Therefore, the calculated f-value is 0.287 and did not indicate
any significant level.
Towards views about objectives and work, the mean score of 36-45
years age group executives was 21.53, above 45 years age group executives
was 21.27, and 26-35 years executives was 21.24, and the standard
deviations are 1.587, 1.910 and 1.810 respectively. Hence, the tested f-value
0.775 found not significant at any level. In the views of individuals on
training, the mean performance of 26-35 years age group executives was
74.75, above 45 years age group was 73.43 and 36-45 years age group
executives was 73.05, and the respective standard deviations are 6.049,
3.990 and 3.877. Therefore, the calculated f-value 3.670 found significant
at 0.05 level.
Regarding features of existing training, the average score of 26-35
years age group executives was 45.43, above 45 years age group executives
was 45.08 and 36-45 years age group executives was 44.96, and the
respective standard deviations are 2.002, 1.842 and 1.406. Hence, the
observed f-value 1.624 found not significant level. In component of training,
the average performance of 26-35 years executives are 20.22, above 45
years age group executives 20.11 and 36-45 years age group executives was
20.04. The respective standard deviations are 0.988, 0.875 and 0.392. Hence,
the observed f-value 0.988 indicates not significant level.

INTERNATIONAL JOURNAL OF MULTIDISCIPLINARY EDUCATIONAL RESEARCHISSN : 2277-7881; IMPACT FACTOR - 2.735; IC VALUE:5.16VOLUME 3, ISSUE 3(4), MARCH 2014
18
Towards training process, the average performance of 26-35 years
age group executives (44.36) found higher than above 45 years executives
(44.10) and 36-45 years executives (43.82) and the respective standard
deviations are 2.011, 1.664 and 1.710. Hence, the calculated f-value 1.989
found not significant. In training criteria, the mean score of 26-35 years
age group executives was 30.87, 36-45 years and above 45 years age group
executives was 30.86 and the standard deviations are 1.011, 1.017 and
1.037 respectively. Hence, the calculated f-value is 0.003 found not
significant level.
According to the above analysis and discussion the lower age group
executives are more positive towards views of individuals on training,
features of existing training methods, components of training, training
process and training criteria in the organization. Whereas, in training and
views about objectives and work the middle age group executives are more
positive than others. Hence, this shows that there is no significant difference
between and within groups of executives by their age towards the
dimensions of training and development in the organization. Therefore,
the null-hypothesis is rejected.

INTERNATIONAL JOURNAL OF MULTIDISCIPLINARY EDUCATIONAL RESEARCHISSN : 2277-7881; IMPACT FACTOR - 2.735; IC VALUE:5.16VOLUME 3, ISSUE 3(4), MARCH 2014
19
The above table explains the significance difference between married
and unmarried employees in Visakhapatnam Steel Plant. Regarding
training, the average performance of the unmarried executives (59.36)
shows little higher than the married executives (58.67) and the respective
standard deviations are 4.733 and 4.226. The calculated t-value 0.603 found
no significant level.
Towards views about objectives and work, the average performance
of the married executives was 21.33 and unmarried executives was 20.50.
The respective standard deviations are 1.843 and 1.829. The tested t-value
1.665 found no significant level. Among the total sample about views of
individuals on training, the average performance of unmarried executives
was 79.79 and married executives was 73.39, and the standard deviations
are 10.304 and 3.957 respectively. Therefore, the derived t-value 5.593 found
significant at 0.01 level.
Towards the features of existing training methods, the average
performance of married executives was 45.12 and unmarried executives
was 44.71, the respective standard deviations are 1.776 and 2.673. The
observed t-value 0.826 found no significant. Regarding components of
training, the average performance of unmarried executives was 21.14 and
married executives was 20.09, and the standard deviations are 1.231 and
0.802 respectively. The tested t-value 4.780 and found significant at 0.01
level.
In training process, the average performance of unmarried 46.36
and married 44.03, the respective standard deviations are 2.240 and 1.673.
The tested t-value is -5.087 and found at 0.05 significant value. Among the
total sample from training criteria, the average performance of married
30.87 little higher than unmarried 30.79, the respectively standard

INTERNATIONAL JOURNAL OF MULTIDISCIPLINARY EDUCATIONAL RESEARCHISSN : 2277-7881; IMPACT FACTOR - 2.735; IC VALUE:5.16VOLUME 3, ISSUE 3(4), MARCH 2014
20
deviations are 1.029 and 1.051. Hence, the derived t-value 0.285 indicates
no significant value.
The above analysis shows that the unmarried executives are more
satisfied in training, individual views on training, components of training
and training process in the organization. Whereas, married executives are
satisfied more in views about objectives and work, features of existing
training methods and training criteria. It indicates that the satisfaction
level of unmarried executives found significantly higher than married
executives. Therefore, this shows that the unmarried executives are
satisfying more than married executives in four dimension, but married
executives are satisfied more than unmarried executives in three
dimensions. An overall there is a significant difference between married
and unmarried executives in their opinion towards dimensions of training
and development in the organization. Hence, the null-hypothesis is rejected.

INTERNATIONAL JOURNAL OF MULTIDISCIPLINARY EDUCATIONAL RESEARCHISSN : 2277-7881; IMPACT FACTOR - 2.735; IC VALUE:5.16VOLUME 3, ISSUE 3(4), MARCH 2014
21
The above table analyses the significant differences in education
qualification of employees in Visakhapatnam Steel Plant. Regarding
training, the average performance of under graduates are 58.84, graduates
are 58.74 and post graduates are 58.11 respectively, the standard deviations
are 3.976, 4.290 and 4.144. Hence, the derived f-value is 0.632 found not
significant.
Towards views about objectives & work, post graduate holders 21.59,
graduates 21.38 and under graduates 20.56, the respective standard
deviations are 1.736, 1.837 and 1.852. Therefore the derived f-value is 6.169
and found there is 1% significant value. Out of the total sample from views
of individuals on training, the average performances of graduates are 74.04,
post graduates 72.41 and under graduate 71.44, the respective standard
deviations are 4.463, 4.236 and 2.358. Hence, the derived f-value is 12.591
and found 1% significant value.
In features of existing training methods, the average performance
of post graduates 45.66, graduates 45.06 and under graduates 44.92. The
respective standard deviations are 1.982, 1.688 and 2.249. Therefore the
derived f-value is 3.363 and found there is 0.05 percent significant value.
According to the total sample from components of training, the average
performance of graduates 20.24, post graduates 20.05 and under graduates
19.32 respectively. The standard deviations are 0.744, 0.425 and 1.184.
Hence, the derived f-value is 37.731 and found there is 1% significant value.
Towards training process, the average performance of post graduate
holders are 44.51, graduate holders are 44.15 and under graduates are
43.29 respectively, the standard deviations are 1.804, 1663 and 1.859.
Therefore the derived f-value is 8.926 and found 1% significant value. From
the total sample from training criteria, the average performance of under

INTERNATIONAL JOURNAL OF MULTIDISCIPLINARY EDUCATIONAL RESEARCHISSN : 2277-7881; IMPACT FACTOR - 2.735; IC VALUE:5.16VOLUME 3, ISSUE 3(4), MARCH 2014
22
graduates are 31.05, graduates are 30.88 and post graduates are 30.52.
The respective standard deviations are 1.093, 1.043 and 0.766. Hence, the
derived f-value is 4.463 and found at 0.05 significant value.
The above analysis and discussion shows that the under graduate
executives are more positive towards training and training criteria, but
graduate executives satisfaction level is more significant in individual views
on training and components of training than others. Whereas, the response
of the post graduate executives indicates significantly more positive towards
views about objectives & work, features of existing training methods and
training process than others. Therefore, it shows that there is a significant
difference between and within the groups of executives by their education
levels towards the dimensions of training and development in the
organization. Hence, the null-hypothesis is rejected.

INTERNATIONAL JOURNAL OF MULTIDISCIPLINARY EDUCATIONAL RESEARCHISSN : 2277-7881; IMPACT FACTOR - 2.735; IC VALUE:5.16VOLUME 3, ISSUE 3(4), MARCH 2014
23
The above table indicates the significant difference in the opinions
of employees by their level of experience. The average performance of 10
to 20 years experienced employees was 59.12, 1 to 5 years experience was
58.80, above 20 years experience was 58.78 and 5 to 10 years experience
was 57.17, and the respective standard deviations are 4.074, 3.816, 4.254
and 4.764. Therefore, the calculated f-value 2.620 found 1% significant
level.
Regarding views about objectives & work, the average performance
of 5 to 10 years experienced employees was 21.62, 10 to 20 years experience
21.46, above 20 years experience 21.25 and 1 to 5 years experienced
employees was 21.16. The standard deviations are 1.922, 1.587, 1.856 and
2.027 respectively. Hence, the observed f-value 0.956 found no significant
level. In views of individuals on training, the mean score of 5 to 10 years
experienced employees was 74.06, 1 to 5 years experience was 73.57, 10 to
20 years experience was 73.54 and above 20 years experienced employees
was 73.47. The respective standard deviations are 2.768, 6.021, 4.438 and
4.054. Therefore, the derived f-value 0.270 and found there is no significant
value.
Towards features of existing training methods, the mean score of
above 20 years experienced employees was 45.18 found higher than 5 to 10
years 45.06, 10 to 20 years 45.02 and 1 to 5 years experienced employees
44.92, and the respective standard deviations are 1.677, 1.720, 1.498 and
2.565 respectively. Therefore, the calculated f-value 0.543 found not
significant level. In components of training, the average performance of
10 to 20 years experienced employees 20.27 indicate significantly higher
than above 20 years experience 20.11, 5 to 10 years experience 20.06 and 1
to 5 years experience 19.99. The standard deviations are 0.668, 0.610, 0.895
INTERNATIONAL JOURNAL OF MULTIDISCIPLINARY EDUCATIONAL RESEARCHISSN : 2277-7881; IMPACT FACTOR - 2.735; IC VALUE:5.16VOLUME 3, ISSUE 3(4), MARCH 2014
24
and 1.501 respectively. Therefore, the tested f-value 1.816 and found not
significant level.
The mean score of 1 to 5 years experienced employees in training
process was 44.70, 10 to 20 years experience was 44.11, above 20 years
experience was 43.98 and 5 to 10 years experience was 43.83. The respective
standard deviations are 1.953, 1.670, 1.696 and 1.505. Hence, the f-value
4.003 found 1% significant level. In training criteria, the average
performance of 5 to 10 years experienced employees was 31.13, 10 to 20
years experience was 30.89, above 20 years experience was 30.84 and 1 to
5 years experience was 30.74, and the respective standard deviations are
0.991, 0.983, 1.065 and 0.929. Therefore, the derived f-value 1.667 and
found there is no significant value.
According to the above discussion it shows that the between 1-5
years experienced executives are more positive towards training process,
between 5-10 years experienced executives found more positive towards
views about objectives & work, components of training and training criteria,
between 10-20 years experienced executives satisfaction level is more in
training in the organization and above 20 years of experienced employees
are comparatively more positives towards features of existing training
methods than others. Therefore, the analysis infers that job experience is
not a factor which determines the impact of training and development on
the executives of RINL. Hence, the null-hypothesis is rejected.

INTERNATIONAL JOURNAL OF MULTIDISCIPLINARY EDUCATIONAL RESEARCHISSN : 2277-7881; IMPACT FACTOR - 2.735; IC VALUE:5.16VOLUME 3, ISSUE 3(4), MARCH 2014
25
Source: Primary Data, ** Significant @ 0.01 level; * Significant @ 0.05
level
The above table analyses the significant difference among different
income level employees in Visakhapatnam Steel Plant towards the impact
of training and development on executives. Regarding training, the average
performance of 1-3 lakh income earners was 58.75, 3-5 lakhs salary holders
was 60.28 and above 5 lakhs salary holders was 58.68, and the respective
standard deviations are 4.361, 3.927 and 4.223. Therefore, the calculated
f-value 5.448 and found significant at 0.01 level.
Towards the views about objectives & work, the average
performance of 1-3 lakhs annual income level employees was 21.23, 3-5
lakhs salary holders was 20.52 and above 5 lakhs salary holders was 21.44,
and the respective standard deviations are 1.957, 2.319 and 1.720.
Therefore, the calculated f-value is 7.164 and found 0.01 level significant.

INTERNATIONAL JOURNAL OF MULTIDISCIPLINARY EDUCATIONAL RESEARCHISSN : 2277-7881; IMPACT FACTOR - 2.735; IC VALUE:5.16VOLUME 3, ISSUE 3(4), MARCH 2014
26
In views of individuals on training, the mean score of 1-3 lakhs income
level employees was 73.92, 3-5 lakhs income level employees was 72.11
and above 5 lakhs salary holders was 73.73, and the respective standard
deviations are 6.522, 3.294 and 4.113. Hence, the observed f-value 4.194
found significant at 0.05 level.
Towards features of existing training methods, the average score of
above 5 lakhs income level employees are 45.17, 1-3 lakhs income level
employees are 44.94 and 3-5 lakhs salary holders are 44.82, and the
respective standard deviations are 1.670, 2.689 and 1.758. Hence, the tested
f-value 1.349 found not significant. In components of training, the average
performance of 3-5 lakhs income level employees are 20.14, 1-3 lakhs salary
holders are 20.13 and above 5 lakhs salary holders are 20.11, and the
respective the standard deviations are 1.413, 1.314 and 0.610. Therefore,
the calculated f-value 0.052 and there is no significant.
Regarding training process, the average performance of 1-3 lakhs
income level employees are 44.69, 3-5 lakhs salary holders are 44.20 and
above 5 lakhs salary holders are 44.00. The standard deviations are 2.054,
1.227 and 1.738 respectively. Hence, the observed f-value 3.908 and found
significant at 0.05 level. Towards training criteria, the average score of
above 5 lakhs income level employees are 30.91, 3-5 lakhs salary holders
are 30.75 and 1-3 lakhs salary holders are 30.65, the respective standard
deviations are 1.058, 0.952 and 0.837. Therefore, the derived f-value 1.808
and found there is no significant level.
From the above discussion it can be conclude that the executives
whose annual income was low (1-3 lakhs), they are more positive towards
individual views on training, features of existing training methods and
training process in the organization, the executives whose annual income

INTERNATIONAL JOURNAL OF MULTIDISCIPLINARY EDUCATIONAL RESEARCHISSN : 2277-7881; IMPACT FACTOR - 2.735; IC VALUE:5.16VOLUME 3, ISSUE 3(4), MARCH 2014
27
levels was middle (3-5 lakhs), they are more positive towards training and
components of training, whereas, the employees whole income level was
high (Above 5 lakhs), they are more positive towards views about objectives
& work and training criteria. An overall it shows that there is a significant
difference between and within the groups of executives by their income
levels towards the dimensions of training and development in the
organization. Therefore, the income levels determining the executives in
their opinions regarding impact of training and development on the
executives of RINL. Hence, the null-hypothesis is rejected.
Discussion
The analysis of the data reveals that female employees are more
satisfied in training, individual views on training, features of existing
training methods, components of training, and training process in the
organization. Whereas, the male executives are dominating in their
satisfaction levels in views about objectives and work, training criteria.
Except training, the female satisfaction level in remaining dimensions found
significantly higher than male executives. Therefore, the female executives
are satisfying more than male executives towards training and development
activities in the organization.
The data infers lower age group executives are more positive towards
views of individuals on training, features of existing training methods,
components of training, training process and training criteria in the
organization. Whereas, in training and views about objectives and work
the middle age group executives are more positive than others. Hence, age
of the employee is not a factor to determine the impact of training and
development in the organization.
INTERNATIONAL JOURNAL OF MULTIDISCIPLINARY EDUCATIONAL RESEARCHISSN : 2277-7881; IMPACT FACTOR - 2.735; IC VALUE:5.16VOLUME 3, ISSUE 3(4), MARCH 2014
28
The analysis of data shows that the under graduate executives are
more positive towards training and training criteria, but graduate
executives satisfaction level is more significant in individual views on
training and components of training than others. Whereas, the response
of the post graduate executives indicates significantly more positive towards
views about objectives & work, features of existing training methods and
training process than others. Therefore, it shows that there is a significant
difference between and within the groups of employees by their education
levels towards the impact of training and development on executives in
the organization.
According to the data, between 1-5 years experienced employees
are more positive towards training process, but between 10-20 years
experienced executives satisfaction level is more in training in the
organization. Whereas, the opinions of 5-10 years experienced employees
found more positive towards views about objectives & work, components
of training and training criteria, and the executives who are having more
than 20 years of experience are comparatively positives towards features
of existing training methods. An overall there is no significant difference
between and within the groups of employees by their experience levels
towards training and development activities in the organization.
It can be conclude from the data that the employees whose annual
income was between 1-3 lakhs are more positive towards individual views
on training, features of existing training methods and training process in
the organization. But the employees whose annual income levels are
between 3-5 lakhs found more positive towards training and components
of training. Whereas, more than 5 lakhs annual income earners are more
positive towards views about objectives & work and training criteria. An
overall it shows that there is a significant difference between and within

INTERNATIONAL JOURNAL OF MULTIDISCIPLINARY EDUCATIONAL RESEARCHISSN : 2277-7881; IMPACT FACTOR - 2.735; IC VALUE:5.16VOLUME 3, ISSUE 3(4), MARCH 2014
29
the groups of employees by their income levels towards the impact of
training and development on executives in the organization.
Conclusion
One of the primary objectives of the industries is to develop a well-
knit personnel policy and a comprehensive personnel programme that will
be result-oriented and to develop organizational objectives. In accordance
with this objective, Visakhapatnam Steel Plant (RINL) has given
considerable emphasis on development of human resources, as well as
formulation and implementation of progressive personnel policies, systems,
rules and procedures to synchronies organizational needs/ business plan
with individual aspirations. VSP has laid emphasis on effective man
management as it believes that effectiveness and success of the organization
depend largely on the skills and commitment of the people.
VSP has developed a comprehensive scheme of career planning and
managerial succession. The size of the organization has necessitated the
development of a computer culture which motivates employees to contribute
their best towards the achievement of organizational based Personnel
Inventory System. In the field of industrial relations, VSP encourages a
participative approach. A career with VSP will mark the beginning for a
quest for advancement. VSP is a fast expanding organization and provides
ample opportunities to bright youngsters to rise in the organizational
hierarchy.
The Company has an exclusive Training and Development Centre
to take care of the training requirements of the officers and workmen as
well as the newly recruited Management Trainees etc. The training
initiative includes special need based Programs and orientation programs
catering to the requirements of various departments of the company.

INTERNATIONAL JOURNAL OF MULTIDISCIPLINARY EDUCATIONAL RESEARCHISSN : 2277-7881; IMPACT FACTOR - 2.735; IC VALUE:5.16VOLUME 3, ISSUE 3(4), MARCH 2014
30
Suggestions
There is a need of linking business strategy and cultural strategy
to the training and development activities. Then it will be easy to identify
how the training supports the strategy. Identify a minimum acceptable
level of effectiveness for training and development curriculum, so that the
expected results can be easily evaluated in the process of functioning.
Each and every training and development activity has to be
measured as soon as the training program is completed and feedback given
to trainee, trainer and concerned department for future improvement/
development.
A variety of terms have been used by researchers, academicians
and practitioners to describe the research area selected by the researcher.
Live training, training and development, employee development, learning
and development and human resource development. The researcher selected
training and development mainly with regard to its impact and
effectiveness.
References
1. Agarwal. M. C. (1983), ‘Management Training Problems in public sector’,
In Management Development and Training in public Enterprises. Ajanta
Publications, Delhi, p. 188.
2. Bhatia. S.K. (1981), ‘Trends in Training and Development’, Indian Journal
of Training and Development, 1 I (4), pp. 42-145.
3. Blanchard, P. Nick and James W. Thacker. (1998), ‘Effective Training
Systems’. Strategies and Practices. Prentice Hall. New Jersey. pp. 13-113.
4. Coffman, Linn. (1990), ‘Involving Managers in Training Evaluation’,
Training and Development Journal. 44 (6), pp. 77-80.

INTERNATIONAL JOURNAL OF MULTIDISCIPLINARY EDUCATIONAL RESEARCHISSN : 2277-7881; IMPACT FACTOR - 2.735; IC VALUE:5.16VOLUME 3, ISSUE 3(4), MARCH 2014
31
5. David McGuire and Kenneth Molberg Jorgensen (2011), Human Resource
development, theory & practice, Sage Publications, New Delhi.
6. Gilley and May Cunich (2000), ‘Organisational learning, performance, and
change’, Addision-wesley.
7. Kanduala Srinivas R. (2002), ‘Strategic Human Resource Development’.
Prentice Hall of India New Delhi.
8. Lynton, Rolf P. and Udai Pareek. (2004), ‘Training for Development, Sage’,
(2nd ed.), New Delhi, pp.3.
9. Mani, Saurabh. (2002), ‘Executive Development in Banking Sector in
India’, Ph.D. Dissertation (Unpublished). Dayalbagh Educational Institute
(Deemed University).
10. Phillips, Jack. (2000), ‘Bottom line Training’. Prentice-Hall, New Delhi.
11. Rao, P. Subba. (1992), ‘Essentials of Human Resource Management and
Industrial Relations’, Himalaya Publishing House, Delhi, pp. 282-283.
12. Rao, T.V. (1996), ‘Human Resource Development’, Sage Publications, New
Delhi.
13. Rao, T.V. (2003), ‘Future of HRD’, Macmillian India Ltd.
14. Sah, A.K. (1991), ‘Systems Approach to Training and Development’,
Sterling Publishers, New Delhi, pp. 6-10.
15. Taylor (2001), ‘Bernard Management Training and Development
Handbook’, McGraw-Hill, London, p. 3.
16. Vir, Dharam. (1997), ‘Managerial Effectiveness: Issues and Challenges’,
Managerial Effectiveness, Ravvat Publications, Jaipur, p. 59.
17. Yasin M.M., (2002), ‘The theory and practice of Bench marking’, An
international Journal.
INTERNATIONAL JOURNAL OF MULTIDISCIPLINARY EDUCATIONAL RESEARCHISSN : 2277-7881; IMPACT FACTOR - 2.735; IC VALUE:5.16VOLUME 3, ISSUE 3(4), MARCH 2014
32
INTERNET MARKETING
N.Prasanna KumarAssistant Professor
Dept of Internationals Business StudiesAcharya Nagarjuna University, Guntur
Definition of Internet Marketing:
Internet marketing is the process and executing the conception,
pricing, promotion, and distribution of ideas, goods, and services to create
exchanges that satisfy individual and organizational goals.
Meaning of Internet Marketing:
Internet marketing is the process of building and maintaining
customer relationship through online activities to facilitate the exchange
of ideas, products, and services that specify the goals of both parties.
THE SEVEN STAGES OF INTERNET MARKETING:
1. Corporate and business-unit strategy
2. Analyze the market opportunity
3. Formulating marketing strategy
4. Design the customer experience
5. Design the marketing program
6. Design the customer interfacing
7. Evaluate the marketing program

INTERNATIONAL JOURNAL OF MULTIDISCIPLINARY EDUCATIONAL RESEARCHISSN : 2277-7881; IMPACT FACTOR - 2.735; IC VALUE:5.16VOLUME 3, ISSUE 3(4), MARCH 2014
33
Stage one- Corporate and business-unit strategy:
Corporate strategy addresses the inter-relationship between the
various business units in a firm, including decisions about which units
should be kept, sold, or augmented. Business unit strategy focuses on how
a particular unit in the company attacks the market to gain competitive
advantage.
Stage tow- Analyze the market opportunity:
In the stage entails the analysis of market opportunities and an
initial first pass of the business concepts—that is, collecting sufficient online
and offline data to establish the burden of proof of opportunity assessment.
Stage three-Formulating marketing strategy:
Internet marketing strategy is based upon corporate, business-unit,
and overall marketing strategies of the firm. The marketing strategy goals,
resources, and sequencing of actions must be tightly aligned with the
business-unit strategy. Finally, the overall marketing strategy comprises
both offline and online marketing activities.
Stage four-Designing the customer experience:
Firms must understand the type of customer experience that needs
to be delivered to meet the market opportunity. The experience should
correlate with the firm’s positioning and marketing strategy.
Stage five-designing the marketing program:
The completion of stages one through four results in clear strategic
direction for the form. The firm has made a go\no-go decision on a particular
option. Moreover, it has decided upon the target segment and the specific
position that it wishes to own in the mind of the target customer.
INTERNATIONAL JOURNAL OF MULTIDISCIPLINARY EDUCATIONAL RESEARCHISSN : 2277-7881; IMPACT FACTOR - 2.735; IC VALUE:5.16VOLUME 3, ISSUE 3(4), MARCH 2014
34
Stage six-Crafting the customer interface:
The Internet has shifted the locus of the exchange from the market
place (i.e., face-to-face interaction) to the market space (i.e., screen-to-face
interaction). The key difference is that the nature of the exchange
relationship is now mediated by technology interface.
Stage seven-Evaluating the market program:
The last stage involves the evaluation of the overall Internet
Marketing program. This includes a balanced focus on both customer and
financial metrics.
The Internet Marketing Mix:
The traditional 4ps of marketing are product, price, promotion,
and place/distribution. All four of these choices are part of the Internet
marketing mix, plus new elements like physical evidence, people and process
when marketing planning for an online service.
PRICING
Setting prices is a key challenge for firms, and the fact is that prices
are often set in an unstructured manner. Firms often have a wide variety
of potential pricing strategies and price points to consider when deciding
how to best implement profit-maximizing strategies. In addition the internet
has strongly influenced old-economy pricing strategies, moreover it internet
has created an entirely new category of pricing tools, the types of pricing
are given below:
Penetration Pricing.
The price charged for products and services is set artificially low in
order to gain market share. Once this is achieved, the price is increased.
This approach was used by France Telecom and Sky TV.

INTERNATIONAL JOURNAL OF MULTIDISCIPLINARY EDUCATIONAL RESEARCHISSN : 2277-7881; IMPACT FACTOR - 2.735; IC VALUE:5.16VOLUME 3, ISSUE 3(4), MARCH 2014
35
Economy Pricing.
This is a no frills low price. The cost of marketing and manufacture
are kept at a minimum. Supermarkets often have economy brands for soups,
spaghetti, etc.
Price Skimming.
Charge a high price because you have a substantial competitive
advantage. However, the advantage is not sustainable. The high price tends
to attract new competitors into the market, and the price inevitably falls
due to increased supply. Manufacturers of digital watches used a skimming
approach in the 1970s. Once other manufacturers were tempted into the
market and the watches were produced at a lower unit cost, other marketing
strategies and pricing approaches are implemented.
Psychological Pricing.
This approach is used when the marketer wants the consumer to
respond on an emotional, rather than rational basis. For example ‘price
point perspective’ 99 cents not one dollar.
Product Line Pricing.
Where there is a range of product or services the pricing reflect the
benefits of parts of the range. For example car washes. Basic wash could
be $2, wash and wax $4, and the whole package $6.
Promotional Pricing.
Pricing to promote a product is a very common application. There
are many examples of promotional pricing including approaches such as
BOGOF (Buy One Get One Free).

INTERNATIONAL JOURNAL OF MULTIDISCIPLINARY EDUCATIONAL RESEARCHISSN : 2277-7881; IMPACT FACTOR - 2.735; IC VALUE:5.16VOLUME 3, ISSUE 3(4), MARCH 2014
36
Geographical Pricing.
Geographical pricing is evident where there are variations in price
in different parts of the world. For example rarity value, or where shipping
costs increase price.
Value Pricing.
This approach is used where external factors such as recession or
increased competition force companies to provide ‘value’ products and
services to retain sales e.g. value meals at McDonalds.
Premium Pricing.
Use a high price where there is a uniqueness about the product or
service. This approach is used where a substantial competitive advantage
exists. Such high prices are charge for luxuries such as Cunard Cruises,
Savoy Hotel rooms, and Concorde flights.
PRODUCT
A product is simply the tangible, physical entity that they may be
buying or selling. In order to actively explore the nature of a product further,
let’s consider it as three different products - the CORE product, the
ACTUAL product, and finally the AUGMENTED product.
CORE PRODUCT:
The CORE product is NOT the tangible, physical product. We can’t
touch it. That’s because the core product is the BENEFIT of the product
that makes it valuable to us. So with the car example, the benefit is
convenience. Another core benefit is speed since we can travel around
relatively quickly.

INTERNATIONAL JOURNAL OF MULTIDISCIPLINARY EDUCATIONAL RESEARCHISSN : 2277-7881; IMPACT FACTOR - 2.735; IC VALUE:5.16VOLUME 3, ISSUE 3(4), MARCH 2014
37
ACTUAL PRODUCT:
The ACTUAL product is the tangible, physical product. We can get
some use out of it. Again with the car example, it is the vehicle that test
drive, buy and then collect.
AUGMENTED PRODUCT:
The AUGMENTED product is the non-physical part of the product.
It usually consists of lots of added value, for which you may or may not
pay a premium. So when we buy a car, part of the augmented product
would be the warranty, the customer service support offered by the car’s
manufacture, and any after-sales service.
PLACE
The e-Marketing space consists of new Internet companies that have
emerged as the Internet has developed, as well as those pre-existing
companies that now employ e-Marketing approaches as part of their overall
marketing plan. For some companies the Internet is an additional channel
that enhances or replaces their traditional channel(s). For others the
Internet has provided the opportunity for a new online company.

INTERNATIONAL JOURNAL OF MULTIDISCIPLINARY EDUCATIONAL RESEARCHISSN : 2277-7881; IMPACT FACTOR - 2.735; IC VALUE:5.16VOLUME 3, ISSUE 3(4), MARCH 2014
38
Pre-existing companies that have adopted e-Marketing.
These are traditional companies that trade on the Internet.
Banking and financial Services e.g. HSBC Bank. Banks and financial
services have benefited tremendously from the popularity of Internet usage.
There is a mixture of new online banks and traditional banks, both offering
online banking services. Essentially banks no longer need to invest in high
cost, high street selling units i.e. old fashioned town-based banks. Labor
costs have also been reduced since much of the traditional banking
bureaucracy is done using IT, and the use of overseas call centers has meant
that salaries are much lower. Software also means that customers can be
retained by using Customer Relationship Management (CRM) eMarketing
approaches.
New Internet companies.
These companies only trade on the Internet.
New online manufacturer brand e.g. Dell.com - Entrepreneurs saw
opportunities for developing online manufacturers’ brands that took

INTERNATIONAL JOURNAL OF MULTIDISCIPLINARY EDUCATIONAL RESEARCHISSN : 2277-7881; IMPACT FACTOR - 2.735; IC VALUE:5.16VOLUME 3, ISSUE 3(4), MARCH 2014
39
advantage of online technologies that enabled innovative new products to
be adapted to customer preferences, and by using IT to enable efficient
and effective operations such as assembly and logistics.
Online Auction e.g. eBay. In common with new online retail brands,
before the emergence of Internet technologies, this concept was not possible.
Essentially eBay is a Consumer-to-Consumer (C2C) business
PROMOTION
Promotion is the way to promote a product in different areas of
media. Promoters use internet advertisement, special events, endorsements,
and newspapers to advertise their product. Many times with the purchase
of a product there is an incentive like discounts, free items, or a contest.
This is to increase the sales of a given product.
Promotions Strategies:.
1. Of course to promote website you should also consider offline
promotion strategies such as those used by non- Internet businesses.
2. Here a selection of other suitable approaches to offline promotion:

INTERNATIONAL JOURNAL OF MULTIDISCIPLINARY EDUCATIONAL RESEARCHISSN : 2277-7881; IMPACT FACTOR - 2.735; IC VALUE:5.16VOLUME 3, ISSUE 3(4), MARCH 2014
40
3. Create a media release or announce a media conference regarding
your website.
4. Advertise using other media such as TV, billboards, radio, newspapers
and magazines, or the cinema.
5. Send out direct mail shots and run campaigns.
6. Print your domain name and e-mail contact addresses upon all of
your corporate material.
7. Offer free products and services. FREE is one of the most powerful
words in marketing.
8. Provide free material e.g. fact sheets or guides that could be posted
or e-mailed to customers.
9. Offer competitions or quizzes (with prizes when possible).
CONCLUSION:
Through this paper I portray the Internet marketing assist the
manufacturers to market their product efficiently and easily in the market
to fascinate the customers.
References
1. haffey, D. et al., 2006. Internet Marketing: Strategy, Implementation and
Practice, Pearson Education.
2. Charlesworth, Alan (2009). Internet marketing: a practical approach.
Butterworth-Heinemann. p. 49
3. “Define Online Marketing”. Yourdictionary.com. Retrieved 9 January 2012.
4. “What Is Social Media Marketing”. Search Engine Land. Retrieved 9
January 2012.
INTERNATIONAL JOURNAL OF MULTIDISCIPLINARY EDUCATIONAL RESEARCHISSN : 2277-7881; IMPACT FACTOR - 2.735; IC VALUE:5.16VOLUME 3, ISSUE 3(4), MARCH 2014
41
IMPACT OF GLOBAL ECONOMIC CRISIS ON INDIANECONOMY: AN ANALYSIS
P.Satya Vara PrasadResearch Scholar
Department of Commerce and Management StudiesAndhra University, Visakhapatnam
Introduction:
Development means growth at a higher level; both are synonymous
to each other. There is close interaction between these two turns because
one follows the other. Development is not a single aspect. It is based upon
the contribution of several other systems like social, political, economic,
and cultural besides all these aspects economic system contributes more
for the development of a country. Due to this reasons scholars like Ilchman,
and Bhargava stressed the need of economic growth in the context of
development. Some times their will be fluctuations in the economic system
which causes economic crisis in the world. The aim of this paper is to
explain about growth and development vs. Global economic crisis and its
impact on developing countries like India.
Global Economic Crisis:
7The Global Economic Crisis first started in U.S and gradually it
has spread to other countries. By the time of the bankruptcy of Lehman
Brothers in September 2008 the financial crisis had become a more general
banking crisis which in turn rapidly impacted on the real economy and
turned into a Global recession. Globalization is a multi-dimensional process
of economic and structural transformation that has a variety of meanings
and interpretations. It generally refers to with the increasing flows of capital
goods and resources and knowledge across national boundaries.

INTERNATIONAL JOURNAL OF MULTIDISCIPLINARY EDUCATIONAL RESEARCHISSN : 2277-7881; IMPACT FACTOR - 2.735; IC VALUE:5.16VOLUME 3, ISSUE 3(4), MARCH 2014
42
However defined globalization has led to the greater Integration of
National Economies through trade liberalization financial sector
deregulation and capital account liberalization and flows of foreign direct
investments (FDI) by transnational corporations (TNCs). Globalization
has opened up new opportunities to low and middle income countries
through improved market access, increased flows of FDI often integrating
them in to global value chains (GVCs) or global production networks (GPNs)
and accelerated technology transfer both product and process technologies
although not as significant as global capital mobility the international
migration of labour has led to reciprocal flows of remittances which have
become a major income source for many developing countries. Increased
economic interdependence between national economies leads inevitably to
greater vulnerability to global economic shocks which are beyond the
control of individual countries. Developing countries run the danger of
becoming locked in to the business cycle financial sector conditions and
the vagaries of policy making in the larger more powerful developed market
(CAPITALIST) economies and many would argue this growing integration
of national economies has not be accompanied by the appropriate
mechanisms and institutions of global economic governance that would
correct the imbalances, address market failure anticipate disequilibria and
coordinate and regulate international flows of goods, services and capital
both FDI and portfolio flows.
In the second half of 2007 the world economy began to face acute
financial turmoil. It was becoming clear that serious losses were occurring
.In the United States a subprime mortgage market and as a result of the
fall in US house prices. The increase in mortgage defaults led to further
corrections in housing prices leading to further defaults using interest
rates to cover bank losses and eventually to the insolvency of lending

INTERNATIONAL JOURNAL OF MULTIDISCIPLINARY EDUCATIONAL RESEARCHISSN : 2277-7881; IMPACT FACTOR - 2.735; IC VALUE:5.16VOLUME 3, ISSUE 3(4), MARCH 2014
43
institutions themselves. Much of the initial funding for mortgages had
been obtained from the interbank money markets and thus other financial
intuitions were compromised and failed or had to be bailed our leading to
a liquidity and credit crunch in the interbank money markets. The
development of an essentially unregulated shadow banking system led to
a loss of confidence fuelled as the extent of toxicity of many assets became
more widely known. Banks cut back on short term lending to those
institution or markets that were seen as excessively risky.
Global Economic crisis was largely owing to non-traditional lending
outside the banking system centering on securitization. Through
securitization loans once held on the books of banks were repackaged and
sold. The scale and institutions and incentives promote successful
industrialization. There is no reason in principle why developing economies
can’t pursue green industrialization by developing and using green
technologies creating new markets and creating a virtuous circle between
environmental production and economic growth.
To understand the origins and evolution of the crisis and its impact
on developing countries we have to locate our analysis within a broader
global context. Financial sector instability is largely but not solely the
result of over two decades of liberalization and deregulation which began
in the 1980s under the Reagan and Thatcher administrations and which
has a fundamental economic instability is in part related to the emergence
surplus and net capital export economies namely China other East and
South East Asian current account surplus economies and the large net oil
exporters.
Another source of global instability is the volatility of oil and
commodity prices. Having reached record levels in April-June 2008,

INTERNATIONAL JOURNAL OF MULTIDISCIPLINARY EDUCATIONAL RESEARCHISSN : 2277-7881; IMPACT FACTOR - 2.735; IC VALUE:5.16VOLUME 3, ISSUE 3(4), MARCH 2014
44
commodity prices fell sharply over the remainder of the year especially oil
a number of metals. Obviously the economic impact of commodity price
fluctuations depends on the structure and composition of production and
track of individual developing countries. Net commodity exporters in
general benefit from rising prices and suffer when prices decline economies
that are heavily dependent on imported oil and foodstuffs other things
being equal will benefit from falling commodity prices.
The causes of financial crisis are complex. According to the IMF
(2010 2011) world output grew by 3 percent in 2008, fell by 0.6 percent in
2009 and grew again by 5 percent in 2010. It is projected to grow by 4.4
percent in 2011 and 4.5 percent in 2012 a clean sign of global recovery. For
advanced economies output grew by 0.5 percent in 2008 fell by 3.4 percent
in 2009 and grew by 3 percent in 2010. It is projected to grow by 2.5 percent
and 2.5 percent for the years 2011 and 2012 respectively. The difference
between world output and advanced country output figures is largely
accounted for by the emerging and developing economies group of countries
and Developing Asia (China, India, Asian -Indonesia, Malaysia, Philippines,
Thailand and Vietnam ) in particular.
It was not until September 2008 that the impact of the financial
crisis on International trade became evident WTO 2009. The full impact
of the crisis was felt across all regions of the Global Economy by the Fourth
quarter of 2008 with Europe experiencing a fall of 16 percent in the fourth
quarter and Asia recording a fall of 5 percent in the exports in the same
period. In the first quarter of 2009 there was a much steeper decline in
merchandise trade with falling commodity price largely to blame(WTO
2009). The IMF (2010-2011) gives data for World Trade volume (goods and
services) for 2008, 2009 and 2010.

INTERNATIONAL JOURNAL OF MULTIDISCIPLINARY EDUCATIONAL RESEARCHISSN : 2277-7881; IMPACT FACTOR - 2.735; IC VALUE:5.16VOLUME 3, ISSUE 3(4), MARCH 2014
45
World GDP and World merchandise exports move in tandem. The
rate of growth in International trade is greater than the rate of growth of
GDP. But the same relationship holds when GDP of its rate of growth fall.
The income elasticity of manufactured exports is greater than that for
total than merchandise exports to changes in income.
As far as the impact of crisis on employment is concerned with the
latest ILO (2010-2011) data indicate that the largest falls in employment
were in the manufacturing sectors in all regions of the Global Economy,
but were greater in developed economies. In the latter group of economies
the fall in employment is estimated to be million jobs as opposed to
approximately 2 million jobs lost in developing economies. There were also
significant but smaller falls in employment in the construction and
wholesale and retail trade sectors in all economies. Significant job losses
could be seen for the period from 2008 to 2009 as the government of major
donor countries struggle to bring their public sector budget deficits in
control.
Impact of global economic crisis on Indian economy an analysis:
Global economic meltdown has affected almost all the countries of
the world, strongest of American. European and Japanese companies are
facing severe crisis of liquidity and credit. This global financial and economic
crisis keeps on getting worse. Recession in the United States is a very bad
news for our country. Our companies in India have most outsourcing deals
from the US. Even our exports to US have increased over the years. Exports
for January, 2009 have declined by 22 percent. There is a decline in the
employment market due to the recession in the West. There has been a
significant drop in the new hiring which is a cause of great concern for us.
Some companies have laid off their employees and there have been cut in

INTERNATIONAL JOURNAL OF MULTIDISCIPLINARY EDUCATIONAL RESEARCHISSN : 2277-7881; IMPACT FACTOR - 2.735; IC VALUE:5.16VOLUME 3, ISSUE 3(4), MARCH 2014
46
promotions, compensation and perks of the employees. Companies in the
private sector and government sector are hesitant to take up new projects.
And they are working on existing projects only. The textile, garment and
handicraft industry are badly affected. There has also been a decline in
the tourist inflow lately. The real estate has also a problem of tight liquidity
situations, where the developers are finding it hard to raise finances.
Further. The manufacturing sector has equally been hit hard by the
economic slowdown.
A recession is a decline in a country’s gross domestic product (GDP)
growth for two or more consecutive quarters of a year. A recession is also
preceded by several quarters of slowing down. An economy which grows
over a period of time to slow down the growth as a part of the normal
economic cycle. A recession normally takes place when consumers lose
confidence in the growth of the economy and spend less. This leads to a
decreased demand for goods and services, which in turn leads to a decrease
in production, lay-offs and a sharp rise in unemployment. Investors spend
less as they fear stocks values will fall and thus stock markets fall on
negative sentiment.
The economic and the stock market are closely related. The stock
markets reflect the buoyancy of the economy. The Indian stock markets
crashed due to a showdown in the US. The Sensex crashed by nearly 13
percent in just two trading sessions in January, 2008.
In November 2008, the giant Citibank and The Bank of America
had to be bailed out with several hundred billion dollars by the American
authorities. It also reported job losses of more than 5,30,000.The biggest
single month figure since 1974,taking the US unemployment rate to
6.7percent,the highest in last 15years.The developed economies of the world

INTERNATIONAL JOURNAL OF MULTIDISCIPLINARY EDUCATIONAL RESEARCHISSN : 2277-7881; IMPACT FACTOR - 2.735; IC VALUE:5.16VOLUME 3, ISSUE 3(4), MARCH 2014
47
like Europe, UK, Japan and US are today officially in recession i.e. they
have experienced two successive quarters of negative growth. This is not
just bad news for India, but also for the rest of the world. There is more
uncertainty about the depth and duration of the current global recession.
The US economy has suffered 10 recessions since the end of World
War II. The Great Depression in the US was an economic slowdown, from
1930 to 1939. It was a decade of high unemployment, low profits, low prices
of goods, and high poverty. The trade market was brought to a standstill,
which consequently affected the world markets in the 1930s. Industries
that suffered the most included agriculture, mining, and logging. In 1937,
the American economy unexpectedly fell, lasting through most of 1938.
Production declined sharply, as did profits and employment. Unemployment
jumped from 14.3 per cent in 1937 to 19.0 percent in 1938. The US saw a
recession during 1982-83 due to a tight monetary policy to control inflation
and sharp correction to over production of the previous decade. This was
followed by Black Monday in October 1987, when a stock market collapse
saw the Dow Jones Industrial Average plunge by 22.6 percent affecting
the lives of millions of Americans. The early 1990s saw a collapse of junk
bonds and a financial crisis. The US saw one of its biggest recessions in
2001, ending ten years of growth, the longest expansion on record. From
March to November 2001, employment dropped by almost 1.7 million. In
the 1990-91 recessions, the GDP fell 1.5 percent from its peak in the second
quarter of 1990. The 2001 recession saw a 0.6 percent decline from the
peak in the fourth quarter of 2000. The dotcom burst hit the US economy
and many developing countries.
The global economic recession has taken its toll on the Indian
economy that has led to multi-crore loss in business and export orders,
thousands of job losses, especially in key sectors like the IT, automobiles,

INTERNATIONAL JOURNAL OF MULTIDISCIPLINARY EDUCATIONAL RESEARCHISSN : 2277-7881; IMPACT FACTOR - 2.735; IC VALUE:5.16VOLUME 3, ISSUE 3(4), MARCH 2014
48
industry and export oriented firms. It has also shaken up the investment
arena. It is a difficult phase for a growing economy like India.
In August, 2008 India recorded inflation at its 16 years high of
12.91%. This inflationary situation forced the regulatory bodies of the
country to take certain anti-inflationary measures by tightening the
monetary policy which in turn made it difficult for institutions and
individuals to borrow money from banks. In some ways, this has also
contributed to the showdown in different sectors and can be considered to
be the start of slowdown in different sectors in India.
Before this economic crisis, there were more than 1500 software
firms in the country. While the employee base of the sector had grown to
5,53,000 (form 4,15,000 in financial year 06). More than 13000 IT companies
were operating in Bangalore alone. This sector has been adversely affected
by the global crisis. As for the IT industry, nasscom had initially projected
a 21-24 percent growth rate for the year 2008, but the software association
revised it downward in the wake of the global financial meltdown.
In February 2008, Tata Consultancy Services (TCS) had asked about
500 employees to leave due to non-performance. Panty Computer Systems
(PCS) has already laid off around 400 employees, or nearly 3% of its 14,800
workforce, on the same ground, while IBM Corporation followed suit in
the case of 700 fresher’s. Wipro, the country’s third largest IT exporter, is
considering firing 3,000 employees over performance-related issues. Other
than IT firms, the IT-enabled service derive 75% or more of their revenues
from the US. Thus, if the Fortune 500 companies slash their IT budgets,
Indian firms could feel the heat.
Industry-wide indications after September, 2008 are also uniformly
gloomy. There reports of significant declines in output of automobiles,

INTERNATIONAL JOURNAL OF MULTIDISCIPLINARY EDUCATIONAL RESEARCHISSN : 2277-7881; IMPACT FACTOR - 2.735; IC VALUE:5.16VOLUME 3, ISSUE 3(4), MARCH 2014
49
commercial vehicles, steel, petrochemicals, construction, real estate,
finance, retail activity and many other sectors. Exports fell by 12 percent
in dollar terms in October, while core industries slowed to 3.4% during the
same month from 4.6% a year ago. The effect of such fob (income) losses
and pay-cuts has been on demand for goods and services. People either
have no money to buy or those who have are postponing their buying
because of the economic uncertainties ahead.
The recession has affected in India in many different ways including the
following:
1. Declines in foreign direct investment especially reductions in
access to loans from banks-India has set up their own sovereign
wealth funds to offset this.
2. Recession has cut export prices-but another key effect has been
increased volatility of prices-this increases revenue uncertainty
for commodity-dependent countries and acts as a barrier against
much-needed capital investment.
3. A recession in global tourism-often a significant share of GDP
for many poorer nations like India.
4. Rising food prices has created a huge problem of food poverty-
the World Bank called this a silent tsunami.
5. Increased unemployment, under-employment puts huge
pressure on government finances in India.
The most worrying aspect of a recession is the sustained drop in
demand leading to deflation that is often caused by a drop in the supply of
money or credit. It is also caused by a contraction in spending, by
government or people. Deflation tends to raise unemployment, causing a

INTERNATIONAL JOURNAL OF MULTIDISCIPLINARY EDUCATIONAL RESEARCHISSN : 2277-7881; IMPACT FACTOR - 2.735; IC VALUE:5.16VOLUME 3, ISSUE 3(4), MARCH 2014
50
vicious spiral. Just to avoid the deflation trap nations is pumping money
into their economics disregarding the deficit they are accumulating. This
is to stimulate spending and to keep the inflation from falling below a
certain level as to become a disincentive to produce.
The following measures can be adopted to tackle the recession
1. Tax cuts are generally the first step any government takes during
slump.
2. Government should hike its spending to create more jobs and boost
the manufacturing sectors in the country.
3. Government should try to increase the export against the initial
export.
4. The way out for builders is to reduce the unrealistic prices of
property to back the buyers into the market. And thus raise finances
for the incomplete projects that they are developing.
5. The falling rupee against the dollar will bring a boost in the export
industry. Thought the buyers in the west might become scare.
6. The oil prices decline will also have a positive impact on the
importers.
India has adopted certain measures to combat recession. Since
October, 2008 The Reserve Bank of India has cut the rate and the CRR by
350 and 400 basis points respectively. The reverse repo rate has been cut
by 200 basis points over the same period. This in turn has made credit
cheaper and has increased the overall liquidity in the system. Further, the
PSU banks of the country have decreased the home loan rates. This is
expected to this government has proposed to cut service tax and excise
duty on most goods.

INTERNATIONAL JOURNAL OF MULTIDISCIPLINARY EDUCATIONAL RESEARCHISSN : 2277-7881; IMPACT FACTOR - 2.735; IC VALUE:5.16VOLUME 3, ISSUE 3(4), MARCH 2014
51
Conclusion:
Developing countries are the worst victims of Global Economic
Crisis. India is not an exception from the same situation. International
Organization like IMF, World Bank etc.., Should not be passive observers
but they must play active role in controlling the Global Economic Crisis.
In addition to this the developed countries like USA, UK and USSR must
try to put their efforts to control the Recession. Government must adapt
all possible devices to come out from the existing situation.
References:
1. The IMF and Global Financial Crisis published:- November 2012-Joseph
P.Joyce
2. Before and Beyond the Global Economic Crisis-2008–Edward Elgar
3. The Financial Crisis-2008-Tony Ciro
4. The Financial Crisis: Who is to Blame-2010- Howard Davies
5. The Global Economic Crisis through an Indian looking glass (2008-09)-
Adauh kishore.
6. w w w. t u t o r 2 u . n e t / b o g / i n d e x . p h p / e c o n o m i c s / c o m m e n t s /
impactofglobalrecessionondevelopingcountries
INTERNATIONAL JOURNAL OF MULTIDISCIPLINARY EDUCATIONAL RESEARCHISSN : 2277-7881; IMPACT FACTOR - 2.735; IC VALUE:5.16VOLUME 3, ISSUE 3(4), MARCH 2014
52
WORK EXTRINSIC AND INTRINSIC MOTIVATION AMONGNURSES
Dr. D. Ravi ShankerAdikavi Nannaya University
Rajahmandry
Dr. D. Renuka RaniSevenhills Hospital
Visakhapatnam
Work motivation is considered to be one of the important topics in
organisational research, it has been the subject of more theories than any
other topic (Baron,1991). It is defined as “set of energetic forces that
originate both within as well as beyond an individual’s being to initiate
work related behaviour, and to determine its form, direction, intensity,
and duration” (Pinder, 2008). In the present scenario, it is important to
understand what motivates an employee is central and sometimes could
be of cardinal value for the organisations overall survival and growth. Since
a motivated work force develops a competitive advantage in any work
environment. Further, one has to understand that motivation is a person’s
internal disposition to be concerned with how he favours positive incentives
over negative incentives. To further this, an incentive is the anticipated
reward or aversive event available in the environment for the employee to
choose between (Deckers, 2010). While motivation can often be used as a
tool to help predict behavior, it varies greatly among individuals and must
often be combined with ability and environmental factors to actually
influence behavior and performance. Because of motivation’s role in
influencing workplace behavior and performance, it is key for organizations
to understand and to structure the work environment to encourage
productive behaviors and discourage those that are unproductive.
An issue that warrants attention in motivation research is the
method and approach used to assess the concept of motivation. Assessments

INTERNATIONAL JOURNAL OF MULTIDISCIPLINARY EDUCATIONAL RESEARCHISSN : 2277-7881; IMPACT FACTOR - 2.735; IC VALUE:5.16VOLUME 3, ISSUE 3(4), MARCH 2014
53
of employee motivation need to be practical, fast, flexible, and accessible
through different means. Short, theory-grounded measures leading to
concrete applied venues are key to addressing these organisational needs.
This study will thus define and review different approaches assessing
motivation in the hospital workplace especially with regard to nursing
employees. Emphasis will be given to intrinsic and extrinsic motivation
among nurses grounded in self determination theories, which should prove
valuable and practical for use in rapidly changing hospital organisational
environments (Tremblay & Blanchard, 2009).
More and more firms are realizing the importance of having
motivated and satisfied employees. Employee motivation is a crucial element
in a successful organisation. Employee satisfaction is often referred to in a
same way as employee motivation. However, being motivated and being
satisfied are two related but different things. The word motivation comes
from the ancient Latin verb ‘movere’, which means to urge or to move.
The problem with finding a suitable definition of motivation is that there
are so many definitions available in the literature. This could be due to the
many different motivational theories present and the various fields where
motivation is used.
Managers and supervisors acknowledge the importance of
motivation in organizations for creating a successful enterprise. Employees
that are motivated to work long and hard are normally more productive
than employees that are not motivated (Daniels and Radebaugh, 2001).
Daniels and Radebaugh (2001) continue by stating that higher productivity,
caused by increased work motivation, normally reduces production costs.
As mentioned before, there are several definitions on motivation available.
One of them is Robbins (2003), who defines motivation as the eagerness to
do something, conditioned by this action’s capacity to satisfy some specific
INTERNATIONAL JOURNAL OF MULTIDISCIPLINARY EDUCATIONAL RESEARCHISSN : 2277-7881; IMPACT FACTOR - 2.735; IC VALUE:5.16VOLUME 3, ISSUE 3(4), MARCH 2014
54
need for the individual. Another definition is given by Kinicki and Kreitner
(2003), who depict motivation as those psychological processes that cause
the stimulation, direction, and determination of voluntary actions that
are goal oriented. In other words, motivation is what drives individuals to
do what they do. Motivation can be traced back in numerous aspects.
Given today’s economy, a motivated workforce represents both a
competitive advantage and a critical strategic asset in any work
environment. In organisational research, work motivation has been the
subject of more theories than any other topic (Baron, 1991); organisational
researchers see employee motivation as a fundamental building block in
the development of effective theories (Steers, Mowday, & Shapiro, 2004).
Indeed, programs of research guided by expectancy-valance theory, self-
regulation and goal-setting formulations, social exchange and justice
approaches, and self perspective (e.g., self-determination theory [SDT];
Deci & Ryan, 1985, 2000) have stimulated the development of organisational
and managerial practises to promote positive worker attitudes (e.g.,
employee commitment) and enhance job performance (e.g., individual and
team effort). Thus understanding the intrinsic and extrinsic motivations
of nurses the hospitals could promote positive worker attitudes like
employee commitment, and enhance perceived organisation support, job
satisfaction, and their overall team effort especially in Indian context.
METHOD
Objectives of the Study:
The objectives of the study include:
To assess work extrinsic and intrinsic motivation orientation among
nurses.

INTERNATIONAL JOURNAL OF MULTIDISCIPLINARY EDUCATIONAL RESEARCHISSN : 2277-7881; IMPACT FACTOR - 2.735; IC VALUE:5.16VOLUME 3, ISSUE 3(4), MARCH 2014
55
To examine the influence of demographic variables (age, experience
and family size) on work extrinsic and intrinsic motivational
orientation among nurses.
Hypothesis:
There will be differences on motivational orientations among nurses
There will be significant influence of demographic variables on
motivational orientations of nurses.
Tools or Measures:
The Work Extrinsic and Intrinsic Motivation Scale (WEIMS)
developed by Tremblay & Blanchard (2009) is an 18-item measure of work
motivation grounded on Self Determination Theory. At the low-end lies
amotivation (AMO) in which individuals either lack the intention to act or
act passively. Next along the continuum is external regulation (ER), namely,
doing an activity only to obtain a reward. Next is introjected regulation
(INTRO), namely the regulation of behaviour through self-worth
contingencies (e.g., self-esteem, guilt). Then there is identified regulation
(IDEN), which refers to doing an activity because one identifies with its
value or meaning, and accepts it as one’s own. Finally, there is integrated
regulation (INTEG), which refers to identifying with the value of an activity
to the point that it becomes part of the individual’s sense of self.
Identification, integration, and intrinsic motivation are the prototype of
self-determined motivations (Intrinsically Motivated) whereas amotivation,
external regulation, and introjection are categorized as non self-determined
motivations (Extrinsically Motivated).
Scoring:
The WEIMS is divided into three-item six subscales, which
correspond to the six types of motivation postulated by SDT (i.e., intrinsic

INTERNATIONAL JOURNAL OF MULTIDISCIPLINARY EDUCATIONAL RESEARCHISSN : 2277-7881; IMPACT FACTOR - 2.735; IC VALUE:5.16VOLUME 3, ISSUE 3(4), MARCH 2014
56
motivation, integrated, identified, introjected and external regulations, and
amotivation). Participants were asked to indicate on a Likert-type scale
ranging from 1 (does not correspond at all) to 5 (corresponds exactly) the
extent to which the items represent the reasons they are presently involved
in their work. Raw scores for each factor are summed up to get the total
score for those particular factors.
Reliability and Validity:
Previous research has shown that the self-determination index
displays high levels of reliability and validity (e.g., Fortier, Vallerand, &
Guay, 1995; Green-Demers, Pelletier, & Me´nard, 1997; Pelletier, Dion,
Slovinec-D’Angelo, & Reid, 2004). The internal consistency (Cronbach’s
alpha coefficient) of the W–SDI was .84. The Cronbach’s alphas assessing
the internal consistency of the WEIMS’s six subscales. Alpha values ranged
from .64 to .83, suggesting adequate reliability (IM _ .80; INTEG _ .83;
IDEN _ .67; INTRO _ .70; EXT _ .77; AMO _ .64). Overall, considering the
fact that these subscales consist of only three indicators each, they show
adequate internal consistency.
Sample
A total of 96 nurses were selected using stratified random sample
technique, the age range of the nurses were between 19 and 38 years with
a mean age of 22.54 (±2.45) years. The study examined the motivational
orientations of nurses and to determine whether these orientations varied
according to age, family size and so on. The sample constituted mostly
unmarried nurses and who worked at different shift timings from Seven
Hills Health care Visakhapatnam, Andhra Pradesh. Of the 96 nurses 77
(80 %) were Telugu speaking, and 19 (20%) belong to non Telugu speaking.

INTERNATIONAL JOURNAL OF MULTIDISCIPLINARY EDUCATIONAL RESEARCHISSN : 2277-7881; IMPACT FACTOR - 2.735; IC VALUE:5.16VOLUME 3, ISSUE 3(4), MARCH 2014
57
Research Design
This is a quantitative study utilizing survey research method and
exploratory in nature, it exploratory in the sense that the organisation is
looking into aspects of the motivations among their nurses for the first
time. So as to enable them to understand the training needs of their nursing
work force.
Data obtained from the samples was analyzed using SPSS to assess
the motivational orientations. t-tests were used to observe the differences
and compare means between demographic groups of the nurses. Simple
frequency and descriptive statistics were used for profiling the sample.
RESULTS AND DISCUSSION
The result of the present study on identifying motivational
orientation among nurses is presented below:
A profile of the sample is presented in Table I.
Table I provides profile of the sample consisting of 96 nurses that
includes 19 Non Telugu speaking (20%) and 77 Telugu speaking (80%)
consisting more than half of the sample. The sample has almost equal
representation of two groups on experience level, where nurses working
less than one year consist 47% and the other half is represented by nurses

INTERNATIONAL JOURNAL OF MULTIDISCIPLINARY EDUCATIONAL RESEARCHISSN : 2277-7881; IMPACT FACTOR - 2.735; IC VALUE:5.16VOLUME 3, ISSUE 3(4), MARCH 2014
58
working more than one year. Family size divided into less than 4 members
and 5 or more than 5 members. 4 or less than 4 members include 61% and
self 5 or more than 5 members include 31%. It has to be noted here that
since most of the sample consisting of Telugu speaking nurses further
analysis like t test were not executed between Telugu speaking and Non
Telugu speaking groups.
This section presents the results regarding the prevalence of
motivational orientations across the sample N=96 for the mean age of
22.54 (±2.45) years. Identified Regulation, Integrated Regulation, and
Intrinsic motivation are the prototype of Self Determined Motivations
(Intrinsically Motivated) whereas Introjected Regulation, External
Regulation and Amotivation are categorized as Non Self Determined
Motivations (Extrinsically Motivated).
The sample selected for examining the prevalence of motivational
orientations is provided in table 2. We can observe that most of the nurses
seem to be more Self Determined Motivation (Intrinsically Motivated) with
a mean score of 52.50 followed by Non Self Determined Motivation
(Extrinsically Motivated) 45.28. Almost similar means were observed on
Intrinsic Motivation (18.58), Integrated Regulation (17.27), Identified
Regulation (16.64) and Introjected Regulation (18.63). Nurses have shown
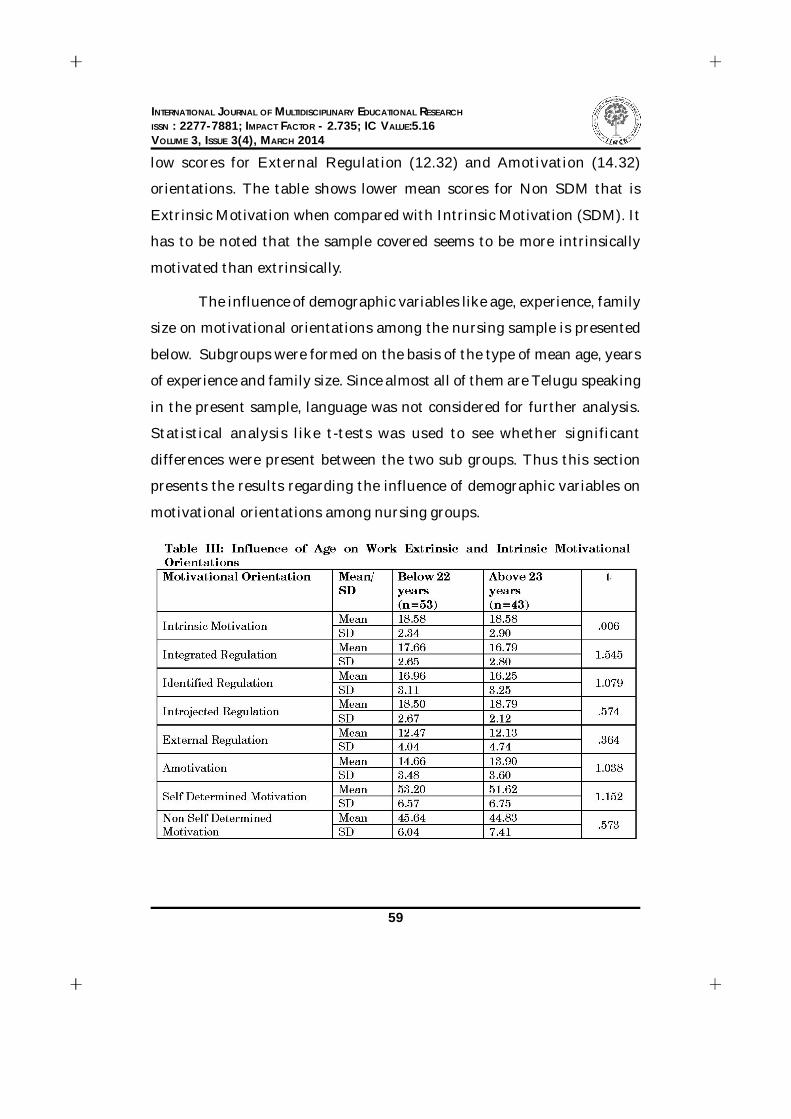
INTERNATIONAL JOURNAL OF MULTIDISCIPLINARY EDUCATIONAL RESEARCHISSN : 2277-7881; IMPACT FACTOR - 2.735; IC VALUE:5.16VOLUME 3, ISSUE 3(4), MARCH 2014
59
low scores for External Regulation (12.32) and Amotivation (14.32)
orientations. The table shows lower mean scores for Non SDM that is
Extrinsic Motivation when compared with Intrinsic Motivation (SDM). It
has to be noted that the sample covered seems to be more intrinsically
motivated than extrinsically.
The influence of demographic variables like age, experience, family
size on motivational orientations among the nursing sample is presented
below. Subgroups were formed on the basis of the type of mean age, years
of experience and family size. Since almost all of them are Telugu speaking
in the present sample, language was not considered for further analysis.
Statistical analysis like t-tests was used to see whether significant
differences were present between the two sub groups. Thus this section
presents the results regarding the influence of demographic variables on
motivational orientations among nursing groups.
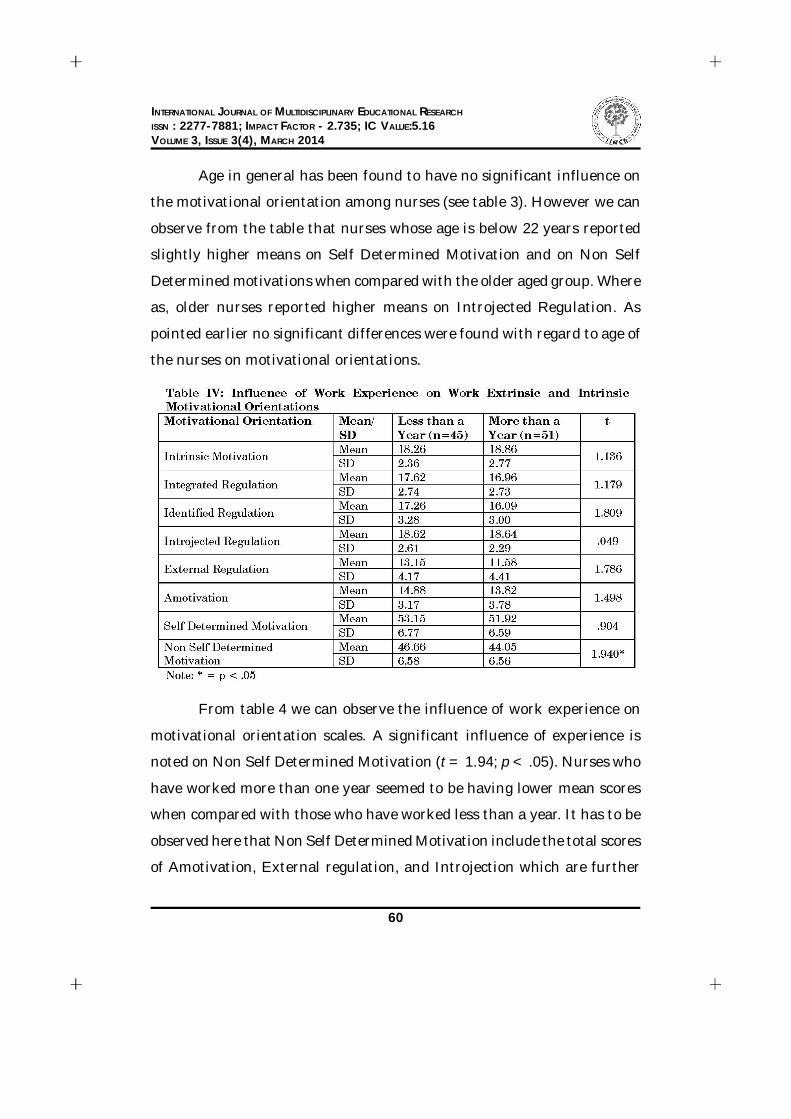
INTERNATIONAL JOURNAL OF MULTIDISCIPLINARY EDUCATIONAL RESEARCHISSN : 2277-7881; IMPACT FACTOR - 2.735; IC VALUE:5.16VOLUME 3, ISSUE 3(4), MARCH 2014
60
Age in general has been found to have no significant influence on
the motivational orientation among nurses (see table 3). However we can
observe from the table that nurses whose age is below 22 years reported
slightly higher means on Self Determined Motivation and on Non Self
Determined motivations when compared with the older aged group. Where
as, older nurses reported higher means on Introjected Regulation. As
pointed earlier no significant differences were found with regard to age of
the nurses on motivational orientations.
From table 4 we can observe the influence of work experience on
motivational orientation scales. A significant influence of experience is
noted on Non Self Determined Motivation (t = 1.94; p < .05). Nurses who
have worked more than one year seemed to be having lower mean scores
when compared with those who have worked less than a year. It has to be
observed here that Non Self Determined Motivation include the total scores
of Amotivation, External regulation, and Introjection which are further

INTERNATIONAL JOURNAL OF MULTIDISCIPLINARY EDUCATIONAL RESEARCHISSN : 2277-7881; IMPACT FACTOR - 2.735; IC VALUE:5.16VOLUME 3, ISSUE 3(4), MARCH 2014
61
categorized as extrinsically motivated. This could be that nurses with less
than one year experience seems to be more extrinsically motivated.
We can observe from the table that these nurses who have less than
a year experience have higher mean score for External Regulation
(mean=13.15; SD=4.17) which indicates that they perform a activity to
obtain a reward which was not the case for more experienced nurses.
Although intrinsic motivation is a very crucial type of motivation, most of
the activities performed by humans are not intrinsically motivated
activities. This can be seen after the early years of a human being, when
the freedom of being moved pure by one’s own interests becomes
overshadowed by social demands and roles one has to play that require
persons to take responsibility for tasks that are not initially intrinsically
motivating (Deci and Ryan, 1985).

INTERNATIONAL JOURNAL OF MULTIDISCIPLINARY EDUCATIONAL RESEARCHISSN : 2277-7881; IMPACT FACTOR - 2.735; IC VALUE:5.16VOLUME 3, ISSUE 3(4), MARCH 2014
62
From table 5 we can observe the influence of family size on motivational
orientation scales. A significant influence of family size is noted on Identified
Regulation (t =2.958; p <.01) and on Self Determined Motivation (t =
2.227; p < .05). Nurses who have larger family size seemed to be having
significantly higher mean scores when compared with those who have lesser
family members. It has to be observed here that Self Determined Motivation
include the total scores of Intrinsic motivation, Integrated regulation, and
Identified regulation which are further categorized as intrinsically
motivated. This could be that nurses with larger family size seems to be
more intrinsically motivated. Identified regulation indicates that these
nurses with more family members seems to be doing an activity because
they identify the profession with its value or meaning, and accepts it as
one’s own. Integrated regulation refers to identifying with the value of an
activity to the point that it becomes part of the individual’s sense of self.
Supported literature do indicate that this motivation comes from internal
tendencies and can direct and motivate behaviour without the presence of
constraints or rewards (Deci and Ryan, 1985). Translating intrinsic
motivation to the work environment, it holds that employees genuinely
care about their work, that employees search for better ways to get their
work done, and that employees are enthusiastic and committed to perform
well at their jobs (Thomas, 2000). According to Amabile (1993), intrinsic
motivators are necessarily bound up with work itself. Thus the above results
indicate that work experience levels and family size have considerable
significant influence on Work Extrinsic and Intrinsic Motivational
orientations among nurses.
SUMMARY
Motivation was considered to be one the most essential psychological
concepts in education. One theoretical view, Self-Determination Theory

INTERNATIONAL JOURNAL OF MULTIDISCIPLINARY EDUCATIONAL RESEARCHISSN : 2277-7881; IMPACT FACTOR - 2.735; IC VALUE:5.16VOLUME 3, ISSUE 3(4), MARCH 2014
63
(SDT), believed that individual behaviour can be intrinsically motivated,
extrinsically motivated, or amotivated. This theoretical approach to
academic motivation has produced an extensive amount of research relevant
to the discipline of education and organisations (Deci & Ryan, 1985, 1991).
The purpose of this study was to examine the motivational orientations
(Identification, integration, and intrinsic motivation are the prototype of
self-determined motivations whereas amotivation, external regulation, and
introjection are categorized as non self-determined motivations) of nurses.
In addition, the study looked at the influences of demographic
characteristics like age, experience, and family size on motivational
orientations. A total of 96 nurses were selected using stratified random
sample technique, the age range of the nurses were between 19 and 38
years with a mean age of 22.54 (±2.45) years. The sample constituted mostly
unmarried nurses and who worked at different shift timings from Seven
Hills Health care Visakhapatnam, Andhra Pradesh. Data was obtained
from administering the English and Telugu versions of Work Extrinsic
and Intrinsic Motivation Scale (WEIMS). Findings indicate that nurses
who have worked more than one year have significantly lower mean scores
on Non Self Determined Motivation (Extrinsic Motivation) when compared
with those who have worked less than a year. That is nurses with lesser
experience tend to be more extrinsically motivated. Nurses who have larger
family size seemed to be having significantly higher mean scores on
Identified Regulation and on Self Determined Motivation (Intrinsic
Motivation) when compared with those who have lesser family members.
The results are to be considered and conclusions to be drawn keeping in
mind the following limitations: The present findings are based on a small
sample. A larger sample for each category would have thrown more light.
It has to be noted that majority of participants predominantly belong to
INTERNATIONAL JOURNAL OF MULTIDISCIPLINARY EDUCATIONAL RESEARCHISSN : 2277-7881; IMPACT FACTOR - 2.735; IC VALUE:5.16VOLUME 3, ISSUE 3(4), MARCH 2014
64
Telugu speaking population. Another limitation of this study is that it
only explored a direct influence of demographic variables on motivational
orientation. It is possible that other psychosocial variables, such as social
support, birth order, SES etc., may influence these orientations.
SUGGESTIONS
The WEIMS forms enable professionals from many backgrounds to
quickly and effectively assess diverse aspects of motivational orientations.
Further studies can use a wider range of population. Both the English
Forms and the Telugu forms shall be of immense benefit in the
organizational and clinical settings, so standardised language specific
development of scales should be incorporated. There is a need to broaden
the scope of the study by including other variables that influence the
motivational orientations. Understanding motivational orientations will
serve as a valuable tool to health organizations seeking ways to help the
workforce improve it overall job satisfaction. This information can then
be utilized when developing interventions (psycho education, counselling
etc) which in turn help the subject to better equip to his living conditions.
References:
1. Amabile, T. M. (1993) Motivational synergy: Toward new
conceptualizations of intrinsic andextrinsic motivation in the
workplace. Human Resource Management Review. 3(3), 185.
2. Amabile, T. M. (1993) Motivational synergy: Toward new
conceptualizations of intrinsic and extrinsic motivation in the
workplace. Human Resource Management Review. 3(3), 185.
3. Ballmann, J. M., & Mueller, J. J. (2008) Using self-determination
theory to describe the academic motivation of allied health

INTERNATIONAL JOURNAL OF MULTIDISCIPLINARY EDUCATIONAL RESEARCHISSN : 2277-7881; IMPACT FACTOR - 2.735; IC VALUE:5.16VOLUME 3, ISSUE 3(4), MARCH 2014
65
professional-level college students. Journal of Allied Health. 37, 90-
96.
4. Baron, R. A. (1991) Motivation in work settings: Reflections on the
core of organizational research. Motivation and Emotion. 15, 1–8.
5. Benabou, R. & Tirole, J. (2003) Intrinsic and extrinsic motivation.
Review of Economic Studies. 70(244), 489-520.
6. Daniels, J. D. & Radebaugh, L. H. (2001) International business.
Environments and operations (Vol. 9th edition). Upper Saddle River,
New Jersey: Prentice-Hall Inc.
7. Deci, E. L. & Ryan, R. M (2000) The “what” and “why” of goal
pursuits: Human needs and the self-determination of behavior.
Psychological Inquiry. 11, 227–268.
8. Deci, E. L. & Ryan, R. M. (1991) A motivational approach to
integration of self: Integration in personality. In R. Dienstbier (Ed.),
Nebraska Symposium on Motivation: Perspectives on motivation (pp.
237–288). Lincoln: University of Nebraska Press.
9. Deci, E. L., & Ryan, R. M. (1985) Intrinsic motivation and self-
determination in human behavior. New York: Plenum Press.
10. Deckers, L. (2010). Motivation; Biological, Psychological and
Environmental. (3rd ed., pp. 2–3). Boston, MA: Pearson.
11. Demers G., I., Pelletier, L. G., & Me´nard, S. (1997) The impact of
behavioural difficulty on the saliency of the association between
selfdetermined motivation and environmental behaviours. Canadian
Journal of Behavioural Science. 29, 157–166.

INTERNATIONAL JOURNAL OF MULTIDISCIPLINARY EDUCATIONAL RESEARCHISSN : 2277-7881; IMPACT FACTOR - 2.735; IC VALUE:5.16VOLUME 3, ISSUE 3(4), MARCH 2014
66
12. Dreikurs Ferguson, E. (2000) Motivation: A biosocial and cognitive
integration of motivation and emotion. New York: Oxford University
Press Inc.
13. Fortier, M. S., Vallerand, R. J., & Guay, F. (1995) Academic motivation
and school performance: Toward a structural model. Contemporary
Educational Psychology. 20, 257–274.
14. Hennessey, B. A. & Amabile, T. M. (1998) Reality, intrinsic
motivation, and creativity. American Psychologist. 53(6), 674-675.
15. Hennessey, B. A. & Amabile, T. M. (2005) Extrinsic and intrinsic
motivation. Blackwell Encyclopedic Dictionary of Organizational
Behavior. 1-1.
16. Heyes, A. (2005) The economics of vocation or ‘why is a badly paid
nurse a good nurse’? Journal of Health Economics. 24(3), 561-569.
17. Iava, P. A. (1994) The self-concepts and motivational orientations
of registered nurse master’s degree students. Journal of Nursing
Education. 33, 317-319.
18. Kinicki, A. and Kreitner, R. (2003) Organizational behavior: Key
concepts, skills and best practices (international ed.). New York:
McGraw-Hill Companies, Inc.
19. Lepper, M. R., Greene, D. & Nisbett, R. E. (1973) Undermining
children’s intrinsic interest with extrinsic reward: A test of the
‘overjustification’ hypothesis. Journal of Personality and Social
Psychology. 28(1), 129-137.
20. Lindenberg, S. (2001) Intrinsic Motivation in a New Light. Kyklos.
54(2/3).

INTERNATIONAL JOURNAL OF MULTIDISCIPLINARY EDUCATIONAL RESEARCHISSN : 2277-7881; IMPACT FACTOR - 2.735; IC VALUE:5.16VOLUME 3, ISSUE 3(4), MARCH 2014
67
21. Oermann, M. H. (1994a) Professional nursing education in the
future: Changes and challenges. Journal of Obstetric, Gynecologic,
and Neonatal Nursing. 23, 153-159. doi:10.1111/j.1552-
6909.1994.tb01865.x.
22. Pelletier, L. G., Dion, S. C., Slovinec-D’Angelo, M., & Reid, R. (2004)
Why do you regulate what you eat? Relationship between forms of
regulation, eating behaviors, sustained dietary behavior change, and
psychological adjustment. Motivation and Emotion. 28, 245–277.
23. Penman, J. (2012) Motivations driving spiritual engagement based
on a phenomenological study of spirituality amongst palliative care
clients and caregivers. Journal of Nursing Education and Practice.
Vol 2, Iss 3.
24. Pinder, C. C. (1998). Work motivation in organizational behavior.
Upper Saddle River, NJ: Prentice Hall.
25. Robbins, S. P. (2003) Essentials of organizational behavior (7th ed.).
Upper Saddle River, New Jersey: Pearson Education, Inc.
26. Ryan, R. M., & Deci, E. L. (2000) Self-determination theory and the
facilitation of intrinsic motivation, social development, and well-
being. American Psychologist. 55, 68-78. doi:10.1037/0003-
066X.55.1.68.
27. Sansone, C. & Harackiewicz, J. M. (2000) Intrinsic and extrinsic
motivation: The search for optimal motivation and performance.
San Diego: Academic Press.
28. Shah, J. Y. & Kruglanski, A. W. in Sansone, C. & Harackiewicz, J.
M. (2000) Intrinsic and extrinsic motivation: The search for optimal
motivation and performance. San Diego: Academic Press.

INTERNATIONAL JOURNAL OF MULTIDISCIPLINARY EDUCATIONAL RESEARCHISSN : 2277-7881; IMPACT FACTOR - 2.735; IC VALUE:5.16VOLUME 3, ISSUE 3(4), MARCH 2014
68
29. Steers, R. M., Mowday, R. T. & Shapiro, D. L. (2004) The future of
work motivation theory. Academy of Management Review. 29, 379–
387.
30. Stevenson, E. L. (2003) Future trends in nursing employment.
American Journal of Nursing, 103. Supplement: Career Guide. 19-
25.
31. Thomas, K. W. (2000) Intrinsic Motivation And How It Works.
Training. 37(10), 130.
32. Tremblay, M., Blanchard, C. & Taylor, S. (2009) Work Extrinsic
and Intrinsic Motivation Scale: Its Value for Organizational
Research. Canadian Journal of Behavioural Science. Vol. 41, No. 4,
213–226.
33. Tummers, G. E. R., Van Merode, G. G. & Landeweerd, J. A. (2006)
Organizational characteristics as predictors of nurses’ psychological
work reactions. Organization Studies (01708406). 27(4), 559-584.

INTERNATIONAL JOURNAL OF MULTIDISCIPLINARY EDUCATIONAL RESEARCHISSN : 2277-7881; IMPACT FACTOR - 2.735; IC VALUE:5.16VOLUME 3, ISSUE 3(4), MARCH 2014
69
A STUDY OF RISK FACTORS ON THE FAMILY LIFE AMONGOVERTIME APPAREL WOMEN WORKERS IN MYSORE CITY-
A SOUTHERN INTERIOR PART OF KARNATAKA
N. VadirajaDept. of Community Medicine
Mysore Medical College & ResearchInstitute, Mysore
N.N. RajgopalDept. of Community Medicine
Mysore Medical College & ResearchInstitute, Mysore
Introduction:
An Apparel industry is booming in India. The economic importance
of the garment industry has increased phenomenally since the introduction
of economic reforms in 1991. Karnataka is one of the states where the
garment industry is witnessing a rapid growth [1]. A major chunk of almost
67.3% of women is working in this segment in Karnataka state capital [2, 3].
The most neglected southern interior part of Karnataka is an upcoming
area in garment segment, especially Mysore city. According to 2011 survey
of Mysore district statistical department almost 5600 workers were working
in this segment [4]. However from the department of factories, Mysore, it
came to know that total sanctioned post was 6199. The total sanctioned
women posts were 4389. Only 3280 women workers were employed in
Mysore city junction[5]. Also that from factories act (1948, section 51 and
54) a worker should not work more than 48 hours per week , else it was
considered as overtime work load with a condition that not exceeding 9
hours in any given day. [6]. However, for one or the other reasons, especially
in apparels, this rule had been totally violated. As a result overtime
workload had direct impact on the risk factors of family life. It was
important to know what all professional factors contributing to the family
life issues among the major chunk of women workers’ and to know the
gray areas of their life. Also that company’s strategies were also based on

INTERNATIONAL JOURNAL OF MULTIDISCIPLINARY EDUCATIONAL RESEARCHISSN : 2277-7881; IMPACT FACTOR - 2.735; IC VALUE:5.16VOLUME 3, ISSUE 3(4), MARCH 2014
70
the opinion of worker’s. In view of this, the paper can also be understood
in company’s perspective, in the sense that to know the gray areas where
the company had to work towards balancing the worker’s issues and non-
issues, so that work environment should not pamper. In this connection,
we planned a cross sectional study to study the implication of risk factors
with respect to the social dimension specifically the professional life on
the family life of overtime apparel women workers in a district head quarter
of Mysore. For easy write up, the selected professional life factors and
family life factors were abbreviated suitably and was tabulated in table 2.
Throughout the paper we use the abbreviation. Objectives were listed
below. Objectives can be understood in worker’s and company’s
perspectives.
Objectives:
1. To find whether professional factors had any influence on family
life factors include issues and non-issues.
2. To find important professional factors contributing to the family
life issues for a major chunk of overtime women workers.
3. To find sub set of professional life factors contributing to
different family life issues and non-issues, as a whole.
4. To find sub set of professional life factors contributing to each
family life issues and non-issues.
Material and method: A total of 100 overtime apparel women workers
were sampled from seven apparel companies in Mysore. An inflated sample
size was estimated using the estimation technique with a proportion of
67.3% women workers in the apparel segment, level of significance 5% and
an admissible error of 10%. A stratified simple random sampling technique

INTERNATIONAL JOURNAL OF MULTIDISCIPLINARY EDUCATIONAL RESEARCHISSN : 2277-7881; IMPACT FACTOR - 2.735; IC VALUE:5.16VOLUME 3, ISSUE 3(4), MARCH 2014
71
with ‘The Rand Corporation’ random number table was used for the
selection purpose[7,8]. The total woman workers had been distributed
according to the registered factories. The list of registered factories had
been obtained from the Department of factories and boilers, Mysore. Thus
the ‘factory registration’ was the stratification factor. The seniority list of
women employees had been collected from the selected factories human
resource department and once again using the Rand number table, first
column, first page, the required number of the overtime employees had
been selected. If the random number obtained was lesser than the total
number of women employees in the respective apparel factory, the women
with corresponding serial number was selected; else that particular random
number was rejected. The next random number was selected and checked
for its belongingness. This process was repeated till the respective number
of selection was met. The written consent form had been taken from the
selected subjects. The closed type, pretested and structured questionnaire
was administered on the selected subjects at one point of time. As a result
we have adopted a cross sectional study. The objective was met using
statistical analysis like proportion, chi-square test for proportions, Pareto
chart and line chart.
Result: The sample size for different apparel factories was given in table
1. The total sample size was 100. Table 2 was providing the information on
the cell frequency. It was noted that 75% women with s1 were happy with
f7 and 79% did not have f5 i.e. time for their own development. 518 did not
have freedom in utilizing their salary across all professional factors. 453
had encouragement from their family to continue with the profession. From
table 3, it was observed that the null hypothesis of independence of
professional life and family life issues was defeated with chi-square p-value
0.047. Also that, dependency among professional life factors and family
INTERNATIONAL JOURNAL OF MULTIDISCIPLINARY EDUCATIONAL RESEARCHISSN : 2277-7881; IMPACT FACTOR - 2.735; IC VALUE:5.16VOLUME 3, ISSUE 3(4), MARCH 2014
72
life non-issues was established with p-value 0.024. As family life issues
were bogging us, it was found that s1,s2,s4 and s5 professional life factors
contributed 80% variations in the family life issues using over imposed
cumulative percent line Pareto charts. From the last two column of table ,
it was found that , all professional factors contributed to the significance
across the family life issues and non-issues, as all p-values were less than
0.0005. The fourth objective was met by analyzing the cell contribution to
rows significance with the alternative family life issues exceed the non-
issues. As a result , from table3, the insignificance were achieved for f1/
s6, f3/s3 and s6, f4/s1, s2, s4 and s5, and f5/s3 and s6. Rest were found
significant. The respective cell adjusted p-values were entered in table 3.
Similarly , the professional factors impact on the family life non-issues
had been analysed and p-value results were found in table3. Figure 2,
supports table 3, an easier way of finding the cell significance and also
compares professional life factors.
Discussion: Karnataka is one of the states where the garment industry is
witnessing a rapid growth. However the southern interior part of
Karnataka, an upcoming area in garment segment, especially the Mysore
city was neglected. In the apparel segment , overtime was a concern for
the employees. Overtime means, according to the factories act (1948, section
51 and 54) a worker should not work more than 48 hours per week , else
it is considered as overtime work load with a condition that not exceeding
9 hours in any given day. As a result cross sectional study had been planned
to study the implication of professional life factors on the family life of
overtime apparel women workers in a district head quarter of Mysore.
Using the estimation technique with a proportion of 67.3% women workers
in the apparel segment, level of significance 5% and an admissible error of
10% , an inflated sample size was estimated at 87. However, a total of 100

INTERNATIONAL JOURNAL OF MULTIDISCIPLINARY EDUCATIONAL RESEARCHISSN : 2277-7881; IMPACT FACTOR - 2.735; IC VALUE:5.16VOLUME 3, ISSUE 3(4), MARCH 2014
73
overtime apparel women workers were sampled from seven apparel
companies in Mysore. A stratified simple random sampling technique having
a stratification factor ‘factory registration’ was achieved and with the help
of ‘The Rand Corporation’ random number table the selection was done.
Table 1 provides the distribution of total woman workers to the registered
factories. The list of registered factories had been obtained from the
Department of factories and boilers, Mysore. The seniority list of women
employees had been collected from the selected factories human resource
department and once again using the Rand number table, first column,
first page, the required number of overtime employees had been selected.
If the random number obtained was lesser than the total number of women
employees in the respective apparel factory, the women with corresponding
serial number was selected; else that particular random number was
rejected. The next random number was selected and checked for its
belongingness. This process was repeated till the respective number of
selection was met. The written consent form had been taken from both
the company and the selected subjects. The sampled subjects were
administered using the closed type, pretested and structured questionnaire.
In table 2, 100 members had answered every family life factor with respect
to each professional factor , as a result , the total number of times a family
life factor addressed was 600. In view of this, 86.3% said they want freedom
for salary utilization, 63% said issue with the time for self development.
However, 72% had a family support and 75% had the opinion of family
encouragement. This indicated that , family encouragement and support
was available for spouse overtime work and on the other hand family was
not giving them the freedom in utilizing their salary and to the cost of the
lack of time for self development. It was important to detect the important
risk factors i.e. professional factors those contributing to the family issues.
INTERNATIONAL JOURNAL OF MULTIDISCIPLINARY EDUCATIONAL RESEARCHISSN : 2277-7881; IMPACT FACTOR - 2.735; IC VALUE:5.16VOLUME 3, ISSUE 3(4), MARCH 2014
74
It was achieved through Pareto chart concept that says that the 20% vital
few creating 80% of the problems. Pareto analysis uses the Pareto
principle[9], also called the 80:20 rule, to analyze and display the main
professional life risk factors. This means that 80 percent of problems stem
from 20 percent of the possible causes. The numbers 80 and 20 are not
meant to be absolutes, however the focus was on the “vital few” problems
(those in the 20% percent category) rather than on the “trivial many” to
understand main risk factors impacting the family issues. A Pareto chart
is a bar chart that displays the relative importance of problems in a format
that is very easy to interpret. The most important risk factor was
represented by the tallest bar, the next most risky factor was represented
by the next tallest bar, and so on. In figure 2 , bars were constructed
according to the average number of women with family life issues. The
Pareto chart shown in figure 2 was a super imposed Pareto chart, super
imposed by the cumulative relative frequency line chart. This helped to
find out cumulative 80% problem causers. According to the chart it was
the first four factors causing almost 80% of the problems in the family life
issues. The important professional factors were according to the figure 2
was s1,s2,s4 and s5. The last cell chi-square p-value (0.047) in Table 3
indicated that the professional life factors and family life issue factors
were dependent on each other and was dependent on family life non-issue
factors too with p-value 0.025 . It was curious to find what all professional
factors contributing to the significance of overall significance. The last
column p-values in table 3 (all p-values < 0.005) indicated that the no
significance difference across different family life issues had been defeated
for all professional factors. Similarly, the significance had been achieved
across the non-issues family life factors for different professional life factors,
last but one column in table 3. This paved the way to find what all cells

INTERNATIONAL JOURNAL OF MULTIDISCIPLINARY EDUCATIONAL RESEARCHISSN : 2277-7881; IMPACT FACTOR - 2.735; IC VALUE:5.16VOLUME 3, ISSUE 3(4), MARCH 2014
75
contributing to the significance of different family life issues and non-
issues for each professional factors. Cells corresponding to s6 of f1, s3, s6
of f3, s1,s2,s4,s5 of f4 and s3,s6 of f6 are insignificant for the alternative
that family issues are greater than the non-issues. The rest cells were
contributing to the significance of family issues for individual professional
factors. Similarly it could be understood for the column wise significance
across professional factors for given family life issues and non-issues
separately. Details of chi-square p-values can be obtained at last two rows
of table 3. All adjusted p-values were compared with the 5% level of
significance to make the decision.
Interpretation: Information regarding ‘Factory serial number’ and
‘Women employed’ were provided by the ‘The Department of Factories
and Boilers’, Mysore. Distribution of sample size was the number of
overtime women workers selected given the factory.
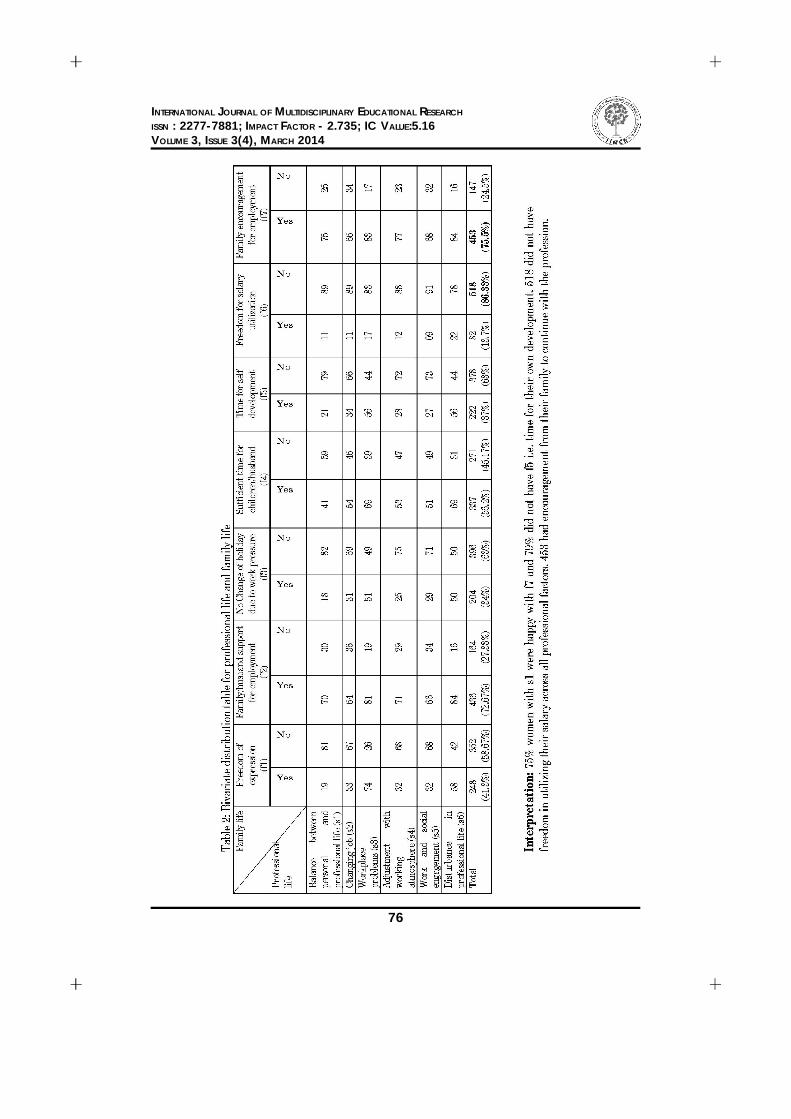
INTERNATIONAL JOURNAL OF MULTIDISCIPLINARY EDUCATIONAL RESEARCHISSN : 2277-7881; IMPACT FACTOR - 2.735; IC VALUE:5.16VOLUME 3, ISSUE 3(4), MARCH 2014
76

INTERNATIONAL JOURNAL OF MULTIDISCIPLINARY EDUCATIONAL RESEARCHISSN : 2277-7881; IMPACT FACTOR - 2.735; IC VALUE:5.16VOLUME 3, ISSUE 3(4), MARCH 2014
77

INTERNATIONAL JOURNAL OF MULTIDISCIPLINARY EDUCATIONAL RESEARCHISSN : 2277-7881; IMPACT FACTOR - 2.735; IC VALUE:5.16VOLUME 3, ISSUE 3(4), MARCH 2014
78
Interpretation: s1, s2, s4, s5 were main professional factors causing 80%
of family issues among overtime working apparel women. s1 had, with
66.9, maximum average number of women having family issues and was
followed by s5 with 62.9. s3 was the least problem creator with 41 as the
average.

INTERNATIONAL JOURNAL OF MULTIDISCIPLINARY EDUCATIONAL RESEARCHISSN : 2277-7881; IMPACT FACTOR - 2.735; IC VALUE:5.16VOLUME 3, ISSUE 3(4), MARCH 2014
79
Figure 2: p-value graph for equality of proportions between ‘yes’ and‘no’ values of family life factors.
Interpretation: Horizontal dotted line was the 0.0011 level of significance
line. p-values above the horizontal dotted line indicate the insignificance.
Conclusion: It was concluded that the family encouragement and support
was available for spouse overtime work and on the other hand family was
not giving them the freedom in utilizing their salary and to the cost of the
lack of time for self development. More than 80% of overtime women
worker’s family life issues were affected by s1, s2, s4 and s5. Other than
the Cells corresponding to s2,s6 of f1, s2,s5 of f2, s3, s6 of f3, s1,s2,s4,s5
of f4, s3,s6 of f6 and s2 of f7 were contributing to overall significance of
professional factors and family life issue factors.
References:
1. Rajasekhar D and Manjula R. Voices of the women garment workers,
Reproduced with the authors’ consent. Originally published in B.C.
Prabhakar, Gender Sensitivity at Workplace, International Labour
Organization, Geneva 2006.

INTERNATIONAL JOURNAL OF MULTIDISCIPLINARY EDUCATIONAL RESEARCHISSN : 2277-7881; IMPACT FACTOR - 2.735; IC VALUE:5.16VOLUME 3, ISSUE 3(4), MARCH 2014
80
2. Roopa M. Garment Workers: Identifying Legal Issues and Strategies. Paper
presented at the Consultation on Labour Standards in the Indian Garment
Industry, Bangalore, September 29-30.
3. Garment Factory Workers Deserve a Better Deal. The Hindu 2003;
September 28.
4. Available from http://www.mysore.nic.in
5. Report. The Department of factories and boilers, Mysore 2013.
6. Factory act 1948, India, chapter 4.
7. Cochran, Sampling Theory
8. The Rand Corporation, A million random digits with 100000 normal
deviates . New York: The free press 1955.
9. Montgomery D C, Woodall H M. A discussion of statistically-based process
monitoring and control. Journal of quality technology 1997; 29(2): 121-
162.

INTERNATIONAL JOURNAL OF MULTIDISCIPLINARY EDUCATIONAL RESEARCHISSN : 2277-7881; IMPACT FACTOR - 2.735; IC VALUE:5.16VOLUME 3, ISSUE 3(4), MARCH 2014
81
A COMPARATIVE STUDY OF SUPER LUMINESCENT DIODE(SLED) AND VERTICAL-CAVITY SURFACE-EMITTING LASER
(VCSEL) AS A SOURCE FOR FIBER OPTIC GYROSCOPE
Namita DasCIT, Kokrajhar
Kaushik Chandra Deva SarmaCIT, Kokrajhar
Apurba Kumar RaibaruahCIT, Kokrajhar
Introduction:
A fiber optic gyroscope (FOG) is an angular rotation measuring
instrument. It consists of an optical source, an optical module and a photo
detector. Different light sources are used in FOG. Out of those two types
sources- super luminescent diode (SLED or SLD) and Vertical cavity surface
emitting laser (VCSEL) are showing great potential in FOG application.
An SLED is an edge-emitting semiconductor light source based on super
luminescence. It combines the high power and brightness of laser diodes
with the low coherence of conventional light-emitting diodes. Its emission
band is 5–100 nm wide. A super luminescent light emitting diode is, similar
to a laser diode, based on an electrically driven pn-junction that, when
biased in forward direction, becomes optically active and generates
amplified spontaneous emission over a wide range of wavelengths. The
peak wavelength and the intensity of the SLED depend on the active
material composition and on the injection current level. The vertical-cavity
surface-emitting laser (VCSEL) A class of semiconductor lasers that can
be monolithically fabricated [2]. The structure common to most VCSELs
consists of two parallel reflectors which sandwich a thin active layer[2].
The reflectivity necessary to reach the lasing threshold should normally
be higher than 99.9%[2].

INTERNATIONAL JOURNAL OF MULTIDISCIPLINARY EDUCATIONAL RESEARCHISSN : 2277-7881; IMPACT FACTOR - 2.735; IC VALUE:5.16VOLUME 3, ISSUE 3(4), MARCH 2014
82
Differential Quantum efficiency:
The differential quantum efficiency of an SLED can be written as

INTERNATIONAL JOURNAL OF MULTIDISCIPLINARY EDUCATIONAL RESEARCHISSN : 2277-7881; IMPACT FACTOR - 2.735; IC VALUE:5.16VOLUME 3, ISSUE 3(4), MARCH 2014
83
Conclusion: a comparison between SLED and VCSEL as a source in fiber
optic gyroscope is presented. The comparison is done by varying the
differential quantum efficiency with Fiber length, internal loss and
reflectivity. It is found that the SLED is more efficient than the VCSEL.
References:
1. M. C. Amann and J. Boeck, “High efficiency superluminescent diodes for
optical-fibre transmission”, Electron. Lett. 15, 41 (1979)
2. Kenichi Iga, “Vertical-Cavity Surface-Emitting Laser (VCSEL)” IEEE,
2013
3. Michael Wootten, “Superluminescence diodes at 2.4 microns from
GaInAsSb/AlGaAsSb quantum well heterostructures for optical glucose
sensing” Iowa Research Online, 2013
4. Kenichi Iga, Fumio Koyama, Susumu Kinoshita, “Surface Emitting
Semiconductor Lasers”, IEEE Journal of Quantum Electronics, Vol. 24,
No. 9, September,1988
5. John M. Senior, Optical Fiber Communications Principles And Practice,
Pearson, Third edition

INTERNATIONAL JOURNAL OF MULTIDISCIPLINARY EDUCATIONAL RESEARCHISSN : 2277-7881; IMPACT FACTOR - 2.735; IC VALUE:5.16VOLUME 3, ISSUE 3(4), MARCH 2014
84
CURRENT SCENARIO OFGLOBAL HUMAN RESOURSE DEVELOPMENT
U.ChakravarthyResearch Scholar
Dept. of HRMAndhra University, Visakhapatnam
Prof. T.SubbarayuduProfessor &
Chairman-Board of StudiesDept. of HRM
Andhra University, Visakhapatnam
Introduction:
The future looks even more exciting and threatening. Organizations
are gearing up for the difficult times ahead by tapping all the resources on
hand. Organizations realize that their people or employees would be one
of the prime resources for establishing a competitive edge in the future.
Consequently, organizations would require workable strategies to align
the individual talents/strengths of their people towards business goals.
This is where Human Resources professionals can play a deciding role.
They have to face newer challenges, take up different, unprecedented roles
and in the process help the business achieve its goals.
More and more employers are assessing the value returned from
each dollar spent on employees. They are targeting specific programs and
practice to the employees that value them the most and becoming more
important than ever. Determining what matter most to employees and
aligning expenditures with priorities is a strategic challenges for HRD
function. Employee change continuously due, in part to bring changes in
personal preference but also in part to the chum that occurs as employees
leave and new ones enter the Organization. However, it is neither cost
effective nor practical to satisfy every employee. Therefore, understanding
employees and issues they face holds the key to the function to respond
quickly. It’s no secret that employees’ attitudes about their jobs, their

INTERNATIONAL JOURNAL OF MULTIDISCIPLINARY EDUCATIONAL RESEARCHISSN : 2277-7881; IMPACT FACTOR - 2.735; IC VALUE:5.16VOLUME 3, ISSUE 3(4), MARCH 2014
85
benefits and their employers can range from exuberant to sour. What’s
less well known and harder to find out is exactly what matter to specific
types of employees and how effective various types of HRD policies, practices
and workplace characteristic are, in spurring employee productivity and
retention. Since human resource development and management is culture
sensitive.
Human resources development is a continuing process comprising three
interdependent Components:
Investment in human resources to enhance productive capabilities.
Utilization of those human resources to produce increased output.
Participation of the human beings who have improved resources
(better education, better skills levels etc.) in the consumption of
that increased output through a better quality of life.
Sustainable human resources development must involve all three
components, as seen in the diagram above. At a national level, investment
in human resources must be turned into effective utilization of those human
resources if national output is to be increased on a sustainable basis. At an
individual level, investment in human resources improves earning
capabilities. Therefore individuals and families have more money to do
many things including pay for their own further skills development. There
is a very strong link between investing inhuman resources development
and improvements in the quality of life. Improvements in nutrition, health
and education are key elements of an improved quality of life and must be
considered important investments in human resources, particularly in
developing countries. Human beings cannot be developed if they do not
have enough food, are in poor health or cannot read or write. For developing
countries, it is extremely important that all members of the society have

INTERNATIONAL JOURNAL OF MULTIDISCIPLINARY EDUCATIONAL RESEARCHISSN : 2277-7881; IMPACT FACTOR - 2.735; IC VALUE:5.16VOLUME 3, ISSUE 3(4), MARCH 2014
86
access to human resource development activities, especially the poor, women
and populations in rural areas.
According to Leonard Nadler, author of Developing Human Resources
Training is a learning activity provided by employers to employees,
to help them perform, their current jobs more efficiently;
Education focuses on learning designed to prepare an individual
for a job different than the one currently held; and
Development focuses on providing knowledge or skills within a
specified area, but is not necessarily job related.
Liberalization has resulted in sudden and increased levels of
competition for Indian Organizations from multinational firms,
globalization and internalization of domestic businesses, concerns for total
quality management, incentives to export, demographic changes in the
employee profile, retaining and redeployment of workforce, focus on
performance appraisal and career management. Thus, with liberalization
there is an increasing pressure on Organizations in India to change from
indigenous, costly, suboptimal levels of technology to performance based,
competitive and higher technology provision.
Increased competition, technological development, and shorter
product life-cycles all suggest that organisation s must be able to respond
more quickly to changes in the future than they have in the past. These
conditions will require that the organizations operate differently. These
differences will be seen in structure, decentralized decision-making, fewer
or no job classifications, multi-skilled work forces, more effective
communication among functional groups. To bring about these changes
within the organisation, the HR Professionals need to get in their expertise

INTERNATIONAL JOURNAL OF MULTIDISCIPLINARY EDUCATIONAL RESEARCHISSN : 2277-7881; IMPACT FACTOR - 2.735; IC VALUE:5.16VOLUME 3, ISSUE 3(4), MARCH 2014
87
and help devolve systems, which support the business needs. The key even
then would lie with the Human Resources and not with the computers.&
machines. The most efficient information systems would be only as good
as the “people” who make up the fabric of the company
Indian Organizations have to develop the workforce capable of
taking up challenges thrown by the new economic environment. To tackle
this challenging situation, Indian academics a nod practitioner have both
advocated the adoption of the concept of human resource development.
The adoption of professionalized HRD practices in India is recent
phenomenon, but has gained momentum in the past ten years.
Organizations are now asking their HRD departments for innovative
approaches and solutions to improve productivity and quality of work life,
while aptly coping with an environment of high uncertainty and intense
global competition. This requires Indian Organizations to develop a diverse
workforce with competitive skill sets. This is difficult given the diverse
socio- economic background of Indian workforce coupled with antagonistic
nature of trade union and colonial time cumbersome labor laws.
The cross-cultural, cross-border mingling has resulted in the
creation of a new class of people, global citizens with global attitudes, taste
and networks. Since it unleashes multiple variables, the borderless world
precludes immense complexity, complexity in the environment, in inter-
organizational relationships, in the modes of conducting business and in
socio-cultural diversity. One of the most important duties of the modern
HR manager is to get things done through people. He has to bring employees
into contact with the organization in such a way that the objectives of
both groups are achieved. He must be interested in people, the work and
the achievement of assigned objectives. To be effective, he must balance
his concern for people and work. In other words he must know how to

INTERNATIONAL JOURNAL OF MULTIDISCIPLINARY EDUCATIONAL RESEARCHISSN : 2277-7881; IMPACT FACTOR - 2.735; IC VALUE:5.16VOLUME 3, ISSUE 3(4), MARCH 2014
88
utilize human as well as non-human resources while translating goals into
action. Here also the role is no different i.e. hiring individuals with requisite
skills to do a particular job. The challenge here is developing tools to
promote a corporate culture that is almost the same everywhere except
that the local sensitivities are taken care of. Also, the deciding upon the
top management or key positions gets very tricky. Whether to choose a
local from the host country for a key position or deploy one from the
headquarters assumes importance; and finally whether or not to have a
uniform hiring policy globally remains a big challenge.
Nevertheless an organization can choose to hire according to any of the
staffing policies mentioned below:
Ethnocentric: Here the Key management positions are filled by
the parent country individuals.
Polycentric: In polycentric staffing policy the host country
nationals manage subsidiaries whereas the headquarter positions
are held by the parent company nationals.
Geocentric: In this staffing policy the best and the most competent
individuals hold key positions irrespective of the nationalities.
Geocentric staffing policy it seems is the best when it comes to Global
HRM. The human resources are deployed productively and it also helps
build a strong cultural and informal management network. The flip side is
that human resources become a bit expensive when hired on a geocentric
basis. Besides the national immigration policies may limit implementation.
Global HRM therefore is a very challenging front in HRM. If one is
able to strike the right chord in designing structures and controls, the job
is half done. Subsidiaries are held together by global HRM, different

INTERNATIONAL JOURNAL OF MULTIDISCIPLINARY EDUCATIONAL RESEARCHISSN : 2277-7881; IMPACT FACTOR - 2.735; IC VALUE:5.16VOLUME 3, ISSUE 3(4), MARCH 2014
89
subsidiaries can function operate coherently only when it is enabled by
efficient structures and control
The challenges for Human Resource Development:
Changing workforce demographic
Competing in global economy
Eliminating the skill gap
Need for lifelong learning
Need for Organizational learning
Part of development includes realizing the skills and abilities that
employees already have. Even the most well trained employees will perform
poorly if they are not assessed properly. Reinforcing previously covered
information, teaching new concepts and introducing new ideas are
development aspects that must be measured and assessed. Employees need
to know what is expected of them. Acceptable performance can only be
known if the employees are assessed and if the assessment information is
communicated to them. Then, the measurement of what people have
learned after training will be more accurate. Feedback from managers to
subordinates and vice versa is essential to the development function. Post
development evaluation criteria and processes are essential. People-
management and management of change issues are the key future training
and development needs for both multinational and indigenous
organizations. Garavan, Heraty, and Morley discuss the differing interest
groups’ perceptions on evaluation of HRD programs. Senior and line
managers use quantitative measures such as optimal utilization of human
resources, increased productivity and enhanced employee flexibility to
evaluate HRD success. HRD specialists and individual learners place more

INTERNATIONAL JOURNAL OF MULTIDISCIPLINARY EDUCATIONAL RESEARCHISSN : 2277-7881; IMPACT FACTOR - 2.735; IC VALUE:5.16VOLUME 3, ISSUE 3(4), MARCH 2014
90
emphasis on qualitative criteria such as the number of training days, how
many and who participated, and improved performance and career options.
Individual learners were primarily concerned about their enhance
HRD is a relatively young field, and there are significant challenges
to its future. Failing to acknowledge these challenges will increasingly
marginalize HRD within organizations. The tasks seen as central to the
HRD profession will be taken on by others who work in professions more
focused on delivering and measuring outcomes, thinking and working
systemically, with a sounder theoretical base, with clear standards and
ethical codes, with stronger professional bodies and competent
practitioners. HRD will be left on the sidelines: a gradually shrinking
number of people who write for themselves, focus on internal process issues,
and react ineffectively to demands long after they have been formulated.
We invite all those with a stake in the future of HRD to join together to
grapple with the critical challenges that face our field, engage in deep
meaningful dialogue about the challenges, and construct workable,
effective, and immediate approaches to addressing the challenges to secure
the future of HRD. Our goal is to banish complacency and to encourage
dialogue. HRD’s human resources are impressive; they must now be
focused.
References
1. Human Resource Development by Bibhuti Bhusan Mahapatro - publishing
for one world, new age international (p) limited, publishers
2. Human Resource Development: Strategies and System- Mitali Pathak &
Dr. B.S. Bodla
3. http://goodmorningishan.blogspot.in
4. http://managementstudyguide.com

INTERNATIONAL JOURNAL OF MULTIDISCIPLINARY EDUCATIONAL RESEARCHISSN : 2277-7881; IMPACT FACTOR - 2.735; IC VALUE:5.16VOLUME 3, ISSUE 3(4), MARCH 2014
91
ISSUES RELATING TO TEACHERS’ STAY AT THEIR WORKPLACES – AN ANALYTICAL STUDY
Dr. H. SubhrahmanyamCoordinator
Department of EducationDr. B.R. Ambedkar University, Srikakulam
Introduction
Education does not merely mean the acquisition of knowledge and
experiences but it means the development of habits, attitudes and skills,
which help a man to lead a full and worthwhile life. The product of education
is the complete man and who understands the process of life. Education is
important from various points of view. Its field of activity is so wide that
all activities and experiences are embraced in its sphere of work. Essentially
it is a process of development, a development of the latent inherent
capacities of a child to the fullest extent. It sublimates the animal basic
instincts in a child to socially useful activities, habits of thinking with
spiritual values, so that he is able to form a strong character useful to his
own-self and the society of which he is an integral part. Further, education
meets the immediate needs of a child and also prepares him for his further
life. It cultures the child promoting social and refined patterns of behavior.
It also develops all his intellectual and emotional powers, so that he is able
to meet the problems of life squarely and solve them successfully. It also
develops the social qualities of service, tolerance, co-operation, fellow feeling
inspiring the child to lay down all, even his life for the glory and prosperity
of his country. Last but not the least, education infuses in the child a spirit
of dynamic citizenship which eggs him on in the service of his nation keeping
into consideration the international understanding and well-being of
humanity as a whole.
INTERNATIONAL JOURNAL OF MULTIDISCIPLINARY EDUCATIONAL RESEARCHISSN : 2277-7881; IMPACT FACTOR - 2.735; IC VALUE:5.16VOLUME 3, ISSUE 3(4), MARCH 2014
92
Educational standards are determined by the quality of education,
the teacher imparts, the curricular of the school and competence of the
teacher are interring independent and contribute to the success of the
educational system. Both the curricular and teaching techniques have to
act as catalyst in developing as strong educational system.
The importance of a teacher in the educational process is
unquestionable. However, the entire edifice of education is shaky if the
teacher is weak and ineffective. An effective teacher is amongst the foremost
factors contributing to educational improvement.
“A true teacher is one who can immediately come down to the level
of the students and transfer his soul to the student’ s soul and see through
and understand through his mind’’ – Swami Vivekananda.
A study by Johnson Moore (2006) described the workplace
conditions that support effective instruction and professional growth
according to recent research. The key workplace conditions includes fair
teaching assignments, opportunities for teachers to collaborate with
colleagues, extra induction support, ongoing professional development and
expanded career opportunities, support for working with students,
curricular support for high standards, adequate and safe facilities and a
supportive school leadership. The study emphasized the influence of
substandard workplace conditions on the high rates at which teachers—
especially new teachers—leave their schools or quit the profession
altogether. It suggests greater numbers of talented teachers can be retained
through improvements in workplace conditions, particularly at hard-to-
staff schools. Hirsch & Emerick (2007) writes that if teachers stay away
from work place, the lack of time to plan, teach, and assess not only creates
stressful work conditions, it diminishes the quality of instruction. By

INTERNATIONAL JOURNAL OF MULTIDISCIPLINARY EDUCATIONAL RESEARCHISSN : 2277-7881; IMPACT FACTOR - 2.735; IC VALUE:5.16VOLUME 3, ISSUE 3(4), MARCH 2014
93
altering schedules, schools are finding creative ways to provide more
instructional time for students and non instructional time for teachers to
plan and collaborate with peers. Practices that ensure productive and
focused use of this time should also be implemented.
Need and significance
Therefore, the role of teacher in this system of school education is
vital and there is a need that the teacher has to stay at work place is also
important one to meet and cater the demands of the society. In this juncture
the Government of Andhra Pradesh made a policy long back for staying of
teachers at working villages along with other department staff like M.R.O’s
& M.D.O’s Office, Panchyathi Office, some other emergency departments
like electricity, drinking water supply, public health and sanitation staff,
who are linked with the developmental activities in the village along with
education.
The district administrations are very much particular to implement
this policy of staying at work places and made it compulsory, then the
teacher organizations and other trade unions opposed the district collectors
orders and not willing to stay at work places because of lack of sufficient
facilities in the villages. The research investigator chooses this topic for
investigation as it is a new policy and identified the reasons, which are
claimed by the concerned teachers at a transparency level. Today every
progress of mankind depends upon the mental and physical energy. Both
of them depend on the standards of living, which in turn depends on
education. Thus education is the critical factor in human development in
the country. The quality of education has to be ensured, but the present
state affair in our country is not encouraging.

INTERNATIONAL JOURNAL OF MULTIDISCIPLINARY EDUCATIONAL RESEARCHISSN : 2277-7881; IMPACT FACTOR - 2.735; IC VALUE:5.16VOLUME 3, ISSUE 3(4), MARCH 2014
94
Objectives
1. To study the perceptions of the teachers on educational aspects to
stay at work place.
2. To study the perceptions of teachers on administrative aspects to
stay at work place.
3. To study the perceptions of teachers on societal aspects to stay at
work place.
4. To study the perceptions of teachers on domestic aspects to stay at
work place.
Methodology
The study is aimed at knowing the opinion of teachers, parents and
school administrative officers on the functioning and benefits of the teachers
stay at work place. The method of investigation includes Sample Survey
Method, where the data gathered from a relatively large number of cases
at a particular time. The size of the sample is 200 teachers were collected
from three mandals form different geographic areas in Srikakulam district.
These sample mandals are selected randomly in three revenue divisions in
the district. Namely they are from Palakonda division Saravakota mandal
(semi-tribal), from Srikakulam division Polaki mandal (coastal) and from
Tekkali division Kotabommali mandal (plain area). The primary data was
computed by using the software called SPSS and tables are generated with
t-test and F-test for data analysis.

INTERNATIONAL JOURNAL OF MULTIDISCIPLINARY EDUCATIONAL RESEARCHISSN : 2277-7881; IMPACT FACTOR - 2.735; IC VALUE:5.16VOLUME 3, ISSUE 3(4), MARCH 2014
95
The above table analyzes comparative mean scores of male and fe-
male teacher respondent’s on different aspects related to stay at work place.
In the educational factors the mean of males (22.24) was significantly higher
than the mean of females (21.02) and the standard deviations are 3.79 and
4.40 respectively. The t-value is 1.9972, is significant at 0.05 level. The
administrative factors mean of males (10.97) was significantly higher than
the mean of females (10.37) and the standard deviations are 1.88 and 1.96
respectively. The t-value is 2.0613, is significant at 0.05 level. The societal
factors mean of males (36.59) was less than the mean of females (37.25)
and the standard deviations are 5.43 and 3.86 respectively. The t-value is
0.8489, is not significant. The domestic factors the mean of males (32.65)
was less than the mean of females (33.52) and the standard deviations are
5.66 and 4.57 respectively. The t-value is 1.0486, is not significant.

INTERNATIONAL JOURNAL OF MULTIDISCIPLINARY EDUCATIONAL RESEARCHISSN : 2277-7881; IMPACT FACTOR - 2.735; IC VALUE:5.16VOLUME 3, ISSUE 3(4), MARCH 2014
96
The above table analyzes comparative mean scores of rural and
urban schoolteacher respondent’s on different aspects related to stay at
work place. The educational factors mean for rural school teachers (21.88)
was equal with the mean of urban school teachers (21.88) and the standard
deviations are 4.03 and 3.83 respectively. The administrative factors mean
for rural school teachers (10.82) was higher than the mean for urban school
teachers (10.00) and the standard deviations are 1.90 and 2.20 respectively.
The t-value of 1.1910, is not significant. The societal factors mean of rural
school teachers (36.68) was more than the mean of urban school teachers
(39.38) and the standard deviations are 4.99 and 5.21 respectively. The t-
value is 1.4931 which is not significant. The domestic factors mean for
rural school teachers (32.81) was less than the mean of urban school
teachers (35.38) and the standard deviations are 5.32 and 5.93 respectively.
The t-value is 1.3307, which is not significant.
The Table-3 analyzes the distribution of means of performance
among different age-group teachers in different factors regarding teachers
stay at work place. The educational aspects mean for below 35 years of age
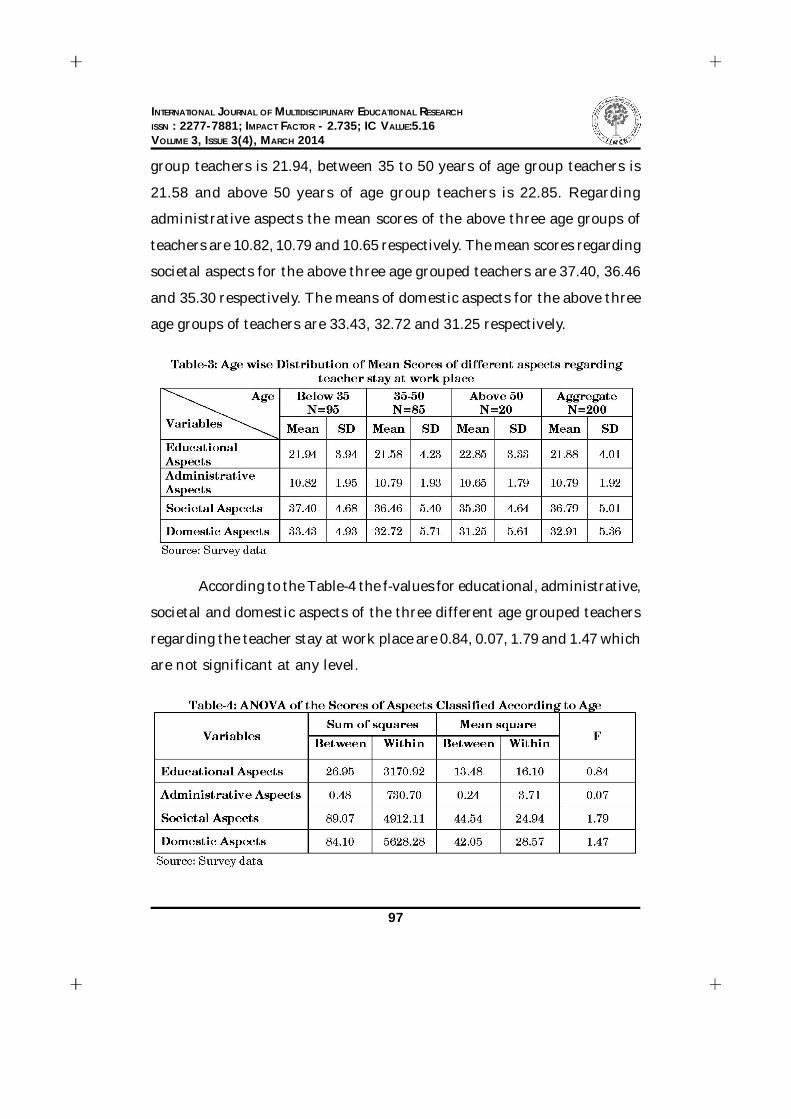
INTERNATIONAL JOURNAL OF MULTIDISCIPLINARY EDUCATIONAL RESEARCHISSN : 2277-7881; IMPACT FACTOR - 2.735; IC VALUE:5.16VOLUME 3, ISSUE 3(4), MARCH 2014
97
group teachers is 21.94, between 35 to 50 years of age group teachers is
21.58 and above 50 years of age group teachers is 22.85. Regarding
administrative aspects the mean scores of the above three age groups of
teachers are 10.82, 10.79 and 10.65 respectively. The mean scores regarding
societal aspects for the above three age grouped teachers are 37.40, 36.46
and 35.30 respectively. The means of domestic aspects for the above three
age groups of teachers are 33.43, 32.72 and 31.25 respectively.
According to the Table-4 the f-values for educational, administrative,
societal and domestic aspects of the three different age grouped teachers
regarding the teacher stay at work place are 0.84, 0.07, 1.79 and 1.47 which
are not significant at any level.

INTERNATIONAL JOURNAL OF MULTIDISCIPLINARY EDUCATIONAL RESEARCHISSN : 2277-7881; IMPACT FACTOR - 2.735; IC VALUE:5.16VOLUME 3, ISSUE 3(4), MARCH 2014
98
This analysis of the table indicates that there is no significant
difference among different age grouped teachers in their performance
regarding the educational, administrative, societal and domestic aspects
which determine the teachers to stay at work place. There is no much
difference between different age group teachers on these aspects of stay at
work place.
The data reveals that there is a significant difference in the
perceptions of male and female teachers on educational and administrative
aspects regarding teacher stay at work place, but in societal and domestic
aspects there is no much difference between male and female teachers.
Among rural and urban school teachers there is no significant difference
in their perceptions towards educational, administrative, societal and
domestic factors relating to teacher stay at work place. In the educational,
administrative, societal and domestic aspects there is no significant
difference among different age grouped teachers in their performance
regarding teachers stay at work place.
Conclusion
As a whole the analysis pertaining to the views of teachers regarding
to their stay at work place on educational, administrative, societal and
domestic aspects reveal that, the views of male and female teachers differ
from each other. However there is unanimity between male and female
teachers, among different age grouped teachers and rural and urban
teachers. All the teachers with different levels of background viewed that
the teacher’s stay at work place will definitely improve the quality of
education, the school administration and social life in the villages. They
felt that their stay at work place would bring all round development of the
students, institutions and the villages where they are working. Be and

INTERNATIONAL JOURNAL OF MULTIDISCIPLINARY EDUCATIONAL RESEARCHISSN : 2277-7881; IMPACT FACTOR - 2.735; IC VALUE:5.16VOLUME 3, ISSUE 3(4), MARCH 2014
99
large, all the sample teachers are following the governmental instructions
in this regard. However they expect that their stay at work place also have
to improve their personal and family welfare, which in turn depends upon
availability of necessary infrastructure as well as minimum facilities for
their comfortable stay at the work place. In this context this paper
ultimately concluded that, teachers need very happy and pleasant socio-
economic and living surroundings at their work places for their progress
and to serve the students, institution and society at their level best.
The above findings of the study ultimately reveals that the teachers
stay at their respective work places will have positive impact on educational,
administrative and societal dimensions of the socio-economic system. In
this regard this study advocates a few policy suggestions, which will be
useful to the policy makers as well as different sections concerned with
this issue.
An orientation programme needs to be under taken to change the
attitude of teachers towards rural places. This kind of orientation
programmes usually provides some sort of positive attitude towards villages.
Government has to provide residential accommodation to the teachers to
enable them to stay at work place. Residential accommodation with all
facilities is very much needed to lead healthy and peaceful life. The village
community has to be motivated to cooperate with the teachers to be
available in the villages. Since without cooperation of villagers the teachers
cannot lead the routine and day by day life in the villages because they
much depend on the villages fulfill their requirements and focus on the
aspects related to the development of villages.

INTERNATIONAL JOURNAL OF MULTIDISCIPLINARY EDUCATIONAL RESEARCHISSN : 2277-7881; IMPACT FACTOR - 2.735; IC VALUE:5.16VOLUME 3, ISSUE 3(4), MARCH 2014
100
References
1. Birds, Rodalie, (2002), “Willingness of teachers to accept change in their
work environment” - Dissertation abstracts International Vol. 63, No. 11,
May 2003.
2. Hirsch & Emerick (2007), “Principle Leadership”. Website.
3. Johnson, Susan Moore, (2006) “The Workplace Matters: Teacher Quality,
Retention and Effectiveness. Working Paper (National Education
Association, Washington, D.C. , Jul 2006). www.nea.org
4. Kohli, V.K. (1987), “Indian education system and its problems”, Vivek
publishers, Ambala City.
5. Misra, K.S. (1993), “Teachers’ issues at work place”, The Associate
Publishers, Ambalacantt.
6. Sharma, M.S.R. (1997), “Attitudes of teacher educators towards work and
working aspects”, The Educational Review, Vol. C111 - No. 8, 1997, August.

INTERNATIONAL JOURNAL OF MULTIDISCIPLINARY EDUCATIONAL RESEARCHISSN : 2277-7881; IMPACT FACTOR - 2.735; IC VALUE:5.16VOLUME 3, ISSUE 3(4), MARCH 2014
101
MAIN CAUSES AND TYPES: ANXIETY
Chaman Lal Banga Assistant Professor
Department of Education ICDEOL, Himachal Pradesh University, Shimla
Introduction
Anxiety is a normal human emotion that everyone experiences at
times. Many people feel anxious, or nervous, when faced with a problem at
work, before taking a test, or making an important decision. Anxiety
disorders, however, are different. They can cause such distress that it
interferes with a person’s ability to lead a normal life. An anxiety disorder
is a serious mental illness. For people with anxiety disorders, worry and
fear are constant and overwhelming, and can be crippling. Anxiety can be
caused by one, or a combination of factors. These include genetic factors,
ongoing stress, family background, physical health issues, or a traumatic
event. Anxiety is a generalized mood condition that can often occur without
an identifiable triggering stimulus. It is distinguished from fear which is
an emotional response to a perceived threat, whereas anxiety is related to
situations perceived as uncontrollable or unavoidable. Also, it is a future-
oriented mood state in which one is ready or prepared to attempt to cope
with upcoming negative events. The physical effects of anxiety may include
heart palpitations, muscle weakness, fatigue, nausea, chest pain, shortness
of breath, stomach aches or headaches. Also, external signs of anxiety
include pale skin, sweating, trembling and papillary dilation. The person
who has anxiety might also experience it as a sense of dread or panic. The
emotional effects may include ‘feelings of apprehension or dread, trouble
concentrating, feeling tense or jumpsy, anticipating the worst, irritability,

INTERNATIONAL JOURNAL OF MULTIDISCIPLINARY EDUCATIONAL RESEARCHISSN : 2277-7881; IMPACT FACTOR - 2.735; IC VALUE:5.16VOLUME 3, ISSUE 3(4), MARCH 2014
102
restlessness, watching/waiting for signs or occurrences of danger and feeling
like one’s mind is gone blank, as well as nightmares, obsessions about
sensations and feeling like everything is scary. It feels a bit like fear but
whereas we know what we are frightened of, we often don’t know what we
are anxious about. Anxiety is defined as “a painful or apprehensive
uneasiness of mind usually over an impending or anticipated ill” (Merriam-
Webster, 2012). Students experiencing academic anxiety feel apprehensive
over academic tasks. Students can feel anxiety related to every academic
task. Some may only feel anxiety related to test taking or other specific
tasks. Anxiety is not always negative. Some students can be motivated by
anxiety.
Review of Literature :
Frost (1969) noted conflicting evidences as regards the relationship
between anxiety and educational achievement in children but the consensus
seems to indicate a negative relation. It was also observed that age, social
class, sex and intelligence each plays a part in determining the precise
relationship between test anxiety and achievement. Boor (1972) found
that none of the test anxiety measures was significantly related to
examination performance. Silva (1984) found that females showed higher
level of social anxiety than the males. He suggested that homogeneous
grouping should be done in order to reduce social anxiety. Namrata (1992)
studied the relationship of personality traits, situational stress and anxiety
factors to students’ achievement. The finding of the study was that students
having lower level of anxiety tended to score higher in high school
examinations. . Mnicholas and Lewiensohn (1998) conducted a study on
the anxiety on the basis of gender differences. The data indicates that at
age 6, females are already twice more likely to have experienced anxiety
disorders than males. . Parents and teachers agree that there is too much
INTERNATIONAL JOURNAL OF MULTIDISCIPLINARY EDUCATIONAL RESEARCHISSN : 2277-7881; IMPACT FACTOR - 2.735; IC VALUE:5.16VOLUME 3, ISSUE 3(4), MARCH 2014
103
stress on all involved concerning standardized testing (Barksdale-Ladd,
& Thomas, 2000).Thomas (1999) found that social anxiety plays very
important role in the overall development of the individuals. He suggested
that social anxiety creates hindrance in the personality development of
the individuals. Hancock (2001) investigated the effects of students’ test
anxiety and teacher’s evaluation practices on students’ achievement and
motivation at post the secondary level. He found statistically significant
results which revealed that all students, especially students with high
anxiety level, performed poorly and were less motivated to learn Ballash
and colleagues (2006) found support for a model where perceived control
acts as a mediator, but not a moderator, between family functioning and
anxiety symptoms in young adults. Although the sequential relation
between locus of control, family functioning, and anxiety symptoms is still
unclear, there is reason to believe that further investigation of perceived
control within the complex family setting may shed light on one of the
many mechanisms involved in development of anxiety disorders, including
SAD. Allen (2009) found that death anxiety has a negative effect on the
development of the individuals. The findings of the study revealed that
people suffering from death anxiety has the low confidence level. Females
showed significantly higher death anxiety than the males. Neelam and
Attri (2013) have attempted to find out the academic anxiety and academic
achievement of secondary school students. It was hypothesized that there
exists a significant difference in academic anxiety and academic
achievement of male and female secondary school students. For verification
of these hypotheses, the data was collected from 200 secondary school
students of Mandi district of Himachal Pradesh by adopting lottery method
of random sampling by administering ‘Academic Anxiety Scale for Children
(AASC)’ and their marks of class 9th were taken as academic achievement.
INTERNATIONAL JOURNAL OF MULTIDISCIPLINARY EDUCATIONAL RESEARCHISSN : 2277-7881; IMPACT FACTOR - 2.735; IC VALUE:5.16VOLUME 3, ISSUE 3(4), MARCH 2014
104
. The statistical technique used was t- test. The findings of the present
study revealed that there exist significant differences in academic anxiety
and academic achievement of male and female secondary school students.
Girls found to be more academically anxious and had better academic
achievement than boys.
Causes of anxiety
Anxiety is often triggered by stress in our lives. Some of us are
more vulnerable to anxiety than others, but even those who become anxious
easily can learn to manage it well. We can also make ourselves anxious
with “negative self-talk” - a habit of always telling ourselves the worst will
happen. While there are some known risk factors for anxiety, the cause of
anxiety is relatively unknown. Here are some of the potential factors that
could cause a person to suffer from anxiety.
Stress
Stress is a major catalyst for anxiety. Anxiety can come from
numerous daily stressors (work, relationships, etc.), and those who don’t
adequately deal with stress run a higher risk of developing chronic anxiety.
Chemical Imbalance
Some research suggests that anxiety may be linked to certain
neurotransmitters, or special chemicals in the brain that move information
from one cell to another. Disturbances or imbalances in these
neurotransmitters can cause numerous problems, including anxiety.
Anxiety can also be caused by disturbances to the amygdala, the part of
the brain that processes fear and anxiety.
Genetics & Family History
Genes and upbringing can also play a role in anxiety.
INTERNATIONAL JOURNAL OF MULTIDISCIPLINARY EDUCATIONAL RESEARCHISSN : 2277-7881; IMPACT FACTOR - 2.735; IC VALUE:5.16VOLUME 3, ISSUE 3(4), MARCH 2014
105
People raised in a stressful or tension-filled home have a greater chance of
developing anxiety. The same is true of children raised by overbearing,
overprotective, or over-demanding parents.
Anxiety often develops in children who are put under pressure to
exceed in school, sports, or other activities. Also, children who grow up
in abusive homes run a much higher risk of developing anxiety and panic
attacks.
Trauma
Stressful events and trauma can lead to the development
of generalized anxiety disorder. These include physical, mental, or sexual
abuse, divorce, changing jobs or schools, or death of a loved one.
Severely traumatic episodes, such as war, can cause stronger types of
anxiety, such as posttraumatic stress disorder, or PTSD.
Medications
Some medications (such as amphetamines, decongestants, diet pills,
and bronchodilators) can cause anxiety as a side-effect, while withdrawal
from other substances (drugs, caffeine, nicotine, and alcohol) can also cause
anxiety. Medications designed to treat anxiety, can, unfortunately, also cause
rebound anxiety if they are not managed properly.
Other causes of Anxiety :
Family history of mental health issues can be a contributing factor.
But it doesn’t mean if there are mental health issues in your family you
will develop anxiety.
Ongoing stressful situations such as job issues or changes, unstable
accommodation, family or relationship breakdown and grief. If you have

INTERNATIONAL JOURNAL OF MULTIDISCIPLINARY EDUCATIONAL RESEARCHISSN : 2277-7881; IMPACT FACTOR - 2.735; IC VALUE:5.16VOLUME 3, ISSUE 3(4), MARCH 2014
106
experienced physical, sexual, verbal abuse, life threatening events or
pregnancy and childbirth you may be at risk
Physical health issues can be the underlying cause of anxiety disorders.
There can be anxiety links for people who suffer from asthma, diabetes,
heart disease and hormonal issues, such as thyroid problems. Sometimes
anxiety symptoms are the first indication of a physical health issue
Substance abuse, particularly cannabis, amphetamines, alcohol and
sedatives can trigger anxiety symptoms. Withdrawing from drugs and
alcohol can also cause withdrawal-related anxiety.
Personality types such as being a perfectionist, low self-esteem or the
need to be in control can make people more susceptible to anxiety.
Environmental and external factors: Environmental factors that are
known to cause several types of anxiety include: a) Trauma from events
such as abuse, victimization, or the death of a loved one, b) Stress in a
personal relationship, marriage, friendship, and divorce, c) Stress at work,
d) Stress from school, e) Stress about finances and money, f) Stress from a
natural disaster, g) Lack of oxygen in high altitude areas.
Medical factors : Anxiety is associated with medical factors such as
anemia, asthma, infections, and several heart conditions. Some medically-
related causes of anxiety include: a) Stress from a serious medical illness,
b) Side effects of medication, c) Symptoms of a medical illness, d) Lack of
oxygen from emphysema, or pulmonary embolism (a blood clot in the lung)
Other emotional and physical symptoms of anxiety are:
Emotional symptoms:
excessive worry about the past, present or future
feeling apprehensive

INTERNATIONAL JOURNAL OF MULTIDISCIPLINARY EDUCATIONAL RESEARCHISSN : 2277-7881; IMPACT FACTOR - 2.735; IC VALUE:5.16VOLUME 3, ISSUE 3(4), MARCH 2014
107
feeling powerless
a sense of impending panic, danger or doom
mind racing, finding it hard to think
difficulty concentrating and remembering things.
Physical symptoms:
increased heart rate
breathing rapidly (hyperventilation) or shortness of breath
sweating
trembling
feeling tired or weak
dizziness
choking
dry mouth
stomach or chest pain
diarrhoea
blushing
muscle tension and headaches
difficulty sleeping and nightmares
Types of Anxiety :
Five different types of anxieties i.e.
1. Academic anxiety,
2. Test anxiety,

INTERNATIONAL JOURNAL OF MULTIDISCIPLINARY EDUCATIONAL RESEARCHISSN : 2277-7881; IMPACT FACTOR - 2.735; IC VALUE:5.16VOLUME 3, ISSUE 3(4), MARCH 2014
108
3. Self anxiety,
4. Death anxiety,
5. Social anxiety.
Anxiety is a common place experience that everyone has from time
to time. It is difficult to describe it concretely because it has so many
different potential causes and degrees of intensity. The reviews of literature
available in the field of anxiety reveals that there are five major types of
anxieties that can influence adolescents’ life. These five types of anxieties
are described briefly as follows :
1. Academic Anxiety : The era of competition makes students more
anxious and the eagerness of whether they can do well in their academic
part or perform well in academic activities may adversely affect the mental
health of students. It is the painful uneasiness of mind while doing or
focusing on academic activities in school or at home. Educational or
academic anxiety is a kind of anxiety which relates to the imminent danger
from the environment of the educational institutions together with teacher
and certain subjects like Chemistry, Physics for numerical, Mathematics,
and English to some extent for some north Indian states. It is a mental
sensitivity of uneasiness or distress in response to school or college
circumstances that is perceived negatively. Academic anxiety afflicts
students during school-related situations. If academic anxiety isn’t properly
addressed, it can have many serious and lasting consequences, such as
causing a student to procrastinate, perform poorly on school work, fail in
classes and withdraw from socializing with peers or pursuing activities
that interest him. Academic anxiety is, to a certain extent, unavoidable,
necessary, and even productive, since it motivates to spend time for academic
tasks. However, when anxiety elevates above this productive lever, negative

INTERNATIONAL JOURNAL OF MULTIDISCIPLINARY EDUCATIONAL RESEARCHISSN : 2277-7881; IMPACT FACTOR - 2.735; IC VALUE:5.16VOLUME 3, ISSUE 3(4), MARCH 2014
109
outcomes such as, lack of concentration during study time, losing focus
during study and attention difficulties occur. Academic anxiety can become
more detrimental over time. As a student’s academic performance suffers,
the anxiety level related to certain academic tasks increases (Huberty,
2012).
2. Test Anxiety : It is a condition wherein someone emotionally or
physically experiences distress at prior, during or after taking on exam. In
other words, ‘too much anxiety about a test is commonly referred to as
test anxiety’. Test anxiety is uneasiness, apprehension or nervousness felt
by students who are afraid of failing an exam. Sweating, dizziness,
headaches, racing heartbeats, nausea, fidgeting and drumming on a dark
are the common symptoms. During the test, one cannot recall material
that he/she has studied and really know and his/her performance on tests
consistently falls below the expectations. Test anxiety is actually a type of
performance anxiety — a feeling someone might have in a situation where
performance really counts or when the pressure is on to do well. For
example, a person might experience performance anxiety when he or she
is about to try out for the school play, sing a solo on stage, step onto the
platform in a diving meet, or go into an important interview. Like other
situations in which a person might feel performance anxiety, test anxiety
can bring on “butterflies,” a stomachache, or a tension headache. Some
students might feel shaky, sweaty, or feel their heart beating quickly as
they wait for the test to be given out. A student with really strong test
anxiety may even feel like he or she might pass out or throw up. Test
anxiety has become a more frequently studied construct in educational
psychology and a primarily concern in the testing and assessment field.
Zeinder (1998) defines test anxiety as the set of phenomenological,
physiological and behavioural responses that accompany concern about
INTERNATIONAL JOURNAL OF MULTIDISCIPLINARY EDUCATIONAL RESEARCHISSN : 2277-7881; IMPACT FACTOR - 2.735; IC VALUE:5.16VOLUME 3, ISSUE 3(4), MARCH 2014
110
possible negative consequences or failure on an exam or similar evaluate
situations. It has been found that students consistently perceive
examination as a source of increase in anxiety and a situation engulfed
with uncertainty/unfairness in letting them demonstrate their true
achievements (Zollar & Ben-chain, 1990; Spielberger, 1985). Such feelings
among students’ limit their potential performance during the test situation,
resulting in higher text anxiety (Hill & Wigfield, 1984) directly causing
drop in the student achievement.
3. Self-Anxiety: It is the most common, widespread form of anxiety.
It affects millions of people throughout the world. It is usually defined as
an on-going state of tension over something ephemeral or unrealistic. In
other words, an individual remains always worried about nothing in specific,
or something that makes no sense being worried about himself. The
common symptoms of self-anxiety are presence of interfering thoughts,
self-task or activity which causes anxiety, presence of physiological-
emotional upset such as nausea, butterflies or seating. The individuals
show inappropriate behaviours such as panic attacks, study avoidance etc.
Such type of anxiety restricts the individual to live his normal life. Since
the person suffering from self-anxiety remains preoccupied with ‘what ifs’
and worst-case scenarios, his/her development is effected to a large extent.
The higher level of anxiety interfere with his/her day to day life – all this
with no positive payoff. The person suffering from self-anxiety becomes
unable to stay calm and collected and thus fails to look at life from a positive
perspective.
4. Death Anxiety: It is the morbid, abnormal or persistent fear of
death or dying. It is a feeling of dread, apprehension or solicitude (anxiety)
when one thinks of the process of dying or ceasing to be or what happens

INTERNATIONAL JOURNAL OF MULTIDISCIPLINARY EDUCATIONAL RESEARCHISSN : 2277-7881; IMPACT FACTOR - 2.735; IC VALUE:5.16VOLUME 3, ISSUE 3(4), MARCH 2014
111
after death. The person suffering from such type of anxiety disorder shows
symptoms like excessive fear of the dark, excessive sweating, shortness of
breath, light headache or fainting, rapid heartbeat and dry mouth. In the
most severe cases, he/she can feel nauseous and short of breath or might
even experience a full-blown panic attack. The person suffering from such
type of disorder remains preoccupied with random thoughts of death, fears
of dark and even panic attacks in the alone. Thus, the person suffering
from death anxiety remains in the terror of dying and shows excessive
abnormal behaviours even in the most normal situations.
5. Social Anxiety : This type of anxiety may be termed as the fear of
attending social situations, interaction with others and being evaluated or
scrutinized by other people. In other words, social anxiety involves intense
feeling of fear in social situations and especially situations that are
unfamiliar or in which he/she will be watched or evaluated by others. Some
of the common symptoms of social anxiety are escaping from the group
situations such as marriages, peer groups, continuously thinking that
everyone is watching him/her, getting afraid to talk to the strangers,
becoming too much self-conscious. People suffering from social anxiety
hate to work with in the groups because of lack of confidence in talking or
because of lack of confidence in talking or working with others. Such
individuals has intense fear of social situations and especially situations
that are unfamiliar to them. Social anxiety disorder (SAD) is a debilitating
and chronic illness characterized by persistent fear of one or more social
or performance situations. The persons suffering from this disorder tend
to remain alone most of the time. Such type of fear and anxiety leads to
the feelings of inadequacy, embarrassment, humiliation and in the most
severe cases, depression. The common types of social anxiety are specific
and generalized social anxieties. A specific social anxiety is the fear of

INTERNATIONAL JOURNAL OF MULTIDISCIPLINARY EDUCATIONAL RESEARCHISSN : 2277-7881; IMPACT FACTOR - 2.735; IC VALUE:5.16VOLUME 3, ISSUE 3(4), MARCH 2014
112
speaking in front of groups only, whereas, people suffering from generalized
social anxiety are anxious, nervous and uncomfortable in almost all social
situations. Social anxiety disorder (SAD) is a debilitating and chronic illness
characterized by “a marked and persistent fear of one or more social or
performance situations involving exposure to unfamiliar people or possible
scrutiny by others” (Furmark 2002, p 84; Schneier 2006, p 1030). Most
teachers will have students with social anxiety and/or academic anxiety.
Social anxiety can also affect a student’s academic performance. If a student
has social anxiety, the student might not be able to complete group tasks
or might not feel comfortable asking for help in class. Social anxiety can
go along with or even lead to academic anxiety. Teaching students self-
regulation can reduce anxiety and increase academic performance (Ader
& Erktin, 2010).
CONCLUSION :
Anxiety is a normal human emotion that everyone experiences at times.
Many people feel anxious, or nervous, when faced with a problem at work,
before taking a test, or making an important decision. Anxiety disorders,
however, are different. They can cause such distress that it interferes with
a person’s ability to lead a normal life. Anxiety is more than just a feeling.
As a product of the body’s fight-or-flight response, anxiety involves a wide
range of physical symptoms. Main causes of anxiety are Stress, Chemical
Imbalance, Genetics & Family History, Trauma, Some medications (such
as amphetamines, decongestants, diet pills, and bronchodilators). Other
causes includes; Family history of mental health issues; Ongoing stressful
; Physical health issues ; Substance abuse, Personality types .
Environmental factors that are known to cause several types of anxiety
include: a) Trauma from events such as abuse, victimization, or the death
of a loved one, b) Stress in a personal relationship, marriage, friendship,

INTERNATIONAL JOURNAL OF MULTIDISCIPLINARY EDUCATIONAL RESEARCHISSN : 2277-7881; IMPACT FACTOR - 2.735; IC VALUE:5.16VOLUME 3, ISSUE 3(4), MARCH 2014
113
and divorce, c) Stress at work, d) Stress from school, e) Stress about finances
and money, f) Stress from a natural disaster, g) Lack of oxygen in high
altitude areas. Anxiety is associated with medical factors such as anemia,
asthma, infections, and several heart conditions. Some medically-related
causes of anxiety include: a) Stress from a serious medical illness, b) Side
effects of medication, c) Symptoms of a medical illness, d) Lack of oxygen
from emphysema, or pulmonary embolism (a blood clot in the lung) . There
are several recognized types of anxiety, including i.e. Academic anxiety,
Test anxiety, Self anxiety, Death anxiety, and Social anxiety. Social and
academic anxiety can have a negative effect on a student’s academic
performance. Teachers and parents can learn to recognize the signs of
anxiety in students. If teachers and parents help students learn to control
anxiety early on, more serious academic problems related to anxiety can
be avoided.
References
[1] Ader, E., & Erktin, E. (2010). Coping as self-regulation of anxiety: A
model for math achievement in high-stakes tests. Cognition, Brain,
Behavior, 14, 311–332. Retrieved from http://www.cbbjournal.ro/.
[2] Allen, Woody (2008). A study of effect of death anxiety on secondary
school students in relation to sex and socio-economic status.
Psychological Abstracts. Retrieved from http:/www.timlebon.com/
DeathAnxiety.htm
[3] Anxiety (2012): In Merriam-Webster, online dictionary.
[4] Ballash NG, Pemble MK, Usui WM, et al. Family functioning, perceived
control, and anxiety: a mediational model. Journal of Anxiety
Disorders. 2006;20:486–97. [PubMed]

INTERNATIONAL JOURNAL OF MULTIDISCIPLINARY EDUCATIONAL RESEARCHISSN : 2277-7881; IMPACT FACTOR - 2.735; IC VALUE:5.16VOLUME 3, ISSUE 3(4), MARCH 2014
114
[5] Boor, M. (1972). Relationship of test-anxiety and academic performance
when controlled for intelligence. Indian journal of psychometry and
education. ISSN, 0378-1003, 35 (1), 123.
[6] Furmark T. Social phobia: overview of community surveys. Acta
Psychiatrica Scandinavica.2002;105:84–93. [PubMed]
[7] Hancock, D. R. (2001). Effect of test anxiety and evaluative threats on
students’ achievement and motivation. The Journal of Educational
Research, 94 (5), 284-290.
[8] Huberty, T. J. (2009). Test and performance anxiety. Principal
Leadership, 10, 12–16. Retrieved from http://www.nasponline.org/
[9] Mnicholas B and Lewiensohn (1998) Anxiety on the Basis Gender
Differences. Jouranl of Abnormal psychology. Vol 107 (1): 109-117
[10] Namrata (1992). The relationship of personality traits, situational
stress and anxiety factors to students achievement. Fifth Survey of
Research in Education (1988-92), Ed. M.B. Buch, New Delhi : NCERT,
II, 1892-1893.
[11] Neelam and Attri, A.K. (2013). Academic Anxiety and Achievement of
Secondary School Students. International Journal of Behavioral Social
and Movement Sciences. (Vol. 02- Issue 1, pp. 27).
[12] Schneier FR. Social anxiety disorder. The New England Journal of
Medicine. 2006;355:1029–36. [PubMed]
[13] Silva, A. Da (1984-85). A study of effect of social anxiety in relation to
sex and socio-economic status. Psyco INFO Database Record. Retrieved
from http:/www.google.com/elias.it.helsinki.fi.htm.
[14] Zeinder, M. (1998) . Test Anxiety : The state of the art . New York :
Plenum.

INTERNATIONAL JOURNAL OF MULTIDISCIPLINARY EDUCATIONAL RESEARCHISSN : 2277-7881; IMPACT FACTOR - 2.735; IC VALUE:5.16VOLUME 3, ISSUE 3(4), MARCH 2014
115
[15] Zoller, U., & Ben-Chain, D. (1990). Gender differences in examination
type, test anxiety, and academic achievement in college science: a case
study. Science education, 74(6), 597-608.
[16] http://www.mindhealthconnect.org.au/anxiety
[17] http://www.medicalnewstoday.com/releases/7603.php
[18] http://www.webmd.com/anxiety-panic/guide/mental-health-anxiety-
disorders
[19] http://www.healthline.com/health/anxiety-causes

INTERNATIONAL JOURNAL OF MULTIDISCIPLINARY EDUCATIONAL RESEARCHISSN : 2277-7881; IMPACT FACTOR - 2.735; IC VALUE:5.16VOLUME 3, ISSUE 3(4), MARCH 2014
116

INTERNATIONAL JOURNAL OF MULTIDISCIPLINARY EDUCATIONAL RESEARCHISSN : 2277-7881; IMPACT FACTOR - 2.735; IC VALUE:5.16VOLUME 3, ISSUE 3(4), MARCH 2014
117

INTERNATIONAL JOURNAL OF MULTIDISCIPLINARY EDUCATIONAL RESEARCHISSN : 2277-7881; IMPACT FACTOR - 2.735; IC VALUE:5.16VOLUME 3, ISSUE 3(4), MARCH 2014
118

INTERNATIONAL JOURNAL OF MULTIDISCIPLINARY EDUCATIONAL RESEARCHISSN : 2277-7881; IMPACT FACTOR - 2.735; IC VALUE:5.16VOLUME 3, ISSUE 3(4), MARCH 2014
119

INTERNATIONAL JOURNAL OF MULTIDISCIPLINARY EDUCATIONAL RESEARCHISSN : 2277-7881; IMPACT FACTOR - 2.735; IC VALUE:5.16VOLUME 3, ISSUE 3(4), MARCH 2014
120

INTERNATIONAL JOURNAL OF MULTIDISCIPLINARY EDUCATIONAL RESEARCHISSN : 2277-7881; IMPACT FACTOR - 2.735; IC VALUE:5.16VOLUME 3, ISSUE 3(4), MARCH 2014
121
INTERNATIONAL JOURNAL OF MULTIDISCIPLINARY EDUCATIONAL RESEARCHISSN : 2277-7881; IMPACT FACTOR - 2.735; IC VALUE:5.16VOLUME 3, ISSUE 3(4), MARCH 2014
122

INTERNATIONAL JOURNAL OF MULTIDISCIPLINARY EDUCATIONAL RESEARCHISSN : 2277-7881; IMPACT FACTOR - 2.735; IC VALUE:5.16VOLUME 3, ISSUE 3(4), MARCH 2014
123

INTERNATIONAL JOURNAL OF MULTIDISCIPLINARY EDUCATIONAL RESEARCHISSN : 2277-7881; IMPACT FACTOR - 2.735; IC VALUE:5.16VOLUME 3, ISSUE 3(4), MARCH 2014
124

INTERNATIONAL JOURNAL OF MULTIDISCIPLINARY EDUCATIONAL RESEARCHISSN : 2277-7881; IMPACT FACTOR - 2.735; IC VALUE:5.16VOLUME 3, ISSUE 3(4), MARCH 2014
125

INTERNATIONAL JOURNAL OF MULTIDISCIPLINARY EDUCATIONAL RESEARCHISSN : 2277-7881; IMPACT FACTOR - 2.735; IC VALUE:5.16VOLUME 3, ISSUE 3(4), MARCH 2014
126

INTERNATIONAL JOURNAL OF MULTIDISCIPLINARY EDUCATIONAL RESEARCHISSN : 2277-7881; IMPACT FACTOR - 2.735; IC VALUE:5.16VOLUME 3, ISSUE 3(4), MARCH 2014
127
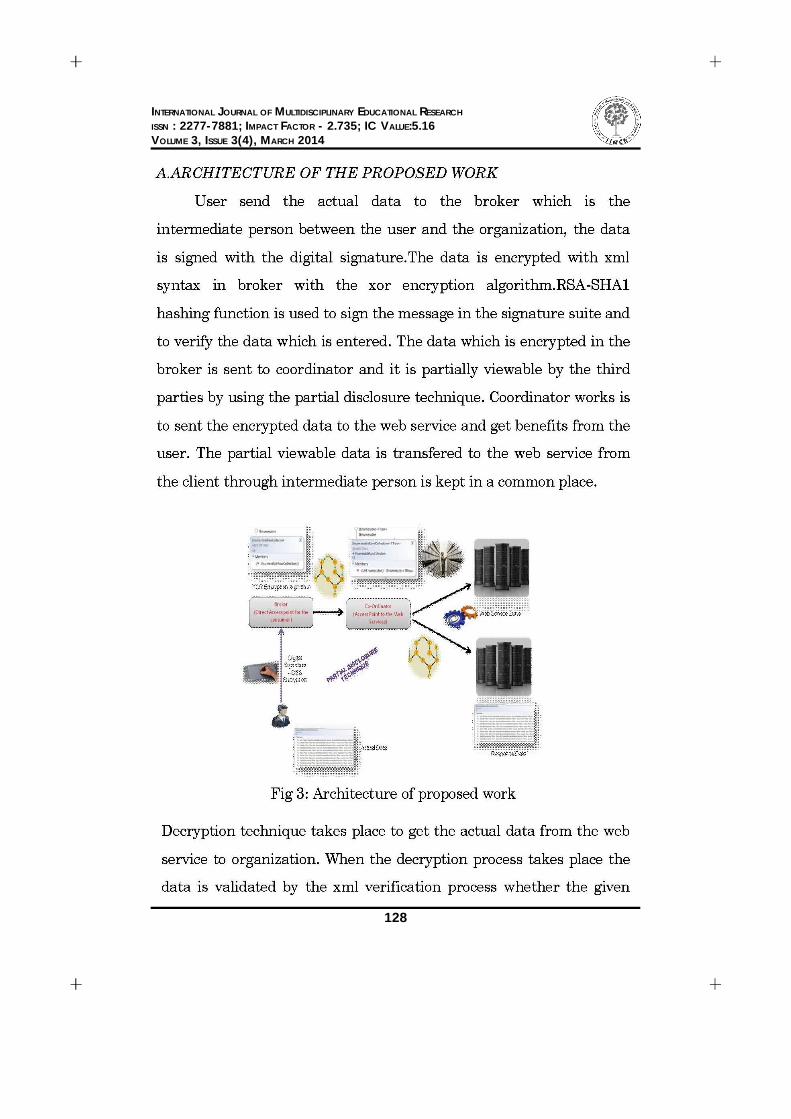
INTERNATIONAL JOURNAL OF MULTIDISCIPLINARY EDUCATIONAL RESEARCHISSN : 2277-7881; IMPACT FACTOR - 2.735; IC VALUE:5.16VOLUME 3, ISSUE 3(4), MARCH 2014
128

INTERNATIONAL JOURNAL OF MULTIDISCIPLINARY EDUCATIONAL RESEARCHISSN : 2277-7881; IMPACT FACTOR - 2.735; IC VALUE:5.16VOLUME 3, ISSUE 3(4), MARCH 2014
129
INTERNATIONAL JOURNAL OF MULTIDISCIPLINARY EDUCATIONAL RESEARCHISSN : 2277-7881; IMPACT FACTOR - 2.735; IC VALUE:5.16VOLUME 3, ISSUE 3(4), MARCH 2014
130

INTERNATIONAL JOURNAL OF MULTIDISCIPLINARY EDUCATIONAL RESEARCHISSN : 2277-7881; IMPACT FACTOR - 2.735; IC VALUE:5.16VOLUME 3, ISSUE 3(4), MARCH 2014
131
INTERNATIONAL JOURNAL OF MULTIDISCIPLINARY EDUCATIONAL RESEARCHISSN : 2277-7881; IMPACT FACTOR - 2.735; IC VALUE:5.16VOLUME 3, ISSUE 3(4), MARCH 2014
132

INTERNATIONAL JOURNAL OF MULTIDISCIPLINARY EDUCATIONAL RESEARCHISSN : 2277-7881; IMPACT FACTOR - 2.735; IC VALUE:5.16VOLUME 3, ISSUE 3(4), MARCH 2014
133

INTERNATIONAL JOURNAL OF MULTIDISCIPLINARY EDUCATIONAL RESEARCHISSN : 2277-7881; IMPACT FACTOR - 2.735; IC VALUE:5.16VOLUME 3, ISSUE 3(4), MARCH 2014
134

INTERNATIONAL JOURNAL OF MULTIDISCIPLINARY EDUCATIONAL RESEARCHISSN : 2277-7881; IMPACT FACTOR - 2.735; IC VALUE:5.16VOLUME 3, ISSUE 3(4), MARCH 2014
135

INTERNATIONAL JOURNAL OF MULTIDISCIPLINARY EDUCATIONAL RESEARCHISSN : 2277-7881; IMPACT FACTOR - 2.735; IC VALUE:5.16VOLUME 3, ISSUE 3(4), MARCH 2014
136
HEALTH INSURANCE MARKET SCENARIO IN INDIA– ANOVERVIEW
Dr. N.Ratna KishorAssistant Professor
Department of Commerce & Business AdministrationAcharya Nagarjuna University
Nagarjuna Nagar,Guntur
1. INTRODUCTION
The term health insurance (popularly known as Medical Insurance
or Mediclaim) is a type of insurance that covers your medical expenses.
The concept of health insurance is new in India but its awareness is growing
fast. Health insurance comes in handy in case of severe emergencies. Life
is unpredictable, insurance can make it safe and secure from bearing huge
financial loss. A health insurance policy is a contract between an insurance
company and an individual. Sometimes it is associated with covering
disability and custodial needs. The contract is renewable annually.
Health insurance is affordable and carries the assurance and
freedom from insecurities that threaten normalcy now and then. The type
and amount of health care costs that will be covered by the health plan are
specified in advance. Health plans are available in two formats, individual
and group plans. In an individual policy you are personally the owner of
the policy. While in a group plan, the sponsor owns the policy and the
people covered under it are called its members.1
Health insurance unique from all other forms of insurance as it
involves party other than the insurer and the insured, without which health
insurance loses its meaning- the healthcare provider. The healthcare
provider pays a major role in determining what services are used, how

INTERNATIONAL JOURNAL OF MULTIDISCIPLINARY EDUCATIONAL RESEARCHISSN : 2277-7881; IMPACT FACTOR - 2.735; IC VALUE:5.16VOLUME 3, ISSUE 3(4), MARCH 2014
137
much of the services are used and how much they cost – which makes it
different and also complex. Economists describe health insurance as an
‘imperfect market’ where normal market forces do not work as expected.
The imperfections include the following concepts which are important to
understand:
1.1. Information Asymmetry
The information available to the insurer and the insured about each
other is not perfectly transport or complete. Insured often does not fully
understand the insurer’s capabilities, or the exact interpretation of his
contract. Similarly, the insurer may not fully know the exact risk status of
a proposer and so may not price the risk correctly.
1.2. Risk selection
The insurer’s natural preference is for lower risk proposer and there is
reluctance to insure those with high risk. This is also called termed as
‘cherry-picking’ or crem-skimming’
This inverse is also true, which is called ‘adverse selection’, whereby
the higher risk persons would want to purchase health insurance more
than health person with low risk. Insurers apply acceptance and pricing
rules to decide which risks they will accept and what price, a process called
underwriting and described in a later section in more detail.
1.3. Moral hazard
Moral hazard works at the insured’s end, as well as the healthcare
providers’ end, and referred to as ‘demand side’ and ‘supply side’
moral hazard respectively.
Demand side moral hazard: consumers seek or accept more health
care services than they would if they did not have health insurance.

INTERNATIONAL JOURNAL OF MULTIDISCIPLINARY EDUCATIONAL RESEARCHISSN : 2277-7881; IMPACT FACTOR - 2.735; IC VALUE:5.16VOLUME 3, ISSUE 3(4), MARCH 2014
138
2. Why health insurance?
Health insurance provides you with an affordable way for you and
the ones you love to stay healthy and get medical care when ill. It also
protects you and your family from the high cost of health care. In some
cases, medical bills can be financially shocking.
In a country where out-of-pocket expenditure by households is very
high in comparison to other countries, and accounts for about 71% of all
health expenditure in the country2, the importance of individuals taking
lead in planning for their own health expenditure, especially when it comes
at a cost affordable to them, needs cannot be over-emphasized.
The increasing awareness of this protective role of health insurance,
and with renewed focus on marketing of health insurance products on the
part of insurers in the detariffed regime, the health insurance portfolio is
now the fastest growing market segment for the non-life insurance industry.
There is, however, tremendous potential, as even today, only about 5% of
the country’s population has been covered by a commercial health insurance
product (excluding mass government schemes)
3. Healthcare Financing
Though the healthcare industry accounts for over 6-7 of our GDP
and is the largest in terms of offering employment, there is serious dearth
of expertise in the sector. Over 70% of the expenditure on healthcare is
still being met by consumers ‘out of packet’. Less than 15% of the India’s
population today has some form of health insurance cover. Community
health insurance schemes are slowly penetrating into the rural markets
with more than 25 schemes covering over 10 million lives all over India.
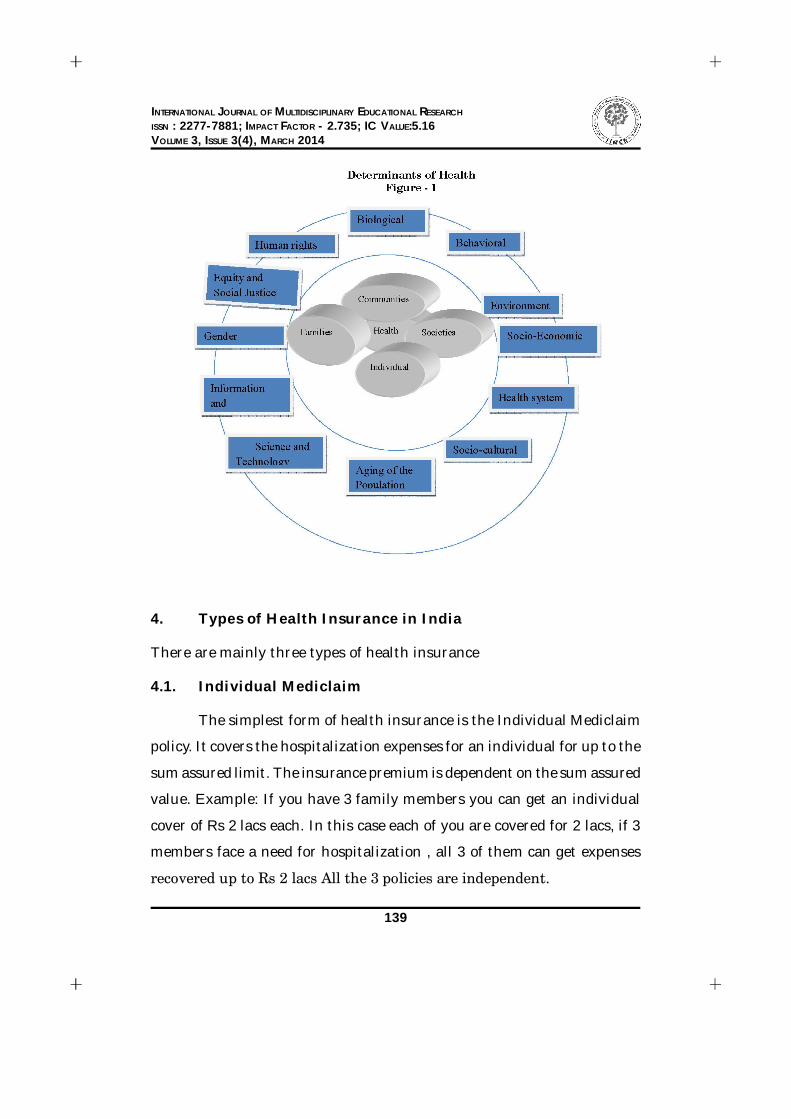
INTERNATIONAL JOURNAL OF MULTIDISCIPLINARY EDUCATIONAL RESEARCHISSN : 2277-7881; IMPACT FACTOR - 2.735; IC VALUE:5.16VOLUME 3, ISSUE 3(4), MARCH 2014
139
4. Types of Health Insurance in India
There are mainly three types of health insurance
4.1. Individual Mediclaim
The simplest form of health insurance is the Individual Mediclaim
policy. It covers the hospitalization expenses for an individual for up to the
sum assured limit. The insurance premium is dependent on the sum assured
value. Example: If you have 3 family members you can get an individual
cover of Rs 2 lacs each. In this case each of you are covered for 2 lacs, if 3
members face a need for hospitalization , all 3 of them can get expenses
recovered up to Rs 2 lacs All the 3 policies are independent.

INTERNATIONAL JOURNAL OF MULTIDISCIPLINARY EDUCATIONAL RESEARCHISSN : 2277-7881; IMPACT FACTOR - 2.735; IC VALUE:5.16VOLUME 3, ISSUE 3(4), MARCH 2014
140
1.2. Family Floater policy
Family Floater Policies are enhanced version of the mediclaim policy.
The sum assured value floats among the family members. I.e. each opted
family member comes under the policy, and it covers expenses for the entire
family up to the sum assured limit. The premium for family floater plans
are typically less than that for separate insurance cover for each family
member.
1.3. Unit Linked Health Plans:
Taking the ULIP route, health insurance companies too have
introduced Unit Linked Health Plans. Such plans combine health insurance
with investment and pay back an amount at the end of the insurance term.
The returns of course are dependent on market performance. These plans
are very new and still in development phase. This is only recommended for
people who can handle market linked products like ULIP and ULPP
5. Evaluation and Growth of Health Insurance in India
The Indian insurance industry seems to be in a state of flux. After
a decade of strong growth, the Indian insurance industry is currently facing
severe headwinds owing to:
Slowing growth
Rising costs
Deteriorating distribution structure
Stalled reforms

INTERNATIONAL JOURNAL OF MULTIDISCIPLINARY EDUCATIONAL RESEARCHISSN : 2277-7881; IMPACT FACTOR - 2.735; IC VALUE:5.16VOLUME 3, ISSUE 3(4), MARCH 2014
141
Source: IRDA Annual Report 2010-11
Despite strong improvement in penetration and density in the last
10 years, India largely remains an under-penetrated market. The market
today is primarily dependent on push, tax incentives and mandatory buying
for sales. There is very little customer pull, which will come from growing
financial awareness and increasing savings and disposable income.
In the long run the insurance industry is still poised for a strong
growth as the domestic economy is expected to grow steadily. This will
lead to rise in per capita and disposable income, while savings are expected
to be stable.
5.2 Insurance growth drivers in India
The demand for insurance products is likely to increase due to the
exponential growth of household savings, purchasing power, the middle
class and the country’s working population. Listed below, are the various
underlying growth drivers for India’s insurance industry:
Growing of the financial industry as a whole
Growth of life and non-life industry

INTERNATIONAL JOURNAL OF MULTIDISCIPLINARY EDUCATIONAL RESEARCHISSN : 2277-7881; IMPACT FACTOR - 2.735; IC VALUE:5.16VOLUME 3, ISSUE 3(4), MARCH 2014
142
Promoting innovation and removing inefficiency
Competition and orderly growth
Growth of specific insurance segments such as motor insurance
5.3 Emerging trends
Multi-distribution i.e. increasing penetration through new modes
of distribution such as the internet, direct and telemarketing and
NGOs
Product innovation i.e. increased levels of customization through
product innovation
Claims management i.e. timely and efficient management of claims
to prevent delays which can increase the claims cost
Profitable growth i.e. expanding product range, developing
innovative products and expanding distribution channels
Regulatory trends i.e. mandated regulatory changes by the IRDA
to promote a competitive environment in both the life and non-life
insurance sectors
5.4 Life insurance: key challenges
In FY12, the life insurance industry witnessed a decline in the first
year premium collected which dropped from INR1, 258 billion in
FY11 to INR1, 142 billion, a drop of approximately 10%. This was
owing to the following challenges that the industry faced in Products
strategy and design
Cost
Taxation

INTERNATIONAL JOURNAL OF MULTIDISCIPLINARY EDUCATIONAL RESEARCHISSN : 2277-7881; IMPACT FACTOR - 2.735; IC VALUE:5.16VOLUME 3, ISSUE 3(4), MARCH 2014
143
Distribution
Prospects and challenges of various channels
Compensation
Customer service
Governance and regulatory issues
5.5 Non-life insurance: factors impacting growth
The non-life insurance industry has been growing in excess of 20%
over the last two years however the penetration was as low as 0.7% of the
GDP in FY10. The key factors for growth include:
Product pricing, innovation and simplicity
Distribution
Compensation
Micro-insurance in non-life widening reach
Governance and regulatory changes
Health insurance
Innovative products to counter the competition
Improved fraud control mechanisms
Standardization to reduce claims loss
Reducing inefficiencies by revisiting third party administrator (TPA)
agreements
5.6 Growth of Health Insurance in India:
In 80s most of the hospitals in Indian government owned and
treatment was free of cost. The private medical care the need for health

INTERNATIONAL JOURNAL OF MULTIDISCIPLINARY EDUCATIONAL RESEARCHISSN : 2277-7881; IMPACT FACTOR - 2.735; IC VALUE:5.16VOLUME 3, ISSUE 3(4), MARCH 2014
144
insurance was felt and various insurance companies introduced mediclaim
insurance as a product. According to recent news report health insurance
continues fastest growing segment with annual growth rate of 25%.health
insurance premium has also increase to Rs. 13345 crores in 2011-2012.

INTERNATIONAL JOURNAL OF MULTIDISCIPLINARY EDUCATIONAL RESEARCHISSN : 2277-7881; IMPACT FACTOR - 2.735; IC VALUE:5.16VOLUME 3, ISSUE 3(4), MARCH 2014
145
6. The Way Forward:
Advanced technologies like networking of operating offices of
insurance companies enabled the insurance companies to offer policy
services in a time bound manner. With population growing at 1.5% p.a. It
is expected that real per capita income quadruples by 2020. There are
changes in the socio economic life style of Indian population. With
fragmentation of joint family system more number of people is leading
independent family units. The income levels of young generation are
also expected to increase significantly. With the development of
infrastructure projects there is a migration of labour forces from rural
to urban lands finding better employment avenues thereby enhancing
the purchasing capacity. 93% of Indian populations are working in
unorganised sector with an absolute number of 369 million While Indian
demography statistics indicate a growth of 45% of working age population,
there is a potentiality of generating 150 – 200 million jobs by 2020*.
Keeping in view these dynamics it is expected that non - life insurance
industry designs market segment-specific insurance solutions to enhance
the acceptance levels of insurance products. With better prospects offered
in technology sector, the ability of the insurance industry to retain
the customer base lays in rendering the timely and effective policy
service.
Insurers to – collect correct data, develop new products price
properly, improve u/w and claims management
Explore possibilities of setting up pure health insurance company
with JV partners
Insurers TPAs Data Warehouse to have common IT framework to
facilitate easy data transfer

INTERNATIONAL JOURNAL OF MULTIDISCIPLINARY EDUCATIONAL RESEARCHISSN : 2277-7881; IMPACT FACTOR - 2.735; IC VALUE:5.16VOLUME 3, ISSUE 3(4), MARCH 2014
146
Govt. to evolve National health scheme for common man in urban
and rural area and Sr.citizen and terminally ill
Support health Insurance scheme for population below poverty line.
Foster Public – private partnership
Providers to be more disciplined, bring standardization,
accreditation etc
Govt. to regulate the healthcare providers
IRDA to set up data warehouse
Implement other recommendations of the sub - group including
Conclusion:
The government to provide universal access to free / low cost health
care insurance can be an important means of mobilizing resources,
providing risk protection and perhaps, improved health outcomes. This
scenario , the challenge , then for Indian policy makers to find way to
improve upon the existing situation in the health sector and to make
equitable, affordable and quality health care accessible to the people,
especially the poor and the vulnerable sections of the society. In the way
inevitable that the state reforms its public health delivery system and
explores other social security option like health insurance
(Footnotes)
1 http://www.policybazaar.com/knowledge-base/health-insurance/what-
health-insurance.html
2 Ministry of Health and Family welfare. National Health Accounts, India.
New Delhi: Government of India, 2009.

INTERNATIONAL JOURNAL OF MULTIDISCIPLINARY EDUCATIONAL RESEARCHISSN : 2277-7881; IMPACT FACTOR - 2.735; IC VALUE:5.16VOLUME 3, ISSUE 3(4), MARCH 2014
147
Reference:
1. Ellis, R., Alam, M., & Gupta, I. (2000). Health Insurance in India:
Prognosis and Prospectus. Economic and Political Weekly. 35, pp. 207-
217
2. Rao, K Sujatha K (2004) –Health Insurance: Concepts, Issues and
Challenges, Economic and Political Weekly, Vol. 39, No. 34 (Aug. 21-
27, 2004), pp. 3835-3844.
3. Jawaharla U, (January 2006), “Indian Health Insurance Market-A
Road Map to the Future”, Insurance Chronicle, Vol-VII, Issue-I, The
ICFAI University Press, Hyderabad, Pp. 24-27
4. A monthly e-health insurance news letter of International Institute
Of Health Management Research, New Delhi, March 2010, Vol.1,
Issue7.
5. Prof. K. Srinath Reddy (2011), “A Critical Assessment of the Existing
Health Insurance Models in India” The Planning Commission of India,
New Delhi.
6. http://www.assocham.org/events/recent/showevent.php?id=310
7. http://www.bimabazaar.com/insurance-articles/83-health-insurance-
article/116-health-insurance-issues-challenges-and-way-forward
8. www.iihmrdelhi.org
9. www.irda.gov.in
INTERNATIONAL JOURNAL OF MULTIDISCIPLINARY EDUCATIONAL RESEARCHISSN : 2277-7881; IMPACT FACTOR - 2.735; IC VALUE:5.16VOLUME 3, ISSUE 3(4), MARCH 2014
148
THE DIGITAL DIVIDE: A GLOBAL PREDICAMENT
R.PurushothamanResearch Scholar
Department of PhilosophyPondicherry University, Puducherry
Introduction
Do we live in an Information Age? Yes, we currently live in the age
of information. The information age has opened up untold possibilities of
human progress. Information and Communication Technologies (ICTs)
revolutionized the every aspect of human life and society. Computers and
the Internet are the central part of our lives. It is also marked as second
industrial revolution. The technology of communications is changing in
ways which will have impact on the entire fabric society in both
economically well developed and developing nations. In the developing
nations, ICTs have brought many challenges along with opportunities, when
compared with the developed ones and they are also facing the hurdle of
digital divide (DD). Witnessing the changes brought in by the ICTs in the
day to-day performances, as a consequence, the modus operandi of the
already existing stratifications of various society of various nation states
becomes more questionable, whether it fell allay or getting more rigid.
The distinct question that arises out of the consequence is, the access to
the available technology - is it for all, especially to the downtrodden.
Globally millions of people are unable to fully experience the fruits of science
and technology. Computers and the Internet technologies are unevenly
accessed by each and every individual, even though it seems accessible to
everyone. This inaccessible scenario creates social division, due to either
poor/lack of access and this phenomenon is termed as the ‘digital divide’.
With these above mentioned focuses the digitial divides that exist in this
INTERNATIONAL JOURNAL OF MULTIDISCIPLINARY EDUCATIONAL RESEARCHISSN : 2277-7881; IMPACT FACTOR - 2.735; IC VALUE:5.16VOLUME 3, ISSUE 3(4), MARCH 2014
149
social order emerge as a major and serious issue of concern for the
developing nations like India as posed by the developed nations. Just like
many other countries India is also affected by the DD. The aim and focus
of the paper is to bring an understanding by providing some basic ideas,
different notions and the ongoing debates regarding the DD.
The concept of digital divide
Since the mid 1990s, the notion of the DD has gained much more
attention in an international level. Being popular in the last decade, the
paradigm of DD brought the issue on the agenda of social, economic,
political and scholarly discussions. From the historical background, DD
was all about technology-haves and technology have-nots. The concept of
DD raises some of the important and interesting questions: Why does the
DD matters? Where does it commonly exist? Who is digitally included and
excluded? What are the reasons for DD? What are the effects of DD on
society? What are the determinant factors of DD? In the present situation,
academic researchers, politicians, activists, policymakers, etc agreed that
the DD is a major social problem and it has serious affects on lot of people
across the world. The issue of DD is a top priority in the world. It is a core
issue of the information society, not only exists between nations as we
think but within the nation states too and there comes many forms and
kinds. In other words, it exists both in developed countries and countries
with poor economy and development. In most of the literature, the DD is
usually described as a dichotomy between those who have access to ICT
and those who do not. Traditionally speaking, the DD refers to the unequal
access to technology. It arises due to factors such as geographical variation/
differences, socio, economic status, age and gender. There are number of
researches carried out to understand the people who are most affected by
the DD. People with farming/ rural background, people with low levels of
INTERNATIONAL JOURNAL OF MULTIDISCIPLINARY EDUCATIONAL RESEARCHISSN : 2277-7881; IMPACT FACTOR - 2.735; IC VALUE:5.16VOLUME 3, ISSUE 3(4), MARCH 2014
150
formal education, the unemployed, the elderly people, economically
deprived or people in disadvantaged communities, person with disabilities.
In addition to, throughout the world homeless populations are also
including in this case. Unfortunately, the above mentioned people are being
left behind in the information age. However, it is really true that deprived
people become excluded, because they are disconnected from technology
based networks. With this in mind, let us get into the definitions to be
more precise.
Defining the digital divide
There are number of studies and works carried out by researchers
pertaining to the DD. A brow of scholars and experts have had explained
the DD in different ways. One common definition accepted by widely, it is
the gap that exists between those who get benefits from technologies
(Television, computers to the Internet) and related services. In a narrow
sense, DD is described as, “significant demographic gaps in computer and
Internet access and usage” (Hacker & Mason, 2003:99). Castells puts it,
“inequality of access to the Internet” Further he argues: “access alone
does not solve the problem, but it is a prerequisite for overcoming inequality
in a society whose dominant functions and social groups are increasingly
organized around the Internet” (Castells, 2001:248). The Internet is
considered as the network of networks. There is a division between those
who do have an Internet access and those do not have an Internet access,
this divide is also popularly referred to as the Internet divide. A good and
standard definition has been offered by the Organization for Economic
Co-operation and Development (OECD): “the gap between individuals,
households, businesses and geographic areas at different socio-economic
levels with regard both to their opportunities to access information and
communication technologies (ICTs) and to their use of the Internet for a

INTERNATIONAL JOURNAL OF MULTIDISCIPLINARY EDUCATIONAL RESEARCHISSN : 2277-7881; IMPACT FACTOR - 2.735; IC VALUE:5.16VOLUME 3, ISSUE 3(4), MARCH 2014
151
wide variety of activities. (OECD, 2001:5). Floridi defines that is the “source
of many of the ethical problems emerging from the evolution of the
information society” (Flordi, 2001:1). Norris understands the divide as a
broad, tripartite social structure: The global divide refers to the divide
between developed and developing societies regard Internet access. The
social divide reveals us the gap between access to information rich and
poor in each country. And finally the democratic divide concerns the
differences between those who do use and do not use digital resources to
engage, mobilize, and participate in public life (Norris, 2001:4). The point
referred is here, if the DD exists in highly industrialized and wealthy nations
themselves face the unduly effect then, what would be the fate of developing
countries and what about economically poor countries? Not everyone is so
fortunate, particularly in the third world nations, the gap gets even wider
and the obstacles are much more difficult to overcome. And infrastructure
and financial resources are lacking in third world nations. The above
definitions, deals and provides an operational framework for it. However,
the phrase ‘DD’ has got much more attention in academic research from
various disciplines such as communications, education, library science,
sociology, political science, geography, and so forth.
Factors behind digital divide
Basically, there are number of different factors contribute to this
disparity. Several researchers focused on the DD are worried that those
advantaged by ICTs have greater access and skills to find information,
causing a growing gap between those who are connected and who are not.
They have written about the effect of the DD on knowledge. One of the
important reasons of DD is knowledge divide. Generally, knowledge
empowers people and can be acquired from books, teachers, and institutions
and also from things around us including nature. Presently, one can get

INTERNATIONAL JOURNAL OF MULTIDISCIPLINARY EDUCATIONAL RESEARCHISSN : 2277-7881; IMPACT FACTOR - 2.735; IC VALUE:5.16VOLUME 3, ISSUE 3(4), MARCH 2014
152
lots of information via the Internet. Information and knowledge have
become most valuable assets. These both can translate into social as well
as political power. ICT is considered to be the potential tool in the field of
knowledge. In particular, the Internet is considered to be the treasure of
knowledge. All sorts of knowledge (for example, social knowledge, cultural
knowledge, political knowledge, scientific knowledge, etc.) are made
available through the Internet. More educated people with computer
knowledge and language proficiency are able to access new technologies.
It would seem that the DD directly relates to knowledge divide. Fallis rightly
observes that “the principle value of access to information technology that
it leads to knowledge” (Fallis, 2007:29). In the debates of DD, it is often
projected as the issue of access to information. But one has to see that
information is not an end in itself and as a means to knowledge and wisdom.
It is well-known that knowledge plays crucial role for any development of
any country. According to an American economist John Kenneth Galbraith,
“but information society, the fuel, the power, is knowledge. Galbraith
emphasizes: “one has now come to see a new class structure divided by
those who have information and those who must function out of ignorance.
This new class has its power not from money, not from land, but from
knowledge” (cf. Jessup et al., 2004:281). However, this will affects especially
those who don’t have access to ICTs. As a result, it leads a person to be
excluded from knowledge level and is also missing out many opportunities.
It has been noted that the language is a driving factor and a major
barrier of DD. Language is the primary vector for communication and is a
tool to communicate the information. It is well known that the Internet is
dominated by the language of English. On the Internet, majority sources
are available only in the language of English. In terms of the Internet
access and utility, the richest linguistic group is English speakers. Many

INTERNATIONAL JOURNAL OF MULTIDISCIPLINARY EDUCATIONAL RESEARCHISSN : 2277-7881; IMPACT FACTOR - 2.735; IC VALUE:5.16VOLUME 3, ISSUE 3(4), MARCH 2014
153
non – English speaking countries are uncomfortable with the language of
English. So, it becomes a difficult to use the Internet by the people who
doesn’t know the language of English and lack of English proficiency has
created a ‘computer fear’. In India and other developing countries, the
disparity is much wider. As a result, people residing in rural areas are
hesitant to use the internet due to lack of English proficiency. Thus, it
becomes obstacle for them who do not know the language of English. For
instance, a person who works in medical field, she or he can gain a global
knowledge about the diseases, techniques, job opportunities, etc. It is
possible only when she or he has good access to computer and internet
facilities, which can be accessed in a better way with the knowledge of
English.
It is interesting to note here technology creates a divide between
those who could afford new technology and those who could not. It is well-
known fact that economy plays a vital role and becomes a chief creator of
DD. This technological gap is largely based on income differences. Those
who have better income possess more access to technology than the poor
neighborhoods one. Students from wealthy families learned better computer
skills than students from poor and minority families. In other words,
affluent people can buy or access the computers and avail the Internet
connection, where low income families are unable to afford new technology.
The major factor that is bound with DD is poverty. Due to poverty millions
of people are unable to have computer ownership, access to computers,
and access to the Internet connection. In the present situation, hardware,
software, and Internet connection is often too expensive for the average
person. The so called the Internet refers to a communication system, which
allows people to share information globally, communicate with people
(family, friends, relatives, etc.), information about financial data, world

INTERNATIONAL JOURNAL OF MULTIDISCIPLINARY EDUCATIONAL RESEARCHISSN : 2277-7881; IMPACT FACTOR - 2.735; IC VALUE:5.16VOLUME 3, ISSUE 3(4), MARCH 2014
154
news, government actions. For these things, people needs computer with
Internet connection, so it requires money. Thus, the DD is closely associates
with merely an economic divide or financial one.
It is true that DD affects not only those in urban areas, but also
those in rural areas. The urban centers have much better facilities and
easily available technical resources as compared to rural areas. However,
there are many people in rural areas who do not know how a computer or
any other innovative technological tools looks like and also do not turned
on computer. It seems likely the vast majority of the rural population will
be excluded from an information society. From the rural background,
patient’s participation in health care is very less compared to urban areas.
As a result, those who live in rural areas, they are most underprivileged
and vulnerable sections in this accessibility of ICT.
In fact, many researchers discussed the DD from the dimension of
age. This divide exists between generations. Compared to earlier days young
people have great familiarity with new digital technologies than any other
old aged group. And also youth have better technological literary skills
than older people. In both developed and developing nations, the Internet
penetration rate among younger people is substantially higher than that
among older people. It is important to note that all these technologies
such as cable television, the Internet, computers, laptop and mobile phone
and other devices were not always readily available for previous generations.
However, generation gap also plays pivotal role in this respective issue.
The digitalized era was earlier philosophically considered to preach
equality among the humanity. But with the advent of ICT, the male
chauvinistic society did not spare to divide the gender as what we call as
DD. Historically, women have had little access to media and communication

INTERNATIONAL JOURNAL OF MULTIDISCIPLINARY EDUCATIONAL RESEARCHISSN : 2277-7881; IMPACT FACTOR - 2.735; IC VALUE:5.16VOLUME 3, ISSUE 3(4), MARCH 2014
155
technologies. As a matter of fact, there is a distinct DD that exists between
male and female segment. Research has showed that is the result of social
inequities and women participation is very less most of the field including
IT. Regarding in this case, women enjoy very less access to information
technology than men. Gender DD refers to access rates between both males
and females. It is true not only the underdeveloped countries, but also the
developing and developed countries. Kennedy et al, expresses that most
women have been online less than men and when they do go online they
spend less time on the Internet than men do (Kennedy et al, 2003:73).
They argue that according to the society’s norm girls and boys raised up
differently, with girls not advised to have interests in computer and scientific
objects. Interestingly, Kennedy et al states that it is not enough just to
know the gender roles exists but we should know and understand why it
exists and how it plays a role in gender and Internet use. (Kennedy et al,
2003:75). It is observed that access to training in information technology
is not equitable and some people have greater access than others with the
likelihood depending on the income, racial and gender categories of which
people are members. White Americans are more likely to have access to
computers and the Internet than African Americans. Males have more
access than females, and wealthier Americans have more access regardless
of race and gender (Cooper and Weaver, 2003: 3). Technologies should be
equally accessible both male and female because everybody was born with
rights. If there is no access to ICTs for women, they become an economically
backwardness, which in turn makes any countries poor. When we look
into the world population, in any country, in any state women constitute a
reasonable number of populations. In such case or scenario, leaving women
population behind will always lead to a definite divide both gender as well
as digital. I believe that libraries are the greatest place for women to access

INTERNATIONAL JOURNAL OF MULTIDISCIPLINARY EDUCATIONAL RESEARCHISSN : 2277-7881; IMPACT FACTOR - 2.735; IC VALUE:5.16VOLUME 3, ISSUE 3(4), MARCH 2014
156
Internet based technologies and gain technology skills. Access to technology
and media is an indispensable for women’s empowerment. However, the
gender gap in the DD is much concern today. As the discussion above, it is
clear that the emergence of DD has many dimensions.
Understanding the digital divide
A number of scholars are engaged in a vigorous debate about this
issue. Basically, when we are dealing, we need to understand the issue
from the broadest sense. Why is it important to understand this social and
ethical issue? In fact unequal income refers to an economic divide; unequal
knowledge refers to knowledge divide and presently digital technologies
create digital divides. Inequality in the world is very high around the globe.
Exclusion and inequality are always present throughout the human
civilization and still exists. Equality is often judged by comparing one
particular aspect of an individual, such as income, wealth, happiness or
education with the same aspect of another. Dallmayr notices that there
are three major areas leads to global inequality, namely power, wealth and
knowledge (Dallmayr, 2002). Servon tries to connect the DD with poverty
and inequality. She argues that is “a symptom of a much larger and more
complex problem- the problem of persistent poverty and inequality” (Servon,
2002). The researchers of DD likely to begin with political and ethical
positions regarding the subject matter. Ethical considerations are central
to all social as well as philosophical research. The question of ethics prevails
everywhere and whenever the dilemmas arise, especially when it goes in
the process of setting something right and wrong. Why there is a need for
such dichotomy and why those should necessarily attend without fail.
According to Hongladarom (2003) naturally the DD concerns many issues
not only in social philosophy, but also in political philosophy. It is clear
that the DD is an aspect of the problem of social inequality and the global

INTERNATIONAL JOURNAL OF MULTIDISCIPLINARY EDUCATIONAL RESEARCHISSN : 2277-7881; IMPACT FACTOR - 2.735; IC VALUE:5.16VOLUME 3, ISSUE 3(4), MARCH 2014
157
DD is a problem of global justice because the divide clearly indicates an
inequality between the two worlds. There is the divide between those who
have access to IT and those who do not. Furthermore, as there are
dimensions to inequality, so there seem to be many dimensions to the DD
also. Moreover philosophers should always to be open and try to find
solutions and approaches that could help to have a better understanding
and give a good lead to the current issues of concern. As well Hongladarom
states every single problem can be viewed through every branches of
philosophy and only the philosophers can guide better and pragmatic
solutions to the all problems rise in the course of any developmental process.
Several researchers have been suggested that digital inequality in
the area of an alternative to the DD phrase. Kvansy’s study goes beyond
describing the DD to analyzing “digital inequality”. She uses the concept
of digital inequality, “to signify a shift and distinction in focus from access
to use of information technology” (Kvansy, 2002:16). Hamelink analyses
the context of information technology using the ‘standard of equality’ and
says that both the traditional human rights theories and the liberal
foundations of human rights law assume that all human beings are equally
capable asserting their rights. He says, “In reality, the powerful are always
better in asserting their rights through litigation that the less powerful”
(Hamelink, 2000:80). He further defines equality as “equal entitlement to
the social conditions that are essential to emancipation and self
development. Increasingly, access to digital ICTs is seen by many as a social
condition that is equally essential for the members of a community as
water, energy and road systems” (Hamelink, 2000:80). Johnson’s popular
book entitled on “Computer Ethics”, discussed access and the DD. She
argues that unequal access poses a serious threat to democracy. Democratic
societies are committed to the idea that every citizen is equal with respect

INTERNATIONAL JOURNAL OF MULTIDISCIPLINARY EDUCATIONAL RESEARCHISSN : 2277-7881; IMPACT FACTOR - 2.735; IC VALUE:5.16VOLUME 3, ISSUE 3(4), MARCH 2014
158
to the state and the law; that is, democratic societies are committed to
political equality. However, political equality cannot be entirely separated
from social and economic inequality. That is, social and economic inequality
can lead to political inequality. Hence, democratic societies have to be
concerned about social and economic inequality. Unequal access to a
powerful resource such as computer and information technology can skew
social and economic opportunities. Unequal access to a powerful resource
can give some individuals much more power than others, so much so that
democracy is threatened. In addition to IT and the Internet are means,
not ends. They are tools or powerful resources. These tools assist individuals
and organizations in acquiring goods and achieving goals (Johnson, 2001:
218-220). However, she explained how computers affect the relationship
between haves and have-nots and also access to computer and IT is
important for democracy.
As the above discussion, the DD’s debates appear to concern social
inequality. The major concern about of this issue is that technology will
cause technological inequalities and force new disparities within and
between countries. There is always discrimination and unequal access
towards any resources and it is also prominent in the field of IT. Those
who do have the power, they enjoy and those who doesn’t have they suffer,
this is applicable to the IT field too. Social stratification is prominent in
the world. In the world, already people are divided on the basis of class/
income, race/caste, education, age group, gender and ethnicity. Because
our Indian societies are unequal, so is the disparity of the Internet. The
ability to access the information technology further breaks them into pieces.
This divide distinguishes educated from illiterate, men from women, and
rich from poor, young from old, urban from rural. Therefore, lack of access
lead to an inequality and brings out social exclusion. The causes of this

INTERNATIONAL JOURNAL OF MULTIDISCIPLINARY EDUCATIONAL RESEARCHISSN : 2277-7881; IMPACT FACTOR - 2.735; IC VALUE:5.16VOLUME 3, ISSUE 3(4), MARCH 2014
159
inequality of access to ICTs are clearly closely related to broader patterns
of socio-economic inequality. However, if we view the DD through the eyes
of underprivileged, we then can begin to understand the existential
significance of this problem.
Conclusion
This paper tried to explain that highly industrialized nations,
developing and economically deprived countries face a new important social
and ethical problem that is called the DD. It is true that the DD exists
between various segments such as rural/urban, men/women, young/old,
etc. It would seem that there is too much of inequalities (social, economic,
and political) exist in the Age of Information. On the one hand, technological
development is tremendous. And the other hand, this technological
development creates a new kind of disparities in our society. While modern
discrimination exists between poor in information and the rich in
information. The DD is a product of old inequality and new inequalities
are appearing. The existing inequalities came to new form as that of the
old saying, the ‘old wine in the new pot’. I feel that the topic of the DD is
currently a vibrant issue that needs a deliberate debate. According to me,
the DD is nothing, but it is the reflections of social divide. Social divide
leads to technological divide and this technology divide encourages social
divide more and more. If underprivileged or unfairly disadvantaged people
get an access to this social medium, they will be able acquired benefits
such as information, access to up-to-date data, knowledge (political, etc.)
and so on. If it is really concern about the Internet access means, then it is
a matter of justice. However, it is clear that the DD is a serious social
problem and needs urgent attention. Access to technologies fails in bridging
this digital gap; people need to be trained in accessing this technology.

INTERNATIONAL JOURNAL OF MULTIDISCIPLINARY EDUCATIONAL RESEARCHISSN : 2277-7881; IMPACT FACTOR - 2.735; IC VALUE:5.16VOLUME 3, ISSUE 3(4), MARCH 2014
160
Even though training is important in bridging this gulf, it becomes once
sided without the aid from ‘policy making’.
References
1. Castells, M. (2001). The internet galaxy: Reflections on the internet,
business, and society. Oxford: Oxford University Press.
2. Cooper, J., & Weaver, K. (2003). Gender and computers: Understanding
the digital divide. Mahwah: Lawrence Erlbaum Associates, Publishers.
3. Dallmayr, F.R. (2002). Globalization and inequality: A plea for global justice.
International Studies Review, 4: 137-156.
4. Fallis, D. (2007). “Epistemic value theory and the digital divide”. In
Rooksby, E & Weckert, J. (Eds.) Information Technology and Social Justice,
(pp. 29-46), Hershey, MA: Information Science Publishing.
5. Flordi, L. (2001). Information ethics: An environmental approach to the
digital divide. Philosophy in the Contemporary World, 9, (1): 1-7.
6. Hacker, K.L., & Mason, S.M. (2003). Ethical gaps in studies of the digital
divide. Ethics and Information Technology, 5: 99-115.
7. Hongladarom, S. (2003). Exploring the philosophical terrain of the digital
divide. Selected Papers from the Conference on Computers and Philosophy,
37: 85-89.
8. Jessup, L., & Valacich, J. (2004). Information systems today. New Delhi:
Prentice-Hall of India.
9. Johnson, D.G. (2001). Computer ethics. (3rd edition) Delhi: Pearson
Education Asia.
10. Kennedy, T., Wellman, B., Klement, K. (2003). Gendering the digital divide.
IT & Society, 1 (5): 72-96.
11. Kumar, D. (2006). Information technology and social change: A study of
digital divide in India. New Delhi: Rawat Publications.

INTERNATIONAL JOURNAL OF MULTIDISCIPLINARY EDUCATIONAL RESEARCHISSN : 2277-7881; IMPACT FACTOR - 2.735; IC VALUE:5.16VOLUME 3, ISSUE 3(4), MARCH 2014
161
12. Kvasny, L. (2002). Problematizing the digital divide: Cultural and social
reproduction in a community Initiative. Unpublished PhD: Georgia State
University, Atlanta.
13. Norris, P. (2001) Digital divide: Civic engagement, information poverty,
and the internet worldwide. New York: Cambridge University Press.
14. OECD. (2001). Understanding the digital divide. Paris: OECD Publications.
15. Servon, L.J. (2002). Bridging the digital divide: Technology, community,
and public policy. Malden, MA: Blackwell.

INTERNATIONAL JOURNAL OF MULTIDISCIPLINARY EDUCATIONAL RESEARCHISSN : 2277-7881; IMPACT FACTOR - 2.735; IC VALUE:5.16VOLUME 3, ISSUE 3(4), MARCH 2014
162
A STUDY OF SOCIAL SKILLS AMONG SCHOOL CHILDRENWITH SPECIAL REFERENCE TO THEIR GENDER
Nishi Tyagi Assistant Professor
Department of Education SRM-University, NCR Campus
Modinagar Ghaziabad,U.P.(INDIA)
Yukti SaraswatResearch Scholar
Department of Education SRM University, NCR Campus,
Modinagar Ghaziabad, UP (INDIA)
Introduction
Education is one of the basic activities of people in all human
societies. The continued subsistence of society depends upon the
transmission of culture to the young. It is essential that every new
generation must be given training in the ways of the group so that the
same tradition will continue. Every society has its own ways and means of
fulfilling this need. Education has come to be one of the ways satisfying
the need. The main social objective of education is to complete the
socialization process. The school and other institutions have come into
being in place of family to complete the socialization process. The family
may fail to provide the child the essential knowledge of the social skills
and value of the wider society. The school or the educational institutions
can help the child to learn new skills and learn to interact with people of
different social backgrounds.
Social skills have been characterized both in terms of ‘ability’ [1]
(Combs & Slaby, 1977) and in terms of ‘behaviour’. Rinn & Markle[2] (1979)
define social skills behaviorally as a repertoire of verbal and nonverbal
behaviors by which children affects the responses of other individual (e.g.
peers, parents, siblings and teachers) in the interpersonal context. This
repertoire acts as a mechanism through which children influence their
environment by obtaining, removing or avoiding desirable and
understanding outcomes in the social sphere.

INTERNATIONAL JOURNAL OF MULTIDISCIPLINARY EDUCATIONAL RESEARCHISSN : 2277-7881; IMPACT FACTOR - 2.735; IC VALUE:5.16VOLUME 3, ISSUE 3(4), MARCH 2014
163
Social skill is any skill facilitating interaction and communication with
others. Social rules and relations are created, communicated, and changed
in verbal and nonverbal ways. The process of learning such skills is called
socialization.
Children’s social skills are important for early school success and
later adjustment. Research has documented that children without an
adequate amount of social skills are at risk for difficulties including peer
rejection, behavior problems, and poor academic achievement. Moreover,
recent research shows disturbing rates of eviction in preschool and
kindergarten, which has fueled efforts to promote these skills [3] (Gilliam
& Shahar, 2006). Broadly speaking, social skills describe how children find
the way social and learning contexts and can be conceptualized as including
interpersonal skills and learning-related skills. An interpersonal skill refers
to the ability to perform competently in social situations, including
interacting positively with others, cooperating, sharing, and respecting
peers. Researcher has found that interpersonal skills are important for
peer acceptance and social adjustment throughout childhood and
adolescence [4]. (Masten et al., 2005).
The quality of the parent-child attachment relationship also predicts
children’s social skills. A number of studies have found that having a safe
attachment with a parent allows children to express emotion effectively
and develop strong self-regulatory skills. Moreover, studies of attachment
highlight the importance of the child’s behavior, including reactivity and
responsiveness, in helping to shape the attachment relationship
[5].(Calkins, 2004).
From early days through teenage years, social skill development
occurs through a mutual and bidirectional relationship between a child’s

INTERNATIONAL JOURNAL OF MULTIDISCIPLINARY EDUCATIONAL RESEARCHISSN : 2277-7881; IMPACT FACTOR - 2.735; IC VALUE:5.16VOLUME 3, ISSUE 3(4), MARCH 2014
164
individual characteristics (e.g., temperament) and the environment (e.g.,
parent love and sensitivity, family factors, and peers). Children begin
developing social skills within the context of the parent-child attachment
relationship [6] (Rubin, Bulkow-ski, & Parker, 2006). It is from this
relationship that children learn to read emotional cues, regulate their own
emotions and behavior, and incorporate the responses of their parents into
their own experiences with people and situations; a process known as social
referencing [7](Thompson & Lagattuta, 2006). From observing family
members, children learn appropriate social rules and behaviors, which they
apply to interactions outside of the family.
SIGNIFICANCE OF THE STUDY
It is important for children to learn socialization skills in school
and at home. Children are naturally egocentric, thinking of themselves as
the center of their world, at birth. It takes development and training to
teach children to think of others as well as themselves.
This tendency is not negative, and is inborn in all human beings.
However, for children to operate successfully in society, they must learn to
interact with others in a healthy, positive, and productive manner. In order
to prepare children to be successful in adults, it is crucial that we as adults
encourage social interaction, monitor social skills, and teach healthy ways
to interact with other children and with adults. Socialization skills are
important not only in school but in all of adult life as well.
Social Skills occupy an important place in every individual child’s
life for their bright and healthy future. Parents and Teachers are playing
a major role to provide the suitable environment and give an opportunity
to practice the skills in home and their classroom situation. Thus
researcher’s study will be proved very beneficial for teachers, Teacher

INTERNATIONAL JOURNAL OF MULTIDISCIPLINARY EDUCATIONAL RESEARCHISSN : 2277-7881; IMPACT FACTOR - 2.735; IC VALUE:5.16VOLUME 3, ISSUE 3(4), MARCH 2014
165
educators and policy makers to provide healthy social environment. Social
skills could be inculcated in the students so that they will become socially
civilized citizens and contributes maximum to the society.
STATEMENT OF THE PROBLEM
“A STUDY OF SOCIAL SKILLS AMONG SCHOOL CHILDREN WITH
SPECIAL REFERENCE TO THEIR GENDER”
OPERATIONAL DEFINATION OF THE TERM USED:
The term used in the statement problem, are defined operationally below:
SOCIAL SKILLS: Social skills can be defined as the set of skills people
use to interact and communicate with one another.
SCHOOL CHILDERN: School children are those children who are
studing in secondary level of the school. They are early adolescents.
OBJECTIVES OF THE STUDY
1. To find and compare of Social Skills and its dimensions (Presentation
Skill, Interaction Skill, Conversation Skill, Social Integration skill,
Attitude towards Children, Attitude towards Adults) among School
Children.
2. To examine and compare of Social Skills and its dimensions
(Presentation Skill, Interaction Skill, Conversation Skill, Social
Integration skill, Attitude towards Children, Attitude towards Adults)
between Boy and Girl School Children.
HYPOTHESIS OF THE STUDY
1. There is no significant difference in mean scores of Social Skills among
School Children.

INTERNATIONAL JOURNAL OF MULTIDISCIPLINARY EDUCATIONAL RESEARCHISSN : 2277-7881; IMPACT FACTOR - 2.735; IC VALUE:5.16VOLUME 3, ISSUE 3(4), MARCH 2014
166
2. There is no significant difference between mean scores of Boy and Girl
School Children in relation to their Presentation Skill.
3. There is no significant difference between mean scores of Boy and Girl
School Children in relation to their Interaction Skill.
4. There is no significant difference between mean scores of Boy and Girl
School Children in relation to their Conversation Skill.
5. There is no significant difference between mean scores of Boy and Girl
School Children in relation to their Social Integration Skill.
6. There is no significant difference between mean scores of Boy and Girl
School Children in relation to their Attitude towards Children.
7. There is no significant difference between mean scores of Boy and Girl
School Children in relation to their Attitude towards Adults
METHODOLOGY:
This study falls under the category of descriptive research. Thus,
survey method was adopted to carry out the research work.
POPULATION:
The population of study consist of all school children of
secondary level in Ghaziabad district.
SAMPLE:
In the present study, sample consisted of 100 school students, 54
boys and 46girls from secondary schools through purposive convenient
sampling method
RESEARCH TOOLS EMPLOYED:
For data collection “Social Skills Problem Behavior Checklist” by
Madhu Mathur and Saroj Aurora was used to measure the problem of
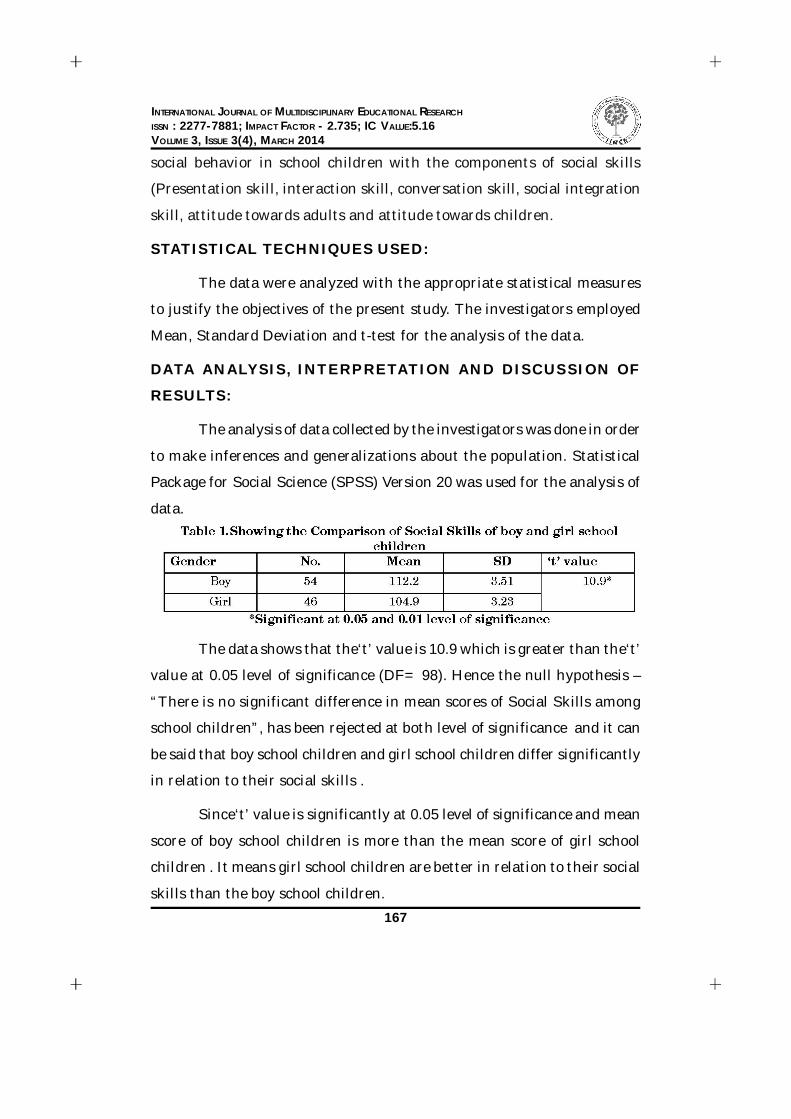
INTERNATIONAL JOURNAL OF MULTIDISCIPLINARY EDUCATIONAL RESEARCHISSN : 2277-7881; IMPACT FACTOR - 2.735; IC VALUE:5.16VOLUME 3, ISSUE 3(4), MARCH 2014
167
social behavior in school children with the components of social skills
(Presentation skill, interaction skill, conversation skill, social integration
skill, attitude towards adults and attitude towards children.
STATISTICAL TECHNIQUES USED:
The data were analyzed with the appropriate statistical measures
to justify the objectives of the present study. The investigators employed
Mean, Standard Deviation and t-test for the analysis of the data.
DATA ANALYSIS, INTERPRETATION AND DISCUSSION OF
RESULTS:
The analysis of data collected by the investigators was done in order
to make inferences and generalizations about the population. Statistical
Package for Social Science (SPSS) Version 20 was used for the analysis of
data.
The data shows that the‘t’ value is 10.9 which is greater than the‘t’
value at 0.05 level of significance (DF= 98). Hence the null hypothesis –
“There is no significant difference in mean scores of Social Skills among
school children”, has been rejected at both level of significance and it can
be said that boy school children and girl school children differ significantly
in relation to their social skills .
Since‘t’ value is significantly at 0.05 level of significance and mean
score of boy school children is more than the mean score of girl school
children . It means girl school children are better in relation to their social
skills than the boy school children.

INTERNATIONAL JOURNAL OF MULTIDISCIPLINARY EDUCATIONAL RESEARCHISSN : 2277-7881; IMPACT FACTOR - 2.735; IC VALUE:5.16VOLUME 3, ISSUE 3(4), MARCH 2014
168
Calculate’ value is 4.95 which is greater than the‘t’ value at both
(0.05 and 0.01) level of significance (DF=98). Hence the null hypothesis –
“There is no significance difference between mean scores of boy and girl
school children in relation to their presentation skill”, has been rejected
and it can be said that boy school children and girl school children differ
significantly in relation to their presentation skill a dimension of social
skill.
Since‘t’ value is significant at 0.01 level of significance and mean
score of boy school children is more than girl school children . It means
girl school children are better in relation to their presentation skill a
dimension of social skills than the boy school children.
Table no. 3 shows calculated ‘t’ value in above table is 0.39 which is
less than the both (0.05 and 0.01) levels of significance (df=98). Hence the
hypothesis – “There is no significant difference between mean scores of
boy and girl school children in relation to their interaction skills”, has
been accepted and it can be said that boy school children and girl school
children are not differ significantly in relation to their interaction skill of
social skills.
It reveals that boy school children and girl school children are equal
to their interaction skill a dimension of social skills.

INTERNATIONAL JOURNAL OF MULTIDISCIPLINARY EDUCATIONAL RESEARCHISSN : 2277-7881; IMPACT FACTOR - 2.735; IC VALUE:5.16VOLUME 3, ISSUE 3(4), MARCH 2014
169
Calculated ‘t’ value is 3.81 which is greater than the‘t’ value at
both (0.05 and 0.01) levels of significance (DF=98). Hence the null
hypothesis – “There is no significance difference between mean scores of
boy and girl school children in relation to their conversation skill”, has
been rejected and it can be said that boy school children and girl school
children differ significantly in relation to their conversation skill.
Data shows that mean score of boy school children is more than the
mean score of girl school children. It means girl school children are better
in relation to their conversation skill than the boy school children.
Showing‘t’ value is 2.59 which is greater than the ‘t’ value at both
(0.05 and 0.01) levels of significance (DF=98). Hence the hypothesis –
“There is no significant difference between Boy and Girl in relation to
their Social Interaction Skill”, has been rejected and it can be said that
boy school children and girl school children are differ significantly in
relation to their social integration skill .
It reveals that girl school children are better in their social
integration skill than the boy school children.

INTERNATIONAL JOURNAL OF MULTIDISCIPLINARY EDUCATIONAL RESEARCHISSN : 2277-7881; IMPACT FACTOR - 2.735; IC VALUE:5.16VOLUME 3, ISSUE 3(4), MARCH 2014
170
Showing‘t’ value is 0.73 which is less than the value at 0.05 level of
significance (df=98). Hence the hypothesis – “ There is no significant
difference between mean scores of Boy and Girl in relation to their Attitude
towards Children”, has been accepted and it can be said that boy school
children and girl school children not differ significantly in relation to
their attitude towards children.
It means boy school children and girl school children are equal in
relation to their attitude towards children.
Find‘t’ value is 11 which is greater than the‘t’ value at both (0.05
and 0.01) levels of significance (df=98). Hence the null hypothesis – “There
is no significance difference between mean scores of Boy and Girl School
Children in relation to their Attitude towards Adults” has been rejected
and it can be said that boy school children and girl school children differ
significantly in relation to their attitude towards adults.
Data shows that mean score of girl school children is less than the
mean score of boy school children which said that the girl have less problem
of attitude towards adults.

INTERNATIONAL JOURNAL OF MULTIDISCIPLINARY EDUCATIONAL RESEARCHISSN : 2277-7881; IMPACT FACTOR - 2.735; IC VALUE:5.16VOLUME 3, ISSUE 3(4), MARCH 2014
171
FINDINGS OF THE STUDY:
On the basis of analysis of the data presented in the fore going pages the
findings are
There is no significant difference in mean scores of Social Skills
among school children” , has been rejected at both level of
significance and it can be said that boy school children have more
problem of social skills than girl school children
There is no significance difference between mean scores of boy and
girl school children in relation to their presentation skill, has been
rejected and it can be said that girls are more presentable than the
boy school children.
There is no significant difference between mean scores of boy and
girl school children in relation to their interaction skills”, has been
accepted and it can be said that girls and boys both have equal skill
of interaction.
There is no significance difference between boy and girl school
children in relation to their conversation skill”, has been rejected
and it can be said that girls have good power of conversation than
boys.
There is no significant difference between Boy and Girl in relation
to their Social Interaction Skill”, has been rejected and it can be
said that girls are more socially integrated than boys.
There is no significant difference between mean scores of Boy and
Girl in relation to their Attitude towards Children”, has been
accepted and it can be said that boy school children and girl school
children have equal attitude towards children.

INTERNATIONAL JOURNAL OF MULTIDISCIPLINARY EDUCATIONAL RESEARCHISSN : 2277-7881; IMPACT FACTOR - 2.735; IC VALUE:5.16VOLUME 3, ISSUE 3(4), MARCH 2014
172
There is no significance difference between Boy and Girl School
Children in relation to their Attitude towards Adults” has been
rejected and it can be said that the attitude of girls are better than
the attitude of boys towards adults.
CONCLUSION:
In this study, the result is concluding that the girls have less social
skills problem of behaviour than boys. In this modern society, girls are
actively participating in several social activities but boys are most probably
like to be in their groups/gangs. By this, it understood that boy more
frequently due to their ill health experiences gained from the peers/society.
It may be said that for reducing the behavioural problem parents and
teachers both are should remain active towards child’s activity, their groups
specially boys. Actively participate to them in social programmes and
cultural programmes in family, society and schools. Motivate and appreciate
them for participation in activities.
References
1. Combs, M.L. & Slaby, D.A.(1977): Social skills training with children in
B.b. Lahey & A.E. Kazdin (Eds), Advances in clinical child psychology
New York Plenum press. 1, 161-201.
2. Rinn, R C, & Markle, A. (1979): Modification of Social skill deficits in
children. in A. Beiaack & M. Hersen (Eds). Research and practice in social
skills training, New York: Plenum press, 107-129.
3. Gilliam, W. S., & Shahar, G. (2006). Preschool and child care expulsion
and suspension: Rates and predictors in one state. Infants and Young
Children, 19(3), 228–245.
4. Masten, A. S., Roisman, G. I., Long, J. D., Burt, K. B., Obradovic, J., Riley,
J. R., et al. (2005). Developmental cascades: Linking academic achievement

INTERNATIONAL JOURNAL OF MULTIDISCIPLINARY EDUCATIONAL RESEARCHISSN : 2277-7881; IMPACT FACTOR - 2.735; IC VALUE:5.16VOLUME 3, ISSUE 3(4), MARCH 2014
173
and externalizing and internalizing symptoms over 20 years.
Developmental Psychology, 41(5), 733–746.
5. Calkins, S. D. (2004). Early attachment processes and the development of
emotional self- regulation. In R. F. Baumeister & K. D. Vohs (Eds.),
Handbook of self-regulation: Research, theory, and applications, New York:
Guildford Press, 324-339.

INTERNATIONAL JOURNAL OF MULTIDISCIPLINARY EDUCATIONAL RESEARCHISSN : 2277-7881; IMPACT FACTOR - 2.735; IC VALUE:5.16VOLUME 3, ISSUE 3(4), MARCH 2014
174
CONSCIOUSNESS AND ITS PLACE IN THE SCIENTIFIC VIEWOF THE WORLD
Sarat Chandra BibharCentre for Philosophy
Jawaharlal Nehru UniversityNew Delhi
Humans have a common intuition of an observing self that hasaccess to conscious sensations, inner speech, images and thoughts.Philosophers such as Gilbert Ryle1 denounced this idea as fallacious, butcurrent evidence seems broadly supportive. This issue has become morepressing in the past decade as scientists have begun to revisit the basictopic of conscious experience. To study consciousness is to study a deepmystery about ourselves. It is to study the nature of our existence, but notthe kind of existence that physics and the other sciences study, study theobjective existence of atoms, galaxies, oceans, cells, time and space, amongother things. Consciousness study deals with the fundamental nature ofour personal existence, our subjective existence, our life as a sequence ofsubjective experiences. In this field of science, we want to understandourselves not only as entities that are alive and behave or interact withtheir environment, like bacteria or trees or dragonflies do, but also asbeings who directly experience or feel or sense their own existence, who arealive in a sense fundamentally different from the ordinary biological notionof ‘being alive’.
Being alive as a conscious subject is something much more thanbeing alive in the purely objective biological sense. A conscious being isnot merely alive in the sense of realizing a collection of physiologicalprocesses and capacities (such as growth or self-replication) that separate

INTERNATIONAL JOURNAL OF MULTIDISCIPLINARY EDUCATIONAL RESEARCHISSN : 2277-7881; IMPACT FACTOR - 2.735; IC VALUE:5.16VOLUME 3, ISSUE 3(4), MARCH 2014
175
biological organisms from nonliving physical systems. A conscious beingis mentally, internally alive. Unlike physical objects and simple biologicalorganisms, a being that possesses a conscious mind also senses or feels orexperiences its own existence. To crystallize this idea: A conscious beinghas an internal psychological reality, a mental life consisting of subjectiveexperiences, with a stream of consciousness flowing within. The innerstream of subjective experience, which is directly present for us andcontinuously revealing itself to us, is consciousness.
Consciousness as the seat of our subjective experiences is themystery to be solved by science. In particular, it is the very phenomenonto be described and explained by the science of consciousness, which iswhy we may call this new science by the name ‘The Science of SubjectiveExperience’, or ‘The Science of Subjectivity’. Hence the study ofconsciousness is an invitation to understand the mystery of consciousnessand an introduction to the new science that specifically enquires into themystery. We need to understand what kind of challenge consciousnessposes to current science and we need to review the modern scientificapproaches to the study of consciousness. Whether or not they willultimately be successful in solving or removing the mystery ofconsciousness may be too early to tell.
David Chalmers the Australian philosopher introduced the easyand hard problems of consciousness2. The easy problems of consciousnessare those concerned with the question of how the mind can processinformation, react to environmental stimuli, and exhibit such capacitiesas discrimination, categorization, and introspection. All of these abilitiesare impressive, but they are, according to Chalmers, not metaphysicallybaffling, since they can all be tackled by means of the standard repertoireof cognitive science and explained in terms of computational or neural

INTERNATIONAL JOURNAL OF MULTIDISCIPLINARY EDUCATIONAL RESEARCHISSN : 2277-7881; IMPACT FACTOR - 2.735; IC VALUE:5.16VOLUME 3, ISSUE 3(4), MARCH 2014
176
mechanisms.3 The hard problem of consciousness is the problem of why,in addition to the information processing that the brain engages in, theremust be a feeling of what it is like associated with the neural processing.We can establish that certain function is accompanied by certain experiencebut we have no idea how that happens. Regardless, how closely wescrutinize the neural mechanisms we seem to have not getting the answerfor that. It is clear that a new field, specifically concentrating onconsciousness, is urgently needed. The already existing fields that studythe mind or the brain have ignored consciousness. Psychology, behaviouralscience, cognitive science and cognitive neuroscience have avoidedconsciousness or have been reluctant to put subjective experience intothe focus of their research programmes. Those fields of study are moreinterested in such things as behaviour, representation, informationprocessing, neural activity and other perfectly objective phenomena thatare fundamentally different from subjective mental life. Therefore, a freshstart is required in order to scientifically zoom in on the subjective streamof experience, or consciousness itself. But what exactly is such a scienceall about? Do we have a clear enough idea of consciousness to approach itscientifically? What is our ‘inner mental life’ the ‘subjective psychologicalreality’? Perhaps we need some clarification of this at the outset.
A person’s subjective psychological reality contains all theexperiences one has at any particular moment. It consists of differentperceptual experiences, such as seeing colours, shapes and visual objects,located within a perceptual space extending in all directions. It containsauditory experiences whose sources are perceived to be located in the spacearound you. It contains smells and tastes, such as the sweet fragranceexperienced when deeply sniffing a rose, eyes closed (as in the cover imageof this book). Furthermore, it contains feelings, emotions and bodily

INTERNATIONAL JOURNAL OF MULTIDISCIPLINARY EDUCATIONAL RESEARCHISSN : 2277-7881; IMPACT FACTOR - 2.735; IC VALUE:5.16VOLUME 3, ISSUE 3(4), MARCH 2014
177
experiences; you perceive and feel your body as being a part of the worldaround you, but you also experience your body from the inside, as a three-dimensional, living, feeling, moving entity whose behaviour you can controlat will. You have a mental space where thoughts are entertained, whereinternal images pass by, memories are relived and where you feel the pullof desires. Taken together, these experiences – the perceptual, the bodilyand the mental – form the contents of your subjective psychological reality.
Experiential events are fleeting. They are directly and vividlypresent in consciousness only briefly, only for a few seconds perhaps. Thecontents of the stream of experience flow ever onwards. The patterns ofexperience change all the time, some only gradually, some abruptly, butthey never cease to move on. Yet, there seems to be a persisting subject –or perhaps the underlying mental ‘space’ of experience itself – that neverchanges. Underneath the ever-changing patterns in the restless streamof experience there is the stable riverbed that unifies these experiencesinto a single inner world, thus forming a single unified psychological reality,the world-for-me, a spatial unity and a temporal continuity of consciousnessand self that transcends the short-lived and changeable contents thatcome and go.
The flow of subjective experiences constitutes our conscious life aswe know it. We know not exactly when it first started flowing, but eversince the beginning it has been going on, save for brief pauses during thenight in deep sleep when even the faintest dream images cease to exist.We know not when it will come to an end, to a final moment ofconsciousness, or even if it ever will. “Is there life after death?” should berephrased as ‘Will there still be a subjective psychological reality going onfor me after death’? or ‘Will some sort of flow of subjective experiencescontinue for me even after my body and my brain are no longer alive in
INTERNATIONAL JOURNAL OF MULTIDISCIPLINARY EDUCATIONAL RESEARCHISSN : 2277-7881; IMPACT FACTOR - 2.735; IC VALUE:5.16VOLUME 3, ISSUE 3(4), MARCH 2014
178
the biological sense of the word’? These are ultimate – and challenging –questions, and the answers depend on the discoveries to be made in thescience of consciousness.
Why consciousness is considered a ‘mystery’? After all, we knowconsciousness intimately from the inside, it is the most natural thing thereis for us and it is ever present in our lives. Of course, in that sense thereis no mystery at all about consciousness. In fact, there is nothing in theworld that we would be acquainted with better than the subjectiveexperiences vividly present for us all the time. The problem, the absolutemystery, is elsewhere: we do not know how to fit consciousness togetherwith the world-view of science. There have been a whole lot of theories toexplain the mystery of consciousness. Both philosopher and scientists haveengaged themselves for decades by suggesting various theories to explainconsciousness. A few of them are worth mentioning here. In multiple draftstheory (Dennett 1991) Dennett argues that consciousness is not afundamental feature of the universe and instead will eventually be fullyexplained by natural phenomena.4 He says consciousness merely playstricks on people so that it appears nonphysical. It simply seems like itrequires nonphysical features to account for its powers. In this way,Dennett compares consciousness to stage magic and its capability to createextraordinary illusions out of ordinary things.5 Global workspace theory(Baars 1988) suggests, consciousness resembles a wide network ofconnections between specialized, non-conscious processing modules thatcompete for access to the global workspace. The message that wins thecompetition and spreads across the whole workspace forms the currentcontent of consciousness. Neurobiological theory (Crick and Koch 1990)explains consciousness by finding the neural correlates of consciousness,defined as the smallest set of brain mechanisms and events sufficient for

INTERNATIONAL JOURNAL OF MULTIDISCIPLINARY EDUCATIONAL RESEARCHISSN : 2277-7881; IMPACT FACTOR - 2.735; IC VALUE:5.16VOLUME 3, ISSUE 3(4), MARCH 2014
179
some specific phenomenal state. Ultimately, if consciousness can beexplained at all, it will be explained in neuronal terms. Externalistrepresentationalism (Tye 1995). The core assumption inrepresentationalist theories is that all conscious states are representationalstates, that is, states that carry information about external (or intentional)objects or states of affair. In the early 1990s John Searle turned hisattention to the problem of consciousness. In his widely known book The
rediscovery of the mind (1992), Searle formulated a view of consciousnesscalled “biological naturalism”. According to this view, consciousness is abiological phenomenon, a higher level feature of brain activity.
Physics and the other natural sciences describe a world whereparticles, force fields, atoms, molecules, stars and planets exist in anobjective way and causally interact with each other. So far as we know,none of the things thoroughly described and explained by the scienceshas an inner psychological reality, a stream of subjective experiences.Thus, despite all the amazing progress in physics, chemistry, biology andneuroscience, science remains incapable of describing – or evenacknowledging the existence of – an inner subjective life. No matter howcarefully we study the physics, chemistry and biology of an animal, theempirical evidence we acquire does not in any objective manner revealwhether the animal in some way feels or senses its own existence – whetherit has an inner subjective psychological reality or not – nor, if it does,what its subjective experiences are like, what it would be like to be thatanimal and to see the world through its eyes.
At present we have no idea how our inner life could be explainedin harmony with the world-view of the natural sciences. In that world-

INTERNATIONAL JOURNAL OF MULTIDISCIPLINARY EDUCATIONAL RESEARCHISSN : 2277-7881; IMPACT FACTOR - 2.735; IC VALUE:5.16VOLUME 3, ISSUE 3(4), MARCH 2014
180
view, there is nothing that even remotely resembles our subjective lives.On the contrary, the scientific picture of the world is in many ways directlyin conflict with our subjective experience. The physical universe as a wholeis a giant, stagnant object in four-dimensional space– time where thedimensions of space and time all exist in one piece and nothing ever“happens”. Past, present and future are simply different parts of thetemporal dimension that coexist with each other and are equally fixed.The universe as described by physics has no particular moment of “now”that would be unique, in that only there do events flow forward, and behindit the past is fixed and before it the future lies wide open. The universe asdescribed by the natural sciences includes no subjective qualities such asthose that characterize each and every one of our experiences: colours,tastes, tones, pains, odours, feelings. The world as described by scienceconsists of spatiotemporal causal structures, physical entities atmicroscopic (forces, particles, waves, fields) and macroscopic levels (planets,galaxies) and laws and mechanisms that can be described objectively andquantitatively. By contrast, our subjective psychological reality is aforward-moving stream of qualitative experiences, located at a particulartime and place in the physical universe, always happening in the “hereand now” and taking place within a particular person’s mind (or brain).How can such a thing exist in the physical universe? Is it something overand above the physical – something other-worldly, a spiritual bubble, awandering soul – that has become attached to a biological organism insidethe physical world? Somehow this small drop of precious soul-stuff seemsto blow an inner mental life into the organisms it inhabits, to live a lifethrough them and to see the world through their eyes. Is that the way weare – tiny drops of magical soul-stuff trapped inside material human bodiesthat are located inside the giant physical machinery of the universe? If
INTERNATIONAL JOURNAL OF MULTIDISCIPLINARY EDUCATIONAL RESEARCHISSN : 2277-7881; IMPACT FACTOR - 2.735; IC VALUE:5.16VOLUME 3, ISSUE 3(4), MARCH 2014
181
such a spiritual view of ourselves seems to be out of the question, then isour consciousness just some kind of complex physical or biologicalmechanism in our bodies? Is our precious inner world simply made out ofquite ordinary, slimy and boring brain-stuff with no other-worldly magicalsouls involved?
As these profound questions suggest, the science of consciousnessis about our very existence. What kind of beings are we really – ourselves,our souls, if you like – in the final analysis? What is consciousness? Whoor what is the ‘subject’ or the ‘self’ who has my conscious experiences?What are our thoughts, experiences and memories made of? What aboutmoments of intense joy, happiness, beauty and awe, when we seem toreach a higher consciousness, full of meaning: are they only fleetingelectrochemical symphonies played by billions of neurons in harmony, orperhaps glimpses of another-worldly mental realm, entirely beyondmatter? Are we, our inner selves, something spiritual, soul-like; could oursubjective life thus survive bodily death? Could our consciousness perhapsbe reborn in some other life-form, so that after death there would be aninner life once again for us, though in a form unlike the present one? Theanswers to these rather fundamental questions depend on what the scienceof consciousness will find out about our subjective psychological realityand about its physical seat, our brain.
References :
1. Baars, B. J. (1988). A cognitive theory of consciousness. New York:Cambridge University Press.
2. Chalmers, David. 1996. The Conscious Mind, Oxford University Press,New York.
3. Dennett, D. C. (1991). Consciousness explained. Boston: Little, Brown.

INTERNATIONAL JOURNAL OF MULTIDISCIPLINARY EDUCATIONAL RESEARCHISSN : 2277-7881; IMPACT FACTOR - 2.735; IC VALUE:5.16VOLUME 3, ISSUE 3(4), MARCH 2014
182
4. Crick, F., & Koch, C. (1990). Towards a neurobiological theory ofconsciousness. Seminars in the Neurosciences, 2, 273–304.
5. Searle, J. R. (1992). The rediscovery of the mind. Cambridge, MA: MITPress.
6. Searle, J. R. (1997). The mystery of consciousness. New York: The NewYork Review Books.
7. Tye, M. (1995). Ten problems of consciousness: A representational theoryof the phenomenal mind. Cambridge, MA: MIT Press.
(Footnotes)
1 Ryle, G. (1949) The Concept of Mind, Hutchinson, London
2 Chalmers, David. 1996. The Conscious Mind, Oxford University Press, New York.
3 Ibid
4 Dennett, Daniel.(1995) “Commentary on Chalmers: Facing Backwards on the
Problem of Consciousness.” http://ase.tufts.edu/cogstud/papers/chalmers.htm,
accessed on 22/3/2013.
5 Dennett, Daniel (2003). “Explaining the ‘Magic’ of Consciousness”. Journal of
Cultural and Evolutionary Psychology, 1(1), pp. 7-19.

INTERNATIONAL JOURNAL OF MULTIDISCIPLINARY EDUCATIONAL RESEARCHISSN : 2277-7881; IMPACT FACTOR - 2.735; IC VALUE:5.16VOLUME 3, ISSUE 3(4), MARCH 2014
183
SUPPORT VECTOR MACHINE AND ITS APPLICATION
Arti KhajoneAmravati University
J.D.I.E.T,Yavatmal,India
Nidhi DesaiAmravati University
J.D.I.E.T,Yavatmal,India
Nikesh PatelAmravati University
J.D.I.E.T,Yavatmali,India
I. Introduction
Support vector machine mainly constructs a hyper plane or set of
hyperplanes, which can be used to classify data, regression or other tasks.
Good separation is achieved by the hyper plane that has the largest distance
to the nearest training data point of any class which is called as functional
margin.
Since in general larger the margin large is the generation error. It
can happen that the sets to discriminate are not linearly separable in that
particular space. To solve this problem, it was proposed that original finite
dimensional space be mapped into a much higher dimensional space so
that separation becomes easier in that space. Mapping used by SVM scheme
are designed to ensure that dot product may be computed easily in terms
of the variables in the original space, by defining them in terms of the
kernel function that is k(x,y).
SVM belongs to the broad family of kernel-based algorithm. SVM
can be used for classification and can perform well than any other
classification algorithm which are available. Also SVM is a relatively new
learning method as compared to other traditional methods used for binary
classification. The basic idea behind this working is to find a hyper plane
which separates data perfectly into its two classes. SVM are well founded

INTERNATIONAL JOURNAL OF MULTIDISCIPLINARY EDUCATIONAL RESEARCHISSN : 2277-7881; IMPACT FACTOR - 2.735; IC VALUE:5.16VOLUME 3, ISSUE 3(4), MARCH 2014
184
and have shown to be practically successful. It has also been extended to
solve regression tasks where the system is trained to output a numerical
value, rather than yes/no classification. A support vector machine (SVM)
is a computer algorithm which learns by example how to assign labels to
objects. For instance Support Vector Machine Classifier introduced by
Vladimir Vapnik in the early 1970’s. This algorithm belongs to the broad
family of kernel-based learning algorithms. It can be used for regression
as well as classification of linear and non-linear data. Support vector
machines seems to be a promising method for classification of data and
knowledge discovery. Basically this concept comes from the frame work of
statistical learning theory or Vapnik-Chervonenkis (VC) theory. VC theory
is considered as most successful tool by now for accurately describing the
capacity of the data. It is the theory mainly on the consistency of a learning
process.
II. SVM CLASSIFICATION
The basic ideas behind the working of SVM algorithm can be explained
without ever reading an equation. To understand SVM classification,
following four points need to be understood :-
A. Separating hyper plane
B. Maximum-margin hyper plane
C. Soft margin
D. Kernel function.
A. The separating hyper plane
Separating hyperplanes are of two types: a) optimal separating hyper
plane. b)generalized optimal separating hyper plane. Figure 1 is the example
of optimal separating hyperplane and figure 2 is the example of generalized

INTERNATIONAL JOURNAL OF MULTIDISCIPLINARY EDUCATIONAL RESEARCHISSN : 2277-7881; IMPACT FACTOR - 2.735; IC VALUE:5.16VOLUME 3, ISSUE 3(4), MARCH 2014
185
optimal separating hyperplane. In figure 1 there are many possible linear
classifiers that can separate the data into its two classes, but we have
considered only one that maximizes the margin (maximizes the distance
between it and the nearest data point of each class).This classifier is the
generalized separating hyper plane so here in this case discussion has been
restricted to the case where the data which is to be separated is linearly
separable. However, there are two approaches to generalizing the problem,
which are dependent upon prior knowledge of the problem and we have to
estimate about the noise on the data. In the case where it is expected or
possibly even known that hyper plane can separate the data. This separating
hyperplane introduces an additional cost function associated with
misclassification. Alternatively a more complex function can be used to
describe the boundary in this case.

INTERNATIONAL JOURNAL OF MULTIDISCIPLINARY EDUCATIONAL RESEARCHISSN : 2277-7881; IMPACT FACTOR - 2.735; IC VALUE:5.16VOLUME 3, ISSUE 3(4), MARCH 2014
186
B. Maximum Margin
If data is linearly separable we can select two hyper planes in a way
that they separate the data and there are no points between them and
then try to maximize distance between them. The region bounded by them
is called “the margin “and these hyper planes can be described by w.x-b=1
and w.x-b=-1.By using geometry we find the distance between two hyper
planes which is 2/ ÐwÐ. Our aim is to minimize w.
C. Soft Margin
We have assumed that any data can be separated using a straight
line. Of course, many real data sets cannot be separated as cleanly by using
straight line, instead, they look like one straight line. Where the data set
which is to be separated contains an error, we would like the SVM to be
able to deal with errors in the data by allowing a few expressions to fall on
the ‘wrong side’ of the separating hyper plane. To handle such problems,
the SVM algorithm has to be modified by adding new concept known as
‘soft margin’.
D. Kernal function
Sometimes we have the maximum-margin separating hyper plane.
It is the case of non separable data set. Here in this case the problem is
that no single point can separate the two classes of data and introducing a
soft margin would not work. To handle such cases, the kernel function
provides a solution to this problem by adding an additional dimension to
the data.
III. SVM Classifier
In case of SVM, data point is viewed as a d -dimensional vector (list of
d numbers) and we want to know whether we can separate such points with a
INTERNATIONAL JOURNAL OF MULTIDISCIPLINARY EDUCATIONAL RESEARCHISSN : 2277-7881; IMPACT FACTOR - 2.735; IC VALUE:5.16VOLUME 3, ISSUE 3(4), MARCH 2014
187
(d-1) dimensional hyperplane. Such classifier is called as linear classifier. There
are many hyper planes that can classify the data but the best hyper planes
are the ones that represents the largest separation or margin between the two
classes. So we can choose the hyper plane such that distance from it to the
nearest data point on each side is maximized. If such a hyper plane exists then
it is called as maximum-margin hyper plane and the linear classifier defined
by it is known as maximum margin classifier.
IV. Linear SVM
Suppose we have some training data D, a set of n points of the form
D=(xi,yi)and the value of y can be +1 or -1 indicating the class to which xi
belongs. Each xi is a real vector. Now, we want to find the margin hyper
plane that divides the points having yi=1 from those having yi=-1.For
that we have equation of hyperplane w.x-b=0 where in this equation ‘.’
denotes dot product and w is normal to the hyperplane. The parameter b/
ÐwÐ determines the offset of the hyperplane from the origin. If given data
is linearly separable then we can select two hyperplanes in a way that
they separate the data and there are no point between them and then try
to maximize distance between them. The region bounded by them i.e.
called “the margin “and separating hyperplanes can be described by w.x-
b=1 and w.x-b=-1.By using geometry we can find the distance between
two hyperplanes is 2/mod w so as to minimize w.
V. Linearly Separable Binary Classification
We have L training data points, where each input xi has D attribute
is (i.e. is of dimensionality D) and is in one of two classes yi = -1 or +1.Here
we are assuming the data is linearly separable, meaning that we can draw
a line on a graph of x1 vs x2 separating the two classes of data when D = 2
and a hyperplane on graphs of x1; x2 : : : xD for when D > 2.

INTERNATIONAL JOURNAL OF MULTIDISCIPLINARY EDUCATIONAL RESEARCHISSN : 2277-7881; IMPACT FACTOR - 2.735; IC VALUE:5.16VOLUME 3, ISSUE 3(4), MARCH 2014
188
This hyperplane can be described by w . x + b = 0 where:
- w is normal to the hyperplane.
- b/ÐwÐ is the perpendicular distance from the hyperplane to the origin.
Support Vectors are the examples closest to the separating
hyperplane and the main aim of Support Vector Machines (SVM) is to
orientate this hyperplane in such a way as to be as far as possible from the
closest members of both classes.
Referring to figure 3, now we implement SVM to select the variables
w and b so that our training data can be described as
xi .w + b = +1 for yi = +1……… (1.1)
xi .w + b = -1 for yi =-1………… (1.2)
If we now just consider the points that lie closest to the separating
hyper-plane which is known as the Support Vectors (shown in circles in
the figure 3), then the two planes H1 and H2 on which these points lie on
can be described by:
xi . w + b = +1 for H1 ……………(1.3)
xi . w + b = -1 for H2…………… (1.4)

INTERNATIONAL JOURNAL OF MULTIDISCIPLINARY EDUCATIONAL RESEARCHISSN : 2277-7881; IMPACT FACTOR - 2.735; IC VALUE:5.16VOLUME 3, ISSUE 3(4), MARCH 2014
189
Referring to figure 3, d1 as being the distance from H1 to the
hyperplane and d2 from H2 to it. The hyper plane’s equidistance from H1
and H2 means that d1 = d2. This quantity is known as the SVM’s margin.
In order to orientate the hyperplane to be as far from the Support Vectors
as possible, we need to maximize this margin. Simple vector geometry shows
that margin is equal to 1/ÐwÐ of w and by maximizing it we get minimum
margin and vice versa [1].
VI. Classification of Genes Using SVM
Here we have take example of classification which we can understand
with the example of classification of cancer gene. A support vector machine
(SVM) is a computer algorithm that can learn by example to assign labels to
objects. For instance, an SVM also can learn to recognize fraud credit card
activity by examining hundreds or thousands of fraud and non-fraud credit
card activity reports. Alternatively, an SVM can learn to recognize handwritten
digits by examining a large collection of scanned images of handwritten zeroes,
ones and so on. SVMs have also been successfully applied to an increasingly
wide variety of biological applications. Here we consider a common biomedical
application of support vector machines which is the automatic classification
of microarray gene expression profiles. Theoretically, an SVM can examine
the gene expression profile derived from a tumor sample or from peripheral
fluid. There are many biological application of SVM, one of them is classifying
objects as diverse as protein and DNA sequences. From the working of SVM
we can say that an SVM is an algorithm for maximizing a particular
mathematical function with respect to a given collection of data.
The problem of classifying cancer gene expression profiles is studied
in this segment. For a given bone marrow sample, the microarray assay returns
6,817 values, each value of which represents the mRNA levels corresponding

INTERNATIONAL JOURNAL OF MULTIDISCIPLINARY EDUCATIONAL RESEARCHISSN : 2277-7881; IMPACT FACTOR - 2.735; IC VALUE:5.16VOLUME 3, ISSUE 3(4), MARCH 2014
190
to that particular given gene. Golub performed this assay on 38 bone marrow
samples, 27 from individuals with acute lymphoblastic leukemia (ALL) and
11 from individuals with acute myeloid leukemia (AML). On the basis of this,
SVM is able to tell the difference between ALL and AML expression profiles.
If the learning is successful, then the SVM will be able to successfully diagnose
a new patient as AML or ALL. This can be done on the basis of bone marrow
expression profile. For now, to allow an easy, geometric interpretation of the
data, imagine that the microarrays contained probes for only two genes. That
is we are considering only two different genes. In this case, our gene expression
profiles consist of two numbers, which can be easily plotted. We have selected
the genes ZYX and MARCKSL1. The values are proportional to the intensity
of the fluorescence on the microarray, so on either axis, a large value indicates
that the gene is highly expressed and vice versa. The expression levels are
indicated by a red or green dot, depending upon whether the sample is from a
patient with ALL or AML. The SVM must learn to tell the difference between
the two groups and, given an unlabeled expression, predict whether it
corresponds to a patient with ALL or AML[2].For understanding this
application. we have to understand some concepts given below
A. The Separating Hyperplane
The human eye is very good at pattern recognition. A simple rule
might state that a patient has AML if the expression level of ABC is twice
as high as the expression level of ZYX, and vice versa for ALL. Geometrically,
this rule corresponds to drawing a line between the two clusters.
Subsequently, predicting the label of an unknown expression profile is easy,
we just need to ask whether the new profile falls on the ALL or the AML
side of the separating line. Now, to define the notion of a separating
hyperplane, consider a situation in which the microarray does not contain
just two genes. It may be a case where microarray can contain more than

INTERNATIONAL JOURNAL OF MULTIDISCIPLINARY EDUCATIONAL RESEARCHISSN : 2277-7881; IMPACT FACTOR - 2.735; IC VALUE:5.16VOLUME 3, ISSUE 3(4), MARCH 2014
191
two genes. But if the microarray contains a single gene, then the ‘space’ in
which the corresponding one dimensional expression profiles resides is a
one-dimensional line. We can divide this line in half by using a single point.
In two dimensions, a straight line divides the space in half, and in three
dimensions, we need a plane to divide the space. We can extrapolate this
procedure mathematically to higher dimensions. The general term for a
straight line in a high-dimensional space is a hyperplane, and so the
separating hyperplane is, essentially, the line that separates the ALL and
AML samples.
B. The maximum-margin hyperplane
The concept of treating the objects to be classified as points in a
high-dimensional space and finding a line that separates them is not unique
to the SVM. The SVM, however, is different from other hyperplane-based
classifiers by virtue of how the hyperplane is selected. Consider again the
classification problem portrayed in Figure 4. We have now established that
the goal of the SVM is to identify a line that separates the ALL from the
AML expression profiles in this two-dimensional space.

INTERNATIONAL JOURNAL OF MULTIDISCIPLINARY EDUCATIONAL RESEARCHISSN : 2277-7881; IMPACT FACTOR - 2.735; IC VALUE:5.16VOLUME 3, ISSUE 3(4), MARCH 2014
192
In other words, one would select the line that separates the two
classes but adopts the maximal distance from any one of the given
expression profiles. If we define the distance from the separating hyperplane
to the nearest expression vector as the margin of the hyperplane, then the
SVM selects the maximum margin separating hyperplane. Selecting this
particular hyperplane maximizes the SVM’s ability to predict the correct
classification of previously unseen examples.
C. Soft Margin
So far, we have assumed that the data can be separated using a
straight line. Of course, many real data sets cannot be separated as cleanly,
where the data set contains an ‘error’, the circled gene expression profile.
Intuitively, we would like the SVM to be able to deal with errors in the
data by allowing a few anomalous expression profiles to fall on the ‘wrong
side’ of the separating hyperplane. To handle cases like these, the SVM
algorithm has to be modified by adding a ‘soft margin’. Essentially, this
allows some data points to push their way through the margin of the
separating hyperplane without affecting the final result. In addition to
allowing SVMs to handle nonlinearly separable data sets and to incorporate
prior knowledge, the kernel function yields at least two additional benefits.
First, kernels can be defined on inputs that are not vectors. This ability to
handle non vector data is critical in biological applications, allowing the
SVM to classify DNA and protein sequences, nodes in metabolic, regulatory
and protein-protein interaction networks and microscopy images. Second,
kernels provide a mathematical formalism for combining different types
of data. Imagine, for example, that we are doing biomarker discovery for
the ALL/AML distinction, and we have the Golub. Data plus a corresponding
collection of mass spectrometry profiles from the same set of patients. It

INTERNATIONAL JOURNAL OF MULTIDISCIPLINARY EDUCATIONAL RESEARCHISSN : 2277-7881; IMPACT FACTOR - 2.735; IC VALUE:5.16VOLUME 3, ISSUE 3(4), MARCH 2014
193
turns out that we can use simple algebra to combine a kernel on microarray
data with a kernel on mass spectrometry data. The resulting joint kernel
would allow us to train a single SVM to perform classification on both
types of data simultaneously[3].
VII. SVM Applications
1. Personal identification
2. Credit rating
3. Medical diagnosis
4. Text classification
5. Character recognition
6. Biometrics
7. Image classification
8. Delivers unique solution[4]
VIII. Conclusion and Future Scope
SVMs also perform better than a variety of alternative methods for
classification. Using this non-separable data can be separated and we are able
to assign an object to one of several categories. Also, we can recognize given
data comes under which topic by text classification. By using kernel function,
this technique becomes more flexible than traditional neural network. It is a
relatively new learning method used for binary classification. By using kernel
function, on-separable data can be separated. It is an exciting machine learning
technique. It is the technique by which o/p is nearly equal to i/p. It provides
evidence that SVM are well suited for text classification. It is a promising
learning method originally developed for pattern recognition.

INTERNATIONAL JOURNAL OF MULTIDISCIPLINARY EDUCATIONAL RESEARCHISSN : 2277-7881; IMPACT FACTOR - 2.735; IC VALUE:5.16VOLUME 3, ISSUE 3(4), MARCH 2014
194
The most obvious drawback to the SVM algorithm, as described thus
far, is that it apparently only handles binary classification problems. We can
discriminate between ALL and AML, but how do we discriminate among a
large variety of cancer classes? Generalizing to multiclass classification is
straightforward and can be accomplished by using any of a variety of methods.
Perhaps the simplest approach is to train multiple, one-versus-all classifiers.
Essentially, to recognize three classes, A, B and C, we simply have to train
three separate SVMs to answer the binary questions, “Is it A? “Is it B?” and
“Is it C?” This simple approach actually works quite well for cancer
classification6. More sophisticated approaches also exist, which generalize the
SVM optimization algorithm to account for multiple classes. For data sets of
thousands of examples, solving the SVM optimization problem is quite fast.
Empirically, running times of state-of-the-art SVM learning algorithms scale
approximately quadratically, which means that when you give the SVM twice
as much data, it requires four times as long to run. SVMs have been successfully
trained on data sets containing approximately one million examples, and fast
approximation algorithms exist that scale almost linearly and perform nearly
as well as the SVM.
Using all 6,817 gene expression measurements, an SVM can achieve
near-perfect classification accuracy on the ALL/AML data set. Furthermore,
an even larger data set has been used to demonstrate that SVMs also perform
better than a variety of alternative methods for cancer classification from
microarray expression profiles. Although this primer has focused on cancer
classification from gene expression profiles, SVM analysis can be applied to a
wide variety of biological data. As we have seen, the SVM boasts a strong
theoretical underpinning, coupled with remarkable empirical results across a
growing spectrum of applications. Thus, SVMs will probably continue to yield

INTERNATIONAL JOURNAL OF MULTIDISCIPLINARY EDUCATIONAL RESEARCHISSN : 2277-7881; IMPACT FACTOR - 2.735; IC VALUE:5.16VOLUME 3, ISSUE 3(4), MARCH 2014
195
valuable insights into the growing quantity and variety of molecular biology
data.
References
1. B. E. Boser, I. M. Guyon, V. N. Vapnik,” A training algorithm for optimal
margin classifiers “, 5th Annual ACM Workshop on COLT (ed. Haussler,
D.) 144–152 (ACM Press, Pittsburgh, PA, 1992).
2. T. Golub,” Molecular classification of cancer: class discovery and class
prediction by gene expression monitoring.”, Science 286, 531–537 (1999).
3. W. K. Härdle, R. A. Moro., D. Schäfer,” Support Vector Machines – Eine
neue Methode zum Rating von Unternehmen “, DIW Wochenbericht No.
49/04, Berlin, 2004.
4. N. Cristianini, J. Shawe-Taylor,” An introduction to support Vector
Machines: and other kernel-based learning methods “,. Cambridge
University Press, New York, NY, USA (2000).

INTERNATIONAL JOURNAL OF MULTIDISCIPLINARY EDUCATIONAL RESEARCHISSN : 2277-7881; IMPACT FACTOR - 2.735; IC VALUE:5.16VOLUME 3, ISSUE 3(4), MARCH 2014
196
BIO GAS AS A CHEAPEST CLEAN ALTERNATIVE ENERGYSOURCE GLOBALLY CREATING AWARENESS AMONG
AGRICULTURAL PEOPLE
Gourav DurejaAssistant Professer
Civil Engineering DepttMaharishi Markandeshwar Group of
Institutions Ramba,Karnal
Neeraj KumarAssistant Professer
Mechanical Engineering DepttMaharishi Markandeshwar Groupof Institutions Ramba,Karnal
1. Introduction
Biogas has globally remained a renewable energy source derived
from plants that use solar energy during the process of photosynthesis.
Agriculture waste is mainly composed of three groups of polymers, namely
cellulose, hemicelluloses, and lignin. Cellulose and hemicelluloses are sugar
rich fractions of interest for use in fermentation processes. India stands
second in the production of Fruits and Vegetables in the world. It
contributes about 10 and 14% of Fruit and Vegetable in the world
production. Vegetable Wastes are created during harvesting, transportation,
storage, marketing and processing. Due to their nature and composition,
they deteriorate easily and cause foul smell. in a rural areas a huge amount
of agricultural waste are produced in fields. farmers are discarded these
wastes in open palace which is very harmful for our health. so to overcome
all these type of difficulties we can make biogas which is a alternate source
of energy for peoples.The main source for production of biogas are cattle
dung, night soil, poultry or piggery dropping, agricultural residues animals
manure, Wood waste from forestry and industry, residues from food and
paper industries, municipal green wastes, sewage sludge dedicated energy
crops such as short rotation (3 to 15 years) grasses, sugar crops (sugarcane,
beet), starch crops (corn, wheat) and oil crops (soy, sunflower, palm oil),

INTERNATIONAL JOURNAL OF MULTIDISCIPLINARY EDUCATIONAL RESEARCHISSN : 2277-7881; IMPACT FACTOR - 2.735; IC VALUE:5.16VOLUME 3, ISSUE 3(4), MARCH 2014
197
kitchen waste, household waste, green waste, human waste.Biogas is a gas
whose primary elements are methane (CH4) 50 to 75% and carbon dioxide
(CO2) 25–50 %, hydrogen (H2); 0 to 1% , nitrogren (N2) 5 to 10% , 1 to 2%
hydrogen sulphide (H2S). Water vapour (0.3%) and 1 to 2% hydrogen
sulphide (H2S).Water vapour (0.3%). biogas is about 20% lighter than air
and has an ignition temperature in the range of 650 to 750°C. The
components of biogas – methane and carbon dioxide- act as greenhouse
gases that harm the environment if released unburned into the atmosphere.
The production of biogas in biogas plants prevents uncontrolled emission
of methane into the atmosphere and, by generating renewable energy in
the form of biogas, reduces the use of fossil fuel.It is a colourless and
odourless gas that burns with 60% efficiency in a conventional biogas stove
the composition of biogas are shown by a table.

INTERNATIONAL JOURNAL OF MULTIDISCIPLINARY EDUCATIONAL RESEARCHISSN : 2277-7881; IMPACT FACTOR - 2.735; IC VALUE:5.16VOLUME 3, ISSUE 3(4), MARCH 2014
198
3. Agricultural waste
Agriculture waste is an organic material and can be used to produce
biogas through anaerobic digestion, thus providing an alternative for
Agriculture waste use and mitigating the pollution. Agriculture waste is
mainly composed of three groups of polymers, namely cellulose,
hemicelluloses, and lignin. Cellulose and hemicelluloses are sugar rich
fractions of interest for use in fermentation processes. against microbial
attack and prevents the accessibility of enzymes to their substrate, hence
making hydrolysis a rate limiting factor in anaerobic digestion of agriculture
waste. there are some types of substratum which produced biogas yield.

INTERNATIONAL JOURNAL OF MULTIDISCIPLINARY EDUCATIONAL RESEARCHISSN : 2277-7881; IMPACT FACTOR - 2.735; IC VALUE:5.16VOLUME 3, ISSUE 3(4), MARCH 2014
199
4. Anaerobic Digestion
Anaerobic digestion is the biological degradation by a complex mi-
crobial ecosystem of organic and occasionally inorganic substrates in the
absence of an organic source. There are four metabolic stages involved in
the production of methane using anaerobic digestion process. First, the
particulate organic matters undergo hydrolysis by extra cellular enzymes
to convert polymers into monomers. Organic acids, alcohols, hydrogen and
carbon dioxide by acidogenic bacteria. Thirdly, the acetogenic bacteria con-
vert the products of acidiogens into acetic acid, hydrogen and carbon diox-
ide. Finally, methanogenic bacteria are responsible for methane produc-
tion from acetogen products. The main advantage in using anaerobic di-
gestion is the biogas production, which can be used for steam heating;
cooking and generation of electricity. The effluent produced can be used as
a biofertiliser or soil conditioner.. A major limitation of anaerobic diges-
tion of vegetable wastes is the rapid acidification due to the lower pH of
wastes and the larger production of volatile fatty acids (VFA), which re-
duce the methanogenic activity of the reactor. Preliminary treatment is
required to minimize organic loading rate, hence aerobic processes are not
preferred for vegetable wastes. The rate limiting step in vegetable wastes
is by methanogenesis rather than by hydrolysis because methanogenic
bacteria take long mass doubling time of 3-4 days in anaerobic reactors.

INTERNATIONAL JOURNAL OF MULTIDISCIPLINARY EDUCATIONAL RESEARCHISSN : 2277-7881; IMPACT FACTOR - 2.735; IC VALUE:5.16VOLUME 3, ISSUE 3(4), MARCH 2014
200
There are different types of reactors used for the Bio energy recovery from
solid wastes and waste water. They include batch reactors, one stage reac-
tors and two stage reactors.
5.1 Direct combustion
Process of burning in presence of oxygen to produce heat and by
products is called combustion complete combustion to ashes is called is
incineration. The process of combustion is applicable to solid, liquid and
gaseous fuel. Such as wood dung, vegetable waste can be dried and burnt
to provide heat or converted into low calorific value gas by “pyrolysis”
5.1.1 Pyrolysis process
In this process organic material to gases solid and liquids by heating
to 500 0C to 900 0C in the absence of oxygen product of wood pyrolysis are
methanol, charcoal and acidic acid all forms of organic materials including
such as rubber and plastic can be converted to a fuel gas which contains
CO ,CH4, other hydrocarbons (CnHm) CO2 and N2.
5.2 Thermochemical conversion
Thermochemical conversion process converts the biomass and its
residues to fuel,chemical and power using gasification and pyrolysis
technologies .

INTERNATIONAL JOURNAL OF MULTIDISCIPLINARY EDUCATIONAL RESEARCHISSN : 2277-7881; IMPACT FACTOR - 2.735; IC VALUE:5.16VOLUME 3, ISSUE 3(4), MARCH 2014
201
5.3 Biochemical conversion
Biochemical conversion by micro-organisms converting biomass to
bio fuels are slow processes taking place at low temp. The principal
conversion process is fermentation. fermentation is a process of
decomposition of organic matter by micro-organism. e.g- decomposition of
sugar to form ethanol and carbon dioxide by yeast and ethanol forming
acetic acid in making vinegar.
5.3.1 Gassification
Heating biomass with about one-thrid of the oxygen necessary for
complete combustion produces a mixture of carbon dioxide and hydrogen
known as syngas. Pyralysis heating biomass in the absence of oxygen
produce a liquid pyrolysis oil both syngas and pyrolysis oil can be used as
fuels both can also be chemically converted to other valuable fuels and
chemicals. ,” Gobar Gas” mainly because cow dung has been the material
for its production . It is not only the excreta of the cattle, but also the
piggery waste as well as poultry droppings are very effectively used for
biogas generation. A few other material through which biogas can be
generated are algae, crop residues. Biogas is produced by digestion, pyrolysis
or hydro gasification. Digestion is a biological process that occurs in the
absence of oxygen and in the presence of anaerobic organisms at ambient
pressures and temperatures of 35-70 C. The container in which this
digestion takes place is known as the digester.
5.4 Anaerobic digestion.
Anaerobic digestion (AD) is a technology widely used for treatment
of organic waste for biogas production.Biogas technology is concerned to
micro organisms. These are living creatures which are microscopic in size
and are invisible to unaided eyes. There are different types of micro
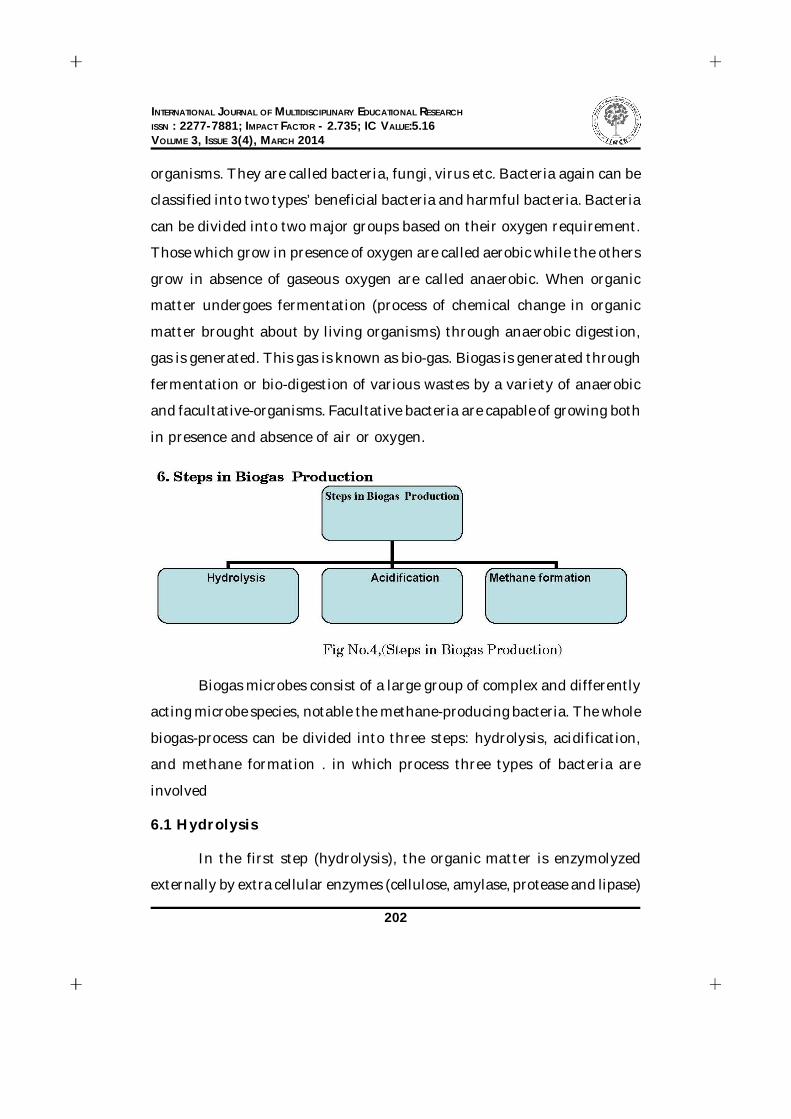
INTERNATIONAL JOURNAL OF MULTIDISCIPLINARY EDUCATIONAL RESEARCHISSN : 2277-7881; IMPACT FACTOR - 2.735; IC VALUE:5.16VOLUME 3, ISSUE 3(4), MARCH 2014
202
organisms. They are called bacteria, fungi, virus etc. Bacteria again can be
classified into two types’ beneficial bacteria and harmful bacteria. Bacteria
can be divided into two major groups based on their oxygen requirement.
Those which grow in presence of oxygen are called aerobic while the others
grow in absence of gaseous oxygen are called anaerobic. When organic
matter undergoes fermentation (process of chemical change in organic
matter brought about by living organisms) through anaerobic digestion,
gas is generated. This gas is known as bio-gas. Biogas is generated through
fermentation or bio-digestion of various wastes by a variety of anaerobic
and facultative-organisms. Facultative bacteria are capable of growing both
in presence and absence of air or oxygen.
Biogas microbes consist of a large group of complex and differently
acting microbe species, notable the methane-producing bacteria. The whole
biogas-process can be divided into three steps: hydrolysis, acidification,
and methane formation . in which process three types of bacteria are
involved
6.1 Hydrolysis
In the first step (hydrolysis), the organic matter is enzymolyzed
externally by extra cellular enzymes (cellulose, amylase, protease and lipase)

INTERNATIONAL JOURNAL OF MULTIDISCIPLINARY EDUCATIONAL RESEARCHISSN : 2277-7881; IMPACT FACTOR - 2.735; IC VALUE:5.16VOLUME 3, ISSUE 3(4), MARCH 2014
203
of microorganisms. Bacteria decompose the long chains of the complex
carbohydrates, proteins and lipids into shorter parts. For example,
polysaccharides are converted into monosaccharide. Proteins are split into
peptides and amino acids.
6.2 Acidification
Acid-producing bacteria, involved in the second step, convert the
intermediates of fermenting bacteria into acetic acid (CH3COOH), hydrogen
(H2) and carbon dioxide (CO2).These bacteria are facultatively anaerobic
and can grow under acid conditions. To produce acetic acid, they need
oxygen and carbon. For this, they use the oxygen solved in the solution or
bounded-oxygen. Hereby, the acid-producing bacteria create an anaerobic
condition which is essential for the methane producing microorganisms.
Moreover, they reduce the compounds with a low molecular weight into
alcohols, organic acids, amino acids, carbon dioxide, hydrogen sulphide
and traces of methane. From a chemical standpoint, this process is partially
endergonic (i.e. only possible with energy input), since bacteria alone are
not capable of sustaining that type of reaction. Acid-producing bacteria,
involved in the second step, convert the intermediates of fermenting
bacteria into acetic acid (CH3COOH), hydrogen(H2) and carbon dioxide
(CO2). These bacteria are facultatively anaerobic and can grow under acid
conditions. To produce acetic acid, they need oxygen and carbon. For this,
they use the oxygen solved in the solution or bound oxygen. Hereby, the
acid producing bacteria create an anaerobic condition which is essential
for the methane producing microorganisms. Moreover, they reduce the
compounds with a low molecular weight into alcohols, organic acids, amino
acids, carbon dioxide, hydrogen sulphide and traces of methane.

INTERNATIONAL JOURNAL OF MULTIDISCIPLINARY EDUCATIONAL RESEARCHISSN : 2277-7881; IMPACT FACTOR - 2.735; IC VALUE:5.16VOLUME 3, ISSUE 3(4), MARCH 2014
204
6.3 Methane formation
Methane-producing bacteria, involved in the third step, decompose
compounds with a low molecular weight. For example, they utilize
hydrogen, carbon dioxide and acetic acid to form methane and carbon
dioxide. Under natural conditions, methane producing microorganisms
occur to the extent that anaerobic conditions are provided, e.g. under water
(for exemple in marine sediments), in ruminant stomachesand in marshes.
They are obligatory anaerobic and very sensitive to environmental
changes. In contrast to the acidogenic and acetogenic bacteria, the
methanogenic bacteria belong to the archaebacter genus, i.e. to a group of
bacteria with a very heterogeneous morphology and a number of common
biochemical and molecular-biological properties that distinguish them from
all other bacterial general. The main difference lies in the makeup of the
bacteria’s cell walls.
6.3.1 Symbiosis of bacteria
Methane and acid-producing bacteria act in a symbiotical way. On
the one hand, acid producing bacteria create an atmosphere with ideal
parameters for methane-producing bacteria (anaerobic conditions,
compounds with a low molecular weight). On the other hand, methane-
producing microorganisms use the intermediates of the acid producing
bacteria. Without consuming them, toxic conditions for the acid-producing
microorganisms would develop. In practical fermentation processes the
metabolic actions of various bacteria all act in concert. No single bacteria
is able to produce fermentation products alone.
7.Parameters and process optimization
Each of the various types of bacteria responsible for the three stages
of the methanogenesisis affected differently by the above parameters. Since

INTERNATIONAL JOURNAL OF MULTIDISCIPLINARY EDUCATIONAL RESEARCHISSN : 2277-7881; IMPACT FACTOR - 2.735; IC VALUE:5.16VOLUME 3, ISSUE 3(4), MARCH 2014
205
interactive effects between the various determining factors exist, no precise
quantitative data on gas production as a function of the above factors are
available. Thus, discussion of the various factors is limited to their
qualitative effects on the process of fermentation.
8. Case study: fixed-dome type plant
A fixed-dome plant consists of a digester with a fixed, non-movable
gas holder, which sits on top of the digester. When gas production starts,
the slurry is displaced into the compensation tank. Gas pressure increases
with the volume of gas stored and the height difference between the slurry
level in the digester and the slurry level in the compensation tank. The
costs of a fixed-dome biogas plant are relatively low. It is simple as no
moving parts exist. There are also no rusting steel parts and hence a long
life of the plant (20 years or more) can be expected.
The plant is constructed underground, protecting it from physical
damage and saving space. While the underground digester is protected
from low temperatures at night and during cold seasons, sunshine and
warm seasons take longer to heat up the digester. No day/night fluctuations

INTERNATIONAL JOURNAL OF MULTIDISCIPLINARY EDUCATIONAL RESEARCHISSN : 2277-7881; IMPACT FACTOR - 2.735; IC VALUE:5.16VOLUME 3, ISSUE 3(4), MARCH 2014
206
of temperature in the digester positively influence the bacteriological
processes. The construction of fixed dome plants is labor-intensive, thus
creating local employment. Fixed-dome plants are not easy to build. They
should only be built where construction can be supervised by experienced
biogas technicians. Otherwise plants may not be gas-tight (porosity and
cracks). The basic elements of a fixed dome plant (here the Nicarao Design)
are shown in the figure below.
Conclusion
Biogas is a clean chepest source of energy for human beings. It is a
alternate source of energy because it is a renewable source of energy. With
the help of this paper we produced a methane gas .and agriculture Wastes
includes all items that people no longer have any use for which they either
intend to get rid of or have already discarded. Additionally, wastes are
such items which people are require to discard.. They are a major
contributor to greenhouse gas emissions and pollution of waters courses if
not managed properly. Biowaste can be degraded anaerobically in a biogas
digester to produce biogas and other gases.One excellent source of energy
is Biogas. This is produced when bacteria decomposeorganic material such
as garbage and sewage, especially in the absence of oxygen. Biogasis a
mixture of about 60 percent methane and 40 percent Carbon dioxide.
Methane is the main component of natural gas. It is relatively clean burning,
colorless, and odorless. This gas can be captured and burned for cooking
and heating. This is already being done on alarge scale in some countries
of the world. Farms that produce a lot of manure, such as hog and dairy
farms, can use biogas generators to produce methane.in village fields a
huge amount of agriculture waste are found and farmers are not used
these wastes.so to solve this problems we make a biogas plant and produce
a gas.
INTERNATIONAL JOURNAL OF MULTIDISCIPLINARY EDUCATIONAL RESEARCHISSN : 2277-7881; IMPACT FACTOR - 2.735; IC VALUE:5.16VOLUME 3, ISSUE 3(4), MARCH 2014
207
Reference:
1. P. Chaiprasert, Biogas Production from Agricultural Wastes in Thailand,
Journal of Sustainable Energy & Environment Special Issue (2011) 63-
65.
2. Richard Arthur a, Martina Francisca Baidoo a, Edward Antwi b, Biogas
as a potential renewable energy source: A Ghanaian case study,
International Journal (ELSEVIER),Vol. 36,Issue 5 ,May 2011.
3. M. Farooq1, I.A. Chaudhry2, S. Hussain3, N. Ramzan4 , M. Ahmed5,
BIOGAS UP GRADATION FOR POWER GENERATION
APPLICATIONS IN PAKISTAN, Journal of Quality and Technology
Management, December 2012, Page 107–118.
4. Md. Forhad Ibne Al Imam1, M. Z. H. Khan2, M. A. R. Sarkar3, S. M. Ali1,
Development of Biogas Processing from Cow dung, Poultry waste, and
Water Hyacinth, International Journal of Natural and Applied Science,
Received 28 February 2013; accepted 12 March 2013
5. Budiyono, I N. Widiasa, S. Johari, and Sunarso, The Kinetic of Biogas
Production Rate fromCattle Manure in Batch Mode, International Journal
of Chemical and Biological Engineering, 3:1 2010.
6. Chima C. Ngumah, Jude N. Ogbulie, Justina C. Orji, and Ekpewerechi S.
Amadi, BIOGAS POTENTIAL OF ORGANIC WASTE IN NIGERIA,
Journal of Urban and Environmental Engineering, v.7, n.1, p.110-116,
ISSN 1982-3932,accepted 28 March 2013
7. Attila Meggyes, Valéria Nagy, Biogas and Energy Production by Utilization
of Different Agricultural Wastes, Acta Polytechnica Hungarica, Vol. 9, No.
6, 2012.

INTERNATIONAL JOURNAL OF MULTIDISCIPLINARY EDUCATIONAL RESEARCHISSN : 2277-7881; IMPACT FACTOR - 2.735; IC VALUE:5.16VOLUME 3, ISSUE 3(4), MARCH 2014
208
DIGITAL TECHNOLOGY IN INFORMATION USERS OFHIGHER EDUCATION IN KANCHIPURAM DISTRICTS
K. VijiResearch Scholar
Dept. of library scienceBharathiar University
R.Valarmady Research Scholar
Dept of Library ScienceBharathiar University
Dr. K.Nithyanandam CHIEF LIBRARIAN Hindustan University
INTRODUCTION
Knowledge is power and access to knowledge is the epitome of
civilization. Communication of knowledge is a dynamic process. It is hidden
and transmitted through information contained in documents that includes
data, resources, records, related files, which ultimately takes the shape of
competitive intelligence from a wide range of sources (D. Rajyalakshmi,
2007). This information is available in different forms and formats like
books, magazines, journals, CD-ROM, Internet sources, online databases,
microfilms and magnetic tapes.
Technologies affect and influenced the way we seek, locate, access
and use information. Changes in technology in recent years have
dramatically altered the manner in which information is accessed, stored
and disseminated. The driving force behind this rapid growth of information
is due to the impact of the Internet. “Although the Internet is the newest
medium for the flow of information it is the fastest growing new medium
for all times, becoming the information medium of first resort for its
users.”(A. C. Lynch & C. M. Preston, 1990). This observation is relevant to
modern academic university libraries as they have to adapt to the growing

INTERNATIONAL JOURNAL OF MULTIDISCIPLINARY EDUCATIONAL RESEARCHISSN : 2277-7881; IMPACT FACTOR - 2.735; IC VALUE:5.16VOLUME 3, ISSUE 3(4), MARCH 2014
209
technology to enable potential users to access the required information
and facilitate the most effective use of such resources.
A university library inevitably becomes an intellectual arena and a
place for the generation and dissemination of an ocean of knowledge. It
provides a world class of resources and services to its users. Previously the
quality of a university library was judged on the basis of the size of its
collections of books, journals and other materials. Now the emphasis has
shifted to the networked information services provided through modern
technologies like CD-ROM networks, Internet and consortia.
Emergence Of Information Technology (IT)
The information revolution of today is indisputably caused by the
unprecedented advances in technology. Computers, Telecommunications,
Micro graphics and Reprographics have emerged to give shape to the
familiar phase known as ―Information Technology. This advancement has
made accessibility to world information and knowledge possible from any
part of the globe. In other words, the increasing importance of information
and the need for its users has resulted in the application of different
technologies widely termed as information technologies.
Impact of Information Technologies on Libraries.
Recognizing the fact that the use of information technologies opened
new avenues for better services in the new digital environment, libraries
in higher educational institutions have adopted new technologies. Many
organizations like IFLA, Global Libraries Initiatives, Technology and Social
Change believe that the library and information technologies are at a point
in their evolution where each is able to provide significant value to the
other. Both share an interest in the use of technology to achieve their
ultimate goals. (H. Billings,1996)

INTERNATIONAL JOURNAL OF MULTIDISCIPLINARY EDUCATIONAL RESEARCHISSN : 2277-7881; IMPACT FACTOR - 2.735; IC VALUE:5.16VOLUME 3, ISSUE 3(4), MARCH 2014
210
Impact of Information Technologies on Collection Management
in University Libraries.
In the opinion of Varalakshmi (2004) IT enhanced the existing modes
of communication for e.g. reduced the cost of production and increased
the level of performance; provided additional alternative channels to
communicate information; for Electronic resources. They facilitated to
provide an entire new information communication channel that achieved
direct interactive and informal means of communication, for Online
Journals. Libraries with good stock of print documents and reading facilities
are no more an attraction. The physical hard volumes of books and journals
are slowly being replaced by electronic media like floppy discs, magnetic
tapes, CD-ROMs and DVDs. The mode of presentation has changed from
static text to graphic, hypertext, audio, video, and interactive multimedia.
Many libraries are redefining their collection management policies to
include digital collections through consortia models.
Review of literature
Gupta and Arora,(2002) made an attempt to focus the role of librarians
in digital libraries. The objectives and characteristics of digital libraries
were highlighted. In components of digital library, high speed LAN and
connectivity to internet, RDBMS that supports variety of digital formats,
search engines to indeed and provide access to resources and electronic
document management were mentioned. The professionals ‘attitude was
not satisfactory towards information technology according to them. The
copy right problem, political barriers, technical barriers etc. were discussed.
Suggestions were given to library professionals to shift traditional
librarianship to digital librarianship.
INTERNATIONAL JOURNAL OF MULTIDISCIPLINARY EDUCATIONAL RESEARCHISSN : 2277-7881; IMPACT FACTOR - 2.735; IC VALUE:5.16VOLUME 3, ISSUE 3(4), MARCH 2014
211
Harish Chandra (2002) stressed upon e-collection in libraries, their
advantages and disadvantages and the role of librarian in e-collection,
development. Various types of e-collection like E-books, E-Journals, etc.
were listed. There is an urgent need to build e-collections to meet the
growing information needs of the users. Therefore, a policy for development
of e-collection is to be evolved. In this situation the traditional librarianship
may have little significance and the professionals need to be trained with
the latest developments taking place in information handling from time to
time.
Hussan Nabi (2002) discussed CD-ROMs as a media for information
packaging retrieval and dissemination. The use of CD-ROMs in libraries
is highlighted. In advantages, high storage capacity, reliability, cost
effectiveness, portability, ability to store graphic data and resource sharing
were discussed. The problems of Indian Libraries particularly the financial
crunch can be minimized by adopting CD-ROM Technology and networking
according to them. So, professionals be imparted with the kind of training
that is necessary to use CD-ROMs was stressed.
Objectives of the Study
The following are the main objectives of the present study:
To understand the IT information technology and network
infrastructure available in the higher education in kanchipuram
districts.
To understand the levels of knowledge and use of the library
professionals on various aspects of IT like computer technology,
network infrastructure, communication media technology, audio-
video technology, printing and publication technology and electronic
resources.

INTERNATIONAL JOURNAL OF MULTIDISCIPLINARY EDUCATIONAL RESEARCHISSN : 2277-7881; IMPACT FACTOR - 2.735; IC VALUE:5.16VOLUME 3, ISSUE 3(4), MARCH 2014
212
To identify the training needs of these library professionals in the
area of Information Technology
To understand the opinion and attitude of library professionals
towards IT and related aspects
To examine the differentials in the opinions and attitudes of the
library professionals with regard to some selected aspects of IT, by
selected background variables
Hypotheses
The following are the hypotheses formulated in the present study:
There are differences in the availability of IT information technology
and network infrastructure in the higher education in kanchipuram
districts.
There are differences in the availability of IT information technology
and network infrastructure in the NBA accredited and non-
accredited higher education in kanchipuram districts.
The attitude and opinion of the library professionals vary among
the Indian continuum.
The attitude and opinion of the library professionals vary with the
library software.
Methodology
Data was collected using questionnaire, the covers faculty members
and questionnaire distributed to faculty member’s processional only. Total
of 300 questionnaires distributed 250 respondents.
Data collection
The data have been collected through well structured questionnaire
form the digital technology in information users of higher education in
kanchipuram districts.

INTERNATIONAL JOURNAL OF MULTIDISCIPLINARY EDUCATIONAL RESEARCHISSN : 2277-7881; IMPACT FACTOR - 2.735; IC VALUE:5.16VOLUME 3, ISSUE 3(4), MARCH 2014
213
Limitation study
The study mainly applicable for digital technology in information
users of higher education in kanchipuram districts.
Table 1 shows that out of 250 respondents belonging to library in
Indian consortia. 105(42.0) highly Asst professor are respondents, 90(36.0)
Assoc professor are respondents Second Poisson from library in Indian
consortia.55 (22.0) Professor Respondents third Poisson from library in
Indian consortia.
From the data collected it is observed that as highly as 70(28.0)
UGC INFONET is respondents from library in Indian consortia. 60(24.0)
IIM Consortium respondents Second Poisson from library in Indian
consortia.57 (22.8) ICMR e-consortia respondents third Poisson from library
in Indian consortia.26 (10.4) CERA respondents fourth Poisson from library
in Indian consortia.22 (8.8) HELNET Consortium respondents fifth Poisson
from library in Indian consortia.15 (6.0) INDEST respondents sixth Poisson
from library in Indian consortia.

INTERNATIONAL JOURNAL OF MULTIDISCIPLINARY EDUCATIONAL RESEARCHISSN : 2277-7881; IMPACT FACTOR - 2.735; IC VALUE:5.16VOLUME 3, ISSUE 3(4), MARCH 2014
214
Table 2 shows that out of 250 respondents belonging to library
scheme of classification. 105(42.0) highly Asst professor are respondents,
90(36.0) Assoc professor are respondents Second Poisson from library
scheme of classification.55 (22.0) Professor Respondents third Poisson from
library scheme of classification.
From the data collected it is observed that as highly as 115(46.0)
UDC is respondents from library scheme of classification. 100 (40.0) DDC
respondents Second Poisson from library scheme of classification.35 (14.0)
CC respondents third Poisson from library scheme of classification.
3. Which software is used for inter library management?
Table 3 shows that out of 250 respondents belonging to library
software. 105(42.0) highly Asst professor are respondents, 90(36.0) Assoc
professor are respondents Second Poisson from the library software.55
(22.0) Professor Respondents third Poisson from the library software.
From the data collected it is observed that as highly as 85(34.0)
AUTOLIB is respondents from the library software. 45(18.0) SOUL

INTERNATIONAL JOURNAL OF MULTIDISCIPLINARY EDUCATIONAL RESEARCHISSN : 2277-7881; IMPACT FACTOR - 2.735; IC VALUE:5.16VOLUME 3, ISSUE 3(4), MARCH 2014
215
respondents Second Poisson from the library software. 40(16.0) CLMS
respondents third Poisson from the library software. 30(12.0) WINSIS
respondents fourth Poisson from the library software. 25(10.0) LIBSYS
and SANJAI respondents last Poisson from the library software.
Table 4 shows that out of 250 respondents belonging to access to
print resources. 105(42.0) highly Asst professor are respondents, 90(36.0)
Assoc professor are respondents Second Poisson from the access to print
resources.55 (22.0) Professor Respondents third Poisson from the access
to print resources.
From the data collected it is observed that as highly as 130(52.0)
OPAC is respondents from the access to print resources. 80(32.0) Web OPAC
respondents Second Poisson from the access to print resources. 40(16.0)
Library catalogue respondents third Poisson from the access to print
resources.
FINDING
Majority of highly as 70(28.0) UGC INFONET is respondents from
library in Indian consortia. 60(24.0) IIM Consortium respondents
Second Poisson from library in Indian consortia. 57 (22.8) ICMR e-
consortia respondents third Poisson from library in Indian consortia.
It is observed that as highly as 115(46.0) UDC is respondents from
library scheme of classification. 100 (40.0) DDC respondents Second
INTERNATIONAL JOURNAL OF MULTIDISCIPLINARY EDUCATIONAL RESEARCHISSN : 2277-7881; IMPACT FACTOR - 2.735; IC VALUE:5.16VOLUME 3, ISSUE 3(4), MARCH 2014
216
Poisson from library scheme of classification.35 (14.0) CC
respondents third Poisson from library scheme of classification.
It is could be seen clearly from above discussion that as highly as
85(34.0) AUTOLIB is respondents from the library software.
45(18.0) SOUL respondents Second Poisson from the library
software. 40(16.0) CLMS respondents third Poisson from the library
software.
It is could be seen clearly from above discussion as highly as
130(52.0) OPAC is respondents from the access to print resources.
Conclusion
In the electronic environment digital technology in information
users of higher education in kanchipuram districts have built their library
collections in print and electronic form. They have incorporated new web
technologies that provide users better, dynamic, user friendly environment
that is interactive and attractive with multimedia collections and services.
Many university libraries are currently building substantial collections of
full text journals in electronic format and continue to access various online
databases. This created focused attention on functions of collection
management in university libraries. In the changed information
environment issues like planning, collection building, budgeting,
organizing, processing, assessment, evaluation, access, licensing, digital
preservation and dissemination of both print and electronic resources need
to be discussed elaborately in collection development policy.
REFERENCES
1. Rajyalakshmi,.D. (2007). Information Professionals- Knowledge and Skills,
for Information Management. ILA Bulletin, 43(4), 8-15.

INTERNATIONAL JOURNAL OF MULTIDISCIPLINARY EDUCATIONAL RESEARCHISSN : 2277-7881; IMPACT FACTOR - 2.735; IC VALUE:5.16VOLUME 3, ISSUE 3(4), MARCH 2014
217
2. Lynch, C. A & Preston, C.M. (1990). Internet access to information
resources. Annual Review of Information Science and Technology, 25, 263-
312.
3. Billings, H. (1996). Library collections and distance information: New
models of collection development for the 21stCentury. Journal of Library
Administration, 24(1and 2), 3-17.
4. Varalakshmi. R. S. R (2004). Collection Management in the Digital
Environment: Policy Statement for University Libraries in India. SRELS
Journal of Information Management, 41(1), 79-90.
5. Gupta Sanjay & Arora, Ajay Kumar.(2002). Digital Libraries - Need of the
Hour. In: information management in E-Libraries by Parthan.SP. &
Jeevan.V.K.J (Ed.), New Delhi, Allied, 346-358.
6. Harish Chandra. (2002). Building e-collection in Science and Technological
Libraries. In: Information management in e-libraries, by Parthan, S.P.
&Jeevan, V.K.J. (Ed.), New Delhi, Allied,421-427.
7. Hussan, Nabi. & Others. (2002). CD – ROM: A Powerful Media for
information packing, retrieval and dissemination. In: information
management in e-libraries by Parthan.S.P. & Jeevan, V.K.J. (Ed.), New
Delhi, Allied, 67- 73.
INTERNATIONAL JOURNAL OF MULTIDISCIPLINARY EDUCATIONAL RESEARCHISSN : 2277-7881; IMPACT FACTOR - 2.735; IC VALUE:5.16VOLUME 3, ISSUE 3(4), MARCH 2014
218

INTERNATIONAL JOURNAL OF MULTIDISCIPLINARY EDUCATIONAL RESEARCHISSN : 2277-7881; IMPACT FACTOR - 2.735; IC VALUE:5.16VOLUME 3, ISSUE 3(4), MARCH 2014
219
INTERNATIONAL JOURNAL OF MULTIDISCIPLINARY EDUCATIONAL RESEARCHISSN : 2277-7881; IMPACT FACTOR - 2.735; IC VALUE:5.16VOLUME 3, ISSUE 3(4), MARCH 2014
220

INTERNATIONAL JOURNAL OF MULTIDISCIPLINARY EDUCATIONAL RESEARCHISSN : 2277-7881; IMPACT FACTOR - 2.735; IC VALUE:5.16VOLUME 3, ISSUE 3(4), MARCH 2014
221

INTERNATIONAL JOURNAL OF MULTIDISCIPLINARY EDUCATIONAL RESEARCHISSN : 2277-7881; IMPACT FACTOR - 2.735; IC VALUE:5.16VOLUME 3, ISSUE 3(4), MARCH 2014
222

INTERNATIONAL JOURNAL OF MULTIDISCIPLINARY EDUCATIONAL RESEARCHISSN : 2277-7881; IMPACT FACTOR - 2.735; IC VALUE:5.16VOLUME 3, ISSUE 3(4), MARCH 2014
223

INTERNATIONAL JOURNAL OF MULTIDISCIPLINARY EDUCATIONAL RESEARCHISSN : 2277-7881; IMPACT FACTOR - 2.735; IC VALUE:5.16VOLUME 3, ISSUE 3(4), MARCH 2014
224

INTERNATIONAL JOURNAL OF MULTIDISCIPLINARY EDUCATIONAL RESEARCHISSN : 2277-7881; IMPACT FACTOR - 2.735; IC VALUE:5.16VOLUME 3, ISSUE 3(4), MARCH 2014
225

INTERNATIONAL JOURNAL OF MULTIDISCIPLINARY EDUCATIONAL RESEARCHISSN : 2277-7881; IMPACT FACTOR - 2.735; IC VALUE:5.16VOLUME 3, ISSUE 3(4), MARCH 2014
226
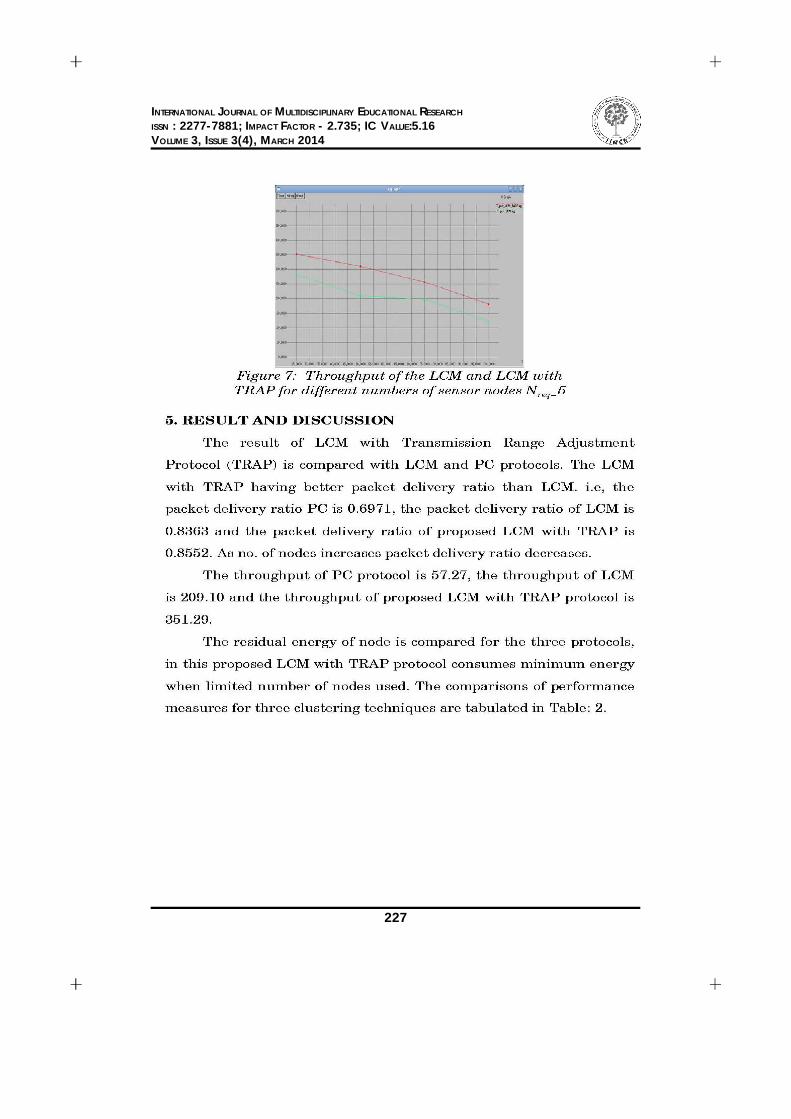
INTERNATIONAL JOURNAL OF MULTIDISCIPLINARY EDUCATIONAL RESEARCHISSN : 2277-7881; IMPACT FACTOR - 2.735; IC VALUE:5.16VOLUME 3, ISSUE 3(4), MARCH 2014
227

INTERNATIONAL JOURNAL OF MULTIDISCIPLINARY EDUCATIONAL RESEARCHISSN : 2277-7881; IMPACT FACTOR - 2.735; IC VALUE:5.16VOLUME 3, ISSUE 3(4), MARCH 2014
228

INTERNATIONAL JOURNAL OF MULTIDISCIPLINARY EDUCATIONAL RESEARCHISSN : 2277-7881; IMPACT FACTOR - 2.735; IC VALUE:5.16VOLUME 3, ISSUE 3(4), MARCH 2014
229

INTERNATIONAL JOURNAL OF MULTIDISCIPLINARY EDUCATIONAL RESEARCHISSN : 2277-7881; IMPACT FACTOR - 2.735; IC VALUE:5.16VOLUME 3, ISSUE 3(4), MARCH 2014
230

INTERNATIONAL JOURNAL OF MULTIDISCIPLINARY EDUCATIONAL RESEARCHISSN : 2277-7881; IMPACT FACTOR - 2.735; IC VALUE:5.16VOLUME 3, ISSUE 3(4), MARCH 2014
231
RTI IN CORRUPTION DRIVEN SYSTEM
Gian SinghResearch scholar
MONAD University, Hapur, U.P
Until 2005, an ordinary citizen had no access to information held
by a public authority. Even in matters affecting legal entitlements for such
subsidized services as food for work, wage employment, basic education
and health care, it was not easy to seek the details of decision making
process that affected or harmed him. Without access to relevant
information, it was not possible for a common man to participate in a
meaningful debate on political and economic options or choices available
to him for realizing socio-economic aspirations. The Constitution of India
has guaranteed (u/s 19) the freedom of expression and speech. Even then a
citizen had no legal right to know about the details of public policies and
expenditures. And, therefore, it was not possible for a common man to
observe and scrutinize the public actions with a view to provide feed back
for rectifying the deficiencies in policy planning and the execution of
programs.
Under the Official Secret Act, 1923, the entire development process
has thus been shrouded in secrecy. The people who voted for the formation
of democratically elected governments and contributed to the huge costs
of financing public activities, had no legal rights to know as to: what process
has been followed in designing the policies affecting them, how the programs
have been implemented, who are the concerned officials associated with
the decision making process and execution of the schemes and why the

INTERNATIONAL JOURNAL OF MULTIDISCIPLINARY EDUCATIONAL RESEARCHISSN : 2277-7881; IMPACT FACTOR - 2.735; IC VALUE:5.16VOLUME 3, ISSUE 3(4), MARCH 2014
232
promises made for delivery of essential services to the poor have not been
fulfilled?.
The Right to information Act, 2005, which came into effect on 12
October, 2005 is one of the most significant legislations enacted by the
Parliament of India. The Act enables the establishment of an unprecedented
regime of right to information for the citizens of the country. It overrides
the ‘Official Secrets Act’ and similar laws/rules. It strikes at the heart of
the paradigm long practiced by Government officials and public
functionaries that ‘confidentiality is the rule and disclosure is an exception’.
The Act seeks to establish that “transparency is the norm and secrecy is
an exception” in the working of every public authority. It aims to ensure
maximum openness and transparency in the machinery and functioning
of Government at all levels: Central, State and Local. The right to
information is expected to lead to an informed citizenry and transparency
of information which are vital to the functioning of a democracy. It will
contain corruption and enable holding Governments and their
instrumentalities accountable to the governed. The ‘People’s Right to Know’
has a long history of prolonged debates, deliberations, discussions, struggles
and movements at both national and international levels.
The fundamental values associated with the concept of freedom of
expression and right to information in a democratic society, are widely
acclaimed internationally as follows:
(1) Freedom of expression is essential to the development of an individual’s
personality. The “Right to Express” and to communicate is central to
self development and realization of one’s potentiality as a human being.
Any restriction on expression of opinion or access to information can
adversely affect individual dignity, integrity and growth.

INTERNATIONAL JOURNAL OF MULTIDISCIPLINARY EDUCATIONAL RESEARCHISSN : 2277-7881; IMPACT FACTOR - 2.735; IC VALUE:5.16VOLUME 3, ISSUE 3(4), MARCH 2014
233
(2) If development is to be realized, people need the freedom to participate
in public life with full information as “informed” citizens, exercise
their “right to say”, put forth their views, and demand, without fear
of discrimination, that their Governments uphold their obligations
and deliver.
(3) Knowledge is power and freedom of information is vital to the
advancement of knowledge society. Enlightened judgment is possible
only if one is provided with opportunity to consider all facts and ideas,
from whatever source, and to test one’s conclusion against opposing
views.
(4) Sustained human development requires that the people, especially
the poor have the “right to know” and are provided with access to
relevant information, including that relating to the conservation of
the environment so that they can take their own “informed” decisions
and realise their right to development.
(5) Free flow of information promotes accountability and transparency,
prevents corruption, and strengthens the capacity of community
groups and civil society organizations to participate in decision-making.
The right to freedom of information is crucial not only in determining
policy but also in checking the Government in its implementation of
policy.
(6) The lack of access to information on Government policies, programmes,
schemes, benefits and deliveries makes corrupt practices thrive. When
corruption siphons off amounts from employment guarantee,
unemployment or disability benefit, misdirects public funds for service
delivery or delays pension and social security payments, it is usually
the poor who suffer the most. Freedom of information can be a potent

INTERNATIONAL JOURNAL OF MULTIDISCIPLINARY EDUCATIONAL RESEARCHISSN : 2277-7881; IMPACT FACTOR - 2.735; IC VALUE:5.16VOLUME 3, ISSUE 3(4), MARCH 2014
234
tool to prevent and fight corruption, i.e. the abuse of public power for
private gains.
(7) Freedom of information is a necessary part of our democratic polity.
All power in a democracy belongs to the people who are the masters
and the Government is their servant. If the people are to perform
their sovereign role and instruct their Government, they must have
access to all information, ideas, and points of view. Thus, democracy
must extend beyond the ballot box and be deepened through “social
citizenship” and “citizen governance”.
(8) Freedom of information is vital to the process of peaceful social change.
It allows ideas to be tested in advance before action is taken, it
legitimizes the decision reached, and it permits adaptation to new
conditions without the use of force or violence. Realising the
importance of the freedom of speech and expression including the
freedom to receive and impart information, many countries – Sweden,
the United States of America, Finland, the Netherlands, Australia,
Canada, the United Kingdom, Japan, South Korea, Jamaica, Israel,
South Africa, Thailand, India etc. – have enacted Freedom of/Right to
Information Acts. The objective behind these enactments is to ensure
that governmental activity is transparent, fair and open. Most
enactments are based on the paradigm that except in matters of
defence, atomic energy and matters concerning the security of a
country, there is no room for secrecy in the affairs of the Government.
Whether it is a matter of taking a decision affecting the people or
whether it is a transaction involving purchase or sale of government
property or whether the matter relates to entering into contracts - in
all these matters, the Government should act in a transparent manner.

INTERNATIONAL JOURNAL OF MULTIDISCIPLINARY EDUCATIONAL RESEARCHISSN : 2277-7881; IMPACT FACTOR - 2.735; IC VALUE:5.16VOLUME 3, ISSUE 3(4), MARCH 2014
235
This means that every citizen who wishes to obtain any information
with respect to any of those matters should be entitled to receive it.
RTI: A Response to Paradigm Shift in Development Approach
Of the major forces which have, of late, led to a re-thinking on issues that
affect economic development, at least three of them are most important.
These are:
(i) Sharing of knowledge and communication strategies for dissemination
of information;
(ii) Involvement of NGOs in designing of policies and implementation of
schemes; and
(iii) Adoption of citizen centric approach to development.
Democratization of information and knowledge
Information and knowledge are critical for realizing all the human
aspirations, such as, improvement in quality of life. In the knowledge
society, in which we live today, acquisition of information and knowledge
and its application have intense and pervasive impact on productivity gains.
People who have access to information and who understand how to make
use of the acquired information in the processes of exercising their political,
economic and legal rights become empowered, which, in turn, enable them
to build their strengths and assets. In view of this, almost every society
has made endeavors for democratizing knowledge resources by way of
putting in place the mechanisms for free flow of information and ideas so
that people can access them without asking for it. They are thus empowered
to make proper choices for participation in development process. The efforts
made thus far to disseminate information and knowledge through the use
of communication technologies such as radio and television, have yielded

INTERNATIONAL JOURNAL OF MULTIDISCIPLINARY EDUCATIONAL RESEARCHISSN : 2277-7881; IMPACT FACTOR - 2.735; IC VALUE:5.16VOLUME 3, ISSUE 3(4), MARCH 2014
236
positive results. Sharing of information, for instance, about the new
techniques of farming, health care facilities, hazards of environmental
degradation, opportunities for learning and earning, legal remedies for
combating gender biases, etc., have, overtime, made significant
contributions to the well being of poor people. Every individual or section
of the society, whether working in farm, industrial or services sectors,
requires a wide range of information to be able to effectively function in
the knowledge and technology driven economy. Democratisation of
information and knowledge, by way of creating conditions for sharing
among the people, who are partners in development, is critical to the task
of equalising opportunities for development. In view of this, the RTI seeks
to set up the facilitation process for free flow of information, which forms
the basis for a healthy debate on issues of vital importance to every section
of the society.
Increasing demand by NGOs for participation in development
activities.
In the backdrop of inefficient implementation of development
programmes, the NGOs/self-help groups have demanded at various fora,
for creating conditions for democratic governance. It has been alleged,
and that not without a basis, that the implementing agencies have
frequently indulged in corrupt practices leading to diversion of resources
from public use to private purposes. And, that the entitlements of the poor
have not been assured, mainly in respects of food grains, jobs, health care
facilities, basic education, etc. Poverty of all forms has thus been
perpetuated, which is a major drag on the overall development of the
country.

INTERNATIONAL JOURNAL OF MULTIDISCIPLINARY EDUCATIONAL RESEARCHISSN : 2277-7881; IMPACT FACTOR - 2.735; IC VALUE:5.16VOLUME 3, ISSUE 3(4), MARCH 2014
237
There are umpteen numbers of cases which demonstrate that the
role of NGOs in exposing corruption and in providing necessary feed back
for designing policies and effective implementation of the programmes has
been commendable. For instance, NGOs have exposed the inclusion of
fictitious names in the list of beneficiaries, under the schemes like
subsidized food grains, employment guarantee scheme for poor, domestic
gas (LPG), medicines, reservation of seats in private schools for the children
from the poor families, etc. Prior to the implementation of RTI Act 2005,
at least eight Indian States had enacted the laws on freedom of information
since 1997. People, in these states took recourse to the various provisions
of transparency norms to obtain information held by the public bodies.
The NGOs also conducted social audits of the schemes, particularly the
poverty alleviation programmes, the outcomes of which have resulted in
appropriate reforms in governance of the projects. This forms the basis for
replicating these experiences throughout the country. In view of
commendable contributions of NGOs in carrying out the programmes in
partnership with the public bodies, the RTI Act has envisaged for providing
a framework for promoting interface between the citizens and the
Government, such that informed decisions could be taken at all levels by
the functionaries of the governments. And, the projects should be executed
under the sunshine to allow for reasonable scrutiny by the citizens.
Citizen-Centric Approach to Development
An equally important concern of the development planners has been
to evolve Citizen Centric Approach to development, as people live in diverse
socioeconomic and geographic conditions. The approach to fit for all sizes,
particularly in respect of poverty alleviation programmes, has failed.
Without obtaining necessary feedback from the people about their socio-
economic aspirations and the manner in which the accepted goals are to

INTERNATIONAL JOURNAL OF MULTIDISCIPLINARY EDUCATIONAL RESEARCHISSN : 2277-7881; IMPACT FACTOR - 2.735; IC VALUE:5.16VOLUME 3, ISSUE 3(4), MARCH 2014
238
be realized, it is not possible to design and implement schemes that may
eradicate poverty and liquidate illiteracy. The RTI therefore empowers every
citizen to take charge of his life and make proper choices, on the basis of
freely available information and knowledge, for effective participation in
political and economic processes or activities. Briefly, RTI has been
implemented in response to the major challenges of development, mainly
the urgency for democratisation of information and knowledge which are
vital for equalizing opportunity for development, increasing NGOs
participation in decision making and democratic governance and for
evolving citizen-centric approaches for addressing the concerns of every
member of the society. In the following paragraphs, an attempt is made to
present the salient features of the Act and to examine the extent to which
the stated objectives of the RTI Act are realized.
Evidently, the major objectives of the Act are:
i) Greater Transparency in functioning of public authorities.
ii) Improvement in accountability and performance of the Government.
iii) Promotion of partnership between citizens and the Government in
decision making process; and
iv) Reduction in corruption in the Government departments
Future of RTI: Tasks Ahead
A major challenge is to develop capacities for access to information.
The capacities of both the public authorities (i.e. the duty – bearers) and
the citizens (i.e. the claim holders) may have to be enhanced, for which a
two pronged strategy would be needed.
First, a comprehensive information management system (IMS) should be
developed by each public authority for storage and retrieval of data and

INTERNATIONAL JOURNAL OF MULTIDISCIPLINARY EDUCATIONAL RESEARCHISSN : 2277-7881; IMPACT FACTOR - 2.735; IC VALUE:5.16VOLUME 3, ISSUE 3(4), MARCH 2014
239
information that may be shared with anyone who seeks to inspect and use
the information for development purposes. Not only the institutional
capacity but also the individuals associated with various public activities
should also be trained and equipped with facilities to cope with the demand
for sharing of information. Second, in order to properly manage the
demand for information from the NGOs, in general, and the citizens, in
particular, a concerted effort would be needed to create mass awareness
among the people to promote information literacy. A multimedia approach
should be adopted to educate and train people as to how to decide and
select what information should be sought for and that from where and
how? Besides, they should be educated as to how to make best use of
information for effective participation in economic and political processes.
This alone can ensure cost-effective use of the provisions of the RTI Act.
Right to Information Act provides a broad framework for
Government and Citizens’ interface to design and monitor relevant projects,
contain corruption, ensure accountability and to mutually share the
responsibility for development. Under the Act, the public authorities are
required to adopt open and transparent procedures and methods of delivery
of services. They ought to reveal what they do, how they do and what are
the outcomes of the policies, programmes and public expenditures. In a
democratic society, the citizen, NGOs and media have the right to know as
to how they are governed and they also have right to exercise their options
to indicate how they ought to be governed and served by the Government.
It is important, therefore, to ensure the following:
Proactive and Suo motu Disclosure of Information
Under Section 4 of the Act, all the ‘Public Authorities’ are required
to make proactive disclosure of information. Almost entire gamut of their

INTERNATIONAL JOURNAL OF MULTIDISCIPLINARY EDUCATIONAL RESEARCHISSN : 2277-7881; IMPACT FACTOR - 2.735; IC VALUE:5.16VOLUME 3, ISSUE 3(4), MARCH 2014
240
activities and the manner in which they are executed are to be disclosed.
The issue is how to present and capture the relevant information that can
be of use to the stakeholders for realizing their rights. The computerization
of records and use of IT resources to ensure transparency in functioning of
different departments should be accorded high priority. The information
should be disclosed on suo motu basis so that a citizen does not have to
resort to the provisions of the RTI Act. Almost all the Ministries/
Departments have put up information on their websites, which needs to
be examined to assess the adequacy of their details for analysis and use of
information.
Promote Information Literacy
The Act empowers every citizen to seek information and to gain
ideas and acquire new knowledge to improve quality of life as well as to
participate in the effective governance of public authorities. The issue is
how to promote information literacy among people to enable them to decide
what to ask for, how to ask and how to make good use of information, so
that they can effectively participate in the process of development, including
control of corruption. The issue of promotion of information literacy among
both educated and not so well educated citizens is critical, because the
people and the government functionaries share the responsibility of
expediting the process of development. Accordingly, under Section 26 of
the Act, provisions have been made for advancement of understanding of
the public through education and training programmes. A multimedia
strategy for promotion of information literacy should be designed by all
the public authorities, including educational institutions, in collaboration
with media agencies so as to ensure greater interface between the
stakeholders. The task is challenging, as less than 10 per cent of the poor
have some awareness about the law on RTI and the manner in which it

INTERNATIONAL JOURNAL OF MULTIDISCIPLINARY EDUCATIONAL RESEARCHISSN : 2277-7881; IMPACT FACTOR - 2.735; IC VALUE:5.16VOLUME 3, ISSUE 3(4), MARCH 2014
241
could be used by them to claim for their entitlements. The potential of IT
resources and widespread educational institutions of all types and levels
should be exploited to promote information literacy.
Concluding Remarks
RTI has significant bearing on good governance and development.
India’s economy in the last three years has grown at unprecedented high
rate of 8 – 9 per cent per annum, which also co-incides with the RTI induced
good governance, as discussed above. The implementation of the law on
right to know for setting up information regime therefore augurs well for
strengthening the knowledge society as well as for increasing the
accountability of public bodies. The trend in improvement in delivery of
services, due to the perceived good governance, provides sufficient
indication for alleviation of poverty and liquidation of illiteracy in a much
shorter duration than envisaged for the realization of Millennium
Development Goals (MDGs). RTI has enabled people to participate in the
process of development, which has resulted in reduction of corruption. It
has just begun to happen for the first time for establishing an open and
participatory governance system that protects and promotes the socio-
economic interests of every citizen, particularly the poor, who are receiving
the benefits of development as per their entitlements.
As the functioning of public authorities becomes more transparent
and ensure proactive disclosure of the policies, programmes and their
outcomes, there would be greater participation by people in every sphere
of development. It is important therefore to enhance the capacity of public
authorities as well as the citizens to develop awareness and understanding
of information, to make its effective use for the benefits of citizens. In
effect, endeavours should be made to increase the effective demand for

INTERNATIONAL JOURNAL OF MULTIDISCIPLINARY EDUCATIONAL RESEARCHISSN : 2277-7881; IMPACT FACTOR - 2.735; IC VALUE:5.16VOLUME 3, ISSUE 3(4), MARCH 2014
242
improvement in delivery of services. Only about 10 per cent of over 300
million population of the poor are aware of the RTI, as a tool for reaping
the benefits of assured entitlements. It, therefore, calls for making concerted
efforts by the Government, NGOs and media for creating mass awareness
among the people, particularly to educate them, as to how to seek
information and how to make the best use of such acquisitions of wealth
of knowledge in every day’s life. The role of NGOs is critical in respect of
both to constantly exert pressure for maximum disclosure of information
relating to public activities and to participate in designing and
implementation of socio-economic programmes. The task is challenging
but easy to cope with provided of course mass media like radio and TV
channels are utilized to reach the target population. In view of diversity of
situations in which people live in different parts of the country, a multimedia
approach should be adopted to promote information literacy and to
democratize knowledge, which, in turn, are vital for people’s empowerment,
ensuring the reach of entitlements to the beneficiary groups and for
equalizing opportunities for sharing the benefits of development.
Reference
1. Abraham, Amrita (1990) ‘Does fighting corruption pay?’ Economic and
Political Weekly, May 26.
2. Commonwealth Human Rights Initiative (CHRI) (1998) Submissions to
Legislators on a Right to Information Law. CHRI, New Delhi.
3. Down to Earth (2000) ‘Right to know’. May 31.
4. Haragopal, G. (1994) ‘Bureaucracy, Rule of Law and Human Rights’.
Indian Journal of Public Administration, January – March.
5. Khan, Mushtaq H. (1996) ‘A typology of corrupt transactions in
developing countries’. IDS Bulletin, Vol. 27(2).

INTERNATIONAL JOURNAL OF MULTIDISCIPLINARY EDUCATIONAL RESEARCHISSN : 2277-7881; IMPACT FACTOR - 2.735; IC VALUE:5.16VOLUME 3, ISSUE 3(4), MARCH 2014
243
6. Krishnan, R. (1996) ‘The sticky business of the Hawala halwa’. Business
Line, February 24.
7. Naik, S.D. (1999)’ Urgent need to downsize government’. Business Line,
March 30, 1999.
8. Palmier, Leslie (1985) The Control of Bureaucratic Corruption: Case
Studies in Asia. Allied Publishers, New Delhi.
9. The Hindu (1996)‘Cong (I) has largest share in Hawala chargesheet’.
February 23.
10. United Nations Development Programme (UNDP) (1996) Corruption
and Good Governance. Discussion Paper 3, Management Development
and Governance Division, UNDP, New York.

INTERNATIONAL JOURNAL OF MULTIDISCIPLINARY EDUCATIONAL RESEARCHISSN : 2277-7881; IMPACT FACTOR - 2.735; IC VALUE:5.16VOLUME 3, ISSUE 3(4), MARCH 2014
244
KUSHANA INSCRIPTIONS AND HISTORY: A NEW
PERSPECTIVE
Pallavi PrasadSatyawati College, University of Delhi
Delhi
The greatest testimony of Kushana power in India is in the form of
abundant Kushana coins and a large number of inscriptions which are
retrieved from all quarters of their empire.As written records either by the
Kushanas themselves or about them, are exceedingly scarce, reconstruction
of their history is primarily based on a meticulous study of their coinage &
inscriptions. Kushanas inscriptions provide an almost unparalleled series
of historical documentation that help us in gleaning various aspects of
polity, society and economy under the Kushana rule.
The recovery of hundreds of Kushana inscriptions from a very large
mass of land extending from Airtam (18km east of Termez) in Uzbekistan
to Ganwaria in eastern Uttar Pradesh, attests to the vast dimensions of
the Kushana empire. The findspots of inscriptions by far is the most reliable
evidence for the reconstruction of the political boundaries of Kushana
empire under individual rulers. They along with coinage are also the most
useful tool for the reconstruction of genealogy and chronology of Kushanas.
The Rabtak inscription of year one (1) of Kanishka is indispensable in this
regard.This inscription in Bactrian language and Greek script was found
in 1993 at a site known as Kafir’s castle at Rabtak near Pul-i-Kumri in
north Afghanistan. In this 23 line inscription dated in the year 1 of Kanishka
era, and read by Nicholas Sims-Williams,1 lines 12 to 14, refer to king
Kujula Kadphises as the great grandfather, king Ooemo-Takto, i.e. Wema

INTERNATIONAL JOURNAL OF MULTIDISCIPLINARY EDUCATIONAL RESEARCHISSN : 2277-7881; IMPACT FACTOR - 2.735; IC VALUE:5.16VOLUME 3, ISSUE 3(4), MARCH 2014
245
Takto as the grandfather and king Ooemo Kadphises, i.e. Wema Kadphises
as the father of Kanishka-I. Thus a hitherto unknown Ooemo-Takto figures
in the genealogy of Kushanas as the son of Kujula Kadphises and the father
of Wema Kadphises. B.N. Mukherjee, however, argues that the correct
reading of this new name is Saddaskana (Sadashkana), who was a son of
Kujula Kadphises. Since there is no coin convincingly attributable to Ooemo
Takto, it appears that he probably served as a junior co-ruler to his father
Kujula Kadphises and predeceased him.2One of the most forceful
statements being made in the Rabtak inscription, on behalf of Kanishka is
the claim that he ruled India as far as Kausambi, Shri Champa, Pataliputra
and beyond. The inscription states that in the first year of his reckoning it
is proclaimed in India and, in fact in all the satrapies and especially in the
cities of Koonadeano (Kaundinya), Ozeno (Ujjain), Zageda (Saketa near
Ayodhya), Kwzambo (Kausambi), Palabotro (Pataliputra) and Shri Champa
(Bhagalpur) that all rulers and important persons had submitted to
Kanishka’s will and he had submitted all India to his will.3 Thus, in the
very first year of his reign Kanishka-I, it seems, extended the limits of the
Kushana empire upto Pataliputra and Champa, i.e. eastern border of the
present territory of Bihar. Kaundinya or Kundina has been identified with
Kaundinyapura on the Wardha river in the Amaravati district of
Maharashtra.4 But going by the numismatic and archaeological evidence
Ujjain may have marked the southern border of the empire.
Apart from the inscriptions issued by royalty, the private records of
common men help us to understand various aspects of society and religion.
These inscriptions are either undated or dated. In case of undated epigraphs
we depend on the palaeographic evidence for dating, which is not always
exact. But the dated inscriptions of Kushanas, especially those dated in
the Kanishka era, ranging from Year 1 to 98, are invaluable for the study

INTERNATIONAL JOURNAL OF MULTIDISCIPLINARY EDUCATIONAL RESEARCHISSN : 2277-7881; IMPACT FACTOR - 2.735; IC VALUE:5.16VOLUME 3, ISSUE 3(4), MARCH 2014
246
of Kushana history and society. According to the “dropped hundred” theory
of Von Lohuizen, the inscriptions dropped 100 and started recounting after
the year 100 of Kanishka, thus adding another 60 years to Kushana rule.5
The inscriptions found in/at different places in different regions have used
different local languages, i.e. standard Sanskrit, hydrid Sanskrit, Prakrit,
Gandhari Prakrit, etc. but are mainly written in two scripts – Kharoshthi
and Brahmi, although Sogdian, Bactrian and Greek alphabets are also
used. The writer of inscriptions called a lipika, first composed the text,
then a stone engraver or a tankaka followed the form and shape of each
letter fashioned by the lipika and engraved them on stone.6
The Kushana epigraphs are mostly short private records
commemorating the actions of a particular patron. These inscriptions are
generally records of religious donations and/or dedications by private
individuals like merchants, bankers, caravan leaders, officials, housewives,
professionals, lay worshippers, monks, nuns, etc. Statues of Buddhas,
Bodhisattvas, Jinas, sealings, stone slabs, etc. were installed, viharas,
stupas, temples, devakulas, tanks, wells, etc. were constructed and repaired,
endowments were made for pious purposes, by people from all walks of
life. Alongwith the acts of merit, these epigraphs mostly record the names
of the donors, their relations, place of origin, professions and even the
name of the monks or nuns who inspired them for the donation. The name
of the reigning Kushana ruler figures prominently in a large number of
records. The donors knew the name of the reigning monarch and sometimes
an administrative head was also associated with these records of gifts and
dedications. Imperial titles like Maharaja, Rajatiraja, Devaputra, Shahi
and rarely, Kaisara are invariably associated with the names of the reigning
Kushana monarchs even in private records which very often correspond to
the titles used on Kushana coins. The subjects expressed allegiance to the

INTERNATIONAL JOURNAL OF MULTIDISCIPLINARY EDUCATIONAL RESEARCHISSN : 2277-7881; IMPACT FACTOR - 2.735; IC VALUE:5.16VOLUME 3, ISSUE 3(4), MARCH 2014
247
king and made religious gifts for the spiritual benefit of not only self and
family members but mostly wished for the welfare of all beings and some
times also for the health, happiness and prosperity of the reigning monarch.
This reflects the idea that merit need not be individually earned but can
be transferred from one person to another and this sentiment finds an
expression in Buddhist, Jain and other donative records as well. Indeed,
the acquisition of merit may have been a major goal of the patrons and
donors who were responsible for the creation of works of art. We learn
about the titles of various officials and at times their names like Kshatrapa,
Mahakshatrapa, Dandanayaka, Mahadandanayaka, Padrapala, Lipika,
Divira (scribe), Gramika (village head man), Navakarmika, (superintendent
of work), Viharakaravhaena (architect of viharas), etc. through these
engraved details which throw light on the administrative set up under the
Kushana.
The nature and scope of Kushana inscriptions can be gleaned from
a few examples only. The Taxila silver scroll inscription of the year
136 of an unidentified era refers to the establishment of the relics of Buddha
in the Dhramarajika Stupa of Taxila by a Bactrian named Urasaka, a
resident of the city of Navachala, for the bestowal of health on an unnamed
Kushana King, Maharaja Rajatiraja Devaputra.7 The Peshawar Casket
inscription of year 1 of Kanishka8 records the religious gift of slave
Agishala who was the navakarmika in Kanishka’s Vihara, in Mahasena
Sangharama in the acceptance of the sarvastivadin teacher. The Sarnath
Boddhisattva inscription of the years 3 of Maharaja Kanishka records
the dedication of the Bodhisattva statue and an umbrella with a post by
Friar Bala along with Mahakshatrapa Kharapallana and Kshatrapa
Vanaspara of Benares.9 The Mathura Stone inscription of year 28 of
Kanishka era records a perpetual endowment of five hundred and fifty
INTERNATIONAL JOURNAL OF MULTIDISCIPLINARY EDUCATIONAL RESEARCHISSN : 2277-7881; IMPACT FACTOR - 2.735; IC VALUE:5.16VOLUME 3, ISSUE 3(4), MARCH 2014
248
(550) puranas in each of the two guilds of Samitakara and Raka for feeding
a hundred Brahmins in the punyashala by lord of Bakan and Kharasalera
in order that the merit might accrue to Devaputra Shahi Huvishka.10 The
Mat inscription of the time of Huvishka records the repair of tank and a
devakula by a Bakanpati, son of Mahadandanayaka for the life and
prosperity of Maharaja Rajatiraja Devaputra Huvishka.11 The Mathura
Jain Image inscription of the year 40 records the dedication of the image
by mother of Simhadatta, wife of the Gramika Jayanaga and daughter-in-
law of the Gramika Jayadeva out of the Varana Gana, Arya-Hatikiya Kula,
Vajrinagri Shakha.12
The economic vibrancy, devotion and religious character of the
society under the Kushanas can be gleaned from these inscriptions. Subtle
details of the society like the names of the donors, their pedigree, their
Gana, Kula, Shakha, etc. are engraved in stone and handed over to posterity.
These men are identified by their profession, their place of origin, official
titles, etc. The Kottiya-gana and ucchenagari Shakha seems to be in the
forefront in making donations at Kankali tila in Mathura. Various
professional groups are mentioned in these epigraphs like Lohakara
(ironsmith), Sarthavaha (caravan-leader), Gandhika (perfume merchant),
Suwarnakara (goldsmith), Vadhaki (carpenter), Vanik (merchant),
Vyavahari (trader or a magistrate), Pravarika (cloak maker), Manikara
(jeweller), Rajaka (washerman), Divira (scribe), Shreshthi (foreman of a
merchant guild), Kutumbika (agricultural householder), Halikaya
(agriculturist), dance troupes, actors, sculptors, etc. These attest to the
flourishing condition of trade and industry during Kushana times. At least
some individuals in these social classes were rich enough to make
magnificent donations. The Mathura Stone inscription of year 28 also
mentions two Shrenis (guilds) of Samitakara (flourmaker) and Raka

INTERNATIONAL JOURNAL OF MULTIDISCIPLINARY EDUCATIONAL RESEARCHISSN : 2277-7881; IMPACT FACTOR - 2.735; IC VALUE:5.16VOLUME 3, ISSUE 3(4), MARCH 2014
249
attesting to the existence of guilds of traders which must have accelerated
the growth of craft and industries. While the statues of royal personages
immortalized them in stone, these donors of various social and professional
groups, perpetuated their names by engraving their acts of merit in these
inscriptions.
These epigraphs even refer to various monks and nuns by name
and their teachers, who not only made costly donations themselves but
also inspired lay-worshippers and professionals for various acts of merit.
It seems that some monks and nuns did possess or retain some wealth,
which was utilized by them for religious donations. Bhikshu Bala and his
disciple Bikshuni Buddhamitra were possibly the most famous donors who
erected Bodhisattva images at Kausambi, Sarnath and Sravasti. A few
Inscribed Gold Bars from Dalverzin-tepe, datable to the Kushana age, bear
Kharoshthi inscriptions referring to these as owned by or donated by monks
of Kalana (Kalyan).13 Several records refer to the donations having been
made by lay-disciples at the request of venerable persons of religious orders
which tempts us to suggest that some of the donations given by monks or
nuns could have been made out of the amount collected from their rich
patrons.14
As many of these inscriptions were commissioned by women, they
also throw valuable light on some aspects of the lives of women in Kushana
times. While no royal women finds mention in these inscriptions, most
donations were made by urban women of fairly wealthy classes. They were
mothers, wives and daughters of affluent men of various professions. In
stark contrast with men whose professions are usually mentioned in the
inscriptions, these women are described by their familial relations, mostly
husband, father, father-in-law or son. They are thus, constantly identified
in terms of their relations with men and yet are disposing a large amount
INTERNATIONAL JOURNAL OF MULTIDISCIPLINARY EDUCATIONAL RESEARCHISSN : 2277-7881; IMPACT FACTOR - 2.735; IC VALUE:5.16VOLUME 3, ISSUE 3(4), MARCH 2014
250
of income, in the form of religious donations, which they do not seem to
have earned themselves. It seems that these rich women otherwise played
a restricted role in the public sphere but religion provided them with an
opportunity to exercise their own authority. Apart from these wealthy
women, nuns are frequently mentioned in inscriptions as making donations
and instigating donations. Women who followed a religious vocation are
identified by their sect and their teachers. The inscriptions show that nuns
played a vital role in attracting donations from secular figures. Buddhist
nun, Buddhamitra was well-versed in tripitika and was trained by monk
Bala of the Sarvastivadin sect. She installed a colossal Bodhisattva image
at Kausambi (Accession no. 2948, Municipal Museum, Allahabad) in the
year 2 of Kanishka era and along with monk Bala also donated other
Bodhisattva stone images at Sarnath (year 3 of Kanishka era) and Sravasti.
Another nun Dhanavati, the daughter of Buddhamitra’s sister, installed a
Bodhisattva image with an inscription in honour of Buddhamitra at
Mathura in the year 33 of Kanishka era. Thus, while the normative text of
this period relegate women to purely domestic roles, these inscriptions
show that at least in the religious sphere, women had an opportunity to
negotiate new roles and carve out new boundaries. They could assert their
own authority in the society by gaining control, as patrons of different
sects and also by proving their worth in attracting patronage of other
women.
Numerous viharas, stupas, chaityas, temples, kutis, etc find mention
in these epigraphic records which reflects on the vibrant religious life of
the people of Kushana age. More than eighteen viharas and monasteries
are mentioned in these inscriptions.15 These epigraphs perpetuate the names
and deeds of monks and nuns as well as common men and women of various
vocations and social classes on the statues of gods of different sects, i.e.

INTERNATIONAL JOURNAL OF MULTIDISCIPLINARY EDUCATIONAL RESEARCHISSN : 2277-7881; IMPACT FACTOR - 2.735; IC VALUE:5.16VOLUME 3, ISSUE 3(4), MARCH 2014
251
Buddha, Bodhisattvas, Maitreya, Jinas, Karttikeya, Shivalingas, Kubera,
Nagas, etc. In the devakulas of Mat and Surkh Kotal even the Kushana
kings were immortalized in stone. Apart from being exquisite works of art
these images remind us of the spirit of co-existence and catholicism that
existed during the rule of the Kushanas. It seems that the common man
had the liberty to practice, follow and patronized any religious sect of his
choice without royal intervention. Jaina inscriptions far outnumber the
Buddhist ones at Mathura. Several images of Naga deities datable to
Kushana age, with or without inscriptions are found in Mathura attesting
to the worship of serpents in north India. The British Museum
inscription of year 10 of Kanishka records the gift of a temple for Naga
worship in the northern Navamika (?).16 Brahmanical faith also flourished
during the rule of Kushanas, which is attested to by numerous sculptures
of Hindu gods and goddesses in Mathura school of art. Sculptures of both
Gandhara and Mathura school of art represented Buddhist, Brahmanical
and Jaina deities. The Mathura Yupa inscription of the year 24 refers
to the setting up of the sacrificial post and performance of sacrificial rites
by Dronala, a Chandyogya Brahmin of the Bharadwaja gotra.17 The Panjtar
Stone inscription records the construction of a temple of lord Shiva in
the eastern part of the territory of Kasua by Moika, son of Urumaja.18 An
image of Karttikeya was set up in the year 11 of Kanishka by brothers
Visvadeva, Visvasoma, Visvabhava and Visvavasi, the sons of Vishvila, who
were Kshatriyas.19 The Surkh-Kotal inscription of year 31 of Kanishka
mentions the repair of a temple called ‘Kanishko Oaninda Bago Laggo’
which appears to have been both a fire temple and a dynastic sanctuary.20
The Rabtak inscription of year 1 of Kanishka era records the command
of Kanishka to construct a sanctuary of Nana in the plains of Kaeypa for
deities Shri, Pharro and Ommo.21 The Rawal inscription, is a clumsy

INTERNATIONAL JOURNAL OF MULTIDISCIPLINARY EDUCATIONAL RESEARCHISSN : 2277-7881; IMPACT FACTOR - 2.735; IC VALUE:5.16VOLUME 3, ISSUE 3(4), MARCH 2014
252
copy of the Shakaradarra inscription recording the excavation of a
well in the year 40 of the Kanishka era. According to S. Konow it brings
out the belief of the people that the inherent magical or spiritual power of
an inscription could be recreated by its duplication.22 Thus these
inscriptionstruly represent the multi-religious society of the Kushana age
and its effervescence.
In the upper regions of Pakistan and ‘Pakistan occupied Kashmir’,
three area-Alam Bridge, Chillas and Hunza, have a huge concentration of
graffiti and thousands of short inscriptions on rocks, which are mostly
scriblings recording the name of the visitors of different sites or those
whose names the visitors wanted to commemorate.23 Though rarely, they
some-times refer to the ruling king or a Shatrap and occasionally to a date.
Nearly two hundred short Kharoshthi inscriptions have been dated to about
the first to third century A.D.24 which coincides with the Kushana rule.
Some Brahmi inscriptions belonging to the later Kushana period have been
identified as well. Most of the Kharoshthi inscriptions of Chillas II, studied
by G. Fussman render proper names without titles. Some of the names
like Buddharakshita, Buddha Gupta, Rahula, etc are Buddhist but a
‘Shivadasa’ i.e. slave of Shiva and Samudra Rama Krishna are also
mentioned. We find etchings of deities like Balarama, Samkarshana,
Vasudeva/Krishna and most probably Hariti apart from Buddhist
iconography.25 Since the 1st century A.D., this route was used by merchants,
Buddhist missionaries, pilgrims and political envoys of the Kushanas who
travelled between Kashmir and the Tarim Basin. Using another access,
traders from the lowlands reached Chillas and founded a Buddhist
sanctuary there.26 The inscriptions of the rocks of Hunza have been edited
by A.H Dani and according to him, they refer to Kushana kings. The
inscription HK-1 refers to ‘Vima Kadhataprisa’ in Kharoshthi characters,

INTERNATIONAL JOURNAL OF MULTIDISCIPLINARY EDUCATIONAL RESEARCHISSN : 2277-7881; IMPACT FACTOR - 2.735; IC VALUE:5.16VOLUME 3, ISSUE 3(4), MARCH 2014
253
who could possibly be Wema Kadphises.27 A male figure, in the well-known
Yueh-Chih dress, is engraved near this inscription on the Hunza rock
number 1. The dated graffiti from Hunza, starting from the year 34 of the
reign of Huvishka clearly give at least 11 dates of Huvishka and Vasudeva.
The epigraph HK-3 of the year 7, may belong to the period of Kanishka
whose name is possibly recorded in an undated document HK-2.28 These
inscriptions clearly indicate that these ancient sites of Alam Bridge, Gilgit
and Hunza were well within the Kushana empire, alluding to Kushana
sway over a portion of the upper regions of modern Kashmir. If all the
records are taken into account, the Kushana rule should have been in this
region at least from the period of Wema Kadphises to that of the year 91 of
the reign of Vasudeva.29
Thus both the Brahmi and Kharoashthi epigraph are indispensable for
the study of Kushana history. Apart from providing information about the
genealogy, chronology and political boundaries of the empire they throw
valuable light on various aspects of the population under the Kushana
rule and the religious ethos.
(Footnotes)
1 N.S. Williams and J. Cribb, ‘A New Bactrian Inscriptions of Kanishka the
Great’, Silk Road Art and Archaeology, The Institute of Silk Road Studies,
Kamakura, Japan, 1995/96, pp.75-123.
2 B.N. Mukherjee, ‘The Great Kushana Testament’, Indian Museum Bulletin,
Calcutta, 1995, pp.10-11.
3 Lines 5-7 of the Rabtak inscription as translated by N.S. William and J.
Cribb, 1995/96, op. cit. pp.75-79, 107.
4 B.N. Mukherjee, 1995, op. cit.
5 J.M. Rosenfield, 1967, op. cit., p.106.

INTERNATIONAL JOURNAL OF MULTIDISCIPLINARY EDUCATIONAL RESEARCHISSN : 2277-7881; IMPACT FACTOR - 2.735; IC VALUE:5.16VOLUME 3, ISSUE 3(4), MARCH 2014
254
6 S. Shrava, Dated Kushan Inscriptions, Delhi, 1993, p. V.
7CII, II, pt. 1, 1929, p.77.
8CII, II, pt. 1, 1929, p.137.
9EI, VIII, pp.196 ff.
10EI, XXI, pp.60f.
11JRAS, 1924, No. 3, p.397 ff.
12 S. Shrava, 1993, op. cit., p.181.
13 B.N. Mukherjee, 1988, op, cit., p.486.
14Ibid., pp.487-88.
15 S. Shrava, 1993, op. cit., p.193.
16EI, IX, pp. 239f, No 1.
17 J.P Vogel, Catalouge of Mathura Museum, No. Q. 13.
18CII, II, pt. 1, p.70.
19Journal of U.P Historical Society, XVI (1), pp.65-66.
20 B. Chattopadhyay, 1967, op. cit., p.172.
21 B.N. Mukherjee, ‘The Great Kushana Testament’, Indian Museum Bulletin,
Calcutta, 1995, pp.10-18, Lines 7-9 of Rabtak inscription.
22 S. Konow, CII, I, 1929, pp.161 and 159-60.
23 S. Shrava, 1993, op. cit., p.135.
24 K. Jettmar (ed.), Antiquities of Northern Pakistan, Vol. I, Mainz, 1993, pp.1-
40.
25Ibid., p. XXXI.
26Ibid., p. XIX.

INTERNATIONAL JOURNAL OF MULTIDISCIPLINARY EDUCATIONAL RESEARCHISSN : 2277-7881; IMPACT FACTOR - 2.735; IC VALUE:5.16VOLUME 3, ISSUE 3(4), MARCH 2014
255
27 A.H. Dani, ‘The Sacred Rock of Hunza’, Journal of Central Asia, Islamabad,
1985, Vol VIII, no. 2, pp.5f, 9.
28Ibid.
29 S. Shrava, 1993, op. cit., p.136.

INTERNATIONAL JOURNAL OF MULTIDISCIPLINARY EDUCATIONAL RESEARCHISSN : 2277-7881; IMPACT FACTOR - 2.735; IC VALUE:5.16VOLUME 3, ISSUE 3(4), MARCH 2014
256

INTERNATIONAL JOURNAL OF MULTIDISCIPLINARY EDUCATIONAL RESEARCHISSN : 2277-7881; IMPACT FACTOR - 2.735; IC VALUE:5.16VOLUME 3, ISSUE 3(4), MARCH 2014
257

INTERNATIONAL JOURNAL OF MULTIDISCIPLINARY EDUCATIONAL RESEARCHISSN : 2277-7881; IMPACT FACTOR - 2.735; IC VALUE:5.16VOLUME 3, ISSUE 3(4), MARCH 2014
258

INTERNATIONAL JOURNAL OF MULTIDISCIPLINARY EDUCATIONAL RESEARCHISSN : 2277-7881; IMPACT FACTOR - 2.735; IC VALUE:5.16VOLUME 3, ISSUE 3(4), MARCH 2014
259

INTERNATIONAL JOURNAL OF MULTIDISCIPLINARY EDUCATIONAL RESEARCHISSN : 2277-7881; IMPACT FACTOR - 2.735; IC VALUE:5.16VOLUME 3, ISSUE 3(4), MARCH 2014
260

INTERNATIONAL JOURNAL OF MULTIDISCIPLINARY EDUCATIONAL RESEARCHISSN : 2277-7881; IMPACT FACTOR - 2.735; IC VALUE:5.16VOLUME 3, ISSUE 3(4), MARCH 2014
261

INTERNATIONAL JOURNAL OF MULTIDISCIPLINARY EDUCATIONAL RESEARCHISSN : 2277-7881; IMPACT FACTOR - 2.735; IC VALUE:5.16VOLUME 3, ISSUE 3(4), MARCH 2014
262

INTERNATIONAL JOURNAL OF MULTIDISCIPLINARY EDUCATIONAL RESEARCHISSN : 2277-7881; IMPACT FACTOR - 2.735; IC VALUE:5.16VOLUME 3, ISSUE 3(4), MARCH 2014
263

INTERNATIONAL JOURNAL OF MULTIDISCIPLINARY EDUCATIONAL RESEARCHISSN : 2277-7881; IMPACT FACTOR - 2.735; IC VALUE:5.16VOLUME 3, ISSUE 3(4), MARCH 2014
264

INTERNATIONAL JOURNAL OF MULTIDISCIPLINARY EDUCATIONAL RESEARCHISSN : 2277-7881; IMPACT FACTOR - 2.735; IC VALUE:5.16VOLUME 3, ISSUE 3(4), MARCH 2014
265

INTERNATIONAL JOURNAL OF MULTIDISCIPLINARY EDUCATIONAL RESEARCHISSN : 2277-7881; IMPACT FACTOR - 2.735; IC VALUE:5.16VOLUME 3, ISSUE 3(4), MARCH 2014
266
INTERNATIONAL JOURNAL OF MULTIDISCIPLINARY EDUCATIONAL RESEARCHISSN : 2277-7881; IMPACT FACTOR - 2.735; IC VALUE:5.16VOLUME 3, ISSUE 3(4), MARCH 2014
267
INTERNATIONAL JOURNAL OF MULTIDISCIPLINARY EDUCATIONAL RESEARCHISSN : 2277-7881; IMPACT FACTOR - 2.735; IC VALUE:5.16VOLUME 3, ISSUE 3(4), MARCH 2014
268

INTERNATIONAL JOURNAL OF MULTIDISCIPLINARY EDUCATIONAL RESEARCHISSN : 2277-7881; IMPACT FACTOR - 2.735; IC VALUE:5.16VOLUME 3, ISSUE 3(4), MARCH 2014
269

INTERNATIONAL JOURNAL OF MULTIDISCIPLINARY EDUCATIONAL RESEARCHISSN : 2277-7881; IMPACT FACTOR - 2.735; IC VALUE:5.16VOLUME 3, ISSUE 3(4), MARCH 2014
270

INTERNATIONAL JOURNAL OF MULTIDISCIPLINARY EDUCATIONAL RESEARCHISSN : 2277-7881; IMPACT FACTOR - 2.735; IC VALUE:5.16VOLUME 3, ISSUE 3(4), MARCH 2014
271
SUICIDE AS NARRATIVE STRATEGY IN TWENTIETHCENTURY WOMEN’S FICTION: DORIS LESSING’S THE GRASS
IS SINGING
Dr. Sajja. DivyaIJM Rain Tree ParkOpp : ANU, Guntur
Suicide is a central narrative theme in much of women’s literature
especially as it connects with female artists seeking autonomy in their
personal and professional lives. In present scenario the novels written by
women suggest suicide’s use as a measure of defiance rather than defeat
and its absence as a mark of personal ascendency. In this study one can
find a fertile critical ground for exploring a female aesthetic using suicide
as a measure of women’s search for autonomy. Here, analysis of Doris
Lessing’s one of the significant works The Grass is Singing indicates the
suicide theme is aggravated many fold if the white women marries a black
man.
The Grass is Singing is about the relation between the individual
and the collective, between black and white, between men and women,
between the settler and the land, between role and identity, between the
Freudian nightmare repetition and the Jungian task of individuation are
related themes appearing in the novel. At the most obvious level it depicts
a complex clash of value systems.
Mary Turner, the central character of the novel, is dead at the start,
and we learn, by way of flashback, the explanation for her death. The
evocation of the atrophied African farm, the way that the environment
sucks the life out of Mary, is superbly done. It is quasi-naturalism, with an
omniscient narrator to direct us to the reality seems obviously an element

INTERNATIONAL JOURNAL OF MULTIDISCIPLINARY EDUCATIONAL RESEARCHISSN : 2277-7881; IMPACT FACTOR - 2.735; IC VALUE:5.16VOLUME 3, ISSUE 3(4), MARCH 2014
272
of inbuilt racism of the colonials in Southern Africa. The connection
between Mary and Moses breaks the great taboo of the colour bar between
the black and white races. With disastrous results and yet in a way that
both emphasizes the decadence and sterility of the life in which Mary is
trapped, and hints that her only hope of renewal is through the forbidden
bond which is being created with Moses.
Roberta has examined The Grass is Singing under the concept of
“Breaking Down, Breaking Out” in her work The Novelistic Vision of Doris
Lessing: Breaking the Forms of Consciousness (1979). As it is a novel of
initiation, taking as its starting point a young woman who has not yet
discovered her own values within the matrix of her geographical, social,
political, psychological universes, or who is unable to act in a way that is
consistent with her own ideals. “Breaking Out” describes the interplay of
forces within as well as outside the personality that produces certain kinds
of relationships and self-discoveries. “Breaking Down” is the extreme form
of that struggle, resulting from the enclosure of the self by constraints
that, whether external/internal are perceived as barriers to it. Hence
Roberta’s argument is primarily concerned with the protagonist’s efforts
to achieve self-awareness and autonomy. In retrospect, it is remarkable to
discover the seeds for so many of Doris Lessing’s later preoccupations in
her first novel, The Grass is Singing. Among her concerns with social,
economic, and political structures, with being female in a conventional
man’s world and white in black Africa, one also finds the central cluster of
her ideas concerning the abnormal consciousness: fragmentation, self-
division, breakdown, the subjective distortions of perception, and implicit
questions about the relationship between internal and external
perspectives/events. In fact, fragmentation itself is an index of inadequate/
coercive social and political structures – such as the oppression of blacks/

INTERNATIONAL JOURNAL OF MULTIDISCIPLINARY EDUCATIONAL RESEARCHISSN : 2277-7881; IMPACT FACTOR - 2.735; IC VALUE:5.16VOLUME 3, ISSUE 3(4), MARCH 2014
273
women. Inwardly, it is the manifestations of one particular response to
those life-denying/intolerable social edifices. The mental breakdown of Mary
Turner anticipates a variety of acute and disorienting mental experiences.
Moses retains a negative vitality. Recognizing his mistress’s
distraught state, the servant one day steers her to bed to rest. His very
solicitousness and assumption of control further distress her, since she
consciously denies the “personal” dimension and, beneath it, the attraction
she feels toward him. Yet the more she denies it, the more she feels herself
in his power. Her dreams haunt her with images of her submission to
Moses’s control and kindness. The relationship between Mary and Moses
depicts in microcosm several forms of power relationships. On the political
level it duplicates the imbalance between the oppressive white minority
and the black majority in South Africa. More suggestively, on the physical
level it reflects the shifting tensions of sexual tensions of sexual dominance
and submission between male and female. On the psychological level it
dramatizes the splits within the fragmenting personality. This
correspondence between the microcosms of private relationship and the
elements of individual personality on the one hand and the macrocosm
within which they develop on the other later becomes one of Lessing’s
most consistent fictional techniques. Moreover, the division into opposing
polarities – whether typified as conscious/unconscious, white/black, male/
female, dominant/submissive – corresponds to the paradigm of the psyche
elaborated by Carl Jung.
The Jungian orientation becomes increasingly visible in Lessing’s
fiction, as she was in direct contact with the ideas of Jung’s psyche through
Jungian analysis. Both in the design of the works and in the
conceptualization of her characters’ psychic realities we can identify it. In
The Grass is Singing the pattern of duality is already present: Mary

INTERNATIONAL JOURNAL OF MULTIDISCIPLINARY EDUCATIONAL RESEARCHISSN : 2277-7881; IMPACT FACTOR - 2.735; IC VALUE:5.16VOLUME 3, ISSUE 3(4), MARCH 2014
274
Turner’s consciousness is split into conscious and unconscious aspects,
the latter of which is psychologically and narratively realized through her
relationship to and perception of Moses. Functioning on the symbolic level
of the narrative as a kind of alter ego or complementary double, Moses
becomes a screen upon which Mary projects her own denied negative self.
Lessing dramatizes Jung’s concept of “shadow” mechanism in the psyche,
as it takes place in Mary Turner, exploring her experience as measured
against the other characters’ perceptions of her behavior. As Mary’s
unwilling involvement with Moses progresses, her mind wanders and she
loses her sense of time. Dick becomes ill again. Interestingly, his stress
results in physical breakdown while his wife’s takes the form of mental
breakdown; as incomplete as he may be, he is not forced to confront his
inner conflicts the way Mary is. One night while Mary is overwhelmed by
terrifying sexual dreams about her father, Moses assumes responsibility
for Dick’s care.
At this point Lessing shifts from the objective narration of the earlier part
of the novel into a subjective point of view, describing events as if perceived
by a consciousness highly distorted by emotional anguish. Looking in on
Dick, for example, Mary sees one of Moses’s legs, “an enormous, more
than life-size leg, the limb of a giant” (191) – suggestive, also, of her denied
sexual feelings. Nightmare and reality become indistinguishable as she
dreams that Dick is dead and ambivalently feels both relief and guilt. Moses
merges into the image of her father, who approaches her lasciviously,
smelling foul. “He came near and put his hand on her arm. It was the voice
of the African she heard. He was comforting her because of Dick’s death .
. . but at the same time it was her father menacing and horrible, who
touched her in desire” (192). Lessing condenses the several important male
figures in Mary’s frigidity, her need/dread of domination, and her repressed

INTERNATIONAL JOURNAL OF MULTIDISCIPLINARY EDUCATIONAL RESEARCHISSN : 2277-7881; IMPACT FACTOR - 2.735; IC VALUE:5.16VOLUME 3, ISSUE 3(4), MARCH 2014
275
sexuality. The obsessive and distorted quality of Mary’s perceptions
increases as Dick becomes not just dreamlike but unreal; the sole reality is
the ubiquitous presence of Moses. Knowing that he senses her fear of him,
which gives him power over her, Mary fears him even more. “They were
like two antagonists, silently sparring. Only he was powerful and sure of
himself, and she was undermined with fear by her terrible dream-filled
nights, her obsession” (196). Thus Moses absorbs more and more of the
positive attributes of Mary’s own disintegrating personality.
The last two chapters of The Grass is Singing juxtapose two very different
perspectives: the external, conventional reality and values of South Africa,
represented by the Turners’ opportunistic neighbor, Charlie Slatter; and
Mary’s disintegrating inner reality. On a rare visit to the Turners, Charlie
notices the altered power relationship between mistress and servant, and
is shocked by the undercurrent of coyness on Mary’s part and the
impersonal contempt on Moses’s. Charlie’s motive for urging the Turners
to leave their failing farm conforms to the “first law of white South Africa,
which is: ‘Thou shalt not let your fellow whites sink lower than a certain
point; because if you do, the nigger will see he is as good as you are’” (210).
A second external perspective is supplied by Tony Marston, a more
compassionate young man whom Charlie calculatingly sends to the Turners
to learn how to manage the farm that he will buy from them. Marston
observes that she giggles, inserts non sequiturs into dinner conversations,
or lapses into staring silences. He confidently labels her condition to himself
as “complete nervous break-down” (217). Later he accidentally witnesses
Mary being dressed by Moses. Her behavior is emotionless, revealing the
radical division between the conscious and unconscious dimensions of her
experience. Mary depersonalizes Moses so completely in her conscious mind
that he is only a machine who caters to her wishes. At the same time she is

INTERNATIONAL JOURNAL OF MULTIDISCIPLINARY EDUCATIONAL RESEARCHISSN : 2277-7881; IMPACT FACTOR - 2.735; IC VALUE:5.16VOLUME 3, ISSUE 3(4), MARCH 2014
276
unconsciously acting out the sexual intimacy that she cannot consciously
acknowledge.
Marston can only comprehend such bizarre behavior in terms of
madness, but at the same time he admits to himself that “she can’t be
mad. She doesn’t behave as if she were. She behaves simply as if she lives
in a world of her own, where other people’s standards don’t count. . .”
(221). Through Marston’s own uncertainties, Lessing suggests the indistinct
boundary between sanity and madness, and condemns the facile
compartmentalization of mental illness that becomes both a judgment and
a way of depersonalizing the sufferer – the position already radical at the
time of the publication of The Grass is Singing. The final chapter of the
novel is told almost entirely from the perspective of the abnormal
consciousness. It begins with Mary’s mind in a rare relaxed moment,
mulling over an imagined reconstruction of her physical surroundings,
beginning with the immediate details of the room and expanding outward
to the house and beyond. This mental exercise involves a progressive
movement outward from the core of the subjective self to greater and greater
objectivity, distance, and psychic release from tension. For Mary it is not
so much a therapeutic exercise as a powerful representation of her self-
alienation, in order to suppress the uncontrollable emotional turmoil within.
The description of Mary Turner’s last day dramatizes the extreme point of
her breakdown, amplifying the dissonant forces within her psyche. The
intensity of the sun and the shrill din of the cicadas cancel out her ecstasy,
as the narrator describes the external object world perceived through the
protagonist’s abnormal consciousness. Mary’s emotional claustrophobia
is symbolized by “the room closing in upon her like a prison” (224) – the
reverse of the out ward movement recounted earlier and a metaphor for
the correspondence between mental state and outer surroundings. Mary’s

INTERNATIONAL JOURNAL OF MULTIDISCIPLINARY EDUCATIONAL RESEARCHISSN : 2277-7881; IMPACT FACTOR - 2.735; IC VALUE:5.16VOLUME 3, ISSUE 3(4), MARCH 2014
277
consciousness is dominated by an awareness of “he” (Moses) outside
somewhere, waiting for her until nightfall.
Further distortions of “external” reality occur where time becomes
space, Mary’s vision of what will happen to her surroundings once she is
gone takes shape in a moment of psychotic insight. The successive
encroachments of rats, beetles, rain, grass, bushes, creepers, branches,
trees, toads, and worms suggest the terrifying impingement of an
unbearable reality upon her own fragmenting self. The impersonal world
she has constructed to protect her from her unacceptable feelings finally
comes to mirror the depersonalization that has reduced her to a shell with
“nothing left” (230). This particular form of Mary’s psychic state at this
point resembles what the British psychiatrist R. D. Laing calls “engulfment”
or “implosion.” In one of Mary Turner’s few remaining acts of will, she
submits herself to the dreaded “other,” walking out into the bush to confront
her destruction. Her mind gropes for order again and seizes on the image
of young Tony, who might be able to save her from the terror, just as, years
earlier, she had chosen Dick, to be “saved from herself by marrying him”
(237). Confronting Tony, however, she sees that there is no escape, that
neither he nor anyone else can save her now. Concerned but helpless, Dick
and Tony cannot see the presence that Mary knows is waiting for her in
the darkness, since he exists primarily in her own inner darkness. Lessing’s
portrayal of her protagonist’s mental state dramatizes the degree to which
Mary inhabits a psychic universe of her own creation. As she expects and
wills, Moses comes to meet her, cutting off her scream, and her life, in the
midst of her one final thought – that the bush had avenged itself upon her.
“The trees advanced in a rush, like beasts, and the thunder was the noise
of their coming” (243).

INTERNATIONAL JOURNAL OF MULTIDISCIPLINARY EDUCATIONAL RESEARCHISSN : 2277-7881; IMPACT FACTOR - 2.735; IC VALUE:5.16VOLUME 3, ISSUE 3(4), MARCH 2014
278
The novel ends with Moses retreating into the bush and then
abruptly turning back to await his own certain fate – “though what thoughts
of regret, of pity, or perhaps even wounded human affection were
compounded with the satisfaction of his completed revenge, it is impossible
to say” (245). For the central reality of Mary’s psychic breakdown is based
finally not on Moses but on what her own disturbed consciousness has
made of him. As the “other” for her, he is the only route left for her desired
escape from herself. The tension between acknowledged and unconscious
feeling is so extreme that the one possible release is her total annihilation.
Moreover, only Moses, the embodiment of her self-hatred and need for
punishment of her illicit desires, can bestow upon her. The physical death
of Mary Turner is the form of her psychic death made tangible.
The Grass Is Singing thus anticipates many of Doris Lessing’s
subsequent explorations of the abnormal consciousness, particularly as
manifested in mental breakdown and madness. The fragmentation to which
she succumbs is a product of both private emptiness and political realities
(understood through sexual power relationships: male/female and black/
white). What Lessing has made so vivid in this first novel is the evolution
of psychic realities as they transform the outer world into projections of
the character’s own denied self. While Mary’s breakdown is an essentially
private one, the novel as a whole provides the corresponding societal context
within which it takes place, through its dramatization of the
dehumanization imposed on both races by the color bar. The political reality
of South Africa is an institutionalized form of fragmentation and madness
in the macrocosm: depersonalization practiced as a culturally accepted
norm. In addition to these thematic concerns, one finds in The Grass Is
Singing the structural patterns; the psychic determinism suggested in
Mary’s situation is mirrored in and reinforced by the organization of the

INTERNATIONAL JOURNAL OF MULTIDISCIPLINARY EDUCATIONAL RESEARCHISSN : 2277-7881; IMPACT FACTOR - 2.735; IC VALUE:5.16VOLUME 3, ISSUE 3(4), MARCH 2014
279
narrative. Each development grows inevitably out of the dialectic of the
plot: the formation of Mary’s character in response to the alternatives
available to her, which in turn shape her subsequent choices; and the inner
dialectic of her mind, split between allowed and prohibited feelings,
dominance and submission, hostility and desire. Both dialectics unfold
toward a single end, achieving a negative resolution in the murder already
announced at the beginning of the novel. Thus the return to the beginning
is the formal expression of Mary’s life. The novel describes a circle that
encloses and shapes the reality from which she cannot escape – the empty
imprisonment of her own fragmented being.
Thus in this study one can find a fertile critical ground for exploring
a female aesthetic using suicide as a measure of women’s search for
autonomy. Here Lessing’s novel, The Grass is Singing has aptly indicated
that “suicide” theme is aggravated many fold if the white women marries
a black man.
References:
1. Lessing, Doris. The Grass is Singing. London: Joseph, 1950.
2. Rubenstein, Roberta. The Novelistic Vision of Doris Lessing: Breaking
the Forms of Consciousness. Urbana: U of Illinois P, 1979. Print.
3. Gindin, James. Postwar British Fiction: New Accents and Attitudes.
Berkeley University of California P, 1991. 64-87. Print.

INTERNATIONAL JOURNAL OF MULTIDISCIPLINARY EDUCATIONAL RESEARCHISSN : 2277-7881; IMPACT FACTOR - 2.735; IC VALUE:5.16VOLUME 3, ISSUE 3(4), MARCH 2014
280
ENHANCING THE QUALITY AND ACCESSIBILITY OFHIGHER EDUCATION THROUGH THE USE OF ICT
Pasupuleti PaparaoAssistant Professor
Department of EducationVivekananda College of Education
Kandukur , Prkasam District. Andhra Pradesh
India, like any other knowledge economy, depends on the
development of its educational sector. Higher education drives the
competitiveness and employment generation in India. However, research
findings have shown that the overall state of higher education is dismal in
the country. There is a severe constraint on the availability of skilled labor
(Agarwal, 2006). There exist socio-economic, cultural, time and geographical
barriers for people who wish to pursue higher education (Bhattacharya
and Sharma, 2007). Innovative use of Information and Communication
Technology can potentially solve this problem. Education is the driving
force of economic and social development in any country (Cholin, 2005)
Considering this, it is necessary to find ways to make education of good
quality, accessible and affordable to all, using the latest technology available.
The last two decades have witnessed a revolution caused by the
rapid development of Information and Communication Technology (ICT).
ICT has changed the dynamics of various industries as well as influenced
the way people interact and work in the society Internet usage in home
and work place has grown exponentially (McGorry, 2002). ICT has the
potential to remove the barriers that are causing the problems of low rate
of education in any country. It can be used as a tool to overcome the issues
of cost, less number of teachers, and poor quality of education as well as to
overcome time and distance barriers (McGorry, 2002).

INTERNATIONAL JOURNAL OF MULTIDISCIPLINARY EDUCATIONAL RESEARCHISSN : 2277-7881; IMPACT FACTOR - 2.735; IC VALUE:5.16VOLUME 3, ISSUE 3(4), MARCH 2014
281
In the current Information society, there is an emergence of lifelong
learners as the shelf life of knowledge and information decreases. People
have to access knowledge via ICT to keep pace with the latest developments.
In such a scenario, education, which always plays a critical role in any
economic and social growth of a country, becomes even more important.
Education not only increases the productive skills of the individual but
also his earning power. It gives him a sense of well being as well as capacity
to absorb new ideas, increases his social interaction, gives access to improved
health and provides several more intangible benefits (Kozma, 2005). The
various kinds of ICT products available and having relevance to education,
such as teleconferencing, email, audio conferencing, television lessons, radio
broadcasts, interactive radio counseling, interactive voice response system,
audiocassettes and CD ROMs etc have been used in education for different
purposes (Bhattacharya and Sharma, 2007).
Today ICTs—including laptops wirelessly connected to the Internet,
personal digital assistants, low cost video cameras, and cell phones have
become affordable, accessible and integrated in large sections of the society
throughout the world. It can restructure organizations, promote
collaboration, increase democratic participation of citizens, improve the
transparency and responsiveness of governmental agencies, make education

INTERNATIONAL JOURNAL OF MULTIDISCIPLINARY EDUCATIONAL RESEARCHISSN : 2277-7881; IMPACT FACTOR - 2.735; IC VALUE:5.16VOLUME 3, ISSUE 3(4), MARCH 2014
282
and health care more widely available, foster cultural creativity, and
enhance the development in social integration (Kozma,2005). It is only
through education and the integration of ICT in education that one can
teach students to be participants in the growth process in this era of rapid
change.
ICT can be used as a tool in the process of education in the
following ways :
Informative tool : It provides vast amount of data in various
formats such as audio, video, documents.
Situating tool : It creates situations, which the student experiences
in real life. Thus, simulation and virtual reality is possible.
Constructive tool : To manipulate the data and generate analysis.
Communicative tool : It can be used to remove communication
barriers such as that of space and time (Lim and Chai, 2004).
The following mediums are used for the delivery and for
conducting the education process :
Voice : Instructional audio tools that include interactive
technologies as well as the passive ones.
Video : Instructional video tools that include still images,
prerecorded moving images, and real-time moving images combined
with audio conferencing.
Print : Instructional print formats that include textbooks, study
guides, workbooks and case studies.
ICTs also allow for the creation of digital resources like digital
libraries where the students, teachers and professionals can access research

INTERNATIONAL JOURNAL OF MULTIDISCIPLINARY EDUCATIONAL RESEARCHISSN : 2277-7881; IMPACT FACTOR - 2.735; IC VALUE:5.16VOLUME 3, ISSUE 3(4), MARCH 2014
283
material and course material from any place at any time. Such facilities
allow the networking of academics and researchers and hence sharing of
scholarly material. This avoids duplication of work (Cholin, 2005).
E-LEARNING HAS THE FOLLOWING ADVANTAGES :
Eliminating time barriers in education for learners as well as
teachers.
Eliminating geographical barriers as learners can log on from any
place.
Asynchronous interaction is made possible leading to thoughtful
and creative interaction.
Enhanced group collaboration made possible via ICT.
New educational approaches can be used.
It can provide speedy dissemination of education to target
disadvantaged groups.
It offers the combination of education while balancing family and
work life.
It enhances the international dimension of educational services.
It allows for just in time and just enough education for employees
in organizations.
It can also be used for non-formal education like health campaigns
and literacy campaigns.
(Source : UNESCO,2002; Bhattacharya and Sharma, 2007)
E learning allows higher participation and greater interaction. It
challenges the concept that face-to-face traditional education is superior

INTERNATIONAL JOURNAL OF MULTIDISCIPLINARY EDUCATIONAL RESEARCHISSN : 2277-7881; IMPACT FACTOR - 2.735; IC VALUE:5.16VOLUME 3, ISSUE 3(4), MARCH 2014
284
to it (Bhattacharya and Sharma, 2007). The web and the Internet is the
core ICTs to spread education through e-learning. The components include
e-portfolios, cyber infrastructures, digital libraries and online learning
object repositories. All the above components create a digital identity of
the student and connect all the stakeholders in the education. It also
facilitates inter disciplinary research (Chandra and Patkar, 2007). Bottino
and Sharma (2003) mention that the use of ICT can improve performance,
teaching, administration, and develop relevant skills in the disadvantaged
communities. It also improves the quality of education by facilitating
learning by doing, real time conversation, delayed time conversation,
directed instruction, self-learning, problem solving, information seeking
and analysis, and critical thinking, as well as the ability to communicate,
collaborate and learn. ICTs also provide a platform for sharing information
and knowledge. This can be used for the betterment of program delivery
in terms of replication of best practices. It also helps researchers by
provision of information, networking, online journals, libraries and data.
The possibility of real time interaction in all the different aspects of the
education system like teaching, collaboration, debates etc hold great
promise for the future (Mason, 2000).
E-learning allows delivery, dialogue and feedback over the Internet.
It allows mass customization in terms of content and exams. E-education
can provide access to the best gurus and the best practices or knowledge
available (UNESCO, 2002). It is possible to leverage the online environment
to facilitate teaching techniques like role-play across time and distance
(Wishart, 2007). It can also facilitate the development of scenarios, which
can be rarely witnessed in practice. ICT can play a valuable role to monitor
and log the progress of the students across time, place and varied activities.
Mooij (2007) states that differentiated ICT based education can be expected

INTERNATIONAL JOURNAL OF MULTIDISCIPLINARY EDUCATIONAL RESEARCHISSN : 2277-7881; IMPACT FACTOR - 2.735; IC VALUE:5.16VOLUME 3, ISSUE 3(4), MARCH 2014
285
to provide greater reliability, validity, and efficiency of data collection and
greater ease of analysis, evaluation, and interpretation at any educational
level. In absence of ICT, most of the responsibility of teaching and learning
lies on the teachers. However, with the help of ICT one can transfer the
responsibilities to the students so that they can self manage. It helps to
individualize the teaching or guidance method as per the student’s need
(Mooij, 2007; Ozdemir and Abrevaya, 2007). It also boosts the confidence
level and the self-esteem of the students who acquire the ICT skills through
the process of being exposed to such kind of learning (Casal, 2007). Mooij
(2007) also puts forth the view that ICT-based registration, evaluation,
and administration helps to link different levels of information and facilitate
an overall view of the whole educational setup. It facilitates the evaluation
and examination of the learning process and results by the students and
the parents in a flexible and convenient way. The globalization process has
also created a large market of offshore students. To reach them, information
technology is the only convenient medium, which can offer education as a
service. It increases education provision substantially and can contribute
to mass education. It also creates competition among the institutions for
providing education and hence improves the quality (Cross and Adam,
2007).
To summarize, the following table shows the main benefits of using
ICT in education to the various stakeholders :

INTERNATIONAL JOURNAL OF MULTIDISCIPLINARY EDUCATIONAL RESEARCHISSN : 2277-7881; IMPACT FACTOR - 2.735; IC VALUE:5.16VOLUME 3, ISSUE 3(4), MARCH 2014
286
India is making use of powerful combination of ICTs such as open
source software, satellite technology, local language interfaces, easy to use
human-computer interfaces, digital libraries, etc. with a long-term plan to
reach the remotest of the villages. Community service centres have been
started to promote e-learning throughout the country (Bhattacharya and
Sharma, 2007).
FACTORS AFFECTING ADOPTION OF ICT IN EDUCATION :
There is a worldwide need felt for integrating ICT into education
in order to improve the pedagogy to reflect the societal change. The main
goals of ICT adoption in the education field are reducing costs per student,
making education more affordable and accessible, increasing enrollments,
improving course quality, and meeting the needs of local employers.

INTERNATIONAL JOURNAL OF MULTIDISCIPLINARY EDUCATIONAL RESEARCHISSN : 2277-7881; IMPACT FACTOR - 2.735; IC VALUE:5.16VOLUME 3, ISSUE 3(4), MARCH 2014
287
The main factors that affect the adoption of ICT in education are
the mission or goal of a particular system, programs and curricula, teaching/
learning strategies and techniques, learning material and resources,
communication and interaction, support and delivery systems, students,
tutors, staff and other experts, management, housing and equipment, and
evaluation (UNESCO, 2002). National vision, supported by coherent
strategies and actions is the most important factor in integrating ICT in
education. Successful implementation of ICT requires strong national
support from government and local support from relevant institutions and
education authorities. Sharma (2003) explains that the political powers of
any nations affect the introduction of any new technology. Sharma and
Amutabi and Oketch (2003) explain that cost is an important issue that
decides and guides the adoption and growth of Information and
Communication Technology especially in developing countries. The
presence of an ICT champion is necessary at all levels of the system. The
strong presence of such leadership is evident wherever ICT integration
has been initiated successfully (Mason, 2000). Along with ICT training,
one needs an ICT related support mechanism to gradually induce the
integration (Lai & Pratt, 2004). This is needed as many teachers in face of
technical difficulties may tend to revert to the older teaching (non-ICT
based) methods. Teachers need support in using and integrating ICT into
the curriculum and teaching methods. Teachers, who perceive greater
ICT-related support being available to them, use technologies in their
teaching much better (Tondeur et al, 2007).
POTENTIAL DRAWBACKS OF USING ICT IN EDUCATION :
Although ICT offers a whole lot of benefits there are some risks of
using ICT in education which have to be mitigated through proper
mechanisms. They are :

INTERNATIONAL JOURNAL OF MULTIDISCIPLINARY EDUCATIONAL RESEARCHISSN : 2277-7881; IMPACT FACTOR - 2.735; IC VALUE:5.16VOLUME 3, ISSUE 3(4), MARCH 2014
288
1. It may create a digital divide within class as students who are more
familiar with ICT will reap more benefits and learn faster than those
who are not as technology savvy.
2. It may shift the attention from the primary goal of the learning
process to developing ICT skills, which is the secondary goal.
3. It can affect the bonding process between the teacher and the student
as ICT becomes a communication tool rather than face to face
conversation and thus the transactional distance is increased.
4. Also since not all teachers are experts with ICT they may be lax in
updating the course content online which can slow down the learning
among students.
5. The potential of plagiarism is high as student can copy information
rather than learning and developing their own skills.
6. There is a need for training all stakeholders in ICT.
7. The cost of hardware and software can be very high.
SUMMARY AND CONCLUSIONS :
Changes in the curriculum do support fundamental economic and
social transformation in the society. Such transformations require new
kinds of skills, capabilities and attitudes, which can be developed by
integrating ICT in education. The overall literature suggests that successful
ICT integration depends on many factors. National policies as well as school
policies and actions taken have a deep impact on the same. Similarly, there
needs to be an ICT plan, support and training to all the stakeholders
involved in the integration. There needs to be shared vision among the
various stakeholders and a collaborative approach should be adopted. Care
should be taken to influence the attitudes and beliefs of all the stakeholders.

INTERNATIONAL JOURNAL OF MULTIDISCIPLINARY EDUCATIONAL RESEARCHISSN : 2277-7881; IMPACT FACTOR - 2.735; IC VALUE:5.16VOLUME 3, ISSUE 3(4), MARCH 2014
289
ICT can affect the delivery of education and enable wider access to
the same. In addition, it will increase flexibility so that learners can access
the education regardless of time and geographical barriers. It can influence
the way students are taught and how they learn. It would enable
development of collaborative skills as well as knowledge creation skills.
This in turn would better prepare the learners for lifelong learning as well
as to join the industry. It can improve the quality of learning and thus
contribute to the economy.
Similarly wider availability of best practices and best course material
in education, which can be shared by means of ICT, can foster better
teaching. However there exist some risks and drawbacks with introducing
ICT in education which have to be mitigated. Successful implementation
of ICT to lead change is more about influencing and empowering teachers
and supporting them in their engagement with students in learning rather
than acquiring computer skills and obtaining software and equipment.
Also proper controls and licensing should be ensured so that accountability,
quality assurance, accreditation and consumer protection are taken care
of. ICT enabled education will ultimately lead to the democratization of
education.
References :
1. Agarwal, P. (2006), ‘Higher education in India : the need for a change’,
Indian Council For Research On International Economic Relations.
2. Amutabi, M. N. & Oketch, M. O. (2003), ‘Experimenting in distance
education: the African Virtual University (AVU) and the paradox of the
World Bank in Kenya’, International Journal of Educational Development
23(1), 57-73.

INTERNATIONAL JOURNAL OF MULTIDISCIPLINARY EDUCATIONAL RESEARCHISSN : 2277-7881; IMPACT FACTOR - 2.735; IC VALUE:5.16VOLUME 3, ISSUE 3(4), MARCH 2014
290
3. Bhattacharya, I. & Sharma, K. (2007), ‘India in the knowledge economy –
an electronic paradigm’, International Journal of Educational Management
Vol. 21 No. 6, pp. 543-568.
4. Bottino, R. M. (2003),’ICT, national policies, and impact on schools and
teachers’ development’ ‘CRPIT ’03: Proceedings of the 3.1 and 3.3 working
groups conference on International federation for information processing’,
Australian Computer Society, Inc., Darlinghurst, Australia, Australia, 3-
6.
5. Chandra, S. & Patkar, V. (2007), ‘ICTS: A catalyst for enriching the learning
process and library services in India’, The International Information &
Library Review 39(1), 1-11.
6. Cholin, V. S. (2005), ‘Study of the application of information technology
for effective access to resources in Indian university libraries’, The
International Information & Library Review 37(3), 189-197.
7. Collins, L. J. (2001),’ICT education and the dissemination of new ideas:
Channels, resources and risks.’ ‘Paper presented at the Australian
Association of Educational Research, Freemantle’.
8. Cross, M. & Adam, F. (2007), ‘ICT Policies and Strategies in Higher
Education in South Africa : National and Institutional Pathways’, Higher
Education Policy 20(1), 73-95.
9. Fluck, A. E. (2003),Why isn’t ICT as effective as it ought to be in school
education?, in ‘CRPIT ’03: Proceedings of the 3.1 and 3.3 working groups
conference on International federation for information processing’,
Australian Computer Society, Inc., Darlinghurst, Australia, Australia, pp.
39—41.
10. Kozma, R. (2005), ‘National Policies That Connect ICT-Based Education
Reform To Economic And Social Development’, Human Technology
Volume 1 (2), October 2005, 117-156.

INTERNATIONAL JOURNAL OF MULTIDISCIPLINARY EDUCATIONAL RESEARCHISSN : 2277-7881; IMPACT FACTOR - 2.735; IC VALUE:5.16VOLUME 3, ISSUE 3(4), MARCH 2014
291
11. Lai, K. W. & Pratt, K. (2004), ‘Information and communication technology
(ICT) in secondary schools: The role of the computer coordinator’, British
Journal of Educational Technology 35, 461–475.
12. McGorry, S. Y. (2002), ‘Online, but on target? Internet-based MBA courses:
A case study’, The Internet and Higher Education 5(2), 167-175.
13. Mehta, S. & Kalra, M. (2006), ‘Information and Communication
Technologies: A bridge for social equity and sustainable development in
India’, The International Information & Library Review 38(3), 147—160.
14. Mooij, T. (2007), ‘Design of educational and ICT conditions to integrate
differences in learning : Contextual learning theory and a first
transformation step in early education’, Computers in Human Behavior
23(3), 1499—1530.
15. Plomp, T.; Pelgrum, W. J. & Law, N. (2007), ‘SITES2006—International
comparative survey of pedagogical practices and ICT in education’,
Education and Information Technologies 12(2), 83-92.
16. UNESCO, (2002), ‘Open And Distance Learning Trends, Policy And
Strategy Considerations’,UNESCO.

INTERNATIONAL JOURNAL OF MULTIDISCIPLINARY EDUCATIONAL RESEARCHISSN : 2277-7881; IMPACT FACTOR - 2.735; IC VALUE:5.16VOLUME 3, ISSUE 3(4), MARCH 2014
292
BODY HYDRATION STATUS AND PSYCHO-PHYSIOLOGICALPROFILE OF COLLEGE LEVEL BASKETBALL PLAYERS
(18-22YEARS)
Avneet Kaur Oberoi Lecturer
Department of Dietetics and Nutrition Amity University, Manesar, Haryana,
India
Dr.Priti Rishi LalAssistant ProfessorLady Irwin College
Delhi University, New Delhi, India
1. Introduction
Water constitutes 60-70% of human body weight, as an integral
part of cell membrane, a cushion to organs and a medium for circulatory
functions, biochemical reactions, metabolism and substrate transport across
cellular membranes (Armstrong, 2007). The total amount of water in human
body “Total body water” (TBW) is distributed between two compartments,
of which 35-40% is outside the cell and is called ECF (Extra cellular fluid),
while 60-65% is inside the cells and is called Intracellular fluid (ICF).
1.1 Dehydration
It refers to an inadequate amount of fluid in the body. During exercise,
sweat output exceeds water intake, producing a water deficit condition or
hypohydration, which lowers both intracellular and extracellular fluid
volumes. Depending upon the adequacy of fluid intake, dehydration of 1-
8% of body mass can occur during physical activity (Sharp, 2006). Cognitive/
mental performance, which is important where concentration, skilled tasks
and tactical issues are involved, is also degraded by dehydration (Cheuvront
et al, 2003).
1.2 Hydration status refers to the status of the fluid-electrolyte balance,
which is important for all humans. Dehydration results in unavoidable,

INTERNATIONAL JOURNAL OF MULTIDISCIPLINARY EDUCATIONAL RESEARCHISSN : 2277-7881; IMPACT FACTOR - 2.735; IC VALUE:5.16VOLUME 3, ISSUE 3(4), MARCH 2014
293
deteriorating effects on physiological function and exercise performance
(Murray, 2007).
1.3 Impact of hydration status on physiological function and
exercise
Prolonged exercise leads to progressive water and electrolyte loss
from the body as sweat is secreted to promote heat loss. Water lost with
sweating is derived from all fluid compartments of the body (both the ECF
and ICF). Dehydration increases physiological strain as measured by heart
rate and perceived exertion responses during exercise-heat stress, induces
premature fatigue (González-Alonso, José, Mora-Rodríguez , Below, &
Coyle, 1997) and changes in muscle metabolism. Hence providing adequate
amounts of fluids to body tissues- “hydration” and therefore “assessment
of hydration status” is very important in maintaining optimal physical
and mental functioning (Shanholtzer and Patterson, 2002).
1.4 Psychophysiology
Psychophysiology is the scientific discipline devoted to the study of
the interrelationships between the physiological and psychological aspects
of behavior (SPR). It is concerned with the brain behavior relationship in
the framework of peripheral and central physiological responses i.e. the
interplay between physiological and psychological effects of behavior
(Hugdahl, 1995).
While cognitive and motor control functions have been extensively
explored with respect to hydration, recent studies in this area have reported
minimal dehydration (0.4%) induced changes in the psycho-physiological
parameters such as Heart rate and Choice reaction time (D’anci, Vibhakar,
Kanter, Mahoney, & Taylor, 2009). A number of studies have supported
the relationship between hydration status and cognition (Danci et al., 2009;

INTERNATIONAL JOURNAL OF MULTIDISCIPLINARY EDUCATIONAL RESEARCHISSN : 2277-7881; IMPACT FACTOR - 2.735; IC VALUE:5.16VOLUME 3, ISSUE 3(4), MARCH 2014
294
Kashihara et al, 2009; Bellisle et al, 2010) but psychophysiology and sports
performance is relatively a new area of research.
Objectives
To determine the body hydration status and psycho-physiological
profile of college level basketball players 18-22 years before and after
exercise and compare both the parameters.
Need for the study
Dehydration hampers aerobic performance capacity and
compromises cognitive capabilities with long term effect of damaging DNA
and increase risk of exertional heat injury. College students trained in
uncontrolled environment coupled with a poor knowledge and practices
related to hydration are confronted with physiological and psychological
challenges that put them at potential risk of dehydration. The onset of
dehydration is preventable or atleast modifiable when hydration protocols
are followed that will ensure voluntary euhydration by the athletes.
2. Methodology
2.1 Subjects- Subjects ranging in age from 18-22 years were taken for the
study selected via purposive sampling technique. The inclusion criterion
was Age (18-22 yrs), only female subjects were chosen. Exclusion criteria
was with those who are not medically fit and under any medication /
smoking/alcohol or drug abuse or suffering from stress, anxiety or fear or
trying to loose or gain weight and also those not willing to participate.
Consent letters were given to all basketball players. Those who returned
the consent forms in affirmation were included for the screening process.
Anthropometry was included in the study (Height, Weight, BMI and Body
Composition)

INTERNATIONAL JOURNAL OF MULTIDISCIPLINARY EDUCATIONAL RESEARCHISSN : 2277-7881; IMPACT FACTOR - 2.735; IC VALUE:5.16VOLUME 3, ISSUE 3(4), MARCH 2014
295
2.2 Criteria for selection of Locale: Homogeneity of the sample and
Easy Accessibility.
2.3 Statistical Analysis- The analysis of data including psychophysiology
as well as hydration status was processed and computerized using SPSS
software (Version 17.0). All the psycho-physiological and biochemical
measurements were compared with the standard values.
2.4 Measurement of Psycho-physiological parameters
a) Heart Rate
Heart rate is the number of heartbeats per unit of time. It indicates the
level of fitness and exercise intensity. Typical healthy resting heart rate in
adults is 60–80 bpm. A calibrated heart rate monitor was used.
b) Reaction Time:
Reaction time is the elapsed time between the presentation of a
sensory stimulus and the subsequent behavioral response (Jensen, 2006).
A calibrated reaction timer was used.
2.5 Measurement of Body Hydration status
Although there is no gold standard for assessing hydration status
changes in urine osmolality, urine pH and urine specific gravity are most
widely used indices (Kavouras, 2002).Urine pH and Urine specific gravity
are used for measuring the hydration status in the study and is performed
using Multistix Reagent strips.
3. Results
3.1 Heart rate
It is a good predictor of the level of fitness as well as the level of fatigue in
an individual. Typical healthy resting heart rate in adults is 60–80 bpm,

INTERNATIONAL JOURNAL OF MULTIDISCIPLINARY EDUCATIONAL RESEARCHISSN : 2277-7881; IMPACT FACTOR - 2.735; IC VALUE:5.16VOLUME 3, ISSUE 3(4), MARCH 2014
296
however highly conditioned athletes often have resting heart rates below
60 bpm. Pre and post exercise HR was measured.
3.1.1 Pre Exercise HR
The lower the basal heart rate; better is the level of fitness of an
individual. The pre exercise HR indicated that about 25% of the subjects
had their basal heart rate in the range of 60-65 bpm, 30% of the subjects
had it in the range of 66-71 bpm. This lower range of heart rate indicated
that the individuals can sustain long bouts of exercise without easily getting
fatigued and therefore it indicates the aerobic capacity of individual. Only
5% of the subjects had slightly high levels of heart rate. Post exercise heart
rate was measured after the completion of cooling down exercises.
3.1.2 Post Exercise HR
Generally, heart rate rises after the exercise but a fit individual’s
rise in HR is low in magnitude indicating better aerobic capacity of the
individual. The post exercise HR indicates that 30% of the subjects had
their HR in the range of 84-89 bpm followed by (20%) in 90-95 bpm and
Only 5 % had their heart rate reaching to a level of 96-101 bpm.
3.2 Reaction Time
RT is another contributor to sports performance. It can be improved
marginally with practice and declines under conditions of fatigue and

INTERNATIONAL JOURNAL OF MULTIDISCIPLINARY EDUCATIONAL RESEARCHISSN : 2277-7881; IMPACT FACTOR - 2.735; IC VALUE:5.16VOLUME 3, ISSUE 3(4), MARCH 2014
297
distractions (Der and Deary, 2006). In case of pre-exercise RT 25% subjects
had excellent to very good RT. However 15 % needed improvement. In case
of post-exercise RT, nearly 15% subjects had below average RT and 85%
needed improvement indicating the severe effects of dehydration and
exercise induced stress on reaction time. T-test was used to compare the
pre and post psycho-physiological parameters. The results are compared
with the standard values (Sahni, 2002).
On comparing the pre and post psycho-physiological measurements
(HR, RT) there was a highly significant difference obtained (p<0.01).Thus
it can be seen that there was decrement in the psycho-physiological
measurements from pre exercise to post exercise period and exercise poses
several physiological and psychological stress on an individual and
ultimately causes fatigue to varying degree. The reaction times were
signiûcantly decreased during exercise. They were shorter at the end of
exercise than at the beginning.
3.3 Urine Specific Gravity
Hydration status was assessed before and after exercise using dipstick
method. The subjects were then classified into various levels of hydration.
The results are compared with the standard values (Casa, Armstrong, &
Hillman, 2002).
INTERNATIONAL JOURNAL OF MULTIDISCIPLINARY EDUCATIONAL RESEARCHISSN : 2277-7881; IMPACT FACTOR - 2.735; IC VALUE:5.16VOLUME 3, ISSUE 3(4), MARCH 2014
298
3.3.1 Pre hydration status
The pre hydration status showed that about 1/3 rd of the subjects (30%)
were in the condition of significant dehydration. About 7 subjects were in
the condition of minimal dehydration and 20% subjects were well hydrated.
A point of concern was that about (15%) were in the condition of serious
dehydration i.e. USG >1.030.Therefore, a need for improved practices and
knowledge was highlighted.
3.3.2 Post hydration status
Post hydration status (USG) was measured after 90 minutes of physical
activity in both groups i.e. after the exercise session. The post hydration
status presented a drastic change from the pre hydration status and an
alarming situation for both the groups. The cases of significant dehydration
increased from 30% to 50%, There was a steep rise in the cases of serious
dehydration being doubled from 15% to 30% probably due to poor fluid
consumption before, during and after exercise in uncontrolled and
fluctuating temperature (hot and humid weather) and varying relative
humidity.
3.4 Urine pH
Pre hydration status (pH) indicated that nearly 80% of the subjects were
in the normal range of 6-7.However those in the level of mild dehydration
were 20% .Although mild dehydration can hurt performance and therefore
should be eliminated. Therefore there is a strict need for a fluid replacement
strategy. Post hydration status (pH) was measured after 90 min of physical
activity in both the groups. The post hydration status for both the groups
showed a change. The cases of mild dehydration increased from 20% to
35% whereas condition in the normal range got worsened. The subjects in
the normal condition dropped from 80% to 65%. The results are compared
with the standard values (Sharma, 2007).

INTERNATIONAL JOURNAL OF MULTIDISCIPLINARY EDUCATIONAL RESEARCHISSN : 2277-7881; IMPACT FACTOR - 2.735; IC VALUE:5.16VOLUME 3, ISSUE 3(4), MARCH 2014
299
4. Findings
Exercise and participation in sports results in enhancing
physiological and psychological health and well being along with improving
self-esteem and self-concept of an individual. However, potential harmful
effects of dehydration are also closely associated with exercise induced
stress Dehydration can be elicited within an hour of exercise if the athletes
enter the exercise session dehydrated. Ethical clearance was taken from
the ethical committee for the conduct of the study.
Data analysis in the present study supports this fact as college
athletes trained in hot and humid conditions turn up in dehydrated state.
Hydration status of the college athletes was poor at the start of the exercise.
Psycho-physiological parameters deteriorate with exercise, with or without
fluid due to exercise induced stress that leads to fatigue. Paired sample t-
test revealed a highly significant difference for parameters pre and post
exercise (p<0.01) revealing exercise induced fatigue and lowering of psycho-
physiological parameters to varying degree.
However, the magnitude of deterioration can be decreased with
improved fluid intake. Therefore, there is a need for implementing a
hydration protocol for athletes realizing the importance of maintaining
proper hydration status before, during and after the exercise session.
5. Suggestions
Some of the students were unwilling to participate in a few or more
of the tests. Proper counseling, explaining and educating the health benefits

INTERNATIONAL JOURNAL OF MULTIDISCIPLINARY EDUCATIONAL RESEARCHISSN : 2277-7881; IMPACT FACTOR - 2.735; IC VALUE:5.16VOLUME 3, ISSUE 3(4), MARCH 2014
300
could have resulted in a larger sample. Due to paucity of time repeated
data collection in hot humid condition was not possible. Studies in varying
temperatures and humidity may also give a better insight into the psycho-
physiological parameters covering areas of cognition, attention span and
vigilance. In the present study, data was collected at a temperature between
30-35°C. An increase in the sample size will further highlight affect of
different fluids on different psycho-physiological parameters. Also the effect
of dehydration in sports and other common injuries should also be studied.
Strategies for improving motivation level of athletes could help to avoid
the deleterious effects of dehydration
References
1. Armstrong, L.E. (2007). Assessing Hydration Status: the elusive gold
standard. J Am Coll Nutr, 26 (5), 575-584.
2. Bellisle, F., Thornton, S.N., Hébel, P., Denizeau, M., Tahiri, M. (2010). A
study of fluid intake from beverages in a sample of healthy French children,
adolescents and adults. European Journal of Clinical Nutr, 64, 350–355.
3. Casa, D.J., Armstrong, L.E., Hillman, S.K. (2000). National Athletic
Trainer’s Association Position Statement: Fluid Replacement for Athletes.
J Athl Train, 35(2):212-224.
4. Cheuvront, S.N., Carter, R .III., Sawka ,M. N. (2003). Fluid balance and
endurance exercise performance. Curr Sports Med Rep, 2, 202 –208.
5. D’anci, K.E., Vibhakar, A., Kanter, J.H., Mahoney, C.R., Taylor, H.A. (2009).
Voluntary dehydration and cognitive performance in trained college
athletes. Percept Mot Skills, 109(1), 251-269.
6. Der, G., Deary, I. (2006). Age and sex differences in reaction time in
adulthood: Results from the United Kingdom health and lifestyle survey.
Psycho Aging, 21, 62-73.

INTERNATIONAL JOURNAL OF MULTIDISCIPLINARY EDUCATIONAL RESEARCHISSN : 2277-7881; IMPACT FACTOR - 2.735; IC VALUE:5.16VOLUME 3, ISSUE 3(4), MARCH 2014
301
7. González-Alonso., José., Mora-Rodríguez, R., Below, P.R., Coyle, E.F.
(1997). Dehydration markedly impairs cardiovascular function in
hyperthermic endurance athletes during exercise. Journal of Applied
Physiology,82 (4), 1229-1236.
8. Hugdahl, K. (1995). Psychophysiology: The mind- body perspective.
Harvard University Press, 8-50.
9. Jensen, A.R. (2006). Clocking the mind: Mental chronometry and individual
differences. Amsterdam: Elsevier.
10. Kashihara, K., Maruyama, T., Murota, M., Nakahara, Y. (2009). Positive
effects of acute and moderate physical exercise on cognitive function. J
Physiol Anthropol, 28(4), 155-64.
11. Kavouras, S.A. (2002). Assessing hydration status. Curr Opin Clin Nutr
Metab Care,5 (5), 519-24.
12. Murray, R. (2007). Hydration and physical performance. J Am Coll Nutr,
26, 542S-548S.
13. Sahni, S.P. (2002). Handbook of Sports Psychology, New Delhi. Sports
Psychology Association of India.
14. Shanholtzer, B.A., Patterson, S.M. (2002). Fluid Hydration Status
Assessment in Behavioral Medicine Research: Seven-Day Test-Retest
Reliability. Annals of Behavioral Medicine, 24, S133.
15. Sharma, S. (2007). Practical Medical Biochemistry. In: Urine BI
Publications Pvt Ltd, 2, 28-43.
16. Sharp, R.L. (2006). Role of sodium in fluid homeostasis with exercise. J
Am Coll Nutr 25, 231S –239S.

INTERNATIONAL JOURNAL OF MULTIDISCIPLINARY EDUCATIONAL RESEARCHISSN : 2277-7881; IMPACT FACTOR - 2.735; IC VALUE:5.16VOLUME 3, ISSUE 3(4), MARCH 2014
302
ETIOLOGY OF ELEVATED ANTHROPOMETRIC PARAMETERSIN YOUNG ADULTS
Dr Luxita SharmaHead
Dietetics and Applied NutritionAmity Medical School
Amity UniversityGurgaon, Haryana, India
Dr Mahavir SinghHead of Institute
Amity Medical SchoolAmity University
Gurgaon Haryana, India
Introduction
The American Heritage dictionary (2003) defines Obesity as
condition of increased body weight that is caused by excess accumulation
of fat ( Gordon ,2004) . Anrig (2003) stated that obesity is abnormal body
weight that is usually more than 20 per cent or above average weight for a
particular age, height or bone structure.
Diagnosis of Obesity : Nafisa (2006) reported that , the most common
clinical tool to define Obesity is increase in body weight that has been
used since years. Obesity may be defined according to BMI, The BMI of a
person is his weight (in kilograms) divided by square of his height ( in
meters).Obesity is defined as BMI > 29.9 kg/m2. Every individual has
certain fat percentage in the body and is determined by the number of fat
cells in the body. Body Fatness for an adult woman ranges from 20-25 per
cent of body weight with 12 per cent essential fat, however in adult woman
essential fat includes fat in breasts, pelvic region and thighs. In adult men
body fat is 18-20 per cent of body weight and approximately 8-10 per cent
is essential fat (Krause, 1996).
Materials and Methods
Locale of study and Selection of the subjects : The study was
conducted on young adults belonging to the cities of Kurukshetra and
Delhi ( NCR).

INTERNATIONAL JOURNAL OF MULTIDISCIPLINARY EDUCATIONAL RESEARCHISSN : 2277-7881; IMPACT FACTOR - 2.735; IC VALUE:5.16VOLUME 3, ISSUE 3(4), MARCH 2014
303
1) One thousand young adults between 18 - 25 years of age were selected
from different localities and institutions, namely - Kurukshetra (Ladwa)
and Delhi (NCR) region and Slimming centers belonging to these areas.
2) The height and weight of all the subjects were measured to find the
Obese subjects among them.
3) From above the BMI was calculated by following the method of Quetelet
(1835) and five hundred obese subjects were selected. The subjects were
further divided equally into 250 male and female subjects. A subsample of
125 male and female subjects each was taken from different regions of
Kurukshetra and Delhi (NCR).
4) All the selected five hundred subjects were (i) Obese with body mass
index (BMI) of > 29.9 kg/m2 (ii) Free from any serious disease. (iii) Not
following any dietary restrictions. (iv) The objective and experimental
protocol of the study was explained to the subjects, and their prior consent
was taken.
Development of Questionnaire : The general information, history of
Obesity, Medical problem and Clinical signs, Dietary intake, Physical
Activity pattern and Anthropometric measurements of the subjects were
taken by developing the Questionnaire .The subjects were interviewed and
interview cum questionnaire method was followed.
Measurement of Body Mass Index (BMI) : The BMI of a person is his
weight (in kilograms ) divided by square of his height ( in meters). Obesity
is defined as BMI > 29.9 kg/m2.
Measurement of Body Fat : The Body fat amount and percentage was
measured by using a portable electronic machine (TANITA Body Fat
Monitor).The information of the subjects about height, age and sex of the

INTERNATIONAL JOURNAL OF MULTIDISCIPLINARY EDUCATIONAL RESEARCHISSN : 2277-7881; IMPACT FACTOR - 2.735; IC VALUE:5.16VOLUME 3, ISSUE 3(4), MARCH 2014
304
subject was entered into the machine. The subject was made to stand
erect, holding the machine firmly in both hands, arms being stretched at
shoulder level, parallel to the ground. After 30 seconds the machine
indicated body fat in kilograms as well as percent body weight, which was
recorded. Another non portable machine called Body Composition Analyser
(TANITA) was also used to analyse the body weight ,fat percentage, fat
weight, muscle weight and a detailed report on a slip delivered by the
machine. The reference value for fat weight in males was15 -18 kgs while
of females was 18 -22 kgs . Whereas the reference value of fat percentage
in males and females was 20 -25 % and 15 -22 % respectively (WHO, 2000)
Results and Discussion:
Causes of weight gain in the subjects: The hereditary was found to be
the cause of obesity in 48 and 44 per cent of the male subjects from
Kurukshetra and Delhi (NCR) region respectively. As in case of female
subjects of Kurukshetra and Delhi (NCR), 46.4 and 54.4 per cent
respectively were prone to obesity due to genetic factors. It is reported
that Genetics and DNA have been found to be a contributing factor for
childhood obesity (Hiller.2003). Canberra (2003) stated that if both the
parents are overweight or obese, there are 80 per cent chances of obesity
prevalence in their children .So in the present study hereditary were found
to be the major cause of obesity in the young adults.
Sharma (2003) observed that the young adults changed their native places
for higher studies or for better job opportunities and these led to
development of obesity due to irregular eating habits, sedentary lifestyle
and other lifestyle modifications. Kellogs (2007) study supported the present
study by stating that change in dietary habits and increased consumption
of energy dense foods due to urbanization is one of major causes of obesity

INTERNATIONAL JOURNAL OF MULTIDISCIPLINARY EDUCATIONAL RESEARCHISSN : 2277-7881; IMPACT FACTOR - 2.735; IC VALUE:5.16VOLUME 3, ISSUE 3(4), MARCH 2014
305
among young adults. He further explained that the software industries, IT
sector is working at night and the subjects were working in these sectors.
Hence a disturbance in food intake as well as lifestyle was major cause of
Obesity among the Young population. A high Glycemic diet, for example, a
diet that consists of meals having high post prandial blood sugar causes a
person to become Obese. Heavy consumption of sugary food raises blood
sugar level which gets converted to fatty acids and makes a person over
weight. Today the Young generation is more prone to eating out more
frequently due to non availability of time and taste factors. Oken (2003)
stated that body adiposity increases with age as the people grow older
their metabolic rate falls and energy expenditure decreases so eating more
frequently unhealthy food The obese Young Adults were ignorant about
their eating habits and were eating whenever they found time to have
food. An equal percentage of the male and female Obese subjects from
Kurukshetra and Delhi (NCR) were having two meals per day.
The study indicated a positive correlation between Alcohol intake
and Obesity in the Young generation. Due to modernization the Young
generation is drawn more towards drinking habits. Nowadays it has become
status symbol to take alcohol. Most of the subjects were eating junk or fast
foods three times a week.
Anthropometric measurements of the subjects: The data for the
weights, BMI and Fat Percentage of the subjects was collected from cities
of Kurukshetra and Delhi (NCR). In all weights of five hundred subjects
was taken. Then subjects were divided into 250 males and 250 females.
The subjects were further divided into different age groups i.e. 18-19, 20-
21, 22-23, 24-25 yrs.
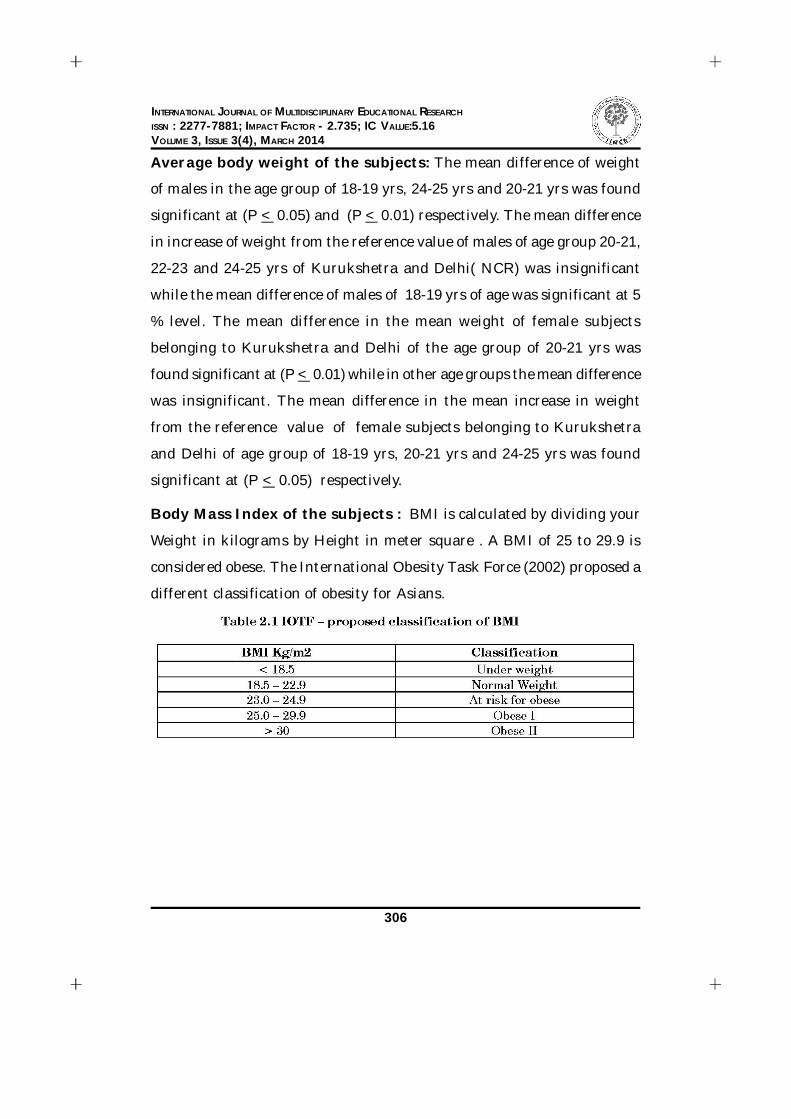
INTERNATIONAL JOURNAL OF MULTIDISCIPLINARY EDUCATIONAL RESEARCHISSN : 2277-7881; IMPACT FACTOR - 2.735; IC VALUE:5.16VOLUME 3, ISSUE 3(4), MARCH 2014
306
Average body weight of the subjects: The mean difference of weight
of males in the age group of 18-19 yrs, 24-25 yrs and 20-21 yrs was found
significant at (P < 0.05) and (P < 0.01) respectively. The mean difference
in increase of weight from the reference value of males of age group 20-21,
22-23 and 24-25 yrs of Kurukshetra and Delhi( NCR) was insignificant
while the mean difference of males of 18-19 yrs of age was significant at 5
% level. The mean difference in the mean weight of female subjects
belonging to Kurukshetra and Delhi of the age group of 20-21 yrs was
found significant at (P < 0.01) while in other age groups the mean difference
was insignificant. The mean difference in the mean increase in weight
from the reference value of female subjects belonging to Kurukshetra
and Delhi of age group of 18-19 yrs, 20-21 yrs and 24-25 yrs was found
significant at (P < 0.05) respectively.
Body Mass Index of the subjects : BMI is calculated by dividing your
Weight in kilograms by Height in meter square . A BMI of 25 to 29.9 is
considered obese. The International Obesity Task Force (2002) proposed a
different classification of obesity for Asians.

INTERNATIONAL JOURNAL OF MULTIDISCIPLINARY EDUCATIONAL RESEARCHISSN : 2277-7881; IMPACT FACTOR - 2.735; IC VALUE:5.16VOLUME 3, ISSUE 3(4), MARCH 2014
307
The mean difference of males of all age groups from regions of
Kurukshetra and Delhi (NCR) was found non significant. The mean
difference of BMI of females of all age groups belonging to Kurukshetra
and Delhi(NCR) was found significant at 5% level.
Fat percentage of the Subjects: In the table no.4, the fat percentages
of hundred males and hundred females were calculated. Fifty males were
selected by purposive random sampling from Kurukshetra region and fifty
from Delhi region (NCR) .In the same way the division of female subjects
was done. In this study there was significant (P < .05) variation in fat
percentage among the Kurukshetra and Delhi males except the age group
of 20-21 yrs. In this study the mean difference of average fat percentage of
females of age group 18-19 ,20-21 was non significant , while the mean
difference of females of age group 22-23 and 24- 25 was significant at 1%
level. In this study there was significant (P < .01) variation in the male
subjects of age group 24 – 25 years, while increase in fat percentage from
reference value among males of age group 18-19 ,20-21, 22-23 years of
Kurukshetra and Delhi region was non significant. In this study there
was significant (P < .01) variation in the female subjects of age group 20-
21 and 24 – 25 years and the mean difference of average increase in fat
percentage of females of age group 18-19 and 24-25 was non significant.
Summary and Conclusion
The subjects selected belonged to very different regions as well as
environment. The epidemic Obesity is spreading in our young generation
with the beginning of many diseases associated with it. The present study
showed a positive correlation between the lifestyle and weight gain of the
subjects. The subjects were more prone to night outs and alcohol intake
that contributed to the increase in their fat percentage and BMI. All the

INTERNATIONAL JOURNAL OF MULTIDISCIPLINARY EDUCATIONAL RESEARCHISSN : 2277-7881; IMPACT FACTOR - 2.735; IC VALUE:5.16VOLUME 3, ISSUE 3(4), MARCH 2014
308
three anthropometric parameters were positively correlated as all of them
showed increase from their reference value. The investigator followed
interview cum questionnaire method with the subjects therefore a majority
of male and female subjects were negligent towards nutritive diets, they
were eating out frequently junk foods. Alcohol intake was common among
both male and female subjects. The subjects were awake during the night
and were away from their native place so they were eating easy available
foods. Therefore a strong need of nutrition education and awareness of
nutrition is needed among the subjects. The epidemic obesity would be
controlled through right and guided awareness of nutrition.
References
1. Anrig ( 2003). Prevention of overweight and obesity .112: 2-4.Archives of
Pediatric and Adolescent Medicine ;157(8):821–827.
2. Canberra CA, Hiller JE, Moss JR, McPhee AJ, Jeffries WS, Robinson JS
and Bray GA (2003) . Effect of treatment of gestational diabetes mellitus
on pregnancy outcomes. The New England Journal of Medicine; 352:2477–
86.
3. International Obesity Task Force (IOTF) report to WHO (2004) . Obesity
in children and young people: A crisis in public health. May, Obesity
reviews.
4. Nafisa.M (2006). National Bureau of Economic Research, 2004. Journal
of Young Investigators. Volume .15.
5. Krause MV and Mahan KL ( 1987). Food Nutrition and diet therapy ( 8th
edition) Philadelphia : WB Saunders Co. p. 561.
6. Oken E, Gillman MW (2003), Fetal origins of obesity, Obes Res,
Apr,11(4),496-506

INTERNATIONAL JOURNAL OF MULTIDISCIPLINARY EDUCATIONAL RESEARCHISSN : 2277-7881; IMPACT FACTOR - 2.735; IC VALUE:5.16VOLUME 3, ISSUE 3(4), MARCH 2014
309
7. Sharma ( 2003). Asian Indian diets , insulin resistance and diabetes .Proc
XXXVII, Annual National Convention , Indian Dietetics Association,
AIIMS, New Delhi ;31-41.
8. World Health Organization. Obesity (2000) Preventing and managing the
global epidemic, Report of a WHO consultation. WHO:Geneva: WHO
Technical Report Series, No. 894.

INTERNATIONAL JOURNAL OF MULTIDISCIPLINARY EDUCATIONAL RESEARCHISSN : 2277-7881; IMPACT FACTOR - 2.735; IC VALUE:5.16VOLUME 3, ISSUE 3(4), MARCH 2014
310

INTERNATIONAL JOURNAL OF MULTIDISCIPLINARY EDUCATIONAL RESEARCHISSN : 2277-7881; IMPACT FACTOR - 2.735; IC VALUE:5.16VOLUME 3, ISSUE 3(4), MARCH 2014
311

INTERNATIONAL JOURNAL OF MULTIDISCIPLINARY EDUCATIONAL RESEARCHISSN : 2277-7881; IMPACT FACTOR - 2.735; IC VALUE:5.16VOLUME 3, ISSUE 3(4), MARCH 2014
312

INTERNATIONAL JOURNAL OF MULTIDISCIPLINARY EDUCATIONAL RESEARCHISSN : 2277-7881; IMPACT FACTOR - 2.735; IC VALUE:5.16VOLUME 3, ISSUE 3(4), MARCH 2014
313

INTERNATIONAL JOURNAL OF MULTIDISCIPLINARY EDUCATIONAL RESEARCHISSN : 2277-7881; IMPACT FACTOR - 2.735; IC VALUE:5.16VOLUME 3, ISSUE 3(4), MARCH 2014
314
THE GLOBAL HR MANAGER
U.ChakravarthyResearch Scholar
Dept. of HRMAndhra University, Visakhapatnam
Introduction:
In these times of internationalization and globalization,
international human resource management is becoming an important
concept for human resource practitioners to be aware of and to practice.
This is vital for human resource managers in multinational corporations
and international joint ventures, and also for domestic based human
resource managers who import staff from overseas. In order to keep up
with the pace, human resource managers will have to have a global vision
on how to manage their people effectively both at home and abroad.
Managing international human resources enables a business to compete
more successfully in the world market place and is an excellent
developmental tool for its employees.
A human resources manager oversees all aspects of workforce
development and management for his employer, ensuring the company is
appropriately staffed. While responsibilities vary on a day-to-day basis, he
regularly serves as a primary point person for all issues related to employee
activity. The human resources manager works with executive management
to ensure the most appropriately qualified employees are positioned in the
most appropriate roles. When hiring needs arise, he develops a job
description, advertises for the position and screens and interviews
applicants. He also performs background checks, contacts references and
invites other executives to be part of the interview process to ensure a

INTERNATIONAL JOURNAL OF MULTIDISCIPLINARY EDUCATIONAL RESEARCHISSN : 2277-7881; IMPACT FACTOR - 2.735; IC VALUE:5.16VOLUME 3, ISSUE 3(4), MARCH 2014
315
good fit with a new employee. When a new employee is hired, the human
resources manager draws up the necessary contractual paperwork and asks
the employee to fill out pertinent tax documentation forms. Human resource
professionals maintain a productive environment by ensuring that
employees have the skills and knowledge to accomplish job tasks. They
make arrangements for training courses that enable employees to get the
proper credentials for performing their function. This also ensures that
companies adhere to all government regulations. For example, all companies
must be certain that employees follow the standards for that assure a safe
and healthy workplace setting. In Europe, work councils composed of both
employers and employees might mandate training not covered by other
trade union agreements. When an employee quits or is fired, the manager
conducts an exit interview, issues a final paycheck and makes arrangements
to file final tax paperwork on the employee’s behalf. He takes possession
of the employee’s keys, codes and access passes prior to finalizing the
termination of employment. Unless the company has a training manager
on staff, the human resources manager is responsible for conducting new
employee orientation. This involves going through an employee manual,
explaining corporate policy and procedure and introducing the new
employee to fellow staffers. He also issues office equipment, keys and
identification and computer passwords. In the event a dispute arises
between colleagues, employees and managers, the human resources
manager serves as mediator. He may counsel each party individually, or
together, and develop a compromise solution that is acceptable to everyone
involved. If there are allegations of misconduct, he recommends disciplinary
action, and documents all interactions in employee files. The executive
division of a company relies on the human resources manager to keep tabs
on changes to employment law and to assist in long-term strategic staffing

INTERNATIONAL JOURNAL OF MULTIDISCIPLINARY EDUCATIONAL RESEARCHISSN : 2277-7881; IMPACT FACTOR - 2.735; IC VALUE:5.16VOLUME 3, ISSUE 3(4), MARCH 2014
316
plans. He consults with upper management about staffing needs, is involved
in retaining consultants and independent contractors and represents the
employer in recruiting venues. As companies become more international,
human resource professionals have become more generalist. They tend to
know less about day-to-day, internal operations and focus more on ensuring
personnel work effectively together as teams. They care about competitive
advantage, profitability and economic survival during tough financial times.
Their role may have been restricted to hiring employees, managing benefits
and handling disciplinary action in the past, but human resource
professionals now deal with controlling health care costs, reducing employee
attrition and participating in the community, as well. International human
resource managers have found that employee relations vary significantly
from country to country and that the strategies used to motivate workers
in one country are sometimes useless in another country. One study found
that Chinese employees expected lifelong employment and also welfare
provisions such as paid sick leave, meals, healthcare and schools. Although
this view has been changing since the late 70’s, many people have
entrenched ideas of what a typical employment relationship should involve.
Traditional expectations will often surface when it comes to the employment
relationship; it is debatable whether the international human resource
manager should try to change these views or not. Barthelme believes the
following: “The intangible cultural fit between western organizations and
their off shore outsourcing opportunities in areas such as employment
work ethics, expectations for long-term relationship development and job-
specific commitment is equally significant to organizations in order for
them to bring such practice to long term success”
A central theme in the literature reflects “a strong socio-
psychological and welfare concern which echoes the not ion of ‘adjustment’.

INTERNATIONAL JOURNAL OF MULTIDISCIPLINARY EDUCATIONAL RESEARCHISSN : 2277-7881; IMPACT FACTOR - 2.735; IC VALUE:5.16VOLUME 3, ISSUE 3(4), MARCH 2014
317
“Effective international managers were said to be those who were adaptable,
flexible, open-minded, speaking in foreign languages, and making friends
with those of many nationalities”. Thus when a company’s business
representative is going overseas to explore a new region it is a challenge
for that person to adjust to a new lifestyle, language, conditions of
employment or different ways of operating human resource activities.
Failure to adjust is often unacceptably high. Gomez-Mejia et al (2004: 329)
report comparatively high failure rates (as evidenced by a premature return)
among US expatriates of 20-40 %, which is roughly three to four times
higher than those experienced by European and Asian companies. This is
attributed to two generations of US economic dominance and a ‘colonial
mentality,’ but specific causes of failure appear to be career blockages,
culture shock, lack of pre-departure cross-cultural training, overemphasis
on technical qualifications, getting rid of a troublesome employee and family
problems. When a business intends to expand to an overseas market, human
resource managers need to utilize human capital in order to conduct the
business more efficiently and effectively. Human resource managers could
consult local representatives of an overseas business regarding: local
culture, employment aspects, safety, customs and traditions in order to
operate in harmony with a local company’s procedures. For example, women
may have a different status in business in other countries compared to the
home country (New Zealand, in this case). In Dubai, as in all Islamic
countries, foreign women are not allowed to be employed. Therefore, this
will affect human resources international recruitment strategy, not only
for the employees, but also for wives of its expatriates. Different ethical
and business standards can also lead to negative experiences. In New
Zealand, employees are required to adhere strictly to legal and ethical
requirements, but in some overseas countries corruption or bribery are

INTERNATIONAL JOURNAL OF MULTIDISCIPLINARY EDUCATIONAL RESEARCHISSN : 2277-7881; IMPACT FACTOR - 2.735; IC VALUE:5.16VOLUME 3, ISSUE 3(4), MARCH 2014
318
considered to be the norm and are acceptable. As companies in almost
every industry stake a large portion of their growth plans on global
expansion, the precision and consistency with which they approach talent
management capabilities, HR policies and leadership development must
increase. Attracting and retaining skilled workers, stabilizing the labor
force in a new market, increasing productivity, structuring an organization
so that credible and competent leadership is placed in the right locations,
fashioning a culture that is consistent but also accommodates local
differences—these are now the activities and competencies that are critical
to success. For a company to execute globally, its governance structures
must allow more decisions to be made locally in areas into which it is
expanding. The company must create processes and ways of working that
encourage innovation at the local level; this is especially critical in industries
for which understanding consumer tastes and preferences within a distinct
market is important. Equally important, leaders must be drawn not only
from where the company has historically done business but also from areas
where there is significant market potential. Processes and governance
structures should be redesigned to put more decision making into the hands
of managers in those new markets.
In order to manage employees in overseas situations it is important
to receive up-to-date feedback and to measure their performance
appropriately. This would reduce the risk of future costly mistakes, such
as paying for failed employees’ recruiting and training costs. “The main
requirement in achieving the measurement of training and development
payback is for human resource professionals to ensure that line managers
view training and development as a means of improving their operation
and helping them to achieve their objectives and solve problems”. The
standards of evaluation and measurement would vary, compared to

INTERNATIONAL JOURNAL OF MULTIDISCIPLINARY EDUCATIONAL RESEARCHISSN : 2277-7881; IMPACT FACTOR - 2.735; IC VALUE:5.16VOLUME 3, ISSUE 3(4), MARCH 2014
319
‘domestic-based’ human resource management. When companies go global
and set up their business in overseas markets, it is the human resources
department’s responsibility to manage their human capital.
Diversity of board makeup is also important. The board of directors
at MasterCard, for example, includes executives from the United Kingdom,
India, the United States, Mexico, Belgium and Hong Kong. Philip Morris
International Management’s board includes members not only from the
United States and Europe but also from Mexico and China. These leadership
structures reflect a company’s global character and market intentions
rather than its more parochial origins.
Leadership development is also critical; the next generation of
executives needs to be exposed to other cultures and receive training in
global management. The Moore School’s Julian Dalzell defines “When you
are living and working in a different culture, you have to test all your
assumptions about how the world works. You gain critical experiences by
being exposed to people, policies, laws, norms and human motivation from
different places around the world.”
An inability to be forearmed against this could create inner conflicts
and impair the expatriate’s performance. Years ago, human resource
professionals in traditional small business settings focused on completing
administrative tasks, such as recruiting and hiring personnel, often without
input from department managers. As companies become more global,
human resource professionals act as business partners to interview and
orient new employees to the workplace. A complex business operation
typically requires specialized personnel, so human resource professionals
must work cooperatively with managers on the production lines. Human
resource professionals who support international business operations

INTERNATIONAL JOURNAL OF MULTIDISCIPLINARY EDUCATIONAL RESEARCHISSN : 2277-7881; IMPACT FACTOR - 2.735; IC VALUE:5.16VOLUME 3, ISSUE 3(4), MARCH 2014
320
typically must to ensure that diverse teams work well together. By
conducting team-building workshops, promoting acceptance of cultural
diversity and motivating employees to achieve strategic goals, they help
their company build strong teams. By recognizing that in some countries
individual recognition plays a larger role than others, human resource
professionals can create awareness about how teams can function effectively
across borders to maintain company profitability.
References
1. Aguilera, R.V.,2004. The Role of HRM in Cross-Border Mergers and
Acquisitions. International Journal of HRM, 15, 8, 1355-1370
2. Bigelow, J.D., 1994. International Skills for Managers: Integrating
International and Managerial Skill Learning.Asia Pacific Journal of
Human Resources, 32, 1, 3-11.
3. Osland, J., 2002. What do expatriates want from HR departments? HR.com.
& www.hr.com
4. “The talent to grow,” Outlook, February 2011
5. “Vive la différence!” Outlook, June 2010
6. http://smallbusiness.chron.com.
7. http://www.accenture.com
8. http://everydaylife.globalpost.com