MIRJ-GTU - Multidisciplinary International Research Journal ...
146
Online ISSN: 2581-8880 MULTIDISCIPLINARY INTERNATIONAL RESEARCH JOURNAL OF GUJARAT TECHNOLOGICAL UNIVERSITY MULTIDISCIPLINARY INTERNATIONAL RESEARCH JOURNAL OF GUJARAT TECHNOLOGICAL UNIVERSITY Gujarat Technological University www.gtu.ac.in Volume 2 Issue 2, July - 2020 MIRJ-GTU
-
Upload
khangminh22 -
Category
Documents
-
view
5 -
download
0
Transcript of MIRJ-GTU - Multidisciplinary International Research Journal ...

Online ISSN: 2581-8880
MULTIDISCIPLINARY
INTERNATIONAL RESEARCH
JOURNAL OF
GUJARAT TECHNOLOGICAL
UNIVERSITY
MULTIDISCIPLINARY
INTERNATIONAL RESEARCH
JOURNAL OF
GUJARAT TECHNOLOGICAL
UNIVERSITY
GujaratTechnological
University
www.gtu.ac.in
Volume 2 Issue 2, July - 2020
MIRJ-GTU

Multidisciplinary International Research Journal of Gujarat Technological University ISSN: 2581-8880
VOLUME 2 ISSUE 2 JULY 2020 1
Editor in Chief
Dr. Pankajray Patel Professor and Director
Graduate School of Management Studies
Gujarat Technological University
Email Id: [email protected]
Contact No.: 079-23267554
Editorial Board Members
Dr. Rajesh Parikh
Director
Graduate School of Pharmacy
Gujarat Technological University
Email Id: [email protected]
Dr. S. D. Panchal
Professor and Director
Graduate School of Engineering and Technology
Gujarat Technological University
Email Id: [email protected]
Dr. Keyur Darji
Deputy Director
Department of International Relations
Gujarat Technological University
Email Id: [email protected]
Dr. Sarika Srivastava
Assistant Professor
Graduate School of Management Studies
Gujarat Technological University
Email Id: [email protected]
Dr. Ushma Anerao
Principal
Government Polytechnic for Girls Email Id: [email protected]
Dr. Sanjay Vij
Dean (Academics)
Institute of Technology & Management Universe Email Id: [email protected]
Editorial Board Members (International)
Prof. (Dr.) Mohamamd Hosein Hosni
Professor & Frankenhoff Chair in
Engineering
Director, University Engineering Alliance
Department of Mechanical and Nuclear
Engineering, Kansas State University, USA
Prof. (Dr.) Kalpdrum Passi
Associate Professor
Department of Mathematics &
Computer Science
Laurentian University, Canada
Prof. (Dr.) Boris Tzankov
Associate Professor
Faculty of Hydraulic Engineering,
Hydraulics & Hydrology, UACEG,
Bulgaria
Prof. (Dr.)Todor Radev
Rector
Varna University of Management,
Bulgaria
Prof. (Dr.) Norbert Gruenwald
Director
Robert-Schmidt-Institute
Hochschule Wismar, Germany
Prof. (Dr.) Zdzislaw Polkowski
Representative for International
Cooperation
Jan Wyzykowski University, Poland

Multidisciplinary International Research Journal of Gujarat Technological University ISSN: 2581-8880
VOLUME 2 ISSUE 2 JULY 2020 2
Gujarat Technological University is a premier academic and research institution which has driven
new ways of thinking and working, since its inception in 2007, by Government of Gujarat vide
Gujarat Act No. 20 of 2007. Today, GTU is an intellectual destination that draws inspired scholars
to its campus, keeping GTU at the nexus of ideas that challenge and change the world. GTU is a
State University with 432 affiliated colleges operating across the state of Gujarat through its five
zones at Ahmedabad, Gandhinagar, Vallabh Vidyanagar, Rajkot and Surat. The University caters
to the fields of Engineering, Architecture, Management, Pharmacy and Computer Science. The
University has about 4, 00,000 students enrolled in a large number of Diploma, Under Graduate,
Post Graduate programs along with the robust Doctoral program.
The Vision, Mission statements and the Objectives it stands to fulfill are:
VISION
To make Gujarat Technological University a World Class University
MISSION
Every single stakeholder of the University should find pleasure in working with GTU.
OBJECTIVES
i. Make our operations transparent and acceptable to all stakeholders.
ii. To provide quality education, training, vocation and research facilities to our students.
iii. To continuously organize and manage Faculty Development Programs (FDPs), Seminars
and Conferences.
iv. Affiliate and Coordinate with Colleges for an effective education delivery mechanism.
v. Timely and efficient conduct of the Examination process.
vi. To facilitate student’s placements into suitable and meaningful careers and future of their
choice.
GTU has emerged as an International Innovative University in its pursuit of bringing innovation
and internationalization in professional education. Within a really short span it has achieved
several national accolades for its endeavor in bringing excellence in professional education. GTU
is a pioneer in introducing some innovative learning methodology like “Active Learning”, a
classroom created online. GTU has the largest International Experience Program in collaboration
with the universities of US, Canada, Bulgaria and Germany, which offers a unique opportunity to
the students to enhance their capabilities and capacities in a global perspective. GTU’s Research
Week, a unique concept, is an evaluation process of dissertations of Master’s and Doctoral
Program students involving experts from the Universities across the Globe. In all GTU is driven
to dig deeper, push further, and ask bigger questions – and to leverage the knowledge evolved to
enrich all human life.
About GTU

Multidisciplinary International Research Journal of Gujarat Technological University ISSN: 2581-8880
VOLUME 2 ISSUE 2 JULY 2020 3
From the Desk of Editor-in-Chief
MESSAGE
I feel pride in publishing the fourth issue of ‘Multidisciplinary
International Research Journal of Gujarat Technological
University’.
This issue includes articles from Heat Transfer, Cyber Security,
Concrete Structure, Cloud Computing, 5S implementation in
Manufacturing industry, Malware Analysis & Detection and
Engineering and Diagrid & Hexagrid structures from
Engineering discipline. It also includes article on Employee Engagement from Management
discipline and Development & Validation of Bio Analytical method from Pharmacy discipline.
I hope the readers will be satisfied with the quality of these articles and these articles will motivate
them for further research in similar areas.
On behalf of Gujarat Technological University I thank GTU editorial board members &
international editorial board members for their efforts in reviewing these articles for publication in
this issue.
Dr. Pankajray Patel
Professor and Director
Graduate School of Management Studies
Gujarat Technological University, Ahmedabad

Multidisciplinary International Research Journal of Gujarat Technological University ISSN: 2581-8880
VOLUME 2 ISSUE 2 JULY 2020 4
INDEX
SR.
NO. MANUSCRIPT TITLE AUTHOR(S) NAME DISCIPLINE
PAGE
NO.
1
DRIVERS OF
EMPLOYEE
ENGAGEMENT AT
SELECTED IT
COMPANIES OF
AHMEDABAD CITY
GAURAVKUMAR
MAHIPATBHAI PATEL
MANAGEMENT 6-16
2
DESIGNING OF A
PROFICIENT HEAT
EXCHANGER BY USING
SPIRAL TUBE FOR
AUGMENTATION OF
HEAT TRANSFER
G. N. DESHPANDE
ENGINEERING 17-26
3
A SURVEY ON THE
USE OF OPEN-SOURCE
FIREWALL FOR MAJOR
SCADA PROTOCOLS
HARDIK MARU
HEPI SUTHAR ENGINEERING 27-43
4
OPEN-SOURCE
IPTABLES BASED
FIREWALL SOLUTION
FOR VARIOUS CYBER-
ATTACKS ON
ICS/SCADA SYSTEMS
HARDIK MARU
HEPI SUTHAR ENGINEERING 44-62
5
COMPRESSIVE
STRENGTH STUDY OF
GREEN CONCRETE BY
USING FERROCK
KAVITA SINGH
ENGINEERING 63-80
6
IMPROVE RESOURE
MIGRATION USING
VIRTUAL MACHINE IN
CLOUD COMPUTING: A
REVIEW
PATEL
HARDIKKUMAR
MAHENDRABHAI
ENGINEERING 81-88
7
5S IMPLEMENTATION
IN CRANE
MANUFACTURING
INDUSTRY
VAIBHAV BHARAMBE
SHUBH PATEL
PRATIK MORADIYA
ENGINEERING 89-105

Multidisciplinary International Research Journal of Gujarat Technological University ISSN: 2581-8880
VOLUME 2 ISSUE 2 JULY 2020 5
8 MALWARE ANALYSIS
AND DETECTION USING
MEMORY FORENSIC
BANSI KHILOSIYA
KISHAN MAKADIYA ENGINEERING 106-117
9
COPARATIVE STUDY
OF DIAGRID SYSTEM,
HEXAGRID SYSTEM
AND SHEAR WALL
SYSTEM IN TALL TUBE-
TYPE BUILDING
MEMAN SURAIYABANU
MOHAMED SALIM
ENGINEERING 118-131
10
DEVELOPMENT AND
VALIDATION OF A
BIOANALYTICAL
METHOD FOR
DETERMINATION OF
SILYMARIN IN PLASMA
DR. DASHARATH M.
PATEL
MR. PANKAJ V. PATEL
DR. HITESH D. KAREN
DR. CHHAGAN N. PATEL
PHARMACY 132-143

Multidisciplinary International Research Journal of Gujarat Technological University ISSN: 2581-8880
VOLUME 2 ISSUE 2 JULY 2020 6
DRIVERS OF EMPLOYEE ENGAGEMENT AT SELECTED IT
COMPANIES OF AHMEDABAD CITY
Gauravkumar Mahipatbhai Patel
Ph.D. Research Scholar (Director, Spectrum HR Services)
Gujarat Technological University
Email: [email protected]
ABSTRACT
One of the most important authority of top management in all organisations, is employee betrothal be it
profit making or non-profit making, small or big. To develop and maintain engagement in their human
resource, organisations of all sizes and types have started investing in employee engagement initiatives. As
manufacturing organisations in most cases have different working environment, employee engagement in
IT companies, has different perspectives. In IT companies, highest level of dedication and engagement from
employees is expected. To understand the effect of drivers of employee engagement in IT companies is the
main point of this survey. Along with ANOVA with gender as unconventional variable, cross engagement
and Chi square was applicable to age and work experience. Based on assenter’s gender, there was a
demographically notable change in drivers of employee betrothal. On various activities of employee
engagement, a notable change was reported. The important factor of employee engagement is career
advancement opportunities and rewards and recognitions. As the findings of the study can be used to their
advantage, this research paper aims to evaluate the employee engagement levels in IT industry in
Ahmedabad City and recommend ways and means to improve engagement levels in the industry.
Keywords: Employee Engagement, IT companies, Challenges, One way ANOVA
1. INTRODUCTION
In today’s fast-paced global business environment, most organizations today realize that a ‘satisfied and
happy’ employee is not necessarily the best employee in terms of productivity & performance. Employees
have become main interest for the management in the firm, whether it is a manufacturing or service sector
organisation. Before some years there was a common apprehension and belief that IT, IT-empowered, and
services-oriented organisations were centered on employees, the other sectors including manufacturing
were reasoned having a sluggish posture towards employees. The notable advantage and dis-advantage is
due to workforce which is the only active, present, lively resource available with the organisation. There

Multidisciplinary International Research Journal of Gujarat Technological University ISSN: 2581-8880
VOLUME 2 ISSUE 2 JULY 2020 7
are two sets of employees i.e. one who are engaged, motivated, and emotionally attached to their
organisation and work and the other who are non-engaged and not attached to their work or the organisation.
The first set of employees gives higher productivity and low overturn which becomes a source of competing
advantage, while the other becomes a burden with low productivity and high cost to the organisation. To
develop and maintain engagement in their human resources, nowadays organisations of all sizes and types
have started investing essentially in human resource practices and their effective management. When the
employees are in change appearance not associated linked completely with either group, the problems for
managers become stiffer. To make an elegant balance between firms yearning from them and their career
yearning, they weigh the positive and negatives. Managers are now realizing pressing needs of investment
in “engaging their human resource” and yielding the short and long-term benefits of it.
1. Notion of Employee Engagement
Understanding and practicing the concept of employee engagement in its full scope has become the need
of the hour for the business world, researchers and academia. Early research on the concept of employee
engagement was put forth by Kahn (1990) which provided solid foundation for the subsequent research
work on the concept of employee engagement. For the first time the term “engagement” was introduced by
Kahn in 1990 which got published in Academy of Management Journal in his article “The Psychological
Conditions of Personal Engagement and Disengagement at Work”. Kahn defined personal engagement at
work as “the harnessing of employees’ selves to their job roles; in engagement, employees employ and
engage themselves physically and cognitively during job performances.” Kahn was of the view that
psychological presence in a job role involves three aspects. i.e. physical, emotional, and cognitive. To
connect with their co-workers, managers, and the top management, engagement is something about creating
the growth opportunities for employees at all levels. Kahn also expressed his views on disengagement
saying when employees are disengaged, they loose their interest in the job and would withdraw themselves
from the job or the work. Drawing the perspectives from the early research and the subsequent efforts
employee engagement is about originating a work environment where the employees are psychologically
and cognitively attached to their work and are ready to walk an extra mile to perform their job.
1. RESEARCH GAP
Several studies have identified Employee Engagement as one of the most critical HR challenges faced by
the organisations nowadays (SHRM, 2017). Indian industry and the workforce, being a multi-lingual and
multi-cultural society needs special attention as far as the employee engagement challenges are concerned.
Furthermore, the role of female and male members of the society is perceived differently with female

Multidisciplinary International Research Journal of Gujarat Technological University ISSN: 2581-8880
VOLUME 2 ISSUE 2 JULY 2020 8
members carrying additional family responsibilities. The rapidly evolving technological advancements,
intensive market competition, and related stress make employee engagement a very complex challenge for
the IT industry. The industry has to come up with tailored solutions to address this challenge of its time.
There have been number of studies undertaken to identify the drivers and antecedents of employee
engagement as well the relationship of the employee engagement construct with other variables. But the
gender-wise employee engagement challenges remain a grey area which is yet to be explored. This study
throws light on these aspects with gender being independent variable for the study.
1. OBJECTIVES OF THE STUDY
(a) To understand the gender specific drivers of employee engagement in selected IT companies of
Ahmedabad City.
(b) To deduce empirical evidence on the influence of drivers on employee engagement.
2. RESEARCH METHODOLOGY
The research is a conclusive and quantitative research which would help in understanding the drivers of the
employee engagement in selected IT companies and decide upon the best course of action in future. Data
was collected from self-designed questionnaire administered to 100 employees at selected IT companies
having more than 50 crores annual turnover and employing more than 300 employees. Convenient and
judgmental sampling method has been used to select the respondents based on the research objectives. 60
male and 40 female employees both from supervisory and senior management were selected as respondents
for the research. A questionnaire was developed taking the drivers of employee engagement which
employed a 5-point Likert scale to indicate the perceptions of the respondents’ employee engagement. The
employees gave their response in the scale of 1- Strongly Agree, 2- Agree, 3- Neutral, 4- Disagree, 5-
Strongly Disagree.
The content validity of the instrument was tested by consulting internal and external experts. To analyze
the data, the statistical cross tabulations and Chi-square was applied to age and work experience, along with
one-way ANOVA with gender as independent variable with the help of SPSS (Statistical Package of Social
Science) software version 21.

Multidisciplinary International Research Journal of Gujarat Technological University ISSN: 2581-8880
VOLUME 2 ISSUE 2 JULY 2020 9
3. LITERATURE REVIEW
Most often employee engagement has been defined as the amount of prudent effort demonstrated by
employees in their job (Frank, Finnegan, & Taylor, 2004) and effusive and mental commitment to the
organisation (Baumruk, 2004; Richman, 2006; Shaw, 2005). A psychological state which is seen to
surround the three extents of engagements discussed by Kahn (1990) and seizure the common theme
running through all the definitions, although it is recognized and accepted that employee engagement is a
multi-fold construct, as antecedently suggested by Kahn (1990), Truss, Soane, Edwards, Wisdom, Croll,
and Burnett (2006).
According to a study conducted by NASSCOM, IT industry in India has witnessed widespread growth
which has attracted enormous foreign direct investment (FDI). This inflow of FDI has contributed
significantly to the growth of the GDP, employment generation, and an increase in the export of IT services.
The research report also states that the paramount challenge for the industry is not just keeping the
employees satisfied but to engage the employees for better productivity, longer association, and individual
career advancement. As the IT sector is predominantly service-oriented, the importance of hiring, attracting,
motivating, managing, and retaining the highly-ambitious workforce has become the need of the hour.
Open Communication culture, Loyalty, Equitable Compensation, Interpersonal Orientation, Advancement
Opportunities and Career Growth are the most prominent engagement drivers within the Public and Private
sector banks (Rashmi, Rakhi, and Trupti, 2014).
(Farai & Steven, 2012) stressed on the importance of employee engagement in the hospitality industry in
their study. The study also emphasized on employee engagement as the driver of competitive advantage in
the two organisations they surveyed in their study. The findings from both the hotels demonstrated the
difference between the two organisations. The study presented a strong evidence that work groups having
high level of engagement outperform the work groups with lower level of engagement. The study clearly
indicated that the hotel with higher level of employee engagement enjoyed competitive edge with the
market share of over 43 per cent.
The key drivers of ‘Employee Engagement’ and its different characteristic together with the ways to
measure it, (Sidhanta & Roy, 2010) in their study “Employee Engagement; Engaging the 21st century
manpower” tried to identify modern ‘Employee Engagement’ practices in corporate and distinct ways to
handle disengaged employees. The article also surveyed the research finding on the effect of employee

Multidisciplinary International Research Journal of Gujarat Technological University ISSN: 2581-8880
VOLUME 2 ISSUE 2 JULY 2020 10
engagement on manufacturing, gainfulness of the firms, customer experience and other related views,
convoyed by firms like Gallup, Hay Group and ISR. To create a highly prompted manpower, that will work
together to achieve the common goals of the firms, it was convoyed that high levels of employee
engagement would lead to elevated employee commitment and psychological involvement towards the job.
The highly motivated and engaged workforce will determinately make the organisation more successful in
terms of financial and non-financial performance parameters found out the study of (Bedarkar & Pandita,
2014) on the drivers of employee engagement effecting three engagement drivers, namely communication,
work life balance and leadership. A model surveying these drivers were abstracted which would lead to
employee and organisational performance.
4. FINDINGS AND DISCUSSION
Crosstabs (Cross tabulations and Chi-Square) using SPSS on age and work experience of respondents
were collected for the study. Table 1 depicts all responses that were considered valid for the study.
Table 1: Case Processing Summary
Cases
Valid Missing Total
N Percent N Percent N Percent
WorkExp * AGE 100 100.00% 0 0.00% 100 100.00%
Source: Created by Author
Table 2: Work Experience * Age Cross Tabulation
Work
Exp.
Age Total
19-25 26-30 31-35 36-40 41-45 46-50 >50
0.5 % within
AGE
3.90
% 4.70% 1.90% 0.00% 0.00% 0.00% 0.00% 10.50%
1 % within
AGE
2.70
% 0.80% 1.20% 0.00% 0.00% 0.00% 0.00% 4.70%
2 % within
AGE
1.90
% 5.40% 4.70% 0.80% 0.00% 0.00% 0.00% 12.80%
3 % within
AGE
3.50
% 5.80% 1.90% 0.40% 0.00% 0.00% 0.00% 11.60%

Multidisciplinary International Research Journal of Gujarat Technological University ISSN: 2581-8880
VOLUME 2 ISSUE 2 JULY 2020 11
4 % within
AGE
3.50
% 2.30% 3.50% 0.80% 0.40% 0.00% 0.00% 10.50%
5 % within
AGE
8.50
% 22.90% 15.10% 1.20% 0.00% 0.80% 0.40% 48.80%
6 % within
AGE
0.00
% 0.00% 0.80% 0.40% 0.00% 0.00% 0.00% 1.20%
TOTAL % within
AGE
24.00
% 41.90% 29.10% 3.50% 0.40% 0.80% 0.40% 100.00%
Source: Created by Author
Table 3: Chi-Square Tests
Value df Asymp. Sig. (2-sided)
Pearson Chi-Square 134.931 a 78 .225
Likelihood Ratio 108.54 78 .896
Linear-by-Linear 10.195 1 .001
Association
N of Valid Cases 258
Source: Created by Author
Table 2 displays work experience and age cross tabulations along with modal frequencies of the response
collected for the study. In age column, respondents with 26-30 years displayed highest percentage count,
followed by 31-35 years as next highest percentage count of the sample taken for the study. Similarly in
work experience row, respondents with five year work experience showed highest percentage count,
followed by two year work experience as next in percentage count to it. The lowest percentage count was
reported in 41-45, 46-50 and above age columns of the response. Similarly the work experience column
reported lowest in one year rows of response for the study.
Table 3 provides the summary statistic information, the Pearson Chi-square value is 134.931, which is
associated with (p- value is .225) of 22.5% risk of being wrong in rejecting the null hypothesis. This is too
great a risk (far exceeding our standard of 5% risk), so we are unable to report any statistical difference
between work experience and age cross tabulation in this sample taken for study.
Further, one-way multivariate analysis of variance i.e. one-way ANOVA is used to determine whether there
are any differences between independent groups on more than one continuous dependent variable. We have
used gender as independent variable into fixed factor, and all the statements on various drivers of employee

Multidisciplinary International Research Journal of Gujarat Technological University ISSN: 2581-8880
VOLUME 2 ISSUE 2 JULY 2020 12
engagement as dependent variables for the study. There were 60 males and 40 females reported in sample
taken for the study.
Table 4: Descriptive Statistics
EE Drivers Gender Mean Std.
Deviation N
Salary &
Benefits
Male 5.25 3.06 60
Female 5.72 2.89 40
Total 5.35 3.03 100
HR Policy
Male 5.93 1.81 60
Female 6.44 1.97 40
Total 6.03 1.86 100
Career
Advancement
Male 6.18 1.91 60
Female 7.50 1.40 40
Total 6.45 1.89 100
Reward &
Recognition
Male 6.28 1.83 60
Female 5.89 1.21 40
Total 6.20 1.73 100
Colleagues
Male 5.40 1.91 60
Female 4.89 2.10 40
Total 5.29 1.96 100
Perceived
Supervisor’s
Support
Male 6.51 1.99 60
Female 5.89 2.20 40
Total 6.38 2.05 100
Organisation
itself
Male 4.40 2.45 60
Female 3.56 1.36 40
Total 4.22 2.29 100
Vision &
Mission of the
organisation
Male 1.72 1.45 60
Female 1.61 0.90 40
Total 1.70 1.35 100
Respectful Job
Male 3.21 2.02 60
Female 3.50 2.61 40
Total 3.27 2.16 100

Multidisciplinary International Research Journal of Gujarat Technological University ISSN: 2581-8880
VOLUME 2 ISSUE 2 JULY 2020 13
Source: Created by Author
Table 4 provides the descriptive statistics on various drivers of employee engagement where
highest mean was observed in Career Advancement opportunities, the lowest mean was observed
for vision and mission of the organization.
Table 5: EE Drivers in Rank Order based on Male Gender
EE Drivers (In Rank Order) Mean Std. Deviation
Perceived Supervisor’s Support 6.51 1.99
Reward & Recognition 6.28 1.83
Career Advancement 6.18 1.91
HR Policy 5.93 1.81
Colleagues 5.4 1.91
Salary & Benefits 5.25 3.06
Organisation itself 4.4 2.45
Respectful Job 3.21 2.02
Vision & Mission of the organisation 1.72 1.45
Source: Created by Author
Table 5 provides descriptive statistics on Drives of Employee Engagement based on Male Gender.
The Table shows that the highest mean observed was for Perceived Supervisor Support and the
lowest mean was observed for Vision and Mission of the organization.
Table 6: EE Drivers in Rank Order based on Female Gender
EE Drivers (In Rank Order) Mean Std. Deviation
Career Advancement 7.5 1.4
HR Policy 6.44 1.97
Reward & Recognition 5.89 1.21
Perceived Supervisor’s Support 5.89 2.2
Salary & Benefits 5.72 2.89
Colleagues 4.89 2.1
Organisation itself 3.56 1.36
Respectful Job 3.5 2.61
Vision & Mission of the organisation 1.61 0.9
Source: Created by Author

Multidisciplinary International Research Journal of Gujarat Technological University ISSN: 2581-8880
VOLUME 2 ISSUE 2 JULY 2020 14
Table 6 provides descriptive statistics on Drives of Employee Engagement based on Female
Gender. The Table shows that the highest mean observed was for Career Advancement and the
lowest mean was observed for Vision and Mission of the organization.
CONCLUSION
Employee Engagement is an emotional attachment employees have towards the work they do, the
organisation, its business activities, and its values. To understand and measure the employees’ perception
on drivers of employee engagement being practiced in the IT industry, the survey has been convoyed on
100 employees of selected IT companies from the Ahmedabad City. It aimed to study the current level of
employee engagement and the drivers for employee engagement in the IT sector in Ahmedabad City with
a special focus on gender as an independent variable. In the sample responses taken for study, a positive
effect on employee engagement drivers have been found. Almost all the employees of the selected IT
businesses believed engagement as the significant factor contributing to the individual and the
organisational success. According to the survey Supervisor’s Support play a most significant role in
engaging male employees, followed by Reward & Recognition, Career Advancement opportunities and HR
Policies. This implies that the male employees tend to give more importance to the support and guidance
they receive from their supervisor, the salary and other benefits the organisation offers, and the
opportunities they have for their career growth at the workplace. The study shows that for female employees
Career Advancement opportunities play most important role in engaging them, followed by HR Policies,
Reward & Recognition, and Supervisor’s Support. Female employees seem to give more importance to
good HR policies and thereby provision of leaves, flexi-timings, and other benefits. They also seem
motivated by the kind of support they receive from their supervisors. Employees want the rewards to be
transparent and merit-based, while they feel that the recognitions must be immediate. Some of the
organisations do show sign of nepotism or favoritism while promoting the employees or sending them for
an offshore overseas project. The management should look into this and make policies and selection criteria
for such projects much fairer and equitable. Furthermore, the study reveals that, for both, male and female
employees, the top four engagement drivers remain the same with different rank order. The study shows
that both, male and female employees, are least motivated by the Vision and Mission of the organisation.
This reveals that the employees are unaware of the organization’s business activities and its objectives in a
larger sense. Organisations must make an effort to inform all employees as to what is happening in the
organisation and engage their employees through more periodic communications on organization’s
progress towards its business goals. Both male and female employees, tend to expect almost a same degree
of respect at their work and enjoy a ‘meaningful’ work.

Multidisciplinary International Research Journal of Gujarat Technological University ISSN: 2581-8880
VOLUME 2 ISSUE 2 JULY 2020 15
The study also shows that employees who have higher-level of support from their supervisor in terms of
freedom, autonomy, decision-making, and performance feedback are highly engaged. Components behind
work engagement are gratifying Career Advancement opportunities, Reward & Recognition, Perceived
Supervisor’s Support and HR Policies. Across the globe and particularly in India, more and more studies
are being conducted on this most-practiced, popular, and airy concept. Similar kind of research can be
undertaken to other cities of the country to gain more insights into the drivers of employee engagement.
REFERENCES
Baumruk, R. (2004). The missing link: The role of employee engagement in business success.
Workspan, 47, 48-52.
Bedarkar, M., & Pandita, D. (2014). A study on the drivers of employee engagement impacting
employee performance. Procedia - Social and Behavioral Sciences, 133, 106-115.
Bhose, J. S. G. R (2003). NGOS and rural development: Theory and practice. New Delhi: Concept
Publishing Company.
Chandrasekhar, S. F. (2000). Sense of the community within the sphere of village: A measurement
and analysis of villager’s responses. Journal of Community Guidance and Research, 17(3), 277-
285.
Chandrasekhar, S. F., & Anjaiah, P. (2002). Organisational Commitment: A study of employees’
responses from select NGOs, management and labour studies, 27(3), 205-209.
David, S., & Pandey, S. (2013). A study of Engagement at work: What drives Employee
Engagement? European Journal of Commerce and Management Research, 2(7), 155-161.
http://www.ejcmr.org/july-2013.html
Frank, F. D., Finnegan, R. P., & Taylor, C. R. (2004). The race for talent: retaining and engaging
workers in the 21st century. Human Resource Planning, 27(3), 12-25.
Kahn, W.A. (1990). Psychological conditions of personal engagement and disengagement at work.
Academy of Management Journal, 33, 692-724.
Imandin, L., Bisschoff, C., & Botha, C. (2014). A model to measure employee engagement.
Problems and Perspectives in Management, 12(4).Richman, A. (2006). Everyone wants an engaged
workforce how can you create it? Workspan, 49, 36-39.
Rashmi, G., Rakhi, T., & Trupti, A. (2014). Comparative Study on Employee Engagement
Practices at Private and Public Banks in South Gujarat Region. Global Journal for Research
Analysis 3(4).

Multidisciplinary International Research Journal of Gujarat Technological University ISSN: 2581-8880
VOLUME 2 ISSUE 2 JULY 2020 16
Sange, R. T. S. (2015). Progressive importance of the drivers of employee engagement. Indian
Journal of Science and Technology, 8(4).
Siddanta. & Roy. (2010), Employee engagement - Engaging the 21st century workforce. Asian
Journal of Management Research.
Shaw, K. (2005). An engagement strategy process for communicators. Strategic Communication
Management, 9(3), 26-29.
Singh, T., Kumar, P., & Priydarshi, P. (2007). Employee engagement: A comparative study on
selected Indian organisations. International Journal of Management Practices and Contemporary
Thoughts, 41-48.
http://www.iimidr.ac.in/iimi/images/IMJ/Impact_ Volume2_Issue2/Employess.pdf.
Swaminathan, J., & Aramvalarthan. (2013). Employee engagement of managerial staff in hospitals:
An Indian pilot study. Journal of Business & Management, 1(3), 166-174.
The NASSCOM-McKinsey Study (2002).
Truss, C., Soane, E., Edwards, C., Wisdom, K., Croll, A., Burnett, J. (2006). Working life:
Employee attitudes and engagement 2006. London, CIPD.

Multidisciplinary International Research Journal of Gujarat Technological University ISSN:2581-8880
VOLUME 2 ISSUE 2 JULY 2020 17
DESIGNING OF A PROFICIENT HEAT EXCHANGER BY USING
SPIRAL TUBE FOR AUGMENTATION OF HEAT TRANSFER
Prof. G. N. Deshpande
Assistant Professor in Mechanical Engineering Department,
Shreeyash College of Engineering & Technology, Aurangabad, Maharashtra
Abstract
Heat exchangers are the equipment that exchanges the heat energy between the surface and the fluid.
Heat exchangers are used in both day to day life and in industrial applications such as thermal power
plant, chemical plant, HVAC, automobiles as radiators. Most of the heat exchangers design depends
upon the requirement and space. Depending on the exchanger design methodology, there are a set of
geometrical parameters that need to be specified before the start of design. Hence proficient design of
heat exchanger is always needed one of them is spiral tube heat exchanger. The present design
procedure is different from that of the design procedure of tubular heat exchanger. Archimedean
principle of spiral geometry is used while designing the spiral coils for spiral tube heat exchanger. The
design of the heat exchanger consists of the specification of the geometry (cross sectional area and
length) that transfers the required heat load within the limitations of allowable pressure drop.
Keywords: Spiral Tube Heat Exchanger, LMTD, curvature ratio, effectiveness of HE etc.
Nomenclature
List of symbols
d - Diameter of spiral tube [mm] D- Diameter of Spiral [mm]
Dis -Diameter of shell [mm] Rh- Radius of header or Straight tube [mm]
P- Pitch of Spiral[mm] Ls- Length of shell[mm]
Lst- Length of header tube [mm] a- Constant in equation of Spiral [mm]
B- Bend allowances [mm] Lo- Developed length of spiral [mm]
LT - Total length of spiral tubes [mm] rn- Neutral axis correction radius [mm]
k- Stretch factor or bend factor t- Thickness of tube [mm]
n- Number of spiral n1- Number of header tube
Q- Heat transfer rate of fluid [W] CP- Specific heat [KJ/kg k]
Th1- Inlet temperature of hot fluid [ºC] Th2- Outlet temperature of hot fluid[ ºC]
Tc1- Inlet temperature of cold fluid [ºC] Tc2- Outlet temperature of cold fluid [ºC]
ΔP- Pressure drop [mm] U- Overall Heat transfer coefficient [W/m2K]

Multidisciplinary International Research Journal of Gujarat Technological University ISSN:2581-8880
VOLUME 2 ISSUE 2 JULY 2020 18
h- Heat transfer coefficient [W/m2K] As- Heat transfer surface area [m2]
R- Capacity ratio m- mass flow rate of fluid [kg/s]
V- Velocity of fluid [m/s] Rs- Thermal resistance of spiral tube
Rst- Thermal resistance of header tube mnp- mass of nanoparticle [g]
mbf – mass of base fluid [g] θ- Temperature difference [⁰C]
Qs- Discharge through shell [mm3/sec] Qt- Discharge through spiral tube [mm3/sec]
De- Effective diameter of shell [mm]
Subscripts
h – hot fluid c- cold fluid bf – base fluid max- maximum
o- outer i-inner avg –average s- shell
Greek Symbols
K - Thermal conductivity [W/m K] ρ − Density [kg/m3]
μ − Dynamic viscosity [Pa s] υ − Kinematic viscosity [m2/s]
δ- Curvature ratio ψ- angle of arc [rad]
ΔθLMTD - Log mean temperature difference [⁰C] ε- Effectiveness of heat exchanger
1 INTRODUCTION
Spiral tube heat exchangers are excellent heat exchanger because of far compact and high heat
transfer efficiency. Spiral tube heat exchangers consist of one or more spirally wound coils which are,
in circular pattern, connected to header through which fluid is entering into the spiral coils. This spiral
coil is installed in a shell, where another fluid is circulated around tube, leads to transfer of heat
between the two fluids.
Curved tubes has the ability to transfer large amounts of heat with less space and size hence, they
have attracted considerable research attention. Many researchers have studied experimentally and
numerically the performance of simple helical coils for heat transfer enhancement. Very few
researchers have studied the effect of pitch and curvature ratio on the heat exchanger performance.
Paper reviewed for this dissertation work are categorize under the helical and spiral tubes, then design
of compact heat exchanges and application of Nano fluid for heat transfer augmentation.
Nunez et al. [1] investigated the application of a graphical tool for the preliminary design of heat
exchangers. The approach, originally developed for the case of shell and tube heat exchangers, later it
is extended to the cases of spiral and welded compact exchangers. Their tool depicts the design space
where a number of combinations of geometrical parameters meet the heat duty and allowable pressure
drops. The enclosed area between three curves is a design space, a curve that represents the particular
heat responsibility and the curves that represent the pressure drop on the hot and cold sides. This
demonstration gives the designer the largely view that allows him to bring together design condition
with the choice of the unit for a given appliance.

Multidisciplinary International Research Journal of Gujarat Technological University ISSN:2581-8880
VOLUME 2 ISSUE 2 JULY 2020 19
Patil et al. [2] they proposed the simple method for designing of helical coil heat exchanger (HCHE).
This HCHE offers lot of advantages over double pipe heat exchanger. One of the important factors of
using a helical coil heat exchanger is the space requirement in helical coil heat exchanger is less as
compared to straight tube heat exchanger.
Tandal et al. [4] they designed and fabricate the innovative Pancake type heat exchanger for process
industry. Cold fluid flows in spiral path while hot fluid flows in axial path. Experimental results and
theoretical values are compared by the parameter called overall heat transfer coefficient. An analytical
model was developed for carrying out design simulations of the Pancake type heat exchanger. Total of
eight pancakes are used in their heat exchanger. The results show the deviation between calculated
values of overall heat transfer coefficient from the experimental results and theoretical values
obtained from the analytical model are within 12%.
Bhavsar et al. [5] they streamline the design procedure for the spiral tube heat exchanger, as the
standard design procedure is not available and the information for designing the spiral tube heat
exchanger is in the scatter form. Afterwards they have fabricated the spiral tube heat exchanger and
carry our experimentation and measure the performance of the spiral tube heat exchanger. Their
results show that spiral tube heat exchanger is compact in size and more heat transfer is occurred as
compared to shell and tube heat exchanger.
From the literature reviewed for this work it is found that very little information is available on design
of spiral tube heat exchangers that too is limited for both fluids flowing in spiral paths. The design
procedure for spiral tube heat exchanger is in scattered form and no specific procedure is available for
designing the spiral tube heat exchangers. Therefore, the present research work is carried out for
establishing the design procedure of the different compact spiral tube heat exchangers.
1.1 Assumption in Design of Spiral Tube Heat Exchanger
1. Properties of cold water and hot water are considered as constant, at an average value of inlet and
outlet temperature with little loss in accuracy.
2. Flow through heat exchanger is fully developed, steady and constant.
3. Fluid stream experiences little or no change in their velocities and elevations hence the Kinetic
Energy and Potential energy changes are negligible.
4. Outer surface of heat exchanger is assumed to be perfectly insulated.
5. There is no fouling in heat exchanger.
2 DESIGNING OF SPIRAL TUBE HEAT EXCHANGER
2.1 Design of Shell
There is no standard method available for calculating the various design parameters of the
spiral tube heat exchanger, such as shell inside diameter, length of shell, curvature ratio, developed
length of spiral tube and total length of spiral tubes. Therefore, the methodology followed by different

Multidisciplinary International Research Journal of Gujarat Technological University ISSN:2581-8880
VOLUME 2 ISSUE 2 JULY 2020 20
researcher studied in literature review is used for the determination of these parameters. Following
data shown in Table 1 is considered for calculating the shell parameters.
Table: 1 Design Parameter for Spiral coil
Parameters Dimensions
O.D. of copper tube, mm (do) 12
I.D. of copper tube, mm (di) 10
Number of Spiral coils (n) 3
Number of Turns 4
Spiral Pitch, mm (P) 20
I.D. of Spiral, mm (Di) 114.02
O.D. of Straight tube, mm (dho) 27
I.D. of Straight tube, mm (dhi) 25
2.2 Inside Diameter of Shell (Dis)
Inside diameter of shell is calculated as,
Dis = 2 (R0 + Rh0) (Eqn. 1)
R0 = Ri + 3P (Eqn. 2)
2.3 Length of Shell (Ls)
Length of shell required for the heat exchanger is calculated as,
Ls =R0
2− Ri2
a (Eqn. 3)
a = P π
2 (Eqn. 4)
2.4 Curvature ratio (δ)
Curvature ratio is the ratio of tube diameter to the diameter of spiral is calculated as,
δ =di
Di (Eqn. 5)
2.5 Developed Length of Spiral Coil (L0)
Length of the spiral coil used in spiral tube heat exchanger is calculated as,
L0 = B1 + B2 + B3 + B4 + B5 + B6 + B7 (Eqn. 6)
or
L0 = L1 + L2 + L3 + L4 + L5 + L6 + L7
B = rn ψ (Eqn. 7)
rn = ( Ri + k t ) (Eqn. 8)
k = 1
3 if Ri ≪ 2 t (Eqn. 9)
In case of Copper k =1
2 if Ri > 2 𝑡 (Eqn. 10)

Multidisciplinary International Research Journal of Gujarat Technological University ISSN:2581-8880
VOLUME 2 ISSUE 2 JULY 2020 21
2.6 Total length of Copper Tubes in Heat Exchanger (LT)
The total length of copper tubes required in the heat exchanger is calculated as,
LT = n L0 (Eqn. 11)
Table: 2 Design Parameter for Spiral Tube Heat Exchanger
Parameter
Tube Side Shell Side
Inner temperature °C 35 70
Outlet temperature °C 43.3 65
Mass flow rate Kg/s 0.05 0.0833
Density kg/m3 989.1 979.4
Specific heat KJ/kg K 4.18 4.18
Dynamic viscosity Ns/m2 5.77 ×10⁻⁴ 4.2 × 10⁻⁴
All the properties of density, specific heat, viscosity, and thermal conductivity of hot water
considered for the shell side calculations are obtained at the average of hot inlet and outlet
temperature as Th,avg.
Th,avg = Th1+ Th2
2 (Eqn. 12)
Similarly, all the properties of density, specific heat, viscosity, and thermal conductivity of
cold water considered for the tube side calculations are obtained at the average of cold inlet and outlet
temperature as Tc,avg .
Tc,avg = Tc1+ Tc2
2 (Eqn. 13)
2.7 Energy Balance
The amount of heat transfer rate or heat potential is calculated by using following energy balance
equations,
Qh = Qc (Eqn. 14)
mh Cph (Th1 − Th2) = mc Cpc (Tc2 − Tc1) (Eqn. 15)
For all the further calculation average of hot and cold heat transfer rate is taken,
Qavg = Qc + Qh
2 (Eqn. 16)
Heat transfer rate is also calculated from Newton’s law of cooling as,
Q = U As (∆θ(LMTD)) (Eqn. 17)
As is the outer surface area of heat exchanger in m2
As = n π d0Lo (Eqn. 18)
Flow arrangement selected is counter flow and accordingly LMTD is calculated as,
∆θ(LMTD) = (θ2− θ1)
ln (θ2)
(θ1)
(Eqn. 19)
θ2 = (Th2 − Tc1) (Eqn. 20)

Multidisciplinary International Research Journal of Gujarat Technological University ISSN:2581-8880
VOLUME 2 ISSUE 2 JULY 2020 22
θ1 = (Th1 − Tc2) (Eqn. 21)
2.8 Effectiveness of Heat Exchanger
Effectiveness of heat exchanger is calculated as,
ϵ =Qavg
Qmax (Eqn. 22)
Qmax = (mCP)min( Th1 − Tc1) (Eqn. 23)
2.9 Number of Transfer Units of Heat Exchanger
Number of Transfer Units for counter flow is the measure of effectiveness of heat exchanger, which is
calculated as,
NTU = 1
R−1ln (
R−1
R ∈ −1) (Eqn. 24)
R = Cmin
Cmax (Eqn. 25)
NTU =U As
Cmin (Eqn. 26)
2.10 Reynolds Number (Re) of Tube Fluid
Reynolds number for cold side i.e. the fluid flowing in the spiral tube is calculated as follows,
Rec = ρc Vc di
μc (Eqn. 27)
Velocity (V) of fluid flowing through the spiral coil is calculated as,
Qt = Ai Vc = π
4di
2 Vc (Eqn. 28)
2.11 Nusselt Number (Nu) of Tube Fluid
Using Kalb and Seader Correlation for determining the Nusselt number for the flow in the spiral
tubes,
Nuc = 0.836 De0.5 Prc0.1 (Eqn. 29)
De = Rec √ri
Ri (Eqn. 30)
Prc = μc CPc
Kc (Eqn. 31)
2.12 Heat Transfer Coefficient of Inner Tube Fluid
Heat transfer coefficient on cold side i.e. inside of spiral tube is calculated as,
hc = Nuc Kc
di (Eqn. 32)
2.13 Reynolds Number (Re) of Shell Fluid
Reynolds number for shell side i.e. the fluid flowing in the shell is calculated as follows,
Reh = ρh Vh De
μh (Eqn.33)
Effective diameter or hydraulic diameter of shell in calculated as;
De = Dis − 2 (dho) − 8 (do) (Eqn.34)
Velocity of fluid flowing through the shell is calculated as,
Qs = Ae Vh = π
4De
2 Vh (Eqn. 35)

Multidisciplinary International Research Journal of Gujarat Technological University ISSN:2581-8880
VOLUME 2 ISSUE 2 JULY 2020 23
2.14 Nusselt Number (Nu) of Shell Fluid
Nusselt number for flow in shell side is calculated by the Correlation used in literature,
Nuh = 0.04 Reh0.8 Prh
0.4 (Eqn.36)
Prh = μh CPh
Kh (Eqn. 37)
2.15 Heat Transfer Coefficient of Shell Fluid
Heat transfer on shell side i.e. at the outside of spiral coil is calculated as,
hh = Nuh Kh
d0 (Eqn. 38)
2.16 Overall Heat Transfer Coefficient
It depends upon on the inside heat transfer coefficient of tube and outside heat transfer coefficient of
heat exchanger is calculated as,
1
U0=
1
Asi hc+ R +
1
hh Aso (Eqn. 39)
1
R=
1
Rs1+
1
Rs2+
1
Rs3+
1
Rst1+
1
Rst2 (Eqn. 40)
Total outer heat transfer surface area is calculated as,
Aso = (n π d0 L0) + (n1 π dho Lst) (Eqn. 41)
Total inside heat transfer surface area is calculated as,
Asi = (n π di L0) + (n1 π dhiLst) (Eqn. 42)
Ls is the length of straight tube, n1 is straight header tube = 2
Rs1 = Rs2 = Rs3 =(d0− di)
2 π K Lo ln(d0di
) (Eqn. 43)
Rst1 = Rst2 =(dh0− dhi)
2 π K Lst ln(dh0dhi
) (Eqn. 44)
Hence by adopting above design procedure two spiral tube heat exchanger with specifications shown
in the table 3 were designed and compared.
Table: 3 Dimensions of Spiral Tube Heat Exchangers
Parameters Spiral Tube Types
Type – A Type - B
O.D. of copper tube (mm) 12 12
I.D. of copper tube (mm) 10 10
Number of Spiral coils 3 3
Number of Turns 4 4
Spiral Pitch (mm) 25 20
Curvature Ratio 0.1136 0.0877
I.D. of Spiral (mm) 88.5 114.02
O.D. of Spiral (mm) 238.5 234.02

Multidisciplinary International Research Journal of Gujarat Technological University ISSN:2581-8880
VOLUME 2 ISSUE 2 JULY 2020 24
I.D. of Shell (mm) 278 278
O.D. of Shell (mm) 280 280
Length of Shell (mm) 270 270
Thickness of Shell (mm) 1 1
O.D. of Straight tube (mm) 27 27
I.D. of Straight tube (mm) 25 25
Total length of Copper Tube (mm) 5880 5880
Material of Shell S.S. S.S.
Fig. 1 and 2 shows the schematic drawing of spiral coils in the Auto Cad software, after calculating
the above-mentioned parameters.
Fig1: Spiral Tube Type A Fig2: Spiral Tube Type B
Fig. 3 and 4 shows the photographic image of spiral coils fabricated with the same dimensions
obtained by design calculation.
Fig.3 Photographic Image of Spiral Coils Type A
Spiral coils are ready for further joining with the straight header tube.
Fig.4 Photographic Image of Spiral Coils Type B

Multidisciplinary International Research Journal of Gujarat Technological University ISSN:2581-8880
VOLUME 2 ISSUE 2 JULY 2020 25
Following data shown in Table 2 is adopted for further calculation of STHE,
Based on above theory and design calculations of STHE, experimental set up is developed
and fabricated. The experimental results clearly states that the high curvature ration and high spiral
pitch heat exchanger generates more secondary turbulent flow which is responsible for high heat
transfer in the same space. Hence while designing of spiral tube heat exchanger the important
parameters are curvature ratio and spiral pitch.
3 CONCLUSION
This paper is an attempt to unite the design procedure for spiral tube heat exchanger by
incorporating the mathematical formulas. This leads to the formulation of systematic procedure for
designing of heat exchanger. This design method of heat exchanger can be used for designing the
similar kind of compact heat exchanger. The main parameters that are to be taken care while
designing of heat exchangers is curvature ratio and spiral pitch.
REFERENCES
1. M. P. Nunez, G. T. Polley, G. M. Rodríguez (2013), Applied Thermal Engineering, 1- 8.
2. R. K. Patil, B. W. Shende, P. K. Ghosh (1981), Chemical Engineering Journal.
3. P. Naphon, S. Wongwises (2005), Expt. Thermal and Fluid Science 29, 511–521.
4 M. S. Tandal, S. M. Joshi (2008), 5th WSEAS Int. Conf. on HMT'08, Acapulco, Mexico, January
25-27.
5. J. J. Bhavsar, V. K. Matawala, S. Dixit (2013), International Journal of Mechanical and Production
Engineering, 2320-2092, Volume – 1, Issue – 1.
6. H. N. Mohammed (2009), Diyala Journal of Engg Sciences Vol. 02 pp. 1-14.
7. M. G. Bandpy, H. Sajjadi (2010), International Journal of Mechanical and Materials Engineering
1:2.
8. Yanuar, N. Putra, Gunawan M. Baqi (2011), IJRRAS 7 (3).
9. P. Naphon, S. Wongwises (2002), Inter. Comm. Heat Mass Transfer, vol. 29, No. 6, pp. 797-809.
10. P. Naphon, J. Suwagrai (2007), International Journal of Heat Mass Transfer, Elsevier Press, 50
444 – 451.

Multidisciplinary International Research Journal of Gujarat Technological University ISSN:2581-8880
VOLUME 2 ISSUE 2 JULY 2020 26
11. H. Shokouhmand, M. R. Salimpour, M. A. A. Behabadi (2008), International Communications in
Heat and Mass Transfer 35 84–92.
12. G. E. Kondhalkar, V. N. Kapatkat (2012), International Journal of Modern Engineering Research,
Vol.2, Issue.3, pp-930-936.
13. N. E. Wijeysundera, J. C. Ho, S. Rajasekar (1996), International Journal of Heat and Mass
Transfer, Vol. 23 No. 5, pp 623-631.
14. S. S. Pawar, V. K. pawar (2013), Experimental Thermal and Fluid Science, 44, 792–804.
15. G. N. Deshpande, N. V. Sali (2014), Applied Mechanics and Materials, Trans Tech Publications,
Switzerland Vols. 592-594, pp 1564-1569.

Multidisciplinary International Research Journal of Gujarat Technological University ISSN: 2581-8880
VOLUME 2 ISSUE 2 JULY 2020 27
A SURVEY ON THE USE OF OPEN-SOURCE FIREWALL FOR MAJOR
SCADA PROTOCOLS
Hardik Maru
Student (M.Tech in Cyber Security)
Marwadi University, Rajkot, Gujarat
Hepi Suthar
Assistant Professor
Marwadi University, Rajkot, Gujarat
ABSTRACT
Supervisory Control and Data Acquisition (SCADA) system is control and monitoring system architecture
used in modern industrial control systems and critical infrastructures. Many SCADA protocols have been
developed to fulfill the essential requirements of SCADA systems, such as high availability, reliability, and
real time response. Among those all protocols, Modbus, DNP3, and IEC 60870-5-104 (aka IEC 104) are
the most used SCADA protocols. These protocols are developed to work over IP to enable the SCADA
systems communication through the internet connectivity. As these protocols enable SCADA system
communication from any remote location with the use of internet, it also opens the door to expose its
existence and invites SCADA specific cyber-attacks. Several traffic filtering based security solutions are
designed for SCADA systems, but Linux iptables based open-source firewall approach is one of the best
among all. This paper presents an overview of SCADA Systems, and major three SCADA protocols with
their architecture. Furthermore various SCADA specific attacks are discussed and iptables firewall is
analyzed against those attacks.
Keywords: SCADA systems, SCADA security, network security, open source, firewalls, IEC 60870-
5-104, Modbus, DNP3, Linux IPT ables.
1 INTRODUCTION
Mostly all the supervising, controlling, and monitoring needs of any critical infrastructure are managed by
SCADA system, and therefore protecting it from any type of threat is critically important. Traditional
SCADA systems has 3 major components, (A) Human Machine Interface (HMI), (B) Master Terminal Unit
(MTU), (C) Remote Terminal Units (RTUs) or Programmable Logic Controllers (PLCs). Controlling and

Multidisciplinary International Research Journal of Gujarat Technological University ISSN: 2581-8880
VOLUME 2 ISSUE 2 JULY 2020 28
monitoring is handled by a SCADA operator using HMI. PLCs or RTUs collect the data from physical end
point devices such as sensors and actuators and send it to MTU. MTU is the heart of the system to manage
core functions like communication, data collecting, processing, storing and representing.
In recent decades, computing and communications have undergone considerable amount of changes.
Computation is preferred on the go with a plenteous demand of mobility support in communicating [27],
[28]. Due to the increasing users in wireless environment, communication paradigm also have shifted to
the concept of Cognitive Radio Networks [25], [26] for better utilization of wireless spectrum. Needless to
say, the advancement in handheld equipment and tremendous popularity of mobile application leads to
necessity of timely analysis and security provisioning of communication environment. In specific to
SCADA systems, SCADA protocols are designed to enable communication between all components of
SCADA system. It transfers data and control commands between MTU and other components. Modbus,
DNP3 and IEC 60870-5-104 are the three majorly used protocols in SCADA systems. Most of the protocols
were initially designed to fulfill the operational requirements only. Over the time these protocols are
extended to work over the internet but, it also invites various threat with this extension. Several cyber-attack
incidents on SCADA are discussed in [14].
To fill this gap of security, traffic filtering-based detection system is better way to detect and prevent any
cyber-attack. Linux Iptables is good option to use as firewall in SCADA system. Several researches have
explored and examined its capabilities against SCADA attacks. In this paper, we provide the study of
SCADA systems, most used three protocols, various attacks on those protocols, and analysis of iptables
rules against those attacks.
Specifically the rest of the paper is sorted out as follows. Section II gives the SCADA system and its security
overview. Section III introduces major three SCADA protocols with its architecture. Section IV provides
the details of various firewall and IDS security solution based researches. Section V represents common
attacks on major three protocols and analyzes whether iptables rule is defined for that particular attack or
not. Section VI discusses the summary of whole works. Finally, Section VII concludes this paper and giving
the new direction of research in this field.
Multidisciplinary International Research Journal of Gujarat Technological University ISSN: 2581-8880
VOLUME 2 ISSUE 2 JULY 2020 29
2 SCADA SYSTEM AND SECURITY OVERVIEW
Figure 1 Generic SCADA Network Architecture
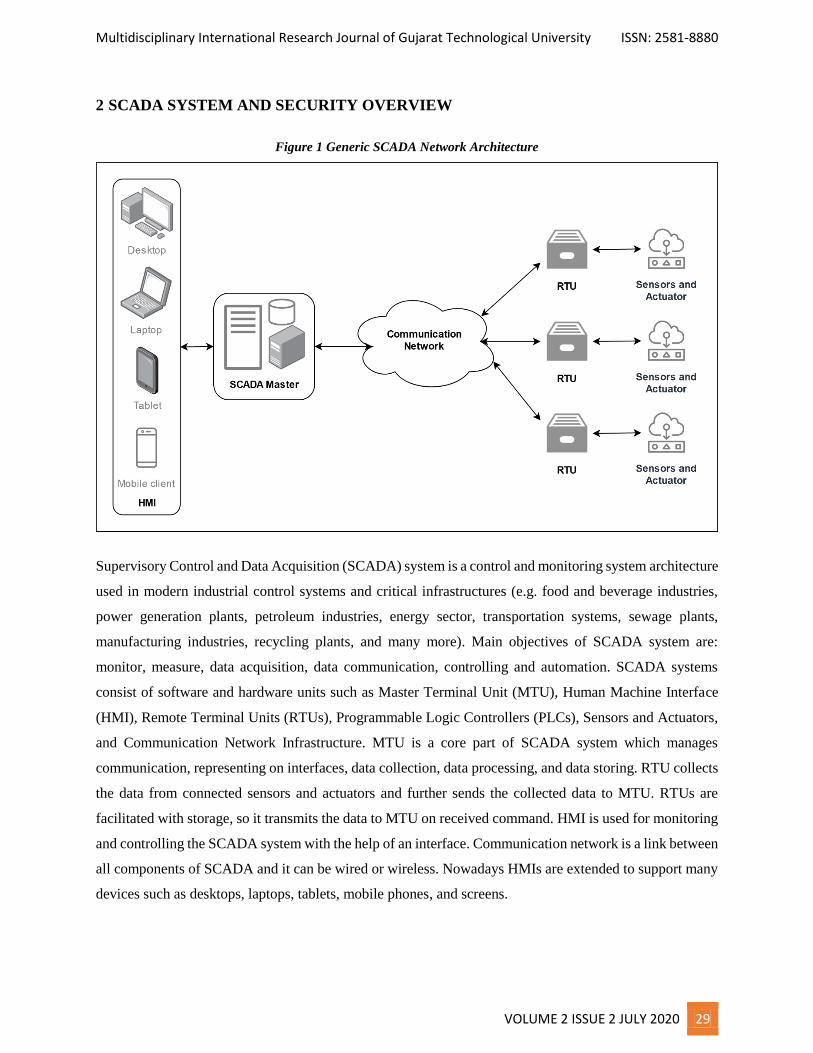
Supervisory Control and Data Acquisition (SCADA) system is a control and monitoring system architecture
used in modern industrial control systems and critical infrastructures (e.g. food and beverage industries,
power generation plants, petroleum industries, energy sector, transportation systems, sewage plants,
manufacturing industries, recycling plants, and many more). Main objectives of SCADA system are:
monitor, measure, data acquisition, data communication, controlling and automation. SCADA systems
consist of software and hardware units such as Master Terminal Unit (MTU), Human Machine Interface
(HMI), Remote Terminal Units (RTUs), Programmable Logic Controllers (PLCs), Sensors and Actuators,
and Communication Network Infrastructure. MTU is a core part of SCADA system which manages
communication, representing on interfaces, data collection, data processing, and data storing. RTU collects
the data from connected sensors and actuators and further sends the collected data to MTU. RTUs are
facilitated with storage, so it transmits the data to MTU on received command. HMI is used for monitoring
and controlling the SCADA system with the help of an interface. Communication network is a link between
all components of SCADA and it can be wired or wireless. Nowadays HMIs are extended to support many
devices such as desktops, laptops, tablets, mobile phones, and screens.

Multidisciplinary International Research Journal of Gujarat Technological University ISSN: 2581-8880
VOLUME 2 ISSUE 2 JULY 2020 30
SCADA systems are now more vulnerable to many threats [1] as modern SCADA systems are extended
from local network to public network with an increased connections. Several studies discovers many
vulnerabilities and attacks on SCADA systems. In [3], the authors have used attack tree methodology to
discover security vulnerabilities in SCADA systems and have identified eleven attacks. In [5], the authors
have classified various SCADA systems based cyber-attacks, such as attacks based on hardware and
software, and communication stack based attacks. In [8], the authors provided detailed information about
four major type of attacks against SCADA system.
3 SCADA COMMUNICATION PROTOCOLS
SCADA communications protocols are designed to transfer data and control messages on industrial
communication networks. Many SCADA protocols have been designed in recent decades, but most of these
were initially designed where network security was not considered as a problem [3]. Because of it, many
SCADA protocols are lacking when it comes to security, which leads to make the critical infrastructure
vulnerable to threats.
Technical details of three major SCADA protocols are provided in the following subsections. This
information enables the readers to understand the protocol overview, its architecture, various commands,
and vulnerabilities/attacks on it.
3.1 Modbus
Figure 2 Modbus/TCP Protocol Architecture
Modbus/TCP is designed for Ethernet communication. It is an extension of Modbus/RTU protocol, which
is a serial communication protocol designed by Modicon to use with PLCs of it. It uses request-response
communication model where a device known as Modbus master is requesting or writing the information

Multidisciplinary International Research Journal of Gujarat Technological University ISSN: 2581-8880
VOLUME 2 ISSUE 2 JULY 2020 31
and devices known as Modbus slaves supplies the information or acknowledge the execution state. There
is one master and up to 247 slaves in one standard Modbus network. Each slave is uniquely assigned with
slave address from 1 to 247.
A Modbus/TCP packet contains Modbus Application Protocol (MBAP) header of 7 bytes and Protocol Data
Unit (PDU) with variable size. MBAP consists transaction and protocol identifier along with the length of
packet, and slave identifier. While PDU consists two fields Function Code (FC) and Data Field which
contains the actual Modbus command. FC is the 1 byte information which instruct the slave device which
task to perform. Data field contains a detailed information of respective FC defined in 1st byte of PDU. This
information could be Read/Write access method, data type, number of registers/coils, starting and ending
address of registers/coils, data to write, sub-function code, device states, and etc.
Some Modbus function codes are publically standardized, which are [21]:
Table: 1 Standard Modbus Function Codes
Function Code Hex Value Action
01 0x01 Read Coils
02 0x02 Read Discrete Inputs
03 0x03 Read Holding Registers
04 0x04 Read Input Registers
05 0x05 Write Single Coil
06 0x06 Write Single Register
07 0x07 Read Exception Status
08 0x08 Diagnostics
11 0x0B Get Communication Event Counter
12 0x0C Get Communication Event Log
15 0x0F Write Multiple Coils
16 0x10 Write Multiple registers
17 0x11 Report Slave ID
20 0x14 Read File Record
21 0x15 Write File Record
22 0x16 Mask Write Register
23 0x17 Read/Write Multiple registers
24 0x18 Read FIFO Queue
43 0x2B Encapsulated Interface Transport
43/13 0x2B/0x0D CANopen General Reference Request and
Response PDU
43/14 0x2B/0x0E Read Device Identification
65-72, 100-110 - Reserved for User Defined Function Codes

Multidisciplinary International Research Journal of Gujarat Technological University ISSN: 2581-8880
VOLUME 2 ISSUE 2 JULY 2020 32
3.2 DNP3
DNP3 is a group of telecommunications protocols that defines communication between SCADA
components such as Master unit, RTUs, Intelligent Electronic Devices (IEDs) and other outstation devices.
It is an open source protocol with many important features which makes it interoperable, robust, and one
of the most efficient protocol in SCADA systems. It transmits data reliably in sequence of relatively small
packets. It supports 4 types of communication mode, one-to-one, multi-slave, multi-master, and hierarchical
[22]. In one-to-one, only one master station manage one slave. In multi-slave, one master station manages
multiple slaves. In multi-master, one slave has been managed by multiple masters. In hierarchical, master
station manages a slave master station as well along with other slaves.
Figure 3 DNP3 Protocol Architecture
A DNP3 message is divided into 4 main parts, (A) Data Link Header is of 10 bytes, which consists starting
address (2 Bytes), length of message (1 Byte), a control field which contains data to manage flow of
message (1 Byte), destination address where message needs to reach (2 Bytes), source address from where
the message was originated (2 Bytes), and cyclic redundancy check code (2 Bytes). (B) Transport Header
is of 1 byte, which consists FIR and FIN bits of 1 bit to indicate start and end of a sequence of frames, and
sequence number (6 bits) denotes the frame sequence number. It can be any from 0 to 63 for initial frame
and increments for each frame comes after initial and number rollover from 63 to 0. (C) Application Header
is of 4 Bytes, which consists application control (1 Byte) to control flow of communication, function code
(1 Byte) indicates the action to be performed, and indicators (2 Bytes) are used in reply message to pass
useful information from outstation device to master station. Reply message can be confirmation, response,
or an unsolicited response. (D) Data Section is of variable size and contains data objects with their header.
Some well-known public function codes of DNP3 are as below [22]:

Multidisciplinary International Research Journal of Gujarat Technological University ISSN: 2581-8880
VOLUME 2 ISSUE 2 JULY 2020 33
Table: 2 DNP3 Function Codes
Function Code Hex Value Action
01 0x01 Read
02 0x02 Write
03 0x03 Select
04 0x04 Operate
05 0x05 Direct Operate
06 0x06 Direct Operate, No Ack
07 0x07 Immediate Freeze
08 0x08 Immediate Freeze, No Ack
09 0x09 Freeze and Clear
10 0x0A Freeze and Clear, No Ack
13 0x0D Cold Restart
14 0x0E Warm Restart
20 0x14 Enable Unsolicited Messages
21 0x15 Disable Unsolicited Messages
22 0x16 Assign Class
23 0x17 Delay Measurement
129 0x81 Response
130 0x82 Unsolicited Response
3.3 IEC 104 (IEC 60870-5-104)
IEC 60870 standards are defined by the International Electrotechnical Commission (IEC) for SCADA
systems in electrical and power systems. Part 5 of these standards consist transmission protocols for
transmitting telecontrol messages between master station and outstation over standard TCP/IP network.
IEC 60870-5-104 (IEC 104) was developed in 2000 and facilitate IEC 60870-5-101 with network access
using standard transport profiles. It is a standard for SCADA systems with TCP/IP based communication
network for monitoring and controlling geographically pervasive processes.

Multidisciplinary International Research Journal of Gujarat Technological University ISSN: 2581-8880
VOLUME 2 ISSUE 2 JULY 2020 34
Figure 4 IEC 104 Protocol Architecture
IEC 104 can be of fixed length and variable length. Fixed length just contains APCI (Application Protocol
Control Information) in APDU (Application Protocol Data Unit), while variable length have APCI and
ASDU (Application Service Data Unit) in APDU. APCI starts with Start field (1 Byte) with fixed value
0x68 followed by length of APDU (1 Byte), and four CF (control fields) (1 Byte each). There are 3 types
of APCI frame (A) I-format (information transfer format) where last bit of CF1 is 0, (B) S-format (numbered
supervisory functions) where last bits of CF1 are 01, (C) U-format (unnumbered control functions) where
last bits of CF1 are 11. Control fields are elaborated in below figure 5. ASDU contains type identification
field of 1 Byte, Structure Qualifier (SQ) bit specifies the addressing of information objects or elements,
number of objects defines the number of objects or elements ASDU contains, T bit indicates ASDU is
generated for test conditions, P/N bit is used for positive or negative confirmation, cause of transmission
(COT) is six-bit code that control the message routing and interpretation of information when it reach the
destination, originator address (ORG) of 1 Byte is used to identify controlling station in case of more than
one else there is no originator address, ASDU address of 2 Bytes is also called as common address which
is associated with the information objects in ASDU. Each information object contains information object
address (IOA) which act as a destination address when it is used in a control direction and as a source
address when it is used in monitor direction.

Multidisciplinary International Research Journal of Gujarat Technological University ISSN: 2581-8880
VOLUME 2 ISSUE 2 JULY 2020 35
Figure 5 IEC 104 Protocol APCI Frames
Some common command types of IEC 104 are [22]:
Table: 3 IEC 104 Common Command Types
Command
Type Reference Description
45 C_SC_NA_1 Single command
46 C_DC_NA_1 Double command
47 C_RC_NA_1 Regulating step command
58 C_SC_TA_1 Single command with time tag CP56Time2a
59 C_DC_TA_1 Double command with time tag CP56Time2a
60 C_RC_TA_1 Regulating step command with time tag CP56Time2a
48 C_SE_NA_1 Setpoint command, normalized value
49 C_SE_NB_1 Setpoint command, scaled value
50 C_SE_NC_1 Setpoint command, short floating point value
61 C_SE_TA_1 Setpoint command, normalized value with time tag
CP56Time2a
62 C_SE_TB_1 Setpoint command, scaled value with time tag CP56Time2a
63 C_SE_TC_1 Setpoint command, short floating point value with time tag
CP56Time2a
103 C_CS_NA_1 Clock synchronization command
105 C_RP_NC_1 Reset process command
107 C_TS_TA_1 Test command with time tag CP56Time2a
101 C_CI_NA_1 Counter interrogation command
102 C_RD_NA_1 Read command

Multidisciplinary International Research Journal of Gujarat Technological University ISSN: 2581-8880
VOLUME 2 ISSUE 2 JULY 2020 36
4 FIREWALL/IDS FOR SCADA SYSTEMS
In this section, we discussed various researches based on filtering solutions for all three major protocols of
SCADA systems. Several work uses Linux iptables while some other uses different approaches. It includes
the information about the work and their limitations.
In [16], critical state-based filtering system, the authors have introduced an innovative state analysis based
filtering system for SCADA systems. They designed a firewall architecture for the Modbus protocol and
DNP3 protocol based SCADA systems with aim to detect off-sequenced command of complex process and
block it. This filtering mechanism can secure the SCADA systems only against specifically crafted attack
which uses set of commands to disturb the process. While all other classes of attacks can still affect the
SCADA systems. Early warning system for the critical state is really helpful, but it cannot be used as solo
firewall. However this approach very helpful for enhancing the SCADA firewalls.
In [17], [14] and [15], the authors have identified the potential of the open source Linux iptables based
firewall solution for network security and SCADA system security. Some of the common network based
attacks were simulated by authors in [17] and tested to examine the capabilities of iptables. Many open
source firewall solutions are being used for network security, but use of it in SCADA system were not
properly investigated. So, in other two researches, the authors used iptables as a firewall solution in the
SCADA systems. For dynamic packet inspection of data, the authors have created iptables rules by utilizing
the advance features of iptables. Rules have been defined, tested and validated for its ability to detect
various simulated attacks only on Modbus protocol, and DNP3 protocol based SCADA systems. However,
rules represented in these papers are for only few attacks, while some more rules needs to be developed for
other common attacks on Modbus and DNP3 protocols. Furthermore no work has been accomplished to
determine the capabilities of iptables against IEC 104 protocol based SCADA systems.
In [13], SCADAWall model is developed and presented by the authors. SCADAWall consists 3 algorithms,
(A) CPI (Comprehensive Packet Inspection), (B) PIPEA (Proprietary Industrial Protocol Extension
Algorithm), and (C) OSDA (Out of Sequence Detection Algorithm). A CPI uses the iptables, but extends
the dynamic packet inspection technique. It checks the data field as well along with the header to ensure
that only trusted payload and packets accepted. A PIPEA enables the SCADAWall users to add any new
proprietary protocol and create rules for it. An OSDA is defined to resolve the issue of off-sequenced
command like we discussed above for [16]. This model is specifically developed and tested against Modbus
protocol based SCADA system.
In [18], [19], and [20], the authors have presented various approaches such as anomaly detection, rule-based
IDS and stateful IDS with the use of DPI (Deep Packet Inspection). Anomaly detection based approach is

Multidisciplinary International Research Journal of Gujarat Technological University ISSN: 2581-8880
VOLUME 2 ISSUE 2 JULY 2020 37
built on Bro platform with capability of detecting any kind of malicious threats, even a zero-day threats.
Authors have tested this approach on IEC 104 SCADA protocol with just three different attacks and
represented the results of it. There are many other attacks which needs to be tested with this approach. Also
authors have used Bro tool to build the proposed IDS system, but additional efforts are needed in writing
parser to convert the network data into Bro compatible format. A rule-based IDS approach is implemented
using snort rules, with the use of a DPI (Deep Packet Inspection) method. It uses signature-based approach
to detect the known attacks, and model-based approach to detect the unknown attacks. Several attacks were
tailored specifically for IEC 104 protocol based SCADA system, tested against both rule-based approaches
and detection, and the result is represented by the authors. According to our analysis, this approach is the
best security solution among all three different approaches. The stateful IDS approach also uses the DPI
method and specifically designed, implemented, and validated for IEC 104 based SCADA systems.
However the proposed approach is limited to 8 different alarm states, mainly representing timer overtime
state. Furthermore, network based or protocol based attacks cannot be detected or prevented using this
approach. From all these three IDS approaches, no one investigated the use of open source Linux iptables
rules to prevent the attacks on SCADA systems.
In [24], the authors have studied and analyzed various firewall systems for Smart Grid (SG) paradigm.
Authors provided overview of seven different firewall solutions and concluded that most of the paper
examined Modbus and DNP3 protocols only, while SCADA protocols like IEC 61850 and IEC 60870 still
need more work.
From all these different solutions, our analysis determines that open source Linux iptables is really good
approach for SCADA security. However till now, only Modbus and DNP3 protocols based only few attacks
are examined. While capability of iptables against IEC 104 protocol based attacks is totally unexplored.
5 COMMON ATTACKS AND IPTABLES RULES
As SCADA systems are controlling critical infrastructures, an attacks on SCADA systems can damage the
system or disrupt the critical operations. Further it can lead to hazardous damages to the environment,
monetary losses, and most dangerous is human losses. In this section, we discussed attacks identified on
Modbus, DNP3, and IEC 104 SCADA protocols and their corresponding iptables rules.

Multidisciplinary International Research Journal of Gujarat Technological University ISSN: 2581-8880
VOLUME 2 ISSUE 2 JULY 2020 38
5.1 Attacks on Modbus Protocol [2], [3], [5], [6], [14]
Table: 4 Attacks on Modbus Protocol
No. Attack Goal Methodology
IPTables
Rule
Defined?
(M1) Gain SCADA system access
Access to wireless PCN, Third party access,
Access to remote field sites, or Use of
SCADA transmission media.
No
(M2) Identify Modbus device FC (Function Code) 43, and Sub FC 14 is
used for reading device identification. Yes
(M3) Disrupt master-slave
communication
Accepting communication/command from an
unauthorized IPs. No
(M4) Disable/Compromise
Master/Slave
Accepting operation commands from an
unauthorized IPs. No
(M5) Unauthorized read/write
data
Accepting read/write commands from an
unauthorized IPs. Yes
(M6) Clear counters and
diagnostic registers
FC 08, and Sub FC 10 is used for clearing
counters and diagnostic registers. Yes
(M7) Remote restart FC 08, and Sub FC 01 is used for restarting
the Modbus device remotely. Yes
(M8) Force PLC into listen-only
mode
FC 08, and Sub FC 04 is used to put PLC into
listen-only mode. Yes
(M9) Report server information Attacker can use FC 17 to enumerate PLCs. Yes
(M10) Clear overrun counters and
diagnostic flags
FC 08, and Sub FC 20 is used for clearing
overrun counters and diagnostic flags. No
(M11) Broadcast message spoofing Attacker sends faked broadcast messages. No
(M12) Direct slave control By identity spoofing, attacker access the slave
device. No
(M13) Passive reconnaissance Passively sniffing network traffic. No
(M14) Response delay Delaying the response from slave devices to
the master. No
(M15) Man in the middle attack
Access to SCADA network and put device
between master and outstation device to sniff
and modify the messages.
No
5.2 Attacks on DNP3 protocol [2], [4], [15]

Multidisciplinary International Research Journal of Gujarat Technological University ISSN: 2581-8880
VOLUME 2 ISSUE 2 JULY 2020 39
Table: 5 Attacks on DNP3 Protocol
No. Attack Goal Methodology
IPTables
Rule
Defined?
(D1) Gain SCADA system access
Access to wireless PCN, Third party access,
Access to remote field sites, or Use of
SCADA transmission media.
No
(D2) Passive reconnaissance Passively sniffing network traffic. No
(D3) Baseline response replay
Attacker sends spoofed message as a response
to master and as a command to an outstation
devices.
No
(D4) Man in the middle attack
Access to SCADA network and put device
between master and an outstation device to
sniff and modify the messages.
No
(D5) Transport sequence
modification
Attacker sends spoofed message in
fragmented message sequence. No
(D6) Outstation write attack FC 2 is used to writes data on an outstation
device. No
(D7) Clear objects attack FC 9, and 10 are used to freeze and clear the
data objects. Yes
(D8) Outstation data reset FC 15 is used to reinitialize the data objects
on outstation. No
(D9) Configuration capture attack
Fifth bit in second byte of the IIN is set in the
message informs master to resend the
configuration file again to an outstation.
No
(D10) Length overflow attack Incorrect value is set in the length field. No
(D11) DFC flag attack Attacker sets DFC flag to indicate an
outstation as busy. No
(D12) Reset function attack FC 1 is used to reset the user process on the
outstation device. No
(D13) Unavailable function attack FC 14 or 15 is used to make the outstation
device unavailable to the master. No
(D14) Destination address
alteration
Attacker alter the destination address field to
affect the communication. No
(D15) Fragmented message
interruption
FIR and FIN flags are set in wrong
fragmented message to disrupt
communication.
No
(D16) Outstation application
termination attack
FC 18 is used by attacker to terminate the
applications running on an outstation. Yes

Multidisciplinary International Research Journal of Gujarat Technological University ISSN: 2581-8880
VOLUME 2 ISSUE 2 JULY 2020 40
(D17) Disable unsolicited responses
attack
FC 21 is used by attacker to stop unsolicited
response update from an outstation to master. Yes
(D18) Warm restart attack
FC 14 is used to restart the communication in
the outstation. Continuous stream of this
attack can lead to DoS attack as well.
Yes
(D19) Cold restart attack FC 13 is used to restart the outstation device. Yes
(D20) Broadcast message spoofing Attacker sends faked broadcast messages. Yes
5.3 Attacks on IEC 104 protocol [19], [18], [7], [9], [23]
Table: 6 Attacks on IEC 104 Protocol
No. Attack Goal Methodology
IPTables
Rule
Defined?
(I1) Gain SCADA system access
Access to wireless PCN, Third party access,
Access to remote field sites, or Use of
SCADA transmission media.
No
(I2) IEC/104 port communication
Establish spoofed connection or hijack the
established connection between client and
server.
No
(I3) Spontaneous messages storm Attacker sends huge amount of false
spontaneous messages. No
(I4) Unauthorized read command Unauthorized client sends command to read
the field device. No
(I5) Unauthorized interrogation
commands
Unauthorized client sends interrogation
command against server. No
(I6)
Remote control commands or
remote adjustment
commands
Unauthorized client sends control or
adjustment command.
No
(I7) Reset process command
Unauthorized client sends command with
type identification 69H to reset the process of
server.
No
(I8) Broadcast request Attacker sends faked broadcast messages. No
(I9) Buffer overflow Incorrect packet length. No
(I10) Network reconnaissance Port scanning from known and unknown
hosts No
(I11) Man in the middle attack
Access to SCADA network and put device
between master and an outstation device to
sniff and modify the messages.
No

Multidisciplinary International Research Journal of Gujarat Technological University ISSN: 2581-8880
VOLUME 2 ISSUE 2 JULY 2020 41
(I12) Single command attack Unauthorized client sends a single command
to execute. No
(I13) Modification and injection
attack
Command is modified or injected in SCADA
system using MiTM. No
6 DISCUSSION
Several papers have examined the SCADA security issues with detailed information of major protocols
used in SCADA systems, attacks on those protocols, attack impacts, and use of different methodology as a
countermeasure. In [1] the authors provide technical details of various SCADA protocols along with their
corresponding packet structure. Among all those protocols, Modbus, DNP3 and IEC 60870-5-104 (aka IEC
104) are the most widely used protocols in SCADA systems. Different vulnerabilities and attacks on above
three major protocols have been identified by the authors in [2], [3], [4], [5], [6], [7], [8], [9], and [10].
Moreover, in [11] the authors have implemented a secure Modbus protocol with the help of cryptography,
in [12] the authors have presented a security framework for DNP3 protocol. In [16], [18], [19] and [20] the
authors have presents various firewall/intrusion detection system (IDS) solutions with different approaches.
In [17], the authors have used iptables as a firewall for network based attacks. Furthermore in [13], [14],
and [15] the authors implements Linux iptables as a firewall for SCADA systems. Although lot of research
work has been accomplished in direction of firewall/IDS for SCADA System, but most of them are for
Modbus protocol and DNP3 protocol and only few for IEC 104 protocol. Also we did not find any paper
that examines or evaluates Linux iptables on IEC 104 protocol.
7 CONCLUSION AND FUTURE PLANS
This paper presented the review of SCADA systems and three major protocols used in SCADA network
communication. We have analyzed various traffic filtering based security solutions and found open-source
Linux iptables are good and effective solution to secure SCADA systems. We have analyzed several attacks
on all these three protocols and determined whether an iptables based rules are defined for those attacks or
not. Our evaluation shows that for Modbus and DNP3 protocols, iptables rules are defined for only few
attacks and lacking for many of the attacks. For IEC 104 protocol, iptables based approach is totally
unexplored and no rule is defined for any of the attacks.
In the future plans,
We will investigate iptables based firewall system against SCADA systems which uses IEC 104
protocol.
We will develop rules for attacks of Modbus and DNP3 protocols where it is lacking.

Multidisciplinary International Research Journal of Gujarat Technological University ISSN: 2581-8880
VOLUME 2 ISSUE 2 JULY 2020 42
REFERENCES
1. Francia, G. A. III., Francia, X. P., Pruitt, A. M.: Towards an In-depth Understanding of Deep Packet
Inspection Using a Suite of Industrial Control Systems Protocol Packets. In: Journal of Cybersecurity
Education, Research and Practice, vol. 2016: no. 2, article 2 (2016).
2. Drias, Z., Serhrouchni, A., Vogel, O.: Taxonomy of attacks on industrial control protocols. In:
International Conference on Protocol Engineering (ICPE) and International Conference on New
Technologies of Distributed Systems (NTDS) (2015).
3. Byres, E. J., Franz, M., Miller, D.: The Use of Attack Trees in Assessing Vulnerabilities in SCADA
Systems. In: IEEE Conf. International Infrastructure Survivability Workshop (IISW'04), Institute of
Electrical and Electronics Engineers. Lisbon, (2004).
4. East, S., Butts, J., Papa, M., Shenoi, S.: A Taxonomy of Attacks on the DNP3 Protocol. In: International
Conference on Critical Infrastructure Protection, pp. 67-81. Springer, Berlin, Heidelberg (2009).
5. Zhu, B., Joseph, A., Sastry, S.: A taxonomy of cyber-attacks on SCADA systems. In: Proc. IEEE Int.
Conf. Internet Things, Int. Conf. 4th Int. Conf. Cyber, Phys. Soc. Comput., pp. 380–388 (2011).
6. Huitsing, P., Chandia, R., Papa, M., Shenoi, S.: Attack taxonomies for the Modbus protocols. In:
International journal of critical infrastructure protection, volume 1, pages: 37-44 (2008).
7. Grammatikis, P. R., Sarigiannidis, P., Giannoulakis, I., Kafetzakis, E., Panaousis, E.: Attacking IEC-
60870-5-104 SCADA Systems. In: IEEE World Congress on Services (SERVICES) (2019).
8. Morris, T. H., Gao, W.: Industrial Control System Cyber Attacks. In: 1st International Symposium for
ICS & SCADA Cyber Security Research 2013 (ICS-CSR 2013) (ICSCSR) (2013).
9. Parcharidis, M. D.: Simulation of cyber-attacks against SCADA systems (2018).
10. Bin, Z., Cheah: Testing and Exploring Vulnerabilities of the Applications Implementing IEC 60870-5-
104 Protocol. In: Institute for telematikk, Sweden (2008).
11. Fovino, I. N., Carcano, A., Masera, M., Trombetta, A.: Design and Implementation of a SecureModbus
Protocol. In: Third Annual IFIP WG 11.10 International Conference on Critical Infrastructure
Protection. Hanover, New Hampshire, USA (2009).
12. Majdalawieh, M., Parisi-Presicce, F., Wijesekera, D.: DNPSec: Distributed Network Protocol Version
3 (DNP3) Security Framework. In: K. Elleithy et al. (eds.), Advances in Computer, Information, and
Systems Sciences, and Engineering, 227–234. Springer, Dordrecht (2007).
13. Li, D., Guo, H., Zhou, J., Zhou, L., Wong, J. W.: SCADAWall: A CPI-Enabled FirewallModel for
SCADA Security. In: Computers & Security, volume-80, pages 134-154 (2018).
14. Nivethan, J., Papa, M.: On the use of open-source firewalls in ICS/SCADA systems. In: Information
Security Journal:A Global Perspective, Volume 25 Issue 1-3, Pages 83-93, Taylor & Francis, Inc.
Bristol, PA, USA (2016).

Multidisciplinary International Research Journal of Gujarat Technological University ISSN: 2581-8880
VOLUME 2 ISSUE 2 JULY 2020 43
15. Nivethan, J., Papa, M.: A Linux-based firewall for the DNP3 protocol. In: Technologies for Homeland
Security (HST), IEEE Symposium on, pp. 1-5. IEEE (2016).
16. Fovino, I. N., Coletta, A., Carcano, A., Masera, M.: Critical state-based filtering system for securing
SCADA network protocols. In: IEEE Transactions on industrial electronics, vol. 59, no. 10, pp. 3943-
3950 (2012).
17. Mihalos, M. G., Nalmpantis, S. I., Ovaliadis, K.: Design and Implementation of Firewall Security
Policies using Linux Iptables. In: Journal of Engineering Science and Technology Review 12 (1) 80 -
86 (2019).
18. Udd, R., Asplund, M., Nadjm-Tehrani, S., Kazemtabrizi, M., Ekstedt, M.: Exploiting Bro for Intrusion
Detection in a SCADA System. In: CPSS '16 Proceedings of the 2nd ACM International Workshop on
Cyber-Physical System Security, Pages: 44-51 (2016).
19. Yang, Y., McLaughlin, K., Littler, T., Sezer, S., Pranggono, B., Wang, H. F.: Intrusion Detection
System for IEC 60870-5-104 based SCADA networks. In: IEEE Power & Energy Society General
Meeting (2013).
20. Yang, Y., McLaughlin, K., Sezer, S., Yuan, Y. B., Huang, W.: Stateful intrusion detection for IEC
60870-5-104 SCADA security. In: IEEE PES General Meeting | Conference & Exposition (2014).
21. The Modbus Organization. “Modbus Application Protocol Specification v1.1b3”.
22. Clarke, G., Reynolds, D.: Practical Modern SCADA Protocols: DNP3, IEC 60870.5 and Related
Systems. Newnes, Oxford, United Kingdom (2004).
23. Maynard, P., McLaughlin, K., Haberler, B.: Towards Understanding Man-In-The-Middle Attacks on
IEC 60870-5-104 SCADA Networks. In: Queen’s University Belfast (2014).
24. Radoglou-Grammatikis, P., Sarigiannidis, P., Liatifis, T., Apostolakos, T., Oikonomou, S.: An
Overview of the Firewall Systems in the Smart Grid Paradigm. In: Global Information Infrastructure
and Networking Symposium (GIIS), Thessaloniki, Greece, 2018, pp. 1-4 (2018).
25. Dutta, N., Sarma, H. K. D., Polkowski, Z.: Cluster based routing in cognitive radio Adhoc networks:
reconnoitering SINR and ETT impact on clustering. In: Com. Com., (Elsevier), pp. 10-20, vol. 115
(2018).
26. Dutta, N., Sarma, H. K. D.: A probability based stable routing for cognitive radio Adhoc networks. In:
Wire. Net., (Springer), vol. 23(1), pp. 65-78 (2017).
27. Dutta, N., Misra, I. S.: Multilayer hierarchical model for mobility management in IPv6: a mathematical
exploration. In: Wire. Pers. Comm. (Springer), vol.78 (2), pp.1413-1439 (2014).
28. Dutta, N., Misra, I. S.: Mathematical modelling of HMIPv6 based network architecture in search of an
optimal Performance. In: IEEE 15th ADCOM, pp. 599-605, Guwahati, India (2007).

Multidisciplinary International Research Journal of Gujarat Technological University ISSN: 2581-8880
VOLUME 2 ISSUE 2 JULY 2020 44
OPEN-SOURCE IPTABLES BASED FIREWALL SOLUTION FOR
VARIOUS CYBER-ATTACKS ON ICS/SCADA SYSTEMS
Hardik Maru
Student (M.Tech in Cyber Security)
Marwadi University, Rajkot, Gujarat
Hepi Suthar
Assistant Professor
Marwadi University, Rajkot, Gujarat
ABSTRACT
There are very limited commercial firewalls are available in the market for SCADA network. In which
open-source IPTables based firewall solution is an identical approach to protect against various attacks. Till
now IPTables based firewall solutions were only experimented against either protocol specific SCADA
attacks, or small number of network based attacks. In this paper, we proposed a script to easily setup the
IPTables rules without much efforts. It provides protections against wide range of SCADA network attacks
including attacks on Modbus, DNP3, and IEC 60870-5-104 SCADA protocols, many network attacks, and
DoS attacks. Proposed solution uses advance features of IPTables and developed in such a way that packets
are only allowed if it passes through all chains of the firewall.
Keywords: SCADA systems; SCADA firewall; SCADA security; network security; open source; firewalls;
IEC 60870-5-104; Modbus; DNP3; network attacks; SCADA attacks; DoS attacks; Linux IPTables.
1 INTRODUCTION
SCADA systems are assigned with crucial duties of monitoring and controlling a critical infrastructures. In
every SCADA systems, Mater Terminal Unit is the core of the system which manages the communication,
and operations both. Human Machine Interfaces (HMIs) are used by the operators to monitor and control
the infrastructure. Before few decades, all these components were at one place within closed internal
network. But with time, technologies evolves and SCADA protocols were developed/upgraded to handle
the SCADA system over external network as well (mainly internet), which provides facilities to monitor
and operate the infrastructure from almost anywhere in the world. This was able to achieve with the use of
Internet Protocol (IP). However such advancement also invites wide range of attacks as the closed internal
SCADA networks are now exposed to internet. The top 3 majorly used protocols in SCADA system are
Modbus, DNP3, and IEC 60870-5-104. These are TCP/IP based protocols enabling SCADA systems to
communicate over the Internet. Various protocol specific attacks are discussed by the authors in [1].
SCADA network are also facing various network based attacks and DoS attacks which are discussed in
later part of the paper.

Multidisciplinary International Research Journal of Gujarat Technological University ISSN: 2581-8880
VOLUME 2 ISSUE 2 JULY 2020 45
Several researchers have proposed different methodologies to protect the SCADA network from these
attacks. Namely whitelisting based approach, anomaly-based approach, IPTables based firewall and etc.
which are discussed already discussed by the authors in [1]. While most of the existing firewall solutions
used in industry for SCADA systems are proprietary, various researchers proposed open-source IPTables
based firewall solution for SCADA network. In our survey [1], we recognized that those works are very
limited in number for SCADA protocol specific attacks, and some network based attacks. Which creates
huge gap to secure SCADA network system in real-time environment. Also implementing IPTables rules
in proper sequence seeking highly technical knowledge and accuracy in order to make it work properly. To
fill these gap authors take a step ahead in the work accomplished till now and initiated a complete SCADA
firewall solution in terms of bash script. This script is developed with objective of easy deployment of
IPTables firewall rules. With minimum efforts anyone can deploy over 45+ rules to protect the SCADA
network from 50+ SCADA attacks. The script is developed to setup the rules in such a way that it protects
against attacks in hierarchy. Which is in descending as follow, DoS attacks, network based attacks, protocol
specific attacks. Proposed solution only allows a packet if it pass though all these hierarchical rules in order
to ensure the optimum security in timely manner.
In this paper our main objectives are to develop an open-source firewall solution for SCADA system which
can be used in real-time SCADA network environment and is also super easy to deploy and maintain by
administrator with almost no knowledge of rule creation thought IPTables. And to achieve these objectives
we proposed a script where just few things are needed to enter, such as legitimate IPs and device physical
addresses and rest of the hard work is fully automated.
Specifically the rest of the paper is sorted out as follows. Section 2 gives the overview of SCADA systems
and major 3 protocols. Section 3 provides details of various network attacks and DoS attacks. Section 4
provides the details of proposed method. Section 5 and 6 represents implementation and experimentation.
Section 7 discusses related works. Finally, Section 8 concludes this paper.

Multidisciplinary International Research Journal of Gujarat Technological University ISSN: 2581-8880
VOLUME 2 ISSUE 2 JULY 2020 46
2 BACKGROUND
Image 1: Generic SCADA Architecture
In critical infrastructures, huge number of parallel industrial processes are running. Due to this monitoring
and controlling of these processes are very difficult because of different types of input and output for each
process. The Supervisory Control and Data Acquisition (SCADA) system is a centralized control and
monitoring system used to manage these complex industrial processes. It collects the data from sensors,
actuators, or instruments, then the collected data is being processed and represented. SCADA systems are
extremely important and widely used in modern industrial control systems and critical infrastructures (e.g.
food and beverage industries, power generation plants, petroleum industries, energy sector, transportation
systems, sewage plants, manufacturing industries, recycling plants, and many more). [1]. It is a software
application that is implanted on the hardware devices to enable SCADA operators to manage industrial
processes. SCADA systems are very crucial as industries are using it for maintaining the plant efficiency,
processes the data for quick and efficient decisions, and reduce the downtime of the industrial process.
Human Machine Interfaces (HMIs), Master Terminal Unit (MTU), Remote Terminal Units (RTUs),
Programmable Logic Controllers (PLCs), Sensors and Actuators, and Communication Network
Infrastructure are the main components of SCADA system. RTUs and PLCs are used to collect the data
from end-point sensors or actuators, store it and forward it to the MTU on the request. MTU is the brain of
the SCADA system which is responsible for collecting, storing, processing, distributing and displaying the

Multidisciplinary International Research Journal of Gujarat Technological University ISSN: 2581-8880
VOLUME 2 ISSUE 2 JULY 2020 47
data along with managing communication. SCADA operators can monitor and control whole SCADA
system with the help of HMIs. Main objectives of the SCADA systems are monitor, measuring, data
acquisition, communication, process controlling and automation.
In order to fulfill above objectives, the SCADA systems needs a protocols for communication. Protocols
are like language or terminology which enables the SCADA components to communication with each other
and transmit the data. Various SCADA protocols are Modbus, DNP3, IEC-60870-5-104, IEC 61850,
Ethernet/IP, Profibus, Conitel, ICCP, OPC, EtherCAT, OSGP, and etc. Overview of only major protocols
are given below.
Modbus/TCP is designed with the basic point-to-point concept for Ethernet communication. Modicon
designed it by extending the Modbus/RTU protocol, for communication with Modicon PLCs. In Modbus
protocol based SCADA systems, there is one master and multiple slaves, all the end devices or equipment
serves as a slave. As it uses request-response communication model, all the slaves only respond to the
command ordered by the master device. Each slave is assigned with unique slave address from 1 to 247. A
detailed technical information about Modbus protocol with its architecture and function codes is provided
by the authors in [1].
The DNP3 (Distributed Network Protocol 3) is combination of communications protocols in one set. These
protocols are used for inter SCADA components communication. Its interoperability, robust structure, and
reliably transmitting data in small sequenced packets increases the SCADA system efficiency. It is mostly
used in water and electric utilities but it has capabilities to use in other industries as well. DNP3 supports 4
different modes of communication, one master-one slave, one master-multiple slaves, multiple masters-one
slave, and a master-slave/s or master/s. A detailed technical information about DNP3 protocol with its
architecture and function codes is provided by the authors in [1].
IEC 60870-5-104 (a.k.a. IEC 104) is an enhanced version of IEC 60870-5-101 with TCP/IP based
communication network access. Where IEC 60870 are standards designed by IEC (International
Electrotechnical Commission) exclusively for SCADA systems in power and electrical systems. A detailed
technical information about IEC 60870-5-104 protocol with its architecture and function codes is provided
by the authors in [1].
3 SCADA ATTACKS
In this section we summaries various attacks on SCADA system for following domains. A. Network based
attacks, B. DoS attacks, C. Modbus protocol based attacks, D. DNP3 protocol based attacks, E. IEC 60870-
5-104 protocol based attacks, and F. IEC 61850 protocol based attacks.

Multidisciplinary International Research Journal of Gujarat Technological University ISSN: 2581-8880
VOLUME 2 ISSUE 2 JULY 2020 48
3.1 Network based attacks
Below described attacks are the most common network based attacks.
3.1.1 Gain unauthorized SCADA access:
Normally, an unauthorized user gain the access to the SCADA network and establish the communication.
And attacker can perform any malicious activity on the network to damage the SCADA system processes.
3.1.2 Invalid packet request attack:
In this attack, an attacker sends an invalid packets the SCADA network. For ex. TCP packets with all TCP
flags unset.
3.1.3 Non-established/Unrelated packet attack:
In this attack, an attacker sends packets to the SCADA network in which communication is not established
or the packets are unrelated to the SCADA system.
3.1.4 Invalid SYN packet attack:
In this attack, an attacker sends packets to the SCADA network with invalid SYN request. For ex. packet
has SYN and RST flags are set together, or SYN and FIN flags are set together, or SYN, FIN, RST, and
ACK flags are set together.
3.1.5 New connection request with wrong flag attack:
In this attack, an attacker sends request packet to establish new connection to the SCADA network with
wrong flags set apart from SYN flag.
3.1.6 Malformed XMAS attack
In this attack, an attacker sends packets to the SCADA network with all TCP flags set.
3.1.7 Malformed NULL attack
In this attack, an attacker sends packets to the SCADA network with all TCP flags unset.
3.1.8 Network reconnaissance
In this attack, an attacker engages with the SCADA network in order to gather information about the
network. TCP packets are used where either URG flag is set, or PSH flag is set, or FIN flag is set, or FIN,
and RST flags are set, or ACK, RST, SYN, FIN, and URG flags are set, or SYN, and ACK flags are set
with new communication request.
3.1.9 Man in The Middle (MiTM) attack

Multidisciplinary International Research Journal of Gujarat Technological University ISSN: 2581-8880
VOLUME 2 ISSUE 2 JULY 2020 49
In this attack, an attacker intercepts the communication between two nodes inside the SCADA network.
Further the intercepted communication can be used to understand the internals of SCADA system and
generate a comprehensive attack.
3.2 DoS attacks [2] [3]
3.2.1 TCP SYN flood attack
In this attack, an attacker sends a huge amount of TCP packets with SYN flag set to flood the target system.
3.2.2 ICMP flooding attack / Ping flood attack / Smurf attack
In this attack, an attacker sends a huge amount of ICMP packets to flood the target system.
3.2.3 UDP flood attack
In this attack, an attacker sends a huge amount of UDP packets to flood the target system.
3.2.4 TCP RST flood attack
In this attack, an attacker sends a huge amount of TCP packets with RST flag set to flood the target system.
3.2.5 TCP FIN flood attack
In this attack, an attacker sends a huge amount of TCP packets with FIN flag set to flood the target system.
3.2.6 TCP ACK flood attack
In this attack, an attacker sends a huge amount of TCP packets with ACK flag set to flood the target system.
3.2.7 Ping of death attack
In this attack, an attacker sends a huge amount of fragmented ICMP packets, or sends IP packets with size
more than 65536 bytes to flood the target system.
3.2.8 Slowloris attack
In this attack, an attacker overwhelm the SCADA network with simultaneously opening and maintain
connections more than the network can handle.
3.3 Modbus protocol based attacks, 3.4 DNP3 protocol based attacks, and 3.5 IEC 60870-5-104
protocol based attacks
Below listed all attacks based on Modbus, DNP3, and IEC 60870-5-104 protocols are already described by
the authors in [1]

Multidisciplinary International Research Journal of Gujarat Technological University ISSN: 2581-8880
VOLUME 2 ISSUE 2 JULY 2020 50
Table 1: Protocol based attacks
Index Modbus DNP3 IEC 60870-5-104
1 Identify Modbus device Outstation write attack Spontaneous message storm
2 Disable/Compromise
master/slave attack
Clear object attack Unauthorized read command
attack
3 Disrupt master-slave
communication
Destination address alteration
address (MiTM)
Unauthorized Interrogation
command attack
4 Data read attack Transport sequence
modification attack (MiTM)
Remote control/Remote
adjustment command attack
5 Data write attack DFC flag attack Reset process attack
6 Clear counters and diagnostic
registers attacks
Outstation application
termination attack
Modification and injection
attack (MiTM)
7 Remote restart attack Disable unsolicited response
attack
Unauthorized single
command attack
8 Force PLC to listen-only
mode attack
Warm restart attack Broadcast message spoofing
attack
9 Report server information
attack
Cold restart attack Invalid ASDU address field
attack
10 Broadcast message spoofing
attack
Broadcast message spoofing
attack
Buffer overflow attack
11 Direct slave control attack
(MiTM)
Baseline response reply attack
(MiTM)
Command injection attack
12 - Configuration capture attack -
13 - Outstation data reset attack -
14 - Reset function attack -
15 - Unavailable function attack -
16 - Length overflow attack -
4 RELATED WORK
In [2], and [3], the authors uses Linux IPTables to develop rules for mitigate only few types of DoS/DDoS
attacks. Several classification of firewalls and details of DoS/DDoS attacks are discussed. Those attacks
are simulated and tested for analyzing the IPTables based firewall.

Multidisciplinary International Research Journal of Gujarat Technological University ISSN: 2581-8880
VOLUME 2 ISSUE 2 JULY 2020 51
In [4], [5], and [15], the authors proposed the use of Linux IPTables as a firewall solution for SCADA
systems. Rules for some attacks based on Modbus protocol and DNP3 protocol are developed and tested
on test-bed. In [4], and [5], rules are created for only few attacks of both protocols, While in [15], the
authors proposed a “SCADAWall” model, which is made up of 3 algorithms, A) Comprehensive Packet
Inspection (CPI), B) Proprietary Industrial Protocol Extension Algorithm (PIPEA), and C) Out of Sequence
Detection Algorithm (OSDA). OSDA is used to determine the off-sequenced process commands in the
SCADA system, while PIPEA enables the firewall model to add any proprietary protocols in the model to
be used. The CPI algorithm proposed to check the payload data as well along with the function code of
Modbus protocol, and insist to develop all rules for whitelisting the legitimate commands and drop
everything which is not whitelisted.
5 PROPOSED METHOD
Linux is one of the most popular open-source operating system, and IPTables is a flexible rule based firewall
utility program available in all Linux distributions. It is a user space command line interface to the Netfilter
systems of Linux kernel. As the Netfilter implements the firewall and routing capabilities within Linux
kernel, any Linux machine can be act as a firewall system used for network packet filtering. It has extremely
useful features to filter the packets based on protocol, source ip address, destination ip address, mac address,
source port number, destination port number, TCP flags, limiting the incoming/outgoing traffic, and etc.
We used these features for creating rules for attacks of Network domain and DoS domain. For creating
rules for protocol specific attacks, we used the u32 feature of an IPTables to check the payload of the packet
and decide whether to allow the packet or not. In [4], and [5], the authors explained the u32 matching
feature of the IPTables for Modbus and DNP3 SCADA protocols.
By default IPTables has 5 types of categories or tables as described below, for our script we will use default
filter table along with the custom chains for the attacks:
Table 2: Tables in IPTables
Table Name Usage Inbuilt Chains
Filter (Default) Packet filtering INPUT, OUTPUT, FORWARD
NAT Network Address Translation PREROUTING, POSTROUTING
Mangle Packet alteration PREROUTING, OUTPUT
Raw Packet ordering PREROUTING, OUTPUT
Security Mandatory Access Control -

Multidisciplinary International Research Journal of Gujarat Technological University ISSN: 2581-8880
VOLUME 2 ISSUE 2 JULY 2020 52
Below table describes all the default chains, but user can also create a custom chain in the IPTables:
Table 3: Chains in IPTables
Chain Name Description
INPUT For packets desired to receive on local machine
FORWARD For packets routed from the local machine
OUTPUT For packets generated from local machine desired to send outside.
PREROUTING For packet modification on arrival
POSTROUTING For packet modification on sending
In this paper, we propose a script to setup the 47 IPTables rules for all the attacks described in previous
section. The script is designed to set and check for all rules in hierarchical approach first by chains and then
by rules for each domain to drop all malicious packets used to attack the SCADA system network. Image
2: Script flowchart
Working flow of the rules is represented in step-by-step flowchart below.
1) Limiting the incoming packets for mitigating DoS attacks.
2) Check for authorized sender identity by source IP address.

Multidisciplinary International Research Journal of Gujarat Technological University ISSN: 2581-8880
VOLUME 2 ISSUE 2 JULY 2020 53
3) Check for authorized sender identity by source MAC address.
4) Check packet destination port to filter the packet for protocol specific rules.
5) If the packet is of Modbus protocol, it will be pass through Modbus specific rules and if it is valid then
IPTables will accept the packer or drop the packet.
6) If the packet is of DNP3 protocol, it will be pass through DNP3 specific rules and if it is valid then
IPTables will accept the packer or drop the packet.
7) If the packet is of IEC 104 protocol, it will be pass through IEC 104 specific rules and if it is valid then
IPTables will accept the packer or drop the packet.
So at the first the script will set the rules to mitigate the DoS/DDoS attacks on SCADA system, then rules
to verify the sender of packets based on IP address and MAC address both, after that packet will be checked
against rules for common network based attacks. If packet is legitimate then it will be further checked for
protocol specific attacks and if it pass those rules then only the firewall will accept the packet.
6 IMPLEMENTATION
A proposed script contains 47 chains for logs and 5 chains for the attack domains. Each LOG chain is
assigned with unique postfix digits according to the rule number. This logging chain mainly consist “log
message” which is set with limit to 5 logs per minute, --log-level 1 define the alert message, and “action”
to either accept or drop the packet.
Image 3: Log Rule Example
Many times when the network is under DoS/DDoS attacks, the firewall or IDS blocks the legitimate
requests as well. To resolve this issue, we used “hashlimit” module of IPTables. It uses hash buckets to
determine the rate limit match each connection. So for example an attacker is flooding SCADA system
from 5 different connections (nodes), then the rules will match the rate limit for each node separately and
will drop the packets when crosses the limit. So legitimate request can be processed properly. In our
proposed script we set the hashlimit to 1 packet per second, -burst 20 defines maximum 20 initial number
of packet can match, -mode srcip defines rule to match based on source address, -srcmask 32 is used to
group all encountered source addresses. All rules of DoS attacks are added to “DOS_RULES” chain.

Multidisciplinary International Research Journal of Gujarat Technological University ISSN: 2581-8880
VOLUME 2 ISSUE 2 JULY 2020 54
Image 4: DoS Attack Rule Example
For filtering packets from trusted/authorized users two chains are created “IP_RULES” and
“MAC_RULES” in which the script reads the trusted IP addresses and MAC addresses from the file and
accept packets only from them.
Image 5: IP Address filtering Rule Example
For Network attacks, Modbus, DNP3, and IEC104 protocol based attacks, “NETWORK_RULES”,
“MODBUS_RULES”, “DNP3_RULES”, “IEC_104_RULES” chains are is created respectively. Example
rule of each chain is represented below.
Image 6: Network Based Attack Rule Example

Multidisciplinary International Research Journal of Gujarat Technological University ISSN: 2581-8880
VOLUME 2 ISSUE 2 JULY 2020 55
For SCADA protocol based attacks we enhanced each rule to allow only specific device to send any
command packet. For example we have 10 trusted devices in SCADA network but only specified device
can send write data command to the slave devices. These rules uses the concept of binary shifting and
masking as u32 matching module of IPTables checks 32 bits (4 Bytes) at once. So if the portion of packet
which needs to check is less than 32 bits then the targeted portion should be shifted and masked in order to
get the desired value. The “0>>22&0x3C@” defines that 4 bytes to match will start from byte ‘0’ of the
packet and right shift it for 22 times, after shifting these bits are being masked with binary conversion of
hex value ‘3C’. ‘@’ sign is used to instruct the IPTables pointer to move at the position which is result of
the shifting and masking. In our case “0>>22&0x3C@” is used to check the length of IP and move to the
start of TCP packet, “12>>26&0x3C@” is used to check the length of the TCP and move to the start of
SCADA protocol. ‘=’ sign is used to check the value is equal or not.
Image 7: Modbus Protocol Based Attack Rule Example
Image 8: DNP3 Protocol Based Attack Rule Example

Multidisciplinary International Research Journal of Gujarat Technological University ISSN: 2581-8880
VOLUME 2 ISSUE 2 JULY 2020 56
Image 9: IEC 104 Protocol Based Attack Rule Example
7 EXPERIMENTATION
Image 10: Test-bed Setup
For experimenting the proposed script of SCADA firewall rules were tested on test bed. Test bed contains
2 all-in-one PCs as a firewall machine and target machine, and 1 laptop as an attacker machine.
Configuration of these machines are: Firewall: Lenevo V310z, Unubtu 18.04.3 LTS (64 bit), 8GB RAM,
Intel Core i5-7400 3.00GHz, Target: Lenevo V310z, Windows 10 Enterprise (64 bit), 8GB RAM, Intel
Core i5-7400 3.00GHz, Dell Inspiron 5521, Windows 8.1 (64 bit), 4 GB RAM, Intel Core i5-<3700>
1.80GHz. All three machines were connected using Ethernet cables, a SMACC HLF1081A (USB to
Ethernet) adapter was used on firewall machine as an additional network interface. We used Wireshark [6]
to analyze the network traffic, which was generate, pass through, and received on attacker, firewall, and
target machines respectively. In VMWare Workstation [8], Kali linux 2019.4 [7] was installed on attacker
machine to generate DoS attacks using “hping3” [9] tool. We used colasoft packet builder [10], for
building/customizing a packet to generate various attacks. For testing SCADA protocol specific rules, we

Multidisciplinary International Research Journal of Gujarat Technological University ISSN: 2581-8880
VOLUME 2 ISSUE 2 JULY 2020 57
used “Modbus Poll” and “Modbus Slave” simulators [11], DNP3 server and client simulators [12], IEC
Server [13], and QTester [14].
A bridge was created on firewall machine to establish inter-connection from the attacker machine to the
target machine. This bridge add both network interfaces (built in network interface + USB to Ethernet
interface) for connection. Steps to create a bridge network are as follow:
Image 11: Bridge Network Setup Steps

Multidisciplinary International Research Journal of Gujarat Technological University ISSN: 2581-8880
VOLUME 2 ISSUE 2 JULY 2020 58
Image 12: Bridge Network Setup
After establishing inter-communication between all three machines, all listed attacks were performed and
IPTables rules were analyzed against it. We determined that IPTables based SCADA firewall was
successfully blocking the attacks.
Image 13: Invalid SYN Packet Attack Generation from Attacker Machine
Image 14: Invalid SYN Packet Attack Traffic on Firewall Machine

Multidisciplinary International Research Journal of Gujarat Technological University ISSN: 2581-8880
VOLUME 2 ISSUE 2 JULY 2020 59
Image 15: Traffic on Target Machine from Invalid SYN Packet Attack
For IEC below screenshots shows that single command was accepted when there were no IPTables rules
deployed and after deployment the same command was dropped by IPTables firewall.

Multidisciplinary International Research Journal of Gujarat Technological University ISSN: 2581-8880
VOLUME 2 ISSUE 2 JULY 2020 60
Image 16: Unauthorized Single Command Attack Generation from Attacker Machine
Image 17: Unauthorized Single Command Attack Traffic on Firewall Machine

Multidisciplinary International Research Journal of Gujarat Technological University ISSN: 2581-8880
VOLUME 2 ISSUE 2 JULY 2020 61
Image 18: No Effects of Unauthorized Single Command Attack on Target Machine
8 CONCLUSION
This paper extended the use of open source IPTables based firewall solution for SCADA systems. Till now
the use of IPTables were limited to either protocol specific attacks or only some of the network based
attacks. In this paper, we have developed a script to easily setup firewall rules specific to SCADA networks
and protect it against wide range of attacks. These includes Modbus, DNP3, IEC 104 protocols based
attacks, as well as many network based attacks, and DoS attacks. Result of experiments shows that our
script is successfully blocking 50+ different attacks on SCADA network. Methodology to develop the rule
is described, also few regions of the script are presented in this paper. The proposed script has been tested
and validated on test bed at the Cyber Security Laboratory at Marwadi University.
REFERENCES
1. Hardik Maru and Hepi Suthar, “A Survey on the Use of Open-Source Firewall for Major SCADA
Protocols”, in Multidisciplinary International Research Journal of Gujarat Technological University,
July 2020.
2. M. G. Mihalos, S. I. Nalmpantis, and K. Ovaliadis. "Design and Implementation of Firewall Security
Policies using Linux Iptables", Journal of Engineering Science and Technology Review 12 (1) 80 -86,
February 2019.

Multidisciplinary International Research Journal of Gujarat Technological University ISSN: 2581-8880
VOLUME 2 ISSUE 2 JULY 2020 62
3. Bahaa Qasim Musawi, “Mitigating DoS/DDoS attacks MITIGATING DoS/DDoS ATTACKS USING
IPTABLES”, in International Journal of Engineering and Technology 12:101-111 · January 2012
4. J. Nivethan & M. Papa, "On the use of open-source firewalls in ICS/SCADA systems", Information
Security Journal:A Global Perspective, Volume 25 Issue 1-3, Pages 83-93, Taylor & Francis, Inc.
Bristol, PA, USA, 2016.
5. Jeyasingam Nivethan, and Mauricio Papa. "A Linux-based firewall for the DNP3 protocol", In
Technologies for Homeland Security (HST), 2016 IEEE Symposium on, pp. 1-5. IEEE, 2016.
6. Wireshark, https://www.wireshark.org/
7. Kali Linux, https://www.kali.org/
8. VMWare Workstation, https://www.vmware.com/
9. Hping3 Tool, http://www.hping.org/hping3.html
10. Colasoft Packet Builder, https://www.colasoft.com/packet_builder/
11. Modbus Tool, https://www.modbustools.com/index.html
12. DNP3 Simulator, http://www.freyrscada.com/dnp3-ieee-1815-Client-Simulator.php
13. IEC Server, https://sourceforge.net/projects/iecserver/
14. QTester for IEC 104, https://sourceforge.net/projects/qtester104/
15. Dong Li, Huaqun Guo, Jianying Zhou, Luying Zhou, and Jun Wen Wong "SCADAWall: A CPI-
Enabled FirewallModel for SCADA Security", Computers & Security, Volume-80, Pages 134-154,
January 2019.

Multidisciplinary International Research Journal of Gujarat Technological University ISSN: 2581-8880
VOLUME 2 ISSUE 2 JULY 2020 63
COMPRESSIVE STRENGTH STUDY OF GREEN CONCRETE BY
USING FERROCK
KAVITA SINGH
Head of the Department & Assistant Professor
Department of Civil Engineering
ITM Vocational University, Vadodara.
Email: [email protected]
ABSTRACT:
As a part of development, rate of building construction is also high, so it means there is lots of use of
concrete. It has been observed that 0.9 tons of CO2 is produced per ton of cement production. Thus, by
the use of green concrete it is possible to reduce the CO2 emission in atmosphere towards eco-friendly
construction. In this project there is replacement of cement with the percentage of ferrock. Ferrock is a
waste material of steel and having a tensile property. In this M20 Grade concrete is used and for that
the mix design was done having the different composition of cement, Fine Aggregate, Coarse Aggregate,
Ferrock and Water. The cubes are tested after the curing duration of 7 days, 28 days, and 56 days. In
this research work, there was replacement of the cement with the ferrock having a percentage variation
5%, 10 %, 15%, 20%. With the replacement of cement with ferrock it was found that compressive
strength of the green concrete was increased, and durability of the concrete was also increased. Also, it
was economical as ferrock is a waste material which is available free of cost, so it reduced the overall
cost of the work. Also, the Ferrock has a property to absorb the Carbon dioxide from the environment
so it is also reducing the air pollution.
Keywords: Green Concrete, Concrete Mix Design, Ferrock, Carbon Dioxide, Compressive
Strength.
1. INTRODUCTION
India is a developing country and due to this reason various construction work is going on. The main
material which is used as construction work in India is Cement. Cement is responsible for the huge
production of carbon dioxide in the environment. This huge production of carbon dioxide in the
environment leads to the environment problems such as air pollution, skin disease, respiratory problems,
global warming, climate change etc. Green concrete does not have any relation with the green colour.
Green concrete means to protect the environment by using the waste product in a constructive way.
Ferrock is created from waste steel dust (which would normally be thrown out) and silica from ground
up glass, which when poured and upon reaction with carbon dioxide creates iron carbonate which binds
carbon dioxide from the atmosphere into the Ferrock. Ferrock are tensile in nature which leads to
increase in the compressive strength and durability of the green concrete.

Multidisciplinary International Research Journal of Gujarat Technological University ISSN: 2581-8880
VOLUME 2 ISSUE 2 JULY 2020 64
2. OBJECTIVES
Following are the objectives of this research work:
To study the effect of Ferrock on the Environment.
To study the effectiveness of concrete by the partial replacement of the cement with ferrock.
To determine the compressive strength of new mix design of grade M 20.
To determine the test result for the compressive strength of green concrete.
To determine the optimum percentage of ferrock in cement so that we can achieve maximum
compressive strength.
3. RESEARCH METHODOLOGY
To fulfil the above objectives following research methodology is applied:
To do the literature review on the green concrete.
To do the deep study of the different ingredients of the green concrete.
To do the Mix Design for M 20 Concrete as per the Indian Codal Provisions.
To cast cubes by using different ingredients as per the Indian Standards.
To test the casted cubes for strength after 7, 28 and 56 days of curing respectively by performing
compressive strength test.
To compare between conventional concrete and green concrete based on various parameters.
4. LITERATURE REVIEW
Some of the research papers literature review are mentioned here. In this different researchers used the
different material for the casting of green concrete in different proportions which is mentioned below
and also shown the research gap (future work scope).
Table 1: Literature Review
Sr. No. Paper Name Literature Review Research Gap
1. High Volume Fly
Ash Mixed Green
Concrete For Civil
Engineering
Purposes[21].
Class F Fly ash is used for
replacing the cement and M 30
grade of Concrete is used having
a two different proportions of
water i.e. 0.42 and 0.40 as per
Indian Codal Provision. As per
the Codal provision 25% of the
cement content was replaced by
Fly Ash. The samples are tested
In initial phase the
compressive strength of
green concrete is less as
compare to the normal
concrete and its flexural
strength is also less.

Multidisciplinary International Research Journal of Gujarat Technological University ISSN: 2581-8880
VOLUME 2 ISSUE 2 JULY 2020 65
for a compressive strength at a
duration of 28 days, 56 days, and
90 days. High volume fly ash
added with green concrete was
having higher strength and
durability as compare to normal
concrete.
2. Experimental Study
on Green
Concrete[20].
Addition of micro silica in
cement reduces the air pollution.
The optimum replacement of
cement with silica 5 % to 15 %
leads to increase in strength
whereas 20 % replacement leads
to the decrease in the strength. It
gains more strength in less time
as silica fume particle size is very
small as compare to the cement.
By replacing the fine aggregate
with demolished brick will not
lead to increase in strength of
concrete but overall cost of the
project will be reduced about
20 %.
Compressive strength of
concrete is decreasing
after the 15 %
replacement of cement
with silica. Silica is also
the product which is
responsible for the air
pollution.
3. Green Concrete: An
Innovative Approach
to Sustainable
Development[8].
This paper deals with the usage
of different by products such as
fly ash, pozzocrete, used foundry
sand etc. It also deals with
finding out the compressive
strength of the concrete when the
cement is replaced by Pozzocrete
P60 as 30 % by weight of cement
and fine aggregate are replaced
by foundry sand 10 %, 25 % and
50 % by weight of cement. This
paper concludes that the use of
Pozzocrete P 60 and foundry
The study on the impact
of long-term properties
of concrete such as creep,
deflection, and shrinkage
etc.

Multidisciplinary International Research Journal of Gujarat Technological University ISSN: 2581-8880
VOLUME 2 ISSUE 2 JULY 2020 66
sand in the form of partial
replacement of cement and fine
aggregate is quite feasible for
strength.
4. A Review on the
Study of Green
Concrete[18].
It includes the convenience of the
usage of various by products
such as dust, fly ash, marble,
plastic waste, marble granules,
silica fumes, blast furnance slag
etc. Use of such materials
approximately 20 % of cement.
Green concrete has greater
strength and durability as
compare to the conventional
concrete.
The drawback of this
work is it has less
flexural strength, high
water absorption, higher
shrinkage, and creep.
5. Green Concrete for
Better Sustainable
Development[19].
Waste material has a significant
potential on green concrete. To
manufacture economical and
environment friendly
concrete , the replacement of
traditional ingredients of
concrete by waste materials and
by products plays a very
important role . It gives
opportunity to produce
environment friendly concrete .
Did not considered the
by-products effect on
strength of the concrete.
5. MATERIAL USED
5.1 Cement
In this project work, 53 grade of Ordinary Portland Cement is used. As per the Indian Standard the
different tests are done for the accuracy such as Fineness Test, Soundness Test, Consistency Test &
Initial and Final Setting time. Apart from this the other things regarding cement are monitored such as
color test, presence of lumps, adulteration test, temperature test, float tests, strength test and date of
packaging. After the testing it was found that this cement can be used for the practical purpose.

Multidisciplinary International Research Journal of Gujarat Technological University ISSN: 2581-8880
VOLUME 2 ISSUE 2 JULY 2020 67
5.2 Aggregate
Aggregate is one of the most important ingredient of the concrete which is responsible to provide the
strength to the structure. To get the better result we used the angular aggregate and as per the Indian
Codal Provisions we did the test such as crushing test, Abrasion test, Impact test, Soundness test, Shape
test, Specific Gravity and Water Abosrption Test. In these test the sample is passed as per the Indian
Codal Norms.
5.3 Ferrock
Ferrock is created from waste steel dust (which would normally be thrown out) and silica from ground
up glass, which when poured and upon reaction with carbon dioxide creates iron carbonate which binds
carbon dioxide from the atmosphere into the Ferrock. Compared to Portland cement (made from chalk
and clay and resembling Portland stone in colour), which is one of the leading types in use throughout
the world today, ferrock is actually five times stronger. It can withstand more compression before
breaking and is far more flexible, meaning it could potentially resist the earth moment cause by seismic
activity or industrial processes. One of the unique properties of ferrock is that it becomes even stronger
in saltwater environments, making it ideal for marine base construction projects. And rather than
emitting large amounts of CO2 as it dries, ferrock actually absorbs and binds it! These results in carbon-
negative process that actually helps to trap greenhouse gases.
6. INDIAN CODAL PROVISIONS FOR CONCRETE MIX DESIGN
6.1 Step 1 : To Find the Standard Deviation as per Indian Standards
Table 2: Standard Deviation Value for M20 Grade Concrete
Step 1 f m = fck + 1.65s
THE STANDARD DEVIATIONS ARE
GRADE VALUE UNIT
M20-M25 4 MPA

Multidisciplinary International Research Journal of Gujarat Technological University ISSN: 2581-8880
VOLUME 2 ISSUE 2 JULY 2020 68
6.2 Step 2: To Determine the W/C from Curves Provided in Indian Standards
Graph 1: Selection of W/C from Curves
6.3 Step 3: Water Content and Sand Contents for Concrete Grade up to M35
Table 3: Water Content and Sand Contents
M.S.A (MM) W (KG/M3) p = Fagg Vol. (% of total)
20 186 35
As per the Indian Standard for Concrete Mix:
Fine Aggregate Zone = 2
W/C = 0.6 upto M35
W/C = 0.35 > M35
Compaction Factor = 0.8
Estimate water content & sand content for concrete grades up to M35/ above M35
(Adjustments)
For change in values in water cement ratio, compaction factor and sand belonging
to zone 3 the following adjustment required.
Table 4: Percentage of Sand in Total Aggregates
Change in Condition Water
Content
Percentage of sand in total
aggregates
For decrease in water cement ratio
0 -2 (0.6 – 0.5) that is 0.1
0.1/0.05*1 = 2.0
For increase in compaction factor 3 0
(0.9 – 0.8) = 0.1
For sand compacting to zone 3 3 -3.5

Multidisciplinary International Research Journal of Gujarat Technological University ISSN: 2581-8880
VOLUME 2 ISSUE 2 JULY 2020 69
6.4 Step 4 : To Calculate the Cement Content and Aggregate Content as per IS
Calculate cement content, aggregate contents,
w/c = Min (W/C curve , W/C durability)
C = Max (W/w/c* , C durability)
V= [W+ C/SC + 1/ p× F agg / S Fagg ] × 1/1000
V = [W + C / SC + 1 / (1-p)×C agg / S Cagg ] × 1/1000
Table 5: IS Requirements for RCC
IS requirement (RCC)
Exposure Min C Max w/c Min Grade
Mild 300 0.55 20
Where,
MSA (MM) = 20
Content (%) = 2
7. MIX DESIGN FOR M 20 GRADE CONCRETE AS PER INDIAN STANDARDS
7.1 Given Data
Grade of concrete = M20
Grade of cement = 53 N/mm2
Moderate exposure zone 3 sand
Degree of workability = 0.9 C.F
Max. size of aggregate = 20 mm
Angular aggregate
Degree of quality control = good
Type of exposure = mild
7.2 Material Testing Data
PPC 53 grade cement is used, with 28 days strength 51N/mm2
Specific gravity of cement = 3.15
Bulk density = 1450 kg/m3

Multidisciplinary International Research Journal of Gujarat Technological University ISSN: 2581-8880
VOLUME 2 ISSUE 2 JULY 2020 70
Table 6: Properties of fine and Coarse aggregate
Aggregate Fine aggregate Coarse aggregate
S.G 2.66 2.75
Bulk density 1700 1800
Water absorption 1 0.5
Free moisture 2 NIL
7.3 To Find the Target Mean Strength for M 20 Concrete
Target mean strength (Fm) = fck + 1.65s
Fm = 26.6 N/mm2 (MPA)
7.4 Selection of W/C from Curve
W/C = 0.5
7.5 Estimate Water Content and Sand Contents for M 20 Grade Concrete
For maximum size of aggregate of 20 mm, the air content is taken as = 2
Water = 186 kg/m3
Sand = 35 % of total aggregate by absolute volume
Required water content = 191.58 lit / m3
Required sand content = 31.5 %
7.6 Determination of Cement Content
Water cement ratio = 0.5
Water = 191.58 lit. or kg
Cement = 383.16 kg/m3 > 300 kg/m3 , therefore O.K.
7.6.1 IS Method
Calculate cement content, aggregate contents,
w/c = Min (W/C curve , W/C durability)
C = Max (W/w/c* , C durability)
V= [W+ C/SC + 1/ p× F agg / S Fagg ] × 1/1000
V = [W + C / SC + 1 / (1-p)×C agg / S Cagg ] × 1/1000

Multidisciplinary International Research Journal of Gujarat Technological University ISSN: 2581-8880
VOLUME 2 ISSUE 2 JULY 2020 71
7.7 Determination of Fine Aggregate and Coarse Aggregate
Consider volume of concrete = 1m3
Entrapped air in wet concrete = 2%
Volume of fresh concrete (V) = 0.98m3
With the quantities of water & cement per unit volume of concrete & the ratio of fine to total aggregate
already determined, the total aggregate content per unit volume of concrete may be calculated from the
following equations.
7.7.1 For Fine Aggregates
Fine aggregate = 558.6966 kg mass of F.A.
Coarse aggregate = 1256.05 kg mass of C.A.
Table 7: Quantity of Different Materials used for the Concrete
Name of the Material Quantity in kg
Cement 383.16
Fine Aggregate 558.70
Coarse Aggregate 1256.05
Table 8 : Variation in the Quantity of Cement when it is Replaced with Ferrock
WHEN ADDED FERROCK (%) IN CEMENT (IT
IS FOR 1 M3) IT IS FOR =
0.00337
5 M3
% OF
FERROC
K
CEMEN
T (KG)
FERROC
K (KG)
F.A.
(KG)
C.A.
(KG)
CEMEN
T (KG)
FERRPC
K (KG)
F.A.
(KG)
C.A.
(KG)
0 383.16 0 558.7 1256.05 1.293 0 1.886 4.239
5 364.02 19.16 558.7 1256.05 1.229 0.065 1.886 4.239
10 344.84 38.32 558.7 1256.05 1.164 0.129 1.886 4.239
15 325.68 57.47 558.7 1256.05 1.099 0.194 1.886 4.239
20 306.52 76.63 558.7 1256.05 1.035 0.259 1.886 4.239
25 287.37 95.79 558.7 1256.05 0.97 0.323 1.886 4.239
30 268.21 114.95 558.7 1256.05 0.905 0.388 1.886 4.239
35 249.05 134.11 558.7 1256.05 0.841 0.453 1.886 4.239
40 229.89 153.26 558.7 1256.05 0.776 0.517 1.886 4.239
45 210.73 172.42 558.7 1256.05 0.711 0.582 1.886 4.239
50 191.58 191.58 558.7 1256.05 0.647 0.647 1.886 4.239
TOTAL 3161.05 1053.69 6145.
7
13816.5
5 10.67 3.557 20.746 46.629

Multidisciplinary International Research Journal of Gujarat Technological University ISSN: 2581-8880
VOLUME 2 ISSUE 2 JULY 2020 72
7.8 Proportion of Material as per the Mix Design for M20 Grade Concrete
Table 9: Proportions of Material
WATER CEMENT F.A. C.A. UNIT
0.28 1 1.458129 3.278136 KG
Table 10: Total Estimate of Quantity of Material used for the Making of Green Concrete
Cubes
WATE
R (kg)
FERROC
K (%)
CEMEN
T (KG)
FERROC
K (KG)
F.A.
(KG)
C.A.
(KG)
NO. OF
CUBES
TOTAL
WEIGHT (kg)
12.4966
8 0
7.780498
286 0
11.3449
7019
25.5055
3153 6 44.631
12.4966
8 1
7.702693
303
0.0778049
83
11.3449
7019
25.5055
3153 6 44.631
12.4966
8 2
7.624888
32
0.1556099
66
11.3449
7019
25.5055
3153 6 44.631
12.4966
8 3
7.547083
337
0.2334149
49
11.3449
7019
25.5055
3153 6 44.631
12.4966
8 4
7.469278
354
0.3112199
31
11.3449
7019
25.5055
3153 6 44.631
12.4966
8 5
7.391473
372
0.3890249
14
11.3449
7019
25.5055
3153 6 44.631
12.4966
8 6
7.313668
389
0.4668298
97
11.3449
7019
25.5055
3153 6 44.631
12.4966
8 7
7.235863
406
0.5446348
8
11.3449
7019
25.5055
3153 6 44.631
12.4966
8 8
7.158058
423
0.6224398
63
11.3449
7019
25.5055
3153 6 44.631
12.4966
8 9
7.080253
44
0.7002448
46
11.3449
7019
25.5055
3153 6 44.631
12.4966
8 10
7.002448
457
0.7780498
29
11.3449
7019
25.5055
3153 6 44.631
12.4966
8 15
6.613423
543
1.1670747
43
11.3449
7019
25.5055
3153 6 44.631

Multidisciplinary International Research Journal of Gujarat Technological University ISSN: 2581-8880
VOLUME 2 ISSUE 2 JULY 2020 73
12.4966
8 20
6.224398
629
1.5560996
57
11.3449
7019
25.5055
3153 6 44.631
12.4966
8 25
5.835373
714
1.9451245
71
11.3449
7019
25.5055
3153 6 44.631
12.4966
8 30
5.446348
8
2.3341494
86
11.3449
7019
25.5055
3153 6 44.631
12.4966
8 35
5.057323
886 2.7231744
11.3449
7019
25.5055
3153 6 44.631
12.4966
8 40
4.668298
972
3.1121993
14
11.3449
7019
25.5055
3153 6 44.631
12.4966
8 45
4.279274
057
3.5012242
29
11.3449
7019
25.5055
3153 6 44.631
12.4966
8 50
3.890249
143
3.8902491
43
11.3449
7019
25.5055
3153 6 44.631
237.436
92
GRAND
TOTAL
123.3208
978
24.508569
6
215.554
4335
484.605
0991 114
Table 11: Data of Green Concrete Cube
SIZE OF ONE CUBE 0.15 M3
NUMBER OF CUBES 6 NOS.
WET VOLUME OF CUBE 0.03078 M3
DENSITY OF CEMENT 1450 KG/M3
WET MATERIAL 0.52
DRY VOLUME OF CUBE 0.02025
WATER CONTENT 0.28
8. COMPRESSIVE STRENGTH TEST RESULT OF CUBES
Table 12: Compressive Strength of Cubes
SR.
NO.
CUBE
NO.
DAY
S
STRENGTH
(N/MM2)
FERROCK
(%) AVERAGE
STRENGTH
1
1
3
6.82
7.57
0%
2 8.06
3 7.85
4
28
18.98
20.64 5 20.74
6 22.2

Multidisciplinary International Research Journal of Gujarat Technological University ISSN: 2581-8880
VOLUME 2 ISSUE 2 JULY 2020 74
7
56
21.03
22.69 8 22.03
9 24.99
2
1
7
15.44
15.07
1%
2 14.65
3 15.13
4
28
20.15
20.76 5 21.53
6 20.62
7
56
26.43
27.19 8 25.25
9 29.91
3
1
7
17.56
17.34
2%
2 16.62
3 17.86
4
28
22.32
21.92 5 20.28
6 23.15
7
56
26.55
28.59 8 34.3
9 24.93
4
1
7
18.27
19.92
3%
2 18.92
3 22.58
4
28
21.97
22.09 5 22.56
6 21.75
7
56
24.8
27.13 8 28.91
9 27.7
5
1
7
18.94
20.58
4%
2 17.92
3 24.89
4
28
21.38
22.77 5 23.46
6 23.47
7
56
25.98
27.83 8 27.87
9 29.65
6
1
7
19.02
21.09
5%
2 20.29
3 23.98
4 28
22.56 23.47
5 22.98

Multidisciplinary International Research Journal of Gujarat Technological University ISSN: 2581-8880
VOLUME 2 ISSUE 2 JULY 2020 75
6 24.89
7
56
26.87
28.44 8 28.67
9 29.78
7
1
7
19.57
21.64
6%
2 20.24
3 25.12
4
28
24.23
24.4 5 23.56
6 25.43
7
56
26.97
29.76 8 29.78
9 32.54
8
1
7
20.76
21.81
7%
2 22.81
3 22.87
4
28
25.46
25.62 5 24.64
6 26.76
7
56
28.23
31.24 8 30.74
9 34.76
9
1
7
21.63
22.16
10%
2 22.39
3 22.48
4
28
24.78
25.94 5 27.59
6 25.46
7
56
36.48
36.67 8 36.34
9 37.2
10
1
7
22.35
22.88
15%
2 23.54
3 22.75
4
28
29.33
30.78 5 28.56
6 34.46
7
56
33.16
34.86 8 36.53
9 34.89
11
1
7
20.45
20.08 20%
2 20.16
3 19.63
4 28 30.56 30.67

Multidisciplinary International Research Journal of Gujarat Technological University ISSN: 2581-8880
VOLUME 2 ISSUE 2 JULY 2020 76
5 30.26
6 31.21
7
56
28.12
29.14 8 29.65
9 29.65
9. ANALYSIS OF THE RESULT
Following are the result analysis at different percentage of replacement of cement with ferrock at the
different curing period of 7 days, 28 days, and 58 days.
Graph 2: Compressive Strength of Green Concrete after 7 Days of Curing
Graph 3: Compressive Strength of Green Concrete after 28 Days of Curing
0
5
10
15
20
25
0% 1% 2% 3% 4% 5% 6% 7% 10% 15% 20%
Ch
arac
teri
stic
Str
en
gth
(N
/mm
2 )
Perctage of Ferrock
7 days
7 days
0
5
10
15
20
25
30
35
0% 1% 2% 3% 4% 5% 6% 7% 10% 15% 20%
Ch
arac
teri
stic
Str
en
gth
(N
/mm
2 )
Percentage of Ferrock
28 Days
28 Days
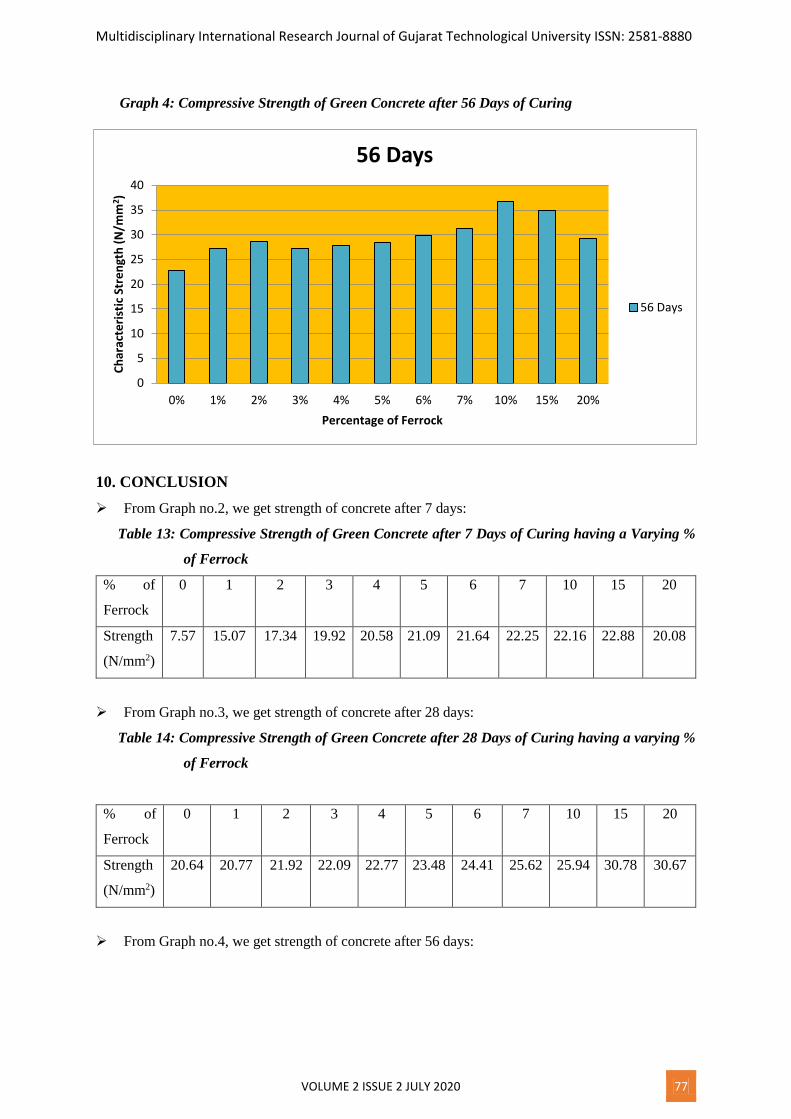
Multidisciplinary International Research Journal of Gujarat Technological University ISSN: 2581-8880
VOLUME 2 ISSUE 2 JULY 2020 77
Graph 4: Compressive Strength of Green Concrete after 56 Days of Curing
10. CONCLUSION
From Graph no.2, we get strength of concrete after 7 days:
Table 13: Compressive Strength of Green Concrete after 7 Days of Curing having a Varying %
of Ferrock
% of
Ferrock
0 1 2 3 4 5 6 7 10 15 20
Strength
(N/mm2)
7.57 15.07 17.34 19.92 20.58 21.09 21.64 22.25 22.16 22.88 20.08
From Graph no.3, we get strength of concrete after 28 days:
Table 14: Compressive Strength of Green Concrete after 28 Days of Curing having a varying %
of Ferrock
% of
Ferrock
0 1 2 3 4 5 6 7 10 15 20
Strength
(N/mm2)
20.64 20.77 21.92 22.09 22.77 23.48 24.41 25.62 25.94 30.78 30.67
From Graph no.4, we get strength of concrete after 56 days:
0
5
10
15
20
25
30
35
40
0% 1% 2% 3% 4% 5% 6% 7% 10% 15% 20%
Ch
arac
teri
stic
Str
en
gth
(N
/mm
2)
Percentage of Ferrock
56 Days
56 Days

Multidisciplinary International Research Journal of Gujarat Technological University ISSN: 2581-8880
VOLUME 2 ISSUE 2 JULY 2020 78
Table 15: Compressive Strength of Green Concrete after 56 Days of Curing having a Varying %
of Ferrock
% of
Ferrock
0 1 2 3 4 5 6 7 10 15 20
Strength
(N/mm2)
22.69 27.2 28.59 27.14 27.83 28.44 29.76 31.24 36.67 34.86 32.67
Green concrete having reduced environmental impact with reduction of the concrete industries CO2
emission by 30%.
Green concrete is having good thermal and fire resistant.
In this concrete recycling use of waste material such as ceramic wastes, aggregates, so increased,
so increased concrete industry’s use of waste products by 30%.
Hence green concrete consumes less energy and becomes economical.
So definitely use of concrete products like green concrete in future will not only reduce the
emission of CO2 in environment and environmental impact but also economical to produce.
From the result it was concluded that compressive strength and durability of green concrete is more
as compare to the conventional concrete up to 15 % replacement of cement with Ferrock and from 20%
the compressive strength of concrete is decreasing.
11. FUTURE WORK SCOPE
Following are the future work scope of this work:
1. To do the parametric study based on the flexural strength of the green concrete.
2. To do the analysis with the help of software and to do parametric study based on that.
3. To do more research on ferrock as environment sustainable material.
12. REFERENCES
1. Proposal from Environmental Protection Agency, (1997) “A strengthened product - effect
approach. An introduction to a debate”, Ministry of Environment and Energy. Environmental Protection
Agency.
2. Damtoft, J. S., (1998), “Use of Fly Ash and Other Waste Materials as Raw Feed and Energy Source
in the Danish Cement Industry” Proceedings from CANMET/ACI International Symposium on
Sustainable Development of the Cement and Concrete Industry, Canada.
3. Abhijeet baikerikar, (2014) “ A Review on Green Concrete”, Journal of Emerging Technologies
and Innovative Research, Belgaum, Karnataka, India, Vol. 1, Issue 6, ISSN:2349-5162.
4. Chirag Garg & Aakash Jain, (2014) “Green Concrete: Efficient & Eco-friendly Construction
Materials,” International Journal of Research in Engineering & Technology 2(2 ) .

Multidisciplinary International Research Journal of Gujarat Technological University ISSN: 2581-8880
VOLUME 2 ISSUE 2 JULY 2020 79
5. Dewanshu Ahlawat, L.G.Kalurkar (2014) “Coconut Shell as Partial Replacement of Coarse
Aggregate in Concrete,” International Conference on Advances in Engineering & Technology.
6. Dhiraj Kumar Tiwari, Ankur Rai, Jagrit Dewan & Rohit Mathew, (2015) “Comparative Study on
Green Concrete,” International Journal of Advanced Research In Engineering Technology & Sciences
2(4).
7. Kakamare M.S. & Nair V.V., (2015) “Sustainable Construction Materials and Technology: Green
Concrete,” International Journal of Advanced Technology in Engineering and Science 3(2).
8. Mehta Neeraj, Sehraya Aashish and Malik Aman, (2015), “Green Concrete: An Innovative
Approach to Sustainable Development”, International Journal of Advances in Engineering and
Scientific Approach, ISSN: 2349-3607, Volume 2 , Issue - 9, Page 1 - 11.
9. Neeraj jain,mridul garg and A.K.minocha,(2015). “Green concrete from sustainable recycled
coarse aggregates,mechanical and durability properties”.
10. Xian LI, Fujin WANG, Fei LI, (2015) “Effect of Recycled Waste Brick Fine Aggregate on
Compressive Strength and Flexural Strength of Mortar,” 5th International Conference on Civil
Engineering and Transportation.
11. Anita Bhatia, Rashmy Nair & Neeru Gakkhar, (2016) “Green Concrete A Stepping Stone For
Future,” International Journal of Engineering Research & Management Technology 3(1).
12. M.sadiqul Islam, (2016). “Waste glass powder as partialreplacement of cement for sustainable
concrete practice”.
13. Praveer Singh, Mohd. Afaque Khan & Abhishek Kumar,( 2016) “The Effect on Concrete by Partial
Replacement of Cement by Silica Fume,” International Research Journal of Engineering and
Technology 3(3).
14. Abbas mohajerani,john vajna,(2017). “Practical recycling applications of crushed waste glass in
construction materials”.
15. Mr. Vardhan Nagarkara, Mr. Sanket Padalkar, Ms. Samruddhi Bhamre, Mr. Akshay Tupe,
(2017)“ Experimental Study on Green Concrete”, International Journal for Research in Applied Science
and Engineering Technology, ISSN-2321-9653, Volume 5, Issue IV.
16. Mr. Vardhan Nagarkar, (2017)“ Experimental study on Green Concrete”, AnantraoPawar college
of Engineering and Research, Pune, India. ISSN:2322-9653.
17. Nihar Khalatkar, (2017), “Study on Green Concrete”, International Journal of Advances in
Mechanical and Civil Engineering, ISSN:2394 - 2827, Volume-4, Issue-2.
18. Pandey Shivam, Dalvi Ankit, Chaurasia Brijesh & Patel Arshan, (2017), “A Review on the Study
of Green Concrete”, International Journal of Advanced Research in Science, Engineering and
Technology, ISSN: 2350-0328,Vol.4, Issue 7.

Multidisciplinary International Research Journal of Gujarat Technological University ISSN: 2581-8880
VOLUME 2 ISSUE 2 JULY 2020 80
19. Priyanshu Shekhar, Rudali Nagpurkar, Bhagyashree Selore, Prashant Sonekar, Rahul Sonaghare,
Mr. Atul Gautam, (2017), “ Green Concrete for Better Sustainable Development”, International
Research Journal of Engineering and Technology, ISSN- 2395 - 0072, Volume - 4, Issue - 3.
20. Prof. Ashok Admute,Mr. Vardhan Nagarkar, Mr. Sanket Padalkar, Ms. Samruddhi Bhamre, Mr.
Akshya Tupe (2017), “Experimental Study on Green Concrete”, International Research Journal of
Engineering and Technology, ISSN: 2395-0056, Volume - 4, Issue - 4.
21. Dr. Arup Saha chaudhuri (2018), “ High Volume Fly Ash Mixed Green Concrete for Civil
Engineering Purposes”, International Journal of Scientific and Engineering Research Volume 9, Issue
- 10.
22. Rahul Hodge, Shrikant Shitole & Deepak Yewale,(2018) “Experimental Study on Green Concrete”,
International Journal of Advance Research in Science and Engineering, Volume No.7, Special Issue
No.3.
References: Indian Standard Codes:
1. Chemical analysis and tests on cement IS: 4031.
2. Codes for designing concrete mixes - IS: 456; 10262; SP 23.
3. Code of Practices for Plain & reinforced concrete etc. IS 456 – 2000.
4. Compressive strength test for cement mortar cubes IS: 2250.
5. Methods of sampling IS: 2430.
6. Methods of sampling and analysis of concrete IS: 1199 .
7. Methods of tests for aggregate for concrete IS: 2386 . (9 parts).
8. Methods of test for aggregate for concrete particle size and shape IS 2386 (Part I) 1963.
9. Methods of test for aggregate for concrete estimation of deleterious materials and organic
impurities. IS 2386 (Part II) 1963.
10. Methods of test for aggregate for specific gravity, density, voids, absorption & bulking IS 2386
(Part III) 1963.
11. Methods of test for aggregate for Mechanical properties. IS 2386 (Part IV) 1963.
12. Methods of test for aggregate Soundness IS 2386 (Part V) 1963.
13. Methods of test for aggregate for alkali-aggregate reactivity IS 2386 (Part VII) 1963.
14. Permissible clay, silt & fine dust contents in sand IS: 2116 .
15. Specifications for fine & coarse aggregate from natural sources for concrete IS: 383.

Multidisciplinary International Research Journal of Gujarat Technological University ISSN: 2581-8880
VOLUME 2 ISSUE 2 JULY 2020 81
Improve Resource Migration Using Virtual Machine in Cloud Computing: A
Review
Patel Hardikkumar Mahendrabhai
1 Assistant Professor, CE Department, SVBIT, VASAN, Gujarat, India
Abstract:
Cloud computing technology can be widely used depends on the virtualized resource scheduling can timely
and reliably assurance user service quality. So efficient and flexible resource scheduling in cloud
computing is of great significance. In view of the cloud computing environment, the resource scheduling
model based on virtual machine migration. Migration contributes to efficient resource management in
cloud computing environment. The core of Cloud computing includes virtualization of hardware resources
such as storage, network and memory provided through virtual machines (VM). When the user needs
additional resources for virtual machine (VM) than the available resources of datacenter, the whole process
will hang and also affects to the other running process in virtual machines of data center.
Keyword: Cloud Computing, Virtual machine, virtualization Migration (VM), Resource Allocation.
I INTRODUCTION
Cloud computing uses network to make a lot of computer resources unified management and scheduling,
forming pools of computing resources, each end user can get powerful computing capability and a variety
of information services according to the needs of the business through the Internet Cloud computing is
based on open standards and services, on the centre of Internet and provides safe, fast and convenient data
storage and network computing service. In Cloud Computing Environment mainly user-based resource
allocation. Resource allocation module and monitoring module mainly adopt dynamic resource allocation
strategy; implement the adaptive dynamic allocation of resources in order to realize the efficient use of
data center resources. The main idea of the resource allocation strategy is to protect user request resources
based on SLA, and timely recover completed tasks resources, reduce unnecessary consumption of
resources to ensure the smooth operation of the system. [1].
Migration techniques can be classified into non-live migration and live migration.
Non-live migration refers to the process of migrated running VM that is firstly paused and afterward
resumes when all the required migration workloads have been completed. Services provided by the VNs

Multidisciplinary International Research Journal of Gujarat Technological University ISSN: 2581-8880
VOLUME 2 ISSUE 2 JULY 2020 82
are not accessible during the migration, and open network connections may cause timeout or
Disconnection. More advanced live migration mechanisms do not require pause of the VMs.
Live migration mechanisms: migrate as fast and efficient as possible in order to provide dynamic load
balance, zero downtime. Live migration provides many benefits such as energy saving, load balancing, and
easy maintenance. [2]
Cloud technology is combination of several other technologies such as Virtualization, Service Oriented
Architecture (SOA) and web Security limitations in these traditional technologies are also inherited in the
overall security of Cloud along with their benefits.
As Cloud infrastructure consists of large scale, distributed, heterogeneous and completely virtualized
resources, therefore the traditional security mechanisms are not enough for this environment. Live
migration of VM introduces severe security risks in traditional data centers as well as in Cloud
environment. The contemporary research on live migration so far is performance oriented and security
issues have not received much attention. There are several security risks in live VM migration process
provided by Xen, KVM and VMware hypervisors. Live VM migration without security features becomes
single point of failure (SPF) for Cloud environment. [3]
.
For better resource utilization, many cloud providers start with static allocation of VMs to physical
machines (PMs) using a resource scheduler as shown in Figure 1. However, the resource utilization in the
cloud environment decreases as the number of VMs increases in the PMs. This is due to mainly the
following two reasons. (1) There are always some unallocated resources left on the PMs. This is due to the
unpredictable incoming VM configurations from cloud users. Without accurate historical data, it is difficult
to allocate VM properly. (2) Memory balloon and CPU virtualization are widely supported features of
virtualization technology. It enables cloud users to configure their VMs memory size and CPU number at
operating time, which makes the scheduler work less efficient. These two reasons make the static
scheduling approach unfit, and instead, requiring dynamic re-allocation. Therefore, a dynamic VM re-
allocation on the PMs is required for improving resource utilization in the cloud environment. [6]
Figure 1. Static VM allocation [6]

Multidisciplinary International Research Journal of Gujarat Technological University ISSN: 2581-8880
VOLUME 2 ISSUE 2 JULY 2020 83
II Dynamic Resource Allocation algorithm
Load balancing is achieved by dynamic migration of the overloaded virtual machines. By migrate the
virtual machines to available data center dynamically, overloading of datacenter can be avoided. This can
be achieved through VM Dynamic resource allocation algorithm and DC balancing algorithm. Thus,
overloaded virtual machine under the datacenter is Migrated to available datacenter using their proposed
Algorithm. Through this, performance of the datacenter is maximized and results in high user's
satisfaction at data centers. [1]
In this Dynamic Resource Allocation Algorithm, the virtual machine under host, will
schedule dynamically as per the user's request. Resources will be provided to the user as per the
requirement of user. If the user wants to extend the memory, user can request for the additional resource as
they need. Dynamically the resource will be given to the requested virtual machine and updated
dynamically. In future, we will develop a Dynamic resource allocation algorithm for underutilized VM in
datacenter. This algorithm should have criteria for selecting a VM, selecting a node which has sufficient
space for underutilized virtual machines. This ensures more Load Balancing in private cloud. [4]
III Auction-Based VM Allocation
They express their needs by submitting bids on the price they would like to spend on the commodities. The
proposed auction based VM allocation mechanism works by modeling agents as bidders and VMs as
commodities, which is described formally in Algorithm step by step. [5]
1. In this Algorithm, initially, all newly submitted VMs _ are unallocated at each bidding round.
2. Each agent ai only bids for the largest unallocated VM that it is capable of hosting.
3. After bidding for the target VM θ * ai, each agent ai broadcasts its bid Bi to all of the other agents for
winner determination.
4. A bid Bi = <pi, λi/ci> consists of the PM identity
pi and its cost-capacity ratio λi/ci.
5. After all bids are broadcasted, all of the agents send a winner acknowledgment message <Ack> to the
winner agent that has the minimum cost-capacity ratio.
6. In the event of a tie, the agent that has the smallest index is selected as the winner.

Multidisciplinary International Research Journal of Gujarat Technological University ISSN: 2581-8880
VOLUME 2 ISSUE 2 JULY 2020 84
7. The agent ai that receives ack from all of the other agents wins the current round bidding. The winner
agent ai then is responsible for running its targe
θ * ai and informing all of the other agents that θ * ai has been allocated.
8. This bidding process (steps 2–7) proceeds round by round until all VMs are allocated.
An auction based VM allocation mechanism, which is devised for agents to decide which VM should be
allocated to which PM for better resource utilization.
IV Negotiation-Based VM Consolidation
To tackle system dynamics and avoid incurring prohibitive VM migration overhead, a local negotiation
based VM consolidation mechanism is devised for agents to exchange their assigned VMs for energy cost
savings. The dynamic experimental results demonstrate that the multi agent approach can adapt to system
dynamics well by consuming as little energy as the benchmark centralized and distributed global-based
resource consolidation approaches, but largely reducing the migration cost, showing its great potential for
practical applications. [5]
A negotiation based VM consolidation mechanism, which is designed for agents to exchange their assigned
VMs to save energy cost and address system dynamics. A possible reason is that there are only a small
number of profitable VM migrations executed in PRO. These advantages make MA approach a preferable
choice for cloud computing resource management to reduce energy cost in real time, while consuming
tolerable amounts of network traffic.
V Cloud Reconfiguration Algorithms
Researching on cloud reconfiguration algorithms is an active research area of Cloud computing. One
problem addressed is trying to minimize number of PMs in the cloud Environment. This is commonly
referred as VM Consolidation. The static re- allocation approach is a simple heuristic for the MDBP
problem and applies it to minimize the number of PMs required to host a given web traffic. A resource
management algorithm to attempts to minimize the number of migrations of VMs while minimizing the
number of PMs used. A similar objective is also pursued in and these approaches, however, have focused
on how to calculate a new configuration, and have neglected the migration overhead. An algorithm is

Multidisciplinary International Research Journal of Gujarat Technological University ISSN: 2581-8880
VOLUME 2 ISSUE 2 JULY 2020 85
proposed to pack VMs according to their CPU needs while minimum the number of migrations will be
used. Researchers have also applied a variety of methods to achieve greater resource utilization.
Prediction techniques and queuing theory results are employed to allocate resources efficiently within a
single PM serving a web workload. It proposes an optimization algorithm for resource economy that
allocates PM resources depending on the expected financial gain for the hosting centre. [6]
By using a probabilistic multivariate model, the algorithm selects suitable PMs for VM re-allocation before
a reconfiguration Plan is generated. their evaluation indicates that there is only a minor decrease in resource
utilization levels that results from reducing number of PMs for re-allocation. So, the approach leads to a
lower number of VMs being reallocated as number of PMs Considered for VM re- allocation decreases.
Cloud reconfiguration algorithms are based on VM reallocation techniques that construct a suitable
reconfiguration plan for achieving greater resource utilization in the cloud environment. Existing cloud
reconfiguration algorithms [8, 9, 10] aim to solve the problem of low PM resource utilization to allow more
VMs to be allocated in the cloud environment
VI Energy Efficient Network-Aware VMs Migration
The destruction of VMs from the PMs gives an opportunity to the service provider to migrate the VMs
from the underutilized PMs to the energy efficient PMs, and thus switching-off underutilized/idle PMs and
switches at the cloud data center. the objective function for muli-objective VMs migration problem is
defined in such a way that VMs are migrated from one PM (source node) to another PM (destination node)
such that the maximum number of VMs are migrated to the destination node within their capacity. [7]

Multidisciplinary International Research Journal of Gujarat Technological University ISSN: 2581-8880
VOLUME 2 ISSUE 2 JULY 2020 86
Table: - Literature Review
Year/
Publication
Author Technique/Algorithm Tools
/Technology
Research
Gap
2012
(IEEE)
Sijin He, Li Guo,
Moustafa Ghanem,
Yike Guo
Improve
resource
utilization
Cloudsim
Author Proposed
developing relationship
between predefine
range and select
suitable physical
machine to improve
migration cost
2014(IEEE)
Divyabairavi
Soundararajan,
,Sankari Subbiah
Dynamic
resource
allocation
Cloudsim
Author Proposed
develop dynamic
resource allocation in
VM datacenter.
2016(IEEE)
Wanyuan Wang,
Yichuan Jiang
Multiagent-
Based
Resource
Allocation
Cloudsim
Author Proposed for
resource allocation
each and every user
take full advantage of
VM resource as per
user request but cloud
service provider cost
will be increase.
2017(IEEE)
Tian Fu , Zhen
Wang
Resource
Scheduling
Mechanism
Based On
Virtual
Machine
Migration
Not
mention
Author Proposed
resource
scheduling model based
on virtual machine
migration can better
achieve the scientific
distribution of data
center resources and
reduce data center load;
provide a practical and
effective approach to
the reasonable

Multidisciplinary International Research Journal of Gujarat Technological University ISSN: 2581-8880
VOLUME 2 ISSUE 2 JULY 2020 87
allocation of resources
and guarantee of user
service
2018(IEEE)
Neeraj
Kumar
Sharma,
Priyanka
Sharma
Energy Efficient
Quality of Service
Aware Virtual
Machine Migration
Cloudsim
Author Proposed that
they have not consider
network aware VM
allocation in cloud data
center.
VII Conclusion
In this paper, we surveyed, resource migration using virtual machine in the cloud computing it is very
important for cloud providers to manage and assign all the resources in time to cloud consumers as their
requirements are changing dynamically. From the comparing above algorithms we conclude that, Cloud
Reconfiguration Algorithms is better than the other algorithm reason is In the user-defined view, the
imbalance heuristic performs slightly better than the volume heuristic. In the provider-defined view, the
volume heuristic performs significantly better than the imbalance heuristic in which it improves resource
allocation, utilization, and energy efficiency in the Cloud
References
[1]. Tian Fu,Zhen Wang,"Research On Resource Scheduling Mechanism Based On Virtual Machine
Migration"978-1-4673-8979-2/17/$31.00 ©2017 IEEE.
[2]. Son, A-young, and Eui-Nam Huh. "Study on a migration scheme by fuzzy-logic-based learning and
decision approach for QoS in cloud computing." Ubiquitous and Future Networks (ICUFN), 2017
Ninth International Conference on. IEEE, 2017.
[3].Ahmad, Naveed, Ayesha Kanwal, and Muhammad Awais Shibli. "Survey on secure live virtual
machine (VM) migration in Cloud." Information Assurance (NCIA), 2013 2nd National
Conference on. IEEE, 2013.
[4].Soundararajan, Divyabairavi, and Sankari Subbiah. "Migration of instance for efficient resource
utilization in private cloud." Advanced Communication Control and Computing Technologies (ICACCCT),
2014 International Conference on. IEEE, 2014.

Multidisciplinary International Research Journal of Gujarat Technological University ISSN: 2581-8880
VOLUME 2 ISSUE 2 JULY 2020 88
[5].Divyabairavi Soundararajan, Sankari Subbiah,” Migration of Instance for Efficient Resource Utilization
in Private Cloud 2014 IEEE International Conference on Advanced Communication Control and
Computing Technologies (ICACCCT).
[6]. Sijin He, Li Guo, Moustafa Ghanem, Yike Guo
,"Improving resource utilization in the cloud environment using multivariate probabilistic models." 2012
IEEE Fifth International Conference on Cloud Computing. IEEE, 2012.
[7]. Sharma,Neeraj Kumar,Priyanka Sharma,and Ram Mohan Reddy Guddeti."Energy efficient quality of
service aware virtual machine migration in cloud computing." 4th International Conference on
RecentAdvances in Information Technology (RAIT) IEEE, 2018
[8] F. Hermenier, X. Lorca, J. M. Menaud, G. Muller, and J. Lawall, "Entropy: a consolidation manager
for clusters," 2009, pp. 41-50
[9] L. He, D. Zou, Z. Zhang, K. Yang, H. Jin, and S.
A. Jarvis, "Optimizing Resource Consumptions in Clouds," 2011, pp. 42- 49.
[10] E. Feller, L. Rilling, and C. Morin, "Energy- Aware Ant Colony Based Workload Placement in
Clouds," 2011.

Multidisciplinary International Research Journal of Gujarat Technological University ISSN: 2581-8880
VOLUME 2 ISSUE 2 JULY 2020 89
5S IMPLEMENTATION IN CRANE MANUFACTURING INDUSTRY
Vaibhav Bharambe
Student
L J Institute of
Engineering and
Technology, Ahmedabad
Shubh Patel
Student
L J Institute of Engineering
and Technology,
Ahmedabad
Pratik Moradiya*
Assistant Professor
L J Institute of Engineering
and Technology,
Ahmedabad
* Corresponding Author
ABSTRACT:
The Japanese methodology 5S (Sort, Set in order, Shine, Standardize, Sustain) is a systematic approach
towards improvement of the manufacturing facility. The paper exhibits the case study of implementing 5S
in a crane industry. Majority of the small-scale industries are ignorant regarding these types of
methodologies. The prime motive of implementing 5S in the crane industry was to raise the productivity
with keeping in mind the safety precautions, with help of appropriate management. Also, this case study
shows that we applied a proper shop floor layout, introduced inventories and bins, and did many changes
in order to make the industry perfect. The effective 5S implementation results the enhancement in
productivity and efficiency.
Keywords: 5S methodology, 5S system, Continuous improvement.
1. INTRODUCTION
1.1 History of 5S
The methodology was developed in Japan in order to improve the work efficiency, effectiveness, and
safety. This systematic technique not only helps to reduce non-value adding time, but also improves
productivity and quality [1]. The Japanese methodology 5S is depended on five various pillars: Seiri (Sort),
Seiton (Set in order), Seiso (Shine), Seiketsu (Standardize) and Shitsuke (Sustain). In past, 5S was known
as the Toyota Production System, which was developed by Taiichi Ohno and Eiji Toyoda with Japanese
industrial engineers in 1950 [1]. After some new improvements in old system, Sakichi Toyoda (Father of
the Japanese industrial revolution), his son Kiichiro and Taiichi Ohno redesigned “TPS” and named as “5S”.
Venice shipbuilders used similar type of concept for quality assembly of the ship in 16th century. They
completed the process in hours rather than completing in days. By the time, the 5S System has expanded
and could be found within Total Productive Maintenance (TPM), Just- In-Time (JIT) process, and the lean

Multidisciplinary International Research Journal of Gujarat Technological University ISSN: 2581-8880
VOLUME 2 ISSUE 2 JULY 2020 90
manufacturing [1]. There were two frameworks given for applying 5s methodology. Later on, Total
Productive Maintenance (TPM), the Just- In-Time (JIT) process, and the lean manufacturing were founded
from the base of the 5S work approach. The second framework of 5S was introduced by Hiroyuki Hirano.
Hirano’s approach was having only “4s”, in which Set in order and Shine were considered as a single aspect;
whereas, the former framework, presented by Osada, suggested that keeping discipline in the training and
education helps to enhance the quality of work as well as work standards. In 1996 Henry Ford introduced
CANDO (Cleaning up, Arranging, Neatness, Discipline and Ongoing improvement), which is also a similar
system like 5s methodology.
1.2 Basics of 5S
Figure (1): 5S Methodology
1.2.1 Sort (Seiri): SORT defines the proper arrangement of everything. The main aim of sort is to
organize the working environment [8]. The things should be sorted according to their needs
and time frequency of working. Another main objective is to remove all the unwanted or not
needed items from the working area.
1. Sort
5. Sustain
3. Shine
2. Set in order
4. Standar
dize
Start

Multidisciplinary International Research Journal of Gujarat Technological University ISSN: 2581-8880
VOLUME 2 ISSUE 2 JULY 2020 91
1.2.2 Set in order (Seiton): SET IN ORDER is the method by which we arrange the things according
to the necessity or the flow of the process [8]. The main objective is to follow the work order.
It helps to reduce the searching time and improve the utilization of the time and work.
1.2.3 Shine (Seiso): SHINE refers the systematic cleaning on the regular basis. Cleanliness means
higher visibility, visible results, and the high quality of work [8]. The aim is the items, which
are out of place or missing, should be recognized easily as well as the hazards or difficult
situations can be understood and accounted easily.
1.2.4 Standardize (Seiketsu): To create appropriate guidelines for sort, set in order, and shine is
called STANDARDIZATION [8]. The purpose of it is to create best practice for members in
system along with communicable and easily maintainable standards.
1.2.5 Sustain (Shitsuke): SUSTAIN comes last because, for implementation of sustain first we have
to implement other 4S [8]. The goal of sustain is the members of the system get habituated the
implemented system. Sustain teaches the discipline and keeps the process running.
1.3 Organization Introduction
“AKASH ENGINEERING WORKS”, which was established in 2002, is one of the reputed crane
industries in Gujarat. In the time of beginning, it was a small-scale industry, but now, because of many new
customers, they are successfully converted into medium scale industry. The organization is the leading
manufacturer of service provider of all the cranes. Also, they provide maintenance as well as distribution
of crane spare parts. AEW generally manufactures E.O.T., H.O.T., Crane hoist and Goods lift. The industry
has the ground area of 8850 square ft. Moreover, in the organization, they use Production flow layout and
for manufacturing of the industrial crane, they use batch production system.
2. PROBLEM STATEMENT
The biggest issue with the industry was poor control over the inventory. The inventory was not
arranged in proper manner, so the time taken for any operation was very high, which was causing
the decrement in productivity. Also, the problem of the storage limitation was also one of the major
concerns, which affects the work efficiency.
Secondly, there was no proper Shop Floor Layout in the industry, which was also a big concern.
Due to absence of shop floor layout, the handling of material was too poor, which influences the
quality control.
Also, unnecessary materials were spread on the floor area by the workers and these items were not
properly put to their respective places by the workers.

Multidisciplinary International Research Journal of Gujarat Technological University ISSN: 2581-8880
VOLUME 2 ISSUE 2 JULY 2020 92
Workers were doing their work without wearing any type of safety equipments. They were not
habituated of the safety shoes and safety glasses whenever they do the operations, which might
cause the serious accidents.
Moreover, proper assembly area was not occupied in the layout and the space utilization was also
not done in appropriate ways, which were the major causes behind low productivity.
Image (2.1): Unorganized Layout
3. LITERATURE REVIEW
Mayank Dev Singh et al. (2015) conducted the study at “Sandvik Asia Pvt. Ltd, Mehsana, Gujarat”
with the prime aim of reducing the abnormality. Also, the waste of time, motion and improper
materials handling were the big difficulties they faced on early stages [3]. In order to solve this
query, they implemented 5S methodology and they used manual sorting of material and provided
the stopper at fallen down area. Additionally, a specific place was introduced for air gun. After
implementing lean manufacturing and 5S, the searching time was reduced to 5-6 minute from 14-
16 minutes. They saved 640+ pages per year by providing updated preventive maintenance system.
By utilizing standardized operation methods, it is possible to reduce human movements in the shop
floor.
How 5S strategy implemented in any industry, Kaushik Kumar et al. (2012) described the steps for
it. With the proper calculations, authors mentioned that lean tool is very beneficiary for the
improvement of the productivity in any organization [4]. They mentioned in detail how and when

Multidisciplinary International Research Journal of Gujarat Technological University ISSN: 2581-8880
VOLUME 2 ISSUE 2 JULY 2020 93
5S can be implemented. Literature gives the detailed idea about the Sort, Set In order, Shine,
Standardize and Sustain. They also stated the various benefits of the system according to industry,
so it can be known exactly how and when to apply this methodology.
The research carried out in a Malaysian Automotive Parts Manufacturing by Nadirah Roslin et al.
(2012) described the progress in its early stages of lean manufacturing implementation [5]. The
literature suggests that there are few critical success factors such as availabilities of resources,
organizational culture and information technology proficiency which impress each dimension of
lean manufacturing. The observation of lean success determinants is limited to this case and care
should be taken while generalizing the results of this case study to other Malaysian manufacturing
organizations. Thus, future studies of multiple case studies can be conducted to get the influence
of a variety of success factors for different lean manufacturing tools.
Gheorghe Dulhai (2008) conducted a study at the manufacturing unit of the auto car exhaust. The
aim of the study was to improve manufacturing of the auto car exhaust by various methods like 5S
and continuous improvement. They used the questionnaires in order to examine the tasks. After
implementation of this 5S strategy, the accidents got reduced. The maximum days they maintained
safety [6] till 56 days. Reduction of physical efforts and fewer accidents during the production
process were obtained. The results were appeared in short time around couple of weeks.
In the Hari Bio-Mass Processing Unit, K Ramesh, and team (2014) conducted the study for
reducing the waste and removing unwanted activities in the biomass plant. They diagnosed the
current flow of the organization in order to implement the transparent process flow. They trained
labors and supervisors for minimization of the waste. Document analysis and result reported that
after implementation of 5S, the industry achieved the clean work space. Also, they washed the
walls to enhance the working environment. As a result, the unwanted activities were reduced, floor
layout became neat and clean and approximate 700 kg of excessive scrap got reduced [7].
By performing the test in the industry, S.R. Dulange (2013) wanted to enhance the textile market
in the country with help of cutting-edge management methods in power looms. They did the
analysis of the lack of production tools, improper management, and many others. These all things
were done by the audit team which was created for the data collection [9]. To sort the items, they
utilized the colour coding method and also various tags were used in power looms too. Moreover,
the bins were used in order to maintain appropriate material flow. Upcoming 30 weeks were the
analysis time after applying this system. Consequently, the improvement in productivity was
achieved. That is why the Solapur Textile Sector was upgraded in the matter of management and
productivity.

Multidisciplinary International Research Journal of Gujarat Technological University ISSN: 2581-8880
VOLUME 2 ISSUE 2 JULY 2020 94
R.T. Salunkhe et al. carried out the study to cut out the searching time of the spare parts in the
industry. In the ABC industry, the lean manufacturing tools such as Kaizen as well as 5S were
taken into the action to curb the issues. There were many unwanted items, which were kept in any
bins, so the bins did not carry the appropriate objects. They segregated the places of pipe and hoses
in variety of racks [10]. By applying 5S methodology the enormous changes came in the searching
time because the bins got the colour codes. Where the searching time was somewhere around 13-
15 minutes before, now it dropped to 6-8 minutes. Eventually, they gained over the inventory
control by maintaining minimum level of self-life items.
Abhay R. Kobarne, et al. (2016) exhibited one of the major issues in the company. As per their
reports, they found that inadequate communication, less contact in the organization. Due to that,
the management took some hard commitments [11]. It was told to all that more and more
cooperation from all level of laymen is much needed during the implementation period. Finally, by
some strict implement, the results started to come satisfactory. Moreover, they found that
continuous training is the basic as well as most important aspect in order to change the
organization’s environment. They also understood that Periodic assessment should focus on the
enhancement and development regarding all inputs in the organization. At the end, some fruitful
results were obtained.
Rastogi Vikas et al. (2014) figured out that some of the top organizations have already applied
some features of the 5S in their regular activities without total awareness of its pros. However,
other investigations are required to implement the 5S as a continuously improving tool in company.
They identified that size and structure are the aspects which not only can affect the application of
the 5S but also its effectiveness. Moreover, they conceive that this methodology is not new, and
they have had it for very long period of time. They also said that they need the 5S at their workplaces
as majority of the individuals do their works without thinking and as all know that 5S can be a
reflection of the behaviors of people. Hubbard [12] exhibited that orderliness helps to stop three
types of waste: searching waste, difficulty-of-use waste, and the waste of returning items to their
proper place. Eventually, it was understood that 5S implementation is not possible without
appropriate training that make the place standardized. Hence, it is perceived that continuous
training is very crucial in order to alter the environment of the company.
Harsha Lingareddy et al. (2013) carried out their research in metal doors manufacturing industry.
They implemented 5S in various stages, where in primary phase they did their research in item
selection in production process as the objects were in haphazard manner. They believed that 5S
methodology depends on the capacity of constructing and maintaining a well-managed, clean,
effective, and high quality work place [13]. Additionally, they worked over shop floor layout too,

Multidisciplinary International Research Journal of Gujarat Technological University ISSN: 2581-8880
VOLUME 2 ISSUE 2 JULY 2020 95
in which they created questionnaire for the workers. Eventually, they got amazing outcomes like
better use of workplace, no losing of tools, maintenance cost reduction, safety enhancement,
reduction in travel time and improved working conditions. They found the rise in efficiency of
every aspect in the industry as the workers did their job appropriately.
Vaibhav Bharambe et al. (2020) (Same authors of this paper) reviewed many research papers of 5S
implementation in various organizations [14]. The detailed review of the research papers, from
various organizations like manufacturing industry, college, temple and many more, has been done.
4. IMPLEMENTATION OF 5S
Inventory control was the biggest problem in the industry. All materials, which were coming for
assembly work; the workers were putting them anywhere in the inventory room. There was no
specific location decided for systematic arrangements of raw material. We firstly did the analysis
of the need of materials and designed the systematic racks accordingly in the industry. In that, we
sorted the materials in three different stores. One for Gear hoist assembly, second for Gear box
assembly and eventual one for electrical panel equipment stores.
Image (4.1): Improper Arrangement of the Materials
Image (4.2): Proper Arrangement of the Materials

Multidisciplinary International Research Journal of Gujarat Technological University ISSN: 2581-8880
VOLUME 2 ISSUE 2 JULY 2020 96
As per above images, we can see that in the before time the couplings, gears, welding rods boxes
were placed on the floor and the things which were placed on the racks were also nasty and not
easily indentified. In order to improve all that difficulties, we redesigned the racks in such a way
that all the materials get organized in the rack. For easy identification, we used the name plates for
each material. Also, in racks, we segregated different TONS of gears in same rack but in ascending
order of it. To solve the disarrangement of bearing and keys, we used the bins and segregated them
according to the size.
Figure (4.3): Old-New Plant Layout

Multidisciplinary International Research Journal of Gujarat Technological University ISSN: 2581-8880
VOLUME 2 ISSUE 2 JULY 2020 97
As we were in early stages, there was no proper shop floor layout in the organization. Due to that
the space related issues in assembly of gear hoist and gear box were occurring. To resolve those
issues, we implemented new process layout according to the data included the movements of the
workers and traveling flow of the material. During designing new layout, we gave proper space for
assembly operations, walkway, and machining area. We constructed walk way in such manner that
no worker gets harmed during walking on that path. Industry affected immensely after
implementation of new shop floor layout. Now workers and other people can walk fearlessly on
the walkway, which enhances the discipline in the company.
Image (4.4): Floor Markings
We conducted safety awareness sessions for the workers’ safety. In these sessions, we showed them
the videos and pictures and explained that how the things might become worst if the safely is
compromised. Also, we provided them the helmets, gloves, and glasses for their own safety.
Additionally, we applied the siren in the shop floor. So, in case of emergency or anything hazard
happens, they can press the buttons and all the workers can immediately stop their work and can
go to the safe place. For spreading more awareness about 5S and safety, we hanged the posters and
various banners, so the visual images can motivate the workers and they become self-aware about
safety every day.
Image (4.5): Before & After Providing the Helmets

Multidisciplinary International Research Journal of Gujarat Technological University ISSN: 2581-8880
VOLUME 2 ISSUE 2 JULY 2020 98
Image (4.6): 5S Safety Tags
5. RESULT ANALYSIS
5.1 Sort Rating:
Sort is the first step of the 5S methodology. For calculation of sort rating [2], we allotted 5 regions for sort
arrangement, and we decided that the system should achieve at least 2.5 out of 5, which shows that the
implemented system is 50% active.
Following are the Sort rating criterion.
(1) Material Availability :
Give ‘1’ marks if necessary, material for assembly is available, if not then mark it ‘0’.
(2) Material Sorting:
Give ‘1’ marks if material for assembly is sorted in its allocated place, if not then mark it ‘0’.

Multidisciplinary International Research Journal of Gujarat Technological University ISSN: 2581-8880
VOLUME 2 ISSUE 2 JULY 2020 99
(3) Gas Cylinder Sorting:
Give ‘1’ marks if empty gas cylinder and filled gas cylinder are sorted in its allocated place, if not
then mark it ‘0’.
(4) Tools Sorting:
Give ‘1’ marks if cutting, measuring, and fitting tools are sorted in its allocated place, if not then
mark it ‘0’.
(5) Waste Elimination:
Let total ‘F’ number of waste are listed but only ‘E’ was eliminated the marks of elimination process
will be Fraction of waste elimination = [E/F]
Table (5.1): Sort Rating
Sr.
no.
Durations
Material
Availability
Material
Sorting
Gas
cylinder
sorting
Tools
sorting
Waste
Elimination
Total
Rating
0 or 1 0 or 1 0 or 1 0 or 1 [E/F]
1 14 Feb 2020 1 0 0 1 0.6 2.6
2 20 Feb 2020 1 1 1 0 0.6 3.6
3 26 Feb 2020 1 1 1 0 0.6 3.6
4 04 Mar 2020 1 0 1 1 0.8 3.8
5 09 Mar 2020 1 1 1 1 0.8 4.8
6 15 Mar 2020 1 1 0 1 0.8 4.8
5.2 Set In Order Rating:
Set in order is the second step of the 5S methodology. It deals with the proper arrangement of the tools,
material, and processes [2].
Following are the Set-in order rating criterion.
(1) Inventory material arrangement:
Give ‘1’ marks if all outsource material are arranged in its allocated place, if not then mark it ‘0’.
(2) Flow path of assembly is followed:
Give ‘1’ marks if suggested assembly flow path is followed, if not then mark it ‘0’.
(3) Taking material for assembly:
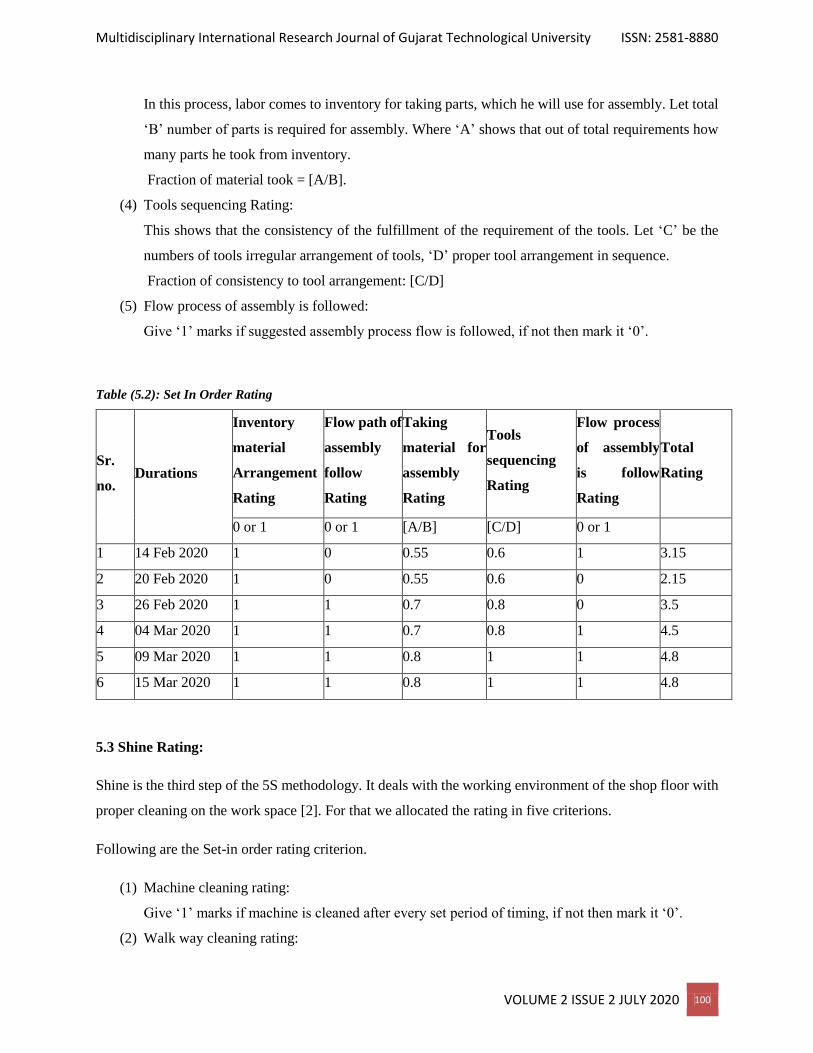
Multidisciplinary International Research Journal of Gujarat Technological University ISSN: 2581-8880
VOLUME 2 ISSUE 2 JULY 2020 100
In this process, labor comes to inventory for taking parts, which he will use for assembly. Let total
‘B’ number of parts is required for assembly. Where ‘A’ shows that out of total requirements how
many parts he took from inventory.
Fraction of material took = [A/B].
(4) Tools sequencing Rating:
This shows that the consistency of the fulfillment of the requirement of the tools. Let ‘C’ be the
numbers of tools irregular arrangement of tools, ‘D’ proper tool arrangement in sequence.
Fraction of consistency to tool arrangement: [C/D]
(5) Flow process of assembly is followed:
Give ‘1’ marks if suggested assembly process flow is followed, if not then mark it ‘0’.
Table (5.2): Set In Order Rating
Sr.
no. Durations
Inventory
material
Arrangement
Rating
Flow path of
assembly
follow
Rating
Taking
material for
assembly
Rating
Tools
sequencing
Rating
Flow process
of assembly
is follow
Rating
Total
Rating
0 or 1 0 or 1 [A/B] [C/D] 0 or 1
1 14 Feb 2020 1 0 0.55 0.6 1 3.15
2 20 Feb 2020 1 0 0.55 0.6 0 2.15
3 26 Feb 2020 1 1 0.7 0.8 0 3.5
4 04 Mar 2020 1 1 0.7 0.8 1 4.5
5 09 Mar 2020 1 1 0.8 1 1 4.8
6 15 Mar 2020 1 1 0.8 1 1 4.8
5.3 Shine Rating:
Shine is the third step of the 5S methodology. It deals with the working environment of the shop floor with
proper cleaning on the work space [2]. For that we allocated the rating in five criterions.
Following are the Set-in order rating criterion.
(1) Machine cleaning rating:
Give ‘1’ marks if machine is cleaned after every set period of timing, if not then mark it ‘0’.
(2) Walk way cleaning rating:

Multidisciplinary International Research Journal of Gujarat Technological University ISSN: 2581-8880
VOLUME 2 ISSUE 2 JULY 2020 101
Give ‘1’ marks if walk way is cleaned during assembly, if not then mark it ‘0’.
(3) Working Environment:
Give ‘1’ marks if air, water, washroom, lighting conditions are good, if not then mark it ‘0’.
(4) Cleaning Consistency rating:
Let total ‘G’ cleaning not on shop floor during every set period of timing. And ‘H’ for total set
period of cleaning required. Fraction of cleaning consistency = [G/H].
(5) Safety from accidents rating:
Let total ‘I’ accidents occurs during auditing because of safety compromise. And ‘J’ for total
number of safety norms created to require the accidents. Fraction of safety from accidents = [1-
{I/J}]
Table (5.3): Shine Rating
Sr.
no. Durations
Machine
cleaning
rating
Walk way
cleaning
rating
Working
environ-
ment
Cleaning
Consistency
rating
Safety
from
accidents
rating
Total
Rating
0 or 1 0 or 1 0 or 1 [G/H] [1-{I/J}]
1 14 Feb 2020 0 1 0 0.25 0.2 1.45
2 20 Feb 2020 0 1 0 0.5 0.4 1.9
3 26 Feb 2020 0 1 1 0.5 0.6 3.1
4 04 Mar 2020 1 1 1 0.75 0.6 4.35
5 09 Mar 2020 1 1 1 0.75 0.8 4.55
6 15 Mar 2020 1 1 1 0.75 0.8 4.55
5.4 Standardize Rating:
Standardize rating will be got by calculating the average of previous three ‘S’, because standards of any
system will rise and fall by mean rate depending factors [2].
𝑆𝑡𝑎𝑛𝑑𝑎𝑟𝑖𝑧𝑒 𝑟𝑎𝑡𝑖𝑛𝑔= Sort +Set in order+Shine
3
Table (5.4): Standardize Rating
Sr. no. Durations Total Rating
= [{S1 +S2 + S3}/3]
1 14 Feb 2020 2.4
2 20 Feb 2020 2.55

Multidisciplinary International Research Journal of Gujarat Technological University ISSN: 2581-8880
VOLUME 2 ISSUE 2 JULY 2020 102
3 26 Feb 2020 3.4
4 04 Mar 2020 4.21
5 09 Mar 2020 4.71
6 15 Mar 2020 4.71
5.5 Sustain Rating:
Sustain rating depends on the previous four ‘S’, because without that the regularity will not be maintained.
Therefore, Sustain rate will be the average of previous four ‘S’ ratings [2]. By following the instructions
accurately, we can maintain the machine condition at its peak level, which may help for better production
and stay away from breakdown.
(1) Removing small faults through the aid of cleaning.
(2) Providing the execution of visual control.
(3) Providing the performance of protective activities.
(4) Granting the responsibility of the machine to the operator.
(5) Formation of a disciplined company.
Table (5.5): Sustain Rating
Sr. no. Durations Total Rating
= [{S1 +S2 + S3 +S4}/4]
1 14 Feb 2020 2.4
2 20 Feb 2020 2.55
3 26 Feb 2020 3.4
4 04 Mar 2020 4.21
5 09 Mar 2020 4.71
6 15 Mar 2020 4.71
5.6 5S System Efficiency:
After implementing 5S, the immense changes in the industry have come. In the initial stage the efficiency
was very less. However, week by week the numbers of system efficiency were rising gradually. Eventually,
we achieved almost near to double efficiency of the initial one. The industry got many benefits after
implementation, which clearly shows the successful implementation of 5S in the industry.

Multidisciplinary International Research Journal of Gujarat Technological University ISSN: 2581-8880
VOLUME 2 ISSUE 2 JULY 2020 103
Table (5.6): 5s System Efficiency
Sr. no. Durations (S1+S2+S3+S4+S5)*100 / 25 Efficiency
(%)
1 14 Feb 2020 (2.6+3.15+1.45+2.4+2.4)*100/25 48.00%
2 20 Feb 2020 (3.6+2.15+1.9+2.55+2.55)*100/25 51.00%
3 26 Feb 2020 (3.6+3.5+3.1+3.4+3.4)*100/25 68.00%
4 04 Mar 2020 (3.8+4.5+4.35+4.21+4.21)*100/25 84.28%
5 09 Mar 2020 (4.8+4.8+4.55+4.71+4.71)*100/25 94.28%
6 15 Mar 2020 (4.8+4.8+4.55+4.71+4.71)*100/25 94.28%
6. CONCLUSION
The 5S system implemented in this crane manufacturing industry is found to be adequate due to many
benefits such as the wastes, scraps and losses were minimized, over production stocks were controlled with
flexible work stations. The 5S is an effective management tool which can improve housekeeping,
environmental conditions and health and safety standards.
SORT
The materials or parts’ finding time declined and it helped to make easy the material handling in
the industry.
Also due to sorting of all materials or parts, they are now easy to access and store in the inventory.
Waste sorting improved the handling of waste material.
Sorting of assembly processes and workers also improved the plant productivity.
SET IN ORDER
Sequencing of the raw material/parts in inventory storage helped to minimize the time of decision
of the worker.
Set the order for the assembly operations of the product helped to shorten the unwanted activities.
SHINE
By introducing Periodic Routine Method, the regular checking of objects is done. Also, the things
like colors, containers and other wet things are periodically checked. Hence, the leaking can be
avoided, and clean floor area is achieved.
Now, after removal of the wastes and dust on the floor area, the working environment became
positive inside the industry.

Multidisciplinary International Research Journal of Gujarat Technological University ISSN: 2581-8880
VOLUME 2 ISSUE 2 JULY 2020 104
STANDARDIZATION
Standardization of the flow of the assembly of the product is done. Due to that, we saved 27
minutes and 102 meter travel distance of the gear hoist in total assembly timing and travel distance
respectively and for gear box we saved 28 minutes of time and 45 meter travel distance from total
assembly of gear box.
Siren and face scanners made the workers self-disciplinary. These objects made the workers to be
on time and to do their respective work by maintaining the discipline in the industry.
SUSTAIN
Workers are feeling motivated because of the standardized process and due to safety tags/banners,
now they follow the safety rules. We organized the safety awareness programs one to one for
workers, so that the workers were got aware about safety.
Also, we ensured sustaining sorting, storage, and shining activities every day. For monitoring all
the systems, we conducted the internal audits and the results are very satisfactory.
Due to all this 5S practice, discipline in the process has been improved and workers are now also
became disciplined.
REFRENCES
[1] Hirano, Hiroyuki (1995): “5 Pillars of visual workplace. Cambridge”, MA: Productivity Press, ISBN
978-1- 56327-047-5.
[2] P. M. Rojasra1, M. N. Qureshi (2013): “Performance Improvement through 5S in Small Scale Industry”
IJMER Vol. 3, Issue. 3, ISSN: 2249-6645, pp.1654-1660.
[3] Mayank Dev Singh, Swati Singh, Abhishek Chokshi, Harshad Chavan, Dhrudipsinh Dabhi (2015):
“Process Flow Improvement through 5S, Kaizen and Visualization” IJIRSET, Vol. 4, Issue 3, ISSN
(Online): 2319 – 8753, pp. 1103-1112.
[4] Kaushik Kumar, Sanjeev Kumar (2012): “Steps for Implementation Of 5S” IJMRA Volume 2, Issue 6
ISSN: 2249-0558 pp.402-416.
[5] Eida Nadirah Roslin, Shamsuddin Ahmed, Siti Zawiah Md. Dawal and Norjamalullail Tamri (2012):
“Strategies for the Successful Lean Manufacturing Implementation” IJERT Vol. 1 Issue 9, ISSN: 2278-
0181pp.01-06.
[6] Gheorghe Dulhai (2008): “The 5S strategy for continuous improvement of the manufacturing process
in autocar exhausts” Management & Marketing Vol. 3, No. 4, pp. 115-120.
[7] K.Ramesh, V.R.Muruganantham, N.R.Arunkumar (2014): “5S Implementation Studies in Biomass”
IJIRSET, ISSN (Online): 2319 – 8753, pp.312-318.

Multidisciplinary International Research Journal of Gujarat Technological University ISSN: 2581-8880
VOLUME 2 ISSUE 2 JULY 2020 105
[8] National Productivity Corporation (2005): “Step-by-step implementation of 5s guide book” ISBN 983-
2025-12-5
[9] S. R. Dulange (2013) : “A Study on Power looms by Management Intervention: 5s Philosophy”
Industrial Engineering Letters ,ISSN 2224-6096 (Paper), ISSN 2225-0581 (online), Vol.3, No.12, 2013, pp.
37-41.
[10] R.T. Salunkhe, G.S. Kamble, Prasad Malage: “Inventory Control and Spare Part Management through
5S , KANBAN and Kaizen at ABC Industry” IOSR-JMCE , ISSN: 2278-1684, pp. 43-47.
[11] Kobarne, A. R., Gaikwad, V. K., Dhaygude, S. S., & Bhalerao, N. A. (2015). Implementation of ‘5s’
technique in a manufacturing organization: a case study. Scholarly Research Journal for Interdisciplinary
Studies, 3, 1851-1872.
[12] Singh J., Rastogi V., & Sharma R. (2014). Implementation of 5S practices: A review. Uncertain Supply
Chain Management, 2(3), 155-162.
[13] Harsha Lingareddy, G.S. Reddy & K. Jagadeshwar,(2013). International Journal of Advanced
Engineering Technology, 4(2), 28-30.
[14] Vaibhav Bharambe, Shubh Patel, Pratik Moradiya, Vishal Acharya (2020): “Implementation of 5s in
Industry: A Review” MIRJ-GTU, Vol. 1, Issue 1 ISSN: 2581-8880, pp.12-27.

Multidisciplinary International Research Journal of Gujarat Technological University ISSN: 2581-8880
VOLUME 2 ISSUE 2 JULY 2020 106
MALWARE ANALYSIS AND DETECTION USING MEMORY
FORENSIC
Bansi Khilosiya
Student
Marwadi University
bansi.khilosiya105924@marwadiuniversit
y.ac.in
Kishan Makadiya
Assistant Professoe
Marwadi University
Kishan.makadiya@marwadieducation.
edu.in
ABSTRACT
Malware harm to system, network, file-malware crime has used in cyber war , isolated malware
depends on its symptoms ,and using malware cyber war has happened that depends on malware
symptoms. After malware crime we could investigate malware footprint in memory such as advanced
malware ,it's malware investigate using memory forensic via live and dead .if we could investigate
malware in RAM and cache then live forensic and if we could find malware from hard disk. Then it is
called dead forensics. Such a malware apt.rootkit, key- logger it is footprint we can Found Depends os
we could find differ malware. There are four techniques of malware analysis: static malware analysis,
dynamic malware analysis, advance static malware analysis, and advance dynamic malware analysis.
After malware crime using memory but we could investigate malware footprint in memory depend on
malware artifacts. Which has found only memory not anywhere in system such as a using file, network,
client, server, application.
Keyword: Linux and Parrot OS, RAT Trojan Malware (Linux Malware) latest malware, live and
dead forensics of memory.
1. INTRODUCTION
Malicious + Software = Malware, Malware Analysis and Memory forensic Have become a must have
skill for fighting advanced malware, targeted attack, and security breaches. But what information has
been stolen, how will this hurt to Business and this will only possible by investigation and forensics.
A lot these answers might only be found through malware analysis and memory forensics. This
forensics is used by security analysis to investigation sophisticated malware such as a root kit. Malware
is harm to system, network, server, client, and file. While cyber warfare among countries has focused
on Windows operating system so far, modern APT such as an advanced malware also aims at Mac OS
X and other os also, Mac OS becomes no longer safe zone. Depends on malware or for symptoms of
malware check we can use analysis tools using analysis all four techniques in analysis but after
malware crime investigate malware footprint, but we could not found in system ,network and using
file. Some advanced malware such as key logger ,apt, advanced persistent threat ,rootkit, we can found
such malware footprint in memory if we could found in ram or cache then live forensic and if found

Multidisciplinary International Research Journal of Gujarat Technological University ISSN: 2581-8880
VOLUME 2 ISSUE 2 JULY 2020 107
from hard disk then it' call dead forensic using differ OS such as Mac OS, parrot OS, windows, android,
iOS, kali, cyber hawk, black-box.
2. OBJECTIVES
While we will do investigate after crime has happened and find malware footprint from memory
not analysis only, it means memory forensic live as well dead both. With latest malware 2019
depends on os memory resident malware.
There are several types of malware:
APT : advanced persistence threat
key logger : data capture from key board
rootkit : unauthorized access in kernel or memory and gather information
adware : from advertisement gather information
fileless : memory residence Malware
downloader : from download link malware download and gather information
spyware : replicate and gather information from victim
RAT : remote access Trojan
There are four malware techniques to analysis of malware:
Static analysis: via API calls static analysis has been done via API calls
Dynamic analysis: via function calls dynamic analysis has been done.
advanced static malware analysis: disassembler
advanced dynamic malware analysis : Debugging
3. RESEARCHMETHODOLOGY
Which has malware find in memory it means symptoms of malware I have been take and take differ
os parrot and compare between live and dead forensic with latest malware2019.
Which has malware find in memory it means symptoms of malware we will take and take differ os
parrot and compare between live and dead forensic with latest malware2019.

Multidisciplinary International Research Journal of Gujarat Technological University ISSN: 2581-8880
VOLUME 2 ISSUE 2 JULY 2020 108
Malware analysis using memory forensic, which has malware effect to memory cause all types of
malware not effect to memory and we will take differ os parrot os with latest malware either 2019 or
2020. and compare between live and dead forensic using differ tool such as Lime and volatility.
Step 1: install free sweep game and make remote trojan access RAT and generate payload via meta
sploit tool.
Step 2: using meta sploit tool and generate payload and spread malware to internet.
Step 3: gather information from victim system.
Step 4: live and dead forensics via time tool, volatility, wireshark.
Figure 1: install game

Multidisciplinary International Research Journal of Gujarat Technological University ISSN: 2581-8880
VOLUME 2 ISSUE 2 JULY 2020 109
Figure 2: Postinst
Figure 3.3: generate payload
Figure 3.4: start reverse handler

Multidisciplinary International Research Journal of Gujarat Technological University ISSN: 2581-8880
VOLUME 2 ISSUE 2 JULY 2020 110
Figure 3.4: Memory Forensics using LiME tool
Malware Forensics:
We could analysis of malware via machine learning, forensics, and four malware analysis techniques.
Here we have did via forensics from memory live and dead forensics. If we have did gather data
from RAM or cache, it is live forensics because data temporarily stored in RAM and cache. If we
have did gather information from hard disk, then it is dead forensics. Because all the information
stored in hard disk. And it is all about called artifacts of memory.
Investigation and find evidence
Memory forensic: live and dead.
Live forensic: Cache and RAM
Dead forensic: Hard disk
Malware enter via source:
File: exe file,.dll file, .bat file
application and software: malicious code
network through: Ransomware, adware downloader
google forms, google link
4. LITERATUREREVIEW
4.1 Detect mac objective-C malware using memory forensics:
In this Paper forensic tool use Mac OS and detect objective -c malware for Mac OS malware analysis
using memory forensic using volatility tool. So, in this they had detected Objective c detective
malware. Objective malware is sophisticated malware. Using APIs, they had did active malicious

Multidisciplinary International Research Journal of Gujarat Technological University ISSN: 2581-8880
VOLUME 2 ISSUE 2 JULY 2020 111
activity and gather information using sophisticated malware. And using Forensic tool volatility in Mac
OS analysis and detect malware and criminal how crime had did that investigate.
4.2 Advanced Malware Analysis through Memory Forensic Technique:
Static analysis method has been complex method. Here in this paper use windows OS Here use static
analysis and dynamic analysis and memory forensic all three method use in this paper. They have taken
200 malware samples. They have shown malware 40 malware Out of 200. VM ware, Virtual Box,
Cuckoo sandbox, Volatility tool, IDA pro, Wireshark, Virus Total are the required tool for analysis.
Some tool volatility for forensic purpose, Ida pro is for static analysis tool use, cuckoo sandbox is use
for dynamic analysis. Many malware Trojan, RAT, Ransomware.
4.3 GPU-assisted malware effect using memory forensics:
In this paper GPU effect malware use. Here in this paper GPU-assisted malware detect. GPU assisted
malware Symptoms to perform malicious activity and still information. They had used lime tool for
forensic. Here window OS used and for forensic anti – forensic techniques use. GPU driver manage
the kernel. Here they had never considered either malicious hardware or code JUST modified of the
graphics card’s Firmware.
4.4 AUMFOR: Automated Memory Forensics for Malware Analysis:
In this paper use AUMFOR is GUI memory forensic tool. Here they had did forensic in volatile
memory RAM or cache that is why here used live forensic. AUMFOR tool is used for window and
Linux OS. Here they had developed AUMFOR tool based on python language. Volatility tool is for
live forensic OS malware memory forensic. This tool has benefit is no need commands. AUMFOR -
Automated Memory Forensic tool is use for forensic investigator by performing all work itself.
4.5 Automated malware detection using artefacts in Forensic memory images:
Here in this paper cuckoo sandbox is use for automatic malware analysis. Using registry, APIs call,
DLLS. Machine learning also use. Here they have taken memory dump. They have detected malware
automatically Using CuckooSandbox.
4.6 Malware Detect using Artifacts of Memory dump and Dynamic Analysis:

Multidisciplinary International Research Journal of Gujarat Technological University ISSN: 2581-8880
VOLUME 2 ISSUE 2 JULY 2020 112
Here in this paper for malware analysis using dynamic malware analysis. Using volatility tool and
cuckoo sandbox they have detected and analysis of malware with machine learning. Using API call,
DLL, Registry feature they have detected Malware. Adware, Ransom ware, Key logger, Downloader
and Backdoor such malware found.
4.7 Android Malware Analysis Based On Memory Forensics:
In this paper they have taken android malware dynamic analysis and memory forensic techniques. They
have found malicious malware using Trojan application such as backdoor. In this paper
APKANALYZER is used for memory forensic tool for android. Ukatemi SHIELD is for analysis
purpose of Android application. They are use Lime tool for capture memory images.
4.8 Review of Mobile Malware Forensic:
Here in this paper take mobile device for analysis of malware. Here they have taken mobile device for
analysis of malware using forensic. Android and IOS mobile used for mobile forensics. Malware such
as backdoor, viruses, worms, Trojans and spyware, botnet. They have taken Open Source Android
Forensics (OSAF) tool for mobile forensic. They have OSAF tool for taken malware investigate with
android application.
4.9 Rootkit detection using memory forensics:
MASHKA is physical tool used for rootkit detection. Malware Analysis System for Hidden Knotty
Anomalies (MASHKA) is used for forensic purpose and this tool is anti-forensics tool. In this paper
how to detect kernel level rootkit from the memory and also analysis of anti-root kit tools. Here in this
paper they have taken window OS. They have taken Volatile memory dump it means live forensics.
4.10 Malware Analysis survey using Static, Dynamic, Hybrid and Memory Analysis:
Here in this paper they have used static malware analysis, dynamic malware analysis and analysis of
memory .They have taken several malware such as virus, worms, Trojan, spyware, root kit, ransom
ware, adware, botnet. In this paper they have taken static analysis using API calls, opcode and in
dynamic analysis using function call and function parameter. And memory analysis using memory
analysis using DLL, Registry key, and network connection. In this paper they have used two type of
malware detection method one is the signature-based detection and second is Heuristic-based
Detection.

Multidisciplinary International Research Journal of Gujarat Technological University ISSN: 2581-8880
VOLUME 2 ISSUE 2 JULY 2020 113
4.11 Smartphone Volatile live Memory forensics:
Here in this paper they have taken mobile device IOS and Android. And they have done live forensic
in volatile memory. They had taken This all are parameter such as a Contacts list, emails, messages,
downloaded confidential documents from email attachment via malware of mobile android and IOS
mobile. They have done comparison between android and IOS Device with raw volatile memory it is
live forensic.
4.12 Malware analysis using Memory forensic via virtual machine introspection tool:
In this paper VM Introspection Tool is used for forensics. Using this tool, they had done Forensic. This
tool is used for both live forensic and dead forensic of malware. Due to malware cyber-attack Happened
therefore they has developed tool for forensic purpose. First, they had run vulnerable software and run
malware exploit and write to memory and target to VM. Third task is read to memory VM. And last
one is run to tools for observation of Event.
4.13 Detection Automatic Analysis and identify using Malware Processes in Forensics via DLLs.
In This paper they had done forensic using DLL dynamic link Libraries .malware forensic collect
evidence and data recovery using Volatility tool. In this paper they had recovered how to restore
processes, system registry, network Information and files that all the information Recovered from
memory. Cause forensics it means live and dead forensics and investigate, find evidence, recovered
data this all are we have to check while we will forensics.
4.14 Detecting Malware and Root kit via Memory Forensics
In this paper they had taken malware and rootkit for detection. That malware is effect to memory. And
steal information of victim. They had used VMI Virtual machine introspection. VMI system is used
for detecting hidden process.
4.15 Formality: Automated Forensic Malware Analysis using volatility:
Here in this paper they had taken volatility tool for investigate using memory forensic. And they had
investigated in RAM memory its live forensic .in this paper for steal information they had inject

Multidisciplinary International Research Journal of Gujarat Technological University ISSN: 2581-8880
VOLUME 2 ISSUE 2 JULY 2020 114
ransomware, and botnet. They had taken RAM Dump form RAM Memory that was live forensics.in
this paper they had taken 5 various malware samples.
5. ANALYSISPART
Table 1: ANALYSIS
Basic Static analysis Basic dynamic
analysis
Advance static
analysis
Advance
dynamic
analysis
Forensics
API CALLS
Opcode
Function call
Function
parameter
Information traces
Disassembler
using IDA
Analysis of the
linked libraries
Debugging
Analysis on
registry
DLL
Registry
Network
connection.
PEview
PEid
Md5deep Virus total
COMODO
ANUBIS
Virtual box
Bintext Ida pro OlldbgRegshot Volatility
Lime GRR
Remnux
6. FINDINGS
Using static and dynamic tool we could not did forensic, for forensic we should be take differ tool
such as volatility, Lime tool, GRR for live and dead forensic. And also find latest malware depends
on os.cause depends on OS. We could find malware according to malware symptoms. And also
check which malware effect to in memory is. And we will find evidence from memory. Here there
are some tools for forensics purpose:
Meta sploit tool
Here we have used meta-sploit tool to generate payload and spread malware into internet and gather
information from victim.

Multidisciplinary International Research Journal of Gujarat Technological University ISSN: 2581-8880
VOLUME 2 ISSUE 2 JULY 2020 115
lime tool
It is use for live forensics. This tool is use for live forensics.
volatility tool
It is use for forensics purpose, but this tool is convert into readable format.
wireshark tool
This tool is use for also forensics purpose.
Two techniques for gather information from kernel and memory via rootkit
There are two techniques of hooking:
IAT hooking
Malware harm to system using two techniques (1) IAT hooking and (2) inline hooking.
Inline hooking:
They both techniques IAT and inline hooking use gather data from kernel and memory.
Table 6.1: FINDINGS PARAMETERS
Sr.
No.
OS Malware analysis
techniques
Techniques for
malware
detection
Analysis
tool
Forensics tool
1 Window Static malware
analysis
machine learning IDA Pro Lime
2 MAC Dynamic malware
analysis
forensics Cuckoo sand
box.
Volatility
3 IoS Dynamic malware
analysis
Via four
Malware
analysis
techniques
PEid Wireshark
4 Android Static malware
analysis
PEview
5 Linux
6 Parrot

Multidisciplinary International Research Journal of Gujarat Technological University ISSN: 2581-8880
VOLUME 2 ISSUE 2 JULY 2020 116
6.2 Diagram of Malware Analysis using memory Forensics:
Pc 1 pc 2
Figure 6.2 : how to malware spread in internet and Forensics via memory
7. CONCLUSION:
We have conclude we can find malware in memory but after attack and crime and we can find
malware evidence and footprint in memory-investigation(memory forensic)-via using different
method and tool of malware analysis and memory forensic for both and use different os for research
work.
Via malware crime it would be not possible to recover the data. So, via malware crime not possible
to recovery. May be some time it will possibly find other techniques and find tools .via modern anti
-techniques perhaps it will possible to recovery data. And use Apple brand OS such a MAC and IOS
OS for further research work. And take latest malware.
8. REFERENCES
[1] Case, A., & Richard, G. (2016). Detecting objective-C malware through memory forensics.
Digital Investigation, 18, S3- S10. doi: 10.1016/j.diin.2016.04.017
[2] Rathnayaka, C., &Jamdagni, A. (2017). An Efficient Approach for Advanced Malware
Analysis Using Memory Forensic Technique. 2017 IEEE Trustcom/Bigdatase/ICESS.
doi:10.1109/trustcom/bigdatase/icess.2017.365
[3] Balzarotti, D., Di Pietro, R., &Villani, A. (2020). The impact of GPU-assisted malware on
memory forensics: A case study. Retrieved 9 February 2020
[4] Igor Korkin, Ivan Nesterov (2014), Applying memory forensics to Rootkit detection.
Malware spread in internet
Forensics: find footprint of
malware symptoms from
memory
Malware
spread in
internet
Memory

Multidisciplinary International Research Journal of Gujarat Technological University ISSN: 2581-8880
VOLUME 2 ISSUE 2 JULY 2020 117
Retrieved 9 February 2020.
[5] Mosli, R., Li, R., Yuan, B., & Pan, Y. (2016). Automated malware detection using artifacts in
forensic memory images. 2016 IEEE Symposium on Technologies for Homeland Security
(HST). doi:10.1109/ths.2016.7568881
[6] Sihwail, R., Omar, K., ZainolAriffin, K., & Al Afghani, S. (2019). Malware Detection
Approach Based on Artifacts in Memory Image and Dynamic Analysis. Applied Sciences,
9(18), 3680. Doi: 10.3390/app9183680
[7] Andr´as Gazdag and Levente Butty´an, Android malware analysis based on memory forensic.
Retrieved 9 February 2020.
[8] Ahmet Efe, Aysenur Dalmis (2019), Reiew of mobile malware forensic. Retrieved 9 February
2020.
[9] Korkin, I., &Nesterov, I. (2020). Applying Memory Forensics to Rootkit Detection. Retrieved
9 February 2020, from https://commons.erau.edu/adfsl/2014/wednesday/1/
[10] Sihwail, R., Omar, K., &ZainolAriffin, K. (2018). A Survey on Malware Analysis
Techniques: Static, Dynamic, Hybrid and Memory Analysis. International Journal on
Advanced Science, Engineering and Information Technology, 8(4- 2), 1662. Doi:
10.18517/ijaseit.8.4-2.6827
[11] Thing, V., & Chua, Z. (2013). Smartphone Volatile Memory Acquisition for Security
Analysis and Forensics Investigation. Security and Privacy Protection in Information
Processing Systems, 217-230. Doi: 10.1007/978-3- 642-39218-4_17
[12] Tien, C., Liao, J., Chang, S., &Kuo, S. (2017). Memory forensics using virtual machine
introspection for Malware analysis. 2017 IEEE Conference on Dependable and Secure
Computing. Doi: 10.1109/desec.2017.8073871
[13] Duan, Y., Fu, X., Luo, B., Wang, Z., Shi, J., & Du, X. (2015). Detective: Automatically
identify and analyze malware processes in forensic scenarios via DLLs. 2015 IEEE
International Conference on Communications (ICC). Doi: 10.1109/icc.2015.7249229
[14] Hua, Q., & Zhang, Y. (2015). Detecting Malware and Rootkit via Memory Forensics. 2015
International Conference on Computer Science and Mechanical Automation (CSMA). Doi:
10.1109/csma.2015.25
[15] H. Rughani, p. (2020). ForMaLity: Automated FORensicMAlware Analysis using
VolatiLITY - PDF Free Download. Retrieved 9 February 2020, from
http://docplayer.net/100192184-Formality-automated-forensic-malware-analysis- using-
volatility.html

Multidisciplinary International Research Journal of Gujarat Technological University ISSN: 2581-8880
VOLUME 2 ISSUE 2 JULY 2020 118
COPARATIVE STUDY OF DIAGRID SYSTEM, HEXAGRID SYSTEM
AND SHEAR WALL SYSTEM IN TALL TUBE-TYPE BUILDING
Meman Suraiyabanu Mohamed Salim
M.E. Student of Civil Engineering
H.J.D. Institute of Technical Education and Research, Kutch.
ABSTRACT
In this paper consistent floor plan of 36 m x 36 m located in seismic zone V for G+49 storey tall
building is considered, and all physical members are planned as per IS 456:2000. Earthquake factors
are measured from 1893-2002. Dead & live loads are mentioned as per Indian Standards. Here,
analysis of diagrid and hexagrid system will be directed by using design software STAAD Pro.
Twelve models are modelled in staad.pro collectively of corner shear wall, core shear wall, diagrid
system and hexagrid system buildings with regard to variation in their combination of exterior
structural system and internal structural system. Both dynamic (Response spectrum analysis) and
static analysis of these models have been conceded out to regulate their performance. The model so
prepared is been compared to the normal building parameters like Storey displacement, Storey drift,
base Shear and bending moment to determine the efficient structure.
Keywords-- Shear wall, diagrid, hexagrid, tall tube building
1 INTRODUCTION
1.1 General
Emporis standards
Buildings height between 35-100 meter is termed as multi-storey building.
Buildings higher than 100m is termed as skyscraper building.
Buildings 300m or higher is termed as super tall building.
Buildings 600m or taller is termed as mega-tall building.
High rise buildings are more popular in these days due to following reasons
scarcity of land
increasing demand for business and residential
economic growth
technological advancement
innovations in structural systems

Multidisciplinary International Research Journal of Gujarat Technological University ISSN: 2581-8880
VOLUME 2 ISSUE 2 JULY 2020 119
desire for aesthetics in urban settings
cultural significance and prestige
human aspiration to build higher
to make denser city and
to reduce the transmission losses of energy
1.2 Lateral Load Resisting System for Tall Buildings
1.2.1 Introduction
Taller buildings demanded by socio-economic trends, structural engineers were pressed to provide
lateral load resisting systems that would cut off cost of structural and reinforcing steel for buildings of
greater height to width aspect ratios and different vertical heights.
Structural Engineers may use concepts in order to control building response to lateral loading, which
are as follows:-
1. By Increase stiffness of the system
2. By Increase building weight
3. By Increase density of the structure with fill-ins
4. By Use of efficient shapes
5. By Generate additional damping forces (tuned mass dampers)
1.2.2 Classification
Lateral load resisting system is broadly classified as
(A) Interior Structural Systems
(B) Exterior Structural System
A system is classified as an interior structure in which the major part of the lateral load resisting
system is detect in the interior of the building in the same way, if the vital part of the lateral load
resisting system is detect at the building perimeter, a system is classified as an exterior structure. In
interior structure, components of the lateral load resisting system are at the exterior face of the
building perimeter. In exterior structure components of the lateral load resisting system is within the
interior of the building to oppose gravitational load

Multidisciplinary International Research Journal of Gujarat Technological University ISSN: 2581-8880
VOLUME 2 ISSUE 2 JULY 2020 120
Figure 1 Lateral load resisting systems
Source: from Wikipedia
Figure 2 Evolution of structure system
Source: From Wikipedia
1.2.3 Interior Structural System
The two basic types of lateral load-resisting systems are the moment-resisting frames and shear
trusses/shear walls. These systems are commonly arranged as planar assemblies in two principal
orthogonal directions and may be take on together as a combined system in which they interact.
Another very important system in this category is the core supported outrigger structure, which is very
extensively used for super tall buildings. The MRFs consists the horizontal and vertical members
rigidly connected together in form of a grid. Moment-resisting frames can be located in or around the
core, on the exterior, and the across the interior of the building with grid lines.

Multidisciplinary International Research Journal of Gujarat Technological University ISSN: 2581-8880
VOLUME 2 ISSUE 2 JULY 2020 121
Figure 3 Interior structure systems
Source: from Wikipedia
1.2.4 Exterior Structure System
The tube structure is one of the most typical exterior structure, which can be defined as a three-
dimensional structural system utilizes the perimeter of the entire building to resist lateral loads. The
earlier application of the tubular notion is associated to Fazlur Khan, who came up with this concept
in 1961, and the first known building was designed as a framed tube. By using this concept world’s
tallest buildings are the the 110-storey World Trade Centre Towers (destroyed in 2001 by a terrorist
attack) in New York and 110-storey Sears Tower. Tubular forms have many types based on the
structural efficiency that they can provide of several heights.
Figure-4 Exterior structure systems

Multidisciplinary International Research Journal of Gujarat Technological University ISSN: 2581-8880
VOLUME 2 ISSUE 2 JULY 2020 122
Source: from Wikipedia
1.2.5 Diagrid Structure
Diagrid is a form of space truss. It contains of perimeter grid made up of a chain of triangulated truss
system. Diagrid is placid by crisscrossing the diagonal and horizontal members. Diagrid has good
look and it is recognizable from far. For less obstruction to the elevation it is necessary to the diagrid
system is lessen the number of vertical column as well as horizontal column and rises the diagonal
members on the aspect of the buildings. Perimeter “diagrid” system reduce the 20 percent of the
structural steel weight related to other structure.
Figure 5 Diagrid system
Source: from Wikipedia
1.2.6 Hexagrid Structure
In hexagrid structural system, all the vertical columns are reserved. Hexagrid structural system is
mostly of two type vertical hexageid system and horizontal hexagrid system. It will be designed of
Hexagon which is a group of hex-angulated truss system. Hexagrid is accumulated by crisscrossing
the diagonal and horizontal members.
Figure 6 Hexagrid Structural system

Multidisciplinary International Research Journal of Gujarat Technological University ISSN: 2581-8880
VOLUME 2 ISSUE 2 JULY 2020 123
Source: from Wikipedia
1.2.7 Shear Wall Structural System
Shear wall is a structural member which is used against lateral forces i.e. parallel to the plane of the
wall. By the Cantilever Action Shear wall resists the loads where the bending deformation is more.
Lateral forces from exterior walls, floors, and roofs to the foundation in a direction parallel to their
planes is transfer by rigid vertical diaphragm. I.e. RC wall. Shear walls are plane or flanged in section
and core walls are of channel sections. To resist lateral displacements, they also provide enough
strength and stiffness.
Figure 7 Shear wall
Source: from Wikipedia
2 OBJECTIVE OF STUDY
The main objective of this study is to understand the analysis and design methodology of new
concept diagrid structural system and hexagrid structural system. .
Analysis of building frames considering seismic analysis.
To carry out assessment on a tall tube type structure models with Shear wall, diagrid and
hexagrid system for well presentation.
The performance of the structure is considered based on the storey displacement, storey drift,
base shear and bending moment.

Multidisciplinary International Research Journal of Gujarat Technological University ISSN: 2581-8880
VOLUME 2 ISSUE 2 JULY 2020 124
3 LITERATURE REVIEW
Lots of research work is carried out in diagrid structure. Some important works are mentioned here
such as 1) Introductory design of tall building structures with an exterior structure system, 2) A Study
on the Seismic Presentation of exterior structure system Hexagrid System with Diverse Patterns, 3)
Relative Study of two exterior structure system Pentagrid and Hexagrid System for Tall Building, 4)
Relative Study of Diagrid Constructions over Braced tube Structures. In this above researches
comparison of building data of diagrid, hexagrid / pentagrid etc. structural system with different shear
wall location are not studied so I do this study. The brief description of these works are described
below.
Farhan Danish obtainable Initial design of tall building structures with a hexagrid system by stiffness
method. Study and design of 60 storey building has been modelled in MIDAS a commercial finite
element software. Hexagrid system is designed for varying size and type. Based on the above design
studies, it is suggested that to use a vertical hexagrid system structure for the reason is a vertical
hexagrid system was stiffer than a horizontal hexagrid system and hexagrid structural system is more
reasonable and provide conflict to lateral forces.
Mobi RIA Mathew presented) A Study on the Seismic Presentation of exterior structure system
Hexagrid System with Diverse Patterns. They concluded at the end for 36‐storey hexagrid structures,
which briefly described below. In this study the building of 1296 sq. m. with storey height 3.6 m. is
modelled In ETAB. In hexagrid structural system the angle is 1200. Comparing the performance of
hexagrid structural system with different patterns. From calculation results, it is indicated that Storey
drift for all structure models are in the permissible limits and decreased hexagrid density increases the
storey drift and storey displacement.
Relative Study of two exterior structure system Pentagrid and Hexagrid System for Tall Building:
This paper focus on the comparison of pentagrid and hexagrid systems behaviour in tall diagrid
Building. Taranath S. D considered for the analysis tall buildings of 40, 50 and 60 floors. From
calculation results, it is indicated that Pentagrid system is more efficient than Hexagrid system.
Comparative Study of Diagrid Structures over Braced tube Structures: Arpitha L M presented a paper
on the models of diagrid system and braced tube systems ware compared for result like the maximum
storey displacement, store drift, base shear, and time period. Analysis result shows that the model
braced structures is stiffer than the diagram structures since the columns are provided in periphery.
The hexagonal plan structure is stiffer and due to square plan displacement is higher and displacement
due to hexagonal plan is less and due to square plan base shear is higher
4 METHODOLOGY OF WORK
4.1 Static Analysis
1. Equivalent static load method

Multidisciplinary International Research Journal of Gujarat Technological University ISSN: 2581-8880
VOLUME 2 ISSUE 2 JULY 2020 125
Static analysis is an engineering branch which studies the stress in materials and structures subjected
to static or dynamic forces or loads. The objective of the analysis is generally to determine whether
the collection of elements, usually referred to as a structure or component, can safely withstand the
specified forces and loads.
This is possible when the defined stress from the applied force is less than the yield strength and the
material is to be able to withstand. This relationship referred as factor of safety (FOS) and is used as
an indicator of success or failure of the analysis.
4.2 Dynamic Analysis
1. Response spectrum method
“Response spectrum is defined as the study of the maximum response of single degree of freedom that
have a certain period and damping during seismic ground motion”. Response Spectrum analysis
should be done to attain the design seismic force. It is required to have a time history record to
perform the seismic analysis and design of a structure built at a particular location. Further, as the
response of the structure depends on the frequency content of the ground motion and its dynamic
properties, the seismic analysis of structures cannot be carried out that depends on the ground
acceleration’s peak value. To overcome these difficulties, the most popular method is response
spectrum in the seismic analysis of structures. In the prediction of displacements and member forces
in structural systems, this method has computational advantages in using the response spectrum
method for seismic analysis.
4.3 Methodology adopted in Present work
In this present comparative study, the analysis of following structures is been carried out:
1. Normal building.
2. Only core shear wall building.
3. Only corner shear wall building.
4. With core shear wall and with corner shear wall building.
5. Only diagrid system building.
6. With core-with corner shear wall diagrid system building.
7. With core-without corner shear wall diagrid system building.
8. With corner-without core shear wall diagrid system building.
9. Only hexagrid building.
10. With core-with corner shear wall hexagrid system building.
11. With core-without corner shear wall hexagrid system building.
12. With corner-without core shear wall hexagrid system building.

Multidisciplinary International Research Journal of Gujarat Technological University ISSN: 2581-8880
VOLUME 2 ISSUE 2 JULY 2020 126
The plan areas of all structures are same through the analysis, also the beam and column dimensions
are kept constant.
The value such as beam column size, hexagrid-diagrid size, Density of rcc, Density of masonry,
Young’s modulus, compressive strength of steel and concrete etc. are kept constant in all buildings.
For same structure data and earthquake data 12 models are analysis by static and dynamic analysis.
The results parameters include the maximum displacement, maximum drift, and maximum storey
shear.etc. Which are to be compared.
4.4 Modelling
The research work consists of hypothetical models of tall tube structures. The work consists of 12
models and which includes normal building, diagrid system, hexagrid system, core shear wall and
corner shear wall structure.
4.5 Modelling Data
The following data is taken for the research work:
Number of stories: 50 storey
Plan: 36m x36m
Seismic zone: V
Floor height: 3 m
Grade of concrete: 30 Mpa
Grade of steel: Fe 415
Size of columns: 900 mm x 900 mm
Size of beams: 450 mm x 800 mm
Wall thickness:230 mm
Depth of slab: 150 mm
Diagrid:650 mm x 650 mm
Hexagrid:300 mm x 300 mm
Dead load: 17.25 KN/m²
Live load: 3.75 KN/m
Floor finish: 1 KN/m²
Angel of diagrid / hexagrid:65
Zone factor: 0.36
Importance factor: 1
Damping ratio: 0.05
Response reduction factor: 5
Type of soil: Medium soi
Figure 8 Hypothetical model

Multidisciplinary International Research Journal of Gujarat Technological University ISSN: 2581-8880
VOLUME 2 ISSUE 2 JULY 2020 127
5 ANALYSIS AND RESULTS
Table: 1 Comparison of Displacement Results
Dis
pla
cem
ent
(mm
)
Storey 0 10 20 30 40 50
Normal building 0 1182 2340 3240 3858 4178
Core shear wall 0 790 1830 2990 3750 4041
Corner shear wall 0 219 337 456 1363 682
Core +Corner 0 200 308 417 526 624
Only diagrid 0 166 257 347 437 528
Core+ Diagrid 0 239 369 499 693 746
Corner+ Diagrid 0 356 616 876 1136 1396
Core+ Corner+
Diagrid 0 157 161 218 275 332
Hexagrid 0 176 272 368 464 560
Hexagrid+ Core 0 196 289 456 569 607
Hexagrid+ Corner 0 186 287 388 815 590
Hexagrid+ Core+
Corner 0 185 286 387 488 589

Multidisciplinary International Research Journal of Gujarat Technological University ISSN: 2581-8880
VOLUME 2 ISSUE 2 JULY 2020 128
Source: from the analysis
Graph: 1 Comparison of Displacement
Source: from the analysis
Table: 2 Comparison of Drift Results
Dri
ft (
mm
)
Storey 0 10 20 30 40 50
Normal building 0 12 10 7.8 5 10
Core shear wall 0 10 12 12 12 11
Corner shear wall 0 12 12 12 12 12
Core +Corner 0 11 11 11 11 11
Only diagrid 0 9 9 9 9 9
Core+ Diagrid 0 10 10 10 10 10
Corner+ Diagrid 0 7 7 7 7 7
Core+Corner+ Diagrid 0 8 8 8 8 8
Hexagrid 0 9.5 9.5 9.5 9.5 9.5
Hexagrid+ Core 0 10 10 11 11 9
Hexagrid+ Corner 0 10 10 10 7 9
Hexagrid+Core+Cornr 0 10 10 10 10 9
Source: from the analysis
Graph: 2 Comparison of Storey Drift

Multidisciplinary International Research Journal of Gujarat Technological University ISSN: 2581-8880
VOLUME 2 ISSUE 2 JULY 2020 129
Source: from the analysis
Table: 3 Comparison of Bending Moment Results
Bending moment ( KN. m )
Direction X
Normal building 471
Core shear wall 271
Corner shear wall 371
Core +Corner 281
Only diagrid 224
Core + Diagrid 349
Corner + Diagrid 310
Core+ Corner+ Diagrid 207
Hexagrid 240
Hexagrid+ Core 247
Hexagrid+ Corner 256
Hexagrid+ Core+ Corner 256
Source: from the analysis
Graph: 3 Comparison of Bending Moment
Source: from the analysis
Table: 4 Comparison of Base Shear Results
Base shear (KN)
Normal building 37000
Core shear wall 28405
Corner shear wall 22317
Core +Corner 23629
Only diagrid 16627

Multidisciplinary International Research Journal of Gujarat Technological University ISSN: 2581-8880
VOLUME 2 ISSUE 2 JULY 2020 130
Core+ Diagrid 14783
Corner+ Diagrid 13588
Core+ Corner+ Diagrid 14096
Hexagrid 5498
Hexagrid+ Core 7871
Hexagrid+ Corner 13002
Hexagrid+ Core+ Corner 14448
Source: from the analysis
Graph: 4 Comparison of Base Shear
Source: from the analysis
6 CONCLUSIONS
1) Comparison of storey displacement:
The values from static and response spectrum method analysis displacement for normal building is 92
% more than the core + corner + diagrid model building. In Diagrid and hexagrid model’s
displacement is less as compare to normal building. So, diagrid and hexagrid system is good in storey
displacement.
2) Comparison of storey drift:
The values of storey drift from the analysis in corner shear wall model is 41% more than the corner +
diagrid model. Storey drift of Diagrid and hexagrid model is less than the normal building and shear
wall buildings model. So, diagrid and hexagrid system is good in storey drift.
3) Comparison of bending moment:
In core + corner +diagrid building bending moment is less and high in normal building. Bending
moment is 56 % more in normal building. So, diagrid and hexagrid system is good in bending
moment.

Multidisciplinary International Research Journal of Gujarat Technological University ISSN: 2581-8880
VOLUME 2 ISSUE 2 JULY 2020 131
4) Comparison of base shear:
Base shear in normal building is 79 % more than the hexagrid building model. Diagrid and hexagrid
building model have less base shear so diagrid and hexagrid building modal is good in base shear. So,
diagrid and hexagrid system is good in base shear.
Comparison of diagrid-hexagrid building and normal building are shows that diagrid and
hexagrid building has less displacement, less storey drift, less bending moment, and base
shear in seismic analysis.
Diagrid and hexagrid structure comparison to normal building provide more aesthetic look it
becomes important for tall structure.
So, from result comparison with normal building, one can adopt diagrid and hexagrid
structure for better lateral and gravitational load resistance.
So, from the results and conclusions final conclusion is diagrid system and hexagrid system is
good for tall tube type RC building.
7 REFERENCES
1. Niloufar Mashhadiali and Ali Kheyroddin. (2012). “Proposing the Hexagrid System as a new
Structural System for Tall buildings”, the structural design of tall and special buildings Wiley Online
Library, Vol 22 pp 1310-1329.
2. Niloufar Mashhadiali and Ali Kheyroddin. “Progressive collapse assessment of new hexagrid
structural system for tall buildings” the structural design of tall and special buildings Wiley Online
3. NiloufarMashhadiali and Ali Kheyroddin, and RouzbehZahiri-Hashem. (2016). “Dynamic Increase
Factor for Investigation of Progressive Collapse Potential in Tall Tube-Type Buildings”, ASCE
(American Society of Civil Engineering) Vol. 30, Issue 6.
4. Massimiliano Fraldi. (2016) “Non-conventional Structural Patterns for Tall Buildings from Diagrid
to Hexagrid and Beyond”, Workshop on Design in Civil and Environmental Engineering, Italy Fifth
International.
5. Peyman A Nejad. (2011) “Beehive, New Innovative Structural system for tall buildings”,
International Journal of High-Rise Buildings Volume 5 Issue 4 pp: 251-262.
6. Mobi RIA Mathew. (2016) “A Study on the Seismic Performance of Hexagrid System with
Different Patterns”, Applied Mechanics and Materials, vol-857, pp: 30-35.
7. Pooja Liz Isaac. (2017) “Comparative Study of Performance of High-Rise Buildings with Diagrid,
Hexagrid and Octagrid Systems under Dynamic Loading”, (IRJET), Volume 4, Issue 5, pp: 2840-
2846.

Multidisciplinary International Research Journal of Gujarat Technological University ISSN: 2581-8880
VOLUME 2 ISSUE 2 JULY 2020 132
DEVELOPMENT AND VALIDATION OF A BIOANALYTICAL
METHOD FOR DETERMINATION OF SILYMARIN IN PLASMA
Dr. Dasharath M. Patel*
Associate Professor
Graduate School of Pharmacy
Gujarat Technological University
Ahmedabad, Gujarat, India
Mr. Pankaj V. Patel
Associate Scientist
Veeda Clinical Research Pvt. Ltd.
Ahmedabad, Gujarat, India
Dr. Hitesh D. Karen
Professor
Shri Sarvajanik Pharmacy College
Mehsana, Gujarat, India
Dr. Chhagan N. Patel
Principal
Shri Sarvajanik Pharmacy College
Mehsana, Gujarat, India
ABSTRACT
Silymarin is the active component of milk thistle plant which is a standardized extract consisting of
silymarin flavonolignans (70-80 %), and a chemically undefined mixture composed of polymeric and
oxidized polyphenolic compounds (20-30 %). Various analytical methods have been reported for its
determination in plasma. Reported methods involved sample pretreatment using liquid-liquid
extraction which makes them more time consuming because of frequent evaporation and
reconstitution steps. Present study was aimed to develop a simple High-Performance Liquid
Chromatography method with minimum time for sample pretreatment. This method was developed
and validated using ultra violet detection for the determination of silymarin in plasma. The method
was based on protein precipitation using methanol. Analysis was performed on ACE C18 column
(150 × 4.6mm, 5µ) with gradient elution using solutions containing orthophosphoric acid: methanol:
water in two different ratios 0.5:35:65 V/V/V and 0.5:50:50 V/V/V, pumped at a rate of 0.8 mL/min.
The UV detection was performed at 288 nm. The retention time for the analysed comonents;
silycristin, silydianin, silybin A, silybin B, isosilybin A and isosilybin B were found to be 7.97, 9.50,
17.04, 18.40, 22.45 and 23.35 min, respectively. The standard curve was linear over the range of 2 to
40 µg/mL with the regression coefficient >0.99. The intraday and interday precision was less than
3.06 and 6.56%, respectively. The results of analysis have been validated statistically and by recovery
studies. The developed method was successfully applied for preclinical pharmacokinetic studies of
silymarin in plasma samples of rabbit that were obtained at different time intervals after oral
administration of silymarin.
Key Words: Silymarin, bioanalytical method, determination, plasma, pharmacokinetic

Multidisciplinary International Research Journal of Gujarat Technological University ISSN: 2581-8880
VOLUME 2 ISSUE 2 JULY 2020 133
1 INTRODUCTION
Silybum marianum is one of the ancient and thoroughly researched plants. It is popularly called as
milk thistle as common name. Active component of this plant is silymarin which is a standardized
extract composed of approximately 70-80 percent silymarin flavonolignans including silybin A & B,
isosilybin A & B, silydianin and silychristin as shown in Figure 1, and flavonoids (taxifolin and
quercetin). Remaining 20-30 percentage part is a chemically undefined mixture comprising of
polymeric and oxidized polyphenolic compounds. The isomers are collectively known as silymarin [1,
2]. Silymarin is a flavonolignans derived from the plant Silybum marianum. It is official in Indian
Pharmacopoeia [3], United States Pharmacopoeia [4] and British Pharmacopoeia [5]. As per Indian
Pharmacopoeia, it is indicated for hepatoprotective and chemoprotective activities [3]. It exhibits
different pharmacological activities, like antioxidant, cardioprotective [6], antiinflammatory,
anticancer, and hepatoprotective [7-11]. It has been used for the treatment of liver cirrhosis [12] and
viral hepatitis [13]. Effect of Silymarin is due to several activities likes regulation of cell membrane
permeability, leukotriene inhibition and reactive oxygen species scavenging properties [14]. Silymarin
has an elimination half life of approximately 6-7 h and it is more than 70% bound to plasma proteins
[15]. The major constituent of silymarin is silybin (also known as silibinin), a mixture of two
diastereomers, silybin A and silybin B, in approximately equimolar ratio [16]. Silymarin is herbal
medicine hence collectively all compounds are active and used for the treatment of liver cirrhosis and
viral hepatitis [17] hence all the components were analyzed in the present method.

Multidisciplinary International Research Journal of Gujarat Technological University ISSN: 2581-8880
VOLUME 2 ISSUE 2 JULY 2020 134
Figure 1: Chemical structure of Silymarin components
Most pharmacopoeial methods for assay of silymarin described HPLC with spectrophotometric
detection at 288 nm [18-20]. Some non-pharmacopoeial methods are also reported for analysis of
silymarin components in non-biological samples [21-24]. Few methods are reported for analysis of
silymarin in biological matrices [25-27]. However, in the reported bioanalytical methods, the sample
pretreatment consisted of liquid-liquid extraction. The liquid-liquid extraction protocols, evaporation
and reconstitution steps used in such methods makes them more time consuming. Therefore, the
present study was aimed to develop a simple HPLC method for determination of silymarin in plasma
with minimum sample pretreatment.
2 MATERIALS AND METHODS
2.1 Chemicals
Silymarin was a generous gift from Centaur Pharmaceutical Private Limited (Goa, India). Methanol of
HPLC grade and phosphoric acid (85%) of analytical grade were obtained from Finar Chemicals Ltd
(Ahmedabad, India). Double distilled water prepared in the laboratory was used during the entire
HPLC procedure.
2.2 Apparatus
2.2.1 HPLC system
The chromatographic separation was carried out using integrated Shimadzu HPLC instrument (Model:
LC 2010 CHT) equipped with an auto injector and UV Visible detector. A reversed column and
gradient elution of a mobile phase were used for chromatographic separation. Spectrophotometric
detection was done at 288 nm. The output signal was monitored and processed using LC solution
software.
2.2.2 Column
ACE C18, 5 μm, 4.6 x 150 mm analytical column with ODS 5 μm, 4.6 x 100 mm guard column was
used for the method development.
2.2.3 Software
LC solution software was used for acquisition, reporting and analysis of data generated in the
experimentation.

Multidisciplinary International Research Journal of Gujarat Technological University ISSN: 2581-8880
VOLUME 2 ISSUE 2 JULY 2020 135
2.3 HPLC Conditions
Samples were eluted using a mobile phase consisting of solution A containing orthophosphoric acid:
methanol: water (0.5:35:65 V/V/V) and solution B containing orthophosphoric acid: methanol: water
(0.5:50:50 V/V/V). The mobile phase was filtered through a membrane filter (0.45 μm pore size, 47
mm diameter, Sartorius India Pvt. Ltd., Mumbai, India) and degassed in a sonicator (Enertech Fast
Clean, Mumbai, India). Pumping of the mobile phase at a flow rate of 0.8 mL/min was carried out in
the gradient mode for the run time of about 51 min. The temperature of column oven was set at 45 °C
and UV detector was set at 288 nm. Samples of 10 µL were injected into column using an auto
injector.
2.4 Preparation of Standard Solutions
Silymarin primary stock solution was prepared in methanol. For the preparation of solution, an
accurately weighed 10 mg of silymarin was transferred to a 10 mL volumetric flask. Then 7 mL of
methanol was added to the flask and stirred well to dissolve the drug. The volume was made up to the
mark with methanol to yield a concentration of 1 mg/mL. Working standard solutions were prepared
by dilution with methanol. Calibration standards were prepared by spiking stock solutions into drug-
free plasma to yield concentrations of 2, 4, 8, 20, 32 and 40 µg/mL. External standard method was
used to analyze the drug samples.
2.5 Preparation of Samples
The storage of collected plasma samples was done at -20 °C. The stored plasma samples were taken
out and allowed to attain a room temperature before further processing. Methanol (2.5 mL) was added
to 500 µL plasma and then mixture was vortexed for 30 s. The tube was centrifuged for 5 min at 2000
rpm (Remi, Cooling Centrifuge, Model C- 24BL, Remi Elektrotechnik Limited, Vasai, India) and
supernatant was filtered through polyvinylidene difluoride (PVDF) syringe filter (Millipore Millex-
HV Hydrophilic, 0.45 μm pore size, 33 mm diameter, Millipore India Pvt. Ltd., Mumbai, India) and
transferred into a clean tube. The resulting solution (10 µL) was injected into the chromatographic
system for analysis.
2.6 Selectivity
The developed method was investigated for its selectivity of the analytes over the potential
interference of endogenous substances by analyzing blank plasma and comparing with LOQ solution
samples from at least six sources.

Multidisciplinary International Research Journal of Gujarat Technological University ISSN: 2581-8880
VOLUME 2 ISSUE 2 JULY 2020 136
2.7 Calibration Curves
The calibration curve was constructed in the range of 2-40 µg/mL to encompass the expected
concentrations in measured samples. The calibration range was selected to cover the expected Cmax
(2-6 µg/mL) of silymarin in tested formulation. The calibration curve was obtained by plotting
silymarin peak area versus the silymarin concentration. Linear regression of the data was performed to
determine correlation.
2.8 Accuracy, Precision and Recovery
The accuracy, precision (within-day and between-day) and recovery values of the method were
determined using the quantification of five QC samples with three different concentrations within the
calibration range. The food and drug administration (FDA) criterion for acceptability of accuracy and
precision is ± 15% deviation from the nominal value, except for the LOQ, which should not exceed
20% [28].
2.9 Stability Study
Short-term, long-term, freeze-thaw and processed sample stability study of silymarin in plasma were
carried out. For the purpose of stability study, spiked QC samples of 2 µg/mL (LQC) and 40 µg/mL
(HQC) were used. Silymarin QC samples were kept room temperature for 24 h before protein
precipitation to perform short-term stability study. For long-term stability study, the plasma QC
samples were stored at -20 °C for 16 days before analysis. Freeze-thaw stability study was conducted
by cycling of the plasma QC samples for three cycles between -20 °C and room temperature. The
plasma sample were analyzed after each cycle. Analysis of freshly prepared plasma QC samples and
samples kept in the auto injector for 6 h before injection was carried out for the assessment of
processed sample stability.
2.10 Application of Developed Method
Developed method was applied for determination of silymarin in plasma following oral administration
of 300 mg/kg dose of silymarin in New Zealand white rabbits (three). The study protocol was
approved by Institutional Animal Ethical Committee (IAEC) of Shri Sarvajanik Pharmacy College,
Mehsana, Gujarat vide Proposal No.: SSPC/IAEC/17/08/2013 as per the guidance of Committee for
the Purpose of Control and Supervision of Experiment on Animals (CPCSEA). Blood samples were
taken from a rabbit prior to dosing and at 0.25, 0.5, 0.75, 1, 2, 4, 6, 8, 12 and 24 h after drug
administration. The blood samples were centrifuged at 5000 rpm for 10 min, and plasma was
collected in polyethylene tubes and stored frozen at -20 °C until analysis.

Multidisciplinary International Research Journal of Gujarat Technological University ISSN: 2581-8880
VOLUME 2 ISSUE 2 JULY 2020 137
3 RESULTS AND DISCUSSION
3.1 Selection of Extraction Solvent
Extraction of silymarin isomers from plasma was tried using extracting solvents like methanol,
ethanol, ethyl acetate, diethyl ether, acetone, and dichloromethane. The solubility in methanol,
ethanol, ethyl acetate, diethyl ether, acetone and dichloromethane were found to be 237.7, 225.3,
198.1, 185.4, 168.5 and 102.9, respectively expressed in mg/mL. From the tested solvents methanol
was used due to high solubility of silymarin isomers in it.
3.2 Chromatographic Selectivity
Typical chromatograms of drug-free plasma and spiked plasma of silymarin (2µg/mL) are shown in
Figure 2. The method selectivity was demonstrated on six blank plasma samples. Chromatograms
were found to be free of interfering peaks. The retention time of silycristin (Sc), silydianin (Sd),
silybin A (SbA), silybin B (SbB), isosilybin A (ISbA) and isosilybin B (ISbB) were 7.97, 9.50, 17.04,
18.40, 22.45 and 23.35 min, respectively under the optimized chromatographic conditions.
Figure 2: Chromatograms of (a) spiked plasma of Silymarin (2 µg/mL) and (b) a drug-free
plasma
3.3 Linearity
The standard curve of silymarin in plasma was linear over the range of 2 to 40 µg/mL as shown in
Table 1. The linearity of the calibration data was evaluated using regression coefficient of 0.999 as
shown in Table 2.

Multidisciplinary International Research Journal of Gujarat Technological University ISSN: 2581-8880
VOLUME 2 ISSUE 2 JULY 2020 138
3.4 Accuracy, Precision and Recovery
Accuracy, intraday and interday precision and recovery were assessed by analyzing the LOQ and QC
samples prepared by spiking the plasma with known amount of silymarin. Results of accuracy data
and intraday precision are shown in Tables 3 and 4, respectively. The accuracy of the method was
higher than 86% for all the concentrations. The mean intraday precision was found to be 3.06%.
Table 1: Calibration Curve of Silymarin in Plasma
Sr.
No.
Concent
ration in
spiked
plasma
(µg/mL)
Concentra
tion of
Silymarin
Std
(µg/mL)
Peak area ± S.D. (n=3) %
Recovery
from
spiked
plasma
%
CV Silymarin in
Spiked plasma
Silymarin Std in
Methanol
1 2 2 29627 ± 1608 31813 ± 1137 93.13 5.42
2 4 4 55873 ± 1534 65029 ± 2154 85.92 2.75
3 8 8 117272 ± 11330 137563 ± 9773 85.25 9.66
4 20 20 302410 ± 10138 320991 ± 13379 94.21 3.35
5 32 32 494199 ± 9859 527288 ± 18154 93.72 1.99
6 40 40 615364 ± 42182 698450 ± 47498 88.10 6.85
Table 2: Linearity Results of Silymarin in Plasma and Methanol
Pearameters Results
Silymarin in Plasma Silymarin in Methanol
Linearity Range 2-40 µg/mL 2-40 µg/mL
Regression Line Equation y = 15519x + 5041 y = 17152x + 6165
Correlation Coefficient (R2) 0.999 0.997
3.5 Stability Study
The stability study was performed as per bioanalytical validation guidelines. From the results of short-
term stability study performed at room temperature, it was observed that low and high QC samples
were stable for 24 h with assay of 90.63 ± 0.67%. From the results of long-term stability, it was found
that silymarin samples stored at -20 °C for 16 days were stable with assay of 95.96 ± 0.95%. The
decrease of silymarin concentration in plasma samples detected after exposing samples to three
freeze-thaw cycles was insignificant, with mean assay of 95.15 ± 0.53%. The results of stability of
processed samples in the autosampler showed that QC samples were stable for at least 6 h at room
temperature, without significant loss of silymarin.
Based on the preliminary stability results, it was concluded that the processing and analysis of the
plasma samples shall be completed within 16 days after animal experiments. The collected plasma
samples were frozen and thawed only once and were processed immediately after thawing. After
processing, the samples were kept in the auto sampler for a time not longer than 6 h.

Multidisciplinary International Research Journal of Gujarat Technological University ISSN: 2581-8880
VOLUME 2 ISSUE 2 JULY 2020 139
Table 3: Accuracy Data of Silymarin in Plasma Samples
Sr.
No.
Concentration
in spiked
plasma
(µg/mL)
Peak area of
Silymarin in
Spiked
plasma
Concentration
Recovered from
plasma (µg/mL)
Mean
Concentration
(µg/mL)
%
Deviation
1 2
31627 1.71
1.69 15.27
30422 1.64
31245 1.69
30945 1.67
32456 1.77
2 8
119272 7.36
7.52 6.03 124585 7.70
122354 7.56
118737 7.33
123562 7.64
3 20
302410 19.16
19.07 4.64 295451 18.71
311424 19.74
304428 19.29
291452 18.46
4 32
474199 30.23
30.66 4.19 492145 31.39
482542 30.77
472962 30.15
482456 30.76
Table 4: Intraday Precision Data of Silymarin in Plasma Samples
Sr.
No.
Concentration
in spiked
plasma
(µg/mL)
Average Peak Area (n=5) S.D. %
CV
1 2 29627 30422 28245 28746 30456 991 3.36
2 8 117272 124585 122354 114737 123562 4275.88 3.55
3 20 302410 295451 315424 304428 291452 9223.30 3.06
4 32 494199 502145 482542 492962 512456 11163 2.25
Results of interday precision and recovery are shown in Tables 5 and 6, respectively. The mean
interday precision was found to be 6.56%. To assess the extraction recovery of silymarin from
plasma, protein precipitation method was chosen due to simplicity. The mean extraction recovery was
91.24 ± 1.27%.
Table 5: Interday Precision Data of Silymarin in Plasma Samples
Sr.
No.
Concentration in
spiked plasma
(µg/mL)
Average Peak Area (n=5) S.D. % CV
Day 1 Day 2 Day 3
1 2 29499 27134 30945 1923 6.59
2 8 120502 102452 112145 9033 8.08
3 20 301833 274154 295412 14487 4.98
4 32 496861 435452 462515 30776 6.62

Multidisciplinary International Research Journal of Gujarat Technological University ISSN: 2581-8880
VOLUME 2 ISSUE 2 JULY 2020 140
Table 6: Recovery Data of Silymarin in Plasma and Methanol
Sr.
No.
Concentra
tion in
spiked
plasma
(µg/mL)
Concentrati
on of
Silymarin
Std (µg/mL)
Average Peak Area ± S.D. (n=5)
%
Recovery Silymarin in
Spiked plasma
Silymarin Std in
Methanol
1 2 2 28367 ± 990 31564 ± 1265 89.55
2 8 8 127272 ± 11330 137563 ± 9773 92.51
3 20 20 292410 ± 10138 320991 ± 13379 91.09
4 32 32 484199 ± 9859 527288 ± 18154 91.82
3.6 Applicability of Developed Method
Suitability of the developed method was investigated in preclinical pharmacokinetic study of
silymarin. Figure 3 shows mean plasma concentration time profile of silymarin after a 300 mg/kg oral
dose administration to New Zealand white rabbit (three). Table 7 shows the pharmacokinetics
parameters determined by noncompartmental analysis of the plasma drug concentration time profile.
Figure 3: Mean plasma concentration Vs time profile of silymarin following a single dose of 300
mg/kg to rabbit
Table 7: Pharmacokinetic Parameters of Silymarin following a single oral dose of 300 mg/kg to
New Zealand White Rabbit
Pharmacokinetic parameters Average ± SD (n=3)
Tmax, h 0.75 ± 0.011
Cmax, µg/mL 4.627 ± 0.058
AUC, µg.h/mL 63.953 ± 1.720
4 CONCLUSION
A simple, sensitive, and reproducible HPLC method that is applicable for preclinical pharmacokinetic
study of silymarin in plasma was developed and validated. The stability studies demonstrated that

Multidisciplinary International Research Journal of Gujarat Technological University ISSN: 2581-8880
VOLUME 2 ISSUE 2 JULY 2020 141
silymarin was stable during assay procedures and for 16 days in frozen storage conditions. The
developed method is selective without any interference of endogenous substances. Developed method
require less time for sample pretreatment and cost effective compared to LC-MS method.
ACKNOWLEDGEMENT
We kindly acknowledge the All India Council for Technical Education, New Delhi, India for
extending financial support for the research work. We acknowledge the support of Shri Sarvajanik
Kelavani Mandal, Mehsana for extending all the laboratory and instrumentation facilities for
completion of this research work.
REFERENCES 1. S.P. Devendra, Ph.D. Thesis, the University of Texas at Austin, 2007.
2. J. Shamama, K. Kanchan, A. Mushir, Reassessing Bioavailability of Silymarin, Altern. Med.
Rev. 16 (2011) 239-249.
3. Indian Pharmacopoeia, 8th Edn, Volume 3, Ministry of Health and Family Welfare, Govt. of
India, Indian Pharmacopoeial Commission, Ghaziabad, 2018, pp. 3832-33833.
4. USP 42 and NF 37, Volume 3, the US Pharmacopoeial Convention, Inc., Rockville, MD 20852,
2019, pp. 5099.
5. British Pharmacopoeia, Volume 4, BP Commission, MHRA, South Colonnade, Canary Wharf,
London 2019, IV-329, Ph. Eur. Monograph 1860.
6. A. Chlopoνkova, J. Psotova, P. Miketova, V. Simanek, Chemoprotective effect of plant
phenolics against anthracycline-induced toxicity on rat cardiomyocytes, Part I. Silymarin and its
flavonolignans. Phytother Res. 18 (2004), pp. 107-110.
7. N. Dixit, S. Baboota, K. Kohli, et al., Silymarin: a review of pharmacological aspects and
bioavailability enhancement approaches, Indian J. Pharmacol. 39 (2007), pp. 172-179
8. L. Abenavoli, A.A. Izzo, N. Milić, C. Cicala, A. Santini, R. Capasso, Milk thistle (Silybum
marianum): A concise overview on its chemistry, pharmacological, and nutraceutical uses in
liver diseases, Phytother. Res. 32 (2018), pp. 2202-2213.
9. S.J. Polyak, C. Morishima, V. Lohmannd, S. Pala, D. Y. Lee, Y. Liue, et al., Identification of
hepatoprotective flavonolignans from silymarin, PNAS. 107 (2010), pp. 5995-5999.
10. H. A. Salmi, S. Sarna, Effect of silymarin on chemical, functional, and morphological
alterations of the liver. A double-blind controlled study, Scand. J. Gastroenterol. 17 (1982), pp.
517-521.
11. J. Feher, G. Deak, G. Muzes, I. Lang, V. Niederland, K. Nekam, M. Karteszi, Liver-protective
action of silymarin therapy in chronic alcoholic liver diseases. Orv. Hetil. 130 (1989), pp. 2723-
2727.

Multidisciplinary International Research Journal of Gujarat Technological University ISSN: 2581-8880
VOLUME 2 ISSUE 2 JULY 2020 142
12. P. Ferenci, B. Dragosics, H. Dittrich, H. Frank, L. Benda, H. Lochs, et al., Randomized
controlled trial of silymarin treatment in patients with cirrhosis of the liver, J. Hepatol. 9 (1989),
pp. 105-113.
13. E. Magliulo, B. Gagliardi, G. P. Fiori, Results of a double-blind study on the effect of silymarin
in the treatment of acute viral hepatitis, carried out at two medical centres, Med. Klin. 73
(1978), pp.1060-1065.
14. S. Reinhard, M. Remy, B. Reto, The use of silymarin in the treatment of liver diseases, Drugs
61 (2001), pp. 2035-2063.
15. J.W. Wu, L.C. Lin, T.H. Tsai, Drug- drug interactions of silymarin on the perspective of
pharmacokinetics, J. Ethnopharmacol. 121 (2009), pp. 185-193.
16. S.P. Davis, Y. Nakanishi, C.K. Nam, et al., Milk thistle and prostate cancer: Differential effects
of pure flavonolignans from silybum marianum on antiproliferative end points in human
prostate carcinoma cells, Cancer Research. 65 (2005), pp. 4448-4457.
17. R. Saller, R. Brignoli, J. Melzer, R. Meier, An updated systematic review with meta-analysis
for the clinical evidence of silymarin, Forsch Komplementmed. 15 (2008), pp.9-20.
18. United States Pharmacopoeia, 36th Ed, the United State Pharmacopoeial Convention, Rockville,
MD, 2013, pp. 1538-1545.
19. European Pharmacopoeia, 7th Ed, Vol. 2, European Directorate for the Quality of Medicines,
France, 2011, pp. 1186-1188.
20. British Pharmacopoeia, Vol 4, British Pharmacopoeia Commission, MHRA, London, 2013, pp.
3779-3782.
21. F. Kvasnicka, B. Biba, R. Sevcik, M. Voldrich, J. Kratka, Analysis of the active components of
silymarin, J. of Chromatogr. A. 990 (2003) 239-245.
22. T. Radjabian, S.H. Rezazadeh, F. Huseini, Analysis of silymarin components in the seed
extracts of some milk thistle ecotype from Iran by HPLC, Iranian J. Science and tech. 32 (2008)
141-146.
23. L. Hong, D. Zhenxia, Y. Qipeng, A novel rapid method for simultaneous determination of eight
active compounds in silymarin using a reversed-phase UPLC-UV detector, J. of Chromatogr. B.
877 (2009) 4159-4163.
24. P.D. Hamrapurkar, L.V. Thakurdesai, M.D. Phale, Quantitative estimation of silybin in Silybum
marianum mother tincture using high performance liquid chromatography, Int. J. of green
Pharma. 4 (2010) 238-241.
25. M. Usman, M. Ahmad, A.U. Madni, N.A.W. Asghar, M. Akhtar, M. Atif, M. Qamar-uz-zaman,
In-vivo kinetics of silymarin (milk thistle) on healthy male volunteers, Tropical J. of Pharma.
Res. 8 (2009) 311-316.

Multidisciplinary International Research Journal of Gujarat Technological University ISSN: 2581-8880
VOLUME 2 ISSUE 2 JULY 2020 143
26. J.W. Wu, L.C. Lin, S.C. Hung, C.W. Chi, T.H. Tsai, Analysis of silybin in rat plasma and bile
for hepatobiliary excretion and oral bioavailability application, J. of Pharma. Biomed. Ana. 45
(2007) 635-641.
27. Z. Wen, T.E. Dumas, S.J. Schrieber, R.L. Hawke, M.W. Fried, P.C. Smith, Pharmacokinetics,
and metabolic profile of free, conjugated, and total silymarin flavonolignans in human plasma
after oral administration of milk thistle extract, Drug Metabolism and Disposition 36 (2008) 65-
72.
28. U.S. Food and Drug Administration, Guidance for Industry: Bioanalytical method validation,
2011, available online at: www.fda.gov/CDER/GUIDANCE/4252fnl.htm.

Multidisciplinary International Research Journal of Gujarat Technological University ISSN: 2581-8880
VOLUME 2 ISSUE 2 JULY 2020 144
Author Guidelines
Disclaimer
Facts and opinions published in Multidisciplinary International Research Journal of Gujarat
Technological University express solely the opinions of the respective authors. Authors are
responsible for their citing of sources and the accuracy of their references and bibliographies. The
editors cannot be held responsible for any possible violations of third parties’ rights.
Contact Person
DR. PANKAJRAY PATEL
Director & Editor in Chief
Graduate School of Management Studies
Gujarat Technological University
DR. SARIKA SRIVASTAVA
Assistant Professor & Editorial Board Member
Graduate School of Management Studies
Gujarat Technological University
Correspondence Address
GUJARAT TECHNOLOGICAL UNIVERSITY
Nr.Vishwakarma Government Engineering College
Nr.Visat Three Roads, Visat - Gandhinagar Highway
Chandkheda, Ahmedabad, Gujarat (INDIA)
Pin code – 382424
Phone: (079) 23267590 / 554
Email: [email protected]
Website: http://www.researchjournal.gtu.ac.in
1. Every author has to register himself /herself on given website
2. After Registration, author will be allotted unique author code (e.g. AM0003) which will be
author’s identification number for further correspondence.
3. All fields in the registration are compulsory, and no changes in the details will be allowed once
the author has registered.
4. If, there are multiple authors for a single manuscript then every author has to register separately.
All the authors will be given a unique author code which they have to use for further
correspondence.
5. This unique Author Id will be communicated to authors by their registered e-mail only. Hence it
is mandatory to provide correct mail id.
For more information click on below link:
http://researchjournal.gtu.ac.in/ImpPdf/GuidelinestoAuthors.pdf

GUJARAT
TECHNOLOGICAL
UNIVERSITY
GUJARAT
TECHNOLOGICAL
UNIVERSITY
Gujarat Technological University
Gujarat Technological University
Nr. Vishwakarma Government Engineering College,
Nr. Visat - Gandhinagar Highway,
Chandkheda, Ahmedabad - 382424, Gujarat (India)
www.researchjournal.gtu.ac.in