A micro-electrode array biosensor for impedance spectroscopy of human umbilical vein endothelial...
6
Sensors and Actuators B 118 (2006) 115–120 A micro-electrode array biosensor for impedance spectroscopy of human umbilical vein endothelial cells Abdur Rub Abdur Rahman a , Chun-Min Lo b , Shekhar Bhansali a,∗ a BioMEMS and Microsystems Laboratory, Department of Electrical Engineering, University of South Florida, 4202 E Fowler Ave., Tampa, FL 33620, United States b Department of Physics, College of Arts and Science, University of South Florida, 4202 E Fowler Ave., Tampa, FL 33620, United States Available online 5 June 2006 Abstract We report on a novel, radial micro-electrode array biosensor for impedance spectroscopy (IS) of Human Umbilical Vein Endothelial Cells (HUVECs). The electrical parameters of the HUVEC monolayer, which are important indicators of physiological factors such as cell–cell inter- actions and cell motility, were measured using this micro-electrode biosensor. HUVEC monolayer was cultured directly on the surface of the micro-electrode array. Impedance modulus and the phase angle of HUVEC’s in the frequency range from 12.5 kHz to 500 kHz were recorded and studied. A modified Randles cell (MRC) equivalent circuit was used to extract the electrical parameters of transendothelial monolayer. Differential analysis of HUVEC and Hanks’ Balanced Salt Solution (HBSS) impedance data shows electrical resonance at 52.5 kHz. The value of capacitance at resonance was measured to be ∼25 F/cm 2 . © 2006 Elsevier B.V. All rights reserved. Keywords: MEMS micro-electrode; Bioimpedance; Impedance spectroscopy; HUVEC; Transendothelial resistance 1. Introduction Bioimpedance can be broadly defined as the impedance of biological specimens ranging from the human body impedance to the impedance of DNA. Bioimpedance analysis enables detec- tion of physiological changes in cell–cell, cell matrix inter- actions caused by the effect of viral and bacterial infections [1–4], environmental parameters [5], toxicity [6] and the effect of pharmaceutical compounds [7]. Electrical investigation of biological materials has been performed over the past cen- tury, using both conventional electrodes and microelectrodes. Micro-electrodes were mainly used for intracellular recordings such as patch-clamp studies to study the ionic channel currents and trans-membrane potential. Currently, micro-electrodes are increasingly being used for extracellular biophysical investiga- tion of cells and monolayers as they offer several advantages over their conventional counterparts for impedemetric investigations. Microelectrodes have a very small I–R drop thereby allowing impedance spectroscopy (IS) of high resistivity samples such as biological fluids and specimens. Microelectrodes generally ∗ Corresponding author. Tel.: +1 813 974 3593; fax: +1 813 974 5250. E-mail address: [email protected] (S. Bhansali). allow small currents; hence, these electrodes are generally non- destructive to the solution and species under investigation. This advantage is significant in biological samples and for in vivo measurements, where such destruction should be eliminated [8]. A commonly used impedance measurement device in bio- physical investigations is the Electrical Cell-substrate Sens- ing (ECS TM ) device [9]. The ECS TM impedance measurement device consists of a 250 m electrode and a counter electrode. Impedance changes due to the fractal motion of cells during their spreading and adhesion can be recorded as impedance changes [10–13]. A planar electrode array with electrodes of varying sizes and spacing was also demonstrated for measuring resistiv- ities of stratified layers of thin biomaterials [14]. In this paper a multi-electrode array based biosensor which is capable of measuring transcellular impedance across 15 elec- trode pairs is presented. Fig. 1(a) schematically illustrates the layout of the biosensor. In this biosensor the electrode tracks are spaced 22.5 ◦ in a radial array. A radial array configuration offers the flexibility of measuring impedance in the close proximity of cells (adjacent electrodes) as well as across the confluence (diag- onal electrodes). Multiple electrode recordings would allow for statistical data correlation in homogenous samples. For cells and tissues with anisotropic impedance distribution, this device can facilitate impedance data recording at several discrete angles 0925-4005/$ – see front matter © 2006 Elsevier B.V. All rights reserved. doi:10.1016/j.snb.2006.04.060
-
Upload
independent -
Category
Documents
-
view
0 -
download
0
Transcript of A micro-electrode array biosensor for impedance spectroscopy of human umbilical vein endothelial...
A
(amsaa©
K
1
btta[obtMsaittMia
0d
Sensors and Actuators B 118 (2006) 115–120
A micro-electrode array biosensor for impedancespectroscopy of human umbilical vein endothelial cells
Abdur Rub Abdur Rahman a, Chun-Min Lo b, Shekhar Bhansali a,∗a BioMEMS and Microsystems Laboratory, Department of Electrical Engineering, University of South Florida,
4202 E Fowler Ave., Tampa, FL 33620, United Statesb Department of Physics, College of Arts and Science, University of South Florida, 4202 E Fowler Ave., Tampa, FL 33620, United States
Available online 5 June 2006
bstract
We report on a novel, radial micro-electrode array biosensor for impedance spectroscopy (IS) of Human Umbilical Vein Endothelial CellsHUVECs). The electrical parameters of the HUVEC monolayer, which are important indicators of physiological factors such as cell–cell inter-ctions and cell motility, were measured using this micro-electrode biosensor. HUVEC monolayer was cultured directly on the surface of theicro-electrode array. Impedance modulus and the phase angle of HUVEC’s in the frequency range from 12.5 kHz to 500 kHz were recorded and
tudied. A modified Randles cell (MRC) equivalent circuit was used to extract the electrical parameters of transendothelial monolayer. Differentialnalysis of HUVEC and Hanks’ Balanced Salt Solution (HBSS) impedance data shows electrical resonance at 52.5 kHz. The value of capacitancet resonance was measured to be ∼25 �F/cm2.
2006 Elsevier B.V. All rights reserved.
UVE
adam
pidIs[si
itl
eywords: MEMS micro-electrode; Bioimpedance; Impedance spectroscopy; H
. Introduction
Bioimpedance can be broadly defined as the impedance ofiological specimens ranging from the human body impedanceo the impedance of DNA. Bioimpedance analysis enables detec-ion of physiological changes in cell–cell, cell matrix inter-ctions caused by the effect of viral and bacterial infections1–4], environmental parameters [5], toxicity [6] and the effectf pharmaceutical compounds [7]. Electrical investigation ofiological materials has been performed over the past cen-ury, using both conventional electrodes and microelectrodes.
icro-electrodes were mainly used for intracellular recordingsuch as patch-clamp studies to study the ionic channel currentsnd trans-membrane potential. Currently, micro-electrodes arencreasingly being used for extracellular biophysical investiga-ion of cells and monolayers as they offer several advantages overheir conventional counterparts for impedemetric investigations.
icroelectrodes have a very small I–R drop thereby allowingmpedance spectroscopy (IS) of high resistivity samples suchs biological fluids and specimens. Microelectrodes generally
∗ Corresponding author. Tel.: +1 813 974 3593; fax: +1 813 974 5250.E-mail address: [email protected] (S. Bhansali).
stcostf
925-4005/$ – see front matter © 2006 Elsevier B.V. All rights reserved.oi:10.1016/j.snb.2006.04.060
C; Transendothelial resistance
llow small currents; hence, these electrodes are generally non-estructive to the solution and species under investigation. Thisdvantage is significant in biological samples and for in vivoeasurements, where such destruction should be eliminated [8].A commonly used impedance measurement device in bio-
hysical investigations is the Electrical Cell-substrate Sens-ng (ECSTM) device [9]. The ECSTM impedance measurementevice consists of a 250 �m electrode and a counter electrode.mpedance changes due to the fractal motion of cells during theirpreading and adhesion can be recorded as impedance changes10–13]. A planar electrode array with electrodes of varyingizes and spacing was also demonstrated for measuring resistiv-ties of stratified layers of thin biomaterials [14].
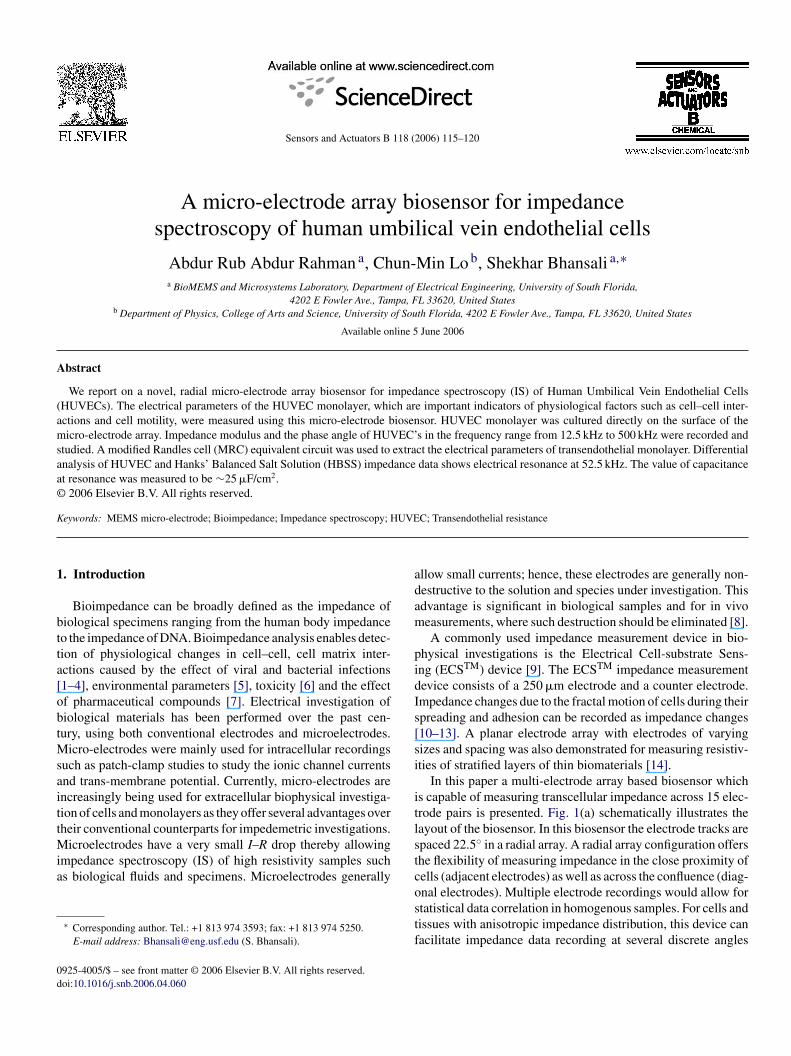
In this paper a multi-electrode array based biosensor whichs capable of measuring transcellular impedance across 15 elec-rode pairs is presented. Fig. 1(a) schematically illustrates theayout of the biosensor. In this biosensor the electrode tracks arepaced 22.5◦ in a radial array. A radial array configuration offershe flexibility of measuring impedance in the close proximity ofells (adjacent electrodes) as well as across the confluence (diag-
nal electrodes). Multiple electrode recordings would allow fortatistical data correlation in homogenous samples. For cells andissues with anisotropic impedance distribution, this device canacilitate impedance data recording at several discrete angles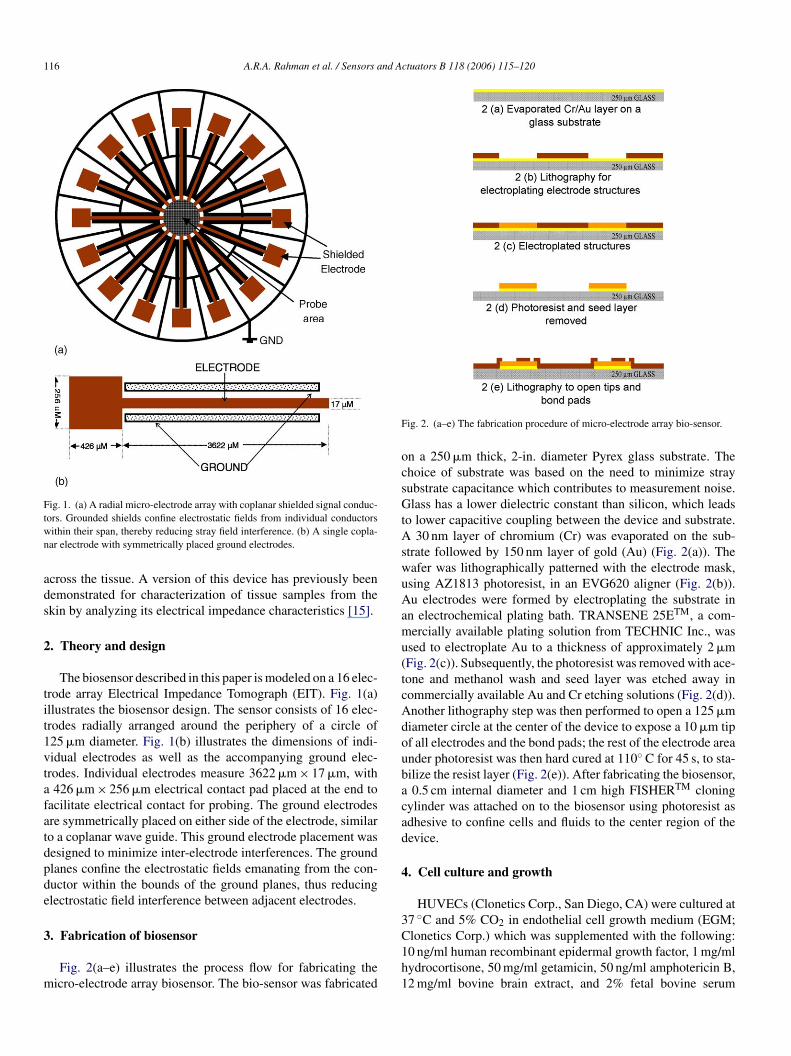
116 A.R.A. Rahman et al. / Sensors and Actuators B 118 (2006) 115–120
Fig. 1. (a) A radial micro-electrode array with coplanar shielded signal conduc-twn
ads
2
tit1vtafatdpde
3
m
F
ocsGtAswuAamu(tcAdoubacad
4
3
ors. Grounded shields confine electrostatic fields from individual conductorsithin their span, thereby reducing stray field interference. (b) A single copla-ar electrode with symmetrically placed ground electrodes.
cross the tissue. A version of this device has previously beenemonstrated for characterization of tissue samples from thekin by analyzing its electrical impedance characteristics [15].
. Theory and design
The biosensor described in this paper is modeled on a 16 elec-rode array Electrical Impedance Tomograph (EIT). Fig. 1(a)llustrates the biosensor design. The sensor consists of 16 elec-rodes radially arranged around the periphery of a circle of25 �m diameter. Fig. 1(b) illustrates the dimensions of indi-idual electrodes as well as the accompanying ground elec-rodes. Individual electrodes measure 3622 �m × 17 �m, with426 �m × 256 �m electrical contact pad placed at the end to
acilitate electrical contact for probing. The ground electrodesre symmetrically placed on either side of the electrode, similaro a coplanar wave guide. This ground electrode placement wasesigned to minimize inter-electrode interferences. The groundlanes confine the electrostatic fields emanating from the con-uctor within the bounds of the ground planes, thus reducinglectrostatic field interference between adjacent electrodes.
. Fabrication of biosensor
Fig. 2(a–e) illustrates the process flow for fabricating theicro-electrode array biosensor. The bio-sensor was fabricated
C1h1
ig. 2. (a–e) The fabrication procedure of micro-electrode array bio-sensor.
n a 250 �m thick, 2-in. diameter Pyrex glass substrate. Thehoice of substrate was based on the need to minimize strayubstrate capacitance which contributes to measurement noise.lass has a lower dielectric constant than silicon, which leads
o lower capacitive coupling between the device and substrate.30 nm layer of chromium (Cr) was evaporated on the sub-
trate followed by 150 nm layer of gold (Au) (Fig. 2(a)). Theafer was lithographically patterned with the electrode mask,sing AZ1813 photoresist, in an EVG620 aligner (Fig. 2(b)).u electrodes were formed by electroplating the substrate in
n electrochemical plating bath. TRANSENE 25ETM, a com-ercially available plating solution from TECHNIC Inc., was
sed to electroplate Au to a thickness of approximately 2 �mFig. 2(c)). Subsequently, the photoresist was removed with ace-one and methanol wash and seed layer was etched away inommercially available Au and Cr etching solutions (Fig. 2(d)).nother lithography step was then performed to open a 125 �miameter circle at the center of the device to expose a 10 �m tipf all electrodes and the bond pads; the rest of the electrode areander photoresist was then hard cured at 110◦ C for 45 s, to sta-ilize the resist layer (Fig. 2(e)). After fabricating the biosensor,0.5 cm internal diameter and 1 cm high FISHERTM cloning
ylinder was attached on to the biosensor using photoresist asdhesive to confine cells and fluids to the center region of theevice.
. Cell culture and growth
HUVECs (Clonetics Corp., San Diego, CA) were cultured at7 ◦C and 5% CO2 in endothelial cell growth medium (EGM;
lonetics Corp.) which was supplemented with the following:0 ng/ml human recombinant epidermal growth factor, 1 mg/mlydrocortisone, 50 mg/ml getamicin, 50 ng/ml amphotericin B,2 mg/ml bovine brain extract, and 2% fetal bovine serum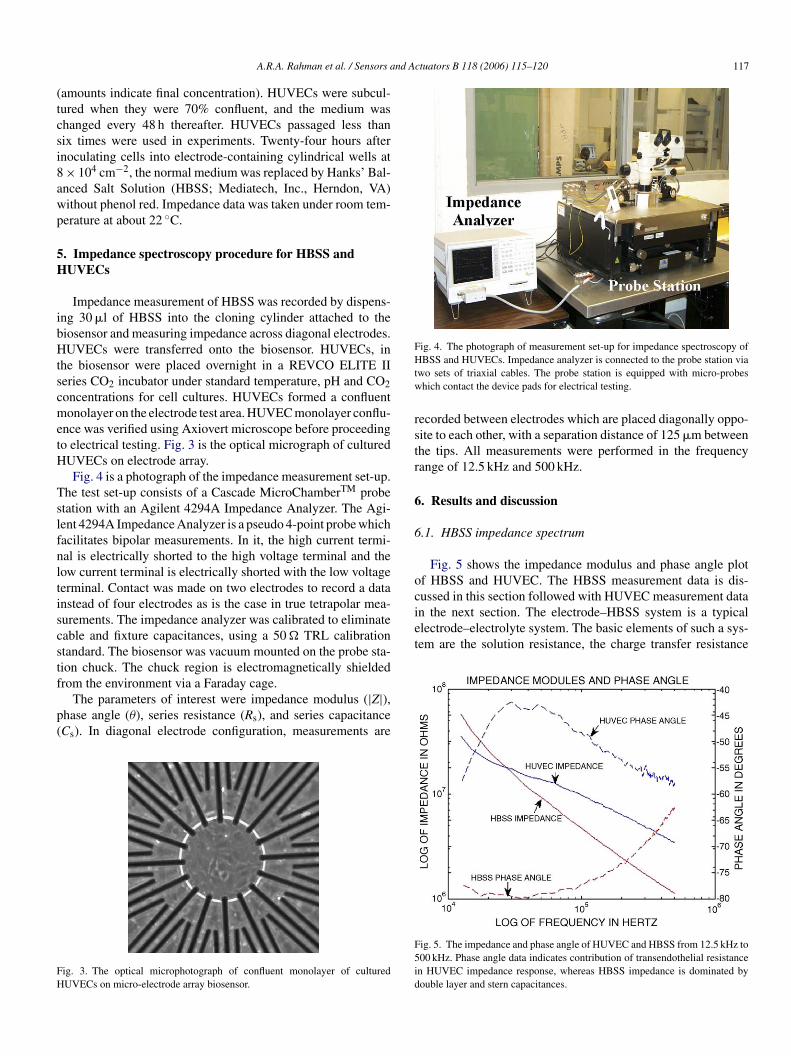
nd Actuators B 118 (2006) 115–120 117
(tcsi8awp
5H
ibHtscmetH
Tslfnltiscstf
p(
FH
Fig. 4. The photograph of measurement set-up for impedance spectroscopy ofHtw
rstr
6
6
ocussed in this section followed with HUVEC measurement datain the next section. The electrode–HBSS system is a typicalelectrode–electrolyte system. The basic elements of such a sys-tem are the solution resistance, the charge transfer resistance
A.R.A. Rahman et al. / Sensors a
amounts indicate final concentration). HUVECs were subcul-ured when they were 70% confluent, and the medium washanged every 48 h thereafter. HUVECs passaged less thanix times were used in experiments. Twenty-four hours afternoculating cells into electrode-containing cylindrical wells at× 104 cm−2, the normal medium was replaced by Hanks’ Bal-nced Salt Solution (HBSS; Mediatech, Inc., Herndon, VA)ithout phenol red. Impedance data was taken under room tem-erature at about 22 ◦C.
. Impedance spectroscopy procedure for HBSS andUVECs
Impedance measurement of HBSS was recorded by dispens-ng 30 �l of HBSS into the cloning cylinder attached to theiosensor and measuring impedance across diagonal electrodes.UVECs were transferred onto the biosensor. HUVECs, in
he biosensor were placed overnight in a REVCO ELITE IIeries CO2 incubator under standard temperature, pH and CO2oncentrations for cell cultures. HUVECs formed a confluentonolayer on the electrode test area. HUVEC monolayer conflu-
nce was verified using Axiovert microscope before proceedingo electrical testing. Fig. 3 is the optical micrograph of culturedUVECs on electrode array.Fig. 4 is a photograph of the impedance measurement set-up.
he test set-up consists of a Cascade MicroChamberTM probetation with an Agilent 4294A Impedance Analyzer. The Agi-ent 4294A Impedance Analyzer is a pseudo 4-point probe whichacilitates bipolar measurements. In it, the high current termi-al is electrically shorted to the high voltage terminal and theow current terminal is electrically shorted with the low voltageerminal. Contact was made on two electrodes to record a datanstead of four electrodes as is the case in true tetrapolar mea-urements. The impedance analyzer was calibrated to eliminateable and fixture capacitances, using a 50 � TRL calibrationtandard. The biosensor was vacuum mounted on the probe sta-ion chuck. The chuck region is electromagnetically shielded
rom the environment via a Faraday cage.The parameters of interest were impedance modulus (|Z|),hase angle (θ), series resistance (Rs), and series capacitanceCs). In diagonal electrode configuration, measurements are
ig. 3. The optical microphotograph of confluent monolayer of culturedUVECs on micro-electrode array biosensor.
F5id
BSS and HUVECs. Impedance analyzer is connected to the probe station viawo sets of triaxial cables. The probe station is equipped with micro-probeshich contact the device pads for electrical testing.
ecorded between electrodes which are placed diagonally oppo-ite to each other, with a separation distance of 125 �m betweenhe tips. All measurements were performed in the frequencyange of 12.5 kHz and 500 kHz.
. Results and discussion
.1. HBSS impedance spectrum
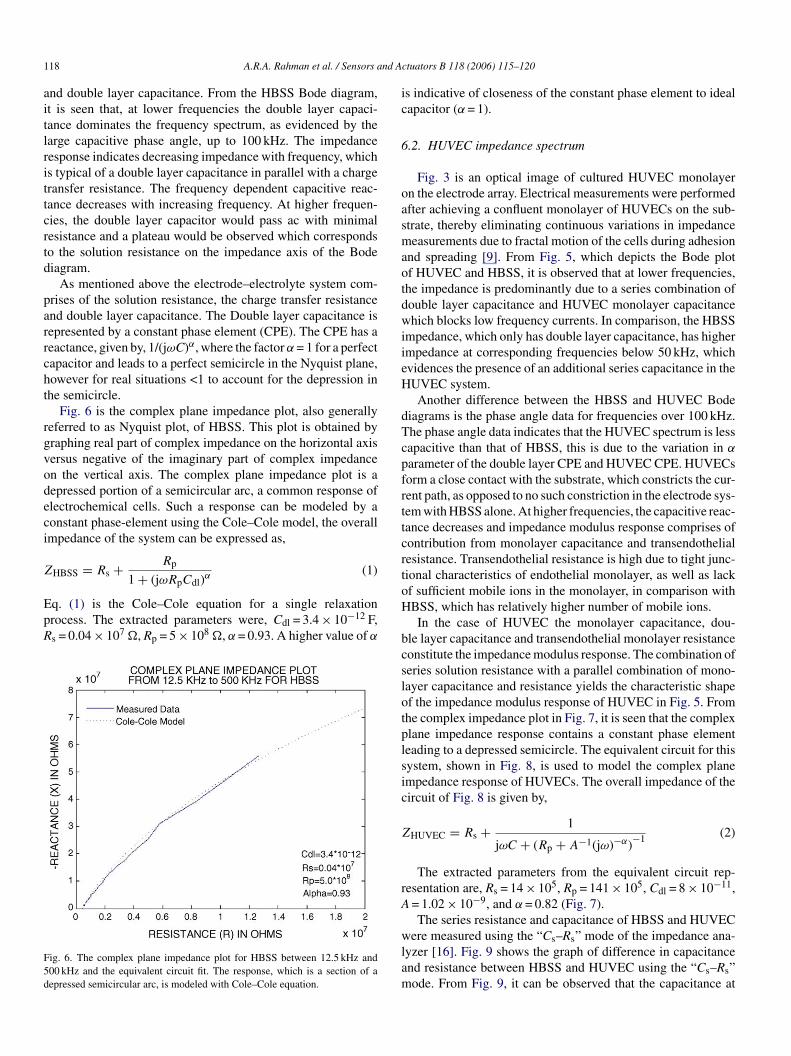
Fig. 5 shows the impedance modulus and phase angle plotf HBSS and HUVEC. The HBSS measurement data is dis-
ig. 5. The impedance and phase angle of HUVEC and HBSS from 12.5 kHz to00 kHz. Phase angle data indicates contribution of transendothelial resistancen HUVEC impedance response, whereas HBSS impedance is dominated byouble layer and stern capacitances.
1 nd A
aitlrittcrtd
parrcht
rgvodeci
Z
EpR
F5d
ic
6
oasmaotdwiieH
dTcpfrttcrt
18 A.R.A. Rahman et al. / Sensors a
nd double layer capacitance. From the HBSS Bode diagram,t is seen that, at lower frequencies the double layer capaci-ance dominates the frequency spectrum, as evidenced by thearge capacitive phase angle, up to 100 kHz. The impedanceesponse indicates decreasing impedance with frequency, whichs typical of a double layer capacitance in parallel with a chargeransfer resistance. The frequency dependent capacitive reac-ance decreases with increasing frequency. At higher frequen-ies, the double layer capacitor would pass ac with minimalesistance and a plateau would be observed which correspondso the solution resistance on the impedance axis of the Bodeiagram.
As mentioned above the electrode–electrolyte system com-rises of the solution resistance, the charge transfer resistancend double layer capacitance. The Double layer capacitance isepresented by a constant phase element (CPE). The CPE has aeactance, given by, 1/(jωC)α, where the factor α = 1 for a perfectapacitor and leads to a perfect semicircle in the Nyquist plane,owever for real situations <1 to account for the depression inhe semicircle.
Fig. 6 is the complex plane impedance plot, also generallyeferred to as Nyquist plot, of HBSS. This plot is obtained byraphing real part of complex impedance on the horizontal axisersus negative of the imaginary part of complex impedancen the vertical axis. The complex plane impedance plot is aepressed portion of a semicircular arc, a common response oflectrochemical cells. Such a response can be modeled by aonstant phase-element using the Cole–Cole model, the overallmpedance of the system can be expressed as,
HBSS = Rs + Rp
1 + (jωR C )α(1)
p dl
q. (1) is the Cole–Cole equation for a single relaxationrocess. The extracted parameters were, Cdl = 3.4 × 10⁻¹² F,s = 0.04 × 10⁷ �, Rp = 5 × 10⁸ �, α = 0.93. A higher value of α
ig. 6. The complex plane impedance plot for HBSS between 12.5 kHz and00 kHz and the equivalent circuit fit. The response, which is a section of aepressed semicircular arc, is modeled with Cole–Cole equation.
oH
bcslotplsic
Z
rA
wlam
ctuators B 118 (2006) 115–120
s indicative of closeness of the constant phase element to idealapacitor (α = 1).
.2. HUVEC impedance spectrum
Fig. 3 is an optical image of cultured HUVEC monolayern the electrode array. Electrical measurements were performedfter achieving a confluent monolayer of HUVECs on the sub-trate, thereby eliminating continuous variations in impedanceeasurements due to fractal motion of the cells during adhesion
nd spreading [9]. From Fig. 5, which depicts the Bode plotf HUVEC and HBSS, it is observed that at lower frequencies,he impedance is predominantly due to a series combination ofouble layer capacitance and HUVEC monolayer capacitancehich blocks low frequency currents. In comparison, the HBSS
mpedance, which only has double layer capacitance, has highermpedance at corresponding frequencies below 50 kHz, whichvidences the presence of an additional series capacitance in theUVEC system.Another difference between the HBSS and HUVEC Bode
iagrams is the phase angle data for frequencies over 100 kHz.he phase angle data indicates that the HUVEC spectrum is lessapacitive than that of HBSS, this is due to the variation in α
arameter of the double layer CPE and HUVEC CPE. HUVECsorm a close contact with the substrate, which constricts the cur-ent path, as opposed to no such constriction in the electrode sys-em with HBSS alone. At higher frequencies, the capacitive reac-ance decreases and impedance modulus response comprises ofontribution from monolayer capacitance and transendothelialesistance. Transendothelial resistance is high due to tight junc-ional characteristics of endothelial monolayer, as well as lackf sufficient mobile ions in the monolayer, in comparison withBSS, which has relatively higher number of mobile ions.In the case of HUVEC the monolayer capacitance, dou-
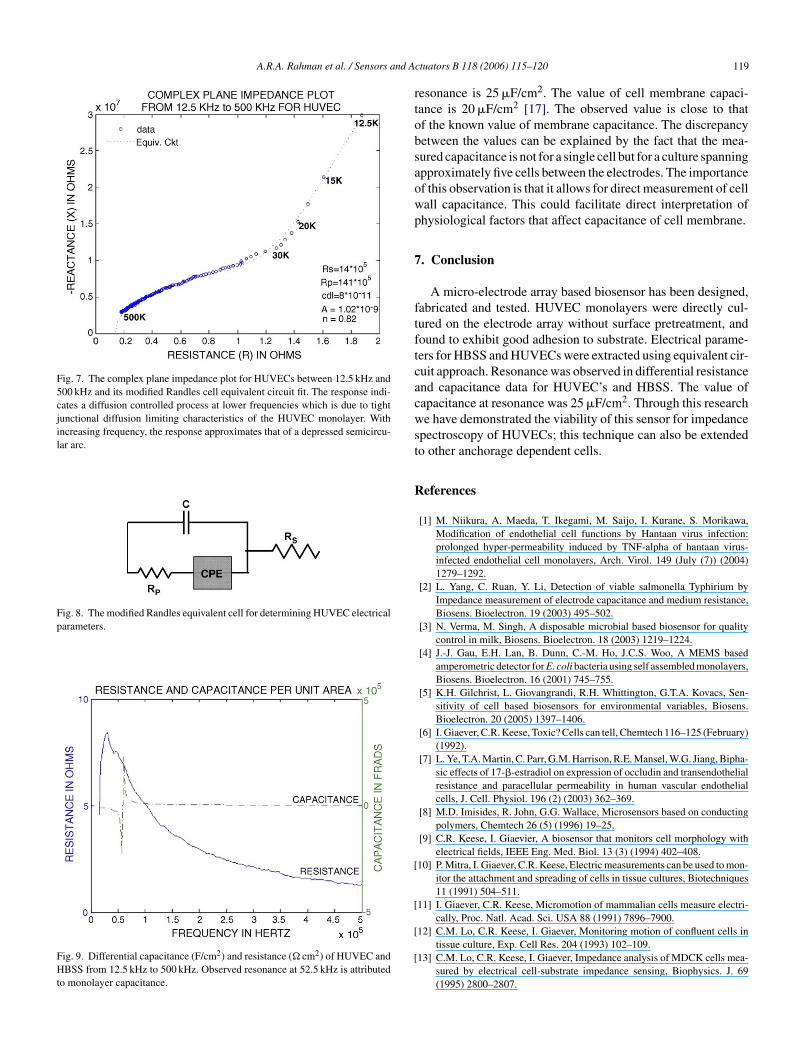
le layer capacitance and transendothelial monolayer resistanceonstitute the impedance modulus response. The combination oferies solution resistance with a parallel combination of mono-ayer capacitance and resistance yields the characteristic shapef the impedance modulus response of HUVEC in Fig. 5. Fromhe complex impedance plot in Fig. 7, it is seen that the complexlane impedance response contains a constant phase elementeading to a depressed semicircle. The equivalent circuit for thisystem, shown in Fig. 8, is used to model the complex planempedance response of HUVECs. The overall impedance of theircuit of Fig. 8 is given by,
HUVEC = Rs + 1
jωC + (Rp + A−1(jω)−α)−1 (2)
The extracted parameters from the equivalent circuit rep-esentation are, Rs = 14 × 105, Rp = 141 × 105, Cdl = 8 × 10⁻¹¹,= 1.02 × 10⁻⁹, and α = 0.82 (Fig. 7).The series resistance and capacitance of HBSS and HUVEC
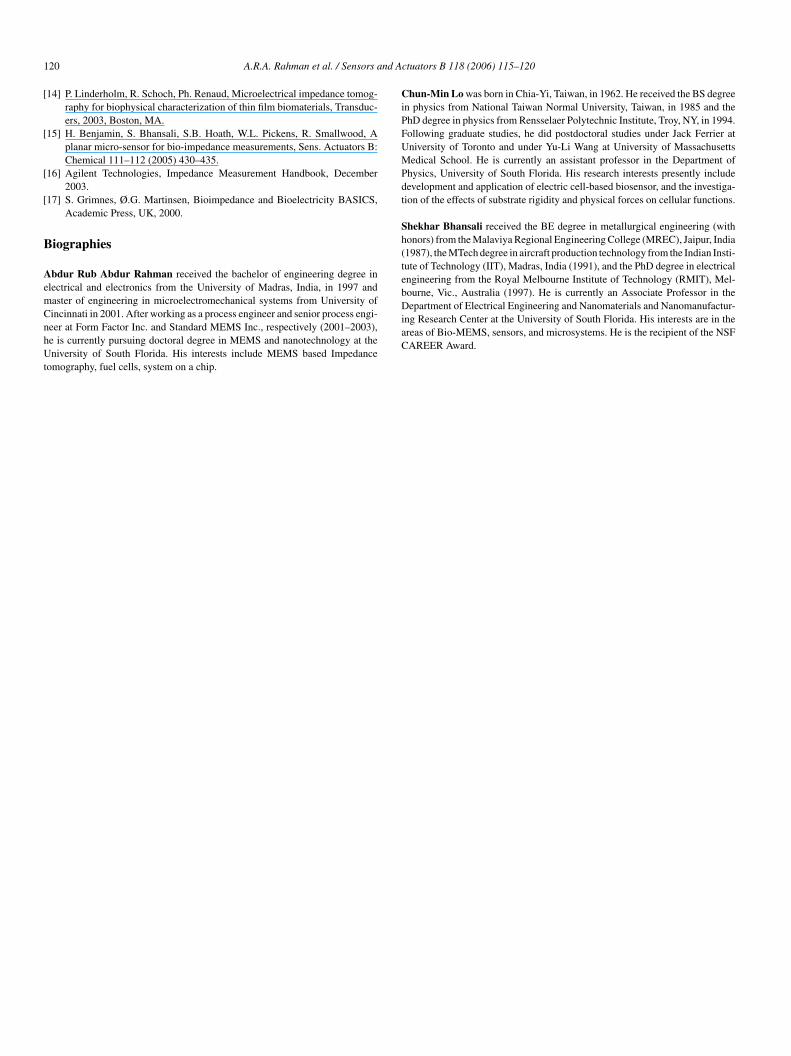
ere measured using the “Cs–Rs” mode of the impedance ana-yzer [16]. Fig. 9 shows the graph of difference in capacitancend resistance between HBSS and HUVEC using the “Cs–Rs”ode. From Fig. 9, it can be observed that the capacitance at
A.R.A. Rahman et al. / Sensors and A
Fig. 7. The complex plane impedance plot for HUVECs between 12.5 kHz and500 kHz and its modified Randles cell equivalent circuit fit. The response indi-cates a diffusion controlled process at lower frequencies which is due to tightjunctional diffusion limiting characteristics of the HUVEC monolayer. Withincreasing frequency, the response approximates that of a depressed semicircu-lar arc.
Fig. 8. The modified Randles equivalent cell for determining HUVEC electricalparameters.
Fig. 9. Differential capacitance (F/cm2) and resistance (� cm2) of HUVEC andHBSS from 12.5 kHz to 500 kHz. Observed resonance at 52.5 kHz is attributedto monolayer capacitance.
rtobsaowp
7
ftftcacwst
R
[
[
[
[
ctuators B 118 (2006) 115–120 119
esonance is 25 �F/cm2. The value of cell membrane capaci-ance is 20 �F/cm2 [17]. The observed value is close to thatf the known value of membrane capacitance. The discrepancyetween the values can be explained by the fact that the mea-ured capacitance is not for a single cell but for a culture spanningpproximately five cells between the electrodes. The importancef this observation is that it allows for direct measurement of cellall capacitance. This could facilitate direct interpretation ofhysiological factors that affect capacitance of cell membrane.
. Conclusion
A micro-electrode array based biosensor has been designed,abricated and tested. HUVEC monolayers were directly cul-ured on the electrode array without surface pretreatment, andound to exhibit good adhesion to substrate. Electrical parame-ers for HBSS and HUVECs were extracted using equivalent cir-uit approach. Resonance was observed in differential resistancend capacitance data for HUVEC’s and HBSS. The value ofapacitance at resonance was 25 �F/cm2. Through this researche have demonstrated the viability of this sensor for impedance
pectroscopy of HUVECs; this technique can also be extendedo other anchorage dependent cells.
eferences
[1] M. Niikura, A. Maeda, T. Ikegami, M. Saijo, I. Kurane, S. Morikawa,Modification of endothelial cell functions by Hantaan virus infection:prolonged hyper-permeability induced by TNF-alpha of hantaan virus-infected endothelial cell monolayers, Arch. Virol. 149 (July (7)) (2004)1279–1292.
[2] L. Yang, C. Ruan, Y. Li, Detection of viable salmonella Typhirium byImpedance measurement of electrode capacitance and medium resistance,Biosens. Bioelectron. 19 (2003) 495–502.
[3] N. Verma, M. Singh, A disposable microbial based biosensor for qualitycontrol in milk, Biosens. Bioelectron. 18 (2003) 1219–1224.
[4] J.-J. Gau, E.H. Lan, B. Dunn, C.-M. Ho, J.C.S. Woo, A MEMS basedamperometric detector for E. coli bacteria using self assembled monolayers,Biosens. Bioelectron. 16 (2001) 745–755.
[5] K.H. Gilchrist, L. Giovangrandi, R.H. Whittington, G.T.A. Kovacs, Sen-sitivity of cell based biosensors for environmental variables, Biosens.Bioelectron. 20 (2005) 1397–1406.
[6] I. Giaever, C.R. Keese, Toxic? Cells can tell, Chemtech 116–125 (February)(1992).
[7] L. Ye, T.A. Martin, C. Parr, G.M. Harrison, R.E. Mansel, W.G. Jiang, Bipha-sic effects of 17-�-estradiol on expression of occludin and transendothelialresistance and paracellular permeability in human vascular endothelialcells, J. Cell. Physiol. 196 (2) (2003) 362–369.
[8] M.D. Imisides, R. John, G.G. Wallace, Microsensors based on conductingpolymers, Chemtech 26 (5) (1996) 19–25.
[9] C.R. Keese, I. Giaevier, A biosensor that monitors cell morphology withelectrical fields, IEEE Eng. Med. Biol. 13 (3) (1994) 402–408.
10] P. Mitra, I. Giaever, C.R. Keese, Electric measurements can be used to mon-itor the attachment and spreading of cells in tissue cultures, Biotechniques11 (1991) 504–511.
11] I. Giaever, C.R. Keese, Micromotion of mammalian cells measure electri-cally, Proc. Natl. Acad. Sci. USA 88 (1991) 7896–7900.
12] C.M. Lo, C.R. Keese, I. Giaever, Monitoring motion of confluent cells intissue culture, Exp. Cell Res. 204 (1993) 102–109.
13] C.M. Lo, C.R. Keese, I. Giaever, Impedance analysis of MDCK cells mea-sured by electrical cell-substrate impedance sensing, Biophysics. J. 69(1995) 2800–2807.
1 nd A
[
[
[
[
B
AemCnhUt
CiPFUMPdt
Sh(tebourne, Vic., Australia (1997). He is currently an Associate Professor in theDepartment of Electrical Engineering and Nanomaterials and Nanomanufactur-
20 A.R.A. Rahman et al. / Sensors a
14] P. Linderholm, R. Schoch, Ph. Renaud, Microelectrical impedance tomog-raphy for biophysical characterization of thin film biomaterials, Transduc-ers, 2003, Boston, MA.
15] H. Benjamin, S. Bhansali, S.B. Hoath, W.L. Pickens, R. Smallwood, Aplanar micro-sensor for bio-impedance measurements, Sens. Actuators B:Chemical 111–112 (2005) 430–435.
16] Agilent Technologies, Impedance Measurement Handbook, December2003.
17] S. Grimnes, Ø.G. Martinsen, Bioimpedance and Bioelectricity BASICS,Academic Press, UK, 2000.
iographies
bdur Rub Abdur Rahman received the bachelor of engineering degree inlectrical and electronics from the University of Madras, India, in 1997 andaster of engineering in microelectromechanical systems from University of
incinnati in 2001. After working as a process engineer and senior process engi-eer at Form Factor Inc. and Standard MEMS Inc., respectively (2001–2003),e is currently pursuing doctoral degree in MEMS and nanotechnology at theniversity of South Florida. His interests include MEMS based Impedanceomography, fuel cells, system on a chip.
iaC
ctuators B 118 (2006) 115–120
hun-Min Lo was born in Chia-Yi, Taiwan, in 1962. He received the BS degreen physics from National Taiwan Normal University, Taiwan, in 1985 and thehD degree in physics from Rensselaer Polytechnic Institute, Troy, NY, in 1994.ollowing graduate studies, he did postdoctoral studies under Jack Ferrier atniversity of Toronto and under Yu-Li Wang at University of Massachusettsedical School. He is currently an assistant professor in the Department of
hysics, University of South Florida. His research interests presently includeevelopment and application of electric cell-based biosensor, and the investiga-ion of the effects of substrate rigidity and physical forces on cellular functions.
hekhar Bhansali received the BE degree in metallurgical engineering (withonors) from the Malaviya Regional Engineering College (MREC), Jaipur, India1987), the MTech degree in aircraft production technology from the Indian Insti-ute of Technology (IIT), Madras, India (1991), and the PhD degree in electricalngineering from the Royal Melbourne Institute of Technology (RMIT), Mel-
ng Research Center at the University of South Florida. His interests are in thereas of Bio-MEMS, sensors, and microsystems. He is the recipient of the NSFAREER Award.