A methodology to predict community college STEM student ...
98
Scholars' Mine Scholars' Mine Doctoral Dissertations Student Theses and Dissertations Summer 2018 A methodology to predict community college STEM student A methodology to predict community college STEM student retention and completion retention and completion Jennifer Lynn Snyder Follow this and additional works at: https://scholarsmine.mst.edu/doctoral_dissertations Part of the Community College Education Administration Commons, Operations Research, Systems Engineering and Industrial Engineering Commons, and the Science and Mathematics Education Commons Department: Engineering Management and Systems Engineering Department: Engineering Management and Systems Engineering Recommended Citation Recommended Citation Snyder, Jennifer Lynn, "A methodology to predict community college STEM student retention and completion" (2018). Doctoral Dissertations. 2711. https://scholarsmine.mst.edu/doctoral_dissertations/2711 This thesis is brought to you by Scholars' Mine, a service of the Missouri S&T Library and Learning Resources. This work is protected by U. S. Copyright Law. Unauthorized use including reproduction for redistribution requires the permission of the copyright holder. For more information, please contact [email protected].
-
Upload
khangminh22 -
Category
Documents
-
view
0 -
download
0
Transcript of A methodology to predict community college STEM student ...
Scholars' Mine Scholars' Mine
Doctoral Dissertations Student Theses and Dissertations
Summer 2018
A methodology to predict community college STEM student A methodology to predict community college STEM student
retention and completion retention and completion
Jennifer Lynn Snyder
Follow this and additional works at: https://scholarsmine.mst.edu/doctoral_dissertations
Part of the Community College Education Administration Commons, Operations Research, Systems
Engineering and Industrial Engineering Commons, and the Science and Mathematics Education
Commons
Department: Engineering Management and Systems Engineering Department: Engineering Management and Systems Engineering
Recommended Citation Recommended Citation Snyder, Jennifer Lynn, "A methodology to predict community college STEM student retention and completion" (2018). Doctoral Dissertations. 2711. https://scholarsmine.mst.edu/doctoral_dissertations/2711
This thesis is brought to you by Scholars' Mine, a service of the Missouri S&T Library and Learning Resources. This work is protected by U. S. Copyright Law. Unauthorized use including reproduction for redistribution requires the permission of the copyright holder. For more information, please contact [email protected].
A METHODOLOGY TO PREDICT COMMUNITY COLLEGE STEM STUDENT
RETENTION AND COMPLETION
by
JENNIFER LYNN SNYDER
A DISSERTATION
Presented to the Faculty of the Graduate School of the
MISSOURI UNIVERSITY OF SCIENCE AND TECHNOLOGY
In Partial Fulfillment of the Requirements for the Degree
DOCTOR OF PHILOSOPHY
in
ENGINEERING MANAGEMENT
2018
Approved by
Dr. Elizabeth Cudney, Advisor
Dr. Susan Murray
Dr. Dincer Konur
Dr. Douglas Ludlow
Dr. Ruwen Qin

2018
Jennifer Lynn Snyder
All Rights Reserved
iii
PUBLICATION DISSERTATION OPTION
This dissertation consists of the following articles that have been published, or
submitted for publication as follows:
Paper I, Pages 5-42 have been published in Journal of STEM Education.
Paper II, Pages 43-58 have been submitted to ASEE Annual
Conference & Exposition.
Paper III, Pages 59-80 have been submitted to Quality in Higher Education
iv
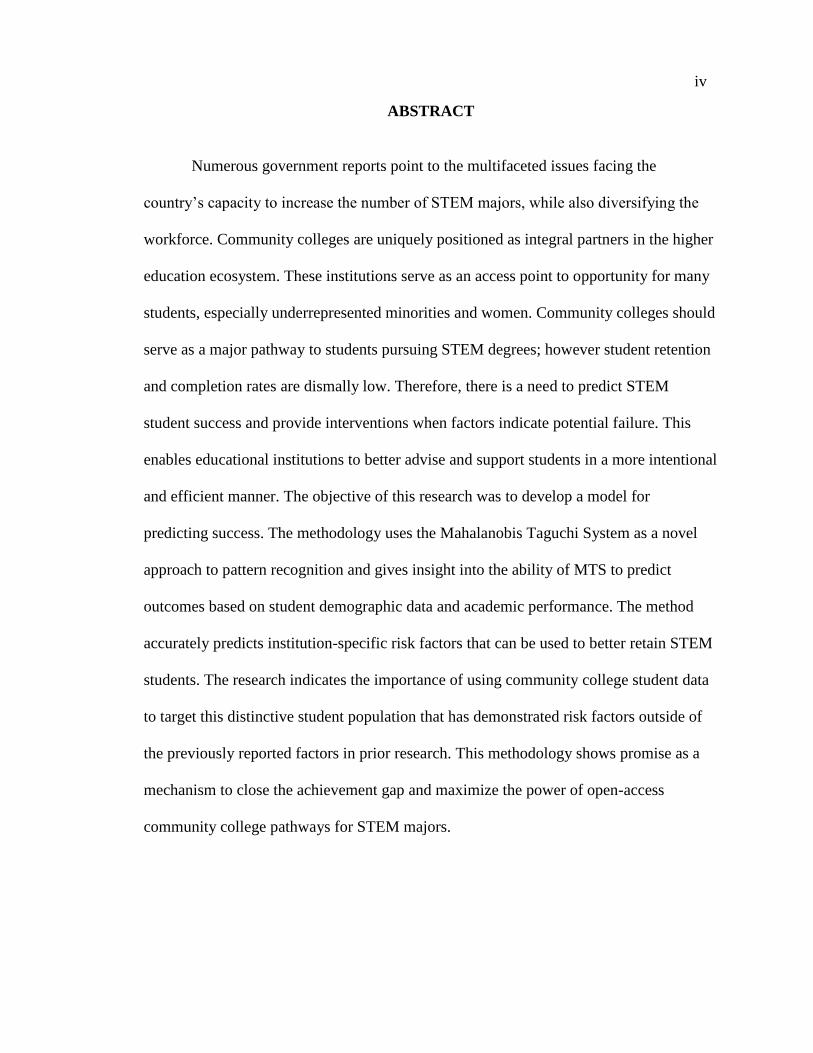
ABSTRACT
Numerous government reports point to the multifaceted issues facing the
country’s capacity to increase the number of STEM majors, while also diversifying the
workforce. Community colleges are uniquely positioned as integral partners in the higher
education ecosystem. These institutions serve as an access point to opportunity for many
students, especially underrepresented minorities and women. Community colleges should
serve as a major pathway to students pursuing STEM degrees; however student retention
and completion rates are dismally low. Therefore, there is a need to predict STEM
student success and provide interventions when factors indicate potential failure. This
enables educational institutions to better advise and support students in a more intentional
and efficient manner. The objective of this research was to develop a model for
predicting success. The methodology uses the Mahalanobis Taguchi System as a novel
approach to pattern recognition and gives insight into the ability of MTS to predict
outcomes based on student demographic data and academic performance. The method
accurately predicts institution-specific risk factors that can be used to better retain STEM
students. The research indicates the importance of using community college student data
to target this distinctive student population that has demonstrated risk factors outside of
the previously reported factors in prior research. This methodology shows promise as a
mechanism to close the achievement gap and maximize the power of open-access
community college pathways for STEM majors.
v
ACKNOWLEDGMENTS
I have always been very fortunate in my academic pursuits, but still feel very
honored to have found Dr. Elizabeth Cudney as a research advisor. I am incredibly
thankful to her for giving me the opportunity to pursue my doctoral studies, while I was
working full-time and furthering my career. She always provided steady guidance and
kept me focused on the goal. I am grateful for my committee members, Dr. Susan
Murray, Dr. Ruwen Qin, Dr. Dincer Konur, and Dr. Douglas Ludlow for their continuous
guidance during my graduate research and studies. This project would not have been
possible without everyone’s support and understanding of my unique situation and life
changes.
In addition to my committee, I would like to thank my employers for allowing me
to pursue this educational opportunity. My love of community colleges and
administration took root at Ozarks Technical Community College in Springfield,
Missouri. Currently, I am supported and guided by Dr. Stacey Johnson at Valencia
College. She has been very supportive and understanding as I balance my research with
work responsibilities. I am so grateful to her and the science department for their
encouragement and support.
Most importantly, I would like to thank my family. I have been blessed to share a
life with Rick Snyder. He never falters in his love and support for my dreams. We have
the most amazing kids, Levi and Lauren, who have shared their mom with work and
academics their whole lives. I love their faces and appreciate their souls. My parents gave
me this crazy thirst for understanding and service, so I owe them everything. My heart is
full.
vi
TABLE OF CONTENTS
Page
PUBLICATION DISSERTATION OPTION ................................................................ iii
ABSTRACT ................................................................................................................... iv
ACKNOWLEDGMENTS ............................................................................................... v
LIST OF ILLUSTRATIONS ......................................................................................... ix
LIST OF TABLES .......................................................................................................... x
SECTION
1. INTRODUCTION ............................................................................................... 1
PAPER
I. RETENTION MODELS FOR STEM MAJORS AND ALIGNMENT
TO COMMUNITY COLLEGES: A REVIEW OF THE LITERATURE ........... 5
ABSTRACT .......................................................................................................... 5
1. INTRODUCTION ............................................................................................. 6
2. RESEARCH METHODOLOGY .................................................................... 11
2.1. PLANNING THE REVIEW .................................................................... 11
2.2. CONDUCTING THE REVIEW .............................................................. 12
3. RETENTION CAUSATION FACTORS AND CURRENT PREDICTIVE
MODELS ........................................................................................................ 13
3.1. REGRESSION ANALYSIS .................................................................... 19
3.2. EXPLORATORY FACTOR ALYSIS………………………...…. ........ 21
3.3. MACHINE LEARNING………………………………..……………… 22
4. RETENTION FACTORS AND MODELS IN COMMUNITY
COLLEGES .................................................................................................... 23
vii
5. FUTURE OPPORTUNITIES TO ALIGN PREDICTIVE MODELS
WITH COMMUNITY COLLEGES .............................................................. 33
REFERENCES .................................................................................................... 35
II. A RETENTION MODEL FOR COMMUNITY COLLEGE STEM
STUDENTS ...................................................................................................... 43
ABSTRACT ........................................................................................................ 43
1. INTRODUCTION ........................................................................................... 44
2. LITERATURE REVIEW ................................................................................ 46
3. DATA ANALYSIS AND PREDICTION MODEL ....................................... 48
4. VALIDATION AND COMPARISON ........................................................... 51
5. CONCLUSIONS ............................................................................................. 55
REFERENCES .................................................................................................... 56
III. A METHODOLOGY FOR PREDICTING STEM RETENTION IN
COMMUNITY COLLEGES ........................................................................... 59
ABSTRACT ....................................................................................................... 59
1. INTRODUCTION .......................................................................................... 60
2. LITERATURE REVIEW .............................................................................. 62
2.1. ACADEMIC ANALYTICS .................................................................... 62
2.2. PREDICTIVE METHODS ...................................................................... 63
3. RESEARCH METHOD AND FINDINGS ................................................... 66
3.1. METHODOLOGY ................................................................................ 66
3.1.1. Step 1 - Data Collection. ................................................................... 67
3.1.2. Step 2 - Define Normal Group and Build Reference Space. ............ 68
3.1.3. Step 3 - Analyze Abnormal Group Against the
Reference Group ............................................................................... 69
viii
3.1.4. Step 4 - Determine the Useful Variables Using MTS. ..................... 69
3.1.5. Step 5 - Develop a Predictive Model. ............................................... 71
3.1.6. Step 6 - Model Validation ................................................................. 71
3.1.7. Step 7 - Analytics-enabled Decision Making ................................ 74
4. CONCLUSION AND FUTURE WORK ....................................................... 75
REFERENCES ................................................................................................... 77
SECTION
2. CONCLUSION .................................................................................................. 81
REFERENCES .............................................................................................................. 84
VITA ............................................................................................................................. 87
ix
LIST OF ILLUSTRATIONS
PAPER I Page
Figure 1. Research methodology for systematic literature review ................................... 11
Figure 2. Publications by year and database/journal searched ......................................... 13
PAPER II
Figure 1. Observed values compared to the predicted probabilities ................................. 53
PAPER III
Figure 1. Predictive Analytics Framework Integrating MTS. .......................................... 67
x
LIST OF TABLES
PAPER I Page
Table 1. Research contributions in STEM student retention ............................................ 17
Table 2. Community college retention factors and models.. ............................................ 27
PAPER II
Table 1. Descriptive Statistics of Raw Data. .................................................................... 50
Table 2. Results of the Mahalanobis Taguchi System ...................................................... 51
Table 3. Stepwise Selction of Terms. ............................................................................... 52
Table 4. Correlation of Predicted and Actual ................................................................... 53
Table 5. Stepwise Selection of Terms............................................................................... 54
PAPER III
Table 1. Descriptive statistics of raw data collected. ........................................................ 68
Table 2. MTS results of demographic and academic performance data ........................... 69
Table 3. S/N ratios for second analysis with course information. .................................... 70
Table 4. Logistic regression summary of data from Table 2. ........................................... 72
Table 5. Model validation ................................................................................................. 73
1. INTRODUCTION
There has been ongoing conversation about the country’s ability to meet the
growing demands of the workforce (Chen, 2013; Olsen, 2014). In 2007, the need for
science, technology, engineering, and math (STEM) majors was the focus of the
governmental report – Rising Above the Gathering Storm (Committee on Science, 2007).
In the report, it is argued that the nation must increase the number of STEM majors to
remain globally competitive in the 21st century and gave recommendations to remain the
world’s leader in science and technology. The Presidential Council of Advisors on
Science and Technology (PCAST) also released a report highlighting the need to increase
the number of STEM majors. In Engaged to Excel, PCAST presented high impact
practices recognizing the need for all educational institutions to increase focus on
attracting and retaining STEM majors (Olson & Riordan, 2012). Currently, it is estimated
that 69% of high school graduate immediately enroll in classes at a post-secondary
institution (McFarland et al., 2017). It is reported that 28% of post-secondary students
declare a STEM bachelor’s degree, while 20% of students declare a STEM associate’s
degree (Chen, 2009). The attrition rate varies based on the institution; however,
approximately 48% of students that declare a bachelor’s degree leave the major. Attrition
is more alarming for students pursuing a STEM associate’s degree where the completion
rate is an average of 31%. Overall, it is estimated that only 4.4% of undergraduate
degrees in the United States are in engineering, which lags other countries considerably,
and is an important degree pathway for the country (Olsen, 2014; Terenzini, Lattuca, Ro,
& Knight, 2014). Arcidiacono, Aucejo, and Hotz (2016) present data indicating parity
amongst different ethnicities in enrollment rates for STEM degrees, but also indicate the

2
continuation of the drastic gap in completing STEM degrees. Enrollment for minorities at
community colleges is often over representative and community colleges provide one of
the only pathways for many students into higher education (Cohen, Kisker, & Brawer,
2014; Horn & Nevill, 2006).
The history of community colleges as a uniquely American institution dates back
to the early Twentieth Century. There was massive expansion of colleges during this time
due to public perception that schooling was the pathway to stronger communities (Cohen
et al., 2014). According to Cohen et al. (2014), “community colleges are defined as any
not-for-profit institution regionally accredited to award the associate of art or the
associate of science as its highest degree”. In recent years, the Carnegie Classification of
Institutions of Higher Education created a new category for some colleges that are
awarding both baccalaureate and associate degrees. For this research, the focus will be on
publicly funded institutions that award associate degrees as a pathway to baccalaureate
degrees at a university. The mission of community colleges is multifaceted including
providing technical degrees, transfer degrees, continuing education, and generally using a
policy of open-admission. Community colleges are a critical component of higher
education and allow post-secondary education to many students that would not have had
the opportunity otherwise, because of their belief that every student has the potential to
achieve success (Calcagno, Bailey, Jenkins, Kienzl, & Leinbach, 2008; Cohen et al.,
2014).
The community college student population largely mirrors the local community
with 96% of graduates being in-state residents with their homes within a median average
of 10 miles (Cohen et al., 2014). Community colleges have allowed a greater number of
3
people from all sectors of society to achieve a higher education. The number of
community colleges has stayed relatively stable, but enrollment has continued to grow
due to trends in college-going rates. The student population of community colleges is
more diverse than traditional universities – attracting more females and underrepresented
minorities (Cohen et al., 2014; Horn & Nevill, 2006). As admission standards and tuition
continues to rise for universities, students have found community colleges to be a logical
place to begin their educational journey. Of students that receive a bachelor’s degree in a
STEM field, approximately half report attending a community college during some
segment of their education (Costello, 2012). In America’s Overlooked Engineers,
Terenzini et al. (2014) articulate the need for community colleges to play a large role
diversify engineering. As institutions with more diversity, it follows that community
colleges should be contributing to an increasingly diverse STEM workforce.
Unfortunately, retention and completion of STEM majors continues to be major
area of concern. Reviewing research, it is apparent that attrition rates and causes remain
relatively unchanged especially for underrepresented minorities (Terenzini et al., 2014).
Recognizing the importance STEM retention completion, there has been an effort to
develop STEM retention models. A majority of STEM retention models involved
university data and the results seemingly agree on certain factors such as high school
GPA, standardized exam scores, and high school exposure to math and science (Snyder
& Cudney, 2017). However, there is very little research into community college STEM
students.
Due to the misalignment of models to community college students, this research
developed a predictive model specific to community college students. The findings
4
indicate that community college students have different risk factors than previously
identified using university data. This is not entirely surprising given the overall
differences in student profiles. Normal admission standards do not necessarily apply to
the community college student from preparation to life circumstances. Therefore, it is
critical to develop a prediction model that fits the community college to university
pathway. By identifying risk factors, advisors can more appropriately work with students
to increase a student’s probability for success. This research is an important step in
understanding STEM students that fall outside the traditional university student profile
and contributes to the growing body of research on community college students.
5
PAPER
I. RETENTION MODELS FOR STEM MAJORS AND ALIGNMENT TO
COMMUNITY COLLEGES: A REVIEW OF THE LITERATURE
Jennifer Snyder and Elizabeth A. Cudney
Department of Engineering Management and Systems Engineering, Missouri University
of Science and Technology, Rolla, MO, USA
ABSTRACT
During the last decade, there have been numerous reports detailing the importance
of increasing science, technology, engineering, and math (STEM) majors in the United
States. Simultaneously an increasing number of studies are being developed to predict a
student’s success and completion of a STEM degree, recognizing that retention is a
significant issue for STEM majors. A majority of the studies focus on traditional college
students that attend college directly after high school, which is no longer the model of the
majority of college students. A growing number of students delay entry into college and
do not enter through traditional routes. One of the growing entry points for STEM
students is the community college or two-year institution. These institutions have grown
in popularity due to tuition increases and lack of preparedness for traditional selective
universities. As the need for more STEM majors and a diverse workforce increases, more
research should be directed towards this growing pool of students. Retention models
should investigate unique retention causation factors more thoroughly to address these
STEM students and this pipeline. This research provides a systematic review of the
6
literature on retention models for STEM education and provides a discussion of future
opportunities to align predictive models with community colleges.
Keywords: Higher Education, STEM Education, Community College, Retention,
Predictive Models
1. INTRODUCTION
After the economic worldwide downturn of 2008, there continues to be
considerable apprehension and scrutiny surrounding the nation’s economy and how to
guard against weaknesses in the new global economy. There is strong evidence to support
the assertion that Science, Technology, Engineering, and Math (STEM) careers will drive
the economy of the future and help the United States remain globally competitive
(Committee on Prospering in the Global Economy of the 21st, National Academy of
Engineering Institute of, & National Academy of, 2007; Olsen, 2014; Vilorio, 2014).
Further, students with substantial math and science training will experience more demand
in the workforce, even if not working directly in STEM careers, due to enhanced critical
thinking skills (Council et al., 2013). Data from the Bureau of Labor Statistics shows
employment in STEM fields is expected to increase by approximately one million jobs
between 2012 and 2022 (Vilorio, 2014). In light of these growing concerns, President
Obama challenged the country to increase the number of STEM graduates by one million
in this ten-year period (Olsen, 2014). In a response to his call, the President’s Council of
Advisors on Science and Technology (PCAST) organized a report on the strategies that
could help attain this goal. In Engage to Excel, PCAST addressed the important points of
7
retention, community colleges, and the need for more diversity, which this review of the
literature will investigate more deeply (Engage to Excel: Producing One Million
Additional College Graduates with Degrees in Science, Technology, Engineering, and
Mathematics, 2012). Despite intensified efforts, the U.S. has seen a decrease or
stagnation in the number of STEM majors in recent decades (Snyder, Dillow, & Staff,
2012).
While there is some scrutiny about the heterogeneity within the STEM labor
market, there is little argument on the need for more diversity in these fields (Committee
on Underrepresented et al., 2011; Terenzini, Lattuca, Ro, & Knight, 2014; Xue & Larson,
2015). The engineering workforce should mirror the diversity of our population if it is
going to keep pace with the global markets (Hagedorn & Purnamasari, 2012; Starobin &
Laanan, 2008; Terenzini, Lattuca, Ro, & Knight, 2014; Xue & Larson, 2015). In 2015,
Solving the Equation: The Variables for Women's Success in Engineering and Computing
illuminated the gender inequity in STEM degrees, especially engineering and computing.
These two segments of STEM account for 80% of the workforce, yet women are
profoundly underrepresented. Women account for a minor fraction of the engineering and
computing workforce, representing just 12% and 26%, respectively. The numbers are
more drastic when one considers women of color (Committee on Underrepresented et al.,
2011; Costello, 2012; Dika & D'Amico, 2016). Increasing access for women to STEM
careers is proposed to help close the gender wage gap (Costello, 2012).
Recent data from governmental sources makes a compelling argument for
attention to STEM majors and retention.
8
Students are choosing STEM majors in sufficient numbers as a whole with
approximately 28% of bachelor’s degree students and 20% of associate’s degree
students choosing a STEM major at some point within six years of entering higher
education (Chen, 2013).
Rates of U.S. undergraduates that choose STEM majors trail key competitors and
the number has not increased drastically in decades (Chen, 2013).
The percent of women enrolled in science and engineering has remained flat from
2000-2013 (National Science Board, 2016).
18.4% of U.S. citizen and permanent resident science and engineering doctorate
recipients reported earning college credit from a community college with the
percent ranging from 12.7% for Asian to 32.3% for American Indian ethnicity
(National Science Board, 2016).
18% of students receiving a bachelor’s degree in science and engineering had
previously earned an associate’s degree (National Science Board, 2016).
69% of the associate degree STEM entrants left the fields. Of these 43% of
female associate’s degree students switched out of STEM, while only 29% of
their male peers left (Chen, 2013).
When looking at the national goal of increasing STEM majors, there must be a
thorough analysis of retention (Drew, 2011; Seymour & Hewitt, 1997). PCAST
recommended efforts be guided toward increasing the retention of students, since a minor
increase in retention could have significant benefits in the total number of graduates.
STEM retention is currently reported to be 48% nationally, which is an average of all
reporting institutions (Chen, 2013). The numbers are more telling when looking at
9
institutions as sectors. Science and Technology institutions have much higher retention
due to various factors and rigorous admittance requirements. The lowest retention (30%)
of STEM majors is seen within community colleges, which struggle with open
enrollment and lack of academic preparedness in many students (Chen, 2013). Retention
increases could help achieve the goals set forth by President Obama and allow the U.S. to
remain competitive in this increasingly important segment of the economy.
One population often overlooked in tackling the nation’s goal for increasing and
diversifying STEM graduates is the community college transfer student (Hoffman,
Starobin, Laanan, & Rivera, 2010). In multiple National Science Foundation (NSF)
reports, there is growing evidence that community colleges are critical to increasing the
diversity of STEM, especially in engineering (Committee on Underrepresented et al.,
2011; Hagedorn & Purnamasari, 2012; S. Starobin & Laanan, 2008). In America’s
Overlooked Engineers, data outlines that community colleges have a much more diverse
student population pursuing engineering degrees. However, when studying engineering
graduates there is little difference in ability between graduates that attended a community
college and those that received all credit from a four-year institution (Terenzini et al.,
2014).
Community colleges currently educate almost half of the countries undergraduate
students including STEM majors (Hagedorn & Purnamasari, 2012; Starobin & Laanan,
2010). Additionally, the community college student population is much more diverse
than universities due to flexible schedules, open enrollment, and lower tuition (Cohen,
Kisker, & Brawer, 2014; Jackson & Laanan, 2011). In light of these factors, the
community college system should be a major partner and contributor to the STEM degree
10
pathway. As a research community, there should be more investigation into this
overlooked resource for quality, diverse undergraduate transfer students. Given that
community colleges have the lowest retention rates, it is important to remember that most
students leave STEM within the first two years (Chang, Eagan, Lin, & Hurtado, 2011;
Seymour & Hewitt, 1997) Increasing community college retention rates could have a
drastic impact on the average STEM graduation rates while also potentially diversifying
the workforce. Ultimately, there cannot be substantial changes to retention rates without
working with community colleges, yet little academic research is focused on this sector
of higher education.
Higher Education Institutions (HEIs) must develop clear strategies to recruit and
retain STEM majors to assist in the national effort to produce quality students. This paper
will outline the importance of STEM majors, the significance of retention values in
maximizing our countries’ economic competitiveness, survey existing predictive models,
and highlight the growing need to incorporate community colleges in the national
dialogue.
The remainder of this paper will be broken into sections. Part II will provide the
literature review methodology. Part III will review the various retention causation factors
and predictive models currently being used by colleges and universities and highlight the
reliability of models and development methods employed. Part IV will relate the
retention factors and models to community colleges and show how the current models do
not address a majority of community college students. Part V will highlight opportunities
to modify these models to properly address community college students.
11
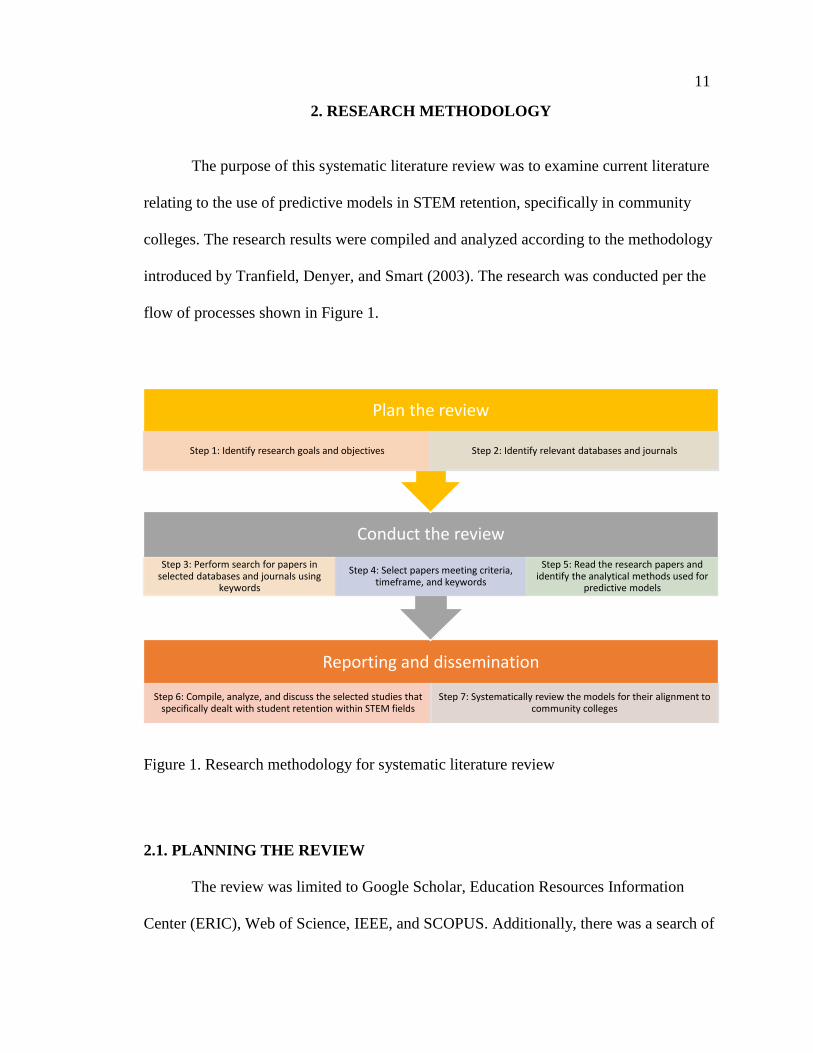
2. RESEARCH METHODOLOGY
The purpose of this systematic literature review was to examine current literature
relating to the use of predictive models in STEM retention, specifically in community
colleges. The research results were compiled and analyzed according to the methodology
introduced by Tranfield, Denyer, and Smart (2003). The research was conducted per the
flow of processes shown in Figure 1.
Figure 1. Research methodology for systematic literature review
2.1. PLANNING THE REVIEW
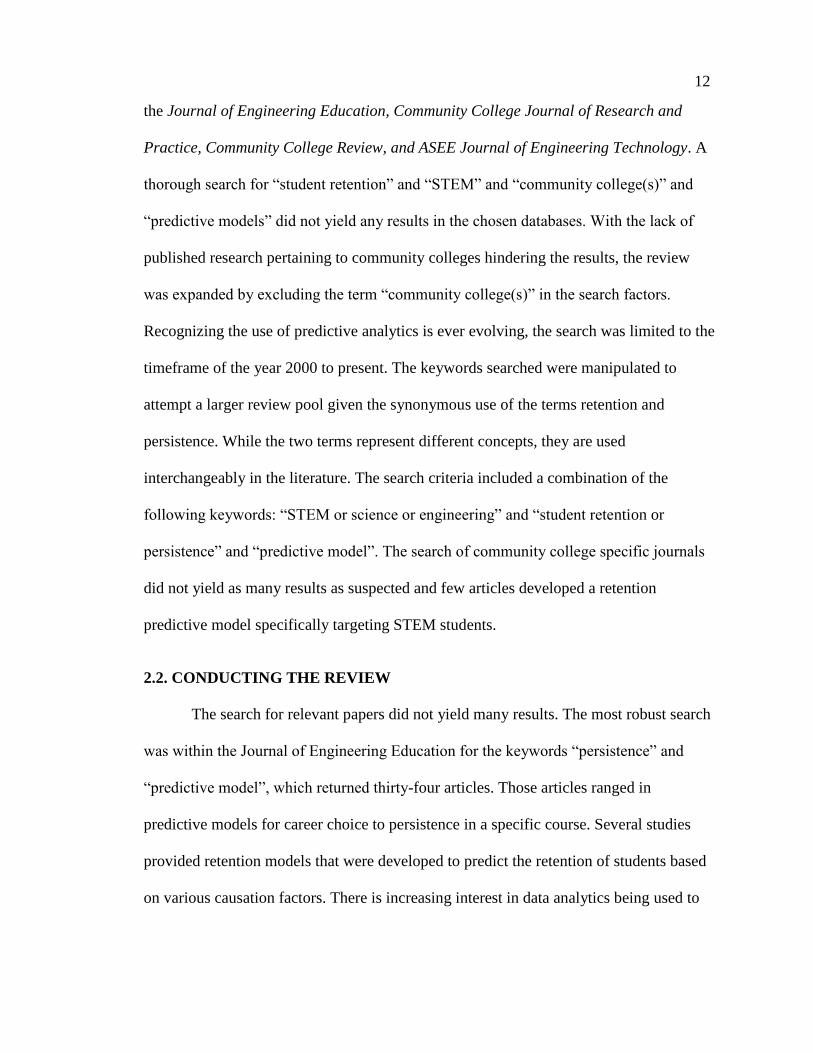
The review was limited to Google Scholar, Education Resources Information
Center (ERIC), Web of Science, IEEE, and SCOPUS. Additionally, there was a search of
Reporting and dissemination
Step 6: Compile, analyze, and discuss the selected studies that specifically dealt with student retention within STEM fields
Step 7: Systematically review the models for their alignment to community colleges
Conduct the review
Step 3: Perform search for papers in selected databases and journals using
keywords
Step 4: Select papers meeting criteria, timeframe, and keywords
Step 5: Read the research papers and identify the analytical methods used for
predictive models
Plan the review
Step 1: Identify research goals and objectives Step 2: Identify relevant databases and journals
12
the Journal of Engineering Education, Community College Journal of Research and
Practice, Community College Review, and ASEE Journal of Engineering Technology. A
thorough search for “student retention” and “STEM” and “community college(s)” and
“predictive models” did not yield any results in the chosen databases. With the lack of
published research pertaining to community colleges hindering the results, the review
was expanded by excluding the term “community college(s)” in the search factors.
Recognizing the use of predictive analytics is ever evolving, the search was limited to the
timeframe of the year 2000 to present. The keywords searched were manipulated to
attempt a larger review pool given the synonymous use of the terms retention and
persistence. While the two terms represent different concepts, they are used
interchangeably in the literature. The search criteria included a combination of the
following keywords: “STEM or science or engineering” and “student retention or
persistence” and “predictive model”. The search of community college specific journals
did not yield as many results as suspected and few articles developed a retention
predictive model specifically targeting STEM students.
2.2. CONDUCTING THE REVIEW
The search for relevant papers did not yield many results. The most robust search
was within the Journal of Engineering Education for the keywords “persistence” and
“predictive model”, which returned thirty-four articles. Those articles ranged in
predictive models for career choice to persistence in a specific course. Several studies
provided retention models that were developed to predict the retention of students based
on various causation factors. There is increasing interest in data analytics being used to
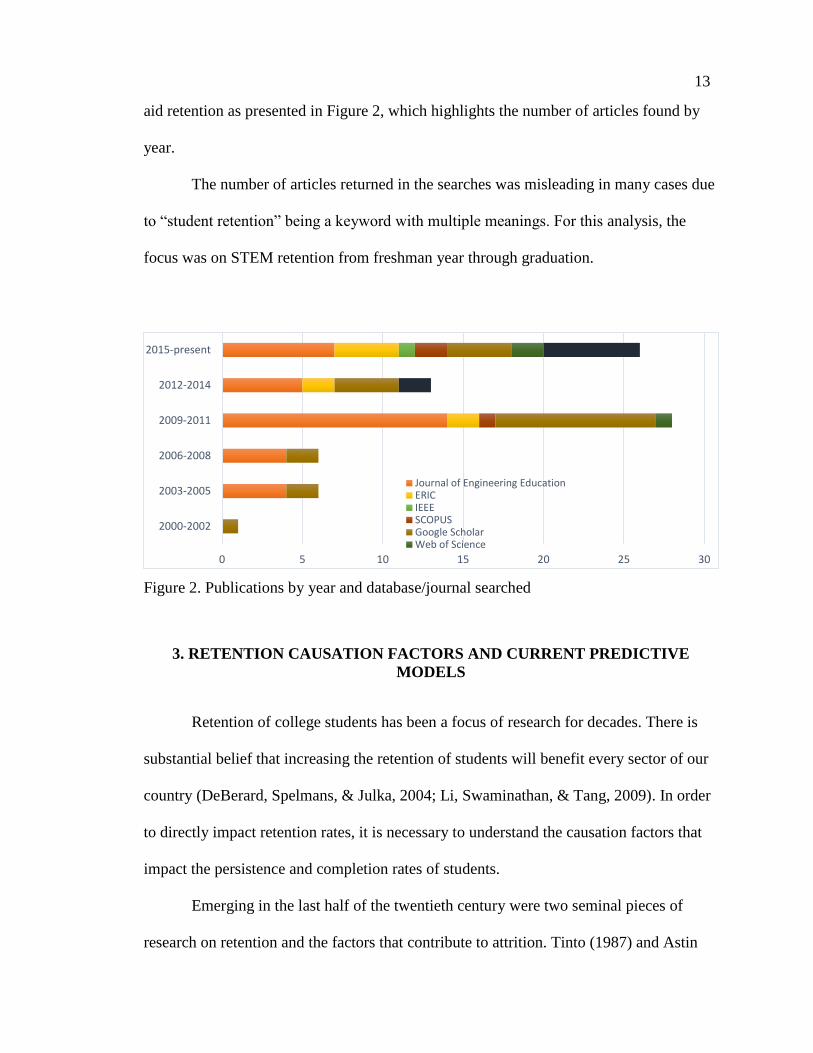
13
aid retention as presented in Figure 2, which highlights the number of articles found by
year.
The number of articles returned in the searches was misleading in many cases due
to “student retention” being a keyword with multiple meanings. For this analysis, the
focus was on STEM retention from freshman year through graduation.
Figure 2. Publications by year and database/journal searched
3. RETENTION CAUSATION FACTORS AND CURRENT PREDICTIVE
MODELS
Retention of college students has been a focus of research for decades. There is
substantial belief that increasing the retention of students will benefit every sector of our
country (DeBerard, Spelmans, & Julka, 2004; Li, Swaminathan, & Tang, 2009). In order
to directly impact retention rates, it is necessary to understand the causation factors that
impact the persistence and completion rates of students.
Emerging in the last half of the twentieth century were two seminal pieces of
research on retention and the factors that contribute to attrition. Tinto (1987) and Astin
0 5 10 15 20 25 30
2000-2002
2003-2005
2006-2008
2009-2011
2012-2014
2015-present
Journal of Engineering EducationERICIEEESCOPUSGoogle ScholarWeb of Science
14
(1993) produced significant research on retention and contributing factors. Both studies
investigated student attributes, but also the institutional effects that influence a student
and their decision to complete college or withdraw.
In Leaving College, Tinto describes in depth the various causation factors that
lead a student to withdraw. Tinto’s model examined individual and institutional factors
that led to a student’s decision to voluntarily withdrawal (Tinto, 1987). The individual
factors of intention and commitment seem to be critical attributes lending to a student’s
success in college. These are qualities that a student has before entering college and can
be influenced, but these qualities are individual in nature. Institutional factors are the
variables that can be impactful after a student enters the higher education system. These
factors speak to the student’s overall integration into the institution. The factors are
adjustment, difficulty, incongruence, and isolation. One of the most significant
relationships appears to be between a student and faculty. It should be recognized that a
negative interaction with faculty or staff can lead a student to feel less connected to the
institution and influence their decision to withdraw. Tinto highlighted the importance of
understanding institutions as systems and viewing the model from a longitudinal
perspective with interacting components (Tinto, 1987).
In What Matters in College, Astin also studied retention and factors that
influenced it. The model Astin produced is referred to as the I-E-O model. It emphasizes
the importance of the input (I) to the system, which is the background and preparation a
student brings to the institution. The institutional environment (E) has an effect on those
inputs and together will determine the outcome (O). This study also emphasizes the
engagement of students with the institution (Astin, 1993).
15
Using these models as a springboard, Seymour and Hewitt (1997) focused on
STEM majors in the book, Talking About Leaving. The overall aim of this research was
to identify sources of qualitative differences in students’ experiences when pursuing a
science, math, or engineering (SME) degree. The research investigated what institutions
and departments did that encouraged attrition amongst the SME majors, while also
comparing the attrition causes of females and minorities to that of the majority. One of
the largest findings is that there was not a significant difference in cognitive ability
between “switchers” and “stayers”. The four most common factors of switching were loss
or lack of interest in science, non-SME degrees held better educational opportunities,
poor teaching by SME faculty, and feeling overwhelmed by the pace and load of an SME
curriculum. When questioning students, it was found that the weed out curriculum of
SME degrees is a factor in their feelings of being overwhelmed. Students felt faculty did
not understand that the weed out system favors students that are independently funded.
This is problematic given the need to diversify SME and increase success of students
from lower socioeconomic backgrounds. When exploring the gender differences in SME
retention, it was found that women were more likely to choose their degree due to an
active influence of others. Females also reported feeling alienated in their programs,
which possibly leads to the higher attrition rate seen for female SME majors. Further,
poor high school preparation was claimed by students of color and women more than
other classes of students. Overall the causes of high attrition rates amongst these majors
was as variable as Tinto and Astin found for all majors; however, it does appear that
SME majors suffer more from a weed out mentality of faculty and poor teaching
(Seymour & Hewitt, 1997).
16
There are still several variables not understood in student decision making about
withdrawing from an institution, but what is clear from the research is the causes do not
lie squarely on the individual student. There seems to be a relationship between a
student’s individual characteristics and their experiences with the institution. Following
these seminal research studies on retention, there have been multiple recent studies into
the student and institutional factors that can predict student success in STEM. There are
several causation factors that appear relevant in these retention studies. Most studies
concentrate on the quantitative factors a student possesses before entering higher
education such as high school GPA, high school rank, and standardized exam scores.
Recognizing the complexity of the causation factors, studies usually include a
multifaceted approach to the investigation including both quantitative and qualitative
variables.
Several studies examined the combination of qualitative and quantitative factors
and found student motivation and confidence significantly impacted their success and
retention (Burtner, 2005; Eris et al., 2010; French, Immekus, & Oakes, 2005; Nicholls,
Wolfe, Besterfield-Sacre, Shuman, & Larpkiattaworn, 2007). Morganson et al. (2015)
investigated a different view of retention by studying the factors that influence a student
to stay and complete a degree using the Embeddedness Theory. The Embeddedness
Theory looks at fit, link, and sacrifice to determine factors that anchor a student to their
degree and institution (Morganson, Major, Streets, Litano, & Myers, 2015). Bernold et al.
(2007) studied learning styles and the influence they had on retention and success
(Bernold, Spurlin, & Anson, 2007). The study shows that learning styles most conducive
to the traditional lecture pedagogy of engineering curriculum have a higher retention rate.
17
From a gender perspective, females were more likely to have a learning style that did not
perform well in the traditional engineering lecture style (Bernold et al., 2007). Table 1
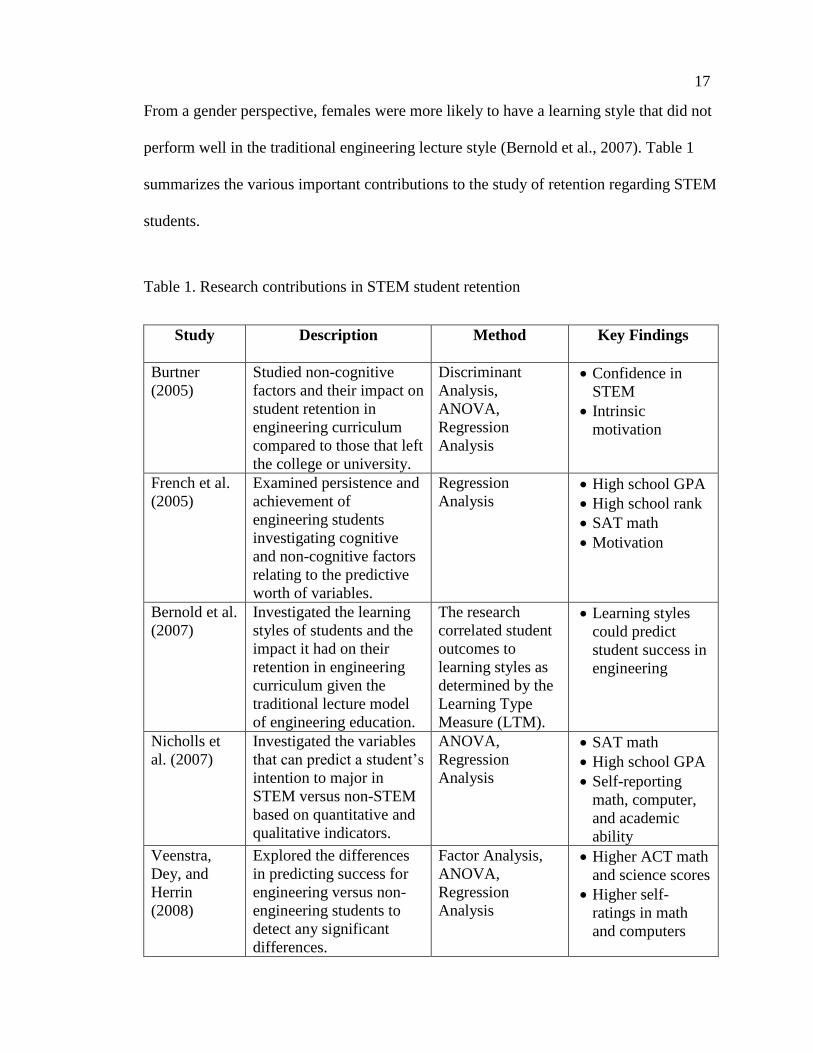
summarizes the various important contributions to the study of retention regarding STEM
students.
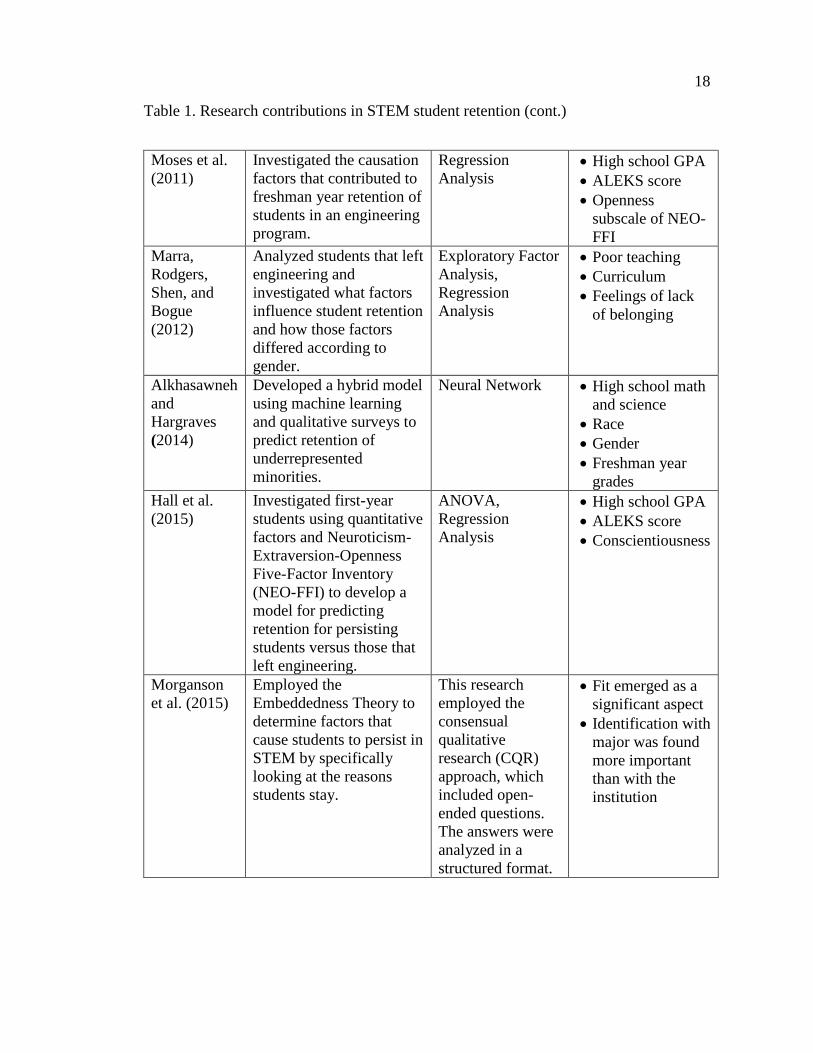
Table 1. Research contributions in STEM student retention
Study Description Method Key Findings
Burtner
(2005)
Studied non-cognitive
factors and their impact on
student retention in
engineering curriculum
compared to those that left
the college or university.
Discriminant
Analysis,
ANOVA,
Regression
Analysis
Confidence in
STEM
Intrinsic
motivation
French et al.
(2005)
Examined persistence and
achievement of
engineering students
investigating cognitive
and non-cognitive factors
relating to the predictive
worth of variables.
Regression
Analysis High school GPA
High school rank
SAT math
Motivation
Bernold et al.
(2007)
Investigated the learning
styles of students and the
impact it had on their
retention in engineering
curriculum given the
traditional lecture model
of engineering education.
The research
correlated student
outcomes to
learning styles as
determined by the
Learning Type
Measure (LTM).
Learning styles
could predict
student success in
engineering
Nicholls et
al. (2007)
Investigated the variables
that can predict a student’s
intention to major in
STEM versus non-STEM
based on quantitative and
qualitative indicators.
ANOVA,
Regression
Analysis
SAT math
High school GPA
Self-reporting
math, computer,
and academic
ability
Veenstra,
Dey, and
Herrin
(2008)
Explored the differences
in predicting success for
engineering versus non-
engineering students to
detect any significant
differences.
Factor Analysis,
ANOVA,
Regression
Analysis
Higher ACT math
and science scores
Higher self-
ratings in math
and computers
18
Table 1. Research contributions in STEM student retention (cont.)
Moses et al.
(2011)
Investigated the causation
factors that contributed to
freshman year retention of
students in an engineering
program.
Regression
Analysis High school GPA
ALEKS score
Openness
subscale of NEO-
FFI
Marra,
Rodgers,
Shen, and
Bogue
(2012)
Analyzed students that left
engineering and
investigated what factors
influence student retention
and how those factors
differed according to
gender.
Exploratory Factor
Analysis,
Regression
Analysis
Poor teaching
Curriculum
Feelings of lack
of belonging
Alkhasawneh
and
Hargraves
(2014)
Developed a hybrid model
using machine learning
and qualitative surveys to
predict retention of
underrepresented
minorities.
Neural Network High school math
and science
Race
Gender
Freshman year
grades
Hall et al.
(2015)
Investigated first-year
students using quantitative
factors and Neuroticism-
Extraversion-Openness
Five-Factor Inventory
(NEO-FFI) to develop a
model for predicting
retention for persisting
students versus those that
left engineering.
ANOVA,
Regression
Analysis
High school GPA
ALEKS score
Conscientiousness
Morganson
et al. (2015)
Employed the
Embeddedness Theory to
determine factors that
cause students to persist in
STEM by specifically
looking at the reasons
students stay.
This research
employed the
consensual
qualitative
research (CQR)
approach, which
included open-
ended questions.
The answers were
analyzed in a
structured format.
Fit emerged as a
significant aspect
Identification with
major was found
more important
than with the
institution
19
It is clear from studies there is importance in a student’s cognitive and non-
cognitive abilities relating to the prediction of success and persistence. These studies
reinforce Seymour and Hewitt’s (1997) findings on several of the causation factors
relating to retention, but many researchers did not investigate the institutional factors that
could provide a more reliable model to investigate both student factors and institutional
contributions.
With a national goal of increasing retention in STEM majors, there have been
several predictive models developed to help institutions target factors that could lead to
increased retention. These models help institutions allocate budgets properly and plan for
programs that enhance student completion. The studies in Table 1 used a variety of
analyses to develop predictive models. Analytical methods were chosen based on the
purpose of the research and the types of variables available. The common methods are
highlighted next.
3.1 REGRESSION ANALYSIS
Many of the studies highlighted in Table 1 used regression analysis in some form,
as it allows for a complete analysis of factors and development of a model. Regression
analysis is often used with historical data and can be useful in expressing relationships
between predictive variables and a response variable (Montgomery, Vining, & Peck,
2012). Many of the studies in Table 1 used regression analysis to develop predictive
models. In Marra et al. (2012), the study determined three factors were important to
student retention: poor teaching and advising, curriculum difficulties, and lack of
belonging. The analysis used simple linear regression and found the number of months
students stayed in engineering was related to the predictive factors of poor teaching and
20
advising and curriculum difficulties. The research also employed regression analysis to
determine the predictive power of original confidence. A negative relationship was found
between original confidence and the lack of belonging as a factor in retention. Multiple
regression analysis was used to examine the impact of poor teaching and advising,
curriculum difficulty, and lack of belonging on students’ cumulative GPA. It was
determined those three variables account for 20.7% of the GPA variation (Marra et al.,
2012).
Veenstra et al. (2008) investigated the differences in modeling engineering versus
non-engineering student success. Stepwise regression was used to determine the set of
predictors for first year success for both engineering and non-engineering students. The
results indicated that 37-38% of the variation of engineering students’ first-year GPA was
explained by pre-college characteristics, which were largely associated with academic
preparation (Veenstra et al., 2008). French et al. (2005) investigated the cognitive and
non-cognitive variables that were predictive factors for student success and persistence
within engineering. Three regression analyses were performed using historical data
collected from two cohorts of engineering undergraduate students. A hierarchical linear
regression was used for predicting GPA and it was determined that several cognitive
factors account for 18% of the variance. When predicting persistence in the university,
only GPA was a significant predictive variable, which resulted in correct classification
89% of the time. The hierarchical logistic regression model for engineering students
found more significant variables including GPA, high school rank, SAT-math, and
motivation. This predictive model had correct classification 65% of the time (French et
al., 2005).
21
Hall et al. (2015) found only one significant parameter for comparing persisting
students with those that left in good standing. The odds of persisting increased by 1.63
for every one standard deviation on the SAT-math score. When comparing persisting
students with those that leave in poor standing, there were three significant predictors
including high school GPA, conscientiousness, and Assessment and Learning in
Knowledge Spaces (ALEKS) score. The success of prediction depended on the group of
students being analyzed, with persisting students (69.9%), left in poor standing (64.7%),
and left in good standing (40.0%) varying in accuracy of prediction (Hall et al., 2015).
DeBerard et al. (2004) successfully used regression analysis to predict GPA, but did not
find statistically significant variables for predicting retention. This reinforces the
multifaceted causation factors that likely exist for retention prediction.
3.2 EXPLORATORY FACTOR ANALYSIS
It is common to have a large set of data and use exploratory factor analysis to
estimate the strength and direction of the influence of factors on a response. Exploratory
factor analysis is a methodology to analyze data and explore significant factors, which
allows for a predictive function of the exploratory factor analysis (Fabrigar & Wegener,
2012; Osborne, 2016). This technique is useful when there is not a suitable hypothesis
and investigation of the data is warranted; such as when Marra et al. (2012) used
exploratory factor analysis to determine which factors influence a students’ decision to
transfer out of engineering. The analysis identified five factors, with the first three factors
explaining 65.92% of the total variance. The three factors were poor teaching and
advising, difficult curriculum, and lack of belonging. Once those factors were identified,
Marra et al. used regression as described previously (Marra et al., 2012). Li et al. (2008)
22
used exploratory factor analysis to determine different perspectives students hold about
engineering and generated four factors from the data with the interest factor being
significant between engineering and non-engineering students (Li, McCoach,
Swaminathan, & Tang, 2008). Many studies use exploratory factor analysis to isolate the
factors required for further investigation with predictive modeling.
3.3 MACHINE LEARNING
Machine learning has gained popularity as a method that might have the ability to
increase the accuracy of predictive models in retention since it encompasses several
techniques such as artificial neural networks (ANN) and decision trees. Decision trees
use splits to generate a model and produce rule sets (Luan, 2002). Decision trees and
neural networks offer advantages in predicting key outcomes over traditional statistics
and have been shown to accurately predict students that would graduate within three
years or less (Herzog, 2006).
Alkhasawneh and Hargraves (2014) used machine learning techniques and
surveys to develop a hybrid model to predict first year retention in STEM. The study
investigated underrepresented minority (URM) students compared to majority students.
The model is a hybrid due to the inclusion of a qualitative survey given to a focus group
attending a summer program. The neural network technique used FeedForward
backpropagation. The resulting hybrid model had an accuracy of prediction of 66% for
URM, which was the lowest accuracy for the groups. The highest accuracy was found
with majority students (Alkhasawneh & Hargraves, 2014). Djulovic and Li (2013)
compared four techniques including Bayes model, C4.5 decision trees, neural networks,
and rule induction with regards to their accuracy of prediction. All four techniques
23
performed very well for predicting retention. The accuracy improved as more variables
were added with a final accuracy of 98.81% for retained students using the rule inductive
model (Djulovic & Li, 2013). Delen (2010) also found decision trees to be promising for
accurately predicting students that will be retained. Regardless of the technique, there
was a lack of sufficient accuracy in predicting attrition.
All of these methods have promise as tools to develop predictive models, but
clearly more powerful methods should be investigated for use in community colleges.
This is an area that is often overlooked in the development of retention models by
researchers (Cohen, 2005).
4. RETENTION FACTORS AND MODELS IN COMMUNITY COLLEGES
As college tuition increases and completion time expands, community colleges
have emerged as a viable option for students. Community colleges have been discussed
heavily in politics lately as an important sector of higher education and their importance
in keeping costs low while impacting the economy with workforce development
(Swanger, 2013). Community colleges grew out of a democratic mission to offer post-
secondary education to everyone (Cohen et al., 2014; Young, 1997) by offering many
smaller communities both general education and technical job training. Community
colleges remain close to their original mission of serving the local community with over
50% of community colleges being located in rural settings (Swanger, 2013). Since 1901,
the establishment of the first community college, the mission has expanded and is seen as
a comprehensive concept. One important aspect of community colleges is the concept of
“open access” with an emphasis on developmental education and preparing students for
24
transfer to universities (Cohen et al., 2014; Deegan, 1985; Hoffman et al., 2010;
Swanger, 2013).
Community colleges serve a very diverse student population (Hoffman et al.,
2010; Horn & Nevill, 2006). This diversity extends to the institutions themselves.
Community colleges can be private or public, focus on transfer preparation or workforce
development, and offer only associate degrees or select bachelor degrees. The academic
and institutional diversity could contribute to difficulties in studying them (Hoffman et
al., 2010).
When investigating women in community college, it is noted that a majority of
community college students are female reaching approximately 58% of the student
population (Hoffman et al., 2010). Costello (2012) reports that 20% of community
college students are women with children and one in ten female students is a single mom.
Even with this large population of females, the number of females pursing STEM degrees
remains small (Hoffman et al., 2010; Packard, Gagnon, LaBelle, Jeffers, & Lynn, 2011).
Community colleges are much more racially congruent with the area in which
they are located than most universities (Cohen et al., 2014; Hoffman et al., 2010).
Additionally, 38.5% of community college students are racial minorities with Hispanic
students representing the fastest growing sector (Hoffman et al., 2010). Unfortunately
data indicates that participation in STEM degrees is low for these demographics
(Hoffman et al., 2010). Tsapogas (2004) noted that Hispanic Science and Engineering
(S&E) graduates were more likely to have attended a community college, with
approximately 51% attending before transferring to receive a bachelor’s degree.
25
Community colleges are a strong resource for diversifying STEM while providing the
increasingly necessary preparation.
There are other factors that contribute to a more diverse demographic profile of
community college students. Studies show 79% of community college students have jobs
and work an average of 32 hours a week, which lends to more part time enrollment
(Costello, 2012; Horn & Nevill, 2006). Data indicates that delayed entrants to college are
more likely to favor a two year institution and this trend was especially noticeable when
looking at minorities and women (Cohen et al., 2014). First generational college students
(FGCS) are also more likely to begin their post-secondary education at a community
college. Unfortunately, FGCS often struggle with the same barriers as women and URM
including factors such as underprepared, work demands, lack of support, and high
attrition rates (Dika & D'Amico, 2016). When investigating S&E graduates, it was found
that older graduates were more likely to attend community college than younger students
(Tsapogas, 2004). Overall, the community college student has a very different
demographic than traditional college students and cannot be viewed through the same
research lens (Costello, 2012; Horn & Nevill, 2006).
Given the increasing number of students attending community colleges, including
racial minorities, it is important to investigate retention at these institutions (Starobin &
Laanan, 2010). Tinto (1987) recognized that withdrawal rates were lowest among two
year institutions and connected this low withdrawal rate to some of the various factors.
The primary reasons for community college withdrawal rates being higher seems to be
related to the lack of preparedness of students and students coming from a lower
socioeconomic background (Cohen et al., 2014; Tinto, 1987). Hagedorn and DuBray
26
(2010) studied a large cohort of community college students in California and found only
12.6% of the STEM-focused transfer-hopeful students were enrolled in a transfer level
math, with the rest of the hopefuls being in lower remedial courses. The research also
found success in math classes was significantly related to demographic data such as
gender and race. The factors that impact student success for traditional university
students might not be the same factors that community college students face, especially
when considering women and minorities (Hagedorn & DuBray, 2010). Therefore, it is
certainly worthy of investigation. Higher education students are no longer one-size-fits
all, and the predictive analytical tools cannot be universal either.
Another area of concern is the lack of attention predictive models give to
institutional factors. Given the importance of institutional factors identified by Tinto
(1987), Astin (1993), and Seymour and Hewitt (1997), it is surprising more recent STEM
studies have continued to largely focus on student attributes. Some student retention
studies investigate the importance of institutional factors, but are not usually concentrated
on STEM education. For instance, Webster et al. (2011) investigated institutional factors
in predicting student retention and found that tuition, student-teacher ratio, and the
amount of aid received all influence a student in their decision to persist. This study also
found a positive relationship between faculty salaries and retention, which reinforces the
idea that more selective institutions have higher retention rates. Seymour and Hewitt
(1997) repeatedly heard from students that the STEM educational system was designed to
weed out minorities and lower socioeconomic students. The institutional diversity among
community colleges needs to be investigated further to ascertain which institutional
model is most successful for increasing STEM majors and diversity.
27
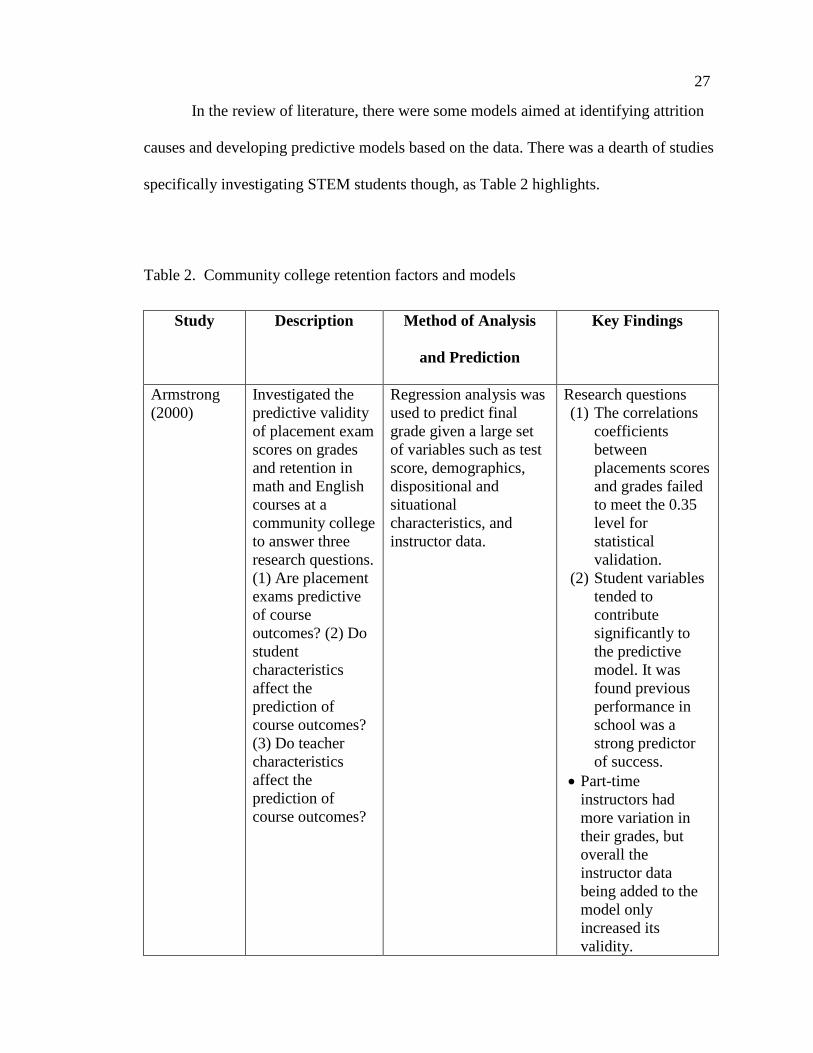
In the review of literature, there were some models aimed at identifying attrition
causes and developing predictive models based on the data. There was a dearth of studies
specifically investigating STEM students though, as Table 2 highlights.
Table 2. Community college retention factors and models
Study Description Method of Analysis
and Prediction
Key Findings
Armstrong
(2000)
Investigated the
predictive validity
of placement exam
scores on grades
and retention in
math and English
courses at a
community college
to answer three
research questions.
(1) Are placement
exams predictive
of course
outcomes? (2) Do
student
characteristics
affect the
prediction of
course outcomes?
(3) Do teacher
characteristics
affect the
prediction of
course outcomes?
Regression analysis was
used to predict final
grade given a large set
of variables such as test
score, demographics,
dispositional and
situational
characteristics, and
instructor data.
Research questions
(1) The correlations
coefficients
between
placements scores
and grades failed
to meet the 0.35
level for
statistical
validation.
(2) Student variables
tended to
contribute
significantly to
the predictive
model. It was
found previous
performance in
school was a
strong predictor
of success.
Part-time
instructors had
more variation in
their grades, but
overall the
instructor data
being added to the
model only
increased its
validity.
28
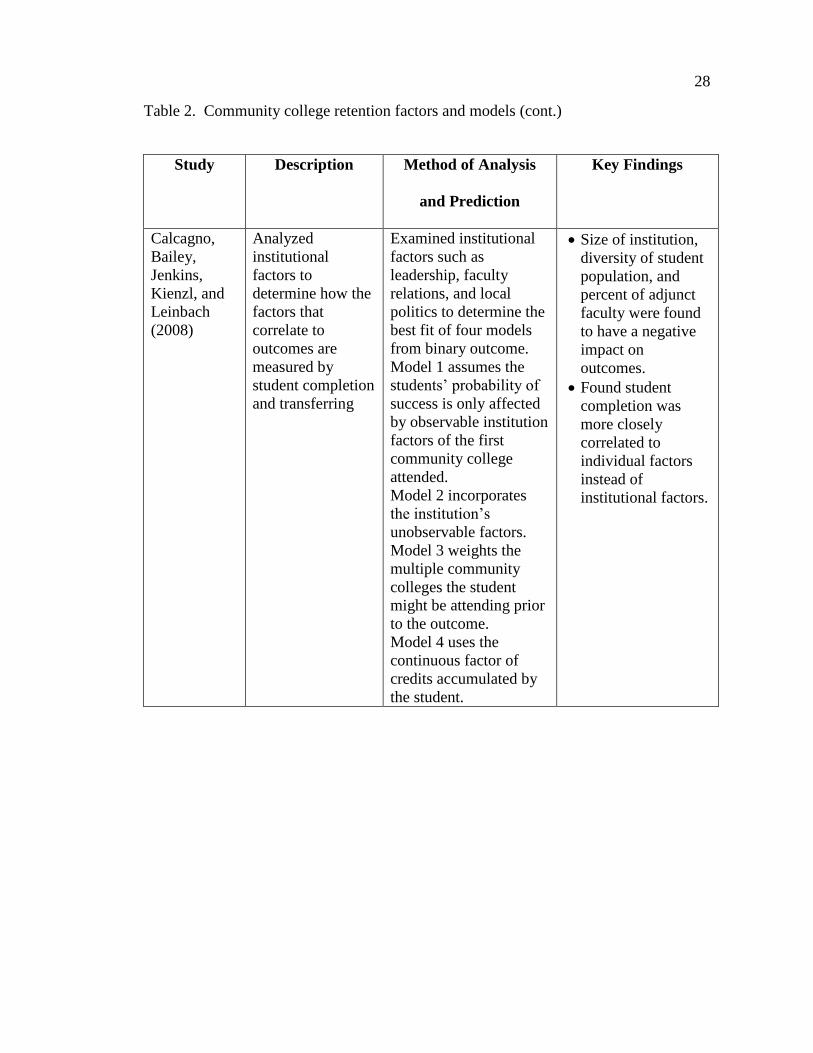
Table 2. Community college retention factors and models (cont.)
Study Description Method of Analysis
and Prediction
Key Findings
Calcagno,
Bailey,
Jenkins,
Kienzl, and
Leinbach
(2008)
Analyzed
institutional
factors to
determine how the
factors that
correlate to
outcomes are
measured by
student completion
and transferring
Examined institutional
factors such as
leadership, faculty
relations, and local
politics to determine the
best fit of four models
from binary outcome.
Model 1 assumes the
students’ probability of
success is only affected
by observable institution
factors of the first
community college
attended.
Model 2 incorporates
the institution’s
unobservable factors.
Model 3 weights the
multiple community
colleges the student
might be attending prior
to the outcome.
Model 4 uses the
continuous factor of
credits accumulated by
the student.
Size of institution,
diversity of student
population, and
percent of adjunct
faculty were found
to have a negative
impact on
outcomes.
Found student
completion was
more closely
correlated to
individual factors
instead of
institutional factors.
29
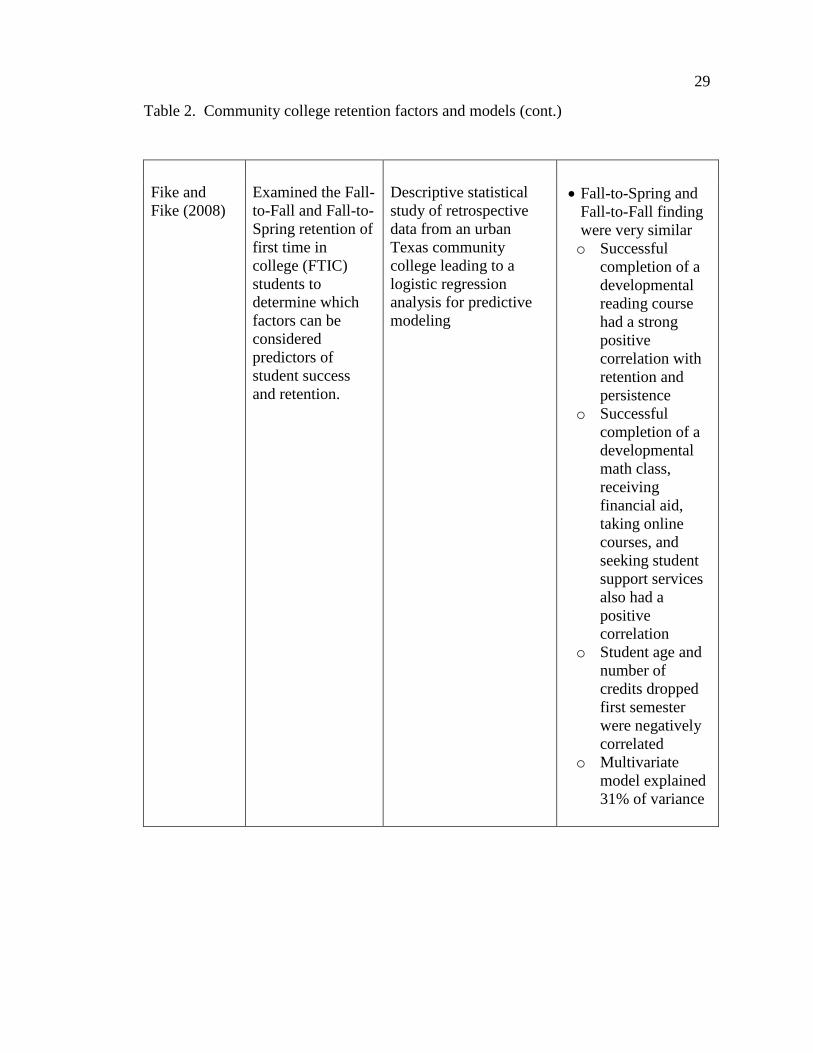
Table 2. Community college retention factors and models (cont.)
Fike and
Fike (2008)
Examined the Fall-
to-Fall and Fall-to-
Spring retention of
first time in
college (FTIC)
students to
determine which
factors can be
considered
predictors of
student success
and retention.
Descriptive statistical
study of retrospective
data from an urban
Texas community
college leading to a
logistic regression
analysis for predictive
modeling
Fall-to-Spring and
Fall-to-Fall finding
were very similar
o Successful
completion of a
developmental
reading course
had a strong
positive
correlation with
retention and
persistence
o Successful
completion of a
developmental
math class,
receiving
financial aid,
taking online
courses, and
seeking student
support services
also had a
positive
correlation
o Student age and
number of
credits dropped
first semester
were negatively
correlated
o Multivariate
model explained
31% of variance
30
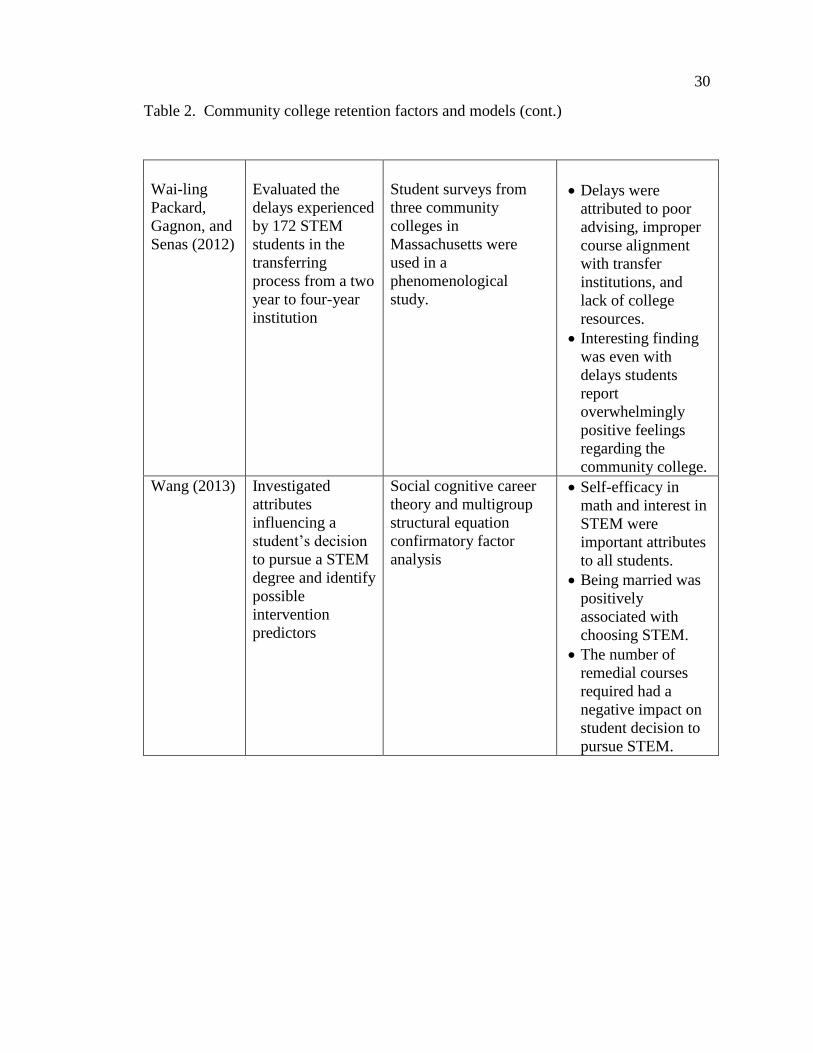
Table 2. Community college retention factors and models (cont.)
Wai-ling
Packard,
Gagnon, and
Senas (2012)
Evaluated the
delays experienced
by 172 STEM
students in the
transferring
process from a two
year to four-year
institution
Student surveys from
three community
colleges in
Massachusetts were
used in a
phenomenological
study.
Delays were
attributed to poor
advising, improper
course alignment
with transfer
institutions, and
lack of college
resources.
Interesting finding
was even with
delays students
report
overwhelmingly
positive feelings
regarding the
community college.
Wang (2013) Investigated
attributes
influencing a
student’s decision
to pursue a STEM
degree and identify
possible
intervention
predictors
Social cognitive career
theory and multigroup
structural equation
confirmatory factor
analysis
Self-efficacy in
math and interest in
STEM were
important attributes
to all students.
Being married was
positively
associated with
choosing STEM.
The number of
remedial courses
required had a
negative impact on
student decision to
pursue STEM.
31
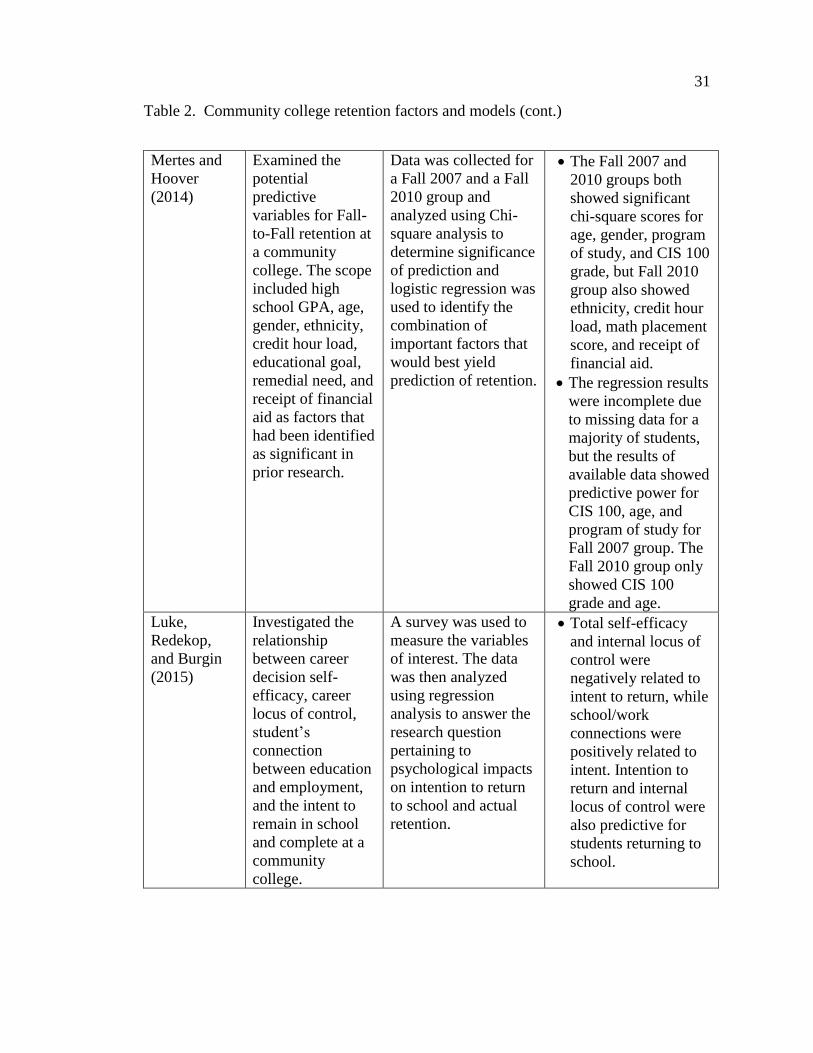
Table 2. Community college retention factors and models (cont.)
Mertes and
Hoover
(2014)
Examined the
potential
predictive
variables for Fall-
to-Fall retention at
a community
college. The scope
included high
school GPA, age,
gender, ethnicity,
credit hour load,
educational goal,
remedial need, and
receipt of financial
aid as factors that
had been identified
as significant in
prior research.
Data was collected for
a Fall 2007 and a Fall
2010 group and
analyzed using Chi-
square analysis to
determine significance
of prediction and
logistic regression was
used to identify the
combination of
important factors that
would best yield
prediction of retention.
The Fall 2007 and
2010 groups both
showed significant
chi-square scores for
age, gender, program
of study, and CIS 100
grade, but Fall 2010
group also showed
ethnicity, credit hour
load, math placement
score, and receipt of
financial aid.
The regression results
were incomplete due
to missing data for a
majority of students,
but the results of
available data showed
predictive power for
CIS 100, age, and
program of study for
Fall 2007 group. The
Fall 2010 group only
showed CIS 100
grade and age.
Luke,
Redekop,
and Burgin
(2015)
Investigated the
relationship
between career
decision self-
efficacy, career
locus of control,
student’s
connection
between education
and employment,
and the intent to
remain in school
and complete at a
community
college.
A survey was used to
measure the variables
of interest. The data
was then analyzed
using regression
analysis to answer the
research question
pertaining to
psychological impacts
on intention to return
to school and actual
retention.
Total self-efficacy
and internal locus of
control were
negatively related to
intent to return, while
school/work
connections were
positively related to
intent. Intention to
return and internal
locus of control were
also predictive for
students returning to
school.
32
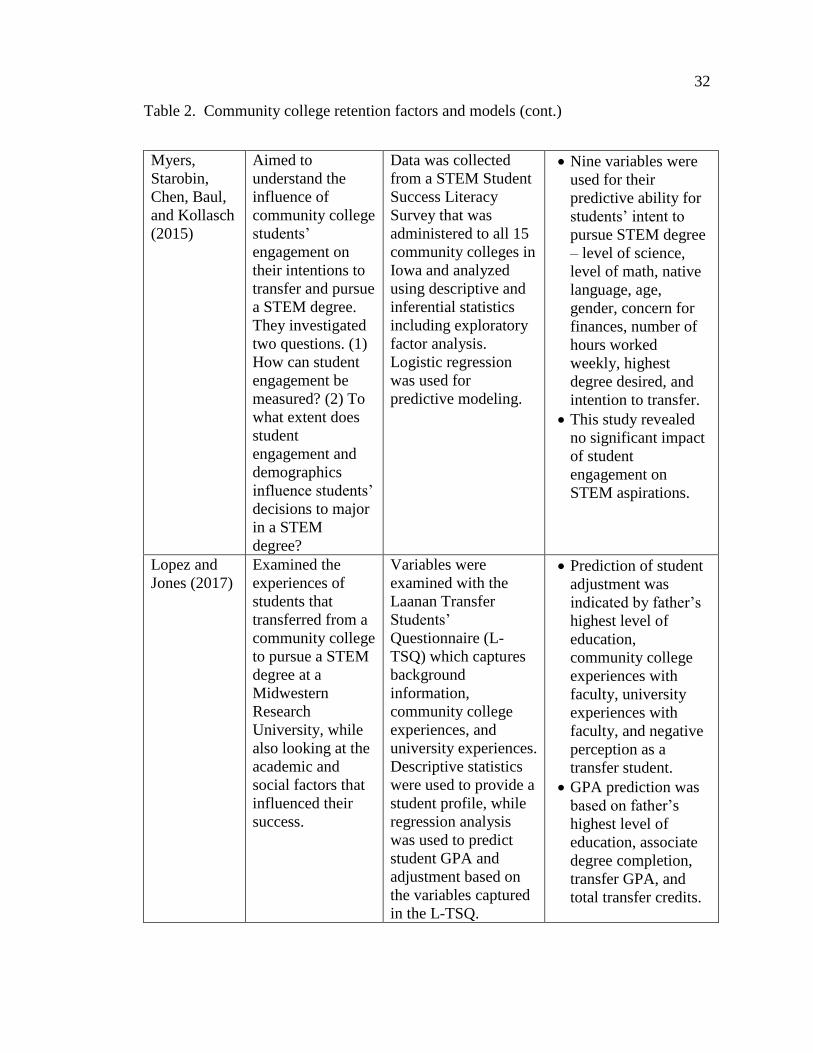
Table 2. Community college retention factors and models (cont.)
Myers,
Starobin,
Chen, Baul,
and Kollasch
(2015)
Aimed to
understand the
influence of
community college
students’
engagement on
their intentions to
transfer and pursue
a STEM degree.
They investigated
two questions. (1)
How can student
engagement be
measured? (2) To
what extent does
student
engagement and
demographics
influence students’
decisions to major
in a STEM
degree?
Data was collected
from a STEM Student
Success Literacy
Survey that was
administered to all 15
community colleges in
Iowa and analyzed
using descriptive and
inferential statistics
including exploratory
factor analysis.
Logistic regression
was used for
predictive modeling.
Nine variables were
used for their
predictive ability for
students’ intent to
pursue STEM degree
– level of science,
level of math, native
language, age,
gender, concern for
finances, number of
hours worked
weekly, highest
degree desired, and
intention to transfer.
This study revealed
no significant impact
of student
engagement on
STEM aspirations.
Lopez and
Jones (2017)
Examined the
experiences of
students that
transferred from a
community college
to pursue a STEM
degree at a
Midwestern
Research
University, while
also looking at the
academic and
social factors that
influenced their
success.
Variables were
examined with the
Laanan Transfer
Students’
Questionnaire (L-
TSQ) which captures
background
information,
community college
experiences, and
university experiences.
Descriptive statistics
were used to provide a
student profile, while
regression analysis
was used to predict
student GPA and
adjustment based on
the variables captured
in the L-TSQ.
Prediction of student
adjustment was
indicated by father’s
highest level of
education,
community college
experiences with
faculty, university
experiences with
faculty, and negative
perception as a
transfer student.
GPA prediction was
based on father’s
highest level of
education, associate
degree completion,
transfer GPA, and
total transfer credits.
33
When looking at predictive models there are some alarming limitations, one of
which is the lack of a large breadth of research on the retention causation factors at the
community college level. Community colleges are educating more students than ever and
a majority of those are transfer students (Hagedorn & DuBray, 2010). It is reported that
approximately half of all students receiving a STEM bachelor degree attended a
community college for courses as undergraduates, but little research is being done to
determine the factors contributing to the extremely low retention rates at two year
colleges for STEM majors. There are many predictive models for student success and
retention that provide strong evidence of causation factors, but few effectively transfer to
the community college model.
5. FUTURE OPPORTUNITIES TO ALIGN PREDICTIVE MODELS WITH
COMMUNITY COLLEGES
There is a large effort to increase STEM retention. Many colleges and universities
have invested in programs to support STEM students more effectively. The National
Science Foundation (NSF) has developed grant opportunities to fill many of these
deficiencies. Learning communities and faculty engagement have been shown to increase
persistence by allowing students to make those important connections (Tinto, 1998,
2015). Louisiana State University developed a framework to show that student retention
is clearly impacted by mentoring and undergraduate research. Their program specifically
targeted academic underperformers and minorities (Wilson et al., 2011). NSF’s S-STEM
grant has provided institutions the ability to award scholarships and impact recruitment
and retention. One institution had remarkable results by focusing on two factors: financial
assistance and giving students a sense of belonging to STEM using various engagement
34
strategies (Jen-Mei, Chuhee, Stevens, & Buonora, 2016). In addition, there are several
collaborative efforts between community colleges and their transfer institutions that have
promise. The Committee on Enhancing the Community College Pathways to Engineering
found that the community college transfer function is critical to increasing and
diversifying the workforce by enhancing the pathways through stronger articulation
agreements and 2 + 2 plans (2005). NSF’s Science Talent Expansion program works
across the educational landscape to increase participation using pathways and transitional
frameworks. It seems there are efforts to increase retention; however, community college
students still do not align with many of the predictive tools being produced currently.
The development of predictive models and data analytics is gaining favor with
educational researchers. There are multiple attempts to discern the best model for STEM
students, but the models do not align with the community college student population.
Most of the models include high school performance data, which might not be the best
indicator for non-traditional students. The models that have been developed could be
used with community college data to determine the efficacy. Additionally, there could be
new models developed using a variety of techniques beyond the traditional regression
analysis. When reviewing the research, engineering educational researchers have been the
most creative in generating predictive models. The limitations of their models are related
to the use of data from traditional universities. Future work should include validation
tests using community college student data, as well as attempts to develop models based
on the data from community colleges. Through a more holistic approach to predictive
models, the problem surrounding STEM attrition could have clarity.
35
REFERENCES
Alkhasawneh, R., & Hargraves, R. H. (2014). Developing a Hybrid Model to Predict
Student First Year Retention in STEM Disciplines Using Machine Learning
Techniques. Journal of STEM Education : Innovations and Research, 15(3), 35-
42.
Armstrong, W. B. (2000). The Association Among Student Success in Courses,
Placement Test Scores, Student Background Data, and Instructor Grading
Practices. Community College Journal of Research and Practice, 24, 681-695.
Astin, A. W. (1993). What matters in college?: four critical years revisited (Vol. 1st).
San Francisco: Jossey-Bass.
Bernold, L. E., Spurlin, J. E., & Anson, C. M. (2007). Understanding Our Students: A
Longitudinal-Study of Success and Failure in Engineering With Implications for
Increased Retention. Journal of Engineering Education, 96(3), 263-274.
doi:10.1002/j.2168-9830.1997.tb00259.x.
Burtner, J. (2005). The Use of Discriminant Analysis to Investigate the Influence of Non-
Cognitive Factors on Engineering School Persistence. Journal of Engineering
Education, 94(3), 335-338. doi:10.1002/j.2168-9830.2005.tb00858.x
Calcagno, J. C., Bailey, T., Jenkins, D., Kienzl, G., & Leinbach, T. (2008). Community
college student success: What institutional characteristics make a difference?
Economics of Education Review, 27(6), 632-645.
doi:http://dx.doi.org/10.1016/j.econedurev.2007.07.003
Chang, M. J., Eagan, M. K., Lin, M. H., & Hurtado, S. (2011). Considering the Impact of
Racial Stigmas and Science Identity: Persistence Among Biomedical and
Behavioral Science Aspirants. The Journal of Higher Education, 82(5), 564-596.
Chen, X. (2013). STEM Attrition: College Students' Paths into and out of STEM Fields.
Statistical Analysis Report. NCES 2014-001. National Center for Education
Statistics.
Cohen. (2005). UCLA community college review: Why practitioners and researchers
ignore each other (even when they are the same person). Community College
Review, 33(1), 51-62.
36
Cohen, Kisker, C. B., & Brawer, F. B. (2014). The American community college (Vol.
Sixth;6;6th;). San Francisco, CA: Jossey-Bass, a Wiley brand.
Committee on Prospering in the Global Economy of the 21st, C., National Academy of
Engineering Institute of, M., & National Academy of, S. (2007). Rising Above
The Gathering Storm: Energizing and Employing America for a Brighter
Economic Future: National Academies Press.
Committee on Underrepresented, G., the Expansion of the, S., Engineering Workforce,
P., Committee on Underrepresented, G., the Expansion of the, S., & Engineering
Workforce, P. (2011). Expanding underrepresented minority participation:
America's science and technology talent at the crossroads. Washington, D.C:
National Academies Press.
Costello, C. B. (2012). Increasing Opportunities for Low-Income Women and Student
Parents in Science, Technology, Engineering, and Math at Community Colleges.
Report# C388. Institute for Women's Policy Research.
Council, N. R., Division on, E., Physical, S., Board on Mathematical, S., Their, A., &
National Research Council . Committee on the Mathematical Sciences, i. (2013).
The mathematical sciences in 2025. Washington, D.C: National Academies Press.
DeBerard, M. S., Spelmans, G. I., & Julka, D. L. (2004). Predictors of Academic
Achievement and Retention Among College Freshmen: A Longitudinal Study.
College Student Journal, 38(1), 66-80.
Deegan, W. L., Tillery, Dale. (1985). Renewing American community college: priorities
and strategies for effective leadership. San Francisco: Jossey-Bass.
Delen, D. (2010). A comparative analysis of machine learning techniques for student
retention management. Decision Support Systems, 49(4), 498-506.
doi:10.1016/j.dss.2010.06.003
Dika, S. L., & D'Amico, M. M. (2016). Early experiences and integration in the
persistence of first‐generation college students in STEM and non‐STEM majors.
Journal of Research in Science Teaching, 53(3), 368-383. doi:10.1002/tea.21301
37
Djulovic, A., & Li, D. (2013). Towards Freshman Retention Prediction: A Comparative
Study. International Journal of Information and Education Technology, 3(5), 494.
doi:10.7763/IJIET.2013.V3.324
Drew, D. E. (2011). STEM the tide: reforming science, technology, engineering, and
math education in America. Baltimore: Johns Hopkins University Press.
Engage to Excel: Producing One Million Additional College Graduates with Degrees in
Science, Technology, Engineering, and Mathematics. (2012). President's Council
of Advisors on Science and Technology.
Eris, O., Chachra, D., Chen, H. L., Sheppard, S., Ludlow, L., Rosca, C., . . . Toye, G.
(2010). Outcomes of a Longitudinal Administration of the Persistence in
Engineering Survey. Journal of Engineering Education, 99(4), 371-395.
doi:10.1002/j.2168-9830.2010.tb01069.x
Fabrigar, L. R., & Wegener, D. T. (2012). Exploratory factor analysis. Oxford;New
York;: Oxford University Press.
Fike, D. S., & Fike, R. (2008). Predictors of First-Year Student Retention in the
Community College. Community College Review, 36(2), 68-88.
French, B. F., Immekus, J. C., & Oakes, W. C. (2005). An Examination of Indicators of
Engineering Students' Success and Persistence. Journal of Engineering
Education, 94(4), 419-425. doi:10.1002/j.2168-9830.2005.tb00869.x
Hagedorn, L. S., & DuBray, D. (2010). Math and science success and nonsuccess:
Journeys within the community college. Journal of Women and Minorities in
Science and Engineering, 16(1).
Hagedorn, L. S., & Purnamasari, A. V. (2012). A Realistic Look at STEM and the Role
of Community Colleges. Community College Review, 40(2), 145-164.
Hall, C. W., Kauffmann, P. J., Wuensch, K. L., Swart, W. E., DeUrquidi, K. A., Griffin,
O. H., & Duncan, C. S. (2015). Aptitude and Personality Traits in Retention of
Engineering Students. Journal of Engineering Education, 104(2), 167-188.
doi:10.1002/jee.20072
38
Herzog, S. (2006). Estimating Student Retention and Degree-Completion Time: Decision
Trees and Neural Networks Vis-a-Vis Regression. New Directions for
Institutional Research, 2006(131), 17-33. doi:10.1002/ir.185
Hoffman, E., Starobin, S., Laanan, F. S., & Rivera, M. (2010). Role of Community
Colleges in STEM Education: Thoughts on Implicaitons for Policy, Practice, and
Future Research. Journal of Women and Minorities in Science and Engineering,
16(1), 85-96.
Horn, L., & Nevill, S. (2006). Profile of undergraduate students in US postsecondary
education institutions: 2003–2004: With a special analysis of community college
students (NCES 2006–184). Washington, DC: US Department of Education.
National Center for Education Statistics.
Jackson, D. L., & Laanan, F. S. (2011). The role of community colleges in educating
women in science and engineering. New Directions for Institutional Research,
2011(152), 39-49. doi:10.1002/ir.407
Jen-Mei, C., Chuhee, K., Stevens, L., & Buonora, P. (2016). Strategies to Recruit and
Retain Students in Physical Sciences and Mathematics on a Diverse College
Campus. Journal of College Science Teaching, 45(3), 14-22.
Li, Q., McCoach, D. B., Swaminathan, H., & Tang, J. (2008). Development of an
Instrument to Measure Perspectives of Engineering Education Among College
Students. Journal of Engineering Education, 97(1), 47-56. doi:10.1002/j.2168-
9830.2008.tb00953.x
Li, Q., Swaminathan, H., & Tang, J. (2009). Development of a Classification System for
Engineering Student Characteristics Affecting College Enrollment and Retention.
Journal of Engineering Education, 98(4), 361-376. doi:10.1002/j.2168-
9830.2009.tb01033.x
Lopez, C., & Jones, S. (2017). Examination of Factors that Predict Academic Adjustment
and Success of Community College Transfer Students in STEM at 4-Year
Institutions. Community College Journal of Research and Practice, 41(3), 168-
182.
Luan, J. (2002). Data Mining and Its Applications in Higher Education. New Directions
for Institutional Research, 2002(113), 17-36. doi:10.1002/ir.35
39
Luke, C., Redekop, F., & Burgin, C. (2015). Psychological Factors in Community
College Student Retention. Community College Journal of Research and
Practice, 39(3), 222-234.
Marra, R. M., Rodgers, K. A., Shen, D., & Bogue, B. (2012). Leaving Engineering: A
Multi-Year Single Institution Study. Journal of Engineering Education, 101(1), 6.
Mertes, S. J., & Hoover, R. C. (2014). Predictors of First-Year Retention in a Community
College. Community College Journal of Research and Practice, 38(7), 651-660.
Montgomery, D. C., Vining, G. G., & Peck, E. A. (2012). Introduction to linear
regression analysis (Vol. 821). Hoboken, NJ: Wiley.
Morganson, V. J., Major, D. A., Streets, V. N., Litano, M. L., & Myers, D. P. (2015).
Using Embeddedness Theory to Understand and Promote Persistence in STEM
Majors. Career Development Quarterly, 63(4), 348-362. doi:10.1002/cdq.12033
Moses, L., Hall, C., Wuensch, K., De Urquidi, K., Kauffmann, P., Swart, W., . . . Dixon,
G. (2011). Are math readiness and personality predictive of first-year retention in
engineering? J Psychol, 145(3), 229-245. doi:10.1080/00223980.2011.557749
Myers, B., Starobin, S., Chen, Y., Baul, T., & Kollasch, A. (2015). Predicting
Community College Student's Intention to Transfer and Major in STEM: Does
Student Engagement Matter? Community College Journal of Research and
Practice, 39(4), 344-354.
National Science Board. (2016). Science and Engineering Indicators 2016. Arlington,
VA: National Science Foundation.
Nicholls, G. M., Wolfe, H., Besterfield-Sacre, M., Shuman, L. J., & Larpkiattaworn, S.
(2007). A Method for Identifying Variables for Predicting STEM Enrollment.
Journal of Engineering Education, 96(1), 33-44. doi:10.1002/j.2168-
9830.2007.tb00913.x
Olsen, S. (2014). The importance of engineering talent to the prosperity and security of
the nation: summary of a forum. Washington, District of Columbia: National
Academies Press.
40
Osborne, J. W. B., Erin S. (2016). Exploratory Factor Analysis with SAS (Vol. 1): SAS
Institute.
Packard, B. W.-L., Gagnon, J. L., LaBelle, O., Jeffers, K., & Lynn, E. (2011). Women's
Experiences in the STEM Community College Transfer Pathway. Journal of
Women and Minorities in Science and Engineering, 17(2), 129-147.
doi:10.1615/JWomenMinorScienEng.2011002470
Seymour, E., & Hewitt, N. M. (1997). Talking about leaving: why undergraduates leave
the sciences. Boulder, Colo: Westview Press.
Sislin, J., Mattis, M. C., & National Research Council . Committee on Enhancing the
Community College Pathway to Engineering, C. (2005). Enhancing the
community college pathway to engineering careers. Washington, D.C: National
Academies Press.
Snyder, T. D., Dillow, S. A., & Staff, I. o. E. S. (2012). Digest of Education Statistics
2011: U.S. Government Printing Office.
Starobin, & Laanan, F. S. (2010). From Community College to PhD: Educational
Pathways in Science, Technology, Engineering, and Mathematics. Journal of
Women and Minorities in Science and Engineering, 16(1), 67-84.
doi:10.1615/JWomenMinorScienEng.v16.i1.50
Starobin, S., & Laanan, F. (2008). Broadening female participation in science,
technology, engineering, and mathematics: Experiences at community colleges.
New Directions for Community Colleges, 2008(142), 37-46. doi:10.1002/cc.323
Swanger, D. (2013). Community colleges: partners in community development :
approaches to developing our regions: Society for College and University
Planning
Terenzini, P. T., Lattuca, L. R., Ro, H. K., & Knight, D. B. (2014). America’s
Overlooked Engineers.
Tinto, V. (1987). Leaving College: Rethinking the Causes and Cures of Student Attrition:
The University of Chicago.
41
Tinto, V. (1998). Colleges as Communities: Taking Research on Student Persistence
Seriously. Review of Higher Education, 21(2), 167.
Tinto, V. (2015). Access without support is not opportunity. Community College Week, p.
S36.
Tranfield, D., Denyer, D., & Smart, P. (2003). Towards a methodology for developing
evidence‐informed management knowledge by means of systematic review.
British Journal of Management, 14(3), 207-222.
Tsapogas, J. (2004). The role of community colleges in the education of recent science
and engineering graduates. InfoBrief NSF, 04-315.
Veenstra, C. P., Dey, E. L., & Herrin, G. D. (2008). Is Modeling of Freshman
Engineering Success Different from Modeling of Non-Engineering Success?
Journal of Engineering Education, 97(4), 467-479.
Vilorio, D. (2014). STEM 101: intro to tomorrow's jobs. Occupational Outlook
Quarterly, 58(1), 2.
Wai-ling Packard, B., Gagnon, J. L., & Senas, A. (2012). Navigating Community College
Transfer in Science, Technical, Engineering, and Mathematics Fields. Community
College Journal of Research and Practice, 36, 670-683.
Wang, X. (2013). Modeling Entrance into STEM Fields of Study Among Students
Beginning at Community Colleges and Four-Year Institutions. Research in
Higher Education, 54(6), 664-692. doi:10.1007/s11162-013-9291-x
Wilson, Z. S., Holmes, L., deGravelles, K., Sylvain, M. R., Batiste, L., Johnson, M., . . .
Warner, I. M. (2011). Hierarchical Mentoring: A Transformative Strategy for
Improving Diversity and Retention in Undergraduate STEM Disciplines. Journal
of Science Education and Technology, 21(1), 148-156. doi:10.1007/s10956-011-
9292-5
Xue, Y., & Larson, R. C. (2015). STEM crisis or STEM surplus? Yes and yes. Monthly
Labor Review, 1B.

42
Young, J. W. (1997). Community Economic Development Through Community
Colleges. New Directions for Higher Education, 1997(97), 74-83.
doi:10.1002/he.9707
43
II. A RETENTION MODEL FOR COMMUNITY COLLEGE STEM
STUDENTS
Jennifer Snyder and Elizabeth A. Cudney
Department of Engineering Management and Systems Engineering, Missouri University
of Science and Technology, Rolla, MO, USA
ABSTRACT
The number of students attending community colleges that take advantage of
transfer pathways to universities continues to rise. Therefore, there is a need to engage in
academic research on these students and their attrition in order to identify areas to
improve retention. Community colleges have a very diverse population and provide entry
into science, technology, engineering, and math (STEM) programs, regardless of student
high school preparedness. It is essential for these students to successfully transfer to
universities and finish their STEM degrees to meet the global workforce demands. This
research develops a predictive model for community college students for degree
completion using the Mahalanobis Taguchi System and regression. Data collected from a
Midwest community college over a five-year period in three specific associate degree
programs will be used for the study. The study identified 92 students that completed a
STEM degree within three years, while 730 students were not able to complete the degree
within that period or at all. The research illuminates specific areas of concern related to
community college students and better informs transfer institutions about this important
sector of transfer students. Especially revealing is the important predictive factors
traditionally found in research for STEM retention had very low correlation for this set of
44
community college students. This research reinforces the need to investigate community
college students more closely and through a different lens.
Keywords: Predictive Analytics, Community College, Education, Mahalanobis Taguchi
System, Diversity
1. INTRODUCTION
Community colleges play a pivotal role in higher education. One area of growth
has been in the area of serving as a pipeline to transfer universities (Adelman, 2005).
These are students that begin their higher education path at a community college; either
completing an associate’s degree or transferring after taking some general education
courses. Many universities find themselves in a position where their growth is dependent
upon transfer students. This process will continue to expand due to the confluence of
rising tuition, student need for remediation, rise in technical degrees, and desire to have a
greater percent of citizens obtaining a post-secondary credential (Cohen, Kisker, &
Brawer, 2014).
One of the most critical student populations are those pursuing a science,
technology, engineering, or math (STEM) degree (Hoffman, Starobin, Laanan, & Rivera,
2010). It has been reported that roughly 50% of graduates with bachelor degrees in
STEM fields took some courses at a community college. Chen (2013) reports that
community college students declaring STEM degrees have a higher attrition rate (69%)
compared to university students (48%). The report further found that of the community
college students that left STEM half changed majors, while the other half left the system
45
without a degree or certificate. As the interest in community colleges has grown, the
research interest has been slow to catch up (Starobin & Laanan, 2010). The causes of
attrition from STEM degrees is not well researched and reported for this sector of
students. A majority of STEM retention models and studies deal with data collected from
traditional university students. The factors available for investigation are limited and
might not be available or indicative for community college students (Snyder & Cudney,
2017). There is a dearth of research into community college STEM students and their
particular risk factors that would prevent them from completing a STEM degree within
150% time to degree, which is three years.
This research seeks to answer some of the questions surrounding this population
of students. The research uses data collected from a community college in the Midwest.
The Mahalanobis Taguchi System (MTS) is used for pattern recognition and a predictive
model is developed using logistic regression. The following questions are investigated:
1. Can the Mahalanobis Taguchi System forecast important variables used for a
STEM retention prediction model?
2. Do community college students have substantially different risk factors than
traditional university students?
The remainder of this paper is structured into the following sections: literature
review and background on community colleges, data analysis and predictive model
development, validation, and comparison to university models.
46
2. LITERATURE REVIEW
Community colleges were born out of a need for higher education and technical
training (Cohen et al., 2014). Joliet Junior College, founded in 1901, was the first public
community college. The primary mission of community colleges has not changed greatly,
but there has been refinement through the years to serve the changing population and
economy (Cohen et al., 2014; Hoffman et al., 2010). Community colleges are more agile
and responsive to market demands on a local level, which can be seen by evaluating the
technical degree landscape.
Community college students are reflective of the region in which the college is
located due to most community colleges being commuter campuses. Further, a greater
number of minority and lower socioeconomic students (SES) attend community colleges
(Costello, 2012; Horn & Nevill, 2006). Carnevale and Strohl (2010) report that bottom
quartile SES outnumber top quartile SES by almost 2 to 1 at community colleges, while
top quartile SES outnumber bottom quartile SES at competitive colleges by almost 10
to1. Community college students are more likely to attend college part time and work full
time (Horn & Nevill, 2006). Costello (2012) reported that twice as many students at
community colleges are parents compared to universities. Community colleges are
usually open access; therefore, there are no entrance requirements such as standardized
exam score benchmarks. In fact, it is estimated that more than 60% of community college
students receive some remedial education upon entrance to college (Crisp & Delgado,
2014). These factors contribute to the outcomes experienced at community colleges.
As the twenty first century moves forward, the country has been charged with
increasing the number of STEM graduates to meet the growing global demands
47
(Committee on Science, 2007). In 2012, The President’s Council of Advisors on Science
and Technology (PCAST) produced a report outlining steps necessary to reach the goal
of increasing STEM graduates by one million (Olson & Riordan, 2012). This goal is only
surmountable if retention rates are increased. It has been reported that a ten percent
increase in retention rates will garner three-quarters of the goal (Carver et al., 2017;
Graham, Frederick, Byars-Winston, Hunter, & Handelsman, 2013). If retention is not
impacted, then the number of students declaring a STEM degree must increase. Student
interest in STEM has remained unchanged for years (Hurtado, Eagan, & Chang, 2010).
The only area of increase of students declaring STEM degrees is in the Hispanic and
African American population. Numbers show that for the first time the declaration rates
are equal for all students (Hurtado et al., 2010).
This increase in minorities and underrepresented populations declaring STEM
degrees is needed to diversify the workforce (Terenzini, Lattuca, Ro, & Knight, 2014).
There has been a call for diversification for years. The needle has moved on intent, but
the retention and completion rates are slow to move (Hurtado et al., 2010).
The transfer pathway should be a critical component in this effort. There should
be more done to increase the retention and completion of community college STEM
students. This is the importance of investigating a predictive model built with community
college student data. If these students are demographically different, then the predictive
models and risk factors are likely very different.
48
3. DATA ANALYSIS AND PREDICTION MODEL
Data for this research was collected from a community college in the Midwest.
This community college is ideal for data collection, because it has associate degrees in
STEM fields that students can declare from the beginning. The raw data, collected over a
five-year period, identified 177 students that completed an associate’s degree in either
chemistry, biology, or engineering; while 727 students were not successful. The
unsuccessful students either withdrew from the college or switched degree to non-STEM
fields.
The raw data illuminates one of the problems associated with an open access
institution such as a community college. There is considerable missing data, inaccurately
reported data, and many students did not have standardized exam scores. The descriptive
statistics for the raw data are shown in Table 1.
The Mahalanobis Taguchi System was chosen for the process of identifying
important variables. MTS is a pattern recognition method used in various industries
(Ghasemi, Aaghaie, & Cudney, 2015). Ghasemi et al. (2015) reviews the approach of
MTS, which involves dividing the data into normal and abnormal groups. Woodall et al.
(2003) breaks MTS into four steps or stages:
Stage 1: The variables are identified that will be defined as normal and abnormal.
For this research, the completion of a STEM associate’s degree within three years is
normal and not completing the STEM degree within three years is abnormal. The
normal data is standardized and a Mahalanobis space is determined using the
normal data, which is referred to as the reference space.
49
Stage 2: The abnormal items, test group, are selected and the Mahalanobis distance
(MD) is calculated. In this research, the MD for the abnormal group is 6.0863. This
MD value indicates that the scale is appropriate as the MD for the abnormal group
is higher than the MD for the normal group, which was verified with this data.
Stage 3: In this stage, the orthogonal arrays (OA) and signal-to-noise (S/N) ratios
are calculated and used to determine the most useful set of predictive variables.
Larger S/N ratios are preferred and indicate a possible useful predictive variable.
Stage 4: The variables that were identified as significant due to a positive S/N are
used to develop a forecasting model.
As an open-admission institution, data such as high school GPA and ACT scores
are not required; therefore, many students had incomplete records. The students that did
not report test scores or high school information were removed from the sample. The
final data set had 97 successful (normal) students and 32 unsuccessful (abnormal)
samples. The results are summarized in Table 2.
A larger the S/N indicates a strong significance for that factor, which implies that
part-time student status and college GPA are the most important factors to explore. It is
interesting to note that ACT math did not have a large S/N ratio, which contrasts with
most STEM retention models that usually weight math scores heavily. MTS results
indicate that the factors with positive S/N ratios are important for forecasting the
completion of a STEM degree for community college students. It is not surprising that
part-time status has a significant impact considering the three-year completion window.
Students that attend school part-time find it very difficult to complete a rigorous
degree in three years. This is an important factor to consider when advising students.
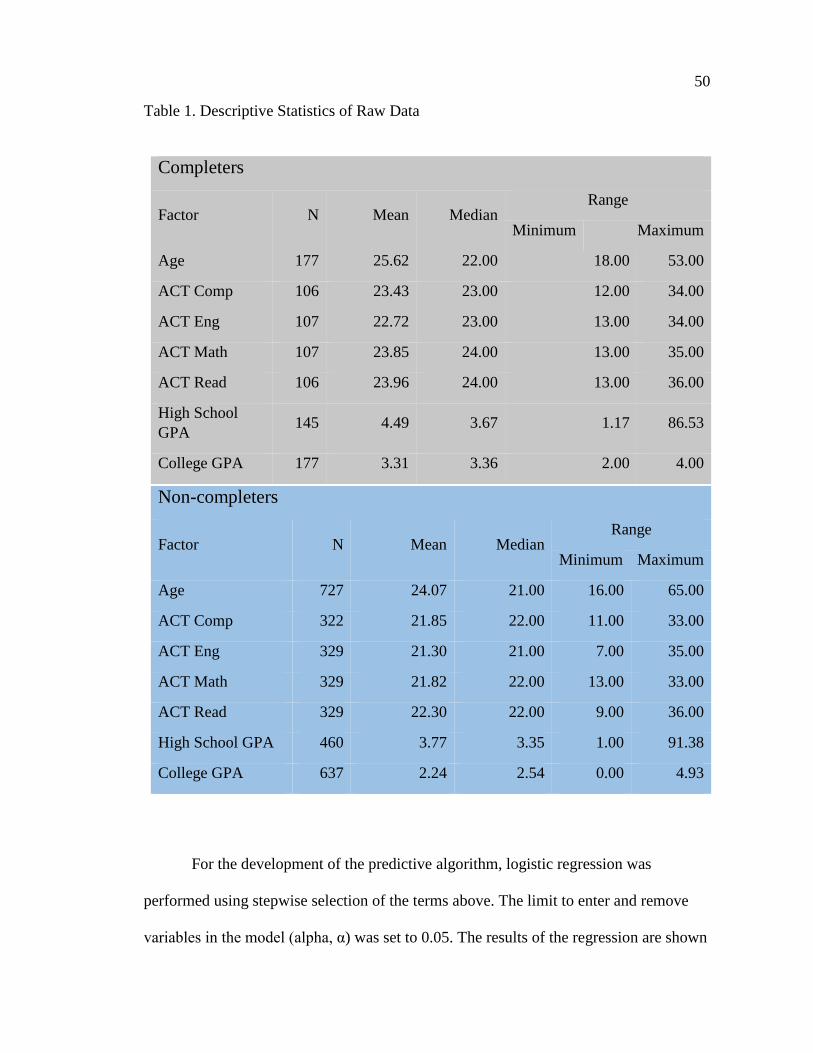
50
Table 1. Descriptive Statistics of Raw Data
Completers
Factor N Mean Median Range
Minimum Maximum
Age 177 25.62 22.00 18.00 53.00
ACT Comp 106 23.43 23.00 12.00 34.00
ACT Eng 107 22.72 23.00 13.00 34.00
ACT Math 107 23.85 24.00 13.00 35.00
ACT Read 106 23.96 24.00 13.00 36.00
High School
GPA 145 4.49 3.67 1.17 86.53
College GPA 177 3.31 3.36 2.00 4.00
Non-completers
Factor N Mean Median Range
Minimum Maximum
Age 727 24.07 21.00 16.00 65.00
ACT Comp 322 21.85 22.00 11.00 33.00
ACT Eng 329 21.30 21.00 7.00 35.00
ACT Math 329 21.82 22.00 13.00 33.00
ACT Read 329 22.30 22.00 9.00 36.00
High School GPA 460 3.77 3.35 1.00 91.38
College GPA 637 2.24 2.54 0.00 4.93
For the development of the predictive algorithm, logistic regression was
performed using stepwise selection of the terms above. The limit to enter and remove
variables in the model (alpha, α) was set to 0.05. The results of the regression are shown
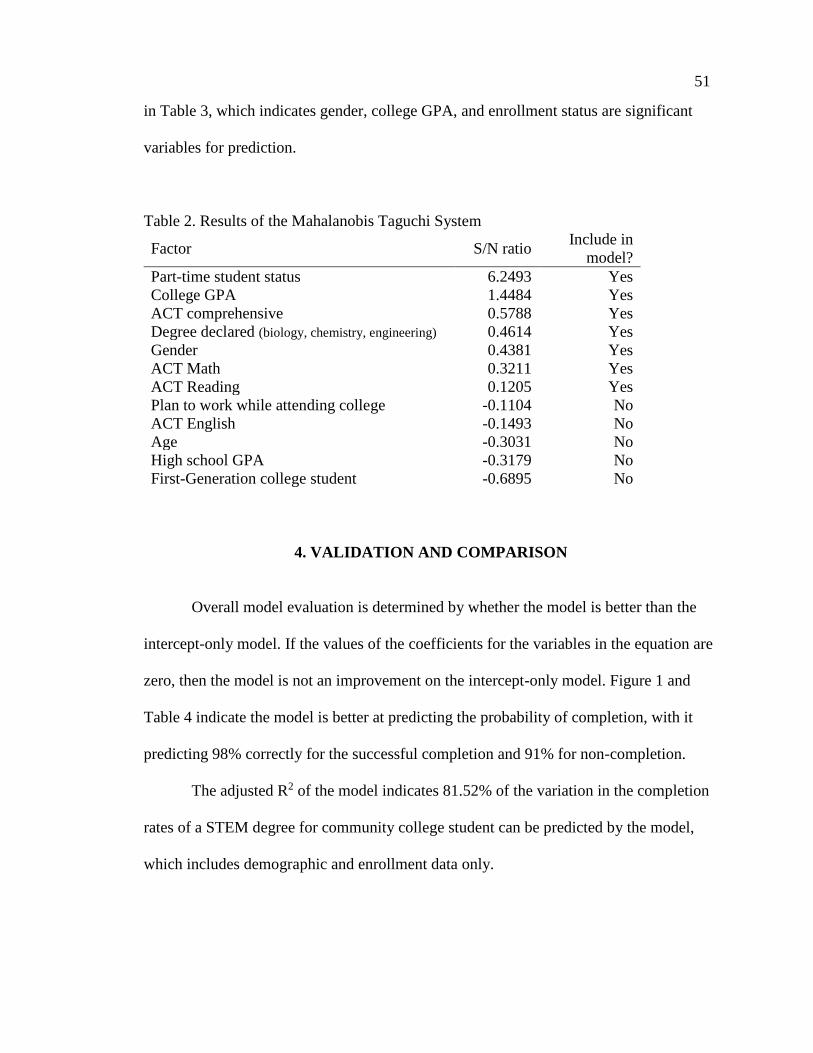
51
in Table 3, which indicates gender, college GPA, and enrollment status are significant
variables for prediction.
Table 2. Results of the Mahalanobis Taguchi System
Factor S/N ratio Include in
model?
Part-time student status 6.2493 Yes
College GPA 1.4484 Yes
ACT comprehensive 0.5788 Yes
Degree declared (biology, chemistry, engineering) 0.4614 Yes
Gender 0.4381 Yes
ACT Math 0.3211 Yes
ACT Reading 0.1205 Yes
Plan to work while attending college -0.1104 No
ACT English -0.1493 No
Age -0.3031 No
High school GPA -0.3179 No
First-Generation college student -0.6895 No
4. VALIDATION AND COMPARISON
Overall model evaluation is determined by whether the model is better than the
intercept-only model. If the values of the coefficients for the variables in the equation are
zero, then the model is not an improvement on the intercept-only model. Figure 1 and
Table 4 indicate the model is better at predicting the probability of completion, with it
predicting 98% correctly for the successful completion and 91% for non-completion.
The adjusted R2 of the model indicates 81.52% of the variation in the completion
rates of a STEM degree for community college student can be predicted by the model,
which includes demographic and enrollment data only.
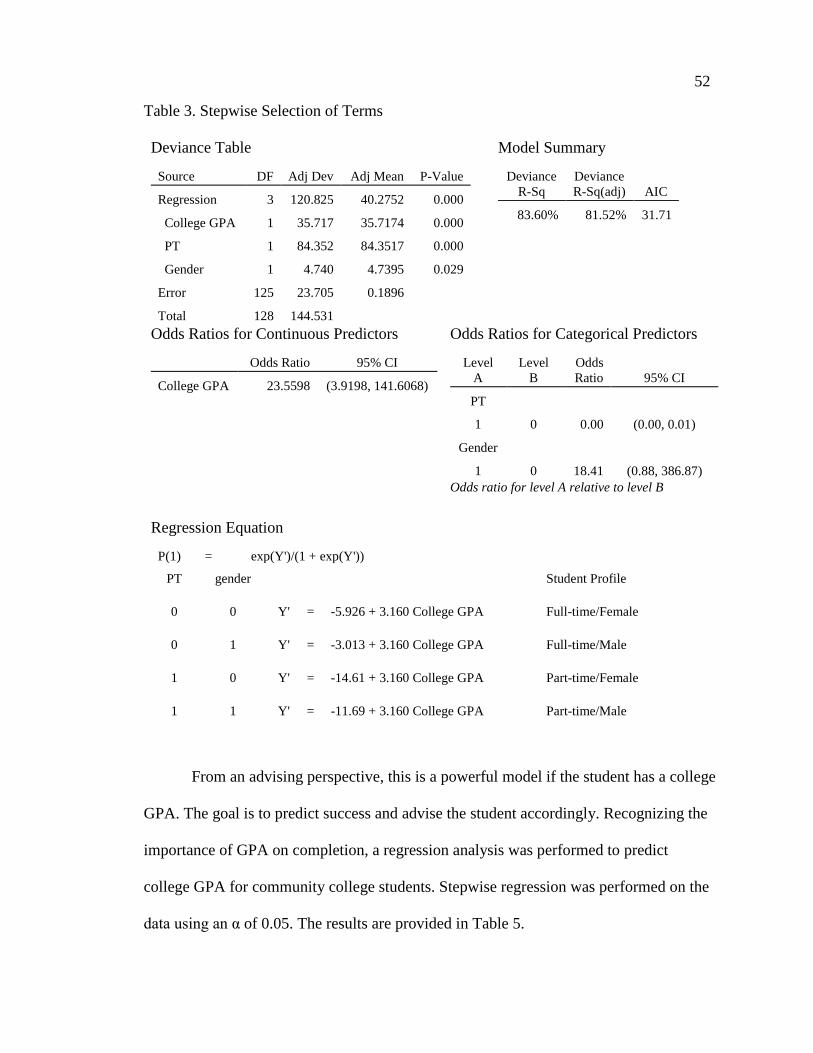
52
Table 3. Stepwise Selection of Terms
Deviance Table
Source DF Adj Dev Adj Mean P-Value
Regression 3 120.825 40.2752 0.000
College GPA 1 35.717 35.7174 0.000
PT 1 84.352 84.3517 0.000
Gender 1 4.740 4.7395 0.029
Error 125 23.705 0.1896
Total 128 144.531
Model Summary
Deviance
R-Sq
Deviance
R-Sq(adj) AIC
83.60% 81.52% 31.71
Odds Ratios for Continuous Predictors
Odds Ratio 95% CI
College GPA 23.5598 (3.9198, 141.6068)
Odds Ratios for Categorical Predictors
Level
A
Level
B
Odds
Ratio 95% CI
PT
1 0 0.00 (0.00, 0.01)
Gender
1 0 18.41 (0.88, 386.87)
Odds ratio for level A relative to level B
Regression Equation
P(1) = exp(Y')/(1 + exp(Y'))
PT gender
Student Profile
0 0 Y' = -5.926 + 3.160 College GPA Full-time/Female
0 1 Y' = -3.013 + 3.160 College GPA Full-time/Male
1 0 Y' = -14.61 + 3.160 College GPA Part-time/Female
1 1 Y' = -11.69 + 3.160 College GPA Part-time/Male
From an advising perspective, this is a powerful model if the student has a college
GPA. The goal is to predict success and advise the student accordingly. Recognizing the
importance of GPA on completion, a regression analysis was performed to predict
college GPA for community college students. Stepwise regression was performed on the
data using an α of 0.05. The results are provided in Table 5.
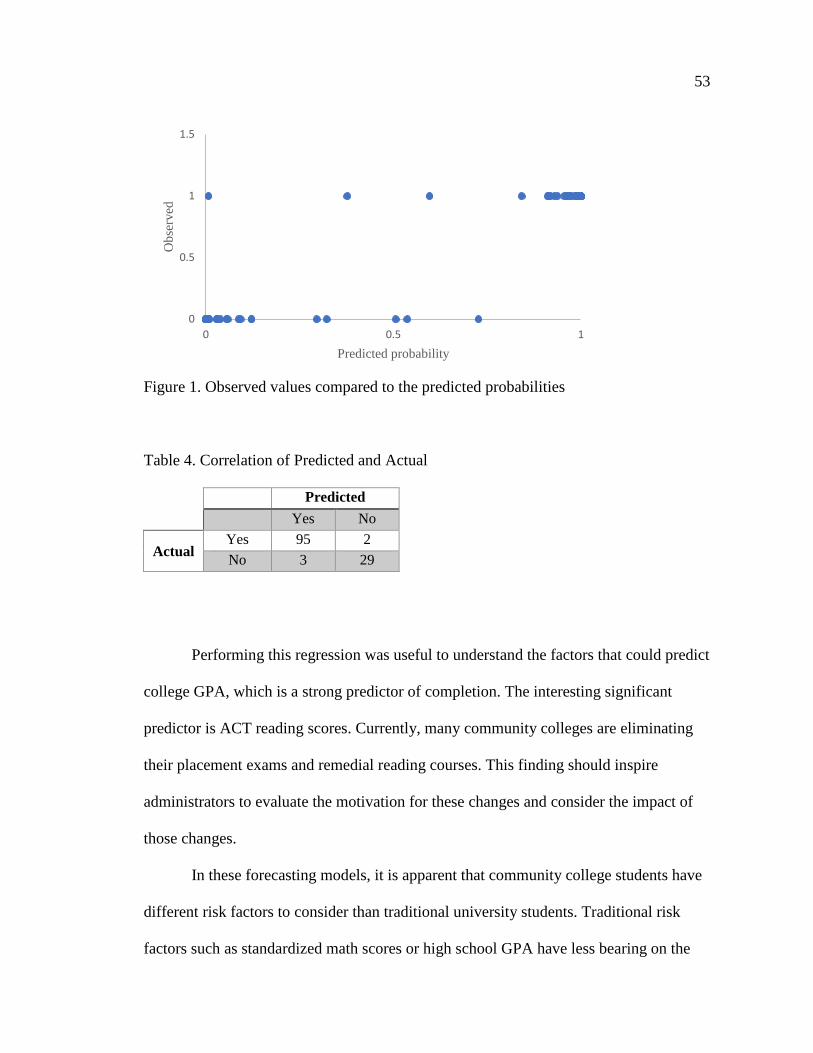
53
Figure 1. Observed values compared to the predicted probabilities
Table 4. Correlation of Predicted and Actual
Predicted
Yes No
Actual Yes 95 2
No 3 29
Performing this regression was useful to understand the factors that could predict
college GPA, which is a strong predictor of completion. The interesting significant
predictor is ACT reading scores. Currently, many community colleges are eliminating
their placement exams and remedial reading courses. This finding should inspire
administrators to evaluate the motivation for these changes and consider the impact of
those changes.
In these forecasting models, it is apparent that community college students have
different risk factors to consider than traditional university students. Traditional risk
factors such as standardized math scores or high school GPA have less bearing on the
0
0.5
1
1.5
0 0.5 1
Ob
serv
ed
Predicted probability
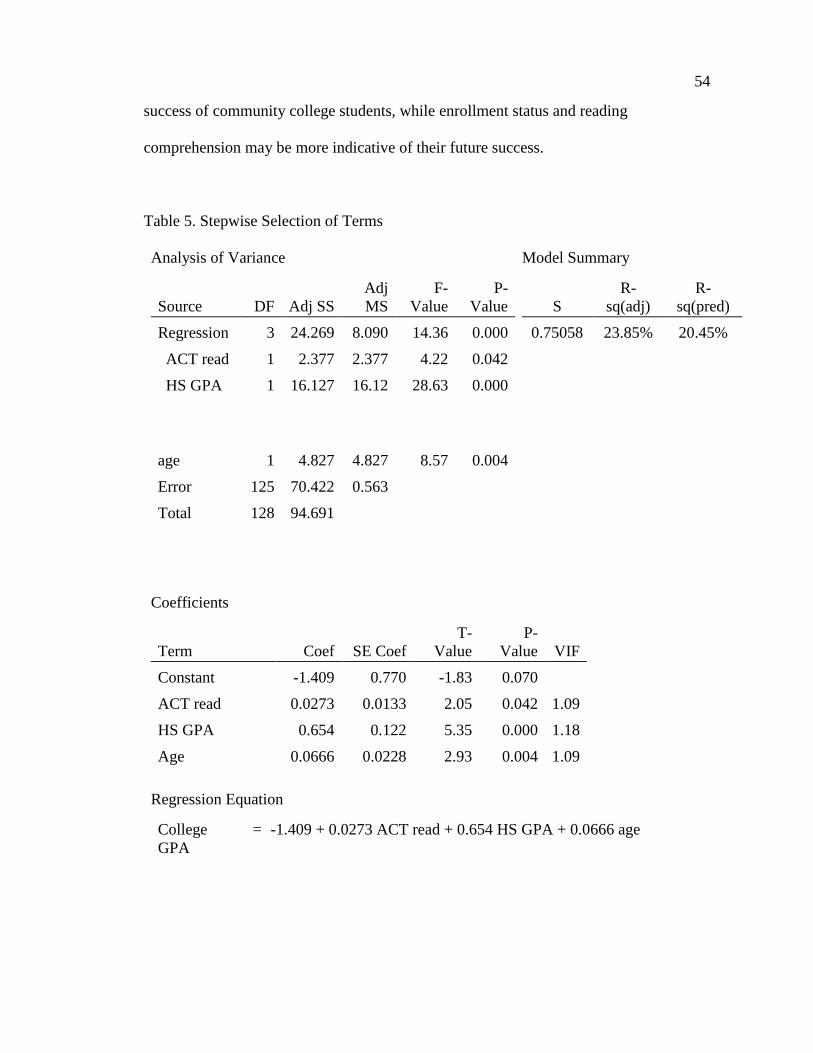
54
success of community college students, while enrollment status and reading
comprehension may be more indicative of their future success.
Table 5. Stepwise Selection of Terms
Analysis of Variance
Source DF Adj SS
Adj
MS
F-
Value
P-
Value
Regression 3 24.269 8.090 14.36 0.000
ACT read 1 2.377 2.377 4.22 0.042
HS GPA 1 16.127 16.12 28.63 0.000
age
1
4.827
4.827
8.57
0.004
Error 125 70.422 0.563
Total 128 94.691
Model Summary
S
R-
sq(adj)
R-
sq(pred)
0.75058 23.85% 20.45%
Coefficients
Term Coef SE Coef
T-
Value
P-
Value VIF
Constant -1.409 0.770 -1.83 0.070
ACT read 0.0273 0.0133 2.05 0.042 1.09
HS GPA 0.654 0.122 5.35 0.000 1.18
Age 0.0666 0.0228 2.93 0.004 1.09
Regression Equation
College
GPA
= -1.409 + 0.0273 ACT read + 0.654 HS GPA + 0.0666 age
55
5. CONCLUSIONS
This case study provided a chance to examine community college STEM student
outcomes. This research indicates that the Mahalanobis Taguchi System can be used to
identify important variables for forecasting completion of a STEM degree. The variables
with large, positive S/N ratios were also included in the logistic regression model. This
supports the use of MTS for pattern recognition and forecasting.
Based on this research, it appears that community college students have a
different set of risk factors that could be used to predict their success in a STEM degree.
Prior student performance as indicated by high school GPA did not appear to predict if a
student will finish a STEM degree. A majority of previously published models showed a
significance in high school GPA and math preparedness scores (Snyder & Cudney,
2017). This data was limited to student demographic data; therefore, there could be other
factors to investigate to clearly understand the unique factors impacting completion rates
among community college students.
While these initial results are promising, further research should be conducted to
address several limitations of this study. Community colleges do not have admission
standards; therefore, many applicants do not have standardized exam scores or report
high school performance. The raw data is missing many important variables for students
causing the sample to shrink considerably for the model.
The findings point to some areas of concern from the community college
perspective. This is a time when many community colleges are scaling down their
remedial reading courses, but reading aptitude appears to be a significant risk factor.
Further research should be done to determine the exact impact reading ability has on a
56
STEM student’s ability to complete a degree. Additionally, research needs to be done on
a more specific student performance scale. Are there courses that predict completion of a
STEM degree? Does the starting point on the math pathway predict successful
completion?
Future studies will further examine factors to build a stronger model for
community college students. These risk factors are critical to community college student
services. The only way to develop early alert systems is to have a more effective
prediction model.
REFERENCES
Adelman, C. (2005). Moving into Town--and Moving On: The Community College in
the Lives of Traditional-Age Students. US Department of Education.
Carnevale, A. P., & Strohl, J. (2010). How increasing college access is increasing
inequality, and what to do about it. In R. D. Kahlenberg (Ed.), Rewarding
Strivers: Helping Low-Income Students Succeed in College (pp. 71-183). New
York: The Century Foundation.
Carver, S., Van Sickle, J., Holcomb, J., Quinn, C., Jackson, D., Resnick, A., . . .
Marquard, A. (2017). Operation STEM: increasing success and improving
retention among first-generation and underrepresented minority students in
STEM. Journal of STEM Education, 18(3), 20-29.
Chen, X. (2013). STEM Attrition: College Students' Paths into and out of STEM Fields.
Statistical Analysis Report. NCES 2014-001. National Center for Education
Statistics: U.S. Department of Education, Washington, D.C.
Cohen, Kisker, C. B., & Brawer, F. B. (2014). The American community college (Vol.
Sixth;6;6th;). San Francisco, CA: Jossey-Bass, a Wiley brand.
57
Committee on Science, E., and Public Policy. (2007). Rising Above The Gathering
Storm: Energizing and Employing America for a Brighter Economic Future.
(9780309100397;0309100399;). National Academies Press.
Costello, C. B. (2012). Increasing Opportunities for Low-Income Women and Student
Parents in Science, Technology, Engineering, and Math at Community Colleges.
Report# C388. Institute for Women's Policy Research.
Crisp, G., & Delgado, C. (2014). The Impact of Developmental Education on Community
College Persistence and Vertical Transfer. Community College Review, 42(2), 99-
117. doi:10.1177/0091552113516488
Ghasemi, E., Aaghaie, A., & Cudney, E. A. (2015). Mahalanobis Taguchi system: a
review. International Journal of Quality & Reliability Management, 32(3), 291-
307.
Graham, M. J., Frederick, J., Byars-Winston, A., Hunter, A.-B., & Handelsman, J.
(2013). Increasing Persistence of College Students in STEM. Science, 341(6153),
1455. doi:10.1126/science.1240487
Hoffman, E., Starobin, S., Laanan, F. S., & Rivera, M. (2010). Role of Community
Colleges in STEM Education: Thoughts on Implicaitons for Policy, Practice, and
Future Research. Journal of Women and Minorities in Science and Engineering,
16(1), 85-96.
Horn, L., & Nevill, S. (2006). Profile of undergraduate students in US postsecondary
education institutions: 2003–2004: With a special analysis of community college
students (NCES 2006–184). Washington, DC: US Department of Education.
National Center for Education Statistics.
Hurtado, S., Eagan, K., & Chang, M. (2010). Degrees of success: Bachelor’s degree
completion rates among initial STEM majors. Higher Education Research
Institute at UCLA, January.
Olson, S., & Riordan, D. G. (2012). Engage to Excel: Producing One Million Additional
College Graduates with Degrees in Science, Technology, Engineering, and
Mathematics. Report to the President. Executive Office of the President.
58
Snyder, J., & Cudney, E. A. (2017). Retention Models for STEM Majors and Alignment
to Community Colleges: A Review of the Literature. Journal of STEM Education:
Innovations and Research, 18(3), 48-57.
Starobin, & Laanan, F. S. (2010). From Community College to PhD: Educational
Pathways in Science, Technology, Engineering, and Mathematics. Journal of
Women and Minorities in Science and Engineering, 16(1), 67-84.
doi:10.1615/JWomenMinorScienEng.v16.i1.50
Terenzini, P. T., Lattuca, L. R., Ro, H. K., & Knight, D. B. (2014). America’s
Overlooked Engineers.
Woodall, W. H., Koudelik, R., Tsui, K.-L., Kim, S. B., Stoumbos, Z. G., & Carvounis, C.
P. (2003). A review and analysis of the Mahalanobis—Taguchi system.
Technometrics, 45(1), 1-15.
59
III. A METHODOLOGY FOR PREDICTING STEM RETENTION IN
COMMUNITY COLLEGES
Jennifer Snyder and Elizabeth A. Cudney
Department of Engineering Management and Systems Engineering, Missouri
University of Science and Technology, Rolla, MO, USA
ABSTRACT
The task of building a strong STEM workforce is a factor in America remaining
globally competitive in future decades. There must be more effort increasing the number
of students finishing STEM degrees. Community colleges play a vital role in providing
educational pathways for many students including a majority of minority and lower
socioeconomic status students. The community college pipeline is diverse and could have
different attrition obstacles compared to traditional university students. A methodology to
predict completion for community college STEM students was developed and
investigated for its viability as a useful tool for advising interventions. This methodology
uses the Mahalanobis Taguchi System to identify useful variables and logistic regression
to develop an early alert system. These early alert systems provide important information
that can create and drive conversations with students about overcoming potential risk
factors.
Keywords: STEM education, Mahalanobis Taguchi System, Predictive Analytics,
Community Colleges
60
1. INTRODUCTION
For the last couple of decades, the number of students wishing to pursue a
science, technology, engineering, and math (STEM) degree has been a consistent area of
study. The Higher Education Research Institute (HERI) Brief, Degrees of Success, finds
the number of students declaring STEM-related majors has not increased significantly
since 1971 (Higher Education Research Institute, 2010). The HERI brief (2010) also
highlights that underrepresented minorities declaring STEM-related majors is increasing
and numbers suggest it is finally relatively equivalent to White and Asian American
students. For STEM students, there is considerable attrition and exit from the degree
plans. This lack of completion has a tremendous impact on the STEM workforce in both
numbers and diversity (Cole & Espinoza, 2008; Hagedorn & Purnamasari, 2012; Starobin
& Laanan, 2010). There is interest in finding a solution for both obstacles, but little effort
and research is looking to the community college pipeline (Hagedorn & Purnamasari,
2012). Tsapogas (2004) found that 44% of all students earning a bachelor’s and master’s
in science and engineering report taking classes at a community college, with 28% of
those students earning an associate’s degree. That number increases when analyzing
females and underrepresented minorities who use the transfer function to prepare for the
rigorous STEM degrees (Jackson & Laanan, 2011; Wai-ling Packard, Gagnon, & Senas,
2012).
Community colleges educate a majority of underrepresented students in this
country, but there is a scarcity of research on the success of STEM students (Cohen,
2005; Starobin & Laanan, 2010). STEM retention in two year colleges is lagging greatly
behind other institutions, but few studies have investigated the causes with meaningful
61
results (Chen, 2013). There are descriptive studies that indicate this student population is
different and could require more substantive studies to determine the factors that lead to
retention (Snyder & Cudney, 2017).
As Rajni and Malaya (2015) examined the use of predictive analytics in higher
education, they found it to be important to higher education on a multitude of fronts. The
most important categories include resource utilization, enrollment management, and
predictive modeling. In the review of educational data mining (EDM), Romero and
Ventura (2010) highlight various methods used to predict student performance. Given the
fact that prediction of student success is one of the most popular applications of EDM,
there have been many models developed using neural networks, regression, and
correlation (Romero & Ventura, 2010). This variety of data analysis corroborate that
most data mining performs two tasks: pattern recognition and predictive modeling (Hung,
Hsu, & Rice, 2012). Mahalanobis Taguchi System (MTS) is an emerging system used in
pattern recognition and predictive analysis. It has not been used widely in EDM, but its
success in other industries indicates it should be evaluated in this area of research.
The goal of this research study was to develop a methodology using MTS to
determine the student factors that affect STEM retention and develop a predictive model
for STEM retention for community college students. Four research questions guided this
analytical study:
1. What factors impact STEM retention and completion in community colleges?
2. Can STEM retention and completion be predicted with MTS?
3. How can the accuracy of prediction be improved?
4. Based on the prediction model, what interventions are recommended?
62
The remainder of this article is organized as follows. A review of the relevant
literature on predictive analytics in education, followed by a review of MTS, then the
proposed research methodology is presented before reporting the findings of the research.
2. LITERATURE REVIEW
As this research concentrates on STEM retention and completion in community
colleges and prediction, this section is further divided into three subsections. First current
academic analytics are discussed to detail the importance of data analytics to higher
education. Then predictive methods in academia are discussed to describe the vast
amount of data that is collected and analyzed for various reasons by higher education
institutions. The final section will review the Mahalanobis Taguchi System.
2.1. ACADEMIC ANALYTICS
Education is experiencing a boom in data, which is collected and sifted through
for analysis by research departments for a variety of reasons (Dutt, Ismail, & Herawan,
2017; Wook, Yusof, & Nazri, 2017). A thorough analysis of the causation factors leading
to student success and completion is necessary to challenge the status quo. One approach
gaining popularity in combating low retention rates is the use of data analytics to predict
student success and outcomes (Baer & Duin, 2014; Baer & Norris, 2016; Daniel, 2015;
Mah, 2016). Baer and Duin (2014) emphasize that higher education institutions have
realized the importance of tracking student success, beyond recruitment and enrollment.
Many states have included completion and retention in funding formulas, which has
increased the pressure on institutions to use data effectively.
63
This need for stronger approaches to data analytics and innovative uses has led to
EDM as an emerging area of research. Romero and Ventura (2010) define the various
aspects of EDM based on users and objectives. The objective of EDM is to harness the
data and solve some of the important issues in education (Hung et al., 2012; Romero &
Ventura, 2010). Two common uses are in learning analytics and academic analytics
(Ferreira & Andrade, 2016; Siemens & Long, 2011). Learning analytics is focused on
data about learners and the learning process on a course level. Academic analytics is an
administrative lens that occurs on the institutional level (Goldstein & Katz, 2005). Daniel
(2015) proports academic analytics can improve decision making and aid in strategic
planning. Academic analytics also allows for the development of predictive models and
early alert systems to reduce attrition (Goldstein & Katz, 2005).
2.2. PREDICTIVE METHODS
Predictive methods have garnered much attention in the last decade in many
industries (Waller & Fawcett, 2013). It has also been the focus of many studies in
education. The methods of analysis and prediction are varied, but a majority have mostly
used traditional statistical techniques such as regression analysis to identify the important
variables (Romero & Ventura, 2010). Daniel (2015) asserts there is interest in
investigating more robust methods of prediction. This is substantiated when reviewing all
of the methods of prediction used in EDM such as neural networks, Bayesian networks,
rule-based systems, clustering, and several regression techniques (Dutt et al., 2017;
Romero & Ventura, 2010). Rusli, Ibrahim, and Janor (2008) used logistic regression,
artificial neural networks, and neuro-fuzzy to predict students’ academic achievement
and found neuro-fuzzy provided the most accurate results.
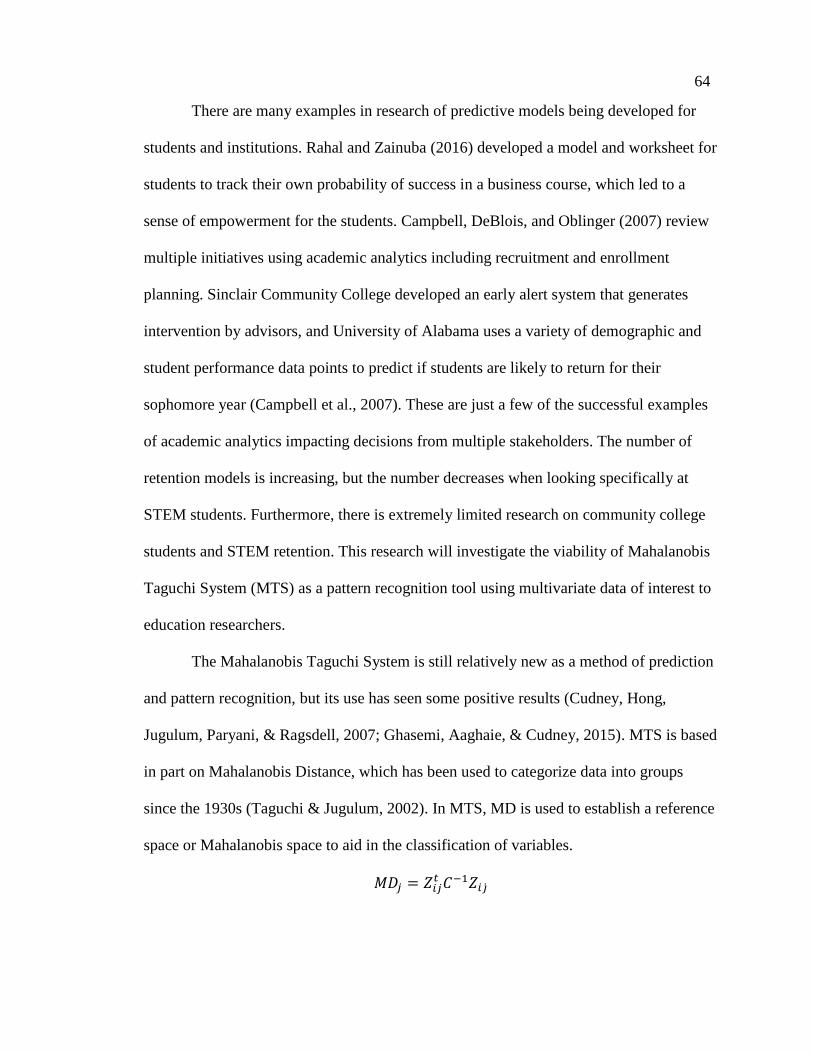
64
There are many examples in research of predictive models being developed for
students and institutions. Rahal and Zainuba (2016) developed a model and worksheet for
students to track their own probability of success in a business course, which led to a
sense of empowerment for the students. Campbell, DeBlois, and Oblinger (2007) review
multiple initiatives using academic analytics including recruitment and enrollment
planning. Sinclair Community College developed an early alert system that generates
intervention by advisors, and University of Alabama uses a variety of demographic and
student performance data points to predict if students are likely to return for their
sophomore year (Campbell et al., 2007). These are just a few of the successful examples
of academic analytics impacting decisions from multiple stakeholders. The number of
retention models is increasing, but the number decreases when looking specifically at
STEM students. Furthermore, there is extremely limited research on community college
students and STEM retention. This research will investigate the viability of Mahalanobis
Taguchi System (MTS) as a pattern recognition tool using multivariate data of interest to
education researchers.
The Mahalanobis Taguchi System is still relatively new as a method of prediction
and pattern recognition, but its use has seen some positive results (Cudney, Hong,
Jugulum, Paryani, & Ragsdell, 2007; Ghasemi, Aaghaie, & Cudney, 2015). MTS is based
in part on Mahalanobis Distance, which has been used to categorize data into groups
since the 1930s (Taguchi & Jugulum, 2002). In MTS, MD is used to establish a reference
space or Mahalanobis space to aid in the classification of variables.
𝑀𝐷𝑗 = 𝑍𝑖𝑗𝑡 𝐶−1𝑍𝑖�̇�
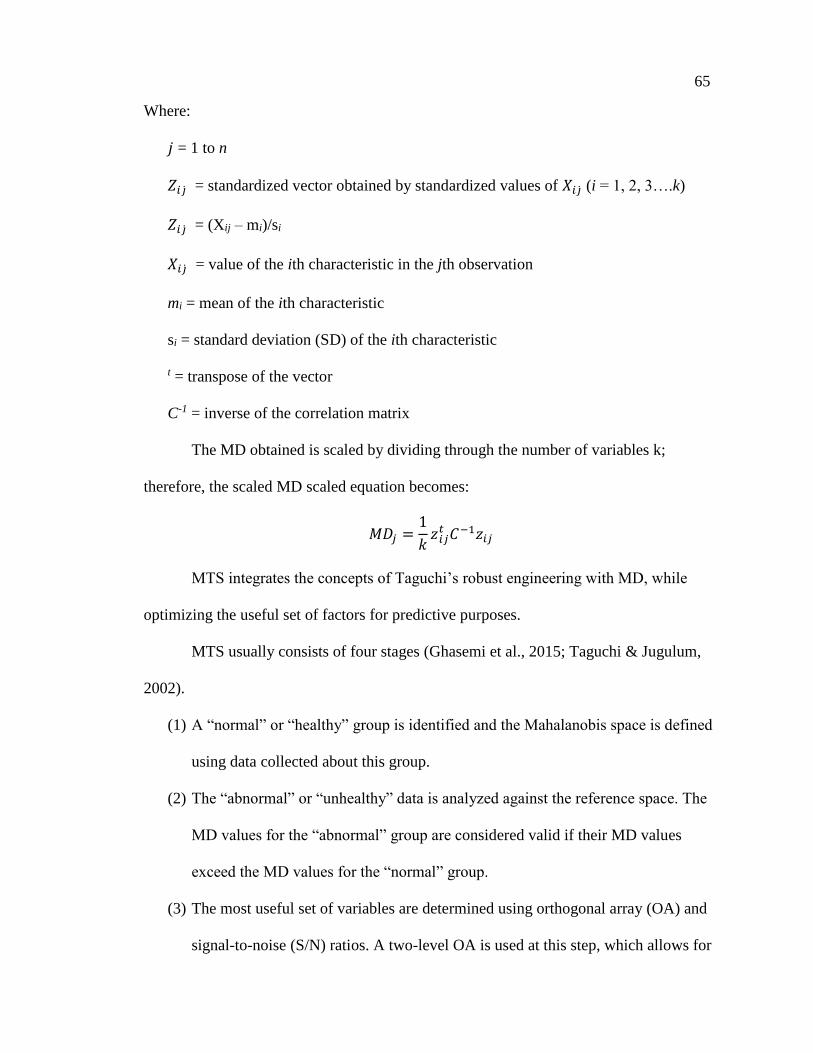
65
Where:
𝑗 = 1 to n
𝑍𝑖�̇� = standardized vector obtained by standardized values of 𝑋𝑖�̇� (i = 1, 2, 3….k)
𝑍𝑖�̇� = (Xij – mi)/si
𝑋𝑖�̇� = value of the ith characteristic in the jth observation
mi = mean of the ith characteristic
si = standard deviation (SD) of the ith characteristic
t = transpose of the vector
C-1 = inverse of the correlation matrix
The MD obtained is scaled by dividing through the number of variables k;
therefore, the scaled MD scaled equation becomes:
𝑀𝐷𝑗 =1
𝑘𝑧𝑖𝑗𝑡 𝐶−1𝑧𝑖𝑗
MTS integrates the concepts of Taguchi’s robust engineering with MD, while
optimizing the useful set of factors for predictive purposes.
MTS usually consists of four stages (Ghasemi et al., 2015; Taguchi & Jugulum,
2002).
(1) A “normal” or “healthy” group is identified and the Mahalanobis space is defined
using data collected about this group.
(2) The “abnormal” or “unhealthy” data is analyzed against the reference space. The
MD values for the “abnormal” group are considered valid if their MD values
exceed the MD values for the “normal” group.
(3) The most useful set of variables are determined using orthogonal array (OA) and
signal-to-noise (S/N) ratios. A two-level OA is used at this step, which allows for
66
the inclusion or exclusion of variables. The S/N ratios are used to determine if a
variable should be included in the final model. The S/N ratio for inclusion and
exclusion are calculated, and the difference is calculated, which is considered the
gain. If the gain is positive, then the inclusion of the variable is useful in the
model.
(4) The last step is diagnosing and predicting future observations. The model is built
using the useful factors identified and forecasting is performed using a threshold
value.
MTS is emerging as a very useful forecasting analysis method. Deepa and
Ganesane (2016) investigated using it as a method to select agricultural crops based on 26
applied selection criteria, finding the MTS – selected set of criteria was validated by
agricultural experts. Hadighi, Sahebjamnia, Mahdavi, Asadollahpour, and Shafieian
(2013) applied MTS for selection of criteria to be used in strategic planning concluding
that human resource, supply chain, and market were important factors to consider when
planning. Its application to a variety of multivariable systems makes it an appealing
choice for further research in predictive model development for STEM student retention
and completion.
3. RESEARCH METHOD AND FINDINGS
3.1. METHODOLOGY
Predictive analytics have been used in educational research (Rajni and Malaya,
2015). The proposed research methodology expands upon previous research and
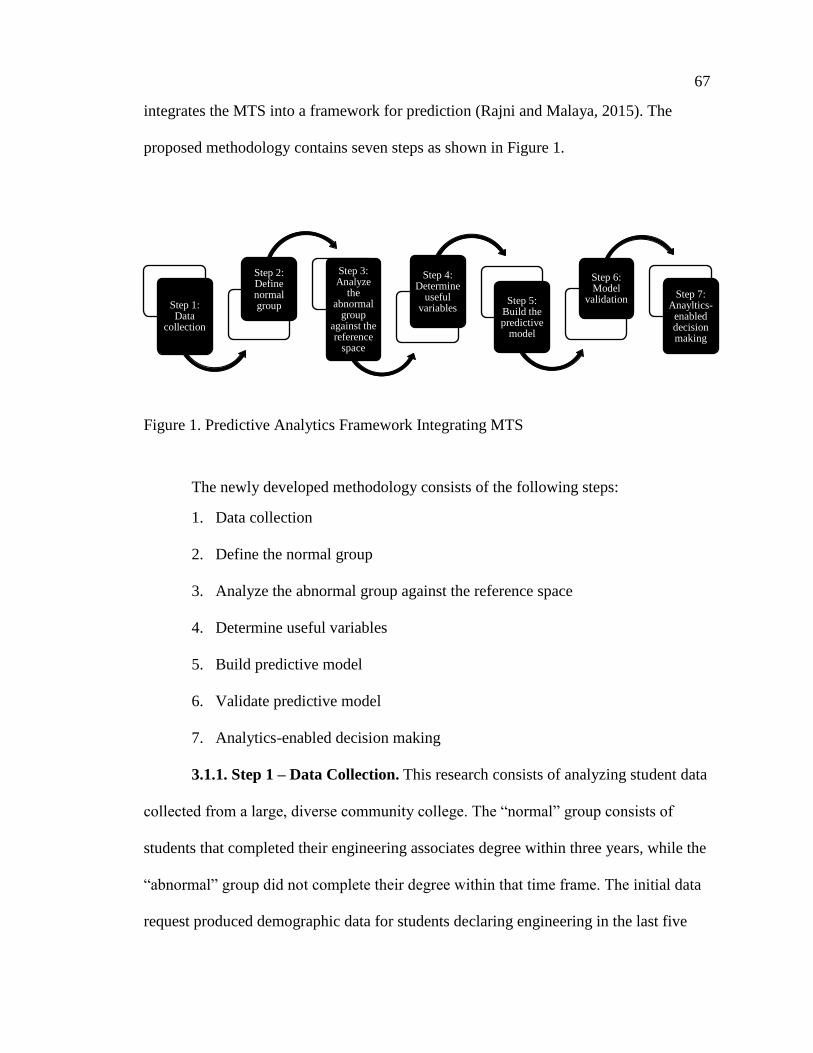
67
integrates the MTS into a framework for prediction (Rajni and Malaya, 2015). The
proposed methodology contains seven steps as shown in Figure 1.
Figure 1. Predictive Analytics Framework Integrating MTS
The newly developed methodology consists of the following steps:
1. Data collection
2. Define the normal group
3. Analyze the abnormal group against the reference space
4. Determine useful variables
5. Build predictive model
6. Validate predictive model
7. Analytics-enabled decision making
3.1.1. Step 1 – Data Collection. This research consists of analyzing student data
collected from a large, diverse community college. The “normal” group consists of
students that completed their engineering associates degree within three years, while the
“abnormal” group did not complete their degree within that time frame. The initial data
request produced demographic data for students declaring engineering in the last five
Step 1: Data
collection
Step 2: Define normal group
Step 3: Analyze
the abnormal
group against the reference
space
Step 4: Determine
useful variables
Step 5: Build the predictive
model
Step 6: Model
validationStep 7:
Anayltics-enabled decision making
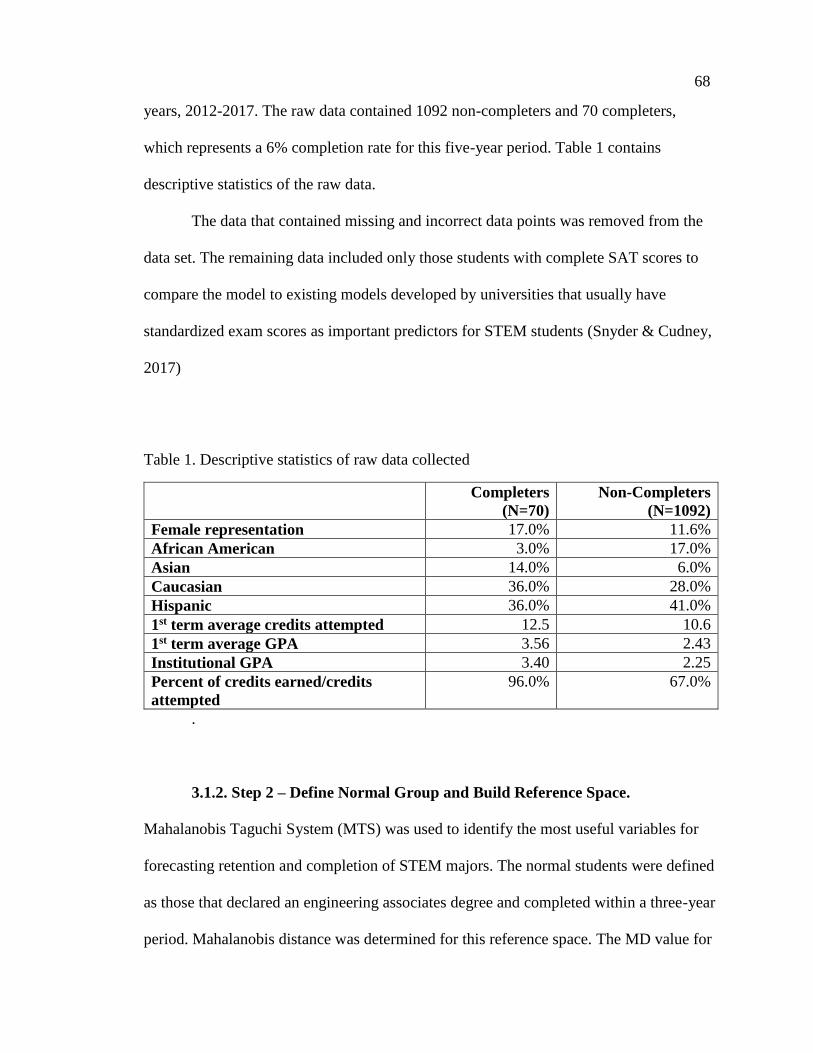
68
years, 2012-2017. The raw data contained 1092 non-completers and 70 completers,
which represents a 6% completion rate for this five-year period. Table 1 contains
descriptive statistics of the raw data.
The data that contained missing and incorrect data points was removed from the
data set. The remaining data included only those students with complete SAT scores to
compare the model to existing models developed by universities that usually have
standardized exam scores as important predictors for STEM students (Snyder & Cudney,
2017)
Table 1. Descriptive statistics of raw data collected
Completers
(N=70)
Non-Completers
(N=1092)
Female representation 17.0% 11.6%
African American 3.0% 17.0%
Asian 14.0% 6.0%
Caucasian 36.0% 28.0%
Hispanic 36.0% 41.0%
1st term average credits attempted 12.5 10.6
1st term average GPA 3.56 2.43
Institutional GPA 3.40 2.25
Percent of credits earned/credits
attempted
96.0% 67.0%
.
3.1.2. Step 2 – Define Normal Group and Build Reference Space.
Mahalanobis Taguchi System (MTS) was used to identify the most useful variables for
forecasting retention and completion of STEM majors. The normal students were defined
as those that declared an engineering associates degree and completed within a three-year
period. Mahalanobis distance was determined for this reference space. The MD value for
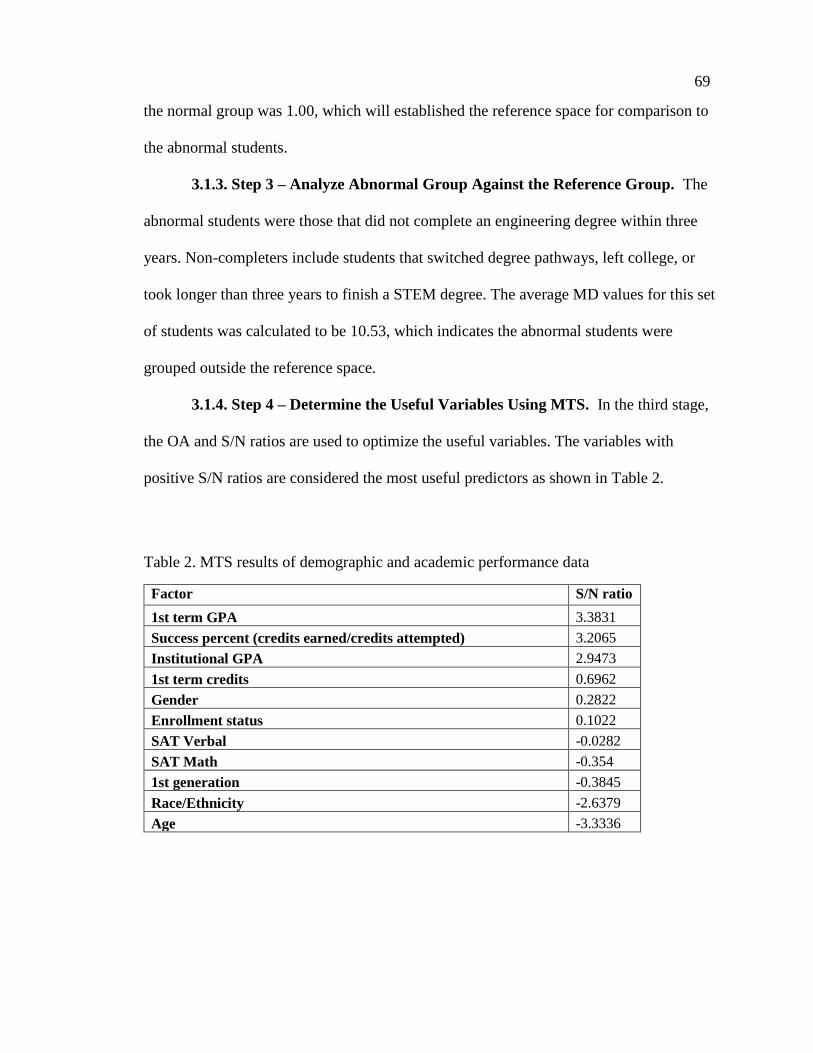
69
the normal group was 1.00, which will established the reference space for comparison to
the abnormal students.
3.1.3. Step 3 – Analyze Abnormal Group Against the Reference Group. The
abnormal students were those that did not complete an engineering degree within three
years. Non-completers include students that switched degree pathways, left college, or
took longer than three years to finish a STEM degree. The average MD values for this set
of students was calculated to be 10.53, which indicates the abnormal students were
grouped outside the reference space.
3.1.4. Step 4 – Determine the Useful Variables Using MTS. In the third stage,
the OA and S/N ratios are used to optimize the useful variables. The variables with
positive S/N ratios are considered the most useful predictors as shown in Table 2.
Table 2. MTS results of demographic and academic performance data
Factor S/N ratio
1st term GPA 3.3831
Success percent (credits earned/credits attempted) 3.2065
Institutional GPA 2.9473
1st term credits 0.6962
Gender 0.2822
Enrollment status 0.1022
SAT Verbal -0.0282
SAT Math -0.354
1st generation -0.3845
Race/Ethnicity -2.6379
Age -3.3336
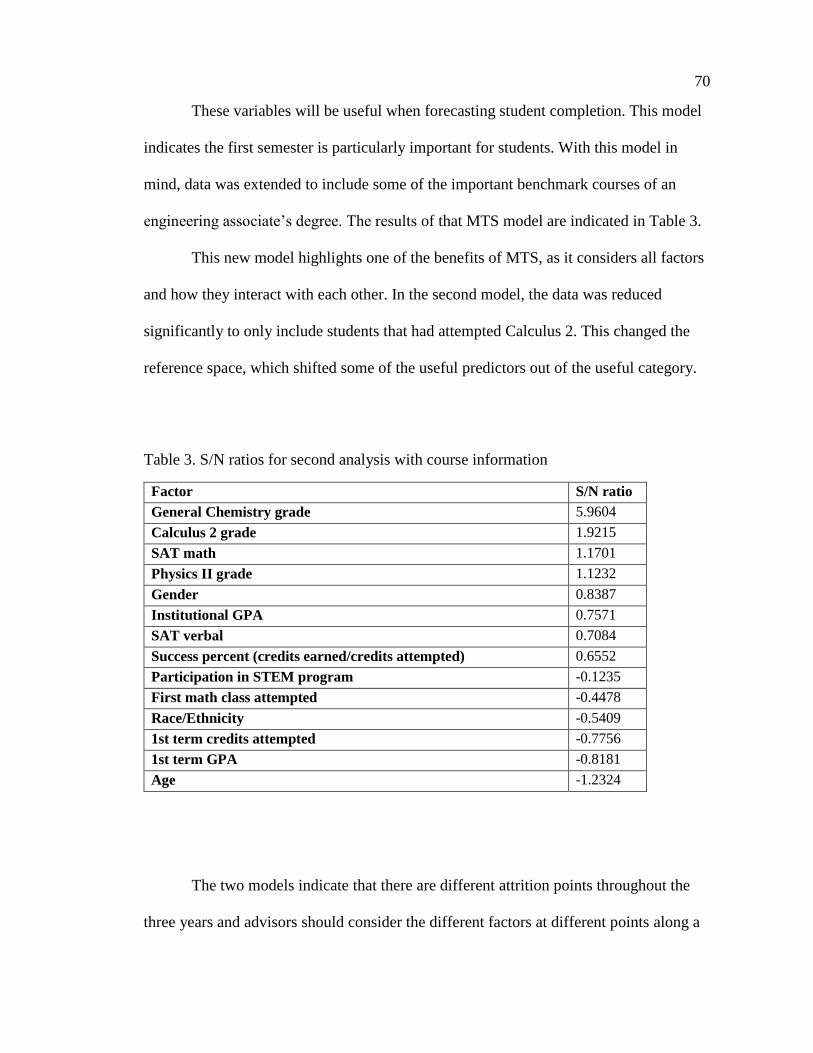
70
These variables will be useful when forecasting student completion. This model
indicates the first semester is particularly important for students. With this model in
mind, data was extended to include some of the important benchmark courses of an
engineering associate’s degree. The results of that MTS model are indicated in Table 3.
This new model highlights one of the benefits of MTS, as it considers all factors
and how they interact with each other. In the second model, the data was reduced
significantly to only include students that had attempted Calculus 2. This changed the
reference space, which shifted some of the useful predictors out of the useful category.
Table 3. S/N ratios for second analysis with course information
Factor S/N ratio
General Chemistry grade 5.9604
Calculus 2 grade 1.9215
SAT math 1.1701
Physics II grade 1.1232
Gender 0.8387
Institutional GPA 0.7571
SAT verbal 0.7084
Success percent (credits earned/credits attempted) 0.6552
Participation in STEM program -0.1235
First math class attempted -0.4478
Race/Ethnicity -0.5409
1st term credits attempted -0.7756
1st term GPA -0.8181
Age -1.2324
The two models indicate that there are different attrition points throughout the
three years and advisors should consider the different factors at different points along a
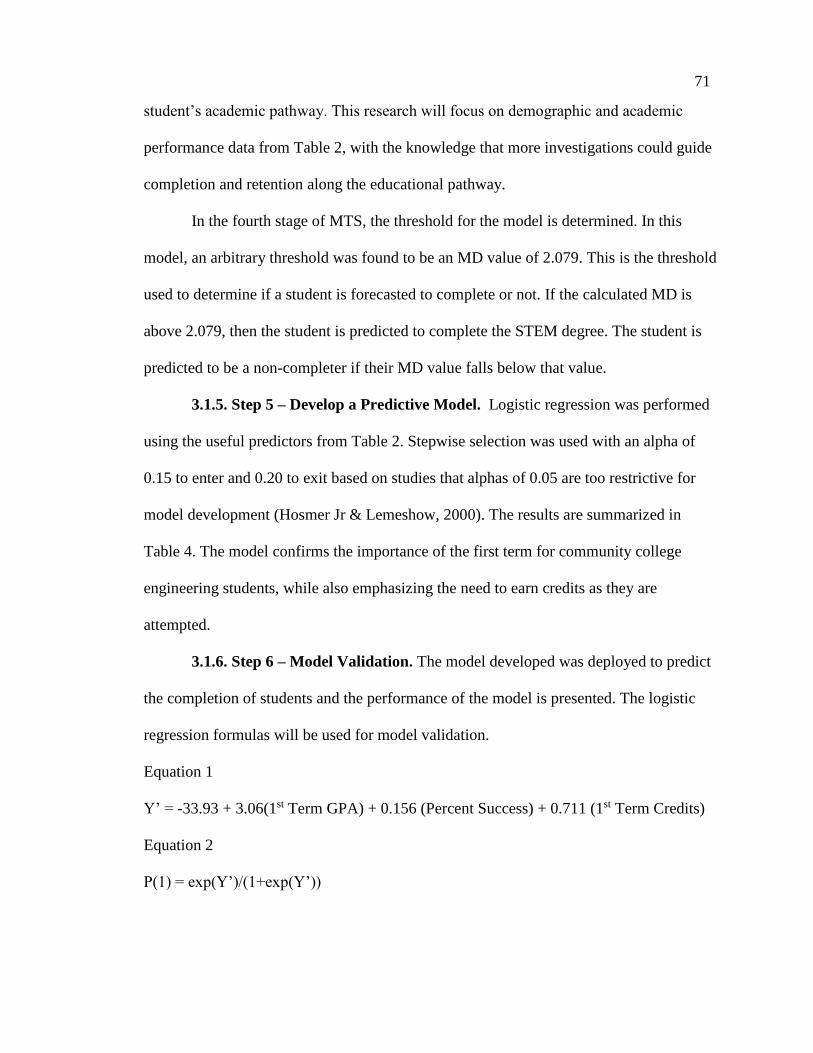
71
student’s academic pathway. This research will focus on demographic and academic
performance data from Table 2, with the knowledge that more investigations could guide
completion and retention along the educational pathway.
In the fourth stage of MTS, the threshold for the model is determined. In this
model, an arbitrary threshold was found to be an MD value of 2.079. This is the threshold
used to determine if a student is forecasted to complete or not. If the calculated MD is
above 2.079, then the student is predicted to complete the STEM degree. The student is
predicted to be a non-completer if their MD value falls below that value.
3.1.5. Step 5 – Develop a Predictive Model. Logistic regression was performed
using the useful predictors from Table 2. Stepwise selection was used with an alpha of
0.15 to enter and 0.20 to exit based on studies that alphas of 0.05 are too restrictive for
model development (Hosmer Jr & Lemeshow, 2000). The results are summarized in
Table 4. The model confirms the importance of the first term for community college
engineering students, while also emphasizing the need to earn credits as they are
attempted.
3.1.6. Step 6 – Model Validation. The model developed was deployed to predict
the completion of students and the performance of the model is presented. The logistic
regression formulas will be used for model validation.
Equation 1
Y’ = -33.93 + 3.06(1st Term GPA) + 0.156 (Percent Success) + 0.711 (1st Term Credits)
Equation 2
P(1) = exp(Y’)/(1+exp(Y’))
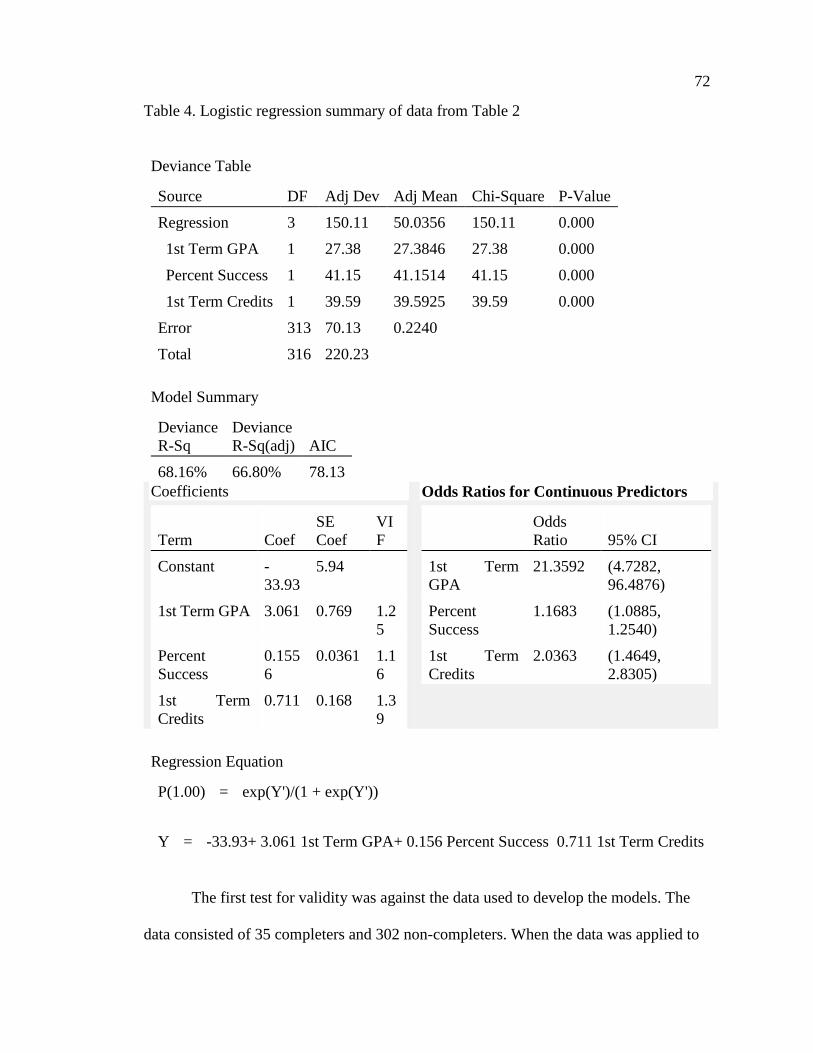
72
Table 4. Logistic regression summary of data from Table 2
The first test for validity was against the data used to develop the models. The
data consisted of 35 completers and 302 non-completers. When the data was applied to
Deviance Table
Source DF Adj Dev Adj Mean Chi-Square P-Value
Regression 3 150.11 50.0356 150.11 0.000
1st Term GPA 1 27.38 27.3846 27.38 0.000
Percent Success 1 41.15 41.1514 41.15 0.000
1st Term Credits 1 39.59 39.5925 39.59 0.000
Error 313 70.13 0.2240
Total 316 220.23
Model Summary
Deviance
R-Sq
Deviance
R-Sq(adj) AIC
68.16% 66.80% 78.13
Coefficients
Term Coef
SE
Coef
VI
F
Constant -
33.93
5.94
1st Term GPA 3.061 0.769 1.2
5
Percent
Success
0.155
6
0.0361 1.1
6
1st Term
Credits
0.711 0.168 1.3
9
Odds Ratios for Continuous Predictors
Odds
Ratio 95% CI
1st Term
GPA
21.3592 (4.7282,
96.4876)
Percent
Success
1.1683 (1.0885,
1.2540)
1st Term
Credits
2.0363 (1.4649,
2.8305)
Regression Equation
P(1.00) = exp(Y')/(1 + exp(Y'))
Y = -33.93+ 3.061 1st Term GPA+ 0.156 Percent Success 0.711 1st Term Credits
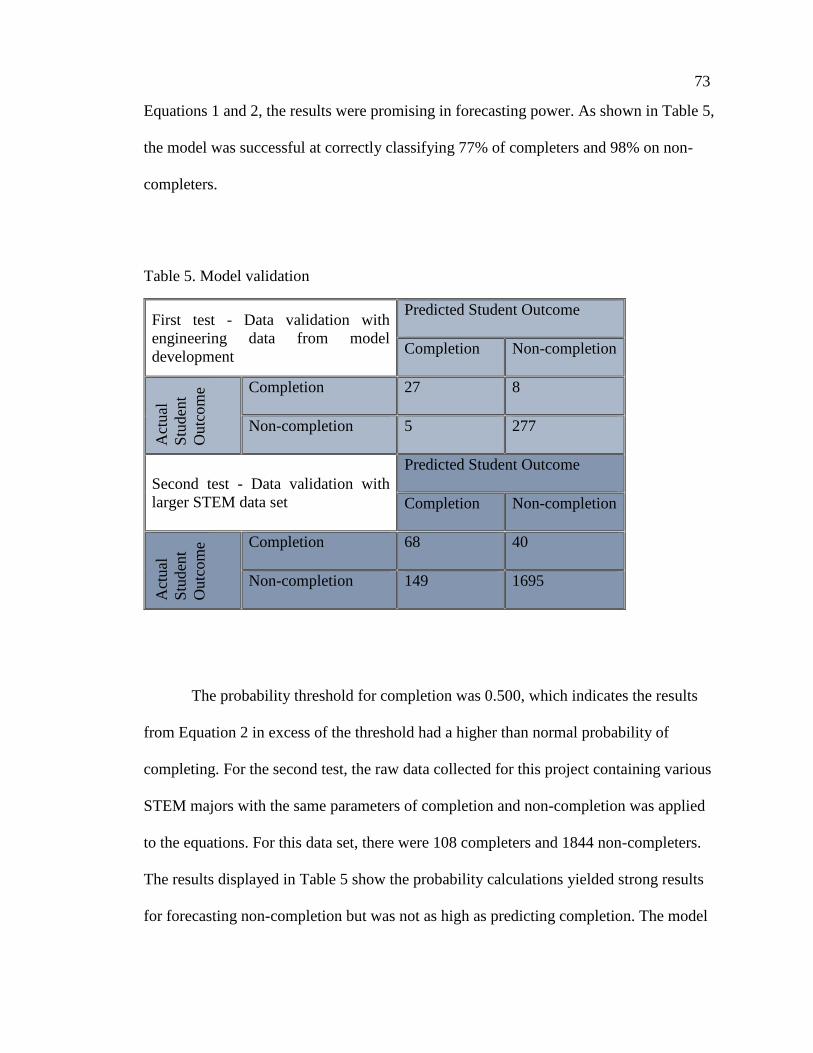
73
Equations 1 and 2, the results were promising in forecasting power. As shown in Table 5,
the model was successful at correctly classifying 77% of completers and 98% on non-
completers.
Table 5. Model validation
First test - Data validation with
engineering data from model
development
Predicted Student Outcome
Completion Non-completion
Act
ual
Stu
den
t
Outc
om
e Completion 27 8
Non-completion 5 277
Second test - Data validation with
larger STEM data set
Predicted Student Outcome
Completion Non-completion
Act
ual
Stu
den
t
Outc
om
e Completion 68 40
Non-completion 149 1695
The probability threshold for completion was 0.500, which indicates the results
from Equation 2 in excess of the threshold had a higher than normal probability of
completing. For the second test, the raw data collected for this project containing various
STEM majors with the same parameters of completion and non-completion was applied
to the equations. For this data set, there were 108 completers and 1844 non-completers.
The results displayed in Table 5 show the probability calculations yielded strong results
for forecasting non-completion but was not as high as predicting completion. The model
74
correctly classified 63% of completers, while maintaining the ability to predict 92% of
non-completers.
3.1.7. Step 7 – Analytics-enabled Decision Making. The models allow student
services and academic parties to make data-driven decisions. The student support
personnel on campus can mediate more sharply throughout a student’s time at the
community college. The MTS and logistic regression models point to the importance of
the first semester in a student’s academic career. These models give quality talking points
that can be deployed to support students in individual ways from course success
strategies to decisions about withdrawing. The models can be used as early alert systems,
which can trigger interventions to circumvent the probable risk factors. Both of the
models are simplistic in their approach and can be modified further to aid the college
employees in their abilities to guide and counsel students. If the student has a high
probability of being a non-completer, then colleges can target their efforts to the students
most at risk of attrition.
The use of academic analytics provides colleges with the tools to make informed
decisions about resource management and should provide more individualized support to
the students. The data is harnessed to increase the efficiency and success of interventions
and retention methods.
75
4. CONCLUSION AND FUTURE WORK
In response to the research questions asked, this research found the following
answers.
1. The research identified factors that are useful in the prediction of completion of a
STEM degree at a community college. These factors were not the same predictors
found in most of the previous research that used traditional university student
data.
2. In both MTS models, the useful variables for predicting retention and completion
of STEM students were identified from a larger set of variables. The ability for
the logistic regression model to forecast non-completers was strong and gives a
firm base for building an early alert system.
3. As shown in Table 3, students will have different predictors as they progress
through their degree pathway. To improve the models, there should be a dynamic
approach to modeling. Student pathways should be investigated more fully to find
the major attrition points. Models could also be developed investigating the
differentiation of useful predictors based on other variables such as gender or
ethnicity.
4. Interventions will vary depending on the risk factors. The methodology is flexible
enough to be used in a variety of predictive purposes involving student retention
and completion. The model developed in this research will be used to provide
more targeted interventions when advising students. The algorithm can be
incorporated into an early alert system to better allocate college resources.
76
Community colleges are an important component of the higher education
ecosystem. The transfer pathway to universities is one of the most critical factors in
diversifying university demographics. It is important that community colleges engage in
meaningful predictive analytics to address the low retention and completion rates and
ensure the transfer pathways are optimized. The methodology proposed provides a high
level of accuracy for predicting completion using student demographic and academic
success data. MTS was useful in identifying the predictors at various points throughout
the degree plan. The useful predictors begin to become more driven by course success as
a student progresses through the curriculum. The individual courses that pose an
unintentional roadblock can be identified using MTS; therefore, the student support
programs developed have a greater impact.
Future research will include identifying the differences in the useful predictors
based on gender and ethnicity. Understanding the variations in students will help guide
the programming that is useful for all students in STEM. It is also important to
investigate the retention and completion differences upon transfer to the university. If a
student successfully transfers to a university from a community college, then they should
have the same graduation success as native students. Unfortunately, studies indicate that
community college transfer students are less likely to complete the bachelor’s degree and
attend graduate school. The use of predictive analytics in the community college should
clarify the differences in these students from native university students, which should
increase their success upon transfer.
This methodology gives promising results making these and other investigations
possible. As more students use the community college to university transfer pathway, it is
77
equally important to understand their risk factors and completion predictors during those
important years at the community college.
REFERENCES
Baer, L., & Duin, A. (2014). Retain Your Students! The Analytics, Policies and Politics
of Reinvention Strategies. Planning for Higher Education, 42(3), 30-41.
Baer, L., & Norris, D. (2016). A Call to Action for Student Success Analytics. Planning
for Higher Education, 44(4), 1-10.
Campbell, J. P., DeBlois, P. B., & Oblinger, D. G. (2007). Academic analytics: A new
tool for a new era. EDUCAUSE review, 42(4), 40.
Chen, X. (2013). STEM Attrition: College Students' Paths into and out of STEM Fields.
Statistical Analysis Report. NCES 2014-001. National Center for Education
Statistics: U.S. Department of Education, Washington, D.C.
Cohen. (2005). UCLA community college review: Why practitioners and researchers
ignore each other (even when they are the same person). Community College
Review, 33(1), 51-62.
Cole, D., & Espinoza, A. (2008). Examining the academic success of Latino students in
science technology engineering and mathematics (STEM) majors. Journal of
College Student Development, 49(4), 285-300.
Cudney, E. A., Hong, J., Jugulum, R., Paryani, K., & Ragsdell, K. M. (2007). An
evaluation of Mahalanobis-Taguchi system and neural network for multivariate
pattern recognition. Journal of Industrial and Systems Engineering, 1(2), 139-
150.
Daniel, B. (2015). Big Data and analytics in higher education: Opportunities and
challenges. British Journal of Educational Technology, 46(5), 904-920.
doi:10.1111/bjet.12230
78
Deepa, N., & Ganesane, K. (2016). Mahalanobis Taguchi system based criteria selection
tool for agriculture crops. Sādhanā, 41(12), 1407-1414. doi:10.1007/s12046-016-
0569-5
Dutt, A., Ismail, M. A., & Herawan, T. (2017). A Systematic Review on Educational
Data Mining. IEEE Access, 5, 15991-16005. doi:10.1109/ACCESS.2017.2654247
Ferreira, S. A., & Andrade, A. (2016). Academic analytics: Anatomy of an exploratory
essay. Education and Information Technologies, 21(1), 229-243.
doi:10.1007/s10639-014-9317-9
Ghasemi, E., Aaghaie, A., & Cudney, E. A. (2015). Mahalanobis Taguchi system: a
review. International Journal of Quality & Reliability Management, 32(3), 291-
307.
Goldstein, P. J., & Katz, R. N. (2005). Academic analytics: The uses of management
information and technology in higher education (Vol. 8): Educause.
Hadighi, S. A., Sahebjamnia, N., Mahdavi, I., Asadollahpour, H., & Shafieian, H. (2013).
Mahalanobis-Taguchi System-based criteria selection for strategy formulation: a
case in a training institution. Journal of Industrial Engineering International,
9(1), 26. doi:10.1186/2251-712x-9-26
Hagedorn, L. S., & Purnamasari, A. V. (2012). A Realistic Look at STEM and the Role
of Community Colleges. Community College Review, 40(2), 145-164.
Higher Education Research Institute. (2010). Degrees of Success. Bachelor's Degree
Completion Rates among Initial STEM Majors.
Hosmer Jr, D. W., & Lemeshow, S. (2000). Applied logistic regression (2 ed. Vol. 398):
John Wiley & Sons.
Hung, J.-L., Hsu, Y.-C., & Rice, K. (2012). Integrating data mining in program
evaluation of K-12 online education. Journal of Educational Technology &
Society, 15(3).
Jackson, D. L., & Laanan, F. S. (2011). The role of community colleges in educating
women in science and engineering. New Directions for Institutional Research,
2011(152), 39-49. doi:10.1002/ir.407
79
Mah, D.-K. (2016). Learning Analytics and Digital Badges: Potential Impact on Student
Retention in Higher Education. Technology, Knowledge and Learning, 21(3),
285-305. doi:10.1007/s10758-016-9286-8
Rahal, A., & Zainuba, M. (2016). Improving students' performance in quantitative
courses: The case of academic motivation and predictive analytics. The
International Journal of Management Education, 14(1), 8-17.
Rajni, J., & Malaya, D. B. (2015). Predictive Analytics in a Higher Education Context. IT
Professional, 17(4), 24-33. doi:10.1109/MITP.2015.68
Romero, C., & Ventura, S. (2010). Educational Data Mining: A Review of the State of
the Art. IEEE Transactions on Systems, Man, and Cybernetics, Part C
(Applications and Reviews), 40(6), 601-618. doi:10.1109/TSMCC.2010.2053532
Rusli, N. M., Ibrahim, Z., & Janor, R. M. (2008, 26-28 Aug. 2008). Predicting
students’ academic achievement: Comparison between logistic
regression, artificial neural network, and Neuro-fuzzy. Paper presented at the
2008 International Symposium on Information Technology.
Siemens, G., & Long, P. (2011). Penetrating the fog: Analytics in learning and education.
EDUCAUSE review, 46(5), 30.
Snyder, J., & Cudney, E. A. (2017). Retention Models for STEM Majors and Alignment
to Community Colleges: A Review of the Literature. Journal of STEM Education:
Innovations and Research, 18(3), 48-57.
Starobin, & Laanan, F. S. (2010). From Community College to PhD: Educational
Pathways in Science, Technology, Engineering, and Mathematics. Journal of
Women and Minorities in Science and Engineering, 16(1), 67-84.
doi:10.1615/JWomenMinorScienEng.v16.i1.50
Taguchi, G., & Jugulum, R. (2002). The Mahalanobis-Taguchi strategy: A pattern
technology system: John Wiley & Sons.
Tsapogas, J. (2004). The role of community colleges in the education of recent science
and engineering graduates. InfoBrief NSF, 04-315.
80
Wai-ling Packard, B., Gagnon, J. L., & Senas, A. (2012). Navigating Community College
Transfer in Science, Technical, Engineering, and Mathematics Fields. Community
College Journal of Research and Practice, 36, 670-683.
Waller, M. A., & Fawcett, S. E. (2013). Click Here for a Data Scientist: Big Data,
Predictive Analytics, and Theory Development in the Era of a Maker Movement
Supply Chain. Journal of Business Logistics, 34(4), 249-252.
doi:10.1111/jbl.12024
Wook, M., Yusof, Z. M., & Nazri, M. Z. A. (2017). Educational data mining acceptance
among undergraduate students. Education and Information Technologies, 22(3),
1195-1216. doi:10.1007/s10639-016-9485-x
81
SECTION
2. CONCLUSION
The U.S. is galvanized to regain their competitiveness in the fields of science,
technology, engineering, and math (STEM). There are too many indicators that our
economy and national security are at risk if action is not taken to increase our STEM
workforce. Furthermore, there is a strong effort to increase the diversity of this
workforce, making it more reflective of the population (Committee on Science, 2007;
Drew, 2011; Terenzini, Lattuca, Ro, & Knight, 2014). For instance, women make up just
over 50% of the population, but only represent 12% of the engineering graduates. When
these concerns are aligned with the growing cost of tuition and competitive nature of
higher education, the need to develop a robust transfer pipeline using community colleges
becomes even more evident.
Community colleges are a sector of the higher educational ecosystem that should
be investigated more thoroughly by researchers. Community colleges traditionally have a
more diverse student population, with Hispanics and African Americans often
overrepresented compared to the general population (Baum & Kurose, 2013; Horn &
Nevill, 2006). This is the very sector of students that the country needs to support and
encourage towards a STEM career. Their participation is vital to our nation and
community colleges should be partners in this effort (Terenzini et al., 2014).
One of the drawbacks to community colleges is the large funding inequity
compared to k-12 and universities. Community colleges receive most of their revenue
from tuition, state, and local appropriations, but there has been a steady decrease in
82
appropriations from government sources (Carnevale & Strohl, 2010). As Baum and
Kurose (2013) note, there is an extreme difference in expenditures at different institutions
with community colleges only realizing a gain of $1 per full-time equivalency (FTE)
between 1999 and 2009. This lack of funding translates into a need to be more intentional
in programmatic decisions (Carnevale & Strohl, 2010). Currently the completion rates for
STEM degrees at community colleges is approximately 20% and sometimes in the single-
digits depending on the metrics (Chen, 2013; Horn & Nevill, 2006). There is substantial
work required to increase the retention and completion of these students. With the
constraints of the budget, a method of providing personalized and targeted advising is
more impactful and efficient for the students and institutions. Therefore, the objective of
this research was to develop a prediction methodology for student completion using
numerous factors. By providing a means to indicate factors that will impede a student’s
degree completion success, institutions can better advise students as they progress
through their associate’s degree and transfer to universities. The methodology is flexible
enough to be employed across the various community college locations. Community
colleges are all unique and tend to reflect the local population; therefore, this
methodology would be very useful in developing very specific retention models leading
to early alert systems. Even within a large community college system, every campus will
have different student populations and could have different risk factors, which this
methodology would allow for with ease.
The methodology was developed to increase retention and completion of
community college STEM students; however, future work could expand to include
different student populations. First, as community college students transfer to
83
universities, these students could present different risk factors as the university-native
students. While most attrition occurs during the first two years, there are still some
students that do not complete their degree after transfer (Reyes, 2011). This methodology
could assist universities in determining the risk factors that should be mitigated to
decrease the transfer attrition. Next, this methodology is versatile and can be applied to
specific student populations to better assist in retention and completion of individual
groups. Within Hispanic-Serving Institutions, a model could be developed that is tailored
to this population of students, understanding that their risk factors could be different.
Lastly, one interesting finding is that some students do not follow their probable
outcomes in the model. It would be important to study these students and determine what
factors made a difference for their success and completion. It will likely necessitate
further development of the methodology given there are qualitative variables that are not
captured in the model.
In addition to the educational retention model, this method uses the Mahalanobis
Taguchi System (MTS) which could be expanded to model retention for employers.
Retention issues regarding underrepresented minorities also plague the STEM workforce
(Corbett & Hill, 2015). This methodology could be used to develop a model for retaining
employees and identifying the risk factors that employers could mitigate.
In conclusion, there is still much room for exploration with this methodology. It
provides new avenues of research and highlights community colleges as an important
sector to study to reach our national goals.
84
REFERENCES
Baum, S., & Kurose, C. (2013). Community colleges in context: Exploring financing of
two-and four-year institutions. Century Foundation Task Force, Bridging the
higher education divide. Strengthening community colleges and restoring the
American dream, 73-108.
Carnevale, A. P., & Strohl, J. (2010). How increasing college access is increasing
inequality, and what to do about it. In R. D. Kahlenberg (Ed.), Rewarding
Strivers: Helping Low-Income Students Succeed in College (pp. 71-183). New
York: The Century Foundation.
Chen, X. (2013). STEM Attrition: College Students' Paths into and out of STEM Fields.
Statistical Analysis Report. NCES 2014-001. National Center for Education
Statistics: U.S. Department of Education, Washington, D.C.
Committee on Science, E., and Public Policy. (2007). Rising Above The Gathering
Storm: Energizing and Employing America for a Brighter Economic Future.
(9780309100397;0309100399;). National Academies Press.
Corbett, C., & Hill, C. (2015). Solving the Equation: The Variables for Women’s Success
in Engineering and Computing (AAUW, Washington, DC).
Drew, D. E. (2011). STEM the tide: reforming science, technology, engineering, and
math education in America. Baltimore: Johns Hopkins University Press.
Horn, L., & Nevill, S. (2006). Profile of undergraduate students in US postsecondary
education institutions: 2003–2004: With a special analysis of community college
students (NCES 2006–184). Washington, DC: US Department of Education.
National Center for Education Statistics.
Reyes, M.-E. (2011). Unique challenges for women of color in STEM transferring from
community colleges to universities. Harvard Educational Review, 81(2), 241-263.
Terenzini, P. T., Lattuca, L. R., Ro, H. K., & Knight, D. B. (2014). America’s
Overlooked Engineers.

85
Arcidiacono, P., Aucejo, E. M., & Hotz, V. J. (2016). University differences in the
graduation of minorities in STEM fields: Evidence from California. American
Economic Review, 106(3), 525-562.
Calcagno, J. C., Bailey, T., Jenkins, D., Kienzl, G., & Leinbach, T. (2008). Community
college student success: What institutional characteristics make a difference?
Economics of Education Review, 27(6), 632-645.
doi:http://dx.doi.org/10.1016/j.econedurev.2007.07.003
Chen, X. (2009). Students Who Study Science, Technology, Engineering, and
Mathematics (STEM) in Postsecondary Education. Stats in Brief. NCES 2009-
161. National Center for Education Statistics.
Chen, X. (2013). STEM Attrition: College Students' Paths into and out of STEM Fields.
Statistical Analysis Report. NCES 2014-001. National Center for Education
Statistics: U.S. Department of Education, Washington, D.C.
Cohen, Kisker, C. B., & Brawer, F. B. (2014). The American community college (Vol.
Sixth;6;6th;). San Francisco, CA: Jossey-Bass, a Wiley brand.
Committee on Science, E., and Public Policy. (2007). Rising Above The Gathering
Storm: Energizing and Employing America for a Brighter Economic Future.
(9780309100397;0309100399;). National Academies Press.
Costello, C. B. (2012). Increasing Opportunities for Low-Income Women and Student
Parents in Science, Technology, Engineering, and Math at Community Colleges.
Report# C388. Institute for Women's Policy Research.
Horn, L., & Nevill, S. (2006). Profile of undergraduate students in US postsecondary
education institutions: 2003–2004: With a special analysis of community college
students (NCES 2006–184). Washington, DC: US Department of Education.
National Center for Education Statistics.
McFarland, J., Hussar, B., de Brey, C., Snyder, T., Wang, X., Wilkinson-Flicker, S., . . .
Barmer, A. (2017). The Condition of Education 2017. NCES 2017-144. National
Center for Education Statistics.
86
Olsen, S. (2014). The importance of engineering talent to the prosperity and security of
the nation: summary of a forum. Washington, District of Columbia: National
Academies Press.
Olson, S., & Riordan, D. G. (2012). Engage to Excel: Producing One Million Additional
College Graduates with Degrees in Science, Technology, Engineering, and
Mathematics. Report to the President. Executive Office of the President.
Snyder, J., & Cudney, E. A. (2017). Retention Models for STEM Majors and Alignment
to Community Colleges: A Review of the Literature. Journal of STEM Education:
Innovations and Research, 18(3), 48-57.
Terenzini, P. T., Lattuca, L. R., Ro, H. K., & Knight, D. B. (2014). America’s
Overlooked Engineers.
87
VITA
Jennifer Lynn Snyder graduated in May 2005, from Southwest Missouri State
University with a Bachelor of Science in Chemistry. Then in May 2007, she graduated
from Missouri State University with a Master of Science in Chemistry and began
teaching full-time at Ozark Technical Community College in Springfield, Missouri. In
May 2013, Jennifer became the department chair of physical science at the college,
leading twelve full-time faculty as the administrator. Jennifer enrolled in the Doctor of
Philosophy (Ph.D.) program in Engineering Management at Missouri University of
Science and Technology in the Spring of 2015 and began conducting research after 2016
qualifying exams. This research involved the development of a methodology for
predicting retention and completion of community college STEM students using
Mahalanobis Taguchi System. During her doctoral studies, Jennifer continued to serve in
administrative roles in community colleges. In November 2016, she became the Dean of
Science for East Campus within the Valencia College system in Orlando, Florida. In July
2018, she received her Doctor of Philosophy (Ph.D.) in Engineering Management from
Missouri S&T.