A meridional scan of the stratospheric gravity wave field over the ocean in 2001 (MeSSO2001
38
JOURNAL OF GEOPHYSICAL RESEARCH, VOL. ???, NO. , PAGES 1–27, A Meridional Scan of the Stratospheric Gravity Wave Field over the Ocean in 2001 (MeSSO2001) Kaoru Sato, 1 Miho Yamamori, 2 Shin-Ya Ogino, 3 Noriyoshi Takahashi, 4 Yoshihiro Tomikawa, 5 and Takashi Yamanouchi 6 DRAFT November 26, 2002, 3:50am DRAFT
-
Upload
independent -
Category
Documents
-
view
0 -
download
0
Transcript of A meridional scan of the stratospheric gravity wave field over the ocean in 2001 (MeSSO2001

JOURNAL OF GEOPHYSICAL RESEARCH, VOL. ???, NO. , PAGES 1–27,
A Meridional Scan of the Stratospheric
Gravity Wave Field over the Ocean in 2001
(MeSSO2001)
Kaoru Sato,1
Miho Yamamori,2
Shin-Ya Ogino,3
Noriyoshi Takahashi,4
Yoshihiro Tomikawa,5
and Takashi Yamanouchi6
D R A F T November 26, 2002, 3:50am D R A F T

2 SATO ET AL.: GRAVITY WAVE FIELD OVER THE OCEAN
K. Sato, National Institute of Polar Research, Tokyo 173-8515, Japan. ([email protected])
M. Yamamori, Center for Climate System Research, University of Tokyo, Tokyo 153-8904,
Japan. ([email protected])
S.-Y. Ogino, Graduate School of Science and Technology, Kobe University, Kobe 657-8501,
Japan. ([email protected])
N. Takahashi, Department of Geophysics, Faculty of Science, Kyoto University, Kyoto 606-
8502, Japan. ([email protected])
Y. Tomikawa, Research Center for Advanced Science and Technology, University of Tokyo,
Tokyo 153-8904, Japan. ([email protected])
T. Yamanouchi, National Institute of Polar Research, Tokyo 173-8515, Japan. (ya-
1National Institute of Polar Research,
Tokyo, Japan
2Center for Climate System Research,
University of Tokyo, Tokyo, Japan
3Graduate School of Science and
Technology, Kobe University, Kobe, Japan
4Department of Geophysics, Faculty of
Science, Kyoto University, Kyoto, Japan
5Research Center for Advanced Science and
Technology, University of Tokyo, Tokyo, Japan
6National Institute of Polar Research,
Tokyo, JapanD R A F T November 26, 2002, 3:50am D R A F T

SATO ET AL.: GRAVITY WAVE FIELD OVER THE OCEAN 3
Abstract. In order to examine gravity wave characteristics over the ocean,
we conducted a radiosonde observation campaign to scan the stratosphere
meridionally over the middle Pacific with Hakuho-maru research vessel op-
erated by the Ocean Research Institute, University of Tokyo. Seventy ver-
tical profiles of temperature, winds and humidity were successfully obtained
over a wide latitude range of 28◦N to 48◦S with an interval of 1 degree. Grav-
ity wave energy and vertical wavenumber spectra were examined as a func-
tion of latitude. Gravity wave energy is maximized in the tropical region where
the convection is active and in the middle latitude region where the subtrop-
ical westerly jet is situated. The wave energy in the tropical region is greater
than the climatology based on operational radiosonde observation over land
regions by Vincent et al. (2002). The gravity wave amplitude does not nec-
essarily increase with altitude, in contradiction to simple vertical propaga-
tion. The latitudinal distribution of wave energy rather suggests that grav-
ity waves propagate meridionally toward higher latitudes. An interesting fea-
ture is that a wave packet having large horizontal wind and temperature am-
plitudes is observed continuously over 7 days in the latitudinal region extend-
ing 26 degrees. Results of hodograph analysis indicate that the wave packet
is due to an inertia-gravity wave with horizontal and vertical wavelengths
of about 1800 km and 4–5km, respectively. This inertia-gravity wave is likely
generated in association with vigorous convection in the Intertropical Con-
vergence Zone (ITCZ) in the Northern Hemisphere and propagated south-
ward interhemispherically. The results in this study show that there are strong
non-stationary gravity wave sources over the ocean. The importance of merid-
ionally propagating gravity waves is discussed.D R A F T November 26, 2002, 3:50am D R A F T

4 SATO ET AL.: GRAVITY WAVE FIELD OVER THE OCEAN
1. Introduction
Atmospheric gravity waves are small-scale waves with the restoring force of buoyancy.
They had been examined mostly from a theoretical point of view and treated as ”noise”
for weather prediction for a long time. However, it was suggested by theoretical works in
1980’s that upward momentum transport by gravity waves is a key process to determine
the dynamical structure of the middle atmosphere in the height region of 10-100 km such as
weak wind layers around the mesopause (Lindzen, 1981; Matsuno, 1982) and in the lower
stratosphere (Tanaka and Yamanaka, 1985) in the middle latitude region. With the aid
of MST radars and radiosondes with high vertical resolution developed in the same time
period, the theoretical prediction was confirmed observationally (Tsuda et al., 1990; Sato,
1994). Then, it is further revealed that the roles of atmospheric gravity waves are more
important than expected theoretically, namely, in the summer stratosphere (Alexander
and Rosenlof, 1996), in the equatorial stratosphere (e.g. Sato and Dunkerton, 1997;
Dunkerton, 1997) and mesosphere (Mayr et al., 1997). Moreover, recent works indicate
the importance of gravity waves in polar regions for the formation of polar stratospheric
clouds (Carslaw et al., 1998; Shibata et al., 2002).
One of the most dominant origins of gravity waves is topography (Fritts and Nastrom,
1992). Several parameterization schemes of topographically-forced gravity wave were pro-
posed and used in the global circulation models for operational and research purposes
(e.g. McFarlane, 1987; Palmer et al., 1986; Iwasaki et al., 1989). On the other hand,
the parameterization of non-orographic gravity waves is needed to simulate several im-
portant features of the middle atmosphere, such as, the quasi-biennial oscillation in the
equatorial stratosphere and zonal wind reversal in the lower thermosphere in the mid-
D R A F T November 26, 2002, 3:50am D R A F T

SATO ET AL.: GRAVITY WAVE FIELD OVER THE OCEAN 5
dle latitude region. However, we do not have sufficient knowledge on the characteristics
of non-orographic gravity waves which have a variety of sources (convection, fronts, jet
stream, tropical and subtropical cyclones, etc). Although several non-orographic gravity
wave parameterizations are proposed (Fritts and Lu, 1993; Medvedev and Klaassen, 1995;
Hines, 1997; Alexander and Dunkerton, 1999; Warner and McIntyre, 2001) so far, one
of the most important issues is how the wave sources are described (e.g., Charron et al.,
2002) .
Recent atmospheric observation by satellites with GPS occultation method is powerful
to examine gravity wave distribution around the world with almost uniform quality (Tsuda
et al., 2000). However, because of the low horizontal resolution, GPS observation captures
only a part of gravity wave spectra. Moreover, because the observed quantities are only
temperature and atmospheric density, it is difficult to estimate gravity wave parameters
such as phase velocities that are necessary to quantify the gravity wave effects.
As for the land regions, daily or twice daily radiosonde observations in the troposphere
and lower stratosphere are made operationally at about two thousand stations for the
purpose of weather forecast. The analysis of horizontal and temperature data provides
the information of gravity wave propagation. Kitamura and Hirota (1989) and Allen and
Vincent (1995) utilized the operational data to examine gravity wave characteristics as a
function of latitude. Yoshiki and Sato (2000) compared the gravity wave characteristics
between the Arctic and Antarctic. Now, a systematic analysis of gravity waves using
original high-resolution data from operational observation is being made by Vincent et al.
(2002) as an SPARC initiative.
D R A F T November 26, 2002, 3:50am D R A F T

6 SATO ET AL.: GRAVITY WAVE FIELD OVER THE OCEAN
On the other hand, there are little radiosonde observations over the ocean, although it
occupies more than 70 % of the earth surface. As the observed wave field in land regions is
sometimes masked by strong topographically-forced gravity wave events (e.g. Sato, 1994),
it is not so easy to examine non-orographic gravity waves. Thus the observation over the
ocean has a merit for investigation of non-orographic gravity waves.
One approach to examine gravity waves over the ocean is the use of high-resolution
global circulation model (GCM). Sato et al. (1999) made simulation of gravity waves
using an aqua-planet GCM with horizontal and vertical resolution of T106 and 600 m,
respectively. Good agreement with MST (Mesosphere-Stratosphere-Troposphere) radar
observations at a middle latitude assured that the simulated gravity fields are realistic.
Statistical characteristics of simulated gravity waves in terms of the frequency spectra as
a function of latitude and the distribution of wave energy and momentum fluxes in the
latitude-height section were shown. The reality over the ocean in the tropical region and
high latitude region remains to be confirmed by observations.
In our study, we conducted a radiosonde observation campaign to scan the stratosphere
meridionally over the middle Pacific with Hakuho-maru research vessel operated by the
Ocean Research Institute, University of Tokyo. Seventy vertical profiles of temperature,
horizontal winds and humidity were successfully obtained covering a wide latitude range
of 28◦N to 48◦S. Detailed description of the observation is made in Section 2. A series of
vertical profiles obtained by the observations is shown in Section 3. Gravity wave energy
and vertical wavenumber spectra are examined as a function of latitude and altitude, and
compared with climatology by Vincent et al. (2002) in Section 4. During the observa-
tion period, an inertia-gravity wave packet is observed over 7 days propagating from the
D R A F T November 26, 2002, 3:50am D R A F T

SATO ET AL.: GRAVITY WAVE FIELD OVER THE OCEAN 7
Northern Hemisphere to the Southern Hemisphere. Detailed analysis in terms of its wave
parameters and source is made in Section 5. Results are discussed in Section 6. Summary
and concluding remarks are made in Section 7.
2. Observation
The observation period is about one month from November 27 through December 25,
2001. To measure horizontal winds, temperature and humidity, Vaisala RS80-15GH ra-
diosondes were launched at almost the same latitude interval of 1 degree in the latitude
range of 28◦N to 48◦S over Hakuho-maru research vessel as shown in Figure 1. The obser-
vation points from the equator to 48◦S are located along a meridian of 160◦W. Although
several trials were failed in the beginning of the campaign period due to a trouble of
receiving system, seventy observations in the troposphere and lower stratosphere reach-
ing the altitude above 24 km were successfully performed. The accuracy of temperature
and winds is 0.1 degree and 0.5 m s−1, respectively. The wind data with original time
resolution of 0.5 sec by GPS observations are smoothed and recorded at every 2 seconds
corresponding to the height resolution of about 10 m. The response time of temperature
sensor is 4, 8 and 12 seconds at altitudes of 8, 16, and 24 km, respectively. This means
that the real height resolution of temperature data is about 20, 40, 80 m, respectively. In
this study, so as to make analysis easier, vertical profiles of temperature and winds were
smoothed with a lowpass filter with a cutoff length of 100 m and interpolated at the same
height intervals of 50 m.
3. Vertical profiles of temperature and winds as a function of latitude
D R A F T November 26, 2002, 3:50am D R A F T

8 SATO ET AL.: GRAVITY WAVE FIELD OVER THE OCEAN
Figures 2a, 2b and 2c are a series of temperature (T ), zonal wind (u), and meridional
wind (v) profiles that were obtained by the observation. The blue closed circle plotted on
each profile in Figure 2a in the latitude range from 20◦S to 48◦S is the tropopause that
is determined by the variation of vertical gradient of temperature following the definition
by WMO. The red closed circle is the altitude with minimum temperature at each profile
in the latitude range north of 25◦S that is considered to be more appropriate tropopause
definition for the tropical region than the WMO one. The tropical tropopause is located
in the altitude region of 17–18 km, while the tropopause to the south of 35◦S is located
in the altitude region of 11–12km. In the transition region from latitudes of 21◦S to 34◦S,
double tropopause structure is seen, i.e., one is in the altitude region of 15–18km as the
high latitude end of the tropical tropopause and the other is in the 8–10km region as the
low latitude end of midlatitude tropopause.
A strong westerly shear is observed in the lower stratosphere in the equatorial region
from 10◦N to 10◦S (Figure 2b). The zonal wind is easterly just above the tropopause
and westerly above the altitude of 23km. This structure is similar to the observation at
Singapore (1.4◦N, 104.0◦E) at a distance of 12,000 km (Naujokat, private communication)
and hence considered to be associated with the quasi-biennial oscillation (QBO). The
subtropical jet stream is situated in the latitude region around 30◦S, which keeps thermal
wind balance with the double tropopause structure seen in the temperature field. In the
lower stratosphere, wind fluctuations with vertical scales of about 1 km are seen at any
latitude and considered to be mostly due to gravity waves.
D R A F T November 26, 2002, 3:50am D R A F T

SATO ET AL.: GRAVITY WAVE FIELD OVER THE OCEAN 9
Meridional wind shown in Figure 2c is generally weak compared with zonal wind. How-
ever, small-scale fluctuations are clearer in the meridional wind field. It is seen that the
vertical wavelengths of the fluctuations are longer in the lower latitude region.
4. Gravity wave characteristics as a function of latitude
In order to examine dynamical characteristics of gravity waves, we extracted pertur-
bation from the third order polynomial fit for a particular altitude range extending over
7 km, as fluctuation components of T ′, u′, and v′, following the SPARC gravity wave
initiative.
First we calculated vertical wavenumber (m) spectra for temperature and wind fluctu-
ations. As the spectral shape is expected to be steep, i.e. almost proportional to m−3
(VanZandt, 1982), pre-whitening and recoloring processes were made before and after
the spectral calculation, respectively. For temperature spectra, a correction for a finite
response time of the temperature sensor was made (Allen and Vincent, 1995). The re-
sponse time is obtained by a linear interpolation using known values described in Section
2. Obtained spectra are averaged in latitude regions extending 10 degrees with centers of
45◦S, 35◦S, 25◦S, 15◦S, 5◦S, 5◦N, 15◦N and 25◦N. Figure 3 shows the vertical wavenumber
spectra of temperature, zonal and meridional wind fluctuations as a function of latitude.
The slope of the spectrum proportional to m−3 is shown by dotted lines. It is gener-
ally seen that the spectral slope is steeper at lower latitude regions, which is clearer in
temperature spectra. This feature comes mostly from the fact that smaller wavenumber
components have larger spectral densities at lower latitudes. On the other hand, larger
wavenumber components have spectral densities almost independent of latitudes. This
tendency is seen also for zonal and meridional wind spectra.
D R A F T November 26, 2002, 3:50am D R A F T

10 SATO ET AL.: GRAVITY WAVE FIELD OVER THE OCEAN
Altitude dependence of the vertical wavenumber spectra is also examined. Figure 4
shows the temperature spectra at an altitude range of 24–31km in the middle stratosphere.
The tendency of the steepness as a function of latitude is similarly observed for the
middle stratosphere spectra. It is interesting that the spectral densities for the middle
stratosphere are generally lower than those for the lower stratosphere in the equatorial
region (5◦S and 5◦N).
Next we show that the gravity wave energy as a function of latitude. Kinetic energy
divided by atmospheric density is defined as u′2 + v′2 ignoring contribution of vertical wind
fluctuations, and potential energy divided by density is defined as (T ′g/TN)2, where N
is the Brunt-Vaisala frequency calculated at each profile and g is the gravity acceleration.
Figure 5 shows the result as a function of latitude for the lower and middle stratosphere.
In the lower stratosphere, both kinetic and potential energy are maximized around the
equator. A weak maximum is also observed for kinetic energy in the latitude region around
34◦S where the subtropical westerly jet stream is situated. However, in general, the gravity
wave energy is weaker at higher latitudes, which is consistent with the climatology in land
regions shown by Vincent et al. (2002) and also with characteristics of gravity waves
simulated by the aqua-planet GCM by Sato et al. (1999). In the middle stratosphere, the
maximum of kinetic and potential energy in the tropical region is observed at off-equator
in both hemispheres. The maximum around the latitude of subtropical jet stream is weak
compared with that in the lower stratosphere.
It should be noted, however, that the kinetic energy maximum around the equator
might be due to contamination by the QBO in the lower stratosphere. It is difficult to
distinguish the QBO and embedded disturbances only from the vertical profiles. Figure 6
D R A F T November 26, 2002, 3:50am D R A F T

SATO ET AL.: GRAVITY WAVE FIELD OVER THE OCEAN 11
shows the latitude profiles of contribution to kinetic energy by zonal and meridional wind
fluctuations. It is seen that the maximum around the equator is mostly contributed to
by the zonal wind fluctuations, which is consistent with the above speculation. However,
the distribution is not symmetric around the equator, suggesting that the peak around
4◦S is due to dominant waves existing there. On the other hand, the meridional wind
contribution is maximized around the latitudes of 5◦S and 5◦N in the lower stratosphere.
In the middle stratosphere, the maxima are shifted toward higher latitude regions, i.e.,
around the latitudes of 15◦S and 15N. It is worth noting that the zonal wind contribution
has maxima in similar latitude regions in the middle stratosphere. The difference in the
maximum location between the lower and middle stratosphere suggests that the waves
propagate toward higher latitudes from the equatorial region.
5. Interhemispheric propagation of an inertia-gravity wave
Since the radiosonde observation was made 4 to 5 times daily and the ship did not
move at constant speed, we need to be careful to interpret the phase structure seen in
the meridional cross section made from the observation data. However, we could detect a
systematic structure in this observation.
Figure 7a shows the meridional cross section of the meridional wind which is smoothed
in the vertical and in the latitudinal with lowpass filters with cutoff lengths of 2km and 5
degrees (roughly corresponding to the running mean of 1km and 2 degrees), respectively.
Several phase lines tilted northward and upward are seen in the stratosphere in the latitude
region of 25◦S to 10◦N. Moreover, the regions with large amplitudes are located at higher
altitudes at more southern latitudes (as shown by a thick broken arrow). These features
may be due to upward propagation of a gravity wave packet.
D R A F T November 26, 2002, 3:50am D R A F T

12 SATO ET AL.: GRAVITY WAVE FIELD OVER THE OCEAN
Figure 8 shows a contour map of the logarithm of the Brunt-Vaisala frequency squared,
obtained from radiosonde temperature data, which is a measure of static stability of the
atmosphere. Red and blue closed circles show the tropical and midlatitude tropopauses,
respectively, as in Figure 2a. Roughly speaking, the static stability is high in the trop-
ical lower stratosphere and low below the tropopause at any latitudes. A characteristic
structure with high static stability associated with low static stability above is seen in the
lower troposphere (z =2–5km) in the latitude regions around 25 degrees in both hemi-
spheres, corresponding to an inversion layer possibly due to large-scale subsidence of the
atmosphere in the subtropical region.
The Brunt-Vaisala frequency squared is also a convenient quantity to see small-scale
vertical structure of temperature, because it is proportional to the vertical gradient of
temperature. It is important that a wave-packet like structure observed in Figure 7 is
also seen in Figure 8 in the tropical stratosphere.
Thus, we will make further analysis to confirm this speculation that the phase structure
observed in the meridional-cross section is due to an inertia-gravity wave. First, we
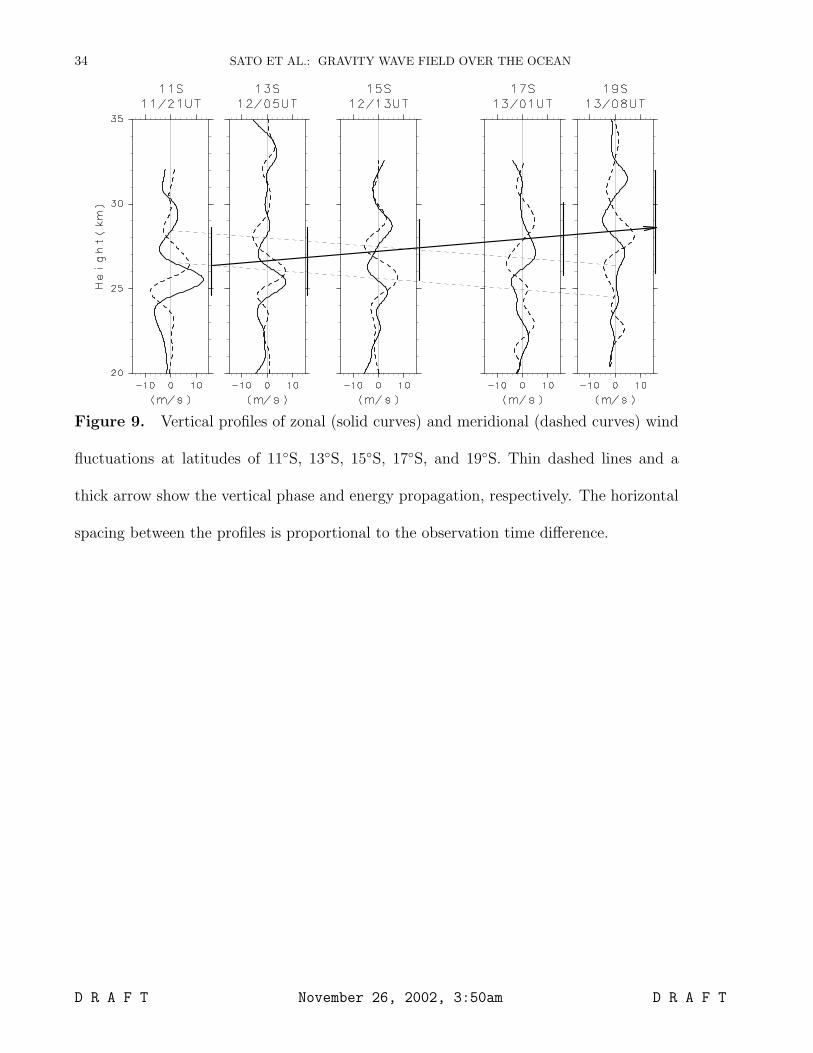
focus on the latitude region of 11◦S to 19◦S where the wave structure is clear in the
height region of 23–32km. In this region, the cruise speed was almost constant (about
550km d−1). Vertical profiles of zonal and meridional wind fluctuations are shown in
Figure 9. Horizontal spacing of the profiles is proportional to the time difference of
observation. As shown by a dotted line, systematic downward phase propagation is seen.
The vertical phase velocity observed on the ship cobsz is estimated at about –2.2km d−1.
On the other hand, the fluctuations show a packet-like structure as shown by a thick
vertical line on the right at each profile. A solid arrow shows the upward propagation of
D R A F T November 26, 2002, 3:50am D R A F T

SATO ET AL.: GRAVITY WAVE FIELD OVER THE OCEAN 13
the wave packet. The upward packet speed, i.e., vertical group velocity observed on the
ship cgobsz is estimated at about 2.1km d−1.
Next, wave parameters are estimated from vertical profiles of wind and temperature
fluctuations for each radiosonde observation. The fluctuations of T ′, u′, and v′ are fitted
into sinusoidal waves under the restriction of the inertia-gravity wave theory that T ′
takes its maximum at the height where the horizontal wind speed√
(u′2 + v′2) takes its
minimum.
The vertical wavenumber m is directly estimated from the fitting. The direction of
hodograph rotation with height indicates vertical energy propagation. Clockwise (anti-
clockwise) rotation with height means upward (downward) energy propagation in the
Northern Hemisphere. This relation is opposite in the Southern Hemisphere. The hori-
zontal wavenumber vector direction, i.e., horizontal phase velocity direction is estimated
at that of the long axis of hodograph, although an ambiguity of 180 degrees remains.
This ambiguity is fixed from the phase relation with the temperature fluctuation. Next
the intrinsic frequency ω is estimated from the ratio of long (a) to short (b) axes of the
hodograph in the following;
f
ω=
b
a, (1)
where f is the inertial frequency. Moreover, using the dispersion relation of an inertia-
gravity wave;
ω2 − f 2
N2 − ω2=
k2
m2(2)
horizontal wavenumber k can be estimated. From these calculations, we can estimate
three dimensional wavenumber vector and intrinsic frequency.
D R A F T November 26, 2002, 3:50am D R A F T

14 SATO ET AL.: GRAVITY WAVE FIELD OVER THE OCEAN
The validity of the estimation can be confirmed by theoretical consistency of horizontal
wind and temperature fluctuation amplitudes. Note that for the wave parameter esti-
mation described above, only phase relation between horizontal wind and temperature
fluctuations was used and amplitudes were not. The temperature fluctuation amplitude
can be estimated from wind fluctuation amplitude a using a theoretical polarization rela-
tion of the inertia-gravity wave as well as estimated wave parameters;
Tamp est =Nk
mω
NT
ga. (3)
Thus, the coincidence of Tamp est and observed amplitude of temperature fluctuation
Tamp obs means that the assumption of inertia-gravity wave is valid and that the wave
parameters are accurately estimated.
The wave parameter estimation was made for five profiles at latitudes of 11◦S, 13◦S,
15◦S, 17◦S and 19◦S with few missing data points. Meaningful wave parameters could
be estimated for the profiles of 11◦S, 15◦S and 19◦S. Fitted profiles and hodographs are
shown in Figure 10. Estimated wave parameters are summarized in Table 1. Note that
the estimated and observed temperature fluctuation amplitudes accord well. The fail-
ure of estimation for the other profiles is probably due to contamination of the other
disturbances.
An important point is that the estimated wave parameters for 11◦S, 15◦S and 19◦S
are similar. The horizontal and vertical wavelengths are about 1800 km and 4.2 km,
respectively. The horizontal phase propagation is southeastward. The vertical energy
propagation is upward. This means that the fluctuations observed in the latitude region
of 11◦S–19◦S are due to the same wave event.
D R A F T November 26, 2002, 3:50am D R A F T

SATO ET AL.: GRAVITY WAVE FIELD OVER THE OCEAN 15
In order to confirm the accuracy of the wave parameter estimation further, the estimated
vertical phase and vertical group velocities are compared with observation in Figure 9.
Figure 11 shows schematic structure of the inertia-gravity wave. Taking a horizontal phase
velocity direction of 49 degrees clockwise from the east and a horizontal wavelength of
1800 km, the meridional wavelength is estimated at 2300 km (Figure 11a). Figure 11b
shows the meridional-cross section of the phase structure of the inertia-gravity wave. The
vertical wavelength of 4.2 km was taken.
Since the cruise speed was 550 km d−1, the nominal vertical phase velocity (i.e. vertical
phase velocity observed on the ship) assuming that the wave structure is stationary (i.e.
ground-based phase speed is zero) is about +1.0 km d−1. On the other hand, the ground-
based vertical phase velocity estimated by the hodograph analysis is about –2.3 km d−1.
Thus, the vertical phase velocity relative to the ship is estimated at –1.3 km d−1. This
value is almost comparable to the observation cobsz of –1.6 km d−1.
The vertical group velocity relative to the ship is estimated at +1.4 km d−1 from the
hodograph analysis. This almost accords well with the observed vertical group velocity
cgobsz of +1.5 km d−1.
Moreover, the consistency of horizontal group velocity is confirmed. In order to observe
the same wave packet for a long time as in this case, the cruise speed should be comparable
to the horizontal group velocity of waves. Assuming that the background meridional wind
is zero (see Figure 7), the horizontal group velocity estimated from the hodograph analysis
is about 420 km d−1. This value is considered consistent with the cruise speed of about 550
km d−1 because the ambiguity of the background meridional wind (i.e. that of meridional
D R A F T November 26, 2002, 3:50am D R A F T

16 SATO ET AL.: GRAVITY WAVE FIELD OVER THE OCEAN
group velocity estimation) in the current discussion can be 1–2 m s−1, namely, 90–170
km d−1.
The consistency of the vertical phase velocity, vertical and meridional group velocities
shown above assures the inference that the wave structure observed in the latitude region
of 11◦S–19◦S is due to the same inertia-gravity wave.
The gravity wave sources are usually considered to be in the troposphere, although there
are some exceptions such as the polar-night jet in the stratosphere (Sato, 2000). Using the
vertical group velocity of 1.5 km d−1, the time when the inertia-gravity wave packet was
located at the tropopause (around 18km) is estimated at 0700UT of December 6, 2001.
At this time the ship was located at the latitude of 8◦N. A thick dashed arrow in Figure
7 shows the propagation of the wave packet calculated using the estimated vertical group
velocity. The continuous wavy structure consistent with the estimated group velocity is
observed in the latitude range from 8◦N to 25◦S in the height range of 18–31km, indicating
that this particular wave packet was observed over 7 days.
Figure 12 shows an IR picture of a geostationary satellite of GOES-W at 2100UT
of December 6, 2001 when the wave packet was located around the tropopause. The
location of the ship at this time is shown by a cross mark. A zonally-elongated cloud
band is observed around the latitude of 8◦N where the ship was located. This cloud
band corresponds to the Northern Hemisphere Intertropical Convergence Zone (ITCZ).
Thus, it is likely that the inertia-gravity wave packet detected by this cruise observation
was excited by convection in ITCZ. In fact, when the ship was located around 8◦N, the
weather was stormy and a few balloon launches were failed under this condition. The
D R A F T November 26, 2002, 3:50am D R A F T

SATO ET AL.: GRAVITY WAVE FIELD OVER THE OCEAN 17
convective activity is suggested by the observation of high humidity extending to the
upper troposphere around 8◦N seen in Figure 7b.
6. Discussion
6.1. Height dependence of the vertical wavenumber spectra
As shown by many observational papers using MST radars and radiosondes with fin
e vertical resolution, it was known that the horizontal wind and temperature fluctua-
tions have vertical wavenumber spectra with a characteristic shape of m−3 at their higher
wavenumber end (O(1/1km) to O(1/100m)) (VanZandt, 1982; Tsuda et al., 1989; Tsuda
et al., 1991; Sato, 1993, 1994). Previous theories on vertical wavenumber spectra in terms
of gravity waves mostly consider the vertical propagation (e.g., Smith et al., 1987; Sato and
Yamada, 1994). Although the wave structure is modified by the large-scale wind and at-
mospheric stability variation, the gravity wave amplitude basically increases exponentially
as the altitude increases when dissipation processes can be ignored, since the air density
decreases exponentially. On the other hand, the gravity wave amplitude is limited, in
other words, saturated by dissipation processes such as local convective/dynamical insta-
bility and radiation. By taking the gravity wave saturation into account, a part of aspects
such as the vertical change of characteristic wavenumber, i.e., the smallest wavenumber
of the spectral range having a shape of m−3 (Murayama et al., 1992) can be explained.
However, the gravity waves can propagate horizontally as shown by present study. Thus,
the altitude dependence of the gravity wave spectra needs to be explained including this
effect. An interesting feature of the wavenumber spectra observed by our experiment is
that the spectrum at 5◦S has smaller amplitude at the higher altitude range. This feature
D R A F T November 26, 2002, 3:50am D R A F T

18 SATO ET AL.: GRAVITY WAVE FIELD OVER THE OCEAN
seems inconsistent with exponential growth of gravity wave amplitudes in the vertical at
a glance.
The inertia-gravity wave discussed in Section 5 is dominant around the latitude of 5◦S
in the lower altitude region of 18–25km for which the spectra were calculated, whereas it is
dominant around 15◦S in the higher region of 24–31km. This explains the feature that the
gravity wave energy is maximized in the higher latitude region at the higher altitude region
in Figure 5. The vertical wavelength of the inertia-gravity wave of 4–5km corresponds to
the smallest wavenumber shown in the spectra (Figure 4). Thus, the smaller amplitude
at higher altitude region at 5◦S is likely due to the escape of this inertia-gravity wave
to the higher latitude region. This inference is consistent with the fact that the spectral
amplitude at the smallest wavenumber is larger at higher altitude region at 15◦S.
6.2. The importance of the meridionally-propagating gravity waves
It is widely recognized that gravity waves excited in the lower atmosphere propagate
upward and deposit the zonal momentum in the middle and upper atmosphere. The
thermal structure largely apart from the radiative balance that is observed in the lower
stratosphere and the upper mesosphere is explained partly and mainly, respectively, by
the existence of meridional circulation due to the wave-induced force. The gravity waves
propagating purely meridionally do not associate with vertical flux of zonal momentum.
So, their importance tends to be ignored. However, it is considered that meridionally
propagating gravity waves have their own roles for the momentum balance in the middle
atmosphere.
First, if the wavenumber vector has nonzero zonal component, the gravity wave propa-
gates vertical flux of zonal momentum meridionally. It means that the zonal momentum
D R A F T November 26, 2002, 3:50am D R A F T

SATO ET AL.: GRAVITY WAVE FIELD OVER THE OCEAN 19
exchange occurs between different latitudes. Sato et al. (1999) analyzed vertical flux
of zonal and meridional momentum in the meridional cross section using high-resolution
GCM simulation of gravity waves, and showed meridional propagation of gravity waves
associating with significant vertical flux of zonal momentum. In particular, gravity waves
excited by convection in the tropical region seem important because they associate with
large momentum fluxes. They propagate energy upward and poleward and can reach the
polar region above the middle stratosphere.
Second, several recent studies using satellite observation data (Lieberman, 1999) and
using a GCM (Miyahara et al., 2000) showed that the vertical flux of meridional mo-
mentum itself is important in the mesosphere and lower thermosphere. As described in
Andrews et al. (1987), it has been considered that the zonal mean zonal wind and geopo-
tential height fields are in the gradient-wind balance and the departure from the balance
is small. However, this is not the fact in the mesosphere and lower thermospheric region.
Lieberman and Miyahara et al. discussed that the departure from the gradient-wind bal-
ance is possibly due to the dissipation of tides and gravity waves associating vertical flux
of meridional momentum.
7. Summary and concluding remarks
In order to examine gravity wave characteristics over the ocean, we conducted a ra-
diosonde observation campaign to scan the stratosphere meridionally over the middle
Pacific with Hakuho-maru research vessel operated by the Ocean Research Institute,
University of Tokyo. Seventy vertical profiles of temperature, winds and humidity were
successfully obtained over a wide latitude range of 28◦N to 48◦S with almost the same
latitudinal interval of 1 degree.
D R A F T November 26, 2002, 3:50am D R A F T

20 SATO ET AL.: GRAVITY WAVE FIELD OVER THE OCEAN
Gravity wave energy and vertical wavenumber spectra were examined as a function
of latitude. Gravity wave energy is maximized in the tropical region where the con-
vection is active and in the middle latitude region where the subtropical westerly jet is
situated. The wave energy in the tropical region is greater than the climatology based
on operational radiosonde observation over land regions by Vincent et al. (2002), while
it is comparable in the higher latitude region. The results in this study indicate that
there are strong non-stationary gravity wave sources over the ocean. The importance of
meridionally propagating gravity waves was discussed. It was also shown that the vertical
wavenumber spectra of horizontal wind and temperature fluctuations have slope steeper
at lower latitudes. The gravity wave amplitude does not simply increase with altitude, in
contradiction to simple vertical propagation. The latitudinal distribution of wave energy
rather suggests that gravity waves propagate meridionally toward higher latitudes.
An interesting feature is that a wave packet having large horizontal wind and temper-
ature amplitudes of 6–9 m s−1 and 1.5–2.5K is observed continuously over 7 days in the
latitudinal region extending 26 degrees. Results of hodograph analysis indicates that the
wave packet can be explained by an inertia-gravity wave with a horizontal wavelength of
about 1800 km and a vertical wavelength of 4–5km. This inertia-gravity wave is likely
generated in association with vigorous convection in the Intertropical Convergence Zone
(ITCZ) in the Northern Hemisphere and propagated southward interhemispherically. It
was seen that this inertia-gravity wave contributes largely to the shape of the vertical
wavenumber spectra and latitudinal distribution of gravity wave energy.
Further analysis of gravity wave characteristics in the middle latitude region based on
this experiment will be presented somewhere. Similar observations over the ocean are
D R A F T November 26, 2002, 3:50am D R A F T

SATO ET AL.: GRAVITY WAVE FIELD OVER THE OCEAN 21
important to examine the stratospheric disturbances in the other regions and different
seasons.
Acknowledgments. The authors thank R. Kimura, H. Niino, K. Ishikawa and their
students at Ocean Research Institute (ORI), University of Tokyo, Japan, for their heartfelt
support to perform this experiment. They are also indebted to I. Koike and M. Terazaki
at ORI, PIs of the Hakuho-maru research cruise for their giving us an opportunity of
this experiment. K. Hara at National Institute of Polar Research (NIPR), Japan, helped
the launch of radiosondes during the cruise. Thanks are also for G. Hashida and N.
Hirasawa at NIPR, H. Nakamura and N. Yoshizaki at Meteorological Research Institute,
Japan, F. Kobayashi at National Defense Academy, Japan for their kind help during
the preparation stage of our experiment. The IR Satellite picture is provided by Space
Science and Engineering Center, University of Wisconsin-Madison and National Oceanic
and Atmospheric Administration, U.S.A. This research was supported by Grant-in-Aid
for Scientific Research (B)(2) 12440126 of the Ministry of Education, Culture, Sports,
Science and Technology, Japan.
References
Alexander, M. J., and T. J. Dunkerton, A spectral parameterization of mean-flow forcing
due to breaking gravity waves, J. Atmos. Sci., 56, 4167–4182, 1999.
Alexander, M. J., and K. H. Rosenlof, Nonstationary gravity wave forcing of the strato-
spheric zonal mean wind, J. Geophys. Res., 101, 23465–23474, 1996.
Allen, S. J., and R. A. Vincent, Gravity wave activity in the lower atmosphere: seasonal
and latitudinal variations. J. Geophys. Res., 100, 1327–1350, 1995.
D R A F T November 26, 2002, 3:50am D R A F T

22 SATO ET AL.: GRAVITY WAVE FIELD OVER THE OCEAN
Andrews, D. G., J. R. Holton, and C. B. Leovy, Middle Atmosphere Dynamics, Academic
Press, 489pp, 1987.
Carslaw, K.S., M. Wirth, A. Tsias, B. P. Luo, A. Dornbrack, M. Leutbecher, H. Volkert,
W. Renger, J. T. Bacmeister, E. Reimer, and Th. Peter, Increased stratospheric ozone
depletion due to mountain-induced atmospheric waves, Nature, 391, 675–678, 1998.
Charron, M., E, Manzini, and C. D. Warner, Intercomparison of gravity wave parame-
terizations: Hines Doppler-spread and Warner and McIntyre ultra-simple schemes, J.
Meteol. Soc. Japan, 80, 335–345, 2002.
Dunkerton, T. J., The role of gravity waves in the quasi-biennial oscillation, J. Geophys.
Res., 102, 26053–26076, 1997.
Medvedev, A. S., G. P. Klaassen, Vertical evolution of gravity wave spectra and the
parameterization of associated wave drag, J. Geophys. Res., 100, 25841–25853, 1995.
Miyahara, S., D. Yamamoto, and Y. Miyoshi, On the geostrophic balance of mean zonal
winds in the Mesosphere and lower Thermosphere, J. Meteorol. Soc. Japan, 78, 683–688,
2000.
Fritts, D. C., and G. D. Nastrom, Sources of mesoscale variability of gravity waves. Part
II: Frontal, convective and jet stream excitation, J. Atmos. Sci., 49, 111–127, 1992.
Fritts, D. C., and W. M. Lu, Spectral estimates of gravity wave energy and momentum
fluxes, II. Parameterization of wave forcing and variability, J. Atmos. Sci., 50, 3695–
3713, 1993.
Hines, C. O., Doppler-spread parameterization of gravity-wave momentum deposition in
the middle atmosphere. 1. Basic formulation, J. Atmos. Sol.-Terr. Phys., 59, 371–386,
1997.
D R A F T November 26, 2002, 3:50am D R A F T

SATO ET AL.: GRAVITY WAVE FIELD OVER THE OCEAN 23
Iwasaki, T., S. Yamada, and K. Tada, A parameterization scheme of orographic gravity
wave drag with two different vertical partitionings Part I: Impacts on Medium-range
forecasts, J. Meteor. Soc, Japan, 67, 11–27, 1989.
Kitamura, Y., and I. Hirota, Small-scale disturbances in the lower stratosphere revealed
by daily rawin sonde observations, J. Meteor. Soc. Japan, 67, 817–831, 1989.
Lieberman, R. S., The gradient wind in the mesosphere and lower thermosphere, Earth,
Planets and Space, 51, 751–761, 1999.
Lindzen, R. S., Turbulence and stress due to gravity wave and tidal breakdown, J. Geo-
phys. Res., 86, 9707–9714, 1981.
Matsuno, T. 1982: A quasi one-dimensional model of the middle atmosphere circulation
interacting with internal gravity-waves, J. Meteor. Soc. Japan, 60, 215–226, 1982.
Mayr, H. G., J. G. Mengel, C. O. Hines, K. L. Chan, N. F. Arnold, C. A. Reddy, and H. S.
Porter, The gravity wave Doppler spread theory applied in a numerical spectral model of
the middle atmosphere, 2. Equatorial oscillations, J. Geophys. Res., 102, 26093–26105,
1997.
McFarlane, N. A., The effect of orographically excited gravity wave drag on the general
circulation of the lower stratosphere and troposphere, J. Atmos. Sci., 44, 1775–1880,
1987.
Murayama, Y., T. Tsuda, M. Yamamoto, T. Nakamura, T. Sato, S. Kato, and S. Fukao,
Dominant vertical scales of gravity waves in the middle atmosphere observed with the
MU radar and rocketsondes, J. Atmos. Terr. Phys., 54, 339–346, 1992.
Palmer, T. N., G. J. Shutts, and R. Swinbank, Alleviation of a systematic westerly bias
in general circulation and numerical weather prediction models through an orographic
D R A F T November 26, 2002, 3:50am D R A F T

24 SATO ET AL.: GRAVITY WAVE FIELD OVER THE OCEAN
gravity wave drag parameterization, Quart. J. Roy. Met. Soc., 112, 1001–1040, 1986.
Sato, K., Small-scale wind disturbances observed by the MU radar during the passage of
Typhoon Kelly, J. Atmos. Sci., 50, 518–537, 1993.
Sato, K., A statistical study of the structure, saturation and sources of inertio-gravity
waves in the lower stratosphere observed with the MU radar, J. Atmos. Terr. Phys.,
56, 755–774, 1994.
Sato, K., Sources of gravity waves in the polar middle atmosphere, Adv. Polar Upper
Atmos. Res., 14, 233–240, 2000.
Sato, K. and T. J. Dunkerton, Estimates of momentum flux associated with equatorial
Kelvin and gravity waves, J. Geophys. Res., 102, 26247–26261, 1997.
Sato, K., and M. Yamada, Vertical structure of atmospheric gravity waves revealed by
the wavelet analysis, J. Geophys. Res., 99, 20623–20631, 1994.
Sato, K., T. Kumakura, and M. Takahashi, Gravity waves observed in a high-resolution
GCM simulation, J. Atmos. Sci., 56, 1005–1018, 1999.
Shibata, T., K. Sato, H. Kobayashi, M. Yabuki, and M. Shiobara, The Antarctic po-
lar stratospheric clouds under the temperature perturbation by non-orographic inertia
gravity waves observed by micro pulse lidar at Syowa station, J. Geophys. Res., in press.
Smith, S. A., D. C. Fritts and T. E. VanZandt, Evidence of a saturation spectrum of
atmospheric gravity waves. J. Atmos. Sci., 44, 1404–1410, 1987.
Tanaka, H., and M. D. Yamanaka, Atmospheric circulation in the lower stratosphere
induced by the mesoscale mountain wave breakdown. J. Meteor. Soc. Japan, 63, 1047–
1054, 1985.
D R A F T November 26, 2002, 3:50am D R A F T

SATO ET AL.: GRAVITY WAVE FIELD OVER THE OCEAN 25
Tsuda, T., T. Inoue, D. C. Fritts, T. E. VanZandt, S. Kato, T. Sato, and S. Fukao, MST
radar observations of a saturated gravity wave spectrum, J. Atmos. Sci., 46, 2440–2447,
1989.
Tsuda, T., Y. Murayama, M. Yamamoto, S. Kato, and S. Fukao, Seasonal variation of
momentum flux in the mesosphere observed with the MU radar. Geophys. Res. Lett., 6,
725–728, 1990.
Tsuda, T., T. E. VanZandt, M. Mizumoto, S. Kato, and S. Fukao, Spectral analysis
of temperature and Brunt-Vaisala frequency fluctuations observed by radiosondes, J.
Geophys. Res., 96, 17265–17278, 1991.
Tsuda, T., M. Nishida, C. Rocken, and R. H. Ware, A global morphology of gravity
wave activity in the stratosphere revealed by the GPS occultation data (GPS/MET),
J. Geophys. Res., 105, 7257–7273, 2000.
VanZandt, T. E., A universal spectrum of buoyancy waves in the atmosphere, Geophys.
Res. Lett., 9, 575–578, 1982.
Vincent, R. A., and others, SPARC Gravity Wave Initiative -Radiosonde Data Analysis-
, http://www.physics.adelaide.edu.au/atmospheric/radiosonde project.html,
2002.
Warner, C. D., and M. E. McIntyre, An ultrasimple spectral parameterization for nonoro-
graphic gravity waves, J. Atmos. Sci., 58, 1837–1857, 2001.
Yoshiki, M., and K. Sato, A statistical study of gravity waves in the polar regions based
on operational radiosonde observation data, J. Geophys. Res., 105, 17995–18011, 2000.
D R A F T November 26, 2002, 3:50am D R A F T

26 SATO ET AL.: GRAVITY WAVE FIELD OVER THE OCEAN
Figure 1. The locations where the GPS radiosondes were launched. The radiosondes
at the locations shown by open circles (cross marks) reached (did not reach) the attitude
of 24 km in the lower stratosphere.
D R A F T November 26, 2002, 3:50am D R A F T

SATO ET AL.: GRAVITY WAVE FIELD OVER THE OCEAN 27
Figure 2. Series of vertical profiles of (a) temperature, (b) zonal and (c) meridional
winds. Profiles on the equator are colored by red. Profiles at every ten degrees latitude
are colored by blue. Scales on the horizontal axis are shown for the profiles of the equator.
Each profile is shifted proportional to the latitude. Red and blue circles show the tropical
and midlatitude tropopauses. See the text for details.
D R A F T November 26, 2002, 3:50am D R A F T

28 SATO ET AL.: GRAVITY WAVE FIELD OVER THE OCEAN
Figure 3. Vertical wavenumber spectra of temperature (T), zonal (u) and meridional
(v) wind fluctuations for the altitude range of 18–25 km in the lower stratosphere as a
function of latitude. Dotted lines show the slope of the spectrum proportional to m−3.
Scales of the horizontal axes are for the spectra for 45◦S. The spectra at the other latitudes
are shifted by 1 order of magnitude, respectively.
D R A F T November 26, 2002, 3:50am D R A F T

SATO ET AL.: GRAVITY WAVE FIELD OVER THE OCEAN 29
Figure 4. The same as Figure 3a but for temperature fluctuations in the altitude range
of 24-31km in the middle stratosphere.
D R A F T November 26, 2002, 3:50am D R A F T

30 SATO ET AL.: GRAVITY WAVE FIELD OVER THE OCEAN
Figure 5. Gravity wave energy divided by atmospheric density as a function of latitude
for (a) the middle (an altitude range of 24–31km) and (b) lower stratosphere (18–25km).
Large and small closed circles show potential and kinetic energy obtained at each latitude,
respectively. Thin and thick curves show smoothed profiles for potential and kinetic energy
by using a lowpass filter with a cutoff length of 6 degrees, respectively.
D R A F T November 26, 2002, 3:50am D R A F T

SATO ET AL.: GRAVITY WAVE FIELD OVER THE OCEAN 31
Figure 6. The same as Figure 5 but for total kinetic energy (solid curves) and con-
tribution to kinetic energy by zonal (dashed curves) and meridional (dotted curves) wind
fluctuations.
D R A F T November 26, 2002, 3:50am D R A F T

32 SATO ET AL.: GRAVITY WAVE FIELD OVER THE OCEAN
Figure 7. A meridional cross section of meridional winds (a) and humidity (b) over the
middle Pacific observed by radiosondes in 30 November to 25 December, 2002. Contour
intervals are 5 m s−1 for meridional winds. A dashed arrow indicates the propagation of
the inertia-gravity wave packet.
D R A F T November 26, 2002, 3:50am D R A F T

SATO ET AL.: GRAVITY WAVE FIELD OVER THE OCEAN 33
Figure 8. The same as Figure7 but for logarithm of the Brunt-Vaisala frequency
squared. Contour intervals are 0.1. Red and blue closed circles indicate the tropical and
midlatitude tropopauses, respectively.
D R A F T November 26, 2002, 3:50am D R A F T
34 SATO ET AL.: GRAVITY WAVE FIELD OVER THE OCEAN
Figure 9. Vertical profiles of zonal (solid curves) and meridional (dashed curves) wind
fluctuations at latitudes of 11◦S, 13◦S, 15◦S, 17◦S, and 19◦S. Thin dashed lines and a
thick arrow show the vertical phase and energy propagation, respectively. The horizontal
spacing between the profiles is proportional to the observation time difference.
D R A F T November 26, 2002, 3:50am D R A F T

SATO ET AL.: GRAVITY WAVE FIELD OVER THE OCEAN 35
Figure 10. Top panels show vertical profiles of zonal (thick solid curves) and merid-
ional (thick long-dashed) wind and temperature fluctuations (thick short-dashed) and
respective fitted curves (thin solid, long-dashed, and short-dashed) in the altitude region
in which the fitting was successfully made at latitudes of 11◦S, 15◦S, and 19◦S. Tem-
perature fluctuations were plotted as the value of T ′g/TN . Observed hodographs (thick
curves) and fitted curves (thin curves) are shown in the bottom panels. Arrows show the
ground-based phase velocities estimated by the hodograph analysis.
D R A F T November 26, 2002, 3:50am D R A F T

36 SATO ET AL.: GRAVITY WAVE FIELD OVER THE OCEAN
Lat. Dir. of wave λh λz τ ch cgy cgz a T ′amp obs T ′
amp est
vector (deg) (km) (km) (h) (m s−1) (km d−1) (km d−1) (m s−1) (K) (K)
11◦ S 19 (ESE) 1700 3.8 41 12 210 1.3 9.0 2.4 2.7
15◦ S 76 (SSE) 1900 3.8 38 14 490 1.0 5.7 1.2 1.4
19◦ S 54 (SE) 1700 5.0 52 9 560 2.0 5.1 1.2 1.4
Ave. 49 (SE) 1800 4.2 44 12 420 1.4 6.6 1.6 1.8
Table 1. Wave parameters obtained by hodograph analysis at latitudes of 11◦ S 15◦ S,
and 17◦ S. Direction of the wave vector is taken clockwise from the east. λh is horizontal
wavelength, λz vertical wavelength, τ ground-based wave period, ch horizontal phase ve-
locity, cgy ground-based southward group velocity, cgz upward group velocity, a amplitude
of horizontal wind component in the direction of wave vector, T ′amp obs observed amplitude
of temperature component, T ′amp est amplitude of temperature component estimated from
v′amp and wave parameters.
D R A F T November 26, 2002, 3:50am D R A F T

SATO ET AL.: GRAVITY WAVE FIELD OVER THE OCEAN 37 ��������������������������������������������������������������������������������������������������������������������������������������������������������������������������������������������������������������������������������������������������������������������������������������������������������������������������������������������������������������������������������������������������������������������������������������������������������������������������������������������������������������������
Figure 11. A schematic illustration of the inertia-gravity wave structure detected by
observation. (a) Horizontal phase structure. (b) Meridional cross section of the phase
structure.
D R A F T November 26, 2002, 3:50am D R A F T

38 SATO ET AL.: GRAVITY WAVE FIELD OVER THE OCEAN ��������������������������������������������������������������������������������������������������������������������������������������������������������������������������������������������������������������������������������������������������������������������������������������������������������������������������������������������������������������������������������������������������������������������������������������������������������������������������������������������������������������������
Figure 12. An IR picture of a geostationary satellite of GOES-W at 2100 UT of
December 6, 2001 when the wave packet was located around the tropopause. The ship
location is shown by a cross mark.
D R A F T November 26, 2002, 3:50am D R A F T