THE GEOGRAPHICAL CONNECTEDNESS OF CHINESE SEAPORTS WITH FORELAND MARKETS: A NEW TREND?
Upload
khangminh22Category
view
0download
0
sustainability
Article
A Measure of Nature Connectedness for Childrenand Adults: Validation, Performance, and Insights
Miles Richardson 1,* , Anne Hunt 2, Joe Hinds 3, Rachel Bragg 4, Dean Fido 1 ,Dominic Petronzi 1, Lea Barbett 1 , Theodore Clitherow 5 and Matthew White 5
1 Human Sciences Research Centre, University of Derby, Derby DE22 1GB, UK; [email protected] (D.F.);[email protected] (D.P.); [email protected] (L.B.)
2 Valuing Environment Team, Natural England, York YO1 7PX, UK; [email protected] Department of Psychology, Social Work and Counselling, Faculty of Education & Health,
University of Greenwich, Greenwich, London SE10 9LS, UK; [email protected] Care Farming UK, Bristol BS3 4NA, UK; [email protected] European Centre for Environment and Human Health, University of Exeter Medical School, Truro,
Cornwall, TR1 3HD, UK; [email protected] (T.C.); [email protected] (M.W.)* Correspondence: [email protected]
Received: 28 March 2019; Accepted: 20 May 2019; Published: 12 June 2019�����������������
Abstract: With benefits to both human well-being and pro-nature conservation behaviors, natureconnectedness is emerging as an important psychological construct for a sustainable future.The growing research and applied and policy-related interests require a straightforward measureof nature connectedness that is suitable for both children and adult populations. To establish thereliability of the new Nature Connection Index (NCI) three factor analyses were conducted. One wasbased on a large Monitor of Engagement with the Natural Environment (MENE) dataset for adults(n = 3568) with a replication from data sets collected online (n = 553), and a third used MENEdata from children (n = 351). To validate the NCI as a measure for nature connectedness an onlinecomparison study (n = 153) included the NCI alongside other established measures. The resultsshowed that the NCI was a reliable and valid scale that offers a short, simple alternative to othermeasures of nature connectedness, particularly for populations including both children and adults,measured face to face or online. The utility of the NCI is also supported, with variations associatedwith various pro-environmental and pro-conservation behaviors observed, and importantly the NCIalso revealed changes in nature connectedness across the lifespan.
Keywords: nature connectedness; pro-nature conservation behaviors; lifespan
1. Introduction
Human connection with the rest of nature is a topic of increasing research interest [1] and is beingrecognized as of relevance to government policy relating to both human health and well-being and thenatural environment [2]. This focus is required owing to the crises in mental well-being [3] and inplanetary health owing to the effects of climate change from human activities [4]. A growing body ofevidence suggests that nature connectedness has benefits to mental well-being (for reviews see [5,6])and can also help deliver pro-environmental attitudes and behaviors [7–9]. The negative human impacton planetary health suggests a failing relationship between people and the rest of nature. There is aneed for a renewed sustainable relationship, one that benefits the natural world, but can also benefithuman well-being. Given the apparent benefits to well-being and influence on pro-nature behaviors,nature connectedness is emerging as an important construct that can help develop a more sustainablerelationship with the natural world. Importantly, nature connectedness is defined, can be measuredand increased through large-scale campaigns [10].
Sustainability 2019, 11, 3250; doi:10.3390/su11123250 www.mdpi.com/journal/sustainability

Sustainability 2019, 11, 3250 2 of 16
With the need for a new human relationship with nature and growing interest in a policy context [2],population measures of nature connectedness are needed to complement those that are already beingused to help monitor and report on people’s relationship with nature, for example the range of naturalenvironment attitude and behavior measures captured through the Monitor of Engagement with theNatural Environment Survey (MENE). Such measures are used to help target, design, and evaluatestrategic policy and practice interventions. Although a range of measures for nature connectednesshave been developed [11], none of these measures would be suitable for use in a national survey contextdue to the number, length, and complexity of item wording. Nor are these measures suitable for usewith both adults and children, which would be necessary to allow patterns across the lifespan to bemonitored and offer the potential for longitudinal research. To meet an emerging need for populationlevel data on nature connectedness, a collaboration of partners recently funded the development andtesting of a short, simple measure suitable for use with both children and adults. The new measure,the Nature Connection Index (NCI), was developed and tested through use in the existing omnibussurvey the MENE survey, which has accredited National Statistic status in the UK.
This paper provides background information on the new measure, presents the strengths andlimitations of this as an approach and provides insight into what the new index reveals about natureconnectedness in both children and adults.
1.1. Summary of the Rationale for Developing a New Measure for Nature Connectedness
The construct of connectedness to nature has multiple dimensions, including affective, cognitiveand experiential factors related to our belonging to the natural world [12,13]. Nature connectedness isalso concerned with an individual’s sense of self [14], where nature and humanity are one. Given themultiple factors, there are several measures used for adult populations (see [11] for a review) and thosefor children e.g., [15]. Each measure approaches the construct from a slightly different perspective,with some debate regarding how measures might tap into beliefs people hold about their connection tonature, rather than an individual’s affective relationship [16]. However, all were found to measure theconstruct of nature connectedness [11].
There is also interest in the relationship between childhood and adult nature connectedness andhow it varies across the lifespan. Concern is often expressed about children’s lack of connection withnature [17] and research has shown that the level of nature connectedness is below that associated withpro-conservation behaviors [18]. However, there is little data on the profile of nature connectednessacross the lifespan. The NCI is intended to allow such data to be collected and through monitoringtrends reveal factors linked to disconnection in childhood. Childhood and adolescence is a time ofmany significant physical and psychological changes where children develop an identity, form socialrelationships, competences, and goals that may conflict with a close connection with nature.
A measure suitable for gathering population data across the lifespan needs to be simple andshort. Many of the existing scales and their items are too long and complex and not suitable for use ina national survey context. A current successful short scale, the NR-6, provides an excellent tool forresearch, but the items are less suitable for children, and perhaps a little esoteric even for some sectionsof the adult population, e.g., “My connection to nature and the environment is a part of my spirituality”.While the child-focused Connection to Nature Index (CNI) is straightforward to understand [15] andhas demonstrated some diagnostic utility with regard to conservation behaviors [18], it is long,and some items are not that suitable for the wider adult population.
1.2. Summary of the Approach
An affective connection plays an important role in people’s engagement with the naturalenvironment [19] and is emerging as a potential mechanism for the well-being benefits [20]. Therefore,affect was a key factor informing the development of the new measure. Item selection consideredpeople’s affective and experiential relationship with nature, rather than a focus on cognitive appraisalsabout nature. A framework to inform the item themes within the NCI was provided by the pathways
Sustainability 2019, 11, 3250 3 of 16
to nature connectedness: emotion, beauty, contact, meaning and compassion [21]. These five types ofrelationship with nature have been found to explain a high level of variance in nature connectedness [21].The pathways themselves are a subset of the nine values of biophilia (utilitarian, naturalistic,ecologistic-scientific, aesthetic, symbolic, humanistic, moralistic, dominionistic, negativistic) [22].Further guidance was provided by reviews of existing nature connection measures e.g., [23,24].
1.3. Justification for the NCI Items
1. The first item related to the nature connectedness pathways [21] is emotion, “Being in nature makesme very happy”. An emotional attachment to nature is essential to nature connectedness [12],and is captured in the humanistic value of biophilia. Happiness has an affective component, it isan emotional experience linked to improvements in nature connectedness and well-being [5,13].Existing measures of nature connection include happiness, e.g., “Being outdoors makesme happy” [15].
2. Given the first item is also a well-being benefit, a second item on emotion takes a different emotionalpathway perspective, “I find being in nature really amazing”. States such as amazement, aweand wonder have been associated with eudemonic aspects of experience and therefore aredifferentiable from happiness [25]. Nature is known to be associated with positive feelings,such as awe and wonder [26,27] and wonder is often noted in observations of everyday nature [28].Again, such emotional responses are associated with enhancing nature connectedness [29,30].
3. The third item is related to the beauty pathway [21], “I always find beauty in nature”. Peopleare known to prefer aesthetically pleasing nature [31]. More recently, engagement with naturalbeauty has been shown to be involved in the relationship between nature connectednessand well-being [20,32,33].
4. The fourth item is related to the contact and meaning pathways [21], “Spending time in nature isvery important to me”. Research into nature connectedness has placed an emphasis on directexperiences with nature that foster an affective relationship [19,34]. Such experiences of naturerequire time in it and time in nature can promote increased levels of nature connectedness [35–37].It is an aspect included in other measures, for example “Spending time in nature is important tome” is included in the Environmental Identity Scale [38].
5. The fifth item is related to the compassion pathway [21], “I always treat nature with respect”.The compassion pathway is derived from the moralistic value of biophilia which involvesethical judgements and revering nature. In framing this aspect suitably for children, thedecision was taken to use the term “respect”. Reverence is related to respect and respectfulactions towards nature involve ethical judgements. The item has a behavioral focus as therecan be a gap between values and action [39]. Furthermore, an action-based framing for thispathway was found to be an important indicator of nature connectedness, slightly above avalue framing [21]. Nature connectedness is linked to pro-environmental attitudes [12,40],and behaviors [13]. This conservation of nature is captured within the moralistic value ofbiophilia [21,22,41]. This aspect of nature connectedness is found in existing measures, e.g., theNature Relatedness Scale for adults [42].
6. The sixth item “I feel part of nature” reflects that connectedness to nature encompasses bothaffective and experiential sense of belonging to the natural world [12]. It relates to a person’sunderstanding of their interconnectedness with nature and their sense of inclusion within nature.It also reflects that nature connectedness captures a breadth of concepts including inclusion of selfin nature, cognitive appraisals, appreciation of nature and emotional affiliations e.g., [43]. Feelingpart of nature is an overarching aspect that taps directly into the concept of humans having ashared place within the natural world. It is a concept included in several other measures ofnature connection, often less directly, and the sole concept of the single-item Inclusion of Naturein Self scale [44].

Sustainability 2019, 11, 3250 4 of 16
1.4. Summary of Methodology for Development of the NCI
Full details of the development work are detailed in [45]. Participants in the development werecollected from early phases of the MENE data collected 2015/16 (n = 1294). Key aspects includedadopting a 7-point response scale, “completely agree” to “completely disagree” based on data from thepilot sample. This was preferred to a 5-point “strongly agree/disagree” as it provided a greater spreadof scores. Results from the pilot, for example skewness, also led to the development of a weightedpoints index from zero to a maximum score of 100 in line with expectations for a national indicatorapproach and following standard approaches to data transformation [46]. The points index was scaledusing the relative weight of item responses based on the distribution of the sum of inverse scoresand variance (see column 3 of Table 1). This sum figure reflected the “importance” or “usefulness”of each item, by giving a higher value to those variables where the mean is lower. This process alsogave greater weight to items with more variance to produce better discriminatory power. The sumof inverse scores and variance for the six items was then used to calculate the contribution weight(see column 4 in Table 1). These weights were then used to create the points index and value of thetop answer code for each item. A non-linear power function was then used to scale the remaining sixresponse options so that each ran from zero up to the maximum. A non-linear approach was taken togive greater emphasis to the top answer codes. The non-linear points system by item shown in Table 2improved dispersion, producing more even percentiles with the overall impact allowing the index tobetter rank respondents on strength of evidence of nature connectedness. The weighted points indexprovided a greater spread of scores, evened out the distribution to provide differentiation in the middlerange and increased the weight of the final overarching item. This ensured balanced representationof all six items and wider variation among the responses. The points index weighting was testedagainst unweighted scores and the simple weighting and produced the most evenly distributed indexallowing the potential for categorization and banding without compromising relationships betweenthe index and other variables of interest (e.g., ecological concern, well-being etc.). The data includedboth children and adults. Further development work included use of the NCI in initial large cohortstudies evaluating applied interventions. Here the NCI has shown that it is sensitive to increases innature connectedness brought about by applied interventions to engage people with nature [10].
Table 1. Calculation of weighted points index for each item.
Inverse Mean Variance Sum Weight (%)
I always find beauty in nature 1.16 1.81 2.97 15.0%I always treat nature with respect 0.80 1.26 2.06 10.4%Being in nature makes me very happy 1.23 1.83 3.06 15.5%Spending time in nature is veryimportant to me 1.45 2.30 3.75 19.0%
I find being in nature really amazing 1.38 1.98 3.36 17.0%I feel part of nature 1.93 2.61 4.54 23.0%
Table 2. NCI items and weighted points index for each point on the response scale.
Response Scale Rating
Statement 1 2 3 4 5 6 7
1—I always find beauty in nature 0 1 2 3 5 9 152—I always treat nature with respect 0 0 1 2 4 6 103—Being in nature makes me veryhappy 0 1 2 3 6 10 16
4—Spending time in nature is veryimportant to me 0 1 2 3 6 11 19
5—I find being in nature really amazing 0 1 2 3 6 10 176—I feel part of nature 0 1 2 4 7 13 23
Sustainability 2019, 11, 3250 5 of 16
The NCI was initially tested and developed through use in the MENE survey. As the MENEsurvey includes questions on environmental attitudes and behaviors there was an opportunity to lookfor evidence of any simple relationships between these factors (and demographics) and the NCI.
1.5. Summary of Potential Utility of the NCI
The potential utility of the measure lies, for example, in helping to explore key issues such asthe “environmental value-action” gap which describes the disparity between the concerns peopleexpress about the natural environment and their own lifestyle. People often report strong concernsabout the environment but show low commitment to changing their own behavior and engaging inpro-environmental behaviors [39]. Nature connectedness is inherently a measure of value placed onthe natural environment and can be compared to both attitudinal and behavioral measures.
Furthermore, as a relatively new psychological construct, nature connectedness provides a newdirection for the study of such issues. For example, early models assumed people’s behavior tobe rational, and proposed a linear relationship, with knowledge shaping attitudes and thereforeinfluencing behavior [47]. However, even though environmental knowledge shows little effect onenvironmental behavior, it is still considered a necessary pre-requisite [48]. Newer approaches oftenfocus on emotional factors, such as connectedness to nature. In fact, connectedness to nature may bean influential variable. It has been shown to be a much stronger predictor of environmental behaviorthan other factors, including knowledge [8]. As it is designed for children and adults, the NCI mightbe particularly useful to examine the relationship between values and behavior as the influence ofconnectedness to nature has been observed at several life stages [8].
To establish the validity and reliability of the NCI, the present paper reports three factor analyses.One based on a large MENE dataset for adults with a replication from data sets collected online and athird uses MENE data from children. The paper also reports variation in NCI by demographics, acrossthe lifespan and the relationship to key attitudes and behaviors. Finally, scale characteristics resultingfrom producing a simple scale allow observations related to the value-action gap.
2. Materials and Methods
2.1. Design and Participants
Cross-sectional data from several sources was used. Participation in the survey was voluntary andthe data collection conforms to the provisions of the Declaration of Helsinki in 1995 (and subsequentrevisions). Ethical guidelines were followed as required for conducting human research.
Adult sample from the MENE survey (Factor Analysis 1): The MENE survey is part of the UK’snational statistics and uses the robust protocols required when collecting data to inform policy.The MENE survey involves weekly waves of interviewing across England to reduce potential seasonaland geographical biases. In each wave, interviews are undertaken with a representative sample ofthe English adult population (aged 16 and over) with a sample of at least 800 achieved per wave.Data is collected in-home using Computer Assisted Personal Interviewing as part of the omnibussurvey. Given the scale and coverage of MENE, the survey provided an ideal vehicle to pilot the newnature connection index. MENE is funded by the UK government’s advisory body for the naturalenvironment, Natural England with support from the government department responsible for forestsand woodlands, the Forestry Commission and the UK government’s Department for EnvironmentFood and Rural Affairs. The MENE data included in the present research was collected from adults2017/ 2018. Complete NCI responses were received from 3568 adults aged 16 to 95 years. The meanage was 49.98 years (SD = 20.05). There were 1826 female respondents and 1742 male respondents.
Adult samples from online surveys (Factor Analysis 2): For the purposes of the second factor analysis,NCI data was combined from two online surveys. The first online survey was distributed via Qualtricsto 400 English adults via an online survey platform (Survey Sampling International) which paysrespondents for completing surveys. The second online comparison survey was also distributed via

Sustainability 2019, 11, 3250 6 of 16
Qualtrics and recruited 153 adults using opportunity sampling after participants followed a link to anonline consent page and debrief. This study included existing measures for comparison. The overallprofile of the 553 participants who provided the second data set collected online was 267 males and286 females, 73 aged 18–24 years; 137 aged 25–34 years; 114 aged 35–44 years; 101 aged 45–54 years;63 aged 55–64 years; 50 aged 65–74 years; 12 aged 74–85 and 3 aged over 85 years.
Child sample from the MENE survey (Factor Analysis 3): Participating children are selected by askingadults for permission to include children in their household in the survey (and the consent of childrenthemselves is also required). A sample of 351 children aged 7 to 15 years with 177 female respondentsand 174 males.
2.2. Existing Measures Comparison
To validate the NCI as a measure for nature connectedness, the online comparison study includedthe NCI alongside other established measures. (It was not possible to include these other measures inthe MENE survey for the NCI development work due to the number, length, and complexity of thesescales or their items.) The measures in the comparison study included:
- The single-item Inclusion of Nature in Self (INS) scale [44]. The INS represents “nature” and“self” within two circles with participants selecting the level of overlap that describes theirinterconnection with the natural environment.
- The six-item short-form Nature Relatedness Scale (NR-6; [49]) which comprises items that arescored on a 5-point Likert scale (where 1 = strongly disagree, 2 = disagree, 3 = neutral, 4 = agree,5 = strongly agree). Example items include: “I always think about how my actions affect theenvironment”, and “My relationship to nature is an important part of who I am”.
- The four-item natural beauty sub-scale from the Engagement with Beauty scale (EWNB) developedby [50] was used. The four items are: “When perceiving beauty in nature I feel something like aspiritual experience, perhaps a sense of oneness, or being united with the universe, or a love ofthe entire world”; “I notice beauty in one or more aspects of nature”; “When perceiving beauty innature I feel emotional, it ‘moves me,’ such as feeling a sense of awe, or wonder or excitement oradmiration or upliftment”; “When perceiving beauty in nature I feel changes in my body, such asa lump in my throat, an expansion in my chest, faster heartbeat, or other bodily responses”.Participants responded on a 7-item “very unlike me” to “very much like me” scale.
To further explore the utility of the NCI in comparison to existing nature connectedness scales,two further measures of interest were included in the online comparison study:
- The 16-item Difficulties in Emotion Regulation Scale (DERS; [51]) was used to indicate ease ofaffect regulation. It has been found that affect regulation mediates the relationship between natureconnectedness and well-being providing, an indication of alternative mechanisms and confirmingthe importance of affect [20]. Therefore, it is interesting to look at the relationship between affectregulation and nature connectedness. DERS has also been found to be associated with measuresrelevant to the benefits of nature connectedness (e.g., psychophysiological measures such as heartrate variability and generalized anxiety disorder) [52].
- A single question on happiness with an 11-point response scale, “In general, do you feel happy?”This single item offers a valid and reliable measure of well-being for community surveys and hasbeen shown to correlate highly with multi-item well-being scales (e.g., Oxford Happiness Indexand Satisfaction with Life Scale) [53]. It was included as happiness is a key well-being outcomeassociated with nature connectedness [6,54].
As covered in the introduction and detailed in [45], the raw NCI data was adjusted throughapplication of the points index shown in Table 2.

Sustainability 2019, 11, 3250 7 of 16
3. Results
3.1. Summary of Results from the MENE Survey to Show NCI Variations by Gender, Age, Ethnicity,and Employment Status
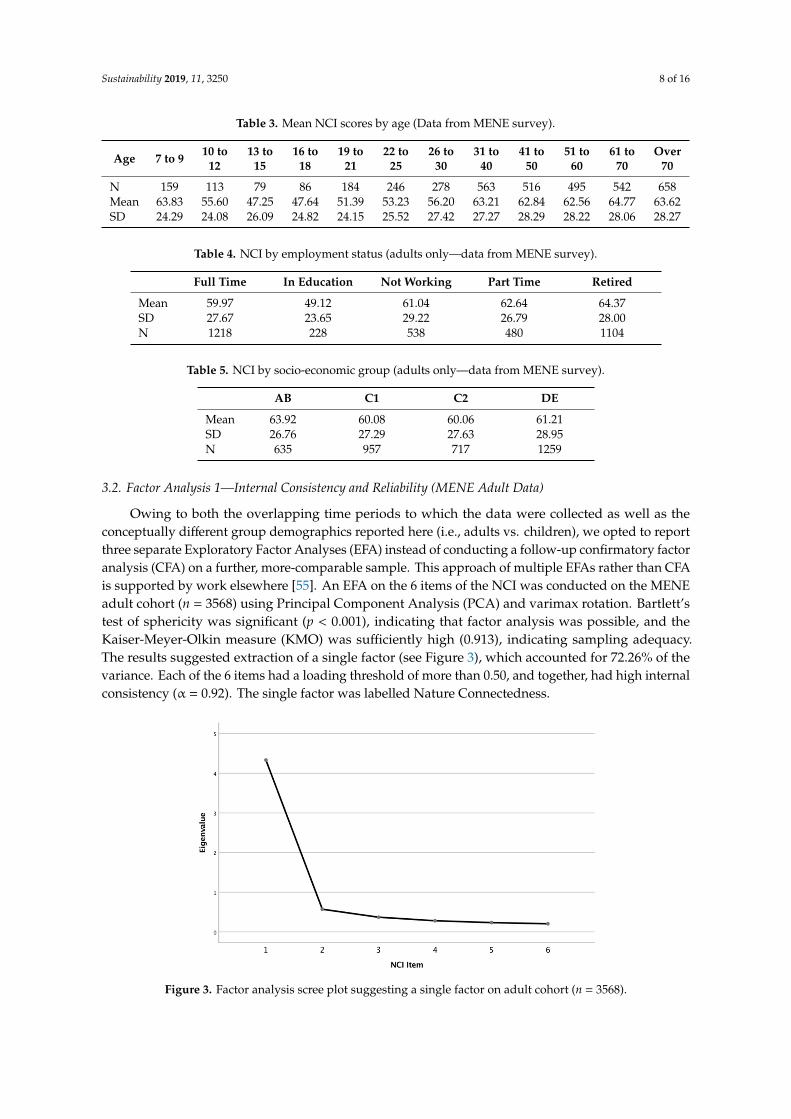
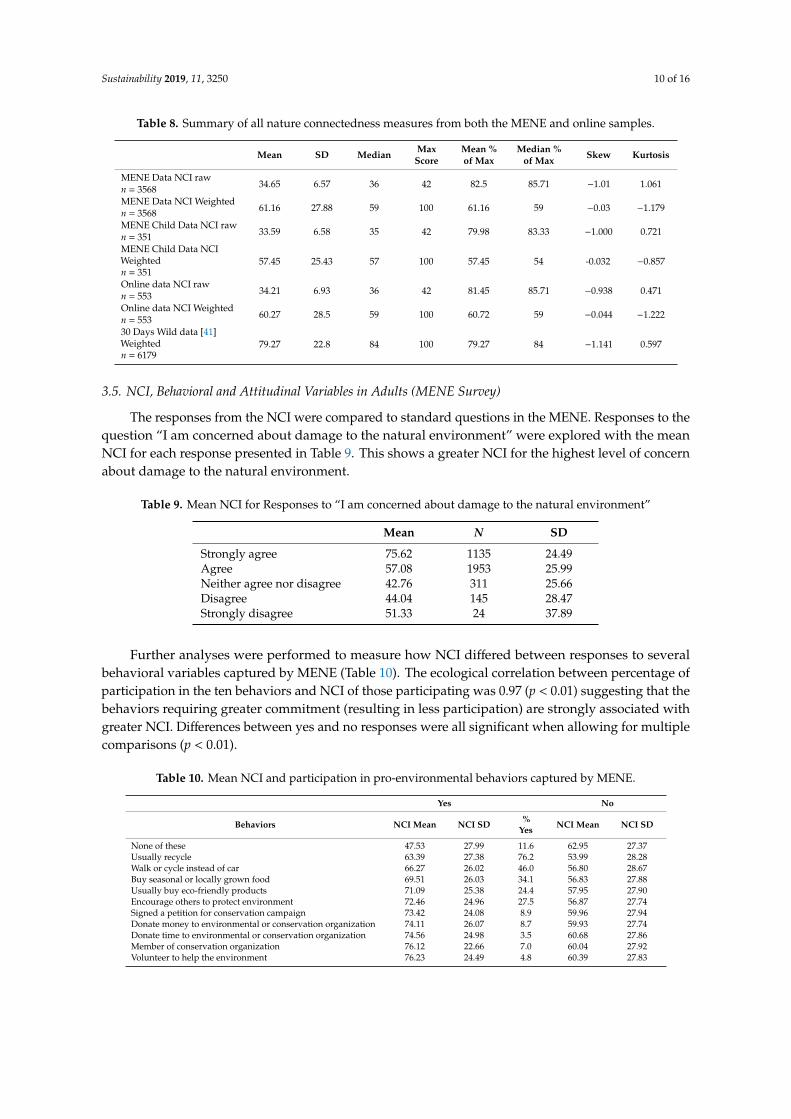
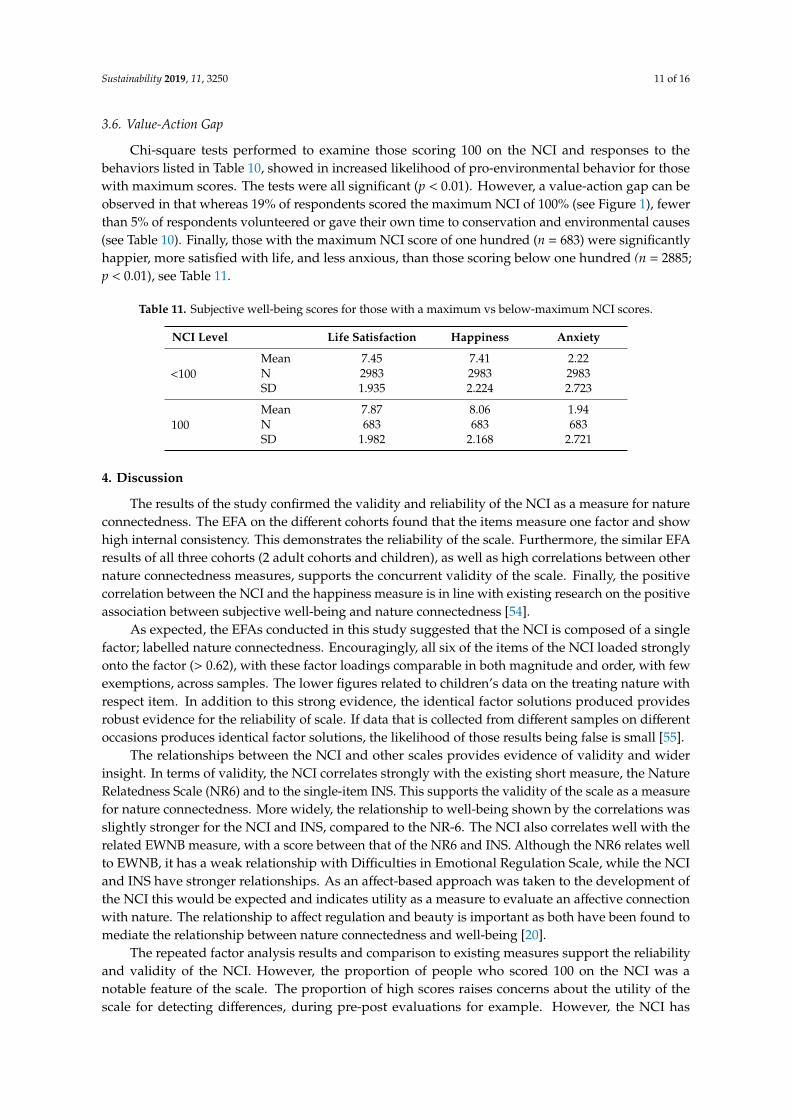
The mean NCI score in adults (16 years old and over) was 61.16 (SD = 27.88) and the distributionis shown in Figure 1. Females scored significantly (p < 0.01) higher (64.21, SD = 27.36) than males(57.96, SD = 28.08). The mean NCI for the non-Black, Asian and Minority Ethnic (BAME) populationwas 60.60 (SD = 27.81; n = 2761) and 63.06 (SD = 28.06; n = 807) for the BAME population. There werenotable differences between age groups as shown in Figure 2 and Table 3. Tables 4 and 5 show theNCI by employment status and socio-economic group. Table 4 reveals a notably lower NCI for thosein education; however, this group had a mean age of 21. Table 5 shows little difference betweensocio-economic groups. The mean score for children aged under 16 years of age was 57.45 (SD = 25.43),with boys (54.60, SD = 24.76) scoring significantly (p = 0.037) lower than girls (60.25, SD = 25.83).
Sustainability 2019, 11, x FOR PEER REVIEW 7 of 16
3. Results
3.1. Summary of Results from the MENE Survey to Show NCI Variations by Gender, Age, Ethnicity, and Employment Status
The mean NCI score in adults (16 years old and over) was 61.16 (SD = 27.88) and the distribution is shown in Figure 1. Females scored significantly (p < 0.01) higher (64.21, SD = 27.36) than males (57.96, SD = 28.08). The mean NCI for the non-Black, Asian and Minority Ethnic (BAME) population was 60.60 (SD = 27.81; n = 2761) and 63.06 (SD = 28.06; n = 807) for the BAME population. There were notable differences between age groups as shown in Figure 2 and Table 3. Tables 4 and 5 show the NCI by employment status and socio-economic group. Table 4 reveals a notably lower NCI for those in education; however, this group had a mean age of 21. Table 5 shows little difference between socio-economic groups. The mean score for children aged under 16 years of age was 57.45 (SD = 25.43), with boys (54.60, SD = 24.76) scoring significantly (p = 0.037) lower than girls (60.25, SD = 25.83).
Figure 1. Distribution of adult NCI scores, n = 3568 (Data from MENE survey).
Table 3. Mean NCI scores by age (Data from MENE survey).
Age 7 to 9 10 to
12 13 to
15 16 to
18 19 to
21 22 to
25 26 to
30 31 to
40 41 to
50 51 to
60 61 to
70 Over
70 N 159 113 79 86 184 246 278 563 516 495 542 658 Mean 63.83. 55.60 47.25 47.64 51.39 53.23 56.20 63.21 62.84 62.56 64.77 63.62 SD 24.29 24.08 26.09 24.82 24.15 25.52 27.42 27.27 28.29 28.22 28.06 28.27
0
100
200
300
400
500
600
700
800
900
10 20 30 40 50 60 70 80 90 100
Freq
uenc
y
Nature Connected Index
Figure 1. Distribution of adult NCI scores, n = 3568 (Data from MENE survey).Sustainability 2019, 11, x FOR PEER REVIEW 8 of 16
Figure 2. Mean NCI scores across the lifespan, n = 3919 (Data from MENE survey).
Table 4. NCI by employment status (adults only—data from MENE survey).
Full Time In
Education Not
Working Part Time Retired
Mean 59.97 49.12 61.04 62.64 64.37 SD 27.67 23.65 29.22 26.79 28.00 N 1218 228 538 480 1104
Table 5. NCI by socio-economic group (adults only—data from MENE survey).
AB C1 C2 DE Mean 63.92 60.08 60.06 61.21 SD 26.76 27.29 27.63 28.95 N 635 957 717 1259
3.2. Factor Analysis 1—Internal Consistency and Reliability (MENE Adult Data)
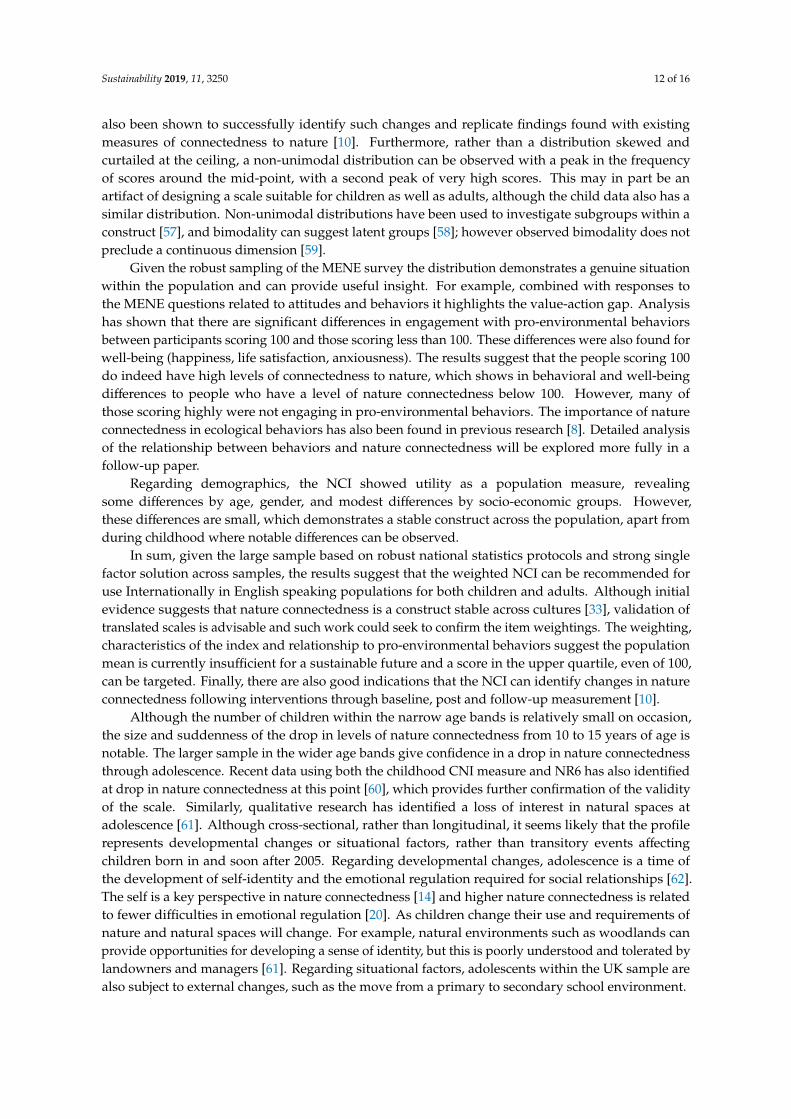
Owing to both the overlapping time periods to which the data were collected as well as the conceptually different group demographics reported here (i.e., adults vs. children), we opted to report three separate Exploratory Factor Analyses (EFA) instead of conducting a follow-up confirmatory factor analysis (CFA) on a further, more-comparable sample. This approach of multiple EFAs rather than CFA is supported by work elsewhere [55]. An EFA on the 6 items of the NCI was conducted on the MENE adult cohort (n = 3568) using Principal Component Analysis (PCA) and varimax rotation. Bartlett’s test of sphericity was significant (p < 0.001), indicating that factor analysis was possible, and the Kaiser-Meyer-Olkin measure (KMO) was sufficiently high (0.913), indicating sampling adequacy. The results suggested extraction of a single factor (see Figure 3), which accounted for 72.26% of the variance. Each of the 6 items had a loading threshold of more than 0.50, and together, had high internal consistency (α = 0.92). The single factor was labelled Nature Connectedness.
35
40
45
50
55
60
65
70
7 to 9 10 to12
13 to15
16 to18
19 to21
22 to25
26 to30
31 to40
41 to50
51 to60
61 to70
Over70
Nat
ure
Con
nect
ion
Inde
x
Age
Figure 2. Mean NCI scores across the lifespan, n = 3919 (Data from MENE survey).
Sustainability 2019, 11, 3250 8 of 16
Table 3. Mean NCI scores by age (Data from MENE survey).
Age 7 to 9 10 to12
13 to15
16 to18
19 to21
22 to25
26 to30
31 to40
41 to50
51 to60
61 to70
Over70
N 159 113 79 86 184 246 278 563 516 495 542 658Mean 63.83 55.60 47.25 47.64 51.39 53.23 56.20 63.21 62.84 62.56 64.77 63.62SD 24.29 24.08 26.09 24.82 24.15 25.52 27.42 27.27 28.29 28.22 28.06 28.27
Table 4. NCI by employment status (adults only—data from MENE survey).
Full Time In Education Not Working Part Time Retired
Mean 59.97 49.12 61.04 62.64 64.37SD 27.67 23.65 29.22 26.79 28.00N 1218 228 538 480 1104
Table 5. NCI by socio-economic group (adults only—data from MENE survey).
AB C1 C2 DE
Mean 63.92 60.08 60.06 61.21SD 26.76 27.29 27.63 28.95N 635 957 717 1259
3.2. Factor Analysis 1—Internal Consistency and Reliability (MENE Adult Data)
Owing to both the overlapping time periods to which the data were collected as well as theconceptually different group demographics reported here (i.e., adults vs. children), we opted to reportthree separate Exploratory Factor Analyses (EFA) instead of conducting a follow-up confirmatory factoranalysis (CFA) on a further, more-comparable sample. This approach of multiple EFAs rather than CFAis supported by work elsewhere [55]. An EFA on the 6 items of the NCI was conducted on the MENEadult cohort (n = 3568) using Principal Component Analysis (PCA) and varimax rotation. Bartlett’stest of sphericity was significant (p < 0.001), indicating that factor analysis was possible, and theKaiser-Meyer-Olkin measure (KMO) was sufficiently high (0.913), indicating sampling adequacy.The results suggested extraction of a single factor (see Figure 3), which accounted for 72.26% of thevariance. Each of the 6 items had a loading threshold of more than 0.50, and together, had high internalconsistency (α = 0.92). The single factor was labelled Nature Connectedness.Sustainability 2019, 11, x FOR PEER REVIEW 9 of 16
Figure 3. Factor analysis scree plot suggesting a single factor on adult cohort (n = 3568).
3.3. Scale Validity—Factor Analysis 2 (Online Data) and Factor Analysis 3 (MENE Child Data)
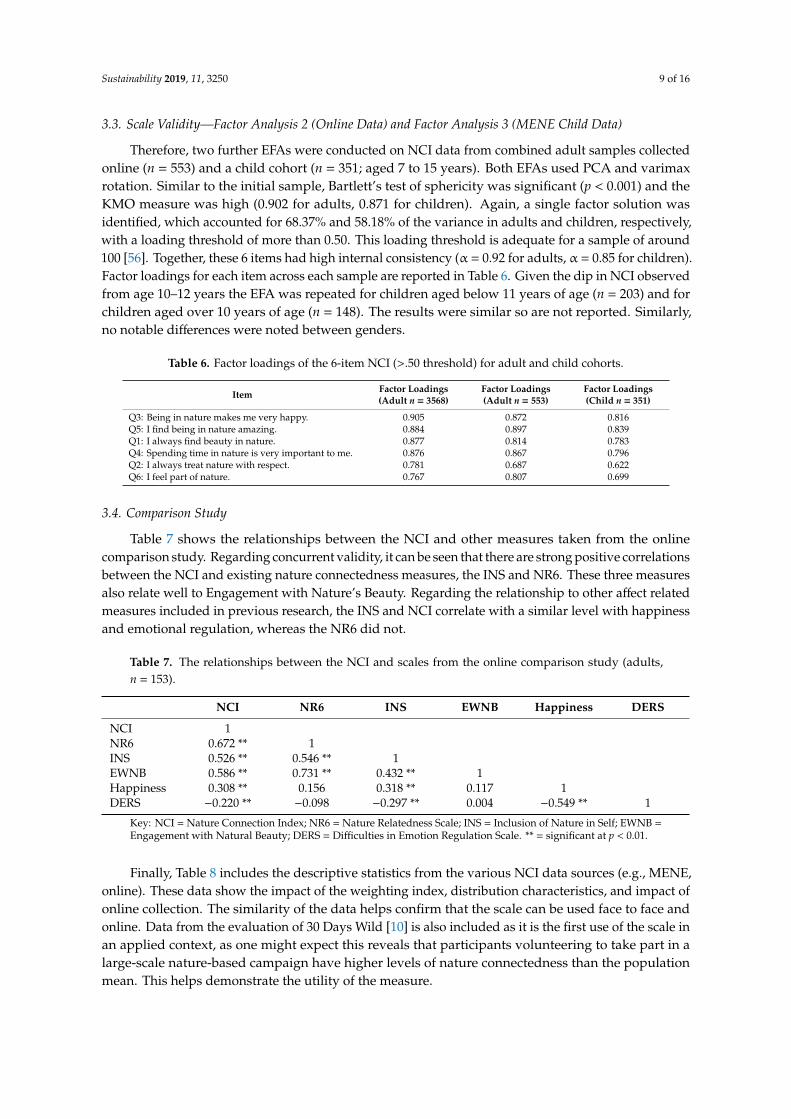
Therefore, two further EFAs were conducted on NCI data from combined adult samples collected online (n = 553) and a child cohort (n = 351; aged 7 to 15 years). Both EFAs used PCA and varimax rotation. Similar to the initial sample, Bartlett’s test of sphericity was significant (p < 0.001) and the KMO measure was high (0.902 for adults, 0.871 for children). Again, a single factor solution was identified, which accounted for 68.37% and 58.18% of the variance in adults and children, respectively, with a loading threshold of more than 0.50. This loading threshold is adequate for a sample of around 100 [56]. Together, these 6 items had high internal consistency (α = 0.92 for adults, α = 0.85 for children). Factor loadings for each item across each sample are reported in Table 6. Given the dip in NCI observed from age 10–12 years the EFA was repeated for children aged below 11 years of age (n = 203) and for children aged over 10 years of age (n = 148). The results were similar so are not reported. Similarly, no notable differences were noted between genders.
Table 6. Factor loadings of the 6-item NCI (>.50 threshold) for adult and child cohorts.
Item Factor Loadings (Adult n = 3568)
Factor Loadings (Adult n = 553)
Factor Loadings (Child n = 351)
Q3: Being in nature makes me very happy. 0.905 0.872 0.816 Q5: I find being in nature amazing. 0.884 0.897 0.839 Q1: I always find beauty in nature. 0.877 0.814 0.783 Q4: Spending time in nature is very important to me. 0.876 0.867 0.796 Q2: I always treat nature with respect. 0.781 0.687 0.622 Q6: I feel part of nature. 0.767 0.807 0.699
3.4. Comparison Study
Table 7 shows the relationships between the NCI and other measures taken from the online comparison study. Regarding concurrent validity, it can be seen that there are strong positive correlations between the NCI and existing nature connectedness measures, the INS and NR6. These three measures also relate well to Engagement with Nature’s Beauty. Regarding the relationship to other affect related measures included in previous research, the INS and NCI correlate with a similar level with happiness and emotional regulation, whereas the NR6 did not.
Figure 3. Factor analysis scree plot suggesting a single factor on adult cohort (n = 3568).
Sustainability 2019, 11, 3250 9 of 16
3.3. Scale Validity—Factor Analysis 2 (Online Data) and Factor Analysis 3 (MENE Child Data)
Therefore, two further EFAs were conducted on NCI data from combined adult samples collectedonline (n = 553) and a child cohort (n = 351; aged 7 to 15 years). Both EFAs used PCA and varimaxrotation. Similar to the initial sample, Bartlett’s test of sphericity was significant (p < 0.001) and theKMO measure was high (0.902 for adults, 0.871 for children). Again, a single factor solution wasidentified, which accounted for 68.37% and 58.18% of the variance in adults and children, respectively,with a loading threshold of more than 0.50. This loading threshold is adequate for a sample of around100 [56]. Together, these 6 items had high internal consistency (α = 0.92 for adults, α = 0.85 for children).Factor loadings for each item across each sample are reported in Table 6. Given the dip in NCI observedfrom age 10–12 years the EFA was repeated for children aged below 11 years of age (n = 203) and forchildren aged over 10 years of age (n = 148). The results were similar so are not reported. Similarly,no notable differences were noted between genders.
Table 6. Factor loadings of the 6-item NCI (>.50 threshold) for adult and child cohorts.
Item Factor Loadings(Adult n = 3568)
Factor Loadings(Adult n = 553)
Factor Loadings(Child n = 351)
Q3: Being in nature makes me very happy. 0.905 0.872 0.816Q5: I find being in nature amazing. 0.884 0.897 0.839Q1: I always find beauty in nature. 0.877 0.814 0.783Q4: Spending time in nature is very important to me. 0.876 0.867 0.796Q2: I always treat nature with respect. 0.781 0.687 0.622Q6: I feel part of nature. 0.767 0.807 0.699
3.4. Comparison Study
Table 7 shows the relationships between the NCI and other measures taken from the onlinecomparison study. Regarding concurrent validity, it can be seen that there are strong positive correlationsbetween the NCI and existing nature connectedness measures, the INS and NR6. These three measuresalso relate well to Engagement with Nature’s Beauty. Regarding the relationship to other affect relatedmeasures included in previous research, the INS and NCI correlate with a similar level with happinessand emotional regulation, whereas the NR6 did not.
Table 7. The relationships between the NCI and scales from the online comparison study (adults,n = 153).
NCI NR6 INS EWNB Happiness DERS
NCI 1NR6 0.672 ** 1INS 0.526 ** 0.546 ** 1EWNB 0.586 ** 0.731 ** 0.432 ** 1Happiness 0.308 ** 0.156 0.318 ** 0.117 1DERS −0.220 ** −0.098 −0.297 ** 0.004 −0.549 ** 1
Key: NCI = Nature Connection Index; NR6 = Nature Relatedness Scale; INS = Inclusion of Nature in Self; EWNB =Engagement with Natural Beauty; DERS = Difficulties in Emotion Regulation Scale. ** = significant at p < 0.01.
Finally, Table 8 includes the descriptive statistics from the various NCI data sources (e.g., MENE,online). These data show the impact of the weighting index, distribution characteristics, and impact ofonline collection. The similarity of the data helps confirm that the scale can be used face to face andonline. Data from the evaluation of 30 Days Wild [10] is also included as it is the first use of the scale inan applied context, as one might expect this reveals that participants volunteering to take part in alarge-scale nature-based campaign have higher levels of nature connectedness than the populationmean. This helps demonstrate the utility of the measure.
Sustainability 2019, 11, 3250 10 of 16
Table 8. Summary of all nature connectedness measures from both the MENE and online samples.
Mean SD Median MaxScore
Mean %of Max
Median %of Max Skew Kurtosis
MENE Data NCI raw34.65 6.57 36 42 82.5 85.71 −1.01 1.061n = 3568
MENE Data NCI Weighted61.16 27.88 59 100 61.16 59 −0.03 −1.179n = 3568
MENE Child Data NCI raw33.59 6.58 35 42 79.98 83.33 −1.000 0.721n = 351
MENE Child Data NCIWeighted 57.45 25.43 57 100 57.45 54 -0.032 −0.857n = 351Online data NCI raw
34.21 6.93 36 42 81.45 85.71 −0.938 0.471n = 553Online data NCI Weighted
60.27 28.5 59 100 60.72 59 −0.044 −1.222n = 55330 Days Wild data [41]Weighted 79.27 22.8 84 100 79.27 84 −1.141 0.597n = 6179
3.5. NCI, Behavioral and Attitudinal Variables in Adults (MENE Survey)
The responses from the NCI were compared to standard questions in the MENE. Responses to thequestion “I am concerned about damage to the natural environment” were explored with the meanNCI for each response presented in Table 9. This shows a greater NCI for the highest level of concernabout damage to the natural environment.
Table 9. Mean NCI for Responses to “I am concerned about damage to the natural environment”
Mean N SD
Strongly agree 75.62 1135 24.49Agree 57.08 1953 25.99Neither agree nor disagree 42.76 311 25.66Disagree 44.04 145 28.47Strongly disagree 51.33 24 37.89
Further analyses were performed to measure how NCI differed between responses to severalbehavioral variables captured by MENE (Table 10). The ecological correlation between percentage ofparticipation in the ten behaviors and NCI of those participating was 0.97 (p < 0.01) suggesting that thebehaviors requiring greater commitment (resulting in less participation) are strongly associated withgreater NCI. Differences between yes and no responses were all significant when allowing for multiplecomparisons (p < 0.01).
Table 10. Mean NCI and participation in pro-environmental behaviors captured by MENE.
Yes No
Behaviors NCI Mean NCI SD %Yes NCI Mean NCI SD
None of these 47.53 27.99 11.6 62.95 27.37Usually recycle 63.39 27.38 76.2 53.99 28.28Walk or cycle instead of car 66.27 26.02 46.0 56.80 28.67Buy seasonal or locally grown food 69.51 26.03 34.1 56.83 27.88Usually buy eco-friendly products 71.09 25.38 24.4 57.95 27.90Encourage others to protect environment 72.46 24.96 27.5 56.87 27.74Signed a petition for conservation campaign 73.42 24.08 8.9 59.96 27.94Donate money to environmental or conservation organization 74.11 26.07 8.7 59.93 27.74Donate time to environmental or conservation organization 74.56 24.98 3.5 60.68 27.86Member of conservation organization 76.12 22.66 7.0 60.04 27.92Volunteer to help the environment 76.23 24.49 4.8 60.39 27.83
Sustainability 2019, 11, 3250 11 of 16
3.6. Value-Action Gap
Chi-square tests performed to examine those scoring 100 on the NCI and responses to thebehaviors listed in Table 10, showed in increased likelihood of pro-environmental behavior for thosewith maximum scores. The tests were all significant (p < 0.01). However, a value-action gap can beobserved in that whereas 19% of respondents scored the maximum NCI of 100% (see Figure 1), fewerthan 5% of respondents volunteered or gave their own time to conservation and environmental causes(see Table 10). Finally, those with the maximum NCI score of one hundred (n = 683) were significantlyhappier, more satisfied with life, and less anxious, than those scoring below one hundred (n = 2885;p < 0.01), see Table 11.
Table 11. Subjective well-being scores for those with a maximum vs below-maximum NCI scores.
NCI Level Life Satisfaction Happiness Anxiety
<100Mean 7.45 7.41 2.22N 2983 2983 2983SD 1.935 2.224 2.723
100Mean 7.87 8.06 1.94N 683 683 683SD 1.982 2.168 2.721
4. Discussion
The results of the study confirmed the validity and reliability of the NCI as a measure for natureconnectedness. The EFA on the different cohorts found that the items measure one factor and showhigh internal consistency. This demonstrates the reliability of the scale. Furthermore, the similar EFAresults of all three cohorts (2 adult cohorts and children), as well as high correlations between othernature connectedness measures, supports the concurrent validity of the scale. Finally, the positivecorrelation between the NCI and the happiness measure is in line with existing research on the positiveassociation between subjective well-being and nature connectedness [54].
As expected, the EFAs conducted in this study suggested that the NCI is composed of a singlefactor; labelled nature connectedness. Encouragingly, all six of the items of the NCI loaded stronglyonto the factor (> 0.62), with these factor loadings comparable in both magnitude and order, with fewexemptions, across samples. The lower figures related to children’s data on the treating nature withrespect item. In addition to this strong evidence, the identical factor solutions produced providesrobust evidence for the reliability of scale. If data that is collected from different samples on differentoccasions produces identical factor solutions, the likelihood of those results being false is small [55].
The relationships between the NCI and other scales provides evidence of validity and widerinsight. In terms of validity, the NCI correlates strongly with the existing short measure, the NatureRelatedness Scale (NR6) and to the single-item INS. This supports the validity of the scale as a measurefor nature connectedness. More widely, the relationship to well-being shown by the correlations wasslightly stronger for the NCI and INS, compared to the NR-6. The NCI also correlates well with therelated EWNB measure, with a score between that of the NR6 and INS. Although the NR6 relates wellto EWNB, it has a weak relationship with Difficulties in Emotional Regulation Scale, while the NCIand INS have stronger relationships. As an affect-based approach was taken to the development ofthe NCI this would be expected and indicates utility as a measure to evaluate an affective connectionwith nature. The relationship to affect regulation and beauty is important as both have been found tomediate the relationship between nature connectedness and well-being [20].
The repeated factor analysis results and comparison to existing measures support the reliabilityand validity of the NCI. However, the proportion of people who scored 100 on the NCI was anotable feature of the scale. The proportion of high scores raises concerns about the utility of thescale for detecting differences, during pre-post evaluations for example. However, the NCI has
Sustainability 2019, 11, 3250 12 of 16
also been shown to successfully identify such changes and replicate findings found with existingmeasures of connectedness to nature [10]. Furthermore, rather than a distribution skewed andcurtailed at the ceiling, a non-unimodal distribution can be observed with a peak in the frequencyof scores around the mid-point, with a second peak of very high scores. This may in part be anartifact of designing a scale suitable for children as well as adults, although the child data also has asimilar distribution. Non-unimodal distributions have been used to investigate subgroups within aconstruct [57], and bimodality can suggest latent groups [58]; however observed bimodality does notpreclude a continuous dimension [59].
Given the robust sampling of the MENE survey the distribution demonstrates a genuine situationwithin the population and can provide useful insight. For example, combined with responses tothe MENE questions related to attitudes and behaviors it highlights the value-action gap. Analysishas shown that there are significant differences in engagement with pro-environmental behaviorsbetween participants scoring 100 and those scoring less than 100. These differences were also found forwell-being (happiness, life satisfaction, anxiousness). The results suggest that the people scoring 100do indeed have high levels of connectedness to nature, which shows in behavioral and well-beingdifferences to people who have a level of nature connectedness below 100. However, many ofthose scoring highly were not engaging in pro-environmental behaviors. The importance of natureconnectedness in ecological behaviors has also been found in previous research [8]. Detailed analysisof the relationship between behaviors and nature connectedness will be explored more fully in afollow-up paper.
Regarding demographics, the NCI showed utility as a population measure, revealingsome differences by age, gender, and modest differences by socio-economic groups. However,these differences are small, which demonstrates a stable construct across the population, apart fromduring childhood where notable differences can be observed.
In sum, given the large sample based on robust national statistics protocols and strong singlefactor solution across samples, the results suggest that the weighted NCI can be recommended foruse Internationally in English speaking populations for both children and adults. Although initialevidence suggests that nature connectedness is a construct stable across cultures [33], validation oftranslated scales is advisable and such work could seek to confirm the item weightings. The weighting,characteristics of the index and relationship to pro-environmental behaviors suggest the populationmean is currently insufficient for a sustainable future and a score in the upper quartile, even of 100,can be targeted. Finally, there are also good indications that the NCI can identify changes in natureconnectedness following interventions through baseline, post and follow-up measurement [10].
Although the number of children within the narrow age bands is relatively small on occasion,the size and suddenness of the drop in levels of nature connectedness from 10 to 15 years of age isnotable. The larger sample in the wider age bands give confidence in a drop in nature connectednessthrough adolescence. Recent data using both the childhood CNI measure and NR6 has also identifiedat drop in nature connectedness at this point [60], which provides further confirmation of the validityof the scale. Similarly, qualitative research has identified a loss of interest in natural spaces atadolescence [61]. Although cross-sectional, rather than longitudinal, it seems likely that the profilerepresents developmental changes or situational factors, rather than transitory events affectingchildren born in and soon after 2005. Regarding developmental changes, adolescence is a time ofthe development of self-identity and the emotional regulation required for social relationships [62].The self is a key perspective in nature connectedness [14] and higher nature connectedness is relatedto fewer difficulties in emotional regulation [20]. As children change their use and requirements ofnature and natural spaces will change. For example, natural environments such as woodlands canprovide opportunities for developing a sense of identity, but this is poorly understood and tolerated bylandowners and managers [61]. Regarding situational factors, adolescents within the UK sample arealso subject to external changes, such as the move from a primary to secondary school environment.
Sustainability 2019, 11, 3250 13 of 16
Considering the psychological factors further, identity formation theory [63] suggests that atthis developmental stage, achieving a clear and defined identity is a crucial process to becoming aproductive adult. The adoption of specific values and goals may not prioritize nature, particularly in atechnology focused generation. The theorized identity crisis that ensues sees childhood characteristicsmerge with emerging adolescent traits, and is theorized to consist of a series of stages alongside copingwith, for example, physical growth, group acceptance, love, and career choices. It may be that duringthis time, nature and one’s connection with nature, may lose relevance and importance. Thus, a childtransitioning into adolescence may temporarily discount the importance of nature until a stable identityis formed.
Further research is required to identify the factors found to be associated with the adolescentdisconnect. This will inform efforts to prevent the decline or facilitate re-connection. Such efforts toimprove nature connectedness can be based on approaches which include contact, emotions, beauty,meaning and compassion [21]. For example, it has been found nature connectedness can be increased byincluding affective elements in outdoor education programs [64], whereas a more traditional outdoorsadventure program did not increase nature connectedness [65].
In conclusion, this study found NCI to be a reliable and valid scale that offers a short, simplealternative to other measures of nature connectedness, particularly for populations including bothchildren and adults, measured face to face or online. The utility of the NCI for exploring key issues fora sustainable future is also supported by the associations with various pro-environmental behaviors.Finally, wider research has shown the NCI can detect increases in nature connectedness duringevaluation [10]. Importantly, the NCI also provides a tool that can be used to reveal changes in natureconnectedness across the lifespan. With the critical global issues of climate change and biodiversityloss symptomatic of human disconnection with nature, there is a growing interest in understandingand improving people’s connection to nature. The NCI provides a population measure that can beused internationally to help understand and track improvement in nature connectedness to informpolicy in this area.
Author Contributions: M.R., J.H., A.H., R.B. worked on the initial design and specification of the scale. D.F., M.R.,M.W., D.P. contributed to data preparation and analysis. T.C. designed and collected online data. M.R., D.F., L.B.,A.H., M.W. contributed to paper writing and review.
Funding: Funding was provided by the following project partners: Natural England, Historic England, Universityof Derby, National Trust, Royal Society for the Protection of Birds and The Wildlife Trusts.
Conflicts of Interest: The authors declare no conflicts of interest.
References
1. Ives, C.D.; Giusti, M.; Fischer, J.; Abson, D.J.; Klaniecki, K.; Dorninger, C.; Raymond, C.M. Human–Natureconnection: A multidisciplinary review. Curr. Opin. Environ. Sustain. 2017, 26, 106–113. [CrossRef]
2. DEFRA. A Green Future: Our 25 Year Plan to Improve the Environment; DEFRA: London, UK, 2018.3. Frankish, H.; Boyce, N.; Horton, R. Mental health for all: A global goal. Lancet 2018, 392, 1493–1495.
[CrossRef]4. Ceballos, G.; Ehrlich, P.R.; Dirzo, R. Biological annihilation via the ongoing sixth mass extinction signaled by
vertebrate population losses and declines. Proc. Natl. Acad. Sci. USA 2017, 114, E6089–E6096. [CrossRef][PubMed]
5. Richardson, M.; Maspero, M.; Golightly, D.; Sheffield, D.; Staples, V.; Lumber, R. Nature: A new paradigmfor Well-Being and ergonomics. Ergonomics 2017, 60, 292–305. [CrossRef] [PubMed]
6. Pritchard, A.; Richardson, M.; Sheffield, D.; McEwan, K. The Relationship Between Nature Connectednessand Eudaimonic Well-Being: A Meta-Analysis. J. Happiness Stud. 2019. [CrossRef]
7. Abrahamse, W.; Steg, L.; Vlek, C.; Rothengatter, T. A review of intervention studies aimed at householdenergy conservation. J. Environ. Psychol. 2005, 25, 273–291. [CrossRef]
Sustainability 2019, 11, 3250 14 of 16
8. Otto, S.; Pensini, P. Nature-based environmental education of children: Environmental knowledge andconnectedness to nature, together, are related to ecological behavior. Glob. Environ. Chang. 2017, 47, 88–94.[CrossRef]
9. Otto, S.; Neaman, A.; Richards, B.; Marió, A. Explaining the ambiguous relations between income, environmentalknowledge, and environmentally significant behavior. Soc. Natl. Resour. 2016, 295, 628–632. [CrossRef]
10. Richardson, M.; McEwan, K.; Garip, G. 30 Days Wild: Who benefits most? J. Public Ment. Health 2018,17, 95–104. [CrossRef]
11. Tam, K.P. Concepts and measures related to connection to nature: Similarities and differences. J. Environ. Psychol.2013, 34, 64–78. [CrossRef]
12. Mayer, F.S.; Frantz, C.M. The connectedness to nature scale: A measure of individuals’ feeling in communitywith nature. J. Environ. Psychol. 2004, 24, 503–515. [CrossRef]
13. Zelenski, J.M.; Nisbet, E.K. Happiness and Feeling Connected the Distinct Role of Nature Relatedness.Environ. Behav. 2014, 46, 3–23. [CrossRef]
14. Schultz, P.W. Inclusion with Nature: The Psychology of Human-Nature Relations. In Psychology of SustainableDevelopment; Schmuck, P., Schultz, P.W., Eds.; Springer: Boston, MA, USA, 2002; pp. 61–78.
15. Cheng, J.; Monroe, M. Connection to nature: Children’s affective attitude toward nature. Environ. Behav.2012, 44, 31–49. [CrossRef]
16. Perrin, J.L.; Benassi, V.A. The connectedness to nature scale: A measure of emotional connection to nature?J. Environ. Psychol. 2009, 29, 434–440. [CrossRef]
17. Louv, R. Last Child in the Woods: Saving our Children from Nature-Deficit Disorder; Algonquin Books:Chapel Hill, NC, USA, 2008.
18. Hughes, J.; Richardson, M.; Lumber, R. Evaluating connection to nature and the relationship with conservationbehavior in children. J. Nat. Conserv. 2018, 45, 11–19. [CrossRef]
19. Hinds, J.; Sparks, P. Engaging with the natural environment: The role of affective connection and identity.J. Environ. Psychol. 2008, 28, 109–120. [CrossRef]
20. Richardson, M.; McEwan, K. 30 Days Wild and the Relationships Between Engagement with Nature’s Beauty,Nature Connectedness and Well-Being. Front. Psychol. 2018, 9. [CrossRef] [PubMed]
21. Lumber, R.; Richardson, M.; Sheffield, D. Beyond knowing nature: Contact, emotion, compassion, meaning,and beauty are pathways to nature connection. PLoS ONE 2017, 12, e0177186. [CrossRef] [PubMed]
22. Kellert, S.H. The Biological Basis for Human Values of Nature. In The Biophilia Hypothesis; Kellert, S.H.,Wilson, E.O., Eds.; Island: Washington, DC, USA, 1993.
23. Bragg, R.; Wood, C.; Barton, J.; Pretty, J. Measuring Connection to Nature in Children Aged 8–12: A RobustMethodology for the RSPB; RSPB: Sandy, UK, 2013.
24. Kals, E.; Schumacher, D.; Montada, L. Emotional affinity toward nature as a motivational basis to protectnature. Environ. Behav. 1999, 31, 178–202. [CrossRef]
25. Howell, A.J.; Dopko, R.L.; Passmore, H.A.; Buro, K. Nature connectedness: Associations with well-being andmindfulness. Personal. Ind. Diff. 2011, 51, 166–171. [CrossRef]
26. Hinds, J. Exploring the psychological rewards of a wilderness experience: An interpretive phenomenologicalanalysis. Hum. Psychol. 2011, 39, 189–205. [CrossRef]
27. Hinds, J.; Sparks, P. The affective quality of human-natural environment relationships. Evolut. Psychol. 2011,9, 451–469. [CrossRef]
28. Richardson, M.; Hallam, J.; Lumber, R. One thousand good things in nature: The aspects of nature that leadto increased nature connectedness. Environ. Values 2015, 24, 603–619. [CrossRef]
29. Richardson, M.; Hallam, J. Exploring the psychological rewards of a familiar semirural landscape: Connectingto local nature through a mindful approach. Hum. Psychol. 2013, 41, 35–53. [CrossRef]
30. White, P.R. Enhancing the experience of connection with nature: Participants’ responses to the MAPINstrategy. Ecopsychology 2012, 4, 345–354. [CrossRef]
31. Kaplan, S. Aesthetics, affect, and cognition: Environmental preferences from an evolutionary perspective.Environ. Behav. 1987, 19, 3–32. [CrossRef]
32. Zhang, J.W.; Howell, R.T.; Iyer, R. Engagement with natural beauty moderates the positive relation betweenconnectedness with nature and psychological well-being. J. Environ. Psychol. 2014, 38, 55–63. [CrossRef]

Sustainability 2019, 11, 3250 15 of 16
33. Capaldi, C.A.; Passmore, H.A.; Ishii, R.; Chistopolskaya, K.A.; Vowinckel, J.; Nikolaev, E.L.; Semikin, G.I.Engaging with natural beauty may be related to well-being because it connects people to nature: Evidencefrom three cultures. Ecopsychology 2017, 9, 199–211. [CrossRef]
34. Beery, T.H.; Wolf-Watz, D. Nature to Place: Rethinking the Environmental. J. Environ. Psychol. 2014,40, 198–205. [CrossRef]
35. Nisbet, E.K.; Zelenski, J.M. Underestimating nearby nature affective forecasting errors obscure the happypath to sustainability. Psychol. Sci. 2011, 22, 1101–1106. [CrossRef] [PubMed]
36. Nisbet, E.K.; Zelenski, J.M.; Murphy, S.A. Happiness is in our nature: Exploring nature relatedness as acontributor to subjective well-being. J. Happiness Stud. 2011, 122, 303–322. [CrossRef]
37. Bragg, R.; Wood, C.; Barton, J. Ecominds: Effects on Mental Wellbeing; Mind: London, UK, 2013.38. Clayton, S. Environmental Identity: A Conceptual and an Operational Definition. In Identity and the Natural
Environment; Clayton, S., Opotow, S., Eds.; MIT Press: Cambridge, MA, USA, 2003; pp. 45–65.39. Flynn, R.; Bellaby, P.; Ricci, M. The ‘Value-Action Gap’in public attitudes towards sustainable energy: The case
of hydrogen energy. Sociol. Rev. 2009, 57, 159–180. [CrossRef]40. Davis, J.L.; Le, B.; Coy, A.E. Building a model of commitment to the natural environment to predict ecological
behavior and willingness to sacrifice. J. Environ. Psychol. 2011, 31, 257–265. [CrossRef]41. Kahn, P.H. Developmental psychology and the Biophilia hypothesis: Children’s affiliation with nature.
Dev. Rev. 1997, 17, 1–61. [CrossRef]42. Nisbet, E.K.; Zelenski, J.M.; Murphy, S.A. The nature relatedness scale: Linking individuals’ connection with
nature to environmental concern and behavior. Environ. Behav. 2009, 41, 715–740. [CrossRef]43. Davis, J.L.; Green, J.D.; Reed, A. Interdependence with the environment: Commitment, interconnectedness,
and environmental behavior. J. Environ. Psychol. 2009, 29, 173–180. [CrossRef]44. Schultz, P.W. The structure of environmental concern: Concern for self, other people, and the biosphere.
J. Environ. Psychol. 2001, 21, 327–339. [CrossRef]45. Hunt, A.; Stewart, D.; Richardson, M.; Hinds, J.; Bragg, R.; White, M.; Burt, J. Monitor of Engagement with
the Natural Environment: Developing a Method to Measure Nature Connection Across the English Population(Adults and Children); Natural England Commissioned Reports Number 233; Natural England publications:York, UK, 2017.
46. Emerson, J.D. Mathematical Aspects of Transformation. In Understanding Robust and Exploratory Data Analysis;Hoaglin, D.C., Mosteller, F., Tukey, J.W., Eds.; John Wiley: New York, NY, USA, 1983.
47. Burgess, J.; Harrison, C.M.; Filius, P. Environmental communication and the cultural politics of environmentalcitizenship. Environ. Plan. A 1998, 30, 1445–1460. [CrossRef]
48. Frick, J.; Kaiser, F.G.; Wilson, M. Environmental knowledge and conservation behavior: Exploring prevalenceand structure in a representative sample. Personal. Ind. Diff. 2004, 37, 1597–1613. [CrossRef]
49. Nisbet, E.K.; Zelenski, J.M. The NR-6: A new brief measure of nature relatedness. Front. Psychol. 2013, 4, 813.[CrossRef] [PubMed]
50. Diessner, R.; Solom, R.D.; Frost, N.K.; Parsons, L.; Davidson, J. Engagement with beauty: Appreciatingnatural, artistic, and moral beauty. J. Psychol. 2008, 142, 303–332. [CrossRef] [PubMed]
51. Bjureberg, J.; Ljótsson, B.; Tull, M.T.; Hedman, E.; Sahlin, H.; Lundh, L.G.; Gratz, K.L. Development andvalidation of a brief version of the difficulties in emotion regulation scale: The DERS-16. J. Psychopathol.Behav. Assess. 2016, 38, 284–296. [CrossRef] [PubMed]
52. Berna, G.; Ott, L.; Nandrino, J.L. Effects of emotion regulation difficulties on the tonic and phasic cardiacautonomic response. PLoS ONE 2014, 9, e102971. [CrossRef] [PubMed]
53. Abdel-Khalek, A.M. Measuring happiness with a single-item scale. Soc. Behav. Personal. Int. J. 2006, 34, 139–150.[CrossRef]
54. Capaldi, C.A.; Dopko, R.L.; Zelenski, J.M. The relationship between nature connectedness and happiness:A meta-analysis. Front. Psychol. 2014, 5, 976. [CrossRef] [PubMed]
55. DeVellis, R.F. Scale Development: Theory and Applications, 3rd ed.; Sage Publications: Thousand Oaks, CA,USA, 2012.
56. Stevens, J.P. Applied Multivariate Statistics for the Social Sciences, 2nd ed.; Erlbaum: Hillsdale, NJ, USA, 1992.57. Munson, J.; Dawson, G.; Sterling, L.; Beauchaine, T.; Zhou, A.; Koehler, E.; Abbott, R. Evidence for latent
classes of IQ in young children with autism spectrum disorder. Am. J. Ment. Retard. 2008, 113, 439–452.[CrossRef] [PubMed]
Sustainability 2019, 11, 3250 16 of 16
58. Meehl, P.E. Bootstraps taxometrics: Solving the classification problem in psychopathology. Am. Psychol.1995, 50, 266–275. [CrossRef] [PubMed]
59. Grayson, D.A. Can categorical and dimensional views of psychiatric illness be distinguished? Br. J. Psychiatry1987, 151, 355–361. [CrossRef] [PubMed]
60. Hughes, J.; Rogerson, M.; Barton, J.; Bragg, R. Age and connection to nature: When is engagement critical?Front. Ecol. Environ. 2019. [CrossRef]
61. Bell, S.; Thompson, C.W.; Travlou, P. Contested views of freedom and control: Children, teenagers and urbanfringe woodlands in Central Scotland. Urban For. Urban Green. 2003, 2, 87–100. [CrossRef]
62. National Research Council. The Science of Adolescent Risk-Taking: Workshop Report; National Academies Press:Washington, DC, USA, 2011.
63. Erikson, E. Youth: Identity and Crisis; W. W. Norton: New York, NY, USA, 1968.64. Braun, T.; Dierkes, P. Connecting students to nature—How intensity of nature experience and student age
influence the success of outdoor education programs. Environ. Educ. Res. 2017, 23, 937–949. [CrossRef]65. Williams, I.R.; Rose, L.M.; Raniti, M.B.; Waloszek, J.; Dudgeon, P.; Olsson, C.A.; Allen, N.B. The impact of an
outdoor adventure program on positive adolescent development: A controlled crossover trial. J. OutdoorEnviron. Educ. 2018, 21, 207–236. [CrossRef]
© 2019 by the authors. Licensee MDPI, Basel, Switzerland. This article is an open accessarticle distributed under the terms and conditions of the Creative Commons Attribution(CC BY) license (http://creativecommons.org/licenses/by/4.0/).
Copyright © 2022 FDOKUMEN