
Evidence from the Connectedness Network Analyses - MDPI
15
healthcare Article On the Network Transmission Mechanisms of Disease-Specific Healthcare Expenditure Spillovers: Evidence from the Connectedness Network Analyses Wen-Yi Chen Citation: Chen, W.-Y. On the Network Transmission Mechanisms of Disease-Specific Healthcare Expenditure Spillovers: Evidence from the Connectedness Network Analyses. Healthcare 2021, 9, 319. https://doi.org/10.3390/ healthcare9030319 Academic Editor: Mustafa Z. Younis Received: 10 February 2021 Accepted: 11 March 2021 Published: 13 March 2021 Publisher’s Note: MDPI stays neutral with regard to jurisdictional claims in published maps and institutional affil- iations. Copyright: © 2021 by the author. Licensee MDPI, Basel, Switzerland. This article is an open access article distributed under the terms and conditions of the Creative Commons Attribution (CC BY) license (https:// creativecommons.org/licenses/by/ 4.0/). Department of Senior Citizen Service Management, National Taichung University of Science and Technology, Taichung 40343, Taiwan; [email protected]; Tel.: +886-4-2219-6932 Abstract: Previous studies investigating factors influencing healthcare expenditure growth ignored the network transmission mechanisms of disease-specific healthcare expenditure spillovers and regarded the processes culminating in healthcare expenditure growth as a black box. In this study, we investigated factors influencing the network transmission mechanisms underlying the determinants of healthcare expenditure growth through the dynamic connectedness network and the robust least square regression analyses. Our results indicate that demographic transition and business cycles are key factors increasing interconnectedness of different disease-specific healthcare expenditures, and that promotion of primary care utilization would reduce total healthcare expenditure spillovers. In order to reduce diffusion of disease-specific healthcare expenditures, health promotion activities should focus on those clinical diagnosis-related groups of diseases classified as pure net transmitters of spillover, and preventive interventions targeting different diseases should be activated in different phrases of the business cycle. Keywords: connectedness network analysis; connectedness index; disease-specific healthcare expen- diture; spillovers; robust least square 1. Introduction The persistent increase in healthcare expenditure is a potential risk jeopardizing the sustainability of the healthcare system and its capacity to deliver affordable healthcare ser- vices to the public. The major determinants of healthcare expenditure growth identified by previous studies include population ageing [1–7], business cycles and income [2,3,6,8–12], technological innovation [1,2,11,13–15], and Baumol’s cost disease, a term used to describe the increase of healthcare price due to unbalanced growth of productivities between the healthcare sector and the whole economy [3,16–18]. It is crucial to point out that the network transmission mechanisms underlying these determinants effecting healthcare expenditure change come from the expansion or compression of morbidities resulting from demographic, socioeconomic, and environmental changes in the process of human development [19,20]. Nevertheless, most of the previous studies investigating factors influ- encing healthcare expenditure growth ignored the network transmission mechanisms of disease-specific healthcare expenditure spillovers and regarded the processes culminating in healthcare expenditure growth as a black box. Therefore, the purpose of this study is twofold: First, we unravel the black box of the processes underlying healthcare expenditure growth by measuring disease-specific healthcare expenditure spillovers using the dynamic connectedness network analyses proposed by Antonakakis and his colleagues [21]. Second, we estimated the robust least square (RLS) regression model proposed by Yohai [22] to identify the network transmission mechanisms of disease-specific and total healthcare expenditure spillovers. In fact, the increased interest in network analyses in the fields of social science and medicine is motivated by a movement by healthcare providers towards greater patient- Healthcare 2021, 9, 319. https://doi.org/10.3390/healthcare9030319 https://www.mdpi.com/journal/healthcare
-
Upload
khangminh22 -
Category
Documents
-
view
0 -
download
0
Transcript of Evidence from the Connectedness Network Analyses - MDPI
healthcare
Article
On the Network Transmission Mechanisms of Disease-SpecificHealthcare Expenditure Spillovers: Evidence from theConnectedness Network Analyses
Wen-Yi Chen
�����������������
Citation: Chen, W.-Y. On the
Network Transmission Mechanisms
of Disease-Specific Healthcare
Expenditure Spillovers: Evidence
from the Connectedness Network
Analyses. Healthcare 2021, 9, 319.
https://doi.org/10.3390/
healthcare9030319
Academic Editor: Mustafa Z. Younis
Received: 10 February 2021
Accepted: 11 March 2021
Published: 13 March 2021
Publisher’s Note: MDPI stays neutral
with regard to jurisdictional claims in
published maps and institutional affil-
iations.
Copyright: © 2021 by the author.
Licensee MDPI, Basel, Switzerland.
This article is an open access article
distributed under the terms and
conditions of the Creative Commons
Attribution (CC BY) license (https://
creativecommons.org/licenses/by/
4.0/).
Department of Senior Citizen Service Management, National Taichung University of Science and Technology,Taichung 40343, Taiwan; [email protected]; Tel.: +886-4-2219-6932
Abstract: Previous studies investigating factors influencing healthcare expenditure growth ignoredthe network transmission mechanisms of disease-specific healthcare expenditure spillovers andregarded the processes culminating in healthcare expenditure growth as a black box. In this study, weinvestigated factors influencing the network transmission mechanisms underlying the determinantsof healthcare expenditure growth through the dynamic connectedness network and the robust leastsquare regression analyses. Our results indicate that demographic transition and business cyclesare key factors increasing interconnectedness of different disease-specific healthcare expenditures,and that promotion of primary care utilization would reduce total healthcare expenditure spillovers.In order to reduce diffusion of disease-specific healthcare expenditures, health promotion activitiesshould focus on those clinical diagnosis-related groups of diseases classified as pure net transmittersof spillover, and preventive interventions targeting different diseases should be activated in differentphrases of the business cycle.
Keywords: connectedness network analysis; connectedness index; disease-specific healthcare expen-diture; spillovers; robust least square
1. Introduction
The persistent increase in healthcare expenditure is a potential risk jeopardizing thesustainability of the healthcare system and its capacity to deliver affordable healthcare ser-vices to the public. The major determinants of healthcare expenditure growth identified byprevious studies include population ageing [1–7], business cycles and income [2,3,6,8–12],technological innovation [1,2,11,13–15], and Baumol’s cost disease, a term used to describethe increase of healthcare price due to unbalanced growth of productivities between thehealthcare sector and the whole economy [3,16–18]. It is crucial to point out that thenetwork transmission mechanisms underlying these determinants effecting healthcareexpenditure change come from the expansion or compression of morbidities resultingfrom demographic, socioeconomic, and environmental changes in the process of humandevelopment [19,20]. Nevertheless, most of the previous studies investigating factors influ-encing healthcare expenditure growth ignored the network transmission mechanisms ofdisease-specific healthcare expenditure spillovers and regarded the processes culminatingin healthcare expenditure growth as a black box. Therefore, the purpose of this study istwofold: First, we unravel the black box of the processes underlying healthcare expendituregrowth by measuring disease-specific healthcare expenditure spillovers using the dynamicconnectedness network analyses proposed by Antonakakis and his colleagues [21]. Second,we estimated the robust least square (RLS) regression model proposed by Yohai [22] toidentify the network transmission mechanisms of disease-specific and total healthcareexpenditure spillovers.
In fact, the increased interest in network analyses in the fields of social science andmedicine is motivated by a movement by healthcare providers towards greater patient-
Healthcare 2021, 9, 319. https://doi.org/10.3390/healthcare9030319 https://www.mdpi.com/journal/healthcare
Healthcare 2021, 9, 319 2 of 15
sharing and care coordination [23,24]. From the perspective of medical cost control ofvarious clinical diagnosis-related groups of diseases, the identification of dynamic con-nectedness network relationships among different disease-specific healthcare expendituresenables us to understand the directional diffusion of disease-specific healthcare expendi-ture and their aggregate total healthcare expenditure spillovers across a period of time.Nevertheless, it is essential to note that there are several challenges inherent in exploringthe network transmission mechanisms underlying the determinants of healthcare expen-diture growth. First, it is difficult to obtain consistently and sufficiently long time seriesdata to allow effective examination of disease-specific morbidities and their healthcareexpenditures. This is because the International Classification of Diseases (ICD) codes (aninternationally consistent classification method used to classify different diseases) did notobtain popularity worldwide until early 1990, when the World Health Organization startedto regularly announce consistent ICD codes and promoted international compatibility inhealthcare data collection and reporting for the purposes of worldwide epidemiologicalsurveillance and health management [25]. Second, healthcare expenditures related to dif-ferent diseases may be jointly influenced by some unobserved factors such as comorbidityof and complications between diseases. Third, changes in some unobservable componentsof human development variables (such as greater preference for healthcare services dueto increased longevity, elevated expectations for future income, hazard exposure predis-posing the general public to diseases, etc.) would lead to a structural change in the datagenerating processes underlying disease-specific and total healthcare spillovers. Failureto accommodate these challenges would create biases when inferring connectedness net-work relationships among different disease-specific healthcare expenditures and obscurethe network transmission mechanisms underlying disease-specific and total healthcareexpenditure spillovers.
In response to the challenges of limited and inconsistent disease-specific time seriesdata for disease-specific morbidity, Taiwan was selected as the target country under study.This is because expansion or compression of morbidity is likely to result from increasedlongevity, and Taiwan has experienced a rapid demographic transition (within 25 years)from an aging society to an aged society, and it was predicted to become a hyper-agedsociety by 2026 [26]. In addition, the Taiwanese healthcare system belongs to the NationalHealth Insurance (NHI) system (characterized by a universal coverage program), andthe government has administrated a population-level database (namely, the NationalInsurance Research Database) collecting consistent disease-specific time series data since1995 intended to capture real-world evidence needed to support decisions on clinicaltreatments, community interventions and health policy-making. Moreover, Taiwan alsounderwent an extraordinary phase of economic development during the latter half ofthe 20th century. In 1960, the GDP per capita in Taiwan was only US $163, jumping toUS $25,909 in 2019 [27]. This striking economic growth and rapid industrialization earnedTaiwan the distinction of being known as one of the Four Little Asian Dragons (the titlegiven to four cutting edge and high-paying economies) alongside Hong Kong, South Korea,and Singapore [28]. These features of having both dramatic demographic and economictransitions as well as a well-established healthcare system make Taiwan a suitable targetcountry for our research.
Methodologically, we employed the dynamic connectedness network analyses, de-veloped by Antonakakis and his colleagues [21], to establish dynamic connectednessnetwork relationships among different disease-specific healthcare expenditures. In thisway, the dynamic connectedness indices for disease-specific and total healthcare expen-diture spillovers could be estimated to measure directional diffusion of disease-specifichealthcare expenditures and their aggregate total healthcare expenditure spillovers. Notethat the procedure for establishing dynamic connectedness networks used in this studyis rooted in the forecast variance decomposition from the time-varying parameter vec-tor autoregressive (TVP-VAR) model [21]. Several appealing features of TVP-VAR-basedconnectedness network analyses are worth highlighting: First, conventional dynamic con-
Healthcare 2021, 9, 319 3 of 15
nectedness network analyses are based on rolling-window estimation [29,30]. Becauseof this, the selection of rolling-window size and loss of observations involved within therolling-window estimation process become two major issues in conventional dynamicconnectedness network analyses. Instead of using conventional dynamic connectednessnetwork analyses, we applied the TVP-VAR model suggested by Antonakakis and hiscolleagues [21] for dynamic connectedness network estimation, allowing us to prevent thepotential issues common to conventional dynamic connectedness network analyses. Sec-ond, the vector autoregressive (VAR) model treats all variables in the model as endogenousvariables, and the time-varying parameter can capture potential structural change in thedata-generating process. Hence, the TVP-VAR estimation under the dynamic connected-ness network analyses can simultaneously deal with structural change and endogeneity ofdifferent disease-specific healthcare expenditures, which is advantageous since these aretwo major challenges in the investigation of network transmission mechanisms underlyingthe determinants of healthcare expenditure growth.
This research contributes to the existing literature on the study of the determinants ofhealthcare expenditure growth in three ways: First, in contrast to previous research on thedeterminants of healthcare expenditure growth, this study elucidates the network trans-mission mechanisms underlying the determinants of healthcare expenditure growth ratherthan simply investigating factors influencing healthcare expenditure [1–18]. Second, weapplied the TVP-VAR-based connectedness network analyses developed by Antonakakisand his colleagues [21] to construct dynamic connectedness indices for disease-specific andtotal healthcare expenditure spillovers. This allowed us to shed light on the block box ofhealthcare expenditure growth processes resulting from the expansion or compression ofmorbidities. Third, in order to better understand the network transmission mechanisms ofdisease-specific and total healthcare expenditure spillovers, we applied the RLS regressionmodel introduced by Yohai [22] to identify a resistant relationship between the dynamicconnectedness indices and various factors (such as demographic transition, business cycles,medical price, primary care utilization, Baumol’s cost disease, etc.) that affect the growthof healthcare expenditure. The results generated from this study provide reliable infor-mation on the network transmission mechanisms of disease-specific and total healthcareexpenditure spillovers.
2. Materials and Methods
The determinants of disease-specific spillovers (measured by the net total directionalconnectedness index, NTDCIit) and total healthcare expenditure spillovers (indicated bythe total connectedness index, TCIt) can be specified as follows:
CIt = π0 + π1DVt + π2SEVt + π3HUt + ξt (1)
where CIt denotes either NTDCIit or TCIt. DVt, SEVt, and HUt represent demographicvariables (such as young-age and old-age economic dependency ratios), socio-economicvariables (such as composite leading index, medical price index, and Baumol’s cost disease),and healthcare utilization (such as volume of primary care utilization), respectively. πi(i = 0, 1, 2, 3) are parameters we need to estimate and ξt is the error term. Equation (1) wasestimated by the RLS method [22] in order to obtain resistant results in the occurrenceof outliers.
Note that the TCIt represents interconnectedness of the network of all different disease-specific healthcare expenditures. NTDCIit denotes the difference between total directionalconnectedness to others and from others for the disease-specific healthcare expenditurei. A positive sign for the NTDCIit demonstrates one condition, in which disease-specifichealthcare expenditure i is driving the network, and a negative sign for the NTDCIitillustrates the other condition, in which disease-specific healthcare expenditure i is drivenby the network. Finally, the net pairwise directional connectedness index (NPDCIij) canbe broken down by the NTDCIit to measure the variance of the overall shocks that thedisease-specific healthcare expenditure i transmitted to the disease-specific healthcare
Healthcare 2021, 9, 319 4 of 15
expenditure j (i.e., the bidirectional relationship between healthcare expenditures of diseasei and disease j). Please see the online Supplementary Materials for technical details.
The data used for the connectedness network analyses include healthcare expendi-tures for eighteen clinical diagnosis-related groups of diseases. These eighteen clinicaldiagnosis-related groups of diseases were classified using the multi-level clinical classifica-tions software (CCS) categories from the US Agency for Healthcare Research and Quality(AHRQ) [31]. We retrieved weekly aggregate healthcare expenditure time series fromthe National Insurance Research Database in Taiwan for the period of 1 January 2000 to30 September 2015, generating 822 weekly observations. This study period was chosen inresponse to consistency in the ICD 9 codes used in the CCS from the US AHRQ [31]. Thesedata were converted to real healthcare expenditure per capita by dividing by the numberof total population and deflated by the medical price index, setting the year of 2014 as thebase period. These eighteen disease-specific healthcare expenditures were proved to bestationary time series data according to the PP (Phillips and Perron) unit root test.
Furthermore, TCI and NTDCI (hereafter, subscripts were skipped for brevity) servedas the dependent variables for the RLS regression analyses. Note that the explanatoryvariables for the RLS regression analyses (such as young-age and old-age economic de-pendency ratios, composite leading index, medical price index, volume of primary care,and Baumol’s cost disease) belong to monthly time series data. For this reason, the weeklydata of TCI and NTDCI were converted into monthly data by weekly average. In addition,we retrieved the Taiwanese age distribution, labor force, index of average regular earn-ings of employees in the healthcare sector (used to measure permanent salary income),share of employed laborers in the healthcare sector, medical price index, and industrialproduction index (as a proxy to measure the productivity of Taiwan’s economy) from theMacroeconomic Statistics and the Demographic Statistics Databases administrated by theTaiwan government. These data enabled us to calculate the young-age (old-age) economicdependency ratios (defined as the population aged 15 and less (aged 65 and above) dividedby labor force), and Baumol’s cost disease (given by the difference between the changesin wage in the healthcare sector and productivity of Taiwan’s economy divided by theshare of labors employed in the healthcare sector). This adjusted type of Baumol’s costdisease was suggested by Colombier [17]. Finally, the composite leading index (used tomeasure business cycles) and volume of primary care utilization (defined as the share ofoutpatient care visits provided by local clinics) were obtained from the Taiwan BusinessIndicators Database and National Insurance Research Database in Taiwan, respectively.The stationarity of these time series data were obtained either through extracting the cycliccomponents of these time series data by the Hodrick and Prescott filter method or takingthe difference of time series [13,32–34]. The detailed results of unit root tests and theconnectedness network analyses can be found in the online Supplementary Materials.
3. Results
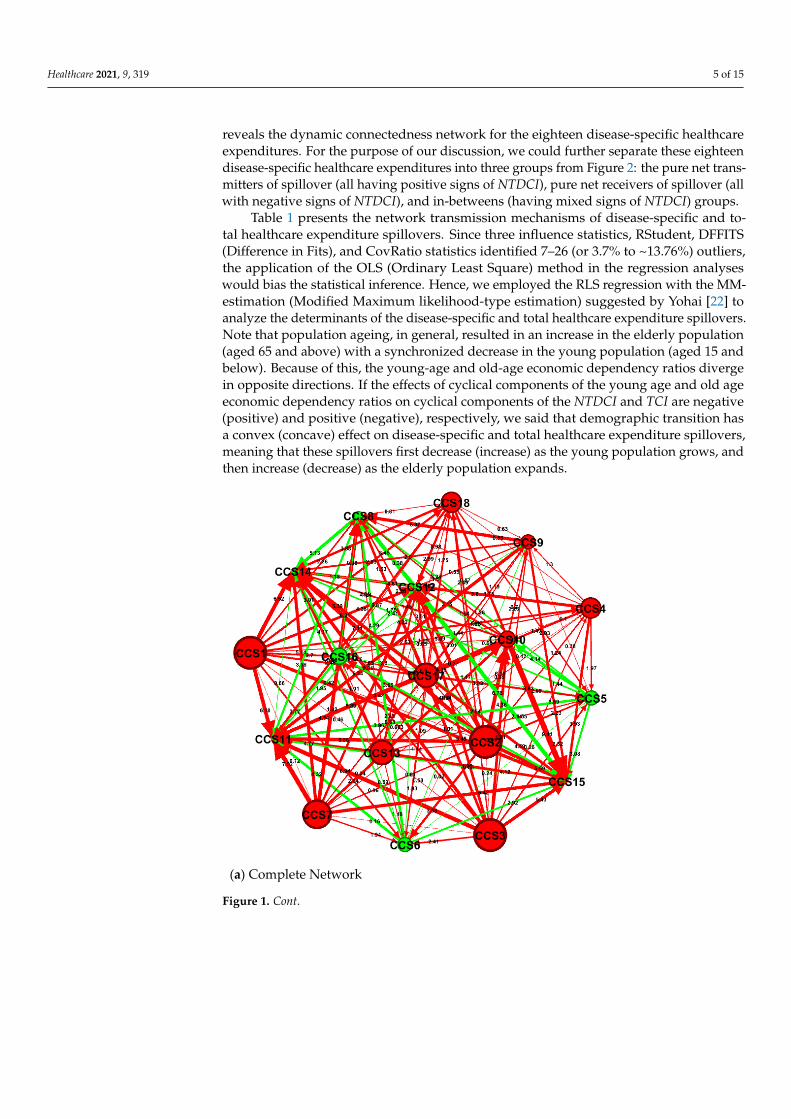
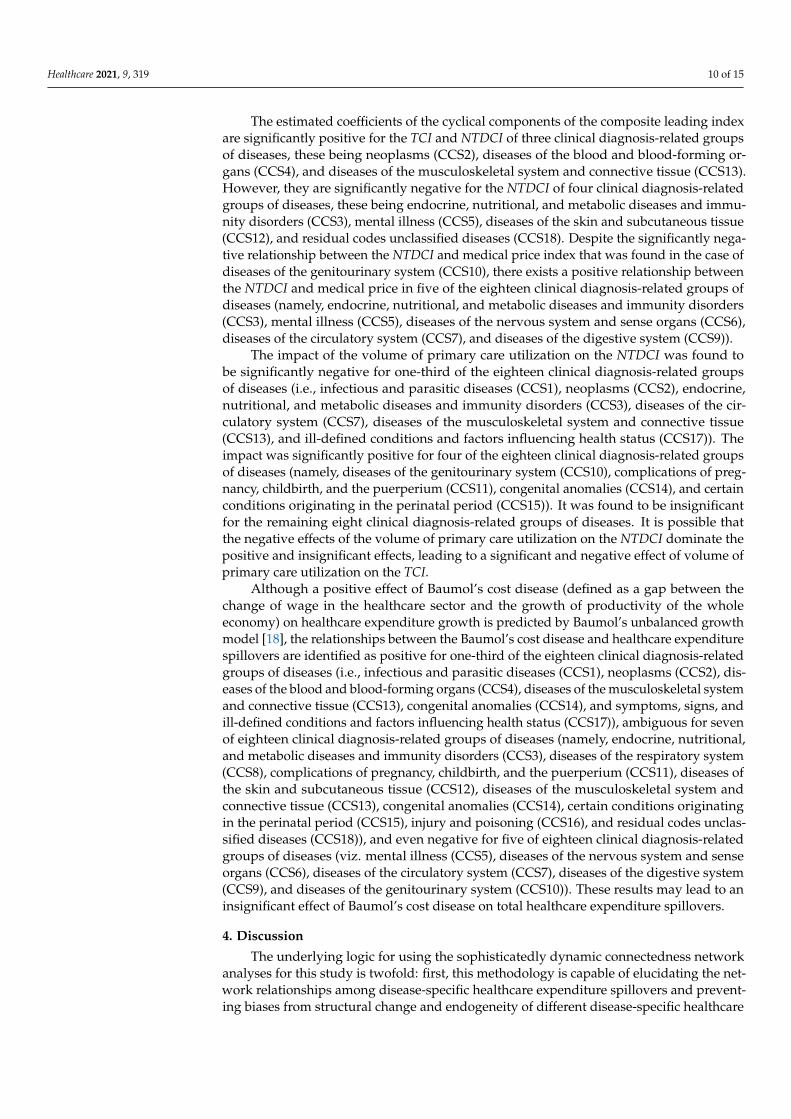
The complete bidirectional relationship between the healthcare expenditures of dis-ease i and disease j (measured by the NPDCIij) is represented in Figure 1. As indicated inFigure 1a, there are 153 (=C18
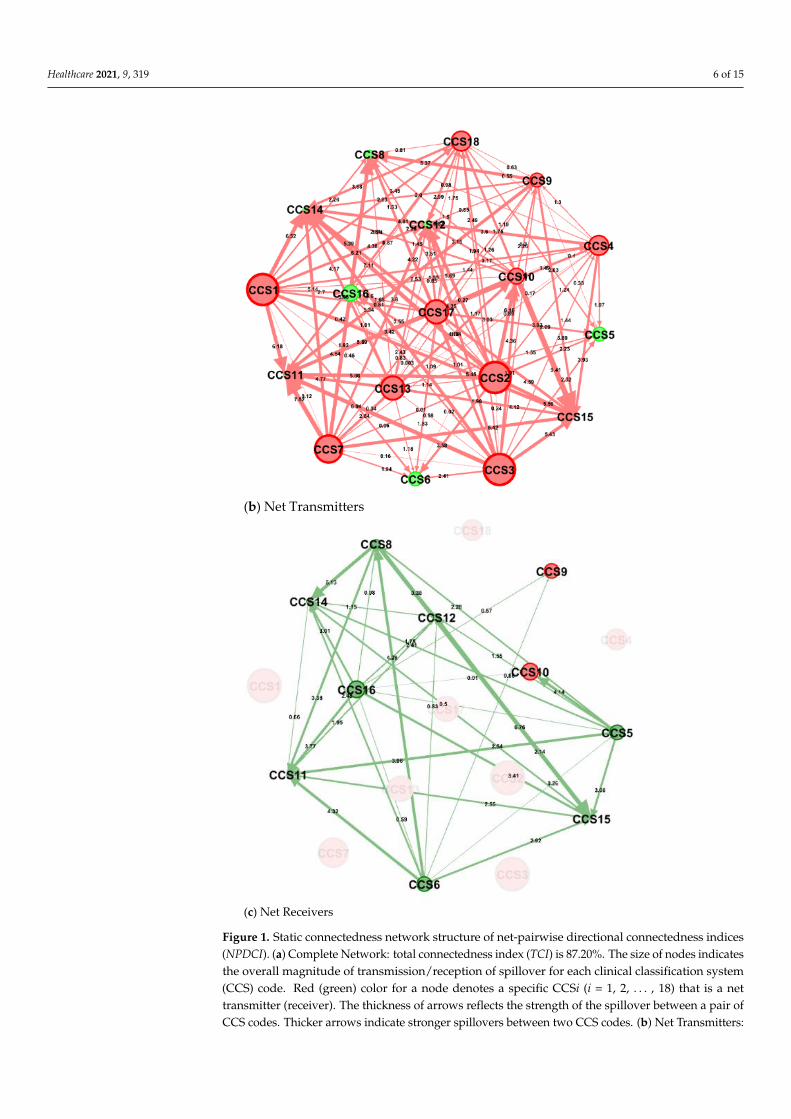
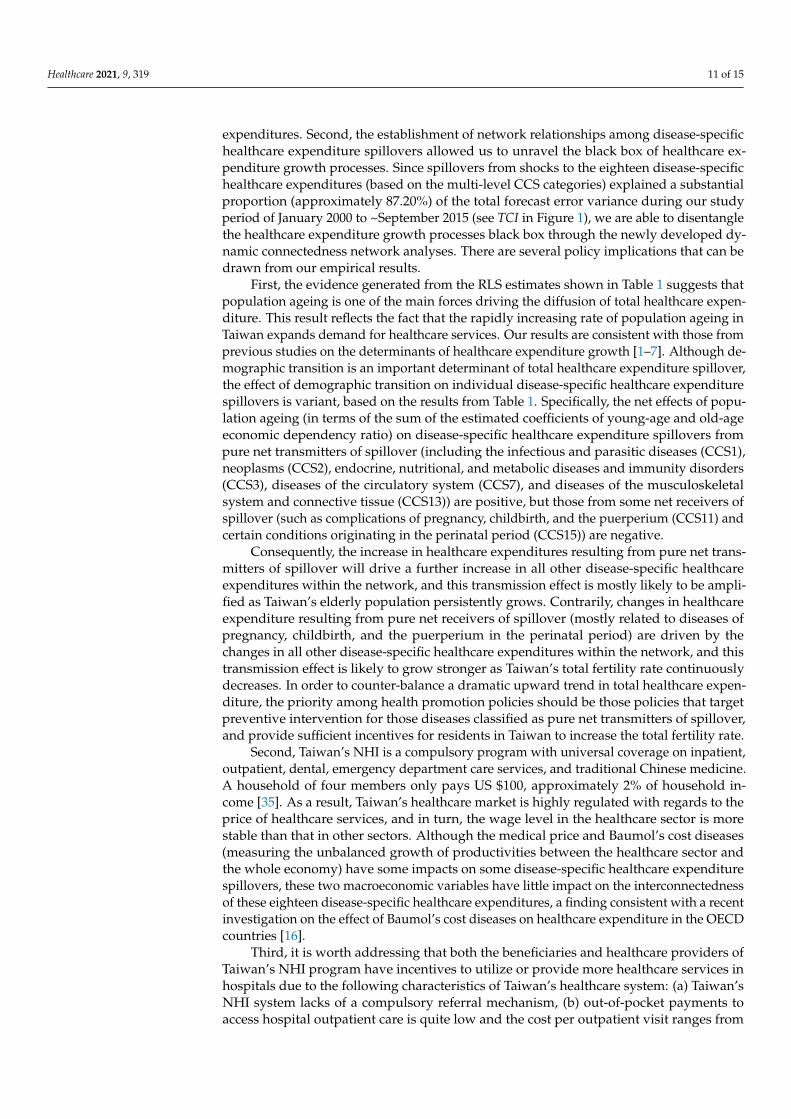
2 ) net pairwise relationships among these eighteen disease-specific healthcare expenditures. The TCI is 87.20%, suggesting that approximately 87.20%of the total forecast error variance can be explained by spillovers from shocks to theseeighteen disease-specific healthcare expenditures. In order to better understand the com-plete network relationship among these eighteen disease-specific healthcare expenditures,we further decomposed the complete connectedness network into the connectedness net-work of net transmitters (average NTDCI > 0, see Figure 1b) and net receivers (averageNTDCI < 0, see Figure 1c). It is evident that the overall magnitude of transmission or recep-tion of spillovers (indicated by the size of nodes) for net transmitters is much higher thanthat for net receivers, and in general, the strength of spillovers (shown by the thickness ofarrows) between a pair of CCS codes within the connectedness network of net transmittersis much higher than that within the connectedness network of net receivers. Figure 2
Healthcare 2021, 9, 319 5 of 15
reveals the dynamic connectedness network for the eighteen disease-specific healthcareexpenditures. For the purpose of our discussion, we could further separate these eighteendisease-specific healthcare expenditures into three groups from Figure 2: the pure net trans-mitters of spillover (all having positive signs of NTDCI), pure net receivers of spillover (allwith negative signs of NTDCI), and in-betweens (having mixed signs of NTDCI) groups.
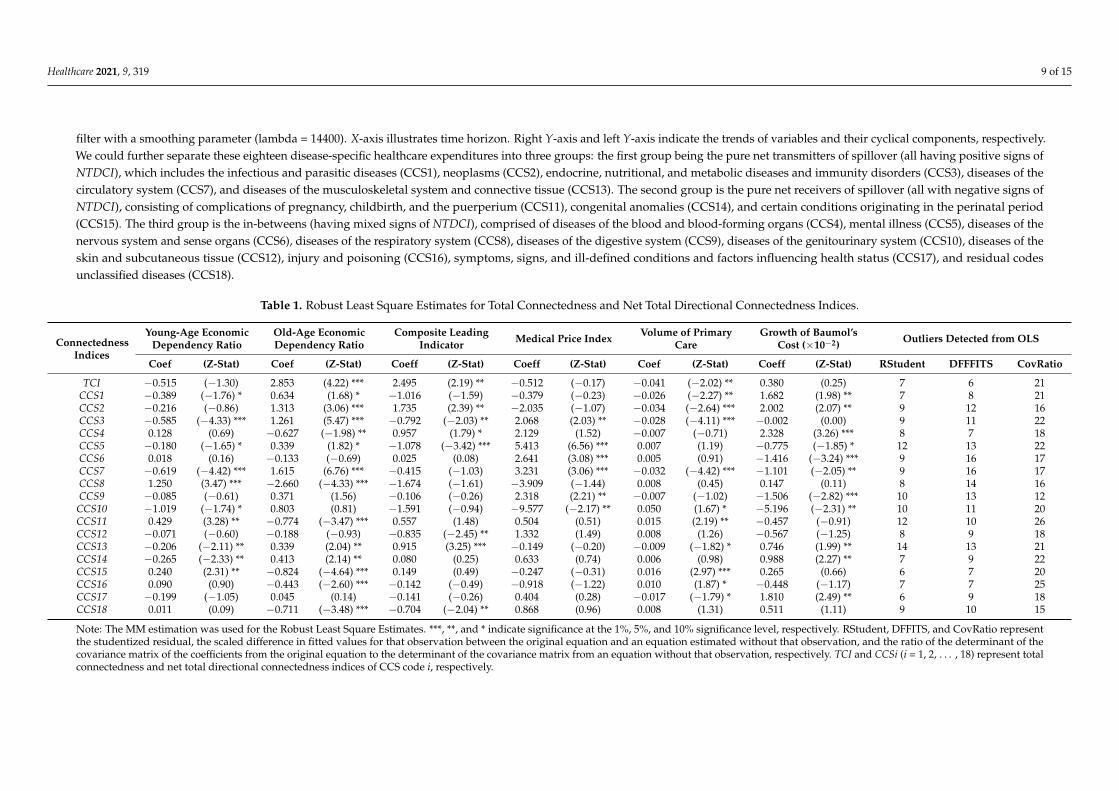
Table 1 presents the network transmission mechanisms of disease-specific and to-tal healthcare expenditure spillovers. Since three influence statistics, RStudent, DFFITS(Difference in Fits), and CovRatio statistics identified 7–26 (or 3.7% to ~13.76%) outliers,the application of the OLS (Ordinary Least Square) method in the regression analyseswould bias the statistical inference. Hence, we employed the RLS regression with the MM-estimation (Modified Maximum likelihood-type estimation) suggested by Yohai [22] toanalyze the determinants of the disease-specific and total healthcare expenditure spillovers.Note that population ageing, in general, resulted in an increase in the elderly population(aged 65 and above) with a synchronized decrease in the young population (aged 15 andbelow). Because of this, the young-age and old-age economic dependency ratios divergein opposite directions. If the effects of cyclical components of the young age and old ageeconomic dependency ratios on cyclical components of the NTDCI and TCI are negative(positive) and positive (negative), respectively, we said that demographic transition hasa convex (concave) effect on disease-specific and total healthcare expenditure spillovers,meaning that these spillovers first decrease (increase) as the young population grows, andthen increase (decrease) as the elderly population expands.
Healthcare 2021, 9, x 5 of 16
or reception of spillovers (indicated by the size of nodes) for net transmitters is much
higher than that for net receivers, and in general, the strength of spillovers (shown by the
thickness of arrows) between a pair of CCS codes within the connectedness network of
net transmitters is much higher than that within the connectedness network of net receiv-
ers. Figure 2 reveals the dynamic connectedness network for the eighteen disease-specific
healthcare expenditures. For the purpose of our discussion, we could further separate
these eighteen disease-specific healthcare expenditures into three groups from Figure 2:
the pure net transmitters of spillover (all having positive signs of NTDCI), pure net receiv-
ers of spillover (all with negative signs of NTDCI), and in-betweens (having mixed signs
of NTDCI) groups.
Table 1 presents the network transmission mechanisms of disease-specific and total
healthcare expenditure spillovers. Since three influence statistics, RStudent, DFFITS (Dif-
ference in Fits), and CovRatio statistics identified 7–26 (or 3.7% to ~13.76%) outliers, the
application of the OLS (Ordinary Least Square) method in the regression analyses would
bias the statistical inference. Hence, we employed the RLS regression with the MM-esti-
mation (Modified Maximum likelihood-type estimation) suggested by Yohai [22] to ana-
lyze the determinants of the disease-specific and total healthcare expenditure spillovers.
Note that population ageing, in general, resulted in an increase in the elderly population
(aged 65 and above) with a synchronized decrease in the young population (aged 15 and
below). Because of this, the young-age and old-age economic dependency ratios diverge
in opposite directions. If the effects of cyclical components of the young age and old age
economic dependency ratios on cyclical components of the NTDCI and TCI are negative
(positive) and positive (negative), respectively, we said that demographic transition has a
convex (concave) effect on disease-specific and total healthcare expenditure spillovers,
meaning that these spillovers first decrease (increase) as the young population grows, and
then increase (decrease) as the elderly population expands.
(a) Complete Network
Figure 1. Cont.
Healthcare 2021, 9, 319 6 of 15Healthcare 2021, 9, x 6 of 16
(b) Net Transmitters
(c) Net Receivers
Figure 1. Static connectedness network structure of net-pairwise directional connectedness indices
(NPDCI). (a) Complete Network: total connectedness index (TCI) is 87.20%. The size of nodes indi-
cates the overall magnitude of transmission/reception of spillover for each clinical classification
system (CCS) code. Red (green) color for a node denotes a specific CCSi (i = 1, 2,…, 18) that is a net
transmitter (receiver). The thickness of arrows reflects the strength of the spillover between a pair
of CCS codes. Thicker arrows indicate stronger spillovers between two CCS codes. (b) Net Trans-
mitters: Ten of these eighteen clinical diagnosis-related groups of diseases (these being infectious
and parasitic diseases (CCS1), neoplasms (CCS2), endocrine, nutritional, and metabolic diseases
Figure 1. Static connectedness network structure of net-pairwise directional connectedness indices(NPDCI). (a) Complete Network: total connectedness index (TCI) is 87.20%. The size of nodes indicatesthe overall magnitude of transmission/reception of spillover for each clinical classification system(CCS) code. Red (green) color for a node denotes a specific CCSi (i = 1, 2, . . . , 18) that is a nettransmitter (receiver). The thickness of arrows reflects the strength of the spillover between a pair ofCCS codes. Thicker arrows indicate stronger spillovers between two CCS codes. (b) Net Transmitters:
Healthcare 2021, 9, 319 7 of 15
Ten of these eighteen clinical diagnosis-related groups of diseases (these being infectious and parasiticdiseases (CCS1), neoplasms (CCS2), endocrine, nutritional, and metabolic diseases and immunitydisorders (CCS3), diseases of the blood and blood-forming organs (CCS4), diseases of the circulatorysystem (CCS7), diseases of the digestive system (CCS9), diseases of the genitourinary system (CCS10)diseases of the musculoskeletal system and connective tissue (CCS13), symptoms, signs, and ill-defined conditions and factors influencing health status (CCS17), and residual codes unclassifieddiseases (CCS18) are net transmitters of spillover. (c) Net Receivers: The other eight of these eighteenclinical diagnosis-related groups of diseases (these being mental illness (CCS5), diseases of thenervous system and sense organs (CCS6), diseases of the respiratory system (CCS8), complications ofpregnancy, childbirth, and the puerperium (CCS11), diseases of the skin and subcutaneous tissue(CCS12), congenital anomalies (CCS14), certain conditions originating in the perinatal period (CCS15),and injury and poisoning (CCS16)) are net receivers of spillover.
As shown in Table 1, we found the cyclical component of the old-age economicdependency ratio has a significantly positive effect on the cyclical component of the TCI, butthe cyclical component of the young-age economic dependency ratio has an insignificanteffect on it. This result means that the deviation from the long-run trend of the old-ageeconomic dependency ratio is positively associated with the deviation from the long-runtrend of the total healthcare expenditure spillover. However, any deviation from the long-run trend of the young-age economic dependency ratio is unrelated with that from thelong-run trend of the total healthcare expenditure spillover. The same condition has beenfound in the relationship between the NTDCI of neoplasms (CCS2) and the demographicvariables used for our analyses.
In addition, the significantly convex effects of demographic transition on disease-specific spillovers were found in some clinical diagnosis-related groups of diseases, thesebeing infectious and parasitic diseases (CCS1), endocrine, nutritional, and metabolic dis-eases and immunity disorders (CCS3), mental illness (CCS5), diseases of the circulatorysystem (CCS7), diseases of the musculoskeletal system and connective tissue (CCS13), andcongenital anomalies (CCS14). Significantly concave effects of demographic transition ondisease-specific spillovers were found in other clinical diagnosis-related groups of diseases,these being diseases of the respiratory system (CCS8), complications of pregnancy, child-birth, and the puerperium (CCS11), and certain conditions originating in the perinatalperiod (CCS15).
Moreover, the cyclical components of three disease-specific healthcare expenditurespillovers (those of diseases of the blood and blood-forming organs (CCS4), injury andpoisoning (CCS16), symptoms, and residual codes unclassified diseases (CCS18)) are nega-tively related to cyclical components of the old-age economic dependency ratio, meaningthat population ageing may offset the spillover effects from these three clinical diagnosis-related groups of diseases. These negative relationships are likely to result from eitherincreasingly efficient treatment for these diseases or increasingly accurate diagnoses forthese diseases as the morbidities expand. Demographic transition did not generate anysignificant results on healthcare expenditure spillovers from some clinical diagnosis-relatedgroups of diseases, these being diseases of the nervous system and sense organs (CCS6),diseases of the digestive system (CCS9), and ill-defined conditions and factors influencinghealth status (CCS17).
Healthcare 2021, 9, 319 8 of 15Healthcare 2021, 9, x 8 of 16
-1.5
-0.5
0.5
1.084
86
88
89
2000 2002 2004 2006 2008 2010 2012 2014
TCI Trend Cycle
-1.2
-0.8
-0.4
0.0
0.4
0.8
0
1
2
3
4
5
2000 2002 2004 2006 2008 2010 2012 2014
NTDCI1 Trend Cycle
-1.2
-0.8
-0.4
0.0
0.4
0.8
0
1
2
4
5
6
2000 2002 2004 2006 2008 2010 2012 2014
NTDCI2 Trend Cycle
-0.6
-0.4
-0.2
0.0
0.2
0.4
0.6
0
1
2
3
4
5
2000 2002 2004 2006 2008 2010 2012 2014
NTDCI3 Trend Cycle
-0.6
-0.4
0.0
0.4
0.8
-1
0
1
2
3
2000 2002 2004 2006 2008 2010 2012 2014
NTDCI4 Trend Cycle
-0.4
-0.2
0.0
0.2
0.4
0.6
-1.0
-0.5
0.0
0.5
1.0
1.5
2000 2002 2004 2006 2008 2010 2012 2014
NTDCI5 Trend Cycle
-0.4
-0.2
0.0
0.2
0.4
-1.5
-1.0
-0.5
0.0
0.5
1.0
2000 2002 2004 2006 2008 2010 2012 2014
NTDCI6 Trend Cycle
-0.6
-0.4
-0.2
0.0
0.2
0.4
0.6
1
2
3
4
5
2000 2002 2004 2006 2008 2010 2012 2014
NTDCI7 Trend Cycle
-2
-1
0
1
2
3
4
-4
-2
0
2
4
2000 2002 2004 2006 2008 2010 2012 2014
NTDCI8 Trend Cycle
-0.6
-0.4
-0.2
0.0
0.2
0.4
-0.4
0.0
0.4
0.8
1.2
2000 2002 2004 2006 2008 2010 2012 2014
NTDCI9 Trend Cycle
-2
0
2
4
6
-4
-2
0
2
4
6
2000 2002 2004 2006 2008 2010 2012 2014
NTDCI10 Trend Cycle
-0.8
-0.4
0.0
0.4
0.8-6
-4
-2
0
2000 2002 2004 2006 2008 2010 2012 2014
NTDCI11 Trend Cycle
-0.4
-0.2
0.0
0.2
0.4
-5
-4
-3
-2
-1
0
1
2000 2002 2004 2006 2008 2010 2012 2014
NTDCI12 Trend Cycle
-0.6
-0.4
-0.2
0.0
0.2
0.4
0.0
0.5
1.0
1.5
2.0
2.5
2000 2002 2004 2006 2008 2010 2012 2014
NTDCI13 Trend Cycle
-0.4
0.0
0.4
0.8
-5
-4
-3
-2
-1
0
2000 2002 2004 2006 2008 2010 2012 2014
NTDCI14 Trend Cycle
-0.4
0.0
0.4
0.8
1.2
-6
-5
-4
-3
-2
2000 2002 2004 2006 2008 2010 2012 2014
NTDCI15 Trend Cycle
-2.0
-1.0
0.0
1.0
-3
-2
-1
0
1
2000 2002 2004 2006 2008 2010 2012 2014
NYDCI16 Trend Cycle
-0.6
-0.2
0.2
0.6
-1
0
1
2
3
4
2000 2002 2004 2006 2008 2010 2012 2014
NTDCI17 Trend Cycle
-0.4
-0.2
0.0
0.2
0.4
-2
-1
0
1
2
3
2000 2002 2004 2006 2008 2010 2012 2014
NTDCI18 Trend Cycle
-0.3
-0.1
0.1
0.3
18
20
22
24
26
2000 2002 2004 2006 2008 2010 2012 2014
Old-age EDR Trend
Cycle
-0.6
-0.2
0.2
0.6
30
35
40
45
50
55
2000 2002 2004 2006 2008 2010 2012 2014
Young-age EDR Trend Cycle
-0.20
-0.10
0.00
0.10
3.8
4.0
4.2
4.4
4.6
4.8
2000 2002 2004 2006 2008 2010 2012 2014
ln(Business Lea d ing Ind ica to r) Trend
Cycle
-0.04
-0.02
0.00
0.02
0.044.3
4.4
4.5
4.6
4.7
2000 2002 2004 2006 2008 2010 2012 2014
ln(Med ica l p rice ind ex ) Trend
Cycle
-6
-4
-2
0
2
4
6
58
62
66
70
2000 2002 2004 2006 2008 2010 2012 2014
Volume of primary care Trend
Cycle
-20
-15
-10
-5
0
5
10
15
-20
-15
-10
-5
0
5
10
15
2000 2002 2004 2006 2008 2010 2012 2014
Growth of Baumol's cost
Gro wth o f Ba umo l's cost (Mea n-Ad justed)
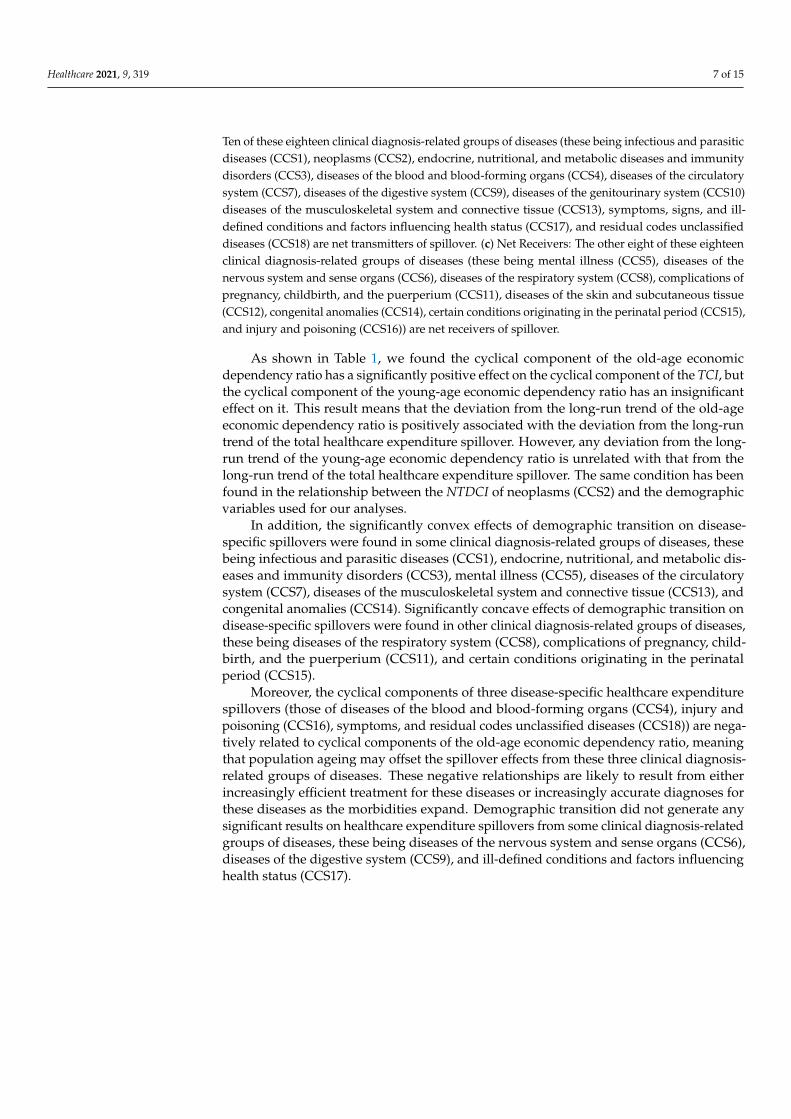
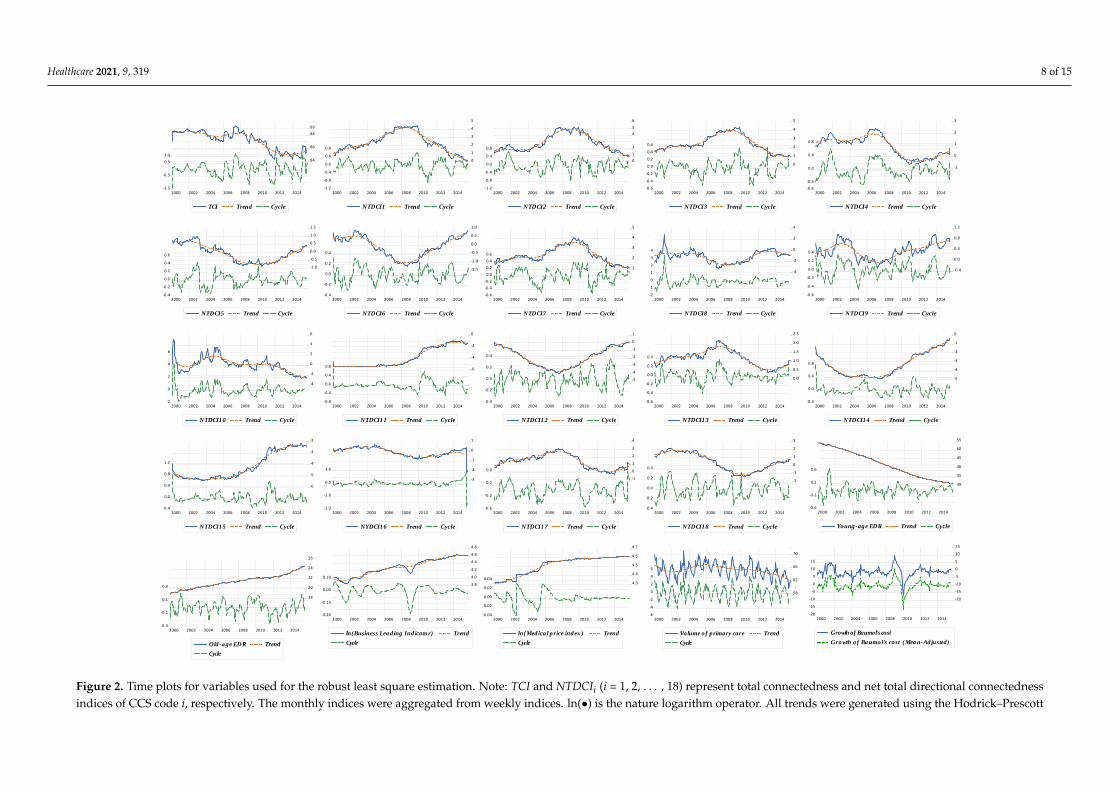
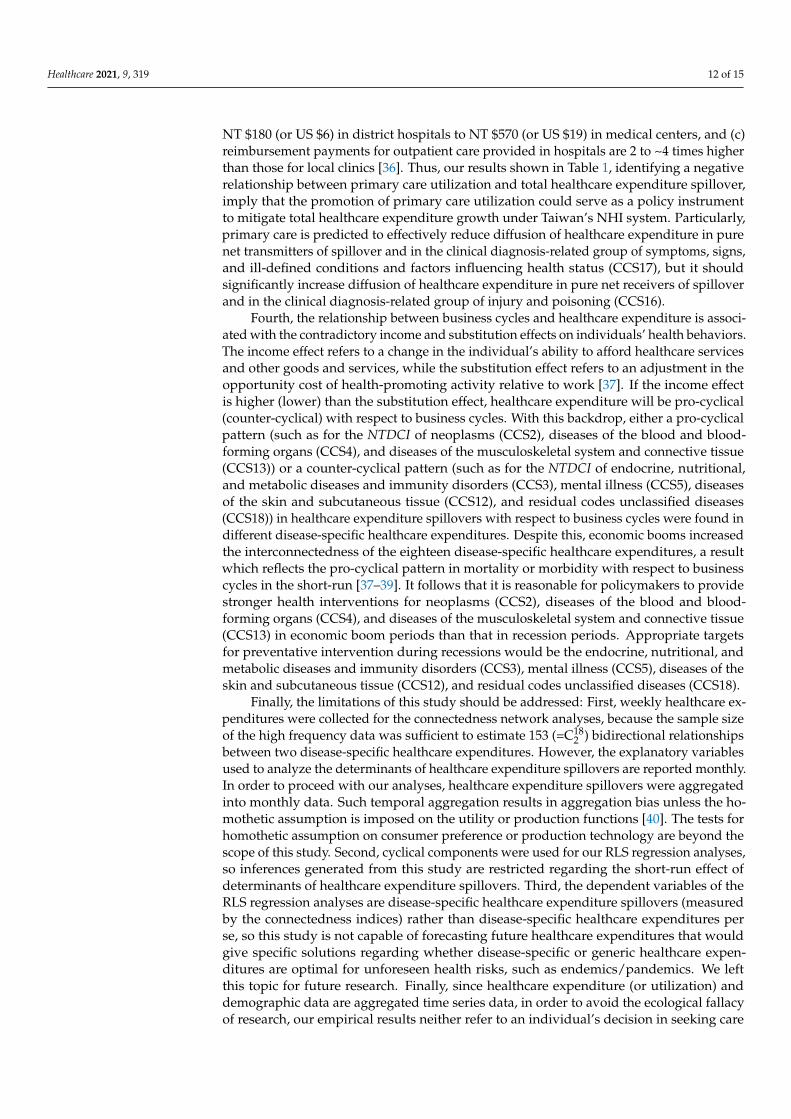
Figure 2. Time plots for variables used for the robust least square estimation. Note: TCI and NTDCIi (i = 1, 2, . . . , 18) represent total connectedness and net total directional connectednessindices of CCS code i, respectively. The monthly indices were aggregated from weekly indices. ln(•) is the nature logarithm operator. All trends were generated using the Hodrick–Prescott
Healthcare 2021, 9, 319 9 of 15
filter with a smoothing parameter (lambda = 14400). X-axis illustrates time horizon. Right Y-axis and left Y-axis indicate the trends of variables and their cyclical components, respectively.We could further separate these eighteen disease-specific healthcare expenditures into three groups: the first group being the pure net transmitters of spillover (all having positive signs ofNTDCI), which includes the infectious and parasitic diseases (CCS1), neoplasms (CCS2), endocrine, nutritional, and metabolic diseases and immunity disorders (CCS3), diseases of thecirculatory system (CCS7), and diseases of the musculoskeletal system and connective tissue (CCS13). The second group is the pure net receivers of spillover (all with negative signs ofNTDCI), consisting of complications of pregnancy, childbirth, and the puerperium (CCS11), congenital anomalies (CCS14), and certain conditions originating in the perinatal period(CCS15). The third group is the in-betweens (having mixed signs of NTDCI), comprised of diseases of the blood and blood-forming organs (CCS4), mental illness (CCS5), diseases of thenervous system and sense organs (CCS6), diseases of the respiratory system (CCS8), diseases of the digestive system (CCS9), diseases of the genitourinary system (CCS10), diseases of theskin and subcutaneous tissue (CCS12), injury and poisoning (CCS16), symptoms, signs, and ill-defined conditions and factors influencing health status (CCS17), and residual codesunclassified diseases (CCS18).
Table 1. Robust Least Square Estimates for Total Connectedness and Net Total Directional Connectedness Indices.
ConnectednessIndices
Young-Age EconomicDependency Ratio
Old-Age EconomicDependency Ratio
Composite LeadingIndicator Medical Price Index Volume of Primary
CareGrowth of Baumol’s
Cost (×10−2) Outliers Detected from OLS
Coef (Z-Stat) Coef (Z-Stat) Coeff (Z-Stat) Coeff (Z-Stat) Coef (Z-Stat) Coeff (Z-Stat) RStudent DFFFITS CovRatio
TCI −0.515 (−1.30) 2.853 (4.22) *** 2.495 (2.19) ** −0.512 (−0.17) −0.041 (−2.02) ** 0.380 (0.25) 7 6 21CCS1 −0.389 (−1.76) * 0.634 (1.68) * −1.016 (−1.59) −0.379 (−0.23) −0.026 (−2.27) ** 1.682 (1.98) ** 7 8 21CCS2 −0.216 (−0.86) 1.313 (3.06) *** 1.735 (2.39) ** −2.035 (−1.07) −0.034 (−2.64) *** 2.002 (2.07) ** 9 12 16CCS3 −0.585 (−4.33) *** 1.261 (5.47) *** −0.792 (−2.03) ** 2.068 (2.03) ** −0.028 (−4.11) *** −0.002 (0.00) 9 11 22CCS4 0.128 (0.69) −0.627 (−1.98) ** 0.957 (1.79) * 2.129 (1.52) −0.007 (−0.71) 2.328 (3.26) *** 8 7 18CCS5 −0.180 (−1.65) * 0.339 (1.82) * −1.078 (−3.42) *** 5.413 (6.56) *** 0.007 (1.19) −0.775 (−1.85) * 12 13 22CCS6 0.018 (0.16) −0.133 (−0.69) 0.025 (0.08) 2.641 (3.08) *** 0.005 (0.91) −1.416 (−3.24) *** 9 16 17CCS7 −0.619 (−4.42) *** 1.615 (6.76) *** −0.415 (−1.03) 3.231 (3.06) *** −0.032 (−4.42) *** −1.101 (−2.05) ** 9 16 17CCS8 1.250 (3.47) *** −2.660 (−4.33) *** −1.674 (−1.61) −3.909 (−1.44) 0.008 (0.45) 0.147 (0.11) 8 14 16CCS9 −0.085 (−0.61) 0.371 (1.56) −0.106 (−0.26) 2.318 (2.21) ** −0.007 (−1.02) −1.506 (−2.82) *** 10 13 12
CCS10 −1.019 (−1.74) * 0.803 (0.81) −1.591 (−0.94) −9.577 (−2.17) ** 0.050 (1.67) * −5.196 (−2.31) ** 10 11 20CCS11 0.429 (3.28) ** −0.774 (−3.47) *** 0.557 (1.48) 0.504 (0.51) 0.015 (2.19) ** −0.457 (−0.91) 12 10 26CCS12 −0.071 (−0.60) −0.188 (−0.93) −0.835 (−2.45) ** 1.332 (1.49) 0.008 (1.26) −0.567 (−1.25) 8 9 18CCS13 −0.206 (−2.11) ** 0.339 (2.04) ** 0.915 (3.25) *** −0.149 (−0.20) −0.009 (−1.82) * 0.746 (1.99) ** 14 13 21CCS14 −0.265 (−2.33) ** 0.413 (2.14) ** 0.080 (0.25) 0.633 (0.74) 0.006 (0.98) 0.988 (2.27) ** 7 9 22CCS15 0.240 (2.31) ** −0.824 (−4.64) *** 0.149 (0.49) −0.247 (−0.31) 0.016 (2.97) *** 0.265 (0.66) 6 7 20CCS16 0.090 (0.90) −0.443 (−2.60) *** −0.142 (−0.49) −0.918 (−1.22) 0.010 (1.87) * −0.448 (−1.17) 7 7 25CCS17 −0.199 (−1.05) 0.045 (0.14) −0.141 (−0.26) 0.404 (0.28) −0.017 (−1.79) * 1.810 (2.49) ** 6 9 18CCS18 0.011 (0.09) −0.711 (−3.48) *** −0.704 (−2.04) ** 0.868 (0.96) 0.008 (1.31) 0.511 (1.11) 9 10 15
Note: The MM estimation was used for the Robust Least Square Estimates. ***, **, and * indicate significance at the 1%, 5%, and 10% significance level, respectively. RStudent, DFFITS, and CovRatio representthe studentized residual, the scaled difference in fitted values for that observation between the original equation and an equation estimated without that observation, and the ratio of the determinant of thecovariance matrix of the coefficients from the original equation to the determinant of the covariance matrix from an equation without that observation, respectively. TCI and CCSi (i = 1, 2, . . . , 18) represent totalconnectedness and net total directional connectedness indices of CCS code i, respectively.
Healthcare 2021, 9, 319 10 of 15
The estimated coefficients of the cyclical components of the composite leading indexare significantly positive for the TCI and NTDCI of three clinical diagnosis-related groupsof diseases, these being neoplasms (CCS2), diseases of the blood and blood-forming or-gans (CCS4), and diseases of the musculoskeletal system and connective tissue (CCS13).However, they are significantly negative for the NTDCI of four clinical diagnosis-relatedgroups of diseases, these being endocrine, nutritional, and metabolic diseases and immu-nity disorders (CCS3), mental illness (CCS5), diseases of the skin and subcutaneous tissue(CCS12), and residual codes unclassified diseases (CCS18). Despite the significantly nega-tive relationship between the NTDCI and medical price index that was found in the case ofdiseases of the genitourinary system (CCS10), there exists a positive relationship betweenthe NTDCI and medical price in five of the eighteen clinical diagnosis-related groups ofdiseases (namely, endocrine, nutritional, and metabolic diseases and immunity disorders(CCS3), mental illness (CCS5), diseases of the nervous system and sense organs (CCS6),diseases of the circulatory system (CCS7), and diseases of the digestive system (CCS9)).
The impact of the volume of primary care utilization on the NTDCI was found tobe significantly negative for one-third of the eighteen clinical diagnosis-related groupsof diseases (i.e., infectious and parasitic diseases (CCS1), neoplasms (CCS2), endocrine,nutritional, and metabolic diseases and immunity disorders (CCS3), diseases of the cir-culatory system (CCS7), diseases of the musculoskeletal system and connective tissue(CCS13), and ill-defined conditions and factors influencing health status (CCS17)). Theimpact was significantly positive for four of the eighteen clinical diagnosis-related groupsof diseases (namely, diseases of the genitourinary system (CCS10), complications of preg-nancy, childbirth, and the puerperium (CCS11), congenital anomalies (CCS14), and certainconditions originating in the perinatal period (CCS15)). It was found to be insignificantfor the remaining eight clinical diagnosis-related groups of diseases. It is possible thatthe negative effects of the volume of primary care utilization on the NTDCI dominate thepositive and insignificant effects, leading to a significant and negative effect of volume ofprimary care utilization on the TCI.
Although a positive effect of Baumol’s cost disease (defined as a gap between thechange of wage in the healthcare sector and the growth of productivity of the wholeeconomy) on healthcare expenditure growth is predicted by Baumol’s unbalanced growthmodel [18], the relationships between the Baumol’s cost disease and healthcare expenditurespillovers are identified as positive for one-third of the eighteen clinical diagnosis-relatedgroups of diseases (i.e., infectious and parasitic diseases (CCS1), neoplasms (CCS2), dis-eases of the blood and blood-forming organs (CCS4), diseases of the musculoskeletal systemand connective tissue (CCS13), congenital anomalies (CCS14), and symptoms, signs, andill-defined conditions and factors influencing health status (CCS17)), ambiguous for sevenof eighteen clinical diagnosis-related groups of diseases (namely, endocrine, nutritional,and metabolic diseases and immunity disorders (CCS3), diseases of the respiratory system(CCS8), complications of pregnancy, childbirth, and the puerperium (CCS11), diseases ofthe skin and subcutaneous tissue (CCS12), diseases of the musculoskeletal system andconnective tissue (CCS13), congenital anomalies (CCS14), certain conditions originatingin the perinatal period (CCS15), injury and poisoning (CCS16), and residual codes unclas-sified diseases (CCS18)), and even negative for five of eighteen clinical diagnosis-relatedgroups of diseases (viz. mental illness (CCS5), diseases of the nervous system and senseorgans (CCS6), diseases of the circulatory system (CCS7), diseases of the digestive system(CCS9), and diseases of the genitourinary system (CCS10)). These results may lead to aninsignificant effect of Baumol’s cost disease on total healthcare expenditure spillovers.
4. Discussion
The underlying logic for using the sophisticatedly dynamic connectedness networkanalyses for this study is twofold: first, this methodology is capable of elucidating the net-work relationships among disease-specific healthcare expenditure spillovers and prevent-ing biases from structural change and endogeneity of different disease-specific healthcare
Healthcare 2021, 9, 319 11 of 15
expenditures. Second, the establishment of network relationships among disease-specifichealthcare expenditure spillovers allowed us to unravel the black box of healthcare ex-penditure growth processes. Since spillovers from shocks to the eighteen disease-specifichealthcare expenditures (based on the multi-level CCS categories) explained a substantialproportion (approximately 87.20%) of the total forecast error variance during our studyperiod of January 2000 to ~September 2015 (see TCI in Figure 1), we are able to disentanglethe healthcare expenditure growth processes black box through the newly developed dy-namic connectedness network analyses. There are several policy implications that can bedrawn from our empirical results.
First, the evidence generated from the RLS estimates shown in Table 1 suggests thatpopulation ageing is one of the main forces driving the diffusion of total healthcare expen-diture. This result reflects the fact that the rapidly increasing rate of population ageing inTaiwan expands demand for healthcare services. Our results are consistent with those fromprevious studies on the determinants of healthcare expenditure growth [1–7]. Although de-mographic transition is an important determinant of total healthcare expenditure spillover,the effect of demographic transition on individual disease-specific healthcare expenditurespillovers is variant, based on the results from Table 1. Specifically, the net effects of popu-lation ageing (in terms of the sum of the estimated coefficients of young-age and old-ageeconomic dependency ratio) on disease-specific healthcare expenditure spillovers frompure net transmitters of spillover (including the infectious and parasitic diseases (CCS1),neoplasms (CCS2), endocrine, nutritional, and metabolic diseases and immunity disorders(CCS3), diseases of the circulatory system (CCS7), and diseases of the musculoskeletalsystem and connective tissue (CCS13)) are positive, but those from some net receivers ofspillover (such as complications of pregnancy, childbirth, and the puerperium (CCS11) andcertain conditions originating in the perinatal period (CCS15)) are negative.
Consequently, the increase in healthcare expenditures resulting from pure net trans-mitters of spillover will drive a further increase in all other disease-specific healthcareexpenditures within the network, and this transmission effect is mostly likely to be ampli-fied as Taiwan’s elderly population persistently grows. Contrarily, changes in healthcareexpenditure resulting from pure net receivers of spillover (mostly related to diseases ofpregnancy, childbirth, and the puerperium in the perinatal period) are driven by thechanges in all other disease-specific healthcare expenditures within the network, and thistransmission effect is likely to grow stronger as Taiwan’s total fertility rate continuouslydecreases. In order to counter-balance a dramatic upward trend in total healthcare expen-diture, the priority among health promotion policies should be those policies that targetpreventive intervention for those diseases classified as pure net transmitters of spillover,and provide sufficient incentives for residents in Taiwan to increase the total fertility rate.
Second, Taiwan’s NHI is a compulsory program with universal coverage on inpatient,outpatient, dental, emergency department care services, and traditional Chinese medicine.A household of four members only pays US $100, approximately 2% of household in-come [35]. As a result, Taiwan’s healthcare market is highly regulated with regards to theprice of healthcare services, and in turn, the wage level in the healthcare sector is morestable than that in other sectors. Although the medical price and Baumol’s cost diseases(measuring the unbalanced growth of productivities between the healthcare sector andthe whole economy) have some impacts on some disease-specific healthcare expenditurespillovers, these two macroeconomic variables have little impact on the interconnectednessof these eighteen disease-specific healthcare expenditures, a finding consistent with a recentinvestigation on the effect of Baumol’s cost diseases on healthcare expenditure in the OECDcountries [16].
Third, it is worth addressing that both the beneficiaries and healthcare providers ofTaiwan’s NHI program have incentives to utilize or provide more healthcare services inhospitals due to the following characteristics of Taiwan’s healthcare system: (a) Taiwan’sNHI system lacks of a compulsory referral mechanism, (b) out-of-pocket payments toaccess hospital outpatient care is quite low and the cost per outpatient visit ranges from
Healthcare 2021, 9, 319 12 of 15
NT $180 (or US $6) in district hospitals to NT $570 (or US $19) in medical centers, and (c)reimbursement payments for outpatient care provided in hospitals are 2 to ~4 times higherthan those for local clinics [36]. Thus, our results shown in Table 1, identifying a negativerelationship between primary care utilization and total healthcare expenditure spillover,imply that the promotion of primary care utilization could serve as a policy instrumentto mitigate total healthcare expenditure growth under Taiwan’s NHI system. Particularly,primary care is predicted to effectively reduce diffusion of healthcare expenditure in purenet transmitters of spillover and in the clinical diagnosis-related group of symptoms, signs,and ill-defined conditions and factors influencing health status (CCS17), but it shouldsignificantly increase diffusion of healthcare expenditure in pure net receivers of spilloverand in the clinical diagnosis-related group of injury and poisoning (CCS16).
Fourth, the relationship between business cycles and healthcare expenditure is associ-ated with the contradictory income and substitution effects on individuals’ health behaviors.The income effect refers to a change in the individual’s ability to afford healthcare servicesand other goods and services, while the substitution effect refers to an adjustment in theopportunity cost of health-promoting activity relative to work [37]. If the income effectis higher (lower) than the substitution effect, healthcare expenditure will be pro-cyclical(counter-cyclical) with respect to business cycles. With this backdrop, either a pro-cyclicalpattern (such as for the NTDCI of neoplasms (CCS2), diseases of the blood and blood-forming organs (CCS4), and diseases of the musculoskeletal system and connective tissue(CCS13)) or a counter-cyclical pattern (such as for the NTDCI of endocrine, nutritional,and metabolic diseases and immunity disorders (CCS3), mental illness (CCS5), diseasesof the skin and subcutaneous tissue (CCS12), and residual codes unclassified diseases(CCS18)) in healthcare expenditure spillovers with respect to business cycles were found indifferent disease-specific healthcare expenditures. Despite this, economic booms increasedthe interconnectedness of the eighteen disease-specific healthcare expenditures, a resultwhich reflects the pro-cyclical pattern in mortality or morbidity with respect to businesscycles in the short-run [37–39]. It follows that it is reasonable for policymakers to providestronger health interventions for neoplasms (CCS2), diseases of the blood and blood-forming organs (CCS4), and diseases of the musculoskeletal system and connective tissue(CCS13) in economic boom periods than that in recession periods. Appropriate targetsfor preventative intervention during recessions would be the endocrine, nutritional, andmetabolic diseases and immunity disorders (CCS3), mental illness (CCS5), diseases of theskin and subcutaneous tissue (CCS12), and residual codes unclassified diseases (CCS18).
Finally, the limitations of this study should be addressed: First, weekly healthcare ex-penditures were collected for the connectedness network analyses, because the sample sizeof the high frequency data was sufficient to estimate 153 (=C18
2 ) bidirectional relationshipsbetween two disease-specific healthcare expenditures. However, the explanatory variablesused to analyze the determinants of healthcare expenditure spillovers are reported monthly.In order to proceed with our analyses, healthcare expenditure spillovers were aggregatedinto monthly data. Such temporal aggregation results in aggregation bias unless the ho-mothetic assumption is imposed on the utility or production functions [40]. The tests forhomothetic assumption on consumer preference or production technology are beyond thescope of this study. Second, cyclical components were used for our RLS regression analyses,so inferences generated from this study are restricted regarding the short-run effect ofdeterminants of healthcare expenditure spillovers. Third, the dependent variables of theRLS regression analyses are disease-specific healthcare expenditure spillovers (measuredby the connectedness indices) rather than disease-specific healthcare expenditures perse, so this study is not capable of forecasting future healthcare expenditures that wouldgive specific solutions regarding whether disease-specific or generic healthcare expen-ditures are optimal for unforeseen health risks, such as endemics/pandemics. We leftthis topic for future research. Finally, since healthcare expenditure (or utilization) anddemographic data are aggregated time series data, in order to avoid the ecological fallacyof research, our empirical results neither refer to an individual’s decision in seeking care
Healthcare 2021, 9, 319 13 of 15
nor the change of an individual’s behavior at his/her specific age in response to changes inhealthcare utilization.
5. Conclusions
The significance of this study is to examine factors influencing the network transmis-sion mechanisms underlying the determinants of healthcare expenditure growth throughthe dynamic connectedness network and the RLS regression analyses for the first time. Ourresults show that demographic transition and business cycles are key factors increasingthe interconnectedness of different disease-specific healthcare expenditures, while thepromotion of primary care utilization could reduce total healthcare expenditure spillover.In order to reduce diffusion of disease-specific healthcare expenditures, health promotionactivities should focus on those clinical diagnosis-related groups of diseases classified aspure net transmitters of spillover, and preventive interventions targeting different diseasesshould be activated in different phrases of the business cycle.
Supplementary Materials: The Supplementary Materials of this study is available online at https://www.mdpi.com/2227-9032/9/3/319/s1.
Funding: This research was funded by the Ministry of Science and Technology in Taiwan for theresearch projects entitled “The effect of demographic structure change on the expansion of diseasesand healthcare expenditure growth: the dynamic connectedness network analysis with Grant No.108-2410-H-025-017”.
Institutional Review Board Statement: The data collection process was approved by the ResearchEthics Committee of Taichung Tzu Chi Hospital with the Certificate of Exempt Review ID: REC108-11.
Informed Consent Statement: Not applicable. This study uses secondary data (i.e., aggregatehealthcare utilization data for all residents in Taiwan), and did not involve any human participantsand/or tissue.
Data Availability Statement: Data for this research came from Taiwan’s National Health InsuranceResearch Database, NHIRD, available at https://nhird.nhri.org.tw/en/Data_Files.html (accessedon 1 January 2021), the Demographic Statistics Database, DSD, available on https://www.ris.gov.tw/app/portal/346 (accessed on 1 January 2021), the Macroeconomics Statistics Database, MSD,available at https://statdb.dgbas.gov.tw/pxweb/Dialog/statfile9L.asp (accessed on 1 January 2021)and Taiwan Business Indicators Database, TBID, available at https://index.ndc.gov.tw/n/en#/(accessed on 1 January 2021), administered by the Taiwanese government.
Acknowledgments: The author would like to thank two anonymous referees for their insightfulcomments and suggestions that allow me to improve the quality of this study. The final proof-reading of the study by Lisa Brutcher (at Washington State University, USA) is deeply acknowledged.All errors are the author’s.
Conflicts of Interest: The author declares no conflict of interest.
References1. Liu, Y.M. Population aging, technological innovation, and the growth of health expenditure: Evidence from patients with Type 2
diabetes in Taiwan. Value Health Reg. Issues 2020, 21, 120–126. [CrossRef]2. Barkat, K.; Sbia, R.; Maouchi, Y. Empirical evidence on the long and short run determinants of health expenditure in the Arab
world. Q. Rev. Econ. Financ. 2019, 73, 78–87. [CrossRef]3. Tian, F.; Gao, J.; Yang, K. A quantile regression approach to panel analysis of health-care expenditure in Organisation for Economic
Co-operation and Development countries. Health Econ. 2018, 27, 1921–1944. [CrossRef] [PubMed]4. Lopreite, M.; Mauro, M. The effects of population ageing on health care expenditure: A Bayesian VAR analysis using data from
Italy. Health Policy 2017, 121, 663–674. [CrossRef]5. Chen, W.Y.; Wen, M.J.; Lin, Y.H.; Liang, Y.W. On the relationship between healthcare expenditure and longevity: Evidence from
continuous wavelet analyses. Qual. Quant. 2016, 50, 1041–1057. [CrossRef]6. Murthy, V.N.R.; Okunade, A.A. Determinants of U.S. health expenditure: Evidence from autoregressive distributed lag (ARDL)
approach to cointegration. Econ. Model. 2016, 59, 67–73. [CrossRef]7. Breyer, F.; Lorenz, N.; Niebel, T. Population ageing and health care expenditures: Is there a Eubie Blake effect? Eur. J. Health Econ.
2015, 16, 95–112. [CrossRef] [PubMed]
Healthcare 2021, 9, 319 14 of 15
8. Bernal-Delgadoa, E.; Comendeiro-Maaløea, M.; Ridao-Lópeza, M.; Rossellób, A.S. Factors underlying the growth of hospitalexpenditure in Spain in a period of unexpected economic shocks: A dynamic analysis on administrative data. Health Policy 2020,124, 389–396. [CrossRef] [PubMed]
9. Abdullah, S.M.; Siddiqua, S.; Huque, R. Is health care a necessary or luxury product for Asian countries? An answer using panelapproach. Health Econ. Rev. 2017, 7, 4. [CrossRef] [PubMed]
10. Baltagi, B.; Lagraviness, R.; Moscone, F.; Tosetti, E. Health care expenditure and income: A global perspective. Health Eco-Nomics2017, 26, 863–874. [CrossRef]
11. You, X.; Okunade, A.A. Income and technology as drivers of Australian healthcare expenditures. Health Econ. 2017, 26, 853–862.[CrossRef] [PubMed]
12. Cleeren, K.; Lamey, L.; Meyer, J.; Ruyter, K.D. How business cycles affect the healthcare sector: A cross-country investigation.Health Econ. 2016, 25, 787–800. [CrossRef]
13. Cinaroglu, S.; Baser, O. The relationship between medical innovation and health expenditure before and after health reform.Health Policy Technol. 2018, 7, 379–387. [CrossRef]
14. Murthy, V.N.R.; Ketenci, N. Is technology still a major driver of health expenditure in the United Sates? evidence fromcointegration analysis with multiple structural breaks. Int. J. Health Econ. Manag. 2017, 17, 29–50. [CrossRef]
15. Willemé, P.; Dumont, M. Machines that go ‘Ping’: Medical technology and health expenditures in OECD countries. Health Econ.2015, 24, 1027–1041. [CrossRef] [PubMed]
16. Atanda, A.; Menclova, A.K.; Reed, W.R. Is health care infected by Baumol’s cost disease? Test of a new model. Health Econ. 2018,27, 832–849. [CrossRef]
17. Colombier, C. Divers of health-care expenditure: What role does Baumol’s cost disease play? Soc. Sci. Q. 2017, 98, 1603–1621.[CrossRef]
18. Baumol, W.J. Health care, education and the cost disease: A looming crisis for public choice. Public Choice 1993, 77, 17–28.[CrossRef]
19. Harris, A.; Sharma, A. Estimating the future health and aged care expenditure in Australia with changes in morbidity. PLoS ONE2018, 13, e0201697. [CrossRef]
20. Caley, M.; Sidhu, K. Estimating the future healthcare costs of an aging population in the UK: Expansion of morbidity and theneed for preventative care. J. Public Health 2010, 33, 117–122. [CrossRef]
21. Antonakakis, N.; Gabauer, D.; Gupta, R.; Plakandaras, V. Dynamic connectedness of uncertainty across developed economies:A time-varying approach. Econ. Lett. 2018, 166, 63–75. [CrossRef]
22. Yohai, V.J. High breakdown-point and high efficiency robust estimates for regression. Ann. Stat. 1987, 15, 642–656. [CrossRef]23. Linde, S. The formation of physician patient sharing networks in medicare: Exploring the effect of hospital affiliation. Health Econ.
2019, 28, 1435–1448. [CrossRef]24. DuGoff, E.H.; Fernandes-Taylor, S.; Weissman, G.E.; Huntley, J.H.; Pollack, C.E. A scoping review of patient-sharing network
studies using administrative data. Transl. Behav. Med. 2018, 8, 598–625. [CrossRef] [PubMed]25. Raminani, S.R. International Classification of Diseases. Encyclopedia Britannica. britannica.com. 2014. Available online:
https://www.britannica.com/topic/International-Classification-of-Diseases (accessed on 20 April 2020).26. National Development Council. Population projection for the R.O.C. (Taiwan) 2018–2065. Executive Yuan, Taiwan. 2019.
Available online: https://www.ndc.gov.tw/News_Content.aspx?n=114AAE178CD95D4C&sms=DF717169EA26F1A3&s=E1EC042108072B67 (accessed on 20 April 2020).
27. DGBAS (2020). Macroeconomics Statistics Database. Directorate-General of Budget, Accounting and Statistics, Executive Yuan,Taiwan. 2020. Available online: https://statdb.dgbas.gov.tw/pxweb/Dialog/statfile9L.asp (accessed on 20 April 2020).
28. Dangayach, Y.; Gupta, A. Four Asian dragons-evolution and their growth. Int. J. Adv. Res. Dev. 2018, 3, 158–162.29. Diebold, F.X.; Yilmaz, K. Measuring financial asset return and volatility spillover, with application to global equity. Econ. J. 2009,
119, 158–171. [CrossRef]30. Diebold, F.X.; Yilmaz, K. Better to given than receive: Predictive directional measurement of volatility spillovers. Interna-Tional J.
Forecast. 2012, 28, 57–66. [CrossRef]31. AHRQ. Clinical Classifications Software (CCS) 2015. Agency for Healthcare Research and Quality. 2016. Available online:
https://www.hcup-us.ahrq.gov/toolssoftware/ccs/CCSUsersGuide.pdf (accessed on 20 April 2020).32. Enders, W. Applied Econometric Time Series; John Wiley&Sons: New York, NY, USA, 2004.33. Stuckler, D.; Basu, S. The Body Economics. Why Austerity Kills? Perseus Book Group: New York, NY, USA, 2013.34. Hodrick, R.J.; Prescott, E.C.; Postwar, U.S. business cycles: An empirical investigation. J. Moneycredit Bank. 1997, 29, 1–16.
[CrossRef]35. NHIA. 2018–2019 National Health Insurance Annual Report. Taipei: National Health Insurance Administration, Ministry of
Health and Welfare. 2019. Available online: http://www.nhi.gov.tw/resource/Webdata/2018-19%E5%85%A8%E6%B0%91%E5%81%A5%E5%BA%B7%E4%BF%9D%E9%9A%AA%E5%B9%B4%E5%A0%B1.pdf (accessed on 20 April 2020).
36. MOHW. National Health Insurance Statistics 2019. Taipei: National Health Insurance Administration, Ministry of Health andWelfare. 2019. Available online: https://dep.mohw.gov.tw/DOS/cp-4648-50662-113.html (accessed on 20 April 2020).
37. Chen, W.Y. Health progress and economic growth in the United States: The continuous wavelet analysis. Empir. Econ. 2016, 50,831–855. [CrossRef]

Healthcare 2021, 9, 319 15 of 15
38. Liu, Y.H.; Chang, W.S.; Chen, W.Y. Health progress and economic growth in the United States: The Mixed Frequency VARanalyses. Qual. Quant. 2019, 53, 1895–1911. [CrossRef]
39. Ruhm, C.J. Are recessions good for your health? Q. J. Econ. 2020, 115, 617–650. [CrossRef]40. Varian, H.R. Microeconomic Analysis, 3rd ed.; Norton & Company Inc.: New York, NY, USA, 1992.