
Online Judging Platform Utilizing Dynamic Plagiarism ... - MDPI
A Malicious Activity Detection System UtilizingPredictive Modeling in Complex Environments
Abdullah Almaatouq∗, Ahmad Alabdulkareem∗, Mariam Nouh∗, Mansour Alsaleh†, Abdulrahman Alarifi†
Abel Sanchez‡, Anas Alfaris∗‡ and John Williams‡
∗ Center for Complex Engineering Systems {a.alamaatouq, a.abdulkareem, m.nouh}@cces-kacst-mit.org† King Abdulaziz City for Science and Technology {maalsaleh, aarifi}@kacst.edu.sa
‡ Massachusetts Institute of Technology {doval, anas, jrw}@mit.edu
Abstract—Complex enterprise environments consist of globallydistributed infrastructure with a variety of applications anda large number of activities occurring on a daily basis. Thisincreases the attack surface and narrows the view of ongoingintrinsic dynamics. Thus, many malicious activities can persistunder the radar of conventional detection mechanisms longenough to achieve critical mass for full-fledged cyber attacks.Many of the typical detection approaches are signature-based andthus are expected to fail in the face of zero-day attacks. In thispaper, we present the building-blocks for developing a MaliciousActivity Detection System (MADS). MADS employs predictivemodeling techniques for the detection of malicious activities.Unlike traditional detection mechanisms, MADS includes thedetection of both network-based intrusions and malicious userbehaviors. The system utilizes a simulator to produce holisticreplication of activities, including both benign and malicious,flowing within a given complex IT environment. We validate theperformance and accuracy of the simulator through a case studyof a Fortune 500 company where we compare the results ofthe simulated infrastructure against the physical one in termsof resource consumption (i.e., CPU utilization), the number ofconcurrent users, and response times. In addition to an evaluationof the detection algorithms with varying hyper-parameters andcomparing the results.
I. INTRODUCTION
Early detection of malicious behavioral patterns in enter-prise environments helps in reducing the impact of cyberattacks. However, identifying the patterns is challenging dueto the complexity of modern organizational structures, a mul-titude of applications, and globally distributed infrastructures.
The IT infrastructure in an enterprise environment is anal-ogous to the biological nervous systems [1], [2]. This anal-ogy compares body parts to interconnected components (e.g.data centers) exchanging signals (request-response messages)in order to coordinate actions (e.g., commit transactions).Therefore, in order to address the scale and complexity ofthese environments, we propose the utilization of a large-scaleholistic infrastructure simulator. For instance, the simulatorwill be used to generate normal and suspicious activities inthe logs of a simulated enterprise environment. This approachprovides a more holistic understanding of activity patterns. Inaddition, the use of the simulator in this context would helpin: (i) providing synthetic system activities to compensate forthe lack of publicly available datasets [3]; and (ii) enablingaccurate evaluation of the detection mechanisms by providinga ground-truth reference.
Most of the malicious activities detection methods suggestedin the literature are rule-based techniques (e.g., signaturematching) and predictive modeling techniques (e.g., anomalydetection) [4], [5]. Rule-based techniques usually use knownmalicious behaviors as a baseline in order to compare againstnew behaviors, which are known to signify security viola-tions [4]. This is typically achieved by embedding heuristics tosearch for known patterns (signatures) in network and/or auditdata. However, it is challenging to come up with maliciousactivity scenarios that cover all patterns or/and unseen patterns(i.e., zero-day attacks). In addition, adversaries might be awareof the detection heuristics used by the detection mechanismand attempt to evade them. Hence, we argue that morerobust and adaptive techniques such as predictive modeling areneeded. Predictive modeling can be described as the processof characterizing and anticipating patterns based on historicalbehaviors [6]. One of these techniques is anomaly detection.Unlike rule-based techniques, anomaly detection employs sta-tistical and machine learning techniques that consider irregularor statistically inconsistent observations as anomalies [7].
The main contributions of this work include:
• We propose an architecture that combines several knowntechniques for data collection, storage and analysis in oneframework in a meaningful context to develop MaliciousActivity Detection System (MADS) that operates onmultiple levels (Section III).
• We introduce a holistic simulator that is utilized to gener-ate normal and anomalous scenarios in the activity logs oflarge scale complex IT infrastructures (Section VI). Theholistic property of the simulator is intended to describethe motivation for this line of work rather than the currentstate presented.
• We validate the performance and accuracy of the simula-tor through a case study of a Fortune 500 company wherewe compare the results of the simulated infrastructureagainst the physical one in terms of resource consumption(i.e., CPU utilization), the number of concurrent users,and response times (Section VII). In addition to anevaluation of the detection algorithms with varying hyperparameters and comparing the results.
Our work focuses on the development of an aggregatebehavior model that leverages observations made throughout

To appear in the proceedings of IEEE - CCNC - Security - Privacy and Content Protection
a system’s holistic behavioral patterns, in order to detectmalicious and suspicious activities.
II. BACKGROUND
Cyber attacks are increasing in frequency and impact. Theyhave demonstrated that extensive vulnerabilities exist in ITinfrastructures, with the potential for serious damage [8].The effects of a successful cyber attack might include se-rious consequences for major economic and industrial sec-tors (e.g., financial and petroleum), threats to infrastructurenetworks (e.g., water and electricity), and disruption of theresponse and communications capabilities of government andsecurity forces. For example, in 2012 a destructive malwareattack on a Saudi oil firm had the ability to corrupt files oncompromised machines and overwrite the Master Boot Record(MBR) in an attempt to render workstations unusable [9].According to security reports, this malware infected around30,000 workstations, causing the firm to spend almost twoweeks to fully recover from the disruption caused by data lossand disabled workstations [10].
Situational Awareness (SA) is a critical capability to attainin order to effectively deal with malicious activities. SA isinformation scaled to one’s level and areas of interest. Itcomprehends one’s role, environment, the adversary, mission,resource status, what is permissible to view, and which authori-ties are relevant. It is critical to understand system performanceand behavior during non-attack periods, in which some attackactivities might exhibit deviations from normal behavior. Oneof the predictive modeling methods used in order to achieveSA is anomaly detection. Anomalies can be described asobservations that deviate from their sample, which wouldentice suspicion that they were generated by a differentmechanism [11]. Anomaly Detection is also known by othernames. For example, authors may describe their detectionmethodologies as outlier detection, novelty detection, noisedetection, deviation detection or exception mining [12]. Mostof the proposed anomaly detection approaches in the literaturecan be categorized based on the following techniques: classifi-cation, the nearest neighbor, clustering, statistical, informationtheoretic and spectral [13].
Recently, employing machine learning techniques (e.g.,anomaly detection) in various problems from many domainshas gained a lot of popularity. However, it faces consider-able amounts of criticism when applied in a cyber securitycontext [14]. This is arguably attributed to the possibilitythat the existing machine learning techniques tend to producemany false positives when applied to security problems. Thisis potentially due to the fact that those machine learningtechniques are trained with datasets that have a very narrowview that misses key information about the examined systems.Also, effectively integrating and fusing a broader array ofcontextual information in order to achieve higher detectionperformance would require a larger number of training exam-ples to generalize correctly and overcome the problem of highdimensionality [15]. In high dimensions, the contrast betweendistances decreases, and the idea of neighborhood diminishes,
which results in most of the examples looking alike [16] [17].However, the non-uniformity of data distribution counteractsthe curse of dimensionality. In many cases of high dimen-sionality, examples are concentrated near a lower-dimensionalmanifold [16], and hence, the problem can explicitly bereduced using dimensionality reduction techniques (e.g., [18]).
Modeling the targeted system could partially achieve situa-tional awareness [15]. Due to the high complexity of largescale IT infrastructures, modeling them becomes a daunt-ing task. Simulation is becoming a very popular techniquefor modeling large computer systems, competing with othermethods for understanding IT infrastructures (e.g., profilingand analytical modeling) [19]. Profiling is the recording andanalysis of a system’s execution and behavioral characteristics,to be able to assess and predict its capabilities, most oftenwith the goal of optimization [19]. Simulation’s edge on othertechniques is attributed to its less expensive and non-intrusivecharacteristics when compared with profiling, a distinctionwhich becomes more apparent in large complex systems [20].Relative to analytical models, simulation is capable of provid-ing higher levels of granularity when capturing the details oflarge complex IT infrastructures, while still maintaining lessof an overhead when compared with profiling. The ability forcreating high fidelity models in addition to a more holisticview of the targeted system leads to accurate and powerfulsituational awareness [15].
III. MADS FRAMEWORK
In this section, we illustrate the building-blocks for de-veloping MADS. MADS is a system that enables betterunderstanding of malicious activity patterns by exploitinghidden structures in the log’s data. The goal is to assisthuman operators in planning cyber operations and providecyberwarfare functions of planning, operation and situationalawareness.
A. MADS Overview
MADS is platform-independent and context-dependent. Itis platform-independent as it attempts to detect suspiciousactivities at multiple levels, including low level network trafficand users’ behaviors at the application level. Also, it iscontext-dependent, in which the interpretation of the observedabnormal behavior might differ based on the context of whichit is presented. For example, an anomalous behavior in a user’sbuying patterns may indicate the existence of a fraud attempt.On the other hand, an anomalous activity at the network levelof an IT infrastructure might alert the network administratorof a particular network attack or intrusion. Another importantcharacteristic of MADS is the ability to scale and to accom-modate the needs of large scale organizations in terms of dataanalysis and decision-making.
B. MADS General Architecture
MADS contains three main components: (1) back-end dataanalytics engine that stores and analyzes log files in orderto detect malicious activities (see Section IV); (2) front-end
2
To appear in the proceedings of IEEE - CCNC - Security - Privacy and Content Protection
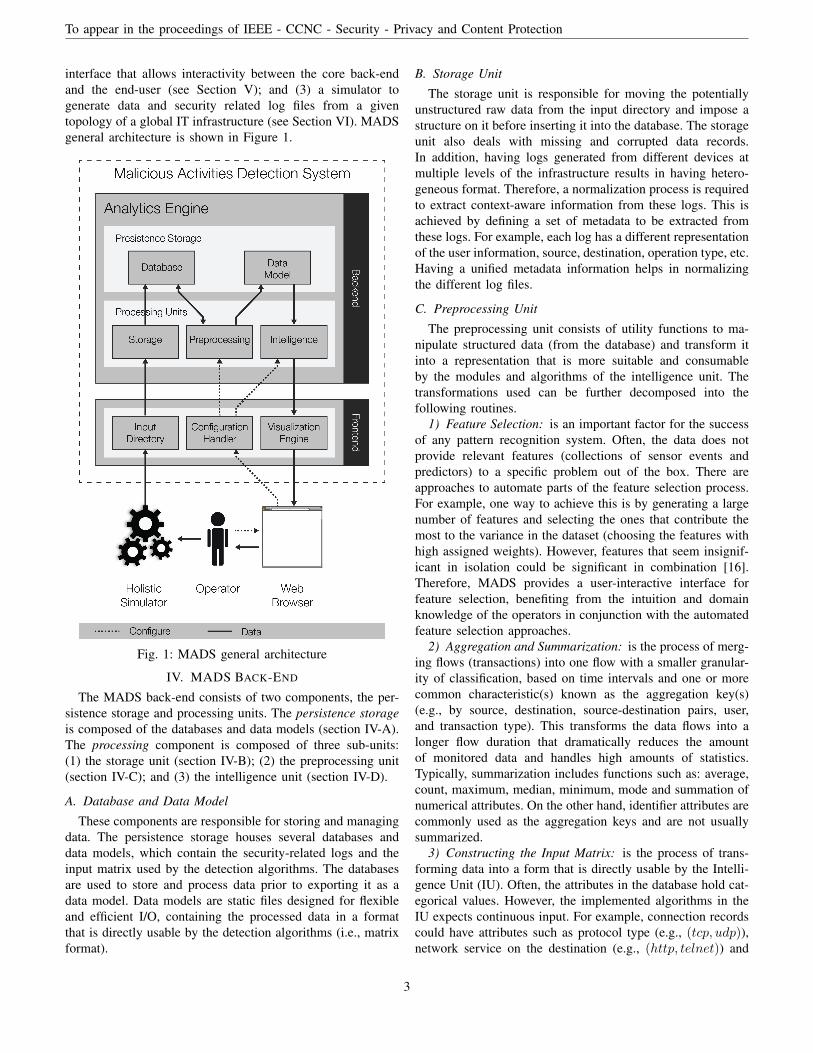
interface that allows interactivity between the core back-endand the end-user (see Section V); and (3) a simulator togenerate data and security related log files from a giventopology of a global IT infrastructure (see Section VI). MADSgeneral architecture is shown in Figure 1.
Fig. 1: MADS general architecture
IV. MADS BACK-END
The MADS back-end consists of two components, the per-sistence storage and processing units. The persistence storageis composed of the databases and data models (section IV-A).The processing component is composed of three sub-units:(1) the storage unit (section IV-B); (2) the preprocessing unit(section IV-C); and (3) the intelligence unit (section IV-D).
A. Database and Data Model
These components are responsible for storing and managingdata. The persistence storage houses several databases anddata models, which contain the security-related logs and theinput matrix used by the detection algorithms. The databasesare used to store and process data prior to exporting it as adata model. Data models are static files designed for flexibleand efficient I/O, containing the processed data in a formatthat is directly usable by the detection algorithms (i.e., matrixformat).
B. Storage Unit
The storage unit is responsible for moving the potentiallyunstructured raw data from the input directory and impose astructure on it before inserting it into the database. The storageunit also deals with missing and corrupted data records.In addition, having logs generated from different devices atmultiple levels of the infrastructure results in having hetero-geneous format. Therefore, a normalization process is requiredto extract context-aware information from these logs. This isachieved by defining a set of metadata to be extracted fromthese logs. For example, each log has a different representationof the user information, source, destination, operation type, etc.Having a unified metadata information helps in normalizingthe different log files.
C. Preprocessing Unit
The preprocessing unit consists of utility functions to ma-nipulate structured data (from the database) and transform itinto a representation that is more suitable and consumableby the modules and algorithms of the intelligence unit. Thetransformations used can be further decomposed into thefollowing routines.
1) Feature Selection: is an important factor for the successof any pattern recognition system. Often, the data does notprovide relevant features (collections of sensor events andpredictors) to a specific problem out of the box. There areapproaches to automate parts of the feature selection process.For example, one way to achieve this is by generating a largenumber of features and selecting the ones that contribute themost to the variance in the dataset (choosing the features withhigh assigned weights). However, features that seem insignif-icant in isolation could be significant in combination [16].Therefore, MADS provides a user-interactive interface forfeature selection, benefiting from the intuition and domainknowledge of the operators in conjunction with the automatedfeature selection approaches.
2) Aggregation and Summarization: is the process of merg-ing flows (transactions) into one flow with a smaller granular-ity of classification, based on time intervals and one or morecommon characteristic(s) known as the aggregation key(s)(e.g., by source, destination, source-destination pairs, user,and transaction type). This transforms the data flows into alonger flow duration that dramatically reduces the amountof monitored data and handles high amounts of statistics.Typically, summarization includes functions such as: average,count, maximum, median, minimum, mode and summation ofnumerical attributes. On the other hand, identifier attributes arecommonly used as the aggregation keys and are not usuallysummarized.
3) Constructing the Input Matrix: is the process of trans-forming data into a form that is directly usable by the Intelli-gence Unit (IU). Often, the attributes in the database hold cat-egorical values. However, the implemented algorithms in theIU expects continuous input. For example, connection recordscould have attributes such as protocol type (e.g., (tcp, udp)),network service on the destination (e.g., (http, telnet)) and
3
To appear in the proceedings of IEEE - CCNC - Security - Privacy and Content Protection
source location (e.g., (Europe, US,Asia)). Such attributescan easily be coded as integers. For instance, connectionstuple [tcp, http,Asia] could be represented as [0, 0, 2], whereeach integer represents a category for a specific attribute.Unfortunately, the IU algorithms interpret such integer rep-resentation of categories as being ordered, which may resultin undesired behaviors (i.e., the set of protocols was orderedarbitrarily). Therefore, using encoding techniques (i.e., 1-of-Kencoding [21]) can be utilized to convert categorical attributesto binary features that can be used by the IU algorithms. Asa result, a flattened vector in which each categorical attributewith K possible values is transformed into K features, withonly one active feature assigned the value 1 and inactivefeatures assigned the value 0.StepOne : [tcp, http,Asia]→ [0, 0, 2]
StepTwo : [0, 0, 2]→ [[1, 0], [1, 0], [0, 0, 1]]
StepThree : [[1, 0], [1, 0], [0, 0, 1]]→ [1, 0, 1, 0, 0, 0, 1]
This can be formulated as follows: To set-up the notation,suppose we are provided with a table T in the database thatcontains I total records (records are donated by lower-caser) and J attributes (attributes are donated by lower-case a).Therefore we can say ri = (a1,i, .., aj,i, .., aJ,i) ∀i, j 0 < i ≤I ∧ 0 < j ≤ J .
The domain, D(Taj ), of the jth attribute in the table T isR in the case of numeric attributes. Alternatively, we definethe domain of categorical attributes as the set of values thatare observed in attribute j across all rows r of table T asD(Taj ) = ∪e ∈ Taj . In the case of categorical attributes, wedefine Kaj as the number of distinct values that the attributej can take; hence, Kaj =
∣∣D(Taj )∣∣. The detection algorithms
expect mathematical representation of this table such thatXm,n ∈ Rm×n where n is the number of observationsand m is the number of features. Now it is assumed thatthere exists some function f (i.e., 1-of-K encoding) such thatf : TI,J → Rn×m where n = I and m ≥ J . Construing theinput matrix step may increase the number of features m fromthe original number of attributes J . Thus, we can compute thenew number of features m by:
m = J +
J∑j=1
g(aj)
Where:
g(aj) =
{0 if D(aj) = RKaj − 1 if D(aj) = ∪e ∈ Taj
D. Intelligence Unit
In the case of MADS, the interpretation of the ”outlierness”factor is context dependent. This is due to the fact that MADSoperates on holistic data objects extracted with varying res-olutions, including low level communication traffic, and userbehavior at the application layer. Therefore, in order to providesecurity operators with multiple views of the outlierness of adata object, IU implements multiple types of detection models.An outlierness score s is assigned by the chosen method to
each observation. In addition, observations are filtered basedon a threshold (i.e., level of tolerance) ε > 0, which is setby the operator. Here, we explore statistical and classificationmodels as examples of the enabling methodologies for thedetection of malicious activities.
1) Statistical Models (Distribution-Based): (e.g., covari-ance estimation) are based on the basic assumption that activ-ities are generated by a known distribution (e.g. normal dis-tribution), where normal activities occur in a high probabilityregion of this model and abnormal activities are data objectswith low probability density function (pdf) [22]. Hence, onepossibility for detecting abnormal activities can be describedas follow: given X an N ×M matrix, each data sample cor-responds to a vector xn ∈ RM , n = 1, ..., N . An observationxn is flagged as an outlier if s = (1−pdf(xn)) | s > ε, wherefor a multivariate normal distribution, the probability densityfunction is
pdf(xn) =1√
(2π)M | Σ |exp−MDist(xn,µ)
2
AndMDist(xn, µ) = (xn − µ)ᵀΣ−1(xn − µ)
Where µ,Σ,MDist are the sample mean, covariance matrixand the Mahalanobis distance of point xn to the mean,respectively.Unlike the Euclidean distance, the Mahalanobistakes into account the correlations between the dimensions(i.e., covariance matrix). The choice of the threshold ε isexpected to have a great effect on the false positive rate. Forexample, we would expect in a single dimensional normallydistributed dataset of 100000 samples, around 270 data pointsto be anomalous at 3σ, ε = 99.73
100 , just by chance. Therefore,it may be necessary to increase the threshold even further,specially in high dimensional cases [17].
2) Classification Models: Unlike statistical models, clas-sification models place no assumptions on the distributionof inlying data. This is specially useful when the datasethas complex boundaries for normal activity, strongly non-Gaussian distribution (e.g., bimodal with separate clustersof normal activities) or poorly balanced observations (i.e.,where the normal/abnormal activities are disproportional). Anexample of a classification method for anomaly detection is theOne-Class Support Vector Machine (OC-SVM). While typicalsupport vector algorithms are supervised machine learningtechniques, OC-SVM represents a natural extension to thecase of unlabeled datasets [23]. OC-SVM attempts to find ahyperplane to separate data from the origin with maximummargin instead of separating positive samples from negativesamples [24]. The details of the algorithm can be found in[25]. The final decision function can be expressed in the form:
f(x) =
N∑n=1
αnK(xn, x)− p
Where α is the Lagrangian multiplier, K is a kernel functionin the input space and p is the bias of the hyper-plane [26].Hence, an observation is classified as an outlier if f(xn) < 0.
4

To appear in the proceedings of IEEE - CCNC - Security - Privacy and Content Protection
10 5 0 5 101. One Class SVM (Classification) (errors: 6)
10
5
0
5
10
10 5 0 5 102. Covariance Estimation (Statistical) (errors: 2)
10
5
0
5
10(A). Gaussian Dsitribution
learned decision functiontrue inlierstrue outliers
10 5 0 5 101. One Class SVM (Classification) (errors: 4)
10
5
0
5
10
10 5 0 5 102. Covariance Estimation (Statistical) (errors: 20)
10
5
0
5
10(B). Bimodal Distribution
Fig. 2: 2D illustration of anomaly detection with different methods
Figure 2 presents an illustration of the two previouslymentioned models for detecting anomalous activities (1000generated observation). When comparing the two detectionmodels, the statistical method (covariance estimation) out-performs the OC-SVM method in the case of the data beinggenerated by a known distribution, such as Gaussian (seeFig. 2.A). On the other hand, when the data is strongly non-Gaussian (see Fig. 2.B), the OC-SVM ability to capture theshape of the data allows it to perform better.
V. MADS FRONT-END
The MADS front-end consists of three main components(presented in Figure 1): input directory, visualization engine,and configuration handler.
A. Input Directory
The input directory is responsible for temporary storing theoutput log files generated from the holistic simulator. Thismodule is intended to act as an integration point with differentsources of activity and event logs. For example, logs generatedfrom network traffic monitoring tools can be integrated withthe input directory and provide input data sets to the MADS.A graphical user interface is needed to guide the user throughthe integration process with different devices.
B. Visualization Engine
The visualization engine is designed to be an interactiveengine to visualize observations and anomalies. Its purposeis to visualize the output scores from the processing unitsin a way that helps security analysts better understand thedifferent observations and activities occurring in their network.Due to the high dimensionality and multi-feature of the outputresults, the visualization engine adopts multiple visualizationviews and techniques to provide the security analysts withgood understanding of the analyzed information.
The visualization engine adopts a layering approach topresent information in varying resolutions. This allows forpresenting the data in different views with the ability to switchfrom one view to the other and understand the connectionsbetween them [27]. The First layer visualizes network topol-ogy and physical components of the IT infrastructure. Eachcomponent is annotated with identification information suchas IP address, MAC address, etc. Such view helps security
analysts connect the identified malicious behavior to a physicalcomponent in their network.
The second layer focuses on visualizing the score-annotatedanomalies generated from the different detection models. Onepossible approach is to use clustering in order to presentthe different observations. In this approach, observations areconsidered similar if they are close to clusters’ centers. Thefarther an observation is from a given cluster’s center the moreanomalous it is [28]. The visualization engine compares thedifferent scores given to detected outlier activities. To do this,scores have to be refitted into equivalent ranges to facilitatecomparisons.
Additionally, filters and keyword searches based on a givenkeyword or data element are two important features to givethe security analyst a more focused view on activities. Forexample, the analyst may be interested to see all activitiestargeted to a given IP address in the network, or those that weregenerated by a given user ID, or produced within a specificperiod of time.
C. Configuration Handler
Through the configuration handler module we provide theuser with an interactive interface to interact and configurethe preprocessing unit and intelligence unit components. Theanalyst has the ability to explicitly specify and control whataggregation keys are used and what summarization functionsare applied on analyzed activities. Similarly, the analyst canconfigure which detection model is applied on the dataset andwhether it is a single model or a combination of multiplemodels. Through this module, we give the analyst the flexibil-ity to customize the analysis process by making use of theirexpertise and intuition.
VI. THE HOLISTIC SIMULATOR
The simulator’s main objective is to produce a holisticreplication of an IT infrastructure. This is achieved by firstlybreaking down the different hardware and software elementsof the infrastructure (or even end-users which are treated asa mix of both) into smaller and more essential parts. Theseparts are either components representing hardware elementsat different granularities or operations representing softwareelements. These components and operations are put togetherand modeled in a multi-layered approach to form a Multi-Agent System (MAS). MAS have been used to simulate self-
5

To appear in the proceedings of IEEE - CCNC - Security - Privacy and Content Protection
Fig. 3: The simulator input parameters, environment, andoutput logs
organizing computer networks [29], Service Oriented Archi-tectures (SOA) [30] and High Performance Computing (HPC)systems [31].
A. Multi-Agent System (MAS)
In this MAS, components are autonomous agents that arestateful and form a multi-layered hierarchy, allowing for multi-ple granularities to be represented. Each level in the hierarchyis a component of sub-components replicating the complexnature of IT infrastructures (system of systems). Operationson the other hand, are the guide for how different componentscommunicate, which is achieved using messages that altercomponents’ internal state [20].
B. Simulator Components
Each level in the MAS hierarchy contains multiple compo-nents, where high-to-mid levels contain aggregate components(e.g., data-centers or servers) and the lowest levels containcomponents that are the basic hardware elements (e.g., CPUor memory). The different granularities provide a powerfulreplication, but their different resolutions have to be carefully
considered, to achieve the goal in the most efficient man-ner. Specific behaviors associated with each component areadjusted to the technical specifications of the real hardwareelement it represents by assigning its configuration parameters(e.g., network topology), which is an input to the simulator(see Figure 3). In the simulator, components are representedby a single queue or a queuing network, and their internalstates react based on their queues’ state and configurationparameters. Clients or users of the IT infrastructure are alsomodeled as components that have queues initiating (basedon the input information) most of the activity in the infras-tructure (other activity could be background jobs initiatedwithin other components). In performance modeling, queuingnetwork models have been used extensively [32] [33], and insimulation they also yield a very realistic replication.
C. Simulator Operations
Applications that run within an IT infrastructure are brokendown into operations (input of the simulator; see Figure 3),which define the interactions between components (agents inMAS). An operation is defined as a set (or tree) of messages,where each message represents an interaction between twocomponents (e.g., client, data-center). A message encapsulatesall of the relevant information required for replicating theeffects of that segment of the process, that includes thesource component, the target component, and other relevantinformation (processing cost, bandwidth consumption, etc.).The message tree dictates all of the component types involved(e.g., server, switch, or CPU); however, the exact instances ofthose components that are effected are synthesized and chosenat run time [19].
D. Simulator Logs
When the simulator is executed, log files are createdrecording every activity (e.g., message, job execution, orprocess initiation) that was simulated. These logs cover alllayers (application layer, network layer, etc.) in addition toother information (e.g., user x initiating a specific processat a particular time), which could be inputted into MADS.However, an examination of a segment of the logs that isrelated to a specific layer (e.g., network layer) should bevery similar to real life logs (e.g., captured by sniffers in theIT network). The simulator was validated from the point ofview of resource utilization, performance measurements, andworkload replication with high success (see Section VII), butmore work remains for the validation of other aspects (e.g.,message content).
E. Synthesizing Malicious Activity
Given all of the relevant input information, the simulatorgenerates all of the desired logs; however, attaining that inputinformation is not straightforward. For the simulator to gener-ate security attacks (e.g., fraud activity), it required parametersand specifications that might not be easy to acquire (i.e., ex-tensive data on that activity). However, generating anomalousactivity is much more attainable. This can be achieved by
6

To appear in the proceedings of IEEE - CCNC - Security - Privacy and Content Protection
TABLE I: Root Mean Square Error (%) (RMSE)Experiment CPU Tapp CPU Tdb CPU Tfs CPU Tidx C# Rt
1: 15-36-60 9.07% 11.41% 7.51% 6.12% 5.98% 5.01%2: 12-29-48 9.94% 12.56% 7.05% 5.40% 5.12% 6.92%3: 10-24-40 10.11% 11.29% 7.42% 5.83% 6.52% 6.62%
Fig. 4: IT Infrastructure Topology
gathering data on normal activity and then creating anomaliesthat deviate from it. We advocate the approach of detectinganomalous activity as the basis for detecting unknown ma-licious activity (e.g., zero-day attacks). The current state ofthe simulator has the ability of synthesizing attacks that haveimpact on resources performance (e.g., distributed denial ofservice), allowing for MADS to test its ability to detect suchscenarios in their early stages (i.e., before it reaches a criticalpoint). The modeling of other cyber attacks (with no directperformance implications such as fraud) and their introductioninto the simulator is one of the main objectives of future work.
VII. CASE STUDY: FORTUNE 500 COMPANY
In order to validate the simulator , we present a case studyin which a down-scaled version of a Fortune 500 company’sreal IT infrastructure is simulated. Information on hardwareutilization, network occupancy, and operation response timesare collected from the physical IT infrastructure and comparedagainst the simulated environment.
The IT infrastructure consists of six data-centers located indifferent continents: North America (DNA), South America(DSA), Europe (DEU ), Africa (DAFR), Asia (DAS), andAustralia (DAUS). DNA is the main site in this network(master datacenter) and is responsible for file synchronizationbetween different sites (slave datacenters) in order to makethe latest files available for users in different datacenters. Themaster datacenter (DNA) hosts four tiers: application servertier (Tapp), database server tier (Tdb), file server tier (Tfs)and index server tier (Tidx). All other slave datacenters hostTfs and Tdb. Figure 4 presents the IT infrastructure topologyof the Fortune 500 company.
A. Validation
Three experiments were performed with different types ofoperation series on both the real physical IT infrastructureand the simulated one. A series is a sequential concatenation
of application operations (Log-in, Open, Save, etc.) whilepreserving the order in which they have been introduced. Forvalidation purposes three types of series were used, each rep-resenting a different volume of information manipulated by theoperations that compose them. Light series for manipulatingsmall size data/files, average series for manipulating averagesize data/files, and finally heavy series for manipulating largesize data/files. The three experiments are described as follows:
1) Experiment-1 (15-36-60): 15s (Light) - 36s (Average) -60s (Heavy)
2) Experiment-2 (12-29-48): 12s (Light) - 29s (Average) -48s (Heavy)
3) Experiment-3 (10-24-40): 10s (Light) - 24s (Average) -40s (Heavy)
The results of these experiments are summarized in Table I.We focus on the results of the validation of CPU utilization,the number of concurrent users, and the response time. TheCPU utilization of a specific tier is obtained by averaging theutilization of all the cores across the servers that compose thattier in a given time sample. To quantify the difference betweenthe simulated and real infrastructure we use the Root MeanSquare Error (RMSE).
RMSE =
√∑tj=tN−1
tj=t0(AvgiTx(tj)− ˆAvgiTx(tj))2
N
Where tj is the jth time step, AvgiTx(tj) is the averageCPU utilization value of tier x measured in the physicalinfrastructure during experiment i at time step j, ˆAvgiTx(tj)is its simulated counterpart, and N is the total number ofsamples taken during the experiment from t0 to tN−1. Asshown in Table I, the RMSE of the CPU utilization rangedbetween approximately 5% to 13%. The RMSE of the numberof concurrent clients C# between the physical and simulatedinfrastructure was 5.1-6.5%, while the response time error Rt
ranged between 5.0-6.9%.
B. Preliminary Evaluation
In section IV-D, we compared different detection methods,(i.e., statistical models and classification models) in terms ofintuition, assumptions, and implementation. In order to furtherinvestigate the practicality of the detection performance of thedifferent techniques, we adopt the following strategy:
1) Utilize the simulator to produce replication of labeledactivities, including both benign activity and syntheticanomalies.
2) Examine the effect of the hyper-parameters: (i) thresholdε; (ii) gamma γ: which defines how far the influence of asingle training example reaches in OC-SVM with RBFkernel; and (iii) C: which is the estimated proportion
7
To appear in the proceedings of IEEE - CCNC - Security - Privacy and Content Protection
10 8 6 4 2 0 2 4 6
ε
0.2
0.4
0.6
0.8
1.0sc
ore
Accuracy
Recall
Precision
F-measure
(a) The effect of ε on the covariance estimator
5 4 3 2 1 0 1 2
ε
0.55
0.60
0.65
0.70
score
Accuracy
Recall
Precision
F-measure
(b) The effect of ε on the OC-SVM
0.0 0.1 0.2 0.3 0.4 0.5
C
0.2
0.4
0.6
0.8
1.0
score
Accuracy
Recall
Precision
F-measure
(c) The effect of C on the covariance estimator
8 6 4 2 0 2
log10(γ)
0.2
0.3
0.4
0.5
0.6
0.7
0.8
0.9
score
Accuracy
Recall
Precision
F-measure
(d) The effect of γ on the OC-SVM
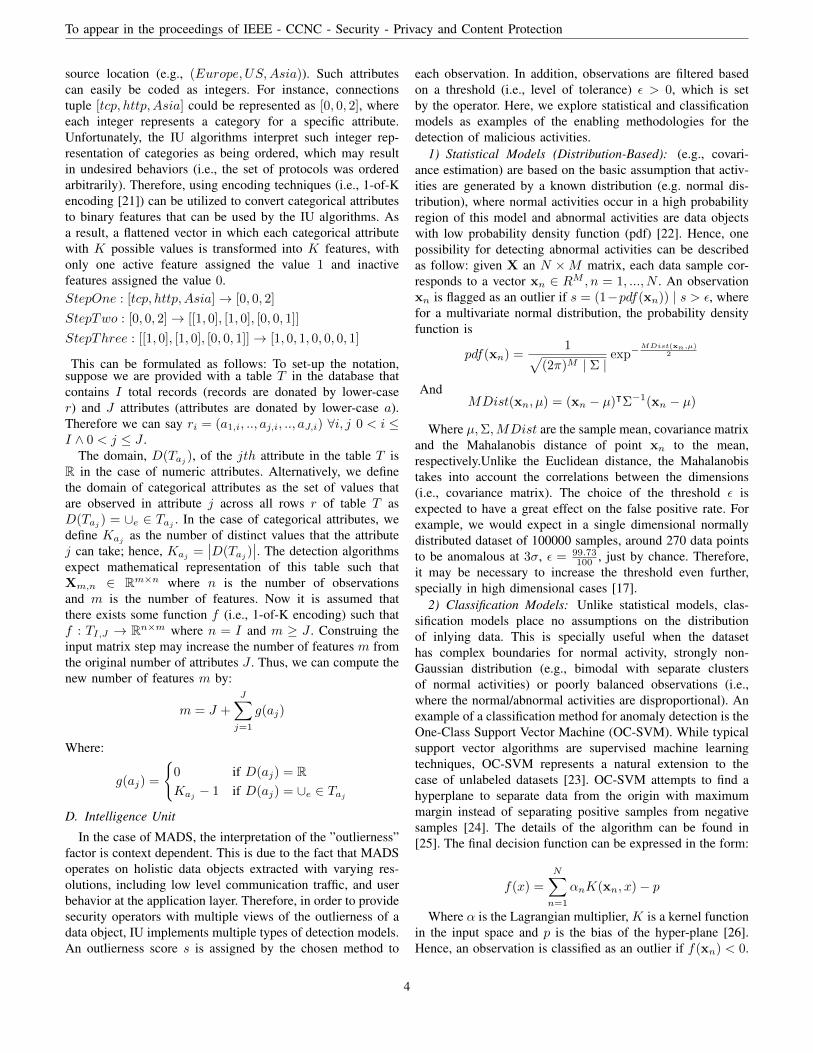
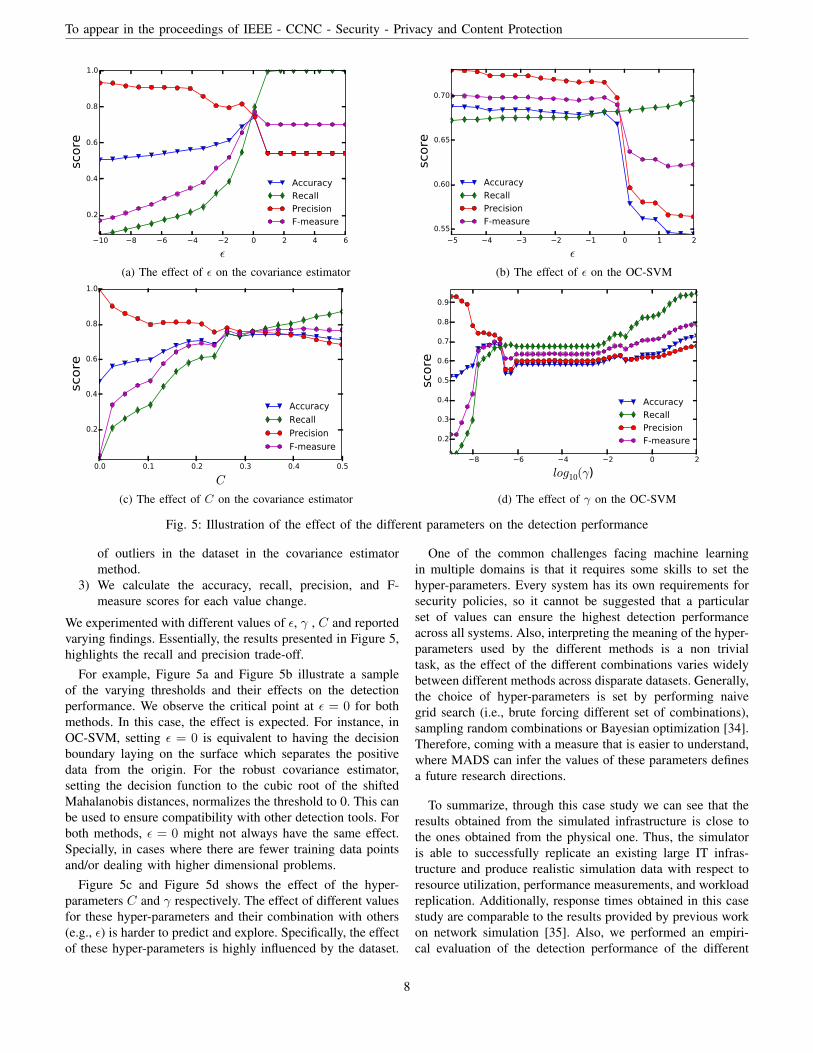
Fig. 5: Illustration of the effect of the different parameters on the detection performance
of outliers in the dataset in the covariance estimatormethod.
3) We calculate the accuracy, recall, precision, and F-measure scores for each value change.
We experimented with different values of ε, γ , C and reportedvarying findings. Essentially, the results presented in Figure 5,highlights the recall and precision trade-off.
For example, Figure 5a and Figure 5b illustrate a sampleof the varying thresholds and their effects on the detectionperformance. We observe the critical point at ε = 0 for bothmethods. In this case, the effect is expected. For instance, inOC-SVM, setting ε = 0 is equivalent to having the decisionboundary laying on the surface which separates the positivedata from the origin. For the robust covariance estimator,setting the decision function to the cubic root of the shiftedMahalanobis distances, normalizes the threshold to 0. This canbe used to ensure compatibility with other detection tools. Forboth methods, ε = 0 might not always have the same effect.Specially, in cases where there are fewer training data pointsand/or dealing with higher dimensional problems.
Figure 5c and Figure 5d shows the effect of the hyper-parameters C and γ respectively. The effect of different valuesfor these hyper-parameters and their combination with others(e.g., ε) is harder to predict and explore. Specifically, the effectof these hyper-parameters is highly influenced by the dataset.
One of the common challenges facing machine learningin multiple domains is that it requires some skills to set thehyper-parameters. Every system has its own requirements forsecurity policies, so it cannot be suggested that a particularset of values can ensure the highest detection performanceacross all systems. Also, interpreting the meaning of the hyper-parameters used by the different methods is a non trivialtask, as the effect of the different combinations varies widelybetween different methods across disparate datasets. Generally,the choice of hyper-parameters is set by performing naivegrid search (i.e., brute forcing different set of combinations),sampling random combinations or Bayesian optimization [34].Therefore, coming with a measure that is easier to understand,where MADS can infer the values of these parameters definesa future research directions.
To summarize, through this case study we can see that theresults obtained from the simulated infrastructure is close tothe ones obtained from the physical one. Thus, the simulatoris able to successfully replicate an existing large IT infras-tructure and produce realistic simulation data with respect toresource utilization, performance measurements, and workloadreplication. Additionally, response times obtained in this casestudy are comparable to the results provided by previous workon network simulation [35]. Also, we performed an empiri-cal evaluation of the detection performance of the different
8

To appear in the proceedings of IEEE - CCNC - Security - Privacy and Content Protection
techniques on the dataset generated by the simulator. Thisevaluation provides insights into strengths and weaknesses ofthe techniques. In addition, it allows us to propose a futureresearch direction of unifying the interpretation of the hyper-parameters used in terms of the practical effect.
VIII. CONCLUSION
In this paper, we presented MADS that combines differenttechniques for anomaly detection and operates on multiplelevels, including low level network communication and highlevel user behavior. We utilized predictive modeling techniquesfor the detection of malicious activities within enterprise envi-ronments. We compared different detection methods, (i.e., sta-tistical models and classification models) in terms of intuition,assumptions, and implementation. In addition, we introduceda holistic simulator to generate activity logs ranging fromcommunication traffic up to user behavior. We validated thesimulator accuracy and performance through a case study ofa Fortune 500 company where we compared the simulatorresults against the ones obtained from the physical infrastruc-ture in terms of resource consumption, network messages, andprocess activity. In addition to an evaluation of the detectionalgorithms with varying hyper parameters and comparingthe results. While current simulated attacks are only in theperformance dimension, our future goal is to simulate moresophisticated cyber attacks. The system state is currently underdevelopment, future enhancements also include developing amethodology for the consolidation of the contradicting resultsproduced by different models.
ACKNOWLEDGEMENTS
The authors would like to thank King Abdulaziz City forScience and Technology (KACST) for funding this work. Inaddition, the authors thank the Center for Complex Engineer-ing Systems (CCES) at KACST and MIT for their support.
REFERENCES
[1] B. Gates, Business @ the speed of thought: Using a digital nervoussystem. New York: Warner, 1999.
[2] J. O. Kephart and D. M. Chess, “The vision of autonomic computing,”Computer, vol. 36, no. 1, pp. 41–50, Jan. 2003.
[3] A. Shiravi, H. Shiravi, M. Tavallaee, and A. A. Ghorbani, “Towarddeveloping a systematic approach to generate benchmark datasets forintrusion detection,” Computers & Security, vol. 31, no. 3, 2012.
[4] A. K. Islam, M. W. Corney, G. M. Mohay, A. J. Clark, S. Bracher,R. Tobias, and U. Flegel, “Fraud detection in erp systems usingscenario matching,” in International Information Security Conference(SEC 2010):Security and Privacy:Silver Linings in the Cloud. BrisbaneConvention & Exhibition Centre, Brisbane, Queensland: Springer, 2010.
[5] M. Nicolett, “Effective security monitoring requires context,” Gartner,Tech. Rep. G00227893, 2012.
[6] J. Altschul, L. Sebastian, K. Heidelberg, and S. Foundation, PredictiveModeling in the Military Similar Goals, Divergent Paths, ser. Preserva-tion research series. SRI Foundation, 2004.
[7] G. Mohay, Computer and Intrusion Forensics, ser. Artech House Com-puter Security Series. ARTECH HOUSE Incorporated, 2003.
[8] Ponemon, “2012 cost of cyber crime study: United states,”Ponemon Institute, Tech. Rep., 2012. [Online]. Available:http://www.ponemon.org/library/2012-cost-of-cyber-crime-study
[9] Symantec, “Internet Security Threat Report 2013,” Symantec, Tech.Rep., 2013.
[10] C. Bronk and E. Tikk-Ringas, “The cyber attack on saudi aramco,”Survival, vol. 55, no. 2, pp. 81–96, 2013.
[11] D. Hawkins, Identification of outliers. Chapman and Hall, 1980.[12] V. J. Hodge and J. Austin, “A survey of outlier detection methodologies,”
Artificial Intelligence Review, vol. 22, p. 2004, 2004.[13] V. Chandola, A. Banerjee, and V. Kumar, “Anomaly detection: A survey,”
ACM Comput. Surv., vol. 41, no. 3, pp. 15:1–15:58, 2009.[14] R. Sommer and V. Paxson, “Outside the closed world: On using machine
learning for network intrusion detection,” in Security and Privacy (SP),2010 IEEE Symposium on, 2010, pp. 305–316.
[15] Barford, M. Dacier, T. G. Dietterich, M. Fredrikson, J. Giffin, S. Jajodia,S. Jha, J. Li, P. Liu, P. Ning, X. Ou, D. Song, L. Strater, V. Swarup,G. Tadda, C. Wang, and J. Yen, Cyber SA : situational awareness forcyber defense. Book chapter N1 in ”Cyber Situational Awareness :Issues and Research”, Sushil Jajodia, Peng Liu, Vipin Swarup, CliffWang, eds., Springer International Series on Advances in InformationSecurity, 2009., 10 2009.
[16] P. Domingos, “A few useful things to know about machine learning,”Commun. ACM, vol. 55, no. 10, pp. 78–87, 2012.
[17] A. Zimek, E. Schubert, and H.-P. Kriegel, “A survey on unsupervisedoutlier detection in high-dimensional numerical data,” Stat. Anal. DataMin., vol. 5, no. 5, pp. 363–387, Oct. 2012.
[18] J. B. Tenenbaum, V. de Silva, and J. C. Langford, “A Global GeometricFramework for Nonlinear Dimensionality Reduction,” Science, Dec.
[19] S. Herrero-Lopez, “Large-Scale Simulator for Global Data InfrastructureOptimization,” Ph.D. dissertation, Massachusetts Institute of Technology,2012.
[20] S. Herrero-Lopez, J. Williams, and A. Sanchez, “Large-scale simulatorfor global data infrastructure optimization,” in Cluster Computing, 2011IEEE International Conference on, 2011, pp. 54–64.
[21] A. Passerini, M. Pontil, and P. Frasconi, “New results on error correctingoutput codes of kernel machines,” Neural Networks, IEEE Transactionson, vol. 15, no. 1, pp. 45–54, 2004.
[22] P.-N. Tan, M. Steinbach, and V. Kumar, Introduction to Data Mining,(First Edition). Boston, MA, USA: Addison-Wesley Longman Pub-lishing Co., Inc., 2005.
[23] B. Scholkopf, J. C. Platt, J. C. Shawe-Taylor, A. J. Smola, and R. C.Williamson, “Estimating the support of a high-dimensional distribution,”Neural Comput., vol. 13, no. 7, pp. 1443–1471, Jul. 2001.
[24] H. Nguyen and F. Porikli, “Support vector shape: A classifier basedshape representation.” IEEE Trans Pattern Anal Mach Intell, 2012.
[25] B. Scholkopf and A. J. Smola, Learning with Kernels: Support VectorMachines, Regularization, Optimization, and Beyond. Cambridge, MA,USA: MIT Press, 2001.
[26] Y. Wang, J. Wong, and A. Miner, “Anomaly intrusion detection usingone class svm,” in Information Assurance Workshop, 2004. Proceedingsfrom the Fifth Annual IEEE SMC, 2004, pp. 358–364.
[27] R. Chang, A. Lee, M. Ghoniem, R. Kosara, W. Ribarsky, J. Yang,E. A. Suma, C. Ziemkiewicz, D. Kern, and A. Sudjianto, “Scalableand interactive visual analysis of financial wire transactions for frauddetection,” Journal of Information Visualization, vol. 7, pp. 63–76, 2008.
[28] I. Davidson, “Anomaly detection, explanation and visualization,” SGI,Tech. Rep., 2007.
[29] M. Niazi and A. Hussain, “Agent-based tools for modeling and simu-lation of self-organization in peer-to-peer, ad hoc, and other complexnetworks,” Communications Magazine, IEEE, vol. 47, no. 3, 2009.
[30] S. Karnouskos and M. M. J. Tariq, “An agent-based simulation of soa-ready devices,” in Proceedings of the Tenth International Conferenceon Computer Modeling and Simulation, ser. UKSIM ’08. Washington,DC, USA: IEEE Computer Society, 2008, pp. 330–335.
[31] Y.-Q. Huang, H.-L. Li, X.-H. Xie, L. Qian, Z.-Y. Hao, F. Guo, andK. Zhang, “Archsim: A system-level parallel simulation platform for thearchitecture design of high performance computer,” Journal of ComputerScience and Technology, vol. 24, no. 5, pp. 901–912, 2009.
[32] E. D. Lazowska and J. Zahorjan, Quantitative System Perfor-mance:Computer System Analysis Using Queueing Network Models,J. A. Brumfield, Ed. Prentice-Hall, Inc, 1984.
[33] S. S. Lavenberg, Computer Performance Modeling Handbook. Orlando,FL, USA: Academic Press, Inc., 1983.
[34] J. Snoek, H. Larochelle, and R. Adams, “Practical bayesian optimizationof machine learning algorithms,” in Advances in Neural InformationProcessing Systems 25, P. Bartlett, F. Pereira, C. Burges, L. Bottou, andK. Weinberger, Eds., 2012, pp. 2960–2968.
[35] S.-H. Lim, B. Sharma, G. Nam, E. K. Kim, and C. Das, “Mdcsim: Amulti-tier data center simulation, platform,” in Cluster Computing andWorkshops. IEEE International Conference., 2009.
9
Copyright © 2022 FDOKUMEN