Utilizing Airport-GIS For SMS Oversight - OpenSIUC
50
Southern Illinois University Carbondale OpenSIUC Research Papers Graduate School 2011 e Next Generation of Aviation Safety: Utilizing Airport-GIS For SMS Oversight Shane Ingolia singolia, [email protected] Follow this and additional works at: hp://opensiuc.lib.siu.edu/gs_rp is Article is brought to you for free and open access by the Graduate School at OpenSIUC. It has been accepted for inclusion in Research Papers by an authorized administrator of OpenSIUC. For more information, please contact [email protected]. Recommended Citation Ingolia, Shane, "e Next Generation of Aviation Safety: Utilizing Airport-GIS For SMS Oversight" (2011). Research Papers. Paper 74. hp://opensiuc.lib.siu.edu/gs_rp/74
-
Upload
khangminh22 -
Category
Documents
-
view
0 -
download
0
Transcript of Utilizing Airport-GIS For SMS Oversight - OpenSIUC

Southern Illinois University CarbondaleOpenSIUC
Research Papers Graduate School
2011
The Next Generation of Aviation Safety: UtilizingAirport-GIS For SMS OversightShane Ingoliasingolia, [email protected]
Follow this and additional works at: http://opensiuc.lib.siu.edu/gs_rp
This Article is brought to you for free and open access by the Graduate School at OpenSIUC. It has been accepted for inclusion in Research Papers byan authorized administrator of OpenSIUC. For more information, please contact [email protected].
Recommended CitationIngolia, Shane, "The Next Generation of Aviation Safety: Utilizing Airport-GIS For SMS Oversight" (2011). Research Papers. Paper 74.http://opensiuc.lib.siu.edu/gs_rp/74

THE NEXT GENERATION OF AVIATION SAFETY: UTILIZING
AIRPORT-GIS FOR SMS OVERSIGHT
by
Shane Ingolia
B.S., Southern Illinois University, 2009
A Research Paper Submitted in Partial Fulfillment of the Requirements for the
Master of Public Administration Degree.
Department of Political Science in the Graduate School
Southern Illinois University Carbondale May 2011
Research Paper APPROVAL
NEXT GENERATION OF AVIATION SAFETY: UTILIZING
AIRPORT-GIS FOR SMS OVERSIGHT
By
Shane Ingolia
A Research Paper Submitted in Partial
Fulfillment of the Requirements
for the Degree of
Master of Public Administration
in the field of Political Science
Approved by:
Dr. John Hamman, Chair
Gary Shafer
Samuel Adu-Prah
Graduate School Southern Illinois University Carbondale
April 8, 2011

i
TABLE OF CONTENTS
SECTION PAGE
LIST OF FIGURES........................................................................................................ ii
SECTIONS
SECTION 1 - INTRODUCTION .......................................................................1
SECTION 2 - OVERVIEW OF SMS AND GIS ................................................4
SECTION 3 - ADVANCING SMS – A CASE STUDY..................................22
SECTION 4 - CONCLUSION..........................................................................38
REFERENCES .............................................................................................................41
VITA ...........................................................................................................................45

ii
LIST OF FIGURES
FIGURE PAGE
Figure 1 ...........................................................................................................................9
Figure 2 .........................................................................................................................11
Figure 3 .........................................................................................................................14
Figure 4 .........................................................................................................................19
Figure 5 .........................................................................................................................27
Figure 6 .........................................................................................................................28
Figure 7 .........................................................................................................................30
Figure 8 .........................................................................................................................31
Figure 9 .........................................................................................................................33
Figure 10 .......................................................................................................................34
Figure 11 .......................................................................................................................35
Figure 12 .......................................................................................................................37

1
INTRODUCTION
According to the National Transportation Safety Board (2010) there were 0.255
accidents per 100,000 departures in scheduled commercial service air travel during 2009.
With such a low accident rate, it is difficult for airport operators to make further
improvements to safety levels. To combat this situation, aviation providers have
separated themselves from the reactive approach to safety by adopting a more proactive
approach to risk identification and mitigation.
A common misconception in aviation accidents is that they are caused by human
error, but that is not always the case. In recent studies, human error was found to be only
the last link in a chain of events that leads to an accident (Ludwig, Andrews, Jester-ten
Veen & Laque, 2007). Thusly, changing people will not avoid accidents; accidents may
become less likely to occur only when the primary factors are addressed. This can be
accomplished by adopting an integrated systems approach to managing safety. No matter
the steps taken, risk can never be eliminated but it can be reduced to an acceptable level
and mitigated. A Safety Management System (SMS) establishes a safety process that
allows airports to identify risks and take action to mitigate their potential consequences
before an accident or incident occurs.
By definition, SMS is a formal, top-down business-like approach to managing
safety risk by expanding on the established safety principles at airport’s (Federal Aviation
Administration, 2007). As of November 2005, it is a requirement for member-states of
the International Civil Aviation Organization (ICAO) to establish SMS at certificated
international airports (FAA, 2007). To further promote the harmonization of

2
international standards, the Federal Aviation Administration (FAA) has developed
consistent safety regulations with ICAO recommended practices. The FAA aims to
implement the SMS requirements in a way that complements the existing airport safety
regulations, not mandate new safety policy requirements.
A safety management system reduces risk and increases safety by providing a
proactive, systematic integration method to safety standards already developed by airport
operators (Ludwig et al., 2007). By researching SMS, the procedures of safety risk
management (SRM) can be explored to show the effectiveness of integrating risk analysis
and assessment within airport information systems using GIS. Through promoting the
integration of a systems approach to safety, SMS establishes itself within the Next
Generation (NextGen) realm of aviation.
NextGen is an umbrella term for the ongoing transformation of the National
Airspace System to evolve aviation from a ground-based system of air traffic control to a
satellite-based system of air traffic management (FAA, 2010). Currently, NextGen is
continuing to improve safety by further expanding the use of satellite-based surveillance,
improving airport runway access and deploying Airport Surface Detection Equipment-
Model X, a surface safety technology used at airports (FAA, 2010). Implementing these
technologies as such will improve situational awareness of all aviation personnel by
providing information that historically was unavailable. This information will be
provided in real-time data transfers to all properly equipped vehicles for more precise
tracking and information sharing via GPS transponders. This information can then be
input into an airport geographic information system (A-GIS) for spatial analysis and data
mining.

3
Implementing NextGen data into A-GIS will provide airports with enough
information to look for trends in operations, disseminate safety reports and identify areas
of concern on the airfield. The A-GIS initiative set forth by the FAA outlines a process
for the collection and maintenance of uniform airport data to be input into an enterprise
GIS system for management and analysis (FAA, 2010). This will ensure the demands of
the NextGen airspace system are met.
The remainder of this paper provides an overview of the relevant literature
relating to SMS and A-GIS and looks at the potential integration of the two disciplines.
A critical examination of how GIS applications can be used in SMS oversight will be
provided. Lastly, a case study for Will Rogers World Airport showing the potential
outputs using theoretical data models will be examined for preliminary findings and
implications of SMS and GIS integration.

4
OVERVIEW OF THE DEVELOPMENT OF SMS AND GIS
It is important that airports develop a safety culture of change to energize and
motivate personnel about the benefits of adopting SMS. Integrating safety information
and databases will make the A-GIS/SMS process a reality. The coming pages explore the
ways SMS and GIS have evolved and provide information on how to gauge the benefit of
integrating them.
SMS
Although the concept of SMS has been around for quite some time, it is relatively
new to airports, especially in the United States. Many of the current safety standards
employed at airports can be used to comply with the requirements of SMS. Currently,
there is no regulation on how airports will incorporate SMS into their Part 139 safety
requirements (FAA, 2007). The FAA is researching multiple ways to implement SMS at
U.S. airports to provide the guidance and regulation for the standards set forth by them in
future SMS requirements. Due to the lack of historical information of SMS adoption at
airports in the United States, it will be most beneficial to look at SMS within other
industries to understand how it has evolved into a safety standard for aviation.
System safety principles have been used in petroleum, nuclear, railroad and
healthcare industries for decades (Ludwig et al., 2007). Historically, safety regulation in
aviation has been reactive instead of proactive, meaning, waiting for the accident or
incident to take place. Thereafter, the cause is determined and the issue is addressed so
that future failures and additional costs are avoided. This is horribly inefficient in terms
of safety risk, monetary losses, liability, cost and public perception to safety. According
5
to Gonzalez, “it is essential to complement the regulatory approach to safety with a
proactive approach. SMS is the most effective way of responding to the need for results-
based supervision with a relatively small workforce,” (as cited in Ayres et al., 2009, p.8).
To further understand what SMS is to aviation, a closer look as to what SMS has been to
other industries in history will be presented in the following paragraphs.
Nuclear Industry
Like many industries, the nuclear industry’s primary concern is safety. In
exploring two significant historical accidents, the industry has adopted new technology to
help improve safety levels and motivate personnel on the advancement of SMS practices.
In March 1979, a nuclear plant’s reactor core was starved of coolant on Three Mile Island
resulting in fuel melting (Ludwig et al., 2007). Although the fuel was contained and no
deaths occurred, the cost of the accident was recorded as $975 million which resulted in
closure of the plant. The investigation concluded with a much greater emphasis for the
agency’s responsibility for reactor safety and mandated improved formal risk assessment
and safety analysis procedures.
In a similar case, in 1986 an electrical engineering experiment caused a reactor to
lose its coolant in Chernobyl. The operators put the entire workforce in a dangerous
situation by operating a poorly designed reactor while conducting potentially dangerous
tests without complying with established operational procedures. The result was 56
immediate deaths and many more due to radiation exposure (Ludwig et al., 2007). The
subsequent investigation revealed the lack of a safety culture and safety management
system. These two accidents resulted in training of personnel in safety analysis, the
6
development of a safety culture and the adoption of several SMS elements that assess and
mitigate risk involved in nuclear operations (Ludwig et al., 2007).
Railway Industry
Historically, the railway industry has been a trustworthy and safe method of
transport for people and goods. Although, from 1994 to 2005 train accidents increased
from 3.67 to 4.09 per million train miles, leading to the adoption of system safety
principles as outlined by a SMS (Ludwig et al., 2007). A case in the railway industry
from 2005 in Graniteville, North Carolina cited a collision that resulted in the derailing of
16 cars, the release of chlorine gas and the death of nine individuals (Ludwig et al., 2007).
The total damage amount surpassed $69 million and the NTSB investigation concluded
that the cause of the accident was human error which resulted in the freight train entering
the wrong set of tracks due to an improperly laid switch.
As a result of this accident, Congress passed a law that called for the development
and use of a safety risk reduction program within the railway industry (Ludwig et al.,
2007). This program outlined the requirements for a regular evaluation of safety risks,
adopted tools to manage those risks when necessary and summarized approved
mitigation strategies that could be used to lower all risk to acceptable levels. By adopting
ongoing practices like these, the railway industry is continuously improving safety in
order to avoid future accidents.
The FAA has opened a rulemaking project to consider a formal requirement for
SMS at certificated airports (FAA, 2010). A total of 570 airports are certificated under 14
CFR Part 139, Certification of Airports, throughout the United States. To promote
harmonization with International Civil Aviation Organization (ICAO) standards, the FAA

7
adopted principles of SMS for aviation service providers and conducted two pilot studies
for airports. In these pilot studies the FAA provided guidance for developing an SMS for
each airport to follow and allowed them to share their experiences and SMS practices
with other airports and the FAA (FAA, 2007).
These pilot studies concluded with an array of valuable information to understand
where the United States aviation industry is in terms of SMS adoption. The methodology
of the study was to identify how well the 22 airports that participated met or exceeded the
basic requirements of SMS. After the airports submitted their findings, the FAA found
that 47.3% of the participating airports had a written safety policy that would meet the
intent of SMS but only 5.9% considered themselves to have an existing SMS plan
adopted (FAA, 2008). More importantly, the FAA (2008) also reported that only 7.7% of
the airports stated that their written safety policies are effectively communicated to airport
employees. It is the accountable executive’s duty to make an ongoing commitment to
SMS and effectively communicate safety objectives of the organization to all personnel.
Of the reporting airports, 83.3% declare that they have an existing organizational
structure to manage safety that would assure safety policies and objectives could be
disseminated across the organization (FAA, 2008).
The FAA anticipates that the implementation of SMS at airports will provide a
systematic, proactive, and well-defined safety program that will allow airport operators to
continue to improve safety as passenger traffic grows (FAA, 2007). By first developing
SMS in a controlled pilot group, the FAA better understood the experiences of
developing the plan at varying activity level airports across the country. This approach
gave the FAA ample results to gauge requirements on Airport Operators when developing

8
a general U.S standard on implementation of SMS at airports of varying size and
complexity (FAA, 2007). In order for a standard implementation strategy to work, the
FAA and airports must first aim to identify gaps in safety requirements from 14 CFR Part
139 to be included in SMS.
The process of identifying existing safety components and comparing them to
SMS program requirements is known as gap analysis. Conducting a gap analysis
provides an airport operator an initial SMS development plan and roadmap for
compliance (FAA, 2007). From this point in the process, this plan should not simply
apply guidance to airports but establish benchmarks for safety rules that they may have to
comply with. These safety benchmarks should complement the existing U.S. safety
requirements in 14 CFR Part 139 and be consistent with Part 139, FAA Advisory
Circulars, and the airport’s Airport Certification Manual (FAA, 2007). This means that
the FAA believes the SMS manual should identify which elements of the airport
operator’s existing practices and guidance materials currently meet SMS requirements,
which elements do not, and how these latter practices and documents will be revised in
the future for consistency with the SMS plan to increase safety at airports (FAA, 2007).
The majority of these safety practices may already exist in some form at U.S.
airports. The implementation of SMS is not intended to completely change safety
requirements and practices but to be a new safety management process, expanding past
practices (Ludwig et al., 2007). By implementing a top-down commitment to safety the
organization will increase the number of people watching for safety issues thus making it
less likely that an accident or incident will occur. This is visually explained through the
“Swiss Cheese” model of accidents presented in figure 1. Meaning each layer of the

9
organization is responsible for safety at the airport but has holes that symbolize the
potential for safety hazards to slip through. When these layers are unified by SMS
principles, it becomes less likely that a hazard makes it though every layer without being
identified and mitigated (Transport Canada, 2010).
Figure 1
This type of safety approach focuses on layers of safety risk management and
eliminates hazards before they develop into something more serious. While SMS unifies
these layers it does not add an additional block-all layer, it simply shifts organizational
weaknesses into a seamless day-to-day safety operation (Ludwig et al., 2007).
The structure of a successful SMS can take on many forms but the generally
accepted standard, including the ICAO recommend format, includes four distinct pillars
Source: Transport Canada, 2010
10
(FAA, 2007). These pillars include safety policy and objectives, safety risk management,
safety assurance, and safety promotion. To implement a successful SMS an airport must
develop strong principles for the safety risk management pillar. Established as the
operational core of SMS, safety risk management is the process in which the airport can
identify hazards, determine potential risks, and design risk mitigation strategies aimed at
avoiding losses that an accident/incident presents (Ludwig et al., 2007). If operational
hazards and risks are properly identified through the means of airport inspections and
communication, the information can be transferred to upper-level management to ensure
unacceptable risks are mitigated.
Upon transfer, the potential consequence of each risk is determined based on
severity and likelihood. The output assessment score is then used to rank identified safety
risks. In doing so, upper-level management can fully analyze risks and explore all
mitigation strategies before choosing their preferred option (Ludwig et al., 2007). Shown
in Figure 2 is a risk matrix that is commonly adopted by airports to identify and assess
operational hazards.
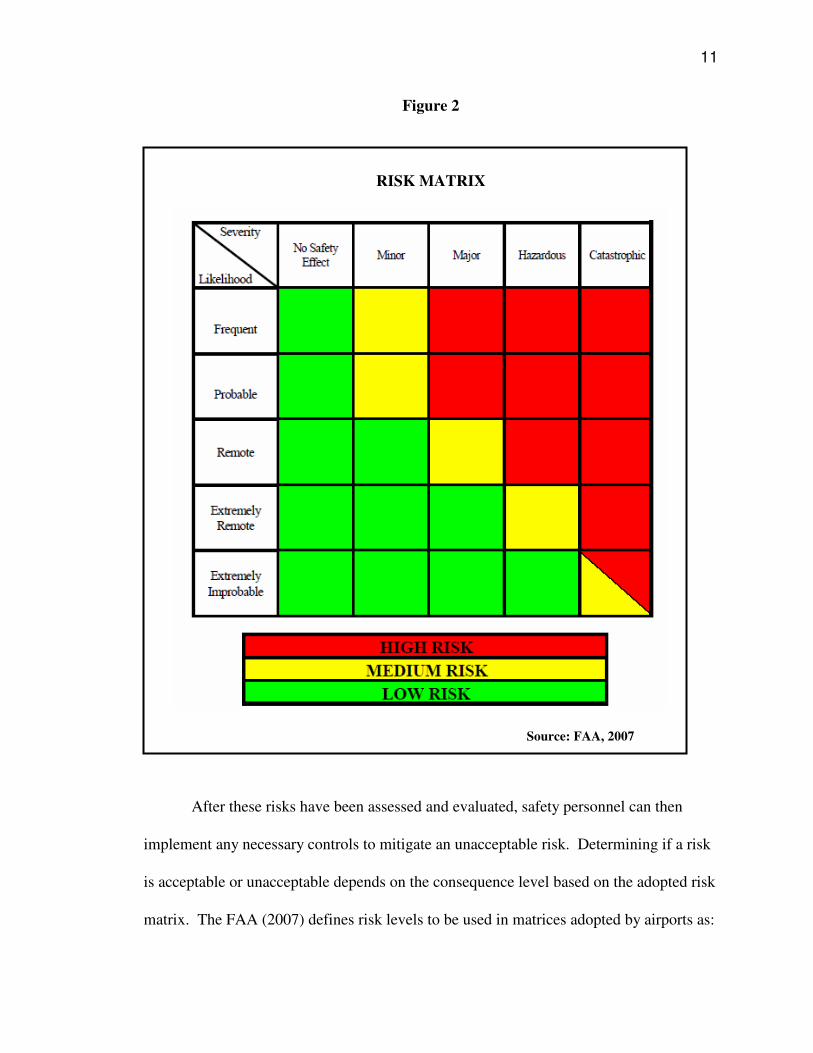
11
Figure 2
RISK MATRIX
Source: FAA, 2007
After these risks have been assessed and evaluated, safety personnel can then
implement any necessary controls to mitigate an unacceptable risk. Determining if a risk
is acceptable or unacceptable depends on the consequence level based on the adopted risk
matrix. The FAA (2007) defines risk levels to be used in matrices adopted by airports as:
12
• “High Risk – unacceptable level, the proposal cannot be implemented or
the activity continued unless hazards are further mitigated so that risk is
reduced to medium or low. Follow-up analysis and hazard tracking is
required.
• Medium Risk – acceptable level, minimum acceptable safety objective,
actions may be continued but hazard tracking and analysis must be
performed.
• Low Risk – target level, acceptable without restriction or limitation,
tracking and analysis is not required but documentation in safety database
is,” (p. 11).
The type and amount of mitigation strategies associated with these risk factors are
dependent on the risk level. For instance, any risk identified as high requires immediate
termination of activity until the action is changed or mitigated in a way that reduces the
risk to acceptable levels. Utilizing a ranking structure as outlined by the FAA allows
airport sponsors to focus investments, both in monetary terms and invested manpower, on
the risks that pose the greatest threat to the operational safety of the airport. These threats
are typically determined using the formula of risk equals probability times severity to
understand the determents each risk poses. It is important that airports understand exactly
how GIS can help manage the thousands, if not tens of thousands, of safety records that
will be stored in local databases as SMS continues to grow within the industry.
13
GIS
Computer based GIS has been used since about 1960, with similar applications
being traced back more than 100 years (Coppock & Rhind, 1991). Although no
substantial written documentation can be found, countries across the world were
developing a certain “GIS” during this time. Notably, the history of GIS can be broken
down into four overlapping phases of development. According to Coppock & Rhind
(1991) these phases are: (1) the pioneer research period from the 1950s to about 1975 that
included the United States and United Kingdom, (2) the formal research and government
funded experiments phase which spanned the years 1973 to the early 1980s, (3) the
commencement of GIS commercialization phase which began in 1982, and (4) the user
dominance phase that includes corporate databases. Corporate databases can be accessed
across networks that are integrated within other technology systems of spatial and non-
spatial databases for the use of every individual not just a GIS specialist.
Databases containing locational information allows us to observe, recognize,
question, interpret and visualize data in many ways that reveal interactions, patterns and
trends in whatever output the user wants (Longley, Goodchild, Maguire & Rhind, 2006).
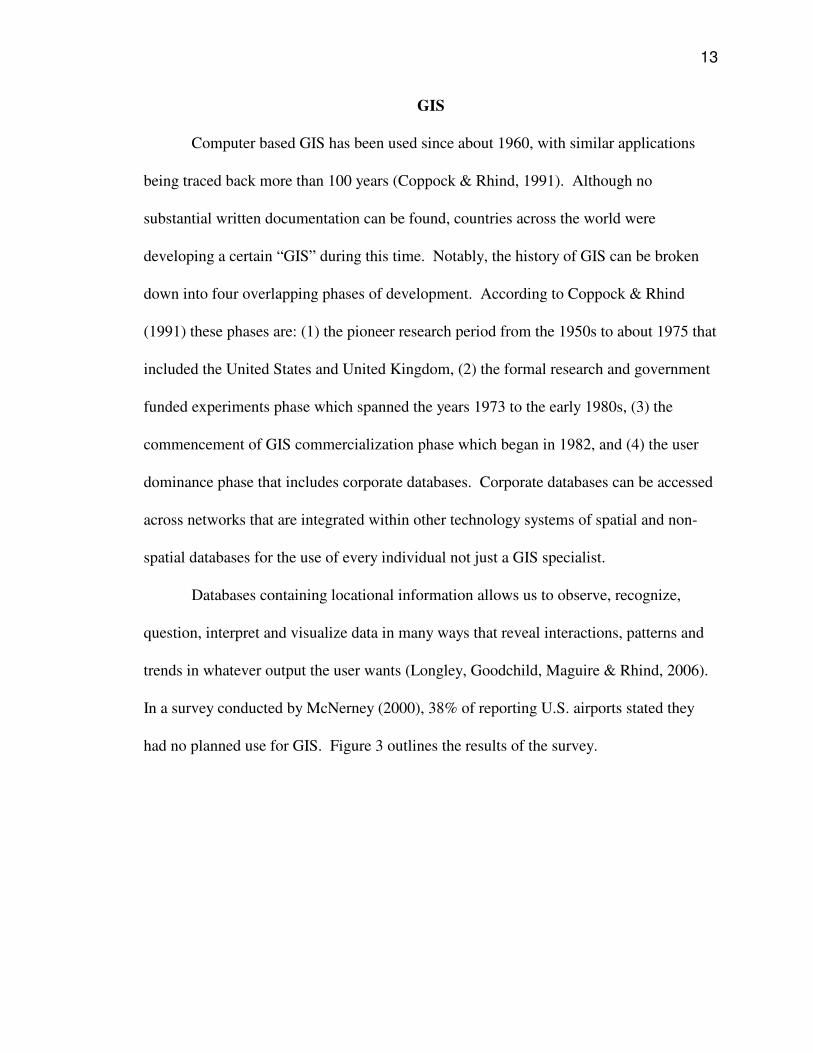
In a survey conducted by McNerney (2000), 38% of reporting U.S. airports stated they
had no planned use for GIS. Figure 3 outlines the results of the survey.
14
Figure 3
Many respondents stated they were unclear on the application of GIS for airports
while a few others were apprehensive about the long term return on investment
(McNerney, 2000). Like any technology, the advancements in GIS over the last decade
have been tremendous and the application to the aviation industry is growing
exponentially.
GIS helps users answer questions to unique and often unsolved problems by
looking at data in ways that other programs cannot. The usefulness of integrating this
technology into an enterprise information system is unrivaled and can be utilized to
capture and distribute information instantly across an entire organization. Many airports
across the country are realizing the wealth of applications that GIS provides and
understand the potential that an enterprise system brings to their day-to-day operations.

15
Phoenix Sky Harbor International Airport
One of the most recent enterprise GIS solutions was adopted by Phoenix Sky
Harbor International Airport in Phoenix, Arizona. Phoenix Sky Harbor is the tenth
busiest airport in the world with approximately 100,000 passengers daily (Freeman,
2010). The enterprise system includes tools for aviation department personnel to manage
the airport’s operations and growing asset base. The data is consists of information such
as: aerial photography and digital orthophotos of areas surrounding the airport operations
area, aboveground features and underground utilities, a geodatabase with 300 feature
classes ranging from smoke detectors and passenger monitors to noise contours and roof
prints, interior floor plan data for buildings in an around the airport and integration with
many existing information systems (Freeman).
There are about 85 users spanning 10 airport divisions who have no formal
training in GIS or information technology but understand the usefulness of the data
outputs and access the GIS portal weekly (Freeman, 2010). Since the inception of the
enterprise GIS, Phoenix Sky Harbor airport has developed a multitude of user tools to
increase safety and productivity at the airport. Examples of the tools that enterprise GIS
bring to Phoenix range from operations to signage management.
To assist with the Fiscal Management Department, the GIS department completed
a space accounting project that reported discrepancies in actual versus leased square
footage that in the past would have been extensive in terms of computations and
manpower to produce (Freeman, 2010). Additionally, one of the most critical tools in the
GIS interface was the integration with the Aviation Department’s work order
management system. This allows a maintenance worker to access the portal to find the

16
exact location for his or her work request as well as other issues near his or her work area
due for maintenance. This maximizes productivity by combining work order requests to
efficiently plan and distribute workers accordingly (Freeman). It is applications like these
that allow the Phoenix Aviation Department to utilize GIS and save money. The airport
is confident that with increased efficiencies and added tools in the future, GIS will pay for
itself in a matter of years (Freeman).
Salt Lake City International
Winter operations is one of the most challenging and expensive times for airports.
Accurate traction reporting is vital during these times to maintain a safe operating
environment. GIS could allow operators to collect real-time pavement temperature and
friction values to make intelligent decisions about when and where to apply de-icing/anti-
icing chemicals and remove excess rubber (Lawson, 2009). Not only does this save the
airport a vast amount of money in anti-icing chemicals, but, more importantly, it increases
operational safety during tough times (Lawson).
Although winter operations are more commonly associated with testing friction
values than rubber build up, excess rubber on runways can cause major safety concerns.
According to the FAA, airports are required to maintain friction values no less than 0.42
for the standard airport friction tester at a speed of 40 mph to ensure aircraft safety during
operation (FAA, 2004). This information can be tested and input into the A-GIS to
produce a map of the specific areas where friction values are being affected. For friction
evaluation of runway surfaces, accurate locations of values are important for thorough
assessment (Ho & Romero, 2007).
17
Salt Lake City International Airport uses this GIS application to evaluate their
pavement friction during both winter and summer operations. By mapping friction
values, the airport can identify the friction loss areas and determine potential factors that
cause the lower friction in these areas (Ho & Romero). This allows upper management to
assess the situation and identify hazardous areas that require mitigation before the hazards
cause a serious issue.
Integration of SMS & GIS
Historically, the data collected in aviation has numerous data gaps in the feeds
from different organizations. For example, the FAA censors its data which creates
significant data gaps for airports and air carriers (Ayres et al., 2009). A-GIS has been
established as the lead provision being used to combat these gaps in data collection. A
specific, uniform data format for airport layout plans will be uploaded onto FAA servers
and provided to approved stakeholders to close the gaps in data feeds (FAA, 2007). This
spatial data will be used to enhance safety practices, map security systems, develop new
approach procedures, conduct obstruction analyses, produce utility maps, update airport
diagrams and keep airport layout plans current (Nuemann, 2009).
The FAA A-GIS program provides a centralized location for the gathering,
coordination, validation, storage, and display of airport data and imagery (FAA, 2007).
The FAA has provided three advisory circulars that help airports collect and format the
required data for submittal into the A-GIS system. Within these advisory circulars, the
FAA establishes general guidance and specifications for the establishment of geodetic
control for submission to the National Geodetic Survey (NGS) in AC 150/5300-16,
airport imagery acquisition for submission to NGS in AC 150/5300-17, and field data

18
collection and GIS standards in AC 150/5300-18. The use of GIS technology and the A-
GIS system will play a major role in the next generation of safety in the aviation industry.
As this modernization effort continues, the aviation industry must continue to rely on
SMS, integrated safety systems and other proactive means of managing processes to
reduce risk and continue superb safety standards.
Due to the recent adoption of NextGen practices, there are no sources that cover
them all simultaneously. Although both initiatives have been around for quite some time,
the benefit of implementing SMS using GIS is just now being realized. An integrated
GIS database that allows airport personnel to query and manipulate airport related data
will reduce costs to airports, air carriers, government agencies and aviation users.
Creating a database that contains the information normally collected at an airport and that
is readily available to personnel, will allow them to make queries and more informed
decisions.
The objective would be to use the integrated information system for daily
database management and maintenance but utilize GIS as a portal into this integrated
system to improve the way airports are managed and operated (Carlson, 2009). GIS can
support safety efforts by identifying potential points of failure and risk before a critical
incident occurs. Airport’s can use enterprise GIS to support efforts in planning,
operations, maintenance and safety/security by adding spatial information and modeling
in their continued effort to provide a safe operating environment (ESRI, 2010). Many
airports are currently planning to utilize GIS throughout various departments to improve
the efficiency and effectiveness of their employees. Figure 4 outlines which airport
departments plan to use GIS.

19
Figure 4
A totally integrated airport can use GIS in SMS by applying the powerful
analytical tools to daily applications for airport personnel. These applications include:
daily airfield inspections, runway condition reporting, wildlife reporting, environmental
inspections, vehicle inspections and data management and tracking. Safety inspections
for airports can be completed more efficiently and effectively utilizing an airport GIS to
understand existing vulnerabilities and pinpoint trends in safety incidents (ESRI, 2010).
Properly integrated, data-rich, GIS systems provide a tool for airport managers to
understand how events relate to each other and the potential risk they present at the
airport in the future (ESRI, 2007). To increase situational awareness of airport safety,
GIS provides managers with spatial analysis and risk exposure maps that are associated
with every accident and incident logged within the database. By utilizing information

20
integration within GIS an airport can increase geocentricity, which is the ability to
consume spatially oriented data within the activity workflow, to improve safety functions
through predictive risk modeling based on historical and real-time data (ESRI, 2007).
Examples of airports that use GIS for information system integration include
Baltimore-Washington International Thurgood Marshall, Southwest Florida International,
Denver International, Orlando International and Philadelphia International. These
airports use spatial analysis tools to more efficiently and effectively manage operational
characteristics ranging from document and inspection management to airport layout and
asset tracking analysis (Carlson, 2009). It is important to understand how to gauge
efficiency and effectiveness benefits when utilizing GIS for airport management.
Simply put, efficiency benefits are seen when GIS is used to do an assignment
previously completed without GIS and effectiveness benefits are realized when the
quality of the output is improved using the technology (Gillespie, 1991). Also,
effectiveness benefits can be observed when that airport produces an output using GIS
that previously was not able to be done. Knowing this, the answer to measuring benefits
is to identify the changes resulting from GIS. For efficiency, the output of the GIS project
may be the same as the output of the project done manually but it is the resources needed
to produce that output that show the benefits (Gillespie). An example would be the
reduction in personnel costs and hours that would be invested in a project to manually
complete difficult tasks related to mathematics, mapping and querying information.
Integrating these tasks into GIS significantly reduces the number of personnel and man-
hours spent to complete the same work and provided the same output.

21
Historically it is hard to measure effectiveness benefits but with GIS these
benefits can be seen. Effectiveness increases when the output has changed in a way that
the value of the output affects the user positively (Gillespie). If the output is presented in
a way that could not have been done without using GIS, then it is an effectiveness benefit.
An example of this would be the production of a population-at-risk map for specific
routes that are being considered for hazardous material transport (Gillespie). Without
GIS, there is no way to generate an accurate map of this type.
22
HOW TO ADVANCE SMS UTILIZING A-GIS – A CASE STUDY
This section provides an overview of the potential that airports could realize in
taking A-GIS initiatives a step further by creating spatially oriented safety databases for
SMS. It will begin by providing an overview of Will Rogers World Airport. After the
case study airport is described, the definitions of the major concepts that were used to
create the safety database will be presented. Finally, multiple scenarios with graphical
representations of potential outputs from the safety database will be presented to illustrate
a spatially oriented safety database.
Will Rogers World Airport
Will Rogers World Airport, or Will Rogers, is located in Oklahoma City,
Oklahoma approximately 6 miles from downtown. The airport is owned by the City of
Oklahoma City and leased to the Oklahoma City Airport Trust which acts as the principal
sponsor for the management and oversight of the airport facilities (Will Rogers World
Airport, 2010). Will Rogers is comprised of three major runways, two 9,800 ft parallel
runways and one 7,800 crosswind runway. In 2010, the number of operations at the
airport exceeded 120,000 (Will Rogers World Airport).
Representing the bulk of these operations are six commercial service air carriers
that have daily departures to 19 nonstop destinations (Will Rogers World Airport, 2010).
Other operators at the airfield include freight, military and corporate jets that help
maintain the operation of 67 companies which employ over 10,000 people. Recently, the
airport was chosen as one of five airports to participate in the FAA’s A-GIS pilot study.
The pilot project consists of three parts: (1) obtaining high resolution aerial

23
photography of the airport; (2) performing an accurate, detailed survey of the airport; and
(3) digitizing all relevant airport features along with inputting attributes to describe the
features (Will Rogers World Airport, 2010). By completing these project tasks, the
airport will be digitized using ortho-rectified aerial imagery that is displayed accurately to
a three inch pixel resolution. Using an airport that is currently undergoing such a leading
edge GIS initiative was imperative for this case study. Accurate base layers allowed for
the seamless integration of the created safety database for data mining and map output.
The spatial database that was created for this case study includes information that
is typically found in various safety reports that airports file separately. Some of the
common information from these reports has been integrated into one format for the
creation of a single database for detailed extraction of data. Before presenting the SMS
scenarios for this case study, it is vital that the definitions of key terms within the
database be given for complete understanding of the outputs. The safety dataset contains
multiple attributes that makeup the data that a user can query and display for analysis.
Each of these attributes contains important metadata that users must understand in order
to verify that they are properly analyzing the data.
Specifically, runway incursion types, runway incursion severity and risk
categories all have separate but very vital subcategories for properly ranking and
mitigating potential safety risks. The definition of high, medium and low safety risks for
SMS has already been provided and maintained within the dataset. However, both
runway incursions and surface incidents are classified by incursion type with incursions
being further classified by level of severity. These types include operational errors, pilot
deviations and vehicle/pedestrian deviations. As summarized by the FAA (2009) the
24
definitions for incursion types are as follow:
• “Operational Error is an action of an Air Traffic Controller that results in
less than the required minimum separation between two or more aircraft,
or between an aircraft and obstacles (including vehicles, equipment and
personnel on runways)
• Pilot Deviations is the action of a pilot that violates any Federal Aviation
Regulation
• Vehicle/Pedestrian Deviation is an incident that includes pedestrians,
vehicles or other objects interfering with aircraft operations by entering or
moving on the runway movement area without authorization from ATC,”
(p. 1).
On October 1 2007, the FAA revised its definition of a runway incursion by
adopting ICAO’s characterization as any unauthorized intrusion onto a runway (FAA,
2007). By doing so, the entire aviation industry accepts a single definition for an
incursion aimed at aiding the determination of common factors that contribute to these
incidents. Incidents in the past that would have been classified as surface incidents are
now considered category C or D runway incursions (FAA, 2007). A surface incident is
“any event where unauthorized or unapproved movement occurs within the movement
area, or an occurrence in the movement area associated with the operation of an aircraft
that affects or could affect the safety of flight,” (FAA, 2009, p. 1).
The severity of incursions is classified using A, B, C or D. Each classification
represents a different level of severity with A being the most severe and D being the least.
By definition, a category D incursion has little or no chance of collision but meets the

25
definition of a runway incursion, category C is a loss in separation but ample time and
distance to avoid a collision is maintained, category B is separation decreases and there is
a significant potential for collision and category A is lost separation with participants
taking extreme action to narrowly avoid a collision (FAA, 2009). The distinction
between these subcategories is of great importance because they affect the way the data is
coded and queried.
Scenarios
Casual factors of airport accidents and incidents, and the effectiveness of adopted
mitigation strategies, can be fully understood and evaluated only if occurrence is
examined in terms of type of event, conditions during that time, and location (Ayres et al.,
2009). Understanding the relationships between and within safety records not only
allows for more detailed investigation but also provides a means for the identification of
commons causes over time. Inputting safety data into an A-GIS system provides airport
personnel an efficient and effective way for accurately surveying hazard information for
risk monitoring, forecasting, program evaluation, policy analysis, risk assessment and
root-cause analysis. In order for airport management to adopt the most effective
mitigation strategies for SMS, they must not only understand what each occurrence is and
how it relates to daily operations, but where these occurrences are taking place. This
situation is the foundation for the first SMS/A-GIS scenario.

26
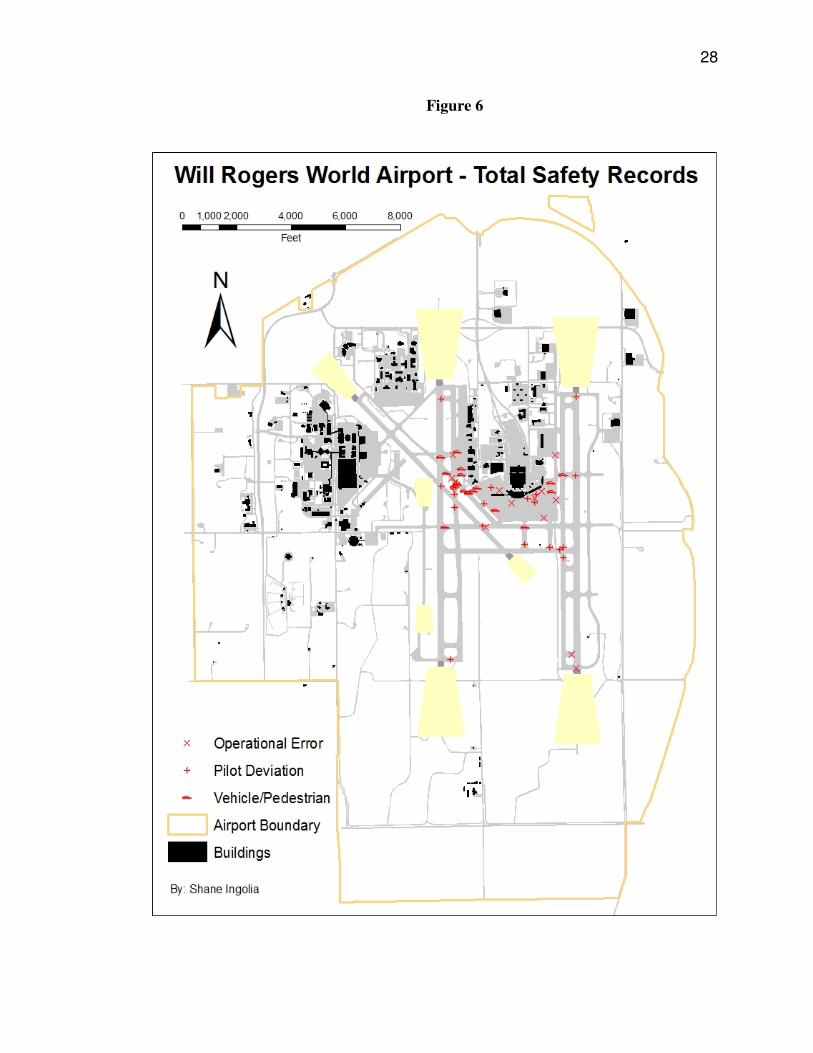
Scenario 1
At the fundamental level, airports that choose to port their safety database from
paper/electronic excel format into an A-GIS system allow their personnel the ability to
instantly depict what they are viewing for clarity. Figure 5 represents what a current
electronic safety database may look like for airports. Here, viewers may not understand
what exactly the data represents and how to develop conclusions on the relationships that
are present within the information. Also, it is important to note that this database only
contains 50 records. Imagine trying to locate information for a specific record when the
database contains 1000 or 10,000 records.

27
Figure 5
As long as the airport management and the safety team invest in the fact that
locational data must be attached to every safety record that is input into the database, the
output transforms from the unclear, numerical representation into an informative
graphical illustration as presented in Figure 6.
28
Figure 6

29
Scenario 2
Hazards are identified through a means of reporting occurrences after an
individual witnesses them or through identification during the SRM process. Either way,
each record must be classified and prioritized to ensure airport management that
mitigation resources are used to their fullest potential. Corrective action must be taken
for all risks identified as high, whereas low risk is acceptable without restrictions.
Understanding where these risks are located assist the safety team in developing risk
control strategies that may lower risks to acceptable levels or eliminate them all together.
SMS/A-GIS helps coordinate this prioritization by mapping safety records to allow for
convenient identification and tracking measures. If utilized in an enterprise system, a
real-time data update could present hazards and their associated risk levels as soon as
they are entered into the safety database. Figure 7 illustrates the safety records at Will
Rogers displayed by their risk classification.
Generation of a map of this type will allow airport personnel to identify the safety
record, review the metadata it contains, recognize exactly where the incident happened
and change the corresponding risk level after mitigation measures have been completed
and the risk classified as acceptable.

30
Figure 7

31
Scenario 3
As a follow-up to mapping every safety record across the entire airport, safety
personnel must be able to easily identify and extract data about a specific record. After
the data is input into the A-GIS system, a single record can be located by searching the
database or using the identify tool. When the record is located, all of the attribute data
attached to the record will be displayed for analysis and assessment. As information
changes through mitigation and follow-up, the SMS coordinator can change the attribute
data by simply editing each input. Illustrated in Figure 8 is the window displaying record
data for a single hazard in the Will Rogers database.
Figure 8
32
Scenario 4
As time passes and SMS is well established in the operating environment at U.S.
airports, more and more safety records will be stored within airport databases. Airports
must be able to quickly and accurately query these databases to extrapolate relationships
and common factors that may span over many years. Using SMS/A-GIS, airport
management would be able to select safety data that meet specific criteria. This enables
individuals to identify common characteristics within hazards and determine the root
cause of accidents, incidents, and incursions. In doing so, a corrective action plan may be
developed and implemented for a hazard that you may not otherwise “see” by simply
looking at monthly or yearly data. These hazards may relate to specific situations that
change like weather, equipment, seasons or personnel.
Figure 9 displays a map with safety records that meet these criteria: a date of
2008, at night, and medium risk. The usefulness of this type of search criteria is
unparalleled and can be accomplished in a matter of minutes. This gives airport
management an understanding if each hazard is a single incident in time or complex web
of interrelationships that require a change in airport procedures or processes to eliminate
the associated risks. In time, airports will require a means to query on-going databases
and SMS/A-GIS provides that.

33
Figure 9

34
Scenario 5
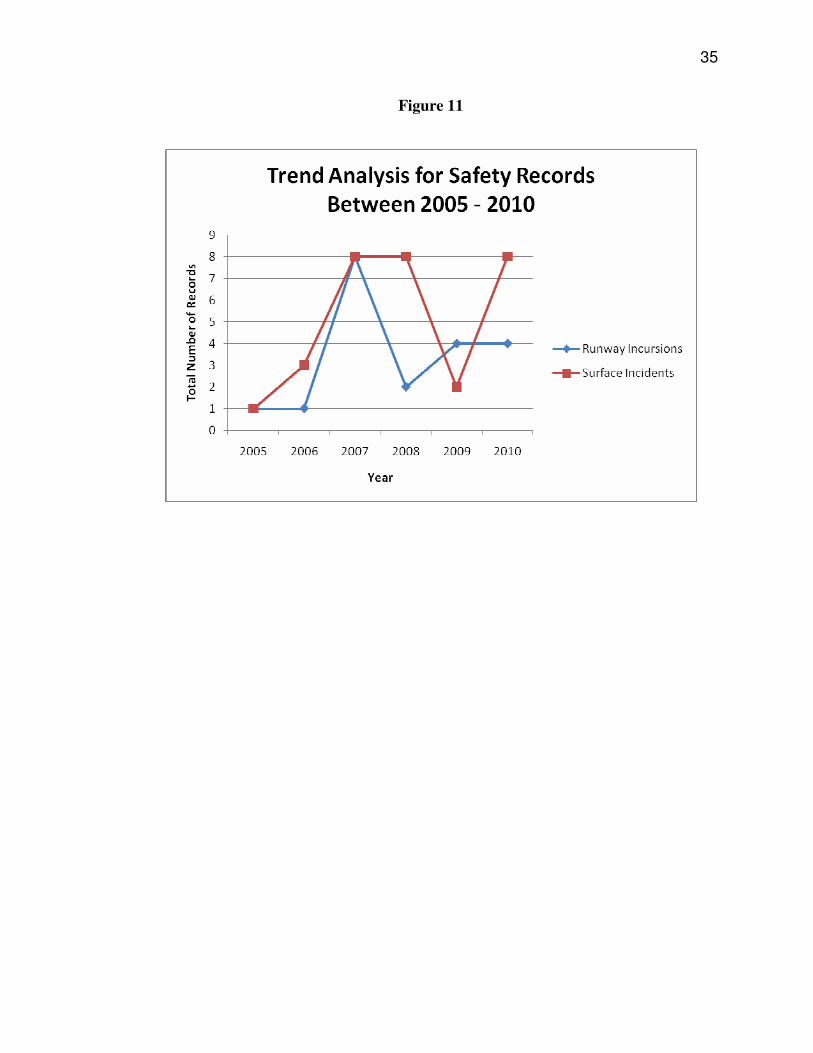
One of the biggest components of SMS is trend analysis. Trend analysis identifies
changes in safety levels over specific periods of time in order to gauge safety performance
at the airport (Ayres et al., 2009). This tool provides a snapshot of the safety levels at the
airport and identifies if the SMS needs to be audited to determine if action is required for
improving safety. After the specific safety objectives of the airport are determined, the
safety team can create charts that depict safety levels based on identified indicators like
total safety records or more specific indicators like safety incursions or surface incidents.
Figure 10 and 11 shows a trend analysis report for the total number of identified hazards
by year and total number by record type.
Figure 10
35
Figure 11
36
Scenario 6
The last scenario is a hot spot analysis. Hot spots are concentrations of incidents
within a limited geographic area that appear over time. The FAA has adopted the ICAO
definition of a hotspot as “a location on an aerodrome movement area with a history or
potential risk of collision or runway incursion, and where heightened attention by pilots
and drivers is necessary,” (FAA, 2010, p. 1). There are particular environments at
airports that may attract specific hazards or concentrations of risks that need to be
identified and analyzed. Indentifying these areas makes it easier for management to plan
the safest path of movement for aircraft, operations vehicles and personnel (FAA, 2010).
Understanding how to implement this tool within the SMS/A-GIS environment gives
airport operators another layer of safety for daily operations in the movement area. Figure
12 depicts identified hotspots on the Will Rogers airfield that may be submitted airport
management, commercial service providers and the FAA for further publication to
increase safety awareness in high risk areas at the airport.

37
Figure 12

38
CONCLUSION
The current FAA initiatives for both SMS and A-GIS are truly leading edge. The
ability of both programs to be customized to fit the needs of each airport, have limitless
applications for reducing hazards found at airports and increase safety. With proper
investment from upper management, airports across the country can realize the benefits
presented through this work. The preliminary findings presented here merely scratch the
surface of the potential that combining SMS into the framework of A-GIS has. Giving
airport operators the ability to query large safety databases and flag safety records that
need mitigation is a specification that needs to be adopted by every airport implementing
SMS at their facility.
The production of multi-layered maps enabling airport management to prioritize
mitigation strategies is essential for the next generation of aviation safety. By adopting
SMS/A-GIS principles, stakeholders can access data, from the convenience of any
computer on the enterprise network that is centrally located and maintained with accurate,
consistent and current in real time. This gives safety personnel the ability to consume
system-wide information while analyzing and assessing safety records at the airport.
Consuming spatially oriented SMS data across the entire airport allows safety
coordinators to extrapolate trends and anomalies over time that may otherwise not be
“seen”. Using GIS analysis, these trends may answer questions such as, (1) is there a
history of similar occurrences or is this an isolated incident, (2) what other equipment of
the same type has been involved in incidents before, (3) is it a specific area of the airfield
that presents hazards that management need to investigate, and (4) is there a specific

39
correlation with airport assets, like signage, that are causing similar incursions over time.
Being able to recognize a root cause for identified hazards at airports that may span
months increases the safety of airport operations.
Future directions of this research include expanding the database to include
attributes such as equipment involved, personnel ID number, cost data, weather data, pilot
information, environmental impact information and more. Another major direction for
future work is the inclusion of the ArcGIS tracking analyst. With this extension, airports
would be able to visualize and analyze temporal data based on position and attributes for
real-time analysis (ESRI, 2003). Being able to record, play back and review spatio-
temporal safety data is another potential layer in the safety matrix with major implications
for NextGen. This ability will give the entire industry the chance to review the real-time
historical event as long as it is stored within the database.
Additionally, airport management may also decide to use spatial statistical tools
within their GIS software to test the significance of spatial clusters. A prime example
would be to extend the hotspot analysis further by utilizing spatial statistics to determine
the Getis-Ord Gi* statistic. This analysis creates a Z score and P-value for the safety
feature class that will represent the significance of the spatial clustering values. A high Z
score and small p-value indicates a spatial clustering of high values (hotspot) while a low
negative Z score and small p-value indicates a spatial clustering of low values (coldspot)
(ESRI, 2010). Airport sponsors can use these outputs of hotspots and coldspots to show
the significance of hazardous clusters at their airport. Statistical significance of incident
clustering may prove extremely beneficial when airports begin submitting requests for
SMS related capital improvements.

40
As mentioned before, the potential is limitless for combining SMS within A-GIS
initiatives. Many key features of SMS can be enhanced through the tools provided by A-
GIS. Efficiency and effectiveness benefits will be explicit for airport management as soon
as the system goes online. Giving airports the ability to do more with less is essential in
today’s economic environment and utilizing A-GIS for SMS oversight provides that.

41
REFERENCES
Ayres, M., Shirzi, H., Cardoso, S., Brown, J., Speir, R., Selezneva, O., . . . McCall, E.
(2009). Airport cooperative research program report 1: Safety management systems
for airports, volume 2: guidebook. Washington DC: Transportation Research Board.
Carlson, K. (2009). GIS—A practical technology for airport systems integration. Transportation GIS Trends, 12-13.
Coppock, J.T. & Rhind, D.W. (1991). The history of GIS. London: Longmans Publishers. ESRI. (2003). ArcGis tracking analysis: Temporal data visualization and analysis. Retrieved from: http://www.esri.com/library/brochures/pdfs/trackinganalyst.pdf. ESRI. (2007). GIS integration with public safety applications. Retrieved from:
http://search.esri.com/results.cfm?q=gis%20integration%20with%20public%
20safety%20applications.
ESRI. (2010). GIS solutions for airports and aviation. Retrieved from:
http://search.esri.com/results.cfm?h=10&ho=0&oq=gis%2520integration
%2520with%2520public%2520safety%2520aplications&q=gis+solutions+for+
airports+and+aviation.
ESRI. (2010). ArcGIS desktop 9.3 help: Hot spot analysis (Getis-Ord Gi*). Retrived
from: http://webhelp.esri.com/arcgisdesktop/9.3/index.cfm?TopicName=Hot_Spot
_Analysis_%28GetisOrd_Gi*%29 _%28Spatial_Statistics%29
Federal Aviation Administration. (2004). Change 1 to measurement, construction, and
maintenance of skid-resistant airport pavement surfaces. (AC 150/5320-12C).
Washington DC: U.S. Department of Transportation.

42
Federal Aviation Administration. (2007). Introduction to safety management systems for
airport operators (AC 150/5200-37). Washington DC: U.S. Department of
Transportation.
Federal Aviation Administration. (2007). General guidance and specifications for
aeronautical surveys: establishment of geodetic control and submission to the
National Geodetic Survey (AC 150/5300-16A). Washington DC: U.S. Department of
Transportation.
Federal Aviation Administration. (2007). Fact Sheet – FAA adopts ICAO definition for
runway incursions. Retrieved from http://www.faa.gov/news/fact_sheets/news_story.
cfm?newsId=9612
Federal Aviation Administration. (2008). Airport SMS pilot project 1 findings.
Washington, DC: U.S. Department of Transportation.
Federal Aviation Administration. (2008). General guidance and specifications for
aeronautical survey airport imagery acquisition and submission to the National
Geodetic Survey (AC 150/5300-17B). Washington DC: U.S. Department of
Transportation.
Federal Aviation Administration. (2010). NextGen. Retrieved from http://
www.faa.gov/about/intiatives/nextgen/
Federal Aviation Administration. (2010) Runway safety – hotspots list. Retrieved from
http://www.faa.gov/airports/runway_safety/hotspots/hotspots_list/
Federal Aviation Administration. (2010). Runway safety – runway incursions. Retrieved
from http://www.faa.gov/airports/runway_safety/news/runway_incursions/

43
Federal Aviation Administration. (2010). Notice of proposed rulemaking: safety
management system for certificated airports (Federal Register Vol. 75, No. 194,
Docket No. FAA-2010-0997). Washington, DC: U.S. Department of Transportation.
Freeman, M. (2010). Enterprise GIS takes off at Phoenix Sky Harbor. Transportation GIS
Trends, 6-10.
Gillespie, S. (1991). Measuring the benefits of GIS use: Two transportation case studies.
URISA Journal, 62-67.
Ho, C. & Romero, P. (2007). GIS-Based applications in airfield infrastructure system
management and maintenance. 2-19.
Lawson, B. (2009). Solutions of airfield operations/maintenance [PowerPoint slides].
Retrieved from http://www.eagleintegrated.net/Carousel2/flashproduct.html
Longley, P., Goodchild, M., Maguire, D., & Rhind, D. (2006). Geographic information
systems and science. England: Wiley.
Ludwig, D., Andrews, C., Jester-ten Veen, N., & Laqui, C. (2007). Airport cooperative
research program report 1: Safety management systems for airports, volume 1:
overview. Washington DC. Transportation Research Board.
McNerney, M. (2000). State of the art airport infrastructure management with
geographic information systems. Washington DC. Transportation Research Board.
National Transportation Safety Board. (2010). U.S. air carrier operations, calendar year
2006: Statistical overview. Washington, DC: NTSB.
Neumann, G. (2009). Airports GIS and electronic ALP [PowerPoint slides]. Retrieved
from http://www.faa.gov/airports/great_lakes/airports_news_Events/2009_
conference/schedule_presentations/view/dsIndex.cfm.

44
Transport Canada. (2010). Pre-Flight. Data gathering-the small stuff. Retrieved from
http://www.tc.gc.ca/eng/civilaviation/publications/tp185-2-06-pre-flight-3656.htm.
Will Rogers World Airport. (2010). Department of airports and airport trust. Retrieved
from http://www.flyokc.com/Department.aspx
Will Rogers World Airport. (2010). Current Projects – WRWA chosen for pilot program
to create a national electronic airport layout plan. Retrieved from
http://www.flyokc.com/CurrentProjectDetails.aspx?ID=ad178035-9e85-45c3-aa34-
2f54dd23d909

45
VITA
Graduate School Southern Illinois University
Shane P. Ingolia Date of Birth: July 20, 1986 62 Ryan Lane Unit 2 De Soto, Illinois 62924 10514 Sir Ector Court, Mapleton, Illinois 61547 Southern Illinois University Carbondale Bachelor of Applied Science and Arts, Aviation Management, May 2009 Research Paper Title: Next Generation of Aviation Safety: Utilizing Airport-GIS for SMS Oversight Major Professor: Dr. John Hamman


![SMS AIR: Lessons Learned from Indonesia Water SMS Project in Malang [EN]](https://static.fdokumen.com/doc/165x107/633b479d4ff01ff16b0f2de2/sms-air-lessons-learned-from-indonesia-water-sms-project-in-malang-en.jpg)