L’occupazione umana del Pleistocene medio di Guado San Nicola (Monteroduni, Molise)
Upload
independentCategory
view
3download
0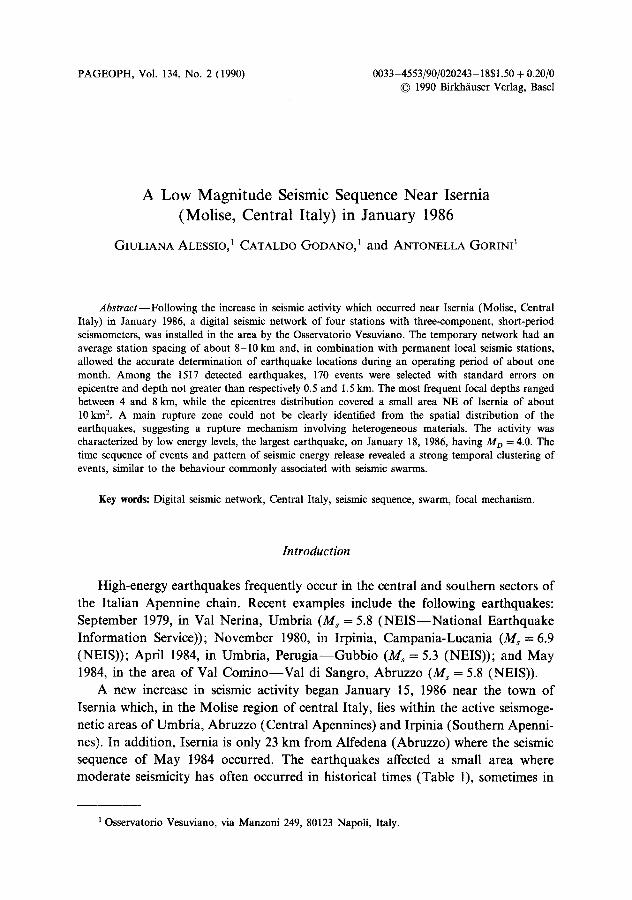
PAGEOPH, Vol. 134, No. 2 (1990) 0033-4553/90/020243-1851.50 + 0.20/0 �9 1990 Birkh/iuser Verlag, Basel
A L o w M a g n i t u d e Seismic Sequence N e a r Isern ia
(Mol ise , Cen t r a l I ta ly) in J a n u a r y 1986
GIULIANA ALESSIO, l CATALDO GODANO, 1 a n d ANTONELLA GORINI 1
Abstract--Following the increase in seismic activity which occurred near Isernia (Molise, Central Italy) in January 1986, a digital seismic network of four stations with three-component, short-period seismometers, was installed in the area by the Osservatorio Vesuviano. The temporary network had an average station spacing of about 8 - I0 km and, in combination with permanent local seismic stations, allowed the accurate determination of earthquake locations during an operating period of about one month. Among the 1517 detected earthquakes, 170 events were selected with standard errors on epicentre and depth not greater than respectively 0.5 and 1.5 km. The most frequent focal depths ranged between 4 and 8 km, while the epicentres distribution covered a small area NE of Isernia of about l0 km 2. A main rupture zone could not be clearly identified from the spatial distribution of the earthquakes, suggesting a rupture mechanism involving heterogeneous materials. The activity was characterized by low energy levels, the largest earthquake, on January 18, 1986, having M D = 4.0. The time sequence of events and pattern of seismic energy release revealed a strong temporal clustering of events, similar to the behaviour commonly associated with seismic swarms.
Key words: Digital seismic network, Central Italy, seismic sequence, swarm, focal mechanism.
Introduction
High-energy earthquakes frequently occur in the central and southern sectors of the Italian Apennine chain. Recent examples include the following earthquakes: September 1979, in Val Nerina, Umbria (M s = 5.8 (NEIS--National Earthquake Information Service)); November 1980, in Irpinia, Campania-Lucania (Ms = 6.9 (NEIS)); April 1984, in Umbria, Perugia--Gubbio (Ms = 5.3 (NEIS)); and May 1984, in the area of Val Comino--Val di Sangro, Abruzzo (M~ = 5.8 (NEIS)).
A new increase in seismic activity began January 15, 1986 near the town of Isernia which, in the Molise region of central Italy, lies within the active seismoge- netic areas of Umbria, Abruzzo (Central Apennines) and Irpinia (Southern Apenni- nes). In addition, Isernia is only 23 km from Alfedena (Abruzzo) where the seismic sequence of May 1984 occurred. The earthquakes affected a small area where moderate seismicity has often occurred in historical times (Table 1), sometimes in
10sservatorio Vesuviano, via Manzoni 249, 80123 Napoli, Italy.
244 G. Alessio et al. PAGEOPH,
Table 1
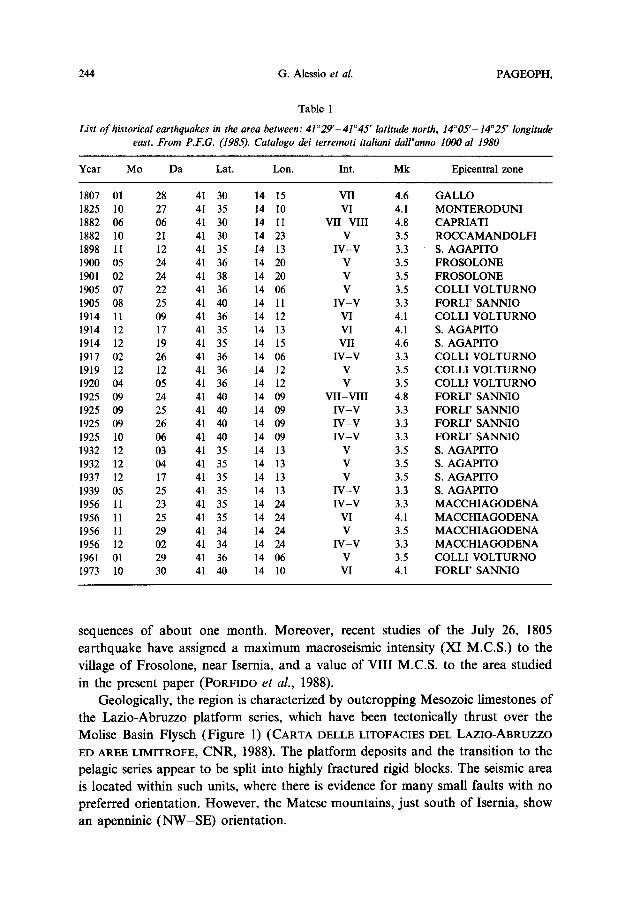
List o f historical earthquakes in the area between: 41~176 ' latitude north, 14~ ' - 14025 ' longitude east. From P.F.G. (1985). Catalogo dei terremoti italiani dall'anno 1000 al 1980
Year Mo Da Lat. Lon. Int. Mk Epicentral zone
1807 01 28 41 30 14 15 VII 4.6 GALLO 1825 10 27 41 35 14 l0 VI 4.1 MONTERODUNI 1882 06 06 41 30 14 11 VII-VIII 4.8 CAPRIATI 1882 10 21 41 30 14 23 V 3.5 ROCCAMANDOLFI 1898 11 12 41 35 14 13 IV-V 3.3 S. AGAPITO 1900 05 24 41 36 14 20 V 3.5 FROSOLONE 1901 02 24 41 38 14 20 V 3.5 FROSOLONE 1905 07 22 41 36 14 06 V 3.5 COLLI VOLTURNO 1905 08 25 41 40 14 11 IV-V 3.3 FORLI' SANNIO 1914 11 09 41 36 14 12 VI 4.1 COLLI VOLTURNO 1914 12 17 41 35 14 13 VI 4.1 S. AGAPITO 1914 12 19 41 35 14 15 VII 4.6 S. AGAPITO 1917 02 26 41 36 14 06 IV-V 3.3 COLLI VOLTURNO 1919 12 12 41 36 14 12 V 3.5 COLLI VOLTURNO 1920 04 05 41 36 14 12 V 3.5 COLLI VOLTURNO 1925 09 24 41 40 14 09 VII-VIII 4.8 FORLI' SANNIO 1925 09 25 41 40 14 09 IV-V 3.3 FORLI' SANNIO 1925 09 26 41 40 14 09 IV-V 3.3 FORLI' SANNIO 1925 10 06 41 40 14 09 IV-V 3.3 FORLI' SANNIO 1932 12 03 41 35 14 13 V 3.5 S. AGAPITO 1932 12 04 41 35 14 13 V 3.5 S. AGAPITO 1937 12 17 41 35 14 13 V 3.5 S. AGAPITO 1939 05 25 41 35 14 13 IV-V 3.3 S. AGAPITO 1956 11 23 41 35 14 24 IV-V 3.3 MACCHIAGODENA 1956 11 25 41 35 14 24 VI 4.1 MACCHIAGODENA 1956 11 29 41 34 14 24 V 3.5 MACCHIAGODENA 1956 12 02 41 34 14 24 IV-V 3.3 MACCHIAGODENA 1961 01 29 41 36 14 06 V 3.5 COLLI VOLTURNO 1973 10 30 41 40 14 10 VI 4.1 FORLI' SANNIO
sequences o f about one month . Moreover , recent studies o f the July 26, 1805
ear thquake have assigned a m a x i m u m macroseismic intensity (XI M.C.S.) to the
village o f Frosolone , near Isernia, and a value o f VI I I M.C.S. to the area studied
in the present paper (PORFIDO e t al . , 1988).
Geological ly, the region is character ized by ou tc ropping Mesozoic l imestones o f
the Laz io -Abruzzo p la t form series, which have been tectonically thrust over the
Molise Basin Flysch (F igure 1) (CARTA DELLE LITOFACIES DEE LAZIO-AaRUZZO
ED AREE LIMITROFE, C N R , 1988). The p la t fo rm deposits and the t ransi t ion to the
pelagic series appear, to be split into highly fractured rigid blocks. The seismic area
is located within such units, where there is evidence for many small faults with no
preferred orientat ion. However , the Matese mounta ins , just south o f Isernia, show
an apenninic ( N W - S E ) orientat ion.

[ \~
-~-.
~\_/
..::.'
-'--.:
.:.:..
_
--
.
..
..
..
-
_-
..._
.---
_'.:
, :.
:.
,..
\~~
;~:.
:..~
. :.
-..:
~
.~ L~
" ~
----
----
--~
: "B
:.:.
:~%
3.'_
:'-
, .
.'-"
"\.
P'L
~
~k-
-~-:
,l
I'~"
"o',
~,~
~
~17
6176
176 ~
~ ~
;:.
"~
"~
-~:l
l I~
'.'.'-
'.'.k
-
".'.
'.'.
'.-~
.'
.'.'
. L
~."
..
~-:
llq
,'.'
.'o
~1
76
.�
9176
'
�91
76
17
61
76
14
9
I~--
"7~
. �
9
, II
""
~' "
M ,
~.'
o'."
V"
-
.�9
14
9
_•
- L
.'.'
~14
9
i i
--
I
__
I
I-
I
I
~___
____
____
__~o
. �9
..
..
S
D]
~1
~'~
,.
RN
R
RC
S .
..
.
C..
,I
~L
�9
--
el
l ~
1~
~
- --
&
;'~
=e
s;.
..-'
.~
i -
-
--
ii
--
�9
.'
. ,,
~
[~
,,
_~Q
..
�9
- .
..
.
A.
.DU
I .
..
..
~
'.%
7.."
~
" --
"
�9 "
----
_ ~
....-.
.IIIH
/II,
~:..
.~:.
. ~s
, ;
..:
..
T..
_
~ T
~
~ :_
-A
" O
- ~
"
I I
:: ":i
: ----
-~:..
---
.~11
H II
~li~
:~
_ -~
.~__
,,d
....
...~
__
~
.
-:
~.
.'--?
~'-~
-".-
- ~
c
--
--_
~S
C
I
&
O.V
d
igit
al
seis
mic
n
etw
ork
I -O
.V
pe
rma
ne
nt
sels
m0
c st
ati
on
I I.
N.G
.. p
erm
an
en
t se
lsm
lc
sta
tio
n
-rrr
rr
Re
vers
e
fau
lts
an
d
ov
ert
hru
sts
No
rma
l a
nd
tr
an
sc
urr
en
t fa
ult
s
Fig
ure
1
Lo
cati
on
of
seis
mic
sta
tio
ns
and
sch
emat
ic t
ecto
nic
map
of
the
Iser
nia
are
a. H
ori
zon
tall
y a
nd
ver
tica
lly
hat
ched
are
as r
espe
ctiv
ely
rep
rese
nt
the
pla
tfo
rm
and
tra
nsi
tio
n s
eque
nces
, d
ott
ed a
reas
rep
rese
nt
bas
in s
eque
nces
.
<
C~
0 .=.
==
z
246 G. Alessio et al. PAGEOPH,
The aim of this study is to describe the microearthquake activity in the Isernia area during the January 1986 activity, focussing attention on the space-time pattern of the sequence.
Data Acquisition
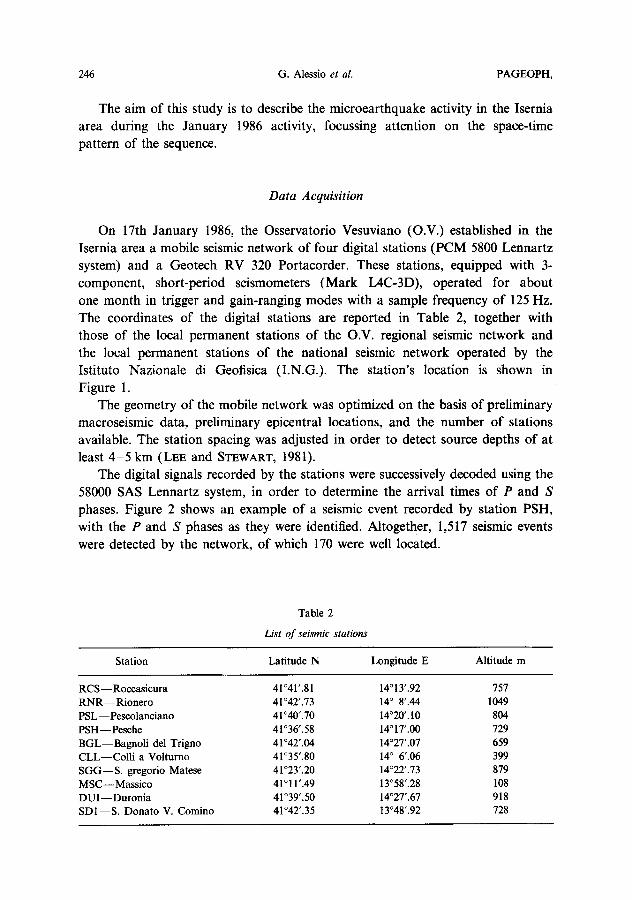
On 17th January 1986, the Osservatorio Vesuviano (O.V.) established in the Isernia area a mobile seismic network of four digital stations (PCM 5800 Lennartz system) and a Geotech RV 320 Portacorder. These stations, equipped with 3- component, short-period seismometers (Mark L4C-3D), operated for about one month in trigger and gain-ranging modes with a sample frequency of 125 Hz. The coordinates of the digital stations are reported in Table 2, together with those of the local permanent stations of the O.V. regional seismic network and the local permanent stations of the national seismic network operated by the Istituto Nazionale di Geofisica (I.N.G.). The station's location is shown in Figure 1.
The geometry of the mobile network was optimized on the basis of preliminary macroseismic data, preliminary epicentral locations, and the number of stations available. The station spacing was adjusted in order to detect source depths of at least 4-5 km (LEE and STEWART, 1981).
The digital signals recorded by the stations were successively decoded using the 58000 SAS Lennartz system, in order to determine the arrival times of P and S phases. Figure 2 shows an example of a seismic event recorded by station PSH, with the P and S phases as they were identified. Altogether, 1,517 seismic events were detected by the network, of which 170 were well located.
Table 2
List o f seismic stations
Station Latitude N Longitude E Altitude rn
RCS - - Roccasicura 41 ~ '.81 14 ~ 13'.92 757 RNR--Rionero 41 ~ 14 ~ 8'.44 1049 PSL--Peseolanciano 41~ 14~ 804 PSH--Pesche 41~ 14~ 729 BGL--Bagnoli del Trigno 41~ 14~ 659 CLL--Coll i a Volturno 41~ 14 ~ 6'.06 399 SGG--S. gregorio Matese 41~ 14~ 879 MSC--Massico 41~ 13~ 108 DUI- -Duron ia 41~ 14~ 918 SD1--S. Donato V. Comino 41~ 13~ 728

Vol. 134, 1990 Low Magnitude Seismic Sequence Near lsernia 247
! 01 !'$
._ ._ e l i I , , , , . . , 2 ............... '~TI
~9
i , U ,, ,
b~
tll P
.......
J I I I I 1 I I I I l I I I ! I 21:59:11 21:59:2~
Figure 2 A seismic event recorded by the station PSH. Z = vertical component, N = N - S horizontal component,
E = E - W horizontal component.
248 G. Alessio et al. PAGEOPH,
Data Analysis
Location of Events and Source Mechanism
Most of the seismic events had low magnitudes, with only a few reaching values comparable with the maximum magnitude of 4.0. As a result, many events were recorded by only two or three stations. Of these, station PSH was the nearest to the active zone (on average < 3 km from the epicentral area (Figure 1)) and recorded most of the events without saturation of the signals, as allowed by the digital instrumentation used.
The P time picking accuracy is typically less than 0.05 sec for the digital stations and 0.1 sec for the permanent analog stations. The events with at least six arrival times (P and S) detected at four or more stations were selected for location analysis; the arrival times were weighted inversely to the uncertainties in the onset of the P phase.
Since no detailed information is available for this specific area, a half-space with Vp = 5.0 km/sec has been assumed for the velocity model. This value is reasonable because (a) after a series of tests using different velocities on a sample of events, it yielded the smallest residual times in locating earthquakes, and (b) it is in good agreement with ScArtAscIA'S (1982) results which show a velocity of 6 km/sec at about 8 km depth along the profile Pescara-Benevento.
A Vp/vs ratio was evaluated from Wadati diagrams of single earthquakes in this sequence. P and S arrival times of 72 events were used to obtain a mean value of vp/vs = 1.75, which is comparable, even if slightly smaller than values obtained for earthquake sequences in different seismotectonic domains of the Apennine region (DESCHAMPS et al., 1984; HAESSLER et al., 1988).
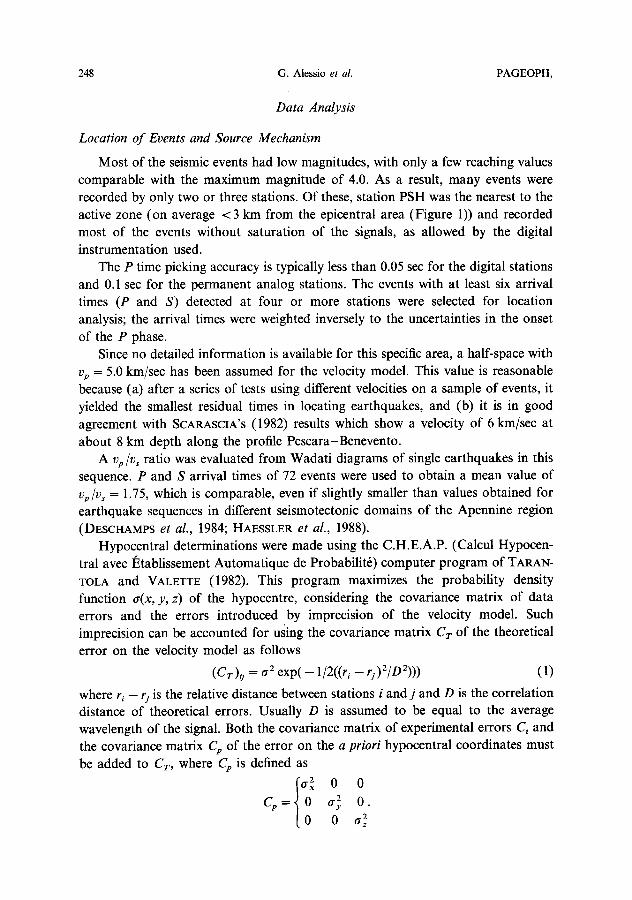
Hypocentral determinations were made using the C.H.E.A.P. (Calcul Hypocen- tral avec l~tablissement Automatique de Probabilitr) computer program of TARAN- TOLA and VALETTE (1982). This program maximizes the probability density function a(x, y, z) of the hypocentre, considering the covariance matrix of data errors and the errors introduced by imprecision of the velocity model. Such imprecision can be accounted for using the covariance matrix Cr of the theoretical error on the velocity model as follows
(C T ) / j = 17 2 exp( - 1/2((r i -- rj ) 2/D 2))) (1)
where ri - rj is the relative distance between stations i and j and D is the correlation distance of theoretical errors. Usually D is assumed to be equal to the average wavelength of the signal. Both the covariance matrix of experimental errors Ct and the covariance matrix Cp of the error on the a priori hypocentral coordinates must be added to C~, where Cp is defined as
(a~ 0 0
~

Vol. 134, 1990 Low Magnitude Seismic Sequence Near Isernia 249
The probability density function of the hypocentre is thus
a(x, y, z) = k exp( - 1/2((t0 - ti(x, y, z))r(Ct + CT) -t(t0 -- ti(x, y, Z))
+ ( p - p o ) C ; l ( p _ p0))) (2)
where p and Po are the positions of, respectively, the hypocentre and the a priori hypocentre, to is the observed arrival time from which the weighted mean of the observed times is subtracted, and t i is the travel time from which the weighted mean of the travel times is subtracted.
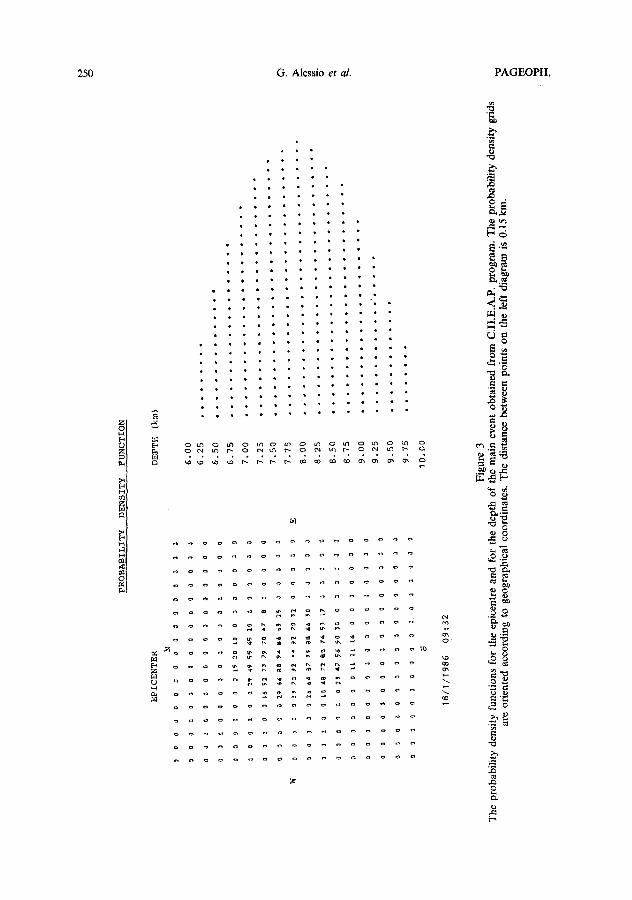
To verify that the solution obtained was the absolute maximum, the probability density function a(x, y, z) around the hypocentre over a fixed grid was calculated with the C.H.E.A.P. program. An example of the results is given in Figure 3 for the epicentre and depth of the main event; it is evident that no secondary maximum of a(x, y, z) is present.
Using 20 observations (12 P-time readings and 8 S-time readings), the hypocen- tral parameters of the main shock, located with the C.H.E.A.P. program, were:
Date To Lat. N Long. E Depth (km) Md
01/18/1986 09:32 45.00 41~ ' 14~ ' 7.93 4.0
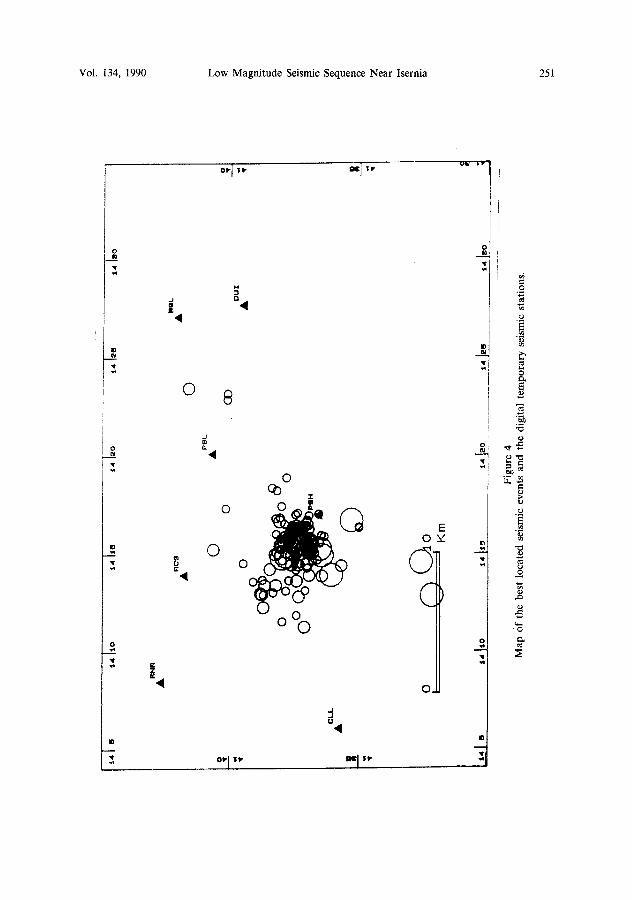
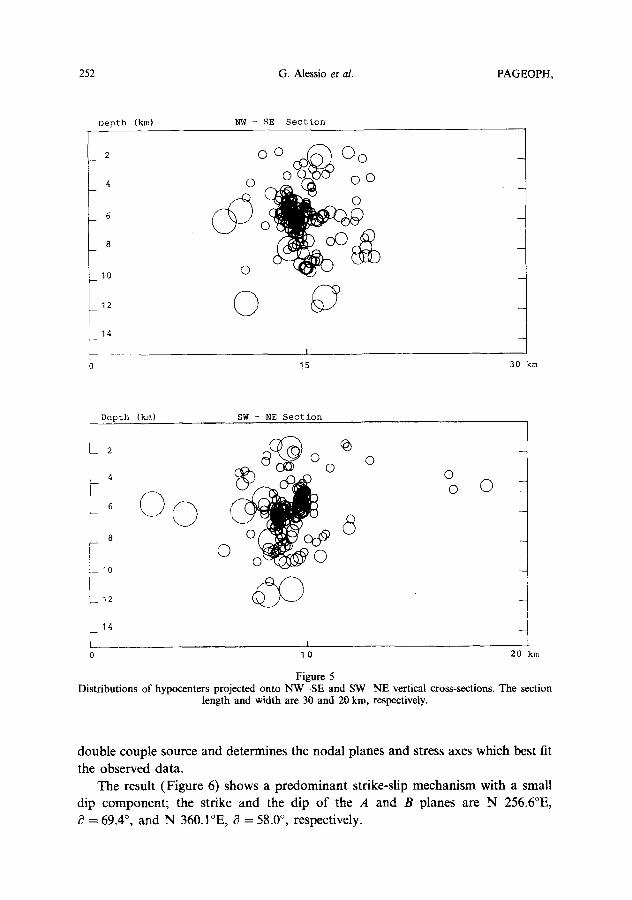
Figure 4 shows the epicentral distribution of events whose hypocentres have been located with errors ~<0.5 and ~< 1.5 km for, respectively, horizontal position and depth. Most of the epicentres are concentrated in an area of about 10 km 2 to the NE of Isernia. They are arranged in clusters NW of station PSH, without any preferential alignments of events (Figure 4). The events also show a clustering with depth. Thus, although the maximum depth of the seismic sources was 12 km, projection of all the hypocentres onto, for example, NW-SE and NE-SW oriented cross-sections, reveals a concentration of hypocentres at depths between about 4 and 8 km (Figure 5). As a result of these clustering patterns, no space trends can be inferred from either epicentral or hypocentral distributions. In addition, no tempo- ral variation of the average focal depth was recognised during the sequence.
Because of the low signal-to-noise ratio and the relatively low number of stations available, it has not been possible to obtain good fault plane solutions for single events. A composite solution, however, can be computed for events with clear polarities, similar waveforms and approximately the same location. This well-tested procedure (MENDIGUREN, 1980; KAGAN and KNOPOFF, 1985) assumes that such events have a similar focal mechanism and, although it yields results which average the polarization directions, it does provide useful information on the average stress field in the area.
The program Utilized was derived from WICKENS and HODGSON (1967), incorporating modifications made at the Osservatorio Vesuviano Computer Centre and using the same velocity model as for the locations. The program assumes a
t~
PROBABILITY
DENSITY
FUNCTION
EPICENTER
N o
o o
d o
o o
o o
o ~
'3
o Q
~ o
0 0
0 (]
0 0
0 0
CI
0 0
0 0
~ 0
~)
~l
6.00
6.25
D a
~ ~
0 o
0 o
D o
~ ~
D D
o o
6.5
0
6.7
5
~ ~
0 0
0 0
15
20
it)
0 0
0 0
CI
0 9
7,00
7.25
7.5
0
7.7
5
8.00
0 Q
:~
,l
S ;16
64
~.7
9~
a8
66
~0
J 3
O ~
J
8.25
8.50
,3
CI
a ~
~
O
2~ &7
~F6
~0 ~CI
O 3
0 ~
,1
6.7
5
0 0
I) 3
Q
0 ii
, 2
1
L6
0 O
3
0 0
'l 0
9.0
0
9.25
0 tl
0 0
0 0
0 0
~ ~
0 0
0 0
0 3
0
9.50
9.75
S 1
0.0
0
18
/I/1
98
6
09
:32
DEPTH
(kin)
,.
~1
76
,~
17
61
76
17
61
76
,,
,o
.~
17
61
76
17
61
76
17
61
76
.,
eo
o~
17
61
76
17
61
76
17
61
76
17
61
76
17
61
76
~
o,
.o
,o
oo
e~
17
61
76
~
17
61
76
17
61
76
> O
Figu
re 3
T
he p
roba
bilit
y de
nsit
y fu
ncti
ons
for
the
epic
entr
e an
d fo
r th
e de
pth
of t
he m
ain
even
t ob
tain
ed f
rom
C.H
,E.A
.P.
prog
ram
. T
he p
roba
bili
ty d
ensi
ty g
rids
ar
e or
ient
ed a
ccor
ding
to
geog
raph
ical
coo
rdin
ates
, T
he d
ista
nce
betw
een
poin
ts o
n th
e le
ft d
iagr
am i
s 0.
15 k
m.
s
CLL
A
RNR
A
RC8
A
�9
0
0
PRL
A
�9
(I)
DQ
L
A
DUZ
A
o
0 K
m
t...~4
1 n
'14 lt
O
14lib
i4
120
1412
~ 14
1SO
Fig
ure
4 M
ap O
f th
e be
st l
ocat
ed s
eism
ic e
vent
s an
d th
e di
gita
l te
mpo
rary
sei
smic
sta
tion
s.
< Q
g~
Oq .=
252 G. Alessio et al. PAGEOPH,
Depth (km) ~q - SE Section
2
4
6
I 0
14
O � 9
0
�9
� 9
0
I
15 30 km
Depth (km)
_ 2
4
8
_ 1 0
_ 1 2
SW - NE Section
�9
6
�9
o �9
14
I
10 20 km
Figure 5 Distributions of hypocenters projected onto N W - S E and S W - N E vertical cross-sections. The section
length and width are 30 and 20 kin, respectively.
double couple source and determines the nodal planes and stress axes which best fit
the observed data. The result (Figure 6) shows a predominant strike-slip mechanism with a small
dip component; the strike and the dip of the A and B planes are N 256.6~ = 69.4 ~ and N 360.1~ ~3 = 58.0 ~ respectively.

Vol. 134, 1990 Low Magnitude Seismic Sequence Near hernia
N
i
PLANE B
N 360.1" E
6= 58.0*
PLANE A
N 256.6 ~ E
8= 69.4*
253
DATE ORIGIN TIME LAT N LONE DEPTH MAG
860118 01:22 49.07 41 36.50 14 14.94 5.15 3.6
860118 08:49 32.99 41 36.13 14 13.92 5.92 3.1
860118 09:32 45.00 41 36.57 14 15.27 7.93 4.0
860118 15:48 23.23 41 32.20 14 12.85 5.40 3.3
860118 21:08 35.92 41 36.85 14 15.05 6.88 2.2
860119 21:56 13.90 41 32.62 14 14.56 6.10 3.6
860120 17:33 46.37 41 38.13 14 15.44 5.97 2.5
860121 08:20 43.12 41 38.72 14 13.39 5.66 2.9
860123 71:41 54.95 41 37.76 14 15.90 5.89 2.2
860124 04:08 24.76 4~ 37.29 14 15.01 9.23 2.8
860124 07:17 58.52 41 37.51 14 14.93 4.16 1.7
860204 22:55 53.27 41 37.88 14 14.89 1.76 3.1
860207 03:16 36.87 41 37.72 14 16.05 5.32 1.6
860208 03:48 10.36 41 37.90 14 13.11 6.16 1.2
860209 18:12 09.57 41 38.39 14 13.02 4.75 0.6
Figure6 Composite fault plane solution obtained from P-wave polarity. Data are plotted on a Wulff stereo- graphic projection, lower hemisphere. The events used in computing the solution are listed in table above
graph. N and 6: strike and dip of plane. + compression, - dilatation.
Time Series and Energy Release
Local magni tudes of the events were calculated from seismogram dura t ions for
the stat ion S. Gregorio Matese (SGG) , a pe rmanen t s tat ion of the O.V. seismic
regional network, using the empirical relationship:
MD = -- 1.85 + 2.70 log(t) + 0.001D (3)

EN
ER
GY
(erg
) N
22E+16
2eE+16
tSE+16
16E+16
$4E'16
12E+16
10[+16
~O
E+tS
6B
E+I~
4e
E+
IS
2@
E*l
S
12E
+13
,.
, g
-5,
15
17
19
21
23
2~
JAN
UA
RY
....
L
, r,
~
r.
,.
r,--
r ,
~-
-l-r
+--
~
....
,
27
z9
31
~2
e,
~6
e~
FE
BR
UA
RY
- 4
00
30
0
- 2
00
10
0
i
Fig
ure
7 D
aily
ene
rgy
rele
ase
(ful
l li
ne)
and
dail
y nu
mbe
r of
eve
nts
(das
hed
line
) ve
rsus
tim
e. D
ata
wer
e re
cord
ed a
t S
GG
per
man
ent
seis
mic
sta
tion
(O
.V.
regi
onal
se
ism
ic n
etw
ork)
.
P o r~
�9
Vol. 134, 1990 Low Magnitude Seismic Sequence Near Isernia 255
where t is the signal duration in seconds and D is the epicentral distance in kilometres; their respective coefficients are determined by correlating signal duration with the Wood-Anderson magnitude (I.N.G., Rome) for a set of selected earth- quakes.
The seismic energy of the events was obtained from the GUTENBERG-RICHTER (1942) relationship:
log E = 9.9 + 1.9ML -- 0.024M 2. (4)
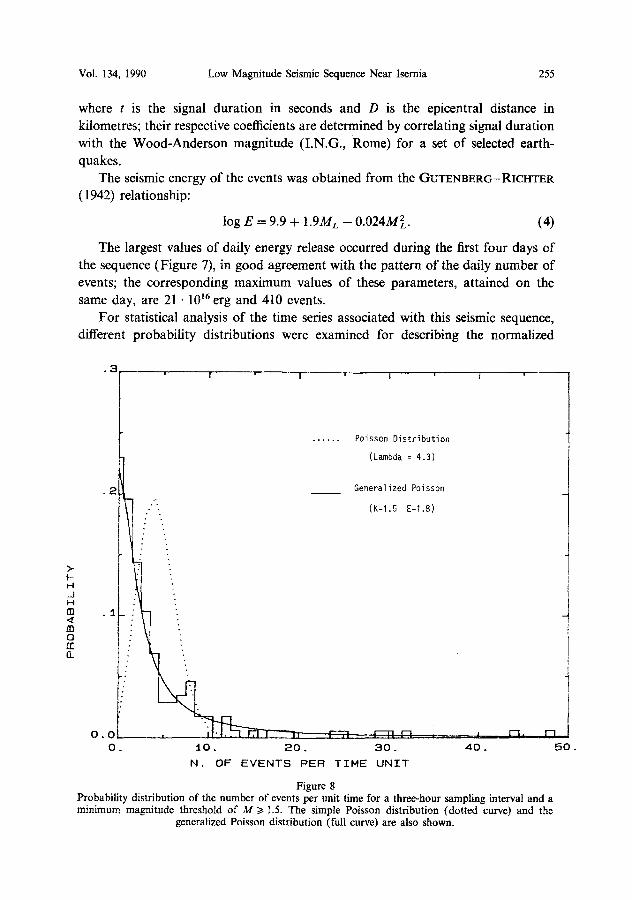
The largest values of daily energy release occurred during the first four days of the sequence (Figure 7), in good agreement with the pattern of the daily number of events; the corresponding maximum values of these parameters, attained on the same day, are 21 �9 10 ~6 erg and 410 events.
For statistical analysis of the time series associated with this seismic sequence, different probability distributions were examined for describing the normalized
. 3
. 2
z T I ....
. . . . . . Poisson D i s t r i bu t i on
(Lambda = 4.3)
Generalized Poisson
ft.
0 . 0
0 . I 0 . 2 0 . 3 0 . 4 0 . ~ 0 .
N. OF EVENTS PER TIME UNIT
Figure 8 Probability distribution of the number of events per unit time for a three-hour sampling interval and a minimum magnitude threshold of M/> 1.5. The simple Poisson distribution (dotted curve) and the
generalized Poisson distribution (full curve) are also shown.

256 G. Alessio et al. PAGEOPH,
frequency distribution of the number of events per unit time. As shown in Figure 8, the frequency distribution cannot be interpreted as a simple Poisson process; the lambda parameter for this distribution, which gives the mean rate of the occurrence of the events, is 4.3 events/3 hours.
A considerably better agreement with the experimental data is obtained using a generalized Poisson process, that is a model of Poisson-distributed clusters; the parameters k and E indicate, respectively, the mean rate of occurrence of clusters and the cluster size distribution (SHLIEN and TOKSOZ, 1970). The low value of 1.8 obtained for E would be consistent with a swarm type of seismic activity (UTSU, 1970; DE NATALE and ZOLLO, 1986); it would also agree with the fact that some events of comparable magnitude (Mma x = 4.0) were observed during the early days of the sequence.
The rapid evolution of the seismic sequence is pointed out by the variation with time of the 'b'-value (GUTENBERG and RICHTER, 1944) computed from the noncumulative magnitude-frequency distribution. The whole sequence is character- ized by an average value of b = 0.85 + 0.02. In detail, however, b increased quickly during the first days of the sequence (Figure 9), later tending to a constant value. The physical meaning of the 'b' coefficient is usually related to the stress level applied to the medium; therefore the observed 'b' variation may be related to the stress-drop after the major shocks.
The observed changes in b might also reflect a variation in the fractal dimension of the seismic fracturing process, as the distribution of events, at first confined effectively to a plane, begins to extend into the surrounding crust in several directions (i.e., the distribution of events evolves from a planar (2D) to volumetric (3D) geometry). However, such an interpretation must remain speculative since, because of the very small crustal volume involved in the Isernia sequence, the hypocentral location errors are relatively large for a clear discrimination between planar and volumetric crustal failure.
Discuss ion and Conclusions
The January-February 1986 seismic sequence, which occurred near Isernia (Molise, Central Italy), affected a small area (about 10 km 2) in the Central-Southern Apennines. The earthquakes had low magnitudes (Mma x = 4.0) and their epicentral distribution shows a clustering of events, without any regular geometry. Similar features have been observed for other seismic sequences in the Central Apennines (DESCHAMPS et al., 1983-1984; FERRI and GORINI, 1986) and may be attributed to the effect of complex fracture mechanisms.
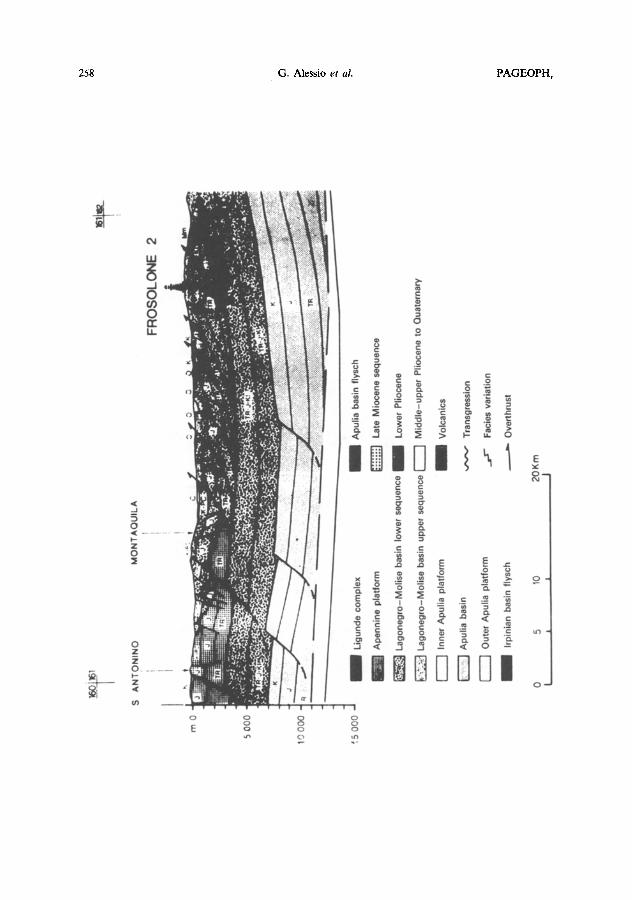
Most of the events were concentrated at depths between 4 and 8 km, broadly coinciding with the overthrust contact between limestones of the Lazio-Abruzzo platform series and the underlying Molise Basin Flysch (Figures 1 and 10), which have different mechanical properties (MOSTARDINI and MERLINI, 1986).

'b'
t.~
1.4
1.3
1.2
l.l
t.@
0.9
0.7
0.6
0.5
0.4
0.3
0.2
8.1
e.Q
__
L
I 1
l I
I I
I l
1 1
! !
1 1
I !
13ll
14
15
16
17
10
19
2
9
21
22
2
3
24
25
2
6
27
2
0
29
3
9
31
days
Fig
ure
9
Tim
e v
aria
tio
n o
f b
-val
ue
fro
m t
he
no
ncu
mu
lati
ve
mag
nit
ud
e-fr
equ
ency
dis
trib
uti
on
fo
r th
e S
GG
st
atio
n.
Mag
nit
ud
e st
ep =
0.3
. M
agn
itu
de
lin
ear
ran
ge:
1.
5 ~<
M
~< 3
.5.
Mo
bil
e w
ind
ow
of
250
even
ts w
ith
a 6
0%
o
ver
lap
.
o [..,
O
0~ _=. z ..,j
~0
i. A
NTO
NIN
O
' V
ION
T A
QU
/LA
=RO
SO
LON
E
2
~o
OO
O
iO 0
00
: 5 0
00
I~B
Ll
gU~a
e co
mpt
ex
B
/~pu
ilu o
duln
uyu
r
B
Ape
nnin
e pt
atfo
rm
~ La
te M
ioce
ne s
eque
nce
Lago
nagr
o-M
olis
e ba
sin
low
er s
eque
nce
~ Lo
wer
Plio
cene
Lago
negr
o-M
olis
e ba
sin
uppe
r se
quen
ce ~
M
iddl
e-up
per
Plio
cene
to Q
uate
rnar
y
Inne
r A
pulia
pla
tform
~
Vol
cani
cs
Apu
lia b
asin
Tr
ansg
ress
ion
Out
er A
putia
pla
tform
~
Fac
ies v
aria
tion
m
Irpin
ian
basi
n fly
sch
~ O
verth
rust
5 t0
20
K m
I
~ j.
l
I. ,=

Vol. 134, 1990 Low Magnitude Seismic Sequence Near Isernia 259
A composi te fault plane solution indicates that the Isernia sequence was related
to a strike-slip failure mechanism with a small dip component . Al though such a
mechanism contrasts with the normal faulting commonly associated with large
ear thquakes in Central Italy, it does not appear to be unusual for small ear thquakes
located along transit ion zones or lateral segments o f the moun ta in chain (GAs-
PARINI et al., 1980, 1985; DESCHAMPS et al., 1984b; HAESSLER et al., 1988;
WESTAWAY et al., 1989). Indeed, for events involving areas as small as the Isernia
sequence, minor structures are likely to strongly influence the rupture mechanism
and provide fault plane solutions unrelated to the regional stress field (JACKSON,
1983).
Acknowledgements
The authors would like to thank Giuseppe De Natale, Giovanni Iannaccone,
Marcello Mart ini and Aldo Zollo who provided some o f the comput ing programs
used in this paper. Thanks are also extended to Chris topher Ki lburn who carefully reviewed the
final version o f the manuscript .
REFERENCES
CARTA DELLE LITOFACIES DEL LAZIO-ABRUZZO ED AREE LIMITROFE--A curs di G. Accordi and F. Carbone--CNR (1988), Quaderni de la 'L~ ricerca scientifica' PFG, Monografie finali, vol. 5.
CARTA GEOLOGICA d'ITALIA--Scala l:100.000, Foglio 161 (Isernia). DE NATALE, G., and ZOLLO, A. (1986), Structural Analysis and Clustering Features of the Phlegrean
Fields Earthquake Sequence (May 1983--May, 1984), Bull. Seismol. Soc. Am. 76 (3), 801-814. DESCHAMPS, A., GASPARINI, C., IANNACCONE, G., and SCARPA, R. (1983), Nuove ipotesi sulla
geometria della sorgente del terremoto umbro del 19 settembre 1979, Atti del II Convegno, vol. I, Gruppo Nazionale di Geofisica della Terra Solida (C.N.R.) Roma, 12-14 dicembre 1983.
DESCHAMPS, A., LANNACCONE, G., and SCARPA, R. (1984a), The Umbrian Earthquake (Italy) of 19 September 1979, Annales Geophysicae 2 (1), 29-36.
DESCHAMPS, A., and KING, G. C. P. (1984b), Afiershocks of the Campania-Lucania (Italy)Earthquake of 23 November 1980, Bull. Seismol. Soc. Am. 74 (6), 2483-2517.
FERRI, M., and GORINI, A. (1986), Gli eventi sismici del maggio 1984 in Abruzzo; una possibile sequema: evento principale--repliche--precursori--evento principale--repliche, Boll. Soc. Naturalisti Napoli XCV, 123-139.
GASPARINI, C., IANNACCONE, G., and SCARPA, R. (1980), On the Focal Mechanism of Italian Earthquakes, Rock Mechanics, Suppl. 9, 85-91.
GASPARINI, C., IANNACCONE, G., and SCARPA, R. (1985), Fault Plane Solutions and Seismicity of the Italian Peninsula, Tectonophysics 117, 59-78.
GUTENBERG, B., and RICHTER, C. F. (1942), Earthquake Magnitude, Intensity, Energy and Acceleration, Bull Seismol. Soc. Am. 32, 163-191.
4 Figure 10
Geological cross-section of the Isernia area section (Section n. 11 of MOSTARDINI and MERLINI, 1986). The limits of the Carta Geologica d'Italia (Foglio 161-Isernia) are reported above the section. See text
for discussion of the correlation between tectonics and focal depths.

260 G. Alessio et al. PAGEOPH,
GUTENBERG, B., and RICHTER, C. F. (1944), Frequency of Earthquakes in California, Bull. Seismol. Soc. Am. 34 (4), 185-188.
HAESSLER, H., GAULON, R., RIVERA, L., CONSOLE, R., FKOGNEUX, M., GASPAR1NI, C., MARTEL, L., PATAU, G., SICILIANO, M., and CISTERNAS, A. (1988), The Perugia (Italy)Earthquake of 29, April 1984: A Microearthquake Survey, BUlL Seismol. Soc. Am. 78(6), 1948-1964.
JACKSON, J. A. (1983), The Use of Earthquake Source Studies in Continental Tectonic Geology, Rendiconti della Scuola internazionale di Fisica "Enrico Fermi", LXXXV Corso, Soc. Italiana di Fisica, Bologna, Italy.
KAGAN, Y. Y., and KNOPOFF, L. (1985), The Two-point Correlation Function of Seismic Moment Tensor, Geophys. J. R. Astr. Soc. 83, 636-657.
LEE, W. H. K., and STEWART, S. W., Principles and Application of Microearthquake Networks (Academic Press, New York 1981).
MENDIGUREN, A. J. (1980), A Procedure to Resolve Areas of Different Source Mechanism when Using Method of Composite Nodal Plane Solution, Bull. Seismol. Soc. Am. 70 (4), 985-998.
MOSTARDINI, F., and MERUNI, S. (1986), Appennino Centro-Meridionale, Sezioni geologiche e proposta di modello strutturale, 73 ~ Congresso Soc. Geologica Italiana, 30 settembre-4 ottobre 1986.
PORFIDO, S., ESPOSlTO, E., MARTURANO, A., and LUONGO, G. (1988), I terremoti d_el XIX secolo dell'Appennino campano-lucano, Atti 74 ~ Congresso Soc. Geologica Italiana, vol. A, 458-467.
PROGETTO FINALIZZATO GEODINAMICA (1985), Catalogo dei terremoti italiani dall'anno 1000 al 1980, Bologna.
SCARASCIA, S.' (1982), Crustal Structure in Southern Apennines Region from DSS Data, Proceedings of EGS-ESC Meeting, Leeds, August 1982.
SHLIEN, S., and T6KSOZ, M. N. (1970), A Clustering Model for Earthquake Occurrence, Bull. Seismol. Soc. Am. 60, 1765-1787.
TARANTOLA, A., and VALETTE, B. (1982), Inverse Problems--Quest for Information, J. Geophys. 50, 159-170.
UTSU, T. (1970), Aftershocks and Earthquake Statistics (1I), Further Investigation of Aftershocks and Other Earthquake Sequences Based on a New Classification of Earthquake Sequences, J. of the Faculty of Science, Hokkaido University, Series VII, Geoph. 3 (4), 197-266.
WESTAWAY, R., GAWTHORP, R., and TozzI, M. (1989), Seismological and Field Observations of the 1984 Lazio-Abruzzo Earthquakes: Implications for the Active Tectonics of Italy, Gcophys. J. 98, 489-514.
WICKENS, A. J., and HODGSON, J. H. (1967), Computer Re-evaluation of Earthquake Mechanism Solutions, Publ. Dom. Obs. Ottawa 33, 1-560.
(Received July 11, 1989, revised/accepted June 1, 1990)
Copyright © 2022 FDOKUMEN