A late Pleistocene predator-accumulated avifauna from Kids Cave, West Coast, South Island, New...
18
. ISBN 0 9757894 5 7/2006/20 $3.00 ©AAP A late Pleistocene predator-accumulated avifauna from Kids Cave, West Coast, South Island, New Zealand TREVOR H. WORTHY and J.X. ZHAO WORTHY, T.H. & ZHAO, J.X., 2006. A late Pleistocene predator-accumulated avifauna from Kids Cave, West Coast, South Island, New Zealand. Alcheringa Special Issue 1, 389-408. ISBN 0 9757894 5 7. A fossil deposit excavated from the floor of Kids Cave, West Coast, South Island, New Zealand, is interpreted as having been primarily accumulated by New Zealand falcon Falco novaeseelandiae, with some contribution by Haast’s eagle Harpagornis moorei. The fauna is rich: 3699 bones represented 41 bird species, two frog species, unspecified geckoes and skinks, and one bat species. Fossil deposition was mainly within the Last Glacial Maximum from about 22,000 cal yr bp to about 15,000 cal yr bp, with a marked change in sediment characteristics at the onset of the LGM’s coldest period. Chronological control is given by three Uranium-series dates for a speleothem and radiocarbon AMS dating of four avian eggshell samples and one bone. The fauna is the first extensive predator accumulation of LGM age described from the West Coast of the South Island, and it indicates a palaeoenvironment of a mosaic of shrublands with forest patches. The onset of the coldest part of the LGM (Aurora 3 glacial advance, 19,500 - 19,000 cal yrs bp) saw marked climate cooling/drying affecting the site, but the avifauna indicates that although open-country taxa became more common in this period, some forest persisted nearby throughout the remainder of the LGM. Trevor H. Worthy [[email protected]], Darling Building, DP 418, Department of Earth and Environmental Sciences, University of Adelaide, North Terrace, Adelaide, SA 5005 & Jian-xin Zhao [[email protected]], Radiogenic Isotope Laboratory Centre for Microscopy and Microanalysis, University of Queensland, Qld 4072; submitted 7.7.2005, accepted 21.8.2006. Key words: Late Pleistocene, Late Glacial Maximum, raptor-accumulated avifauna, palaeoenvironment, Kids Cave, West Coast, South Island. QUATERNARY terrestrial vertebrate faunas of New Zealand are now well known, resulting from 160 years of collections since the first moa bones came to Richard Owen’s attention in England in 1843, and the following modern regional studies (e.g. Worthy & Holdaway 1993, 1994a, 1995, 1996a, 2000; Worthy 1997, 1998a, b; Worthy et al. 2002a, 2002b). Fossils are derived mainly from dunes, swamps and caves, though there is a single significant lacustrine deposit (Horn 1983, Worthy 2004). Fluvial deposits are minor sources (Worthy & Holdaway 2002). As a result of these diverse sources and of the combination of taphonomic processes generating the faunas (pitfall, swamp-miring, and predation), most components of the vertebrate faunas are fairly well sampled, allowing comment on distribution and relative frequency of species over the last 50,000 years (Worthy & Holdaway 2002). One area that was not favoured with a diverse range of taphonomic processes contributing to the available faunas is the West Coast of the South Island. There fossil avifaunas were derived mainly from limestone caves, so the distribution of limestone dictates the geographical source of faunas. In the northern part of the West Coast, the rich and multiple fossil sites in Honeycomb Hill Cave System have yielded large faunas of Holocene and Late Glacial Maximum (LGM) ages, but only one deposit known as the Graveyard has more than a single fossiliferous layer, but it
-
Upload
independent -
Category
Documents
-
view
3 -
download
0
Transcript of A late Pleistocene predator-accumulated avifauna from Kids Cave, West Coast, South Island, New...

.
ISBN 0 9757894 5 7/2006/20 $3.00 ©AAP
A late Pleistocene predator-accumulated avifauna fromKids Cave, West Coast, South Island, New ZealandTREVOR H. WORTHY and J.X. ZHAO
WORTHY, T.H. & ZHAO, J.X., 2006. A late Pleistocene predator-accumulated avifaunafrom Kids Cave, West Coast, South Island, New Zealand. Alcheringa Special Issue 1,389-408. ISBN 0 9757894 5 7.
A fossil deposit excavated from the floor of Kids Cave, West Coast, South Island, NewZealand, is interpreted as having been primarily accumulated by New Zealand falconFalco novaeseelandiae, with some contribution by Haast’s eagle Harpagornis moorei.The fauna is rich: 3699 bones represented 41 bird species, two frog species, unspecifiedgeckoes and skinks, and one bat species. Fossil deposition was mainly within the LastGlacial Maximum from about 22,000 cal yr bp to about 15,000 cal yr bp, with a markedchange in sediment characteristics at the onset of the LGM’s coldest period. Chronologicalcontrol is given by three Uranium-series dates for a speleothem and radiocarbon AMSdating of four avian eggshell samples and one bone. The fauna is the first extensivepredator accumulation of LGM age described from the West Coast of the South Island,and it indicates a palaeoenvironment of a mosaic of shrublands with forest patches. Theonset of the coldest part of the LGM (Aurora 3 glacial advance, 19,500 - 19,000 cal yrsbp) saw marked climate cooling/drying affecting the site, but the avifauna indicates thatalthough open-country taxa became more common in this period, some forest persistednearby throughout the remainder of the LGM.
Trevor H. Worthy [[email protected]], Darling Building, DP 418,Department of Earth and Environmental Sciences, University of Adelaide, North Terrace,Adelaide, SA 5005 & Jian-xin Zhao [[email protected]], Radiogenic Isotope LaboratoryCentre for Microscopy and Microanalysis, University of Queensland, Qld 4072; submitted7.7.2005, accepted 21.8.2006.
Key words: Late Pleistocene, Late Glacial Maximum, raptor-accumulated avifauna,palaeoenvironment, Kids Cave, West Coast, South Island.
QUATERNARY terrestrial vertebrate faunas ofNew Zealand are now well known, resulting from160 years of collections since the first moa bonescame to Richard Owen’s attention in England in1843, and the following modern regional studies(e.g. Worthy & Holdaway 1993, 1994a, 1995,1996a, 2000; Worthy 1997, 1998a, b; Worthy etal. 2002a, 2002b). Fossils are derived mainly fromdunes, swamps and caves, though there is asingle significant lacustrine deposit (Horn 1983,Worthy 2004). Fluvial deposits are minor sources(Worthy & Holdaway 2002). As a result of thesediverse sources and of the combination oftaphonomic processes generating the faunas(pitfall, swamp-miring, and predation), most
components of the vertebrate faunas are fairlywell sampled, allowing comment on distributionand relative frequency of species over the last50,000 years (Worthy & Holdaway 2002).
One area that was not favoured with a diverserange of taphonomic processes contributing tothe available faunas is the West Coast of theSouth Island. There fossil avifaunas were derivedmainly from limestone caves, so the distributionof limestone dictates the geographical source offaunas. In the northern part of the West Coast,the rich and multiple fossil sites in HoneycombHill Cave System have yielded large faunas ofHolocene and Late Glacial Maximum (LGM) ages,but only one deposit known as the Graveyardhas more than a single fossiliferous layer, but it
ALCHERINGA390 WORTHY & ZHAO
has few micro-vertebrates (Worthy 1993, Worthy& Mildenhall 1989). No predator-accumulatedsites were identified in this system during thoseinvestigations: none had been recognised inNew Zealand by that time. Recently, a smallpredator-derived site was located in HoneycombHill Cave (THW pers. observ.)
In the first of a series of regional studies oflate Quaternary avifaunas, Worthy & Holdaway(1993) described the late Pleistocene andHolocene terrestrial vertebrate faunas found incaves in the Barrytown Syncline betweenPunakaiki and Charleston on the West Coast.These revealed faunal turnover from thePleistocene to the Holocene. The Pleistoceneglacial fauna was represented mainly by moa taxa[Euryapteryx gravis (Owen, 1870), Pachyorniselephantopus (Owen, 1856), Megalapteryxdidinus (Owen, 1883), and Dinornis Owen, 1843]with South Island goose Cnemiornis calcitransOwen, 1865 and Finsch’s duck Chenonettafinschi (Van Beneden, 1875) present exclusivelyin late Pleistocene deposits. A small and diversefauna from Hermits Cave, of LGM age, becamethe first recognised predator deposit from NewZealand, and was attributed to the laughing owlSceloglaux albifacies (Gray, 1844) (Worthy &Holdaway 1993, 1994b). Whereas many smallfaunas of Holocene age were described, nonewas a large diverse assemblage rich in small taxa,such as have been found more recently elsewhere(Worthy & Holdaway 1994a, 1996a; Worthy 1997,1998a); stratified sites, such as are known fromTe Waka (Worthy et al. 2002a), Zweiholen Cave(Worthy & Swabey 2002), or Takaka Fossil Cave(Worthy & Roscoe 2003), are to date also lackingfrom this part of the West Coast.
More recently, a further rich and diversepredator-accumulated site was located on theGouland Downs and attributed to laughing owls(Worthy 2001); however, this site is from anupland environment, about 600 m altitude withbeech forest and grasslands, so is notcomparable to the lowland sites near Punakaiki.It is not stratified and is undated.
Kids Cave is a small cave in the limestonecliffs on the true right of Makirikiri Stream, a
tributary of the Nile River, near Charleston, onthe West Coast. It is located at the map sheet/grid reference K30/840163 on the metric 1:50,000NZMS 260 series maps. It was first recognised asa fossil site by Worthy & Holdaway (1993), wholisted a small fauna in the Canterbury Museum fromsurface deposits and allocated the GeologicalSociety of New Zealand Fossil Record NumberK30/f90 to the site. Recently a review of NewZealand fossil sites led us to believe that a predatorcould have been active in the cave, so when theopportunity presented itself the cave was examinedfor fossil deposits, and particularly to see if astratified predator accumulation was present.
MethodsThe cave was first investigated for its fossilpotential on 17 April 2003 by T.H. Worthy andothers when a test excavation 20 by 20 cm inarea was made, revealing bones were abundantto a depth of 30 cm. Over 6-9 April 2004, twosquare metres were excavated in the cave in fourpits 1.0 x 0.5 m in area and the cave mapped (Fig.
Fig 1. Plan of Kids Cave showing location ofexcavations.

ALCHERINGA 391LATE PLEISTOCENE AVIFAUNA FROM NEW ZEALAND
1). The fossiliferous horizons were excavated byhand using trowels in 50 mm spits parallel to thesurface until the basal fluvial sediments werereached. The spits were then associated intounits or layers with reference to the sedimentstructure and characters visible in the sections.Sediment from each spit was transported to thenearby stream and sieved by gentle agitation on3-4 mm mesh. The resultant concentrate wasbagged and taken back to the laboratory for arewash on 1 mm sieves, and then dried andsorted. Sorting was by hand, with a small amountof material spread on a tray at a time such that allobjects were separated from all others beforesearching for bones.
Bones were identified and catalogued into theMuseum of New Zealand Te Papa TongarewaFossil Vertebrate Collection by THW in lotsseparated by species, excavation unit and depth,within the catalogue range MNZ S42996 – 43673.The identity of Puffinus Brisson, 1760 species inthe P. spelaeus Holdaway & Worthy, 1994 - P.gavia Forster, 1844 - P. huttoni Mathews, 1912complex is problematic. On average these taxaincrease in size in the given order and, while thereare some proportional differences (Holdaway &Worthy 1994), there is wide overlap in size rangesof elements. The identity of the fossil Puffinusfrom Kids Cave is assessed below.
The nomenclature of avian species followsTurbott (1990) as modified by Holdaway &Worthy (1994), Holdaway et al. (2001), Worthy& Olson (2002) and Worthy et al. (2002b); thatfor frogs, Worthy (1987); and for mammals, King(1990).
Radiocarbon DatingFour radiocarbon dates were obtained oneggshell and one on a Puffinus bone. Sampleswere prepared for dating by the RadiocarbonDating Laboratory, The University of Waikato,Hamilton, and the AMS measurements made byThe Rafter Laboratory, Institute of Geologicaland Nuclear Sciences, Lower Hutt. The eggshellsamples were ultrasonically cleaned to removedetritus from the exterior. A fresh-looking piecewas selected, acid etched in 2M HCl for 150
seconds, rinsed and dried, before dating. Thebone was first cleaned and visible contaminantsremoved before being ground. Chemical pre-treatment was as follows: It was decalcified in2% HCl, rinsed and dried, then gelatinised atpH=3 with HCl at 90°C for 4 hours, and rinsedand dried. The bone collagen has a C/N ratio of3.34, indicating it was well preserved. The ä13Cvalue of -12.42 is as expected for a marine bird,and the result was calibrated with a 100% marinecalibration.
Uranium series datingThe 108 mm tall stalagmite from excavation Bwas chosen for Uranium series dating as it had avery clean crystal structure. Half is preserved asMNZ S43408.Three samples were chosen, oneat the base, one just above the base, and one atthe tip, in order to determine the period of timeover which the stalagmite grew. Analysis wasundertaken on a thermal ionisation massspectrometer at ACQUIRE (Radiogenic IsotopeLaboratory Centre for Microscopy andMicroanalysis), University of Queensland,Brisbane, Australia, following a procedure similarto that described in Zhao et al. (2001), except inthe present new procedure a 233U-236U doublespike was used for mass fractionation correctionfor U isotopic measurement.
AbbreviationsMNI, minimum number of individuals, determinedfrom the most frequently occurring element(maximum of left or right side only, if relevant); NISP,number of individual specimens; MNZ, Museumof New Zealand Te Papa Tongarewa.
Skeletal elements: Hum, humerus; cmc,carpometacarpus; fem, femur; tib AL, tibiotarsuslength from proximal articular surface; tmt,tarsometatarsus. L, left; R, right. Where p or dprecedes L or R, it refers to a proximal or distal partrespectively.
ResultsStratigraphy
Kids Cave consists of a short section (about

ALCHERINGA392 WORTHY & ZHAO
40 m) of cave passage, formed by a stream,looping between two entrances in the limestonecliff of the valley side some 10 m above the presentvalley floor (Fig. 1). There is a series of passagesentering the cliff above the cave described herethat represents an older cave development. Themain passage (Fig. 1) is about 5 m wide and goesto a chamber about 10 by 10 m some 15-20 m intothe cave depending on the entrance used. Fromthis chamber a vertical drop leads to a lowerchamber that was not explored for theseinvestigations. The main cave passage waspartially infilled with fluvial sediments in the pastand probably contemporaneous fluvialsediments are seen in notches in the nearby cliffat a similar maximum height above the valley floor.Before total abandonment of the stream from thecave, some of these sediments were removed,leaving rounded banks of sediment rising toabout 1 m above the excavation sites A-C alongthe north wall of the passage. Since that time,further sediments have been eroded from thechamber area by water flows emanating from anephemeral inlet 7 m beyond Square D, which
drained out an exit in the northwest side of thechamber.
The fossil deposits extend from the main(southern) entrance into the cave partially infillingthe remnants of the stream channel incised in theprimary fluvial sediment infill. There is littleevidence that they have been transported to orwithin the site by water flows. The sediments arenot laminated as typically seen in water-laidsediments; there was no observed alignment ofspecimens, nor is there any abrasion typical ofwater-transported bones. Doubtless, there hasbeen some movement down-slope due to gravitybut water transport was rare. Possibly in extremerain events, percolation water through roof cracksand via speleothems may have generatedsufficient flows to transport bones, but suchwater flows were probably restricted to surfacesheets.
Since the fossiliferous deposits were laiddown, drip erosion has created a significantdepression at the main entrance and large slabsof limestone, several metres square, have spalledfrom the roof.
Fig 2. Stratigraphy of Excavation C showing Layers 1-4. The location of samples are shown from which radiocarbonsamples (Wk xxxxx) and their associated calibrated dates were obtained. The stratigraphic position of the stalagmitefrom excavation B is also shown – its height is increased in this figure to portray the stratigraphic relationships it hadwhen in situ in excavation B where the stratigraphy was more compressed.

ALCHERINGA 393LATE PLEISTOCENE AVIFAUNA FROM NEW ZEALAND
The excavations A, B and C, located 1 mapart as shown in Fig. 1, revealed a stratigraphyof layers that shallowed rapidly with distancefrom the entrance. Excavation C, closest to andabout 7-9 m from the entrance drip-line, had threefossiliferous layers (Fig. 2). Layer 1 (L1) was asurface crust of sediment and stones partiallyconcreted together with microcrystalline calcitethat ranged 0-25 mm deep. A few calcite-encrusted bones lay on the surface. Layer 2 (L2),extending to about 300 mm depth, comprisedunconsolidated grey silts with abundant angularlimestone fragments. Bones were abundant andeggshell was especially abundant in the lowerpart of the layer. There were no speleothemfragments. Layer 2 graded over about 20-30 mminto Layer 3 (L3), which then extended to 470-500 mm depth. The sediment was red-brown andmore consolidated (held a flat vertical excavationface) than in L2. It had few limestone clasts andabundant speleothem fragments, particularly ofstraw stalactites, with some in situ stalagmites.Layer 4 (L4), beginning at a sharp boundary withL3 had a horizontal upper surface and comprisedlaminated fluvial sediments of silts and sandswith ferruginous clasts up to 1 cm in diameter.While the occasional bone was worked into itsupper surface, bones were absent from this layer.
Excavation A, 1 m further into the cave thanexcavation C, had the boundary of L2 and L3 atabout 200 mm depth, and the base of L3 at 280mm.
Excavation B, a further metre from excavationA, had the L1-L2 boundary at just 160-165 mmdepth at the cave wall, and the L3-L4 boundaryat 200 mm depth.
Excavation D, was located about 15 m fromthe entrance, 4 m further into the cave thanexcavation B. L1 was 40 mm of consolidatedreddish loam impregnated with softmicrocrystalline calcite, and L2 extended to 100mm depth as a yellowish-red loam rich in fossilswith a very few limestone clasts. L3 was similarsediment with no limestone clasts and few bonesthat extended to 200 mm depth. The laminatedfluvial sediments of L4 commenced at 200 mmdepth.
In the excavations, L3 had abundantevidence of speleothem growth in the form offragments of straw stalactites found at all depthsand several in situ stalagmites. In the deeperstratigraphy of excavation C, several smallstalagmites were found in growth positions withtheir bases at varying heights above the L3-L4boundary. The largest of these had its base at400 mm depth, indicating that its growth beganmid way through the deposition of L3. A sectionof this stalagmite showed growth lamellae thatwere more or less parallel to the flat top, did notextend down the sides, and incorporated muchsediment in their crystal matrices, suggestingthat it grew at the sediment surface. Thereforespeleothem deposition was coeval with sedimentdeposition of L3. In the compressed stratigraphyof excavation B, a 108 mm tall stalagmite begangrowing on top of the fluvial sediments of L4and its top reached the L3 – L2 boundary. Itsconical form and clean crystalline structureindicate that it largely protruded from thesediment for most of its growth; however, itsupper approximate 3 cm accreted layersincorporating sediment that thicken towards thetip, surrounding the older conical tip of cleancrystal, indicating the stalagmite was in theprocess of being buried by sediment in this finalgrowth stage.
The area of floor between the southernentrance and the floor just past excavation Destimated to contain fossil deposits is about 20-25 m2. A few bones were located in the mud ofthe wet area in the chamber. Several bones of asmall shearwater were found on the slope abovethe chamber leading to the northern entranceand therefore are not part of the main fossildeposit and resulted from individual deaths ofbirds on the cave floor near that point.
Radiocarbon DatingRadiocarbon dating was based mainly on materialfrom excavation C, where the deeper stratigraphyallowed better resolution of the layers (Table 1).Wk14806 from Square B provides a maximum agefor the surface of the deposit and indicates thatdeposition of L2 continued at least to 13,852±122

ALCHERINGA394 WORTHY & ZHAO
C14 yrs BP (16,900-16,300 cal yrs bp). Wk14808was selected from eggshell in the spit 200-250mm and so provides a date for the lower part ofL2 of 14,584±98 C14 yrs BP (17,750-17150 cal yrsbp) at which level a Cnemiornis ulna was located.The boundary of L2-L3 is at 300 mm. Wk14807was from -370 mm depth, or 70 mm below the L2-L3 boundary and 100 mm above the boundarywith the fluvial sediments of L4 at -470 mm (Fig.2). It had an age of 16,859±118 C14 yrs BP (20,400-19,700 cal yrs bp). Wk16780 was a piece ofeggshell from the spit 400-450 mm below thesurface in excavation C, and had a radiocarbonage of 16,414±109 C14 yrs BP (19,850-19,300 calyrs bp). Wk16781 was a part of a humerus of
Puffinus gavia/huttoni from 410 mm depth inexcavation C, and had a radiocarbon age of18,630±135 C14 yrs BP (22,150-21,150 cal yrs bp).
Uranium Series datingThe results of the Uranium-series ages are givenin Table 2. The uncorrected age was calculatedassuming there was no non-radiogenic 230Th,whereas the corrected age, assumed a non-radiogenic 230Th/232Th (230Thnr/
232Th) activityratio of 0.8251 ±50% (or Th/U = 3.8 ±1.9), whichis the average upper crustal value (representativeof clays). As the samples contain very low U,especially in the basal part, the non-radiogenic230Th has a significant contribution to the total
Table 1. Radiocarbon dating results from samples for Kids Cave. The laboratory number is for the RadiocarbonLaboratory, University of Waikato; NZA No. is for the Accelerator Mass Spectrometry analysis at Rafter Laboratory,IGNS; Cal age is calendar age. Errors are quoted at 1standard deviation. Specimen depths are depths below surface.
Table 2. Uranium series ages for samples from a stalagmite buried in Layer 3 in excavation B, Kids Cave, halfpreserved as MNZ S43408. Note: Ratios in parentheses are activity ratios calculated from the atomic ratios. Errorsare at 2 standard deviations to the last significant digits. Corr. and uncorr. denote corrected and uncorrected. Thecorrected 230Th ages and initial (234U/238U) ratios include a small correction for non-radiogenic 234U and 230Th usingaverage crustal 232Th/238U atomic ratio of 3.8±1.9 (230Th, 234U and 238U are assumed to be in secular equilibrium).
22
Table 1: Radiocarbon dating results from samples for Kids Cave. The laboratory number is for the Radiocarbon Laboratory, University of Waikato; NZA No. is for the Accelerator Mass Spectrometry analysis at Rafter Laboratory, IGNS; Cal age is calendar age. Errors are quoted at 1standard deviation. Specimen depths are depths below surface. LabNumber
NZA No.
Taxon Material Radiocarbon age
Cal age 95.4% yr BP
Cal age 68.2% yr BP
13C Provenance Square and depth
WK14806 20119 Bird Eggshell, 1.08 mm
13852±122 17150-16050
16900-16300 -14.4 Sq B, 45 mm
WK14808 20120 M. didinus Eggshell 14584±98 18050-16850
17750-17150 -11.7 Sq C, 200-250 mm
WK14807 20514 Bird Eggshell, 0.84 mm thick
16859±118 20750-19350
20400-19700 -15.9 Sq C, 370 mm
WK16780 22429 Bird 1 piece thin white eggshell
16414±109 19850-19300
19790-19680 (20.2%), 19590-19420 (48%)
-13.9 THWKIDS/4. Sq C, -400–450 mm, ex MNZ S43004.
WK16781 22430 Puffinus gavia/huttoni
part left humerus MNZ S43566
18630±135 22150-21150
22000-21450 -12.6 THWKIDS/5.Sq C, 410 mm
Table 2. Uranium series ages for samples from a stalagmite buried in Layer 3 in excavation B, Kids Cave, half preserved as MNZ S43408.
Name Level (mm)
U(ppm)
232Th(ppb)
(230Th/232Th)
(234U/238U)
(230Th/238U)
uncorr. 230Th Age
(ka)
corr.230Th
Age (ka)
Initial (234U/238U)
TW-tip 0-7 0.0700 3.747 19.23 1.3380 4 0.3391 04 31.4 0.4 30.2 0.7 1.374 05TW-B2 82-88 0.0069 0.860 15.62 1.5091 7 0.6409 08 58.1 0.8 55.7 1.2 1.527 12TW-base 94-102 0.0071 2.410 6.69 1.4926 3 0.7509 14 72.7 1.9 66.2 3.1 1.655 31
Note: Ratios in parentheses are activity ratios calculated from the atomic ratios. Errors are at 2 standard deviations to the last significant digits. Corr. and uncorr. denote corrected and uncorrected. The corrected 230Th ages and initial (234U/238U) ratios include a small correction for non-radiogenic 234U and 230Th using average crustal 232Th/238U atomic ratio of 3.8±1.9 (230Th, 234U and 238U are assumed to be in secular equilibrium).

ALCHERINGA 395LATE PLEISTOCENE AVIFAUNA FROM NEW ZEALAND
Table 3. Summary statistics for lengths (mm) of long bones of Puffinus sp. from Kids Cave after small outliers referredto P. spelaeus were removed from the sample following the parameters determined in Figure 3.
Table 4. Summary statistics for lengths (mm) from Puffinus huttoni from the following specimens: THW colln exKaikoura Mountains, MNZ 528S, 834S, 13322, 13323, 13324, 13325, 13603, 16062, 16196, 16197, 21463, 24070,24147.
Table 5. Summary statistics for lengths (mm) from Puffinus gavia from the following specimens: THW colln fromTokerau Beach, MNZ 526, 527S, 620S, 785S, 833S, 890, 784S, 12663, 12664, 12666, 13315, 13606, 15923, 15940,16086, 16194, 16195, 17201, 17253, 17254, 17257, 17335, 21462, 23897, 24285a.
Table 6. Summary statistics for lengths (mm) from Puffinus spelaeus from Te Ana Titi after Holdaway & Worthy(1994).
23
Table 3. Summary statistics for lengths (mm) of long bones of Puffinus sp. from Kids Cave after small outliers referred to P. spelaeus were removed from the sample following the parameters determined in Figure 3.
Kids cave Hum Ulna Cmc Fem Tib AL Tmt Cor MLMean 75.5 65.4 39.7 30.7 62.1 42.3 28.4Standard Error 0.34 0.37 0.20 0.15 0.41 0.20 0.19Standard Deviation 1.57 1.63 0.79 0.73 2.02 1.15 0.79Minimum 72.4 63.0 38.8 29.4 59.2 40.1 27.1Maximum 79.0 70.0 41.2 32.4 67.3 44.2 30.3Count 22 20 15 23 24 32 18
Table 4. Summary statistics for lengths (mm) from Puffinus huttoni from the following specimens: THW colln ex Kaikoura Mountains, MNZ 528S, 834S, 13322, 13323, 13324, 13325, 13603, 16062, 16196, 16197, 21463, 24070, 24147.
huttoni Hum Ulna Cmc Fem Tib AL Tmt Mean 76.4 69.0 41.2 30.0 61.3 43.7Standard Error 0.50 0.40 0.28 0.27 0.57 0.31Standard Deviation 1.86 1.51 1.07 1.01 2.12 1.16Minimum 73.1 67.0 39.0 28.2 57.3 41.4Maximum 79.4 72.1 42.6 31.8 65.1 45.6Count 14 14 14 14 14 14
Table 5. Summary statistics for lengths (mm) from Puffinus gavia from the following specimens: THW colln from Tokerau Beach, MNZ 526, 527S, 620S, 785S, 833S, 890, 784S, 12663, 12664, 12666, 13315, 13606, 15923, 15940, 16086, 16194, 16195, 17201, 17253, 17254, 17257, 17335, 21462, 23897, 24285a.
gavia Hum Ulna Cmc Fem Tib AL TmtL Mean 72.2 63.3 38.5 29.1 60.6 43.1Standard Error 0.35 0.27 0.20 0.25 0.46 0.90Standard Deviation 1.77 1.36 1.00 1.25 2.29 4.49Minimum 67.5 59.9 35.8 26.3 55.1 39.6Maximum 75.3 65.8 40.2 31.6 65.0 63.6Count 26 25 25 26 25 25
24
Table 6. Summary statistics for lengths (mm) from Puffinus spelaeus from Te Ana Titi after Holdaway and Worthy (1994). spelaeus Hum Ulna Cmc Fem Tib AL Tmt Mean 69.2 60.2 35.8 27.7 57 38.4Standard Error 0.24 0.28 0.25 0.17 0.42 0.27Minimum 66.9 57.7 33.7 26.5 52 35.6Maximum 71.4 63.1 39 28.9 58.9 40.5Count 25 28 25 17 17 22
Table 7. t-test statistics, two-sample assuming unequal variances, for comparisons of P. gaviaand P. huttoni with Kids Cave Puffinus for selected elements.
P. gavia – Kids Puffinus P. huttoni – Kids PuffinusHumerus -6.80067, df = 46, P < 0.001 2.13638, df = 31, P = 0.041 Ulna -4.64076, df = 37, P < 0.001 6.68291, df = 33, P < 0.001 Carpometacarpus -4.20084, df = 35, P < 0.001 4.71590, df = 30, P < 0.001 Femur -5.41412, df = 41, P < 0.001 -0.9050, df = 29, P = 0.373 Tibiotarsus -2.42887, df = 47, P = 0.019 -0.26315, df = 31, P = 0.794 Tarsometatarsus 0.902446, df = 26, P = 0.375 3.92504, df = 25, P < 0.001
ALCHERINGA396 WORTHY & ZHAO
230Th in the sample, and must be corrected for.Because 230Thnr/
232Th activity ratio in thesamples is unknown, the assumption results inlarge uncertainties in the calculated age. Theaverage upper crustal value representative ofminute clays incorporated into speleothemgrowth layers is generally assumed for thecorrection, which is often the case. However,the likelihood for an elevated 230Thnr/
232Thactivity ratio in New Zealand caves cannot bedisregarded. The 230Thnr/
232Th activity ratio mustbe less than 5, because if 230Thnr/
232Th = 5, thecorrected ages for the tip and base would bethe same (24.1 and 24.3 ka, respectively, and if
230Thnr/232Th > 5, the corrected tip and base ages
would be reversed. This suggests that the tip ofthe stalagmite must be older than 24 ka, but ismore likely to be close to 30 ka, in which case,the growth rate of the stalagmite is relativelysmoother and the assumption for 230Thnr/
232Th ismore reasonable.
The large crystals in the stalagmite indicateslow growth, which is supported by the datesindicating growth of just 108 mm in 36,000 years.The stalagmite continued to grow for a whileafter the dated section of the tip (TW tip) asindicated by the last accreted layers thatupwardly thickened and incorporated sediment.
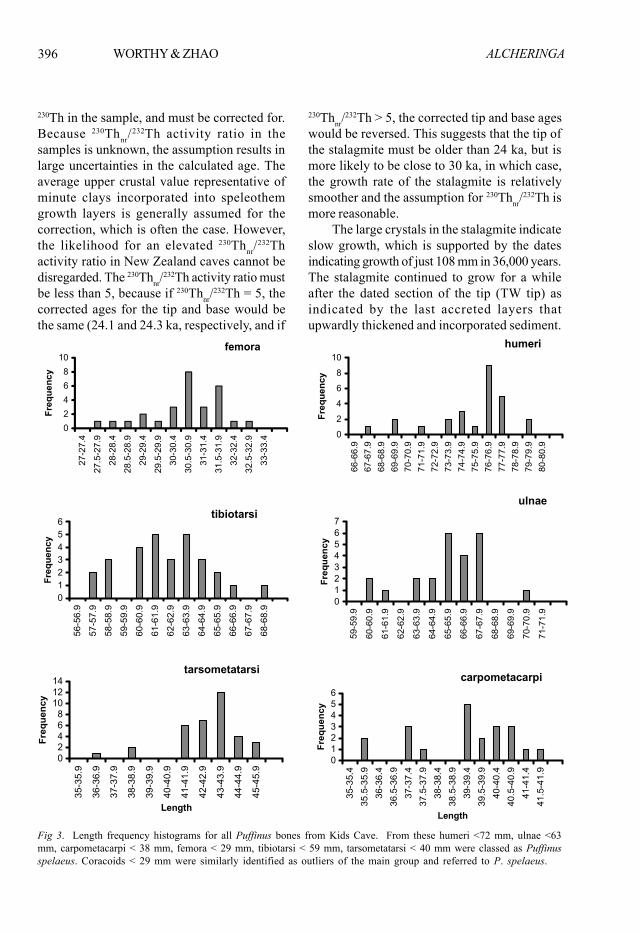
Fig 3. Length frequency histograms for all Puffinus bones from Kids Cave. From these humeri <72 mm, ulnae <63mm, carpometacarpi < 38 mm, femora < 29 mm, tibiotarsi < 59 mm, tarsometatarsi < 40 mm were classed as Puffinusspelaeus. Coracoids < 29 mm were similarly identified as outliers of the main group and referred to P. spelaeus.
31
Figure 3.
femora
0246810
27-27.4
27.5-27.9
28-28.4
28.5-28.9
29-29.4
29.5-29.9
30-30.4
30.5-30.9
31-31.4
31.5-31.9
32-32.4
32.5-32.9
33-33.4
Frequency
humeri
0
2
4
6
8
1066-66.9
67-67.9
68-68.9
69-69.9
70-70.9
71-71.9
72-72.9
73-73.9
74-74.9
75-75.9
76-76.9
77-77.9
78-78.9
79-79.9
80-80.9
Frequency
ulnae
01234567
59-59.9
60-60.9
61-61.9
62-62.9
63-63.9
64-64.9
65-65.9
66-66.9
67-67.9
68-68.9
69-69.9
70-70.9
71-71.9
Frequency
carpometacarpi
0123456
35-35.4
35.5-35.9
36-36.4
36.5-36.9
37-37.4
37.5-37.9
38-38.4
38.5-38.9
39-39.4
39.5-39.9
40-40.4
40.5-40.9
41-41.4
41.5-41.9
Length
Frequency
tibiotarsi
0123456
56-56.9
57-57.9
58-58.9
59-59.9
60-60.9
61-61.9
62-62.9
63-63.9
64-64.9
65-65.9
66-66.9
67-67.9
68-68.9
Frequency
tarsometatarsi
02468101214
35-35.9
36-36.9
37-37.9
38-38.9
39-39.9
40-40.9
41-41.9
42-42.9
43-43.9
44-44.9
45-45.9
Length
Frequency

ALCHERINGA 397LATE PLEISTOCENE AVIFAUNA FROM NEW ZEALAND
The duration of growth in this section isunknown, however, because the growth at thetip would usually have been at a much slowerrate. The dates indicate that the stalagmitegrowth was initiated about 66,000 years ago andceased after 30,000 years ago, possibly becausesedimentation overtook the stalagmite growth.As the top of the stalagmite was at the L3-L2boundary, L3 potentially spans from 66,000 yearsago to some time after 30,000 years BP.
Identity of the Puffinus speciesThe Puffinus bones from Kids Cave belong tothe P. gavia/huttoni/spelaeus superspeciescomplex. A plot of length distributions indicatesa few specimens are small outliers of the maingroup (Fig. 3). These were found mostly on thesurface or in spit 1, with just four from depths50-100 mm and one from 100-150 mm and includesome from outside the area of the predatordeposit, are within the size range of topotypicalPuffinus spelaeus, and so are referred to thattaxon (Fig. 3). Summary statistics of the remainingPuffinus bones are given in Table 3, with similardata for Puffinus huttoni, P. gavia, and P.spelaeus in Tables 4-6. Mean measurements forbones of P. gavia are significantly smaller, withthe exception of tarsometatarsi, and those of P.huttoni significantly larger in all elements exceptfor femora and tibiotarsi (Table 7) than the fossilsfrom Kids Cave, although clearly there is overlapin length of the fossils with both taxa. The datado not allow referral of the Kids Cave Puffinusto one or other taxon, so hereafter they arereferred to as P. gavia/huttoni.
Vertebrate diversity
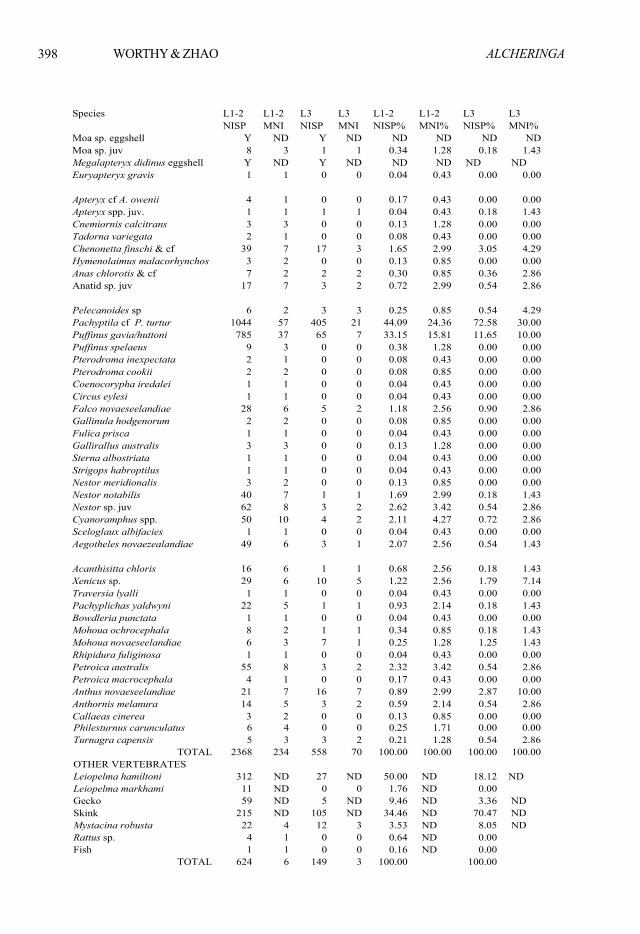
The vertebrate fauna from Kids Cave is rich anddiverse (Table 8, Appendix 1). A total of 3699bones was identified to taxon (41 spp. birds, 2frog sp, unspecified geckoes, unspecified skinks,1 bat sp., 1 rat sp., and a fish), and could beascribed to particular layers from the 2 squaremetres of excavation and the test pit. Only a fewfrom the initial testpit from the depth range 100-250 mm could not be used in the analyses as thisrange overlapped two layers. Data from L1 andL2 were combined as L1 is a surface crust intowhich bones from L2 protrude. As such, L1contains specimens that were deposited betweenthe present time and the end of the main periodof L2 deposition. The rat bones observed on thesurface of excavation C are expected, and notnecessarily contemporary with adjacentshearwater bones.
Excavations of L1 and L2 contained 2368 birdbones and 624 bones of other vertebrates. Fortyspecies of birds are represented by bones and atleast one further species of moa is representedby eggshell. Skink bones comprise about 34.5%of the non-avian fauna, with geckoes only 9.5%.The smaller frog, Leiopelma hamiltoniMcCulloch, 1919, accounts for 50% of the non-avian fauna NISP. Among the birds, seabirdsdominate the fauna with about 78% of NISP or43% of MNI. Species of Nestor Lesson, 1830account for 4.44 % NISP and 7.26% MNI, withjuveniles about 3.4% of birds. ParakeetsCyanoramphus Bonaparte, 1854 are 2.11% NISPand 4.27% MNI. Moas are represented only byjuvenile bones. There are 14 species of passerines(8.1% NISP) but these small taxa constitute 23.5%MNI. There are a few big birds other than juvenilemoa and seabirds: one adult and one or two
Table 7. t-test statistics, two-sample assuming unequal variances, for comparisons of pp. gavia and pp. huttoni withKids Cave Puffinus for selected elements.
24
Table 6. Summary statistics for lengths (mm) from Puffinus spelaeus from Te Ana Titi after Holdaway and Worthy (1994). spelaeus Hum Ulna Cmc Fem Tib AL Tmt Mean 69.2 60.2 35.8 27.7 57 38.4Standard Error 0.24 0.28 0.25 0.17 0.42 0.27Minimum 66.9 57.7 33.7 26.5 52 35.6Maximum 71.4 63.1 39 28.9 58.9 40.5Count 25 28 25 17 17 22
Table 7. t-test statistics, two-sample assuming unequal variances, for comparisons of P. gaviaand P. huttoni with Kids Cave Puffinus for selected elements.
P. gavia – Kids Puffinus P. huttoni – Kids PuffinusHumerus -6.80067, df = 46, P < 0.001 2.13638, df = 31, P = 0.041 Ulna -4.64076, df = 37, P < 0.001 6.68291, df = 33, P < 0.001 Carpometacarpus -4.20084, df = 35, P < 0.001 4.71590, df = 30, P < 0.001 Femur -5.41412, df = 41, P < 0.001 -0.9050, df = 29, P = 0.373 Tibiotarsus -2.42887, df = 47, P = 0.019 -0.26315, df = 31, P = 0.794 Tarsometatarsus 0.902446, df = 26, P = 0.375 3.92504, df = 25, P < 0.001
ALCHERINGA398 WORTHY & ZHAO
25
Table 8. Summary table of vertebrate fauna from Kids Cave by Layers (L1-2, Layer 1 and 2; L3 Layer 3). ND is not determined. Y is taxon present but does not contribute to MNI.
Species L1-2 L1-2 L3 L3 L1-2 L1-2 L3 L3 NISP MNI NISP MNI NISP% MNI% NISP% MNI%Moa sp. eggshell Y ND Y ND ND ND ND NDMoa sp. juv 8 3 1 1 0.34 1.28 0.18 1.43Megalapteryx didinus eggshell Y ND Y ND ND ND ND ND Euryapteryx gravis 1 1 0 0 0.04 0.43 0.00 0.00
Apteryx cf A. owenii 4 1 0 0 0.17 0.43 0.00 0.00Apteryx spp. juv. 1 1 1 1 0.04 0.43 0.18 1.43Cnemiornis calcitrans 3 3 0 0 0.13 1.28 0.00 0.00Tadorna variegata 2 1 0 0 0.08 0.43 0.00 0.00Chenonetta finschi & cf 39 7 17 3 1.65 2.99 3.05 4.29Hymenolaimus malacorhynchos 3 2 0 0 0.13 0.85 0.00 0.00Anas chlorotis & cf 7 2 2 2 0.30 0.85 0.36 2.86Anatid sp. juv 17 7 3 2 0.72 2.99 0.54 2.86
Pelecanoides sp 6 2 3 3 0.25 0.85 0.54 4.29Pachyptila cf P. turtur 1044 57 405 21 44.09 24.36 72.58 30.00Puffinus gavia/huttoni 785 37 65 7 33.15 15.81 11.65 10.00Puffinus spelaeus 9 3 0 0 0.38 1.28 0.00 0.00Pterodroma inexpectata 2 1 0 0 0.08 0.43 0.00 0.00Pterodroma cookii 2 2 0 0 0.08 0.85 0.00 0.00Coenocorypha iredalei 1 1 0 0 0.04 0.43 0.00 0.00Circus eylesi 1 1 0 0 0.04 0.43 0.00 0.00Falco novaeseelandiae 28 6 5 2 1.18 2.56 0.90 2.86Gallinula hodgenorum 2 2 0 0 0.08 0.85 0.00 0.00Fulica prisca 1 1 0 0 0.04 0.43 0.00 0.00Gallirallus australis 3 3 0 0 0.13 1.28 0.00 0.00Sterna albostriata 1 1 0 0 0.04 0.43 0.00 0.00Strigops habroptilus 1 1 0 0 0.04 0.43 0.00 0.00Nestor meridionalis 3 2 0 0 0.13 0.85 0.00 0.00Nestor notabilis 40 7 1 1 1.69 2.99 0.18 1.43Nestor sp. juv 62 8 3 2 2.62 3.42 0.54 2.86Cyanoramphus spp. 50 10 4 2 2.11 4.27 0.72 2.86Sceloglaux albifacies 1 1 0 0 0.04 0.43 0.00 0.00Aegotheles novaezealandiae 49 6 3 1 2.07 2.56 0.54 1.43
Acanthisitta chloris 16 6 1 1 0.68 2.56 0.18 1.43Xenicus sp. 29 6 10 5 1.22 2.56 1.79 7.14Traversia lyalli 1 1 0 0 0.04 0.43 0.00 0.00Pachyplichas yaldwyni 22 5 1 1 0.93 2.14 0.18 1.43Bowdleria punctata 1 1 0 0 0.04 0.43 0.00 0.00Mohoua ochrocephala 8 2 1 1 0.34 0.85 0.18 1.43Mohoua novaeseelandiae 6 3 7 1 0.25 1.28 1.25 1.43Rhipidura fuliginosa 1 1 0 0 0.04 0.43 0.00 0.00Petroica australis 55 8 3 2 2.32 3.42 0.54 2.86Petroica macrocephala 4 1 0 0 0.17 0.43 0.00 0.00Anthus novaeseelandiae 21 7 16 7 0.89 2.99 2.87 10.00Anthornis melanura 14 5 3 2 0.59 2.14 0.54 2.86Callaeas cinerea 3 2 0 0 0.13 0.85 0.00 0.00
26
Philesturnus carunculatus 6 4 0 0 0.25 1.71 0.00 0.00Turnagra capensis 5 3 3 2 0.21 1.28 0.54 2.86
TOTAL 2368 234 558 70 100.00 100.00 100.00 100.00OTHER VERTEBRATES Leiopelma hamiltoni 312 ND 27 ND 50.00 ND 18.12 ND Leiopelma markhami 11 ND 0 0 1.76 ND 0.00 Gecko 59 ND 5 ND 9.46 ND 3.36 ND Skink 215 ND 105 ND 34.46 ND 70.47 ND Mystacina robusta 22 4 12 3 3.53 ND 8.05 ND Rattus sp. 4 1 0 0 0.64 ND 0.00 Fish 1 1 0 0 0.16 ND 0.00
TOTAL 624 6 149 3 100.00 100.00

ALCHERINGA 399LATE PLEISTOCENE AVIFAUNA FROM NEW ZEALAND
juvenile South Island goose Cnemiorniscalcitrans Owen, 1865, seven Finsch’s duckChenonetta finschi (Van Beneden, 1875), two blueduck Hymenolaimus malacorhynchos (Gmelin,1789), three weka Gallirallus australis (Sparrman,1786), one New Zealand coot Fulica priscaHamilton, 1893, one kakapo Strigops habroptilusGray, 1845, seven adult kea Nestor notabilisGould, 1856, one Eyles’s harrier Circus eylesiScarlett, 1953, six New Zealand falcon Falconovaeseelandiae Gmelin, 1789, and one laughingowl Sceloglaux albifacies (Gray, 1844). Nine taxawere represented by just one bone and a furtherthree by just two bones: 30% of the avian diversitywas represented by two bones or less.
A notable feature of the assemblage is thelarge number of juvenile birds represented. Forexample, in L1+L2 ducklings represented about3% MNI, Nestor chicks a further 3% of MNI, andthere were chicks of at least one kiwi, three moa,one Cnemiornis, and undetermined numbers ofpetrels. Given the very fragile nature of suchbones, the number identified probably muchunderestimates the proportion of juveniles in theoriginal deposit.
There is eggshell of two moa (Megalapteryxdidinus with green shell, and another specieswith white eggshell c. 1.0-1.3 mm thick), a fewpieces of eggshell 0.7-0.9 mm thick of a big birdbut not a moa, and very abundant pieces of thineggshell (0.24-0.30 mm thick). These indicate thattwo species of moa and two other birds nestedin the cave at this time.
In Layer 3, there were many fewer bones:558 bird bones and 149 non-bird bones. As couldbe expected, many avian taxa that were rare in L1and L2 were therefore absent from L3. Nineteenspecies of birds were represented by bones, towhich can be added Megalapteryx didinus(Owen, 1883) on the basis of its eggshell. Othervertebrates included L. hamiltoni, geckos (rare),skinks (common), and Mystacina robusta Dwyer,1962.
There were few trends in species frequencybetween L1+L2 and L3 (Table 8). Prions(Pachyptila turtur (Kuhl, 1820) increased from44% to 72% NISP, or from 24% to 30% MNI fromL1+L2 to L3. In contrast, Puffinus gavia/huttonidecreased (33% to 12 % for NISP; 16% to 10% forMNI). Most other differences are not consideredmeaningful as they are related to disproportionatesample size effects.
The NISP data in Table 9 for excavation Cindicate that fossil deposition rates have beenvariable over time. Fossil numbers were muchgreater in the depth range 200-350 mm inexcavation C than at depths above or below thisrange.
TaphonomyThe fossil deposit has accumulated as a resultof several taphonomic processes. The mostimportant is predation by one or more birds.Secondly, the site has been a nesting site for anumber of taxa. Thirdly, a few remains derivefrom occasional deaths of animals visiting thesite.
Nesting: There is extremely abundant thineggshell, which we interpret as that of theprimary predator responsible for theaccumulation of fossil bones in the site forreasons outlined below. It is thin (mean 0.27 mm,SE=0.0048, SD=0.0216, range = 0.24-0.30 mm,n=20) and white. Falcon eggshell bleaches whitewithin a few weeks of laying (Noel Hyde, pers.comm. 5 May 2004) and is of appropriatethickness for the fossil shell. Considering theprey remains, described below, it is most probablethat this shell is from falcon eggs.
The presence of eggshell suggests that atleast two species of moa nested in the site. Moasnesting in cave entrances was a commonoccurrence elsewhere in New Zealand (Worthy& Holdaway 2002). There remains a possibilitythat some of the shell was brought to the site bythe predator, as must have been the case in somesites (e.g., Worthy 1997: 117), but the volumesuggests rather that eggs were laid nearby.Megalapteryx didinus, with its green eggshell,
Table 8. Summary table of vertebrate fauna from KidsCave by Layers (L1-2, Layer 1 and 2; L3 Layer 3). NDis not determined. Y is taxon present but does not con-tribute to MNI.

ALCHERINGA400 WORTHY & ZHAO
nested in the site from the earliest period to themiddle of L2. Its shell was not found shallowerthan 200 mm in excavation C where layers werethickest. Another moa, with white eggshell,occasionally nested in the site throughout theperiod of deposition. There are also rare piecesof eggshell 0.7-0.9 mm thick, which show that afurther large bird nested in the site. It lacks the
obvious elongate surface pores of moa and istoo thin for any but small North Island moa taxa,and its curvature is much greater than that ofmoa eggshell. The only birds in New Zealandthat are sufficiently large to have eggshell in thissize range are Aptornis Mantell, 1848, Cnemiornisand Harpagornis Haast, 1872. There are bonesof juvenile Cnemiornis in the site, which might
Table 9. Percentage NISP data by depth in excavation C. Y is taxon present but does not contribute to MNI.
27
Table 9. Percentage NISP data by depth in excavation C. Y is taxon present but does not contribute to MNI.
Layer Layer 1 and 2 Layer 3 Depth (mm) 0-50 -100 -150 -200 -250 -300 -350 -400 -450
Megalapteryx didinus eggshell Y Y Y YCnemiornis calcitrans 0.00 0.00 0.00 1.92 0.00 0.00 0.00 0.00 0.00Chenonetta finschi & cf 0.00 0.76 0.00 0.00 0.78 0.45 0.00 0.00 12.00Anas chlorotis & cf 0.00 0.00 0.00 1.92 1.55 0.00 0.00 0.00 0.00Anatid sp. juv 0.00 0.00 0.00 0.00 0.00 3.64 0.52 0.00 0.00Pelecanoides sp. 0.00 0.00 1.01 1.92 0.00 0.45 0.00 1.28 0.00Pachyptila cf P. turtur 39.05 31.30 23.23 61.54 72.87 79.09 90.63 75.64 52.00Puffinus spp. 35.24 49.62 45.45 17.31 7.75 5.45 5.21 5.13 8.00Coenocorypha iredalei 0.00 0.00 0.00 0.00 0.00 0.45 0.00 0.00 0.00Falco novaeseelandiae 0.00 0.00 2.02 0.00 0.78 0.00 0.52 2.56 0.00Gallinula hodgenorum 0.00 0.00 0.00 0.00 0.78 0.00 0.00 0.00 0.00Gallirallus australis 0.00 0.00 0.00 1.92 0.00 0.00 0.00 0.00 0.00Nestor meridionalis 0.95 0.00 0.00 0.00 0.00 0.00 0.00 0.00 0.00Nestor notabilis 0.00 0.00 15.15 5.77 0.78 0.00 0.00 0.00 0.00Cyanoramphus spp. 14.29 6.11 2.02 0.00 1.55 0.00 0.00 0.00 12.00Aegotheles novaezealandiae 2.86 3.05 0.00 0.00 0.00 0.00 0.00 3.85 0.00Acanthisitta chloris 0.00 0.76 2.02 0.00 3.10 0.45 0.00 1.28 0.00Xenicus spp. 2.86 0.00 1.01 0.00 3.10 2.27 0.00 2.56 12.00Pachyplichas yaldwyni 0.95 1.53 2.02 1.92 0.00 0.00 0.00 0.00 0.00Mohoua ochrocephala 0.00 2.29 0.00 0.00 0.00 0.00 0.52 0.00 0.00Mohoua novaeseelandiae 0.00 0.00 0.00 0.00 0.00 0.00 1.04 6.41 0.00Petroica australis 0.00 2.29 4.04 0.00 3.88 3.64 0.52 0.00 0.00Petroica macrocephala 0.00 0.00 0.00 3.85 1.55 0.00 0.00 0.00 0.00Anthus novaeseelandiae 0.00 0.00 0.00 0.00 1.55 1.82 0.52 1.28 4.00Anthornis melanura 0.95 2.29 2.02 0.00 0.00 0.91 0.00 0.00 0.00Callaeas cinerea 0.00 0.00 0.00 1.92 0.00 0.00 0.00 0.00 0.00Philesturnus carunculatus 2.86 0.00 0.00 0.00 0.00 0.00 0.00 0.00 0.00Turnagra capensis 0.00 0.00 0.00 0.00 0.00 1.36 0.52 0.00 0.00
TOTAL 100 100 100 100 100 100 100 100 100
Leiopelma hamiltoni 54.55 52.94 28.57 45.83 21.21 13.04 29.03 3.70 0.00Leiopelma markhami 0.00 29.41 21.43 0.00 0.00 1.09 0.00 0.00 0.00Gecko 18.18 17.65 7.14 8.33 12.12 16.30 3.23 0.00 0.00Skink 15.15 0.00 28.57 45.83 62.12 65.22 58.06 92.59 100.00Mystacina robusta 0.00 0.00 14.29 0.00 4.55 4.35 9.68 3.70 0.00Rattus sp. 12.12 0.00 0.00 0.00 0.00 0.00 0.00 0.00 0.00
TOTAL 100 100 100 100 100 100 100 100 100

ALCHERINGA 401LATE PLEISTOCENE AVIFAUNA FROM NEW ZEALAND
support the identity of the shell as of this taxon,but some of the bones in the site have breakagepatterns consistent with having been eaten, areof animals too large to have been prey of anythingother than Harpagornis. These include adult andjuvenile specimens of Cnemiornis, and bones ofadult Fulica prisca and very large adult Falconovaeseelandiae. Therefore it is possible thatHarpagornis nested in the site on occasion.
Vagrants: Animals occasionally visit andsometimes die in cave entrance zones. Remainsderived from such events are reported fromwidespread places in New Zealand (Worthy &Holdaway 1996a, 2000; Worthy 1997, Worthy etal. 2002) where rockshelter sites have beenexcavated. In Kids Cave, some of the bonesfound on the surface are probably of this origin.Several skeletons of brush-tailed possumTrichosurus vulpecula (Kerr, 1792) lay in the cave.Bones of an unidentified rat from L1 in excavationC are probably of similar origin. Also in L1,concentrations of complete unbroken bones ofowlet nightjar Aegotheles novaezealandiae(Scarlett, 1968) are probably derived from animalsthat died while visiting the cave. Lastly, parts oftwo individual Puffinus spelaeus skeletons fromthe slope above the drain hole in the mainchamber, and perhaps some from L1-L2 in thetest pit are of birds that died after entering thecave as they were not predated.
Predation: There is abundant evidence toindicate that most bones in the site wereaccumulated as a result of predator activities andthere is no other potential accumulationmechanism, such as pitfall entrapment (noentrance available) or fluvial transport (nosedimentary features to indicate its presence).Avian predators leave characteristic signaturesin the patterns of damage, element survival, andspecies representation in faunas (e.g., Andrews1990, Bochenski 1997, Bochenski & Tomek 1994,1997; Bochenski et al. 1993). In New Zealand,faunas have been attributed with supportingtaphonomic data to both laughing owls(Holdaway & Worthy 1996, Worthy 1997, 2001;
Worthy & Holdaway 1994b, 1996a, b), and tofalcons (Worthy 1997, Worthy & Holdaway 1995,Worthy et al. 2002a).
It is not the intent of this paper to give acomprehensive taphonomic analysis of theremains from Kids Cave; however, the followingobservations are typically seen in avian predatordeposits elsewhere in New Zealand (seereferences above) and so indicate the predationorigin of this deposit. Numerous bones arebroken with greenstick fractures, indicatingbreakage at or shortly after death. Many bonesdisplay acid etching typical of digestion (e.g.,Andrews 1990), especially of broken ends to theextent that the shaft breakage is thinned to apoint rather than preserving its thickness. Thesurvival of elements is very biased towardsthose of the extremities, with trunk elements(sterna, vertebrae, pelves) and crania very under-represented, given the numbers of humeri orulnae. The species representation in Kids Caveis very different from that seen in pitfall depositselsewhere in New Zealand, as there arecomparatively few taxa that habitually spendmost of their time on the ground and that usuallydominate pitfall sites, for example, species of kiwiApteryx Shaw & Nodder, 1813, Gallirallusaustralis, and Chenonetta finschi (e.g. Worthy& Holdaway 1993, 1994a).
The normal activity periods of the preyindicate that the predator in Kids Cave wasprimarily diurnal. Excluding petrels, only 11 of101 individual birds for L1+L2 are nocturnal(Apteryx, Coenocorypha iredalei Rothschild,1921, Strigops habroptilus, Sceloglauxalbifacies, Aegotheles novaezealandiae), andamong other vertebrates, diurnal skinks faroutnumber nocturnal geckos. WhereasLeiopelma species are nocturnal, most of theirremains are likely to be from death of vagrants:very few show evidence of digestion. Petrels areavailable to both nocturnal and diurnal predatorsas they come to the nesting site at or after duskand leave about dawn. Diurnally active taxa thusdominate the fauna, which is a feature of falconsites in New Zealand (Worthy 1997, Worthy &Holdaway 1995, Worthy et al. 2002). That the
ALCHERINGA402 WORTHY & ZHAO
prey species include laughing owl Sceloglauxalbifacies, but not morepork Ninoxnovaeseelandiae (Gmelin, 1788) as seen inGouland Downs (Worthy 2001), supports theinference that falcons were responsible for muchof the prey. The dominance of petrels in this siteis similar to that seen in Te Waka in North Island,where most fossils were inferred on taphonomicgrounds to be accumulated by falcons (Worthyet al. 2002). Falcons can hunt in darkness andare known to take petrels near petrel colonies(Harrow 1976, Lawrence & Gay 1991, Marchant& Higgins 1993, 282-3).
Falcons and the larger Circus eylesi werealso both prey items on occasion. As some ofthe falcon bones were of extremely largeindividuals, and as adults of other large taxa suchas Nestor notabilis, Fulica prisca, Chenonettafinschi, Paradise shelduck Tadorna variegata(Gmelin, 1789), and Cnemiornis calcitrans wereprey items, we suggest that a larger predatorthan a falcon was also occasionally using thesite. Specifically, that robust bones like thehumerus, coracoid, and tibia of all these taxa werebroken into small pieces suggests a largepowerful predator. The obvious contender forthis predator is Haast’s eagle Harpagornismoorei Haast, 1872. It is possible that theeggshell 0.7-0.9 mm thick recorded above is ofthe eagle, but verification of this requiresstructural analysis of the shell. This is the firsttime prey remains have been ascribed to Haast’seagle.
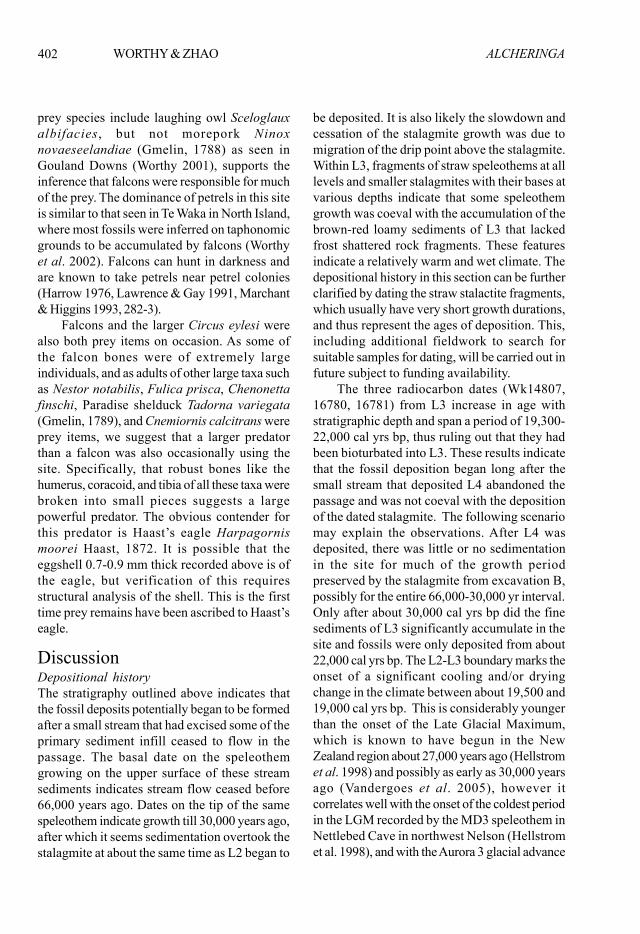
DiscussionDepositional historyThe stratigraphy outlined above indicates thatthe fossil deposits potentially began to be formedafter a small stream that had excised some of theprimary sediment infill ceased to flow in thepassage. The basal date on the speleothemgrowing on the upper surface of these streamsediments indicates stream flow ceased before66,000 years ago. Dates on the tip of the samespeleothem indicate growth till 30,000 years ago,after which it seems sedimentation overtook thestalagmite at about the same time as L2 began to
be deposited. It is also likely the slowdown andcessation of the stalagmite growth was due tomigration of the drip point above the stalagmite.Within L3, fragments of straw speleothems at alllevels and smaller stalagmites with their bases atvarious depths indicate that some speleothemgrowth was coeval with the accumulation of thebrown-red loamy sediments of L3 that lackedfrost shattered rock fragments. These featuresindicate a relatively warm and wet climate. Thedepositional history in this section can be furtherclarified by dating the straw stalactite fragments,which usually have very short growth durations,and thus represent the ages of deposition. This,including additional fieldwork to search forsuitable samples for dating, will be carried out infuture subject to funding availability.
The three radiocarbon dates (Wk14807,16780, 16781) from L3 increase in age withstratigraphic depth and span a period of 19,300-22,000 cal yrs bp, thus ruling out that they hadbeen bioturbated into L3. These results indicatethat the fossil deposition began long after thesmall stream that deposited L4 abandoned thepassage and was not coeval with the depositionof the dated stalagmite. The following scenariomay explain the observations. After L4 wasdeposited, there was little or no sedimentationin the site for much of the growth periodpreserved by the stalagmite from excavation B,possibly for the entire 66,000-30,000 yr interval.Only after about 30,000 cal yrs bp did the finesediments of L3 significantly accumulate in thesite and fossils were only deposited from about22,000 cal yrs bp. The L2-L3 boundary marks theonset of a significant cooling and/or dryingchange in the climate between about 19,500 and19,000 cal yrs bp. This is considerably youngerthan the onset of the Late Glacial Maximum,which is known to have begun in the NewZealand region about 27,000 years ago (Hellstromet al. 1998) and possibly as early as 30,000 yearsago (Vandergoes et al. 2005), however itcorrelates well with the onset of the coldest periodin the LGM recorded by the MD3 speleothem inNettlebed Cave in northwest Nelson (Hellstromet al. 1998), and with the Aurora 3 glacial advance

ALCHERINGA 403LATE PLEISTOCENE AVIFAUNA FROM NEW ZEALAND
of Williams (1996). It also correlates with anegative excursion in the oxygen isotope recordbetween 19,300 and 18,100 cal yrs bp found in acomposite stalagmite record from northwestSouth Island (Williams et al. 2004).
Samples Wk 14806 and 14808 indicatedeposition of L2 continued from about 17,750-17,150 cal yrs bp at 200-250 mm depth to 16,900-16,300 cal yrs bp near the surface. Therefore, it islikely that L2 was mostly deposited over theperiod from about 19,000 to about 15,000 yearsago when speleothem records indicate that theclimate had significantly warmed (Hellstrom etal. 1998, Williams et al. 2004).
The site thus records speleothemdeposition during the last glacial in the period66,000 to 30,000 cal yrs bp. Cessation of theirgrowth in this site only a few metres from anentrance may thus be correlated with the onsetof the LGM 28,500-30,500 cal yrs bp as indicatedby the onset of grass pollen peaks in West Coastrecords (Vandergoes et al. 2005). Sedimentarychanges, however, do not occur in the recorduntil about 19,000 cal yrs bp with the onset ofthe coldest and most severe period of the LGM.The commencement of frost shattering affectingthe cave entrance was probably associated witha decrease in vegetation about the cave entrance,specifically the loss of trees and shrubs,increasing its exposure to the elements, therebyenabling ice formation. The cave entrance,located above the valley floor and below a smallcliff, and at that time not surrounded in shrub ortree vegetation, was an attractive nesting sitefor predators, primarily falcons but also eagleson occasion. New Zealand falcons nest in arange of sites nowadays: on ledges on cliffs,usually with some vegetation screen over thenest; on open ground below a log; at the foot ofan overhang; or in epiphytes in tall forest trees(Marchant & Higgins 1993). Significant climatewarming would have been accompanied byrevegetation with tall shrubs and trees aboutthe entrance rendering it much less attractive tofalcons as a nest site. There is no evidence thatthey have nested there in the entire post-glacialperiod.
Faunal changes with depthThe composition of the avifauna changedmarkedly over the 150-250 mm depth range (Table9). Below 200 mm in Excavation C, fairy prionsPachyptila turtur dominate the fauna with 61-91% NISP, while Puffinus gavia/huttoni has lessthan 10% of NISP. Above 150 mm Puffinus gavia/huttoni accounts for 35-50% NISP and prionsdrop to 23-39%. Sample sizes in Excavation C arenot adequate to determine if there are any trendsin other species. Even when all samples arecombined and comparisons reduced to L2 versusL3, no other real trend is apparent. The muchgreater sample for L2 (2368 NISP) than L3 (558NISP) allows greater diversity to be detected,and it is: 41 versus 20 bird species.
Certain avian taxa are key environmentalindicators. Cnemiornis, Tadorna, Chenonetta,and Anthus all occur only where there areshrublands or grasslands (Worthy 1999, Worthy& Holdaway 2002). Also, Nestor notabilis,Gallinula hodgenorum (Scarlett, 1955), andFulica prisca are normally found in theassemblages derived from such habitats.However, a key indicator of shrublands/grasslands is Coturnix novaezelandiae Quoyand Gaimard, 1830 and, despite the large sample,this species is absent from the entire Kids Caveassemblage. Coturnix is a major prey item inHolocene falcon sites in eastern South Island(Worthy & Holdaway 1995), but it is very rare inthe extensive Late Pleistocene deposits ofHoneycomb Hill Cave in northwest Nelson(Worthy & Mildenhall 1989), so it seems thatwhile shrub and grassland was available on theWest Coast at this time, environmental conditionsdid not favour the quail. The other grassland/shrubland taxa occur in both L2 and L3 in KidsCave, or in the case of the rarer taxa (Cnemiornis,Tadorna, Gallinula, Fulica), only in L2. Incontrast, taxa such as Nestor meridionalis(Gmelin, 1788), Acanthisitta chloris (Sparrman,1787), Mohoua Lesson, 1835, Rhipidura Vigorsand Horsfield, 1827, Petroica australis(Sparrman, 1788), Callaeas Forster, 1788, andPhilesturnus Geoffroy St.-Hilaire, 1832 all requirea vegetation of at least a tall shrubland if not a

ALCHERINGA404 WORTHY & ZHAO
forest to live in. Their presence in L2 and L3indicates that a true vegetation mosaic existedin the lowland karst of the West Coast, withpatches of forest or tall shrubland interspersedwith grasslands and short shrublands,throughout the period from the LGM to the onsetof the Holocene.
An early palynological study of organiclayers in the terraces of the Westport district,which lies just north of the Nile River, found thatthe Otiran (last glacial period) had an interstadialcharacterised by a mosaic of grassland andshrubland of Phyllocladus, Dacrydium bidwilli,Coprosma, Leptospermum and Myrsine, whichbegan earlier than 31,000 yrs BP and ended about26,000 yrs BP (Moar & Suggate 1978). Relativelyabundant Nothofagus fusca pollen at this timewas assumed to be derived from stands ofNothofagus persisting in sheltered situations.After 26,000 yrs BP grassland became dominanton these coastal terraces with local areas ofdiverse shrublands. Throughout the northernSouth Island, LGM pollen assemblages attest toa vegetation dominated by grasslands withrelatively limited shrublands (McGlone 1988), butthese are not representative of the full range ofenvironments. For example, the vegetationhistories of the Westport region are derived fromsites on the exposed coastal terraces behind CapeFoulwind, and sites from within the shelteredvalleys such as afforded by the PunakaikiSyncline between the Nile and Pororari rivers(Charleston – Punakaiki) have as yet not revealedpollen histories. However, an avifauna fromHermits Cave, which was the first diverseassemblage of LGM age from this region (Worthy& Holdaway 1993), had a species compositionthat indicated that a mosaic of grassland,shrubland and forest existed in these valleys atthe time. Similarly, data from avifaunas in theOparara Basin in North Westland indicated thelikely presence of forest and shrubland over theLGM in this inland basin (Worthy & Mildenhall1989). The Kids Cave fauna also documents adiverse avifauna with open country taxa foundin grassland – shrubland environments andothers typical of forest habitats existing in the
environs of the cave for much of the LGM. Whilethere is evidence that grassland-shrubland taxabecame more common in the coldest part of theLGM, forest taxa continued to live in the areathroughout this time. These observationssuggest that pockets of beech forest, doubtlessinterspersed with podocarps, existed in thesheltered situations the valleys of the PunakaikiSyncline provided throughout the last glacial.The karst areas of the Punakaiki Syncline couldnot have been entirely bleak grassland duringthe LGM as the diverse suite of animalspresumably required diverse vegetation types,and thus the area provided a refuge from whichplants and animals alike could have dispersedwith the onset of the Holocene.
AcknowledgementsWe are grateful to the Department ofConservation for permitting the excavations inKids Cave and to the following for their sterlingefforts in carrying gear and sediment: RussellBromley, Deborah Carden, Jenny Jones, PaulScofield, Alan Tennyson, and Chippy Wood. Wethank Paul Scofield for his comments on the text.We thank Ian Sommers, Masterton, for sawingthe stalagmite in half that we used for dating.We thank Yuexing Feng, ACQUIRE, for technicalassistance and contributions from an ARClinkage grant for Feng’s salary. This researchwas supported by funding to THW from thePublic Good Science Fund of the New ZealandFoundation for Research, Science andTechnology, under contract TWOX0201.
ReferencesANDREWS, P., 1990. Owls, caves and fossils. Predation,
preservation, and accumulation of small mammalbones in caves, with an analysis of the Pleistocenecave faunas from Westbury - sub-Mendip, Somerset,UK. University of Chicago Press, Chicago, 231 pp.
BOCHENSKI, Z.M., 1997. Preliminary taphonomic studieson damage to bird bones by snowy owls Nycteascandiaca, with comments on the survival of bonesin palaeontological sites. Acta ZoologicaCracoviensia 40, 279-292.
BOCHENSKI, Z.M. & TOMEK, T., 1994. Pattern of bird bonefragmentation in pellets of the long-eared owl Asiootus and its taphonomic implications. Acta zoologica
ALCHERINGA 405LATE PLEISTOCENE AVIFAUNA FROM NEW ZEALAND
cracoviensia 37(1), 177-190.BOCHENSKI, Z. M. & TOMEK, T., 1997. Preservation of bird
bones: erosion versus digestion by owls. InternationalJournal of Osteoarchaeology 7, 372-387.
BOCHENSKI, Z.M., TOMEK, T., BOEV, Z. & MITEV, I., 1993.Patterns of bird bone fragmentation in pellets of thetawny owl (Strix aluco) and the eagle owl (Bubobubo) and their taphonomic implications. ActaZoologica Cracoviensia 36, 313-328.
HARROW, G., 1976. Some observations of Hutton’sshearwater. Notornis 23, 269-288.
HELLSTROM, J., MCCULLOCH, M. & STONE, J., 1998. A detailed31,000-year record of climate and vegetation change,from the isotope geochemistry of two New Zealandspeleothems. Quaternary Research 50, 167-178.
HOLDAWAY, R.N. & WORTHY, T.H., 1994. A new fossilspecies of shearwater Puffinus from the lateQuaternary of the South Island, New Zealand, andnotes on the biogeography and evolution of thePuffinus gavia superspecies. Emu 94, 201-215.
HOLDAWAY, R.N. & WORTHY, T.H., 1996. Diet and biologyof the laughing owl Sceloglaux albifacies (Aves:Strigidae) on Takaka Hill, Nelson, New Zealand.Journal of Zoology, London 239, 545-572.
HOLDAWAY, R.N., WORTHY, T.H. & TENNYSON, A.J.D., 2001.A working list of breeding bird species of the NewZealand region at first human contact. New ZealandJournal of Zoology 28, 119-187.
HORN, P.L., 1983. Subfossil avian remains from Poukawa,Hawke’s Bay, and the first record of Oxyura australis(Blue-billed duck) from New Zealand. Journal of theRoyal Society of New Zealand 13, 67-78.
KING, C.M., 1990 (Editor). The handbook of New Zealandmammals. Oxford University Press, Auckland, 600pp.
LAWRENCE, S.B. & GAY, C.G., 1991. Behaviour of fledglingNew Zealand falcons (Falco novaeseelandiae).Notornis 38, 173-182.
MARCHANT, S. & HIGGINS, PP.J. (editors), 1993. Handbookof Australian, New Zealand & Antarctic birds, vol. 2- Raptors to Lapwings. Melbourne, OxfordUniversity Press.
MCGLONE, M. S., 1988. New Zealand. pp. 557-599. in: B.HUNTLEY & T. WEBB III, eds, Handbook of vegetationscience, Volume 7: Vegetation history. Dordrecht,Netherlands, Kluwer Scientific Publishers.
MOAR, N.T. & SUGGATE, R.P., 1979. Contributions to theQuaternary history of the New Zealand flora. 8.Interglacial and glacial vegetation in the WestportDistrict, South Island. New Zealand Journal ofBotany 17, 361-387.
TURBOTT, E.G. (CONVENER), 1990. Checklist of the birds ofNew Zealand and Ross Dependency, Antarctica. 3rd.ed. Ornithological Society of New Zealand andRandom Century, Auckland, xv + 247 pp.
VANDERGOES, M.J., NEWNHAM, R.N., PREUSSER, F., HENDY,C.H., LOWELL, T.V., FITZSIMONS, S.J., HOGG, A.G., KASPER,H.U., & SCHLÛCHTER, C. 2005. Regional insolationforcing of late Quaternary climate change in the
Southern Hemisphere. Nature 436, 242-245.WILLIAMS, P.W., 1996. A 230ka record of glacial and
interglacial events from Aurora Cave, Fiordland, NewZealand. New Zealand Journal of Geology andGeophysics 39, 225-241.
WILLIAMS, P.W., KING, D.N.T., ZHAO, J.-X. & COLLERSON,K.D. 2004. Late Pleistocene to Holocene compositespeleothem 18O and 13C chronologies from SouthIsland, New Zealand – did a global Younger Dryasexist? Earth and Planetary Letters 230, 301-317.
WORTHY, T.H., 1987. Osteology of Leiopelma (Amphibia:Leiopelmatidae) and descriptions of three newsubfossil Leiopelma species. Journal of the RoyalSociety of New Zealand 17, 201-251.
WORTHY, T.H., 1993. Fossils of Honeycomb Hill. Museumof New Zealand Te Papa Tongarewa, Wellington, 56pp.
WORTHY, T.H., 1997. The Quaternary fossil fauna ofSouth Canterbury, South Island, New Zealand. Journalof the Royal Society of New Zealand 27, 67-162.
WORTHY, T.H., 1998a. Quaternary fossil faunas of Otago,South Island, New Zealand. Journal of the RoyalSociety of New Zealand 28, 421-521.
WORTHY, T.H., 1998b. The Quaternary fossil avifauna ofSouthland, South Island, New Zealand. Journal ofthe Royal Society of New Zealand 28, 537-589.
WORTHY, T.H., 1999. Changes induced in the New Zealandavifauna by climate during the last glacial - interglacialperiod. Proceedings of the 4th International meetingof the Society of Avian Paleontology and Evolution.Washington, USA, June 1996. SmithsonianContributions to Paleobiology 89, 111-123.
WORTHY, T.H., 2000. Two late-Glacial avifaunas fromeastern North Island, New Zealand - Te Aute Swampand Wheturau Quarry. Journal of the Royal Societyof New Zealand 30, 1-26.
WORTHY, T.H., 2001. A fossil vertebrate fauna accumulatedby laughing owls (Sceloglaux albifacies) on theGouland Downs, Northwest Nelson, South Island.Notornis 48, 225-233.
WORTHY, T.H., 2004. The Holocene fossil waterfowl faunaof Lake Poukawa, North Island, New Zealand.Tuhinga 15, 77-120.
WORTHY, T.H. & HOLDAWAY, R.N., 1993. Quaternary fossilfaunas from caves in the Punakaiki area, West Coast,South Island, New Zealand. Journal of the RoyalSociety of New Zealand 23, 147 - 254.
WORTHY, T.H. & HOLDAWAY, R.N., 1994a. Quaternary fossilfaunas from caves in Takaka Valley and on TakakaHill, northwest Nelson, South Island, New Zealand.Journal of the Royal Society of New Zealand 24,297-391.
WORTHY, T.H. & HOLDAWAY, R.N., 1994b. Scraps from anowl’s table - predator activity as a significanttaphonomic process newly recognised from NewZealand Quaternary deposits. Alcheringa 18, 229-245.
WORTHY, T.H. & HOLDAWAY, R.N., 1995. Quaternary fossilfaunas from caves on Mt Cookson, North Canterbury,
ALCHERINGA406 WORTHY & ZHAO
South Island, New Zealand. Journal of the RoyalSociety of New Zealand 25, 333-370.
WORTHY, T.H. & HOLDAWAY, R.N., 1996a. Quaternary fossilfaunas, overlapping taphonomies, and palaeofaunalreconstruction in North Canterbury, South Island,New Zealand. Journal of the Royal Society of NewZealand 26, 275-361.
WORTHY, T.H. & HOLDAWAY, R.N., 1996b. Taphonomy oftwo Holocene microvertebrate deposits, Takaka Hill,Nelson, New Zealand, and identification of the avianpredator responsible. Historical Biology 12, 1-24.
WORTHY, T.H. & HOLDAWAY, R.N., 2000. Terrestrial Fossilvertebrate faunas from inland Hawke’s Bay, NorthIsland New Zealand. Part 1. Records of the CanterburyMuseum 14, 89-154.
WORTHY, T.H. & HOLDAWAY, R.N., 2002. The lost world ofthe moa: Prehistoric life of New Zealand. IndianaUniversity Press, Indiana, xxxiii + 718 pp.
WORTHY, T.H., HOLDAWAY, R.N., ALLOWAY, B.V., JONES, J.,WINN, J. & TURNER, D., 2002a. A rich Pleistocene –Holocene avifaunal sequence from Te Waka #1:terrestrial fossil vertebrate faunas from inlandHawke’s Bay, North Island, New Zealand. Part 2.Tuhinga, Records of the Museum of New Zealand TePapa Tongarewa 13, 1-38.
WORTHY, T.H. & MILDENHALL, D.C., 1989. A late Otiran-Holocene paleoenvironmental reconstruction basedon cave excavations in northwest Nelson, NewZealand. New Zealand Journal of Geology andGeophysics 32, 243-253.
WORTHY, T. H., MISKELLY, C.M. & CHING, R.A., 2002b.Taxonomy of North and South Island snipe (Aves:Scolopacidae: Coenocorypha), with analysis of aremarkable collection of snipe bones fromGreymouth, New Zealand. New Zealand Journal ofZoology 29, 231-244.
WORTHY, T.H. & OLSON S.L., 2002. Relationships,adaptations, and habits of the extinct duck‘Euryanas’ finschi. Notornis 49, 1-17.
WORTHY, T.H. & ROSCOE, D., 2003. Takaka Fossil Cave –a stratified Late Glacial to Late Holocene depositfrom Takaka Hill, New Zealand. Tuhinga 14, 41-60.
WORTHY, T.H. & SWABEY, S.E.J., 2002. Avifaunal changesrevealed in Quaternary deposits near Waitomo Caves,North Island, New Zealand. Journal of the RoyalSociety of New Zealand 32, 293-325.
ZHAO, J.X., HU, K., COLLERSON, K.D., & XU, H.K., 2001,Thermal ionization mass spectrometry U-seriesdating of a hominid site near Nanjing, China. Geology29, 27-30.