A laboratory feasibility study of dilute surfactant injection for the Yibal field, Oman
16
A laboratory feasibility study of dilute surfactant injection for the Yibal field, Oman T. Babadagli a, * , A. Al-Bemani b , F. Boukadi b , R. Al-Maamari b a University of Alberta, Department of Civil and Env. Eng., School of Mining and Petroleum, 3-112 Markin CNRL/NREF Edmonton, AB, Canada T6G 2W2 b Sultan Qaboos University, Department of Petroleum and Chemical Engineering, Oman Received 26 January 2004; received in revised form 27 January 2005; accepted 27 April 2005 Abstract The Yibal field, the largest oil field in Oman, comprises 15% of the oil production of the country. The field has had a high ultimate recovery factor and in order to maintain the current recovery trend, different management strategies have been sought. One of the options is the injection of a dilute surfactant in addition to the current waterflooding. The cores from the chalky Shuaiba formation were saturated with brine and oilflooded to restore the initial reservoir condition after cleaning. Nineteen samples were waterflooded followed by dilute surfactant injection. Eight samples were flooded with dilute surfactant. The reason for this scheme is that some parts of the reservoir under study were totally watered out while others are still untouched. In addition to these experiments, nine capillary (static) imbibition experiments were conducted to treat fractured zones where recovery by capillary imbibition during injection is a possibility. Twelve different surfactants (at different concentrations) were tested. Five surfactants were non-ionic, two cationic, four anionic, and one was a mixture of anionic and non-ionic. The selection of the optimum concentrations was based on IFT values at different concentrations. The results were evaluated in terms of the final oil recovery. The average waterflooding recovery was found to be 75.1% of OOIP (out of 19 experiments) whereas surfactant injection yielded an average of 69.9% of OOIP (out of 8 experiments). This indicates that the surfactant injection is not preferable and not recommended over waterflooding for the untouched portion of the reservoir where the rock matrix dominates the flow (unfractured portions). An additional recovery by surfactant solution injection succeeding waterflooding was obtained and found to vary between 0% and 7.4% of OOIP. The surfactant injection is, therefore, recommendable in the pre-waterflooded unfractured zones as long as the proper surfactant type is selected. Half of the surfactant solutions yielded higher and faster capillary imbibition recovery than brine. For the untouched fractured zones of the chalky reservoir, it is more effective to start the injection with 0920-4105/$ - see front matter D 2005 Elsevier B.V. All rights reserved. doi:10.1016/j.petrol.2005.04.005 * Corresponding author. Tel.: +1 780 492 9626; fax: +1 780 492 0249. E-mail address: [email protected] (T. Babadagli). Journal of Petroleum Science and Engineering 48 (2005) 37 – 52 www.elsevier.com/locate/petrol
-
Upload
independent -
Category
Documents
-
view
0 -
download
0
Transcript of A laboratory feasibility study of dilute surfactant injection for the Yibal field, Oman
www.elsevier.com/locate/petrol
Journal of Petroleum Science and E
A laboratory feasibility study of dilute surfactant injection for the
Yibal field, Oman
T. Babadaglia,*, A. Al-Bemanib, F. Boukadib, R. Al-Maamarib
aUniversity of Alberta, Department of Civil and Env. Eng., School of Mining and Petroleum, 3-112 Markin CNRL/NREF Edmonton,
AB, Canada T6G 2W2bSultan Qaboos University, Department of Petroleum and Chemical Engineering, Oman
Received 26 January 2004; received in revised form 27 January 2005; accepted 27 April 2005
Abstract
The Yibal field, the largest oil field in Oman, comprises 15% of the oil production of the country. The field has
had a high ultimate recovery factor and in order to maintain the current recovery trend, different management
strategies have been sought. One of the options is the injection of a dilute surfactant in addition to the current
waterflooding.
The cores from the chalky Shuaiba formation were saturated with brine and oilflooded to restore the initial reservoir
condition after cleaning. Nineteen samples were waterflooded followed by dilute surfactant injection. Eight samples were
flooded with dilute surfactant. The reason for this scheme is that some parts of the reservoir under study were totally
watered out while others are still untouched. In addition to these experiments, nine capillary (static) imbibition
experiments were conducted to treat fractured zones where recovery by capillary imbibition during injection is a
possibility. Twelve different surfactants (at different concentrations) were tested. Five surfactants were non-ionic, two
cationic, four anionic, and one was a mixture of anionic and non-ionic. The selection of the optimum concentrations was
based on IFT values at different concentrations.
The results were evaluated in terms of the final oil recovery. The average waterflooding recovery was found to be
75.1% of OOIP (out of 19 experiments) whereas surfactant injection yielded an average of 69.9% of OOIP (out of
8 experiments). This indicates that the surfactant injection is not preferable and not recommended over waterflooding for
the untouched portion of the reservoir where the rock matrix dominates the flow (unfractured portions). An additional
recovery by surfactant solution injection succeeding waterflooding was obtained and found to vary between 0% and 7.4%
of OOIP. The surfactant injection is, therefore, recommendable in the pre-waterflooded unfractured zones as long as the
proper surfactant type is selected. Half of the surfactant solutions yielded higher and faster capillary imbibition recovery
than brine. For the untouched fractured zones of the chalky reservoir, it is more effective to start the injection with
0920-4105/$ - s
doi:10.1016/j.pe
* Correspondi
E-mail addre
ngineering 48 (2005) 37–52
ee front matter D 2005 Elsevier B.V. All rights reserved.
trol.2005.04.005
ng author. Tel.: +1 780 492 9626; fax: +1 780 492 0249.
ss: [email protected] (T. Babadagli).
T. Babadagli et al. / Journal of Petroleum Science and Engineering 48 (2005) 37–5238
surfactant addition rather than waterflooding alone. Surfactant types and concentrations yielding the best performances
were identified and listed in this paper.
D 2005 Elsevier B.V. All rights reserved.
Keywords: Surfactant injection; Water injection; Yibal oil field; Tertiary oil recovery; Mature fields; Secondary oil recovery; Chalk; Naturally
fractured reservoirs
1. Introduction
Different schemes of surfactant injection received
attention in the late 1970s and early 1980s due to
economic feasibility for field applications. Early
studies were performed on sandstone reservoirs
(Boneau and Clampitt, 1977; Bae, 1985; Bae and
Syed, 1986; Bae and Petrick, 1986; Clark et al.,
1988; Saad et al., 1989; Maerker and Gale, 1992;
Kuhlman et al., 2000). More recently, laboratory
and field scale applications were reported for chalks
(Flumerfelt et al., 1993; Milter and Austad, 1996;
Michels et al., 1996; Austad and Milter, 1997;
Austad et al., 1998; Spinler, 2000; Chen et al.,
2000). The economics of the surfactant injection is
critical due to the high cost of the chemicals.
Therefore, optimum injection scheme has to be
designed (Salager et al., 1979a,b; Barua et al.,
1986; Jakobsen and Hovland, 1994; Baviere et al.,
1994; Tsau et al., 2000). Adsorption is an important
aspect of the process that plays a role in the opti-
mization and cost analysis of the projects (Hurd,
1976; Lawson and Dilgren, 1978; Lawson, 1978;
Ramirez et al., 1980; Stournas, 1983; Lewis et al.,
1986; Hong and Bae, 1990; Mannhardt et al., 1990;
Tabatabai et al., 1991). This literature provided not
only the previous experience on surfactant flooding
but was useful to gain insight into the surfactant
types used for different rock types and injection
schemes applied.
Based on recent experience with chalky carbo-
nates, surfactant injection was considered as an al-
ternative for the Yibal field to maintain the high
recovery trend. The Yibal field (a tight and fractured
carbonate reservoir), containing light oil, has been
producing with a high recovery factor. Because the
field also has a high value of original oil in place,
the possibility of EOR applications should be eval-
uated. This is a crucial issue to extend the field life
and a challenging application of effective reservoir
management.
The Yibal field has undergone different develop-
ment plans since it was discovered. Several attempts
were made to characterize the reservoir and propose
different development schemes. Litsey et al. (1986)
provided a detailed geological and petrophysical
study on the Shuaiba chalk, which is the main oil
producing formation. After an extensive field scale
reservoir simulation study, Blaskovich et al. (1985)
suggested a pattern type waterflooding scheme for
the field. Later, Bos (1989) and Eckford (1999)
evaluated the existing field performance and recom-
mended long term development scenarios. Water-
flooding performance during different periods of
the production was also evaluated and the results
were published (Grant, 1981; Mugheiry et al.,
2001).
The possibility of injecting dilute surfactant solu-
tions in the Yibal field was investigated using exper-
imental modeling, and core-flooding experiments with
plugs to clarify the response of the reservoir to sur-
factant supported water injection.
2. Experimental study
To examine the compatibility of the reservoir rock
to the injected fluids, core-flooding tests were con-
ducted. The experiments were divided into three
groups: (1) displacement of oil by unmodified
water injection in a virgin sample (primary water-
flooding), (2) displacement of oil by surfactant solu-
tion in an oil saturated core sample (secondary
recovery by surfactant), and (3) displacement of oil
in a core sample originally fully flooded by unmod-
ified injection water (tertiary recovery by surfactant).
The effect of surfactant addition to injected water on
the capillary imbibition of water into the Shuaiba
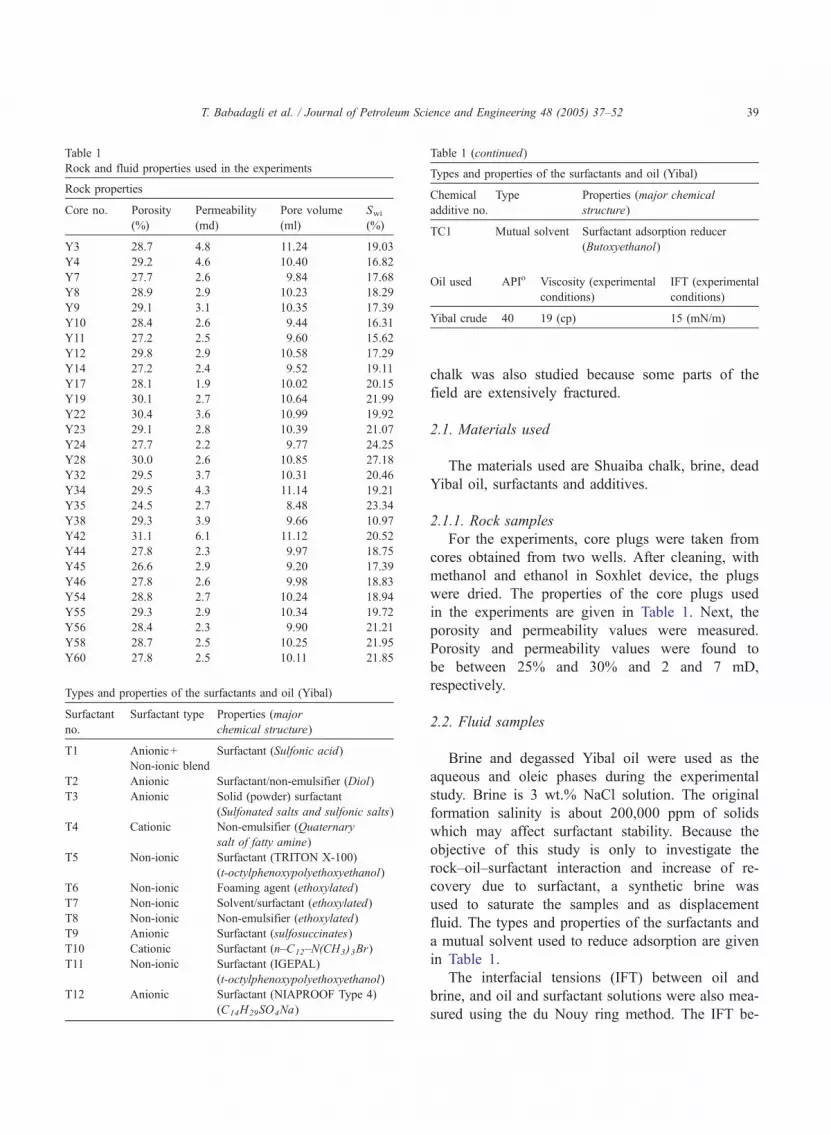
Table 1
Rock and fluid properties used in the experiments
Rock properties
Core no. Porosity
(%)
Permeability
(md)
Pore volume
(ml)
Swi(%)
Y3 28.7 4.8 11.24 19.03
Y4 29.2 4.6 10.40 16.82
Y7 27.7 2.6 9.84 17.68
Y8 28.9 2.9 10.23 18.29
Y9 29.1 3.1 10.35 17.39
Y10 28.4 2.6 9.44 16.31
Y11 27.2 2.5 9.60 15.62
Y12 29.8 2.9 10.58 17.29
Y14 27.2 2.4 9.52 19.11
Y17 28.1 1.9 10.02 20.15
Y19 30.1 2.7 10.64 21.99
Y22 30.4 3.6 10.99 19.92
Y23 29.1 2.8 10.39 21.07
Y24 27.7 2.2 9.77 24.25
Y28 30.0 2.6 10.85 27.18
Y32 29.5 3.7 10.31 20.46
Y34 29.5 4.3 11.14 19.21
Y35 24.5 2.7 8.48 23.34
Y38 29.3 3.9 9.66 10.97
Y42 31.1 6.1 11.12 20.52
Y44 27.8 2.3 9.97 18.75
Y45 26.6 2.9 9.20 17.39
Y46 27.8 2.6 9.98 18.83
Y54 28.8 2.7 10.24 18.94
Y55 29.3 2.9 10.34 19.72
Y56 28.4 2.3 9.90 21.21
Y58 28.7 2.5 10.25 21.95
Y60 27.8 2.5 10.11 21.85
Types and properties of the surfactants and oil (Yibal)
Surfactant
no.
Surfactant type Properties (major
chemical structure)
T1 Anionic+
Non-ionic blend
Surfactant (Sulfonic acid)
T2 Anionic Surfactant/non-emulsifier (Diol)
T3 Anionic Solid (powder) surfactant
(Sulfonated salts and sulfonic salts)
T4 Cationic Non-emulsifier (Quaternary
salt of fatty amine)
T5 Non-ionic Surfactant (TRITON X-100)
(t-octylphenoxypolyethoxyethanol)
T6 Non-ionic Foaming agent (ethoxylated)
T7 Non-ionic Solvent/surfactant (ethoxylated)
T8 Non-ionic Non-emulsifier (ethoxylated)
T9 Anionic Surfactant (sulfosuccinates)
T10 Cationic Surfactant (n–C12–N(CH3)3Br)
T11 Non-ionic Surfactant (IGEPAL)
(t-octylphenoxypolyethoxyethanol)
T12 Anionic Surfactant (NIAPROOF Type 4)
(C14H29SO4Na)
Table 1 (continued)
Types and properties of the surfactants and oil (Yibal)
Chemical
additive no.
Type Properties (major chemical
structure)
TC1 Mutual solvent Surfactant adsorption reducer
(Butoxyethanol)
Oil used APIo Viscosity (experimental
conditions)
IFT (experimental
conditions)
Yibal crude 40 19 (cp) 15 (mN/m)
T. Babadagli et al. / Journal of Petroleum Science and Engineering 48 (2005) 37–52 39
chalk was also studied because some parts of the
field are extensively fractured.
2.1. Materials used
The materials used are Shuaiba chalk, brine, dead
Yibal oil, surfactants and additives.
2.1.1. Rock samples
For the experiments, core plugs were taken from
cores obtained from two wells. After cleaning, with
methanol and ethanol in Soxhlet device, the plugs
were dried. The properties of the core plugs used
in the experiments are given in Table 1. Next, the
porosity and permeability values were measured.
Porosity and permeability values were found to
be between 25% and 30% and 2 and 7 mD,
respectively.
2.2. Fluid samples
Brine and degassed Yibal oil were used as the
aqueous and oleic phases during the experimental
study. Brine is 3 wt.% NaCl solution. The original
formation salinity is about 200,000 ppm of solids
which may affect surfactant stability. Because the
objective of this study is only to investigate the
rock–oil–surfactant interaction and increase of re-
covery due to surfactant, a synthetic brine was
used to saturate the samples and as displacement
fluid. The types and properties of the surfactants and
a mutual solvent used to reduce adsorption are given
in Table 1.
The interfacial tensions (IFT) between oil and
brine, and oil and surfactant solutions were also mea-
sured using the du Nouy ring method. The IFT be-

T. Babadagli et al. / Journal of Petroleum Science and Engineering 48 (2005) 37–5240
tween oil and brine was found to be 15 mN/m. This
value was also the same for oil-formation water pair.
To establish the base for the selection of the
surfactant concentrations, IFT measurements were
also conducted for surfactant solution/oil pairs. The
IFT values for different concentrations are given in
Table 2.
Table 2
IFT values for different surfactant concentrations
Surfactant no. Concentration (%) IFT (m/Nm)
T1 0.01 9.5
0.1 1
0.5 0.4
1 0.4
T2 0.01 7.5
0.03 1
0.05 1
0.1 1
T3 0.01 2.5
0.05 3
0.1 3
T4 0.01 0.4
0.05 0.5
0.1 0.5
1 0.7
T5 0.01 7.5
0.05 3
0.1 1.5
1 1
T6 0.1 4
1 2.7
1.5 2.5
T7 0.01 11
0.05 7.5
0.1 5
1 3
T8 0.01 8.5
0.03 6.5
0.05 0.4
0.1 0.2
T9 0.005 5.5
0.01 1
1 0.5
T10 0.01 8.5
0.05 3
1 2
T11 0.005 7.5
0.01 4
1 1
T12 0.01 7.5
0.03 5
0.05 3
1 0.2
2.3. Experimental procedure
After cleaning and drying the core plugs, poros-
ity and permeability values were measured. Then
the samples were saturated with brine and drained
by oil displacement to irreducible water saturation.
Oil was pumped at 0.03 ml/min until 20-pore
volumes (PV) oil has been injected to ensure
complete displacement of water to its irreducible
value. The cores were exposed to the same clean-
ing procedure and aging time before starting the
waterflooding at 0.3 ml/min. Some of the experi-
ments were followed by the surfactant solution
injection using the same rate. Each core was
used only once and all experiments were conducted
at room temperature.
3. Results and analysis
3.1. Dynamic displacement experiments
Two sets of dynamic experiments were used: (1)
waterflooding succeeded by surfactant solution injec-
tion; this was used mainly to quantify the surfactant
injection recovery as a tertiary method for the water-
flooded areas in the field, (2) surfactant solution
injection (modified waterflooding) experiments into
the oil saturated samples to quantify recovery
obtained by injecting surfactant solution as an alter-
native to waterflooding.
3.1.1. Surfactant injection after waterflooding
The experiments were continued until 100% pro-
duced water cut is reached. To ensure that water-
flooding would not yield more oil, several pore
volumes of water were injected after reaching
100% water cut. Two examples of the recovery
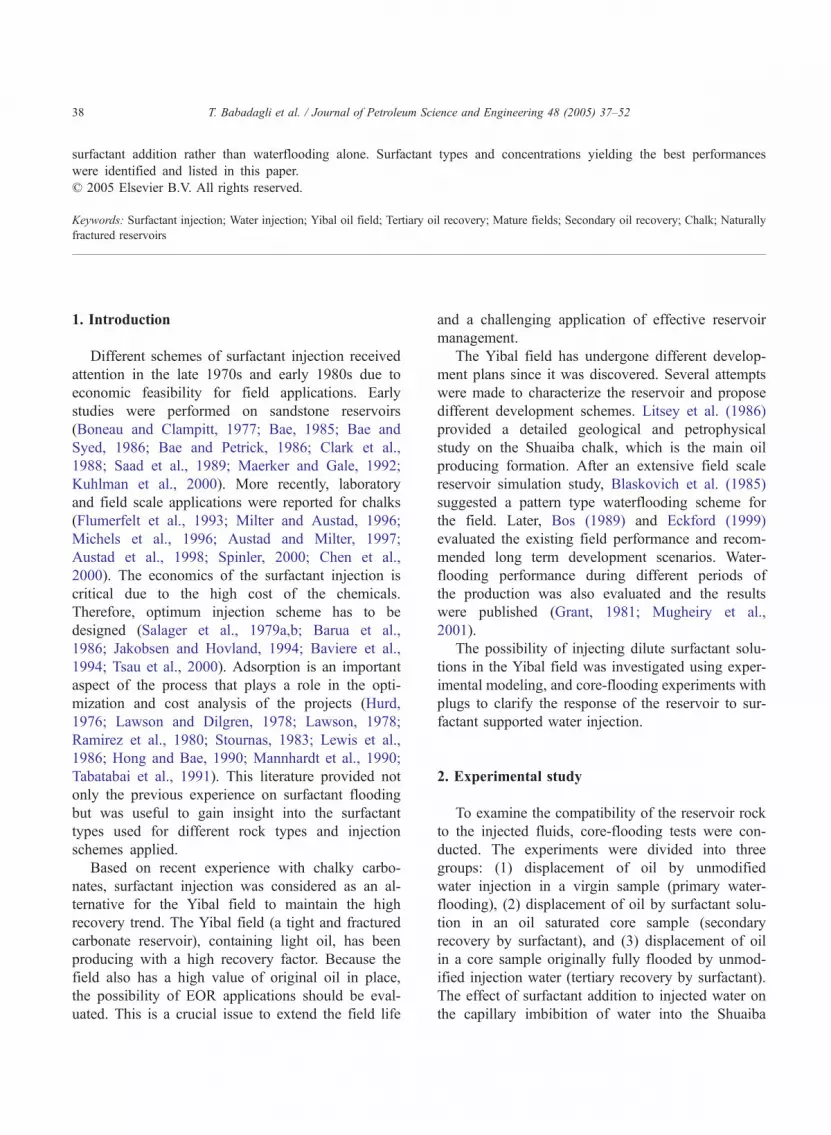
plots are shown in Fig. 1. In these experiments
different recovery trends were observed. Some
cases represented earlier water breakthrough. Some
other cases exhibited high waterflooding recovery
whereas some cases exhibited low waterflooding
but high surfactant recovery. Thus, it was decided
to evaluate the results using different performance
indicators.
The first indicator was the oil recovered per vol-
ume of water injected and the performances of 20
0
0.2
0.4
0.6
0.8
0 20 40 60
Produced Oil
Typ
e-T
3 @
0.1
%
Typ
e-T
2 @
0.1
%
0
0.2
0.4
0.6
0.8
0 20 40
Po
re V
olu
me
Oil
Pro
du
ced
Pore Volume Water Injected Pore Volume Water Injected
Produced Oil
Typ
e-T
1 @
0.1
%
Waterflooding
Waterflooding
Surfactant injection starts
Sur
fact
ant i
njec
tion
star
ts
Po
re V
olu
me
Oil
Pro
du
ced
Fig. 1. Recovery performance of two core samples.
0
0.1
0.2
0.3
0.4
0.5
0.6
0.7
0.8
Y-17, T
11-0.2
Y-22, T
10-0.5
Y-35, T
10-1
Y-44, T
2-0.01
Y-45, T
12-0.1
Y-54, T
11-1
Y-38, T
5-0.1
Y-10, T
6-0.1
Y-4, T
3-0.1
Y-4, T
3~T2-.1
Y-19, T
8+TC
1-0.1+5
Y-8, T
7-1
Y-46, T
9-0.01
Y-23, T
8-0.01
Y-11, T
1-0.5
Y-12, T
8-0.1
Y-3, T
1-0.1
Y-9, T
2-0.1
Y-14, T
7-0.1
Y-7, T
4-0.01
Core Number, Surfactant Type, and Percentage
Oil
Rec
ove
red
per
Po
re V
olu
me
Inje
cted
, ml/p
v
Water Flood
Surfactant Flood
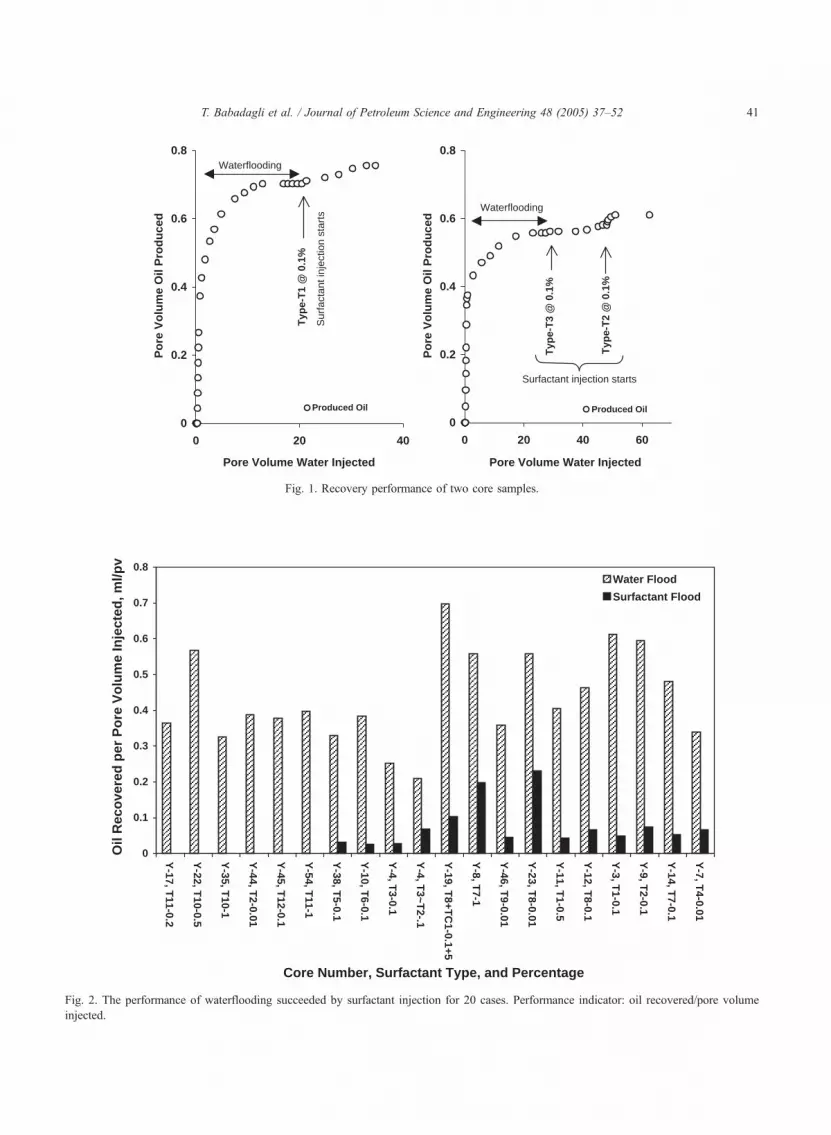
Fig. 2. The performance of waterflooding succeeded by surfactant injection for 20 cases. Performance indicator: oil recovered/pore volume
injected.
T. Babadagli et al. / Journal of Petroleum Science and Engineering 48 (2005) 37–52 41
T. Babadagli et al. / Journal of Petroleum Science and Engineering 48 (2005) 37–5242
different cases are given in Fig. 2. Note that one of the
plugs (Y-4) was exposed to two types of surfactant
injection after waterflooding. Both surfactants yielded
an additional recovery. Thus, there actually exists only
one waterflooding (unmodified) on Y-4 sample
(marked as Y-4, T3-0.1%). The second waterflooding
case of Y-4 (marked as Y-4, T3~T2-0.1) is water-
flooding+previous surfactant recovery (T-3-0.1%).
Hence, actually 19 waterfloods are shown in Fig. 2.
Also, one surfactant (T8) was tested twice because it
is the only surfactant with the additional chemical
(TC1, Table 1) to observe the effect of the chemical
as a wettability and adsorption changer. This plot
indicates that there is no typical trend with respect
to the amount injected for recovery of oil by water and
surfactant flooding. For plug Y-19, oil recovery/pore
volume injected is 0.7 whereas this value decreases to
0.24 for plug Y-4 (waterflooding only). One possible
explanation for this difference may be the heteroge-
neous structure of the samples. Although the plugs
were carefully selected from the homogeneous/unfrac-
0
0.1
0.2
0.3
0.4
0.5
0.6
0.7
0.8
Y-17, T
11-0.2
Y-22, T
10-0.5
Y-35, T
10-1
Y-44, T
2-0.01
Y-45, T
12-0.1
Y-54, T
11-1
Y-38, T
5-0.1
Y-10, T
6-0.1
Y-4, T
3-0.1
Y-4, T
3~T2-.1
Core Number, Surfacta
Po
re V
olu
me
Oil
Rec
ove
red
Fig. 3. The performance of waterflooding succeeded by surfactant in
waterflooding and surfactant as pore volume.
tured parts of the cores, microfractures are common in
the Shuaiba chalk and this might cause inconsistent
breakthrough times.
Another performance indicator was the pore vol-
ume (PV) oil recovered with respect to different
surfactant type (Fig. 3). The final recovery fluctuates
between 0.55% and 0.65% of PV oil with two
exceptions, which go above 0.70% of PV. Additional
recovery due to tertiary surfactant injection was also
included in Fig. 3. Samples Y-38 and Y-3 resulted in
75.56% and 75.62% of PV waterflooding recoveries,
respectively. But, 1.03% and 5.33% of PV recoveries
were added by tertiary surfactant injection, respec-
tively. On the other hand, the lowest waterflooding
recoveries were obtained for sample Y-4, Y-9, Y-19,
and Y-23. All these yielded additional surfactant
recoveries: 2.4%, 4.34%, 3.28%, and 3.84% of PV,
which are not the highest surfactant recoveries. Like-
wise, samples Y-17 and Y22 did not produce any oil
due to surfactant injection in spite of their relatively
lower waterflooding recoveries. Obviously, the per-
Y-19, T
8+TC
1-0.1+5
Y-8, T
7-1
Y-46, T
9-0.01
Y-23, T
8-0.01
Y-11, T
1-0.5
Y-12, T
8-0.1
Y-3, T
1-0.1
Y-9, T
2-0.1
Y-14, T
7-0.1
Y-7, T
4-0.01
nt Type, and Percentage
Water Flood
Surfactant Flood
jection for 20 cases. Performance indicator: oil recovery due to
T. Babadagli et al. / Journal of Petroleum Science and Engineering 48 (2005) 37–52 43
formance of tertiary surfactant recovery (after un-
modified waterflooding) depends on the surfactant
type and concentration but it can be said that no
typical effect of the previous waterflooding (second-
ary recovery) history on the surfactant (tertiary) re-
covery was observed.
For evaluation of the additional recovery by sur-
factant solution injection, the percentage of the recov-
ery due to surfactant as PV and additional recovery
due to tertiary surfactant injection as PV are plotted in
Figs. 4 and 5. The percentage of the oil recovery due
to surfactant injection after waterflooding as PV was
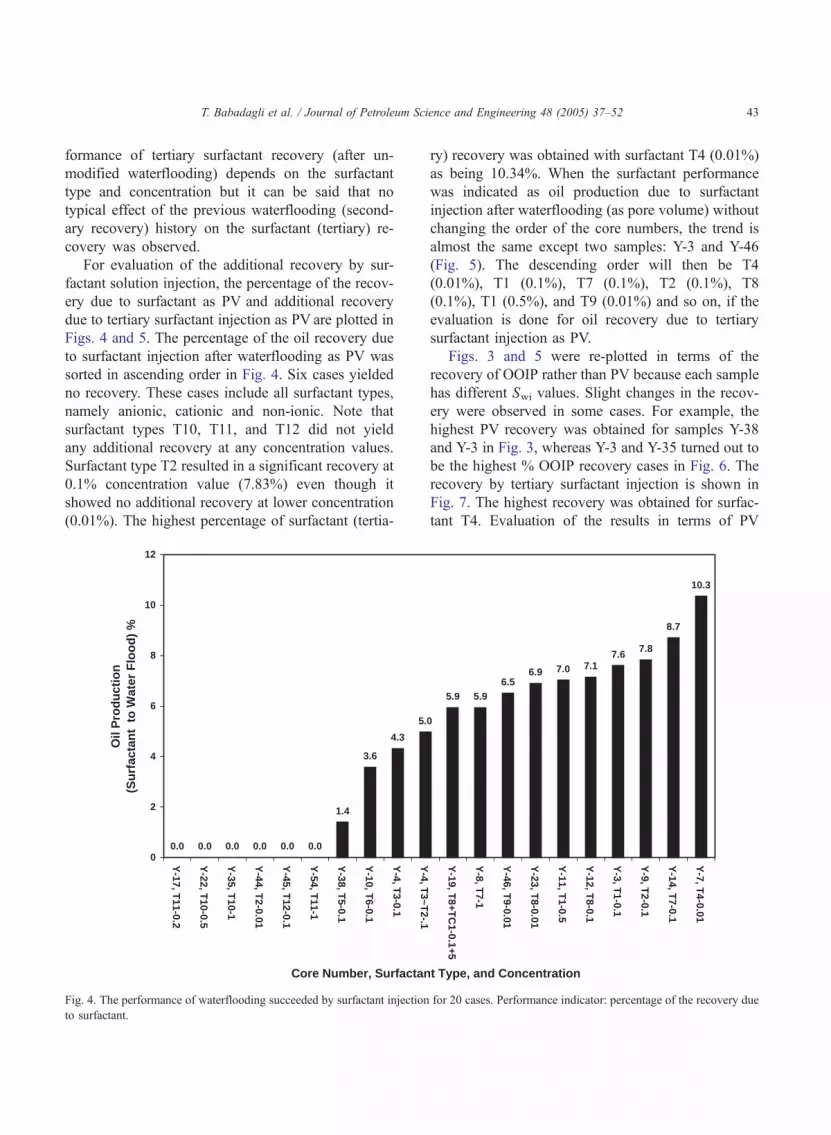
sorted in ascending order in Fig. 4. Six cases yielded
no recovery. These cases include all surfactant types,
namely anionic, cationic and non-ionic. Note that
surfactant types T10, T11, and T12 did not yield
any additional recovery at any concentration values.
Surfactant type T2 resulted in a significant recovery at
0.1% concentration value (7.83%) even though it
showed no additional recovery at lower concentration
(0.01%). The highest percentage of surfactant (tertia-
1.4
3.6
4.3
5.
0.0 0.0 0.0 0.0 0.0 0.00
2
4
6
8
10
12
Y-17, T
11-0.2
Y-22, T
10-0.5
Y-35, T
10-1
Y-44, T
2-0.01
Y-45, T
12-0.1
Y-54, T
11-1
Y-38, T
5-0.1
Y-10, T
6-0.1
Y-4, T
3-0.1
Y-4, T
3~T2-.1
Core Number, Surfactan
Oil
Pro
du
ctio
n(S
urf
acta
nt
to
Wat
er F
loo
d)
%
Fig. 4. The performance of waterflooding succeeded by surfactant injection
to surfactant.
ry) recovery was obtained with surfactant T4 (0.01%)
as being 10.34%. When the surfactant performance
was indicated as oil production due to surfactant
injection after waterflooding (as pore volume) without
changing the order of the core numbers, the trend is
almost the same except two samples: Y-3 and Y-46
(Fig. 5). The descending order will then be T4
(0.01%), T1 (0.1%), T7 (0.1%), T2 (0.1%), T8
(0.1%), T1 (0.5%), and T9 (0.01%) and so on, if the
evaluation is done for oil recovery due to tertiary
surfactant injection as PV.
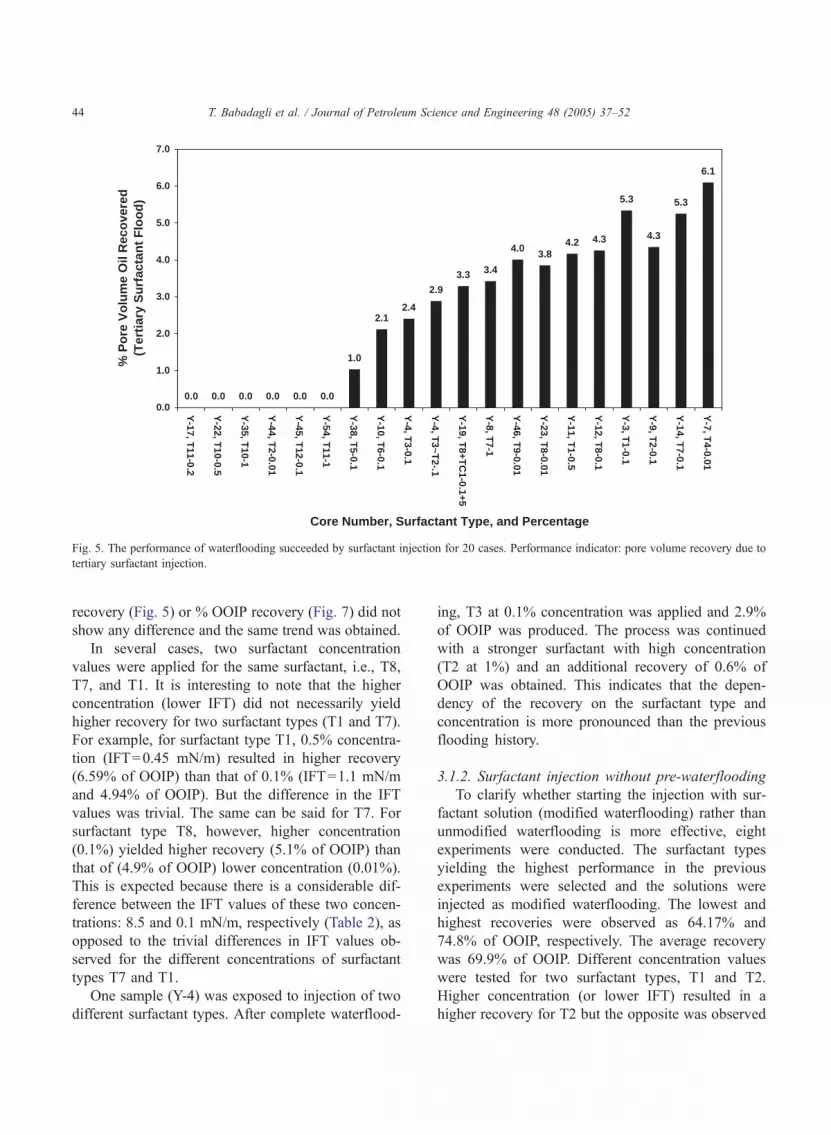
Figs. 3 and 5 were re-plotted in terms of the
recovery of OOIP rather than PV because each sample
has different Swi values. Slight changes in the recov-
ery were observed in some cases. For example, the
highest PV recovery was obtained for samples Y-38
and Y-3 in Fig. 3, whereas Y-3 and Y-35 turned out to
be the highest % OOIP recovery cases in Fig. 6. The
recovery by tertiary surfactant injection is shown in
Fig. 7. The highest recovery was obtained for surfac-
tant T4. Evaluation of the results in terms of PV
0
5.9 5.96.5
6.9 7.0 7.17.6 7.8
8.7
10.3
Y-19, T
8+TC
1-0.1+5
Y-8, T
7-1
Y-46, T
9-0.01
Y-23, T
8-0.01
Y-11, T
1-0.5
Y-12, T
8-0.1
Y-3, T
1-0.1
Y-9, T
2-0.1
Y-14, T
7-0.1
Y-7, T
4-0.01
t Type, and Concentration
for 20 cases. Performance indicator: percentage of the recovery due
1.0
2.12.4
2.9
3.3 3.4
4.0 3.84.2 4.3
5.3
4.3
5.3
6.1
0.00.00.0 0.0 0.0 0.00.0
1.0
2.0
3.0
4.0
5.0
6.0
7.0
Y-17, T
11-0.2
Y-22, T
10-0.5
Y-35, T
10-1
Y-44, T
2-0.01
Y-45, T
12-0.1
Y-54, T
11-1
Y-38, T
5-0.1
Y-10, T
6-0.1
Y-4, T
3-0.1
Y-4, T
3~T2-.1
Y-19, T
8+TC
1-0.1+5
Y-8, T
7-1
Y-46, T
9-0.01
Y-23, T
8-0.01
Y-11, T
1-0.5
Y-12, T
8-0.1
Y-3, T
1-0.1
Y-9, T
2-0.1
Y-14, T
7-0.1
Y-7, T
4-0.01
Core Number, Surfactant Type, and Percentage
% P
ore
Vo
lum
e O
il R
eco
vere
d(T
erti
ary
Su
rfac
tan
t F
loo
d)
Fig. 5. The performance of waterflooding succeeded by surfactant injection for 20 cases. Performance indicator: pore volume recovery due to
tertiary surfactant injection.
T. Babadagli et al. / Journal of Petroleum Science and Engineering 48 (2005) 37–5244
recovery (Fig. 5) or % OOIP recovery (Fig. 7) did not
show any difference and the same trend was obtained.
In several cases, two surfactant concentration
values were applied for the same surfactant, i.e., T8,
T7, and T1. It is interesting to note that the higher
concentration (lower IFT) did not necessarily yield
higher recovery for two surfactant types (T1 and T7).
For example, for surfactant type T1, 0.5% concentra-
tion (IFT=0.45 mN/m) resulted in higher recovery
(6.59% of OOIP) than that of 0.1% (IFT=1.1 mN/m
and 4.94% of OOIP). But the difference in the IFT
values was trivial. The same can be said for T7. For
surfactant type T8, however, higher concentration
(0.1%) yielded higher recovery (5.1% of OOIP) than
that of (4.9% of OOIP) lower concentration (0.01%).
This is expected because there is a considerable dif-
ference between the IFT values of these two concen-
trations: 8.5 and 0.1 mN/m, respectively (Table 2), as
opposed to the trivial differences in IFT values ob-
served for the different concentrations of surfactant
types T7 and T1.
One sample (Y-4) was exposed to injection of two
different surfactant types. After complete waterflood-
ing, T3 at 0.1% concentration was applied and 2.9%
of OOIP was produced. The process was continued
with a stronger surfactant with high concentration
(T2 at 1%) and an additional recovery of 0.6% of
OOIP was obtained. This indicates that the depen-
dency of the recovery on the surfactant type and
concentration is more pronounced than the previous
flooding history.
3.1.2. Surfactant injection without pre-waterflooding
To clarify whether starting the injection with sur-
factant solution (modified waterflooding) rather than
unmodified waterflooding is more effective, eight
experiments were conducted. The surfactant types
yielding the highest performance in the previous
experiments were selected and the solutions were
injected as modified waterflooding. The lowest and
highest recoveries were observed as 64.17% and
74.8% of OOIP, respectively. The average recovery
was 69.9% of OOIP. Different concentration values
were tested for two surfactant types, T1 and T2.
Higher concentration (or lower IFT) resulted in a
higher recovery for T2 but the opposite was observed
0
10
20
30
40
50
60
70
80
90
100
Y-17, T
11-0.2
Y-22, T
10-0.5
Y-35, T
10-1
Y-44, T
2-0.01
Y-45, T
12-0.1
Y-54, T
11-1
Y-38, T
5-0.1
Y-10, T
6-0.1
Y-4, T
3-0.1
Y-4, T
3~T2-.1
Y-19, T
8+TC
1-0.1+5
Y-8, T
7-1
Y-46, T
9-0.01
Y-23, T
8-0.01
Y-11, T
1-0.5
Y-12, T
8-0.1
Y-3, T
1-0.1
Y-9, T
2-0.1
Y-14, T
7-0.1
Y-7, T
4-0.01
Core Number, Surfactant Type, and Percentage
% o
f O
OIP
Rec
ove
red
Water Flood
Surfactant Flood
Fig. 6. The performance of waterflooding succeeded by surfactant injection for 20 cases. Performance indicator: oil recovery due to
waterflooding and surfactant as % OOIP.
T. Babadagli et al. / Journal of Petroleum Science and Engineering 48 (2005) 37–52 45
for T1. The IFT decreased from 1.1 to 0.45 mN/m
when the concentration is increased from 0.1% to
0.5% for T1. This change is trivial and no significant
effect in the recovery performance is expected. In case
of surfactant type T2, however, the IFT decreased
8 fold (from 7.5 to 0.9 mN/m) by increasing the
concentration from 0.01 to 0.1 mN/m. This is
expected to be the reason behind the difference in
the two recovery values. The performances of T1
and T2 in both modified and unmodified injection
cases are in similar manner.
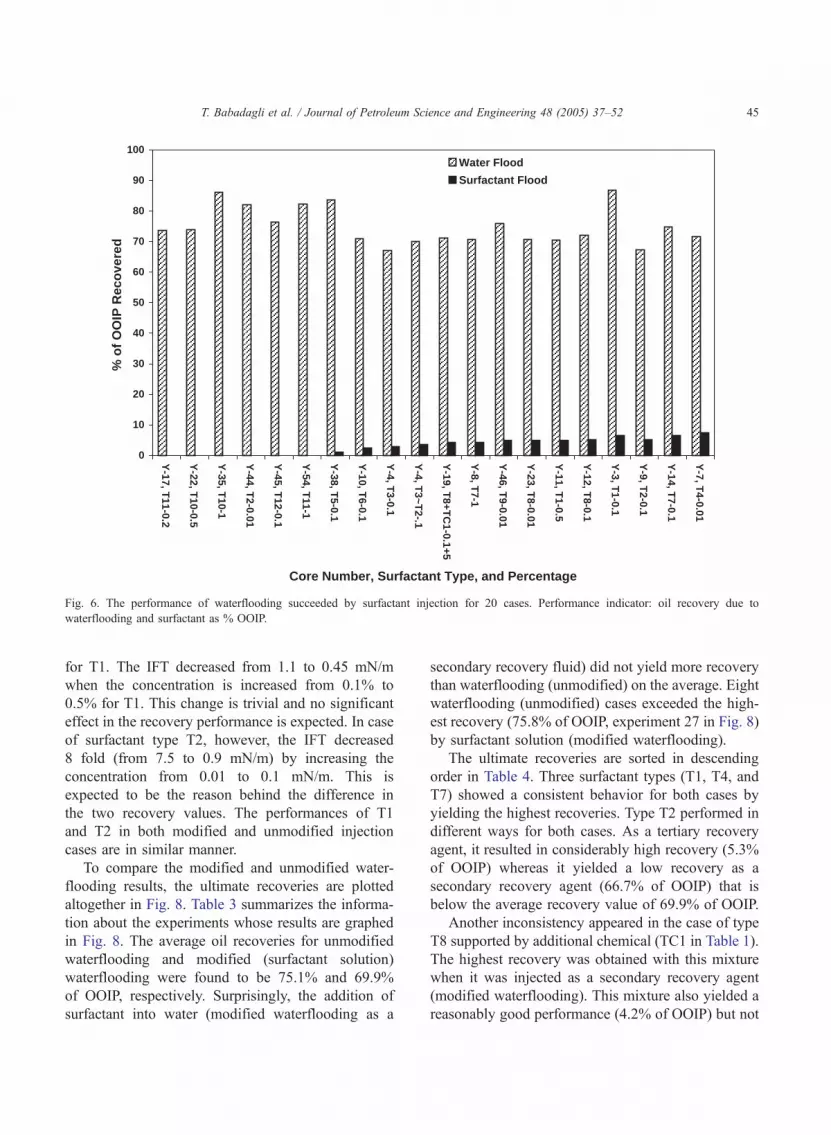
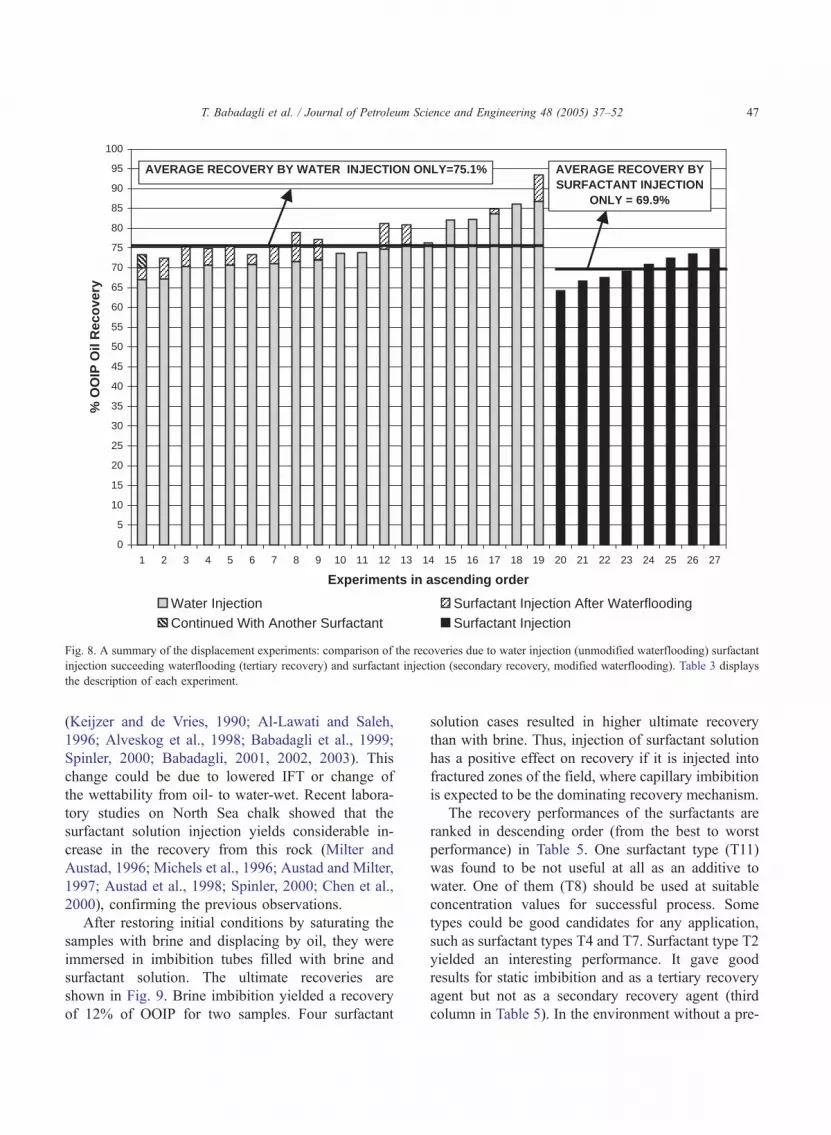
To compare the modified and unmodified water-
flooding results, the ultimate recoveries are plotted
altogether in Fig. 8. Table 3 summarizes the informa-
tion about the experiments whose results are graphed
in Fig. 8. The average oil recoveries for unmodified
waterflooding and modified (surfactant solution)
waterflooding were found to be 75.1% and 69.9%
of OOIP, respectively. Surprisingly, the addition of
surfactant into water (modified waterflooding as a
secondary recovery fluid) did not yield more recovery
than waterflooding (unmodified) on the average. Eight
waterflooding (unmodified) cases exceeded the high-
est recovery (75.8% of OOIP, experiment 27 in Fig. 8)
by surfactant solution (modified waterflooding).
The ultimate recoveries are sorted in descending
order in Table 4. Three surfactant types (T1, T4, and
T7) showed a consistent behavior for both cases by
yielding the highest recoveries. Type T2 performed in
different ways for both cases. As a tertiary recovery
agent, it resulted in considerably high recovery (5.3%
of OOIP) whereas it yielded a low recovery as a
secondary recovery agent (66.7% of OOIP) that is
below the average recovery value of 69.9% of OOIP.
Another inconsistency appeared in the case of type
T8 supported by additional chemical (TC1 in Table 1).
The highest recovery was obtained with this mixture
when it was injected as a secondary recovery agent
(modified waterflooding). This mixture also yielded a
reasonably good performance (4.2% of OOIP) but not
0.0 0.0 0.0 0.0 0.0 0.0
1.2
2.52.9
3.5
4.2 4.2
4.9 4.9 4.95.1
6.6
5.3
6.5
7.4
0
2
4
6
8
10
Y-17, T
11-0.2
Y-22, T
10-0.5
Y-35, T
10-1
Y-44, T
2-0.01
Y-45, T
12-0.1
Y-54, T
11-1
Y-38, T
5-0.1
Y-10, T
6-0.1
Y-4, T
3-0.1
Y-4, T
3~T2-.1
Y-19, T
8+TC
1-0.1+5
Y-8, T
7-1
Y-46, T
9-0.01
Y-23, T
8-0.01
Y-11, T
1-0.5
Y-12, T
8-0.1
Y-3, T
1-0.1
Y-9, T
2-0.1
Y-14, T
7-0.1
Y-7, T
4-0.01
Core Number, Surfactant Type, and Percentage
% o
f O
OIP
Rec
ove
red
by
Ter
tiar
y S
urf
acta
nt
Flo
od
Fig. 7. The performance of waterflooding succeeded by surfactant injection for 20 cases. Performance indicator: recovery due to tertiary
surfactant injection as % OOIP.
T. Babadagli et al. / Journal of Petroleum Science and Engineering 48 (2005) 37–5246
the highest as a tertiary injection agent (tertiary injec-
tion of surfactant solution).
The performances of T8 supported by the mutual
solvent (TC1) as injectants in secondary and tertiary
injection processes needed further analysis. The addi-
tive TC1 (mutual solvent) is commonly used in silica
origin formation to prevent the adsorption of surfac-
tant onto silica surface, emulsion preventer, and ren-
der the silica water-wet when mixed with an anionic
surfactant. Because of these properties, it yielded the
highest recovery among the surfactant (modified
waterflooding) cases. In other words, it provided a
better penetration of the injected fluid into formation.
This validates the second point above regarding the
microemulsion effects on the recovery by surfactant
solution injection. As a tertiary injection fluid (after
waterflooding) the addition of the mutual solvent did
not result in an increase in the recovery. Surfactant
type T8 yielded additional 5.1% of OOIP recovery at
0.1% concentration. With the addition of the mutual
solvent, the recovery was 4.2% of OOIP.
When the surfactant solution is injected as a sec-
ondary recovery fluid, the critical issue is the better
penetration of the fluid provided by less emulsion,
more water wettability, and less adsorption. On the
other hand, when the surfactant is injected as a tertiary
recovery fluid (after waterflooding) the critical issue is
the reduced IFT between oil and water and oil and
rock rather than a better penetration causing a better
sweep.
3.2. Static imbibition experiments
This type of experimentation was conducted to
clarify recovery due to capillary imbibition in the
fractured portions of the Shuaiba chalk. Surfactant
solutions are expected to change capillary imbibition
performance on sandstone and chalky carbonates
0
5
10
15
20
25
30
35
40
45
50
55
60
65
70
75
80
85
90
95
100
1 2 3 4 5 6 7 8 9 10 11 12 13 14 15 16 17 18 19 20 21 22 23 24 25 26 27
Experiments in ascending order
% O
OIP
Oil
Rec
ove
ry
Water Injection Surfactant Injection After WaterfloodingContinued With Another Surfactant Surfactant Injection
AVERAGE RECOVERY BY WATER INJECTION ONLY=75.1% AVERAGE RECOVERY BY SURFACTANT INJECTION
ONLY = 69.9%
Fig. 8. A summary of the displacement experiments: comparison of the recoveries due to water injection (unmodified waterflooding) surfactant
injection succeeding waterflooding (tertiary recovery) and surfactant injection (secondary recovery, modified waterflooding). Table 3 displays
the description of each experiment.
T. Babadagli et al. / Journal of Petroleum Science and Engineering 48 (2005) 37–52 47
(Keijzer and de Vries, 1990; Al-Lawati and Saleh,
1996; Alveskog et al., 1998; Babadagli et al., 1999;
Spinler, 2000; Babadagli, 2001, 2002, 2003). This
change could be due to lowered IFT or change of
the wettability from oil- to water-wet. Recent labora-
tory studies on North Sea chalk showed that the
surfactant solution injection yields considerable in-
crease in the recovery from this rock (Milter and
Austad, 1996; Michels et al., 1996; Austad and Milter,
1997; Austad et al., 1998; Spinler, 2000; Chen et al.,
2000), confirming the previous observations.
After restoring initial conditions by saturating the
samples with brine and displacing by oil, they were
immersed in imbibition tubes filled with brine and
surfactant solution. The ultimate recoveries are
shown in Fig. 9. Brine imbibition yielded a recovery
of 12% of OOIP for two samples. Four surfactant
solution cases resulted in higher ultimate recovery
than with brine. Thus, injection of surfactant solution
has a positive effect on recovery if it is injected into
fractured zones of the field, where capillary imbibition
is expected to be the dominating recovery mechanism.
The recovery performances of the surfactants are
ranked in descending order (from the best to worst
performance) in Table 5. One surfactant type (T11)
was found to be not useful at all as an additive to
water. One of them (T8) should be used at suitable
concentration values for successful process. Some
types could be good candidates for any application,
such as surfactant types T4 and T7. Surfactant type T2
yielded an interesting performance. It gave good
results for static imbibition and as a tertiary recovery
agent but not as a secondary recovery agent (third
column in Table 5). In the environment without a pre-
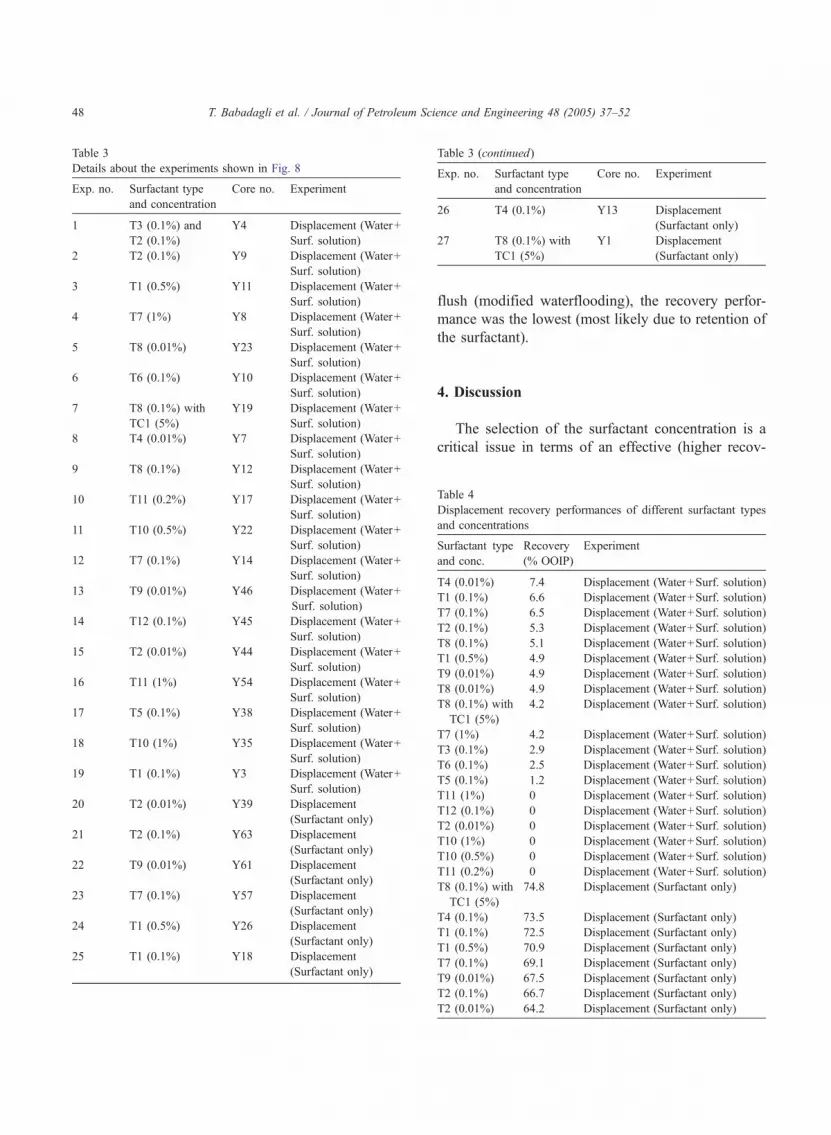
Table 3
Details about the experiments shown in Fig. 8
Exp. no. Surfactant type
and concentration
Core no. Experiment
1 T3 (0.1%) and
T2 (0.1%)
Y4 Displacement (Water+
Surf. solution)
2 T2 (0.1%) Y9 Displacement (Water+
Surf. solution)
3 T1 (0.5%) Y11 Displacement (Water+
Surf. solution)
4 T7 (1%) Y8 Displacement (Water+
Surf. solution)
5 T8 (0.01%) Y23 Displacement (Water+
Surf. solution)
6 T6 (0.1%) Y10 Displacement (Water+
Surf. solution)
7 T8 (0.1%) with
TC1 (5%)
Y19 Displacement (Water+
Surf. solution)
8 T4 (0.01%) Y7 Displacement (Water+
Surf. solution)
9 T8 (0.1%) Y12 Displacement (Water+
Surf. solution)
10 T11 (0.2%) Y17 Displacement (Water+
Surf. solution)
11 T10 (0.5%) Y22 Displacement (Water+
Surf. solution)
12 T7 (0.1%) Y14 Displacement (Water+
Surf. solution)
13 T9 (0.01%) Y46 Displacement (Water+
Surf. solution)
14 T12 (0.1%) Y45 Displacement (Water+
Surf. solution)
15 T2 (0.01%) Y44 Displacement (Water+
Surf. solution)
16 T11 (1%) Y54 Displacement (Water+
Surf. solution)
17 T5 (0.1%) Y38 Displacement (Water+
Surf. solution)
18 T10 (1%) Y35 Displacement (Water+
Surf. solution)
19 T1 (0.1%) Y3 Displacement (Water+
Surf. solution)
20 T2 (0.01%) Y39 Displacement
(Surfactant only)
21 T2 (0.1%) Y63 Displacement
(Surfactant only)
22 T9 (0.01%) Y61 Displacement
(Surfactant only)
23 T7 (0.1%) Y57 Displacement
(Surfactant only)
24 T1 (0.5%) Y26 Displacement
(Surfactant only)
25 T1 (0.1%) Y18 Displacement
(Surfactant only)
Table 3 (continued)
Exp. no. Surfactant type
and concentration
Core no. Experiment
26 T4 (0.1%) Y13 Displacement
(Surfactant only)
27 T8 (0.1%) with
TC1 (5%)
Y1 Displacement
(Surfactant only)
T. Babadagli et al. / Journal of Petroleum Science and Engineering 48 (2005) 37–5248
flush (modified waterflooding), the recovery perfor-
mance was the lowest (most likely due to retention of
the surfactant).
4. Discussion
The selection of the surfactant concentration is a
critical issue in terms of an effective (higher recov-
Table 4
Displacement recovery performances of different surfactant types
and concentrations
Surfactant type
and conc.
Recovery
(% OOIP)
Experiment
T4 (0.01%) 7.4 Displacement (Water+Surf. solution)
T1 (0.1%) 6.6 Displacement (Water+Surf. solution)
T7 (0.1%) 6.5 Displacement (Water+Surf. solution)
T2 (0.1%) 5.3 Displacement (Water+Surf. solution)
T8 (0.1%) 5.1 Displacement (Water+Surf. solution)
T1 (0.5%) 4.9 Displacement (Water+Surf. solution)
T9 (0.01%) 4.9 Displacement (Water+Surf. solution)
T8 (0.01%) 4.9 Displacement (Water+Surf. solution)
T8 (0.1%) with
TC1 (5%)
4.2 Displacement (Water+Surf. solution)
T7 (1%) 4.2 Displacement (Water+Surf. solution)
T3 (0.1%) 2.9 Displacement (Water+Surf. solution)
T6 (0.1%) 2.5 Displacement (Water+Surf. solution)
T5 (0.1%) 1.2 Displacement (Water+Surf. solution)
T11 (1%) 0 Displacement (Water+Surf. solution)
T12 (0.1%) 0 Displacement (Water+Surf. solution)
T2 (0.01%) 0 Displacement (Water+Surf. solution)
T10 (1%) 0 Displacement (Water+Surf. solution)
T10 (0.5%) 0 Displacement (Water+Surf. solution)
T11 (0.2%) 0 Displacement (Water+Surf. solution)
T8 (0.1%) with
TC1 (5%)
74.8 Displacement (Surfactant only)
T4 (0.1%) 73.5 Displacement (Surfactant only)
T1 (0.1%) 72.5 Displacement (Surfactant only)
T1 (0.5%) 70.9 Displacement (Surfactant only)
T7 (0.1%) 69.1 Displacement (Surfactant only)
T9 (0.01%) 67.5 Displacement (Surfactant only)
T2 (0.1%) 66.7 Displacement (Surfactant only)
T2 (0.01%) 64.2 Displacement (Surfactant only)
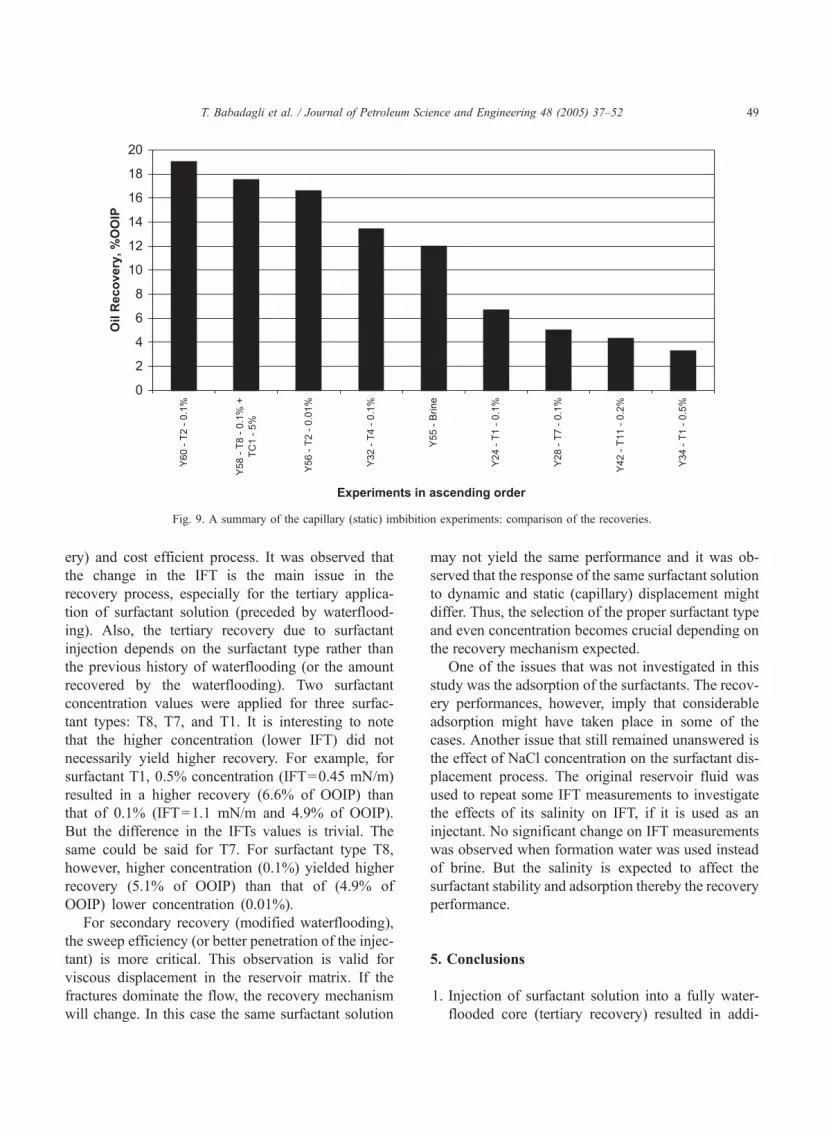
0
2
4
6
8
10
12
14
16
18
20
Y6
0 -
T2
- 0
.1%
Y58 -
T8 -
0.1
% +
TC
1 -
5%
Y5
6 -
T2
- 0
.01
%
Y3
2 -
T4
- 0
.1%
Y5
5 -
Bri
ne
Y2
4 -
T1
- 0
.1%
Y2
8 -
T7
- 0
.1%
Y4
2 -
T1
1 -
0.2
%
Y3
4 -
T1
- 0
.5%
Experiments in ascending order
Oil R
eco
very
, %
OO
IP
Fig. 9. A summary of the capillary (static) imbibition experiments: comparison of the recoveries.
T. Babadagli et al. / Journal of Petroleum Science and Engineering 48 (2005) 37–52 49
ery) and cost efficient process. It was observed that
the change in the IFT is the main issue in the
recovery process, especially for the tertiary applica-
tion of surfactant solution (preceded by waterflood-
ing). Also, the tertiary recovery due to surfactant
injection depends on the surfactant type rather than
the previous history of waterflooding (or the amount
recovered by the waterflooding). Two surfactant
concentration values were applied for three surfac-
tant types: T8, T7, and T1. It is interesting to note
that the higher concentration (lower IFT) did not
necessarily yield higher recovery. For example, for
surfactant T1, 0.5% concentration (IFT=0.45 mN/m)
resulted in a higher recovery (6.6% of OOIP) than
that of 0.1% (IFT=1.1 mN/m and 4.9% of OOIP).
But the difference in the IFTs values is trivial. The
same could be said for T7. For surfactant type T8,
however, higher concentration (0.1%) yielded higher
recovery (5.1% of OOIP) than that of (4.9% of
OOIP) lower concentration (0.01%).
For secondary recovery (modified waterflooding),
the sweep efficiency (or better penetration of the injec-
tant) is more critical. This observation is valid for
viscous displacement in the reservoir matrix. If the
fractures dominate the flow, the recovery mechanism
will change. In this case the same surfactant solution
may not yield the same performance and it was ob-
served that the response of the same surfactant solution
to dynamic and static (capillary) displacement might
differ. Thus, the selection of the proper surfactant type
and even concentration becomes crucial depending on
the recovery mechanism expected.
One of the issues that was not investigated in this
study was the adsorption of the surfactants. The recov-
ery performances, however, imply that considerable
adsorption might have taken place in some of the
cases. Another issue that still remained unanswered is
the effect of NaCl concentration on the surfactant dis-
placement process. The original reservoir fluid was
used to repeat some IFT measurements to investigate
the effects of its salinity on IFT, if it is used as an
injectant. No significant change on IFT measurements
was observed when formation water was used instead
of brine. But the salinity is expected to affect the
surfactant stability and adsorption thereby the recovery
performance.
5. Conclusions
1. Injection of surfactant solution into a fully water-
flooded core (tertiary recovery) resulted in addi-
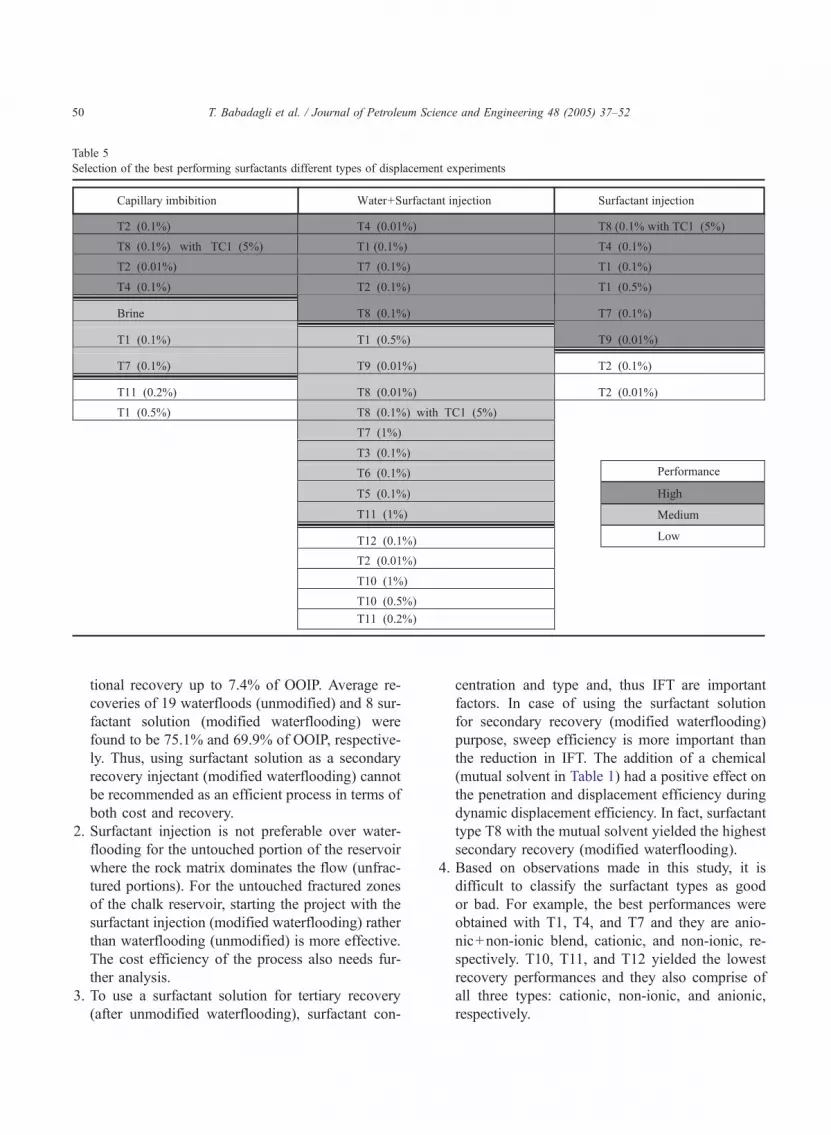
Table 5
Selection of the best performing surfactants different types of displacement experiments
T. Babadagli et al. / Journal of Petroleum Science and Engineering 48 (2005) 37–5250
tional recovery up to 7.4% of OOIP. Average re-
coveries of 19 waterfloods (unmodified) and 8 sur-
factant solution (modified waterflooding) were
found to be 75.1% and 69.9% of OOIP, respective-
ly. Thus, using surfactant solution as a secondary
recovery injectant (modified waterflooding) cannot
be recommended as an efficient process in terms of
both cost and recovery.
2. Surfactant injection is not preferable over water-
flooding for the untouched portion of the reservoir
where the rock matrix dominates the flow (unfrac-
tured portions). For the untouched fractured zones
of the chalk reservoir, starting the project with the
surfactant injection (modified waterflooding) rather
than waterflooding (unmodified) is more effective.
The cost efficiency of the process also needs fur-
ther analysis.
3. To use a surfactant solution for tertiary recovery
(after unmodified waterflooding), surfactant con-
centration and type and, thus IFT are important
factors. In case of using the surfactant solution
for secondary recovery (modified waterflooding)
purpose, sweep efficiency is more important than
the reduction in IFT. The addition of a chemical
(mutual solvent in Table 1) had a positive effect on
the penetration and displacement efficiency during
dynamic displacement efficiency. In fact, surfactant
type T8 with the mutual solvent yielded the highest
secondary recovery (modified waterflooding).
4. Based on observations made in this study, it is
difficult to classify the surfactant types as good
or bad. For example, the best performances were
obtained with T1, T4, and T7 and they are anio-
nic+non-ionic blend, cationic, and non-ionic, re-
spectively. T10, T11, and T12 yielded the lowest
recovery performances and they also comprise of
all three types: cationic, non-ionic, and anionic,
respectively.
T. Babadagli et al. / Journal of Petroleum Science and Engineering 48 (2005) 37–52 51
Acknowledgments
We would like to thank the Ministry of Oil and Gas,
Oman for the permission to publish this paper. This
study was supported by an internal grant from Sultan
Qaboos University (SQU) (IG/ENG/PMRE/99/01) and
a project from Petroleum Development Oman (PDO)
(CR/ENG/PMRE/01/12). We gratefully acknowledge
this support.
We greatly benefited from the discussion sessions
with Said Al-Abri, Dan Rayes, William I. Ferguson,
Iain Blair, Chris Mijnssen, Amran Al-Marhubi, and
Mohammed Al-Lawatia (PDO) at different phases of
the project. We are also thankful to Brian Thomson
(PDO) for the preparation of the core plugs used in the
experiments and Nayar Afzal (SQU) for the assistance
during the lab work.
Lastly, we wish to express our gratitude to Erkan
Fidan and Matt Ohler (Halliburton Worldwide) for
providing some of the surfactants used in the experi-
ments. Detailed information on the use of the surfac-
tants given by Erkan Fidan was so helpful in leading
us to the right direction during the experimental study.
This paper is an enhanced version of SPE 78352
that was presented at the 2002 SPE EUROPEC,
Aberdeen, UK, Oct. 29–31.
References
Al-Lawati, S., Saleh, S., 1996. Oil recovery in fractured oil reser-
voirs by low IFT imbibition process. SPE 36688, SPE Annual
Tech. Conf. and Exh. Denver, CO, Oct. 6–9.
Alveskog, P.L., Holt, T., Torsaeter, O., 1998. The effect of surfactant
concentration on the Amott wettability index and residual oil
saturation. J. Pet. Sci. Eng. 20, 247–252.
Austad, T., Milter, J., 1997. Spontaneous imbibition of water into
low permeable chalk at different wettabilities using surfactants.
SPE 37236, SPE Int. Symp. On Oilfield Chemistry, Houston,
TX, Feb. 18–21.
Austad, T., et al., 1998. Chemical flooding of oil reservoirs 8:
spontaneous oil expulsion from oil- and water-wet low-per-
meable chalk material by imbibition of aqueous surfactant
solutions. Colloids Surf., A Physicochem. Eng. Asp. 137,
117.
Babadagli, T., 2001. Scaling of capillary co-current and counter-
current capillary imbibition for surfactant and polymer injection
in naturally fractured reservoirs. SPEJ, 465–478 (December).
Babadagli, T., 2002. Dynamics of capillary imbibition when surfac-
tant, polymer and hot water are used as aqueous phase.
J. Colloid Interface Sci. 246 (1), 203–213.
Babadagli, T., 2003. Selection of proper enhanced oil recovery
fluid for efficient matrix recovery in fractured oil reser-
voirs. Colloids Surf., A Physicochem. Eng. Asp. 223 (1–3),
57–175.
Babadagli, T., Al-Bemani, A., Boukadi, F., 1999. Analysis of
capillary imbibition recovery considering the simultaneous
effects of gravity, low IFT, and boundary conditions. SPE
57321, SPE Asia Pacific Improved Oil Recovery Conference,
Kuala Lumpur, Malaysia, Oct. 25–26.
Bae, J.H., 1985. Glenn Pool surfactant-flood expansion project: a
technical summary. SPE Reserv. Eng., 123 (May).
Bae, J.H., Petrick, C.B., 1986. Glenn Pool surfactant flood pilot test:
comparison of laboratory and observation-well data. SPE
Reserv. Eng., 593 (November).
Bae, J.H., Syed, E.U., 1986. Glenn Pool surfactant flood pilot tests:
part II-field operations. SPE 15551, SPE 61st Annual Technical
Conference and Exhibition, New Orleans, LA, October 5–8.
Barua, J., Prescott, T., Haldorsen, H.H., 1986. Financial and tech-
nical decision making for surfactant flooding. SPE 15074, SPE
56th Calif. Reg. Meet., Oakland, CA, April, pp. 2–4.
Baviere, M., Glenat, P.P., Plazanet, V., Labrid, J., 1994. Improve-
ment of the efficiency /cost ratio of chemical EOR processes by
using surfactants, polymers, and alkalis in combination. SPE/
DOE 27821, SPE Ninth Symposium on Imp. Oil Rec., Tulsa,
OK, April 17–20.
Blaskovich, F.T., Thurber, S.S., Echois, D.P., Al-Hinai, K.B.M.,
1985. Reservoir management of the Yibal field in north
Oman: a simulation approach. SPE 13716, SPE Middle East
Oil Tech. Conf. and Exh., Bahrain, March 11–14.
Bos, C.F.M., 1989. Planning of an appraisal/development program
for the complex Khuff carbonate reservoir in the Yibal Field,
north Oman. SPE 17988, SPE Middle East Oil Tech. Conf. and
Exh., Bahrain, March 11–14.
Boneau, D.F., Clampitt, R.L., 1977. A surfactant system for the oil-
wet sandstone of the north Burbank unit. JPT, 501 (May).
Chen, H.L., Lucas, L.R., Nogaret, L.A.D., Yang, H.D., Kenyon,
D.E., 2000. Laboratory monitoring of surfactant imbibition
using computerized tomography. SPE 59006, SPE Int. Petr.
Conf. and Exh., Veracruz, Mexico, Feb., pp. 1–3.
Clark, S.R., Pitts, M.J., Smith, S.M., 1988. Design and application
of an alkaline-surfactant-polymer recovery system to the west
Kiehl field. SPE 17538, SPE Rocky Mountain Regional Meet-
ing held in Casper, WY, May 11–13.
Eckford, P., 1999. Justifying a full field rationalisation: preparing
the Yibal field for the next 30 years. SPE 53226, SPE Middle
East Oil Tech. Conf. and Exh. Bahrain, Feb. 20–23.
Flumerfelt, R.W., Li, X., Cox, J.C., Hsu, W.F., 1993. A cyclic
surfactant-based imbibition/solution gas drive process for low-
permeability, fractured reservoirs. SPE 26373, SPE Ann. Tech.
Conf. and Exh. Houston, TX, Oct., pp. 3–6.
Grant, A.J., 1981. Large scale waterflooding in the Yibal Shuaiba
chalk reservoir, Oman: field performance and simulation stud-
ies. SPE 9587, SPE Middle East Oil Tech. Conf. and Exh.
Bahrain, March 9–12.
Hong, S.A., Bae, J.H., 1990. Field experiment of lignosulfonate
preflushing for surfactant adsorption reduction. SPE Reserv.
Eng., 467 (November).
T. Babadagli et al. / Journal of Petroleum Science and Engineering 48 (2005) 37–5252
Hurd, B.G., 1976. Adsorption and transport of chemical species in
laboratory surfactant waterflooding experiments. SPE 5818, SPE
Improved Oil Recovery Symposium, Tulsa, OK, March 22–24.
Jakobsen, S.R., Hovland, F., 1994. Surfactant flooding: technical
and economical conditions to succeed. SPE 27824, SPE/DOE
Ninth Symp. on Imp. Oil Rec., Tulsa, OK, April, pp. 17–20.
Keijzer, P.P.M., de Vries, A.S., 1990. Imbibition of surfactant solu-
tions. SPE 20222, SPE/DOE 7th Symp. on Enhanced Oil Re-
covery, Tulsa, OK, April, pp. 22–25.
Kuhlman, M.I., Lau, H.C., Falls, A.H., 2000. Surfactant criteria for
successful carbon dioxide foam in sandstone reservoirs. SPE
Reserv. Evalu. Eng., 35 (February).
Lawson, J.B., 1978. The adsorption of non-ionic and anionic sur-
factants of sandstone and carbonate. SPE 7052, SPE Fifth
Symp. on Imp. Oil Rec., Tulsa, OK, April 16–19.
Lawson, J.B., Dilgren, R.E., 1978. Adsorption of sodium alkyl aryl
sulfonates on sandstone. SPEJ, 75 (February).
Lewis, S.J., Verkruyse, L.A., Salter, S.J., 1986. Selection of non-
ionic surfactants for minimized adsorption and maximized sol-
ubilization. SPE/DOE 14910, SPE Fifth Symp. on Enh. Oil Rec,
Tulsa, OK, April 20–23.
Litsey, L.R., MacBride, W.L., Al-Hinai, K.M., Dismukes, N.B.,
1986. Shuaiba reservoir geological study, Yibal field, Oman.
JPT, 651 (June).
Maerker, J.M., Gale, W.W., 1992. Surfactant flood process design
for Loudon. SPE Reserv. Eng., 36 (February).
Mannhardt, K., Schramm, L.L., Novosad, J.J., 1990. Effect of rock
type and brine composition on adsorption of two foam-forming
surfactants. SPE 20463, SPE 65th Annual Technical Conference
and Exhibition, New Orleans, LA, September 23–26.
Michels, A.M., Djojosoeparto, R.S., Haas, H., Mattern, R.B., van
der Weg, P.B., Schulte, W.M., 1996. Enhanced waterflooding
design with dilute surfactant concentrations for North Sea con-
ditions. SPE Reserv. Eng., 189 (Aug.).
Milter, J., Austad, T., 1996. Chemical flooding of oil reservoirs 6:
evaluation of the mechanism for oil expulsion by spontaneous
imbibition of brine with and without surfactant in water-wet,
low-permeable, chalk material. Colloids Surf., A Physicochem.
Eng. Asp. 113, 269.
Mugheiry, M.A., Al-Barwany, A., Al-Abry, Y., Lozano, J., Al-
Lawati, M., 2001. A pragmatic approach to injection manage-
ment of a large water flood in the largest field in Oman. SPE
68068, Middle East Oil Tech. Conf. and Exh. held in Bahrain,
March 17–20.
Ramirez, W.F., Friedman, F., Denoyelle, L.C., Shuler, P.J., 1980.
Adsorption and interfacial tension dynamics of surfactants in
porous media. SPE 9280, SPE 55th Annual Fall Technical
Conference and Exhibition, Dallas, Texas, September 21–24.
Saad, N., Pope, G.A., Sepehrnoori, K., 1989. Simulation of Big
Muddy surfactant pilot. SPE Reserv. Eng., 24 (February).
Salager, J.L., Morgan, J.C., Schechter, R.S., Wade, W.H., Vasquez,
E., 1979a. Optimum formulation of surfactant/water/oil systems
for minimum interfacial tension or phase behavior. SPEJ, 107
(April).
Salager, J.L., Bourrel, M., Schechter, R.S., Wade, W.H., 1979b.
Mixing rules for optimum phase behavior formulations of sur-
factant/oil/water systems. SPEJ, 271 (October).
Spinler, E.A., 2000. Enhancement of oil recovery using a low
concentration of surfactant to improve spontaneous and forced
imbibition in chalk. SPE 59290, SPE/DOE Imp. Oil. Rec.
Symp., Tulsa, OK, April, pp. 3–5.
Stournas, S., 1983. Brine-resistant sulfonate surfactants for en-
hanced oil recovery. SPE 11773, SPE International Sympo-
sium on Oilfield and Geothermal Chemistry, Denver, CO.,
June 1–3.
Tabatabai, A., Gonzalez, M.V., Harwell, J.H., Scamehorn, J.F.,
1991. Reducing surfactant adsorption on carbonate reservoirs.
SPE 24105 Unsolicited.
Tsau, J.S., Syahputra, A.E., Grigg, R.B., 2000. Economic evaluation
of surfactant adsorption in CO2 foam application. SPE 59365,
SPE/DOE Improved Oil Recovery Symposium, Tulsa, OK,
April 3–5.