'A Great Big Melting Pot: Exploring Patterns of Glass Supply, Consumption and Recycling in Roman...
28
A GREAT BIG MELTING POT: EXPLORING PATTERNS OF GLASS SUPPLY, CONSUMPTION AND RECYCLING IN ROMAN COPPERGATE, YORK* C. M. JACKSON† Department of Archaeology, University of Sheffield, Northgate House, West Street, Sheffield S1 4ET, UK and S. PAYNTER English Heritage, Fort Cumberland, Fort Cumberland Road, Eastney, Portsmouth PO4 9LD, UK One hundred and ninety three glass fragments from the canabae in York were analysed (first to fourth centuries). They fall into six compositional groups: antimony colourless (Sb), high- manganese (high-Mn), low-manganese (low-Mn), mixed antimony and manganese (Sb–Mn), high iron, manganese and titanium (HIMT) and plant ash. Some groups represent production groups, some of which appear to be in limited supply in this western outpost, but are more prevalent elsewhere, and others reflect changing supply mechanisms. The majority of glasses fall into groups that demonstrate extensive recycling of glass. This has important implications for determining provenance using trace elements and isotopes. KEYWORDS: ROMAN GLASS, NATURALLY COLOURED, COLOURLESS, ANTIMONY, MANGANESE, PRODUCTION GROUPS, RECYCLING, BRITAIN, ICP–AES THE ROMAN GLASS FROM COPPERGATE Although perhaps best known for its Viking deposits (Hall 1984), the site at 16–22 Coppergate, York also produced deposits rich in Roman finds, including glass. The putative glass-making or glassworking remains have already been published (Jackson et al. 2003), but the site also yielded a large assemblage of glass fragments, typical of a consumption assemblage from the first to fourth centuries and which is probably unrelated to the glassworking debris found at the site (Jackson 1992). The assemblage comprises forms that can be dated from the first to fourth centuries and represents a microcosm of glass found in the western provinces at this period. The scale of the assemblage is not surprising: Eboracum (Roman York) was an important Roman centre in Britain, occupied from ad 71 to 410, housing a fortress and large manufacturing and civilian districts. Coppergate was outside the fortress, within the city walls, and is likely to have been a trading or manufacturing area as part of the canabae, although Roman remains from the site have been largely robbed (Mainman 1990). Within scientific research into Roman glass, the composition of colourless glass has been well studied, as has later glass from the mid-third and fourth centuries onwards (e.g., Freestone et al. 2005; Jackson 2005; Paynter 2006; Silvestri et al. 2008; Foster and Jackson 2009, 2010; Gallo et al. 2013), but naturally coloured glass of the first to third centuries has often been neglected. ‘Naturally coloured’ here describes transparent glass with a range of mostly *Received 17 June 2014; accepted 22 October 2014 †Corresponding author: email C.M.Jackson@Sheffield.ac.uk Archaeometry ••, •• (2015) ••–•• doi: 10.1111/arcm.12158 © 2015 The Authors. Archaeometry published by John Wiley & Sons Ltd on behalf of University of Oxford This is an open access article under the terms of the Creative Commons Attribution License, which permits use, distribution and reproduction in any medium, provided the original work is properly cited.
-
Upload
independent -
Category
Documents
-
view
1 -
download
0
Transcript of 'A Great Big Melting Pot: Exploring Patterns of Glass Supply, Consumption and Recycling in Roman...
A GREAT BIG MELTING POT: EXPLORING PATTERNS OFGLASS SUPPLY, CONSUMPTION AND RECYCLING IN
ROMAN COPPERGATE, YORK*
C. M. JACKSON†
Department of Archaeology, University of Sheffield, Northgate House, West Street, Sheffield S1 4ET, UK
and S. PAYNTER
English Heritage, Fort Cumberland, Fort Cumberland Road, Eastney, Portsmouth PO4 9LD, UK
One hundred and ninety three glass fragments from the canabae in York were analysed (firstto fourth centuries). They fall into six compositional groups: antimony colourless (Sb), high-manganese (high-Mn), low-manganese (low-Mn), mixed antimony and manganese (Sb–Mn),high iron, manganese and titanium (HIMT) and plant ash. Some groups represent productiongroups, some of which appear to be in limited supply in this western outpost, but are moreprevalent elsewhere, and others reflect changing supply mechanisms. The majority of glassesfall into groups that demonstrate extensive recycling of glass. This has important implicationsfor determining provenance using trace elements and isotopes.
KEYWORDS: ROMAN GLASS, NATURALLY COLOURED, COLOURLESS, ANTIMONY,MANGANESE, PRODUCTION GROUPS, RECYCLING, BRITAIN, ICP–AES
THE ROMAN GLASS FROM COPPERGATE
Although perhaps best known for its Viking deposits (Hall 1984), the site at 16–22 Coppergate,York also produced deposits rich in Roman finds, including glass. The putative glass-making orglassworking remains have already been published (Jackson et al. 2003), but the site also yieldeda large assemblage of glass fragments, typical of a consumption assemblage from the first tofourth centuries and which is probably unrelated to the glassworking debris found at the site(Jackson 1992). The assemblage comprises forms that can be dated from the first to fourthcenturies and represents a microcosm of glass found in the western provinces at this period. Thescale of the assemblage is not surprising: Eboracum (Roman York) was an important Romancentre in Britain, occupied from ad 71 to 410, housing a fortress and large manufacturing andcivilian districts. Coppergate was outside the fortress, within the city walls, and is likely to havebeen a trading or manufacturing area as part of the canabae, although Roman remains from thesite have been largely robbed (Mainman 1990).
Within scientific research into Roman glass, the composition of colourless glass has beenwell studied, as has later glass from the mid-third and fourth centuries onwards (e.g., Freestoneet al. 2005; Jackson 2005; Paynter 2006; Silvestri et al. 2008; Foster and Jackson 2009,2010; Gallo et al. 2013), but naturally coloured glass of the first to third centuries has oftenbeen neglected. ‘Naturally coloured’ here describes transparent glass with a range of mostly
*Received 17 June 2014; accepted 22 October 2014†Corresponding author: email [email protected]
bs_bs_banner
Archaeometry ••, •• (2015) ••–•• doi: 10.1111/arcm.12158
© 2015 The Authors.Archaeometry published by John Wiley & Sons Ltd on behalf of University of OxfordThis is an open access article under the terms of the Creative Commons Attribution License, which permits use, distribution andreproduction in any medium, provided the original work is properly cited.
blue–green hues caused by small amounts of iron oxide in the glass (Price and Cottam 1998),as opposed to containing intentionally added colourants. The Coppergate assemblage is sig-nificant because it includes naturally coloured, as well as colourless, glass in many commonforms from a long-lived site, including many fragments that date from the second and thirdcenturies. This study is therefore able to analyse a large corpus of material from a single siteto demonstrate the availability of different raw glass types, and the extent of recycled glasswithin the trading network operating throughout the Roman world. By identifying changingglass compositions through time and noting which compositional types were used to manu-facture different objects, the study will begin to fill a void in our knowledge of the consump-tion of glasses in the far north-west provinces. Within a system where glass was centrallyproduced and then distributed and reworked elsewhere, glass groups found in a British contextcan be compared to those found elsewhere across the empire (e.g., Arletti et al. 2008; Schibilleet al. 2012; Gallo et al. 2013) to enable a better understanding of the complex web of themovement of raw glasses, the consumption of raw and recycled glass at different glass work-shops, through to the use of different glass types in finished objects at settlement sites over aperiod of 400 years.
The samples chosen for analysis are representative of the glass artefacts found at the site. Theuse of diagnostic pieces from recognizable objects of known date allows a relative chronology tobe determined for the different compositional groups of glass (Price and Cottam 1998), resultingin a broad timeline for each composition and form of the glass artefacts in circulation (especiallyimportant because of the disturbance of contexts at this site). The number of diagnostic formsincluded was limited because the analytical technique required relatively large samples anddestructive sampling; therefore the use of non-diagnostic fragments provides further evidence fordifferent compositions at the site. A variety of forms, typical of a large consumption assemblage,are represented, including vessels, such as bottles, cups, jars and beakers, and window glass,some produced by blowing and some by casting. The range of vessels shows that occupation atthe site spanned the first to fourth centuries. These include first-century forms (Isings 3, pillarmoulded bowls), globular jugs (first to early second centuries, Isings 52), cylindrical cups(second to third centuries, Isings 85b), cylindrical bottles (late second to early third centuries,Isings 50/51) and fourth-century conical beakers (Isings 106). This group of glasses is one of thelargest assemblages of common types and forms from the late first to fourth centuries—but mostimportantly from the second and third centuries—to be analysed from Britain and as suchprovides a valuable data set of chemical compositions for naturally coloured and colourless glassin this period.
THE PRODUCTION AND CIRCULATION OF ROMAN GLASS
Roman glass was typically made with sand and natron (or trona) as the alkali, and it is nowgenerally believed, as postulated by Sayre (1964) and Velde (1990), that the consistent compo-sition seen in most Roman glass is because it was manufactured in large installations and thentraded as raw glass. It was subsequently shaped into utilitarian objects at the many glassworkinginstallations throughout the provinces. This hypothesis has since been strengthened by findingsof large glass blocks, which appear to be the remains of broken raw glass slabs in variouslocations around the Roman world (Price 2005), and by the analysis of glass to determine traceelement and isotopic compositions, which has placed these installations, for late Roman andByzantine glass in particular, in the Eastern Mediterranean, in Syro-Palestine and in Egypt(Freestone et al. 2002; Foy et al. 2003; Brems and Degryse 2014). Thus a combination of
2 C. M. Jackson and S. Paynter
© 2015 The Authors.Archaeometry published by John Wiley & Sons Ltd on behalf of University of Oxford, Archaeometry ••, •• (2015) ••–••

archaeological investigation and chemical analysis has now allowed a small number of manu-facturing groups with tentatively assigned provenances to be established, especially for the fourthcentury.
This paper uses the glass compositions from Coppergate, York, UK to establish which groupsof glass were present in the north-west provinces from the first to fourth centuries and howdifferent glass compositions were used. Only naturally coloured glass, which has a blue–greenhue, and colourless glass are presented here, as these have not been modified with colourants oropacifiers and so form the best data set for examining the different manufacturing groups incirculation. The chemical groups determined in the analysis of the Coppergate glass will bediscussed in the context of known glass types and also new groups or subgroups determinedwhere the glass does not fit clearly into a defined group. The reasons for the development of newgroups will be discussed in the context of our understanding of glass manufacture in the Romanperiod.
METHODS
The glass samples were solubilized using the method devised for silicates and analysed byICP–AES at the Geology Department, Royal Holloway University of London. The materials,methods, instrumentation and data validation are given in Jackson et al. (2003). Although thesample dissolution method loses silica by volatilization, it has the advantage of providing a large,accurate data set, including elements at major, minor and trace concentrations. Eleven elementsare given as oxides in wt% and 10 as ppm. Lead and antimony concentrations were calculatedseparately using prepared single element standards and Corning and NIST glass standards ofknown composition. A subsection of the data has been presented previously (Jackson 2005) in thecontext of colourless glass; these data are discussed here as part of the Coppergate assemblage asa whole and in the light of the production groups that have been identified more recently, ordefined here.
RESULTS: IDENTIFICATION OF COMPOSITIONAL GROUPS
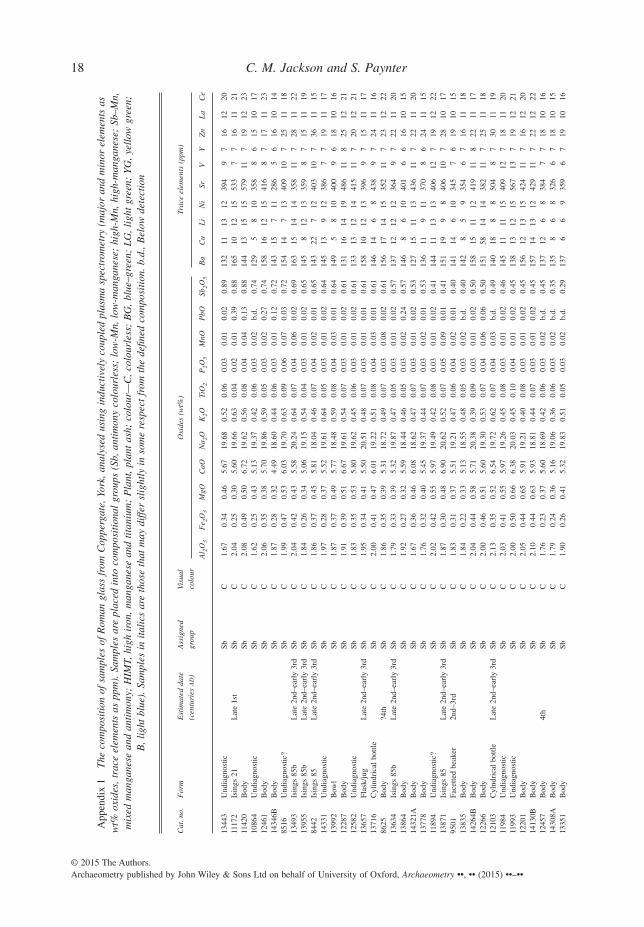
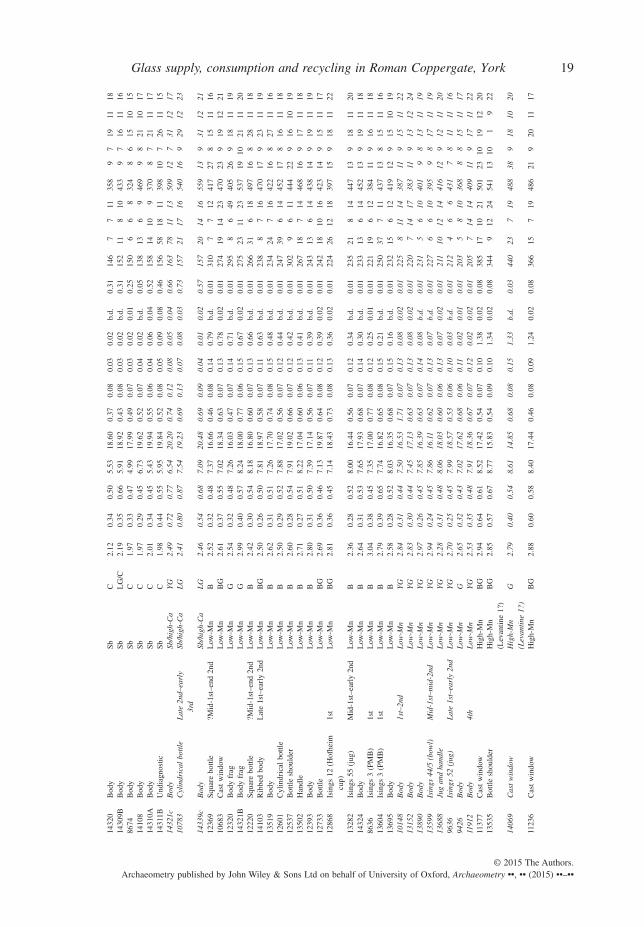
The results of 193 analyses of naturally coloured and colourless glass dating from the first tofourth centuries are presented in Appendix 1. The glass can be defined by six compositionalgroups: (1) antimony colourless (Sb); (2) low-manganese (low-Mn); (3) high-manganese (high-Mn); (4) high iron, manganese and titanium (HIMT) (including weak and strong variants); (5)plant ash; and (6) mixed antimony–manganese (Sb–Mn) (with the possible inclusion of a seventhgroup of ‘Levantine 1’; see below). The mean compositions of the groups can be seen in Table 1.In addition, there are eight outliers that do not clearly fit into any of these groups.
Although other compositional differences relating to the primary glass-forming componentsused in manufacture will be discussed, the groups can broadly be described by their concentra-tions of antimony and manganese (Fig. 1 (a)). Comparative data from previously publishedanalyses to support the definitions of these groups are presented in Appendix 2.
Antimony colourless (Sb)
This group of colourless glasses is well represented in assemblages from the first to thirdcenturies. It is a very coherent group, manufactured with high-purity sands, containing lowconcentrations of alumina, titanium, calcium and often iron, and is also soda rich (Jackson 2005
Glass supply, consumption and recycling in Roman Coppergate, York 3
© 2015 The Authors.Archaeometry published by John Wiley & Sons Ltd on behalf of University of Oxford, Archaeometry ••, •• (2015) ••–••

Table 1 Means and ranges of the compositional groups identified in the glass analysed from Coppergate, York (notethat ranges are affected by sample size and relate to this data set only). Key as in Appendix 1
No.Sb Sb–Mn High-Mn Low-Mn HIMT2(W) HIMT1(S) Plant ash44 80 13 26 19 1 2
Wt%Al2O3 1.97 2.40 2.92 2.67 2.38 2.62 2.28
1.62–2.49 1.78–2.83 2.65–3.28 2.28–3.04 2.08–4.11 2.25–2.31Fe2O3 0.37 0.58 0.46 0.31 0.63 1.17 0.75
0.22–0.80 0.27–0.98 0.30–0.64 0.24–0.40 0.32–0.83 0.70–0.79MgO 0.48 0.58 0.63 0.50 0.71 1.27 1.35
0.3–0.87 0.39–0.86 0.51–0.88 0.43–0.65 0.42–0.88 1.29–1.41CaO 5.82 6.59 8.48 7.66 6.19 6.48 8.07
4.49–7.54 5.19–8.15 7.86–9.04 7.02–8.24 4.86–7.66 7.25–8.89Na2O 19.39 18.69 16.81 17.47 19.41 19.26 17.82
17.99–20.62 16.20–20.42 14.76–18.39 16.03–19.87 17.20–20.46 16.92–18.71K2O 0.51 0.82 0.68 0.67 0.87 0.56 1.61
0.36–0.74 0.47–1.56 0.46–0.85 0.46–1.71 0.51–1.26 1.51–1.71TiO2 0.07 0.09 0.08 0.07 0.11 0.23 0.14
0.04–0.13 0.05–0.14 0.07–0.09 0.06–0.08 0.07–0.14 1.12–0.16P2O5 0.04 0.11 0.11 0.13 0.09 0.06 0.40
0.02–0.08 0.04–0.19 0.08–0.19 0.10–0.15 0.04–0.28 0.35–0.45MnO 0.03 0.40 1.15 0.34 0.87 1.8 0.12
0.01–0.09 0.10–1.01 0.84–1.66 0.02–0.79 0.65–1.03 ∼PbO 0.04 0.06 0.01 <0.01 0.03 0.03 0.01
b.d.–0.39 b.d.–0.45 b.d.–0.02 b.d.–0.02 b.d.–0.05 b.d.–0.01Sb2O5 0.54 0.35 0.04 <0.01 0.10 0.03 0.18
0.05–0.89 0.11–0.69 0.01–0.08 0.01–0.01 0.01–0.17 0.13–0.23
ppmBa 147 229 432 243 273 342 191
127–165 149–341 282–581 203–310 218–467 189–192Cu 16 155 18 15 88 51 41
5–78 14–1718 9–27 4–39 11–219 34–47Li 10 17 10 8 18 16 9
5–18 7–59 7–14 6–14 8–32 8–9Ni 12 16 19 15 19 29 13
8–19 7–24 13–24 6–49 13–22 12–14Sr 414 415 506 430 445 588 642
286–579 334–516 450–569 368–537 348–675 580–703V 9 17 25 15 22 35 15
5–16 7–29 13–62 7–27 19–28 13–16Y 7 8 9 9 8 10 7
60–9 6–10 8–10 8–10 9–9 ∼Zn 21 36 17 17 36 31 32
15–36 21–108 1–25 11–28 18–57 30–34La 11 12 11 11 12 13 11
10–12 10–14 9–13 10–12 11–13 ∼Ce 18 20 20 19 21 25 20
14–23 13–26 17–24 16–24 16–24 18–21
4 C. M. Jackson and S. Paynter
© 2015 The Authors.Archaeometry published by John Wiley & Sons Ltd on behalf of University of Oxford, Archaeometry ••, •• (2015) ••–••

0.0
0.1
0.2
0.3
0.4
0.5
0.6
0.7
0.8
0.9
1.0
0.0 0.2 0.4 0.6 0.8 1.0 1.2 1.4 1.6 1.8 2.0
Sb2O
3(w
t%)
MnO (wt%)
Mixing of recycled Sb-Mn with low-Mn glass
Mixing of Sb and High-Mn glass
0.0
0.2
0.4
0.6
0.8
1.0
1.2
1.4
1.6
1.8
2.0
4 5 6 7 8 9 10
MnO
(wt%
)
(a)
(b)
CaO (wt%)
Sb Low-Mn Sb-Mn High-Mn HIMT2 HIMT1
Sb Low-Mn Sb-Mn High-Mn HIMT2 HIMT1
Mixing of Sb and High-Mn glass
Figure 1 (a) A plot of manganese versus antimony oxides for the Roman glass from Coppergate, York, showing thespread of manganese and antimony oxide contents for the mixed glass, between the Sb and high-Mn glass compositions.(b) A plot of calcium versus manganese oxide for the Roman glass from Coppergate, York, showing how the lime andmanganese contents are correlated in the Sb–Mn glass, best fitting a mixture of high-manganese (high-Mn) glass withantimony colourless (Sb) glass.
Glass supply, consumption and recycling in Roman Coppergate, York 5
© 2015 The Authors.Archaeometry published by John Wiley & Sons Ltd on behalf of University of Oxford, Archaeometry ••, •• (2015) ••–••
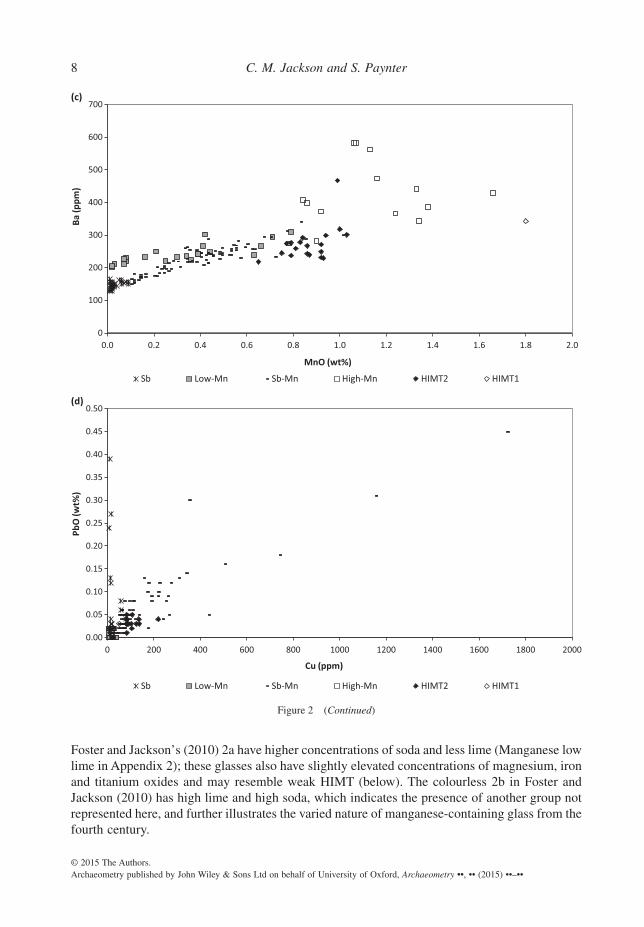
(groups 1a and 1b); Paynter 2006; and reviewed in Paynter and Jackson forthcoming) (Figs 2 (a)and 2 (b)); the decolourizer is antimony. Paynter (2006) suggests there is a variant of thiscomposition, which is low in lime, alumina and barium and often contains very high levels ofantimony (Sb/low-Ca); and is found amongst very early, high-quality vessels (Appendix 2). Thisvariant is not present in the glasses analysed here (Fig. 2 (c)). Similarly, the presence of(>300 ppm) lead in some early colourless Roman glass (Baxter et al. 2005), suggested by Paynter(2010) to derive from a lead-bearing antimony source, is seen in only three examples, one ofwhich is dated to the first century (Appendix 1). Current research suggests that the antimonycolourless glass may originate in the Eastern Mediterranean (Ganio et al. 2012), although Italyhas also been postulated as a possible origin for glass with these compositional characteristics(Brems and Degryse 2014). The absence of the Sb/low-Ca glass composition and the lownumbers of lead-bearing antimony examples reflect the date of the Coppergate assemblage. Sincemost diagnostic fragments are from the second and third centuries, they postdate these earliercompositional traits, and few high-status vessels of the type typically made from the rarerSb/low-Ca composition are represented.
Low-manganese (low-Mn)
This group of naturally coloured glasses, predominantly blue–green or ‘aqua’, generally containslow concentrations of manganese of up to 0.8 wt%, but no antimony (Fig. 1). This glass tends tocontain less soda, but more alumina, than the Sb colourless glass (Figs 2 (a) and 2 (b)). Thisnaturally coloured glass is known from Roman assemblages elsewhere and is the dominant, raw,blue–green glass by the first century, and is thought to be manufactured in the Syria-Palestineregion (Foy et al. 2000) (Appendix 2). The Coppergate samples also contain a subset of the ‘lightgreen’ examples, which contain very little manganese oxide (less than 0.1 wt%), but otherwise fitthe general compositional patterning for low-Mn glasses.
High-manganese (high-Mn)
This composition is characterized by high concentrations of manganese (0.8–1.5 wt%) but inother respects is similar to the low-Mn glass, but with slightly higher calcium and lower soda(Figs 1, 2 (b) and 2 (c)). The lower MnO threshold of 0.8 wt% was selected because it is theapproximate minimum seen in manganese decolourized glass, such as the first-century colourlessexamples from Adria studied by Gallo et al. (2013) (Appendices 1 and 2). The higher MnOthreshold of 1.5 wt% for this group was selected to exclude deliberately coloured purple glass. Inmany reported instances, the high-Mn composition produces a colourless glass, especially wherethe manganese concentrations are at the higher end of the range (see Vichy et al. 2003; Silvestriet al. 2008; Foster and Jackson 2010; Schibille et al. 2012; Gliozzo et al. 2013; Paynter andJackson forthcoming); however, all the samples analysed here have a blue or light green hue (onenearly colourless) and cannot be distinguished visually from other blue–green or naturallycoloured glasses (e.g., low-Mn).
The separation of Levantine 1, low-Mn and high-Mn is in terms of manganese content anddate, since the base glass composition appears very similar otherwise (Foster and Jackson 2010);this might suggest they have a similar provenance or are a continuation of a manufacturingtradition (Appendix 2). Taking into account the similarities in composition, three late Romansamples from Coppergate (5495, 13535 and 14069), assigned here to the high-Mn group, may bethe same as the Levantine 1a group of Foster and Jackson (2009).
6 C. M. Jackson and S. Paynter
© 2015 The Authors.Archaeometry published by John Wiley & Sons Ltd on behalf of University of Oxford, Archaeometry ••, •• (2015) ••–••

From the fourth century onwards, the compositional range of manganese-containing glassbecomes even more diverse, as illustrated by Foster and Jackson (2010) and Meek (2013), whohave identified two groups of colourless high-manganese glasses, differing in their soda andcalcium concentrations. Meek’s (2013) type 2b matches the high-Mn glasses here. Meek’s 2a and
1.0
1.5
2.0
2.5
3.0
3.5
4.0
4.5
0.0 0.2 0.4 0.6 0.8 1.0 1.2 1.4 1.6 1.8
Al2O
3(w
t%)
K2O (wt%)
12
13
14
15
16
17
18
19
20
21
22
4.0 5.0 6.0 7.0 8.0 9.0 10.0
Na 2
O (w
t%)
CaO (wt%)Sb Low-Mn Sb-Mn High-Mn HIMT2 HIMT1
Sb Low-Mn Sb-Mn High-Mn HIMT2 HIMT1
(a)
(b)
Figure 2 A plot of oxides for the Roman glass from Coppergate, York, showing the different glass groups represented:(a) Al2O3 versus K2O; (b) Na2O versus CaO; (c) Ba versus MnO; (d) Cu versus PbO. In all charts, the Sb–Mn groupshows significant mixing.
Glass supply, consumption and recycling in Roman Coppergate, York 7
© 2015 The Authors.Archaeometry published by John Wiley & Sons Ltd on behalf of University of Oxford, Archaeometry ••, •• (2015) ••–••
Foster and Jackson’s (2010) 2a have higher concentrations of soda and less lime (Manganese lowlime in Appendix 2); these glasses also have slightly elevated concentrations of magnesium, ironand titanium oxides and may resemble weak HIMT (below). The colourless 2b in Foster andJackson (2010) has high lime and high soda, which indicates the presence of another group notrepresented here, and further illustrates the varied nature of manganese-containing glass from thefourth century.
0
100
200
300
400
500
600
700
0.0 0.2 0.4 0.6 0.8 1.0 1.2 1.4 1.6 1.8 2.0
Ba (p
pm)
MnO (wt%)
0.00
0.05
0.10
0.15
0.20
0.25
0.30
0.35
0.40
0.45
0.50
0 200 400 600 800 1000 1200 1400 1600 1800 2000
PbO
(wt%
)
Cu (ppm)
Sb Low-Mn Sb-Mn High-Mn HIMT2 HIMT1
Sb Low-Mn Sb-Mn High-Mn HIMT2 HIMT1
(c)
(d)
Figure 2 (Continued)
8 C. M. Jackson and S. Paynter
© 2015 The Authors.Archaeometry published by John Wiley & Sons Ltd on behalf of University of Oxford, Archaeometry ••, •• (2015) ••–••
Mixed antimony and manganese (Sb–Mn)
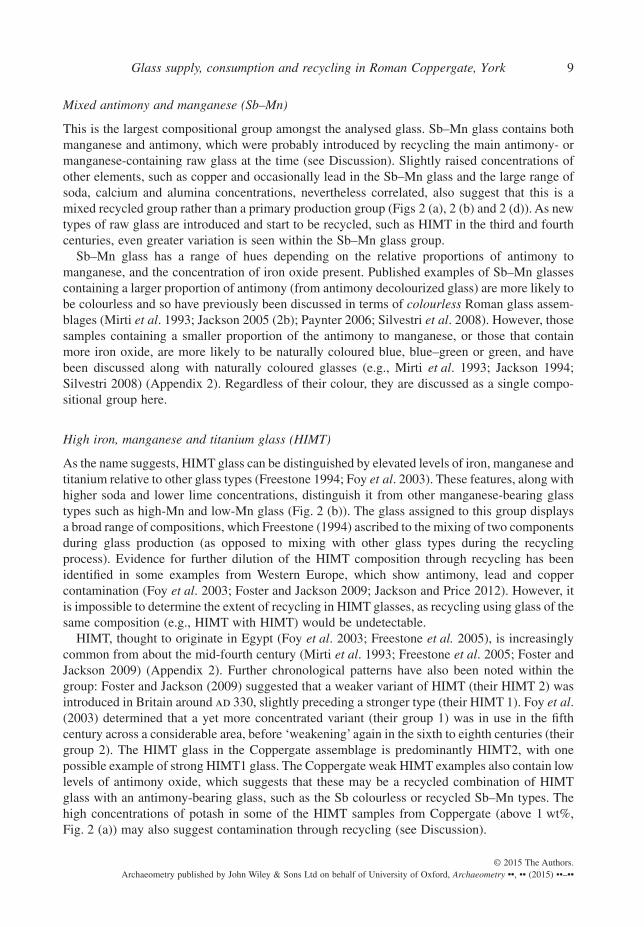
This is the largest compositional group amongst the analysed glass. Sb–Mn glass contains bothmanganese and antimony, which were probably introduced by recycling the main antimony- ormanganese-containing raw glass at the time (see Discussion). Slightly raised concentrations ofother elements, such as copper and occasionally lead in the Sb–Mn glass and the large range ofsoda, calcium and alumina concentrations, nevertheless correlated, also suggest that this is amixed recycled group rather than a primary production group (Figs 2 (a), 2 (b) and 2 (d)). As newtypes of raw glass are introduced and start to be recycled, such as HIMT in the third and fourthcenturies, even greater variation is seen within the Sb–Mn glass group.
Sb–Mn glass has a range of hues depending on the relative proportions of antimony tomanganese, and the concentration of iron oxide present. Published examples of Sb–Mn glassescontaining a larger proportion of antimony (from antimony decolourized glass) are more likely tobe colourless and so have previously been discussed in terms of colourless Roman glass assem-blages (Mirti et al. 1993; Jackson 2005 (2b); Paynter 2006; Silvestri et al. 2008). However, thosesamples containing a smaller proportion of the antimony to manganese, or those that containmore iron oxide, are more likely to be naturally coloured blue, blue–green or green, and havebeen discussed along with naturally coloured glasses (e.g., Mirti et al. 1993; Jackson 1994;Silvestri 2008) (Appendix 2). Regardless of their colour, they are discussed as a single compo-sitional group here.
High iron, manganese and titanium glass (HIMT)
As the name suggests, HIMT glass can be distinguished by elevated levels of iron, manganese andtitanium relative to other glass types (Freestone 1994; Foy et al. 2003). These features, along withhigher soda and lower lime concentrations, distinguish it from other manganese-bearing glasstypes such as high-Mn and low-Mn glass (Fig. 2 (b)). The glass assigned to this group displaysa broad range of compositions, which Freestone (1994) ascribed to the mixing of two componentsduring glass production (as opposed to mixing with other glass types during the recyclingprocess). Evidence for further dilution of the HIMT composition through recycling has beenidentified in some examples from Western Europe, which show antimony, lead and coppercontamination (Foy et al. 2003; Foster and Jackson 2009; Jackson and Price 2012). However, itis impossible to determine the extent of recycling in HIMT glasses, as recycling using glass of thesame composition (e.g., HIMT with HIMT) would be undetectable.
HIMT, thought to originate in Egypt (Foy et al. 2003; Freestone et al. 2005), is increasinglycommon from about the mid-fourth century (Mirti et al. 1993; Freestone et al. 2005; Foster andJackson 2009) (Appendix 2). Further chronological patterns have also been noted within thegroup: Foster and Jackson (2009) suggested that a weaker variant of HIMT (their HIMT 2) wasintroduced in Britain around ad 330, slightly preceding a stronger type (their HIMT 1). Foy et al.(2003) determined that a yet more concentrated variant (their group 1) was in use in the fifthcentury across a considerable area, before ‘weakening’ again in the sixth to eighth centuries (theirgroup 2). The HIMT glass in the Coppergate assemblage is predominantly HIMT2, with onepossible example of strong HIMT1 glass. The Coppergate weak HIMT examples also contain lowlevels of antimony oxide, which suggests that these may be a recycled combination of HIMTglass with an antimony-bearing glass, such as the Sb colourless or recycled Sb–Mn types. Thehigh concentrations of potash in some of the HIMT samples from Coppergate (above 1 wt%,Fig. 2 (a)) may also suggest contamination through recycling (see Discussion).
Glass supply, consumption and recycling in Roman Coppergate, York 9
© 2015 The Authors.Archaeometry published by John Wiley & Sons Ltd on behalf of University of Oxford, Archaeometry ••, •• (2015) ••–••
Levantine 1 glass
This term has been used to describe glass of the fourth century and later, which is high in limeand alumina and low in soda (Appendix 2) (Brill 1988; Freestone et al. 2000; Foster and Jackson2009). In terms of bulk composition, Levantine 1 glass is similar to the earlier glass groupshigh-Mn and, to a lesser extent, low-Mn. However, it generally does not contain any decolourizer(Freestone et al. 2000; but see summary in Foster and Jackson 2009) and this also differentiatesit from most other first- to fourth-century types. Analysis of glass from tank furnaces at Apolloniahas demonstrated that this glass was manufactured on the Levantine coast (Foy et al. 2003; Talet al. 2004). Although fourth-century glass is present at Coppergate, no samples of Levantine 1composition were identified (but see the section on high-Mn glasses). This outcome is notunexpected, as Foster and Jackson (2009) note that this glass is poorly represented in late Romanassemblages in Britain.
Plant-ash glass
Two glass samples, one from a cast window and the other from a bottle, which have mixedconcentrations of antimony and manganese, also contain elevated concentrations of potash,magnesia (both around 1.5 wt%) and phosphorus (around 0.4 wt%) (Appendix 1 and Table 1).This may indicate that these glasses were made wholly or in part using soda plant ashes, or fromrecycled glass including some made with high-soda plant ashes or were potentially contaminatedwith fuel ash (Paynter 2008). Roman glasses made from plant ashes have been noted in othercontexts, including strongly coloured first-century glasses (e.g., Arletti et al. 2008; Jackson et al.2009; Gallo et al. 2013; Jackson and Cottam in prep.). Plant-ash compositions tend to be rare inmost Roman glass assemblages and have only been noted relatively recently; their provenancehas been a matter of speculation.
Outliers
Eight samples do not fall clearly into any of the groups defined above (Appendix 1 (OUT)). Theseoutliers have characteristics that are similar to one of the defined groups but differ in particularrespects (e.g., 10203 could potentially be Sb–Mn, but has exceptionally high concentrations ofmanganese; 14072 has low soda but higher alumina and mixed antimony–manganese). There aretoo few of these to speculate about whether they might indicate the existence of separatecompositional groups, or are atypical examples of existing compositions (with one or twoelemental anomalies), but they are included in case similar examples are found in future studies.
DISCUSSION
Recycling and contamination
By far the largest group represented is the Sb–Mn glass. The range of compositions in this groupcan be approximated as a mixing line between the contemporary raw glass types in circulation:the Sb colourless glass and the high-Mn glass, illustrated in Figures 1 (a) and 1 (b). This mixingof antimony and high-manganese glasses may be explained through selective recycling.Colourless glass was a valuable raw material, with the Sb colourless glass in particular reservedfor finewares. It may therefore be anticipated that glassworkers would recycle colourless glass
10 C. M. Jackson and S. Paynter
© 2015 The Authors.Archaeometry published by John Wiley & Sons Ltd on behalf of University of Oxford, Archaeometry ••, •• (2015) ••–••
separately wherever possible, combining Sb colourless glass and the high-Mn glass, or usinghigh-Mn glass to extend the antimony colourless glass, even though much of the high-Mn glassoften has a slight greyish or greenish tinge. This would explain the incorporation of bothantimony and manganese into the glass, and the correlation between these elements. However, thelevels of titanium, iron, potassium and copper oxides detected in the Sb–Mn mixed glass arehigher than would be expected for a straightforward mixture of the two Sb and high-Mnraw glass types (Paynter 2006) (Table 1); other factors must be contributing to the overallcomposition.
Upon subsequent re-melting, all recycled glass including colourless, would gradually spoil byabsorbing iron-bearing contaminants, eventually acquiring a blue–green tinge. Experimentalwork has shown that, during re-melting, glass absorbs aluminium, titanium, potassium and ironoxides from clay crucibles or furnace linings, as well as potassium oxide vapour generated by thefurnace fuel, and lesser amounts of calcium, magnesium and phosphorus oxides from settling fuelashes (Paynter 2008). In addition, fragments of glass-working waste are sometimes stronglycoloured by iron oxide scale from the blowing iron. These extraneous materials would ultimatelycontaminate the glass, which would acquire a stronger blue–green hue. This may lead to therecycled ‘colourless’ glass becoming blue–green and eventually being used as, and recycled with,blue–green stock, as can be seen in Table 1, where the Sb–Mn glass often has higher concentra-tions of elements associated with recycling.
The variation in concentration is because these glasses will have different recycling histories,with recycled and raw glass combined in variable proportions an unknown number of times, andso it is not possible to quantify the extent of recycling from the compositions. The amount ofcrucible and vapour contamination in the glass depends upon the crucible composition, thetemperature and time of melting and the number of times the glass has been re-melted (Paynter2008, 208). Figures 1 (a) and 1 (b) do show, however, that a small number of samples arecontaminated by other naturally coloured glasses in circulation at different periods—for example,low-Mn or HIMT (Foster and Jackson 2009)—indicating that some of the glass has probablybeen recycled at least twice: first as part of a colourless batch and subsequently, once spoiled, aspart of a naturally coloured batch. Consequently, the contaminants introduced during repeatedrecycling, potentially with many different glass compositions, account for the discrepanciesbetween the predicted and actual composition of the Sb–Mn mixed glass.
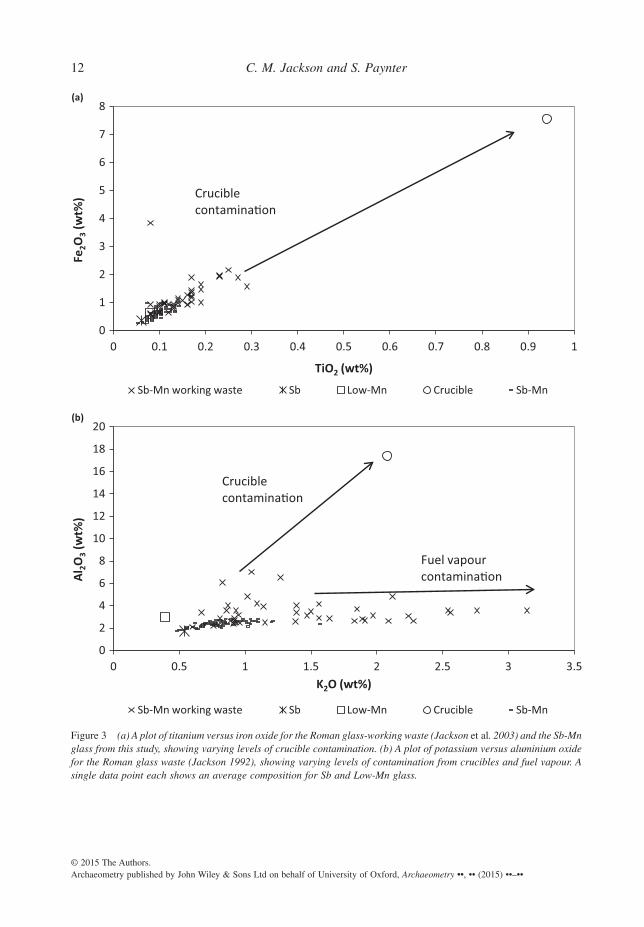
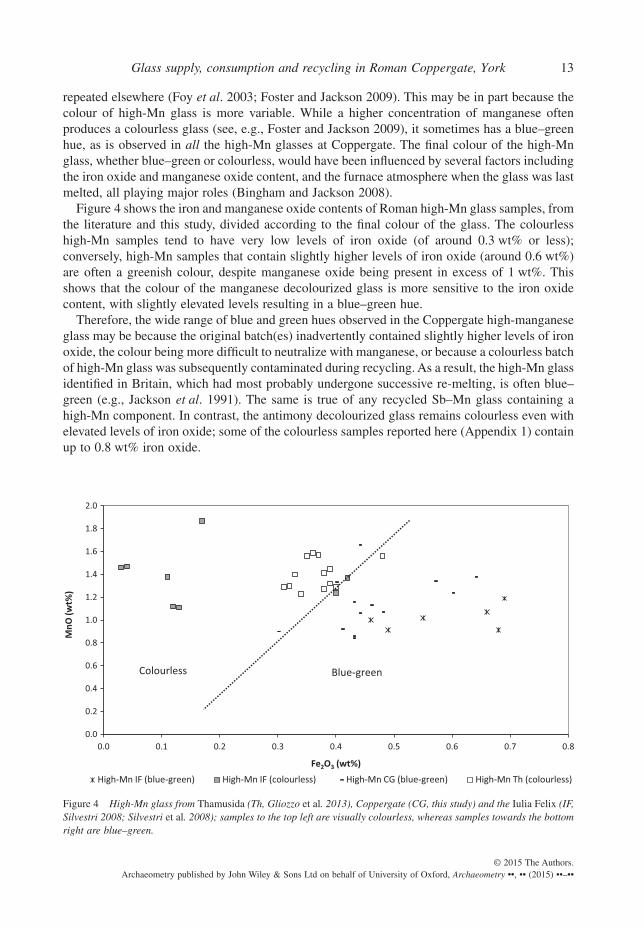
To demonstrate the effect of contamination during recycling, analyses of the Romanglassworking waste (partly melted material, drips and glass from inside melting pots), also fromCoppergate, York (Jackson 1992; Jackson et al. 1998, 2003), have been plotted (Figs 3 (a) and3 (b)), together with the typical composition of the glass-melting crucibles from Coppergate, andthe average compositions of Sb colourless glass, high-Mn glass and the mixed Sb–Mn glass. Inmost of the waste glass and the mixed Sb–Mn glass, the concentrations of aluminium, titanium,potassium, phosphorus and iron oxides are elevated relative to the compositions of the originalunaltered colourless glass types in a manner consistent with crucible and fuel vapour contami-nation. Some of the waste glasses have much higher concentrations of contaminants because theywere in direct contact with the crucible wall.
Comparing antimony and manganese decolourized glass
At Coppergate, high-manganese (high-Mn) glass was used only rarely for high-status vessels,and predominantly during periods when the antimony decolourized glass was scarce; forexample, earlier in the first century and then again in the fourth century and later. This pattern is
Glass supply, consumption and recycling in Roman Coppergate, York 11
© 2015 The Authors.Archaeometry published by John Wiley & Sons Ltd on behalf of University of Oxford, Archaeometry ••, •• (2015) ••–••
0
1
2
3
4
5
6
7
8
0 0.1 0.2 0.3 0.4 0.5 0.6 0.7 0.8 0.9 1
Fe2O
3(w
t%)
TiO2 (wt%)
Sb-Mn working waste Sb Low-Mn Crucible Sb-Mn
Sb-Mn working waste Sb Low-Mn Crucible Sb-Mn
Cruciblecontamina�on
0
2
4
6
8
10
12
14
16
18
20
0 0.5 1 1.5 2 2.5 3 3.5
Al2O
3(w
t%)
(a)
(b)
K2O (wt%)
Cruciblecontamina�on
Fuel vapour contamina�on
Figure 3 (a) A plot of titanium versus iron oxide for the Roman glass-working waste (Jackson et al. 2003) and the Sb-Mnglass from this study, showing varying levels of crucible contamination. (b) A plot of potassium versus aluminium oxidefor the Roman glass waste (Jackson 1992), showing varying levels of contamination from crucibles and fuel vapour. Asingle data point each shows an average composition for Sb and Low-Mn glass.
12 C. M. Jackson and S. Paynter
© 2015 The Authors.Archaeometry published by John Wiley & Sons Ltd on behalf of University of Oxford, Archaeometry ••, •• (2015) ••–••
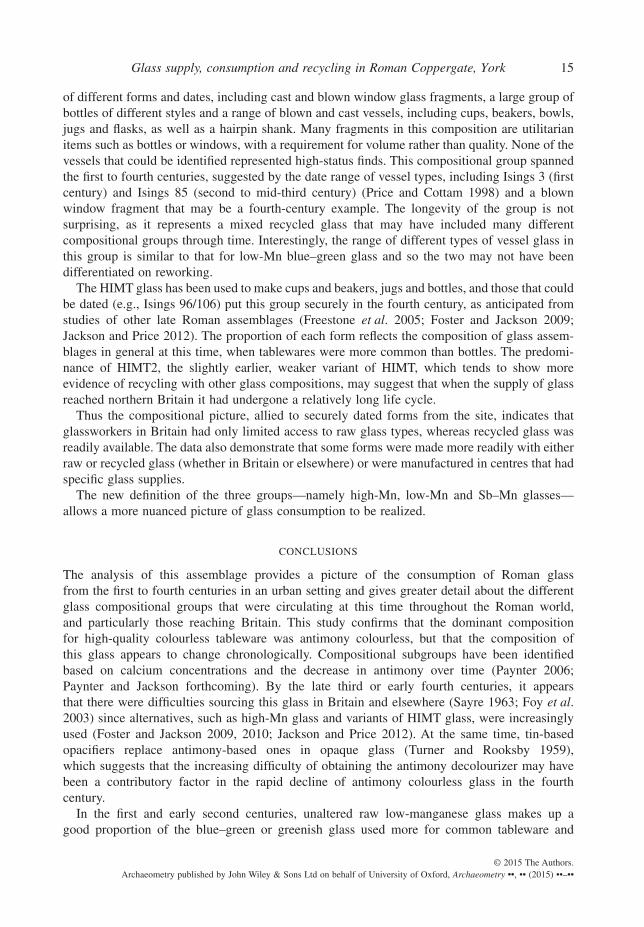
repeated elsewhere (Foy et al. 2003; Foster and Jackson 2009). This may be in part because thecolour of high-Mn glass is more variable. While a higher concentration of manganese oftenproduces a colourless glass (see, e.g., Foster and Jackson 2009), it sometimes has a blue–greenhue, as is observed in all the high-Mn glasses at Coppergate. The final colour of the high-Mnglass, whether blue–green or colourless, would have been influenced by several factors includingthe iron oxide and manganese oxide content, and the furnace atmosphere when the glass was lastmelted, all playing major roles (Bingham and Jackson 2008).
Figure 4 shows the iron and manganese oxide contents of Roman high-Mn glass samples, fromthe literature and this study, divided according to the final colour of the glass. The colourlesshigh-Mn samples tend to have very low levels of iron oxide (of around 0.3 wt% or less);conversely, high-Mn samples that contain slightly higher levels of iron oxide (around 0.6 wt%)are often a greenish colour, despite manganese oxide being present in excess of 1 wt%. Thisshows that the colour of the manganese decolourized glass is more sensitive to the iron oxidecontent, with slightly elevated levels resulting in a blue–green hue.
Therefore, the wide range of blue and green hues observed in the Coppergate high-manganeseglass may be because the original batch(es) inadvertently contained slightly higher levels of ironoxide, the colour being more difficult to neutralize with manganese, or because a colourless batchof high-Mn glass was subsequently contaminated during recycling. As a result, the high-Mn glassidentified in Britain, which had most probably undergone successive re-melting, is often blue–green (e.g., Jackson et al. 1991). The same is true of any recycled Sb–Mn glass containing ahigh-Mn component. In contrast, the antimony decolourized glass remains colourless even withelevated levels of iron oxide; some of the colourless samples reported here (Appendix 1) containup to 0.8 wt% iron oxide.
0.0
0.2
0.4
0.6
0.8
1.0
1.2
1.4
1.6
1.8
2.0
0.0 0.1 0.2 0.3 0.4 0.5 0.6 0.7 0.8
MnO
(wt%
)
Fe2O3 (wt%)
High-Mn IF (blue-green) High-Mn IF (colourless) High-Mn CG (blue-green) High-Mn Th (colourless)
Colourless Blue-green
Figure 4 High-Mn glass from Thamusida (Th, Gliozzo et al. 2013), Coppergate (CG, this study) and the Iulia Felix (IF,Silvestri 2008; Silvestri et al. 2008); samples to the top left are visually colourless, whereas samples towards the bottomright are blue–green.
Glass supply, consumption and recycling in Roman Coppergate, York 13
© 2015 The Authors.Archaeometry published by John Wiley & Sons Ltd on behalf of University of Oxford, Archaeometry ••, •• (2015) ••–••

Glass supply and use through time
The large and varied Coppergate assemblage includes examples of multiple glass groups, someidentified here and others defined previously, but all have parallels elsewhere in Europe. There-fore, the Coppergate glass fits a broader pattern of glass production, circulation and consumption,which changes over time, both in terms of the supply of raw or recycled glasses and the types ofvessels used in the Roman world (Appendix 2).
The antimony colourless glass was used for fine tableware; there are no window fragments andonly rarely bottles. The samples in this group, such as the faceted beaker dated to the second orthird century and the Isings 21 beaker, are of high quality. The data also further illustrate how theSb colourless glass composition changes over time, particularly with respect to the diminishingantimony oxide content (Paynter 2006; Paynter and Jackson forthcoming). Previously identified,early variants of antimony colourless glass (Sb/low-Ca or samples with >300 ppm of lead) arepoorly represented in the assemblage, probably because the majority of the Coppergate antimonyglasses are second/third century. There are, however, a number of the late second- and earlythird-century Sb samples that contain atypically high levels of lime and alumina, with low levelsof antimony (Figs 1 (a) and 1 (b); Appendix 1, ‘Sb/high-Ca’ samples), which suggests that theremay be a chronologically later subgroup as well.
The range of forms seen outside Britain in high-Mn glass—for example, the colourlessexamples from the Iulia Felix wreck (Silvestri et al. 2008)—suggest that this glass was predomi-nantly used for window glass and bottles up to the third century. The Coppergate assemblagemirrors this, with windows, bottles and jugs, in an extended range of colours. However, by thelate third to fourth centuries, more high-quality tablewares are also present in this glass (e.g.,Isings 106), and this is also seen in other fourth-century assemblages (Foster and Jackson 2010;Schibille et al. 2012), illustrating a chronological change in the availability of this compositionalgroup over time.
There may also be chronological variation in composition, since later samples in thisassemblage (fourth century) contain higher levels of manganese oxide, in some cases inexcess of 1 wt%, whereas earlier samples contain less. Glass with similarly high levels ofmanganese has been reported elsewhere from the late second or early third centuries (Ganioet al. 2012; Gliozzo et al. 2013) onwards, but it seems poorly represented in Britain until alater date, the island receiving only limited supply. The increased incidence of this glass atCoppergate in the fourth century could be related to the scarcity of the Sb colourless glass bythis time; hence the need to source an alternative glass for finewares (Paynter and Jacksonforthcoming).
No window glass was found in the naturally coloured, low-manganese (low-Mn) glass, butsome bottles and a variety of vessels are represented, predominantly tablewares from the firstcentury, including Isings 3 (cast pillar moulded bowls) and Isings 12 (Hofheim cups) forms.Nearly all of the diagnostic fragments are from the first or second centuries. This glass type mayrepresent the blue–green Judean glass mentioned in the edicts of Diocletian, whereas the Sb-glassis more likely to be the glass described as Alexandrian (Barag 1987). In Britain, however, it wouldseem that the supply of low-Mn glass was limited, and that the recycled Sb–Mn glass largelyserved the same function as the low-Mn glass but was more readily available. Therefore, themixed Sb–Mn glass becomes dominant in the second and third centuries; it is visually identicaland would appear so to the glassworker.
Overall, the most common glass composition amongst the samples was recycled blue–greenmixed antimony and manganese glass. Sb–Mn glass is represented in the assemblage by a variety
14 C. M. Jackson and S. Paynter
© 2015 The Authors.Archaeometry published by John Wiley & Sons Ltd on behalf of University of Oxford, Archaeometry ••, •• (2015) ••–••
of different forms and dates, including cast and blown window glass fragments, a large group ofbottles of different styles and a range of blown and cast vessels, including cups, beakers, bowls,jugs and flasks, as well as a hairpin shank. Many fragments in this composition are utilitarianitems such as bottles or windows, with a requirement for volume rather than quality. None of thevessels that could be identified represented high-status finds. This compositional group spannedthe first to fourth centuries, suggested by the date range of vessel types, including Isings 3 (firstcentury) and Isings 85 (second to mid-third century) (Price and Cottam 1998) and a blownwindow fragment that may be a fourth-century example. The longevity of the group is notsurprising, as it represents a mixed recycled glass that may have included many differentcompositional groups through time. Interestingly, the range of different types of vessel glass inthis group is similar to that for low-Mn blue–green glass and so the two may not have beendifferentiated on reworking.
The HIMT glass has been used to make cups and beakers, jugs and bottles, and those that couldbe dated (e.g., Isings 96/106) put this group securely in the fourth century, as anticipated fromstudies of other late Roman assemblages (Freestone et al. 2005; Foster and Jackson 2009;Jackson and Price 2012). The proportion of each form reflects the composition of glass assem-blages in general at this time, when tablewares were more common than bottles. The predomi-nance of HIMT2, the slightly earlier, weaker variant of HIMT, which tends to show moreevidence of recycling with other glass compositions, may suggest that when the supply of glassreached northern Britain it had undergone a relatively long life cycle.
Thus the compositional picture, allied to securely dated forms from the site, indicates thatglassworkers in Britain had only limited access to raw glass types, whereas recycled glass wasreadily available. The data also demonstrate that some forms were made more readily with eitherraw or recycled glass (whether in Britain or elsewhere) or were manufactured in centres that hadspecific glass supplies.
The new definition of the three groups—namely high-Mn, low-Mn and Sb–Mn glasses—allows a more nuanced picture of glass consumption to be realized.
CONCLUSIONS
The analysis of this assemblage provides a picture of the consumption of Roman glassfrom the first to fourth centuries in an urban setting and gives greater detail about the differentglass compositional groups that were circulating at this time throughout the Roman world,and particularly those reaching Britain. This study confirms that the dominant compositionfor high-quality colourless tableware was antimony colourless, but that the composition ofthis glass appears to change chronologically. Compositional subgroups have been identifiedbased on calcium concentrations and the decrease in antimony over time (Paynter 2006;Paynter and Jackson forthcoming). By the late third or early fourth centuries, it appearsthat there were difficulties sourcing this glass in Britain and elsewhere (Sayre 1963; Foy et al.2003) since alternatives, such as high-Mn glass and variants of HIMT glass, were increasinglyused (Foster and Jackson 2009, 2010; Jackson and Price 2012). At the same time, tin-basedopacifiers replace antimony-based ones in opaque glass (Turner and Rooksby 1959),which suggests that the increasing difficulty of obtaining the antimony decolourizer may havebeen a contributory factor in the rapid decline of antimony colourless glass in the fourthcentury.
In the first and early second centuries, unaltered raw low-manganese glass makes up agood proportion of the blue–green or greenish glass used more for common tableware and
Glass supply, consumption and recycling in Roman Coppergate, York 15
© 2015 The Authors.Archaeometry published by John Wiley & Sons Ltd on behalf of University of Oxford, Archaeometry ••, •• (2015) ••–••
storage vessels, but by the later second and third centuries recycled mixed Sb–Mn glass domi-nates.
The high-manganese glass is not well represented in the Coppergate assemblage until the laterthird and fourth centuries. However, it appears to be common in bottle and window assemblagesfrom the late second and early third centuries in Continental Europe and further afield, and thereare some examples from the western provinces in the first century.
A significant finding is the very high number of samples that show clear evidence of recy-cling. Sb–Mn glass, made from a mixture of the antimony colourless and the high-manganeseglass, appears to dominate blue–green assemblages in Britain, and was used for everythingexcept the highest-quality tablewares. The high-Mn component of this recycled glass seemsrelatively uncommon in Britain, so perhaps much of the mixing took place elsewhere toproduce Sb–Mn recycled glass, which then reached Britain ready-made, although there isample evidence for glassworkers re-melting and using Sb–Mn glass in Britain (Jackson et al.1991).
The Coppergate assemblage illustrates how contamination of the glass during recycling byceramic crucibles, furnace structures and other types of glass influences both the compositionand colour of the glass. Some glass which was probably colourless or nearly colourless initially,eventually acquired a blue–green hue. Contaminated blue–green recycled glass was then morelikely to be further mixed with other blue–green glass types, such as low-Mn or HIMT, depend-ing on the date. This Sb–Mn recycled glass is known to have been melted and worked inBritain, as this composition is seen in the glassworking waste at the sites of Mancetter andLeicester, and it was clearly used for the manufacture of glass-hungry items such as windowsand bottles and for more common vessel forms (Jackson et al. 1991). At the extremes of theRoman world in the second and third centuries, this recycled mixture appears to have becomemore readily available than the raw low-Mn blue–green glass. Since the Sb–Mn compositionresulted from the dilution and recycling of antimony decolourized glass, it follows the samepattern of decline in the fourth century; HIMT glass, which is also often recycled, becomesincreasingly common in its place.
The assemblage from Coppergate therefore illustrates the different compositional typesreaching the western edges of the Roman world, but also how the composition and appearanceof glass changes once it has been through more than one ‘great big melting pot’. The recycledantimony–manganese glass makes up more than 40% of the analysed glass. This has importantimplications for trace element and isotopic analysis, because if the chemical composition of theglass has been affected by glass mixing, ceramic crucibles and furnace materials, then the traceelement and isotopic composition of the glass is likely to have been affected too. As onereferee suggests, the ‘big melting pot’ is not entirely homogenizing all of the glass, and com-positional groups can still be identified. However, these groups are the dominant primaryglasses reaching their market in that particular period and as such recycling becomes almostinvisible, because like is being mixed with like. It is clear from the data set that much of theglass is reused, perhaps over many years, providing a large reservoir for re-melting, againstwhich rarer compositional groups, perhaps made on a smaller scale, traded less extensively orin decline, are more difficult to detect—for example, the products of the subordinate glassmanufacturing centres referred to by Pliny the Elder (Eichholz 1962), or plant-ash glass typesthat may be the products of an earlier glass industry. These glasses, introduced into the recy-cling pool, would soon become diluted to the extent that they were difficult to recognize. Thusan appreciation of the scale and effects of recycling is key to understanding manufacturinglocations and glass compositional groups.
16 C. M. Jackson and S. Paynter
© 2015 The Authors.Archaeometry published by John Wiley & Sons Ltd on behalf of University of Oxford, Archaeometry ••, •• (2015) ••–••

ACKNOWLEDGEMENTS
This project was funded by the Science and Engineering Research Council in the form of a Ph.D.grant to CMJ (SERC 88803864), and supervised by Dr S. E. Warren and Professor J. R. Hunterof the Department of Archaeological Science, University of Bradford, UK. Help with chemicalanalysis was kindly provided by Drs J. N. Walsh and S. James of the then NERC ICP–AESfacility at Royal Holloway University of London, UK. York Archaeological Trust, especially DrA. Mainman, are thanked for the loan of the study material. Dr H. E. M. Cool is acknowledgedand thanked for the typological assessment. Apologies to Blue Mink for mangling their song title.
Glass supply, consumption and recycling in Roman Coppergate, York 17
© 2015 The Authors.Archaeometry published by John Wiley & Sons Ltd on behalf of University of Oxford, Archaeometry ••, •• (2015) ••–••
App
endi
x1
The
com
posi
tion
ofsa
mpl
esof
Rom
angl
ass
from
Cop
perg
ate,
York
,ana
lyse
dus
ing
indu
ctiv
ely
coup
led
plas
ma
spec
trom
etry
(maj
oran
dm
inor
elem
ents
asw
t%ox
ides
,tra
ceel
emen
tsas
ppm
).Sa
mpl
esar
epl
aced
into
com
posi
tion
algr
oups
(Sb,
anti
mon
yco
lour
less
;lo
w-M
n,lo
w-m
anga
nese
;hi
gh-M
n,hi
gh-m
anga
nese
;Sb
–Mn,
mix
edm
anga
nese
and
anti
mon
y;H
IMT,
high
iron
,man
gane
sean
dti
tani
um;
Pla
nt,p
lant
ash;
colo
ur—
C,c
olou
rles
s;B
G,b
lue–
gree
n;L
G,l
ight
gree
n;Y
G,y
ello
wgr
een;
B,l
ight
blue
).Sa
mpl
esin
ital
ics
are
thos
eth
atm
aydi
ffer
slig
htly
inso
me
resp
ect
from
the
defin
edco
mpo
siti
on.b
.d.,
Bel
owde
tect
ion
Cat
.no.
For
mE
stim
ated
date
(cen
turi
esA
D)
Ass
igne
dgr
oup
Visu
alco
lour
Oxi
des
(wt%
)Tr
ace
elem
ents
(ppm
)
Al 2
O3
Fe 2
O3
MgO
CaO
Na 2
OK
2OTi
O2
P2O
5M
nOP
bOSb
2O5
Ba
Cu
Li
Ni
SrV
YZ
nL
aC
e
1344
3U
ndia
gnos
ticSb
C1.
670.
340.
465.
6719
.68
0.52
0.06
0.03
0.01
0.02
0.89
132
1113
1239
49
716
1220
1117
2Is
ings
21L
ate
1st
SbC
2.04
0.25
0.30
5.60
19.6
60.
630.
040.
020.
010.
390.
8816
510
1215
533
77
1611
2111
420
Bod
ySb
C2.
080.
490.
506.
7219
.62
0.56
0.08
0.04
0.04
0.13
0.88
144
1315
1557
911
719
1223
1086
4U
ndia
gnos
ticSb
C1.
620.
250.
435.
1319
.37
0.42
0.06
0.03
0.02
b.d.
0.74
129
58
1035
88
615
1017
1246
1B
ody
SbC
2.06
0.35
0.38
5.70
19.8
60.
590.
050.
030.
020.
270.
7415
816
1215
416
87
1711
2314
346B
Bod
ySb
C1.
870.
280.
324.
4918
.60
0.44
0.06
0.03
0.01
0.12
0.72
143
157
1128
65
616
1014
8516
Und
iagn
ostic
?Sb
C1.
990.
470.
536.
0319
.70
0.63
0.09
0.06
0.07
0.03
0.72
154
147
1340
910
725
1118
1349
3Is
ings
85b
Lat
e2n
d–ea
rly
3rd
SbC
2.04
0.42
0.43
5.58
20.2
40.
640.
070.
040.
060.
020.
6916
315
1414
358
117
2811
2213
955
Isin
gs85
bL
ate
2nd–
earl
y3r
dSb
C1.
840.
260.
345.
0619
.15
0.54
0.04
0.03
0.01
0.02
0.65
145
812
1335
98
715
1119
8442
Isin
gs85
Lat
e2n
d–ea
rly
3rd
SbC
1.86
0.37
0.45
5.81
18.0
40.
460.
070.
040.
020.
010.
6514
322
712
403
107
3611
1514
331
Und
iagn
ostic
SbC
1.97
0.28
0.37
5.52
19.6
10.
640.
050.
030.
010.
020.
6414
513
912
386
77
1911
1713
992
Bow
lSb
C1.
870.
370.
495.
7718
.48
0.59
0.08
0.04
0.03
0.01
0.64
149
58
1040
09
618
1016
1228
7B
ody
SbC
1.91
0.39
0.51
6.67
19.6
10.
540.
070.
030.
010.
020.
6113
116
1419
486
118
2512
2112
582
Und
iagn
ostic
SbC
1.83
0.35
0.53
5.80
19.6
20.
450.
060.
030.
010.
020.
6113
313
1214
415
117
2012
2113
657
Flas
k/ju
gL
ate
2nd–
earl
y3r
dSb
C1.
950.
340.
415.
5020
.51
0.48
0.07
0.03
0.01
0.01
0.61
158
1012
1339
69
715
1117
1371
6C
ylin
dric
albo
ttle
SbC
2.00
0.41
0.47
6.01
19.2
20.
510.
080.
040.
030.
010.
6114
614
68
438
97
2411
1686
25B
ody
?4th
SbC
1.86
0.35
0.39
5.31
18.7
20.
490.
070.
030.
080.
020.
6115
617
1415
352
117
2312
2213
634
Isin
gs85
bL
ate
2nd–
earl
y3r
dSb
C1.
790.
330.
395.
3219
.87
0.47
0.05
0.03
0.01
0.02
0.57
137
1212
1236
49
722
1120
1386
4B
ody
SbC
1.92
0.27
0.32
5.59
18.4
40.
460.
050.
030.
020.
240.
5714
68
610
401
66
1610
1514
321A
Bod
ySb
C1.
670.
360.
466.
0818
.62
0.47
0.07
0.03
0.01
0.02
0.53
127
1511
1343
611
722
1120
1377
8B
ody
SbC
1.76
0.32
0.40
5.45
19.3
70.
440.
070.
030.
020.
010.
5313
611
911
370
86
2411
1511
894
Und
iagn
ostic
?Sb
C2.
020.
420.
555.
9719
.49
0.42
0.08
0.03
0.01
0.02
0.41
144
1113
1340
612
719
1222
1387
1Is
ings
85L
ate
2nd–
earl
y3r
dSb
C1.
870.
300.
486.
9020
.62
0.52
0.07
0.05
0.09
0.01
0.41
151
199
840
610
728
1017
9501
Face
tted
beak
er2n
d–3r
dSb
C1.
830.
310.
375.
5119
.21
0.47
0.06
0.04
0.02
0.01
0.40
141
146
1034
57
619
1015
1383
5B
ody
SbC
1.84
0.22
0.33
5.13
18.5
50.
480.
050.
030.
02b.
d.0.
4014
28
59
354
67
1611
1814
264B
Bod
ySb
C2.
040.
440.
585.
7120
.38
0.39
0.09
0.03
0.01
0.02
0.50
158
1511
1241
911
822
1117
1226
6B
ody
SbC
2.00
0.46
0.51
5.60
19.3
00.
530.
070.
040.
060.
060.
5015
158
1414
382
117
2511
1812
103
Cyl
ndri
cal
bottl
eL
ate
2nd–
earl
y3r
dSb
C2.
130.
350.
526.
5419
.72
0.62
0.07
0.04
0.03
b.d.
0.49
140
188
850
48
730
1119
1198
4U
ndia
gnos
ticSb
C2.
030.
410.
555.
9719
.26
0.45
0.08
0.03
0.01
0.02
0.46
145
1111
1540
912
718
1120
1199
3U
ndia
gnos
ticSb
C2.
000.
500.
666.
3820
.03
0.45
0.10
0.04
0.01
0.02
0.45
138
1312
1556
713
719
1221
1220
1B
ody
SbC
2.05
0.44
0.65
5.91
19.2
10.
400.
080.
030.
010.
020.
4515
612
1315
424
117
1612
2014
130B
Bod
ySb
C2.
100.
440.
635.
9318
.81
0.44
0.07
0.03
0.01
0.02
0.45
157
1413
1242
911
722
1222
1245
7B
ody
4th
SbC
1.76
0.23
0.37
5.60
18.6
90.
420.
060.
030.
02b.
d.0.
4513
712
68
384
77
1810
1614
308A
Bod
ySb
C1.
790.
240.
365.
1619
.06
0.36
0.06
0.03
0.02
b.d.
0.35
135
86
832
66
718
1015
1335
1B
ody
SbC
1.90
0.26
0.41
5.32
19.8
30.
510.
050.
030.
02b.
d.0.
2913
76
69
359
67
1910
16
18 C. M. Jackson and S. Paynter
© 2015 The Authors.Archaeometry published by John Wiley & Sons Ltd on behalf of University of Oxford, Archaeometry ••, •• (2015) ••–••
1432
0B
ody
SbC
2.12
0.34
0.50
5.53
18.6
00.
370.
080.
030.
02b.
d.0.
3114
67
711
358
97
1911
1814
309B
Bod
ySb
LG
/C2.
190.
350.
665.
9118
.92
0.43
0.08
0.03
0.02
b.d.
0.31
152
118
1043
39
716
1116
8674
Bod
ySb
C1.
970.
330.
474.
9917
.99
0.49
0.07
0.03
0.02
0.01
0.25
150
66
832
48
615
1015
1410
8B
ody
SbC
1.97
0.29
0.45
6.73
19.6
20.
520.
070.
040.
02b.
d.0.
0513
813
69
469
98
2110
1714
310A
Bod
ySb
C2.
010.
340.
455.
4319
.94
0.55
0.06
0.04
0.06
0.04
0.52
158
1410
937
08
721
1117
1431
1BU
ndia
gnos
ticSb
C1.
980.
440.
555.
9519
.84
0.52
0.08
0.05
0.09
0.08
0.46
156
5818
1139
810
726
1115
1432
1cB
ody
Sb/h
igh-
Ca
YG
2.49
0.72
0.77
6.54
20.2
00.
740.
120.
080.
050.
040.
6616
378
1113
509
127
3112
1710
783
Cyl
indr
ical
bott
leL
ate
2nd–
earl
y3r
dSb
/hig
h-C
aL
G2.
410.
800.
877.
5419
.23
0.69
0.13
0.07
0.08
0.03
0.73
157
2117
1654
016
929
1223
1433
9cB
ody
Sb/h
igh-
Ca
LG
2.46
0.54
0.68
7.09
20.4
80.
690.
090.
040.
010.
020.
5715
720
1416
559
139
3112
2112
369
Squa
rebo
ttle
?Mid
-1st
–end
2nd
Low
-Mn
B2.
520.
320.
487.
3716
.66
0.46
0.08
0.14
0.79
b.d.
0.01
310
77
1241
727
815
1116
1068
3C
ast
win
dow
Low
-Mn
BG
2.61
0.37
0.55
7.02
18.3
40.
630.
070.
130.
780.
020.
0127
419
1423
470
239
1912
2112
320
Bod
yfr
agL
ow-M
nG
2.54
0.32
0.48
7.26
16.0
30.
470.
070.
140.
71b.
d.0.
0129
58
649
405
269
1811
1914
321B
Bod
yfr
agL
ow-M
nG
2.99
0.40
0.57
8.24
18.0
00.
770.
060.
150.
670.
020.
0127
523
1123
537
1910
2111
2012
220
Squa
rebo
ttle
?Mid
-1st
–end
2nd
Low
-Mn
B2.
420.
300.
548.
1816
.80
0.60
0.07
0.13
0.66
b.d.
0.01
266
316
1849
716
828
1118
1410
3R
ibbe
dbo
dyL
ate
1st–
earl
y2n
dL
ow-M
nB
G2.
500.
260.
507.
8118
.97
0.58
0.07
0.11
0.63
b.d.
0.01
238
87
1647
017
923
1119
1351
9B
ody
Low
-Mn
B2.
620.
310.
517.
2617
.70
0.74
0.08
0.15
0.48
b.d.
0.01
234
247
1642
216
827
1116
1260
1C
ylin
dric
albo
ttle
Low
-Mn
B2.
500.
290.
527.
8817
.02
0.56
0.07
0.12
0.44
b.d.
0.01
247
396
1445
217
816
1118
1253
7B
ottle
shou
lder
Low
-Mn
B2.
600.
280.
547.
9119
.02
0.66
0.07
0.12
0.42
b.d.
0.01
302
96
1144
422
916
1019
1350
2H
andl
eL
ow-M
nB
2.71
0.27
0.51
8.22
17.0
40.
600.
060.
130.
41b.
d.0.
0126
718
714
468
169
1711
1812
393
Bod
yL
ow-M
nB
2.80
0.31
0.50
7.39
17.1
40.
560.
070.
110.
39b.
d.0.
0124
313
614
438
149
1911
1912
733
Bot
tleL
ow-M
nB
G2.
690.
360.
467.
1319
.87
0.64
0.08
0.12
0.39
0.02
0.01
242
1810
1642
314
915
1117
1286
8Is
ings
12(H
ofhe
imcu
p)1s
tL
ow-M
nB
G2.
810.
360.
457.
1418
.43
0.73
0.08
0.13
0.36
0.02
0.01
224
2612
1839
715
918
1122
1328
2Is
ings
55(j
ug)
Mid
-1st
–ear
ly2n
dL
ow-M
nB
2.36
0.28
0.52
8.00
16.4
40.
560.
070.
120.
34b.
d.0.
0123
521
814
447
139
1811
2014
324
Bod
yL
ow-M
nB
2.64
0.31
0.53
7.65
17.9
30.
680.
070.
140.
30b.
d.0.
0123
313
614
452
139
1911
1886
36Is
ings
3(P
MB
)1s
tL
ow-M
nB
3.04
0.38
0.45
7.35
17.0
00.
770.
080.
120.
250.
010.
0122
119
612
384
119
1611
1813
604
Isin
gs3
(PM
B)
1st
Low
-Mn
B2.
790.
390.
657.
7416
.82
0.65
0.08
0.15
0.21
b.d.
0.01
250
377
1143
713
815
1116
1369
5B
ody
Low
-Mn
B2.
580.
280.
528.
0316
.35
0.68
0.07
0.15
0.16
b.d.
0.01
232
156
1241
912
915
1019
1014
8B
ody
1st–
2nd
Low
-Mn
YG
2.84
0.31
0.44
7.50
16.5
31.
710.
070.
130.
080.
020.
0122
58
1114
387
119
1511
2213
152
Bod
yL
ow-M
nY
G2.
830.
300.
447.
4517
.13
0.63
0.07
0.13
0.08
0.02
0.01
220
714
1738
311
913
1224
1389
0B
ody
Low
-Mn
YG
2.97
0.26
0.45
7.85
16.3
90.
630.
070.
140.
08b.
d.0.
0123
15
610
401
98
1311
1913
599
Isin
gs44
/5(b
owl)
Mid
-1st
–mid
-2nd
Low
-Mn
YG
2.94
0.24
0.45
7.86
16.1
10.
620.
070.
130.
07b.
d.0.
0122
76
610
395
98
1711
1913
688
Jug
and
hand
leL
ow-M
nY
G2.
280.
310.
488.
0618
.03
0.60
0.06
0.13
0.07
0.02
0.01
211
1012
1441
612
912
1120
9636
Isin
gs52
(jug
)L
ate
1st–
earl
y2n
dL
ow-M
nY
G2.
700.
250.
457.
9918
.57
0.53
0.06
0.10
0.03
b.d.
0.01
212
46
643
17
811
1116
9426
Bod
yL
ow-M
nG
2.65
0.32
0.43
7.02
17.6
20.
680.
060.
110.
020.
010.
0120
35
810
368
88
1511
1711
912
Bod
y4t
hL
ow-M
nY
G2.
530.
350.
487.
9118
.36
0.67
0.07
0.12
0.02
0.02
0.01
205
714
1440
911
917
1122
1137
7C
ast
win
dow
Hig
h-M
nB
G2.
940.
640.
618.
5217
.42
0.54
0.07
0.10
1.38
0.02
0.08
385
1710
2150
123
1019
1220
1353
5B
ottle
shou
lder
Hig
h-M
n(L
evan
tine
1?)
BG
2.85
0.57
0.67
8.77
15.8
30.
540.
090.
101.
340.
020.
0834
49
1224
541
1310
19
22
1406
9C
ast
win
dow
Hig
h-M
n(L
evan
tine
1?)
G2.
790.
400.
548.
6114
.85
0.68
0.08
0.15
1.33
b.d.
0.03
440
237
1948
838
918
1020
1123
6C
ast
win
dow
Hig
h-M
nB
G2.
880.
600.
588.
4017
.44
0.46
0.08
0.09
1.24
0.02
0.08
366
157
1948
621
920
1117
Glass supply, consumption and recycling in Roman Coppergate, York 19
© 2015 The Authors.Archaeometry published by John Wiley & Sons Ltd on behalf of University of Oxford, Archaeometry ••, •• (2015) ••–••

App
endi
x1
(Con
tinu
ed)
Cat
.no.
For
mE
stim
ated
date
(cen
turi
esA
D)
Ass
igne
dgr
oup
Visu
alco
lour
Oxi
des
(wt%
)Tr
ace
elem
ents
(ppm
)
Al 2
O3
Fe 2
O3
MgO
CaO
Na 2
OK
2OTi
O2
P2O
5M
nOP
bOSb
2O5
Ba
Cu
Li
Ni
SrV
YZ
nL
aC
e
1271
7Fl
ask/
jug
Hig
h-M
nL
G3.
030.
430.
558.
4916
.65
0.79
0.07
0.10
1.16
0.02
0.01
473
2712
1956
937
916
1119
1131
6C
up4t
hH
igh-
Mn
LG
3.28
0.46
0.68
9.00
18.3
90.
850.
080.
091.
130.
020.
0456
218
1318
522
2010
2011
2313
562
Isin
gs10
6be
aker
4th
Hig
h-M
nL
G3.
170.
480.
708.
7717
.38
0.69
0.08
0.09
1.07
0.02
0.01
581
2214
1853
220
1017
1323
1278
8B
ody
frag
men
tH
igh-
Mn
LG
/C2.
650.
440.
598.
1017
.78
0.74
0.07
0.08
1.06
0.02
0.08
581
2511
1646
121
918
1121
9791
Isin
gs10
6be
aker
4th
Hig
h-M
nG
3.19
0.41
0.59
9.04
18.1
70.
830.
080.
100.
920.
020.
0137
214
1217
525
1810
1711
1910
734
Jug
Lat
e1s
t–ea
rly
2nd
Hig
h-M
nY
G2.
800.
300.
517.
8817
.03
0.78
0.07
0.19
0.90
b.d.
0.01
282
97
1948
120
820
1118
1017
9Fa
cette
dbe
aker
End
3rd–
earl
y4t
hH
igh-
Mn
LG
2.87
0.43
0.62
8.29
17.1
60.
650.
080.
100.
860.
020.
0139
918
1419
454
199
1612
2454
95F
acet
ted
beak
erE
nd3r
d–ea
rly
4th
Hig
h-M
n(L
evan
tine
1?)
LG
2.87
0.43
0.62
8.48
15.7
20.
660.
080.
110.
840.
010.
0140
717
713
450
179
1911
19
1354
7M
elte
dbo
dyfr
agm
ent
Hig
h-M
nY
G2.
690.
440.
887.
8614
.76
0.63
0.09
0.13
1.66
b.d.
0.01
429
179
2356
662
925
1220
1328
8B
ody
Sb–M
nC
1.85
0.29
0.41
5.51
19.4
20.
490.
060.
040.
110.
010.
4115
217
89
355
97
2310
1715
522
Bod
ySb
–Mn
C1.
780.
270.
395.
1919
.62
0.47
0.05
0.04
0.10
0.01
0.49
149
168
833
47
626
1016
1431
1AU
ndia
gnos
ticSb
–Mn
C2.
050.
430.
576.
0119
.75
0.55
0.07
0.04
0.10
0.06
0.48
164
6125
1341
611
725
1221
1434
6AB
ody
Sb–M
nY
G2.
030.
500.
495.
8119
.17
0.81
0.08
0.06
0.14
0.06
0.56
172
9121
1538
214
742
1222
8207
Bea
ker
flask
Lat
e2n
d–ea
rly
3rd
Sb–M
nC
1.84
0.37
0.43
5.47
19.4
70.
510.
070.
040.
130.
020.
5816
219
1616
356
127
2512
2314
291A
Bod
ySb
–Mn
C1.
940.
440.
485.
8818
.44
0.63
0.07
0.05
0.14
0.06
0.53
169
105
2214
392
127
3212
2112
037
Whe
el-c
utbe
aker
2nd
Sb–M
nC
1.99
0.31
0.43
5.70
19.0
10.
550.
060.
050.
110.
010.
3916
217
910
377
97
2310
1614
308B
Bod
ySb
–Mn
Y2.
150.
290.
445.
7619
.88
1.01
0.06
0.05
0.14
0.02
0.41
172
2012
936
59
725
1017
1426
4CB
ody
Sb–M
nL
G2.
310.
480.
546.
4319
.68
0.68
0.07
0.06
0.34
0.12
0.64
228
221
3117
438
168
3312
2114
306B
Und
iagn
osti
cSb
–Mn
G2.
370.
680.
576.
0219
.33
0.92
0.10
0.10
0.14
0.05
0.69
179
4716
1640
316
734
1223
1225
2B
ody
4th
Sb–M
nC
2.10
0.36
0.53
6.14
19.2
50.
660.
080.
060.
200.
030.
4517
656
1310
403
137
3211
1897
07V
ertic
al-r
ibbe
dju
g2n
d–3r
dSb
–Mn
C1.
950.
420.
465.
8419
.64
0.62
0.08
0.06
0.24
0.02
0.53
185
219
1238
813
727
1116
1426
4DB
ody
Sb–M
nL
G2.
200.
550.
536.
2720
.42
0.82
0.09
0.07
0.21
0.03
0.49
201
4614
1341
912
756
1113
1395
2C
up3r
dSb
–Mn
LG
2.34
0.46
0.55
7.07
18.5
00.
750.
080.
131.
010.
020.
3229
924
1117
437
298
2511
1912
143
Cas
tw
indo
wSb
–Mn
B2.
380.
460.
577.
1216
.20
0.67
0.09
0.09
0.63
0.02
0.25
256
4459
1644
320
834
1119
1265
7Ja
rSb
–Mn
B2.
380.
510.
546.
3518
.59
0.71
0.07
0.09
0.25
0.02
0.24
197
6811
1438
811
834
1120
1409
7Ju
gha
ndle
Sb–M
nB
2.45
0.38
0.52
6.87
16.9
00.
690.
080.
130.
480.
040.
2422
756
815
412
167
2811
1912
212
Cas
tw
indo
wSb
–Mn
BG
2.46
0.73
0.60
6.91
17.8
80.
770.
100.
130.
590.
080.
2426
211
121
2143
122
935
1222
8785
Bod
ySb
–Mn
BG
2.53
0.53
0.57
7.32
17.1
50.
760.
090.
140.
620.
050.
2425
756
1016
452
259
2711
1912
253
Isin
gs85
Lat
e2n
d–m
id-3
rdSb
–Mn
B2.
690.
530.
637.
4817
.85
0.80
0.09
0.11
0.67
0.02
0.24
295
6314
1746
619
932
1120
1389
9C
ast
win
dow
Sb–M
nG
2.75
0.59
0.63
7.52
16.9
70.
770.
100.
120.
700.
080.
2329
318
712
1746
222
936
1119
1295
6Pr
ism
atic
bottl
eSb
–Mn
BG
2.46
0.48
0.55
6.97
18.5
40.
680.
080.
130.
480.
050.
2124
272
1318
444
208
2111
1981
09Fu
nnel
-mou
thja
rSb
–Mn
BG
2.61
0.83
0.68
6.76
17.2
61.
050.
110.
130.
490.
160.
2126
150
419
1843
020
872
1119
1198
1C
ast
win
dow
Sb–M
nB
G2.
620.
670.
607.
2617
.56
0.72
0.09
0.13
0.74
0.10
0.21
286
163
2021
447
249
3112
24
20 C. M. Jackson and S. Paynter
© 2015 The Authors.Archaeometry published by John Wiley & Sons Ltd on behalf of University of Oxford, Archaeometry ••, •• (2015) ••–••
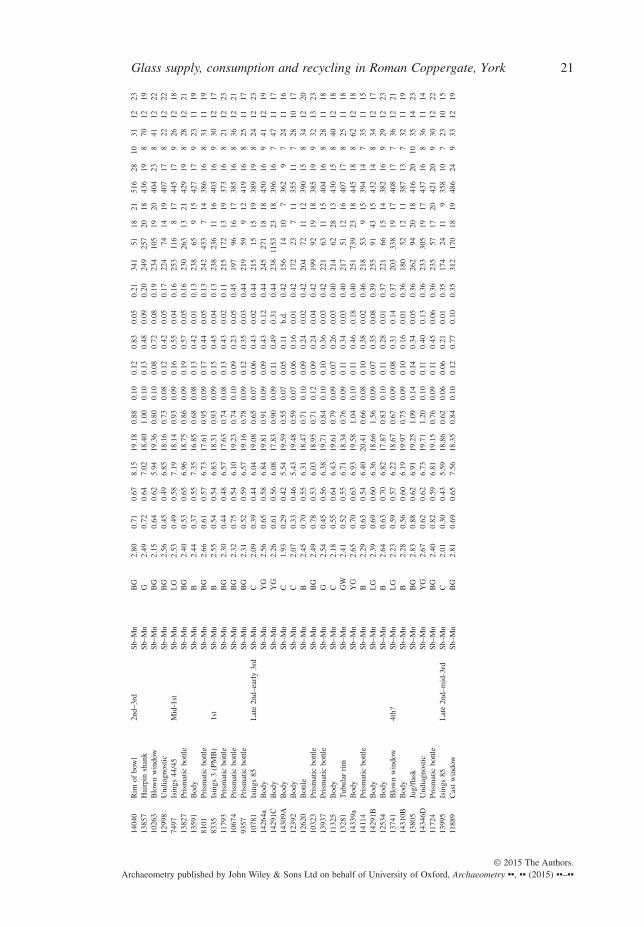
1404
0R
imof
bow
l2n
d–3r
dSb
–Mn
BG
2.80
0.71
0.67
8.15
19.1
80.
880.
100.
120.
830.
050.
2134
151
1821
516
2810
3112
2313
857
Hai
rpin
shan
kSb
–Mn
G2.
490.
720.
647.
0218
.40
1.00
0.10
0.13
0.48
0.09
0.20
249
257
2018
436
198
7012
1910
263
Blo
wn
win
dow
Sb–M
nB
G2.
150.
640.
625.
9419
.36
0.80
0.10
0.08
0.72
0.08
0.19
234
105
1920
404
238
4112
2212
998
Und
iagn
ostic
Sb–M
nB
G2.
560.
450.
496.
8518
.16
0.73
0.08
0.12
0.42
0.05
0.17
224
7414
1940
717
822
1222
7497
Isin
gs44
/45
Mid
-1st
Sb–M
nL
G2.
530.
490.
587.
1918
.14
0.93
0.09
0.16
0.55
0.04
0.16
253
116
817
445
179
2612
1813
827
Pris
mat
icbo
ttle
Sb–M
nB
G2.
400.
530.
656.
9618
.75
0.86
0.09
0.19
0.57
0.05
0.16
230
263
1321
429
198
2812
2113
591
Bod
ySb
–Mn
B2.
440.
370.
557.
3516
.85
0.68
0.08
0.13
0.42
0.01
0.13
238
659
1542
717
923
1119
8101
Pris
mat
icbo
ttle
Sb–M
nB
G2.
660.
610.
576.
7317
.61
0.95
0.09
0.17
0.44
0.05
0.13
242
433
714
386
168
3111
1983
35Is
ings
3(P
MB
)1s
tSb
–Mn
B2.
550.
540.
546.
8318
.31
0.93
0.09
0.15
0.45
0.04
0.13
238
236
1116
403
169
3012
1711
793
Pris
mat
icbo
ttle
Sb–M
nB
G2.
300.
440.
486.
5717
.63
0.74
0.08
0.13
0.43
0.02
0.11
215
172
1319
373
168
2112
2310
674
Pris
mat
icbo
ttle
Sb–M
nB
G2.
320.
750.
546.
1019
.23
0.74
0.10
0.09
0.23
0.05
0.45
197
9616
1738
516
836
1221
9357
Pris
mat
icbo
ttle
Sb–M
nB
G2.
310.
520.
596.
5719
.16
0.78
0.09
0.12
0.35
0.03
0.44
219
599
1241
916
825
1117
1078
1Is
ings
85L
ate
2nd–
earl
y3r
dSb
–Mn
C2.
090.
390.
446.
0419
.08
0.65
0.07
0.06
0.43
0.02
0.44
215
1515
1938
919
824
1223
1426
4aB
ody
Sb–M
nY
G2.
560.
650.
586.
8419
.81
0.91
0.09
0.09
0.43
0.12
0.44
245
271
1818
450
169
4112
1914
291C
Bod
ySb
–Mn
YG
2.26
0.61
0.56
6.08
17.8
30.
900.
090.
110.
490.
310.
4423
811
5323
1839
616
747
1117
1430
9AB
ody
Sb–M
nC
1.93
0.29
0.42
5.54
19.5
90.
550.
070.
050.
11b.
d.0.
4215
614
107
362
97
2411
1612
392
Bod
ySb
–Mn
C2.
070.
330.
465.
4319
.48
0.59
0.07
0.06
0.16
0.01
0.42
172
237
1135
511
728
1017
1262
0B
ottle
Sb–M
nB
2.45
0.70
0.55
6.31
18.4
70.
710.
100.
090.
240.
020.
4220
472
1112
390
158
3412
2010
323
Pris
mat
icbo
ttle
Sb–M
nB
G2.
490.
780.
536.
0318
.95
0.71
0.12
0.09
0.24
0.04
0.42
199
9219
1838
519
932
1323
1393
7Pr
ism
atic
bottl
eSb
–Mn
G2.
540.
450.
566.
3819
.71
0.84
0.10
0.10
0.36
0.03
0.42
221
6311
1540
416
828
1118
1132
5B
ody
Sb–M
nC
2.18
0.55
0.64
6.43
19.6
10.
790.
090.
070.
260.
030.
4021
462
2813
430
158
4012
1813
281
Tub
ular
rim
Sb–M
nG
W2.
410.
520.
556.
7118
.34
0.76
0.09
0.11
0.34
0.03
0.40
217
5112
1640
717
825
1118
1433
9aB
ody
Sb–M
nY
G2.
650.
700.
636.
9319
.58
1.04
0.10
0.11
0.46
0.18
0.40
251
739
2318
445
188
6212
1814
114
Pris
mat
icbo
ttle
Sb–M
nB
2.29
0.63
0.54
6.40
20.4
10.
660.
080.
100.
380.
020.
4621
853
915
394
147
3511
1514
291B
Bod
ySb
–Mn
LG
2.39
0.69
0.60
6.36
18.6
61.
560.
090.
070.
350.
080.
3925
591
4315
432
148
3412
1712
534
Bod
ySb
–Mn
B2.
640.
630.
706.
8217
.87
0.83
0.10
0.11
0.28
0.01
0.37
221
6615
1438
216
929
1223
1374
1B
low
nw
indo
w4t
h?Sb
–Mn
LG
2.23
0.59
0.57
6.22
18.6
70.
670.
090.
080.
310.
140.
3720
333
819
1740
817
736
1221
1431
0BB
ody
Sb–M
nB
2.28
0.56
0.60
6.19
19.9
70.
750.
090.
100.
160.
010.
3618
052
1211
387
137
3211
1913
805
Jug/
flask
Sb–M
nB
G2.
830.
880.
626.
9119
.25
1.09
0.14
0.14
0.34
0.05
0.36
262
9420
1841
620
1035
1423
1434
6DU
ndia
gnos
ticSb
–Mn
YG
2.67
0.62
0.62
6.73
19.7
11.
200.
100.
110.
400.
130.
3623
330
519
1743
716
836
1114
1172
4Pr
ism
atic
bottl
eSb
–Mn
BG
2.40
0.82
0.59
6.81
19.1
50.
760.
090.
110.
450.
060.
3623
557
1720
421
209
3012
2213
995
Isin
gs85
Lat
e2n
d–m
id-3
rdSb
–Mn
C2.
010.
300.
435.
5918
.86
0.62
0.06
0.06
0.21
0.01
0.35
174
2411
935
810
723
1015
1188
9C
ast
win
dow
Sb–M
nB
G2.
810.
690.
657.
5618
.35
0.84
0.10
0.12
0.77
0.10
0.35
312
170
1819
486
249
3312
19
Glass supply, consumption and recycling in Roman Coppergate, York 21
© 2015 The Authors.Archaeometry published by John Wiley & Sons Ltd on behalf of University of Oxford, Archaeometry ••, •• (2015) ••–••

App
endi
x1
(Con
tinu
ed)
Cat
.no.
For
mE
stim
ated
date
(cen
turi
esA
D)
Ass
igne
dgr
oup
Visu
alco
lour
Oxi
des
(wt%
)Tr
ace
elem
ents
(ppm
)
Al 2
O3
Fe 2
O3
MgO
CaO
Na 2
OK
2OTi
O2
P2O
5M
nOP
bOSb
2O5
Ba
Cu
Li
Ni
SrV
YZ
nL
aC
e
1213
5C
ast
win
dow
Sb–M
nB
2.67
0.66
0.62
7.09
17.2
80.
980.
120.
140.
380.
080.
3325
324
917
1740
819
940
1221
1334
1B
ottle
,han
dle
reed
edSb
–Mn
B2.
530.
710.
616.
9719
.58
0.82
0.09
0.13
0.40
0.05
0.33
244
9915
1542
517
835
1117
1398
4B
ottle
shou
lder
Sb–M
nB
G2.
340.
500.
606.
6717
.42
0.83
0.08
0.16
0.41
0.05
0.33
208
6013
1939
817
824
1223
8066
Und
iagn
ostic
Sb–M
nB
G2.
350.
880.
576.
9317
.59
1.03
0.09
0.13
0.52
0.05
0.33
240
8636
1641
521
836
1221
1264
1Pr
ism
atic
bottl
eSb
–Mn
B2.
190.
970.
496.
0918
.27
0.65
0.07
0.08
0.26
0.01
0.32
189
4010
1436
712
732
1119
1076
3Pr
ism
atic
bottl
eSb
–Mn
BG
2.47
0.69
0.60
6.86
18.4
80.
830.
100.
130.
530.
050.
3225
270
2121
430
238
2912
2314
315
Bod
ySb
–Mn
G2.
830.
680.
626.
7518
.01
0.97
0.13
0.14
0.33
0.03
0.31
259
8716
1540
518
932
1322
1386
9Pr
ism
atic
bottl
eSb
–Mn
B2.
580.
570.
597.
0818
.24
0.82
0.10
0.14
0.40
0.03
0.31
244
119
1513
408
188
4011
1913
907
Bod
ySb
–Mn
LG
2.53
0.67
0.63
6.65
18.0
20.
910.
090.
120.
430.
120.
3128
717
420
1742
318
865
1224
8417
Bod
ySb
–Mn
BG
2.44
0.70
0.63
6.86
18.3
71.
020.
090.
130.
490.
090.
3124
418
718
1543
219
851
1119
1208
6H
andl
eju
gSb
–Mn
BG
2.39
0.43
0.59
7.23
20.0
10.
680.
080.
090.
550.
010.
3026
839
1015
472
169
3111
1912
879
Bod
ySb
–Mn
BG
2.50
0.70
0.62
7.20
18.4
80.
840.
100.
130.
540.
080.
2926
970
1215
440
219
3311
1898
66B
ottle
,ree
ded
hand
leSb
–Mn
BG
2.81
0.67
0.63
7.59
19.1
01.
030.
110.
140.
560.
050.
2928
213
329
1945
223
935
1324
8391
Pris
mat
icbo
ttle
Sb–M
nG
2.54
0.77
0.67
6.87
18.4
81.
190.
110.
130.
530.
090.
2825
821
528
1644
120
910
812
1810
249
Pris
mat
icbo
ttle
Sb–M
nL
G/B
G2.
650.
600.
707.
0018
.67
1.04
0.10
0.11
0.85
0.03
0.11
288
9119
2043
020
938
1221
1021
9C
ast
win
dow
Sb–M
nB
G2.
540.
760.
666.
7119
.17
1.09
0.10
0.13
0.55
0.10
0.25
261
216
3920
443
218
8613
2314
041
Pris
mat
icbo
ttle
Sb–M
nG
2.60
0.55
0.75
7.17
17.1
80.
930.
100.
170.
600.
020.
2527
267
1215
464
238
2911
2013
259
Mel
ted
bottl
eSb
–Mn
BG
2.67
0.91
0.86
6.94
18.0
21.
000.
120.
100.
300.
040.
5321
975
2620
362
2110
3413
2614
130A
Bod
ySb
–Mn
YG
2.53
0.98
0.62
6.72
18.6
30.
910.
100.
130.
430.
450.
5324
517
1819
1940
018
870
1118
9718
Bod
ySb
–Mn
LG
/C2.
120.
510.
526.
0519
.37
0.67
0.08
0.07
0.22
0.30
0.54
183
350
2716
401
157
6011
2113
755
Bot
tleSb
–Mn
BG
2.23
0.55
0.59
6.05
18.8
30.
770.
100.
110.
270.
050.
5419
769
914
382
167
3112
1912
092
Bot
tle/ju
gSb
–Mn
LG
/BG
2.61
0.69
0.67
6.57
20.1
41.
070.
130.
150.
530.
130.
5823
915
414
2446
022
936
1323
1413
0CB
ody
Sb–M
nL
G2.
460.
510.
616.
1820
.23
0.61
0.09
0.06
0.11
0.04
0.41
181
6322
1447
112
737
1215
9904
Jug,
tubu
lar,
push
edin
base
ring
HIM
T2(
W)
LG
2.41
0.66
0.70
6.60
19.7
01.
180.
110.
080.
830.
030.
0127
883
2020
456
218
3512
21
1392
5B
ody
HIM
T2(
W)
B4.
110.
320.
424.
8618
.39
1.03
0.08
0.15
0.84
b.d.
0.01
292
258
2134
819
923
1118
9573
Bod
y4t
hH
IMT
2(W
)L
G2.
430.
830.
796.
4020
.00
1.20
0.14
0.10
0.99
0.03
0.08
467
137
2520
462
258
5313
2313
564
Bod
y4t
hH
IMT
2(W
)L
G2.
090.
670.
866.
7619
.88
0.51
0.13
0.04
1.03
0.02
0.03
301
1614
1956
222
818
1223
1031
5B
ody
HIM
T2(
W)
LG
/C2.
230.
710.
745.
9519
.76
0.98
0.12
0.07
1.00
0.03
0.08
318
8524
2143
022
844
1222
1262
8Is
ings
96/1
06(c
up/b
eake
r)4t
hH
IMT
2(W
)L
G/C
2.27
0.73
0.77
5.53
19.9
90.
850.
130.
070.
920.
040.
1623
184
2218
394
248
3812
22
22 C. M. Jackson and S. Paynter
© 2015 The Authors.Archaeometry published by John Wiley & Sons Ltd on behalf of University of Oxford, Archaeometry ••, •• (2015) ••–••
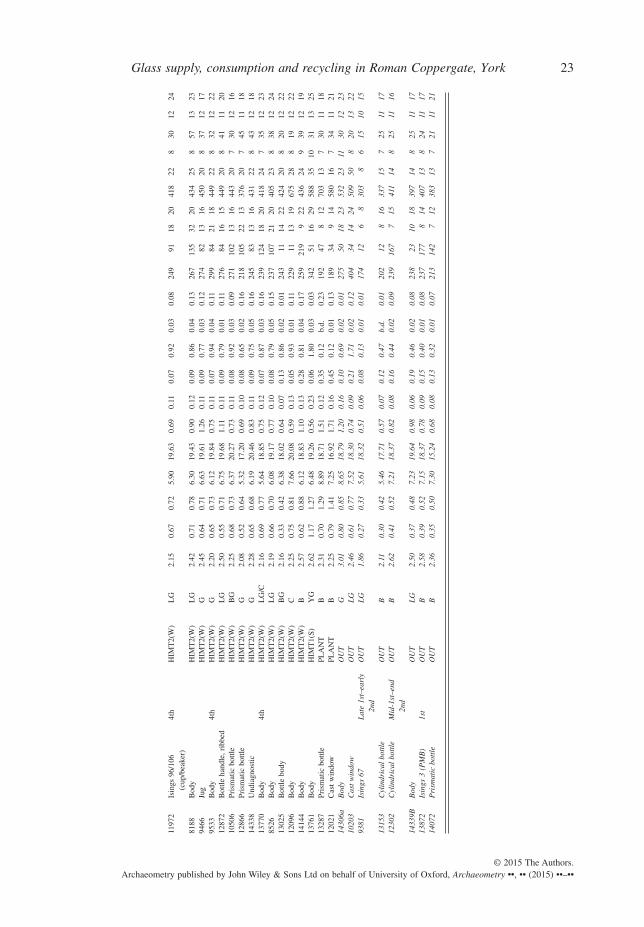
1197
2Is
ings
96/1
06(c
up/b
eake
r)4t
hH
IMT
2(W
)L
G2.
150.
670.
725.
9019
.63
0.69
0.11
0.07
0.92
0.03
0.08
249
9118
2041
822
830
1224
8188
Bod
yH
IMT
2(W
)L
G2.
420.
710.
786.
3019
.43
0.90
0.12
0.09
0.86
0.04
0.13
267
135
3220
434
258
5713
2394
66Ju
gH
IMT
2(W
)G
2.45
0.64
0.71
6.63
19.6
11.
260.
110.
090.
770.
030.
1227
482
1316
450
208
3712
1795
33B
ody
4th
HIM
T2(
W)
G2.
200.
650.
736.
1219
.84
0.75
0.11
0.07
0.94
0.04
0.11
299
8421
1844
922
832
1222
1287
2B
ottle
hand
le,r
ibbe
dH
IMT
2(W
)L
G2.
500.
550.
716.
7519
.68
1.11
0.11
0.09
0.79
0.01
0.11
276
8416
1544
920
841
1120
1050
6Pr
ism
atic
bottl
eH
IMT
2(W
)B
G2.
250.
680.
736.
3720
.27
0.73
0.11
0.08
0.92
0.03
0.09
271
102
1316
443
207
3012
1612
866
Pris
mat
icbo
ttle
HIM
T2(
W)
G2.
080.
520.
645.
3217
.20
0.69
0.10
0.08
0.65
0.02
0.16
218
105
2213
376
207
4511
1814
338
Und
iagn
ostic
HIM
T2(
W)
G2.
280.
650.
686.
1920
.46
0.83
0.11
0.09
0.75
0.05
0.16
245
8313
1643
122
843
1218
1377
0B
ody
4th
HIM
T2(
W)
LG
/C2.
160.
690.
775.
6418
.85
0.75
0.12
0.07
0.87
0.03
0.16
239
124
1820
418
247
3512
2385
26B
ody
HIM
T2(
W)
LG
2.19
0.66
0.70
6.08
19.1
70.
770.
100.
080.
790.
050.
1523
710
721
2040
523
838
1224
1302
5B
ottle
body
HIM
T2(
W)
BG
2.16
0.33
0.42
6.38
18.0
20.
640.
070.
130.
860.
020.
0124
311
1422
424
208
2012
2212
096
Bod
yH
IMT
2(W
)C
2.25
0.75
0.81
7.66
20.0
80.
590.
130.
050.
930.
010.
1122
911
1319
675
288
1912
2214
144
Bod
yH
IMT
2(W
)B
2.57
0.62
0.88
6.12
18.8
31.
100.
130.
280.
810.
040.
1725
921
99
2243
624
939
1219
1376
1B
ody
HIM
T1(
S)Y
G2.
621.
171.
276.
4819
.26
0.56
0.23
0.06
1.80
0.03
0.03
342
5116
2958
835
1031
1325
1328
7Pr
ism
atic
bottl
ePL
AN
TB
2.31
0.70
1.29
8.89
18.7
11.
510.
120.
350.
12b.
d.0.
2319
247
812
703
137
3011
1812
021
Cas
tw
indo
wPL
AN
TB
2.25
0.79
1.41
7.25
16.9
21.
710.
160.
450.
120.
010.
1318
934
914
580
167
3411
2114
306a
Bod
yO
UT
G3.
010.
800.
858.
6518
.79
1.20
0.16
0.10
0.69
0.02
0.01
275
5018
2353
223
1130
1223
1020
3C
ast
win
dow
OU
TL
G2.
460.
610.
777.
5218
.30
0.74
0.09
0.21
1.71
0.02
0.12
404
3414
2450
950
820
1322
9381
Isin
gs67
Lat
e1s
t–ea
rly
2nd
OU
TL
G1.
860.
270.
335.
6118
.32
0.51
0.06
0.08
0.13
0.01
0.01
174
126
830
38
615
1015
1315
3C
ylin
dric
albo
ttle
OU
TB
2.11
0.30
0.42
5.46
17.7
10.
570.
070.
120.
47b.
d.0.
0120
212
816
337
157
2511
1712
302
Cyl
indr
ical
bott
leM
id-1
st–e
nd2n
dO
UT
B2.
620.
410.
527.
2118
.37
0.82
0.08
0.16
0.44
0.02
0.09
239
167
715
411
148
2511
16
1433
9BB
ody
OU
TL
G2.
500.
370.
487.
2319
.64
0.98
0.06
0.19
0.46
0.02
0.08
238
2310
1839
714
825
1117
1387
2Is
ings
3(P
MB
)1s
tO
UT
B2.
580.
390.
527.
1518
.37
0.78
0.09
0.15
0.40
0.01
0.08
237
177
814
407
138
2411
1714
072
Pri
smat
icbo
ttle
OU
TB
2.36
0.35
0.50
7.30
15.2
40.
680.
080.
130.
320.
010.
0721
314
27
1238
313
721
1121
Glass supply, consumption and recycling in Roman Coppergate, York 23
© 2015 The Authors.Archaeometry published by John Wiley & Sons Ltd on behalf of University of Oxford, Archaeometry ••, •• (2015) ••–••
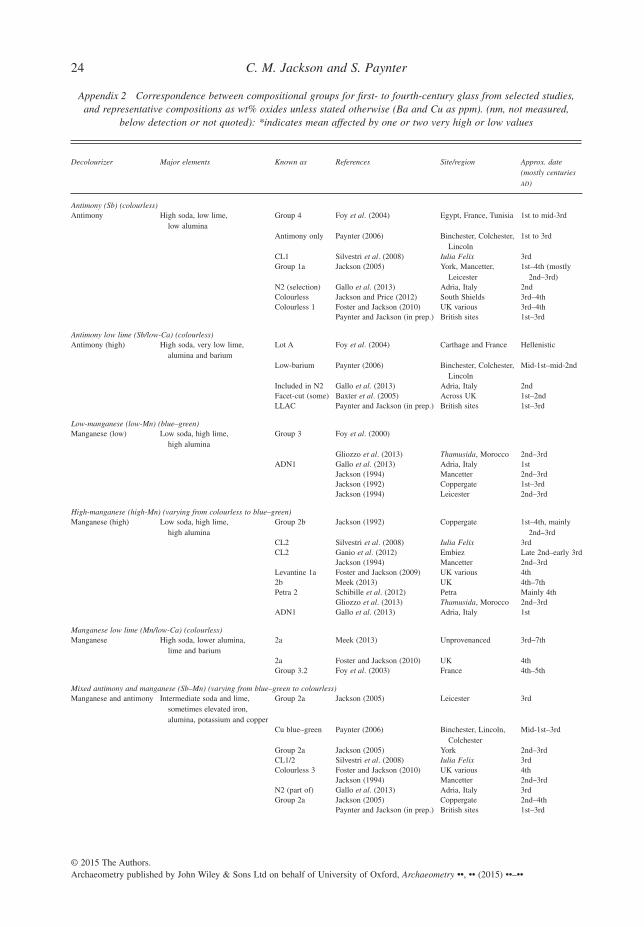
Appendix 2 Correspondence between compositional groups for first- to fourth-century glass from selected studies,and representative compositions as wt% oxides unless stated otherwise (Ba and Cu as ppm). (nm, not measured,
below detection or not quoted): *indicates mean affected by one or two very high or low values
Decolourizer Major elements Known as References Site/region Approx. date(mostly centuriesAD)
Antimony (Sb) (colourless)Antimony High soda, low lime,
low aluminaGroup 4 Foy et al. (2004) Egypt, France, Tunisia 1st to mid-3rd
Antimony only Paynter (2006) Binchester, Colchester,Lincoln
1st to 3rd
CL1 Silvestri et al. (2008) Iulia Felix 3rdGroup 1a Jackson (2005) York, Mancetter,
Leicester1st–4th (mostly
2nd–3rd)N2 (selection) Gallo et al. (2013) Adria, Italy 2ndColourless Jackson and Price (2012) South Shields 3rd–4thColourless 1 Foster and Jackson (2010) UK various 3rd–4th
Paynter and Jackson (in prep.) British sites 1st–3rd
Antimony low lime (Sb/low-Ca) (colourless)Antimony (high) High soda, very low lime,
alumina and bariumLot A Foy et al. (2004) Carthage and France Hellenistic
Low-barium Paynter (2006) Binchester, Colchester,Lincoln
Mid-1st–mid-2nd
Included in N2 Gallo et al. (2013) Adria, Italy 2ndFacet-cut (some) Baxter et al. (2005) Across UK 1st–2ndLLAC Paynter and Jackson (in prep.) British sites 1st–3rd
Low-manganese (low-Mn) (blue–green)Manganese (low) Low soda, high lime,
high aluminaGroup 3 Foy et al. (2000)
Gliozzo et al. (2013) Thamusida, Morocco 2nd–3rdADN1 Gallo et al. (2013) Adria, Italy 1st
Jackson (1994) Mancetter 2nd–3rdJackson (1992) Coppergate 1st–3rdJackson (1994) Leicester 2nd–3rd
High-manganese (high-Mn) (varying from colourless to blue–green)Manganese (high) Low soda, high lime,
high aluminaGroup 2b Jackson (1992) Coppergate 1st–4th, mainly
2nd–3rdCL2 Silvestri et al. (2008) Iulia Felix 3rdCL2 Ganio et al. (2012) Embiez Late 2nd–early 3rd
Jackson (1994) Mancetter 2nd–3rdLevantine 1a Foster and Jackson (2009) UK various 4th2b Meek (2013) UK 4th–7thPetra 2 Schibille et al. (2012) Petra Mainly 4th
Gliozzo et al. (2013) Thamusida, Morocco 2nd–3rdADN1 Gallo et al. (2013) Adria, Italy 1st
Manganese low lime (Mn/low-Ca) (colourless)Manganese High soda, lower alumina,
lime and barium2a Meek (2013) Unprovenanced 3rd–7th
2a Foster and Jackson (2010) UK 4thGroup 3.2 Foy et al. (2003) France 4th–5th
Mixed antimony and manganese (Sb–Mn) (varying from blue–green to colourless)Manganese and antimony Intermediate soda and lime,
sometimes elevated iron,alumina, potassium and copper
Group 2a Jackson (2005) Leicester 3rd
Cu blue–green Paynter (2006) Binchester, Lincoln,Colchester
Mid-1st–3rd
Group 2a Jackson (2005) York 2nd–3rdCL1/2 Silvestri et al. (2008) Iulia Felix 3rdColourless 3 Foster and Jackson (2010) UK various 4th
Jackson (1994) Mancetter 2nd–3rdN2 (part of) Gallo et al. (2013) Adria, Italy 3rdGroup 2a Jackson (2005) Coppergate 2nd–4th
Paynter and Jackson (in prep.) British sites 1st–3rd
24 C. M. Jackson and S. Paynter
© 2015 The Authors.Archaeometry published by John Wiley & Sons Ltd on behalf of University of Oxford, Archaeometry ••, •• (2015) ••–••
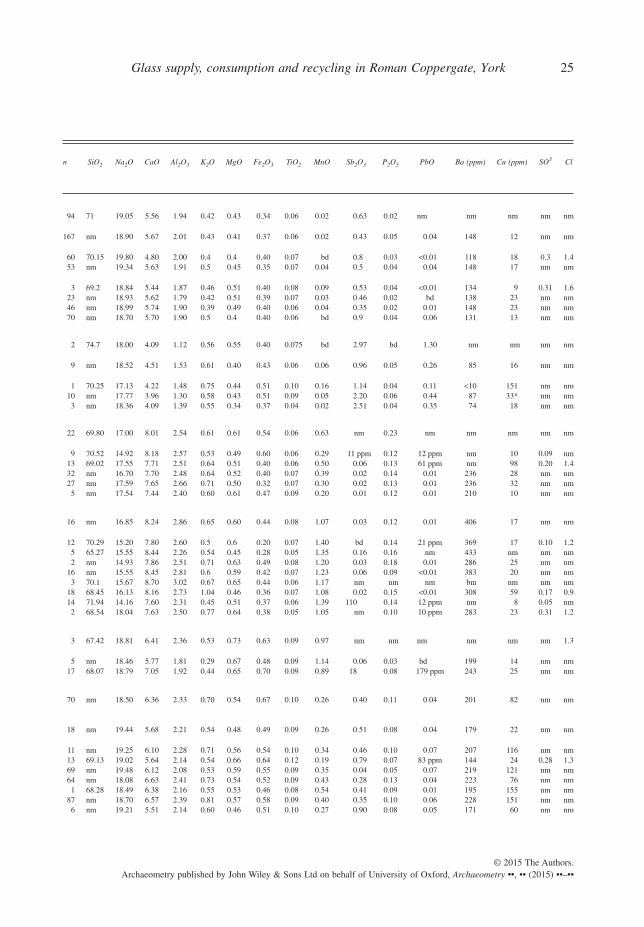
n SiO2 Na2O CaO Al2O3 K2O MgO Fe2O3 TiO2 MnO Sb2O3 P2O5 PbO Ba (ppm) Cu (ppm) SO3 Cl
94 71 19.05 5.56 1.94 0.42 0.43 0.34 0.06 0.02 0.63 0.02 nm nm nm nm nm
167 nm 18.90 5.67 2.01 0.43 0.41 0.37 0.06 0.02 0.43 0.05 0.04 148 12 nm nm
60 70.15 19.80 4.80 2.00 0.4 0.4 0.40 0.07 bd 0.8 0.03 <0.01 118 18 0.3 1.453 nm 19.34 5.63 1.91 0.5 0.45 0.35 0.07 0.04 0.5 0.04 0.04 148 17 nm nm
3 69.2 18.84 5.44 1.87 0.46 0.51 0.40 0.08 0.09 0.53 0.04 <0.01 134 9 0.31 1.623 nm 18.93 5.62 1.79 0.42 0.51 0.39 0.07 0.03 0.46 0.02 bd 138 23 nm nm46 nm 18.99 5.74 1.90 0.39 0.49 0.40 0.06 0.04 0.35 0.02 0.01 148 23 nm nm70 nm 18.70 5.70 1.90 0.5 0.4 0.40 0.06 bd 0.9 0.04 0.06 131 13 nm nm
2 74.7 18.00 4.09 1.12 0.56 0.55 0.40 0.075 bd 2.97 bd 1.30 nm nm nm nm
9 nm 18.52 4.51 1.53 0.61 0.40 0.43 0.06 0.06 0.96 0.05 0.26 85 16 nm nm
1 70.25 17.13 4.22 1.48 0.75 0.44 0.51 0.10 0.16 1.14 0.04 0.11 <10 151 nm nm10 nm 17.77 3.96 1.30 0.58 0.43 0.51 0.09 0.05 2.20 0.06 0.44 87 33* nm nm
3 nm 18.36 4.09 1.39 0.55 0.34 0.37 0.04 0.02 2.51 0.04 0.35 74 18 nm nm
22 69.80 17.00 8.01 2.54 0.61 0.61 0.54 0.06 0.63 nm 0.23 nm nm nm nm nm
9 70.52 14.92 8.18 2.57 0.53 0.49 0.60 0.06 0.29 11 ppm 0.12 12 ppm nm 10 0.09 nm13 69.02 17.55 7.71 2.51 0.64 0.51 0.40 0.06 0.50 0.06 0.13 61 ppm nm 98 0.20 1.432 nm 16.70 7.70 2.48 0.64 0.52 0.40 0.07 0.39 0.02 0.14 0.01 236 28 nm nm27 nm 17.59 7.65 2.66 0.71 0.50 0.32 0.07 0.30 0.02 0.13 0.01 236 32 nm nm
5 nm 17.54 7.44 2.40 0.60 0.61 0.47 0.09 0.20 0.01 0.12 0.01 210 10 nm nm
16 nm 16.85 8.24 2.86 0.65 0.60 0.44 0.08 1.07 0.03 0.12 0.01 406 17 nm nm
12 70.29 15.20 7.80 2.60 0.5 0.6 0.20 0.07 1.40 bd 0.14 21 ppm 369 17 0.10 1.25 65.27 15.55 8.44 2.26 0.54 0.45 0.28 0.05 1.35 0.16 0.16 nm 433 nm nm nm2 nm 14.93 7.86 2.51 0.71 0.63 0.49 0.08 1.20 0.03 0.18 0.01 286 25 nm nm
16 nm 15.55 8.45 2.81 0.6 0.59 0.42 0.07 1.23 0.06 0.09 <0.01 383 20 nm nm3 70.1 15.67 8.70 3.02 0.67 0.65 0.44 0.06 1.17 nm nm nm bm nm nm nm
18 68.45 16.13 8.16 2.73 1.04 0.46 0.36 0.07 1.08 0.02 0.15 <0.01 308 59 0.17 0.914 71.94 14.16 7.60 2.31 0.45 0.51 0.37 0.06 1.39 110 0.14 12 ppm nm 8 0.05 nm
2 68.54 18.04 7.63 2.50 0.77 0.64 0.38 0.05 1.05 nm 0.10 10 ppm 283 23 0.31 1.2
3 67.42 18.81 6.41 2.36 0.53 0.73 0.63 0.09 0.97 nm nm nm nm nm nm 1.3
5 nm 18.46 5.77 1.81 0.29 0.67 0.48 0.09 1.14 0.06 0.03 bd 199 14 nm nm17 68.07 18.79 7.05 1.92 0.44 0.65 0.70 0.09 0.89 18 0.08 179 ppm 243 25 nm nm
70 nm 18.50 6.36 2.33 0.70 0.54 0.67 0.10 0.26 0.40 0.11 0.04 201 82 nm nm
18 nm 19.44 5.68 2.21 0.54 0.48 0.49 0.09 0.26 0.51 0.08 0.04 179 22 nm nm
11 nm 19.25 6.10 2.28 0.71 0.56 0.54 0.10 0.34 0.46 0.10 0.07 207 116 nm nm13 69.13 19.02 5.64 2.14 0.54 0.66 0.64 0.12 0.19 0.79 0.07 83 ppm 144 24 0.28 1.369 nm 19.48 6.12 2.08 0.53 0.59 0.55 0.09 0.35 0.04 0.05 0.07 219 121 nm nm64 nm 18.08 6.63 2.41 0.73 0.54 0.52 0.09 0.43 0.28 0.13 0.04 223 76 nm nm
1 68.28 18.49 6.38 2.16 0.55 0.53 0.46 0.08 0.54 0.41 0.09 0.01 195 155 nm nm87 nm 18.70 6.57 2.39 0.81 0.57 0.58 0.09 0.40 0.35 0.10 0.06 228 151 nm nm
6 nm 19.21 5.51 2.14 0.60 0.46 0.51 0.10 0.27 0.90 0.08 0.05 171 60 nm nm
Glass supply, consumption and recycling in Roman Coppergate, York 25
© 2015 The Authors.Archaeometry published by John Wiley & Sons Ltd on behalf of University of Oxford, Archaeometry ••, •• (2015) ••–••
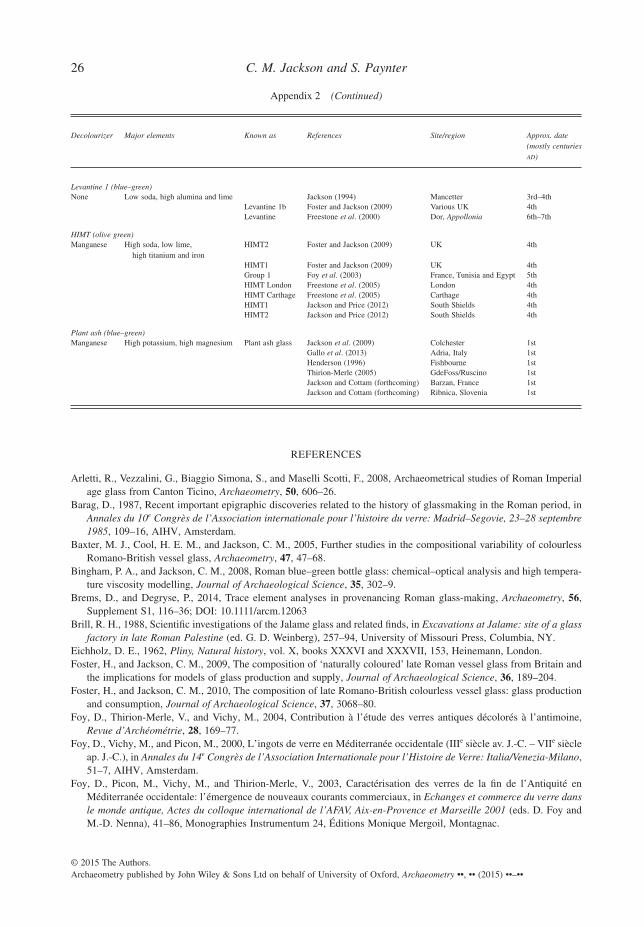
REFERENCES
Arletti, R., Vezzalini, G., Biaggio Simona, S., and Maselli Scotti, F., 2008, Archaeometrical studies of Roman Imperialage glass from Canton Ticino, Archaeometry, 50, 606–26.
Barag, D., 1987, Recent important epigraphic discoveries related to the history of glassmaking in the Roman period, inAnnales du 10e Congrès de l’Association internationale pour l’histoire du verre: Madrid–Segovie, 23–28 septembre1985, 109–16, AIHV, Amsterdam.
Baxter, M. J., Cool, H. E. M., and Jackson, C. M., 2005, Further studies in the compositional variability of colourlessRomano-British vessel glass, Archaeometry, 47, 47–68.
Bingham, P. A., and Jackson, C. M., 2008, Roman blue–green bottle glass: chemical–optical analysis and high tempera-ture viscosity modelling, Journal of Archaeological Science, 35, 302–9.
Brems, D., and Degryse, P., 2014, Trace element analyses in provenancing Roman glass-making, Archaeometry, 56,Supplement S1, 116–36; DOI: 10.1111/arcm.12063
Brill, R. H., 1988, Scientific investigations of the Jalame glass and related finds, in Excavations at Jalame: site of a glassfactory in late Roman Palestine (ed. G. D. Weinberg), 257–94, University of Missouri Press, Columbia, NY.
Eichholz, D. E., 1962, Pliny, Natural history, vol. X, books XXXVI and XXXVII, 153, Heinemann, London.Foster, H., and Jackson, C. M., 2009, The composition of ‘naturally coloured’ late Roman vessel glass from Britain and
the implications for models of glass production and supply, Journal of Archaeological Science, 36, 189–204.Foster, H., and Jackson, C. M., 2010, The composition of late Romano-British colourless vessel glass: glass production
and consumption, Journal of Archaeological Science, 37, 3068–80.Foy, D., Thirion-Merle, V., and Vichy, M., 2004, Contribution à l’étude des verres antiques décolorés à l’antimoine,
Revue d’Archéométrie, 28, 169–77.Foy, D., Vichy, M., and Picon, M., 2000, L’ingots de verre en Méditerranée occidentale (IIIe siècle av. J.-C. – VIIe siècle
ap. J.-C.), in Annales du 14e Congrès de l’Association Internationale pour l’Histoire de Verre: Italia/Venezia-Milano,51–7, AIHV, Amsterdam.
Foy, D., Picon, M., Vichy, M., and Thirion-Merle, V., 2003, Caractérisation des verres de la fin de l’Antiquité enMéditerranée occidentale: l’émergence de nouveaux courants commerciaux, in Echanges et commerce du verre dansle monde antique, Actes du colloque international de l’AFAV, Aix-en-Provence et Marseille 2001 (eds. D. Foy andM.-D. Nenna), 41–86, Monographies Instrumentum 24, Éditions Monique Mergoil, Montagnac.
Appendix 2 (Continued)
Decolourizer Major elements Known as References Site/region Approx. date(mostly centuriesAD)
Levantine 1 (blue–green)None Low soda, high alumina and lime Jackson (1994) Mancetter 3rd–4th
Levantine 1b Foster and Jackson (2009) Various UK 4thLevantine Freestone et al. (2000) Dor, Appollonia 6th–7th
HIMT (olive green)Manganese High soda, low lime,
high titanium and ironHIMT2 Foster and Jackson (2009) UK 4th
HIMT1 Foster and Jackson (2009) UK 4thGroup 1 Foy et al. (2003) France, Tunisia and Egypt 5thHIMT London Freestone et al. (2005) London 4thHIMT Carthage Freestone et al. (2005) Carthage 4thHIMT1 Jackson and Price (2012) South Shields 4thHIMT2 Jackson and Price (2012) South Shields 4th
Plant ash (blue–green)Manganese High potassium, high magnesium Plant ash glass Jackson et al. (2009) Colchester 1st
Gallo et al. (2013) Adria, Italy 1stHenderson (1996) Fishbourne 1stThirion-Merle (2005) GdeFoss/Ruscino 1stJackson and Cottam (forthcoming) Barzan, France 1stJackson and Cottam (forthcoming) Ribnica, Slovenia 1st
26 C. M. Jackson and S. Paynter
© 2015 The Authors.Archaeometry published by John Wiley & Sons Ltd on behalf of University of Oxford, Archaeometry ••, •• (2015) ••–••

Freestone, I. C., 1994, Appendix: chemical analysis of ‘raw’ glass fragments, in Excavations at Carthage, vol. II, 1. TheCircular Harbour, north side. The site and finds other than pottery (ed. H. R. Hurst), 290, British AcademyMonographs in Archaeology, no. 4, Oxford University Press, Oxford.
Freestone, I. C., Gorin-Rosen, Y., and Hughes, M. J., 2000, Primary glass from Israel and the production of glass in thelate antiquity and the early Islamic period, in La route du verre: ateliers primaires et secondaires du second millénaireav. J.-C. au Moyen Âge (ed. M.-D. Nenna), 65–84, Travaux de la Maison de l’Orient Méditerranéen—Jean Pouilloux,no. 33, Lyon.
Freestone, I. C., Ponting, M., and Hughes, M. J., 2002, Origins of Byzantine glass from Maroni Petrera, Cyprus,Archaeometry, 44, 257–72.
Freestone, I. C., Wolf, S., and Thirlwall, M., 2005, The production of HIMT glass: elemental and isotopic evidence, inAnnales du 16e Congrès de l’Association Internationale pour l’Histoire du Verre, London, 7–13 September 2003,AIHV, Nottingham.
Gallo, F., Silvestri, A., and Molin, G., 2013, Glass from the archaeological museum of Adria (north-east Italy): newinsights into early Roman production technologies, Journal of Archaeological Science, 40, 2589–605.
Ganio, M., Boyen, S., Brems, D., Scott, R., Foy, D., Latruwe, K., Molin, G., Silvestri, A., Vanhaecke, F., and Degryse,P., 2012, Trade routes across the Mediterranean: a Sr/Nd isotopic investigation on Roman colourless glass, GlassTechnology: European Journal of Glass Science and Technology Part A, 53(5), 217–24.
Gliozzo, E., Barbone, A. S., and D’Acapito, F., 2013, Waste glass, vessels and window-panes from Thamusida(Morocco): grouping natron-based blue–green and colourless Roman glasses, Archaeometry, 55, 609–39.
Hall, R., 1984, The Viking dig, Bodley Head, London.Henderson, J., 1996, Scientific analysis of selected Fishbourne vessel glass and its archaeological interpretation, in
Chichester excavations, 189–92, Chichester Civic Society Excavations Committee, Chichester.Jackson, C. M., 1992, Compositional analysis of Roman and early post-Roman glass and glassworking waste from
selected British sites, Unpublished Ph.D. thesis, University of Bradford.Jackson, C. M., 1994, Appendix 1: compositional data from the Romano-British glassmelting debris from Mancetter and
Leicester, in Exploratory multivariate analysis in archaeology (M. J. Baxter), Edinburgh University Press, Edinburgh.Jackson, C. M., 2005, Making colourless glass in the Roman period, Archaeometry, 47, 763–80.Jackson, C. M., and Cottam, S., in preparation, Compositional and typological observations concerning the production of
emerald green glass vessels in the 1st century A.D.
n SiO2 Na2O CaO Al2O3 K2O MgO Fe2O3 TiO2 MnO Sb2O3 P2O5 PbO Ba (ppm) Cu (ppm) SO3 Cl
5 nm 16.74 8.72 2.46 0.67 0.56 0.39 0.07 0.04 0.01 0.14 0.01 206 5 nm nm8 nm 14.56 8.55 2.93 0.72 0.45 0.33 0.06 0.10 0.06 0.08 0.02 254 15 nm nm
23 69.01 15.98 9.06 2.99 0.83 0.63 0.42 0.12 nm nm 0.14 nm 223 nm 0.3 0.9
221 nm 19.65 6.00 2.25 0.58 0.76 0.72 0.12 0.98 0.11 0.05 0.02 290 105 nm nm
123 nm 19.11 6.08 2.49 0.5 0.98 1.36 0.33 1.71 0.05 0.05 0.01 600 91 nm nm43 64.5 19.1 6.22 2.88 0.41 1.23 2.28 0.49 2.02 7 ppm 0.11 63 ppm 654 79 nm nm14 66.38 18.54 5.99 2.47 0.57 0.92 1.28 0.33 1.9 nm nm nm nm nm nm nm
1 64.77 18.74 5.24 3.18 0.44 1.29 2.30 0.68 2.66 nm nm nm nm nm nm nm9 nm 18.79 5.74 2.26 0.49 0.93 1.14 0.23 1.39 0.01 0.05 0.01 249 71 nm nm8 nm 18.1 5.78 2.05 0.64 0.74 0.70 0.12 0.83 0.08 0.06 0.02 263 99 nm nm
16 63.06 16.54 6.96 2.14 1.73 1.84 1.44 0.19 0.79 0.34 0.77 0.49 600 16 720 0.24 0.96 63.44 17.94 6.73 2.26 1.46 1.96 1.26 0.18 0.73 0.05 0.83 0.04 312 13 084 0.27 1.35 64.04 15.54 6.88 2.04 1.88 2.24 1.09 0.10 0.88 nm 1.00 0.10 nm 18 000 0.34 1.05 64.66 17.26 6.75 2.32 1.64 1.76 1.55 0.20 1.07 518 ppm 1.06 0.13 420 15 091 nm nm
12 62.12 17.10 6.63 2.62 1.50 1.85 1.27 0.18 0.80 0.29 0.65 0.29 100 16 400 0.28 1.019 62.69 16.64 6.47 2.42 1.70 2.20 1.34 0.18 0.86 0.14 0.73 0.06 200 18 080 0.27 0.9
Glass supply, consumption and recycling in Roman Coppergate, York 27
© 2015 The Authors.Archaeometry published by John Wiley & Sons Ltd on behalf of University of Oxford, Archaeometry ••, •• (2015) ••–••
Jackson, C. M., and Price, J., 2012, Analyses of late Roman glass from the Commandant’s House of the fort at SouthShields, Tyne and Wear, UK, Annales du 18e Congrès de l’Association Internationale pour l’Histoire du Verre(Thessaloniki 2009), 181–8, AIHV, Corning, NY.
Jackson, C. M., Cool, H. E. M., and Wager, E. C. W., 1998, The manufacture of glass in Roman York, Journal of GlassStudies, 40, 55–61.
Jackson, C. M., Price, J., and Lemke, C., 2009, Glass production in the 1st century A.D. Insights into glass technology,in Annales du 17e Congrès de l’Association Internationale pour l’Histoire du Verre (Antwerp 2006), 150–156.
Jackson, C. M., Hunter, J. R., Warren, S. E., and Cool, H. E. M., 1991, The analysis of blue–green glass and glassy wastefrom two Romano-British glass working sites, in Archaeometry ’90: international symposium on archaeometry,Heidelberg, Germany 2–6 April 1990 (eds. E. Pernicka and G. A. Wagner), 295–305, Birkhäuser Verlag, Basel.
Jackson C. M., Wager, E. C., Joyner, L., Day, P. M., Booth, C. A., and Kilikoglou, V., 2003, Small-scale glass makingat Coppergate, York: analytical evidence for the nature of production, Archaeometry, 45, 435–56.
Mainman, A., 1990, Anglo-Scandinavian pottery from York, The Archaeology of York 16/5, Council for British Archae-ology, York.
Meek, A., 2013, Gold glass in Late Antiquity: scientific analysis of the British Museum collection, in New light on oldglass: recent research on Byzantine glass and mosaics (eds. C. Entwistle and L. James), 121–30, British MuseumResearch Publication 179, British Museum, London.
Mirti, P., Casoli, A., and Appolonia, L., 1993, Scientific analysis of Roman glass from Augusta Praetoria, Archaeometry,35, 225–40.
Paynter, S., 2006, Analyses of colourless Roman glass from Binchester, County Durham, Journal of ArchaeologicalScience, 33, 1037–57.
Paynter, S., 2008, Experiments in the reconstruction of Roman wood-fired glassworking furnaces: waste products andtheir formation processes, Glass Studies, 50, 271–90.
Paynter, S., 2010, Analyses of colourless Roman glass, in The beautiful rooms are empty. Excavations at BinchesterRoman Fort, County Durham 1976–1981 and 1986–1991. Part 2 (I. Ferris), 333–8, Durham County Council,Durham.
Paynter, S., and Jackson, C. M., forthcoming, The supply, use and recycling of colourless glass in Roman Britain.Price, J., 2005, Glass-working and glassworkers in cities and towns, in Roman working lives and urban living (eds. A.
MacMahon and J. Price), 167–90, Oxbow, Oxford.Price, J., and Cottam, S., 1998, Romano-British glass vessels: a handbook, Practical Handbooks in Archaeology, no. 14,
Council for British Archaeology, York.Sayre, E. V., 1963, The intentional use of antimony and manganese in ancient glasses, in Advances in glass technology:
history papers and discussions of the technical papers (eds. F. R. Matson and G. E. Rindone), 263–82, Plenum Press,New York.
Sayre, E. V., 1964, Some ancient glass specimens with compositions of particular archaeological significance, 1–25,Brookhaven National Laboratory, Upton, NY.
Schibille, N., Degryse, P., O’Hea, M., Izmer, A., Vanhaecke, F., and Mckenzie, J., 2012, Late Roman glass from the‘Great Temple’ at Petra and Khirbet Et-Tannur, Jordan—technology and provenance, Archaeometry, 54, 997–1022.
Silvestri, A., 2008, The coloured glass of the Iulia Felix, Journal of Archaeological Science, 35, 1489–501.Silvestri, A., Molin, G., and Salviulo, G., 2008, The colourless glass of Iulia Felix, Journal of Archaeological Science,
35, 331–41.Tal, O., Jackson-Tal, R. E., and Freestone, I. C., 2004, New evidence of the production of raw glass at late Byzantine
Apollonia–Arsuf, Israel, Journal of Glass Studies, 46, 51–66.Thirion-Merle, V., 2005, Les verres de Beyrouth et les verres du Haut Empire dans le monde Occidental et Oriental: étude
archéométrique, Journal of Glass Studies, 47, 37–53.Turner, W. E. S., and Rooksby, H. P., 1959, A study of the opalising agents in ancient glasses throughout three thousand
four hundred years, Glastechnische Berichte, 8, 17–28.Velde, B., 1990, Alumina and calcium oxide content of glass found in Western and Northern Europe, first to ninth
centuries, Oxford Journal of Archaeology, 9, 105–17.Vichy, M., Picon, M., and Thirion-Merle, V., 2003, Le manganèse comme impureté, décolorant ou colorant des verres au
natron, Bulletin de l’AFAV, 15–17.
28 C. M. Jackson and S. Paynter
© 2015 The Authors.Archaeometry published by John Wiley & Sons Ltd on behalf of University of Oxford, Archaeometry ••, •• (2015) ••–••