energy efficiency study of household gas burner using pot ...
222
i ENERGY EFFICIENCY STUDY OF HOUSEHOLD GAS BURNER USING POT-BOTTOM SHIELD AND MODIFIED POT ARRANGEMENT ASHFARUL ISLAM DEPARTMENT OF CHEMICAL ENGINEERING BANGLADESH UNIVERSITY OF ENGINEERING AND TECHNOLOGY, DHAKA-1000 MARCH, 2019
-
Upload
khangminh22 -
Category
Documents
-
view
0 -
download
0
Transcript of energy efficiency study of household gas burner using pot ...

i
ENERGY EFFICIENCY STUDY OF
HOUSEHOLD GAS BURNER USING
POT-BOTTOM SHIELD AND MODIFIED
POT ARRANGEMENT
ASHFARUL ISLAM
DEPARTMENT OF CHEMICAL ENGINEERING
BANGLADESH UNIVERSITY OF ENGINEERING AND
TECHNOLOGY, DHAKA-1000
MARCH, 2019

ii
ENERGY EFFICIENCY STUDY OF HOUSEHOLD GAS BURNER USING POT-BOTTOM SHIELD AND MODIFIED POT ARRANGEMENT
by ASHFARUL ISLAM
M. Sc. in Chemical Engineering. Department of Chemical Engineering
BANGLADESH UNIVERSITY OF ENGINEERING AND TECHNOLOGY March, 2019

iii
The thesis titled “ENERGYEFFICIENCY STUDY OF HOUSEHOLD GAS BURNER USING POT-BOTTOM SHIELD AND MODIFIED POT ARRANGEMENT” submitted by ASHFARUL ISLAM, Roll No: 040502007 F and session: April 2005 has been accepted as satisfactory in fulfillment of the requirement for the degree of M.Sc. in Chemical Engineering on 25thMarch 2019.
BOARD OF EXAMINERS Dr. Md. Mominur Rahman Chairman
Associate Professor Department of Chemical Engineering, BUET, Dhaka -1000, Bangladesh.
Head of the Department Member (Ex-Officio) Department of Chemical Engineering,
BUET, Dhaka -1000, Bangladesh.
Dr. Syeda Sultana Razia Member
Professor, Department of Chemical Engineering, BUET, Dhaka -1000, Bangladesh.
Dr. KawnishKirtania Member Assistant Professor, Department of Chemical Engineering BUET, Dhaka -1000, Bangladesh.
Dr. Aloke Kumar Mozumder Member (External) Professor, Department of Mechanical Engineering BUET, Dhaka -1000, Bangladesh

iv
CANDIDATE’S DECLARATION I hereby declare that this thesis on “ENERGY EFFICIENCY STUDY OF HOUSEHOLD GAS BURNER USING POT-BOTTOM SHIELD AND MODIFIED POT ARRANGEMENT” contains no material which has been accepted for the award of any other degree or diploma at any university or other equivalent institution.
ASHFARUL ISLAM

v
ACKNOWLEDGEMENTS The author expresses his sincere thanks to Dr. Md. Mominur Rahman (Associate Professor
of Chemical Engineering Department, BUET) for his valuable guidance and supervision
throughout the entire work. I appreciate his encouragement during this work.
Special thanks to Dr. Ijaz Hossain, Professor of Chemical Engineering Department, Dr. Kazi
Bayzid Kabir and Dr. Mohidus Samad Khan, Associate Professors of Chemical Engineering
Department, BUET at different stages of the research work.
The author is indebted to Engr. Mezba-ur-Rahman, Deputy Manager of Titas Gas
Transmission and Distribution Company Ltd. for cooperation with information and reports
of the organization.
Bangladesh University of Engineering and Technology (BUET) is acknowledged for
financing the project.

vi
ABSTRACT
The main objectives of this study were to design, develop and evaluate practically applicable
pot-bottom shield and finned-pot in different pot-shield arrangements for better thermal and
emission performances of a conventional household radial flow NG burner. Therefore,
eleven sets of perforated hollow cylindrical pot-bottom shields having different height were
fabricated from thin metal sheet with a provision of secondary combustion air. These were
built in such a way that each of the pot-bottom shields maintains a flue gas exit channel of 4
mm height between the pot-bottom and pot-support. One of the two identical flat bottom
pots was converted to spot welded finned pot. The thermal and emission performances of the
NG burner were then evaluated following the standard water boiling test (WBT) protocol
with four different pot arrangements, namely ordinary flat bottom pot without shield and
with shield and spot welded finned pot without shield and with shield at eleven different
loading heights (from 2.5 cm to 7.5 cm with an increment of 0.5 cm) and six different NG
supply pressures (4, 6, 10, 14, 18 and 20 mbar)keeping the burner primary air opening fixed
at 50%.It was found that a simple inclusion of a pot-bottom shield can dramatically improve
the thermal efficiency of a natural gas cooking system for the both type of pots though pot
bottom shield increases CO emissions. A 20% improved thermal efficiency was evaluated
for the NG burner with ordinary pot and pot-bottom shield arrangement at 6 mbar pressure
and 3 cm loading height corresponded to the highest efficiency of the burner at base setting
(burner with ordinary pot at 6 mbar NG pressure and 4 cm loading height). It was also found
that the operation of the burner at its highest thermal efficiency was still within the safe
operation limit in terms of CO emission in comparison to international standards.

vii
Table of Contents Page
No. Acknowledgements v Abstract vi List of Figures ix List of Tables xiii Abbreviations xv Symbols xviii Chapter 1: Introduction 1.1 Background 1 1.2 Objectives of the Study 3 1.3 Scope of the Study 3 1.4 Organization of the Thesis 4 Chapter 2: Literature Review
2.1 Introductions 6 2.2 Cooking Energy System 6 2.2.1 Cooking Fuels 7 2.2.2 Fuel-specific efficiency aspects 8 2.3 Fundamental Physics Governing Heat Transfer in Cook stoves 2.3.1. Combustion Reaction of NG 9 2.3.2. Contributing Roles of Conduction, Convection, and Radiation 10 2.4 Studies on Household NG Burners 13 Chapter 3:Experimental Design 3.1 Introduction 24 3.2 Experimental Design 24 3.2.1 Experimental NG burner 24 3.2.2 Experimental pots 25 3.2.3 Pot support and shield 27 3.2.4Experimental setup 28 3.2.5Experimental methodology 30 3.2.5.1 Overall thermal efficiency, hc (%) 31 3.2.5.2 Modified combustion efficiency (MCE) 31 3.2.5.3 Heat transfer efficiency (HTE) 32 3.2.5.4 Temperature corrected boiling time (ΔtTc ) 32 3.2.5.5 Firepower (FPc) 33 3.2.5.6 Ratio of CO and CO2 (CO/CO2) 33 Chapter 4: Results and Discussions 4.1 Introduction 34 4.2 Thermal Efficiency, Combustion Efficiency, Heat Transfer Efficiency, Boiling Time,
and CO/CO2 Ratio of the NG Burner with Different Pot and Shield Arrangements 34
4.2.1 Thermal efficiency of the NG burner with different pot and shield 35

viii
arrangements 4.2.2 Modified combustion efficiency (MCE) of the NG burner with different pot
and shield arrangements 41
4.2.3 Heat transfer efficiency (HTE) of the NG burner with different pot and shield arrangements
46
4.2.4 Temperature corrected boiling time of the NG burner with different pot and shield arrangements
51
4.2.5 Ratio of CO and CO2 (CO/CO2) of the NG burner with different pot and shield arrangements
55
4.3 Overall Comparison of Thermal and Environmental Performances of the NG Burner with Different Pot and Shield Arrangements
60
4.3.1 Overall thermal efficiencies of NG burner with different pot-shield arrangements at 6 mbar NG pressure
60
4.3.2 Overall environmental performances (CO/CO2 ratio and CO emission rate) of NG burner with different pot-shield arrangements at 6 mbar NG pressure
61
Chapter 5: Conclusions and Recommendations 5.1 Conclusions 69 5.2 Recommendations for Future Study 70 References 71 Appendix A: Experimental data sheet 79 Appendix B: Calculated data sheet 128 Appendix C: Experimental Pictures 178 Appendix D: Sample Calculations used in WBT 187 Appendix E: Lower Heating Value of Natural Gas (LHV) 194 Appendix F: Calculated data sheet for CO and CO2 emission 196 Appendix G: Calculated data sheet for NG Flow (Liter/min) at STAP 204

ix
List of Figures Page
No. Figure 2.1: Products of Natural Gas after incomplete combustion Reaction. 9 Figure 2.2: Relations among flame temperature and formation of CO, and NOx in
regard to air-fuel ratio ( 10
Figure 2.3: The direction of flame based on loading height. (A) Short gap between burner head and saucepan renders incomplete combustion and low thermal efficiency (B) Maximum thermal efficiency at optimum loading height (C) Gap between burner head and saucepan is more than optimum loading height results quenching of flame and low thermal efficiency
15
Figure 2.4: Cooking vessels used for the study by Lucky and Hossain (2001) 15 Figure 2.5: NG burner set used for the study by Lucky and Hossain (2001) 16 Figure 2.6: Conventional NG burner head 16 Figure 2.7: Perforated NG burner head 17 Figure 2.8: Perforated surrounding shield used for cooking vessels 17 Figure 2.9: Cross sectional view of the double layer modified surrounding pot shield 18 Figure 2.10: Dimensions of the pots used in the study 18 Figure 2.11: Ceramic burner cover 19 Figure 2.11: Flue gas exit channel thickness between pot and cover 19 Figure 2.13: Efficiency and energy losses with flue gas exit channel gap 19 Figure 2.14: Dimensions of the surrounding shield 20 Figure 2.15: Converted pot with projection in the pot center and standard pot for
efficiency study with LPG burner 21
Figure 2.16: Standard original pot (OP) and modified pots (MP) for the study 22 Figure 2.17: Energy efficiency of LPG burner with original pot (OP) and modified
pots (MP) made of steel 22
Figure 2.18 : Energy efficiency of LPG burner with original pot (OP) and modified pots (MP) made of aluminum
23
Figure 2.19: Experimental variation of efficiency with loading height for PNG at 21 mbar pressure
23
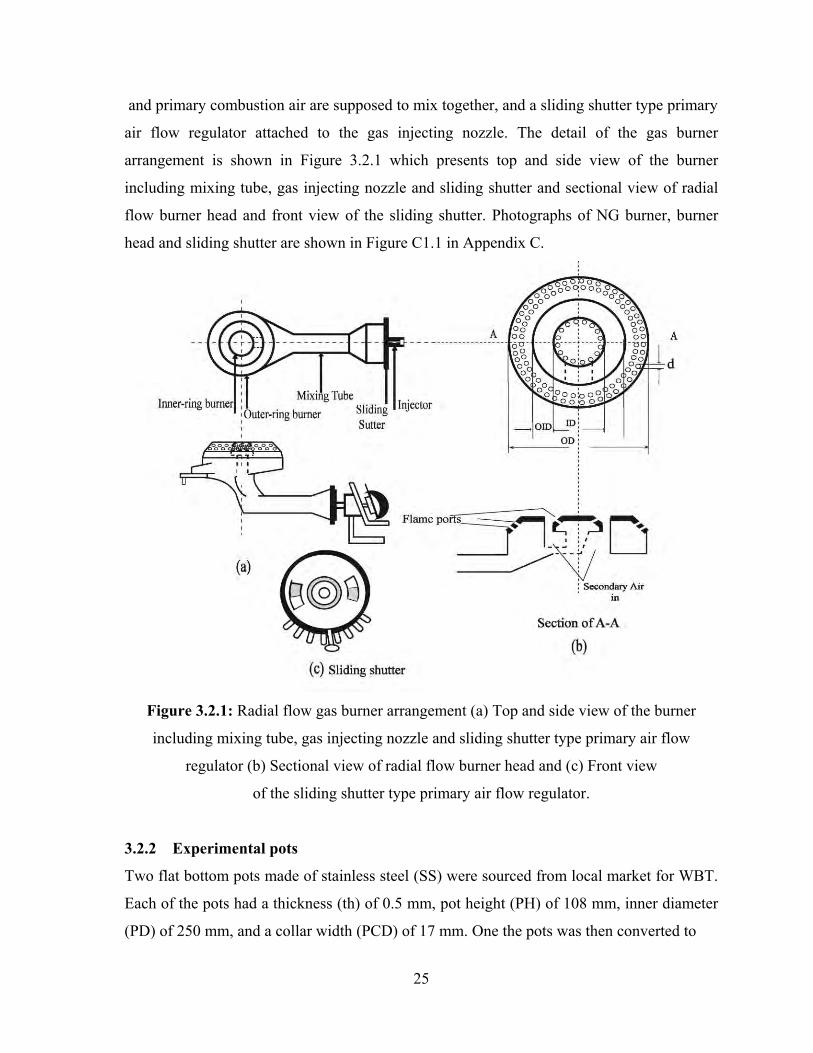
Figure 3.2.1: Radial flow gas burner arrangement (a) Top and side view of the burner including mixing tube, gas injecting nozzle and sliding shutter type primary air flow regulator (b) Sectional view of radial flow burner head and (c) Front view of the sliding shutter type primary air flow regulator.
26
Figure 3.2.2: Dimensions of finned pot (a) and regular flat bottom pot (b) used in the study.
27
Figure 3.2.3: Schematic diagram of (a and d) Pot support (b) Shield (c) Pot support with Shield (e) circular shield.
28
Figure 3.2.4: Schematic of the experimental setup for WBT of NG burner 30 Figure 3.2.5: Schematic of pot, shield and NG burner arrangement during WBT 31 Figure 4.1: Thermal efficiency of NG burner with ordinary flat bottom pot without
shield at various loading height and NG supply pressure. 37
Figure 4.2: Thermal efficiency of NG burner with ordinary flat bottom pot with bottom shield at various loading height and NG supply pressure.
39

x
Figure 4.3: Thermal efficiency of NG burner with finned pot without shield at various loading height and NG supply pressure
40
Figure 4.4: Thermal efficiency of NG burner with finned pot and shield at various loading height and NG supply pressure
41
Figure 4.5: MCE of NG burner with ordinary flat bottom pot without shield at various loading height and NG supply pressure
43
Figure 4.6: MCE of NG burner with ordinary flat bottom pot with shield at various loading height and NG supply pressure
44
Figure 4.7: MCE of NG burner with spot welded finned pot without shield at various loading height and NG supply pressure
45
Figure 4.8: MCE of NG burner with spot welded finned pot having shield at various loading height and NG supply pressure
46
Figure 4.9: HTE of NG burner with ordinary flat bottom pot without shield at various loading height and NG supply pressure
48
Figure 4.10: HTE of NG burner with ordinary flat bottom pot with shield at various loading height and NG supply pressure
50
Figure 4.11: HTE of NG burner with spot welded finned pot without shield at various loading height and NG supply pressure
51
Figure 4.12: HTE of NG burner with spot welded finned pot with shield at various loading height and NG supply pressure
52
Figure 4.13: Temperature corrected boiling time of NG burner with ordinary flat bottom pot without shield at various loading height and NG supply pressure
53
Figure 4.14: Temperature corrected boiling time of NG burner with ordinary flat bottom pot with shield at various loading height and NG supply pressure
54
Figure 4.15: Temperature corrected boiling time of NG burner having spot welded finned pot without shield at various loading height and NG supply pressure
55
Figure 4.16: Temperature corrected boiling time of NG burner with spot welded finned pot and shield at various loading height and NG supply pressure
56
Figure 4.17: CO/CO2 ratio of NG burner with ordinary flat bottom pot without shield at various loading height and NG supply pressure
57
Figure 4.18: CO/CO2 ratio of NG burner with ordinary flat bottom pot with bottom shield at various loading height and NG supply pressure
58
Figure 4.19: CO/CO2 ratio of NG burner with spot welded finned pot without bottom shield at various loading height and NG supply pressure
59
Figure 4.20: CO/CO2 ratio of NG burner with spot welded finned pot with bottom shield at various loading height and NG supply pressure
60
Figure 4.21: Variation of thermal efficiency of the NG burner with different pot-shield arrangements at different loading height and 6 mbar NG pressure
61
Figure 4.22: Variation of CO/CO2 ratios of the NG burner with different pot-shield arrangements at different loading height and 6 mbar NG pressure
63
Figure 4.23: Variation of CO emission rate of the NG burner with different pot-shield arrangements at different loading height and 6 mbar NG pressure
64
Figure C1.1: Practical Experimental Setup.
174

xi
Figure C1.2: Practical Experimental Setup during experiment. 175 Figure C1.3: Picture of (a) Gas burner without pot support, (b) Radial flow burner
head and (c) Sliding Sutter. 176
Figure C1.4: Top and side view of Radial flame burner. 177 Figure C1.5: Picture of (A) Pot supports (B) Circular Shields (C) Pot support with
Shield (D) Single Shield 178
Figure C 1.6: Pictures of (A) Finned and normal pots (B) Finned pot observing (C) Spot welded finned pot and (D) Spot argon welding view in inner side of finned pot
179
Figure C 1.7: Pictures of normal pots with pot Support and Shield. 180 Figure C 1.8: Pictures of normal pots with pot Support, without shield. 181 Figure C 1.9: Finned pot before adding Finns. 181 Figure C 1.20: Actual picture of finned pot. 182 Figure C 1.21: red circles represent spot welded area of finned pot. 182

xii
List of Tables Page
No. Table 2.1: General Properties for Some Common Fuels 8 Table A 1.1 : Experimental data for flat bottom pot without Shield at 4 mbar NG Pressure. 77 Table A 1.2 : Experimental data for Finned pot without Shield at 4 mbar NG pressure. 79 Table A 1.3 : Experimental data for flat bottom pot with Shield at 4 mbar NG pressure. 81 Table A 1.4 : Experimental data for Finned pot with Shield at 4 mbar NG pressure. 83 Table A 1.5 : Experimental data for flat bottom pot without Shield at 6 mbar NG Pressure. 85 Table A 1.6 : Experimental data for Finned pot without Shield at 6 mbar NG pressure. 87 Table A 1.7 : Experimental data for flat bottom pot with Shield at 6 mbar NG pressure. 89 Table A 1.8 : Experimental data for Finned pot with Shield at 6 mbar NG pressure. 91 Table A 1.9 : Experimental data for flat bottom pot without Shield at 10 mbar NG
Pressure. 93
Table A 1.10 : Experimental data for Finned pot without Shield at 10 mbar NG pressure. 95 Table A 1.11: Experimental data for flat bottom pot with Shield at 10 mbar NG pressure. 97 Table A 1.12 : Experimental data for Finned pot with Shield at 10 mbar NG pressure. 99 Table A 1.13 : Experimental data for flat bottom pot without Shield at 14 mbar NG
Pressure. 101
Table A 1.14 : Experimental data for Finned pot without Shield at 14 mbar NG pressure. 103 Table A 1.15 : Experimental data for flat bottom pot with Shield at 14 mbar NG pressure. 105 Table A 1.16: Experimental data for Finned pot with Shield at 14 mbar NG pressure. 107 Table A 1.17: Experimental data for flat bottom pot without Shield at 18 mbar NG
Pressure. 109
Table A 1.18: Experimental data for Finned pot without Shield at 18 mbar NG pressure. 111 Table A 1.19: Experimental data for flat bottom pot with Shield at 18 mbar NG pressure. 113 Table A 1.20: Experimental data for Finned pot with Shield at 18 mbar NG pressure. 115 Table A 1.21: Experimental data for flat bottom pot without Shield at 20 mbar NG
Pressure. 117
Table A 1.22: Experimental data for Finned pot without Shield at 20 mbar NG pressure. 119 Table A 1.23: Experimental data for flat bottom pot with Shield at 20 mbar NG pressure. 121 Table A 1.24: Experimental data for Finned pot with Shield at 20 mbar NG pressure. 123 Table B 1.1 : Calculated data for flat bottom pot without Shield at 4 mbar NG pressure. 126 Table B 1.2 : Calculated data for Finned pot without Shield at 4 mbar NG pressure 128 Table B 1.3 : Calculated data for flat bottom pot with Shield at 4 mbar NG pressure. 130 Table B 1.4 : Calculated data for Finned pot with Shield at 4 mbar NG pressure. 132 Table B 1.5 : Calculated data for flat bottom pot without Shield at 6 mbar NG pressure. 134 Table B 1.6 : Calculated data for Finned pot without Shield at 6 mbar NG pressure 136 Table B 1.7 : Calculated data for flat bottom pot with Shield at 6 mbar NG pressure. 138 Table B 1.8 : Calculated data for Finned pot with Shield at 4 mbar NG pressure. 140 Table B 1.9 : Calculated data for flat bottom pot without Shield at 6 mbar NG pressure. 142 Table B 1.10 : Calculated data for Finned pot without Shield at 6 mbar NG pressure 144 Table B 1.11: Calculated data for flat bottom pot with Shield at 6 mbar NG pressure. 146 Table B 1.12 : Calculated data for Finned pot with Shield at 6 mbar NG pressure. 148 Table B 1.13 : Calculated data for flat bottom pot without Shield at 10 mbar NG pressure. 150 Table B 1.14 : Calculated data for Finned pot without Shield at 10 mbar NG pressure 152
xiii
Table B 1.15 : Calculated data for flat bottom pot with Shield at 10 mbar NG pressure. 154 Table B 1.16: Calculated data for Finned pot with Shield at 10 mbar NG pressure. 156 Table B 1.17: Calculated data for flat bottom pot without Shield at 14 mbar NG pressure. 158 Table B 1.18: Calculated data for Finned pot without Shield at 14 mbar NG pressure 160 Table B 1.19: Calculated data for flat bottom pot with Shield at 14 mbar NG pressure. 162 Table B 1.20: Calculated data for Finned pot with Shield at 14 mbar NG pressure. 164 Table B 1.21: Calculated data for flat bottom pot without Shield at 20 mbar NG pressure. 166 Table B 1.22: Calculated data for Finned pot without Shield at 20 mbar NG pressure 168 Table B 1.23: Calculated data for flat bottom pot with Shield at 20 mbar NG pressure. 170 Table B 1.24: Calculated data for Finned pot with Shield at 20 mbar NG pressure. 172 Table F 1.1: Flat bottom pot without Shield (Cco and Cco2 in mg/m3) 191 Table F 1.2: Flat bottom pot with Shield (Cco and Cco2 in mg/m3) 193 Table F 1.3: Finned pot without Shield (Cco and Cco2 in mg/m3) 195 Table F 1.4: Finned pot with Shield (Cco and Cco2 in mg/m3) 197

xiv
ABBREVIATIONS
ASTM American Society for Testing and Materials
WBT Water Boiling Test
BUET Bangladesh University of Engineering and Technology
HHV Gross calorific value / Higher Heating Value (KJ/KG)
LHV Lower heating value (also called Net calorific value) (KJ/KG)
MC Moisture Content (% wet basis)
OAB Old Academic Building
WHO World Health Organization
NG Natural Gas
EHV Effective calorific value (KJ/KG)
P1 Weight of the empty pot.
fci Volume of fuel (NG) before test (Liters)
P1ci Mass of pot of water before test (grams)
T1ci Water temperature at start of test (ºC)
tci Time at start of test (min)
fcf Volume of fuel (NG) after test (Liters)
P1cf Mass of pot of water after test (grams)
T1cf Water temperature at end of test (ºC)
tcf Time at end of test (min)
Pmbar NG Supplied Pressure (mbar)
Tng Natural Gas (NG) Temperature (OC)
Ta Air Temperature (0C):
Thd Stack Temperature (O C)
PStc Stack Pressure. mbar
Vstc Stack exhaust velocity km/hr
CO2h CO2 in percentage

xv
COh CO in ppmv
fcm Fuel (NG) consumed in grams
fcd Equivalent dry fuel (NG) consumed (grams)
wcv Water vaporized (grams)
wcr Effective mass of water boiled (grams)
Δtc Time to boil (min)
hc Thermal efficiency (%)
FPc Firepower (W)
HTE Heat Transfer Efficiency (%)
SET Temp-corrected specific energy consumption (kJ/liter water)
MCE Modified Combustion Efficiency
ΔtTc Temperature corrected time to boil (min)
Ecor At SATP CO emission rate (g/min)
Eco2r At SATP CO2 emission rate (g/min)
Q Total exhaust flow (m3)
ECOw At SATP CO emission per water boiled (grams emission/liter water)
ECO2w At SATP CO2 emission per water boiled (grams emission/liter water)
LH Loading Height
PSD Pot Support inner Diameter
PSC Top side of Chanel for shield
SD Shield Diameter
SH Shield Height
TSH Total number of holes in Shield
DHS Diameter of holes in Shield
St Thickness of Shield
d Port diameter
ID Inner burner head Diameter
OID Outside and inside burner head distance
OD Outside burner Diameter

xvi
th Thickness of pot
PH Height of pot
PD Inner Diameter of pot
PCD Pot collar width
fh Fin Height at the bottom of pot
fw Fin width at the bottom of pot
fd Fin top to top distance at the bottom of pot
TF Total Number of Fin at the bottom of pot
fdb Fin distance from side wall of the pot at the bottom
HTE Heat Transfer Efficiency
NG Natural Gas
LPG Liquefied Petroleum Gas.
CO Carbon monoxide
CO2 Carbon dioxide
O2 Oxygen
STP Standard Temperature and Pressure
NTP Normal Temperature and Pressure
SATP Standard Ambient Temperature and Pressure
ISA International Standard Atmosphere

xvii
SYMBOLS
cm centimeter
°C Degree Celsius
K Degree Kelvin
Pa Pascal
m3 Cubic meter
gm/mol Gram per mol
kJ/liter Kilojoules per liter
Min minute
g/m3 Gram per cubic meter
m3/min Cubic meter per minute
ppmv parts per million by volume
mbar Millibar
m/min Meter per minute
L liter
% percentage
km/hr Kilometer per hour
ppm parts per million
avg. Average

1
CHAPTER 1 INTRODUCTION
1.1 Background
In developing countries like Bangladesh, energy used for cooking constitutes a
significant portion of the total energy requirement (Prasad, 1982; OTA, 1991), while in
developed countries, this item is generally ignored because of its negligible share to the
total energy. Presently in Bangladesh, three types of important cooking fuels are
biomass, natural gas (NG), and liquefied petroleum gas (LPG) of which biomass is the
predominant one. With economic growth and development Bangladesh is experiencing a
gradual shift towards commercial fuels, namely, NG and LPG due to their clean burning
in household cooking. Besides, Bangladesh Country Action Plan (CAP) for clean
cookstoves has a goal towards achieving 100% clean cooking solution by 2030 (CAP,
2013). Thus the demand for clean cooking fuel is expected to be increased dramatically
in near future.
NG is the most significant native source of energy in Bangladesh which is processed and
utilized in significant quantities throughout the year. About 74% of the commercial
energy of Bangladesh comes from natural gas (Malek et al., 2015). Six NG distribution
companies in Bangladesh are now serving 4.1 million households countrywide which
consume yearly 141.5 billion cubic feet of NG (14.63% of total production) for cooking
purpose (Petrobangla, 2016). Currently, there is only 11.91 trillion cubic feet (TCF) of
recoverable NG reserve in Bangladesh for the next eight to nine years out of estimated
total 27.12 TCF recoverable gas reserve (Petrobangla, 2017). Though the household
sector in Bangladesh consumes only a fraction of the total NG produced, most of the
households suffer from gas supply pressure as the real demand is higher than the supply
(Malek et al., 2015). This is due to the production of 2700 million cubic feet of gas per
day (mmcfd) against the demand of 3700 mmcfd, leaving a shortage of 1000 mmcfd. To
overcome this situation and tackle gas supply shortfall the government has already
started importing liquefied natural gas (LNG) through different operators in Bangladesh
(Petrobangla, 2017). As the international price of LNG is much higher than the domestic
NG price it is obvious that the NG based cooking will be rather pricey in near future.

2
Domestic market of Bangladesh is still dependent on imported and locally made low
efficiency household NG burners. Recent work shows that the household NG burners
usually used in Bangladesh (locally made and imported) have thermal efficiency ranges
from 35% to 52% (Islam and Zia, 2017). An inefficient NG burner can contribute to poor
indoor air quality (Klug et al., 2011). Improper design and operation of household NG
burner may contribute 25 to 39% to indoor nitrogen dioxide (NO2), while for carbon
monoxide (CO) the indoor contribution ranges from 21 to 30% depending on seasonal
variations (Logue et al., 2014). Though emissions from NG burners are much lower than
coal, oil and biomass fired cookstoves, inefficient household NG burners emitting
excessive NO2, CO, formaldehyde (HCHO) and very fine particles can exacerbate
various respiratory and other health ailments (Jarvis et al., 1998; EPA, 2013; Kile et al.,
2014; Vrijheid et al., 2012; Pajot et al., 2016; Malouf and Wimberly, 2001; Knibbs et al.,
2018).
Though there are considerable amount of published works related to burner design
parameters for improved thermal efficiency, such as gas flow rate through injector, air-
fuel ratio, injector orifice, throat, primary and secondary air supply, flame shape and
stability, loading height or pot support, fuel specifications, burner port – swirl and radial,
mixed flow burner head, swirl angle and inclination angle (Surange et al., 2014; Couto et
al., 2004; Jones, 1989; Ko and Lin, 2003; Hou and Chou, 2013; Hou and Chou, 2014), a
limited published works are available on shield and cooking utensil design for better heat
utilization and hence improved overall thermal efficiency. Literatures show that a simple
addition of a single layer perforated metallic circular shield around the cooking pot can
increase the overall thermal efficiency of the gas burner in the order of 4 -12% (Hou and
Chou, 2013; Lucky and Hossain, 2001). Inclusion of a small projection in the centre of a
cooking pot can save energy by 14% (Krishnan et al., 2012). However, all the shields and
modified pots found in literatures were far beyond the practical applications.
Domestic market of Bangladesh is still dependent on imported and locally made low
efficiency household gas burners. From an energy conservation viewpoint, studies on the
heat utilization efficiencies of cookstoves are important rather than designing gas burner
for a developing country like Bangladesh. In view of these considerations, the objectives
of the present investigation were to design and develop pot bottom shield and modified

3
utensil and study their thermal and emission performances using a commonly used
household NG burner for cooking.
1.2 Objectives of the Study
The main focuses of this study are to search simple and cost effective way of increasing
the overall efficiency of general household NG burners for cooking. Overall thermal
efficiency of any cookstove mostly depends on combustion efficiency and heat transfer
efficiency. Though, there are extensive works in literature for improving combustion
efficiency of NG burner, few works exist on improving heat transfer efficiency of the
same type of burner. Moreover, the published works on improving heat transfer
efficiency of NG burner seem to have complicacy in practical application. Therefore, the
present work emphasizes on some cost effective and practically applicable means of
increasing the heat transfer efficiency of existing household NG burner in the market.
The main objectives of this research work are as follows:
1. Design and development of low cost and practically applicable pot bottom shield
and finned pot for better heat transfer efficiency and
2. Evaluation of thermal and emission performances of the designed shield and pot
in different configurations with reference to the baseline configuration.
1.3 Scope of the Study
This research work will develop scientific correlation among thermal performance,
emission behavior, loading height with and without pot-bottom shield using ordinary and
modified finned pot of conventional household NG burner at various NG supply
pressures. The output of the study will help users to adopt the optimum configuration of
loading height with or without pot-bottom shield using ordinary or modified finned pot,
and NG pressure for minimizing gas consumption and emission during cooking with
conventional household NG burner.
The study results could be helpful for local decision making organization such as
Petrobangla, local and global NG burner producers and researchers in developing and
marketing efficient NG burners for household cooking with a minimal expense.

4
1.4 Organization of the Thesis
This research work is organized in five chapters in the following format:
Chapter 1 entitled as ‘INTRODUCTION’ presents Background and importance of heat
transfer in cookstove, Emission Impacts on Health and Environment, Objectives of the
Study, Scope of the Study and Organization of the Thesis. In Short, importance of the
present study, various tasks under major objectives, and the areas where there are scopes
to work with.
Chapter 2 entitled as ‘LITERATURE REVIEW’ covers in-depth in the Cooking Energy
System with different Cooking Fuels like Cooking with Solid Fuels, Cooking with Gas,
Cooking with Liquid Fuels. Fuel’s specific efficiency aspect. Fundamental Physics
Governing Heat Transfer in Cookstoves. Combustion reaction of natural gas,
Contributing Roles of Conduction, Convection, and Radiation, Thermal efficiency based
on different arrangement, Emission of Carbon monoxide [CO] based on different
arrangement.
Chapter 3 entitled as ‘EXPERIMENTAL DESIGN’ describes experimental procedures
and methodology used in detail where necessary. Here, Thermal Efficiency based on
different arrangement has been observed. They are Thermal efficiency based on loading
height and Natural Gas (NG) pressure, Modified combustion efficiency (MCE) based on
loading height and NG pressure, Heat transfer efficiency based on loading height and
NG pressure, Variation of Temperature corrected boiling time with NG pressure and
loading height, Firepower based on NG pressure of different settings, Emission of
Carbon monoxide [CO] and Carbon dioxide [CO2] with loading height and NG Pressure.
Chapter 4 entitled as ‘RESULTS AND DISCUSSIONS’ covers the findings and results
out of various tasks under major objectives with criticism and references. This chapter
includes the results and discussions of Thermal Efficiency based on different
arrangement like Thermal efficiency based on loading height and Natural Gas (NG)
pressure, MCE based on loading height and NG pressure, Heat transfer efficiency based
on loading height and NG pressure, Variation of Temperature corrected boiling time with
NG pressure and loading height, Firepower based on NG pressure of different settings,

5
Emission of CO and CO2 with loading height and NG Pressure and Comparison among
different experimental setup of Flat bottom and Finned pot with and without shield.
Chapter 5 entitled as ‘Conclusion and Recommendations for future study’ presents a
summary of the main findings of this research work and suggestions for future research.

6
CHAPTER 2 LITERATURE SURVEY
2.1 Introduction
Cookstoves are the essential household appliances that are required to meet every day
cooking need worldwide. There are several types of cookstoves based on fuel used, such
as biomass based cookstove, kerosene fired cookstoves, NG fired coostoves, LPG fired
cookstoves, methanol/ethanol fired cookstoves, di-methyl-ethar (DME) based
cookstoves, solar cookstove and so on. However, NG, LPG, methanol/ethanol, DME and
solar based cookstoves provide clean cooking solution to general households. Among
various types of cookstoves, household NG burners are being used in 4.1 million general
households under six NG distribution companies at various geographical areas in
Bangladesh which consume yearly 141.5 billion cubic feet of NG (14.63% of total
production) for cooking purpose (Petrobangla, 2016). NG burner is a device which
enables a chemical reaction of fuel and oxidizer (usually oxygen from air) to produce
heat in a controlled way. Though the NG burners offer clean cooking solution to
household, their thermal performance is important to energy conservation perspective.
2.2 Cooking energy system Cooking in households is a complex system, comprising of different factors related to
fuel and cooking devices, as well as to user behavior, cooking equipment and
environment. Users not only make choices regarding ‘stoves and fuels’, but also make
decisions around which meal to prepare, which cooking equipment (pots and pans) to use
and, most importantly, how to cook (cooking practices range from high power phase to
low power simmering phase). The place of cooking, e.g. outdoors, in a well-ventilated
space or in a closed kitchen room is a decisive factor on the concentration and dose of
harmful cookstove emissions to which people are exposed while cooking. In household
energy projects, the focus is often directed towards technical solutions, namely the
cookstove itself with the respective fuel. In laboratories, well-engineered stoves and fuels
have been proven to enhance the performance of cooking energy devices in respect to the
heat output, energy efficiency and emissions. However, these positive results don´t often
directly translate to actual improvements within households. The focus on stoves and
fuels far too often neglects the importance of the user’s capacity to manage fuel, handle

7
the stove, and manage the cooking process in an efficient manner. In short, user behavior
directly influences ‘performance’ within the multi-dimensional cooking energy system
(GIZ, 2014).
2.2.1 Cooking fuel
It has been observed that household´s fuel choice is strongly influenced by the
accessibility, affordability and convenience of the fuel, as well as dependent on the
economic and technical options of a household and the respective social and cultural
determination. In many households, cooking with wood fuels is so deeply rooted in
culture that other fuels have little appeal, although they might provide recognizable
health and economic benefits. Solid fuels are comprised of fossil fuels and solid biomass.
The solid biomass fuels can be differentiated into unprocessed fuels such as wood,
agricultural residues and dung, with processed fuels further categorized
into carbonized and un-carbonized fuels. Liquid fuels include kerosene, methanol,
ethanol and plant oil, whilst renewable gaseous fuels consist of wood gas and biogas.
The fossil gaseous fuels are comprised of petroleum gas (LPG) and NG (GIZ, 2014).
Solid fuels, including both biomass and fossil fuels (firewood, charcoal, dung,
agricultural residues, coal etc.) when used in a traditional manner can result in
measurable inefficient burning, and high concentrations of harmful emissions. Design
deficiency of the traditional cookstoves leads to incomplete and inefficient combustion
which produces significant quantities of ‘products of incomplete combustion’ (PIC)
importantly respirable particulates that have more global warming potential (GWP) than
CO2 (Smith et al., 2000). Incomplete combustion of biomass in traditional cookstoves
also releases carbon monoxide (CO), nitrous oxide (N2O), methane (CH4), polycyclic
aromatic hydrocarbons (PAHs), particles composed of elementary or black carbon, and
other organic compounds (Bhattacharya et al., 2000).
Gaseous fuels can be distinguished into gas generated from a fossil fuel source, such as LPG and NG, and gas generated from a renewable energy source, such as biogas and wood gas, which are obtained from biomass. In case households are used to solid fuels, the introduction of gaseous fuels for cooking requires a change of cooking habits. This is influenced by a new handling of the fuel itself, the new cooking equipment and the different cooking process, i.e., due to different flame temperature (Bajgain and Shakya, 2005; GIZ, 2014; Roth, 2013).

8
Liquid fuels can be categorized into several different fuels, which are derived from the
conversion of biomass, such as alcohols (i.e., ethanol, methanol), plant oil, and those
generated from fossil fuels (i.e., kerosene, also known as paraffin). Ethanol can be also
produced from fossil fuel sources, to produce ethylene which is created by the acid-
catalyzed hydration of petroleum. By using biomass to produce ethanol, the fuel is
classed as a renewable energy source, as the greenhouse gases released in its production
and consumption are theoretically equivalent to those absorbed during its growth cycle
(Lam et al., 2012; Bates et al., 2011; Lambe et al., 2015; Stokes and Crocco, 2005).
2.2.2 Fuel-specific efficiency aspects
Table 2.1 shows the higher heating value (HHV) and lower heating value (LHV) of
commonly used household cooking fuel including their carbon intensity (EFDS, 2011).
Table 2.1: General Properties for Some Common Fuels (EFDS, 2011)
Fuels LHV HHV
Carbon
Intensity
(MJ/L) (MJ/kg) (MJ/L) (MJ/kg) (g CO2-eq / MJ LHV)
Crude Oil 36.84 ± 1.05 43.05 ± 1.40 38.76 ± 1.10 45.30 ± 1.47 73.5 ± 2.6 Petrol /
Gasoline 32.70 ± 0.44 44.15 ± 0.74 34.77 ± 0.47 46.94 ± 0.70 70.8 ± 4.4
Diesel 35.94 ± 0.45 42.91 ± 0.46 38.19 ± 0.47 45.60 ± 0.49 74.3 ± 2.3 Fuel Oil 39.21 ± 1.09 40.87 ± 0.94 41.50 ± 1.15 43.26 ± 1.00 77.8 ± 2.1
LPG 24.67 ± 0.80 46.28 ± 0.74 26.57 ± 0.86 49.84 ± 0.80 63.9 ± 2.1 Kerosene 35.24 ± 0.41 43.69 ± 0.51 37.10 ± 0.43 45.99 ± 0.54 72.0 ± 1.8
(MJ/kg) (MJ/kg) (g/MJ LHV) Coal - 25.75 ± 2.64 - 27.05 ± 2.77 95.7 ± 7.0
(MJ/m3) (MJ/kg) (MJ/m3) (MJ/kg) (g/MJ LHV) Natural Gas 35.22 ± 2.22 45.86 ± 3.95 39.05 ± 2.47 50.84 ± 4.38 56.9 ± 3.4 Hydrogen (1 atm.) 10.05 ± 0.01 119.95 ± 0.13 11.88 ± 0.01 141.88 ±
0.16 0
In respect to energy density, combustion efficiency, heat-transfer efficiency and heat
control characteristics, LPG assumes the leading position among the energy carriers.
Despite the fact that it is a fossil fuel, LPG can be burnt very efficiently and emits few
pollutants (GIZ, 2014). From Table 2.1 it is observed that LPG and NG have almost
same net calorific value, but carbon intensity of NG is less than LPG. However, firewood
has an average LHV around 16 MJ/kg (WNA, 2018). Depending on the type of wood
fuel, charcoal production, and cookstove, between 7.3 and 29.7 kg of wood would be

9
required to provide the same amount of useful cooking energy- found in 1 kg of LPG
(GIZ, 2014).
2.3 Fundamental Physics Governing Heat Transfer in Cookstoves
2.3.1 Combustion reaction of NG
Device which enables a chemical reaction of fuel and oxidizer (usually oxygen from air)
to produce heat in a controlled way is called burner. Theoretical stoichiometric
combustion of NG (mainly methane) involves the air to fuel ratio (lambda, ) equals to
one which is shown by the following equation:
CH4 + 2 (O2 + 3.76 N2) CO2 + 2 H2O + 7.52 N2 -889 kJ (at Standard conditions of 1
atm and 25oC).
Bethold et al. (2017) observed and analyzed complete reaction mechanism of NG with
stoichiometric amount of air. This study showed incomplete combustion of NG in
stoichiometric requirement which is shown in Figure 2.1.
Figure 2.1: Products of NG after incomplete combustion reaction [Bethold et al. (2017)]. Incomplete combustion of NG produces environment pollutants like CO, nitrogen oxides
(NOx) beside the main combustion products CO2, and H2O. Side by side the reaction
produces heat energy. This study also shows that stoichiometrical reactions in most cases
are not advantageous regarding flame temperature, NOx and CO emission. The relations
among flame temperature, NOx and CO formations in regard to air/fuel ratio ( are
shown in Figure 2.2. NOx formation dominates in combustion of nitrogen rich fuel
which is known as fuel NOx. Since NG contains no nitrogen, fuel NOx is not important
for methane combustion. Thermal NOx occurs at high temperature (>1800oK) and is
predominately in nitric oxide (NO) form. Prompt NO occurs at low temperature in fuel
rich flame regions and can be significant in NG flames. CO formation during NG

10
combustion occurs due to poor combustion control (flame stability, mixing etc.), flame
impact or quenching against cold surfaces (loses heat quickly) and equilibrium
dissociation of CO2 to CO.
Figure 2.2: Relations among flame temperature and formation of CO, and NOx in regard
to air-fuel ratio (
2.3.2 Contributing roles of conduction, convection and radiation
Contributions of conduction, convection, and radiation to the overall stove energy
balance was described by Baldwin (1987), and later on observed in detail by Zube
(2010). Conductive heat transfer occurs through the floor of the stove to the ground,
through the body of the stove to the surroundings, and through the thickness of the pot.
There is zero energy gains associated with conduction heat transfer to the pot. The rate
of steady state conduction heat transfer is defined by equation 2.3.1.
𝑄𝑐𝑜𝑛𝑑𝑢𝑐𝑡𝑖𝑜𝑛 = 𝑘∗𝐴∗Δ𝑇/𝐿 ……………………… (2.3.1)
where,
𝑘: thermal conductivity), 𝐴: cross sectional area of object, Δ𝑇: temperature difference
and L: objects thickness.
Conduction through the stove walls does not directly contribute to the energy balance.

11
Hot combustion gases interact with two separate surfaces: (a). the inner surface of the
stove (losses) and (b). the outer surface of the pot (gains). The rate of steady state
convective heat transfer is defined by equation 2.3.2.
𝑄𝑐𝑜𝑛𝑣𝑒𝑐𝑡𝑖𝑜𝑛 = ℎ∗𝐴∗Δ𝑇 ……………………(2.3.2)
where,
ℎ: convection coefficient (𝑊/𝑚2𝐾), 𝐴: exposed surface area (m2), Δ𝑇: temperature
difference (oK).
The magnitude of convective heat transfer is influenced by the velocity of the gases
flowing through the stove, the exposed surface area contacting the gases, and the
temperature difference between the gases and the exposed surface. Higher flow velocities
and increased temperature differences through the stove increase convective heat
transfer. Convective heat transfer improves by increasing the exposed surface area of the
pot and/or decreasing the inner surface area of the stove. Since the latter is not practical,
focus is often placed on increasing the surface area of the pot exposed to combustion
gases.
It has been observed that total convection gains come from two sources: (a) impinging
combustion gases upon the bottom surface of the pot, and (b) scraping of the same gases
along the sides of the pot. When bottom surface area is considered, estimated
contribution found lower than expected. It is also obvious that hot gases are buoyantly
driven up the sides of the pot which increases the exposed area. Pot skirt reduces the
cross sectional flow area which forces the gases to more closely follow the contours of
the pot and also reduces the surface boundary layer thickness. Surface boundary layer
thickness reduces as the gas velocity increases during traveling through the flow
restriction, thereby increases the convection coefficient.
In the case of radiation, all objects (materials) continuously emit electromagnetic
radiation due to internal molecular and atomic motion. The higher the object's
temperature, the greater the amount of energy so radiated. Radiant energy originating
from flames is transferred to the stove body, pot, or ambient surroundings. The rate of
blackbody radiation heat transfer between two surfaces is described by equation 2.3.3.

12
𝑄𝑟𝑎𝑑𝑖𝑎𝑡𝑖𝑜𝑛=𝐴∗𝜎∗ (𝑇42 –𝑇4
1)………………………(2.3.3)
where,
𝑇2 and 𝑇1 are the respective temperatures of each surface.
The magnitude of radiation being emitted as either a loss or a gain is strongly dependent
on the temperature difference between the two objects, the area of the emitting surfaces,
emissivity of both surfaces, and the associated view factor. As each of these variables
grows larger, radiation heat transfer increases. The view factor is a dimensionless
number used in surface-to-surface radiation calculations which accounts for the relative
areas of each surface along with the distance between them. Emissivity values for all
objects of concern are used along with transmissivity and reflectivity values of the flame
and drip pan, respectively, based on a flame reflectivity of zero and assuming the pan is a
gray surface. View factors are used to correct for relative areas of the respective surfaces
and also the distance between them. The pot surface is assumed to behave as a black
body since it absorbs all incident radiation; however, irradiation from the pot surface to
the hotter object is ignored.
Widodo (2016) defined the energy losses in the cooking system are relatively
complicated to identify because of the complexity of geometry of the heating system.
The easiest way to identify energy losses is radiation heat transfer from the stove cover
as shown in equation 2.3.4
Qrad = ATS4 … … … … … … … . . (2.3.4)
where,
Qrad is radiation heat transfer, is emissivity of the surface, = 5.67 x 10⁻⁸ W/m2·K4 is
the Stefan–Boltzmann constant and Ts is surface temperature.
Due to the complexity related to the identification of every heat transfer processes such
as conduction and convection, energy losses can be determined and furthermore
expressed by equation 2.3.5.
13
Ec = Eabs + Er.cov + El … … … … … … … . . (2.3.5)
where,
Ec is energy from combustion process, Eabs is energy which is absorbed by water, Er.cov is
radiation energy that is emitted by stove cover and El is energy losses instead of radiation
energy.
2.4 Studies on Household NG Burners
Tamir et al. (1989) carried out the study on thermal efficiency behavior of the NG burner
at various NG flow rate and found that thermal efficiency of the burner first increased
and then decreased with increasing NG supply flow rate. The researchers concluded that
at relatively low gas-input rates, the heat-transfer coefficient between the combustion
gases and the bottom of the pan is relatively small because of the low velocity of the
combustion gas flows under the pan bottom. The process of heat transfer is enhanced by
raising the gas-input rate until optimum conditions are obtained, i.e., when the thermal
efficiency reaches its highest value. Beyond this point, the surface area available for heat
transfer at the vessel bottom for a given mass of water and a fixed temperature becomes
the controlling factor. In other words, the rates of heat loss with the flue gases to the
environment grow faster than the heat-absorption rate of the vessel. At very low gas flow
rates, the researchers observed that there was a distinct gap between the tip of the flame
and the bottom of the cooking vessel. Under such operating conditions, the hot gases will
inevitably cool before impinging on the vessel and will have a temperature lower than
the maximum flame temperature thus adversely affecting efficiency. With increasing gas
flow the flame height was observed to increase. At flow rates in the vicinity of the
maximum efficiency, the flame was impinging on the vessel bottom and covering the
entire surface by flowing along it. At flow rates beyond the maximum efficiency, the
flame heights were greater than the distance between the burner head and the vessel
bottom. Under such operating conditions the following two factors contribute towards
lowering of the efficiency:
1. The combustion reaction stops as soon as the flame hits the vessel bottom and
2. The residence time (in contact with the cooking vessel) is too low for
completing the combustion reaction.
Therefore, the extra gas flow does not contribute much in the way of transferring heat to
the cooking vessel.

14
The similar work was carried out by Bussmann (1981) earlier but with wood burning
stove. The researcher found that at a distance of approximately 17 cm from the fire bed,
the temperature was the highest at 1500°C when no pan was placed; with the pan at 5, 10
and 15 cm from the fire bed the temperature at the bottom of the pan was approximately
1250°C, 1400°C and slightly less than 1500°C respectively.
Eusuf et al. (1990) studied the thermal efficiency of NG burner at various flow rate of
NG based on flame tip height at Institute of Fuel Research and Development (IFRD) of
Bangladesh Council of Scientific and Industrial Research (BCSIR) and found that the
maximum thermal efficiency (61.3%) was obtained at a gas flow rate of 217 L/h.
Lucky and Hossain (2001) studied the thermal performances of a NG burner with round
and flat bottom at various NG flow rates. The flat bottom pot was found to give higher
efficiencies compared to round bottom pot. With regard to NG flow rate the researchers
found that the efficiency first increases and then decreases with increasing gas flow rate.
This study also carried out the efficiency study of the NG burner with a simple
perforated sheet metal shield around the flame and a portion of the cooking vessel. The
modified cooking system was found to increase the heat utilization efficiency. Cooking
vessels and NG burner set used for this study are shown in Figures 2.4 and 2.5
respectively.
Figure 2.4: Cooking vessels used for the study by Lucky and Hossain (2001)

15
Figure 2.5: NG burner set used for the study by Lucky and Hossain (2001)
However, the researchers carried out the thermal efficiency study on conventional gas
burner and with perforated radial port gas burner (Figures 2.6 and 2.7) with and without
a perforated sheet metal shield (Figure 2.8) around the cooking vessels i.e., flat bottom
and round bottom vessels.
Figure 2.6: Conventional NG burner head [Lucky and Hossain (2001)]
Figure 2.7: Perforated NG burner head

16
Figure 2.8: Perforated surrounding shield used for cooking vessels [Lucky and Hossain,
(2001)]
The study reported a thermal efficiency gain of 3.1% to 6.3% for perforated burner with
shield configuration respectively with flat bottom and round bottom pot.
Farzana et al. (2017) designed and developed a modified pot shield and examine its
effect on thermal efficiency of the household gas burner. This modified version of pot
shield was a double layer metallic enclosure having annular gap that was operated with
rockwool insulation or without insulation. Three aluminium flat bottom cooking pots of
different sizes were used for the study which made 0.002 m, 0.004 m and 0.013 m
channel gap between the pot wall and the inner lining of the shield when placed inside
the shield for experiment. Channel gap was provided to allow combustion gases to pass
through it. A partially premixed atmospheric swirl flow gas burner was used to run the
experiments. Each of the pots was used for water boiling test (WBT) filled with 3 kg tap
water in different configurations, namely: pot only, pot in shield without insulation and
pot in shield with rockwool insulation at different natural gas supply pressures (0.1 psig,
0.15 psig, 0.2 psig and 0.25 psig) keeping the burner primary air opening fixed at 50%. It
was found that shield with rockwool insulation performed the best among the three
configurations. Thermal efficiency of the burner at this configuration was ascertained to
be the highest (75%) for 0.004 m channel gap at 0.15 psig gas pressure which was 70%
higher than the maximum efficiency obtained with pot only configuration at the same
pressure. However, in all cases the exposure concentration of CO inside the test kitchen
was found to be lower than 24-hour average indoor CO value of 6 ppm prescribed by the

17
World Health Organization (WHO). Cross sectional view of the double layer
surrounding pot shield and the dimensions of the pots used are shown in Figures 2.9 and
2.10.
Figure 2.9: Cross sectional view of the double layer modified surrounding pot shield
[Farzana et al. (2017)]
Figure 2.10: Dimensions of the pots used in the study [Farzana et al. (2017)]
Widodo (2016) carried out the energy efficiency study of LPG burner with a ceramic built burner cover shown in Figure 2.11. The burner cover had 10 cm dia at base which ended with a dia of 8 cm at the top. The height of the cover was 3 cm. The study was focused to find out the optimum thickness for flue gas exit channel between the pot and the burner cover which is shown in Figure 2.12.

18
Figure 2.11: Ceramic burner cover [Widodo (2016)] The study found the maximum thermal efficiency of 46.4% at a channel gap of 4 mm which is shown in Figure 2.13.
Figure 2.13: Efficiency and energy losses with flue gas exit channel gap [Widodo
(2016)]
Andreatta (2009) studied the thermal efficiency of various finned pots with simulated
stoves using NG as fuel. Study found that the pots with fins on and near the bottom of
the pot performed well and gave around 1.76 fold improvement in heat transfer. The pots
with fins on the sides of the pot were found to perform even better and gave 2 fold
improvements in heat transfer.
Tamir et al. (1989) developed swirling flame gas burner and tested for the thermal
efficiency. Efficiency associated with the developed burner was higher by 10-30% that
that of conventional gas burners.
Figure 2.12: Flue gas exit channel thickness
Between pot and cover [Widodo (2016)]

19
Hou and Chou (2013) investigated the influence of three significant parameters, such as
swirl flow, loading height and semi confined combustion flame on thermal efficiency
and CO emission of multi-port gas burners. Study found that the swirl flow burner yields
higher thermal efficiency and emits less CO than those of the conventional radial flow
burner. Study also compared the thermal efficiencies and CO emissions of the
conventional radial port burner and the improved swirl flow burner at different values of
swirl angle. They concluded that the swirl flame burner gives higher thermal efficiency
than the conventional radial flow burner at the same values of thermal input and loading
height for either open flame or semi-confined flame. However, swirl flame burner gives
somewhat higher CO than the conventional radial flow burner at the same thermal input
and loading height. The study also found that the thermal efficiency and CO emission
decrease with the increase of loading height at same power output of the burners. They
studied the single layer perforated shield around the pot and found that addition of a
shield around the pot can achieve an increase in thermal efficiency by 4-5% and a
reduction in CO emission for the same burner (swirl flow or radial flow). The
dimensions of the shield they used in the study are shown in Figure 2.14.
Figure 2.14: Dimensions of the surrounding shield [Hou and Chou (2013)]
Krishnan et al. (2012) designed a cooking pot putting a small projection in the center
which would increase the area of contact thereby increasing the area of heat transfer. The
pot was then tested for thermal efficiency with LPG burner in comparison to a standard
pot without the projection in the pot center. Modified pot with projection in the center
and standard pot used for comparison are shown in Figure 2.15. The study found around
14% less energy consumption for the converted pot with projection in the center.

20
Figure 2.15: Converted pot with projection in the pot center and standard pot for
efficiency study with LPG burner [Krishnan et al. (2012)]
Naphon (2014) conducted thermal efficiency study with standard pots (OP, 3 different
sizes) and modified pots (3 different sizes) made of aluminum and steel using LPG
burner. Modified pots were double layer having no insulation (MP1), double layer pot
with insulation (MP2) and double layer with spirally twisted tape (MP3). Pots are shown
in Figure 2.16. In both the cases thermal efficiencies (TE) obtained in the following
order: TEMP3 ˃ TEMP2 ˃ TEMP1 ˃ OP. The comparison of the thermal efficiencies for
original pot and modified pots of aluminum and steel are shown in Figures 2.17 and
2.18. It is found that the modified cooking pot required 15-20% less energy than the
original cooking pot to bring water to boiling. It was seen that the gas flow direction and
decreasing convection heat losses have significant effect on the thermal efficiency of the
cooking pot.

21
Figure 2.16: Standard original pot (OP) and modified pots (MP) for the study [Naphon
(2014)]
Figure 2.17: Energy efficiency of LPG burner with original pot (OP) and modified pots
(MP) made of steel [Naphon (2014)]

22
Figure 2.18: Energy efficiency of LPG burner with original pot (OP) and modified pots
(MP) made of aluminum [Naphon (2014)]
Boggavarapu et al. (2014) studied the thermal efficiency of a conventional domestic
burner both experimentally and numerically for piped natural gas (PNG) fuel. For PNG,
loading height was ascertained to be a much more important factor affecting efficiency
of the burner and an optimal loading height could be identified. Experiments show an
improvement in burner thermal efficiency of 10% for PNG with the optimal loading
height. The efficiency variations of the burner with loading height are shown in Figure
2.19.
Figure 2.19: Experimental variation of efficiency with loading height for PNG at 21
mbar pressure [Boggavarapu et al. (2014)]

23
Ko and Lin (2003) studied the effect of gas pressure, heating value of NG and percentage
primary combustion air on thermal and emission performances of NG burner. They
observed that NG having high heating value results in a decrease in thermal efficiency
(due to higher thermal input) and an increase in CO emission compared to NG having
low heating value. They also observed that thermal efficiency decreases with increasing
flow rate of NG which also increases CO emission. Researchers also found that with
increasing primary aeration, CO emission decreases but the thermal efficiency remains
almost unaffected. With increasing loading height, the CO emission decreases, which is
attributed to decreased quenching by flame impingement on the load. However, at higher
loading height, the flame and combustion gases are cooled to a greater extent by mixing
with ambient air before contacting the loading vessel, and thus, the temperature driving
force for heat transfer is decreased, leading to the decrease of thermal efficiency.
Kotb and Saad (2018) studied the CO emission and thermal efficiency of counter-swirl
domestic burners compared to non-swirl domestic burner and found that the burner
performance was affected by the loading height. Both thermal efficiency and CO
emission decreased with the increasing value of the loading height irrespective to type of
burners.
Considering all the studies previously done, still there is scope to access the energy
efficiency of household gas burner using a pot bottom shield of various heights and
modifying the pot using fins for improved heat transfer area. This will provide both
scientific and practical insight on the NG burner efficiency on household cooking.

24
CHAPTER 3
EXPERIMENTAL DESIGN
3.1 Introduction
This chapter includes the detail of design, development and experimentation of modified
pot-bottom shield, spot welded finned pot for the thermal and emission performance study
of household gas burner. Different configurations of pots and shields (i.e., flat bottom pot
with shield, flat bottom pot without shield, finned pot with Shield and Finned pot without
shield) were tested for overall efficiency, heat transfer efficiency and modified combustion
efficiency (MCE) following standard water boiling test (WBT) protocol at different loading
height and different NG supply pressure to ascertain the optimum operating condition for
each configuration.
3.2 Experimental Design
In this study a single NG burner and two standard flat bottom pots made of stainless steel
were sourced from local market. One of the pots was converted to finned pot by spot
welding. Several loading heights and pot-bottom shields of different height were fabricated
in local workshop. Finally the experimental set up was arrayed by coupling the coarse and
fine NG flow regulators, wet gas meter, pressure gauge and the NG burner. The
specifications of the above items, the description of the experimental rig and experimental
methodology are given in the following sub-sections.
3.2.1 Experimental NG burner
A market leading concentric radial flow double ring NG burner was sourced from local
market for this experiment. There were 96 radial ports on the outer ring of the burner head
arrayed in two concentric circular geometry whereas, the inner ring of the burner head
contained only 16 radial ports on a single circular geometry. Each of the radial port had a
diameter (d) of 2.8 mm. The diameters of the outer ring (OD) and inner ring (ID) were 9.6
cm and 3.4 cm respectively. The gap between the two rings (OID) was measured as 1.3 cm.
The burner had also a single gas injecting nozzle connected with a mixing tube wherein gas
25
and primary combustion air are supposed to mix together, and a sliding shutter type primary
air flow regulator attached to the gas injecting nozzle. The detail of the gas burner
arrangement is shown in Figure 3.2.1 which presents top and side view of the burner
including mixing tube, gas injecting nozzle and sliding shutter and sectional view of radial
flow burner head and front view of the sliding shutter. Photographs of NG burner, burner
head and sliding shutter are shown in Figure C1.1 in Appendix C.
Figure 3.2.1: Radial flow gas burner arrangement (a) Top and side view of the burner
including mixing tube, gas injecting nozzle and sliding shutter type primary air flow
regulator (b) Sectional view of radial flow burner head and (c) Front view
of the sliding shutter type primary air flow regulator.
3.2.2 Experimental pots
Two flat bottom pots made of stainless steel (SS) were sourced from local market for WBT.
Each of the pots had a thickness (th) of 0.5 mm, pot height (PH) of 108 mm, inner diameter
(PD) of 250 mm, and a collar width (PCD) of 17 mm. One the pots was then converted to

26
finned pot by adding wavy fins of SS on the outer bottom side of the pot by spot welding for
extended surface with a view to better heat transfer to pot content. The wavy nature of fins
was selected to render high extended heat transfer area and less obstructed exit for
combustion gases. The welded fins were in a circular shape on the pot bottom. The fins were
welded at a distance (fdb) of 34.5 mm from the outer pot bottom periphery. The height (fh)
and the width (fw) of the welded fins were 12 mm and 25.6 mm respectively. The pitch (fd)
between the fins was maintained at 11 mm during fabrication. There were 56 peaks in the
welded fin system. Figure 3.2.2 shows the dimensions of finned pot and regular flat bottom
pot used in this study.
Figure 3.2.2: Dimensions of finned pot (a) and regular flat bottom pot (b) used in the study.
Actual pictures of flat bottom and finned pots used in this experiment are shown in Figure
C1.2 in Appendix C.

27
3.2.3 Pot support and shield
To study the thermal and emission performances of NG burners at various loading height
with shield and without shield several pot supports and circular shields of different height
were fabricated. Pot supports were made of a metal (mild steel) circular ring welded with
five vertical metal bars of different height to support the pot during WBT. The dimensions
and shapes of pot support and pot shield are shown in Figure 3.2.3. The loading height (LH)
varied from 2.5 cm to 7.5 cm with an incremental height of 0.5 cm. Therefore, eleven
different loading heights were employed during the performance test of the NG burner.
Similarly, eleven sets of cylindrical shields were fabricated from thin metal sheet (thickness
0.3 mm) and the height (SH) of those shield varied from 2.1 cm to 7.1 cm leaving a circular
flue gas exit channel (PSC) of 0.4 cm for each of the pot support and shield arrangements.
Figure 3.2.3: Schematic diagram of (a and d) Pot support (b) Shield (c) Pot support with
Shield (e) circular shield.

28
There were total 84 circular holes on each shield spaced equally at an elevation of 1.1 cm
from base. The diameter (DHS) of each circular hole was maintained at 0.5 cm. Each of the
pot support had a base diameter (PSD) of 22 cm whereas the diameter of the shields (SD)
was maintained at 23 cm since it encircle outside the pot support. Photographs of pot
support, circular shields, and pot support with shield are shown in Figure C1.3 in Appendix
C.
Incorporating the pot-bottom shield in this efficiency study was envisaged to minimize heat
loss from the combustion gases into the surrounding air that might increase the thermal as
well as the emission performance of the particular NG burner in question. The narrow exit
(4 mm circular opening between pot and shield) for combustion gases from combustion
chamber was also thought to provide turbulence for better heat transfer efficiency. The holes
on the shield were provided to supply secondary are for better combustion of NG.
3.2.4 Experimental setup
In this study, distributed pipe NG of Titas Gas Transmission and Distribution Company
Limited (TGTDCL) having a measured (using gas chromatograph, GC) lower heating value
(LHV) 48,833.44 kj/kg was used as fuel to carry out the standard water boiling test of
different configurations of pot support (with and without shield) and pot (ordinary flat
bottom pot and finned pot) at different loading heights and NG supply pressure. The
experimental setup used for this study is shown in Figure 3.2.4. However, pictorial views of
the experimental setup are shown in Figures C1.4 and C1.5 in Appendix C. There was a
pressure regulator at main NG supply line for coarse control wherefrom NG enters into the
wet gas meter (Shinagawa Corporation, Japan). The wet gas meter measured the consumed
amount of NG at a rate 5 liter/revolution. A fine pressure regulator was connected to the
outlet tube of the wet gas meter. The outlet of the fine control valve was connected to the
inlet gas nozzle of the burner (radial port single gas burner described in section 3.2.1) with
another piece of tube which was fitted with a pressure gauge (0-100 mbar) to read the supply
pressure of the NG to burner. The wet gas meter was fitted with a standard thermometer to
read the temperature of the supply gas. The wet gas meter gave the total volume of NG
consumed during the WBT. Two electronic temperature reader coupled with standard K-
type thermocouple were used to monitor the temperature of water and ambient temperature

29
inside the test kitchen during WBT. One flat bottom SS pot and another converted spot
welded SS finned pot (specifications are given in 3.2.2) were used for the WBT. Several pot
supports and shields of different heights (specifications are given in 3.2.3) were also
employed for the efficiency study.
Figure 3.2.4: Schematic of the experimental setup for WBT of NG burner
A portable flue gas analyzer (Kane455, 2009) with IR thermal printer (Taiwan) was used to
measure the concentrations of CO, CO2, static pressure and temperature of the flue gases
inside the chimney during WBT. A thermo anemometer (Model: CEM DT-618, China,
working temperature range: 0-60oC) was used to measure the exit velocity of the flue gas to
estimate the volumetric flow rate of flue in the chimney. The water used for the WBT was
simply the supply tap water of BUET.
30
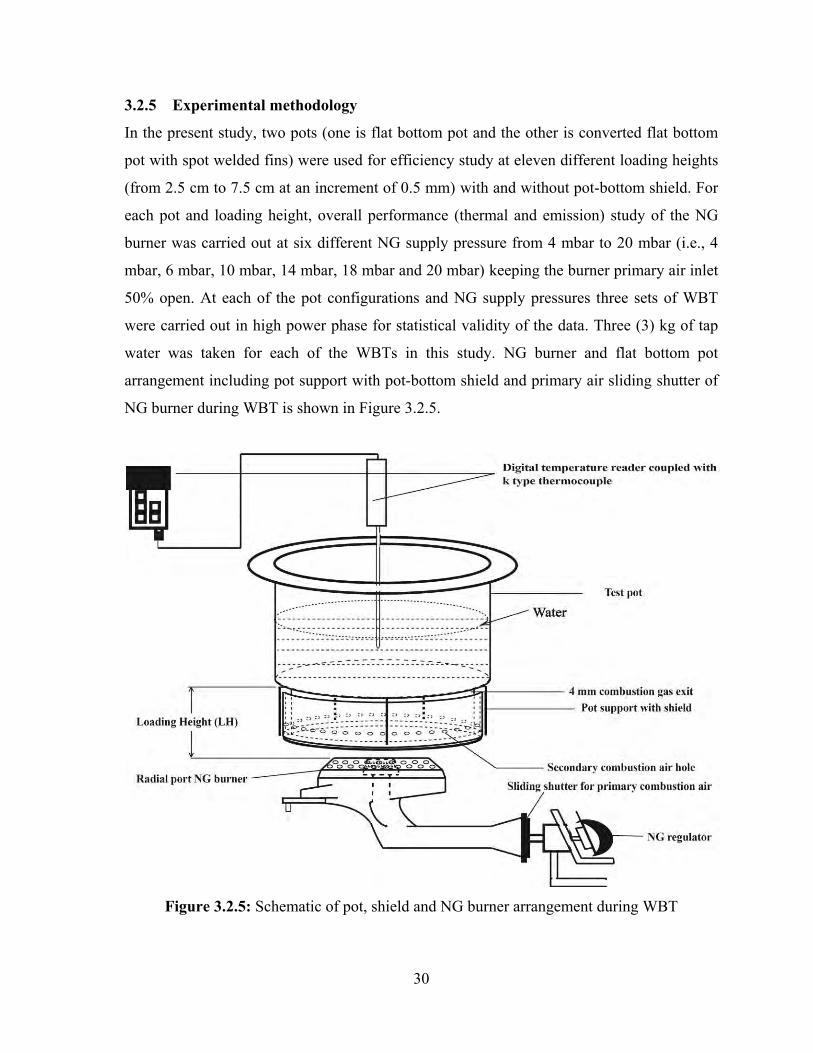
3.2.5 Experimental methodology
In the present study, two pots (one is flat bottom pot and the other is converted flat bottom
pot with spot welded fins) were used for efficiency study at eleven different loading heights
(from 2.5 cm to 7.5 cm at an increment of 0.5 mm) with and without pot-bottom shield. For
each pot and loading height, overall performance (thermal and emission) study of the NG
burner was carried out at six different NG supply pressure from 4 mbar to 20 mbar (i.e., 4
mbar, 6 mbar, 10 mbar, 14 mbar, 18 mbar and 20 mbar) keeping the burner primary air inlet
50% open. At each of the pot configurations and NG supply pressures three sets of WBT
were carried out in high power phase for statistical validity of the data. Three (3) kg of tap
water was taken for each of the WBTs in this study. NG burner and flat bottom pot
arrangement including pot support with pot-bottom shield and primary air sliding shutter of
NG burner during WBT is shown in Figure 3.2.5.
Figure 3.2.5: Schematic of pot, shield and NG burner arrangement during WBT
31
Initial and final boiling temperatures of water, water boiling time, mass of water evaporated,
NG supply pressure and temperature, volume of NG consumed, combustion air temperature,
flue gas temperature, pressure, and velocity and concentrations of CO and CO2 inside the
hood chimney were measured and monitored for each of the WBTs. With all the measured
values, overall thermal efficiency, modified combustion efficiency, heat transfer efficiency,
temperature corrected boiling time, fire power and emission ratio CO/CO2 were calculated
following the ISO/IWA WBT protocol, version 4.2.3 (ISO/IWA, 2014)
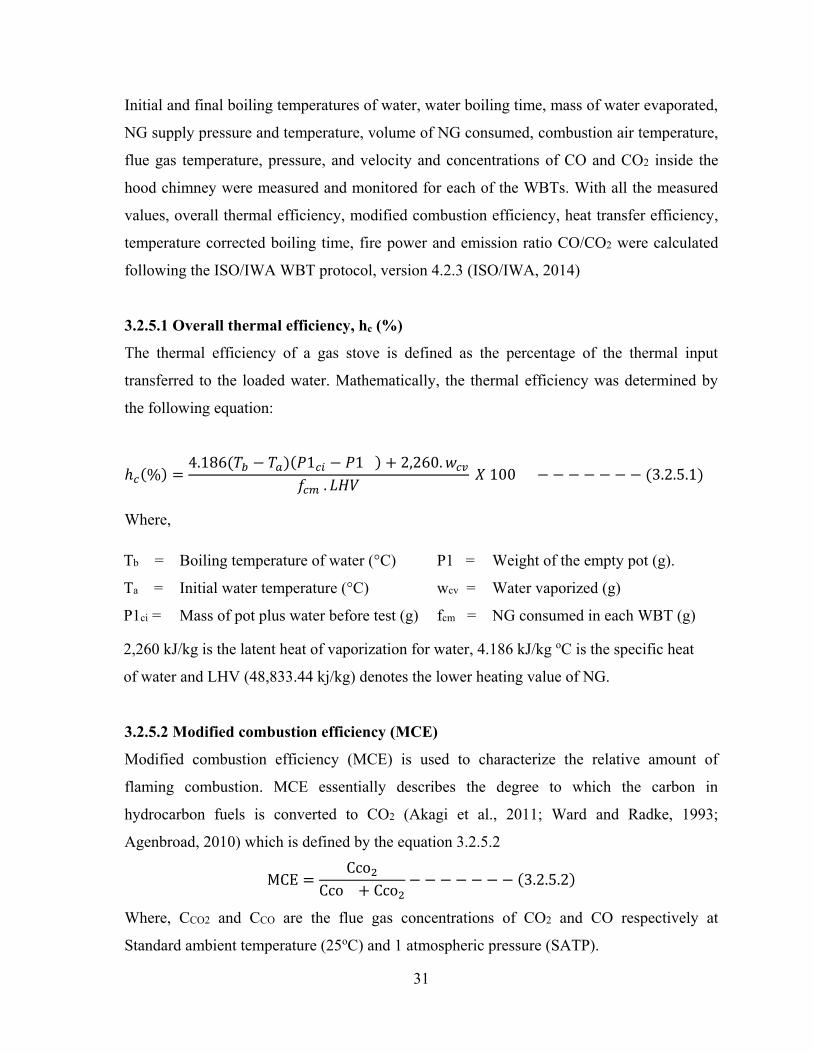
3.2.5.1 Overall thermal efficiency, hc (%)
The thermal efficiency of a gas stove is defined as the percentage of the thermal input
transferred to the loaded water. Mathematically, the thermal efficiency was determined by
the following equation:
ℎ𝑐(%) =4.186(𝑇𝑏 − 𝑇𝑎)(𝑃1𝑐𝑖 − 𝑃1 ) + 2,260. 𝑤𝑐𝑣
𝑓𝑐𝑚 . 𝐿𝐻𝑉 𝑋 100 − − − − − − − (3.2.5.1)
Where,
Tb = Boiling temperature of water (°C) P1 = Weight of the empty pot (g).
Ta = Initial water temperature (°C) wcv = Water vaporized (g)
P1ci = Mass of pot plus water before test (g) fcm = NG consumed in each WBT (g)
2,260 kJ/kg is the latent heat of vaporization for water, 4.186 kJ/kg oC is the specific heat
of water and LHV (48,833.44 kj/kg) denotes the lower heating value of NG.
3.2.5.2 Modified combustion efficiency (MCE)
Modified combustion efficiency (MCE) is used to characterize the relative amount of
flaming combustion. MCE essentially describes the degree to which the carbon in
hydrocarbon fuels is converted to CO2 (Akagi et al., 2011; Ward and Radke, 1993;
Agenbroad, 2010) which is defined by the equation 3.2.5.2
MCE =Cco2
Cco + Cco2− − − − − − − (3.2.5.2)
Where, CCO2 and CCO are the flue gas concentrations of CO2 and CO respectively at
Standard ambient temperature (25oC) and 1 atmospheric pressure (SATP).

32
3.2.5.3 Heat transfer efficiency (HTE)
Insufficient combustion air results to low flame temperatures that minimizes heat transfer to
the cooking pot. Incomplete combustion and minimal heat transfer directly affect the overall
cookstove efficiency (Baldwin, 1987). Heat transfer efficiency (HTE) is the percentage of
heat contained in the combustion gases that is transferred to the cooking pot. Smith (1994)
developed correlation among HTE, overall thermal efficiency and combustion efficiency
which is given in the following equation
HTE = hc/MCE − − − (3.2.5.3)
Where,
hc = Overall thermal efficiency in percentage
MCE= Modified combustion efficiency
HTE = Heat transfer efficiency in percentage
From the measured values of hc and MCE, THE can be found from the eq. 3.2.5.3.
3.2.5.4 Temperature corrected boiling time (ΔtTc )
The temperature-corrected time to boil is same as the time to boil (difference between start
and finish times), but adjusts the result to a standard 75 ºC temperature change (from 25 ºC
to 100 ºC). This adjustment standardizes the results and facilitates a comparison between
tests that may have used water with higher or lower initial temperatures. It is calculated in
the following way (ISO/IWA, 2014)
Temperature corrected time to boil (min) ΔtTc:
ΔtcT = Δtc.
75
(T1cf − T1ci) − − − − − − − − − − − − − − − − − (3.2.5.4)
Where,
Δtc = Time to boil (min)
T1cf = Final water temperature (ºC)
T1ci = Initial water temperature (ºC)
33
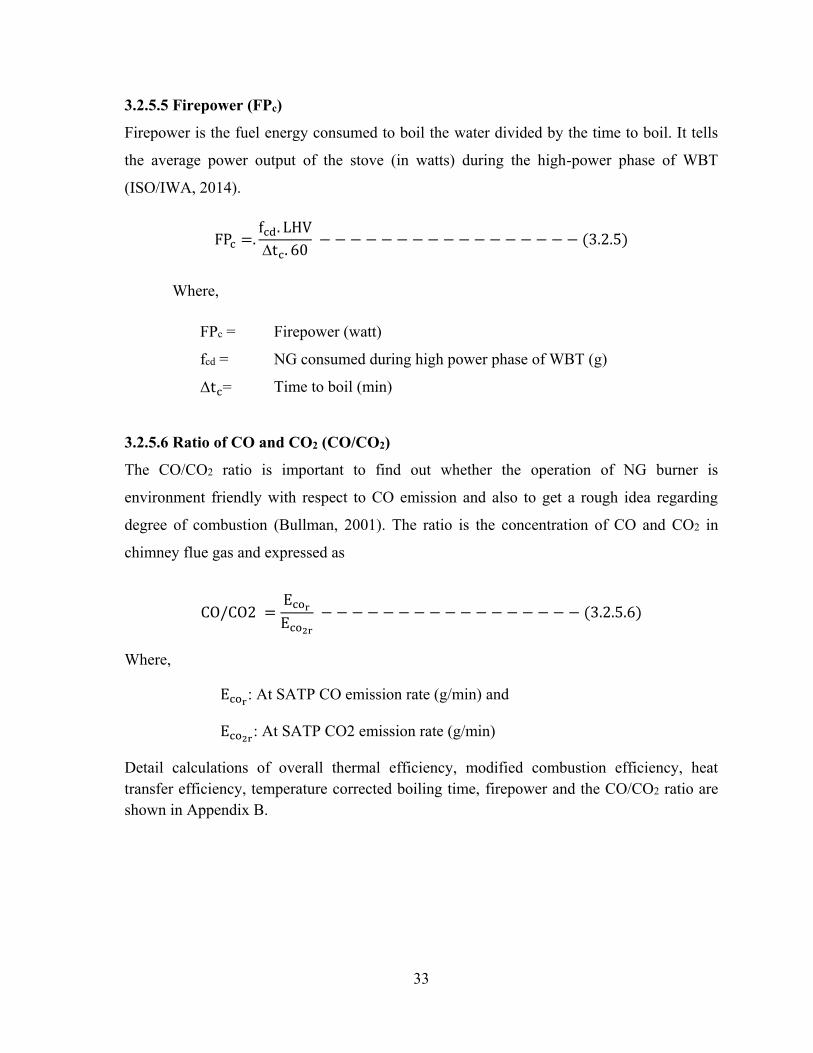
3.2.5.5 Firepower (FPc)
Firepower is the fuel energy consumed to boil the water divided by the time to boil. It tells
the average power output of the stove (in watts) during the high-power phase of WBT
(ISO/IWA, 2014).
FPc =.fcd. LHV
tc. 60 − − − − − − − − − − − − − − − − − (3.2.5)
Where,
FPc = Firepower (watt)
fcd = NG consumed during high power phase of WBT (g)
Δtc= Time to boil (min)
3.2.5.6 Ratio of CO and CO2 (CO/CO2)
The CO/CO2 ratio is important to find out whether the operation of NG burner is
environment friendly with respect to CO emission and also to get a rough idea regarding
degree of combustion (Bullman, 2001). The ratio is the concentration of CO and CO2 in
chimney flue gas and expressed as
CO/CO2 =Ecor
Eco2r
− − − − − − − − − − − − − − − − − (3.2.5.6)
Where,
Ecor: At SATP CO emission rate (g/min) and
Eco2r: At SATP CO2 emission rate (g/min)
Detail calculations of overall thermal efficiency, modified combustion efficiency, heat transfer efficiency, temperature corrected boiling time, firepower and the CO/CO2 ratio are shown in Appendix B.

34
CHAPTER 4
RESULTS AND DISCUSSIONS
4. 1 Introduction:
Thermal and emission performances of a concentric two rings radial port household NG burner
were tested in different configurations of pots and shields (i.e., flat bottom pot with shield, flat
bottom pot without shield, finned pot with shield and finned pot without shield) at different
loading height (11 different height started from 2.5 cm with an increment of 0.5 cm) and
different NG supply pressure (6 different NG supply pressure: 4, 6, 10, 14, 18 and 20 mbar)
keeping the primary air inlet open at 50%. Overall efficiency, temperature corrected boiling time
and firepower of the NG burner were evaluated through standard water boiling test (WBT),
version 4.2.3 (ISO/IWA, 2014). Concentrations of CO and CO2 in chimney flue gases were
continuously measured along with flue gas temperature, pressure and velocity inside the chimney
to evaluate the MCE for finding the heat transfer efficiency and CO/CO2 ratio and CO emission
rate data for environmental compliance during each of the high power phase WBTs. The findings
of this study are important to ascertain the optimum operating condition for each configuration of
pot type, pot-bottom shield, loading height and NG supply pressure. The higher heating value
(HHV) and lower heating value (LHV) of the TGTDCL supplied pipeline NG were measured as
54,195 kj/kg and 48,833 kj/kg respectively. The detail composition of the NG and the calculation
of HHV and LHV are given in Appendix E.
4.2 Thermal Efficiency, Combustion Efficiency, Heat Transfer Efficiency, Boiling Time,
and CO/CO2 Ratio of the NG Burner with Different Pot and Shield Arrangements
Thermal efficiencies, combustion efficiencies, heat transfer efficiencies, temperature corrected
boiling time, and CO/CO2 ratio of the NG burner were tested with different pot and shield
arrangement at different loading heights and NG supply pressure using standard water boiling
test protocol where TGTDCL supplied pipeline NG was used as burner fuel. Different pot and
shield arrangements were ordinary flat bottom pot without shield and with shield, and spot
welded finned pot without shield and with shield. The thermal efficiencies, combustion
efficiencies, heat transfer efficiencies, temperature corrected boiling time, and CO/CO2 ratio of

35
the NG burner obtained with different pots and shield arrangements are discussed in the
following subsections.
4.2.1 Thermal efficiency of the NG burner with different pot and shield arrangements
Thermal efficiencies of the NG burner with ordinary flat bottom pot and spot welded finned pot
without shield and with shield at different NG supply pressure and loading height are shown in
Figures 4.1, 4.2, 4.3 and 4.4 respectively.
Ordinary flat bottom pot without bottom shield
From the Figure 4.1 it is obvious that the thermal efficiencies of the burner with flat bottom pot
without shield gradually decrease with the increasing loading height from 2.5 cm to 7.5 cm. This
might be due to the heat loss to surrounding environment as the combustion gas exit area
increases with the increase of loading height. Also as the combustion gas exit area increases with
the increasing of loading height, velocity of the combustion gases decreases (reduced turbulence)
at a particular NG supply pressure which might reduce the convective heat transfer to the pot
water. Though radiative heat transfer component was not measured directly, it is envisaged there
might be reduced radiative heat transfer with increasing loading height (Baldwin, 1987). The
highest efficiencies (56.4-62.2%) at all NG supply pressures (from 4 mbar to 20 mbar) for this
configuration (Figure 4.1) were obtained at 2.5 cm loading height. It is also interesting to note
that at a fixed loading height, thermal efficiency decreases with the increasing NG supply
pressure (Figure 4.1) except the NG supply pressure at 6 mbar. At 2.5 cm loading height, the
highest thermal efficiency (62.2%) was obtained at 6 mbar NG supply pressure which might be
expected at 4 mbar NG pressure with regard to the thermal efficiency trend obtained for NG
pressures at 10, 14, 18, and 20 mbar. This phenomenon can be explained in terms of flame height
in the combustion chamber. At 4 mbar pressure the height of the flame produced was not
sufficient to impinge the pot bottom which caused low heat transfer to the utensil content. At
relatively low gas-input rates, the heat-transfer coefficient between the combustion gases and the
bottom of the pot is relatively small because of the low velocity of the gas flows under the pot
bottom. However, at 6 mbar pressure the flame tip was very close to the pot bottom which
accelerated effective heat transfer to the pot content. Flames produced at NG supply pressures
10, 14, 18 and 20 mbar other than 4 and 6 mbar pressures hit the pot bottom at

36
the mid height of the flame and spattered around the pot. These could result flame quenching and
reduced heat transfer to the pot material which might give lower thermal efficiencies at higher
NG pressures. This flame quenching phenomenon is more dominating with increasing NG
supply pressure at a fixed loading height. However, with the increasing loading height the flame
quenching effect might be expected to reduce and therefore higher thermal efficiency could be
the result. But the opposite was true for the experiment due to excessive heat loss to the
surrounding as the contact area of combustion gases and surrounding ambient air increases with
the increase of loading height. In other sense, the surface area available for heat transfer at the
vessel bottom for higher NG supply pressure became limited which induced faster heat loss with
the flue gases to the environment compared to the heat-absorption rate of the vessel. Similar
phenomena were observed for thermal efficiency by Bussmann (1981), Tamir et al. (1989), and
Islam and Zia (2017). It is to be noted that the experimental NG burner was originally fitted with
a 4 cm pot support and the thermal efficiencies of the burner varied from 52.2% to 53.8% at this
loading height and at NG pressure ranges from 4 mbar to 20 mbar. Contrarily, the highest
thermal efficiencies (56.4-62.2%) were obtained at 2.5 cm height for the same NG pressure
range which were 8% to 15.5% higher compared to the efficiencies for original setting of the NG
burner.
.
Figure 4.1: Thermal efficiency of NG burner with ordinary flat bottom pot without shield at
various loading height and NG supply pressure.
35
40
45
50
55
60
65
2.5 3 3.5 4 4.5 5 5.5 6 6.5 7 7.5 8
Ther
mal
Effi
cien
cy (%
)
Loading Height (cm)
4 mbar6 mbar10 mbar14 mbar18 mbar20 mbar

37
Ordinary flat bottom pot with bottom shield
Thermal efficiency of the NG burner with ordinary flat bottom pot was also carried out following
the standard WBT protocol using pot-bottom shield at 11 different loading height and 6 different
NG supply pressure. Thermal efficiency of ordinary flat bottom pot with bottom shield at
different NG supply pressure and loading height are shown in Figure 4.2. Though the highest
thermal efficiencies of the burner with flat bottom pot without shield (Figure 4.1) at different NG
pressures were obtained at 2.5 cm loading height, the highest thermal efficiencies of the burner
with ordinary pot and shield arrangement (Figure 4.2) were found at 3 cm loading height at each
of the NG supply pressures. Thermal efficiency of the burner (with ordinary pot and shield
arrangement) first increased from 2.5 cm loading height to a maximum at 3 cm height and then
went down with the increasing pot loading height and reached to a minimum at 7.5 cm height for
all NG pressures. The shifting of highest efficiencies from 2.5 cm in Figure 4.2 (pot with shield
arrangement) compared to Figure 4.1 (pot without shield arrangement) might be due to the
shifting of flame height. As there was a bottom shield of the pot there was less chance of the
produced flame to interact with the surrounding environment and thereby the flame height might
be longer than observed for pot without shield arrangement (Figure 4.1) at same height.
Therefore, thermal efficiencies (52.4-62%) at 2.5 cm height and 4 to 20 mbar NG pressures for
flat bottom pot with shield arrangement (Figure 4.2) were lower than the thermal efficiencies
(56.4-62.2%) obtained for flat bottom pot without shield configuration (Figure 4.1). For flat
bottom pot and shield arrangement, the highest thermal efficiencies at 3 cm loading height varied
from 58 to 64.4% for the same NG pressure range of 4 to 20 mbar. The highest thermal
efficiency (64.4%) for flat bottom pot with shield was also found at 6 mbar pressure (Figure 4.2)
like flat bottom pot without shield (Figure 4.1) but at different height of 3 cm. Considering the
baseline thermal efficiency (52.2% to 53.8%) of the NG burner at 4 cm high pot support and
pressure range of 4 mbar to 20 mbar, maximum thermal efficiencies of NG burner with flat
bottom pot and shield arrangement were found to be 58% to 64.4% at 3 cm loading height and
same NG pressure range which were 11 to 19.7% higher than the baseline efficiencies of the NG
burner. Therefore, a maximum of ~20% thermal efficiency increase of the NG burner was
obvious with ordinary flat bottom pot with shield arrangement compared to ordinary flat bottom
pot without shield which can be attributed to the pot bottom shield.

38
Figure 4.2: Thermal efficiency of NG burner with ordinary flat bottom pot with bottom shield at
various loading height and NG supply pressure.
Spot welded finned pot without bottom shield
It is seen from Figure 4.3 that the thermal efficiencies of the burner with finned pot without
shield arrangement gradually increased from 2.5 cm loading height and reached to a maximum at
3.5 cm loading height and then decreased gradually with a minimum at 7.5 cm loading height.
The trend in variation of thermal efficiency in this case was similar to that found for flat bottom
pot with shield configuration shown in Figure 4.2. A remarkable reduction in thermal efficiency
was obvious for finned pot without shield arrangement at each loading height and NG supply
pressure compared to ordinary flat bottom pot with and without shield configurations shown in
Figures 4.1 and 4.2. This might be due to the spot welded outside bottom fins of the pot which
rendered passive contact to pot bottom. Stagnant film of combustion product might get into the
crevices of the spot welded fins and created additional resistance to heat transfer to pot water.
The thermal conductivity of the stagnant film of combustion product is very much similar to air
which can resist heat transfer to pot water to a great extent (Baldwin, 1987) to cause reduced
thermal efficiency. However, the maximum thermal efficiencies of finned pot without shield
arrangement were found at 3.5 cm loading height which was 3 cm and 2.5 cm for flat bottom pot
with shield and without shield (Figures 4.2 and 4.1) arrangements respectively. This shifting of
loading height was due to the outside bottom fins of the pot that
50
52
54
56
58
60
62
64
66
2.5 3 3.5 4 4.5 5 5.5 6 6.5 7 7.5 8
Ther
mal
Effi
ency
(%)
Loading Height (cm)
4 mbar6 mbar10 mbar14 mbar18 mbar20 mbar

39
partially reduced the effective height of the flame to travel upward. Interestingly the maximum
thermal efficiency (54.6%) in this case was also obtained at 6 mbar NG pressure which was 12%
and 15% lower than the highest efficiencies obtained with flat bottom pot without shield and
with shield arrangements respectively. However, the highest thermal efficiency (54.6%) was
~1.5% higher than the highest thermal efficiency of the original burner with ordinary flat bottom
pot at 6 mbar pressure and 4 cm pot height
Figure 4.3: Thermal efficiency of NG burner with finned pot without shield at various loading
height and NG supply pressure
Spot welded finned pot with bottom shield
In case of finned pot with bottom shield configuration (Figure 4.4), thermal efficiencies varied in
a similar fashion i.e., thermal efficiencies increased gradually to a maximum and then fall again
gradually. However, like finned pot without bottom shield (Figure 4.3) the maximum thermal
efficiencies in this case (finned pot with shield, Figure 4.4) were 56.7% and 58.3% at 3.5 cm
loading height for 4 and 6 mbar NG pressures respectively. The maximum thermal efficiencies
for finned pot with shield at 10, 14, 18 and 20 mbar NG pressures were also found at 3.5 cm like
that found in finned pot without shield arrangement (Figure 4.3). However, thermal efficiencies
of finned pot with shield arrangement were found better than in finned pot without
40
42
44
46
48
50
52
54
56
2.5 3 3.5 4 4.5 5 5.5 6 6.5 7 7.5 8
Ther
mal
Effi
cien
cy (%
)
Loading Height (cm)
4 mbar6 mbar10 mbar14 mbar18 mbar20 mbar

40
shield configuration (Figure 4.3) but lower than the thermal efficiencies obtained in ordinary pot
with shield configuration (Figure 4.2). Considering the baseline maximum thermal efficiency
(53.8%) of the NG burner at 4 cm high loading height and 6 mbar NG pressure, maximum
thermal efficiency of NG burner with finned pot and shield arrangement was found to be 58.3%
at 3.5 cm loading height and 6 mbar NG pressure which was 8% higher than the maximum
baseline efficiency of the NG burner. Here the maximum thermal efficiency increased in a order
of ~7% compared to finned pot without shield which can be attributed to the pot bottom shield.
Figure 4.4: Thermal efficiency of NG burner with finned pot and shield at various loading
height and NG supply pressure
However, a clear insight on the variations in thermal efficiencies at different loading heights and
NG supply pressures can be deduced from modified combustion efficiency, heat transfer
efficiency and CO/CO2 ratio which are discussed in the subsequent sections.
45
47
49
51
53
55
57
59
2.5 3 3.5 4 4.5 5 5.5 6 6.5 7 7.5 8
Ther
mal
Effi
cien
cy (%
)
Loading Height (cm)
4 mbar6 mbar10 mbar14 mbar18 mbar20 mbar
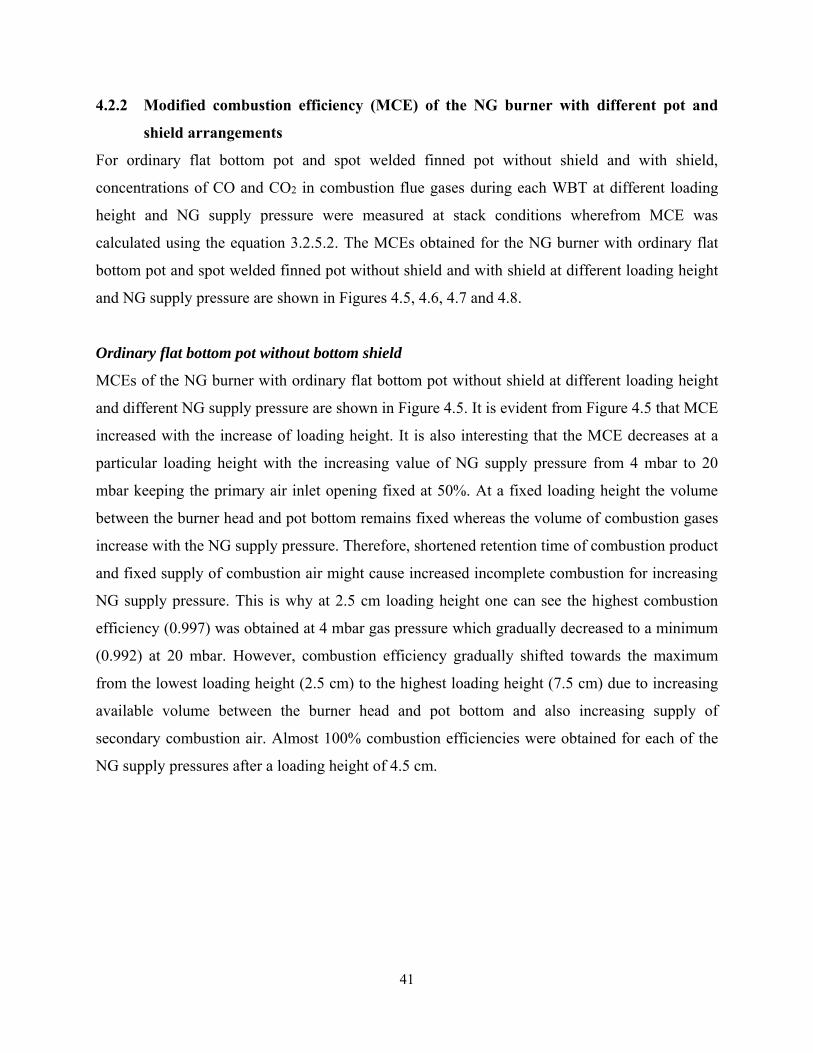
41
4.2.2 Modified combustion efficiency (MCE) of the NG burner with different pot and
shield arrangements
For ordinary flat bottom pot and spot welded finned pot without shield and with shield,
concentrations of CO and CO2 in combustion flue gases during each WBT at different loading
height and NG supply pressure were measured at stack conditions wherefrom MCE was
calculated using the equation 3.2.5.2. The MCEs obtained for the NG burner with ordinary flat
bottom pot and spot welded finned pot without shield and with shield at different loading height
and NG supply pressure are shown in Figures 4.5, 4.6, 4.7 and 4.8.
Ordinary flat bottom pot without bottom shield
MCEs of the NG burner with ordinary flat bottom pot without shield at different loading height
and different NG supply pressure are shown in Figure 4.5. It is evident from Figure 4.5 that MCE
increased with the increase of loading height. It is also interesting that the MCE decreases at a
particular loading height with the increasing value of NG supply pressure from 4 mbar to 20
mbar keeping the primary air inlet opening fixed at 50%. At a fixed loading height the volume
between the burner head and pot bottom remains fixed whereas the volume of combustion gases
increase with the NG supply pressure. Therefore, shortened retention time of combustion product
and fixed supply of combustion air might cause increased incomplete combustion for increasing
NG supply pressure. This is why at 2.5 cm loading height one can see the highest combustion
efficiency (0.997) was obtained at 4 mbar gas pressure which gradually decreased to a minimum
(0.992) at 20 mbar. However, combustion efficiency gradually shifted towards the maximum
from the lowest loading height (2.5 cm) to the highest loading height (7.5 cm) due to increasing
available volume between the burner head and pot bottom and also increasing supply of
secondary combustion air. Almost 100% combustion efficiencies were obtained for each of the
NG supply pressures after a loading height of 4.5 cm.

42
Figure 4.5: MCE of NG burner with ordinary flat bottom pot without shield at various loading
height and NG supply pressure
Ordinary flat bottom pot with bottom shield
MCEs of the NG burner with ordinary flat bottom pot with shield at different loading height and different NG supply pressure are shown in Figure 4.6. It is evident from figure that MCE increased with the increase of loading height. It is also interesting that the MCE followed the same trend as discussed for ordinary flat bottom pot without bottom shield as shown in Figure 4.5. Same reasons (as discussed for flat bottom pot without shield) are true for the MCEs trend found for Figure 4.6. However, the MCEs of the burner with flat bottom pot and bottom shield were lower than those obtained for flat bottom pot without bottom shields. At 2.5 cm loading height one can see the highest combustion efficiency (0.98) was obtained at 4 mbar gas pressure which gradually decreased to a minimum (0.88) at 20 mbar. These lower MCEs were the cause of pot bottom shields which allowed only a 4 mm cylindrical gap for flue gas exit and 84 circular holes of diameter 0.5 cm on the bottom shield for secondary combustion air. However, for this pot and shield arrangement almost 100% combustion efficiencies were obtained for each of the NG supply pressures after a loading height of 5 cm. Though the MCEs were relatively lower than pot without bottom shield arrangement, thermal efficiencies were obtained higher in pot with shield arrangement as heat loss was restricted by the bottom shield which can be evident from heat transfer efficiency discussion.
0.992
0.993
0.994
0.995
0.996
0.997
0.998
0.999
1
2.5 3 3.5 4 4.5 5 5.5 6 6.5 7 7.5 8
MC
E
Loading Height (cm)
4 mbar6 mbar10 mbar14 mbar18 mbar20 mbar

43
Figure 4.6: MCE of NG burner with ordinary flat bottom pot with shield at various loading
height and NG supply pressure
Spot welded finned pot without bottom shield
MCEs of the NG burner with spot welded finned pot without shield at different loading height and different NG supply pressure are shown in Figure 4.7. It is evident from Figure 4.7 that MCE increased with the increase of loading height. It is also interesting that the MCE followed the same trend as discussed for ordinary flat bottom pot without bottom shield and with shield configurations (Figures 4.5 and 4.6). Same reasons (as discussed for flat bottom pot without shield and with shield) are true for the MCEs trend found for spot welded finned pot without shield (Figure 4.7). At a fixed loading height the volume between the burner head and pot bottom remains fixed whereas the volume of combustion gases increase with the NG supply pressure. Therefore, shortened retention time of combustion product and fixed supply of combustion air might cause increased incomplete combustion for increasing NG supply pressure. This is why at 2.5 cm loading height one can see the highest combustion efficiency (0.95) was obtained at 4 mbar gas pressure which gradually decreased to a minimum (0.89) at 20 mbar. However, combustion efficiency gradually shifted towards the maximum from the lowest loading height (2.5 cm) to the highest loading height (7.5 cm) due to increasing available volume between the burner head and pot bottom and also increasing supply of secondary combustion air. Almost 100% combustion efficiencies were obtained for each of the NG supply pressures after a loading height of 6 cm. However, MCEs values at initial loading heights
0.86
0.88
0.9
0.92
0.94
0.96
0.98
1
2.5 3 3.5 4 4.5 5 5.5 6 6.5 7 7.5 8
MC
E
Loading Height (cm)
4 mbar6 mbar10 mbar14 mbar18 mbar20 mbar

44
were lower compared to the ordinary flat bottom pot without shield and with shield configurations (Figures 4.5 and 4.6). This might be due to the extra fins on outside pot bottom which essentially reduced effective volume between burner head and pot bottom.
Figure 4.7: MCE of NG burner with spot welded finned pot without shield at various loading
height and NG supply pressure
Spot welded finned pot with bottom shield
MCEs of the NG burner with spot welded finned pot with shield at different loading height and different NG supply pressure are shown in Figure 4.8. It is evident from the figure that MCE increased with the increase of loading height. It is also interesting that the MCE followed the same trend as discussed for ordinary flat bottom pot without and with shield, and spot welded finned pot without shield as shown in Figures 4.5, 4.6 and 4.7 respectively. Same reasons (as discussed for flat bottom pot without and with shield, and spot welded finned pot without shield) are true for the MCEs trend found for finned pot with shield arrangement (Figure 4.8). However, the MCEs of the burner with finned pot and bottom shield were lower at initial loading heights than those obtained for other pot and shield arrangements. At 2.5 cm loading height one can see the highest combustion efficiency (0.88) was obtained at 4 and 6 mbar gas pressure which gradually decreased to a minimum (0.85) at 20 mbar. These lower MCEs were the cause of fins on outside pot bottom and bottom shields which allowed only a 4 mm cylindrical gap for flue gas exit and 84 circular holes of diameter 0.5 cm on the bottom shield for secondary combustion air. However, for this finned pot and shield arrangement almost 100% combustion efficiencies were obtained for each of the NG supply pressures after a loading height of 5 cm. Though the MCEs of this setting were the lowest among all configurations, thermal efficiencies
0.88
0.9
0.92
0.94
0.96
0.98
1
2.5 3 3.5 4 4.5 5 5.5 6 6.5 7 7.5 8
MC
E
Loading Height (cm)
4 mbar6 mbar10 mbar14 mbar18 mbar20 mbar
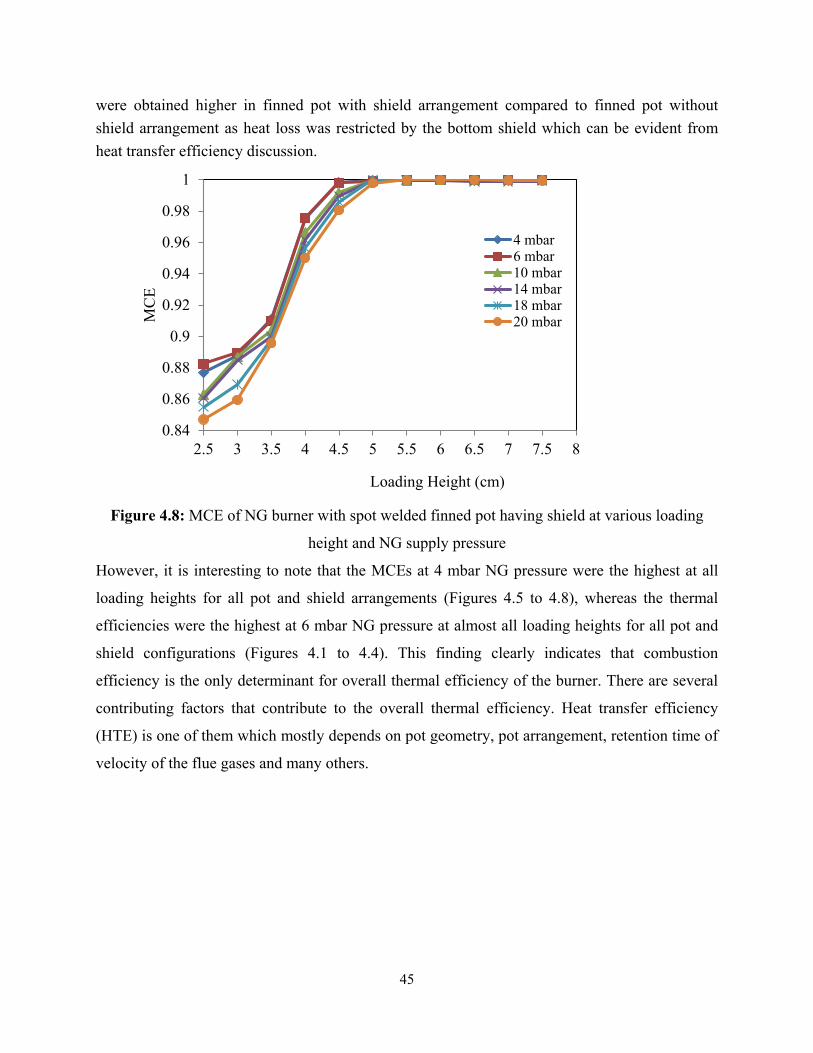
45
were obtained higher in finned pot with shield arrangement compared to finned pot without shield arrangement as heat loss was restricted by the bottom shield which can be evident from heat transfer efficiency discussion.
Figure 4.8: MCE of NG burner with spot welded finned pot having shield at various loading
height and NG supply pressure
However, it is interesting to note that the MCEs at 4 mbar NG pressure were the highest at all
loading heights for all pot and shield arrangements (Figures 4.5 to 4.8), whereas the thermal
efficiencies were the highest at 6 mbar NG pressure at almost all loading heights for all pot and
shield configurations (Figures 4.1 to 4.4). This finding clearly indicates that combustion
efficiency is the only determinant for overall thermal efficiency of the burner. There are several
contributing factors that contribute to the overall thermal efficiency. Heat transfer efficiency
(HTE) is one of them which mostly depends on pot geometry, pot arrangement, retention time of
velocity of the flue gases and many others.
0.84
0.86
0.88
0.9
0.92
0.94
0.96
0.98
1
2.5 3 3.5 4 4.5 5 5.5 6 6.5 7 7.5 8
MC
E
Loading Height (cm)
4 mbar6 mbar10 mbar14 mbar18 mbar20 mbar

46
4.2.3 Heat transfer efficiency (HTE) of the NG burner with different pot and shield
arrangements
For ordinary flat bottom pot and spot welded finned pot without shield and with shield, thermal
efficiencies and modified combustion efficiencies during each WBT at different loading height
and NG supply pressure were determined. Thereafter, the heat transfer efficiencies (HTEs) were
calculated using the equation 3.2.5.3. Sample calculations and calculated data are shown in
Appendix D and B. The HTEs obtained for the NG burner with ordinary flat bottom pot and spot
welded finned pot without shield and with shield at different loading height and NG supply
pressure are shown in Figures 4.9, 4.10, 4.11 and 4.12. It is observed from equation 3.2.5.3 in
chapter 3 that HTE is inversely related to MCE and proportionally related to overall thermal
efficiency (Smith, 1994).
Ordinary flat bottom pot without bottom shield
From the Figure 4.9 it is obvious that the HTEs of the burner with flat bottom pot without shield
followed the same trend of overall thermal efficiencies discussed in the section 4.2.1 which
gradually decreased with the increasing loading height from 2.5 cm to 7.5 cm. This might be due
to the heat loss to surrounding environment as the combustion gas exit area increases with the
increase of loading height. Also as the combustion gas exit area increases with the increasing of
loading height velocity of the combustion gases decreases (reduced turbulence) at a particular
NG supply pressure which might reduce the convective heat transfer to the pot water. Though
radiative heat transfer component was not measured directly, it is envisaged there might be
reduced radiative heat transfer with increasing loading height (Baldwin, 1987). The highest
HTEs (56.8-62.4%) at all NG supply pressures (from 4 mbar to 20 mbar) for this configuration
were obtained at 2.5 cm loading height. It is also interesting to note that at a fixed loading height,
HTEs decreased with the increasing NG supply pressure (Figure 4.9) except the NG supply
pressure at 6 mbar.

47
Figure 4.9: HTE of NG burner with ordinary flat bottom pot without shield at various loading
height and NG supply pressure
At 2.5 cm loading height the highest HTE (62.4%) was obtained at 6 mbar NG supply pressure
which might be expected at 4 mbar NG pressure with regard to the HTE trend obtained for NG
pressures of 10, 14, 18, and 20 mbar. This phenomenon can be explained in terms of flame
height in the combustion chamber. At 4 mbar pressure the height of the flame produced was not
sufficient to impinge the pot bottom which caused low heat transfer to the utensil content. At
relatively low gas-input rates, the heat-transfer coefficient between the combustion gases and the
bottom of the pot is relatively small because of the low velocity of the gas flows under the pot
bottom. However, at 6 mbar pressure the flame tip might be very close to the pot bottom which
accelerated effective heat transfer to the pot content. Flames produced at NG supply pressures
10, 14, 18 and 20 mbar other than 4 and 6 mbar pressures might hit the pot bottom at the mid
height of the flame and spatter around the pot. These could result flame quenching and reduced
heat transfer to the pot material which could result lower HTEs at higher NG pressures. This
flame quenching phenomenon is more dominating with increasing NG supply pressure at a fixed
loading height. However, with the increasing loading height the flame quenching effect might be
expected to reduce and therefore higher HTE could be the result. But the opposite was true for
the experiment due to excessive heat loss to the surrounding
35
40
45
50
55
60
65
2.5 3 3.5 4 4.5 5 5.5 6 6.5 7 7.5 8
Hea
t Tra
nfer
Effi
cien
cy (%
)
Loading Height (cm)
4 mbar6 mbar10 mbar14 mbar18 mbar20 mbar

48
as the contact area of combustion gases and surrounding ambient air increases with the increase
of loading height. In other sense, the surface area available for heat transfer to the vessel bottom
at higher NG supply pressure became limited which induced faster heat loss with the flue gases
to the environment compared to the heat-absorption rate of the vessel.
Ordinary flat bottom pot with bottom shield
HTE of the NG burner with ordinary flat bottom pot was also carried out following the standard
WBT protocol using pot-bottom shield at 11 different loading height and 6 different NG supply
pressure. HTE of ordinary flat bottom pot with bottom shield at different NG supply pressure and
loading height are shown in Figure 4.10. Though the highest HTEs of the burner with flat bottom
pot without shield (Figure 4.9) were obtained at 2.5 cm loading height at different NG pressures,
the highest HTEs of the burner with ordinary pot and shield arrangement (Figure 4.10) were
found at 3 cm loading height at each of the NG supply pressures. HTE of the burner (with
ordinary pot and shield arrangement) first increased from 2.5 cm loading height to a maximum at
3 cm height and then went down with the increasing loading height and reached to a minimum at
7.5 cm height for all NG pressures. The shifting of the highest HTEs from 2.5 cm in Figure 4.10
(pot with shield arrangement) compared to Figure 4.9 (pot without shield arrangement) might be
due to the shifting of flame height. As there was a bottom shield of the pot there was less chance
of the produced flame to interact with the surrounding environment and thereby the flame height
might be longer than observed for pot without shield arrangement at same height. For lower heat
loss due to bottom shield, HTEs of NG burner with flat bottom pot and shield arrangement were
60.0-64.6% at 2.5 cm height and 4 to 20 mbar NG pressures (Figure 4.10) which were higher
than the HTEs (56.8-62.4%) obtained for flat bottom pot without shield configuration (Figure
4.9). For flat bottom pot and shield arrangement, the highest HTEs at 3 cm loading height varied
from 60.5 to 65.2% for the same NG pressure range of 4 to 20 mbar. The highest HTE (64.4%)
for flat bottom pot with shield was also found at 6 mbar pressure (Figure 4.10) like flat bottom
pot without shield (Figure 4.9) but at different height of 3 cm. Considering the baseline
maximum HTE (53.8%) of the NG burner at 4 cm high pot support and NG pressure of 6 mbar,
maximum HTE of NG burner with flat bottom pot and shield arrangement was found to be
64.4% at 3 cm loading height and 6 mbar NG pressure which was 19.7% higher than the baseline
maximum HTE of the NG burner.

49
Figure 4.10: HTE of NG burner with ordinary flat bottom pot with shield at various loading
height and NG supply pressure
Spot welded finned pot without bottom shield
It is seen from Figure 4.11 that the HTEs of the burner with finned pot without shield
arrangement gradually increased from 2.5 cm loading height and reached to a maximum at 3.5
cm loading height and then decreased gradually with a minimum at 7.5 cm loading height. The
trend in variation of HTEs in this case was similar to that found for flat bottom pot with shield
configuration shown in Figure 4.10. A remarkable reduction in HTE was obvious for finned pot
without shield arrangement at each loading height and NG supply pressure compared to ordinary
flat bottom pot with and without shield configurations shown in Figures 4.9 and 4.10. This might
be due to the spot welded outside bottom fins of the pot which rendered passive contact to pot
bottom. Stagnant film of combustion product might get into the crevices of the spot welded fins
and created additional resistance to heat transfer to pot water. The thermal conductivity of the
stagnant film of combustion product is very much similar to air which can resist heat transfer to
pot water to a great extent (Baldwin, 1987) to cause reduced HTE. However the maximum HTE
of finned pot without shield arrangement was found at 3.5 cm loading height which was 3 cm
and 2.5 cm for flat bottom pot with shield and without shield (Figures 4.10 and 4.9)
arrangements respectively. This shifting of loading height was due to
505254565860626466
2.5 3 3.5 4 4.5 5 5.5 6 6.5 7 7.5 8
Hea
t Tra
nfer
Effi
cien
cy (%
)
Loading Height (cm)
4 mbar6 mbar10 mbar14 mbar18 mbar20 mbar
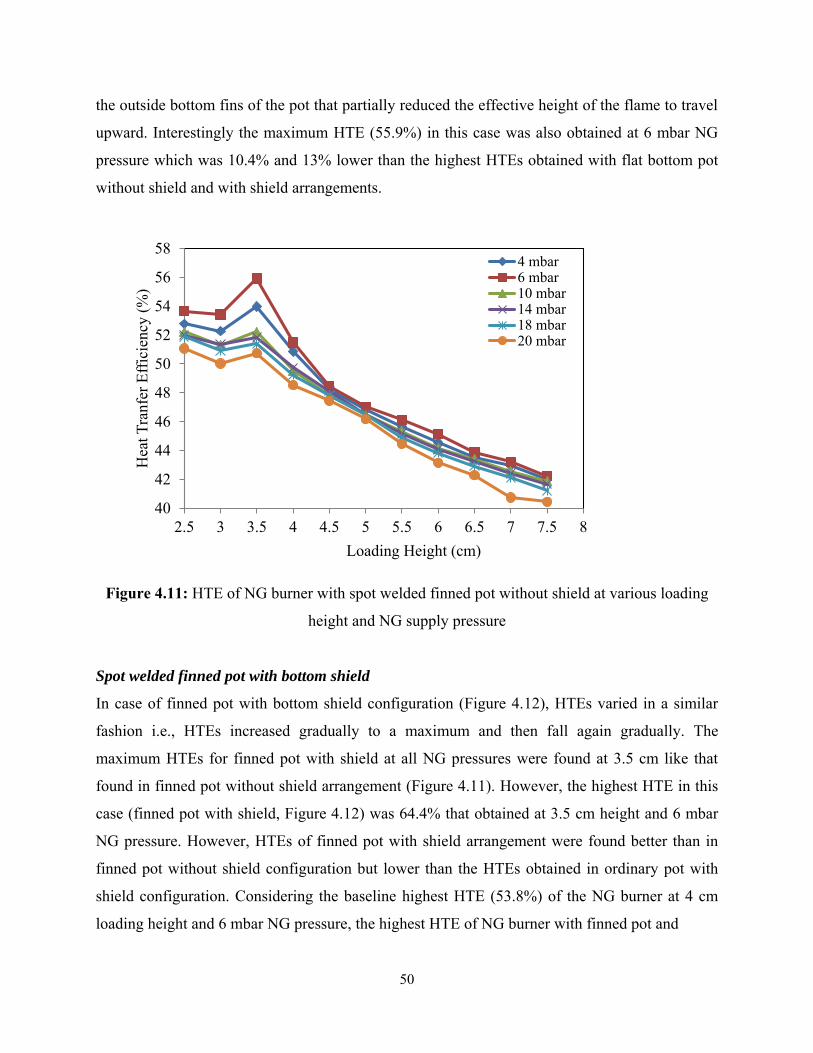
50
the outside bottom fins of the pot that partially reduced the effective height of the flame to travel
upward. Interestingly the maximum HTE (55.9%) in this case was also obtained at 6 mbar NG
pressure which was 10.4% and 13% lower than the highest HTEs obtained with flat bottom pot
without shield and with shield arrangements.
Figure 4.11: HTE of NG burner with spot welded finned pot without shield at various loading
height and NG supply pressure
Spot welded finned pot with bottom shield
In case of finned pot with bottom shield configuration (Figure 4.12), HTEs varied in a similar
fashion i.e., HTEs increased gradually to a maximum and then fall again gradually. The
maximum HTEs for finned pot with shield at all NG pressures were found at 3.5 cm like that
found in finned pot without shield arrangement (Figure 4.11). However, the highest HTE in this
case (finned pot with shield, Figure 4.12) was 64.4% that obtained at 3.5 cm height and 6 mbar
NG pressure. However, HTEs of finned pot with shield arrangement were found better than in
finned pot without shield configuration but lower than the HTEs obtained in ordinary pot with
shield configuration. Considering the baseline highest HTE (53.8%) of the NG burner at 4 cm
loading height and 6 mbar NG pressure, the highest HTE of NG burner with finned pot and
40
42
44
46
48
50
52
54
56
58
2.5 3 3.5 4 4.5 5 5.5 6 6.5 7 7.5 8
Hea
t Tra
nfer
Effi
cien
cy (%
)
Loading Height (cm)
4 mbar6 mbar10 mbar14 mbar18 mbar20 mbar

51
shield arrangement was found to be 19.7% higher. Thus the increased HTE by 19.7% can be
attributed to the pot bottom shield.
Figure 4.12: HTE of NG burner with spot welded finned pot with shield at various loading
height and NG supply pressure
4.2.4 Temperature corrected boiling time of the NG burner with different pot and shield
arrangements
Boiling time in WBT is a measure of cooking fastness. Temperature corrected boiling time was
considered as a measure to compare the cooking fastness among the various configurations of
pots, shields, NG pressures and loading height. In the present study four different pot and shield
arrangements were considered (i.e., ordinary flat bottom pot without bottom shield, ordinary flat
bottom pot with bottom shield, spot welded finned pot without bottom shield and spot welded
finned pot with bottom shield). Each of the pot and shield configurations was tested for its
boiling time at different loading height and NG supply pressure using the intended NG burner
through WBT which are then corrected for a 75oC temperature difference which is known as
temperature corrected boiling time. This adjustment standardizes the results and facilitates a
comparison between tests that had used water with higher or lower initial temperatures
47
49
51
53
55
57
59
61
63
65
67
2.5 3 3.5 4 4.5 5 5.5 6 6.5 7 7.5 8
Hea
t Tra
nfer
Effi
cien
cy (
%)
Loading Height (cm)
4 mbar6 mbar10 mbar14 mbar18 mbar20 mbar

52
(ISO/IWA, 2014). Temperature corrected boiling times of the NG burner with different pot and
shield arrangements are shown in Figures 4.13, 4.14, 4.15 and 4.16.
Ordinary flat bottom pot without bottom shield The temperature corrected boiling time of the NG burner with ordinary flat bottom pot without shield at different loading height is shown in Figure 4.13.
Figure 4.13: Temperature corrected boiling time of NG burner with ordinary flat bottom pot
without shield at various loading height and NG supply pressure
It is evident that the boiling time for 3 L water at a particular height increased with the
decreasing NG supply pressure and increased with the loading height at a particular NG supply
pressure. As the fire power of the burner is low at lower NG supply pressure, it took somewhat
higher time to boil compared to the higher fire power of the burner at higher NG supply
pressures. The highest thermal efficiency for the setting was obtained at 6 mbar pressure and 2.5
mbar NG pressure that corresponds to a boiling time of 12.15 minutes which was lower than the
boiling time 14 minutes found for original setting of NG burner with flat bottom pot at 4 cm
height and 6 mbar pressure.
8
10
12
14
16
18
20
22
2.5 3 3.5 4 4.5 5 5.5 6 6.5 7 7.5 8
Tem
pera
ture
cor
rect
ed b
oilin
g tim
e (m
in)
Loading Height (cm)
4 mbar6 mbar10 mbar14 mbar18 mbar20 mbar

53
Ordinary flat bottom pot with bottom shield The temperature corrected boiling time of the NG burner with ordinary flat bottom pot with
shield at different loading height is shown in Figure 4.14.
Figure 4.14: Temperature corrected boiling time of NG burner with ordinary flat bottom pot
with shield at various loading height and NG supply pressure
Similar boiling time trend was observed in this case as obtained for flat bottom pot without
shield except at 3 cm loading height for all NG supply pressures. Without some minor deviations
at NG pressure of 14 mbar, the lowest boiling points for all other NG pressures were obtained at
3 cm loading height. However, the maximum thermal efficiency for this setting was obtained at 6
mbar pressure and 3 cm loading height which corresponds to a boiling time of 12.3 minutes.
10
10.5
11
11.5
12
12.5
13
13.5
14
14.5
15
2.5 3 3.5 4 4.5 5 5.5 6 6.5 7 7.5 8
Tem
pera
ture
cor
rect
ed b
oilin
g tim
e (m
in)
Loading Height (cm)
4 mbar6 mbar10 mbar14 mbar18 mbar20 mbar

54
Spot welded finned pot without bottom shield
The temperature corrected boiling time of the NG burner with spot welded finned pot without
shield at different loading height is shown in Figure 4.15.
Figure 4.15: Temperature corrected boiling time of NG burner having spot welded finned pot
without shield at various loading height and NG supply pressure
In this case minimum boiling time was found between 3 to 3.5 cm heights for all NG pressure.
However, the maximum thermal efficiency of this setting was obtained at 6 mbar NG pressure
and 3.5 cm which correspond to a boiling time of 14.73 minutes which was higher than found in
flat bottom pot with and without pot bottom shield.
Spot welded finned pot with bottom shield
The temperature corrected boiling time of the NG burner with spot welded finned pot with
bottom shield at different loading height is shown in Figure 4.16. In this case minimum boiling
time was found between 3 to 5 cm heights for all NG pressure. However, the maximum thermal
efficiency of this setting was obtained at 6 mbar NG pressure and 3.5 cm which correspond to a
boiling time of 13.49 minutes and was higher than found in flat bottom pot with and without pot
bottom shield but lower than finned pot without pot bottom shield.
11
12
13
14
15
16
17
18
19
20
21
2.5 3 3.5 4 4.5 5 5.5 6 6.5 7 7.5 8
Tem
pera
ture
cor
rect
ed b
oilin
g tim
e (m
in)
Loading Height (cm)
4 mbar6 mbar10 mbar14 mbar18 mbar20 mbar

55
Figure 4.16: Temperature corrected boiling time of NG burner with spot welded finned pot and
shield at various loading height and NG supply pressure
4.2.5 Ratio of CO and CO2 (CO/CO2) of the NG burner with different pot and shield
arrangements
For ordinary flat bottom pot and spot welded finned pot without shield and with shield,
concentrations of CO and CO2 in combustion flue gases during each WBT at different loading
height and NG supply pressure were measured at stack conditions wherefrom the respective
concentrations of CO and CO2 were converted to SATP and the CO/CO2 ratios were calculated
using the equation 3.2.5.5. The CO/CO2 ratio is important to find out whether the operation of
NG burner is environment friendly with respect to CO emission (Bullman, 2001; Ashman, 1994).
Experimental data, calculated data and the detail calculations for determining CO/CO2 ratios are
given in Appendix A, B, D and F. The CO/CO2 ratios obtained for the NG burner with ordinary
flat bottom pot and spot welded finned pot without shield and with shield at different loading
height and NG supply pressure are shown in Figures 4.17, 4.18, 4.19 and 4.20.
10
11
12
13
14
15
16
17
2.5 3 3.5 4 4.5 5 5.5 6 6.5 7 7.5 8
Tem
pera
ture
cor
rect
ed b
oilin
g tim
e(m
in)
Loading Height (cm)
4 mbar6 mbar10 mbar14 mbar18 mbar20 mbar

56
Ordinary flat bottom pot without bottom shield CO/CO2 ratios obtained for ordinary flat bottom pot without shield configuration at various
loading height and NG supply pressures are shown in Figure 4.17. It is evident that the ratio
varied with loading height and NG supply pressure. It is seen from the figure that CO/CO2 ratio
at a particular loading height decreased with decreasing NG pressure. At loading height of 2.5
cm, CO/CO2 ratio was found maximum at 20 mbar pressure and minimum at 4 mbar NG
pressure. Again, CO/CO2 ratio decreased with increasing loading height at a particular NG
pressure which eventually became almost zero beyond 4.5 cm loading height. Loading height
and NG pressure are among many parameters that affect CO/CO2 ratio for gas burner. With
increasing loading height, the CO/CO2 ratio decreases, which is attributed to decreased
quenching effect by flame impingement on the load (Hou and Chou, 2014). However, at higher
loading height, the flame and combustion gases are cooled to a greater extent by mixing with
ambient air before contacting the loading vessel, and thus, the temperature driving force for heat
transfer is decreased, leading to the decrease of thermal efficiency (which is evident from Figure
4.1). The MCE and CO/CO2 ratio are inversely related which is also evident from Figures 4.2
and 4.17. However, the CO/CO2 in this case shows clean burning with regard to any loading
height and NG pressure as the manufacturing certification standard for gas appliances in terms of
maximum CO/CO2 ratio is set at 0.02 (Bullman, 2001).
Figure 4.17: CO/CO2 ratio of NG burner with ordinary flat bottom pot without shield at various
loading height and NG supply pressure
-0.001
2.2E-17
0.001
0.002
0.003
0.004
0.005
0.006
0.007
0.008
2.5 3 3.5 4 4.5 5 5.5 6 6.5 7 7.5 8
CO
/CO
2
Loading Height (cm)
4 mbar6 mbar10 mbar14 mbar18 mbar20 mbar

57
Ordinary flat bottom pot with bottom shield
Figure 4.18 represents variation of CO/CO2 ratio at different NG pressure and loading height for
flat bottom pot with bottom shield. The overall trend of the ratio with loading height and NG
pressure was found similar to that found for flat bottom pot without shield (Figure 4.17) with the
exceptions that the ratio became almost zero at 5 cm loading height and onward due to complete
combustion and ratio values were higher below 5 cm loading height compared to ordinary pot
without bottom shield arrangement (Figure 4.17). The higher ratio values in this case were due to
the pot bottom shield which restricted the entrance for secondary combustion air. However, it is
seen from the figure that one can operate this burner arrangement at 2.5 cm loading height and 4
mbar NG pressure, 3 cm loading height and 4, 6 and 10 mbar Ng pressure, 3.5 cm loading height
and 4, 6, 10, 14 and 18 mbar NG pressure, and 4 cm loading height and all NG pressures from 4
to 20 mbar. The highest thermal efficiency (64.4%) for this burner-pot-shield arrangement was
obtained at 6 mbar NG pressure and 3 cm loading height which allows operating the burner in an
environment friendly manner as the maximum allowable limit for CO/CO2 ratio is 0.02
(Bullman, 2001).
Figure 4.18: CO/CO2 ratio of NG burner with ordinary flat bottom pot with bottom shield at
various loading height and NG supply pressure
0
0.02
0.04
0.06
0.08
0.1
0.12
0.14
0.16
2.5 3 3.5 4 4.5 5 5.5 6 6.5 7 7.5 8
CO
/CO
2
Loading Height (cm)
4 mbar6 mbar10 mbar14 mbar18 mbar20 mbar

58
Spot welded finned pot without bottom shield
CO/CO2 ratios obtained for spot welded finned pot without shield configuration at various
loading height and NG supply pressures are shown in Figure 4.19. The overall trend of the ratio
with loading height and NG pressure was found similar to that found for flat bottom pot without
and with shield (Figures 4.17 and 4.18) with the exceptions that the ratio became almost zero at 6
cm loading height and onward due to complete combustion and ratio values were higher below 6
cm loading height compared to ordinary pot without and with bottom shield arrangement
(Figures 4.17 and 4.18). The higher ratio values in this case were due to fins on outside pot
bottom that might increase the flame quenching effect at a particular loading height with
increasing NG pressure. Contrarily, with increasing loading height at a particular NG pressure,
the CO/CO2 ratio decreased, which might be attributed to decreased quenching effect by flame
impingement on the load (Hou and Chou, 2014). The highest thermal efficiency (54.6%) for this
burner-pot-shield arrangement was obtained at 6 mbar NG pressure and 3.5 cm loading height.
Operating the burner at 6 mbar pressure and 3.5 cm loading height surmounts the acceptable
maximum value of CO/CO2 ratio of 0.02 (Bullman, 2001).
Figure 4.19: CO/CO2 ratio of NG burner with spot welded finned pot without bottom shield at
various loading height and NG supply pressure
0
0.02
0.04
0.06
0.08
0.1
0.12
0.14
2.5 3 3.5 4 4.5 5 5.5 6 6.5 7 7.5 8
CO
/CO
2
Loading Height (cm)
4 mbar6 mbar10 mbar14 mbar18 mbar20 mbar

59
Spot welded finned pot with bottom shield
CO/CO2 ratios obtained for spot welded finned pot with bottom shield configuration at various
loading height and NG supply pressures are shown in Figure 4.20. The overall trend of the ratio
with loading height and NG pressure was found similar to that found for flat bottom pot without
and with shield (Figures 4.17 and 4.18) and finned pot without bottom shield (Figure 4.19) with
the exceptions that the ratio became almost zero at 5.5 cm loading height and onward due to
complete combustion and ratio values were higher below 5.5 cm loading height compared to
ordinary pot without and with bottom shield arrangement and finned pot without bottom shield.
The higher ratio values in this case were due to fins on outside pot bottom and bottom shield that
combinedly might increase the flame quenching effect at a particular loading height with
increasing NG pressure. Contrarily, the CO/CO2 ratio decreased with increasing loading height at
a particular NG pressure, which might be attributed to decreased quenching effect by flame
impingement on the load (Hou and Chou, 2014). The highest thermal efficiency (58.3%) for this
burner-pot-shield arrangement was obtained at 6 mbar NG pressure and 3.5 cm loading height.
Operating the burner at 6 mbar pressure and 3.5 cm loading height surmounts the acceptable
maximum value of CO/CO2 ratio of 0.02 (Bullman, 2001).
Figure 4.20: CO/CO2 ratio of NG burner with spot welded finned pot with bottom shield at
various loading height and NG supply pressure
0
0.02
0.04
0.06
0.08
0.1
0.12
0.14
0.16
0.18
0.2
2.5 3 3.5 4 4.5 5 5.5 6 6.5 7 7.5 8
CO
/CO
2
Loading Height (cm)
4 mbar6 mbar10 mbar14 mbar18 mbar20 mbar

60
4.3 Overall Comparison of Thermal and Environmental Performances of the NG
Burner with Different Pot and Shield Arrangements
Since the highest thermal efficiencies of the NG burner with different pot and shield
arrangements (ordinary flat bottom pot without shield and with shield, spot welded finned pot
without shield and with shield) were obtained at 6 mbar NG pressure at different loading height,
thermal efficiencies, CO/CO2 ratios and CO emission rate (g/min) of the NG burner at 6 mbar
pressure and different loading height are compared for different pot and shield arrangements.
4.3.1 Overall thermal efficiencies of NG burner with different pot-shield arrangements at
6 mbar NG pressure
Overall thermal efficiencies of the burner with different pot-shield arrangements at 6 mbar NG
pressure are shown in Figure 4.21.
Figure 4.21: Variation of thermal efficiency of the NG burner with different pot-shield
arrangements at different loading height and 6 mbar NG pressure
35
39
43
47
51
55
59
63
67
2.5 3 3.5 4 4.5 5 5.5 6 6.5 7 7.5 8
Ther
mal
Effi
cien
cy (%
)
Loading Height (cm)
Flat botton pot without ShieldFlat botton pot with ShieldFinned pot without ShieldFinned pot with Shield

61
The highest thermal efficiency among the four different pot and shield arrangements was
obtained with ordinary flat bottom pot with bottom shield at 3 cm loading height at 6 mbar NG
pressure which was 64.4%. This efficiency was ~20% higher than the highest baseline thermal
efficiency (53.8%) of the NG burner with ordinary flat bottom pot without shield at 4 cm loading
height and 6 mbar NG pressure. The burner with ordinary pot only configuration gave the
highest thermal efficiency (62.2%) at 2.5 cm loading height and 6 mbar pressure which was
15.5% higher than the baseline thermal efficiency (53.8%) of the burner. However, the highest
thermal efficiencies of the burner having spot welded finned pot without shield and with shield
arrangements were ascertained to be 54.6% and 58.3% respectively at 3.5 cm loading height and
6 mbar pressure. Though these thermal efficiency values were lower compared to ordinary flat
bottom pot without and with shield arrangement, they were still higher than the base line thermal
efficiency value (53.8%) of the burner. Though Zube (2010) and Andreatta (2009) observed
better thermal efficiency for finned pot, the results with finned pot for this present study was not
encouraging due to using spot welded finned pot instead of continuous welded finned pot.
Reasons for the variation of thermal efficiency values for different pot-shield arrangement at
different NG pressures are discussed elaborately in the sections 4.2.1 to 4.2.3. Presently, six NG
distribution companies in Bangladesh are serving 4.1 million households countrywide which
consume yearly 141.5 billion cubic feet of NG (14.63% of total production) for cooking purpose
(Petrobangla, 2016). Therefore, considering the best configuration of the tested burner (ordinary
flat bottom pot with bottom shield) yearly around 28 billion cubic feet of NG can be saved.
Figure 4.22 showing the same Figure like Figure 4.2, here in the place of loading height, used
dimensionless value (Loading height divided pot diameter) at 6 mbar NG pressure.

62
Figure 4.22: Variation of thermal efficiency of the NG burner with different pot-shield
arrangements at different ratio of loading height and Pot diameter at 6 mbar NG pressure
The following figure 4.23 showing variation of NG flow rate (SATP) with NG supplied pressure
(data taken from Appendix G).
35
39
43
47
51
55
59
63
67
0.1 0.12 0.14 0.16 0.18 0.2 0.22 0.24 0.26 0.28 0.3 0.32
Ther
mal
Effi
cien
cy %
LH/PD
Flat botton pot without ShieldFlat botton pot with ShieldFinned pot without ShieldFinned pot with Shield

63
Figure 4.23: Variation of NG flow rate (SATP) with NG supplied pressure.
4.3.2 Overall environmental performances (CO/CO2 ratio and CO emission rate) of NG
burner with different pot-shield arrangements at 6 mbar NG pressure
Though there is no standard value for CO/CO2 ratio for household NG appliances in Bangladesh,
CO/CO2 ratios of the NG burner obtained for different pot-shield arrangements at 6 mbar NG
pressure were compared against the Australian standard where the maximum allowable value of
CO/CO2 is set at 0.02 (Bullman, 2001). CO/CO2 ratios of the NG burner with different pot-
shield arrangements at 6 mbar pressure are shown in Figure 4.23. The highest thermal
efficiencies of the NG burner having flat bottom pot without and with bottom shield and spot
welded finned pot without and with bottom shield were obtained respectively at 2.5 cm, 3 cm
and 3.5 cm loading heights and 6 mbar NG pressure. It is obvious from Figure 4.23 that the
operations of the burner having spot welded finned pot with and without bottom shield at 3.5 cm
for the highest thermal efficiency will generate higher CO/CO2 ratio (excessive CO emission to
environment) compared to the standard value 0.02 (Bullman, 2001). Therefore, the operations of
the burner having the above mentioned pot-shield arrangement at 6 mbar NG pressure for the
highest thermal efficiencies are not environment friendly. However, the CO/CO2 ratios for the
operations of the burner having flat bottom pot without shield at 2.5 cm loading height and 6
4.24.34.44.54.64.74.84.9
55.15.2
4 6 8 10 12 14 16 18 20 22
NG
Flo
w ra
te (L
/min
)
NG pressure (mbar)
NG flow…

64
mbar pressure and flat bottom pot with shield at 3 cm loading height and 6 mbar fall within the
guideline value of CO/CO2 (i.e., 0.02). Therefore, one can easily operate the NG burner having
flat bottom pot with bottom shield for the highest thermal efficiency (64.4%) at 3.5 cm loading
height and 6 mbar pressure without stretching the environment.
Figure 4.24: Variation of CO/CO2 ratios of the NG burner with different pot-shield
arrangements at different loading height and 6 mbar NG pressure
Figure 4.24: showing variation of CO/CO2 ratios of the NG burner with different pot-shield
arrangements at different ratio of loading height (LH) to Pot Diameter (PD) at 6 mbar NG
pressure
0
0.02
0.04
0.06
0.08
0.1
0.12
0.14
2.5 3 3.5 4 4.5 5 5.5 6 6.5 7 7.5 8
CO
/CO
2
Loading Height (cm)
Flat botton pot without ShieldFlat botton pot with ShieldFinned pot without ShieldFinned pot with ShieldMax. limit (Bullman, 2001)
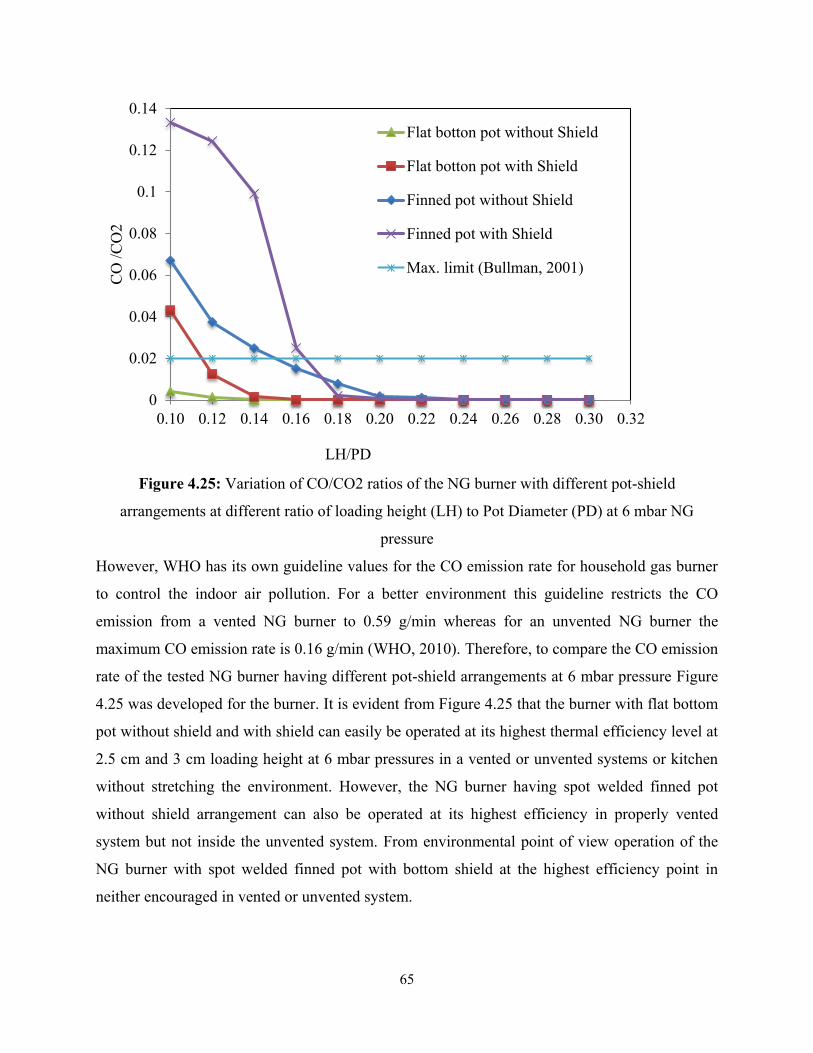
65
Figure 4.25: Variation of CO/CO2 ratios of the NG burner with different pot-shield
arrangements at different ratio of loading height (LH) to Pot Diameter (PD) at 6 mbar NG
pressure
However, WHO has its own guideline values for the CO emission rate for household gas burner
to control the indoor air pollution. For a better environment this guideline restricts the CO
emission from a vented NG burner to 0.59 g/min whereas for an unvented NG burner the
maximum CO emission rate is 0.16 g/min (WHO, 2010). Therefore, to compare the CO emission
rate of the tested NG burner having different pot-shield arrangements at 6 mbar pressure Figure
4.25 was developed for the burner. It is evident from Figure 4.25 that the burner with flat bottom
pot without shield and with shield can easily be operated at its highest thermal efficiency level at
2.5 cm and 3 cm loading height at 6 mbar pressures in a vented or unvented systems or kitchen
without stretching the environment. However, the NG burner having spot welded finned pot
without shield arrangement can also be operated at its highest efficiency in properly vented
system but not inside the unvented system. From environmental point of view operation of the
NG burner with spot welded finned pot with bottom shield at the highest efficiency point in
neither encouraged in vented or unvented system.
0
0.02
0.04
0.06
0.08
0.1
0.12
0.14
0.10 0.12 0.14 0.16 0.18 0.20 0.22 0.24 0.26 0.28 0.30 0.32
CO
/CO
2
LH/PD
Flat botton pot without Shield
Flat botton pot with Shield
Finned pot without Shield
Finned pot with Shield
Max. limit (Bullman, 2001)

66
Figure 4.26: Variation of CO emission rate of the NG burner with different pot-shield
arrangements at different loading height and 6 mbar NG pressure
Figure 4.26 showing a dimensionless presentation of Figure 4.25 in the place of loading height
(cm), used the ratio of loading height (LH) divide by pot diameter (PD).
Figure 4.27: Variation of CO emission rate of the NG burner with different arrangements at
different ratio of loading height (LH) and pot diameter (PD) at 6 mbar NG pressure
0
0.5
1
1.5
2
2.5
2.5 3 3.5 4 4.5 5 5.5 6 6.5 7 7.5 8
CO
(g/m
in)
Loading Height (cm)
Flat botton pot without Shield
Flat botton pot with Shield
Finned pot without Shield
Finned pot with Shield
Standard Unvented CO emissionRate (WHO, 2010)
0
0.5
1
1.5
2
2.5
0.1 0.12 0.14 0.16 0.18 0.2 0.22 0.24 0.26 0.28 0.3 0.32
CO
(g/m
in)
LH/PD
Flat botton pot without Shield
Flat botton pot with Shield
Finned pot without Shield
Finned pot with Shield
Standard Unvented CO emission Rate(WHO, 2010)Standard Vented CO emission rate (WHO,2010)

67
The whole scenario can be shown pictorially in Figure 2.28 as the direction of flame based on
fixed NG pressure, varying loading heights and Figure 2.29 as the direction of flame based on
varying NG pressure at fixed loading height.
Figure 2.28: The direction of flame based on loading height.
(A) Short gap between burner head and saucepan renders incomplete combustion and low thermal efficiency (B) Maximum thermal efficiency at optimum loading height (C) Gap between burner head and saucepan is more than optimum loading height results quenching of flame and
low thermal efficiency
Figure 2.29: The direction of flame based on varying NG pressure at fixed loading height. (D)
When NG pressure is less than the optimum position of thermal efficiency, in other word: flame tip is more away from pot bottom. (E) Maximum thermal efficiency at optimum NG pressure (F)
NG pressure is more than optimum NG pressure, results quenching of flame and low thermal efficiency and (G) Quenching of flame becoming more after increasing NG pressure.

68
Table 4.1: Summary of findings
Name Flat bottom pot Without shield
Flat bottom Pot with
shield
Finned pot without shield
Finned pot with shield
Pot dimensions
(Figure 3.2.2)
Material: stainless steel (SS),
thickness (th): 0.5 mm, pot
height (PH): 108 mm, inner
diameter (PD): 250 mm, collar
width (PCD): 17 mm.
Pot dimension is same as flat bottom
pot. Fin (distance from the outer pot
bottom periphery (fdb): 34.5 mm,
height (fh): 12 mm, width (fw) : 25.6
mm, pitch (fd): 11 mm., peaks: 56).
NG Pressures 4, 6, 10, 14, 18 and 20 mbar
Shields
(Figure 3.2.3)
Thickness of Shield (St) = 0.3 mm, hole’s diameter in Shield (DHS) = 5 mm, Total holes (TSH) = 84, Shield Height (SH) = 1.6, 2.1, 2.6, 3.1, 3.6, 4.1, 4.6, 5.1, 5.6, 6.1 and 6.6 cm, Shield Diameter (SD) = 230 mm,
Supports
(Figure 3.2.3) Pot Support Height (PSH) = 2, 2.5, 3, 3.5, 4, 4.5, 5, 5.5, 6, 6.5 and 7 cm. Chanel gap (PSC) = 4 mm, inner Diameter (PSD) = 220 cm.
Loading Heights 2.5, 3, 3.5, 4, 4.5, 5, 5.5, 6, 6.5, 7 and 7.5 cm
Base line setting Thermal efficiency: 52.19- 53.81%, 4 cm (Loading height), 4- 20 mbar
NG pressure.
Max. thermal
efficiency (%) for NG
pressure: 4-20 mbar
56.39-62.16%,
at 2.5 cm
(Loading height)
Max. 62.16% at
6 mbar
58 – 64.4%, at
3 cm (Loading
height)
Max. 64.4% at
6 mbar
48.15 – 54.6%, at
3.5 cm (Loading
height)
Max. 54.6% at 6
mbar
53.2 – 58.6%, at
3.5 cm (Loading
height)
Max. 58.6% at 6
mbar
Max. Heat Transfer
Efficiency (%)
62.42%, 6mbar
and 2.5 cm
65.2%, 6 mbar
and 3 cm
59.99%, 6 mbar
and 3.5 cm
60.5%, 6mbar
and 3 cm
Ratio of CO/CO2 at
Max. Thermal
Efficiency.
0.004 0.012 0.025 0.099
Australian standard: Maximum allowable value of CO/CO2 is set at 0.02 (Bullman, 2001).
Emission of CO
(g/min) at Max.
Thermal Efficiency.
0.094
0.16
0.59
1.8
Standard Unvented and vented CO emission Rate (WHO, 2010) = 0.16 g/min and 0.59 g/min

69
CHAPTER 5
CONCLUSIONS AND RECOMMENDATIONS
5.1 Conclusions
Several factors are responsible for the overall thermal efficiency and emission characteristics
of the cooking system. Size and shape of the cooking vessel, pot loading height, gas flow
rate and pot bottom shield have great effects for natural gas cooking system. From the
results of this study it can be concluded that using a simple pot bottom shield can
dramatically improve the thermal efficiency of a conventional radial port NG burner.
Among the different pot arrangements (ordinary flat bottom pot with and without pot bottom
shield, spot welded finned pot with and without pot bottom shield), ordinary flat bottom pot
with pot bottom shield arrangement provides the highest improvement in thermal efficiency
(~20%) compared to the base line efficiency of the NG burner with flat bottom pot. Thermal
efficiency of finned pot arrangements was not so encouraging. Since the fins were spot
welded on outside pot bottom there might be micro air gap between the pot bottom and fins
which provided additional resistance to heat transfer to pot content.In general it was
observed that at fixed pot height thermal efficiency and heat transfer efficiency decrease
with increasing gas pressure and at fixed gas pressure both efficiencies first increase and
reach to a maximum and then decrease with increasing pot height with the only exception
found in ordinary flat bottom pot without bottom shield arrangement. However, it was found
that at fixed pot height MCE generally decreases with increasing gas pressure and at fixed
gas pressure it increases with increasing pot height. It was also observed that optimum pot
loading height varies with different pot arrangements. The study also found that the
CO/CO2ratio increases with the inclusion of pot bottom shield and finned pot compared to
pot only arrangement. However, at fixed pot height CO/CO2 ratio increases with increasing
gas pressure and at a fixed gas pressure it decreases with increasing pot height. The highest
thermal efficiency for all pot arrangements was obtained at a gas supply pressure of 6 mbar
which is well below the pipeline supply pressure maintained at 20 mbar by the gas
distribution companies in Bangladesh. General households in Bangladesh have a tendency
to operate the gas burner at the pipeline supply pressure to expedite the cooking process,

70
whereas this study manifests that operating this gas burner beyond the optimum pressure
results unnecessary gas wastage. This simple pot bottom shield arrangement can
significantly contribute to energy conservation, lessening of greenhouse gas emission,
lowering the energy cost for cooking and thereby can save huge money which can be
otherwise used for national development.
5.2 Recommendations for Future Study
Very limited literatures were found on thermal efficiency and emission characteristics of
household Natural Gas (NG) cooking system. Therefore, huge opportunities are there to
work with cooking system with NG. This study incorporated spot welded finned pot for
thermal and emission performances. However, as discussed earlier that the overall
performances of the finned pot were not encouraging. This might be due to the presence of
micron level air gap between the fins and pot surface that resists heat transfers to top
content. Therefore, some recommendations for future study are given below:
Study of thermal efficiency and emission characteristics of NG and LPG burners
with various continuous welded finned pots having different shape and size
Study of thermal efficiency and emission characteristics of NG and LPG burners
with various shields (bottom shield and skirt) of different materials

71
REFERENCES Agenbroad, J. N., (2010) . A Simplified Model for Understanding Natural Convection
Driven Biomass Cooking Stoves. Colorado State University Fort Collins, Colorado.(url:https://mountainscholar.org/bitstream/handle/10217/39250/2010_Summer_Agenbroad_Joshua.pdf?sequence=1&isAllowed=y; accessed date: 03.08.2018) pp 3-83.
Akagi, S. K., Yokelson, R. J., Wiedinmyer, C., Alvarado, M. J., Reid, J. S., Karl, T., Crounse, J. D., and Wennberg, P. O.: Emission factors for open and domestic biomass burning for use in atmospheric models, Atmos. Chem. Phys., 11, 4039–4072, doi:10.5194/acp-11-4039-2011, 2011.
Andreatta, D., (2009). Finned Pots as a Means of Increasing Efficiency, executive summary a pot with heat transfer. (http://bioenergylists.org/stovesdoc/Andreatta/02%2015%2009%20Finned%20Pot/Finned%20pot%20final%20report.pdf; accessed date: 19.11.2018) pp. 1-20.
ASHMAN, P. J., JUNUS, R., STUBINGTON, J. F., and SERGEANT, G. D., (2007). The Effects of Load Height on the Emissions from a Natural Gas-Fired Domestic Cooktop Burner, Combustion Science and Technology, vol. 103, 1994, Issue 1-6. (url:https://www.tandfonline.com/doi/abs/10.1080/00102209408907699)pp. 283-298.
Aunan, K., Berntsen, T. K., Myhre, G., Rypdal, K., Streets, D. G., Jung-Hun Woo, J-H., and Smith, K. R., (2009). Radiative Forcing From Household Fuel Burning in Asia, Atmospheric Environment, vol. 43. (url:http://citeseerx.ist.psu.edu/viewdoc/download?doi=10.1.1.497.8456&rep=rep1&type=pdf; accessed date: 27.10.2018) pp. 5674-5681.
Bajgain, S. and Shakya, I. (2005). The Nepal biogas support program: A successful model of public private partnership for rural household energy supply, SNV-Netherlands Development Organisation. (url:http://siteresources.worldbank.org/INTENERGY/Publications/20918309/NepalBiogasSupportProgram.pdf; accessed on November 15, 2018)
Baldwin, S. F. (1987), Biomass stoves: engineering design, development and dissemination.
1600 Wilson Boulevard, Arlington, Virgnia 22209, USA, pp. 46-382.
Bates, L., Jagoe, K., and Rouse, J. (2011). Ethanol as a household fuel in Madagascar, Review of Sub-Saharan Africa Experience in scaling-up household energy interventions, Final report for Practical Action.
(url: https://www.cleancookingalliance.org/resources/231.html; accessed on November12, 2018)
Bethold, G., Barozzi L., Dotti M., Gilioli M., Gangale G.. (2017). Gas Burner Technology & Gas Burner Design for Application. (http://www.asge-national.org/wp-

72
content/uploads/2017/09/7BurnerTechnology-ASGE2011-Worgas-G_Berthold.pdf; accessed date: 18.12.2018) pp 1-40.
Berry, W. M., Brumbaugh, I. V., Moulton, G. F., Shawn, G. B. (1921). Design of atmospheric gas burners, Technologic Papers of the Bureau of Standards, No. 193, DEPARTMENT OF COMMERCE, WASHINGTON GOVERNMENT PRINTING OFFICE. (url: https://nvlpubs.nist.gov/nistpubs/nbstechnologic/ nbstechnologicpaperT193.pdf; accessed date: 26.10.2018) pp 5-64.
Bhattacharya S.C., Salam P.A., and Sharma M. (2000). Emissions from biomass energy use in some selected Asian countries, Energy, vol. 25(2), pp. 169–188.
Boggavarapu, P., Ray, B., and Ravikrishna, R. V. (2014). Thermal efficiency of LPG and
PNG-fired burners: Experimental and numerical studies, Fuel, vol. 116(2014), pp. 709-715.
Bruce, N., Perez-Padilla, R. and Albalak, R. (2000). Indoor Air Pollution in Developing
Countries: a major environmental and public health challenge, Bulletin of the World Health Organization 2000; 78(9). (https://www.ncbi.nlm.nih.gov/pmc/articles/PMC2560841/; accessed date:12.01.2019) pp. 1078-1092.
Bullman, S. (2001). Comparison of measurements of absolute CO and CO/CO2 ratio as combustion performance indicators, Advantica report designation: R4188, Advantica Ltd., Loughborough, Leicestershire, LE11 3GR, UK.
Bussmann, PJT., (1981). In: Prasad KK, editor. Some studies on open fires, shielded fires
and heavy stoves. Eindhoven: Woodburning Stove Group, Eindhoven University of Technology.
CAP., (2013). Country Action Plan for Clean Cookstoves, Power Division, Ministry of Power, Energy and Mineral Resources, Government of the People’s Republic of Bangladesh. (http://www.sreda.gov.bd/d3pbs_uploads/files/policy_5_cap_final.pdf; accessed date: 03.09.2018) pp. 7-26.
Couto, H. S., Duarte, J. B. F., and Bastos-Netto, D. (2004), Domestic Range Burner Design Procedure, The Seventh Asia-Pacific International Symposium on Combustion and Energy Utilization, Hong Kong SAR. (url: https://docslide.net › Category Documents; accessed date: 28.10.2018)

73
EFDS, (2011). The Energy and Fuel Data Sheet, Iain Staffell, University of Birmingham, UK, W1P1 – Revision 1. (url: http://www.claverton-energy.com/wordpress/wp-content/uploads/2012/08/the_energy_and_fuel_data_sheet1.pdf; accessed date: 19.10.2018 ) pp 2-3.
EIA, (1999). Natural Gas Issues and Trends, Energy Information Administration Office of Oil and Gas, U.S. Department of Energy Washington, DC 20585. (url: http://webapp1.dlib.indiana.edu/virtual_disk_library/index.cgi/ 4265704/FID1578/pdf/gas/056098.pdf; accessed date: 12.12.2018)
Elmnefi, M. S., (2010). New Optical Method for Heat Flux Measurements in Stagnation Point Laminar Methane/Air Flames and Hydrogen/Methane/Air Flames using Thermographic Phosphors . (https://duepublico.uni-duisburg-essen.de/servlets/DerivateServlet/Derivate-25648/Elmnefi_Mohamed_Salem_Diss.pdf; accessed date: 13.11.2018)
Energy Kids, (online). U.S . Energy Administration. (url: https://www.eia.gov/kids/energy.php?page=natural_gas_home-basics; accessed date: 22.09.2018)
Energypedia, (online). GIZ HERA Cooking Energy Compendium, a practical guide book for cooking energy innovation. (url: https://energypedia.info/wiki/GIZ_HERA_Cooking_Energy_Compendium; accessed date 20.01.2019).
EPA, (2013). Formaldehyde: Hazard Summary, U.S. Environmental Protection Agency, Washington DC, U.S.A.
(url: http://www.epa.gov/ttnatw01/hlthef/formalde.html; accessed date: 21.08.2018).
Eusuf M, Khan AMHR, Banu LB, 1990. Improved model of domestic gas cooking stove. Bangladesh Patent No.1002248; 1990.
Farzana, A., Mahfuz. T. and Rahman, M. M. (2017). Modified pot shield for improved burner efficiency, Fifth International Conference on Chemical Engineering (ICChE 2017), Chemical Engineering Department, Bangladesh University of Engineering and Technology, Dhaka-1000, Bangladesh, pp. 1-8.
Flores-Pajot, M. C., Ofner M., Do M. T., Lavigne E., and Villeneuve P. J., (2016). Childhood autism spectrum disorders and exposure to nitrogen dioxide, and particulate matter air pollution: A review and meta-analysis, Environmental Research,vol.151. (https://www.sciencedirect.com/science/article/pii/S0013935116303176; accessed date: 24.12.2018) Pp. 763-776.
GACC, (2020). Global Alliance for Clean Cookstoves, The Global Alliance for Clean Cookstoves is a public-private partnership with a mission to save lives, improve livelihoods, empower women, and protect the environment by creating a thriving global market for clean cookstoves and fuels, with a goal of enabling 100 million households to adopt clean and efficient cooking technologies by

74
2020. (http://carbonfinanceforcookstoves.org/about-cookstoves/cooking-and-climate-change/;accessed date:12.10.2018)
GELLER, H. S., (1982). Fuel efficiency and performance of traditional and innovative cookstoves. Centre for the Application of Science and Technology to Rural Areas (ASTRA), Indian Institute of Science, Bangalore 560 012, India. Prec. Indian Acad. Sci. (Engg. Sci.), Vol. 5, Pt. 4. (url:https://www.ias.ac.in/article/fulltext/sadh/005/04/0373-0393) pp. 373-393.
GIZ (2014). Multiple-Household Fuel Use – a balanced choice between firewood, charcoal and LPG, Deutsche Gesellschaft für Internationale Zusammenarbeit (GIZ) GmbH, Federal Ministry for Economic Cooperation and Development, Germany, pp. 1-40. (url.https://energypedia.info/images/3/32/2014-03_Multiple_Household_Cooking_Fuels_GIZ_HERA_eng.pdf)
Hou, S.-S., and Chou, C.-H., (2013). Parametric Study of High-Efficiency and Low-Emission Gas Burners, Advances in Materials Science and Engineering, Vol. 2013, Article ID 154957, pp. 1-7.
Hou, S.-S., and Chou, C.-H., (2014). Performance characteristics of multi-port gas burners, Innovation, Communication and Engineering, Meen, Prior & Lam (Eds), pp. 421-424.
Islam, S., and Zia, M. Z. U., (2017). Evaluating the Benchmark Performances and Efficiencies of Existing Gas Stoves in Bangladesh and Maximizing the Thermal Performance through Incorporating some Minor Modification, B.Sc. Thesis in Chemical Engineering, Bangladesh University of Engineering and Technology, Dhaka, Bangladesh.
ISO/IWA (2014). The Water Boiling Test, Version 4.2.3. Cookstove Emissions and Efficiency in a Controlled Laboratory Setting. (url:https://cleancookstoves.org/binary-data/DOCUMENT/file/000/000/399-1.pdf)
Jarvis, D., Chinn, S., Sterne, J., Luczynska, C., and Burney, P. (1998). The association of respiratory symptoms and lung function with the use of gas for cooking. European Community Respiratory Health Survey, Eur Respir J, vol. 11(3), (url: http://www.ncbi.nlm.nih.gov/pubmed/9596117; accessed date: 13.11.2018) pp.651–658.
Jones, H. R. N.(1989), The Application of Combustion Principles to Gas Burner Design, British Gas. (url: https://books.google.com › Science › Applied Sciences; accessed date: 15.10.2018). pp. 2–35.
Kane455, (2009). Flue Gas Analyser with direct CO2 measurement, Kane International Ltd, U.K. (url: https://www.kane.co.uk/knowledge-centre/what-are-safe-levels-of-co-and-co2-in-rooms).
Khalequzzaman, M., (2007). Indoor Air Pollution and Its Impact on Children Under 5 Years
Old in Bangladesh.

75
(url:https://www.researchgate.net/publication/50833131_Indoor_Air_Pollution_and_Health_of_Children_in_Biomass_Fuel-using_Households_of_Bangladesh _Comparison_between_Urban_and_Rural_Areas; accessed date: 27.12.2018) pp. 468-474.
Kile, M. L, Coker, E. S, Smit E., Sudakin, D., Molitor J., Harding A. K., (2014). A cross-
sectional study of the association between ventilation of gas stoves and chronic respiratory illness in U.S. children enrolled in NHANESIII, Environmental Health, 2014; 13 (1): 71 (url: https://ehjournal.biomedcentral.com/track/pdf/10.1186/1476-069X-13-71; accessed date: 11.11.2018).
Klug, V. L., Agnes B. Lobscheid, and Singer, B. C, (2011). Cooking Appliance Use in California Homes—Data Collected from a Web-based Survey, Environmental Energy Technologies Division, Ernest Orlando Lawrence, Berkeley National Laboratory, LBNL-5028E. (url: http://homes. lbl.gov/sites/all/files/lbnl-5028e-cooking-appliance.pdf; accessed date: 09.02.2019).
Kotb, A. and Saad, H. (2018). Case study for co and counter swirling domestic burners, Case Studies in Thermal Engineering, vol. 11, pp. 98-104.
Ko, Y-C., and Lin, T-H., (2003). Emissions and efficiency of a domestic gas stove burning natural gases with various compositions, Department of Mechanical Engineering, National Cheng Kung University, Tainan 70101, Taiwan. (url: https://www.researchgate.net/publication/237897196; accessed date: 20.07.2018) .Pp 1-15.
Ko Y-C., and Lin T-H., (2003). Emissions and Efficiency Of a Domestic Gas Stove Burning Natural Gases With Various Compositions. Article in Energy Conversion and Management 44(19):3001-3014. (url:https://www.researchgate.net/publication/237897196_Emissions_and_efficiency_of_a_domestic_gas_stove_burning_natural_gases_with_various_compositions; accessed date: 21.01.2019)
Knibbs, L. D, Woldeyohannes, L., Marks, G. B., and Cowie C. T., Med J., ( 2018). Damp housing, gas stoves, and the burden of childhood asthma in Australia, vol., 208, ISSUE 7. (url: https://www.mja.com.au/journal/2018/208/7/damp-housing-gas-stoves-and-burden-childhood-asthma-australia; accessed date: 23.10.2018)
Krishnan, S. M., Barath, P., Manoj, V., and Stalin, J. M., (2012). Energy Conservation by
Improving the Design of Cook Pot, Int. Journal of Mechanical Engineering and Technology, vol. 3(3), pp. 638-644.

76
Lam, N. L., Smith, K. R., Gauthier, A., and Bates, M. N. (2012). Kerosene: A review of household use and their hazards in low-and middle-income countries, J Toxicol Environ Health B Crit Rev., vol. 15(6), pp. 396-432.
Lambe, F., Jürisoo, M., and Wikman, A. (2015). Ethanol: towards a viable alternative for
domestic cooking in Ethiopia, Stockholm Environment Institute (SEI), Sweden. (url: https://www.cleancookingalliance.org/resources/386.html; accessed on
November 12, 2018) Logue, J. M., Klepeis, N. E., Lobscheid, A. B., and Singer, B. C., (2014). Pollutant
exposures from natural gas cooking burners: a simulation-based assessment for Southern California, Environmental Health Perspectives. (url:http://dx.doi.org/10.1289/ehp.1306673; accessed date: 26.02.2019) pp. 43-50.
Lucky, R. A., and Hossain, I., (2001). Efficiency study of Bangladeshi cookstoves with an
emphasis on gas cookstove, Energy, vol. 26, pp. 221-237. Malek, M. I., Hossain, M. M., and Sarkar, M. A. R. (2015). Production and utilization of
natural gas in Bangladesh, Proceedings of the 7th IMEC, January, Dhaka, Bangladesh,
Malouf, A. and Wimberly, D. (2001). The Health Hazards of Natural Gas, Nova Scotia Allergy and Environmental Health Association. (http://greenheatusa.com/Files/TheHealthHazardsofNaturalGas.pdf; accessed date: 12.01.2019).
Naphon, P. (2014). Thermal Efficiency Enhancement of Domestic Cooking Pots, Asian
Journal of Engineering and Technology (ISSN: 2321 – 2462) Volume 02 – Issue 05, October 2014. Pp 1-6
OTA, (1991). Energy in developing countries, Office of Technology Assessment, US
Congress, Washington, DC: US Government Printing Office. (url: https://ota.fas.org/reports/9118.pdf; accessed date: 29.12.2018)
Parry, M. L., Canziani, O. F., Palutikof, J. P., van der Linden, P. J., and Hanson, C. E., (2007). Impacts, Adaptation, and Vulnerability: A Summary of the Report from IPCC Working Group 2 and Implications for the Western U.S., Cambridge University Press, Cambridge, United Kingdom and New York, NY, USA. (https://www.ipcc.ch/pdf/assessment-report/ar4/wg2/ar4_wg2_full_report.pdf; accessed date: 22.12.2018) pp. 7-22.
Petrobangla, (2016).Annual Report, Bangladesh Oil, Gas and Mineral Corporation. (url: https://petrobangla.org.bd/admin/attachment/webtable/596_upload_0.pdf; accessed date: 21.10.2018)
77
Petrobangla, (2017).Annual Report, Bangladesh Oil, Gas and Mineral Corporation. (url: https://petrobangla.org.bd/admin/attachment/webtable/1064_upload_0.pdf; accesses date: 21.10.2018)
Prasad, K. K. (1982). Cooking energy, In: A cross country study prepared for the Workshop on End-Use Focused Global Energy Strategy. Princeton, NJ: Princeton University Press.
Roth, C. (2013). Micro-gasification: cooking with gas from dry biomass, An introduction to concepts and applications of wood-gas burning technologies for cooking, GIZ, Germany. (url:https://energypedia.info/images/0/05/Micro_Gasification_2.0_Cooking_with_gas_from_dry_biomass.pdf; accessed on November 14, 2018)
Schlag, N., and Zuzarte, F., (2008). Market Barriers to Clean Cooking Fuels in Sub-Saharan Africa: A Review of Literature, Stockholm Environment Institute, Stockholm. (url:https://pdfs.semanticscholar.org/6965/b960ed89e9d4b2514f7658c78b2aadbc73f2.pdf; accessed date: 02.01.2019) pp 1-19.
Sebastian, M. (2015). Replacing traditional cooking stoves with gas stoves is transforming lives. (url:https://europa.eu/capacity4dev/article/replacing-traditional-cooking-stoves-gas-stoves-transforming-lives; accessed date: 27 12.2018)
SEI, (online). Stockholm Environment Institute– bridging science and policy. An international non-profit research and policy organization that tackles environment and development challenges.
(url: https://www.sei.org/topic/climate/; accessed date: 11.01.2019). Smith, K. R., (1994). Health, energy, and greenhouse-gas impacts of biomass combustion in
household stoves, Energy for Sustainable Development, vol. 4. (url:http://citeseerx.ist.psu.edu/viewdoc/download?doi=10.1.1.646.2601&rep=rep1&type=pdf) pp. 23-29.
Smith K.R., Uma R., Kishore V.V.N., Zhang J., Joshi V., and Khalil M.A.K., (2000). Greenhouse implications of household stoves: an analysis for India. Annual Rev. of Energy and the Environ., vol. 25, pp. 741–63.
Stokes, H. C. and Crocco, J. R. (2005). The reality of methanol use as a cooking fuel in developing countries, pp. 1-8.
(url: https://projectgaia.com/wp-content/uploads/2013/10/The-Reality-of-Methanol-Use-as-a-Cooking-Fuel-in-Developing-Countries-2005.pdf; accessed on December 10, 2018)
Surange, J. R., Patil, N. K., and Rajput, A.V., (2014). Performance analysis of burners used in LPG cooking stove – a review, International Journal of Innovative Research in Science, Engineering and Technology, vol. 3(4). (url: https://www.ijirset.com/upload/2014/special/vishwatech/paper-16_Performance.pdf; accessed date: 12.10.2018; accessed date: 26.11.2018) pp. 87-97.
Tamir A., Elperin I., and Yotzer S., (1989). Performance characteristics of a gas burner with a swirling central flame, Energy, vol. 14, no. 7, pp. 373–382.

78
Viskanta, R., (1993). Heat Transfer to Impinging Isothermal Gas and Flame Jets,
Experimental Thermal and Fluid Science (ISSN 0894-1777), vol. 6, no. 2. (url: http://adsabs.harvard.edu/abs/1993ExTFS...6..111V) pp. 111-134.
Vrijheid, Martine; Martinez, David; Aguilera, Inma; Bustamante, Mariona; Ballester, Ferran; Estarlich, Marisa; Fernandez-Somoano, Ana; Guxens, Mònica; Lertxundi, Nerea; Martinez, M. Dolores; Tardon, Adonina; Sunyer, Jordi , (2012). Indoor Air Pollution From Gas Cooking and Infant Neurodevelopment, Epidemiology: vol. 23, Issue 1. (https://journals.lww.com/epidem/Fulltext/2012/01000/ Indoor_Air_Pollution_From_Gas_Cooking_and_Infant.5.aspx) pp. 23–32.
Ward, D. E., and Radke, L. F., (1993). Emission measurements from vegetation fires: a comparative evaluation of methods and results, Intermountain Research Station, Forest Service, U.S. Department of Agriculture, Missoula, MT 59807, U.S.A. 2National Center for Atmospheric Research/Research Aviation Facility, Boulder, CO 80307, U.S.A. (https://www.fs.fed.us/rm/pubs_other/rmrs_1993_ward_d001.pdf; accessed date: 12.02.2019) pp. 1-24.
WHO, (2010). WHO air quality guideline. (url:https://www.who.int/airpollution/guidelines /household-fuel-combustion/Tables_R1_R2_R3_rev1.pdf?ua=1).
Widodo, A. S. (2016). Efficiency of household gas stove by optimizing gap of pan and stove
cover, ARPN Journal of Engineering and Applied Sciences, vol. 11, no. 4 (2016), ISSN 1819-6608. Pp. 1-4
WNA (2018). Heat Values of Various Fuels, World nuclear association. (url:http://www.world-nuclear.org/information-library/facts-and-figures/heat-values-of-various-fuels.aspx; accessed date: 10.02.2019).
WRI, 2010. Climate Analysis Indicators Tool, World Resources Institute - [Online] [Cited: May 4, 2010.] (url: http://cait.wri.org/figures/World-FlowChart.pdf.; accessed date: 19.08.2018)
Zube, D. J. (2010). Heat transfer efficiency of biomass cookstoves, Department of Mechanical Engineering, Colorado State University, Fort Collins, Colorado.(url:https://mountainscholar.org/bitstream/handle/10217/39344/2010_Summer_Zube_Daniel.pdf?sequence=1&isAllowed=y; accessed date: 26.09.2018). pp 14- 155.

Appendix A Experimental data sheet
79
Variables that measured during Experiment.
TSL = Test Serial number.
TD = Tested date.
P1ci= Int. weight of Pot with water (g).
P1cf = Final weight of Pot with water (g).
wcv= Water evaporated (g).
T1ci= Initial water temperature (0C).
T1cf= Final water temperature (0C).
Δtc= Boiling time (min).
fci= Initial WET GAS Meter Reading (L).
fcf= Final WET GAS Meter Reading (L).
fcf - fci = Gas consumption (L).
LH = Loading Height (cm).
Pmbar = Supplied NG pressure (mbar).
Tng = Supplied NG Temp. (0C).
Ta = Air Temp. (0C). Thd= Stack Temp. (0C). PStc= Stack Pressure (mbar). Vstc = Stack velocity (km/hr). CO2h = Carbon dioxide (%). COh= Carbon monoxide (ppm).
O2h = Oxygen (%).

Appendix A Experimental data sheet
80
Table A 1.1: Experimental data for flat bottom pot without Shield at 4 mbar NG Pressure.
1
21-April
18
3.406 3.317 89 26 98 11.63 56.3
2.5
27 26 45.7 0.06 0.4 18 20.9 2 3.406 3.316 90 26.8 98 11.67 55.92 27.5 28 48.25 0.0625 0.35 17 20.9 3 3.406 3.315 91 27.6 98 11.71 55.54 28 30 50.8 0.065 0.3 16 20.9
Avg.= 90 26.8 11.67 55.92 27.5 28 48.25 0.0625 0.35 17 20.9
STDEV= ± 1.00 0.8 0.04 0.38 0.5 2 2.55 0.0025 0.05 1 0 4 3.406 3.318 88 23.7 98 12.61 58.44
3
25 27 48.7 0.065 0.4 7 20.9 5 3.406 3.3185 87.5 26.1 98 12.095 57.995 27 28.5 49.65 0.075 0.375 6.75 20.9 6 3.406 3.319 87 28.5 98 11.58 57.55 29 30 50.6 0.085 0.35 6.5 20.9
Avg.= 87.5 26.1 12.095 57.995 27 28.5 49.65 0.075 0.375 6.75 20.9
STDEV= ± 0.5 2.4 0.515 0.445 2 1.5 0.95 0.01 0.025 0.25 0 7 3.406 3.32 86 26.7 98 12.73 58.31
3.5
25 28 49.05 0.075 0.3 0 20.9 8 3.406 3.3195 86.5 27.7 98 12.545 58.65 26.5 28.5 50.275 0.075 0.3 0 20.9 9 3.406 3.319 87 28.7 98 12.36 58.99 28 29 51.5 0.075 0.3 0 20.9
Avg.= 86.5 27.7 12.545 58.65 26.5 28.5 50.275 0.075 0.3 0 20.9
STDEV= ± 0.5 1 0.185 0.34 1.5 0.5 1.225 0 0 0 0 10 3.406 3.297 109 27.5 98 14.21 64
4
25 28 50.8 0.125 0.3 0 20.9 11 3.406 3.3015 104.5 29.75 98 13.285 62.845 26 28.5 51.325 0.09 0.3 0 20.9 12 3.406 3.306 100 32 98 12.36 61.69 27 29 51.85 0.055 0.3 0 20.9
Avg.= 104.5 29.75 13.285 62.845 26 28.5 51.325 0.09 0.3 0 20.9
STDEV= ± 4.5 2.25 0.925 1.155 1 0.5 0.525 0.035 0 0 0 13
3.406 3.298 108 27.6 98 14.5 66.59
4.5
27 29 51.7 0.11 0.3 0 20.9 14 3.406 3.3 106 29.35 98 14.23 66.605 27 29 53.85 0.09 0.3 0 20.9 15 3.406 3.302 104 31.1 98 13.96 66.62 27 29 56 0.07 0.3 0 20.9
Avg.= 106 29.35 98 14.23 66.605 27 29 53.85 0.09 0.3 0 20.9
STDEV= ± 2 1.75 0 0.27 0.015 0 0 2.15 0.02 0 0 0 16 3.406 3.29 116 27.7 98 15.21 70.95 5 27 28 54.7 0.13 0.3 0 20.9
SL TD P1ci P1cf wcv T1ci
T1cf
Δtc fcf - fci
LH Tng Ta Thd PStc CO2h COh O2h
Pmbar = 4 and Vstc = 10

Appendix A Experimental data sheet
81
17
22- April
18
3.406 3.295 111 29.15 98 14.605 69.745 27.5 29 55.625 0.115 0.3 0 20.9 18 3.406 3.3 106 30.6 98 14 68.54 28 30 56.55 0.1 0.3 0 20.9
Avg.= 111 29.15 14.605 69.745 27.5 29 55.625 0.115 0.3 0 20.9
STDEV= ± 5 1.45 0.605 1.205 0.5 1 0.925 0.015 0 0 0 19 3.406 3.298 108 26 98 15.3 74.48
5.5
26 28 53.5 0.025 0.3 0.5 20.9 20 3.406 3.2935 112.5 28.05 98 15.455 74.235 27 29 54.45 0.07 0.3 0.5 20.9 21 3.406 3.289 117 30.1 98 15.61 73.99 28 30 55.4 0.115 0.3 0.5 20.9
Avg.= 112.5 28.05 15.455 74.235 27 29 54.45 0.07 0.3 0.5 20.9
STDEV= ± 4.5 2.05 0.155 0.245 1 1 0.95 0.045 0 0 0 22 3.406 3.281 125 24.8 98 16.83 80.05
6
26 29 54.9 0.04 0.3 0 20.9 23 3.406 3.2835 122.5 25.95 98 16.595 80.025 26.5 28 55.05 0.025 0.3 0 20.9 24 3.406 3.286 120 27.1 98 16.36 80 27 27 55.2 0.01 0.3 0 20.9
Avg.= 122.5 25.95 16.595 80.025 26.5 28 55.05 0.025 0.3 0 20.9
STDEV= ± 2.5 1.15 0.235 0.025 0.5 1 0.15 0.015 0 0 0 25 3.406 3.272 134 25.4 98 17.75 85.05
6.5
27 29 55.6 0.075 0.3 0 20.9 26 3.406 3.2575 148.5 26.3 98 18.155 88.18 27 28.5 56.275 0.065 0.3 0 20.9 27 3.406 3.243 163 27.2 98 18.56 91.31 27 28 56.95 0.055 0.3 0 20.9
Avg.= 148.5 26.3 18.155 88.18 27 28.5 56.275 0.065 0.3 0 20.9
STDEV= ± 14.5 0.9 0.405 3.13 0 0.5 0.675 0.01 0 0 0 28 3.406 3.256 150 27 98 19.25 92.23
7
27 29 56.95 0.08 0.3 0 20.9 29 3.406 3.257 149 27.05 98 19.1 90.94 27 28.5 56.925 0.08 0.3 0 20.9 30 3.406 3.258 148 27.1 98 18.95 89.65 27 28 56.9 0.08 0.3 0 20.9
Avg.= 149 27.05 19.1 90.94 27 28.5 56.925 0.08 0.3 0 20.9
STDEV= ± 1 0.05 0.15 1.29 0 0.5 0.025 0 0 0 0 31 3.406 3.245 161 26 98 20.6 99.12
7.5
27 29 57.25 0.045 0.3 0 20.9 32 3.406 3.248 158 26.3 98 20.3 97.16 27 28.5 57.25 0.0575 0.3 0 20.9 33 3.406 3.251 155 26.6 98 20 95.2 27 28 57.25 0.07 0.3 0 20.9
Avg.= 158 26.3 20.3 97.16 27 28.5 57.25 0.0575 0.3 0 20.9
STDEV= ± 3 0.3 0.3 1.96 0 0.5 0 0.0125 0 0 0

Appendix A Experimental data sheet
82
Table A 1.2 : Experimental data for Finned pot without Shield at 4 mbar NG pressure.
1
23 April 18
3.525 3.387 138 25 98 15.85 75.9
2.5
27 26 40.3 0.025 0.25 205 20.9 2 3.525 3.392 133 25 98 15.755 74.315 27.5 28 43.075 0.04 0.225 202.75 20.9 3 3.525 3.397 128 25 98 15.66 72.73 28 30 45.85 0.055 0.2 200.5 20.9
Avg.= 133 25 15.755 74.315 27.5 28 43.075 0.04 0.225 202.75 20.9
STDEV= ± 5.00 0 0.095 1.585 0.5 2 2.775 0.015 0.025 2.25 0 4 3.525 3.385 140 23.1 98 15.6 74.87
3
25 27 43.1 0.05 0.3 153 20.9 5 3.525 3.394 131 24.55 98 15.375 72.97 26.5 28.5 45 0.0625 0.3 148.75 20.9 6 3.525 3.403 122 26 98 15.15 71.07 28 30 46.9 0.075 0.3 144.5 20.9
Avg.= 131 24.55 15.375 72.97 26.5 28.5 45 0.0625 0.3 148.75 20.9
STDEV= ± 9.00 1.45 0.225 1.9 1.5 1.5 1.9 0.0125 0 4.25 0 7 3.525 3.397 128 27 98 14.61 67.09
3.5
25 28 46.7 0.09 0.3 98 20.9 8 3.525 3.393 132 27 98 14.585 68.33 27 29 47.425 0.085 0.3 91.5 20.9 9 3.525 3.389 136 27 98 14.56 69.57 29 30 48.15 0.08 0.3 85 20.9
Avg.= 132 27 14.585 68.33 27 29 47.425 0.085 0.3 91.5 20.9
STDEV= ± 4.00 0 0.025 1.24 2 1 0.725 0.005 0 6.5 0 10 3.525 3.389 136 27.1 98 15.4 72.7
4
25 28 48.85 0.13 0.4 60 20.9 11 3.525 3.393 132 27.3 98 15.265 71.62 26.5 28.5 49.475 0.105 0.375 68 20.9 12 3.525 3.397 128 27.5 98 15.13 70.54 28 29 50.1 0.08 0.35 76 20.9
Avg.= 132 27.3 15.265 71.62 26.5 28.5 49.475 0.105 0.375 68 20.9
STDEV= ± 4.00 0.2 0.135 1.08 1.5 0.5 0.625 0.025 0.025 8 0 13 3.525 3.385 140 27.4 98 16.31 76.75
4.5
27 29 49.7 0.075 0.3 33.5 20.9 14 3.525 3.386 138.5 28.7 98 15.905 75 27 29 51.175 0.07 0.35 28.75 20.9 15 3.525 3.388 137 30 98 15.5 73.25 27 29 52.65 0.065 0.4 24 20.9
Avg.= 138.5 28.7 15.905 75 27 29 51.175 0.07 0.35 28.75 20.9
STDEV= ± 1.50 1.3 0.405 1.75 0 0 1.475 0.005 0.05 4.75 0 16 3.525 3.392 133 28 98 16.23 76.86
5 27 29 51.85 0.12 0.35 9 20.9
17 3.525 3.399 126 29.4 98 15.89 74.685 27.5 29.5 52.4 0.105 0.35 10.25 20.9 18 3.525 3.406 119 30.8 98 15.55 72.51 28 30 52.95 0.09 0.35 11.5 20.9
TSL
TD
P1ci P1cf wcv T1ci
T1cf
Δtc fcf - fci
LH Tng Ta Thd PStc CO2h COh O2h
Pmbar = 4 and Vstc = 10

Appendix A Experimental data sheet
83
Avg.= 126 29.4 15.89 74.685 27.5 29.5 52.4 0.105 0.35 10.25 20.9
STDEV= ± 7.00 1.4 0.34 2.175 0.5 0.5 0.55 0.015 6.8E-17 1.25 0 19
24 April 18
3.525 3.385 140 23.7 98 17.33 82.2
5.5
25 27 48 0.08 0.35 5 20.9 20 3.525 3.385 140 27.1 98 17.005 80.3 26.5 28.5 51.28 0.095 0.35 4.5 20.9 21 3.525 3.385 140 30.5 98 16.68 78.4 28 30 54.56 0.11 0.35 4 20.9
Avg.= 140 27.1 17.005 80.3 26.5 28.5 51.28 0.095 0.35 4.5 20.9
STDEV= ± 0.00 3.4 0.325 1.9 1.5 1.5 3.28 0.015 6.8E-17 0.5 0 22 3.525 3.397 128 24.8 98 17.46 80.83
6
27 28 53.25 0.035 0.35 0 20.9 23 3.525 3.393 131.5 25.5 98 17.665 82.415 27 27 52.05 0.05 0.35 0 20.9 24 3.525 3.39 135 26.2 98 17.87 84 27 26 50.85 0.065 0.35 0 20.9
Avg.= 131.5 25.5 17.665 82.415 27 27 52.05 0.05 0.35 0 20.9
STDEV= ± 3.50 0.7 0.205 1.585 0 1 1.2 0.015 6.8E-17 0 0 25 3.525 3.345 180 26.4 98 18.2 90.92
6.5
27 27 53.1 0.075 0.35 0 20.9 26 3.525 3.348 176.5 26.4 98 18.15 90.715 27 27 53.325 0.0775 0.35 0.25 20.9 27 3.525 3.352 173 26.4 98 18.1 90.51 27 27 53.55 0.08 0.35 0.5 20.9
Avg.= 176.5 26.4 18.15 90.715 27 27 53.325 0.0775 0.35 0.25 20.9
STDEV= ± 3.50 4.4E-15 0.05 0.205 0 0 0.225 0.0025 6.8E-17 0.25 0
28 3.525 3.346 179 25.3 98 19.66 93.86
7
28 29 54.65 0.075 0.35 4 20.9 29 3.525 3.358 167 26.4 98 18.88 90.62 27.5 28.5 54.875 0.0725 0.35 4 20.9 30 3.525 3.37 155 27.5 98 18.1 87.38 27 28 55.1 0.07 0.35 4 20.9
Avg.= 167 26.4 18.88 90.62 27.5 28.5 54.875 0.0725 0.35 4 20.9
STDEV= ± 12.00 1.1 0.78 3.24 0.5 0.5 0.225 0.0025 6.8E-17 0 0 31 3.525 3.383 142 25.4 98 19.3 88.47
7.5
27 29 54.55 0.075 0.35 0 20.9 32 3.525 3.381 144 26.15 98 19.4 88.855 27 28.5 54.8 0.0775 0.35 0 20.9 33 3.525 3.379 146 26.9 98 19.5 89.24 27 28 55.05 0.08 0.35 0 20.9
Avg.= 144 26.15 19.4 88.855 27 28.5 54.8 0.0775 0.35 0 20.9
STDEV= ± 2.00 0.75 0.1 0.385 0 0.5 0.25 0.0025 6.8E-17 0 0

Appendix A Experimental data sheet
84
Table A 1.3: Experimental data for flat bottom pot with Shield at 4 mbar NG pressure.
1
7 - A P R I L - 1 8
3.406 3.276 130 26.7 98 12.4 60.79
2.5
27 29 42.6 0.03 0.3 92 20.9 2 3.406 3.286 120 26.45 98 12.2 59.29 28 29.5 42.6 0.03 0.3 91.5 20.9 3 3.406 3.296 110 26.2 98 12 57.79 29 30 42.6 0.03 0.3 91 20.9
Avg.= 120 26.45 12.2 59.29 28 29.5 42.6 0.03 0.3 91.5 20.9 STDEV= ± 10.00 0.25 0.2 1.5 1 0.5 0 0 0 0.5 0
4 3.406 3.322 84 29.5 98 11.45 53.1
3
29 30 45.6 0.075 0.3 14.5 20.9 5 3.406 3.3225 83.5 29.55 98 11.325 52.62 29.5 30 45.6 0.075 0.25 12.75 20.9 6 3.406 3.323 83 29.6 98 11.2 52.14 30 30 45.6 0.075 0.2 11 20.9
Avg.= 83.5 29.55 11.325 52.62 29.5 30 45.6 0.075 0.25 12.75 20.9 STDEV= ± 0.50 0.05 0.125 0.48 0.5 0 0 0 0.05 1.75 0
7 3.406 3.325 81 30.5 98 11.2 52.11
3.5
30 30 46.85 0.09 0.3 3.5 20.9 8 3.406 3.3255 80.5 30.5 98 11.3 52.505 30.25 30 46.85 0.09 0.325 1.75 20.9 9 3.406 3.326 80 30.5 98 11.4 52.9 30.5 30 46.85 0.09 0.35 0 20.9
Avg.= 80.5 30.5 11.3 52.505 30.25 30 46.85 0.09 0.325 1.75 20.9
STDEV= ± 0.50 0 0.1 0.395 0.25 0 0 1.7E-17 0.025 1.75 0
10 3.406 3.316 90 29.9 98 12 55.03
4
30.5 30.5 46.5 0.105 0.3 0 20.9 11 3.406 3.3175 88.5 29.9 98 11.95 54.315 30.625 30.5 46.5 0.105 0.3 0 20.9 12 3.406 3.319 87 29.9 98 11.9 53.6 30.75 30.5 46.5 0.105 0.3 0 20.9
Avg.= 88.5 29.9 11.95 54.315 30.625 30.5 46.5 0.105 0.3 0 20.9
STDEV= ± 1.50 4.4E-15 0.05 0.715 0.125 0 0 0 0 0 0
13 3.406 3.308 98 29.8 98 12.1 57.34
4.5
30.5 30 45.8 0.115 0.35 0 20.9 14 3.406 3.31 96 29.8 98 11.95 56.92 30.125 30 45.8 0.115 0.325 0 20.9 15 3.406 3.312 94 29.8 98 11.8 56.5 29.75 30 45.8 0.115 0.3 0 20.9
Avg.= 96 29.8 11.95 56.92 30.125 30 45.8 0.115 0.325 0 20.9
STDEV= ± 2.00 0 0.15 0.42 0.375 0 8.7E-15 0 0.025 0 0
16 3.406 3.311 95 30.1 98 12.5 57.87 5 29.75 30 47.6 0.12 0.35 0 20.9 17 3.406 3.3125 93.5 30.1 98 12.4 57.585 29.875 30 47.6 0.12 0.375 0 20.9
TSL
TD P1ci P1cf wcv T1ci
T1cf
Δtc fcf - fci
LH Tng Ta Thd PStc CO2h COh O2h
Pmbar = 4 and Vstc = 10

Appendix A Experimental data sheet
85
18 3.406 3.314 92 30.1 98 12.3 57.3 30 30 47.6 0.12 0.4 0 20.9 Avg.= 93.5 30.1 12.4 57.585 29.875 30 47.6 0.12 0.375 0 20.9
STDEV= ± 1.50 4.4E-15 0.1 0.285 0.125 0 0 0 0.025 0 0
19 3.406 3.308 98 28.4 98 13.2 60.78
5.5
30 31 49.9 0.165 0.35 0 20.9 20 3.406 3.304 102 28.5 98 13.25 60.84 30.25 31 49.9 0.165 0.35 0 20.9 21 3.406 3.3 106 28.6 98 13.3 60.9 30.5 31 49.9 0.165 0.35 0 20.9
Avg.= 102 28.5 13.25 60.84 30.25 31 49.9 0.165 0.35 0 20.9
STDEV= ± 4.00 0.1 0.05 0.06 0.25 0 0 0 6.8E-17 0 0
22 3.406 3.31 96 28.3 98 13.25 61.57
6
30 31 46.45 0.265 0.4 0 20.9 23 3.406 3.313 93 28.3 98 13.225 61.335 30.125 31 46.45 0.265 0.35 0 20.9 24 3.406 3.316 90 28.3 98 13.2 61.1 30.25 31 46.45 0.265 0.3 0 20.9
Avg.= 93 28.3 13.225 61.335 30.125 31 46.45 0.265 0.35 0 20.9
STDEV= ± 3.00 0 0.025 0.235 0.125 0 8.7E-15 0 0.05 0 0
25 3.406 3.299 107 28.1 98 13.8 63.97
6.5
30 30 47.4 0.28 0.3 0 20.9 26 3.406 3.303 103 27.95 98 13.825 63.885 30 30 47.4 0.28 0.275 0 20.9 27 3.406 3.307 99 27.8 98 13.85 63.8 30 30 47.4 0.28 0.25 0 20.9
Avg.= 103 27.95 13.825 63.885 30 30 47.4 0.28 0.275 0 20.9 STDEV= ± 4.00 0.15 0.025 0.085 0 0 0 0 0.025 0 0
28 3.406 3.296 110 27.8 98 13.98 65.85
7
27 26 47.95 0.13 0.3 2.5 20.9 29 3.406 3.295 111 27.8 98 13.97 65.825 27 26 47.95 0.13 0.3 2.5 20.9 30 3.406 3.294 112 27.8 98 13.96 65.8 27 26 47.95 0.13 0.3 2.5 20.9
Avg.= 111 27.8 13.97 65.825 27 26 47.95 0.13 0.3 2.5 20.9
STDEV= ± 1.00 0 0.01 0.025 0 0 8.7E-15 0 0 0 0
31 3.406 3.292 114 26.8 98 13.95 67.66
7.5
27 26 45 0.105 0.35 3 20.9 32 3.406 3.291 115 26.8 98 13.9 67.61 27 26 45 0.105 0.35 3 20.9 33 3.406 3.29 116 26.8 98 13.85 67.56 27 26 45 0.105 0.35 3 20.9
Avg.= 115 26.8 13.9 67.61 27 26 45 0.105 0.35 3 20.9
STDEV= ± 1.00 0 0.05 0.05 0 0 0 0 6.8E-17 0 0

Appendix A Experimental data sheet
86
Table A 1.4 : Experimental data for Finned pot with Shield at 4 mbar NG pressure.
1
09 .04 .18
3.525 3.433 92 30.3 98 12.85 58.79
2.5
29 30 42.8 0.05 0.1 277 20.9 2 3.525 3.436 89 30.6 98 12.815 58.695 29 30 42.8 0.05 0.125 268.5 20.9 3 3.525 3.439 86 30.9 98 12.78 58.6 29 30 42.8 0.05 0.15 260 20.9
Avg.= 89 30.6 12.815 58.695 29 30 42.8 0.05 0.125 268.5 20.9
STDEV= ± 3.00 0.3 0.035 0.095 0 0 8.7E-15 8.5E-18 0.025 8.5 0
4 3.525 3.43 95 31.2 98 12.4 57.7
3
29 30 45.3 0.08 0.13 240 20.9 5 3.525 3.429 96 31.2 98 12.35 57.6 29 30 45.3 0.08 0.125 247 20.9 6 3.525 3.428 97 31.2 98 12.3 57.5 29 30 45.3 0.08 0.12 254 20.9
Avg.= 96 31.2 12.35 57.6 29 30 45.3 0.08 0.125 247 20.9
STDEV= ± 1.00 0 0.05 0.1 0 0 8.7E-15 0 0.005 7 0 7 3.525 3.415 110 30.2 98 12.4 57.94
3.5
29 30 45.3 0.09 0.16 260 20.9 8 3.525 3.4165 108.5 30.85 98 12.3 57.87 29 30 45.3 0.09 0.16 245 20.9 9 3.525 3.418 107 31.5 98 12.2 57.8 29 30 45.3 0.09 0.16 230 20.9
Avg.= 108.5 30.85 12.3 57.87 29 30 45.3 0.09 0.16 245 20.9
STDEV= ± 1.50 0.65 0.1 0.07 0 0 8.7E-15 1.7E-17 0 15 0
10 3.525 3.424 101 29.6 98 12.6 58.63
4
29 30 45.3 0.1 0.3 135 20.9 11 3.525 3.425 100 30.4 98 12.58 58.575 29 30 45.3 0.1 0.325 127.5 20.9 12 3.525 3.426 99 31.2 98 12.56 58.52 29 30 45.3 0.1 0.35 120 20.9
Avg.= 100 30.4 12.58 58.575 29 30 45.3 0.1 0.325 127.5 20.9
STDEV= ± 1.00 0.8 0.02 0.055 0 0 8.7E-15 1.7E-17 0.025 7.5 0
13
3.525 3.415 110 29.7 98 13 60.81
4.5
29 30 44.8 0.11 0.36 10 20.9 14 3.525 3.416 109 29.7 98 12.95 60.755 29 30 44.8 0.11 0.38 11 20.9 15 3.525 3.417 108 29.7 98 12.9 60.7 29 30 44.8 0.11 0.4 12 20.9
Avg.= 109 29.7 12.95 60.755 29 30 44.8 0.11 0.38 11 20.9
STDEV= ± 1.00 0 0.05 0.055 0 0 8.7E-15 0 0.02 1 0
TSL
TD
P1ci P1cf wcv T1ci
T1cf
Δtc fcf - fci
LH Tng Ta Thd PStc CO2h COh O2h
Pmbar = 4 and Vstc = 10

Appendix A Experimental data sheet
87
16
10 .04 .18
3.525 3.425 100 29.8 98 13.2 60.31
5
29 30 47.4 0.12 0.4 1.5 20.9 17 3.525 3.426 99 29.8 98 13.225 60.3 29 30 47.4 0.12 0.4 3 20.9 18 3.525 3.427 98 29.8 98 13.25 60.29 29 30 47.4 0.12 0.4 4.5 20.9
Avg.= 99 29.8 13.225 60.3 29 30 47.4 0.12 0.4 3 20.9
STDEV= ± 1.00 0 0.025 0.01 0 0 0 0 6.8E-17 1.5 0 19 3.525 3.397 128 30.3 98 13.4 64.65
5.5
29 31 47.15 0.17 0.4 1 20.9 20 3.525 3.3985 126.5 30.3 98 13.45 64.62 29 31 47.15 0.17 0.4 1.75 20.9 21 3.525 3.4 125 30.3 98 13.5 64.59 29 31 47.15 0.17 0.4 2.5 20.9
Avg.= 126.5 30.3 13.45 64.62 29 31 47.15 0.17 0.4 1.75 20.9
STDEV= ± 1.50 0 0.05 0.03 0 0 0 0 6.8E-17 0.75 0 22 3.525 3.401 124 28.1 98 14 67.26
6
30 31 45.6 0.19 0.4 1 20.9 23 3.525 3.403 122 27.95 98 14.1 67.23 30 31 45.6 0.19 0.4 1.25 20.9 24 3.525 3.405 120 27.8 98 14.2 67.2 30 31 45.6 0.19 0.4 1.5 20.9
Avg.= 122 27.95 14.1 67.23 30 31 45.6 0.19 0.4 1.25 20.9
STDEV= ± 2.00 0.15 0.1 0.03 0 0 0 3.4E-17 6.8E-17 0.25 0
25 3.525 3.395 130 29 98 14.2 68.7
6.5
30 30 46.25 0.275 0.4 3 20.9 26 3.525 3.397 128 28.8 98 14.25 68.66 30 30 46.25 0.275 0.4 3 20.9 27 3.525 3.399 126 28.6 98 14.3 68.62 30 30 46.25 0.275 0.4 3 20.9
Avg.= 128 28.8 14.25 68.66 30 30 46.25 0.275 0.4 3 20.9
STDEV= ± 2.00 0.2 0.05 0.04 0 0 0 0 6.8E-17 0 0 28 3.525 3.388 137 26.4 98 14.9 72.22
7
27 26 44.9 0.145 0.4 3 20.9 29 3.525 3.389 136 26.4 98 14.95 72.185 27 26 44.9 0.145 0.4 3 20.9 30 3.525 3.39 135 26.4 98 15 72.15 27 26 44.9 0.145 0.4 3 20.9
Avg.= 136 26.4 14.95 72.185 27 26 44.9 0.145 0.4 3 20.9
STDEV= ± 1.00 4.4E-15 0.05 0.035 0 0 0 0 6.8E-17 0 0
31 3.525 3.391 134 28 98 15.15 70.58
7.5
27 26 44.7 0.12 0.4 2 20.9 32 3.525 3.39 135 28.5 98 15.125 70.54 27 26 44.7 0.12 0.4 2 20.9 33 3.525 3.389 136 29 98 15.1 70.5 27 26 44.7 0.12 0.4 2 20.9
Avg.= 135 28.5 15.125 70.54 27 26 44.7 0.12 0.4 2 20.9
STDEV= ± 1.00 0.5 0.025 0.04 0 0 8.7E-15 0 6.8E-17 0 0

Appendix A Experimental data sheet
88
Table A 1.5: Experimental data for flat bottom pot without Shield at 6 mbar NG Pressure.
1
12. 03. 18
3.406 3.282 124 29.9 98.8 11.32 56.3
2.5
28.5 24 44.35 0.02 0.2 16 20.9 2 3.406 3.281 125 29.15 98.75 11.275 56.675 28 24 44.05 0.02 0.25 16 20.9 3 3.406 3.28 126 28.4 98.7 11.23 57.05 27.5 24 43.75 0.02 0.3 16 20.9
Avg.= 125 29.15 11.275 56.675 28 24 44.05 0.02 0.25 16 20.9
STDEV= ± 1.00 0.75 0.045 0.375 0.5 0 0.3 0 0.05 0 0 4 3.406 3.312 94 28.6 98 11.32 56.98
3
27 27 46.8 0.015 0.2 6.5 20.9 5 3.406 3.314 92 28.75 98 11.315 55.91 27 27.75 47.725 0.0125 0.225 4.75 20.9 6 3.406 3.316 90 28.9 98 11.31 54.84 27 28.5 48.65 0.01 0.25 3 20.9
Avg.= 92 28.75 11.315 55.91 27 27.75 47.725 0.0125 0.225 4.75 20.9
STDEV= ± 2.00 0.15 0.005 1.07 0 0.75 0.925 0.0025 0.025 1.75 0 7 3.406 3.3 106 28.8 98 12 60.46
3.5
28 29 49.45 0.035 0.2 1 20.9 8 3.406 3.301 105 28.8 98 12.1 60.43 28 29 49.45 0.035 0.25 0.5 20.9 9 3.406 3.302 104 28.8 98 12.2 60.4 28 29 49.45 0.035 0.3 0 20.9
Avg.= 105 28.8 12.1 60.43 28 29 49.45 0.035 0.25 0.5 20.9
STDEV= ± 1.00 0 0.1 0.03 0 0 8.7E-15 0 0.05 0.5 0
10 3.406 3.312 94 29.4 98.9 12.88 61.36
4
28.5 30 52.35 0.065 0.2 0 20.9 11 3.406 3.313 93 29.4 98.45 12.84 61.305 28.5 30 52.35 0.065 0.25 0 20.9 12 3.406 3.314 92 29.4 98 12.8 61.25 28.5 30 52.35 0.065 0.3 0 20.9
Avg.= 93 29.4 12.84 61.305 28.5 30 52.35 0.065 0.25 0 20.9
STDEV= ± 1.00 4.4E-15 0.04 0.055 0 0 0 0 0.05 0 0
13
3.406 3.279 127 30.1 98.2 13.17 68.2
4.5
28.6 30 53.35 0.08 0.3 0 20.9 14 3.406 3.28 126 30.1 98.1 13.235 68.1 28.6 30 53.35 0.08 0.3 0 20.9 15 3.406 3.281 125 30.1 98 13.3 68 28.6 30 53.35 0.08 0.3 0 20.9
Avg.= 126 30.1 13.235 68.1 28.6 30 53.35 0.08 0.3 0 20.9
STDEV= ± 1.00 4.4E- 0.065 0.1 4.4E- 0 0 0 0 0 0
TSL
TD P1ci P1cf wcv T1ci
T1cf
Δtc fcf - fci
LH Tng Ta Thd PStc CO2h COh O2h
Pmbar = 6 and Vstc = 10.05

Appendix A Experimental data sheet
89
30. 03 .18
15 15 16 3.406 3.296 110 30.1 98.1 13.4 66.9
5
28.8 30.5 53.45 0.1 0.25 0 20.9 17 3.406 3.283 123 31.05 98.05 13.75 69.515 28.4 30.75 54.075 0.1225 0.325 0 20.9 18 3.406 3.27 136 32 98 14.1 72.13 28 31 54.7 0.145 0.4 0 20.9
Avg.= 123 31.05 13.75 69.515 28.4 30.75 54.075 0.1225 0.325 0 20.9
STDEV= ± 13.00 0.95 0.35 2.615 0.4 0.25 0.625 0.0225 0.075 0 0 19 3.406 3.281 125 30.5 98 14.5 73.45
5.5
29.6 32 55.8 0.14 0.2 0 20.9 20 3.406 3.2795 126.5 30.5 98 14.55 73.495 29.6 32 55.8 0.14 0.3 0 20.9 21 3.406 3.278 128 30.5 98 14.6 73.54 29.6 32 55.8 0.14 0.4 0 20.9
Avg.= 126.5 30.5 14.55 73.495 29.6 32 55.8 0.14 0.3 0 20.9
STDEV= ± 1.50 0 0.05 0.045 4.4E-15 0 8.7E-
15 0 0.1 0 0
22 3.406 3.28 126 31 98 15.1 77.28
6
30 32 57.45 0.155 0.2 0 20.9 23 3.406 3.279 127 30.5 98 15.175 77.48 30 32 57.45 0.155 0.2 0 20.9 24 3.406 3.278 128 30 98 15.25 77.68 30 32 57.45 0.155 0.2 0 20.9
Avg.= 127 30.5 15.175 77.48 30 32 57.45 0.155 0.2 0 20.9
STDEV= ± 1.00 0.5 0.075 0.2 0 0 8.7E-15 0 3E-17 0 0
25 3.406 3.286 120 32 98 15.94 78.59
6.5
30 32 58.65 0.165 0.2 0 20.9 26 3.406 3.285 121 32 98 15.97 78.605 30 32 58.65 0.165 0.25 0 20.9 27 3.406 3.284 122 32 98 16 78.62 30 32 58.65 0.165 0.3 0 20.9
Avg.= 121 32 15.97 78.605 30 32 58.65 0.165 0.25 0 20.9
STDEV= ± 1.00 0 0.03 0.015 0 0 0 0 0.05 0 0 28 3.406 3.28 126 32.6 98 16.98 81.59
7
30 32 58.25 0.16 0.2 0 20.9 29 3.406 3.281 125 32.6 98 16.99 81.795 30 32 58.25 0.16 0.25 0 20.9 30 3.406 3.282 124 32.6 98 17 82 30 32 58.25 0.16 0.3 0 20.9
Avg.= 125 32.6 16.99 81.795 30 32 58.25 0.16 0.25 0 20.9
STDEV= ± 1.00 0 0.01 0.205 0 0 0 0 0.05 0 0 31 3.406 3.222 184 33.5 98 18 95.2
7.5
30 31.5 58.7 0.155 0.25 0 20.9 32 3.406 3.223 183 33.5 98 18.05 95.1 30 31.5 58.7 0.155 0.275 0 20.9 33 3.406 3.224 182 33.5 98 18.1 95 30 31.5 58.7 0.155 0.3 0 20.9
Avg.= 183 33.5 18.05 95.1 30 31.5 58.7 0.155 0.275 0 20.9
STDEV= ± 1.00 0 0.05 0.1 0 0 8.7E-15 0 0.025 0 0
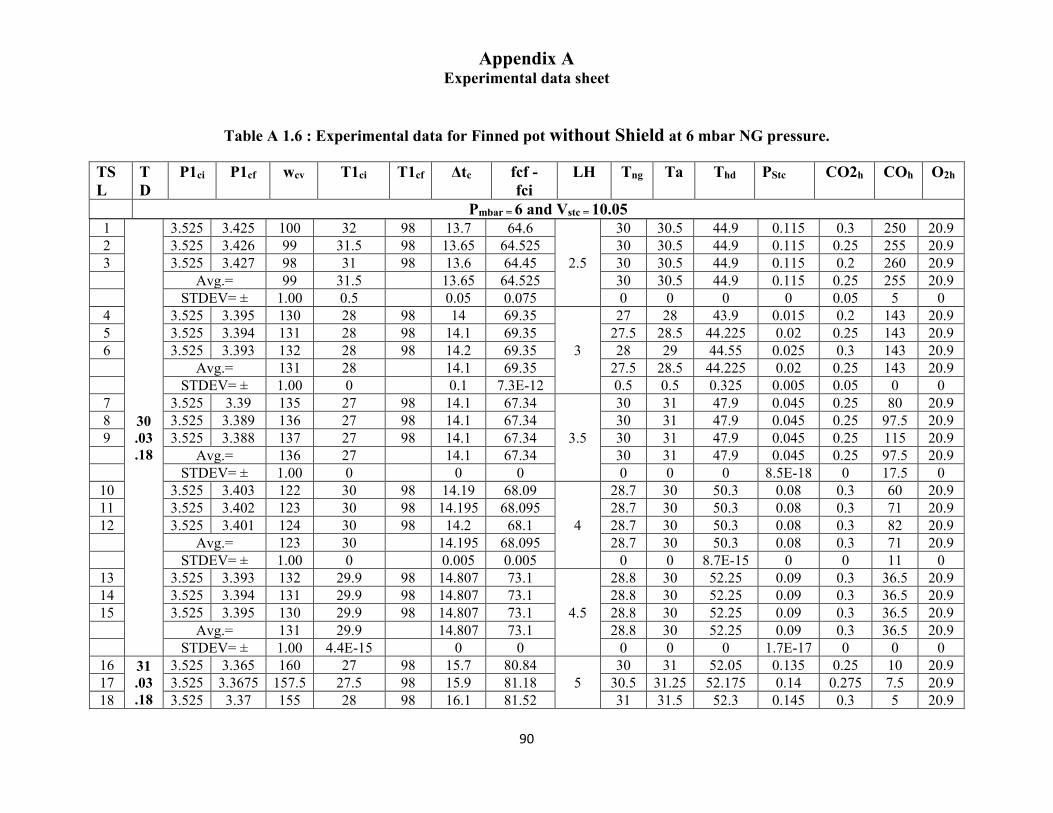
Appendix A Experimental data sheet
90
Table A 1.6 : Experimental data for Finned pot without Shield at 6 mbar NG pressure.
1
30 .03 .18
3.525 3.425 100 32 98 13.7 64.6
2.5
30 30.5 44.9 0.115 0.3 250 20.9 2 3.525 3.426 99 31.5 98 13.65 64.525 30 30.5 44.9 0.115 0.25 255 20.9 3 3.525 3.427 98 31 98 13.6 64.45 30 30.5 44.9 0.115 0.2 260 20.9
Avg.= 99 31.5 13.65 64.525 30 30.5 44.9 0.115 0.25 255 20.9
STDEV= ± 1.00 0.5 0.05 0.075 0 0 0 0 0.05 5 0 4 3.525 3.395 130 28 98 14 69.35
3
27 28 43.9 0.015 0.2 143 20.9 5 3.525 3.394 131 28 98 14.1 69.35 27.5 28.5 44.225 0.02 0.25 143 20.9 6 3.525 3.393 132 28 98 14.2 69.35 28 29 44.55 0.025 0.3 143 20.9
Avg.= 131 28 14.1 69.35 27.5 28.5 44.225 0.02 0.25 143 20.9
STDEV= ± 1.00 0 0.1 7.3E-12 0.5 0.5 0.325 0.005 0.05 0 0 7 3.525 3.39 135 27 98 14.1 67.34
3.5
30 31 47.9 0.045 0.25 80 20.9 8 3.525 3.389 136 27 98 14.1 67.34 30 31 47.9 0.045 0.25 97.5 20.9 9 3.525 3.388 137 27 98 14.1 67.34 30 31 47.9 0.045 0.25 115 20.9
Avg.= 136 27 14.1 67.34 30 31 47.9 0.045 0.25 97.5 20.9
STDEV= ± 1.00 0 0 0 0 0 0 8.5E-18 0 17.5 0 10 3.525 3.403 122 30 98 14.19 68.09
4
28.7 30 50.3 0.08 0.3 60 20.9 11 3.525 3.402 123 30 98 14.195 68.095 28.7 30 50.3 0.08 0.3 71 20.9 12 3.525 3.401 124 30 98 14.2 68.1 28.7 30 50.3 0.08 0.3 82 20.9
Avg.= 123 30 14.195 68.095 28.7 30 50.3 0.08 0.3 71 20.9
STDEV= ± 1.00 0 0.005 0.005 0 0 8.7E-15 0 0 11 0 13 3.525 3.393 132 29.9 98 14.807 73.1
4.5
28.8 30 52.25 0.09 0.3 36.5 20.9 14 3.525 3.394 131 29.9 98 14.807 73.1 28.8 30 52.25 0.09 0.3 36.5 20.9 15 3.525 3.395 130 29.9 98 14.807 73.1 28.8 30 52.25 0.09 0.3 36.5 20.9
Avg.= 131 29.9 14.807 73.1 28.8 30 52.25 0.09 0.3 36.5 20.9
STDEV= ± 1.00 4.4E-15 0 0 0 0 0 1.7E-17 0 0 0 16 31
.03
.18
3.525 3.365 160 27 98 15.7 80.84 5
30 31 52.05 0.135 0.25 10 20.9 17 3.525 3.3675 157.5 27.5 98 15.9 81.18 30.5 31.25 52.175 0.14 0.275 7.5 20.9 18 3.525 3.37 155 28 98 16.1 81.52 31 31.5 52.3 0.145 0.3 5 20.9
TSL
TD
P1ci P1cf wcv T1ci
T1cf
Δtc fcf - fci
LH Tng Ta Thd PStc CO2h COh O2h
Pmbar = 6 and Vstc = 10.05

Appendix A Experimental data sheet
91
Avg.= 157.5 27.5 15.9 81.18 30.5 31.25 52.175 0.14 0.275 7.5 20.9
STDEV= ± 2.50 0.5 0.2 0.34 0.5 0.25 0.125 0.005 0.025 2.5 0 19 3.525 3.353 172 30.9 98 15.8 81.78
5.5
29 32 52.8 0.14 0.3 5 20.9 20 3.525 3.352 173 30.9 98 15.775 81.78 29 32 52.8 0.14 0.3 5 20.9 21 3.525 3.351 174 30.9 98 15.75 81.78 29 32 52.8 0.14 0.3 5 20.9
Avg.= 173 30.9 15.775 81.78 29 32 52.8 0.14 0.3 5 20.9
STDEV= ± 1.00 4.4E-15 0.025 0 0 0 8.7E-15 0 0 0 0 22 3.525 3.389 136 31.5 98 15.86 77.86
6
30 32 54.75 0.155 0.3 0 20.9 23 3.525 3.387 138 31.5 98 15.87 77.88 30 32 54.75 0.155 0.3 0 20.9 24 3.525 3.385 140 31.5 98 15.88 77.9 30 32 54.75 0.155 0.3 0 20.9
Avg.= 138 31.5 15.87 77.88 30 32 54.75 0.155 0.3 0 20.9
STDEV= ± 2.00 0 0.01 0.02 0 0 0 0 0 0 0 25 3.525 3.386 139 32.1 98 16.187 79.61
6.5
30 32 56.25 0.17 0.3 0 20.9 26 3.525 3.387 138 32.1 98 16.187 79.61 30 32 56.25 0.17 0.3 0 20.9 27 3.525 3.388 137 32.1 98 16.187 79.61 30 32 56.25 0.17 0.3 0 20.9
Avg.= 138 32.1 16.187 79.61 30 32 56.25 0.17 0.3 0 20.9
STDEV= ± 1.00 0 0 0 0 0 0 0 0 0 0 28 3.525 3.372 153 32 97.6 16.94 82.64
7
30 32 55.85 0.155 0.3 0 20.9 29 3.525 3.373 152 32.1 97.6 16.94 82.705 30 31.5 55.5 0.15 0.3 0 20.9 30 3.525 3.374 151 32.2 97.6 16.94 82.77 30 31 55.15 0.145 0.3 0 20.9
Avg.= 152 32.1 16.94 82.705 30 31.5 55.5 0.15 0.3 0 20.9
STDEV= ± 1.00 0.1 0 0.065 0 0.5 0.35 0.005 0 0 0 31 3.525 3.388 137 33.9 98 16.7 81.01
7.5
30 31 55.45 0.155 0.3 0 20.9 32 3.525 3.387 138 33.9 98 16.75 81.045 30 31 55.45 0.155 0.3 0 20.9 33 3.525 3.386 139 33.9 98 16.8 81.08 30 31 55.45 0.155 0.3 0 20.9
Avg.= 138 33.9 16.75 81.045 30 31 55.45 0.155 0.3 0 20.9
STDEV= ± 1.00 0 0.05 0.035 0 0 8.7E-15 0 0 0 0

Appendix A Experimental data sheet
92
Table A 1.7 : Experimental data for flat bottom pot with Shield at 6 mbar NG pressure.
1
07 .04 .18
3.406 3.31 96 30.2 98 11.67 53.26
2.5
26 27 43 0.05 0.1 70 20.9 2 3.406 3.3095 96.5 30.1 98 11.475 52.67 25.7 27.7 43.27 0.055 0.115 75 20.9 3 3.406 3.309 97 30 98 11.28 52.08 25.5 28.5 43.55 0.06 0.13 80 20.9
Avg.= 96.5 30.1 11.475 52.67 25.7 27.7 43.27 0.055 0.115 75 20.9 STDEV= ± 0.50 0.1 0.195 0.59 0.25 0.75 0.275 0.005 0.015 5 0
4 3.406 3.305 101 28.5 98 11.55 52.85
3
26 29 44.45 0.08 0.1 19.5 20.9 5 3.406 3.3025 103.5 28.55 98 11.425 52.49 26.4 29 45.22 0.04 0.1 19.5 20.9 6 3.406 3.3 106 28.6 98 11.3 52.13 26.8 29 46 0 0.1 19.5 20.9
Avg.= 103.5 28.55 11.425 52.49 26.4 29 45.22 0.04 0.1 19.5 20.9 STDEV= ± 2.50 0.05 0.125 0.36 0.4 0 0.77 0.04 1.7E-17 0 0
7 3.406 3.322 84 31.4 98 10.97 50.89
3.5
27.5 29.5 46.7 0.085 0.3 7 20.9 8 3.406 3.3185 87.5 31.5 98 11.1 51.39 27.7 29.75 46.6 0.1 0.3 7 20.9 9 3.406 3.315 91 31.6 98 11.23 51.89 28 30 46.5 0.115 0.3 7 20.9
Avg.= 87.5 31.5 11.1 51.39 27.75 29.75 46.6 0.1 0.3 7 20.9 STDEV= ± 3.50 0.1 0.13 0.5 0.25 0.25 0.1 0.015 0 0 0 10 3.406 3.308 98 32 98.3 11.53 53.26
4
28 30 45.55 0.12 0.3 0 20.9 11 3.406 3.311 95 32 98.15 11.415 53.08 28 30 45.55 0.1075 0.3 0 20.9 12 3.406 3.314 92 32 98 11.3 52.9 28 30 45.55 0.095 0.3 0 20.9
Avg.= 95 32 11.415 53.08 28 30 45.55 0.1075 0.3 0 20.9 STDEV= ± 3.00 0 0.115 0.18 0 0 8.7E-15 0.0125 0 0 0 13 3.406 3.313 93 31.4 98 11.58 56
4.5
28 29 45.25 0.08 0.25 0 20.9 14 3.406 3.3145 91.5 31.5 98 11.465 54.535 28 29.5 45.85 0.0775 0.25 0 20.9 15 3.406 3.316 90 31.6 98 11.35 53.07 28 30 46.45 0.075 0.25 0 20.9
Avg.= 91.5 31.5 11.465 54.535 28 29.5 45.85 0.0775 0.25 0 20.9 STDEV= ± 1.50 0.1 0.115 1.465 0 0.5 0.6 0.0025 0 0 0 16 3.406 3.313 93 31.2 98 12.15 54.78
5 28 30 47.85 0.08 0.2 0 20.9
17 3.406 3.312 94 30.9 98 12.08 56.135 28 30 47.9 0.085 0.2 0 20.9 18 3.406 3.311 95 30.6 98 12.01 57.49 28 30 47.95 0.09 0.2 0 20.9
TSL
TD P1ci P1cf wcv T1ci
T1cf
Δtc fcf - fci
LH Tng Ta Thd PStc CO2h COh O2h
Pmbar = 6 and Vstc = 10.05

Appendix A Experimental data sheet
93
Avg.= 94 30.9 12.08 56.135 28 30 47.9 0.085 0.2 0 20.9 STDEV= ± 1.00 0.3 0.07 1.355 0 0 0.05 0.005 3.4E-17 0 0 19 3.406 3.288 118 30.5 98 12.61 60.38
5.5
28 29 50.8 0.08 0.2 0 20.9 20 3.406 3.282 124 30.55 98 12.785 61.365 28 29 50.825 0.08 0.2 0 20.9 21 3.406 3.276 130 30.6 98 12.96 62.35 28 29 50.85 0.08 0.2 0 20.9
Avg.= 124 30.55 12.785 61.365 28 29 50.825 0.08 0.2 0 20.9 STDEV= ± 6.00 0.05 0.175 0.985 0 0 0.025 0 3.4E-17 0 0 22 3.406 3.3 106 30.2 98 12.71 61.64
6
28 29 50.2 0.07 0.2 0 20.9 23 3.406 3.296 110 30.2 98 12.77 61.32 28 29 49.3 0.0575 0.2 0 20.9 24 3.406 3.292 114 30.2 98 12.83 61 28 29 48.4 0.045 0.2 0 20.9
Avg.= 110 30.2 12.77 61.32 28 29 49.3 0.0575 0.2 0 20.9 STDEV= ± 4.00 0 0.06 0.32 0 0 0.9 0.0125 3.4E-17 0 0 25 3.406 3.304 102 30.7 98 13 61.57
6.5
28 29 49.15 0.03 0.2 0 20.9 26 3.406 3.2985 107.5 30.65 98 13.2 61.66 27.5 29 49.05 0.03 0.2 0 20.9 27 3.406 3.293 113 30.6 98 13.4 61.75 27 29 48.95 0.03 0.2 0 20.9
Avg.= 107.5 30.65 13.2 61.66 27.5 29 49.05 0.03 0.2 0 20.9 STDEV= ± 5.50 0.05 0.2 0.09 0.5 0 0.1 0 3.4E-17 0 0 28 3.406 3.296 110 28.6 98 13.78 64.72
7
27.5 28.5 49.7 0.08 0.2 0 20.9 29 3.406 3.297 109 28.55 98 13.765 64.71 27.5 28.5 49.7 0.08 0.2 0 20.9 30 3.406 3.298 108 28.5 98 13.75 64.7 27.5 28.5 49.7 0.08 0.2 0 20.9
Avg.= 109 28.55 13.765 64.71 27.5 28.5 49.7 0.08 0.2 0 20.9
STDEV= ± 1.00 0.05 0.015 0.01 0 0 8.7E-15 0 3.4E-17 0 0
31 3.406 3.295 111 28.3 98 13.56 65.5
7.5
27 28 48.4 0.06 0.2 0 20.9 32 3.406 3.296 110 28.3 98 13.505 65.475 27 28 48.4 0.06 0.2 0 20.9 33 3.406 3.297 109 28.3 98 13.45 65.45 27 28 48.4 0.06 0.2 0 20.9
Avg.= 110 28.3 13.505 65.475 27 28 48.4 0.06 0.2 0 20.9 STDEV= ± 1.00 0 0.055 0.025 0 0 0 0 3.4E-17 0 0

Appendix A Experimental data sheet
94
Table A 1.8: Experimental data for Finned pot with Shield at 6 mbar NG pressure.
1
11 .04 .18
3.525 3.42 105 29.9 98 12.53 59.45
2.5
25 28 42.95 0.055 0.2 414 20.9 2 3.525 3.416 109 30.4 98 12.49 58.835 25.5 28.5 42.35 0.0625 0.2 418.5 20.9 3 3.525 3.412 113 30.9 98 12.45 58.22 26 29 41.75 0.07 0.2 423 20.9
Avg.= 109 30.4 12.49 58.835 25.5 28.5 42.35 0.0625 0.2 418.5 20.9
STDEV= ± 4.00 0.5 0.04 0.615 0.5 0.5 0.6 0.0075 3.4E-17 4.5 0 4 3.525 3.436 89 32 98 11.67 54.3
3
26 29 43.65 0.075 0.18 380 20.9 5 3.525 3.4255 99.5 31.6 98 12.085 56.1 26.5 29 44.325 0.06 0.19 370 20.9 6 3.525 3.415 110 31.2 98 12.5 57.9 27 29 45 0.045 0.2 360 20.9
Avg.= 99.5 31.6 12.085 56.1 26.5 29 44.325 0.06 0.19 370 20.9
STDEV= ± 10.50 0.4 0.415 1.8 0.5 0 0.675 0.015 0.01 10 0 7 3.525 3.428 97 30.4 98 11.97 55.7
3.5
28 29 45.25 0.095 0.2 320 20.9 8 3.525 3.4185 106.5 30.45 98 12.16 56.56 28 29.5 44.975 0.1025 0.2 311 20.9 9 3.525 3.409 116 30.5 98 12.35 57.42 28 30 44.7 0.11 0.2 302 20.9
Avg.= 106.5 30.45 12.16 56.56 28 29.5 44.975 0.1025 0.2 311 20.9
STDEV= ± 9.50 0.05 0.19 0.86 0 0.5 0.275 0.0075 3.4E-17 9 0 10 3.525 3.393 132 32 98 12.3 59.42
4
28 30 45.85 0.11 0.3 120 20.9 11 3.525 3.4035 121.5 32.1 98 12.15 58.855 28 30 44.825 0.105 0.3 117.5 20.9 12 3.525 3.414 111 32.2 98 12 58.29 28 30 43.8 0.1 0.3 115 20.9
Avg.= 121.5 32.1 12.15 58.855 28 30 44.825 0.105 0.3 117.5 20.9
STDEV= ± 10.50 0.1 0.15 0.565 0 0 1.025 0.005 0 2.5 0 13 3.525 3.427 98 32 98 12.4 56.99
4.5
28 29.5 45.4 0.08 0.4 15 20.9 14 3.525 3.427 98 31.75 98 12.225 56.75 28 29.75 45.75 0.0775 0.4 12.5 20.9 15 3.525 3.427 98 31.5 98 12.05 56.51 28 30 46.1 0.075 0.4 10 20.9
Avg.= 98 31.75 12.225 56.75 28 29.75 45.75 0.0775 0.4 12.5 20.9
STDEV= ± 0.00 0.25 0.175 0.24 0 0.25 0.35 0.0025 6.8E-17 2.5 0 16 3.525 3.397 128 30 98 13.06 62.68
5 28 30 47.5 0.085 0.4 6 20.9
17 3.525 3.402 123 30.75 98 12.895 61.91 28 29.5 47.25 0.0875 0.4 5.5 20.9 18 3.525 3.407 118 31.5 98 12.73 61.14 28 29 47 0.09 0.4 5 20.9
TSL
TD P1ci P1cf wcv T1ci
T1cf
Δtc fcf - fci
LH Tng Ta Thd PStc CO2h COh O2h
Pmbar = 6 and Vstc = 10.05

Appendix A Experimental data sheet
95
Avg.= 123 30.75 12.895 61.91 28 29.5 47.25 0.0875 0.4 5.5 20.9
STDEV= ± 5.00 0.75 0.165 0.77 0 0.5 0.25 0.0025 6.8E-17 0.5 0 19 3.525 3.399 126 29 98 13.2 63.78
5.5
28 29 48.2 0.08 0.4 0 20.9 20 3.525 3.393 132 29.35 98 13.34 65.18 28 29 46.975 0.075 0.4 0 20.9 21 3.525 3.387 138 29.7 98 13.48 66.58 28 29 45.75 0.07 0.4 0 20.9
Avg.= 132 29.35 13.34 65.18 28 29 46.975 0.075 0.4 0 20.9
STDEV= ± 6.00 0.35 0.14 1.4 0 0 1.225 0.005 6.8E-17 0 0 22 3.525 3.388 137 30.9 98 13.3 65.3
6
28 29 46.4 0.055 0.4 0 20.9 23 3.525 3.3925 132.5 33.65 98 12.9 63.315 28 29 45.975 0.0425 0.4 0 20.9 24 3.525 3.397 128 36.4 98 12.5 61.33 28 29 45.55 0.03 0.4 0 20.9
Avg.= 132.5 33.65 12.9 63.315 28 29 45.975 0.0425 0.4 0 20.9
STDEV= ± 4.50 2.75 0.4 1.985 0 0 0.425 0.0125 6.8E-17 0 0 25 3.525 3.413 112 33.1 98 13.18 63.86
6.5
28 29 46.35 0.02 0.4 0 20.9 26 3.525 3.404 121 32.25 98 13.44 64.405 27.5 28.5 45.675 0.0375 0.4 0 20.9 27 3.525 3.395 130 31.4 98 13.7 64.95 27 28 45 0.055 0.4 0 20.9
Avg.= 121 32.25 13.44 64.405 27.5 28.5 45.675 0.0375 0.4 0 20.9
STDEV= ± 9.00 0.85 0.26 0.545 0.5 0.5 0.675 0.0175 6.8E-17 0 0 28 3.525 3.397 128 29.7 98 13.9 67.1
7
27.5 28 46.7 0.075 0.4 0 20.9 29 3.525 3.4 125 30.55 98 14 67.075 27.5 28 46.7 0.075 0.4 0 20.9 30 3.525 3.403 122 31.4 98 14.1 67.05 27.5 28 46.7 0.075 0.4 0 20.9
Avg.= 125 30.55 14 67.075 27.5 28 46.7 0.075 0.4 0 20.9
STDEV= ± 3.00 0.85 0.1 0.025 0 0 8.7E-15 0 6.8E-17 0 0
31 3.525 3.409 116 31.4 98 14.6 66.6
7.5
28 28.5 46.35 0.07 0.4 0 20.9 32 3.525 3.412 113 31.4 98 14.2 65.3 28 28.5 46.35 0.07 0.4 0 20.9 33 3.525 3.415 110 31.4 98 13.8 64 28 28.5 46.35 0.07 0.4 0 20.9
Avg.= 113 31.4 14.2 65.3 28 28.5 46.35 0.07 0.4 0 20.9
STDEV= ± 3.00 4.4E-15 0.4 1.3 0 0 0 0 6.8E-17 0 0
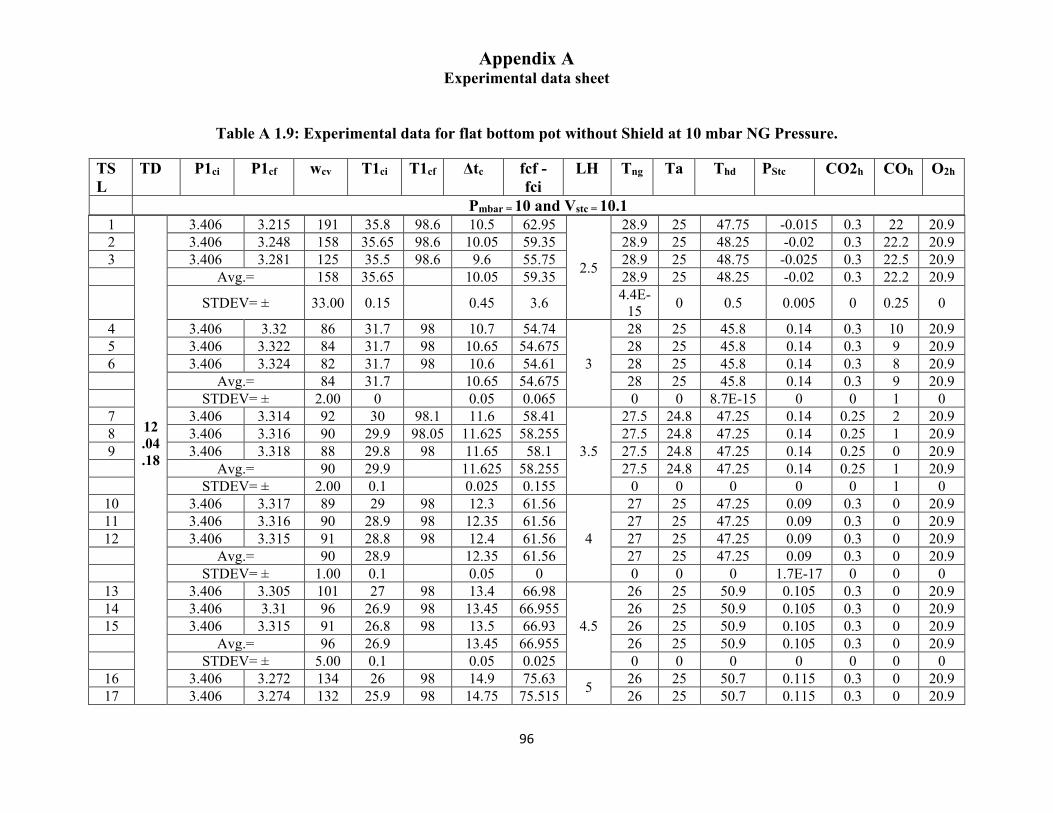
Appendix A Experimental data sheet
96
Table A 1.9: Experimental data for flat bottom pot without Shield at 10 mbar NG Pressure.
1
12 .04 .18
3.406 3.215 191 35.8 98.6 10.5 62.95
2.5
28.9 25 47.75 -0.015 0.3 22 20.9 2 3.406 3.248 158 35.65 98.6 10.05 59.35 28.9 25 48.25 -0.02 0.3 22.2 20.9 3 3.406 3.281 125 35.5 98.6 9.6 55.75 28.9 25 48.75 -0.025 0.3 22.5 20.9
Avg.= 158 35.65 10.05 59.35 28.9 25 48.25 -0.02 0.3 22.2 20.9
STDEV= ± 33.00 0.15 0.45 3.6 4.4E-15 0 0.5 0.005 0 0.25 0
4 3.406 3.32 86 31.7 98 10.7 54.74
3
28 25 45.8 0.14 0.3 10 20.9 5 3.406 3.322 84 31.7 98 10.65 54.675 28 25 45.8 0.14 0.3 9 20.9 6 3.406 3.324 82 31.7 98 10.6 54.61 28 25 45.8 0.14 0.3 8 20.9
Avg.= 84 31.7 10.65 54.675 28 25 45.8 0.14 0.3 9 20.9
STDEV= ± 2.00 0 0.05 0.065 0 0 8.7E-15 0 0 1 0 7 3.406 3.314 92 30 98.1 11.6 58.41
3.5
27.5 24.8 47.25 0.14 0.25 2 20.9 8 3.406 3.316 90 29.9 98.05 11.625 58.255 27.5 24.8 47.25 0.14 0.25 1 20.9 9 3.406 3.318 88 29.8 98 11.65 58.1 27.5 24.8 47.25 0.14 0.25 0 20.9
Avg.= 90 29.9 11.625 58.255 27.5 24.8 47.25 0.14 0.25 1 20.9
STDEV= ± 2.00 0.1 0.025 0.155 0 0 0 0 0 1 0 10 3.406 3.317 89 29 98 12.3 61.56
4
27 25 47.25 0.09 0.3 0 20.9 11 3.406 3.316 90 28.9 98 12.35 61.56 27 25 47.25 0.09 0.3 0 20.9 12 3.406 3.315 91 28.8 98 12.4 61.56 27 25 47.25 0.09 0.3 0 20.9
Avg.= 90 28.9 12.35 61.56 27 25 47.25 0.09 0.3 0 20.9
STDEV= ± 1.00 0.1 0.05 0 0 0 0 1.7E-17 0 0 0 13 3.406 3.305 101 27 98 13.4 66.98
4.5
26 25 50.9 0.105 0.3 0 20.9 14 3.406 3.31 96 26.9 98 13.45 66.955 26 25 50.9 0.105 0.3 0 20.9 15 3.406 3.315 91 26.8 98 13.5 66.93 26 25 50.9 0.105 0.3 0 20.9
Avg.= 96 26.9 13.45 66.955 26 25 50.9 0.105 0.3 0 20.9
STDEV= ± 5.00 0.1 0.05 0.025 0 0 0 0 0 0 0 16 3.406 3.272 134 26 98 14.9 75.63 5 26 25 50.7 0.115 0.3 0 20.9 17 3.406 3.274 132 25.9 98 14.75 75.515 26 25 50.7 0.115 0.3 0 20.9
TSL
TD P1ci P1cf wcv T1ci
T1cf
Δtc fcf - fci
LH Tng Ta Thd PStc CO2h COh O2h
Pmbar = 10 and Vstc = 10.1

Appendix A Experimental data sheet
97
18 3.406 3.276 130 25.8 98 14.6 75.4 26 25 50.7 0.115 0.3 0 20.9
Avg.= 132 25.9 14.75 75.515 26 25 50.7 0.115 0.3 0 20.9
STDEV= ± 2.00 0.1 0.15 0.115 0 0 8.7E-15 0 0 0 0 19 3.406 3.301 105 25.8 98 15.3 75.11
5.5
26 25 52.5 0.105 0.3 0 20.9 20 3.406 3.301 105 25.5 98 15.4 75.11 26 25 52.5 0.105 0.3 0 20.9 21 3.406 3.301 105 25.2 98 15.5 75.11 26 25 52.5 0.105 0.3 0 20.9
Avg.= 105 25.5 15.4 75.11 26 25 52.5 0.105 0.3 0 20.9
STDEV= ± 0.00 0.3 0.1 0 0 0 0 0 0 0 0 22 3.406 3.3 106 25.2 98.2 15.9 78.84
6
26 25 52.9 0.16 0.3 0 20.9 23 3.406 3.3 106 25.15 98.1 15.925 78.84 26 25 52.9 0.16 0.3 0 20.9 24 3.406 3.3 106 25.1 98 15.95 78.84 26 25 52.9 0.16 0.3 0 20.9
Avg.= 106 25.15 15.925 78.84 26 25 52.9 0.16 0.3 0 20.9
STDEV= ± 0.00 0.05 0.025 0 0 0 0 0 0 0 0 25 3.406 3.288 118 25.1 98 16.7 83.33
6.5
25.5 25 53.65 0.195 0.3 0 20.9 26 3.406 3.2895 116.5 25.1 98 16.55 83.33 25.5 25 53.65 0.195 0.3 0 20.9 27 3.406 3.291 115 25.1 98 16.4 83.33 25.5 25 53.65 0.195 0.3 0 20.9
Avg.= 116.5 25.1 16.55 83.33 25.5 25 53.65 0.195 0.3 0 20.9
STDEV= ± 1.50 4.4E-15 0.15 0 0 0 0 3.4E-17 0 0 0
28 3.406 3.27 136 24.5 98 17.9 90.24
7
25 25 53.5 0.18 0.3 0 20.9 29 3.406 3.271 135 24.4 98 17.85 90.24 25 25 53.5 0.18 0.3 0 20.9 30 3.406 3.272 134 24.3 98 17.8 90.24 25 25 53.5 0.18 0.3 0 20.9
Avg.= 135 24.4 17.85 90.24 25 25 53.5 0.18 0.3 0 20.9
STDEV= ± 1.00 0.1 0.05 0 0 0 0 3.4E-17 0 0 0 31 3.406 3.266 140 24.3 98.2 18.7 93.7
7.5
25 24.7 54.45 0.18 0.3 0 20.9 32 3.406 3.266 140 24.3 97.9 18.75 93.7 25 24.7 54.45 0.18 0.3 0 20.9 33 3.406 3.266 140 24.3 97.6 18.8 93.7 25 24.7 54.45 0.18 0.3 0 20.9
Avg.= 140 24.3 18.75 93.7 25 24.7 54.45 0.18 0.3 0 20.9
STDEV= ± 0.00 0 0.05 0 0 0 8.7E-15 3.4E-17 0 0 0

Appendix A Experimental data sheet
98
Table A 1.10 : Experimental data for Finned pot without Shield at 10 mbar NG pressure.
1
30 .03 .18
3.525 3.425 100 32.6 98 12.9 65.44
2.5
29 26 41.85 0.165 0.2 230 20.9 2 3.525 3.426 99 32.6 98 12.9 65.44 29 26 41.85 0.165 0.2 235 20.9 3 3.525 3.427 98 32.6 98 12.9 65.44 29 26 41.85 0.165 0.2 240 20.9
Avg.= 99 32.6 12.9 65.44 29 26 41.85 0.165 0.2 235 20.9
STDEV= ± 1.0 0 0 0 0 0 0 0 3.4E-17 5 0 4 3.525 3.415 110 32 98 12.95 65.9
3
28 25.5 44.9 0.145 0.25 146 20.9 5 3.525 3.421 104 32 98 12.925 65.55 28 25.5 44.9 0.145 0.225 148 20.9 6 3.525 3.427 98 32 98 12.9 65.2 28 25.5 44.9 0.145 0.2 150 20.9
Avg.= 104 32 12.925 65.55 28 25.5 44.9 0.145 0.225 148 20.9
STDEV= ± 6.0 0 0.025 0.35 0 0 0 0 0.025 2 0 7 3.525 3.397 128 30.6 98 13.3 67.1
3.5
27 25 45.15 0.135 0.25 120 20.9 8 3.525 3.402 123 30.6 98 13.1 66.82 27 25 45.15 0.135 0.275 115 20.9 9 3.525 3.407 118 30.6 98 12.9 66.54 27 25 45.15 0.135 0.3 110 20.9
Avg.= 123 30.6 13.1 66.82 27 25 45.15 0.135 0.275 115 20.9
STDEV= ± 5.00 4.4E-15 0.2 0.28 0 0 0 0 0.025 5 0 10 3.525 3.417 108 28.6 98 13.95 69.36
4
27 25 47.7 0.1 0.3 87.5 20.9 11 3.525 3.417 108 28.6 98 13.95 69.36 27 25 47.7 0.1 0.3 90.5 20.9 12 3.525 3.417 108 28.6 98 13.95 69.36 27 25 47.7 0.1 0.3 93.5 20.9
Avg.= 108 28.6 13.95 69.36 27 25 47.7 0.1 0.3 90.5 20.9
STDEV= ± 0.0 4.4E-15 2.2E-
15 0 0 0 8.7E-15 1.7E-17 0 3 0
13 3.525 3.417 108 26.9 98 14.65 72.53
4.5
27 25 48.7 0.11 0.4 45 20.9 14 3.525 3.417 108 26.9 98 14.625 72.53 27 25 48.7 0.11 0.4 54.25 20.9 15 3.525 3.417 108 26.9 98 14.6 72.53 27 25 48.7 0.11 0.4 63.5 20.9
Avg.= 108 26.9 14.625 72.53 27 25 48.7 0.11 0.4 54.25 20.9
STDEV= ± 0.00 4.4E-15 0.025 0 0 0 8.7E-15 0 6.8E-17 9.25 0
16 3.525 3.411 114 26 98 15.6 75.62 5 26 25 48.5 0.12 0.4 27 20.9
TSL
TD P1ci P1cf wcv T1ci
T1cf
Δtc fcf - fci
LH Tng Ta Thd PStc CO2h COh O2h
Pmbar = 10 and Vstc = 10.1

Appendix A Experimental data sheet
99
17 3.525 3.411 114 26 98 15.5 75.62 26 25 48.5 0.12 0.4 25.5 20.9 18 3.525 3.411 114 26 98 15.4 75.62 26 25 48.5 0.12 0.4 24 20.9
Avg.= 114 26 15.5 75.62 26 25 48.5 0.12 0.4 25.5 20.9
STDEV= ± 0.0 0 0.1 0 0 0 0 0 6.8E-17 1.5 0 19 3.525 3.406 119 25.4 98 16.4 78.53
5.5
26 25 49.75 0.13 0.4 16 20.9 20 3.525 3.407 118 25.4 98 16.375 78.465 26 25 49.75 0.13 0.4 11.5 20.9 21 3.525 3.408 117 25.4 98 16.35 78.4 26 25 49.75 0.13 0.4 7 20.9
Avg.= 118 25.4 16.375 78.465 26 25 49.75 0.13 0.4 11.5 20.9
STDEV= ± 1.0 4.4E-15 0.025 0.065 0 0 0 0 6.8E-17 4.5 0 22 3.525 3.408 117 25.2 98 17.05 80.58
6
26 25 51.7 0.18 0.4 0 20.9 23 3.525 3.407 118 25.2 98 17.075 80.6 26 25 51.7 0.18 0.4 0 20.9 24 3.525 3.406 119 25.2 98 17.1 80.62 26 25 51.7 0.4 0 20.9
Avg.= 118 25.2 17.075 80.6 26 25 51.7 0.18 0.4 0 20.9
STDEV= ± 1.00 0 0.025 0.02 0 0 8.7E-15 0 6.8E-17 0 0
25 3.525 3.373 152 24.4 98 17.9 87.91
6.5
25.7 25 52.6 0.19 0.4 0 20.9 26 3.525 3.373 152 24.4 98 17.925 87.91 25.7 25 52.6 0.19 0.4 0 20.9 27 3.525 3.373 152 24.4 98 17.95 87.91 25.7 25 52.6 0.19 0.4 0 20.9
Avg.= 152 24.4 17.925 87.91 25.7 25 52.6 0.19 0.4 0 20.9
STDEV= ± 0.0 4.4E-15 0.025 0 0 0 0 3.4E-17 6.8E-17 0 0 28 3.525 3.357 168 24 98 18.4 92.1
7
25 24.8 51.4 0.18 0.4 0 20.9 29 3.525 3.359 166 24 98 18.425 91.99 25 24.8 51.4 0.18 0.4 0 20.9 30 3.525 3.361 164 24 98 18.45 91.88 25 24.8 51.4 0.18 0.4 0 20.9
Avg.= 166 24 18.425 91.99 25 24.8 51.4 0.18 0.4 0 20.9
STDEV= ± 2.0 0 0.025 0.11 0 0 0 3.4E-17 6.8E-17 0 0 31 3.525 3.374 151 23.7 98 19.3 91.38
7.5
25 25 50.8 0.17 0.4 0 20.9 32 3.525 3.374 151 23.7 98 19.2 91.38 25 25 50.8 0.17 0.4 0 20.9 33 3.525 3.374 151 23.7 98 19.1 91.38 25 25 50.8 0.17 0.4 0 20.9
Avg.= 151 23.7 19.2 91.38 25 25 50.8 0.17 0.4 0 20.9
STDEV= ± 0.0 0 0.1 0 0 0 8.7E-15 0 6.8E-17 0 0

Appendix A Experimental data sheet
100
Table A 1.11 : Experimental data for flat bottom pot with Shield at 10 mbar NG pressure.
1
04. 08. 18
3.406 3.321 85 24.3 98 12.38 57.51
2.5
25 27 42.8 0.06 0.2 161.5 20.9 2 3.406 3.32 86 24.65 98 11.995 57.75 25.5 27.5 43.1 0.0625 0.2 152.5 20.9 3 3.406 3.319 87 25 98 11.61 58 26 28 43.4 0.065 0.2 143.5 20.9
Avg.= 86 24.65 11.995 57.75 25.5 27.5 43.1 0.0625 0.2 152.5 20.9
STDEV= ± 1.00 0.35 0.385 0.245 0.5 0.5 0.3 0.0025 3.4E-17 9 0
4 3.406 3.314 92 25 98 11.48 56.82
3
26 28 44.45 0.065 0.2 37.5 20.9 5 3.406 3.318 88 24.85 98 11.265 56.2 26.5 28.25 44.95 0.0725 0.2 49.5 20.9 6 3.406 3.322 84 24.7 98 11.05 55.58 27 28.5 45.45 0.08 0.2 61.5 20.9
Avg.= 88 24.85 11.265 56.2 26.5 28.25 44.95 0.0725 0.2 49.5 20.9
STDEV= ± 4.00 0.15 0.215 0.62 0.5 0.25 0.5 0.0075 3.4E-17 12 0
7 3.406 3.321 85 24.8 98 11.25 56.04
3.5
27 29 43.95 0.095 0.25 17.5 20.9 8 3.406 3.322 84 25.1 98 11.225 55.86 27 29 44.25 0.095 0.275 16.5 20.9 9 3.406 3.323 83 25.4 98 11.2 55.69 27 29 44.55 0.095 0.3 15.5 20.9
Avg.= 84 25.1 11.225 55.86 27 29 44.25 0.095 0.275 16.5 20.9 STDEV= ± 1.00 0.3 0.025 0.175 0 0 0.3 1.7E-17 0.025 1 0
10 3.406 3.325 81 25 98 11.4 56.64
4
27 29 45.15 0.1 0.3 17.5 20.9 11 3.406 3.321 85 24.35 98 11.48 57.17 27.5 29 45 0.125 0.3 18.25 20.9 12 3.406 3.317 89 23.7 98 11.56 57.7 28 29 44.85 0.15 0.3 19 20.9
Avg.= 85 24.35 11.48 57.17 27.5 29 45 0.125 0.3 18.25 20.9 STDEV= ± 4.00 0.65 0.08 0.53 0.5 0 0.15 0.025 0 0.75 0
13 3.406 3.308 98 25.2 98 11.85 59.25
4.5
28 30 45.15 0.13 0.3 8 20.9 14 3.406 3.3115 94.5 25.65 98 11.625 58.96 28 30 45.35 0.1325 0.3 9.5 20.9 15 3.406 3.315 91 26.1 98 11.4 58.67 28 30 45.55 0.135 0.3 11 20.9
Avg.= 94.5 25.65 11.625 58.96 28 30 45.35 0.1325 0.3 9.5 20.9 STDEV= ± 3.50 0.45 0.225 0.29 0 0 0.2 0.0025 0 1.5 0
16 3.406 3.3 106 25.6 98.3 12.06 61.92 5
28 30 47.2 0.12 0.3 9 20.9 17 3.406 3.309 97 25.75 98.15 11.72 60.45 28 29.75 47.075 0.1325 0.3 5 20.9 18 3.406 3.318 88 25.9 98 11.38 58.99 28 29.5 46.95 0.145 0.3 1 20.9
TSL
TD P1ci P1cf wcv T1ci
T1cf
Δtc fcf - fci
LH Tng Ta Thd PStc CO2h COh O2h
Pmbar = 10 and Vstc = 10.43

Appendix A Experimental data sheet
101
Avg.= 97 25.75 11.72 60.45 28 29.75 47.075 0.1325 0.3 5 20.9 STDEV= ± 9.00 0.15 0.34 1.465 0 0.25 0.125 0.0125 0 4 0
19 3.406 3.308 98 25.4 98 11.96 61.87
5.5
28 28 46.4 0.155 0.25 2.5 20.9 20 3.406 3.307 99 25.8 98 11.93 61.9 28 27.75 46.375 0.15 0.275 2.25 20.9 21 3.406 3.306 100 26.2 98 11.9 61.93 28 27.5 46.35 0.145 0.3 2 20.9
Avg.= 99 25.8 11.93 61.9 28 27.75 46.375 0.15 0.275 2.25 20.9 STDEV= ± 1.00 0.4 0.03 0.03 0 0.25 0.025 0.005 0.025 0.25 0
22 3.406 3.3 106 25.6 98 12.1 63.88
6
27 28 47 0.16 0.25 1.5 20.9 23 3.406 3.305 101 26 98 11.95 63.16 27 27.5 47.1 0.1575 0.275 1.75 20.9 24 3.406 3.31 96 26.4 98 11.8 62.45 27 27 47.2 0.155 0.3 2 20.9
Avg.= 101 26 11.95 63.16 27 27.5 47.1 0.1575 0.275 1.75 20.9 STDEV= ± 5.00 0.4 0.15 0.715 0 0.5 0.1 0.0025 0.025 0.25 0
25 3.406 3.318 88 25.6 98 11.85 62.59
6.5
27 27 46.8 0.15 0.3 3 20.9 26 3.406 3.312 94 26 98 12.33 63.27 27 27 46.4 0.1475 0.25 3.75 20.9 27 3.406 3.306 100 26.4 98 12.81 63.95 27 27 46 0.145 0.2 4.5 20.9
Avg.= 94 26 12.33 63.27 27 27 46.4 0.1475 0.25 3.75 20.9 STDEV= ± 6.00 0.4 0.48 0.68 0 0 0.4 0.0025 0.05 0.75 0
28 3.406 3.302 104 26.5 98 12.8 65.63
7
27 26.5 48.6 0.15 0.3 5.5 20.9 29 3.406 3.298 108 26.25 98 12.9 66.19 27 26.25 48.25 0.1075 0.25 7.5 20.9 30 3.406 3.294 112 26 98 13 66.76 27 26 47.9 0.065 0.2 9.5 20.9
Avg.= 108 26.25 12.9 66.19 27 26.25 48.25 0.1075 0.25 7.5 20.9 STDEV= ± 4.00 0.25 0.1 0.565 0 0.25 0.35 0.0425 0.05 2 0
31 3.406 3.32 86 26 98 12.63 63.42
7.5
26.5 26.5 47.15 0.11 0.3 8.5 20.9 32 3.406 3.312 94 26.25 98 12.855 64.92 26.5 26.5 47.425 0.1125 0.3 10.25 20.9 33 3.406 3.304 102 26.5 98 13.08 66.42 26.5 26.5 47.7 0.115 0.3 12 20.9
Avg.= 94 26.25 12.855 64.92 26.5 26.5 47.425 0.1125 0.3 10.25 20.9 STDEV= ± 8.00 0.25 0.225 1.5 0 0 0.275 0.0025 0 1.75 0

Appendix A Experimental data sheet
102
Table A 1.12 : Experimental data for Finned pot with Shield at 10 mbar NG pressure.
1
14 .04 .18
3.525 3.422 103 24.5 98 13.86 74.16
2.5
25 28 41.35 0.05 0.14 335.5 20.9 2 3.525 3.415 110 25.4 98 13.105 70.425 25 28 41.9 0.0675 0.14 349.25 20.9 3 3.525 3.408 117 26.3 98 12.35 66.69 25 28 42.45 0.085 0.14 363 20.9
Avg.= 110 25.4 13.105 70.425 25 28 41.9 0.0675 0.14 349.25 20.9
STDEV= ± 7.00 0.9 0.755 3.735 0 0 0.55 0.0175 0 13.75 0 4 3.525 3.417 108 25.3 98 12.35 63
3
25.5 29 44.1 0.09 0.16 280 20.9 5 3.525 3.416 109 26.75 98 12.325 63.005 25.75 29 44.65 0.095 0.155 310 20.9 6 3.525 3.415 110 28.2 98 12.3 63.01 26 29 45.2 0.1 0.15 340 20.9
Avg.= 109 26.75 12.325 63.005 25.75 29 44.65 0.095 0.155 310 20.9
STDEV= ± 1.00 1.45 0.025 0.005 0.25 0 0.55 0.005 0.005 30 0 7 3.525 3.415 110 25.2 98 12.6 61.63
3.5
27 30 45.45 0.115 0.175 290 20.9 8 3.525 3.412 113 25.55 98 12.65 62.285 27.25 30 45.6 0.1175 0.1675 280 20.9 9 3.525 3.409 116 25.9 98 12.7 62.94 27.5 30 45.75 0.12 0.16 270 20.9
Avg.= 113 25.55 12.65 62.285 27.25 30 45.6 0.1175 0.1675 280 20.9
STDEV= ± 3.00 0.35 0.05 0.655 0.25 0 0.15 0.0025 0.0075 10 0 10 3.525 3.407 118 26.3 98 12.4 61.28
4
27.5 30 46.2 0.13 0.25 140 20.9 11 3.525 3.405 120 26.1 98 12.65 64.11 27.75 30 46.025 0.135 0.25 136 20.9 12 3.525 3.403 122 25.9 98 12.9 66.94 28 30 45.85 0.14 0.25 132 20.9
Avg.= 120 26.1 12.65 64.11 27.75 30 46.025 0.135 0.25 136 20.9
STDEV= ± 2.00 0.2 0.25 2.83 0.25 0 0.175 0.005 0 4 0 13 3.525 3.417 108 26.1 98 13.06 61.3
4.5
28 30 48.4 0.145 0.3 40 20.9 14 3.525 3.422 103 25.9 98 12.595 62.61 28.5 30 50.95 0.155 0.3 37.5 20.9 15 3.525 3.427 98 25.7 98 12.13 63.92 29 30 53.5 0.165 0.3 35 20.9
Avg.= 103 25.9 12.595 62.61 28.5 30 50.95 0.155 0.3 37.5 20.9
STDEV= ± 5.00 0.2 0.465 1.31 0.5 0 2.55 0.01 0 2.5 0 16 3.525 3.407 118 26.7 98 13.2 65.19
5 30 30 48.85 0.17 0.3 0 20.9
17 3.525 3.415 110 26.75 98 12.8 63.815 29.5 30.25 48.45 0.165 0.3 1.5 20.9 18 3.525 3.423 102 26.8 98 12.4 62.44 29 30.5 48.05 0.16 0.3 3 20.9
TSL
TD P1ci P1cf wcv T1ci
T1cf
Δtc fcf - fci
LH Tng Ta Thd PStc CO2h COh O2h
Pmbar = 10 and Vstc = 10.7

Appendix A Experimental data sheet
103
Avg.= 110 26.75 12.8 63.815 29.5 30.25 48.45 0.165 0.3 1.5 20.9
STDEV= ± 8.00 0.05 0.4 1.375 0.5 0.25 0.4 0.005 0 1.5 0 19 3.525 3.403 122 26.8 98 12.9 66.78
5.5
29 31 47.35 0.155 0.25 0 20.9 20 3.525 3.401 124 26.7 98 13.04 66.725 29 31 47.775 0.15 0.225 2 20.9 21 3.525 3.399 126 26.6 98 13.18 66.67 29 31 48.2 0.145 0.2 4 20.9
Avg.= 124 26.7 13.04 66.725 29 31 47.775 0.15 0.225 2 20.9
STDEV= ± 2.00 0.1 0.14 0.055 0 0 0.425 0.005 0.025 2 0 22 3.525 3.382 143 26.7 98 13.78 69.95
6
29 31 49.15 0.145 0.3 0 20.9 23 3.525 3.3985 126.5 26.9 98 13.28 68.2 29 30.5 48.925 0.1475 0.35 2 20.9 24 3.525 3.415 110 27.1 98 12.78 66.45 29 30 48.7 0.15 0.4 4 20.9
Avg.= 126.5 26.9 13.28 68.2 29 30.5 48.925 0.1475 0.35 2 20.9
STDEV= ± 16.50 0.2 0.5 1.75 0 0.5 0.225 0.0025 0.05 2 0 25 3.525 3.415 110 27.6 98 13.8 67.85
6.5
29 30 49.1 0.14 0.4 0 20.9 26 3.525 3.419 106 27.65 98 13.35 66.235 29 30 49.2 0.135 0.4 0 20.9 27 3.525 3.423 102 27.7 98 12.9 64.62 29 30 49.3 0.13 0.4 0 20.9
Avg.= 106 27.65 13.35 66.235 29 30 49.2 0.135 0.4 0 20.9
STDEV= ± 4.00 0.05 0.45 1.615 0 0 0.1 0.005 6.8E-17 0 0
28 3.525 3.405 120 28.1 98 13.28 69.4
7
29 29 47.55 0.12 0.4 0 20.9 29 3.525 3.408 117 28.55 98 13.305 68.24 29 29 48.8 0.115 0.4 0 20.9 30 3.525 3.411 114 29 98 13.33 67.08 29 29 50.05 0.11 0.4 0 20.9
Avg.= 117 28.55 13.305 68.24 29 29 48.8 0.115 0.4 0 20.9
STDEV= ± 3.00 0.45 0.025 1.16 0 0 1.25 0.005 6.8E-17 0 0
31 3.525 3.403 122 28.9 98 14.2 69.54
7.5
29 29 50.3 0.11 0.4 0 20.9 32 3.525 3.415 110 28.6 98 13.625 67.6 29 29 49.45 0.1075 0.4 0 20.9 33 3.525 3.427 98 28.3 98 13.05 65.66 29 29 48.6 0.105 0.4 0 20.9
Avg.= 110 28.6 13.625 67.6 29 29 49.45 0.1075 0.4 0 20.9
STDEV= ± 12.00 0.3 0.575 1.94 0 0 0.85 0.0025 6.8E-17 0 0

Appendix A Experimental data sheet
104
Table A 1.13: Experimental data for flat bottom pot without Shield at 14 mbar NG Pressure.
1
17. 03. 18
3.406 3.306 100 29.4 98.7 10.62 57.2
2.5
29 25 51.25 0.015 0.3 28 20.9 2 3.406 3.3015 104.5 29.65 98.7 10.645 57.59 29 25 51.075 0.015 0.3 26.5 20.9 3 3.406 3.297 109 29.9 98.7 10.67 57.98 29 25 50.9 0.015 0.3 25 20.9
Avg.= 104.5 29.65 10.645 57.59 29 25 51.075 0.015 0.3 26.5 20.9 STDEV= ± 4.50 0.25 0.025 0.39 0 0 0.175 0 0 1.5 0
4 3.406 3.302 104 28.3 98.7 10.65 59.5
3
28 24 49.35 0.075 0.3 13.5 20.9 5 3.406 3.303 103 28.95 98.7 10.62 58.875 28 25 49.725 0.075 0.325 13.5 20.9 6 3.406 3.304 102 29.6 98.7 10.59 58.25 28 26 50.1 0.075 0.35 13.5 20.9
Avg.= 103 28.95 10.62 58.875 28 25 49.725 0.075 0.325 13.5 20.9 STDEV= ± 1.00 0.65 0.03 0.625 0 1 0.375 0 0.025 0 0
7 3.406 3.308 98 29.4 98.7 10.88 59.51
3.5
28 26 49.85 0.045 0.4 4.5 20.9 8 3.406 3.306 100 29.4 98.7 10.94 60 28 26 51.35 0.03 0.4 2.25 20.9 9 3.406 3.304 102 29.4 98.7 11 60.49 28 26 52.85 0.015 0.4 0 20.9
Avg.= 100 29.4 10.94 60 28 26 51.35 0.03 0.4 2.25 20.9
STDEV= ± 2.00 4.4E-15 0.06 0.49 0 0 1.5 0.015 6.8E-
17 2.25 0
10 3.406 3.288 118 29 98.9 11.8 65.81
4
28 26 52.1 0 0.4 1 20.9 11 3.406 3.292 114 28.75 99 11.55 65.135 28 26 52.025 0 0.4 1 20.9 12 3.406 3.296 110 28.5 99.1 11.3 64.46 28 26 51.95 0 0.4 1 20.9
Avg.= 114 28.75 11.55 65.135 28 26 52.025 0 0.4 1 20.9
STDEV= ± 4.00 0.25 0.25 0.675 0 0 0.075 0 6.8E-17 0 0
13 3.406 3.292 114 27.7 98.9 12.1 68.88
4.5
29 25 57.8 0.015 0.3 0 20.9 14 3.406 3.283 123 29.9 98.9 12.15 69.285 29 25.75 57.05 0.0175 0.3 0 20.9 15 3.406 3.274 132 32.1 98.9 12.2 69.69 29 26.5 56.3 0.02 0.3 0 20.9
Avg.= 123 29.9 12.15 69.285 29 25.75 57.05 0.0175 0.3 0 20.9 STDEV= ± 9.00 2.2 0.05 0.405 0 0.75 0.75 0.0025 0 0 0
16 3.406 3.288 118 31 98.7 12.9 71.2 5 30 27 56.9 0.035 0.3 0 20.9
TSL
TD P1ci P1cf wcv T1ci
T1cf
Δtc fcf - fci
LH Tng Ta Thd PStc CO2h COh O2h
Pmbar = 14 and Vstc = 10

Appendix A Experimental data sheet
105
17 19 .03
.18
3.406 3.285 121 31.3 98.7 12.825 70.86 29.5 27 56.875 0.04 0.3 0 20.9 18 3.406 3.282 124 31.6 98.7 12.75 70.52 29 27 56.85 0.045 0.3 0 20.9
Avg.= 121 31.3 12.825 70.86 29.5 27 56.875 0.04 0.3 0 20.9 STDEV= ± 3.00 0.3 0.075 0.34 0.5 0 0.025 0.005 0 0 0
19 3.406 3.282 124 31.5 98.7 13.66 75.69
5.5
29 27.4 58.6 0.05 0.35 0 20.9 20 3.406 3.287 119 31.5 98.7 13.33 73.945 29.25 27.4 59.075 0.045 0.375 0 20.9 21 3.406 3.292 114 31.5 98.7 13 72.2 29.5 27.4 59.55 0.04 0.4 0 20.9
Avg.= 119 31.5 13.33 73.945 29.25 27.4 59.075 0.045 0.375 0 20.9
STDEV= ± 5.00 0 0.33 1.745 0.25 4.4E-15 0.475 0.005 0.025 0 0
22 3.406 3.27 136 31.1 99 14.39 80.58
6
29 28.5 58.25 0.04 0.35 0 20.9 23 3.406 3.2795 126.5 31.05 98.85 14.11 78.92 29 28.5 59.25 0.045 0.375 0 20.9 24 3.406 3.289 117 31 98.7 13.83 77.26 29 28.5 60.25 0.05 0.4 0 20.9
Avg.= 126.5 31.05 14.11 78.92 29 28.5 59.25 0.045 0.375 0 20.9 STDEV= ± 9.50 0.05 0.28 1.66 0 0 1 0.005 0.025 0 0
25 3.406 3.266 140 29.1 98.7 15 85.63
6.5
28 26 56.7 0 0.3 0 20.9 26 3.406 3.272 134 29.3 98.7 14.925 84.175 28.25 26 57.45 0.005 0.3 0 20.9 27 3.406 3.278 128 29.5 98.7 14.85 82.72 28.5 26 58.2 0.01 0.3 0 20.9
Avg.= 134 29.3 14.925 84.175 28.25 26 57.45 0.005 0.3 0 20.9 STDEV= ± 6.00 0.2 0.075 1.455 0.25 0 0.75 0.005 0 0 0
28 3.406 3.27 136 29.9 98.8 15.45 87.48
7
29 25.8 57.65 0.025 0.3 0 20.9 29 3.406 3.275 131 30 98.8 15.33 86.825 28.75 25.7 58.375 0.04 0.3 0 20.9 30 3.406 3.28 126 30.1 98.80 15.21 86.17 28.5 25.6 59.1 0.055 0.3 0 20.9
Avg.= 131 30 15.33 86.825 28.75 25.7 58.375 0.04 0.3 0 20.9 STDEV= ± 5.00 0.1 0.12 0.655 0.25 0.1 0.725 0.015 0 0 0
31 3.406 3.257 149 29.6 98.8 16.53 93.7
7.5
28 25.6 59.8 0.07 0.35 0 20.9 32 3.406 3.272 134 29.6 98.75 15.97 90.69 28 25.6 59.95 0.0825 0.35 0 20.9 33 3.406 3.287 119 29.6 98.7 15.41 87.68 28 25.6 60.1 0.095 0.35 0 20.9
Avg.= 134 29.6 15.97 90.69 28 25.6 59.95 0.0825 0.35 0 20.9
STDEV= ± 15.00 4.4E-15 0.56 3.01 0 4.4E-
15 0.15 0.0125 6.8E-17 0 0

Appendix A Experimental data sheet
106
Table A 1.14 : Experimental data for Finned pot without Shield at 14 mbar NG pressure.
1
23 .03 .18
And 24 .03 .18
3.525 3.441 84 37.7 98.7 11.08 60.5
2.5
29 24.4 48.8 0.005 0.3 438.5 20.9 2 3.525 3.44 85 37.35 98.7 11.18 60.9 28.75 24.5 49.15 0.0175 0.275 375.25 20.9 3 3.525 3.439 86 37 98.7 11.28 61.3 28.5 24.6 49.5 0.03 0.25 312 20.9
Avg.= 85 37.35 11.18 60.9 28.75 24.5 49.15 0.0175 0.275 375.25 20.9
STDEV= ± 1.00 0.35 0.1 0.4 0.25 0.1 0.35 0.0125 0.025 63.25 0 4 3.525 3.437 88 36.8 98.7 10.8 60.65
3
29 25 50.3 0.04 0.3 217.5 20.9 5 3.525 3.435 90 36.55 98.7 11 61.225 29 25 50.4 0.045 0.275 232.75 20.9 6 3.525 3.433 92 36.3 98.7 11.2 61.8 29 25 50.5 0.05 0.25 248 20.9
Avg.= 90 36.55 11 61.225 29 25 50.4 0.045 0.275 232.75 20.9
STDEV= ± 2.00 0.25 0.2 0.575 0 0 0.1 0.005 0.025 15.25 0 7 3.525 3.389 136 35 98.7 11.7 67.3
3.5
29 25.4 49.9 0.055 0.3 180 20.9 8 3.525 3.391 134 34.9 98.7 11.6 67.2 29 25.4 50.775 0.055 0.275 177 20.9 9 3.525 3.393 132 34.8 98.7 11.5 67.1 29 25.4 51.65 0.055 0.25 174 20.9
Avg.= 134 34.9 11.6 67.2 29 25.4 50.775 0.055 0.275 177 20.9
STDEV= ± 2.00 0.1 0.1 0.1 0 4.4E-15 0.875 0 0.025 3 0 10 3.525 3.379 146 34.8 98.7 11.9 70.91
4
29 24.8 51.85 0.05 0.3 118 20.9 11 3.525 3.386 139 34.8 98.7 11.8 69.955 29.5 24.8 52.1 0.055 0.275 114 20.9 12 3.525 3.393 132 34.8 98.7 11.7 69 30 24.8 52.35 0.06 0.25 110 20.9
Avg.= 139 34.8 11.8 69.955 29.5 24.8 52.1 0.055 0.05 114 20.9
STDEV= ± 7.00 0 0.1 0.955 0.5 0 0.25 0.005 0.025 4 0 13 3.525 3.383 142 34.8 98.7 11.8 72.85
4.5
30 24.2 54.75 0.04 0.3 77 20.9 14 3.525 3.3745 150.5 34.5 98.7 12.1 74 30 24.2 54.5 0.045 0.25 81.25 20.9 15 3.525 3.366 159 34.2 98.7 12.4 75.15 30 24.2 54.25 0.05 0.2 85.5 20.9
Avg.= 150.5 34.5 12.1 74 30 24.2 54.5 0.045 0.25 81.25 20.9
STDEV= ± 8.50 0.3 0.3 1.15 0 0 0.25 0.005 0.05 4.25 0 16 3.525 3.365 160 32 98.7 13.93 79.31 5 29 23 52 0.04 0.3 55 20.9 17 3.525 3.375 150 32.5 98.7 13.215 77.125 29 23 53.05 0.045 0.275 47.75 20.9
TSL
TD P1ci P1cf wcv T1ci
T1cf
Δtc fcf - fci
LH Tng Ta Thd PStc CO2h COh O2h
Pmbar = 14 and Vstc = 10

Appendix A Experimental data sheet
107
18 3.525 3.385 140 33 98.7 12.5 74.94 29 23 54.1 0.05 0.25 40.5 20.9
Avg.= 150 32.5 13.215 77.125 29 23 53.05 0.045 0.275 47.75 20.9
STDEV= ± 10.00 0.5 0.715 2.185 0 0 1.05 0.005 0.025 7.25 0 19 3.525 3.407 118 31.8 98 13.8 73.2
5.5
29 23 53.1 0.08 0.2 14 20.9 20 3.525 3.4015 123.5 31.65 98 13.78 74.9 29 22.9 54.675 0.095 0.25 14 20.9 21 3.525 3.396 129 31.5 98 13.76 76.6 29 22.8 56.25 0.11 0.3 14 20.9
Avg.= 123.5 31.65 13.78 74.9 29 22.9 54.675 0.095 0.25 14 20.9
STDEV= ± 5.50 0.15 0.02 1.7 0 0.1 1.575 0.015 0.05 0 0 22 3.525 3.386 139 30.7 98 14.3 80.15
6
29 22.8 55.25 0.01 0.25 3.5 20.9 23 3.525 3.39 135 30.75 98 14.22 79.15 29 22.8 56.2 0.02 0.25 3.5 20.9 24 3.525 3.394 131 30.8 98 14.14 78.15 29 22.8 57.15 0.03 0.25 3.5 20.9
Avg.= 135 30.75 14.22 79.15 29 22.8 56.2 0.02 0.25 3.5 20.9
STDEV= ± 4.00 0.05 0.08 1 0 0 0.95 0.01 0 0 0 25 3.525 3.406 119 25.8 98 15.6 81.75
6.5
27 27 52.95 0.075 0.3 2 20.9 26 3.525 3.408 117 26.9 98 15.4 80.7 27.5 27.5 54.55 0.09 0.325 1 20.9 27 3.525 3.41 115 28 98 15.2 79.65 28 28 56.15 0.105 0.35 0 20.9
Avg.= 117 26.9 15.4 80.7 27.5 27.5 54.55 0.09 0.325 1 20.9
STDEV= ± 2.00 1.1 0.2 1.05 0.5 0.5 1.6 0.015 0.025 1 0 28 3.525 3.403 122 28 98 15.4 82
7
28 27 55.8 0.16 0.3 0 20.9 29 3.525 3.3965 128.5 27.8 98 15.7 83.475 28 27 56 0.1725 0.3 0 20.9 30 3.525 3.39 135 27.6 98 16 84.95 28 27 56.2 0.185 0.3 0 20.9
Avg.= 128.5 27.8 15.7 83.475 28 27 56 0.1725 0.3 0 20.9
STDEV= ± 6.50 0.2 0.3 1.475 0 0 0.2 0.0125 0 0 0 31 3.525 3.392 133 27.5 98 16.18 85.8
7.5
28.5 27 56.15 0.205 0.3 0 20.9 32 3.525 3.389 136 27.6 98 16.32 86.5 28.5 27 56.3 0.215 0.2 0 20.9 33 3.525 3.386 139 27.7 98 16.46 87.2 28.5 27 56.45 0.225 0.1 0 20.9
Avg.= 136 27.6 16.32 86.5 28.5 27 56.3 0.215 0.2 0 20.9
STDEV= ± 3.00 0.1 0.14 0.7 0 0 0.15 0.01 0.1 0 0

Appendix A Experimental data sheet
108
Table A 1.15 : Experimental data for flat bottom pot with Shield at 14 mbar NG pressure.
1
04. 09. 18
3.406 3.288 118 27.9 98 11.31 62.22
2.5
27 28.5 44.85 0.015 0.25 280 20.9 2 3.406 3.295 111 27.95 98 10.92 59.665 27.5 28.75 45.875 0.0175 0.275 250.25 20.9 3 3.406 3.302 104 28 98 10.53 57.11 28 29 46.9 0.02 0.3 220.5 20.9
Avg.= 111 27.95 10.92 59.665 27.5 28.75 45.875 0.0175 0.275 250.25 20.9 STDEV= ± 7.00 0.05 0.39 2.555 0.5 0.25 1.025 0.0025 0.025 29.75 0
4 3.406 3.314 92 28.3 98 10.1 54.61
3
28 29 46.95 0.025 0.25 97.5 20.9 5 3.406 3.318 88 28.95 98 10.06 54.27 28 29.5 47.6 0.0275 0.25 88.25 20.9 6 3.406 3.322 84 29.6 98 10.02 53.93 28 30 48.25 0.03 0.25 79 20.9
Avg.= 88 28.95 10.06 54.27 28 29.5 47.6 0.0275 0.25 88.25 20.9 STDEV= ± 4.00 0.65 0.04 0.34 0 0.5 0.65 0.0025 0 9.25 0
7 3.406 3.296 110 28.3 98 9.98 57.21
3.5
26 27 44.65 0.07 0.3 80 20.9 8 3.406 3.305 101 28.8 98 10.055 55.67 26 27.5 45.5 0.08 0.3 52.75 20.9 9 3.406 3.314 92 29.3 98 10.13 54.13 26 28 46.35 0.09 0.3 25.5 20.9
Avg.= 101 28.8 10.055 55.67 26 27.5 45.5 0.08 0.3 52.75 20.9 STDEV= ± 9.00 0.5 0.075 1.54 0 0.5 0.85 0.01 0 27.25 0 10 3.406 3.326 80 28.5 98 9.95 53.86
4
27 28 46.45 0.13 0.3 34.5 20.9 11 3.406 3.327 79 28.75 98 9.99 53.865 27 28 46.525 0.14 0.3 26.5 20.9 12 3.406 3.328 78 29 98 10.03 53.87 27 28 46.6 0.15 0.3 18.5 20.9
Avg.= 79 28.75 9.99 53.865 27 28 46.525 0.14 0.3 26.5 20.9 STDEV= ± 1.00 0.25 0.04 0.005 0 0 0.075 0.01 0 8 0 13 3.406 3.324 82 28.9 98 10.25 55.15
4.5
27 28 45.6 0.165 0.3 8 20.9 14 3.406 3.33 76 28.75 98 10.255 54.725 27.25 28.5 46.35 0.1675 0.3 6.75 20.9 15 3.406 3.336 70 28.6 98 10.26 54.3 27.5 29 47.1 0.17 0.3 5.5 20.9
Avg.= 76 28.75 10.255 54.725 27.25 28.5 46.35 0.1675 0.3 6.75 20.9 STDEV= ± 6.00 0.15 0.005 0.425 0.25 0.5 0.75 0.0025 0 1.25 0 16 3.406 3.32 86 28.3 98 10.26 57.64 5 28 30 48.05 0.015 0.3 5.5 20.9
TSL
TD P1ci P1cf wcv T1ci
T1cf
Δtc fcf - fci
LH Tng Ta Thd PStc CO2h COh O2h
Pmbar = 14 and Vstc = 10.23
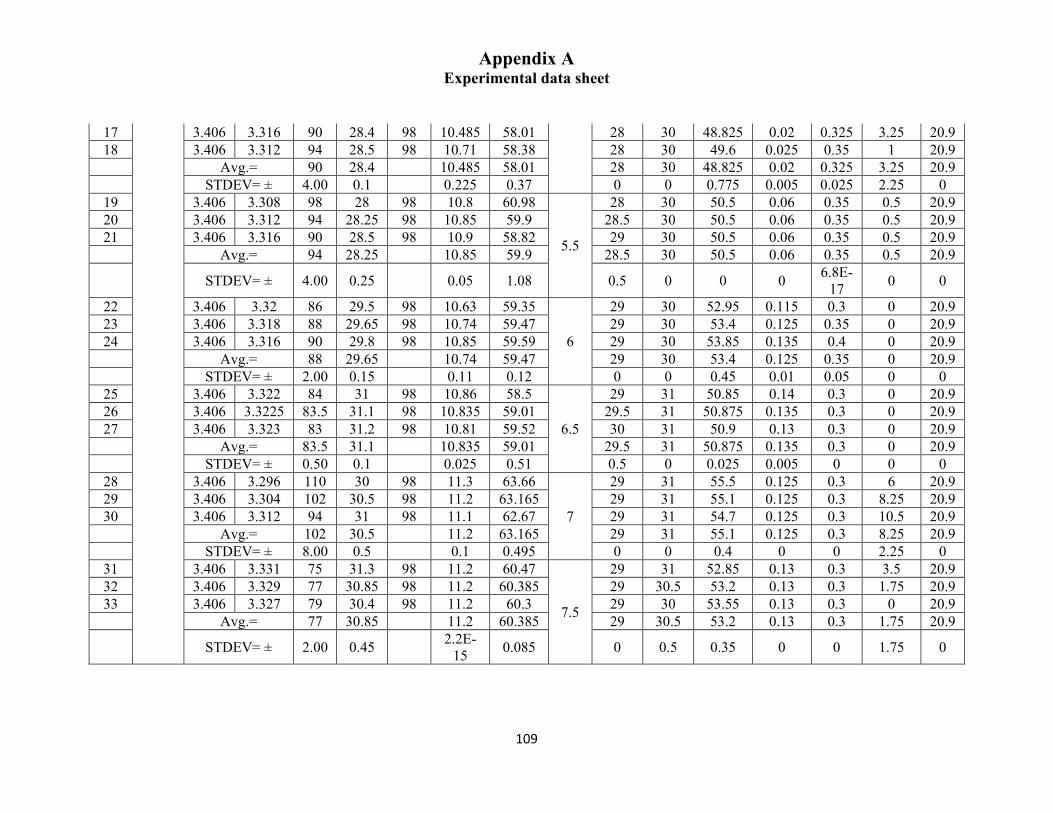
Appendix A Experimental data sheet
109
17 3.406 3.316 90 28.4 98 10.485 58.01 28 30 48.825 0.02 0.325 3.25 20.9 18 3.406 3.312 94 28.5 98 10.71 58.38 28 30 49.6 0.025 0.35 1 20.9
Avg.= 90 28.4 10.485 58.01 28 30 48.825 0.02 0.325 3.25 20.9 STDEV= ± 4.00 0.1 0.225 0.37 0 0 0.775 0.005 0.025 2.25 0 19 3.406 3.308 98 28 98 10.8 60.98
5.5
28 30 50.5 0.06 0.35 0.5 20.9 20 3.406 3.312 94 28.25 98 10.85 59.9 28.5 30 50.5 0.06 0.35 0.5 20.9 21 3.406 3.316 90 28.5 98 10.9 58.82 29 30 50.5 0.06 0.35 0.5 20.9
Avg.= 94 28.25 10.85 59.9 28.5 30 50.5 0.06 0.35 0.5 20.9
STDEV= ± 4.00 0.25 0.05 1.08 0.5 0 0 0 6.8E-17 0 0
22 3.406 3.32 86 29.5 98 10.63 59.35
6
29 30 52.95 0.115 0.3 0 20.9 23 3.406 3.318 88 29.65 98 10.74 59.47 29 30 53.4 0.125 0.35 0 20.9 24 3.406 3.316 90 29.8 98 10.85 59.59 29 30 53.85 0.135 0.4 0 20.9
Avg.= 88 29.65 10.74 59.47 29 30 53.4 0.125 0.35 0 20.9 STDEV= ± 2.00 0.15 0.11 0.12 0 0 0.45 0.01 0.05 0 0 25 3.406 3.322 84 31 98 10.86 58.5
6.5
29 31 50.85 0.14 0.3 0 20.9 26 3.406 3.3225 83.5 31.1 98 10.835 59.01 29.5 31 50.875 0.135 0.3 0 20.9 27 3.406 3.323 83 31.2 98 10.81 59.52 30 31 50.9 0.13 0.3 0 20.9
Avg.= 83.5 31.1 10.835 59.01 29.5 31 50.875 0.135 0.3 0 20.9 STDEV= ± 0.50 0.1 0.025 0.51 0.5 0 0.025 0.005 0 0 0 28 3.406 3.296 110 30 98 11.3 63.66
7
29 31 55.5 0.125 0.3 6 20.9 29 3.406 3.304 102 30.5 98 11.2 63.165 29 31 55.1 0.125 0.3 8.25 20.9 30 3.406 3.312 94 31 98 11.1 62.67 29 31 54.7 0.125 0.3 10.5 20.9
Avg.= 102 30.5 11.2 63.165 29 31 55.1 0.125 0.3 8.25 20.9 STDEV= ± 8.00 0.5 0.1 0.495 0 0 0.4 0 0 2.25 0 31 3.406 3.331 75 31.3 98 11.2 60.47
7.5
29 31 52.85 0.13 0.3 3.5 20.9 32 3.406 3.329 77 30.85 98 11.2 60.385 29 30.5 53.2 0.13 0.3 1.75 20.9 33 3.406 3.327 79 30.4 98 11.2 60.3 29 30 53.55 0.13 0.3 0 20.9
Avg.= 77 30.85 11.2 60.385 29 30.5 53.2 0.13 0.3 1.75 20.9
STDEV= ± 2.00 0.45 2.2E-15 0.085 0 0.5 0.35 0 0 1.75 0
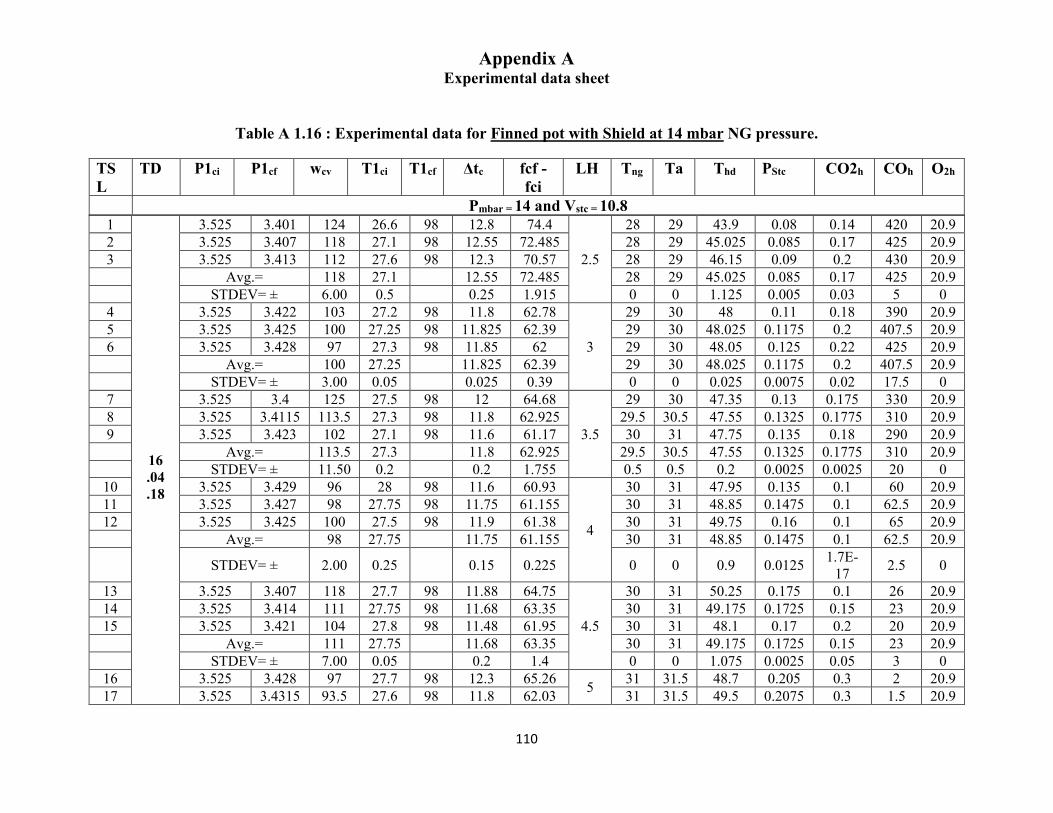
Appendix A Experimental data sheet
110
Table A 1.16 : Experimental data for Finned pot with Shield at 14 mbar NG pressure.
1
16 .04 .18
3.525 3.401 124 26.6 98 12.8 74.4
2.5
28 29 43.9 0.08 0.14 420 20.9 2 3.525 3.407 118 27.1 98 12.55 72.485 28 29 45.025 0.085 0.17 425 20.9 3 3.525 3.413 112 27.6 98 12.3 70.57 28 29 46.15 0.09 0.2 430 20.9
Avg.= 118 27.1 12.55 72.485 28 29 45.025 0.085 0.17 425 20.9
STDEV= ± 6.00 0.5 0.25 1.915 0 0 1.125 0.005 0.03 5 0 4 3.525 3.422 103 27.2 98 11.8 62.78
3
29 30 48 0.11 0.18 390 20.9 5 3.525 3.425 100 27.25 98 11.825 62.39 29 30 48.025 0.1175 0.2 407.5 20.9 6 3.525 3.428 97 27.3 98 11.85 62 29 30 48.05 0.125 0.22 425 20.9
Avg.= 100 27.25 11.825 62.39 29 30 48.025 0.1175 0.2 407.5 20.9
STDEV= ± 3.00 0.05 0.025 0.39 0 0 0.025 0.0075 0.02 17.5 0 7 3.525 3.4 125 27.5 98 12 64.68
3.5
29 30 47.35 0.13 0.175 330 20.9 8 3.525 3.4115 113.5 27.3 98 11.8 62.925 29.5 30.5 47.55 0.1325 0.1775 310 20.9 9 3.525 3.423 102 27.1 98 11.6 61.17 30 31 47.75 0.135 0.18 290 20.9
Avg.= 113.5 27.3 11.8 62.925 29.5 30.5 47.55 0.1325 0.1775 310 20.9
STDEV= ± 11.50 0.2 0.2 1.755 0.5 0.5 0.2 0.0025 0.0025 20 0 10 3.525 3.429 96 28 98 11.6 60.93
4
30 31 47.95 0.135 0.1 60 20.9 11 3.525 3.427 98 27.75 98 11.75 61.155 30 31 48.85 0.1475 0.1 62.5 20.9 12 3.525 3.425 100 27.5 98 11.9 61.38 30 31 49.75 0.16 0.1 65 20.9
Avg.= 98 27.75 11.75 61.155 30 31 48.85 0.1475 0.1 62.5 20.9
STDEV= ± 2.00 0.25 0.15 0.225 0 0 0.9 0.0125 1.7E-17 2.5 0
13 3.525 3.407 118 27.7 98 11.88 64.75
4.5
30 31 50.25 0.175 0.1 26 20.9 14 3.525 3.414 111 27.75 98 11.68 63.35 30 31 49.175 0.1725 0.15 23 20.9 15 3.525 3.421 104 27.8 98 11.48 61.95 30 31 48.1 0.17 0.2 20 20.9
Avg.= 111 27.75 11.68 63.35 30 31 49.175 0.1725 0.15 23 20.9
STDEV= ± 7.00 0.05 0.2 1.4 0 0 1.075 0.0025 0.05 3 0 16 3.525 3.428 97 27.7 98 12.3 65.26 5 31 31.5 48.7 0.205 0.3 2 20.9 17 3.525 3.4315 93.5 27.6 98 11.8 62.03 31 31.5 49.5 0.2075 0.3 1.5 20.9
TSL
TD P1ci P1cf wcv T1ci
T1cf
Δtc fcf - fci
LH Tng Ta Thd PStc CO2h COh O2h
Pmbar = 14 and Vstc = 10.8

Appendix A Experimental data sheet
111
18
3.525 3.435 90 27.5 98 11.3 58.8 31 31.5 50.3 0.21 0.3 1 20.9
Avg.= 93.5 27.6 11.8 62.03 31 31.5 49.5 0.2075 0.3 1.5 20.9
STDEV= ± 3.50 0.1 0.5 3.23 0 0 0.8 0.0025 0 0.5 0 19 3.525 3.424 101 32 98 11.11 60.3
5.5
31 31.5 51.05 0.2 0.2 1 20.9 20 3.525 3.413 112 32 98 11.345 62.325 31 31.5 51.05 0.2 0.25 1.5 20.9 21 3.525 3.402 123 32 98 11.58 64.35 31 31.5 51.05 0.2 0.3 2 20.9
Avg.= 112 32 11.345 62.325 31 31.5 51.05 0.2 0.25 1.5 20.9
STDEV= ± 11.00 0 0.235 2.025 0 0 8.7E-15
3.4E-17 0.05 0.5 0
22 3.525 3.405 120 34 98 11.3 62.84
6
31 31.5 50.7 0.21 0.3 0 20.9 23 3.525 3.4075 117.5 34 98 11.275 62.525 31 31.5 50.6 0.21 0.275 1 20.9 24 3.525 3.41 115 34 98 11.25 62.21 31 31.5 50.5 0.21 0.25 2 20.9
Avg.= 117.5 34 11.275 62.525 31 31.5 50.6 0.21 0.275 1 20.9
STDEV= ± 2.50 0 0.025 0.315 0 0 0.1 0 0.025 1 0 25 3.525 3.385 134 32 98 11.6 67
6.5
31 31 51.15 0.2 0.3 5 20.9 26 3.525 3.379 140 32 98 11.8 68.295 31 31 51.05 0.195 0.3 5 20.9 27 3.525 3.385 146 32 98 12 69.59 31 31 50.95 0.19 0.3 5 20.9
Avg.= 140 32 11.8 68.295 31 31 51.05 0.195 0.3 5 20.9
STDEV= ± 6.00 0 0.2 1.295 0 0 0.1 0.005 0 0 0 28 3.525 3.397 128 32 98 12.38 68.29
7
31 31 52.45 0.175 0.3 6 20.9 29 3.525 3.411 114 32 98 12.155 65.88 30.5 31 52.3 0.17 0.3 6 20.9 30 3.525 3.425 100 32 98 11.93 63.47 30 31 52.15 0.165 0.3 6 20.9
Avg.= 114 32 12.155 65.88 30.5 31 52.3 0.17 0.3 6 20.9
STDEV= ± 14.00 0 0.225 2.41 0.5 0 0.15 0.005 0 0 0 31 3.525 3.423 102 34.3 98 12.8 74.69
7.5
30 31 53.5 0.18 0.3 4.5 20.9 32 3.525 3.43 95 33.35 98 12.1 63.975 30 31 52.375 0.175 0.3 4.5 20.9 33 3.525 3.437 88 32.4 98 11.4 53.26 30 31 51.25 0.17 0.3 4.5 20.9
Avg.= 95 33.35 12.1 63.975 30 31 52.375 0.175 0.3 4.5 20.9
STDEV= ± 7.00 0.95 0.7 10.715 0 0 1.125 0.005 0 0 0

Appendix A Experimental data sheet
112
Table A 1.17: Experimental data for flat bottom pot without Shield at 18 mbar NG Pressure.
1
24. 03. 18
and
25. 03. 18
3.406 3.335 71 27.5 98 9.9 56.1
2.5
28 30 55.25 0.255 0.3 32 20.9 2 3.406 3.331 75 28.65 98 9.785 54.97 28 30 54.3 0.2525 0.35 32 20.9 3 3.406 3.327 79 29.8 98 9.67 53.84 28 30 53.35 0.25 0.4 32 20.9
Avg.= 75 28.65 9.785 54.97 28 30 54.3 0.2525 0.35 32 20.9 STDEV= ± 4.00 1.15 0.115 1.13 0 0 0.95 0.0025 0.05 0 0
4 3.406 3.332 74 30 98 9.81 54.9
3
29 30 53.1 0.245 0.3 14.5 20.9 5 3.406 3.3295 76.5 30.5 98.5 9.835 55.125 29.25 30 54.325 0.2475 0.35 15.5 20.9 6 3.406 3.327 79 31 99 9.86 55.35 29.5 30 55.55 0.25 0.4 16.5 20.9
Avg.= 76.5 30.5 9.835 55.125 29.25 30 54.325 0.2475 0.35 15.5 20.9 STDEV= ± 2.50 0.5 0.025 0.225 0.25 0 1.225 0.0025 0.05 1 0
7 3.406 3.333 73 30.8 98 10 56.2
3.5
29.5 30 54.45 0.255 0.4 6.5 20.9 8 3.406 3.327 79 31.5 98.5 10.115 56.575 29.5 30.5 55.75 0.2525 0.4 6.5 20.9 9 3.406 3.321 85 32.2 99 10.23 56.95 29.5 31 57.05 0.25 0.4 6.5 20.9
Avg.= 79 31.5 10.115 56.575 29.5 30.5 55.75 0.2525 0.4 6.5 20.9
STDEV= ± 6.00 0.7 0.115 0.375 0 0.5 1.3 0.0025 6.8E-17 0 0
10 3.406 3.327 79 32 98 10.58 59.21
4
29 31 57.2 0.26 0.3 2 20.9 11 3.406 3.3295 76.5 32.1 98 10.445 58.455 29 31 57.375 0.26 0.3 1.5 20.9 12 3.406 3.332 74 32.2 98 10.31 57.7 29 31 57.55 0.26 0.3 1 20.9
Avg.= 76.5 32.1 10.445 58.455 29 31 57.375 0.26 0.3 1.5 20.9 STDEV= ± 2.50 0.1 0.135 0.755 0 0 0.175 0 0 0.5 0
13 3.406 3.318 88 32.2 98 11.18 63.1
4.5
29 31 58.85 0.27 0.4 0 20.9 14 3.406 3.325 81 32.2 98 11.015 62.15 29.5 31.25 59.375 0.265 0.4 0 20.9 15 3.406 3.332 74 32.2 98 10.85 61.2 30 31.5 59.9 0.26 0.4 0 20.9
Avg.= 81 32.2 11.015 62.15 29.5 31.25 59.375 0.265 0.4 0 20.9
STDEV= ± 7.00 0 0.165 0.95 0.5 0.25 0.525 0.005 6.8E-17 0 0
16 3.406 3.321 85 31.6 98 11.26 66.5 5 29.5 30 56.7 0.03 0.3 0 20.9
TSL
TD P1ci P1cf wcv T1ci
T1cf
Δtc fcf - fci
LH Tng Ta Thd PStc CO2h COh O2h
Pmbar = 18 and Vstc = 10.57

Appendix A Experimental data sheet
113
17 3.406 3.315 91 31.95 98 11.43 66.375 29.5 30.5 58.125 0.04 0.35 0 20.9 18 3.406 3.309 97 32.3 98 11.6 66.25 29.5 31 59.55 0.05 0.4 0 20.9
Avg.= 91 31.95 11.43 66.375 29.5 30.5 58.125 0.04 0.35 0 20.9 STDEV= ± 6.00 0.35 0.17 0.125 0 0.5 1.425 0.01 0.05 0 0
19 3.406 3.306 100 32 98 12.63 71.61
5.5
29 31 59.75 0.07 0.3 0 20.9 20 3.406 3.314 92 31.85 98.1 12.315 69.88 29.25 31 59.85 0.075 0.3 0 20.9 21 3.406 3.322 84 31.7 98.2 12 68.15 29.5 31 59.95 0.08 0.3 0 20.9
Avg.= 92 31.85 12.315 69.88 29.25 31 59.85 0.075 0.3 0 20.9 STDEV= ± 8.00 0.15 0.315 1.73 0.25 0 0.1 0.005 0 0 0
22 3.406 3.326 80 31.3 98 12.81 72.05
6
29.5 30.5 60.15 0.09 0.3 0 20.9 23 3.406 3.322 84 31.25 98 12.895 72.235 29.5 30.25 60.125 0.0925 0.3 0 20.9 24 3.406 3.318 88 31.2 98 12.98 72.42 29.5 30 60.1 0.095 0.3 0 20.9
Avg.= 84 31.25 12.895 72.235 29.5 30.25 60.125 0.0925 0.3 0 20.9 STDEV= ± 4.00 0.05 0.085 0.185 0 0.25 0.025 0.0025 0 0 0
25 3.406 3.316 90 30.7 98 13.57 76.45
6.5
29.5 30 60.95 0.1 0.3 0 20.9 26 3.406 3.312 94 30.25 98 13.59 77.045 29.25 30 60.95 0.1 0.3 0 20.9 27 3.406 3.308 98 29.8 98 13.61 77.64 29 30 60.95 0.1 0.3 0 20.9
Avg.= 94 30.25 13.59 77.045 29.25 30 60.95 0.1 0.3 0 20.9
STDEV= ± 4.00 0.45 0.02 0.595 0.25 0 8.7E-15
1.7E-17 0 0 0
28 3.406 3.316 90 31 98 14.12 79.4
7
29.5 30 61.2 0.11 0.3 0 20.9 29 3.406 3.314 92 31 98 14.125 79.45 29.5 30 61.2 0.11 0.3 0 20.9 30 3.406 3.312 94 31 98.0 14.13 79.5 29.5 30 61.2 0.11 0.3 0 20.9
Avg.= 92 31 14.125 79.45 29.5 30 61.2 0.11 0.3 0 20.9
STDEV= ± 2.00 0 0.005 0.05 0 0 8.7E-15 0 0 0 0
31 3.406 3.298 108 31 98.2 15.1 84.88
7.5
29 30 60.7 0.11 0.3 0 20.9 32 3.406 3.299 107 31 98.1 15.05 84.84 29 30 60.7 0.11 0.3 0 20.9 33 3.406 3.3 106 31 98 15 84.8 29 30 60.7 0.11 0.3 0 20.9
Avg.= 107 31 15.05 84.84 29 30 60.7 0.11 0.3 0 20.9
STDEV= ± 1.00 0 0.05 0.04 0 0 8.7E-15 0 0 0 0

Appendix A Experimental data sheet
114
Table A 1.18 : Experimental data for Finned pot without Shield at 18 mbar NG pressure.
1
23 .05 .18
And 24 .05 .18
3.525 3.451 74 30 98 11.7 65.36
2.5
28 30 49.85 0.25 0.25 405 20.9 2 3.525 3.448 77 30.05 98 11.775 65.605 28.5 30 50.125 0.245 0.275 428 20.9 3 3.525 3.445 80 30.1 98 11.85 65.85 29 30 50.4 0.24 0.3 451 20.9
Avg.= 77 30.05 11.775 65.605 28.5 30 50.125 0.245 0.275 428 20.9
STDEV= ± 3.00 0.05 0.075 0.245 0.5 0 0.275 0.005 0.025 23 0 4 3.525 3.441 84 30.1 98 11.56 65.55
3
29 30 51.9 0.25 0.25 232 20.9 5 3.525 3.443 82 30.55 98 11.455 64.9 29.25 30.25 51.9 0.25 0.25 232 20.9 6 3.525 3.445 80 31 98 11.35 64.25 29.5 30.5 51.9 0.25 0.25 232 20.9
Avg.= 82 30.55 11.455 64.9 29.25 30.25 51.9 0.25 0.25 232 20.9
STDEV= ± 2.00 0.45 0.105 0.65 0.25 0.25 5E-15 0 0 0 0 7 3.525 3.427 98 31.4 98 11.7 65.05
3.5
29.5 31 54.05 0.26 0.25 197.5 20.9 8 3.525 3.421 104 31.6 98 11.85 65.845 29.5 31 53.75 0.26 0.275 200.75 20.9 9 3.525 3.415 110 31.8 98 12 66.64 29.5 31 53.45 0.26 0.3 204 20.9
Avg.= 104 31.6 11.85 65.845 29.5 31 53.75 0.26 0.275 200.75 20.9
STDEV= ± 6.00 0.2 0.15 0.795 0 0 0.3 0 0.025 3.25 0 10 3.525 3.443 82 31.5 98 11.48 64.15
4
29.5 31 55.1 0.255 0.23 120.5 20.9 11 3.525 3.441 84 31.65 98 11.59 64.9 29.5 31 54.875 0.2625 0.265 135.75 20.9 12 3.525 3.439 86 31.8 98 11.7 65.65 29.5 31 54.65 0.27 0.3 151 20.9
Avg.= 84 31.65 11.59 64.9 29.5 31 54.875 0.2625 0.265 135.75 20.9
STDEV= ± 2.00 0.15 0.11 0.75 0 0 0.225 0.0075 0.035 15.25 0 13 3.525 3.429 96 32.5 98 11.95 67
4.5
30 32 57.25 0.27 0.35 145 20.9 14 3.525 3.425 100 32.65 98 12.065 67.875 30 31.5 57.325 0.27 0.375 142.5 20.9 15 3.525 3.421 104 32.8 98 12.18 68.75 30 31 57.4 0.27 0.4 140 20.9
Avg.= 100 32.65 12.065 67.875 30 31.5 57.325 0.27 0.375 142.5 20.9
STDEV= ± 4.00 0.15 0.115 0.875 0 0.5 0.075 0 0.025 2.5 0 16 3.525 3.43 95 32.4 98 11.75 68.3
5 29.5 31 57.05 0.04 0.3 64 20.9
17 3.525 3.4235 101.5 32.45 98 12.055 69.47 29.65 31 56.975 0.05 0.3 67 20.9 18 3.525 3.417 108 32.5 98 12.36 70.64 29.8 31 56.9 0.06 0.3 70 20.9
TSL
TD P1ci P1cf wcv T1ci
T1cf
Δtc fcf - fci
LH Tng Ta Thd PStc CO2h COh O2h
Pmbar = 18 and Vstc = 10.57

Appendix A Experimental data sheet
115
Avg.= 101.5 32.45 12.055 69.47 29.65 31 56.975 0.05 0.25 67 20.9
STDEV= ± 6.50 0.05 0.305 1.17 0.15 0 0.075 0.01 0 3 0 19 3.525 3.429 96 32.1 98 12.55 70.95
5.5
29.8 31 56.7 0.07 0.4 26 20.9 20 3.525 3.421 104 31.8 98.1 12.865 72.21 29.8 31 56.5 0.0775 0.4 23.75 20.9 21 3.525 3.413 112 31.5 98.2 13.18 73.47 29.8 31 56.3 0.085 0.4 21.5 20.9
Avg.= 104 31.8 12.865 72.21 29.8 31 56.5 0.0775 0.4 23.75 20.9
STDEV= ± 8.00 0.3 0.315 1.26 0 0 0.2 0.0075 6.8E-17 2.25 0
22 3.525 3.408 117 31.1 98 13.63 76.01
6
29.5 30 57.5 0.09 0.4 7.5 20.9 23 3.525 3.4145 110.5 31 98 13.465 75.405 29.5 30 58.5 0.095 0.4 7.25 20.9 24 3.525 3.421 104 30.9 98 13.3 74.8 29.5 30 59.5 0.1 0.4 7 20.9
Avg.= 110.5 31 13.465 75.405 29.5 30 58.5 0.095 0.4 7.25 20.9
STDEV= ± 6.50 0.1 0.165 0.605 0 0 1 0.005 6.8E-17 0.25 0
25 3.525 3.412 113 30.6 98 13.85 77.55
6.5
29.5 30 58.25 0.105 0.4 1 20.9 26 3.525 3.413 112 30.55 98 13.835 77.515 29.5 30 58.25 0.105 0.4 0.5 20.9 27 3.525 3.414 111 30.5 98 13.82 77.48 29.5 30 58.25 0.105 0.4 0 20.9
Avg.= 112 30.55 13.835 77.515 29.5 30 58.25 0.105 0.4 0.5 20.9
STDEV= ± 1.00 0.05 0.015 0.035 0 0 0 1.7E-17
6.8E-17 0.5 0
28 3.525 3.417 108 30.2 98 14 78.55
7
29.5 30 58.3 0.1 0.4 0 20.9 29 3.525 3.418 107 30.15 98 14 78.525 29.5 30 58.3 0.1 0.4 0 20.9 30 3.525 3.419 106 30.1 98 14 78.5 29.5 30 58.3 0.1 0.4 0 20.9
Avg.= 107 30.15 14 78.525 29.5 30 58.3 0.1 0.4 0 20.9
STDEV= ± 1.00 0.05 0 0.025 0 0 8.7E-15
1.7E-17
6.8E-17 0 0
31 3.525 3.408 117 29.9 98 14.45 81.82
7.5
29 30 59.3 0.1 0.4 0 20.9 32 3.525 3.409 116 29.9 98 14.425 81.805 29 30 60.075 0.1 0.4 0 20.9 33 3.525 3.41 115 29.9 98 14.4 81.79 29 30 60.85 0.1 0.4 0 20.9
Avg.= 116 29.9 14.425 81.805 29 30 60.075 0.1 0.4 0 20.9
STDEV= ± 1.00 4.4E-15 0.025 0.015 0 0 0.775 1.7E-
17 6.8E-
17 0 0

Appendix A Experimental data sheet
116
Table A 1.19 : Experimental data for flat bottom pot with Shield at 18 mbar NG pressure.
1
4 .
10 .
18
3.406 3.291 115 29 98 10.7 65.34
2.5
29 30 46.8 0.09 0.108 300 20.9 2 3.406 3.3005 105.5 29 98 10.6 63.25 29 29.5 46.25 0.085 0.154 302.75 20.9 3 3.406 3.31 96 29 98 10.5 61.16 29 29 45.7 0.08 0.2 305.5 20.9
Avg.= 105.5 29 10.6 63.25 29 29.5 46.25 0.085 0.154 302.75 20.9 STDEV= ± 9.50 0 0.1 2.09 0 0.5 0.55 0.005 0.046 2.75 0
4 3.406 3.328 78 28.8 98 9.56 53.68
3
29 29 48.55 0.07 0.2 96 20.9 5 3.406 3.325 81 29.3 98 9.605 54.21 28.5 29 48.075 0.065 0.19 103 20.9 6 3.406 3.322 84 29.8 98 9.65 54.74 28 29 47.6 0.06 0.18 110 20.9
Avg.= 81 29.3 9.605 54.21 28.5 29 48.075 0.065 0.19 103 20.9 STDEV= ± 3.00 0.5 0.045 0.53 0.5 0 0.475 0.005 0.01 7 0
7 3.406 3.337 69 28.8 98 9.68 53.35
3.5
28 30 48.9 0.145 0.18 60 20.9 8 3.406 3.335 71 28.65 98 9.73 53.68 28.5 30 49.175 0.1625 0.215 55 20.9 9 3.406 3.333 73 28.5 98 9.78 54.01 29 30 49.45 0.18 0.25 50 20.9
Avg.= 71 28.65 9.73 53.68 28.5 30 49.175 0.1625 0.215 55 20.9 STDEV= ± 2.00 0.15 0.05 0.33 0.5 0 0.275 0.0175 0.035 5 0 10 3.406 3.322 84 30 98 9.63 54.75
4
29 30 49.25 0.18 0.35 41 20.9 11 3.406 3.325 81 29.75 98 9.63 54.57 29 30.5 49.3 0.19 0.375 40 20.9 12 3.406 3.328 78 29.5 98 9.63 54.39 29 31 49.35 0.2 0.4 39 20.9
Avg.= 81 29.75 9.63 54.57 29 30.5 49.3 0.19 0.375 40 20.9 STDEV= ± 3.00 0.25 0 0.18 0 0.5 0.05 0.01 0.025 1 0 13 3.406 3.332 74 29.6 98.2 9.9 55.3
4.5
29 31 49.75 0.2 0.4 19 20.9 14 3.406 3.335 71 29.55 98.1 9.8 54.96 29 31 49.725 0.21 0.4 16.5 20.9 15 3.406 3.338 68 29.5 98 9.7 54.62 29 31 49.7 0.22 0.4 14 20.9
Avg.= 71 29.55 9.8 54.96 29 31 49.725 0.21 0.4 16.5 20.9
STDEV= ± 3.00 0.05 0.1 0.34 0 0 0.025 0.01 6.8E-17 2.5 0
16 3.406 3.326 80 29.2 98 10.21 57.45 5 29 31 52.8 0.225 0.4 0 20.9 17 3.406 3.3295 76.5 29.05 98 10.22 57.22 29.25 31.25 52.875 0.2275 0.4 0 20.9
TSL
TD P1ci P1cf wcv T1ci
T1cf
Δtc fcf - fci
LH Tng Ta Thd PStc CO2h COh O2h
Pmbar = 18 and Vstc = 10.57

Appendix A Experimental data sheet
117
18 3.406 3.333 73 28.9 98 10.23 56.99 29.5 31.5 52.95 0.23 0.4 0 20.9 Avg.= 76.5 29.05 10.22 57.22 29.25 31.25 52.875 0.2275 0.4 0 20.9
STDEV= ± 3.50 0.15 0.01 0.23 0.25 0.25 0.075 0.0025 6.8E-17 0 0
19 3.406 3.334 72 29.6 98 10.35 57.49
5.5
30 31.5 53.25 0.235 0.4 0 20.9 20 3.406 3.3305 75.5 29.55 98 10.425 57.91 30 31.5 53.45 0.2475 0.325 0 20.9 21 3.406 3.327 79 29.5 98 10.5 58.33 30 31.5 53.65 0.26 0.25 0 20.9
Avg.= 75.5 29.55 10.425 57.91 30 31.5 53.45 0.2475 0.325 0 20.9 STDEV= ± 3.50 0.05 0.075 0.42 0 0 0.2 0.0125 0.075 0 0 22 3.406 3.322 84 28.3 98.3 10.8 61.11
6
30 31 54.3 0.035 0.25 0 20.9 23 3.406 3.325 81 28.3 98.15 10.75 60.575 30 31 53.475 0.0425 0.25 0 20.9 24 3.406 3.328 78 28.3 98 10.7 60.04 30 31 52.65 0.05 0.25 0 20.9
Avg.= 81 28.3 10.75 60.575 30 31 53.475 0.0425 0.25 0 20.9 STDEV= ± 3.00 0 0.05 0.535 0 0 0.825 0.0075 0 0 0 25 3.406 3.333 73 29.1 98 10.75 60.11
6.5
30 31 53.6 0.05 0.3 0 20.9 26 3.406 3.328 78 29.35 98 10.675 60.065 30 31.25 53.875 0.0475 0.3 0 20.9 27 3.406 3.323 83 29.6 98 10.6 60.02 30 31.5 54.15 0.045 0.3 0 20.9
Avg.= 78 29.35 10.675 60.065 30 31.25 53.875 0.0475 0.3 0 20.9 STDEV= ± 5.00 0.25 0.075 0.045 0 0.25 0.275 0.0025 0 0 0 28 3.406 3.31 96 29 98 11.08 63.76
7
30 31 55.7 0.06 0.3 0 20.9 29 3.406 3.314 92 28.75 98 10.98 63.505 30 31 56.175 0.0625 0.3 0 20.9 30 3.406 3.318 88 28.5 98 10.88 63.25 30 31 56.65 0.065 0.3 0 20.9
Avg.= 92 28.75 10.98 63.505 30 31 56.175 0.0625 0.3 0 20.9 STDEV= ± 4.00 0.25 0.1 0.255 0 0 0.475 0.0025 0 0 0 31 3.406 3.33 76 28.9 98 11 61.97
7.5
30 31 53.55 0.05 0.3 0 20.9 32 3.406 3.332 74 28.9 98 10.95 61.585 30 31 53.65 0.05 0.3 0 20.9 33 3.406 3.334 72 28.9 98 10.9 61.2 30 31 53.75 0.05 0.3 0 20.9
Avg.= 74 28.9 10.95 61.585 30 31 53.65 0.05 0.3 0 20.9
STDEV= ± 2.00 4.4E-15 0.05 0.385 0 0 0.1 8.5E-
18 0 0 0

Appendix A Experimental data sheet
118
Table A 1.20 : Experimental data for Finned pot with Shield at 18 mbar NG pressure.
1 3.525 3.397 128 31.9 98 11.7 72.51
2.5
30 30 45.75 0.17 0.15 380 20.9 2 3.525 3.4035 121.5 32 98 11.55 70.49 30 30 45.45 0.1625 0.15 400 20.9 3 3.525 3.41 115 32.1 98 11.4 68.47 30 30 45.15 0.155 0.15 420 20.9
Avg.= 121.5 32 11.55 70.49 30 30 45.45 0.1625 0.15 400 20.9 STDEV= ± 6.50 0.1 0.15 2.02 0 0 0.3 0.0075 0 20 0 4 3.525 3.428 97 32.3 98 10.5 60.24
3
30 30 47.75 0.145 0.13 300 20.9 5 3.525 3.4245 100.5 33 98 10.65 60.94 30 30 47.875 0.14 0.125 295 20.9 6 3.525 3.421 104 33.7 98 10.8 61.64 30 30 48 0.135 0.12 290 20.9
Avg.= 100.5 33 10.65 60.94 30 30 47.875 0.14 0.125 295 20.9 STDEV= ± 3.50 0.7 0.15 0.7 0 0 0.125 0.005 0.005 5 0 7 3.525 3.391 134 28.8 98 11.41 64.2
3.5
28 29 48.25 0.11 0.18 220 20.9 8 3.525 3.399 126 28.85 98 11.395 64 28 29 48.15 0.115 0.14 235 20.9 9 3.525 3.407 118 28.9 98 11.38 63.8 28 29 48.05 0.12 0.1 250 20.9
Avg.= 126 28.85 11.395 64 28 29 48.15 0.115 0.14 235 20.9 STDEV= ± 8.00 0.05 0.015 0.2 0 0 0.1 0.005 0.04 15 0 10 3.525 3.422 103 30.5 98 11.15 60.36
4
28 30 47.15 0.125 0.11 80 20.9 11 3.525 3.42 105 30.35 98 11.065 60.37 28 30 47.75 0.13 0.105 75 20.9 12 3.525 3.418 107 30.2 98 10.98 60.38 28 30 48.35 0.135 0.1 70 20.9 Avg.= 105 30.35 11.065 60.37 28 30 47.75 0.13 0.105 75 20.9 STDEV= ± 2.00 0.15 0.085 0.01 0 0 0.6 0.005 0.005 5 0 13 3.525 3.425 100 30.5 98 10.8 60.2
4.5
29 30 48.05 0.16 0.17 45 20.9 14 3.525 3.423 102 30.75 98 11 60.325 29 30 48.55 0.1625 0.165 37.5 20.9 15 3.525 3.421 104 31 98 11.2 60.45 29 30 49.05 0.165 0.16 30 20.9 Avg.= 102 30.75 11 60.325 29 30 48.55 0.1625 0.165 37.5 20.9 STDEV= ± 2.00 0.25 0.2 0.125 0 0 0.5 0.0025 0.005 7.5 0 16 3.525 3.417 108 27.8 98 11.6 63.64
5 28 27 47.6 0.175 0.3 1.5 20.9
17 3.525 3.4185 106.5 28.05 98 11.4 63.26 28 27 47.125 0.18 0.3 0.75 20.9 18 3.525 3.42 105 28.3 98 11.2 62.88 28 27 46.65 0.185 0.3 0 20.9
TSL
TD P1ci P1cf wcv T1ci
T1cf
Δtc fcf - fci
LH Tng Ta Thd PStc CO2h COh O2h
Pmbar = 18 and Vstc = 10.57

Appendix A Experimental data sheet
119
Avg.= 106.5 28.05 11.4 63.26 28 27 47.125 0.18 0.3 0.75 20.9 STDEV= ± 1.50 0.25 0.2 0.38 0 0 0.475 0.005 0 0.75 0 19 3.525 3.418 107 26.6 98 11.95 64.84
5.5
27 27 45.75 0.185 0.3 0 20.9 20 3.525 3.423 102 26.8 98 11.675 63.895 27 27 46.5 0.1875 0.3 0 20.9 21 3.525 3.428 97 27 98 11.4 62.95 27 27 47.25 0.19 0.3 0 20.9 Avg.= 102 26.8 11.675 63.895 27 27 46.5 0.1875 0.3 0 20.9 STDEV= ± 5.00 0.2 0.275 0.945 0 0 0.75 0.0025 0 0 0 22 3.525 3.43 95 28 98 11.8 63.22
6
27 27 47.05 0.18 0.3 0 20.9 23 3.525 3.4295 95.5 28.65 98 11.515 62.775 27 27 47.275 0.185 0.3 0 20.9 24 3.525 3.429 96 29.3 98 11.23 62.33 27 27 47.5 0.19 0.3 0 20.9 Avg.= 95.5 28.65 11.515 62.775 27 27 47.275 0.185 0.3 0 20.9 STDEV= ± 0.50 0.65 0.285 0.445 0 0 0.225 0.005 0 0 0 25 3.525 3.427 98 28.3 98 11.9 64.7
6.5
27 28 48.1 0.19 0.3 0 20.9 26 3.525 3.432 93 28.45 98 11.7 63.675 27 28 47.8 0.1875 0.3 0 20.9 27 3.525 3.437 88 28.6 98 11.5 62.65 27 28 47.5 0.185 0.3 0 20.9 Avg.= 93 28.45 11.7 63.675 27 28 47.8 0.1875 0.3 0 20.9 STDEV= ± 5.00 0.15 0.2 1.025 0 0 0.3 0.0025 0 0 0 28 3.525 3.427 98 29.3 98 11.81 66.14
7
27 28 48.9 0.19 0.3 0 20.9 29 3.525 3.418 107 29.15 98 11.905 66.315 27 28 50.025 0.185 0.3 0 20.9 30 3.525 3.409 116 29 98 12 66.49 27 28 51.15 0.18 0.3 0 20.9 Avg.= 107 29.15 11.905 66.315 27 28 50.025 0.185 0.3 0 20.9 STDEV= ± 9.00 0.15 0.095 0.175 0 0 1.125 0.005 0 0 0 31 3.525 3.418 107 29.2 98 11.96 67.89
7.5
27 28 48.95 0.18 0.3 0 20.9 32 3.525 3.417 108 28.9 98 12.13 67.31 27 28 49.975 0.19 0.3 0 20.9 33 3.525 3.416 109 28.6 98 12.3 66.73 27 28 51 0.2 0.3 0 20.9 Avg.= 108 28.9 12.13 67.31 27 28 49.975 0.19 0.3 0 20.9 STDEV= ± 1.00 0.3 0.17 0.58 0 0 1.025 0.01 0 0 0

Appendix A Experimental data sheet
120
Table A 1.21: Experimental data for flat bottom pot without Shield at 20 mbar NG Pressure.
1
26 . 03 . 18
3.406 3.333 73 30.8 98 9.4 56.36
2.5
29 29 53.65 0.075 0.3 34 20.9 2 3.406 3.3325 73.5 30.7 98 9.24 54.615 29 29.5 53.65 0.075 0.3 36.25 20.9 3 3.406 3.332 74 30.6 98 9.08 52.87 29 30 53.65 0.075 0.3 38.5 20.9
Avg.= 73.5 30.7 9.24 54.615 29 29.5 53.65 0.075 0.3 36.25 20.9 STDEV= ± 0.50 0.1 0.16 1.745 0 0.5 0 0 0 2.25 0
4 3.406 3.332 74 31.1 98 9.45 54.77
3
29 30 55.45 0.075 0.35 23.5 20.9 5 3.406 3.3325 73.5 31.2 98 9.41 54.31 29 30.25 55.5 0.07 0.375 20.5 20.9 6 3.406 3.333 73 31.3 98 9.37 53.85 29 30.5 55.55 0.065 0.4 17.5 20.9
Avg.= 73.5 31.2 9.41 54.31 29 30.25 55.5 0.07 0.375 20.5 20.9 STDEV= ± 0.50 0.1 0.04 0.46 0 0.25 0.05 0.005 0.025 3 0
7 3.406 3.336 70 31.1 98 9.75 56.12
3.5
29 30.8 55.25 0.08 0.4 7.5 20.9 8 3.406 3.338 68 31.15 98 9.675 55.495 29.25 30.9 56.3 0.035 0.375 6.75 20.9 9 3.406 3.34 66 31.2 98 9.6 54.87 29.5 31 57.35 -0.01 0.35 6 20.9
Avg.= 68 31.15 9.675 55.495 29.25 30.9 56.3 0.035 0.375 6.75 20.9 STDEV= ± 2.00 0.05 0.075 0.625 0.25 0.1 1.05 0.045 0.025 0.75 0
10 3.406 3.34 66 31.1 98 10.2 58.18
4
29.8 31.3 58.25 0.05 0.4 2 20.9 11 3.406 3.339 67 31.15 98.1 10.18 58.365 29.8 31.3 58.325 0.055 0.4 2 20.9 12 3.406 3.338 68 31.2 98.2 10.16 58.55 29.8 31.3 58.4 0.06 0.4 2 20.9
Avg.= 67 31.15 10.18 58.365 29.8 31.3 58.325 0.055 0.4 2 20.9 STDEV= ± 1.00 0.05 0.02 0.185 0 0 0.075 0.005 6.8E-17 0 0
13 3.406 3.316 90 31.1 98 11.03 63.66
4.5
30 32 59.2 0.05 0.4 0 20.9 14 3.406 3.319 87 31.35 98 10.85 64.13 30 31.5 58.05 0.0275 0.35 0 20.9 15 3.406 3.322 84 31.6 98 10.67 64.6 30 31 56.9 0.005 0.3 0 20.9
Avg.= 87 31.35 10.85 64.13 30 31.5 58.05 0.0275 0.35 0 20.9 STDEV= ± 3.00 0.25 0.18 0.47 0 0.5 1.15 0.0225 0.05 0 0
16 3.406 3.33 76 32.2 98 11.12 65.06 5
30 31.5 59.75 -0.01 0.3 0 20.9 17 3.406 3.328 78 32.2 98 11.015 64.77 30 31.25 60.3 0.035 0.3 0 20.9 18 3.406 3.326 80 32.2 98 10.91 64.48 30 31 60.85 0.08 0.3 0 20.9
TSL
TD P1ci P1cf wcv T1ci
T1cf
Δtc fcf - fci
LH Tng Ta Thd PStc CO2h COh O2h
Pmbar = 20 and Vstc = 10.8

Appendix A Experimental data sheet
121
Avg.= 78 32.2 11.015 64.77 30 31.25 60.3 0.035 0.3 0 20.9 STDEV= ± 2.00 0 0.105 0.29 0 0.25 0.55 0.045 0 0 0
19 3.406 3.308 98 32.2 98 12.28 72.28
5.5
30 31 60 0.12 0.3 0 20.9 20 3.406 3.315 91 32.35 98 11.925 69.91 29.75 30.5 60.35 0.13 0.35 0 20.9 21 3.406 3.322 84 32.5 98 11.57 67.54 29.5 30 60.7 0.14 0.4 0 20.9
Avg.= 91 32.35 11.925 69.91 29.75 30.5 60.35 0.13 0.35 0 20.9 STDEV= ± 7.00 0.15 0.355 2.37 0.25 0.5 0.35 0.01 0.05 0 0
22 3.406 3.336 70 32.4 98.2 12.03 69.52
6
29.5 30 61.1 0.11 0.4 0 20.9 23 3.406 3.332 74 32.4 98.1 12.105 69.89 29.5 30 60.675 0.1075 0.375 0 20.9 24 3.406 3.328 78 32.4 98 12.18 70.26 29.5 30 60.25 0.105 0.35 0 20.9
Avg.= 74 32.4 12.105 69.89 29.5 30 60.675 0.1075 0.375 0 20.9 STDEV= ± 4.00 0 0.075 0.37 0 0 0.425 0.0025 0.025 0 0
25 3.406 3.326 80 32 98 12.55 73.51
6.5
29 29.5 61.15 0.095 0.3 0 20.9 26 3.406 3.325 81 32 98 12.575 73.555 29 29.5 61.15 0.095 0.3 0 20.9 27 3.406 3.324 82 32 98 12.6 73.6 29 29.5 61.15 0.095 0.3 0 20.9
Avg.= 81 32 12.575 73.555 29 29.5 61.15 0.095 0.3 0 20.9
STDEV= ± 1.00 0 0.025 0.045 0 0 0 1.7E-17 0 0 0
28 3.406 3.316 90 30.5 98 13.57 79.75
7
29 29.5 62.6 0.08 0.3 0 20.9 29 3.406 3.314 92 30.95 98 13.535 79.725 29 29.5 62.6 0.08 0.3 0 20.9 30 3.406 3.312 94 31.4 98.0 13.5 79.7 29 29.5 62.6 0.08 0.3 0 20.9
Avg.= 92 30.95 13.535 79.725 29 29.5 62.6 0.08 0.3 0 20.9 STDEV= ± 2.00 0.45 0.035 0.025 0 0 0 0 0 0 0
31 3.406 3.296 110 30.5 98 14.55 86.55
7.5
29 29 63.15 0.08 0.3 0 20.9 32 3.406 3.294 112 30.35 98 14.575 86.575 29 29 63.15 0.08 0.3 0 20.9 33 3.406 3.292 114 30.2 98 14.6 86.6 29 29 63.15 0.08 0.3 0 20.9
Avg.= 112 30.35 14.575 86.575 29 29 63.15 0.08 0.3 0 20.9 STDEV= ± 2.00 0.15 0.025 0.025 0 0 0 0 0 0 0

Appendix A Experimental data sheet
122
Table A 1.22 : Experimental data for Finned pot without Shield at 20 mbar NG pressure.
1 22 .09 .18
And 23 .09 .18
3.525 3.445 80 32.1 98 11.2 66.49
2.5
28 30 49.8 0.08 0.2 427.5 20.9 2 3.525 3.448 77 32 98 11.1 65.925 28 30 50.425 0.075 0.225 412.75 20.9 3 3.525 3.451 74 31.9 98 11 65.36 28 30 51.05 0.07 0.25 398 20.9
Avg.= 77 32 11.1 65.925 28 30 50.425 0.075 0.225 412.75 20.9
STDEV= ± 3.00 0.1 0.1 0.565 0 0 0.625 0.005 0.025 14.75 0 4 3.525 3.449 76 31 98 11.05 65.5
3
29 30 52.35 0.07 0.25 330 20.9 5 3.525 3.447 78 31 98 11.1 65.805 29 30.25 51.9 0.0725 0.275 315.5 20.9 6 3.525 3.445 80 31 98 11.15 66.11 29 30.5 51.45 0.075 0.3 301 20.9
Avg.= 78 31 11.1 65.805 29 30.25 51.9 0.0725 0.275 315.5 20.9
STDEV= ± 2.00 0 0.05 0.305 0 0.25 0.45 0.0025 0.025 14.5 0 7 3.525 3.431 94 31.1 98 11.16 66.01
3.5
29 31 55.05 0.075 0.35 295 20.9 8 3.525 3.426 99 31.1 98 11.31 66.625 29.25 31.25 54.425 0.055 0.325 274.5 20.9 9 3.525 3.421 104 31.1 98 11.46 67.24 29.5 31.5 53.8 0.035 0.3 254 20.9
Avg.= 99 31.1 11.31 66.625 29.25 31.25 54.425 0.055 0.325 274.5 20.9
STDEV= ± 5.00 4.4E-15 0.15 0.615 0.25 0.25 0.625 0.02 0.025 20.5 0 10 3.525 3.443 82 31.3 98 11.43 66.02
4
29.7 31.5 55.95 0.055 0.4 258 20.9 11 3.525 3.44 85 31.15 98 11.47 66.655 29.8 31.5 56.325 0.0575 0.4 239.25 20.9 12 3.525 3.437 88 31 98 11.51 67.29 29.9 31.5 56.7 0.06 0.4 220.5 20.9
Avg.= 85 31.15 11.47 66.655 29.8 31.5 56.325 0.0575 0.4 239.25 20.9
STDEV= ± 3.00 0.15 0.04 0.635 0.1 0 0.375 0.0025 6.8E-17 18.75 0 13 3.525 3.437 88 31.6 98 11.73 67.9
4.5
30 32 57.25 0.03 0.4 130 20.9 14 3.525 3.435 90 31.65 98 11.6 67.855 30 32 57.25 0.03 0.4 171 20.9 15 3.525 3.433 92 31.7 98 11.47 67.81 30 32 57.25 0.03 0.4 212 20.9
Avg.= 90 31.65 11.6 67.855 30 32 57.25 0.03 0.4 171 20.9
STDEV= ± 2.00 0.05 0.13 0.045 0 0 0 0 6.8E-17 41 0 16 3.525 3.434 91 32 98 11.82 68.95
5 30 31.5 58.45 0.055 0.3 80 20.9
17 3.525 3.429 96 32.1 98 11.865 69.605 30 31.1 58.7 0.07 0.3 85 20.9 18 3.525 3.424 101 32.2 98 11.91 70.26 30 30.7 58.95 0.085 0.3 90 20.9
TSL
TD P1ci P1cf wcv T1ci
T1cf
Δtc fcf - fci
LH Tng Ta Thd PStc CO2h COh O2h
Pmbar = 20 and Vstc = 10.8

Appendix A Experimental data sheet
123
Avg.= 96 32.1 11.865 69.605 30 31.1 58.7 0.07 0.3 85 20.9
STDEV= ± 5.00 0.1 0.045 0.655 0 0.4 0.25 0.015 0 5 0 19 3.525 3.431 94 32.5 98 12.07 70.67
5.5
29.5 30 59.25 0.15 0.35 42 20.9 20 3.525 3.4305 94.5 32.45 98 12.12 70.86 29.5 30 58.6 0.135 0.375 40 20.9 21 3.525 3.43 95 32.4 98 12.17 71.05 29.5 30 57.95 0.12 0.4 38 20.9
Avg.= 94.5 32.45 12.12 70.86 29.5 30 58.6 0.135 0.375 40 20.9
STDEV= ± 0.50 0.05 0.05 0.19 0 0 0.65 0.015 0.025 2 0
22 3.525 3.422 103 32 98.1 12.7 74.22
6
29.5 30 58 0.115 0.4 13 20.9
23 3.525 3.417 108 31.85 98.05 12.85 75.31 29.25 29.75 57.9 0.1075 0.4 13.5 20.9
24 3.525 3.412 113 31.7 98 13 76.4 29 29.5 57.8 0.1 0.4 14 20.9
Avg.= 108 31.85 12.85 75.31 29.25 29.75 57.9 0.1075 0.4 13.5 20.9
STDEV= ± 5.00 0.15 0.15 1.09 0.25 0.25 0.1 0.0075 6.8E-17 0.5 0 25 3.525 3.418 107 31 98 13.13 77.29
6.5
29 29 59.65 0.095 0.4 3.5 20.9 26 3.525 3.418 107 31 98 13.13 77.3 29 29 59.65 0.095 0.4 8.25 20.9 27 3.525 3.418 107 31 98 13.13 77.31 29 29 59.65 0.095 0.4 13 20.9
Avg.= 107 31 13.13 77.3 29 29 59.65 0.095 0.4 8.25 20.9
STDEV= ± 0.00 0 0 0.01 0 0 0 1.7E-17 6.8E-17 4.75 0
28 3.525 3.415 110 30.5 98 13.5 81.06
7
29 29 60.8 0.09 0.4 0 20.9 29 3.525 3.415 110 30.5 98 13.55 81.08 29 29 60.8 0.59 0.4 0 20.9 30 3.525 3.415 110 30.5 98 13.6 81.1 29 29 60.8 1.09 0.4 0 20.9
Avg.= 110 30.5 13.55 81.08 29 29 60.8 0.59 0.4 0 20.9
STDEV= ± 0.00 0 0.05 0.02 0 0 8.7E-15 0.5 6.8E-17 0 0
31 3.525 3.391 134 29.9 98 14.2 86.28
7.5
29 29 59.05 0.07 0.4 0 20.9 32 3.525 3.391 134 29.9 98 14.225 86.29 29 29 59.05 0.07 0.4 0 20.9 33 3.525 3.391 134 29.9 98 14.25 86.3 29 29 59.05 0.07 0.4 0 20.9
Avg.= 134 29.9 14.225 86.29 29 29 59.05 0.07 0.4 0 20.9
STDEV= ± 0.00 4.4E-15 0.025 0.01 0 0 8.7E-15 0 6.8E-17 0 0

Appendix A Experimental data sheet
124
Table A 1.23 : Experimental data for flat bottom pot with Shield at 20 mbar NG pressure.
1 3.406 3.305 101 26.7 98 11.6 68.77
2.5
28 30 46.3 0.055 0.2 300 20.9 2
15 .
07 .
18 And 16 .
07 .
18
3.406 3.315 91 30.2 98 10.35 61.355 27.5 30.25 47.275 0.0575 0.15 310 20.9 3 3.406 3.325 81 33.7 98 9.1 53.94 27 30.5 48.25 0.06 0.1 320 20.9
Avg.= 91 30.2 10.35 61.355 27.5 30.25 47.275 0.0575 0.15 310 20.9 STDEV= ± 10.00 3.5 1.25 7.415 0.5 0.25 0.975 0.0025 0.05 10 0
4 3.406 3.333 73 32.5 98 9.06 51.2
3
27 30.5 49.7 0.085 0.1 98 20.9 5 3.406 3.332 74 32.25 98 9.12 51.7 27 30.5 49.825 0.085 0.2 110 20.9 6 3.406 3.331 75 32 98 9.18 52.2 27 30.5 49.95 0.085 0.3 140 20.9
Avg.= 74 32.25 9.12 51.7 27 30.5 49.825 0.085 0.2 120 20.9 STDEV= ± 1.00 0.25 0.06 0.5 0 0 0.125 0 0.1 21.633 0
7 3.406 3.328 78 32.9 98 9 51.69
3.5
28.5 30.5 50.45 0.08 0.2 80.5 20.9 8 3.406 3.329 77 33.25 98 9.025 51.715 28.75 30.25 50.35 0.07 0.25 80.75 20.9 9 3.406 3.33 76 33.6 98 9.05 51.74 29 30 50.25 0.06 0.3 81 20.9
Avg.= 77 33.25 9.025 51.715 28.75 30.25 50.35 0.07 0.25 80.75 20.9 STDEV= ± 1.00 0.35 0.025 0.025 0.25 0.25 0.1 0.01 0.05 0.25 0 10 3.406 3.33 76 32.5 98 9.18 53.08
4
29 30 49.85 0.065 0.35 68.5 20.9 11 3.406 3.334 72 32.35 98 9.14 52.195 29 30 49.925 0.0625 0.375 56.5 20.9 12 3.406 3.338 68 32.2 98 9.1 51.31 29 30 50 0.06 0.4 44.5 20.9
Avg.= 72 32.35 9.14 52.195 29 30 49.925 0.0625 0.375 56.5 20.9 STDEV= ± 4.00 0.15 0.04 0.885 0 0 0.075 0.0025 0.025 12 0 13 3.406 3.332 74 32.2 98 9.45 53.9
4.5
29 30 49.1 0.06 0.4 34 20.9 14 3.406 3.332 74 31.85 98 9.4 54.295 29 30 49.55 0.055 0.4 34.25 20.9 15 3.406 3.332 74 31.5 98 9.35 54.69 29 30 50 0.05 0.4 34.5 20.9
Avg.= 74 31.85 9.4 54.295 29 30 49.55 0.055 0.4 34.25 20.9 STDEV= ± 0.00 0.35 0.05 0.395 0 0 0.45 0.005 6.8E-17 0.25 0 16 3.406 3.341 65 31 98 9.6 54.68
5 29.5 29 52.3 0.045 0.45 4.5 20.9
17 3.406 3.342 64 30.5 98 9.675 54.74 29.25 29 51.9 0.045 0.425 2.25 20.9 18 3.406 3.343 63 30 98 9.75 54.8 29 29 51.5 0.045 0.4 0 20.9
TSL
TD P1ci P1cf wcv T1ci
T1cf
Δtc fcf - fci
LH Tng Ta Thd PStc CO2h COh O2h
Pmbar = 20 and Vstc = 10.8

Appendix A Experimental data sheet
125
Avg.= 64 30.5 9.675 54.74 29.25 29 51.9 0.045 0.425 2.25 20.9
STDEV= ± 1.00 0.5 0.075 0.06 0.25 0 0.4 8.5E-18 0.025 2.25 0
19 3.406 3.338 68 30 98 9.83 56.1
5.5
29 29 52.8 0.065 0.4 0 20.9 20 3.406 3.336 70 30.5 98 9.945 56.29 28.5 29 52.575 0.07 0.4 0 20.9 21 3.406 3.334 72 31 98 10.06 56.48 28 29 52.35 0.075 0.4 0 20.9
Avg.= 70 30.5 9.945 56.29 28.5 29 52.575 0.07 0.4 0 20.9 STDEV= ± 2.00 0.5 0.115 0.19 0.5 0 0.225 0.005 6.8E-17 0 0 22 3.406 3.33 76 30 98 10.26 58.88
6
28 29 54.6 0.065 0.4 0 20.9 23 3.406 3.331 75 29.5 98 10.235 58.57 28 29 53.95 0.0675 0.4 0 20.9 24 3.406 3.332 74 29 98 10.21 58.26 28 29 53.3 0.07 0.4 0 20.9
Avg.= 75 29.5 10.235 58.57 28 29 53.95 0.0675 0.4 0 20.9 STDEV= ± 1.00 0.5 0.025 0.31 0 0 0.65 0.0025 6.8E-17 0 0 25 3.406 3.334 72 30 98 10.1 58.6
6.5
27 29 52.25 0.07 0.4 0 20.9 26 3.406 3.33 76 29.5 98 10.45 59.2 27.5 29 51.875 0.07 0.375 0 20.9 27 3.406 3.326 80 29 98 10.8 59.8 28 29 51.5 0.07 0.35 0 20.9
Avg.= 76 29.5 10.45 59.2 27.5 29 51.875 0.07 0.375 0 20.9 STDEV= ± 4.00 0.5 0.35 0.6 0.5 0 0.375 0 0.025 0 0 28 3.406 3.325 81 29 98 10.75 61.66
7
28 29 54.55 0.105 0.4 0 20.9 29 3.406 3.324 82 29 98 10.8 61.695 28 29 55.25 0.115 0.4 0 20.9 30 3.406 3.323 83 29 98 10.85 61.73 28 29 55.95 0.125 0.4 0 20.9
Avg.= 82 29 10.8 61.695 28 29 55.25 0.115 0.4 0 20.9 STDEV= ± 1.00 0 0.05 0.035 0 0 0.7 0.01 6.8E-17 0 0 31 3.406 3.338 68 30 98 10.61 59.5
7.5
28 30 55.55 0.14 0.4 0 20.9 32 3.406 3.3365 69.5 30 98 10.705 59.825 28 30.5 54.725 0.14 0.4 0 20.9 33 3.406 3.335 71 30 98 10.8 60.15 28 31 53.9 0.14 0.4 0 20.9
Avg.= 69.5 30 10.705 59.825 28 30.5 54.725 0.14 0.4 0 20.9 STDEV= ± 1.50 0 0.095 0.325 0 0.5 0.825 0 6.8E-17 0 0

Appendix A Experimental data sheet
126
Table A 1.24 : Experimental data for Finned pot with Shield at 20 mbar NG pressure.
1
27 .07 .18
And 28 .07 .18
3.525 3.436 89 34.2 98 10.72 64.88
2.5
27 30.5 46.95 0.075 0.2 520 20.9 2 3.525 3.433 92 33.85 98 10.81 64.955 27 30.75 47.15 0.08 0.185 522.5 20.9 3 3.525 3.43 95 33.5 98 10.9 65.03 27 31 47.35 0.085 0.17 525 20.9
Avg.= 92 33.85 10.81 64.955 27 30.75 47.15 0.08 0.185 522.5 20.9
STDEV= ± 3.00 0.35 0.09 0.075 0 0.25 0.2 0.005 0.015 2.5 0 4 3.525 3.431 94 33.1 98 10.33 64.34
3
28 30.5 48.25 0.085 0.15 410 20.9 5 3.525 3.434 91 33 98 10.17 60.83 28 30.25 48.575 0.08 0.15 385 20.9 6 3.525 3.437 88 32.9 98 10.01 57.32 28 30 48.9 0.075 0.15 360 20.9
Avg.= 91 33 10.17 60.83 28 30.25 48.575 0.08 0.15 385 20.9
STDEV= ± 3.00 0.1 0.16 3.51 0 0.25 0.325 0.005 0 25 0 7 3.525 3.433 92 33.1 98 10.11 57.69
3.5
27 30.5 48.6 0.03 0.14 270 20.9 8 3.525 3.4355 89.5 33.05 98 10.095 57.38 27.5 30.5 48.775 0.05 0.145 265 20.9 9 3.525 3.438 87 33 98 10.08 57.07 28 30.5 48.95 0.07 0.15 260 20.9
Avg.= 89.5 33.05 10.095 57.38 27.5 30.5 48.775 0.05 0.145 265 20.9
STDEV= ± 2.50 0.05 0.015 0.31 0.5 0 0.175 0.02 0.005 5 0 10 3.525 3.441 84 32.6 98 10.01 57.44
4
29 30 48.55 0.065 0.17 140 20.9 11 3.525 3.438 87 32.5 98 10.105 57.475 28.75 30 48.625 0.065 0.185 152.5 20.9 12 3.525 3 90 32.4 98 10.2 57.51 28.5 30 48.7 0.065 0.2 165 20.9
Avg.= 87 32.5 10.105 57.475 28.75 30 48.625 0.065 0.185 152.5 20.9
STDEV= ± 3.00 0.1 0.095 0.035 0.25 0 0.075 0 0.015 12.5 0 13 3.525 3.442 83 31.9 98 10.08 57.39
4.5
29 30 48.8 0.05 0.2 60 20.9 14 3.525 3.441 84 31.2 98 10.14 58.26 29 30 49.15 0.05 0.2 62.5 20.9 15 3.525 3.44 85 30.5 98 10.2 59.13 29 30 49.5 0.05 0.2 65 20.9
Avg.= 84 31.2 10.14 58.26 29 30 49.15 0.05 0.2 62.5 20.9
STDEV= ± 1.00 0.7 0.06 0.87 0 0 0.35 8.5E-18
3.4E-17 2.5 0
16 3.525 3.447 78 30 98 10.13 58.12 5 28 29 50.45 0.04 0.2 5 20.9 17 3.525 3.4445 80.5 30.5 98 10.17 58.615 28.25 29.25 50.45 0.045 0.15 5 20.9
TSL
TD P1ci P1cf wcv T1ci
T1cf
Δtc fcf - fci
LH Tng Ta Thd PStc CO2h COh O2h
Pmbar = 20 and Vstc = 10.8

Appendix A Experimental data sheet
127
18
3.525 3.442 83 31 98 10.21 59.11 28.5 29.5 50.45 0.05 0.1 5 20.9
Avg.= 80.5 30.5 10.17 58.615 28.25 29.25 50.45 0.045 0.15 5 20.9
STDEV= ± 2.50 0.5 0.04 0.495 0.25 0.25 8.7E-15 0.005 0.05 0 0
19 3.525 3.447 78 30.5 98 10.21 58.67
5.5
28 29 50.7 0.07 0.3 0 20.9 20 3.525 3.4415 83.5 30 98 10.51 59.7 28 29 50.825 0.07 0.3 0 20.9 21 3.525 3.436 89 29.5 98 10.81 60.73 28 29 50.95 0.07 0.3 0 20.9
Avg.= 83.5 30 10.51 59.7 28 29 50.825 0.07 0.3 0 20.9
STDEV= ± 5.50 0.5 0.3 1.03 0 0 0.125 0 0 0 0 22 3.525 3.437 88 30 98 10.71 61.48
6
28 29 52.4 0.075 0.3 0 20.9 23 3.525 3.438 87 30 98 10.68 61.085 28 29 51.9 0.0725 0.3 0 20.9 24 3.525 3.439 86 30 98 10.65 60.69 28 29 51.4 0.07 0.3 0 20.9
Avg.= 87 30 10.68 61.085 28 29 51.9 0.0725 0.3 0 20.9
STDEV= ± 1.00 0 0.03 0.395 0 0 0.5 0.0025 0 0 0 25 3.525 3.439 86 28.6 98 11.01 61.79
6.5
27 29 50.8 0.055 0.3 0 20.9 26 3.525 3.436 89 28.2 98 11.105 63.695 27.5 29 49.625 0.0575 0.3 0 20.9 27 3.525 3.433 92 27.8 98 11.2 65.6 28 29 48.45 0.06 0.3 0 20.9
Avg.= 89 28.2 11.105 63.695 27.5 29 49.625 0.0575 0.3 0 20.9
STDEV= ± 3.00 0.4 0.095 1.905 0.5 0 1.175 0.0025 0 0 0 28 3.525 3.435 90 30 98 11.8 64.34
7
28 29 53.5 0.09 0.3 1.5 20.9 29 3.525 3.4365 88.5 29.05 98 11.655 64.195 28 29 53.65 0.105 0.3 1.5 20.9 30 3.525 3.438 87 28.1 98 11.51 64.05 28 29 53.8 0.12 0.3 1.5 20.9
Avg.= 88.5 29.05 11.655 64.195 28 29 53.65 0.105 0.3 1.5 20.9
STDEV= ± 1.50 0.95 0.145 0.145 0 0 0.15 0.015 0 0 0 31 3.525 3.443 82 29 98 11.7 63.48
7.5
28 30 52.25 0.115 0.3 2.5 20.9 32 3.525 3.447 78 29.5 98 11.5 63.065 28 30.5 53.25 0.1275 0.3 2.5 20.9 33 3.525 3.451 74 30 98 11.3 62.65 28 31 54.25 0.14 0.3 2.5 20.9
Avg.= 78 29.5 11.5 63.065 28 30.5 53.25 0.1275 0.3 2.5 20.9
STDEV= ± 4.00 0.5 0.2 0.415 0 0.5 1 0.0125 0 0 0

Appendix B Calculated data sheet
128
Table A: Calculated data (average) for flat bottom and Finned pot with/without Shield. Burner Name: RFL (TOPPER) Burner type: Single nozzle, perforated burner head Fuel Type: Natural Gas Pot Specification: Height is 4.4 inch, top diameter is 9.7 inch and bottom diameter is 9.2 inch. Flat bottom pot: Stainless Steel saucepan, Empty pot wt. (P1) = 406 gm. Finned Pot: Finned Stainless Steel saucepan, Empty pot wt. (P1) = 525 gm.
All calculation done at SATP [Standard Ambient Temperature and Pressure is a reference with temperature of 25oC (298.15 K) and pressure of 101.325 kPa. At these conditions, the volume of 1 mol of a gas is 24.4651 liters.] Name of the Variables that are calculated from Experimental data:
LH: Loading Height (cm). (fcm): Fuel (NG) consumed (gm). (fcd): Equivalent dry fuel (NG) consumed (gm) (wcr): Effective mass of water boiled (gm) (hc): Thermal efficiency (%) (ΔtTc): Temperature corrected time to boil (min)
Q : At SATP total exha ust flow (m3/min)
Ecor : At SATP CO emission rate (g/min)
Eco2r : At SATP CO2 emission rate (g/min)
Eco2r/(Ecor+Eco2r)]: Modified Combustion Efficiency (MCE). CO/CO2 : Ratio of Carbon monoxide and Carbon dioxide.
FPc: Fire power (Watt) HTE: Heat transfer efficiency

Appendix B Calculated data sheet
129

Appendix B Calculated data sheet
130
Table B 1.1: Calculated data for flat bottom pot without Shield at 4 mbar NG pressure.
SL LH (fcm) (fcd) (wcr) (hc) (ΔtTc) Ecor ECO2r Q MCE CO/CO2 FPc HTE 1 2.5 37.92 37.92 2879.01 60.23 12.11 0.10 36.41 5.05 0.997 0.0029 2654 60.40 2 2.5 37.60 37.60 2877.67 60.32 12.29 0.10 31.61 5.01 0.997 0.0031 2622 60.50 3 2.5 37.28 37.28 2876.31 60.40 12.48 0.09 26.88 4.97 0.997 0.0034 2591 60.61 Avg.= 37.60 37.60 2877.66 60.32 12.29 0.10 31.63 5.01 0.997 0.0031 2622.54 60.51
STDEV= ± 0.32 0.32 1.35 0.09 0.18 0.01 4.77 0.04 0.000 0.0003 31.17 0.10 4 3 39.63 39.63 2880.98 59.02 12.73 0.04 36.07 5.01 0.999 0.0011 2558 59.08 5 3 39.06 39.06 2880.45 58.23 12.62 0.04 33.72 4.99 0.999 0.0011 2629 58.29 6 3 38.51 38.51 2879.85 57.41 12.50 0.04 31.38 4.98 0.999 0.0012 2706 57.47 Avg.= 39.06 39.06 2880.43 58.22 12.61 0.04 33.72 4.99 0.999 0.0011 2630.84 58.28
STDEV= ± 0.56 0.56 0.57 0.80 0.12 0.00 2.35 0.01 0.000 0.0000 74.41 0.80 7 3.5 39.54 39.54 2881.67 56.96 13.39 0.00 27.02 5.00 1.000 0.0000 2528 56.96 8 3.5 39.57 39.57 2880.72 56.32 13.38 0.00 26.92 4.98 1.000 0.0000 2567 56.32 9 3.5 39.60 39.60 2879.76 55.69 13.38 0.00 26.82 4.96 1.000 0.0000 2608 55.69 Avg.= 39.57 39.57 2880.71 56.33 13.38 0.00 26.92 4.98 1.000 0.0000 2567.55 56.33
STDEV= ± 0.03 0.03 0.96 0.64 0.01 0.00 0.10 0.02 0.000 0.0000 39.90 0.64 10 4 43.40 43.40 2858.56 53.88 15.12 0.00 26.88 4.97 1.000 0.0000 2486 53.88 11 4 42.47 42.47 2861.95 53.20 14.60 0.00 26.83 4.97 1.000 0.0000 2602 53.20 12 4 41.55 41.55 2865.27 52.48 14.05 0.00 26.79 4.96 1.000 0.0000 2736 52.48
Avg.= 42.47 42.47 2861.93 53.18 14.59 0.00 26.83 4.97 1.000 0.0000 2607.84 53.18 STDEV= ± 0.92 0.92 3.35 0.70 0.54 0.00 0.04 0.01 0.000 0.0000 125.37 0.70 13 4.5 44.85 44.85 2859.51 51.97 15.45 0.00 26.80 4.96 1.000 0.0000 2518 51.97 14 4.5 44.86 44.86 2860.66 50.75 15.55 0.00 26.63 4.93 1.000 0.0000 2566 50.75 15 4.5 44.87 44.87 2861.78 49.53 15.65 0.00 26.45 4.90 1.000 0.0000 2616 49.53
Avg.= 44.86 44.86 2860.65 50.75 15.55 0.00 26.63 4.93 1.000 0.0000 2566.49 50.75 STDEV= ± 0.01 0.01 1.14 1.22 0.10 0.00 0.18 0.03 0.000 0.0000 49.28 1.22 16 5 47.79 47.79 2851.55 49.49 16.23 0.00 26.56 4.92 1.000 0.0000 2557 49.49 17 5 46.90 46.90 2855.82 49.15 15.91 0.00 26.48 4.90 1.000 0.0000 2613 49.15 18 5 46.01 46.01 2860.05 48.78 15.58 0.00 26.41 4.89 1.000 0.0000 2675 48.78

Appendix B Calculated data sheet
131
Avg.= 46.90 46.90 2855.81 49.14 15.91 0.00 26.48 4.90 1.000 0.0000 2615.17 49.14 STDEV= ± 0.89 0.89 4.25 0.36 0.32 0.00 0.07 0.01 0.000 0.0000 58.88 0.36 19 5.5 50.33 50.33 2860.22 47.12 15.94 0.00 26.65 4.93 1.000 0.0001 2678 47.13 20 5.5 50.00 50.00 2854.85 46.80 16.57 0.00 26.58 4.92 1.000 0.0001 2633 46.81 21 5.5 49.67 49.67 2849.43 46.47 17.24 0.00 26.50 4.90 1.000 0.0001 2590 46.47
Avg.= 50.00 50.00 2854.83 46.80 16.58 0.00 26.58 4.92 1.000 0.0001 2633.46 46.80 STDEV= ± 0.33 0.33 5.40 0.33 0.65 0.00 0.08 0.01 0.000 0.0000 43.88 0.33 22 6 54.10 54.10 2843.92 45.87 17.24 0.00 26.54 4.91 1.000 0.0000 2616 45.87 23 6 53.99 53.99 2845.90 45.20 17.27 0.00 26.53 4.91 1.000 0.0000 2648 45.20 24 6 53.88 53.88 2847.87 44.53 17.31 0.00 26.52 4.91 1.000 0.0000 2681 44.53
Avg.= 53.99 53.99 2845.90 45.20 17.27 0.00 26.53 4.91 1.000 0.0000 2648.23 45.20 STDEV= ± 0.11 0.11 1.97 0.67 0.03 0.00 0.01 0.00 0.000 0.0000 32.26 0.67 25 6.5 57.28 57.28 2834.76 43.78 18.34 0.00 26.48 4.90 1.000 0.0000 2627 43.78 26 6.5 59.39 59.39 2820.04 42.96 18.99 0.00 26.43 4.89 1.000 0.0000 2663 42.96 27 6.5 61.50 61.50 2805.30 42.20 19.66 0.00 26.38 4.88 1.000 0.0000 2697 42.20
Avg.= 59.39 59.39 2820.03 42.98 19.00 0.00 26.43 4.89 1.000 0.0000 2662.08 42.98 STDEV= ± 2.11 2.11 14.73 0.79 0.66 0.00 0.05 0.01 0.000 0.0000 35.13 0.79 28 7 62.12 62.12 2818.25 40.90 20.33 0.00 26.38 4.88 1.000 0.0000 2626 40.90 29 7 61.25 61.25 2819.21 41.38 20.19 0.00 26.38 4.88 1.000 0.0000 2610 41.38 30 7 60.38 60.38 2820.18 41.88 20.05 0.00 26.38 4.88 1.000 0.0000 2593 41.88
Avg.= 61.25 61.25 2819.21 41.39 20.19 0.00 26.38 4.88 1.000 0.0000 2610.00 41.39 STDEV= ± 0.87 0.87 0.97 0.49 0.14 0.00 0.00 0.00 0.000 0.0000 16.53 0.49 31 7.5 66.76 66.76 2807.80 39.20 21.46 0.00 26.35 4.88 1.000 0.0000 2638 39.20 32 7.5 65.44 65.44 2810.64 39.66 21.23 0.00 26.35 4.88 1.000 0.0000 2624 39.66 33 7.5 64.12 64.12 2813.48 40.14 21.01 0.00 26.35 4.88 1.000 0.0000 2609 40.14
Avg.= 65.44 65.44 2810.64 39.67 21.23 0.00 26.35 4.88 1.000 0.0000 2623.62 39.67 STDEV= ± 1.32 1.32 2.84 0.47 0.22 0.00 0.00 0.00 0.000 0.0000 14.16 0.47

Appendix B Calculated data sheet
132
Table B 1.2 : Calculated data for Finned pot without Shield at 4 mbar NG pressure
SL PH (fcm) (fcd) (wcr) (hc) (ΔtTc) Ecor ECO2r Q MCE CO/CO2 FPc HTE 1 2.5 51.12 51.12 2830.98 49.21 16.11 1.21 23.15 5.14 0.95 0.052222 2625.1 51.8 2 2.5 49.97 49.97 2835.92 49.88 16.01 1.19 20.65 5.10 0.95 0.057387 2581.5 52.7 3 2.5 48.82 48.82 2840.87 50.58 15.91 1.16 18.20 5.05 0.94 0.063844 2537.5 53.8 Avg.= 49.97 49.97 2835.92 49.89 16.01 1.19 20.66 5.10 0.95 0.06 2581.4 52.8
STDEV= ± 1.15 1.15 4.95 0.68 0.10 0.02 2.48 0.04 0.01 0.01 43.8 1.0 4 3 50.77 50.77 2829.78 50.70 15.46 0.89 27.53 5.10 0.97 0.032479 2648.6 52.4 5 3 49.23 49.23 2838.09 50.68 15.53 0.86 27.37 5.06 0.97 0.031577 2606.1 52.3 6 3 47.71 47.71 2846.37 50.64 15.61 0.83 27.20 5.03 0.97 0.030675 2563.1 52.2 Avg.= 49.24 49.24 2838.08 50.68 15.53 0.86 27.37 5.07 0.97 0.03 2605.9 52.3
STDEV= ± 1.53 1.53 8.30 0.03 0.08 0.03 0.16 0.03 0.00 0.00 42.8 0.1 7 3.5 45.49 45.49 2840.00 53.16 15.26 0.57 27.22 5.04 0.98 0.020804 2534.2 54.3 8 3.5 46.02 46.02 2836.04 52.95 15.24 0.53 27.16 5.03 0.98 0.019424 2568.3 54.0 9 3.5 46.55 46.55 2832.09 52.75 15.21 0.49 27.10 5.02 0.98 0.018044 2602.0 53.7 Avg.= 46.02 46.02 2836.04 52.95 15.24 0.53 27.16 5.03 0.98 0.02 2568.2 54.0
STDEV= ± 0.53 0.53 3.96 0.21 0.03 0.04 0.06 0.01 0.00 0.00 33.9 0.3 10 4 49.30 49.30 2832.04 49.75 16.11 0.34 36.05 5.00 0.99 0.009553 2605.3 50.2 11 4 48.32 48.32 2835.91 50.27 16.01 0.39 33.73 4.99 0.99 0.011548 2576.3 50.9 12 4 47.35 47.35 2839.78 50.80 15.92 0.43 31.42 4.99 0.99 0.013829 2547.3 51.5
Avg.= 48.32 48.32 2835.91 50.27 16.01 0.39 33.74 4.99 0.99 0.01 2576.3 50.9 STDEV= ± 0.97 0.97 3.87 0.52 0.10 0.05 2.31 0.01 0.00 0.00 29.0 0.6 13 4.5 51.69 51.69 2827.96 47.65 17.13 0.19 26.97 4.99 0.99 0.007111 2579.6 48.0 14 4.5 50.52 50.52 2828.84 47.97 17.02 0.16 31.32 4.97 0.99 0.005231 2585.0 48.2 15 4.5 49.34 49.34 2829.71 48.29 16.90 0.14 35.63 4.95 1.00 0.003821 2590.6 48.5
Avg.= 50.52 50.52 2828.84 47.97 17.02 0.16 31.31 4.97 0.99 0.01 2585.1 48.2 STDEV= ± 1.18 1.18 0.88 0.32 0.12 0.03 4.33 0.02 0.00 0.00 5.5 0.2 16 5 51.77 51.77 2834.60 46.66 17.19 0.05 31.25 4.96 1.00 0.001638 2596.1 46.7 17 5 50.22 50.22 2840.87 46.74 17.17 0.06 31.20 4.95 1.00 0.001865 2572.3 46.8 18 5 48.68 48.68 2847.11 46.82 17.15 0.07 31.15 4.94 1.00 0.002093 2547.7 46.9

Appendix B Calculated data sheet
133
Avg.= 50.22 50.22 2840.86 46.74 17.17 0.06 31.20 4.95 1.00 0.00 2572.0 46.8 STDEV= ± 1.55 1.55 6.25 0.08 0.02 0.01 0.05 0.01 0.00 0.00 24.2 0.1 19 5.5 55.74 55.74 2829.53 45.91 17.31 0.03 31.63 5.02 1.00 0.00091 2617.6 45.9 20 5.5 54.18 54.18 2828.09 45.61 17.79 0.03 31.31 4.97 1.00 0.000819 2593.0 45.7 21 5.5 52.63 52.63 2826.50 45.29 18.32 0.02 31.00 4.92 1.00 0.000728 2568.1 45.3
Avg.= 54.18 54.18 2828.04 45.60 17.80 0.03 31.31 4.97 1.00 0.00 2592.9 45.6 STDEV= ± 1.55 1.55 1.52 0.31 0.50 0.00 0.32 0.05 0.00 0.00 24.8 0.3 22 6 54.44 54.44 2840.95 45.46 17.70 0.00 31.12 4.94 1.00 0 2537.8 45.5 23 6 55.51 55.51 2837.19 44.55 18.07 0.00 31.24 4.96 1.00 0 2557.6 44.6 24 6 56.58 56.58 2833.43 43.68 18.46 0.00 31.35 4.97 1.00 0 2576.8 43.7
Avg.= 55.51 55.51 2837.19 44.56 18.08 0.00 31.24 4.96 1.00 0.00 2557.4 44.6 STDEV= ± 1.07 1.07 3.76 0.89 0.38 0.00 0.12 0.02 0.00 0.00 19.5 0.9 25 6.5 61.24 61.24 2788.84 43.67 18.85 0.00 31.14 4.94 1.00 0 2738.5 43.7 26 6.5 61.10 61.10 2792.30 43.50 18.80 0.00 31.11 4.94 1.00 4.55E-05 2739.9 43.5 27 6.5 60.96 60.96 2795.76 43.34 18.75 0.00 31.09 4.93 1.00 9.1E-05 2741.3 43.3
Avg.= 61.10 61.10 2792.30 43.50 18.80 0.00 31.11 4.94 1.00 0.00 2739.9 43.5 STDEV= ± 0.14 0.14 3.46 0.17 0.05 0.00 0.02 0.00 0.00 0.00 1.4 0.2 28 7 63.01 63.01 2790.30 42.82 20.06 0.02 30.99 4.92 1.00 0.000728 2608.5 42.8 29 7 60.94 60.94 2801.70 42.90 19.56 0.02 30.97 4.91 1.00 0.000728 2626.8 42.9 30 7 58.85 58.85 2813.08 42.99 19.04 0.02 30.95 4.91 1.00 0.000728 2646.5 43.0
Avg.= 60.93 60.93 2801.69 42.90 19.55 0.02 30.97 4.91 1.00 0.00 2627.3 42.9 STDEV= ± 2.08 2.08 11.39 0.09 0.51 0.00 0.02 0.00 0.00 0.00 19.0 0.1 31 7.5 59.59 59.59 2826.85 42.36 19.72 0.00 31.00 4.92 1.00 0 2512.9 42.4 32 7.5 59.85 59.85 2824.55 42.01 20.03 0.00 30.97 4.91 1.00 0 2510.8 42.0 33 7.5 60.11 60.11 2822.24 41.66 20.34 0.00 30.95 4.91 1.00 0 2508.8 41.7
Avg.= 59.85 59.85 2824.55 42.01 20.03 0.00 30.97 4.91 1.00 0.00 2510.8 42.0 STDEV= ± 0.26 0.26 2.30 0.35 0.31 0.00 0.02 0.00 0.00 0.00 2.1 0.3

Appendix B Calculated data sheet
134
Table B 1.3 : Calculated data for flat bottom pot with Shield at 4 mbar NG pressure.
SL LH (fcm) (fcd) (wcr) (hc) (ΔtTc) Ecor ECO2r Q MCE CO/CO2 FPc HTE
1 2.5 40.94 40.94 2838.16 59.98 13.04 0.54 27.58 5.10 0.98 0.01953 2687 61.14869 2 2.5 39.80 39.80 2848.15 60.70 12.79 0.54 27.58 5.10 0.98 0.019424 2655 61.87736 3 2.5 38.67 38.67 2858.15 61.45 12.53 0.53 27.58 5.10 0.98 0.019318 2623 62.63708 Avg.= 39.80 39.80 2848.15 60.71 12.79 0.54 27.58 5.10 0.98 0.02 2655.09 61.89
STDEV= ± 1.14 1.14 10.00 0.74 0.25 0.00 0.00 0.00 0.00 0.00 32.47 0.74 4 3 35.53 35.53 2882.34 61.10 12.54 0.08 27.32 5.06 1.00 0.003078 2525 61.29022 5 3 35.15 35.15 2882.81 61.66 12.41 0.07 22.76 5.06 1.00 0.003248 2526 61.8594 6 3 34.77 34.77 2883.28 62.23 12.28 0.06 18.21 5.06 1.00 0.003503 2527 62.444 Avg.= 35.15 35.15 2882.81 61.66 12.41 0.07 22.76 5.06 1.00 0.00 2526.09 61.86
STDEV= ± 0.38 0.38 0.47 0.56 0.13 0.01 4.55 0.00 0.00 0.00 0.67 0.58 7 3.5 34.75 34.75 2884.81 61.33 12.44 0.02 27.21 5.04 1.00 0.000743 2525 61.37508 8 3.5 34.99 34.99 2885.30 60.85 12.56 0.01 29.48 5.04 1.00 0.000343 2520 60.87304 9 3.5 35.22 35.22 2885.80 60.38 12.67 0.00 31.74 5.04 1.00 0 2514 60.38186 Avg.= 34.99 34.99 2885.30 60.85 12.56 0.01 29.48 5.04 1.00 0.00 2519.89 60.88
STDEV= ± 0.23 0.23 0.49 0.47 0.11 0.01 2.27 0.00 0.00 0.00 5.42 0.50 10 4 36.64 36.64 2876.21 59.73 13.22 0.00 27.24 5.04 1.00 0 2485 59.72901 11 4 36.15 36.15 2877.69 60.35 13.16 0.00 27.24 5.04 1.00 0 2462 60.34815 12 4 35.66 35.66 2879.18 60.98 13.11 0.00 27.24 5.04 1.00 0 2439 60.98364
Avg.= 36.15 36.15 2877.69 60.35 13.16 0.00 27.24 5.04 1.00 0.00 2461.85 60.35 STDEV= ± 0.49 0.49 1.48 0.63 0.06 0.00 0.00 0.00 0.00 0.00 23.12 0.63 13 4.5 38.18 38.18 2868.35 58.36 13.31 0.00 31.85 5.05 1.00 0 2568 58.35995 14 4.5 37.94 37.94 2870.33 58.47 13.14 0.00 29.57 5.05 1.00 0 2584 58.47403 15 4.5 37.71 37.71 2872.31 58.59 12.98 0.00 27.30 5.05 1.00 0 2601 58.59042
Avg.= 37.94 37.94 2870.33 58.47 13.14 0.00 29.57 5.05 1.00 0.00 2584.36 58.47 STDEV= ± 0.23 0.23 1.98 0.12 0.16 0.00 2.27 0.00 0.00 0.00 16.57 0.12 16 5 38.62 38.62 2871.17 57.12 13.81 0.00 31.67 5.02 1.00 0 2515 57.12344 17 5 38.42 38.42 2872.65 57.25 13.70 0.00 33.93 5.02 1.00 0 2522 57.24915 18 5 38.21 38.21 2874.14 57.38 13.59 0.00 36.19 5.02 1.00 0 2529 57.37596
Avg.= 38.42 38.42 2872.65 57.25 13.70 0.00 33.93 5.02 1.00 0.00 2521.66 57.25

Appendix B Calculated data sheet
135
STDEV= ± 0.21 0.21 1.48 0.13 0.11 0.00 2.26 0.00 0.00 0.00 6.82 0.13 19 5.5 40.53 40.53 2869.02 55.85 14.22 0.00 31.44 4.99 1.00 0 2499 55.85449 20 5.5 40.54 40.54 2865.02 56.24 14.30 0.00 31.44 4.99 1.00 0 2490 56.23863 21 5.5 40.55 40.55 2861.02 56.62 14.37 0.00 31.44 4.99 1.00 0 2481 56.62265
Avg.= 40.54 40.54 2865.02 56.24 14.30 0.00 31.44 4.99 1.00 0.00 2490.19 56.24 STDEV= ± 0.01 0.01 4.00 0.38 0.07 0.00 0.00 0.00 0.00 0.00 8.99 0.38 22 6 41.06 41.06 2871.05 54.98 14.26 0.00 36.32 5.04 1.00 0 2522 54.97503 23 6 40.89 40.89 2874.01 54.87 14.23 0.00 31.78 5.04 1.00 0 2516 54.86884 24 6 40.71 40.71 2876.98 54.76 14.20 0.00 27.24 5.04 1.00 0 2510 54.76156
Avg.= 40.89 40.89 2874.01 54.87 14.23 0.00 31.78 5.04 1.00 0.00 2516.21 54.87 STDEV= ± 0.17 0.17 2.97 0.11 0.03 0.00 4.54 0.00 0.00 0.00 5.92 0.11 25 6.5 42.66 42.66 2860.26 54.23 14.81 0.00 27.16 5.03 1.00 0 2516 54.22639 26 6.5 42.60 42.60 2864.29 53.95 14.80 0.00 24.90 5.03 1.00 0 2508 53.95457 27 6.5 42.55 42.55 2868.31 53.68 14.80 0.00 22.64 5.03 1.00 0 2500 53.68202
Avg.= 42.60 42.60 2864.29 53.95 14.80 0.00 24.90 5.03 1.00 0.00 2508.12 53.95 STDEV= ± 0.06 0.06 4.02 0.27 0.00 0.00 2.26 0.00 0.00 0.00 7.87 0.27 28 7 44.35 44.35 2857.44 52.64 14.94 0.01 27.12 5.02 1.00 0.000531 2582 52.67186 29 7 44.34 44.34 2856.45 52.77 14.93 0.01 27.12 5.02 1.00 0.000531 2583 52.79631 30 7 44.32 44.32 2855.46 52.89 14.91 0.01 27.12 5.02 1.00 0.000531 2584 52.92084
Avg.= 44.34 44.34 2856.45 52.77 14.93 0.01 27.12 5.02 1.00 0.00 2583.02 52.80 STDEV= ± 0.02 0.02 0.99 0.12 0.01 0.00 0.00 0.00 0.00 0.00 0.87 0.12 31 7.5 45.57 45.57 2853.93 52.21 14.69 0.02 31.93 5.06 1.00 0.000546 2659 52.23463 32 7.5 45.54 45.54 2852.94 52.35 14.64 0.02 31.93 5.06 1.00 0.000546 2666 52.37494 33 7.5 45.50 45.50 2851.96 52.49 14.59 0.02 31.93 5.06 1.00 0.000546 2674 52.51546
Avg.= 45.54 45.54 2852.94 52.35 14.64 0.02 31.93 5.06 1.00 0.00 2666.44 52.38 STDEV= ± 0.03 0.03 0.99 0.14 0.05 0.00 0.00 0.00 0.00 0.00 7.62 0.14

Appendix B Calculated data sheet
136
Table B 1.4 : Calculated data for Finned pot with Shield at 4 mbar NG pressure.
SL LH (fcm) (fcd) (wcr) (hc) (ΔtTc) Ecor ECO2r Q MCE CO/CO2 FPc HTE 1 2.5 39.34 39.34 2874.04 55.08 14.07 1.62 9.19 5.10 0.85 0.176407 2491.43 64.80 2 2.5 39.27 39.27 2876.85 54.62 14.09 1.57 11.48 5.10 0.88 0.136795 2494.20 62.09 3 2.5 39.21 39.21 2879.67 54.16 14.12 1.52 13.78 5.10 0.90 0.110387 2496.98 60.14 Avg.= 39.27 39.27 2876.85 54.62 14.09 1.57 11.48 5.10 0.88 0.14 2494.20 62.34
STDEV= ± 0.06 0.06 2.81 0.46 0.02 0.05 2.30 0.00 0.03 0.03 2.78 2.34 4 3 38.61 38.61 2870.62 55.88 13.76 1.39 11.85 5.06 0.89 0.117572 2533.98 62.45 5 3 38.54 38.54 2869.63 56.10 13.70 1.43 11.39 5.06 0.89 0.125842 2539.83 63.16 6 3 38.47 38.47 2868.64 56.32 13.65 1.47 10.94 5.06 0.88 0.1348 2545.72 63.91 Avg.= 38.54 38.54 2869.63 56.10 13.70 1.43 11.39 5.06 0.89 0.13 2539.84 63.18
STDEV= ± 0.07 0.07 0.99 0.22 0.06 0.04 0.46 0.00 0.01 0.01 5.87 0.73 7 3.5 38.77 38.77 2856.30 58.11 13.56 1.51 14.58 5.06 0.91 0.103488 2544.52 64.12 8 3.5 38.72 38.72 2857.46 57.57 13.58 1.42 14.58 5.06 0.91 0.097518 2562.10 63.18 9 3.5 38.67 38.67 2858.61 57.02 13.60 1.33 14.58 5.06 0.92 0.091547 2579.98 62.24 Avg.= 38.72 38.72 2857.46 57.57 13.58 1.42 14.58 5.06 0.91 0.10 2562.20 63.18
STDEV= ± 0.05 0.05 1.16 0.54 0.02 0.09 0.00 0.00 0.00 0.01 17.73 0.94 10 4 39.23 39.23 2865.49 56.75 13.66 0.78 27.34 5.06 0.97 0.028658 2533.95 58.38 11 4 39.19 39.19 2866.08 56.16 13.79 0.74 29.62 5.06 0.98 0.024984 2535.60 57.57 12 4 39.15 39.15 2866.67 55.57 13.93 0.70 31.90 5.06 0.98 0.021835 2537.25 56.79
Avg.= 39.19 39.19 2866.08 56.16 13.79 0.74 29.62 5.06 0.98 0.03 2535.60 57.58 STDEV= ± 0.04 0.04 0.59 0.59 0.14 0.04 2.28 0.00 0.00 0.00 1.65 0.80 13 4.5 40.69 40.69 2856.54 55.68 14.11 0.06 32.86 5.07 1.00 0.001769 2547.30 55.78 14 4.5 40.65 40.65 2857.53 55.62 14.06 0.06 34.69 5.07 1.00 0.001844 2554.82 55.72 15 4.5 40.61 40.61 2858.52 55.55 14.00 0.07 36.51 5.07 1.00 0.001911 2562.40 55.66
Avg.= 40.65 40.65 2857.53 55.62 14.06 0.06 34.69 5.07 1.00 0.00 2554.84 55.72 STDEV= ± 0.04 0.04 0.99 0.06 0.05 0.01 1.83 0.00 0.00 0.00 7.55 0.06 16 5 40.35 40.35 2866.38 54.93 14.35 0.01 36.22 5.03 1.00 0.000239 2488.08 54.94 17 5 40.35 40.35 2867.37 54.83 14.38 0.02 36.22 5.03 1.00 0.000478 2482.96 54.85 18 5 40.34 40.34 2868.35 54.72 14.40 0.03 36.22 5.03 1.00 0.000716 2477.87 54.76

Appendix B Calculated data sheet
137
Avg.= 40.35 40.35 2867.37 54.83 14.38 0.02 36.22 5.03 1.00 0.00 2482.97 54.85 STDEV= ± 0.01 0.01 0.99 0.11 0.03 0.01 0.00 0.00 0.00 0.00 5.11 0.09 19 5.5 43.26 43.26 2838.46 53.94 14.67 0.01 36.24 5.03 1.00 0.000159 2627.32 53.95 20 5.5 43.24 43.24 2839.94 53.81 14.73 0.01 36.24 5.03 1.00 0.000279 2616.33 53.82 21 5.5 43.22 43.22 2841.42 53.67 14.78 0.01 36.24 5.03 1.00 0.000398 2605.43 53.69
Avg.= 43.24 43.24 2839.94 53.81 14.73 0.01 36.24 5.03 1.00 0.00 2616.36 53.82 STDEV= ± 0.02 0.02 1.48 0.14 0.05 0.00 0.00 0.00 0.00 0.00 10.94 0.13 22 6 44.85 44.85 2843.46 52.87 14.85 0.01 36.42 5.06 1.00 0.000159 2607.61 52.88 23 6 44.83 44.83 2845.50 52.77 14.93 0.01 36.42 5.06 1.00 0.000199 2587.96 52.78 24 6 44.81 44.81 2847.55 52.68 15.00 0.01 36.42 5.06 1.00 0.000239 2568.59 52.69
Avg.= 44.83 44.83 2845.50 52.77 14.93 0.01 36.42 5.06 1.00 0.00 2588.05 52.78 STDEV= ± 0.02 0.02 2.05 0.10 0.07 0.00 0.00 0.00 0.00 0.00 19.51 0.09 25 6.5 45.81 45.81 2837.11 51.86 15.26 0.02 36.35 5.05 1.00 0.000478 2625.92 51.89 26 6.5 45.79 45.79 2839.18 51.80 15.27 0.02 36.35 5.05 1.00 0.000478 2615.19 51.83 27 6.5 45.76 45.76 2841.25 51.74 15.28 0.02 36.35 5.05 1.00 0.000478 2604.52 51.77
Avg.= 45.79 45.79 2839.18 51.80 15.27 0.02 36.35 5.05 1.00 0.00 2615.21 51.83 STDEV= ± 0.03 0.03 2.07 0.06 0.01 0.00 0.00 0.00 0.00 0.00 10.70 0.06 28 7 48.64 48.64 2831.36 50.89 15.44 0.02 36.50 5.07 1.00 0.000478 2657.08 50.91 29 7 48.62 48.62 2832.35 50.82 15.49 0.02 36.50 5.07 1.00 0.000478 2646.91 50.84 30 7 48.60 48.60 2833.34 50.75 15.54 0.02 36.50 5.07 1.00 0.000478 2636.80 50.77
Avg.= 48.62 48.62 2832.35 50.82 15.49 0.02 36.50 5.07 1.00 0.00 2646.93 50.84 STDEV= ± 0.02 0.02 0.99 0.07 0.05 0.00 0.00 0.00 0.00 0.00 10.14 0.07 31 7.5 47.54 47.54 2833.62 50.91 16.05 0.01 36.52 5.07 1.00 0.000318 2553.89 50.93 32 7.5 47.51 47.51 2832.40 50.77 16.14 0.01 36.52 5.07 1.00 0.000318 2556.66 50.78 33 7.5 47.48 47.48 2831.17 50.62 16.22 0.01 36.52 5.07 1.00 0.000318 2559.44 50.64
Avg.= 47.51 47.51 2832.40 50.77 16.14 0.01 36.52 5.07 1.00 0.00 2556.66 50.78 STDEV= ± 0.03 0.03 1.22 0.14 0.09 0.00 0.00 0.00 0.00 0.00 2.78 0.14

Appendix B Calculated data sheet
138
Table B 1.5 : Calculated data for flat bottom pot without Shield at 6 mbar NG pressure.
SL LH (fcm) (fcd) (wcr) (hc) (ΔtTc) Ecor ECO2r Q MCE CO/CO2 FPc THE 1 2.5 37.81 37.81 2876.00 62.05 12.32 0.09 18.37 5.10 0.99 0.005095 2718 62.36 2 2.5 38.12 38.12 2872.94 62.16 12.15 0.09 22.99 5.11 1.00 0.004076 2752 62.41 3 2.5 38.44 38.44 2869.92 62.27 11.98 0.09 27.61 5.11 1.00 0.003397 2786 62.48
Avg.= 38.12 38.12 2872.95 62.16 12.15 0.09 22.99 5.11 1.00 0.00 2751.91 62.42 STDEV= ± 0.32 0.32 3.04 0.11 0.17 0.00 4.62 0.00 0.00 0.00 33.76 0.06 4 3 38.45 38.45 2872.88 58.26 12.23 0.04 18.23 5.06 1.00 0.00207 2765 58.38 5 3 37.73 37.73 2874.79 59.03 12.25 0.03 20.45 5.05 1.00 0.001344 2714 59.11 6 3 37.01 37.01 2876.70 59.82 12.28 0.02 22.66 5.03 1.00 0.000764 2663 59.87
Avg.= 37.73 37.73 2874.79 59.04 12.25 0.03 20.45 5.05 1.00 0.00 2714.05 59.12 STDEV= ± 0.72 0.72 1.91 0.78 0.02 0.01 2.21 0.01 0.00 0.00 50.74 0.75 7 3.5 40.67 40.67 2860.93 56.33 13.01 0.01 18.08 5.02 1.00 0.000318 2758 56.35 8 3.5 40.65 40.65 2861.91 56.24 13.11 0.00 22.60 5.02 1.00 0.000127 2734 56.25 9 3.5 40.63 40.63 2862.90 56.16 13.22 0.00 27.12 5.02 1.00 0 2710 56.16
Avg.= 40.65 40.65 2861.91 56.24 13.11 0.00 22.60 5.02 1.00 0.00 2734.19 56.25 STDEV= ± 0.02 0.02 0.99 0.09 0.11 0.00 4.52 0.00 0.00 0.00 23.95 0.09 10 4 41.20 41.20 2910.19 53.87 13.90 0.00 17.92 4.98 1.00 0 2604 53.87 11 4 41.17 41.17 2892.34 53.81 13.95 0.00 22.40 4.98 1.00 0 2609 53.81 12 4 41.13 41.13 2874.48 53.74 13.99 0.00 26.88 4.98 1.00 0 2615 53.74
Avg.= 41.17 41.17 2892.34 53.81 13.95 0.00 22.40 4.98 1.00 0.00 2609.48 53.81 STDEV= ± 0.04 0.04 17.85 0.06 0.05 0.00 4.48 0.00 0.00 0.00 5.79 0.06 13 4.5 45.78 45.78 2847.91 51.43 14.50 0.00 26.80 4.96 1.00 0 2829 51.43 14 4.5 45.71 45.71 2844.72 51.40 14.60 0.00 26.80 4.96 1.00 0 2811 51.40 15 4.5 45.65 45.65 2841.52 51.38 14.69 0.00 26.80 4.96 1.00 0 2793 51.38
Avg.= 45.71 45.71 2844.72 51.40 14.60 0.00 26.80 4.96 1.00 0.00 2811.31 51.40 STDEV= ± 0.07 0.07 3.19 0.03 0.09 0.00 0.00 0.00 0.00 0.00 17.94 0.03 16 5 44.88 44.88 2860.55 50.71 14.78 0.00 22.33 4.96 1.00 0 2726 50.71 17 5 46.70 46.70 2845.15 49.50 15.39 0.00 28.97 4.95 1.00 0 2764 49.50 18 5 48.52 48.52 2829.70 48.38 16.02 0.00 35.59 4.94 1.00 0 2801 48.38

Appendix B Calculated data sheet
139
Avg.= 46.70 46.70 2845.14 49.53 15.40 0.00 28.96 4.95 1.00 0.00 2763.48 49.53 STDEV= ± 1.82 1.82 15.43 1.16 0.62 0.00 6.63 0.01 0.00 0.00 37.31 1.16 19 5.5 49.14 49.14 2841.33 47.51 16.11 0.00 17.73 4.92 1.00 0 2758 47.51 20 5.5 49.17 49.17 2839.84 47.62 16.17 0.00 26.60 4.92 1.00 0 2751 47.62 21 5.5 49.20 49.20 2838.36 47.74 16.22 0.00 35.47 4.92 1.00 0 2743 47.74
Avg.= 49.17 49.17 2839.84 47.62 16.17 0.00 26.60 4.92 1.00 0.00 2750.66 47.62 STDEV= ± 0.03 0.03 1.48 0.11 0.06 0.00 8.87 0.00 0.00 0.00 7.77 0.11 22 6 51.64 51.64 2840.09 45.06 16.90 0.00 17.65 4.90 1.00 0 2783 45.06 23 6 51.77 51.77 2839.35 45.28 16.86 0.00 17.65 4.90 1.00 0 2777 45.28 24 6 51.91 51.91 2838.60 45.50 16.82 0.00 17.65 4.90 1.00 0 2770 45.50
Avg.= 51.77 51.77 2839.35 45.28 16.86 0.00 17.65 4.90 1.00 0.00 2776.71 45.28 STDEV= ± 0.13 0.13 0.74 0.22 0.04 0.00 0.00 0.00 0.00 0.00 6.56 0.22 25 6.5 52.51 52.51 2845.51 43.29 18.11 0.00 17.58 4.88 1.00 0 2681 43.29 26 6.5 52.52 52.52 2844.52 43.37 18.15 0.00 21.98 4.88 1.00 0 2677 43.37 27 6.5 52.53 52.53 2843.53 43.45 18.18 0.00 26.37 4.88 1.00 0 2672 43.45
Avg.= 52.52 52.52 2844.52 43.37 18.15 0.00 21.98 4.88 1.00 0.00 2676.78 43.37 STDEV= ± 0.01 0.01 0.99 0.08 0.03 0.00 4.40 0.00 0.00 0.00 4.52 0.08 28 7 54.52 54.52 2839.27 41.92 19.47 0.00 17.60 4.89 1.00 0 2613 41.92 29 7 54.65 54.65 2840.26 41.73 19.48 0.00 22.00 4.89 1.00 0 2618 41.73 30 7 54.79 54.79 2841.24 41.54 19.50 0.00 26.40 4.89 1.00 0 2623 41.54
Avg.= 54.65 54.65 2840.26 41.73 19.48 0.00 22.00 4.89 1.00 0.00 2618.18 41.73 STDEV= ± 0.14 0.14 0.99 0.19 0.01 0.00 4.40 0.00 0.00 0.00 5.02 0.19 31 7.5 63.61 63.61 2781.50 39.79 20.93 0.00 21.97 4.88 1.00 0 2876 39.79 32 7.5 63.54 63.54 2782.49 39.75 20.99 0.00 24.17 4.88 1.00 0 2865 39.75 33 7.5 63.48 63.48 2783.48 39.72 21.05 0.00 26.37 4.88 1.00 0 2854 39.72
Avg.= 63.54 63.54 2782.49 39.75 20.99 0.00 24.17 4.88 1.00 0.00 2865.32 39.75 STDEV= ± 0.07 0.07 0.99 0.03 0.06 0.00 2.20 0.00 0.00 0.00 10.95 0.03

Appendix B Calculated data sheet
140
Table B 1.6 : Calculated data for Finned pot without Shield at 6 mabr NG Pressure.
SL LH (fcm) (fcd) (wcr) (hc) (ΔtTc) Ecor ECO2r Q MCE CO/CO2 FPc HTE 1 2.5 43.17 43.17 2865.27 50.04 15.38 1.46 27.51 5.09 0.95 0.053071 2564 52.70 2 2.5 43.12 43.12 2866.52 50.29 15.21 1.49 22.93 5.09 0.94 0.064959 2571 53.56 3 2.5 43.06 43.06 2867.76 50.54 15.04 1.52 18.34 5.09 0.92 0.08279 2577 54.72
Avg.= 43.12 43.12 2866.51 50.29 15.21 1.49 22.93 5.09 0.94 0.07 2570.78 53.66 STDEV= ± 0.05 0.05 1.24 0.25 0.17 0.03 4.59 0.00 0.01 0.01 6.43 1.02
4 3 46.80 46.80 2837.57 51.32 14.83 0.84 18.40 5.11 0.96 0.045535 2721 53.65 5 3 46.72 46.72 2836.58 51.50 14.94 0.84 22.98 5.10 0.96 0.036428 2697 53.38 6 3 46.65 46.65 2835.59 51.69 15.04 0.84 27.54 5.10 0.97 0.030357 2674 53.26
Avg.= 46.72 46.72 2836.58 51.50 14.94 0.84 22.97 5.10 0.96 0.04 2697.17 53.43 STDEV= ± 0.08 0.08 0.99 0.18 0.11 0.00 4.57 0.01 0.01 0.01 23.61 0.20
7 3.5 45.00 45.00 2833.08 54.46 14.73 0.46 22.71 5.04 0.98 0.020379 2597 55.57 8 3.5 45.00 45.00 2832.09 54.57 14.73 0.56 22.71 5.04 0.98 0.024837 2597 55.92 9 3.5 45.00 45.00 2831.10 54.67 14.73 0.67 22.71 5.04 0.97 0.029295 2597 56.27
Avg.= 45.00 45.00 2832.09 54.57 14.73 0.56 22.71 5.04 0.98 0.02 2597.29 55.92 STDEV= ± 0.00 0.00 0.99 0.10 0.00 0.10 0.00 0.00 0.00 0.00 0.00 0.35 10 4 45.69 45.69 2844.53 50.63 15.47 0.34 27.05 5.01 0.99 0.012737 2621 51.27 11 4 45.70 45.70 2843.55 50.72 15.47 0.41 27.05 5.01 0.99 0.015072 2620 51.49 12 4 45.70 45.70 2842.56 50.82 15.48 0.47 27.05 5.01 0.98 0.017407 2619 51.71
Avg.= 45.70 45.70 2843.55 50.72 15.47 0.41 27.05 5.01 0.99 0.02 2620.07 51.49 STDEV= ± 0.00 0.00 0.99 0.10 0.01 0.06 0.00 0.00 0.00 0.00 0.73 0.22 13 4.5 49.04 49.04 2834.70 48.17 16.12 0.21 26.89 4.98 0.99 0.007748 2695 48.54 14 4.5 49.04 49.04 2835.69 48.07 16.12 0.21 26.89 4.98 0.99 0.007748 2695 48.45 15 4.5 49.04 49.04 2836.68 47.98 16.12 0.21 26.89 4.98 0.99 0.007748 2695 48.35
Avg.= 49.04 49.04 2835.69 48.07 16.12 0.21 26.89 4.98 0.99 0.01 2695.50 48.45 STDEV= ± 0.00 0.00 0.99 0.09 0.00 0.00 0.00 0.00 0.00 0.00 0.00 0.10 16 5 54.02 54.02 2808.36 47.51 16.40 0.06 22.42 4.98 1.00 0.002547 2800 47.63 17 5 54.15 54.15 2810.61 46.94 16.73 0.04 24.66 4.98 1.00 0.001737 2772 47.02 18 5 54.29 54.29 2812.85 46.37 17.06 0.03 26.89 4.98 1.00 0.001061 2745 46.42

Appendix B Calculated data sheet
141
Avg.= 54.15 54.15 2810.61 46.94 16.73 0.04 24.65 4.98 1.00 0.00 2772.29 47.02 STDEV= ± 0.14 0.14 2.25 0.57 0.33 0.01 2.23 0.00 0.00 0.00 27.83 0.61 19 5.5 54.83 54.83 2794.68 45.99 17.45 0.03 26.85 4.97 1.00 0.001061 2824 46.04 20 5.5 54.83 54.83 2793.69 46.08 17.42 0.03 26.85 4.97 1.00 0.001061 2829 46.13 21 5.5 54.83 54.83 2792.70 46.16 17.40 0.03 26.85 4.97 1.00 0.001061 2833 46.21
Avg.= 54.83 54.83 2793.69 46.08 17.42 0.03 26.85 4.97 1.00 0.00 2828.65 46.13 STDEV= ± 0.00 0.00 0.99 0.08 0.03 0.00 0.00 0.00 0.00 0.00 4.48 0.08 22 6 52.03 52.03 2829.96 44.97 17.67 0.00 26.69 4.94 1.00 0 2670 44.97 23 6 52.04 52.04 2827.98 45.14 17.69 0.00 26.69 4.94 1.00 0 2669 45.14 24 6 52.05 52.05 2826.00 45.30 17.70 0.00 26.69 4.94 1.00 0 2668 45.30
Avg.= 52.04 52.04 2827.98 45.14 17.69 0.00 26.69 4.94 1.00 0.00 2668.80 45.14 STDEV= ± 0.01 0.01 1.98 0.17 0.01 0.00 0.00 0.00 0.00 0.00 1.00 0.17 25 6.5 53.19 53.19 2826.69 43.95 18.20 0.00 26.56 4.92 1.00 0 2675 43.95 26 6.5 53.19 53.19 2827.67 43.86 18.20 0.00 26.56 4.92 1.00 0 2675 43.86 27 6.5 53.19 53.19 2828.66 43.78 18.20 0.00 26.56 4.92 1.00 0 2675 43.78
Avg.= 53.19 53.19 2827.67 43.86 18.20 0.00 26.56 4.92 1.00 0.00 2674.66 43.86 STDEV= ± 0.00 0.00 0.99 0.09 0.00 0.00 0.00 0.00 0.00 0.00 0.00 0.09 28 7 55.22 55.22 2795.86 43.37 19.02 0.00 26.60 4.92 1.00 0 2653 43.37 29 7 55.26 55.26 2796.76 43.21 19.05 0.00 26.62 4.93 1.00 0 2655 43.21 30 7 55.31 55.31 2797.67 43.04 19.08 0.00 26.65 4.93 1.00 0 2657 43.04
Avg.= 55.26 55.26 2796.76 43.21 19.05 0.00 26.62 4.93 1.00 0.00 2655.12 43.21 STDEV= ± 0.04 0.04 0.91 0.16 0.03 0.00 0.03 0.01 0.00 0.00 2.09 0.16 31 7.5 54.13 54.13 2827.71 42.17 19.30 0.00 26.63 4.93 1.00 0 2638 42.17 32 7.5 54.15 54.15 2826.72 42.23 19.36 0.00 26.63 4.93 1.00 0 2631 42.23 33 7.5 54.18 54.18 2825.73 42.30 19.41 0.00 26.63 4.93 1.00 0 2625 42.30
Avg.= 54.15 54.15 2826.72 42.23 19.36 0.00 26.63 4.93 1.00 0.00 2631.36 42.23 STDEV= ± 0.02 0.02 0.99 0.07 0.06 0.00 0.00 0.00 0.00 0.00 6.72 0.07

Appendix B Calculated data sheet
142
Table B 1.7: Calculated data for flat bottom pot with Shield at 6 mbar NG pressure.
SL LH (fcm) (fcd) (wcr) (hc) (ΔtTc) Ecor ECO2r Q MCE CO/CO2 FPc HTE
1 2.5 36.06 36.06 2870.13 61.24 12.91 0.41 9.23 5.12 0.96 0.047722 2515 63.97 2 2.5 35.69 35.69 2869.69 62.01 12.67 0.44 10.60 5.12 0.96 0.044264 2532 64.58 3 2.5 35.32 35.32 2869.24 62.80 12.44 0.47 11.97 5.11 0.96 0.036773 2549 65.26
Avg.= 35.69 35.69 2869.69 62.01 12.68 0.44 10.60 5.12 0.96 0.04 2531.85 64.60 STDEV= ± 0.37 0.37 0.44 0.78 0.23 0.03 1.37 0.00 0.00 0.01 16.79 0.65
4 3 35.79 35.79 2866.01 63.58 12.46 0.11 9.18 5.10 0.99 0.012388 2522 64.37 5 3 35.49 35.49 2863.51 64.39 12.34 0.11 9.16 5.09 0.99 0.012388 2529 65.19 6 3 35.20 35.20 2861.02 65.21 12.21 0.11 9.14 5.07 0.99 0.012449 2536 66.02
Avg.= 35.50 35.50 2863.51 64.39 12.34 0.11 9.16 5.09 0.99 0.01 2528.64 65.19 STDEV= ± 0.29 0.29 2.50 0.82 0.13 0.00 0.02 0.01 0.00 0.00 6.95 0.83
7 3.5 34.29 34.29 2881.39 61.89 12.35 0.04 27.36 5.06 1.00 0.001486 2544 61.98 8 3.5 34.60 34.60 2877.88 61.73 12.52 0.04 27.37 5.06 1.00 0.001486 2537 61.82 9 3.5 34.90 34.90 2874.37 61.58 12.68 0.04 27.37 5.07 1.00 0.001486 2530 61.67
Avg.= 34.59 34.59 2877.88 61.73 12.52 0.04 27.37 5.06 1.00 0.00 2536.68 61.83 STDEV= ± 0.31 0.31 3.51 0.16 0.17 0.00 0.01 0.00 0.00 0.00 7.14 0.16 10 4 35.82 35.82 2880.28 60.61 13.04 0.00 27.46 5.08 1.00 0 2529 60.61 11 4 35.70 35.70 2876.73 60.43 12.94 0.00 27.46 5.08 1.00 0 2546 60.43 12 4 35.58 35.58 2873.17 60.24 12.84 0.00 27.46 5.08 1.00 0 2563 60.24
Avg.= 35.70 35.70 2876.73 60.43 12.94 0.00 27.46 5.08 1.00 0.00 2545.75 60.43 STDEV= ± 0.12 0.12 3.55 0.18 0.10 0.00 0.00 0.00 0.00 0.00 17.02 0.18 13 4.5 37.67 37.67 2872.50 57.44 13.04 0.00 22.90 5.09 1.00 0 2647 57.44 14 4.5 36.68 36.68 2873.93 58.73 12.93 0.00 22.86 5.08 1.00 0 2604 58.73 15 4.5 35.70 35.70 2875.36 60.08 12.82 0.00 22.82 5.07 1.00 0 2560 60.08
Avg.= 36.68 36.68 2873.93 58.75 12.93 0.00 22.86 5.08 1.00 0.00 2603.72 58.75 STDEV= ± 0.99 0.99 1.43 1.32 0.11 0.00 0.04 0.01 0.00 0.00 43.84 1.32 16 5 36.85 36.85 2872.60 58.86 13.64 0.00 18.17 5.05 1.00 0 2468 58.86 17 5 37.76 37.76 2871.76 57.77 13.50 0.00 18.17 5.04 1.00 0 2544 57.77 18 5 38.67 38.67 2870.92 56.72 13.36 0.00 18.17 5.04 1.00 0 2621 56.72
Avg.= 37.76 37.76 2871.76 57.78 13.50 0.00 18.17 5.04 1.00 0.00 2544.24 57.78

Appendix B Calculated data sheet
143
STDEV= ± 0.91 0.91 0.84 1.07 0.14 0.00 0.00 0.00 0.00 0.00 76.15 1.07 19 5.5 40.61 40.61 2848.24 56.69 14.01 0.00 18.01 5.00 1.00 0 2621 56.69 20 5.5 41.28 41.28 2842.29 56.42 14.22 0.00 18.01 5.00 1.00 0 2628 56.42 21 5.5 41.94 41.94 2836.33 56.16 14.42 0.00 18.00 5.00 1.00 0 2634 56.16
Avg.= 41.28 41.28 2842.29 56.43 14.22 0.00 18.01 5.00 1.00 0.00 2627.55 56.43 STDEV= ± 0.66 0.66 5.95 0.26 0.21 0.00 0.00 0.00 0.00 0.00 6.21 0.26 22 6 41.46 41.46 2860.25 54.38 14.06 0.00 18.04 5.01 1.00 0 2655 54.38 23 6 41.25 41.25 2856.30 55.11 14.13 0.00 18.09 5.02 1.00 0 2629 55.11 24 6 41.03 41.03 2852.34 55.85 14.19 0.00 18.14 5.04 1.00 0 2603 55.85
Avg.= 41.25 41.25 2856.30 55.12 14.13 0.00 18.09 5.02 1.00 0.00 2628.85 55.12 STDEV= ± 0.22 0.22 3.95 0.74 0.07 0.00 0.05 0.01 0.00 0.00 26.07 0.74 25 6.5 41.41 41.41 2863.96 53.69 14.49 0.00 18.10 5.02 1.00 0 2593 53.69 26 6.5 41.54 41.54 2858.55 54.16 14.70 0.00 18.11 5.03 1.00 0 2561 54.16 27 6.5 41.67 41.67 2853.13 54.63 14.91 0.00 18.11 5.03 1.00 0 2531 54.63
Avg.= 41.54 41.54 2858.55 54.16 14.70 0.00 18.11 5.03 1.00 0.00 2561.81 54.16 STDEV= ± 0.13 0.13 5.41 0.47 0.21 0.00 0.01 0.00 0.00 0.00 30.82 0.47 28 7 43.60 43.60 2857.07 53.08 14.89 0.00 18.07 5.02 1.00 0 2575 53.08 29 7 43.60 43.60 2858.08 53.01 14.87 0.00 18.07 5.02 1.00 0 2578 53.01 30 7 43.59 43.59 2859.09 52.94 14.84 0.00 18.07 5.02 1.00 0 2580 52.94
Avg.= 43.60 43.60 2858.08 53.01 14.87 0.00 18.07 5.02 1.00 0.00 2577.85 53.01 STDEV= ± 0.01 0.01 1.01 0.07 0.03 0.00 0.00 0.00 0.00 0.00 2.41 0.07 31 7.5 44.20 44.20 2856.22 52.64 14.59 0.00 18.14 5.04 1.00 0 2653 52.64 32 7.5 44.19 44.19 2857.21 52.55 14.53 0.00 18.14 5.04 1.00 0 2663 52.55 33 7.5 44.17 44.17 2858.19 52.47 14.47 0.00 18.14 5.04 1.00 0 2673 52.47
Avg.= 44.19 44.19 2857.21 52.55 14.53 0.00 18.14 5.04 1.00 0.00 2663.00 52.55 STDEV= ± 0.02 0.02 0.99 0.08 0.06 0.00 0.00 0.00 0.00 0.00 9.83 0.08

Appendix B Calculated data sheet
144
Table B 1.8: Calculated data for Finned pot with Shield at 6 mbar NG pressure.
SL LH (fcm) (fcd) (wcr) (hc) (ΔtTc) Ecor ECO2r Q MCE CO/CO2 FPc HTE 1 2.5 40.39 40.39 2861.39 55.39 13.64 2.43 18.45 5.12 0.88 0.131828 2624 62.69 2 2.5 39.91 39.91 2857.19 56.20 13.70 2.46 18.49 5.13 0.88 0.133261 2600 63.69 3 2.5 39.42 39.42 2852.99 57.04 13.75 2.50 18.53 5.14 0.88 0.134694 2577 64.72
Avg.= 39.91 39.91 2857.19 56.21 13.70 2.46 18.49 5.13 0.88 0.13 2600.35 63.70 STDEV= ± 0.48 0.48 4.20 0.82 0.06 0.03 0.04 0.01 0.00 0.00 23.21 1.01
4 3 36.77 36.77 2876.14 57.36 13.10 2.23 16.57 5.11 0.88 0.134446 2564 65.08 5 3 37.92 37.92 2865.97 57.17 13.49 2.16 17.46 5.10 0.89 0.124018 2554 64.26 6 3 39.07 39.07 2855.80 56.99 13.87 2.10 18.34 5.09 0.90 0.114633 2544 63.52
Avg.= 37.92 37.92 2865.97 57.17 13.49 2.16 17.45 5.10 0.89 0.12 2554.17 64.29 STDEV= ± 1.15 1.15 10.17 0.19 0.38 0.06 0.88 0.01 0.01 0.01 10.03 0.78
7 3.5 37.47 37.47 2869.05 58.38 13.13 1.87 18.32 5.09 0.91 0.101896 2547 64.33 8 3.5 38.04 38.04 2859.63 58.62 13.34 1.82 18.34 5.09 0.91 0.09903 2546 64.42 9 3.5 38.62 38.62 2850.22 58.84 13.56 1.76 18.35 5.10 0.91 0.096164 2545 64.50
Avg.= 38.04 38.04 2859.63 58.61 13.34 1.82 18.34 5.09 0.91 0.10 2546.35 64.42 STDEV= ± 0.58 0.58 9.41 0.23 0.22 0.05 0.02 0.00 0.00 0.00 1.07 0.09 10 4 39.97 39.97 2833.65 57.75 13.81 0.70 27.43 5.08 0.98 0.025474 2645 59.22 11 4 39.59 39.59 2843.98 57.01 13.66 0.69 27.52 5.09 0.98 0.024943 2652 58.43 12 4 39.21 39.21 2854.30 56.26 13.51 0.67 27.61 5.11 0.98 0.024413 2659 57.63
Avg.= 39.59 39.59 2843.98 57.01 13.66 0.69 27.52 5.09 0.98 0.02 2651.91 58.43 STDEV= ± 0.38 0.38 10.32 0.75 0.15 0.01 0.09 0.02 0.00 0.00 7.28 0.79 13 4.5 38.33 38.33 2867.25 56.11 13.92 0.09 36.63 5.08 1.00 0.002388 2516 56.24 14 4.5 38.17 38.17 2867.38 56.51 13.67 0.07 36.59 5.08 1.00 0.00199 2541 56.63 15 4.5 38.01 38.01 2867.50 56.92 13.43 0.06 36.55 5.07 1.00 0.001592 2567 57.01
Avg.= 38.17 38.17 2867.37 56.51 13.68 0.07 36.59 5.08 1.00 0.00 2541.56 56.63 STDEV= ± 0.16 0.16 0.13 0.41 0.25 0.01 0.04 0.01 0.00 0.00 25.64 0.39 16 5 42.16 42.16 2838.60 55.53 14.24 0.03 36.39 5.05 1.00 0.000955 2627 55.58 17 5 41.64 41.64 2843.18 55.20 14.21 0.03 36.41 5.05 1.00 0.000876 2628 55.25 18 5 41.12 41.12 2847.74 54.86 14.19 0.03 36.44 5.06 1.00 0.000796 2629 54.91

Appendix B Calculated data sheet
145
Avg.= 41.64 41.64 2843.17 55.20 14.21 0.03 36.41 5.05 1.00 0.00 2628.34 55.25 STDEV= ± 0.52 0.52 4.57 0.33 0.03 0.00 0.03 0.00 0.00 0.00 0.94 0.34 19 5.5 42.90 42.90 2841.06 54.95 14.18 0.00 36.31 5.04 1.00 0 2645 54.95 20 5.5 43.84 43.84 2834.96 54.20 14.41 0.00 36.45 5.06 1.00 0 2675 54.20 21 5.5 44.78 44.78 2828.87 53.48 14.63 0.00 36.59 5.08 1.00 0 2704 53.48
Avg.= 43.84 43.84 2834.96 54.21 14.41 0.00 36.45 5.06 1.00 0.00 2674.65 54.21 STDEV= ± 0.94 0.94 6.10 0.74 0.22 0.00 0.14 0.02 0.00 0.00 29.38 0.74 22 6 43.92 43.92 2829.27 53.72 14.69 0.00 36.51 5.07 1.00 0 2688 53.72 23 6 42.59 42.59 2832.29 53.26 14.85 0.00 36.56 5.07 1.00 0 2687 53.26 24 6 41.25 41.25 2835.18 52.76 15.02 0.00 36.61 5.08 1.00 0 2686 52.76
Avg.= 42.59 42.59 2832.25 53.25 14.86 0.00 36.56 5.07 1.00 0.00 2686.92 53.25 STDEV= ± 1.34 1.34 2.96 0.48 0.17 0.00 0.05 0.01 0.00 0.00 0.92 0.48 25 6.5 42.95 42.95 2852.83 50.92 15.05 0.00 36.52 5.07 1.00 0 2652 50.92 26 6.5 43.39 43.39 2844.39 51.87 15.15 0.00 36.59 5.08 1.00 0 2628 51.87 27 6.5 43.83 43.83 2835.93 52.80 15.24 0.00 36.67 5.09 1.00 0 2604 52.80
Avg.= 43.39 43.39 2844.39 51.86 15.15 0.00 36.59 5.08 1.00 0.00 2628.09 51.86 STDEV= ± 0.44 0.44 8.45 0.94 0.10 0.00 0.08 0.01 0.00 0.00 24.24 0.94 28 7 45.21 45.21 2838.75 51.95 15.09 0.00 36.48 5.06 1.00 0 2647 51.95 29 7 45.19 45.19 2841.30 51.18 15.38 0.00 36.48 5.06 1.00 0 2627 51.18 30 7 45.17 45.17 2843.84 50.41 15.69 0.00 36.48 5.06 1.00 0 2608 50.41
Avg.= 45.19 45.19 2841.30 51.18 15.39 0.00 36.48 5.06 1.00 0.00 2627.31 51.18 STDEV= ± 0.02 0.02 2.55 0.77 0.30 0.00 0.00 0.00 0.00 0.00 19.75 0.77 31 7.5 44.80 44.80 2849.77 50.22 16.25 0.00 36.52 5.07 1.00 0 2497 50.22 32 7.5 43.92 43.92 2852.73 50.90 15.80 0.00 36.52 5.07 1.00 0 2517 50.90 33 7.5 43.05 43.05 2855.70 51.61 15.36 0.00 36.52 5.07 1.00 0 2539 51.61
Avg.= 43.92 43.92 2852.73 50.91 15.80 0.00 36.52 5.07 1.00 0.00 2517.87 50.91 STDEV= ± 0.87 0.87 2.96 0.70 0.45 0.00 0.00 0.00 0.00 0.00 20.82 0.70
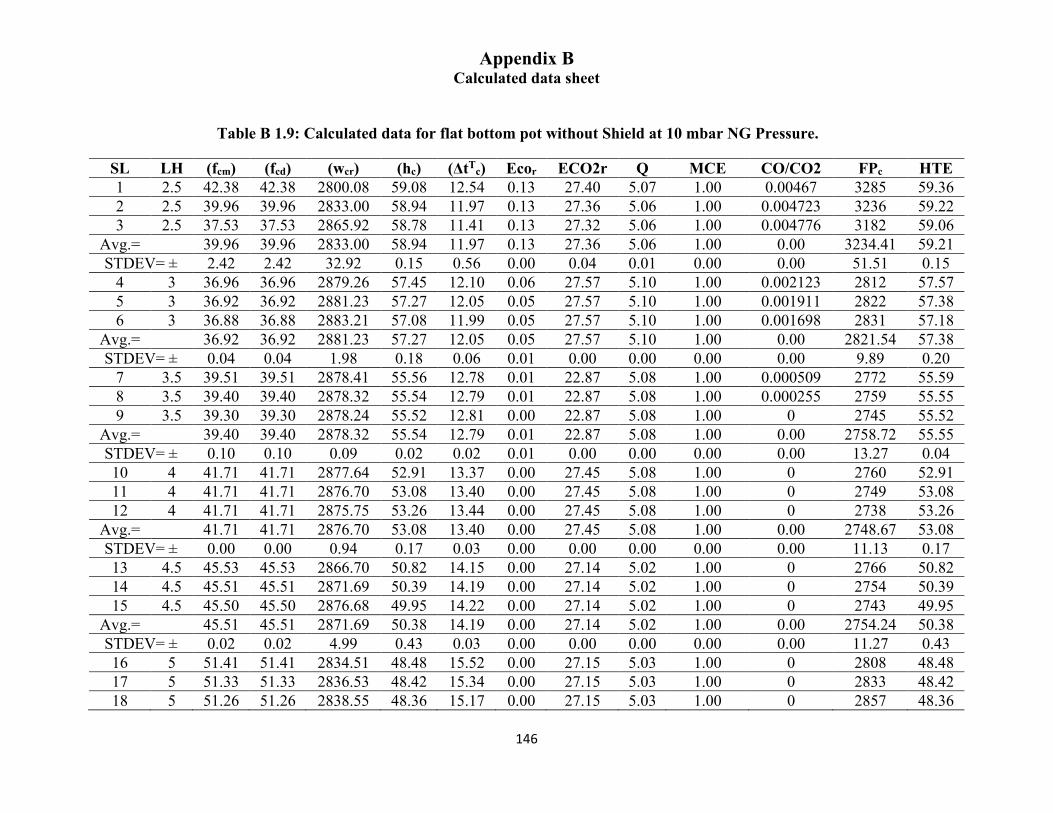
Appendix B Calculated data sheet
146
Table B 1.9: Calculated data for flat bottom pot without Shield at 10 mbar NG Pressure.
SL LH (fcm) (fcd) (wcr) (hc) (ΔtTc) Ecor ECO2r Q MCE CO/CO2 FPc HTE 1 2.5 42.38 42.38 2800.08 59.08 12.54 0.13 27.40 5.07 1.00 0.00467 3285 59.36 2 2.5 39.96 39.96 2833.00 58.94 11.97 0.13 27.36 5.06 1.00 0.004723 3236 59.22 3 2.5 37.53 37.53 2865.92 58.78 11.41 0.13 27.32 5.06 1.00 0.004776 3182 59.06
Avg.= 39.96 39.96 2833.00 58.94 11.97 0.13 27.36 5.06 1.00 0.00 3234.41 59.21 STDEV= ± 2.42 2.42 32.92 0.15 0.56 0.00 0.04 0.01 0.00 0.00 51.51 0.15
4 3 36.96 36.96 2879.26 57.45 12.10 0.06 27.57 5.10 1.00 0.002123 2812 57.57 5 3 36.92 36.92 2881.23 57.27 12.05 0.05 27.57 5.10 1.00 0.001911 2822 57.38 6 3 36.88 36.88 2883.21 57.08 11.99 0.05 27.57 5.10 1.00 0.001698 2831 57.18
Avg.= 36.92 36.92 2881.23 57.27 12.05 0.05 27.57 5.10 1.00 0.00 2821.54 57.38 STDEV= ± 0.04 0.04 1.98 0.18 0.06 0.01 0.00 0.00 0.00 0.00 9.89 0.20
7 3.5 39.51 39.51 2878.41 55.56 12.78 0.01 22.87 5.08 1.00 0.000509 2772 55.59 8 3.5 39.40 39.40 2878.32 55.54 12.79 0.01 22.87 5.08 1.00 0.000255 2759 55.55 9 3.5 39.30 39.30 2878.24 55.52 12.81 0.00 22.87 5.08 1.00 0 2745 55.52
Avg.= 39.40 39.40 2878.32 55.54 12.79 0.01 22.87 5.08 1.00 0.00 2758.72 55.55 STDEV= ± 0.10 0.10 0.09 0.02 0.02 0.01 0.00 0.00 0.00 0.00 13.27 0.04 10 4 41.71 41.71 2877.64 52.91 13.37 0.00 27.45 5.08 1.00 0 2760 52.91 11 4 41.71 41.71 2876.70 53.08 13.40 0.00 27.45 5.08 1.00 0 2749 53.08 12 4 41.71 41.71 2875.75 53.26 13.44 0.00 27.45 5.08 1.00 0 2738 53.26
Avg.= 41.71 41.71 2876.70 53.08 13.40 0.00 27.45 5.08 1.00 0.00 2748.67 53.08 STDEV= ± 0.00 0.00 0.94 0.17 0.03 0.00 0.00 0.00 0.00 0.00 11.13 0.17 13 4.5 45.53 45.53 2866.70 50.82 14.15 0.00 27.14 5.02 1.00 0 2766 50.82 14 4.5 45.51 45.51 2871.69 50.39 14.19 0.00 27.14 5.02 1.00 0 2754 50.39 15 4.5 45.50 45.50 2876.68 49.95 14.22 0.00 27.14 5.02 1.00 0 2743 49.95
Avg.= 45.51 45.51 2871.69 50.38 14.19 0.00 27.14 5.02 1.00 0.00 2754.24 50.38 STDEV= ± 0.02 0.02 4.99 0.43 0.03 0.00 0.00 0.00 0.00 0.00 11.27 0.43 16 5 51.41 51.41 2834.51 48.48 15.52 0.00 27.15 5.03 1.00 0 2808 48.48 17 5 51.33 51.33 2836.53 48.42 15.34 0.00 27.15 5.03 1.00 0 2833 48.42 18 5 51.26 51.26 2838.55 48.36 15.17 0.00 27.15 5.03 1.00 0 2857 48.36

Appendix B Calculated data sheet
147
Avg.= 51.33 51.33 2836.53 48.42 15.34 0.00 27.15 5.03 1.00 0.00 2832.71 48.42 STDEV= ± 0.08 0.08 2.02 0.06 0.18 0.00 0.00 0.00 0.00 0.00 24.49 0.06 19 5.5 51.06 51.06 2863.27 46.28 15.89 0.00 27.00 5.00 1.00 0 2716 46.28 20 5.5 51.06 51.06 2863.40 46.44 15.93 0.00 27.00 5.00 1.00 0 2698 46.44 21 5.5 51.06 51.06 2863.53 46.59 15.97 0.00 27.00 5.00 1.00 0 2681 46.59
Avg.= 51.06 51.06 2863.40 46.44 15.93 0.00 27.00 5.00 1.00 0.00 2698.52 46.44 STDEV= ± 0.00 0.00 0.13 0.15 0.04 0.00 0.00 0.00 0.00 0.00 17.52 0.15 22 6 53.59 53.59 2870.41 44.47 16.34 0.00 26.97 4.99 1.00 0 2743 44.47 23 6 53.59 53.59 2866.49 44.49 16.37 0.00 26.97 4.99 1.00 0 2739 44.49 24 6 53.59 53.59 2862.59 44.52 16.41 0.00 26.97 4.99 1.00 0 2735 44.52
Avg.= 53.59 53.59 2866.50 44.49 16.37 0.00 26.97 4.99 1.00 0.00 2739.07 44.49 STDEV= ± 0.00 0.00 3.91 0.02 0.04 0.00 0.00 0.00 0.00 0.00 4.30 0.02 25 6.5 56.74 56.74 2850.72 43.03 17.18 0.00 26.91 4.98 1.00 0 2765 43.03 26 6.5 56.74 56.74 2852.20 42.90 17.03 0.00 26.91 4.98 1.00 0 2790 42.90 27 6.5 56.74 56.74 2853.68 42.78 16.87 0.00 26.91 4.98 1.00 0 2816 42.78
Avg.= 56.74 56.74 2852.20 42.90 17.03 0.00 26.91 4.98 1.00 0.00 2790.55 42.90 STDEV= ± 0.00 0.00 1.48 0.12 0.15 0.00 0.00 0.00 0.00 0.00 25.29 0.12 28 7 61.55 61.55 2833.16 41.27 18.27 0.00 26.92 4.98 1.00 0 2799 41.27 29 7 61.55 61.55 2834.19 41.24 18.19 0.00 26.92 4.98 1.00 0 2806 41.24 30 7 61.55 61.55 2835.22 41.20 18.11 0.00 26.92 4.98 1.00 0 2814 41.20
Avg.= 61.55 61.55 2834.19 41.24 18.19 0.00 26.92 4.98 1.00 0.00 2806.42 41.24 STDEV= ± 0.00 0.00 1.03 0.03 0.08 0.00 0.00 0.00 0.00 0.00 7.86 0.03 31 7.5 63.91 63.91 2836.97 40.12 18.98 0.00 26.84 4.97 1.00 0 2782 40.12 32 7.5 63.91 63.91 2825.45 40.12 19.11 0.00 26.84 4.97 1.00 0 2774 40.12 33 7.5 63.91 63.91 2813.93 40.12 19.24 0.00 26.84 4.97 1.00 0 2767 40.12
Avg.= 63.91 63.91 2825.45 40.12 19.11 0.00 26.84 4.97 1.00 0.00 2774.15 40.12 STDEV= ± 0.00 0.00 11.52 0.00 0.13 0.00 0.00 0.00 0.00 0.00 7.40 0.00

Appendix B Calculated data sheet
148
Table B 1.10: Calculated data for Finned pot without Shield at 10 mbar NG pressure.
SL LH (fcm) (fcd) (wcr) (hc) (ΔtTc) Ecor ECO2r Q MCE CO/CO2 FPc HTE 1 2.5 44.04 44.04 2864.95 48.69 14.61 1.36 18.61 5.17 0.93 0.073238 2779 52.26 2 2.5 44.04 44.04 2865.94 48.59 14.61 1.39 18.61 5.17 0.93 0.07483 2779 52.22 3 2.5 44.04 44.04 2866.93 48.48 14.61 1.42 18.61 5.17 0.93 0.076422 2779 52.19
Avg.= 44.04 44.04 2865.94 48.59 14.61 1.39 18.61 5.17 0.93 0.07 2778.79 52.22 STDEV= ± 0.00 0.00 0.99 0.11 0.00 0.03 0.00 0.00 0.00 0.00 0.00 0.04
4 3 44.50 44.50 2855.39 49.58 14.54 0.86 23.04 5.12 0.96 0.037192 2797 51.42 5 3 44.26 44.26 2861.32 49.22 14.51 0.87 20.74 5.12 0.96 0.041891 2787 51.28 6 3 44.03 44.03 2867.25 48.85 14.48 0.88 18.43 5.12 0.95 0.047764 2778 51.18
Avg.= 44.26 44.26 2861.32 49.22 14.51 0.87 20.74 5.12 0.96 0.04 2787.29 51.30 STDEV= ± 0.24 0.24 5.93 0.36 0.03 0.01 2.30 0.00 0.00 0.01 9.49 0.12
7 3.5 45.46 45.46 2838.31 51.16 14.63 0.70 23.02 5.11 0.97 0.030569 2782 52.72 8 3.5 45.27 45.27 2843.25 50.86 14.41 0.67 25.33 5.11 0.97 0.026632 2813 52.21 9 3.5 45.08 45.08 2848.19 50.56 14.19 0.65 27.63 5.11 0.98 0.023351 2844 51.74
Avg.= 45.27 45.27 2843.25 50.86 14.41 0.67 25.33 5.11 0.97 0.03 2813.01 52.22 STDEV= ± 0.19 0.19 4.94 0.30 0.22 0.03 2.30 0.00 0.00 0.00 31.16 0.49 10 4 46.99 46.99 2859.04 48.61 14.90 0.51 27.41 5.07 0.98 0.018575 2742 49.52 11 4 46.99 46.99 2859.04 48.61 14.90 0.53 27.41 5.07 0.98 0.019212 2742 49.55 12 4 46.99 46.99 2859.04 48.61 14.90 0.54 27.41 5.07 0.98 0.019848 2742 49.58
Avg.= 46.99 46.99 2859.04 48.61 14.90 0.53 27.41 5.07 0.98 0.02 2741.71 49.55 STDEV= ± 0.00 0.00 0.00 0.00 0.00 0.02 0.00 0.00 0.00 0.00 0.00 0.03 13 4.5 49.14 49.14 2859.82 47.38 15.28 0.26 36.43 5.06 0.99 0.007165 2730 47.72 14 4.5 49.14 49.14 2859.82 47.38 15.26 0.31 36.43 5.06 0.99 0.008637 2735 47.79 15 4.5 49.14 49.14 2859.82 47.38 15.23 0.37 36.43 5.06 0.99 0.01011 2739 47.86
Avg.= 49.14 49.14 2859.82 47.38 15.26 0.31 36.43 5.06 0.99 0.01 2734.70 47.79 STDEV= ± 0.00 0.00 0.00 0.00 0.03 0.05 0.00 0.00 0.00 0.00 4.67 0.07 16 5 51.41 51.41 2854.29 46.28 16.07 0.16 36.45 5.06 1.00 0.004299 2682 46.48 17 5 51.41 51.41 2854.29 46.28 15.97 0.15 36.45 5.06 1.00 0.00406 2699 46.47 18 5 51.41 51.41 2854.29 46.28 15.87 0.14 36.45 5.06 1.00 0.003821 2717 46.46

Appendix B Calculated data sheet
149
Avg.= 51.41 51.41 2854.29 46.28 15.97 0.15 36.45 5.06 1.00 0.00 2699.31 46.47 STDEV= ± 0.00 0.00 0.00 0.00 0.10 0.01 0.00 0.00 0.00 0.00 17.42 0.01 19 5.5 53.38 53.38 2849.60 45.29 16.76 0.09 36.31 5.04 1.00 0.002547 2649 45.40 20 5.5 53.34 53.34 2850.59 45.24 16.73 0.07 36.31 5.04 1.00 0.001831 2651 45.32 21 5.5 53.29 53.29 2851.58 45.19 16.71 0.04 36.31 5.04 1.00 0.001114 2653 45.24
Avg.= 53.34 53.34 2850.59 45.24 16.73 0.07 36.31 5.04 1.00 0.00 2651.13 45.32 STDEV= ± 0.04 0.04 0.99 0.05 0.03 0.03 0.00 0.00 0.00 0.00 1.85 0.08 22 6 54.78 54.78 2851.66 44.06 17.37 0.00 36.09 5.01 1.00 0 2615 44.06 23 6 54.79 54.79 2850.67 44.14 17.40 0.00 36.09 5.01 1.00 0 2612 44.14 24 6 54.80 54.80 2849.68 44.21 17.43 0.00 36.09 5.01 1.00 0 2608 44.21
Avg.= 54.79 54.79 2850.67 44.14 17.40 0.00 36.09 5.01 1.00 0.00 2611.62 44.14 STDEV= ± 0.01 0.01 0.99 0.07 0.03 0.00 0.00 0.00 0.00 0.00 3.18 0.07 25 6.5 59.82 59.82 2817.38 43.40 18.04 0.00 35.99 5.00 1.00 0 2720 43.40 26 6.5 59.82 59.82 2817.38 43.40 18.07 0.00 35.99 5.00 1.00 0 2716 43.40 27 6.5 59.82 59.82 2817.38 43.40 18.09 0.00 35.99 5.00 1.00 0 2712 43.40
Avg.= 59.82 59.82 2817.38 43.40 18.07 0.00 35.99 5.00 1.00 0.00 2716.14 43.40 STDEV= ± 0.00 0.00 0.00 0.00 0.03 0.00 0.00 0.00 0.00 0.00 3.79 0.00 28 7 62.82 62.82 2801.71 42.67 18.45 0.00 36.13 5.01 1.00 0 2779 42.67 29 7 62.74 62.74 2803.69 42.57 18.47 0.00 36.13 5.01 1.00 0 2772 42.57 30 7 62.67 62.67 2805.67 42.48 18.50 0.00 36.13 5.01 1.00 0 2764 42.48
Avg.= 62.74 62.74 2803.69 42.57 18.47 0.00 36.13 5.01 1.00 0.00 2771.56 42.57 STDEV= ± 0.08 0.08 1.98 0.10 0.03 0.00 0.00 0.00 0.00 0.00 7.07 0.10 31 7.5 62.33 62.33 2818.65 41.87 19.27 0.00 36.19 5.02 1.00 0 2628 41.87 32 7.5 62.33 62.33 2818.65 41.87 19.17 0.00 36.19 5.02 1.00 0 2642 41.87 33 7.5 62.33 62.33 2818.65 41.87 19.07 0.00 36.19 5.02 1.00 0 2656 41.87
Avg.= 62.33 62.33 2818.65 41.87 19.17 0.00 36.19 5.02 1.00 0.00 2642.09 41.87 STDEV= ± 0.00 0.00 0.00 0.00 0.10 0.00 0.00 0.00 0.00 0.00 13.76 0.00

Appendix B Calculated data sheet
150
Table B 1.11: Calculated data for flat bottom pot with Shield at 10 mbar NG pressure.
SL LH (fcm) (fcd) (wcr) (hc) (ΔtTc) Ecor ECO2r Q MCE CO/CO2 FPc HTE
1 2.5 39.23 39.23 2883.70 58.87 12.60 0.99 19.16 5.32 0.95 0.051426 2579 61.90 2 2.5 39.33 39.33 2882.56 58.61 12.26 0.93 19.14 5.31 0.95 0.04856 2668 61.45 3 2.5 39.43 39.43 2881.42 58.35 11.93 0.87 19.13 5.31 0.96 0.045694 2764 61.01
Avg.= 39.33 39.33 2882.56 58.61 12.26 0.93 19.14 5.31 0.95 0.05 2670.38 61.46 STDEV= ± 0.10 0.10 1.14 0.26 0.34 0.06 0.02 0.01 0.00 0.00 92.61 0.44
4 3 38.63 38.63 2876.48 60.16 11.79 0.23 19.06 5.29 0.99 0.011941 2738 60.88 5 3 38.14 38.14 2880.50 60.54 11.55 0.30 19.03 5.28 0.98 0.015762 2756 61.49 6 3 37.66 37.66 2884.52 60.93 11.31 0.37 19.00 5.28 0.98 0.019583 2774 62.12
Avg.= 38.14 38.14 2880.50 60.54 11.55 0.30 19.03 5.28 0.98 0.02 2755.86 61.50 STDEV= ± 0.48 0.48 4.02 0.38 0.24 0.07 0.03 0.01 0.00 0.00 17.60 0.62
7 3.5 37.97 37.97 2883.49 60.48 11.53 0.11 23.87 5.30 1.00 0.004458 2747 60.75 8 3.5 37.85 37.85 2884.35 60.34 11.55 0.10 26.23 5.30 1.00 0.003821 2744 60.58 9 3.5 37.73 37.73 2885.21 60.21 11.57 0.09 28.58 5.29 1.00 0.00329 2742 60.41
Avg.= 37.85 37.85 2884.35 60.34 11.55 0.10 26.23 5.30 1.00 0.00 2744.35 60.58 STDEV= ± 0.12 0.12 0.86 0.14 0.02 0.01 2.36 0.01 0.00 0.00 2.48 0.17 10 4 38.37 38.37 2887.36 59.22 11.71 0.11 28.53 5.28 1.00 0.003715 2740 59.44 11 4 38.67 38.67 2883.68 59.68 11.69 0.11 28.54 5.28 1.00 0.003874 2742 59.92 12 4 38.96 38.96 2879.99 60.14 11.67 0.12 28.56 5.29 1.00 0.004033 2743 60.38
Avg.= 38.67 38.67 2883.68 59.68 11.69 0.11 28.54 5.28 1.00 0.00 2741.48 59.91 STDEV= ± 0.29 0.29 3.68 0.46 0.02 0.00 0.01 0.00 0.00 0.00 1.75 0.47 13 4.5 40.01 40.01 2870.46 58.64 12.21 0.05 28.53 5.28 1.00 0.001698 2748 58.74 14 4.5 39.81 39.81 2873.72 58.23 12.05 0.06 28.51 5.28 1.00 0.002017 2787 58.35 15 4.5 39.62 39.62 2876.99 57.82 11.89 0.07 28.49 5.27 1.00 0.002335 2828 57.95
Avg.= 39.81 39.81 2873.72 58.23 12.05 0.06 28.51 5.28 1.00 0.00 2787.97 58.35 STDEV= ± 0.20 0.20 3.27 0.41 0.16 0.01 0.02 0.00 0.00 0.00 40.26 0.39 16 5 41.81 41.81 2874.23 56.75 12.44 0.05 28.35 5.25 1.00 0.001911 2822 56.86 17 5 40.82 40.82 2877.17 57.01 12.14 0.03 28.36 5.25 1.00 0.001061 2835 57.07 18 5 39.83 39.83 2880.04 57.29 11.84 0.01 28.37 5.25 1.00 0.000212 2849 57.30
Avg.= 40.82 40.82 2877.15 57.02 12.14 0.03 28.36 5.25 1.00 0.00 2835.22 57.08

Appendix B Calculated data sheet
151
STDEV= ± 0.99 0.99 2.91 0.27 0.30 0.02 0.01 0.00 0.00 0.00 13.56 0.22 19 5.5 41.78 41.78 2870.37 56.04 12.36 0.02 23.68 5.26 1.00 0.000637 2843 56.07 20 5.5 41.80 41.80 2869.21 55.87 12.39 0.01 26.05 5.26 1.00 0.000521 2852 55.90 21 5.5 41.82 41.82 2868.04 55.71 12.43 0.01 28.42 5.26 1.00 0.000425 2860 55.73
Avg.= 41.80 41.80 2869.21 55.87 12.39 0.01 26.05 5.26 1.00 0.00 2851.64 55.90 STDEV= ± 0.02 0.02 1.16 0.16 0.04 0.00 2.37 0.00 0.00 0.00 8.55 0.17 22 6 43.28 43.28 2862.37 54.83 12.53 0.01 23.64 5.25 1.00 0.000382 2911 54.85 23 6 42.80 42.80 2867.14 54.67 12.45 0.01 25.99 5.25 1.00 0.000405 2915 54.69 24 6 42.31 42.31 2871.91 54.50 12.36 0.01 28.35 5.25 1.00 0.000425 2918 54.53
Avg.= 42.80 42.80 2867.14 54.67 12.45 0.01 25.99 5.25 1.00 0.00 2914.74 54.69 STDEV= ± 0.48 0.48 4.77 0.16 0.09 0.00 2.35 0.00 0.00 0.00 3.59 0.16 25 6.5 42.41 42.41 2880.17 53.99 12.28 0.02 28.38 5.25 1.00 0.000637 2913 54.03 26 6.5 42.87 42.87 2874.07 53.82 12.84 0.02 23.68 5.26 1.00 0.000955 2830 53.87 27 6.5 43.33 43.33 2867.96 53.65 13.42 0.03 18.97 5.27 1.00 0.001433 2753 53.73
Avg.= 42.87 42.87 2874.07 53.82 12.85 0.02 23.68 5.26 1.00 0.00 2831.65 53.88 STDEV= ± 0.46 0.46 6.11 0.17 0.57 0.00 4.71 0.01 0.00 0.00 79.88 0.15 28 7 44.47 44.47 2863.96 52.64 13.43 0.03 28.22 5.22 1.00 0.001168 2827 52.70 29 7 44.85 44.85 2860.11 52.74 13.48 0.04 23.55 5.23 1.00 0.001911 2830 52.85 30 7 45.23 45.23 2856.26 52.85 13.54 0.06 18.86 5.24 1.00 0.003025 2832 53.01
Avg.= 44.85 44.85 2860.11 52.74 13.48 0.04 23.54 5.23 1.00 0.00 2829.57 52.85 STDEV= ± 0.38 0.38 3.85 0.11 0.06 0.01 4.68 0.01 0.00 0.00 2.22 0.16 31 7.5 43.04 43.04 2881.98 52.74 13.16 0.05 28.35 5.25 1.00 0.001804 2774 52.84 32 7.5 44.06 44.06 2873.96 52.22 13.44 0.06 28.33 5.24 1.00 0.002176 2789 52.33 33 7.5 45.08 45.08 2865.93 51.72 13.72 0.07 28.30 5.24 1.00 0.002547 2805 51.85
Avg.= 44.06 44.06 2873.96 52.23 13.44 0.06 28.33 5.24 1.00 0.00 2789.26 52.34 STDEV= ± 1.02 1.02 8.02 0.51 0.28 0.01 0.02 0.00 0.00 0.00 15.63 0.49

Appendix B Calculated data sheet
152
Table B 1.12: Calculated data for Finned pot with Shield at 10 mbar NG pressure.
SL LH (fcm) (fcd) (wcr) (hc) (ΔtTc) Ecor ECO2r Q MCE CO/CO2 FPc HTE 1 2.5 50.58 50.58 2865.81 46.79 13.99 2.11 13.82 5.48 0.87 0.152617 2970 53.93 2 2.5 48.03 48.03 2858.50 49.47 13.39 2.19 13.80 5.47 0.86 0.158871 2983 57.32 3 2.5 45.49 45.49 2851.19 52.44 12.78 2.27 13.78 5.46 0.86 0.165126 2998 61.10
Avg.= 48.03 48.03 2858.50 49.57 13.39 2.19 13.80 5.47 0.86 0.16 2983.71 57.45 STDEV= ± 2.55 2.55 7.31 2.83 0.61 0.08 0.02 0.01 0.00 0.01 13.71 3.58
4 3 42.90 42.90 2860.52 55.23 12.60 1.75 15.66 5.43 0.90 0.111449 2827 61.39 5 3 42.87 42.87 2858.90 54.51 12.83 1.93 15.15 5.43 0.89 0.12737 2831 61.46 6 3 42.83 42.83 2857.25 53.79 13.07 2.11 14.63 5.42 0.87 0.144353 2834 61.56
Avg.= 42.87 42.87 2858.89 54.51 12.83 1.93 15.15 5.43 0.89 0.13 2830.66 61.47 STDEV= ± 0.03 0.03 1.64 0.72 0.23 0.18 0.51 0.01 0.01 0.02 3.60 0.08
7 3.5 41.76 41.76 2858.59 57.03 12.84 1.80 17.06 5.41 0.90 0.105535 2697 63.05 8 3.5 42.16 42.16 2855.47 56.59 12.95 1.74 16.32 5.41 0.90 0.106458 2713 62.62 9 3.5 42.57 42.57 2852.35 56.16 13.07 1.67 15.58 5.41 0.90 0.107468 2728 62.20
Avg.= 42.16 42.16 2855.47 56.59 12.95 1.74 16.32 5.41 0.90 0.11 2712.75 62.62 STDEV= ± 0.41 0.41 3.12 0.43 0.11 0.06 0.74 0.00 0.00 0.00 15.55 0.42 10 4 41.45 41.45 2850.20 57.66 12.83 0.87 24.31 5.40 0.97 0.035664 2721 59.72 11 4 43.33 43.33 2848.31 55.49 13.05 0.84 24.32 5.40 0.97 0.034645 2788 57.41 12 4 45.20 45.20 2846.42 53.51 13.27 0.82 24.34 5.41 0.97 0.033626 2852 55.31
Avg.= 43.33 43.33 2848.31 55.55 13.05 0.84 24.32 5.40 0.97 0.03 2786.72 57.48 STDEV= ± 1.88 1.88 1.89 2.08 0.22 0.02 0.01 0.00 0.00 0.00 65.68 2.20 13 4.5 41.39 41.39 2860.18 56.74 13.47 0.25 28.97 5.36 0.99 0.008491 2580 57.22 14 4.5 42.21 42.21 2865.21 55.22 12.96 0.23 28.74 5.32 0.99 0.007961 2728 55.66 15 4.5 43.02 43.02 2870.24 53.76 12.45 0.21 28.52 5.28 0.99 0.00743 2887 54.16
Avg.= 42.21 42.21 2865.21 55.24 12.96 0.23 28.75 5.32 0.99 0.01 2731.23 55.68 STDEV= ± 0.81 0.81 5.03 1.49 0.51 0.02 0.23 0.04 0.00 0.00 153.49 1.53 16 5 43.73 43.73 2850.02 54.42 13.73 0.00 28.93 5.35 1.00 0 2696 54.42 17 5 42.88 42.88 2857.91 54.60 13.32 0.01 28.97 5.36 1.00 0.000318 2726 54.62 18 5 42.02 42.02 2865.80 54.80 12.92 0.02 29.00 5.37 1.00 0.000637 2758 54.84

Appendix B Calculated data sheet
153
Avg.= 42.88 42.88 2857.91 54.61 13.32 0.01 28.97 5.36 1.00 0.00 2727.03 54.63 STDEV= ± 0.85 0.85 7.89 0.19 0.41 0.01 0.04 0.01 0.00 0.00 30.99 0.21 19 5.5 44.95 44.95 2846.02 53.30 13.44 0.00 24.22 5.38 1.00 0 2836 53.30 20 5.5 44.91 44.91 2844.09 53.61 13.56 0.01 21.77 5.37 1.00 0.000566 2803 53.64 21 5.5 44.87 44.87 2842.16 53.92 13.69 0.02 19.33 5.37 1.00 0.001274 2771 53.98
Avg.= 44.91 44.91 2844.09 53.61 13.56 0.01 21.77 5.37 1.00 0.00 2803.17 53.64 STDEV= ± 0.04 0.04 1.93 0.31 0.13 0.01 2.45 0.01 0.00 0.00 32.41 0.34 22 6 47.08 47.08 2825.30 53.00 14.33 0.00 28.91 5.35 1.00 0 2781 53.00 23 6 45.90 45.90 2841.53 52.59 13.85 0.01 33.75 5.35 1.00 0.000364 2813 52.61 24 6 44.72 44.72 2857.75 52.15 13.37 0.02 38.59 5.36 1.00 0.000637 2848 52.18
Avg.= 45.90 45.90 2841.53 52.58 13.85 0.01 33.75 5.35 1.00 0.00 2813.97 52.60 STDEV= ± 1.18 1.18 16.23 0.43 0.48 0.01 4.84 0.00 0.00 0.00 33.79 0.41 25 6.5 45.67 45.67 2857.53 50.79 14.54 0.00 38.55 5.35 1.00 0 2693 50.79 26 6.5 44.58 44.58 2861.46 51.59 14.07 0.00 38.53 5.35 1.00 0 2718 51.59 27 6.5 43.49 43.49 2865.39 52.42 13.61 0.00 38.52 5.35 1.00 0 2744 52.42
Avg.= 44.58 44.58 2861.46 51.60 14.07 0.00 38.53 5.35 1.00 0.00 2718.32 51.60 STDEV= ± 1.09 1.09 3.93 0.81 0.46 0.00 0.01 0.00 0.00 0.00 25.38 0.81 28 7 46.71 46.71 2847.41 50.37 14.09 0.00 38.73 5.38 1.00 0 2863 50.37 29 7 45.93 45.93 2850.17 50.68 14.20 0.00 38.58 5.36 1.00 0 2809 50.68 30 7 45.15 45.15 2852.92 50.99 14.32 0.00 38.43 5.33 1.00 0 2757 50.99
Avg.= 45.93 45.93 2850.17 50.68 14.21 0.00 38.58 5.36 1.00 0.00 2809.55 50.68 STDEV= ± 0.78 0.78 2.76 0.31 0.12 0.00 0.15 0.02 0.00 0.00 53.04 0.31 31 7.5 46.80 46.80 2845.06 50.03 15.24 0.00 38.40 5.33 1.00 0 2683 50.03 32 7.5 45.50 45.50 2857.07 50.42 14.56 0.00 38.50 5.34 1.00 0 2718 50.42 33 7.5 44.19 44.19 2869.07 50.82 13.88 0.00 38.61 5.36 1.00 0 2756 50.82
Avg.= 45.50 45.50 2857.07 50.42 14.56 0.00 38.50 5.34 1.00 0.00 2718.80 50.42 STDEV= ± 1.31 1.31 12.00 0.40 0.68 0.00 0.10 0.01 0.00 0.00 36.78 0.40

Appendix B Calculated data sheet
154
Table B 1.13: Calculated data for flat bottom pot without Shield at 14 mbar NG pressure.
SL LH (fcm) (fcd) (wcr) (hc) (ΔtTc) Ecor ECO2r Q MCE CO/CO2 FPc HTE
1 2.5 38.65 38.65 2895.82 58.15 11.49 0.16 26.84 4.97 0.99 0.005944 2962 58.50 2 2.5 38.91 38.91 2891.31 58.13 11.56 0.15 26.85 4.97 0.99 0.005626 2975 58.46 3 2.5 39.18 39.18 2886.80 58.11 11.63 0.14 26.87 4.97 0.99 0.005307 2988 58.41
Avg.= 38.91 38.91 2891.31 58.13 11.56 0.15 26.85 4.97 0.99 0.01 2975.06 58.46 STDEV= ± 0.26 0.26 4.51 0.02 0.07 0.01 0.01 0.00 0.00 0.00 13.16 0.04
4 3 40.34 40.34 2891.89 56.88 11.35 0.08 27.00 5.00 1.00 0.002866 3083 57.04 5 3 39.91 39.91 2892.85 56.95 11.42 0.08 29.21 4.99 1.00 0.002645 3059 57.10 6 3 39.49 39.49 2893.81 57.02 11.49 0.08 31.42 4.99 1.00 0.002456 3035 57.16
Avg.= 39.91 39.91 2892.85 56.95 11.42 0.08 29.21 4.99 1.00 0.00 3058.70 57.10 STDEV= ± 0.42 0.42 0.96 0.07 0.07 0.00 2.21 0.01 0.00 0.00 23.83 0.06
7 3.5 40.34 40.34 2897.82 55.48 11.77 0.03 35.94 4.99 1.00 0.000716 3018 55.52 8 3.5 40.67 40.67 2895.82 55.26 11.84 0.01 35.77 4.97 1.00 0.000358 3026 55.28 9 3.5 41.01 41.01 2893.82 55.03 11.90 0.00 35.61 4.94 1.00 0 3034 55.03
Avg.= 40.67 40.67 2895.82 55.26 11.84 0.01 35.78 4.97 1.00 0.00 3025.98 55.28 STDEV= ± 0.33 0.33 2.00 0.22 0.06 0.01 0.17 0.02 0.00 0.00 8.12 0.24 10 4 44.61 44.61 2886.13 52.48 12.66 0.01 35.69 4.95 1.00 0.000159 3077 52.48 11 4 44.16 44.16 2894.24 52.75 12.33 0.01 35.70 4.96 1.00 0.000159 3111 52.75 12 4 43.70 43.70 2902.33 53.02 12.00 0.01 35.71 4.96 1.00 0.000159 3147 53.03
Avg.= 44.16 44.16 2894.23 52.75 12.33 0.01 35.70 4.96 1.00 0.00 3112.00 52.76 STDEV= ± 0.46 0.46 8.10 0.27 0.33 0.00 0.01 0.00 0.00 0.00 35.12 0.27 13 4.5 46.54 46.54 2890.06 50.62 12.75 0.00 26.31 4.87 1.00 0 3130 50.62 14 4.5 46.81 46.81 2881.18 50.01 13.21 0.00 26.37 4.88 1.00 0 3136 50.01 15 4.5 47.09 47.09 2872.30 49.40 13.70 0.00 26.43 4.89 1.00 0 3141 49.40
Avg.= 46.81 46.81 2881.18 50.01 13.22 0.00 26.37 4.88 1.00 0.00 3135.87 50.01 STDEV= ± 0.27 0.27 8.88 0.61 0.48 0.00 0.06 0.01 0.00 0.00 5.43 0.61 16 5 47.95 47.95 2877.75 47.75 14.29 0.00 26.38 4.88 1.00 0 3025 47.75 17 5 47.80 47.80 2874.73 48.03 14.27 0.00 26.38 4.88 1.00 0 3033 48.03 18 5 47.65 47.65 2871.72 48.31 14.25 0.00 26.38 4.88 1.00 0 3042 48.31
Avg.= 47.80 47.80 2874.73 48.03 14.27 0.00 26.38 4.88 1.00 0.00 3033.37 48.03

Appendix B Calculated data sheet
155
STDEV= ± 0.15 0.15 3.01 0.28 0.02 0.00 0.00 0.00 0.00 0.00 8.20 0.28 19 5.5 51.14 51.14 2871.73 45.06 15.25 0.00 30.62 4.86 1.00 0 3047 45.06 20 5.5 49.92 49.92 2876.72 45.70 14.88 0.00 32.76 4.85 1.00 0 3048 45.70 21 5.5 48.70 48.70 2881.71 46.37 14.51 0.00 34.89 4.84 1.00 0 3049 46.37
Avg.= 49.92 49.92 2876.72 45.71 14.88 0.00 32.76 4.85 1.00 0.00 3048.07 45.71 STDEV= ± 1.22 1.22 4.99 0.65 0.37 0.00 2.14 0.01 0.00 0.00 1.01 0.65 22 6 54.45 54.45 2872.46 43.54 15.89 0.00 30.65 4.86 1.00 0 3079 43.54 23 6 53.32 53.32 2875.62 43.65 15.61 0.00 32.74 4.85 1.00 0 3076 43.65 24 6 52.20 52.20 2878.75 43.77 15.32 0.00 34.82 4.83 1.00 0 3072 43.77
Avg.= 53.32 53.32 2875.61 43.65 15.61 0.00 32.74 4.85 1.00 0.00 3075.74 43.65 STDEV= ± 1.12 1.12 3.14 0.12 0.29 0.00 2.08 0.01 0.00 0.00 3.66 0.12 25 6.5 58.05 58.05 2855.90 42.04 16.16 0.00 26.40 4.89 1.00 0 3150 42.04 26 6.5 57.02 57.02 2861.88 42.22 16.13 0.00 26.34 4.87 1.00 0 3109 42.22 27 6.5 55.98 55.98 2867.86 42.41 16.09 0.00 26.28 4.86 1.00 0 3068 42.41
Avg.= 57.02 57.02 2861.88 42.23 16.13 0.00 26.34 4.87 1.00 0.00 3109.07 42.23 STDEV= ± 1.03 1.03 5.98 0.19 0.03 0.00 0.06 0.01 0.00 0.00 40.70 0.19 28 7 59.11 59.11 2864.00 40.63 16.82 0.00 26.32 4.87 1.00 0 3114 40.63 29 7 58.71 58.71 2869.00 40.46 16.71 0.00 26.26 4.86 1.00 0 3117 40.46 30 7 58.32 58.32 2874.00 40.29 16.60 0.00 26.21 4.85 1.00 0 3121 40.29
Avg.= 58.71 58.71 2869.00 40.46 16.71 0.00 26.26 4.86 1.00 0.00 3117.17 40.46 STDEV= ± 0.39 0.39 5.00 0.17 0.11 0.00 0.06 0.01 0.00 0.00 3.47 0.17 31 7.5 63.52 63.52 2851.00 38.87 17.92 0.00 30.51 4.84 1.00 0 3128 38.87 32 7.5 61.48 61.48 2863.93 39.03 17.32 0.00 30.49 4.84 1.00 0 3133 39.03 33 7.5 59.44 59.44 2876.84 39.20 16.73 0.00 30.48 4.84 1.00 0 3139 39.20
Avg.= 61.48 61.48 2863.92 39.04 17.32 0.00 30.49 4.84 1.00 0.00 3133.36 39.04 STDEV= ± 2.04 2.04 12.92 0.17 0.59 0.00 0.01 0.00 1.00 0.00 5.89 0.17

Appendix B Calculated data sheet
156
Table B 1.14: Calculated data for Finned pot without Shield at 14 mbar NG pressure.
SL LH (fcm) (fcd) (wcr) (hc) (ΔtTc) Ecor ECO2r Q MCE CO/CO2 FPc HTE 1 2.5 40.88 40.88 2911.23 47.88 13.60 2.52 27.04 5.01 0.91 0.093086 3003 52.34 2 2.5 41.18 41.18 2910.26 47.86 13.65 2.15 24.76 5.00 0.92 0.086901 2998 52.02 3 2.5 41.49 41.49 2909.28 47.84 13.69 1.79 22.49 4.99 0.93 0.079479 2993 51.64
Avg.= 41.18 41.18 2910.26 47.86 13.65 2.15 24.76 5.00 0.92 0.09 2998.04 52.00 STDEV= ± 0.30 0.30 0.97 0.02 0.04 0.37 2.28 0.01 0.01 0.01 4.64 0.35
4 3 40.98 40.98 2907.30 48.78 13.06 1.24 26.92 4.98 0.96 0.046172 3088 51.04 5 3 41.37 41.37 2905.33 48.70 13.25 1.33 24.67 4.98 0.95 0.053901 3061 51.33 6 3 41.76 41.76 2903.35 48.63 13.44 1.42 22.42 4.98 0.94 0.063176 3034 51.70
Avg.= 41.37 41.37 2905.33 48.70 13.25 1.33 24.67 4.98 0.95 0.05 3061.11 51.35 STDEV= ± 0.39 0.39 1.98 0.08 0.19 0.09 2.25 0.00 0.01 0.01 26.92 0.33
7 3.5 45.47 45.47 2859.51 49.87 13.75 1.03 26.95 4.99 0.96 0.038211 3163 51.77 8 3.5 45.40 45.40 2861.51 49.79 13.62 1.01 24.64 4.97 0.96 0.04099 3186 51.83 9 3.5 45.34 45.34 2863.52 49.72 13.48 0.99 22.34 4.96 0.96 0.044325 3209 51.92
Avg.= 45.40 45.40 2861.51 49.79 13.62 1.01 24.64 4.97 0.96 0.04 3185.85 51.84 STDEV= ± 0.07 0.07 2.00 0.07 0.14 0.02 2.31 0.01 0.00 0.00 22.72 0.08 10 4 47.91 47.91 2849.54 48.40 13.95 0.67 26.79 4.96 0.98 0.025049 3277 49.61 11 4 47.19 47.19 2856.53 48.46 13.83 0.65 24.54 4.95 0.97 0.0264 3255 49.74 12 4 46.47 46.47 2863.52 48.51 13.71 0.62 22.29 4.95 0.97 0.028021 3232 49.87
Avg.= 47.19 47.19 2856.53 48.46 13.83 0.65 24.54 4.95 0.97 0.03 3254.66 49.74 STDEV= ± 0.72 0.72 6.99 0.06 0.12 0.02 2.25 0.00 0.00 0.00 22.23 0.13 13 4.5 49.06 49.06 2853.53 46.89 13.83 0.43 26.55 4.91 0.98 0.016346 3384 47.66 14 4.5 49.83 49.83 2845.07 47.11 14.11 0.46 22.14 4.92 0.98 0.020698 3352 48.08 15 4.5 50.61 50.61 2836.60 47.31 14.40 0.48 17.73 4.92 0.97 0.027225 3322 48.60
Avg.= 49.83 49.83 2845.07 47.10 14.11 0.46 22.14 4.92 0.98 0.02 3352.55 48.11 STDEV= ± 0.77 0.77 8.47 0.21 0.28 0.02 4.41 0.00 0.01 0.01 31.04 0.47 16 5 53.59 53.59 2835.75 45.83 15.64 0.31 26.78 4.96 0.99 0.011676 3131 46.36 17 5 52.11 52.11 2845.70 45.99 14.95 0.27 24.47 4.94 0.99 0.011058 3209 46.50 18 5 50.63 50.63 2855.65 46.16 14.25 0.23 22.17 4.92 0.99 0.010317 3297 46.64
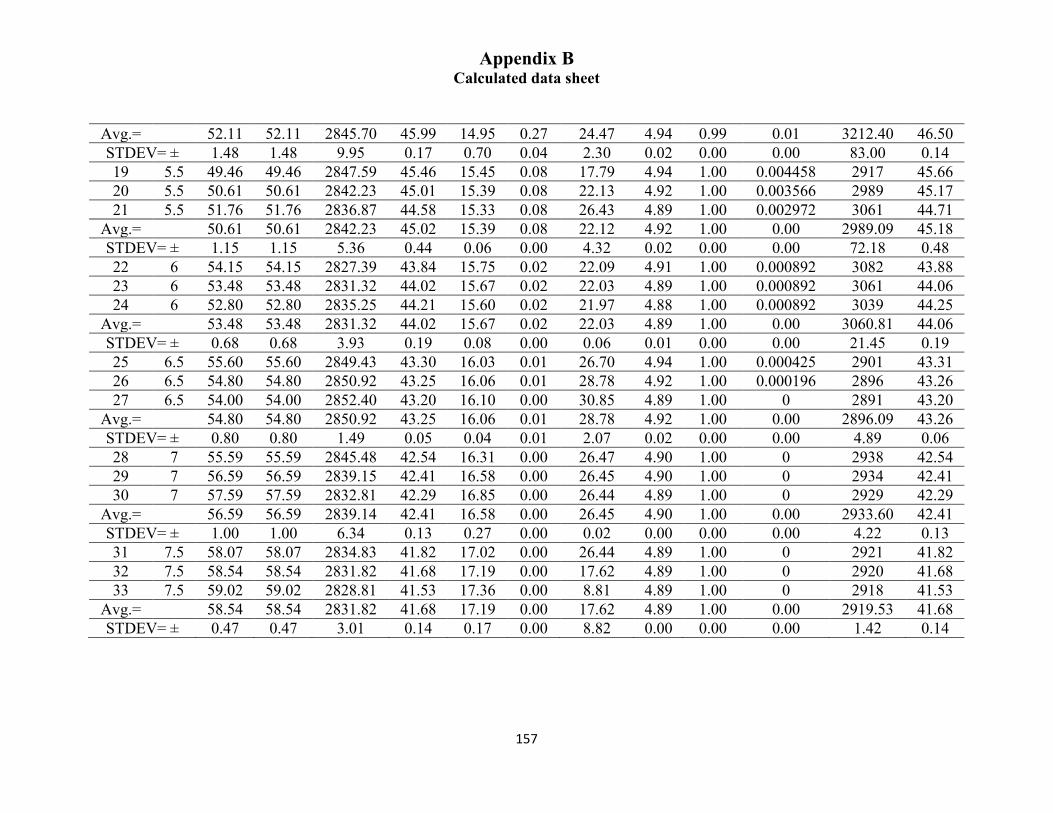
Appendix B Calculated data sheet
157
Avg.= 52.11 52.11 2845.70 45.99 14.95 0.27 24.47 4.94 0.99 0.01 3212.40 46.50 STDEV= ± 1.48 1.48 9.95 0.17 0.70 0.04 2.30 0.02 0.00 0.00 83.00 0.14 19 5.5 49.46 49.46 2847.59 45.46 15.45 0.08 17.79 4.94 1.00 0.004458 2917 45.66 20 5.5 50.61 50.61 2842.23 45.01 15.39 0.08 22.13 4.92 1.00 0.003566 2989 45.17 21 5.5 51.76 51.76 2836.87 44.58 15.33 0.08 26.43 4.89 1.00 0.002972 3061 44.71
Avg.= 50.61 50.61 2842.23 45.02 15.39 0.08 22.12 4.92 1.00 0.00 2989.09 45.18 STDEV= ± 1.15 1.15 5.36 0.44 0.06 0.00 4.32 0.02 0.00 0.00 72.18 0.48 22 6 54.15 54.15 2827.39 43.84 15.75 0.02 22.09 4.91 1.00 0.000892 3082 43.88 23 6 53.48 53.48 2831.32 44.02 15.67 0.02 22.03 4.89 1.00 0.000892 3061 44.06 24 6 52.80 52.80 2835.25 44.21 15.60 0.02 21.97 4.88 1.00 0.000892 3039 44.25
Avg.= 53.48 53.48 2831.32 44.02 15.67 0.02 22.03 4.89 1.00 0.00 3060.81 44.06 STDEV= ± 0.68 0.68 3.93 0.19 0.08 0.00 0.06 0.01 0.00 0.00 21.45 0.19 25 6.5 55.60 55.60 2849.43 43.30 16.03 0.01 26.70 4.94 1.00 0.000425 2901 43.31 26 6.5 54.80 54.80 2850.92 43.25 16.06 0.01 28.78 4.92 1.00 0.000196 2896 43.26 27 6.5 54.00 54.00 2852.40 43.20 16.10 0.00 30.85 4.89 1.00 0 2891 43.20
Avg.= 54.80 54.80 2850.92 43.25 16.06 0.01 28.78 4.92 1.00 0.00 2896.09 43.26 STDEV= ± 0.80 0.80 1.49 0.05 0.04 0.01 2.07 0.02 0.00 0.00 4.89 0.06 28 7 55.59 55.59 2845.48 42.54 16.31 0.00 26.47 4.90 1.00 0 2938 42.54 29 7 56.59 56.59 2839.15 42.41 16.58 0.00 26.45 4.90 1.00 0 2934 42.41 30 7 57.59 57.59 2832.81 42.29 16.85 0.00 26.44 4.89 1.00 0 2929 42.29
Avg.= 56.59 56.59 2839.14 42.41 16.58 0.00 26.45 4.90 1.00 0.00 2933.60 42.41 STDEV= ± 1.00 1.00 6.34 0.13 0.27 0.00 0.02 0.00 0.00 0.00 4.22 0.13 31 7.5 58.07 58.07 2834.83 41.82 17.02 0.00 26.44 4.89 1.00 0 2921 41.82 32 7.5 58.54 58.54 2831.82 41.68 17.19 0.00 17.62 4.89 1.00 0 2920 41.68 33 7.5 59.02 59.02 2828.81 41.53 17.36 0.00 8.81 4.89 1.00 0 2918 41.53
Avg.= 58.54 58.54 2831.82 41.68 17.19 0.00 17.62 4.89 1.00 0.00 2919.53 41.68 STDEV= ± 0.47 0.47 3.01 0.14 0.17 0.00 8.82 0.00 0.00 0.00 1.42 0.14
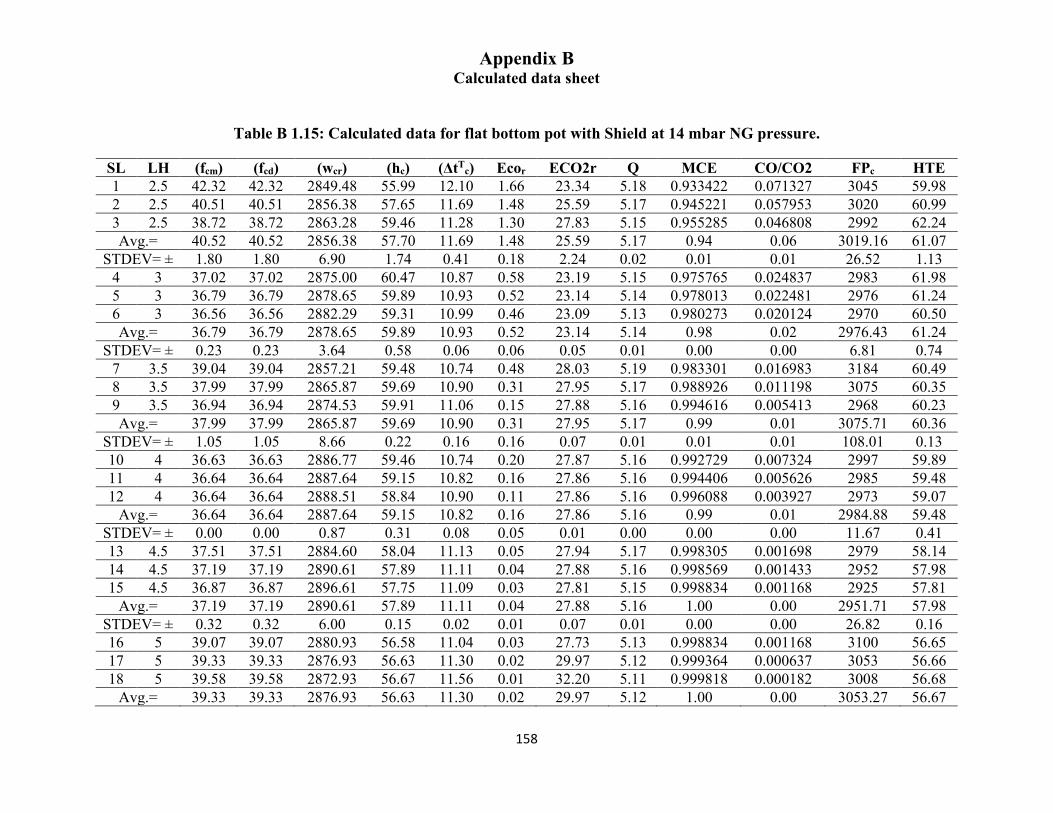
Appendix B Calculated data sheet
158
Table B 1.15: Calculated data for flat bottom pot with Shield at 14 mbar NG pressure.
SL LH (fcm) (fcd) (wcr) (hc) (ΔtTc) Ecor ECO2r Q MCE CO/CO2 FPc HTE
1 2.5 42.32 42.32 2849.48 55.99 12.10 1.66 23.34 5.18 0.933422 0.071327 3045 59.98 2 2.5 40.51 40.51 2856.38 57.65 11.69 1.48 25.59 5.17 0.945221 0.057953 3020 60.99 3 2.5 38.72 38.72 2863.28 59.46 11.28 1.30 27.83 5.15 0.955285 0.046808 2992 62.24 Avg.= 40.52 40.52 2856.38 57.70 11.69 1.48 25.59 5.17 0.94 0.06 3019.16 61.07
STDEV= ± 1.80 1.80 6.90 1.74 0.41 0.18 2.24 0.02 0.01 0.01 26.52 1.13 4 3 37.02 37.02 2875.00 60.47 10.87 0.58 23.19 5.15 0.975765 0.024837 2983 61.98 5 3 36.79 36.79 2878.65 59.89 10.93 0.52 23.14 5.14 0.978013 0.022481 2976 61.24 6 3 36.56 36.56 2882.29 59.31 10.99 0.46 23.09 5.13 0.980273 0.020124 2970 60.50 Avg.= 36.79 36.79 2878.65 59.89 10.93 0.52 23.14 5.14 0.98 0.02 2976.43 61.24
STDEV= ± 0.23 0.23 3.64 0.58 0.06 0.06 0.05 0.01 0.00 0.00 6.81 0.74 7 3.5 39.04 39.04 2857.21 59.48 10.74 0.48 28.03 5.19 0.983301 0.016983 3184 60.49 8 3.5 37.99 37.99 2865.87 59.69 10.90 0.31 27.95 5.17 0.988926 0.011198 3075 60.35 9 3.5 36.94 36.94 2874.53 59.91 11.06 0.15 27.88 5.16 0.994616 0.005413 2968 60.23 Avg.= 37.99 37.99 2865.87 59.69 10.90 0.31 27.95 5.17 0.99 0.01 3075.71 60.36
STDEV= ± 1.05 1.05 8.66 0.22 0.16 0.16 0.07 0.01 0.01 0.01 108.01 0.13 10 4 36.63 36.63 2886.77 59.46 10.74 0.20 27.87 5.16 0.992729 0.007324 2997 59.89 11 4 36.64 36.64 2887.64 59.15 10.82 0.16 27.86 5.16 0.994406 0.005626 2985 59.48 12 4 36.64 36.64 2888.51 58.84 10.90 0.11 27.86 5.16 0.996088 0.003927 2973 59.07
Avg.= 36.64 36.64 2887.64 59.15 10.82 0.16 27.86 5.16 0.99 0.01 2984.88 59.48 STDEV= ± 0.00 0.00 0.87 0.31 0.08 0.05 0.01 0.00 0.00 0.00 11.67 0.41 13 4.5 37.51 37.51 2884.60 58.04 11.13 0.05 27.94 5.17 0.998305 0.001698 2979 58.14 14 4.5 37.19 37.19 2890.61 57.89 11.11 0.04 27.88 5.16 0.998569 0.001433 2952 57.98 15 4.5 36.87 36.87 2896.61 57.75 11.09 0.03 27.81 5.15 0.998834 0.001168 2925 57.81
Avg.= 37.19 37.19 2890.61 57.89 11.11 0.04 27.88 5.16 1.00 0.00 2951.71 57.98 STDEV= ± 0.32 0.32 6.00 0.15 0.02 0.01 0.07 0.01 0.00 0.00 26.82 0.16 16 5 39.07 39.07 2880.93 56.58 11.04 0.03 27.73 5.13 0.998834 0.001168 3100 56.65 17 5 39.33 39.33 2876.93 56.63 11.30 0.02 29.97 5.12 0.999364 0.000637 3053 56.66 18 5 39.58 39.58 2872.93 56.67 11.56 0.01 32.20 5.11 0.999818 0.000182 3008 56.68
Avg.= 39.33 39.33 2876.93 56.63 11.30 0.02 29.97 5.12 1.00 0.00 3053.27 56.67

Appendix B Calculated data sheet
159
STDEV= ± 0.25 0.25 4.00 0.04 0.26 0.01 2.23 0.01 0.00 0.00 46.06 0.02 19 5.5 41.34 41.34 2869.21 55.01 11.57 0.00 32.11 5.09 0.999909 9.1E-05 3115 55.02 20 5.5 40.54 40.54 2873.05 55.48 11.67 0.00 32.11 5.09 0.999909 9.1E-05 3041 55.49 21 5.5 39.74 39.74 2876.88 55.97 11.76 0.00 32.11 5.09 0.999909 9.1E-05 2968 55.97
Avg.= 40.54 40.54 2873.05 55.49 11.67 0.00 32.11 5.09 1.00 0.00 3041.27 55.49 STDEV= ± 0.80 0.80 3.84 0.48 0.10 0.00 0.00 0.00 0.00 0.00 73.89 0.48 22 6 40.10 40.10 2880.36 54.37 11.64 0.00 27.31 5.06 1 0 3070 54.37 23 6 40.18 40.18 2878.31 54.39 11.78 0.00 31.82 5.05 1 0 3045 54.39 24 6 40.26 40.26 2876.26 54.42 11.93 0.00 36.32 5.04 1 0 3020 54.42
Avg.= 40.18 40.18 2878.31 54.39 11.79 0.00 31.82 5.05 1.00 0.00 3045.19 54.39 STDEV= ± 0.08 0.08 2.05 0.02 0.15 0.00 4.50 0.01 0.00 0.00 25.05 0.02 25 6.5 39.53 39.53 2881.59 53.95 12.16 0.00 27.49 5.09 1 0 2962 53.95 26 6.5 39.81 39.81 2882.04 53.45 12.15 0.00 27.49 5.09 1 0 2990 53.45 27 6.5 40.08 40.08 2882.48 52.95 12.14 0.00 27.49 5.09 1 0 3018 52.95
Avg.= 39.80 39.80 2882.04 53.45 12.15 0.00 27.49 5.09 1.00 0.00 2990.05 53.45 STDEV= ± 0.28 0.28 0.44 0.50 0.01 0.00 0.00 0.00 0.00 0.00 27.80 0.50 28 7 43.01 43.01 2856.40 52.97 12.46 0.03 27.10 5.02 0.998728 0.001274 3098 53.04 29 7 42.68 42.68 2864.06 52.22 12.44 0.05 27.13 5.02 0.998252 0.001751 3101 52.31 30 7 42.34 42.34 2871.71 51.45 12.43 0.06 27.17 5.03 0.997776 0.002229 3105 51.56
Avg.= 42.68 42.68 2864.05 52.21 12.44 0.05 27.13 5.02 1.00 0.00 3101.40 52.30 STDEV= ± 0.33 0.33 7.66 0.76 0.02 0.01 0.03 0.01 0.00 0.00 3.39 0.74 31 7.5 40.86 40.86 2890.33 50.98 12.59 0.02 27.32 5.06 0.999258 0.000743 2969 51.02 32 7.5 40.80 40.80 2888.59 51.56 12.51 0.01 27.29 5.05 0.999629 0.000371 2965 51.58 33 7.5 40.74 40.74 2886.84 52.15 12.43 0.00 27.26 5.05 1 0 2961 52.15
Avg.= 40.80 40.80 2888.59 51.56 12.51 0.01 27.29 5.05 1.00 0.00 2964.89 51.58 STDEV= ± 0.06 0.06 1.75 0.58 0.08 0.01 0.03 0.01 0.00 0.00 4.17 0.56

Appendix B Calculated data sheet
160
Table B 1.16: Calculated data for Finned pot with Shield at 14 mbar NG pressure.
SL LH (fcm) (fcd) (wcr) (hc) (ΔtTc) Ecor ECO2r Q MCE CO/CO2 FPc HTE 1 2.5 50.44 50.44 2844.13 47.78 13.30 2.64 13.84 5.49 0.839592 0.191055 3207 56.91 2 2.5 49.14 49.14 2849.84 48.22 13.13 2.67 16.75 5.47 0.862655 0.159212 3187 55.90 3 2.5 47.84 47.84 2855.55 48.68 12.96 2.69 19.63 5.45 0.879567 0.136923 3166 55.34
Avg.= 49.14 49.14 2849.84 48.23 13.13 2.67 16.74 5.47 0.86 0.16 3186.42 56.05 STDEV= ± 1.30 1.30 5.71 0.45 0.17 0.02 2.90 0.02 0.02 0.03 20.72 0.80 4 3 42.42 42.42 2864.63 54.16 12.36 2.42 17.57 5.42 0.878747 0.137984 2926 61.63 5 3 42.15 42.15 2867.58 54.14 12.40 2.53 19.52 5.42 0.885145 0.129758 2901 61.16 6 3 41.89 41.89 2870.52 54.12 12.43 2.64 21.47 5.42 0.89045 0.123028 2877 60.78
Avg.= 42.15 42.15 2867.58 54.14 12.40 2.53 19.52 5.42 0.88 0.13 2901.46 61.19 STDEV= ± 0.26 0.26 2.94 0.02 0.03 0.11 1.95 0.00 0.01 0.01 24.27 0.43 7 3.5 43.70 43.70 2842.74 54.72 12.62 2.06 17.11 5.43 0.892784 0.120092 2964 61.29 8 3.5 42.45 42.45 2854.20 55.21 12.38 1.93 17.35 5.43 0.899908 0.111224 2928 61.35 9 3.5 41.19 41.19 2865.67 55.72 12.13 1.80 17.58 5.42 0.906944 0.102604 2890 61.44
Avg.= 42.45 42.45 2854.20 55.22 12.38 1.93 17.35 5.43 0.90 0.11 2927.33 61.36 STDEV= ± 1.25 1.25 11.46 0.50 0.24 0.13 0.23 0.00 0.01 0.01 36.88 0.07 10 4 41.03 41.03 2871.19 54.70 12.29 0.37 9.76 5.42 0.963195 0.038211 2879 56.79 11 4 41.18 41.18 2869.32 54.88 12.40 0.39 9.73 5.40 0.961721 0.039803 2853 57.06 12 4 41.34 41.34 2867.46 55.06 12.52 0.40 9.71 5.39 0.96025 0.041395 2827 57.34
Avg.= 41.18 41.18 2869.32 54.88 12.40 0.39 9.73 5.40 0.96 0.04 2852.92 57.06 STDEV= ± 0.15 0.15 1.86 0.18 0.11 0.01 0.03 0.02 0.00 0.00 25.93 0.27 13 4.5 43.60 43.60 2849.57 53.98 12.53 0.16 9.69 5.38 0.983712 0.016558 2987 54.88 14 4.5 42.66 42.66 2856.47 54.39 12.33 0.14 14.59 5.40 0.990329 0.009765 2973 54.92 15 4.5 41.72 41.72 2863.37 54.81 12.13 0.12 19.51 5.42 0.993672 0.006368 2958 55.16
Avg.= 42.66 42.66 2856.47 54.39 12.33 0.14 14.60 5.40 0.99 0.01 2972.63 54.98 STDEV= ± 0.94 0.94 6.90 0.41 0.20 0.02 4.91 0.02 0.01 0.01 14.80 0.15 16 5 43.80 43.80 2870.34 51.52 12.97 0.01 29.22 5.41 0.999576 0.000425 2899 51.54 17 5 41.64 41.64 2873.84 53.87 12.43 0.01 29.14 5.39 0.999682 0.000318 2872 53.89 18 5 39.47 39.47 2877.35 56.49 11.89 0.01 29.07 5.38 0.999788 0.000212 2843 56.50

Appendix B Calculated data sheet
161
Avg.= 41.64 41.64 2873.84 53.96 12.43 0.01 29.14 5.39 1.00 0.00 2870.99 53.98 STDEV= ± 2.17 2.17 3.51 2.49 0.54 0.00 0.07 0.01 0.00 0.00 27.91 2.48 19 5.5 40.47 40.47 2864.28 53.48 12.47 0.01 19.34 5.37 0.999682 0.000318 2965 53.50 20 5.5 41.83 41.83 2853.41 52.96 12.74 0.01 24.17 5.37 0.999618 0.000382 3001 52.98 21 5.5 43.19 43.19 2842.54 52.47 13.00 0.01 29.00 5.37 0.999576 0.000425 3036 52.50
Avg.= 41.83 41.83 2853.41 52.97 12.74 0.01 24.17 5.37 1.00 0.00 3000.67 52.99 STDEV= ± 1.36 1.36 10.87 0.50 0.26 0.00 4.83 0.00 0.00 0.00 35.36 0.50 22 6 42.18 42.18 2844.44 52.19 13.08 0.00 29.04 5.37 1 0 3038 52.19 23 6 41.97 41.97 2846.91 52.17 13.05 0.01 26.62 5.38 0.999768 0.000232 3029 52.19 24 6 41.76 41.76 2849.38 52.16 13.02 0.01 24.21 5.38 0.999491 0.000509 3021 52.19
Avg.= 41.97 41.97 2846.91 52.17 13.05 0.01 26.62 5.38 1.00 0.00 3029.47 52.19 STDEV= ± 0.21 0.21 2.47 0.01 0.03 0.01 2.41 0.00 0.00 0.00 8.55 0.00 25 6.5 44.97 44.97 2831.68 51.53 13.02 0.03 29.00 5.37 0.99894 0.001061 3155 51.58 26 6.5 45.84 45.84 2825.75 51.16 13.25 0.03 29.00 5.37 0.99894 0.001061 3162 51.21 27 6.5 46.71 46.71 2819.82 50.80 13.47 0.03 29.01 5.37 0.99894 0.001061 3168 50.86
Avg.= 45.84 45.84 2825.75 51.16 13.25 0.03 29.00 5.37 1.00 0.00 3161.76 51.22 STDEV= ± 0.87 0.87 5.93 0.36 0.22 0.00 0.01 0.00 0.00 0.00 6.37 0.36 28 7 45.84 45.84 2837.60 49.95 13.90 0.04 28.88 5.34 0.998728 0.001274 3013 50.01 29 7 44.29 44.29 2851.44 50.23 13.65 0.04 28.89 5.35 0.998728 0.001274 2966 50.29 30 7 42.74 42.74 2865.27 50.54 13.39 0.04 28.91 5.35 0.998728 0.001274 2916 50.60
Avg.= 44.29 44.29 2851.44 50.24 13.65 0.04 28.89 5.35 1.00 0.00 2965.11 50.30 STDEV= ± 1.55 1.55 13.83 0.29 0.25 0.00 0.01 0.00 0.00 0.00 48.74 0.29 31 7.5 50.30 50.30 2862.06 41.95 14.88 0.03 28.79 5.33 0.999046 0.000955 3198 41.99 32 7.5 43.08 43.08 2869.49 48.79 13.87 0.03 28.89 5.35 0.999046 0.000955 2898 48.84 33 7.5 35.87 35.87 2876.92 58.39 12.88 0.03 28.99 5.36 0.999046 0.000955 2561 58.44
Avg.= 43.08 43.08 2869.49 49.71 13.88 0.03 28.89 5.35 1.00 0.00 2885.63 49.76 STDEV= ± 7.22 7.22 7.43 8.26 1.00 0.00 0.10 0.02 0.00 0.00 318.96 8.26

Appendix B Calculated data sheet
162
Table B 1.17: Calculated data for flat bottom pot without Shield at 18 mbar NG pressure.
SL LH (fcm) (fcd) (wcr) (hc) (ΔtTc) Ecor ECO2r Q MCE CO/CO2 FPc HTE
1 2.5 38.18 38.18 2896.14 56.63 10.53 0.19 28.02 5.19 0.99 0.006793 3139 57.02 2 2.5 37.41 37.41 2891.64 57.50 10.58 0.19 32.79 5.20 0.99 0.005823 3112 57.84 3 2.5 36.64 36.64 2887.13 58.41 10.63 0.19 37.58 5.22 0.99 0.005095 3084 58.70
Avg.= 37.41 37.41 2891.64 57.51 10.58 0.19 32.80 5.20 0.99 0.01 3111.43 57.85 STDEV= ± 0.77 0.77 4.50 0.89 0.05 0.00 4.78 0.02 0.00 0.00 27.40 0.84
4 3 37.24 37.24 2891.98 56.71 10.82 0.09 28.21 5.22 1.00 0.003078 3089 56.88 5 3 37.36 37.36 2910.66 56.49 10.85 0.09 32.79 5.20 1.00 0.00282 3092 56.65 6 3 37.48 37.48 2929.62 56.27 10.88 0.10 37.33 5.18 1.00 0.002627 3094 56.42
Avg.= 37.36 37.36 2910.75 56.49 10.85 0.09 32.78 5.20 1.00 0.00 3091.71 56.65 STDEV= ± 0.12 0.12 18.82 0.22 0.03 0.01 4.56 0.02 0.00 0.00 2.20 0.23
7 3.5 38.06 38.06 2892.56 54.83 11.16 0.04 37.46 5.20 1.00 0.001035 3097 54.88 8 3.5 38.31 38.31 2907.98 54.72 11.32 0.04 37.31 5.18 1.00 0.001035 3083 54.77 9 3.5 38.57 38.57 2923.75 54.61 11.49 0.04 37.16 5.16 1.00 0.001035 3068 54.67
Avg.= 38.31 38.31 2908.10 54.72 11.32 0.04 37.31 5.18 1.00 0.00 3082.77 54.77 STDEV= ± 0.25 0.25 15.59 0.11 0.16 0.00 0.15 0.02 0.00 0.00 14.62 0.11 10 4 40.16 40.16 2886.02 51.88 12.02 0.01 27.86 5.16 1.00 0.000425 3090 51.90 11 4 39.65 39.65 2888.44 52.19 11.89 0.01 27.84 5.15 1.00 0.000318 3090 52.21 12 4 39.14 39.14 2890.85 52.51 11.75 0.01 27.83 5.15 1.00 0.000212 3090 52.52
Avg.= 39.65 39.65 2888.44 52.19 11.89 0.01 27.84 5.15 1.00 0.00 3089.57 52.21 STDEV= ± 0.51 0.51 2.42 0.32 0.14 0.00 0.01 0.00 0.00 0.00 0.03 0.31 13 4.5 42.80 42.80 2877.02 49.53 12.74 0.00 36.96 5.13 1.00 0 3116 49.53 14 4.5 42.09 42.09 2883.94 49.60 12.56 0.00 36.90 5.12 1.00 0 3110 49.60 15 4.5 41.37 41.37 2890.85 49.67 12.37 0.00 36.84 5.11 1.00 0 3104 49.67
Avg.= 42.09 42.09 2883.94 49.60 12.56 0.00 36.90 5.12 1.00 0.00 3109.73 49.60 STDEV= ± 0.71 0.71 6.92 0.07 0.19 0.00 0.06 0.01 0.00 0.00 6.09 0.07 16 5 45.03 45.03 2880.30 47.11 12.72 0.00 27.90 5.16 1.00 0 3255 47.11 17 5 44.95 44.95 2874.19 47.62 12.98 0.00 32.41 5.14 1.00 0 3201 47.62 18 5 44.86 44.86 2868.08 48.13 13.24 0.00 36.88 5.12 1.00 0 3148 48.13
Avg.= 44.95 44.95 2874.19 47.62 12.98 0.00 32.40 5.14 1.00 0.00 3201.08 47.62

Appendix B Calculated data sheet
163
STDEV= ± 0.08 0.08 6.11 0.51 0.26 0.00 4.49 0.02 0.00 0.00 53.64 0.51 19 5.5 48.57 48.57 2865.27 44.89 14.35 0.00 27.64 5.12 1.00 0 3130 44.89 20 5.5 47.36 47.36 2877.60 45.34 13.94 0.00 27.64 5.11 1.00 0 3130 45.34 21 5.5 46.15 46.15 2889.93 45.81 13.53 0.00 27.63 5.11 1.00 0 3130 45.81
Avg.= 47.36 47.36 2877.60 45.35 13.94 0.00 27.64 5.11 1.00 0.00 3130.04 45.35 STDEV= ± 1.21 1.21 12.33 0.46 0.41 0.00 0.01 0.00 0.00 0.00 0.04 0.46 22 6 48.79 48.79 2885.39 43.17 14.40 0.00 27.61 5.11 1.00 0 3100 43.17 23 6 48.92 48.92 2881.47 43.46 14.49 0.00 27.61 5.11 1.00 0 3087 43.46 24 6 49.04 49.04 2877.54 43.75 14.57 0.00 27.62 5.11 1.00 0 3075 43.75
Avg.= 48.92 48.92 2881.47 43.46 14.49 0.00 27.61 5.11 1.00 0.00 3087.46 43.46 STDEV= ± 0.13 0.13 3.93 0.29 0.08 0.00 0.00 0.00 0.00 0.00 12.44 0.29 25 6.5 51.77 51.77 2875.81 41.87 15.12 0.00 27.55 5.10 1.00 0 3105 41.87 26 6.5 52.22 52.22 2872.09 42.09 15.04 0.00 27.55 5.10 1.00 0 3127 42.09 27 6.5 52.66 52.66 2868.35 42.31 14.97 0.00 27.55 5.10 1.00 0 3149 42.31
Avg.= 52.22 52.22 2872.08 42.09 15.04 0.00 27.55 5.10 1.00 0.00 3127.16 42.09 STDEV= ± 0.45 0.45 3.73 0.22 0.08 0.00 0.00 0.00 0.00 0.00 22.13 0.22 28 7 53.77 53.77 2875.66 40.17 15.81 0.00 27.52 5.09 1.00 0 3099 40.17 29 7 53.80 53.80 2873.69 40.32 15.81 0.00 27.52 5.09 1.00 0 3100 40.32 30 7 53.84 53.84 2871.71 40.47 15.82 0.00 27.52 5.09 1.00 0 3101 40.47
Avg.= 53.80 53.80 2873.69 40.32 15.81 0.00 27.52 5.09 1.00 0.00 3100.07 40.32 STDEV= ± 0.03 0.03 1.98 0.15 0.01 0.00 0.00 0.00 0.00 0.00 0.85 0.15 31 7.5 57.57 57.57 2866.41 38.97 16.85 0.00 27.57 5.10 1.00 0 3103 38.97 32 7.5 57.55 57.55 2863.13 38.90 16.82 0.00 27.57 5.10 1.00 0 3112 38.90 33 7.5 57.52 57.52 2859.85 38.84 16.79 0.00 27.57 5.10 1.00 0 3121 38.84
Avg.= 57.55 57.55 2863.13 38.90 16.82 0.00 27.57 5.10 1.00 0.00 3112.09 38.90 STDEV= ± 0.03 0.03 3.28 0.06 0.03 0.00 0.00 0.00 0.00 0.00 8.87 0.06

Appendix B Calculated data sheet
164
Table B 1.18: Calculated data for Finned pot without Shield at 18 mbar NG pressure.
SL LH (fcm) (fcd) (wcr) (hc) (ΔtTc) Ecor ECO2r Q MCE CO/CO2 FPc HTE 1 2.5 44.48 44.48 2891.98 47.01 12.75 2.45 23.74 5.27 0.91 0.10317 3094 51.86 2 2.5 44.57 44.57 2888.99 47.20 12.85 2.59 26.10 5.27 0.91 0.099117 3081 51.88 3 2.5 44.67 44.67 2886.00 47.38 12.94 2.72 28.44 5.26 0.91 0.09574 3068 51.92
Avg.= 44.57 44.57 2888.99 47.20 12.85 2.59 26.09 5.27 0.91 0.10 3080.97 51.89 STDEV= ± 0.09 0.09 2.99 0.18 0.09 0.14 2.35 0.00 0.00 0.00 13.23 0.03
4 3 44.46 44.46 2882.04 48.02 12.62 1.39 23.59 5.24 0.94 0.0591 3130 50.85 5 3 43.98 43.98 2883.80 48.06 12.59 1.39 23.59 5.24 0.94 0.0591 3125 50.90 6 3 43.51 43.51 2885.55 48.11 12.56 1.39 23.59 5.24 0.94 0.0591 3120 50.95
Avg.= 43.99 43.99 2883.80 48.06 12.59 1.39 23.59 5.24 0.94 0.06 3125.17 50.90 STDEV= ± 0.48 0.48 1.75 0.05 0.03 0.00 0.00 0.00 0.00 0.00 5.24 0.05
7 3.5 44.05 44.05 2867.55 49.18 13.02 1.18 23.44 5.21 0.95 0.050311 3064 51.65 8 3.5 44.59 44.59 2861.52 49.09 13.23 1.20 25.81 5.21 0.96 0.04649 3062 51.37 9 3.5 45.13 45.13 2855.49 49.01 13.43 1.22 28.18 5.22 0.96 0.043306 3061 51.13
Avg.= 44.59 44.59 2861.52 49.09 13.23 1.20 25.81 5.21 0.96 0.05 3062.48 51.38 STDEV= ± 0.54 0.54 6.03 0.09 0.21 0.02 2.37 0.00 0.00 0.00 1.79 0.26 10 4 43.44 43.44 2883.31 48.10 12.79 0.72 21.49 5.19 0.97 0.033365 3080 49.71 11 4 43.95 43.95 2881.26 47.67 12.94 0.81 24.78 5.19 0.97 0.032624 3086 49.22 12 4 44.46 44.46 2879.21 47.25 13.10 0.90 28.07 5.20 0.97 0.032055 3093 48.76
Avg.= 43.95 43.95 2881.26 47.67 12.95 0.81 24.78 5.19 0.97 0.03 3086.19 49.23 STDEV= ± 0.51 0.51 2.05 0.43 0.15 0.09 3.29 0.00 0.00 0.00 6.37 0.47 13 4.5 45.30 45.30 2868.96 47.00 13.52 0.86 32.50 5.16 0.97 0.026384 3085 48.23 14 4.5 45.89 45.89 2864.93 46.71 13.68 0.84 34.81 5.15 0.98 0.0242 3096 47.84 15 4.5 46.48 46.48 2860.90 46.43 13.84 0.83 37.12 5.15 0.98 0.02229 3106 47.46
Avg.= 45.89 45.89 2864.93 46.71 13.68 0.84 34.81 5.15 0.98 0.02 3095.44 47.85 STDEV= ± 0.59 0.59 4.03 0.28 0.16 0.01 2.31 0.00 0.00 0.00 10.40 0.39 16 5 46.25 46.25 2870.00 45.98 13.27 0.38 27.87 5.16 0.99 0.013586 3204 46.60 17 5 47.02 47.02 2863.55 45.84 13.63 0.40 27.88 5.16 0.99 0.014223 3175 46.49 18 5 47.79 47.79 2857.10 45.71 13.98 0.41 27.88 5.16 0.99 0.01486 3147 46.39

Appendix B Calculated data sheet
165
Avg.= 47.02 47.02 2863.55 45.84 13.63 0.40 27.88 5.16 0.99 0.01 3175.01 46.49 STDEV= ± 0.77 0.77 6.45 0.14 0.36 0.02 0.01 0.00 0.00 0.00 28.45 0.11 19 5.5 48.00 48.00 2869.17 44.56 14.11 0.15 37.20 5.16 1.00 0.00414 3113 44.75 20 5.5 48.85 48.85 2865.74 44.75 14.40 0.14 37.22 5.17 1.00 0.003781 3090 44.92 21 5.5 49.70 49.70 2862.25 44.94 14.69 0.13 37.25 5.17 1.00 0.003423 3069 45.09
Avg.= 48.85 48.85 2865.72 44.75 14.40 0.14 37.22 5.17 1.00 0.00 3090.82 44.92 STDEV= ± 0.85 0.85 3.46 0.19 0.29 0.01 0.02 0.00 0.00 0.00 21.76 0.17 22 6 51.47 51.47 2848.93 43.94 15.10 0.04 37.11 5.15 1.00 0.001194 3074 44.00 23 6 51.06 51.06 2855.41 43.76 14.89 0.04 37.00 5.14 1.00 0.001154 3086 43.81 24 6 50.65 50.65 2861.88 43.57 14.69 0.04 36.89 5.12 1.00 0.001114 3100 43.62
Avg.= 51.06 51.06 2855.41 43.76 14.90 0.04 37.00 5.14 1.00 0.00 3086.57 43.81 STDEV= ± 0.41 0.41 6.47 0.19 0.20 0.00 0.11 0.02 0.00 0.00 13.06 0.19 25 6.5 52.51 52.51 2853.13 42.96 15.23 0.01 37.03 5.14 1.00 0.000159 3086 42.97 26 6.5 52.49 52.49 2854.15 42.92 15.20 0.00 37.03 5.14 1.00 7.96E-05 3088 42.92 27 6.5 52.47 52.47 2855.16 42.87 15.18 0.00 37.03 5.14 1.00 0 3090 42.87
Avg.= 52.49 52.49 2854.15 42.92 15.20 0.00 37.03 5.14 1.00 0.00 3087.97 42.92 STDEV= ± 0.02 0.02 1.01 0.04 0.03 0.00 0.00 0.00 0.00 0.00 1.95 0.05 28 7 53.19 53.19 2858.27 42.17 15.31 0.00 37.02 5.14 1.00 0 3092 42.17 29 7 53.18 53.18 2859.29 42.13 15.29 0.00 37.02 5.14 1.00 0 3091 42.13 30 7 53.16 53.16 2860.30 42.08 15.28 0.00 37.02 5.14 1.00 0 3090 42.08
Avg.= 53.18 53.18 2859.29 42.13 15.29 0.00 37.02 5.14 1.00 0.00 3091.34 42.13 STDEV= ± 0.02 0.02 1.01 0.05 0.01 0.00 0.00 0.00 0.00 0.00 0.98 0.05 31 7.5 55.50 55.50 2849.53 41.31 15.73 0.00 36.91 5.12 1.00 0 3126 41.31 32 7.5 55.49 55.49 2850.51 41.24 15.70 0.00 36.82 5.11 1.00 0 3131 41.24 33 7.5 55.48 55.48 2851.50 41.16 15.67 0.00 36.74 5.10 1.00 0 3136 41.16
Avg.= 55.49 55.49 2850.51 41.24 15.70 0.00 36.82 5.11 1.00 0.00 3130.76 41.24 STDEV= ± 0.01 0.01 0.99 0.08 0.03 0.00 0.09 0.01 0.00 0.00 4.85 0.08

Appendix B Calculated data sheet
166
Table B 1.19: Calculated data for Flat bottom pot with Shield at 18 mbar NG
SL LH (fcm) (fcd) (wcr) (hc) (ΔtTc) Ecor ECO2r Q MCE CO/CO2 FPc HTE
1 2.5 44.32 44.32 2851.93 52.51 11.63 1.83 10.36 5.32 0.85 0.176903 3371 61.80 2 2.5 42.90 42.90 2861.33 53.22 11.52 1.85 14.79 5.33 0.89 0.125199 3294 59.88 3 2.5 41.48 41.48 2870.72 53.98 11.41 1.87 19.24 5.34 0.91 0.097279 3216 59.23
Avg.= 42.90 42.90 2861.33 53.24 11.52 1.85 14.80 5.33 0.88 0.13 3293.63 60.30 STDEV= ± 1.42 1.42 9.39 0.73 0.11 0.02 4.44 0.01 0.03 0.04 77.78 1.34
4 3 36.41 36.41 2888.61 59.35 10.36 0.58 19.07 5.29 0.97 0.030569 3100 61.17 5 3 36.83 36.83 2885.40 58.70 10.49 0.63 18.14 5.30 0.97 0.034524 3121 60.73 6 3 37.25 37.25 2882.19 58.07 10.61 0.67 17.22 5.31 0.96 0.038919 3142 60.33
Avg.= 36.83 36.83 2885.40 58.71 10.49 0.63 18.14 5.30 0.97 0.03 3120.92 60.74 STDEV= ± 0.42 0.42 3.21 0.64 0.13 0.04 0.93 0.01 0.00 0.00 21.06 0.42
7 3.5 36.31 36.31 2897.50 58.38 10.49 0.36 17.15 5.29 0.98 0.021228 3053 59.61 8 3.5 36.47 36.47 2895.60 58.47 10.52 0.33 20.46 5.28 0.98 0.016292 3051 59.43 9 3.5 36.63 36.63 2893.69 58.57 10.55 0.30 23.77 5.28 0.99 0.012737 3049 59.32
Avg.= 36.47 36.47 2895.60 58.47 10.52 0.33 20.46 5.28 0.98 0.02 3050.72 59.45 STDEV= ± 0.16 0.16 1.91 0.10 0.03 0.03 3.31 0.00 0.00 0.00 1.98 0.15 10 4 37.14 37.14 2882.09 58.11 10.62 0.25 33.30 5.28 0.99 0.00746 3139 58.54 11 4 37.01 37.01 2885.18 58.10 10.58 0.24 35.68 5.28 0.99 0.006793 3128 58.49 12 4 36.89 36.89 2888.27 58.09 10.54 0.24 38.05 5.28 0.99 0.006209 3118 58.45
Avg.= 37.01 37.01 2885.18 58.10 10.58 0.24 35.68 5.28 0.99 0.01 3128.33 58.50 STDEV= ± 0.12 0.12 3.09 0.01 0.04 0.01 2.37 0.00 0.00 0.00 10.32 0.05 13 4.5 37.51 37.51 2900.63 56.57 10.82 0.11 38.00 5.27 1.00 0.003025 3084 56.74 14 4.5 37.28 37.28 2899.39 56.58 10.72 0.10 38.00 5.28 1.00 0.002627 3096 56.73 15 4.5 37.05 37.05 2898.15 56.60 10.62 0.08 38.01 5.28 1.00 0.002229 3109 56.72
Avg.= 37.28 37.28 2899.39 56.58 10.72 0.10 38.00 5.28 1.00 0.00 3096.12 56.73 STDEV= ± 0.23 0.23 1.24 0.01 0.10 0.02 0.00 0.00 0.00 0.00 12.44 0.01 16 5 38.97 38.97 2886.44 55.43 11.13 0.00 37.65 5.23 1.00 0 3106 55.43 17 5 38.78 38.78 2889.97 55.38 11.12 0.00 37.64 5.22 1.00 0 3088 55.38 18 5 38.59 38.59 2893.50 55.33 11.10 0.00 37.63 5.22 1.00 0 3070 55.33
Avg.= 38.78 38.78 2889.97 55.38 11.12 0.00 37.64 5.22 1.00 0.00 3088.34 55.38

Appendix B Calculated data sheet
167
STDEV= ± 0.19 0.19 3.53 0.05 0.01 0.00 0.01 0.00 0.00 0.00 17.99 0.05 19 5.5 38.87 38.87 2894.15 54.36 11.35 0.00 37.59 5.22 1.00 0 3056 54.36 20 5.5 39.15 39.15 2890.72 54.41 11.42 0.00 30.53 5.22 1.00 0 3057 54.41 21 5.5 39.43 39.43 2887.28 54.46 11.50 0.00 23.47 5.21 1.00 0 3057 54.46
Avg.= 39.15 39.15 2890.72 54.41 11.42 0.00 30.53 5.22 1.00 0.00 3056.52 54.41 STDEV= ± 0.28 0.28 3.44 0.05 0.07 0.00 7.06 0.00 0.00 0.00 0.18 0.05 22 6 41.31 41.31 2895.32 53.29 11.57 0.00 23.42 5.20 1.00 0 3113 53.29 23 6 40.95 40.95 2892.09 53.42 11.54 0.00 23.48 5.21 1.00 0 3101 53.42 24 6 40.59 40.59 2888.84 53.56 11.51 0.00 23.54 5.23 1.00 0 3087 53.56
Avg.= 40.95 40.95 2892.08 53.43 11.54 0.00 23.48 5.21 1.00 0.00 3100.48 53.43 STDEV= ± 0.36 0.36 3.24 0.13 0.03 0.00 0.06 0.01 0.00 0.00 12.96 0.13 25 6.5 40.64 40.64 2893.40 52.42 11.70 0.00 28.17 5.21 1.00 0 3077 52.42 26 6.5 40.61 40.61 2888.34 52.87 11.66 0.00 28.14 5.21 1.00 0 3096 52.87 27 6.5 40.58 40.58 2883.28 53.32 11.62 0.00 28.12 5.20 1.00 0 3116 53.32
Avg.= 40.61 40.61 2888.34 52.87 11.66 0.00 28.14 5.21 1.00 0.00 3096.11 52.87 STDEV= ± 0.03 0.03 5.06 0.45 0.04 0.00 0.02 0.00 0.00 0.00 19.43 0.45 28 7 43.11 43.11 2870.72 51.95 12.04 0.00 27.99 5.18 1.00 0 3166 51.95 29 7 42.93 42.93 2874.79 51.88 11.89 0.00 27.94 5.17 1.00 0 3182 51.88 30 7 42.76 42.76 2878.86 51.80 11.74 0.00 27.90 5.16 1.00 0 3199 51.80
Avg.= 42.93 42.93 2874.79 51.88 11.89 0.00 27.94 5.17 1.00 0.00 3182.50 51.88 STDEV= ± 0.17 0.17 4.07 0.07 0.15 0.00 0.04 0.01 0.00 0.00 16.21 0.07 31 7.5 41.90 41.90 2890.54 51.30 11.94 0.00 28.17 5.21 1.00 0 3100 51.30 32 7.5 41.64 41.64 2892.51 51.40 11.88 0.00 28.16 5.21 1.00 0 3095 51.40 33 7.5 41.37 41.37 2894.49 51.50 11.83 0.00 28.15 5.21 1.00 0 3089 51.50
Avg.= 41.64 41.64 2892.51 51.40 11.88 0.00 28.16 5.21 1.00 0.00 3094.63 51.40 STDEV= ± 0.26 0.26 1.98 0.10 0.05 0.00 0.01 0.00 0.00 0.00 5.22 0.10

Appendix B Calculated data sheet
168
Table B 1.20: Calculated data for Finned pot with Shield at 18 mbar NG Pressure.
SL LH (fcm) (fcd) (wcr) (hc) (ΔtTc) Ecor ECO2r Q MCE CO/CO2 FPc HTE 1 2.5 49.02 49.02 2837.66 46.76 13.12 2.33 14.43 5.34 0.86 0.161335 3410 54.30 2 2.5 47.66 47.66 2844.03 47.41 12.97 2.45 14.44 5.35 0.85 0.169827 3358 55.47 3 2.5 46.29 46.29 2850.40 48.11 12.82 2.58 14.46 5.35 0.85 0.178318 3305 56.69
Avg.= 47.66 47.66 2844.03 47.43 12.97 2.45 14.44 5.35 0.85 0.17 3357.66 55.49 STDEV= ± 1.37 1.37 6.37 0.67 0.15 0.12 0.01 0.01 0.01 0.01 52.63 1.19
4 3 40.73 40.73 2868.08 52.51 11.84 1.83 12.43 5.31 0.87 0.146965 3157 60.23 5 3 41.20 41.20 2864.25 51.86 12.14 1.80 11.94 5.31 0.87 0.150297 3148 59.66 6 3 41.67 41.67 2860.41 51.23 12.44 1.76 11.46 5.30 0.87 0.153905 3140 59.11
Avg.= 41.20 41.20 2864.25 51.87 12.14 1.80 11.95 5.31 0.87 0.15 3148.57 59.67 STDEV= ± 0.47 0.47 3.83 0.64 0.30 0.03 0.48 0.00 0.00 0.00 8.18 0.56
7 3.5 43.69 43.69 2833.25 54.92 12.23 1.34 17.18 5.30 0.93 0.077837 3117 59.20 8 3.5 43.56 43.56 2841.13 54.22 12.22 1.43 13.37 5.30 0.90 0.1069 3111 60.01 9 3.5 43.42 43.42 2849.02 53.50 12.21 1.52 9.55 5.30 0.86 0.159212 3105 62.02
Avg.= 43.56 43.56 2841.13 54.21 12.22 1.43 13.37 5.30 0.90 0.11 3110.92 60.41 STDEV= ± 0.14 0.14 7.89 0.71 0.01 0.09 3.81 0.00 0.03 0.04 5.63 1.45 10 4 41.08 41.08 2863.07 53.86 12.24 0.49 10.54 5.32 0.96 0.046316 2998 56.36 11 4 41.08 41.08 2861.17 54.17 12.12 0.46 10.04 5.31 0.96 0.045489 3022 56.64 12 4 41.09 41.09 2859.26 54.48 12.00 0.43 9.54 5.30 0.96 0.044579 3046 56.91
Avg.= 41.08 41.08 2861.16 54.17 12.12 0.46 10.04 5.31 0.96 0.05 3022.12 56.63 STDEV= ± 0.01 0.01 1.90 0.31 0.12 0.03 0.50 0.01 0.00 0.00 23.72 0.28 13 4.5 40.83 40.83 2866.03 53.84 11.86 0.27 16.24 5.30 0.98 0.016858 3077 54.75 14 4.5 40.92 40.92 2863.93 53.80 12.12 0.23 15.73 5.29 0.99 0.014474 3028 54.58 15 4.5 41.00 41.00 2861.83 53.76 12.39 0.18 15.23 5.29 0.99 0.011941 2980 54.40
Avg.= 40.92 40.92 2863.93 53.80 12.12 0.23 15.73 5.29 0.99 0.01 3028.13 54.58 STDEV= ± 0.08 0.08 2.10 0.04 0.26 0.05 0.50 0.01 0.00 0.00 48.79 0.18 16 5 43.31 43.31 2859.41 53.22 12.25 0.01 28.69 5.31 1.00 0.000318 3039 53.24 17 5 43.05 43.05 2860.78 53.23 12.08 0.00 28.73 5.32 1.00 0.000159 3074 53.24 18 5 42.79 42.79 2862.15 53.24 11.91 0.00 28.78 5.33 1.00 0 3110 53.24

Appendix B Calculated data sheet
169
Avg.= 43.05 43.05 2860.78 53.23 12.08 0.00 28.73 5.32 1.00 0.00 3074.02 53.24 STDEV= ± 0.26 0.26 1.37 0.01 0.17 0.00 0.04 0.01 0.00 0.00 35.47 0.00 19 5.5 44.27 44.27 2860.94 52.66 12.41 0.00 28.86 5.34 1.00 0 3015 52.66 20 5.5 43.63 43.63 2865.80 52.79 12.16 0.00 28.79 5.33 1.00 0 3041 52.79 21 5.5 42.98 42.98 2870.65 52.92 11.91 0.00 28.72 5.32 1.00 0 3069 52.92
Avg.= 43.63 43.63 2865.80 52.79 12.16 0.00 28.79 5.33 1.00 0.00 3041.86 52.79 STDEV= ± 0.65 0.65 4.85 0.13 0.25 0.00 0.07 0.01 0.00 0.00 26.67 0.13 22 6 43.17 43.17 2872.18 51.89 12.50 0.00 28.74 5.32 1.00 0 2977 51.89 23 6 42.86 42.86 2871.38 51.92 12.31 0.00 28.72 5.32 1.00 0 3030 51.92 24 6 42.56 42.56 2870.57 51.95 12.12 0.00 28.70 5.31 1.00 0 3085 51.95
Avg.= 42.86 42.86 2871.37 51.92 12.31 0.00 28.72 5.32 1.00 0.00 3030.53 51.92 STDEV= ± 0.30 0.30 0.80 0.03 0.19 0.00 0.02 0.00 0.00 0.00 53.55 0.03 25 6.5 44.18 44.18 2869.07 50.84 12.66 0.00 28.65 5.30 1.00 0 3022 50.84 26 6.5 43.48 43.48 2873.94 51.04 12.47 0.00 28.67 5.31 1.00 0 3024 51.04 27 6.5 42.78 42.78 2878.81 51.24 12.29 0.00 28.70 5.31 1.00 0 3028 51.24
Avg.= 43.48 43.48 2873.94 51.04 12.47 0.00 28.67 5.31 1.00 0.00 3024.52 51.04 STDEV= ± 0.70 0.70 4.87 0.20 0.19 0.00 0.03 0.00 0.00 0.00 3.02 0.20 28 7 45.16 45.16 2868.60 49.16 12.74 0.00 28.58 5.29 1.00 0 3112 49.16 29 7 45.28 45.28 2859.77 50.04 12.82 0.00 28.48 5.27 1.00 0 3096 50.04 30 7 45.40 45.40 2850.95 50.91 12.89 0.00 28.38 5.25 1.00 0 3079 50.91
Avg.= 45.28 45.28 2859.77 50.04 12.82 0.00 28.48 5.27 1.00 0.00 3095.73 50.04 STDEV= ± 0.12 0.12 8.83 0.87 0.07 0.00 0.10 0.02 0.00 0.00 16.53 0.87 31 7.5 46.36 46.36 2859.75 48.85 12.89 0.00 28.57 5.29 1.00 0 3155 48.85 32 7.5 45.96 45.96 2858.90 49.54 13.02 0.00 28.48 5.27 1.00 0 3084 49.54 33 7.5 45.56 45.56 2858.05 50.24 13.14 0.00 28.39 5.25 1.00 0 3015 50.24
Avg.= 45.96 45.96 2858.90 49.54 13.01 0.00 28.48 5.27 1.00 0.00 3084.46 49.54 STDEV= ± 0.40 0.40 0.85 0.70 0.13 0.00 0.09 0.02 0.00 0.00 69.81 0.70

Appendix B Calculated data sheet
170
Table B 1.21: Calculated data for flat bottom pot without Shield at 20 mbar NG pressure.
SL LH (fcm) (fcd) (wcr) (hc) (ΔtTc) Ecor ECO2r Q MCE CO/CO2 FPc HTE
1 2.5 38.30 38.30 2892.56 54.47 10.49 0.21 28.77 5.33 0.992834 0.007218 3316 54.87 2 2.5 37.12 37.12 2892.12 56.35 10.30 0.22 28.77 5.33 0.992363 0.007695 3269 56.78 3 2.5 35.93 35.93 2891.68 58.34 10.10 0.24 28.77 5.33 0.991893 0.008173 3221 58.82 Avg.= 37.12 37.12 2892.12 56.39 10.30 0.22 28.77 5.33 0.99 0.01 3268.83 56.82
STDEV= ± 1.19 1.19 0.44 1.93 0.19 0.01 0.00 0.00 0.00 0.00 47.86 1.98 4 3 37.22 37.22 2891.42 55.97 10.59 0.14 33.39 5.30 0.995742 0.004276 3206 56.21 5 3 36.91 36.91 2891.87 56.31 10.57 0.12 35.76 5.30 0.996531 0.003481 3192 56.51 6 3 36.60 36.60 2892.31 56.66 10.54 0.11 38.14 5.29 0.997222 0.002786 3179 56.82 Avg.= 36.91 36.91 2891.87 56.32 10.57 0.12 35.76 5.30 1.00 0.00 3192.35 56.51
STDEV= ± 0.31 0.31 0.44 0.34 0.03 0.02 2.38 0.00 0.00 0.00 13.47 0.30 7 3.5 38.14 38.14 2895.38 54.14 10.93 0.05 38.18 5.30 0.998807 0.001194 3184 54.21 8 3.5 37.68 37.68 2897.33 54.52 10.85 0.04 35.68 5.28 0.998855 0.001146 3170 54.58 9 3.5 37.23 37.23 2899.28 54.90 10.78 0.04 33.19 5.27 0.998909 0.001092 3156 54.96 Avg.= 37.68 37.68 2897.33 54.52 10.85 0.04 35.68 5.28 1.00 0.00 3170.03 54.58
STDEV= ± 0.46 0.46 1.95 0.38 0.08 0.00 2.49 0.02 0.00 0.00 13.75 0.38 10 4 39.44 39.44 2899.33 51.89 11.43 0.01 37.83 5.25 0.999682 0.000318 3147 51.91 11 4 39.56 39.56 2902.65 51.81 11.40 0.01 37.82 5.25 0.999682 0.000318 3163 51.83 12 4 39.69 39.69 2905.98 51.73 11.37 0.01 37.82 5.25 0.999682 0.000318 3179 51.75
Avg.= 39.56 39.56 2902.65 51.81 11.40 0.01 37.82 5.25 1.00 0.00 3162.90 51.83 STDEV= ± 0.13 0.13 3.32 0.08 0.03 0.00 0.01 0.00 0.00 0.00 16.24 0.08 13 4.5 43.12 43.12 2875.61 50.03 12.37 0.00 37.72 5.24 1 0 3182 50.03 14 4.5 43.44 43.44 2878.45 49.20 12.21 0.00 33.12 5.25 1 0 3259 49.20 15 4.5 43.76 43.76 2881.29 48.38 12.05 0.00 28.49 5.27 1 0 3338 48.38
Avg.= 43.44 43.44 2878.45 49.20 12.21 0.00 33.11 5.25 1.00 0.00 3259.40 49.20 STDEV= ± 0.32 0.32 2.84 0.83 0.16 0.00 4.62 0.02 0.00 0.00 77.97 0.83 16 5 44.07 44.07 2888.88 46.84 12.67 0.00 28.25 5.23 1 0 3226 46.84 17 5 43.87 43.87 2886.90 47.27 12.56 0.00 28.20 5.22 1 0 3242 47.27 18 5 43.68 43.68 2884.92 47.69 12.44 0.00 28.15 5.21 1 0 3258 47.69
Avg.= 43.87 43.87 2886.90 47.27 12.56 0.00 28.20 5.22 1.00 0.00 3241.86 47.27

Appendix B Calculated data sheet
171
STDEV= ± 0.20 0.20 1.98 0.42 0.12 0.00 0.05 0.01 0.00 0.00 16.39 0.42 19 5.5 48.96 48.96 2867.14 44.24 14.00 0.00 28.23 5.22 1 0 3245 44.24 20 5.5 47.39 47.39 2873.98 44.94 13.62 0.00 32.89 5.22 1 0 3235 44.94 21 5.5 45.83 45.83 2880.81 45.69 13.25 0.00 37.55 5.21 1 0 3224 45.69
Avg.= 47.39 47.39 2873.98 44.96 13.62 0.00 32.89 5.22 1.00 0.00 3234.40 44.96 STDEV= ± 1.57 1.57 6.84 0.72 0.37 0.00 4.66 0.01 0.00 0.00 10.71 0.72 22 6 47.17 47.17 2903.52 43.07 13.71 0.00 37.51 5.21 1 0 3191 43.07 23 6 47.42 47.42 2895.15 43.23 13.82 0.00 35.21 5.21 1 0 3188 43.23 24 6 47.67 47.67 2886.80 43.39 13.93 0.00 32.90 5.22 1 0 3185 43.39
Avg.= 47.42 47.42 2895.16 43.23 13.82 0.00 35.21 5.21 1.00 0.00 3188.31 43.23 STDEV= ± 0.25 0.25 8.36 0.16 0.11 0.00 2.30 0.01 0.00 0.00 2.88 0.16 25 6.5 49.96 49.96 2885.03 41.80 14.26 0.00 28.13 5.21 1 0 3240 41.80 26 6.5 49.99 49.99 2884.04 41.86 14.29 0.00 28.13 5.21 1 0 3235 41.86 27 6.5 50.02 50.02 2883.05 41.93 14.32 0.00 28.13 5.21 1 0 3231 41.93
Avg.= 49.99 49.99 2884.04 41.86 14.29 0.00 28.13 5.21 1.00 0.00 3235.42 41.86 STDEV= ± 0.03 0.03 0.99 0.07 0.03 0.00 0.00 0.00 0.00 0.00 4.45 0.07 28 7 54.20 54.20 2875.92 40.09 15.08 0.00 28.01 5.18 1 0 3251 40.09 29 7 54.18 54.18 2873.71 40.06 15.14 0.00 28.01 5.18 1 0 3258 40.06 30 7 54.16 54.16 2871.51 40.03 15.20 0.00 28.01 5.18 1 0 3266 40.03
Avg.= 54.18 54.18 2873.71 40.06 15.14 0.00 28.01 5.18 1.00 0.00 3258.10 40.06 STDEV= ± 0.02 0.02 2.20 0.03 0.06 0.00 0.00 0.00 0.00 0.00 7.40 0.03 31 7.5 58.82 58.82 2856.15 38.52 16.17 0.00 27.96 5.17 1 0 3290 38.52 32 7.5 58.84 58.84 2854.25 38.73 16.16 0.00 27.96 5.17 1 0 3286 38.73 33 7.5 58.85 58.85 2852.34 38.94 16.15 0.00 27.96 5.17 1 0 3281 38.94
Avg.= 58.84 58.84 2854.25 38.73 16.16 0.00 27.96 5.17 1.00 0.00 3285.57 38.73 STDEV= ± 0.02 0.02 1.90 0.21 0.01 0.00 0.00 0.00 0.00 0.00 4.69 0.21

Appendix B Calculated data sheet
172
Table B 1.22: Calculated data for Finned pot without Shield at 20 mbar NG pressure.
SL LH (fcm) (fcd) (wcr) (hc) (ΔtTc) Ecor ECO2r Q MCE CO/CO2 FPc HTE 1 2.5 45.34 45.34 2884.98 45.55 12.59 2.64 19.41 5.39 0.880184 0.136127 3295 51.75 2 2.5 44.95 44.95 2887.99 45.68 12.46 2.55 21.80 5.38 0.895394 0.116827 3296 51.02 3 2.5 44.57 44.57 2891.01 45.83 12.33 2.45 24.17 5.37 0.907946 0.101387 3298 50.47
Avg.= 44.95 44.95 2887.99 45.69 12.46 2.55 21.79 5.38 0.89 0.12 3296.05 51.08 STDEV= ± 0.39 0.39 3.02 0.14 0.13 0.10 2.38 0.01 0.01 0.02 1.45 0.64 4 3 44.51 44.51 2889.50 46.61 12.22 2.02 24.07 5.35 0.922455 0.084064 3279 50.53 5 3 44.72 44.72 2887.52 46.60 12.28 1.94 26.52 5.35 0.931911 0.073064 3279 50.00 6 3 44.93 44.93 2885.55 46.59 12.33 1.85 28.97 5.36 0.93994 0.063897 3280 49.57
Avg.= 44.72 44.72 2887.52 46.60 12.28 1.94 26.52 5.35 0.93 0.07 3279.15 50.03 STDEV= ± 0.21 0.21 1.98 0.01 0.06 0.09 2.45 0.01 0.01 0.01 0.43 0.48 7 3.5 44.86 44.86 2871.66 48.05 12.36 1.79 33.43 5.30 0.949057 0.053677 3272 50.63 8 3.5 45.24 45.24 2866.72 48.15 12.53 1.67 31.10 5.31 0.948956 0.053789 3256 50.74 9 3.5 45.62 45.62 2861.78 48.26 12.70 1.55 28.76 5.32 0.948839 0.05392 3240 50.86
Avg.= 45.24 45.24 2866.72 48.15 12.53 1.67 31.09 5.31 0.95 0.05 3255.80 50.74 STDEV= ± 0.38 0.38 4.94 0.11 0.17 0.12 2.33 0.01 0.00 0.00 15.82 0.12 10 4 44.76 44.76 2883.42 46.80 12.70 1.56 38.10 5.29 0.960544 0.041077 3188 48.72 11 4 45.18 45.18 2880.53 46.76 12.72 1.45 38.05 5.28 0.963306 0.038092 3206 48.54 12 4 45.60 45.60 2877.64 46.72 12.73 1.33 38.01 5.28 0.966084 0.035106 3224 48.36
Avg.= 45.18 45.18 2880.53 46.76 12.72 1.45 38.05 5.28 0.96 0.04 3205.83 48.54 STDEV= ± 0.42 0.42 2.89 0.04 0.02 0.12 0.04 0.01 0.00 0.00 18.30 0.18 13 4.5 45.99 45.99 2877.33 45.98 13.09 0.79 37.95 5.27 0.979722 0.020698 3191 46.93 14 4.5 45.96 45.96 2875.33 46.18 12.96 1.03 37.95 5.27 0.973496 0.027225 3225 47.44 15 4.5 45.93 45.93 2873.33 46.39 12.82 1.28 37.95 5.27 0.967349 0.033753 3259 47.95
Avg.= 45.96 45.96 2875.33 46.18 12.96 1.03 37.95 5.27 0.97 0.03 3225.15 47.44 STDEV= ± 0.03 0.03 2.00 0.20 0.14 0.25 0.00 0.00 0.01 0.01 34.01 0.51 16 5 46.70 46.70 2874.16 45.36 13.27 0.48 28.36 5.25 0.983301 0.016983 3216 46.13 17 5 47.15 47.15 2869.17 45.37 13.34 0.51 28.34 5.24 0.982276 0.018044 3234 46.19 18 5 47.59 47.59 2864.18 45.38 13.41 0.54 28.31 5.24 0.981253 0.019105 3252 46.24

Appendix B Calculated data sheet
173
Avg.= 47.15 47.15 2869.17 45.37 13.34 0.51 28.34 5.24 0.98 0.02 3234.13 46.19 STDEV= ± 0.44 0.44 4.99 0.01 0.07 0.03 0.02 0.00 0.00 0.00 18.17 0.06 19 5.5 47.95 47.95 2870.94 44.20 13.65 0.25 33.00 5.24 0.992416 0.007642 3233 44.54 20 5.5 48.08 48.08 2870.47 44.16 13.70 0.24 35.43 5.25 0.993253 0.006793 3229 44.46 21 5.5 48.21 48.21 2870.00 44.11 13.75 0.23 37.87 5.26 0.993986 0.00605 3224 44.38
Avg.= 48.08 48.08 2870.47 44.16 13.70 0.24 35.43 5.25 0.99 0.01 3228.56 44.46 STDEV= ± 0.13 0.13 0.47 0.04 0.05 0.01 2.43 0.01 0.00 0.00 4.66 0.08 22 6 50.36 50.36 2866.64 43.22 14.26 0.08 37.86 5.26 0.997935 0.00207 3227 43.31 23 6 51.14 51.14 2859.60 43.06 14.40 0.08 37.87 5.26 0.997855 0.002149 3239 43.16 24 6 51.92 51.92 2852.58 42.91 14.53 0.08 37.88 5.26 0.997776 0.002229 3251 43.00
Avg.= 51.14 51.14 2859.61 43.06 14.39 0.08 37.87 5.26 1.00 0.00 3238.98 43.16 STDEV= ± 0.78 0.78 7.03 0.16 0.14 0.00 0.01 0.00 0.00 0.00 11.75 0.15 25 6.5 52.53 52.53 2858.86 42.23 14.52 0.02 37.67 5.23 0.999443 0.000557 3256 42.25 26 6.5 52.53 52.53 2858.86 42.22 14.52 0.05 37.67 5.23 0.998688 0.001314 3256 42.28 27 6.5 52.54 52.54 2858.86 42.22 14.52 0.08 37.67 5.23 0.997935 0.00207 3257 42.31
Avg.= 52.53 52.53 2858.86 42.22 14.52 0.05 37.67 5.23 1.00 0.00 3256.42 42.28 STDEV= ± 0.01 0.01 0.00 0.01 0.00 0.03 0.00 0.00 0.00 0.00 0.42 0.03 28 7 55.09 55.09 2856.15 40.75 14.82 0.00 37.54 5.21 1 0 3321 40.75 29 7 55.10 55.10 2856.15 40.74 14.88 0.00 37.54 5.21 1 0 3310 40.74 30 7 55.12 55.12 2856.15 40.73 14.93 0.00 37.54 5.21 1 0 3298 40.73
Avg.= 55.10 55.10 2856.15 40.74 14.88 0.00 37.54 5.21 1.00 0.00 3309.82 40.74 STDEV= ± 0.01 0.01 0.00 0.01 0.05 0.00 0.00 0.00 0.00 0.00 11.40 0.01 31 7.5 58.64 58.64 2832.72 40.44 15.46 0.00 37.74 5.24 1 0 3361 40.44 32 7.5 58.64 58.64 2832.72 40.44 15.48 0.00 37.74 5.24 1 0 3355 40.44 33 7.5 58.65 58.65 2832.72 40.43 15.51 0.00 37.74 5.24 1 0 3350 40.43
Avg.= 58.64 58.64 2832.72 40.44 15.48 0.00 37.74 5.24 1.00 0.00 3355.33 40.44 STDEV= ± 0.01 0.01 0.00 0.00 0.03 0.00 0.00 0.00 0.00 0.00 5.51 0.00

Appendix B Calculated data sheet
174
Table B 1.23: Calculated data for flat bottom pot with Shield at 20 mbar NG pressure.
SL LH (fcm) (fcd) (wcr) (hc) (ΔtTc) Ecor ECO2r Q MCE CO/CO2 FPc HTE
1 2.5 46.89 46.89 2866.83 49.51 12.20 1.87 19.62 5.45 0.912802 0.095527 3290 54.24 2 2.5 41.91 41.91 2875.08 52.15 11.45 1.93 14.67 5.43 0.883692 0.131616 3295 59.01 3 2.5 36.90 36.90 2883.13 55.52 10.61 1.99 9.75 5.41 0.830708 0.203792 3301 66.84 Avg.= 41.90 41.90 2875.01 52.39 11.42 1.93 14.68 5.43 0.88 0.14 3295.30 60.03
STDEV= ± 4.99 4.99 8.15 3.02 0.79 0.06 4.94 0.02 0.04 0.06 5.21 6.36 4 3 35.03 35.03 2891.68 58.32 10.37 0.61 9.71 5.39 0.941255 0.062411 3147 61.96 5 3 35.37 35.37 2890.83 58.07 10.40 0.68 19.41 5.39 0.966159 0.035027 3157 60.10 6 3 35.71 35.71 2889.97 57.82 10.43 0.86 29.10 5.39 0.971138 0.02972 3166 59.54 Avg.= 35.37 35.37 2890.83 58.07 10.40 0.72 19.41 5.39 0.96 0.04 3156.46 60.53
STDEV= ± 0.34 0.34 0.86 0.25 0.03 0.13 9.70 0.00 0.02 0.02 9.76 1.27 7 3.5 35.19 35.19 2886.53 58.42 10.37 0.50 19.37 5.38 0.975007 0.025633 3182 59.92 8 3.5 35.18 35.18 2887.33 58.05 10.45 0.50 24.22 5.38 0.979844 0.02057 3172 59.25 9 3.5 35.16 35.16 2888.12 57.69 10.54 0.50 29.08 5.38 0.983096 0.017195 3162 58.68 Avg.= 35.18 35.18 2887.33 58.05 10.45 0.50 24.22 5.38 0.98 0.02 3172.18 59.28
STDEV= ± 0.01 0.01 0.80 0.37 0.09 0.00 4.85 0.00 0.00 0.00 9.88 0.62 10 4 36.07 36.07 2888.72 57.01 10.51 0.42 33.96 5.39 0.987689 0.012464 3198 57.72 11 4 35.47 35.47 2892.75 57.57 10.44 0.35 36.38 5.39 0.990496 0.009595 3159 58.12 12 4 34.87 34.87 2896.78 58.14 10.37 0.27 38.80 5.39 0.992965 0.007085 3119 58.55
Avg.= 35.47 35.47 2892.75 57.57 10.44 0.35 36.38 5.39 0.99 0.01 3158.59 58.13 STDEV= ± 0.60 0.60 4.03 0.56 0.07 0.07 2.42 0.00 0.00 0.00 39.74 0.41 13 4.5 36.63 36.63 2890.85 56.10 10.77 0.21 38.91 5.40 0.994616 0.005413 3155 56.41 14 4.5 36.90 36.90 2891.04 55.94 10.66 0.21 38.85 5.39 0.994577 0.005453 3195 56.25 15 4.5 37.17 37.17 2891.22 55.78 10.55 0.21 38.80 5.39 0.994537 0.005493 3235 56.08
Avg.= 36.90 36.90 2891.04 55.94 10.66 0.21 38.85 5.39 0.99 0.01 3195.05 56.25 STDEV= ± 0.27 0.27 0.18 0.16 0.11 0.00 0.05 0.01 0.00 0.00 40.24 0.16 16 5 37.10 37.10 2900.37 55.10 10.75 0.03 43.34 5.35 0.999364 0.000637 3145 55.14 17 5 37.17 37.17 2901.61 55.22 10.75 0.01 40.98 5.35 0.999663 0.000337 3127 55.24 18 5 37.24 37.24 2902.85 55.33 10.75 0.00 38.62 5.36 1 0 3109 55.33
Avg.= 37.17 37.17 2901.61 55.22 10.75 0.01 40.98 5.35 1.00 0.00 3127.05 55.24

Appendix B Calculated data sheet
175
STDEV= ± 0.07 0.07 1.24 0.12 0.00 0.01 2.36 0.01 0.00 0.00 18.23 0.10 19 5.5 38.13 38.13 2897.91 54.66 10.84 0.00 38.47 5.34 1 0 3157 54.66 20 5.5 38.32 38.32 2895.68 54.29 11.05 0.00 38.49 5.34 1 0 3136 54.29 21 5.5 38.51 38.51 2893.45 53.93 11.26 0.00 38.52 5.35 1 0 3116 53.93
Avg.= 38.32 38.32 2895.68 54.29 11.05 0.00 38.49 5.34 1.00 0.00 3136.15 54.29 STDEV= ± 0.19 0.19 2.23 0.37 0.21 0.00 0.03 0.00 0.00 0.00 20.48 0.37 22 6 40.15 40.15 2890.00 52.83 11.32 0.00 38.25 5.31 1 0 3185 52.83 23 6 39.94 39.94 2891.23 53.31 11.21 0.00 38.33 5.32 1 0 3176 53.31 24 6 39.73 39.73 2892.46 53.81 11.10 0.00 38.41 5.33 1 0 3167 53.81
Avg.= 39.94 39.94 2891.23 53.32 11.21 0.00 38.33 5.32 1.00 0.00 3175.79 53.32 STDEV= ± 0.21 0.21 1.23 0.49 0.11 0.00 0.08 0.01 0.00 0.00 9.05 0.49 25 6.5 40.09 40.09 2893.95 52.44 11.14 0.00 38.53 5.35 1 0 3231 52.44 26 6.5 40.43 40.43 2890.25 52.77 11.44 0.00 36.16 5.35 1 0 3149 52.77 27 6.5 40.78 40.78 2886.53 53.10 11.74 0.00 33.79 5.36 1 0 3073 53.10
Avg.= 40.43 40.43 2890.24 52.77 11.44 0.00 36.16 5.35 1.00 0.00 3150.88 52.77 STDEV= ± 0.34 0.34 3.71 0.33 0.30 0.00 2.37 0.01 0.00 0.00 78.90 0.33 28 7 42.04 42.04 2885.54 51.61 11.68 0.00 38.26 5.31 1 0 3183 51.61 29 7 42.07 42.07 2884.56 51.69 11.74 0.00 38.18 5.30 1 0 3170 51.69 30 7 42.09 42.09 2883.57 51.77 11.79 0.00 38.10 5.29 1 0 3157 51.77
Avg.= 42.07 42.07 2884.56 51.69 11.74 0.00 38.18 5.30 1.00 0.00 3170.28 51.69 STDEV= ± 0.02 0.02 0.99 0.08 0.05 0.00 0.08 0.01 0.00 0.00 12.88 0.08 31 7.5 40.57 40.57 2897.91 51.37 11.70 0.00 38.14 5.29 1 0 3112 51.37 32 7.5 40.79 40.79 2896.42 51.26 11.81 0.00 38.24 5.31 1 0 3101 51.26 33 7.5 41.01 41.01 2894.94 51.15 11.91 0.00 38.34 5.32 1 0 3091 51.15
Avg.= 40.79 40.79 2896.42 51.26 11.81 0.00 38.24 5.31 1.00 0.00 3101.49 51.26 STDEV= ± 0.22 0.22 1.48 0.11 0.10 0.00 0.10 0.01 0.00 0.00 10.68 0.11
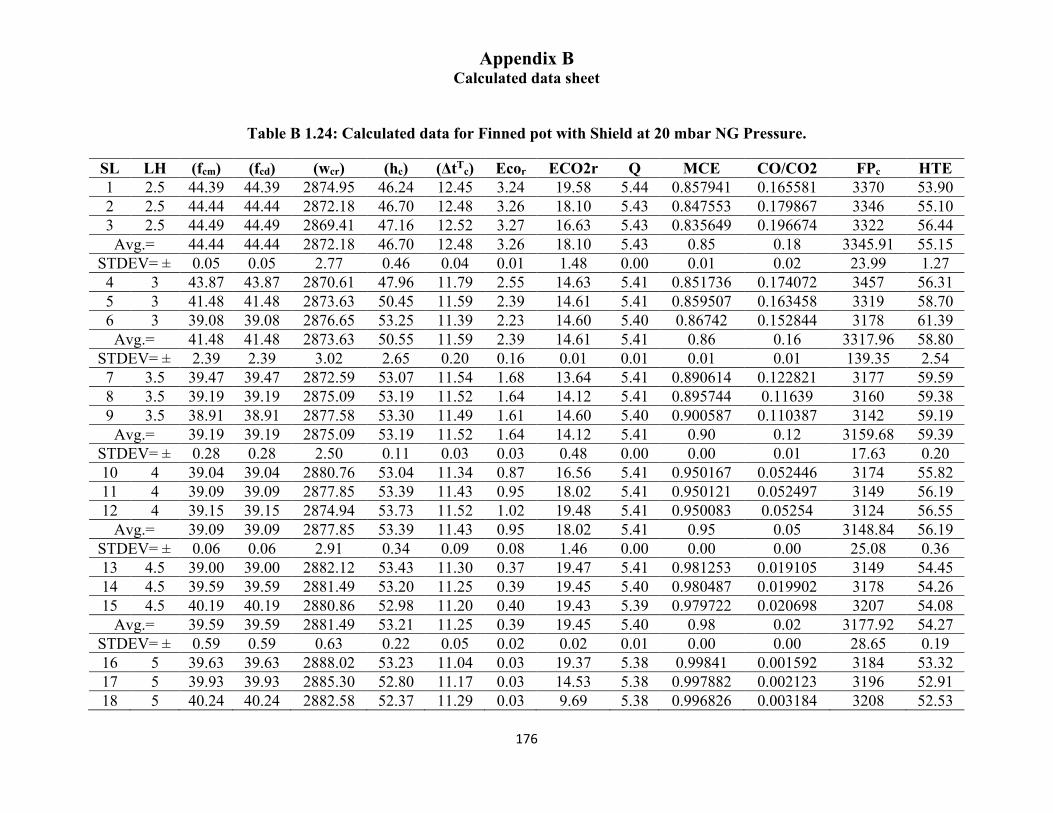
Appendix B Calculated data sheet
176
Table B 1.24: Calculated data for Finned pot with Shield at 20 mbar NG Pressure.
SL LH (fcm) (fcd) (wcr) (hc) (ΔtTc) Ecor ECO2r Q MCE CO/CO2 FPc HTE 1 2.5 44.39 44.39 2874.95 46.24 12.45 3.24 19.58 5.44 0.857941 0.165581 3370 53.90 2 2.5 44.44 44.44 2872.18 46.70 12.48 3.26 18.10 5.43 0.847553 0.179867 3346 55.10 3 2.5 44.49 44.49 2869.41 47.16 12.52 3.27 16.63 5.43 0.835649 0.196674 3322 56.44
Avg.= 44.44 44.44 2872.18 46.70 12.48 3.26 18.10 5.43 0.85 0.18 3345.91 55.15 STDEV= ± 0.05 0.05 2.77 0.46 0.04 0.01 1.48 0.00 0.01 0.02 23.99 1.27
4 3 43.87 43.87 2870.61 47.96 11.79 2.55 14.63 5.41 0.851736 0.174072 3457 56.31 5 3 41.48 41.48 2873.63 50.45 11.59 2.39 14.61 5.41 0.859507 0.163458 3319 58.70 6 3 39.08 39.08 2876.65 53.25 11.39 2.23 14.60 5.40 0.86742 0.152844 3178 61.39
Avg.= 41.48 41.48 2873.63 50.55 11.59 2.39 14.61 5.41 0.86 0.16 3317.96 58.80 STDEV= ± 2.39 2.39 3.02 2.65 0.20 0.16 0.01 0.01 0.01 0.01 139.35 2.54
7 3.5 39.47 39.47 2872.59 53.07 11.54 1.68 13.64 5.41 0.890614 0.122821 3177 59.59 8 3.5 39.19 39.19 2875.09 53.19 11.52 1.64 14.12 5.41 0.895744 0.11639 3160 59.38 9 3.5 38.91 38.91 2877.58 53.30 11.49 1.61 14.60 5.40 0.900587 0.110387 3142 59.19
Avg.= 39.19 39.19 2875.09 53.19 11.52 1.64 14.12 5.41 0.90 0.12 3159.68 59.39 STDEV= ± 0.28 0.28 2.50 0.11 0.03 0.03 0.48 0.00 0.00 0.01 17.63 0.20 10 4 39.04 39.04 2880.76 53.04 11.34 0.87 16.56 5.41 0.950167 0.052446 3174 55.82 11 4 39.09 39.09 2877.85 53.39 11.43 0.95 18.02 5.41 0.950121 0.052497 3149 56.19 12 4 39.15 39.15 2874.94 53.73 11.52 1.02 19.48 5.41 0.950083 0.05254 3124 56.55
Avg.= 39.09 39.09 2877.85 53.39 11.43 0.95 18.02 5.41 0.95 0.05 3148.84 56.19 STDEV= ± 0.06 0.06 2.91 0.34 0.09 0.08 1.46 0.00 0.00 0.00 25.08 0.36 13 4.5 39.00 39.00 2882.12 53.43 11.30 0.37 19.47 5.41 0.981253 0.019105 3149 54.45 14 4.5 39.59 39.59 2881.49 53.20 11.25 0.39 19.45 5.40 0.980487 0.019902 3178 54.26 15 4.5 40.19 40.19 2880.86 52.98 11.20 0.40 19.43 5.39 0.979722 0.020698 3207 54.08
Avg.= 39.59 39.59 2881.49 53.21 11.25 0.39 19.45 5.40 0.98 0.02 3177.92 54.27 STDEV= ± 0.59 0.59 0.63 0.22 0.05 0.02 0.02 0.01 0.00 0.00 28.65 0.19 16 5 39.63 39.63 2888.02 53.23 11.04 0.03 19.37 5.38 0.99841 0.001592 3184 53.32 17 5 39.93 39.93 2885.30 52.80 11.17 0.03 14.53 5.38 0.997882 0.002123 3196 52.91 18 5 40.24 40.24 2882.58 52.37 11.29 0.03 9.69 5.38 0.996826 0.003184 3208 52.53

Appendix B Calculated data sheet
177
Avg.= 39.93 39.93 2885.30 52.80 11.17 0.03 14.53 5.38 1.00 0.00 3195.86 52.92 STDEV= ± 0.30 0.30 2.72 0.43 0.13 0.00 4.84 0.00 0.00 0.00 11.77 0.39 19 5.5 40.01 40.01 2887.77 52.41 11.21 0.00 29.04 5.37 1 0 3189 52.41 20 5.5 40.71 40.71 2882.59 52.45 11.46 0.00 29.02 5.37 1 0 3152 52.45 21 5.5 41.41 41.41 2877.40 52.49 11.70 0.00 29.01 5.37 1 0 3118 52.49
Avg.= 40.71 40.71 2882.59 52.45 11.46 0.00 29.02 5.37 1.00 0.00 3153.05 52.45 STDEV= ± 0.70 0.70 5.19 0.04 0.24 0.00 0.01 0.00 0.00 0.00 35.63 0.04 22 6 41.92 41.92 2878.14 51.43 11.68 0.00 28.88 5.35 1 0 3186 51.43 23 6 41.65 41.65 2879.13 51.65 11.64 0.00 28.93 5.35 1 0 3174 51.65 24 6 41.38 41.38 2880.12 51.87 11.61 0.00 28.97 5.36 1 0 3163 51.87
Avg.= 41.65 41.65 2879.13 51.65 11.64 0.00 28.93 5.35 1.00 0.00 3174.14 51.65 STDEV= ± 0.27 0.27 0.99 0.22 0.03 0.00 0.04 0.01 0.00 0.00 11.61 0.22 25 6.5 42.27 42.27 2880.79 51.63 11.76 0.00 29.03 5.37 1 0 3125 51.63 26 6.5 43.50 43.50 2878.01 50.73 11.80 0.00 29.13 5.39 1 0 3188 50.73 27 6.5 44.73 44.73 2875.23 49.88 11.83 0.00 29.24 5.41 1 0 3251 49.88
Avg.= 43.50 43.50 2878.01 50.75 11.80 0.00 29.13 5.39 1.00 0.00 3187.95 50.75 STDEV= ± 1.23 1.23 2.78 0.88 0.03 0.00 0.11 0.02 0.00 0.00 62.79 0.88 28 7 43.87 43.87 2876.16 49.35 12.86 0.01 28.79 5.33 0.999682 0.000318 3026 49.37 29 7 43.77 43.77 2878.11 49.86 12.53 0.01 28.77 5.33 0.999682 0.000318 3057 49.88 30 7 43.67 43.67 2880.04 50.38 12.21 0.01 28.76 5.32 0.999682 0.000318 3088 50.39
Avg.= 43.77 43.77 2878.10 49.87 12.54 0.01 28.77 5.33 1.00 0.00 3056.97 49.88 STDEV= ± 0.10 0.10 1.94 0.51 0.33 0.00 0.01 0.00 0.00 0.00 31.13 0.51 31 7.5 43.28 43.28 2884.56 49.76 12.57 0.02 28.90 5.35 0.99947 0.000531 3011 49.79 32 7.5 43.00 43.00 2888.27 49.36 12.45 0.02 28.81 5.33 0.99947 0.000531 3043 49.39 33 7.5 42.72 42.72 2891.98 48.95 12.32 0.02 28.72 5.32 0.99947 0.000531 3077 48.98
Avg.= 43.00 43.00 2888.27 49.36 12.45 0.02 28.81 5.33 1.00 0.00 3043.76 49.38 STDEV= ± 0.28 0.28 3.71 0.40 0.13 0.00 0.09 0.02 0.00 0.00 32.91 0.40

APPENDIX-C EXPERIMENTAL
178
Figure C 1: Actual experimental pictures.
Figure C1.1: Practical Experimental Setup.

APPENDIX-C EXPERIMENTAL
179
Figure C1.2: Practical Experimental Setup during experiment.

APPENDIX-C EXPERIMENTAL
180
Figure C1.3: Picture of (a) Gas burner without pot support, (b) Radial flow burner head and
(c) Sliding Sutter.

APPENDIX-C EXPERIMENTAL
181
Figure C1.4: Top and side view of Radial flame burner.

APPENDIX-C EXPERIMENTAL
182
Figure C1.5: Picture of (A) Pot supports (B) Circular Shields (C) Pot support with Shield
(D) Single Shield
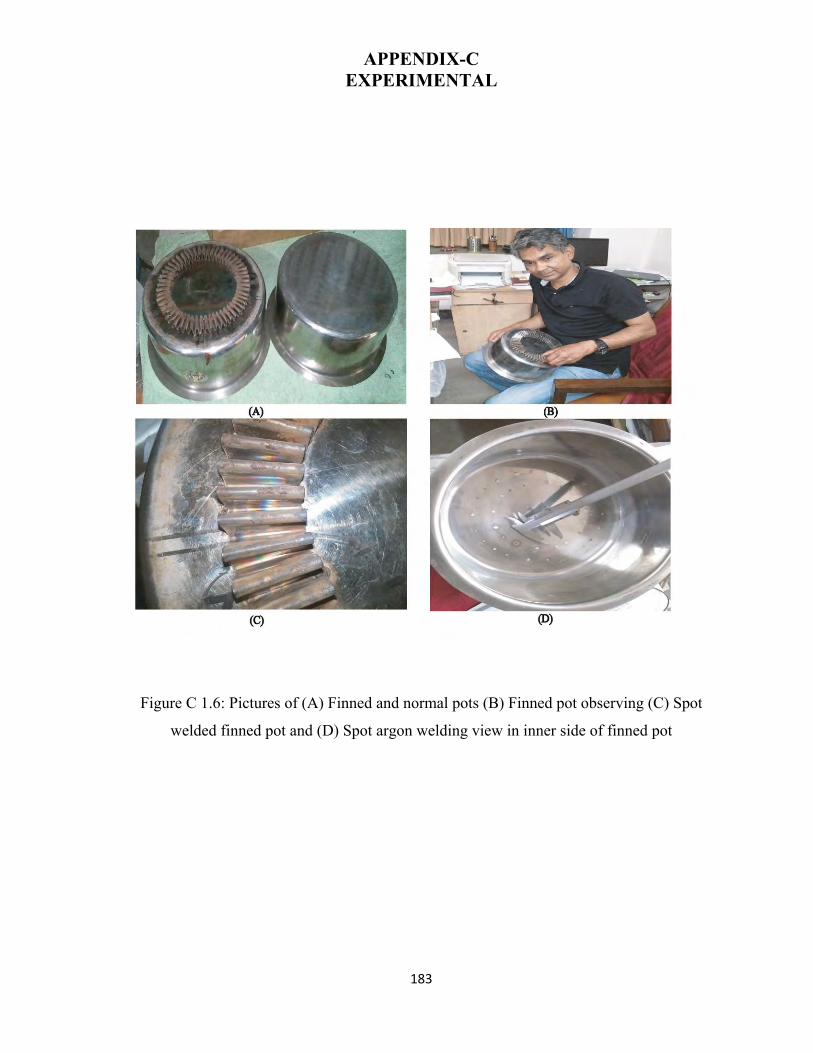
APPENDIX-C EXPERIMENTAL
183
Figure C 1.6: Pictures of (A) Finned and normal pots (B) Finned pot observing (C) Spot
welded finned pot and (D) Spot argon welding view in inner side of finned pot

APPENDIX-C EXPERIMENTAL
184
Figure C 1.7: Pictures of normal pots with pot Support and Shield.

APPENDIX-C EXPERIMENTAL
185
.
Figure C 1.8: Pictures of normal pots with pot Support, without shield.
Figure C 1.9: Finned pot before adding Finns.

APPENDIX-C EXPERIMENTAL
186
Figure C 1.20: Actual picture of finned pot.
Figure C 1.21: red circles represent spot welded area of finned pot.

187
APPENDIX-D
Sample Calculations used in WBT
For this Sample calculation, data taken from Appendix A of Table A 1.1: Experimental data for flat bottom pot without Shield at 4 mbar NG Pressure (SL 01). After calculation, data recoded in Table B 1.1: Calculated data for flat bottom pot without Shield at 4 mbar NG pressure (SL 01) of Appendix B.
Overall thermal efficiency, hc (%) Equation (3.2.5.1) taken from Chapter 3 is following:
ℎ𝑐(%) =4.186(𝑇𝑏 − 𝑇𝑎)(𝑃1𝑐𝑖 − 𝑃1 ) + 2260. 𝑤𝑐𝑣
𝑓𝑐𝑚 . 𝐿𝐻𝑉 𝑋 100 − − − −(3.2.5.1)
here,
Tb = Local boiling point of water =
98.8°C
P1= Weight of the empty pot.= 406 g
Ta = Ambient Temperature = 26 °C Wcv = Water vaporized = 89 g
P1ci = Mass of pot of water before test =
3406 g
fcm = NG consumed in each WBT ( g)
Where, latent heat of evaporation of water is 2260 kJ/kg and lower heating value (LHV) is
48,833.44 kj/kg (Appendix E)
NG consumed (grams) fcm :
fcm = mNG(g) =PNG. VNG. MWNG
RTNG
According to ideal gas law:
PV =𝑚
𝑀𝑊 𝑅𝑇
Here,

188
mNG = gram of Natural Gas (NG)
R = universal gas constant = 8.314 (Pa.m3/mol.K)
TNG = temperature of the NG in Kelvin = Tng+273.15= 27+273.15 = 300.15 0 K
PNG = Absolute Pressure of Supplied Natural gas (pa)
= (Pmbar+1013.25)*100 = (4+1013.25)*100 = 101725 pa
VNG = Volume of NG consumed (m3)= (fcf - fci)/1000 = (56.3/1000 )m3
MWNG = Molecular weight of Natural Gas (NG) = 16.5244 gm/mol
Putting values in Equation 3.2.1.2.1:
fcm = 101725 pa . (
56.31000
) m3. 16.5244 g/mol
8.312 pa.m3
mol. k. 300.15 K
= 37.92 g
Putting all values to equation 3.2.5.1:
hc(%) =4.186(98oC − 26oC)(3406 g − 406 g ) + 2260
kjkg
. 89 g
37.9 g .48833.44kjkg
X 100
= 60.23 %
Calculation of Modified combustion efficiency (MCE): Equation (3.2.5.2) taken from Chapter 3 is following:
MCE =Eco2r
Ecor + Eco2r− − − (3.2.5.2)

189
Where,
Eco2r= At SATP CO2 emission rate (g/min)
Ecor= At SATP CO emission rate (g/min)
Putting the values of equation 3.2.6.1 and equation 3.2.6.2 to equation 3.2.5.2,
MCE =Eco2r
Ecor+Eco2r=
36.4
0.104+36.4= 0.997
Calculation of Heat Transfer Efficiency (HTE):
Equation taken from Chapter 3,
HTE = hc/MCE − − − (3.2.5.3)
Where,
hc = Overall thermal efficiency in percentage
MCE= Modified combustion efficiency
THE= heat transfer efficiency in percentage
Putting the values of equation 3.2.5.2 and equation 3.2.5.1 to equation 3.2.5.3,
HTE =60.23%
0.997= 60.4 %
Calculation of Temperature corrected time to boil (min) ΔtTc:
ΔtcT = Δtc.
75
(T1cf − T1ci) − − − − − − − − − − − −(3.2.5.4)
Δtc = 11.63 min
ΔtcT = 11.63 min .
75
(98 − 26)= 12.11 min

190
Calculation of Fire power:
FPc =.fcm. LHV
tc. 60 − − − − − − − − − − − − − − − − − (3.2.5)
Where,
FPc = Firepower (watt)
fcm = Equivalent dry fuel (NG) consumed (grams) = 37.92 g (taken from hc calculation)
Δtc= Time to boil (min) = 11.63 min
Putting above values in equation 3.2.5, FPc = 2653.7 watt
Calculation of ratio of Carbon monoxide [CO] and Carbon dioxide [CO2]
CO/CO2 =Ecor
Eco2r
− − − − − − − − − − − − − − − − − (3.2.5.6)
Where,
Ecor: At SATP CO emission rate (g/min) and
Eco2r: At SATP CO2 emission rate (g/min)
At SATP emission rate:
Ecor= (𝐸𝑆𝐴𝑇𝑃𝑐𝑜 (
𝑔
𝑚3) 𝑋 𝑄 (
𝑚3
min)) … … … … … . . (𝐴)
Eco2r= (𝐸𝑆𝐴𝑇𝑃𝑐𝑜2
(𝑔
𝑚3) 𝑋 𝑄 (
𝑚3
min)) − − − −(𝐵)
Where,
ESATPco = AT SATP Amount of CO (g/m3 flue gas).
ESATPco2 = AT SATP Amount of CO2 (g/m3 flue gas).
Q = At SATP Exhaust flow (m3 flue gas/min)
ESATPco = 𝐶𝑂ℎ . 44.95 .𝑀𝑊𝐶𝑂
1000000.273
298− − − − − (C)

191
ESATPco2= 𝐶𝑂2ℎ .10.
𝑀𝑊𝐶𝑂2
22.4 .
273
298− − − − − − − −(𝐷)
Where, COh = At STP Stack CO (ppmv) = 18 ppmv MWCO = Molecular weight of CO ( 28.01 g/mol)
CO2h = At STP Stack CO2 in percentage (m/m, v/v, mole/mole)= 0.4%
MWCO2 = Molecular weight of CO2 ( 44 g/mol)
Putting values in equations C and D,
ESATPco = 0.02076g
m3 flue gas And
ESATPco2= 7.2
𝑔
𝑚3 𝑓𝑙𝑢𝑒 𝑔𝑎𝑠
At SATP Exhaust flow (m3/min) Q:
Q (m3
min) =
PStcA. TSATP. QStc
PSATP . ThdA − − − − − − − −(E)
𝐏𝐒𝐀𝐓𝐏 𝐐
𝐓𝐒𝐀𝐓𝐏=
𝐏𝐒𝐭𝐜𝐐𝐒𝐭𝐜
𝐓𝐒𝐭𝐜 (According to Gas Law:)
Where,
PStcA = [ PStc + 1013.25] mbar = 0.06+1013.25= 1013.31 mbar
PStc = Stack Pressure in mbar = 0.06 mbar
TSATP = Standard Ambient Temperature of 25oC (298.15 K)
QStc = Stack Gas flow (m3/min)
PSATP = Standard pressure of 1013.25 mbar.
ThdA = [ Thd.+273] K = [45.7+273] = 318.7 K
Thd = Stack Temperature (O C) = 45.7 O C
QStc =𝜋DStc
2
4 X VStcm − − − − − − − − − − − (F)
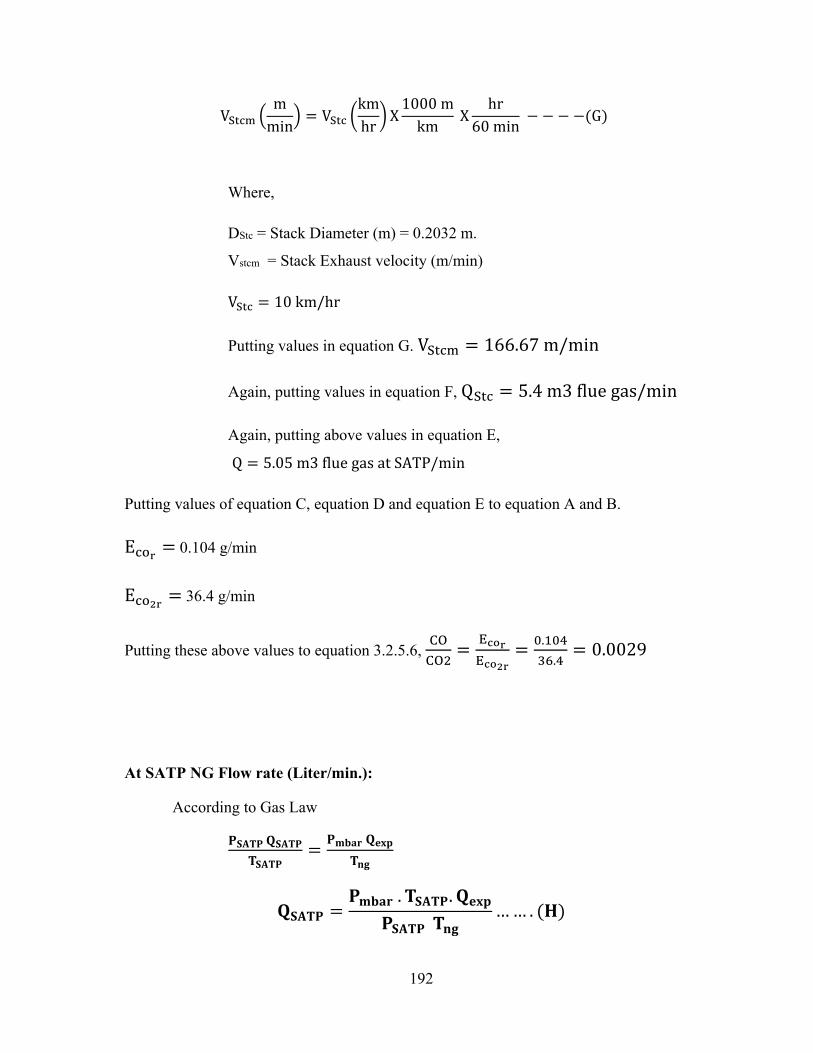
192
VStcm (m
min) = VStc (
km
hr) X
1000 m
km X
hr
60 min − − − −(G)
Where,
DStc = Stack Diameter (m) = 0.2032 m.
Vstcm = Stack Exhaust velocity (m/min)
VStc = 10 km/hr
Putting values in equation G. VStcm = 166.67 m/min
Again, putting values in equation F, QStc = 5.4 m3 flue gas/min
Again, putting above values in equation E,
Q = 5.05 m3 flue gas at SATP/min
Putting values of equation C, equation D and equation E to equation A and B.
Ecor= 0.104 g/min
Eco2r= 36.4 g/min
Putting these above values to equation 3.2.5.6, CO
CO2=
Ecor
Eco2r
=0.104
36.4= 0.0029
At SATP NG Flow rate (Liter/min.):
According to Gas Law
𝐏𝐒𝐀𝐓𝐏 𝐐𝐒𝐀𝐓𝐏
𝐓𝐒𝐀𝐓𝐏=
𝐏𝐦𝐛𝐚𝐫 𝐐𝐞𝐱𝐩
𝐓𝐧𝐠
𝐐𝐒𝐀𝐓𝐏 =𝐏𝐦𝐛𝐚𝐫 . 𝐓𝐒𝐀𝐓𝐏. 𝐐𝐞𝐱𝐩
𝐏𝐒𝐀𝐓𝐏 𝐓𝐧𝐠… … . (𝐇)

193
Where,
Pmbar = Supplied NG pressure (mbar) = [ 4 + 1013.25] mbar =1017.25 mbar
PSATP = 1013.25 mbar
TSATP = Standard Ambient Temperature of 25oC (298.15 K)
Tng = Supplied NG temp. (O C) = 28.02 O C (taken from Appendix A, avg.
flow rate of pot arrangement at 4 mbar, given in Appendix G)
QSATP = NG flow rate (Liter/min)=?
Qexp = Avg.NG flow rate (Liter/min) in experiment= 4.72 (taken from
Appendix A, avg. flow rate of pot arrangement at 4 mbar, given in
Appendix G)
From equation (H)
𝐐𝐒𝐀𝐓𝐏 = (𝟏𝟎𝟏𝟕. 𝟐𝟓
𝟏𝟎𝟏𝟑. 𝟐𝟓) . (
𝟐𝟓
𝟐𝟖. 𝟎𝟐) . 𝟒. 𝟕𝟐 = 𝟒. 𝟐𝟑 𝐋/𝐦𝐢𝐧
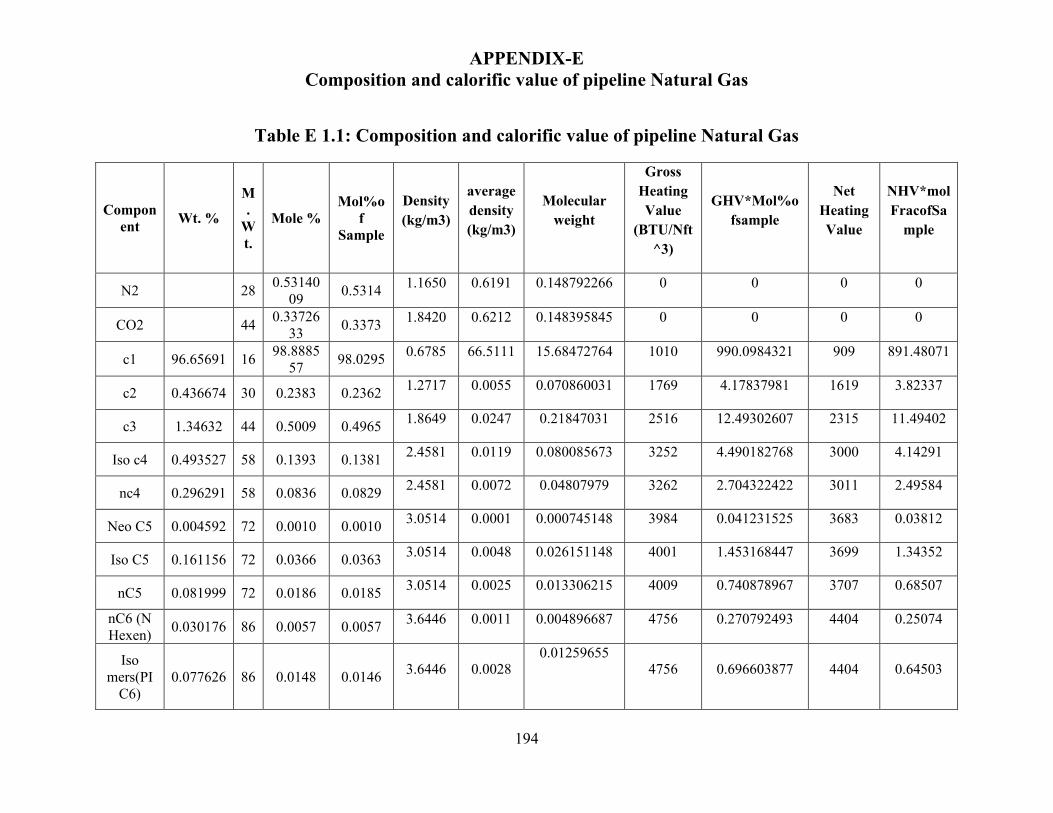
APPENDIX-E Composition and calorific value of pipeline Natural Gas
194
Table E 1.1: Composition and calorific value of pipeline Natural Gas
Component Wt. %
M.
Wt.
Mole % Mol%o
f Sample
Density(kg/m3)
average density (kg/m3)
Molecular weight
Gross Heating Value
(BTU/Nft^3)
GHV*Mol%ofsample
Net Heating Value
NHV*molFracofSa
mple
N2 28 0.5314009 0.5314 1.1650 0.6191 0.148792266 0 0 0 0
CO2 44 0.3372633 0.3373 1.8420 0.6212 0.148395845 0 0 0 0
c1 96.65691 16 98.888557 98.0295 0.6785 66.5111 15.68472764 1010 990.0984321 909 891.48071
c2 0.436674 30 0.2383 0.2362 1.2717 0.0055 0.070860031 1769 4.17837981 1619 3.82337
c3 1.34632 44 0.5009 0.4965 1.8649 0.0247 0.21847031 2516 12.49302607 2315 11.49402
Iso c4 0.493527 58 0.1393 0.1381 2.4581 0.0119 0.080085673 3252 4.490182768 3000 4.14291
nc4 0.296291 58 0.0836 0.0829 2.4581 0.0072 0.04807979 3262 2.704322422 3011 2.49584
Neo C5 0.004592 72 0.0010 0.0010 3.0514 0.0001 0.000745148 3984 0.041231525 3683 0.03812
Iso C5 0.161156 72 0.0366 0.0363 3.0514 0.0048 0.026151148 4001 1.453168447 3699 1.34352
nC5 0.081999 72 0.0186 0.0185 3.0514 0.0025 0.013306215 4009 0.740878967 3707 0.68507
nC6 (N Hexen) 0.030176 86 0.0057 0.0057 3.6446 0.0011 0.004896687 4756 0.270792493 4404 0.25074
Iso mers(PI
C6) 0.077626 86 0.0148 0.0146 3.6446 0.0028
0.01259655
4756 0.696603877 4404 0.64503

APPENDIX-E Composition and calorific value of pipeline Natural Gas
195
M. Cy c5 0.04136 84 0.0081 0.0080 3.6446 0.0015 0.006711655 4501 0.359648821 4199 0.33553
Cy c6 0.048148 84 0.0094 0.0093 3.6446 0.0017 0.007813055 4482 0.41685437 4180 0.38876
C6H6 0.043576 78 0.0091 0.0091 3.6446 0.0016 0.0070711 3742 0.339213364 3591 0.32553
nc7 0.018149 100 0.0030 0.0029 4.2378 0.0008 0.002945109 5503 0.162054619 5100 0.15020
Paraffin Isomers (PIC7)
0.019899 100 0.0033 0.0032 4.2378 0.0008 0.003228975 5503 0.177674342 5100 0.16468
MCyC6 0.079327 98 0.0133 0.0131 4.2378 0.0033 0.01287261 5216 0.685124958 4864 0.63885
Tolune 0.071735 92 0.0128 0.0127 4.2378 0.0030 0.011640632 4475 0.566215513 4274 0.54073
nC8 0.0164 114 0.0024 0.0023 4.8310 0.0008 0.002661243 6249 0.145875802 5796 0.13531
Xylene 0.061047 106 0.0094 0.0093 4.8310 0.0029 0.009906211 5209 0.48678747 4957 0.46327
nC9 0.015088 128 0.0019 0.0019 5.4242 0.0008 0.002448344 6997 0.133826842 6493 0.12420
100 100.868
7 100.000
0
148.2781 67.8290 16.5244 182196.50
00 1020.6403 169569.7000 919.6664
Molecular weight of NG= 16.5244 gm .
Gross Heating Value Corrected = 1025.14 and Corrected Net heating value = 923.72 BTU/ft3 at 600 F (15.560C).
At SATP: HHV is 54195.11 and LHV is 48833.44 kj/kg.

Appendix F Calculated data sheet for CO and CO2 (mg/m3)
196
Table F 1.1: Flat bottom pot without Shield (Cco and Cco2 in mg/m3)
SL PH 4 mbar NG
pressure Cco Cco2
1 2.5 20.65 7204.26 2 2.5 19.50 6303.73 3 2.5 18.35 5403.20
Avg.= 19.50 6303.73 STDEV= ± 1.15 900.53 4 3 8.03 7204.26 5 3 7.74 6754.00 6 3 7.45 6303.73
Avg.= 7.74 6754.00 STDEV= ± 0.29 450.26 7 3.5 0 5403.20 8 3.5 0 5403.20 9 3.5 0 5403.20
Avg.= 0 5403.20 STDEV= ± 0 0 10 4 0 5403.20 11 4 0 5403.20 12 4 0 5403.20
Avg.= 0 5403.20 STDEV= ± 0 0 13 4.5 0 5403.20 14 4.5 0 5403.20 15 4.5 0 5403.20
Avg.= 0 5403.20 STDEV= ± 0 0 16 5 0 5403.20 17 5 0 5403.20 18 5 0 5403.20
Avg.= 0 5403.20 STDEV= ± 0 0 19 5.5 0.57 5403.20
6 mbar NG pressure
Cco Cco2 18.35 3602.13 18.35 4502.66 18.35 5403.20 18.35 4502.66
0 900.53 7.45 3602.13 5.44 4052.40 3.44 4502.66 5.44 4052.40 2.01 450.26 1.15 3602.13 0.57 4502.66
0 5403.20 0.57 4502.66 0.57 900.53
0 3602.13 0 4502.66 0 5403.20 0 4502.66 0 900.53 0 5403.20 0 5403.20 0 5403.20 0 5403.20 0 0 0 4502.66 0 5853.46 0 7204.26 0 5853.46 0 1350.8 0 3602.13
10 mbar NG pressure
Cco Cco2 25.23 5403.20 25.52 5403.20 25.81 5403.20 25.52 5403.20 0.29 0
11.47 5403.20 10.32 5403.20 9.18 5403.20
10.32 5403.20 1.15 0 2.29 4502.67 1.15 4502.67
0 4502.67 1.15 4502.67 1.15 0
0 5403.20 0 5403.20 0 5403.20 0 5403.20 0 0 0 5403.20 0 5403.20 0 5403.20 0 5403.20 0 0 0 5403.20 0 5403.20 0 5403.20 0 5403.20 0 0 0 5403.20
14 mbar NG pressure
Cco Cco2 32.12 5403.20 30.40 5403.20 28.68 5403.20 30.40 5403.20 1.72 0.00
15.48 5403.20 15.48 5853.47 15.48 6303.73 15.48 5853.47 0.00 450.27 5.16 7204.27 2.58 7204.27 0.00 7204.27 2.58 7204.27 2.58 0.00 1.15 7204.27 1.15 7204.27 1.15 7204.27 1.15 7204.27 0.00 0.00 0.00 5403.20 0.00 5403.20 0.00 5403.20 0.00 5403.20 0.00 0.00 0.00 5403.20 0.00 5403.20 0.00 5403.20 0.00 5403.20 0.00 0.00 0.00 6303.73
18 mbar NG pressure
Cco Cco2 36.70 5403.20 36.70 6303.73 36.70 7204.27 36.70 6303.73 0.00 900.53
16.63 5403.20 17.78 6303.73 18.93 7204.27 17.78 6303.73 1.15 900.53 7.46 7204.27 7.46 7204.27 7.46 7204.27 7.46 7204.27 0.00 0.00 2.29 5403.20 1.72 5403.20 1.15 5403.20 1.72 5403.20 0.57 0.00 0.00 7204.27 0.00 7204.27 0.00 7204.27 0.00 7204.27 0.00 0.00 0.00 5403.20 0.00 6303.73 0.00 7204.27 0.00 6303.73 0.00 900.53 0.00 5403.20
20 mbar NG pressure
Cco Cco2 39.00 5403.20 41.58 5403.20 44.16 5403.20 41.58 5403.20 2.58 0.00
26.95 6303.73 23.51 6754.00 20.07 7204.27 23.51 6754.00 3.44 450.27 8.60 7204.27 7.74 6754.00 6.88 6303.73 7.74 6754.00 0.86 450.27 2.29 7204.27 2.29 7204.27 2.29 7204.27 2.29 7204.27 0.00 0.00 0.00 7204.27 0.00 6303.73 0.00 5403.20 0.00 6303.73 0.00 900.53 0.00 5403.20 0.00 5403.20 0.00 5403.20 0.00 5403.20 0.00 0.00 0.00 5403.20

Appendix F Calculated data sheet for CO and CO2 (mg/m3)
197
20 5.5 0.57 5403.20 21 5.5 0.57 5403.20
Avg.= 0.57 5403.20 STDEV= ± 0 0 22 6 0 5403.20 23 6 0 5403.20 24 6 0 5403.20
Avg.= 0 5403.20 STDEV= ± 0 0 25 6.5 0 5403.20 26 6.5 0 5403.20 27 6.5 0 5403.20
Avg.= 0 5403.20 STDEV= ± 0 0 28 7 0 5403.20 29 7 0 5403.20 30 7 0 5403.20
Avg.= 0 5403.20 STDEV= ± 0 0 31 7.5 0 5403.20 32 7.5 0 5403.20 33 7.5 0 5403.20
Avg.= 0 5403.20 STDEV= ± 0 0
0 5403.20 0 7204.26 0 5403.20 0 1801.06 0 3602.13 0 3602.13 0 3602.13 0 3602.13 0 0 0 3602.13 0 4502.66 0 5403.20 0 4502.66 0 900.53 0 3602.13 0 4502.66 0 5403.20 0 4502.66 0 900.53 0 4502.66 0 4952.93 0 5403.20 0 4952.93 0 450.26
0 5403.20 0 5403.20 0 5403.20 0 0 0 5403.20 0 5403.20 0 5403.20 0 5403.20 0 0 0 5403.20 0 5403.20 0 5403.20 0 5403.20 0 0 0 5403.20 0 5403.20 0 5403.20 0 5403.20 0 0 0 5403.20 0 5403.20 0 5403.20 0 5403.20 0 0
0.00 6754.00 0.00 7204.27 0.00 6754.00 0.00 450.27 0.00 6303.73 0.00 6754.00 0.00 7204.27 0.00 6754.00 0.00 450.27 0.00 5403.20 0.00 5403.20 0.00 5403.20 0.00 5403.20 0.00 0.00 0.00 5403.20 0.00 5403.20 0.00 5403.20 0.00 5403.20 0.00 0.00 0.00 6303.73 0.00 6303.73 0.00 6303.73 0.00 6303.73 0.00 0.00
0.00 5403.20 0.00 5403.20 0.00 5403.20 0.00 0.00 0.00 5403.20 0.00 5403.20 0.00 5403.20 0.00 5403.20 0.00 0.00 0.00 5403.20 0.00 5403.20 0.00 5403.20 0.00 5403.20 0.00 0.00 0.00 5403.20 0.00 5403.20 0.00 5403.20 0.00 5403.20 0.00 0.00 0.00 5403.20 0.00 5403.20 0.00 5403.20 0.00 5403.20 0.00 0.00
0.00 6303.73 0.00 7204.27 0.00 6303.73 0.00 900.53 0.00 7204.27 0.00 6754.00 0.00 6303.73 0.00 6754.00 0.00 450.27 0.00 5403.20 0.00 5403.20 0.00 5403.20 0.00 5403.20 0.00 0.00 0.00 5403.20 0.00 5403.20 0.00 5403.20 0.00 5403.20 0.00 0.00 0.00 5403.20 0.00 5403.20 0.00 5403.20 0.00 5403.20 0.00 0.00
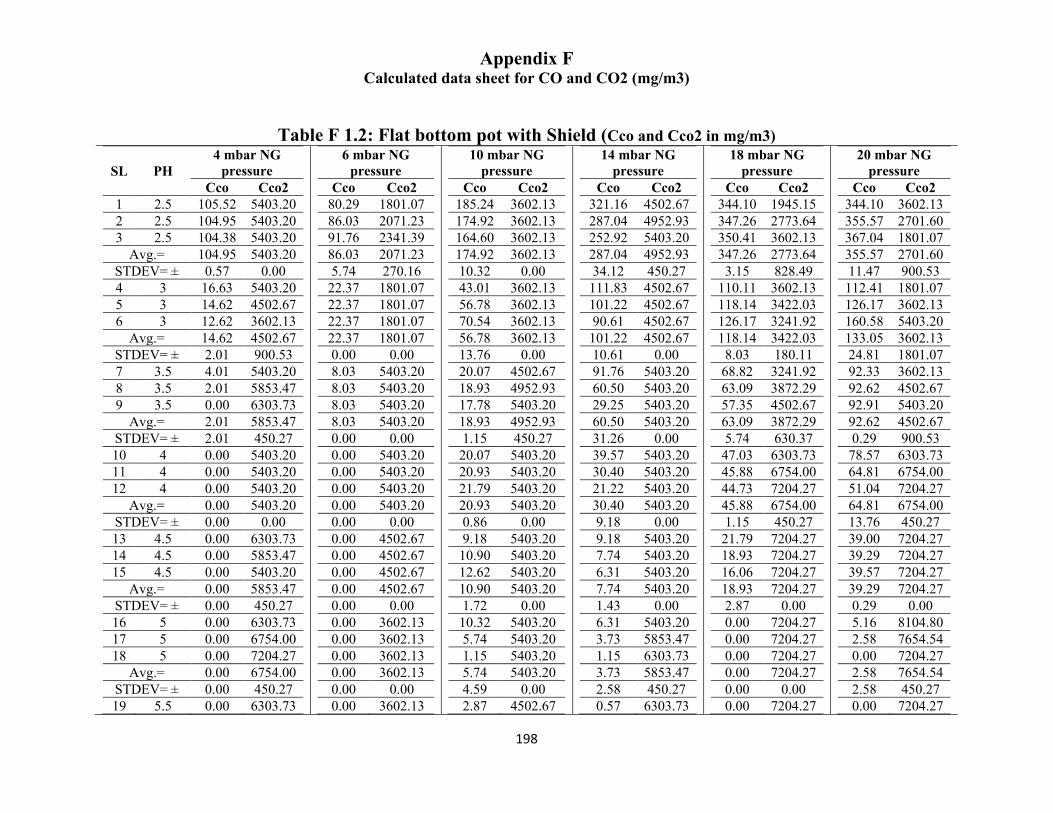
Appendix F Calculated data sheet for CO and CO2 (mg/m3)
198
Table F 1.2: Flat bottom pot with Shield (Cco and Cco2 in mg/m3)
SL PH 4 mbar NG
pressure Cco Cco2
1 2.5 105.52 5403.20 2 2.5 104.95 5403.20 3 2.5 104.38 5403.20
Avg.= 104.95 5403.20 STDEV= ± 0.57 0.00 4 3 16.63 5403.20 5 3 14.62 4502.67 6 3 12.62 3602.13
Avg.= 14.62 4502.67 STDEV= ± 2.01 900.53 7 3.5 4.01 5403.20 8 3.5 2.01 5853.47 9 3.5 0.00 6303.73
Avg.= 2.01 5853.47 STDEV= ± 2.01 450.27 10 4 0.00 5403.20 11 4 0.00 5403.20 12 4 0.00 5403.20
Avg.= 0.00 5403.20 STDEV= ± 0.00 0.00 13 4.5 0.00 6303.73 14 4.5 0.00 5853.47 15 4.5 0.00 5403.20
Avg.= 0.00 5853.47 STDEV= ± 0.00 450.27 16 5 0.00 6303.73 17 5 0.00 6754.00 18 5 0.00 7204.27
Avg.= 0.00 6754.00 STDEV= ± 0.00 450.27 19 5.5 0.00 6303.73
6 mbar NG pressure
Cco Cco2 80.29 1801.07 86.03 2071.23 91.76 2341.39 86.03 2071.23 5.74 270.16
22.37 1801.07 22.37 1801.07 22.37 1801.07 22.37 1801.07 0.00 0.00 8.03 5403.20 8.03 5403.20 8.03 5403.20 8.03 5403.20 0.00 0.00 0.00 5403.20 0.00 5403.20 0.00 5403.20 0.00 5403.20 0.00 0.00 0.00 4502.67 0.00 4502.67 0.00 4502.67 0.00 4502.67 0.00 0.00 0.00 3602.13 0.00 3602.13 0.00 3602.13 0.00 3602.13 0.00 0.00 0.00 3602.13
10 mbar NG pressure
Cco Cco2 185.24 3602.13 174.92 3602.13 164.60 3602.13 174.92 3602.13 10.32 0.00 43.01 3602.13 56.78 3602.13 70.54 3602.13 56.78 3602.13 13.76 0.00 20.07 4502.67 18.93 4952.93 17.78 5403.20 18.93 4952.93 1.15 450.27
20.07 5403.20 20.93 5403.20 21.79 5403.20 20.93 5403.20 0.86 0.00 9.18 5403.20
10.90 5403.20 12.62 5403.20 10.90 5403.20 1.72 0.00
10.32 5403.20 5.74 5403.20 1.15 5403.20 5.74 5403.20 4.59 0.00 2.87 4502.67
14 mbar NG pressure
Cco Cco2 321.16 4502.67 287.04 4952.93 252.92 5403.20 287.04 4952.93 34.12 450.27
111.83 4502.67 101.22 4502.67 90.61 4502.67
101.22 4502.67 10.61 0.00 91.76 5403.20 60.50 5403.20 29.25 5403.20 60.50 5403.20 31.26 0.00 39.57 5403.20 30.40 5403.20 21.22 5403.20 30.40 5403.20 9.18 0.00 9.18 5403.20 7.74 5403.20 6.31 5403.20 7.74 5403.20 1.43 0.00 6.31 5403.20 3.73 5853.47 1.15 6303.73 3.73 5853.47 2.58 450.27 0.57 6303.73
18 mbar NG pressure
Cco Cco2 344.10 1945.15 347.26 2773.64 350.41 3602.13 347.26 2773.64
3.15 828.49 110.11 3602.13 118.14 3422.03 126.17 3241.92 118.14 3422.03
8.03 180.11 68.82 3241.92 63.09 3872.29 57.35 4502.67 63.09 3872.29 5.74 630.37
47.03 6303.73 45.88 6754.00 44.73 7204.27 45.88 6754.00 1.15 450.27
21.79 7204.27 18.93 7204.27 16.06 7204.27 18.93 7204.27 2.87 0.00 0.00 7204.27 0.00 7204.27 0.00 7204.27 0.00 7204.27 0.00 0.00 0.00 7204.27
20 mbar NG pressure
Cco Cco2 344.10 3602.13 355.57 2701.60 367.04 1801.07 355.57 2701.60 11.47 900.53
112.41 1801.07 126.17 3602.13 160.58 5403.20 133.05 3602.13 24.81 1801.07 92.33 3602.13 92.62 4502.67 92.91 5403.20 92.62 4502.67 0.29 900.53
78.57 6303.73 64.81 6754.00 51.04 7204.27 64.81 6754.00 13.76 450.27 39.00 7204.27 39.29 7204.27 39.57 7204.27 39.29 7204.27 0.29 0.00 5.16 8104.80 2.58 7654.54 0.00 7204.27 2.58 7654.54 2.58 450.27 0.00 7204.27

Appendix F Calculated data sheet for CO and CO2 (mg/m3)
199
20 5.5 0.00 6303.73 21 5.5 0.00 6303.73
Avg.= 0.00 6303.73 STDEV= ± 0.00 0.00 22 6 0.00 7204.27 23 6 0.00 6303.73 24 6 0.00 5403.20
Avg.= 0.00 6303.73 STDEV= ± 0.00 900.53 25 6.5 0.00 5403.20 26 6.5 0.00 4952.93 27 6.5 0.00 4502.67
Avg.= 0.00 4952.93 STDEV= ± 0.00 450.27 28 7 2.87 5403.20 29 7 2.87 5403.20 30 7 2.87 5403.20
Avg.= 2.87 5403.20 STDEV= ± 0.00 0.00 31 7.5 3.44 6303.73 32 7.5 3.44 6303.73 33 7.5 3.44 6303.73
Avg.= 3.44 6303.73 STDEV= ± 0.00 0.00
0.00 3602.13 0.00 3602.13 0.00 3602.13 0.00 0.00 0.00 3602.13 0.00 3602.13 0.00 3602.13 0.00 3602.13 0.00 0.00 0.00 3602.13 0.00 3602.13 0.00 3602.13 0.00 3602.13 0.00 0.00 0.00 3602.13 0.00 3602.13 0.00 3602.13 0.00 3602.13 0.00 0.00 0.00 3602.13 0.00 3602.13 0.00 3602.13 0.00 3602.13 0.00 0.00
2.58 4952.93 2.29 5403.20 2.58 4952.93 0.29 450.27 1.72 4502.67 2.01 4952.93 2.29 5403.20 2.01 4952.93 0.29 450.27 3.44 5403.20 4.30 4502.67 5.16 3602.13 4.30 4502.67 0.86 900.53 6.31 5403.20 8.60 4502.67
10.90 3602.13 8.60 4502.67 2.29 900.53 9.75 5403.20
11.76 5403.20 13.76 5403.20 11.76 5403.20 2.01 0.00
0.57 6303.73 0.57 6303.73 0.57 6303.73 0.00 0.00 0.00 5403.20 0.00 6303.73 0.00 7204.27 0.00 6303.73 0.00 900.53 0.00 5403.20 0.00 5403.20 0.00 5403.20 0.00 5403.20 0.00 0.00 6.88 5403.20 9.46 5403.20
12.04 5403.20 9.46 5403.20 2.58 0.00 4.01 5403.20 2.01 5403.20 0.00 5403.20 2.01 5403.20 2.01 0.00
0.00 5853.47 0.00 4502.67 0.00 5853.47 0.00 1350.80 0.00 4502.67 0.00 4502.67 0.00 4502.67 0.00 4502.67 0.00 0.00 0.00 5403.20 0.00 5403.20 0.00 5403.20 0.00 5403.20 0.00 0.00 0.00 5403.20 0.00 5403.20 0.00 5403.20 0.00 5403.20 0.00 0.00 0.00 5403.20 0.00 5403.20 0.00 5403.20 0.00 5403.20 0.00 0.00
0.00 7204.27 0.00 7204.27 0.00 7204.27 0.00 0.00 0.00 7204.27 0.00 7204.27 0.00 7204.27 0.00 7204.27 0.00 0.00 0.00 7204.27 0.00 6754.00 0.00 6303.73 0.00 6754.00 0.00 450.27 0.00 7204.27 0.00 7204.27 0.00 7204.27 0.00 7204.27 0.00 0.00 0.00 7204.27 0.00 7204.27 0.00 7204.27 0.00 7204.27 0.00 0.00

Appendix F Calculated data sheet for CO and CO2 (mg/m3)
200
Table F 1.3: Finned pot without Shield (Cco and Cco2 in mg/m3)
SL PH 4 mbar NG
pressure Cco Cco2
1 2.5 235.1 4502.6 2 2.5 232.5 4052.4 3 2.5 229.9 3602.1
Avg.= 232.5 4052.4 STDEV= ± 2.58 450.27 4 3 175.4 5403.2 5 3 170.6 5403.2 6 3 165.7 5403.2
Avg.= 170.6 5403.2 STDEV= ± 4.87 0.00 7 3.5 112.4 5403.2 8 3.5 104.9 5403.2 9 3.5 97.50 5403.2
Avg.= 104.9 5403.2 STDEV= ± 7.46 0.00 10 4 68.82 7204.2 11 4 78.00 6754.0 12 4 87.17 6303.7
Avg.= 78.00 6754.0 STDEV= ± 9.18 450.27 13 4.5 38.42 5403.20 14 4.5 32.98 6303.73 15 4.5 27.53 7204.27
Avg.= 32.98 6303.73 STDEV= ± 5.45 900.53 16 5 10.32 6303.73 17 5 11.76 6303.73 18 5 13.19 6303.73
Avg.= 11.76 6303.73 STDEV= ± 1.43 0.00 19 5.5 5.74 6303.73
6 mbar NG pressure
Cco Cco2 286.75 5403.20 292.49 4502.67 298.22 3602.13 292.49 4502.67
5.74 900.53 164.02 3602.13 164.02 4502.67 164.02 5403.20 164.02 4502.67
0.00 900.53 91.76 4502.67
111.83 4502.67 131.91 4502.67 111.83 4502.67 20.07 0.00 68.82 5403.20 81.44 5403.20 94.05 5403.20 81.44 5403.20 12.62 0.00 41.87 5403.20 41.87 5403.20 41.87 5403.20 41.87 5403.20 0.00 0.00
11.47 4502.67 8.60 4952.93 5.74 5403.20 8.60 4952.93 2.87 450.27 5.74 5403.20
10 mbar NG pressure
Cco Cco2 263.81 3602.13 269.55 3602.13 275.28 3602.13 269.55 3602.13 5.74 0.00
167.46 4502.67 169.76 4052.40 172.05 3602.13 169.76 4052.40 2.29 450.27
137.64 4502.67 131.91 4952.93 126.17 5403.20 131.91 4952.93 5.74 450.27
100.36 5403.20 103.80 5403.20 107.25 5403.20 103.80 5403.20 3.44 0.00
51.62 7204.27 62.23 7204.27 72.84 7204.27 62.23 7204.27 10.61 0.00 30.97 7204.27 29.25 7204.27 27.53 7204.27 29.25 7204.27 1.72 0.00
18.35 7204.27
14 mbar NG pressure
Cco Cco2 502.96 5403.20 430.42 4952.93 357.87 4502.67 430.42 4952.93 72.55 450.27 249.47 5403.20 266.97 4952.93 284.46 4502.67 266.97 4952.93 17.49 450.27 206.46 5403.20 203.02 4952.93 199.58 4502.67 203.02 4952.93 3.44 450.27
135.35 5403.20 130.76 4952.93 126.17 4502.67 130.76 4952.93 4.59 450.27
88.32 5403.20 93.19 4502.67 98.07 3602.13 93.19 4502.67 4.87 900.53
63.09 5403.20 54.77 4952.93 46.45 4502.67 54.77 4952.93 8.32 450.27
16.06 3602.13
18 mbar NG pressure
Cco Cco2 464.54 4502.67 490.92 4952.93 517.30 5403.20 490.92 4952.93 26.38 450.27 266.11 4502.67 266.11 4502.67 266.11 4502.67 266.11 4502.67 0.00 0.00
226.53 4502.67 230.26 4952.93 233.99 5403.20 230.26 4952.93 3.73 450.27
138.21 4142.45 155.71 4772.83 173.20 5403.20 155.71 4772.83 17.49 630.37 166.32 6303.73 163.45 6754.00 160.58 7204.27 163.45 6754.00 2.87 450.27
73.41 5403.20 76.85 5403.20 80.29 5403.20 76.85 5403.20 3.44 0.00
29.82 7204.27
20 mbar NG pressure
Cco Cco2 490.35 3602.13 473.43 4052.40 456.51 4502.67 473.43 4052.40 16.92 450.27 378.51 4502.67 361.88 4952.93 345.25 5403.20 361.88 4952.93 16.63 450.27 338.37 6303.73 314.85 5853.47 291.34 5403.20 314.85 5853.47 23.51 450.27 295.93 7204.27 274.42 7204.27 252.92 7204.27 274.42 7204.27 21.51 0.00 149.11 7204.27 196.14 7204.27 243.17 7204.27 196.14 7204.27 47.03 0.00 91.76 5403.20 97.50 5403.20 103.23 5403.20 97.50 5403.20 5.74 0.00
48.17 6303.73

Appendix F Calculated data sheet for CO and CO2 (mg/m3)
201
20 5.5 5.16 6303.73 21 5.5 4.59 6303.73
Avg.= 5.16 6303.73 STDEV= ± 0.57 0.00 22 6 0.00 6303.73 23 6 0.00 6303.73 24 6 0.00 6303.73
Avg.= 0.00 6303.73 STDEV= ± 0.00 0.00 25 6.5 0.00 6303.73 26 6.5 0.29 6303.73 27 6.5 0.57 6303.73
Avg.= 0.29 6303.73 STDEV= ± 0.29 0.00 28 7 4.59 6303.73 29 7 4.59 6303.73 30 7 4.59 6303.73
Avg.= 4.59 6303.73 STDEV= ± 0.00 0.00 31 7.5 0.00 6303.73 32 7.5 0.00 6303.73 33 7.5 0.00 6303.73
Avg.= 0.00 6303.73 STDEV= ± 0.00 0.00
5.74 5403.20 5.74 5403.20 5.74 5403.20 0.00 0.00 0.00 5403.20 0.00 5403.20 0.00 5403.20 0.00 5403.20 0.00 0.00 0.00 5403.20 0.00 5403.20 0.00 5403.20 0.00 5403.20 0.00 0.00 0.00 5403.20 0.00 5403.20 0.00 5403.20 0.00 5403.20 0.00 0.00 0.00 5403.20 0.00 5403.20 0.00 5403.20 0.00 5403.20 0.00 0.00
13.19 7204.27 8.03 7204.27
13.19 7204.27 5.16 0.00 0.00 7204.27 0.00 7204.27 0.00 7204.27 0.00 7204.27 0.00 0.00 0.00 7204.27 0.00 7204.27 0.00 7204.27 0.00 7204.27 0.00 0.00 0.00 7204.27 0.00 7204.27 0.00 7204.27 0.00 7204.27 0.00 0.00 0.00 7204.27 0.00 7204.27 0.00 7204.27 0.00 7204.27 0.00 0.00
16.06 4502.67 16.06 5403.20 16.06 4502.67 0.00 900.53 4.01 4502.67 4.01 4502.67 4.01 4502.67 4.01 4502.67 0.00 0.00 2.29 5403.20 1.15 5853.47 0.00 6303.73 1.15 5853.47 1.15 450.27 0.00 5403.20 0.00 5403.20 0.00 5403.20 0.00 5403.20 0.00 0.00 0.00 5403.20 0.00 3602.13 0.00 1801.07 0.00 3602.13 0.00 1801.07
27.24 7204.27 24.66 7204.27 27.24 7204.27 2.58 0.00 8.60 7204.27 8.32 7204.27 8.03 7204.27 8.32 7204.27 0.29 0.00 1.15 7204.27 0.57 7204.27 0.00 7204.27 0.57 7204.27 0.57 0.00 0.00 7204.27 0.00 7204.27 0.00 7204.27 0.00 7204.27 0.00 0.00 0.00 7204.27 0.00 7204.27 0.00 7204.27 0.00 7204.27 0.00 0.00
45.88 6754.00 43.59 7204.27 45.88 6754.00 2.29 450.27
14.91 7204.27 15.48 7204.27 16.06 7204.27 15.48 7204.27 0.57 0.00 4.01 7204.27 9.46 7204.27
14.91 7204.27 9.46 7204.27 5.45 0.00 0.00 7204.27 0.00 7204.27 0.00 7204.27 0.00 7204.27 0.00 0.00 0.00 7204.27 0.00 7204.27 0.00 7204.27 0.00 7204.27 0.00 0.00
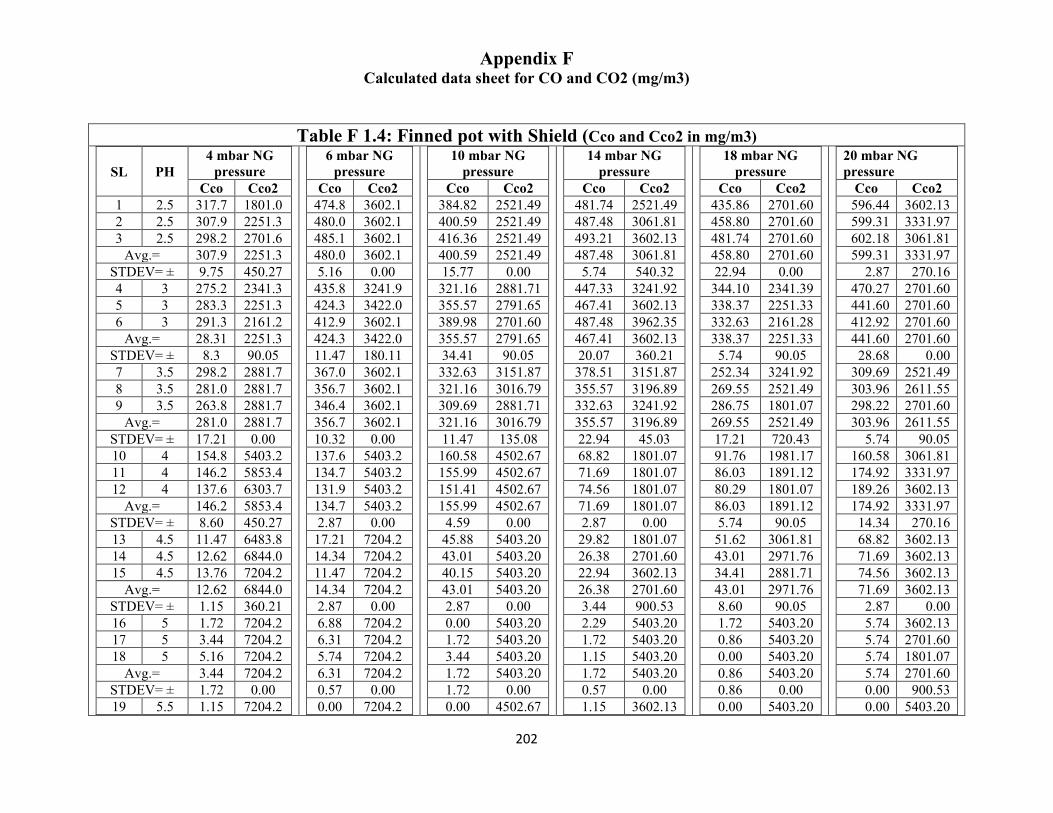
Appendix F Calculated data sheet for CO and CO2 (mg/m3)
202
Table F 1.4: Finned pot with Shield (Cco and Cco2 in mg/m3)
SL PH 4 mbar NG
pressure Cco Cco2
1 2.5 317.7 1801.0 2 2.5 307.9 2251.3 3 2.5 298.2 2701.6
Avg.= 307.9 2251.3 STDEV= ± 9.75 450.27 4 3 275.2 2341.3 5 3 283.3 2251.3 6 3 291.3 2161.2
Avg.= 28.31 2251.3 STDEV= ± 8.3 90.05 7 3.5 298.2 2881.7 8 3.5 281.0 2881.7 9 3.5 263.8 2881.7
Avg.= 281.0 2881.7 STDEV= ± 17.21 0.00 10 4 154.8 5403.2 11 4 146.2 5853.4 12 4 137.6 6303.7
Avg.= 146.2 5853.4 STDEV= ± 8.60 450.27 13 4.5 11.47 6483.8 14 4.5 12.62 6844.0 15 4.5 13.76 7204.2
Avg.= 12.62 6844.0 STDEV= ± 1.15 360.21 16 5 1.72 7204.2 17 5 3.44 7204.2 18 5 5.16 7204.2
Avg.= 3.44 7204.2 STDEV= ± 1.72 0.00 19 5.5 1.15 7204.2
6 mbar NG pressure
Cco Cco2 474.8 3602.1 480.0 3602.1 485.1 3602.1 480.0 3602.1 5.16 0.00
435.8 3241.9 424.3 3422.0 412.9 3602.1 424.3 3422.0 11.47 180.11 367.0 3602.1 356.7 3602.1 346.4 3602.1 356.7 3602.1 10.32 0.00 137.6 5403.2 134.7 5403.2 131.9 5403.2 134.7 5403.2 2.87 0.00
17.21 7204.2 14.34 7204.2 11.47 7204.2 14.34 7204.2 2.87 0.00 6.88 7204.2 6.31 7204.2 5.74 7204.2 6.31 7204.2 0.57 0.00 0.00 7204.2
10 mbar NG pressure
Cco Cco2 384.82 2521.49 400.59 2521.49 416.36 2521.49 400.59 2521.49 15.77 0.00 321.16 2881.71 355.57 2791.65 389.98 2701.60 355.57 2791.65 34.41 90.05 332.63 3151.87 321.16 3016.79 309.69 2881.71 321.16 3016.79 11.47 135.08 160.58 4502.67 155.99 4502.67 151.41 4502.67 155.99 4502.67 4.59 0.00
45.88 5403.20 43.01 5403.20 40.15 5403.20 43.01 5403.20 2.87 0.00 0.00 5403.20 1.72 5403.20 3.44 5403.20 1.72 5403.20 1.72 0.00 0.00 4502.67
14 mbar NG pressure
Cco Cco2 481.74 2521.49 487.48 3061.81 493.21 3602.13 487.48 3061.81 5.74 540.32
447.33 3241.92 467.41 3602.13 487.48 3962.35 467.41 3602.13 20.07 360.21 378.51 3151.87 355.57 3196.89 332.63 3241.92 355.57 3196.89 22.94 45.03 68.82 1801.07 71.69 1801.07 74.56 1801.07 71.69 1801.07 2.87 0.00
29.82 1801.07 26.38 2701.60 22.94 3602.13 26.38 2701.60 3.44 900.53 2.29 5403.20 1.72 5403.20 1.15 5403.20 1.72 5403.20 0.57 0.00 1.15 3602.13
18 mbar NG pressure
Cco Cco2 435.86 2701.60 458.80 2701.60 481.74 2701.60 458.80 2701.60 22.94 0.00 344.10 2341.39 338.37 2251.33 332.63 2161.28 338.37 2251.33 5.74 90.05
252.34 3241.92 269.55 2521.49 286.75 1801.07 269.55 2521.49 17.21 720.43 91.76 1981.17 86.03 1891.12 80.29 1801.07 86.03 1891.12 5.74 90.05
51.62 3061.81 43.01 2971.76 34.41 2881.71 43.01 2971.76 8.60 90.05 1.72 5403.20 0.86 5403.20 0.00 5403.20 0.86 5403.20 0.86 0.00 0.00 5403.20
20 mbar NG pressure
Cco Cco2 596.44 3602.13 599.31 3331.97 602.18 3061.81 599.31 3331.97
2.87 270.16 470.27 2701.60 441.60 2701.60 412.92 2701.60 441.60 2701.60 28.68 0.00
309.69 2521.49 303.96 2611.55 298.22 2701.60 303.96 2611.55
5.74 90.05 160.58 3061.81 174.92 3331.97 189.26 3602.13 174.92 3331.97 14.34 270.16 68.82 3602.13 71.69 3602.13 74.56 3602.13 71.69 3602.13
2.87 0.00 5.74 3602.13 5.74 2701.60 5.74 1801.07 5.74 2701.60 0.00 900.53 0.00 5403.20

Appendix F Calculated data sheet for CO and CO2 (mg/m3)
203
20 5.5 2.01 7204.2 21 5.5 2.87 7204.2
Avg.= 2.01 7204.2 STDEV= ± 0.86 0.00 22 6 1.15 7204.2 23 6 1.43 7204.2 24 6 1.72 7204.2
Avg.= 1.43 7204.2 STDEV= ± 0.29 0.00 25 6.5 3.44 7204.2 26 6.5 3.44 7204.2 27 6.5 3.44 7204.2
Avg.= 3.44 7204.2 STDEV= ± 0.00 0.00 28 7 3.44 7204.2 29 7 3.44 7204.2 30 7 3.44 7204.2
Avg.= 3.44 7204.2 STDEV= ± 0.00 0.00 31 7.5 2.29 7204.2 32 7.5 2.29 7204.2 33 7.5 2.29 7204.2
Avg.= 2.29 7204.2 STDEV= ± 0.00 0.00
0.00 7204.2 0.00 7204.2 0.00 7204.2 0.00 0.00 0.00 7204.2 0.00 7204.2 0.00 7204.2 0.00 7204.2 0.00 0.00 0.00 7204.2 0.00 7204.2 0.00 7204.2 0.00 7204.2 0.00 0.00 0.00 7204.2 0.00 7204.2 0.00 7204.2 0.00 7204.2 0.00 0.00 0.00 7204.2 0.00 7204.2 0.00 7204.2 0.00 7204.2 0.00 0.00
2.29 4052.40 4.59 3602.13 2.29 4052.40 2.29 450.27 0.00 5403.20 2.29 6303.73 4.59 7204.27 2.29 6303.73 2.29 900.53 0.00 7204.27 0.00 7204.27 0.00 7204.27 0.00 7204.27 0.00 0.00 0.00 7204.27 0.00 7204.27 0.00 7204.27 0.00 7204.27 0.00 0.00 0.00 7204.27 0.00 7204.27 0.00 7204.27 0.00 7204.27 0.00 0.00
1.72 4502.67 2.29 5403.20 1.72 4502.67 0.57 900.53 0.00 5403.20 1.15 4952.93 2.29 4502.67 1.15 4952.93 1.15 450.27 5.74 5403.20 5.74 5403.20 5.74 5403.20 5.74 5403.20 0.00 0.00 6.88 5403.20 6.88 5403.20 6.88 5403.20 6.88 5403.20 0.00 0.00 5.16 5403.20 5.16 5403.20 5.16 5403.20 5.16 5403.20 0.00 0.00
0.00 5403.20 0.00 5403.20 0.00 5403.20 0.00 0.00 0.00 5403.20 0.00 5403.20 0.00 5403.20 0.00 5403.20 0.00 0.00 0.00 5403.20 0.00 5403.20 0.00 5403.20 0.00 5403.20 0.00 0.00 0.00 5403.20 0.00 5403.20 0.00 5403.20 0.00 5403.20 0.00 0.00 0.00 5403.20 0.00 5403.20 0.00 5403.20 0.00 5403.20 0.00 0.00
0.00 5403.20 0.00 5403.20 0.00 5403.20 0.00 0.00 0.00 5403.20 0.00 5403.20 0.00 5403.20 0.00 5403.20 0.00 0.00 0.00 5403.20 0.00 5403.20 0.00 5403.20 0.00 5403.20 0.00 0.00 1.72 5403.20 1.72 5403.20 1.72 5403.20 1.72 5403.20 0.00 0.00 2.87 5403.20 2.87 5403.20 2.87 5403.20 2.87 5403.20 0.00 0.00

Appendix G Calculated data sheet for NG Flow (Liter/min) at STAP
199
Table G 1.1: Calculated data of NG flow rate (Liter/min.) at different NG supplied pressure.
SL Name Avg. Flow rate (L/min) Avg. Temp. (0C) At SATP avg. flow rate
(L/min)
01 Pot Arrangement at 4 mbar 4.72 28.02 4.23
02 Pot Arrangement at 6 mbar 4.84 28.35 4.30
03 Pot Arrangement at 10 mbar 5.03 27.03 4.70
04 Pot Arrangement at 14 mbar 5.52 28.90 4.84
05 Pot Arrangement at 18 mbar 5.63 29.00 4.94
06 Pot Arrangement at 20 mbar 5.80 28.72 5.15