
A Geographical Information System (GIS)Based Simulation Tool to Assess Civilian Harbor Protection...
18
IEEE JOURNAL OF OCEANIC ENGINEERING, VOL. 37, NO. 1, JANUARY 2012 85 A Geographical Information System (GIS)-Based Simulation Tool to Assess Civilian Harbor Protection Levels Andrea Caiti, Senior Member, IEEE, Andrea Munafò, Member, IEEE, and Giancarlo Vettori Abstract—This paper introduces a new simulative approach to assess the level of underwater security in civilian harbor installa- tions, with the aim of bridging the gaps between system specifica- tions and operative performance of anti-intrusion systems. The in- tegration of a geographical information system (GIS), acoustic and magnetic sensor models, with a dynamic simulator makes it pos- sible to simulate the impact of both new sensors and modification in the sensors placement in the overall harbor protection system. With the proposed approach it is possible to model the harbor environment including geographical and environmental informa- tion, to set up the surveillance system with underwater acoustic and magnetic sensors and reacquisition vehicles, and to add sev- eral types of intruders to estimate, through dynamic simulations, what security level is obtained by the sensors configuration chosen against the selected intruder. The intention is that of hiding the physical aspects of acoustic and magnetic propagation while pro- viding high-level figures of merit (probability to stop the intruder, expected halt distance from the high value asset (HVA), and ex- pect halt time to intercept) capable of a clear representation of the system capability to detect, classify, and stop a menace. For this purpose, a software simulator tool has been developed and its usage in several scenarios has been reported (e.g., sensors configuration and deployment, performance sensitivity to changing oceanic con- ditions). Index Terms—Data fusion, geographical information system (GIS), harbor protection, sensor models. NOMENCLATURE APL Applied Physics Laboratory. AUV Autonomous underwater vehicle. BoS Barrier of sensors. CW Clockwise. DDS Diver detection sonar. FAP False alarm probability. Manuscript received March 06, 2009; revised November 11, 2010 and July 15, 2011; accepted October 27, 2011. Date of publication December 13, 2011; date of current version January 13, 2012. This work was supported in part by the European Union and Regione Liguria through the Parco Scientifico e Tec- nologico della Regione Liguria. Associate Editor: D. A. Abraham. A. Caiti is with the Interdepartmental Research Center “E.Piaggio,” Faculty of Engineering, University of Pisa, Pisa 56127, Italy. A. Munafò and G. Vettori are with the Interuniversity Center of Integrated Systems for the Marine Environment (ISME), Genoa 16145, Italy (e-mail: mu- [email protected]). Color versions of one or more of the figures in this paper are available online at http://ieeexplore.ieee.org. Digital Object Identifier 10.1109/JOE.2011.2174675 GIS Geographical information system. HVA High value asset. MGNS MaGNetic Simulator. PB Patrol boat. PHB PHysical Barrier. PC Probability of classification. PD Probability of detection. SSP Sound-speed profile. I. INTRODUCTION I N the last few years, there has been a remarkable interest in civilian harbor protection because of increasing threats against civilian targets. Up to now the harbor security problem was investigated only in military scenarios where there are dif- ferent possibilities to act and react against a menace and where the harbor traffic is tightly controlled: in a military scenario it is possible to think of each ship as a potential sensor to protect the port [1]. In civilian ports the problems are dramatically dif- ferent: the traffic is not completely controlled; there are fewer possibilities to test the harbor security in an effective way; and each ship is not a security asset but a possible menace. However, in recent years, an understanding of the great importance of the problems connected with the civilian harbor security has been growing [2], [3], considering both civilian and commercial as- pects crucial for the protection of nonmilitary harbors. In partic- ular, there are over 46 000 ships engaged in carrying 80% of the world trade between 4000 ports; a small number of these ports manage the majority of the trade, making these places a very im- portant and, up to now, vulnerable targets for terrorist attacks. A study in the United States, reported in [3], concluded that a small but clever attack on two U.S. ports would have an eco- nomic impact of up to $58 billion dollars on the United States alone. It is clear that harbor security is an important issue. Having software tools to simulate harbor security systems will be needed to customize an anti-intrusion system for a specific environment. Simulation software can handle both military and civilian scenarios and allow testing of changes in the protection configuration for the specific environment for many of the less likely threat possibilities in order to make a proper choice. Building an underwater anti-intrusion system is always a complex operation, starting from the selection of the right 0364-9059/$26.00 © 2011 IEEE
-
Upload
independent -
Category
Documents
-
view
0 -
download
0
Transcript of A Geographical Information System (GIS)Based Simulation Tool to Assess Civilian Harbor Protection...
IEEE JOURNAL OF OCEANIC ENGINEERING, VOL. 37, NO. 1, JANUARY 2012 85
A Geographical Information System (GIS)-BasedSimulation Tool to Assess Civilian
Harbor Protection LevelsAndrea Caiti, Senior Member, IEEE, Andrea Munafò, Member, IEEE, and Giancarlo Vettori
Abstract—This paper introduces a new simulative approach toassess the level of underwater security in civilian harbor installa-tions, with the aim of bridging the gaps between system specifica-tions and operative performance of anti-intrusion systems. The in-tegration of a geographical information system (GIS), acoustic andmagnetic sensor models, with a dynamic simulator makes it pos-sible to simulate the impact of both new sensors and modificationin the sensors placement in the overall harbor protection system.With the proposed approach it is possible to model the harborenvironment including geographical and environmental informa-tion, to set up the surveillance system with underwater acousticand magnetic sensors and reacquisition vehicles, and to add sev-eral types of intruders to estimate, through dynamic simulations,what security level is obtained by the sensors configuration chosenagainst the selected intruder. The intention is that of hiding thephysical aspects of acoustic and magnetic propagation while pro-viding high-level figures of merit (probability to stop the intruder,expected halt distance from the high value asset (HVA), and ex-pect halt time to intercept) capable of a clear representation of thesystem capability to detect, classify, and stop a menace. For thispurpose, a software simulator tool has been developed and its usagein several scenarios has been reported (e.g., sensors configurationand deployment, performance sensitivity to changing oceanic con-ditions).
Index Terms—Data fusion, geographical information system(GIS), harbor protection, sensor models.
NOMENCLATURE
APL Applied Physics Laboratory.
AUV Autonomous underwater vehicle.
BoS Barrier of sensors.
CW Clockwise.
DDS Diver detection sonar.
FAP False alarm probability.
Manuscript received March 06, 2009; revised November 11, 2010 and July15, 2011; accepted October 27, 2011. Date of publication December 13, 2011;date of current version January 13, 2012. This work was supported in part bythe European Union and Regione Liguria through the Parco Scientifico e Tec-nologico della Regione Liguria.Associate Editor: D. A. Abraham.A. Caiti is with the Interdepartmental Research Center “E.Piaggio,” Faculty
of Engineering, University of Pisa, Pisa 56127, Italy.A. Munafò and G. Vettori are with the Interuniversity Center of Integrated
Systems for the Marine Environment (ISME), Genoa 16145, Italy (e-mail: [email protected]).Color versions of one or more of the figures in this paper are available online
at http://ieeexplore.ieee.org.Digital Object Identifier 10.1109/JOE.2011.2174675
GIS Geographical information system.
HVA High value asset.
MGNS MaGNetic Simulator.
PB Patrol boat.
PHB PHysical Barrier.
PC Probability of classification.
PD Probability of detection.
SSP Sound-speed profile.
I. INTRODUCTION
I N the last few years, there has been a remarkable interestin civilian harbor protection because of increasing threats
against civilian targets. Up to now the harbor security problemwas investigated only in military scenarios where there are dif-ferent possibilities to act and react against a menace and wherethe harbor traffic is tightly controlled: in a military scenario itis possible to think of each ship as a potential sensor to protectthe port [1]. In civilian ports the problems are dramatically dif-ferent: the traffic is not completely controlled; there are fewerpossibilities to test the harbor security in an effective way; andeach ship is not a security asset but a possible menace. However,in recent years, an understanding of the great importance of theproblems connected with the civilian harbor security has beengrowing [2], [3], considering both civilian and commercial as-pects crucial for the protection of nonmilitary harbors. In partic-ular, there are over 46 000 ships engaged in carrying 80% of theworld trade between 4000 ports; a small number of these portsmanage the majority of the trade, making these places a very im-portant and, up to now, vulnerable targets for terrorist attacks.A study in the United States, reported in [3], concluded that asmall but clever attack on two U.S. ports would have an eco-nomic impact of up to $58 billion dollars on the United Statesalone.It is clear that harbor security is an important issue. Having
software tools to simulate harbor security systems will beneeded to customize an anti-intrusion system for a specificenvironment. Simulation software can handle both military andcivilian scenarios and allow testing of changes in the protectionconfiguration for the specific environment for many of the lesslikely threat possibilities in order to make a proper choice.Building an underwater anti-intrusion system is always a
complex operation, starting from the selection of the right
0364-9059/$26.00 © 2011 IEEE
86 IEEE JOURNAL OF OCEANIC ENGINEERING, VOL. 37, NO. 1, JANUARY 2012
detection sensors to be placed in the specific port. Severalsystems, such as acoustic systems [4] or magnetic sensors [5],as well as AUVs [6], [7], can be used to control an underwaterharbor area, but the selection of the most appropriate one in aspecific harbor may require a long time and big investments.The major difficulty is related to the fact that detection sensors(either acoustic or magnetic) are usually characterized by in-strument manufacturers with nominal performances that do notnecessarily represent the true performance in the field. In fact,as is well known (see, for instance, [8] for a reference in theharbor protection context), sensor performance is significantlyaffected by the environment and other local factors, as in thecase of acoustic systems, bathymetry, SSP, and ambient noise.The real information provided by the sensor manufacturers isrelated to the operating specifications of each system, such asfrequency of operation, bandwidth, beam pattern, source level,etc., but the same instrument parameters may correspond tovery different operative performance. Moreover, the analysisbecomes even more complex when, as is usually the case, sev-eral sensors are used together, in cooperation, to continuouslymonitor the protected area. In this case, not only is it difficult topredict how sensors interact with each other, but it is even morecomplex to figure out what is the performance of the wholesystem in terms of its capability to detect and stop a threat.It has to be remarked that, traditionally, in military situa-
tions, operative performances have been evaluated experimen-tally through specific testing in the field to reach satisfying per-formance by a judicious trial and error. This traditional approachis difficult to be translated to commercial or civilian harbors be-cause it needs a high level of influence in the normal activi-ties, requiring to stop port operations several times during theanti-intrusion deployments and then causing severe economicproblems and inconvenience.The work presented in this paper aims at providing tools to
bridge the gap between system specifications and operative per-formances, proposing a new approach, based on a software sim-ulator, which is able to include most of the geographical and en-vironmental effects, using magnetic and acoustic propagationcodes, widely used in the scientific community [25], [26], ascomputational engines to predict the detection performance ofmagnetometers and sonars, and finally combining all the datatogether to produce operative information on the anti-intrusionsystem. The use of an approach based on simulative tools [6],[11], [12] does not have any influence in the normal harbor ac-tivities during the test phase and permits to try different kindsof detection systems in several configurations in order to findthe most appropriate. However, any solution based on simula-tions is clearly not equivalent to the physical deployment of thesystem, and the simulated results are to be regarded as estimatesof the expected system performance.The proposed method is based on the integration of three
instruments: 1) acoustic and magnetic sensor mathematicalmodels to simulate and predict the detection performanceof anti-intrusion devices; 2) a GIS to model the geographyand the environment of the marine area; and 3) a dynamicsimulator, based on a pseudo-Monte-Carlo approach, to testthe performance of the anti-intrusion system as a whole, mod-eling the combined effects of sensors and of surface vehicles,
acting as reactive components capable of accurate searchingand equipped with deterrence means. Finally, the results arereported in terms of maps of the predicted area coverage, pro-viding a graphical representation of the detection performance(map of detection), and in terms of anti-intrusion performancegraphs (probability to stop the threats, average halt distance,etc.) giving a direct indication on the system’s capability todetect, classify, and stop intrusions.While some software tools are becoming available along this
line, their focus is usually on real-time data representation andintegration using web interfaces [9] and mostly dedicated toenvironmental mapping [10], rather than on the design of thesurveillance system.The paper is organized as follows. In Section II, the gen-
eral features of the proposed modeling approach are shown.Section III gives detailed description of the models usedto define harbor environments, detection sensors, and in-truders. Section IV describes the implementation details ofthe GIS-based simulator tool, which realizes the modelingapproach proposed, and depicts the kinds of results provided tohelp set up the protection system. Section V focuses on the as-sumptions and limitations of the methodology, and Section VIreports some simulative results obtained using the simulatortool to verify the security level of harbors in some representa-tive cases. Finally, conclusions are reported in Section VII.
II. GENERAL FEATURES OF THE MODELING APPROACH
The approach proposed in this paper intends to model com-plex scenarios of harbor intrusions typically composed by thefollowing building blocks: 1) the harbor environment; 2) theanti-intrusion system; 3) the HVA; and 4) the intruders. Finally,the performance of the anti-intrusion system is defined on thebasis of figures of merit that aim at providing a clear represen-tation of the protection level.
A. The Harbor Environment
The harbor environment can be defined through any kind ofenvironmental and geographic data, such as information aboutthe coastline and the bathymetric profile, and by including theweather data such as rainfall levels or water temperature in thearea.
B. The Anti-Intrusion System
The definition of the anti-intrusion system has several steps:1) placement of underwater fixed sensors; 2) placement of PBs;and 3) definition of PHBs. Underwater fixed sensors representthe base of the surveillance system: they continuously scan thearea of interest and are capable of providing the first alarm toPBs when a threat tries to intrude. It is possible to introduce sen-sors in the system by defining new or loading existing devicesand specifying all the desired characteristics in terms of workingfrequency, band, directivity index, or any other acoustically ormagnetically related parameter. The sensor implementation de-tails are finally hidden through the definition of the sensor PDfunction used to sum up the sensor performance in the harbor.The PD function expresses the probability of detecting an in-truder belonging to a given class (see Section III-D on threatmodeling) as a function of the spatial position of the intruder
CAITI et al.: A GIS-BASED SIMULATION TOOL TO ASSESS CIVILIAN HARBOR PROTECTION LEVELS 87
with respect to the sensor. In addition, the PD can be (as it is forthe most of existing detection systems) a function of several en-vironmental factors, such as bathymetry, wind speed, ambientnoise, etc., that depend on the specific harbor.PBs are surface vessels with reacquisition capabilities, and
they represent the reactive element of the anti-intrusion system.PBs can be either moored or patrolling along user-defined routesor areas, and in both cases, the vehicles are alerted by fixed sen-sors and driven to the desired zone. When the alarmed area hasbeen reached, PBs start a deep investigation using on-board sen-sors, trying to detect, classify, and finally stop the threat, if thereis any. Anti-intrusion performances, in terms of their effective-ness in stopping the menace, are therefore strictly connectedwith the capabilities of the PBs.Finally, PHBs can be inserted to limit intruders’ trajectories;
they cannot be trespassed by any kind of intruder and they canbe used to prevent access to specific harbor areas or to makeintruders pass areas effectively covered by underwater sensors.
C. The High Value Asset
The HVA represents the most important element to be de-fended within the harbor. Its position affects the PBs’ reacquisi-tion strategies, as its defence is their main objective. Dependingon the position of the HVA with respect to the fixed sensors, aPB is able to optimize the searching path to increase the detec-tion probability.
D. Intruders
Intruders are the threats for the HVA, and they are definedboth in terms of their acoustic or magnetic signatures and on thebasis of their intrusion trajectories (latitude, longitude, depth,and speed).
E. Figures of Merit
To represent the performance of an anti-intrusion system, thefollowing figures of merit are defined: 1) the overall probabilityof detection to represent the total protected area in the harbor,computed in accordance to a set of rules involving sensors tech-nical characteristics, the environment, and the type of intruders;2) the probability to stop the intruder computed as a numberof total anti-intrusion victories over the entire number of intru-sions; 3) the expected halt time from initial detection by sensorsto interception by surface response crafts; and 4) the expectedhalt distance of underwater intruders of various speeds coveringseveral and complex trajectories in the port.The anti-intrusion capabilities of the system depend on the
specific scenario defined, and are computed using acoustic andmagnetic mathematical models to evaluate the sensors perfor-mance on the basis of the geographical and environmental char-acteristics and with respect to the specific selected intruder. Themodel data are used to build a static 3-D graphical visualizationof the PD and therefore to show the predicted area coverage, andfinally, this information is merged within a dynamic simulationof sensors, intruders, and PBs to provide operative data on thesurveillance system (e.g., expected halt distance and time to stopthe threats). In this way, the simulator gives access to operative
information on the anti-intrusion system that directly shows ca-pabilities of the sensor configuration chosen, hiding the under-neath physical sensors layer based on the physics of acousticand magnetic propagation.The possibility of a PD representation of the sensors perfor-
mance as well as the results of the dynamic simulation providesa direct feedback to set up the surveillance system and to obtaina desired level of protection.
III. COMPONENTS MODELING
This section describes models used for creating the harborenvironment and for calculating the performance of the acousticand magnetic sensors that can be included in an anti-intrusionprotection system.
A. Harbor Modeling
The modeling of the harbor is based on the use of a GIS ar-chitecture that allows for inclusion of the required geographicaland environmental data with the user-desired level of detail.The GIS platform is a well-known platform in the field of ge-
ographical information software and this allows using historicalenvironmental information or information used with other GIStools. In a GIS software environment, each map of a given areais built from geographically overlapping layers and in each layeronly one kind of information is represented: different data typesare stored in different layers. Finally, each map layer is relatedto a database that records all the attributes of all the objects inthat specific layer.For handling the maps, we use a commercial software li-
brary provided by the Environmental Systems Research Insti-tute (ESRI) corporation called ESRI MapObject library [20],which is a standard interface for cartographic software, witha related file type called “ESRI shape,” to represent all mapdata: each map is codified as vector product format (VPF) andrecorded as ESRI shape file.Through the GIS platform, it is possible to load any kind
of cartographic data (e.g., bathymetric profiles, coastline data,etc.) and environmental information, such as the ambient noiselevel in the area of interest or the SSP characterizing the harbor.Specifically, to simulate the sensor models (see Section III-B),five types of environmental information have to be loaded: 1)the wind speed (or the sea state); 2) the ambient noise (or thetraffic level); 3) the rainfall level; 4) the SSP as a unique infor-mation for the whole harbor area; and finally, 5) seabed types. Inour implementation, the simulator works with only one SSP forthe whole harbor while its values can be modified on the basisof seasons and/or hours of the day (e.g., morning, night). Theharbor seabed can be characterized by different kinds of bot-toms, choosing among the following classes: rough rock, rock,cobble, sandy gravel, coarse sand, medium sand, very fine sand,medium silt, and very fine silt. Each sensor can be placed on aspecific seabed type and the harbor can be characterized by asmany bottom areas as the number of fixed sensors.
B. Anti-Intrusion Sensors Modeling
Three types of sensors are modeled and simulated in thesoftware: passive and active acoustic, and magnetic sensors.The simulator hides the implementation details of the sensors
88 IEEE JOURNAL OF OCEANIC ENGINEERING, VOL. 37, NO. 1, JANUARY 2012
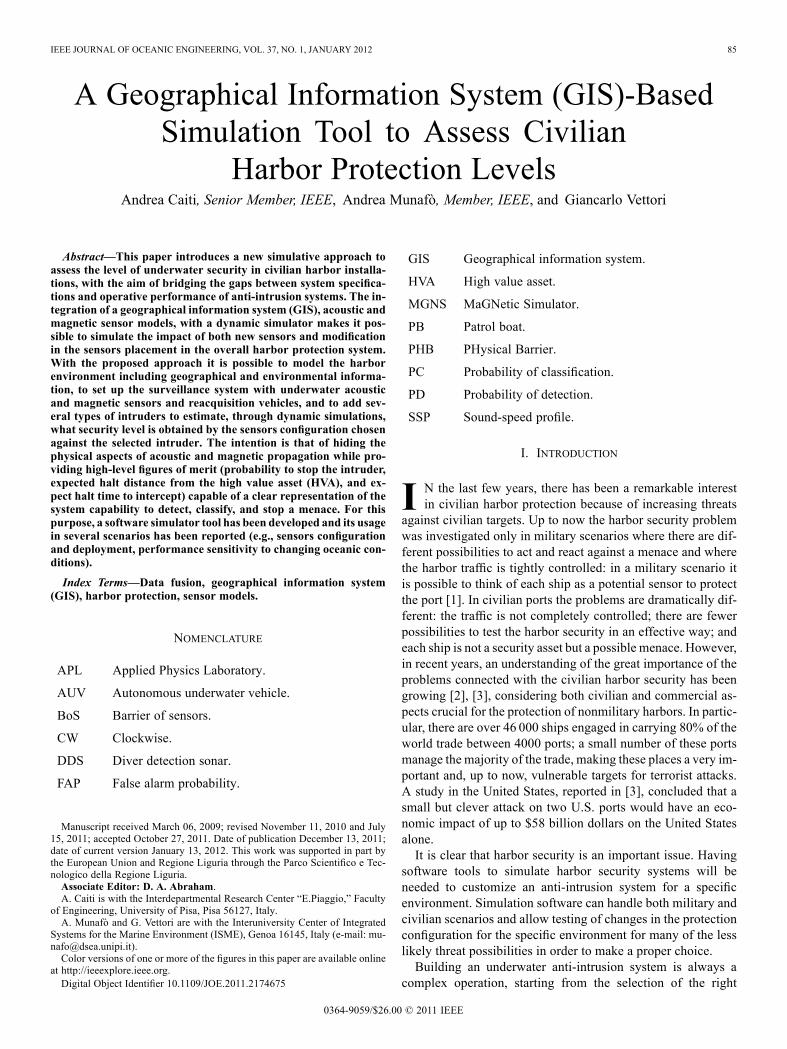
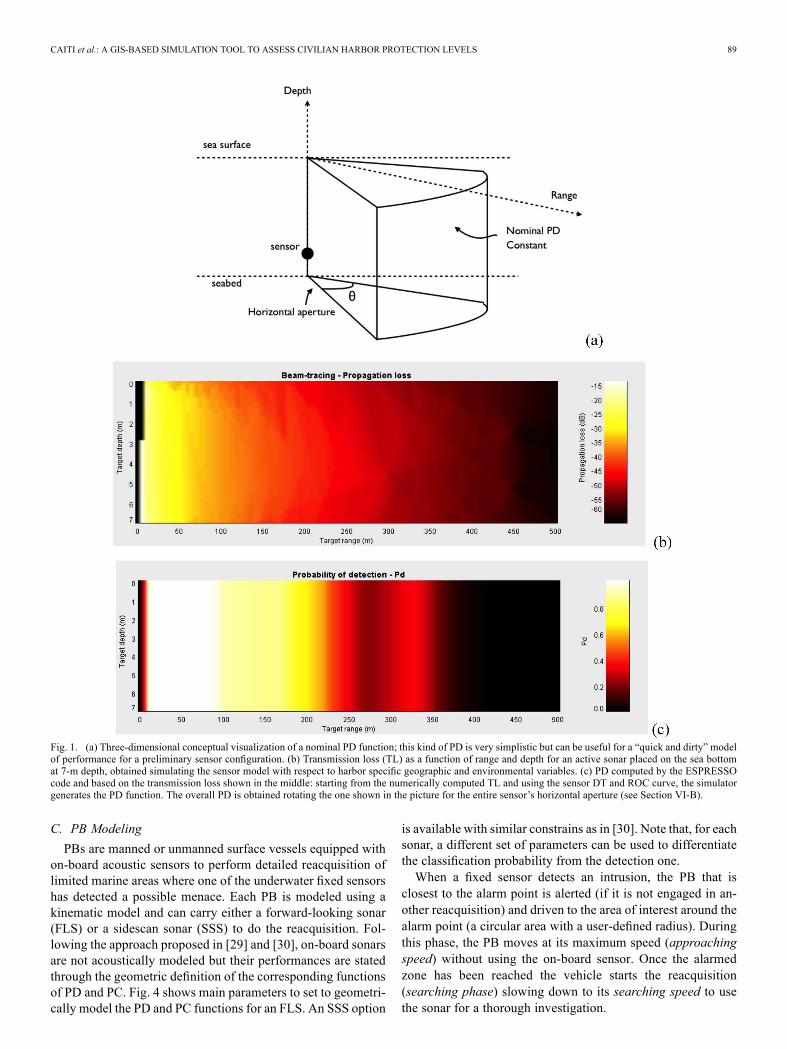
representing their performance in terms of “probability ofdetecting” an intruder. Each underwater fixed sensor is in factconnected with two probability functions: a nominal detectionprobability and a simulated one. The first one represents asimple sensor characterization that does not consider either theenvironmental conditions in the area or the particular intruderselected. Moreover, the spatial distribution in the neighborhoodof the sensor assumes simple geometrical shapes (circle orcircular sectors) characterizing the sensor performance asconstant functions within these areas. Fig. 1(a) shows a sensorcharacterized by a simple nominal PD. Within the circularsector the PD is constant. These kinds of PDs are obviouslyvery simplistic, but they can indeed be useful for a “quick anddirty” model of performance for a preliminary sensor config-uration to be refined in successive steps with a more realisticsensor modeling that can be obtained using the simulated typeof PD [Fig. 1(c)].This second PD function is a detailed sensor characterization
and it is obtained considering the environment, the geography ofthe area, the specific intruder selected, and using mathematicalmodels to finally compute the sensor performance. The shape ofthe simulated PD depends on the particular scenario and for thisreason it is difficult to predict a priori even for an expert userwithout deploying the sensor into the water to actually test it.1) Acoustic Sensor Models: The performance of any kind
of acoustic system critically depends on the transmission loss(TL), on the noise level , and, in the case of active sonars,on the reverberation level (RL). All these quantities are relatedby the well-known sonar equation, reported for the passive (top)and monostatic active cases
SL TL SNR
SL TL TS SNR RL (1)
In (1), SL is the source level, which is an information usuallyavailable for any instrument, while TS is the target strength inthe active sonar case. SNR stands for the signal-to-noise ratio.All quantities express acoustic intensity in dB re 1 Pa@1 m.The simulator uses numerical solvers to predict the evolution
of these quantities with respect to the oceanic variables consid-ered, and finally it uses the appropriate sonar equation (1) tocompute the PD function as an indication of the likelihood ofdetecting an event (i.e., the intruder) when the event does occur[23], and hence as an indication of the detection performanceof the sensor in the specific harbor environment with respect tothe selected threat. Once the TL has been calculated, the sonarequation is used to produce the SNR at the receiver, given thetransmitter source level, the reverberation level, and the ambientnoise [24]. Finally, the PD function is obtained using the sensordetection threshold (DT) and on the basis of the receiver op-erating characteristic (ROC) curve of the simulated sonar [seeFig. 1(b) and (c)].To simulate passive and active sonars, respectively, two sci-
entifically validated models are used: range-dependent acousticmodel (RAM) [25] and a custom modified version of theESPRESSO code [26], which implements the APL94 models[27] for surface and bottom reflections and scattering strength.Custom modification of the ESPRESSO code refers to software
integration of the ESPRESSO within the general structure ofour simulator; the computation of the acoustic quantities withinESPRESSO has been left unaltered.In both cases, the environmental conditions in which acoustic
wave propagation is simulated are assumed as range indepen-dent; this implies that the characteristics of one point (thesensor’s geographical location) are representative for the wholesensor’s range.2) Magnetic Sensor Model: An ad hoc magnetic model
called MGNS has been developed to evaluate the detection per-formance of magnetic sensors on the basis of the geographicaland environmental conditions.Since a magnetic sensor has a very limited range, much
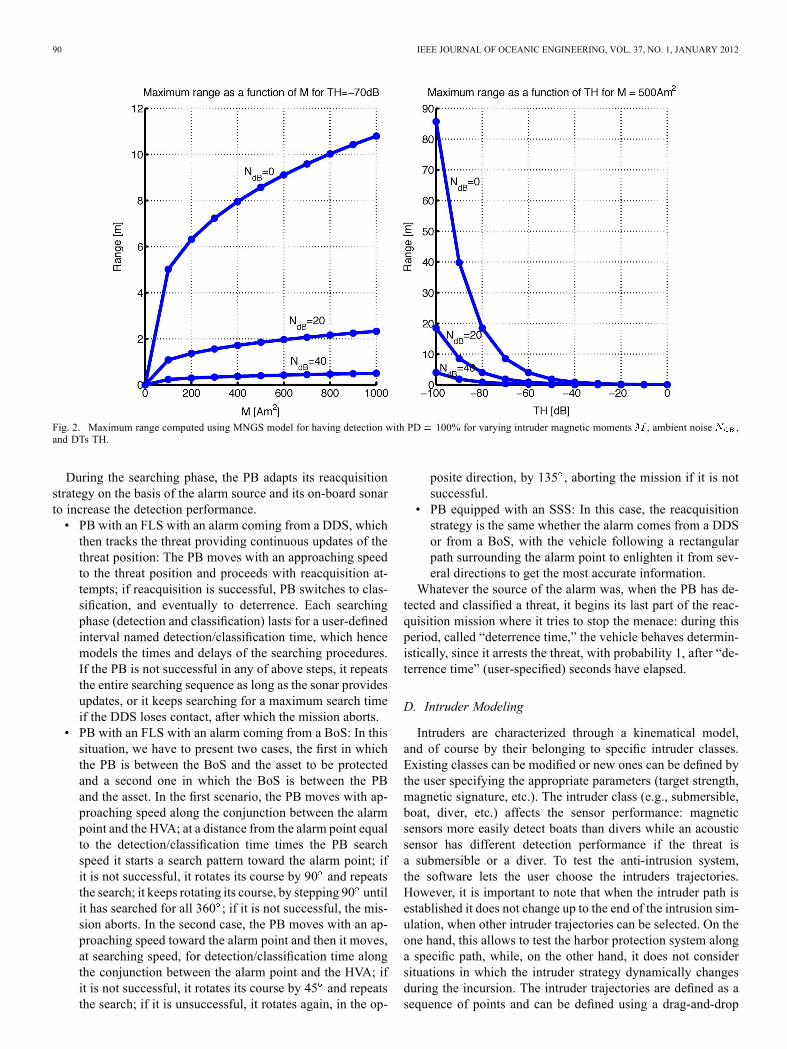
smaller than an acoustic sensor, it was decided to representsuch a sensor through an ON–OFF model: MGNS determinesthe maximum sensor range and uses this value as the radiusof a circular area centered at the sensor position where themagnetometer provides a 100% PD, whereas outside this zonethe PD is always 0%.The MGNS model performs an energetic balance, conceptu-
ally equal to the sonar equation used in the acoustic case, to ob-tain the maximum range for a specific magnetometer, a specifictarget, and with a certain amount of ambient noise.The target is modeled as a magnetic dipole, with a magnetic
field force specified in
(2)
where the magnetic field is expressed in nano Tesla (nT),is the magnetic constant in Newton (am-
pere) (NA ), is the target magnetic moment in ampere-square meters (Am ), and is the target-sensor distance in me-ters.Equation (3) shows the energetic balance between the mag-
netic field force and the ambient noise root mean square (rms)expressed in nT, the signal processing gain , and the sensor
threshold TH as SNR, after the signal processing, to have detec-tion, expressed in decibels
TH (3)
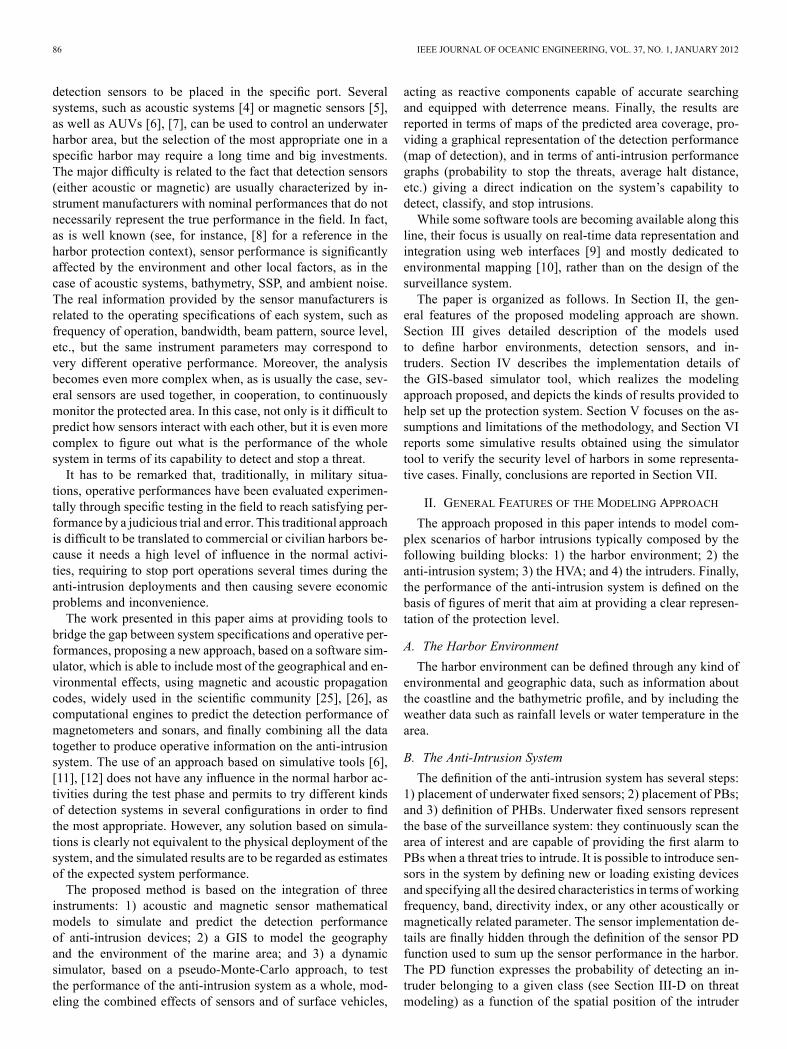
The maximum range at which the magnetic sensor is able todetect an event with PD 100% is hence computed from (3) as
(4)
Fig. 2 shows the maximum range computed using MGNSmodel for varying intruder magnetic moments , ambientnoise , and DTs TH.3) BoS Modeling: The underwater sensors, either acoustic
or magnetic, can be configured to work as a BoS. In this case,the barrier is always placed on the sea bottom and modeled as aset of ON–OFF sensors with an omnidirectional maximum range
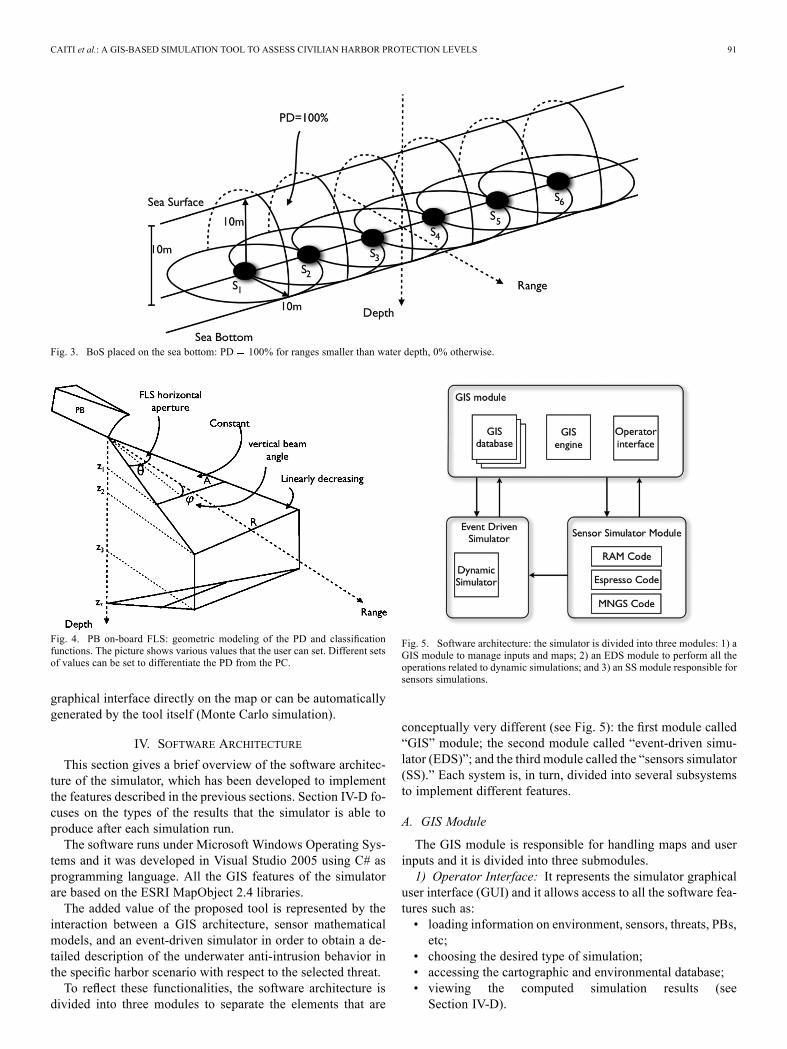
equal to the water depth at the array location. The PDis always 100% until and 0 for farther distances. Fig. 3shows a conceptual view of a barrier of six sensorsplaced on the sea bottom at 10-m depth.
CAITI et al.: A GIS-BASED SIMULATION TOOL TO ASSESS CIVILIAN HARBOR PROTECTION LEVELS 89
Fig. 1. (a) Three-dimensional conceptual visualization of a nominal PD function; this kind of PD is very simplistic but can be useful for a “quick and dirty” modelof performance for a preliminary sensor configuration. (b) Transmission loss (TL) as a function of range and depth for an active sonar placed on the sea bottomat 7-m depth, obtained simulating the sensor model with respect to harbor specific geographic and environmental variables. (c) PD computed by the ESPRESSOcode and based on the transmission loss shown in the middle: starting from the numerically computed TL and using the sensor DT and ROC curve, the simulatorgenerates the PD function. The overall PD is obtained rotating the one shown in the picture for the entire sensor’s horizontal aperture (see Section VI-B).
C. PB Modeling
PBs are manned or unmanned surface vessels equipped withon-board acoustic sensors to perform detailed reacquisition oflimited marine areas where one of the underwater fixed sensorshas detected a possible menace. Each PB is modeled using akinematic model and can carry either a forward-looking sonar(FLS) or a sidescan sonar (SSS) to do the reacquisition. Fol-lowing the approach proposed in [29] and [30], on-board sonarsare not acoustically modeled but their performances are statedthrough the geometric definition of the corresponding functionsof PD and PC. Fig. 4 shows main parameters to set to geometri-cally model the PD and PC functions for an FLS. An SSS option
is available with similar constrains as in [30]. Note that, for eachsonar, a different set of parameters can be used to differentiatethe classification probability from the detection one.When a fixed sensor detects an intrusion, the PB that is
closest to the alarm point is alerted (if it is not engaged in an-other reacquisition) and driven to the area of interest around thealarm point (a circular area with a user-defined radius). Duringthis phase, the PB moves at its maximum speed (approachingspeed) without using the on-board sensor. Once the alarmedzone has been reached the vehicle starts the reacquisition(searching phase) slowing down to its searching speed to usethe sonar for a thorough investigation.
90 IEEE JOURNAL OF OCEANIC ENGINEERING, VOL. 37, NO. 1, JANUARY 2012
Fig. 2. Maximum range computed using MNGS model for having detection with PD 100% for varying intruder magnetic moments , ambient noise ,and DTs TH.
During the searching phase, the PB adapts its reacquisitionstrategy on the basis of the alarm source and its on-board sonarto increase the detection performance.• PB with an FLS with an alarm coming from a DDS, whichthen tracks the threat providing continuous updates of thethreat position: The PB moves with an approaching speedto the threat position and proceeds with reacquisition at-tempts; if reacquisition is successful, PB switches to clas-sification, and eventually to deterrence. Each searchingphase (detection and classification) lasts for a user-definedinterval named detection/classification time, which hencemodels the times and delays of the searching procedures.If the PB is not successful in any of above steps, it repeatsthe entire searching sequence as long as the sonar providesupdates, or it keeps searching for a maximum search timeif the DDS loses contact, after which the mission aborts.
• PB with an FLS with an alarm coming from a BoS: In thissituation, we have to present two cases, the first in whichthe PB is between the BoS and the asset to be protectedand a second one in which the BoS is between the PBand the asset. In the first scenario, the PB moves with ap-proaching speed along the conjunction between the alarmpoint and the HVA; at a distance from the alarm point equalto the detection/classification time times the PB searchspeed it starts a search pattern toward the alarm point; ifit is not successful, it rotates its course by 90 and repeatsthe search; it keeps rotating its course, by stepping 90 untilit has searched for all 360 ; if it is not successful, the mis-sion aborts. In the second case, the PB moves with an ap-proaching speed toward the alarm point and then it moves,at searching speed, for detection/classification time alongthe conjunction between the alarm point and the HVA; ifit is not successful, it rotates its course by 45 and repeatsthe search; if it is unsuccessful, it rotates again, in the op-
posite direction, by 135 , aborting the mission if it is notsuccessful.
• PB equipped with an SSS: In this case, the reacquisitionstrategy is the same whether the alarm comes from a DDSor from a BoS, with the vehicle following a rectangularpath surrounding the alarm point to enlighten it from sev-eral directions to get the most accurate information.
Whatever the source of the alarm was, when the PB has de-tected and classified a threat, it begins its last part of the reac-quisition mission where it tries to stop the menace: during thisperiod, called “deterrence time,” the vehicle behaves determin-istically, since it arrests the threat, with probability 1, after “de-terrence time” (user-specified) seconds have elapsed.
D. Intruder Modeling
Intruders are characterized through a kinematical model,and of course by their belonging to specific intruder classes.Existing classes can be modified or new ones can be defined bythe user specifying the appropriate parameters (target strength,magnetic signature, etc.). The intruder class (e.g., submersible,boat, diver, etc.) affects the sensor performance: magneticsensors more easily detect boats than divers while an acousticsensor has different detection performance if the threat isa submersible or a diver. To test the anti-intrusion system,the software lets the user choose the intruders trajectories.However, it is important to note that when the intruder path isestablished it does not change up to the end of the intrusion sim-ulation, when other intruder trajectories can be selected. On theone hand, this allows to test the harbor protection system alonga specific path, while, on the other hand, it does not considersituations in which the intruder strategy dynamically changesduring the incursion. The intruder trajectories are defined as asequence of points and can be defined using a drag-and-drop
CAITI et al.: A GIS-BASED SIMULATION TOOL TO ASSESS CIVILIAN HARBOR PROTECTION LEVELS 91
Fig. 3. BoS placed on the sea bottom: PD 100% for ranges smaller than water depth, 0% otherwise.
Fig. 4. PB on-board FLS: geometric modeling of the PD and classificationfunctions. The picture shows various values that the user can set. Different setsof values can be set to differentiate the PD from the PC.
graphical interface directly on the map or can be automaticallygenerated by the tool itself (Monte Carlo simulation).
IV. SOFTWARE ARCHITECTURE
This section gives a brief overview of the software architec-ture of the simulator, which has been developed to implementthe features described in the previous sections. Section IV-D fo-cuses on the types of the results that the simulator is able toproduce after each simulation run.The software runs under Microsoft Windows Operating Sys-
tems and it was developed in Visual Studio 2005 using C# asprogramming language. All the GIS features of the simulatorare based on the ESRI MapObject 2.4 libraries.The added value of the proposed tool is represented by the
interaction between a GIS architecture, sensor mathematicalmodels, and an event-driven simulator in order to obtain a de-tailed description of the underwater anti-intrusion behavior inthe specific harbor scenario with respect to the selected threat.To reflect these functionalities, the software architecture is
divided into three modules to separate the elements that are
Fig. 5. Software architecture: the simulator is divided into three modules: 1) aGIS module to manage inputs and maps; 2) an EDS module to perform all theoperations related to dynamic simulations; and 3) an SS module responsible forsensors simulations.
conceptually very different (see Fig. 5): the first module called“GIS” module; the second module called “event-driven simu-lator (EDS)”; and the third module called the “sensors simulator(SS).” Each system is, in turn, divided into several subsystemsto implement different features.
A. GIS Module
The GIS module is responsible for handling maps and userinputs and it is divided into three submodules.1) Operator Interface: It represents the simulator graphical
user interface (GUI) and it allows access to all the software fea-tures such as:• loading information on environment, sensors, threats, PBs,etc;
• choosing the desired type of simulation;• accessing the cartographic and environmental database;• viewing the computed simulation results (seeSection IV-D).

92 IEEE JOURNAL OF OCEANIC ENGINEERING, VOL. 37, NO. 1, JANUARY 2012
Fig. 6. Composition, according to (5), of the PDs of two active sonars mod-eled using ESPRESSO to obtain the overall PD in the harbor area. The coloredregion represents the resulting PD map. In the picture, black contours representbathymetric lines.
2) GIS Database: The GIS database stores all the geograph-ical and environmental information, including shorelines andbathymetric data, weather conditions (temperature, rainfalls,etc.), SVPs, seabed types, etc.3) GIS Engine: The GIS engine is the GIS module core. It
connects all the submodels together to create a complex anti-intrusion scenario. It handles the GIS maps. It allows objectsplacement using custom symbols for sensors, threats, and PBs.It updates the scenario during a dynamic simulation, and finallyplots the results at the end.
B. Event-Driven Simulator
The EDS module manages a dynamic simulation using anevent-driven architecture in which all the objects are executedonly when there is a change in their state. The simulator operatesby maintaining a queue of scheduled events, and the occurrenceof one event (e.g., intruder detection) may cause later events tobe scheduled in the queue (e.g., PB activation for detailed reac-quisition). The simulator runs until the event queue is emptyor until either the intruder is arrested or the HVA has been de-stroyed. The EDS implements a pseudo-Monte-Carlo simulatorwhich takes the threat trajectory, the nominal or simulated sen-sors PDs, and the PB models to run a simulation. In this case,the result of each run of the simulation depends on both sen-sors and the PB performance as defined in terms of detectionand classification probabilities. No false alarms are consideredat this stage, as their influence was already considered duringthe definition of the sensors PDs. Each different run within aMonte Carlo simulation extracts random samples considering auniform probability distribution within the computed PD levelsof the map. For instance, assuming that the threat is within anarea where the PD map has computed a PD of 70%, at eachacquisition event, a random number between 0 and 1 is gener-ated from a uniform probability distribution, and the “detected”event is generated if such a number is below 0.7.
Fig. 7. Scenario used in the first simulation: Final sensor layout choice andrelated area coverage. The distance of the DDS from the standoff circle is rep-resented by . The HVA is in position (100, 900) m.
C. Sensors Simulator Module
The sensor simulator module is the part of the software thatallows the simulation of acoustic andmagnetic sensors using thecorresponding mathematical model and is in accordance withthe specific geographical and environmental data loaded.
D. Provided Results
The system returns two types of results (displayed throughthe operator interface GUI): static results represented by themaps of the area coverage that describe the overall detectionprobability in the harbor area as dependent on the environ-ment, the chosen sensors deployment, and the intruders (seeSection III-D); and dynamic results obtained as the output ofthe Monte Carlo simulations, which provide some figures ofmerit (performance graphs) to sum up the surveillance systembehavior. These two kinds of results are described in the fol-lowing, pointing out how they can be useful in modifying orsetting up a new anti-intrusion deployment.1) Static Results—Detection Probability Maps: The simu-
lator can produce a map of the area coverage guaranteed by thechosen anti-intrusion configuration in terms of combined PDs(either nominal or simulated) starting from the PD of the varioussensors. In particular, it is assumed that the PDs of each sensorare independent from each other. Hence, for a given spatial po-sition, the probability of detecting the intruder at that positionis given by the probability that at least one of the sensors is de-tecting the intruder.
CAITI et al.: A GIS-BASED SIMULATION TOOL TO ASSESS CIVILIAN HARBOR PROTECTION LEVELS 93
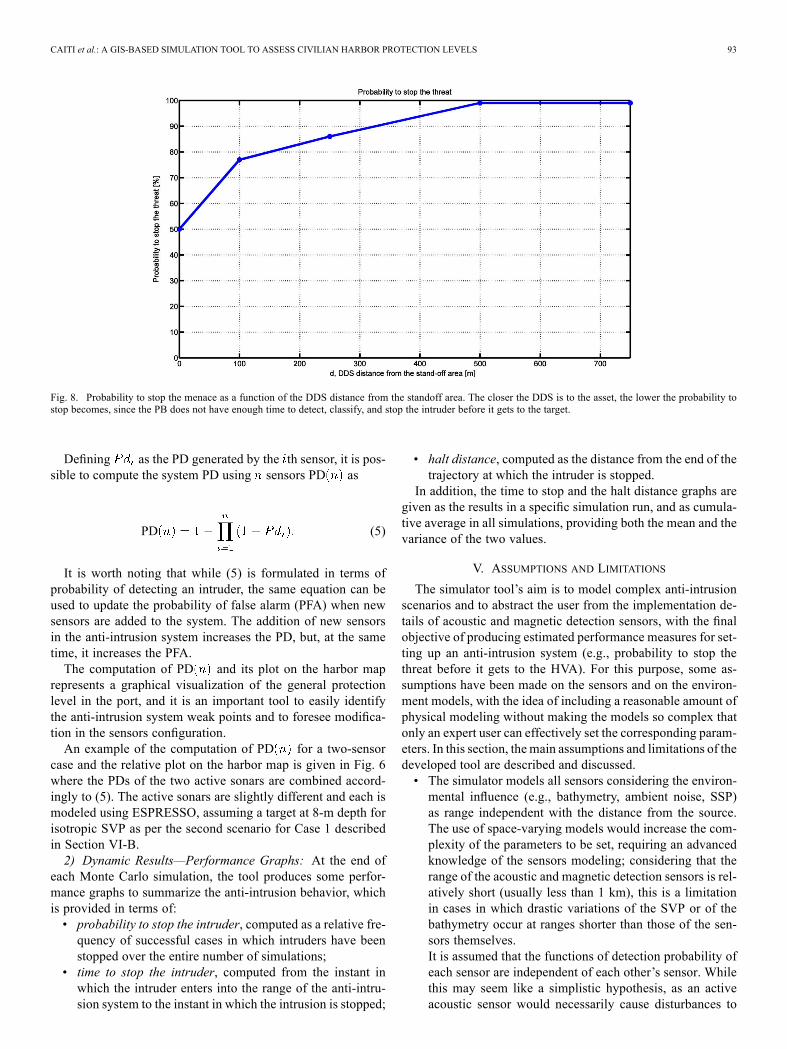
Fig. 8. Probability to stop the menace as a function of the DDS distance from the standoff area. The closer the DDS is to the asset, the lower the probability tostop becomes, since the PB does not have enough time to detect, classify, and stop the intruder before it gets to the target.
Defining as the PD generated by the th sensor, it is pos-sible to compute the system PD using sensors PD as
PD (5)
It is worth noting that while (5) is formulated in terms ofprobability of detecting an intruder, the same equation can beused to update the probability of false alarm (PFA) when newsensors are added to the system. The addition of new sensorsin the anti-intrusion system increases the PD, but, at the sametime, it increases the PFA.The computation of PD and its plot on the harbor map
represents a graphical visualization of the general protectionlevel in the port, and it is an important tool to easily identifythe anti-intrusion system weak points and to foresee modifica-tion in the sensors configuration.An example of the computation of PD for a two-sensor
case and the relative plot on the harbor map is given in Fig. 6where the PDs of the two active sonars are combined accord-ingly to (5). The active sonars are slightly different and each ismodeled using ESPRESSO, assuming a target at 8-m depth forisotropic SVP as per the second scenario for Case 1 describedin Section VI-B.2) Dynamic Results—Performance Graphs: At the end of
each Monte Carlo simulation, the tool produces some perfor-mance graphs to summarize the anti-intrusion behavior, whichis provided in terms of:• probability to stop the intruder, computed as a relative fre-quency of successful cases in which intruders have beenstopped over the entire number of simulations;
• time to stop the intruder, computed from the instant inwhich the intruder enters into the range of the anti-intru-sion system to the instant in which the intrusion is stopped;
• halt distance, computed as the distance from the end of thetrajectory at which the intruder is stopped.
In addition, the time to stop and the halt distance graphs aregiven as the results in a specific simulation run, and as cumula-tive average in all simulations, providing both the mean and thevariance of the two values.
V. ASSUMPTIONS AND LIMITATIONS
The simulator tool’s aim is to model complex anti-intrusionscenarios and to abstract the user from the implementation de-tails of acoustic and magnetic detection sensors, with the finalobjective of producing estimated performance measures for set-ting up an anti-intrusion system (e.g., probability to stop thethreat before it gets to the HVA). For this purpose, some as-sumptions have been made on the sensors and on the environ-ment models, with the idea of including a reasonable amount ofphysical modeling without making the models so complex thatonly an expert user can effectively set the corresponding param-eters. In this section, themain assumptions and limitations of thedeveloped tool are described and discussed.• The simulator models all sensors considering the environ-mental influence (e.g., bathymetry, ambient noise, SSP)as range independent with the distance from the source.The use of space-varying models would increase the com-plexity of the parameters to be set, requiring an advancedknowledge of the sensors modeling; considering that therange of the acoustic and magnetic detection sensors is rel-atively short (usually less than 1 km), this is a limitationin cases in which drastic variations of the SVP or of thebathymetry occur at ranges shorter than those of the sen-sors themselves.It is assumed that the functions of detection probability ofeach sensor are independent of each other’s sensor. Whilethis may seem like a simplistic hypothesis, as an activeacoustic sensor would necessarily cause disturbances to
94 IEEE JOURNAL OF OCEANIC ENGINEERING, VOL. 37, NO. 1, JANUARY 2012
Fig. 9. (a) DDS-only case and (b) DDS with a BoS and a PHB.
other sensors, both active and passive, the inclusion of sucha correlation is very challenging and still an open problemwithin the acoustic community. In any case, it is possible toinclude other sensor disturbances before computing the de-tection probability function of each sensor, modifying cor-respondingly an SNR degradation parameter. In this case,the PD will be computed as independent but it will in factbe related to the other sensors activities.
• The impact of tides on the performance is not directly mod-eled in the simulator. However, it is possible to approx-imate the dynamic change of sea level due to tides as asequence of static snapshots, running one simulation perscenario (i.e., per variation of water depth).
• The ESPRESSO acoustic model deals with noise in twoways: selecting one of the three light, medium, or heavydeep-ocean Wenz ambient-noise curves or the user mayspecify the ambient noise manually. These data, uniquefor the whole scenario, are used to compute the detectionprobability associated to each sensor. More specific effects(e.g., ship wakes) are not modeled.
• Each sensor in the system is characterized by a FAP and thesimulator computes the anti-intrusion system’s total FAPusing an equation similar to (5) where the FAP substitutesthe PD.
VI. SIMULATIVE RESULTS
In this section, several anti-intrusion scenarios are modeledwithin the simulator and the performance of different sensorsconfiguration is compared.
A. Sensor Deployment
The first scenario investigates the preferred deployment of aDDS in shallow waters. The problem is formally cast as an op-timization problem with respect to model performance predic-tions. It is clear that the “optimized” deployment of the sensoras resulting from the simulator output may not be such as inthe field, depending on the limiting assumptions described inSection V. In this DDS deployment scenario, the focus is not onthe performance of the detection sonars, but it is on how a mod-ification of the system, in terms of sensor placement, can helpimprove the anti-intrusion capability, and on how PBs reacquisi-tion performance is related to the fixed sensor performance. Forthis reason, the acoustic sensors are all modeled using their nom-inal values as read from commercial sonars datasheets and theyare not simulated using the acoustic models as no geograph-ical or environmental effects are considered. The scenario (seeFig. 7) consists of a linear coastline with an industrial asset tobe protected on shore. The bottom is flat here, with a depth of15 m. A standoff circle (dashed) with a radius of 150 m is alsoindicated, representing the area into which the threat should notenter in any case.The scenario represents a typical situation in which it is nec-
essary to limit the cost of the anti-intrusion system, minimizingthe number of sensors, while maximizing the protection level.On this base, we first analyze the performance of only one om-nidirectional active acoustic sensor, the DDS, with respect to itsposition on the scenario and to different intruders trajectories,and then, we increase the complexity adding a BoS to see howthe performance changes. One PB is also available as a reactivecomponent of the anti-intrusion system and it is moored closeto the HVA.
CAITI et al.: A GIS-BASED SIMULATION TOOL TO ASSESS CIVILIAN HARBOR PROTECTION LEVELS 95
Fig. 10. Probability to stop the threat as a function of the intruder angle of attack. The solid line represents the DDS-only case; the dashed line represents the DDSBoS case. Note that in the case with DDS BoS, the presence of a PHB limits intruders’ trajectories to an attack angle greater or equal to 30 .
Fig. 11. Average stopping distance from the target as a function of the intruder angle of attack. The solid line represents the DDS-only case; the dashed linerepresents the DDS BoS case. The standoff distance is represented by the dotted line.
In particular, the following are the selected characteristics forvarious components of the scenario. The sonar characteristicsare based on commercially available sonars, and are here sim-plified. No false alarms are considered in the Monte Carlo runs.• DDS: placed on the sea bottom, with 360 coverage and aconstant detection probability of 90% up to a range of 500m and for each depth from 0 to 15 m.
• PB: approaching speed to the alarm point: 7.5 m/s; searchspeed for reacquisition with FLS: 2m/s; activation distancefrom the alarm point of the search mode: 150 m; activationdelay: 150 s (it adds up all the time delays in PB operation,as track formation time with any sensor, time for PB tounlock, start its engine and go full speed, time to slow downand activate its sonar); deterrence time: 60 s (time to deterthe threat).
• PB FLS: horizontal aperture 120 ; constant detection prob-ability 90% up to a range of 100m, then linearly decreasingto 0% at a distance of 150 m, for any depth from 0 to 15 m;constant classification probability 70% up to a range of 40m, then linearly decreasing to 0% at 50 m, for any depthfrom 0 to 15 m; detection/classification time 90 s; max-imum time search 100 s.
• Threat: one intruder moving along a strait course towardsthe target, at a depth of 5 m and at a speed of 1.5 m/s (as adiver with scooter).
1) Case 1: DDSDistance Optimization for 90 Intrusion Tra-jectories: When just one DDS is available, the position thatmaximizes the protection of the asset is closely related to theperformance of the PB, the component of the system which isresponsible for stopping the threat before it gets to the HVA. For

96 IEEE JOURNAL OF OCEANIC ENGINEERING, VOL. 37, NO. 1, JANUARY 2012
Fig. 12. Average time to stop the threat as a function of the intruder angle of attack. The solid line represents the DDS-only case; the dashed line represents theDDS BoS case. The average time to stop the menace is not defined in the DDS-only case for angles smaller than 35 as the probability to stop the threat andthe halt distance are zero.
Fig. 13. Solid line: winter (isospeed) SSP. Dashed line: summer SSP with a main thermocline. The profiles are used to compare the protection system performancewith varying oceanic variables.
this reason, when the DDS is very close to the HVA ( closeto zero), it is able to cover all the possible intrusion trajecto-ries, but it may not be able to generate the alarm soon enoughto allow the PB to get to the alarm point, start the reacquisition,and finally stop the threat in time. On the other hand, moving theDDS farther away from the coast permits to generate the alarmearly enough for the vessel to successfully stop the threat butleaves uncovered regions. Fig. 8 shows how the probability tostop an intrusion coming with an attack angle of 90 CW fromnorth varies as a function of the DDS distance from the standoffcircle (results from Monte-Carlo-like simulations with 50 runsper each distance chosen). Placing the sonar at 500 m from thestandoff area allows to maximize the probability to stop the in-trusion when it comes with an attack angle of 90 CW fromnorth and it is the closest position to the HVA, which allows to
cover the lateral directions as much as possible. It is also worthnoting that not only does the DDS leave unprotected trajecto-ries, but also the closer the intruder’s path is to the border of thedetection area (sonar’s maximum range), the shorter the intrudertrajectory stays within the covered area and, consequently, thepoorer the surveillance is.2) Case 2: Angles of Attack Degradation for DDS: The sce-
nario with the DDS placed at 500 m from the standoff line hasbeen tested in the simulation with intruder’s attack angles equalto 90 , 70 , 50 , 45 , 35 , 30 CW from north [Fig. 9(a)]. Notethat, as explained before, small angles of attack correspond tothe situation in which the sonar is poorly effective. The resultsare summarized in Figs. 10–12, indicating the average proba-bility of stopping the threat, the halt distance, and the time tostop, each versus the attack angle (the standoff distance is 150
CAITI et al.: A GIS-BASED SIMULATION TOOL TO ASSESS CIVILIAN HARBOR PROTECTION LEVELS 97
Fig. 14. Sonar 1 detection probability function as computed by the ESPRESSO code in summer for case 1. For depths greater than 7.5 m, the decrease in perfor-mance due to the presence of the thermocline is particularly evident. The source is placed at 9.7 m and the bottom is at 10.7-m depth. Note that the acoustic codeused performed a smoothing of the simplified summer SVP shown in Fig. 13 and the effect of the thermocline is visible before 10 m. The detection probability ofsonar 1 for case 2 is shown in Fig. 1(c).
Fig. 15. Second simulated scenario characterized by a complex shoreline and adetailed bathymetric profile. Two active sonars and a PB compose the anti-intru-sion system. The colored region corresponds to the computation of the systemdetection probability with a winter-like SSP (see Fig. 13). The dashed lines rep-resent the area where the intrusions arrive: red dashed–dotted lines representintruders’ trajectories.
m). The results show that the probability of stopping decreasesdrastically as the attack angle decreases: as expected, the closerthe intruder moves to the circle edge, the less data the sonar canprovide to the PB, and hence the less effective the anti-intrusionsystem is. For attack angles lower than 30 CW, no coverage isprovided.3) Case 3: Modifying the Anti-Intrusion Configuration:
The anti-intrusion configuration is now modified [Fig. 9(b)]inserting a BoS and a PHB, as it is usually cheaper than addinganother DDS. Note that a similar placement should be foreseenon the symmetrical side of the asset, but it is not shown inFig. 9. The insertion of the PHB and of the BoS takes care ofsmall attack angles by forcing the threat to pass the PHB farfrom shore and hence to transit over the array. Even though the
Fig. 16. The same scenario represented in Fig. 15 but now the colored re-gion corresponds to the computation of the system detection probability witha summer SSP (see Fig. 13). From a comparison between the two pictures, thedecrease in performance due to the sound-speed variation is clear.
intruder passes in area characterized by poor sonar’s coverage,the early warning of the BoS effectively gives the PB someextra time to intercept the threat. Note that the 30 attack angleintruder trajectory just grazes the DDS range; this implies thatin this case detection and classifications are limited by thePB characteristics with a probability of stopping close to theclassification probability of the PB instrument. The cases ofcorrect classification, though, lead to a halt distance that islarger than the one of the 35 attack angle, in which both DDSand PB cooperate. Figs. 10–12 show the comparison betweenthe DDS-only case and the DDS plus BoS scenario. Note thatwhen the attack angle is greater than 45 , the two cases coincideas the DDS is the only instrument able to detect the intruder.In this case, in fact, the difference in performance is withinthe statistical variance of the Monte-Carlo-like simulationsperformed.
98 IEEE JOURNAL OF OCEANIC ENGINEERING, VOL. 37, NO. 1, JANUARY 2012
Fig. 17. Modification in the sensor deployment. The new location of sonar 1makes it less affected by the environmental change raising its detection rangeand hence the overall harbor protection.
B. Variation of Environmental Variables
In the second scenario, we evaluate how a protection systemis affected by variations in environmental variables, and in par-ticular, we highlight the relation between seasonal changing ofthe SVP and the system performance. Two simplified SVPsare used (see Fig. 13): one representative for the winter season(isovelocity), and one with a typical shape as in summer char-acterized by a main thermocline.The analyzed scenario (case 1) consists of a complex coast-
line and bathymetry (see Fig. 15) with a sea bottom character-ized asmedium sand in the whole harbor; the considered volumescattering strength is constant and equal to 80 dB. Fair weatherconditions are considered with 1 kn of wind and no rain. Twoactive sonars and one PB for reacquisition compose the anti-in-trusion system.• Sonars: Both sonars are characterized by the followingnominal performance (based on commercially availablesonars): constant nominal detection probability of 90% upto the maximum range and for each depth from 0 to thesea bottom; their working frequency is 100 kHz witha pulse length of 0.1 ms and a transmitter source level of220 dB// Pa@1 m. The transmitter vertical beam width is15 . Finally, the receiver has a horizontal beamwidth of2.5 , a bandwidth of 10 kHz, and a directivity index of 30dB.Sonar 1 is placed at 9.7 m, on the sea bottom, and has amaximum nominal range of 1000 m. Its horizontal apertureis 140 . Sonar 2 is placed at 8.2 m, on the seabed, with anominal range of 500 m, and it is characterized by a 90horizontal coverage.
• PB: The PB is equipped with an FLS whose character-istics are the same of the ones already reported for thefirst simulated scenario (see Section VI-A). The vehicleapproaching speed to the alarm point is 7.5 m/s and thesearching speed for reacquisition is 2 m/s; activation dis-tance from the alarm point of the searching phase: 150 m;activation delay: 90 s; time to deter the threat: 60 s.
The system was tested with Monte Carlo simulations against anintruder characterized by an acoustic target strength TS 20dB, moving at a depth of 8 m and at a speed of 1.5 m/s andfollowing trajectories with angles of attack between 180 and240 , measured CW from north (see Fig. 15). Note that no intru-sion trajectories with greater angles are considered; in practice,this can be obtained, for instance, because of the presence ofa PHB, which forces the intruders to modify their approachingroutes.The variation in the detection performance, in terms of overall
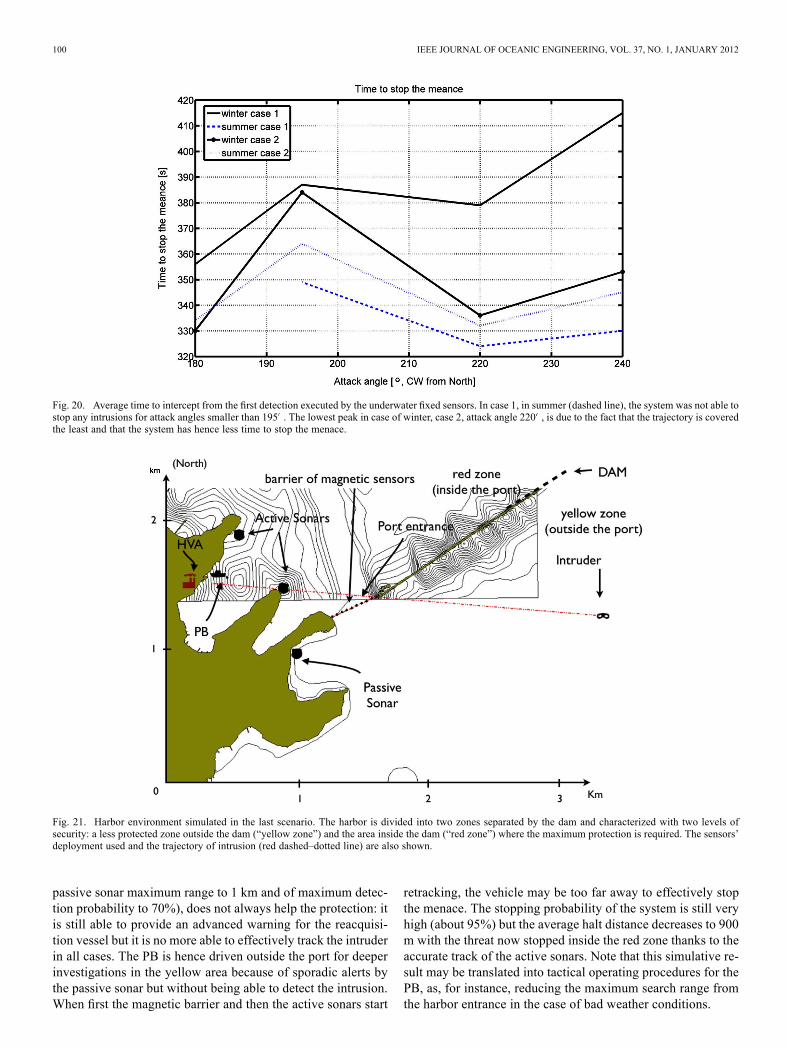
PD in the two seasons, is shown by Figs. 15 and 16. The system,as depicted in Fig. 18–20 (case 1), performs much better inwinter than in summer. In this latter case, in fact, sonar 1 de-creases its performance in the whole water column, and in par-ticular, it severely reduces its detection range for depths greaterthan 7.5 m because of the presence of a thermocline very closeto the sea bottom (see Fig. 14). The reduction in performanceof sonar 1 is translated into a loss of efficiency for the wholesystem, which becomes inadequate for the harbor protection,especially for small angles of attacks (intruders coming fromsouth). Modifying the sensor configuration (case 2) it is pos-sible to increase the security level in summer: moving sonar 1closer to the asset in a shallower area (sonar 1 depth at new posi-tion is 7 m), as shown in Fig. 17, makes the device less affectedby the environmental change increasing its detection range [seealso Fig. 1(b) and (c) where the sonar 1 transmission loss andthe detection probability function for case 2 are shown as a func-tion of depth and range], but also gives less time to the surfacevehicle for reacquisition. In this case, the probability to stop thethreat goes above 40% for all the trajectories considered witha minimum halt distance of 80 m from the HVA. In winter, themodified system has better performance than in summer, but thenew position of sonar 1, very close to the HVA,makes it not ableto alert the PB with an adequate warning causing a general de-crease in performance with respect to the previous configurationfor all trajectories except for those coming with an attack angleof 180 (south). In case 1 of winter configuration, the intruderarriving from south passes first inside the high probability areaof sonar 2 and then moves within an area characterized by alower level of PD. In case 2, all intrusion trajectories comingfrom south become much more protected. Interestingly, for in-truders coming with attack angle equal to 240 , the inability ofsonar 1 in the new configuration (case 2) to give the PB an earlywarning has a bigger impact on the overall protection than thedecrease of performance in summer.The probability to stop the menace as a function of the in-
truder’s attack angle, the average halt distance, and the averagetime to intercept are shown for both seasons and for both sensordeployments, respectively, in Figs. 18–20.
C. Multisensors Harbor Protection Systems
One last scenario is simulated to show a more complex anti-intrusion system composed of active and passive acoustic sonarsand a barrier of magnetic sensors. In this case, the marine areais divided into two areas characterized by two different levels ofprotection (Fig. 21): a “yellow zone,” external to the harbor, inwhich a less accurate surveillance can be tolerated, and a “redzone,” in which the maximum security level is required. The

CAITI et al.: A GIS-BASED SIMULATION TOOL TO ASSESS CIVILIAN HARBOR PROTECTION LEVELS 99
Fig. 18. Average probability to stop the threat obtained with Monte-Carlo-like simulations (50 runs per attack angle). As expected, the winter performance isalways better than the summer one in both cases. With the sensor deployment of case 2 (sonar 1 closer to the HVA; see Fig. 17) there is a general increase of theperformance in summer. In case 1, in summer (dashed line), the system was not able to stop any intrusions for attack angles smaller than 195 .
Fig. 19. Average halt distance obtained with Monte-Carlo-like simulations (50 runs per attack angle) from the HVA at which the threat is stopped. Case 1 corre-sponds to the sensor deployment shown Fig. 15, case 2 to the configuration depicted in Fig. 17. In case 1, in summer (dashed line), the system was not able to stopany intrusions for attack angles smaller than 195 .
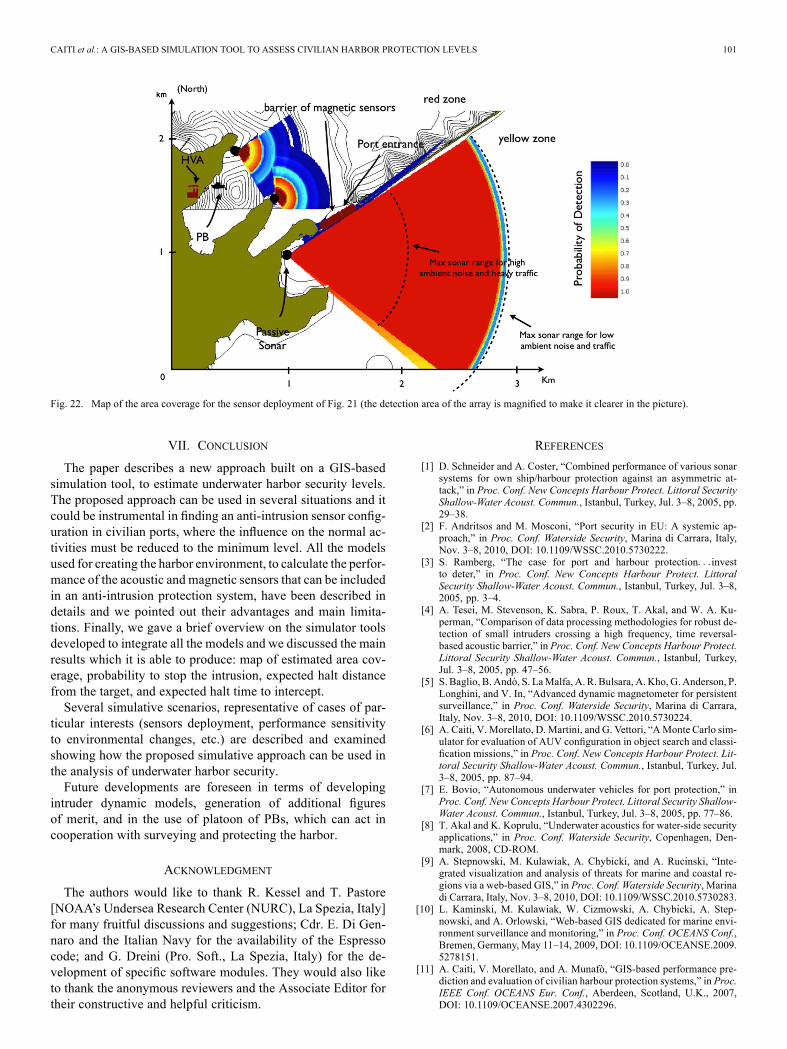
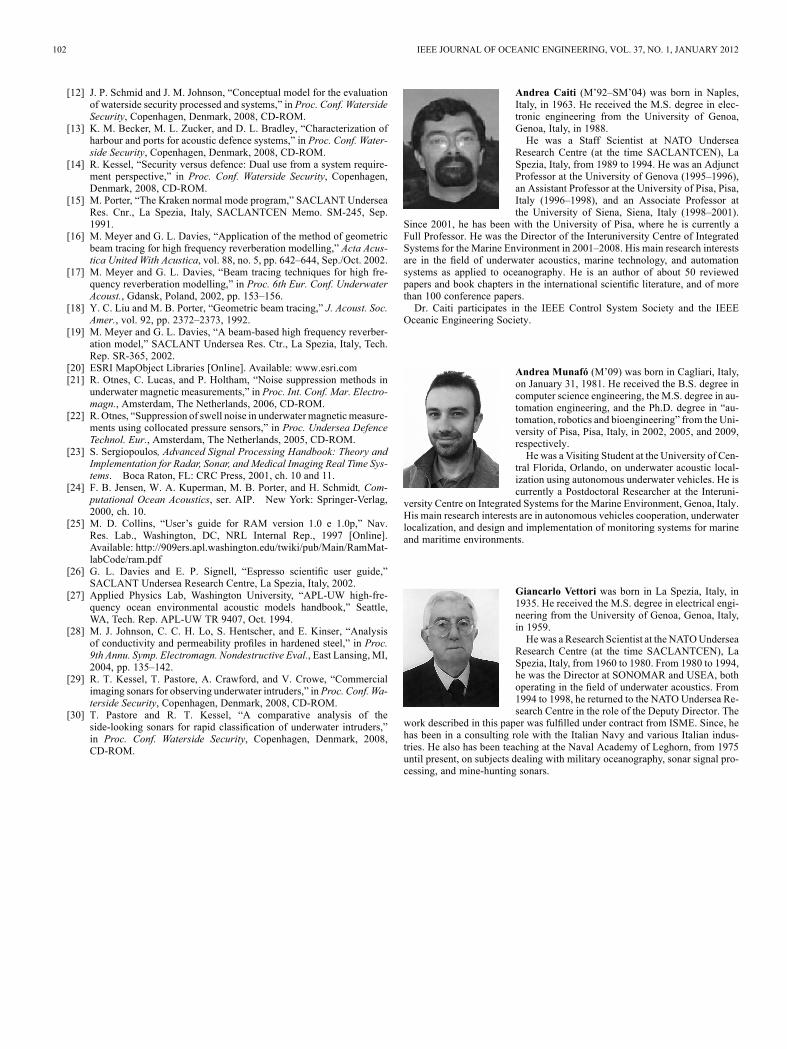
protection system is realized using a long range passive acousticsonar outside the port to protect the yellow zone (working fre-quency 437 Hz, bandwidth 309 Hz, directivity indexDI 9 dB, degradation factor DF 6 dB); two active sonars(operative characteristics as in Section VI-B, variation of en-vironmental variables) inside the harbor, in the red zone, fora more accurate tracking and localization, and finally using abarrier of magnetic sensors as a proximity sensor to detect theintruder’s entrance within the harbor area. Finally, a PB withthe same characteristics of the previous cases is used as reac-tive element, and it is moored close to the HVA inside the port.Fig. 22 shows the scenario and the obtained detection proba-
bility using a winter-like SVP (see Fig. 13), good weather con-ditions (no wind and no rain), and a low traffic level. The systemperformance, evaluated with pseudo-Monte-Carlo simulations(30 runs) with respect to an intruder coming with an angle ofabout 90 at a depth of 6 m and at 1.5 m/s, is characterized bya 100% stopping probability and a halt distance of 2 km, as thePB is always able to stop the menace outside the harbor, in theyellow area, thanks to the very advanced warning provided bythe passive sonar. Increasing the ambient noise and the trafficlevel (wind: 4 kn, rain: 10 mm/h, heavy traffic conditions) de-grades the general system performance and the use of the pas-sive sonar, which is the most affected device (decrease of the
100 IEEE JOURNAL OF OCEANIC ENGINEERING, VOL. 37, NO. 1, JANUARY 2012
Fig. 20. Average time to intercept from the first detection executed by the underwater fixed sensors. In case 1, in summer (dashed line), the system was not able tostop any intrusions for attack angles smaller than 195 . The lowest peak in case of winter, case 2, attack angle 220 , is due to the fact that the trajectory is coveredthe least and that the system has hence less time to stop the menace.
Fig. 21. Harbor environment simulated in the last scenario. The harbor is divided into two zones separated by the dam and characterized with two levels ofsecurity: a less protected zone outside the dam (“yellow zone”) and the area inside the dam (“red zone”) where the maximum protection is required. The sensors’deployment used and the trajectory of intrusion (red dashed–dotted line) are also shown.
passive sonar maximum range to 1 km and of maximum detec-tion probability to 70%), does not always help the protection: itis still able to provide an advanced warning for the reacquisi-tion vessel but it is no more able to effectively track the intruderin all cases. The PB is hence driven outside the port for deeperinvestigations in the yellow area because of sporadic alerts bythe passive sonar but without being able to detect the intrusion.When first the magnetic barrier and then the active sonars start
retracking, the vehicle may be too far away to effectively stopthe menace. The stopping probability of the system is still veryhigh (about 95%) but the average halt distance decreases to 900m with the threat now stopped inside the red zone thanks to theaccurate track of the active sonars. Note that this simulative re-sult may be translated into tactical operating procedures for thePB, as, for instance, reducing the maximum search range fromthe harbor entrance in the case of bad weather conditions.
CAITI et al.: A GIS-BASED SIMULATION TOOL TO ASSESS CIVILIAN HARBOR PROTECTION LEVELS 101
Fig. 22. Map of the area coverage for the sensor deployment of Fig. 21 (the detection area of the array is magnified to make it clearer in the picture).
VII. CONCLUSION
The paper describes a new approach built on a GIS-basedsimulation tool, to estimate underwater harbor security levels.The proposed approach can be used in several situations and itcould be instrumental in finding an anti-intrusion sensor config-uration in civilian ports, where the influence on the normal ac-tivities must be reduced to the minimum level. All the modelsused for creating the harbor environment, to calculate the perfor-mance of the acoustic and magnetic sensors that can be includedin an anti-intrusion protection system, have been described indetails and we pointed out their advantages and main limita-tions. Finally, we gave a brief overview on the simulator toolsdeveloped to integrate all the models and we discussed the mainresults which it is able to produce: map of estimated area cov-erage, probability to stop the intrusion, expected halt distancefrom the target, and expected halt time to intercept.Several simulative scenarios, representative of cases of par-
ticular interests (sensors deployment, performance sensitivityto environmental changes, etc.) are described and examinedshowing how the proposed simulative approach can be used inthe analysis of underwater harbor security.Future developments are foreseen in terms of developing
intruder dynamic models, generation of additional figuresof merit, and in the use of platoon of PBs, which can act incooperation with surveying and protecting the harbor.
ACKNOWLEDGMENT
The authors would like to thank R. Kessel and T. Pastore[NOAA’s Undersea Research Center (NURC), La Spezia, Italy]for many fruitful discussions and suggestions; Cdr. E. Di Gen-naro and the Italian Navy for the availability of the Espressocode; and G. Dreini (Pro. Soft., La Spezia, Italy) for the de-velopment of specific software modules. They would also liketo thank the anonymous reviewers and the Associate Editor fortheir constructive and helpful criticism.
REFERENCES
[1] D. Schneider and A. Coster, “Combined performance of various sonarsystems for own ship/harbour protection against an asymmetric at-tack,” in Proc. Conf. New Concepts Harbour Protect. Littoral SecurityShallow-Water Acoust. Commun., Istanbul, Turkey, Jul. 3–8, 2005, pp.29–38.
[2] F. Andritsos and M. Mosconi, “Port security in EU: A systemic ap-proach,” in Proc. Conf. Waterside Security, Marina di Carrara, Italy,Nov. 3–8, 2010, DOI: 10.1109/WSSC.2010.5730222.
[3] S. Ramberg, “The case for port and harbour protection investto deter,” in Proc. Conf. New Concepts Harbour Protect. LittoralSecurity Shallow-Water Acoust. Commun., Istanbul, Turkey, Jul. 3–8,2005, pp. 3–4.
[4] A. Tesei, M. Stevenson, K. Sabra, P. Roux, T. Akal, and W. A. Ku-perman, “Comparison of data processing methodologies for robust de-tection of small intruders crossing a high frequency, time reversal-based acoustic barrier,” in Proc. Conf. New Concepts Harbour Protect.Littoral Security Shallow-Water Acoust. Commun., Istanbul, Turkey,Jul. 3–8, 2005, pp. 47–56.
[5] S. Baglio, B. Andò, S. LaMalfa, A. R. Bulsara, A. Kho, G. Anderson, P.Longhini, and V. In, “Advanced dynamic magnetometer for persistentsurveillance,” in Proc. Conf. Waterside Security, Marina di Carrara,Italy, Nov. 3–8, 2010, DOI: 10.1109/WSSC.2010.5730224.
[6] A. Caiti, V. Morellato, D. Martini, and G. Vettori, “AMonte Carlo sim-ulator for evaluation of AUV configuration in object search and classi-fication missions,” in Proc. Conf. New Concepts Harbour Protect. Lit-toral Security Shallow-Water Acoust. Commun., Istanbul, Turkey, Jul.3–8, 2005, pp. 87–94.
[7] E. Bovio, “Autonomous underwater vehicles for port protection,” inProc. Conf. New Concepts Harbour Protect. Littoral Security Shallow-Water Acoust. Commun., Istanbul, Turkey, Jul. 3–8, 2005, pp. 77–86.
[8] T. Akal and K. Koprulu, “Underwater acoustics for water-side securityapplications,” in Proc. Conf. Waterside Security, Copenhagen, Den-mark, 2008, CD-ROM.
[9] A. Stepnowski, M. Kulawiak, A. Chybicki, and A. Rucinski, “Inte-grated visualization and analysis of threats for marine and coastal re-gions via a web-based GIS,” in Proc. Conf. Waterside Security, Marinadi Carrara, Italy, Nov. 3–8, 2010, DOI: 10.1109/WSSC.2010.5730283.
[10] L. Kaminski, M. Kulawiak, W. Cizmowski, A. Chybicki, A. Step-nowski, and A. Orlowski, “Web-based GIS dedicated for marine envi-ronment surveillance and monitoring,” in Proc. Conf. OCEANS Conf.,Bremen, Germany, May 11–14, 2009, DOI: 10.1109/OCEANSE.2009.5278151.
[11] A. Caiti, V. Morellato, and A. Munafò, “GIS-based performance pre-diction and evaluation of civilian harbour protection systems,” in Proc.IEEE Conf. OCEANS Eur. Conf., Aberdeen, Scotland, U.K., 2007,DOI: 10.1109/OCEANSE.2007.4302296.
102 IEEE JOURNAL OF OCEANIC ENGINEERING, VOL. 37, NO. 1, JANUARY 2012
[12] J. P. Schmid and J. M. Johnson, “Conceptual model for the evaluationof waterside security processed and systems,” in Proc. Conf. WatersideSecurity, Copenhagen, Denmark, 2008, CD-ROM.
[13] K. M. Becker, M. L. Zucker, and D. L. Bradley, “Characterization ofharbour and ports for acoustic defence systems,” in Proc. Conf. Water-side Security, Copenhagen, Denmark, 2008, CD-ROM.
[14] R. Kessel, “Security versus defence: Dual use from a system require-ment perspective,” in Proc. Conf. Waterside Security, Copenhagen,Denmark, 2008, CD-ROM.
[15] M. Porter, “The Kraken normal mode program,” SACLANT UnderseaRes. Cnr., La Spezia, Italy, SACLANTCEN Memo. SM-245, Sep.1991.
[16] M. Meyer and G. L. Davies, “Application of the method of geometricbeam tracing for high frequency reverberation modelling,” Acta Acus-tica United With Acustica, vol. 88, no. 5, pp. 642–644, Sep./Oct. 2002.
[17] M. Meyer and G. L. Davies, “Beam tracing techniques for high fre-quency reverberation modelling,” in Proc. 6th Eur. Conf. UnderwaterAcoust., Gdansk, Poland, 2002, pp. 153–156.
[18] Y. C. Liu and M. B. Porter, “Geometric beam tracing,” J. Acoust. Soc.Amer., vol. 92, pp. 2372–2373, 1992.
[19] M. Meyer and G. L. Davies, “A beam-based high frequency reverber-ation model,” SACLANT Undersea Res. Ctr., La Spezia, Italy, Tech.Rep. SR-365, 2002.
[20] ESRI MapObject Libraries [Online]. Available: www.esri.com[21] R. Otnes, C. Lucas, and P. Holtham, “Noise suppression methods in
underwater magnetic measurements,” in Proc. Int. Conf. Mar. Electro-magn., Amsterdam, The Netherlands, 2006, CD-ROM.
[22] R.Otnes, “Suppression of swell noise in underwatermagneticmeasure-ments using collocated pressure sensors,” in Proc. Undersea DefenceTechnol. Eur., Amsterdam, The Netherlands, 2005, CD-ROM.
[23] S. Sergiopoulos, Advanced Signal Processing Handbook: Theory andImplementation for Radar, Sonar, and Medical Imaging Real Time Sys-tems. Boca Raton, FL: CRC Press, 2001, ch. 10 and 11.
[24] F. B. Jensen, W. A. Kuperman, M. B. Porter, and H. Schmidt, Com-putational Ocean Acoustics, ser. AIP. New York: Springer-Verlag,2000, ch. 10.
[25] M. D. Collins, “User’s guide for RAM version 1.0 e 1.0p,” Nav.Res. Lab., Washington, DC, NRL Internal Rep., 1997 [Online].Available: http://909ers.apl.washington.edu/twiki/pub/Main/RamMat-labCode/ram.pdf
[26] G. L. Davies and E. P. Signell, “Espresso scientific user guide,”SACLANT Undersea Research Centre, La Spezia, Italy, 2002.
[27] Applied Physics Lab, Washington University, “APL-UW high-fre-quency ocean environmental acoustic models handbook,” Seattle,WA, Tech. Rep. APL-UW TR 9407, Oct. 1994.
[28] M. J. Johnson, C. C. H. Lo, S. Hentscher, and E. Kinser, “Analysisof conductivity and permeability profiles in hardened steel,” in Proc.9th Annu. Symp. Electromagn. Nondestructive Eval., East Lansing, MI,2004, pp. 135–142.
[29] R. T. Kessel, T. Pastore, A. Crawford, and V. Crowe, “Commercialimaging sonars for observing underwater intruders,” in Proc. Conf. Wa-terside Security, Copenhagen, Denmark, 2008, CD-ROM.
[30] T. Pastore and R. T. Kessel, “A comparative analysis of theside-looking sonars for rapid classification of underwater intruders,”in Proc. Conf. Waterside Security, Copenhagen, Denmark, 2008,CD-ROM.
Andrea Caiti (M’92–SM’04) was born in Naples,Italy, in 1963. He received the M.S. degree in elec-tronic engineering from the University of Genoa,Genoa, Italy, in 1988.He was a Staff Scientist at NATO Undersea
Research Centre (at the time SACLANTCEN), LaSpezia, Italy, from 1989 to 1994. He was an AdjunctProfessor at the University of Genova (1995–1996),an Assistant Professor at the University of Pisa, Pisa,Italy (1996–1998), and an Associate Professor atthe University of Siena, Siena, Italy (1998–2001).
Since 2001, he has been with the University of Pisa, where he is currently aFull Professor. He was the Director of the Interuniversity Centre of IntegratedSystems for the Marine Environment in 2001–2008. His main research interestsare in the field of underwater acoustics, marine technology, and automationsystems as applied to oceanography. He is an author of about 50 reviewedpapers and book chapters in the international scientific literature, and of morethan 100 conference papers.Dr. Caiti participates in the IEEE Control System Society and the IEEE
Oceanic Engineering Society.
Andrea Munafó (M’09) was born in Cagliari, Italy,on January 31, 1981. He received the B.S. degree incomputer science engineering, the M.S. degree in au-tomation engineering, and the Ph.D. degree in “au-tomation, robotics and bioengineering” from the Uni-versity of Pisa, Pisa, Italy, in 2002, 2005, and 2009,respectively.He was a Visiting Student at the University of Cen-
tral Florida, Orlando, on underwater acoustic local-ization using autonomous underwater vehicles. He iscurrently a Postdoctoral Researcher at the Interuni-
versity Centre on Integrated Systems for the Marine Environment, Genoa, Italy.His main research interests are in autonomous vehicles cooperation, underwaterlocalization, and design and implementation of monitoring systems for marineand maritime environments.
Giancarlo Vettori was born in La Spezia, Italy, in1935. He received the M.S. degree in electrical engi-neering from the University of Genoa, Genoa, Italy,in 1959.Hewas a Research Scientist at the NATOUndersea
Research Centre (at the time SACLANTCEN), LaSpezia, Italy, from 1960 to 1980. From 1980 to 1994,he was the Director at SONOMAR and USEA, bothoperating in the field of underwater acoustics. From1994 to 1998, he returned to the NATOUndersea Re-search Centre in the role of the Deputy Director. The
work described in this paper was fulfilled under contract from ISME. Since, hehas been in a consulting role with the Italian Navy and various Italian indus-tries. He also has been teaching at the Naval Academy of Leghorn, from 1975until present, on subjects dealing with military oceanography, sonar signal pro-cessing, and mine-hunting sonars.


![1986-12-25 - Newport Harbor Ensign[Icon]](https://static.fdokumen.com/doc/165x107/631b1d25f6a8ee1ff700a4c5/1986-12-25-newport-harbor-ensignicon.jpg)